| | OMB APPROVAL |
| | OMB Number: 3235-0570 |
| | Expires: November 30, 2005 |
| | Estimated average burden
hours per response. . . . 5.0 |
UNITED STATES
SECURITIES AND EXCHANGE COMMISSION
Washington, D.C. 20549
FORM N-CSR
CERTIFIED SHAREHOLDER REPORT OF REGISTERED
MANAGEMENT INVESTMENT COMPANIES
Investment Company Act file number 811-05309
First American Investment Funds, Inc.
(Exact name of registrant as specified in charter)
800 Nicollet Mall, Minneapolis, MN | | 55402 |
(Address of principal executive offices) | | (Zip code) |
Charles D. Gariboldi 800 Nicollet Mall, Minneapolis, MN 55402
(Name and address of agent for service)
Registrant’s telephone number, including area code: 800-677-3863
Date of fiscal year end: September 30
Date of reporting period: September 30, 2004
Form N-CSR is to be used by management investment companies to file reports with the Commission not later than 10 days after the transmission to stockholders of any report that is required to be transmitted to stockholders under Rule 30e-1 under the Investment Company Act of 1940 (17 CFR 270.30e-1). The Commission may use the information provided on Form N-CSR in its regulatory, disclosure review, inspection, and policymaking roles.
A registrant is required to disclose the information specified by Form N-CSR, and the Commission will make this information public. A registrant is not required to respond to the collection of information contained in Form N-CSR unless the Form displays a currently valid Office of Management and Budget (“OMB”) control number. Please direct comments concerning the accuracy of the information collection burden estimate and any suggestions for reducing the burden to Secretary, Securities and Exchange Commission, 450 Fifth Street, NW, Washington, DC 20549-0609. The OMB has reviewed this collection of information under the clearance requirements of 44 U.S.C. Section 3507.
Item 1. Report to Shareholders

| 2004
Annual Report |
| |
| STOCK
FUNDS |
First American Stock Funds
Stocks are shares of ownership that a company sells in order to raise money to run its business. As an owner or shareholder, you take part in the company’s achievements and failures.
Stocks and stock funds offer you a number of options. Some are defined by the size of the companies they invest in, some by the style of the company, and others by where they invest – by geographic location or by industry. Because the various types of stocks outperform and underperform at different times, dividing your money among several types may help smooth out your portfolio’s returns.
TABLE OF CONTENTS
Message to Shareholders | |
Report of Independent Registered Public Accounting Firm | |
Sector Funds | |
Schedule of Investments | |
Statements of Assets and Liabilities | |
Statements of Operations | |
Statements of Changes in Net Assets | |
Financial Highlights | |
International Fund | |
Schedule of Investments | |
Statement of Assets and Liabilities | |
Statement of Operations | |
Statement of Changes in Net Assets | |
Financial Highlights | |
Small Cap Funds | |
Schedule of Investments | |
Statements of Assets and Liabilities | |
Statements of Operations | |
Statements of Changes in Net Assets | |
Financial Highlights | |
Mid Cap Funds | |
Schedule of Investments | |
Statements of Assets and Liabilities | |
Statements of Operations | |
Statements of Changes in Net Assets | |
Financial Highlights | |
Large Cap Funds | |
Schedule of Investments | |
Statements of Assets and Liabilities | |
Statements of Operations | |
Statements of Changes in Net Assets | |
Financial Highlights | |
Growth & Income Funds | |
Schedule of Investments | |
Statements of Assets and Liabilities | |
Statements of Operations | |
Statements of Changes in Net Assets | |
Financial Highlights | |
| |
Notes to Financial Statements | |
| |
Notice to Shareholders | |
Mutual fund investing involves risk; principal loss is possible.
NOT FDIC INSURED NO BANK GUARANTEE MAY LOSE VALUE
Message to SHAREHOLDERS November 15, 2004
Dear Shareholders:
We invite you to take a few minutes to review the results of the fiscal year ended September 30, 2004.
This report includes comparative performance graphs and tables, portfolio commentaries, complete listings of portfolio holdings, and additional fund information. We hope you will find this helpful in monitoring your investment portfolio.
Also, through our website, firstamericanfunds.com, we provide quarterly performance fact sheets on all First American funds, the economic outlook as viewed by our senior investment officers, and other information about fund investments and portfolio strategies.
Please contact your financial professional if you have questions about First American Funds or contact First American Investor Services at 800.677.FUND.
We appreciate your investment with First American Funds and look forward to serving your financial needs in the future.
Sincerely,
/s/ Virginia L. Stringer | | /s/ Thomas S. Schreier | |
Virginia L. Stringer | Thomas S. Schreier, Jr. |
Chairperson of the Board | President |
First American Investment Funds, Inc. | First American Investment Funds, Inc. |
1
Real Estate Securities fund
Investment Objective: to provide above-average current income and long-term capital appreciation
How did the Fund perform for the fiscal year ended September 30, 2004?
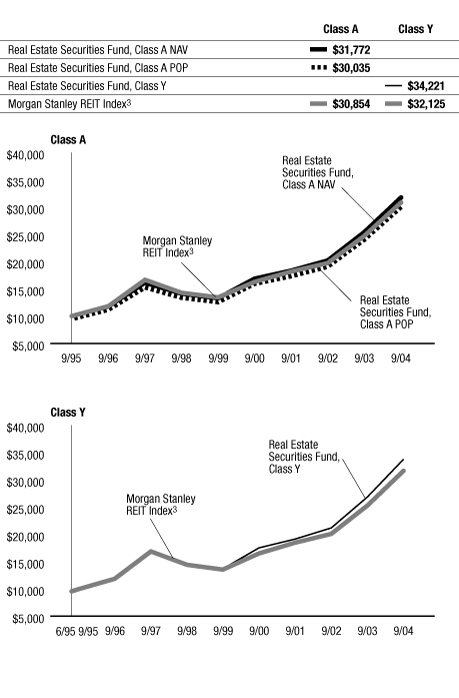
The First American Real Estate Securities Fund, Class Y shares, returned 25.33% for the fiscal year ended September 30, 2004 (Class A shares returned 24.98% at net asset value). By comparison, the Fund's benchmark, the Morgan Stanley REIT Index*, returned 24.85% for the same period.
How did general economic and market conditions affect performance?
Long-term quantitative studies show little correlation between REIT price movement and changes in the
10-year Treasury. However, as the fourth quarter of 2003 and the first quarter of 2004 saw a continued low-yield environment, REITs became the yield alternative for many investors. This changed abruptly on April 2, 2004, with the first strong employment growth numbers and a corresponding rise in interest rates, particularly that of the 10-year Treasury. From April 2, 2004, to May 10, 2004, the Morgan Stanley REIT Index lost 18.61%. Since that time, interest rates have rallied and REITs completely recovered to set a new high on the Morgan Stanley REIT Index on September 7, 2004, and closed out the fiscal year within 2% of that level.
The real estate markets need healthy job growth to generate demand for real estate space. Generally, on average, healthy job growth did not occur during the fiscal year. Thus the fundamental operating environment for most property types remains challenging. The relative strong yield characteristics of REITs was a primary driver in another strong year of stock performance.
What worked for the Fund and why?
The Fund benefited from being overweight in a number of companies that were acquired during the year: Extended Stay America, Keystone Property Group, and Chelsea Property Group. The Fund also benefited by owning and then strategically selling Equity Office Properties and Apartment Investment & Management Co. The Fund was also overweight in LaSalle Hotel Properties, which had a 12-month return of 65.69%.
What did not work for the Fund and why?
In a period when REITs were up more than 25%, even the Fund's cash position of less than 3% was detrimental to the Fund's performance. Owning two stocks not included in the Morgan Stanley REIT Index, Boardwalk Equities, Inc. and Anthracite Capital, detracted from performance.
What strategic moves were made by the Fund and why?
The Fund has increased its weighting in the hotel sector as we believe the return of the business traveler, lack of new construction, and short lease duration will create the greatest potential for growth in this REIT sector.
*Unlike mutual funds, index returns do not reflect any expenses, transaction costs, or cash flow effects.
| Top 10 Companies as of September 30, 20041 (% of net assets) | |
| Simon Property Group | | | 4.9 | % | |
| Public Storage | | | 4.2 | % | |
| Vornado Realty Trust | | | 3.8 | % | |
| Macerich | | | 3.7 | % | |
| Boston Properties | | | 3.7 | % | |
| Rouse | | | 3.5 | % | |
| Avalonbay Communities | | | 3.5 | % | |
| Essex Property Trust | | | 3.4 | % | |
| Lasalle Hotel Properties | | | 3.2 | % | |
| Apartment Investment & Management | | | 3.0 | % | |
| Sector Allocation as of September 30, 20041 (% of net assets) | |
| | | Fund2 | | Morgan Stanley
REIT Index3 | |
| Apartments | | | 12.9 | % | | | 20.5 | % | |
| Community Centers | | | 9.9 | % | | | 10.7 | % | |
| Diversified | | | 8.7 | % | | | 6.1 | % | |
| Hotels | | | 12.7 | % | | | 5.4 | % | |
| Industrial | | | 10.5 | % | | | 8.5 | % | |
| Malls | | | 15.4 | % | | | 13.9 | % | |
| Office | | | 18.9 | % | | | 27.1 | % | |
| Other | | | 2.6 | % | | | 0.8 | % | |
| Self-Storage | | | 4.2 | % | | | 4.4 | % | |
| Specialty | | | 2.9 | % | | | 2.6 | % | |
1Fund holdings and sector allocations are subject to change at any time and are not recommendations to buy or sell any security.
2The percentages shown represent the allocation by industry as a percent of net assets of the Fund.
3The percentages shown represent the percent allocation by industry of the index.
FIRST AMERICAN FUNDS Annual Report 2004
2
Real Estate Securities fund continued
| Annualized Performance1 as of September 30, 2004 | |
| | | | | Since Inception | |
| | | 1 year | | 5 years | | 6/30/1995 | | 9/29/1995 | | 2/1/2000 | | 9/24/2001 | |
| Average annual return with sales charge (POP) | | | | | | | | | | | | | | | | | | | | | | | | | |
| Class A | | | 18.12 | % | | | 17.64 | % | | | - | | | | 12.99 | % | | | - | | | | - | | |
| Class B | | | 19.06 | % | | | 17.92 | % | | | - | | | | 12.83 | % | | | - | | | | - | | |
| Class C | | | 23.12 | % | | | - | | | | - | | | | - | | | | 19.50 | % | | | - | | |
| Average annual return without sales charge (NAV) | | | | | | | | | | | | | | | | | | | | | | | | | |
| Class A | | | 24.98 | % | | | 18.99 | % | | | - | | | | 13.70 | % | | | - | | | | - | | |
| Class B | | | 24.06 | % | | | 18.13 | % | | | - | | | | 12.83 | % | | | - | | | | - | | |
| Class C | | | 24.12 | % | | | - | | | | - | | | | - | | | | 19.50 | % | | | - | | |
| Class R4 | | | 24.94 | % | | | - | | | | - | | | | - | | | | - | | | | 21.83 | % | |
| Class Y | | | 25.33 | % | | | 19.30 | % | | | 14.22 | % | | | - | | | | - | | | | - | | |
| Morgan Stanley REIT Index3 | | | 24.85 | % | | | 18.07 | % | | | 13.46 | % | | | 13.33 | % | | | 19.39 | % | | | 21.31 | % | |
Value of a $10,000 Investment1, 2 as of September 30, 2004
The performance data quoted on this page represents past performance and does not guarantee future results. The investment return and principal value of an investment will fluctuate so that an investor's shares, when redeemed, may be worth more or less than their original cost. Current performance of the Fund may be lower or higher than the performance data quoted. Performance data current to the most recent month-end may be obtained by calling 800.677.FUND.
1 Performance does not reflect the deduction of taxes that a shareholder would pay on fund distributions or redemption of fund shares. Performance reflects voluntary fee waivers in effect. In the absence of such fee waivers, total returns would be reduced. Index performance is for illustrative purposes only and does not reflect any expenses, transaction costs, or cash flow effects. Investment in the index is not available.
Sector funds such as the First American Real Estate Securities Fund are more vulnerable to price fluctuation as a result of events that may affect the industry in which they focus than are funds that invest in multiple industries. Share prices of sector funds also will fluctuate with changing market conditions, as will share prices of other stock funds. Sector funds should not be treated as a core investment; rather, their role is to round out the growth portion of a well-diversified investment portfolio.
Total returns at net asset value ("NAV") reflect performance over the time period indicated without including the Fund's maximum sales charge and assume reinvestment of all distributions at NAV.
Total returns at public offering price ("POP") reflect performance over the time period indicated including a maximum front-end sales charge of 5.50% for Class A shares and the maximum contingent deferred sales charge ("CDSC") for Class B and Class C shares for the relevant period. Maximum CDSC is 5.00% for Class B shares in the first year, decreasing annually to 0% in the seventh year following purchase, and 1.00% for Class C shares. Total returns assume reinvestment of all distributions at NAV.
2 Performance for Class B, Class C, and Class R shares is not presented. Performance for these classes will vary due to different expense structures.
3 An unmanaged index of the most actively traded real estate investment trusts.
4 Prior to July 1, 2004, Class R shares were designated Class S shares, which had lower fees and expenses. Performance information prior to that date is based on the performance of the Class S shares. If current fees and expenses had been in effect for the entire period presented, performance would have been lower. Please refer to the prospectus for details.
FIRST AMERICAN FUNDS Annual Report 2004
3
Real Estate Securities fund continued
Expense Example
As a shareholder of the Real Estate Securities Fund, you incur two types of costs: (1) transaction costs, including sales charges (loads) on purchase payments; and (2) ongoing costs, including management fees; distribution and/or service (12b-1) fees; and other Fund expenses. This example is intended to help you understand your ongoing costs (in dollars) of investing in the Fund and to compare these costs with the ongoing costs of investing in other mutual funds. The example is based on an investment of $1,000 invested at the beginning of the period and held for the entire period from April 1, 2004, to September 30, 2004.
Actual Expenses
For each class, the first line of the table below provides information about actual account values and actual expenses. You may use the information in this line, together with the amount you invested, to estimate the expenses that you paid over the period. Simply divide your account value by $1,000 (for example, an $8,600 account value divided by $1,000 = 8.6), then multiply the result by the number in the first line under the heading entitled "Expenses Paid During Period" to estimate the expenses you paid on your account during this period.
Hypothetical Example for Comparison Purposes
For each class, the second line of the table below provides information about hypothetical account values and hypothetical expenses based on the Fund's actual expense ratio and an assumed rate of return of 5% per year before expenses, which is not the Fund's actual return. The hypothetical account values and expenses may not be used to estimate the actual ending account balance or expenses you paid for the period. You may use this information to compare the ongoing costs of investing in the Fund and other funds. To do so, compare this 5% hypothetical example with the 5% hypothetical examples that appear in the shareholder reports of the other funds.
Please note that the expenses shown in the table are meant to highlight your ongoing costs only and do not reflect any transactional costs, such as sales charges (loads). Therefore, the second line of the table for each class is useful in comparing ongoing costs only, and will not help you determine the relative total costs of owning different funds. In addition, if these transactional costs were included, your costs would have been higher.
Expense Examples
| | | Beginning Account
Value (4/1/2004) | | Ending Account
Value (9/30/2004) | | Expenses Paid During
Period1 (4/1/2004 to
9/30/2004) | |
| Class A Actual | | $ | 1,000.00 | | | $ | 1,010.30 | | | $ | 6.18 | | |
| Class A Hypothetical (5% return before expenses) | | $ | 1,000.00 | | | $ | 1,018.85 | | | $ | 6.21 | | |
| Class B Actual | | $ | 1,000.00 | | | $ | 1,006.60 | | | $ | 9.93 | | |
| Class B Hypothetical (5% return before expenses) | | $ | 1,000.00 | | | $ | 1,015.10 | | | $ | 9.97 | | |
| Class C Actual | | $ | 1,000.00 | | | $ | 1,006.50 | | | $ | 9.93 | | |
| Class C Hypothetical (5% return before expenses) | | $ | 1,000.00 | | | $ | 1,015.10 | | | $ | 9.97 | | |
| Class R Actual2 | | $ | 1,000.00 | | | $ | 1,009.50 | | | $ | 6.81 | | |
| Class R Hypothetical (5% return before expenses)2 | | $ | 1,000.00 | | | $ | 1,018.22 | | | $ | 6.84 | | |
| Class Y Actual | | $ | 1,000.00 | | | $ | 1,011.90 | | | $ | 4.93 | | |
| Class Y Hypothetical (5% return before expenses) | | $ | 1,000.00 | | | $ | 1,020.10 | | | $ | 4.95 | | |
1Expenses are equal to the Fund's annualized expense ratio of 1.23%, 1.98%, 1.98%, 1.36%, and 0.98% for Class A, Class B, Class C, Class R, and Class Y, respectively, multiplied by the average account value over the period, multiplied by the number of days in the most recent half-year/366 days (to reflect the one-half year period).
2Prior to July 1, 2004, Class R had a different expense ratio. Had the current expense ratio been in place for the most recent one-half year, the actual and hypothetical expenses would have been $7.44 and $7.47, respectively.
FIRST AMERICAN FUNDS Annual Report 2004
4
Technology fund
Investment Objective: long-term growth of capital
How did the Fund perform for the fiscal year ended September 30, 2004?
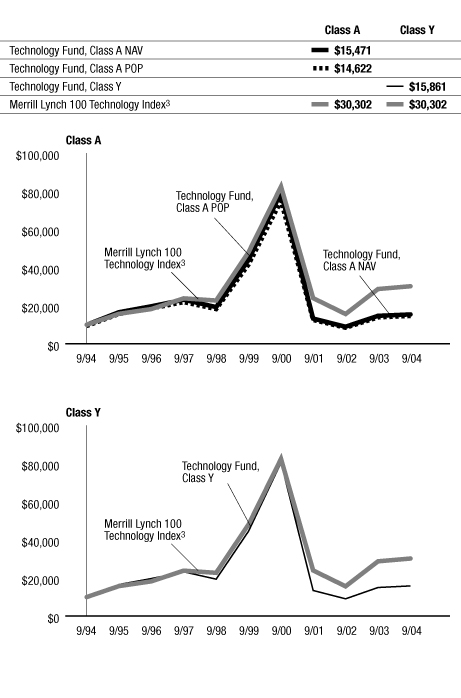
The First American Technology Fund, Class Y shares, returned 5.22% for the fiscal year ended September 30, 2004 (Class A shares returned 4.96% at net asset value). By comparison, the Fund's benchmark, the Merrill Lynch 100 Technology Index*, returned 4.72% for the same period.
How did general economic and market conditions affect performance?
During the past year, we saw an improving economic environment that featured above-trend economic growth (i.e., exceeding the average of 3.15% since 1970), strong gains in productivity, and a significant rise in corporate profits. The improving economic environment led to sharp gains in payrolls from March through May 2004, which, along with higher inflation readings during the early months of the year, led the Federal Reserve to begin raising its target interest rate. Higher current and expected short-term interest rates, along with steep increases in oil prices during the first nine months of 2004, have led to growing concerns about the economic and profit growth outlook. These concerns have resulted in equity markets generating little in the way of gains since the first months of the calendar year despite solid earnings growth and continued low long-term interest rates. The markets hav e become more attractively valued as a result.
What worked for the Fund and why?
During the past year, several of the Technology Fund's best performers were nonbenchmark names, including Pixelworks, Autodesk, Given Imaging, Sierra Wireless, and Altiris. Perhaps more importantly, much of the Fund's positive performance, when compared with our benchmark, the Merrill Lynch 100 Technology Index, came from not owning a number of poorly performing benchmark names. These included Seagate Technology, Synopsys, LSI Logic, BEA Systems, and Unisys.
What did not work for the Fund and why?
Although the Technology Fund did outperform its benchmark in the last year, our total performance was hindered somewhat by owning names that clearly underperformed, such as MKS Instruments and Maxtor, and not owning names in our benchmark that performed quite well. Those in this latter category included eBay, L.M. Ericsson, Symantec, and QUALCOMM. Fortunately, the shares of these latter companies have weakened in recent months, owing to market factors, and we have been able to invest in these shares at discounted levels. Not owning Yahoo was the biggest negative driver of performance in the internet software and services sectors.
What strategic moves were made by the Fund and why?
In general, the only major strategic move during the past year was to gradually increase the Fund's exposure to large-cap names, while decreasing its exposure to small-cap names. Otherwise our strategy has remained constant: to choose companies that we feel will be able to grow revenue, produce positive cash flow, and increase or maintain market share.
*Unlike mutual funds, index returns do not reflect any expenses, transaction costs, or cash flow effects.
| Top 10 Companies as of September 30, 20041 (% of net assets) | |
| Infosys Technologies | | | 1.9 | % | |
| QUALCOMM | | | 1.6 | % | |
| Marvell Technology Group | | | 1.6 | % | |
| Symantec | | | 1.6 | % | |
| Accenture | | | 1.6 | % | |
| NCR | | | 1.6 | % | |
| Applied Materials | | | 1.5 | % | |
| L.M. Ericsson | | | 1.5 | % | |
| Analog Devices | | | 1.5 | % | |
| Adobe Systems | | | 1.5 | % | |
| Sector Allocation as of September 30, 20041 (% of net assets) | |
| | | Fund2 | | Merrill Lynch
100 Tech Index3 | |
| Application Software | | | 12.1 | % | | | 8.0 | % | |
| Communications Equipment | | | 16.9 | % | | | 18.0 | % | |
| Computer Hardware | | | 4.9 | % | | | 7.5 | % | |
| Data Processing & Outsourced Service | | | 6.2 | % | | | 7.5 | % | |
| Electronic Manufacturing Services | | | 5.6 | % | | | 5.5 | % | |
| IT Consulting & Other Services | | | 4.5 | % | | | 4.2 | % | |
| Other | | | 23.3 | % | | | 18.9 | % | |
| Semiconductor Equipment | | | 4.7 | % | | | 4.4 | % | |
| Semiconductors | | | 15.7 | % | | | 17.1 | % | |
| Systems Software | | | 6.2 | % | | | 8.9 | % | |
1Fund holdings and sector allocations are subject to change at any time and are not recommendations to buy or sell any security.
2The percentages shown represent the allocation by industry as a percent of net assets of the Fund.
3The percentages shown represent the percent allocation by industry of the index.
FIRST AMERICAN FUNDS Annual Report 2004
5
Technology fund continued
| Annualized Performance1 as of September 30, 2004 | |
| | | | | Since
Inception | |
| | | 1 year | | 5 years | | 10 years | | 2/1/2000 | |
| Average annual return with sales charge (POP) | | | | | | | | | | | | | | | | | |
| Class A | | | (0.80 | %) | | | (19.85 | %) | | | 3.87 | % | | | - | | |
| Class B | | | (0.87 | %) | | | (19.77 | %) | | | 3.65 | % | | | - | | |
| Class C | | | 3.08 | % | | | - | | | | - | | | | (30.94 | %) | |
| Average annual return without sales charge (NAV) | | | | | | | | | | | | | | | | | |
| Class A | | | 4.96 | % | | | (18.94 | %) | | | 4.46 | % | | | - | | |
| Class B | | | 4.13 | % | | | (19.57 | %) | | | 3.65 | % | | | - | | |
| Class C | | | 4.08 | % | | | - | | | | - | | | | (30.94 | %) | |
| Class Y | | | 5.22 | % | | | (18.72 | %) | | | 4.72 | % | | | - | | |
| Merrill Lynch 100 Technology Index3 | | | 4.72 | % | | | (8.95 | %) | | | 11.70 | % | | | (18.70 | %) | |
Value of a $10,000 Investment1, 2 as of September 30, 2004
The performance data quoted on this page represents past performance and does not guarantee future results. The investment return and principal value of an investment will fluctuate so that an investor's shares, when redeemed, may be worth more or less than their original cost. Current performance of the Fund may be lower or higher than the performance data quoted. Performance data current to the most recent month-end may be obtained by calling 800.677.FUND.
1 Performance does not reflect the deduction of taxes that a shareholder would pay on fund distributions or redemption of fund shares. Performance reflects voluntary fee waivers in effect. In the absence of such fee waivers, total returns would be reduced. Index performance is for illustrative purposes only and does not reflect any expenses, transaction costs, or cash flow effects. Investment in the index is not available.
Sector funds such as the First American Technology Fund are more vulnerable to price fluctuation as a result of events that may affect the industry in which they focus than are funds that invest in multiple industries. Share prices of sector funds also will fluctuate with changing market conditions, as will share prices of other stock funds. Sector funds should not be treated as a core investment; rather, their role is to round out the growth portion of a well-diversified investment portfolio.
Total returns at net asset value ("NAV") reflect performance over the time period indicated without including the Fund's maximum sales charge and assume reinvestment of all distributions at NAV.
Total returns at public offering price ("POP") reflect performance over the time period indicated including a maximum front-end sales charge of 5.50% for Class A shares and the maximum contingent deferred sales charge ("CDSC") for Class B and Class C shares for the relevant period. Maximum CDSC is 5.00% for Class B shares in the first year, decreasing annually to 0% in the seventh year following purchase, and 1.00% for Class C shares. Total returns assume reinvestment of all distributions at NAV.
The Technology Fund's 1999 returns were higher due in part to its strategy of investing in IPOs and technology-related stocks in a period favorable for IPO and technology stock investing. Of course, such favorable returns involve accepting the risk of volatility, and there is no assurance that the Fund's future investment in IPOs and technology stocks will have the same effect on performance as it did in 1999. Investments in the First American Technology Fund are more vulnerable to price fluctuation as a result of the narrow focus of technology investing and the fact that the products of companies in which the Fund invests may be subject to rapid obsolescence.
2 Performance for Class B and Class C shares is not presented. Performance for these classes will vary due to different expense structures.
3 An equally weighted index of the 100 largest technology companies, as measured by market capitalization.
FIRST AMERICAN FUNDS Annual Report 2004
6
Technology fund continued
Expense Example
As a shareholder of the Technology Fund, you incur two types of costs: (1) transaction costs, including sales charges (loads) on purchase payments; and (2) ongoing costs, including management fees; distribution and/or service (12b-1) fees; and other Fund expenses. This example is intended to help you understand your ongoing costs (in dollars) of investing in the Fund and to compare these costs with the ongoing costs of investing in other mutual funds. The example is based on an investment of $1,000 invested at the beginning of the period and held for the entire period from April 1, 2004, to September 30, 2004.
Actual Expenses
For each class, the first line of the table below provides information about actual account values and actual expenses. You may use the information in this line, together with the amount you invested, to estimate the expenses that you paid over the period. Simply divide your account value by $1,000 (for example, an $8,600 account value divided by $1,000 = 8.6), then multiply the result by the number in the first line under the heading entitled "Expenses Paid During Period" to estimate the expenses you paid on your account during this period.
Hypothetical Example for Comparison Purposes
For each class, the second line of the table below provides information about hypothetical account values and hypothetical expenses based on the Fund's actual expense ratio and an assumed rate of return of 5% per year before expenses, which is not the Fund's actual return. The hypothetical account values and expenses may not be used to estimate the actual ending account balance or expenses you paid for the period. You may use this information to compare the ongoing costs of investing in the Fund and other funds. To do so, compare this 5% hypothetical example with the 5% hypothetical examples that appear in the shareholder reports of the other funds.
Please note that the expenses shown in the table are meant to highlight your ongoing costs only and do not reflect any transactional costs, such as sales charges (loads). Therefore, the second line of the table for each class is useful in comparing ongoing costs only, and will not help you determine the relative total costs of owning different funds. In addition, if these transactional costs were included, your costs would have been higher.
Expense Examples
| | | Beginning Account
Value (4/1/2004) | | Ending Account
Value (9/30/2004) | | Expenses Paid During
Period1 (4/1/2004 to
9/30/2004) | |
| Class A Actual | | $ | 1,000.00 | | | $ | 871.60 | | | $ | 5.76 | | |
| Class A Hypothetical (5% return before expenses) | | $ | 1,000.00 | | | $ | 1,018.85 | | | $ | 6.21 | | |
| Class B Actual | | $ | 1,000.00 | | | $ | 867.50 | | | $ | 9.24 | | |
| Class B Hypothetical (5% return before expenses) | | $ | 1,000.00 | | | $ | 1,015.10 | | | $ | 9.97 | | |
| Class C Actual | | $ | 1,000.00 | | | $ | 867.60 | | | $ | 9.24 | | |
| Class C Hypothetical (5% return before expenses) | | $ | 1,000.00 | | | $ | 1,015.10 | | | $ | 9.97 | | |
| Class Y Actual | | $ | 1,000.00 | | | $ | 872.40 | | | $ | 4.59 | | |
| Class Y Hypothetical (5% return before expenses) | | $ | 1,000.00 | | | $ | 1,020.10 | | | $ | 4.95 | | |
1Expenses are equal to the Fund's annualized expense ratio of 1.23%, 1.98%, 1.98%, and 0.98% for Class A, Class B, Class C, and Class Y, respectively, multiplied by the average account value over the period, multiplied by the number of days in the most recent half-year/366 days (to reflect the one-half year period).
FIRST AMERICAN FUNDS Annual Report 2004
7
International fund
Investment Objective: long-term growth of capital
How did the Fund perform for the fiscal year ended September 30, 2004?
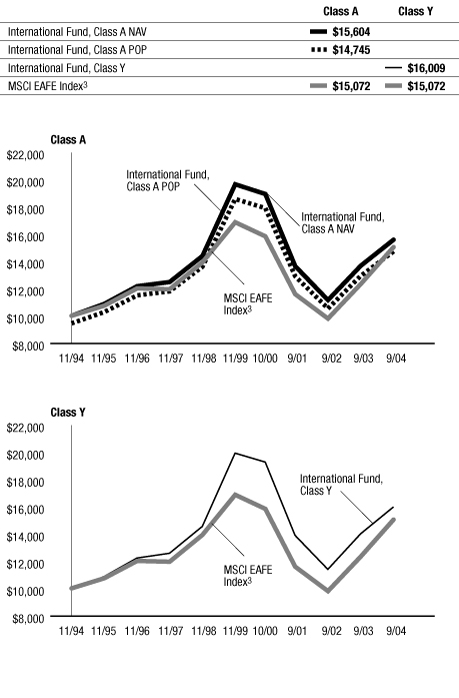
The First American International Fund, Class Y shares, returned 14.13% for the fiscal year ended September 30, 2004 (Class A shares returned 13.91% at net asset value). By comparison, the Fund's benchmark, the MSCI EAFE Index*, returned 22.52% for the same period.
How did general economic and market conditions affect performance?
The fiscal year was highlighted by a transition from a recovery phase to the beginning of a period of slower economic growth. Markets posted positive returns on the back of strong earnings growth and modest valuations. Across the globe, slowing growth, monetary tightening, and rising commodity prices affected markets. Oil had the largest impact of all commodities, with the West Texas Intermediate crude oil price rising through the $50 level by fiscal year end.
Emerging markets continued to outperform developed markets as rising commodity prices supported these resource-rich economies. Japan was the weakest performing region, as the high oil price and slower economic growth weighed on the market. The escalating price of oil also hindered the performance of economically sensitive sectors, such as industrials and information technology, while energy and materials groups were among the best performers.
What worked for the Fund and why?
The Fund was well served by its exposure to the emerging markets, which are not represented in the benchmark. Led by stellar results from our holdings in Brazil, Mexico, China, Turkey, and South Africa, the emerging market portion of the Fund returned 31.4%. With oil prices soaring during the period, the Fund benefited from its positions in Eni and Total, allowing the Fund to outpace the benchmark return in the European energy sector. Other positive factors during the period included a strong return from our Japanese financials exposure, led by Mitsubishi Tokyo Financial, and outperformance in Hong Kong.
What did not work for the Fund and why?
The underperformance of growth stocks relative to more value-oriented shares had a significantly negative impact on Fund results in both Europe and Asia for the 12-month period. The Fund was also hampered by the preference of investors for companies with higher operational leverage over many of their higher-quality, economically sensitive peers. These factors, combined with several stock-specific disappointments, including Nichii Gakkan, Nokia, and Compass Group, caused the Fund to fall short of the benchmark return in Europe and Japan. An underweight to the former region and an overweight to the latter further eroded results.
What strategic moves were made by the Fund and why?
We have been reducing the amount of risk in the portfolio relative to the benchmark. Notably, exposure to the emerging markets, which are not a part of the index, has been reduced to 5.7%. During the fiscal year, the portfolio maintained overweights to the emerging markets and Japan, while underweighting Europe. Also during the period, we increased our weighting in the Pacific Basin ex Japan, as we found many attractive opportunities in the Hong Kong market.
*Unlike mutual funds, index returns do not reflect any expenses, transaction costs, or cash flow effects.
| Top 10 Companies as of September 30, 20041 (% of net assets) | |
| Vodafone | | | 3.5 | % | |
| Total | | | 3.3 | % | |
| Eni | | | 2.7 | % | |
| Royal Bank of Scotland | | | 2.6 | % | |
| BNP Paribas | | | 2.5 | % | |
| Roche | | | 2.4 | % | |
| Sanofi-Aventis | | | 2.3 | % | |
| HBOS | | | 2.0 | % | |
| Siemens | | | 1.7 | % | |
| Mitsubishi Tokyo Financial Group | | | 1.7 | % | |
| Country Allocation as of September 30, 20041 (% of net assets) | |
| Japan | | | 24.2 | % | |
| Great Britain | | | 17.4 | % | |
| France | | | 14.3 | % | |
| Germany | | | 6.6 | % | |
| Switzerland | | | 5.9 | % | |
| Hong Kong | | | 5.8 | % | |
| Italy | | | 5.0 | % | |
| Australia | | | 4.4 | % | |
| Ireland | | | 3.5 | % | |
| Spain | | | 3.0 | % | |
| Other | | | 9.9 | % | |
1Fund holdings and country holdings are subject to change at any time and are not recommendations to buy or sell any security.
FIRST AMERICAN FUNDS Annual Report 2004
8
International fund continued
| Annualized Performance1 as of September 30, 2004 | |
| | | | | Since Inception4 | |
| | | 1 year | | 5 years | | 10 years | | 3/6/1995 | | 9/24/2001 | |
| Average annual return with sales charge (POP) | | | | | | | | | | | | | | | | | | | | | |
| Class A | | | 7.68 | % | | | (3.53 | %) | | | 3.61 | % | | | - | | | | - | | |
| Class B | | | 8.12 | % | | | (3.48 | %) | | | - | | | | 4.35 | % | | | - | | |
| Class C | | | 12.14 | % | | | - | | | | - | | | | - | | | | 5.49 | % | |
| Average annual return without sales charge (NAV) | | | | | | | | | | | | | | | | | | | | | |
| Class A | | | 13.91 | % | | | (2.43 | %) | | | 4.20 | % | | | - | | | | - | | |
| Class B | | | 13.12 | % | | | (3.16 | %) | | | - | | | | 4.35 | % | | | - | | |
| Class C | | | 13.14 | % | | | - | | | | - | | | | - | | | | 5.49 | % | |
| Class R5 | | | 13.16 | % | | | (2.58 | %) | | | 4.09 | % | | | - | | | | - | | |
| Class Y | | | 14.13 | % | | | (2.19 | %) | | | 4.47 | % | | | - | | | | - | | |
| MSCI EAFE Index3 | | | 22.52 | % | | | (0.51 | %) | | | 4.34 | % | | | 4.47 | % | | | 9.52 | % | |
Value of a $10,000 Investment1, 2 as of September 30, 2004
The performance data quoted on this page represents past performance and does not guarantee future results. The investment return and principal value of an investment will fluctuate so that an investor's shares, when redeemed, may be worth more or less than their original cost. Current performance of the Fund may be lower or higher than the performance data quoted. Performance data current to the most recent month-end may be obtained by calling 800.677.FUND.
1 Performance does not reflect the deduction of taxes that a shareholder would pay on fund distributions or redemption of fund shares. Performance reflects voluntary fee waivers in effect. In the absence of such fee waivers, total returns would be reduced. Index performance is for illustrative purposes only and does not reflect any expenses, transaction costs, or cash flow effects. Investment in the index is not available.
International investing involves risks not typically associated with domestic investing, including risks of adverse currency fluctuations, potential political and economic instability, different accounting standards, foreign government regulations, currency exchange rates, limited liquidity, and volatile prices.
Total returns at net asset value ("NAV") reflect performance over the time period indicated without including the Fund's maximum sales charge and assume reinvestment of all distributions at NAV.
Total returns at public offering price ("POP") reflect performance over the time period indicated including a maximum front-end sales charge of 5.50% for Class A shares and the maximum contingent deferred sales charge ("CDSC") for Class B and Class C shares for the relevant period. Maximum CDSC is 5.00% for Class B shares in the first year, decreasing annually to 0% in the seventh year following purchase, and 1.00% for Class C shares. Total returns assume reinvestment of all distributions at NAV.
On July 1, 2001, Clay Finlay Inc. was hired as subadvisor to manage the Fund's assets. On September 24, 2001, the First American International Fund merged with Firstar International Growth Fund and Firstar International Value Fund, both subadvised by Clay Finlay Inc. Performance history prior to September 24, 2001, represents that of the Firstar International Growth Fund.
2 Performance for Class B, Class C, and Class R shares is not presented. Performance for these classes will vary due to different expense structures.
3 The MSCI EAFE (Morgan Stanley Capital International, Europe, Australasia, Far East) Index is an unmanaged index including approximately 1,000 companies representing the stock markets of 21 countries in Europe, Australasia, and the Far East.
4 The performance since inception for the index is calculated from the month end following the inception of the class.
5 Prior to July 1, 2004, Class R shares were designated Class S shares, which had lower fees and expenses. Performance information prior to that date is based on the performance of the Class S shares. If current fees and expenses had been in effect for the entire period presented, performance would have been lower. Please refer to the prospectus for details.
FIRST AMERICAN FUNDS Annual Report 2004
9
International fund continued
Expense Example
As a shareholder of the International Fund, you incur two types of costs: (1) transaction costs, including sales charges (loads) on purchase payments; and (2) ongoing costs, including management fees; distribution and/or service (12b-1) fees; and other Fund expenses. This example is intended to help you understand your ongoing costs (in dollars) of investing in the Fund and to compare these costs with the ongoing costs of investing in other mutual funds. The example is based on an investment of $1,000 invested at the beginning of the period and held for the entire period from April 1, 2004, to September 30, 2004.
Actual Expenses
For each class, the first line of the table below provides information about actual account values and actual expenses. You may use the information in this line, together with the amount you invested, to estimate the expenses that you paid over the period. Simply divide your account value by $1,000 (for example, an $8,600 account value divided by $1,000 = 8.6), then multiply the result by the number in the first line under the heading entitled "Expenses Paid During Period" to estimate the expenses you paid on your account during this period.
Hypothetical Example for Comparison Purposes
For each class, the second line of the table below provides information about hypothetical account values and hypothetical expenses based on the Fund's actual expense ratio and an assumed rate of return of 5% per year before expenses, which is not the Fund's actual return. The hypothetical account values and expenses may not be used to estimate the actual ending account balance or expenses you paid for the period. You may use this information to compare the ongoing costs of investing in the Fund and other funds. To do so, compare this 5% hypothetical example with the 5% hypothetical examples that appear in the shareholder reports of the other funds.
Please note that the expenses shown in the table are meant to highlight your ongoing costs only and do not reflect any transactional costs, such as sales charges (loads). Therefore, the second line of the table for each class is useful in comparing ongoing costs only, and will not help you determine the relative total costs of owning different funds. In addition, if these transactional costs were included, your costs would have been higher.
Expense Examples
| | | Beginning Account
Value (4/1/2004) | | Ending Account
Value (9/30/2004) | | Expenses Paid During
Period1 (4/1/2004 to
9/30/2004) | |
| Class A Actual | | $ | 1,000.00 | | | $ | 956.80 | | | $ | 7.83 | | |
| Class A Hypothetical (5% return before expenses) | | $ | 1,000.00 | | | $ | 1,017.00 | | | $ | 8.07 | | |
| Class B Actual | | $ | 1,000.00 | | | $ | 953.50 | | | $ | 11.48 | | |
| Class B Hypothetical (5% return before expenses) | | $ | 1,000.00 | | | $ | 1,013.25 | | | $ | 11.83 | | |
| Class C Actual | | $ | 1,000.00 | | | $ | 954.10 | | | $ | 11.48 | | |
| Class C Hypothetical (5% return before expenses) | | $ | 1,000.00 | | | $ | 1,013.25 | | | $ | 11.83 | | |
| Class R Actual2 | | $ | 1,000.00 | | | $ | 951.10 | | | $ | 8.42 | | |
| Class R Hypothetical (5% return before expenses)2 | | $ | 1,000.00 | | | $ | 1,016.37 | | | $ | 8.70 | | |
| Class Y Actual | | $ | 1,000.00 | | | $ | 958.20 | | | $ | 6.61 | | |
| Class Y Hypothetical (5% return before expenses) | | $ | 1,000.00 | | | $ | 1,018.25 | | | $ | 6.81 | | |
1Expenses are equal to the Fund's annualized expense ratio of 1.60%, 2.35%, 2.35%, 1.73%, and 1.35% for Class A, Class B, Class C, Class R, and Class Y, respectively, multiplied by the average account value over the period, multiplied by the number of days in the most recent half-year/366 days (to reflect the one-half year period).
2Prior to July 1, 2004, Class R had a different expense ratio. Had the current expense ratio been in place for the most recent one-half year, the actual and hypothetical expenses would have been $9.02 and $9.32, respectively.
FIRST AMERICAN FUNDS Annual Report 2004
10
Small Cap Growth Opportunities fund
Investment Objective: growth of capital
How did the Fund perform for the fiscal year ended September 30, 2004?
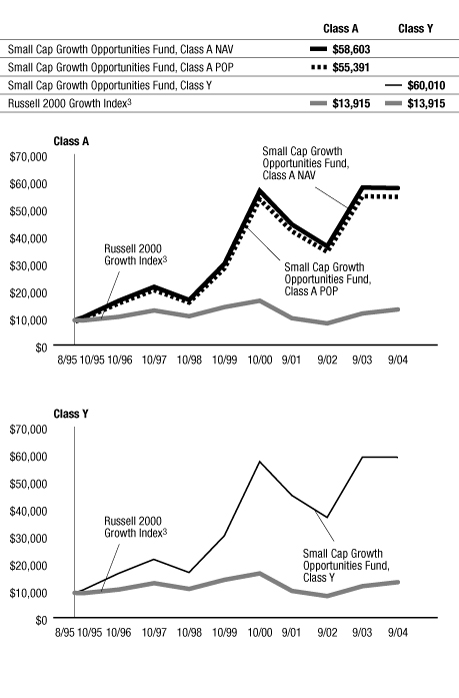
The First American Small Cap Growth Opportunities Fund, Class Y shares, returned (0.11%) for the fiscal year ended September 30, 2004 (Class A shares returned (0.39%) at net asset value). By comparison, the Fund's benchmark, the Russell 2000 Growth Index*, returned 11.92% for the same period.
How did general economic and market conditions affect performance?
During the past year, we saw an improving economic environment that featured above-trend economic growth (i.e., exceeding the average of 3.15% since 1970), strong gains in productivity, and a significant rise in corporate profits. The improving economic environment led to sharp gains in payrolls from March through May 2004 which, along with higher inflation readings during the early months of the year, led the Federal Reserve to begin raising its target interest rate. Higher current and expected short-term interest rates, along with steep increases in oil prices during the first nine months of 2004, have led to growing concerns about the economic and profit growth outlook. These concerns have resulted in equity markets generating little in the way of gains since the first months of the calendar year despite solid earnings growth and continued low long-term interest rates. The markets have beco me more attractively valued as a result.
What worked for the Fund and why?
The Fund benefited from good stock selection in the information technology and materials sectors, as well as a general overweight in the energy sector relative to the Russell 2000 Growth Index. Within the technology sector, electronic equipment and instrument companies Aeroflex and FARO Technologies drove performance while chemical company Headwaters Inc. and metal and mining company Century Aluminum added value in the materials sector.
| Top 10 Companies as of September 30, 20041 (% of net assets) | |
| Spanish Broadcasting System | | | 3.1 | % | |
| Taro Pharmaceutical Industries | | | 2.9 | % | |
| Watson Pharmaceuticals | | | 2.8 | % | |
| Encore Medical | | | 2.7 | % | |
| Landry's Restaurants | | | 2.6 | % | |
| ADTRAN | | | 2.3 | % | |
| SAFENET | | | 2.2 | % | |
| Bradley Pharmaceuticals | | | 2.1 | % | |
| Amylin Pharmaceuticals | | | 2.0 | % | |
| Cullen/Frost Bankers | | | 2.0 | % | |
What did not work for the Fund and why?
Adverse stock selection across a number of different sectors was the primary reason for the underperformance relative to the Russell 2000 Growth Index. Commercial service and supply companies within the industrial sector took the biggest toll on performance. Among these companies were Exult and Gevity, both human resource outsourcing companies, and Integrated Alarm Services Group, a provider of security alarm servicing systems. Healthcare stocks Encore Medical and Select Medical also had a negative impact on Fund performance. Select Medical fell victim to a change in government policies regarding the reimbursement for outpatient rehabilitation while Encore Medical's acquisitions of noncore businesses hurt the stock performance. Lastly, specialty retail companies Wet Seal, Sports Authority, and Select Comfort disappointed in the consumer discretionary sector. Wet Seal, a teen clothing distribut or under new management, saw slow sales of its new line of merchandise while the merger between The Sport Authority and Gart Sports did not result in increased sales. Finally, Select Comfort, a producer of specialty mattresses, received complaints that their beds were developing mold, causing the market to fear a potential for significant warranty claims.
What strategic moves were made by the Fund and why?
During the second half of the fiscal year, the First American Small Cap Growth Opportunities Fund came under new management. The new management team's strategy is to focus on companies that are leveraged to secular trends (e.g., the aging population). As a result, the Fund has taken underweight positions in the basic materials, industrials, transportation, and utilities sectors. Conversely, the Fund has taken overweight positions in the consumer cyclical, staples, energy, and technology sectors.
*Unlike mutual funds, index returns do not reflect any expenses, transaction costs, or cash flow effects.
| Sector Allocation as of September 30, 20041 (% of net assets) | |
| | | Fund2 | | Russell 2000
Growth Index3 | |
| Consumer Discretionary | | | 18.8 | % | | | 15.8 | % | |
| Consumer Staples | | | 0.0 | % | | | 2.2 | % | |
| Energy | | | 5.9 | % | | | 5.1 | % | |
| Financials | | | 9.2 | % | | | 9.9 | % | |
| Healthcare | | | 28.2 | % | | | 21.8 | % | |
| Industrials | | | 0.5 | % | | | 14.1 | % | |
| Information Technology | | | 30.2 | % | | | 26.7 | % | |
| Materials | | | 0.0 | % | | | 3.5 | % | |
| Telecommunication Services | | | 2.0 | % | | | 0.9 | % | |
1Fund holdings and sector allocations are subject to change at any time and are not recommendations to buy or sell any security.
2The percentages shown represent the allocation by industry as a percent of net assets of the Fund.
3The percentages shown represent the percent allocation by industry of the index.
FIRST AMERICAN FUNDS Annual Report 2004
11
Small Cap Growth Opportunities fund continued
| Annualized Performance1 as of September 30, 2004 | |
| | | | | Since Inception | |
| | | 1 year | | 5 years | | 8/1/1995 | | 3/1/1999 | | 12/11/2000 | | 9/24/2001 | |
| Average annual return with sales charge (POP) | | | | | | | | | | | | | | | | | | | | | | | | | |
| Class A | | | (5.88 | %) | | | 14.08 | % | | | 20.54 | % | | | - | | | | - | | | | - | | |
| Class B | | | (6.04 | %) | | | 14.26 | % | | | - | | | | 20.95 | % | | | - | | | | - | | |
| Class C | | | (2.13 | %) | | | - | | | | - | | | | - | | | | - | | | | 9.41 | % | |
| Average annual return without sales charge (NAV) | | | | | | | | | | | | | | | | | | | | | | | | | |
| Class A | | | (0.39 | %) | | | 15.38 | % | | | 21.28 | % | | | - | | | | - | | | | - | | |
| Class B | | | (1.13 | %) | | | 14.49 | % | | | - | | | | 21.03 | % | | | - | | | | - | | |
| Class C | | | (1.14 | %) | | | - | | | | - | | | | - | | | | - | | | | 9.41 | % | |
| Class R4 | | | (0.39 | %) | | | - | | | | - | | | | - | | | | 2.39 | % | | | - | | |
| Class Y | | | (0.11 | %) | | | 15.67 | % | | | 21.60 | % | | | - | | | | - | | | | - | | |
| Russell 2000 Growth Index3 | | | 11.92 | % | | | (0.68 | %) | | | 3.67 | % | | | 1.46 | % | | | (3.39 | %) | | | 9.75 | % | |
Value of a $10,000 Investment1, 2 as of September 30, 2004
The performance data quoted on this page represents past performance and does not guarantee future results. The investment return and principal value of an investment will fluctuate so that an investor's shares, when redeemed, may be worth more or less than their original cost. Current performance of the Fund may be lower or higher than the performance data quoted. Performance data current to the most recent month-end may be obtained by calling 800.677.FUND.
1 Performance does not reflect the deduction of taxes that a shareholder would pay on fund distributions or redemption of fund shares. Performance reflects voluntary fee waivers in effect. In the absence of such fee waivers, total returns would be reduced. Index performance is for illustrati ve purposes only and does not reflect any expenses, transaction costs, or cash flow effects. Investment in the index is not available.
Stocks of small-capitalization companies involve substantial risk. These stocks historically have experienced greater price volatility than stocks of larger companies, and they may be expected to do so in the future.
Total returns at net asset value ("NAV") reflect performance over the time period indicated without including the Fund's maximum sales charge and assume reinvestment of all distributions at NAV.
Total returns at public offering price ("POP") reflect performance over the time period indicated including a maximum front-end sales charge of 5.50% for Class A shares and the maximum contingent deferred sales charge ("CDSC") for Class B and Class C shares for the relevant period. Maximum CDSC is 5.00% for Class B shares in the first year, decreasing annually to 0% in the seventh year following purchase, and 1.00% for Class C shares. Total returns assume reinvestment of all distributions at NAV.
On December 12, 2002, the Fund changed its main investment strategy such that it was permitted to invest in securities of companies with market capitalizations within the range of companies in the Russell 2000 Index. Previously, the Fund invested primarily in companies with market capitalizations of below $500 million at the time of purchase.
On September 24, 2001, the First American Small Cap Growth Opportunities Fund became the successor by merger to the Firstar MicroCap Fund, a series of Firstar Funds, Inc. Prior to the merger, the First American fund had no assets or liabilities. Performance presented prior to September 24, 2001, represents that of the Firstar MicroCap Fund.
The First American Small Cap Growth Opportunities Fund's 1999 returns were higher due in substantial part to its strategy of investing in IPOs in a period favorable for IPO investing. Of course, such favorable returns involve accepting the risk of volatility, and there is no assurance that the Fund's future investment in IPOs will have the same effect on performance as it did in 1999.
2 Performance for Class B, Class C, and Class R shares is not presented. Performance for these classes will vary due to different expense structures.
3 An unmanaged index that measures the performance of those companies in the Russell 2000 Index with higher price-to-book ratios and higher forecasted growth values. The Russell 2000 Index is an unmanaged index that measures the performance of the 2,000 smallest companies in the Russell 3000 Index. The Russell 3000 Index measures the performance of the 3,000 largest U.S. companies based on total market capitalization, which represents approximately 98% of the investable U.S. equity market.
4 Prior to July 1, 2004, Class R shares were designated Class S shares, which had lower fees and expenses. Performance information prior to that date is based on the performance of the Class S shares. If current fees and expenses had been in effect for the entire period presented, performance would have been lower. Please refer to the prospectus for details.
FIRST AMERICAN FUNDS Annual Report 2004
12
Small Cap Growth Opportunities fund continued
Expense Example
As a shareholder of the Small Cap Growth Opportunities Fund, you incur two types of costs: (1) transaction costs, including sales charges (loads) on purchase payments; and (2) ongoing costs, including management fees; distribution and/or service (12b-1) fees; and other Fund expenses. This example is intended to help you understand your ongoing costs (in dollars) of investing in the Fund and to compare these costs with the ongoing costs of investing in other mutual funds. The example is based on an investment of $1,000 invested at the beginning of the period and held for the entire period from April 1, 2004, to September 30, 2004.
Actual Expenses
For each class, the first line of the table below provides information about actual account values and actual expenses. You may use the information in this line, together with the amount you invested, to estimate the expenses that you paid over the period. Simply divide your account value by $1,000 (for example, an $8,600 account value divided by $1,000 = 8.6), then multiply the result by the number in the first line under the heading entitled "Expenses Paid During Period" to estimate the expenses you paid on your account during this period.
Hypothetical Example for Comparison Purposes
For each class, the second line of the table below provides information about hypothetical account values and hypothetical expenses based on the Fund's actual expense ratio and an assumed rate of return of 5% per year before expenses, which is not the Fund's actual return. The hypothetical account values and expenses may not be used to estimate the actual ending account balance or expenses you paid for the period. You may use this information to compare the ongoing costs of investing in the Fund and other funds. To do so, compare this 5% hypothetical example with the 5% hypothetical examples that appear in the shareholder reports of the other funds.
Please note that the expenses shown in the table are meant to highlight your ongoing costs only and do not reflect any transactional costs, such as sales charges (loads). Therefore, the second line of the table for each class is useful in comparing ongoing costs only, and will not help you determine the relative total costs of owning different funds. In addition, if these transactional costs were included, your costs would have been higher.
Expense Examples
| | | Beginning Account
Value (4/1/2004) | | Ending Account
Value (9/30/2004) | | Expenses Paid During
Period1 (4/1/2004 to
9/30/2004) | |
| Class A Actual | | $ | 1,000.00 | | | $ | 833.60 | | | $ | 8.85 | | |
| Class A Hypothetical (5% return before expenses) | | $ | 1,000.00 | | | $ | 1,015.35 | | | $ | 9.72 | | |
| Class B Actual | | $ | 1,000.00 | | | $ | 830.90 | | | $ | 12.27 | | |
| Class B Hypothetical (5% return before expenses) | | $ | 1,000.00 | | | $ | 1,011.60 | | | $ | 13.48 | | |
| Class C Actual | | $ | 1,000.00 | | | $ | 830.60 | | | $ | 12.27 | | |
| Class C Hypothetical (5% return before expenses) | | $ | 1,000.00 | | | $ | 1,011.60 | | | $ | 13.48 | | |
| Class R Actual2 | | $ | 1,000.00 | | | $ | 832.90 | | | $ | 9.42 | | |
| Class R Hypothetical (5% return before expenses)2 | | $ | 1,000.00 | | | $ | 1,014.72 | | | $ | 10.35 | | |
| Class Y Actual | | $ | 1,000.00 | | | $ | 834.60 | | | $ | 7.71 | | |
| Class Y Hypothetical (5% return before expenses) | | $ | 1,000.00 | | | $ | 1,016.60 | | | $ | 8.47 | | |
1Expenses are equal to the Fund's annualized expense ratio of 1.93%, 2.68%, 2.68%, 2.06%, and 1.68% for Class A, Class B, Class C, Class R, and Class Y, respectively, multiplied by the average account value over the period, multiplied by the number of days in the most recent half-year/366 days (to reflect the one-half year period).
2Prior to July 1, 2004, Class R had a different expense ratio. Had the current expense ratio been in place for the most recent one-half year, the actual and hypothetical expenses would have been $9.99 and $10.98, respectively.
FIRST AMERICAN FUNDS Annual Report 2004
13
Small Cap Select fund
Investment Objective: capital appreciation
How did the Fund perform for the fiscal year ended September 30, 2004?
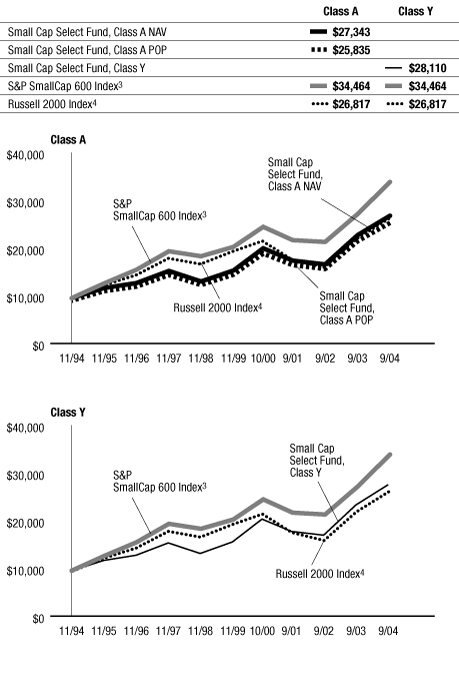
The First American Small Cap Select Fund, Class Y shares, returned 17.98% for the fiscal year ended September 30, 2004 (Class A shares returned 17.64% at net asset value). By comparison, the Fund's benchmark, the Russell 2000 Index*, returned 18.77% for the same period. During the past year, the Fund's benchmark changed from The Standard and Poor's Small Cap 600 Composite Index to the Russell 2000 Index. The benchmark was changed to reflect the advisor's belief that the Russell 2000 Index was a better measure of the Fund's investment objective, capital appreciation.
How did general economic and market conditions affect performance?
During the past year, we saw an improving economic environment that featured above trend economic growth (i.e., exceeding the average of 3.15% since 1970), strong gains in productivity, and a significant rise in corporate profits. The improving economic environment led to sharp gains in payrolls from March through May 2004 which, along with higher inflation readings during the early months of the year, led the Federal Reserve to begin raising its target interest rate. Higher current and expected short-term interest rates, along with steep increases in oil prices during the first nine months of 2004, have led to growing concerns about the economic and profit growth outlook. These concerns have resulted in equity markets generating little in the way of gains since the first months of the calendar year despite solid earnings growth and continued low long-term interest rates. The markets have beco me more attractively valued as a result.
What worked for the Fund and why?
Good stock selection in the technology, healthcare, and energy sectors was the reason for the Fund's outperformance relative to the Russell 2000 Index in these areas. Research in Motion was the biggest positive driver of performance in the technology sector. Research in Motion, a manufacturer of wireless data devices, saw earnings estimates rise 10-fold during the fiscal year as sales of its BlackBerry wireless devices were strong. Within healthcare, good general stock selection in the biotech industry and the acquisition of healthcare provider and service company Inveresk Research Group by Charles River Labs added value. Finally, energy stock Ultra Petroleum added the most performance to the Fund overall relative to the benchmark as commodity prices, an efficient production process, and a positive reg ulatory environment helped the stock.
What did not work for the Fund and why?
Adverse stock selection across the materials, consumer discretionary, financials, and consumer staples sectors detracted from performance relative to the Russell 2000 Index. Anchor Glass Container Corp. hurt performance in the materials sector as the demand for their products declined and the raw input costs for their products increased. Media companies and specialty retailers negatively impacted performance in the consumer discretionary sector. Specifically in the specialty retail area, the merger between Sports Authority and Gart Sports did not result in increased sales and led to poor stock performance. In the financial sector, thrift, mortgage, and insurance stocks disappointed. Lastly, Performance Food Group was the leading detractor in the consumer staples sector.
What strategic moves were made by the Fund and why?
During the second half of the fiscal year the Fund came under new management and the Fund's benchmark, the Standard and Poor's SmallCap 600 Index, was changed to the Russell 2000 Index. The Index change was a result of the advisor's belief that the Russell 2000 Index was more representative of the Fund's investment objective of capital appreciation. The biggest strategic change by the new management team was decreasing the weight in the consumer discretionary sector based on the team's feeling that a decrease in refinancing activity and tax-rebate-driven spending, coupled with a slow recovery in employment, has put pressure on the sector.
*Unlike mutual funds, index returns do not reflect any expenses, transaction costs, or cash flow effects.
| Top 10 Companies as of September 30, 20041 (% of net assets) | |
| TIBCO Software | | | 2.2 | % | |
| Logitech International | | | 2.2 | % | |
| Georgia Gulf | | | 2.0 | % | |
| FactSet Research Systems | | | 2.0 | % | |
| Marvel Enterprises | | | 1.8 | % | |
| City National | | | 1.7 | % | |
| Chicago Bridge & Iron | | | 1.6 | % | |
| Station Casinos | | | 1.5 | % | |
| Cullen/Frost Bankers | | | 1.5 | % | |
| Covance | | | 1.5 | % | |
| Sector Allocation as of September 30, 20041 (% of net assets) | |
| | | Fund2 | | Russell 2000
Index3 | |
| Consumer Discretionary | | | 17.2 | % | | | 14.8 | % | |
| Consumer Staples | | | 0.0 | % | | | 2.7 | % | |
| Energy | | | 6.2 | % | | | 5.5 | % | |
| Financials | | | 16.7 | % | | | 22.5 | % | |
| Healthcare | | | 13.1 | % | | | 12.9 | % | |
| Industrials | | | 17.9 | % | | | 14.0 | % | |
| Information Technology | | | 21.2 | % | | | 17.0 | % | |
| Materials | | | 4.6 | % | | | 6.3 | % | |
| Telecommunication Services | | | 0.5 | % | | | 0.9 | % | |
| Utilities | | | 0.0 | % | | | 3.3 | % | |
1Fund holdings and sector allocations are subject to change at any time and are not recommendations to buy or sell any security.
2The percentages shown represent the allocation by industry as a percent of net assets of the Fund.
3The percentages shown represent the percent allocation by industry of the index.
FIRST AMERICAN FUNDS Annual Report 2004
14
Small Cap Select fund continued
Annualized Performance1 as of September 30, 2004
| | | | | Since Inception | |
| | | 1 year | | 5 years | | 10 years | | 3/6/1995 | | 9/24/2001 | |
| Average annual return with sales charge (POP) | | | |
| Class A | | | 11.13 | % | | | 11.82 | % | | | 9.81 | % | | | - | | | | - | | |
| Class B | | | 11.88 | % | | | 12.03 | % | | | - | | | | 9.62 | % | | | - | | |
| Class C | | | 15.79 | % | | | - | | | | - | | | | - | | | | 15.05 | % | |
| Average annual return without sales charge (NAV) | | | |
| Class A | | | 17.64 | % | | | 13.08 | % | | | 10.44 | % | | | - | | | | - | | |
| Class B | | | 16.88 | % | | | 12.28 | % | | | - | | | | 9.62 | % | | | - | | |
| Class C | | | 16.79 | % | | | - | | | | - | | | | - | | | | 15.05 | % | |
| Class R5 | | | 17.60 | % | | | 13.13 | % | | | 10.46 | % | | | - | | | | - | | |
| Class Y | | | 17.98 | % | | | 13.38 | % | | | 10.75 | % | | | - | | | | - | | |
| S&P SmallCap 600 Index3 | | | 24.58 | % | | | 11.49 | % | | | 12.62 | % | | | 13.18 | % | | | 17.34 | % | |
| Russell 2000 Index4 | | | 18.77 | % | | | 7.41 | % | | | 9.87 | % | | | 10.27 | % | | | 14.71 | % | |
Value of $10,000 Investment1, 2 as of September 30, 2004
The performance data quoted on this page represents past performance and does not guarantee future results. The investment return and principal value of an investment will fluctuate so that an investor's shares, when redeemed, may be worth more or less than their original cost. Current performance of the Fund may be lower or higher than the performance data quoted. Performance data current to the most recent month-end may be obtained by calling 800.677.FUND.
1 Performance does not reflect the deduction of taxes that a shareholder would pay on fund distributions or redemption of fund shares. Performance reflects voluntary fee waivers in effect. In the absence of such fee waivers, total returns would be reduced. Index performance is for illustrative purposes only and does not reflect any expenses, transaction costs, or cash flow effects. Investment in an index is not available.
Stocks of small-capitalization companies involve substantial risk. These stocks historically have experienced greater price volatility than stocks of larger companies, and they may be expected to do so in the future.
Total returns at net asset value ("NAV") reflect performance over the time period indicated without including the Fund's maximum sales charge and assume reinvestment of all distributions at NAV.
Total returns at public offering price ("POP") reflect performance over the time period indicated including a maximum front-end sales charge of 5.50% for Class A shares and the maximum contingent deferred sales charge ("CDSC") for Class B and Class C shares for the relevant period. Maximum CDSC is 5.00% for Class B shares in the first year, decreasing annually to 0% in the seventh year following purchase, and 1.00% for Class C shares. Total returns assume reinvestment of all distributions at NAV.
On September 24, 2001, the First American Small Cap Select Fund became the successor by merger to the Firstar SmallCap Core Equity Fund, a series of Firstar Funds, Inc. Prior to the merger, the First American fund had no assets or liabilities. Performance presented prior to September 24, 2001, represents that of the Firstar SmallCap Core Equity Fund. The Firstar SmallCap Core Equity Fund was organized on November 27, 2000, and prior to that, was a separate series of Mercantile Funds, Inc.
2 Performance for Class B, Class C, and Class R shares is not presented. Performance for these classes will vary due to different expense structures.
3 An unmanaged, capitalization-weighted index that measures the performance of selected U.S. stocks with small market capitalizations.
4 An unmanaged index that measures the performance of the 2,000 smallest companies in the Russell 3000 Index. The Russell 3000 Index measures the performance of the 3,000 largest companies based on total market capitalization, which represents approximately 98% of the investable U.S. equity market.
5 Prior to July 1, 2004, Class R shares were designated Class S shares, which had lower fees and expenses. Performance information prior to that date is based on the performance of the Class S shares. If current fees and expenses had been in effect for the entire period presented, performance would have been lower. Please refer to the prospectus for details.
FIRST AMERICAN FUNDS Annual Report 2004
15
Small Cap Select fund continued
Expense Example
As a shareholder of the Small Cap Select Fund, you incur two types of costs: (1) transaction costs, including sales charges (loads) on purchase payments; and (2) ongoing costs, including management fees; distribution and/or service (12b-1) fees; and other Fund expenses. This example is intended to help you understand your ongoing costs (in dollars) of investing in the Fund and to compare these costs with the ongoing costs of investing in other mutual funds. The example is based on an investment of $1,000 invested at the beginning of the period and held for the entire period from April 1, 2004, to September 30, 2004.
Actual Expenses
For each class, the first line of the table below provides information about actual account values and actual expenses. You may use the information in this line, together with the amount you invested, to estimate the expenses that you paid over the period. Simply divide your account value by $1,000 (for example, an $8,600 account value divided by $1,000 = 8.6), then multiply the result by the number in the first line under the heading entitled "Expenses Paid During Period" to estimate the expenses you paid on your account during this period.
Hypothetical Example for Comparison Purposes
For each class, the second line of the table below provides information about hypothetical account values and hypothetical expenses based on the Fund's actual expense ratio and an assumed rate of return of 5% per year before expenses, which is not the Fund's actual return. The hypothetical account values and expenses may not be used to estimate the actual ending account balance or expenses you paid for the period. You may use this information to compare the ongoing costs of investing in the Fund and other funds. To do so, compare this 5% hypothetical example with the 5% hypothetical examples that appear in the shareholder reports of the other funds.
Please note that the expenses shown in the table are meant to highlight your ongoing costs only and do not reflect any transactional costs, such as sales charges (loads). Therefore, the second line of the table for each class is useful in comparing ongoing costs only, and will not help you determine the relative total costs of owning different funds. In addition, if these transactional costs were included, your costs would have been higher.
Expense Examples
| | | Beginning Account
Value (4/1/2004) | | Ending Account
Value (9/30/2004) | | Expenses Paid During
Period1 (4/1/2004 to
9/30/2004) | |
| Class A Actual | | $ | 1,000.00 | | | $ | 964.30 | | | $ | 5.94 | | |
| Class A Hypothetical (5% return before expenses) | | $ | 1,000.00 | | | $ | 1,018.95 | | | $ | 6.11 | | |
| Class B Actual | | $ | 1,000.00 | | | $ | 961.10 | | | $ | 9.61 | | |
| Class B Hypothetical (5% return before expenses) | | $ | 1,000.00 | | | $ | 1,015.20 | | | $ | 9.87 | | |
| Class C Actual | | $ | 1,000.00 | | | $ | 960.60 | | | $ | 9.61 | | |
| Class C Hypothetical (5% return before expenses) | | $ | 1,000.00 | | | $ | 1,015.20 | | | $ | 9.87 | | |
| Class R Actual2 | | $ | 1,000.00 | | | $ | 964.20 | | | $ | 6.56 | | |
| Class R Hypothetical (5% return before expenses)2 | | $ | 1,000.00 | | | $ | 1,018.32 | | | $ | 6.74 | | |
| Class Y Actual | | $ | 1,000.00 | | | $ | 965.60 | | | $ | 4.72 | | |
| Class Y Hypothetical (5% return before expenses) | | $ | 1,000.00 | | | $ | 1,020.20 | | | $ | 4.85 | | |
1Expenses are equal to the Fund's annualized expense ratio of 1.21%, 1.96%, 1.96%, 1.34%, and 0.96% for Class A, Class B, Class C, Class R, and Class Y, respectively, multiplied by the average account value over the period, multiplied by the number of days in the most recent half-year/366 days (to reflect the one-half year period).
2Prior to July 1, 2004, Class R had a different expense ratio. Had the current expense ratio been in place for the most recent one-half year, the actual and hypothetical expenses would have been $7.17 and $7.36, respectively.
FIRST AMERICAN FUNDS Annual Report 2004
16
Small Cap Value fund
Investment Objective: capital appreciation
How did the Fund perform for the fiscal year ended September 30, 2004?
The First American Small Cap Value Fund, Class Y shares, returned 23.02% for the fiscal year ended September 30, 2004 (Class A shares returned 22.70% at net asset value). By comparison, the Fund's benchmark, the Russell 2000 Value Index*, returned 25.66% for the same period.
How did general economic and market conditions affect performance?
During the past year, we saw an improving economic environment that featured above trend economic growth (i.e., exceeding the average of 3.15% since 1970), strong gains in productivity, and a significant rise in corporate profits. The improving economic environment led to sharp gains in payrolls from March through May 2004 which, along with higher inflation readings during the early months of the year, led the Federal Reserve to begin raising its target interest rate. Higher current and expected short-term interest rates, along with steep increases in oil prices during the first nine months of 2004, have led to growing concerns about the economic and profit growth outlook. These concerns have resulted in equity markets generating little in the way of gains since the first months of the calendar year despite solid earnings growth and continued low long-term interest rates. The markets have beco me more attractively valued as a result.
What worked for the Fund and why?
The Fund benefited from good stock selection in the healthcare and materials sectors, as well as the private banking industry. Additionally, a general overweight in the energy sector added to performance relative to the Russell 2000 Value Index. Within healthcare, Serological Corp., a biotechnology company that provides the raw materials used in a number of drugs, added to performance as end-user demand for certain drugs increased. Chemical stock, Georgia Gulf Corp., was the best performing stock in the materials sector as demand for their product increased due to the global demand for PVC plastic. Lastly, First Republic Bank of California aided performance, driven by continued stability and strength in the California real estate market and solid growth in asset management.
What did not work for the Fund and why?
Adverse stock selection in the technology, consumer discretionary, and industrials sectors was the primary reason for the Fund's underperformance relative to the Russell 2000 Value Index. Within the technology sector, slower-than-expected adoption of a new product, coupled with pricing pressure that offset unit growth, led to poor performance from data storage company Advanced Digital Information. Auto components company, Tower Automotive, had disappointing results in the consumer discretionary sector as the auto industry realized excess inventory and the company increased balance sheet leverage to support anticipated growth from recent successes in obtaining new customers. Finally, Integrated Alarm Services Group hurt results in the industrials sector as the management team failed to execute on transforming the company's business model.
What strategic moves were made by the Fund and why?
One of the largest strategic moves the management team made during the fiscal year was to tilt the financial sector toward firms that would be less impacted by an increasing interest-rate environment. This entailed moving away from real estate investment trusts (REITs) and thrifts and toward asset management companies more leveraged to a better economic environment. The Fund also moved to an overweight position in the energy sector, as fundamental conditions for exploration and production companies remained strong.
*Unlike mutual funds, index returns do not reflect any expenses, transaction costs, or cash flow effects.
| Top 10 Companies as of September 30, 20041 (% of net assets) | |
| Georgia Gulf | | | 2.0 | % | |
| Cooper | | | 1.7 | % | |
| Radian Group | | | 1.7 | % | |
| NCO Group | | | 1.6 | % | |
| First Republic Bank – California | | | 1.6 | % | |
| City National | | | 1.5 | % | |
| Artesyn Technologies | | | 1.5 | % | |
| Sky Financial Group | | | 1.5 | % | |
| American Capital Strategies | | | 1.5 | % | |
| Men's Wearhouse | | | 1.4 | % | |
| Sector Allocation as of September 30, 20041 (% of net assets) | |
| | | Fund2 | | Russell 2000
Value Index3 | |
| Consumer Discretionary | | | 12.2 | % | | | 13.9 | % | |
| Consumer Staples | | | 1.3 | % | | | 3.1 | % | |
| Energy | | | 8.1 | % | | | 5.9 | % | |
| Financials | | | 30.6 | % | | | 33.9 | % | |
| Healthcare | | | 6.7 | % | | | 4.9 | % | |
| Industrials | | | 19.2 | % | | | 13.8 | % | |
| Information Technology | | | 6.9 | % | | | 8.4 | % | |
| Materials | | | 8.2 | % | | | 8.8 | % | |
| Telecommunication Services | | | 0.7 | % | | | 1.0 | % | |
| Utilities | | | 4.7 | % | | | 6.3 | % | |
1Fund holdings and sector allocations are subject to change at any time and are not recommendations to buy or sell any security.
2The percentages shown represent the allocation by industry as a percent of net assets of the Fund.
3The percentages shown represent the percent allocation by industry of the index.
FIRST AMERICAN FUNDS Annual Report 2004
17
Small Cap Value fund continued
Annualized Performance1 as of September 30, 2004
| | | | | Since Inception | |
| | | 1 year | | 5 years | | 10 years | | 11/24/1997 | | 2/1/1999 | | 9/24/2001 | |
| Average annual return with sales charge (POP) | |
| Class A | | | 15.96 | % | | | 10.66 | % | | | 12.31 | % | | | - | | | | - | | | | - | | |
| Class B | | | 16.76 | % | | | 10.79 | % | | | - | | | | 6.01 | % | | | - | | | | - | | |
| Class C | | | 20.83 | % | | | 11.09 | % | | | - | | | | - | | | | 10.29 | % | | | - | | |
| Average annual return without sales charge (NAV) | |
| Class A | | | 22.70 | % | | | 11.92 | % | | | 12.94 | % | | | - | | | | - | | | | - | | |
| Class B | | | 21.76 | % | | | 11.05 | % | | | - | | | | 6.01 | % | | | - | | | | - | | |
| Class C | | | 21.83 | % | | | 11.09 | % | | | - | | | | - | | | | 10.29 | % | | | - | | |
| Class R4 | | | 22.69 | % | | | - | | | | - | | | | - | | | | - | | | | 16.57 | % | |
| Class Y | | | 23.02 | % | | | 12.20 | % | | | 13.20 | % | | | - | | | | - | | | | - | | |
| Russell 2000 Value Index3 | | | 25.66 | % | | | 14.71 | % | | | 13.41 | % | | | 9.63 | % | | | 12.85 | % | | | 19.01 | % | |
Value of $10,000 Investment1, 2 as of September 30, 2004
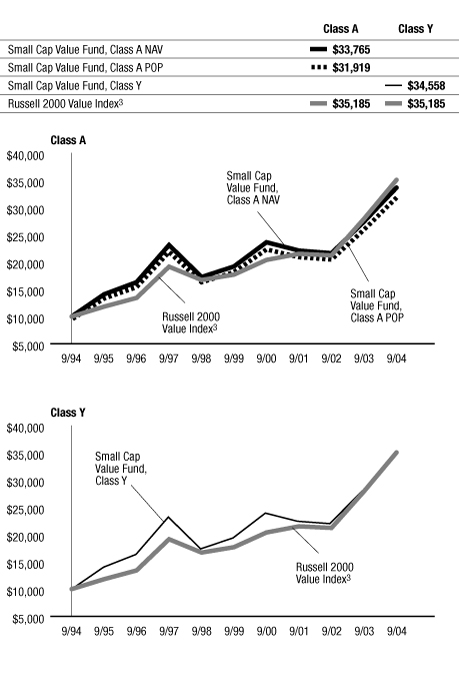
The performance data quoted on this page represents past performance and does not guarantee future results. The investment return and principal value of an investment will fluctuate so that an investor's shares, when redeemed, may be worth more or less than their original cost. Current performance of the Fund may be lower or higher than the performance data quoted. Performance data current to the most recent month-end may be obtained by calling 800.677.FUND.
1 Performance does not reflect the deduction of taxes that a shareholder would pay on fund distributions or redemption of fund shares. Performance reflects voluntary fee waivers in effect. In the absence of such fee waivers, total returns would be reduced. Index performance is for illustrative purposes only and does not reflect any expenses, transaction costs, or cash flow effects. Investment in the index is not available.
Stocks of small-capitalization companies involve substantial risk. These stocks have historically experienced greater price volatility than stocks of larger companies, and they may be expected to do so in the future.
Total returns at net asset value ("NAV") reflect performance over the time period indicated without including the Fund's maximum sales charge and assume reinvestment of all distributions at NAV.
Total returns at public offering price ("POP") reflect performance over the time period indicated including a maximum front-end sales charge of 5.50% for Class A shares and the maximum contingent deferred sales charge ("CDSC") for Class B and Class C shares for the relevant period. Maximum CDSC is 5.00% for Class B shares in the first year, decreasing annually to 0% in the seventh year following purchase, and 1.00% for Class C shares. Total returns assume reinvestment of all distributions at NAV.
Performance prior to August 1, 1994, is that of the Small Company Value Trust Fund, a predecessor collective trust fund. On August 1, 1994, substantially all of the assets of the Small Company Value Trust Fund were transferred into Qualivest Small Companies Value Fund, a mutual fund registered under the Investment Company Act of 1940. On November 21, 1997, the First American Small Cap Value Fund became the successor by merger to Qualivest Small Companies Value Fund. Small Company Value Trust Fund was not registered under the Investment Company Act of 1940 and therefore was not subject to certain investment restrictions that might have adversely affected performance.
2 Performance for Class B, Class C, and Class R shares is not presented. Performance for these classes will vary due to different expense structures.
3 An unmanaged index that measures the performance of those Russell 2000 companies with lower price-to-book ratios and lower forecasted growth values. The Russell 2000 Index is an unmanaged index comprised of the smallest 2,000 companies in the Russell 3000 Index. The Russell 3000 Index is composed of 3,000 large U.S. companies based on total market capitalization, representing approximately 98% of the investable U.S. equity market.
4 Prior to July 1, 2004, Class R shares were designated Class S shares, which had lower fees and expenses. Performance information prior to that date is based on the performance of the Class S shares. If current fees and expenses had been in effect for the entire period presented, performance would have been lower. Please refer to the prospectus for details.
FIRST AMERICAN FUNDS Annual Report 2004
18
Small Cap Value fund continued
Expense Example
As a shareholder of the Small Cap Value Fund, you incur two types of costs: (1) transaction costs, including sales charges (loads) on purchase payments; and (2) ongoing costs, including management fees; distribution and/or service (12b-1) fees; and other Fund expenses. This example is intended to help you understand your ongoing costs (in dollars) of investing in the Fund and to compare these costs with the ongoing costs of investing in other mutual funds. The example is based on an investment of $1,000 invested at the beginning of the period and held for the entire period from April 1, 2004, to September 30, 2004.
Actual Expenses
For each class, the first line of the table below provides information about actual account values and actual expenses. You may use the information in this line, together with the amount you invested, to estimate the expenses that you paid over the period. Simply divide your account value by $1,000 (for example, an $8,600 account value divided by $1,000 = 8.6), then multiply the result by the number in the first line under the heading entitled "Expenses Paid During Period" to estimate the expenses you paid on your account during this period.
Hypothetical Example for Comparison Purposes
For each class, the second line of the table below provides information about hypothetical account values and hypothetical expenses based on the Fund's actual expense ratio and an assumed rate of return of 5% per year before expenses, which is not the Fund's actual return. The hypothetical account values and expenses may not be used to estimate the actual ending account balance or expenses you paid for the period. You may use this information to compare the ongoing costs of investing in the Fund and other funds. To do so, compare this 5% hypothetical example with the 5% hypothetical examples that appear in the shareholder reports of the other funds.
Please note that the expenses shown in the table are meant to highlight your ongoing costs only and do not reflect any transactional costs, such as sales charges (loads). Therefore, the second line of the table for each class is useful in comparing ongoing costs only, and will not help you determine the relative total costs of owning different funds. In addition, if these transactional costs were included, your costs would have been higher.
Expense Examples
| | | Beginning Account
Value (4/1/2004) | | Ending Account
Value (9/30/2004) | | Expenses Paid During
Period1 (4/1/2004 to
9/30/2004) | |
| Class A Actual | | $ | 1,000.00 | | | $ | 1,010.70 | | | $ | 6.18 | | |
| Class A Hypothetical (5% return before expenses) | | $ | 1,000.00 | | | $ | 1,018.85 | | | $ | 6.21 | | |
| Class B Actual | | $ | 1,000.00 | | | $ | 1,006.30 | | | $ | 9.93 | | |
| Class B Hypothetical (5% return before expenses) | | $ | 1,000.00 | | | $ | 1,015.10 | | | $ | 9.97 | | |
| Class C Actual | | $ | 1,000.00 | | | $ | 1,006.90 | | | $ | 9.93 | | |
| Class C Hypothetical (5% return before expenses) | | $ | 1,000.00 | | | $ | 1,015.10 | | | $ | 9.97 | | |
| Class R Actual2 | | $ | 1,000.00 | | | $ | 1,009.90 | | | $ | 6.81 | | |
| Class R Hypothetical (5% return before expenses)2 | | $ | 1,000.00 | | | $ | 1,018.22 | | | $ | 6.84 | | |
| Class Y Actual | | $ | 1,000.00 | | | $ | 1,011.30 | | | $ | 4.93 | | |
| Class Y Hypothetical (5% return before expenses) | | $ | 1,000.00 | | | $ | 1,020.10 | | | $ | 4.95 | | |
1Expenses are equal to the Fund's annualized expense ratio of 1.23%, 1.98%, 1.98%, 1.36%, and 0.98% for Class A, Class B, Class C, Class R, and Class Y, respectively, multiplied by the average account value over the period, multiplied by the number of days in the most recent half-year/366 days (to reflect the one-half year period).
2Prior to July 1, 2004, Class R had a different expense ratio. Had the current expense ratio been in place for the most recent one-half year, the actual and hypothetical expenses would have been $7.44 and $7.47, respectively.
FIRST AMERICAN FUNDS Annual Report 2004
19
Mid Cap Growth Opportunities fund
Investment Objective: capital appreciation
How did the Fund perform for the fiscal year ended September 30, 2004?
The First American Mid Cap Growth Opportunities Fund, Class Y shares, returned 17.18% for the fiscal year ended September 30, 2004 (Class A shares returned 16.88% at net asset value). By comparison, the Fund's benchmark, the Russell Midcap Growth Index*, returned 13.68% for the same period.
How did general economic and market conditions affect performance?
During the past year, we saw an improving economic environment that featured above trend economic growth (i.e., exceeding the average of 3.15% since 1970), strong gains in productivity, and a significant rise in corporate profits. The improving economic environment led to sharp gains in payrolls from March through May 2004 which, along with higher inflation readings during the early months of the year, led the Federal Reserve to begin raising its target interest rate. Higher current and expected short-term interest rates, along with steep increases in oil prices during the first nine months of 2004, have led to growing concerns about the economic and profit growth outlook. These concerns have resulted in equity markets generating little in the way of gains since the first months of the calendar year despite solid earnings growth and continued low long-term interest rates. The markets have beco me more attractively valued as a result.
What worked for the Fund and why?
The majority of the Fund's outperformance relative to the Russell Midcap Growth Index was a result of good stock selection in the information technology, healthcare, and industrial sectors. To a lesser extent, an overweight position in the energy sector benefited the Fund. Within the technology sector, Research In Motion and NCR drove performance. Research In Motion, a manufacturer of wireless data devices, saw earnings estimates rise 10-fold during the fiscal year while NCR Corp., driven by increasing demand for their hardware and software business solutions, consistently posted earnings that significantly outpaced estimates. In the industrial sector, Monster Worldwide Inc., provider of the world's number one job search web site, added value. Finally, industry pricing power, coupled with a succes sful company turnaround, led insurance provider Aetna to positive results in the health care sector.
What did not work for the Fund and why?
Adverse stock selection in the consumer discretionary sector was the primary detractor of performance relative to the Russell Midcap Growth Index. Within the consumer discretionary sector, media companies Westwood One and Entercom Communications were the key detractors of performance. Both lacked a rebound in traditional advertising (radio, television and print), leading to weak performance. Additionally, leisure company Marvel posted poor results as merchandising around the release of the movie Spiderman 2 fell short of company and Wall Street expectations.
What strategic moves were made by the Fund and why?
The biggest strategic change in the Fund was in the consumer sector. The Fund began the fiscal year with overweights in all of the major consumer categories, including retail, media, and leisure (restaurant/lodging/
gaming). At the end of the fiscal year, the Fund's only subsector overweight was in the leisure area, having gone to underweights in both retail and media. The consumer discretionary sector is now the largest underweight sector relative to the Russell Midcap Growth Index.
*Unlike mutual funds, index returns do not reflect any expenses, transaction costs, or cash flow effects.
| Top 10 Companies as of September 30, 20041 (% of net assets) | |
| NCR | | | 3.9 | % | |
| Research in Motion | | | 3.2 | % | |
| Bunge Limited | | | 2.6 | % | |
| PerkinElmer | | | 2.4 | % | |
| Aetna | | | 2.3 | % | |
| Marvel Enterprises | | | 2.2 | % | |
| Investors Financial Services | | | 2.0 | % | |
| Dun & Bradstreet | | | 2.0 | % | |
| Republic Services | | | 1.8 | % | |
| Station Casinos | | | 1.7 | % | |
| Sector Allocation as of September 30, 20041 (% of net assets) | |
| | | Fund2 | | Russell Midcap
Growth Index3 | |
| Consumer Discretionary | | | 18.1 | % | | | 22.3 | % | |
| Consumer Staples | | | 4.2 | % | | | 3.4 | % | |
| Energy | | | 8.1 | % | | | 5.0 | % | |
| Financials | | | 7.2 | % | | | 8.7 | % | |
| Healthcare | | | 19.9 | % | | | 18.7 | % | |
| Industrials | | | 9.9 | % | | | 12.8 | % | |
| Information Technology | | | 27.1 | % | | | 24.5 | % | |
| Materials | | | 0.8 | % | | | 2.9 | % | |
| Telecommunication Services | | | 0.0 | % | | | 1.2 | % | |
| Utilities | | | 0.0 | % | | | 0.5 | % | |
1Fund holdings and sector allocations are subject to change at any time and are not recommendations to buy or sell any security.
2The percentages shown represent the allocation by industry as a percent of net assets of the Fund.
3The percentages shown represent the percent allocation by industry of the index.
FIRST AMERICAN FUNDS Annual Report 2004
20
Mid Cap Growth Opportunities fund continued
Annualized Performance1 as of September 30, 2004
| | | | | Since Inception | |
| | | 1 year | | 5 years | | 10 years | | 1/9/19954 | | 3/1/19996 | | 12/11/20004 | | 9/24/20014 | |
| Average annual return with sales charge (POP) | | | |
| Class A | | | 10.45 | % | | | 10.69 | % | | | - | | | | 10.34 | % | | | - | | | | - | | | | - | | |
| Class B | | | 11.03 | % | | | 10.83 | % | | | - | | | | - | | | | 8.40 | % | | | - | | | | - | | |
| Class C | | | 15.03 | % | | | - | | | | - | | | | - | | | | - | | | | - | | | | 12.00 | % | |
| Average annual return without sales charge (NAV) | | | |
| Class A | | | 16.88 | % | | | 11.95 | % | | | - | | | | 10.98 | % | | | - | | | | - | | | | - | | |
| Class B | | | 16.03 | % | | | 11.10 | % | | | - | | | | - | | | | 8.52 | % | | | - | | | | - | | |
| Class C | | | 16.03 | % | | | - | | | | - | | | | - | | | | - | | | | - | | | | 12.00 | % | |
| Class R5 | | | 16.83 | % | | | - | | | | - | | | | - | | | | - | | | | 2.54 | % | | | - | | |
| Class Y | | | 17.18 | % | | | 12.23 | % | | | 10.90 | % | | | - | | | | - | | | | - | | | | - | | |
| Russell Midcap Growth Index3 | | | 13.68 | % | | | 0.63 | % | | | 9.64 | % | | | 10.01 | % | | | 2.42 | % | | | (4.59 | %) | | | 10.09 | % | |
Value of $10,000 Investment1, 2 as of September 30, 2004
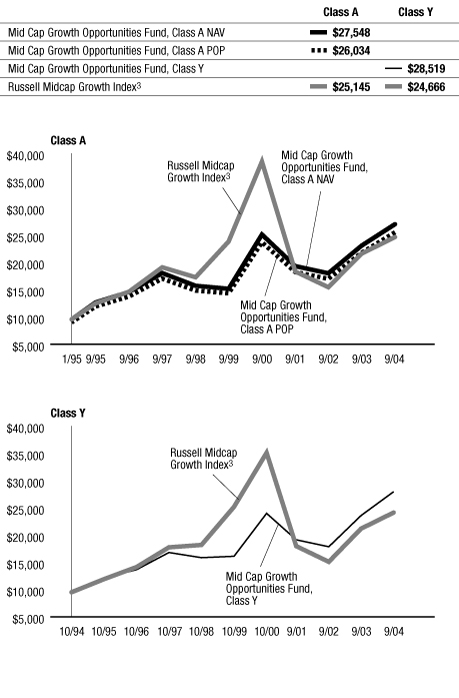
The performance data quoted on this page represents past performance and does not guarantee future results. The investment return and principal value of an investment will fluctuate so that an investor's shares, when redeemed, may be worth more or less than their original cost. Current performance of the Fund may be lower or higher than the performance data quoted. Performance data current to the most recent month-end may be obtained by calling 800.677.FUND.
1 Performance does not reflect the deduction of taxes that a shareholder would pay on fund distributions or redemption of fund shares. Performance reflects voluntary fee waivers in effect. In the absence of such fee waivers, total returns would be reduced. Index performance is for illustrative purposes only and does not reflect any expenses, transaction costs, or cash flow effects. Investment in the index is not available.
Stocks of mid-capitalization companies may be slightly less volatile than those of small-capitalization companies, but they still involve substantial risk and may be subject to increased volatility and more price fluctuation than large-capitalization companies.
Total returns at net asset value ("NAV") reflect performance over the time period indicated without including the Fund's maximum sales charge and assume reinvestment of all distributions at NAV.
Total returns at public offering price ("POP") reflect performance over the time period indicated including a maximum front-end sales charge of 5.50% for Class A shares and the maximum contingent deferred sales charge ("CDSC") for Class B and Class C shares for the relevant period. Maximum CDSC is 5.00% for Class B shares in the first year, decreasing annually to 0% in the seventh year following purchase, and 1.00% for Class C shares. Total returns assume reinvestment of all distributions at NAV.
On September 24, 2001, the First American Mid Cap Growth Opportunities Fund became the successor by merger to the Firstar MidCap Core Equity Fund, a series of Firstar Funds, Inc. Prior to the merger, the First American fund had no assets or liabilities. Performance presented prior to September 24, 2001, represents that of the Firstar MidCap Core Equity Fund.
2 Performance for Class B, Class C, and Class R shares is not presented. Performance for these classes will vary due to different expense structures.
3 An unmanaged index that measures the performance of those Russell mid-cap companies with higher price-to-book ratios and higher forecasted growth values. The Russell Midcap Growth Index is part of the larger Russell 1000 Growth Index. The Russell 1000 Growth Index is an unmanaged index that measures performance of those Russell 1000 companies with higher price-to-book ratios and higher forecasted growth values. Russell 1000 companies include the 1,000 largest companies in the Russell 3000 Index. The Russell 3000 Index measures the performance of the 3,000 largest U.S. companies based on total market capitalization, which represents approximately 98% of the investable U.S. equity market.
4 The performance since inception for each index is calculated from the month end following the inception of the class.
5 Prior to July 1, 2004, Class R shares were designated Class S shares, which had lower fees and expenses. Performance information prior to that date is based on the performance of the Class S shares. If current fees and expenses had been in effect for the entire period presented, performance would have been lower. Please refer to the prospectus for details.
6 The performance since inception for the index is calculated from the previous month end prior to the inception of the class.
FIRST AMERICAN FUNDS Annual Report 2004
21
Mid Cap Growth Opportunities fund continued
Expense Example
As a shareholder of the Mid Cap Growth Opportunities Fund, you incur two types of costs: (1) transaction costs, including sales charges (loads) on purchase payments; and (2) ongoing costs, including management fees; distribution and/or service (12b-1) fees; and other Fund expenses. This example is intended to help you understand your ongoing costs (in dollars) of investing in the Fund and to compare these costs with the ongoing costs of investing in other mutual funds. The example is based on an investment of $1,000 invested at the beginning of the period and held for the entire period from April 1, 2004, to September 30, 2004.
Actual Expenses
For each class, the first line of the table below provides information about actual account values and actual expenses. You may use the information in this line, together with the amount you invested, to estimate the expenses that you paid over the period. Simply divide your account value by $1,000 (for example, an $8,600 account value divided by $1,000 = 8.6), then multiply the result by the number in the first line under the heading entitled "Expenses Paid During Period" to estimate the expenses you paid on your account during this period.
Hypothetical Example for Comparison Purposes
For each class, the second line of the table below provides information about hypothetical account values and hypothetical expenses based on the Fund's actual expense ratio and an assumed rate of return of 5% per year before expenses, which is not the Fund's actual return. The hypothetical account values and expenses may not be used to estimate the actual ending account balance or expenses you paid for the period. You may use this information to compare the ongoing costs of investing in the Fund and other funds. To do so, compare this 5% hypothetical example with the 5% hypothetical examples that appear in the shareholder reports of the other funds.
Please note that the expenses shown in the table are meant to highlight your ongoing costs only and do not reflect any transactional costs, such as sales charges (loads). Therefore, the second line of the table for each class is useful in comparing ongoing costs only, and will not help you determine the relative total costs of owning different funds. In addition, if these transactional costs were included, your costs would have been higher.
Expense Examples
| | | Beginning Account
Value (4/1/2004) | | Ending Account
Value (9/30/2004) | | Expenses Paid During
Period1 (4/1/2004 to
9/30/2004) | |
| Class A Actual | | $ | 1,000.00 | | | $ | 982.00 | | | $ | 5.95 | | |
| Class A Hypothetical (5% return before expenses) | | $ | 1,000.00 | | | $ | 1,019.00 | | | $ | 6.06 | | |
| Class B Actual | | $ | 1,000.00 | | | $ | 978.20 | | | $ | 9.64 | | |
| Class B Hypothetical (5% return before expenses) | | $ | 1,000.00 | | | $ | 1,015.25 | | | $ | 9.82 | | |
| Class C Actual | | $ | 1,000.00 | | | $ | 978.30 | | | $ | 9.64 | | |
| Class C Hypothetical (5% return before expenses) | | $ | 1,000.00 | | | $ | 1,015.25 | | | $ | 9.82 | | |
| Class R Actual2 | | $ | 1,000.00 | | | $ | 981.50 | | | $ | 6.57 | | |
| Class R Hypothetical (5% return before expenses)2 | | $ | 1,000.00 | | | $ | 1,018.37 | | | $ | 6.69 | | |
| Class Y Actual | | $ | 1,000.00 | | | $ | 983.10 | | | $ | 4.71 | | |
| Class Y Hypothetical (5% return before expenses) | | $ | 1,000.00 | | | $ | 1,020.25 | | | $ | 4.80 | | |
1Expenses are equal to the Fund's annualized expense ratio of 1.20%, 1.95%, 1.95%, 1.33%, and 0.95% for Class A, Class B, Class C, Class R, and Class Y, respectively, multiplied by the average account value over the period, multiplied by the number of days in the most recent half-year/366 days (to reflect the one-half year period).
2Prior to July 1, 2004, Class R had a different expense ratio. Had the current expense ratio been in place for the most recent one-half year, the actual and hypothetical expenses would have been $7.18 and $7.31, respectively.
FIRST AMERICAN FUNDS Annual Report 2004
22
Mid Cap Value fund
Investment Objective: capital appreciation
How did the Fund perform for the fiscal year ended September 30, 2004?
The First American Mid Cap Value Fund, Class Y shares, returned 23.95% for the fiscal year ended September 30, 2004 (Class A shares returned 23.65% at net asset value). By comparison, the Fund's benchmark, the Russell Midcap Value Index*, returned 25.62% for the same period.
How did general economic and market conditions affect performance?
During the past year, we saw an improving economic environment that featured above trend economic growth (i.e., exceeding the average of 3.15% since 1970), strong gains in productivity, and a significant rise in corporate profits. The improving economic environment led to sharp gains in payrolls from March through May 2004 which, along with higher inflation readings during the early months of the year, led the Federal Reserve to begin raising its target interest rate. Higher current and expected short-term interest rates, along with steep increases in oil prices during the first nine months of 2004, have led to growing concerns about the economic and profit growth outlook. These concerns have resulted in equity markets generating little in the way of gains since the first months of the calendar year despite solid earnings growth and continued low long-term interest rates. The markets have beco me more attractively valued as a result.
What worked for the Fund and why?
The Fund benefited from good stock selection in the healthcare, consumer discretionary, and utilities sectors, as well as a general overweight in the energy sector relative to the Russell Midcap Value Index. Healthcare equipment and supply companies C.R. Bard and Fisher Scientific International, as well as healthcare provider and services company, Inveresk Research Group, were the key drivers of performance in the healthcare sector. Within the consumer discretionary sector, an improvement in occupancy levels driven by a strong convention season led to positive results from the Mandalay Bay Group and the refinancing boom and upward trend in home improvement lifted specialty retailer Sherwin Williams Co. Finally, new management and financial restructuring helped utility company TXU Corp. produce strong r esults.
What did not work for the Fund and why?
Adverse stock selection across the technology, industrials, and consumer staples sectors were the primary drivers of underperformance relative to the Russell Midcap Value Index. An overweight in the electronic equipment and instrument industry, coupled with poor stock selection in the software industry, led to poor results in the technology sector. Within software, a delay in the potential acquisition of PeopleSoft by Oracle and missed earnings led to disappointing results from PeopleSoft. In the industrials sector, an underweight, coupled with poor stock selection in the road and rail industry, detracted from performance. Lastly, in the consumer staples sector unfavorable stock selection in the food and staples retailing industry, coupled with poor performance from Coca-Cola Enterprises, detracted from Fund performance.
What strategic moves were made by the Fund and why?
In terms of sector positioning, the Fund ended the fiscal year as it began. Overweightings were maintained in the technology and energy sector as the management team continued to feel that technology stocks would benefit from a strengthening economy and that the continuation of high commodity prices, coupled with supply and demand characteristics, would lead to strong performance in the energy sector. The management team maintained underweights in the financials and utilities sectors based on its belief that these sectors are overvalued and will likely underperform in an increasing interest-rate environment.
*Unlike mutual funds, index returns do not reflect any expenses, transaction costs, or cash flow effects.
| Top 10 Companies as of September 30, 20041 (% of net assets) | |
| NCR | | | 2.5 | % | |
| Sherwin Williams | | | 2.4 | % | |
| Eaton | | | 2.1 | % | |
| Clorox | | | 2.0 | % | |
| Hilton Hotels | | | 2.0 | % | |
| TXU | | | 1.8 | % | |
| PG & E | | | 1.7 | % | |
| Marshall & Ilsley | | | 1.6 | % | |
| Republic Services | | | 1.6 | % | |
| CIGNA | | | 1.5 | % | |
| Sector Allocation as of September 30, 20041 (% of net assets) | |
| | | Fund2 | | Russell Midcap
Value Index3 | |
| Consumer Discretionary | | | 14.7 | % | | | 14.1 | % | |
| Consumer Staples | | | 4.1 | % | | | 5.6 | % | |
| Energy | | | 8.9 | % | | | 6.9 | % | |
| Financials | | | 26.0 | % | | | 31.1 | % | |
| Healthcare | | | 4.0 | % | | | 4.4 | % | |
| Industrials | | | 9.6 | % | | | 9.0 | % | |
| Information Technology | | | 10.2 | % | | | 6.7 | % | |
| Materials | | | 8.1 | % | | | 8.5 | % | |
| Telecommunication Services | | | 1.1 | % | | | 1.2 | % | |
| Utilities | | | 10.2 | % | | | 12.5 | % | |
1Fund holdings and sector allocations are subject to change at any time and are not recommendations to buy or sell any security.
2The percentages shown represent the allocation by industry as a percent of net assets of the Fund.
3The percentages shown represent the percent allocation by industry of the index.
FIRST AMERICAN FUNDS Annual Report 2004
23
Mid Cap Value fund continued
Annualized Performance1 as of September 30, 2004
| | | | | Since Inception | |
| | | 1 year | | 5 years | | 10 years | | 2/1/1999 | | 9/24/2001 | |
| Average annual return with sales charge (POP) | | | |
| Class A | | | 16.84 | % | | | 8.68 | % | | | 8.68 | % | | | - | | | | - | | |
| Class B | | | 17.69 | % | | | 8.82 | % | | | 8.49 | % | | | - | | | | - | | |
| Class C | | | 21.69 | % | | | 9.10 | % | | | - | | | | 6.98 | % | | | - | | |
| Average annual return without sales charge (NAV) | | | |
| Class A | | | 23.65 | % | | | 9.91 | % | | | 9.30 | % | | | - | | | | - | | |
| Class B | | | 22.69 | % | | | 9.11 | % | | | 8.49 | % | | | - | | | | - | | |
| Class C | | | 22.69 | % | | | 9.10 | % | | | - | | | | 6.98 | % | | | - | | |
| Class R4 | | | 23.51 | % | | | - | | | | - | | | | - | | | | 15.41 | % | |
| Class Y | | | 23.95 | % | | | 10.17 | % | | | 9.58 | % | | | - | | | | - | | |
| Russell Midcap Value Index3 | | | 25.62 | % | | | 11.47 | % | | | 13.88 | % | | | 9.81 | % | | | 16.31 | % | |
Value of $10,000 Investment1, 2 as of September 30, 2004
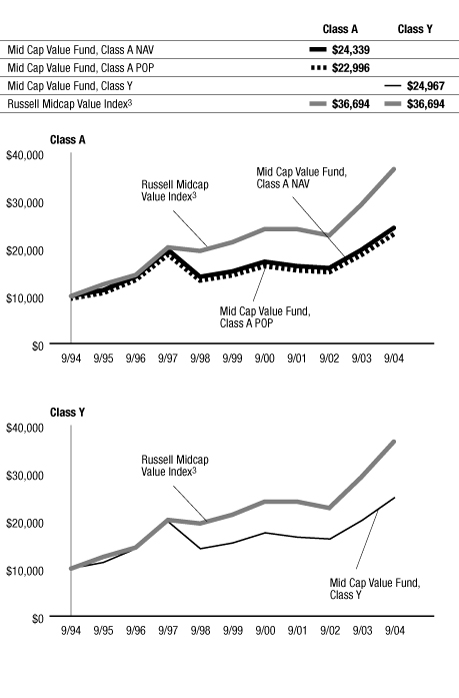
The performance data quoted on this page represents past performance and does not guarantee future results. The investment return and principal value of an investment will fluctuate so that an investor's shares, when redeemed, may be worth more or less than their original cost. Current performance of the Fund may be lower or higher than the performance data quoted. Performance data current to the most recent month-end may be obtained by calling 800.677.FUND.
1 Performance does not reflect the deduction of taxes that a shareholder would pay on fund distributions or redemption of fund shares. Performance reflects voluntary fee waivers in effect. In the absence of such fee waivers, total returns would be reduced. Index performance is for illustrative purposes only and does not reflect any expenses, transaction costs, or cash flow effects. Investment in the index is not available.
Stocks of mid-capitalization companies may be slightly less volatile than those of small-capitalization companies, but they still involve substantial risk and may be subject to increased volatility and more price fluctuation than large-capitalization companies.
Total returns at net asset value ("NAV") reflect performance over the time period indicated without including the Fund's maximum sales charge and assume reinvestment of all distributions at NAV.
Total returns at public offering price ("POP") reflect performance over the time period indicated including a maximum front-end sales charge of 5.50% for Class A shares and the maximum contingent deferred sales charge ("CDSC") for Class B and Class C shares for the relevant period. Maximum CDSC is 5.00% for Class B shares in the first year, decreasing annually to 0% in the seventh year following purchase, and 1.00% for Class C shares. Total returns assume reinvestment of all distributions at NAV.
2 Performance for Class B, Class C, and Class R shares is not presented. Performance for these classes will vary due to different expense structures.
3 An unmanaged index that measures the performance of those Russell mid-cap companies with lower price-to-book ratios and lower forecasted growth values. The Russell Midcap Value Index is part of the larger Russell 1000 Value Index. The Russell 1000 Value Index is an unmanaged index that measures performance of those Russell 1000 companies with lower price-to-book ratios and lower forecasted growth values. Russell 1000 companies include the 1,000 largest companies in the Russell 3000 Index. The Russell 3000 Index measures the performance of the 3,000 largest U.S. companies based on total market capitalization, which represents approximately 98% of the investable U.S. equity market.
4 Prior to July 1, 2004, Class R shares were designated Class S shares, which had lower fees and expenses. Performance information prior to that date is based on the performance of the Class S shares. If current fees and expenses had been in effect for the entire period presented, performance would have been lower. Please refer to the prospectus for details.
FIRST AMERICAN FUNDS Annual Report 2004
24
Mid Cap Value fund continued
Expense Example
As a shareholder of the Mid Cap Value Fund, you incur two types of costs: (1) transaction costs, including sales charges (loads) on purchase payments; and (2) ongoing costs, including management fees; distribution and/or service (12b-1) fees; and other Fund expenses. This example is intended to help you understand your ongoing costs (in dollars) of investing in the Fund and to compare these costs with the ongoing costs of investing in other mutual funds. The example is based on an investment of $1,000 invested at the beginning of the period and held for the entire period from April 1, 2004, to September 30, 2004.
Actual Expenses
For each class, the first line of the table below provides information about actual account values and actual expenses. You may use the information in this line, together with the amount you invested, to estimate the expenses that you paid over the period. Simply divide your account value by $1,000 (for example, an $8,600 account value divided by $1,000 = 8.6), then multiply the result by the number in the first line under the heading entitled "Expenses Paid During Period" to estimate the expenses you paid on your account during this period.
Hypothetical Example for Comparison Purposes
For each class, the second line of the table below provides information about hypothetical account values and hypothetical expenses based on the Fund's actual expense ratio and an assumed rate of return of 5% per year before expenses, which is not the Fund's actual return. The hypothetical account values and expenses may not be used to estimate the actual ending account balance or expenses you paid for the period. You may use this information to compare the ongoing costs of investing in the Fund and other funds. To do so, compare this 5% hypothetical example with the 5% hypothetical examples that appear in the shareholder reports of the other funds.
Please note that the expenses shown in the table are meant to highlight your ongoing costs only and do not reflect any transactional costs, such as sales charges (loads). Therefore, the second line of the table for each class is useful in comparing ongoing costs only, and will not help you determine the relative total costs of owning different funds. In addition, if these transactional costs were included, your costs would have been higher.
Expense Examples
| | | Beginning Account
Value (4/1/2004) | | Ending Account
Value (9/30/2004) | | Expenses Paid During
Period1 (4/1/2004 to
9/30/2004) | |
| Class A Actual | | $ | 1,000.00 | | | $ | 1,029.60 | | | $ | 6.09 | | |
| Class A Hypothetical (5% return before expenses) | | $ | 1,000.00 | | | $ | 1,019.00 | | | $ | 6.06 | | |
| Class B Actual | | $ | 1,000.00 | | | $ | 1,025.90 | | | $ | 9.88 | | |
| Class B Hypothetical (5% return before expenses) | | $ | 1,000.00 | | | $ | 1,015.25 | | | $ | 9.82 | | |
| Class C Actual | | $ | 1,000.00 | | | $ | 1,026.00 | | | $ | 9.88 | | |
| Class C Hypothetical (5% return before expenses) | | $ | 1,000.00 | | | $ | 1,015.25 | | | $ | 9.82 | | |
| Class R Actual2 | | $ | 1,000.00 | | | $ | 1,029.10 | | | $ | 6.72 | | |
| Class R Hypothetical (5% return before expenses)2 | | $ | 1,000.00 | | | $ | 1,018.37 | | | $ | 6.69 | | |
| Class Y Actual | | $ | 1,000.00 | | | $ | 1,031.00 | | | $ | 4.82 | | |
| Class Y Hypothetical (5% return before expenses) | | $ | 1,000.00 | | | $ | 1,020.25 | | | $ | 4.80 | | |
1Expenses are equal to the Fund's annualized expense ratio of 1.20%, 1.95%, 1.95%, 1.33%, and 0.95% for Class A, Class B, Class C, Class R, and Class Y, respectively, multiplied by the average account value over the period, multiplied by the number of days in the most recent half-year/366 days (to reflect the one-half year period).
2Prior to July 1, 2004, Class R had a different expense ratio. Had the current expense ratio been in place for the most recent one-half year, the actual and hypothetical expenses would have been $7.36 and $7.31, respectively.
FIRST AMERICAN FUNDS Annual Report 2004
25
Large Cap Growth Opportunities fund
Investment Objective: long-term growth of capital
How did the Fund perform for the fiscal year ended September 30, 2004?
The First American Large Cap Growth Opportunities Fund, Class Y shares, returned 9.76% for the fiscal year ended September 30, 2004 (Class A shares returned 9.52% at net asset value). By comparison, the Fund's benchmark, the Russell 1000 Growth Index*, returned 7.51% for the same period.
How did general economic and market conditions affect performance?
During the past year, we saw an improving economic environment that featured above trend economic growth (i.e., exceeding the average of 3.15% since 1970), strong gains in productivity, and a significant rise in corporate profits. The improving economic environment led to sharp gains in payrolls from March through May 2004 which, along with higher inflation readings during the early months of the year, led the Federal Reserve to begin raising its target interest rate. Higher current and expected short-term interest rates, along with steep increases in oil prices during the first nine months of 2004, have led to growing concerns about the economic and profit growth outlook. These concerns have resulted in equity markets generating little in the way of gains since the first months of the calendar year despite solid earnings growth and continued low long-term interest rates. The markets have become more attractively valued as a result.
What worked for the Fund and why?
The majority of the Fund's outperformance relative to the Russell 1000 Growth Index was a result of good stock selection in the information technology and energy sectors, as well as a general overweight position in the energy sector. Within the technology sector, Research In Motion and NCR drove performance. Research in Motion, a manufacturer of wireless data devices, saw earnings estimates rise 10-fold during the fiscal year while NCR Corp., driven by increasing demand for their hardware and software business solutions, consistently posted earnings that significantly outpaced estimates. Additionally, stock selection in the semiconductors and semiconductor equipment industry benefited results in the technology sector. Apache Corp. and BP led results in the energy sector, as strong production rates and conti nued high commodity prices propelled their stock prices.
What did not work for the Fund and why?
Stock selection in the healthcare sector and the food and staples retailing industry detracted from performance relative to the Russell 1000 Growth Index. Within the healthcare sector, pharmaceutical companies Biovail Corp. and Abbott Laboratories did not meet earnings estimates, driving their stock prices lower. Even though the Fund was significantly underweight in consumer staples stock Wal-Mart, which disappointed, the exposure to the stock, coupled with poor performance from food distributor Sysco Corp., depressed performance in the food and staples retailing industry.
What strategic moves were made by the Fund and why?
The Fund management team gained confidence in specific companies throughout the fiscal year, which led the team to reduce the number of stocks held within the portfolio and increase the weightings of the holdings relative to the Fund's benchmark. Additionally, the team moved from an overweight position in mega-capitalization stocks (defined as the top 50 companies within the Russell 1000 Growth Index) to an underweight position as the team felt that smaller large-cap stocks would benefit more from an improving economy.
*Unlike mutual funds, index returns do not reflect any expenses, transaction costs, or cash flow effects.
| Top 10 Companies as of September 30, 20041 (% of net assets) | |
| Pfizer | | | 5.1 | % | |
| Medtronic | | | 2.8 | % | |
| NCR | | | 2.7 | % | |
| Johnson & Johnson | | | 2.6 | % | |
| American International Group | | | 2.5 | % | |
| Intel | | | 2.4 | % | |
| Cisco Systems | | | 2.2 | % | |
| Dell | | | 2.2 | % | |
| UnitedHealth Group | | | 2.1 | % | |
| Wal-Mart Stores | | | 2.1 | % | |
| Sector Allocation as of September 30, 20041 (% of net assets) | |
| | | Fund2 | | Russell 1000
Growth Index3 | |
| Consumer Discretionary | | | 15.5 | % | | | 16.5 | % | |
| Consumer Staples | | | 8.6 | % | | | 13.5 | % | |
| Energy | | | 2.3 | % | | | 1.3 | % | |
| Financials | | | 12.4 | % | | | 11.2 | % | |
| Healthcare | | | 23.9 | % | | | 25.6 | % | |
| Industrials | | | 8.5 | % | | | 11.6 | % | |
| Information Technology | | | 27.4 | % | | | 18.5 | % | |
| Materials | | | 0.0 | % | | | 1.2 | % | |
| Telecommunication Services | | | 0.0 | % | | | 0.6 | % | |
1Fund holdings and sector allocations are subject to change at any time and are not recommendations to buy or sell any security.
2The percentages shown represent the allocation by industry as a percent of net assets of the Fund.
3The percentages shown represent the percent allocation by industry of the index.
FIRST AMERICAN FUNDS Annual Report 2004
26
Large Cap Growth Opportunities fund continued
Performance1 as of September 30, 2004
| | | | | Since Inception | |
| | | 1 year | | 5 years | | 10 years | | 1/9/1995 | | 3/1/1999 | | 11/27/2000 | | 9/24/2001 | |
| Average annual return with sales charge (POP) | | | |
| Class A | | | 3.50 | % | | | (4.63 | %) | | | - | | | | 6.56 | % | | | - | | | | - | | | | - | | |
| Class B | | | 3.69 | % | | | (4.59 | %) | | | - | | | | - | | | | (4.51 | %) | | | - | | | | - | | |
| Class C | | | 7.69 | % | | | - | | | | - | | | | - | | | | - | | | | - | | | | 1.13 | % | |
| Average annual return without sales charge (NAV) | | | |
| Class A | | | 9.52 | % | | | (3.55 | %) | | | - | | | | 7.18 | % | | | - | | | | - | | | | - | | |
| Class B | | | 8.69 | % | | | (4.27 | %) | | | - | | | | - | | | | (4.37 | %) | | | - | | | | - | | |
| Class C | | | 8.69 | % | | | - | | | | - | | | | - | | | | - | | | | - | | | | 1.13 | % | |
| Class R4 | | | 9.38 | % | | | - | | | | - | | | | - | | | | - | | | | (8.68 | %) | | | - | | |
| Class Y | | | 9.76 | % | | | (3.31 | %) | | | 6.96 | % | | | - | | | | - | | | | - | | | | - | | |
| Russell 1000 Growth Index3 | | | 7.51 | % | | | (6.78 | %) | | | 8.71 | % | | | 8.94 | % | | | (5.22 | %) | | | (10.33 | %) | | | 2.59 | % | |
Value of a $10,000 Investment1, 2 as of September 30, 2004
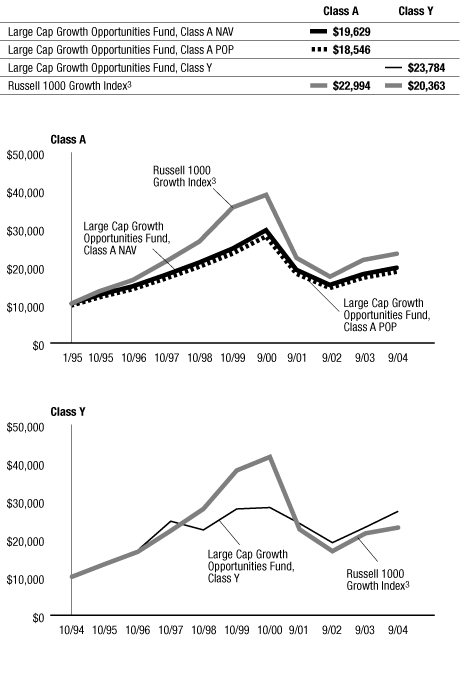
The performance data quoted on this page represents past performance and does not guarantee future results. The investment return and principal value of an investment will fluctuate so that an investor's shares, when redeemed, may be worth more or less than their original cost. Current performance of the Fund may be lower or higher than the performance data quoted. Performance data current to the most recent month-end may be obtained by calling 800.677.FUND.
1 Performance does not reflect the deduction of taxes that a shareholder would pay on fund distributions or redemption of fund shares. Performance reflects voluntary fee waivers in effect. In the absence of such fee waivers, total returns would be reduced. Index performance is for illustrative purposes only and does not reflect any expenses, transaction costs, or cash flow effects. Investment in the index is not available.
Total returns at net asset value ("NAV") reflect performance over the time period indicated without including the Fund's maximum sales charge and assume reinvestment of all distributions at NAV.
Total returns at public offering price ("POP") reflect performance over the time period indicated including a maximum front-end sales charge of 5.50% for Class A shares, and the maximum contingent deferred sales charge ("CDSC") for Class B and Class C shares for the relevant period. Maximum CDSC is 5.00% for Class B shares in the first year, decreasing annually to 0% in the seventh year following purchase, and 1.00% for Class C shares. Total returns assume reinvestment of all distributions at NAV.
On September 24, 2001, the First American Large Cap Growth Opportunities Fund became the successor by merger to the Firstar Large Cap Core Equity Fund, a series of Firstar Funds, Inc. Prior to the merger, the First American fund had no assets or liabilities. Performance presented prior to September 24, 2001, represents that of the Firstar Large Cap Core Equity Fund. Prior to January 10, 1995, the Firstar fund offered one class of shares to investors without a distribution or shareholder servicing fee. Performance presented prior to January 10, 1995, does not reflect these fees.
2 Performance for Class B, Class C, and Class R shares is not presented. Performance for these classes will vary due to different expense structures.
3 An unmanaged index that measures the performance of those Russell 1000 companies with higher price-to-book ratios and higher forecasted growth values. Russell 1000 companies include the 1,000 largest companies in the Russell 3000 Index. The Russell 3000 Index measures the performance of the 3,000 largest U.S. companies based on total market capitalization, which represents approximately 98% of the investable U.S. equity market.
4 Prior to July 1, 2004, Class R shares were designated Class S shares, which had lower fees and expenses. Performance information prior to that date is based on the performance of the Class S shares. If current fees and expenses had been in effect for the entire period presented, performance would have been lower. Please refer to the prospectus for details.
FIRST AMERICAN FUNDS Annual Report 2004
27
Large Cap Growth Opportunities fund continued
Expense Example
As a shareholder of the Large Cap Growth Opportunities Fund, you incur two types of costs: (1) transaction costs, including sales charges (loads) on purchase payments; and (2) ongoing costs, including management fees; distribution and/or service (12b-1) fees; and other Fund expenses. This example is intended to help you understand your ongoing costs (in dollars) of investing in the Fund and to compare these costs with the ongoing costs of investing in other mutual funds. The example is based on an investment of $1,000 invested at the beginning of the period and held for the entire period from April 1, 2004, to September 30, 2004.
Actual Expenses
For each class, the first line of the table below provides information about actual account values and actual expenses. You may use the information in this line, together with the amount you invested, to estimate the expenses that you paid over the period. Simply divide your account value by $1,000 (for example, an $8,600 account value divided by $1,000 = 8.6), then multiply the result by the number in the first line under the heading entitled "Expenses Paid During Period" to estimate the expenses you paid on your account during this period.
Hypothetical Example for Comparison Purposes
For each class, the second line of the table below provides information about hypothetical account values and hypothetical expenses based on the Fund's actual expense ratio and an assumed rate of return of 5% per year before expenses, which is not the Fund's actual return. The hypothetical account values and expenses may not be used to estimate the actual ending account balance or expenses you paid for the period. You may use this information to compare the ongoing costs of investing in the Fund and other funds. To do so, compare this 5% hypothetical example with the 5% hypothetical examples that appear in the shareholder reports of the other funds.
Please note that the expenses shown in the table are meant to highlight your ongoing costs only and do not reflect any transactional costs, such as sales charges (loads). Therefore, the second line of the table for each class is useful in comparing ongoing costs only, and will not help you determine the relative total costs of owning different funds. In addition, if these transactional costs were included, your costs would have been higher.
Expense Examples
| | | Beginning Account
Value (4/1/2004) | | Ending Account
Value (9/30/2004) | | Expenses Paid During
Period1 (4/1/2004 to
9/30/2004) | |
| Class A Actual | | $ | 1,000.00 | | | $ | 974.40 | | | $ | 5.68 | | |
| Class A Hypothetical (5% return before expenses) | | $ | 1,000.00 | | | $ | 1,019.25 | | | $ | 5.81 | | |
| Class B Actual | | $ | 1,000.00 | | | $ | 970.50 | | | $ | 9.36 | | |
| Class B Hypothetical (5% return before expenses) | | $ | 1,000.00 | | | $ | 1,015.50 | | | $ | 9.57 | | |
| Class C Actual | | $ | 1,000.00 | | | $ | 971.10 | | | $ | 9.36 | | |
| Class C Hypothetical (5% return before expenses) | | $ | 1,000.00 | | | $ | 1,015.50 | | | $ | 9.57 | | |
| Class R Actual2 | | $ | 1,000.00 | | | $ | 973.60 | | | $ | 6.29 | | |
| Class R Hypothetical (5% return before expenses)2 | | $ | 1,000.00 | | | $ | 1,018.62 | | | $ | 6.44 | | |
| Class Y Actual | | $ | 1,000.00 | | | $ | 975.60 | | | $ | 4.45 | | |
| Class Y Hypothetical (5% return before expenses) | | $ | 1,000.00 | | | $ | 1,020.50 | | | $ | 4.55 | | |
1Expenses are equal to the Fund's annualized expense ratio of 1.15%, 1.90%, 1.90%, 1.28%, and 0.90% for Class A, Class B, Class C, Class R, and Class Y, respectively, multiplied by the average account value over the period, multiplied by the number of days in the most recent half-year/366 days (to reflect the one-half year period).
2Prior to July 1, 2004, Class R had a different expense ratio. Had the current expense ratio been in place for the most recent one-half year, the actual and hypothetical expenses would have been $6.91 and $7.06, respectively.
FIRST AMERICAN FUNDS Annual Report 2004
28
Large Cap Select fund
Investment Objective: capital appreciation
How did the Fund perform for the fiscal year ended September 30, 2004?
The First American Large Cap Select Fund, Class Y shares, returned 11.10% for the fiscal year ended September 30, 2004 (Class A shares returned 10.82% at net asset value). By comparison, the Fund's benchmark, the Standard and Poor's 500 Composite Index*, returned 13.87% for the same period.
How did general economic and market conditions affect performance?
During the past year, we saw an improving economic environment that featured above trend economic growth (i.e., exceeding the average of 3.15% since 1970), strong gains in productivity, and a significant rise in corporate profits. The improving economic environment led to sharp gains in payrolls from March through May 2004 which, along with higher inflation readings during the early months of the year, led the Federal Reserve to begin raising its target interest rate. Higher current and expected short-term interest rates, along with steep increases in oil prices during the first nine months of 2004, have led to growing concerns about the economic and profit growth outlook. These concerns have resulted in equity markets generating little in the way of gains since the first months of the calendar year despite solid earnings growth and continued low long-term interest rates. The markets have become more attractively valued as a result.
What worked for the Fund and why?
The Fund benefited from good stock selection in the consumer discretionary sector, as well as a general overweight in the energy sector relative to the Standard and Poor's 500 Composite Index. Media company Walt Disney Co. was the biggest driver of results within the consumer discretionary sector. Walt Disney Co. appreciated on takeover bids by Comcast Corp., allowing the Fund management team to sell the stock at an attractive price. Within the utilities sector, new management and financial restructuring helped utility company TXU Corp. produce strong results. Lastly, technology stocks NCR, Texas Instruments, and Research in Motion were key drivers of the Fund's performance.
What did not work for the Fund and why?
Adverse stock selection across the financials, industrials, and telecommunications sectors, as well as a general overweight in the technology sector, were the primary drivers of underperformance relative to the Standard and Poor's 500 Composite Index. Disappointing earnings from State Street Corp., coupled with an underweight in the commercial banking industry, led to poor results relative to the benchmark within the financial sector. Within the healthcare sector, pharmaceutical companies Biovail Corp. and Abbott Laboratories did not meet earnings estimates, driving their stock prices lower. Lastly, generally adverse stock selection in the industrials sector detracted from performance while Nortel's restatement of earnings fell short of the Fund management team's expectations and led to disappointing results in the telecom sector.
What strategic moves were made by the Fund and why?
At the beginning of the fiscal year, the Fund's holdings strongly emphasized the largest-cap stocks in our candidate universe. Recently, we have lowered the average market capitalization of the portfolio with regard to the S&P 500. Also in contrast to a year ago, the portfolio places additional emphasis on recently successful stocks, an emphasis that is sometimes called a "momentum" strategy. In terms of sector emphasis, the team has trimmed, but retained an emphasis on, tech names and expanded its overweight on energy stocks.
*Unlike mutual funds, index returns do not reflect any expenses, transaction costs, or cash flow effects.
| Top 10 Companies as of September 30, 20041 (% of net assets) | |
| NCR | | | 4.8 | % | |
| Citigroup | | | 3.4 | % | |
| Johnson & Johnson | | | 3.3 | % | |
| American International Group | | | 2.7 | % | |
| Pfizer | | | 2.6 | % | |
| Exxon Mobil | | | 2.6 | % | |
| Bank of America | | | 2.5 | % | |
| Procter & Gamble | | | 2.4 | % | |
| BP, ADR | | | 2.3 | % | |
| Hilton Hotels | | | 2.3 | % | |
| Sector Allocation as of September 30, 20041 (% of net assets) | |
| | | Fund2 | | S&P 500
Composite Index3 | |
| Consumer Discretionary | | | 8.3 | % | | | 11.1 | % | |
| Consumer Staples | | | 7.8 | % | | | 10.7 | % | |
| Energy | | | 11.0 | % | | | 7.4 | % | |
| Financials | | | 19.9 | % | | | 20.6 | % | |
| Healthcare | | | 15.5 | % | | | 13.1 | % | |
| Industrials | | | 9.3 | % | | | 11.7 | % | |
| Information Technology | | | 16.6 | % | | | 15.7 | % | |
| Materials | | | 3.2 | % | | | 3.1 | % | |
| Telecommunication Services | | | 1.4 | % | | | 3.7 | % | |
| Utilities | | | 0.9 | % | | | 2.9 | % | |
1Fund holdings and sector allocations are subject to change at any time and are not recommendations to buy or sell any security.
2The percentages shown represent the allocation by industry as a percent of net assets of the Fund.
3The percentages shown represent the percent allocation by industry of the index.
FIRST AMERICAN FUNDS Annual Report 2004
29
Large Cap Select fund continued
Annualized Performance1 as of September 30, 2004
| | | | | Since Inception | |
| | | 1 year | | 1/31/2003 | |
| Average annual return with sales charge (POP) | | | | | | | | | |
| Class A | | | 4.70 | % | | | 11.79 | % | |
| Class B | | | 4.89 | % | | | 11.86 | % | |
| Class C | | | 8.98 | % | | | 14.73 | % | |
| Average annual return without sales charge (NAV) | | | | | | | | | |
| Class A | | | 10.82 | % | | | 15.64 | % | |
| Class B | | | 9.89 | % | | | 14.62 | % | |
| Class C | | | 9.98 | % | | | 14.73 | % | |
| Class R4 | | | 10.60 | % | | | 15.42 | % | |
| Class Y | | | 11.10 | % | | | 15.89 | % | |
| S&P 500 Composite Index3 | | | 13.87 | % | | | 19.32 | % | |
Value of a $10,000 Investment1, 2 as of September 30, 2004
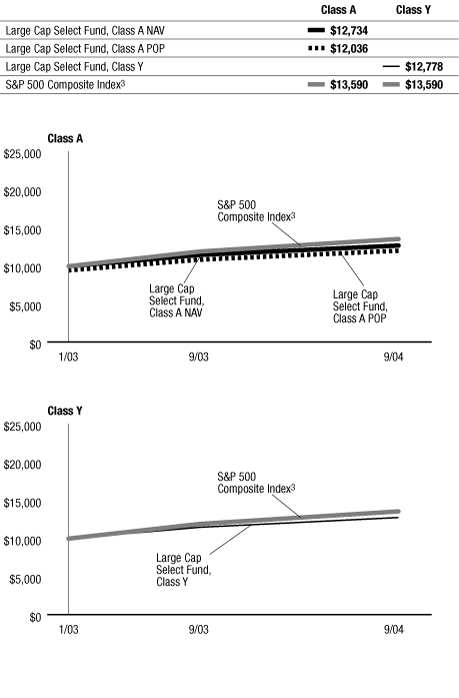
The performance data quoted on this page represents past performance and does not guarantee future results. The investment return and principal value of an investment will fluctuate so that an investor's shares, when redeemed, may be worth more or less than their original cost. Current performance of the Fund may be lower or higher than the performance data quoted. Performance data current to the most recent month-end may be obtained by calling 800.677.FUND.
1 Performance does not reflect the deduction of taxes that a shareholder would pay on fund distributions or redemption of fund shares. Performance reflects voluntary fee waivers in effect. In the absence of such fee waivers, total returns would be reduced. Index performance is for illustrative purposes only and does not reflect any expenses, transaction costs, or cash flow effects. Investment in the index is not available.
Total returns at net asset value ("NAV") reflect performance over the time period indicated without including the Fund's maximum sales charge and assume reinvestment of all distributions at NAV.
Total returns at public offering price ("POP") reflect performance over the time period indicated including a maximum front-end sales charge of 5.50% for Class A shares and the maximum contingent deferred sales charge ("CDSC") for Class B and Class C shares for the relevant period. Maximum CDSC is 5.00% for Class B shares in the first year, decreasing annually to 0% in the seventh year following purchase, and 1.00% for Class C shares. Total returns assume reinvestment of all distributions at NAV.
2 Performance for Class B, Class C, and Class R shares is not presented. Performance for these classes will vary due to different expense structures.
3 An unmanaged index of large-capitalization stocks that includes a representative sample of 500 leading companies in leading industries of the U.S. economy. Although the S&P 500 focuses on the large-cap segment of the market, with over 80% coverage of U.S. equities, it also serves as a proxy for the total market.
4 Prior to July 1, 2004, Class R shares were designated Class S shares, which had lower fees and expenses. Performance information prior to that date is based on the performance of the Class S shares. If current fees and expenses had been in effect for the entire period presented, performance would have been lower. Please refer to the prospectus for details.
FIRST AMERICAN FUNDS Annual Report 2004
30
Large Cap Select fund continued
Expense Example
As a shareholder of the Large Cap Select Fund, you incur two types of costs: (1) transaction costs, including sales charges (loads) on purchase payments; and (2) ongoing costs, including management fees; distribution and/or service (12b-1) fees; and other Fund expenses. This example is intended to help you understand your ongoing costs (in dollars) of investing in the Fund and to compare these costs with the ongoing costs of investing in other mutual funds. The example is based on an investment of $1,000 invested at the beginning of the period and held for the entire period from April 1, 2004, to September 30, 2004.
Actual Expenses
For each class, the first line of the table below provides information about actual account values and actual expenses. You may use the information in this line, together with the amount you invested, to estimate the expenses that you paid over the period. Simply divide your account value by $1,000 (for example, an $8,600 account value divided by $1,000 = 8.6), then multiply the result by the number in the first line under the heading entitled "Expenses Paid During Period" to estimate the expenses you paid on your account during this period.
Hypothetical Example for Comparison Purposes
For each class, the second line of the table below provides information about hypothetical account values and hypothetical expenses based on the Fund's actual expense ratio and an assumed rate of return of 5% per year before expenses, which is not the Fund's actual return. The hypothetical account values and expenses may not be used to estimate the actual ending account balance or expenses you paid for the period. You may use this information to compare the ongoing costs of investing in the Fund and other funds. To do so, compare this 5% hypothetical example with the 5% hypothetical examples that appear in the shareholder reports of the other funds.
Please note that the expenses shown in the table are meant to highlight your ongoing costs only and do not reflect any transactional costs, such as sales charges (loads). Therefore, the second line of the table for each class is useful in comparing ongoing costs only, and will not help you determine the relative total costs of owning different funds. In addition, if these transactional costs were included, your costs would have been higher.
Expense Examples
| | | Beginning Account
Value (4/1/2004) | | Ending Account
Value (9/30/2004) | | Expenses Paid During
Period1 (4/1/2004 to
9/30/2004) | |
| Class A Actual | | $ | 1,000.00 | | | $ | 987.70 | | | $ | 5.71 | | |
| Class A Hypothetical (5% return before expenses) | | $ | 1,000.00 | | | $ | 1,019.25 | | | $ | 5.81 | | |
| Class B Actual | | $ | 1,000.00 | | | $ | 983.20 | | | $ | 9.42 | | |
| Class B Hypothetical (5% return before expenses) | | $ | 1,000.00 | | | $ | 1,015.50 | | | $ | 9.57 | | |
| Class C Actual | | $ | 1,000.00 | | | $ | 983.90 | | | $ | 9.42 | | |
| Class C Hypothetical (5% return before expenses) | | $ | 1,000.00 | | | $ | 1,015.50 | | | $ | 9.57 | | |
| Class R Actual2 | | $ | 1,000.00 | | | $ | 986.60 | | | $ | 6.34 | | |
| Class R Hypothetical (5% return before expenses)2 | | $ | 1,000.00 | | | $ | 1,018.62 | | | $ | 6.44 | | |
| Class Y Actual | | $ | 1,000.00 | | | $ | 988.50 | | | $ | 4.47 | | |
| Class Y Hypothetical (5% return before expenses) | | $ | 1,000.00 | | | $ | 1,020.50 | | | $ | 4.55 | | |
1Expenses are equal to the Fund's annualized expense ratio of 1.15%, 1.90%, 1.90%, 1.28%, and 0.90% for Class A, Class B, Class C, Class R, and Class Y, respectively, multiplied by the average account value over the period, multiplied by the number of days in the most recent half-year/366 days (to reflect the one-half year period).
2Prior to July 1, 2004, Class R had a different expense ratio. Had the current expense ratio been in place for the most recent one-half year, the actual and hypothetical expenses would have been $6.95 and $7.06, respectively.
FIRST AMERICAN FUNDS Annual Report 2004
31
Large Cap Value fund
Investment Objective: primary – capital appreciation; secondary – current income
How did the Fund perform for the fiscal year ended September 30, 2004?
The First American Large Cap Value Fund, Class Y shares, returned 16.31% for the fiscal year ended September 30, 2004 (Class A shares returned 16.01% at net asset value). By comparison, the Fund's benchmark, the Russell 1000 Value Index*, returned 20.52% for the same period.
How did general economic and market conditions affect performance?
During the past year, we saw an improving economic environment that featured above trend economic growth (i.e., exceeding the average of 3.15% since 1970), strong gains in productivity, and a significant rise in corporate profits. The improving economic environment led to sharp gains in payrolls from March through May 2004 which, along with higher inflation readings during the early months of the year, led the Federal Reserve to begin raising its target interest rate. Higher current and expected short-term interest rates, along with steep increases in oil prices during the first nine months of 2004, have led to growing concerns about the economic and profit growth outlook. These concerns have resulted in equity markets generating little in the way of gains since the first months of the calendar year despite solid earnings growth and continued low long-term interest rates. The markets have beco me more attractively valued as a result.
What worked for the Fund and why?
The Fund benefited from good stock selection in the consumer discretionary and utilities sectors, as well as a general overweight in the energy sector relative to the Russell 1000 Value Index. The biggest drivers of results within the consumer discretionary space were in the media industry. Walt Disney Co. appreciated on takeover bids by Comcast Corp., allowing the Fund management team to sell the stock at an attractive price, while an underweight in fellow media giant Viacom, which had weak performance in the period, proved beneficial. Additionally, within the consumer discretionary sector, an improvement in occupancy levels driven by larger company travel budgets led to positive results from Hilton Hotels Corp. and the refinancing boom and growth trend in home improvement lifted specialty retailer Sh erwin Williams Co. Finally, new management and financial restructuring helped utility company TXU Corp. produce strong results.
What did not work for the Fund and why?
Unfavorable stock selection across the financials, telecommunications, and industrials sectors, as well as a general overweight in the healthcare sector were the primary drivers of underperformance relative to the Russell 1000 Value Index. Within the financial sector, disappointing earnings from State Street Corp., coupled with underweights in the commercial banking and thrift and mortgage industry, led to poor results relative to the benchmark. Within the telecommunications sector, Nortel's restatement of earnings fell short of the Fund management team's expectations and led to disappointing results. Lastly, in the industrials sector, generally adverse stock selection and no representation in the road and rail industry detracted from performance.
What strategic moves were made by the Fund and why?
In terms of sector positioning, the Fund ended the fiscal year as it began. Overweightings were maintained in the technology and energy sector as the management team continued to feel that technology stocks would benefit from a strengthening economy and that the continuation of high commodity prices, coupled with supply and demand characteristics, would lead to strong performance in the energy sector. The management team maintained underweights in the financials and utilities sectors based on its belief that these sectors are overvalued and will likely underperform in an increasing interest-rate environment.
*Unlike mutual funds, index returns do not reflect any expenses, transaction costs, or cash flow effects.
| Top 10 Companies as of September 30, 20041 (% of net assets) | |
| Exxon Mobil | | | 5.2 | % | |
| Bank of America | | | 4.4 | % | |
| Citigroup | | | 3.8 | % | |
| Time Warner | | | 3.6 | % | |
| Dow Chemical | | | 2.8 | % | |
| General Electric | | | 2.8 | % | |
| Emerson Electric | | | 2.6 | % | |
| Weyerhaeuser | | | 2.4 | % | |
| American International Group | | | 2.4 | % | |
| Hilton Hotels | | | 2.3 | % | |
| Sector Allocation as of September 30, 20041 (% of net assets) | |
| | | Fund2 | | Russell 1000
Value Index3 | |
| Consumer Discretionary | | | 11.2 | % | | | 10.3 | % | |
| Consumer Staples | | | 4.3 | % | | | 6.0 | % | |
| Energy | | | 15.4 | % | | | 12.1 | % | |
| Financials | | | 29.0 | % | | | 33.2 | % | |
| Healthcare | | | 5.3 | % | | | 3.6 | % | |
| Industrials | | | 10.4 | % | | | 12.4 | % | |
| Information Technology | | | 8.3 | % | | | 5.5 | % | |
| Materials | | | 6.5 | % | | | 5.0 | % | |
| Telecommunication Services | | | 4.0 | % | | | 5.8 | % | |
| Utilities | | | 4.0 | % | | | 6.1 | % | |
1Fund holdings and sector allocations are subject to change at any time and are not recommendations to buy or sell any security.
2The percentages shown represent the allocation by industry as a percent of net assets of the Fund.
3The percentages shown represent the percent allocation by industry of the index.
FIRST AMERICAN FUNDS Annual Report 2004
32
Large Cap Value fund continued
Annualized Performance1 as of September 30, 2004
| | | | | Since Inception | |
| | | 1 year | | 5 years | | 10 years | | 2/1/1999 | | 9/24/2001 | |
| Average annual return with sales charge (POP) | | | | | | | | | | | | | | | | | | | | | |
| Class A | | | 9.64 | % | | | (1.79 | %) | | | 8.15 | % | | | - | | | | - | | |
| Class B | | | 10.19 | % | | | (1.73 | %) | | | 7.96 | % | | | - | | | | - | | |
| Class C | | | 14.21 | % | | | (1.41 | %) | | | - | | | | (0.96 | %) | | | - | | |
| Average annual return without sales charge (NAV) | | | | | | | | | | | | | | | | | | | | | |
| Class A | | | 16.01 | % | | | (0.67 | %) | | | 8.77 | % | | | - | | | | - | | |
| Class B | | | 15.19 | % | | | (1.41 | %) | | | 7.96 | % | | | - | | | | - | | |
| Class C | | | 15.21 | % | | | (1.41 | %) | | | - | | | | (0.96 | %) | | | - | | |
| Class R4 | | | 16.05 | % | | | - | | | | - | | | | - | | | | 4.99 | % | |
| Class Y | | | 16.31 | % | | | (0.42 | %) | | | 9.05 | % | | | - | | | | - | | |
| Russell 1000 Value Index3 | | | 20.52 | % | | | 4.31 | % | | | 12.53 | % | | | 4.08 | % | | | 9.05 | % | |
Value of a $10,000 Investment1, 2 as of September 30, 2004
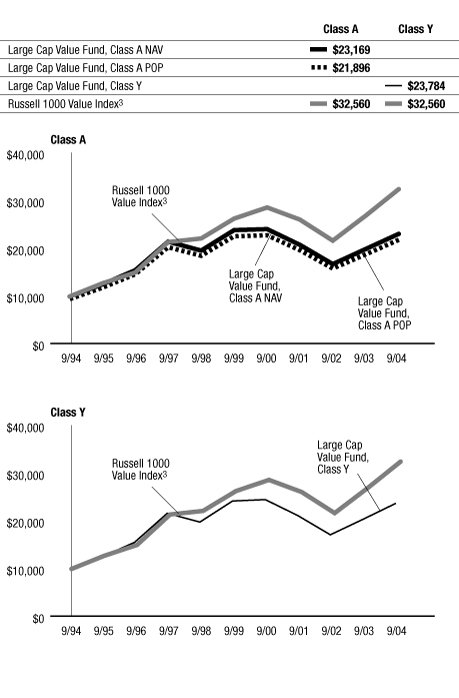
The performance data quoted on this page represents past performance and does not guarantee future results. The investment return and principal value of an investment will fluctuate so that an investor's shares, when redeemed, may be worth more or less than their original cost. Current performance of the Fund may be lower or higher than the performance data quoted. Performance data current to the most recent month-end may be obtained by calling 800.677.FUND.
1 Performance does not reflect the deduction of taxes that a shareholder would pay on fund distributions or redemption of fund shares. Performance reflects voluntary fee waivers in effect. In the absence of such fee waivers, total returns would be reduced. Index performance is for illustrative purposes only and does not reflect any expenses, transaction costs, or cash flow effects. Investment in the index is not available.
Total returns at net asset value ("NAV") reflect performance over the time period indicated without including the Fund's maximum sales charge and assume reinvestment of all distributions at NAV.
Total returns at public offering price ("POP") reflect performance over the time period indicated including a maximum front-end sales charge of 5.50% for Class A shares and the maximum contingent deferred sales charge ("CDSC") for Class B and Class C shares for the relevant period. Maximum CDSC is 5.00% for Class B shares in the first year, decreasing annually to 0% in the seventh year following purchase, and 1.00% for Class C shares. Total returns assume reinvestment of all distributions at NAV.
2 Performance for Class B, Class C, and Class R shares is not presented. Performance for these classes will vary due to different expense structures.
3 An unmanaged index that measures the performance of those Russell 1000 companies with lower price-to-book ratios and lower forecasted growth values. Russell 1000 companies include the 1,000 largest companies in the Russell 3000 Index. The Russell 3000 Index measures the performance of the 3,000 largest U.S. companies based on total market capitalization, which represents approximately 98% of the investable U.S. equity market.
4 Prior to July 1, 2004, Class R shares were designated Class S shares, which had lower fees and expenses. Performance information prior to that date is based on the performance of the Class S shares. If current fees and expenses had been in effect for the entire period presented, performance would have been lower. Please refer to the prospectus for details.
FIRST AMERICAN FUNDS Annual Report 2004
33
Large Cap Value fund continued
Expense Example
As a shareholder of the Large Cap Value Fund, you incur two types of costs: (1) transaction costs, including sales charges (loads) on purchase payments; and (2) ongoing costs, including management fees; distribution and/or service (12b-1) fees; and other Fund expenses. This example is intended to help you understand your ongoing costs (in dollars) of investing in the Fund and to compare these costs with the ongoing costs of investing in other mutual funds. The example is based on an investment of $1,000 invested at the beginning of the period and held for the entire period from April 1, 2004, to September 30, 2004.
Actual Expenses
For each class, the first line of the table below provides information about actual account values and actual expenses. You may use the information in this line, together with the amount you invested, to estimate the expenses that you paid over the period. Simply divide your account value by $1,000 (for example, an $8,600 account value divided by $1,000 = 8.6), then multiply the result by the number in the first line under the heading entitled "Expenses Paid During Period" to estimate the expenses you paid on your account during this period.
Hypothetical Example for Comparison Purposes
For each class, the second line of the table below provides information about hypothetical account values and hypothetical expenses based on the Fund's actual expense ratio and an assumed rate of return of 5% per year before expenses, which is not the Fund's actual return. The hypothetical account values and expenses may not be used to estimate the actual ending account balance or expenses you paid for the period. You may use this information to compare the ongoing costs of investing in the Fund and other funds. To do so, compare this 5% hypothetical example with the 5% hypothetical examples that appear in the shareholder reports of the other funds.
Please note that the expenses shown in the table are meant to highlight your ongoing costs only and do not reflect any transactional costs, such as sales charges (loads). Therefore, the second line of the table for each class is useful in comparing ongoing costs only, and will not help you determine the relative total costs of owning different funds. In addition, if these transactional costs were included, your costs would have been higher.
Expense Examples
| | | Beginning Account
Value (4/1/2004) | | Ending Account
Value (9/30/2004) | | Expenses Paid During
Period1 (4/1/2004 to
9/30/2004) | |
| Class A Actual | | $ | 1,000.00 | | | $ | 1,005.60 | | | $ | 5.77 | | |
| Class A Hypothetical (5% return before expenses) | | $ | 1,000.00 | | | $ | 1,019.25 | | | $ | 5.81 | | |
| Class B Actual | | $ | 1,000.00 | | | $ | 1,002.40 | | | $ | 9.51 | | |
| Class B Hypothetical (5% return before expenses) | | $ | 1,000.00 | | | $ | 1,015.50 | | | $ | 9.57 | | |
| Class C Actual | | $ | 1,000.00 | | | $ | 1,002.30 | | | $ | 9.51 | | |
| Class C Hypothetical (5% return before expenses) | | $ | 1,000.00 | | | $ | 1,015.50 | | | $ | 9.57 | | |
| Class R Actual2 | | $ | 1,000.00 | | | $ | 1,005.40 | | | $ | 6.40 | | |
| Class R Hypothetical (5% return before expenses)2 | | $ | 1,000.00 | | | $ | 1,018.62 | | | $ | 6.44 | | |
| Class Y Actual | | $ | 1,000.00 | | | $ | 1,007.50 | | | $ | 4.52 | | |
| Class Y Hypothetical (5% return before expenses) | | $ | 1,000.00 | | | $ | 1,020.50 | | | $ | 4.55 | | |
1Expenses are equal to the Fund's annualized expense ratio of 1.15%, 1.90%, 1.90%, 1.28%, and 0.90% for Class A, Class B, Class C, Class R, and Class Y, respectively, multiplied by the average account value over the period, multiplied by the number of days in the most recent half-year/366 days (to reflect the one-half year period).
2Prior to July 1, 2004, Class R had a different expense ratio. Had the current expense ratio been in place for the most recent one-half year, the actual and hypothetical expenses would have been $7.02 and $7.06, respectively.
FIRST AMERICAN FUNDS Annual Report 2004
34
Balanced fund
Investment Objective: maximize total return (capital appreciation plus income)
How did the Fund perform for the fiscal year ended September 30, 2004?
The First American Balanced Fund, Class Y shares, returned 8.62% for the fiscal year ended September 30, 2004 (Class A shares returned 8.39% at net asset value). By comparison, the Fund's benchmarks, the Russell 3000 Index* and the Lehman Aggregate Bond Index*, returned 14.26% and 3.68%, respectively, for the same period.
How did general economic and market conditions affect performance?
The fiscal year saw the continuation of a rising economic tide. While stocks in general were up in excess of their long-term historical averages, small- and mid-capitalization stocks generally outperformed large-capitalization stocks, as they tend to do during an improving economy. Value strategies also outperformed growth strategies, as the sectors that value stocks typically dominate fared well. This was partly due to the strong returns in the energy sector, which saw a surge as the need for energy outstripped the supply.
As the year progressed, increasing oil prices and hints of wider-spread inflation started to weigh on the market and led the Federal Reserve to increase interest rates for the first time since May 2000. During the second half of the year, election rhetoric and the uncertainty of the election's outcome, coupled with decelerating company earnings growth rates, caused the market to neither grow nor decline much. Because the Fund is broadly diversified within both the stock and bond portions of its portfolio, over the long term it tends to operate reasonably well during transitions in the market. However, the Fund's larger-than-normal allocation to equities as a whole, particularly to large-capitalization stocks, did have an adverse effect on the Fund's performance.
What worked for the Fund and why?
Within the stock portion of the Fund, the sectors that contributed the most to performance were the energy and consumer discretionary sectors. The Fund had an overweight to energy compared to the Russell 3000 Index, which worked well, as that sector also had the highest absolute return of the sectors in the Fund. In addition, the Fund's position in consumer discretionaries posted the next largest contribution to performance as consumer spending increased over the fiscal year. Within the bond portion, the Fund increased its overweights to lower investment grade corporate bonds and asset-backed securities, relative to the Lehman Aggregate Bond Index, which boosted returns as credit fundamentals continued to improve.
What did not work for the Fund and why?
The overweight to large-capitalization stocks, relative to the Russell 3000 Index, detracted from the performance of the Fund as mid-capitalization and small-capitalization stocks outperformed. Because the overall stock portion of the Fund's portfolio was approximately 69%, more than the normal allocation, the large-capitalization bias had a greater effect on the Fund that it normally would. In addition, the overweight to the technology sector, relative to the Russell 3000 Index, had an adverse effect on the portfolio as the sector posted disappointing results during the fiscal year.
What strategic moves were made by the Fund and why?
Based upon our view for strong earnings growth and a continued decline in credit default rates, we allocated about 5% of the fixed-income portion of the Fund to high-yield corporate bonds ("junk bonds"). This proved to be a profitable move as high yield continued to outperform both stocks and high grade bonds during the fiscal year.
*Unlike mutual funds, index returns do not reflect any expenses, transaction costs, or cash flow effects.
| Top 10 Companies as of September 30, 20041 (% of net assets) | |
| NCR | | | 3.1 | % | |
| Citigroup | | | 2.1 | % | |
| Johnson & Johnson | | | 1.9 | % | |
| Exxon Mobil | | | 1.8 | % | |
| Pfizer | | | 1.7 | % | |
| American International Group | | | 1.6 | % | |
| Bank of America | | | 1.6 | % | |
| Hilton Hotels | | | 1.4 | % | |
| Motorola | | | 1.4 | % | |
| Intel | | | 1.3 | % | |
| Portfoio Allocation as of September 30, 20041 (% of net assets) | |
| Stocks | | | 68.7 | % | |
| Bonds | | | 25.0 | % | |
| Cash Equivalents | | | 1.8 | % | |
1Fund holdings and portfolio allocations are subject to change at any time and are not recommendations to buy or sell any security.
FIRST AMERICAN FUNDS Annual Report 2004
35
Balanced fund continued
Annualized Performance1 as of September 30, 2004
| | | | | Since Inception | |
| | | 1 year | | 5 years | | 10 years | | 1/9/19955 | | 3/1/19997 | | 11/27/20005 | | 9/24/20015 | |
| Average annual return with sales charge (POP) | | | | | | | | | | | | | | | | | | | | | | | | | | | | | |
| Class A | | | 2.44 | % | | | 1.71 | % | | | - | | | | 7.11 | % | | | - | | | | - | | | | - | | |
| Class B | | | 2.46 | % | | | 1.82 | % | | | - | | | | - | | | | 1.18 | % | | | - | | | | - | | |
| Class C | | | 6.53 | % | | | - | | | | - | | | | - | | | | - | | | | - | | | | 3.82 | % | |
| Average annual return without sales charge (NAV) | | | | | | | | | | | | | | | | | | | | | | | | | | | | | |
| Class A | | | 8.39 | % | | | 2.87 | % | | | - | | | | 7.74 | % | | | - | | | | - | | | | - | | |
| Class B | | | 7.46 | % | | | 2.13 | % | | | - | | | | - | | | | 1.32 | % | | | - | | | | - | | |
| Class C | | | 7.53 | % | | | - | | | | - | | | | - | | | | - | | | | - | | | | 3.82 | % | |
| Class R6 | | | 8.22 | % | | | - | | | | - | | | | - | | | | - | | | | (0.93 | %) | | | - | | |
| Class Y | | | 8.62 | % | | | 3.17 | % | | | 7.67 | % | | | - | | | | - | | | | - | | | | - | | |
| Russell 3000 Index3 | | | 14.26 | % | | | (0.10 | %) | | | 10.87 | % | | | 11.09 | % | | | 0.02 | % | | | (1.58 | %) | | | 5.31 | % | |
| Lehman Aggregate Bond Index4 | | | 3.68 | % | | | 7.48 | % | | | 7.66 | % | | | 7.68 | % | | | 6.74 | % | | | 7.31 | % | | | 5.88 | % | |
Value of a $10,000 Investment1, 2 as of September 30, 2004
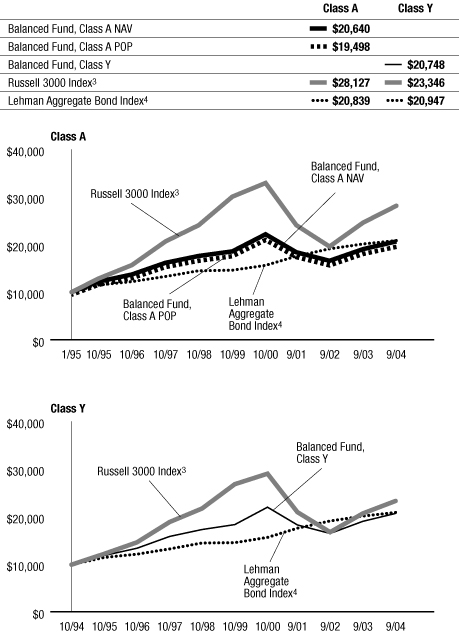
The performance data quoted on this page represents past performance and does not guarantee future results. The investment return and principal value of an investment will fluctuate so that an investor's shares, when redeemed, may be worth more or less than their original cost. Current performance of the Fund may be lower or higher than the performance data quoted. Performance data current to the most recent month-end may be obtained by calling 800.677.FUND.
1 Performance does not reflect the deduction of taxes that a shareholder would pay on fund distributions or redemption of fund shares. Performance reflects voluntary fee waivers in effect. In the absence of such fee waivers, total returns would be reduced. Index performance is for illustrative purposes only and does not reflect any expenses, transaction costs, or cash flow effects. Investment in an index is not available.
Total returns at net asset value ("NAV") reflect performance over the time period indicated without including the Fund's maximum sales charge and assume reinvestment of all distributions at NAV.
Total returns at public offering price ("POP") reflect performance over the time period indicated including a maximum front-end sales charge of 5.50% for Class A shares and the maximum contingent deferred sales charge ("CDSC") for Class B and Class C shares for the relevant period. Maximum CDSC is 5.00% for Class B shares in the first year, decreasing annually to 0% in the seventh year following purchase, and 1.00% for Class C shares. Total returns assume reinvestment of all distributions at NAV.
On September 24, 2001, the First American Balanced Fund combined with Firstar Balanced Growth Fund and Firstar Balanced Income Fund. Performance history prior to September 24, 2001, represents that of Firstar Balanced Growth Fund.
2 Performance for Class B, Class C, and Class R shares is not presented. Performance for these classes will vary due to different expense structures.
3 An unmanaged index that measures the performance of the 3,000 largest U.S. companies based on total market capitalization, which represents approximately 98% of the investable U.S. equity market.
4 An unmanaged index composed of the Lehman Government/Credit Bond Index, the Lehman Mortgage Backed Securities Index, and the Lehman Asset Backed Securities Index. The Lehman Government/Credit Bond Index is comprised of Treasury securities, other securities issued or guaranteed by the U.S. government or its agencies or instrumentalities, including U.S. agency mortgage securities, and investment-grade corporate debt securities. The Lehman Mortgage Backed Securities Index is comprised of the mortgage-backed pass-through securities of Ginnie Mae, Fannie Mae, and Freddie Mac. The Lehman Asset Backed Securities Index is comprised of debt securities rated investment grade or higher that are backed by credit card, auto, and home equity loans.
5 The performance since inception for each index is calculated from the month end following the inception of the class.
6 Prior to July 1, 2004, Class R shares were designated Class S shares, which had lower fees and expenses. Performance information prior to that date is based on the performance of the Class S shares. If current fees and expenses had been in effect for the entire period presented, performance would have been lower. Please refer to the prospectus for details.
7 The performance since inception for the index is calculated from the previous month end prior to the inceptoin of the class.
FIRST AMERICAN FUNDS Annual Report 2004
36
Balanced fund continued
Expense Example
As a shareholder of the Balanced Fund, you incur two types of costs: (1) transaction costs, including sales charges (loads) on purchase payments; and (2) ongoing costs, including management fees; distribution and/or service (12b-1) fees; and other Fund expenses. This example is intended to help you understand your ongoing costs (in dollars) of investing in the Fund and to compare these costs with the ongoing costs of investing in other mutual funds. The example is based on an investment of $1,000 invested at the beginning of the period and held for the entire period from April 1, 2004, to September 30, 2004.
Actual Expenses
For each class, the first line of the table below provides information about actual account values and actual expenses. You may use the information in this line, together with the amount you invested, to estimate the expenses that you paid over the period. Simply divide your account value by $1,000 (for example, an $8,600 account value divided by $1,000 = 8.6), then multiply the result by the number in the first line under the heading entitled "Expenses Paid During Period" to estimate the expenses you paid on your account during this period.
Hypothetical Example for Comparison Purposes
For each class, the second line of the table below provides information about hypothetical account values and hypothetical expenses based on the Fund's actual expense ratio and an assumed rate of return of 5% per year before expenses, which is not the Fund's actual return. The hypothetical account values and expenses may not be used to estimate the actual ending account balance or expenses you paid for the period. You may use this information to compare the ongoing costs of investing in the Fund and other funds. To do so, compare this 5% hypothetical example with the 5% hypothetical examples that appear in the shareholder reports of the other funds.
Please note that the expenses shown in the table are meant to highlight your ongoing costs only and do not reflect any transactional costs, such as sales charges (loads). Therefore, the second line of the table for each class is useful in comparing ongoing costs only, and will not help you determine the relative total costs of owning different funds. In addition, if these transactional costs were included, your costs would have been higher.
Expense Examples
| | | Beginning Account
Value (4/1/2004) | | Ending Account
Value (9/30/2004) | | Expenses Paid During
Period1 (4/1/2004 to
9/30/2004) | |
| Class A Actual | | $ | 1,000.00 | | | $ | 987.70 | | | $ | 5.22 | | |
| Class A Hypothetical (5% return before expenses) | | $ | 1,000.00 | | | $ | 1,019.75 | | | $ | 5.30 | | |
| Class B Actual | | $ | 1,000.00 | | | $ | 983.90 | | | $ | 8.93 | | |
| Class B Hypothetical (5% return before expenses) | | $ | 1,000.00 | | | $ | 1,016.00 | | | $ | 9.07 | | |
| Class C Actual | | $ | 1,000.00 | | | $ | 983.90 | | | $ | 8.93 | | |
| Class C Hypothetical (5% return before expenses) | | $ | 1,000.00 | | | $ | 1,016.00 | | | $ | 9.07 | | |
| Class R Actual2 | | $ | 1,000.00 | | | $ | 987.30 | | | $ | 5.84 | | |
| Class R Hypothetical (5% return before expenses)2 | | $ | 1,000.00 | | | $ | 1,019.12 | | | $ | 5.93 | | |
| Class Y Actual | | $ | 1,000.00 | | | $ | 989.00 | | | $ | 3.98 | | |
| Class Y Hypothetical (5% return before expenses) | | $ | 1,000.00 | | | $ | 1,021.00 | | | $ | 4.04 | | |
1Expenses are equal to the Fund's annualized expense ratio of 1.05%, 1.80%, 1.80%, 1.18%, and 0.80% for Class A, Class B, Class C, Class R, and Class Y, respectively, multiplied by the average account value over the period, multiplied by the number of days in the most recent half-year/366 days (to reflect the one-half year period).
2Prior to July 1, 2004, Class R had a different expense ratio. Had the current expense ratio been in place for the most recent one-half year, the actual and hypothetical expenses would have been $6.46 and $6.56, respectively.
FIRST AMERICAN FUNDS Annual Report 2004
37
Equity Income fund
Investment Objective: long-term growth of capital and income
How did the Fund perform for the fiscal year ended September 30, 2004?
The First American Equity Income Fund, Class Y shares, returned 12.54% for the fiscal year ended September 30, 2004 (Class A shares returned 12.26% at net asset value). By comparison, the Fund's benchmark, the Standard and Poor's 500 Composite Index*, returned 13.87% for the same period.
How did general economic and market conditions affect performance?
During the past year, we saw an improving economic environment that featured above trend economic growth (i.e., exceeding the average of 3.15% since 1970), strong gains in productivity, and a significant rise in corporate profits. The improving economic environment led to sharp gains in payrolls from March through May 2004 which, along with higher inflation readings during the early months of the year, led the Federal Reserve to begin raising its target interest rate. Higher current and expected short-term interest rates, along with steep increases in oil prices during the first nine months of 2004, have led to growing concerns about the economic and profit growth outlook. These concerns have resulted in equity markets generating little in the way of gains since the first months of the calendar year despite solid earnings growth and continued low long-term interest rates. The markets have beco me more attractively valued as a result.
What worked for the Fund and why?
The Fund benefited from good stock selection in the consumer discretionary and materials sectors, as well as a general overweight in the materials sector relative to the Standard and Poor's 500 Composite Index. Within the consumer discretionary sector, an overweight position in Starwood Hotels and Resorts and the lack of exposure to media giant Viacom, which had weak performance in the period, drove Fund results. An improving economy led to an increase in occupancy rates and pricing power for Starwood Hotels that benefited the stock price. In the materials sector, Compass Minerals, a producer of road salt, proved to be a good stock as poor weather and a decrease in competition from abroad due to increased shipping costs elevated the stock. Industrial gas producer Praxair and container board maker Templ e Inland were also positive contributors in the materials sector.
What did not work for the Fund and why?
Adverse stock selection across a number of different sectors was the primary reason for underperformance relative to the Standard and Poor's 500 Composite Index. Insurance stocks turned in particularly poor performance as an underweight to American International Group and an overweight to Marsh & McLennan detracted from results. Even though the Fund was significantly underweight in consumer staples stock Wal-Mart, which disappointed, the exposure to the stock depressed performance. In the healthcare and industrial sectors, adverse stock selection in the pharmaceutical, industrial conglomerates, and machinery industries also detracted from results.
What strategic moves were made by the Fund and why?
The Fund added to its technology exposure early in the fiscal year and gradually increased its exposure to healthcare based on the stocks reaching attractive valuation levels. Additionally, the Fund has decreased its weighting to consumer staples, which is consistent with the management team's belief that we are in a better economic environment, which will result in that sector lagging the overall market.
*Unlike mutual funds, index returns do not reflect any expenses, transaction costs, or cash flow effects.
| Top 10 Companies as of September 30, 20041 (% of net assets) | |
| Microsoft | | | 3.4 | % | |
| Exxon Mobil | | | 2.9 | % | |
| Pfizer | | | 2.7 | % | |
| Citigroup | | | 2.6 | % | |
| J.P. Morgan Chase | | | 2.2 | % | |
| Caterpillar | | | 2.1 | % | |
| Bank of America | | | 2.1 | % | |
| General Electric | | | 2.0 | % | |
| Wal-Mart Stores | | | 1.7 | % | |
| Praxair | | | 1.7 | % | |
| Sector Allocation as of September 30, 20041 (% of net assets) | |
| | | Fund2 | | S&P 500 Composite Index3 | |
| Consumer Discretionary | | | 6.5 | % | | | 11.1 | % | |
| Consumer Staples | | | 8.7 | % | | | 10.7 | % | |
| Energy | | | 8.3 | % | | | 7.4 | % | |
| Financials | | | 25.1 | % | | | 20.6 | % | |
| Healthcare | | | 11.4 | % | | | 13.1 | % | |
| Industrials | | | 12.4 | % | | | 11.7 | % | |
| Information Technology | | | 11.0 | % | | | 15.7 | % | |
| Materials | | | 7.1 | % | | | 3.1 | % | |
| Telecommunication Services | | | 4.1 | % | | | 3.7 | % | |
| Utilities | | | 3.2 | % | | | 2.9 | % | |
1Fund holdings and sector allocations are subject to change at any time and are not recommendations to buy or sell any security.
2The percentages shown represent the allocation by industry as a percent of net assets of the Fund.
3The percentages shown represent the percent allocation by industry of the index.
FIRST AMERICAN FUNDS Annual Report 2004
38
Equity Income fund continued
Annualized Performance1 as of September 30, 2004
| | | | | Since Inception | |
| | | 1 year | | 5 years | | 10 years | | 2/1/1999 | | 9/24/2001 | |
| Average annual return with sales charge (POP) | | | |
| Class A | | | 6.11 | % | | | 2.30 | % | | | 9.16 | % | | | - | | | | - | | |
| Class B | | | 6.37 | % | | | 2.41 | % | | | 8.99 | % | | | - | | | | - | | |
| Class C | | | 10.34 | % | | | 2.69 | % | | | - | | | | 1.82 | % | | | - | | |
| Average annual return without sales charge (NAV) | | | |
| Class A | | | 12.26 | % | | | 3.47 | % | | | 9.78 | % | | | - | | | | - | | |
| Class B | | | 11.37 | % | | | 2.70 | % | | | 8.99 | % | | | - | | | | - | | |
| Class C | | | 11.34 | % | | | 2.69 | % | | | - | | | | 1.82 | % | | | - | | |
| Class R4 | | | 12.18 | % | | | - | | | | - | | | | - | | | | 5.14 | % | |
| Class Y | | | 12.54 | % | | | 3.73 | % | | | 10.08 | % | | | - | | | | - | | |
| S&P 500 Composite Index3 | | | 13.87 | % | | | (1.31 | %) | | | 11.08 | % | | | (0.87 | %) | | | 5.31 | % | |
Value of a $10,000 Investment1, 2 as of September 30, 2004
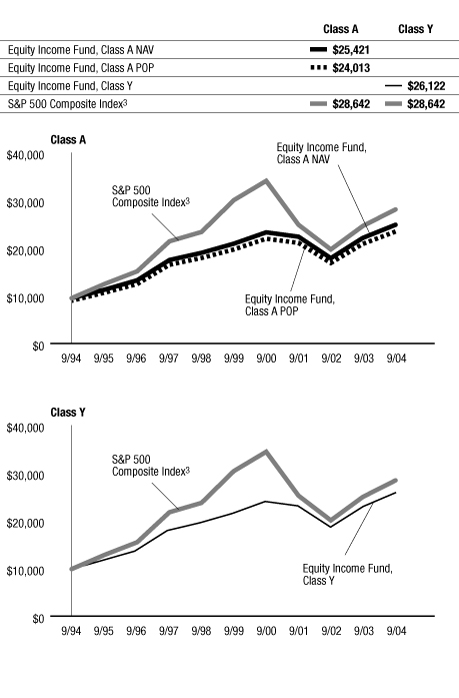
The performance data quoted on this page represents past performance and does not guarantee future results. The investment return and principal value of an investment will fluctuate so that an investor's shares, when redeemed, may be worth more or less than their original cost. Current performance of the Fund may be lower or higher than the performance data quoted. Performance data current to the most recent month-end may be obtained by calling 800.677.FUND.
1 Performance does not reflect the deduction of taxes that a shareholder would pay on fund distributions or redemption of fund shares. Performance reflects voluntary fee waivers in effect. In the absence of such fee waivers, total returns would be reduced. Index performance is for illustrative purposes only and does not reflect any expenses, transaction costs, or cash flow effects. Investment in the index is not available.
Total returns at net asset value ("NAV") reflect performance over the time period indicated without including the Fund's maximum sales charge and assume reinvestment of all distributions at NAV.
Total returns at public offering price ("POP") reflect performance over the time period indicated including a maximum front-end sales charge of 5.50% for Class A shares and the maximum contingent deferred sales charge ("CDSC") for Class B and Class C shares for the relevant period. Maximum CDSC is 5.00% for Class B shares in the first year, decreasing annually to 0% in the seventh year following purchase, and 1.00% for Class C shares. Total returns assume reinvestment of all distributions at NAV.
On May 18, 1994, the Equity Income Fund became the successor by merger to the Boulevard Strategic Balance Fund. Prior to the merger, the First American fund had no assets or liabilities. Performance prior to May 18, 1994, is that of the Boulevard Strategic Balance Fund.
2 Performance for Class B, Class C, and Class R shares is not presented. Performance for these classes will vary due to different expense structures.
3 An unmanaged index of large-capitalization stocks that includes a representative sample of 500 leading companies in leading industries of the U.S. economy. Although the S&P 500 focuses on the large-cap segment of the market, with over 80% coverage of U.S. equities, it also serves as a proxy for the total market.
4 Prior to July 1, 2004, Class R shares were designated Class S shares, which had lower fees and expenses. Performance information prior to that date is based on the performance of the Class S shares. If current fees and expenses had been in effect for the entire period presented, performance would have been lower. Please refer to the prospectus for details.
FIRST AMERICAN FUNDS Annual Report 2004
39
Equity Income fund continued
Expense Example
As a shareholder of the Equity Income Fund, you incur two types of costs: (1) transaction costs, including sales charges (loads) on purchase payments; and (2) ongoing costs, including management fees; distribution and/or service (12b-1) fees; and other Fund expenses. This example is intended to help you understand your ongoing costs (in dollars) of investing in the Fund and to compare these costs with the ongoing costs of investing in other mutual funds. The example is based on an investment of $1,000 invested at the beginning of the period and held for the entire period from April 1, 2004, to September 30, 2004.
Actual Expenses
For each class, the first line of the table below provides information about actual account values and actual expenses. You may use the information in this line, together with the amount you invested, to estimate the expenses that you paid over the period. Simply divide your account value by $1,000 (for example, an $8,600 account value divided by $1,000 = 8.6), then multiply the result by the number in the first line under the heading entitled "Expenses Paid During Period" to estimate the expenses you paid on your account during this period.
Hypothetical Example for Comparison Purposes
For each class, the second line of the table below provides information about hypothetical account values and hypothetical expenses based on the Fund's actual expense ratio and an assumed rate of return of 5% per year before expenses, which is not the Fund's actual return. The hypothetical account values and expenses may not be used to estimate the actual ending account balance or expenses you paid for the period. You may use this information to compare the ongoing costs of investing in the Fund and other funds. To do so, compare this 5% hypothetical example with the 5% hypothetical examples that appear in the shareholder reports of the other funds.
Please note that the expenses shown in the table are meant to highlight your ongoing costs only and do not reflect any transactional costs, such as sales charges (loads). Therefore, the second line of the table for each class is useful in comparing ongoing costs only, and will not help you determine the relative total costs of owning different funds. In addition, if these transactional costs were included, your costs would have been higher.
Expense Examples
| | | Beginning Account
Value (4/1/2004) | | Ending Account
Value (9/30/2004) | | Expenses Paid During
Period1 (4/1/2004 to
9/30/2004) | |
| Class A Actual | | $ | 1,000.00 | | | $ | 1,000.20 | | | $ | 5.75 | | |
| Class A Hypothetical (5% return before expenses) | | $ | 1,000.00 | | | $ | 1,019.25 | | | $ | 5.81 | | |
| Class B Actual | | $ | 1,000.00 | | | $ | 995.70 | | | $ | 9.48 | | |
| Class B Hypothetical (5% return before expenses) | | $ | 1,000.00 | | | $ | 1,015.50 | | | $ | 9.57 | | |
| Class C Actual | | $ | 1,000.00 | | | $ | 995.70 | | | $ | 9.48 | | |
| Class C Hypothetical (5% return before expenses) | | $ | 1,000.00 | | | $ | 1,015.50 | | | $ | 9.57 | | |
| Class R Actual2 | | $ | 1,000.00 | | | $ | 998.70 | | | $ | 6.37 | | |
| Class R Hypothetical (5% return before expenses)2 | | $ | 1,000.00 | | | $ | 1,018.62 | | | $ | 6.44 | | |
| Class Y Actual | | $ | 1,000.00 | | | $ | 1,001.50 | | | $ | 4.50 | | |
| Class Y Hypothetical (5% return before expenses) | | $ | 1,000.00 | | | $ | 1,020.50 | | | $ | 4.55 | | |
1Expenses are equal to the Fund's annualized expense ratio of 1.15%, 1.90%, 1.90%, 1.28%, and 0.90% for Class A, Class B, Class C, Class R, and Class Y, respectively, multiplied by the average account value over the period, multiplied by the number of days in the most recent half-year/366 days (to reflect the one-half year period).
2Prior to July 1, 2004, Class R had a different expense ratio. Had the current expense ratio been in place for the most recent one-half year, the actual and hypothetical expenses would have been $7.00 and $7.06, respectively.
FIRST AMERICAN FUNDS Annual Report 2004
40
Report of Independent Registered Public Accounting Firm
To the Shareholders and Board of Directors
First American Investment Funds, Inc.
We have audited the accompanying statements of assets and liabilities, including the schedules of investments, of the Real Estate Securities, Technology, International, Small Cap Growth Opportunities, Small Cap Select, Small Cap Value, Mid Cap Growth Opportunities, Mid Cap Value, Large Cap Growth Opportunities, Large Cap Select, Large Cap Value, Balanced, and Equity Income Funds (certain funds constituting First American Investment Funds, Inc.) (the "Funds") as of September 30, 2004, and the related statements of operations for the year then ended and changes in net assets for each of the two years in the period then ended and financial highlights for each of the periods indicated therein, except as noted below. These financial statements and the financial highlights are the responsibility of the Funds' management. Our responsibility is to express an opinion on these financial statements and fi nancial highlights based on our audits. The financial highlights of the International, Small Cap Growth Opportunities, Small Cap Select, Mid Cap Growth Opportunities, Large Cap Growth Opportunities, Balanced, and Equity Income Funds for the periods presented through October 31, 2000, were audited by other auditors whose reports dated December 29, 2000, and January 21, 2000, expressed unqualified opinions on those financial highlights.
We conducted our audits in accordance with the standards of the Public Company Accounting Oversight Board (United States). Those standards require that we plan and perform the audit to obtain reasonable assurance about whether the financial statements and financial highlights are free of material misstatement. An audit includes examining, on a test basis, evidence supporting the amounts and disclosures in the financial statements and financial highlights. Our procedures included confirmation of securities owned as of September 30, 2004, by correspondence with the custodian and brokers or by other appropriate auditing procedures where replies from brokers were not received. An audit also includes assessing the accounting principles used and significant estimates made by management, as well as evaluating the overall financial statement presentation. We believe that our audits provide a reasonable basis for our opinion.
In our opinion, the financial statements and financial highlights audited by us as referred to above present fairly, in all material respects, the financial position of the Funds listed above of First American Investment Funds, Inc. at September 30, 2004, the results of their operations for the year then ended, the changes in their net assets for each of the two years in the period then ended and their financial highlights for each of the periods indicated herein, in conformity with U.S. generally accepted accounting principles.

Minneapolis, Minnesota
November 12, 2004
FIRST AMERICAN FUNDS Annual Report 2004
41
Schedule of Investments September 30, 2004
Real Estate Securities Fund
| DESCRIPTION | | SHARES | | VALUE (000) | |
| Common Stocks – 98.7% (a) | | | |
| Real Estate Investment Trusts – 98.7% | | | |
| Apartments – 12.9% | | | |
| Apartment Investment & Management (b) | | | 442,750 | | | $ | 15,399 | | |
| Avalonbay Communities (b) | | | 295,170 | | | | 17,775 | | |
| Essex Property Trust | | | 242,150 | | | | 17,399 | | |
| Manufactured Home Communities (b) | | | 150,830 | | | | 5,014 | | |
| Post Properties | | | 182,980 | | | | 5,471 | | |
| Summit Properties (b) | | | 170,570 | | | | 4,614 | | |
| | | | 65,672 | | |
| Community Centers – 9.9% | | | |
| Acadia Realty Trust | | | 491,160 | | | | 7,245 | | |
| Developers Diversified | | | 252,763 | | | | 9,896 | | |
| Federal Realty Investment Trust (b) | | | 269,610 | | | | 11,863 | | |
| Kite Realty Group Trust | | | 162,220 | | | | 2,133 | | |
| Pan Pacific Retail Properties | | | 77,780 | | | | 4,208 | | |
| Ramco-Gershenson Properties Trust (b) | | | 286,900 | | | | 7,769 | | |
| Regency Centers (b) | | | 158,220 | | | | 7,356 | | |
| | | | 50,470 | | |
| Diversified – 8.6% | | | |
| Cousins Properties (b) | | | 356,670 | | | | 12,237 | | |
| Forest City Enterprises, CI A | | | 128,100 | | | | 7,058 | | |
| Trizec Properties | | | 338,690 | | | | 5,409 | | |
| Vornado Realty Trust (b) | | | 309,910 | | | | 19,425 | | |
| | | | 44,129 | | |
| Health Care – 2.6% | | | |
| LTC Properties (b) | | | 295,290 | | | | 5,283 | | |
| Ventas | | | 311,040 | | | | 8,062 | | |
| | | | 13,345 | | |
| Hotels – 12.7% | | | |
| Hilton Hotels | | | 608,470 | | | | 11,464 | | |
| Host Marriott (b) | | | 733,470 | | | | 10,291 | | |
| Innkeepers USA Trust | | | 624,800 | | | | 7,772 | | |
| Lasalle Hotel Properties | | | 590,830 | | | | 16,307 | | |
| Marriott International, CI A | | | 93,510 | | | | 4,859 | | |
| Starwood Hotels & Resorts Worldwide | | | 307,510 | | | | 14,275 | | |
| | | | 64,968 | | |
| Industrial – 10.5% | | | |
| Catellus Development (b) | | | 330,650 | | | | 8,766 | | |
| Centerpoint Properties Trust (b) | | | 159,980 | | | | 6,872 | | |
| EastGroup Properties | | | 185,160 | | | | 6,147 | | |
| First Industrial Realty Trust (b) | | | 146,200 | | | | 6,395 | | |
| First Potomac Realty Trust | | | 240,580 | | | | 4,070 | | |
| Liberty Property Trust | | | 172,800 | | | | 6,884 | | |
| Prologis | | | 407,880 | | | | 14,374 | | |
| | | | 53,508 | | |
| Malls – 15.5% | | | |
| Macerich (b) | | | 358,280 | | | | 19,093 | | |
| Mills (b) | | | 276,050 | | | | 14,319 | | |
| Rouse | | | 265,960 | | | | 17,787 | | |
| Simon Property Group (b) | | | 467,640 | | | | 25,080 | | |
| Taubman Centers | | | 95,480 | | | | 2,466 | | |
| | | | 78,745 | | |
| Office – 18.9% | | | |
| Arden Realty | | | 224,080 | | | | 7,299 | | |
| BioMed Realty Trust | | | 339,670 | | | | 5,975 | | |
Real Estate Securities Fund (continued)
| DESCRIPTION | | SHARES/PAR (000) | | VALUE (000) | |
| Boston Properties (b) | | | 337,000 | | | $ | 18,666 | | |
| Corporate Office Properties Trust (b) | | | 345,120 | | | | 8,842 | | |
| Duke Realty Investments | | | 315,880 | | | | 10,487 | | |
| Kilroy Realty (b) | | | 259,510 | | | | 9,869 | | |
| Mack-Cali Realty (b) | | | 164,630 | | | | 7,293 | | |
| Parkway Properties | | | 92,150 | | | | 4,280 | | |
| Prentiss Properties Trust | | | 128,670 | | | | 4,632 | | |
| Reckson Associates Realty (b) | | | 323,300 | | | | 9,295 | | |
| SL Green Realty | | | 187,330 | | | | 9,706 | | |
| | | | 96,344 | | |
| Self Storage – 4.2% | | | |
| Public Storage (b) | | | 433,830 | | | | 21,496 | | |
| Specialty Real Estate – 2.9% | |
| Capital Automotive | | | 328,260 | | | | 10,265 | | |
| Global Signal | | | 203,800 | | | | 4,667 | | |
| | | | 14,932 | | |
| Total Real Estate Investment Trusts | | | | | | | 503,609 | | |
Total Common Stocks
(Cost $437,736) | | | | | | | 503,609 | | |
| Private Real Estate Companies – 0.1% | |
| Beacon Capital* (c) | | | 33,750 | | | | 88 | | |
| Newcastle Investment Holdings* (c) | | | 35,000 | | | | 202 | | |
| Wyndham International* (c) | | | 2,262 | | | | 51 | | |
| Wyndham Voting Trust* (c) | | | 1,295 | | | | 29 | | |
Total Private Real Estate Companies
(Cost $813) | | | | | | | 370 | | |
| Affilated Money Market Fund – 1.4% | |
First American Prime
Obligations Fund, Cl Z (d) | | | 7,499,817 | | | | 7,500 | | |
Total Affiliated Money Market Fund
(Cost $7,500) | | | | | | | 7,500 | | |
Investments Purchased with Proceeds
from Securities Lending – 23.5% | |
| Commercial Paper – 7.6% | |
| Bluegrass | |
| 1.881%, 05/18/05 | | $ | 505 | | | | 505 | | |
| 1.891%, 08/18/05 | | | 401 | | | | 401 | | |
| Concord Minutemen Capital | |
| 1.650%, 10/01/04 | | | 828 | | | | 828 | | |
| 1.680%, 10/05/04 | | | 1,840 | | | | 1,840 | | |
| 1.720%, 10/06/04 | | | 1,360 | | | | 1,360 | | |
| 1.740%, 10/14/04 | | | 910 | | | | 910 | | |
Descartes Funding Trust
1.760%, 11/15/04 | | | 1,022 | | | | 1,022 | | |
| Ford Credit Floor Plan | |
| 1.622%, 10/05/04 | | | 2,044 | | | | 2,044 | | |
| 1.526%, 10/06/04 | | | 1,431 | | | | 1,431 | | |
| 1.655%, 10/22/04 | | | 449 | | | | 449 | | |
Goldman Sachs
1.975%, 01/18/05 | | | 1,022 | | | | 1,022 | | |
Independence
1.830%, 04/15/05 | | | 1,264 | | | | 1,264 | | |
Jupiter Securities Corp
1.793%, 10/21/04 | | | 3,886 | | | | 3,886 | | |
Lakeside Funding
1.790%, 10/08/04 | | | 2,167 | | | | 2,167 | | |
Landesbank Baden
1.480%, 11/12/04 | | | 408 | | | | 408 | | |
The accompanying notes are an integral part of the financial statements.
FIRST AMERICAN FUNDS Annual Report 2004
42
Real Estate Securities Fund (continued)
| DESCRIPTION | | PAR (000) | | VALUE (000) | |
Leaf's LLC
1.821%, 04/20/05 | | $ | 1,125 | | | $ | 1,125 | | |
| Liquid Funding | |
| 1.743%, 10/13/04 | | | 1,430 | | | | 1,430 | | |
| 1.830%, 05/25/05 | | | 1,022 | | | | 1,022 | | |
| MBNA Credit | |
| 1.683%, 10/12/04 | | | 994 | | | | 994 | | |
| 1.764%, 10/26/04 | | | 551 | | | | 551 | | |
| Main Street Warehouse | |
| 1.742%, 10/04/04 | | | 1,349 | | | | 1,349 | | |
| 1.683%, 10/04/04 | | | 1,666 | | | | 1,666 | | |
| 1.742%, 10/08/04 | | | 1,022 | | | | 1,022 | | |
| 1.742%, 10/08/04 | | | 1,022 | | | | 1,022 | | |
| Mortgage Interest Network | |
| 1.752%, 10/12/04 | | | 674 | | | | 674 | | |
| 1.763%, 10/14/04 | | | 715 | | | | 715 | | |
| Netexis Banques | |
| 1.700%, 12/16/04 | | | 1,018 | | | | 1,018 | | |
| Orchard Park | |
| 1.796%, 04/06/05 | | | 1,022 | | | | 1,022 | | |
| 1.766%, 07/06/05 | | | 2,110 | | | | 2,110 | | |
| Park Granada LLC | |
| 1.622%, 10/01/04 | | | 1,799 | | | | 1,799 | | |
| 1.743%, 10/13/04 | | | 1,165 | | | | 1,165 | | |
Sigma Finance
1.512%, 11/29/04 | | | 510 | | | | 510 | | |
| Total Commercial Paper | | | | | | | 38,731 | | |
| Corporate Obligations – 6.3% | | | |
| Allstate Life Global | |
| 1.780%, 10/14/05 | | | 2,045 | | | | 2,045 | | |
| 1.750%, 10/14/05 | | | 511 | | | | 511 | | |
Bayer Landbank NY
1.830%, 06/24/05 | | | 1,942 | | | | 1,942 | | |
Blue Heron Funding
1.850%, 05/18/05 | | | 572 | | | | 572 | | |
Castle Hill III
1.910%, 09/15/15 | | | 613 | | | | 613 | | |
Depfa Bank PLC
1.860%, 06/15/05 | | | 1,022 | | | | 1,022 | | |
Duke Funding VI
1.320%, 04/08/05 | | | 1,237 | | | | 1,237 | | |
General Electric Capital Corporation
1.838%, 10/07/05 | | | 1,023 | | | | 1,023 | | |
Jackson National Life
1.760%, 04/15/05 | | | 1,022 | | | | 1,022 | | |
Jefferson Pilot
1.788%, 08/17/05 | | | 1,022 | | | | 1,022 | | |
Liquid Funding
1.840%, 06/28/05 | | | 920 | | | | 920 | | |
Merrill Lynch
1.696%, 10/01/05 | | | 2,045 | | | | 2,045 | | |
| Metlife Global Funding | |
| 1.800%, 10/14/05 | | | 1,227 | | | | 1,227 | | |
| 1.880%, 10/28/05 | | | 859 | | | | 859 | | |
Morgan Stanley
1.850%, 12/26/08 | | | 1,022 | | | | 1,022 | | |
Natexis Banq NY
1.920%, 07/12/05 | | | 1,125 | | | | 1,125 | | |
Northlake CDO
1.895%, 03/07/05 | | | 613 | | | | 613 | | |
| Premium Asset Trust | |
| 1.848%, 12/22/04 | | | 767 | | | | 767 | | |
| 1.760%, 05/13/05 | | | 1,431 | | | | 1,431 | | |
Real Estate Securities Fund (continued)
| DESCRIPTION | | PAR (000) | | VALUE (000) | |
| 1.740%, 06/01/05 | | $ | 3,046 | | | $ | 3,046 | | |
| 1.770%, 10/14/05 | | | 818 | | | | 818 | | |
REMAC
1.840%, 09/29/05 | | | 1,125 | | | | 1,125 | | |
RMAC
1.740%, 06/12/05 | | | 1,179 | | | | 1,179 | | |
SMM Trust 2004
1.833%, 09/23/05 | | | 1,902 | | | | 1,902 | | |
Societe Generale NYC
1.960%, 12/08/04 | | | 2,045 | | | | 2,045 | | |
Svenska Handl
1.170%, 10/21/04 | | | 1,022 | | | | 1,022 | | |
| Total Corporate Obligations | | | | | | | 32,155 | | |
| Other Short-Term Investments – 1.6% | |
ARLO III Ltd
2.000%, 09/28/05 | | | 3,067 | | | | 3,067 | | |
Commonwealth Life
2.115%, 12/31/04 (e) | | | 1,032 | | | | 1,032 | | |
General Electric Capital Assurance
1.980%, 01/19/05 | | | 409 | | | �� | 409 | | |
HBOS Treasury Services
1.640%, 11/01/05 | | | 1,124 | | | | 1,124 | | |
Security Life of Denver
1.900%, 12/30/04 | | | 2,658 | | | | 2,658 | | |
| Total Other Short-Term Investments | | | | | | | 8,290 | | |
| Repurchase Agreements – 8.0% | |
Bear Stearns
2.045%, dated 09/30/04, matures 10/01/04,
repurchase price $2,044,691
(collateralized by various securities:
Total market value $2,086,606) | | | 2,045 | | | | 2,045 | | |
Bear Stearns
2.060%, dated 09/30/04, matures 12/23/04,
repurchase price $616,321
(collateralized by various securities:
Total market value $625,859) | | | 613 | | | | 613 | | |
Citibank
1.945%, dated 09/30/04, matures 10/01/04,
repurchase price $4,089,371
(collateralized by corporate securities:
Total market value $4,330,211) | | | 4,089 | | | | 4,089 | | |
Citibank
1.925%, dated 09/30/04, matures 10/01/04,
repurchase price $1,022,342
(collateralized by various securities:
Total market value $1,045,050) | | | 1,022 | | | | 1,022 | | |
Citibank
1.925%, dated 09/30/04, matures 10/01/04,
repurchase price $1,022,342
(collateralized by various securities:
Total market value $1,042,747) | | | 1,022 | | | | 1,022 | | |
Greenwich Capital Markets
1.950%, dated 09/30/04, matures 10/01/04,
repurchase price $6,134,057
(collateralized by U.S. government securities:
Total market value $6,256,479) | | | 6,134 | | | | 6,134 | | |
Goldman Sachs
2.025%, dated 09/30/04, matures 10/01/04,
repurchase price $1,431,283
(collateralized by various securities:
Total market value $1,475,469) | | | 1,431 | | | | 1,431 | | |
FIRST AMERICAN FUNDS Annual Report 2004
43
Schedule of Investments September 30, 2004
Real Estate Securities Fund (continued)
| DESCRIPTION | | PAR (000) | | VALUE (000) | |
Goldman Sachs
2.025%, dated 09/30/04, matures 10/01/04,
repurchase price $613,407
(collateralized by various securities:
Total market value $632,359) | | $ | 613 | | | $ | 613 | | |
Goldman Sachs
2.025%, dated 09/30/04, matures 10/01/04,
repurchase price $613,407
(collateralized by various securities:
Total market value $632,358) | | | 613 | | | | 613 | | |
Goldman Sachs
2.025%, dated 09/30/04, matures 10/01/04,
repurchase price $1,533,517
(collateralized by corporate securities:
Total market value $1,580,865) | | | 1,534 | | | | 1,534 | | |
Goldman Sachs
1.425%, dated 09/30/04, matures 10/18/04,
repurchase price $2,557,540
(collateralized by corporate securities:
Total market value $2,607,892) | | | 2,556 | | | | 2,556 | | |
Goldman Sachs
1.480%, dated 09/30/04, matures 10/18/04,
repurchase price $1,534,566
(collateralized by various securities:
Total market value $1,580,865) | | | 1,534 | | | | 1,534 | | |
Goldman Sachs
2.205%, dated 09/30/04, matures 3/07/05,
repurchase price $1,032,181
(collateralized by corporate securities:
Total market value $1,043,164) | | | 1,022 | | | | 1,022 | | |
Lehman Brothers
2.055%, dated 09/30/04, matures 10/01/04,
repurchase price $4,089,383
(collateralized by collateralized mortgage
obligations: Total market value $4,170,933) | | | 4,089 | | | | 4,089 | | |
Lehman Brothers
1.910%, dated 09/30/04, matures 10/01/04,
repurchase price $6,134,050
(collateralized by U.S. government securities:
Total market value $6,256,498) | | | 6,134 | | | | 6,134 | | |
Lehman Brothers
1.935%, dated 09/30/04, matures 10/01/04,
repurchase price $4,089,370
(collateralized by collateralized mortgage
obligations: Total market value $4,496,357) | | | 4,089 | | | | 4,089 | | |
Merrill Lynch
1.925%, dated 09/30/04, matures 10/01/04,
repurchase price $2,044,684
(collateralized by corporate securities:
Total market value $2,146,848) | | | 2,045 | | | | 2,045 | | |
Total Repurchase Agreements
(Cost $40,585) | | | | | | | 40,585 | | |
Total Investments Purchased with Proceeds
from Securities Lending
(Cost $119,761) | | | | | | | 119,761 | | |
Total Investments – 123.7%
(Cost $565,810) | | | | | | | 631,240 | | |
| Other Assets and Liabilities, Net – (23.7)% | | | | | | | (121,040 | ) | |
| Total Net Assets – 100.0% | | | | | | $ | 510,200 | | |
Real Estate Securities Fund (concluded)
* Non-income producing security
(a) The Fund is primarily invested in the Real Estate sector and therefore is subject to additional risks. See notes 1 and 7 in Notes to Financial Statements.
(b) This security or a portion of this security is out on loan at September 30, 2004. Total loaned securities had a market value of $116,500,393 at September 30, 2004. See note 2 in Notes to Financial Statements.
(c) Securities considered illiquid investments and are fair valued under guidelines established by the Board of Directors. As of September 30, 2004, the fair value of these investments was $370,175 or 0.1% of total net assets. See note 2 in Notes to Financial Statements.
(d) Investment in affiliated security. This money market fund is advised by U.S. Bancorp Asset Management, Inc., which also serves as advisor to this Fund. See note 3 in Notes to Financial Statements.
(e) Security has demand features which qualify it as a short term security. The date disclosed is the next put date.
Cl – Class
The accompanying notes are an integral part of the financial statements.
FIRST AMERICAN FUNDS Annual Report 2004
44
Technology Fund
| DESCRIPTION | | SHARES | | VALUE (000) | |
| Common Stocks – 98.4% (a) | | | |
| Aerospace & Defense – 3.7% | | | |
| Engineered Support Systems (b) | | | 16,280 | | | $ | 743 | | |
| Goodrich | | | 28,360 | | | | 889 | | |
| L-3 Communications Holdings | | | 13,910 | | | | 932 | | |
| Precision Castparts | | | 12,510 | | | | 751 | | |
| | | | 3,315 | | |
| Chemicals – 0.6% | | | |
| Landec | | | 71,610 | | | | 537 | | |
| Communications Equipment – 17.1% | | | |
| ADTRAN | | | 35,940 | | | | 815 | | |
| Arris Group* (b) | | | 117,780 | | | | 615 | | |
| Avaya* (b) | | | 87,100 | | | | 1,214 | | |
| C-COR* (b) | | | 98,820 | | | | 835 | | |
| Cisco Systems* | | | 41,550 | | | | 752 | | |
| Comverse Technology* (b) | | | 70,070 | | | | 1,319 | | |
| Corning* (b) | | | 112,110 | | | | 1,242 | | |
| Juniper Networks* (b) | | | 42,970 | | | | 1,014 | | |
| L.M. Ericsson* (b) | | | 43,750 | | | | 1,367 | | |
| Motorola | | | 62,280 | | | | 1,124 | | |
| Nortel Networks* (b) | | | 234,810 | | | | 798 | | |
| Packeteer* | | | 41,940 | | | | 453 | | |
| QUALCOMM | | | 37,860 | | | | 1,478 | | |
| SAFENET* | | | 31,210 | | | | 823 | | |
| Scientific-Atlanta | | | 30,480 | | | | 790 | | |
| Tekelec* (b) | | | 48,500 | | | | 809 | | |
| | | | 15,448 | | |
| Computers & Peripherals – 9.4% | | | |
| Dell* | | | 34,560 | | | | 1,230 | | |
| EMC* (b) | | | 94,610 | | | | 1,092 | | |
| Hewlett-Packard | | | 49,124 | | | | 921 | | |
| IBM | | | 10,670 | | | | 915 | | |
| Lexmark International Group, Cl A* (b) | | | 13,740 | | | | 1,154 | | |
| Mobility Electronics* | | | 110,780 | | | | 913 | | |
| NCR* | | | 29,050 | | | | 1,441 | | |
| Synaptics* | | | 41,460 | | | | 836 | | |
| | | | 8,502 | | |
| Electrical Equipment – 0.8% | | | |
| Color Kinetics* | | | 56,800 | | | | 727 | | |
| Electronic Equipment & Instruments – 9.0% | | | |
| Aeroflex* | | | 70,890 | | | | 749 | | |
| Agilent Technologies* | | | 37,010 | | | | 798 | | |
| Benchmark Electronics* (b) | | | 32,460 | | | | 967 | | |
| Flextronics International* (b) | | | 90,720 | | | | 1,202 | | |
| Jabil Circuit* (b) | | | 46,030 | | | | 1,059 | | |
| LeCroy* | | | 50,070 | | | | 837 | | |
| RadiSys* (b) | | | 62,925 | | | | 878 | | |
| Trimble Navigation* (b) | | | 32,645 | | | | 1,032 | | |
| Vishay Intertechnology* (b) | | | 50,690 | | | | 654 | | |
| | | | 8,176 | | |
| Health Care Equipment & Supplies – 0.9% | | | |
| Candela* | | | 74,052 | | | | 855 | | |
Technology Fund (continued)
| DESCRIPTION | | SHARES | | VALUE (000) | |
| Household Durables – 0.9% | | | |
| Garmin (b) | | | 19,360 | | | $ | 837 | | |
| Internet & Catalog Retail – 2.2% | | | |
| Amazon.com* (b) | | | 21,660 | | | | 885 | | |
| eBay* (b) | | | 11,940 | | | | 1,098 | | |
| | | | 1,983 | | |
| Internet Software & Services – 1.0% | | | |
| Google* (b) | | | 7,302 | | | | 946 | | |
| IT Services – 10.8% | | | |
| Accenture* | | | 54,270 | | | | 1,468 | | |
| Affiliated Computer Services, Cl A* (b) | | | 17,050 | | | | 949 | | |
| Computer Sciences* (b) | | | 21,650 | | | | 1,020 | | |
| DST Systems* (b) | | | 21,870 | | | | 973 | | |
| eFunds* | | | 57,310 | | | | 1,065 | | |
| Fiserv* | | | 28,810 | | | | 1,004 | | |
| Infosys Technologies (b) | | | 30,390 | | | | 1,720 | | |
| Satyam Computer Services (b) | | | 39,360 | | | | 910 | | |
| SunGard Data Systems* | | | 28,340 | | | | 674 | | |
| | | | 9,783 | | |
| Media – 0.8% | | | |
| Clear Channel Communications (b) | | | 22,430 | | | | 699 | | |
| Pharmaceuticals – 1.0% | | | |
| Perrigo | | | 45,000 | | | | 925 | | |
| Semiconductors & Semiconductor Equipment – 20.6% | | | |
| Advanced Micro Devices* (b) | | | 68,500 | | | | 891 | | |
| Analog Devices (b) | | | 34,790 | | | | 1,349 | | |
| Applied Materials* | | | 85,530 | | | | 1,410 | | |
| Broadcom, Cl A* | | | 31,130 | | | | 850 | | |
| Intel | | | 52,330 | | | | 1,050 | | |
| Linear Technology (b) | | | 26,580 | | | | 963 | | |
| LogicVision* | | | 256,390 | | | | 433 | | |
| Marvell Technology Group* (b) | | | 56,500 | | | | 1,476 | | |
| Maxim Integrated Products (b) | | | 25,130 | | | | 1,063 | | |
| Microchip Technology (b) | | | 47,720 | | | | 1,281 | | |
| Micron Technology* (b) | | | 69,280 | | | | 834 | | |
| Novellus Systems* | | | 23,790 | | | | 633 | | |
| PDF Solutions* | | | 86,970 | | | | 1,057 | | |
| Pixelworks* | | | 25,510 | | | | 255 | | |
| Taiwan Semiconductor Manufacturing, ADR (b) | | | 184,141 | | | | 1,315 | | |
| Teradyne* (b) | | | 55,770 | | | | 747 | | |
| Texas Instruments | | | 40,714 | | | | 866 | | |
| United Microelectronics* (b) | | | 335,586 | | | | 1,134 | | |
| Xilinx (b) | | | 39,050 | | | | 1,054 | | |
| | | | 18,661 | | |
| Software – 18.5% | | | |
| Adobe Systems (b) | | | 26,950 | | | | 1,333 | | |
| Altiris* | | | 32,470 | | | | 1,028 | | |
| Aspen Technology* (b) | | | 134,230 | | | | 938 | | |
| Citrix Systems* | | | 61,540 | | | | 1,078 | | |
| Computer Associates International (b) | | | 41,290 | | | | 1,086 | | |
| Hyperion Solutions* (b) | | | 18,240 | | | | 620 | | |
FIRST AMERICAN FUNDS Annual Report 2004
45
Schedule of Investments September 30, 2004
Technology Fund (continued)
| DESCRIPTION | | SHARES/PAR (000) | | VALUE (000) | |
| Intuit* (b) | | | 24,590 | | | $ | 1,116 | | |
| Lawson Software* | | | 132,430 | | | | 742 | | |
| MapInfo* | | | 90,600 | | | | 979 | | |
| Mercury Interactive* (b) | | | 27,130 | | | | 946 | | |
| Moldflow* | | | 81,780 | | | | 981 | | |
| PeopleSoft* | | | 46,750 | | | | 928 | | |
| Radware* | | | 34,950 | | | | 769 | | |
| RSA Security* (b) | | | 48,680 | | | | 940 | | |
| SAP, ADR | | | 27,100 | | | | 1,056 | | |
| ScanSoft* | | | 183,640 | | | | 749 | | |
| Symantec* (b) | | | 27,340 | | | | 1,501 | | |
| | | | 16,790 | | |
| Wireless Telecommunications Services – 1.1% | | | |
| AT Road* | | | 95,770 | | | | 404 | | |
| Wireless Facilities* (b) | | | 81,300 | | | | 567 | | |
| | | | 971 | | |
Total Common Stocks
(Cost $88,113) | | | | | | | 89,155 | | |
| Affiliated Money Market Fund – 2.8% | |
First American Prime
Obligations Fund, Cl Z (c) | | | 2,525,131 | | | | 2,525 | | |
Total Affiliated Money Market Fund
(Cost $2,525) | | | | | | | 2,525 | | |
Investments Purchased with Proceeds
from Securities Lending – 46.9% | |
| Commercial Paper – 15.2% | |
| Bluegrass | |
| 1.881%, 05/18/05 | | $ | 179 | | | | 179 | | |
| 1.891%, 08/18/05 | | | 142 | | | | 142 | | |
| Concord Minutemen Capital | |
| 1.650%, 10/01/04 | | | 294 | | | | 294 | | |
| 1.680%, 10/05/04 | | | 653 | | | | 653 | | |
| 1.720%, 10/06/04 | | | 483 | | | | 483 | | |
| 1.740%, 10/14/04 | | | 323 | | | | 323 | | |
Descartes Funding Trust
1.760%, 11/15/04 | | | 363 | | | | 363 | | |
| Ford Credit Floor Plan | |
| 1.622%, 10/05/04 | | | 725 | | | | 725 | | |
| 1.526%, 10/06/04 | | | 508 | | | | 508 | | |
| 1.655%, 10/22/04 | | | 159 | | | | 159 | | |
Goldman Sachs
1.975%, 01/18/05 | | | 363 | | | | 363 | | |
Independence
1.830%, 04/15/05 | | | 448 | | | | 448 | | |
Jupiter Securities Corp
1.793%, 10/21/04 | | | 1,379 | | | | 1,379 | | |
Lakeside Funding
1.790%, 10/08/04 | | | 769 | | | | 769 | | |
Landesbank Baden
1.480%, 11/12/04 | | | 145 | | | | 145 | | |
Leaf's LLC
1.821%, 04/20/05 | | | 399 | | | | 399 | | |
| Liquid Funding | |
| 1.743%, 10/13/04 | | | 508 | | | | 508 | | |
| 1.830%, 05/25/05 | | | 363 | | | | 363 | | |
| MBNA Credit | |
| 1.683%, 10/12/04 | | | 353 | | | | 353 | | |
| 1.764%, 10/26/04 | | | 196 | | | | 196 | | |
Technology Fund (continued)
| DESCRIPTION | | PAR (000) | | VALUE (000) | |
| Main Street Warehouse | |
| 1.742%, 10/04/04 | | $ | 479 | | | $ | 479 | | |
| 1.683%, 10/04/04 | | | 591 | | | | 591 | | |
| 1.742%, 10/08/04 | | | 363 | | | | 363 | | |
| 1.742%, 10/08/04 | | | 363 | | | | 363 | | |
| Mortgage Interest Network | |
| 1.752%, 10/12/04 | | | 239 | | | | 239 | | |
| 1.763%, 10/14/04 | | | 254 | | | | 254 | | |
Netexis Banques
1.700%, 12/16/04 | | | 361 | | | | 361 | | |
| Orchard Park | |
| 1.796%, 04/06/05 | | | 363 | | | | 363 | | |
| 1.766%, 07/06/05 | | | 749 | | | | 749 | | |
| Park Granada LLC | |
| 1.622%, 10/01/04 | | | 638 | | | | 638 | | |
| 1.743%, 10/13/04 | | | 413 | | | | 413 | | |
| Sigma Finance | |
| 1.512%, 11/29/04 | | | 181 | | | | 181 | | |
| Total Commercial Paper | | | | | | | 13,746 | | |
| Corporate Obligations – 12.6% | | | |
| Allstate Life Global | |
| 1.780%, 10/14/05 | | | 726 | | | | 726 | | |
| 1.750%, 10/14/05 | | | 181 | | | | 181 | | |
Bayer Landbank NY
1.830%, 06/24/05 | | | 689 | | | | 689 | | |
Blue Heron Funding
1.850%, 05/18/05 | | | 203 | | | | 203 | | |
Castle Hill III
1.910%, 09/15/15 | | | 218 | | | | 218 | | |
Depfa Bank PLC
1.860%, 06/15/05 | | | 363 | | | | 363 | | |
Duke Funding VI
1.320%, 04/08/05 | | | 439 | | | | 439 | | |
General Electric Capital Corporation
1.838%, 10/07/05 | | | 363 | | | | 363 | | |
Jackson National Life
1.760%, 04/15/05 | | | 363 | | | | 363 | | |
Jefferson Pilot
1.788%, 08/17/05 | | | 363 | | | | 363 | | |
Liquid Funding
1.840%, 06/28/05 | | | 326 | | | | 326 | | |
Merrill Lynch
1.696%, 10/01/05 | | | 726 | | | | 726 | | |
| Metlife Global Funding | |
| 1.800%, 10/14/05 | | | 435 | | | | 435 | | |
| 1.880%, 10/28/05 | | | 305 | | | | 305 | | |
Morgan Stanley
1.850%, 12/26/08 | | | 363 | | | | 363 | | |
Natexis Banq NY
1.920%, 07/12/05 | | | 399 | | | | 399 | | |
Northlake CDO
1.895%, 03/07/05 | | | 218 | | | | 218 | | |
| Premium Asset Trust | |
| 1.848%, 12/22/04 | | | 272 | | | | 272 | | |
| 1.760%, 05/13/05 | | | 508 | | | | 508 | | |
| 1.740%, 06/01/05 | | | 1,081 | | | | 1,081 | | |
| 1.770%, 10/14/05 | | | 290 | | | | 290 | | |
REMAC
1.840%, 09/29/05 | | | 399 | | | | 399 | | |
RMAC
1.740%, 06/12/05 | | | 419 | | | | 419 | | |
The accompanying notes are an integral part of the financial statements.
FIRST AMERICAN FUNDS Annual Report 2004
46
Technology Fund (continued)
| DESCRIPTION | | PAR (000) | | VALUE (000) | |
SMM Trust 2004
1.833%, 09/23/05 | | $ | 675 | | | $ | 675 | | |
Societe Generale NYC
1.960%, 12/08/04 | | | 726 | | | | 726 | | |
Svenska Handl
1.170%, 10/21/04 | | | 363 | | | | 363 | | |
| Total Corporate Obligations | | | | | | | 11,413 | | |
| Other Short-Term Investments – 3.2% | |
ARLO III Ltd
2.000%, 09/28/05 | | | 1,089 | | | | 1,089 | | |
Commonwealth Life
2.115%, 12/31/04 (d) | | | 366 | | | | 366 | | |
General Electric Capital Assurance
1.980%, 01/19/05 | | | 145 | | | | 145 | | |
HBOS Treasury Services
1.640%, 11/01/05 | | | 399 | | | | 399 | | |
Security Life of Denver
1.900%, 12/30/04 | | | 943 | | | | 943 | | |
| Total Other Short-Term Investments | | | | | | | 2,942 | | |
| Repurchase Agreements – 15.9% | |
Bear Stearns
2.045%, dated 09/30/04, matures 10/01/04,
repurchase price $725,694
(collateralized by various securities:
Total market value $740,571) | | | 725 | | | | 725 | | |
Bear Stearns
2.060%, dated 09/30/04, matures 12/23/04,
repurchase price $218,742
(collateralized by various securities:
Total market value $222,127) | | | 218 | | | | 218 | | |
Citibank
1.945%, dated 09/30/04, matures 10/01/04,
repurchase price $1,451,384
(collateralized by corporate Securities:
Total market value $1,536,862) | | | 1,451 | | | | 1,451 | | |
Citibank
1.925%, dated 09/30/04, matures 10/01/04,
repurchase price $362,846
(collateralized by various securities:
Total market value $370,905) | | | 363 | | | | 363 | | |
Citibank
1.925%, dated 09/30/04, matures 10/01/04,
repurchase price $362,846
(collateralized by various securities:
Total market value $370,088) | | | 363 | | | | 363 | | |
Greenwich Capital Markets
1.950%, dated 09/30/04, matures 10/01/04,
repurchase price $2,177,077
(collateralized by U.S. government securities:
Total market value $2,220,526) | | | 2,177 | | | | 2,177 | | |
Goldman Sachs
2.025%, dated 09/30/04, matures 10/01/04,
repurchase price $507,986
(collateralized by various securities:
Total market value $523,668) | | | 508 | | | | 508 | | |
Goldman Sachs
2.025%, dated 09/30/04, matures 10/01/04,
repurchase price $217,708
(collateralized by various securities:
Total market value $224,434) | | | 218 | | | | 218 | | |
Technology Fund (concluded)
| DESCRIPTION | | PAR (000) | | VALUE (000) | |
Goldman Sachs
2.025%, dated 09/30/04, matures 10/01/04,
repurchase price $217,708
(collateralized by various securities:
Total market value $224,434) | | $ | 218 | | | $ | 218 | | |
Goldman Sachs
2.025%, dated 09/30/04, matures 10/01/04,
repurchase price $544,270
(collateralized by corporate securities:
Total market value $561,075) | | | 544 | | | | 544 | | |
Goldman Sachs
1.425%, dated 09/30/04, matures 10/18/04,
repurchase price $907,712
(collateralized by corporate securities:
Total market value $925,583) | | | 907 | | | | 907 | | |
Goldman Sachs
1.480%, dated 09/30/04, matures 10/18/04,
repurchase price $544,642
(collateralized by various securities:
Total market value $561,075) | | | 544 | | | | 544 | | |
Goldman Sachs
2.205%, dated 09/30/04, matures 03/07/05,
repurchase price $366,337
(collateralized by corporate securities:
Total market value $370,236) | | | 363 | | | | 363 | | |
Lehman Brothers
2.055%, dated 09/30/04, matures 10/01/04,
repurchase price $1,451,389
(collateralized by collateralized mortgage
obligations: Total market value $1,480,332) | | | 1,451 | | | | 1,451 | | |
Lehman Brothers
1.910%, dated 09/30/04, matures 10/01/04,
repurchase price $2,177,074
(collateralized by U.S. government securities:
Total market value $2,220,533) | | | 2,177 | | | | 2,177 | | |
Lehman Brothers
1.935%, dated 09/30/04, matures 10/01/04,
repurchase price $1,451,384
(collateralized by collateralized mortgage
obligations: Total market value $1,595,830) | | | 1,451 | | | | 1,451 | | |
Merrill Lynch
1.925%, dated 09/30/04, matures 10/01/04,
repurchase price $725,692
(collateralized by corporate securities:
Total market value $761,951) | | | 726 | | | | 726 | | |
Total Repurchase Agreements
(Cost $14,404) | | | | | | | 14,404 | | |
Total Investments Purchased with Proceeds
from Securities Lending
(Cost $42,505) | | | | | | | 42,505 | | |
Total Investments – 148.1%
(Cost $133,143) | | | | | | | 134,185 | | |
| Other Assets and Liabilities, Net – (48.1)% | | | | | | | (43,626 | ) | |
| Total Net Assets – 100.0% | | | | | | $ | 90,559 | | |
* Non-income producing security
(a) The Fund is primarily invested in the technology sector and therefore is subject to additional risks. See notes 1 and 7 in Notes to Financial Statements.
(b) This security or a portion of this security is out on loan at September 30, 2004. Total loaned securities had a market value of $40,593,842 at September 30, 2004. See note 2 in Notes to Financial Statements.
(c) Investment in affiliated security. This money market fund is advised by U.S. Bancorp Asset Management, Inc., which also serves as advisor to this Fund. See note 3 in Notes to Financial Statements.
(d) Security has demand features which qualify it as a short term security. The date disclosed is the next put date.
ADR – American Depository Receipt
Cl – Class
FIRST AMERICAN FUNDS Annual Report 2004
47
Statements of Assets and Liabilities September 30, 2004, in thousands, except for per share data
| | | Real Estate
Securities Fund | | Technology
Fund | |
| ASSETS: | | | |
| Investments in unaffliated securities, at value*† | | $ | 583,155 | | | $ | 117,256 | | |
| Investments in affliated money market fund, at value** | | | 7,500 | | | | 2,525 | | |
| Repurchase agreements, at value*** | | | 40,585 | | | | 14,404 | | |
| Cash**** | | | 16 | | | | 6 | | |
| Receivable for dividends and interest | | | 2,202 | | | | 16 | | |
| Receivable for capital shares sold | | | 932 | | | | 26 | | |
| Prepaid expenses and other assets | | | 30 | | | | 31 | | |
| Total assets | | | 634,420 | | | | 134,264 | | |
| LIABILITIES: | | | |
| Payable for capital shares redeemed | | | 493 | | | | 1,115 | | |
| Payable upon return of securities loaned | | | 119,777 | | | | 42,511 | | |
| Payable for investment securities purchased | | | 3,585 | | | | - | | |
| Payable for advisory, co-administration, and custodian fees | | | 339 | | | | 57 | | |
| Payable for distribution and shareholder servicing fees | | | 22 | | | | 21 | | |
| Accrued expenses and other liabilities | | | 4 | | | | 1 | | |
| Total liabilities | | | 124,220 | | | | 43,705 | | |
| Net assets | | $ | 510,200 | | | $ | 90,559 | | |
| COMPOSITION OF NET ASSETS: | | | |
| Portfolio capital | | $ | 414,524 | | | $ | 558,879 | | |
| Undistributed net investment income | | | 1,227 | | | | - | | |
| Accumulated net realized gain (loss) on investments | | | 29,019 | | | | (469,362 | ) | |
| Net unrealized appreciation of investments | | | 65,430 | | | | 1,042 | | |
| Net assets | | $ | 510,200 | | | $ | 90,559 | | |
| * Investments in unaffiliated securities, at cost | | $ | 517,725 | | | $ | 116,214 | | |
| ** Investments in affiliated money market fund, at cost | | $ | 7,500 | | | $ | 2,525 | | |
| *** Investments in repurchase agreements, at cost | | $ | 40,585 | | | $ | 14,404 | | |
| **** Includes cash related to securities loaned | | $ | 16 | | | $ | 6 | | |
| † Including securities loaned, at value | | $ | 116,500 | | | $ | 40,594 | | |
| Class A: | | | |
| Net assets | | $ | 86,996 | | | $ | 27,356 | | |
| Shares issued and outstanding ($0.0001 par value - 2 billion authorized) | | | 4,672 | | | | 3,698 | | |
| Net asset value and redemption price per share | | $ | 18.62 | | | $ | 7.40 | | |
| Maximum offering price per share (1) | | $ | 19.70 | | | $ | 7.83 | | |
| Class B: | | | |
| Net assets | | $ | 4,412 | | | $ | 13,445 | | |
| Shares issued and outstanding ($0.0001 par value - 2 billion authorized) | | | 240 | | | | 2,053 | | |
| Net asset value, offering price and redemption price per share (2) | | $ | 18.41 | | | $ | 6.55 | | |
| Class C: | | | |
| Net assets | | $ | 4,247 | | | $ | 6,000 | | |
| Shares issued and outstanding ($0.0001 par value - 2 billion authorized) | | | 230 | | | | 840 | | |
| Net asset value, offering price and redemption price per share (2) | | $ | 18.47 | | | $ | 7.14 | | |
| Class R: | | | |
| Net assets | | $ | 1 | | | | - | | |
| Shares issued and outstanding ($0.0001 par value - 2 billion authorized) | | | - | | | | - | | |
| Net asset value, offering price, and redemption price per share | | $ | 18.80 | | | | - | | |
| Class Y: | | | |
| Net assets | | $ | 414,544 | | | $ | 43,758 | | |
| Shares issued and outstanding ($0.0001 par value - 2 billion authorized) | | | 22,161 | | | | 5,716 | | |
| Net asset value, offering price, and redemption price per share | | $ | 18.71 | | | $ | 7.66 | | |
(1) The offering price is calculated by dividing the net asset value by 1 minus the maximum sales charge of 5.50%.
(2) Class B and C have a contingent deferred sales charge. For a description of this sales charge, see notes 1 and 3 in Notes to Financial Statements.
The accompanying notes are an integral part of the financial statements.
FIRST AMERICAN FUNDS Annual Report 2004
48
Statements of Operations For the fiscal year ended September 30, 2004, in thousands
| | | Real Estate
Securities Fund | | Technology
Fund | |
| INVESTMENT INCOME: | | | |
| Dividends from affiliated money market fund | | $ | 156 | | | $ | 18 | | |
| Dividends from unaffiliated securities | | | 18,185 | | | | 213 | | |
| Less: Foreign taxes withheld | | | (22 | ) | | | (6 | ) | |
| Securities lending | | | 44 | | | | 71 | | |
| Other | | | - | | | | 144 | | |
| Total investment income | | | 18,363 | | | | 440 | | |
| EXPENSES: | | | |
| Investment advisory fees | | | 2,612 | | | | 813 | | |
| Co-administration fees and expenses (including transfer agency fees) | | | 1,005 | | | | 324 | | |
| Custodian fees | | | 37 | | | | 11 | | |
| Directors' fees | | | 9 | | | | 3 | | |
| Registration fees | | | 31 | | | | 32 | | |
| Professional fees | | | 18 | | | | 6 | | |
| Printing | | | 12 | | | | 4 | | |
| Other | | | 16 | | | | 7 | | |
| Distribution and shareholder servicing fees – Class A | | | 136 | | | | 77 | | |
| Distribution and shareholder servicing fees – Class B | | | 40 | | | | 164 | | |
| Distribution and shareholder servicing fees – Class C | | | 40 | | | | 73 | | |
| Distribution and shareholder servicing fees – Class R | | | 4 | | | | 6 | | |
| Total expenses | | | 3,960 | | | | 1,520 | | |
| Less: Fee waivers | | | (97 | ) | | | (63 | ) | |
| Total net expenses | | | 3,863 | | | | 1,457 | | |
| Investment income (loss) – net | | | 14,500 | | | | (1,017 | ) | |
| REALIZED AND UNREALIZED GAINS (LOSSES) ON INVESTMENTS AND WRITTEN OPTIONS – NET: | | | |
| Net realized gain on investments | | | 35,085 | | | | 4,958 | | |
| Net realized gain on written options | | | - | | | | 104 | | |
| Net change in unrealized appreciation or depreciation of investments | | | 32,394 | | | | 3,406 | | |
| Net change in unrealized appreciation or depreciation of written options | | | - | | | | (72 | ) | |
| Net gain on investments and written options | | | 67,479 | | | | 8,396 | | |
| Net increase in net assets resulting from operations | | $ | 81,979 | | | $ | 7,379 | | |
The accompanying notes are an integral part of the financial statements.
FIRST AMERICAN FUNDS Annual Report 2004
49
Statements of Changes in Net Assets in thousands
| | | Real Estate
Securities Fund | | Technology
Fund | |
| | | 10/01/03
to
9/30/04 | | 10/01/02
to
9/30/03 | | 10/01/03
to
9/30/04 | | 10/01/02
to
9/30/03 | |
| OPERATIONS: | |
| Investment income (loss) – net | | $ | 14,500 | | | $ | 8,399 | | | $ | (1,017 | ) | | $ | (518 | ) | |
| Net realized gain (loss) on investments | | | 35,085 | | | | 5,589 | | | | 4,958 | | | | (12,773 | ) | |
| Net realized gain (loss) on written options | | | - | | | | - | | | | 104 | | | | (328 | ) | |
| Net change in unrealized appreciation or depreciation of investments | | | 32,394 | | | | 27,408 | | | | 3,406 | | | | 60,854 | | |
| Net change in unrealized appreciation or depreciation of written options | | | - | | | | - | | | | (72 | ) | | | 72 | | |
| Net increase in net assets resulting from operations | | | 81,979 | | | | 41,396 | | | | 7,379 | | | | 47,307 | | |
| DISTRIBUTIONS TO SHAREHOLDERS FROM: | |
| Investment income – net: | |
| Class A | | | (2,018 | ) | | | (1,183 | ) | | | - | | | | - | | |
| Class B | | | (123 | ) | | | (120 | ) | | | - | | | | - | | |
| Class C | | | (120 | ) | | | (87 | ) | | | - | | | | - | | |
| Class R | | | (56 | ) | | | (86 | ) | | | - | | | | - | | |
| Class Y | | | (12,334 | ) | | | (7,094 | ) | | | - | | | | - | | |
| Net realized gain on investments: | |
| Class A | | | (1,410 | ) | | | (368 | ) | | | - | | | | - | | |
| Class B | | | (136 | ) | | | (63 | ) | | | - | | | | - | | |
| Class C | | | (131 | ) | | | (28 | ) | | | - | | | | - | | |
| Class R | | | (97 | ) | | | (34 | ) | | | - | | | | - | | |
| Class Y | | | (8,059 | ) | | | (2,941 | ) | | | - | | | | - | | |
| Total distributions | | | (24,484 | ) | | | (12,004 | ) | | | - | | | | - | | |
| CAPITAL SHARE TRANSACTIONS (1): | |
| Class A: | |
| Proceeds from sales | | | 50,157 | | | | 26,968 | | | | 18,402 | | | | 11,348 | | |
| Reinvestment of distributions | | | 3,282 | | | | 1,489 | | | | - | | | | - | | |
| Payments for redemptions | | | (10,941 | ) | | | (12,978 | ) | | | (20,148 | ) | | | (13,072 | ) | |
| Increase (decrease) in net assets from Class A transactions | | | 42,498 | | | | 15,479 | | | | (1,746 | ) | | | (1,724 | ) | |
| Class B: | |
| Proceeds from sales | | | 1,101 | | | | 1,090 | | | | 884 | | | | 1,475 | | |
| Reinvestment of distributions | | | 236 | | | | 169 | | | | - | | | | - | | |
| Payments for redemptions | | | (1,051 | ) | | | (732 | ) | | | (4,394 | ) | | | (3,295 | ) | |
| Increase (decrease) in net assets from Class B transactions | | | 286 | | | | 527 | | | | (3,510 | ) | | | (1,820 | ) | |
| Class C: | |
| Proceeds from sales | | | 1,777 | | | | 2,174 | | | | 952 | | | | 1,303 | | |
| Reinvestment of distributions | | | 239 | | | | 109 | | | | - | | | | - | | |
| Payments for redemptions | | | (1,533 | ) | | | (437 | ) | | | (2,394 | ) | | | (2,252 | ) | |
| Increase (decrease) in net assets from Class C transactions | | | 483 | | | | 1,846 | | | | (1,442 | ) | | | (949 | ) | |
| Class R: | |
| Proceeds from sales | | | 1,277 | | | | 2,686 | | | | 1,139 | | | | 2,553 | | |
| Reinvestment of distributions | | | 137 | | | | 115 | | | | - | | | | - | | |
| Payments for redemptions | | | (4,196 | ) | | | (1,825 | ) | | | (5,754 | ) | | | (1,840 | ) | |
| Increase (decrease) in net assets from Class R transactions | | | (2,782 | ) | | | 976 | | | | (4,615 | ) | | | 713 | | |
| Class Y: | |
| Proceeds from sales | | | 228,629 | | | | 80,412 | | | | 33,338 | | | | 33,169 | | |
| Reinvestment of distributions | | | 8,467 | | | | 3,092 | | | | - | | | | - | | |
| Payments for redemptions | | | (64,875 | ) | | | (32,025 | ) | | | (53,593 | ) | | | (42,450 | ) | |
| Increase (decrease) in net assets from Class Y transactions | | | 172,221 | | | | 51,479 | | | | (20,255 | ) | | | (9,281 | ) | |
| Increase (decrease) in net assets from capital share transactions | | | 212,706 | | | | 70,307 | | | | (31,568 | ) | | | (13,061 | ) | |
| Total increase (decrease) in net assets | | | 270,201 | | | | 99,699 | | | | (24,189 | ) | | | 34,246 | | |
| Net assets at beginning of period | | | 239,999 | | | | 140,300 | | | | 114,748 | | | | 80,502 | | |
| Net assets at end of period | | $ | 510,200 | | | $ | 239,999 | | | $ | 90,559 | | | $ | 114,748 | | |
| Undistributed net investment income at end of period | | $ | 1,227 | | | $ | 809 | | | $ | - | | | $ | - | | |
(1) See note 4 in Notes to Financial Statements for additional information.
The accompanying notes are an integral part of the financial statements.
FIRST AMERICAN FUNDS Annual Report 2004
50
(This page has been left blank intentionally.)
Financial Highlights For a share outstanding throughout the periods ended September 30, unless otherwise indicated.
| | | Net Asset
Value
Beginning
of Period | | Net
Investment
Income (Loss) | | Realized and
Unrealized
Gains
(Losses) on
Investments | | Dividends
from Net
Investment
Income | | Distributions
from Net
Realized Gains | | Distributions
from
Return of
Capital | | Net Asset
Value
End of
Period | | Total
Return (5) | | Net Assets
End of
Period (000) | | Ratio of
Expenses to
Average
Net Assets | | Ratio of Net
Investment
Income (Loss)
to Average
Net Assets | | Ratio of
Expenses to
Average
Net Assets
(Excluding
Waivers) | | Ratio of Net
Investment
Income (Loss)
to Average Net
Assets (Excluding
Waivers) | | Portfolio
Turnover
Rate | |
| Real Estate Securities Fund | |
| | Class A | | | | | | | | | | | | | | | | | | | | | | | | | | | | | | | | | | | | | | | | | | | | | | | | | | | | | | | | | | |
| | 2004 | (1) | | $ | 16.00 | | | $ | 0.63 | | | $ | 3.21 | | | $ | (0.62 | ) | | $ | (0.60 | ) | | $ | - | | | $ | 18.62 | | | | 24.98 | % | | $ | 86,996 | | | | 1.23 | % | | | 3.63 | % | | | 1.26 | % | | | 3.60 | % | | | 127 | % | |
| | 2003 | (1) | | | 13.68 | | | | 0.69 | | | | 2.65 | | | | (0.69 | ) | | | (0.33 | ) | | | - | | | | 16.00 | | | | 25.92 | | | | 35,754 | | | | 1.23 | | | | 4.82 | | | | 1.28 | | | | 4.77 | | | | 69 | | |
| | 2002 | (1) | | | 13.12 | | | | 0.71 | | | | 0.61 | | | | (0.69 | ) | | | - | | | | (0.07 | ) | | | 13.68 | | | | 10.07 | | | | 15,422 | | | | 1.23 | | | | 5.06 | | | | 1.32 | | | | 4.97 | | | | 99 | | |
| | 2001 | (1) | | | 12.71 | | | | 0.76 | | | | 0.32 | | | | (0.64 | ) | | | - | | | | (0.03 | ) | | | 13.12 | | | | 8.69 | | | | 2,421 | | | | 1.04 | | | | 5.89 | | | | 1.25 | | | | 5.68 | | | | 85 | | |
| | 2000 | | | | 10.78 | | | | 0.74 | | | | 2.00 | | | | (0.79 | ) | | | - | | | | (0.02 | ) | | | 12.71 | | | | 26.68 | | | | 2,035 | | | | 1.05 | | | | 6.59 | | | | 1.24 | | | | 6.40 | | | | 45 | | |
| | Class B | | | | | | | | | | | | | | | | | | | | | | | | | | | | | | | | | | | | | | | | | | | | | | | | | | | | | | | | | | |
| | 2004 | (1) | | $ | 15.85 | | | $ | 0.50 | | | $ | 3.17 | | | $ | (0.51 | ) | | $ | (0.60 | ) | | $ | - | | | $ | 18.41 | | | | 24.06 | % | | $ | 4,412 | | | | 1.98 | % | | | 2.91 | % | | | 2.01 | % | | | 2.88 | % | | | 127 | % | |
| | 2003 | (1) | | | 13.55 | | | | 0.57 | | | | 2.64 | | | | (0.58 | ) | | | (0.33 | ) | | | - | | | | 15.85 | | | | 25.03 | | | | 3,559 | | | | 1.98 | | | | 4.10 | | | | 2.03 | | | | 4.05 | | | | 69 | | |
| | 2002 | (1) | | | 13.02 | | | | 0.59 | | | | 0.61 | | | | (0.60 | ) | | | - | | | | (0.07 | ) | | | 13.55 | | | | 9.21 | | | | 2,577 | | | | 1.98 | | | | 4.27 | | | | 2.07 | | | | 4.18 | | | | 99 | | |
| | 2001 | (1) | | | 12.61 | | | | 0.65 | | | | 0.33 | | | | (0.54 | ) | | | - | | | | (0.03 | ) | | | 13.02 | | | | 7.93 | | | | 1,724 | | | | 1.79 | | | | 5.13 | | | | 2.00 | | | | 4.92 | | | | 85 | | |
| | 2000 | | | | 10.69 | | | | 0.64 | | | | 2.00 | | | | (0.69 | ) | | | - | | | | (0.03 | ) | | | 12.61 | | | | 25.81 | | | | 1,874 | | | | 1.80 | | | | 5.79 | | | | 1.99 | | | | 5.60 | | | | 45 | | |
| | Class C | | | | | | | | | | | | | | | | | | | | | | | | | | | | | | | | | | | | | | | | | | | | | | | | | | | | | | | | | | |
| | 2004 | (1) | | $ | 15.89 | | | $ | 0.50 | | | $ | 3.19 | | | $ | (0.51 | ) | | $ | (0.60 | ) | | $ | - | | | $ | 18.47 | | | | 24.12 | % | | $ | 4,247 | | | | 1.98 | % | | | 2.92 | % | | | 2.01 | % | | | 2.89 | % | | | 127 | % | |
| | 2003 | (1) | | | 13.62 | | | | 0.59 | | | | 2.62 | | | | (0.61 | ) | | | (0.33 | ) | | | - | | | | 15.89 | | | | 24.88 | | | | 3,229 | | | | 1.98 | | | | 4.12 | | | | 2.03 | | | | 4.07 | | | | 69 | | |
| | 2002 | (1) | | | 13.08 | | | | 0.62 | | | | 0.59 | | | | (0.60 | ) | | | - | | | | (0.07 | ) | | | 13.62 | | | | 9.27 | | | | 986 | | | | 1.98 | | | | 4.43 | | | | 2.07 | | | | 4.34 | | | | 99 | | |
| | 2001 | (1) | | | 12.68 | | | | 0.69 | | | | 0.30 | | | | (0.59 | ) | | | - | | | | - | | | | 13.08 | | | | 7.93 | | | | 341 | | | | 1.79 | | | | 5.27 | | | | 2.00 | | | | 5.06 | | | | 85 | | |
| | 2000 | (2) | | | 10.61 | | | | 0.50 | | | | 2.14 | | | | (0.57 | ) | | | - | | | | - | | | | 12.68 | | | | 25.56 | | | | 164 | | | | 1.80 | | | | 5.79 | | | | 1.99 | | | | 5.60 | | | | 45 | | |
| | Class R (1) | | | | | | | | | | | | | | | | | | | | | | | | | | | | | | | | | | | | | | | | | | | | | | | | | | | | | | | | | | |
| | 2004 | (3) | | $ | 16.00 | | | $ | 0.61 | | | $ | 3.24 | | | $ | (0.45 | ) | | $ | (0.60 | ) | | $ | - | | | $ | 18.80 | | | | 24.94 | % | | $ | 1 | | | | 1.23 | % | | | 3.57 | % | | | 1.26 | % | | | 3.54 | % | | | 127 | % | |
| | 2003 | | | | 13.69 | | | | 0.69 | | | | 2.64 | | | | (0.69 | ) | | | (0.33 | ) | | | - | | | | 16.00 | | | | 25.80 | | | | 2,524 | | | | 1.23 | | | | 4.87 | | | | 1.28 | | | | 4.82 | | | | 69 | | |
| | 2002 | | | | 13.12 | | | | 0.70 | | | | 0.62 | | | | (0.68 | ) | | | - | | | | (0.07 | ) | | | 13.69 | | | | 10.13 | | | | 1,224 | | | | 1.23 | | | | 5.00 | | | | 1.32 | | | | 4.91 | | | | 99 | | |
| | 2001 | (4) | | | 12.52 | | | | 0.11 | | | | 0.49 | | | | - | | | | - | | | | - | | | | 13.12 | | | | 4.87 | | | | 320 | | | | 0.56 | | | | 43.93 | | | | 1.01 | | | | 43.48 | | | | 85 | | |
| | Class Y | | | | | | | | | | | | | | | | | | | | | | | | | | | | | | | | | | | | | | | | | | | | | | | | | | | | | | | | | | |
| | 2004 | (1) | | $ | 16.06 | | | $ | 0.69 | | | $ | 3.22 | | | $ | (0.66 | ) | | $ | (0.60 | ) | | $ | - | | | $ | 18.71 | | | | 25.33 | % | | $ | 414,544 | | | | 0.98 | % | | | 3.95 | % | | | 1.01 | % | | | 3.92 | % | | | 127 | % | |
| | 2003 | (1) | | | 13.73 | | | | 0.73 | | | | 2.66 | | | | (0.73 | ) | | | (0.33 | ) | | | - | | | | 16.06 | | | | 26.19 | | | | 194,933 | | | | 0.98 | | | | 5.13 | | | | 1.03 | | | | 5.08 | | | | 69 | | |
| | 2002 | (1) | | | 13.15 | | | | 0.73 | | | | 0.63 | | | | (0.71 | ) | | | - | | | | (0.07 | ) | | | 13.73 | | | | 10.40 | | | | 120,091 | | | | 0.98 | | | | 5.27 | | | | 1.07 | | | | 5.18 | | | | 99 | | |
| | 2001 | (1) | | | 12.73 | | | | 0.84 | | | | 0.28 | | | | (0.68 | ) | | | - | | | | (0.02 | ) | | | 13.15 | | | | 9.01 | | | | 96,263 | | | | 0.80 | | | | 6.50 | | | | 1.01 | | | | 6.29 | | | | 85 | | |
| | 2000 | | | | 10.80 | | | | 0.77 | | | | 2.00 | | | | (0.81 | ) | | | - | | | | (0.03 | ) | | | 12.73 | | | | 26.95 | | | | 56,347 | | | | 0.80 | | | | 6.79 | | | | 0.99 | | | | 6.60 | | | | 45 | | |
| Technology Fund | |
| | Class A | | | | | | | | | | | | | | | | | | | | | | | | | | | | | | | | | | | | | | | | | | | | | | | | | | | | | | | | | | |
| | 2004 | (1) | | $ | 7.05 | | | $ | (0.07 | ) | | $ | 0.42 | | | $ | - | | | $ | - | | | $ | - | | | $ | 7.40 | | | | 4.96 | % | | $ | 27,356 | | | | 1.23 | % | | | (0.86 | )% | | | 1.28 | % | | | (0.91 | )% | | | 51 | % | |
| | 2003 | (1) | | | 4.29 | | | | (0.03 | ) | | | 2.79 | | | | - | | | | - | | | | - | | | | 7.05 | | | | 64.34 | | | | 27,936 | | | | 1.23 | | | | (0.52 | ) | | | 1.29 | | | | (0.58 | ) | | | 110 | | |
| | 2002 | (1) | | | 6.36 | | | | (0.07 | ) | | | (2.00 | ) | | | - | | | | - | | | | - | | | | 4.29 | | | | (32.55 | ) | | | 18,267 | | | | 1.23 | | | | (0.89 | ) | | | 1.70 | | | | (1.36 | ) | | | 288 | | |
| | 2001 | (1) | | | 47.68 | | | | (0.15 | ) | | | (33.55 | ) | | | - | | | | (7.62 | ) | | | - | | | | 6.36 | | | | (83.30 | ) | | | 29,084 | | | | 1.15 | | | | (0.88 | ) | | | 1.22 | | | | (0.95 | ) | | | 269 | | |
| | 2000 | | | | 34.22 | | | | (0.35 | ) | | | 24.87 | | | | - | | | | (11.06 | ) | | | - | | | | 47.68 | | | | 80.11 | | | | 155,533 | | | | 1.15 | | | | (0.93 | ) | | | 1.15 | | | | (0.93 | ) | | | 195 | | |
| | Class B | | | | | | | | | | | | | | | | | | | | | | | | | | | | | | | | | | | | | | | | | | | | | | | | | | | | | | | | | | |
| | 2004 | (1) | | $ | 6.29 | | | $ | (0.11 | ) | | $ | 0.37 | | | $ | - | | | $ | - | | | $ | - | | | $ | 6.55 | | | | 4.13 | % | | $ | 13,445 | | | | 1.98 | % | | | (1.60 | )% | | | 2.03 | % | | | (1.65 | )% | | | 51 | % | |
| | 2003 | (1) | | | 3.86 | | | | (0.07 | ) | | | 2.50 | | | | - | | | | - | | | | - | | | | 6.29 | | | | 62.95 | | | | 16,016 | | | | 1.98 | | | | (1.26 | ) | | | 2.04 | | | | (1.32 | ) | | | 110 | | |
| | 2002 | (1) | | | 5.77 | | | | (0.11 | ) | | | (1.80 | ) | | | - | | | | - | | | | - | | | | 3.86 | | | | (33.10 | ) | | | 11,190 | | | | 1.98 | | | | (1.64 | ) | | | 2.45 | | | | (2.11 | ) | | | 288 | | |
| | 2001 | (1) | | | 44.40 | | | | (0.26 | ) | | | (30.75 | ) | | | - | | | | (7.62 | ) | | | - | | | | 5.77 | | | | (83.42 | ) | | | 15,974 | | | | 1.90 | | | | (1.63 | ) | | | 1.97 | | | | (1.70 | ) | | | 269 | | |
| | 2000 | | | | 32.59 | | | | (0.35 | ) | | | 23.22 | | | | - | | | | (11.06 | ) | | | - | | | | 44.40 | | | | 78.77 | | | | 97,003 | | | | 1.90 | | | | (1.68 | ) | | | 1.90 | | | | (1.68 | ) | | | 195 | | |
| | Class C | | | | | | | | | | | | | | | | | | | | | | | | | | | | | | | | | | | | | | | | | | | | | | | | | | | | | | | | | | |
| | 2004 | (1) | | $ | 6.86 | | | $ | (0.12 | ) | | $ | 0.40 | | | $ | - | | | $ | - | | | $ | - | | | $ | 7.14 | | | | 4.08 | % | | $ | 6,000 | | | | 1.98 | % | | | (1.60 | )% | | | 2.03 | % | | | (1.65 | )% | | | 51 | % | |
| | 2003 | (1) | | | 4.20 | | | | (0.07 | ) | | | 2.73 | | | | - | | | | - | | | | - | | | | 6.86 | | | | 63.33 | | | | 7,056 | | | | 1.98 | | | | (1.25 | ) | | | 2.04 | | | | (1.31 | ) | | | 110 | | |
| | 2002 | (1) | | | 6.28 | | | | (0.12 | ) | | | (1.96 | ) | | | - | | | | - | | | | - | | | | 4.20 | | | | (33.12 | ) | | | 5,064 | | | | 1.98 | | | | (1.64 | ) | | | 2.45 | | | | (2.11 | ) | | | 288 | | |
| | 2001 | (1) | | | 47.49 | | | | (0.26 | ) | | | (33.33 | ) | | | - | | | | (7.62 | ) | | | - | | | | 6.28 | | | | (83.43 | ) | | | 9,010 | | | | 1.90 | | | | (1.63 | ) | | | 1.98 | | | | (1.71 | ) | | | 269 | | |
| | 2000 | (2) | | | 50.30 | | | | (0.35 | ) | | | (2.46 | ) | | | - | | | | - | | | | - | | | | 47.49 | | | | (5.59 | ) | | | 33,605 | | | | 1.90 | | | | (1.67 | ) | | | 1.88 | | | | (1.65 | ) | | | 195 | | |
| | Class Y | | | | | | | | | | | | | | | | | | | | | | | | | | | | | | | | | | | | | | | | | | | | | | | | | | | | | | | | | | |
| | 2004 | (1) | | $ | 7.28 | | | $ | (0.05 | ) | | $ | 0.43 | | | $ | - | | | $ | - | | | $ | - | | | $ | 7.66 | | | | 5.22 | % | | $ | 43,758 | | | | 0.98 | % | | | (0.60 | )% | | | 1.03 | % | | | (0.65 | )% | | | 51 | % | |
| | 2003 | (1) | | | 4.42 | | | | (0.01 | ) | | | 2.87 | | | | - | | | | - | | | | - | | | | 7.28 | | | | 64.71 | | | | 59,817 | | | | 0.98 | | | | (0.24 | ) | | | 1.04 | | | | (0.30 | ) | | | 110 | | |
| | 2002 | (1) | | | 6.53 | | | | (0.05 | ) | | | (2.06 | ) | | | - | | | | - | | | | - | | | | 4.42 | | | | (32.31 | ) | | | 44,134 | | | | 0.98 | | | | (0.64 | ) | | | 1.45 | | | | (1.11 | ) | | | 288 | | |
| | 2001 | (1) | | | 48.60 | | | | (0.11 | ) | | | (34.34 | ) | | | - | | | | (7.62 | ) | | | - | | | | 6.53 | | | | (83.26 | ) | | | 59,653 | | | | 0.90 | | | | (0.62 | ) | | | 0.96 | | | | (0.67 | ) | | | 269 | | |
| | 2000 | | | | 34.64 | | | | (0.34 | ) | | | 25.36 | | | | - | | | | (11.06 | ) | | | - | | | | 48.60 | | | | 80.71 | | | | 436,938 | | | | 0.90 | | | | (0.67 | ) | | | 0.90 | | | | (0.67 | ) | | | 195 | | |
(1) Per share data calculated using average shares outstanding method.
(2) Class of shares has been offered since February 1, 2000. All ratios for the period have been annualized, except total return and portfolio turnover.
(3) Prior to July 1, 2004, Class R shares were named Class S shares, which had lower fees and expenses.
(4) Class of shares has been offered since September 24, 2001. All ratios for the period have been annualized, except for total return and portfolio turnover.
(5) Total return does not reflect sales charges. Total return would have been lower had certain expenses not been waived.
The accompanying notes are an integral part of the financial statements.
FIRST AMERICAN FUNDS Annual Report 2004
52
FIRST AMERICAN FUNDS Annual Report 2004
53
Schedule of Investments September 30, 2004
International Fund
| DESCRIPTION | | SHARES | | VALUE (000) | |
| Foreign Common Stocks – 97.4% | | | |
| Australia – 4.4% | | | |
| Macquarie Bank | | | 369,100 | | | $ | 9,710 | | |
| News | | | 1,401,400 | | | | 11,044 | | |
| Patrick (a) | | | 2,233,200 | | | | 9,140 | | |
| Publishing & Broadcasting (a) | | | 638,200 | | | | 6,333 | | |
| QBE Insurance Group (a) | | | 320,400 | | | | 3,040 | | |
| Westfield Holdings (a) | | | 427,600 | | | | 4,711 | | |
| Westpac Banking | | | 335,800 | | | | 4,313 | | |
| Woodside Petroleum | | | 361,200 | | | | 5,102 | | |
| | | | 53,393 | | |
| Austria – 1.3% | | | |
| Erste Bank | | | 378,000 | | | | 15,727 | | |
| Brazil – 0.5% | | | |
| Companhia Brasileira De Distribuicao, ADR (a) | | | 76,200 | | | | 1,523 | | |
| Companhia Siderurgica Nacional | | | 284 | | | | 4 | | |
| Petroleo Brasileiro, ADR (a) | | | 49,600 | | | | 1,748 | | |
| Tele Norte Leste Participacoes, ADR (a) | | | 167,000 | | | | 2,209 | | |
| Votorantim Celulose e Papel, ADR | | | 22,700 | | | | 784 | | |
| | | | 6,268 | | |
| Chile – 0.0% | | | |
| Genesis Chile Fund, ADR | | | 10,000 | | | | 632 | | |
| China – 0.2% | | | |
| China Telecom | | | 2,392,000 | | | | 775 | | |
| Denway Motors (a) | | | 1,444,000 | | | | 481 | | |
| Golden Meditech (a) | | | 2,924,000 | | | | 615 | | |
| Hengan International | | | 52,000 | | | | 26 | | |
| Hutchison Telecommunications* | | | 12,693 | | | | - | | |
| | | | 1,897 | | |
| France – 14.3% | | | |
| Axa (a) | | | 964,000 | | | | 19,504 | | |
| BNP Paribas (a) | | | 466,900 | | | | 30,154 | | |
| Bouygues (a) | | | 402,900 | | | | 15,112 | | |
| Groupe Danone | | | 70,800 | | | | 5,566 | | |
| LYMH Moet Hennessy Louis Vuitton (a) | | | 217,900 | | | | 14,546 | | |
| Pernod Ricard (a) | | | 149,150 | | | | 19,803 | | |
| Sanofi-Aventis (a) | | | 387,800 | | | | 28,128 | | |
| Total (a) | | | 193,750 | | | | 39,465 | | |
| | | | 172,278 | | |
| Germany – 6.6% | | | |
| Bayerische Motoren Werke (BMW) (a) | | | 269,100 | | | | 11,079 | | |
| Deutsche Boerse | | | 374,137 | | | | 18,936 | | |
| Deutsche Telekom* (a) | | | 833,600 | | | | 15,426 | | |
| E.ON | | | 90,900 | | | | 6,689 | | |
| Metro | | | 71,600 | | | | 3,184 | | |
| SAP | | | 20,750 | | | | 3,234 | | |
| Siemens (a) | | | 279,600 | | | | 20,489 | | |
| | | | 79,037 | | |
| Great Britain – 17.4% | | | |
| 3i Group | | | 1,260,200 | | | | 12,668 | | |
| Anglo American, ADR (a) | | | 95,000 | | | | 2,304 | | |
| AstraZeneca | | | 432,700 | | | | 17,735 | | |
| BP | | | 574,400 | | | | 5,483 | | |
| Compass Group | | | 1,396,000 | | | | 5,570 | | |
| HBOS | | | 1,769,000 | | | | 23,880 | | |
International Fund (continued)
| DESCRIPTION | | SHARES | | VALUE (000) | |
| Pearson | | | 1,724,800 | | | $ | 18,446 | | |
| Reckitt Benckiser | | | 576,200 | | | | 14,118 | | |
| Royal Bank of Scotland | | | 1,064,000 | | | | 30,729 | | |
| Sage | | | 2,790,000 | | | | 8,191 | | |
| Smith & Nephew | | | 982,400 | | | | 9,031 | | |
| Standard Chartered | | | 1,079,600 | | | | 18,530 | | |
| Vodafone | | | 17,835,000 | | | | 42,681 | | |
| | | | 209,366 | | |
| Hong Kong – 5.8% | | | |
| CNOOC | | | 1,341,000 | | | | 701 | | |
| Esprit Holdings | | | 2,426,000 | | | | 12,320 | | |
| Far East Pharmaceutical Technology | | | 2,836,000 | | | | - | | |
| Hutchison Whampoa | | | 952,000 | | | | 7,447 | | |
| Kingdee International Software | | | 86,000 | | | | 23 | | |
| Peregrine Investment Holdings (b) | | | 142,000 | | | | - | | |
| Sino Land (a) | | | 20,514,000 | | | | 15,258 | | |
| Sun Hung Kai Properties (a) | | | 1,416,000 | | | | 13,346 | | |
| Swire Pacific | | | 851,000 | | | | 5,920 | | |
| Wharf | | | 4,387,000 | | | | 14,768 | | |
| | | | 69,783 | | |
| Hungary – 0.1% | | | |
| OTP Bank | | | 45,841 | | | | 1,026 | | |
| India – 0.1% | | | |
| ICICI Bank, ADR | | | 132,400 | | | | 1,827 | | |
| Indonesia – 0.4% | | | |
| Astra International | | | 2,232,000 | | | | 1,669 | | |
| Bank Danamon | | | 4,107,000 | | | | 1,670 | | |
| Dankos Laboratories | | | 2,213,200 | | | | 145 | | |
| Telekomunikasi Indonesia, ADR (a) | | | 73,800 | | | | 1,306 | | |
| | | | 4,790 | | |
| Ireland – 3.5% | | | |
| Bank of Ireland | | | 954,800 | | | | 12,867 | | |
| Independent News & Media | | | 5,903,000 | | | | 14,736 | | |
| Kerry Group, Cl A | | | 647,600 | | | | 14,253 | | |
| | | | 41,856 | | |
| Israel – 0.2% | | | |
| Teva Pharmaceutical Industries, ADR | | | 77,100 | | | | 2,001 | | |
| Italy – 5.0% | | | |
| Banco Popolare di Verona e Novara (a) | | | 792,000 | | | | 13,889 | | |
| Eni (a) | | | 1,425,800 | | | | 31,946 | | |
| UniCredito Italiano (a) | | | 2,766,000 | | | | 13,948 | | |
| | | | 59,783 | | |
| Japan – 24.2% | | | |
| Aeon Credit Service | | | 235,200 | | | | 13,402 | | |
| Arisawa Manufacturing (a) | | | 172,420 | | | | 7,071 | | |
| Canon | | | 245,000 | | | | 11,515 | | |
| Chugai Pharmaceutical | | | 813,000 | | | | 11,721 | | |
| Citizen Electronics (a) | | | 145,200 | | | | 7,641 | | |
| Don Quijote (a) | | | 216,100 | | | | 12,549 | | |
| Fast Retailing | | | 176,500 | | | | 11,995 | | |
| Fuji Soft | | | 197,500 | | | | 6,200 | | |
| Fujisawa Pharmeceutical (a) | | | 420,000 | | | | 9,470 | | |
| Fujitsu (a) | | | 1,140,000 | | | | 6,589 | | |
The accompanying notes are an integral part of the financial statements.
FIRST AMERICAN FUNDS Annual Report 2004
54
International Fund (continued)
| DESCRIPTION | | SHARES | | VALUE (000) | |
| Funai Electric (a) | | | 96,400 | | | $ | 12,997 | | |
| Honda Motor (a) | | | 183,400 | | | | 8,886 | | |
| Keyence | | | 73,960 | | | | 15,555 | | |
| Mitsubishi (a) | | | 1,027,000 | | | | 11,098 | | |
| Mitsubishi Tokyo Financial Group | | | 2,433 | | | | 20,287 | | |
| NEC System Technologies | | | 136,800 | | | | 4,717 | | |
| Net One Systems | | | 2,509 | | | | 9,265 | | |
| Nippon Oil | | | 925 | | | | 6 | | |
| Nitto Denko | | | 63,300 | | | | 2,912 | | |
| Nomura | | | 457,000 | | | | 5,867 | | |
| NTT DoCoMo | | | 2,280 | | | | 3,868 | | |
| OBIC | | | 47,500 | | | | 8,913 | | |
| OJI Paper (a) | | | 1,211,000 | | | | 6,845 | | |
| ORIX | | | 66,000 | | | | 6,767 | | |
| Seven-Eleven Japan | | | 248,000 | | | | 7,088 | | |
| Sumitomo Metal Mining (a) | | | 1,061,000 | | | | 7,355 | | |
| Sumitomo Realty & Development (a) | | | 895,000 | | | | 9,542 | | |
| Sumitomo Trust and Banking | | | 1,456,000 | | | | 8,613 | | |
| TDK (a) | | | 183,700 | | | | 12,234 | | |
| Toyoda Gosei (a) | | | 540,900 | | | | 10,478 | | |
| Ushio | | | 450,000 | | | | 7,586 | | |
| Yamada Denki (a) | | | 372,900 | | | | 12,857 | | |
| | | | 291,889 | | |
| Luxembourg – 0.1% | | | |
| Tenaris, ADR | | | 23,700 | | | | 1,080 | | |
| Malaysia – 0.3% | |
| Public Bank | | | 615,800 | | | | 1,151 | | |
| Resorts World | | | 228,000 | | | | 600 | | |
| Setia | | | 939,000 | | | | 914 | | |
| Silverstone Berhad (b) | | | 3,469 | | | | - | | |
| Telekom Malaysia | | | 397,000 | | | | 1,170 | | |
| | | | 3,835 | | |
| Mexico – 0.6% | | | |
| Corporacion Interamericana de Entretenimiento* | | | 592,200 | | | | 1,220 | | |
| Gruopo Financiero Banorte | | | 200,000 | | | | 943 | | |
| Grupo IMSA, ADR | | | 39,900 | | | | 898 | | |
| Wal-Mart De Mexico | | | 1,252,000 | | | | 4,245 | | |
| | | | 7,306 | | |
| Peru – 0.1% | | | |
| Compania De Minas Buenaventura, ADR | | | 33,300 | | | | 791 | | |
| Russian Federation – 0.1% | |
| AO VimpelCom, ADR* (a) | | | 7,600 | | | | 827 | | |
| LUKOIL, ADR | | | 6,100 | | | | 756 | | |
| | | | 1,583 | | |
| Singapore – 0.9% | | | |
| DBS | | | 548,000 | | | | 5,208 | | |
| Venture | | | 558,000 | | | | 5,469 | | |
| | | | 10,677 | | |
| South Africa – 0.6% | | | |
| ABSA | | | 209,900 | | | | 2,110 | | |
| MTN | | | 203,200 | | | | 967 | | |
| Sappi, ADR (a) | | | 300,000 | | | | 4,296 | | |
| | | | 7,373 | | |
| South Korea – 0.7% | | | |
| Hana Bank | | | 69,500 | | | | 1,654 | | |
| Hyundai Mobis | | | 14,900 | | | | 750 | | |
International Fund (continued)
| DESCRIPTION | | SHARES | | VALUE (000) | |
| Industrial Bank of Korea, GDR | | | 89,200 | | | $ | 548 | | |
| Pulmuone | | | 15,630 | | | | 658 | | |
| Samsung Electronics | | | 6,740 | | | | 2,681 | | |
| Shinsegae | | | 8,590 | | | | 2,286 | | |
| | | | 8,577 | | |
| Spain – 3.0% | | | |
| Banco Bilbano Vizcaya Argentaria (a) | | | 884,400 | | | | 12,171 | | |
| Iberdrola | | | 484,400 | | | | 10,047 | | |
| Telefonica | | | 939,600 | | | | 14,062 | | |
| | | | 36,280 | | |
| Switzerland – 5.9% | | | |
| Nestle | | | 78,060 | | | | 17,879 | | |
| Novartis | | | 232,100 | | | | 10,818 | | |
| Roche | | | 275,600 | | | | 28,472 | | |
| Zurich Financial Services | | | 96,250 | | | | 13,720 | | |
| | | | 70,889 | | |
| Taiwan – 0.4% | | | |
| Formosa International Hotels | | | 139,000 | | | | 156 | | |
| Hon Hai Precision | | | 34,350 | | | | 118 | | |
| Hon Hai Precision Industries, GDR | | | 495,801 | | | | 3,619 | | |
| Taiwan Semiconductor Manufacturing, ADR | | | 161,400 | | | | 1,152 | | |
| | | | 5,045 | | |
| Thailand – 0.4% | | | |
| Land & Houses | | | 4,254,000 | | | | 976 | | |
| Major Cineplex Group | | | 2,578,000 | | | | 803 | | |
| PTT Exploration & Production | | | 111,950 | | | | 805 | | |
| Shin | | | 1,580,900 | | | | 1,441 | | |
| Siam Cement | | | 211,600 | | | | 1,359 | | |
| | | | 5,384 | | |
| Turkey – 0.3% | | | |
| Akbank Turk Anonim Sirketi, ADR | | | 77,250 | | | | 698 | | |
| DenizBank | | | 256,000,000 | | | | 489 | | |
| Dogan Sirketler Grubu | | | 323,653,000 | | | | 580 | | |
| Dogus Otomotiv Servis ve Ticaret* | | | 354,867,000 | | | | 1,202 | | |
| Turkcell Iletisim Hizmetleri, ADR | | | 116,400 | | | | 1,305 | | |
| | | | 4,274 | | |
Total Foreign Common Stocks
(Cost $1,039,947) | | | | | | | 1,174,647 | | |
Investments Purchased with Proceeds
from Securities Lending – 25.7% | | | |
| State Street Navigator Prime | | | 310,687,908 | | | | 310,688 | | |
Total Investments Purchased with Proceeds
from Securities Lending
(Cost $310,688) | | | | | | | 310,688 | | |
Total Investments – 123.1%
(Cost $1,350,635) | | | | | | | 1,485,335 | | |
| Other Assets and Liabilities, Net – (23.1)% | | | | | | | (279,161 | ) | |
| Total Net Assets – 100.0% | | | | | | $ | 1,206,174 | | |
* Non-income producing security
(a) This security or a portion of this security is out on loan at September 30, 2004. Total loaned securities had a market value of $296,251,292 at September 30, 2004. See note 2 in Notes to Financial Statements.
(b) Securities considered illiquid investments and are fair valued under guidelines established by the Board of Directors. As of September 30, 2004, the fair value of these investments was $183 or 0.0% of total net assets. See note 2 in Notes to Financial Statements.
FIRST AMERICAN FUNDS Annual Report 2004
55
Schedule of Investments September 30, 2004
International Fund (concluded)
ADR – American Depository Receipt
GDR – Global Depository Receipt
At September 30, 2004, sector diversification of the Fund was as follows:
| | | % of
Net Assets | | Value (000) | |
| Foreign Common Stock | | | |
| Banks | | | 16.5 | % | | $ | 198,552 | | |
| Diversified Financials | | | 15.2 | | | | 183,852 | | |
| Pharmaceutical & Biotechnology | | | 8.8 | | | | 106,489 | | |
| Energy | | | 7.1 | | | | 86,012 | | |
| Telecommunication Services | | | 7.1 | | | | 86,037 | | |
| Technology Hardware & Equipment | | | 5.8 | | | | 69,992 | | |
| Food & Beverage | | | 5.1 | | | | 61,343 | | |
| Retailing | | | 4.4 | | | | 52,543 | | |
| Media | | | 4.2 | | | | 50,559 | | |
| Consumer Durables & Apparel | | | 3.5 | | | | 42,119 | | |
| Commercial Services & Supplies | | | 3.4 | | | | 41,070 | | |
| Materials | | | 2.9 | | | | 34,419 | | |
| Automobiles & Components | | | 2.9 | | | | 34,545 | | |
| Consumer Discretionary | | | 1.9 | | | | 22,613 | | |
| Insurance | | | 1.4 | | | | 16,760 | | |
| Capital Goods | | | 1.3 | | | | 15,555 | | |
| Household & Personal Products | | | 1.2 | | | | 14,118 | | |
| Health Care | | | 1.0 | | | | 11,647 | | |
| Utilities | | | 0.8 | | | | 10,047 | | |
| Software & Services | | | 0.8 | | | | 9,823 | | |
| Transportation | | | 0.8 | | | | 9,140 | | |
| Manufacturing | | | 0.7 | | | | 9,063 | | |
| Food & Drug Retailing | | | 0.4 | | | | 5,570 | | |
| Hotels, Restaurants & Leisure | | | 0.2 | | | | 2,779 | | |
| Total Foreign Common Stocks | | | 97.4 | | | | 1,174,647 | | |
Total Investments Purchased with
Proceeds from Securities Lending | | | 25.7 | | | | 310,688 | | |
| Total Investments | | | 123.1 | | | | 1,485,335 | | |
| Other Assets and Liabilities, Net | | | (23.1 | ) | | | (279,161 | ) | |
| Net Assets | | | 100.0 | % | | $ | 1,206,174 | | |
The accompanying notes are an integral part of the financial statements.
FIRST AMERICAN FUNDS Annual Report 2004
56
Statement of Assets and Liabilities September 30, 2004, in thousands, except for per share data
| | | International
Fund | |
| ASSETS: | | | |
| Investments in securities, at value*† | | $ | 1,485,335 | | |
| Cash denominated in foreign currencies, at value** | | | 4,935 | | |
| Cash | | | 4,294 | | |
| Receivable for dividends and interest | | | 2,417 | | |
| Receivable for investment securities sold | | | 24,117 | | |
| Receivable for capital shares sold | | | 241 | | |
| Receivable for foreign withholding tax reclaim | | | 87 | | |
| Prepaid expenses and other assets | | | 37 | | |
| Total assets | | | 1,521,463 | | |
| LIABILITIES: | | | |
| Payable for investment securities purchased | | | 1,766 | | |
| Payable for capital shares redeemed | | | 1,825 | | |
| Payable upon return of securities loaned | | | 310,688 | | |
| Payable for advisory, co-administration, and custodian fees | | | 990 | | |
| Payable for distribution and shareholder servicing fees | | | 11 | | |
| Accrued expenses and other liabilities | | | 9 | | |
| Total liabilities | | | 315,289 | | |
| Net assets | | $ | 1,206,174 | | |
| COMPOSITION OF NET ASSETS: | | | |
| Portfolio capital | | $ | 1,294,446 | | |
| Undistributed net investment income | | | 8,800 | | |
| Accumulated net realized loss on investments | | | (231,752 | ) | |
| Net unrealized appreciation of investments | | | 134,700 | | |
Net unrealized depreciation of foreign currency, and
translation of other assets and liabilities in foreign currency | | | (20 | ) | |
| Net assets | | $ | 1,206,174 | | |
| * Investments in securities, at cost | | $ | 1,350,635 | | |
| ** Cash denominated in foreign currencies, at cost | | $ | 4,940 | | |
| † Including securities loaned, at value | | $ | 296,251 | | |
| Class A: | | | |
| Net assets | | $ | 44,851 | | |
| Shares issued and outstanding ($0.0001 par value - 2 billion authorized) | | | 4,402 | | |
| Net asset value and redemption price per share | | $ | 10.19 | | |
| Maximum offering price per share (1) | | $ | 10.78 | | |
| Class B: | | | |
| Net assets | | $ | 7,371 | | |
| Shares issued and outstanding ($0.0001 par value - 2 billion authorized) | | | 782 | | |
| Net asset value, offering price and redemption price per share (2) | | $ | 9.43 | | |
| Class C: | | | |
| Net assets | | $ | 8,542 | | |
| Shares issued and outstanding ($0.0001 par value - 2 billion authorized) | | | 875 | | |
| Net asset value, offering price and redemption price per share (2) | | $ | 9.76 | | |
| Class R: | | | |
| Net assets | | $ | 1 | | |
| Shares issued and outstanding ($0.0001 par value - 2 billion authorized) | | | - | | |
| Net asset value, offering price, and redemption price per share | | $ | 10.11 | | |
| Class Y: | | | |
| Net assets | | $ | 1,145,409 | | |
| Shares issued and outstanding ($0.0001 par value - 2 billion authorized) | | | 111,072 | | |
| Net asset value, offering price, and redemption price per share | | $ | 10.31 | | |
(1) The offering price is calculated by dividing the net asset value by 1 minus the maximum sales charge of 5.50%.
(2) Class B and C have a contingent deferred sales charge. For a description of this sales charge, see notes 1 and 3 in Notes to Financial Statements.
The accompanying notes are an integral part of the financial statements.
FIRST AMERICAN FUNDS Annual Report 2004
57
Statement of Operations For the fiscal year ended September 30, 2004, in thousands
| | | International
Fund | |
| INVESTMENT INCOME: | | | |
| Interest | | $ | 199 | | |
| Dividends | | | 26,611 | | |
| Less: Foreign taxes withheld | | | (3,197 | ) | |
| Securities lending | | | 1,224 | | |
| Other income | | | 151 | | |
| Total investment income | | | 24,988 | | |
| EXPENSES: | | | |
| Investment advisory fees | | | 13,785 | | |
| Co-administration fees and expenses (including transfer agency fees) | | | 3,358 | | |
| Custodian fees | | | 125 | | |
| Directors' fees | | | 28 | | |
| Registration fees | | | 45 | | |
| Professional fees | | | 71 | | |
| Printing | | | 44 | | |
| Other | | | 21 | | |
| Distribution and shareholder servicing fees – Class A | | | 112 | | |
| Distribution and shareholder servicing fees – Class B | | | 83 | | |
| Distribution and shareholder servicing fees – Class C | | | 100 | | |
| Distribution and shareholder servicing fees – Class R | | | 13 | | |
| Total expenses | | | 17,785 | | |
| Less: Fee waivers | | | (560 | ) | |
| Total net expenses | | | 17,225 | | |
| Investment income – net | | | 7,763 | | |
| REALIZED AND UNREALIZED GAINS (LOSSES) ON INVESTMENTS AND FOREIGN CURRENCY TRANSACTIONS – NET: | | | |
| Net realized gain on investments | | | 135,849 | | |
| Net realized loss on foreign currency transactions | | | (430 | ) | |
| Net change in unrealized appreciation or depreciation of investments | | | 6,817 | | |
Net change in unrealized appreciation or depreciation of foreign currency, and translation of
other assets and liabilities denominated in foreign currency | | | (278 | ) | |
| Net gain on investments and foreign currency transactions | | | 141,958 | | |
| Net increase in net assets resulting from operations | | $ | 149,721 | | |
The accompanying notes are an integral part of the financial statements.
FIRST AMERICAN FUNDS Annual Report 2004
58
Statement of Changes in Net Assets in thousands
| | | International
Fund | |
| | | 10/01/03
to
9/30/04 | | 10/01/02
to
9/30/03 | |
| OPERATIONS: | |
| Investment income – net | | $ | 7,763 | | | $ | 8,624 | | |
| Net realized gain (loss) on investments | | | 135,849 | | | | (93,319 | ) | |
| Net realized gain (loss) on foreign currency transactions | | | (430 | ) | | | 1,056 | | |
| Net increase from payment by affiliate (1) | | | - | | | | 621 | | |
| Net change in unrealized appreciation or depreciation of investments | | | 6,817 | | | | 275,880 | | |
Net change in unrealized appreciation or depreciation of foreign currency, and translation of other assets and liabilities
denominated in foreign currency | | | (278 | ) | | | 247 | | |
| Net increase in net assets resulting from operations | | | 149,721 | | | | 193,109 | | |
| DISTRIBUTIONS TO SHAREHOLDERS FROM: | |
| Investment income – net: | |
| Class A | | | (212 | ) | | | - | | |
| Class B | | | (4 | ) | | | - | | |
| Class C | | | (5 | ) | | | - | | |
| Class S | | | (43 | ) | | | - | | |
| Class Y | | | (8,556 | ) | | | - | | |
| Total distributions | | | (8,820 | ) | | | - | | |
| CAPITAL SHARE TRANSACTIONS (2): | |
| Class A: | |
| Proceeds from sales | | | 20,466 | | | | 160,663 | | |
| Reinvestment of distributions | | | 202 | | | | - | | |
| Payments for redemptions | | | (20,179 | ) | | | (170,978 | ) | |
| Shares issued in connection with the acquisition of Fund net assets | | | - | | | | 2,429 | | |
| Increase (decrease) in net assets from Class A transactions | | | 489 | | | | (7,886 | ) | |
| Class B: | |
| Proceeds from sales | | | 606 | | | | 533 | | |
| Reinvestment of distributions | | | 4 | | | | - | | |
| Payments for redemptions | | | (2,218 | ) | | | (1,796 | ) | |
| Shares issued in connection with the acquisition of Fund net assets | | | - | | | | 254 | | |
| Decrease in net assets from Class B transactions | | | (1,608 | ) | | | (1,009 | ) | |
| Class C: | |
| Proceeds from sales | | | 853 | | | | 1,964 | | |
| Reinvestment of distributions | | | 5 | | | | - | | |
| Payments for redemptions | | | (4,123 | ) | | | (4,764 | ) | |
| Shares issued in connection with the acquisition of Fund net assets | | | - | | | | 149 | | |
| Decrease in net assets from Class C transactions | | | (3,265 | ) | | | (2,651 | ) | |
| Class R: | |
| Proceeds from sales | | | 1,377 | | | | 4,103 | | |
| Reinvestment of distributions | | | 40 | | | | - | | |
| Payments for redemptions | | | (11,223 | ) | | | (8,219 | ) | |
| Shares issued in connection with the acquisition of Fund net assets | | | - | | | | 43 | | |
| Decrease in net assets from Class R transactions | | | (9,806 | ) | | | (4,073 | ) | |
| Class Y: | |
| Proceeds from sales | | | 321,648 | | | | 469,337 | | |
| Reinvestment of distributions | | | 5,397 | | | | - | | |
| Payments for redemptions | | | (304,768 | ) | | | (243,349 | ) | |
| Shares issued in connection with the acquisition of Fund net assets | | | - | | | | 46,678 | | |
| Increase in net assets from Class Y transactions | | | 22,277 | | | | 272,666 | | |
| Increase in net assets from capital share transactions | | | 8,087 | | | | 257,047 | | |
| Total increase in net assets | | | 148,706 | | | | 450,156 | | |
| Net assets at beginning of period | | | 1,057,186 | | | | 607,030 | | |
| Net assets at end of period | | $ | 1,206,174 | | | $ | 1,057,186 | | |
| Undistributed net investment income at end of period | | $ | 8,800 | | | $ | 10,297 | | |
(1) See note 8 in Notes to Financial Statements for additional information.
(2) See note 4 in Notes to Financial Statements for additional information
The accompanying notes are an integral part of the financial statements.
FIRST AMERICAN FUNDS Annual Report 2004
59
Financial Highlights For a share outstanding throughout the periods ended September 30, unless otherwise indicated.
| | | Net Asset
Value
Beginning
of Period | | Net
Investment
Income (Loss) | | Realized and
Unrealized
Gains
(Losses) on
Investments | | Dividends
from Net
Investment
Income | | Distributions
from Net
Realized Gains | | Net Asset
Value
End of
Period | | Total
Return (8) | | Net Assets
End of
Period (000) | | Ratio of
Expenses to
Average
Net Assets | | Ratio of Net
Investment
Income (Loss)
to Average
Net Assets | | Ratio of
Expenses to
Average
Net Assets
(Excluding
Waivers) | | Ratio of Net
Investment
Income (Loss)
to Average Net
Assets (Excluding
Waivers) | | Portfolio
Turnover
Rate | |
| | International Fund (1) | | | | |
| Class A | |
| | 2004 | (2) | | $ | 8.99 | | | $ | 0.03 | | | $ | 1.22 | | | $ | (0.05 | ) | | $ | - | | | $ | 10.19 | | | | 13.91 | % | | $ | 44,851 | | | | 1.60 | % | | | 0.31 | % | | | 1.64 | % | | | 0.27 | % | | | 77 | % | |
| | 2003 | (2) | | | 7.33 | | | | 0.06 | | | | 1.60 | | | | - | | | | - | | | | 8.99 | | | | 22.65 | | | | 39,251 | | | | 1.60 | | | | 0.77 | | | | 1.65 | | | | 0.72 | | | | 82 | | |
| | 2002 | (2) | | | 8.96 | | | | - | | | | (1.63 | ) | | | - | | | | - | | | | 7.33 | | | | (18.19 | ) | | | 37,232 | | | | 1.60 | | | | 0.04 | | | | 1.66 | | | | (0.02 | ) | | | 72 | | |
| | 2001 | (2) (3) | | | 13.96 | | | | 0.10 | | | | (3.63 | ) | | | (0.10 | ) | | | (1.37 | ) | | | 8.96 | | | | (28.00 | ) | | | 64,907 | | | | 1.49 | | | | 1.02 | | | | 1.59 | | | | 0.92 | | | | 72 | | |
| | 2000 | (2) (4) | | | 15.94 | | | | (0.03 | ) | | | (0.42 | ) | | | (0.10 | ) | | | (1.43 | ) | | | 13.96 | | | | (3.59 | ) | | | 3,591 | | | | 1.58 | | | | (0.26 | ) | | | 1.76 | | | | (0.44 | ) | | | 90 | | |
| | 1999 | (5) | | | 12.42 | | | | - | | | | 4.26 | | | | (0.04 | ) | | | (0.70 | ) | | | 15.94 | | | | 36.62 | | | | 3,939 | | | | 1.56 | | | | (0.01 | ) | | | 1.75 | | | | (0.20 | ) | | | 94 | | |
| Class B | |
| | 2004 | (2) | | $ | 8.34 | | | $ | (0.05 | ) | | $ | 1.14 | | | $ | - | | | $ | - | | | $ | 9.43 | | | | 13.12 | % | | $ | 7,371 | | | | 2.35 | % | | | (0.48 | )% | | | 2.39 | % | | | (0.52 | )% | | | 77 | % | |
| | 2003 | (2) | | | 6.85 | | | | - | | | | 1.49 | | | | - | | | | - | | | | 8.34 | | | | 21.75 | | | | 7,936 | | | | 2.35 | | | | 0.02 | | | | 2.40 | | | | (0.03 | ) | | | 82 | | |
| | 2002 | (2) | | | 8.45 | | | | (0.06 | ) | | | (1.54 | ) | | | - | | | | - | | | | 6.85 | | | | (18.94 | ) | | | 7,459 | | | | 2.35 | | | | (0.68 | ) | | | 2.41 | | | | (0.74 | ) | | | 72 | | |
| | 2001 | (2) (3) | | | 13.28 | | | | 0.01 | | | | (3.43 | ) | | | (0.07 | ) | | | (1.34 | ) | | | 8.45 | | | | (28.57 | ) | | | 10,857 | | | | 2.17 | | | | 0.06 | | | | 2.27 | | | | (0.04 | ) | | | 72 | | |
| | 2000 | (2) (4) | | | 15.27 | | | | (0.10 | ) | | | (0.42 | ) | | | (0.07 | ) | | | (1.40 | ) | | | 13.28 | | | | (4.22 | ) | | | 732 | | | | 2.28 | | | | (0.96 | ) | | | 2.46 | | | | (1.14 | ) | | | 90 | | |
| | 1999 | (5) | | | 11.97 | | | | (0.09 | ) | | | 4.09 | | | | (0.01 | ) | | | (0.69 | ) | | | 15.27 | | | | 35.65 | | | | 781 | | | | 2.26 | | | | (0.71 | ) | | | 2.45 | | | | (0.90 | ) | | | 94 | | |
| Class C (2) | |
| | 2004 | | | $ | 8.63 | | | $ | (0.05 | ) | | $ | 1.18 | | | $ | - | | | $ | - | | | $ | 9.76 | | | | 13.14 | % | | $ | 8,542 | | | | 2.35 | % | | | (0.52 | )% | | | 2.39 | % | | | (0.56 | )% | | | 77 | % | |
| | 2003 | | | | 7.09 | | | | - | | | | 1.54 | | | | - | | | | - | | | | 8.63 | | | | 21.72 | | | | 10,439 | | | | 2.35 | | | | (0.01 | ) | | | 2.40 | | | | (0.06 | ) | | | 82 | | |
| | 2002 | | | | 8.75 | | | | (0.06 | ) | | | (1.60 | ) | | | - | | | | - | | | | 7.09 | | | | (18.97 | ) | | | 11,027 | | | | 2.35 | | | | (0.71 | ) | | | 2.41 | | | | (0.77 | ) | | | 72 | | |
| | 2001 | (6) | | | 8.31 | | | | 0.01 | | | | 0.43 | | | | - | | | | - | | | | 8.75 | | | | 5.29 | | | | 17,806 | | | | 1.48 | | | | 4.15 | | | | 1.48 | | | | 4.15 | | | | 72 | | |
| Class R | |
| | 2004 | (2) (7) | | $ | 8.98 | | | $ | (0.01 | ) | | $ | 1.19 | | | $ | (0.05 | ) | | $ | - | | | $ | 10.11 | | | | 13.16 | % | | $ | 1 | | | | 1.60 | % | | | (0.11 | )% | | | 1.64 | % | | | (0.15 | )% | | | 77 | % | |
| | 2003 | (2) | | | 7.31 | | | | 0.04 | | | | 1.63 | | | | - | | | | - | | | | 8.98 | | | | 22.85 | (9) | | | 8,533 | | | | 1.60 | | | | 0.57 | | | | 1.65 | | | | 0.52 | | | | 82 | | |
| | 2002 | (2) | | | 8.96 | | | | 0.01 | | | | (1.66 | ) | | | - | | | | - | | | | 7.31 | | | | (18.42 | ) | | | 10,817 | | | | 1.60 | | | | 0.16 | | | | 1.66 | | | | 0.10 | | | | 72 | | |
| | 2001 | (2) (3) | | | 13.97 | | | | (0.04 | ) | | | (3.50 | ) | | | (0.10 | ) | | | (1.37 | ) | | | 8.96 | | | | (28.03 | ) | | | 9,461 | | | | 1.46 | | | | (0.33 | ) | | | 1.61 | | | | (0.48 | ) | | | 72 | | |
| | 2000 | (2) (4) | | | 15.95 | | | | (0.03 | ) | | | (0.42 | ) | | | (0.10 | ) | | | (1.43 | ) | | | 13.97 | | | | (3.59 | ) | | | 16,373 | | | | 1.58 | | | | (0.26 | ) | | | 1.76 | | | | (0.44 | ) | | | 90 | | |
| | 1999 | (5) | | | 12.43 | | | | (0.01 | ) | | | 4.27 | | | | (0.04 | ) | | | (0.70 | ) | | | 15.95 | | | | 36.61 | | | | 11,307 | | | | 1.56 | | | | - | | | | 1.75 | | | | (0.19 | ) | | | 94 | | |
| Class Y | |
| | 2004 | (2) | | $ | 9.10 | | | $ | 0.06 | | | $ | 1.23 | | | $ | (0.08 | ) | | $ | - | | | $ | 10.31 | | | | 14.13 | % | | $ | 1,145,409 | | | | 1.35 | % | | | 0.59 | % | | | 1.39 | % | | | 0.55 | % | | | 77 | % | |
| | 2003 | (2) | | | 7.40 | | | | 0.09 | | | | 1.61 | | | | - | | | | - | | | | 9.10 | | | | 22.97 | (9) | | | 991,027 | | | | 1.35 | | | | 1.08 | | | | 1.40 | | | | 1.03 | | | | 82 | | |
| | 2002 | (2) | | | 9.03 | | | | 0.03 | | | | (1.66 | ) | | | - | | | | - | | | | 7.40 | | | | (18.05 | ) | | | 540,495 | | | | 1.35 | | | | 0.36 | | | | 1.41 | | | | 0.30 | | | | 72 | | |
| | 2001 | (2) (3) | | | 14.03 | | | | 0.07 | | | | (3.61 | ) | | | (0.11 | ) | | | (1.35 | ) | | | 9.03 | | | | (27.93 | ) | | | 661,886 | | | | 1.23 | | | | 0.67 | | | | 1.36 | | | | 0.54 | | | | 72 | | |
| | 2000 | (2) (4) | | | 15.97 | | | | 0.01 | | | | (0.42 | ) | | | (0.12 | ) | | | (1.41 | ) | | | 14.03 | | | | (3.27 | ) | | | 122,329 | | | | 1.28 | | | | 0.04 | | | | 1.76 | | | | (0.44 | ) | | | 90 | | |
| | 1999 | (5) | | | 12.42 | | | | 0.06 | | | | 4.25 | | | | (0.06 | ) | | | (0.70 | ) | | | 15.97 | | | | 36.98 | | | | 92,778 | | | | 1.26 | | | | 0.28 | | | | 1.75 | | | | (0.21 | ) | | | 94 | | |
(1) The financial highlights for the International Fund as set forth herein include the historical financial highlights of the Firstar International Growth Fund. The assets of the Firstar Fund were acquired by the First American International Fund on September 24, 2001. In connection with such acquisition, (i) Class A shares of the Firstar International Growth Fund were exchanged for Class A shares of the First American International Fund, (ii) Firstar Class B shares were exchanged for Class B shares of the First American International Fund, (iii) Firstar Class Y shares were exchanged for Class S shares (now designated Class R shares) of the First American Fund, and (iv) Firstar Institutional Class shares were exchanged for Class Y shares of the First American International Fund. Historical per share amounts have been adjusted to reflect the conversion ratios utilized for the merger of the International Fund and Firstar International Growth Fund. Firstar International Growth Fund is the accounting survivor.
(2) Per share data calculated using average shares outstanding method.
(3) For the period November 1, 2000, to September 30, 2001. Effective in 2001, the Fund's fiscal year end was changed from October 31 to September 30. All ratios for the period have been annualized, except total return and portfolio turnover.
(4) For the period December 1, 1999, to October 31, 2000. Effective in 2000, the Fund's fiscal year end was changed from November 30 to October 31. All ratios for the period have been annualized, except total return and portfolio turnover.
(5) For the fiscal year ended November 30.
(6) Class of shares has been offered since September 24, 2001. All ratios for the period have been annualized, except total return and portfolio turnover.
(7) Prior to July 1, 2004, Class R shares were named Class S shares, which had lower fees and expenses.
(8) Total return does not reflect sales charges. Total return would have been lower had certain expenses not been waived.
(9) In 2003, 0.14% of Class R share's and 0.13% of Class Y share's total return was a result of the reimbursement as described in note 8 to the
Financial Statements by the advisor related to foreign currency principal trades between the International Fund and U.S. Bank. Excluding the
reimbursement, total return for Class R and Class Y shares would have been 22.71% and 22.84%, respectively.
The accompanying notes are an integral part of the financial statements.
FIRST AMERICAN FUNDS Annual Report 2004
60
FIRST AMERICAN FUNDS Annual Report 2004
61
Schedule of Investments September 30, 2004
Small Cap Growth Opportunities Fund
| DESCRIPTION | | SHARES | | VALUE (000) | |
| Common Stocks – 94.8% | | | |
| Consumer Discretionary – 18.8% | | | |
| CBRL Group (a) | | | 152,510 | | | $ | 5,503 | | |
| Hibbett Sporting Goods* | | | 150,860 | | | | 3,091 | | |
| Knology* | | | 965,188 | | | | 4,005 | | |
| Lakes Entertainment* (a) | | | 323,450 | | | | 3,389 | | |
| Landry's Restaurants (a) | | | 316,850 | | | | 8,647 | | |
| Marvel Enterprises* (a) | | | 459,080 | | | | 6,684 | | |
| Men's Wearhouse* (a) | | | 210,650 | | | | 6,119 | | |
| Pacific Sunwear of California* (a) | | | 319,270 | | | | 6,721 | | |
| Panera Bread, Cl A* (a) | | | 137,450 | | | | 5,160 | | |
| Priceline.com* (a) | | | 171,330 | | | | 3,798 | | |
| Spanish Broadcasting System* | | | 1,076,435 | | | | 10,592 | | |
| | | | | | | | 63,709 | | |
| Energy – 5.9% | | | |
| Carrizo Oil & Gas* | | | 400,820 | | | | 3,836 | | |
| Comstock Resources* | | | 269,745 | | | | 5,643 | | |
| KCS Energy* | | | 373,640 | | | | 5,198 | | |
| Meridian Resource* | | | 268,220 | | | | 2,368 | | |
| Rowan* (a) | | | 108,420 | | | | 2,862 | | |
| | | | | | | | 19,907 | | |
| Financials – 9.2% | | | |
| Affirmative Insurance* | | | 309,960 | | | | 4,891 | | |
| Boston Private Financial (a) | | | 148,420 | | | | 3,705 | | |
| Cullen/Frost Bankers (a) | | | 146,550 | | | | 6,810 | | |
| Scottish Annuity & Life (a) | | | 292,770 | | | | 6,198 | | |
| Southwest Bancorp of Texas (a) | | | 314,850 | | | | 6,341 | | |
| UCBH | | | 86,400 | | | | 3,376 | | |
| | | | | | | | 31,321 | | |
| Health Care – 28.2% (b) | | | |
| Able Laboratories* (a) | | | 270,470 | | | | 5,182 | | |
| Allscripts Healthcare Solutions* (a) | | | 104,530 | | | | 941 | | |
| Amylin Pharmaceuticals* (a) | | | 337,750 | | | | 6,931 | | |
| Bradley Pharmaceuticals* (a) | | | 355,260 | | | | 7,230 | | |
| Caliper Life Sciences* | | | 87,650 | | | | 616 | | |
| Cutera* | | | 402,165 | | | | 4,536 | | |
| Digene* (a) | | | 186,930 | | | | 4,853 | | |
| Encore Medical* | | | 1,820,410 | | | | 9,066 | | |
| Encysive Pharmaceuticals* (a) | | | 381,740 | | | | 3,447 | | |
| Genelabs Technologies* | | | 1,301,860 | | | | 3,398 | | |
| Immtech International* (a) | | | 223,540 | | | | 2,168 | | |
| Incyte* (a) | | | 196,980 | | | | 1,897 | | |
| Martek Bioscience* (a) | | | 62,030 | | | | 3,017 | | |
| POZEN* | | | 256,214 | | | | 2,239 | | |
| Taro Pharmaceutical Industries* (a) | | | 419,500 | | | | 9,808 | | |
| Triad Hospitals* (a) | | | 151,210 | | | | 5,208 | | |
| VaxGen* (a) | | | 434,300 | | | | 5,798 | | |
| Watson Pharmaceuticals* | | | 317,610 | | | | 9,357 | | |
| Xenogen* | | | 582,140 | | | | 3,609 | | |
| Zoll Medical* | | | 187,560 | | | | 6,263 | | |
| | | | | | | | 95,564 | | |
| Industrials – 0.5% | | | |
| Navigant Consulting* | | | 78,300 | | | | 1,719 | | |
| Information Technology – 30.2% (b) | | | |
| ADTRAN (a) | | | 342,920 | | | | 7,778 | | |
| Applied Films* | | | 333,280 | | | | 6,002 | | |
Small Cap Growth Opportunities Fund (continued)
| DESCRIPTION | | SHARES/PAR (000) | | VALUE (000) | |
| Avocent* (a) | | | 158,670 | | | $ | 4,130 | | |
| Captiva Software* | | | 196,990 | | | | 2,206 | | |
| Digitas* | | | 574,615 | | | | 4,442 | | |
| Electronics for Imaging* (a) | | | 128,770 | | | | 2,091 | | |
| Embarcadero Technologies* | | | 488,670 | | | | 4,134 | | |
| FormFactor* (a) | | | 204,230 | | | | 3,956 | | |
| Foundry Networks* (a) | | | 535,792 | | | | 5,085 | | |
| Global Payments | | | 95,410 | | | | 5,109 | | |
| Hyperion Solutions* (a) | | | 114,170 | | | | 3,881 | | |
| Integrated Circuit Systems* (a) | | | 116,440 | | | | 2,503 | | |
| Integrated Device Technology* (a) | | | 276,200 | | | | 2,632 | | |
| Ixia* | | | 678,770 | | | | 6,598 | | |
| Komag* | | | 384,130 | | | | 5,339 | | |
| LeCroy* | | | 161,980 | | | | 2,707 | | |
| QLogic* (a) | | | 202,740 | | | | 6,003 | | |
| Quest Software* | | | 480,760 | | | | 5,346 | | |
| SAFENET* (a) | | | 278,320 | | | | 7,342 | | |
| Take-Two Interactive Software* (a) | | | 173,120 | | | | 5,687 | | |
| Tekelec* | | | 250,000 | | | | 4,170 | | |
| Tridium Warrant* (c) | | | 20,500 | | | | - | | |
| Tridium, Cl B (c) | | | 278,500 | | | | 122 | | |
Varian Semiconductor Equipment
Associates* (a) | | | 125,750 | | | | 3,886 | | |
| VideoPropulsion* (c) | | | 809,856 | | | | - | | |
| WebSideStory* | | | 156,740 | | | | 1,450 | | |
| | | | | | | | 102,599 | | |
| Telecommunication Services – 2.0% | | | |
| General Communications* | | | 739,398 | | | | 6,692 | | |
Total Common Stocks
(Cost $309,948) | | | | | | | 321,511 | | |
| Affiliated Money Market Fund – 5.9% | | | |
First American Prime
Obligations Fund, Cl Z (d) | | | 20,115,756 | | | | 20,116 | | |
Total Affiliated Money Market Fund
(Cost $20,116) | | | | | | | 20,116 | | |
Investments Purchased with Proceeds
from Securities Lending – 40.0% | | | |
| Commercial Paper – 12.9% | | | |
| Bluegrass | |
| 1.881%, 05/18/05 | | $ | 571 | | | | 571 | | |
| 1.891%, 08/18/05 | | | 454 | | | | 454 | | |
| Concord Minutemen Capital | |
| 1.650%, 10/01/04 | | | 938 | | | | 938 | | |
| 1.680%, 10/05/04 | | | 2,083 | | | | 2,083 | | |
| 1.720%, 10/06/04 | | | 1,539 | | | | 1,539 | | |
| 1.740%, 10/14/04 | | | 1,030 | | | | 1,030 | | |
Descartes Funding Trust
1.760%, 11/15/04 | | | 1,157 | | | | 1,157 | | |
| Ford Credit Floor Plan | |
| 1.622%, 10/05/04 | | | 2,314 | | | | 2,314 | | |
| 1.526%, 10/06/04 | | | 1,620 | | | | 1,620 | | |
| 1.655%, 10/22/04 | | | 509 | | | | 509 | | |
Goldman Sachs
1.975%, 01/18/05 | | | 1,157 | | | | 1,157 | | |
Independence
1.830%, 04/15/05 | | | 1,431 | | | | 1,431 | | |
Jupiter Securities Corp
1.793%, 10/21/04 | | | 4,400 | | | | 4,400 | | |
Lakeside Funding
1.790%, 10/08/04 | | | 2,454 | | | | 2,454 | | |
Landesbank Baden
1.480%, 11/12/04 | | | 462 | | | | 462 | | |
The accompanying notes are an integral part of the financial statements.
FIRST AMERICAN FUNDS Annual Report 2004
62
Small Cap Growth Opportunities Fund (continued)
| DESCRIPTION | | PAR (000) | | VALUE (000) | |
Leaf's LLC
1.821%, 04/20/05 | | $ | 1,273 | | | $ | 1,273 | | |
| Liquid Funding | |
| 1.743%, 10/13/04 | | | 1,619 | | | | 1,619 | | |
| 1.830%, 05/25/05 | | | 1,157 | | | | 1,157 | | |
| MBNA Credit | |
| 1.683%, 10/12/04 | | | 1,125 | | | | 1,125 | | |
| 1.764%, 10/26/04 | | | 624 | | | | 624 | | |
| Main Street Warehouse | |
| 1.742%, 10/04/04 | | | 1,528 | | | | 1,528 | | |
| 1.683%, 10/04/04 | | | 1,887 | | | | 1,887 | | |
| 1.742%, 10/08/04 | | | 1,157 | | | | 1,157 | | |
| 1.742%, 10/08/04 | | | 1,157 | | | | 1,157 | | |
| Mortgage Interest Network | |
| 1.752%, 10/12/04 | | | 764 | | | | 764 | | |
| 1.763%, 10/14/04 | | | 810 | | | | 810 | | |
Netexis Banques
1.700%, 12/16/04 | | | 1,153 | | | | 1,153 | | |
| Orchard Park | |
| 1.796%, 04/06/05 | | | 1,157 | | | | 1,157 | | |
| 1.766%, 07/06/05 | | | 2,389 | | | | 2,389 | | |
| Park Granada LLC | |
| 1.622%, 10/01/04 | | | 2,037 | | | | 2,037 | | |
| 1.743%, 10/13/04 | | | 1,319 | | | | 1,319 | | |
Sigma Finance
1.512%, 11/29/04 | | | 577 | | | | 577 | | |
| Total Commercial Paper | | | | | | | 43,852 | | |
| Corporate Obligations – 10.7% | | | |
| Allstate Life Global | |
| 1.780%, 10/14/05 | | | 2,315 | | | | 2,315 | | |
| 1.750%, 10/14/05 | | | 579 | | | | 579 | | |
Bayer Landbank NY
1.830%, 06/24/05 | | | 2,199 | | | | 2,199 | | |
Blue Heron Funding
1.850%, 05/18/05 | | | 648 | | | | 648 | | |
Castle Hill III
1.910%, 09/15/15 | | | 695 | | | | 695 | | |
Depfa Bank PLC
1.860%, 06/15/05 | | | 1,157 | | | | 1,157 | | |
Duke Funding VI
1.320%, 04/08/05 | | | 1,401 | | | | 1,401 | | |
General Electric Capital Corporation
1.838%, 10/07/05 | | | 1,159 | | | | 1,159 | | |
Jackson National Life
1.760%, 04/15/05 | | | 1,157 | | | | 1,157 | | |
Jefferson Pilot
1.788%, 08/17/05 | | | 1,157 | | | | 1,157 | | |
Liquid Funding
1.840%, 06/28/05 | | | 1,042 | | | | 1,042 | | |
Merrill Lynch
1.696%, 10/01/05 | | | 2,315 | | | | 2,315 | | |
| Metlife Global Funding | |
| 1.800%, 10/14/05 | | | 1,389 | | | | 1,389 | | |
| 1.880%, 10/28/05 | | | 972 | | | | 972 | | |
Morgan Stanley
1.850%, 12/26/08 | | | 1,158 | | | | 1,158 | | |
Natexis Banq NY
1.920%, 07/12/05 | | | 1,273 | | | | 1,273 | | |
Northlake CDO
1.895%, 03/07/05 | | | 694 | | | | 694 | | |
| Premium Asset Trust | |
| 1.848%, 12/22/04 | | | 868 | | | | 868 | | |
| 1.760%, 05/13/05 | | | 1,620 | | | | 1,620 | | |
| 1.740%, 06/01/05 | | | 3,449 | | | | 3,449 | | |
| 1.770%, 10/14/05 | | | 926 | | | | 926 | | |
REMAC
1.840%, 09/29/05 | | | 1,273 | | | | 1,273 | | |
Small Cap Growth Opportunities Fund (continued)
| DESCRIPTION | | PAR (000) | | VALUE (000) | |
RMAC
1.740%, 06/12/05 | | $ | 1,335 | | | $ | 1,335 | | |
SMM Trust 2004
1.833%, 09/23/05 | | | 2,153 | | | | 2,153 | | |
Societe Generale NYC
1.960%, 12/08/04 | | | 2,315 | | | | 2,315 | | |
Svenska Handl
1.170%, 10/21/04 | | | 1,157 | | | | 1,157 | | |
| Total Corporate Obligations | | | | | | | 36,406 | | |
| Other Short-Term Investments – 2.8% | |
ARLO III Ltd
2.000%, 09/28/05 | | | 3,472 | | | | 3,472 | | |
Commonwealth Life
2.115%, 12/31/04 (e) | | | 1,169 | | | | 1,169 | | |
General Electric Capital Assurance
1.980%, 01/19/05 | | | 463 | | | | 463 | | |
HBOS Treasury Services
1.640%, 11/01/05 | | | 1,273 | | | | 1,273 | | |
Security Life of Denver
1.900%, 12/30/04 | | | 3,009 | | | | 3,009 | | |
| Total Other Short-Term Investments | | | | | | | 9,386 | | |
| Repurchase Agreements – 13.6% | |
Bear Stearns
2.045%, dated 09/30/04, matures 10/01/04,
repurchase price $2,314,992
(collateralized by various securities:
Total market value $2,362,449) | | | 2,315 | | | | 2,315 | | |
Bear Stearns
2.060%, dated 09/30/04, matures 12/23/04,
repurchase price $697,796
(collateralized by various securities:
Total market value $708,595) | | | 694 | | | | 694 | | |
Citibank
1.945%, dated 09/30/04, matures 10/01/04,
repurchase price $4,629,972
(collateralized by corporate securities:
Total market value $4,902,651) | | | 4,630 | | | | 4,630 | | |
Citibank
1.925%, dated 09/30/04, matures 10/01/04,
repurchase price $1,157,492
(collateralized by various securities:
Total market value $1,183,201) | | | 1,157 | | | | 1,157 | | |
Citibank
1.925%, dated 09/30/04, matures 10/01/04,
repurchase price $1,157,492
(collateralized by various securities:
Total market value $1,180,595) | | | 1,157 | | | | 1,157 | | |
Greenwich Capital Markets
1.950%, dated 09/30/04, matures 10/01/04,
repurchase price $6,944,959
(collateralized by U.S. government securities:
Total market value $7,083,565) | | | 6,945 | | | | 6,945 | | |
Goldman Sachs
2.025%, dated 09/30/04, matures 10/01/04,
repurchase price $1,620,494
(collateralized by various securities:
Total market value $1,670,521) | | | 1,620 | | | | 1,620 | | |
Goldman Sachs
2.025%, dated 09/30/04, matures 10/01/04,
repurchase price $694,497
(collateralized by various securities:
Total market value $715,954) | | | 695 | | | | 695 | | |
Goldman Sachs
2.025%, dated 09/30/04, matures 10/01/04,
repurchase price $694,497
(collateralized by various securities:
Total market value $715,954) | | | 694 | | | | 694 | | |
FIRST AMERICAN FUNDS Annual Report 2004
63
Schedule of Investments September 30, 2004
Small Cap Growth Opportunities Fund (concluded)
| DESCRIPTION | | PAR (000) | | VALUE (000) | |
Goldman Sachs
2.025%, dated 09/30/04, matures 10/01/04,
repurchase price $1,736,243
(collateralized by corporate securities:
Total market value $1,789,850) | | $ | 1,736 | | | $ | 1,736 | | |
Goldman Sachs
1.425%, dated 09/30/04, matures 10/18/04,
repurchase price $2,895,638
(collateralized by corporate securities:
Total market value $2,952,646) | | | 2,894 | | | | 2,894 | | |
Goldman Sachs
1.480%, dated 09/30/04, matures 10/18/04,
repurchase price $1,737,430
(collateralized by various securities:
Total market value $1,789,850) | | | 1,736 | | | | 1,736 | | |
Goldman Sachs
2.205%, dated 09/30/04, matures 03/07/05,
repurchase price $1,168,631
(collateralized by corporate securities:
Total market value $1,181,067) | | | 1,157 | | | | 1,157 | | |
Lehman Brothers
2.055%, dated 09/30/04, matures 10/01/04,
repurchase price $4,629,986
(collateralized by collateralized
mortgage obligations:
Total market value $4,722,316) | | | 4,630 | | | | 4,630 | | |
Lehman Brothers
1.910%, dated 09/30/04, matures 10/01/04,
repurchase price $6,944,951
(collateralized by U.S. government securities:
Total market value $7,083,586) | | | 6,945 | | | | 6,945 | | |
Lehman Brothers
1.935%, dated 09/30/04, matures 10/01/04,
repurchase price $4,629,970
(collateralized by collateralized
mortgage obligations:
Total market value $5,090,761) | | | 4,630 | | | | 4,630 | | |
Merrill Lynch
1.925%, dated 09/30/04, matures 10/01/04,
repurchase price $2,314,985
(collateralized by corporate securities:
Total market value $2,430,654) | | | 2,315 | | | | 2,315 | | |
Total Repurchase Agreements
(Cost $45,950) | | | | | | | 45,950 | | |
Total Investments Purchased with Proceeds
from Securities Lending
(Cost $135,594) | | | | | | | 135,594 | | |
Total Investments – 140.7%
(Cost $465,658) | | | | | | | 477,221 | | |
| Other Assets and Liabilities, Net – (40.7)% | | | | | | | (138,025 | ) | |
| Total Net Assets – 100.0% | | | | | | $ | 339,196 | | |
* Non-income producing security
(a) This security or a portion of this security is out on loan at September 30, 2004. Total loaned securities had a market value of $129,681,551 at September 30, 2004. See note 2 in Notes to Financial Statements.
(b) The Fund is significantly invested in this industry sector and therefore is subject to additional risks. See note 7 in Notes to Financial Statements.
(c) Securities considered illiquid investments and are fair valued under guidelines established by the Board of Directors. As of September 30, 2004, the fair value of these investments was $122,540 or 0.0% of total net assets. See note 2 in Notes to Financial Statements.
(d) Investment in affiliated security. This money market fund is advised by U.S. Bancorp Asset Management, Inc., which also serves as advisor to this Fund. See note 3 in Notes to Financial Statements.
(e) Security has demand features which qualify it as a short term security. The date disclosed is the next put date.
Cl – Class
Small Cap Select Fund
| DESCRIPTION | | SHARES | | VALUE (000) | |
| Common Stocks – 97.4% | | | |
| Consumer Discretionary – 17.2% | | | |
| American Eagle Outfitters (a) | | | 258,930 | | | $ | 9,542 | | |
| CBRL Group (a) | | | 186,540 | | | | 6,730 | | |
| Collins & Aikman* (a) | | | 962,610 | | | | 4,024 | | |
| Cooper Tire & Rubber (a) | | | 421,820 | | | | 8,508 | | |
| Gray Television | | | 630,150 | | | | 7,499 | | |
| Guitar Center* (a) | | | 101,160 | | | | 4,380 | | |
| Kerzner International* (a) | | | 229,940 | | | | 10,110 | | |
| Life Time Fitness* | | | 194,100 | | | | 4,981 | | |
| Marvel Enterprises* (a) | | | 1,099,180 | | | | 16,004 | | |
| Men's Wearhouse* | | | 303,980 | | | | 8,831 | | |
| Michaels Stores | | | 137,020 | | | | 8,113 | | |
| Panera Bread, Cl A* (a) | | | 176,750 | | | | 6,635 | | |
| Petco Animal Supplies* (a) | | | 66,750 | | | | 2,180 | | |
| Radio One* (a) | | | 606,550 | | | | 8,631 | | |
| Ruby Tuesday (a) | | | 473,040 | | | | 13,184 | | |
| Ryland Group (a) | | | 61,220 | | | | 5,673 | | |
| Sports Authority* (a) | | | 107,400 | | | | 2,492 | | |
| Standard Pacific | | | 47,260 | | | | 2,664 | | |
| Station Casinos (a) | | | 280,320 | | | | 13,747 | | |
| Too* | | | 224,380 | | | | 4,054 | | |
| WCI Communities* (a) | | | 270,750 | | | | 6,308 | | |
| | | | | | | | 154,290 | | |
| Energy – 6.2% | | | |
| ENSCO International (a) | | | 282,040 | | | | 9,214 | | |
| Newfield Exploration* | | | 201,200 | | | | 12,321 | | |
| Rowan* (a) | | | 175,560 | | | | 4,635 | | |
| Ultra Petroleum* | | | 264,920 | | | | 12,994 | | |
| Varco International* | | | 177,070 | | | | 4,749 | | |
| Western Gas Resources (a) | | | 213,040 | | | | 6,091 | | |
| W-H Energy Services* | | | 274,480 | | | | 5,695 | | |
| | | | | | | | 55,699 | | |
| Financials – 16.7% | | | |
| Affiliated Managers Group* (a) | | | 42,320 | | | | 2,266 | | |
| AmerUS Group (a) | | | 329,470 | | | | 13,508 | | |
| Bank Mutual | | | 967,130 | | | | 11,606 | | |
| City National (a) | | | 237,147 | | | | 15,403 | | |
| CoBiz (a) | | | 143,430 | | | | 2,371 | | |
| Cullen/Frost Bankers | | | 295,420 | | | | 13,728 | | |
| East West Bancorp | | | 55,110 | | | | 1,851 | | |
| First Financial Bankshares | | | 56,220 | | | | 2,258 | | |
| First Niagara Financial Group (a) | | | 809,290 | | | | 10,828 | | |
| Glacier Bancorp (a) | | | 336,690 | | | | 9,818 | | |
| Investors Financial Services (a) | | | 288,870 | | | | 13,037 | | |
| Jefferies Group (a) | | | 185,528 | | | | 6,395 | | |
| KNBT Bancorp | | | 316,430 | | | | 5,329 | | |
| Navigators Group* | | | 185,880 | | | | 5,435 | | |
| New Alliance Bancshares (a) | | | 369,297 | | | | 5,299 | | |
| Providian Financial* (a) | | | 662,050 | | | | 10,288 | | |
| Radian Group | | | 150,595 | | | | 6,962 | | |
| TrustCo Bank Corporation of New York | | | 448,050 | | | | 5,744 | | |
| Trustmark | | | 148,320 | | | | 4,610 | | |
| Winston Hotels | | | 228,010 | | | | 2,440 | | |
| | | | | | | | 149,176 | | |
| Health Care – 13.1% | | | |
| Abgenix* (a) | | | 522,942 | | | | 5,156 | | |
| Able Laboratories* | | | 436,150 | | | | 8,357 | | |
The accompanying notes are an integral part of the financial statements.
FIRST AMERICAN FUNDS Annual Report 2004
64
Small Cap Select Fund (continued)
| DESCRIPTION | | SHARES | | VALUE (000) | |
| AMERIGROUP* | | | 177,160 | | | $ | 9,965 | | |
| Biosite* (a) | | | 111,170 | | | | 5,443 | | |
| Covance* (a) | | | 338,990 | | | | 13,549 | | |
| Encysive Pharmaceuticals* (a) | | | 418,100 | | | | 3,775 | | |
| Eyetech Pharmaceuticals* (a) | | | 106,960 | | | | 3,636 | | |
| Given Imaging* (a) | | | 114,660 | | | | 4,409 | | |
| Human Genome Sciences* | | | 475,770 | | | | 5,191 | | |
| INAMED* | | | 61,680 | | | | 2,940 | | |
| Inveresk Research Group* | | | 125,000 | | | | 4,611 | | |
| Medicis, Cl A (a) | | | 152,760 | | | | 5,964 | | |
| Nektar Therapeutics* | | | 281,530 | | | | 4,076 | | |
| NPS Pharmaceuticals* (a) | | | 216,120 | | | | 4,707 | | |
| Ocular Sciences* (a) | | | 98,470 | | | | 4,724 | | |
| Onyx Pharmaceuticals* (a) | | | 88,400 | | | | 3,802 | | |
| PerkinElmer | | | 131,800 | | | | 2,270 | | |
| Protein Design Labs* (a) | | | 343,240 | | | | 6,721 | | |
| Respironics* | | | 105,189 | | | | 5,621 | | |
| SonoSite* | | | 88,010 | | | | 2,293 | | |
| Techne* (a) | | | 106,890 | | | | 4,081 | | |
| Triad Hospitals* (a) | | | 140,355 | | | | 4,834 | | |
| Urologix* | | | 229,990 | | | | 1,453 | | |
| | | | | | | | 117,578 | | |
| Industrials – 17.9% | |
| Actuant, Cl A* (a) | | | 172,140 | | | | 7,094 | | |
| AirTran Holdings* | | | 804,430 | | | | 8,012 | | |
| Albany International, Cl A | | | 234,610 | | | | 6,994 | | |
| Allied Waste Industries* (a) | | | 266,280 | | | | 2,357 | | |
| Applied Signal Technology | | | 325,330 | | | | 10,407 | | |
| Chicago Bridge & Iron | | | 484,880 | | | | 14,541 | | |
| EGL* (a) | | | 218,740 | | | | 6,619 | | |
| Genlyte Group* | | | 152,430 | | | | 9,815 | | |
| Heartland Express (a) | | | 346,110 | | | | 6,386 | | |
| Hughes Supply (a) | | | 258,220 | | | | 7,765 | | |
| Kennametal | | | 274,920 | | | | 12,413 | | |
| Mercury Computer Systems* (a) | | | 342,830 | | | | 9,229 | | |
| MTC Technologies* | | | 484,090 | | | | 13,375 | | |
| Power-One* (a) | | | 629,300 | | | | 4,078 | | |
| Republic Services | | | 333,800 | | | | 9,934 | | |
| Roper Industries (a) | | | 172,630 | | | | 9,919 | | |
| Ryder System (a) | | | 188,350 | | | | 8,860 | | |
| Thomas Industries | | | 136,210 | | | | 4,277 | | |
| United Defense Industries* | | | 211,260 | | | | 8,448 | | |
| | | | | | | | 160,523 | | |
| Information Technology – 21.2% | |
| Actel* | | | 267,610 | | | | 4,068 | | |
| ADC Telecommunications* (a) | | | 3,540,770 | | | | 6,409 | | |
| Aeroflex* | | | 328,794 | | | | 3,475 | | |
| Avocent* | | | 244,780 | | | | 6,372 | | |
| BearingPoint* | | | 1,285,980 | | | | 11,497 | | |
| Benchmark Electronics* (a) | | | 355,120 | | | | 10,583 | | |
| Cabot Microelectronics* (a) | | | 132,440 | | | | 4,801 | | |
| Carreker* | | | 472,640 | | | | 3,597 | | |
| Digitas* (a) | | | 533,540 | | | | 4,124 | | |
| eFunds* | | | 188,010 | | | | 3,495 | | |
| Entegris* (a) | | | 443,200 | | | | 3,696 | | |
| Equinix* (a) | | | 92,348 | | | | 2,841 | | |
| FactSet Research Systems (a) | | | 370,110 | | | | 17,839 | | |
| Hyperion Solutions* (a) | | | 333,580 | | | | 11,338 | | |
Small Cap Select Fund (continued)
| DESCRIPTION | | SHARES/PAR (000) | | VALUE (000) | |
| Integrated Device Technology* (a) | | | 478,200 | | | $ | 4,557 | | |
| Intersil, Cl A (a) | | | 256,770 | | | | 4,090 | | |
| Leadis Technology | | | 46,350 | | | | 523 | | |
| Logitech International* (a) | | | 398,280 | | | | 19,253 | | |
| Macrovision* (a) | | | 534,090 | | | | 12,861 | | |
| MTS Systems | | | 218,160 | | | | 4,636 | | |
| QLogic* (a) | | | 266,660 | | | | 7,896 | | |
| SAFENET* (a) | | | 510,560 | | | | 13,469 | | |
| Stellent* | | | 869,280 | | | | 6,702 | | |
| TIBCO Software* (a) | | | 2,310,850 | | | | 19,665 | | |
| ValueClick* | | | 249,540 | | | | 2,356 | | |
| | | | | | | | 190,143 | | |
| Materials – 4.6% | | | |
| Anchor Glass Container | | | 395,060 | | | | 3,243 | | |
| Georgia Gulf | | | 405,830 | | | | 18,096 | | |
| Hercules* (a) | | | 327,050 | | | | 4,660 | | |
| Olin | | | 386,280 | | | | 7,726 | | |
| Oregon Steel Mills* | | | 214,060 | | | | 3,560 | | |
| Steel Dynamics (a) | | | 102,100 | | | | 3,943 | | |
| | | | | | | | 41,228 | | |
| Telecommunication Services – 0.5% | | | |
| General Communications* | | | 494,450 | | | | 4,475 | | |
Total Common Stocks
(Cost $741,092) | | | | | | | 873,112 | | |
| Affiliated Money Market Fund – 2.7% | | | |
First American Prime
Obligations Fund, Cl Z (b) | | | 24,093,526 | | | | 24,094 | | |
Total Affiliated Money Market Fund
(Cost $24,094) | | | | | | | 24,094 | | |
Investments Purchased with Proceeds
from Securities Lending – 38.3% | | | |
| Commercial Paper – 12.4% | | | |
| Bluegrass | |
| 1.881%, 05/18/05 | | $ | 1,443 | | | | 1,443 | | |
| 1.891%, 08/18/05 | | | 1,146 | | | | 1,146 | | |
| Concord Minutemen Capital | |
| 1.650%, 10/01/04 | | | 2,369 | | | | 2,369 | | |
| 1.680%, 10/05/04 | | | 5,263 | | | | 5,263 | | |
| 1.720%, 10/06/04 | | | 3,889 | | | | 3,889 | | |
| 1.740%, 10/14/04 | | | 2,602 | | | | 2,602 | | |
Descartes Funding Trust
1.760%, 11/15/04 | | | 2,924 | | | | 2,924 | | |
| Ford Credit Floor Plan | |
| 1.622%, 10/05/04 | | | 5,847 | | | | 5,847 | | |
| 1.526%, 10/06/04 | | | 4,094 | | | | 4,094 | | |
| 1.655%, 10/22/04 | | | 1,285 | | | | 1,285 | | |
Goldman Sachs
1.975%, 01/18/05 | | | 2,924 | | | | 2,924 | | |
Independence
1.830%, 04/15/05 | | | 3,614 | | | | 3,614 | | |
Jupiter Securities Corp
1.793%, 10/21/04 | | | 11,115 | | | | 11,115 | | |
Lakeside Funding
1.790%, 10/08/04 | | | 6,199 | | | | 6,199 | | |
Landesbank Baden
1.480%, 11/12/04 | | | 1,167 | | | | 1,167 | | |
Leaf's LLC
1.821%, 04/20/05 | | | 3,217 | | | | 3,217 | | |
| Liquid Funding | |
| 1.743%, 10/13/04 | | | 4,091 | | | | 4,091 | | |
| 1.830%, 05/25/05 | | | 2,924 | | | | 2,924 | | |
FIRST AMERICAN FUNDS Annual Report 2004
65
Schedule of Investments September 30, 2004
Small Cap Select Fund (continued)
| DESCRIPTION | | PAR (000) | | VALUE (000) | |
| MBNA Credit | |
| 1.683%, 10/12/04 | | $ | 2,842 | | | $ | 2,842 | | |
| 1.764%, 10/26/04 | | | 1,577 | | | | 1,577 | | |
| Main Street Warehouse | |
| 1.742%, 10/04/04 | | | 3,859 | | | | 3,859 | | |
| 1.683%, 10/04/04 | | | 4,766 | | | | 4,766 | | |
| 1.742%, 10/08/04 | | | 2,923 | | | | 2,923 | | |
| 1.742%, 10/08/04 | | | 2,924 | | | | 2,924 | | |
| Mortgage Interest Network | |
| 1.752%, 10/12/04 | | | 1,929 | | | | 1,929 | | |
| 1.763%, 10/14/04 | | | 2,046 | | | | 2,046 | | |
Netexis Banques
1.700%, 12/16/04 | | | 2,912 | | | | 2,912 | | |
| Orchard Park | |
| 1.796%, 04/06/05 | | | 2,924 | | | | 2,924 | | |
| 1.766%, 07/06/05 | | | 6,035 | | | | 6,035 | | |
| Park Granada LLC | |
| 1.622%, 10/01/04 | | | 5,146 | | | | 5,146 | | |
| 1.743%, 10/13/04 | | | 3,331 | | | | 3,331 | | |
Sigma Finance
1.512%, 11/29/04 | | | 1,458 | | | | 1,458 | | |
| Total Commercial Paper | | | | | | | 110,785 | | |
| Corporate Obligations – 10.3% | |
| Allstate Life Global | |
| 1.780%, 10/14/05 | | | 5,848 | | | | 5,848 | | |
| 1.750%, 10/14/05 | | | 1,462 | | | | 1,462 | | |
Bayer Landbank NY
1.830%, 06/24/05 | | | 5,555 | | | | 5,555 | | |
Blue Heron Funding
1.850%, 05/18/05 | | | 1,638 | | | | 1,638 | | |
Castle Hill III
1.910%, 09/15/15 | | | 1,755 | | | | 1,755 | | |
Depfa Bank PLC
1.860%, 06/15/05 | | | 2,923 | | | | 2,923 | | |
Duke Funding VI
1.320%, 04/08/05 | | | 3,538 | | | | 3,538 | | |
General Electric Capital Corporation
1.838%, 10/07/05 | | | 2,927 | | | | 2,927 | | |
Jackson National Life
1.760%, 04/15/05 | | | 2,924 | | | | 2,924 | | |
Jefferson Pilot
1.788%, 08/17/05 | | | 2,924 | | | | 2,924 | | |
Liquid Funding
1.840%, 06/28/05 | | | 2,631 | | | | 2,631 | | |
Merrill Lynch
1.696%, 10/01/05 | | | 5,848 | | | | 5,848 | | |
| Metlife Global Funding | |
| 1.800%, 10/14/05 | | | 3,509 | | | | 3,509 | | |
| 1.880%, 10/28/05 | | | 2,457 | | | | 2,457 | | |
Morgan Stanley
1.850%, 12/26/08 | | | 2,924 | | | | 2,924 | | |
Natexis Banq NY
1.920%, 07/12/05 | | | 3,217 | | | | 3,217 | | |
Northlake CDO
1.895%, 03/07/05 | | | 1,755 | | | | 1,755 | | |
| Premium Asset Trust | |
| 1.848%, 12/22/04 | | | 2,193 | | | | 2,193 | | |
| 1.760%, 05/13/05 | | | 4,093 | | | | 4,093 | | |
| 1.740%, 06/01/05 | | | 8,714 | | | | 8,714 | | |
| 1.770%, 10/14/05 | | | 2,339 | | | | 2,339 | | |
REMAC
1.840%, 09/29/05 | | | 3,217 | | | | 3,217 | | |
RMAC
1.740%, 06/12/05 | | | 3,374 | | | | 3,374 | | |
Small Cap Select Fund (continued)
| DESCRIPTION | | PAR (000) | | VALUE (000) | |
SMM Trust 2004
1.833%, 09/23/05 | | $ | 5,439 | | | $ | 5,439 | | |
Societe Generale NYC
1.960%, 12/08/04 | | | 5,848 | | | | 5,848 | | |
Svenska Handl
1.170%, 10/21/04 | | | 2,924 | | | | 2,924 | | |
| Total Corporate Obligations | | | | | | | 91,976 | | |
| Other Short-Term Investments – 2.6% | | | |
ARLO III Ltd
2.000%, 09/28/05 | | | 8,772 | | | | 8,772 | | |
Commonwealth Life
2.115%, 12/31/04 (c) | | | 2,953 | | | | 2,953 | | |
General Electric Capital Assurance
1.980%, 01/19/05 | | | 1,169 | | | | 1,169 | | |
HBOS Treasury Services
1.640%, 11/01/05 | | | 3,215 | | | | 3,215 | | |
Security Life of Denver
1.900%, 12/30/04 | | | 7,603 | | | | 7,603 | | |
| Total Other Short-Term Investments | | | | | | | 23,712 | | |
| Repurchase Agreements – 13.0% | | | |
Bear Stearns
2.045%, dated 09/30/04, matures 10/01/04,
repurchase price $5,848,519
(collateralized by various securities:
Total market value $5,968,411) | | | 5,848 | | | | 5,848 | | |
Bear Stearns
2.060%, dated 09/30/04, matures 12/23/04,
repurchase price $1,762,889
(collateralized by various securities:
Total market value $1,790,171) | | | 1,755 | | | | 1,755 | | |
Citibank
1.945%, dated 09/30/04, matures 10/01/04,
repurchase price $11,697,005
(collateralized by corporate securities:
Total market value $12,385,891) | | | 11,696 | | | | 11,696 | | |
Citibank
1.925%, dated 09/30/04, matures 10/01/04,
repurchase price $2,924,249
(collateralized by various securities:
Total market value $2,989,201) | | | 2,924 | | | | 2,924 | | |
Citibank
1.925%, dated 09/30/04, matures 10/01/04,
repurchase price $2,924,249
(collateralized by various securities:
Total market value $2,982,615) | | | 2,924 | | | | 2,924 | | |
Greenwich Capital Markets
1.950%, dated 09/30/04, matures 10/01/04,
repurchase price $17,545,509
(collateralized by U.S. government securities:
Total market value $17,895,679) | | | 17,545 | | | �� | 17,545 | | |
Goldman Sachs
2.025%, dated 09/30/04, matures 10/01/04,
repurchase price $4,093,961
(collateralized by various securities:
Total market value $4,220,347) | | | 4,094 | | | | 4,094 | | |
Goldman Sachs
2.025%, dated 09/30/04, matures 10/01/04,
repurchase price $1,754,555
(collateralized by various securities:
Total market value $1,808,763) | | | 1,755 | | | | 1,755 | | |
Goldman Sachs
2.025%, dated 09/30/04, matures 10/01/04,
repurchase price $1,754,555
(collateralized by various securities:
Total market value $1,808,762) | | | 1,754 | | | | 1,754 | | |
The accompanying notes are an integral part of the financial statements.
FIRST AMERICAN FUNDS Annual Report 2004
66
Small Cap Select Fund (concluded)
| DESCRIPTION | | PAR (000) | | VALUE (000) | |
Goldman Sachs
2.025%, dated 09/30/04, matures 10/01/04,
repurchase price $4,386,386
(collateralized by corporate securities:
Total market value $4,521,817) | | $ | 4,386 | | | $ | 4,386 | | |
Goldman Sachs
1.425%, dated 09/30/04, matures 10/18/04,
repurchase price $7,315,441
(collateralized by corporate securities:
Total market value $7,459,466) | | | 7,310 | | | | 7,310 | | |
Goldman Sachs
1.480%, dated 09/30/04, matures 10/18/04,
repurchase price $4,389,385
(collateralized by various securities:
Total market value $4,521,818) | | | 4,386 | | | | 4,386 | | |
Goldman Sachs
2.205%, dated 09/30/04, matures 03/07/05,
repurchase price $2,952,391
(collateralized by corporate securities:
Total market value $2,983,808) | | | 2,924 | | | | 2,924 | | |
Lehman Brothers
2.055%, dated 09/30/04, matures 10/01/04,
repurchase price $11,697,040
(collateralized by collateralized
mortgage obligations:
Total market value $11,930,300) | | | 11,696 | | | | 11,696 | | |
Lehman Brothers
1.910%, dated 09/30/04, matures 10/01/04,
repurchase price $17,545,490
(collateralized by U.S. government securities:
Total market value $17,895,732) | | | 17,545 | | | | 17,545 | | |
Lehman Brothers
1.935%, dated 09/30/04, matures 10/01/04,
repurchase price $11,697,001
(collateralized by collateralized
mortgage obligations:
Total market value $12,861,126) | | | 11,696 | | | | 11,696 | | |
Merrill Lynch
1.925%, dated 09/30/04, matures 10/01/04,
repurchase price $5,848,499
(collateralized by corporate securities:
Total market value $6,140,722) | | | 5,848 | | | | 5,848 | | |
Total Repurchase Agreements
(Cost $116,086) | | | | | | | 116,086 | | |
Total Investments Purchased with Proceeds
from Securities Lending
(Cost $342,559) | | | | | | | 342,559 | | |
Total Investments – 138.4%
(Cost $1,107,745) | | | | | | | 1,239,765 | | |
| Other Assets and Liabilities, Net – (38.4)% | | | | | | | (344,099 | ) | |
| Total Net Assets – 100.0% | | | | | | $ | 895,666 | | |
* Non-income producing security
(a) This security or a portion of this security is out on loan at September 30, 2004. Total loaned securities had a market value of $329,812,202 at September 30, 2004. See note 2 in Notes to Financial Statements.
(b) Investment in affiliated security. This money market is advised by U.S. Bancorp Asset Management, Inc., which also serves as advisor to this Fund. See note 3 in Notes to Financial Statements.
(c) Security has demand features which qualify it as a short term security. The date disclosed is the next put date.
Cl – Class
Small Cap Value Fund
| DESCRIPTION | | SHARES | | VALUE (000) | |
| Common Stocks – 98.6% | | | |
| Consumer Discretionary – 12.2% | | | |
| ADVO | | | 90,875 | | | $ | 2,812 | | |
| American Axle & Manufacturing (a) | | | 88,830 | | | | 2,599 | | |
| Ashworth* | | | 172,480 | | | | 1,414 | | |
| Aztar* | | | 87,830 | | | | 2,328 | | |
| Fairmont Hotels & Resorts (a) | | | 95,920 | | | | 2,621 | | |
| La Quinta* | | | 427,830 | | | | 3,337 | | |
| Lin TV, Cl A* (a) | | | 127,780 | | | | 2,489 | | |
| Linens 'N Things* (a) | | | 136,050 | | | | 3,152 | | |
| LodgeNet Entertainment* | | | 235,746 | | | | 3,112 | | |
| Men's Wearhouse* | | | 209,210 | | | | 6,078 | | |
| ProQuest* (a) | | | 119,620 | | | | 3,074 | | |
| R.H. Donnelley* | | | 67,270 | | | | 3,320 | | |
| Regis | | | 84,030 | | | | 3,380 | | |
| Ruby Tuesday (a) | | | 155,570 | | | | 4,336 | | |
| Stanley Furniture | | | 52,059 | | | | 2,291 | | |
| Steiner Leisure* | | | 242,530 | | | | 5,360 | | |
| | | | | | | | 51,703 | | |
| Consumer Staples – 1.3% | | | |
| Dean Foods* (a) | | | 57,300 | | | | 1,720 | | |
| Elizabeth Arden* | | | 173,480 | | | | 3,653 | | |
| | | | | | | | 5,373 | | |
| Energy – 8.1% | | | |
| Brigham Exploration* | | | 392,590 | | | | 3,690 | | |
| Forest Oil* (a) | | | 100,620 | | | | 3,031 | | |
| Global Industries* | | | 521,110 | | | | 3,220 | | |
| Hornbeck Offshore Services* (a) | | | 158,850 | | | | 2,621 | | |
| Houston Exploration* (a) | | | 69,580 | | | | 4,130 | | |
| Newfield Exploration* | | | 87,560 | | | | 5,362 | | |
| Range Resources (a) | | | 208,580 | | | | 3,648 | | |
| Spinnaker Exploration* (a) | | | 65,250 | | | | 2,286 | | |
| TODCO* | | | 160,470 | | | | 2,784 | | |
| Tsakos Energy Navigation | | | 108,720 | | | | 3,822 | | |
| | | | | | | | 34,594 | | |
| Financials – 30.6% (b) | | | |
| American Capital Strategies | | | 199,530 | | | | 6,253 | | |
| Astoria Financial | | | 158,650 | | | | 5,630 | | |
| Capitol Bancorp | | | 166,860 | | | | 4,896 | | |
| CBL & Associates Properties (REIT) (a) | | | 82,610 | | | | 5,035 | | |
| City National (a) | | | 99,100 | | | | 6,437 | | |
| Corporate Office Properties Trust (REIT) | | | 182,150 | | | | 4,667 | | |
| Donegal Group, Cl A | | | 116,600 | | | | 2,239 | | |
| Equity One (REIT) | | | 127,530 | | | | 2,502 | | |
| Federal Agricultural Mortgage, Cl C* | | | 166,140 | | | | 3,687 | | |
| First Midwest Bancorp | | | 73,110 | | | | 2,527 | | |
| First Potomac Realty Trust (REIT)* | | | 112,880 | | | | 2,332 | | |
| First Republic Bank – California (a) | | | 147,990 | | | | 6,808 | | |
| Glenborough Realty Trust (REIT) | | | 122,680 | | | | 2,548 | | |
| Greater Bay Bancorp (a) | | | 161,370 | | | | 4,639 | | |
| IBERIABANK | | | 57,250 | | | | 3,304 | | |
| Lexington Corporate Properties Trust (REIT) | | | 226,336 | | | | 4,914 | | |
| Newcastle Investment (REIT) | | | 102,830 | | | | 3,157 | | |
| Philadelphia Consolidated Holding* (a) | | | 59,260 | | | | 3,266 | | |
| Phoenix Companies (a) | | | 248,610 | | | | 2,591 | | |
| Platinum Underwriter Holdings | | | 180,190 | | | | 5,276 | | |
| Protective Life | | | 124,710 | | | | 4,902 | | |
| Radian Group | | | 152,198 | | | | 7,036 | | |
| Redwood Trust (REIT) (a) | | | 90,160 | | | | 5,628 | | |
FIRST AMERICAN FUNDS Annual Report 2004
67
Schedule of Investments September 30, 2004
Small Cap Value Fund (continued)
| DESCRIPTION | | SHARES | | VALUE (000) | |
| RLI | | | 122,950 | | | $ | 4,617 | | |
| Sky Financial Group | | | 252,910 | | | | 6,323 | | |
| Sterling Bancshares (a) | | | 376,210 | | | | 5,060 | | |
| Texas Capital Bancshares* | | | 129,420 | | | | 2,349 | | |
| Umpqua Holdings (a) | | | 232,710 | | | | 5,250 | | |
| USI Holdings* | | | 191,980 | | | | 2,621 | | |
| Windrose Medical Properties Trust (REIT) | | | 290,120 | | | | 3,769 | | |
| | | | | | | | 130,263 | | |
| Health Care – 6.7% | |
| Abgenix* (a) | | | 77,530 | | | | 764 | | |
| CNS | | | 218,020 | | | | 2,398 | | |
| Cooper (a) | | | 106,560 | | | | 7,305 | | |
| Cytyc* (a) | | | 192,670 | | | | 4,653 | | |
| Pediatrix Medical Group* | | | 45,030 | | | | 2,470 | | |
| Province Healthcare* (a) | | | 108,530 | | | | 2,270 | | |
| Renal Care* (a) | | | 99,915 | | | | 3,220 | | |
| Serologicals* (a) | | | 235,850 | | | | 5,502 | | |
| | | | | | | | 28,582 | | |
| Industrials – 19.2% | |
| Alliant Techsystems* (a) | | | 92,075 | | | | 5,571 | | |
| American Woodmark | | | 97,700 | | | | 3,617 | | |
| Artesyn Technologies* | | | 643,980 | | | | 6,427 | | |
| Barnes Group (a) | | | 107,610 | | | | 2,956 | | |
| C&D Technologies | | | 111,150 | | | | 2,114 | | |
| Dollar Thrifty Automotive* (a) | | | 112,350 | | | | 2,733 | | |
| ESCO Technologies* | | | 82,560 | | | | 5,594 | | |
| ExpressJet Holdings* (a) | | | 224,030 | | | | 2,243 | | |
| Genlyte Group* | | | 46,820 | | | | 3,015 | | |
| Landstar* (a) | | | 84,610 | | | | 4,965 | | |
| Mercury Computer Systems* (a) | | | 117,050 | | | | 3,151 | | |
| Moog, Cl A* | | | 156,660 | | | | 5,687 | | |
| NCO Group* (a) | | | 255,330 | | | | 6,881 | | |
| Northwest Airlines* (a) | | | 246,950 | | | | 2,027 | | |
| Oshkosh Truck | | | 38,060 | | | | 2,172 | | |
| Pacer International* | | | 130,350 | | | | 2,138 | | |
| Pentair (a) | | | 145,980 | | | | 5,096 | | |
| Simpson Manufacturing (a) | | | 54,500 | | | | 3,444 | | |
| Teletech Holdings* (a) | | | 319,490 | | | | 3,016 | | |
| Terex* (a) | | | 68,340 | | | | 2,966 | | |
| Toro (a) | | | 50,880 | | | | 3,475 | | |
| York International (a) | | | 79,800 | | | | 2,521 | | |
| | | | | | | | 81,809 | | |
| Information Technology – 6.9% | |
| Actel* | | | 220,580 | | | | 3,353 | | |
| Andrew* (a) | | | 194,583 | | | | 2,382 | | |
| CommScope* (a) | | | 92,740 | | | | 2,003 | | |
| Electronics for Imaging* (a) | | | 124,830 | | | | 2,027 | | |
| Entegris* | | | 127,520 | | | | 1,064 | | |
| Gateway* (a) | | | 456,060 | | | | 2,258 | | |
| MKS Instruments* (a) | | | 82,400 | | | | 1,262 | | |
| Open Text* (a) | | | 118,220 | | | | 2,040 | | |
| SERENA Software* (a) | | | 166,090 | | | | 2,779 | | |
| Skyworks Solutions* | | | 124,520 | | | | 1,183 | | |
| Synnex* | | | 162,580 | | | | 2,878 | | |
| THQ* (a) | | | 116,550 | | | | 2,268 | | |
| Vastera* | | | 496,870 | | | | 879 | | |
| Xyratex | | | 233,060 | | | | 2,715 | | |
| | | | | | | | 29,091 | | |
Small Cap Value Fund (continued)
| DESCRIPTION | | SHARES/PAR (000) | | VALUE (000) | |
| Materials – 8.2% | | | |
| Crown Holdings* (a) | | | 463,610 | | | $ | 4,780 | | |
| FMC* (a) | | | 86,760 | | | | 4,214 | | |
| Georgia Gulf | | | 191,980 | | | | 8,560 | | |
| Gibraltar Steel | | | 92,120 | | | | 3,331 | | |
| GrafTech International* (a) | | | 330,080 | | | | 4,605 | | |
| Headwaters* (a) | | | 73,280 | | | | 2,261 | | |
| Louisiana Pacific (a) | | | 144,410 | | | | 3,747 | | |
| Metals USA | | | 99,560 | | | | 1,766 | | |
| Quanex | | | 32,620 | | | | 1,673 | | |
| | | | | | | | 34,937 | | |
| Telecommunication Services – 0.7% | | | |
| General Communication* | | | 331,540 | | | | 3,000 | | |
| Utilities – 4.7% | | | |
| AGL Resources | | | 67,250 | | | | 2,069 | | |
| Black Hills (a) | | | 108,430 | | | | 3,012 | | |
| CLECO (a) | | | 79,250 | | | | 1,366 | | |
| CMS Energy* (a) | | | 272,780 | | | | 2,597 | | |
| New Jersey Resources | | | 61,120 | | | | 2,530 | | |
| NSTAR | | | 73,090 | | | | 3,589 | | |
| PNM Resources (a) | | | 122,745 | | | | 2,763 | | |
| Westar Energy | | | 107,360 | | | | 2,169 | | |
| | | | | | | | 20,095 | | |
Total Common Stocks
(Cost $311,015) | | | | | | | 419,447 | | |
| Affiliated Money Market Fund – 2.5% | | | |
First American Prime
Obligations Fund, Cl Z (c) | | | 10,902,629 | | | | 10,903 | | |
Total Affiliated Money Market Fund
(Cost $10,903) | | | | | | | 10,903 | | |
Investments Purchased with Proceeds
from Securities Lending - 32.8% | | | |
| Commercial Paper – 10.6% | | | |
| Bluegrass | |
| 1.881%, 05/18/05 | | $ | 587 | | | | 587 | | |
| 1.891%, 08/18/05 | | | 466 | | | | 466 | | |
| Concord Minutemen Capital | |
| 1.650%, 10/01/04 | | | 964 | | | | 964 | | |
| 1.680%, 10/05/04 | | | 2,141 | | | | 2,141 | | |
| 1.720%, 10/06/04 | | | 1,582 | | | | 1,582 | | |
| 1.740%, 10/14/04 | | | 1,059 | | | | 1,059 | | |
Descartes Funding Trust
1.760%, 11/15/04 | | | 1,190 | | | | 1,190 | | |
| Ford Credit Floor Plan | |
| 1.622%, 10/05/04 | | | 2,379 | | | | 2,379 | | |
| 1.526%, 10/06/04 | | | 1,666 | | | | 1,666 | | |
| 1.655%, 10/22/04 | | | 523 | | | | 523 | | |
Goldman Sachs
1.975%, 01/18/05 | | | 1,190 | | | | 1,190 | | |
Independence
1.830%, 04/15/05 | | | 1,471 | | | | 1,471 | | |
Jupiter Securities Corp
1.793%, 10/21/04 | | | 4,522 | | | | 4,522 | | |
Lakeside Funding
1.790%, 10/08/04 | | | 2,522 | | | | 2,522 | | |
Landesbank Baden
1.480%, 11/12/04 | | | 475 | | | | 475 | | |
Leaf's LLC
1.821%, 04/20/05 | | | 1,309 | | | | 1,309 | | |
The accompanying notes are an integral part of the financial statements.
FIRST AMERICAN FUNDS Annual Report 2004
68
Small Cap Value Fund (continued)
| DESCRIPTION | | PAR (000) | | VALUE (000) | |
Liquid Funding
1.743%, 10/13/04 | | $ | 1,665 | | | $ | 1,665 | | |
| 1.830%, 05/25/05 | | | 1,190 | | | | 1,190 | | |
| MBNA Credit | |
| 1.683%, 10/12/04 | | | 1,156 | | | | 1,156 | | |
| 1.764%, 10/26/04 | | | 642 | | | | 642 | | |
| Main Street Warehouse | |
| 1.742%, 10/04/04 | | | 1,570 | | | | 1,570 | | |
| 1.683%, 10/04/04 | | | 1,939 | | | | 1,939 | | |
| 1.742%, 10/08/04 | | | 1,189 | | | | 1,189 | | |
| 1.742%, 10/08/04 | | | 1,190 | | | | 1,190 | | |
| Mortgage Interest Network | |
| 1.752%, 10/12/04 | | | 785 | | | | 785 | | |
| 1.763%, 10/14/04 | | | 832 | | | | 832 | | |
Netexis Banques
1.700%, 12/16/04 | | | 1,185 | | | | 1,185 | | |
| Orchard Park | |
| 1.796%, 04/06/05 | | | 1,190 | | | | 1,190 | | |
| 1.766%, 07/06/05 | | | 2,455 | | | | 2,455 | | |
| Park Granada LLC | |
| 1.622%, 10/01/04 | | | 2,094 | | | | 2,094 | | |
| 1.743%, 10/13/04 | | | 1,355 | | | | 1,355 | | |
Sigma Finance
1.512%, 11/29/04 | | | 593 | | | | 593 | | |
| Total Commercial Paper | | | | | | | 45,076 | | |
| Corporate Obligations – 8.8% | | | |
| Allstate Life Global | |
| 1.780%, 10/14/05 | | | 2,379 | | | | 2,379 | | |
| 1.750%, 10/14/05 | | | 595 | | | | 595 | | |
Bayer Landbank NY
1.830%, 06/24/05 | | | 2,260 | | | | 2,260 | | |
Blue Heron Funding
1.850%, 05/18/05 | | | 666 | | | | 666 | | |
Castle Hill III
1.910%, 09/15/15 | | | 714 | | | | 714 | | |
Depfa Bank PLC
1.860%, 06/15/05 | | | 1,189 | | | | 1,189 | | |
Duke Funding VI
1.320%, 04/08/05 | | | 1,439 | | | | 1,439 | | |
General Electric Capital Corporation
1.838%, 10/07/05 | | | 1,191 | | | | 1,191 | | |
Jackson National Life
1.760%, 04/15/05 | | | 1,190 | | | | 1,190 | | |
Jefferson Pilot
1.788%, 08/17/05 | | | 1,190 | | | | 1,190 | | |
Liquid Funding
1.840%, 06/28/05 | | | 1,070 | | | | 1,070 | | |
Merrill Lynch
1.696%, 10/01/05 | | | 2,380 | | | | 2,380 | | |
| Metlife Global Funding | |
| 1.800%, 10/14/05 | | | 1,428 | | | | 1,428 | | |
| 1.880%, 10/28/05 | | | 1,000 | | | | 1,000 | | |
Morgan Stanley
1.850%, 12/26/08 | | | 1,190 | | | | 1,190 | | |
Natexis Banq NY
1.920%, 07/12/05 | | | 1,309 | | | | 1,309 | | |
Northlake CDO
1.895%, 03/07/05 | | | 714 | | | | 714 | | |
| Premium Asset Trust | |
| 1.848%, 12/22/04 | | | 892 | | | | 892 | | |
| 1.760%, 05/13/05 | | | 1,665 | | | | 1,665 | | |
| 1.740%, 06/01/05 | | | 3,545 | | | | 3,545 | | |
| 1.770%, 10/14/05 | | | 952 | | | | 952 | | |
Small Cap Value Fund (continued)
| DESCRIPTION | | PAR (000) | | VALUE (000) | |
REMAC
1.840%, 09/29/05 | | $ | 1,309 | | | $ | 1,309 | | |
RMAC
1.740%, 06/12/05 | | | 1,373 | | | | 1,373 | | |
SMM Trust 2004
1.833%, 09/23/05 | | | 2,213 | | | | 2,213 | | |
Societe Generale NYC
1.960%, 12/08/04 | | | 2,379 | | | | 2,379 | | |
Svenska Handl
1.170%, 10/21/04 | | | 1,190 | | | | 1,190 | | |
| Total Corporate Obligations | | | | | | | 37,422 | | |
| Other Short-Term Investments – 2.3% | |
ARLO III Ltd
2.000%, 09/28/05 | | | 3,569 | | | | 3,569 | | |
Commonwealth Life
2.115%, 12/31/04 (d) | | | 1,202 | | | | 1,202 | | |
General Electric Capital Assurance
1.980%, 01/19/05 | | | 476 | | | | 476 | | |
HBOS Treasury Services
1.640%, 11/01/05 | | | 1,308 | | | | 1,308 | | |
Security Life of Denver
1.900%, 12/30/04 | | | 3,093 | | | | 3,093 | | |
| Total Other Short-Term Investments | | | | | | | 9,648 | | |
| Repurchase Agreements – 11.1% | |
Bear Stearns
2.045%, dated 09/30/04, matures 10/01/04,
repurchase price $2,379,625
(collateralized by various securities:
Total market value $2,428,406) | | | 2,379 | | | | 2,379 | | |
Bear Stearns
2.060%, dated 09/30/04, matures 12/23/04,
repurchase price $717,278
(collateralized by various securities:
Total market value $728,379) | | | 714 | | | | 714 | | |
Citibank
1.945%, dated 09/30/04, matures 10/01/04,
repurchase price $4,759,236
(collateralized by corporate securities:
Total market value $5,039,529) | | | 4,759 | | | | 4,759 | | |
Citibank
1.925%, dated 09/30/04, matures 10/01/04,
repurchase price $1,189,808
(collateralized by various securities:
Total market value $1,216,236) | | | 1,190 | | | | 1,190 | | |
Citibank
1.925%, dated 09/30/04, matures 10/01/04,
repurchase price $1,189,808
(collateralized by various securities:
Total market value $1,213,556) | | | 1,190 | | | | 1,190 | | |
Greenwich Capital Markets
1.950%, dated 09/30/04, matures 10/01/04,
repurchase price $7,138,856
(collateralized by U.S. government securities:
Total market value $7,281,332) | | | 7,139 | | | | 7,139 | | |
Goldman Sachs
2.025%, dated 09/30/04, matures 10/01/04,
repurchase price $1,665,737
(collateralized by various securities:
Total market value $1,717,160) | | | 1,665 | | | | 1,665 | | |
Goldman Sachs
2.025%, dated 09/30/04, matures 10/01/04,
repurchase price $713,887
(collateralized by various securities:
Total market value $735,943) | | | 714 | | | | 714 | | |
FIRST AMERICAN FUNDS Annual Report 2004
69
Schedule of Investments September 30, 2004
Small Cap Value Fund (concluded)
| DESCRIPTION | | PAR (000) | | VALUE (000) | |
Goldman Sachs
2.025%, dated 09/30/04, matures 10/01/04,
repurchase price $713,887
(collateralized by various securities:
Total market value $735,943) | | $ | 714 | | | $ | 714 | | |
| Goldman Sachs | |
2.025%, dated 09/30/04, matures 10/01/04,
repurchase price $1,784,718
(collateralized by corporate securities:
Total market value $1,839,821) | | | 1,785 | | | | 1,785 | | |
Goldman Sachs
1.425%, dated 09/30/04, matures 10/18/04,
repurchase price $2,976,481
(collateralized by corporate securities:
Total market value $3,035,082) | | | 2,974 | | | | 2,974 | | |
Goldman Sachs
1.480%, dated 09/30/04, matures 10/18/04,
repurchase price $1,785,938
(collateralized by various securities:
Total market value $1,839,822) | | | 1,785 | | | | 1,785 | | |
Goldman Sachs
2.205%, dated 09/30/04, matures 03/07/05,
repurchase price $1,201,259
(collateralized by corporate securities:
Total market value $1,214,042) | | | 1,190 | | | | 1,190 | | |
Lehman Brothers
2.055%, dated 09/30/04, matures 10/01/04,
repurchase price $4,759,251
(collateralized by collateralized mortgage
obligations: Total market value $4,854,159) | | | 4,759 | | | | 4,759 | | |
Lehman Brothers
1.910%, dated 09/30/04, matures 10/01/04,
repurchase price $7,138,848
(collateralized by U.S. government securities:
Total market value $7,281,354) | | | 7,138 | | | | 7,138 | | |
Lehman Brothers
1.935%, dated 09/30/04, matures 10/01/04,
repurchase price $4,759,235
(collateralized by collateralized mortgage
obligations: Total market value $5,232,890) | | | 4,759 | | | | 4,759 | | |
Merrill Lynch
1.925%, dated 09/30/04, matures 10/01/04,
repurchase price $2,379,617
(collateralized by corporate securities:
Total market value $2,498,516) | | | 2,379 | | | | 2,379 | | |
Total Repurchase Agreements
(Cost $47,233) | | | | | | | 47,233 | | |
Total Investments Purchased with Proceeds
from Securities Lending
(Cost $139,379) | | | | | | | 139,379 | | |
Total Investments – 133.9%
(Cost $461,297) | | | | | | | 569,729 | | |
| Other Assets and Liabilities, Net – (33.9)% | | | | | | | (144,252 | ) | |
| Total Net Assets – 100.0% | | | | | | $ | 425,477 | | |
* Non-income producing security
(a) This security or a portion of this security is out on loan at September 30, 2004. Total loaned securities had a market value of $134,967,297 at September 30, 2004. See note 2 in Notes to Financial Statements.
(b) The Fund is significantly invested in this industry sector and therefore is subject to additional risks. See note 7 in Notes to Financial Statements.
(c) Investment in affiliated security. This money market fund is advised by U.S. Bancorp Asset Management, Inc., which also serves as advisor to this Fund. See note 3 in Notes to Financial Statements.
(d) Security has demand features which qualify it as a short term security. The date disclosed is the next put date.
Cl – Class
REIT – Real Estate Investment Trust
The accompanying notes are an integral part of the financial statements.
FIRST AMERICAN FUNDS Annual Report 2004
70
Statements of Assets and Liabilities September 30, 2004, in thousands, except for per share data
| | | | | Small Cap Growth
Opportunities Fund | | Small Cap
Select Fund | | Small Cap
Value Fund | |
| ASSETS: | |
| Investments in unaffiliated securities, at value*† | | | | $ | 411,155 | | | $ | 1,099,585 | | | $ | 511,593 | | |
| Investments in affiliated money market fund, at value** | | | | | 20,116 | | | | 24,094 | | | | 10,903 | | |
| Repurchase agreements, at value*** | | | | | 45,950 | | | | 116,086 | | | | 47,233 | | |
| Cash**** | | | | | 777 | | | | 61 | | | | 1,184 | | |
| Receivable for dividends and interest | | | | | 11 | | | | 340 | | | | 638 | | |
| Receivable for investment securities sold | | | | | 5,913 | | | | 6,238 | | | | 327 | | |
| Receivable for capital shares sold | | | | | 1,776 | | | | 558 | | | | 156 | | |
| Prepaid expenses and other assets | | | | | 29 | | | | 34 | | | | 36 | | |
| Total assets | | | | | 485,727 | | | | 1,246,996 | | | | 572,070 | | |
| LIABILITIES: | |
| Payable for capital shares redeemed | | | | | 951 | | | | 3,774 | | | | 5,968 | | |
| Payable upon return of securities loaned | | | | | 135,613 | | | | 342,606 | | | | 139,398 | | |
| Payable for investment securities purchased | | | | | 9,509 | | | | 4,184 | | | | 862 | | |
| Payable for advisory, co-administration, and custodian fees | | | | | 424 | | | | 717 | | | | 341 | | |
| Payable for distribution and shareholder servicing fees | | | | | 32 | | | | 42 | | | | 21 | | |
| Accrued expenses and other liabilities | | | | | 2 | | | | 7 | | | | 3 | | |
| Total liabilities | | | | | 146,531 | | | | 351,330 | | | | 146,593 | | |
| Net assets | | | | $ | 339,196 | | | $ | 895,666 | | | $ | 425,477 | | |
| COMPOSITION OF NET ASSETS: | |
| Portfolio capital | | | | $ | 292,640 | | | $ | 675,233 | | | $ | 256,299 | | |
| Undistributed (distributions in excess of) net investment income | | | | | (2 | ) | | | (1 | ) | | | 485 | | |
| Accumulated net realized gain on investments | | | | | 34,995 | | | | 88,414 | | | | 60,261 | | |
| Net unrealized appreciation of investments | | | | | 11,563 | | | | 132,020 | | | | 108,432 | | |
| Net assets | | | | $ | 339,196 | | | $ | 895,666 | | | $ | 425,477 | | |
| * Investments in unaffiliated securities, at cost | | | | $ | 399,592 | | | $ | 967,565 | | | $ | 403,161 | | |
| ** Investments in affiliated money market fund, at cost | | | | $ | 20,116 | | | $ | 24,094 | | | $ | 10,903 | | |
| *** Investments in repurchase agreements, at cost | | | | $ | 45,950 | | | $ | 116,086 | | | $ | 47,233 | | |
| **** Includes cash related to securities loaned | | | | $ | 19 | | | $ | 47 | | | $ | 19 | | |
| † Including securities loaned, at value | | | | $ | 129,682 | | | $ | 329,812 | | | $ | 134,967 | | |
| Class A: | |
| Net assets | | | | $ | 101,031 | | | $ | 97,775 | | | $ | 43,192 | | |
| Shares issued and outstanding ($0.0001 par value - 2 billion authorized) | | | | | 4,647 | | | | 6,128 | | | | 2,565 | | |
| Net asset value and redemption price per share | | | | $ | 21.74 | | | $ | 15.95 | | | $ | 16.84 | | |
| Maximum offering price per share (1) | | | | $ | 23.01 | | | $ | 16.88 | | | $ | 17.82 | | |
| Class B: | |
| Net assets | | | | $ | 9,063 | | | $ | 13,050 | | | $ | 9,901 | | |
| Shares issued and outstanding ($0.0001 par value - 2 billion authorized) | | | | | 438 | | | | 897 | | | | 622 | | |
| Net asset value, offering price, and redemption price per share (2) | | | | $ | 20.69 | | | $ | 14.56 | | | $ | 15.92 | | |
| Class C: | |
| Net assets | | | | $ | 4,669 | | | $ | 13,841 | | | $ | 4,609 | | |
| Shares issued and outstanding ($0.0001 par value - 2 billion authorized) | | | | | 219 | | | | 887 | | | | 287 | | |
| Net asset value, offering price and redemption price per share (2) | | | | $ | 21.28 | | | $ | 15.60 | | | $ | 16.10 | | |
| Class R: | |
| Net assets | | | | $ | 1 | | | $ | 19 | | | $ | 1 | | |
| Shares issued and outstanding ($0.0001 par value - 2 billion authorized) | | | | | - | | | | 1 | | | | - | | |
| Net asset value, offering price, and redemption price per share | | | | $ | 21.74 | | | $ | 15.91 | | | $ | 16.83 | | |
| Class Y: | |
| Net assets | | | | $ | 224,432 | | | $ | 770,981 | | | $ | 367,774 | | |
| Shares issued and outstanding ($0.0001 par value - 2 billion authorized) | | | | | 9,951 | | | | 46,601 | | | | 21,571 | | |
| Net asset value, offering price, and redemption price per share | | | | $ | 22.55 | | | $ | 16.54 | | | $ | 17.05 | | |
(1) The offering price is calculated by dividing the net asset value by 1 minus the maximum sales charge of 5.50%.
(2) Class B and C have a contingent deferred sales charge. For a description of this sales charge, see notes 1 and 3 in Notes to Financial Statements.
The accompanying notes are an integral part of the financial statements.
FIRST AMERICAN FUNDS Annual Report 2004
71
Statements of Operations For the fiscal year ended September 30, 2004, in thousands
| | | Small Cap Growth
Opportunities Fund | | Small Cap
Select Fund | | Small Cap
Value Fund | |
| INVESTMENT INCOME: | | | |
| Dividends from affiliated money market fund | | $ | 183 | | | $ | 290 | | | $ | 72 | | |
| Dividends from unaffiliated securities | | | 563 | | | | 3,986 | | | | 6,777 | | |
| Less: Foreign taxes withheld | | | - | | | | (19 | ) | | | (1 | ) | |
| Securities lending | | | 176 | | | | 411 | | | | 108 | | |
| Other income | | | 1,264 | | | | 181 | | | | 2 | | |
| Total investment income | | | 2,186 | | | | 4,849 | | | | 6,958 | | |
| EXPENSES: | | | |
| Investment advisory fees | | | 6,773 | | | | 7,654 | | | | 3,306 | | |
| Co-administration fees and expenses (including transfer agency fees) | | | 1,299 | | | | 2,898 | | | | 1,262 | | |
| Custodian fees | | | 48 | | | | 109 | | | | 47 | | |
| Directors' fees | | | 11 | | | | 27 | | | | 11 | | |
| Registration fees | | | 55 | | | | 29 | | | | 21 | | |
| Professional fees | | | 22 | | | | 50 | | | | 22 | | |
| Printing | | | 18 | | | | 39 | | | | 17 | | |
| Other | | | 21 | | | | 48 | | | | 22 | | |
| Distribution and shareholder servicing fees – Class A | | | 286 | | | | 237 | | | | 109 | | |
| Distribution and shareholder servicing fees – Class B | | | 95 | | | | 134 | | | | 116 | | |
| Distribution and shareholder servicing fees – Class C | | | 37 | | | | 135 | | | | 49 | | |
| Distribution and shareholder servicing fees – Class R | | | 6 | | | | 21 | | | | 3 | | |
| Total expenses | | | 8,671 | | | | 11,381 | | | | 4,985 | | |
| Less: Fee waivers | | | (122 | ) | | | (359 | ) | | | (83 | ) | |
| Total net expenses | | | 8,549 | | | | 11,022 | | | | 4,902 | | |
| Investment income (loss) – net | | | (6,363 | ) | | | (6,173 | ) | | | 2,056 | | |
| REALIZED AND UNREALIZED GAINS (LOSSES) ON INVESTMENTS – NET: | | | |
| Net realized gain on investments | | | 89,817 | | | | 231,411 | | | | 92,122 | | |
| Net change in unrealized appreciation or depreciation of investments | | | (68,591 | ) | | | (19,782 | ) | | | 7,329 | | |
| Net gain on investments | | | 21,226 | | | | 211,629 | | | | 99,451 | | |
| Net increase in net assets resulting from operations | | $ | 14,863 | | | $ | 205,456 | | | $ | 101,507 | | |
The accompanying notes are an integral part of the financial statements.
FIRST AMERICAN FUNDS Annual Report 2004
72
(This page has been left blank intentionally.)
Statements of Changes in Net Assets in thousands
| | | Small Cap Growth
Opportunities Fund | | Small Cap
Select Fund | | Small Cap
Value Fund | |
| | | 10/01/03
to
9/30/04 | | 10/01/02
to
9/30/03 | | 10/01/03
to
9/30/04 | | 10/01/02
to
9/30/03 | | 10/01/03
to
9/30/04 | | 10/01/02
to
9/30/03 | |
| OPERATIONS: | | | |
| Investment income (loss) – net | | $ | (6,363 | ) | | $ | (4,607 | ) | | $ | (6,173 | ) | | $ | (4,341 | ) | | $ | 2,056 | | | $ | 958 | | |
| Net realized gain on investments | | | 89,817 | | | | 10,572 | | | | 231,411 | | | | 67,050 | | | | 92,122 | | | | 10,221 | | |
| Net change in unrealized appreciation or depreciation of investments | | | (68,591 | ) | | | 139,419 | | | | (19,782 | ) | | | 220,321 | | | | 7,329 | | | | 94,923 | | |
| Net increase in net assets resulting from operations | | | 14,863 | | | | 145,384 | | | | 205,456 | | | | 283,030 | | | | 101,507 | | | | 106,102 | | |
| DISTRIBUTIONS TO SHAREHOLDERS FROM: | | | |
| Investment income – net: | |
| Class A | | | - | | | | - | | | | - | | | | - | | | | (92 | ) | | | (8 | ) | |
| Class R | | - | | - | | - | | - | | (3) | |
| Class Y | | | - | | | | - | | | | - | | | | - | | | | (1,696 | ) | | | (615 | ) | |
| Net realized gain on investments: | |
| Class A | | | (611 | ) | | | - | | | | (5,360 | ) | | | - | | | | (1,428 | ) | | | - | | |
| Class B | | | (47 | ) | | | - | | | | (900 | ) | | | - | | | | (487 | ) | | | - | | |
| Class C | | | (12 | ) | | | - | | | | (821 | ) | | | - | | | | (183 | ) | | | - | | |
| Class R | | | (23 | ) | | | - | | | | (862 | ) | | | - | | | | (54 | ) | | | - | | |
| Class Y | | | (2,392 | ) | | | - | | | | (70,619 | ) | | | - | | | | (16,522 | ) | | | - | | |
| Total distributions | | | (3,085 | ) | | | - | | | | (78,562 | ) | | | - | | | | (20,465 | ) | | | (623 | ) | |
| CAPITAL SHARE TRANSACTIONS (1): | | | |
| Class A: | |
| Proceeds from sales | | | 79,928 | | | | 55,667 | | | | 47,056 | | | | 16,194 | | | | 19,021 | | | | 6,374 | | |
| Reinvestment of distributions | | | 577 | | | | - | | | | 5,191 | | | | - | | | | 1,486 | | | | 8 | | |
| Payments for redemptions | | | (57,140 | ) | | | (44,245 | ) | | | (35,163 | ) | | | (15,339 | ) | | | (16,067 | ) | | | (8,061 | ) | |
| Shares issued in connection with the acquisition of Fund net assets | | | - | | | | - | | | | - | | | | 20,525 | | | | - | | | | - | | |
| Increase (decrease) in net assets from Class A transactions | | | 23,365 | | | | 11,422 | | | | 17,084 | | | | 21,380 | | | | 4,440 | | | | (1,679 | ) | |
| Class B: | |
| Proceeds from sales | | | 6,009 | | | | 1,532 | | | | 2,158 | | | | 1,801 | | | | 1,193 | | | | 917 | | |
| Reinvestment of distributions | | | 45 | | | | - | | | | 873 | | | | - | | | | 481 | | | | - | | |
| Payments for redemptions | | | (2,734 | ) | | | (959 | ) | | | (2,565 | ) | | | (1,370 | ) | | | (6,346 | ) | | | (3,127 | ) | |
| Shares issued in connection with the acquisition of Fund net assets | | | - | | | | - | | | | - | | | | 3,570 | | | | - | | | | - | | |
| Increase (decrease) in net assets from Class B transactions | | | 3,320 | | | | 573 | | | | 466 | | | | 4,001 | | | | (4,672 | ) | | | (2,210 | ) | |
| Class C: | |
| Proceeds from sales | | | 4,614 | | | | 1,218 | | | | 3,975 | | | | 3,292 | | | | 1,179 | | | | 839 | | |
| Reinvestment of distributions | | | 11 | | | | - | | | | 817 | | | | - | | | | 183 | | | | - | | |
| Payments for redemptions | | | (1,012 | ) | | | (195 | ) | | | (3,114 | ) | | | (1,945 | ) | | | (1,855 | ) | | | (2,299 | ) | |
| Shares issued in connection with the acquisition of Fund net assets | | | - | | | | - | | | | - | | | | 3,933 | | | | - | | | | - | | |
| Increase (decrease) in net assets from Class C transactions | | | 3,613 | | | | 1,023 | | | | 1,678 | | | | 5,280 | | | | (493 | ) | | | (1,460 | ) | |
| Class R: | |
| Proceeds from sales | | | 976 | | | | 1,143 | | | | 3,323 | | | | 5,478 | | | | 1,145 | | | | 776 | | |
| Reinvestment of distributions | | | 23 | | | | - | | | | 808 | | | | - | | | | 52 | | | | - | | |
| Payments for redemptions | | | (5,357 | ) | | | (797 | ) | | | (17,289 | ) | | | (4,898 | ) | | | (2,727 | ) | | | (127 | ) | |
| Shares issued in connection with the acquisition of Common Trust Fund net assets | | | - | | | | - | | | | - | | | | 494 | | | | - | | | | - | | |
| Increase (decrease) in net assets from Class R transactions | | | (4,358 | ) | | | 346 | | | | (13,158 | ) | | | 1,074 | | | | (1,530 | ) | | | 649 | | |
| Class Y: | |
| Proceeds from sales | | | 101,703 | | | | 126,507 | | | | 132,590 | | | | 240,050 | | | | 59,568 | | | | 61,916 | | |
| Reinvestment of distributions | | | 1,934 | | | | - | | | | 57,505 | | | | - | | | | 15,745 | | | | 486 | | |
| Payments for redemptions | | | (278,211 | ) | | | (68,542 | ) | | | (559,280 | ) | | | (186,907 | ) | | | (208,150 | ) | | | (96,256 | ) | |
| Shares isued in connection with the acquisition of Fund net assets | | | - | | | | - | | | | - | | | | 182,343 | | | | - | | | | - | | |
| Shares issued in connection with the acquisition of Common Trust Fund net assets | | | - | | | | - | | | | - | | | | 129,674 | | | | - | | | | - | | |
| Increase (decrease) in net assets from Class Y transactions | | | (174,574 | ) | | | 57,965 | | | | (369,185 | ) | | | 365,160 | | | | (132,837 | ) | | | (33,854 | ) | |
| Increase (decrease) in net assets from capital share transactions | | | (148,634 | ) | | | 71,329 | | | | (363,115 | ) | | | 396,895 | | | | (135,092 | ) | | | (38,554 | ) | |
| Total increase (decrease) in net assets | | | (136,856 | ) | | | 216,713 | | | | (236,221 | ) | | | 679,925 | | | | (54,050 | ) | | | 66,925 | | |
| Net assets at beginning of period | | | 476,052 | | | | 259,339 | | | | 1,131,887 | | | | 451,962 | | | | 479,527 | | | | 412,602 | | |
| Net assets at end of period | | $ | 339,196 | | | $ | 476,052 | | | $ | 895,666 | | | $ | 1,131,887 | | | $ | 425,477 | | | $ | 479,527 | | |
| Undistributed (distributions in excess of) net investment income at end of period | | $ | (2 | ) | | $ | (3 | ) | | $ | (1 | ) | | $ | (2 | ) | | $ | 485 | | | $ | 144 | | |
(1) See note 4 in Notes to Financial Statements for additional information.
The accompanying notes are an integral part of the financial statements.
FIRST AMERICAN FUNDS Annual Report 2004
74
FIRST AMERICAN FUNDS Annual Report 2004
75
Financial Highlights For a share outstanding throughout the periods ended September 30, unless otherwise indicated.
| | | Net Asset
Value
Beginning
of Period | | Net
Investment
Loss | | Realized and
Unrealized
Gains
(Losses) on
Investments | | Distributions
from Net
Realized Gains | | Distributions
from
Return of
Capital | | Net Asset
Value
End of
Period | | Total
Return (9) | | Net Assets
End of
Period (000) | | Ratio of
Expenses to
Average
Net Assets | | Ratio of Net
Investment
Loss
to Average
Net Assets | | Ratio of
Expenses to
Average
Net Assets
(Excluding
Waivers) | | Ratio of Net
Investment
Loss
to Average Net
Assets (Excluding
Waivers) | | Portfolio
Turnover
Rate | |
| | Small Cap Growth Opportunities Fund (1) | | | | |
| Class A | |
| | 2004 | (2) | | $ | 21.95 | | | $ | (0.35 | ) | | $ | 0.27 | | | $ | (0.13 | ) | | $ | - | | | $ | 21.74 | | | | (0.39 | )% | | $ | 101,031 | | | | 1.93 | % | | | (1.42 | )% | | | 1.96 | % | | | (1.45 | )% | | | 178 | % | |
| | 2003 | (2) | | | 13.86 | | | | (0.28 | ) | | | 8.37 | | | | - | | | | - | | | | 21.95 | | | | 58.37 | | | | 81,999 | | | | 1.93 | | | | (1.63 | ) | | | 1.97 | | | | (1.67 | ) | | | 137 | | |
| | 2002 | | | | 16.89 | | | | (0.26 | ) | | | (2.74 | ) | | | - | | | | (0.03 | ) | | | 13.86 | | | | (17.84 | ) | | | 44,834 | | | | 1.93 | | | | (1.53 | ) | | | 1.97 | | | | (1.57 | ) | | | 123 | | |
| | 2001 | (2) (3) | | | 31.26 | | | | (0.17 | ) | | | (5.20 | ) | | | (9.00 | ) | | | - | | | | 16.89 | | | | (21.51 | ) | | | 45,233 | | | | 1.93 | | | | (0.91 | ) | | | 1.99 | | | | (0.97 | ) | | | 125 | | |
| | 2000 | (2) (4) | | | 21.80 | | | | (0.40 | ) | | | 15.99 | | | | (6.13 | ) | | | - | | | | 31.26 | | | | 87.43 | | | | 43,031 | | | | 1.96 | | | | (1.31 | ) | | | 1.96 | | | | (1.31 | ) | | | 179 | | |
| | 1999 | (4) | | | 12.38 | | | | (0.26 | ) | | | 9.71 | | | | (0.03 | ) | | | - | | | | 21.80 | | | | 76.54 | | | | 21,988 | | | | 2.01 | | | | (1.43 | ) | | | 2.02 | | | | (1.44 | ) | | | 200 | | |
| Class B | |
| | 2004 | (2) | | $ | 21.05 | | | $ | (0.50 | ) | | $ | 0.27 | | | $ | (0.13 | ) | | $ | - | | | $ | 20.69 | | | | (1.13 | )% | | $ | 9,063 | | | | 2.68 | % | | | (2.16 | )% | | | 2.71 | % | | | (2.19 | )% | | | 178 | % | |
| | 2003 | (2) | | | 13.39 | | | | (0.40 | ) | | | 8.06 | | | | - | | | | - | | | | 21.05 | | | | 57.21 | | | | 6,441 | | | | 2.68 | | | | (2.38 | ) | | | 2.72 | | | | (2.42 | ) | | | 137 | | |
| | 2002 | | | | 16.44 | | | | (0.39 | ) | | | (2.63 | ) | | | - | | | | (0.03 | ) | | | 13.39 | | | | (18.45 | ) | | | 3,779 | | | | 2.68 | | | | (2.28 | ) | | | 2.72 | | | | (2.32 | ) | | | 123 | | |
| | 2001 | (2) (3) | | | 30.84 | | | | (0.31 | ) | | | (5.09 | ) | | | (9.00 | ) | | | - | | | | 16.44 | | | | (22.07 | ) | | | 3,165 | | | | 2.68 | | | | (1.68 | ) | | | 2.74 | | | | (1.74 | ) | | | 125 | | |
| | 2000 | (2) (4) | | | 21.69 | | | | (0.61 | ) | | | 15.89 | | | | (6.13 | ) | | | - | | | | 30.84 | | | | 86.13 | | | | 2,136 | | | | 2.71 | | | | (2.06 | ) | | | 2.71 | | | | (2.06 | ) | | | 179 | | |
| | 1999 (2) (4) (5) | | | | 13.74 | | | | (0.30 | ) | | | 8.25 | | | | - | | | | - | | | | 21.69 | | | | 57.86 | | | | 140 | | | | 2.78 | | | | (2.36 | ) | | | 2.78 | | | | (2.36 | ) | | | 200 | | |
| Class C | |
| | 2004 | (2) | | $ | 21.65 | | | $ | (0.49 | ) | | $ | 0.25 | | | $ | (0.13 | ) | | $ | - | | | $ | 21.28 | | | | (1.14 | )% | | $ | 4,669 | | | | 2.68 | % | | | (2.07 | )% | | | 2.71 | % | | | (2.10 | )% | | | 178 | % | |
| | 2003 | (2) | | | 13.77 | | | | (0.43 | ) | | | 8.31 | | | | - | | | | - | | | | 21.65 | | | | 57.23 | | | | 1,529 | | | | 2.68 | | | | (2.38 | ) | | | 2.72 | | | | (2.42 | ) | | | 137 | | |
| | 2002 | | | | 16.90 | | | | (0.19 | ) | | | (2.91 | ) | | | - | | | | (0.03 | ) | | | 13.77 | | | | (18.42 | ) | | | 260 | | | | 2.68 | | | | (2.31 | ) | | | 2.72 | | | | (2.35 | ) | | | 123 | | |
| | 2001 | (2) (6) | | | 16.34 | | | | - | | | | 0.56 | | | | - | | | | - | | | | 16.90 | | | | 3.43 | | | | 1 | | | | 1.63 | | | | (0.41 | ) | | | 1.76 | | | | (0.54 | ) | | | 125 | | |
| Class R | |
| | 2004 | (2) (7) | | $ | 21.95 | | | $ | (0.42 | ) | | $ | 0.34 | | | $ | (0.13 | ) | | $ | - | | | $ | 21.74 | | | | (0.39 | )% | | $ | 1 | | | | 1.93 | % | | | (1.67 | )% | | | 1.96 | % | | | (1.70 | )% | | | 178 | % | |
| | 2003 | (2) | | | 13.86 | | | | (0.28 | ) | | | 8.37 | | | | - | | | | - | | | | 21.95 | | | | 58.37 | | | | 3,694 | | | | 1.93 | | | | (1.62 | ) | | | 1.97 | | | | (1.66 | ) | | | 137 | | |
| | 2002 | | | | 16.89 | | | | (0.26 | ) | | | (2.74 | ) | | | - | | | | (0.03 | ) | | | 13.86 | | | | (17.84 | ) | | | 2,027 | | | | 1.93 | | | | (1.53 | ) | | | 1.97 | | | | (1.57 | ) | | | 123 | | |
| | 2001 | (2) (8) | | | 20.01 | | | | (0.19 | ) | | | (2.93 | ) | | | - | | | | - | | | | 16.89 | | | | (15.59 | ) | | | 2,014 | | | | 1.94 | | | | (1.06 | ) | | | 2.00 | | | | (1.12 | ) | | | 125 | | |
| Class Y | |
| | 2004 | (2) | | $ | 22.70 | | | $ | (0.32 | ) | | $ | 0.30 | | | $ | (0.13 | ) | | $ | - | | | $ | 22.55 | | | | (0.11 | )% | | $ | 224,432 | | | | 1.68 | % | | | (1.25 | )% | | | 1.71 | % | | | (1.28 | )% | | | 178 | % | |
| | 2003 | (2) | | | 14.30 | | | | (0.25 | ) | | | 8.65 | | | | - | | | | - | | | | 22.70 | | | | 58.74 | | | | 382,389 | | | | 1.68 | | | | (1.38 | ) | | | 1.72 | | | | (1.42 | ) | | | 137 | | |
| | 2002 | | | | 17.38 | | | | (0.25 | ) | | | (2.80 | ) | | | - | | | | (0.03 | ) | | | 14.30 | | | | (17.62 | ) | | | 208,439 | | | | 1.68 | | | | (1.28 | ) | | | 1.72 | | | | (1.32 | ) | | | 123 | | |
| | 2001 | (2) (3) | | | 31.83 | | | | (0.12 | ) | | | (5.33 | ) | | | (9.00 | ) | | | - | | | | 17.38 | | | | (21.35 | ) | | | 266,115 | | | | 1.68 | | | | (0.64 | ) | | | 1.74 | | | | (0.70 | ) | | | 125 | | |
| | 2000 | (4) | | | 22.06 | | | | (0.31 | ) | | | 16.21 | | | | (6.13 | ) | | | - | | | | 31.83 | | | | 87.90 | | | | 322,981 | | | | 1.71 | | | | (1.06 | ) | | | 1.71 | | | | (1.06 | ) | | | 179 | | |
| | 1999 | (4) | | | 12.49 | | | | (0.19 | ) | | | 9.79 | | | | (0.03 | ) | | | - | | | | 22.06 | | | | 77.06 | | | | 150,898 | | | | 1.76 | | | | (1.18 | ) | | | 1.77 | | | | (1.19 | ) | | | 200 | | |
(1) The financial highlights for the Small Cap Growth Opportunities Fund as set forth herein include the historical financial highlights of the Firstar Micro Cap Fund.
The assets of the Firstar Fund were acquired by the First American Small Cap Growth Opportunities Fund on September 24, 2001. In connection with such acquisition,
(i) Class A shares of the Firstar Micro Cap Fund were exchanged for Class A shares of the First American Small Cap Growth Opportunities Fund, (ii) Firstar Class B shares
were exchanged for Class B shares of the First American Fund, (iii) Firstar Class Y shares were exchanged for Class S shares (now designated Class R shares) of the
First American Fund, and (iv) Firstar Institutional Class shares were exchanged for Class Y shares of the First American Fund .
(2) Per share data calculated using average shares outstanding method.
(3) For the period November 1, 2000, to September 30, 2001. Effective in 2001, the Fund's fiscal year end was changed from October 31 to September 30. All ratios for the
period have been annualized, except total return and portfolio turnover.
(4) For the fiscal period ended October 31.
(5) Class of shares has been offered since March 1, 1999. All ratios for the period have been annualized, except total return and portfolio turnover.
(6) Class of shares has been offered since September 24, 2001. All ratios for the period have been annualized, except total return and portfolio turnover.
(7) Prior to July 1, 2004, Class R shares were named Class S shares, which had lower fees and expenses.
(8) Class of shares has been offered since December 11, 2000. All ratios for the period have been annualized, except total return and portfolio turnover.
(9) Total return does not reflect sales charges. Total return would have been lower had certain expenses not been waived.
The accompanying notes are an integral part of the financial statements.
FIRST AMERICAN FUNDS Annual Report 2004
76
FIRST AMERICAN FUNDS Annual Report 2004
77
Financial Highlights For a share outstanding throughout the periods ended September 30, unless otherwise indicated.
| | | Net Asset
Value
Beginning
of Period | | Net
Investment
Income (Loss) | | Realized and
Unrealized
Gains
(Losses) on
Investments | | Dividends
from Net
Investment
Income | | Distributions
from Net
Realized Gains | | Net Asset
Value
End of
Period | | Total
Return (8) | | Net Assets
End of
Period (000) | | Ratio of
Expenses to
Average
Net Assets | | Ratio of Net
Investment
Income (Loss)
to Average
Net Assets | | Ratio of
Expenses to
Average
Net Assets
(Excluding
Waivers) | | Ratio of Net
Investment
Income (Loss)
to Average Net
Assets (Excluding
Waivers) | | Portfolio
Turnover
Rate | |
| | Small Cap Select Fund (1) | | | | |
| Class A (2) | |
| | 2004 | | | $ | 14.52 | | | $ | (0.12 | ) | | $ | 2.60 | | | $ | - | | | $ | (1.05 | ) | | $ | 15.95 | | | | 17.64 | % | | $ | 97,775 | | | | 1.21 | % | | | (0.76 | )% | | | 1.24 | % | | | (0.79 | )% | | | 116 | % | |
| | 2003 | | | | 10.68 | | | | (0.09 | ) | | | 3.93 | | | | - | | | | - | | | | 14.52 | | | | 35.96 | | | | 73,445 | | | | 1.21 | | | | (0.73 | ) | | | 1.25 | | | | (0.77 | ) | | | 145 | | |
| | 2002 | | | | 11.97 | | | | (0.10 | ) | | | (0.30 | ) | | | - | | | | (0.89 | ) | | | 10.68 | | | | (4.56 | ) | | | 33,586 | | | | 1.21 | | | | (0.81 | ) | | | 1.25 | | | | (0.85 | ) | | | 171 | | |
| | 2001 | (3) | | | 17.60 | | | | (0.03 | ) | | | (1.89 | ) | | | - | | | | (3.71 | ) | | | 11.97 | | | | (12.63 | ) | | | 17,351 | | | | 1.19 | | | | (0.24 | ) | | | 1.22 | | | | (0.27 | ) | | | 204 | | |
| | 2000 | (4) | | | 13.84 | | | | (0.10 | ) | | | 4.13 | | | | (0.01 | ) | | | (0.26 | ) | | | 17.60 | | | | 29.65 | | | | 9,538 | | | | 1.28 | | | | (0.01 | ) | | | 1.39 | | | | (0.12 | ) | | | 91 | | |
| | 1999 | (5) | | | 11.86 | | | | (0.07 | ) | | | 2.10 | | | | - | | | | (0.05 | ) | | | 13.84 | | | | 17.21 | | | | 8,885 | | | | 1.26 | | | | (0.57 | ) | | | 1.36 | | | | (0.67 | ) | | | 72 | | |
| Class B (2) | |
| | 2004 | | | $ | 13.42 | | | $ | (0.22 | ) | | $ | 2.41 | | | $ | - | | | $ | (1.05 | ) | | $ | 14.56 | | | | 16.88 | % | | $ | 13,050 | | | | 1.96 | % | | | (1.51 | )% | | | 1.99 | % | | | (1.54 | )% | | | 116 | % | |
| | 2003 | | | | 9.95 | | | | (0.17 | ) | | | 3.64 | | | | - | | | | - | | | | 13.42 | | | | 34.88 | | | | 11,541 | | | | 1.96 | | | | (1.48 | ) | | | 2.00 | | | | (1.52 | ) | | | 145 | | |
| | 2002 | | | | 11.28 | | | | (0.19 | ) | | | (0.25 | ) | | | - | | | | (0.89 | ) | | | 9.95 | | | | (5.23 | ) | | | 4,613 | | | | 1.96 | | | | (1.56 | ) | | | 2.00 | | | | (1.60 | ) | | | 171 | | |
| | 2001 | (3) | | | 16.90 | | | | (0.12 | ) | | | (1.79 | ) | | | - | | | | (3.71 | ) | | | 11.28 | | | | (13.21 | ) | | | 1,979 | | | | 1.93 | | | | (0.99 | ) | | | 1.97 | | | | (1.03 | ) | | | 204 | | |
| | 2000 | (4) | | | 13.38 | | | | (0.13 | ) | | | 3.92 | | | | - | | | | (0.27 | ) | | | 16.90 | | | | 28.81 | | | | 1,331 | | | | 1.98 | | | | (0.71 | ) | | | 2.09 | | | | (0.82 | ) | | | 91 | | |
| | 1999 | (5) | | | 11.53 | | | | (0.16 | ) | | | 2.06 | | | | - | | | | (0.05 | ) | | | 13.38 | | | | 16.57 | | | | 1,094 | | | | 1.96 | | | | (1.27 | ) | | | 2.06 | | | | (1.37 | ) | | | 72 | | |
| Class C | |
| | 2004 | | | $ | 14.32 | | | $ | (0.24 | ) | | $ | 2.57 | | | $ | - | | | $ | (1.05 | ) | | $ | 15.60 | | | | 16.79 | % | | $ | 13,841 | | | | 1.96 | % | | | (1.50 | )% | | | 1.99 | % | | | (1.53 | )% | | | 116 | % | |
| | 2003 | | | | 10.62 | | | | (0.18 | ) | | | 3.88 | | | | - | | | | - | | | | 14.32 | | | | 34.84 | | | | 11,128 | | | | 1.96 | | | | (1.47 | ) | | | 2.00 | | | | (1.51 | ) | | | 145 | | |
| | 2002 | | | | 11.97 | | | | (0.20 | ) | | | (0.26 | ) | | | - | | | | (0.89 | ) | | | 10.62 | | | | (5.09 | ) | | | 3,096 | | | | 1.96 | | | | (1.61 | ) | | | 2.02 | | | | (1.67 | ) | | | 171 | | |
| | 2001 | (6) | | | 11.72 | | | | - | | | | 0.25 | | | | - | | | | - | | | | 11.97 | | | | 2.13 | | | | - | | | | - | | | | - | | | | - | | | | - | | | | 204 | | |
| Class R (2) | |
| | 2004 | (7) | | $ | 14.49 | | | $ | (0.13 | ) | | $ | 2.60 | | | $ | - | | | $ | (1.05 | ) | | $ | 15.91 | | | | 17.60 | % | | $ | 19 | | | | 1.21 | % | | | (0.81 | )% | | | 1.24 | % | | | (0.84 | )% | | | 116 | % | |
| | 2003 | | | | 10.66 | | | | (0.09 | ) | | | 3.92 | | | | - | | | | - | | | | 14.49 | | | | 35.93 | | | | 11,627 | | | | 1.21 | | | | (0.75 | ) | | | 1.25 | | | | (0.79 | ) | | | 145 | | |
| | 2002 | | | | 11.94 | | | | (0.10 | ) | | | (0.29 | ) | | | - | | | | (0.89 | ) | | | 10.66 | | | | (4.48 | ) | | | 7,640 | | | | 1.21 | | | | (0.80 | ) | | | 1.25 | | | | (0.84 | ) | | | 171 | | |
| | 2001 | (3) | | | 17.55 | | | | (0.01 | ) | | | (1.89 | ) | | | - | | | | (3.71 | ) | | | 11.94 | | | | (12.52 | ) | | | 3,721 | | | | 1.07 | | | | (0.05 | ) | | | 1.14 | | | | (0.12 | ) | | | 204 | | |
| | 2000 | (4) | | | 13.80 | | | | (0.01 | ) | | | 4.03 | | | | (0.01 | ) | | | (0.26 | ) | | | 17.55 | | | | 29.67 | | | | 4,442 | | | | 1.28 | | | | (0.01 | ) | | | 1.39 | | | | (0.12 | ) | | | 91 | | |
| | 1999 | (5) | | | 11.82 | | | | (0.07 | ) | | | 2.10 | | | | - | | | | (0.05 | ) | | | 13.80 | | | | 17.27 | | | | 2,448 | | | | 1.26 | | | | (0.59 | ) | | | 1.36 | | | | (0.69 | ) | | | 72 | | |
| Class Y (2) | |
| | 2004 | | | $ | 14.98 | | | $ | (0.09 | ) | | $ | 2.70 | | | $ | - | | | $ | (1.05 | ) | | $ | 16.54 | | | | 17.98 | % | | $ | 770,981 | | | | 0.96 | % | | | (0.52 | )% | | | 0.99 | % | | | (0.55 | )% | | | 116 | % | |
| | 2003 | | | | 11.00 | | | | (0.06 | ) | | | 4.04 | | | | - | | | | - | | | | 14.98 | | | | 36.18 | | | | 1,024,146 | | | | 0.96 | | | | (0.48 | ) | | | 1.00 | | | | (0.52 | ) | | | 145 | | |
| | 2002 | | | | 12.26 | | | | (0.07 | ) | | | (0.30 | ) | | | - | | | | (0.89 | ) | | | 11.00 | | | | (4.19 | ) | | | 403,027 | | | | 0.96 | | | | (0.55 | ) | | | 1.00 | | | | (0.59 | ) | | | 171 | | |
| | 2001 | (3) | | | 17.92 | | | | - | | | | (1.95 | ) | | | - | | | | (3.71 | ) | | | 12.26 | | | | (12.49 | ) | | | 291,706 | | | | 0.93 | | | | 0.01 | | | | 0.96 | | | | (0.02 | ) | | | 204 | | |
| | 2000 | (4) | | | 14.07 | | | | 0.05 | | | | 4.10 | | | | (0.03 | ) | | | (0.27 | ) | | | 17.92 | | | | 30.01 | | | | 134,617 | | | | 0.98 | | | | 0.29 | | | | 1.39 | | | | (0.12 | ) | | | 91 | | |
| | 1999 | (5) | | | 12.02 | | | | (0.03 | ) | | | 2.13 | | | | - | | | | (0.05 | ) | | | 14.07 | | | | 17.57 | | | | 111,643 | | | | 0.96 | | | | (0.26 | ) | | | 1.36 | | | | (0.66 | ) | | | 72 | | |
(1) The financial highlights for the Small Cap Select Fund as set forth herein include the historical financial highlights of the Firstar Small Cap Core Equity Fund. The assets
of the Firstar Fund were acquired by the First American Small Cap Select Fund on September 24, 2001. In connection with such acquisition, (i) Class A shares of the
Firstar Fund were exchanged for Class A shares of the First American Fund, (ii) Firstar Class B shares were exchanged for Class B shares of the First American Fund,
(iii) Firstar Class Y shares were exchanged for Class S shares (now designated Class R shares) of the First American Fund, and (iv) Firstar Institutional Class shares
were exchanged for Class Y shares of the First American Fund.
(2) Per share data calculated using average shares outstanding method.
(3) For the period November 1, 2000, to September 30, 2001. Effective in 2001, the Fund's fiscal year end was changed from October 31 to September 30. All ratios for
the period have been annualized, except total return and portfolio turnover.
(4) For the period December 1, 1999, to October 31, 2000. Effective in 2000, the Fund's fiscal year end was changed from November 30 to October 31. All ratios for the
period have been annualized, except total return and portfolio turnover.
(5) For the fiscal year ended November 30.
(6) Class of shares has been offered since September 24, 2001. All ratios for the period have been annualized, except total return and portfolio turnover.
(7) Prior to July 1, 2004, Class R shares were named Class S shares, which had lower fees and expenses.
(8) Total return does not reflect sales charges. Total return would have been lower had certain expenses not been waived.
The accompanying notes are an integral part of the financial statements.
FIRST AMERICAN FUNDS Annual Report 2004
78
FIRST AMERICAN FUNDS Annual Report 2004
79
Financial Highlights For a share outstanding throughout the periods ended September 30, unless otherwise indicated.
| | | Net Asset
Value
Beginning
of Period | | Net
Investment
Income (Loss) | | Realized and
Unrealized
Gains
(Losses) on
Investments | | Dividends
from Net
Investment
Income | | Distributions
from Net
Realized Gains | | Net Asset
Value
End of
Period | | Total
Return (4) | | Net Assets
End of
Period (000) | | Ratio of
Expenses to
Average
Net Assets | | Ratio of Net
Investment
Income (Loss)
to Average
Net Assets | | Ratio of
Expenses to
Average
Net Assets
(Excluding
Waivers) | | Ratio of Net
Investment
Income (Loss)
to Average Net
Assets (Excluding
Waivers) | | Portfolio
Turnover
Rate | |
| | Small Cap Value Fund | | | | |
| Class A | |
| | 2004 | (1) | | $ | 14.28 | | | $ | 0.03 | | | $ | 3.13 | | | $ | (0.04 | ) | | $ | (0.56 | ) | | $ | 16.84 | | | | 22.70 | % | | $ | 43,192 | | | | 1.23 | % | | | 0.21 | % | | | 1.25 | % | | | 0.19 | % | | | 34 | % | |
| | 2003 | (1) | | | 11.26 | | | | - | | | | 3.02 | | | | - | | | | - | | | | 14.28 | | | | 26.86 | | | | 32,416 | | | | 1.23 | | | | 0.02 | | | | 1.25 | | | | - | | | | 49 | | |
| | 2002 | (1) | | | 13.40 | | | | (0.02 | ) | | | (0.13 | ) | | | - | | | | (1.99 | ) | | | 11.26 | | | | (2.19 | ) | | | 27,205 | | | | 1.23 | | | | (0.12 | ) | | | 1.26 | | | | (0.15 | ) | | | 37 | | |
| | 2001 | (1) | | | 17.09 | | | | 0.02 | | | | (0.97 | ) | | | (0.05 | ) | | | (2.69 | ) | | | 13.40 | | | | (6.36 | ) | | | 34,292 | | | | 1.15 | | | | 0.11 | | | | 1.15 | | | | 0.11 | | | | 53 | | |
| | 2000 | | | | 13.94 | | | | (0.01 | ) | | | 3.23 | | | | - | | | | (0.07 | ) | | | 17.09 | | | | 23.19 | | | | 35,858 | | | | 1.14 | | | | (0.13 | ) | | | 1.16 | | | | (0.15 | ) | | | 73 | | |
| Class B | |
| | 2004 | (1) | | $ | 13.60 | | | $ | (0.08 | ) | | $ | 2.96 | | | $ | - | | | $ | (0.56 | ) | | $ | 15.92 | | | | 21.76 | % | | $ | 9,901 | | | | 1.98 | % | | | (0.51 | )% | | | 2.00 | % | | | (0.53 | )% | | | 34 | % | |
| | 2003 | (1) | | | 10.80 | | | | (0.08 | ) | | | 2.88 | | | | - | | | | - | | | | 13.60 | | | | 25.93 | | | | 12,560 | | | | 1.98 | | | | (0.73 | ) | | | 2.00 | | | | (0.75 | ) | | | 49 | | |
| | 2002 | (1) | | | 13.01 | | | | (0.11 | ) | | | (0.11 | ) | | | - | | | | (1.99 | ) | | | 10.80 | | | | (2.91 | ) | | | 12,008 | | | | 1.98 | | | | (0.87 | ) | | | (2.01 | ) | | | (0.90 | ) | | | 37 | | |
| | 2001 | (1) | | | 16.76 | | | | (0.09 | ) | | | (0.97 | ) | | | - | | | | (2.69 | ) | | | 13.01 | | | | (7.24 | ) | | | 12,392 | | | | 1.90 | | | | (0.64 | ) | | | 1.90 | | | | (0.64 | ) | | | 53 | | |
| | 2000 | | | | 13.77 | | | | (0.09 | ) | | | 3.15 | | | | - | | | | (0.07 | ) | | | 16.76 | | | | 22.31 | | | | 13,646 | | | | 1.88 | | | | (0.89 | ) | | | 1.90 | | | | (0.91 | ) | | | 73 | | |
| Class C | |
| | 2004 | (1) | | $ | 13.74 | | | $ | (0.08 | ) | | $ | 3.00 | | | $ | - | | | $ | (0.56 | ) | | $ | 16.10 | | | | 21.83 | % | | $ | 4,609 | | | | 1.98 | % | | | (0.52 | )% | | | 2.00 | % | | | (0.54 | )% | | | 34 | % | |
| | 2003 | (1) | | | 10.91 | | | | (0.09 | ) | | | 2.92 | | | | - | | | | - | | | | 13.74 | | | | 25.94 | | | | 4,354 | | | | 1.98 | | | | (0.74 | ) | | | 2.00 | | | | (0.76 | ) | | | 49 | | |
| | 2002 | (1) | | | 13.13 | | | | (0.11 | ) | | | (0.12 | ) | | | - | | | | (1.99 | ) | | | 10.91 | | | | (2.96 | ) | | | 4,873 | | | | 1.98 | | | | (0.87 | ) | | | 2.01 | | | | (0.90 | ) | | | 37 | | |
| | 2001 | (1) | | | 16.88 | | | | (0.10 | ) | | | (0.95 | ) | | | (0.01 | ) | | | (2.69 | ) | | | 13.13 | | | | (7.08 | ) | | | 4,547 | | | | 1.90 | | | | (0.65 | ) | | | 1.90 | | | | (0.65 | ) | | | 53 | | |
| | 2000 | | | | 13.87 | | | | (0.06 | ) | | | 3.14 | | | | - | | | | (0.07 | ) | | | 16.88 | | | | 22.29 | | | | 1,099 | | | | 1.88 | | | | (0.84 | ) | | | 1.91 | | | | (0.87 | ) | | | 73 | | |
| Class R (1) | |
| | 2004 | (2) | | $ | 14.27 | | | $ | 0.03 | | | $ | 3.12 | | | $ | (0.03 | ) | | $ | (0.56 | ) | | $ | 16.83 | | | | 22.69 | % | | $ | 1 | | | | 1.23 | % | | | 0.22 | % | | | 1.25 | % | | | 0.20 | % | | | 34 | % | |
| | 2003 | | | | 11.26 | | | | 0.01 | | | | 3.01 | | | | (0.01 | ) | | | - | | | | 14.27 | | | | 26.79 | | | | 1,351 | | | | 1.23 | | | | 0.04 | | | | 1.25 | | | | 0.02 | | | | 49 | | |
| | 2002 | | | | 13.40 | | | | (0.01 | ) | | | (0.14 | ) | | | - | | | | (1.99 | ) | | | 11.26 | | | | (2.19 | ) | | | 424 | | | | 1.24 | | | | (0.11 | ) | | | 1.27 | | | | (0.14 | ) | | | 37 | | |
| | 2001 | (3) | | | 12.84 | | | | - | | | | 0.56 | | | | - | | | | - | | | | 13.40 | | | | 4.36 | | | | - | | | | - | | | | - | | | | - | | | | - | | | | 53 | | |
| Class Y | |
| | 2004 | (1) | | $ | 14.44 | | | $ | 0.08 | | | $ | 3.16 | | | $ | (0.07 | ) | | $ | (0.56 | ) | | $ | 17.05 | | | | 23.02 | % | | $ | 367,774 | | | | 0.98 | % | | | 0.50 | % | | | 1.00 | % | | | 0.48 | % | | | 34 | % | |
| | 2003 | (1) | | | 11.38 | | | | 0.03 | | | | 3.05 | | | | (0.02 | ) | | | - | | | | 14.44 | | | | 27.10 | | | | 428,846 | | | | 0.98 | | | | 0.27 | | | | 1.00 | | | | 0.25 | | | | 49 | | |
| | 2002 | (1) | | | 13.48 | | | | 0.02 | | | | (0.12 | ) | | | (0.01 | ) | | | (1.99 | ) | | | 11.38 | | | | (1.83 | ) | | | 368,092 | | | | 0.98 | | | | 0.13 | | | | 1.01 | | | | 0.10 | | | | 37 | | |
| | 2001 | (1) | | | 17.19 | | | | 0.06 | | | | (1.00 | ) | | | (0.08 | ) | | | (2.69 | ) | | | 13.48 | | | | (6.25 | ) | | | 434,097 | | | | 0.90 | | | | 0.37 | | | | 0.90 | | | | 0.37 | | | | 53 | | |
| | 2000 | | | | 13.98 | | | | 0.02 | | | | 3.26 | | | | - | | | | (0.07 | ) | | | 17.19 | | | | 23.56 | | | | 431,906 | | | | 0.89 | | | | 0.11 | | | | 0.91 | | | | 0.09 | | | | 73 | | |
(1) Per share data calculated using average shares outstanding method.
(2) Prior to July 1, 2004, Class R shares were named Class S shares, which had lower fees and expenses.
(3) Class of shares has been offered since September 24, 2001. All ratios for the period have been annualized, except total return and portfolio turnover.
(4) Total return does not reflect sales charges. Total return would have been lower had certain expenses not been waived.
The accompanying notes are an integral part of the financial statements.
FIRST AMERICAN FUNDS Annual Report 2004
80
FIRST AMERICAN FUNDS Annual Report 2004
81
Schedule of Investments September 30, 2004
Mid Cap Growth Opportunities Fund
| DESCRIPTION | | SHARES | | VALUE (000) | |
| Common Stocks – 95.3% | | | |
| Consumer Discretionary – 18.1% | | | |
| Best Buy (a) | | | 215,430 | | | $ | 11,685 | | |
| Blockbuster, Cl A (a) | | | 441,540 | | | | 3,351 | | |
| Blockbuster, Cl B* (b) | | | 961,080 | | | | 6,901 | | |
| Brunswick | | | 297,230 | | | | 13,601 | | |
| Cheesecake Factory* (a) | | | 164,970 | | | | 7,160 | | |
| Chico's FAS* (a) | | | 188,150 | | | | 6,435 | | |
| Dollar General (a) | | | 382,010 | | | | 7,697 | | |
| EchoStar Communications, Cl A* (a) | | | 325,280 | | | | 10,123 | | |
| Fortune Brands | | | 57,760 | | | | 4,279 | | |
| Gaylord Entertainment* (a) | | | 543,480 | | | | 16,848 | | |
| GTECH Holdings | | | 464,480 | | | | 11,761 | | |
| Hilton Hotels | | | 389,110 | | | | 7,331 | | |
| International Game Technology | | | 460,950 | | | | 16,571 | | |
| Journal Communications | | | 312,340 | | | | 5,478 | | |
| Marriott International, Cl A | | | 442,590 | | | | 22,997 | | |
| Marvel Enterprises* (a) | | | 2,031,895 | | | | 29,584 | | |
| Radio One* (a) | | | 665,928 | | | | 9,476 | | |
| Staples (a) | | | 484,670 | | | | 14,453 | | |
| Station Casinos (a) | | | 481,430 | | | | 23,609 | | |
| Univision Communications, Cl A* (a) | | | 347,590 | | | | 10,987 | | |
| Wendy's International | | | 195,310 | | | | 6,562 | | |
| | | | 246,889 | | |
| Consumer Staples – 4.2% | | | |
| Bunge Limited (a) | | | 873,660 | | | | 34,929 | | |
| Clorox (a) | | | 200,670 | | | | 10,696 | | |
| Hershey Foods (a) | | | 238,340 | | | | 11,133 | | |
| | | | 56,758 | | |
| Energy – 8.1% | | | |
| Apache | | | 241,544 | | | | 12,104 | | |
| Baker Hughes (a) | | | 236,360 | | | | 10,334 | | |
| BJ Services (a) | | | 267,520 | | | | 14,021 | | |
| ENSCO International (a) | | | 457,260 | | | | 14,939 | | |
| GlobalSantaFe | | | 273,770 | | | | 8,391 | | |
| National-Oilwell* (a) | | | 416,090 | | | | 13,673 | | |
| Newfield Exploration* | | | 238,080 | | | | 14,580 | | |
| Patterson-UTI Energy (a) | | | 174,439 | | | | 3,327 | | |
| Weatherford International* (a) | | | 151,810 | | | | 7,745 | | |
| XTO Energy (a) | | | 374,850 | | | | 12,175 | | |
| | | | 111,289 | | |
| Financials – 7.2% | | | |
| Ameritrade Holding* (a) | | | 1,548,110 | | | | 18,593 | | |
| Capital One Financial (a) | | | 157,150 | | | | 11,613 | | |
| Everest Re Group | | | 160,885 | | | | 11,959 | | |
| Investors Financial Services (a) | | | 612,365 | | | | 27,636 | | |
| Platinum Underwriter Holdings (a) | | | 230,780 | | | | 6,757 | | |
| RenaissanceRe Holdings (a) | | | 208,000 | | | | 10,729 | | |
| Synovus Financial | | | 432,820 | | | | 11,318 | | |
| | | | 98,605 | | |
| Health Care – 19.9% | | | |
| Aetna (a) | | | 307,970 | | | | 30,776 | | |
| Amylin Pharmaceuticals* (a) | | | 172,880 | | | | 3,547 | | |
| Barr Pharmaceuticals* | | | 427,882 | | | | 17,727 | | |
| Biomet | | | 164,540 | | | | 7,714 | | |
| C.R. Bard | | | 94,160 | | | | 5,332 | | |
| Caremark Rx* (a) | | | 344,300 | | | | 11,042 | | |
Mid Cap Growth Opportunities Fund (continued)
| DESCRIPTION | | SHARES | | VALUE (000) | |
| Chiron* (a) | | | 139,760 | | | $ | 6,177 | | |
| Community Health Systems* (a) | | | 312,100 | | | | 8,327 | | |
| DENTSPLY International | | | 378,720 | | | | 19,671 | | |
| Fisher Scientific International* (a) | | | 334,000 | | | | 19,482 | | |
| Genzyme* (a) | | | 222,830 | | | | 12,124 | | |
| ImClone Systems* (a) | | | 61,490 | | | | 3,250 | | |
| Invitrogen* (a) | | | 106,060 | | | | 5,832 | | |
| PerkinElmer | | | 1,914,630 | | | | 32,970 | | |
| Quest Diagnostics (a) | | | 166,500 | | | | 14,689 | | |
| Radiation Therapy Services* (a) | | | 242,550 | | | | 2,750 | | |
| St. Jude Medical* (a) | | | 123,190 | | | | 9,272 | | |
| Teva Pharmaceutical Industries, ADR (a) | | | 471,214 | | | | 12,228 | | |
| Triad Hospitals* (a) | | | 212,175 | | | | 7,307 | | |
| Varian Medical Systems* (a) | | | 546,840 | | | | 18,904 | | |
| Watson Pharmaceuticals* (a) | | | 408,380 | | | | 12,031 | | |
| Zimmer Holdings* (a) | | | 134,150 | | | | 10,603 | | |
| | | | 271,755 | | |
| Industrials – 9.9% | | | |
| Donaldson | | | 384,770 | | | | 10,924 | | |
| Dun & Bradstreet* (a) | | | 462,690 | | | | 27,160 | | |
| L-3 Communications Holdings | | | 328,610 | | | | 22,017 | | |
| Monster Worldwide* (a) | | | 715,000 | | | | 17,618 | | |
| MSC Industrial Direct | | | 281,500 | | | | 9,593 | | |
| Power-One* (a) | | | 1,467,460 | | | | 9,509 | | |
| Republic Services | | | 843,505 | | | | 25,103 | | |
| Stericycle* (a) | | | 293,660 | | | | 13,479 | | |
| | | | 135,403 | | |
| Information Technology – 27.1% (c) | | | |
| Adobe Systems (a) | | | 357,180 | | | | 17,670 | | |
| Altera* (a) | | | 777,520 | | | | 15,216 | | |
| Apple Computer* (a) | | | 553,650 | | | | 21,454 | | |
| Avaya* | | | 1,042,410 | | | | 14,531 | | |
| Avocent* (a) | | | 321,250 | | | | 8,362 | | |
| Benchmark Electronics* (a) | | | 108,910 | | | | 3,245 | | |
| CDW (a) | | | 400,415 | | | | 23,236 | | |
| Entegris* (a) | | | 699,450 | | | | 5,833 | | |
| Fiserv* (a) | | | 668,990 | | | | 23,321 | | |
| Hyperion Solutions* (a) | | | 619,920 | | | | 21,071 | | |
| Iron Mountain* (a) | | | 300,840 | | | | 10,183 | | |
| Juniper Networks* (a) | | | 526,987 | | | | 12,437 | | |
| Linear Technology (a) | | | 348,610 | | | | 12,634 | | |
| Marvell Technology Group* (a) | | | 395,510 | | | | 10,335 | | |
| Mercury Interactive* (a) | | | 100,160 | | | | 3,494 | | |
| Microchip Technology (a) | | | 347,060 | | | | 9,315 | | |
| National Semiconductor* (a) | | | 407,140 | | | | 6,307 | | |
| NCR* (a) | | | 1,073,720 | | | | 53,246 | | |
| Research in Motion* (a) | | | 578,900 | | | | 44,193 | | |
| Symantec* (a) | | | 135,120 | | | | 7,415 | | |
| Take-Two Interactive Software* (a) | | | 252,620 | | | | 8,299 | | |
| TIBCO Software* (a) | | | 2,255,140 | | | | 19,191 | | |
| VeriSign* (a) | | | 611,910 | | | | 12,165 | | |
| Xilinx* (a) | | | 237,960 | | | | 6,425 | | |
| | | | 369,578 | | |
| Materials – 0.8% | | | |
| Pactiv* | | | 468,500 | | | | 10,893 | | |
Total Common Stocks
(Cost $1,149,324) | | | | | | | 1,301,170 | | |
The accompanying notes are an integral part of the financial statements.
FIRST AMERICAN FUNDS Annual Report 2004
82
Mid Cap Growth Opportunities Fund (continued)
| DESCRIPTION | | SHARES/PAR (000) | | VALUE (000) | |
| Affiliated Money Market Fund – 6.5% | |
First American Prime
Obligations Fund, Cl Z (d) | | | 88,340,904 | | | $ | 88,341 | | |
Total Affiliated Money Market Fund
(Cost $88,341) | | | | | | | 88,341 | | |
Investments Purchased with Proceeds
from Securities Lending – 45.4% | |
| Commercial Paper – 14.7% | |
| Bluegrass | |
| 1.881%, 05/18/05 | | $ | 2,609 | | | | 2,609 | | |
| 1.891%, 08/18/05 | | | 2,073 | | | | 2,073 | | |
| Concord Minutemen Capital | |
| 1.650%, 10/01/04 | | | 4,283 | | | | 4,283 | | |
| 1.680%, 10/05/04 | | | 9,518 | | | | 9,518 | | |
| 1.720%, 10/06/04 | | | 7,032 | | | | 7,032 | | |
| 1.740%, 10/14/04 | | | 4,706 | | | | 4,706 | | |
Descartes Funding Trust
1.760%, 11/15/04 | | | 5,288 | | | | 5,288 | | |
| Ford Credit Floor Plan | |
| 1.622%, 10/05/04 | | | 10,573 | | | | 10,573 | | |
| 1.526%, 10/06/04 | | | 7,403 | | | | 7,403 | | |
| 1.655%, 10/22/04 | | | 2,324 | | | | 2,324 | | |
Goldman Sachs
1.975%, 01/18/05 | | | 5,288 | | | | 5,288 | | |
Independence
1.830%, 04/15/05 | | | 6,536 | | | | 6,536 | | |
Jupiter Securities Corp
1.793%, 10/21/04 | | | 20,099 | | | | 20,099 | | |
Lakeside Funding
1.790%, 10/08/04 | | | 11,210 | | | | 11,210 | | |
Landesbank Baden
1.480%, 11/12/04 | | | 2,110 | | | | 2,110 | | |
Leaf's LLC
1.821%, 04/20/05 | | | 5,816 | | | | 5,816 | | |
| Liquid Funding | |
| 1.743%, 10/13/04 | | | 7,398 | | | | 7,398 | | |
| 1.830%, 05/25/05 | | | 5,288 | | | | 5,288 | | |
| MBNA Credit | |
| 1.683%, 10/12/04 | | | 5,139 | | | | 5,139 | | |
| 1.764%, 10/26/04 | | | 2,852 | | | | 2,852 | | |
| Main Street Warehouse | |
| 1.742%, 10/04/04 | | | 6,978 | | | | 6,978 | | |
| 1.683%, 10/04/04 | | | 8,619 | | | | 8,619 | | |
| 1.742%, 10/08/04 | | | 5,286 | | | | 5,286 | | |
| 1.742%, 10/08/04 | | | 5,288 | | | | 5,288 | | |
| Mortgage Interest Network | |
| 1.752%, 10/12/04 | | | 3,488 | | | | 3,488 | | |
| 1.763%, 10/14/04 | | | 3,699 | | | | 3,699 | | |
Netexis Banques
1.700%, 12/16/04 | | | 5,266 | | | | 5,266 | | |
| Orchard Park | |
| 1.796%, 04/06/05 | | | 5,288 | | | | 5,288 | | |
| 1.766%, 07/06/05 | | | 10,913 | | | | 10,913 | | |
| Park Granada LLC | |
| 1.622%, 10/01/04 | | | 9,306 | | | | 9,306 | | |
| 1.743%, 10/13/04 | | | 6,024 | | | | 6,024 | | |
Sigma Finance
1.512%, 11/29/04 | | | 2,636 | | | | 2,636 | | |
| Total Commercial Paper | | | | | | | 200,336 | | |
Mid Cap Growth Opportunities Fund (continued)
| DESCRIPTION | | PAR (000) | | VALUE (000) | |
| Corporate Obligations – 12.2% | | | |
| Allstate Life Global | |
| 1.780%, 10/14/05 | | $ | 10,575 | | | $ | 10,575 | | |
| 1.750%, 10/14/05 | | | 2,644 | | | | 2,644 | | |
Bayer Landbank NY
1.830%, 06/24/05 | | | 10,046 | | | | 10,046 | | |
Blue Heron Funding
1.850%, 05/18/05 | | | 2,961 | | | | 2,961 | | |
Castle Hill III
1.910%, 09/15/15 | | | 3,173 | | | | 3,173 | | |
Depfa Bank PLC
1.860%, 06/15/05 | | | 5,286 | | | | 5,286 | | |
Duke Funding VI
1.320%, 04/08/05 | | | 6,398 | | | | 6,398 | | |
General Electric Capital Corporation
1.838%, 10/07/05 | | | 5,294 | | | | 5,294 | | |
Jackson National Life
1.760%, 04/15/05 | | | 5,288 | | | | 5,288 | | |
Jefferson Pilot
1.788%, 08/17/05 | | | 5,288 | | | | 5,288 | | |
Liquid Funding
1.840%, 06/28/05 | | | 4,758 | | | | 4,758 | | |
Merrill Lynch
1.696%, 10/01/05 | | | 10,576 | | | | 10,576 | | |
| Metlife Global Funding | |
| 1.800%, 10/14/05 | | | 6,345 | | | | 6,345 | | |
| 1.880%, 10/28/05 | | | 4,443 | | | | 4,443 | | |
Morgan Stanley
1.850%, 12/26/08 | | | 5,288 | | | | 5,288 | | |
Natexis Banq NY
1.920%, 07/12/05 | | | 5,816 | | | | 5,816 | | |
Northlake CDO
1.895%, 03/07/05 | | | 3,173 | | | | 3,173 | | |
| Premium Asset Trust | |
| 1.848%, 12/22/04 | | | 3,966 | | | | 3,966 | | |
| 1.760%, 05/13/05 | | | 7,402 | | | | 7,402 | | |
| 1.740%, 06/01/05 | | | 15,757 | | | | 15,757 | | |
| 1.770%, 10/14/05 | | | 4,230 | | | | 4,230 | | |
REMAC
1.840%, 09/29/05 | | | 5,816 | | | | 5,816 | | |
RMAC
1.740%, 06/12/05 | | | 6,101 | | | | 6,101 | | |
SMM Trust 2004
1.833%, 09/23/05 | | | 9,835 | | | | 9,835 | | |
Societe Generale NYC
1.960%, 12/08/04 | | | 10,575 | | | | 10,575 | | |
Svenska Handl
1.170%, 10/21/04 | | | 5,288 | | | | 5,288 | | |
| Total Corporate Obligations | | | | | | | 166,322 | | |
| Other Short-Term Investments – 3.1% | | | |
ARLO III Ltd
2.000%, 09/28/05 | | | 15,863 | | | | 15,863 | | |
Commonwealth Life
2.115%, 12/31/04 (e) | | | 5,340 | | | | 5,340 | | |
General Electric Capital Assurance
1.980%, 01/19/05 | | | 2,115 | | | | 2,115 | | |
HBOS Treasury Services
1.640%, 11/01/05 | | | 5,814 | | | | 5,814 | | |
Security Life of Denver
1.900%, 12/30/04 | | | 13,748 | | | | 13,748 | | |
| Total Other Short-Term Investments | | | | | | | 42,880 | | |
FIRST AMERICAN FUNDS Annual Report 2004
83
Schedule of Investments September 30, 2004
Mid Cap Growth Opportunities Fund (continued)
| DESCRIPTION | | PAR (000) | | VALUE (000) | |
| Repurchase Agreements – 15.4% | |
Bear Stearns
2.045%, dated 09/30/04, matures 10/01/04,
repurchase price $10,576,050
(collateralized by various securities:
Total market value $10,792,855) | | $ | 10,575 | | | $ | 10,575 | | |
Bear Stearns
2.060%, dated 09/30/04, matures 12/23/04,
repurchase price $3,187,885
(collateralized by various securities:
Total market value $3,237,220) | | | 3,173 | | | | 3,173 | | |
Citibank
1.945%, dated 09/30/04, matures 10/01/04,
repurchase price $21,152,042
(collateralized by corporate securities:
Total market value $22,397,776) | | | 21,151 | | | | 21,151 | | |
Citibank
1.925%, dated 09/30/04, matures 10/01/04,
repurchase price $5,288,007
(collateralized by various securities:
Total market value $5,405,461) | | | 5,288 | | | | 5,288 | | |
Citibank
1.925%, dated 09/30/04, matures 10/01/04,
repurchase price $5,288,007
(collateralized by various securities:
Total market value $5,405,461) | | | 5,288 | | | | 5,288 | | |
Greenwich Capital Markets
1.950%, dated 09/30/04, matures 10/01/04,
repurchase price $31,728,067
(collateralized by U.S. government securities:
Total market value $32,361,289) | | | 31,726 | | | | 31,726 | | |
Goldman Sachs
2.025%, dated 09/30/04, matures 10/01/04,
repurchase price $7,403,231
(collateralized by various securities:
Total market value $7,631,779) | | | 7,403 | | | | 7,403 | | |
Goldman Sachs
2.025%, dated 09/30/04, matures 10/01/04,
repurchase price $3,172,813
(collateralized by various securities:
Total market value $3,270,840) | | | 3,173 | | | | 3,173 | | |
Goldman Sachs
2.025%, dated 09/30/04, matures 10/01/04,
repurchase price $3,172,813
(collateralized by various securities:
Total market value $3,270,839) | | | 3,173 | | | | 3,173 | | |
Goldman Sachs
2.025%, dated 09/30/04, matures 10/01/04,
repurchase price $7,932,033
(collateralized by corporate securities:
Total market value $8,176,937) | | | 7,930 | | | | 7,930 | | |
Goldman Sachs
1.425%, dated 09/30/04, matures 10/18/04,
repurchase price $13,228,731
(collateralized by corporate securities:
Total market value $13,489,174) | | | 13,219 | | | | 13,219 | | |
Goldman Sachs
1.480%, dated 09/30/04, matures 10/18/04,
repurchase price $7,937,457
(collateralized by various securities:
Total market value $8,176,938) | | | 7,932 | | | | 7,932 | | |
Goldman Sachs
2.205%, dated 09/30/04, matures 03/07/05,
repurchase price $5,338,897
(collateralized by corporate securities:
Total market value $5,395,710) | | | 5,288 | | | | 5,288 | | |
Mid Cap Growth Opportunities Fund (concluded)
| DESCRIPTION | | PAR (000) | | VALUE (000) | |
Lehman Brothers
2.055%, dated 09/30/04, matures 10/01/04,
repurchase price $21,152,106
(collateralized by collateralized
mortgage obligations:
Total market value $21,573,917) | | $ | 21,151 | | | $ | 21,151 | | |
Lehman Brothers
1.910%, dated 09/30/04, matures 10/01/04,
repurchase price $31,728,032
(collateralized by U.S. government securities:
Total market value $32,361,386) | | | 31,726 | | | | 31,726 | | |
Lehman Brothers
1.935%, dated 09/30/04, matures 10/01/04,
repurchase price $21,152,036
(collateralized by collateralized
mortgage obligations:
Total market value $23,257,157) | | | 21,151 | | | | 21,151 | | |
Merrill Lynch
1.925%, dated 09/30/04, matures 10/01/04,
repurchase price $10,576,015
(collateralized by corporate securities:
Total market value $11,104,451) | | | 10,575 | | | | 10,575 | | |
Total Repurchase Agreements
(Cost $209,922) | | | | | | | 209,922 | | |
Total Investments Purchased with
Proceeds from Securities Lending
(Cost $619,460) | | | | | | | 619,460 | | |
Total Investments – 147.2%
(Cost $1,857,125) | | | | | | | 2,008,971 | | |
| Other Assets and Liabilities, Net – (47.2)% | | | | | | | (643,984 | ) | |
| Total Net Assets – 100.0% | | | | | | $ | 1,364,987 | | |
* Non-income producing security
(a) This security or a portion of this security is out on loan at September 30, 2004. Total loaned securities had a market value of $599,820,601 at September 30, 2004. See note 2 in Notes to Financial Statements.
(b) Security purchased on a when-issued basis. On September 30, 2004, the total cost of this investment was $6,847,826. See note 2 in Notes to Financial Statements.
(c) The Fund is significantly invested in this industry sector and therefore is subject to additional risks. See note 7 in Notes to Financial Statements.
(d) Investment in affiliated security. This money market fund is advised by U.S. Bancorp Asset Management, Inc., which also serves as advisor to this Fund. See note 3 in Notes to Financial Statements.
(e) Security has demand features which qualify it as a short term security. The date disclosed is the next put date.
ADR – American Depository Receipt
Cl – Class
The accompanying notes are an integral part of the financial statements.
FIRST AMERICAN FUNDS Annual Report 2004
84
Mid Cap Value Fund
| DESCRIPTION | | SHARES | | VALUE (000) | |
| Common Stocks – 96.9% | |
| Consumer Discretionary – 14.7% | |
| Abercrombie & Fitch (a) | | | 111,430 | | | $ | 3,510 | | |
| Black & Decker (a) | | | 52,110 | | | | 4,035 | | |
| Dana (a) | | | 151,720 | | | | 2,684 | | |
| Dex Media* | | | 135,370 | | | | 2,866 | | |
| Eastman Kodak (a) | | | 114,450 | | | | 3,688 | | |
| Federated Department Stores (a) | | | 100,270 | | | | 4,555 | | |
| Fortune Brands (a) | | | 44,540 | | | | 3,300 | | |
| Hearst-Argyle Television | | | 170,410 | | | | 4,166 | | |
| Hilton Hotels (a) | | | 495,700 | | | | 9,339 | | |
| J.C. Penney (a) | | | 84,600 | | | | 2,985 | | |
| Lear | | | 34,050 | | | | 1,854 | | |
| Lennar (a) | | | 68,940 | | | | 3,282 | | |
| Limited | | | 237,240 | | | | 5,288 | | |
| Liz Claiborne (a) | | | 121,190 | | | | 4,571 | | |
| Sherwin Williams | | | 258,300 | | | | 11,355 | | |
| Yum! Brands (a) | | | 62,450 | | | | 2,539 | | |
| | | | 70,017 | | |
| Consumer Staples – 4.1% | | | |
| Bunge Limited (a) | | | 108,520 | | | | 4,339 | | |
| Clorox (a) | | | 178,590 | | | | 9,518 | | |
| Dean Foods* (a) | | | 77,100 | | | | 2,315 | | |
| Smithfield Foods* | | | 137,130 | | | | 3,428 | | |
| | | | 19,600 | | |
| Energy – 8.9% | | | |
| Apache | | | 94,934 | | | | 4,757 | | |
| Ashland (a) | | | 129,390 | | | | 7,256 | | |
| EOG Resources (a) | | | 97,550 | | | | 6,424 | | |
| GlobalSantaFe | | | 77,220 | | | | 2,367 | | |
| Halliburton (a) | | | 115,480 | | | | 3,890 | | |
| National-Oilwell* (a) | | | 181,550 | | | | 5,966 | | |
| Valero Energy (a) | | | 86,290 | | | | 6,921 | | |
| Williams | | | 377,360 | | | | 4,566 | | |
| | | | 42,147 | | |
| Financials – 26.0% (b) | | | |
| ACE | | | 117,610 | | | | 4,711 | | |
| Ambac Financial Group (a) | | | 64,510 | | | | 5,158 | | |
| Apartment Investment & Management (a) | | | 138,090 | | | | 4,803 | | |
| Boston Properties (REIT) | | | 103,550 | | | | 5,736 | | |
| Chelsea Property Group (REIT) | | | 62,480 | | | | 4,192 | | |
| CIT Group | | | 188,610 | | | | 7,052 | | |
| City National (a) | | | 66,350 | | | | 4,309 | | |
| Compass Bancshares (a) | | | 54,280 | | | | 2,379 | | |
| Developers Diversified Realty (REIT) | | | 96,850 | | | | 3,792 | | |
| E*TRADE Financial* (a) | | | 424,420 | | | | 4,847 | | |
| General Growth Properties (REIT) (a) | | | 121,320 | | | | 3,761 | | |
| Genworth Financial (a) | | | 174,200 | | | | 4,059 | | |
| GreenPoint Financial | | | 146,170 | | | | 6,762 | | |
| Hibernia, Cl A | | | 187,740 | | | | 4,958 | | |
| Istar Financial | | | 120,520 | | | | 4,969 | | |
| Lincoln National | | | 113,770 | | | | 5,347 | | |
| Marshall & Ilsley (a) | | | 191,750 | | | | 7,728 | | |
| Northern Trust | | | 104,680 | | | | 4,271 | | |
| PMI Group (a) | | | 137,390 | | | | 5,575 | | |
| Protective Life | | | 86,730 | | | | 3,409 | | |
| SAFECO (a) | | | 89,470 | | | | 4,084 | | |
| SouthTrust | | | 114,600 | | | | 4,774 | | |
Mid Cap Value Fund (continued)
| DESCRIPTION | | SHARES | | VALUE (000) | |
| Synovus Financial | | | 90,770 | | | $ | 2,374 | | |
| TCF Financial (a) | | | 219,700 | | | | 6,655 | | |
| Torchmark (a) | | | 108,920 | | | | 5,792 | | |
| W.R. Berkley | | | 53,815 | | | | 2,269 | | |
| | | | 123,766 | | |
| Health Care – 4.0% | | | |
| C.R. Bard | | | 62,300 | | | | 3,528 | | |
| CIGNA (a) | | | 104,490 | | | | 7,276 | | |
| Community Health Systems* | | | 174,350 | | | | 4,652 | | |
| McKesson HBOC | | | 134,030 | | | | 3,438 | | |
| | | | 18,894 | | |
| Industrials – 9.6% | | | |
| American Standard* | | | 181,250 | | | | 7,052 | | |
| Cooper Industries | | | 82,300 | | | | 4,856 | | |
| Dover | | | 135,810 | | | | 5,279 | | |
| Eaton (a) | | | 160,490 | | | | 10,177 | | |
| Joy Global (a) | | | 200,310 | | | | 6,887 | | |
| Republic Services | | | 256,910 | | | | 7,646 | | |
| Rockwell Collins | | | 100,150 | | | | 3,720 | | |
| | | | 45,617 | | |
| Information Technology – 10.2% | | | |
| Affiliated Computer Services, Cl A* (a) | | | 66,170 | | | | 3,684 | | |
| Agilent Technologies* | | | 181,280 | | | | 3,910 | | |
| Avaya* (a) | | | 206,710 | | | | 2,882 | | |
| Computer Sciences* (a) | | | 98,840 | | | | 4,655 | | |
| Harris (a) | | | 116,850 | | | | 6,420 | | |
| Imation | | | 98,820 | | | | 3,517 | | |
| Intuit* (a) | | | 82,520 | | | | 3,746 | | |
| National Semiconductor* | | | 204,410 | | | | 3,166 | | |
| NCR* (a) | | | 239,480 | | | | 11,876 | | |
| Xerox* (a) | | | 336,810 | | | | 4,742 | | |
| | | | 48,598 | | |
| Materials – 8.1% | | | |
| Air Products and Chemicals | | | 75,070 | | | | 4,082 | | |
| Bemis | | | 184,150 | | | | 4,895 | | |
| Bowater (a) | | | 104,800 | | | | 4,002 | | |
| Cytec Industries | | | 82,750 | | | | 4,051 | | |
| MeadWestvaco | | | 192,330 | | | | 6,135 | | |
| NuCor (a) | | | 33,990 | | | | 3,106 | | |
| Phelps Dodge (a) | | | 31,800 | | | | 2,927 | | |
| Rohm & Haas (a) | | | 98,150 | | | | 4,217 | | |
| Temple-Inland | | | 71,760 | | | | 4,819 | | |
| | | | 38,234 | | |
| Telecommunication Services – 1.1% | | | |
| CenturyTel (a) | | | 155,280 | | | | 5,317 | | |
| Utilities - 10.2% | |
| Cinergy (a) | | | 143,440 | | | | 5,680 | | |
| Constellation Energy (a) | | | 167,150 | | | | 6,659 | | |
| Entergy | | | 75,980 | | | | 4,605 | | |
| Equitable Resources (a) | | | 66,390 | | | | 3,606 | | |
| PG&E* (a) | | | 267,770 | | | | 8,140 | | |
| PPL (a) | | | 140,760 | | | | 6,641 | | |
| Sempra Energy (a) | | | 125,610 | | | | 4,546 | | |
| TXU (a) | | | 182,480 | | | | 8,744 | | |
| | | | 48,621 | | |
Total Common Stocks
(Cost $380,105) | | | | | | | 460,811 | | |
FIRST AMERICAN FUNDS Annual Report 2004
85
Schedule of Investments September 30, 2004
Mid Cap Value Fund (continued)
| DESCRIPTION | | SHARES/PAR (000) | | VALUE (000) | |
| Affiliated Money Market Fund – 2.7% | | | |
First American Prime
Obligations Fund, Cl Z (c) | | | 13,141,463 | | | $ | 13,141 | | |
Total Affiliated Money Market Fund
(Cost $13,141) | | | | | | | 13,141 | | |
Investments Purchased with Proceeds
from Securities Lending – 41.2% | | | |
| Commercial Paper – 13.3% | | | |
| Bluegrass | |
| 1.881%, 05/18/05 | | $ | 825 | | | | 825 | | |
| 1.891%, 08/18/05 | | | 655 | | | | 655 | | |
| Concord Minutemen Capital | |
| 1.650%, 10/01/04 | | | 1,354 | | | | 1,354 | | |
| 1.680%, 10/05/04 | | | 3,009 | | | | 3,009 | | |
| 1.720%, 10/06/04 | | | 2,223 | | | | 2,223 | | |
| 1.740%, 10/14/04 | | | 1,488 | | | | 1,488 | | |
Descartes Funding Trust
1.760%, 11/15/04 | | | 1,672 | | | | 1,672 | | |
| Ford Credit Floor Plan | |
| 1.622%, 10/05/04 | | | 3,343 | | | | 3,343 | | |
| 1.526%, 10/06/04 | | | 2,340 | | | | 2,340 | | |
| 1.655%, 10/22/04 | | | 735 | | | | 735 | | |
Goldman Sachs
1.975%, 01/18/05 | | | 1,672 | | | | 1,672 | | |
Independence
1.830%, 04/15/05 | | | 2,066 | | | | 2,066 | | |
Jupiter Securities Corp
1.793%, 10/21/04 | | | 6,354 | | | | 6,354 | | |
Lakeside Funding
1.790%, 10/08/04 | | | 3,544 | | | | 3,544 | | |
Landesbank Baden
1.480%, 11/12/04 | | | 667 | | | | 667 | | |
Leaf's LLC
1.821%, 04/20/05 | | | 1,839 | | | | 1,839 | | |
| Liquid Funding | |
| 1.743%, 10/13/04 | | | 2,339 | | | | 2,339 | | |
| 1.830%, 05/25/05 | | | 1,672 | | | | 1,672 | | |
| MBNA Credit | |
| 1.683%, 10/12/04 | | | 1,625 | | | | 1,625 | | |
| 1.764%, 10/26/04 | | | 902 | | | | 902 | | |
| Main Street Warehouse | |
| 1.742%, 10/04/04 | | | 2,206 | | | | 2,206 | | |
| 1.683%, 10/04/04 | | | 2,725 | | | | 2,725 | | |
| 1.742%, 10/08/04 | | | 1,671 | | | | 1,671 | | |
| 1.742%, 10/08/04 | | | 1,672 | | | | 1,672 | | |
| Mortgage Interest Network | |
| 1.752%, 10/12/04 | | | 1,103 | | | | 1,103 | | |
| 1.763%, 10/14/04 | | | 1,169 | | | | 1,169 | | |
Netexis Banques
1.700%, 12/16/04 | | | 1,665 | | | | 1,665 | | |
| Orchard Park | |
| 1.796%, 04/06/05 | | | 1,672 | | | | 1,672 | | |
| 1.766%, 07/06/05 | | | 3,450 | | | | 3,450 | | |
| Park Granada LLC | |
| 1.622%, 10/01/04 | | | 2,942 | | | | 2,942 | | |
| 1.743%, 10/13/04 | | | 1,905 | | | | 1,905 | | |
Sigma Finance
1.512%, 11/29/04 | | | 833 | | | | 833 | | |
| Total Commercial Paper | | | | | | | 63,337 | | |
Mid Cap Value Fund (continued)
| DESCRIPTION | | PAR (000) | | VALUE (000) | |
| Corporate Obligations – 11.1% | |
| Allstate Life Global | |
| 1.780%, 10/14/05 | | $ | 3,343 | | | $ | 3,343 | | |
| 1.750%, 10/14/05 | | | 836 | | | | 836 | | |
Bayer Landbank NY
1.830%, 06/24/05 | | | 3,176 | | | | 3,176 | | |
Blue Heron Funding
1.850%, 05/18/05 | | | 936 | | | | 936 | | |
Castle Hill III
1.910%, 09/15/15 | | | 1,003 | | | | 1,003 | | |
Depfa Bank PLC
1.860%, 06/15/05 | | | 1,671 | | | | 1,671 | | |
Duke Funding VI
1.320%, 04/08/05 | | | 2,023 | | | | 2,023 | | |
General Electric Capital Corporation
1.838%, 10/07/05 | | | 1,674 | | | | 1,674 | | |
Jackson National Life
1.760%, 04/15/05 | | | 1,672 | | | | 1,672 | | |
Jefferson Pilot
1.788%, 08/17/05 | | | 1,672 | | | | 1,672 | | |
Liquid Funding
1.840%, 06/28/05 | | | 1,504 | | | | 1,504 | | |
Merrill Lynch
1.696%, 10/01/05 | | | 3,344 | | | | 3,344 | | |
| Metlife Global Funding | |
| 1.800%, 10/14/05 | | | 2,006 | | | | 2,006 | | |
| 1.880%, 10/28/05 | | | 1,405 | | | | 1,405 | | |
Morgan Stanley
1.850%, 12/26/08 | | | 1,672 | | | | 1,672 | | |
Natexis Banq NY
1.920%, 07/12/05 | | | 1,839 | | | | 1,839 | | |
Northlake CDO
1.895%, 03/07/05 | | | 1,003 | | | | 1,003 | | |
| Premium Asset Trust | |
| 1.848%, 12/22/04 | | | 1,254 | | | | 1,254 | | |
| 1.760%, 05/13/05 | | | 2,340 | | | | 2,340 | | |
| 1.740%, 06/01/05 | | | 4,982 | | | | 4,982 | | |
| 1.770%, 10/14/05 | | | 1,337 | | | | 1,337 | | |
REMAC
1.840%, 09/29/05 | | | 1,839 | | | | 1,839 | | |
RMAC
1.740%, 06/12/05 | | | 1,929 | | | | 1,929 | | |
SMM Trust 2004
1.833%, 09/23/05 | | | 3,109 | | | | 3,109 | | |
Societe Generale NYC
1.960%, 12/08/04 | | | 3,343 | | | | 3,343 | | |
Svenska Handl
1.170%, 10/21/04 | | | 1,672 | | | | 1,672 | | |
| Total Corporate Obligations | | | | | | | 52,584 | | |
| Other Short-Term Investments – 2.8% | |
ARLO III Ltd
2.000%, 09/28/05 | | | 5,016 | | | | 5,016 | | |
Commonwealth Life
2.115%, 12/31/04 (d) | | | 1,688 | | | | 1,688 | | |
General Electric Capital Assurance
1.980%, 01/19/05 | | | 669 | | | | 669 | | |
HBOS Treasury Services
1.640%, 11/01/05 | | | 1,838 | | | | 1,838 | | |
Security Life of Denver
1.900%, 12/30/04 | | | 4,346 | | | | 4,346 | | |
| Total Other Short-Term Investments | | | | | | | 13,557 | | |
The accompanying notes are an integral part of the financial statements.
FIRST AMERICAN FUNDS Annual Report 2004
86
Mid Cap Value Fund (continued)
| DESCRIPTION | | PAR (000) | | VALUE (000) | |
| Repurchase Agreements – 14.0% | | | |
Bear Stearns
2.045%, dated 09/30/04, matures 10/01/04,
repurchase price $3,343,694
(collateralized by various securities:
Total market value $3,412,238) | | $ | 3,343 | | | $ | 3,343 | | |
Bear Stearns
2.060%, dated 09/30/04, matures 12/23/04,
repurchase price $1,007,873
(collateralized by various securities:
Total market value $1,023,470) | | | 1,003 | | | | 1,003 | | |
Citibank
1.945%, dated 09/30/04, matures 10/01/04,
repurchase price $6,687,370
(collateralized by corporate securities:
Total market value $7,081,217) | | | 6,687 | | | | 6,687 | | |
Citibank
1.925%, dated 09/30/04, matures 10/01/04,
repurchase price $1,671,841
(collateralized by various securities:
Total market value $1,708,975) | | | 1,672 | | | | 1,672 | | |
Citibank
1.925%, dated 09/30/04, matures 10/01/04,
repurchase price $1,671,841
(collateralized by various securities:
Total market value $1,705,210) | | | 1,672 | | | | 1,672 | | |
Greenwich Capital Markets
1.950%, dated 09/30/04, matures 10/01/04,
repurchase price $10,031,056
(collateralized by U.S. government securities:
Total market value $10,231,253) | | | 10,031 | | | | 10,031 | | |
Goldman Sachs
2.025%, dated 09/30/04, matures 10/01/04,
repurchase price $2,340,585
(collateralized by various securities:
Total market value $2,412,842) | | | 2,340 | | | | 2,340 | | |
Goldman Sachs
2.025%, dated 09/30/04, matures 10/01/04,
repurchase price $1,003,108
(collateralized by various securities:
Total market value $1,034,100) | | | 1,003 | | | | 1,003 | | |
Goldman Sachs
2.025%, dated 09/30/04, matures 10/01/04,
repurchase price $1,003,108
(collateralized by various securities:
Total market value $1,034,099) | | | 1,003 | | | | 1,003 | | |
Goldman Sachs
2.025%, dated 09/30/04, matures 10/01/04,
repurchase price $2,507,769
(collateralized by corporate securities:
Total market value $2,585,197) | | | 2,508 | | | | 2,508 | | |
Goldman Sachs
1.425%, dated 09/30/04, matures 10/18/04,
repurchase price $4,182,357
(collateralized by corporate securities:
Total market value $4,264,699) | | | 4,179 | | | | 4,179 | | |
Goldman Sachs
1.480%, dated 09/30/04, matures 10/18/04,
repurchase price $2,509,484
(collateralized by various securities:
Total market value $2,585,197) | | | 2,508 | | | | 2,508 | | |
Goldman Sachs
2.205%, dated 09/30/04, matures 03/07/05,
repurchase price $1,687,930
(collateralized by corporate securities:
Total market value $1,705,892) | | | 1,672 | | | | 1,672 | | |
Mid Cap Value Fund (concluded)
| DESCRIPTION | | PAR (000) | | VALUE (000) | |
Lehman Brothers
2.055%, dated 09/30/04, matures 10/01/04,
repurchase price $6,687,390
(collateralized by collateralized
mortgage obligations:
Total market value $6,820,748) | | $ | 6,687 | | | $ | 6,687 | | |
Lehman Brothers
1.910%, dated 09/30/04, matures 10/01/04,
repurchase price $10,031,045
(collateralized by U.S. government securities:
Total market value $10,231,284) | | | 10,031 | | | | 10,031 | | |
Lehman Brothers
1.935%, dated 09/30/04, matures 10/01/04,
repurchase price $6,687,368
(collateralized by collateralized
mortgage obligations:
Total market value $7,352,917) | | | 6,687 | | | | 6,687 | | |
Merrill Lynch
1.925%, dated 09/30/04, matures 10/01/04,
repurchase price $3,343,683
(collateralized by corporate securities:
Total market value $3,510,752) | | | 3,343 | | | | 3,343 | | |
Total Repurchase Agreements
(Cost $66,369) | | | | | | | 66,369 | | |
Total Investments Purchased with
Proceeds from Securities Lending
(Cost $195,847) | | | | | | | 195,847 | | |
Total Investments – 140.8%
(Cost $589,093) | | | | | | | 669,799 | | |
| Other Assets and Liabilities, Net – (40.8)% | | | | | | | (194,088 | ) | |
| Total Net Assets – 100.0% | | | | | | $ | 475,711 | | |
* Non-income producing security
(a) This security or a portion of this security is out on loan at September 30, 2004. Total loaned securities had a market value of $191,052,173 at September 30, 2004. See note 2 in Notes to Financial Statements.
(b) The Fund is significantly invested in this industry sector and therefore is subject to additional risks. See note 7 in Notes to Financial Statements.
(c) Investment in affiliated security. This money market fund is advised by U.S. Bancorp Asset Management, Inc., which also serves as advisor to this Fund. See note 3 in Notes to Financial Statements.
(d) Security has demand features which qualify it as a short term security. The date disclosed is the next put date.
Cl – Class
REIT – Real Estate Investment Trust
FIRST AMERICAN FUNDS Annual Report 2004
87
Statements of Assets and Liabilities September 30, 2004, in thousands, except for per share data
| | | Mid Cap Growth
Opportunities Fund | | Mid Cap
Value Fund | |
| ASSETS: | | | |
| Investments in unaffiliated securities, at value*† | | $ | 1,710,708 | | | $ | 590,289 | | |
| Investments in affiliated money market fund, at value** | | | 88,341 | | | | 13,141 | | |
| Repurchase agreements, at value*** | | | 209,922 | | | | 66,369 | | |
| Cash**** | | | 103 | | | | 27 | | |
| Receivable for dividends and interest | | | 445 | | | | 541 | | |
| Receivable for investment securities sold | | | 5,405 | | | | 13,756 | | |
| Receivable for capital shares sold | | | 278 | | | | 268 | | |
| Prepaid expenses and other assets | | | 40 | | | | 33 | | |
| Total assets | | | 2,015,242 | | | | 684,424 | | |
| LIABILITIES: | | | |
| Payable for capital shares redeemed | | | 8,126 | | | | 1,290 | | |
| Payable upon return of securities loaned | | | 619,545 | | | | 195,874 | | |
| Payable for investment securities purchased | | | 21,498 | | | | 11,195 | | |
| Payable for advisory, co-administration, and custodian fees | | | 1,022 | | | | 334 | | |
| Payable for distribution and shareholder servicing fees | | | 54 | | | | 17 | | |
| Accrued expenses and other liabilities | | | 10 | | | | 3 | | |
| Total liabilities | | | 650,255 | | | | 208,713 | | |
| Net assets | | $ | 1,364,987 | | | $ | 475,711 | | |
| COMPOSITION OF NET ASSETS: | | | |
| Portfolio capital | | $ | 1,093,013 | | | $ | 453,220 | | |
| Undistributed (distributions in excess of) net investment income | | | (2 | ) | | | 153 | | |
| Accumulated net realized gain (loss) on investments | | | 120,130 | | | | (58,368 | ) | |
| Net unrealized appreciation of investments | | | 151,846 | | | | 80,706 | | |
| Net assets | | $ | 1,364,987 | | | $ | 475,711 | | |
| * Investments in unaffiliated securities, at cost | | $ | 1,558,862 | | | $ | 509,583 | | |
| ** Investments in affiliated money market fund, at cost | | $ | 88,341 | | | $ | 13,141 | | |
| *** Investments in repurchase agreements, at cost | | $ | 209,922 | | | $ | 66,369 | | |
| **** Includes cash related to securities loaned | | $ | 85 | | | $ | 27 | | |
| † Including securities loaned, at value | | $ | 599,821 | | | $ | 191,052 | | |
| Class A: | | | |
| Net assets | | $ | 173,436 | | | $ | 28,561 | | |
| Shares issued and outstanding ($0.0001 par value - 2 billion authorized) | | | 4,541 | | | | 1,422 | | |
| Net asset value and redemption price per share | | $ | 38.19 | | | $ | 20.09 | | |
| Maximum offering price per share (1) | | $ | 40.41 | | | $ | 21.26 | | |
| Class B: | | | |
| Net assets | | $ | 10,974 | | | $ | 9,928 | | |
| Shares issued and outstanding ($0.0001 par value - 2 billion authorized) | | | 303 | | | | 512 | | |
| Net asset value, offering price and redemption price per share (2) | | $ | 36.31 | | | $ | 19.39 | | |
| Class C: | | | |
| Net assets | | $ | 12,356 | | | $ | 3,342 | | |
| Shares issued and outstanding ($0.0001 par value - 2 billion authorized) | | | 330 | | | | 169 | | |
| Net asset value, offering price and redemption price per share (2) | | $ | 37.40 | | | $ | 19.77 | | |
| Class R: | | | |
| Net assets | | $ | 1 | | | $ | 1 | | |
| Shares issued and outstanding ($0.0001 par value - 2 billion authorized) | | | - | | | | - | | |
| Net asset value, offering price, and redemption price per share | | $ | 38.15 | | | $ | 20.09 | | |
| Class Y: | | | |
| Net assets | | $ | 1,168,220 | | | $ | 433,879 | | |
| Shares issued and outstanding ($0.0001 par value - 2 billion authorized) | | | 29,514 | | | | 21,515 | | |
| Net asset value, offering price, and redemption price per share | | $ | 39.58 | | | $ | 20.17 | | |
(1) The offering price is calculated by dividing the net asset value by 1 minus the maximum sales charge of 5.50%.
(2) Class B and C have a contingent deferred sales charge. For a description of this sales charge, see notes 1 and 3 in Notes to Financial Statements.
The accompanying notes are an integral part of the financial statements.
FIRST AMERICAN FUNDS Annual Report 2004
88
Statements of Operations For the fiscal year ended September 30, 2004, in thousands
| | | Mid Cap Growth
Opportunities Fund | | Mid Cap
Value Fund | |
| INVESTMENT INCOME: | | | |
| Dividends from affiliated money market fund | | $ | 340 | | | $ | 89 | | |
| Dividends from unaffiliated securities | | | 5,099 | | | | 6,409 | | |
| Less: Foreign taxes withheld | | | (16 | ) | | | (2 | ) | |
| Securities lending | | | 389 | | | | 97 | | |
| Other income | | | 62 | | | | 344 | | |
| Total investment income | | | 5,874 | | | | 6,937 | | |
| EXPENSES: | | | |
| Investment advisory fees | | | 10,029 | | | | 3,023 | | |
| Co-administration fees and expenses (including transfer agency fees) | | | 3,796 | | | | 1,156 | | |
| Custodian fees | | | 143 | | | | 43 | | |
| Directors' fees | | | 35 | | | | 11 | | |
| Registration fees | | | 21 | | | | 23 | | |
| Professional fees | | | 66 | | | | 20 | | |
| Printing | | | 50 | | | | 15 | | |
| Other | | | 62 | | | | 20 | | |
| Distribution and shareholder servicing fees – Class A | | | 429 | | | | 54 | | |
| Distribution and shareholder servicing fees – Class B | | | 107 | | | | 106 | | |
| Distribution and shareholder servicing fees – Class C | | | 132 | | | | 32 | | |
| Distribution and shareholder servicing fees – Class R | | | 16 | | | | 2 | | |
| Total expenses | | | 14,886 | | | | 4,505 | | |
| Less: Fee waivers | | | (592 | ) | | | (208 | ) | |
| Total net expenses | | | 14,294 | | | | 4,297 | | |
| Investment income (loss) – net | | | (8,420 | ) | | | 2,640 | | |
| REALIZED AND UNREALIZED GAINS ON INVESTMENTS – NET: | | | |
| Net realized gain on investments | | | 222,462 | | | | 47,402 | | |
| Net change in unrealized appreciation or depreciation of investments | | | 10,165 | | | | 37,910 | | |
| Net gain on investments | | | 232,627 | | | | 85,312 | | |
| Net increase in net assets resulting from operations | | $ | 224,207 | | | $ | 87,952 | | |
The accompanying notes are an integral part of the financial statements.
FIRST AMERICAN FUNDS Annual Report 2004
89
Statements of Changes in Net Assets in thousands
| | | Mid Cap Growth
Opportunities Fund | | Mid Cap
Value Fund | |
| | | 10/01/03
to
9/30/04 | | 10/01/02
to
9/30/03 | | 10/01/03
to
9/30/04 | | 10/01/02
to
9/30/03 | |
| OPERATIONS: | | | |
| Investment income (loss) – net | | $ | (8,420 | ) | | $ | (3,746 | ) | | $ | 2,640 | | | $ | 4,336 | | |
| Net realized gain (loss) on investments | | | 222,462 | | | | 74,155 | | | | 47,402 | | | | (4,597 | ) | |
| Net change in unrealized appreciation or depreciation of investments | | | 10,165 | | | | 203,246 | | | | 37,910 | | | | 67,910 | | |
| Net increase in net assets resulting from operations | | | 224,207 | | | | 273,655 | | | | 87,952 | | | | 67,649 | | |
| DISTRIBUTIONS TO SHAREHOLDERS FROM: | | | |
| Investment income – net: | |
| Class A | | | - | | | | - | | | | (65 | ) | | | (118 | ) | |
| Class B | | | - | | | | - | | | | (4 | ) | | | (35 | ) | |
| Class C | | | - | | | | - | | | | (1 | ) | | | (10 | ) | |
| Class R | | | - | | | | - | | | | (3 | ) | | | (5 | ) | |
| Class Y | | | - | | | | - | | | | (2,029 | ) | | | (2,852 | ) | |
| Net realized gain on investments: | |
| Class A | | | (4,797 | ) | | | - | | | | - | | | | - | | |
| Class B | | | (306 | ) | | | - | | | | - | | | | - | | |
| Class C | | | (393 | ) | | | - | | | | - | | | | - | | |
| Class R | | | (322 | ) | | | - | | | | - | | | | - | | |
| Class Y | | | (34,963 | ) | | | - | | | | - | | | | - | | |
| Return of capital: | |
| Class A | | | - | | | | - | | | | (2 | ) | | | (7 | ) | |
| Class B (2) | | | - | | | | - | | | | - | | | | (4 | ) | |
| Class C (2) | | | - | | | | - | | | | - | | | | (1 | ) | |
| Class R (2) | | | | | | - | |
| Class Y | | | - | | | | - | | | | (55 | ) | | | (129 | ) | |
| Total distributions | | | (40,781 | ) | | | - | | | | (2,159 | ) | | | (3,161 | ) | |
| CAPITAL SHARE TRANSACTIONS (1): | | | |
| Class A: | |
| Proceeds from sales | | | 29,575 | | | | 15,500 | | | | 13,198 | | | | 3,858 | | |
| Reinvestment of distributions | | | 4,705 | | | | - | | | | 65 | | | | 121 | | |
| Payments for redemptions | | | (35,852 | ) | | | (22,438 | ) | | | (5,352 | ) | | | (3,492 | ) | |
| Shares issued in connection with the acquisition of Fund net assets | | | - | | | | 53,452 | | | | - | | | | - | | |
| Increase (decrease) in net assets from Class A transactions | | | (1,572 | ) | | | 46,514 | | | | 7,911 | | | | 487 | | |
| Class B: | |
| Proceeds from sales | | | 2,328 | | | | 1,615 | | | | 1,051 | | | | 689 | | |
| Reinvestment of distributions | | | 291 | | | | - | | | | 4 | | | | 38 | | |
| Payments for redemptions | | | (1,842 | ) | | | (1,028 | ) | | | (3,446 | ) | | | (2,995 | ) | |
| Shares issued in connection with the acquisition of Fund net assets | | | - | | | | 2,462 | | | | - | | | | - | | |
| Increase (decrease) in net assets from Class B transactions | | | 777 | | | | 3,049 | | | | (2,391 | ) | | | (2,268 | ) | |
| Class C: | |
| Proceeds from sales | | | 1,776 | | | | 9,100 | | | | 1,189 | | | | 371 | | |
| Reinvestment of distributions | | | 392 | | | | - | | | | 1 | | | | 11 | | |
| Payments for redemptions | | | (4,056 | ) | | | (3,390 | ) | | | (1,405 | ) | | | (1,260 | ) | |
| Shares issued in connection with the acquisition of Fund net assets | | | - | | | | 3,422 | | | | - | | | | - | | |
| Increase (decrease) in net assets from Class C transactions | | | (1,888 | ) | | | 9,132 | | | | (215 | ) | | | (878 | ) | |
| Class R: | |
| Proceeds from sales | | | 1,017 | | | | 6,911 | | | | 776 | | | | 992 | | |
| Reinvestment of distributions | | | 285 | | | | - | | | | 2 | | | | 4 | | |
| Payments for redemptions | | | (13,131 | ) | | | (4,881 | ) | | | (1,919 | ) | | | (321 | ) | |
| Shares issued in connection with the acquisition of Fund net assets | | | - | | | | 190 | | | | - | | | | - | | |
| Increase (decrease) in net assets from Class R transactions | | | (11,829 | ) | | | 2,220 | | | | (1,141 | ) | | | 675 | | |
| Class Y: | |
| Proceeds from sales | | | 142,884 | | | | 300,126 | | | | 101,305 | | | | 89,296 | | |
| Reinvestment of distributions | | | 29,145 | | | | - | | | | 1,435 | | | | 2,012 | | |
| Payments for redemptions | | | (316,100 | ) | | | (262,559 | ) | | | (79,863 | ) | | | (77,783 | ) | |
| Shares issued in connection with the acquisition of Fund net assets | | | - | | | | 159,215 | | | | - | | | | - | | |
| Shares issued in connection with the acquisition of Common Trust Fund net assets | | | - | | | | 245,348 | | | | - | | | | - | | |
| Increase (decrease) in net assets from Class Y transactions | | | (144,071 | ) | | | 442,130 | | | | 22,877 | | | | 13,525 | | |
| Increase (decrease) in net assets from capital share transactions | | | (158,583 | ) | | | 503,045 | | | | 27,041 | | | | 11,541 | | |
| Total increase in net assets | | | 24,843 | | | | 776,700 | | | | 112,834 | | | | 76,029 | | |
| Net assets at beginning of period | | | 1,340,144 | | | | 563,444 | | | | 362,877 | | | | 286,848 | | |
| Net assets at end of period | | $ | 1,364,987 | | | $ | 1,340,144 | | | $ | 475,711 | | | $ | 362,877 | | |
| Undistributed (distributions in excess of) net investment income at end of period | | $ | (2 | ) | | $ | (3 | ) | | $ | 153 | | | $ | 27 | | |
(1) See note 4 in Notes to Financial Statements for additional information.
(2) For the Mid Cap Value Fund for the period 10/1/03 to 9/30/04 and due to the presentation of the financial statements in thousands, the numbers round to zero.
The accompanying notes are an integral part of the financial statements.
FIRST AMERICAN FUNDS Annual Report 2004
90
(This page has been left blank intentionally.)
Financial Highlights For a share outstanding throughout the periods ended September 30, unless otherwise indicated.
| | | Net Asset
Value
Beginning
of Period | | Net
Investment
Income (Loss) | | Realized and
Unrealized
Gains
(Losses) on
Investments | | Dividends
from Net
Investment
Income | | Distributions
from Net
Realized Gains | | Distributions
from Return
of Capital | | Net Asset
Value
End of
Period | | Total
Return (9) | | Net Assets
End of
Period (000) | | Ratio of
Expenses to
Average
Net Assets | | Ratio of Net
Investment
Income (Loss)
to Average
Net Assets | | Ratio of
Expenses to
Average
Net Assets
(Excluding
Waivers) | | Ratio of Net
Investment
Income (Loss)
to Average Net
Assets (Excluding
Waivers) | | Portfolio
Turnover
Rate | |
| Mid Cap Growth Opportunities Fund (1) | |
| Class A | |
| | 2004 | (2) | | $ | 33.68 | | | $ | (0.30 | ) | | $ | 5.88 | | | $ | - | | | $ | (1.07 | ) | | $ | - | | | $ | 38.19 | | | | 16.88 | % | | $ | 173,436 | | | | 1.20 | % | | | (0.79 | )% | | | 1.24 | % | | | (0.83 | )% | | | 135 | % | |
| | 2003 | (2) | | | 26.45 | | | | (0.18 | ) | | | 7.41 | | | | - | | | | - | | | | - | | | | 33.68 | | | | 27.33 | | | | 154,499 | | | | 1.20 | | | | (0.58 | ) | | | 1.25 | | | | (0.63 | ) | | | 145 | | |
| | 2002 | | | | 28.33 | | | | (0.11 | ) | | | (1.77 | ) | | | - | | | | - | | | | - | | | | 26.45 | | | | (6.64 | ) | | | 75,002 | | | | 1.20 | | | | (0.34 | ) | | | 1.26 | | | | (0.40 | ) | | | 162 | | |
| | 2001 | (2) (3) | | | 54.63 | | | | (0.06 | ) | | | (8.40 | ) | | | - | | | | (17.84 | ) | | | - | | | | 28.33 | | | | (20.00 | ) | | | 82,043 | | | | 1.20 | | | | (0.19 | ) | | | 1.22 | | | | (0.21 | ) | | | 204 | | |
| | 2000 | (2) (4) | | | 37.80 | | | | (0.18 | ) | | | 17.80 | | | | - | | | | (0.79 | ) | | | - | | | | 54.63 | | | | 47.23 | | | | 108,326 | | | | 1.20 | | | | (0.38 | ) | | | 1.22 | | | | (0.40 | ) | | | 205 | | |
| | 1999 | (2) (4) | | | 37.59 | | | | (0.08 | ) | | | 0.60 | | | | - | | | | (0.31 | ) | | | - | | | | 37.80 | | | | 1.31 | | | | 95,758 | | | | 1.19 | | | | (0.21 | ) | | | 1.21 | | | | (0.23 | ) | | | 140 | | |
| Class B | |
| | 2004 | (2) | | $ | 32.30 | | | $ | (0.55 | ) | | $ | 5.63 | | | $ | - | | | $ | (1.07 | ) | | $ | - | | | $ | 36.31 | | | | 16.03 | % | | $ | 10,974 | | | | 1.95 | % | | | (1.54 | )% | | | 1.99 | % | | | (1.58 | )% | | | 135 | % | |
| | 2003 | (2) | | | 25.56 | | | | (0.39 | ) | | | 7.13 | | | | - | | | | - | | | | - | | | | 32.30 | | | | 26.37 | | | | 9,055 | | | | 1.95 | | | | (1.33 | ) | | | 2.00 | | | | (1.38 | ) | | | 145 | | |
| | 2002 | | | | 27.59 | | | | (0.18 | ) | | | (1.85 | ) | | | - | | | | - | | | | - | | | | 25.56 | | | | (7.36 | ) | | | 4,227 | | | | 1.95 | | | | (1.08 | ) | | | 2.01 | | | | (1.14 | ) | | | 162 | | |
| | 2001 | (2) (3) | | | 53.97 | | | | (0.29 | ) | | | (8.25 | ) | | | - | | | | (17.84 | ) | | | - | | | | 27.59 | | | | (20.60 | ) | | | 2,606 | | | | 1.94 | | | | (0.95 | ) | | | 1.97 | | | | (0.98 | ) | | | 204 | | |
| | 2000 | (2) (4) | | | 37.63 | | | | (0.53 | ) | | | 17.66 | | | | - | | | | (0.79 | ) | | | - | | | | 53.97 | | | | 46.13 | | | | 666 | | | | 1.95 | | | | (1.13 | ) | | | 1.97 | | | | (1.15 | ) | | | 205 | | |
| | 1999 (2) (4) (5) | | | | 37.57 | | | | (0.23 | ) | | | 0.29 | | | | - | | | | - | | | | - | | | | 37.63 | | | | 0.16 | | | | 126 | | | | 1.95 | | | | (0.89 | ) | | | 1.97 | | | | (0.91 | ) | | | 140 | | |
| Class C | |
| | 2004 | (2) | | $ | 33.24 | | | $ | (0.57 | ) | | $ | 5.80 | | | $ | - | | | $ | (1.07 | ) | | $ | - | | | $ | 37.40 | | | | 16.03 | % | | $ | 12,356 | | | | 1.95 | % | | | (1.54 | )% | | | 1.99 | % | | | (1.58 | )% | | | 135 | % | |
| | 2003 | (2) | | | 26.29 | | | | (0.40 | ) | | | 7.35 | | | | - | | | | - | | | | - | | | | 33.24 | | | | 26.43 | | | | 12,649 | | | | 1.95 | | | | (1.33 | ) | | | 2.00 | | | | (1.38 | ) | | | 145 | | |
| | 2002 | | | | 28.33 | | | | (0.10 | ) | | | (1.94 | ) | | | - | | | | - | | | | - | | | | 26.29 | | | | (7.20 | ) | | | 1,136 | | | | 1.95 | | | | (1.07 | ) | | | 2.01 | | | | (1.13 | ) | | | 162 | | |
| | 2001 | (2) (6) | | | 27.40 | | | | - | | | | 0.93 | | | | - | | | | - | | | | - | | | | 28.33 | | | | 3.39 | | | | - | | | | - | | | | - | | | | - | | | | - | | | | 204 | | |
| Class R | |
| | 2004 | (2) (7) | | $ | 33.66 | | | $ | (0.30 | ) | | $ | 5.86 | | | $ | - | | | $ | (1.07 | ) | | $ | - | | | $ | 38.15 | | | | 16.83 | % | | $ | 1 | | | | 1.20 | % | | | (0.81 | )% | | | 1.24 | % | | | (0.85 | )% | | | 135 | % | |
| | 2003 | (2) | | | 26.43 | | | | (0.17 | ) | | | 7.40 | | | | - | | | | - | | | | - | | | | 33.66 | | | | 27.36 | | | | 10,284 | | | | 1.20 | | | | (0.56 | ) | | | 1.25 | | | | (0.61 | ) | | | 145 | | |
| | 2002 | | | | 28.29 | | | | (0.07 | ) | | | (1.79 | ) | | | - | | | | - | | | | - | | | | 26.43 | | | | (6.58 | ) | | | 5,869 | | | | 1.20 | | | | (0.33 | ) | | | 1.26 | | | | (0.39 | ) | | | 162 | | |
| | 2001 | (2) (8) | | | 35.75 | | | | (0.06 | ) | | | (7.40 | ) | | | - | | | | - | | | | - | | | | 28.29 | | | | (20.87 | ) | | | 1,484 | | | | 1.19 | | | | (0.24 | ) | | | 1.23 | | | | (0.28 | ) | | | 204 | | |
| Class Y | |
| | 2004 | (2) | | $ | 34.78 | | | $ | (0.21 | ) | | $ | 6.08 | | | $ | - | | | $ | (1.07 | ) | | $ | - | | | $ | 39.58 | | | | 17.18 | % | | $ | 1,168,220 | | | | 0.95 | % | | | (0.54 | )% | | | 0.99 | % | | | (0.58 | )% | | | 135 | % | |
| | 2003 | (2) | | | 27.25 | | | | (0.09 | ) | | | 7.62 | | | | - | | | | - | | | | - | | | | 34.78 | | | | 27.68 | | | | 1,153,657 | | | | 0.95 | | | | (0.30 | ) | | | 1.00 | | | | (0.35 | ) | | | 145 | | |
| | 2002 | | | | 29.11 | | | | (0.05 | ) | | | (1.81 | ) | | | - | | | | - | | | | - | | | | 27.25 | | | | (6.39 | ) | | | 477,210 | | | | 0.95 | | | | (0.08 | ) | | | 1.01 | | | | (0.14 | ) | | | 162 | | |
| | 2001 | (2) (3) | | | 55.52 | | | | 0.02 | | | | (8.59 | ) | | | - | | | | (17.84 | ) | | | - | | | | 29.11 | | | | (19.84 | ) | | | 406,349 | | | | 0.95 | | | | 0.06 | | | | 0.97 | | | | 0.04 | | | | 204 | | |
| | 2000 | (2) (4) | | | 38.32 | | | | (0.05 | ) | | | 18.04 | | | | - | | | | (0.79 | ) | | | - | | | | 55.52 | | | | 47.56 | | | | 435,613 | | | | 0.95 | | | | (0.13 | ) | | | 0.97 | | | | (0.15 | ) | | | 205 | | |
| | 1999 | (2) (4) | | | 38.01 | | | | 0.02 | | | | 0.60 | | | | - | | | | (0.31 | ) | | | - | | | | 38.32 | | | | 1.56 | | | | 359,947 | | | | 0.94 | | | | 0.04 | | | | 0.96 | | | | 0.02 | | | | 140 | | |
| Mid Cap Value Fund | |
| Class A | |
| | 2004 | (2) | | $ | 16.30 | | | $ | 0.08 | | | $ | 3.77 | | | $ | (0.06 | ) | | $ | - | | | $ | - | (10) | | $ | 20.09 | | | | 23.65 | % | | $ | 28,561 | | | | 1.20 | % | | | 0.41 | % | | | 1.25 | % | | | 0.36 | % | | | 83 | % | |
| | 2003 | (2) | | | 13.29 | | | | 0.18 | | | | 2.96 | | | | (0.12 | ) | | | - | | | | (0.01 | ) | | | 16.30 | | | | 23.71 | | | | 16,598 | | | | 1.20 | | | | 1.21 | | | | 1.25 | | | | 1.16 | | | | 102 | | |
| | 2002 | (2) | | | 13.74 | | | | 0.13 | | | | (0.44 | ) | | | (0.10 | ) | | | - | | | | (0.04 | ) | | | 13.29 | | | | (2.41 | ) | | | 13,083 | | | | 1.20 | | | | 0.83 | | | | 1.26 | | | | 0.77 | | | | 90 | | |
| | 2001 | (2) | | | 14.62 | | | | 0.10 | | | | (0.88 | ) | | | (0.10 | ) | | | - | | | | - | | | | 13.74 | | | | (5.41 | ) | | | 13,583 | | | | 1.15 | | | | 0.67 | | | | 1.15 | | | | 0.67 | | | | 104 | | |
| | 2000 | | | | 12.95 | | | | 0.08 | | | | 1.67 | | | | (0.08 | ) | | | - | | | | - | | | | 14.62 | | | | 13.58 | | | | 13,568 | | | | 1.15 | | | | 0.53 | | | | 1.19 | | | | 0.49 | | | | 141 | | |
| Class B | |
| | 2004 | (2) | | $ | 15.81 | | | $ | (0.06 | ) | | $ | 3.65 | | | $ | (0.01 | ) | | $ | - | | | $ | - | (10) | | $ | 19.39 | | | | 22.69 | % | | $ | 9,928 | | | | 1.95 | % | | | (0.35 | )% | | | 2.00 | % | | | (0.40 | )% | | | 83 | % | |
| | 2003 | (2) | | | 12.92 | | | | 0.07 | | | | 2.87 | | | | (0.04 | ) | | | - | | | | (0.01 | ) | | | 15.81 | | | | 22.84 | | | | 10,154 | | | | 1.95 | | | | 0.50 | | | | 2.00 | | | | 0.45 | | | | 102 | | |
| | 2002 | (2) | | | 13.37 | | | | 0.01 | | | | (0.41 | ) | | | (0.01 | ) | | | - | | | | (0.04 | ) | | | 12.92 | | | | (3.07 | ) | | | 10,410 | | | | 1.95 | | | | 0.08 | | | | 2.01 | | | | 0.02 | | | | 90 | | |
| | 2001 | (2) | | | 14.28 | | | | (0.01 | ) | | | (0.88 | ) | | | (0.02 | ) | | | - | | | | - | | | | 13.37 | | | | (6.21 | ) | | | 11,311 | | | | 1.90 | | | | (0.08 | ) | | | 1.90 | | | | (0.08 | ) | | | 104 | | |
| | 2000 | | | | 12.67 | | | | 0.02 | | | | 1.61 | | | | (0.02 | ) | | | - | | | | - | | | | 14.28 | | | | 12.85 | | | | 12,495 | | | | 1.90 | | | | (0.22 | ) | | | 1.94 | | | | (0.26 | ) | | | 141 | | |
| Class C | |
| | 2004 | (2) | | $ | 16.12 | | | $ | (0.06 | ) | | $ | 3.72 | | | $ | (0.01 | ) | | $ | - | | | $ | - | (10) | | $ | 19.77 | | | | 22.69 | % | | $ | 3,342 | | | | 1.95 | % | | | (0.33 | )% | | | 2.00 | % | | | (0.38 | )% | | | 83 | % | |
| | 2003 | (2) | | | 13.17 | | | | 0.07 | | | | 2.93 | | | | (0.04 | ) | | | - | | | | (0.01 | ) | | | 16.12 | | | | 22.84 | | | | 2,916 | | | | 1.95 | | | | 0.51 | | | | 2.00 | | | | 0.46 | | | | 102 | | |
| | 2002 | (2) | | | 13.63 | | | | 0.01 | | | | (0.43 | ) | | | - | | | | - | | | | (0.04 | ) | | | 13.17 | | | | (3.09 | ) | | | 3,207 | | | | 1.95 | | | | 0.08 | | | | 2.01 | | | | 0.02 | | | | 90 | | |
| | 2001 | (2) | | | 14.55 | | | | (0.01 | ) | | | (0.89 | ) | | | (0.02 | ) | | | - | | | | - | | | | 13.63 | | | | (6.17 | ) | | | 3,312 | | | | 1.90 | | | | (0.04 | ) | | | 1.90 | | | | (0.04 | ) | | | 104 | | |
| | 2000 | | | | 12.92 | | | | 0.02 | | | | 1.63 | | | | (0.02 | ) | | | - | | | | - | | | | 14.55 | | | | 12.81 | | | | 1,430 | | | | 1.90 | | | | (0.15 | ) | | | 1.93 | | | | (0.18 | ) | | | 141 | | |
| Class R (2) | |
| | 2004 | (7) | | $ | 16.31 | | | $ | 0.07 | | | $ | 3.76 | | | $ | (0.05 | ) | | $ | - | | | $ | - | (10) | | $ | 20.09 | | | | 23.51 | % | | $ | 1 | | | | 1.20 | % | | | 0.37 | % | | | 1.25 | % | | | 0.32 | % | | | 83 | % | |
| | 2003 | | | | 13.29 | | | | 0.16 | | | | 2.99 | | | | (0.12 | ) | | | - | | | | (0.01 | ) | | | 16.31 | | | | 23.80 | | | | 966 | | | | 1.20 | | | | 1.07 | | | | 1.25 | | | | 1.02 | | | | 102 | | |
| | 2002 | | | | 13.74 | | | | 0.13 | | | | (0.44 | ) | | | (0.10 | ) | | | - | | | | (0.04 | ) | | | 13.29 | | | | (2.40 | ) | | | 158 | | | | 1.20 | | | | 0.87 | | | | 1.26 | | | | 0.81 | | | | 90 | | |
| | 2001 | (6) | | | 13.31 | | | | 0.01 | | | | 0.42 | | | | - | | | | - | | | | - | | | | 13.74 | | | | 3.23 | | | | 44 | | | | 0.85 | | | | 5.19 | | | | 0.85 | | | | 5.19 | | | | 104 | | |
| Class Y | |
| | 2004 | (2) | | $ | 16.36 | | | $ | 0.12 | | | $ | 3.79 | | | $ | (0.10 | ) | | $ | - | | | $ | - | (10) | | $ | 20.17 | | | | 23.95 | % | | $ | 433,879 | | | | 0.95 | % | | | 0.66 | % | | | 1.00 | % | | | 0.61 | % | | | 83 | % | |
| | 2003 | (2) | | | 13.33 | | | | 0.21 | | | | 2.98 | | | | (0.15 | ) | | | - | | | | (0.01 | ) | | | 16.36 | | | | 24.06 | | | | 332,243 | | | | 0.95 | | | | 1.45 | | | | 1.00 | | | | 1.40 | | | | 102 | | |
| | 2002 | (2) | | | 13.77 | | | | 0.17 | | | | (0.44 | ) | | | (0.13 | ) | | | - | | | | (0.04 | ) | | | 13.33 | | | | (2.12 | ) | | | 259,990 | | | | 0.95 | | | | 1.08 | | | | 1.01 | | | | 1.02 | | | | 90 | | |
| | 2001 | (2) | | | 14.68 | | | | 0.14 | | | | (0.92 | ) | | | (0.13 | ) | | | - | | | | - | | | | 13.77 | | | | (5.37 | ) | | | 291,932 | | | | 0.90 | | | | 0.92 | | | | 0.90 | | | | 0.92 | | | | 104 | | |
| | 2000 | | | | 12.99 | | | | 0.11 | | | | 1.69 | | | | (0.11 | ) | | | - | | | | - | | | | 14.68 | | | | 13.94 | | | | 275,128 | | | | 0.90 | | | | 0.79 | | | | 0.94 | | | | 0.75 | | | | 141 | | |
(1) The financial highlights for the Mid Cap Growth Opportunities Fund as set forth herein include the historical financial highlights of the Firstar Mid Cap Core Equity Fund. The assets of the Firstar Fund were acquired by the First American Mid Cap Growth Opportunities Fund on September 24, 2001. In connection with such acquisition, (i) Class A shares of the Fistar Mid Cap Core Equity Fund were exchanged for Class A shares of the First American Mid Cap Growth Opportunities Fund, (ii) Firstar Class B shares were exchanged for Class B shares of the First American Fund, (iii) Firstar Class Y shares were exchanged for Class S shares (now designated Class R shares) of the First American Fund, and (iv) Firstar Class Institutional shares were exchanged for Class Y shares of the First American Fund.
(2) Per share data calculated using average shares outstanding method.
(3) For the period November 1, 2000, to September 30, 2001. Effective in 2001, the Fund's fiscal year end was changed from October 31 to September 30. All ratios for the period have been annualized, except total return and portfolio turnover.
(4) For the fiscal year ended October 31.
(5) Class of shares has been offered since March 1, 1999. All ratios for the period have been annualized, except total return and portfolio turnover.
(6) Class of shares has been offered since September 24, 2001. All ratios for the period have been annualized, except total return and portfolio turnover.
(7) Prior to July 1, 2004, Class R shares were named Class S shares, which had lower fees and expenses.
(8) Class of shares has been offered since December 11, 2000. All ratios for the period have been annualized, except total return and portfolio turnover.
(9) Total return does not include sales charges. Total return would have been lower had certain expenses not been waived.
(10) Includes a tax return of capital of less than $0.01.
The accompanying notes are an integral part of the financial statements.
FIRST AMERICAN FUNDS Annual Report 2004
92
FIRST AMERICAN FUNDS Annual Report 2004
93
Schedule of Investments September 30, 2004
Large Cap Growth Opportunities Fund
| DESCRIPTION | | SHARES | | VALUE (000) | |
| Common Stocks – 98.6% | |
| Consumer Discretionary – 15.5% | |
| Best Buy (a) | | | 258,310 | | | $ | 14,011 | | |
| Brunswick (a) | | | 180,470 | | | | 8,258 | | |
| Dollar General (a) | | | 541,420 | | | | 10,910 | | |
| Getty Images* (a) | | | 162,460 | | | | 8,984 | | |
| Hilton Hotels (a) | | | 673,160 | | | | 12,682 | | |
| Home Depot | | | 519,670 | | | | 20,371 | | |
| International Game Technology | | | 308,640 | | | | 11,096 | | |
| Lowe's (a) | | | 480,940 | | | | 26,139 | | |
| Marriott International, Cl A | | | 217,010 | | | | 11,276 | | |
| Marvel Enterprises* (a) | | | 374,755 | | | | 5,456 | | |
| McGraw-Hill (a) | | | 279,790 | | | | 22,296 | | |
| Omnicom Group (a) | | | 89,580 | | | | 6,545 | | |
| Staples | | | 568,030 | | | | 16,939 | | |
| Station Casinos (a) | | | 154,250 | | | | 7,564 | | |
| Target (a) | | | 305,290 | | | | 13,814 | | |
| Yum! Brands (a) | | | 281,380 | | | | 11,441 | | |
| | | | 207,782 | | |
| Consumer Staples – 8.6% | | | |
| Avon Products (a) | | | 620,540 | | | | 27,105 | | |
| Clorox (a) | | | 164,770 | | | | 8,782 | | |
| PepsiCo | | | 546,170 | | | | 26,571 | | |
| Procter & Gamble | | | 297,220 | | | | 16,086 | | |
| Sysco (a) | | | 316,230 | | | | 9,462 | | |
| Wal-Mart Stores | | | 515,990 | | | | 27,451 | | |
| | | | 115,457 | | |
| Energy – 2.3% | | | |
| Apache | | | 321,320 | | | | 16,102 | | |
| BP, ADR | | | 125,510 | | | | 7,220 | | |
| Schlumberger | | | 118,300 | | | | 7,963 | | |
| | | | 31,285 | | |
| Financials – 12.4% | | | |
| American International Group | | | 494,961 | | | | 33,652 | | |
| AmeriTrade Holding* | | | 435,340 | | | | 5,228 | | |
| Capital One Financial (a) | | | 265,090 | | | | 19,590 | | |
| Fannie Mae (a) | | | 198,390 | | | | 12,578 | | |
| Goldman Sachs Group (a) | | | 159,660 | | | | 14,887 | | |
| Investors Financial Services (a) | | | 463,990 | | | | 20,940 | | |
| Lehman Brothers Holdings (a) | | | 173,920 | | | | 13,865 | | |
| MBNA | | | 831,195 | | | | 20,946 | | |
| Northern Trust | | | 231,740 | | | | 9,455 | | |
| Wells Fargo | | | 245,880 | | | | 14,662 | | |
| | | | 165,803 | | |
| Health Care – 23.9% | | | |
| Aetna (a) | | | 170,260 | | | | 17,014 | | |
| Boston Scientific* (a) | | | 281,830 | | | | 11,197 | | |
| C.R. Bard | | | 181,840 | | | | 10,298 | | |
| Caremark Rx* (a) | | | 300,456 | | | | 9,636 | | |
| DENTSPLY International | | | 155,240 | | | | 8,063 | | |
| Forest Laboratories, Cl A* (a) | | | 215,570 | | | | 9,696 | | |
| Genentech* (a) | | | 112,370 | | | | 5,890 | | |
| Johnson & Johnson (a) | | | 608,000 | | | | 34,249 | | |
| McKesson HBOC | | | 116,440 | | | | 2,987 | | |
| Medtronic (a) | | | 713,580 | | | | 37,035 | | |
| Pfizer | | | 2,220,980 | | | | 67,962 | | |
| Quest Diagnostics (a) | | | 180,860 | | | | 15,955 | | |
Large Cap Growth Opportunities Fund (continued)
| DESCRIPTION | | SHARES/PAR (000) | | VALUE (000) | |
| St. Jude Medical* (a) | | | 141,270 | | | $ | 10,633 | | |
| Teva Pharmaceutical Industries, ADR (a) | | | 551,020 | | | | 14,299 | | |
| UnitedHealth Group (a) | | | 380,080 | | | | 28,027 | | |
| Varian Medical Systems* (a) | | | 303,600 | | | | 10,495 | | |
| Wyeth Pharmaceuticals | | | 271,120 | | | | 10,140 | | |
| Zimmer Holdings* (a) | | | 212,879 | | | | 16,826 | | |
| | | | 320,402 | | |
| Industrials – 8.5% | | | |
| 3M | | | 285,430 | | | | 22,826 | | |
| Danaher (a) | | | 191,190 | | | | 9,804 | | |
| General Electric | | | 607,120 | | | | 20,387 | | |
| MSC Industrial Direct | | | 159,300 | | | | 5,429 | | |
| Rockwell Collins (a) | | | 331,390 | | | | 12,308 | | |
| Tyco International (a) | | | 318,120 | | | | 9,754 | | |
| United Technologies | | | 242,000 | | | | 22,598 | | |
| Waste Management | | | 367,660 | | | | 10,052 | | |
| | | | 113,158 | | |
| Information Technology – 27.4% (b) | | | |
| Altera* | | | 207,110 | | | | 4,053 | | |
| Analog Devices (a) | | | 487,420 | | | | 18,903 | | |
| CDW (a) | | | 330,640 | | | | 19,187 | | |
| Cisco Systems* | | | 1,656,378 | | | | 29,980 | | |
| Dell* | | | 841,360 | | | | 29,952 | | |
| eBay* (a) | | | 128,570 | | | | 11,821 | | |
| Intel | | | 1,585,180 | | | | 31,799 | | |
| Maxim Integrated Products (a) | | | 150,600 | | | | 6,369 | | |
| Microchip Technology (a) | | | 326,960 | | | | 8,776 | | |
| Microsoft | | | 963,190 | | | | 26,632 | | |
| Motorola | | | 987,010 | | | | 17,806 | | |
| National Semiconductor* | | | 339,180 | | | | 5,254 | | |
| NCR* (a) | | | 738,360 | | | | 36,615 | | |
| Oracle* | | | 1,168,340 | | | | 13,179 | | |
| QUALCOMM | | | 673,500 | | | | 26,293 | | |
| Research in Motion* (a) | | | 165,550 | | | | 12,638 | | |
| SAP, ADR | | | 201,390 | | | | 7,844 | | |
| Symantec* (a) | | | 211,450 | | | | 11,604 | | |
| Texas Instruments | | | 805,500 | | | | 17,141 | | |
| Xerox* (a) | | | 590,590 | | | | 8,315 | | |
| Xilinx (a) | | | 444,130 | | | | 11,992 | | |
| Yahoo!* (a) | | | 292,870 | | | | 9,931 | | |
| | | | 366,084 | | |
Total Common Stocks
(Cost $1,224,184) | | | | | | | 1,319,971 | | |
| Affiliated Money Market Fund – 2.3% | | | |
First American Prime
Obligations Fund, Cl Z (c) | | | 30,950,153 | | | | 30,950 | | |
Total Affiliated Money Market Fund
(Cost $30,950) | | | | | | | 30,950 | | |
| Investments Purchased with Proceeds from Securities Lending – 42.5% | | | |
| Commercial Paper - 13.8% | | | |
| Bluegrass | |
| 1.881%, 05/18/05 | | $ | 2,396 | | | | 2,396 | | |
| 1.891%, 08/18/05 | | | 1,904 | | | | 1,904 | | |
| Concord Minutemen Capital | |
| 1.650%, 10/01/04 | | | 3,934 | | | | 3,934 | | |
| 1.680%, 10/05/04 | | | 8,742 | | | | 8,742 | | |
| 1.720%, 10/06/04 | | | 6,459 | | | | 6,459 | | |
| 1.740%, 10/14/04 | | | 4,323 | | | | 4,323 | | |
The accompanying notes are an integral part of the financial statements.
FIRST AMERICAN FUNDS Annual Report 2004
94
Large Cap Growth Opportunities Fund (continued)
| DESCRIPTION | | PAR (000) | | VALUE (000) | |
Descartes Funding Trust
1.760%, 11/15/04 | | $ | 4,857 | | | $ | 4,857 | | |
| Ford Credit Floor Plan | |
| 1.622%, 10/05/04 | | | 9,711 | | | | 9,711 | | |
| 1.526%, 10/06/04 | | | 6,799 | | | | 6,799 | | |
| 1.655%, 10/22/04 | | | 2,135 | | | | 2,135 | | |
Goldman Sachs
1.975%, 01/18/05 | | | 4,857 | | | | 4,857 | | |
Independence
1.830%, 04/15/05 | | | 6,003 | | | | 6,003 | | |
Jupiter Securities Corp
1.793%, 10/21/04 | | | 18,461 | | | | 18,461 | | |
Lakeside Funding
1.790%, 10/08/04 | | | 10,296 | | | | 10,296 | | |
Landesbank Baden
1.480%, 11/12/04 | | | 1,938 | | | | 1,938 | | |
Leaf's LLC
1.821%, 04/20/05 | | | 5,342 | | | | 5,342 | | |
| Liquid Funding | |
| 1.743%, 10/13/04 | | | 6,795 | | | | 6,795 | | |
| 1.830%, 05/25/05 | | | 4,857 | | | | 4,857 | | |
| MBNA Credit | |
| 1.683%, 10/12/04 | | | 4,720 | | | | 4,720 | | |
| 1.764%, 10/26/04 | | | 2,619 | | | | 2,619 | | |
| Main Street Warehouse | |
| 1.742%, 10/04/04 | | | 6,410 | | | | 6,410 | | |
| 1.683%, 10/04/04 | | | 7,916 | | | | 7,916 | | |
| 1.742%, 10/08/04 | | | 4,855 | | | | 4,855 | | |
| 1.742%, 10/08/04 | | | 4,857 | | | | 4,857 | | |
| Mortgage Interest Network | |
| 1.752%, 10/12/04 | | | 3,204 | | | | 3,204 | | |
| 1.763%, 10/14/04 | | | 3,397 | | | | 3,397 | | |
Netexis Banques
1.700%, 12/16/04 | | | 4,837 | | | | 4,837 | | |
| Orchard Park | |
| 1.796%, 04/06/05 | | | 4,857 | | | | 4,857 | | |
| 1.766%, 07/06/05 | | | 10,024 | | | | 10,024 | | |
| Park Granada LLC | |
| 1.622%, 10/01/04 | | | 8,548 | | | | 8,548 | | |
| 1.743%, 10/13/04 | | | 5,533 | | | | 5,533 | | |
Sigma Finance
1.512%, 11/29/04 | | | 2,421 | | | | 2,421 | | |
| Total Commercial Paper | | | | | | | 184,007 | | |
| Corporate Obligations – 11.4% | |
| Allstate Life Global | |
| 1.780%, 10/14/05 | | | 9,713 | | | | 9,713 | | |
| 1.750%, 10/14/05 | | | 2,428 | | | | 2,428 | | |
Bayer Landbank NY
1.830%, 06/24/05 | | | 9,227 | | | | 9,227 | | |
Blue Heron Funding
1.850%, 05/18/05 | | | 2,720 | | | | 2,720 | | |
Castle Hill III
1.910%, 09/15/15 | | | 2,914 | | | | 2,914 | | |
Depfa Bank PLC
1.860%, 06/15/05 | | | 4,855 | | | | 4,855 | | |
Duke Funding VI
1.320%, 04/08/05 | | | 5,877 | | | | 5,877 | | |
General Electric Capital Corporation
1.838%, 10/07/05 | | | 4,862 | | | | 4,862 | | |
Jackson National Life
1.760%, 04/15/05 | | | 4,857 | | | | 4,857 | | |
Large Cap Growth Opportunities Fund (continued)
| DESCRIPTION | | PAR (000) | | VALUE (000) | |
Jefferson Pilot
1.788%, 08/17/05 | | $ | 4,857 | | | $ | 4,857 | | |
Liquid Funding
1.840%, 06/28/05 | | | 4,370 | | | | 4,370 | | |
Merrill Lynch
1.696%, 10/01/05 | | | 9,714 | | | | 9,714 | | |
| Metlife Global Funding | |
| 1.800%, 10/14/05 | | | 5,828 | | | | 5,828 | | |
| 1.880%, 10/28/05 | | | 4,081 | | | | 4,081 | | |
Morgan Stanley
1.850%, 12/26/08 | | | 4,857 | | | | 4,857 | | |
Natexis Banq NY
1.920%, 07/12/05 | | | 5,342 | | | | 5,342 | | |
Northlake CDO
1.895%, 03/07/05 | | | 2,914 | | | | 2,914 | | |
| Premium Asset Trust | |
| 1.848%, 12/22/04 | | | 3,643 | | | | 3,643 | | |
| 1.760%, 05/13/05 | | | 6,799 | | | | 6,799 | | |
| 1.740%, 06/01/05 | | | 14,473 | | | | 14,473 | | |
| 1.770%, 10/14/05 | | | 3,885 | | | | 3,885 | | |
REMAC
1.840%, 09/29/05 | | | 5,342 | | | | 5,342 | | |
RMAC
1.740%, 06/12/05 | | | 5,604 | | | | 5,604 | | |
SMM Trust 2004
1.833%, 09/23/05 | | | 9,034 | | | | 9,034 | | |
Societe Generale NYC
1.960%, 12/08/04 | | | 9,713 | | | | 9,713 | | |
Svenska Handl
1.170%, 10/21/04 | | | 4,857 | | | | 4,857 | | |
| Total Corporate Obligations | | | | | | | 152,766 | | |
| Other Short-Term Investments – 2.9% | | | |
ARLO III Ltd
2.000%, 09/28/05 | | | 14,570 | | | | 14,570 | | |
Commonwealth Life
2.115%, 12/31/04 (d) | | | 4,904 | | | | 4,904 | | |
General Electric Capital Assurance
1.980%, 01/19/05 | | | 1,943 | | | | 1,943 | | |
HBOS Treasury Services
1.640%, 11/01/05 | | | 5,340 | | | | 5,340 | | |
Security Life of Denver
1.900%, 12/30/04 | | | 12,628 | | | | 12,628 | | |
| Total Other Short-Term Investments | | | | | | | 39,385 | | |
| Repurchase Agreements – 14.4% | | | |
Bear Stearns
2.045%, dated 09/30/04, matures 10/01/04,
repurchase price $9,714,042
(collateralized by various securities:
Total market value $9,913,176) | | | 9,713 | | | | 9,713 | | |
Bear Stearns
2.060%, dated 09/30/04, matures 12/23/04,
repurchase price $2,928,054
(collateralized by various securities:
Total market value $2,973,368) | | | 2,914 | | | | 2,914 | | |
Citibank
1.945%, dated 09/30/04, matures 10/01/04,
repurchase price $19,428,030
(collateralized by corporate securities:
Total market value $20,572,230) | | | 19,427 | | | | 19,427 | | |
FIRST AMERICAN FUNDS Annual Report 2004
95
Schedule of Investments September 30, 2004
Large Cap Growth Opportunities Fund (continued)
| DESCRIPTION | | PAR (000) | | VALUE (000) | |
Citibank
1.925%, dated 09/30/04, matures 10/01/04,
repurchase price $4,857,005
(collateralized by various securities:
Total market value $4,964,885) | | $ | 4,857 | | | $ | 4,857 | | |
Citibank
1.925%, dated 09/30/04, matures 10/01/04,
repurchase price $4,857,005
(collateralized by various securities:
Total market value $4,953,946) | | | 4,857 | | | | 4,857 | | |
Greenwich Capital Markets
1.950%, dated 09/30/04, matures 10/01/04,
repurchase price $29,142,049
(collateralized by U.S. government securities:
Total market value $29,723,659) | | | 29,140 | | | | 29,140 | | |
Goldman Sachs
2.025%, dated 09/30/04, matures 10/01/04,
repurchase price $6,799,826
(collateralized by various securities:
Total market value $7,009,746) | | | 6,799 | | | | 6,799 | | |
Goldman Sachs
2.025%, dated 09/30/04, matures 10/01/04,
repurchase price $2,914,211
(collateralized by various securities:
Total market value $3,004,248) | | | 2,914 | | | | 2,914 | | |
Goldman Sachs
2.025%, dated 09/30/04, matures 10/01/04,
repurchase price $2,914,211
(collateralized by U.S. government securities:
Total market value $3,004,247) | | | 2,914 | | | | 2,914 | | |
Goldman Sachs
2.025%, dated 09/30/04, matures 10/01/04,
repurchase price $7,285,527
(collateralized by corporate securities:
Total market value $7,510,470) | | | 7,285 | | | | 7,285 | | |
Goldman Sachs
1.425%, dated 09/30/04, matures 10/18/04,
repurchase price $12,150,514
(collateralized by corporate securities:
Total market value $12,389,729) | | | 12,142 | | | | 12,142 | | |
Goldman Sachs
1.480%, dated 09/30/04, matures 10/18/04,
repurchase price $7,290,509
(collateralized by U.S. government securities:
Total market value $7,510,471) | | | 7,285 | | | | 7,285 | | |
Goldman Sachs
2.205%, dated 09/30/04, matures 03/07/05,
repurchase price $4,903,746
(collateralized by corporate securities:
Total market value $4,955,929) | | | 4,857 | | | | 4,857 | | |
Lehman Brothers
2.055%, dated 09/30/04, matures 10/01/04,
repurchase price $19,428,089
(collateralized by collateralized mortgage
obligations: Total market value $19,815,520) | | | 19,427 | | | | 19,427 | | |
Lehman Brothers
1.910%, dated 09/30/04, matures 10/01/04,
repurchase price $29,142,016
(collateralized by U.S. government securities:
Total market value $29,723,749) | | | 29,141 | | | | 29,141 | | |
Lehman Brothers
1.935%, dated 09/30/04, matures 10/01/04,
repurchase price $19,428,024
(collateralized by collateralized mortgage
obligations: Total market value $21,361,566) | | | 19,427 | | | | 19,427 | | |
Large Cap Growth Opportunities Fund (concluded)
| DESCRIPTION | | PAR (000) | | VALUE (000) | |
Merrill Lynch
1.925%, dated 09/30/04, matures 10/01/04,
repurchase price $9,714,009
(collateralized by corporate securities:
Total market value $10,199,375) | | $ | 9,714 | | | $ | 9,714 | | |
Total Repurchase Agreements
(Cost $192,813) | | | | | 192,813 | | |
Total Investments Purchased with Proceeds
from Securities Lending
(Cost $568,971) | | | | | 568,971 | | |
Total Investments – 143.4%
(Cost $1,824,105) | | | | | 1,919,892 | | |
| Other Assets and Liabilities, Net – (43.4)% | | | | | (580,807 | ) | |
| Total Net Assets – 100.0% | | | | $ | 1,339,085 | | |
* Non-income producing security
(a) This security or a portion of this security is out to loan at September 30, 2004. Total loaned securities had a market value of $552,689,490 at September 30, 2004. See note 2 in Notes to Financial Statements.
(b) The Fund is significantly invested in this industry sector and therefore is subject to additional risks. See note 7 in Notes to Financial Statements.
(c) Investment in affiliated security. This money market fund is advised by U.S. Bancorp Asset Management, Inc., which also serves as advisor to this Fund. See note 3 in Notes to Financial Statements.
(d) Security has demand features which qualify it as a short term security. The date disclosed is the next put date.
ADR – American Depositary Receipt
Cl – Class
The accompanying notes are an integral part of the financial statements.
FIRST AMERICAN FUNDS Annual Report 2004
96
Large Cap Select Fund
| DESCRIPTION | | SHARES | | VALUE (000) | |
| Common Stocks – 93.9% | | | |
| Consumer Discretionary – 8.3% | | | |
| Gap (a) | | | 228,270 | | | $ | 4,269 | | |
| Hilton Hotels | | | 361,120 | | | | 6,803 | | |
| Lowe's (a) | | | 47,970 | | | | 2,607 | | |
| Marvel Enterprises* (a) | | | 27,960 | | | | 407 | | |
| Sherwin Williams (a) | | | 93,510 | | | | 4,111 | | |
| Time Warner* (a) | | | 339,460 | | | | 5,479 | | |
| Yum! Brands (a) | | | 16,450 | | | | 669 | | |
| | | | 24,345 | | |
| Consumer Staples – 7.8% | | | |
| Altria Group | | | 17,550 | | | | 826 | | |
| Avon Products (a) | | | 79,820 | | | | 3,486 | | |
| Clorox | | | 88,565 | | | | 4,720 | | |
| PepsiCo | | | 60,020 | | | | 2,920 | | |
| Procter & Gamble | | | 127,988 | | | | 6,927 | | |
| Sysco (a) | | | 24,810 | | | | 742 | | |
| Wal-Mart Stores | | | 61,086 | | | | 3,250 | | |
| | | | 22,871 | | |
| Energy – 11.0% | | | |
| Apache | | | 88,552 | | | | 4,437 | | |
| BP, ADR | | | 119,340 | | | | 6,866 | | |
| ChevronTexaco | | | 22,700 | | | | 1,218 | | |
| ConocoPhillips | | | 12,901 | | | | 1,069 | | |
| EOG Resources (a) | | | 33,740 | | | | 2,222 | | |
| Exxon Mobil | | | 154,430 | | | | 7,464 | | |
| Halliburton (a) | | | 119,106 | | | | 4,013 | | |
| National-Oilwell* (a) | | | 92,940 | | | | 3,054 | | |
| Schlumberger | | | 28,100 | | | | 1,891 | | |
| | | | 32,234 | | |
| Financials – 19.9% | | | |
| Allstate (a) | | | 58,352 | | | | 2,800 | | |
| American Express (a) | | | 30,010 | | | | 1,544 | | |
| American International Group | | | 114,057 | | | | 7,755 | | |
| Bank of America | | | 168,658 | | | | 7,308 | | |
| Capital One Financial (a) | | | 35,500 | | | | 2,623 | | |
| CIT Group | | | 93,370 | | | | 3,491 | | |
| Citigroup | | | 226,960 | | | | 10,013 | | |
| Fannie Mae (a) | | | 43,645 | | | | 2,767 | | |
| Goldman Sachs Group (a) | | | 28,951 | | | | 2,699 | | |
| Investors Financial Services (a) | | | 25,960 | | | | 1,172 | | |
| J. P. Morgan Chase | | | 135,713 | | | | 5,392 | | |
| Lehman Brothers Holdings (a) | | | 12,720 | | | | 1,014 | | |
| MBNA | | | 115,840 | | | | 2,919 | | |
| Merrill Lynch (a) | | | 31,750 | | | | 1,579 | | |
| PMI Group (a) | | | 26,720 | | | | 1,084 | | |
| State Street (a) | | | 54,370 | | | | 2,322 | | |
| Wells Fargo (a) | | | 32,160 | | | | 1,918 | | |
| | | | 58,400 | | |
| Health Care – 15.5% | | | |
| Aetna (a) | | | 20,910 | | | | 2,089 | | |
| Boston Scientific* | | | 63,830 | | | | 2,536 | | |
| Caremark Rx* (a) | | | 91,380 | | | | 2,931 | | |
| CIGNA (a) | | | 12,690 | | | | 884 | | |
| Johnson & Johnson (a) | | | 172,771 | | | | 9,732 | | |
| McKesson HBOC | | | 97,740 | | | | 2,507 | | |
| Medtronic (a) | | | 71,785 | | | | 3,726 | | |
Large Cap Select Fund (continued)
| DESCRIPTION | | SHARES/PAR (000) | | VALUE (000) | |
| Pfizer | | | 247,918 | | | $ | 7,586 | | |
| Quest Diagnostics (a) | | | 16,440 | | | | 1,450 | | |
| St. Jude Medical* (a) | | | 29,240 | | | | 2,201 | | |
| Teva Pharmaceutical Industries, ADR (a) | | | 86,220 | | | | 2,237 | | |
| UnitedHealth Group (a) | | | 45,144 | | | | 3,329 | | |
| Varian Medical Systems* | | | 21,520 | | | | 744 | | |
| Wyeth Pharmaceuticals | | | 62,100 | | | | 2,323 | | |
| Zimmer Holdings* | | | 13,710 | | | | 1,084 | | |
| | | | 45,359 | | |
| Industrials – 9.3% | | | |
| 3M | | | 28,614 | | | | 2,288 | | |
| Danaher (a) | | | 52,200 | | | | 2,677 | | |
| Eaton | | | 42,340 | | | | 2,685 | | |
| Emerson Electric | | | 70,400 | | | | 4,357 | | |
| General Electric | | | 168,468 | | | | 5,657 | | |
| Tyco International (a) | | | 142,370 | | | | 4,365 | | |
| United Technologies | | | 23,195 | | | | 2,166 | | |
| Waste Management | | | 108,230 | | | | 2,959 | | |
| | | | 27,154 | | |
| Information Technology – 16.6% | | | |
| CDW (a) | | | 32,810 | | | | 1,904 | | |
| Cisco Systems* | | | 180,539 | | | | 3,268 | | |
| Dell* | | | 52,502 | | | | 1,869 | | |
| eBay* (a) | | | 13,650 | | | | 1,255 | | |
| Hewlett-Packard | | | 149,160 | | | | 2,797 | | |
| Intel | | | 311,496 | | | | 6,249 | | |
| Microsoft | | | 53,006 | | | | 1,466 | | |
| Motorola (a) | | | 335,000 | | | | 6,044 | | |
| National Semiconductor* | | | 150,820 | | | | 2,336 | | |
| NCR* (a) | | | 283,120 | | | | 14,040 | | |
| QUALCOMM | | | 81,746 | | | | 3,191 | | |
| Research in Motion* (a) | | | 27,780 | | | | 2,121 | | |
| Xilinx (a) | | | 40,250 | | | | 1,087 | | |
| Yahoo!* (a) | | | 28,560 | | | | 968 | | |
| | | | 48,595 | | |
| Materials – 3.2% | | | |
| Dow Chemical | | | 126,500 | | | | 5,715 | | |
| MeadWestvaco | | | 44,530 | | | | 1,420 | | |
| Weyerhaeuser | | | 32,880 | | | | 2,186 | | |
| | | | 9,321 | | |
| Telecommunication Services – 1.4% | | | |
| BellSouth (a) | | | 47,470 | | | | 1,287 | | |
| SBC Communications (a) | | | 45,040 | | | | 1,169 | | |
| Verizon Communications (a) | | | 40,658 | | | | 1,601 | | |
| | | | 4,057 | | |
| Utilities – 0.9% | | | |
| Exelon (a) | | | 18,702 | | | | 686 | | |
| TXU (a) | | | 43,200 | | | | 2,070 | | |
| | | | 2,756 | | |
Total Common Stocks
(Cost $262,813) | | | | | | | 275,092 | | |
| Short-Term Investments – 5.7% | |
| U.S. Treasury Obligation – 0.6% | |
U.S. Treasury Bill (b)
1.895%, 03/03/05 | | $ | 1,700 | | | | 1,686 | | |
| Total U.S. Treasury Obligation | | | | | | | 1,686 | | |
FIRST AMERICAN FUNDS Annual Report 2004
97
Schedule of Investments September 30, 2004
Large Cap Select Fund (continued)
| DESCRIPTION | | SHARES/PAR (000) | | VALUE (000) | |
| Affiliated Money Market Fund – 5.1% | |
First American Prime
Obligations Fund, Cl Z (c) | | | 14,834,660 | | | $ | 14,835 | | |
| Total Affiliated Money Market Fund | | | | | | | 14,835 | | |
Total Short-Term Investments
(Cost $16,521) | | | | | | | 16,521 | | |
Investments Purchased with Proceeds
from Securities Lending – 37.4% | |
| Commercial Paper – 12.1% | |
| Bluegrass | |
| 1.881%, 05/18/05 | | $ | 462 | | | | 462 | | |
| 1.891%, 08/18/05 | | | 367 | | | | 367 | | |
| Concord Minutemen Capital | |
| 1.650%, 10/01/04 | | | 758 | | | | 758 | | |
| 1.680%, 10/05/04 | | | 1,684 | | | | 1,684 | | |
| 1.720%, 10/06/04 | | | 1,244 | | | | 1,244 | | |
| 1.740%, 10/14/04 | | | 833 | | | | 833 | | |
Descartes Funding Trust
1.760%, 11/15/04 | | | 935 | | | | 935 | | |
| Ford Credit Floor Plan | |
| 1.622%, 10/05/04 | | | 1,870 | | | | 1,870 | | |
| 1.526%, 10/06/04 | | | 1,310 | | | | 1,310 | | |
| 1.655%, 10/22/04 | | | 411 | | | | 411 | | |
Goldman Sachs
1.975%, 01/18/05 | | | 935 | | | | 935 | | |
Independence
1.830%, 04/15/05 | | | 1,156 | | | | 1,156 | | |
Jupiter Securities Corp
1.793%, 10/21/04 | | | 3,556 | | | | 3,556 | | |
Lakeside Funding
1.790%, 10/08/04 | | | 1,983 | | | | 1,983 | | |
Landesbank Baden
1.480%, 11/12/04 | | | 373 | | | | 373 | | |
Leaf's LLC
1.821%, 04/20/05 | | | 1,029 | | | | 1,029 | | |
| Liquid Funding | |
| 1.743%, 10/13/04 | | | 1,309 | | | | 1,309 | | |
| 1.830%, 05/25/05 | | | 935 | | | | 935 | | |
| MBNA Credit | |
| 1.683%, 10/12/04 | | | 909 | | | | 909 | | |
| 1.764%, 10/26/04 | | | 504 | | | | 504 | | |
| Main Street Warehouse | |
| 1.742%, 10/04/04 | | | 1,235 | | | | 1,235 | | |
| 1.683%, 10/04/04 | | | 1,525 | | | | 1,525 | | |
| 1.742%, 10/08/04 | | | 935 | | | | 935 | | |
| 1.742%, 10/08/04 | | | 935 | | | | 935 | | |
| Mortgage Interest Network | |
| 1.752%, 10/12/04 | | | 617 | | | | 617 | | |
| 1.763%, 10/14/04 | | | 654 | | | | 654 | | |
Netexis Banques
1.700%, 12/16/04 | | | 932 | | | | 932 | | |
| Orchard Park | |
| 1.796%, 04/06/05 | | | 936 | | | | 936 | | |
| 1.766%, 07/06/05 | | | 1,931 | | | | 1,931 | | |
| Park Granada LLC | |
| 1.622%, 10/01/04 | | | 1,646 | | | | 1,646 | | |
| 1.743%, 10/13/04 | | | 1,066 | | | | 1,066 | | |
Sigma Finance
1.512%, 11/29/04 | | | 466 | | | | 466 | | |
| Total Commercial Paper | | | | | | | 35,441 | | |
Large Cap Select Fund (continued)
| DESCRIPTION | | PAR (000) | | VALUE (000) | |
| Corporate Obligations – 10.0% | | | |
| Allstate Life Global | |
| 1.780%, 10/14/05 | | $ | 1,871 | | | $ | 1,871 | | |
| 1.750%, 10/14/05 | | | 468 | | | | 468 | | |
Bayer Landbank NY
1.830%, 06/24/05 | | | 1,777 | | | | 1,777 | | |
Blue Heron Funding
1.850%, 05/18/05 | | | 524 | | | | 524 | | |
Castle Hill III
1.910%, 09/15/15 | | | 561 | | | | 561 | | |
Depfa Bank PLC
1.860%, 06/15/05 | | | 935 | | | | 935 | | |
Duke Funding VI
1.320%, 04/08/05 | | | 1,132 | | | | 1,132 | | |
General Electric Capital Corporation
1.838%, 10/07/05 | | | 936 | | | | 936 | | |
Jackson National Life
1.760%, 04/15/05 | | | 935 | | | | 935 | | |
Jefferson Pilot
1.788%, 08/17/05 | | | 935 | | | | 935 | | |
Liquid Funding
1.840%, 06/28/05 | | | 842 | | | | 842 | | |
Merrill Lynch
1.696%, 10/01/05 | | | 1,871 | | | | 1,871 | | |
| Metlife Global Funding | |
| 1.800%, 10/14/05 | | | 1,123 | | | | 1,123 | | |
| 1.880%, 10/28/05 | | | 786 | | | | 786 | | |
Morgan Stanley
1.850%, 12/26/08 | | | 936 | | | | 936 | | |
Natexis Banq NY
1.920%, 07/12/05 | | | 1,029 | | | | 1,029 | | |
Northlake CDO
1.895%, 03/07/05 | | | 561 | | | | 561 | | |
| Premium Asset Trust | |
| 1.848%, 12/22/04 | | | 702 | | | | 702 | | |
| 1.760%, 05/13/05 | | | 1,310 | | | | 1,310 | | |
| 1.740%, 06/01/05 | | | 2,788 | | | | 2,788 | | |
| 1.770%, 10/14/05 | | | 748 | | | | 748 | | |
REMAC
1.840%, 09/29/05 | | | 1,029 | | | | 1,029 | | |
RMAC
1.740%, 06/12/05 | | | 1,079 | | | | 1,079 | | |
SMM Trust 2004
1.833%, 09/23/05 | | | 1,740 | | | | 1,740 | | |
Societe Generale NYC
1.960%, 12/08/04 | | | 1,871 | | | | 1,871 | | |
Svenska Handl
1.170%, 10/21/04 | | | 935 | | | | 935 | | |
| Total Corporate Obligations | | | | | | | 29,424 | | |
| Other Short-Term Investments – 2.6% | | | |
| ARLO III Ltd | |
| 2.000%, 09/28/05 | | | 2,806 | | | | 2,806 | | |
| Commonwealth Life | |
| 2.115%, 12/31/04 (d) | | | 945 | | | | 945 | | |
| General Electric Capital Assurance | |
| 1.980%, 01/19/05 | | | 374 | | | | 374 | | |
| HBOS Treasury Services | |
| 1.640%, 11/01/05 | | | 1,029 | | | | 1,029 | | |
| Security Life of Denver | |
| 1.900%, 12/30/04 | | | 2,432 | | | | 2,432 | | |
| Total Other Short-Term Investments | | | | | | | 7,586 | | |
The accompanying notes are an integral part of the financial statements.
FIRST AMERICAN FUNDS Annual Report 2004
98
Large Cap Select Fund (continued)
| DESCRIPTION | | PAR (000) | | VALUE (000) | |
| Repurchase Agreements – 12.7% | | | |
Bear Stearns
2.045%, dated 09/30/04, matures 10/01/04,
repurchase price $1,870,984
(collateralized by various securities:
Total market value $1,909,339) | | $ | 1,871 | | | $ | 1,871 | | |
Bear Stearns
2.060%, dated 09/30/04, matures 12/23/04,
repurchase price $563,961
(collateralized by various securities:
Total market value $572,689) | | | 561 | | | | 561 | | |
Citibank
1.945%, dated 09/30/04, matures 10/01/04,
repurchase price $3,741,958
(collateralized by corporate securities:
Total market value $3,962,338) | | | 3,742 | | | | 3,742 | | |
Citibank
1.925%, dated 09/30/04, matures 10/01/04,
repurchase price $935,489
(collateralized by various securities:
Total market value $956,267) | | | 935 | | | | 935 | | |
Citibank
1.925%, dated 09/30/04, matures 10/01/04,
repurchase price $935,489
(collateralized by various securities:
Total market value $954,161) | | | 935 | | | | 935 | | |
Greenwich Capital Markets
1.950%, dated 09/30/04, matures 10/01/04,
repurchase price $5,612,938
(collateralized by U.S. government securities:
Total market value $5,724,960) | | | 5,613 | | | | 5,613 | | |
Goldman Sachs
2.025%, dated 09/30/04, matures 10/01/04,
repurchase price $1,309,688
(collateralized by various securities:
Total market value $1,350,120) | | | 1,310 | | | | 1,310 | | |
Goldman Sachs
2.025%, dated 09/30/04, matures 10/01/04,
repurchase price $561,295
(collateralized by various securities:
Total market value $578,637) | | | 561 | | | | 561 | | |
Goldman Sachs
2.025%, dated 09/30/04, matures 10/01/04,
repurchase price $561,295
(collateralized by U.S. government securities:
Total market value $578,636) | | | 561 | | | | 561 | | |
Goldman Sachs
2.025%, dated 09/30/04, matures 10/01/04,
repurchase price $1,403,238
(collateralized by corporate securities:
Total market value $1,446,563) | | | 1,403 | | | | 1,403 | | |
Goldman Sachs
1.425%, dated 09/30/04, matures 10/18/04,
repurchase price $2,340,264
(collateralized by corporate securities:
Total market value $2,386,338) | | | 2,338 | | | | 2,338 | | |
Goldman Sachs
1.480%, dated 09/30/04, matures 10/18/04,
repurchase price $1,404,197
(collateralized by U.S. government securities:
Total market value $1,446,563) | | | 1,403 | | | | 1,403 | | |
Large Cap Select Fund (concluded)
| DESCRIPTION | | PAR (000) | | VALUE (000) | |
Goldman Sachs
2.205%, dated 09/30/04, matures 03/07/05,
repurchase price $944,492
(collateralized by corporate securities:
Total market value $954,542) | | $ | 935 | | | $ | 935 | | |
Lehman Brothers
2.055%, dated 09/30/04, matures 10/01/04,
repurchase price $3,741,970
(collateralized by collateralized mortgage
obligations: Total market value $3,816,591) | | | 3,742 | | | | 3,742 | | |
Lehman Brothers
1.910%, dated 09/30/04, matures 10/01/04,
repurchase price $5,612,932
(collateralized by U.S. government securities:
Total market value $5,724,977) | | | 5,613 | | | | 5,613 | | |
Lehman Brothers
1.935%, dated 09/30/04, matures 10/01/04,
repurchase price $3,741,957
(collateralized by collateralized mortgage
obligations: Total market value $4,114,369) | | | 3,742 | | | | 3,742 | | |
Merrill Lynch
1.925%, dated 09/30/04, matures 10/01/04,
repurchase price $1,870,978
(collateralized by corporate securities:
Total market value $1,964,463) | | | 1,871 | | | | 1,871 | | |
Total Repurchase Agreements
(Cost $37,136) | | | | | | | 37,136 | | |
Total Investments Purchased with Proceeds
from Securities Lending
(Cost $109,587) | | | | | | | 109,587 | | |
Total Investments – 137.0%
(Cost $388,921) | | | | | | | 401,200 | | |
| Other Assets and Liabilities, Net – (37.0)% | | | | | | | (108,349 | ) | |
| Total Net Assets – 100.0% | | | | | | $ | 292,851 | | |
* Non-income producing security
(a) This security or a portion of this security is out to loan at September 30, 2004. Total loaned securities had a market value of $106,469,426 at September 30, 2004. See note 2 in Notes to Financial Statements.
(b) Security has been deposited as initial margin on open futures contracts. Yield shown is effective yield at date of purchase. See note 2 in Notes to Financial Statements.
(c) Investment in affiliated security. This money market fund is advised by U.S. Bancorp Asset Management, Inc., which also serves as advisor to this Fund. See note 3 in Notes to Financial Statements.
(d) Security has demand features which qualify it as a short term security. The date disclosed is the next put date.
ADR – American Depositary Receipt
Cl – Class
Schedule of Open Futures Contracts
| Description | | Number of
Contracts | | Market Value
Covered By
Contracts | | Settlement
Month | | Unrealized
Depreciation | |
S&P 500 Index Futures Contracts
purchased | | | 58 | | | $ | 16,165 | | | Dec. 04 | | $ | (165 | ) | |
FIRST AMERICAN FUNDS Annual Report 2004
99
Schedule of Investments September 30, 2004
Large Cap Value Fund
| DESCRIPTION | | SHARES | | VALUE (000) | |
| Common Stocks – 98.4% | |
| Consumer Discretionary – 11.2% | |
| Gap (a) | | | 703,140 | | | $ | 13,149 | | |
| Hilton Hotels (a) | | | 1,447,350 | | | | 27,268 | | |
| McDonald's | | | 629,020 | | | | 17,631 | | |
| McGraw-Hill | | | 84,310 | | | | 6,719 | | |
| Sherwin Williams (a) | | | 544,550 | | | | 23,938 | | |
| Time Warner* (a) | | | 2,571,750 | | | | 41,508 | | |
| | | | 130,213 | | |
| Consumer Staples – 4.3% | | | |
| Altria Group | | | 182,670 | | | | 8,593 | | |
| Clorox | | | 293,680 | | | | 15,653 | | |
| H.J. Heinz | | | 386,250 | | | | 13,913 | | |
| Kimberly-Clark | | | 188,670 | | | | 12,186 | | |
| | | | 50,345 | | |
| Energy – 15.4% | | | |
| Apache | | | 240,944 | | | | 12,074 | | |
| BP, ADR | | | 413,510 | | | | 23,789 | | |
| ChevronTexaco (a) | | | 223,840 | | | | 12,007 | | |
| ConocoPhillips | | | 161,950 | | | | 13,418 | | |
| EOG Resources (a) | | | 249,100 | | | | 16,403 | | |
| Exxon Mobil | | | 1,242,044 | | | | 60,028 | | |
| Halliburton (a) | | | 742,020 | | | | 24,999 | | |
| National-Oilwell* (a) | | | 484,000 | | | | 15,904 | | |
| | | | 178,622 | | |
| Financials – 29.0% (b) | | | |
| ACE | | | 230,250 | | | | 9,224 | | |
| Allstate (a) | | | 258,960 | | | | 12,427 | | |
| American Express (a) | | | 248,520 | | | | 12,789 | | |
| American International Group | | | 406,750 | | | | 27,655 | | |
| Bank of America | | | 1,179,076 | | | | 51,089 | | |
| CIT Group | | | 476,150 | | | | 17,803 | | |
| Citigroup | | | 1,001,222 | | | | 44,174 | | |
| City National (a) | | | 93,510 | | | | 6,073 | | |
| Genworth Financial (a) | | | 463,650 | | | | 10,803 | | |
| Goldman Sachs Group (a) | | | 158,430 | | | | 14,772 | | |
| J. P. Morgan Chase | | | 661,976 | | | | 26,300 | | |
| Marshall & Ilsley (a) | | | 154,270 | | | | 6,217 | | |
| MBNA | | | 369,040 | | | | 9,300 | | |
| Merrill Lynch (a) | | | 251,660 | | | | 12,513 | | |
| Northern Trust (a) | | | 202,220 | | | | 8,251 | | |
| PMI Group (a) | | | 297,350 | | | | 12,066 | | |
| State Street (a) | | | 250,460 | | | | 10,697 | | |
| TCF Financial (a) | | | 353,780 | | | | 10,716 | | |
| Wachovia | | | 306,600 | | | | 14,395 | | |
| Wells Fargo (a) | | | 345,280 | | | | 20,589 | | |
| | | | 337,853 | | |
| Health Care – 5.3% | | | |
| Boston Scientific* (a) | | | 156,100 | | | | 6,202 | | |
| CIGNA (a) | | | 170,320 | | | | 11,859 | | |
| Johnson & Johnson (a) | | | 321,020 | | | | 18,083 | | |
| McKesson HBOC | | | 318,970 | | | | 8,182 | | |
| Merck | | | 175,540 | | | | 5,793 | | |
| Wyeth Pharmaceuticals | | | 302,260 | | | | 11,305 | | |
| | | | 61,424 | | |
Large Cap Value Fund (continued)
| DESCRIPTION | | SHARES/PAR (000) | | VALUE (000) | |
| Industrials – 10.4% | | | |
| Eaton (a) | | | 229,700 | | | $ | 14,565 | | |
| Emerson Electric | | | 485,390 | | | | 30,041 | | |
| General Dynamics (a) | | | 98,250 | | | | 10,031 | | |
| General Electric | | | 960,610 | | | | 32,257 | | |
| Honeywell International | | | 176,990 | | | | 6,347 | | |
| Tyco International (a) | | | 459,780 | | | | 14,097 | | |
| Waste Management | | | 495,900 | | | | 13,558 | | |
| | | | 120,896 | | |
| Information Technology – 8.3% | | | |
| Computer Associates International (a) | | | 470,640 | | | | 12,378 | | |
| Hewlett-Packard (a) | | | 1,152,788 | | | | 21,615 | | |
| Intuit* (a) | | | 207,310 | | | | 9,412 | | |
| Motorola (a) | | | 1,039,000 | | | | 18,744 | | |
| National Semiconductor* (a) | | | 607,480 | | | | 9,410 | | |
| NCR* (a) | | | 510,550 | | | | 25,318 | | |
| | | | 96,877 | | |
| Materials – 6.5% | | | |
| Dow Chemical | | | 728,140 | | | | 32,897 | | |
| MeadWestvaco | | | 438,610 | | | | 13,992 | | |
| Weyerhaeuser | | | 425,750 | | | | 28,304 | | |
| | | | 75,193 | | |
| Telecommunication Services – 4.0% | | | |
| BellSouth (a) | | | 546,320 | | | | 14,816 | | |
| SBC Communications (a) | | | 482,166 | | | | 12,512 | | |
| Verizon Communications (a) | | | 485,442 | | | | 19,117 | | |
| | | | 46,445 | | |
| Utilities – 4.0% | | | |
| Entergy | | | 237,790 | | | | 14,412 | | |
| Exelon (a) | | | 400,460 | | | | 14,693 | | |
| TXU (a) | | | 354,410 | | | | 16,983 | | |
| | | | 46,088 | | |
Total Common Stocks
(Cost $1,020,279) | | | | | | | 1,143,956 | | |
| Affiliated Money Market Fund – 0.8% | | | |
First American Prime
Obligations Fund, Cl Z (c) | | | 9,236,432 | | | | 9,236 | | |
Total Affiliated Money Market Fund
(Cost $9,236) | | | | | | | 9,236 | | |
| Investments Purchased with Proceeds from Securities Lending – 34.0% | | | |
| Commercial Paper – 11.0% | | | |
| Bluegrass | |
| 1.881%, 05/18/05 | | $ | 1,666 | | | | 1,666 | | |
| 1.891%, 08/18/05 | | | 1,324 | | | | 1,324 | | |
| Concord Minutemen Capital | |
| 1.650%, 10/01/04 | | | 2,736 | | | | 2,736 | | |
| 1.680%, 10/05/04 | | | 6,079 | | | | 6,079 | | |
| 1.720%, 10/06/04 | | | 4,492 | | | | 4,492 | | |
| 1.740%, 10/14/04 | | | 3,006 | | | | 3,006 | | |
Descartes Funding Trust
1.760%, 11/15/04 | | | 3,377 | | | | 3,377 | | |
| Ford Credit Floor Plan | |
| 1.622%, 10/05/04 | | | 6,753 | | | | 6,753 | | |
| 1.526%, 10/06/04 | | | 4,728 | | | | 4,728 | | |
| 1.655%, 10/22/04 | | | 1,484 | | | | 1,484 | | |
The accompanying notes are an integral part of the financial statements.
FIRST AMERICAN FUNDS Annual Report 2004
100
Large Cap Value Fund (continued)
| DESCRIPTION | | PAR (000) | | VALUE (000) | |
Goldman Sachs
1.975%, 01/18/05 | | $ | 3,377 | | | $ | 3,377 | | |
Independence
1.830%, 4/15/05 | | | 4,174 | | | | 4,174 | | |
Jupiter Securities Corp
1.793%, 10/21/04 | | | 12,838 | | | | 12,838 | | |
Lakeside Funding
1.790%, 10/08/04 | | | 7,160 | | | | 7,160 | | |
Landesbank Baden
1.480%, 11/12/04 | | | 1,348 | | | | 1,348 | | |
Leaf's LLC
1.821%, 4/20/05 | | | 3,715 | | | | 3,715 | | |
| Liquid Funding | |
| 1.743%, 10/13/04 | | | 4,725 | | | | 4,725 | | |
| 1.830%, 05/25/05 | | | 3,377 | | | | 3,377 | | |
| MBNA Credit | |
| 1.683%, 10/12/04 | | | 3,283 | | | | 3,283 | | |
| 1.764%, 10/26/04 | | | 1,822 | | | | 1,822 | | |
| Main Street Warehouse | |
| 1.742%, 10/04/04 | | | 4,457 | | | | 4,457 | | |
| 1.683%, 10/04/04 | | | 5,505 | | | | 5,505 | | |
| 1.742%, 10/08/04 | | | 3,376 | | | | 3,376 | | |
| 1.742%, 10/08/04 | | | 3,377 | | | | 3,377 | | |
| Mortgage Interest Network | |
| 1.752%, 10/12/04 | | | 2,228 | | | | 2,228 | | |
| 1.763%, 10/14/04 | | | 2,363 | | | | 2,363 | | |
Netexis Banques
1.700%, 12/16/04 | | | 3,364 | | | | 3,364 | | |
| Orchard Park | |
| 1.796%, 04/06/05 | | | 3,377 | | | | 3,377 | | |
| 1.766%, 07/06/05 | | | 6,970 | | | | 6,970 | | |
| Park Granada LLC | |
| 1.622%, 10/01/04 | | | 5,944 | | | | 5,944 | | |
| 1.743%, 10/13/04 | | | 3,848 | | | | 3,848 | | |
Sigma Finance
1.512%, 11/29/04 | | | 1,684 | | | | 1,684 | | |
| Total Commercial Paper | | | | | | | 127,957 | | |
| Corporate Obligations – 9.1% | | | |
| Allstate Life Global | |
| 1.780%, 10/14/05 | | | 6,755 | | | | 6,755 | | |
| 1.750%, 10/14/05 | | | 1,689 | | | | 1,689 | | |
Bayer Landbank NY
1.830%, 06/24/05 | | | 6,416 | | | | 6,416 | | |
Blue Heron Funding
1.850%, 05/18/05 | | | 1,891 | | | | 1,891 | | |
Castle Hill III
1.910%, 09/15/15 | | | 2,026 | | | | 2,026 | | |
Depfa Bank PLC
1.860%, 06/15/05 | | | 3,376 | | | | 3,376 | | |
Duke Funding VI
1.320%, 04/08/05 | | | 4,087 | | | | 4,087 | | |
General Electric Capital Corporation
1.838%, 10/07/05 | | | 3,381 | | | | 3,381 | | |
Jackson National Life
1.760%, 04/15/05 | | | 3,377 | | | | 3,377 | | |
Jefferson Pilot
1.788%, 08/17/05 | | | 3,377 | | | | 3,377 | | |
Liquid Funding
1.840%, 06/28/05 | | | 3,039 | | | | 3,039 | | |
Merrill Lynch
1.696%, 10/01/05 | | | 6,755 | | | | 6,755 | | |
Large Cap Value Fund (continued)
| DESCRIPTION | | PAR (000) | | VALUE (000) | |
| Metlife Global Funding | |
| 1.800%, 10/14/05 | | $ | 4,053 | | | $ | 4,053 | | |
| 1.880%, 10/28/05 | | | 12,838 | | | | 2,838 | | |
Morgan Stanley
1.850%, 12/26/08 | | | 3,377 | | | | 3,377 | | |
Natexis Banq NY
1.920%, 7/12/05 | | | 3,715 | | | | 3,715 | | |
Northlake CDO
1.895%, 3/07/05 | | | 2,026 | | | | 2,026 | | |
| Premium Asset Trust | |
| 1.848%, 12/22/04 | | | 2,533 | | | | 2,533 | | |
| 1.760%, 5/13/05 | | | 4,728 | | | | 4,728 | | |
| 1.740%, 6/01/05 | | | 10,065 | | | | 10,065 | | |
| 1.770%, 10/14/05 | | | 2,702 | | | | 2,702 | | |
REMAC
1.840%, 9/29/05 | | | 3,715 | | | | 3,715 | | |
RMAC
1.740%, 6/12/05 | | | 3,897 | | | | 3,897 | | |
SMM Trust 2004
1.833%, 9/23/05 | | | 6,282 | | | | 6,282 | | |
Societe Generale NYC
1.960%, 12/08/04 | | | 6,755 | | | | 6,755 | | |
Svenska Handl
1.170%, 10/21/04 | | | 3,377 | | | | 3,377 | | |
| Total Corporate Obligations | | | | | | | 106,232 | | |
| Other Short-Term Investments – 2.4% | | | |
ARLO III Ltd
2.000%, 9/28/05 | | | 10,132 | | | | 10,132 | | |
Commonwealth Life
2.115%, 12/31/04 (d) | | | 3,410 | | | | 3,410 | | |
General Electric Capital Assurance
1.980%, 1/19/05 | | | 1,351 | | | | 1,351 | | |
HBOS Treasury Services
1.640%, 11/01/05 | | | 3,714 | | | | 3,714 | | |
Security Life of Denver
1.900%, 12/30/04 | | | 8,781 | | | | 8,781 | | |
| Total Other Short-Term Investments | | | | | | | 27,388 | | |
| Repurchase Agreements – 11.5% | | | |
Bear Stearns
2.045%, dated 09/30/04, matures 10/01/04,
repurchase price $6,755,021
(collateralized by various securities:
Total market value $6,893,497) | | | 6,755 | | | | 6,755 | | |
Bear Stearns
2.060%, dated 09/30/04, matures 12/23/04,
repurchase price $2,036,131
(collateralized by various securities:
Total market value $2,067,642) | | | 2,027 | | | | 2,027 | | |
Citibank
1.945%, dated 09/30/04, matures 10/01/04,
repurchase price $13,510,005
(collateralized by corporate securities:
Total market value $14,305,667) | | | 13,509 | | | | 13,509 | | |
Citibank
1.925%, dated 09/30/04, matures 10/01/04,
repurchase price $3,377,499
(collateralized by various securities:
Total market value $3,452,518) | | | 3,377 | | | | 3,377 | | |
FIRST AMERICAN FUNDS Annual Report 2004
101
Schedule of Investments September 30, 2004
Large Cap Value Fund (continued)
| DESCRIPTION | | PAR (000) | | VALUE (000) | |
Citibank
1.925%, dated 09/30/04, matures 10/01/04,
repurchase price $3,377,499
(collateralized by various securities:
Total market value $3,444,911) | | $ | 3,377 | | | $ | 3,377 | | |
Greenwich Capital Markets
1.950%, dated 09/30/04, matures 10/01/04,
repurchase price $20,265,010
(collateralized by U.S. government securities:
Total market value $20,669,455) | | | 20,264 | | | | 20,264 | | |
Goldman Sachs
2.025%, dated 09/30/04, matures 10/01/04,
repurchase price $4,728,512
(collateralized by various securities:
Total market value $4,874,488) | | | 4,728 | | | | 4,728 | | |
Goldman Sachs
2.025%, dated 09/30/04, matures 10/01/04,
repurchase price $2,026,505
(collateralized by various securities:
Total market value $2,089,116) | | | 2,026 | | | | 2,026 | | |
Goldman Sachs
2.025%, dated 09/30/04, matures 10/01/04,
repurchase price $2,026,505
(collateralized by U.S. government securities:
Total market value $2,089,115) | | | 2,026 | | | | 2,026 | | |
Goldman Sachs
2.025%, dated 09/30/04, matures 10/01/04,
repurchase price $5,066,263
(collateralized by corporate securities:
Total market value $5,222,685) | | | 5,066 | | | | 5,066 | | |
Goldman Sachs
1.425%, dated 09/30/04, matures 10/18/04,
repurchase price $8,449,313
(collateralized by corporate securities:
Total market value $8,615,660) | | | 8,443 | | | | 8,443 | | |
Goldman Sachs
1.480%, dated 09/30/04, matures 10/18/04,
repurchase price $5,069,727
(collateralized by U.S. government securities:
Total market value $5,222,686) | | | 5,066 | | | | 5,066 | | |
Goldman Sachs
2.205%, dated 09/30/04, matures 03/07/05,
repurchase price $3,410,003
(collateralized by corporate securities:
Total market value $3,446,290) | | | 3,377 | | | | 3,377 | | |
Lehman Brothers
2.055%, dated 09/30/04, matures 10/01/04,
repurchase price $13,510,046
(collateralized by collateralized mortgage
obligations: Total market value $13,779,461) | | | 13,509 | | | | 13,509 | | |
Lehman Brothers
1.910%, dated 09/30/04, matures 10/01/04,
repurchase price $20,264,988
(collateralized by U.S. government securities:
Total market value $20,669,517) | | | 20,264 | | | | 20,264 | | |
Lehman Brothers
1.935%, dated 09/30/04, matures 10/01/04,
repurchase price $13,510,001
(collateralized by collateralized mortgage
obligations: Total market value $14,854,562) | | | 13,509 | | | | 13,509 | | |
Large Cap Value Fund (concluded)
| DESCRIPTION | | PAR (000) | | VALUE (000) | |
Merrill Lynch
1.925%, dated 09/30/04, matures 10/01/04,
repurchase price $6,754,999
(collateralized by corporate securities:
Total market value $7,092,516) | | $ | 6,755 | | | $ | 6,755 | | |
Total Repurchase Agreements
(Cost $134,078) | | | | | 134,078 | | |
Total Investments Purchased with Proceeds
from Securities Lending
(Cost $395,655) | | | | | 395,655 | | |
Total Investments – 133.2%
(Cost $1,425,170) | | | | | 1,548,847 | | |
| Other Assets and Liabilities, Net – (33.2)% | | | | | (385,793 | ) | |
| Total Net Assets – 100.0% | | | | $ | 1,163,054 | | |
* Non-income producing security
(a) This security or a portion of this security is out to loan at September 30, 2004. Total loaned securities had a market value of $384,356,089 at September 30, 2004. See note 2 in Notes to Financial Statements.
(b) The Fund is significantly invested in this industry sector and therefore is subject to additional risks. See note 7 in Notes to Financial Statements.
(c) Investment in affiliated security. This money market fund is advised by U.S. Bancorp Asset Management, Inc., which also serves as advisor to this Fund. See note 3 in Notes to Financial Statements.
(d) Security has demand features which qualify it as a short term security. The date disclosed is the next put date.
ADR – American Depositary Receipt
The accompanying notes are an integral part of the financial statements.
FIRST AMERICAN FUNDS Annual Report 2004
102
Statements of Assets and Liabilities September 30, 2004, in thousands, except for per share data
| | | Large Cap Growth
Opportunities Fund | | Large Cap
Select Fund | | Large Cap
Value Fund | |
| ASSETS: | | | |
| Investments in unaffiliated securities, at value*† | | $ | 1,696,129 | | | $ | 349,229 | | | $ | 1,405,533 | | |
| Investments in affiliated money market fund, at value** | | | 30,950 | | | | 14,835 | | | | 9,236 | | |
| Repurchase agreements, at value*** | | | 192,813 | | | | 37,136 | | | | 134,078 | | |
| Cash**** | | | 78 | | | | 55 | | | | 54 | | |
| Receivable for dividends and interest | | | 606 | | | | 187 | | | | 1,200 | | |
| Receivable for investment securities sold | | | 33,088 | | | | 1,663 | | | | 15,368 | | |
| Receivable for capital shares sold | | | 371 | | | | 79 | | | | 263 | | |
| Prepaid expenses and other assets | | | 38 | | | | 31 | | | | 37 | | |
| Total assets | | | 1,954,073 | | | | 403,215 | | | | 1,565,769 | | |
| LIABILITIES: | | | |
| Payable for investment securities purchased | | | 40,675 | | | | 514 | | | | 3,694 | | |
| Payable upon return of securities loaned | | | 569,049 | | | | 109,602 | | | | 395,709 | | |
| Payable for capital shares redeemed | | | 4,253 | | | | 91 | | | | 2,435 | | |
| Payable for variation margin | | | - | | | | 3 | | | | - | | |
| Payable for advisory, co-administration, and custodian fees | | | 946 | | | | 151 | | | | 821 | | |
| Payable for distribution and shareholder servicing fees | | | 55 | | | | 1 | | | | 47 | | |
| Accrued expenses and other liabilities | | | 10 | | | | 2 | | | | 9 | | |
| Total liabilities | | | 614,988 | | | | 110,364 | | | | 402,715 | | |
| Net assets | | $ | 1,339,085 | | | $ | 292,851 | | | $ | 1,163,054 | | |
| COMPOSITION OF NET ASSETS: | | | |
| Portfolio capital | | $ | 1,429,288 | | | $ | 277,647 | | | $ | 1,100,666 | | |
| Undistributed (distributions in excess of) net investment income | | | (2 | ) | | | 18 | | | | 119 | | |
| Accumulated net realized gain (loss) on investments | | | (185,988 | ) | | | 3,072 | | | | (61,408 | ) | |
| Net unrealized appreciation of investments | | | 95,787 | | | | 12,279 | | | | 123,677 | | |
| Net unrealized depreciation of futures contracts | | | - | | | | (165 | ) | | | - | | |
| Net assets | | $ | 1,339,085 | | | $ | 292,851 | | | $ | 1,163,054 | | |
| * Investments in unaffiliated securities, at cost | | $ | 1,600,342 | | | $ | 336,950 | | | $ | 1,281,856 | | |
| ** Investments in affiliated money market fund, at cost | | $ | 30,950 | | | $ | 14,835 | | | $ | 9,236 | | |
| *** Investments in repurchase agreements, at cost | | $ | 192,813 | | | $ | 37,136 | | | $ | 134,078 | | |
| **** Includes cash related to securities loaned | | $ | 78 | | | $ | 15 | | | $ | 54 | | |
| † Including securities loaned, at value | | $ | 552,689 | | | $ | 106,469 | | | $ | 384,356 | | |
| Class A: | | | |
| Net assets | | $ | 112,379 | | | $ | 714 | | | $ | 113,683 | | |
| Shares issued and outstanding ($0.0001 par value - 2 billion authorized) | | | 4,495 | | | | 57 | | | | 6,604 | | |
| Net asset value and redemption price per share | | $ | 25.00 | | | $ | 12.52 | | | $ | 17.21 | | |
| Maximum offering price per share (1) | | $ | 26.46 | | | $ | 13.25 | | | $ | 18.21 | | |
| Class B: | | | |
| Net assets | | $ | 25,633 | | | $ | 270 | | | $ | 21,829 | | |
| Shares issued and outstanding ($0.0001 par value - 2 billion authorized) | | | 1,067 | | | | 22 | | | | 1,294 | | |
| Net asset value, offering price and redemption price per share (2) | | $ | 24.02 | | | $ | 12.41 | | | $ | 16.87 | | |
| Class C: | | | |
| Net assets | | $ | 12,811 | | | $ | 59 | | | $ | 6,344 | | |
| Shares issued and outstanding ($0.0001 par value - 2 billion authorized) | | | 523 | | | | 5 | | | | 372 | | |
| Net asset value, offering price and redemption price per share (2) | | $ | 24.51 | | | $ | 12.43 | | | $ | 17.07 | | |
| Class R: | | | |
| Net assets | | $ | 1 | | | $ | 1 | | | $ | 1 | | |
| Shares issued and outstanding ($0.0001 par value - 2 billion authorized) | | | - | | | | - | | | | - | | |
| Net asset value, offering price, and redemption price per share | | $ | 24.98 | | | $ | 12.49 | | | $ | 17.22 | | |
| Class Y: | | | |
| Net assets | | $ | 1,188,261 | | | $ | 291,807 | | | $ | 1,021,197 | | |
| Shares issued and outstanding ($0.0001 par value - 2 billion authorized) | | | 46,354 | | | | 23,293 | | | | 59,162 | | |
| Net asset value, offering price, and redemption price per share | | $ | 25.63 | | | $ | 12.53 | | | $ | 17.26 | | |
(1) The offering price is calculated by dividing the net asset value by 1 minus the maximum sales charge of 5.50%.
(2) Class B and C have a contingent deferred sales charge. For a description of this sales charge, see notes 1 and 3 in Notes to Financial Statements.
The accompanying notes are an integral part of the financial statements.
FIRST AMERICAN FUNDS Annual Report 2004
103
Statements of Operations For the fiscal year ended September 30, 2004, in thousands
| | | Large Cap Growth
Opportunities Fund | | Large Cap
Select Fund | | Large Cap
Value Fund | |
| INVESTMENT INCOME: | |
| Interest from unaffiliated securities | | $ | - | | | $ | 14 | | | $ | - | | |
| Dividends from affiliated money market fund | | | 163 | | | | 172 | | | | 79 | | |
| Dividends from unaffiliated securities | | | 13,588 | | | | 3,150 | | | | 23,703 | | |
| Less: Foreign taxes withheld | | | (66 | ) | | | (11 | ) | | | (43 | ) | |
| Securities lending | | | 299 | | | | 34 | | | | 193 | | |
| Other income | | | 6 | | | | - | | | | 86 | | |
| Total investment income | | | 13,990 | | | | 3,359 | | | | 24,018 | | |
| EXPENSES: | |
| Investment advisory fees | | | 8,840 | | | | 1,488 | | | | 7,547 | | |
| Co-administration fees and expenses (including transfer agency fees) | | | 3,608 | | | | 625 | | | | 3,082 | | |
| Custodian fees | | | 136 | | | | 23 | | | | 116 | | |
| Directors' fees | | | 34 | | | | 5 | | | | 27 | | |
| Registration fees | | | 19 | | | | 38 | | | | 22 | | |
| Professional fees | | | 65 | | | | 11 | | | | 54 | | |
| Printing | | | 47 | | | | 8 | | | | 41 | | |
| Other | | | 60 | | | | 10 | | | | 51 | | |
| Distribution and shareholder servicing fees – Class A | | | 271 | | | | 2 | | | | 260 | | |
| Distribution and shareholder servicing fees – Class B | | | 335 | | | | 2 | | | | 287 | | |
| Distribution and shareholder servicing fees – Class C | | | 146 | | | | 1 | | | | 71 | | |
| Distribution and shareholder servicing fees – Class R | | | 23 | | | | - | | | | 34 | | |
| Total expenses | | | 13,584 | | | | 2,213 | | | | 11,592 | | |
| Less: Fee waivers | | | (569 | ) | | | (148 | ) | | | (490 | ) | |
| Total net expenses | | | 13,015 | | | | 2,065 | | | | 11,102 | | |
| Investment income – net | | | 975 | | | | 1,294 | | | | 12,916 | | |
REALIZED AND UNREALIZED GAINS (LOSSES) ON
INVESTMENTS AND FUTURES CONTRACTS – NET: | |
| Net realized gain on investments | | | 81,430 | | | | 2,068 | | | | 109,490 | | |
| Net realized gain on futures contracts | | | - | | | | 1,671 | | | | - | | |
| Net change in unrealized appreciation or depreciation of investments | | | 36,383 | | | | 9,176 | | | | 44,184 | | |
| Net change in unrealized appreciation or depreciation of futures contracts | | | - | | | | (50 | ) | | | - | | |
| Net gain on investments and futures contracts | | | 117,813 | | | | 12,865 | | | | 153,674 | | |
| Net increase in net assets resulting from operations | | $ | 118,788 | | | $ | 14,159 | | | $ | 166,590 | | |
The accompanying notes are an integral part of the financial statements.
FIRST AMERICAN FUNDS Annual Report 2004
104
Statements of Changes in Net Assets in thousands
| | | Large Cap Growth
Opportunities Fund | | Large Cap
Select Fund | | Large Cap
Value Fund | |
| | | 10/01/03
to
9/30/04 | | 10/01/02
to
9/30/03 | | 10/01/03
to
9/30/04 | | 1/31/03 (2)
to
9/30/03 | | 10/01/03
to
9/30/04 | | 10/01/02
to
9/30/03 | |
| OPERATIONS: | |
| Investment income – net | | $ | 975 | | | $ | 2,263 | | | $ | 1,294 | | | $ | 212 | | | $ | 12,916 | | | $ | 15,213 | | |
| Net realized gain (loss) on investments | | | 81,430 | | | | (8,348 | ) | | | 2,068 | | | | 645 | | | | 109,490 | | | | (74,910 | ) | |
| Net realized gain on futures | | | - | | | | - | | | | 1,671 | | | | 244 | | | | - | | | | - | | |
| Net change in unrealized appreciation or depreciation of investments | | | 36,383 | | | | 181,534 | | | | 9,176 | | | | 3,103 | | | | 44,184 | | | | 235,175 | | |
| Net change in unrealized appreciation or depreciation of futures contracts | | | - | | | | - | | | | (50 | ) | | | (115 | ) | | | - | | | | - | | |
| Net increase in net assets resulting from operations | | | 118,788 | | | | 175,449 | | | | 14,159 | | | | 4,089 | | | | 166,590 | | | | 175,478 | | |
| DISTRIBUTIONS TO SHAREHOLDERS FROM: | |
| Investment income – net: | |
| Class A | | | (50 | ) | | | (72 | ) | | | (2 | ) | | | - | | | | (930 | ) | | | (1,096 | ) | |
| Class B | | | - | | | | (1 | ) | | | - | | | | - | | | | (107 | ) | | | (194 | ) | |
| Class C | | | - | | | | (2 | ) | | | - | | | | - | | | | (25 | ) | | | (42 | ) | |
| Class R | | | (7 | ) | | | (15 | ) | | | - | | | | - | | | | (126 | ) | | | (325 | ) | |
| Class Y | | | (1,127 | ) | | | (2,319 | ) | | | (1,279 | ) | | | (207 | ) | | | (11,517 | ) | | | (13,005 | ) | |
| Net realized gain on investments: | |
| Class A | | | - | | | | - | | | | (3 | ) | | | - | | | | - | | | | - | | |
| Class B | | | - | | | | - | | | | (1 | ) | | | - | | | | - | | | | - | | |
| Class Y | | | - | | | | - | | | | (1,552 | ) | | | - | | | | - | | | | - | | |
| Return of capital: | |
| Class A | | | (11 | ) | | | - | | | | - | | | | - | | | | - | | | | (9 | ) | |
| Class B (3) | | | - | | | | - | | | | - | | | | - | | | | - | | | | (3 | ) | |
| Class C (3) | | | - | | | | - | | | | - | | | | - | | | | - | | | | (1 | ) | |
| Class R | | | (1 | ) | | | - | | | | - | | | | - | | | | - | | | | (3 | ) | |
| Class Y | | | (249 | ) | | | - | | | | - | | | | - | | | | - | | | | (91 | ) | |
| Total distributions | | | (1,445 | ) | | | (2,409 | ) | | | (2,837 | ) | | | (207 | ) | | | (12,705 | ) | | | (14,769 | ) | |
| CAPITAL SHARE TRANSACTIONS (1): | |
| Class A: | |
| Proceeds from sales | | | 40,942 | | | | 14,680 | | | | 973 | | | | 207 | | | | 38,252 | | | | 12,490 | | |
| Reinvestment of distributions | | | 59 | | | | 68 | | | | 5 | | | | - | | | | 878 | | | | 1,055 | | |
| Payments for redemptions | | | (30,173 | ) | | | (16,989 | ) | | | (501 | ) | | | (1 | ) | | | (26,540 | ) | | | (24,446 | ) | |
| Shares issued in connection with the acquisition of Fund net assets | | | - | | | | 56,074 | | | | - | | | | - | | | | - | | | | - | | |
| Increase (decrease) in net assets from Class A transactions | | | 10,828 | | | | 53,833 | | | | 477 | | | | 206 | | | | 12,590 | | | | (10,901 | ) | |
| Class B: | |
| Proceeds from sales | | | 2,182 | | | | 1,467 | | | | 204 | | | | 110 | | | | 909 | | | | 1,108 | | |
| Reinvestment of distributions | | | - | | | | 1 | | | | 1 | | | | - | | | | 106 | | | | 195 | | |
| Payments for redemptions | | | (18,001 | ) | | | (6,688 | ) | | | (57 | ) | | | - | | | | (14,541 | ) | | | (9,181 | ) | |
| Shares issued in connection with the acquisition of Fund net assets | | | - | | | | 33,725 | | | | - | | | | - | | | | - | | | | - | | |
| Increase (decrease) in net assets from Class B transactions | | | (15,819 | ) | | | 28,505 | | | | 148 | | | | 110 | | | | (13,526 | ) | | | (7,878 | ) | |
| Class C: | |
| Proceeds from sales | | | 1,418 | | | | 3,480 | | | | 49 | | | | 32 | | | | 808 | | | | 1,111 | | |
| Reinvestment of distributions | | | - | | | | 2 | | | | - | | | | - | | | | 25 | | | | 42 | | |
| Payments for redemptions | | | (5,343 | ) | | | (2,744 | ) | | | (19 | ) | | | (7 | ) | | | (2,322 | ) | | | (2,932 | ) | |
| Shares issued in connection with the acquisition of Fund net assets | | | - | | | | 11,793 | | | | - | | | | - | | | | - | | | | - | | |
| Increase (decrease) in net assets from Class C transactions | | | (3,925 | ) | | | 12,531 | | | | 30 | | | | 25 | | | | (1,489 | ) | | | (1,779 | ) | |
| Class R: | |
| Proceeds from sales | | | 1,810 | | | | 5,934 | | | | 1 | | | | 1 | | | | 2,695 | | | | 7,302 | | |
| Reinvestment of distributions | | | 7 | | | | 12 | | | | - | | | | - | | | | 125 | | | | 323 | | |
| Payments for redemptions | | | (19,633 | ) | | | (3,637 | ) | | | (1 | ) | | | - | | | | (29,940 | ) | | | (11,536 | ) | |
| Shares issued in connection with the acquisition of Fund net assets | | | - | | | | 8,878 | | | | - | | | | - | | | | - | | | | - | | |
| Increase (decrease) in net assets from Class R transactions | | | (17,816 | ) | | | 11,187 | | | | - | | | | 1 | | | | (27,120 | ) | | | (3,911 | ) | |
| Class Y: | |
| Proceeds from sales | | | 312,207 | | | | 293,846 | | | | 169,597 | | | | 123,607 | | | | 216,890 | | | | 148,267 | | |
| Reinvestment of distributions | | | 725 | | | | 955 | | | | 2,310 | | | | 126 | | | | 7,917 | | | | 8,829 | | |
| Payments for redemptions | | | (299,071 | ) | | | (317,222 | ) | | | (17,779 | ) | | | (1,211 | ) | | | (210,060 | ) | | | (245,103 | ) | |
| Shares issued in connection with the acquisition of Fund net assets | | | - | | | | 418,499 | | | | - | | | | - | | | | - | | | | - | | |
| Shares issued in connection with the acquisition of Common Trust Fund net assets | | | - | | | | 273,701 | | | | - | | | | - | | | | - | | | | - | | |
| Increase (decrease) in net assets from Class Y transactions | | | 13,861 | | | | 669,779 | | | | 154,128 | | | | 122,522 | | | | 14,747 | | | | (88,007 | ) | |
| Increase (decrease) in net assets from capital share transactions | | | (12,871 | ) | | | 775,835 | | | | 154,783 | | | | 122,864 | | | | (14,798 | ) | | | (112,476 | ) | |
| Total increase in net assets | | | 104,472 | | | | 948,875 | | | | 166,105 | | | | 126,746 | | | | 139,087 | | | | 48,233 | | |
| Net assets at beginning of period | | | 1,234,613 | | | | 285,738 | | | | 126,746 | | | | - | | | | 1,023,967 | | | | 975,734 | | |
| Net assets at end of period | | $ | 1,339,085 | | | $ | 1,234,613 | | | $ | 292,851 | | | $ | 126,746 | | | $ | 1,163,054 | | | $ | 1,023,967 | | |
| Undistributed (distributions in excess of) net investment income at end of period | | $ | (2 | ) | | $ | 212 | | | $ | 18 | | | $ | 5 | | | $ | 119 | | | $ | - | | |
(1) See note 4 in Notes to Financial Statements for additional information.
(2) Commencement of operations.
(3) For the Large Cap Growth Opportunities Fund for the period 10/1/03 to 9/30/04 and due to the presentation of the financial statements in thousands, the numbers round to zero.
The accompanying notes are an integral part of the financial statements.
FIRST AMERICAN FUNDS Annual Report 2004
105
Financial Highlights For a share outstanding throughout the periods ended September 30, unless otherwise indicated.
| | | Net Asset
Value
Beginning
of Period | | Net
Investment
Income (Loss) | | Realized and
Unrealized
Gains
(Losses) on
Investments | | Dividends
from Net
Investment
Income | | Distributions
from Net
Realized Gains | | Distributions
from Return
of Capital | | Net Asset
Value
End of
Period | | Total
Return (10) | | Net Assets
End of
Period (000) | | Ratio of
Expenses to
Average
Net Assets | | Ratio of Net
Investment
Income (Loss)
to Average
Net Assets | | Ratio of
Expenses to
Average
Net Assets
(Excluding
Waivers) | | Ratio of Net
Investment
Income (Loss)
to Average Net
Assets (Excluding
Waivers) | | Portfolio
Turnover
Rate | |
| Large Cap Growth Opportunities Fund (1) (2) | |
| | Class A | | | | | | | | | | | | | | | | | | | | | | | | | | | | | | | | | | | | | | | | | | | | | | | | | | | | | | | | |
| | 2004 | | | $ | 22.84 | | | $ | (0.03 | ) | | $ | 2.20 | | | $ | (0.01 | ) | | $ | - | | | $ | - | (11) | | $ | 25.00 | | | | 9.52 | % | | $ | 112,379 | | | | 1.15 | % | | | (0.13 | )% | | | 1.19 | % | | | (0.17 | )% | | | 113 | % | |
| | 2003 | | | | 19.16 | | | | - | | | | 3.73 | | | | (0.05 | ) | | | - | | | | - | | | | 22.84 | | | | 19.50 | | | | 93,331 | | | | 1.15 | | | | (0.02 | ) | | | 1.19 | | | | (0.06 | ) | | | 83 | | |
| | 2002 | | | | 24.44 | | | | - | | | | (5.23 | ) | | | (0.05 | ) | | | - | | | | - | | | | 19.16 | | | | (21.46 | ) | | | 24,647 | | | | 1.15 | | | | (0.02 | ) | | | 1.22 | | | | (0.09 | ) | | | 43 | | |
| | 2001 | (3) | | | 43.33 | | | | (0.01 | ) | | | (14.00 | ) | | | - | | | | (4.88 | ) | | | - | | | | 24.44 | | | | (35.83 | ) | | | 34,330 | | | | 1.20 | | | | (0.04 | ) | | | 1.24 | | | | (0.08 | ) | | | 40 | | |
| | 2000 | (4) | | | 37.96 | | | | (0.15 | ) | | | 7.55 | | | | - | | | | (2.03 | ) | | | - | | | | 43.33 | | | | 19.92 | | | | 51,232 | | | | 1.20 | | | | (0.35 | ) | | | 1.21 | | | | (0.36 | ) | | | 60 | | |
| | 1999 | (4) | | | 35.72 | | | | (0.12 | ) | | | 6.42 | | | | (0.02 | ) | | | (4.04 | ) | | | - | | | | 37.96 | | | | 17.92 | | | | 47,238 | | | | 1.19 | | | | (0.31 | ) | | | 1.20 | | | | (0.32 | ) | | | 59 | | |
| | Class B | | | | | | | | | | | | | | | | | | | | | | | | | | | | | | | | | | | | | | | | | | | | | | | | | | | | |
| | 2004 | | | $ | 22.10 | | | $ | (0.21 | ) | | $ | 2.13 | | | $ | - | | | $ | - | | | $ | - | (11) | | $ | 24.02 | | | | 8.69 | % | | $ | 25,633 | | | | 1.90 | % | | | (0.87 | )% | | | 1.94 | % | | | (0.91 | )% | | | 113 | % | |
| | 2003 | | | | 18.64 | | | | (0.18 | ) | | | 3.64 | | | | - | | | | - | | | | - | | | | 22.10 | | | | 18.58 | | | | 37,853 | | | | 1.90 | | | | (0.84 | ) | | | 1.94 | | | | (0.88 | ) | | | 83 | | |
| | 2002 | | | | 23.94 | | | | (0.18 | ) | | | (5.09 | ) | | | (0.03 | ) | | | - | | | | - | | | | 18.64 | | | | (22.06 | ) | | | 2,928 | | | | 1.90 | | | | (0.75 | ) | | | 1.97 | | | | (0.82 | ) | | | 43 | | |
| | 2001 | (3) | | | 42.80 | | | | (0.22 | ) | | | (13.76 | ) | | | - | | | | (4.88 | ) | | | - | | | | 23.94 | | | | (36.28 | ) | | | 2,954 | | | | 1.93 | | | | (0.79 | ) | | | 1.97 | | | | (0.83 | ) | | | 40 | | |
| | 2000 | (4) | | | 37.78 | | | | (0.47 | ) | | | 7.52 | | | | - | | | | (2.03 | ) | | | - | | | | 42.80 | | | | 19.06 | | | | 1,483 | | | | 1.95 | | | | (1.10 | ) | | | 1.96 | | | | (1.11 | ) | | | 60 | | |
| | 1999 | (4) (5) | | | 36.92 | | | | (0.29 | ) | | | 1.15 | | | | - | | | | - | | | | - | | | | 37.78 | | | | 2.33 | | | | 722 | | | | 1.96 | | | | (1.17 | ) | | | 1.97 | | | | (1.18 | ) | | | 59 | | |
| | Class C | | | | | | | | | | | | | | | | | | | | | | | | | | | | | | | | | | | | | | | | | | | | | | | | | | | | |
| | 2004 | | | $ | 22.55 | | | $ | (0.21 | ) | | $ | 2.17 | | | $ | - | | | $ | - | | | $ | - | (11) | | $ | 24.51 | | | | 8.69 | % | | $ | 12,811 | | | | 1.90 | % | | | (0.87 | )% | | | 1.94 | % | | | (0.91 | )% | | | 113 | % | |
| | 2003 | | | | 19.03 | | | | (0.18 | ) | | | 3.72 | | | | (0.02 | ) | | | - | | | | - | | | | 22.55 | | | | 18.60 | | | | 15,365 | | | | 1.90 | | | | (0.81 | ) | | | 1.94 | | | | (0.85 | ) | | | 83 | | |
| | 2002 | | | | 24.44 | | | | (0.18 | ) | | | (5.19 | ) | | | (0.04 | ) | | | - | | | | - | | | | 19.03 | | | | (22.03 | ) | | | 476 | | | | 1.90 | | | | (0.73 | ) | | | 1.97 | | | | (0.80 | ) | | | 43 | | |
| | 2001 | (6) | | | 23.75 | | | | - | | | | 0.69 | | | | - | | | | - | | | | - | | | | 24.44 | | | | 2.95 | | | | - | | | | - | | | | - | | | | - | | | | - | | | | 40 | | |
| | Class R | | | | | | | | | | | | | | | | | | | | | | | | | | | | | | | | | | | | | | | | | | | | | | | | | | | | |
| | 2004 | (7) | | $ | 22.85 | | | $ | (0.02 | ) | | $ | 2.16 | | | $ | (0.01 | ) | | $ | - | | | $ | - | (11) | | $ | 24.98 | | | | 9.38 | % | | $ | 1 | | | | 1.15 | % | | | (0.08 | )% | | | 1.19 | % | | | (0.12 | )% | | | 113 | % | |
| | 2003 | | | | 19.17 | | | | - | | | | 3.73 | | | | (0.05 | ) | | | - | | | | - | | | | 22.85 | | | | 19.51 | | | | 15,890 | | | | 1.15 | | | | (0.01 | ) | | | 1.19 | | | | (0.05 | ) | | | 83 | | |
| | 2002 | | | | 24.45 | | | | - | | | | (5.23 | ) | | | (0.05 | ) | | | - | | | | - | | | | 19.17 | | | | (21.45 | ) | | | 2,376 | | | | 1.15 | | | | - | | | | 1.22 | | | | (0.07 | ) | | | 43 | | |
| | 2001 | (8) | | | 35.53 | | | | (0.01 | ) | | | (11.07 | ) | | | - | | | | - | | | | - | | | | 24.45 | | | | (31.16 | ) | | | 2,802 | | | | 1.18 | | | | (0.03 | ) | | | 1.22 | | | | (0.07 | ) | | | 40 | | |
| | Class Y | | | | | | | | | | | | | | | | | | | | | | | | | | | | | | | | | | | | | | | | | | | | | | | | | | | | |
| | 2004 | | | $ | 23.38 | | | $ | 0.03 | | | $ | 2.25 | | | $ | (0.02 | ) | | $ | - | | | $ | (0.01 | ) | | $ | 25.63 | | | | 9.76 | % | | $ | 1,188,261 | | | | 0.90 | % | | | 0.13 | % | | | 0.94 | % | | | 0.09 | % | | | 113 | % | |
| | 2003 | | | | 19.59 | | | | 0.07 | | | | 3.80 | | | | (0.08 | ) | | | - | | | | - | | | | 23.38 | | | | 19.78 | | | | 1,072,174 | | | | 0.90 | | | | 0.31 | | | | 0.94 | | | | 0.27 | | | | 83 | | |
| | 2002 | | | | 24.93 | | | | 0.06 | | | | (5.33 | ) | | | (0.07 | ) | | | - | | | | - | | | | 19.59 | | | | (21.23 | ) | | | 255,311 | | | | 0.90 | | | | 0.24 | | | | 0.97 | | | | 0.17 | | | | 43 | | |
| | 2001 | (3) | | | 44.00 | | | | 0.06 | | | | (14.25 | ) | | | - | | | | (4.88 | ) | | | - | | | | 24.93 | | | | (35.70 | ) | | | 316,213 | | | | 0.94 | | | | 0.20 | | | | 0.98 | | | | 0.16 | | | | 40 | | |
| | 2000 | (4) | | | 38.42 | | | | (0.04 | ) | | | 7.65 | | | | - | | | | (2.03 | ) | | | - | | | | 44.00 | | | | 20.24 | | | | 339,166 | �� | | | 0.95 | | | | (0.10 | ) | | | 0.96 | | | | (0.11 | ) | | | 60 | | |
| | 1999 | (4) | | | 36.05 | | | | (0.02 | ) | | | 6.47 | | | | (0.04 | ) | | | (4.04 | ) | | | - | | | | 38.42 | | | | 18.18 | | | | 306,832 | | | | 0.94 | | | | (0.06 | ) | | | 0.95 | | | | (0.07 | ) | | | 59 | | |
| Large Cap Select Fund (2) (9) | |
| | Class A | | | | | | | | | | | | | | | | | | | | | | | | | | | | | | | | | | | | | | | | | | | | | | | | | | | | | | | | |
| | 2004 | | | $ | 11.45 | | | $ | 0.04 | | | $ | 1.19 | | | $ | (0.05 | ) | | $ | (0.11 | ) | | $ | - | | | $ | 12.52 | | | | 10.82 | % | | $ | 714 | | | | 1.15 | % | | | 0.30 | % | | | 1.21 | % | | | 0.24 | % | | | 67 | % | |
| | 2003 | | | | 10.00 | | | | 0.03 | | | | 1.46 | | | | (0.04 | ) | | | - | | | | - | | | | 11.45 | | | | 14.91 | | | | 215 | | | | 1.15 | | | | 0.42 | | | | 1.24 | | | | 0.33 | | | | 65 | | |
| | Class B | | | | | | | | | | | | | | | | | | | | | | | | | | | | | | | | | | | | | | | | | | | | | | | | | | | | |
| | 2004 | | | $ | 11.41 | | | $ | (0.06 | ) | | $ | 1.18 | | | $ | (0.01 | ) | | $ | (0.11 | ) | | $ | - | | | $ | 12.41 | | | | 9.89 | % | | $ | 270 | | | | 1.90 | % | | | (0.44 | )% | | | 1.96 | % | | | (0.50 | )% | | | 67 | % | |
| | 2003 | | | | 10.00 | | | | (0.03 | ) | | | 1.45 | | | | (0.01 | ) | | | - | | | | - | | | | 11.41 | | | | 14.18 | | | | 113 | | | | 1.90 | | | | (0.35 | ) | | | 1.99 | | | | (0.44 | ) | | | 65 | | |
| | Class C | | | | | | | | | | | | | | | | | | | | | | | | | | | | | | | | | | | | | | | | | | | | | | | | | | | | |
| | 2004 | | | $ | 11.42 | | | $ | (0.06 | ) | | $ | 1.19 | | | $ | (0.01 | ) | | $ | (0.11 | ) | | $ | - | | | $ | 12.43 | | | | 9.98 | % | | $ | 59 | | | | 1.90 | % | | | (0.45 | )% | | | 1.96 | % | | | (0.51 | )% | | | 67 | % | |
| | 2003 | | | | 10.00 | | | | (0.02 | ) | | | 1.45 | | | | (0.01 | ) | | | - | | | | - | | | | 11.42 | | | | 14.27 | | | | 26 | | | | 1.90 | | | | (0.32 | ) | | | 1.99 | | | | (0.41 | ) | | | 65 | | |
| | Class R | | | | | | | | | | | | | | | | | | | | | | | | | | | | | | | | | | | | | | | | | | | | | | | | | | | | |
| | 2004 | (7) | | $ | 11.44 | | | $ | 0.02 | | | $ | 1.18 | | | $ | (0.04 | ) | | $ | (0.11 | ) | | $ | - | | | $ | 12.49 | | | | 10.60 | % | | $ | 1 | | | | 1.32 | % | | | 0.18 | % | | | 1.38 | % | | | 0.12 | % | | | 67 | % | |
| | 2003 | | | | 10.00 | | | | 0.03 | | | | 1.44 | | | | (0.03 | ) | | | - | | | | - | | | | 11.44 | | | | 14.76 | | | | 1 | | | | 1.15 | | | | 0.39 | | | | 1.24 | | | | 0.30 | | | | 65 | | |
| | Class Y | | | | | | | | | | | | | | | | | | | | | | | | | | | | | | | | | | | | | | | | | | | | | | | | | | | | |
| | 2004 | | | $ | 11.45 | | | $ | 0.07 | | | $ | 1.19 | | | $ | (0.07 | ) | | $ | (0.11 | ) | | $ | - | | | $ | 12.53 | | | | 11.10 | % | | $ | 291,807 | | | | 0.90 | % | | | 0.57 | % | | | 0.96 | % | | | 0.51 | % | | | 67 | % | |
| | 2003 | | | | 10.00 | | | | 0.05 | | | | 1.45 | | | | (0.05 | ) | | | - | | | | - | | | | 11.45 | | | | 15.02 | | | | 126,391 | | | | 0.90 | | | | 0.71 | | | | 0.99 | | | | 0.62 | | | | 65 | | |
(1) The financial highlights for the Large Cap Growth Opportunities Fund as set forth herein include the historical financial highlights of the Firstar Large Cap
Core Equity Fund. The assets of the Firstar Fund were acquired by the First American Large Cap Growth Opportunities Fund on September 24, 2001.
In connection with such acquisition, (i) Class A shares of the Firstar Large Cap Core Fund were exchanged for Class A shares of the First American Large
Cap Growth Opportunities Fund, (ii) Firstar Class B shares were exchanged for Class B shares of the First American Fund, (iii) Firstar Class Y shares were
exchanged for Class S shares (now designated Class R shares) of the First American Fund, and (iv) Firstar Class Institutional shares were exchanged for
Class Y shares of the First American Fund.
(2) Per share data calculated using average shares outstanding method.
(3) For the period November 1, 2000, to September 30, 2001. Effective in 2001, the Fund's fiscal year end was changed from October 31 to September 30.
All ratios for the period have been annualized, except total return and portfolio turnover.
(4) For the fiscal period ended October 31.
(5) Class of shares has been offered since March 1, 1999. All ratios for the period have been annualized, except total return and portfolio turnover.
(6) Class of shares has been offered since September 24, 2001. All ratios for the period have been annualized, except total return and portfolio turnover.
(7) Prior to July 1, 2004, Class R shares were named Class S shares, which had lower fees and expenses.
(8) Class of shares has been offered since November 27, 2000. All ratios for the period have been annualized, except total return and portfolio turnover.
(9) Commenced operations on January 31, 2003. All ratios for the period have been annualized, except total return and portfolio turnover.
(10) Total return does not reflect sales charges. Total return would have been lower had certain expenses not been waived.
(11) Includes a tax return of capital of less than $0.01.
The accompanying notes are an integral part of the financial statements.
FIRST AMERICAN FUNDS Annual Report 2004
106
FIRST AMERICAN FUNDS Annual Report 2004
107
Financial Highlights For a share outstanding throughout the periods ended September 30, unless otherwise indicated.
| | | Net Asset
Value
Beginning
of Period | | Net
Investment
Income | | Realized and
Unrealized
Gains
(Losses) on
Investments | | Dividends
from Net
Investment
Income | | Distributions
from Net
Realized Gains | | Net Asset
Value
End of
Period | | Total
Return (4) | | Net Assets
End of
Period (000) | | Ratio of
Expenses to
Average
Net Assets | | Ratio of Net
Investment
Income
to Average
Net Assets | | Ratio of
Expenses to
Average
Net Assets
(Excluding
Waivers) | | Ratio of Net
Investment
Income
to Average Net
Assets (Excluding
Waivers) | | Portfolio
Turnover
Rate | |
| Large Cap Value Fund | |
| | Class A | | | | | | | | | | | | | | | | | | | | | | | | | | | | | | | | | | | | | | | | | | | | | | | | | | | | | | |
| | 2004 | (1) | | $ | 14.97 | | | $ | 0.15 | | | $ | 2.24 | | | $ | (0.15 | ) | | $ | - | | | $ | 17.21 | | | | 16.01 | % | | $ | 113,683 | | | | 1.15 | % | | | 0.91 | % | | | 1.19 | % | | | 0.87 | % | | | 104 | % | |
| | 2003 | (1) | | | 12.77 | | | | 0.18 | | | | 2.20 | | | | (0.18 | ) | | | - | | | | 14.97 | | | | 18.71 | | | | 88,024 | | | | 1.15 | | | | 1.30 | | | | 1.20 | | | | 1.25 | | | | 94 | | |
| | 2002 | (1) | | | 15.98 | | | | 0.14 | | | | (3.21 | ) | | | (0.14 | ) | | | - | | | | 12.77 | | | | (19.37 | ) | | | 85,182 | | | | 1.15 | | | | 0.86 | | | | 1.20 | | | | 0.81 | | | | 82 | | |
| | 2001 | (1) | | | 20.59 | | | | 0.16 | | | | (2.67 | ) | | | (0.16 | ) | | | (1.94 | ) | | | 15.98 | | | | (13.72 | ) | | | 94,064 | | | | 1.05 | | | | 0.88 | | | | 1.15 | | | | 0.78 | | | | 64 | | |
| | 2000 | | | | 23.12 | | | | 0.17 | | | | 0.22 | | | | (0.17 | ) | | | (2.75 | ) | | | 20.59 | | | | 0.92 | | | | 138,146 | | | | 1.05 | | | | (0.45 | ) | | | 1.13 | | | | (0.53 | ) | | | 68 | | |
| | Class B | | | | | | | | | | | | | | | | | | | | | | | | | | | | | | | | | | | | | | | | | | | | | | | | | | | | | | |
| | 2004 | (1) | | $ | 14.70 | | | $ | 0.03 | | | $ | 2.20 | | | $ | (0.06 | ) | | $ | - | | | $ | 16.87 | | | | 15.19 | % | | $ | 21,829 | | | | 1.90 | % | | | 0.19 | % | | | 1.94 | % | | | 0.15 | % | | | 104 | % | |
| | 2003 | (1) | | | 12.55 | | | | 0.08 | | | | 2.15 | | | | (0.08 | ) | | | - | | | | 14.70 | | | | 17.83 | | | | 30,987 | | | | 1.90 | | | | 0.56 | | | | 1.95 | | | | 0.51 | | | | 94 | | |
| | 2002 | (1) | | | 15.71 | | | | 0.02 | | | | (3.15 | ) | | | (0.03 | ) | | | - | | | | 12.55 | | | | (19.96 | ) | | | 33,720 | | | | 1.90 | | | | 0.11 | | | | 1.95 | | | | 0.06 | | | | 82 | | |
| | 2001 | (1) | | | 20.30 | | | | 0.02 | | | | (2.63 | ) | | | (0.04 | ) | | | (1.94 | ) | | | 15.71 | | | | (14.42 | ) | | | 38,108 | | | | 1.80 | | | | 0.13 | | | | 1.90 | | | | 0.03 | | | | 64 | | |
| | 2000 | | | | 22.87 | | | | 0.05 | | | | 0.18 | | | | (0.05 | ) | | | (2.75 | ) | | | 20.30 | | | | 0.17 | | | | 49,662 | | | | 1.80 | | | | (1.20 | ) | | | 1.88 | | | | (1.28 | ) | | | 68 | | |
| | Class C | | | | | | | | | | | | | | | | | | | | | | | | | | | | | | | | | | | | | | | | | | | | | | | | | | | | | | |
| | 2004 | (1) | | $ | 14.87 | | | $ | 0.03 | | | $ | 2.23 | | | $ | (0.06 | ) | | $ | - | | | $ | 17.07 | | | | 15.21 | % | | $ | 6,344 | | | | 1.90 | % | | | 0.18 | % | | | 1.94 | % | | | 0.14 | % | | | 104 | % | |
| | 2003 | (1) | | | 12.70 | | | | 0.08 | | | | 2.17 | | | | (0.08 | ) | | | - | | | | 14.87 | | | | 17.76 | | | | 6,844 | | | | 1.90 | | | | 0.56 | | | | 1.95 | | | | 0.51 | | | | 94 | | |
| | 2002 | (1) | | | 15.90 | | | | 0.02 | | | | (3.19 | ) | | | (0.03 | ) | | | - | | | | 12.70 | | | | (19.97 | ) | | | 7,524 | | | | 1.90 | | | | 0.11 | | | | 1.95 | | | | 0.06 | | | | 82 | | |
| | 2001 | (1) | | | 20.51 | | | | 0.02 | | | | (2.65 | ) | | | (0.04 | ) | | | (1.94 | ) | | | 15.90 | | | | (14.36 | ) | | | 10,141 | | | | 1.80 | | | | 0.12 | | | | 1.90 | | | | 0.02 | | | | 64 | | |
| | 2000 | | | | 23.09 | | | | 0.06 | | | | 0.17 | | | | (0.06 | ) | | | (2.75 | ) | | | 20.51 | | | | 0.17 | | | | 6,551 | | | | 1.80 | | | | (1.20 | ) | | | 1.88 | | | | (1.28 | ) | | | 68 | | |
| | Class R (1) | | | | | | | | | | | | | | | | | | | | | | | | | | | | | | | | | | | | | | | | | | | | | | | | | | | | | | |
| | 2004 | (2) | | $ | 14.96 | | | $ | 0.17 | | | $ | 2.23 | | | $ | (0.14 | ) | | $ | - | | | $ | 17.22 | | | | 16.05 | % | | $ | 1 | | | | 1.15 | % | | | 1.00 | % | | | 1.19 | % | | | 0.96 | % | | | 104 | % | |
| | 2003 | | | | 12.77 | | | | 0.18 | | | | 2.19 | | | | (0.18 | ) | | | - | | | | 14.96 | | | | 18.63 | | | | 23,845 | | | | 1.15 | | | | 1.30 | | | | 1.20 | | | | 1.25 | | | | 94 | | |
| | 2002 | | | | 15.97 | | | | 0.13 | | | | (3.18 | ) | | | (0.15 | ) | | | - | | | | 12.77 | | | | (19.36 | ) | | | 24,129 | | | | 1.15 | | | | 0.90 | | | | 1.20 | | | | 0.85 | | | | 82 | | |
| | 2001 | (3) | | | 15.32 | | | | - | | | | 0.65 | | | | - | | | | - | | | | 15.97 | | | | 4.24 | | | | - | | | | - | | | | - | | | | - | | | | - | | | | 64 | | |
| | Class Y | | | | | | | | | | | | | | | | | | | | | | | | | | | | | | | | | | | | | | | | | | | | | | | | | | | | | | |
| | 2004 | (1) | | $ | 15.01 | | | $ | 0.20 | | | $ | 2.24 | | | $ | (0.19 | ) | | $ | - | | | $ | 17.26 | | | | 16.31 | % | | $ | 1,021,197 | | | | 0.90 | % | | | 1.17 | % | | | 0.94 | % | | | 1.13 | % | | | 104 | % | |
| | 2003 | (1) | | | 12.80 | | | | 0.22 | | | | 2.20 | | | | (0.21 | ) | | | - | | | | 15.01 | | | | 19.04 | | | | 874,267 | | | | 0.90 | | | | 1.55 | | | | 0.95 | | | | 1.50 | | | | 94 | | |
| | 2002 | (1) | | | 16.02 | | | | 0.18 | | | | (3.22 | ) | | | (0.18 | ) | | | - | | | | 12.80 | | | | (19.22 | ) | | | 825,179 | | | | 0.90 | | | | 1.11 | | | | 0.95 | | | | 1.06 | | | | 82 | | |
| | 2001 | (1) | | | 20.64 | | | | 0.21 | | | | (2.68 | ) | | | (0.21 | ) | | | (1.94 | ) | | | 16.02 | | | | (13.53 | ) | | | 970,190 | | | | 0.80 | | | | 1.13 | | | | 0.90 | | | | 1.03 | | | | 64 | | |
| | 2000 | | | | 23.17 | | | | 0.23 | | | | 0.21 | | | | (0.22 | ) | | | (2.75 | ) | | | 20.64 | | | | 1.17 | | | | 1,186,787 | | | | 0.80 | | | | (0.20 | ) | | | 0.88 | | | | (0.28 | ) | | | 68 | | |
(1) Per share data calculated using average shares outstanding method.
(2) Prior to July 1, 2004, Class R shares were named Class S shares, which had lower fees and expenses.
(3) Class of shares has been offered since September 24, 2001. All ratios for the period have been annualized, except total return and portfolio turnover.
(4) Total return does not reflect sales charges. Total return would have been lower had certain expenses not been waived.
The accompanying notes are an integral part of the financial statements.
FIRST AMERICAN FUNDS Annual Report 2004
108
FIRST AMERICAN FUNDS Annual Report 2004
109
Schedule of Investments September 30, 2004
Balanced Fund
| DESCRIPTION | | SHARES | | VALUE (000) | |
| Common Stocks – 68.7% | | | |
| Consumer Discretionary – 6.8% | | | |
| American Eagle Outfitters | | | 8,270 | | | $ | 305 | | |
| Black & Decker (a) | | | 2,182 | | | | 169 | | |
| CBRL Group | | | 5,950 | | | | 215 | | |
| Collins & Aikman* (a) | | | 30,730 | | | | 128 | | |
| Cooper Tire & Rubber | | | 13,470 | | | | 272 | | |
| eBay* (a) | | | 12,360 | | | | 1,136 | | |
| Entercom Communications* | | | 5,880 | | | | 192 | | |
| Federated Department Stores | | | 4,375 | | | | 199 | | |
| Fortune Brands | | | 1,734 | | | | 128 | | |
| Gap (a) | | | 209,830 | | | | 3,924 | | |
| Gray Television | | | 20,120 | | | | 239 | | |
| Guitar Center* | | | 3,230 | | | | 140 | | |
| Hilton Hotels | | | 319,830 | | | | 6,026 | | |
| J.C. Penney | | | 3,220 | | | | 114 | | |
| Kerzner International* (a) | | | 7,340 | | | | 323 | | |
| Lear (a) | | | 4,107 | | | | 224 | | |
| Lennar (a) | | | 3,956 | | | | 188 | | |
| Life Time Fitness* | | | 6,200 | | | | 159 | | |
| Limited Brands (a) | | | 4,420 | | | | 99 | | |
| Liz Claiborne (a) | | | 3,822 | | | | 144 | | |
| Lowe's (a) | | | 30,080 | | | | 1,635 | | |
| Marriott International, Cl A | | | 10,240 | | | | 532 | | |
| Marvel Enterprises* (a) | | | 77,190 | | | | 1,124 | | |
| Men's Wearhouse* (a) | | | 9,700 | | | | 282 | | |
| Michaels Stores | | | 4,370 | | | | 259 | | |
| Panera Bread, Cl A* (a) | | | 5,640 | | | | 212 | | |
| Petco Animal Supplies* (a) | | | 2,130 | | | | 70 | | |
| Radio One* (a) | | | 19,360 | | | | 275 | | |
| Ruby Tuesday (a) | | | 15,100 | | | | 421 | | |
| Ryland Group (a) | | | 1,950 | | | | 181 | | |
| Sherwin Williams | | | 81,860 | | | | 3,599 | | |
| Sports Authority* (a) | | | 3,430 | | | | 80 | | |
| Standard Pacific | | | 1,510 | | | | 85 | | |
| Station Casinos (a) | | | 8,950 | | | | 439 | | |
| Time Warner* (a) | | | 255,345 | | | | 4,121 | | |
| Too* | | | 7,160 | | | | 129 | | |
| WCI Communities* (a) | | | 8,300 | | | | 193 | | |
| Yum! Brands (a) | | | 37,035 | | | | 1,506 | | |
| | | | 29,467 | | |
| Consumer Staples – 4.8% | | | |
| Avon Products (a) | | | 73,130 | | | | 3,194 | | |
| Bunge Limited (a) | | | 10,867 | | | | 434 | | |
| Clorox (a) | | | 76,269 | | | | 4,065 | | |
| Dean Foods* (a) | | | 3,831 | | | | 115 | | |
| PepsiCo | | | 74,043 | | | | 3,602 | | |
| Procter & Gamble | | | 104,110 | | | | 5,634 | | |
| Sysco | | | 24,070 | | | | 720 | | |
| Wal-Mart Stores | | | 63,040 | | | | 3,354 | | |
| | | | 21,118 | | |
| Energy – 7.3% | | | |
| Apache | | | 82,524 | | | | 4,135 | | |
| Ashland | | | 9,550 | | | | 536 | | |
| BJ Services (a) | | | 10,200 | | | | 535 | | |
| BP, ADR | | | 87,840 | | | | 5,053 | | |
| ChevronTexaco (a) | | | 15,600 | | | | 837 | | |
| ConocoPhillips | | | 20,255 | | | | 1,678 | | |
Balanced Fund (continued)
| DESCRIPTION | | SHARES | | VALUE (000) | |
| ENSCO International | | | 18,186 | | | $ | 594 | | |
| EOG Resources (a) | | | 25,530 | | | | 1,681 | | |
| Exxon Mobil | | | 157,580 | | | | 7,616 | | |
| Halliburton | | | 109,570 | | | | 3,691 | | |
| National-Oilwell* (a) | | | 76,620 | | | | 2,518 | | |
| Newfield Exploration* | | | 6,420 | | | | 393 | | |
| Rowan* (a) | | | 5,610 | | | | 148 | | |
| Schlumberger | | | 22,310 | | | | 1,502 | | |
| Ultra Petroleum* | | | 8,453 | | | | 415 | | |
| Valero Energy | | | 2,264 | | | | 182 | | |
| Varco International* | | | 5,648 | | | | 151 | | |
| Western Gas Resources | | | 6,800 | | | | 194 | | |
| W-H Energy Services* | | | 8,760 | | | | 182 | | |
| | | | 32,041 | | |
| Financials – 14.4% | | | |
| Affiliated Managers Group* (a) | | | 1,350 | | | | 72 | | |
| Allstate (a) | | | 81,612 | | | | 3,917 | | |
| Ambac Financial Group (a) | | | 4,989 | | | | 399 | | |
| American Express | | | 41,560 | | | | 2,139 | | |
| American International Group | | | 103,089 | | | | 7,009 | | |
| Ameritrade Holding* | | | 7,700 | | | | 92 | | |
| AmerUS Group, Cl A (a) | | | 10,520 | | | | 431 | | |
| Bank Mutual | | | 30,870 | | | | 370 | | |
| Bank of America (a) | | | 158,452 | | | | 6,866 | | |
| Boston Properties (REIT) | | | 5,128 | | | | 284 | | |
| Capital One Financial (a) | | | 33,416 | | | | 2,469 | | |
| CIT Group | | | 87,410 | | | | 3,268 | | |
| Citigroup | | | 204,457 | | | | 9,021 | | |
| City National (a) | | | 7,574 | | | | 492 | | |
| CoBiz (a) | | | 4,580 | | | | 76 | | |
| Compass Bancshares (a) | | | 3,035 | | | | 133 | | |
| Cullen/Frost Bankers | | | 9,430 | | | | 438 | | |
| Developers Diversified Realty (REIT) | | | 8,774 | | | | 343 | | |
| East West Bancorp | | | 1,770 | | | | 60 | | |
| Everest Re Group | | | 1,813 | | | | 135 | | |
| Fannie Mae (a) | | | 29,230 | | | | 1,853 | | |
| First Financial Bankshares | | | 1,790 | | | | 72 | | |
| First Niagara Financial Group (a) | | | 25,840 | | | | 346 | | |
| General Growth Properties (REIT) (a) | | | 19,728 | | | | 612 | | |
| Glacier Bancorp | | | 10,750 | | | | 313 | | |
| Goldman Sachs Group (a) | | | 40,988 | | | | 3,822 | | |
| Investors Financial Services (a) | | | 43,802 | | | | 1,977 | | |
| J. P. Morgan Chase | | | 128,180 | | | | 5,093 | | |
| Jefferies Group (a) | | | 5,920 | | | | 204 | | |
| KNBT Bancorp | | | 10,100 | | | | 170 | | |
| Lehman Brothers Holdings (a) | | | 12,330 | | | | 983 | | |
| Manulife Financial | | | 8,146 | | | | 357 | | |
| MBNA | | | 106,228 | | | | 2,677 | | |
| Merrill Lynch (a) | | | 23,850 | | | | 1,186 | | |
| Navigators Group* | | | 5,930 | | | | 173 | | |
| New Alliance Bancshares | | | 11,788 | | | | 169 | | |
| Providian Financial* (a) | | | 21,140 | | | | 328 | | |
| Radian Group (a) | | | 4,620 | | | | 214 | | |
| SAFECO | | | 3,993 | | | | 182 | | |
| SouthTrust | | | 9,400 | | | | 392 | | |
| State Street | | | 37,870 | | | | 1,617 | | |
| TrustCo Bank Corporation of New York | | | 14,300 | | | | 183 | | |
| Trustmark | | | 4,730 | | | | 147 | | |
| W.R. Berkley | | | 7,077 | | | | 298 | | |
The accompanying notes are an integral part of the financial statements.
FIRST AMERICAN FUNDS Annual Report 2004
110
Balanced Fund (continued)
| DESCRIPTION | | SHARES | | VALUE (000) | |
| Wells Fargo | | | 24,560 | | | $ | 1,464 | | |
| Winston Hotels (REIT) | | | 7,280 | | | | 78 | | |
| | | | 62,924 | | |
| Health Care – 10.6% | | | |
| Abgenix* (a) | | | 16,695 | | | | 165 | | |
| Able Laboratories* (a) | | | 13,920 | | | | 267 | | |
| Aetna (a) | | | 24,259 | | | | 2,424 | | |
| AMERIGROUP* | | | 5,660 | | | | 318 | | |
| Barr Pharmaceuticals* | | | 7,463 | | | | 309 | | |
| Biosite* (a) | | | 3,550 | | | | 174 | | |
| Boston Scientific* (a) | | | 57,400 | | | | 2,280 | | |
| C.R Bard | | | 6,072 | | | | 344 | | |
| Caremark Rx* (a) | | | 62,097 | | | | 1,991 | | |
| CIGNA | | | 1,710 | | | | 119 | | |
| Covance* (a) | | | 10,820 | | | | 432 | | |
| Encysive Pharmaceuticals* (a) | | | 13,360 | | | | 121 | | |
| Eyetech Pharmaceuticals* (a) | | | 3,410 | | | | 116 | | |
| Genzyme* | | | 4,230 | | | | 230 | | |
| Given Imaging* (a) | | | 3,660 | | | | 141 | | |
| Human Genome Sciences* (a) | | | 15,190 | | | | 166 | | |
| ImClone Systems* | | | 1,590 | | | | 84 | | |
| INAMED* | | | 1,970 | | | | 94 | | |
| Inveresk Research Group* | | | 3,990 | | | | 147 | | |
| Johnson & Johnson (a) | | | 145,337 | | | | 8,187 | | |
| McKesson HBOC (a) | | | 97,500 | | | | 2,501 | | |
| Medicis, Cl A | | | 4,880 | | | | 190 | | |
| Medtronic | | | 67,831 | | | | 3,520 | | |
| Nektar Therapeutics* | | | 8,990 | | | | 130 | | |
| NPS Pharmaceuticals* (a) | | | 6,900 | | | | 150 | | |
| Ocular Sciences* | | | 3,140 | | | | 151 | | |
| Onyx Pharmaceuticals* (a) | | | 2,820 | | | | 121 | | |
| PerkinElmer | | | 4,220 | | | | 73 | | |
| Pfizer | | | 236,730 | | | | 7,244 | | |
| Protein Design Labs* (a) | | | 10,520 | | | | 206 | | |
| Quest Diagnostics | | | 11,200 | | | | 988 | | |
| Respironics* | | | 3,360 | | | | 180 | | |
| SonoSite* | | | 2,820 | | | | 73 | | |
| St. Jude Medical* (a) | | | 18,620 | | | | 1,402 | | |
| Techne* (a) | | | 3,410 | | | | 130 | | |
| Teva Pharmaceutical Industries, ADR (a) | | | 89,262 | | | | 2,316 | | |
| Triad Hospitals* | | | 4,480 | | | | 154 | | |
| UnitedHealth Group (a) | | | 55,280 | | | | 4,076 | | |
| Urologix* | | | 7,340 | | | | 46 | | |
| Varian Medical Systems* (a) | | | 35,280 | | | | 1,220 | | |
| Wyeth | | | 57,310 | | | | 2,143 | | |
| Zimmer Holdings* (a) | | | 12,050 | | | | 952 | | |
| | | | 46,075 | | |
| Industrials – 7.7% | | | |
| 3M | | | 33,096 | | | | 2,647 | | |
| Actuant, Cl A* (a) | | | 5,500 | | | | 227 | | |
| AirTran Holdings* | | | 25,680 | | | | 256 | | |
| Albany International, Cl A | | | 7,490 | | | | 223 | | |
| Allied Waste Industries* (a) | | | 8,500 | | | | 75 | | |
| American Standard* | | | 7,377 | | | | 287 | | |
| Applied Signal Technology | | | 10,390 | | | | 332 | | |
| ARAMARK, Cl B* | | | 12,491 | | | | 302 | | |
| Chicago Bridge & Iron | | | 15,480 | | | | 464 | | |
| Danaher (a) | | | 40,680 | | | | 2,086 | | |
Balanced Fund (continued)
| DESCRIPTION | | SHARES | | VALUE (000) | |
| Dun & Bradstreet* (a) | | | 4,515 | | | $ | 265 | | |
| Eaton | | | 37,754 | | | | 2,394 | | |
| EGL* (a) | | | 6,980 | | | | 211 | | |
| Emerson Electric | | | 57,180 | | | | 3,539 | | |
| Fastenal (a) | | | 1,895 | | | | 109 | | |
| General Electric | | | 155,866 | | | | 5,234 | | |
| Genlyte Group* | | | 4,870 | | | | 314 | | |
| Heartland Express | | | 11,050 | | | | 204 | | |
| Hughes Supply (a) | | | 8,240 | | | | 248 | | |
| Kennametal | | | 8,780 | | | | 396 | | |
| Mercury Computer Systems* (a) | | | 10,940 | | | | 294 | | |
| MTC Technologies* | | | 15,450 | | | | 427 | | |
| Power-One* (a) | | | 20,090 | | | | 130 | | |
| Republic Services | | | 30,446 | | | | 906 | | |
| Roper Industries (a) | | | 5,510 | | | | 317 | | |
| Ryder System (a) | | | 6,010 | | | | 283 | | |
| Thomas Industries | | | 4,350 | | | | 137 | | |
| Tyco International | | | 117,890 | | | | 3,614 | | |
| United Defense Industries* | | | 6,740 | | | | 270 | | |
| United Technologies | | | 49,721 | | | | 4,643 | | |
| Waste Management | | | 103,190 | | | | 2,821 | | |
| | | | 33,655 | | |
| Information Technology – 12.8% | | | |
| Actel* | | | 8,540 | | | | 130 | | |
| ADC Telecommunications* (a) | | | 108,620 | | | | 197 | | |
| Adobe Systems (a) | | | 4,270 | | �� | | 211 | | |
| Aeroflex* | | | 10,500 | | | | 111 | | |
| Affiliated Computer Services, Cl A* | | | 2,708 | | | | 151 | | |
| Altera* (a) | | | 6,430 | | | | 126 | | |
| Analog Devices (a) | | | 22,310 | | | | 865 | | |
| Apple Computer* (a) | | | 8,624 | | | | 334 | | |
| Avaya* | | | 6,760 | | | | 94 | | |
| Avnet* | | | 13,420 | | | | 230 | | |
| Avocent* | | | 7,810 | | | | 203 | | |
| BearingPoint* | | | 41,050 | | | | 367 | | |
| Benchmark Electronics* (a) | | | 11,340 | | | | 338 | | |
| Cabot Microelectronics* (a) | | | 4,230 | | | | 153 | | |
| Carreker* | | | 15,090 | | | | 115 | | |
| CDW (a) | | | 39,169 | | | | 2,273 | | |
| Cisco Systems* | | | 154,759 | | | | 2,801 | | |
| Dell* | | | 74,877 | | | | 2,666 | | |
| Digitas* | | | 17,030 | | | | 132 | | |
| eFunds* | | | 6,000 | | | | 112 | | |
| Entegris* | | | 14,150 | | | | 118 | | |
| Equinix* (a) | | | 2,833 | | | | 87 | | |
| FactSet Research Systems (a) | | | 11,350 | | | | 547 | | |
| Fiserv* (a) | | | 10,270 | | | | 358 | | |
| Hewlett-Packard | | | 149,570 | | | | 2,804 | | |
| Hyperion Solutions* (a) | | | 10,650 | | | | 362 | | |
| Integrated Device Technology* (a) | | | 15,270 | | | | 146 | | |
| Intel | | | 283,703 | | | | 5,691 | | |
| Intersil, Cl A (a) | | | 8,200 | | | | 131 | | |
| Intuit* (a) | | | 2,560 | | | | 116 | | |
| Juniper Networks* (a) | | | 11,160 | | | | 263 | | |
| Leadis Technology | | | 1,480 | | | | 17 | | |
| Linear Technology (a) | | | 2,400 | | | | 87 | | |
| Logitech International* (a) | | | 12,710 | | | | 614 | | |
| Macrovision* (a) | | | 17,050 | | | | 411 | | |
| Microchip Technology (a) | | | 18,270 | | | | 490 | | |
FIRST AMERICAN FUNDS Annual Report 2004
111
Schedule of Investments September 30, 2004
Balanced Fund (continued)
| DESCRIPTION | | SHARES/PAR (000) | | VALUE (000) | |
| Microsoft | | | 46,227 | | | $ | 1,278 | | |
| Motorola | | | 328,010 | | | | 5,917 | | |
| MTS Systems | | | 6,960 | | | | 148 | | |
| National Semiconductor* (a) | | | 87,120 | | | | 1,349 | | |
| NCR* (a) | | | 269,730 | | | | 13,376 | | |
| QLogic* (a) | | | 8,510 | | | | 252 | | |
| QUALCOMM (a) | | | 83,558 | | | | 3,262 | | |
| Research in Motion* (a) | | | 27,810 | | | | 2,123 | | |
| SAFENET* (a) | | | 16,300 | | | | 430 | | |
| Stellent* | | | 27,750 | | | | 214 | | |
| TIBCO Software* (a) | | | 73,770 | | | | 628 | | |
| ValueClick* | | | 7,970 | | | | 75 | | |
| VeriSign* | | | 16,650 | | | | 331 | | |
| Vishay Intertechnology* | | | 9,957 | | | | 128 | | |
| Xerox* (a) | | | 37,060 | | | | 522 | | |
| Xilinx (a) | | | 28,400 | | | | 767 | | |
| Yahoo!* (a) | | | 33,370 | | | | 1,132 | | |
| | | | 55,783 | | |
| Materials – 2.4% | | | |
| Air Products and Chemicals | | | 2,222 | | | | 121 | | |
| Anchor Glass Container | | | 12,610 | | | | 104 | | |
| Bemis | | | 19,030 | | | | 506 | | |
| Dow Chemical | | | 114,140 | | | | 5,157 | | |
| Georgia Gulf | | | 12,960 | | | | 578 | | |
| Hercules* (a) | | | 10,440 | | | | 149 | | |
| NuCor | | | 2,044 | | | | 187 | | |
| Olin | | | 12,330 | | | | 247 | | |
| Oregon Steel Mills* | | | 6,830 | | | | 114 | | |
| Pactiv* | | | 21,530 | | | | 501 | | |
| Phelps Dodge (a) | | | 1,660 | | | | 153 | | |
| Steel Dynamics | | | 3,260 | | | | 126 | | |
| Temple-Inland | | | 2,225 | | | | 149 | | |
| Weyerhaeuser | | | 37,260 | | | | 2,477 | | |
| | | | 10,569 | | |
| Telecommunication Services – 0.8% | | | |
| BellSouth | | | 45,250 | | | | 1,227 | | |
| CenturyTel | | | 6,682 | | | | 229 | | |
| General Communication* | | | 15,783 | | | | 143 | | |
| SBC Communications | | | 17,660 | | | | 458 | | |
| Verizon Communications | | | 35,880 | | | | 1,413 | | |
| | | | 3,470 | | |
| Utilities – 1.1% | | | |
| Equitable Resources (a) | | | 8,056 | | | | 438 | | |
| Exelon (a) | | | 53,006 | | | | 1,945 | | |
| PG&E* (a) | | | 6,020 | | | | 183 | | |
| TXU (a) | | | 43,230 | | | | 2,072 | | |
| | | | 4,638 | | |
Total Common Stocks
(Cost $274,302) | | | | | | | 299,740 | | |
U.S. Government Agency Mortgage-Backed
Securities – 8.7% | |
| Adjustable Rate – 0.8% | |
| FNMA Pool | |
| 6.198%, 04/01/18, #070009 | | $ | 73 | | | | 75 | | |
| 3.648%, 08/01/27, #555840 (a) | | | 1,607 | | | | 1,657 | | |
| 3.558%, 01/01/28, #786281 | | | 582 | | | | 599 | | |
| 3.492%, 09/01/33, #725553 | | | 1,313 | | | | 1,353 | | |
| | | | 3,684 | | |
Balanced Fund (continued)
| DESCRIPTION | | PAR (000) | | VALUE (000) | |
| Fixed Rate – 7.9% | | | |
| FNMA Pool | |
| 5.500%, 03/01/06, #424411 | | $ | 140 | | | $ | 142 | | |
| 3.790%, 07/01/13, #386314 (a) | | | 1,410 | | | | 1,360 | | |
| 6.000%, 09/01/17, #653368 | | | 584 | | | | 613 | | |
| 5.000%, 03/01/18, #00FNMA (c) | | | 1,255 | | | | 1,275 | | |
| 5.000%, 05/01/18, #697019 (a) | | | 1,111 | | | | 1,129 | | |
| 5.000%, 07/01/18, #555621 | | | 1,845 | | | | 1,876 | | |
| 4.500%, 06/01/19, #045181 (a) | | | 473 | | | | 471 | | |
| 6.000%, 10/01/22, #254513 (a) | | | 830 | | | | 865 | | |
| 7.000%, 04/01/29, #323681 | | | 205 | | | | 217 | | |
| 6.500%, 05/01/32, #640032 | | | 1,346 | | | | 1,414 | | |
| 7.000%, 07/01/32, #545815 (a) | | | 469 | | | | 497 | | |
| 6.500%, 08/01/32, #656871 (a) | | | 1,255 | | | | 1,317 | | |
| 3.594%, 12/01/32, #555257 | | | 1,661 | | | | 1,726 | | |
| 6.000%, 01/01/33, #676647 | | | 1,394 | | | | 1,445 | | |
| 5.500%, 04/01/33, #694605 (a) | | | 1,598 | | | | 1,623 | | |
| 6.000%, 04/01/33, #000TBA (c) | | | 1,305 | | | | 1,350 | | |
| 5.500%, 06/01/33, #709033 (a) | | | 749 | | | | 760 | | |
| 5.500%, 07/01/33, #728667 | | | 891 | | | | 904 | | |
| 5.500%, 08/01/33, #733380 (a) | | | 1,747 | | | | 1,774 | | |
| 6.000%, 11/01/33, #772256 | | | 364 | | | | 376 | | |
| 6.000%, 11/01/33, #772130 | | | 353 | | | | 365 | | |
| 5.500%, 12/01/33, #751018 (a) | | | 175 | | | | 177 | | |
| 5.500%, 12/01/33, #756202 (a) | | | 994 | | | | 1,009 | | |
| 5.500%, 01/01/34, #255028 (a) | | | 1,406 | | | | 1,428 | | |
| 5.500%, 05/01/34, #357571 (a) | | | 1,240 | | | | 1,258 | | |
| 5.500%, 06/01/34, #788087 | | | 930 | | | | 943 | | |
| 5.500%, 10/01/34, #255411 (a) | | | 1,265 | | | | 1,283 | | |
| FHLMC Pool | |
| 6.500%, 04/01/08, #E00225 | | | 32 | | | | 34 | | |
| 7.000%, 04/01/08, #E46044 | | | 15 | | | | 16 | | |
| 4.000%, 10/01/10, #M80855 | | | 1,223 | | | | 1,224 | | |
| 5.500%, 03/01/13, #E00546 | | | 231 | | | | 241 | | |
| 6.500%, 11/01/28, #C00676 | | | 930 | | | | 979 | | |
| 6.500%, 12/01/28, #C00689 (a) | | | 436 | | | | 459 | | |
| 7.000%, 12/01/29, #G01091 | | | 211 | | | | 224 | | |
| 6.000%, 05/01/32, #C01361 | | | 190 | | | | 197 | | |
| GNMA Pool | |
| 6.500%, 10/20/10, #002108 | | | 56 | | | | 60 | | |
| 7.500%, 06/15/27, #447728 | | | 25 | | | | 26 | | |
| 7.500%, 09/15/27, #455516 | | | 22 | | | | 24 | | |
| 7.000%, 04/15/29, #506639 | | | 375 | | | | 399 | | |
| 6.000%, 06/15/33, #00GNMA (a) | | | 1,246 | | | | 1,293 | | |
| 6.000%, 11/15/33, #00GNMA (a) | | | 1,451 | | | | 1,504 | | |
| | | | 34,277 | | |
Total U.S. Government Agency
Mortgage-Backed Securities
(Cost $37,659) | | | | | | | 37,961 | | |
| U.S. Government & Agency Securities – 6.5% | | | |
| U.S. Agency Debentures – 2.5% | | | |
| FHLMC | |
| 3.250%, 02/25/08 | | | 1,500 | | | | 1,481 | | |
| 4.125%, 09/01/09 (a) | | | 1,460 | | | | 1,458 | | |
| FNMA | |
| 3.750%, 05/17/07 | | | 2,820 | | | | 2,836 | | |
| 7.250%, 01/15/10 (a) | | | 510 | | | | 592 | | |
| 5.250%, 08/01/12 (a) | | | 1,400 | | | | 1,446 | | |
| 4.625%, 10/15/14 (a) | | | 1,250 | | | | 1,245 | | |
| 5.000%, 04/01/34 (a) | | | 1,058 | | | | 1,049 | | |
| 5.000%, 04/01/34 | | | 861 | | | | 854 | | |
| | | | 10,961 | | |
The accompanying notes are an integral part of the financial statements.
FIRST AMERICAN FUNDS Annual Report 2004
112
Balanced Fund (continued)
| DESCRIPTION | | PAR (000) | | VALUE (000) | |
| U.S. Treasuries – 4.0% | | | |
| U.S. Treasury Bills | |
| 1.435%, 11/18/04 (d) | | $ | 110 | | | $ | 110 | | |
| 1.895%, 03/03/05 (d) | | | 2,500 | | | | 2,480 | | |
| U.S. Treasury Bonds (a) | |
| 2.000%, 07/15/14 (e) | | | 2,809 | | | | 2,872 | | |
| 2.375%, 01/15/25 (e) | | | 1,336 | | | | 1,392 | | |
| 5.500%, 08/15/28 | | | 1,150 | | | | 1,236 | | |
| 5.250%, 11/15/28 | | | 1,900 | | | | 1,977 | | |
| 5.250%, 02/15/29 | | | 2,270 | | | | 2,363 | | |
| 5.375%, 02/15/31 | | | 3,500 | | | | 3,752 | | |
| U.S. Treasury Notes | |
| 4.250%, 08/15/14 (a) | | | 1,000 | | | | 1,010 | | |
| | | | 17,192 | | |
Total U.S. Government & Agency Securities
(Cost $27,410) | | | | | | | 28,153 | | |
| Corporate Bonds – 5.1% | | | |
| Banking – 0.2% | | | |
Mizuho Financial Group
5.790%, 04/15/14 (b) | | | 410 | | | | 424 | | |
Washington Mutual
4.625%, 04/01/14 | | | 560 | | | | 537 | | |
| | | | 961 | | |
| Basic Industry – 0.6% | | | |
Bowater Canada Finance
7.950%, 11/15/11 | | | 300 | | | | 322 | | |
International Paper
4.000%, 04/01/10 | | | 440 | | | | 431 | | |
International Steel Group
6.500%, 04/15/14 (b) | | | 450 | | | | 450 | | |
| Meadwestvaco | |
| 6.850%, 04/01/12 | | | 280 | | | | 312 | | |
| 6.800%, 11/15/32 | | | 245 | | | | 255 | | |
PolyOne
10.625%, 05/15/10 | | | 300 | | | | 327 | | |
Tembec Industries
8.500%, 02/01/11 | | | 450 | | | | 472 | | |
| | | | 2,569 | | |
| Brokerage – 0.1% | | | |
Merrill Lynch
5.360%, 02/01/07 | | | 420 | | | | 439 | | |
| Capital Goods – 0.2% | | | |
Allied Waste North America
7.875%, 04/15/13 | | | 400 | | | | 421 | | |
Case New Holland
9.250%, 08/01/11 (b) | | | 250 | | | | 281 | | |
Owens-Illinois
8.100%, 05/15/07 | | | 250 | | | | 262 | | |
| | | | 964 | | |
| Communications – 1.0% | | | |
AT&T Wireless Services
8.750%, 03/01/31 | | | 350 | | | | 459 | | |
Cablevision Systems
8.000%, 04/15/12 (b) | | | 400 | | | | 417 | | |
Deutsche Telekom International
8.250%, 06/15/30 | | | 300 | | | | 386 | | |
Dex Media West
9.875%, 08/15/13 (b) | | | 396 | | | | 465 | | |
France Telecom
8.500%, 03/01/31 | | | 720 | | | | 950 | | |
Balanced Fund (continued)
| DESCRIPTION | | PAR (000) | | VALUE (000) | |
News American
7.700%, 10/30/25 | | $ | 600 | | | $ | 706 | | |
Qwest
8.875%, 03/15/12 (b) | | | 400 | | | | 441 | | |
Sprint Capital
8.750%, 03/15/32 (a) | | | 325 | | | | 413 | | |
Time Warner
8.375%, 07/15/33 | | | 270 | | | | 329 | | |
| | | | 4,566 | | |
| Consumer Cyclical – 0.7% | | | |
D.R. Horton
5.000%, 01/15/09 | | | 350 | | | | 356 | | |
Duty Free International
7.000%, 01/15/04 (f) | | | 656 | | | | 39 | | |
Ford Motor Credit
7.000%, 10/01/13 | | | 700 | | | | 740 | | |
General Motors
8.375%, 07/15/33 | | | 510 | | | | 542 | | |
General Motors Acceptance
5.625%, 05/15/09 | | | 670 | | | | 682 | | |
Liberty Media
2.670%, 09/17/06 | | | 495 | | | | 501 | | |
Park Place Entertainment
8.125%, 05/15/11 (a) | | | 300 | | | | 345 | | |
| | | | 3,205 | | |
| Consumer Non-Cyclical – 0.3% | | | |
Delhaize America
9.000%, 04/15/31 | | | 240 | | | | 292 | | |
Kraft Foods
4.625%, 11/01/06 | | | 670 | | | | 689 | | |
Medco Health Solutions
7.250%, 08/15/13 | | | 300 | | | | 331 | | |
| | | | 1,312 | | |
| Electric – 0.7% | | | |
AES
7.750%, 03/01/14 | | | 400 | | | | 412 | | |
Duke Energy
6.450%, 10/15/32 | | | 255 | | | | 267 | | |
Homer City Funding
8.137%, 10/01/19 | | | 297 | | | | 327 | | |
Nevada Power
9.000%, 08/15/13 (b) | | | 300 | | | | 346 | | |
Pepco Holdings
6.450%, 08/15/12 | | | 430 | | | | 468 | | |
PSEG Energy Holdings
8.625%, 02/15/08 | | | 260 | | | | 287 | | |
TXU Energy
7.000%, 03/15/13 | | | 720 | | | | 810 | | |
| | | | 2,917 | | |
| Energy – 0.4% | | | |
Chesapeake Energy
7.000%, 08/15/14 (b) | | | 235 | | | | 248 | | |
Devon Financing
7.875%, 09/30/31 | | | 350 | | | | 427 | | |
Gazprom International
7.201%, 02/01/20 (b) | | | 350 | | | | 354 | | |
Kerr McGee
6.950%, 07/01/24 | | | 270 | | | | 284 | | |
| 7.875%, 09/15/31 (a) | | | 355 | | | | 417 | | |
| | | | 1,730 | | |
FIRST AMERICAN FUNDS Annual Report 2004
113
Schedule of Investments September 30, 2004
Balanced Fund (continued)
| DESCRIPTION | | PAR (000) | | VALUE (000) | |
| Finance Companies – 0.2% | |
American General Finance
5.875%, 07/14/06 | | $ | 400 | | | $ | 419 | | |
Countrywide Financial
4.000%, 03/22/11 | | | 300 | | | | 290 | | |
| | | | 709 | | |
| Natural Gas – 0.2% | | | |
Duke Energy Field Services
7.875%, 08/16/10 | | | 300 | | | | 349 | | |
El Paso Natural Gas
7.625%, 08/01/10 | | | 300 | | | | 323 | | |
Enterprise Production
5.600%, 10/15/14 (c) | | | 310 | | | | 311 | | |
| | | | 983 | | |
| Sovereigns – 0.3% | | | |
Corporacion Andina De Fomento
5.200%, 05/21/13 | | | 300 | | | | 301 | | |
PEMEX
7.375%, 12/15/14 | | | 490 | | | | 534 | | |
United Mexican States
6.750%, 09/27/34 | | | 365 | | | | 350 | | |
| | | | 1,185 | | |
| Technology – 0.1% | | | |
Ciena
3.750%, 02/01/08 | | | 120 | | | | 102 | | |
Corning
Zero Coupon Bond,
2.000%, 11/08/15 (i) | | | 260 | | | | 205 | | |
| | | | 307 | | |
| Transportation – 0.1% | | | |
Hertz
7.625%, 06/01/12 | | | 275 | | | | 298 | | |
Total Corporate Bonds
(Cost $22,317) | | | | | | | 22,145 | | |
| CMO – Private Mortgage-Backed Securities – 4.0% | |
| Fixed Rate – 4.0% | |
Bank of America Mortgage Backed Securities
4.232%, 08/25/34 | | | 810 | | | | 811 | | |
Bear Stearns Asset Backed Securities
5.200%, 01/12/41 | | | 875 | | | | 902 | | |
Commercial Mortgage
2.078%, 09/15/14 (c) | | | 500 | | | | 500 | | |
Deutsche Mortgage and Asset Receiving
6.538%, 06/15/31 | | | 678 | | | | 725 | | |
GMAC Commercial Mortgage
3.896%, 08/10/38 | | | 802 | | | | 809 | | |
Greenwich Capital Commercial Funding
5.317%, 06/10/36 | | | 445 | | | | 462 | | |
IMPAC Mortgage Holdings
1.470%, 12/25/33 | | | 1,007 | | | | 1,010 | | |
MLCC Mortgage Investors
2.899%, 05/25/29 | | | 815 | | | | 840 | | |
| Merrill Lynch Mortgage Investors | |
| 6.310%, 11/15/26 | | | 425 | | | | 437 | | |
| 2.828%, 01/25/29 | | | 1,342 | | | | 1,383 | | |
| 2.885%, 01/25/29 | | | 423 | | | | 435 | | |
Residential Asset Securities
5.200%, 11/25/32 | | | 431 | | | | 432 | | |
Balanced Fund (continued)
| DESCRIPTION | | PAR (000) | | VALUE (000) | |
| Sequoia Mortgage Trust | |
| 1.400%, 05/20/34 | | $ | 1,191 | | | $ | 1,188 | | |
| 2.757%, 06/20/34 | | | 1,052 | | | | 1,078 | | |
| 2.923%, 08/20/34 | | | 800 | | | | 822 | | |
Structured Adjustable Rate Mortgage Loan Trust
3.825%, 08/25/34 | | | 591 | | | | 609 | | |
WAMU Mortgage
5.000%, 10/25/18 | | | 1,274 | | | | 1,277 | | |
| Wells Fargo Mortgage Backed Securities | |
| 4.750%, 12/25/18 (c) | | | 812 | | | | 812 | | |
| 4.878%, 02/25/33 | | | 781 | | | | 789 | | |
| 4.154%, 08/25/34 | | | 1,080 | | | | 1,081 | | |
| 3.450%, 09/25/34 | | | 790 | | | | 788 | | |
Westam Mortgage Financial Series 11, Class A
6.360%, 08/29/20 | | | 2 | | | | 2 | | |
Total CMO – Private Mortgage-Backed Securities
(Cost $18,521) | | | | | | | 17,192 | | |
| Asset-Backed Securities – 3.3% | | | |
| Automobiles – 1.0% | | | |
Bank One Auto Receivable
1.820%, 09/20/07 | | | 1,250 | | | | 1,240 | | |
Capital Auto Receivables Asset Trust
2.000%, 11/15/07 | | | 1,010 | | | | 999 | | |
ONYX Acceptance Auto Trust
2.190%, 03/15/08 | | | 1,190 | | | | 1,180 | | |
USAA Auto Loan Grantor Trust
2.040%, 02/15/10 | | | 1,000 | | | | 986 | | |
| | | | 4,405 | | |
| Commercial – 0.2% | | | |
Nomura Asset Securities
6.590%, 03/15/30 | | | 750 | | | | 820 | | |
| Credit Cards – 1.0% | | | |
Bank One Issuance Trust
2.940%, 06/15/08 | | | 1,500 | | | | 1,508 | | |
Capital One Master Trust
2.950%, 08/15/09 | | | 1,000 | | | | 1,000 | | |
| Citibank Credit Card Issuance Trust | |
| 2.500%, 04/07/08 | | | 625 | | | | 622 | | |
| 3.100%, 03/10/10 | | | 410 | | | | 406 | | |
Providian Gateway Master Trust
3.350%, 09/15/11 | | | 975 | | | | 968 | | |
| | | | 4,504 | | |
| Equipment Leases – 0.3% | | | |
CNH
2.470%, 01/15/08 | | | 1,315 | | | | 1,312 | | |
| Home Equity – 0.6% | | | |
Contimortgage
7.120%, 08/15/28 | | | 97 | | | | 96 | | |
| Countrywide Financial | |
| 1.715%, 11/25/23 | | | 423 | | | | 423 | | |
| 1.850%, 03/25/33 | | | 327 | | | | 329 | | |
First Franklin Mortgage
4.264%, 06/25/24 | | | 580 | | | | 580 | | |
Saxon Asset Securities Trust
1.370%, 03/25/35 | | | 805 | | | | 806 | | |
Structured Asset Investment Loan Trust
1.955%, 06/25/33 | | | 561 | | | | 561 | | |
| | | | 2,795 | | |
The accompanying notes are an integral part of the financial statements.
FIRST AMERICAN FUNDS Annual Report 2004
114
Balanced Fund (continued)
| DESCRIPTION | | PAR (000)/CONTRACTS/SHARES | | VALUE (000) | |
| Other – 0.2% | |
Williams Street Funding
1.930%, 09/23/10 | | $ | 895 | | | | 895 | | |
Total Asset-Backed Securities
(Cost $13,288) | | | | | | | 14,731 | | |
| Municipal Bonds – 0.5% | |
Harris County Texas
5.000%, 08/15/33 | | | 1,095 | | | | 1,112 | | |
Miami-Dade County Aviation
5.000%, 10/01/37 | | | 1,095 | | | | 1,112 | | |
Total Municipal Bonds
(Cost $2,169) | | | | | | | 2,224 | | |
CMO – U.S. Government Agency
Mortgage-Backed Securities – 0.2% | |
| Fixed Rate – 0.2% | |
FHLMC
8.600%, 01/15/21 | | | 136 | | | | 136 | | |
| 6.000%, 09/15/21 | | | 137 | | | | 137 | | |
| FNMA | |
| 9.500%, 06/25/20 | | | 31 | | | | 34 | | |
| 6.500%, 07/25/20 | | | 8 | | | | 8 | | |
| 6.500%, 09/25/20 | | | 106 | | | | 111 | | |
| 6.000%, 02/25/11 | | | 333 | | | | 348 | | |
| 8.800%, 01/25/19 | | | 9 | | | | 10 | | |
| 8.000%, 07/25/19 | | | 153 | | | | 166 | | |
| 6.500%, 03/25/20 | | | 78 | | | | 81 | | |
GNMA
6.500%, 06/17/20 | | | 13 | | | | 13 | | |
Total CMO – U.S. Government Agency
Mortgage-Backed Securities
(Cost $1,030) | | | | | | | 1,044 | | |
| Purchased Options – 0.0% | |
| U.S. Treasury 5 Year Note Future Call @ 112 11/04 | | | 30 | | | | 2 | | |
| U.S. Treasury 5 Year Note Future Put @ 106.50 12/04 | | | 6 | | | | - | | |
| U.S. Treasury 5 Year Note Future Put @ 107 12/04 | | | 78 | | | | 3 | | |
| U.S. Treasury 5 Year Note Future Put @ 109 12/04 | | | 60 | | | | 11 | | |
| U.S. Treasury 5 Year Note Future Put @ 109.50 12/04 | | | 30 | | | | 9 | | |
| U.S. Treasury 10 Year Note Future Put @ 105 12/04 | | | 12 | | | | - | | |
Total Purchased Options
(Cost $146) | | | | | | | 25 | | |
| Affiliated Money Market Fund – 1.8% | |
First American Prime
Obligations Fund, Cl Z (g) | | | 7,917,805 | | | | 7,918 | | |
Total Affiliated Money Market Fund
(Cost $7,918) | | | | | | | 7,918 | | |
Investments Purchased with Proceeds
from Securities Lending – 37.4% | |
| Commercial Paper – 12.1% | |
| Bluegrass | |
| 1.881%, 05/18/05 | | $ | 687 | | | | 687 | | |
| 1.891%, 08/18/05 | | | 546 | | | | 546 | | |
| Concord Minutemen Capital | |
| 1.650%, 10/01/04 | | | 1,128 | | | | 1,128 | | |
| 1.680%, 10/05/04 | | | 2,506 | | | | 2,506 | | |
| 1.720%, 10/06/04 | | | 1,852 | | | | 1,852 | | |
| 1.740%, 10/14/04 | | | 1,239 | | | | 1,239 | | |
Descartes Funding Trust
1.760%, 11/15/04 | | | 1,392 | | | | 1,392 | | |
| Ford Credit Floor Plan | |
| 1.622%, 10/05/04 | | | 2,784 | | | | 2,784 | | |
| 1.526%, 10/06/04 | | | 1,949 | | | | 1,949 | | |
| 1.655%, 10/22/04 | | | 612 | | | | 612 | | |
Balanced Fund (continued)
| DESCRIPTION | | PAR (000) | | VALUE (000) | |
Goldman Sachs
1.975%, 01/18/05 | | $ | 1,392 | | | $ | 1,392 | | |
Independence
1.830%, 04/15/05 | | | 1,721 | | | | 1,721 | | |
Jupiter Securities Corp
1.793%, 10/21/04 | | | 5,293 | | | | 5,293 | | |
Lakeside Funding
1.790%, 10/08/04 | | | 2,952 | | | | 2,952 | | |
Landesbank Baden
1.480%, 11/12/04 | | | 556 | | | | 556 | | |
Leaf's LLC
1.821%, 04/20/05 | | | 1,532 | | | | 1,532 | | |
| Liquid Funding | |
| 1.743%, 10/13/04 | | | 1,948 | | | | 1,948 | | |
| 1.830%, 05/25/05 | | | 1,392 | | | | 1,392 | | |
| MBNA Credit | |
| 1.683%, 10/12/04 | | | 1,353 | | | | 1,353 | | |
| 1.764%, 10/26/04 | | | 751 | | | | 751 | | |
| Main Street Warehouse | |
| 1.742%, 10/04/04 | | | 1,838 | | | | 1,838 | | |
| 1.683%, 10/04/04 | | | 2,270 | | | | 2,270 | | |
| 1.742%, 10/08/04 | | | 1,392 | | | | 1,392 | | |
| 1.742%, 10/08/04 | | | 1,392 | | | | 1,392 | | |
| Mortgage Interest Network | |
| 1.752%, 10/12/04 | | | 918 | | | | 918 | | |
| 1.763%, 10/14/04 | | | 974 | | | | 974 | | |
Netexis Banques
1.700%, 12/16/04 | | | 1,387 | | | | 1,387 | | |
| Orchard Park | |
| 1.796%, 04/06/05 | | | 1,392 | | | | 1,392 | | |
| 1.766%, 07/06/05 | | | 2,874 | | | | 2,874 | | |
| Park Granada LLC | |
| 1.622%, 10/01/04 | | | 2,450 | | | | 2,450 | | |
| 1.743%, 10/13/04 | | | 1,586 | | | | 1,586 | | |
Sigma Finance
1.512%, 11/29/04 | | | 694 | | | | 694 | | |
| Total Commercial Paper | | | | | | | 52,752 | | |
| Corporate Obligations – 10.0% | |
| Allstate Life Global | |
| 1.780%, 10/14/05 | | | 2,785 | | | | 2,785 | | |
| 1.750%, 10/14/05 | | | 696 | | | | 696 | | |
Bayer Landbank NY
1.830%, 06/24/05 | | | 2,645 | | | | 2,645 | | |
Blue Heron Funding
1.850%, 05/18/05 | | | 780 | | | | 780 | | |
Castle Hill III
1.910%, 09/15/15 | | | 835 | | | | 835 | | |
Depfa Bank PLC
1.860%, 06/15/05 | | | 1,392 | | | | 1,392 | | |
Duke Funding VI
1.320%, 04/08/05 | | | 1,685 | | | | 1,685 | | |
General Electric Capital Corporation
1.838%, 10/07/05 | | | 1,394 | | | | 1,394 | | |
Jackson National Life
1.760%, 04/15/05 | | | 1,392 | | | | 1,392 | | |
Jefferson Pilot
1.788%, 08/17/05 | | | 1,392 | | | | 1,392 | | |
Liquid Funding
1.840%, 06/28/05 | | | 1,253 | | | | 1,253 | | |
Merrill Lynch
1.696%, 10/01/05 | | | 2,785 | | | | 2,785 | | |
FIRST AMERICAN FUNDS Annual Report 2004
115
Schedule of Investments September 30, 2004
Balanced Fund (continued)
| DESCRIPTION | | PAR (000) | | VALUE (000) | |
Metlife Global Funding
1.800%, 10/14/05 | | $ | 1,671 | | | $ | 1,671 | | |
| 1.880%, 10/28/05 | | | 1,170 | | | | 1,170 | | |
Morgan Stanley
1.850%, 12/26/08 | | | 1,392 | | | | 1,392 | | |
Natexis Banq NY
1.920%, 07/12/05 | | | 1,532 | | | | 1,532 | | |
Northlake CDO
1.895%, 03/07/05 | | | 835 | | | | 835 | | |
| Premium Asset Trust | |
| 1.848%, 12/22/04 | | | 1,044 | | | | 1,044 | | |
| 1.760%, 05/13/05 | | | 1,949 | | | | 1,949 | | |
| 1.740%, 06/01/05 | | | 4,149 | | | | 4,149 | | |
| 1.770%, 10/14/05 | | | 1,114 | | | | 1,114 | | |
REMAC
1.840%, 09/29/05 | | | 1,532 | | | | 1,532 | | |
RMAC
1.740%, 06/12/05 | | | 1,606 | | | | 1,606 | | |
SMM Trust 2004
1.833%, 09/23/05 | | | 2,590 | | | | 2,590 | | |
Societe Generale NYC
1.960%, 12/08/04 | | | 2,785 | | | | 2,785 | | |
Svenska Handl
1.170%, 10/21/04 | | | 1,392 | | | | 1,392 | | |
| Total Corporate Obligations | | | | | | | 43,795 | | |
| Other Short-Term Investments – 2.6% | |
ARLO III Ltd
2.000%, 09/28/05 | | | 4,177 | | | | 4,177 | | |
Commonwealth Life
2.115%, 12/31/04 (h) | | | 1,406 | | | | 1,406 | | |
General Electric Capital Assurance
1.980%, 01/19/05 | | | 557 | | | | 557 | | |
HBOS Treasury Services
1.640%, 11/01/05 | | | 1,531 | | | | 1,531 | | |
Security Life of Denver
1.900%, 12/30/04 | | | 3,620 | | | | 3,620 | | |
| Total Other Short-Term Investments | | | | | | | 11,291 | | |
| Repurchase Agreements – 12.7% | |
Bear Stearns
2.045%, dated 09/30/04, matures 10/01/04,
repurchase price $2,784,838
(collateralized by various securities:
Total market value $2,841,927) | | | 2,785 | | | | 2,785 | | |
Bear Stearns
2.060%, dated 09/30/04, matures 12/23/04,
repurchase price $839,420
(collateralized by various securities:
Total market value $852,410) | | | 836 | | | | 836 | | |
Citibank
1.945%, dated 09/30/04, matures 10/01/04,
repurchase price $5,569,662
(collateralized by corporate securities:
Total market value $5,897,683) | | | 5,569 | | | | 5,569 | | |
Citibank
1.925%, dated 09/30/04, matures 10/01/04,
repurchase price $1,392,415
(collateralized by various securities:
Total market value $1,423,342) | | | 1,392 | | | | 1,392 | | |
Balanced Fund (continued)
| DESCRIPTION | | PAR (000) | | VALUE (000) | |
Citibank
1.925%, dated 09/30/04, matures 10/01/04,
repurchase price $1,392,415
(collateralized by various securities:
Total market value $1,420,206) | | $ | 1,392 | | | $ | 1,392 | | |
Greenwich Capital Markets
1.950%, dated 09/30/04, matures 10/01/04,
repurchase price $8,354,494
(collateralized by U.S. government securities:
Total market value $8,521,231) | | | 8,354 | | | | 8,354 | | |
Goldman Sachs
2.025%, dated 09/30/04, matures 10/01/04,
repurchase price $1,949,386
(collateralized by various securities:
Total market value $2,009,566) | | | 1,949 | | | | 1,949 | | |
Goldman Sachs
2.025%, dated 09/30/04, matures 10/01/04,
repurchase price $835,451
(collateralized by various securities:
Total market value $861,263) | | | 836 | | | | 836 | | |
Goldman Sachs
2.025%, dated 09/30/04, matures 10/01/04,
repurchase price $835,451
(collateralized by various securities:
Total market value $861,263) | | | 835 | | | | 835 | | |
Goldman Sachs
2.025%, dated 09/30/04, matures 10/01/04,
repurchase price $2,088,628
(collateralized by corporate securities:
Total market value $2,153,114) | | | 2,089 | | | | 2,089 | | |
Goldman Sachs
1.425%, dated 09/30/04, matures 10/18/04,
repurchase price $3,483,331
(collateralized by corporate securities:
Total market value $3,551,909) | | | 3,481 | | | | 3,481 | | |
Goldman Sachs
1.480%, dated 09/30/04, matures 10/18/04,
repurchase price $2,090,056
(collateralized by various securities:
Total market value $2,153,115) | | | 2,089 | | | | 2,089 | | |
Goldman Sachs
2.205%, dated 09/30/04, matures 03/07/05,
repurchase price $1,405,815
(collateralized by corporate securities:
Total market value $1,420,774) | | | 1,392 | | | | 1,392 | | |
Lehman Brothers
2.055%, dated 09/30/04, matures 10/01/04,
repurchase price $5,569,679
(collateralized by collateralized
mortgage obligations:
Total market value $5,680,748) | | | 5,569 | | | | 5,569 | | |
Lehman Brothers
1.910%, dated 09/30/04, matures 10/01/04,
repurchase price $8,354,485
(collateralized by U.S. government securities:
Total market value $8,521,257) | | | 8,354 | | | | 8,354 | | |
Lehman Brothers
1.935%, dated 09/30/04, matures 10/01/04,
repurchase price $5,569,660
(collateralized by collateralized
mortgage obligations:
Total market value $6,123,971) | | | 5,569 | | | | 5,569 | | |
The accompanying notes are an integral part of the financial statements.
FIRST AMERICAN FUNDS Annual Report 2004
116
Balanced Fund (continued)
| DESCRIPTION | | PAR (000) | | VALUE (000) | |
Merrill Lynch
1.925%, dated 09/30/04, matures 10/01/04,
repurchase price $2,784,829
(collateralized by corporate securities:
Total market value $2,923,975) | | $ | 2,785 | | | $ | 2,785 | | |
Total Repurchase Agreements
(Cost $55,276) | | | | | 55,276 | | |
Total Investments Purchased with Proceeds
from Securities Lending
(Cost $163,114) | | | | | 163,114 | | |
Total Investments – 136.2%
(Cost $567,874) | | | | | 594,247 | | |
| Other Assets and Liabilities, Net – (36.2)% | | | | | (157,958 | ) | |
| Total Net Assets – 100.0% | | | | $ | 436,289 | | |
* Non-income producing security
(a) This security or a portion of this security is out on loan at September 30, 2004. Total loaned securities had a market value of $157,902,439 at September 30, 2004. See note 2 in Notes to Financial Statements.
(b) Security sold within the terms of a private placement memorandum, exempt from registration under Rule 144A of the Securities Act of 1933, as amended, and may be sold only to dealers in that program or other "qualified institutional buyers." These securities have been determined to be liquid under the guidelines established by the Funds' board of directors. As of September 30, 2004, the value of these investments was $3,426,183 or 0.8% of total net assets. See note 2 in Notes to Financial Statements.
(c) Security purchased on a when-issued basis. On September 30, 2004, the total cost of investments purchased on a when-issued basis was $4,252,131. See note 2 in Notes to Financial Statements.
(d) Security has been deposited as initial margin on open futures contracts. Yield shown is effective yield at date of purchase. See note 2 in Notes to Financial Statements.
(e) U.S. Treasury inflation-protected securities (TIPS) are securities in which the principal amount is adjusted for inflation and the semiannual interest payments equal a fixed percentage of the inflation-adjusted principal amount.
(f) Security considered illiquid investment and is fair valued under the guidelines established by the Board of Directors. As of September 30, 2004, the fair value of these investments is $39,330 or 0.0% of total net assets. See note 2 in Notes to Financial Statements.
(g) Investment in affiliated security. This money market fund is advised by U.S. Bancorp Asset Management, Inc., which also serves as advisor to this Fund. See note 3 in Notes to Financial Statements.
(h) Security has demand features which qualify it as a short term security. The date disclosed is the next put date.
(i) The rate shown is the effective yield at time of purchase.
ADR – American Depository Receipt
Cl – Class
CMO – Collateralized Mortgage Obligation
FHLMC – Federal Home Loan Mortgage Corporation
FNMA – Federal National Mortgage Association
GNMA – Government National Mortgage Association
REIT – Real Estate Investment Trust
Balanced Fund (concluded)
Schedule of Open Futures Contracts
| Description | | Number of
Contracts | | Market Value
Covered By
Contracts | | Settlement
Month | | Unrealized
Appreciation/
(Depreciation) | |
90 Day Eurodollars
Futures purchased | | | 30 | | | $ | 7,327 | | | Dec-04 | | $ | 21 | | |
90 Day Eurodollars
Futures sold | | | (30 | ) | | | (7,256 | ) | | Dec-05 | | | (63 | ) | |
90 Day Eurodollars
Futures sold | | | (10 | ) | | | (2,430 | ) | | Jun-05 | | | (23 | ) | |
Russell 2000 Futures
purchased | | | 2 | | | | 861 | | | Dec-04 | | | 6 | | |
| S&P 500 Futures purchased | | | 28 | | | | 7,804 | | | Dec-04 | | | (32 | ) | |
U.S. Treasury 5-Yr Note
Futures sold | | | (43 | ) | | | (4,762 | ) | | Dec-04 | | | (3 | ) | |
U.S. Treasury 10-Yr Note
Futures sold | | | (119 | ) | | | (13,405 | ) | | Dec-04 | | | (14 | ) | |
U.S. Treasury Long Bond
Futures purchased | | | 24 | | | | 2,697 | | | Dec-04 | | | (4 | ) | |
| | | $ | (112 | ) | |
FIRST AMERICAN FUNDS Annual Report 2004
117
Schedule of Investments September 30, 2004
Equity Income Fund
| DESCRIPTION | | SHARES | | VALUE (000) | |
| Common Stocks – 97.8% | |
| Consumer Discretionary – 6.5% | |
| Gannett (a) | | | 184,150 | | | $ | 15,424 | | |
| Home Depot | | | 443,500 | | | | 17,385 | | |
| McDonald's | | | 658,430 | | | | 18,456 | | |
| Omnicom Group | | | 100,930 | | | | 7,374 | | |
| Starwood Hotels & Resorts Worldwide (a) | | | 491,980 | | | | 22,838 | | |
| Target (a) | | | 356,860 | | | | 16,148 | | |
| Walt Disney | | | 350,010 | | | | 7,893 | | |
| | | | 105,518 | | |
| Consumer Staples – 8.7% | | | |
| Altria Group | | | 410,470 | | | | 19,309 | | |
| Anheuser-Busch | | | 252,350 | | | | 12,605 | | |
| Coca-Cola | | | 442,560 | | | | 17,725 | | |
| General Mills (a) | | | 327,700 | | | | 14,714 | | |
| H.J. Heinz | | | 579,840 | | | | 20,886 | | |
| PepsiCo | | | 290,550 | | | | 14,135 | | |
| Procter & Gamble | | | 278,890 | | | | 15,094 | | |
| Wal-Mart Stores | | | 531,440 | | | | 28,273 | | |
| | | | 142,741 | | |
| Energy – 8.3% | | | |
| Baker Hughes (a) | | | 224,180 | | | | 9,801 | | |
| BP, ADR | | | 168,556 | | | | 9,697 | | |
| ChevronTexaco | | | 390,180 | | | | 20,929 | | |
| ConocoPhillips | | | 133,170 | | | | 11,033 | | |
| Exxon Mobil | | | 963,362 | | | | 46,559 | | |
| Kerr-McGee (a) | | | 230,660 | | | | 13,205 | | |
| Royal Dutch Petroleum, ADR | | | 154,160 | | | | 7,955 | | |
| Schlumberger (a) | | | 236,600 | | | | 15,926 | | |
| | | | 135,105 | | |
| Financials – 25.1% (b) | | | |
| Alliance Capital Management Holding (a) | | | 414,930 | | | | 14,730 | | |
| AMB Property (REIT) | | | 316,020 | | | | 11,699 | | |
| American Express (a) | | | 268,770 | | | | 13,831 | | |
| American International Group | | | 231,300 | | | | 15,726 | | |
| Apartment Investment & Management (a) | | | 523,100 | | | | 18,193 | | |
| Bank of America | | | 775,288 | | | | 33,593 | | |
| Chubb (a) | | | 228,080 | | | | 16,029 | | |
| Citigroup | | | 946,131 | | | | 41,743 | | |
| Duke Realty (REIT) (a) | | | 193,122 | | | | 6,412 | | |
| Fannie Mae (a) | | | 260,460 | | | | 16,513 | | |
| Freddie Mac (a) | | | 209,390 | | | | 13,661 | | |
| Goldman Sachs Group (a) | | | 81,580 | | | | 7,607 | | |
| Hartford Financial Services Group (a) | | | 267,590 | | | | 16,572 | | |
| Healthcare Realty Trust (REIT) | | | 114,480 | | | | 4,469 | | |
| J. P. Morgan Chase | | | 889,010 | | | | 35,320 | | |
| Kimco Realty (REIT) | | | 46,880 | | | | 2,405 | | |
| Manufactured Home Communities (REIT) | | | 121,250 | | | | 4,030 | | |
| Marsh & McLennan (a) | | | 265,350 | | | | 12,142 | | |
| Merrill Lynch (a) | | | 269,520 | | | | 13,401 | | |
| Morgan Stanley | | | 224,130 | | | | 11,050 | | |
| Northern Trust | | | 187,235 | | | | 7,639 | | |
| Partners Trust Financial Group | | | 434,420 | | | | 4,501 | | |
| Simon Property Group (REIT) (a) | | | 135,770 | | | | 7,281 | | |
| SouthTrust | | | 273,310 | | | | 11,386 | | |
| State Street | | | 465,180 | | | | 19,868 | | |
| Wachovia | | | 360,010 | | | | 16,902 | | |
Equity Income Fund (continued)
| DESCRIPTION | | SHARES | | VALUE (000) | |
| Wells Fargo | | | 275,920 | | | $ | 16,453 | | |
| Zions Bancorporation | | | 273,050 | | | | 16,667 | | |
| | | | 409,823 | | |
| Health Care – 11.4% | | | |
| Abbott Laboratories | | | 319,200 | | | | 13,521 | | |
| Baxter International | | | 587,010 | | | | 18,878 | | |
| Bristol-Myers Squibb | | | 405,830 | | | | 9,606 | | |
| CIGNA (a) | | | 189,800 | | | | 13,216 | | |
| Eli Lilly (a) | | | 106,340 | | | | 6,386 | | |
| HCA | | | 228,030 | | | | 8,699 | | |
| Johnson & Johnson (a) | | | 439,690 | | | | 24,768 | | |
| McKesson HBOC (a) | | | 391,420 | | | | 10,040 | | |
| Medtronic | | | 164,750 | | | | 8,551 | | |
| Merck | | | 500,650 | | | | 16,521 | | |
| Pfizer | | | 1,446,252 | | | | 44,255 | | |
| Wyeth | | | 308,180 | | | | 11,526 | | |
| | | | 185,967 | | |
| Industrials – 12.4% | | | |
| 3M (a) | | | 276,680 | | | | 22,126 | | |
| Avery Dennison (a) | | | 164,804 | | | | 10,841 | | |
| Caterpillar (a) | | | 419,630 | | | | 33,759 | | |
| Emerson Electric | | | 254,610 | | | | 15,758 | | |
| General Dynamics | | | 176,110 | | | | 17,981 | | |
| General Electric | | | 951,370 | | | | 31,947 | | |
| Honeywell International | | | 640,590 | | | | 22,972 | | |
| Ingersoll-Rand, Cl A | | | 237,350 | | | | 16,133 | | |
| United Parcel Service, Cl B | | | 204,520 | | | | 15,527 | | |
| Waste Management | | | 560,760 | | | | 15,331 | | |
| | | | 202,375 | | |
| Information Technology – 11.0% | | | |
| Automatic Data Processing (a) | | | 284,560 | | | | 11,758 | | |
| Hewlett-Packard | | | 844,735 | | | | 15,839 | | |
| IBM | | | 248,930 | | | | 21,343 | | |
| Intel | | | 1,162,960 | | | | 23,329 | | |
| Microsoft (a) | | | 1,974,520 | | | | 54,596 | | |
| Motorola (a) | | | 1,291,420 | | | | 23,297 | | |
| QUALCOMM (a) | | | 361,820 | | | | 14,125 | | |
| SAP, ADR | | | 194,990 | | | | 7,595 | | |
| Texas Instruments (a) | | | 360,200 | | | | 7,665 | | |
| | | | 179,547 | | |
| Materials – 7.1% | | | |
| Alcoa | | | 233,090 | | | | 7,830 | | |
| Bemis (a) | | | 663,940 | | | | 17,648 | | |
| Compass Minerals International (a) | | | 352,470 | | | | 7,825 | | |
| Dow Chemical | | | 226,250 | | | | 10,222 | | |
| E.I. DuPont de Nemours | | | 327,860 | | | | 14,032 | | |
| Ecolab (a) | | | 242,880 | | | | 7,636 | | |
| Praxair | | | 631,070 | | | | 26,972 | | |
| Temple-Inland | | | 158,360 | | | | 10,634 | | |
| Weyerhaeuser (a) | | | 191,729 | | | | 12,746 | | |
| | | | 115,545 | | |
| Telecommunication Services – 4.1% | | | |
| ALLTEL | | | 158,410 | | | | 8,698 | | |
| BellSouth (a) | | | 549,980 | | | | 14,915 | | |
| SBC Communications (a) | | | 768,930 | | | | 19,954 | | |
| Verizon Communications (a) | | | 595,110 | | | | 23,435 | | |
| | | | 67,002 | | |
The accompanying notes are an integral part of the financial statements.
FIRST AMERICAN FUNDS Annual Report 2004
118
Equity Income Fund (continued)
| DESCRIPTION | | SHARES/PAR (000) | | VALUE (000) | |
| Utilities – 3.2% | |
| Alliant Energy | | | 644,550 | | | $ | 16,036 | | |
| Cinergy (a) | | | 444,570 | | | | 17,605 | | |
| Xcel Energy | | | 1,139,630 | | | | 19,738 | | |
| | | | 53,379 | | |
Total Common Stocks
(Cost $1,338,396) | | | | | | | 1,597,002 | | |
| Convertible Corporate Bonds – 1.9% | |
Charter Communications
5.750%, 10/15/05 | | $ | 9,520 | | | | 8,481 | | |
Tower Automotive
5.000%, 08/01/04 | | | 190 | | | | 3,046 | | |
Tribune
2.000%, 05/15/29 | | | 218 | | | | 19,552 | | |
Total Convertible Corporate Bonds
(Cost $31,249) | | | | | | | 31,079 | | |
| Affiliated Money Market Fund – 0.4% | |
| First American Prime Obligations Fund, Cl Z (c) | | | 6,315,610 | | | | 6,316 | | |
Total Affiliated Money Market Fund
(Cost $6,316) | | | | | | | 6,316 | | |
Investments Purchased with Proceeds
from Securities Lending – 25.3% | |
| Commercial Paper – 8.2% | |
| Bluegrass | |
| 1.881%, 05/18/05 | | $ | 1,734 | | | | 1,734 | | |
| 1.891%, 08/18/05 | | | 1,378 | | | | 1,378 | | |
| Concord Minutemen Capital | |
| 1.650%, 10/01/04 | | | 2,847 | | | | 2,847 | | |
| 1.680%, 10/05/04 | | | 6,326 | | | | 6,326 | | |
| 1.720%, 10/06/04 | | | 4,675 | | | | 4,675 | | |
| 1.740%, 10/14/04 | | | 3,128 | | | | 3,128 | | |
Descartes Funding Trust
1.760%, 11/15/04 | | | 3,515 | | | | 3,515 | | |
| Ford Credit Floor Plan | |
| 1.622%, 10/05/04 | | | 7,028 | | | | 7,028 | | |
| 1.526%, 10/06/04 | | | 4,921 | | | | 4,921 | | |
| 1.655%, 10/22/04 | | | 1,545 | | | | 1,545 | | |
Goldman Sachs
1.975%, 01/18/05 | | | 3,515 | | | | 3,515 | | |
Independence
1.830%, 04/15/05 | | | 4,344 | | | | 4,344 | | |
Jupiter Securities Corp
1.793%, 10/21/04 | | | 13,360 | | | | 13,360 | | |
Lakeside Funding
1.790%, 10/08/04 | | | 7,451 | | | | 7,451 | | |
Landesbank Baden
1.480%, 11/12/04 | | | 1,403 | | | | 1,403 | | |
Leaf's LLC
1.821%, 04/20/05 | | | 3,866 | | | | 3,866 | | |
| Liquid Funding | |
| 1.743%, 10/13/04 | | | 4,918 | | | | 4,918 | | |
| 1.830%, 05/25/05 | | | 3,515 | | | | 3,515 | | |
| MBNA Credit | |
| 1.683%, 10/12/04 | | | 3,416 | | | | 3,416 | | |
| 1.764%, 10/26/04 | | | 1,896 | | | | 1,896 | | |
| Main Street Warehouse | |
| 1.742%, 10/04/04 | | | 4,639 | | | | 4,639 | | |
| 1.683%, 10/04/04 | | | 5,729 | | | | 5,729 | | |
| 1.742%, 10/08/04 | | | 3,513 | | | | 3,513 | | |
| 1.742%, 10/08/04 | | | 3,515 | | | | 3,515 | | |
Equity Income Fund (continued)
| DESCRIPTION | | PAR (000) | | VALUE (000) | |
| Mortgage Interest Network | |
| 1.752%, 10/12/04 | | $ | 2,318 | | | $ | 2,318 | | |
| 1.763%, 10/14/04 | | | 2,459 | | | | 2,459 | | |
Netexis Banques
1.700%, 12/16/04 | | | 3,501 | | | | 3,501 | | |
| Orchard Park | |
| 1.796%, 04/06/05 | | | 3,515 | | | | 3,515 | | |
| 1.766%, 07/06/05 | | | 7,254 | | | | 7,254 | | |
| Park Granada LLC | |
| 1.622%, 10/01/04 | | | 6,186 | | | | 6,186 | | |
| 1.743%, 10/13/04 | | | 4,004 | | | | 4,004 | | |
Sigma Finance
1.512%, 11/29/04 | | | 1,752 | | | | 1,752 | | |
| Total Commercial Paper | | | | | | | 133,166 | | |
| Corporate Obligations – 6.8% | |
| Allstate Life Global | |
| 1.780%, 10/14/05 | | | 7,030 | | | | 7,030 | | |
| 1.750%, 10/14/05 | | | 1,757 | | | | 1,757 | | |
Bayer Landbank NY
1.830%, 06/24/05 | | | 6,677 | | | | 6,677 | | |
Blue Heron Funding
1.850%, 05/18/05 | | | 1,968 | | | | 1,968 | | |
Castle Hill III
1.910%, 09/15/15 | | | 2,109 | | | | 2,109 | | |
Depfa Bank PLC
1.860%, 06/15/05 | | | 3,513 | | | | 3,513 | | |
Duke Funding VI
1.320%, 04/08/05 | | | 4,253 | | | | 4,253 | | |
General Electric Capital Corporation
1.838%, 10/07/05 | | | 3,519 | | | | 3,519 | | |
Jackson National Life
1.760%, 04/15/05 | | | 3,515 | | | | 3,515 | | |
Jefferson Pilot
1.788%, 08/17/05 | | | 3,515 | | | | 3,515 | | |
Liquid Funding
1.840%, 06/28/05 | | | 3,163 | | | | 3,163 | | |
| Metlife Global Funding | |
| 1.800%, 10/14/05 | | | 7,030 | | | | 7,030 | | |
| 1.880%, 10/28/05 | | | 4,218 | | | | 4,218 | | |
| Merrill Lynch | |
| 1.696%, 10/01/05 | | | 2,953 | | | | 2,953 | | |
Morgan Stanley
1.850%, 12/26/08 | | | 3,515 | | | | 3,515 | | |
Natexis Banq NY
1.920%, 07/12/05 | | | 3,866 | | | | 3,866 | | |
Northlake CDO
1.895%, 03/07/05 | | | 2,109 | | | | 2,109 | | |
| Premium Asset Trust | |
| 1.848%, 12/22/04 | | | 2,636 | | | | 2,636 | | |
| 1.760%, 05/13/05 | | | 4,920 | | | | 4,920 | | |
| 1.740%, 06/01/05 | | | 10,474 | | | | 10,474 | | |
| 1.770%, 10/14/05 | | | 2,812 | | | | 2,812 | | |
REMAC
1.840%, 09/29/05 | | | 3,866 | | | | 3,866 | | |
RMAC
1.740%, 06/12/05 | | | 4,055 | | | | 4,055 | | |
SMM Trust 2004
1.833%, 09/23/05 | | | 6,538 | | | | 6,538 | | |
Societe Generale NYC
1.960%, 12/08/04 | | | 7,030 | | | | 7,030 | | |
Svenska Handl
1.170%, 10/21/04 | | | 3,515 | | | | 3,515 | | |
| Total Corporate Obligations | | | | | | | 110,556 | | |
FIRST AMERICAN FUNDS Annual Report 2004
119
Schedule of Investments September 30, 2004
Equity Income Fund (continued)
| DESCRIPTION | | PAR (000) | | VALUE (000) | |
| Other Short-Term Investments – 1.7% | |
ARLO III Ltd
2.000%, 09/28/05 | | $ | 10,544 | | | $ | 10,544 | | |
Commonwealth Life
2.115%, 12/31/04 (d) | | | 3,549 | | | | 3,549 | | |
General Electric Capital Assurance
1.980%, 01/19/05 | | | 1,406 | | | | 1,406 | | |
HBOS Treasury Services
1.640%, 11/01/05 | | | 3,865 | | | | 3,865 | | |
Security Life of Denver
1.900%, 12/30/04 | | | 9,139 | | | | 9,139 | | |
| Total Other Short-Term Investments | | | | | | | 28,503 | | |
| Repurchase Agreements – 8.6% | |
Bear Stearns
2.045%, dated 09/30/04, matures 10/01/04,
repurchase price $7,030,032
(collateralized by various securities:
Total market value $7,174,145) | | | 7,030 | | | | 7,030 | | |
Bear Stearns
2.060%, dated 09/30/04, matures 12/23/04,
repurchase price $2,119,027
(collateralized by various securities:
Total market value $2,151,820) | | | 2,109 | | | | 2,109 | | |
Citibank
1.945%, dated 09/30/04, matures 10/01/04,
repurchase price $14,060,025
(collateralized by corporate securities:
Total market value $14,888,080) | | | 14,059 | | | | 14,059 | | |
Citibank
1.925%, dated 09/30/04, matures 10/01/04,
repurchase price $3,515,004
(collateralized by various securities:
Total market value $3,593,077) | | | 3,515 | | | | 3,515 | | |
Citibank
1.925%, dated 09/30/04, matures 10/01/04,
repurchase price $3,515,004
(collateralized by various securities:
Total market value $3,585,161) | | | 3,515 | | | | 3,515 | | |
Greenwich Capital Markets
1.950%, dated 09/30/04, matures 10/01/04,
repurchase price $21,090,041
(collateralized by U.S. government securities:
Total market value $21,510,951) | | | 21,089 | | | | 21,089 | | |
Goldman Sachs
2.025%, dated 09/30/04, matures 10/01/04,
repurchase price $4,921,020
(collateralized by various securities:
Total market value $5,072,939) | | | 4,921 | | | | 4,921 | | |
Goldman Sachs
2.025%, dated 09/30/04, matures 10/01/04,
repurchase price $2,109,008
(collateralized by various securities:
Total market value $2,174,168) | | | 2,109 | | | | 2,109 | | |
Goldman Sachs
2.025%, dated 09/30/04, matures 10/01/04,
repurchase price $2,109,008
(collateralized by various securities:
Total market value $2,174,167) | | | 2,109 | | | | 2,109 | | |
Goldman Sachs
2.025%, dated 09/30/04, matures 10/01/04,
repurchase price $5,272,521
(collateralized by corporate securities:
Total market value $5,435,311) | | | 5,272 | | | | 5,272 | | |
Equity Income Fund (concluded)
| DESCRIPTION | | PAR (000) | | VALUE (000) | |
Goldman Sachs
1.425%, dated 09/30/04, matures 10/18/04,
repurchase price $8,793,302
(collateralized by corporate securities:
Total market value $8,966,422) | | $ | 8,787 | | | $ | 8,787 | | |
Goldman Sachs
1.480%, dated 09/30/04, matures 10/18/04,
repurchase price $5,276,126
(collateralized by various securities:
Total market value $5,435,312) | | | 5,272 | | | | 5,272 | | |
Goldman Sachs
2.205%, dated 09/30/04, matures 03/07/05,
repurchase price $3,548,831
(collateralized by corporate securities:
Total market value $3,586,595) | | | 3,515 | | | | 3,515 | | |
Lehman Brothers
2.055%, dated 09/30/04, matures 10/01/04,
repurchase price $14,060,068
(collateralized by collateralized
mortgage obligations:
Total market value $14,340,451) | | | 14,059 | | | | 14,059 | | |
Lehman Brothers
1.910%, dated 09/30/04, matures 10/01/04,
repurchase price $21,090,017
(collateralized by U.S. government securities:
Total market value $21,511,016) | | | 21,089 | | | | 21,089 | | |
Lehman Brothers
1.935%, dated 09/30/04, matures 10/01/04,
repurchase price $14,060,021
(collateralized by collateralized
mortgage obligations:
Total market value $15,459,321) | | | 14,059 | | | | 14,059 | | |
Merrill Lynch
1.925%, dated 09/30/04, matures 10/01/04,
repurchase price $7,030,009
(collateralized by corporate securities:
Total market value $7,381,267) | | | 7,029 | | | | 7,029 | | |
Total Repurchase Agreements
(Cost $139,538) | | | | | | | 139,538 | | |
Total Investments Purchased with Proceeds
from Securities Lending
(Cost $411,763) | | | | | | | 411,763 | | |
Total Investments – 125.4%
(Cost $1,787,724) | | | | | | | 2,046,160 | | |
| Other Assets and Liabilities, Net – (25.4)% | | | | | | | (414,178 | ) | |
| Total Net Assets – 100.0% | | | | | | $ | 1,631,982 | | |
(a) This security or a portion of this security is out on loan at September 30, 2004. Total loaned securities had a market value of $398,728,337 at September 30, 2004. See note 2 in Notes to Financial Statements.
(b) The Fund is significantly invested in this industry sector and therefore is subject to additional risks. See note 7 in Notes to Financial Statements.
(c) Investment in affiliated security. This money market fund is advised by U.S. Bancorp Asset Management, Inc., which also serves as advisor to this Fund. See note 3 in Notes to Financial Statements.
(d) Security has demand features which qualify it as a short term security. The date disclosed is the next put date.
ADR – American Depository Receipt
Cl – Class
REIT – Real Estate Investment Trust
The accompanying notes are an integral part of the financial statements.
FIRST AMERICAN FUNDS Annual Report 2004
120
Statements of Assets and Liabilities September 30, 2004, in thousands, except per share data
| | | Balanced
Fund | | Equity
Income Fund | |
| ASSETS: | | | |
| Investments in unaffiliated securities, at value*† | | $ | 531,053 | | | $ | 1,900,306 | | |
| Investments in affiliated money market fund, at value** | | | 7,918 | | | | 6,316 | | |
| Repurchase agreements, at value*** | | | 55,276 | | | | 139,538 | | |
| Cash**** | | | 40 | | | | 57 | | |
| Receivable for dividends and interest | | | 1,043 | | | | 2,504 | | |
| Receivable for investment securities sold | | | 18,850 | | | | - | | |
| Receivable for capital shares sold | | | 101 | | | | 742 | | |
| Receivable for variation margin | | | 10 | | | | - | | |
| Prepaid expenses and other assets | | | 35 | | | | 45 | | |
| Total assets | | | 614,326 | | | | 2,049,508 | | |
| LIABILITIES: | | | |
| Payable for investment securities purchased | | | 5,855 | | | | - | | |
| Payable upon return of securities loaned | | | 163,136 | | | | 411,820 | | |
| Payable for capital shares redeemed | | | 8,661 | | | | 4,462 | | |
| Payable for advisory, co-administration, and custodian fees | | | 329 | | | | 1,157 | | |
| Payable for distribution and shareholder servicing fees | | | 53 | | | | 74 | | |
| Accrued expenses and other liabilities | | | 3 | | | | 13 | | |
| Total liabilities | | | 178,037 | | | | 417,526 | | |
| Net assets | | $ | 436,289 | | | $ | 1,631,982 | | |
| COMPOSITION OF NET ASSETS: | | | |
| Portfolio capital | | $ | 454,891 | | | $ | 1,406,237 | | |
| Undistributed (distributions in excess of) net investment income | | | 89 | | | | (4,922 | ) | |
| Accumulated net realized loss on investments and options written | | | (44,952 | ) | | | (27,769 | ) | |
| Net unrealized appreciation of investments | | | 26,373 | | | | 258,436 | | |
| Net unrealized depreciation of futures contracts | | | (112 | ) | | | - | | |
| Net assets | | $ | 436,289 | | | $ | 1,631,982 | | |
| * | | Investments in unaffiliated securities, at cost | | $ | 504,680 | | | $ | 1,641,872 | | |
| ** | | Investments in affiliated money market fund, at cost | | $ | 7,918 | | | $ | 6,316 | | |
| *** | | Investments in repurchase agreements, at cost | | $ | 55,276 | | | $ | 139,536 | | |
| **** Includes cash related to securities loaned | | $ | 22 | | | $ | 57 | | |
| † Including securities loaned, at value | | $ | 157,902 | | | $ | 398,728 | | |
| Class A: | |
| Net assets | | $ | 119,292 | | | $ | 184,381 | | |
| Shares issued and outstanding ($0.0001 par value - 2 billion authorized) | | | 11,790 | | | | 14,441 | | |
| Net asset value and redemption price per share | | $ | 10.12 | | | $ | 12.77 | | |
| Maximum offering price per share (1) | | $ | 10.71 | | | $ | 13.51 | | |
| Class B: | |
| Net assets | | $ | 28,101 | | | $ | 23,869 | | |
| Shares issued and outstanding ($0.0001 par value - 2 billion authorized) | | | 2,799 | | | | 1,882 | | |
| Net asset value, offering price, and redemption price per share (2) | | $ | 10.04 | | | $ | 12.68 | | |
| Class C: | |
| Net assets | | $ | 5,890 | | | $ | 19,300 | | |
| Shares issued and outstanding ($0.0001 par value - 2 billion authorized) | | | 584 | | | | 1,519 | | |
| Net asset value, offering price and redemption price per share (2) | | $ | 10.08 | | | $ | 12.70 | | |
| Class R: | |
| Net assets | | $ | 1 | | | $ | 1 | | |
| Shares issued and outstanding ($0.0001 par value - 2 billion authorized) | | | - | | | | - | | |
| Net asset value, offering price, and redemption price per share | | $ | 10.14 | | | $ | 12.78 | | |
| Class Y: | |
| Net assets | | $ | 283,005 | | | $ | 1,404,431 | | |
| Shares issued and outstanding ($0.0001 par value - 2 billion authorized) | | | 27,896 | | | | 109,305 | | |
| Net asset value, offering price, and redemption price per share | | $ | 10.15 | | | $ | 12.85 | | |
(1) The offering price is calculated by dividing the net asset value by 1 minus the maximum sales charge of 5.50%.
(2) Class B and C have a contingent deferred sales charge. For a description of this sales charge, see notes 1 and 3 in Notes to Financial Statements.
The accompanying notes are an integral part of the financial statements.
FIRST AMERICAN FUNDS Annual Report 2004
121
Statements of Operations For the fiscal year ended September 30, 2004, in thousands
| | | Balanced
Fund | | Equity
Income Fund | |
| INVESTMENT INCOME: | | | |
| Interest from unaffliliated securities | | $ | 7,108 | | | $ | 2,612 | | |
| Dividends from affiliated money market fund | | | 162 | | | | 237 | | |
| Dividends from unaffiliated securities | | | 4,372 | | | | 38,723 | | |
| Less: Foreign taxes withheld | | | (14 | ) | | | (66 | ) | |
| Securities lending | | | 96 | | | | 234 | | |
| Other income | | | 32 | | | | - | | |
| Total investment income | | | 11,756 | | | | 41,740 | | |
| EXPENSES: | | | |
| Investment advisory fees | | | 3,262 | | | | 10,636 | | |
| Co-administration fees and expenses (including transfer agency fees) | | | 1,361 | | | | 4,342 | | |
| Custodian fees | | | 50 | | | | 164 | | |
| Directors' fees | | | 17 | | | | 38 | | |
| Registration fees | | | 22 | | | | 31 | | |
| Professional fees | | | (11 | ) | | | 73 | | |
| Printing | | | 11 | | | | 56 | | |
| Other | | | 24 | | | | 71 | | |
| Distribution and shareholder servicing fees – Class A | | | 274 | | | | 426 | | |
| Distribution and shareholder servicing fees – Class B | | | 318 | | | | 245 | | |
| Distribution and shareholder servicing fees – Class C | | | 66 | | | | 202 | | |
| Distribution and shareholder servicing fees – Class R | | | 39 | | | | 27 | | |
| Total expenses | | | 5,433 | | | | 16,311 | | |
| Less: Fee Waivers | | | (722 | ) | | | (684 | ) | |
| Total net expenses | | | 4,711 | | | | 15,627 | | |
| Investment income – net | | | 7,045 | | | | 26,113 | | |
REALIZED AND UNREALIZED GAINS ON INVESTMENTS, FUTURES CONTRACTS,
AND WRITTEN OPTIONS – NET: | | | |
| Net realized gain on investments | | | 26,114 | | | | 22,327 | | |
| Net realized gain on futures contracts | | | 923 | | | | - | | |
| Net realized gain on written options | | | 214 | | | | - | | |
| Net change in unrealized appreciation or depreciation of investments | | | 8,139 | | | | 134,451 | | |
| Net change in unrealized appreciation or depreciation of futures contracts | | | 202 | | | | - | | |
| Net change in unrealized appreciation or depreciation of written options | | | 28 | | | | - | | |
| Net gain on investments, futures contracts and written options | | | 35,620 | | | | 156,778 | | |
| Net increase in net assets resulting from operations | | $ | 42,665 | | | $ | 182,891 | | |
The accompanying notes are an integral part of the financial statements.
FIRST AMERICAN FUNDS Annual Report 2004
122
Statements of Changes in Net Assets in thousands
| | | Balanced
Fund | | Equity
Income Fund | |
| | | 10/01/03
to
9/30/04 | | 10/01/02
to
9/30/03 | | 10/01/03
to
9/30/04 | | 10/01/02
to
9/30/03 | |
| OPERATIONS: | |
| Investment income – net | | $ | 7,045 | | | $ | 9,774 | | | $ | 26,113 | | | $ | 24,360 | | |
| Net realized gain (loss) on investments | | | 26,114 | | | | 8,549 | | | | 22,327 | | | | (1,648 | ) | |
| Net realized gain on futures contracts | | | 923 | | | | 2,849 | | | | - | | | | - | | |
| Net realized gain on written options | | | 214 | | | | - | | | | - | | | | - | | |
| Net change in unrealized appreciation or depreciation of investments | | | 8,139 | | | | 49,930 | | | | 134,451 | | | | 219,694 | | |
| Net change in unrealized appreciation or depreciation of futures contracts | | | 202 | | | | (314 | ) | | | - | | | | - | | |
| Net change in unrealized appreciation or depreciation of written options | | | 28 | | | | (28 | ) | | | - | | | | - | | |
| Net increase in net assets resulting from operations | | | 42,665 | | | | 70,760 | | | | 182,891 | | | | 242,406 | | |
| DISTRIBUTIONS TO SHAREHOLDERS FROM: | |
| Investment income – net: | |
| Class A | | | (1,535 | ) | | | (1,700 | ) | | | (2,721 | ) | | | (2,199 | ) | |
| Class B | | | (228 | ) | | | (345 | ) | | | (224 | ) | | | (180 | ) | |
| Class C | | | (47 | ) | | | (74 | ) | | | (183 | ) | | | (163 | ) | |
| Class R | | | (237 | ) | | | (501 | ) | | | (196 | ) | | | (370 | ) | |
| Class Y | | | (5,588 | ) | | | (7,143 | ) | | | (25,834 | ) | | | (20,336 | ) | |
| Return of capital: | |
| Class A | | | - | | | | - | | | | - | | | | (188 | ) | |
| Class B | | | - | | | | - | | | | - | | | | (29 | ) | |
| Class C | | | - | | | | - | | | | - | | | | (25 | ) | |
| Class R | | | - | | | | - | | | | - | | | | (22 | ) | |
| Class Y | | | - | | | | - | | | | - | | | | (1,666 | ) | |
| Total distributions | | | (7,635 | ) | | | (9,763 | ) | | | (29,158 | ) | | | (25,178 | ) | |
| CAPITAL SHARE TRANSACTIONS (1): | |
| Class A: | |
| Proceeds from sales | | | 33,852 | | | | 6,543 | | | | 53,380 | | | | 19,326 | | |
| Reinvestment of distributions | | | 1,487 | | | | 1,644 | | | | 2,528 | | | | 2,200 | | |
| Payments for redemptions | | | (20,593 | ) | | | (20,769 | ) | | | (31,031 | ) | | | (30,519 | ) | |
| Increase (decrease) in net assets from Class A transactions | | | 14,746 | | | | (12,582 | ) | | | 24,877 | | | | (8,993 | ) | |
| Class B: | |
| Proceeds from sales | | | 1,605 | | | | 1,814 | | | | 4,986 | | | | 4,210 | | |
| Reinvestment of distributions | | | 219 | | | | 333 | | | | 209 | | | | 195 | | |
| Payments for redemptions | | | (8,962 | ) | | | (8,965 | ) | | | (5,788 | ) | | | (4,601 | ) | |
| Decrease in net assets from Class B transactions | | | (7,138 | ) | | | (6,818 | ) | | | (593 | ) | | | (196 | ) | |
| Class C: | |
| Proceeds from sales | | | 858 | | | | 7,057 | | | | 2,790 | | | | 9,712 | | |
| Reinvestment of distributions | | | 47 | | | | 74 | | | | 183 | | | | 187 | | |
| Payments for redemptions | | | (2,596 | ) | | | (2,895 | ) | | | (5,027 | ) | | | (4,602 | ) | |
| Increase (decrease) in net assets from Class C transactions | | | (1,691 | ) | | | 4,236 | | | | (2,054 | ) | | | 5,297 | | |
| Class R: | |
| Proceeds from sales | | | 3,496 | | | | 11,177 | | | | 2,328 | | | | 11,462 | | |
| Reinvestment of distributions | | | 237 | | | | 500 | | | | 191 | | | | 379 | | |
| Payments for redemptions | | | (29,325 | ) | | | (27,455 | ) | | | (21,497 | ) | | | (35,880 | ) | |
| Decrease in net assets from Class R transactions | | | (25,592 | ) | | | (15,778 | ) | | | (18,978 | ) | | | (24,039 | ) | |
| Class Y: | |
| Proceeds from sales | | | 61,896 | | | | 141,133 | | | | 300,945 | | | | 387,332 | | |
| Reinvestment of distributions | | | 5,332 | | | | 6,753 | | | | 9,109 | | | | 8,467 | | |
| Payments for redemptions | | | (171,415 | ) | | | (115,733 | ) | | | (316,521 | ) | | | (235,567 | ) | |
| Shares issued in connection with the acquisition of Common Trust Fund net assets | | | - | | | | - | | | | - | | | | 259,049 | | |
| Increase (decrease) in net assets from Class Y transactions | | | (104,187 | ) | | | 32,153 | | | | (6,467 | ) | | | 419,281 | | |
| Increase (decrease) in net assets from capital share transactions | | | (123,862 | ) | | | 1,211 | | | | (3,215 | ) | | | 391,350 | | |
| Total increase (decrease) in net assets | | | (88,832 | ) | | | 62,208 | | | | 150,518 | | | | 608,578 | | |
| Net assets at beginning of period | | | 525,121 | | | | 462,913 | | | | 1,481,464 | | | | 872,886 | | |
| Net assets at end of period | | $ | 436,289 | | | $ | 525,121 | | | $ | 1,631,982 | | | $ | 1,481,464 | | |
| Undistributed (distributions in excess of) net investment income at end of period | | $ | 89 | | | $ | 338 | | | $ | (4,922 | ) | | $ | 488 | | |
(1) See note 4 in Notes to Financial Statements for additional information.
The accompanying notes are an integral part of the financial statements.
FIRST AMERICAN FUNDS Annual Report 2004
123
Financial Highlights For a share outstanding throughout the periods ended September 30, unless otherwise indicated.
| | | Net Asset
Value
Beginning
of Period | | Net
Investment
Income | | Realized and
Unrealized
Gains
(Losses) on
Investments | | Dividends
from Net
Investment
Income | | Distributions
from Net
Realized Gains | | Net Asset
Value
End of
Period | | Total
Return (10) | | Net Assets
End of
Period (000) | | Ratio of
Expenses to
Average
Net Assets | | Ratio of Net
Investment
Income
to Average
Net Assets | | Ratio of
Expenses to
Average
Net Assets
(Excluding
Waivers) | | Ratio of Net
Investment
Income
to Average Net
Assets (Excluding
Waivers) | | Portfolio
Turnover
Rate | |
| | Balanced Fund (1) | | | | |
| Class A | |
| | 2004 | (2) | | $ | 9.47 | | | $ | 0.13 | | | $ | 0.66 | | | $ | (0.14 | ) | | $ | - | | | $ | 10.12 | | | | 8.39 | % | | $ | 119,292 | | | | 1.05 | % | | | 1.27 | % | | | 1.19 | % | | | 1.13 | % | | | 110 | % | |
| | 2003 | | | | 8.38 | | | | 0.17 | | | | 1.08 | | | | (0.16 | ) | | | - | | | | 9.47 | | | | 14.98 | | | | 98,016 | | | | 1.05 | | | | 1.75 | | | | 1.23 | | | | 1.57 | | | | 156 | | |
| | 2002 | (2) | | | 9.50 | | | | 0.20 | | | | (1.12 | ) | | | (0.20 | ) | | | - | | | | 8.38 | | | | (9.90 | ) | | | 98,557 | | | | 1.05 | | | | 2.07 | | | | 1.23 | | | | 1.89 | | | | 79 | | |
| | 2001 | (2) (3) | | | 13.83 | | | | 0.18 | | | | (2.24 | ) | | | (0.20 | ) | | | (2.07 | ) | | | 9.50 | | | | (17.03 | ) | | | 127,590 | | | | 1.22 | | | | 1.96 | | | | 1.28 | | | | 1.90 | | | | 54 | | |
| | 2000 | (4) | | | 12.39 | | | | 0.23 | | | | 2.12 | | | | (0.22 | ) | | | (0.69 | ) | | | 13.83 | | | | 19.46 | | | | 54,380 | | | | 1.22 | | | | 1.66 | | | | 1.28 | | | | 1.60 | | | | 79 | | |
| | 1999 | (4) | | | 12.30 | | | | 0.20 | | | | 0.49 | | | | (0.20 | ) | | | (0.40 | ) | | | 12.39 | | | | 5.56 | | | | 53,807 | | | | 1.18 | | | | 1.59 | | | | 1.25 | | | | 1.52 | | | | 69 | | |
| Class B | |
| | 2004 | (2) | | $ | 9.41 | | | $ | 0.05 | | | $ | 0.65 | | | $ | (0.07 | ) | | $ | - | | | $ | 10.04 | | | | 7.46 | % | | $ | 28,101 | | | | 1.80 | % | | | 0.54 | % | | | 1.94 | % | | | 0.40 | % | | | 110 | % | |
| | 2003 | | | | 8.32 | | | | 0.10 | | | | 1.08 | | | | (0.09 | ) | | | - | | | | 9.41 | | | | 14.25 | | | | 33,015 | | | | 1.80 | | | | 1.00 | | | | 1.98 | | | | 0.82 | | | | 156 | | |
| | 2002 | (2) | | | 9.44 | | | | 0.13 | | | | (1.12 | ) | | | (0.13 | ) | | | - | | | | 8.32 | | | | (10.64 | ) | | | 35,641 | | | | 1.80 | | | | 1.32 | | | | 1.98 | | | | 1.14 | | | | 79 | | |
| | 2001 | (2) (3) | | | 13.75 | | | | 0.17 | | | | (2.29 | ) | | | (0.13 | ) | | | (2.06 | ) | | | 9.44 | | | | (17.64 | ) | | | 47,150 | | | | 1.93 | | | | 1.22 | | | | 1.99 | | | | 1.16 | | | | 54 | | |
| | 2000 | (4) | | | 12.33 | | | | 0.13 | | | | 2.11 | | | | (0.14 | ) | | | (0.68 | ) | | | 13.75 | | | | 18.77 | | | | 2,243 | | | | 1.97 | | | | 0.91 | | | | 2.03 | | | | 0.85 | | | | 79 | | |
| | 1999 | (4) (5) | | | 12.37 | | | | 0.07 | | | | (0.04 | ) | | | (0.07 | ) | | | - | | | | 12.33 | | | | 0.25 | | | | 630 | | | | 1.97 | | | | 0.87 | | | | 2.03 | | | | 0.81 | | | | 69 | | |
| Class C | |
| | 2004 | (2) | | $ | 9.44 | | | $ | 0.05 | | | $ | 0.66 | | | $ | (0.07 | ) | | $ | - | | | $ | 10.08 | | | | 7.53 | % | | $ | 5,890 | | | | 1.80 | % | | | 0.55 | % | | | 1.94 | % | | | 0.41 | % | | | 110 | % | |
| | 2003 | | | | 8.35 | | | | 0.09 | | | | 1.10 | | | | (0.10 | ) | | | - | | | | 9.44 | | | | 14.24 | | | | 7,089 | | | | 1.80 | | | | 0.99 | | | | 1.98 | | | | 0.81 | | | | 156 | | |
| | 2002 | (2) | | | 9.49 | | | | 0.13 | | | | (1.14 | ) | | | (0.13 | ) | | | - | | | | 8.35 | | | | (10.77 | ) | | | 2,233 | | | | 1.80 | | | | 1.32 | | | | 1.98 | | | | 1.14 | | | | 79 | | |
| | 2001 | (2) (6) | | | 9.29 | | | | - | | | | 0.20 | | | | - | | | | - | | | | 9.49 | | | | 2.15 | | | | 2,351 | | | | 0.94 | | | | 2.20 | | | | 0.94 | | | | 2.20 | | | | 54 | | |
| Class R | |
| | 2004 | (2) (7) | | $ | 9.49 | | | $ | 0.14 | | | $ | 0.64 | | | $ | (0.13 | ) | | $ | - | | | $ | 10.14 | | | | 8.22 | % | | $ | 1 | | | | 1.05 | % | | | 1.39 | % | | | 1.19 | % | | | 1.25 | % | | | 110 | % | |
| | 2003 | | | | 8.39 | | | | 0.15 | | | | 1.10 | | | | (0.15 | ) | | | - | | | | 9.49 | | | | 15.08 | | | | 23,844 | | | | 1.05 | | | | 1.76 | | | | 1.23 | | | | 1.58 | | | | 156 | | |
| | 2002 | (2) | | | 9.50 | | | | 0.20 | | | | (1.12 | ) | | | (0.19 | ) | | | - | | | | 8.39 | | | | (9.90 | ) | | | 36,194 | | | | 1.05 | | | | 2.07 | | | | 1.23 | | | | 1.89 | | | | 79 | | |
| | 2001 | (2) (8) | | | 11.27 | | | | 0.18 | | | | (1.74 | ) | | | (0.21 | ) | | | - | | | | 9.50 | | | | (14.03 | ) | | | 39,527 | | | | 1.22 | | | | 1.94 | | | | 1.28 | | | | 1.88 | | | | 54 | | |
| Class Y | |
| | 2004 | (2) | | $ | 9.50 | | | $ | 0.16 | | | $ | 0.66 | | | $ | (0.17 | ) | | $ | - | | | $ | 10.15 | | | | 8.62 | % | | $ | 283,005 | | | | 0.80 | % | | | 1.55 | % | | | 0.94 | % | | | 1.41 | % | | | 110 | % | |
| | 2003 | | | | 8.40 | | | | 0.19 | | | | 1.09 | | | | (0.18 | ) | | | - | | | | 9.50 | | | | 15.35 | | | | 363,157 | | | | 0.80 | | | | 2.00 | | | | 0.98 | | | | 1.82 | | | | 156 | | |
| | 2002 | (2) | | | 9.53 | | | | 0.23 | | | | (1.13 | ) | | | (0.23 | ) | | | - | | | | 8.40 | | | | (9.74 | ) | | | 290,288 | | | | 0.80 | | | | 2.32 | | | | 0.98 | | | | 2.14 | | | | 79 | | |
| | 2001 | (2) (3) | | | 13.87 | | | | 0.16 | | | | (2.20 | ) | | | (0.23 | ) | | | (2.07 | ) | | | 9.53 | | | | (16.84 | ) | | | 375,983 | | | | 0.97 | | | | 2.21 | | | | 1.04 | | | | 2.14 | | | | 54 | | |
| | 2000 | (4) | | | 12.43 | | | | 0.26 | | | | 2.13 | | | | (0.26 | ) | | | (0.69 | ) | | | 13.87 | | | | 19.94 | | | | 163,158 | | | | 0.97 | | | | 1.91 | | | | 1.03 | | | | 1.85 | | | | 79 | | |
| | 1999 | (4) | | | 12.32 | | | | 0.24 | | | | 0.49 | | | | (0.23 | ) | | | (0.39 | ) | | | 12.43 | | | | 5.87 | | | | 180,737 | | | | 0.93 | | | | 1.84 | | | | 1.00 | | | | 1.77 | | | | 69 | | |
| | Equity Income Fund | | | | |
| Class A | |
| | 2004 | (2) | | $ | 11.56 | | | $ | 0.18 | | | $ | 1.23 | | | $ | (0.20 | ) | | $ | - | | | $ | 12.77 | | | | 12.26 | % | | $ | 184,381 | | | | 1.15 | % | | | 1.39 | % | | | 1.19 | % | | | 1.35 | % | | | 12 | % | |
| | 2003 | (2) | | | 9.58 | | | | 0.18 | | | | 1.99 | | | | (0.19 | ) | | | - | | | | 11.56 | | | | 22.81 | | | | 144,282 | | | | 1.15 | | | | 1.70 | | | | 1.20 | | | | 1.65 | | | | 43 | | |
| | 2002 | (2) | | | 12.13 | | | | 0.16 | | | | (2.48 | ) | | | (0.19 | ) | | | (0.04 | ) | | | 9.58 | | | | (19.51 | ) | | | 128,142 | | | | 1.15 | | | | 1.43 | | | | 1.20 | | | | 1.38 | | | | 38 | | |
| | 2001 | (2) | | | 16.29 | | | | 0.29 | | | | (0.74 | ) | | | (0.32 | ) | | | (3.39 | ) | | | 12.13 | | | | (3.89 | ) | | | 24,557 | | | | 1.00 | | | | 1.97 | | | | 1.15 | | | | 1.82 | | | | 33 | | |
| | 2000 | | | | 15.94 | | | | 0.28 | | | | 1.45 | | | | (0.28 | ) | | | (1.10 | ) | | | 16.29 | | | | 11.11 | | | | 20,607 | | | | 1.00 | | | | 1.69 | | | | 1.14 | | | | 1.55 | | | | 36 | | |
| Class B | |
| | 2004 | (2) | | $ | 11.49 | | | $ | 0.08 | | | $ | 1.22 | | | $ | (0.11 | ) | | $ | - | | | $ | 12.68 | | | | 11.37 | % | | $ | 23,869 | | | | 1.90 | % | | | 0.65 | % | | | 1.94 | % | | | 0.61 | % | | | 12 | % | |
| | 2003 | (2) | | | 9.52 | | | | 0.10 | | | | 1.98 | | | | (0.11 | ) | | | - | | | | 11.49 | | | | 21.97 | | | | 22,156 | | | | 1.90 | | | | 0.95 | | | | 1.95 | | | | 0.90 | | | | 43 | | |
| | 2002 | (2) | | | 12.07 | | | | 0.09 | | | | (2.49 | ) | | | (0.11 | ) | | | (0.04 | ) | | | 9.52 | | | | (20.10 | ) | | | 18,699 | | | | 1.90 | | | | 0.80 | | | | 1.95 | | | | 0.75 | | | | 38 | | |
| | 2001 | (2) | | | 16.24 | | | | 0.18 | | | | (0.75 | ) | | | (0.21 | ) | | | (3.39 | ) | | | 12.07 | | | | (4.64 | ) | | | 11,516 | | | | 1.75 | | | | 1.20 | | | | 1.90 | | | | 1.05 | | | | 33 | | |
| | 2000 | | | | 15.90 | | | | 0.18 | | | | 1.44 | | | | (0.18 | ) | | | (1.10 | ) | | | 16.24 | | | | 10.35 | | | | 10,366 | | | | 1.75 | | | | 0.95 | | | | 1.89 | | | | 0.81 | | | | 36 | | |
| Class C | |
| | 2004 | (2) | | $ | 11.51 | | | $ | 0.08 | | | $ | 1.22 | | | $ | (0.11 | ) | | $ | - | | | $ | 12.70 | | | | 11.34 | % | | $ | 19,300 | | | | 1.90 | % | | | 0.66 | % | | | 1.94 | % | | | 0.62 | % | | | 12 | % | |
| | 2003 | (2) | | | 9.54 | | | | 0.10 | | | | 1.98 | | | | (0.11 | ) | | | - | | | | 11.51 | | | | 21.95 | | | | 19,386 | | | | 1.90 | | | | 0.95 | | | | 1.95 | | | | 0.90 | | | | 43 | | |
| | 2002 | (2) | | | 12.09 | | | | 0.10 | | | | (2.50 | ) | | | (0.11 | ) | | | (0.04 | ) | | | 9.54 | | | | (20.08 | ) | | | 11,171 | | | | 1.90 | | | | 0.86 | | | | 1.95 | | | | 0.81 | | | | 38 | | |
| | 2001 | (2) | | | 16.28 | | | | 0.18 | | | | (0.76 | ) | | | (0.22 | ) | | | (3.39 | ) | | | 12.09 | | | | (4.74 | ) | | | 8,028 | | | | 1.75 | | | | 1.20 | | | | 1.90 | | | | 1.05 | | | | 33 | | |
| | 2000 | | | | 15.93 | | | | 0.19 | | | | 1.44 | | | | (0.18 | ) | | | (1.10 | ) | | | 16.28 | | | | 10.41 | | | | 2,511 | | | | 1.75 | | | | 0.88 | | | | 1.89 | | | | 0.74 | | | | 36 | | |
| | 1999 | (9) | | | 16.62 | | | | 0.21 | | | | (0.70 | ) | | | (0.20 | ) | | | - | | | | 15.93 | | | | (3.02 | ) | | | 1,700 | | | | 1.76 | | | | 0.65 | | | | 1.88 | | | | 0.53 | | | | 35 | | |
| Class R (2) | |
| | 2004 | (7) | | $ | 11.56 | | | $ | 0.19 | | | $ | 1.22 | | | $ | (0.19 | ) | | $ | - | | | $ | 12.78 | | | | 12.18 | % | | $ | 1 | | | | 1.15 | % | | | 1.52 | % | | | 1.19 | % | | | 1.48 | % | | | 12 | % | |
| | 2003 | | | | 9.57 | | | | 0.19 | | | | 1.99 | | | | (0.19 | ) | | | - | | | | 11.56 | | | | 22.91 | | | | 17,170 | | | | 1.15 | | | | 1.80 | | | | 1.20 | | | | 1.75 | | | | 43 | | |
| | 2002 | | | | 12.12 | | | | 0.15 | | | | (2.47 | ) | | | (0.19 | ) | | | (0.04 | ) | | | 9.57 | | | | (19.47 | ) | | | 36,522 | | | | 1.15 | | | | 1.34 | | | | 1.20 | | | | 1.29 | | | | 38 | | |
| | 2001 | (6) | | | 11.57 | | | | 0.01 | | | | 0.54 | | | | - | | | | - | | | | 12.12 | | | | 4.75 | | | | 328 | | | | 1.23 | | | | 4.08 | | | | 1.42 | | | | 3.89 | | | | 33 | | |
| Class Y | |
| | 2004 | (2) | | $ | 11.63 | | | $ | 0.21 | | | $ | 1.24 | | | $ | (0.23 | ) | | $ | - | | | $ | 12.85 | | | | 12.54 | % | | $ | 1,404,431 | | | | 0.90 | % | | | 1.65 | % | | | 0.94 | % | | | 1.61 | % | | | 12 | % | |
| | 2003 | (2) | | | 9.63 | | | | 0.21 | | | | 2.00 | | | | (0.21 | ) | | | - | | | | 11.63 | | | | 23.20 | | | | 1,278,470 | | | | 0.90 | | | | 1.95 | | | | 0.95 | | | | 1.90 | | | | 43 | | |
| | 2002 | (2) | | | 12.20 | | | | 0.21 | | | | (2.52 | ) | | | (0.22 | ) | | | (0.04 | ) | | | 9.63 | | | | (19.30 | ) | | | 678,352 | | | | 0.90 | | | | 1.80 | | | | 0.95 | | | | 1.75 | | | | 38 | | |
| | 2001 | (2) | | | 16.37 | | | | 0.33 | | | | (0.76 | ) | | | (0.35 | ) | | | (3.39 | ) | | | 12.20 | | | | (3.71 | ) | | | 267,361 | | | | 0.75 | | | | 2.21 | | | | 0.90 | | | | 2.06 | | | | 33 | | |
| | 2000 | | | | 16.00 | | | | 0.32 | | | | 1.47 | | | | (0.32 | ) | | | (1.10 | ) | | | 16.37 | | | | 11.46 | | | | 275,436 | | | | 0.75 | | | | 1.99 | | | | 0.89 | | | | 1.85 | | | | 36 | | |
(1) The financial highlights for the Balanced Fund as set forth herein include the historical financial highlights of the Firstar Balanced Growth Fund. The assets of the Firstar Fund were acquired by the
First American Balanced Fund on September 24, 2001. In connection with such acquisition, (i) Class A shares of the Firstar Balanced Growth Fund were exchanged for Class A shares of the First
American Balanced Fund, (ii) Firstar Class B shares were exchanged for Class B shares of the First American Fund, (iii) Firstar Class Y shares were exchanged for Class S shares (now designated
Class R shares) of the First American Fund, and (iv) Firstar Class Institutional shares were exchanged for Class Y shares of the First American Fund.
(2) Per share data calculated using average shares outstanding method.
(3) For the period November 1, 2000, to September 30, 2001. Effective in 2001, the Fund's fiscal year end was changed from October 31 to September 30. All ratios for the period have been annualized,
except total return and portfolio turnover.
(4) For the fiscal period ended October 31.
(5) Class of shares has been offered since March 1, 1999. All ratios for the period have been annualized, except total return and portfolio turnover.
(6) Class of shares has been offered since September 24, 2001. All ratios for the period have been annualized, except total return and portfolio turnover.
(7) Prior to July 1, 2004, Class R shares were named Class S shares, which had lower fees and expenses.
(8) Class of shares has been offered since November 27, 2000. All ratios for the period have been annualized, except total return and portfolio turnover.
(9) Class of shares has been offered since February 1, 1999. All ratios for the period have been annualized, except total return and portfolio turnover.
(10) Total return does not include sales charges. Total return would have been lower had certain expenses not been waived.
The accompanying notes are an integral part of the financial statements.
FIRST AMERICAN FUNDS Annual Report 2004
124
FIRST AMERICAN FUNDS Annual Report 2004
125
Notes to Financial Statements September 30, 2004
1 > Organization
The First American Real Estate Securities Fund, Technology Fund, International Fund, Small Cap Growth Opportunities Fund, Small Cap Select Fund, Small Cap Value Fund, Mid Cap Growth Opportunities Fund, Mid Cap Value Fund, Large Cap Growth Opportunities Fund, Large Cap Select Fund, Large Cap Value Fund, Balanced Fund and Equity Income Fund (each a "Fund" and collectively, the "Funds") are mutual funds offered by First American Investment Funds, Inc. ("FAIF"), which is a member of the First American Family of Funds. As of September 30, 2004, FAIF offered 37 funds, including the Funds listed above. FAIF is registered under the Investment Company Act of 1940, as amended, as an open-end management investment company. FAIF's articles of incorporation permit the Fund's board of directors to create additional funds in the future. The International Fund, Small Cap Growth Opportunities Fund, Small Cap Select Fund, Small Cap Value Fund, Mid Cap Growth Opportunities Fund, Mid Cap Value Fund, Large Cap Growth Opportunities, Large Cap Select Fund, Large Cap Value Fund, Balanced Fund and Equity Income Fund are each diversified open-end management investment companies. The Real Estate Securities Fund and Technology Fund are non-diversified open-end management investment companies. Non-diversified funds may invest a large component of their net assets in securities of relatively few issuers.
The Funds offer Class A, Class B, Class C, Class R, and Class Y shares. Prior to July 1, 2004, Class R shares were named Class S shares. Class A shares are sold with a front-end sales charge. Class B shares are subject to a contingent deferred sales charge for six years and automatically convert to Class A shares after eight years. Class C shares may be subject to a contingent deferred sales charge for 12 months, and will not convert to Class A shares. Class R shares have no sales charge and are offered only through certain tax-deferred retirement plans. Class Y shares have no sales charge and are offered only to qualifying institutional investors and certain other qualifying accounts.
The Funds' prospectuses provide descriptions of each Fund's investment objective, principal investment strategies and principal risks. All classes of shares of a Fund have identical voting, dividend, liquidation and other rights, and the same terms and conditions, except that the level of distribution and shareholder servicing fees charged may differ among classes. Each class has exclusive voting rights on any matters relating to that class' servicing or distribution arrangements.
2 > Summary of Significant Accounting Policies
The significant accounting policies followed by the Funds are as follows:
SECURITY VALUATION – Security valuations for the Funds' investments are furnished by one or more independent pricing services that have been approved by the Funds' board of directors. Investments in equity securities that are traded on a national securities exchange (or reported on the Nasdaq national market system) are stated at the last quoted sales price if readily available for such securities on each business day. For securities traded on the Nasdaq national market system, the Funds utilize the Nasdaq Official Closing Price which compares the last trade to the bid/ask range of a security. If the last trade falls within the bid/ask range, then that price will be the closing price. If the last trade is outside the bid/ask range, and falls above the ask, the ask will be the c losing price. If the last trade is below the bid, the bid will be the closing price. Other equity securities traded in the over-the-counter market and listed equity securities for which no sale was reported on that date are stated at the last quoted bid price. Debt obligations exceeding 60 days to maturity are valued by an independent pricing service. The pricing service may employ methodologies that utilize actual market transactions, broker-dealer supplied valuations, or other formula-driven valuation techniques. These techniques generally consider such factors as yields or prices of bonds of comparable quality, type of issue, coupon, maturity, ratings and general market conditions. Securities for which prices are not available from an independent pricing service but where an active market exists are valued using market quotations obtained from one or more dealers that make markets in the securities or from a widely-used quotation system. When market quotations are not readily available, securities are val ued at fair value as determined in good faith by procedures established and approved by the Funds' board of directors. Some of the factors which may be considered by the board of directors in determining fair value are fundamental analytical data relating to the investment; the nature and duration of any restrictions on disposition; trading in similar securities of the same issuer or comparable companies; information from broker-dealers; and an evaluation of the forces that influence the market in which the securities are purchased and sold. If
FIRST AMERICAN FUNDS Annual Report 2004
126
events occur that materially affect the value of securities (including non-U.S. securities) between the close of trading in those securities and the close of regular trading on the New York Stock Exchange, the securities will be valued at fair value. The International Fund is supplied with information from an unaffiliated third party with respect to the fair value of foreign securities. Price movements in futures contracts and American Depository Receipts, and various other indices, may be reviewed in the course of making a good faith determination of a security's fair value. The use of fair value pricing by a fund may cause the net asset value of its shares to differ significantly from the net asset value that would be calculated without regard to such considerations. As of September 30, 2004, Real Estate Securities Fund, International Fund, Small Cap Growth Opportunities Fund, and the Balance d Fund held fair valued securities with a market value of $370,175, $183, $122,540, and $39,330, respectively, or 0.1%, 0.0%, 0.0%, and 0.0% of total net assets, respectively. Debt obligations with 60 days or less remaining until maturity may be valued at their amortized cost, which approximates market value. Foreign securities are valued at the closing prices on the principal exchange on which they trade. The prices for foreign securities are reported in local currency and converted to U.S. dollars using currency exchange rates. Exchange rates are provided daily by recognized independent pricing agents. Investments in open-end mutual funds are valued at the respective net asset value of each underlying fund on the valuation date.
SECURITY TRANSACTIONS AND INVESTMENT INCOME – The Funds record security transactions on the trade date of the security purchase or sale. Dividend income is recorded on the ex-dividend date. Interest income, including amortization of bond premium and discount, is recorded on an accrual basis. Security gains and losses are determined on the basis of identified cost, which is the same basis used for federal income-tax purposes.
DISTRIBUTIONS TO SHAREHOLDERS – Balanced Fund, Equity Income Fund, Large Cap Growth Opportunities Fund, Large Cap Select Fund, Large Cap Value Fund, Mid Cap Growth Opportunities Fund and Mid Cap Value Fund declare and pay income dividends monthly. Small Cap Growth Opportunities Fund, Small Cap Select Fund, Small Cap Value Fund, Real Estate Securities Fund and Technology Fund declare and pay income dividends quarterly. International Fund declares and pays income dividends annually. Any net realized capital gains on sales of a Fund's securities are distributed to shareholders at least annually.
The Real Estate Securities Fund receives substantial distributions from holdings in REITs. Distributions from REITs may be characterized as ordinary income, net capital gain, or a return of capital to the REIT shareholder. The proper characterization of REIT distributions is generally not known until after the end of each calendar year. As such, the Real Estate Securities Fund must use estimates in reporting the character of its income and distributions for financial statement purposes. The actual character of distributions to fund shareholders will be reflected on the Form 1099 received by shareholders after the end of the calendar year. Due to the nature of REIT investments, a portion of the distributions received by a fund shareholder may represent a return of capital.
FEDERAL TAXES – Each Fund is treated as a separate taxable entity. Each Fund intends to continue to qualify as a regulated investment company as provided in Subchapter M of the Internal Revenue Code, as amended, and to distribute all taxable income, if any, to its shareholders. Accordingly, no provision for federal income taxes is required.
Net investment income and net realized gains (losses) may differ for financial statement and tax purposes because of temporary or permanent book/tax differences. These differences are primarily due to post-October losses, losses deferred due to wash sales, proceeds from securities litigation, foreign currency gains and losses, investments in limited partnerships and REITs, tax equalization and the "mark-to-market" of certain Passive Foreign Investment Companies (PFICs) for tax purposes. To the extent these differences are permanent, reclassifications are made to the appropriate equity accounts in the period that the differences arise.
On the Statement of Assets and Liabilities the following reclassifications were made (000):
| Fund | | Accumulated
Net Realized
Gain (Loss) | | Undistributed
Net Investment
Income | | Portfolio
Capital | |
| Real Estate Securities Fund | | $ | (569 | ) | | $ | 569 | | | $ | - | | |
| Technology Fund | | | 143 | | | | 1,017 | | | | (1,160 | ) | |
| International Fund | | | 809 | | | | (440 | ) | | | (369 | ) | |
| Small Cap Growth Opportunities Fund | | | (40,266 | ) | | | 6,364 | | | | 33,902 | | |
| Small Cap Select Fund | | | (34,920 | ) | | | 6,174 | | | | 28,746 | | |
| Small Cap Value Fund | | | (19,535 | ) | | | 76 | | | | 19,459 | | |
| Mid Cap Growth Opportunities Fund | | | (8,421 | ) | | | 8,421 | | | | - | | |
| Mid Cap Value Fund | | | 412 | | | | (355 | ) | | | (57 | ) | |
| Large Cap Growth Opportunities Fund | | | 5 | | | | 256 | | | | (261 | ) | |
| Large Cap Select Fund | | | - | | | | - | | | | - | | |
| Large Cap Value Fund | | | 92 | | | | (92 | ) | | | - | | |
| Balanced Fund | | | (341 | ) | | | 341 | | | | - | | |
| Equity Income Fund | | | 435 | | | | (2,365 | ) | | | 1,930 | | |
FIRST AMERICAN FUNDS Annual Report 2004
127
Notes to Financial Statements September 30, 2004
The character of distributions made during the year from net investment income or net realized gains may differ from the ultimate characterization for federal income tax purposes. In addition, due to the timing of dividend distributions, the fiscal year in which the amounts are distributed may differ from the year that the income or realized gains (losses) were recorded by the Fund. The distributions paid during the fiscal years ended September 30, 2004, and September 30, 2003, were characterized as follows (000):
| | | 2004 | |
| Fund | | Ordinary
Income | | Long Term
Gain | | Return
of Capital | |
Total | |
| Real Estate Securities Fund | | $ | 17,709 | | | $ | 6,775 | | | $ | - | | | $ | 24,484 | | |
| International Fund | | | 8,820 | | | | - | | | | - | | | | 8,820 | | |
Small Cap Growth
Opportunities Fund | | | - | | | | 3,085 | | | | - | | | | 3,085 | | |
| Small Cap Select Fund | | | 62,602 | | | | 15,960 | | | | - | | | | 78,562 | | |
| Small Cap Value Fund | | | 6,941 | | | | 13,524 | | | | - | | | | 20,465 | | |
Mid Cap Growth
Opportunities Fund | | | 19,503 | | | | 21,278 | | | | - | | | | 40,781 | | |
| Mid Cap Value Fund | | | 2,102 | | | | - | | | | 57 | | | | 2,159 | | |
Large Cap Growth
Opportunities Fund | | | 1,184 | | | | - | | | | 261 | | | | 1,445 | | |
| Large Cap Select Fund | | | 2,504 | | | | 333 | | | | - | | | | 2,837 | | |
| Large Cap Value Fund | | | 12,705 | | | | - | | | | - | | | | 12,705 | | |
| Balanced Fund | | | 7,635 | | | | - | | | | - | | | | 7,635 | | |
| Equity Income Fund | | | 29,158 | | | | - | | | | - | | | | 29,158 | | |
| | | 2003 | |
| Fund | | Ordinary
Income | | Long Term
Gain | | Return
of Capital | |
Total | |
| Real Estate Securities Fund | | $ | 8,570 | | | $ | 3,434 | | | $ | - | | | $ | 12,004 | | |
| Small Cap Value Fund | | | 429 | | | | 194 | | | | - | | | | 623 | | |
| Mid Cap Value Fund | | | 3,020 | | | | - | | | | 141 | | | | 3,161 | | |
Large Cap Growth
Opportunities Fund | | | 2,409 | | | | - | | | | - | | | | 2,409 | | |
| Large Cap Select Fund | | | 206 | | | | - | | | | - | | | | 206 | | |
| Large Cap Value Fund | | | 14,662 | | | | - | | | | 107 | | | | 14,769 | | |
| Balanced Fund | | | 9,763 | | | | - | | | | - | | | | 9,763 | | |
| Equity Income Fund | | | 23,248 | | | | - | | | | 1,930 | | | | 25,178 | | |
As of September 30, 2004, the components of accumulated earnings (deficit) on a tax basis were as follows (000):
| Fund | |
Undistributed
Ordinary
Income | |
Undistributed
Long Term
Capital Gains | | Accumulated
Capital and
Post-October
Losses | |
Unrealized
Appreciation
(Depreciation) | | Total
Accumulated
Earnings
(Deficit) | |
| Real Estate Securities Fund | | $ | 8,274 | | | $ | 20,757 | | | $ | - | | | $ | 66,645 | | | $ | 95,676 | | |
| Technology Fund | | | - | | | | - | | | | (468,869 | ) | | | 549 | | | | (468,320 | ) | |
| International Fund | | | 9,866 | | | | - | | | | (230,464 | ) | | | 132,348 | | | | (88,250 | ) | |
Small Cap Growth
Opportunities Fund | | | 12,907 | | | | 26,016 | | | | - | | | | 7,635 | | | | 46,558 | | |
| Small Cap Select Fund | | | 59,890 | | | | 88,149 | | | | (58,325 | ) | | | 130,720 | | | | 220,434 | | |
| Small Cap Value Fund | | | 7,203 | | | | 53,358 | | | | - | | | | 108,617 | | | | 169,178 | | |
Mid Cap Growth
Opportunities Fund | | | 62,200 | | | | 119,980 | | | | (60,505 | ) | | | 150,301 | | | | 271,976 | | |
| Mid Cap Value Fund | | | - | | | | - | | | | (57,479 | ) | | | 79,970 | | | | 22,491 | | |
Large Cap Growth
Opportunities Fund | | | - | | | | - | | | | (183,848 | ) | | | 93,648 | | | | (90,200 | ) | |
| Large Cap Select Fund | | | 2,184 | | | | 1,165 | | | | - | | | | 12,020 | | | | 15,369 | | |
| Large Cap Value Fund | | | 43 | | | | - | | | | (58,864 | ) | | | 121,209 | | | | 62,388 | | |
| Balanced Fund | | | 88 | | | | - | | | | (44,689 | ) | | | 26,114 | | | | (18,487 | ) | |
| Equity Income Fund | | | 2,135 | | | | - | | | | (25,813 | ) | | | 249,425 | | | | 225,747 | | |
FIRST AMERICAN FUNDS Annual Report 2004
128
The difference between book and tax basis unrealized appreciation (depreciation) is primarily due to the tax deferral of losses on wash sales and investments in limited partnerships and REITs, and the amount of gain (loss) recognized for tax purposes due to mark to market adjustments on open futures contracts and the mark to market for certain Passive Foreign Investments Companies (PFICs) for tax purposes.
As of September 30, 2004, the following Funds had capital loss carryforwards (000):
| | | Expiration Year | |
| Fund | | 2008 | | 2009 | | 2010 | | 2011 | | 2012 | | Total | |
| Technology Fund | | $ | 12,002 | | | $ | 11,235 | | | $ | 339,005 | | | $ | 102,106 | | | $ | 4,320 | | | $ | 468,668 | | |
| International Fund | | | 3,470 | | | | 15,879 | | | | 106,716 | | | | 103,959 | | | | - | | | | 230,024 | | |
| Small Cap Select Fund | | | - | | | | - | | | | 58,325 | | | | - | | | | - | | | | 58,325 | | |
| Mid Cap Growth Opportunities Fund | | | - | | | | - | | | | 60,505 | | | | - | | | | - | | | | 60,505 | | |
| Mid Cap Value Fund | | | 53,676 | | | | - | | | | - | | | | 3,803 | | | | - | | | | 57,479 | | |
| Large Cap Growth Opportunities Fund | | | - | | | | 7,189 | | | | 144,016 | | | | 32,643 | | | | - | | | | 183,848 | | |
| Large Cap Value Fund | | | - | | | | - | | | | - | | | | 58,864 | | | | - | | | | 58,864 | | |
| Balanced Fund | | | - | | | | - | | | | 18,256 | | | | 26,433 | | | | - | | | | 44,689 | | |
| Equity Income Fund | | | 2,250 | | | | 1,731 | | | | - | | | | 21,832 | | | | - | | | | 25,813 | | |
In accordance with Section 382 of the Internal Revenue Code, utilization of all or a portion of the above capital loss carryovers is limited on an annual basis for International Fund, Large Cap Growth Opportunities Fund, Mid Cap Growth Opportunities Fund, Small Cap Select Fund, and Technology Fund to (000) $8,327, $24,385, $10,084, $9,721 and $1,524, respectively.
Certain Funds incurred a loss for tax purposes for the period from November 1, 2003, to September 30, 2004. As permitted by tax regulations, the Funds intend to elect to defer and treat these losses as arising in the fiscal year ending September 30, 2005. The following Funds had deferred losses (000):
| Fund | | Amount | |
| Technology Fund | | $ | 200 | | |
| International Fund | | | 440 | | |
FUTURES TRANSACTIONS – In order to gain exposure to or protect against changes in the market and to maintain sufficient liquidity to meet redemption requests, certain Funds may enter into S&P stock index futures contracts and other stock index futures contracts. Balanced Fund may also enter into interest rate index futures contracts. Upon entering into a futures or currency contract, the Fund is required to deposit cash or pledge U.S. government securities in an amount equal to five percent of the purchase price indicated in the futures or currency contract (initial margin). Subsequent payments, which are dependent on the daily fluctuations in the value of the underlying index, are made or received by the Fund each day (daily variation margin) and are recorded as unrea lized gains (losses) until the contract is closed. When the contract is closed, the Fund records a realized gain (loss) equal to the difference between the proceeds from (or cost of) the closing transaction and the Fund's basis in the contract.
Risks of entering into futures contracts, in general, include the possibility that there will not be a perfect price correlation between the futures contracts and the underlying securities. Second, it is possible that a lack of liquidity for futures contracts could exist, resulting in an inability to close a futures position prior to its maturity date. Third, the purchase of a futures contract involves the risk that a fund could lose more than the original margin deposit required to initiate a futures transaction. These contracts involve market risk in excess of the amount reflected in the Fund's statement of assets and liabilities. Unrealized gains (losses) on outstanding positions in futures contracts held at the close of the year will be recognized as capital gains (losses) for federal income tax purposes.
OPTIONS TRANSACTIONS – The Funds may utilize options in an attempt to manage market or business risk or enhance their yield. When a call or put option is written, an amount equal to the premium received is recorded as a liability. The liability is marked-to-market daily to reflect the current market value of the option written. When a written option expires, a gain is realized in the amount of the premium originally received. If a closing purchase contract is entered into, a gain or loss is realized in the amount of the original premium less the cost of the closing transaction. If a written call option is exercised,
FIRST AMERICAN FUNDS Annual Report 2004
129
Notes to Financial Statements September 30, 2004
a gain or loss is realized from the sale of the underlying security, and the proceeds from such sale are increased by the premium originally received. If a written put option is exercised, the amount of the premium originally received reduces the cost of the security which is purchased upon exercise of the option.
Purchased options are recorded as investments and marked-to-market daily to reflect the current market value of the option contract. If a purchased option expires, a loss is realized in the amount of the cost of the option. If a closing transaction is entered into, a gain or loss is realized, to the extent that the proceeds from the sale are greater or less than the cost of the option. If a put option is exercised, a gain or loss is realized from the sale of the underlying security by adjusting the proceeds from such sale by the amount of the premium originally paid. If a call option is exercised, the cost of the security purchased upon exercise is increased by the premium originally paid.
FOREIGN CURRENCY TRANSLATION – The books and records of International Fund relating to the Fund's non-U.S. dollar denominated investments are maintained in U.S. dollars on the following basis:
• market value of investment securities, assets, and liabilities are translated at the current rate of exchange; and
• purchases and sales of investment securities, income, and expenses are translated at the relevant rates of exchange prevailing on the respective dates of such transactions.
The International Fund does not isolate the portion of gains and losses on investments in equity securities that is due to changes in the foreign exchange rates from that which is due to changes in market prices of equity securities.
The International Fund reports certain foreign currency-related transactions as components of realized gains for financial reporting purposes, whereas such components are treated as ordinary income for federal income tax purposes.
FORWARD FOREIGN CURRENCY CONTRACTS – The International Fund may enter into forward foreign currency contracts as hedges against either specific transactions or Fund positions. The aggregate principal amount of the contracts are not recorded because the International Fund intends to settle the contracts prior to delivery. All commitments are "marked-to-market" daily at the applicable foreign exchange rate, and any resulting unrealized gains or losses are recorded currently. The International Fund realizes gains or losses at the time the forward contracts are extinguished. Unrealized gains or losses on outstanding positions in forward foreign currency contracts held at the close of the per iod are recognized as ordinary income or loss for federal income tax purposes.
The use of forward foreign currency contracts does not eliminate fluctuations in the underlying prices of the securities, but it does establish a rate of exchange that can be achieved in the future. Although forward foreign currency contracts limit the risk of loss due to a decline in the value of the hedged currency, they also limit a potential gain that might result should the value of the currency increase. These contracts involve market risk in excess of the amount reflected in the Fund's statement of assets and liabilities. The face or contract amount in U.S. dollars reflects the total exposure the Fund has in that particular currency contract. In addition, there could be exposure to risks (limited to the amount of unrealized gains) if the counterparties to the contracts are unable to meet the terms of their contracts. There were no outstanding forward foreign currency contracts at September 30 , 2004.
SECURITIES PURCHASED ON A WHEN-ISSUED BASIS – Delivery and payment for securities that have been purchased by a Fund on a forward-commitment or when-issued basis can take place up to a month or more after the transaction date. During this period, such securities are subject to market fluctuations and the portfolio maintains, in a segregated account with its custodian, assets with a market value equal to or greater than the amount of its purchase commitments. The purchase of securities on a when-issued or forward-commitment basis may increase the volatility of the Fund's net asset value if the Fund makes such purchases while remaining substantially fully invested. At September 30, 2004, the following Funds had outstanding when-issued commitments (000):
| Fund | | Cost | | Segregated
Assets | |
| Mid Cap Growth Opportunities Fund | | $ | 6,848 | | | $ | 0 | | |
| Balanced Fund | | | 4,252 | | | | 17,430 | | |
In connection with the ability to purchase securities on a when-issued basis, each Fund may also enter into dollar rolls in which the Fund sells securities purchased on a forward-commitment basis and simultaneously contracts with a counterparty to repurchase similar (same type, coupon, and maturity), but not identical securities on a specified future date. Dollar rolls are considered a form of leverage.
FIRST AMERICAN FUNDS Annual Report 2004
130
ILLIQUID OR RESTRICTED SECURITIES – A security may be considered illiquid if it lacks a readily available market or if its valuation has not changed for a certain period of time. Each Fund intends to invest no more than 15% of its net assets (determined at the time of purchase and reviewed periodically) in illiquid securities. Certain restricted securities may be considered illiquid. Restricted securities are often purchased in private placement transactions, are not registered under the Securities Act of 1933, may have contractual restrictions on resale, and may be valued under methods approved by the Funds' board of directors as reflecting fair value. Certain restricted securities eligible for resale to qualified institutional investors, including Rule 144A securities, are no t subject to the limitation on a Fund's investment in illiquid securities if they are determined to be liquid in accordance with procedures adopted by the Funds' board of directors. At September 30, 2004, Real Estate Securities Fund, International Fund, Small Cap Growth Opportunities Fund, and Balanced Fund had investments in illiquid securities with a total market value of $370,175, $183, $122,540, and $39,330, respectively, or 0.1%, 0.0%, 0.0%, and 0.0%, respectively, of total net assets.
Information concerning illiquid securities, including restricted securities considered to be illiquid, is as follows (000):
Real Estate Securities Fund
| Security | | Shares | | Dates
Acquired | | Cost Basis | |
| Beacon Capital | | | 33,750 | | | 3/98 | | $ | 660 | | |
| Newcastle Investment Holdings | | | 35,000 | | | 6/98 | | | 153 | | |
| Wyndham International | | | 2,262 | | | 3/00-4/00 | | | - | | |
| Wyndham Voting Trust | | | 1,295 | | | 3/98 | | | - | | |
International Fund
| Security | | Shares | | Dates
Acquired | | Cost Basis | |
| Peregrine Investment Holdings | | | 142,000 | | | 12/94-8/97 | | $ | 288 | | |
| Silverstone Berhad | | | 3,469 | | | 8/95-5/96 | | | 2 | | |
Small Cap Growth Opportunities Fund
| Security | | Shares | | Dates
Acquired | | Cost Basis | |
| Tridium Warrant | | | 20,500 | | | 4/99 | | $ | - | | |
| Tridium, Cl B | | | 278,500 | | | 4/99-8/99 | | | 1,524 | | |
| VideoPropulsion | | | 809,856 | | | 12/99 | | | - | | |
Balanced Fund
| Security | | Shares/Par | | Dates
Acquired | | Cost Basis | |
| Duty Free International | | | 656 | | | 1/99-11/02 | | $ | 655 | | |
SECURITIES LENDING – In order to generate additional income, a Fund may lend securities representing up to one-third of the value of its total assets (which includes collateral for securities on loan) to broker-dealers, banks, or other institutional borrowers of securities. Each Fund's policy is to maintain collateral in the form of cash, U.S. Government securities, or other high-grade debt obligations equal to at least 100% of the value of securities loaned. The collateral is then "marked-to-market" daily until the securities are returned. As with other extensions of credit, there may be risks of delay in recovery of the securities or even loss of rights in the collateral should the bor rower of the security fail financially.
U.S. Bancorp Asset Management, Inc. ("USBAM") serves as the securities lending agent for the Funds in transactions involving the lending of portfolio securities on behalf of the Funds. USBAM acts as the securities lending agent pursuant to, and subject to compliance with conditions contained in, an exemptive order issued by the Securities and Exchange Commission ("SEC"). During the fiscal year ended September 30, 2004, USBAM received fees equal to 25% of the Fund's income from securities lending transactions. With respect to International Fund, a portion of this amount was paid to State Street Bank and Trust for acting as sub-lending agent. The Funds also paid an administrative fee to USBAM equal to 0.025% based on the cash collateral held for the securities on loan. Fees paid to USBAM by the Funds for the fiscal year ended September 30, 2004, were as follows (000):
| Fund | | Amount | |
| Real Estate Securities Fund | | $ | 42 | | |
| Technology Fund | | | 59 | | |
| International Fund | | | 309 | | |
| Small Cap Growth Opportunities Fund | | | 159 | | |
| Small Cap Select Fund | | | 362 | | |
| Small Cap Value Fund | | | 92 | | |
| Mid Cap Growth Opportunities Fund | | | 343 | | |
| Mid Cap Value Fund | | | 85 | | |
| Large Cap Growth Opportunities Fund | | | 257 | | |
| Large Cap Select Fund | | | 32 | | |
| Large Cap Value Fund | | | 165 | | |
| Balanced Fund | | | 82 | | |
| Equity Income Fund | | | 209 | | |
As of October 1, 2004, USBAM will receive fees equal to 35% of the Funds' income from securities lending transactions. The Funds will no longer pay an administrative fee to USBAM in connection with securities lending.
REPURCHASE AGREEMENTS – A repurchase agreement is an agreement by which the seller of a security agrees to purchase the security sold at a mutually agreed upon time and price. At the time the Funds enter into a repurchase agreement, the value of the underlying collateral security (ies), including accrued interest, will be equal to or exceed
FIRST AMERICAN FUNDS Annual Report 2004
131
Notes to Financial Statements September 30, 2004
the value of the repurchase agreement. Securities that serve to collateralize the repurchase agreement are held by each Fund's custodian in book entry or physical form in the custodial account of the Fund. Repurchase agreements are valued at cost plus accrued interest receivable.
Pursuant to an exemptive order issued by the SEC, the Funds may transfer uninvested cash balances from proceeds from securities lending into joint repurchase agreements for the First American Funds complex managed by USBAM. As set forth in the accompanying schedules of investments, each of the Funds included in this annual report has an interest in joint repurchase agreements dated September 30, 2004. Information regarding these agreements is as follows (000):
Broker | |
Rate | |
Principal | | Collateral
Value | | Security Type | | Coupon Rate | | Maturity | |
| Bear Stearns | | | 2.060 | % | | $ | 30,000 | | | $ | 30,611 | | | Commercial Loans | | | 0.000 | % | | | 2033 | - 2034 | |
| Bear Stearns | | | 2.045 | % | | | 100,000 | | | | 102,056 | | | Commercial Loans | | | 3.850% - 6.230% | | | | 2004 | - 2014 | |
| Citibank | | | 1.945 | % | | | 200,000 | | | | 211,790 | | | Collateralized Mortgage Obligations | | | 2.340% - 9.700% | | | | 2015 | - 2034 | |
| | | | | | | Corporate Bonds | | 0.000% - 9.125% | | 2006 - 2042 | |
| Citibank | | | 1.925 | % | | | 100,000 | | | | 102,114 | | | Israeli Government Bonds | | | 0.000 | % | | | 2005 | - 2018 | |
| | | | | | | Financing Corporation Bonds | | 0.000% - 10.350% | | 2017 - 2018 | |
| | | | | | | Easy Growth TR Interest Certificates | | 0.000% | | 2005 - 2006 | |
| | | | | | | Treasury Investors Growth Receipt (TIGER) | | 0.000% | | 2007 | |
| | | | | | | Certificate of Accrual on Treasury Securities (CATS) | | 0.000% | | 2011 | |
| | | | | | | U.S. Treasury Notes | | 1.625% - 5.000% | | 2005 - 2011 | |
| | | | | | | U.S. Treasury Bill | | 0.000% | | 2004 | |
| | | | | | | Resolution Funding Corporation Bonds | | 8.625% | | 2030 | |
| | | | | | | International Finance Corporation Notes | | 4.750% - 5.250% | | 2006 - 2007 | |
| | | | | | | Inter-American Development Bank Notes | | 5.375% - 8.500% | | 2006 - 2011 | |
| | | | | | | Asian Development Bank Note | | 4.50% | | 2012 | |
| Greenwich Capital Markets | | | 1.950 | % | | | 300,000 | | | | 306,004 | | | Federal Home Loan Mortgage Corporation Bonds | | | 0.000% - 9.000% | | | | 2006 | - 2034 | |
| | | | | | | Federal National Mortgage Association Bonds | | 0.000% - 6.500% | | 2007 - 2042 | |
| Goldman Sachs | | | 2.205 | % | | | 50,000 | | | | 51,021 | | | Commercial Loans | | | 0.00 | % | | | 2005 | - 2011 | |
| Goldman Sachs | | | 2.025 | % | | | 205,000 | | | | 211,342 | | | Mortgage Loans | | | 6.088% - 6.722% | | | | 2010 | | |
| | | | | | | Commercial Loans | | 0.00% | | 2007 | |
| Goldman Sachs | | | 1.480 | % | | | 75,000 | | | | 77,320 | | | Commercial Loans | | | 0.00 | % | | | 2004 | | |
| Goldman Sachs | | | 1.425 | % | | | 125,000 | | | | 127,552 | | | Commercial Loans | | | 0.00 | % | | | 2005 | - 2020 | |
| Lehman Brothers | | | 2.055 | % | | | 200,000 | | | | 204,000 | | | Home Equity Loans | | | 0.000% - 14.101% | | | | 2010 | - 2034 | |
| Lehman Brothers | | | 1.935 | % | | | 200,000 | | | | 219,916 | | | Collateralized Mortgage Obligations | | | 0.000% - 7.109% | | | | 2008 | - 2044 | |
| Lehman Brothers | | | 1.910 | % | | | 300,000 | | | | 306,005 | | | Federal Farm Credit Bank Note | | | 4.500 | % | | | 2009 | | |
| | | | | | | Federal Home Loan Bank Bonds | | 0.000% - 5.750% | | 2005 - 2018 | |
| | | | | | | Federal Home Loan Mortgage Corporation Notes | | 2.375% - 3.550% | | 2006 - 2009 | |
| | | | | | | Federal National Mortgage Association Bonds | | 3.100% - 6.000% | | 2007 - 2018 | |
| Merrill Lynch | | | 1.925 | % | | | 100,000 | | | | 105,002 | | | Corporate Bonds | | | 0.000% - 10.125% | | | | 2005 | - 2043 | |
OTHER INCOME – Income from settlement proceeds related to specific portfolio securities is recorded as an adjustment to realized or unrealized gains or losses. Income from settlement proceeds related to securities that are no longer included in the portfolio is recorded in other income. For the fiscal year ended September 30, 2004, Technology Fund, Small Cap Growth Opportunities Fund, Small Cap Select Fund, Small Cap Value Fund, Mid Cap Growth Opportunities Fund, Mid Cap Value Fund, Large Cap Growth Opportunities Fund, Large Cap Value Fund, and Balanced Fund recorded $143,519, $1,263,916, $180,534, $1,915, $61,637, $343,681, $5,594, $85,572, $32,265, respectively, in other income for settlement proceeds related to securities no longer included in the portfolio.
EXPENSES – Expenses that are directly related to one of the Funds are charged directly to that Fund. Other operating expenses are allocated to the Funds on the basis of relative net assets of all Funds within the First American Fund complex. Class specific expenses, such as 12b-1 fees, are borne by that class. Income, other expenses, and realized and unrealized gains and losses of a Fund are allocated to each respective class in proportion to the relative net assets of each class.
INTERFUND LENDING PROGRAM – Pursuant to an exemptive order issued by the SEC, the Funds, along with other registered investment companies in the First American Family of Funds, may participate in an interfund lending program. This program provides an alternative credit facility allowing the Funds to borrow from, or lend money to, other participating Funds. The Funds did not have any interfund lending transactions during the fiscal year ended September 30, 2004.
FIRST AMERICAN FUNDS Annual Report 2004
132
DEFERRED COMPENSATION PLAN – Under a Deferred Compensation Plan (the "Plan"), non-interested directors of the First American Fund family may participate and elect to defer receipt of their annual compensation. Deferred amounts are treated as though equivalent dollar amounts had been invested in shares of selected open-end First American Funds as designated by the board of directors. All amounts in the Plan are 100% vested and accounts under the Plan are obligations of the Funds. Deferred amounts remain in the Funds until distributed in accordance with the Plan.
USE OF ESTIMATES IN PREPARATION OF FINANCIAL STATEMENTS – The preparation of financial statements, in conformity with U.S. generally accepted accounting principles, requires management to make estimates and assumptions that affect the reported amount of net assets and liabilities and disclosure of contingent assets and liabilities at the date of the financial statements and the reported results of operations during the reporting period. Actual results could differ from those estimates.
3 > Fees and Expenses
ADVISORY FEES – Pursuant to an investment advisory agreement (the "Agreement"), USBAM manages each Fund's assets and furnishes related office facilities, equipment, research, and personnel. The Agreement requires each Fund to pay USBAM a monthly fee based upon average daily net assets. The annual fee for each Fund is as follows:
| Real Estate Securities Fund | | | 0.70 | % | |
| Technology Fund | | | 0.70 | % | |
| International Fund | | | 1.10 | % | |
| Small Cap Growth Opportunities Fund | | | 1.40 | % | |
| Small Cap Select Fund | | | 0.70 | % | |
| Small Cap Value Fund | | | 0.70 | % | |
| Mid Cap Growth Opportunities Fund | | | 0.70 | % | |
| Mid Cap Value Fund | | | 0.70 | % | |
| Large Cap Growth Opportunities Fund | | | 0.65 | % | |
| Large Cap Select Fund | | | 0.65 | % | |
| Large Cap Value Fund | | | 0.65 | % | |
| Balanced Fund | | | 0.65 | % | |
| Equity Income Fund | | | 0.65 | % | |
Under the Agreement, the fee paid to USBAM by International Fund is equal to a rate of 1.10% of the average daily net assets up to $1.5 billion, 1.05% of the average daily net assets on the next $1 billion, and 1.00% of the average daily net assets in excess of $2.5 billion. The fees paid by Large Cap Growth Opportunities Fund, Large Cap Select Fund, Large Cap Value Fund, Balanced Fund, and Equity Income Fund are equal to an annual rate of 0.65% of the average daily net assets up to $3 billion, 0.625% of the average daily net assets on the next $2 billion, and 0.60% of the average daily net assets in excess of $5 billion. USBAM voluntarily waived fees during the fiscal year ended September 30, 2004 so that total fund operating expenses, as a percentage of average daily net assets, did not exceed the foll owing amounts:
| | | Share Class | |
| Fund | | A | | B | | C | | R* | | Y | |
| Real Estate Securities Fund | | | 1.23 | % | | | 1.98 | % | | | 1.98 | % | | | 1.48 | % | | | 0.98 | % | |
| Technology Fund | | | 1.23 | | | | 1.98 | | | | 1.98 | | | | NA | | | | 0.98 | | |
| International Fund | | | 1.60 | | | | 2.35 | | | | 2.35 | | | | 1.85 | | | | 1.35 | | |
Small Cap Growth
Opportunities Fund | | | 1.93 | | | | 2.68 | | | | 2.68 | | | | 2.18 | | | | 1.68 | | |
| Small Cap Select Fund | | | 1.21 | | | | 1.96 | | | | 1.96 | | | | 1.46 | | | | 0.96 | | |
| Small Cap Value Fund | | | 1.23 | | | | 1.98 | | | | 1.98 | | | | 1.48 | | | | 0.98 | | |
Mid Cap Growth
Opportunities Fund | | | 1.20 | | | | 1.95 | | | | 1.95 | | | | 1.45 | | | | 0.95 | | |
| Mid Cap Value Fund | | | 1.20 | | | | 1.95 | | | | 1.95 | | | | 1.45 | | | | 0.95 | | |
Large Cap Growth
Opportunities Fund | | | 1.15 | | | | 1.90 | | | | 1.90 | | | | 1.40 | | | | 0.90 | | |
| Large Cap Select Fund | | | 1.15 | | | | 1.90 | | | | 1.90 | | | | 1.40 | | | | 0.90 | | |
| Large Cap Value Fund | | | 1.15 | | | | 1.90 | | | | 1.90 | | | | 1.40 | | | | 0.90 | | |
| Balanced Fund | | | 1.05 | | | | 1.80 | | | | 1.80 | | | | 1.30 | | | | 0.80 | | |
| Equity Income Fund | | | 1.15 | | | | 1.90 | | | | 1.90 | | | | 1.40 | | | | 0.90 | | |
* Prior to July 1, 2004, Class R shares were designated Class S Shares, which had lower fees and expenses. During the period from October 1, 2003, to June 30, 2004, USBAM voluntarily waived fees for this class so that total operating expenses, as a percent of average daily net assets, did not exceed 1.23%, 1.23%, 1.60%, 1.93%, 1.21%, 1.23%, 1.20%, 1.20%, 1.15%, 1.15%, 1.15%, 1.05%, and 1.15% for Real Estate Securities Fund, Technology Fund, International Fund, Small Cap Growth Opportunities Fund, Small Cap Select Fund, Small Cap Value Fund, Mid Cap Growth Opportunties Fund, Mid Cap Value Fund, Large Cap Growth Opportunities Fund, Large Cap Select Fund, Large Cap Value Fund, Balanced Fund and Equity Income Fund, respectively.
NA = not applicable
The Funds may invest in related money market funds that are series of First American Funds, Inc. ("FAF"), subject to certain limitations. In order to avoid the payment of duplicative investment advisory fees to USBAM, which acts as the investment adviser to both the investing Funds and the related money market funds, USBAM will reimburse each investing Fund an amount equal to that portion of USBAM's investment advisory fee received from the related money market funds that is attributable to the assets of the investing Fund. For financial statement purposes, these reimbursements are recorded as investment income.
SUB-ADVISORY FEES – Clay Finlay, Inc. ("Clay Finlay") serves as investment sub-advisor to International Fund, pursuant to a Sub-Advisory Agreement with USBAM. For its services under the Sub-Advisory Agreement with USBAM, Clay Finlay is paid a monthly fee by USBAM calculated on
FIRST AMERICAN FUNDS Annual Report 2004
133
Notes to Financial Statements September 30, 2004
an annual basis equal to 0.25% of the first $500 million of the Fund's average daily net assets and 0.10% of the Fund's average daily net assets in excess of $500 million.
CO-ADMINISTRATION FEES – USBAM and U.S. Bancorp Fund Services, LLC ("USBFS") (collectively, the "Administrators") serve as the co-administrators pursuant to a co-administration agreement between the Administrators and the Funds. USBAM is a subsidiary of U.S. Bank National Association ("U.S. Bank"). Both U.S. Bank and USBFS are direct subsidiaries of U.S. Bancorp. Under the co-administration agreement, the Administrators are compensated to provide, or compensate other entities to provide, services to the Funds. These services include various legal, oversight and administrative services, accounting services, transfer agency and dividend disbursing services, and shareholder services. The Funds pay the Administrators at an annual rate, calculated daily and paid monthly, based on th e average daily net assets of all open-end mutual funds in the First American Family of Funds, equal to each Fund's pro rata share of an amount equal to 0.25% of the aggregate average daily net assets up to $8 billion, 0.235% of the next $17 billion of the aggregate average daily assets, 0.22% of the next $25 billion of the aggregate average daily net assets, and 0.20% of the aggregate average daily net assets in excess of $50 billion. FAIF pays transfer agent fees of $18,500 per share class and additional per account fees for transfer agent services. These fees are allocated to each Fund based upon the Fund's pro rata share of aggregate average daily net assets of the funds that comprise FAIF. For the fiscal year ended September 30, 2004, administration fees paid to USBAM and USBFS by the Funds included in this annual report were as follows (000):
| Fund | | Amount | |
| Real Estate Securities Fund | | $ | 986 | | |
| Technology Fund | | | 306 | | |
| International Fund | | | 3,302 | | |
| Small Cap Growth Opportunities Fund | | | 1,273 | | |
| Small Cap Select Fund | | | 2,877 | | |
| Small Cap Value Fund | | | 1,244 | | |
| Mid Cap Growth Opportunities Fund | | | 3,774 | | |
| Mid Cap Value Fund | | | 1,138 | | |
| Large Cap Growth Opportunities Fund | | | 3,583 | | |
| Large Cap Select Fund | | | 605 | | |
| Large Cap Value Fund | | | 3,059 | | |
| Balanced Fund | | | 1,321 | | |
| Equity Income Fund | | | 4,311 | | |
CUSTODIAN FEES – U.S. Bank serves as the Funds' custodian pursuant to a custodian agreement with FAIF. The fee for each Fund is equal to an annual rate of 0.01% of average daily net assets. These fees are computed daily and paid monthly.
DISTRIBUTION AND SHAREHOLDER SERVICING FEES – Quasar Distributors LLC ("Quasar"), a subsidiary of U.S. Bancorp, serves as distributor of the Funds pursuant to a distribution agreement with FAIF. Under the distribution agreement, each Fund pays Quasar a monthly distribution and/or shareholder servicing fee equal to an annual rate of 0.25%, 1.00%, 1.00% and 0.50% of each Fund's average daily net assets of the Class A shares, Class B shares, Class C shares and Class R shares, respectively. No distribution or shareholder servicing fees are paid by Class Y shares. These fees may be used by Quasar to provide compensation for sales support, distribution activities, or shareholder servicing activities.
FAIF has also adopted and entered into a shareholder servicing plan and agreement with USBAM with respect to the Class R shares. Each Fund, except Technology Fund, pays USBAM a monthly shareholder servicing fee equal to an annual rate of 0.15% of the average daily net assets of the Fund's Class R shares. USBAM is currently waiving all fees under this plan and agreement. This waiver may be discontinued at any time.
Under these distribution and shareholder servicing agreements, the following amounts were retained by Quasar and USBAM or paid to affiliates of USBAM for the fiscal year ended September 30, 2004 (000):
| Fund | | Amount | |
| Real Estate Securities Fund | | $ | 136 | | |
| Technology Fund | | | 107 | | |
| International Fund | | | 143 | | |
| Small Cap Growth Opportunities Fund | | | 218 | | |
| Small Cap Select Fund | | | 313 | | |
| Small Cap Value Fund | | | 129 | | |
| Mid Cap Growth Opportunities Fund | | | 471 | | |
| Mid Cap Value Fund | | | 75 | | |
| Large Cap Growth Opportunities Fund | | | 384 | | |
| Large Cap Select Fund | | | 2 | | |
| Large Cap Value Fund | | | 315 | | |
| Balanced Fund | | | 406 | | |
| Equity Income Fund | | | 593 | | |
OTHER FEES – In addition to the investment advisory fees, custodian fees, distribution and shareholder servicing fees, and co-administration fees, each Fund is responsible for paying most other operating expenses including fees and expenses of independent directors, registration fees, printing of shareholder reports, legal, auditing, insurance and other miscellaneous expenses. For the fiscal year ended September 30, 2004, legal fees and expenses were paid to a law firm of which the Secretary and two Assistant Secretaries of the Funds were partners.
FIRST AMERICAN FUNDS Annual Report 2004
134
SALES CHARGES – A contingent deferred sales charge ("CDSC") is imposed on redemptions made in the Class B shares. The CDSC varies depending on the number of years from time of payment for the purchase of Class B shares until the redemption of such shares. Class B shares automatically convert to Class A shares after eight years.
Year Since Purchase | | CDSC as a
Percentage of Dollar
Amount Subject to Charge | |
| First | | | 5.00 | % | |
| Second | | | 5.00 | % | |
| Third | | | 4.00 | % | |
| Fourth | | | 3.00 | % | |
| Fifth | | | 2.00 | % | |
| Sixth | | | 1.00 | % | |
| Seventh | | | - | | |
| Eighth | | | - | | |
A CDSC of 1.00% is imposed on redemptions made in Class C shares for the first twelve months.
The CDSC for Class B shares and Class C shares is imposed on the value of the purchased shares or the value at the time of redemption, whichever is less.
For the fiscal year ended September 30, 2004, total sales charges retained by affiliates of USBAM for distributing the Funds' shares were as follows (000):
| Fund | | Amount | |
| Real Estate Securities Fund | | $ | 211 | | |
| Technology Fund | | | 48 | | |
| International Fund | | | 88 | | |
| Small Cap Growth Opportunities Fund | | | 600 | | |
| Small Cap Select Fund | | | 206 | | |
| Small Cap Value Fund | | | 122 | | |
| Mid Cap Growth Opportunities Fund | | | 325 | | |
| Mid Cap Value Fund | | | 113 | | |
| Large Cap Growth Opportunities Fund | | | 222 | | |
| Large Cap Select Fund | | | 27 | | |
| Large Cap Value Fund | | | 113 | | |
| Balanced Fund | | | 227 | | |
| Equity Income Fund | | | 880 | | |
4 > Capital Share Transactions
FAIF has 420 billion shares of $0.0001 par value capital stock authorized. Capital share transactions for the Funds were as follows (000):
| | | Real Estate
Securities Fund | | Technology
Fund | | International
Fund | |
| | | 10/01/03
to
9/30/04 | | 10/01/02
to
9/30/03 | | 10/01/03
to
9/30/04 | | 10/01/02
to
9/30/03 | | 10/01/03
to
9/30/04 | | 10/01/02
to
9/30/03 | |
| Class A: | |
| Shares issued | | | 2,885 | | | | 1,923 | | | | 2,255 | | | | 1,908 | | | | 1,986 | | | | 20,293 | | |
| Shares issued in lieu of cash distributions | | | 192 | | | | 106 | | | | - | | | | - | | | | 20 | | | | - | | |
| Shares redeemed | | | (640 | ) | | | (921 | ) | | | (2,520 | ) | | | (2,202 | ) | | | (1,969 | ) | | | (21,356 | ) | |
Shares issued in connection with acquisition of Fund
net assets | | | - | | | | - | | | | - | | | | - | | | | - | | | | 347 | | |
| Total Class A transactions | | | 2,437 | | | | 1,108 | | | | (265 | ) | | | (294 | ) | | | 37 | | | | (716 | ) | |
| Class B: | |
| Shares issued | | | 64 | | | | 77 | | | | 123 | | | | 293 | | | | 64 | | | | 73 | | |
| Shares issued in lieu of cash distributions | | | 14 | | | | 12 | | | | - | | | | - | | | | 1 | | | | - | | |
| Shares redeemed | | | (63 | ) | | | (54 | ) | | | (616 | ) | | | (647 | ) | | | (234 | ) | | | (249 | ) | |
Shares issued in connection with acquisition of Fund
net assets | | | - | | | | - | | | | - | | | | - | | | | - | | | | 39 | | |
| Total Class B transactions | | | 15 | | | | 35 | | | | (493 | ) | | | (354 | ) | | | (169 | ) | | | (137 | ) | |
| Class C: | |
| Shares issued | | | 104 | | | | 154 | | | | 119 | | | | 223 | | | | 87 | | | | 262 | | |
| Shares issued in lieu of cash distributions | | | 14 | | | | 8 | | | | - | | | | - | | | | 1 | | | | - | | |
| Shares redeemed | | | (91 | ) | | | (32 | ) | | | (308 | ) | | | (398 | ) | | | (422 | ) | | | (630 | ) | |
Shares issued in connection with acquisition of Fund
net assets | | | - | | | | - | | | | - | | | | - | | | | - | | | | 22 | | |
| Total Class C transactions | | | 27 | | | | 130 | | | | (189 | ) | | | (175 | ) | | | (334 | ) | | | (346 | ) | |
| Class R: | |
| Shares issued | | | 75 | | | | 195 | | | | 138 | | | | 459 | | | | 135 | | | | 532 | | |
| Shares issued in lieu of cash distributions | | | 8 | | | | 8 | | | | - | | | | - | | | | 4 | | | | - | | |
| Shares redeemed | | | (241 | ) | | | (134 | ) | | | (697 | ) | | | (330 | ) | | | (1,090 | ) | | | (1,066 | ) | |
Shares issued in connection with acquisition of Fund
net assets | | | - | | | | - | | | | - | | | | - | | | | - | | | | 6 | | |
| Total Class R transactions | | | (158 | ) | | | 69 | | | | (559 | ) | | | 129 | | | | (951 | ) | | | (528 | ) | |
| Class Y: | |
| Shares issued | | | 13,274 | | | | 5,372 | | | | 3,912 | | | | 5,455 | | | | 31,294 | | | | 60,261 | | |
| Shares issued in lieu of cash distributions | | | 499 | | | | 224 | | | | - | | | | - | | | | 526 | | | | - | | |
| Shares redeemed | | | (3,750 | ) | | | (2,207 | ) | | | (6,414 | ) | | | (7,227 | ) | | | (29,700 | ) | | | (30,752 | ) | |
Shares issued in connection with acquisition of Fund
net assets | | | - | | | | - | | | | - | | | | - | | | | - | | | | 6,391 | | |
| Total Class Y transactions | | | 10,023 | | | | 3,389 | | | | (2,502 | ) | | | (1,772 | ) | | | 2,120 | | | | 35,900 | | |
| Net increase (decrease) in capital shares | | | 12,344 | | | | 4,731 | | | | (4,008 | ) | | | (2,466 | ) | | | 703 | | | | 34,173 | | |
FIRST AMERICAN FUNDS Annual Report 2004
135
Notes to Financial Statements September 30, 2004
| | | Small Cap Growth
Opportunities Fund | | Small Cap
Select Fund | | Small Cap
Value Fund | |
| | | 10/01/03
to
9/30/04 | | 10/01/02
to
9/30/03 | | 10/01/03
to
9/30/04 | | 10/01/02
to
9/30/03 | | 10/01/03
to
9/30/04 | | 10/01/02
to
9/30/03 | |
| Class A: | |
| Shares issued | | | 3,228 | | | | 2,921 | | | | 2,909 | | | | 1,232 | | | | 1,192 | | | | 522 | | |
| Shares issued in lieu of cash distributions | | | 25 | | | | - | | | | 352 | | | | - | | | | 100 | | | | 1 | | |
| Shares redeemed | | | (2,342 | ) | | | (2,420 | ) | | | (2,193 | ) | | | (1,222 | ) | | | (997 | ) | | | (668 | ) | |
Shares issued in connection with acquisition of Fund
net assets | | | - | | | | - | | | | - | | | | 1,906 | | | | - | | | | - | | |
| Total Class A transactions | | | 911 | | | | 501 | | | | 1,068 | | | | 1,916 | | | | 295 | | | | (145 | ) | |
| Class B: | |
| Shares issued | | | 251 | | | | 85 | | | | 146 | | | | 158 | | | | 77 | | | | 81 | | |
| Shares issued in lieu of cash distributions | | | 2 | | | | - | | | | 65 | | | | - | | | | 34 | | | | - | | |
| Shares redeemed | | | (121 | ) | | | (61 | ) | | | (174 | ) | | | (118 | ) | | | (413 | ) | | | (269 | ) | |
Shares issued in connection with acquisition of Fund
net assets | | | - | | | | - | | | | - | | | | 357 | | | | - | | | | - | | |
| Total Class B transactions | | | 132 | | | | 24 | | | | 37 | | | | 397 | | | | (302 | ) | | | (188 | ) | |
| Class C: | |
| Shares issued | | | 191 | | | | 64 | | | | 251 | | | | 272 | | | | 77 | | | | 73 | | |
| Shares issued in lieu of cash distributions | | | - | | | | - | | | | 56 | | | | - | | | | 13 | | | | - | | |
| Shares redeemed | | | (43 | ) | | | (12 | ) | | | (197 | ) | | | (154 | ) | | | (120 | ) | | | (202 | ) | |
Shares issued in connection with acquisition of Fund
net assets | | | - | | | | - | | | | - | | | | 367 | | | | - | | | | - | | |
| Total Class C transactions | | | 148 | | | | 52 | | | | 110 | | | | 485 | | | | (30 | ) | | | (129 | ) | |
| Class R: | |
| Shares issued | | | 39 | | | | 69 | | | | 208 | | | | 447 | | | | 72 | | | | 68 | | |
| Shares issued in lieu of cash distributions | | | 1 | | | | - | | | | 55 | | | | - | | | | 3 | | | | - | | |
| Shares redeemed | | | (208 | ) | | | (47 | ) | | | (1,065 | ) | | | (407 | ) | | | (170 | ) | | | (11 | ) | |
Shares issued in connection with acquisition of Fund
net assets | | | - | | | | - | | | | - | | | | 46 | | | | - | | | | - | | |
| Total Class R transactions | | | (168 | ) | | | 22 | | | | (802 | ) | | | 86 | | | | (95 | ) | | | 57 | | |
| Class Y: | |
| Shares issued | | | 4,004 | | | | 6,194 | | | | 8,030 | | | | 19,375 | | | | 3,675 | | | | 5,082 | | |
| Shares issued in lieu of cash distributions | | | 79 | | | | - | | | | 3,768 | | | | - | | | | 1,045 | | | | 40 | | |
| Shares redeemed | | | (10,975 | ) | | | (3,929 | ) | | | (33,562 | ) | | | (14,243 | ) | | | (12,846 | ) | | | (7,783 | ) | |
Shares issued in connection with acquisition of Fund
net assets | | | - | | | | - | | | | - | | | | 16,348 | | | | - | | | | - | | |
Shares issued in connection with acquisition of
Common Trust Fund net assets | | | - | | | | - | | | | - | | | | 10,235 | | | | - | | | | - | | |
| Total Class Y transactions | | | (6,892 | ) | | | 2,265 | | | | (21,764 | ) | | | 31,715 | | | | (8,126 | ) | | | (2,661 | ) | |
| Net increase (decrease) in capital shares | | | (5,869 | ) | | | 2,864 | | | | (21,351 | ) | | | 34,599 | | | | (8,258 | ) | | | (3,066 | ) | |
FIRST AMERICAN FUNDS Annual Report 2004
136
| | | Mid Cap Growth
Opportunities
Fund | | Mid Cap
Value Fund | | Large Cap Growth
Opportunities
Fund | |
| | | 10/01/03
to
9/30/04 | | 10/01/02
to
9/30/03 | | 10/01/03
to
9/30/04 | | 10/01/02
to
9/30/03 | | 10/01/03
to
9/30/04 | | 10/01/02
to
9/30/03 | |
| Class A: | |
| Shares issued | | | 778 | | | | 503 | | | | 682 | | | | 261 | | | | 1,608 | | | | 676 | | |
| Shares issued in lieu of cash distributions | | | 135 | | | | - | | | | 4 | | | | 8 | | | | 2 | | | | 3 | | |
| Shares redeemed | | | (959 | ) | | | (737 | ) | | | (282 | ) | | | (236 | ) | | | (1,201 | ) | | | (787 | ) | |
Shares issued in connection with acquisition of Fund
net assets | | | - | | | | 1,985 | | | | - | | | | - | | | | - | | | | 2,908 | | |
| Total Class A transactions | | | (46 | ) | | | 1,751 | | | | 404 | | | | 33 | | | | 409 | | | | 2,800 | | |
| Class B: | |
| Shares issued | | | 65 | | | | 56 | | | | 57 | | | | 49 | | | | 89 | | | | 50 | | |
| Shares issued in lieu of cash distributions | | | 9 | | | | - | | | | - | | | | 3 | | | | - | | | | - | | |
| Shares redeemed | | | (51 | ) | | | (36 | ) | | | (188 | ) | | | (215 | ) | | | (735 | ) | | | (317 | ) | |
Shares issued in connection with acquisition of Fund
net assets | | | - | | | | 95 | | | | - | | | | - | | | | - | | | | 1,823 | | |
| Total Class B transactions | | | 23 | | | | 115 | | | | (131 | ) | | | (163 | ) | | | (646 | ) | | | 1,556 | | |
| Class C: | |
| Shares issued | | | 48 | | | | 323 | | | | 64 | | | | 26 | | | | 57 | | | | 166 | | |
| Shares issued in lieu of cash distributions | | | 11 | | | | - | | | | - | | | | 1 | | | | - | | | | - | | |
| Shares redeemed | | | (110 | ) | | | (113 | ) | | | (76 | ) | | | (89 | ) | | | (216 | ) | | | (127 | ) | |
Shares issued in connection with acquisition of Fund
net assets | | | - | | | | 128 | | | | - | | | | - | | | | - | | | | 618 | | |
| Total Class C transactions | | | (51 | ) | | | 338 | | | | (12 | ) | | | (62 | ) | | | (159 | ) | | | 657 | | |
| Class R: | |
| Shares issued | | | 27 | | | | 239 | | | | 41 | | | | 69 | | | | 72 | | | | 280 | | |
| Shares issued in lieu of cash distributions | | | 8 | | | | - | | | | - | | | | - | | | | - | | | | 1 | | |
| Shares redeemed | | | (341 | ) | | | (162 | ) | | | (100 | ) | | | (22 | ) | | | (767 | ) | | | (170 | ) | |
Shares issued in connection with acquisition of Fund
net assets | | | - | | | | 7 | | | | - | | | | - | | | | - | | | | 460 | | |
| Total Class R transactions | | | (306 | ) | | | 84 | | | | (59 | ) | | | 47 | | | | (695 | ) | | | 571 | | |
| Class Y: | |
| Shares issued | | | 3,700 | | | | 9,998 | | | | 5,379 | | | | 6,010 | | | | 12,178 | | | | 13,440 | | |
| Shares issued in lieu of cash distributions | | | 810 | | | | - | | | | 77 | | | | 139 | | | | 29 | | | | 46 | | |
| Shares redeemed | | | (8,163 | ) | | | (8,534 | ) | | | (4,252 | ) | | | (5,344 | ) | | | (11,718 | ) | | | (14,585 | ) | |
Shares issued in connection with acquisition of Fund
net assets | | | - | | | | 5,734 | | | | - | | | | - | | | | - | | | | 21,251 | | |
Shares issued in connection with acquisition of
Common Trust Fund net assets | | | - | | | | 8,454 | | | | - | | | | - | | | | - | | | | 12,677 | | |
| Total Class Y transactions | | | (3,653 | ) | | | 15,652 | | | | 1,204 | | | | 805 | | | | 489 | | | | 32,829 | | |
| Net increase (decrease) in capital shares | | | (4,033 | ) | | | 17,940 | | | | 1,406 | | | | 660 | | | | (602 | ) | | | 38,413 | | |
FIRST AMERICAN FUNDS Annual Report 2004
137
Notes to Financial Statements September 30, 2004
| | | Large Cap
Select Fund | | Large Cap
Value Fund | | Balanced
Fund | |
| | | 10/01/03
to
9/30/04 | | 1/31/03 (1)
to
9/30/03 | | 10/01/03
to
9/30/04 | | 10/01/02
to
9/30/03 | | 10/01/03
to
9/30/04 | | 10/01/02
to
9/30/03 | |
| Class A: | |
| Shares issued | | | 78 | | | | 19 | | | | 2,249 | | | | 885 | | | | 3,334 | | | | 729 | | |
| Shares issued in lieu of cash distributions | | | - | | | | - | | | | 53 | | | | 75 | | | | 148 | | | | 183 | | |
| Shares redeemed | | | (40 | ) | | | - | | | | (1,580 | ) | | | (1,747 | ) | | | (2,038 | ) | | | (2,326 | ) | |
| Total Class A transactions | | | 38 | | | | 19 | | | | 722 | | | | (787 | ) | | | 1,444 | | | | (1,414 | ) | |
| Class B: | |
| Shares issued | | | 17 | | | | 10 | | | | 55 | | | | 81 | | | | 159 | | | | 206 | | |
| Shares issued in lieu of cash distributions | | | - | | | | - | | | | 6 | | | | 14 | | | | 22 | | | | 37 | | |
| Shares redeemed | | | (5 | ) | | | - | | | | (876 | ) | | | (672 | ) | | | (892 | ) | | | (1,015 | ) | |
| Total Class B transactions | | | 12 | | | | 10 | | | | (815 | ) | | | (577 | ) | | | (711 | ) | | | (772 | ) | |
| Class C: | |
| Shares issued | | | 4 | | | | 3 | | | | 49 | | | | 80 | | | | 85 | | | | 798 | | |
| Shares issued in lieu of cash distributions | | | - | | | | - | | | | 2 | | | | 3 | | | | 4 | | | | 8 | | |
| Shares redeemed | | | (1 | ) | | | (1 | ) | | | (139 | ) | | | (216 | ) | | | (256 | ) | | | (322 | ) | |
| Total Class C transactions | | | 3 | | | | 2 | | | | (88 | ) | | | (133 | ) | | | (167 | ) | | | 484 | | |
| Class R: | |
| Shares issued | | | - | | | | - | | | | 160 | | | | 529 | | | | 345 | | | | 1,256 | | |
| Shares issued in lieu of cash distributions | | | - | | | | - | | | | 7 | | | | 23 | | | | 23 | | | | 56 | | |
| Shares redeemed | | | - | | | | - | | | | (1,761 | ) | | | (848 | ) | | | (2,881 | ) | | | (3,113 | ) | |
| Total Class R transactions | | | - | | | | - | | | | (1,594 | ) | | | (296 | ) | | | (2,513 | ) | | | (1,801 | ) | |
| Class Y: | |
| Shares issued | | | 13,492 | | | | 11,138 | | | | 12,949 | | | | 10,622 | | | | 6,123 | | | | 15,854 | | |
| Shares issued in lieu of cash distributions | | | 191 | | | | 12 | | | | 471 | | | | 626 | | | | 529 | | | | 750 | | |
| Shares redeemed | | | (1,430 | ) | | | (110 | ) | | | (12,532 | ) | | | (17,421 | ) | | | (16,991 | ) | | | (12,921 | ) | |
| Total Class Y transactions | | | 12,253 | | | | 11,040 | | | | 888 | | | | (6,173 | ) | | | (10,339 | ) | | | 3,683 | | |
| Net increase (decrease) in capital shares | | | 12,306 | | | | 11,071 | | | | (887 | ) | | | (7,966 | ) | | | (12,286 | ) | | | 180 | | |
(1) Commencement of operations
| | | Equity
Income Fund | |
| | | 10/01/03
to
9/30/04 | | 10/01/02
to
9/30/03 | |
| Class A: | |
| Shares issued | | | 4,209 | | | | 1,778 | | |
| Shares issued in lieu of cash distributions | | | 200 | | | | 07 | | |
| Shares redeemed | | | (2,448 | ) | | | (2,888 | ) | |
| Total Class A transactions | | | 1,961 | | | | (903 | ) | |
| Class B: | |
| Shares issued | | | 396 | | | | 390 | | |
| Shares issued in lieu of cash distributions | | | 17 | | | | 18 | | |
| Shares redeemed | | | (459 | ) | | | (444 | ) | |
| Total Class B transactions | | | (46 | ) | | | (36 | ) | |
| Class C: | |
| Shares issued | | | 221 | | | | 935 | | |
| Shares issued in lieu of cash distributions | | | 14 | | | | 18 | | |
| Shares redeemed | | | (401 | ) | | | (439 | ) | |
| Total Class C transactions | | | (166 | ) | | | 514 | | |
| Class R: | |
| Shares issued | | | 185 | | | | 1,108 | | |
| Shares issued in lieu of cash distributions | | | 15 | | | | 36 | | |
| Shares redeemed | | | (1,685 | ) | | | (3,475 | ) | |
| Total Class R transactions | | | (1,485 | ) | | | (2,331 | ) | |
| Class Y: | |
| Shares issued | | | 23,673 | | | | 36,512 | | |
| Shares issued in lieu of cash distributions | | | 718 | | | | 790 | | |
| Shares redeemed | | | (25,006 | ) | | | (21,995 | ) | |
Shares issued in connection with acquisition of
Common Trust Fund net assets | | | - | | | | 24,188 | | |
| Total Class Y transactions | | | (615 | ) | | | 39,495 | | |
| Net increase (decrease) in capital shares | | | (351 | ) | | | 36,739 | | |
FIRST AMERICAN FUNDS Annual Report 2004
138
5 > Investment Security Transactions
During the fiscal year ended September 30, 2004, purchases of securities and proceeds from sales of securities, other than temporary investments in short-term securities, were as follows (000):
| | | U.S. Government
Securities | | Other Investment
Securities | |
| Fund | | Purchases | | Sales | | Purchases | | Sales | |
| Real Estate Securities Fund | | $ | - | | | $ | - | | | $ | 663,195 | | | $ | 460,692 | | |
| Technology Fund | | | - | | | | - | | | | 56,904 | | | | 90,991 | | |
| International Fund | | | - | | | | - | | | | 928,935 | | | | 926,516 | | |
Small Cap Growth
Opportunities Fund | | | - | | | | - | | | | 811,660 | | | | 962,005 | | |
| Small Cap Select Fund | | | - | | | | - | | | | 1,231,138 | | | | 1,679,899 | | |
| Small Cap Value Fund | | | - | | | | - | | | | 158,718 | | | | 306,596 | | |
Mid Cap Growth
Opportunities Fund | | | - | | | | - | | | | 1,884,114 | | | | 2,138,692 | | |
| Mid Cap Value Fund | | | - | | | | - | | | | 370,355 | | | | 352,740 | | |
Large Cap Growth
Opportunities Fund | | | - | | | | - | | | | 1,509,580 | | | | 1,537,319 | | |
| Large Cap Select Fund | | | - | | | | - | | | | 285,237 | | | | 141,382 | | |
| Large Cap Value Fund | | | - | | | | - | | | | 1,193,393 | | | | 1,230,048 | | |
| Balanced Fund | | | 164,864 | | | | 226,043 | | | | 369,010 | | | | 426,246 | | |
| Equity Income Fund | | | - | | | | - | | | | 235,940 | | | | 167,637 | | |
The aggregate gross unrealized appreciation and depreciation of securities held by the Funds and the total cost of securities (including cost of securities purchased with proceeds from securities lending) for federal tax purposes at September 30, 2004, were as follows (000):
| Fund | | Aggregate
Gross
Appreciation | | Aggregate
Gross
Depreciation | |
Net | | Federal
Income
Tax Cost | |
| Real Estate Securities | | $ | 69,086 | | | $ | (2,441 | ) | | $ | 66,645 | | | $ | 564,595 | | |
| Technology | | | 12,497 | | | | (11,948 | ) | | | 549 | | | | 133,637 | | |
| International | | | 178,607 | | | | (46,259 | ) | | | 132,348 | | | | 1,043,371 | | |
Small Cap Growth
Opportunities | | | 28,746 | | | | (21,111 | ) | | | 7,635 | | | | 469,586 | | |
| Small Cap Select | | | 161,621 | | | | (30,901 | ) | | | 130,720 | | | | 1,109,047 | | |
| Small Cap Value | | | 122,471 | | | | (13,854 | ) | | | 108,617 | | | | 461,112 | | |
Mid Cap Growth
Opportunities | | | 200,888 | | | | (50,587 | ) | | | 150,301 | | | | 1,858,672 | | |
| Mid Cap Value | | | 85,488 | | | | (5,518 | ) | | | 79,970 | | | | 589,829 | | |
Large Cap Growth
Opportunities | | | 160,366 | | | | (66,718 | ) | | | 93,648 | | | | 1,826,245 | | |
| Large Cap Select | | | 22,256 | | | | (10,236 | ) | | | 12,020 | | | | 389,180 | | |
| Large Cap Value | | | 146,529 | | | | (25,320 | ) | | | 121,209 | | | | 1,427,639 | | |
| Balanced | | | 39,715 | | | | (13,601 | ) | | | 26,114 | | | | 568,133 | | |
| Equity Income | | | 307,479 | | | | (58,054 | ) | | | 249,425 | | | | 1,796,735 | | |
The difference between cost for financial statement purposes and federal tax purposes is primarily due to losses deferred from wash sales, investments in limited partnerships and REITs, the amount of gain (loss) recognized for tax purposes due to mark to market adjustments on open futures contracts and the mark to market of certain Passive Foreign Investments Companies (PFICs) for tax purposes.
6 > Options Written
Transactions in options written for the fiscal year ended September 30, 2004, were as follows:
| | | Number of
Contracts | | Premium
Amount (000) | |
| Put Options Written | |
| Balanced Fund: | |
| Balance at September 30, 2003 | | | 250 | | | $ | 15 | | |
| Opened | | | 3,545 | | | | 118 | | |
| Expired | | | (1,090 | ) | | | (67 | ) | |
| Exercised | | | - | | | | - | | |
| Closed | | | (2,705 | ) | | | (66 | ) | |
| Balance at September 30, 2004 | | | - | | | $ | - | | |
| Call Options Written | |
| Technology Fund: | |
| Balance at September 30, 2003 | | | 2,882 | | | $ | 511 | | |
| Opened | | | - | | | | - | | |
| Expired | | | (1,877 | ) | | | (278 | ) | |
| Exercised | | | (529 | ) | | | (79 | ) | |
| Closed | | | (476 | ) | | | (154 | ) | |
| Balance at September 30, 2004 | | | - | | | $ | - | | |
| Balanced Fund: | |
| Balance at September 30, 2003 | | | 500 | | | $ | 31 | | |
| Opened | | | 890 | | | | 51 | | |
| Expired | | | (640 | ) | | | (36 | ) | |
| Exercised | | | - | | | | - | | |
| Closed | | | (750 | ) | | | (46 | ) | |
| Balance at September 30, 2004 | | | - | | | $ | - | | |
7 > Concentration of Risks
Portfolios that primarily invest in a particular sector may experience greater volatility than portfolios investing in a broad range of industry sectors. The Real Estate Securities Fund primarily invests in income-producing common stocks of publicly traded companies engaged in the real estate industry. The real estate industry has been subject to substantial fluctuations and declines on a local, regional and national basis in the past and may continue to in the future. The Technology Fund primarily invests in equity securities of companies in the technology industry. Competitive pressures may have a significant effect on the financial condition of companies in this industry. For example, if technology continues to advance at an accelerated rate and the number of companies and product offerings continues to expand, these companies could become increasingly sensitive to short product cycles and a ggressive pricing. As of September 30, 2004 the Large Cap Growth Opportunities Fund, Mid Cap Growth Opportunities Fund, and Small Cap Growth Opportunities Fund each had a significant portion of their assets invested in the information technology sector, which could be more sensitive to short product cycles and aggressive pricing than the technology industry as a whole. During the same period, Small Cap Growth Opportunities Fund also had a significant portion of its assets invested in the healthcare sector. The healthcare sector may be more greatly impacted by the performance of the overall economy, interest rates, competition, consumer confidence and spending, and changes in demographics and
FIRST AMERICAN FUNDS Annual Report 2004
139
Notes to Financial Statements September 30, 2004
consumer tastes. During the same period, the Small Cap Value Fund, Mid Cap Value Fund, Large Cap Value Fund, and Equity Income Fund also had a significant portion of their assets invested in the financials sector. The financials sector may be more greatly impacted by the performance of the overall economy, interest rates, competition and consumer confidence and spending.
8 > Payment Made by Affiliate
In 2003, the International Fund received a reimbursement from USBAM related to foreign currency principal trades between the International Fund and U.S. Bank from April 1994 to September 2001, which were in violation of the Investment Company Act of 1940. The amount of the reimbursement was $621,143 or $0.005 per share based upon the shares outstanding as of September 30, 2003.
9 > Fund Mergers
On March 13, 2003, shareholders of Health Sciences Fund and Large Cap Growth Fund, Mid Cap Growth Fund, Emerging Markets Fund, and Small Cap Growth Fund approved the Agreement and Plan of Reorganization recommended by the board of directors, providing for the merger into Large Cap Growth Opportunities Fund, Mid Cap Growth Opportunities Fund, International Fund, and Small Cap Select Fund, respectively, at the close of business March 14, 2003. The following table illustrates the specifics of the mergers (000):
| Acquired Fund | | Acquiring Fund | | Acquired
Funds Net
Assets | | Shares Issued to
Shareholders of
Acquired Fund | |
Acquiring Fund
Net Assets | |
Continued
Net Assets | |
Tax Status
of Transfer | |
| First American Health Sciences Fund | | First American Large Cap Growth
Opportunities Fund (1) | | $ | 15,899 | (2) | | | | | | $ | 548,575 | | | $ | 1,077,544 | | | Non-taxable | |
| Class A | | Class A | | | | | | | 240 | | | | | | | | | | | | |
| Class B | | Class B | | | | | | | 138 | | | | | | | | | | | | |
| Class C | | Class C | | | | | | | 139 | | | | | | | | | | | | |
| Class S | | Class S | | | | | | | 5 | | | | | | | | | | | | |
| Class Y | | Class Y | | | | | | | 300 | | | | | | | | | | | | |
| First American Large Cap Growth Fund | | | | | 513,070 | (3) | | | | | | | | | | | | | | | |
| Class A | | Class A | | | | | | | 2,668 | | | | | | | | | | | | |
| Class B | | Class B | | | | | | | 1,685 | | | | | | | | | | | | |
| Class C | | Class C | | | | | | | 479 | | | | | | | | | | | | |
| Class S | | Class S | | | | | | | 455 | | | | | | | | | | | | |
| Class Y | | Class Y | | | | | | | 20,951 | | | | | | | | | | | | |
| First American Mid Cap Growth Fund | | First American Mid Cap Growth
Opportunities Fund (1) | | | 218,741 | (4) | | | | | | | 895,749 | | | | 1,114,490 | | | Non-taxable | |
| Class A | | Class A | | | | | | | 1,985 | | | | | | | | | | | | |
| Class B | | Class B | | | | | | | 95 | | | | | | | | | | | | |
| Class C | | Class C | | | | | | | 128 | | | | | | | | | | | | |
| Class S | | Class S | | | | | | | 7 | | | | | | | | | | | | |
| Class Y | | Class Y | | | | | | | 5,734 | | | | | | | | | | | | |
| First American Emerging Markets Fund | | First American International Fund (1) | | | 49,553 | (5) | | | | | | | 725,636 | | | | 775,189 | | | Non-taxable | |
| Class A | | Class A | | | | | | | 347 | | | | | | | | | | | | |
| Class B | | Class B | | | | | | | 39 | | | | | | | | | | | | |
| Class C | | Class C | | | | | | | 22 | | | | | | | | | | | | |
| Class S | | Class S | | | | | | | 6 | | | | | | | | | | | | |
| Class Y | | Class Y | | | | | | | 6,391 | | | | | | | | | | | | |
| First American Small Cap Growth Fund | | First American Small Cap Select Fund (1) | | | 210,865 | (6) | | | | | | | 656,515 | | | | 867,380 | | | Non-taxable | |
| Class A | | Class A | | | | | | | 1,906 | | | | | | | | | | | | |
| Class B | | Class B | | | | | | | 357 | | | | | | | | | | | | |
| Class C | | Class C | | | | | | | 367 | | | | | | | | | | | | |
| Class S | | Class S | | | | | | | 46 | | | | | | | | | | | | |
| Class Y | | Class Y | | | | | | | 16,348 | | | | | | | | | | | | |
(1) Accounting survivor.
(2) Includes capital loss carryover and tax losses deferred due to wash sales of $3,407, and unrealized depreciation of $2,164.
(3) Includes capital loss carryover and tax losses deferred due to wash sales of $302,762, and unrealized depreciation of $94,007.
(4) Includes capital loss carryover and tax losses deferred due to wash sales of $230,571, and unrealized depreciation of $12,121.
(5) Includes capital loss carryover and tax losses deferred due to wash sales of $14,472, and unrealized appreciation of $4,334.
(6) Includes capital loss carryover and tax losses deferred due to wash sales of $174,110, and unrealized depreciation of $18,040.
FIRST AMERICAN FUNDS Annual Report 2004
140
On November 22, 2002, the Equity Income Fund and Small Cap Select Fund acquired substantially all of the assets of the Growth & Income and Emerging Growth Common Trust Funds (sponsored by U.S. Bank), respectively, in exchange for Class Y shares of the respective First American Funds. The following table illustrates the specifics of the mergers (000):
| Acquired Fund | | Acquiring Fund | | Acquired
Fund's Net
Assets | | Shares Issued to
Shareholders of
Acquired Fund | |
Acquiring Fund
Net Assets | |
Combined
Net Assets | |
Tax Status
of Transfer | |
| Growth & Income Common Trust Fund | | First American Equity Income Fund (1) | | | | | | | | | | | |
| Class Y | | Class Y | | $ | 259,049 | (2) | | | 24,188 | | | $ | 1,088,937 | | | $ | 1,347,986 | | | Non-taxable | |
| Emerging Growth C | | First American Small Cap | | | | | | | | | | | |
| Common Trust Fund | | Select Fund (1) | | | | | | | | | | | |
| Class Y | | Class Y | | | 129,674 | (3) | | | 10,235 | | | | 604,122 | | | | 733,796 | | | Non-taxable | |
(1) Accounting survivor.
(2) Includes unrealized depreciation of $7,163.
(3) Includes unrealized appreciation of $3,452.
On October 25, 2002, the Large Cap Growth Opportunities, Mid Cap Growth Opportunities, and Large Cap Growth Opportunities Fund acquired substantially all of the assets of the Equity Growth A, Special Equity Growth B and Common Stock (KS) Common Trust Funds (sponsored by U.S. Bank), respectively, in exchange for Class Y shares of the respective First American Funds. The following table illustrates the specifics of the mergers (000):
| Acquired Fund | | Acquiring Fund | | Acquired
Fund's Net
Assets | | Shares Issued to
Shareholders of
Acquired Fund | |
Acquiring Fund
Net Assets | |
Combined
Net Assets | |
Tax Status
of Transfer | |
| Equity Growth Common Trust | | First American Large Cap Growth | | | | | | | | | | | | | | | |
| | | Opportunities Fund (1) | | | | | | | | | | | | | | | |
| Class Y | | Class Y | | $ | 258,080 | (2) | | | 11,944 | | | $ | 374,478 | | | $ | 648,179 | | | Non-taxable | |
| Common Stock (KS) Common Trust | | First American Large Cap Growth | | | | | | | | | | | | | | | |
| | | Opportunities Fund (1) | | | | | | | | | | | | | | | |
| Class Y | | Class Y | | | 15,621 | (3) | | | 733 | | | | | | | | |
| Special Equity Growth B | | First American Mid Cap Growth | | | | | | | | | | | | | | | |
| Common Trust | | Opportunities Fund (1) | | | | | | | | | | | | | | | |
| Class Y | | Class Y | | | 245,348 | (4) | | | 8,454 | | | | 611,311 | | | | 856,659 | | | Non-taxable | |
(1) Accounting survivor.
(2) Includes unrealized depreciation of $12,067.
(3) Includes unrealized appreciation of $9,464.
(4) Includes unrealized depreciation of $4,760.
10 > Indemnifications
The Funds enter into contracts that contain a variety of indemnifications. The Funds' maximum exposure under these arrangements is unknown. However, the Funds have not had prior claims of losses pursuant to these contracts and expect the risk of loss to be remote.
11 > Additional Information Related to Small Cap Growth Opportunities Fund
As a result of an internal review, USBAM uncovered an action involving potentially improper trading of a portfolio security held in the First American Small Cap Growth Opportunities Fund. USBAM engaged an outside law firm to conduct a review of these trades, and, as a result of this review, the law firm concluded that no USBAM employee violated the applicable securities laws. USBAM has reported this to the Fund's board of directors and to the Securities and Exchange Commission (SEC). The SEC is conducting an informal inquiry into this matter, and USBAM is cooperating fully with the SEC in its inquiry.
12 > Proposed Replacement of Investment Sub-Advisor
On September 16, 2004, the Funds' board of directors approved the appointment of J.P Morgan Investment Management Inc. ("JPMorgan") to replace Clay Finlay, Inc. as the investment sub-advisor to International Fund, subject to the approval of the shareholders of the Fund. A special meeting of the shareholders of the Fund will be held on December 8, 2004 to vote upon the appointment of JPMorgan.
FIRST AMERICAN FUNDS Annual Report 2004
141
NOTICE TO SHAREHOLDERS September 30, 2004 (unaudited)
TAX INFORMATION
The information set forth below is for each Fund's fiscal year as required by federal laws. Shareholders, however, must report distributions on a calendar year basis for income tax purposes, which may include distributions for portions of two fiscal years of a Fund. Accordingly, the information needed by shareholders for income tax purposes will be sent in early 2005 on Form 1099. Please consult your tax advisor for proper treatment of this information.
Dear First American Shareholders:
For the fiscal year ended September 30, 2004, each Fund has designated long-term capital gain dividends, dividends qualifying for the corporate dividends received deduction, and qualified dividend income with regard to distributions paid during the year as follows:
| Fund | | Long Term
Capital Gains
Distributions
(Tax Basis) (a) | | Ordinary
Income
Distributions
(Tax Basis) (a) | | Total
Distributions
(Tax Basis) | | Corporate
Dividends
Received
Deduction (b) | | Qualified
Dividend
Income (000) | | Qualified
Dividend
Income (b) (c) | |
| Real Estate Securities Fund | | | 28 | % | | | 72 | % | | | 100 | % | | | - | % | | $ | 98 | | | | - | % | |
| International Fund (d) | | | - | | | | 100 | | | | 100 | | | | - | | | | 21,090 | | | | - | | |
| Small Cap Growth Opportunities Fund | | | 100 | | | | - | | | | 100 | | | | - | | | | 168 | | | | - | | |
| Small Cap Select Fund | | | 42 | | | | 58 | | | | 100 | | | | 2 | | | | 2,456 | | | | 2 | | |
| Small Cap Value Fund | | | 66 | | | | 34 | | | | 100 | | | | 26 | | | | 2,862 | | | | 20 | | |
| Mid Cap Growth Opportunities Fund | | | 52 | | | | 48 | | | | 100 | | | | 5 | | | | 2,919 | | | | 4 | | |
| Mid Cap Value Fund | | | - | | | | 97 | | | | 100 | | | | 100 | | | | 2,817 | | | | 100 | | |
| Large Cap Growth Opportunities Fund | | | - | | | | 82 | | | | 100 | | | | 100 | | | | 8,301 | | | | 100 | | |
| Large Cap Select Fund | | | 12 | | | | 88 | | | | 100 | | | | 65 | | | | 2,109 | | | | 68 | | |
| Large Cap Value Fund | | | - | | | | 100 | | | | 100 | | | | 100 | | | | 14,667 | | | | 100 | | |
| Balanced Fund | | | - | | | | 100 | | | | 100 | | | | 54 | | | | 4,235 | | | | 56 | | |
| Equity Income Fund | | | - | | | | 100 | | | | 100 | | | | 100 | | | | 32,700 | | | | 98 | | |
(a) Based on a percentage of the Fund's total distributions.
(b) Based on a percentage of ordinary income distributions of the Fund.
(c) For the fiscal year ended September 30, 2004 certain dividends paid by the funds may be subject to a maximum tax rate of 15%, as provided by the Internal Revenue Code 1(h). The Funds intend to designate the maximum amounts as taxed at a maximum rate of 15%. Complete information was computed and reported in conjunction with your 2003 Form 1099-Div. As of September 30, 2004, for the calendar year to date, qualified dividend income as a percentage of ordinary income distributions for each Fund was as follows: Real Estate Securities Fund, International, Small Cap Growth Opportunities, Small Cap Select, Small Cap Value, Mid Cap Growth Opportunities, Mid Cap Value, Large Cap Growth Opportunities, Large Cap Select, Large Cap Value, Balanced and Equity Income Funds were 0%, 0%, 0%, 2%, 20%, 4%, 100%,100%, 68%, 100%, 56% and 98%, respectively.
(d) The International Fund has elected to pass through to shareholders foreign taxes under Section 853 of the Internal Revenue Code. Foreign taxes paid and foreign source income for the fund were $3,197,245 and $26,479,713, respectively.
HOW TO OBTAIN A COPY OF THE FUNDS' PROXY VOTING POLICIES AND PROXY VOTING RECORD
A description of the policies and procedures that the Funds use to determine how to vote proxies relating to portfolio securities, as well as information regarding how the Funds voted proxies relating to portfolio securities during the most recent 12 month period ended June 30, is available (1) without charge upon request by calling 800.677.FUND; (2) at firstamericanfunds.com; and (3) on the U.S. Securities and Exchange Commission's website at http://www.sec.gov.
QUARTERLY PORTFOLIO HOLDINGS INFORMATION
Beginning with the quarter ending December 31, 2004, each Fund will file its complete schedule of portfolio holdings for the first and third quarters of each fiscal year with the Securities and Exchange Commission on Form N-Q. The Funds' Forms N-Q will be available (1) without charge upon request by calling 800.677.FUND; (2) at firstamericanfunds.com; and (3) on the U.S. Securities and Exchange Commission's website at http://www.sec.gov. In addition, you may review and copy the Funds' Forms N-Q at the Commission's Public Reference Room in Washington, D.C. You may obtain information on the operation of the Public Reference Room by calling 1-800-SEC-0330.
FIRST AMERICAN FUNDS Annual Report 2004
142
Directors and Officers of the Funds
Independent Directors
Name, Address, and
Year of Birth | |
Position(s)
Held
with Fund | |
Term of Office
and Length of
Time Served | |
Principal Occupation(s)
During Past 5 Years | | Other
Number of Portfolios
in Fund Complex
Overseen by Director | | Directorships
Held by
Director † | |
Benjamin R. Field III,
P.O. Box 1329,
Minneapolis, MN 55440-1329 (1938) | | Director | | Term expiring earlier of death, resignation, removal, disqualification, or successor duly elected and qualified. Director of FAIF, since September 2003 | | Retired; Senior Financial Advisor, Bemis Company, Inc. from May 2002 through June 2004; Senior Vice President, Chief Financial Officer & Treasurer, Bemis, through April 2002. | | First American Funds Complex: eleven registered investment companies, including fifty-six portfolios | | None | |
|
Mickey P. Foret,
P.O. Box 1329,
Minneapolis, MN
55440-1329 (1945) | | Director | | Term expiring earlier of death, resignation, removal, disqualification, or successor duly elected and qualified. Director of FAIF since September 2003 | | Consultant to Northwest Airlines, Inc. since 2002; Executive Vice President and Chief Financial Officer, Northwest Airlines, through 2002. | | First American Funds Complex: eleven registered investment companies, including fifty-six portfolios | | ADC Telecommu-nications, Inc.
Champion Airlines, Inc.
MAIR Holdings Inc.
(a holding company for regional air carriers)
URS Corporation
(an engineer-ing firm) | |
|
Roger A. Gibson,
P.O. Box 1329,
Minneapolis, MN
55440-1329 (1946) | | Director | | Term expiring earlier of death, resignation, removal, disqualification, or successor duly elected and qualified. Director of FAIF since October 1997 | | Retired; Vice President,
Cargo-United Airlines, from July 2001 through July 2004; Vice President, North America - Mountain Region for United Airlines, prior to July 2001. | | First American Funds Complex: eleven registered investment companies, including fifty-six portfolios | | None | |
|
Victoria J. Herget,
P.O. Box 1329,
Minneapolis, MN
55440-1329 (1951) | | Director | | Term expiring earlier of death, resignation, removal, disqualification, or successor duly elected and qualified. Director of FAIF since September 2003 | | Investment consultant and non-profit board member since 2001; Managing Director of Zurich Scudder Investments through 2001. | | First American Funds Complex: eleven registered investment companies, including fifty-six portfolios | | None | |
|
Leonard W. Kedrowski,
P.O. Box 1329,
Minneapolis, MN
55440-1329 (1941) | | Director | | Term expiring earlier of death, resignation, removal, disqualification, or successor duly elected and qualified. Director of FAIF since November 1993 | | Owner, Executive and Management Consulting, Inc., a management consulting firm; Board member, GC McGuiggan Corporation (dba Smyth Companies), a label printer; former Chief Executive Officer, Creative Promotions International, LLC, a promotional award programs and products company, through October 2003; Advisory Board member, Designer Doors, manufacturer of designer doors, through 2002. | | First American Funds Complex: eleven registered investment companies, including fifty-six portfolios | | None | |
|
FIRST AMERICAN FUNDS Annual Report 2004
143
NOTICE TO SHAREHOLDERS September 30, 2004 (unaudited)
Independent Directors - continued
Name, Address, and
Year of Birth | |
Position(s)
Held
with Fund | |
Term of Office
and Length of
Time Served | |
Principal Occupation(s)
During Past 5 Years | | Other
Number of Portfolios
in Fund Complex
Overseen by Director | | Directorships
Held by
Director † | |
Richard K. Riederer,
P.O. Box 1329,
Minneapolis, MN
55440-1329 (1944) | | Director | | Term expiring earlier of death, resignation, removal, disqualification, or successor duly elected and qualified. Director of FAIF since August 2001 | | Retired; Director, President and Chief Executive Officer, Weirton Steel through 2001. | | First American Funds Complex: eleven registered investment companies, including fifty-six portfolios | | None | |
|
Joseph D. Strauss,
P.O. Box 1329,
Minneapolis, MN
55440-1329 (1940) | | Director | | Term expiring earlier of death, resignation, removal, disqualification, or successor duly elected and qualified. Director of FAIF since April 1991 | | Owner, Chairman and Chief Executive Officer, Excensus(TM), LLC, a consulting firm, since 2001; owner and President, Strauss Management Company, a Minnesota holding company for various organizational management business ventures; owner, Chairman and Chief Executive Officer, Community Resource Partnerships, Inc., a strategic planning, operations management, government relations, transportation planning and public relations organization; attorney at law. | | First American Funds Complex: eleven registered investment companies, including fifty-six portfolios | | None | |
|
Virginia L. Stringer,
P.O. Box 1329,
Minneapolis, MN
55440-1329 (1944) | | Chair; Director | | Chair Term three years. Directors Term expiring earlier of death, resignation, removal, disqualification, or successor duly elected and qualified. Chair of FAIF's Board since September 1997; Director of FAIF since August 1987 | | Owner and President, Strategic Management Resources, Inc., a management consulting firm; Executive Consultant to State Farm Insurance Company. | | First American Funds Complex: eleven registered investment companies, including fifty-six portfolios | | None | |
|
James M. Wade,
P.O. Box 1329,
Minneapolis, MN
55440-1329 (1943) | | Director | | Term expiring earlier of death, resignation, removal, disqualification, or successor duly elected and qualified. Director of FAIF since August 2001 | | Owner and President, Jim Wade Homes, a homebuilding company, since 1999. | | First American Funds Complex: eleven registered investment companies, including fifty-six portfolios | | None | |
|
† Includes only directorships in a company with a class of securities registered pursuant to Section 12 of the Securities Exchange Act or subject to the requirements of Section 15(d) of the Securities Exchange Act, or any company registered as an investment company under the Investment Company Act.
The Statement of Additional Information (SAI) includes additional information about fund directors and is available upon request without charge by calling 800-677-FUND or writing to First American Funds, P.O. Box 1330, Minneapolis, Minnesota, 55440-1330.
FIRST AMERICAN FUNDS Annual Report 2004
144
Officers
Position(s)
Name, Address, and
Year of Birth | | Term of Office
Held
with Fund | | and Length of
Time Served | | Principal Occupation(s) During Past 5 Years | |
Thomas S. Schreier, Jr.,
U.S. Bancorp Asset
Management, Inc.,
800 Nicollet Mall,
Minneapolis, MN
55402 (1962)* | | President | | Re-elected by the Board annually; President of FAIF since February 2001 | | Chief Executive Officer of the Advisor since May 2001; prior thereto, Chief Executive Officer of First American Asset Management since December 2000 and of Firstar Investment & Research Management Company ("FIRMCO") since February 2001; Senior Managing Director and Head of Equity Research of U.S. Bancorp Piper Jaffray from October 1998 through December 2000; prior to October 1998, Senior Airline Equity Analyst and a Director in the Equity Research Department of Credit Suisse First Boston. | |
|
Mark S. Jordahl,
U.S. Bancorp
Asset Management, Inc.
800 Nicollet Mall,
Minneapolis, MN
55402 (1960)* | | Vice President– Investments | | Re-elected by the Board annually; Vice President – Investments of FAIF since September 2001 | | Chief Investment Officer of U.S. Bancorp Asset Management, Inc. since September 2001; President and Chief Investment Officer, ING Investment Management - Americas, September 2000 to June 2001; Senior Vice President and Chief Investment Officer, ReliaStar Financial Corp., January 1998 to September 2000. | |
|
Jeffery M. Wilson,
U.S. Bancorp
Asset Management, Inc.
800 Nicollet Mall,
Minneapolis, MN
55402 (1956)* | | Vice President– Administration | | Re-elected by the Board annually; Vice President – Administration of FAIF since March 2000 | | Senior Vice President of U.S. Bancorp Asset Management, Inc. since May 2001; prior thereto, Senior Vice President of First American Asset Management. | |
|
Joseph M. Ulrey III,
U.S. Bancorp
Asset Management, Inc.
800 Nicollet Mall,
Minneapolis, MN
55402 (1958)* | | Treasurer | | Re-elected by the Board annually; Treasurer of FAIF since December 2003 | | Chief Financial Officer since September 2004 and Senior Managing Director, Fund Treasury, since December 2003; Senior Managing Director, Risk Management and Quantitative Analysis, since May 2001, U.S. Bancorp Asset Management, Inc. ("USBAM"); from May 2001 through December 2001, Senior Managing Director, Securities Lending and Money Market Funds, USBAM; prior thereto, Senior Managing Director, Securities Lending and Money Market Funds, First American Asset Management. | |
|
Douglas A. Paul,
U.S. Bancorp
Asset Management, Inc.
800 Nicollet Mall,
Minneapolis, MN
55402 (1947)* | | Chief Compliance Officer | | Re-elected by the Board annually; Chief Compliance Officer of FAIF since June 2004 | | Chief Compliance Officer of U.S. Bancorp Asset Management, Inc. since June 2004; prior thereto, Partner, Kirkpatrick & Lockhart LLP since March 2000; prior thereto, Director of Compliance, Associate General Counsel, Vice President, American Century Investments. | |
|
Kathleen L. Prudhomme,
U.S. Bancorp
Asset Management, Inc.
800 Nicollet Mall,
Minneapolis, MN
55402 (1953)* | | Assistant Secretary | | Re-elected by the Board annually; Assistant Secretary of FAIF since September 1998 | | Deputy General Counsel, U.S. Bancorp Asset Management, Inc. since November 2004; prior thereto, Partner, Dorsey & Whitney LLP, a Minneapolis-based law firm. | |
|
James D. Alt,
50 South Sixth Street,
Suite 1500,
Minneapolis, MN
55402 (1951) | | Secretary | | Re-elected by the Board annually; Assistant Secretary of FAIF from September 1998 through June 2002. Secretary of FAIF since June 2002 | | Partner, Dorsey & Whitney LLP, a Minneapolis-based law firm. | |
|
Michael J. Radmer,
50 South Sixth Street,
Suite 1500,
Minneapolis, MN
55402 (1945) | | Assistant Secretary | | Re-elected by the Board annually; Assistant Secretary of FAIF since March 2000; Secretary of FAIF from September 1999 through March 2000 | | Partner, Dorsey & Whitney LLP, a Minneapolis-based law firm. | |
|
James R. Arnold,
615 E. Michigan Street,
Milwaukee, WI
53202 (1957)* | | Assistant Secretary | | Re-elected by the Board annually; Assistant Secretary of FAIF since June 2003 | | Vice President, U.S. Bancorp Fund Services, LLC since March 2002; Senior Administration Services Manager, UMB Fund Services, Inc. through March 2002. | |
|
Douglas G. Hess,
615 E. Michigan Street,
Milwaukee, WI
53202 (1967)* | | Assistant Secretary | | Re-elected by the Board annually; Assistant Secretary of FAIF since September 2001 | | Vice President, U.S. Bancorp Fund Services, LLC. | |
|
* Messrs. Schreier, Jordahl, Wilson, Ulrey, Paul and Ms. Prudhomme are each officers of U.S. Bancorp Asset Management, Inc., which serves as investment adviser and co-administrator for FAIF. Messrs. Hess and Arnold are officers of U.S. Bancorp Fund Services, LLC, which is a subsidiary of U.S. Bancorp and which serves as co-administrator for FAIF.
FIRST AMERICAN FUNDS Annual Report 2004
145
(This page has been left blank intentionally.)
(This page has been left blank intentionally.)
(This page has been left blank intentionally.)
Board of Directors First American Investment Funds, Inc.
Virginia Stringer
Chairperson of First American Investment Funds, Inc.
Owner and President of Strategic Management Resources, Inc.
Benjamin Field III
Director of First American Investment Funds, Inc.
Senior Financial Advisor to, and formerly Senior Vice President, Chief Financial Officer, and Treasurer of, Bemis Company, Inc.
Mickey Foret
Director of First American Investment Funds, Inc.
Consultant to, and formerly Executive Vice President and Chief Financial Officer of, Northwest Airlines, Inc.
Roger Gibson
Director of First American Investment Funds, Inc.
retired; former Vice President of Cargo-United Airlines
Victoria Herget
Director of First American Investment Funds, Inc.
Investment Consultant; former Managing Director of Zurich Scudder Investments
Leonard Kedrowski
Director of First American Investment Funds, Inc.
Owner and President of Executive and Management Consulting, Inc.
Richard Riederer
Director of First American Investment Funds, Inc.
Retired; former President and Chief Executive Officer of Weirton Steel
Joseph Strauss
Director of First American Investment Funds, Inc.
Owner and President of Strauss Management Company
James Wade
Director of First American Investment Funds, Inc.
Owner and President of Jim Wade Homes
First American Investment Funds’ Board of Directors is comprised entirely of independent directors.

Direct fund correspondence to:
First American Funds
P.O. Box 1330
Minneapolis, MN 55440-1330
This report and the financial statements contained herein are not intended to be a forecast of future events, a guarantee of future results, or investment advice. Further, there is no assurance that certain securities will remain in or out of each fund’s portfolio. The views expressed in this report reflect those of the portfolio managers only through the period ended September 30, 2004. The portfolio managers’ views are subject to change at any time based upon market or other conditions.
This report is for the information of shareholders of the First American Investment Funds, Inc. It may also be used as sales literature when preceded or accompanied by a current prospectus, which contains information concerning investment objectives, risks, and charges and expenses of the Funds. Read the prospectus carefully before investing.
The figures in this report represent past performance and do not guarantee future results. The principal value of an investment and investment return will fluctuate so that an investor’s shares, when redeemed, may be worth more or less than their original cost.
INVESTMENT ADVISOR
U.S. Bancorp Asset Management, Inc.
800 Nicollet Mall
Minneapolis, Minnesota 55402
CO-ADMINISTRATORS
U.S. Bancorp Asset Management, Inc.
800 Nicollet Mall
Minneapolis, Minnesota 55402
U.S. Bancorp Fund Services, LLC
615 East Michigan Street
Milwaukee, Wisconsin 53202
CUSTODIAN
U.S. Bank National Association
180 East Fifth Street
St. Paul, Minnesota 55101
DISTRIBUTOR
Quasar Distributors, LLC
615 East Michigan Street
Milwaukee, Wisconsin 53202
INDEPENDENT REGISTERED PUBLIC ACCOUNTING FIRM
Ernst & Young LLP
220 South Sixth Street
Suite 1400
Minneapolis, Minnesota 55402
COUNSEL
Dorsey & Whitney LLP
50 South Sixth Street
Suite 1500
Minneapolis, Minnesota 55402
First American Funds
P.O. Box 1330
Minneapolis, MN 55440-1330
In an attempt to reduce shareholder costs and help eliminate duplication, First American Funds will try to limit their mailing to one report for each address that lists one or more shareholders with the same last name. If you would like additional copies, please call First American Investor Services at 800.677.FUND or visit firstamericanfunds.com.
0389-04 11/2004 AH-EQUITY
Item 2—Code of Ethics - Did registrant adopt a code of ethics, as of the end of the period covered by this report, that applies to the registrant’s principal executive officer, principal financial officer, principal accounting officer or controller, or persons performing similar functions, regardless of whether these individuals are employed by the registrant or a third party? If not, why not? Briefly describe any amendments or waivers that occurred during the period. State here if code of ethics/amendments/waivers are on website and give website address. State here if fund will send code of ethics to shareholders without charge upon request.
Response: The registrant has adopted a code of ethics (designated as the “Code of Ethical Conduct”) that applies to its principal executive officer and principal financial officer. The registrant undertakes to furnish a copy of such Code of Ethical Conduct to any person upon request, without charge, by calling 1-800-677-3863.
Item 3—Audit Committee Financial Expert - Did the registrant’s board of directors determine that the registrant either: (i) has at least one audit committee financial expert serving on its audit committee; or (ii) does not have an audit committee financial expert serving on its audit committee? If yes, disclose name of financial expert and whether he/she is “independent,” (fund may, but is not required, to disclose name/independence of more than one financial expert) If no, explain why not.
Response: The registrant’s Board of Directors has determined that Leonard Kedrowski, Benjamin Field, and Mickey Foret, members of the registrant’s Audit Committee, are each an “audit committee financial expert” and are “independent,” as these terms are defined in this Item. This designation will not increase the designees’ duties, obligations or liability as compared to their duties, obligations and liability as members of the Audit Committee and of the Board of Directors.
Item 4—Principal Accountant Fees and Services – Only disclosed annually.
(a) Audit Fees - Disclose aggregate fees billed for each of the last two fiscal years for professional services rendered by the principal accountant for the audit of the registrant’s annual financial statements or services that are normally provided by the accountant in connection with statutory and regulatory filings or engagements for those fiscal years.
Response: Ernst & Young LLP (“E&Y”) billed the registrant audit fees totaling $391,795 in the fiscal year ended September 30, 2004 and $312,163 in the fiscal year ended September 30, 2003, including fees associated with the annual audit, SEC Rule 17f-2 security count filings and filings of the registrant’s Form NCSR.
(b) Audit-Related Fees - Disclose aggregate fees billed in each of the last two fiscal years for assurance and related services by the principal accountant that are reasonably related to the performance of the audit of the registrant’s financial statements and are not reported under paragraph (a) of this Item. Registrants shall describe the nature of the services comprising the fees disclosed under this category.
Response: Ernst & Young LLP (“E&Y”) billed the registrant audit-related fees totaling $36,134 in the fiscal year ended September 30, 2004 and $0 in the fiscal year ended September 30, 2003, for professional services associated with .
(c) Tax Fees - Disclose aggregate fees billed in each of the last two fiscal years for professional services rendered by the principal accountant for tax compliance, tax advice, and tax planning. Registrants shall describe the nature of the services comprising the fees disclosed under this category.
Response: E&Y billed the registrant fees of $115,034 in the fiscal year ended September 30, 2004 and $129,482 in the fiscal year ended September 30, 2003 for tax services, including tax compliance, tax advice and tax planning. Tax compliance, tax advice and tax planning services primarily relate to preparation of original and amended tax returns, timely RIC qualification reviews, and tax distribution analysis and planning.
(d) All Other Fees - Disclose aggregate fees billed in each of the last two fiscal years for products and services provided by the principal accountant, other than the services reported in paragraphs (a) through (c) of this Item. Registrants shall describe the nature of the services comprising the fees disclosed under this category.
Response: There were no fees billed by E&Y for other services to the registrant during the fiscal years ended September 30, 2003 and 2004.
(e)(1) Disclose the audit committee’s pre-approval policies and procedures pursuant to paragraph (c)(7) of Rule 2-01 of
Regulation S-X.
Response: Set forth below are the audit committee’s pre-approval policies and procedures pursuant to paragraph (c)(7) of
Rule 2-01 of Regulation S-X:
Audit Committee policy regarding pre-approval of services provided by the Independent Auditor
The Audit Committee of the First American Funds has responsibility for ensuring that all services performed by the independent audit firm for the funds do not impair the firm’s independence. This review is intended to provide reasonable oversight without removing management from its responsibility for day-to-day operations. In this regard, the Audit Committee should:
• Understand the nature of the professional services expected to be provided and their impact on auditor independence and audit quality
• Examine and evaluate the safeguards put into place by the Company and the auditor to safeguard independence
• Meet quarterly with the partner of the independent audit firm
• Consider approving categories of service that are not deemed to impair independence for a one-year period
It is important that a qualitative rather than a mere quantitative evaluation be performed by the Committee in discharging its responsibilities.
Policy for Audit and Non-Audit Services Provided to the Funds
On an annual basis, the Audit Committee of the First American Funds (“Committee”) will review and consider whether to pre-approve the financial plan for audit fees as well as categories of audit-related and non-audit services that may be performed by the Fund’s independent audit firm directly for the Funds. At least annually the Committee will receive a report from the independent audit firm of all audit and non-audit services, which were approved during the year.
The engagement of the independent audit firm for any non-audit service requires the written pre-approval of the Treasurer of the Funds and all non-audit services performed by the independent audit firm will be disclosed in the required SEC periodic filings.
In connection with the Audit Committee review and pre-approval responsibilities, the review by the Audit Committee will consist of the following:
Audit Services
The categories of audit services and related fees to be reviewed and considered for pre-approval annually by the Committee or its delegate include the following:
• Annual Fund financial statement audits
• Seed audits (related to new product filings, as required)
• SEC and regulatory filings and consents
Audit-related Services
In addition, the following categories of audit-related services are deemed to be consistent with the role of the independent firm and, as such, will be considered for pre-approval by the Committee or its delegate, on an annual basis.
• Accounting consultations
• Fund merger support services
• Other accounting related matters
• Agreed Upon Procedure Reports
• Attestation Reports
• Other Internal Control Reports
Notwithstanding any annual pre-approval of these categories of services, individual projects with an estimated fee in excess of $25,000 are subject to pre-approval by the Audit Committee Chair or its delegate on a case-by-case basis. Individual projects with an estimated fee in excess of $50,000 are subject to pre-approval by the Audit Committee or its delegate on a case-by-case basis.
Tax Services
The following categories of tax services are deemed to be consistent with the role of the independent audit firm and, as such, will be considered for pre-approval by the Committee or its delegate, on an annual basis.
• Tax compliance services related to the filing or amendment of the following:
• Federal, state and local income tax compliance, and
• Sales and use tax compliance
• Timely RIC qualification reviews
• Tax distribution analysis and planning
• Tax authority examination services
• Tax appeals support services
• Accounting methods studies
• Fund merger support services
• Tax consulting services and related projects
Notwithstanding any annual pre-approval of these categories of services, individual projects with an estimated fee in excess of $25,000 are subject to pre-approval by the Audit Committee Chair or its delegate on a case-by-case basis. Individual projects
with an estimated fee in excess of $50,000 are subject to pre-approval by the Audit Committee or its delegate on a case-by-case basis.
Other Non-audit Services
The SEC auditor independence rules adopted in response to the Sarbanes-Oxley Act specifically allow certain non-audit services. Because of the nature of these services, none of these services may be commenced by the independent firm without the prior approval of the Audit Committee. The Committee may delegate this responsibility to one or more of the Committee members, with the decisions presented to the full Committee at the next scheduled meeting.
Proscribed Services
In accordance with SEC rules on independence, the independent audit firm is prohibited from performing services in the following categories of non-audit services:
• Management functions
• Accounting and bookkeeping services
• Internal audit services
• Financial information systems design and implementation
• Valuation services supporting the financial statements
• Actuarial services supporting the financial statements
• Executive recruitment
• Expert services (e.g., litigation support)
• Investment banking
Policy for Pre-approval of Non-Audit Services Provided to Other Entities within the Investment Company Complex
The Audit Committee of the First American Funds is also responsible for pre-approving certain non-audit services provided to U.S. Bancorp Asset Management, U.S. Bank N.A., Quasar Distributors, U.S. Bancorp Fund Services, LLC and any other entity under common control with U.S. Bancorp Asset Management that provides ongoing services to the Funds. The only non-audit services provided to these entities which require pre-approval are those services that relate directly to the operations and financial reporting of the Funds.
Although the Audit Committee is not required to pre-approve all services provided to U.S. Bancorp Asset Management and affiliated service providers, the Audit Committee will annually receive a report from the independent audit firm on the aggregate fees for all services provided to U.S. Bancorp and affiliates.
(e)(2) Disclose the percentage of services described in each of paragraphs (b) through (d) of this Item that were approved by the audit committee pursuant to paragraph (c)(7)(i)(C) of Rule 2-01 of Regulation S-X.
Response: All of the services described in paragraphs (b) through (d) of Item 4 that were provided to the registrant on or after May 6, 2003, the effective date of SEC rules relating to the pre-approval of non-audit services, were pre-approved by the audit committee.
(f) If greater than 50%, disclose the percentage of hours expended on the principal accountant’s engagement to audit the registrant’s financial statements for the most recent fiscal year that were attributed to work performed by persons other than the principal accountant’s full-time, permanent employees.
Response: All services performed on the engagement to audit the registrant’s financial statements for the most recent fiscal year end were performed by the principal accountant’s full-time, permanent employees.
(g) Disclose the aggregate non-audit fees billed by the registrant’s accountant for services rendered to the registrant, and rendered to the registrant’s investment adviser (not including any sub-adviser whose role is primarily portfolio management and is subcontracted with or overseen by another investment adviser), and any entity controlling, controlled by, or under common control with the adviser that provides ongoing services to the registrant for each of the last two fiscal years of the registrant.
Response: The aggregate non-audit fees billed by E&Y to the registrant, the registrant’s investment adviser (not including any sub-adviser whose role is primarily portfolio management and is subcontracted with or overseen by another investment adviser), and any entity controlling, controlled by, or under common control with the adviser that provides ongoing services to the registrant, totaled $181,918 in the fiscal year ended September 30, 2004 and $261,682 in the fiscal year ended September 30, 2003, including services provided prior to May 6, 2003, the effective date of SEC rules relating to the pre-approval of non-audit services.
(h) Disclose whether the registrant’s audit committee has considered whether the provision of non-audit services that were rendered to the registrant’s investment adviser (not including any Subadvisor whose role is primarily portfolio management and is subcontracted with or overseen by another investment adviser), and any entity
controlling, controlled by, or under common control with the investment adviser that provides ongoing services to the registrant that were not pre-approved pursuant to paragraph (c)(7)(ii) of Rule 2-01 of Regulation S-X is compatible with maintaining the principal accountant’s independence.
Response: The registrant’s audit committee has determined that the provision of non-audit services to the registrant’s investment adviser, and any entity controlling, controlled by, or under common control with the investment adviser that provides ongoing services to the registrant, that were not pre-approved and that were rendered on or after May 6, 2003 (the effective date of SEC rules relating to the pre-approval of non-audit services), is compatible with maintaining E&Y’s independence.
Item 5—Audit Committee of Listed Registrants
(a) If the registrant is a listed issuer as defined in Rule 10A-3 under the Exchange Act (17 CFR 240.10A-3), state whether or not the registrant has a separately-designated standing audit committee established in accordance with Section 3(a)(58)(A) of the Exchange Act (15 U.S.C. 78c(a)(58)(A)). If the registrant has such a committee, however designated, identify each committee member. If the entire board of directors is acting as the registrant’s audit committee as specified in Section 3(a)(58)(B) of the Exchange Act (15 U.S.C. 78c(a)(58)(B)), so state.
(b) If applicable, provide the disclosure required by Rule 10A-3(d) under the Exchange Act (17 CFR 240.10A-3(d)) regarding an exemption from the listing standards for audit committees.
Response: Not applicable. Registrant is not a listed issuer.
Item 6—Schedule of Investments (applicable for periods ending on or after July 9, 2004) – File Schedule I – Investments in securities of unaffiliated issuers as of the close of the reporting period as set forth in Section 210.12-12 of Regulation S-X [17 CFR 210.12-12], unless the schedule is included as part of the report to shareholders filed under Item 1 of this Form.
Response: The schedule is included as part of the report to shareholders filed under Item 1 of this Form.
Item 7—Disclosure of Proxy Voting Policies and Procedures for Closed-End Management Investment Companies - - For closed-end funds that contain voting securities in their portfolio, describe the policies and procedures that it uses to determine how to vote proxies relating to those portfolio securities.
Response: Not applicable
Item 8—Portfolio Managers of Closed-End Management Investment Companies.
(a) If the registrant is a closed-end management investment company that is filing an annual report on this Form N-CSR, provide the following information:
(1) State the name, title, and length of service of the person or persons employed by or associated with the registrant or an investment advisor of the registrant who are primarily responsible for the day-to-day management of the registrant’s portfolio (“Portfolio Manager”). Also state each Portfolio Manager’s business experience during the past 5 years.
(2) If a Portfolio Manager required to be identified in response to paragraph (a) (1) of this Item is primarily responsible for the day-to-day management of the portfolio of any other account, provided the following information:
(i) The Portfolio Manager’s name;
(ii) The number of other accounts managed within each of the following categories and the total assets in the account managed within each category:
(A) Registered investment companies;
(B) Other pooled investment vehicles; and
(C) Other accounts.
(iii) For each of the categories in paragraph (a) (2) (ii) of this Item, the number of accounts and the total assets in the accounts with respect to which the advisory fee is based on the performance of the account; and
(iv) A description of any material conflicts of interest that may arise in connection with the Portfolio Manager’s management of the registrant’s investments, on the one hand, and the investments of the other accounts included in response to paragraph (a) (2) (ii) of this Item, on the other. This description would include, for example, material conflicts between the investment strategy of the registrant and the investment strategy of other accounts managed by the Portfolio Manager and material conflicts in allocation of investment opportunities between the registrant and other accounts managed by the Portfolio Manager.
(3) Described the structure of, and the method used to determine, the compensation of each Portfolio Manager required to be identified in response to paragraph (a) (1) of this Item. For each type of compensation (e.g., salary, bonus, deferred compensation, retirement plans and arrangements), describe with specificity the criteria on which the type of compensation is based, for example, whether compensation is fixed, whether (and, if so, how) compensation is based on the registrant’s pre- or aftertax performance over a certain time period, and whether (and, if so, how) compensation is based on the value of assets held in the registrant’s portfolio. For example, if compensaton is based solely or in part on performance, identify any benchmark used
to measure performance and state the length of the period over which performance is measured.
(4) For each Portfolio Manager required to be identified in response to paragraph (a) (1) of this Item, state the dollar range of equity securities in the registrant beneficially owned by the Portfolio Manager using the following ranges: none, $1-$10,000, $10,001-$50,000, $50,001-$100,000, $100,001-$500,000, $500,001-$1,000,000, or over $1,000,000.
(b) If the registrant is a closed-end management investment company that is filing a report on this Form N-CSR other than an annual report, disclose any change, as of the date of filing, in any of the Portfolio Managers identified in response to paragraph (a) (1) of this Item in the registrant’s most recent annual report on Form N-CSR. In addition, for any newly identified Portfolio Manager, provided the information required by paragraph (a) (1) of this Item as the date of filing of the report and the information required by paragraphs (a) (2), (a) (3), and (a) (4) of this Item as of the most recent practicable date.
Response: Not applicable
Item 9—Purchases of Equity Securities by Closed-End Management Investment Company and Affiliated Purchasers
(a) If the registrant is a closed-end management investment company, in the following tabular format, provide the information specified in paragraph (b) of this Item with respect to any purchase made by or on behalf of the registrant or any “affiliated purchaser,” as defined in Rule 10b-18(a)(3) under the Exchange Act (17 CFR 240.10b-18(a)(3)), of shares or other units of any class of the registrant’s equity securities that is registered pursuant to Section 12 of the Exchange Act (15 U.S.C. 781).
Registrant Purchases of Equity Securities
Period (identify
beginning and
ending dates for
each Month) | | (a) Total Number
of Shares (or
Units) Purchased | | (b) Average Price
Paid per Share
(or Unit) | | (c) Total Number
of Shares (or Units)
Purchased as Part of
Publicly Announced
Plans or Programs | | (d) Maximum Number
(or Approximate
Dollar Value) of
Shares (or Units) that
May Yet Be Purchased
Under the Plans or
Programs | |
Month #1 | | | | | | | | | |
Month #2 | | | | | | | | | |
Month #3 | | | | | | | | | |
Month #4 | | | | | | | | | |
Month #5 | | | | | | | | | |
Month #6 | | | | | | | | | |
Month #7 | | | | | | | | | |
Total | | | | | | | | | |
(b) The table shall include the following information for each class of securities for each month included in the period covered by the report:
(1) The total number of shares (or units) purchased (column (a));
(2) The average price paid per share (or unit) (column (b));
(3) The number of shares (or units) purchased as part of publicly announced repurchase plans or programs (column (c)); and
(4) The maximum number (or approximate dollar value) of shares (or units) that may yet be purchased under the plans or programs (column (d)).
Response: Not applicable
Item 10—Submission of Matters to a Vote of Security Holders – Describe any material changes to the procedures by which shareholders may recommend nominees to the registrant’s board of directors, where those changes were implemented after the registrant last provided disclosure in response to the requirements of Item 7(d)(2)(ii)(G) of Schedule 14A (17 CFR 240.14a-101), or this Item.
Response: There have been no material changes to the procedures by which shareholders may recommend nominees to the registrant’s board of directors, where those changes were implemented after the registrant last provided disclosure in response to the requirements of Item 7(d)(2)(ii)(G) of Schedule 14A (17 CFR 240.14a-101), or this item.
Item 11—Controls and Procedures
(a) Disclose the conclusions of the registrant’s principal executive officer or officers and principal financial officer or officers, or persons performing similar functions, about the effectiveness of the registrant’s disclosure controls and procedures (as defined in Rule 30a-3(c) under the Act (17 CFR 270.30a-3(c))) based on their evaluation of these controls and procedures as of a date within 90 days of the filing date of the report that includes the disclosure required by this paragraph.
Response: The registrant’s Principal Executive Officer and Principal Financial Officer have evaluated the registrant’s disclosure controls and procedures within 90 days of the date of this filing and have concluded that the registrant’s disclosure controls and procedures were effective, as of that date, in ensuring that information required to be disclosed by the registrant in this Form N-CSR was recorded, processed, summarized and reported timely.
(b) Disclose any change in the registrant’s internal control over financial reporting (as defined in Rule 30a-3(c) under the Act (17 CFR 270.30a-3(c))) that occurred during the registrant’s last fiscal half-year (the registrant’s second fiscal half-year in the case of an annual report) that has materially affected, or is reasonably likely to materially affect, the registrant’s internal control over financial reporting.
Response: There were no changes in the registrant’s internal control over financial reporting that occurred during the registrant’s most recent fiscal half-year that have materially affected, or are reasonably likely to materially affect, the registrant’s internal control over financial reporting.
Item 12 — Exhibits
11(a) - Attach code of ethics or amendments/waivers, unless code of ethics or amendments/waivers is on website or offered to shareholders upon request without charge.
Response: This code of ethics is offered to shareholders upon request without charge.
11(b) - Attach certifications (4 in total pursuant to Sections 302 and 906 for PEO/PFO).
Response: Attached hereto.
Signatures
Pursuant to the requirements of the Securities Exchange Act of 1934 and the Investment Company Act of 1940, the registrant has duly caused this report to be signed on its behalf by the undersigned, thereunto duly authorized.
First American Investment Funds, Inc.
By: |
| /s/ Thomas S. Schreier, Jr. | |
| Thomas S. Schreier, Jr. |
| President |
Date: December 9, 2004
Pursuant to the requirements of the Securities Exchange Act of 1934 and the Investment Company Act of 1940, this report has been signed below by the following persons on behalf of the registrant and in the capacities and on the dates indicated.
By: |
| /s/ Thomas S. Schreier, Jr. | |
| Thomas S. Schreier, Jr. |
| President |
Date: December 9, 2004
By: |
| /s/ Charles D. Gariboldi | |
| |
| Charles D. Gariboldi |
| Treasurer |
Date: December 9, 2004