| | OMB APPROVAL |
| | OMB Number: 3235-0570 |
| | Expires: November 30, 2005 |
| | Estimated average burden
hours per response. . . . 5.0 |
UNITED STATES
SECURITIES AND EXCHANGE COMMISSION
Washington, D.C. 20549
FORM N-CSR
CERTIFIED SHAREHOLDER REPORT OF REGISTERED
MANAGEMENT INVESTMENT COMPANIES
Investment Company Act file number 811-05309
First American Investment Funds, Inc.
(Exact name of registrant as specified in charter)
800 Nicollet Mall, Minneapolis, MN | | 55402 |
(Address of principal executive offices) | | (Zip code) |
Charles D. Gariboldi 800 Nicollet Mall, Minneapolis, MN 55402
(Name and address of agent for service)
Registrant’s telephone number, including area code: 800-677-3863
Date of fiscal year end: September 30
Date of reporting period: September 30, 2005
Form N-CSR is to be used by management investment companies to file reports with the Commission not later than 10 days after the transmission to stockholders of any report that is required to be transmitted to stockholders under Rule 30e-1 under the Investment Company Act of 1940 (17 CFR 270.30e-1). The Commission may use the information provided on Form N-CSR in its regulatory, disclosure review, inspection, and policymaking roles.
A registrant is required to disclose the information specified by Form N-CSR, and the Commission will make this information public. A registrant is not required to respond to the collection of information contained in Form N-CSR unless the Form displays a currently valid Office of Management and Budget (“OMB”) control number. Please direct comments concerning the accuracy of the information collection burden estimate and any suggestions for reducing the burden to Secretary, Securities and Exchange Commission, 450 Fifth Street, NW, Washington, DC 20549-0609. The OMB has reviewed this collection of information under the clearance requirements of 44 U.S.C. Section 3507.
Item 1. Report to Shareholders

| 2005
Annual Report |

First American Index Funds
An index fund is a mutual fund that seeks to mirror, as closely as possible, the returns of a market index. It does so by purchasing almost all of the holdings in the index in roughly the same percentages. An equity index measures the collective value of a group of stocks in a specific segment of the marketplace. The most commonly known market index is the S&P 500 Index.

TABLE OF CONTENTS
Message to Shareholders | 1 |
Report of Independent Registered Public Accounting Firm | 11 |
Schedule of Investments | 12 |
Statements of Assets and Liabilities | 42 |
Statements of Operations | 43 |
Statements of Changes in Net Assets | 44 |
Financial Highlights | 46 |
Notes to Financial Statements | 52 |
Notice to Shareholders | 60 |
| Mutual fund investing involves risk; principal loss is possible. |
| |
| NOT FDIC INSURED NO BANK GUARANTEE MAY LOSE VALUE |
Message to SHAREHOLDERS November 14, 2005
Dear Shareholders:
We invite you to take a few minutes to review the results of the fiscal year ended September 30, 2005.
This report includes comparative performance graphs and tables, portfolio commentaries, complete listings of portfolio holdings, and additional fund information. We hope you will find this helpful in monitoring your investment portfolio.
Also, through our website, firstamericanfunds.com, we provide quarterly performance fact sheets on all First American Funds, the economic outlook as viewed by our senior investment officers, and other information about fund investments and portfolio strategies.
Please contact your financial professional if you have questions about First American Funds or contact First American Investor Services at 800.677.FUND.
We appreciate your investment with First American Funds and look forward to serving your financial needs in the future.
Sincerely,
/s/ Virginia L. Stringer | | /s/ Thomas S. Schreier, Jr. | |
| |
Virginia L. Stringer | Thomas S. Schreier, Jr. |
Chairperson of the Board | President |
First American Investment Funds, Inc. | First American Investment Funds, Inc. |
FIRST AMERICAN FUNDS Annual Report 2004
1
Equity Index fund
Investment Objective: to provide investment results that correspond to the performance of the Standard & Poor's 500 Composite Index ("S&P 500 Composite Index")
How did the fund perform for the fiscal year ended September 30, 2005?
The First American Equity Index Fund (the "fund"), Class Y shares, returned 11.92% for the fiscal year ended September 30, 2005 (Class A shares returned 11.69% without taking the sales charge into account). By comparison, the fund's benchmark, the S&P 500 Composite Index*, returned 12.25% for the same period.
How did general economic and market conditions affect performance?
Economic growth moderated but nevertheless continued at a solid pace over the course of the fiscal year. Solid economic growth, in turn, improved labor market conditions. While core inflation has been basically stable at a relatively low level, overall inflation has risen with the continuing climb of energy prices during the past year. The combination of solid growth, lower unemployment, and the potential for higher energy prices to be reflected by broader inflation measures has kept the Fed incrementally raising the Fed Funds Rate at each Federal Open Market Committee meeting since June 2004. The corporate sector of the economy has performed very well in this economic environment, with operating earnings up sharply through the third quarter of 2005. The energy sector proved a standout, making the most substantial contribution to the fund's performance.
While stocks in general were up in excess of their long-term historical averages, mid- and small-capitalization stocks generally outperformed large-capitalization stocks as they were more leveraged to the growing economy. The S&P 500 Composite Index, constructed of large-cap stocks, lagged somewhat behind the mid- and small- cap indices but still experienced positive returns of more than 12%.
Underlying economic conditions remain generally favorable for the financial markets, although risks have risen with energy prices and the widespread disruption to activity from Hurricanes Katrina and Rita.
Fund Overview
The fund is invested to replicate the S&P 500 Composite Index as closely as possible with consideration to turnover costs and fees. As a result, the fund performed very similarly to the index. The index includes 500 leading companies in the leading industries of the U.S. economy and covers about 75% of the dollar value of all traded stocks in the U.S. market.
During the fiscal year, Standard & Poor's modified its methodology: rather than counting all shares outstanding of a particular stock, the index now counts only the freely traded "float" shares outstanding. Since insiders often have significant impediments to trading even if the stock appears over or undervalued, tracking holdings of independent investors (i.e., noninsiders) allows the index to better reflect the consensus judgment of the potential benefit of holding a specific company's stock.
Like the index, the fund benefited from strong performance by the energy sector, which had a total return of 48%. Of the 29 company stocks currently in the energy sector, seven more than doubled in price and none had a total return of less than 24%. In keeping with the developments in the energy market, the small utilities sector rose 39%, primarily on the performance of independent power producers.
Last year's top performer, the consumer discretionary sector, proved the largest detractor from performance during this fiscal period, with a total return of 5% for the year. Although the economy was growing steadily and consumer spending remained robust, the sector was weakened chiefly because it contained two of the three worst performing industries, automobiles and auto components (the third was leisure equipment and products).
*Unlike mutual funds, index returns do not reflect any expenses, transaction costs, or cash flow effects.
| Top 10 Holdings as of September 30, 20051 (% of net assets) | |
| Exxon Mobil | | | 3.6 | % | |
| General Electric | | | 3.2 | % | |
| Microsoft | | | 2.1 | % | |
| Citigroup | | | 2.1 | % | |
| Pfizer | | | 1.7 | % | |
| Johnson & Johnson | | | 1.7 | % | |
| Bank of America | | | 1.5 | % | |
| American International Group | | | 1.4 | % | |
| Intel | | | 1.4 | % | |
| Altria Group | | | 1.4 | % | |
| Sector Allocation as of September 30, 20051 (% of net assets) | |
| Financials | | | 19.7 | % | |
| Information Technology | | | 15.6 | % | |
| Heath Care | | | 13.0 | % | |
| Industrials | | | 11.1 | % | |
| Consumer Discretionary | | | 10.1 | % | |
| Energy | | | 10.1 | % | |
| Consumer Staples | | | 9.6 | % | |
| Utilities | | | 3.5 | % | |
| Telecommunication Services | | | 3.0 | % | |
| Materials | | | 2.9 | % | |
| Short Term Investments | | | 1.5 | % | |
| Other Assets and Liabilities, Net | | | (0.1 | )% | |
| | | | 100.0 | % | |
1Fund holdings and sector allocations are subject to change at any time and are not recommendations to buy or sell any security.
FIRST AMERICAN FUNDS Annual Report 2005
2
Equity Index fund continued
Annual Performance1 as of September 30, 2005
| | | | | | | | | Since Inception | |
| | | 1 year | | 5 years | | 10 years | | 2/01/1999 | | 9/24/2001 | |
| Average annual return with sales charge (POP) | | | |
| Class A | | | 5.54 | % | | | (3.11 | )% | | | 8.25 | % | | | - | | | | - | | |
| Class B | | | 5.86 | % | | | (3.10 | )% | | | 8.06 | % | | | - | | | | - | | |
| Class C | | | 9.84 | % | | | (2.75 | )% | | | - | | | | (0.37 | )% | | | - | | |
| Average annual return without sales charge (NAV) | | | |
| Class A | | | 11.69 | % | | | (2.00 | )% | | | 8.86 | % | | | - | | | | - | | |
| Class B | | | 10.86 | % | | | (2.73 | )% | | | 8.06 | % | | | - | | | | - | | |
| Class C | | | 10.84 | % | | | (2.75 | )% | | | - | | | | (0.37 | )% | | | - | | |
| Class R | | | 11.38 | % | | | - | | | | - | | | | - | | | | 6.31 | % | |
| Class Y | | | 11.92 | % | | | (1.76 | )% | | | 9.13 | % | | | - | | | | - | | |
| S&P 500 Composite Index2 | | | 12.25 | % | | | (1.49 | )% | | | 9.49 | % | | | 1.00 | % | | | 7.00 | % | |
Value of $10,000 Investment1, 3 as of September 30, 2005
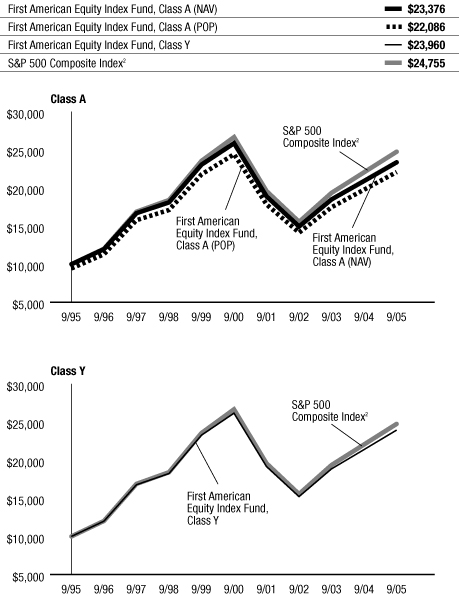
The performance data quoted on this page represents past performance and does not guarantee future results. The investment return and principal value of an investment will fluctuate so that an investor's shares, when redeemed, may be worth more or less than their original cost. Current performance of the Fund may be lower or higher than the performance data quoted. Performance data current to the most recent month-end may be obtained by calling 800.677.FUND.
1 Performance does not reflect the deduction of taxes that a shareholder would pay on fund distributions or redemption of fund shares. Investment performance reflects fee waivers that are or were in effect. In the absence of such fee waivers, total returns would be reduced. Index performance is for illustrative purposes only and does not reflect any expenses, transaction costs, or cash flow effects. Direct investment in the index is not available.
Total returns at net asset value ("NAV") reflect performance over the time period indicated without including the fund's maximum sales charge and assume reinvestment of all distributions at NAV.
Total returns at public offering price ("POP") reflect performance over the time period indicated including a maximum front-end sales charge of 5.50% for Class A shares and the maximum contingent deferred sales charge ("CDSC") for Class B and Class C shares for the relevant period. Maximum CDSC is 5.00% for Class B shares, decreasing annually to 0% in the seventh year following purchase, and 1.00% for Class C shares. Total returns assume reinvestment of all distributions at NAV.
2 An unmanaged index of large-capitalization stocks that includes a representative sample of 500 leading companies in leading industries of the U.S. economy. Although the S&P 500 focuses on the large-cap segment of the market, with over 80% coverage of U.S. equities, it also serves as a proxy for the total market.
3 Performance for Class B, Class C, and Class R shares is not presented. Performance for these classes will vary due to different expense structures.
The charts above illustrate the total value of an assumed $10,000 investment in the fund's Class A and Class Y shares (from 9/30/1995 to 9/30/2005) as compared to the S&P 500 Composite Index.2
FIRST AMERICAN FUNDS Annual Report 2005
3
Equity Index fund continued
Expense Example
As a shareholder of the Equity Index Fund (the "fund"), you incur two types of costs: (1) transaction costs, including sales charges (loads) on purchase payments; and (2) ongoing costs, including advisory fees; distribution and/or service (12b-1) fees; and other fund expenses. This example is intended to help you understand your ongoing costs (in dollars) of investing in the fund and to compare these costs with the ongoing costs of investing in other mutual funds. The example is based on an investment of $1,000 invested at the beginning of the period and held for the entire period from April 1, 2005, to September 30, 2005.
Actual Expenses
For each class, the first line of the table below provides information about actual account values and actual expenses. You may use the information in this line, together with the amount you invested, to estimate the expenses that you paid over the period. Simply divide your account value by $1,000 (for example, an $8,600 account value divided by $1,000 = 8.6), then multiply the result by the number in the first line under the heading entitled "Expenses Paid During Period" to estimate the expenses you paid on your account during this period.
Hypothetical Example for Comparison Purposes
For each class, the second line of the table below provides information about hypothetical account values and hypothetical expenses based on the fund's actual expense ratio and an assumed rate of return of 5% per year before expenses, which is not the fund's actual return. The hypothetical account values and expenses may not be used to estimate the actual ending account balance or expenses you paid for the period. You may use this information to compare the ongoing costs of investing in the fund and other funds. To do so, compare this 5% hypothetical example with the 5% hypothetical examples that appear in the shareholder reports of the other funds.
Please note that the expenses shown in the table are meant to highlight your ongoing costs only and do not reflect any transactional costs, such as sales charges (loads). Therefore, the second line of the table for each class is useful in comparing ongoing costs only, and will not help you determine the relative total costs of owning different funds. In addition, if these transactional costs were included, your costs would have been higher.
Expense Examples
| | | Beginning Account
Value (4/01/05) | | Ending Account
Value (9/30/05) | | Expenses Paid During
Period1 (4/01/05 to
9/30/05) | |
| Class A Actual2 | | $ | 1,000.00 | | | $ | 1,047.60 | | | $ | 3.18 | | |
| Class A Hypothetical (5% return before expenses) | | $ | 1,000.00 | | | $ | 1,021.96 | | | $ | 3.14 | | |
| Class B Actual2 | | $ | 1,000.00 | | | $ | 1,043.80 | | | $ | 7.02 | | |
| Class B Hypothetical (5% return before expenses) | | $ | 1,000.00 | | | $ | 1,018.20 | | | $ | 6.93 | | |
| Class C Actual2 | | $ | 1,000.00 | | | $ | 1,043.60 | | | $ | 7.02 | | |
| Class C Hypothetical (5% return before expenses) | | $ | 1,000.00 | | | $ | 1,018.20 | | | $ | 6.93 | | |
| Class R Actual2 | | $ | 1,000.00 | | | $ | 1,046.00 | | | $ | 4.46 | | |
| Class R Hypothetical (5% return before expenses) | | $ | 1,000.00 | | | $ | 1,020.71 | | | $ | 4.41 | | |
| Class Y Actual2 | | $ | 1,000.00 | | | $ | 1,048.40 | | | $ | 1.90 | | |
| Class Y Hypothetical (5% return before expenses) | | $ | 1,000.00 | | | $ | 1,023.21 | | | $ | 1.88 | | |
1 Expenses are equal to the fund's annualized expense ratio for the most recent six-month period of 0.62%, 1.37%, 1.37%, 0.87% and 0.37% for Class A, Class B, Class C, Class R and Class Y, respectively, multiplied by the average account value over the period, multiplied by the number of days in the most recent half-year/365 days (to reflect the one-half year period).
2 Based on the actual returns for the six months ended September 30, 2005: 4.76% for Class A, 4.38% for Class B, 4.36% for Class C, 4.60% for Class R, and 4.84% for Class Y.
FIRST AMERICAN FUNDS Annual Report 2005
4
Mid Cap Index fund
Investment Objective: to provide investment results that correspond to the performance of the Standard & Poor's MidCap 400 Composite Index ("S&P MidCap 400 Index")
How did the fund perform for the fiscal year ended September 30, 2005?
The First American Mid Cap Index Fund (the "fund"), Class Y shares, returned 21.82% for the fiscal year ended September 30, 2005 (Class A shares returned 21.43% without taking the sales charge into account). By comparison, the fund's benchmark, the S&P MidCap 400 Index*, returned 22.16% for the same period.
How did general economic and market conditions affect performance?
Economic growth moderated but nevertheless continued at a solid pace over the course of the fiscal year. Solid economic growth, in turn, improved labor market conditions. While core inflation has been basically stable at a relatively low level, overall inflation has risen with the continuing climb of energy prices during the past year. The combination of solid growth, lower unemployment, and the potential for higher energy prices to be reflected by broader inflation measures has kept the Fed incrementally raising the Fed Funds Rate at each Federal Open Market Committee meeting since June 2004. The corporate sector of the economy has performed very well in this economic environment, with operating earnings up sharply through the third quarter of 2005. The energy sector proved a standout, making the most substantial contribution to the fund's performance.
While stocks in general were up in excess of their long-term historical averages, the fund benefited from the fact that mid- and small-capitalization stocks generally outperformed large-capitalization stocks as they were more leveraged to the growing economy. The S&P MidCap 400 Index, constructed of stocks in the middle range of company size (companies with market capitalizations between $1.5 billion to $5 billion) reflected this performance, returning more than 22% for the fiscal year.
Underlying economic conditions remain generally favorable for the financial markets, although risks have risen with energy prices and the widespread disruption to activity from Hurricanes Katrina and Rita.
Fund Overview
The fund is invested to replicate the S&P MidCap 400 Index closely before fees, while attempting to reduce turnover costs. As a result, the fund performed very similarly to that index. The index includes stocks that reflect the risk and return characteristics of the broader mid-cap universe. Mid-cap stocks are now being recognized as an independent asset class and the capitalization range of this index covers about 10% of the U.S. equities market.
During the fiscal year, the largest contributor to performance for the fund was the energy sector, which had, on an average, a weighting of 9% and a total return of 61%. Other contributors to the fund's performance were the consumer staples and utilities sectors, which performed better than the overall index.
The telecommunications sector, in which the fund had a small position, experienced the worst overall performance, falling 2.5% during the fiscal year.
*Unlike mutual funds, index returns do not reflect any expenses, transaction costs, or cash flow effects.
| Top 10 Holdings as of September 30, 20051 (% of net assets) | |
| Legg Mason | | | 1.1 | % | |
| Peabody Energy | | | 1.0 | % | |
| Whole Foods Market | | | 0.8 | % | |
| SanDisk | | | 0.8 | % | |
| Noble Energy | | | 0.8 | % | |
| Lennar | | | 0.7 | % | |
| Pioneer Natural Resources | | | 0.7 | % | |
| Fidelity National Financial | | | 0.7 | % | |
| Questar | | | 0.7 | % | |
| ENSCO International | | | 0.7 | % | |
| Sector Allocation as of September 30, 20051 (% of net assets) | |
| Financials | | | 17.9 | % | |
| Consumer Discretionary | | | 15.6 | % | |
| Information Technology | | | 14.6 | % | |
| Industrials | | | 13.4 | % | |
| Health Care | | | 12.0 | % | |
| Utilities | | | 8.0 | % | |
| Energy | | | 7.7 | % | |
| Materials | | | 5.7 | % | |
| Consumer Staples | | | 3.3 | % | |
| Short Term Investments | | | 1.6 | % | |
| Telecommunication Services | | | 0.5 | % | |
| Other Assets and Liabilities, Net | | | (0.3 | )% | |
| | | | 100.0 | % | |
1Fund holdings and sector allocations are subject to change at any time and are not recommendations to buy or sell any security.
FIRST AMERICAN FUNDS Annual Report 2005
5
Mid Cap Index fund continued
Annual Performance1 as of September 30, 2005
| | | | | | | Since Inception | |
| | | 1 year | | 5 year | | 11/04/1999 | | 11/27/2000 | | 9/24/2001 | |
| Average annual return with sales charge (POP) | | | |
| Class A | | | 14.75 | % | | | 4.79 | % | | | 8.93 | % | | | - | | | | - | | |
| Class B | | | 15.57 | % | | | 4.92 | % | | | 9.09 | % | | | - | | | | - | | |
| Class C | | | 19.60 | % | | | - | | | | - | | | | - | | | | 13.91 | % | |
| Average annual return without sales charge (NAV) | | | |
| Class A | | | 21.43 | % | | | 5.99 | % | | | 9.97 | % | | | - | | | | - | | |
| Class B | | | 20.57 | % | | | 5.25 | % | | | 9.20 | % | | | - | | | | - | | |
| Class C | | | 20.60 | % | | | - | | | | - | | | | - | | | | 13.91 | % | |
| Class R | | | 21.09 | % | | | - | | | | - | | | | 7.63 | % | | | - | | |
| Class Y | | | 21.82 | % | | | 6.27 | % | | | 10.24 | % | | | - | | | | - | | |
| S&P MidCap 400 Index2 | | | 22.16 | % | | | 7.05 | % | | | 11.17 | % | | | 8.73 | % | | | 15.69 | % | |
Value of $10,000 Investment1, 3 as of September 30, 2005
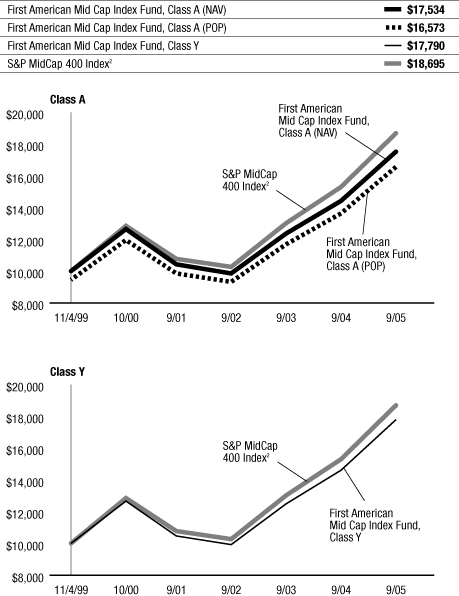
The charts above illustrate the total value of an assumed $10,000 investment in the fund's Class A and Class Y shares (from 11/4/1999 to 9/30/2005) as compared to the S&P MidCap 400 Index.2
The performance data quoted on this page represents past performance and does not guarantee future results. The investment return and principal value of an investment will fluctuate so that an investor's shares, when redeemed, may be worth more or less than their original cost. Current performance of the fund may be lower or higher than the performance data quoted. Performance data current to the most recent month-end may be obtained by calling 800.677.FUND.
1 Performance does not reflect the deduction of taxes that a shareholder would pay on fund distributions or redemption of fund shares. Investment performance reflects fee waivers that are or were in effect. In the absence of such fee waivers, total returns would be reduced. Index performance is for illustrative purposes only and does not reflect any expenses, transaction costs, or cash flow effects. Direct investment in the index is not available.
Stocks of mid-capitalization companies may be slightly less volatile than those of small-capitalization companies, but they still involve substantial risk and may be subject to increased volatility and more price fluctuation than large-capitalization companies.
Total returns at net asset value ("NAV") reflect performance over the time period indicated without including the fund's maximum sales charge and assume reinvestment of all distributions at NAV.
Total returns at public offering price ("POP") reflect performance over the time period indicated including a maximum front-end sales charge of 5.50% for Class A shares and the maximum contingent deferred sales charge ("CDSC") for Class B and Class C shares for the relevant period. Maximum CDSC is 5.00% for Class B shares, decreasing annually to 0% in the seventh year following purchase, and 1.00% for Class C shares. Total returns assume reinvestment of all distributions at NAV.
On September 24, 2001, the Mid Cap Index Fund became the successor by merger to the Firstar MidCap Index Fund, a series of the Firstar Funds, Inc. Prior to the merger, the First American Fund had no assets or liabilities. Performance presented prior to September 24, 2001, represents that of the Firstar MidCap Index Fund.
2 An unmanaged, capitalization-weighted index that represents the aggregate market value of the common equity of 400 companies chosen by Standard & Poor's with a median capitalization of approximately $700 million to measure the performance of the mid-range sector of the U.S. stock market.
3 Performance for Class B, Class C, and Class R shares is not presented. Performance for these classes will vary due to different expense structures.
FIRST AMERICAN FUNDS Annual Report 2005
6
Mid Cap Index fund continued
Expense Example
As a shareholder of the Mid Cap Index Fund (the "fund"), you incur two types of costs: (1) transaction costs, including sales charges (loads) on purchase payments; and (2) ongoing costs, including advisory fees; distribution and/or service (12b-1) fees; and other fund expenses. This example is intended to help you understand your ongoing costs (in dollars) of investing in the fund and to compare these costs with the ongoing costs of investing in other mutual funds. The example is based on an investment of $1,000 invested at the beginning of the period and held for the entire period from April 1, 2005, to September 30, 2005.
Actual Expenses
For each class, the first line of the table below provides information about actual account values and actual expenses. You may use the information in this line, together with the amount you invested, to estimate the expenses that you paid over the period. Simply divide your account value by $1,000 (for example, an $8,600 account value divided by $1,000 = 8.6), then multiply the result by the number in the first line under the heading entitled "Expenses Paid During Period" to estimate the expenses you paid on your account during this period.
Hypothetical Example for Comparison Purposes
For each class, the second line of the table below provides information about hypothetical account values and hypothetical expenses based on the fund's actual expense ratio and an assumed rate of return of 5% per year before expenses, which is not the fund's actual return. The hypothetical account values and expenses may not be used to estimate the actual ending account balance or expenses you paid for the period. You may use this information to compare the ongoing costs of investing in the fund and other funds. To do so, compare this 5% hypothetical example with the 5% hypothetical examples that appear in the shareholder reports of the other funds.
Please note that the expenses shown in the table are meant to highlight your ongoing costs only and do not reflect any transactional costs, such as sales charges (loads). Therefore, the second line of the table for each class is useful in comparing ongoing costs only, and will not help you determine the relative total costs of owning different funds. In addition, if these transactional costs were included, your costs would have been higher.
Expense Examples
| | | Beginning Account
Value (4/01/05) | | Ending Account
Value (9/30/05) | | Expenses Paid During
Period1 (4/01/05 to
9/30/05) | |
| Class A Actual2 | | $ | 1,000.00 | | | $ | 1,091.20 | | | $ | 3.93 | | |
| Class A Hypothetical (5% return before expenses) | | $ | 1,000.00 | | | $ | 1,021.31 | | | $ | 3.80 | | |
| Class B Actual2 | | $ | 1,000.00 | | | $ | 1,087.60 | | | $ | 7.85 | | |
| Class B Hypothetical (5% return before expenses) | | $ | 1,000.00 | | | $ | 1,017.55 | | | $ | 7.59 | | |
| Class C Actual2 | | $ | 1,000.00 | | | $ | 1,087.30 | | | $ | 7.85 | | |
| Class C Hypothetical (5% return before expenses) | | $ | 1,000.00 | | | $ | 1,017.55 | | | $ | 7.59 | | |
| Class R Actual2 | | $ | 1,000.00 | | | $ | 1,089.60 | | | $ | 5.24 | | |
| Class R Hypothetical (5% return before expenses) | | $ | 1,000.00 | | | $ | 1,020.05 | | | $ | 5.05 | | |
| Class Y Actual2 | | $ | 1,000.00 | | | $ | 1,092.40 | | | $ | 2.62 | | |
| Class Y Hypothetical (5% return before expenses) | | $ | 1,000.00 | | | $ | 1,022.56 | | | $ | 2.54 | | |
1 Expenses are equal to the fund's annualized expense ratio for the most recent six-month period of 0.75%, 1.50%, 1.50%, 1.00% and 0.50% for Class A, Class B, Class C, Class R and Class Y, respectively, multiplied by the average account value over the period, multiplied by the number of days in the most recent half-year/365 days (to reflect the one-half year period).
2 Based on the actual returns for the six months ended September 30, 2005: 9.12% for Class A, 8.76% for Class B, 8.73% for Class C, 8.96% for Class R, and 9.24% for Class Y.
FIRST AMERICAN FUNDS Annual Report 2005
7
Small Cap Index fund
Investment Objective: to provide investment results that correspond to the performance of the Russell 2000 Index
How did the fund perform for the fiscal year ended September 30, 2005?
The First American Small Cap Index Fund (the "fund"), Class Y shares, returned 16.93% for the fiscal year ended September 30, 2005 (Class A shares returned 17.08% without taking the sales charge into account). By comparison, the fund's benchmark, the Russell 2000 Index*, returned 17.95% for the same period.
How did general economic and market conditions affect performance?
Economic growth moderated but nevertheless continued at a solid pace over the course of the fiscal year. Solid economic growth, in turn, improved labor market conditions. While core inflation has been basically stable at a relatively low level, overall inflation has risen with the continuing climb of energy prices during the past year. The combination of solid growth, lower unemployment, and the potential for higher energy prices to be reflected by broader inflation measures has kept the Fed incrementally raising the Fed Funds Rate at each Federal Open Market Committee meeting since June 2004. The corporate sector of the economy has performed very well in this economic environment, with operating earnings up sharply through the third quarter of 2005. The energy sector proved a standout, making the most substantial contribution to the fund's performance.
While stocks in general were up in excess of their long-term historical averages, the fund benefited from the fact that mid- and small-capitalization stocks generally outperformed large-capitalization stocks as they were more leveraged to the growing economy. The Russell 2000 Index, constructed of small-cap stocks, reflected this performance, returning more than 17% for the fiscal year.
Underlying economic conditions remain generally favorable for the financial markets, although risks have risen with energy prices and the widespread disruption to activity from Hurricanes Katrina and Rita.
Fund Overview
The fund is invested to replicate the Russell 2000 Index as closely as possible with consideration to turnover costs and fees. The index includes the traded shares of U.S. companies ranked 1,001 through 3,000 in size, thereby skipping large- and mid-capitalization names in the list of investable companies. When Russell "re-constitutes" its list to reflect changes in company size (in late June of each year), the index incurs turnover in excess of 25%.
Unlike the index, the fund must pay transactions costs to adjust its holdings. From these costs – and from management's efforts to reduce them by updating holdings at slightly different dates than other index managers were selling and buying the same names – the fund's performance lagged slightly behind the index.
The fund's 6% weighting in the energy sector helped it take advantage of a very strong performance in that area. During the fiscal year, the sector rose 74%, with many of the smaller, independent producers more than doubling in price. The fund also benefited from exposure to industrials, with a 14% weighting, mainly due to the strong performance of the construction and engineering industries.
Last year's top performer, the consumer discretionary sector, proved the largest detractor from performance during this fiscal period, with a total return of 10.5% for the year. Although the economy was growing steadily and consumer spending remained robust, the sector was weakened chiefly because it contained two of the three worst performing industries, automobiles and auto components (the third was leisure equipment and products).
*Unlike mutual funds, index returns do not reflect any expenses, transaction costs, or cash flow effects.
| Top 10 Holdings as of September 30, 20051 (% of net assets) | |
| Cimarex Energy | | | 0.3 | % | |
| Amylin Pharmaceuticals | | | 0.3 | % | |
| Cabot Oil & Gas | | | 0.2 | % | |
| Intuitive Surgical | | | 0.2 | % | |
| Cal Dive International | | | 0.2 | % | |
| Frontier Oil | | | 0.2 | % | |
| York International | | | 0.2 | % | |
| Eagle Materials | | | 0.2 | % | |
| Vertex Pharmaceuticals | | | 0.2 | % | |
| Jarden | | | 0.2 | % | |
| Sector Allocation as of September 30, 20051 (% of net assets) | |
| Financials | | | 21.4 | % | |
| Information Technology | | | 17.9 | % | |
| Industrials | | | 14.9 | % | |
| Consumer Discretionary | | | 14.1 | % | |
| Heath Care | | | 12.8 | % | |
| Energy | | | 6.6 | % | |
| Materials | | | 4.7 | % | |
| Consumer Staples | | | 2.8 | % | |
| Utilities | | | 2.7 | % | |
| Telecommunication Services | | | 1.3 | % | |
| Short Term Investments | | | 0.7 | % | |
| Other Assets and Liabilities, Net | | | 0.1 | % | |
| | | | 100.0 | % | |
1Fund holdings and sector allocations are subject to change at any time and are not recommendations to buy or sell any security.
FIRST AMERICAN FUNDS Annual Report 2005
8
Small Cap Index fund continued
Annual Performance1 as of September 30, 2005
| | | | | | | Since Inception | |
| | | 1 year | | 5 years | | 12/30/1998 | | 12/11/2000 | | 9/24/2001 | |
| Average annual return with sales charge (POP) | |
| Class A | | | 10.63 | % | | | 6.40 | % | | | 8.03 | % | | | - | | | | - | | |
| Class B | | | 10.82 | % | | | - | | | | - | | | | 6.92 | % | | | - | | |
| Class C | | | 14.84 | % | | | - | | | | - | | | | - | | | | 12.96 | % | |
| Average annual return without sales charge (NAV) | |
| Class A | | | 17.08 | % | | | 7.61 | % | | | 8.93 | % | | | - | | | | - | | |
| Class B | | | 15.82 | % | | | - | | | | - | | | | 7.24 | % | | | - | | |
| Class C | | | 15.84 | % | | | - | | | | - | | | | - | | | | 12.96 | % | |
| Class R | | | 16.45 | % | | | 7.44 | % | | | 8.75 | % | | | - | | | | - | | |
| Class Y | | | 16.93 | % | | | 7.81 | % | | | 9.12 | % | | | - | | | | - | | |
| Russell 2000 Index2 | | | 17.95 | % | | | 6.44 | % | | | 8.81 | % | | | 8.18 | % | | | 15.51 | % | |
Value of $10,000 Investment1, 3 as of September 30, 2005
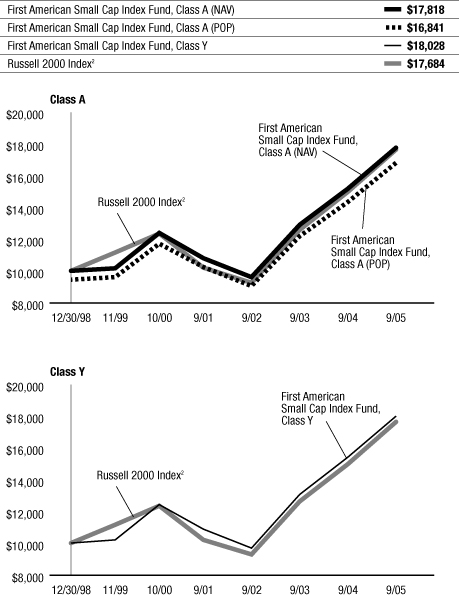
The charts above illustrate the total value of an assumed $10,000 investment in the funds Class A and Class Y shares (from 12/30/1998 to 9/30/2005) as compared to the Russell 2000 Index.2
The performance data quoted on this page represents past performance and does not guarantee future results. The investment return and principal value of an investment will fluctuate so that an investor's shares, when redeemed, may be worth more or less than their original cost. Current performance of the fund may be lower or higher than the performance data quoted. Performance data current to the most recent month-end may be obtained by calling 800.677.FUND.
1 Performance does not reflect the deduction of taxes that a shareholder would pay on fund distributions or redemption of fund shares. Investment performance reflects fee waivers that are or were in effect. In the absence of such fee waivers, total returns would be reduced. Index performance is for illustrative purposes only and does not reflect any expenses, transaction costs, or cash flow effects. Direct investment in the index is not available.
Stocks of small-capitalization companies involve substantial risk. These stocks historically have experienced greater price volatility than stocks of larger companies, and they may be expected to do so in the future.
Total returns at net asset value ("NAV") reflect performance over the time period indicated without including the fund's maximum sales charge and assume reinvestment of all distributions at NAV.
Total returns at public offering price ("POP") reflect performance over the time period indicated including a maximum front-end sales charge of 5.50% for Class A shares and the maximum contingent deferred sales charge ("CDSC") for Class B and Class C shares for the relevant period. Maximum CDSC is 5.00% for Class B shares, decreasing annually to 0% in the seventh year following purchase, and 1.00% for Class C shares. Total returns assume reinvestment of all distributions at NAV.
On September 24, 2001, the Small Cap Index Fund became the successor by merger to the Firstar Small Cap Index Fund, a series of the Firstar Funds, Inc. Prior to the merger, the First American Fund had no assets or liabilities. Performance presented prior to September 24, 2001, represents that of the Firstar Small Cap Index Fund. The Firstar Small Cap Index Fund was organized on December 11, 2000, and, prior to that, was a separate series of Mercantile Mutual Funds, Inc.
2 An unmanaged index that measures the performance of the 2,000 smallest companies in the Russell 3000 Index. The Russell 3000 Index measures the performance of the 3,000 largest U.S. companies based on total market capitalization, which represents approximately 98% of the investable U.S. equity market.
3 Performance for Class B, Class C, and Class R shares is not presented. Performance for these classes will vary due to different expense structures.
FIRST AMERICAN FUNDS Annual Report 2005
9
Small Cap Index fund continued
Expense Example
As a shareholder of the Small Cap Index Fund, you incur two types of costs: (1) transaction costs, including sales charges (loads) on purchase payments; and (2) ongoing costs, including advisory fees; distribution and/or service (12b-1) fees; and other fund expenses. This example is intended to help you understand your ongoing costs (in dollars) of investing in the fund and to compare these costs with the ongoing costs of investing in other mutual funds. The example is based on an investment of $1,000 invested at the beginning of the period and held for the entire period from April 1, 2005, to September 30, 2005.
Actual Expenses
For each class, the first line of the table below provides information about actual account values and actual expenses. You may use the information in this line, together with the amount you invested, to estimate the expenses that you paid over the period. Simply divide your account value by $1,000 (for example, an $8,600 account value divided by $1,000 = 8.6), then multiply the result by the number in the first line under the heading entitled "Expenses Paid During Period" to estimate the expenses you paid on your account during this period.
Hypothetical Example for Comparison Purposes
For each class, the second line of the table below provides information about hypothetical account values and hypothetical expenses based on the fund's actual expense ratio and an assumed rate of return of 5% per year before expenses, which is not the fund's actual return. The hypothetical account values and expenses may not be used to estimate the actual ending account balance or expenses you paid for the period. You may use this information to compare the ongoing costs of investing in the fund and other funds. To do so, compare this 5% hypothetical example with the 5% hypothetical examples that appear in the shareholder reports of the other funds.
Please note that the expenses shown in the table are meant to highlight your ongoing costs only and do not reflect any transactional costs, such as sales charges (loads). Therefore, the second line of the table for each class is useful in comparing ongoing costs only, and will not help you determine the relative total costs of owning different funds. In addition, if these transactional costs were included, your costs would have been higher.
Expense Examples
| | | Beginning Account
Value (4/01/05) | | Ending Account
Value (9/30/05) | | Expenses Paid During
Period1 (4/01/05 to
9/30/05) | |
| Class A Actual2,3 | | $ | 1,000.00 | | | $ | 1,085.70 | | | $ | 4.60 | | |
| Class A Hypothetical (5% return before expenses) | | $ | 1,000.00 | | | $ | 1,020.66 | | | $ | 4.46 | | |
| Class B Actual2,3 | | $ | 1,000.00 | | | $ | 1,081.40 | | | $ | 8.50 | | |
| Class B Hypothetical (5% return before expenses) | | $ | 1,000.00 | | | $ | 1,016.90 | | | $ | 8.24 | | |
| Class C Actual2,3 | | $ | 1,000.00 | | | $ | 1,081.50 | | | $ | 8.50 | | |
| Class C Hypothetical (5% return before expenses) | | $ | 1,000.00 | | | $ | 1,016.90 | | | $ | 8.24 | | |
| Class R Actual2,3 | | $ | 1,000.00 | | | $ | 1,085.20 | | | $ | 5.91 | | |
| Class R Hypothetical (5% return before expenses) | | $ | 1,000.00 | | | $ | 1,019.40 | | | $ | 5.72 | | |
| Class Y Actual2,3 | | $ | 1,000.00 | | | $ | 1,087.00 | | | $ | 3.29 | | |
| Class Y Hypothetical (5% return before expenses) | | $ | 1,000.00 | | | $ | 1,021.91 | | | $ | 3.19 | | |
1 Expenses are equal to the fund's annualized expense ratio for the most recent six-month period of 0.88%, 1.63%, 1.63%, 1.13% and 0.63% for Class A, Class B, Class C, Class R and Class Y, respectively, multiplied by the average account value over the period, multiplied by the number of days in the most recent fiscal half-year/365 (to reflect the one-half year period).
2 Based on the actual returns for the six months ended September 30, 2005: 8.57% Class A, 8.14% Class B, 8.15% Class C, 8.52% Class R, and 8.70% for Class Y, respectively.
3 Prior to July 1, 2005 the contractual limitation on annual expenses was 0.93%, 1.68%, 1.68%, 1.18%, and 0.68% for Class A, Class B, Class C, Class R, and Class Y, respectively. Effective July 1, 2005, the contractual limitation on annual expenses for Class A, Class B, Class C, Class R, and Class Y was lowered to 0.83%, 1.58%, 1.58%, 1.08%, and 0.58%, respectively. If this new limitation had been in place during the entire period, actual and hypothetical ending account balances would hav e been $1,085.96 and $1,020.91 for Class A, $1,081.66 and $1,017.15 for Class B, $1,081.76 and $1,017.15 for Class C, $1,085.46 and $1,019.65 for Class R, and $1,087.26 and $1,022.16 for Class Y, and the actual and hypothetical expenses paid during the period would have been approximately $4.34 and $4.20 for Class A, $8.24 and $7.99 for Class B, $8.24 and $7.99 for Class C, $5.65 and $5.47 for Class R, and $3.03 and $2.94 for Class Y.
FIRST AMERICAN FUNDS Annual Report 2005
10
Report of Independent Registered Public Accounting Firm
To the Shareholders and Board of Directors
First American Investment Funds, Inc.
We have audited the accompanying statements of assets and liabilities, including the schedules of investments, of the Equity Index, Mid Cap Index, and Small Cap Index Funds (series of First American Investment Funds, Inc.) (the "funds") as of September 30, 2005, and the related statements of operations, statements of changes in net assets and the financial highlights for each of the periods indicated therein, except as noted below. These financial statements and financial highlights are the responsibility of the funds' management. Our responsibility is to express an opinion on these financial statements and financial highlights based on our audits. The financial highlights of the Mid Cap Index and Small Cap Index Funds for the periods presented through October 31, 2000, were audited by other auditors whose report dated December 29, 2000 expressed an unqualified opinion on those financial highlights.
We conducted our audits in accordance with the standards of the Public Company Accounting Oversight Board (United States). Those standards require that we plan and perform the audit to obtain reasonable assurance about whether the financial statements and financial highlights are free of material misstatement. We were not engaged to perform an audit of the funds' internal control over financial reporting. Our audits included consideration of internal control over financial reporting as a basis for designating audit procedures that are appropriate in the circumstances, but not for the purpose of expressing an opinion on the effectiveness of the funds' internal control over financial reporting. Accordingly, we express no such opinion. An audit also includes examining, on a test basis, evidence supporting the amounts and disclosures in the financial statements and financial highlights, assessing the ac counting principles used and significant estimates made by management, and evaluating the overall financial statement presentation. Our procedures included confirmation of securities owned as of September 30, 2005, by correspondence with the custodian and brokers or by other appropriate auditing procedures where replies from brokers were not received. We believe that our audits provide a reasonable basis for our opinion.
In our opinion, the financial statements and financial highlights audited by us as referred to above present fairly, in all material respects, the financial position of the funds listed above of the First American Investment Funds, Inc. at September 30, 2005, the results of their operations for the year then ended, the changes in their net assets for each of the two years in the period then ended and their financial highlights for each of the periods indicated herein in conformity with U.S. generally accepted accounting principles.

Minneapolis, Minnesota
November 18, 2005
FIRST AMERICAN FUNDS Annual Report 2005
11
Schedule of Investments September 30, 2005
Equity Index Fund
| DESCRIPTION | | SHARES | | VALUE (000) | |
| Common Stocks – 98.6% | |
| Consumer Discretionary – 10.1% | |
| AutoNation* (a) | | | 36,590 | | | $ | 731 | | |
| Autozone* | | | 13,254 | | | | 1,103 | | |
| Bed Bath & Beyond* | | | 59,503 | | | | 2,391 | | |
| Best Buy | | | 86,529 | | | | 3,767 | | |
| Big Lots* (a) | | | 23,098 | | | | 254 | | |
| Black & Decker | | | 15,719 | | | | 1,290 | | |
| Brunswick | | | 18,613 | | | | 702 | | |
| Carnival (a) | | | 101,533 | | | | 5,075 | | |
| Centex (a) | | | 25,324 | | | | 1,635 | | |
| Circuit City Stores | | | 41,375 | | | | 710 | | |
| Clear Channel Communications | | | 95,365 | | | | 3,137 | | |
| Coach* | | | 75,306 | | | | 2,362 | | |
| Comcast, Class A* (a) | | | 445,645 | | | | 13,093 | | |
| Cooper Tire & Rubber | | | 12,929 | | | | 197 | | |
| D.R. Horton | | | 53,920 | | | | 1,953 | | |
| Dana (a) | | | 30,366 | | | | 286 | | |
| Darden Restaurants | | | 27,909 | | | | 848 | | |
| Delphi | | | 114,633 | | | | 316 | | |
| Dillards, Class A | | | 14,252 | | | | 298 | | |
| Dollar General (a) | | | 60,055 | | | | 1,101 | | |
| Dow Jones & Company | | | 14,122 | | | | 539 | | |
| Eastman Kodak (a) | | | 56,661 | | | | 1,379 | | |
| Family Dollar Stores | | | 33,838 | | | | 672 | | |
| Federated Department Stores | | | 53,514 | | | | 3,578 | | |
| Ford Motor (a) | | | 371,866 | | | | 3,667 | | |
| Fortune Brands | | | 28,725 | | | | 2,336 | | |
| Gannett (a) | | | 50,184 | | | | 3,454 | | |
| Gap | | | 123,951 | | | | 2,160 | | |
| General Motors (a) | | | 114,260 | | | | 3,497 | | |
| Genuine Parts | | | 34,608 | | | | 1,485 | | |
| Goodyear Tire & Rubber* (a) | | | 35,553 | | | | 554 | | |
| Harley-Davidson | | | 58,672 | | | | 2,842 | | |
| Harrah's Entertainment | | | 31,512 | | | | 2,054 | | |
| Hasbro | | | 31,797 | | | | 625 | | |
| Hilton Hotels | | | 75,458 | | | | 1,684 | | |
| Home Depot (a) | | | 437,526 | | | | 16,687 | | |
| International Game Technology (a) | | | 69,000 | | | | 1,863 | | |
| Interpublic Group of Companies* (a) | | | 84,361 | | | | 982 | | |
| J.C. Penney | | | 53,312 | | | | 2,528 | | |
| Johnson Controls | | | 37,496 | | | | 2,327 | | |
| Jones Apparel Group | | | 24,349 | | | | 694 | | |
| KB HOME (a) | | | 15,656 | | | | 1,146 | | |
| Knight-Ridder (a) | | | 13,733 | | | | 806 | | |
| Kohl's* (a) | | | 62,453 | | | | 3,134 | | |
| Leggett & Platt | | | 37,737 | | | | 762 | | |
| Limited | | | 71,922 | | | | 1,469 | | |
| Liz Claiborne (a) | | | 21,714 | | | | 854 | | |
| Lowe's (a) | | | 153,891 | | | | 9,911 | | |
| Marriott International, Class A (a) | | | 40,271 | | | | 2,537 | | |
| Mattel (a) | | | 81,925 | | | | 1,367 | | |
| Maytag (a) | | | 16,242 | | | | 297 | | |
| McDonald's (a) | | | 252,258 | | | | 8,448 | | |
| McGraw-Hill (a) | | | 75,652 | | | | 3,634 | | |
| New York Times, Class A | | | 29,575 | | | | 880 | | |
| Newell Rubbermaid (a) | | | 54,258 | | | | 1,229 | | |
| News | | | 523,110 | | | | 8,155 | | |
| Nike, Class B (a) | | | 41,949 | | | | 3,426 | | |
| Nordstrom | | | 43,596 | | | | 1,496 | | |
| Office Depot* (a) | | | 61,244 | | | | 1,819 | | |
| Officemax | | | 13,316 | | | | 422 | | |
| Omnicom Group (a) | | | 37,431 | | | | 3,130 | | |
| Pulte | | | 47,080 | | | | 2,021 | | |
| RadioShack | | | 28,263 | | | | 701 | | |
| Reebok International | | | 11,933 | | | | 675 | | |
Equity Index Fund (continued)
| DESCRIPTION | | SHARES | | VALUE (000) | |
| Sears* (a) | | | 20,660 | | | $ | 2,571 | | |
| Sherwin Williams (a) | | | 30,372 | | | | 1,338 | | |
| Snap-On | | | 11,538 | | | | 417 | | |
| Stanley Works (a) | | | 16,419 | | | | 766 | | |
| Staples (a) | | | 149,051 | | | | 3,178 | | |
| Starbucks* (a) | | | 79,976 | | | | 4,007 | | |
| Starwood Hotels & Resorts Worldwide (a) | | | 40,820 | | | | 2,334 | | |
| Target (a) | | | 178,575 | | | | 9,273 | | |
| Tiffany & Company | | | 29,181 | | | | 1,161 | | |
| Time Warner (a) | | | 931,138 | | | | 16,863 | | |
| TJX | | | 95,054 | | | | 1,947 | | |
| Tribune (a) | | | 59,311 | | | | 2,010 | | |
| Univision Communications, Class A* (a) | | | 51,773 | | | | 1,374 | | |
| V.F. (a) | | | 17,498 | | | | 1,014 | | |
| Viacom, Class B (a) | | | 327,178 | | | | 10,800 | | |
| Visteon* | | | 26,057 | | | | 255 | | |
| Walt Disney (a) | | | 404,173 | | | | 9,753 | | |
| Wendy's International | | | 22,437 | | | | 1,013 | | |
| Whirlpool (a) | | | 13,258 | | | | 1,005 | | |
| Yum! Brands | | | 57,664 | | | | 2,792 | | |
| | | | 229,046 | | |
| Consumer Staples – 9.6% | | | |
| Alberto-Culver, Class B | | | 16,946 | | | | 758 | | |
| Albertson's | | | 74,582 | | | | 1,913 | | |
| Altria Group | | | 413,621 | | | | 30,488 | | |
| Anheuser-Busch (a) | | | 158,300 | | | | 6,813 | | |
| Archer-Daniels-Midland | | | 123,753 | | | | 3,052 | | |
| Avon Products | | | 93,416 | | | | 2,522 | | |
| Brown-Forman, Class B | | | 9,846 | | | | 586 | | |
| Campbell Soup | | | 55,814 | | | | 1,660 | | |
| Clorox (a) | | | 30,623 | | | | 1,701 | | |
| Coca-Cola | | | 432,631 | | | | 18,685 | | |
| Coca-Cola Enterprises | | | 47,507 | | | | 926 | | |
| Colgate-Palmolive (a) | | | 105,732 | | | | 5,582 | | |
| ConAgra Foods (a) | | | 104,873 | | | | 2,596 | | |
| Constellation Brands, Class A* (a) | | | 33,200 | | | | 863 | | |
| Costco Wholesale (a) | | | 99,260 | | | | 4,277 | | |
| CVS (a) | | | 158,520 | | | | 4,599 | | |
| General Mills (a) | | | 66,015 | | | | 3,182 | | |
| Gillette | | | 191,880 | | | | 11,167 | | |
| H.J. Heinz | | | 69,550 | | | | 2,541 | | |
| Hershey Foods (a) | | | 43,274 | | | | 2,437 | | |
| Kellogg | | | 57,352 | | | | 2,646 | | |
| Kimberly-Clark | | | 95,057 | | | | 5,659 | | |
| Kroger* | | | 146,178 | | | | 3,010 | | |
| McCormick | | | 27,600 | | | | 901 | | |
| Molson Coors Brewing (a) | | | 15,666 | | | | 1,003 | | |
| Pepsi Bottling (a) | | | 38,883 | | | | 1,110 | | |
| PepsiCo | | | 336,660 | | | | 19,092 | | |
| Procter & Gamble (a) | | | 492,488 | | | | 29,283 | | |
| Reynolds American (a) | | | 17,150 | | | | 1,424 | | |
| Safeway (a) | | | 90,595 | | | | 2,319 | | |
| Sara Lee (a) | | | 156,284 | | | | 2,962 | | |
| SUPERVALU | | | 26,471 | | | | 824 | | |
| Sysco (a) | | | 132,130 | | | | 4,145 | | |
| Tyson Foods, Class A | | | 50,150 | | | | 905 | | |
| UST (a) | | | 33,476 | | | | 1,401 | | |
| Walgreen (a) | | | 203,512 | | | | 8,843 | | |
| Wal-Mart Stores (a) | | | 520,667 | | | | 22,816 | | |
| Wrigley, William Jr. | | | 33,203 | | | | 2,387 | | |
| | | | 217,078 | | |
| Energy – 10.1% | | | |
| Amerada Hess (a) | | | 16,049 | | | | 2,207 | | |
| Anadarko Petroleum (a) | | | 47,624 | | | | 4,560 | | |
| Apache | | | 66,318 | | | | 4,988 | | |
The accompanying notes are an integral part of the financial statements.
FIRST AMERICAN FUNDS Annual Report 2005
12
Equity Index Fund (continued)
| DESCRIPTION | | SHARES | | VALUE (000) | |
| Baker Hughes (a) | | | 68,876 | | | $ | 4,111 | | |
| BJ Services (a) | | | 65,436 | | | | 2,355 | | |
| Burlington Resources | | | 77,894 | | | | 6,334 | | |
| ChevronTexaco (a) | | | 453,961 | | | | 29,385 | | |
| ConocoPhillips | | | 281,328 | | | | 19,668 | | |
| Devon Energy (a) | | | 95,722 | | | | 6,570 | | |
| El Paso (a) | | | 130,237 | | | | 1,810 | | |
| EOG Resources (a) | | | 48,442 | | | | 3,628 | | |
| Exxon Mobil (a) | | | 1,279,042 | | | | 81,270 | | |
| Halliburton (a) | | | 102,195 | | | | 7,002 | | |
| Kerr-McGee | | | 23,525 | | | | 2,285 | | |
| Kinder Morgan (a) | | | 19,226 | | | | 1,849 | | |
| Marathon Oil | | | 70,678 | | | | 4,872 | | |
| Murphy Oil | | | 31,340 | | | | 1,563 | | |
| Nabors Industries* | | | 29,560 | | | | 2,123 | | |
| National-Oilwell Varco* (a) | | | 34,765 | | | | 2,288 | | |
| Noble | | | 27,453 | | | | 1,879 | | |
| Occidental Petroleum | | | 80,474 | | | | 6,875 | | |
| Rowan* (a) | | | 21,883 | | | | 777 | | |
| Schlumberger (a) | | | 119,054 | | | | 10,046 | | |
| Sunoco | | | 27,314 | | | | 2,136 | | |
| Transocean* | | | 69,462 | | | | 4,259 | | |
| Valero Energy (a) | | | 60,810 | | | | 6,875 | | |
| Weatherford International* (a) | | | 28,960 | | | | 1,988 | | |
| Williams (a) | | | 115,342 | | | | 2,889 | | |
| XTO Energy | | | 72,930 | | | | 3,305 | | |
| | | | 229,897 | | |
| Financials – 19.7% | | | |
| ACE | | | 55,940 | | | | 2,633 | | |
| AFLAC (a) | | | 101,587 | | | | 4,602 | | |
| Allstate | | | 138,567 | | | | 7,661 | | |
| Ambac Financial Group (a) | | | 21,529 | | | | 1,551 | | |
| American Express | | | 232,347 | | | | 13,346 | | |
| American International Group | | | 524,330 | | | | 32,487 | | |
| AmSouth Bancorp (a) | | | 69,346 | | | | 1,752 | | |
| AON | | | 64,217 | | | | 2,060 | | |
| Apartment Investment & Management (a) | | | 19,538 | | | | 758 | | |
| Archstone-Smith Trust (a) | | | 40,210 | | | | 1,603 | | |
| Bank of America (a) | | | 814,452 | | | | 34,288 | | |
| Bank of New York | | | 153,539 | | | | 4,516 | | |
| BB&T (a) | | | 107,976 | | | | 4,216 | | |
| Bear Stearns (a) | | | 21,591 | | | | 2,370 | | |
| Capital One Financial (a) | | | 58,293 | | | | 4,635 | | |
| Charles Schwab (a) | | | 202,294 | | | | 2,919 | | |
| Chubb (a) | | | 37,048 | | | | 3,318 | | |
| Cincinnati Financial | | | 31,632 | | | | 1,325 | | |
| CIT Group | | | 40,732 | | | | 1,840 | | |
| Citigroup (a) | | | 1,039,734 | | | | 47,329 | | |
| Comerica (a) | | | 34,690 | | | | 2,043 | | |
| Compass Bancshares | | | 9,660 | | | | 443 | | |
| Countrywide Financial (a) | | | 113,318 | | | | 3,737 | | |
| E*TRADE Financial* | | | 74,620 | | | | 1,313 | | |
| Equity Office Properties Trust (REIT) | | | 82,897 | | | | 2,712 | | |
| Equity Residential Properties Trust (REIT) (a) | | | 57,246 | | | | 2,167 | | |
| Fannie Mae | | | 193,852 | | | | 8,688 | | |
| Federated Investors, Class B | | | 19,160 | | | | 637 | | |
| Fifth Third Bancorp | | | 111,395 | | | | 4,092 | | |
| First Horizon National | | | 24,885 | | | | 905 | | |
| Franklin Resources | | | 35,645 | | | | 2,993 | | |
| Freddie Mac (a) | | | 136,757 | | | | 7,721 | | |
| Golden West Financial (a) | | | 53,464 | | | | 3,175 | | |
| Goldman Sachs Group (a) | | | 89,898 | | | | 10,930 | | |
| Hartford Financial Services Group (a) | | | 57,939 | | | | 4,471 | | |
| Huntington Bancshares | | | 45,212 | | | | 1,016 | | |
| J.P. Morgan Chase | | | 711,001 | | | | 24,124 | | |
Equity Index Fund (continued)
| DESCRIPTION | | SHARES | | VALUE (000) | |
| Janus Capital Group | | | 47,381 | | | $ | 685 | | |
| Jefferson-Pilot (a) | | | 26,933 | | | | 1,378 | | |
| KeyCorp (a) | | | 81,886 | | | | 2,641 | | |
| Lehman Brothers Holdings (a) | | | 55,047 | | | | 6,412 | | |
| Lincoln National | | | 35,165 | | | | 1,829 | | |
| Loew's | | | 29,676 | | | | 2,742 | | |
| M & T Bank | | | 16,540 | | | | 1,748 | | |
| Marsh & McLennan (a) | | | 105,272 | | | | 3,199 | | |
| Marshall & Ilsley | | | 42,377 | | | | 1,844 | | |
| MBIA (a) | | | 28,709 | | | | 1,740 | | |
| MBNA | | | 256,143 | | | | 6,311 | | |
| Mellon Financial | | | 85,196 | | | | 2,724 | | |
| Merrill Lynch | | | 187,616 | | | | 11,510 | | |
| Metlife (a) | | | 152,013 | | | | 7,575 | | |
| MGIC Investment (a) | | | 19,638 | | | | 1,261 | | |
| Moody's (a) | | | 53,748 | | | | 2,745 | | |
| Morgan Stanley | | | 218,423 | | | | 11,782 | | |
| National City | | | 118,265 | | | | 3,955 | | |
| North Fork Bancorp | | | 94,017 | | | | 2,397 | | |
| Northern Trust (a) | | | 43,746 | | | | 2,211 | | |
| Plum Creek Timber (REIT) (a) | | | 36,766 | | | | 1,394 | | |
| PNC Financial Services (a) | | | 55,381 | | | | 3,213 | | |
| Principal Financial Group (a) | | | 64,140 | | | | 3,038 | | |
| Progressive (a) | | | 39,718 | | | | 4,161 | | |
| Prologis (a) | | | 36,820 | | | | 1,631 | | |
| Providian Financial* (a) | | | 59,519 | | | | 1,052 | | |
| Prudential Financial (a) | | | 102,120 | | | | 6,899 | | |
| Public Storage (a) | | | 17,960 | | | | 1,203 | | |
| Regions Financial (a) | | | 92,982 | | | | 2,894 | | |
| SAFECO | | | 24,785 | | | | 1,323 | | |
| Simon Property Group (REIT) (a) | | | 44,306 | | | | 3,284 | | |
| SLM | | | 83,370 | | | | 4,472 | | |
| Sovereign Bancorp | | | 69,222 | | | | 1,526 | | |
| St. Paul Travelers Companies | | | 136,146 | | | | 6,109 | | |
| State Street | | | 70,435 | | | | 3,446 | | |
| SunTrust Banks | | | 64,764 | | | | 4,498 | | |
| Synovus Financial | | | 59,559 | | | | 1,651 | | |
| T. Rowe Price Group | | | 25,046 | | | | 1,636 | | |
| Torchmark | | | 20,727 | | | | 1,095 | | |
| U.S. Bancorp (b) | | | 371,914 | | | | 10,443 | | |
| UnumProvident (a) | | | 60,147 | | | | 1,233 | | |
| Vornado Realty Trust (a) | | | 19,380 | | | | 1,679 | | |
| Wachovia | | | 319,897 | | | | 15,224 | | |
| Washington Mutual (a) | | | 173,846 | | | | 6,818 | | |
| Wells Fargo | | | 335,648 | | | | 19,659 | | |
| XL Capital Limited, Class A | | | 26,999 | | | | 1,837 | | |
| Zions Bancorporation (a) | | | 17,740 | | | | 1,263 | | |
| | | | 445,746 | | |
| Health Care – 13.0% | | | |
| Abbott Laboratories | | | 310,178 | | | | 13,152 | | |
| Aetna | | | 58,714 | | | | 5,058 | | |
| Allergan (a) | | | 25,816 | | | | 2,365 | | |
| AmerisourceBergen (a) | | | 20,944 | | | | 1,619 | | |
| Amgen* (a) | | | 250,553 | | | | 19,962 | | |
| Applied Biosystems Group – Applera | | | 39,038 | | | | 907 | | |
| Bausch & Lomb (a) | | | 10,292 | | | | 830 | | |
| Baxter International | | | 121,373 | | | | 4,839 | | |
| Becton, Dickinson & Company | | | 50,223 | | | | 2,633 | | |
| Biogen IDEC* (a) | | | 68,592 | | | | 2,708 | | |
| Biomet | | | 49,957 | | | | 1,734 | | |
| Boston Scientific* (a) | | | 142,904 | | | | 3,340 | | |
| Bristol-Myers Squibb (a) | | | 386,084 | | | | 9,289 | | |
| C.R. Bard | | | 19,100 | | | | 1,261 | | |
| Cardinal Health | | | 88,083 | | | | 5,588 | | |
| Caremark Rx* (a) | | | 89,340 | | | | 4,461 | | |
FIRST AMERICAN FUNDS Annual Report 2005
13
Schedule of Investments September 30, 2005
Equity Index Fund (continued)
| DESCRIPTION | | SHARES | | VALUE (000) | |
| Chiron* (a) | | | 23,560 | | | $ | 1,028 | | |
| CIGNA (a) | | | 26,668 | | | | 3,143 | | |
| Coventry Health Care* | | | 21,260 | | | | 1,829 | | |
| Eli Lilly (a) | | | 224,064 | | | | 11,992 | | |
| Express Scripts* (a) | | | 30,500 | | | | 1,897 | | |
| Fisher Scientific International* (a) | | | 23,673 | | | | 1,469 | | |
| Forest Laboratories, Class A* | | | 69,093 | | | | 2,693 | | |
| Genzyme* (a) | | | 49,547 | | | | 3,550 | | |
| Gilead Sciences* (a) | | | 86,010 | | | | 4,194 | | |
| Guidant | | | 63,694 | | | | 4,388 | | |
| HCA | | | 83,147 | | | | 3,984 | | |
| Health Management Associates, Class A (a) | | | 47,401 | | | | 1,113 | | |
| Hospira* | | | 30,890 | | | | 1,266 | | |
| Humana* (a) | | | 31,968 | | | | 1,531 | | |
| IMS Health | | | 46,223 | | | | 1,163 | | |
| Johnson & Johnson (a) | | | 590,899 | | | | 37,392 | | |
| King Pharmaceuticals* | | | 48,849 | | | | 751 | | |
| Laboratory Corporation of America Holdings* (a) | | | 27,581 | | | | 1,343 | | |
| Manor Care (a) | | | 17,628 | | | | 677 | | |
| McKesson HBOC | | | 58,528 | | | | 2,777 | | |
| Medco Health Solutions* | | | 60,923 | | | | 3,340 | | |
| MedImmune* | | | 49,418 | | | | 1,663 | | |
| Medtronic | | | 241,558 | | | | 12,952 | | |
| Merck | | | 445,173 | | | | 12,113 | | |
| Millipore* | | | 9,917 | | | | 624 | | |
| Mylan Laboratories | | | 43,327 | | | | 834 | | |
| PerkinElmer | | | 24,388 | | | | 497 | | |
| Pfizer | | | 1,500,955 | | | | 37,479 | | |
| Quest Diagnostics | | | 36,186 | | | | 1,829 | | |
| Schering-Plough (a) | | | 292,463 | | | | 6,156 | | |
| St. Jude Medical* | | | 71,998 | | | | 3,370 | | |
| Stryker (a) | | | 76,228 | | | | 3,768 | | |
| Tenet Healthcare* (a) | | | 91,708 | | | | 1,030 | | |
| Thermo Electron* (a) | | | 32,105 | | | | 992 | | |
| UnitedHealth Group (a) | | | 256,938 | | | | 14,440 | | |
| Watson Pharmaceuticals* (a) | | | 21,647 | | | | 792 | | |
| WellPoint Health Networks* | | | 118,772 | | | | 9,005 | | |
| Wyeth Pharmaceuticals | | | 265,222 | | | | 12,272 | | |
| Zimmer Holdings* (a) | | | 49,926 | | | | 3,439 | | |
| | | | 294,521 | | |
| Industrials – 11.1% | | | |
| 3M (a) | | | 156,270 | | | | 11,464 | | |
| Allied Waste Industries* | | | 42,805 | | | | 362 | | |
| American Power Conversion | | | 34,401 | | | | 891 | | |
| American Standard | | | 35,557 | | | | 1,655 | | |
| Apollo Group, Class A* (a) | | | 28,993 | | | | 1,925 | | |
| Avery Dennison (a) | | | 21,315 | | | | 1,117 | | |
| Boeing (a) | | | 167,985 | | | | 11,415 | | |
| Burlington Northern Santa Fe | | | 74,948 | | | | 4,482 | | |
| Caterpillar (a) | | | 135,834 | | | | 7,980 | | |
| Cendant (a) | | | 210,578 | | | | 4,346 | | |
| Cintas (a) | | | 27,356 | | | | 1,123 | | |
| Cooper Industries (a) | | | 18,480 | | | | 1,278 | | |
| CSX | | | 42,294 | | | | 1,966 | | |
| Cummins (a) | | | 8,270 | | | | 728 | | |
| Danaher | | | 54,762 | | | | 2,948 | | |
| Deere & Company | | | 48,695 | | | | 2,980 | | |
| Dover | | | 34,462 | | | | 1,406 | | |
| Eaton | | | 29,706 | | | | 1,888 | | |
| Emerson Electric | | | 83,601 | | | | 6,003 | | |
| Equifax | | | 27,797 | | | | 971 | | |
| FedEx (a) | | | 60,031 | | | | 5,230 | | |
| Fluor (a) | | | 16,131 | | | | 1,039 | | |
| General Dynamics | | | 38,983 | | | | 4,660 | | |
| General Electric (a) | | | 2,136,791 | | | | 71,946 | | |
Equity Index Fund (continued)
| DESCRIPTION | | SHARES | | VALUE (000) | |
| Goodrich | | | 23,775 | | | $ | 1,054 | | |
| H & R Block (a) | | | 71,186 | | | | 1,707 | | |
| Honeywell International | | | 170,122 | | | | 6,380 | | |
| Illinois Tool Works | | | 55,803 | | | | 4,594 | | |
| Ingersoll-Rand, Class A | | | 68,608 | | | | 2,623 | | |
| ITT Industries | | | 18,266 | | | | 2,075 | | |
| L-3 Communications Holdings (a) | | | 20,661 | | | | 1,634 | | |
| Lockheed Martin (a) | | | 79,543 | | | | 4,855 | | |
| Masco | | | 92,656 | | | | 2,843 | | |
| Monster Worldwide* (a) | | | 23,505 | | | | 722 | | |
| Navistar International* | | | 13,242 | | | | 429 | | |
| Norfolk Southern | | | 79,588 | | | | 3,228 | | |
| Northrop Grumman | | | 71,304 | | | | 3,875 | | |
| Paccar | | | 35,132 | | | | 2,385 | | |
| Pall | | | 24,545 | | | | 675 | | |
| Parker Hannifin | | | 23,353 | | | | 1,502 | | |
| Pitney Bowes | | | 38,637 | | | | 1,613 | | |
| R.R. Donnelley & Sons (a) | | | 42,381 | | | | 1,571 | | |
| Raytheon | | | 88,211 | | | | 3,354 | | |
| Robert Half International | | | 31,640 | | | | 1,126 | | |
| Rockwell Automation | | | 34,136 | | | | 1,806 | | |
| Rockwell Collins (a) | | | 35,139 | | | | 1,698 | | |
| Ryder System | | | 12,511 | | | | 428 | | |
| Southwest Airlines | | | 154,416 | | | | 2,293 | | |
| Textron | | | 27,086 | | | | 1,943 | | |
| Tyco International | | | 408,075 | | | | 11,365 | | |
| Union Pacific | | | 52,176 | | | | 3,741 | | |
| United Parcel Service, Class B (a) | | | 222,341 | | | | 15,370 | | |
| United Technologies | | | 209,726 | | | | 10,872 | | |
| W.W. Grainger | | | 18,043 | | | | 1,135 | | |
| Waste Management | | | 114,010 | | | | 3,262 | | |
| | | | 251,961 | | |
| Information Technology – 15.6% | | | |
| ADC Telecommunications* (a) | | | 23,486 | | | | 537 | | |
| Adobe Systems (a) | | | 99,234 | | | | 2,962 | | |
| Advanced Micro Devices* (a) | | | 77,076 | | | | 1,942 | | |
| Affiliated Computer Services, Class A* (a) | | | 26,030 | | | | 1,421 | | |
| Agilent Technologies* | | | 97,467 | | | | 3,192 | | |
| Altera* (a) | | | 75,682 | | | | 1,446 | | |
| Analog Devices (a) | | | 74,903 | | | | 2,782 | | |
| Andrew* (a) | | | 31,575 | | | | 352 | | |
| Apple Computer* (a) | | | 167,554 | | | | 8,983 | | |
| Applied Materials | | | 333,598 | | | | 5,658 | | |
| Applied Micro Circuits* | | | 62,612 | | | | 188 | | |
| Autodesk | | | 46,392 | | | | 2,154 | | |
| Automatic Data Processing (a) | | | 118,331 | | | | 5,093 | | |
| Avaya* (a) | | | 96,388 | | | | 993 | | |
| BMC Software* (a) | | | 45,204 | | | | 954 | | |
| Broadcom, Class A* (a) | | | 57,080 | | | | 2,678 | | |
| CIENA* | | | 116,869 | | | | 309 | | |
| Cisco Systems* (a) | | | 1,293,939 | | | | 23,200 | | |
| Citrix Systems* | | | 34,343 | | | | 863 | | |
| Computer Associates International (a) | | | 94,402 | | | | 2,625 | | |
| Computer Sciences* (a) | | | 37,021 | | | | 1,751 | | |
| Compuware* | | | 78,826 | | | | 749 | | |
| Comverse Technology* (a) | | | 38,829 | | | | 1,020 | | |
| Convergys* (a) | | | 32,160 | | | | 462 | | |
| Corning* | | | 292,843 | | | | 5,661 | | |
| Dell * | | | 483,990 | | | | 16,552 | | |
| eBay* (a) | | | 220,886 | | | | 9,101 | | |
| Electronic Arts* (a) | | | 62,208 | | | | 3,539 | | |
| Electronic Data Systems | | | 97,618 | | | | 2,191 | | |
| EMC* (a) | | | 486,080 | | | | 6,290 | | |
| First Data | | | 161,559 | | | | 6,462 | | |
| Fiserv* (a) | | | 38,286 | | | | 1,756 | | |
The accompanying notes are an integral part of the financial statements.
FIRST AMERICAN FUNDS Annual Report 2005
14
Equity Index Fund (continued)
| DESCRIPTION | | SHARES | | VALUE (000) | |
| Freescale Semiconductor* (a) | | | 79,367 | | | $ | 1,871 | | |
| Gateway* | | | 58,921 | | | | 159 | | |
| Hewlett-Packard (a) | | | 575,934 | | | | 16,817 | | |
| IBM | | | 330,319 | | | | 26,498 | | |
| Intel | | | 1,247,330 | | | | 30,747 | | |
| Intuit* (a) | | | 37,463 | | | | 1,679 | | |
| Jabil Circuit* (a) | | | 38,647 | | | | 1,195 | | |
| JDS Uniphase* (a) | | | 333,029 | | | | 739 | | |
| KLA-Tencor (a) | | | 38,504 | | | | 1,877 | | |
| Lexmark International Group, Class A* (a) | | | 25,305 | | | | 1,545 | | |
| Linear Technology (a) | | | 60,899 | | | | 2,289 | | |
| LSI Logic* (a) | | | 76,908 | | | | 758 | | |
| Lucent Technologies* (a) | | | 895,173 | | | | 2,909 | | |
| Maxim Integrated Products (a) | | | 64,998 | | | | 2,772 | | |
| Mercury Interactive* (a) | | | 17,932 | | | | 710 | | |
| Micron Technology* (a) | | | 120,591 | | | | 1,604 | | |
| Microsoft | | | 1,878,122 | | | | 48,324 | | |
| Molex | | | 29,406 | | | | 785 | | |
| Motorola (a) | | | 485,448 | | | | 10,724 | | |
| National Semiconductor (a) | | | 70,678 | | | | 1,859 | | |
| NCR* (a) | | | 37,856 | | | | 1,208 | | |
| Network Appliance* | | | 71,815 | | | | 1,705 | | |
| Novell* (a) | | | 77,299 | | | | 576 | | |
| Novellus Systems* (a) | | | 29,810 | | | | 748 | | |
| NVIDIA* (a) | | | 33,151 | | | | 1,136 | | |
| Oracle* | | | 747,999 | | | | 9,268 | | |
| Parametric Technology* (a) | | | 55,129 | | | | 384 | | |
| Paychex (a) | | | 74,605 | | | | 2,766 | | |
| PMC-Sierra* (a) | | | 35,351 | | | | 311 | | |
| QLogic* (a) | | | 18,653 | | | | 638 | | |
| QUALCOMM (a) | | | 326,434 | | | | 14,608 | | |
| Sabre Holdings, Class A (a) | | | 28,450 | | | | 577 | | |
| Sanmina – SCI* | | | 106,912 | | | | 459 | | |
| Scientific-Atlanta (a) | | | 30,345 | | | | 1,138 | | |
| Seagate Escrow Security (c) (d) | | | 44,886 | | | | - | | |
| Siebel Systems (a) | | | 104,855 | | | | 1,083 | | |
| Solectron* | | | 194,533 | | | | 761 | | |
| Sun Microsystems* (a) | | | 673,374 | | | | 2,640 | | |
| Symantec* (a) | | | 241,856 | | | | 5,480 | | |
| Symbol Technologies | | | 48,163 | | | | 466 | | |
| Tektronix | | | 16,770 | | | | 423 | | |
| Tellabs* | | | 90,766 | | | | 955 | | |
| Teradyne* (a) | | | 38,636 | | | | 637 | | |
| Texas Instruments (a) | | | 336,540 | | | | 11,409 | | |
| Unisys* | | | 65,967 | | | | 438 | | |
| Waters* | | | 24,009 | | | | 999 | | |
| Xerox* (a) | | | 190,531 | | | | 2,601 | | |
| Xilinx (a) | | | 68,801 | | | | 1,916 | | |
| Yahoo!* (a) | | | 245,486 | | | | 8,307 | | |
| | | | 353,364 | | |
| Materials – 2.9% | | | |
| Air Products and Chemicals | | | 44,936 | | | | 2,478 | | |
| Alcoa | | | 176,144 | | | | 4,301 | | |
| Allegheny Technologies | | | 17,586 | | | | 545 | | |
| Ashland | | | 13,339 | | | | 737 | | |
| Ball (a) | | | 22,032 | | | | 809 | | |
| Bemis (a) | | | 21,140 | | | | 522 | | |
| Dow Chemical | | | 194,230 | | | | 8,094 | | |
| E.I. DuPont de Nemours (a) | | | 201,269 | | | | 7,884 | | |
| Eastman Chemical | �� | | 15,047 | | | | 707 | | |
| Ecolab | | | 44,396 | | | | 1,418 | | |
| Engelhard | | | 24,383 | | | | 681 | | |
| Freeport-McMoran Copper & Gold, Class B (a) | | | 36,311 | | | | 1,764 | | |
| Georgia-Pacific | | | 52,566 | | | | 1,790 | | |
| Hercules* (a) | | | 21,918 | | | | 268 | | |
Equity Index Fund (continued)
| DESCRIPTION | | SHARES | | VALUE (000) | |
| International Flavors & Fragrances | | | 14,319 | | | $ | 510 | | |
| International Paper (a) | | | 99,310 | | | | 2,959 | | |
| Louisiana Pacific (a) | | | 21,635 | | | | 599 | | |
| MeadWestvaco | | | 36,401 | | | | 1,005 | | |
| Monsanto | | | 54,193 | | | | 3,401 | | |
| Newmont Mining (a) | | | 89,973 | | | | 4,244 | | |
| NuCor | | | 32,380 | | | | 1,910 | | |
| Pactiv* | | | 31,179 | | | | 546 | | |
| Phelps Dodge (a) | | | 19,106 | | | | 2,482 | | |
| PPG Industries (a) | | | 34,067 | | | | 2,016 | | |
| Praxair (a) | | | 65,360 | | | | 3,133 | | |
| Rohm & Haas (a) | | | 38,413 | | | | 1,580 | | |
| Sealed Air* (a) | | | 16,796 | | | | 797 | | |
| Sigma-Aldrich | | | 14,013 | | | | 898 | | |
| Temple-Inland | | | 23,108 | | | | 944 | | |
| United States Steel (a) | | | 23,074 | | | | 977 | | |
| Vulcan Materials (a) | | | 20,092 | | | | 1,491 | | |
| Weyerhaeuser | | | 47,008 | | | | 3,232 | | |
| | | | 64,722 | | |
| Telecommunication Services – 3.0% | | | |
| ALLTEL (a) | | | 66,232 | | | | 4,312 | | |
| AT&T | | | 161,892 | | | | 3,205 | | |
| BellSouth (a) | | | 367,574 | | | | 9,667 | | |
| CenturyTel (a) | | | 26,583 | | | | 930 | | |
| Citizens Communications (a) | | | 69,291 | | | | 939 | | |
| Qwest Communications International* | | | 332,798 | | | | 1,364 | | |
| SBC Communications (a) | | | 667,096 | | | | 15,990 | | |
| Sprint (a) | | | 580,114 | | | | 13,795 | | |
| Verizon Communications | | | 550,387 | | | | 17,992 | | |
| | | | 68,194 | | |
| Utilities – 3.5% | | | |
| AES* (a) | | | 131,984 | | | | 2,168 | | |
| Allegheny Energy* (a) | | | 32,350 | | | | 994 | | |
| Ameren (a) | | | 38,137 | | | | 2,040 | | |
| American Electric Power (a) | | | 78,161 | | | | 3,103 | | |
| Calpine* (a) | | | 130,493 | | | | 338 | | |
| CenterPoint Energy (a) | | | 60,543 | | | | 900 | | |
| Cinergy | | | 36,004 | | | | 1,599 | | |
| CMS Energy* (a) | | | 44,209 | | | | 727 | | |
| Consolidated Edison (a) | | | 45,475 | | | | 2,208 | | |
| Constellation Energy | | | 32,968 | | | | 2,031 | | |
| Dominion Resources (a) | | | 68,803 | | | | 5,927 | | |
| DTE Energy (a) | | | 33,250 | | | | 1,525 | | |
| Duke Energy (a) | | | 191,727 | | | | 5,593 | | |
| Dynegy* (a) | | | 65,856 | | | | 310 | | |
| Edison International | | | 64,437 | | | | 3,047 | | |
| Entergy (a) | | | 45,143 | | | | 3,355 | | |
| Exelon (a) | | | 135,204 | | | | 7,225 | | |
| FirstEnergy (a) | | | 65,238 | | | | 3,400 | | |
| FPL Group (a) | | | 78,570 | | | | 3,740 | | |
| KeySpan | | | 34,056 | | | | 1,253 | | |
| NICOR | | | 8,938 | | | | 376 | | |
| NiSource (a) | | | 51,937 | | | | 1,259 | | |
| People's Energy (a) | | | 3,070 | | | | 121 | | |
| PG&E | | | 83,534 | | | | 3,279 | | |
| Pinnacle West Capital | | | 18,032 | | | | 795 | | |
| PPL (a) | | | 72,468 | | | | 2,343 | | |
| Progress Energy (a) | | | 48,731 | | | | 2,181 | | |
| Progress Energy-CVO* | | | 7,906 | | | | 1 | | |
| Public Service Enterprises | | | 46,971 | | | | 3,023 | | |
| Sempra Energy | | | 48,095 | | | | 2,263 | | |
| Southern (a) | | | 148,122 | | | | 5,297 | | |
| TECO Energy (a) | | | 39,562 | | | | 713 | | |
FIRST AMERICAN FUNDS Annual Report 2005
15
Schedule of Investments September 30, 2005
Equity Index Fund (concluded)
| DESCRIPTION | | SHARES/PAR (000) | | VALUE (000) | |
| TXU (a) | | | 51,152 | | | $ | 5,774 | | |
| Xcel Energy (a) | | | 77,960 | | | | 1,529 | | |
| | | | 80,437 | | |
Total Common Stocks
(Cost $1,626,578) | | | | | | | 2,234,966 | | |
| Short Term Investments – 1.5% | | | |
| Affiliated Money Market Fund – 1.3% | | | |
First American Prime
Obligations Fund, Class Z (b) (e) | | | 28,481,314 | | | | 28,481 | | |
| U.S. Treasury Obligation – 0.2% | | | |
U.S. Treasury Bill
3.735%, 03/02/06 (f) | | $ | 4,600 | | | | 4,528 | | |
Total Short-Term Investments
(Cost $33,013) | | | | | | | 33,009 | | |
Investments Purchased with Proceeds
from Securities Lending (g) – 31.4% | | | |
| | | | (Cost $712,377) | | | | 712,377 | | |
Total Investments – 131.5%
(Cost $2,371,968) | | | | | | | 2,980,352 | | |
| Other Assets and Liabilities, Net – (31.5)% | | | | | | | (714,628 | ) | |
| Total Net Assets – 100.0% | | | | | | $ | 2,265,724 | | |
* Non-income producing security
(a) This security or a portion of this security is out on loan at September 30, 2005. Total loaned securities had a market value of $697,331,391 at September 30, 2005. See note 2 in Notes to Financial Statements.
(b) Investments in affiliated securities. As of September, 2005, the market value of these investments was $38,924,659 or 1.7% of total net assets. See notes 3 and 4 in Notes to Financial Statements.
(c) Security considered illiquid or restricted. As of September 30, 2005, the market value of this investment was $0 or 0.0% of total net assets. See note 2 in Notes to Financial Satements.
(d) Security is fair valued. As of September 30, 2005, the fair value of this investment was $0 or 0.0% of total net assets. See note 2 in Notes to Financial Statements.
(e) This money market fund is advised by U.S. Bancorp Asset Management, Inc., which also serves as advisor to this fund. See note 3 in Notes to Financial Statements.
(f) Security has been deposited as initial margin on open futures contracts. Yield shown is the effective yield as of September 30, 2005. See note 2 in Notes to Financial Statements.
(g) The fund may loan securities in return for collateral in the form of cash, U.S. Government securities, or other high grade debt obligations. The cash collateral is invested in various short-term fixed income securities, such as repurchase agreements, commercial paper, money market funds and other corporate obligations. See note 2 in Notes to Financial Statements.
CVO – Contingent Value Obligation
REIT – Real Estate Investment Trust
Schedule of Open Futures Contracts
| Description | | Number of
Contracts
Purchased
(Sold) | | Notional
Contract
Value
(000) | | Settlement
Month | | Unrealized
Appreciation
(000) | |
S&P 500 Index
Futures Contracts | | | 90 | | | $ | 27,772 | | | December-05 | | $ | 143 | | |
Mid Cap Index Fund
| DESCRIPTION | | SHARES | | VALUE (000) | |
| Common Stocks – 98.7% | |
| Consumer Discretionary – 15.6% | |
| 99 Cents Only Stores* | | | 16,863 | | | $ | 156 | | |
| Abercrombie & Fitch | | | 30,352 | | | | 1,513 | | |
| Advanced Auto Parts* (a) | | | 37,785 | | | | 1,462 | | |
| Aeropostale* (a) | | | 19,492 | | | | 414 | | |
| American Eagle Outfitters (a) | | | 45,330 | | | | 1,067 | | |
| American Greetings, Class A (a) | | | 23,170 | | | | 635 | | |
| AnnTaylor Stores* | | | 25,120 | | | | 667 | | |
| Applebee's International | | | 27,790 | | | | 575 | | |
| ArvinMeritor | | | 24,153 | | | | 404 | | |
| Bandag | | | 4,392 | | | | 188 | | |
| Barnes & Noble | | | 20,314 | | | | 766 | | |
| Belo, Class A | | | 36,539 | | | | 835 | | |
| BLYTH | | | 9,189 | | | | 205 | | |
| Bob Evans Farms | | | 11,877 | | | | 270 | | |
| Borders Group (a) | | | 25,715 | | | | 570 | | |
| BorgWarner (a) | | | 19,252 | | | | 1,087 | | |
| Boyd Gaming | | | 14,978 | | | | 646 | | |
| Brinker International (a) | | | 29,758 | | | | 1,118 | | |
| Callaway Golf (a) | | | 24,017 | | | | 362 | | |
| CarMax* (a) | | | 36,639 | | | | 1,146 | | |
| Catalina Marketing, Class C (a) | | | 13,847 | | | | 315 | | |
| CBRL Group (a) | | | 16,491 | | | | 555 | | |
| Cheesecake Factory* (a) | | | 26,650 | | | | 833 | | |
| Chico's FAS* (a) | | | 62,310 | | | | 2,293 | | |
| Claire's Stores | | | 33,880 | | | | 818 | | |
| Corinthian Colleges* | | | 30,990 | | | | 411 | | |
| DeVry* (a) | | | 20,186 | | | | 385 | | |
| Dollar Tree Stores* (a) | | | 38,544 | | | | 834 | | |
| Emmis Communications, Class A* | | | 10,421 | | | | 230 | | |
| Entercom Communications* | | | 13,690 | | | | 432 | | |
| Foot Locker (a) | | | 53,822 | | | | 1,181 | | |
| Furniture Brands International | | | 18,185 | | | | 328 | | |
| Gentex (a) | | | 54,928 | | | | 956 | | |
| GTECH Holdings | | | 39,700 | | | | 1,273 | | |
| Harman International Industries (a) | | | 21,850 | | | | 2,235 | | |
| Harte-Hanks | | | 20,053 | | | | 530 | | |
| Hovnanian Enterprises, Class A* (a) | | | 12,690 | | | | 650 | | |
| International Speedway, Class A | | | 12,364 | | | | 649 | | |
| Krispy Kreme Doughnuts* (a) | | | 21,498 | | | | 135 | | |
| Lear (a) | | | 23,140 | | | | 786 | | |
| Lee Enterprises | | | 15,684 | | | | 666 | | |
| Lennar (a) | | | 46,156 | | | | 2,758 | | |
| Media General, Class A | | | 8,204 | | | | 476 | | |
| Michaels Stores (a) | | | 46,482 | | | | 1,537 | | |
| Modine Manufacturing | | | 11,023 | | | | 404 | | |
| Mohawk Industries* (a) | | | 18,214 | | | | 1,462 | | |
| Neiman Marcus Group | | | 16,720 | | | | 1,671 | | |
| O'Reilly Automotive* | | | 35,890 | | | | 1,011 | | |
| Outback Steakhouse (a) | | | 22,593 | | | | 827 | | |
| Pacific Sunwear of California* | | | 26,380 | | | | 566 | | |
| Payless ShoeSource* (a) | | | 23,694 | | | | 412 | | |
| PETsMART | | | 49,748 | | | | 1,084 | | |
| Pier 1 Imports (a) | | | 29,414 | | | | 332 | | |
| Polo Ralph Lauren Corp. | | | 20,770 | | | | 1,045 | | |
| Reader's Digest Association, Class A | | | 34,190 | | | | 546 | | |
| Regis | | | 15,200 | | | | 575 | | |
| Rent-A-Center* | | | 24,400 | | | | 471 | | |
| Ross Stores | | | 50,378 | | | | 1,194 | | |
| Ruby Tuesday (a) | | | 22,240 | | | | 484 | | |
| Ryland Group (a) | | | 16,600 | | | | 1,136 | | |
| Saks* | | | 49,120 | | | | 909 | | |
| Scholastic* (a) | | | 12,806 | | | | 473 | | |
| Thor Industries (a) | | | 11,910 | | | | 405 | | |
The accompanying notes are an integral part of the financial statements.
FIRST AMERICAN FUNDS Annual Report 2005
16
Mid Cap Index Fund (continued)
| DESCRIPTION | | SHARES | | VALUE (000) | |
| Timberland, Class A* | | | 19,286 | | | $ | 651 | | |
| Toll Brothers* (a) | | | 39,328 | | | | 1,757 | | |
| Tupperware (a) | | | 18,990 | | | | 433 | | |
| Urban Outfitters* (a) | | | 37,520 | | | | 1,103 | | |
| Valassis Communications* (a) | | | 17,561 | | | | 685 | | |
| Washington Post, Class B | | | 1,789 | | | | 1,436 | | |
| Westwood One | | | 23,329 | | | | 464 | | |
| Williams-Sonoma* (a) | | | 39,953 | | | | 1,532 | | |
| | | | 58,420 | | |
| Consumer Staples – 3.3% | | | |
| BJ's Wholesale Club* (a) | | | 23,792 | | | | 661 | | |
| Church and Dwight | | | 21,394 | | | | 790 | | |
| Dean Foods* | | | 51,546 | | | | 2,003 | | |
| Energizer Holdings* | | | 24,780 | | | | 1,405 | | |
| Hormel Foods | | | 25,120 | | | | 829 | | |
| JM Smucker (a) | | | 20,145 | | | | 978 | | |
| Lancaster Colony | | | 8,844 | | | | 380 | | |
| PepsiAmericas | | | 24,358 | | | | 554 | | |
| Ruddick | | | 12,808 | | | | 295 | | |
| Smithfield Foods* | | | 30,925 | | | | 918 | | |
| Tootsie Roll Industries | | | 8,686 | | | | 276 | | |
| Universal | | | 8,756 | | | | 340 | | |
| Whole Foods Market (a) | | | 22,934 | | | | 3,083 | | |
| | | | 12,512 | | |
| Energy – 7.7% | | | |
| Cooper Cameron* (a) | | | 19,318 | | | | 1,428 | | |
| Denbury Resources* | | | 19,960 | | | | 1,007 | | |
| ENSCO International | | | 53,211 | | | | 2,479 | | |
| FMC Technologies* | | | 24,325 | | | | 1,024 | | |
| Forest Oil* (a) | | | 19,011 | | | | 990 | | |
| Grant Prideco* | | | 43,840 | | | | 1,782 | | |
| Hanover Compressor* | | | 28,440 | | | | 394 | | |
| Helmerich & Payne | | | 18,116 | | | | 1,094 | | |
| Newfield Exploration* (a) | | | 44,454 | | | | 2,183 | | |
| Noble Energy (a) | | | 61,104 | | | | 2,866 | | |
| Overseas Shipholding Group | | | 11,148 | | | | 650 | | |
| Patterson-UTI Energy | | | 59,640 | | | | 2,152 | | |
| Pioneer Natural Resources (a) | | | 48,933 | | | | 2,687 | | |
| Plains Exploration & Production* (a) | | | 27,050 | | | | 1,158 | | |
| Pogo Producing | | | 20,588 | | | | 1,213 | | |
| Pride International* | | | 49,891 | | | | 1,422 | | |
| Smith International (a) | | | 73,224 | | | | 2,439 | | |
| Tidewater (a) | | | 21,358 | | | | 1,040 | | |
| Western Gas Resources (a) | | | 19,312 | | | | 989 | | |
| | | | 28,997 | | |
| Financials – 17.9% | | | |
| A.G. Edwards | | | 26,189 | | | | 1,147 | | |
| Allmerica Financial* | | | 18,230 | | | | 750 | | |
| AMB Property | | | 28,426 | | | | 1,276 | | |
| American Financial Group | | | 16,124 | | | | 547 | | |
| AmeriCredit* (a) | | | 48,102 | | | | 1,148 | | |
| AmerUS Group, Class A (a) | | | 13,404 | | | | 769 | | |
| Arthur J. Gallagher (a) | | | 30,243 | | | | 871 | | |
| Associated Banc-Corp (a) | | | 44,336 | | | | 1,351 | | |
| Astoria Financial (a) | | | 33,612 | | | | 888 | | |
| Bank of Hawaii | | | 18,139 | | | | 893 | | |
| Brown & Brown | | | 19,600 | | | | 974 | | |
| City National (a) | | | 14,301 | | | | 1,002 | | |
| Colonial BancGroup | | | 49,114 | | | | 1,100 | | |
| Commerce Bancorp (a) | | | 57,084 | | | | 1,752 | | |
| Cullen/Frost Bankers (a) | | | 16,770 | | | | 827 | | |
| Developers Diversified Realty (REIT) (a) | | | 38,180 | | | | 1,783 | | |
| Eaton Vance | | | 45,950 | | | | 1,140 | | |
Mid Cap Index Fund (continued)
| DESCRIPTION | | SHARES | | VALUE (000) | |
| Everest Re Group (a) | | | 19,151 | | | $ | 1,875 | | |
| Fidelity National Financial | | | 59,767 | | | | 2,661 | | |
| First American | | | 29,573 | | | | 1,351 | | |
| FirstMerit (a) | | | 28,888 | | | | 774 | | |
| GATX | | | 17,586 | | | | 696 | | |
| Greater Bay Bancorp | | | 17,819 | | | | 439 | | |
| HCC Insurance Holdings (a) | | | 34,843 | | | | 994 | | |
| Highwoods Properties (REIT) (a) | | | 18,150 | | | | 536 | | |
| Horace Mann Educators | | | 14,785 | | | | 292 | | |
| Hospitality Properties Trust (REIT) | | | 24,250 | | | | 1,039 | | |
| Independence Community Bank (a) | | | 25,416 | | | | 866 | | |
| IndyMac Bancorp | | | 21,230 | | | | 840 | | |
| Investors Financial Services (a) | | | 23,520 | | | | 774 | | |
| Jefferies Group | | | 17,640 | | | | 768 | | |
| LaBranche* (a) | | | 19,428 | | | | 169 | | |
| Legg Mason (a) | | | 38,404 | | | | 4,213 | | |
| Leucadia National (a) | | | 28,693 | | | | 1,237 | | |
| Liberty Property Trust (REIT) (a) | | | 30,120 | | | | 1,281 | | |
| Macerich (REIT) | | | 20,970 | | | | 1,362 | | |
| Mack-Cali Realty (REIT) | | | 19,170 | | | | 862 | | |
| Mercantile Bankshares | | | 27,125 | | | | 1,462 | | |
| Mercury General | | | 11,470 | | | | 688 | | |
| MoneyGram International | | | 30,315 | | | | 658 | | |
| New Plan Excel Realty Trust (REIT) | | | 35,150 | | | | 807 | | |
| New York Community Bancorp (a) | | | 81,582 | | | | 1,338 | | |
| Ohio Casualty | | | 21,274 | | | | 577 | | |
| Old Republic International | | | 62,498 | | | | 1,667 | | |
| PMI Group (a) | | | 32,620 | | | | 1,301 | | |
| Protective Life | | | 23,800 | | | | 980 | | |
| Radian Group (a) | | | 30,486 | | | | 1,619 | | |
| Raymond James Financial | | | 22,650 | | | | 728 | | |
| Rayonier (a) | | | 17,665 | | | | 1,018 | | |
| Regency Centers (a) | | | 21,530 | | | | 1,237 | | |
| SEI Investments | | | 22,215 | | | | 835 | | |
| StanCorp Financial Group | | | 9,733 | | | | 820 | | |
| SVB Financial Group* (a) | | | 12,430 | | | | 605 | | |
| TCF Financial | | | 43,286 | | | | 1,158 | | |
| Texas Regional Bancshares, Class A | | | 12,890 | | | | 371 | | |
| United Dominion Realty Trust (REIT) | | | 47,830 | | | | 1,134 | | |
| Unitrin (a) | | | 17,984 | | | | 854 | | |
| W.R. Berkley | | | 40,889 | | | | 1,614 | | |
| Waddell & Reed Financial (a) | | | 28,794 | | | | 557 | | |
| Washington Federal (a) | | | 30,122 | | | | 680 | | |
| Webster Financial | | | 18,185 | | | | 818 | | |
| Weingarten Realty Investors | | | 29,353 | | | | 1,111 | | |
| Westamerica Bancorporation | | | 10,941 | | | | 565 | | |
| Wilmington Trust | | | 21,947 | | | | 800 | | |
| | | | 67,249 | | |
| Health Care – 12.0% | | | |
| Advanced Medical Optics* | | | 21,977 | | | | 834 | | |
| Apria Healthcare Group* | | | 16,668 | | | | 532 | | |
| Barr Pharmaceuticals* | | | 35,621 | | | | 1,956 | | |
| Beckman Coulter | | | 21,003 | | | | 1,134 | | |
| Cephalon* (a) | | | 19,750 | | | | 917 | | |
| Charles River Laboratories International* (a) | | | 24,781 | | | | 1,081 | | |
| Community Health Systems* (a) | | | 30,867 | | | | 1,198 | | |
| Covance* | | | 21,479 | | | | 1,031 | | |
| Cytyc* | | | 39,854 | | | | 1,070 | | |
| DENTSPLY International | | | 25,104 | | | | 1,356 | | |
| Edwards Lifesciences* | | | 20,354 | | | | 904 | | |
| Gen-Probe* | | | 17,780 | | | | 879 | | |
| Health Net* | | | 38,533 | | | | 1,823 | | |
| Henry Schein* | | | 29,468 | | | | 1,256 | | |
| Hillenbrand Industries (a) | | | 19,856 | | | | 934 | | |
| INAMED* (a) | | | 12,520 | | | | 948 | | |
FIRST AMERICAN FUNDS Annual Report 2005
17
Schedule of Investments September 30, 2005
Mid Cap Index Fund (continued)
| DESCRIPTION | | SHARES | | VALUE (000) | |
| Intuitive Surgical* (a) | | | 12,220 | | | $ | 896 | | |
| Invitrogen* (a) | | | 18,301 | | | | 1,377 | | |
| IVAX* | | | 74,182 | | | | 1,955 | | |
| Lifepoint Hospitals* (a) | | | 19,650 | | | | 859 | | |
| Lincare Holdings* (a) | | | 34,366 | | | | 1,411 | | |
| Martek Biosciences* (a) | | | 11,160 | | | | 392 | | |
| Millennium Pharmaceuticals* (a) | | | 106,361 | | | | 992 | | |
| Omnicare (a) | | | 36,333 | | | | 2,043 | | |
| PacifiCare Health Systems* (a) | | | 30,004 | | | | 2,394 | | |
| Par Pharmaceutical Companies* | | | 12,020 | | | | 320 | | |
| Patterson Companies* (a) | | | 47,166 | | | | 1,888 | | |
| Perrigo (a) | | | 29,660 | | | | 424 | | |
| Protein Design Labs* | | | 37,136 | | | | 1,040 | | |
| Renal Care* | | | 23,190 | | | | 1,097 | | |
| Sepracor* (a) | | | 36,849 | | | | 2,174 | | |
| STERIS | | | 23,670 | | | | 563 | | |
| Techne* | | | 13,300 | | | | 758 | | |
| Triad Hospitals* (a) | | | 30,306 | | | | 1,372 | | |
| Universal Health Services | | | 19,976 | | | | 951 | | |
| Valeant Pharmaceuticals International | | | 32,304 | | | | 649 | | |
| Varian* (a) | | | 11,882 | | | | 408 | | |
| Varian Medical Systems* (a) | | | 46,526 | | | | 1,838 | | |
| VCA Antech* | | | 26,448 | | | | 675 | | |
| Vertex Pharmaceuticals* (a) | | | 32,708 | | | | 731 | | |
| | | | 45,060 | | |
| Industrials – 13.4% | | | |
| Adesa | | | 31,399 | | | | 694 | | |
| AGCO* (a) | | | 30,713 | | | | 559 | | |
| AirTran Holdings* (a) | | | 30,760 | | | | 389 | | |
| Alaska Air Group* (a) | | | 8,724 | | | | 254 | | |
| Alexander & Baldwin | | | 14,917 | | | | 794 | | |
| Alliant Techsystems* (a) | | | 12,570 | | | | 938 | | |
| AMETEK (a) | | | 24,494 | | | | 1,053 | | |
| Banta | | | 8,610 | | | | 438 | | |
| Brinks | | | 19,431 | | | | 798 | | |
| C. H. Robinson Worldwide | | | 29,189 | | | | 1,872 | | |
| Career Education* (a) | | | 35,136 | | | | 1,249 | | |
| Carlisle Companies (a) | | | 10,660 | | | | 678 | | |
| ChoicePoint* | | | 30,645 | | | | 1,323 | | |
| CNF | | | 17,705 | | | | 930 | | |
| Copart* | | | 25,450 | | | | 607 | | |
| Corporate Executive Board | | | 14,050 | | | | 1,096 | | |
| Crane | | | 18,790 | | | | 559 | | |
| Deluxe (a) | | | 17,460 | | | | 701 | | |
| Donaldson (a) | | | 24,418 | | | | 745 | | |
| Dun & Bradstreet* | | | 23,669 | | | | 1,559 | | |
| Dycom Industries* (a) | | | 16,849 | | | | 341 | | |
| Education Management* | | | 23,168 | | | | 747 | | |
| Expeditors International of Washington (a) | | | 36,508 | | | | 2,073 | | |
| Fastenal (a) | | | 21,709 | | | | 1,326 | | |
| Federal Signal | | | 15,707 | | | | 268 | | |
| Flowserve* | | | 19,462 | | | | 707 | | |
| Graco (a) | | | 23,680 | | | | 812 | | |
| Granite Construction | | | 11,784 | | | | 451 | | |
| Harsco | | | 14,737 | | | | 966 | | |
| Herman Miller | | | 24,723 | | | | 749 | | |
| HNI | | | 17,548 | | | | 1,057 | | |
| Hubbell, Class B | | | 21,555 | | | | 1,012 | | |
| ITT Educational Services* | | | 13,080 | | | | 646 | | |
| J.B. Hunt Transport Services (a) | | | 45,586 | | | | 867 | | |
| Jacobs Engineering Group* (a) | | | 19,944 | | | | 1,344 | | |
| JetBlue Airways* (a) | | | 33,082 | | | | 582 | | |
| Joy Global (a) | | | 28,110 | | | | 1,418 | | |
| Kelly Services, Class A | | | 7,153 | | | | 219 | | |
| Kennametal | | | 13,025 | | | | 639 | | |
Mid Cap Index Fund (continued)
| DESCRIPTION | | SHARES | | VALUE (000) | |
| Korn/Ferry International* | | | 12,737 | | | $ | 209 | | |
| Laureate Education* (a) | | | 16,793 | | | | 822 | | |
| Manpower | | | 30,039 | | | | 1,333 | | |
| Nordson | | | 10,882 | | | | 414 | | |
| Pentair | | | 35,790 | | | | 1,306 | | |
| Precision Castparts | | | 45,032 | | | | 2,391 | | |
| Quanta Services* (a) | | | 40,679 | | | | 519 | | |
| Republic Services | | | 42,366 | | | | 1,495 | | |
| Rollins | | | 10,986 | | | | 214 | | |
| Sequa, Class A* | | | 2,380 | | | | 140 | | |
| Sotheby's Holdings, Class A* | | | 11,284 | | | | 189 | | |
| SPX (a) | | | 25,226 | | | | 1,159 | | |
| Stericycle* (a) | | | 15,330 | | | | 876 | | |
| Swift Transportation* (a) | | | 18,038 | | | | 319 | | |
| Tecumseh Products, Class A | | | 5,452 | | | | 117 | | |
| Teleflex | | | 13,111 | | | | 924 | | |
| Thomas & Betts* | | | 19,201 | | | | 661 | | |
| Timken (a) | | | 28,400 | | | | 841 | | |
| Trinity Industries (a) | | | 13,319 | | | | 539 | | |
| United Rentals* | | | 24,599 | | | | 485 | | |
| Werner Enterprises | | | 17,805 | | | | 308 | | |
| Yellow Roadway* (a) | | | 19,490 | | | | 807 | | |
| York International | | | 14,784 | | | | 829 | | |
| | | | 50,357 | | |
| Information Technology – 14.6% | | | |
| 3Com* (a) | | | 129,950 | | | | 530 | | |
| Activision* (a) | | | 69,757 | | | | 1,427 | | |
| Acxiom | | | 26,966 | | | | 505 | | |
| ADTRAN | | | 21,444 | | | | 675 | | |
| Advent Software* | | | 8,524 | | | | 230 | | |
| Alliance Data Systems* (a) | | | 21,030 | | | | 823 | | |
| Amphenol, Class A | | | 31,020 | | | | 1,251 | | |
| Anteon International* (a) | | | 10,170 | | | | 435 | | |
| Arrow Electronics* | | | 41,384 | | | | 1,298 | | |
| Atmel* (a) | | | 150,797 | | | | 311 | | |
| Avnet* (a) | | | 50,883 | | | | 1,244 | | |
| Avocent* (a) | | | 17,064 | | | | 540 | | |
| BISYS Group* | | | 41,173 | | | | 553 | | |
| Cabot Microelectronics* (a) | | | 8,490 | | | | 249 | | |
| Cadence Design Systems* (a) | | | 94,390 | | | | 1,525 | | |
| CDW (a) | | | 21,661 | | | | 1,276 | | |
| Ceridian* | | | 50,939 | | | | 1,057 | | |
| Certegy | | | 21,413 | | | | 857 | | |
| CheckFree* (a) | | | 30,179 | | | | 1,141 | | |
| Cognizant Technology Solutions* | | | 47,690 | | | | 2,222 | | |
| CommScope* (a) | | | 17,277 | | | | 300 | | |
| Credence Systems* (a) | | | 32,645 | | | | 261 | | |
| Cree* (a) | | | 26,465 | | | | 662 | | |
| CSG Systems International* | | | 17,797 | | | | 386 | | |
| Cypress Semiconductor* (a) | | | 46,339 | | | | 697 | | |
| Diebold | | | 24,250 | | | | 836 | | |
| DST Systems* (a) | | | 24,069 | | | | 1,320 | | |
| F5 Networks* | | | 13,110 | | | | 570 | | |
| Fair Isaac (a) | | | 23,285 | | | | 1,043 | | |
| Fairchild Semiconductor International, Class A* (a) | | | 41,327 | | | | 614 | | |
| Gartner, Class A* (a) | | | 21,308 | | | | 249 | | |
| Harris | | | 46,842 | | | | 1,958 | | |
| Imation | | | 10,443 | | | | 448 | | |
| Integrated Device Technology* (a) | | | 67,855 | | | | 729 | | |
| International Rectifier* | | | 22,238 | | | | 1,002 | | |
| Intersil, Class A | | | 52,893 | | | | 1,152 | | |
| Jack Henry & Associates | | | 27,580 | | | | 535 | | |
| Keane* (a) | | | 16,180 | | | | 185 | | |
| KEMET* | | | 29,836 | | | | 250 | | |
| Lam Research* (a) | | | 47,048 | | | | 1,434 | | |
The accompanying notes are an integral part of the financial statements.
FIRST AMERICAN FUNDS Annual Report 2005
18
Mid Cap Index Fund (continued)
| DESCRIPTION | | SHARES | | VALUE (000) | |
| Lattice Semiconductor* (a) | | | 38,846 | | | $ | 166 | | |
| LTX* | | | 20,948 | | | | 88 | | |
| Macromedia* | | | 26,486 | | | | 1,077 | | |
| Macrovision* (a) | | | 17,037 | | | | 325 | | |
| McAfee* (a) | | | 57,208 | | | | 1,797 | | |
| McDATA, Class A* | | | 55,552 | | | | 291 | | |
| MEMC Electronic Materials* (a) | | | 54,150 | | | | 1,234 | | |
| Mentor Graphics* (a) | | | 26,152 | | | | 225 | | |
| Micrel* (a) | | | 22,694 | | | | 255 | | |
| Microchip Technology (a) | | | 72,134 | | | | 2,173 | | |
| MPS Group* | | | 35,725 | | | | 422 | | |
| National Instruments (a) | | | 19,082 | | | | 470 | | |
| Newport* | | | 14,040 | | | | 196 | | |
| Plantronics | | | 16,557 | | | | 510 | | |
| Plexus* | | | 14,781 | | | | 253 | | |
| Polycom* (a) | | | 33,289 | | | | 538 | | |
| Powerwave Technologies* (a) | | | 38,570 | | | | 501 | | |
| Reynolds & Reynolds, Class A | | | 17,782 | | | | 487 | | |
| RF Micro Devices* | | | 66,156 | | | | 374 | | |
| RSA Security* | | | 23,832 | | | | 303 | | |
| SanDisk* (a) | | | 63,216 | | | | 3,050 | | |
| Semtech* (a) | | | 25,564 | | | | 421 | | |
| Silicon Laboratories* (a) | | | 13,190 | | | | 401 | | |
| SRA International, Class A* | | | 10,000 | | | | 355 | | |
| Sybase* (a) | | | 31,310 | | | | 733 | | |
| Synopsys* (a) | | | 49,616 | | | | 938 | | |
| Tech Data* (a) | | | 19,903 | | | | 731 | | |
| Transaction Systems Architects, Class A* (a) | | | 11,893 | | | | 331 | | |
| TriQuint Semiconductor* | | | 47,131 | | | | 166 | | |
| UTStarcom* (a) | | | 35,010 | | | | 286 | | |
| Vishay Intertechnology* | | | 62,241 | | | | 744 | | |
| Western Digital* (a) | | | 74,630 | | | | 965 | | |
| Wind River Systems* (a) | | | 26,493 | | | | 343 | | |
| Zebra Technology, Class A* (a) | | | 24,880 | | | | 973 | | |
| | | | 54,902 | | |
| Materials – 5.7% | | | |
| Airgas | | | 24,800 | | | | 735 | | |
| Albemarle | | | 13,177 | | | | 497 | | |
| Arch Coal (a) | | | 22,050 | | | | 1,488 | | |
| Bowater (a) | | | 19,061 | | | | 539 | | |
| Cabot | | | 21,389 | | | | 706 | | |
| Chemtura Corp. | | | 83,200 | | | | 1,033 | | |
| Cytec Industries | | | 14,081 | | | | 611 | | |
| Ferro | | | 14,467 | | | | 265 | | |
| FMC* | | | 13,213 | | | | 756 | | |
| Glatfelter | | | 10,670 | | | | 150 | | |
| Longview Fibre | | | 17,660 | | | | 344 | | |
| Lubrizol (a) | | | 23,465 | | | | 1,017 | | |
| Lyondell Chemical (a) | | | 68,383 | | | | 1,957 | | |
| Martin Marietta Materials | | | 15,961 | | | | 1,252 | | |
| Minerals Technologies (a) | | | 7,081 | | | | 405 | | |
| Olin (a) | | | 24,060 | | | | 457 | | |
| Packaging Corporation of America | | | 24,144 | | | | 469 | | |
| Peabody Energy | | | 44,158 | | | | 3,725 | | |
| Potlatch (a) | | | 10,253 | | | | 534 | | |
| RPM | | | 40,190 | | | | 740 | | |
| Scotts | | | 7,780 | | | | 684 | | |
| Sensient Technologies | | | 16,739 | | | | 317 | | |
| Sonoco Products (a) | | | 33,805 | | | | 923 | | |
| Steel Dynamics (a) | | | 13,990 | | | | 475 | | |
| Valspar (a) | | | 35,216 | | | | 787 | | |
| Worthington Industries (a) | | | 24,570 | | | | 517 | | |
| | | | 21,383 | | |
Mid Cap Index Fund (continued)
| DESCRIPTION | | SHARES/PAR (000) | | VALUE (000) | |
| Telecommunication Services – 0.5% | |
| Cincinnati Bell* | | | 83,996 | | | $ | 370 | | |
| Telephone & Data Systems (a) | | | 17,052 | | | | 665 | | |
| Telephone & Data Systems Special Shares (a) | | | 18,332 | | | | 688 | | |
| | | | 1,723 | | |
| Utilities – 8.0% | | | |
| AGL Resources | | | 25,680 | | | | 953 | | |
| Alliant Energy | | | 39,572 | | | | 1,153 | | |
| Aqua America | | | 33,740 | | | | 1,283 | | |
| Aquila* | | | 130,647 | | | | 517 | | |
| Black Hills (a) | | | 11,210 | | | | 486 | | |
| DPL (a) | | | 44,490 | | | | 1,237 | | |
| Duquesne Light Holdings (a) | | | 26,329 | | | | 453 | | |
| Energy East | | | 51,876 | | | | 1,307 | | |
| Equitable Resources | | | 41,582 | | | | 1,624 | | |
| Great Plains Energy (a) | | | 26,228 | | | | 784 | | |
| Hawaiian Electric Industries | | | 27,838 | | | | 776 | | |
| IDACORP (a) | | | 14,406 | | | | 434 | | |
| MDU Resources Group | | | 41,542 | | | | 1,481 | | |
| National Fuel Gas | | | 25,823 | | | | 883 | | |
| Northeast Utilities | | | 43,974 | | | | 877 | | |
| NSTAR (a) | | | 37,522 | | | | 1,085 | | |
| OGE Energy (a) | | | 27,980 | | | | 786 | | |
| ONEOK (a) | | | 35,420 | | | | 1,205 | | |
| Pepco Holdings | | | 65,450 | | | | 1,523 | | |
| PNM Resources (a) | | | 24,307 | | | | 697 | | |
| Puget Energy (a) | | | 34,240 | | | | 804 | | |
| Questar | | | 28,889 | | | | 2,546 | | |
| SCANA | | | 38,501 | | | | 1,626 | | |
| Sierra Pacific Resources* (a) | | | 63,240 | | | | 939 | | |
| Vectren | | | 26,242 | | | | 744 | | |
| Westar Energy (a) | | | 29,748 | | | | 718 | | |
| WGL Holdings | | | 15,725 | | | | 505 | | |
| Wisconsin Energy | | | 40,913 | | | | 1,633 | | |
| WPS Resources (a) | | | 13,302 | | | | 769 | | |
| | | | 29,828 | | |
Total Common Stocks
(Cost $299,208) | | | | | | | 370,431 | | |
| Short-Term Investments – 1.6% | |
| Affiliated Money Market Fund – 1.2% | |
First American Prime
Obligations Fund, Class Z (b) | | | 4,590,527 | | | | 4,591 | | |
| U.S. Treasury Obligation – 0.4% | |
U.S. Treasury Bill
3.735%, 03/02/06 (c) | | $ | 1,500 | | | | 1,476 | | |
Total Short-Term Investments
(Cost $6,067) | | | | | | | 6,067 | | |
Investments Purchased with Proceeds
from Securities Lending (d) – 36.2% | |
| | | | (Cost $135,867) | | | | 135,867 | | |
Total Investments – 136.5%
(Cost $441,142) | | | | | | | 512,365 | | |
| Other Assets and Liabilities, Net – (36.5)% | | | | | | | (136,983 | ) | |
| Total Net Assets – 100.0% | | | | | | $ | 375,382 | | |
* Non-income producing security
(a) This security or a portion of this security is out on loan at September 30, 2005. Total loaned securities had a market value of $133,612,818 at September 30, 2005. See note 2 in Notes to Financial Statements.
FIRST AMERICAN FUNDS Annual Report 2005
19
Schedule of Investments September 30, 2005
Mid Cap Index Fund (concluded)
(b) Investment in affiliated security. This money market fund is advised by U.S. Bancorp Asset Management, Inc., which also serves as advisor to this fund. See note 3 in Notes to Financial Statements.
(c) Security has been deposited as initial margin on open futures contracts. Yield shown is effective yield as of September 30, 2005. See note 2 in Notes to Financial Statements.
(d) The fund may loan securities in return for collateral in the form of cash, U.S. Government securities, or other high grade debt obligations. The cash collateral is invested in various short-term fixed income securities, such as repurchase agreements, commercial paper, money market funds and other corporate obligations. See note 2 in Notes to Financial Statements.
REIT – Real Estate Investment Trust
Schedule of Open Futures Contracts
| Description | | Number of
Contracts
Purchased
(Sold) | | Notional
Contract
Value
(000) | | Settlement
Month | | Unrealized
Appreciation
(000) | |
S&P Mid Cap 400
Futures Contracts | | | 12 | | | $ | 4,324 | | | December-05 | | $ | 20 | | |
Small Cap Index Fund
| DESCRIPTION | | SHARES | | VALUE (000) | |
| Common Stocks – 99.2% | |
| Consumer Discretionary – 14.1% | |
| 1-800 Contacts* | | | 1,234 | | | $ | 23 | | |
| 1-800 Flowers* | | | 3,802 | | | | 27 | | |
| 4Kids Entertainment* | | | 2,378 | | | | 41 | | |
| 99 Cents Only Stores* | | | 6,630 | | | | 61 | | |
| A.C. Moore Arts & Crafts* | | | 2,361 | | | | 45 | | |
| Aaron Rents | | | 6,096 | | | | 129 | | |
| ADVO | | | 4,703 | | | | 147 | | |
| Aeropostale* (a) | | | 8,223 | | | | 175 | | |
| AFC Enterprises | | | 3,130 | | | | 36 | | |
| Aftermarket Technology* | | | 2,299 | | | | 42 | | |
| Alliance Gaming* (a) | | | 7,707 | | | | 84 | | |
| Alloy* | | | 5,567 | | | | 27 | | |
| Ambassadors Group | | | 2,736 | | | | 61 | | |
| American Axle & Manufacturing Holdings (a) | | | 5,800 | | | | 134 | | |
| America's Car-Mart* | | | 1,455 | | | | 26 | | |
| Ameristar Casinos | | | 3,926 | | | | 82 | | |
| Andersons | | | 1,050 | | | | 31 | | |
| Arbitron | | | 4,749 | | | | 189 | | |
| Arctic Cat | | | 2,013 | | | | 41 | | |
| Argosy Gaming* | | | 4,138 | | | | 194 | | |
| ArvinMeritor | | | 10,570 | | | | 177 | | |
| Asbury Automotive Group* | | | 1,925 | | | | 33 | | |
| Audible* (a) | | | 3,730 | | | | 46 | | |
| Avatar Holdings* | | | 796 | | | | 47 | | |
| Aztar* (a) | | | 5,221 | | | | 161 | | |
| Bandag | | | 1,669 | | | | 72 | | |
| Bassett Furniture | | | 1,699 | | | | 32 | | |
| Beasley Broadcast Group* | | | 593 | | | | 8 | | |
| Big 5 Sporting Goods | | | 3,057 | | | | 73 | | |
| Big Lots* | | | 16,090 | | | | 177 | | |
| BJs Restaurants* | | | 1,863 | | | | 38 | | |
| Blair | | | 372 | | | | 14 | | |
| Blockbuster, Class A (a) | | | 27,580 | | | | 131 | | |
| Blount International* | | | 3,390 | | | | 60 | | |
| Blue Nile* (a) | | | 1,720 | | | | 54 | | |
| Bluegreen* | | | 2,940 | | | | 52 | | |
| BLYTH | | | 3,320 | | | | 74 | | |
| Bob Evans Farms | | | 5,325 | | | | 121 | | |
| Bombay Company* | | | 6,108 | | | | 27 | | |
| Bon-Ton Stores | | | 630 | | | | 12 | | |
| Brookfield Homes | | | 2,215 | | | | 123 | | |
| Brookstone* | | | 3,439 | | | | 69 | | |
| Brown Shoe | | | 2,753 | | | | 91 | | |
| Buckle | | | 1,128 | | | | 38 | | |
| Buffalo Wild Wings* (a) | | | 980 | | | | 26 | | |
| Build-A-Bear Workshop* (a) | | | 1,550 | | | | 35 | | |
| Building Materials Holding | | | 2,097 | | | | 195 | | |
| Burlington Coat Factory | | | 2,562 | | | | 97 | | |
| Cabelas* (a) | | | 3,740 | | | | 69 | | |
| Cache* | | | 1,640 | | | | 25 | | |
| California Coastal Communities* | | | 1,240 | | | | 44 | | |
| California Pizza Kitchen* | | | 3,232 | | | | 95 | | |
| Callaway Golf (a) | | | 11,412 | | | | 172 | | |
| Carmike Cinemas (a) | | | 1,501 | | | | 34 | | |
| Carters* (a) | | | 2,460 | | | | 140 | | |
| Casual Male Retail Group* | | | 4,826 | | | | 33 | | |
| Catalina Marketing, Class C (a) | | | 7,506 | | | | 171 | | |
| Cato, Class A | | | 4,527 | | | | 90 | | |
| CEC Entertainment* | | | 5,695 | | | | 181 | | |
| Champion Enterprise* (a) | | | 11,945 | | | | 177 | | |
| Charles & Colvard | | | 1,852 | | | | 46 | | |
| Charlotte Russe Holding* | | | 1,995 | | | | 27 | | |
| Charming Shoppes* (a) | | | 18,037 | | | | 192 | | |
The accompanying notes are an integral part of the financial statements.
FIRST AMERICAN FUNDS Annual Report 2005
20
Small Cap Index Fund (continued)
| DESCRIPTION | | SHARES | | VALUE (000) | |
| Charter Communications, Class A* (a) | | | 45,385 | | | $ | 68 | | |
| Cherokee | | | 1,176 | | | | 41 | | |
| Children's Place Retail Stores* | | | 3,012 | | | | 107 | | |
| Christopher & Banks | | | 5,402 | | | | 75 | | |
| Churchill Downs | | | 1,316 | | | | 46 | | |
| Citadel Broadcasting* | | | 6,440 | | | | 88 | | |
| Citi Trends* (a) | | | 600 | | | | 13 | | |
| CKE Restaurants | | | 8,892 | | | | 117 | | |
| Coachmen Industries | | | 2,427 | | | | 28 | | |
| Coldwater Creek* (a) | | | 5,646 | | | | 142 | | |
| Comstock Homebuilding, Class A* | | | 680 | | | | 14 | | |
| Conns* (a) | | | 720 | | | | 20 | | |
| Cooper Tire & Rubber (a) | | | 9,593 | | | | 146 | | |
| Corinthian Colleges* | | | 14,080 | | | | 187 | | |
| Cost Plus* | | | 3,300 | | | | 60 | | |
| Courier | | | 1,652 | | | | 62 | | |
| Cox Radio* (a) | | | 4,160 | | | | 63 | | |
| Crown Media Holdings, Class A* | | | 2,509 | | | | 27 | | |
| CSK Auto* | | | 6,812 | | | | 101 | | |
| CSS Industries | | | 972 | | | | 32 | | |
| Cumulus Media, Class A* | | | 8,412 | | | | 105 | | |
| Dave & Busters* | | | 1,905 | | | | 25 | | |
| Deb Shops | | | 297 | | | | 6 | | |
| Deckers Outdoor* (a) | | | 1,540 | | | | 37 | | |
| Denny's* | | | 14,060 | | | | 58 | | |
| Design Within Reach* | | | 730 | | | | 7 | | |
| DeVry* (a) | | | 8,280 | | | | 158 | | |
| DHB Industries* | | | 4,093 | | | | 17 | | |
| Dixie Group* | | | 1,700 | | | | 27 | | |
| Dominos Pizza | | | 3,770 | | | | 88 | | |
| Dover Downs Gaming & Entertainment | | | 1,201 | | | | 16 | | |
| Dover Motorsports | | | 2,461 | | | | 17 | | |
| Dress Barn* (a) | | | 3,171 | | | | 72 | | |
| Drew Industries* | | | 2,448 | | | | 63 | | |
| Drugstore.com* | | | 10,574 | | | | 39 | | |
| DSW* | | | 1,050 | | | | 22 | | |
| Earle M. Jorgensen* | | | 2,810 | | | | 27 | | |
| Electronics Boutique Holdings* | | | 1,767 | | | | 111 | | |
| Emmis Communications, Class A* | | | 4,845 | | | | 107 | | |
| Entercom Communications* | | | 5,400 | | | | 171 | | |
| Entravision Communications* | | | 9,400 | | | | 74 | | |
| Escala Group* | | | 870 | | | | 14 | | |
| Escalade | | | 1,350 | | | | 18 | | |
| Ethan Allen Interiors | | | 5,250 | | | | 165 | | |
| Finish Line, Class A | | | 6,356 | | | | 93 | | |
| Fisher Communications* | | | 1,039 | | | | 48 | | |
| Fleetwood Enterprises* (a) | | | 8,977 | | | | 110 | | |
| Fossil* | | | 7,520 | | | | 137 | | |
| Fred's (a) | | | 6,004 | | | | 75 | | |
| FTD Group* | | | 2,270 | | | | 23 | | |
| Furniture Brands International | | | 7,410 | | | | 134 | | |
| Gamestop* | | | 6,350 | | | | 180 | | |
| Gaylord Entertainment* | | | 5,591 | | | | 266 | | |
| Gemstar-TV Guide International* | | | 38,120 | | | | 113 | | |
| Genesco* | | | 3,344 | | | | 125 | | |
| Goody's Family Clothing | | | 3,236 | | | | 24 | | |
| Gray Television | | | 6,555 | | | | 69 | | |
| Great Wolf Resorts* | | | 3,890 | | | | 40 | | |
| Group 1 Automotive* | | | 3,352 | | | | 93 | | |
| GSI Commerce* (a) | | | 4,025 | | | | 80 | | |
| Guess?* | | | 2,557 | | | | 55 | | |
| Guitar Center* | | | 3,898 | | | | 215 | | |
| Gymboree* | | | 5,254 | | | | 72 | | |
| Handleman (a) | | | 3,444 | | | | 43 | | |
| Harris Interactive* | | | 9,045 | | | | 39 | | |
| Hartmarx* | | | 3,910 | | | | 26 | | |
Small Cap Index Fund (continued)
| DESCRIPTION | | SHARES | | VALUE (000) | |
| Haverty Furniture | | | 3,184 | | | $ | 39 | | |
| Hayes Lemmerz International* | | | 4,690 | | | | 21 | | |
| Hibbett Sporting Goods* | | | 5,268 | | | | 117 | | |
| Hollinger International | | | 9,630 | | | | 94 | | |
| Hooker Furniture | | | 1,180 | | | | 20 | | |
| Hot Topic* | | | 6,762 | | | | 104 | | |
| IHOP | | | 3,022 | | | | 123 | | |
| Innovo Group* | | | 3,980 | | | | 8 | | |
| Insight Communications* | | | 7,513 | | | | 87 | | |
| Insight Enterprises* | | | 7,298 | | | | 136 | | |
| Interface, Class A* | | | 7,618 | | | | 63 | | |
| Isle of Capri Casinos* (a) | | | 2,299 | | | | 49 | | |
| J. Jill Group* | | | 3,049 | | | | 48 | | |
| Jack in the Box* (a) | | | 5,500 | | | | 165 | | |
| JAKKS Pacific* (a) | | | 3,844 | | | | 62 | | |
| Jarden* (a) | | | 7,590 | | | | 312 | | |
| Jo-Ann Stores* | | | 3,244 | | | | 56 | | |
| JOS A Bank Clothiers* (a) | | | 1,761 | | | | 76 | | |
| Journal Communications | | | 3,490 | | | | 52 | | |
| Journal Register | | | 6,317 | | | | 102 | | |
| K2* | | | 7,163 | | | | 82 | | |
| Kellwood (a) | | | 4,304 | | | | 111 | | |
| Kenneth Cole Productions | | | 1,433 | | | | 39 | | |
| Keystone Automotive Industries* | | | 2,610 | | | | 75 | | |
| Kimball International | | | 3,288 | | | | 40 | | |
| Krispy Kreme Doughnuts* (a) | | | 8,330 | | | | 52 | | |
| K-Swiss, Class A | | | 3,774 | | | | 112 | | |
| La Quinta (REIT)* (a) | | | 28,164 | | | | 245 | | |
| Landry's Restaurants (a) | | | 2,484 | | | | 73 | | |
| La-Z-Boy (a) | | | 8,000 | | | | 106 | | |
| LeapFrog Enterprises* (a) | | | 4,720 | | | | 70 | | |
| Levitt, Class A | | | 2,640 | | | | 61 | | |
| Libbey | | | 2,088 | | | | 32 | | |
| Liberty | | | 2,221 | | | | 104 | | |
| Life Time Fitness* | | | 2,940 | | | | 97 | | |
| Lifetime Brands | | | 1,090 | | | | 29 | | |
| Lin TV, Class A* | | | 4,085 | | | | 57 | | |
| Linens 'N Things* (a) | | | 6,655 | | | | 178 | | |
| Lithia Motors | | | 2,454 | | | | 71 | | |
| LKQ* | | | 2,500 | | | | 76 | | |
| LodgeNet Entertainment* | | | 2,502 | | | | 37 | | |
| Lodgian* | | | 3,740 | | | | 38 | | |
| Lone Star Steakhouse & Saloon | | | 1,914 | | | | 50 | | |
| Luby's* | | | 3,540 | | | | 46 | | |
| M/I Homes | | | 1,942 | | | | 105 | | |
| Magna Entertainment* (a) | | | 6,473 | | | | 43 | | |
| Maidenform Brands* | | | 750 | | | | 10 | | |
| Marcus | | | 3,007 | | | | 60 | | |
| Marine Products | | | 2,229 | | | | 25 | | |
| MarineMax* | | | 2,002 | | | | 51 | | |
| Martha Stewart Living* (a) | | | 3,029 | | | | 76 | | |
| Maytag (a) | | | 11,470 | | | | 209 | | |
| McCormick & Schmicks Seafood Restaurant* | | | 1,220 | | | | 26 | | |
| Media General, Class A | | | 2,750 | | | | 160 | | |
| Mediacom Communications* | | | 9,314 | | | | 69 | | |
| Mestek* | | | 30 | | | | - | | |
| Midas* | | | 2,657 | | | | 53 | | |
| Mikohn Gaming* | | | 3,550 | | | | 47 | | |
| Modine Manufacturing | | | 4,111 | | | | 151 | | |
| Monaco Coach (a) | | | 4,491 | | | | 66 | | |
| Monarch Casino & Resort* | | | 1,370 | | | | 23 | | |
| Monro Muffler Brake | | | 1,607 | | | | 42 | | |
| Morningstar* | | | 1,340 | | | | 43 | | |
| Movado Group | | | 2,616 | | | | 49 | | |
| Movie Gallery (a) | | | 3,778 | | | | 39 | | |
| MTR Gaming Group* | | | 3,988 | | | | 32 | | |
FIRST AMERICAN FUNDS Annual Report 2005
21
Schedule of Investments September 30, 2005
Small Cap Index Fund (continued)
| DESCRIPTION | | SHARES | | VALUE (000) | |
| Multimedia Games* (a) | | | 4,058 | | | $ | 39 | | |
| National Presto Industries | | | 803 | | | | 34 | | |
| Nautilus Group (a) | | | 4,937 | | | | 109 | | |
| Navarre* (a) | | | 3,820 | | | | 22 | | |
| Netflix* (a) | | | 5,670 | | | | 147 | | |
| New York & Company* | | | 1,740 | | | | 29 | | |
| Noble International | | | 1,090 | | | | 26 | | |
| NutriSystems* (a) | | | 3,430 | | | | 86 | | |
| Oakley | | | 3,555 | | | | 62 | | |
| O'Charley's* | | | 3,646 | | | | 52 | | |
| Outdoor Channel Holdings* | | | 1,490 | | | | 22 | | |
| Overstock.com* | | | 1,714 | | | | 66 | | |
| Oxford Industries (a) | | | 2,284 | | | | 103 | | |
| P.F. Chang's China Bistro* (a) | | | 4,120 | | | | 185 | | |
| Pacific Sunwear of California* | | | 10,910 | | | | 234 | | |
| Palm Harbor Homes* | | | 1,631 | | | | 32 | | |
| Papa John's International* | | | 1,868 | | | | 94 | | |
| Party City* | | | 1,966 | | | | 33 | | |
| Payless ShoeSource* | | | 10,412 | | | | 181 | | |
| Pep Boys – Manny Moe & Jack | | | 8,583 | | | | 119 | | |
| Perry Ellis International* | | | 915 | | | | 20 | | |
| PETCO Animal Supplies* | | | 8,270 | | | | 175 | | |
| Phillips Van-Heusen | | | 4,153 | | | | 129 | | |
| Pier 1 Imports (a) | | | 11,840 | | | | 133 | | |
| Pinnacle Entertainment* | | | 6,098 | | | | 112 | | |
| Playboy Enterprises, Class B* (a) | | | 3,361 | | | | 47 | | |
| Prestige Brand Holdings* | | | 4,820 | | | | 59 | | |
| Priceline.com* | | | 3,705 | | | | 72 | | |
| PRIMEDIA* | | | 22,870 | | | | 94 | | |
| ProQuest* | | | 4,047 | | | | 147 | | |
| Provide Commerce* | | | 1,240 | | | | 30 | | |
| Quantum Fuel Systems Technologies Worldwde* | | | 7,070 | | | | 29 | | |
| R&B* | | | 1,580 | | | | 16 | | |
| Radio One* (a) | | | 12,540 | | | | 165 | | |
| RARE Hospitality International* | | | 5,647 | | | | 145 | | |
| RC2* | | | 2,831 | | | | 96 | | |
| RCN* (a) | | | 3,540 | | | | 75 | | |
| Reader's Digest Association, Class A | | | 15,440 | | | | 247 | | |
| Red Robin Gourmet Burgers* (a) | | | 2,055 | | | | 94 | | |
| Regent Communication* | | | 5,986 | | | | 31 | | |
| Regis | | | 6,320 | | | | 239 | | |
| Rent-Way* | | | 4,504 | | | | 31 | | |
| Restoration Hardware* | | | 4,524 | | | | 29 | | |
| Retail Ventures* (a) | | | 2,280 | | | | 25 | | |
| Riviera Holdings* | | | 1,310 | | | | 29 | | |
| Ruby Tuesday (a) | | | 8,800 | | | | 191 | | |
| Russ Berrie and Company | | | 525 | | | | 7 | | |
| Russell | | | 4,921 | | | | 69 | | |
| Ruth's Chris Steak House* | | | 810 | | | | 15 | | |
| Ryans Restaurant Group* | | | 7,096 | | | | 83 | | |
| Saga Communications, Class A* | | | 2,553 | | | | 34 | | |
| Salem Communications* | | | 1,648 | | | | 30 | | |
| Sauer-Danfoss | | | 1,727 | | | | 35 | | |
| Scholastic* | | | 5,020 | | | | 186 | | |
| Select Comfort* (a) | | | 5,442 | | | | 109 | | |
| Sharper Image* | | | 2,014 | | | | 25 | | |
| Shoe Carnival* | | | 1,267 | | | | 20 | | |
| Shopko* | | | 4,496 | | | | 115 | | |
| Shuffle Master* (a) | | | 5,579 | | | | 147 | | |
| Sinclair Broadcast Group, Class A | | | 6,614 | | | | 59 | | |
| Six Flags* | | | 13,799 | | | | 99 | | |
| Skechers USA* | | | 3,409 | | | | 56 | | |
| Skyline | | | 1,164 | | | | 47 | | |
| Sonic Automotive, Class A | | | 4,660 | | | | 104 | | |
| Source Interlink Companies* | | | 3,422 | | | | 38 | | |
| Spanish Broadcasting System* (a) | | | 6,350 | | | | 46 | | |
Small Cap Index Fund (continued)
| DESCRIPTION | | SHARES | | VALUE (000) | |
| Speedway Motorsports | | | 2,360 | | | $ | 86 | | |
| Sports Authority* (a) | | | 3,770 | | | | 111 | | |
| Stage Stores | | | 4,064 | | | | 109 | | |
| Stamps.com* | | | 2,350 | | | | 40 | | |
| Standard Motor Products | | | 2,075 | | | | 17 | | |
| Stanley Furniture | | | 1,924 | | | | 50 | | |
| Steak 'N Shake* (a) | | | 4,109 | | | | 75 | | |
| Stein Mart | | | 4,256 | | | | 86 | | |
| Steinway Musical Instruments* | | | 1,153 | | | | 30 | | |
| Steven Madden* | | | 1,987 | | | | 46 | | |
| Strattec Security* | | | 639 | | | | 33 | | |
| Stride Rite | | | 5,369 | | | | 69 | | |
| Sturm, Ruger & Company | | | 2,228 | | | | 20 | | |
| Sunterra* (a) | | | 3,190 | | | | 42 | | |
| Superior Industries International (a) | | | 3,632 | | | | 78 | | |
| SYMS | | | 30 | | | | - | | |
| Systemax* | | | 1,656 | | | | 12 | | |
| Talbots | | | 2,900 | | | | 87 | | |
| TBC* | | | 3,401 | | | | 117 | | |
| Technical Olympic USA | | | 1,981 | | | | 52 | | |
| Tenneco Automotive* | | | 6,681 | | | | 117 | | |
| Texas Roadhouse, Class A* (a) | | | 5,040 | | | | 75 | | |
| Thomas Nelson | | | 1,724 | | | | 32 | | |
| Thor Industries (a) | | | 5,128 | | | | 174 | | |
| TiVo* (a) | | | 8,821 | | | | 48 | | |
| Too* (a) | | | 5,170 | | | | 142 | | |
| Tractor Supply* | | | 4,944 | | | | 226 | | |
| Trans World Entertainment* | | | 2,939 | | | | 23 | | |
| Triarc, Class B | | | 6,144 | | | | 94 | | |
| Tuesday Morning | | | 3,901 | | | | 101 | | |
| Tupperware (a) | | | 8,114 | | | | 185 | | |
| UniFirst | | | 1,508 | | | | 53 | | |
| United Auto Group | | | 3,319 | | | | 110 | | |
| Universal Electronics* | | | 2,396 | | | | 41 | | |
| Vail Resorts* | | | 3,909 | | | | 112 | | |
| Valassis Communications* | | | 7,050 | | | | 275 | | |
| ValueVision Media* (a) | | | 3,124 | | | | 35 | | |
| Visteon | | | 19,399 | | | | 190 | | |
| Volcom* | | | 100 | | | | 3 | | |
| Warnaco Group, Class A* | | | 7,092 | | | | 155 | | |
| WCI Communities* (a) | | | 5,221 | | | | 148 | | |
| WESCO International* (a) | | | 4,792 | | | | 162 | | |
| West Marine* | | | 2,309 | | | | 34 | | |
| Wet Seal, Class A* (a) | | | 6,680 | | | | 30 | | |
| Weyco Group | | | 36 | | | | 1 | | |
| William Lyon Homes* (a) | | | 382 | | | | 59 | | |
| Wilsons The Leather Experts* | | | 2,930 | | | | 18 | | |
| Winnebago Industries | | | 4,498 | | | | 130 | | |
| WMS Industries* | | | 3,334 | | | | 94 | | |
| Wolverine World Wide | | | 8,971 | | | | 189 | | |
| World Wrestling Entertainment | | | 471 | | | | 6 | | |
| WorldSpace* | | | 800 | | | | 11 | | |
| WPT Enterprises* | | | 890 | | | | 8 | | |
| Xerium Technologies | | | 2,130 | | | | 24 | | |
| Yankee Candle | | | 6,850 | | | | 168 | | |
| Zale* (a) | | | 7,842 | | | | 213 | | |
| Zumiez* | | | 490 | | | | 16 | | |
| | | | 25,230 | | |
| Consumer Staples – 2.8% | | | |
| Alico | | | 606 | | | | 31 | | |
| Alliance One International | | | 12,262 | | | | 43 | | |
| American Italian Pasta (a) | | | 2,754 | | | | 29 | | |
| Arden Group, Class A | | | 224 | | | | 17 | | |
| Boston Beer, Class A* (a) | | | 450 | | | | 11 | | |
| Casey's General Stores (a) | | | 7,554 | | | | 175 | | |
The accompanying notes are an integral part of the financial statements.
FIRST AMERICAN FUNDS Annual Report 2005
22
Small Cap Index Fund (continued)
| DESCRIPTION | | SHARES | | VALUE (000) | |
| Central European Distribution* | | | 2,009 | | | $ | 86 | | |
| Central Garden & Pet* | | | 2,901 | | | | 131 | | |
| Chattem* | | | 2,677 | | | | 95 | | |
| Chiquita Brands International (a) | | | 6,366 | | | | 178 | | |
| Coca-Cola Bottling | | | 678 | | | | 33 | | |
| Corn Products International (a) | | | 11,442 | | | | 231 | | |
| Darling International* | | | 11,339 | | | | 40 | | |
| Delta & Pine Land | | | 5,387 | | | | 142 | | |
| Elizabeth Arden* | | | 3,848 | | | | 83 | | |
| Farmer Brothers | | | 1,160 | | | | 23 | | |
| Flowers Foods | | | 7,868 | | | | 215 | | |
| Gold Kist* | | | 7,080 | | | | 138 | | |
| Great Atlantic & Pacific Tea* | | | 2,715 | | | | 77 | | |
| Green Mountain Coffee Roasters* | | | 680 | | | | 24 | | |
| Hain Celestial Group* (a) | | | 4,433 | | | | 86 | | |
| Hansen Natural* (a) | | | 2,060 | | | | 97 | | |
| Ingles Markets, Class A | | | 1,760 | | | | 28 | | |
| Inter Parfums (a) | | | 654 | | | | 13 | | |
| J&J Snack Foods | | | 1,076 | | | | 62 | | |
| John B. Sanfilippo & Son* | | | 1,075 | | | | 19 | | |
| Lancaster Colony | | | 4,010 | | | | 172 | | |
| Lance | | | 4,410 | | | | 77 | | |
| Longs Drug Stores | | | 4,756 | | | | 204 | | |
| M & F Worldwide* | | | 1,745 | | | | 27 | | |
| Mannatech (a) | | | 2,440 | | | | 29 | | |
| Maui Land & Pineapple* | | | 562 | | | | 17 | | |
| Nash-Finch (a) | | | 1,921 | | | | 81 | | |
| National Beverage* | | | 1,340 | | | | 10 | | |
| Natures Sunshine Product | | | 1,657 | | | | 39 | | |
| NBTY* | | | 7,940 | | | | 187 | | |
| Nu Skin Enterprises | | | 8,462 | | | | 161 | | |
| Pantry* | | | 2,249 | | | | 84 | | |
| Parlux Fragrances* (a) | | | 980 | | | | 29 | | |
| Pathmark Stores* | | | 6,213 | | | | 70 | | |
| Peets Coffee & Tea* | | | 2,026 | | | | 62 | | |
| Performance Food Group* | | | 5,590 | | | | 176 | | |
| Playtex Products* | | | 5,970 | | | | 66 | | |
| Ralcorp Holdings | | | 4,467 | | | | 187 | | |
| Reddy Ice Holdings | | | 300 | | | | 6 | | |
| Revlon* | | | 21,882 | | | | 70 | | |
| Ruddick | | | 5,145 | | | | 119 | | |
| Sanderson Farms | | | 2,226 | | | | 83 | | |
| Seaboard | | | 52 | | | | 71 | | |
| Smart & Final* | | | 2,148 | | | | 28 | | |
| Spartan Stores* | | | 3,220 | | | | 33 | | |
| Star Scientific* | | | 5,069 | | | | 17 | | |
| Tiens Biotech Group USA* | | | 720 | | | | 3 | | |
| Tootsie Roll Industries | | | 2,950 | | | | 94 | | |
| Topps | | | 6,087 | | | | 50 | | |
| United Natural Foods* (a) | | | 6,462 | | | | 228 | | |
| Universal | | | 3,832 | | | | 149 | | |
| Usana Health Sciences* (a) | | | 1,546 | | | | 74 | | |
| Vector Group | | | 3,937 | | | | 79 | | |
| WD-40 Company | | | 2,584 | | | | 69 | | |
| Weis Markets | | | 1,140 | | | | 46 | | |
| Wild Oats Markets* (a) | | | 4,815 | | | | 62 | | |
| | | | 5,066 | | |
| Energy – 6.6% | | | |
| Alon USA Energy* | | | 890 | | | | 21 | | |
| Atlas America* | | | 1,901 | | | | 93 | | |
| ATP Oil & Gas* (a) | | | 2,810 | | | | 92 | | |
| Atwood Oceanics* (a) | | | 2,024 | | | | 170 | | |
| Berry Petroleum, Class A | | | 2,589 | | | | 173 | | |
| Bill Barrett* (a) | | | 1,490 | | | | 55 | | |
| Bois D' Arc Energy* | | | 2,100 | | | | 36 | | |
Small Cap Index Fund (continued)
| DESCRIPTION | | SHARES | | VALUE (000) | |
| Brigham Exploration* | | | 4,350 | | | $ | 56 | | |
| Cabot Oil & Gas | | | 7,586 | | | | 383 | | |
| Cal Dive International* (a) | | | 5,834 | | | | 370 | | |
| Callon Petroleum* | | | 2,150 | | | | 45 | | |
| Carbo Ceramics | | | 3,219 | | | | 212 | | |
| Carrizo Oil & Gas* | | | 2,910 | | | | 85 | | |
| Cheniere Energy* (a) | | | 7,220 | | | | 299 | | |
| Cimarex Energy* (a) | | | 12,486 | | | | 566 | | |
| Clayton Williams Energy* | | | 869 | | | | 38 | | |
| Comstock Resources* | | | 5,988 | | | | 196 | | |
| Crosstex Energy | | | 360 | | | | 23 | | |
| Delta Petroleum* | | | 3,480 | | | | 72 | | |
| Dril-Quip* | | | 1,115 | | | | 54 | | |
| Edge Petroleum* | | | 2,240 | | | | 59 | | |
| Encore Acquisition* | | | 6,200 | | | | 241 | | |
| Endeavour International* (a) | | | 8,740 | | | | 44 | | |
| Energy Partners* | | | 4,303 | | | | 134 | | |
| Foundation Coal Holdings | | | 3,580 | | | | 138 | | |
| Frontier Oil | | | 8,120 | | | | 360 | | |
| FX Energy* (a) | | | 5,310 | | | | 64 | | |
| Gasco Energy* (a) | | | 9,940 | | | | 66 | | |
| Giant Industries* | | | 1,860 | | | | 109 | | |
| Global Industries* (a) | | | 12,275 | | | | 181 | | |
| Goodrich Petroleum* (a) | | | 1,580 | | | | 37 | | |
| Grey Wolf* | | | 31,204 | | | | 263 | | |
| Gulf Island Fabrication | | | 724 | | | | 21 | | |
| GulfMark Offshore* | | | 2,481 | | | | 80 | | |
| Hanover Compressor* | | | 11,793 | | | | 163 | | |
| Harvest Natural Resources* | | | 6,178 | | | | 66 | | |
| Holly | | | 3,348 | | | | 214 | | |
| Hornbeck Offshore Services* | | | 1,470 | | | | 54 | | |
| Houston Exploration* | | | 3,818 | | | | 257 | | |
| Hydril* | | | 2,732 | | | | 188 | | |
| Input/Output* (a) | | | 10,951 | | | | 87 | | |
| James River Coal* | | | 1,850 | | | | 93 | | |
| KCS Energy* | | | 7,507 | | | | 207 | | |
| KFX* (a) | | | 8,862 | | | | 152 | | |
| Lone Star Technologies* | | | 4,713 | | | | 262 | | |
| Lufkin Industries | | | 2,130 | | | | 93 | | |
| Maritrans | | | 1,320 | | | | 42 | | |
| MarkWest Hydrocarbon | | | 880 | | | | 22 | | |
| Maverick Tube* (a) | | | 6,427 | | | | 193 | | |
| McMoRan Exploration* (a) | | | 3,083 | | | | 60 | | |
| Meridian Resource* | | | 10,579 | | | | 44 | | |
| Newpark Resources* | | | 12,374 | | | | 104 | | |
| NGP Capital Resources | | | 2,790 | | | | 42 | | |
| NS Group* | | | 3,393 | | | | 133 | | |
| Oceaneering International* (a) | | | 4,215 | | | | 225 | | |
| Offshore Logistics* | | | 3,478 | | | | 129 | | |
| Oil States International* | | | 5,044 | | | | 183 | | |
| Pacific Ethanol* (a) | | | 500 | | | | 5 | | |
| Parallel Petroleum* | | | 4,830 | | | | 68 | | |
| Parker Drilling* | | | 14,426 | | | | 134 | | |
| Penn Virginia | | | 2,898 | | | | 167 | | |
| Petrocorp Escrow Shares (b) (c) | | | 2,040 | | | | - | | |
| Petrohawk Energy* | | | 6,917 | | | | 100 | | |
| Petroleum Developement* | | | 2,664 | | | | 102 | | |
| Petroquest Energy* | | | 6,330 | | | | 66 | | |
| Pioneer Drilling Company* | | | 3,090 | | | | 60 | | |
| Remington Oil & Gas* | | | 3,719 | | | | 154 | | |
| Resource America, Class A | | | 2,547 | | | | 45 | | |
| RPC | | | 2,457 | | | | 63 | | |
| St. Mary Land & Exploration | | | 8,482 | | | | 310 | | |
| SEACOR Holdings* | | | 2,722 | | | | 198 | | |
| Spinnaker Exploration* | | | 3,725 | | | | 241 | | |
| Stone Energy* | | | 3,554 | | | | 217 | | |
FIRST AMERICAN FUNDS Annual Report 2005
23
Schedule of Investments September 30, 2005
Small Cap Index Fund (continued)
| DESCRIPTION | | SHARES | | VALUE (000) | |
| Superior Energy Services* | | | 10,591 | | | $ | 245 | | |
| Superior Well Services* | | | 140 | | | | 3 | | |
| Swift Energy* | | | 4,260 | | | | 195 | | |
| Syntroleum* | | | 6,060 | | | | 88 | | |
| Tetra Technologies* | | | 4,770 | | | | 149 | | |
| Tipperary* | | | 2,800 | | | | 21 | | |
| TODCO | | | 6,310 | | | | 263 | | |
| Toreador Resources* (a) | | | 2,200 | | | | 78 | | |
| TransMontaigne* | | | 5,125 | | | | 41 | | |
| Tri Valley* (a) | | | 4,050 | | | | 40 | | |
| Universal Compression Holdings* | | | 2,899 | | | | 115 | | |
| Veritas DGC* | | | 5,108 | | | | 187 | | |
| W&T Offshore | | | 1,480 | | | | 48 | | |
| Warren Resources* (a) | | | 2,920 | | | | 49 | | |
| W-H Energy Services* | | | 4,226 | | | | 137 | | |
| Whiting Petroleum* | | | 4,680 | | | | 205 | | |
| World Fuel Services | | | 3,452 | | | | 112 | | |
| | | | 11,755 | | |
| Financials – 21.4% | | | |
| 1st Source | | | 1,794 | | | | 42 | | |
| 21st Century Insurance Group | | | 3,817 | | | | 61 | | |
| Aames Investment | | | 7,090 | | | | 45 | | |
| ABC Bancorp | | | 2,019 | | | | 39 | | |
| Acadia Realty Trust | | | 4,569 | | | | 82 | | |
| Accredited Home Lenders Holdings* (a) | | | 2,611 | | | | 92 | | |
| Ace Cash Express* (a) | | | 1,550 | | | | 30 | | |
| Advance America Cash Advance Centers | | | 10,230 | | | | 136 | | |
| Advanta, Class B | | | 2,863 | | | | 81 | | |
| Affirmative Insurance | | | 1,620 | | | | 24 | | |
| Affordable Residential Communities | | | 3,910 | | | | 40 | | |
| Agree Realty | | | 40 | | | | 1 | | |
| Alabama National | | | 2,052 | | | | 131 | | |
| Alexander's (REIT)* | | | 341 | | | | 92 | | |
| Alexandria Real Estate Equities (a) | | | 3,340 | | | | 276 | | |
| Alfa | | | 5,669 | | | | 95 | | |
| AMCORE Financial | | | 3,295 | | | | 103 | | |
| Amegy Bancorp | | | 10,576 | | | | 239 | | |
| American Campus Communities | | | 2,070 | | | | 50 | | |
| American Equity Investment Life Holding | | | 3,750 | | | | 43 | | |
| American Home Mortgage Investment (REIT) | | | 5,381 | | | | 163 | | |
| American Physicians Capital* | | | 1,462 | | | | 72 | | |
| American West Bancorp* | | | 1,757 | | | | 41 | | |
| Ames National | | | 420 | | | | 12 | | |
| AMLI Residential Properties Trust (REIT) | | | 3,980 | | | | 128 | | |
| Anchor Bancorp | | | 3,388 | | | | 100 | | |
| Anthracite Capital (REIT) | | | 8,246 | | | | 95 | | |
| Anworth Mortgage Asset (REIT) | | | 7,680 | | | | 64 | | |
| Apollo Investment | | | 9,390 | | | | 186 | | |
| Arbor Realty Trust | | | 1,220 | | | | 34 | | |
| Archipelago Holdings* | | | 4,100 | | | | 163 | | |
| Ares Capital | | | 3,880 | | | | 63 | | |
| Argonaut Group* | | | 3,963 | | | | 107 | | |
| Arrow Financial | | | 1,575 | | | | 43 | | |
| Ashford Hospitality Trust | | | 4,700 | | | | 51 | | |
| Asta Funding (a) | | | 1,600 | | | | 49 | | |
| Baldwin & Lyons, Class B | | | 1,381 | | | | 35 | | |
| Banc – Alabama* | | | 2,070 | | | | 22 | | |
| BancFirst | | | 552 | | | | 47 | | |
| Bancorp Bank* | | | 1,356 | | | | 22 | | |
| BancorpSouth | | | 11,830 | | | | 270 | | |
| BancTrust Financial Group | | | 1,470 | | | | 28 | | |
| Bank Mutual | | | 8,917 | | | | 96 | | |
| Bank of Granite | | | 1,995 | | | | 38 | | |
| Bank of the Ozarks | | | 1,830 | | | | 63 | | |
| BankAtlantic Bancorp | | | 7,313 | | | | 124 | | |
Small Cap Index Fund (continued)
| DESCRIPTION | | SHARES | | VALUE (000) | |
| BankUnited Financial | | | 3,914 | | | $ | 90 | | |
| Banner | | | 1,726 | | | | 46 | | |
| Bedford Property Investors (REIT) | | | 2,179 | | | | 52 | | |
| Berkshire Hills Bancorp | | | 919 | | | | 31 | | |
| Beverly Hills Bancorp | | | 2,280 | | | | 23 | | |
| BFC Financial* | | | 1,476 | | | | 10 | | |
| Bimini Mortgage Management | | | 3,250 | | | | 37 | | |
| BioMed Realty Trust | | | 5,400 | | | | 134 | | |
| BKF Capital Group | | | 1,050 | | | | 32 | | |
| Boston Private Financial | | | 4,231 | | | | 112 | | |
| Boykin Lodging (REIT)* | | | 1,810 | | | | 22 | | |
| Brandywine Realty Trust (REIT) (a) | | | 8,171 | | | | 254 | | |
| Bristol West Holdings (a) | | | 2,600 | | | | 47 | | |
| Brookline Bancorp | | | 10,144 | | | | 160 | | |
| Calamos Asset Management | | | 3,470 | | | | 86 | | |
| Camden National | | | 1,322 | | | | 50 | | |
| Capital Automotive | | | 6,272 | | | | 243 | | |
| Capital City Bank Group | | | 1,752 | | | | 66 | | |
| Capital Corporation of the West | | | 1,538 | | | | 47 | | |
| Capital Crossing Bank* | | | 730 | | | | 25 | | |
| Capital Lease Funding | | | 3,890 | | | | 40 | | |
| Capital Southwest | | | 410 | | | | 35 | | |
| Capital Trust | | | 1,780 | | | | 57 | | |
| Capitol Bancorp | | | 1,751 | | | | 57 | | |
| Cardinal Financial* | | | 2,070 | | | | 20 | | |
| Cascade Bancorp | | | 2,858 | | | | 60 | | |
| Cash America International | | | 4,345 | | | | 90 | | |
| Cathay General Bancorp | | | 6,224 | | | | 221 | | |
| Cedar Shopping Centers | | | 3,270 | | | | 47 | | |
| Center Financial | | | 1,654 | | | | 39 | | |
| Central Coast Bancorp* | | | 1,916 | | | | 41 | | |
| Central Pacific Financial | | | 4,855 | | | | 171 | | |
| Ceres Group* | | | 5,180 | | | | 29 | | |
| Charter Financial | | | 689 | | | | 23 | | |
| CharterMac (a) | | | 6,455 | | | | 132 | | |
| Chemical Financial | | | 3,796 | | | | 123 | | |
| Chittenden | | | 6,992 | | | | 185 | | |
| Citizens* | | | 4,768 | | | | 31 | | |
| Citizens Banking | | | 6,396 | | | | 182 | | |
| Citizens Northern | | | 350 | | | | 9 | | |
| City Bank | | | 1,322 | | | | 45 | | |
| City Holdings | | | 2,871 | | | | 103 | | |
| Clark | | | 2,771 | | | | 47 | | |
| Clifton Savings Bancorp | | | 2,360 | | | | 24 | | |
| CNA Surety* | | | 2,674 | | | | 38 | | |
| Coastal Financial | | | 2,668 | | | | 40 | | |
| CoBiz | | | 2,207 | | | | 41 | | |
| Cohen & Steers | | | 1,290 | | | | 26 | | |
| Collegiate Funding Services* | | | 1,400 | | | | 21 | | |
| Colonial Properties Trust (REIT) | | | 4,860 | | | | 216 | | |
| Colony Bankcorp | | | 850 | | | | 23 | | |
| Columbia Bancorp – Maryland | | | 996 | | | | 40 | | |
| Columbia Banking System | | | 2,324 | | | | 61 | | |
| Commercial Bankshares | | | 20 | | | | 1 | | |
| Commercial Capital Bancorp | | | 6,278 | | | | 107 | | |
| Commercial Federal | | | 5,937 | | | | 203 | | |
| Commercial Net Lease Realty (REIT) | | | 7,844 | | | | 157 | | |
| Community Bancorp – Nevada* | | | 20 | | | | 1 | | |
| Community Bank System | | | 4,642 | | | | 105 | | |
| Community Banks | | | 3,251 | | | | 91 | | |
| Community Trust Bancorp | | | 2,012 | | | | 65 | | |
| CompuCredit* (a) | | | 2,913 | | | | 129 | | |
| Consolidated-Tomoka Land | | | 841 | | | | 57 | | |
| Corporate Office Properties Trust (REIT) | | | 4,527 | | | | 158 | | |
| Correctional Properties Trust (REIT) | | | 1,631 | | | | 48 | | |
| Corus Bankshares | | | 2,678 | | | | 147 | | |
The accompanying notes are an integral part of the financial statements.
FIRST AMERICAN FUNDS Annual Report 2005
24
Small Cap Index Fund (continued)
| DESCRIPTION | | SHARES | | VALUE (000) | |
| Cousins Properties | | | 6,170 | | | $ | 186 | | |
| Covanta Holding* | | | 15,318 | | | | 206 | | |
| Crawford & Company | | | 2,204 | | | | 17 | | |
| Criimi Mae (REIT)* | | | 2,420 | | | | 42 | | |
| CVB Financial | | | 6,976 | | | | 130 | | |
| Deerfield Triarc Capital* | | | 1,340 | | | | 19 | | |
| Delphi Financial Group | | | 4,134 | | | | 193 | | |
| Delta Financial | | | 1,670 | | | | 12 | | |
| DiamondRock Hospitality (a) | | | 2,010 | | | | 24 | | |
| Digital Realty Trust | | | 1,430 | | | | 26 | | |
| Dime Community Bancshares | | | 4,034 | | | | 59 | | |
| Direct General (a) | | | 2,500 | | | | 49 | | |
| Donegal Group, Class A | | | 1,444 | | | | 31 | | |
| Doral Financial (a) | | | 12,350 | | | | 161 | | |
| EastGroup Properties (REIT) | | | 3,302 | | | | 144 | | |
| ECC Capital (REIT) | | | 9,870 | | | | 32 | | |
| Education Realty Trust (REIT) | | | 3,280 | | | | 55 | | |
| E-Loan* | | | 8,490 | | | | 36 | | |
| EMC Insurance Group | | | 1,053 | | | | 19 | | |
| Encore Capital Group* | | | 2,080 | | | | 37 | | |
| Enstar Group* | | | 583 | | | | 38 | | |
| Enterprise Financial Services | | | 1,200 | | | | 25 | | |
| Entertainment Properties Trust (REIT) | | | 3,789 | | | | 169 | | |
| Equity Inns (REIT) | | | 8,687 | | | | 117 | | |
| Equity Lifestyle Properties | | | 2,949 | | | | 133 | | |
| Equity One (REIT) | | | 5,838 | | | | 136 | | |
| eSPEED, Class A* | | | 3,848 | | | | 29 | | |
| EuroBancshares* | | | 1,390 | | | | 21 | | |
| Extra Space Storage | | | 4,720 | | | | 73 | | |
| F.N.B | | | 8,700 | | | | 150 | | |
| F.N.B. – Virginia | | | 1,245 | | | | 34 | | |
| Farmers Capital Bank | | | 1,033 | | | | 32 | | |
| FBL Financial Group, Class A | | | 1,951 | | | | 58 | | |
| Federal Agricultural Mortgage, Class C | | | 1,449 | | | | 35 | | |
| FelCor Lodging Trust (REIT)* | | | 7,780 | | | | 118 | | |
| Fidelity Bankshares | | | 3,490 | | | | 107 | | |
| Fieldstone Investment (REIT) | | | 7,353 | | | | 86 | | |
| Financial Federal | | | 2,582 | | | | 103 | | |
| Financial Institutions | | | 1,382 | | | | 25 | | |
| First Acceptance* | | | 3,510 | | | | 35 | | |
| First Bancorp – North Carolina | | | 1,916 | | | | 38 | | |
| First Bancorp of Puerto Rico | | | 10,140 | | | | 172 | | |
| First Busey | | | 2,284 | | | | 44 | | |
| First Cash Financial Services* | | | 2,020 | | | | 53 | | |
| First Charter | | | 4,585 | | | | 112 | | |
| First Citizens Bancshares, Class A | | | 909 | | | | 155 | | |
| First Commonwealth Financial – Pennsylvania | | | 10,825 | | | | 144 | | |
| First Community Bancorp | | | 1,938 | | | | 93 | | |
| First Community Bancshares – Nevada | | | 1,493 | | | | 44 | | |
| First Defiance Financial | | | 30 | | | | 1 | | |
| First Financial – Indiana | | | 2,040 | | | | 55 | | |
| First Financial Bancorp – Ohio | | | 5,454 | | | | 101 | | |
| First Financial Bankshares | | | 2,772 | | | | 97 | | |
| First Financial Holdings | | | 2,073 | | | | 64 | | |
| First Indiana | | | 1,800 | | | | 61 | | |
| First Industrial Realty Trust (REIT) (a) | | | 6,470 | | | | 259 | | |
| First Merchants | | | 2,791 | | | | 72 | | |
| First Midwest Bancorp (a) | | | 6,770 | | | | 252 | | |
| First Niagara Financial Group | | | 17,447 | | | | 252 | | |
| First Oak Brook Bancshares | | | 1,154 | | | | 35 | | |
| First Place Financial | | | 2,345 | | | | 52 | | |
| First Potomac Realty Trust (REIT) | | | 2,590 | | | | 67 | | |
| First Regional Bancorp* | | | 370 | | | | 29 | | |
| First Republic Bank – California (a) | | | 3,342 | | | | 118 | | |
| First South Bancorp | | | 20 | | | | 1 | | |
| First State Bancorp – New Mexico | | | 2,628 | | | | 56 | | |
Small Cap Index Fund (continued)
| DESCRIPTION | | SHARES | | VALUE (000) | |
| FirstBank Fractional Shares (b) (c) | | | - | | | $ | - | | |
| FirstFed Financial* | | | 2,791 | | | | 150 | | |
| Flagstar Bancorp (a) | | | 5,402 | | | | 87 | | |
| Flushing Financial | | | 2,904 | | | | 48 | | |
| FPIC Insurance Group* | | | 1,380 | | | | 50 | | |
| Franklin Bank* | | | 1,820 | | | | 29 | | |
| Fremont General (a) | | | 9,620 | | | | 210 | | |
| Frontier Financial | | | 3,711 | | | | 108 | | |
| GAMCO Investors | | | 1,137 | | | | 52 | | |
| GATX | | | 6,524 | | | | 258 | | |
| GB&T Bancshares | | | 1,764 | | | | 37 | | |
| Getty Realty (REIT) | | | 2,599 | | | | 75 | | |
| GFI Group* | | | 540 | | | | 22 | | |
| Glacier Bancorp | | | 4,627 | | | | 143 | | |
| Gladstone Capital | | | 1,631 | | | | 37 | | |
| Gladstone Investment | | | 2,375 | | | | 35 | | |
| Glenborough Realty Trust (REIT) | | | 2,974 | | | | 57 | | |
| Glimcher Realty Trust (REIT) | | | 5,395 | | | | 132 | | |
| GMH Communities Trust | | | 4,970 | | | | 73 | | |
| Gold Banc | | | 5,909 | | | | 88 | | |
| Government Properties Trust | | | 3,320 | | | | 33 | | |
| Gramercy Capital | | | 1,640 | | | | 39 | | |
| Great American Financial Resources | | | 1,360 | | | | 27 | | |
| Great Southern Bancorp | | | 1,774 | | | | 53 | | |
| Greater Bay Bancorp | | | 7,938 | | | | 196 | | |
| Greene County Bancshares | | | 30 | | | | 1 | | |
| Greenhill & Company | | | 1,650 | | | | 69 | | |
| Hancock Holding | | | 4,032 | | | | 138 | | |
| Hanmi Financial | | | 5,110 | | | | 92 | | |
| Harbor Florida Bancshares | | | 3,084 | | | | 112 | | |
| Harleysville Group | | | 2,220 | | | | 53 | | |
| Harleysville National | | | 4,160 | | | | 91 | | |
| Harris & Harris Group* | | | 2,670 | | | | 30 | | |
| Heartland Financial USA | | | 1,710 | | | | 33 | | |
| Heritage Commerce | | | 1,840 | | | | 38 | | |
| Heritage Property Investment Trust (REIT) | | | 3,710 | | | | 130 | | |
| Hersha Hospitality Trust | | | 3,140 | | | | 31 | | |
| Highland Hospitality | | | 5,940 | | | | 61 | | |
| Highwoods Properties (REIT) (a) | | | 7,971 | | | | 235 | | |
| Hilb, Rogal & Hobbs (a) | | | 4,801 | | | | 179 | | |
| Home Properties (REIT) | | | 4,899 | | | | 192 | | |
| HomeBanc | | | 7,220 | | | | 56 | | |
| Horace Mann Educators | | | 6,458 | | | | 128 | | |
| Horizon Financial | | | 1,800 | | | | 40 | | |
| Hudson United Bancorp | | | 3,750 | | | | 159 | | |
| IBERIABANK | | | 1,356 | | | | 72 | | |
| IMPAC Mortgage Holdings (REIT) (a) | | | 11,655 | | | | 143 | | |
| Independence Holdings | | | 786 | | | | 14 | | |
| Independent Bank | | | 2,527 | | | | 77 | | |
| Independent Bank – Michigan | | | 3,350 | | | | 97 | | |
| Infinity Property & Casualty | | | 3,123 | | | | 110 | | |
| Inland Real Estate | | | 8,420 | | | | 132 | | |
| Innkeepers USA Trust (REIT) | | | 6,378 | | | | 99 | | |
| Integra Bank | | | 2,624 | | | | 57 | | |
| Interchange Financial Services | | | 2,832 | | | | 49 | | |
| International Securities Exchange* | | | 1,740 | | | | 41 | | |
| Investment Technology Group* | | | 6,173 | | | | 183 | | |
| Investors Real Estate Trust (REIT) | | | 7,311 | | | | 69 | | |
| Irwin Financial | | | 3,011 | | | | 61 | | |
| ITLA Capital* | | | 911 | | | | 48 | | |
| Jones Lang LaSalle | | | 5,042 | | | | 232 | | |
| Kansas City Life Insurance | | | 152 | | | | 8 | | |
| Kearny Financial | | | 3,379 | | | | 42 | | |
| Kilroy Realty (REIT) (a) | | | 4,470 | | | | 250 | | |
| Kite Realty Group Trust | | | 3,330 | | | | 50 | | |
| KMG America* | | | 3,340 | | | | 27 | | |
FIRST AMERICAN FUNDS Annual Report 2005
25
Schedule of Investments September 30, 2005
Small Cap Index Fund (continued)
| DESCRIPTION | | SHARES | | VALUE (000) | |
| KNBT Bancorp | | | 5,250 | | | $ | 82 | | |
| Knight Capital Group* | | | 16,693 | | | | 139 | | |
| LaBranche* (a) | | | 8,130 | | | | 71 | | |
| Lakeland Bancorp | | | 3,085 | | | | 47 | | |
| Lakeland Financial | | | 995 | | | | 41 | | |
| LandAmerica Financial Group (a) | | | 2,723 | | | | 176 | | |
| Lasalle Hotel Properties (REIT) | | | 5,063 | | | | 174 | | |
| Lexington Corporate Properties Trust (REIT) | | | 8,267 | | | | 195 | | |
| LTC Properties (REIT) | | | 2,539 | | | | 54 | | |
| Luminent Mortgage Capital | | | 5,750 | | | | 43 | | |
| Macatawa Bank | | | 1,715 | | | | 59 | | |
| MAF Bancorp | | | 4,090 | | | | 168 | | |
| Maguire Properties | | | 5,840 | | | | 175 | | |
| Main Street Banks | | | 2,542 | | | | 68 | | |
| MainSource Financial Group | | | 1,685 | | | | 30 | | |
| MarketAxess Holdings* | | | 3,570 | | | | 49 | | |
| Marlin Business Services* | | | 1,020 | | | | 24 | | |
| MB Financial | | | 3,312 | | | | 129 | | |
| MBT Financial | | | 2,476 | | | | 46 | | |
| MCG Capital | | | 5,712 | | | | 96 | | |
| Mercantile Bank | | | 1,296 | | | | 55 | | |
| MeriStar Hospitality (REIT)* | | | 13,582 | | | | 124 | | |
| Metris* | | | 9,031 | | | | 132 | | |
| MFA Mortgage Investments (REIT) (a) | | | 12,409 | | | | 76 | | |
| Mid-America Apartment Communities (REIT) (a) | | | 2,332 | | | | 108 | | |
| Midland | | | 1,561 | | | | 56 | | |
| Mid-State Bancshares | | | 3,459 | | | | 95 | | |
| Midwest Banc Holdings | | | 1,852 | | | | 43 | | |
| MoneyGram International | | | 12,980 | | | | 282 | | |
| MortgageIT Holdings | | | 2,530 | | | | 36 | | |
| Nara Bancorp | | | 3,160 | | | | 47 | | |
| NASB Financial | | | 522 | | | | 21 | | |
| Nasdaq Stock Market* (a) | | | 6,910 | | | | 175 | | |
| National Financial Partners | | | 5,490 | | | | 248 | | |
| National Health Investors (REIT) | | | 3,527 | | | | 97 | | |
| National Health Realty (REIT) | | | 30 | | | | 1 | | |
| National Interstate | | | 60 | | | | 1 | | |
| National Penn Bancshares | | | 5,214 | | | | 130 | | |
| National Western Life Insurance, Class A* | | | 330 | | | | 70 | | |
| Nationwide Health Properties (REIT) | | | 10,388 | | | | 242 | | |
| Navigators Group* | | | 1,471 | | | | 55 | | |
| NBC Capital | | | 32 | | | | 1 | | |
| NBT Bancorp | | | 5,030 | | | | 119 | | |
| NetB@nk | | | 7,976 | | | | 66 | | |
| NewAlliance Bancshares | | | 15,080 | | | | 221 | | |
| Newcastle Investment (REIT) (a) | | | 6,219 | | | | 174 | | |
| Northern Empire Bancshares* | | | 1,240 | | | | 31 | | |
| Northstar Realty Finance | | | 2,960 | | | | 28 | | |
| Northwest Bancorp | | | 3,241 | | | | 69 | | |
| NovaStar Financial (REIT) (a) | | | 4,086 | | | | 135 | | |
| OceanFirst Financial | | | 1,535 | | | | 37 | | |
| Ocwen Financial* | | | 6,068 | | | | 42 | | |
| Odyssey Re Holdings | | | 100 | | | | 3 | | |
| Ohio Casualty | | | 9,436 | | | | 256 | | |
| Old National Bancorp | | | 10,239 | | | | 217 | | |
| Old Second Bancorp | | | 2,304 | | | | 69 | | |
| Omega Financial | | | 1,957 | | | | 55 | | |
| OMEGA Healthcare Investors (REIT) (a) | | | 8,264 | | | | 115 | | |
| One Liberty Properties | | | 40 | | | | 1 | | |
| optionsXpress Holdings | | | 3,540 | | | | 67 | | |
| Oriental Financial Group | | | 3,336 | | | | 41 | | |
| Origen Financial | | | 1,410 | | | | 11 | | |
| Orleans Homebuilders (a) | | | 413 | | | | 10 | | |
| Pacific Capital Bancorp | | | 6,896 | | | | 230 | | |
| Park National | | | 1,893 | | | | 205 | | |
| Parkway Properties (REIT) | | | 1,944 | | | | 91 | | |
Small Cap Index Fund (continued)
| DESCRIPTION | | SHARES | | VALUE (000) | |
| Partners Trust Financial Group (a) | | | 5,350 | | | $ | 62 | | |
| Peapack-Gladstone Financial | | | 1,257 | | | | 34 | | |
| PennFed Financial Services | | | 1,498 | | | | 27 | | |
| Pennsylvania (REIT) | | | 5,406 | | | | 228 | | |
| Pennsylvania Commerce Bancorp* | | | 680 | | | | 24 | | |
| Peoples Bancorp – Ohio | | | 1,459 | | | | 40 | | |
| PFF Bancorp | | | 3,204 | | | | 97 | | |
| Phoenix Companies (a) | | | 14,319 | | | | 175 | | |
| Pinnacle Financial Partners* | | | 1,130 | | | | 28 | | |
| Piper Jaffray Companies* | | | 3,090 | | | | 92 | | |
| Placer Sierra Bancshares | | | 1,000 | | | | 27 | | |
| PMA Capital* | | | 4,644 | | | | 41 | | |
| Post Properties (REIT) | | | 6,002 | | | | 224 | | |
| Preferred Bank Los Angeles | | | 20 | | | | 1 | | |
| Premierwest Bancorp* | | | 2,030 | | | | 31 | | |
| Prentiss Properties Trust (REIT) | | | 6,702 | | | | 272 | | |
| Presidential Life | | | 3,092 | | | | 56 | | |
| PrivateBancorp | | | 2,820 | | | | 97 | | |
| ProAssurance* | | | 4,427 | | | | 207 | | |
| Prosperity Bancshares | | | 2,864 | | | | 87 | | |
| Provident Bankshares | | | 5,107 | | | | 178 | | |
| Provident Financial Holdings | | | 868 | | | | 24 | | |
| Provident Financial Services | | | 10,930 | | | | 192 | | |
| Provident New York Bancorp | | | 6,312 | | | | 74 | | |
| PS Business Parks (REIT) | | | 2,705 | | | | 124 | | |
| QC Holdings* | | | 850 | | | | 11 | | |
| R&G Financial | | | 4,198 | | | | 58 | | |
| RAIT Investment Trust (REIT) | | | 3,962 | | | | 113 | | |
| Ramco-Gershenson Properties Trust (REIT) | | | 2,448 | | | | 71 | | |
| Redwood Trust (REIT) (a) | | | 3,050 | | | | 148 | | |
| Renasant | | | 1,542 | | | | 49 | | |
| Republic Bancorp | | | 10,947 | | | | 155 | | |
| Republic Bancorp, Class A – Kentucky | | | 1,062 | | | | 22 | | |
| RLI (a) | | | 3,484 | | | | 161 | | |
| Rockville Financial* | | | 1,390 | | | | 19 | | |
| Royal Bancshares of Pennsylvania, Class A | | | 17 | | | | - | | |
| S&T Bancorp (a) | | | 4,065 | | | | 154 | | |
| Safety Insurance Group | | | 1,715 | | | | 61 | | |
| Sanders Morris Harris Group | | | 2,069 | | | | 34 | | |
| Sandy Spring Bancorp | | | 2,168 | | | | 73 | | |
| Santander Bancorp | | | 904 | | | | 22 | | |
| Saul Centers (REIT) | | | 1,919 | | | | 69 | | |
| Saxon Capital | | | 7,520 | | | | 89 | | |
| SCBT Financial | | | 1,396 | | | | 44 | | |
| SeaBright Insurance Holdings* | | | 1,310 | | | | 17 | | |
| Seacoast Banking | | | 1,987 | | | | 47 | | |
| Security Bank | | | 1,606 | | | | 40 | | |
| Selective Insurance Group | | | 4,277 | | | | 209 | | |
| Senior Housing Properties Trust (REIT) (a) | | | 9,227 | | | | 175 | | |
| Sierra Bancorp | | | 580 | | | | 13 | | |
| Signature Bank* | | | 1,090 | | | | 29 | | |
| Simmons First National, Class A | | | 2,174 | | | | 62 | | |
| Sizeler Property Investors (REIT) | | | 2,860 | | | | 35 | | |
| Sound Federal Bancorp | | | 50 | | | | 1 | | |
| Southside Bancshares | | | 1,682 | | | | 32 | | |
| Southwest Bancorp – Oklahoma | | | 1,834 | | | | 40 | | |
| Sovran Self Storage (REIT) | | | 2,556 | | | | 125 | | |
| Spirit Finance | | | 10,930 | | | | 123 | | |
| State Auto Financial | | | 2,315 | | | | 73 | | |
| State Bancorp | | | 1,664 | | | | 30 | | |
| State Financial Services, Class A | | | 987 | | | | 36 | | |
| Sterling Bancorp | | | 2,776 | | | | 62 | | |
| Sterling Bancshares | | | 6,811 | | | | 100 | | |
| Sterling Financial – Pennsylvania | | | 3,863 | | | | 78 | | |
| Sterling Financial – Washington | | | 5,121 | | | | 115 | | |
| Stewart Information Services | | | 2,584 | | | | 132 | | |
The accompanying notes are an integral part of the financial statements.
FIRST AMERICAN FUNDS Annual Report 2005
26
Small Cap Index Fund (continued)
| DESCRIPTION | | SHARES | | VALUE (000) | |
| Stifel Financial* | | | 1,246 | | | $ | 45 | | |
| Strategic Hotel Capital | | | 4,620 | | | | 84 | | |
| Suffolk Bancorp | | | 1,578 | | | | 50 | | |
| Summit Bancshares | | | 50 | | | | 1 | | |
| Summit Financial Group | | | 790 | | | | 22 | | |
| Sun Bancorp – New Jersey* | | | 1,748 | | | | 37 | | |
| Sun Communities (REIT) | | | 2,507 | | | | 82 | | |
| Sunstone Hotel Investors | | | 3,400 | | | | 83 | | |
| Susquehanna Bancshares | | | 7,224 | | | | 174 | | |
| SVB Financial Group* | | | 5,218 | | | | 254 | | |
| SWS Group | | | 2,615 | | | | 43 | | |
| SY Bancorp | | | 2,034 | | | | 48 | | |
| Tanger Factory Outlet Centers (REIT) | | | 4,676 | | | | 130 | | |
| Tarragon Realty Investors* | | | 1,834 | | | | 34 | | |
| Taubman Centers (REIT) | | | 7,852 | | | | 249 | | |
| Taylor Capital Group | | | 670 | | | | 25 | | |
| Technology Investment Capital | | | 410 | | | | 6 | | |
| Tejon Ranch* | | | 1,304 | | | | 61 | | |
| Texas Capital Bancshares* | | | 3,650 | | | | 77 | | |
| Texas Regional Bancshares, Class A | | | 6,206 | | | | 179 | | |
| TierOne | | | 2,684 | | | | 71 | | |
| Tompkins Trustco | | | 964 | | | | 42 | | |
| Tower Group | | | 2,590 | | | | 39 | | |
| Town & Country Trust (REIT) (a) | | | 2,650 | | | | 77 | | |
| Tradestation Group* | | | 3,229 | | | | 33 | | |
| Trammell Crow* | | | 5,174 | | | | 128 | | |
| Triad Guaranty* (a) | | | 1,491 | | | | 58 | | |
| TriCo Bancshares | | | 1,926 | | | | 41 | | |
| TrustCo Bank Corporation of New York (a) | | | 11,331 | | | | 142 | | |
| Trustmark | | | 7,010 | | | | 195 | | |
| Trustreet Properties (REIT) | | | 9,250 | | | | 145 | | |
| UCBH Holdings (a) | | | 12,520 | | | | 229 | | |
| UICI | | | 5,335 | | | | 192 | | |
| UMB Financial | | | 2,355 | | | | 155 | | |
| Umpqua Holdings (a) | | | 6,961 | | | | 169 | | |
| Union Bankshares | | | 1,489 | | | | 62 | | |
| United Bankshares | | | 5,800 | | | | 203 | | |
| United Capital* | | | 40 | | | | 1 | | |
| United Community Banks | | | 4,895 | | | | 140 | | |
| United Community Financial | | | 4,635 | | | | 52 | | |
| United Fire & Casualty | | | 2,484 | | | | 112 | | |
| United PanAm Financial* | | | 801 | | | | 20 | | |
| United Security Bancshares | | | 900 | | | | 25 | | |
| Universal American Financial* (a) | | | 3,770 | | | | 86 | | |
| Universal Health Realty Income Trust (REIT) | | | 1,747 | | | | 58 | | |
| Univest Corporation of Pennsylvania | | | 1,965 | | | | 54 | | |
| Unizan Financial | | | 3,324 | | | | 80 | | |
| Urstadt Biddle Properties, Class A (REIT) | | | 3,617 | | | | 55 | | |
| USB Holding | | | 2,053 | | | | 47 | | |
| USB Holding Company Fractional Share (b) (c) | | | - | | | | - | | |
| USI Holdings* | | | 6,079 | | | | 79 | | |
| U-Store-It-Trust | | | 4,840 | | | | 98 | | |
| Vineyard National Bancorp | | | 1,210 | | | | 36 | | |
| Virginia Commerce Bancorp* | | | 1,467 | | | | 40 | | |
| Virginia Financial Group | | | 1,237 | | | | 45 | | |
| W Holding Company | | | 14,590 | | | | 139 | | |
| Waddell & Reed Financial (a) | | | 10,230 | | | | 198 | | |
| Washington Real Estate Investment Trust (REIT) | | | 6,337 | | | | 197 | | |
| Washington Trust Bancorp | | | 1,792 | | | | 49 | | |
| WesBanco | | | 3,246 | | | | 89 | | |
| West Bancorp | | | 2,896 | | | | 54 | | |
| West Coast Bancorp – Oregon | | | 2,580 | | | | 65 | | |
| Westamerica Bancorporation | | | 4,230 | | | | 218 | | |
| Western Sierra Bancorp* | | | 1,108 | | | | 38 | | |
| Westfield Financial | | | 561 | | | | 13 | | |
| Wilshire Bancorp | | | 2,390 | | | | 37 | | |
Small Cap Index Fund (continued)
| DESCRIPTION | | SHARES | | VALUE (000) | |
| Winston Hotels (REIT) | | | 3,986 | | | $ | 40 | | |
| Wintrust Financial | | | 3,643 | | | | 183 | | |
| World Acceptance* | | | 2,765 | | | | 70 | | |
| WSFS Financial | | | 1,033 | | | | 61 | | |
| Yardville National Bancorp | | | 1,494 | | | | 53 | | |
| Zenith National Insurance | | | 1,853 | | | | 116 | | |
| ZipRealty* | | | 790 | | | | 10 | | |
| | | | 38,114 | | |
| Health Care – 12.8% | | | |
| Aastrom Biosciences* (a) | | | 15,760 | | | | 37 | | |
| Abaxis* | | | 3,000 | | | | 39 | | |
| Abgenix* (a) | | | 13,758 | | | | 174 | | |
| ABIOMED* | | | 2,620 | | | | 26 | | |
| ACADIA Pharmaceuticals* | | | 2,530 | | | | 29 | | |
| Adams Respiratory Therapeutics* | | | 720 | | | | 23 | | |
| Adeza Biomedical* | | | 650 | | | | 11 | | |
| Adolor* | | | 6,513 | | | | 70 | | |
| Advanced Neuromodulation Systems* | | | 2,990 | | | | 142 | | |
| Advisory Board* (a) | | | 3,042 | | | | 158 | | |
| Albany Molecular Research* | | | 3,583 | | | | 44 | | |
| Alderwoods Group* | | | 6,040 | | | | 99 | | |
| Alexion Pharmaceuticals* | | | 4,212 | | | | 117 | | |
| Align Technology* (a) | | | 8,984 | | | | 60 | | |
| Alkermes* (a) | | | 13,383 | | | | 225 | | |
| Alliance Imaging* | | | 2,171 | | | | 19 | | |
| Allied Healthcare International* | | | 4,780 | | | | 27 | | |
| Allscripts Healthcare Solutions* (a) | | | 4,731 | | | | 85 | | |
| Alpharma, Class A | | | 5,971 | | | | 149 | | |
| AMEDISYS* (a) | | | 2,230 | | | | 87 | | |
| America Service Group* | | | 1,830 | | | | 30 | | |
| American Dental Partners* | | | 1,230 | | | | 42 | | |
| American Healthways* | | | 4,908 | | | | 208 | | |
| American Medical Systems* | | | 9,410 | | | | 190 | | |
| American Retirement* | | | 4,280 | | | | 81 | | |
| AMICAS* | | | 6,960 | | | | 38 | | |
| AMN Healthcare Services* | | | 1,968 | | | | 30 | | |
| Amsurg, Class A* (a) | | | 4,450 | | | | 122 | | |
| Amylin Pharmaceuticals* (a) | | | 15,780 | | | | 549 | | |
| Analogic | | | 1,940 | | | | 98 | | |
| Andrx Group* | | | 11,330 | | | | 175 | | |
| Angiodynamics* | | | 380 | | | | 8 | | |
| Animas* (a) | | | 1,110 | | | | 17 | | |
| Antigenetics* (a) | | | 4,358 | | | | 24 | | |
| Applera* | | | 11,423 | | | | 139 | | |
| Apria Healthcare Group* | | | 7,210 | | | | 230 | | |
| Arena Pharmaceuticals* | | | 5,460 | | | | 54 | | |
| Ariad Pharmaceuticals* | | | 7,960 | | | | 59 | | |
| Arqule* | | | 4,880 | | | | 38 | | |
| Array Biopharma* | | | 5,500 | | | | 39 | | |
| Arrow International | | | 3,184 | | | | 90 | | |
| Arthrocare* | | | 3,626 | | | | 146 | | |
| Aspect Medical Systems* | | | 2,128 | | | | 63 | | |
| AtheroGenics* (a) | | | 5,685 | | | | 91 | | |
| AVANIR Pharmaceuticals* | | | 16,650 | | | | 51 | | |
| Barrier Therapeutics* | | | 1,460 | | | | 12 | | |
| Bentley Pharmaceuticals* | | | 2,639 | | | | 32 | | |
| Beverly Enterprises* (a) | | | 16,502 | | | | 202 | | |
| Bioenvision* | | | 5,270 | | | | 42 | | |
| BioMarin Pharmaceutical* | | | 11,070 | | | | 97 | | |
| Bio-Rad Laboratories, Class A* | | | 2,650 | | | | 146 | | |
| Bio-Reference Labs* | | | 1,440 | | | | 25 | | |
| BioScrip* | | | 5,790 | | | | 38 | | |
| Biosite* | | | 2,238 | | | | 138 | | |
| Bruker BioSciences* | | | 3,747 | | | | 16 | | |
| Caliper Life Sciences* | | | 4,240 | | | | 30 | | |
FIRST AMERICAN FUNDS Annual Report 2005
27
Schedule of Investments September 30, 2005
Small Cap Index Fund (continued)
| DESCRIPTION | | SHARES | | VALUE (000) | |
| Candela* | | | 3,302 | | | $ | 32 | | |
| Cantel Medical* (a) | | | 1,770 | | | | 37 | | |
| Caraco Pharmaceutical Laboratories* | | | 1,560 | | | | 14 | | |
| Cell Genesys* | | | 6,839 | | | | 37 | | |
| Cell Therapeutics* (a) | | | 10,577 | | | | 30 | | |
| Centene* | | | 6,270 | | | | 157 | | |
| Cepheid* | | | 6,392 | | | | 47 | | |
| Chemed | | | 3,746 | | | | 162 | | |
| CNS | | | 2,210 | | | | 58 | | |
| Coley Pharmaceuticals Group* | | | 190 | | | | 3 | | |
| Computer Programs & Systems | | | 1,119 | | | | 39 | | |
| CONMED* | | | 4,349 | | | | 121 | | |
| Connetics* (a) | | | 5,318 | | | | 90 | | |
| Conor Medsystems* | | | 1,370 | | | | 32 | | |
| Corvel* | | | 1,088 | | | | 26 | | |
| Cotherix* | | | 1,940 | | | | 27 | | |
| Cross Country Healthcare* | | | 3,984 | | | | 74 | | |
| Cubist Pharmaceuticals* (a) | | | 8,163 | | | | 176 | | |
| CuraGen* | | | 7,404 | | | | 37 | | |
| Curis* | | | 8,210 | | | | 38 | | |
| CV Therapeutics* (a) | | | 6,089 | | | | 163 | | |
| Cyberonics* (a) | | | 3,252 | | | | 97 | | |
| Cypress Biosciences* | | | 5,050 | | | | 27 | | |
| Datascope | | | 1,734 | | | | 54 | | |
| deCODE Genetics* | | | 8,248 | | | | 69 | | |
| Dendreon* | | | 9,770 | | | | 66 | | |
| Dendrite International* | | | 6,134 | | | | 123 | | |
| DexCom* | | | 740 | | | | 9 | | |
| Diagnostic Products | | | 3,381 | | | | 178 | | |
| Digene* | | | 2,416 | | | | 69 | | |
| Discovery Laboratories* | | | 8,060 | | | | 52 | | |
| Diversa* | | | 4,068 | | | | 24 | | |
| DJ Orthopedics* (a) | | | 3,087 | | | | 89 | | |
| DOV Pharmaceutical* | | | 3,523 | | | | 60 | | |
| Durect* (a) | | | 5,212 | | | | 36 | | |
| DUSA Pharmaceuticals* | | | 2,580 | | | | 27 | | |
| Eclipsys* (a) | | | 6,104 | | | | 109 | | |
| Emageon* | | | 1,380 | | | | 19 | | |
| Encore Medical* (a) | | | 6,470 | | | | 30 | | |
| Encysive Pharmaceuticals* | | | 8,755 | | | | 103 | | |
| Enzo Biochem* | | | 4,356 | | | | 67 | | |
| Enzon* | | | 6,621 | | | | 44 | | |
| EPIX Medical* | | | 3,924 | | | | 30 | | |
| eResearch Technology* | | | 7,543 | | | | 107 | | |
| EV3* | | | 710 | | | | 13 | | |
| Exelixis* | | | 11,323 | | | | 87 | | |
| Eyetech Pharmaceuticals* | | | 5,240 | | | | 94 | | |
| First Horizon Pharmaceutical* (a) | | | 4,503 | | | | 89 | | |
| FoxHollow Technologies* (a) | | | 2,000 | | | | 95 | | |
| Genesis HealthCare* | | | 3,076 | | | | 124 | | |
| Genitope* (a) | | | 3,730 | | | | 26 | | |
| Gentiva Health Services* | | | 3,528 | | | | 64 | | |
| Geron* (a) | | | 8,353 | | | | 86 | | |
| Greatbatch* | | | 3,252 | | | | 89 | | |
| GTx* | | | 940 | | | | 9 | | |
| Haemonetics* | | | 3,486 | | | | 166 | | |
| HealthExtras* | | | 3,215 | | | | 69 | | |
| HealthTronics* | | | 5,280 | | | | 53 | | |
| Hi-Tech Pharmacal* | | | 810 | | | | 24 | | |
| Hologic* | | | 3,225 | | | | 186 | | |
| Hooper Holmes | | | 9,836 | | | | 39 | | |
| Horizon Health* | | | 830 | | | | 23 | | |
| Human Genome Sciences* (a) | | | 19,850 | | | | 270 | | |
| ICOS* | | | 9,070 | | | | 251 | | |
| ICU Medical* (a) | | | 1,831 | | | | 53 | | |
| Idenix Pharmaceuticals* | | | 1,040 | | | | 26 | | |
Small Cap Index Fund (continued)
| DESCRIPTION | | SHARES | | VALUE (000) | |
| IDX Systems* | | | 3,509 | | | $ | 152 | | |
| I-Flow* (a) | | | 3,120 | | | | 43 | | |
| Illumina* | | | 5,020 | | | | 64 | | |
| Immucor* (a) | | | 6,847 | | | | 188 | | |
| ImmunoGen* | | | 6,293 | | | | 46 | | |
| Incyte* | | | 11,749 | | | | 55 | | |
| Inspire Pharmaceuticals* | | | 6,968 | | | | 53 | | |
| Integra LifeSciences* | | | 3,277 | | | | 125 | | |
| InterMune* | | | 3,795 | | | | 63 | | |
| IntraLase* | | | 1,350 | | | | 20 | | |
| Introgen Therapeutics* (a) | | | 2,850 | | | | 15 | | |
| Intuitive Surgical* (a) | | | 5,210 | | | | 382 | | |
| Invacare | | | 4,442 | | | | 185 | | |
| Inverness Medical Innovations* | | | 2,447 | | | | 65 | | |
| IRIS International* | | | 2,560 | | | | 47 | | |
| Isis Pharmaceuticals* | | | 8,906 | | | | 45 | | |
| Ista Pharmaceuticals* | | | 1,810 | | | | 12 | | |
| Kensey Nash* (a) | | | 1,638 | | | | 50 | | |
| Keryx Biopharmaceuticals* (a) | | | 3,720 | | | | 59 | | |
| Kindred Healthcare* | | | 4,464 | | | | 133 | | |
| K-V Pharmaceutical, Class A* | | | 5,413 | | | | 96 | | |
| Kyphon* | | | 4,019 | | | | 177 | | |
| LabOne* | | | 2,879 | | | | 125 | | |
| Laserscope* (a) | | | 3,118 | | | | 88 | | |
| LCA-Vision | | | 2,845 | | | | 106 | | |
| Lexicon Genetics* | | | 9,590 | | | | 38 | | |
| LifeCell* | | | 4,670 | | | | 101 | | |
| Lifeline Systems* | | | 1,906 | | | | 64 | | |
| Luminex* | | | 3,858 | | | | 39 | | |
| Magellan Health Services* | | | 4,050 | | | | 142 | | |
| MannKind* | | | 3,060 | | | | 42 | | |
| Marshall Edwards* (a) | | | 1,240 | | | | 7 | | |
| Martek Biosciences* (a) | | | 4,810 | | | | 169 | | |
| Matria Healthcare* | | | 2,658 | | | | 100 | | |
| Matthews International, Class A | | | 4,812 | | | | 182 | | |
| Maxygen* | | | 3,869 | | | | 32 | | |
| Medarex* | | | 16,641 | | | | 158 | | |
| MedCath* | | | 1,040 | | | | 25 | | |
| Medicines* | | | 7,324 | | | | 169 | | |
| Medicis Pharmaceutical, Class A (a) | | | 7,970 | | | | 260 | | |
| Mentor (a) | | | 4,722 | | | | 260 | | |
| Merge Technologies* (a) | | | 1,890 | | | | 32 | | |
| Meridian Bioscience | | | 2,640 | | | | 55 | | |
| Merit Medical Systems* | | | 4,025 | | | | 71 | | |
| MGI Pharma* | | | 10,350 | | | | 241 | | |
| Micro Therapeutics* | | | 2,025 | | | | 11 | | |
| Mine Safety Appliances | | | 4,006 | | | | 155 | | |
| Molecular Devices* | | | 2,672 | | | | 56 | | |
| Molina Healthcare* | | | 1,780 | | | | 44 | | |
| Momenta Pharmaceuticals* (a) | | | 1,430 | | | | 39 | | |
| Monogram Biosciences* | | | 18,980 | | | | 45 | | |
| MWI Veterinary Supply* | | | 110 | | | | 2 | | |
| Myogen* | | | 2,740 | | | | 64 | | |
| Myriad Genetics* | | | 4,636 | | | | 101 | | |
| NABI Biopharmaceuticals* | | | 8,866 | | | | 116 | | |
| Nanogen* | | | 7,200 | | | | 23 | | |
| Nastech Pharmaceutical* | | | 2,790 | | | | 39 | | |
| National Healthcare | | | 1,027 | | | | 36 | | |
| NDCHealth | | | 5,341 | | | | 101 | | |
| Nektar Therapeutics* (a) | | | 12,500 | | | | 212 | | |
| NeoPharm* | | | 2,961 | | | | 37 | | |
| Neurocrine Biosciences* (a) | | | 5,160 | | | | 254 | | |
| Neurogen* | | | 3,440 | | | | 24 | | |
| Neurometrix* | | | 890 | | | | 26 | | |
| New River Pharmaceuticals* | | | 950 | | | | 46 | | |
| Nitromed* | | | 2,550 | | | | 46 | | |
The accompanying notes are an integral part of the financial statements.
FIRST AMERICAN FUNDS Annual Report 2005
28
Small Cap Index Fund (continued)
| DESCRIPTION | | SHARES | | VALUE (000) | |
| Northfield Laboratories* (a) | | | 3,540 | | | $ | 46 | | |
| Noven Pharmaceuticals* | | | 3,553 | | | | 50 | | |
| NPS Pharmaceuticals* | | | 6,299 | | | | 64 | | |
| NuVasive* | | | 1,360 | | | | 25 | | |
| Nuvelo* | | | 6,268 | | | | 60 | | |
| OCA* (a) | | | 7,257 | | | | 11 | | |
| Occulogix* | | | 1,450 | | | | 9 | | |
| Odyssey Healthcare* | | | 5,461 | | | | 93 | | |
| Onyx Pharmaceuticals* | | | 5,467 | | | | 137 | | |
| Option Care | | | 3,415 | | | | 50 | | |
| OraSure Technologies* | | | 6,826 | | | | 64 | | |
| Orchid Cellmark* | | | 3,790 | | | | 32 | | |
| Owens & Minor | | | 5,677 | | | | 167 | | |
| Pain Therapeutics* | | | 4,225 | | | | 27 | | |
| PainCare Holdings* | | | 6,690 | | | | 25 | | |
| Palomar Medical Technologies* | | | 2,620 | | | | 69 | | |
| Par Pharmaceutical Companies* | | | 5,150 | | | | 137 | | |
| PAREXEL International* | | | 3,873 | | | | 78 | | |
| Pediatrix Medical Group* (a) | | | 3,375 | | | | 259 | | |
| Penwest Pharmaceuticals* | | | 3,364 | | | | 59 | | |
| Perrigo (a) | | | 12,748 | | | | 182 | | |
| Per-Se Technologies* (a) | | | 3,764 | | | | 78 | | |
| Pharmion* (a) | | | 3,800 | | | | 83 | | |
| PolyMedica | | | 2,796 | | | | 98 | | |
| POZEN* | | | 4,125 | | | | 45 | | |
| PRA International* | | | 1,430 | | | | 43 | | |
| Priority Healthcare, Class B* | | | 4,986 | | | | 139 | | |
| Progenics Pharmaceutical* | | | 2,270 | | | | 54 | | |
| PSS World Medical* | | | 9,755 | | | | 130 | | |
| Psychiatric Solutions* (a) | | | 3,410 | | | | 185 | | |
| Radiation Therapy Services* (a) | | | 1,230 | | | | 39 | | |
| Regeneron Pharmaceutical* | | | 5,251 | | | | 50 | | |
| RehabCare Group* | | | 2,783 | | | | 57 | | |
| Renovis* | | | 2,990 | | | | 40 | | |
| Res-Care* | | | 3,000 | | | | 46 | | |
| Rigel Pharmaceuticals* | | | 2,840 | | | | 68 | | |
| Salix Pharmaceuticals* (a) | | | 5,522 | | | | 117 | | |
| Savient Pharmaceuticals* | | | 9,410 | | | | 35 | | |
| Seattle Genetics* | | | 4,010 | | | | 21 | | |
| Senomyx* | | | 3,260 | | | | 56 | | |
| Serologicals* (a) | | | 5,393 | | | | 122 | | |
| SFBC International* (a) | | | 2,408 | | | | 107 | | |
| Somanetics* | | | 1,600 | | | | 40 | | |
| SonoSite* | | | 2,531 | | | | 75 | | |
| Specialty Laboratories* | | | 1,368 | | | | 18 | | |
| StemCells* (a) | | | 9,680 | | | | 53 | | |
| Stereotaxis* | | | 1,870 | | | | 14 | | |
| STERIS | | | 10,450 | | | | 249 | | |
| Stewart Enterprises, Class A | | | 16,029 | | | | 106 | | |
| Stratagene* | | | 1,160 | | | | 10 | | |
| Sunrise Senior Living* (a) | | | 2,533 | | | | 169 | | |
| SuperGen* (a) | | | 8,548 | | | | 54 | | |
| SurModics* (a) | | | 2,441 | | | | 94 | | |
| Sybron Dental Specialties* | | | 5,944 | | | | 247 | | |
| Symbion* | | | 1,870 | | | | 48 | | |
| Symmetry Medical* | | | 1,380 | | | | 33 | | |
| Tanox* | | | 4,083 | | | | 60 | | |
| Telik* (a) | | | 7,644 | | | | 125 | | |
| Tercica* | | | 980 | | | | 11 | | |
| Thoratec* | | | 7,594 | | | | 135 | | |
| Threshold Pharmaceutical* | | | 30 | | | | - | | |
| Trimeris* | | | 2,685 | | | | 41 | | |
| TriPath Imaging* | | | 4,732 | | | | 33 | | |
| TriZetto Group* | | | 5,451 | | | | 77 | | |
| U.S. Physical Therapy* | | | 1,840 | | | | 33 | | |
| United Surgical Partners* | | | 6,502 | | | | 254 | | |
Small Cap Index Fund (continued)
| DESCRIPTION | | SHARES | | VALUE (000) | |
| United Therapeutics* | | | 3,291 | | | $ | 230 | | |
| Varian* (a) | | | 4,806 | | | | 165 | | |
| Ventana Medical Systems* | | | 4,640 | | | | 177 | | |
| Ventiv Health* | | | 3,340 | | | | 88 | | |
| Vertex Pharmaceuticals* (a) | | | 14,040 | | | | 314 | | |
| ViaCell* | | | 1,280 | | | | 7 | | |
| Viasys Healthcare* | | | 4,623 | | | | 116 | | |
| VistaCare, Class A* | | | 1,550 | | | | 22 | | |
| Vital Images* (a) | | | 1,900 | | | | 42 | | |
| Vital Signs | | | 979 | | | | 45 | | |
| VNUS Medical Technologies* | | | 940 | | | | 10 | | |
| WellCare Group* | | | 2,310 | | | | 86 | | |
| West Pharmaceutical Services | | | 4,702 | | | | 140 | | |
| Wright Medical Group* | | | 4,564 | | | | 113 | | |
| Young Innovations | | | 806 | | | | 31 | | |
| Zoll Medical* | | | 1,585 | | | | 42 | | |
| ZymoGenetics* | | | 3,339 | | | | 55 | | |
| | | | 22,813 | | |
| Industrials – 14.9% | | | |
| 3D Systems* | | | 1,880 | | | | 42 | | |
| A.O. Smith | | | 2,526 | | | | 72 | | |
| A.S.V.* | | | 2,694 | | | | 61 | | |
| AAON* | | | 1,510 | | | | 28 | | |
| AAR* | | | 4,893 | | | | 84 | | |
| ABM Industries | | | 6,359 | | | | 132 | | |
| ABX Air* | | | 9,040 | | | | 74 | | |
| Accuride* | | | 1,730 | | | | 24 | | |
| Actuant, Class A | | | 4,038 | | | | 189 | | |
| Acuity Brands (a) | | | 6,646 | | | | 197 | | |
| Administaff | | | 3,051 | | | | 121 | | |
| AGCO* (a) | | | 13,220 | | | | 241 | | |
| AirTran Holdings* (a) | | | 13,075 | | | | 166 | | |
| Alamo Group | | | 950 | | | | 19 | | |
| Alaska Air Group* (a) | | | 4,213 | | | | 122 | | |
| Albany International, Class A | | | 4,245 | | | | 157 | | |
| Amerco | | | 1,600 | | | | 93 | | |
| American Ecology | | | 1,870 | | | | 37 | | |
| American Reprographics* | | | 1,010 | | | | 17 | | |
| American Science & Engineering* | | | 1,280 | | | | 84 | | |
| American Superconductor* (a) | | | 4,300 | | | | 45 | | |
| American Woodmark | | | 1,838 | | | | 62 | | |
| Ameron International | | | 1,408 | | | | 65 | | |
| Angelica | | | 1,537 | | | | 27 | | |
| Apogee Enterprises | | | 4,193 | | | | 72 | | |
| Applied Industrial Technology | | | 4,416 | | | | 158 | | |
| Applied Signal Technology | | | 1,704 | | | | 33 | | |
| ARGON ST* | | | 1,370 | | | | 40 | | |
| Arkansas Best | | | 3,722 | | | | 130 | | |
| Armor Holdings* (a) | | | 4,982 | | | | 214 | | |
| Artesyn Technologies* (a) | | | 5,907 | | | | 55 | | |
| Asset Acceptance Capital* | | | 1,350 | | | | 40 | | |
| Astec Industries* | | | 2,372 | | | | 67 | | |
| Aviall* | | | 4,390 | | | | 148 | | |
| Badger Meter | | | 870 | | | | 34 | | |
| Baldor Electric | | | 4,873 | | | | 124 | | |
| Banta | | | 3,928 | | | | 200 | | |
| Barnes Group | | | 2,585 | | | | 93 | | |
| BE Aerospace* | | | 8,590 | | | | 142 | | |
| Beacon Roofing Supply* | | | 2,370 | | | | 77 | | |
| BlueLinx Holdings | | | 1,010 | | | | 14 | | |
| Bowne & Company | | | 5,159 | | | | 74 | | |
| Brady, Class A (a) | | | 6,246 | | | | 193 | | |
| Briggs & Stratton | | | 6,670 | | | | 231 | | |
| Bright Horizons Family Solutions* | | | 4,080 | | | | 157 | | |
| Bucyrus International | | | 2,670 | | | | 131 | | |
FIRST AMERICAN FUNDS Annual Report 2005
29
Schedule of Investments September 30, 2005
Small Cap Index Fund (continued)
| DESCRIPTION | | SHARES | | VALUE (000) | |
| Builders FirstSource* | | | 1,010 | | | $ | 23 | | |
| C&D Technologies | | | 3,826 | | | | 36 | | |
| Cascade | | | 1,836 | | | | 89 | | |
| Casella Waste Systems* | | | 3,373 | | | | 44 | | |
| CBIZ* | | | 10,858 | | | | 55 | | |
| CDI | | | 1,190 | | | | 35 | | |
| Central Parking | | | 3,183 | | | | 48 | | |
| Cenveo* | | | 7,600 | | | | 79 | | |
| Ceradyne* | | | 3,694 | | | | 135 | | |
| Circor International | | | 2,577 | | | | 71 | | |
| CLARCOR | | | 7,764 | | | | 223 | | |
| Clean Harbors* | | | 2,460 | | | | 84 | | |
| Coinstar* | | | 3,821 | | | | 71 | | |
| Color Kinetics* | | | 1,050 | | | | 16 | | |
| Comfort Systems USA* | | | 6,610 | | | | 58 | | |
| Commercial Vehicle Group* | | | 1,700 | | | | 36 | | |
| CompX International | | | 20 | | | | - | | |
| COMSYS IT Partners* | | | 1,950 | | | | 24 | | |
| Consolidated Graphics* | | | 1,753 | | | | 75 | | |
| Continental Airlines, Class B* (a) | | | 10,333 | | | | 100 | | |
| Corrections Corporation of America* | | | 5,937 | | | | 236 | | |
| CoStar Group* | | | 2,415 | | | | 113 | | |
| Covenant Transport, Class A* | | | 1,493 | | | | 18 | | |
| CRA International* | | | 1,747 | | | | 73 | | |
| Crane | | | 6,880 | | | | 205 | | |
| Cubic (a) | | | 2,693 | | | | 46 | | |
| Curtiss-Wright | | | 3,176 | | | | 196 | | |
| Delta Air Lines* (a) | | | 20,780 | | | | 16 | | |
| DiamondCluster, Class A* | | | 4,040 | | | | 31 | | |
| Dollar Thrifty Automotive* | | | 3,722 | | | | 125 | | |
| DRS Technologies | | | 4,076 | | | | 201 | | |
| Duratek* | | | 1,748 | | | | 32 | | |
| Dycom Industries* (a) | | | 7,486 | | | | 151 | | |
| Dynamex* | | | 1,800 | | | | 28 | | |
| Dynamic Materials | | | 420 | | | | 18 | | |
| EDO | | | 2,345 | | | | 70 | | |
| Educate* | | | 3,080 | | | | 46 | | |
| EGL* | | | 5,781 | | | | 157 | | |
| Electro Rent* | | | 3,099 | | | | 39 | | |
| ElkCorp | | | 3,044 | | | | 109 | | |
| EMCOR Group* (a) | | | 2,406 | | | | 143 | | |
| Encore Wire* | | | 2,727 | | | | 44 | | |
| Energy Conversion Devices* (a) | | | 3,282 | | | | 147 | | |
| EnerSys* | | | 5,580 | | | | 85 | | |
| Engineered Support Systems | | | 5,773 | | | | 237 | | |
| Ennis Business Forms | | | 3,770 | | | | 63 | | |
| EnPro Industries* | | | 3,145 | | | | 106 | | |
| ESCO Technologies* (a) | | | 3,922 | | | | 196 | | |
| Essex* | | | 2,790 | | | | 60 | | |
| Esterline Technologies* (a) | | | 3,717 | | | | 141 | | |
| Evergreen Solar* | | | 6,110 | | | | 57 | | |
| Exponent* | | | 1,030 | | | | 32 | | |
| ExpressJet Holdings* (a) | | | 6,572 | | | | 59 | | |
| Federal Signal | | | 7,294 | | | | 125 | | |
| First Advantage* | | | 20 | | | | 1 | | |
| Flanders* | | | 2,250 | | | | 27 | | |
| Florida East Coast Industries, Class A | | | 3,916 | | | | 177 | | |
| Flowserve* (a) | | | 8,506 | | | | 309 | | |
| Forward Air | | | 4,873 | | | | 180 | | |
| Franklin Electric | | | 2,738 | | | | 113 | | |
| Freightcar America | | | 1,240 | | | | 51 | | |
| Frontier Airlines* | | | 5,380 | | | | 53 | | |
| Frozen Food Express Industries* | | | 2,370 | | | | 25 | | |
| FTI Consulting* | | | 6,391 | | | | 161 | | |
| FuelCell Energy* (a) | | | 7,169 | | | | 79 | | |
| G&K Services, Class A | | | 2,646 | | | | 104 | | |
Small Cap Index Fund (continued)
| DESCRIPTION | | SHARES | | VALUE (000) | |
| Gardner Denver* | | | 3,616 | | | $ | 161 | | |
| Gehl Company* | | | 1,575 | | | | 44 | | |
| GenCorp* | | | 8,170 | | | | 152 | | |
| General Cable* | | | 5,817 | | | | 98 | | |
| Genesee & Wyoming, Class A* | | | 3,076 | | | | 98 | | |
| Genlyte Group* (a) | | | 3,614 | | | | 174 | | |
| Geo Group* | | | 1,427 | | | | 38 | | |
| GEVITY HR | | | 4,074 | | | | 111 | | |
| Global Power Equipment Group* | | | 5,814 | | | | 41 | | |
| Gorman-Rupp | | | 1,428 | | | | 34 | | |
| Granite Construction | | | 5,215 | | | | 199 | | |
| Greenbrier Companies | | | 979 | | | | 33 | | |
| Griffon* (a) | | | 4,213 | | | | 104 | | |
| Healthcare Services Group | | | 4,059 | | | | 78 | | |
| Heartland Express (a) | | | 7,103 | | | | 144 | | |
| HEICO | | | 3,350 | | | | 78 | | |
| Heidrick & Struggles International* | | | 2,881 | | | | 93 | | |
| Herley Industries* | | | 1,972 | | | | 37 | | |
| Hexcel* | | | 7,730 | | | | 141 | | |
| Hub Group* | | | 2,640 | | | | 97 | | |
| Hudson Highland Group* | | | 3,432 | | | | 86 | | |
| Hughes Supply (a) | | | 9,430 | | | | 307 | | |
| Huron Consulting Group* | | | 970 | | | | 26 | | |
| Huttig Building Products* | | | 2,230 | | | | 20 | | |
| II-VI* | | | 3,474 | | | | 62 | | |
| IKON Office Solutions | | | 15,510 | | | | 155 | | |
| Imagistics International* | | | 2,293 | | | | 96 | | |
| Innovative Solutions and Support* (a) | | | 1,800 | | | | 28 | | |
| Insituform Technologies, Class A* | | | 4,041 | | | | 70 | | |
| Interline Brands* | | | 2,150 | | | | 45 | | |
| Intermagnetics General* | | | 4,157 | | | | 116 | | |
| Interpool | | | 1,290 | | | | 24 | | |
| Ionatron* (a) | | | 3,780 | | | | 38 | | |
| Jackson Hewitt Tax Service | | | 5,580 | | | | 133 | | |
| Jacuzzi Brands* | | | 11,560 | | | | 93 | | |
| JLG Industries | | | 7,554 | | | | 276 | | |
| John H. Harland | | | 4,150 | | | | 184 | | |
| K&F Industries Holdings* | | | 1,170 | | | | 20 | | |
| Kadant* | | | 2,092 | | | | 42 | | |
| Kaman | | | 3,504 | | | | 72 | | |
| Kansas City Southern Industries* | | | 12,260 | | | | 286 | | |
| Kaydon (a) | | | 4,247 | | | | 121 | | |
| Kelly Services, Class A | | | 2,957 | | | | 91 | | |
| Kennametal | | | 5,621 | | | | 276 | | |
| Kforce* | | | 4,390 | | | | 45 | | |
| Kirby* | | | 3,283 | | | | 162 | | |
| Knight Transportation | | | 6,180 | | | | 151 | | |
| Knoll | | | 670 | | | | 12 | | |
| Korn/Ferry International* | | | 5,371 | | | | 88 | | |
| LaBarge* | | | 1,560 | | | | 20 | | |
| Labor Ready* | | | 7,286 | | | | 187 | | |
| Lawson Products | | | 680 | | | | 25 | | |
| Layne Christensen* | | | 1,690 | | | | 40 | | |
| Learning Tree International* (a) | | | 1,507 | | | | 20 | | |
| LECG* | | | 2,250 | | | | 52 | | |
| Lennox International | | | 7,618 | | | | 209 | | |
| Lincoln Electric Holdings | | | 5,421 | | | | 214 | | |
| Lindsay Manufacturing | | | 1,953 | | | | 43 | | |
| LSI Industries | | | 2,933 | | | | 56 | | |
| MAIR Holdings* | | | 60 | | | | - | | |
| Manitowoc | | | 4,473 | | | | 225 | | |
| Marten Transport* | | | 1,580 | | | | 40 | | |
| Mascotech Escrow Shares (b) (c) | | | 9,571 | | | | - | | |
| MasTec* | | | 4,033 | | | | 44 | | |
| McGrath Rentcorp | | | 3,320 | | | | 94 | | |
| Medis Technologies* (a) | | | 2,236 | | | | 40 | | |
The accompanying notes are an integral part of the financial statements.
FIRST AMERICAN FUNDS Annual Report 2005
30
Small Cap Index Fund (continued)
| DESCRIPTION | | SHARES | | VALUE (000) | |
| Mercury Computer Systems* (a) | | | 3,161 | | | $ | 83 | | |
| Mesa Air Group* (a) | | | 5,411 | | | | 45 | | |
| Middleby* | | | 630 | | | | 46 | | |
| Mobile Mini* (a) | | | 2,191 | | | | 95 | | |
| Moog, Class A* | | | 5,269 | | | | 156 | | |
| MTC Technologies* | | | 1,242 | | | | 40 | | |
| Mueller Industries | | | 5,508 | | | | 153 | | |
| NACCO Industries, Class A | | | 769 | | | | 88 | | |
| Navigant Consulting* | | | 7,259 | | | | 139 | | |
| NCI Building Systems* (a) | | | 3,144 | | | | 128 | | |
| NCO Group* | | | 4,649 | | | | 96 | | |
| Nordson | | | 3,660 | | | | 139 | | |
| NuCo2* | | | 1,420 | | | | 37 | | |
| Odyssey Marine Exploration* | | | 5,540 | | | | 20 | | |
| Old Dominion Freight Lines* | | | 2,834 | | | | 95 | | |
| Omega Flex* | | | 30 | | | | - | | |
| Orbital Sciences* | | | 8,674 | | | | 108 | | |
| PAM Transportation Services* | | | 29 | | | | - | | |
| Pacer International | | | 4,770 | | | | 126 | | |
| Perini* | | | 1,811 | | | | 33 | | |
| PHH* | | | 7,250 | | | | 199 | | |
| Pico Holdings* | | | 1,369 | | | | 48 | | |
| Pike Electric* | | | 1,360 | | | | 25 | | |
| Pinnacle Airlines* | | | 3,330 | | | | 22 | | |
| Plug Power* | | | 6,639 | | | | 45 | | |
| Portfolio Recovery Associates* (a) | | | 2,096 | | | | 91 | | |
| Powell Industries* | | | 1,172 | | | | 26 | | |
| Power-One* | | | 10,805 | | | | 60 | | |
| Preformed Line Products | | | 20 | | | | 1 | | |
| Pre-Paid Legal Services | | | 1,680 | | | | 65 | | |
| PRG-Schultz International* | | | 7,044 | | | | 21 | | |
| Quanta Services* (a) | | | 16,077 | | | | 205 | | |
| RailAmerica* | | | 6,325 | | | | 75 | | |
| Raven Industries | | | 2,314 | | | | 68 | | |
| Regal-Beloit (a) | | | 3,800 | | | | 123 | | |
| Reliance Steel & Aluminum | | | 4,296 | | | | 227 | | |
| Republic Airways Holdings* | | | 880 | | | | 13 | | |
| Resources Connection* | | | 7,056 | | | | 209 | | |
| Robbins & Myers | | | 1,864 | | | | 42 | | |
| Rollins | | | 4,672 | | | | 91 | | |
| Rush Enterprises* | | | 3,240 | | | | 50 | | |
| Schawk | | | 1,564 | | | | 31 | | |
| School Specialty* | | | 3,377 | | | | 165 | | |
| SCS Transportation* | | | 2,555 | | | | 40 | | |
| Sequa, Class A* | | | 930 | | | | 55 | | |
| Shaw Group* | | | 11,917 | | | | 294 | | |
| SI International* | | | 1,140 | | | | 35 | | |
| Simpson Manufacturing | | | 5,474 | | | | 214 | | |
| SIRVA* | | | 3,630 | | | | 27 | | |
| SkyWest | | | 8,628 | | | | 231 | | |
| Sotheby's Holdings, Class A* | | | 5,582 | | | | 93 | | |
| SOURCECORP* | | | 2,365 | | | | 51 | | |
| Spherion* | | | 9,285 | | | | 71 | | |
| Standard Register | | | 2,031 | | | | 30 | | |
| Standex International | | | 2,032 | | | | 54 | | |
| Stewart & Stevenson Services | | | 4,356 | | | | 104 | | |
| Strayer Education | | | 2,209 | | | | 209 | | |
| Sun Hydraulics | | | 1,035 | | | | 25 | | |
| Sypris Solutions | | | 1,163 | | | | 12 | | |
| Tecumseh Products, Class A | | | 2,485 | | | | 53 | | |
| Teledyne Technologies* | | | 5,016 | | | | 173 | | |
| Teletech Holdings* | | | 5,384 | | | | 54 | | |
| Tennant | | | 920 | | | | 38 | | |
| Tetra Tech* | | | 7,907 | | | | 133 | | |
| The Providence Service* | | | 1,490 | | | | 46 | | |
| Titan International (a) | | | 2,010 | | | | 28 | | |
Small Cap Index Fund (continued)
| DESCRIPTION | | SHARES | | VALUE (000) | |
| Tredegar | | | 4,315 | | | $ | 56 | | |
| Trex* (a) | | | 1,769 | | | | 42 | | |
| Trinity Industries | | | 6,048 | | | | 245 | | |
| Triumph Group* | | | 2,388 | | | | 89 | | |
| TRM* | | | 1,690 | | | | 26 | | |
| TurboChef Technologies* (a) | | | 2,000 | | | | 31 | | |
| U.S. Xpress Enterprises* | | | 1,003 | | | | 12 | | |
| UAP Holding | | | 4,790 | | | | 87 | | |
| Ultralife Batteries* | | | 2,410 | | | | 31 | | |
| United Industrial | | | 1,450 | | | | 52 | | |
| United Rentals* | | | 9,486 | | | | 187 | | |
| United Stationers* | | | 4,891 | | | | 234 | | |
| Universal Forest Products | | | 2,363 | | | | 135 | | |
| Universal Technical Institute* | | | 2,730 | | | | 97 | | |
| Universal Truckload Services* | | | 20 | | | | - | | |
| URS* (a) | | | 5,698 | | | | 230 | | |
| USA Truck* | | | 790 | | | | 20 | | |
| Valence Technology* (a) | | | 6,557 | | | | 18 | | |
| Valmont Industries | | | 2,354 | | | | 69 | | |
| Vertrue* | | | 882 | | | | 32 | | |
| Viad | | | 2,730 | | | | 75 | | |
| Vicor | | | 2,890 | | | | 44 | | |
| Volt Information Sciences* | | | 1,366 | | | | 28 | | |
| Wabash National | | | 4,608 | | | | 91 | | |
| Wabtec | | | 6,772 | | | | 185 | | |
| Walter Industries | | | 5,495 | | | | 269 | | |
| Washington Group International* | | | 4,061 | | | | 219 | | |
| Waste Connections* (a) | | | 5,511 | | | | 193 | | |
| Waste Industries USA | | | 880 | | | | 12 | | |
| Waste Services* | | | 9,880 | | | | 37 | | |
| Water Pik Technologies* | | | 1,710 | | | | 35 | | |
| Watsco (a) | | | 3,335 | | | | 177 | | |
| Watson Wyatt & Company Holdings | | | 5,348 | | | | 144 | | |
| Watts Water Technologies, Class A | | | 3,708 | | | | 107 | | |
| Werner Enterprises | | | 7,580 | | | | 131 | | |
| Woodward Governor | | | 1,479 | | | �� | 126 | | |
| World Air Holdings* | | | 3,640 | | | | 39 | | |
| York International | | | 6,219 | | | | 349 | | |
| | | | 26,515 | | |
| Information Technology – 17.9% | | | |
| 3Com* (a) | | | 55,250 | | | | 225 | | |
| Actel* | | | 3,801 | | | | 55 | | |
| Acxiom | | | 13,280 | | | | 249 | | |
| Adaptec* | | | 16,796 | | | | 64 | | |
| ADE* | | | 1,630 | | | | 37 | | |
| Adtran | | | 9,490 | | | | 299 | | |
| Advanced Analogic Technologies* | | | 460 | | | | 5 | | |
| Advanced Digital Information* | | | 9,623 | | | | 90 | | |
| Advanced Energy Industries* | | | 3,579 | | | | 39 | | |
| Advent Software* (a) | | | 3,462 | | | | 93 | | |
| Aeroflex* (a) | | | 11,199 | | | | 105 | | |
| Agile Software* | | | 8,968 | | | | 64 | | |
| Agilysys | | | 4,434 | | | | 75 | | |
| Airspan Networks* (a) | | | 5,290 | | | | 27 | | |
| Altiris* | | | 3,522 | | | | 54 | | |
| AMIS Holdings* | | | 5,420 | | | | 64 | | |
| Amkor Technology* (a) | | | 15,510 | | | | 68 | | |
| Anaren* | | | 2,827 | | | | 40 | | |
| Anixter International | | | 4,349 | | | | 175 | | |
| Ansoft* | | | 1,127 | | | | 33 | | |
| ANSYS* (a) | | | 4,686 | | | | 180 | | |
| Anteon International* (a) | | | 4,114 | | | | 176 | | |
| Applied Digital Solutions* (a) | | | 9,660 | | | | 28 | | |
| Applied Films* | | | 2,534 | | | | 53 | | |
| Applied Micro Circuits* | | | 45,340 | | | | 136 | | |
FIRST AMERICAN FUNDS Annual Report 2005
31
Schedule of Investments September 30, 2005
Small Cap Index Fund (continued)
| DESCRIPTION | | SHARES | | VALUE (000) | |
| aQuantive* (a) | | | 8,072 | | | $ | 162 | | |
| Ariba* | | | 9,801 | | | | 56 | | |
| Arris Group* | | | 14,171 | | | | 168 | | |
| AsiaInfo Holdings* | | | 6,063 | | | | 29 | | |
| Aspen Technology* | | | 7,098 | | | | 44 | | |
| Asyst Technologies* | | | 8,076 | | | | 38 | | |
| Atari* | | | 7,518 | | | | 11 | | |
| Atheros Communications* (a) | | | 3,910 | | | | 38 | | |
| Atmel* | | | 65,080 | | | | 134 | | |
| ATMI* | | | 5,470 | | | | 170 | | |
| Audiovox* | | | 2,681 | | | | 37 | | |
| August Technology* | | | 2,660 | | | | 28 | | |
| Autobytel* | | | 7,141 | | | | 36 | | |
| Avocent* (a) | | | 7,040 | | | | 223 | | |
| Axcelis Technologies* (a) | | | 15,013 | | | | 78 | | |
| Bankrate* (a) | | | 1,470 | | | | 40 | | |
| BearingPoint* (a) | | | 27,000 | | | | 205 | | |
| BEI Technologies | | | 1,844 | | | | 65 | | |
| Bel Fuse | | | 1,724 | | | | 63 | | |
| Belden CDT (a) | | | 6,936 | | | | 135 | | |
| Bell Microproducts* | | | 4,480 | | | | 45 | | |
| Benchmark Electronics* (a) | | | 6,176 | | | | 186 | | |
| Black Box (a) | | | 2,558 | | | | 107 | | |
| Blackbaud | | | 1,278 | | | | 18 | | |
| Blackboard* | | | 2,100 | | | | 53 | | |
| Blue Coat Systems* | | | 1,580 | | | | 69 | | |
| Borland Software* | | | 12,003 | | | | 70 | | |
| Bottomline Technologies* | | | 1,990 | | | | 30 | | |
| Brightpoint* | | | 4,050 | | | | 78 | | |
| Brocade Communications Systems* | | | 40,440 | | | | 165 | | |
| Brooks Automation* (a) | | | 6,711 | | | | 89 | | |
| Cabot Microelectronics* (a) | | | 3,775 | | | | 111 | | |
| Catapult Communications* | | | 1,223 | | | | 22 | | |
| CCC Information Services Group* | | | 1,349 | | | | 35 | | |
| C-COR.net* (a) | | | 7,199 | | | | 49 | | |
| Checkpoint Systems* | | | 5,608 | | | | 133 | | |
| China Energy Savings Technology* | | | 10 | | | | - | | |
| CIBER* (a) | | | 8,761 | | | | 65 | | |
| Ciena* | | | 84,210 | | | | 222 | | |
| Cirrus Logic* | | | 12,823 | | | | 97 | | |
| Click Commerce* | | | 1,280 | | | | 23 | | |
| CMGI* | | | 72,646 | | | | 121 | | |
| CNET Networks* (a) | | | 19,492 | | | | 265 | | |
| Cogent* (a) | | | 3,130 | | | | 74 | | |
| Cognex | | | 6,095 | | | | 183 | | |
| Coherent* | | | 4,534 | | | | 133 | | |
| Cohu | | | 3,208 | | | | 76 | | |
| CommScope* (a) | | | 8,260 | | | | 143 | | |
| Comtech Telecommunications* | | | 3,269 | | | | 136 | | |
| Concur Technologies* | | | 4,502 | | | | 56 | | |
| Conexant Systems* | | | 72,960 | | | | 131 | | |
| Covansys* | | | 3,770 | | | | 60 | | |
| Credence Systems* (a) | | | 12,092 | | | | 96 | | |
| CSG Systems International* | | | 7,596 | | | | 165 | | |
| CTS | | | 5,452 | | | | 66 | | |
| CyberGuard* | | | 2,945 | | | | 24 | | |
| CyberSource* | | | 4,640 | | | | 31 | | |
| Cymer* | | | 5,469 | | | | 171 | | |
| Cypress Semiconductor* (a) | | | 19,530 | | | | 294 | | |
| Daktronics (a) | | | 2,481 | | | | 59 | | |
| Digi International* | | | 3,690 | | | | 40 | | |
| Digital Insight* | | | 5,259 | | | | 137 | | |
| Digital River* (a) | | | 5,159 | | | | 180 | | |
| Digitas* (a) | | | 12,343 | | | | 140 | | |
| Diodes* | | | 1,223 | | | | 44 | | |
| Dionex* | | | 3,044 | | | | 165 | | |
Small Cap Index Fund (continued)
| DESCRIPTION | | SHARES | | VALUE (000) | |
| Ditech Communications* | | | 4,823 | | | $ | 33 | | |
| Dot Hill Systems* | | | 6,599 | | | | 44 | | |
| DSP Group* | | | 4,264 | | | | 109 | | |
| DTS* | | | 2,600 | | | | 44 | | |
| EarthLink* | | | 18,813 | | | | 201 | | |
| Echelon* | | | 4,372 | | | | 40 | | |
| eCollege.com* | | | 2,742 | | | | 41 | | |
| eFunds* | | | 6,847 | | | | 129 | | |
| Electro Scientific Industries* | | | 4,277 | | | | 96 | | |
| Electronics for Imaging* | | | 8,023 | | | | 184 | | |
| EMCORE* | | | 5,730 | | | | 35 | | |
| Emulex* (a) | | | 12,380 | | | | 250 | | |
| EndWave* (a) | | | 1,050 | | | | 14 | | |
| Entegris* | | | 16,057 | | | | 181 | | |
| Entrust* | | | 9,343 | | | | 52 | | |
| Epicor Software* | | | 7,184 | | | | 93 | | |
| EPIQ Systems* | | | 2,346 | | | | 51 | | |
| Equinix* | | | 2,380 | | | | 99 | | |
| Euronet Worldwide* | | | 4,448 | | | | 132 | | |
| Exar* | | | 5,434 | | | | 76 | | |
| Excel Technologies* | | | 1,815 | | | | 47 | | |
| Extreme Networks* (a) | | | 18,265 | | | | 81 | | |
| FactSet Research Systems | | | 5,180 | | | | 183 | | |
| Fairchild Semiconductor International, Class A* (a) | | | 17,000 | | | | 253 | | |
| FalconStor Software* (a) | | | 3,577 | | | | 22 | | |
| Fargo Electronics* | | | 1,960 | | | | 34 | | |
| FARO Technologies* (a) | | | 1,820 | | | | 35 | | |
| FEI* | | | 3,510 | | | | 68 | | |
| FileNet* | | | 6,017 | | | | 168 | | |
| Finisar* | | | 28,416 | | | | 39 | | |
| FormFactor* | | | 4,790 | | | | 109 | | |
| Forrester Research* | | | 1,918 | | | | 40 | | |
| Foundry Networks* (a) | | | 17,280 | | | | 219 | | |
| Gartner, Class A* (a) | | | 8,416 | | | | 98 | | |
| Gateway* | | | 37,823 | | | | 102 | | |
| Genesis Microchip* | | | 4,952 | | | | 109 | | |
| Glenayre Technologies* | | | 10,360 | | | | 37 | | |
| Global Imaging Systems* | | | 3,478 | | | | 118 | | |
| GlobeTel Communications* (a) | | | 9,880 | | | | 14 | | |
| Greenfield Online* | | | 1,610 | | | | 9 | | |
| Harmonic* | | | 11,015 | | | | 64 | | |
| Helix Technology | | | 3,937 | | | | 58 | | |
| Homestore* (a) | | | 19,786 | | | | 86 | | |
| HouseValues* (a) | | | 980 | | | | 14 | | |
| Hutchinson Technology* (a) | | | 3,741 | | | | 98 | | |
| Hypercom* | | | 7,912 | | | | 52 | | |
| Identix* | | | 13,401 | | | | 63 | | |
| iGATE* | | | 3,583 | | | | 13 | | |
| Imation | | | 4,860 | | | | 208 | | |
| Infocrossing* (a) | | | 2,700 | | | | 25 | | |
| Informatica* | | | 13,089 | | | | 157 | | |
| InfoSpace* | | | 5,002 | | | | 119 | | |
| infoUSA | | | 5,471 | | | | 58 | | |
| Integral Systems | | | 1,610 | | | | 33 | | |
| Integrated Device Technology* | | | 28,845 | | | | 310 | | |
| Integrated Silicon Solution* | | | 6,132 | | | | 52 | | |
| InterDigital Communications* | | | 7,920 | | | | 156 | | |
| Intergraph* | | | 4,253 | | | | 190 | | |
| International DisplayWorks* (a) | | | 4,790 | | | | 28 | | |
| Internet Capital Group* | | | 5,790 | | | | 51 | | |
| Internet Security Systems* | | | 5,899 | | | | 142 | | |
| Inter-Tel | | | 3,224 | | | | 68 | | |
| Intervideo* | | | 1,470 | | | | 15 | | |
| InterVoice* | | | 5,696 | | | | 51 | | |
| Interwoven* | | | 6,121 | | | | 50 | | |
| Intevac* | | | 2,870 | | | | 30 | | |
The accompanying notes are an integral part of the financial statements.
FIRST AMERICAN FUNDS Annual Report 2005
32
Small Cap Index Fund (continued)
| DESCRIPTION | | SHARES | | VALUE (000) | |
| Intrado* | | | 2,966 | | | $ | 53 | | |
| iPass* | | | 7,630 | | | | 41 | | |
| iPayment* | | | 1,809 | | | | 68 | | |
| Itron* | | | 3,449 | | | | 157 | | |
| iVillage* | | | 6,120 | | | | 44 | | |
| Ixia* (a) | | | 4,569 | | | | 67 | | |
| IXYS* | | | 3,241 | | | | 34 | | |
| J2 Global Communications* (a) | | | 3,202 | | | | 129 | | |
| Jack Henry & Associates | | | 9,810 | | | | 190 | | |
| JAMDAT Mobile* (a) | | | 1,420 | | | | 30 | | |
| JDA Software* | | | 4,426 | | | | 67 | | |
| Jupitermedia* (a) | | | 2,910 | | | | 52 | | |
| Kanbay International* | | | 3,070 | | | | 58 | | |
| Keane* (a) | | | 7,234 | | | | 83 | | |
| Keithley Instruments | | | 1,890 | | | | 28 | | |
| KEMET* (a) | | | 12,822 | | | | 107 | | |
| Keynote Systems* | | | 2,645 | | | | 34 | | |
| Komag* (a) | | | 4,365 | | | | 140 | | |
| Kopin* | | | 10,434 | | | | 73 | | |
| Kronos* | | | 4,828 | | | | 216 | | |
| Kulicke & Soffa* | | | 8,378 | | | | 61 | | |
| Landauer | | | 1,132 | | | | 55 | | |
| Lattice Semiconductor* (a) | | | 17,131 | | | | 73 | | |
| Lawson Software* (a) | | | 9,545 | | | | 66 | | |
| Leadis Technology* | | | 1,070 | | | | 7 | | |
| LeCroy* | | | 1,420 | | | | 21 | | |
| Lexar Media* | | | 11,974 | | | | 77 | | |
| Lionbridge Technologies* (a) | | | 6,443 | | | | 43 | | |
| Littelfuse* | | | 3,324 | | | | 94 | | |
| Lo-Jack* | | | 2,620 | | | | 55 | | |
| LTX* | | | 9,246 | | | | 39 | | |
| Macrovision* (a) | | | 7,595 | | | | 145 | | |
| Magma Design Automation* | | | 4,284 | | | | 35 | | |
| Majesco Entertainment Company* | | | 2,550 | | | | 3 | | |
| Manhattan Associates* | | | 4,541 | | | | 105 | | |
| ManTech International* | | | 2,365 | | | | 62 | | |
| MapInfo* (a) | | | 3,470 | | | | 43 | | |
| Marchex* (a) | | | 3,070 | | | | 51 | | |
| MatrixOne* | | | 8,698 | | | | 46 | | |
| Mattson Technology* | | | 6,857 | | | | 51 | | |
| Maximus | | | 2,840 | | | | 102 | | |
| Maxtor* | | | 38,190 | | | | 168 | | |
| McDATA, Class A* | | | 20,340 | | | | 107 | | |
| Measurement Specialties* | | | 1,830 | | | | 39 | | |
| Mentor Graphics* (a) | | | 11,767 | | | | 101 | | |
| Methode Electronics, Class A | | | 5,391 | | | | 62 | | |
| Metrologic Instruments* | | | 1,796 | | | | 33 | | |
| Micrel* (a) | | | 9,404 | | | | 106 | | |
| Micromuse* | | | 11,958 | | | | 94 | | |
| Micros Systems* (a) | | | 5,470 | | | | 239 | | |
| Microsemi* (a) | | | 9,286 | | | | 237 | | |
| MicroStrategy* (a) | | | 2,082 | | | | 146 | | |
| Microtune* | | | 8,840 | | | | 55 | | |
| Midway Games* (a) | | | 2,800 | | | | 43 | | |
| MIPS Technologies, Class A* | | | 6,290 | | | | 43 | | |
| MKS Instruments* (a) | | | 4,924 | | | | 85 | | |
| Mobility Electronics* | | | 4,240 | | | | 45 | | |
| Monolithic Power Systems* | | | 2,670 | | | | 23 | | |
| Motive* | | | 1,890 | | | | 12 | | |
| MPS Group* | | | 15,636 | | | | 185 | | |
| MRO Software* | | | 3,364 | | | | 57 | | |
| MRV Communications* | | | 15,725 | | | | 33 | | |
| MTS Systems | | | 2,977 | | | | 112 | | |
| Multi-Fineline Electronix* | | | 1,030 | | | | 30 | | |
| Ness Technologies* | | | 2,340 | | | | 23 | | |
| NETGEAR* (a) | | | 4,800 | | | | 115 | | |
Small Cap Index Fund (continued)
| DESCRIPTION | | SHARES | | VALUE (000) | |
| NetIQ* | | | 8,476 | | | $ | 104 | | |
| Netlogic Microsystems* | | | 1,620 | | | | 35 | | |
| NetRatings* | | | 2,128 | | | | 32 | | |
| NetScout Systems* | | | 4,077 | | | | 22 | | |
| Newport* | | | 5,460 | | | | 76 | | |
| NIC* | | | 5,349 | | | | 35 | | |
| Novatel Wireless* (a) | | | 4,500 | | | | 65 | | |
| OmniVision Technologies* (a) | | | 8,590 | | | | 108 | | |
| ON Semiconductor* | | | 20,838 | | | | 108 | | |
| Online Resources* | | | 3,290 | | | | 35 | | |
| Open Solutions* | | | 2,280 | | | | 50 | | |
| Openwave Systems* (a) | | | 10,364 | | | | 186 | | |
| Oplink Communications* | | | 15,512 | | | | 24 | | |
| Opsware* | | | 9,974 | | | | 52 | | |
| Optical Communication Products* | | | 89 | | | | - | | |
| OSI Systems* (a) | | | 2,269 | | | | 36 | | |
| Packeteer* | | | 5,017 | | | | 63 | | |
| Palm* (a) | | | 6,265 | | | | 177 | | |
| PAR Technology* | | | 620 | | | | 14 | | |
| Parametric Technology* | | | 40,257 | | | | 281 | | |
| Park Electrochemical | | | 2,998 | | | | 80 | | |
| Paxar* | | | 5,289 | | | | 89 | | |
| PDF Solutions* | | | 2,516 | | | | 42 | | |
| Pegasus Solutions* | | | 3,731 | | | | 34 | | |
| Pegasystems* | | | 1,940 | | | | 12 | | |
| Pericom Semiconductor* | | | 3,801 | | | | 34 | | |
| Perot Systems, Class A* | | | 12,691 | | | | 180 | | |
| Phase Forward* | | | 1,720 | | | | 19 | | |
| Phoenix Technologies* | | | 3,850 | | | | 29 | | |
| Photon Dynamics* | | | 2,555 | | | | 49 | | |
| Photronics* (a) | | | 5,607 | | | | 109 | | |
| Pixelworks* | | | 6,959 | | | | 46 | | |
| Plantronics | | | 7,020 | | | | 216 | | |
| Plexus* | | | 6,542 | | | | 112 | | |
| PLX Technology* | | | 3,700 | | | | 31 | | |
| PMC-Sierra* (a) | | | 26,730 | | | | 235 | | |
| Polycom* (a) | | | 14,130 | | | | 228 | | |
| PortalPlayer* (a) | | | 1,740 | | | | 48 | | |
| Power Integrations* | | | 4,743 | | | | 103 | | |
| Powerwave Technologies* (a) | | | 14,763 | | | | 192 | | |
| Presstek* | | | 4,417 | | | | 57 | | |
| Progress Software* | | | 4,787 | | | | 152 | | |
| QAD | | | 2,194 | | | | 18 | | |
| Quality Systems | | | 1,152 | | | | 80 | | |
| Quantum* (a) | | | 27,624 | | | | 85 | | |
| Quest Software* (a) | | | 8,474 | | | | 128 | | |
| Radiant Systems* | | | 3,550 | | | | 37 | | |
| RadiSys* | | | 2,953 | | | | 57 | | |
| Rambus* (a) | | | 14,890 | | | | 180 | | |
| RealNetworks* | | | 17,070 | | | | 97 | | |
| Redback Networks* | | | 5,410 | | | | 54 | | |
| Renaissance Learning | | | 1,314 | | | | 23 | | |
| RF Micro Devices* | | | 28,272 | | | | 160 | | |
| RightNow Technologies* | | | 1,080 | | | | 16 | | |
| Rimage* | | | 1,470 | | | | 39 | | |
| Rofin-Sinar Technologies* | | | 2,295 | | | | 87 | | |
| Rogers* | | | 2,483 | | | | 96 | | |
| RSA Security* | | | 10,726 | | | | 136 | | |
| Rudolph Technologies* (a) | | | 1,950 | | | | 26 | | |
| S1* | | | 10,580 | | | | 41 | | |
| SAFENET* (a) | | | 3,645 | | | | 132 | | |
| Sapient* (a) | | | 12,367 | | | | 77 | | |
| ScanSoft* | | | 14,581 | | | | 78 | | |
| ScanSource* | | | 1,880 | | | | 92 | | |
| SeaChange International* | | | 4,205 | | | | 27 | | |
| Secure Computing* | | | 6,112 | | | | 69 | | |
FIRST AMERICAN FUNDS Annual Report 2005
33
Schedule of Investments September 30, 2005
Small Cap Index Fund (continued)
| DESCRIPTION | | SHARES | | VALUE (000) | |
| Semitool* | | | 2,792 | | | $ | 22 | | |
| Semtech* (a) | | | 10,140 | | | | 167 | | |
| SERENA Software* | | | 3,929 | | | | 78 | | |
| SigmaTel* | | | 5,180 | | | | 105 | | |
| Silicon Image* | | | 11,908 | | | | 106 | | |
| Silicon Laboratories* (a) | | | 6,290 | | | | 191 | | |
| Silicon Storage Technology* | | | 14,091 | | | | 76 | | |
| SiRF Technology Holdings* | | | 4,670 | | | | 141 | | |
| Skyworks Solutions* (a) | | | 23,740 | | | | 167 | | |
| Sohu.com* | | | 3,801 | | | | 65 | | |
| Sonic Solutions* | | | 3,241 | | | | 70 | | |
| SonicWALL* | | | 7,929 | | | | 50 | | |
| Sonus Networks* | | | 36,780 | | | | 213 | | |
| Spatialight* (a) | | | 4,040 | | | | 18 | | |
| SpectraLink | | | 2,885 | | | | 37 | | |
| SPSS* | | | 2,439 | | | | 59 | | |
| SS&C Technologies | | | 2,337 | | | | 86 | | |
| SSA Global Technologies* | | | 1,460 | | | | 26 | | |
| Standard Microsystems* | | | 3,172 | | | | 95 | | |
| StarTek | | | 876 | | | | 12 | | |
| Stellent* | | | 3,520 | | | | 30 | | |
| StorageNetworks* (b) (c) | | | 15,089 | | | | - | | |
| Stratasys* (a) | | | 1,581 | | | | 47 | | |
| Superior Essex* | | | 2,300 | | | | 41 | | |
| Supertex* | | | 1,531 | | | | 46 | | |
| Supportsoft* | | | 6,235 | | | | 31 | | |
| Sycamore Networks* | | | 26,157 | | | | 99 | | |
| Sykes Enterprises* | | | 4,308 | | | | 51 | | |
| Symmetricom* | | | 6,951 | | | | 54 | | |
| Synaptics* (a) | | | 3,459 | | | | 65 | | |
| SYNNEX* | | | 1,130 | | | | 19 | | |
| Syntel | | | 1,257 | | | | 25 | | |
| TALX (a) | | | 2,954 | | | | 97 | | |
| TASER International* (a) | | | 9,460 | | | | 58 | | |
| Technitrol | | | 6,275 | | | | 96 | | |
| Tekelec* | | | 8,404 | | | | 176 | | |
| Telkonet* (a) | | | 5,500 | | | | 22 | | |
| Terayon Communications* | | | 11,477 | | | | 45 | | |
| Terremark Worldwide* | | | 5,149 | | | | 23 | | |
| Tessera Technologies* | | | 6,460 | | | | 193 | | |
| ThermoGenesis* | | | 6,800 | | | | 36 | | |
| THQ* | | | 8,880 | | | | 189 | | |
| TIBCO Software* | | | 31,980 | | | | 267 | | |
| TNS* | | | 1,150 | | | | 28 | | |
| Transaction Systems Architects, Class A* (a) | | | 5,678 | | | | 158 | | |
| TranSwitch* (a) | | | 16,040 | | | | 28 | | |
| Travelzoo* | | | 360 | | | | 8 | | |
| Trident Microsystems* (a) | | | 3,720 | | | | 118 | | |
| TriQuint Semiconductor* | | | 20,579 | | | | 72 | | |
| TTM Technologies* | | | 6,397 | | | | 46 | | |
| Tyler Technologies* | | | 5,322 | | | | 44 | | |
| Ulticom* | | | 1,784 | | | | 20 | | |
| Ultimate Software Group* | | | 2,820 | | | | 52 | | |
| Ultratech* | | | 3,639 | | | | 57 | | |
| United Online | | | 9,043 | | | | 125 | | |
| Universal Display* | | | 3,578 | | | | 40 | | |
| UNOVA* (a) | | | 7,355 | | | | 257 | | |
| UTStarcom* (a) | | | 15,080 | | | | 123 | | |
| ValueClick* (a) | | | 12,465 | | | | 213 | | |
| Varian Semiconductor Equipment Associates* | | | 5,552 | | | | 235 | | |
| Vasco Data Security International* | | | 3,710 | | | | 34 | | |
| Veeco Instruments* | | | 3,900 | | | | 63 | | |
| VeriFone Holdings* (a) | | | 3,650 | | | | 73 | | |
| Verint Systems* | | | 2,001 | | | | 82 | | |
| Verity* | | | 4,739 | | | | 50 | | |
| ViaSat* | | | 3,244 | | | | 83 | | |
Small Cap Index Fund (continued)
| DESCRIPTION | | SHARES | | VALUE (000) | |
| Vignette* | | | 4,384 | | | $ | 70 | | |
| Viisage Technology* | | | 5,250 | | | | 22 | | |
| Virage Logic* | | | 2,110 | | | | 16 | | |
| Vitesse Semiconductor* | | | 32,897 | | | | 62 | | |
| Volterra Semiconductor* | | | 1,470 | | | | 18 | | |
| WebEx Communications* (a) | | | 4,867 | | | | 119 | | |
| webMethods* | | | 7,944 | | | | 56 | | |
| Websense* | | | 3,600 | | | | 184 | | |
| WebSideStory* | | | 1,390 | | | | 25 | | |
| Westell Technologies, Class A* | | | 8,460 | | | | 31 | | |
| Wind River Systems* (a) | | | 10,690 | | | | 138 | | |
| Witness Systems* | | | 3,790 | | | | 79 | | |
| Wright Express* | | | 6,120 | | | | 132 | | |
| X-Rite | | | 3,187 | | | | 40 | | |
| Zhone Technologies* | | | 12,450 | | | | 32 | | |
| Zoran* | | | 6,558 | | | | 94 | | |
| | | | 31,885 | | |
| Materials – 4.7% | | | |
| A. Schulman | | | 4,815 | | | | 86 | | |
| A.M. Castle & Company* | | | 1,620 | | | | 28 | | |
| AK Steel Holdings* | | | 16,274 | | | | 139 | | |
| Aleris International* | | | 4,440 | | | | 122 | | |
| Alpha Natural Resources* | | | 4,370 | | | | 131 | | |
| AMCOL International | | | 3,254 | | | | 62 | | |
| American Vanguard (a) | | | 1,720 | | | | 31 | | |
| Arch Chemicals | | | 3,558 | | | | 83 | | |
| Balchem | | | 1,210 | | | | 33 | | |
| Bowater (a) | | | 7,830 | | | | 221 | | |
| Brush Engineered Metals* | | | 2,900 | | | | 46 | | |
| Buckeye Technologies* | | | 4,966 | | | | 40 | | |
| Calgon Carbon | | | 5,838 | | | | 46 | | |
| Cambrex | | | 3,975 | | | | 75 | | |
| Caraustar Industries* | | | 4,267 | | | | 47 | | |
| Carpenter Technology | | | 3,647 | | | | 214 | | |
| Century Aluminum* (a) | | | 3,186 | | | | 72 | | |
| CF Industries Holdings* (a) | | | 4,660 | | | | 69 | | |
| Chaparral Steel* | | | 3,360 | | | | 85 | | |
| Chesapeake | | | 2,970 | | | | 55 | | |
| Cleveland-Cliffs (a) | | | 3,298 | | | | 287 | | |
| Coeur D'Alene Mines* | | | 35,324 | | | | 149 | | |
| Commercial Metals (a) | | | 8,960 | | | | 302 | | |
| Compass Minerals International | | | 2,600 | | | | 60 | | |
| Deltic Timber | | | 1,694 | | | | 78 | | |
| Eagle Materials (a) | | | 2,716 | | | | 330 | | |
| Ferro | | | 6,317 | | | | 116 | | |
| Georgia Gulf | | | 4,848 | | | | 117 | | |
| Gibraltar Industries (a) | | | 3,573 | | | | 82 | | |
| Glatfelter | | | 4,939 | | | | 70 | | |
| GrafTech International* | | | 14,718 | | | | 80 | | |
| Graphic Packaging* | | | 9,820 | | | | 27 | | |
| Greif, Class A | | | 2,209 | | | | 133 | | |
| H.B. Fuller | | | 4,272 | | | | 133 | | |
| Headwaters* (a) | | | 6,228 | | | | 233 | | |
| Hecla Mining* (a) | | | 17,989 | | | | 79 | | |
| Hercules* | | | 17,016 | | | | 208 | | |
| Kronos Worldwide | | | 544 | | | | 17 | | |
| Longview Fibre | | | 7,703 | | | | 150 | | |
| MacDermid | | | 4,646 | | | | 122 | | |
| Mercer International* | | | 4,510 | | | | 37 | | |
| Metal Management | | | 2,980 | | | | 76 | | |
| Metals USA* | | | 3,140 | | | | 64 | | |
| Minerals Technologies (a) | | | 3,141 | | | | 180 | | |
| Myers Industries | | | 4,130 | | | | 48 | | |
| Neenah Paper | | | 1,510 | | | | 44 | | |
| NewMarket Group* | | | 2,353 | | | | 41 | | |
The accompanying notes are an integral part of the financial statements.
FIRST AMERICAN FUNDS Annual Report 2005
34
Small Cap Index Fund (continued)
| DESCRIPTION | | SHARES | | VALUE (000) | |
| NL Industries | | | 1,367 | | | $ | 26 | | |
| NN | | | 2,894 | | | | 35 | | |
| Octel | | | 1,881 | | | | 31 | | |
| Olin (a) | | | 10,552 | | | | 200 | | |
| OM Group* | | | 4,291 | | | | 86 | | |
| Oregon Steel Mills* | | | 5,330 | | | | 149 | | |
| Pioneer Companies* | | | 1,750 | | | | 42 | | |
| PolyOne* | | | 13,882 | | | | 84 | | |
| Potlatch | | | 4,431 | | | | 231 | | |
| Quanex | | | 3,714 | | | | 246 | | |
| Roanoke Electric Steel | | | 1,730 | | | | 35 | | |
| Rock-Tenn, Class A | | | 4,442 | | | | 67 | | |
| Rockwood Holdings* | | | 180 | | | | 3 | | |
| Royal Gold (a) | | | 2,395 | | | | 64 | | |
| RTI International Metals* | | | 3,341 | | | | 131 | | |
| Ryerson Tull (a) | | | 3,783 | | | | 81 | | |
| Schnitzer Steel Industries, Class A | | | 3,320 | | | | 108 | | |
| Schweitzer-Mauduit International | | | 2,253 | | | | 50 | | |
| Sensient Technologies | | | 7,110 | | | | 135 | | |
| Silgan Holdings | | | 3,364 | | | | 112 | | |
| Spartech | | | 4,345 | | | | 85 | | |
| Steel Dynamics (a) | | | 5,816 | | | | 198 | | |
| Steel Technologies | | | 1,720 | | | | 45 | | |
| Stepan | | | 274 | | | | 7 | | |
| Stillwater Mining* (a) | | | 6,142 | | | | 56 | | |
| Symyx Technologies* | | | 4,772 | | | | 125 | | |
| Terra Industries* | | | 11,790 | | | | 78 | | |
| Texas Industries | | | 3,420 | | | | 186 | | |
| Titanium Metals* | | | 1,760 | | | | 70 | | |
| USEC | | | 12,965 | | | | 145 | | |
| W.R. Grace & Company* (a) | | | 10,075 | | | | 90 | | |
| Wausau-Mosinee Paper | | | 6,418 | | | | 80 | | |
| Wellman | | | 5,482 | | | | 35 | | |
| Westlake Chemical | | | 2,040 | | | | 55 | | |
| Wheeling-Pittsburgh* | | | 1,320 | | | | 22 | | |
| Worthington Industries (a) | | | 9,230 | | | | 194 | | |
| Zoltek Companies* | | | 1,690 | | | | 22 | | |
| | | | 8,357 | | |
| Telecommunication Services – 1.3% | | | |
| Alaska Communications Systems Holdings | | | 1,730 | | | | 20 | | |
| Arbinet-thexchange* | | | 510 | | | | 4 | | |
| Broadwing* (a) | | | 10,159 | | | | 51 | | |
| Centennial Communications, Class A* | | | 3,063 | | | | 46 | | |
| Cincinnati Bell* (a) | | | 37,047 | | | | 163 | | |
| Cogent Communications Group* | | | 860 | | | | 4 | | |
| Commonwealth Telephone Enterprises | | | 3,190 | | | | 120 | | |
| Consolidated Communications Holdings | | | 910 | | | | 12 | | |
| CT Communications | | | 2,816 | | | | 35 | | |
| Dobson Communications, Class A* (a) | | | 16,898 | | | | 130 | | |
| FairPoint Communications | | | 4,020 | | | | 59 | | |
| General Communication* (a) | | | 7,810 | | | | 77 | | |
| Golden Telecom (a) | | | 2,820 | | | | 89 | | |
| Hungarian Telephone & Cable* | | | 630 | | | | 9 | | |
| IDT* | | | 8,630 | | | | 105 | | |
| InPhonic* | | | 2,390 | | | | 33 | | |
| Iowa Telecommunications Services | | | 3,320 | | | | 56 | | |
| Level 3 Communications* (a) | | | 104,020 | | | | 241 | | |
| Neon Communications* (b) (c) | | | 34,093 | | | | - | | |
| NeuStar* | | | 2,260 | | | | 72 | | |
| North Pittsburgh | | | 2,197 | | | | 45 | | |
| Premiere Global Services* | | | 10,815 | | | | 88 | | |
| Price Communications* | | | 6,339 | | | | 104 | | |
| SBA Communications* | | | 11,406 | | | | 176 | | |
| Shenandoah Telecommunications | | | 1,016 | | | | 42 | | |
| SureWest Communications | | | 2,202 | | | | 63 | | |
Small Cap Index Fund (continued)
| DESCRIPTION | | SHARES | | VALUE (000) | |
| Syniverse Holdings* | | | 1,740 | | | $ | 27 | | |
| Talk America Holdings* | | | 4,098 | | | | 39 | | |
| Time Warner Telecom, Class A* | | | 7,565 | | | | 59 | | |
| UbiquiTel* | | | 12,090 | | | | 106 | | |
| USA Mobility* | | | 4,108 | | | | 111 | | |
| Valor Communications Group | | | 4,430 | | | | 60 | | |
| Wireless Facilities* (a) | | | 8,179 | | | | 47 | | |
| | | | 2,293 | | |
| Utilities – 2.7% | | | |
| ALLETE (a) | | | 3,820 | | | | 175 | | |
| American States Water | | | 2,594 | | | | 87 | | |
| Aquila* | | | 51,082 | | | | 202 | | |
| Avista | | | 7,184 | | | | 139 | | |
| Black Hills (a) | | | 4,909 | | | | 213 | | |
| California Water Service | | | 2,603 | | | | 107 | | |
| Calpine* (a) | | | 85,120 | | | | 220 | | |
| Cascade Natural Gas | | | 1,244 | | | | 27 | | |
| Central Vermont Public Service | | | 1,838 | | | | 32 | | |
| CH Energy Group | | | 2,382 | | | | 113 | | |
| CLECO | | | 7,515 | | | | 177 | | |
| Connecticut Water Service | | | 1,363 | | | | 34 | | |
| Duquesne Light Holdings (a) | | | 11,670 | | | | 201 | | |
| El Paso Electric* | | | 7,191 | | | | 150 | | |
| Empire District Electric | | | 3,823 | | | | 87 | | |
| EnergySouth | | | 1,168 | | | | 32 | | |
| IDACORP (a) | | | 6,253 | | | | 188 | | |
| Infrasource Services* | | | 1,490 | | | | 22 | | |
| ITC Holdings | | | 500 | | | | 14 | | |
| Laclede Group | | | 3,272 | | | | 106 | | |
| MGE Energy | | | 3,078 | | | | 112 | | |
| Middlesex Water | | | 1,944 | | | | 44 | | |
| New Jersey Resources | | | 4,254 | | | | 196 | | |
| NICOR (a) | | | 5,550 | | | | 233 | | |
| Northwest Natural Gas | | | 4,263 | | | | 159 | | |
| NorthWestern | | | 5,360 | | | | 162 | | |
| Ormat Technologies | | | 1,250 | | | | 28 | | |
| Otter Tail | | | 4,412 | | | | 137 | | |
| People's Energy | | | 5,460 | | | | 215 | | |
| Sierra Pacific Resources* (a) | | | 17,449 | | | | 259 | | |
| SJW | | | 1,117 | | | | 54 | | |
| South Jersey Industries | | | 4,212 | | | | 123 | | |
| Southern Union Company Fractional Share (b) (c) | | | - | | | | - | | |
| Southwest Gas | | | 5,817 | | | | 159 | | |
| Southwest Water (a) | | | 3,306 | | | | 48 | | |
| UIL Holdings | | | 1,857 | | | | 97 | | |
| UniSource Energy Holding | | | 5,351 | | | | 178 | | |
| WGL Holdings | | | 7,340 | | | | 236 | | |
| | | | 4,766 | | |
Total Common Stocks
(Cost $139,752) | | | | | | | 176,794 | | |
FIRST AMERICAN FUNDS Annual Report 2005
35
Schedule of Investments September 30, 2005
Small Cap Index Fund (concluded)
| DESCRIPTION | | SHARES/PAR (000) | | VALUE (000) | |
| Short-Term Investments – 0.7% | | | |
| Affiliated Money Market Fund – 0.5% | |
First American Prime
Obligations Fund, Class Z (d) | | | 972,482 | | | $ | 972 | | |
| U.S. Treasury Obligations – 0.2% | | | |
U.S. Treasury Bill
3.490%, 03/02/06 (e) | | $ | 300 | | | | 296 | | |
Total Short-Term Investments
(Cost $1,268) | | | | | 1,268 | | |
Investments Purchased with Proceeds
from Securities Lending (f) – 23.0% | | | |
| | | (Cost $40,990) | | | 40,990 | | |
Total Investments – 122.9%
(Cost $182,010) | | | | | 219,052 | | |
| Other Assets and Liabilities, Net – (22.9)% | | | | | (40,751 | ) | |
| Total Net Assets – 100.0% | | | | $ | 178,301 | | |
* Non-income producing security
(a) This security or a portion of this security is out on loan at September 30, 2005. Total loaned securities had a market value of $39,574,289 at September 30, 2005. See note 2 in Notes to Financial Statements.
(b) Securities are fair valued. As of September 30, 2005, the fair value of these investments was $0 or 0.0% of total net assets. See note 2 in Notes to Financial Statements.
(c) Securities considered illiquid. As of September 30, 2005, the value of these investments was $0 or 0.0% of total net assets. See note 2 in Notes to Financial Statements.
(d) Investment in affiliated security. This money market fund is advised by U.S. Bancorp Asset Management, Inc., which also serves as advisor to this fund. See note 3 in Notes to Financial Statements.
(e) Security has been deposited as initial margin on open futures contracts. Yield shown is effective yield as of September 30, 2005. See note 2 in Notes to Financial Statements.
(f) The fund may loan securities in return for collateral in the form of cash, U.S. Government securities, or other high grade debt obligations. The cash collateral is invested in various short-term fixed income securities, such as repurchase agreements, commercial paper, money market funds and other corporate obligations. See note 2 in Notes to Financial Statements.
REIT – Real Estate Investment Trust
Schedule of Open Futures Contracts
| Description | | Number of
Contracts
Purchased
(Sold) | | Notional
Contract
Value
(000) | |
Settlement
Month | |
Unrealized
Depreciation
(000) | |
Russell 2000 Index
Futures Contracts | | | 2 | | | $ | 672 | | | December-05 | | $ | 0 | | |
The accompanying notes are an integral part of the financial statements.
FIRST AMERICAN FUNDS Annual Report 2005
36
(This page has been left blank intentionally.)
Statements of Assets and Liabilities September 30, 2005, in thousands, except for per share data
| | | Equity
Index Fund | | Mid Cap
Index Fund | | Small Cap
Index Fund | |
| ASSETS: | |
Investments in unaffiliated securities, at value*
(cost: $1,622,733, $300,684, $140,048)(note 2) | | $ | 2,229,051 | | | $ | 371,907 | | | $ | 177,090 | | |
| Investments in affiliated securities, at value (cost: $36,858, $4,591, $972)(note 2) | | | 38,924 | | | | 4,591 | | | | 972 | | |
Investments purchased with proceeds from securities lending
(cost $712,377, $135,867, $40,990)(note 2) | | | 712,377 | | | | 135,867 | | | | 40,990 | | |
| Cash** | | | 6,761 | | | | 1,287 | | | | 390 | | |
| Receivable for dividends and interest | | | 2,576 | | | | 232 | | | | 194 | | |
| Receivable for investment securities sold | | | - | | | | - | | | | 457 | | |
| Receivable for capital shares sold | | | 1,462 | | | | 163 | | | | 40 | | |
| Receivable for variation margin | | | 61 | | | | 40 | | | | 5 | | |
| Prepaid expenses and other assets | | | 41 | | | | 31 | | | | 29 | | |
| Total assets | | | 2,991,253 | | | | 514,118 | | | | 220,167 | | |
| LIABILITIES: | |
| Payable for investment securities purchased | | | - | | | | - | | | | 140 | | |
| Payable upon return of securities loaned (note 2) | | | 719,125 | | | | 137,154 | | | | 41,378 | | |
| Payable for capital shares redeemed | | | 5,555 | | | | 1,401 | | | | 231 | | |
| Payable to affiliates (note 3) | | | 651 | | | | 146 | | | | 88 | | |
| Payable for distribution and shareholder servicing fees | | | 120 | | | | 9 | | | | 5 | | |
| Accrued expenses and other liabilities | | | 78 | | | | 26 | | | | 24 | | |
| Total liabilities | | | 725,529 | | | | 138,736 | | | | 41,866 | | |
| Net assets | | $ | 2,265,724 | | | $ | 375,382 | | | $ | 178,301 | | |
| COMPOSITION OF NET ASSETS: | |
| Portfolio capital | | $ | 1,689,670 | | | $ | 285,867 | | | $ | 137,085 | | |
| Undistributed net investment income | | | - | | | | 99 | | | | - | | |
| Accumulated net realized gain on investments | | | (32,473 | ) | | | 18,173 | | | | 4,174 | | |
| Net unrealized appreciation of investments | | | 608,384 | | | | 71,223 | | | | 37,042 | | |
| Net unrealized appreciation of futures contracts | | | 143 | | | | 20 | | | | - | | |
| Net assets | | $ | 2,265,724 | | | $ | 375,382 | | | $ | 178,301 | | |
| * Including securities loaned, at value | | $ | 697,331 | | | $ | 133,613 | | | $ | 39,574 | | |
| ** Includes cash collateral received related to securities loaned (note 2) | | $ | 6,748 | | | $ | 1,287 | | | $ | 388 | | |
| Class A: | |
| Net assets | | $ | 238,379 | | | $ | 14,827 | | | $ | 10,323 | | |
| Shares issued and outstanding ($0.0001 par value - 2 billion authorized) | | | 10,364 | | | | 1,073 | | | | 708 | | |
| Net asset value, and redemption price per share | | $ | 23.00 | | | $ | 13.82 | | | $ | 14.57 | | |
| Maximum offering price per share (1) | | $ | 24.34 | | | $ | 14.62 | | | $ | 15.42 | | |
| Class B: | |
| Net assets | | $ | 58,857 | | | $ | 3,546 | | | $ | 1,555 | | |
| Shares issued and outstanding ($0.0001 par value - 2 billion authorized) | | | 2,591 | | | | 261 | | | | 110 | | |
| Net asset value, offering price, and redemption price per share (2) | | $ | 22.72 | | | $ | 13.59 | | | $ | 14.21 | | |
| Class C: | |
| Net assets | | $ | 26,258 | | | $ | 3,533 | | | $ | 2,256 | | |
| Shares issued and outstanding ($0.0001 par value - 2 billion authorized) | | | 1,149 | | | | 259 | | | | 157 | | |
| Net asset value, offering price, and redemption price per share (2) | | $ | 22.85 | | | $ | 13.63 | | | $ | 14.34 | | |
| Class R: | |
| Net assets | | $ | 1,663 | | | $ | 122 | | | $ | 11 | | |
| Shares issued and outstanding ($0.0001 par value - 2 billion authorized) | | | 72 | | | | 9 | | | | 1 | | |
| Net asset value, offering price, and redemption price per share | | $ | 22.98 | | | $ | 13.78 | | | $ | 14.43 | | |
| Class Y: | |
| Net assets | | $ | 1,940,567 | | | $ | 353,354 | | | $ | 164,156 | | |
| Shares issued and outstanding ($0.0001 par value - 2 billion authorized) | | | 84,392 | | | | 25,550 | | | | 11,263 | | |
| Net asset value, offering price, and redemption price per share | | $ | 22.99 | | | $ | 13.83 | | | $ | 14.57 | | |
(1) The offering price is calculated by dividing the net asset value by 1 minus the maximum sales charge of 5.50%.
(2) Class B and C have a contingent deferred sales charge. For a description of this sales charge, see notes 1 and 3 in Notes to Financial Statements.
The accompanying notes are an integral part of the financial statements.
FIRST AMERICAN FUNDS Annual Report 2005
38
Statements of Operations For the fiscal year ended September 30, 2005, in thousands
| | | Equity
Index Fund | | Mid Cap
Index Fund | | Small Cap
Index Fund | |
| INVESTMENT INCOME: | |
| Dividends from unaffiliated securities | | $ | 48,778 | | | $ | 4,788 | | | $ | 2,379 | | |
| Dividends from affiliated securities | | | 933 | | | | 241 | | | | 90 | | |
| Interest from unaffiliated securities | | | 152 | | | | 46 | | | | 14 | | |
| Securities lending income | | | 612 | | | | 121 | | | | 134 | | |
| Total investment income | | | 50,475 | | | | 5,196 | | | | 2,617 | | |
| EXPENSES (note 3): | |
| Investment advisory fees | | | 5,859 | | | | 913 | | | | 732 | | |
| Administration fees | | | 4,793 | | | | 759 | | | | 451 | | |
| Transfer agent fees | | | 1,478 | | | | 236 | | | | 116 | | |
| Custodian fees | | | 206 | | | | 32 | | | | 16 | | |
| Professional fees | | | 136 | | | | 38 | | | | 29 | | |
| Other expenses | | | 89 | | | | 24 | | | | 32 | | |
| Postage and printing fees | | | 78 | | | | 12 | | | | 9 | | |
| Directors' fees | | | 55 | | | | 8 | | | | 4 | | |
| Registration fees | | | 44 | | | | 44 | | | | 43 | | |
| Distribution and shareholder servicing fees – Class A | | | 603 | | | | 35 | | | | 25 | | |
| Distribution and shareholder servicing fees – Class B | | | 665 | | | | 34 | | | | 16 | | |
| Distribution and shareholder servicing fees – Class C | | | 291 | | | | 30 | | | | 21 | | |
| Distribution and shareholder servicing fees – Class R (1) | | | 5 | | | | - | | | | - | | |
| Total expenses | | | 14,302 | | | | 2,165 | | | | 1,494 | | |
| Less: Fee waivers (note 3) | | | (4,067 | ) | | | (239 | ) | | | (234 | ) | |
| Total net expenses | | | 10,235 | | | | 1,926 | | | | 1,260 | | |
| Investment income – net | | | 40,240 | | | | 3,270 | | | | 1,357 | | |
REALIZED AND UNREALIZED GAINS (LOSSES) ON INVESTMENTS AND
FUTURES CONTRACTS – NET (note 6): | |
| Net realized gain (loss) on unaffiliated investments | | | (5,937 | ) | | | 21,217 | | | | 9,562 | | |
| Net realized gain on affiliated investments | | | 513 | | | | - | | | | - | | |
| Net realized gain on in-kind distribution (note 8) | | | 115,666 | | | | - | | | | - | | |
| Net realized gain (loss) on futures contracts | | | (787 | ) | | | 1,346 | | | | 740 | | |
| Net change in unrealized appreciation or depreciation of unaffiliated investments | | | 111,289 | | | | 45,063 | | | | 16,613 | | |
| Net change in unrealized appreciation or depreciation of affiliated investments | | | (819 | ) | | | - | | | | - | | |
| Net change in unrealized appreciation or depreciation of future contracts | | | 277 | | | | (1 | ) | | | (11 | ) | |
| Net gain on investments and futures contracts | | | 220,202 | | | | 67,625 | | | | 26,904 | | |
| Net increase in net assets resulting from operations | | $ | 260,442 | | | $ | 70,895 | | | $ | 28,261 | | |
(1) For the Mid Cap Index Fund and the Small Cap Index Fund due to the presentation of the financial statements in thousands, the numbers round to zero.
FIRST AMERICAN FUNDS Annual Report 2005
39
Statements of Changes in Net Assets in thousands
| | | Equity
Index Fund | | Mid Cap
Index Fund | | Small Cap
Index Fund | |
| | | Year
Ended
9/30/05 | | Year
Ended
9/30/04 | | Year
Ended
9/30/05 | | Year
Ended
9/30/04 | | Year
Ended
9/30/05 | | Year
Ended
9/30/04 | |
| OPERATIONS: | | | |
| Investment income – net | | $ | 40,240 | | | $ | 30,485 | | | $ | 3,270 | | | $ | 2,246 | | | $ | 1,357 | | | $ | 785 | | |
| Net realized gain (loss) on unaffiliated investments | | | (5,937 | ) | | | 4,194 | | | | 21,217 | | | | 9,956 | | | | 9,562 | | | | 6,383 | | |
| Net realized gain on affiliated investments | | | 513 | | | | - | | | | - | | | | - | | | | - | | | | - | | |
| Net realized gain on in-kind distributions | | | 115,666 | | | | - | | | | - | | | | - | | | | - | | | | - | | |
| Net realized gain (loss) on futures contracts | | | (787 | ) | | | 7,968 | | | | 1,346 | | | | 1,639 | | | | 740 | | | | 1,070 | | |
| Net change in unrealized appreciation or depreciation of unaffiliated investments | | | 111,289 | | | | 233,457 | | | | 45,063 | | | | 30,236 | | | | 16,613 | | | | 15,627 | | |
| Net change in unrealized appreciation or depreciation of affiliated investments | | | (819 | ) | | | 2,166 | | | | - | | | | - | | | | - | | | | - | | |
| Net change in unrealized appreciation or depreciation of futures contracts | | | 277 | | | | 1,118 | | | | (1 | ) | | | 152 | | | | (11 | ) | | | 228 | | |
| Net increase in net assets resulting from operations | | | 260,442 | | | | 279,388 | | | | 70,895 | | | | 44,229 | | | | 28,261 | | | | 24,093 | | |
| DISTRIBUTIONS TO SHAREHOLDERS FROM: | | | |
| Investment income – net: | |
| Class A | | | (3,686 | ) | | | (2,311 | ) | | | (93 | ) | | | (42 | ) | | | (46 | ) | | | (15 | ) | |
| Class B | | | (543 | ) | | | (335 | ) | | | (4 | ) | | | (1 | ) | | | - | | | | - | | |
| Class C | | | (235 | ) | | | (141 | ) | | | (3 | ) | | | (1 | ) | | | - | | | | - | | |
| Class R | | | (10 | ) | | | (391 | ) | | | - | | | | (13 | ) | | | - | | | | (7 | ) | |
| Class Y | | | (35,527 | ) | | | (27,416 | ) | | | (3,117 | ) | | | (2,153 | ) | | | (1,212 | ) | | | (717 | ) | |
| Net realized gain on investments: | |
| Class A | | | - | | | | - | | | | (453 | ) | | | (99 | ) | | | (657 | ) | | | (25 | ) | |
| Class B | | | - | | | | - | | | | (114 | ) | | | (46 | ) | | | (112 | ) | | | (7 | ) | |
| Class C | | | - | | | | - | | | | (95 | ) | | | (33 | ) | | | (140 | ) | | | (10 | ) | |
| Class R | | | - | | | | - | | | | - | | | | (76 | ) | | | - | | | | (23 | ) | |
| Class Y | | | - | | | | - | | | | (11,737 | ) | | | (4,643 | ) | | | (12,476 | ) | | | (855 | ) | |
| Return of capital: | |
| Class A | | | (12 | ) | | | (18 | ) | | | - | | | | - | | | | - | | | | - | | |
| Class B | | | (2 | ) | | | (3 | ) | | | - | | | | - | | | | - | | | | - | | |
| Class C | | | (1 | ) | | | (1 | ) | | | - | | | | - | | | | - | | | | - | | |
| Class R (1) | | | - | | | | (3 | ) | | | - | | | | - | | | | - | | | | - | | |
| Class Y | | | (118 | ) | | | (210 | ) | | | - | | | | - | | | | - | | | | - | | |
| Total distributions | | | (40,134 | ) | | | (30,829 | ) | | | (15,616 | ) | | | (7,107 | ) | | | (14,643 | ) | | | (1,659 | ) | |
| CAPITAL SHARE TRANSACTIONS (note 5): | | | |
| Class A: | |
| Proceeds from sales | | | 44,458 | | | | 101,208 | | | | 4,932 | | | | 9,000 | | | | 2,981 | | | | 6,263 | | |
| Reinvestment of distributions | | | 3,435 | | | | 2,238 | | | | 532 | | | | 139 | | | | 694 | | | | 39 | | |
| Payments for redemptions | | | (66,590 | ) | | | (45,584 | ) | | | (4,723 | ) | | | (3,198 | ) | | | (2,870 | ) | | | (1,649 | ) | |
| Increase (decrease) in net assets from Class A transactions | | | (18,697 | ) | | | 57,862 | | | | 741 | | | | 5,941 | | | | 805 | | | | 4,653 | | |
| Class B: | |
| Proceeds from sales | | | 2,433 | | | | 4,621 | | | | 306 | | | | 628 | | | | 215 | | | | 446 | | |
| Reinvestment of distributions | | | 531 | | | | 329 | | | | 116 | | | | 46 | | | | 108 | | | | 7 | | |
| Payments for redemptions (note 3) | | | (20,370 | ) | | | (15,132 | ) | | | (523 | ) | | | (304 | ) | | | (379 | ) | | | (118 | ) | |
| Increase (decrease) in net assets from Class B transactions | | | (17,406 | ) | | | (10,182 | ) | | | (101 | ) | | | 370 | | | | (56 | ) | | | 335 | | |
| Class C: | |
| Proceeds from sales | | | 2,768 | | | | 4,397 | | | | 1,082 | | | | 1,356 | | | | 705 | | | | 917 | | |
| Reinvestment of distributions | | | 228 | | | | 138 | | | | 92 | | | | 33 | | | | 133 | | | | 10 | | |
| Payments for redemptions (note 3) | | | (9,668 | ) | | | (9,413 | ) | | | (747 | ) | | | (753 | ) | | | (676 | ) | | | (476 | ) | |
| Increase (decrease) in net assets from Class C transactions | | | (6,672 | ) | | | (4,878 | ) | | | 427 | | | | 636 | | | | 162 | | | | 451 | | |
| Class R: | |
| Proceeds from sales | | | 1,362 | | | | 11,681 | | | | 119 | | | | 1,049 | | | | 11 | | | | 1,722 | | |
| Reinvestment of distributions | | | 10 | | | | 389 | | | | - | | | | 79 | | | | - | | | | 29 | | |
| Payments for redemptions | | | (99 | ) | | | (71,464 | ) | | | - | | | | (5,895 | ) | | | (2 | ) | | | (5,464 | ) | |
| Increase (decrease) in net assets from Class R transactions | | | 1,273 | | | | (59,394 | ) | | | 119 | | | | (4,767 | ) | | | 9 | | | | (3,713 | ) | |
| Class Y: | |
| Proceeds from sales | | | 363,331 | | | | 533,400 | | | | 73,080 | | | | 108,384 | | | | 49,781 | | | | 91,307 | | |
| Reinvestment of distributions | | | 22,938 | | | | 19,144 | | | | 8,661 | | | | 3,958 | | | | 8,310 | | | | 1,001 | | |
| Payments for redemptions | | | (613,170 | ) | | | (556,690 | ) | | | (93,999 | ) | | | (73,284 | ) | | | (62,922 | ) | | | (75,927 | ) | |
| Increase (decrease) in net assets from Class Y transactions | | | (226,901 | ) | | | (4,146 | ) | | | (12,258 | ) | | | 39,058 | | | | (4,831 | ) | | | 16,381 | | |
| Increase (decrease) in net assets from capital share transactions | | | (268,403 | ) | | | (20,738 | ) | | | (11,072 | ) | | | 41,238 | | | | (3,911 | ) | | | 18,107 | | |
| Total increase (decrease) in net assets | | | (48,095 | ) | | | 227,821 | | | | 44,207 | | | | 78,360 | | | | 9,707 | | | | 40,541 | | |
| Net assets at beginning of period | | | 2,313,819 | | | | 2,085,998 | | | | 331,175 | | | | 252,815 | | | | 168,594 | | | | 128,053 | | |
| Net assets at end of period | | $ | 2,265,724 | | | $ | 2,313,819 | | | $ | 375,382 | | | $ | 331,175 | | | $ | 178,301 | | | $ | 168,594 | | |
| Undistributed net investment income at end of period | | $ | - | | | $ | 51 | | | $ | 99 | | | $ | 40 | | | $ | - | | | $ | 157 | | |
(1) For the year ended September 30, 2005, due to the presentation of the financial statements in thousands, the number rounds to zero.
The accompanying notes are an integral part of the financial statements.
FIRST AMERICAN FUNDS Annual Report 2005
40
FIRST AMERICAN FUNDS Annual Report 2005
41
Financial Highlights For a share outstanding throughout the periods ended September 30, unless otherwise indicated.
| | | Net Asset
Value
Beginning
of Period | | Net
Investment
Income | | Realized and
Unrealized
Gains or
(Losses) on
Investments | | Distributions
from Net
Investment
Income | | Distributions
from Net
Realized Gains | | Distributions
from Return
of Capital (4) | | Net Asset
Value
End of
Period | |
| | Equity Index Fund (1) | | | | |
| Class A | |
| | 2005 | | | $ | 20.91 | | | $ | 0.34 | | | $ | 2.09 | | | $ | (0.34 | ) | | $ | - | | | $ | - | | | $ | 23.00 | | |
| | 2004 | | | | 18.70 | | | | 0.23 | | | | 2.22 | | | | (0.24 | ) | | | - | | | | - | | | | 20.91 | | |
| | 2003 | | | | 15.31 | | | | 0.21 | | | | 3.38 | | | | (0.20 | ) | | | - | | | | - | | | | 18.70 | | |
| | 2002 | | | | 19.50 | | | | 0.18 | | | | (4.19 | ) | | | (0.18 | ) | | | - | | | | - | | | | 15.31 | | |
| | 2001 | | | | 27.75 | | | | 0.18 | | | | (7.43 | ) | | | (0.17 | ) | | | (0.83 | ) | | | - | | | | 19.50 | | |
| Class B | |
| | 2005 | | | $ | 20.66 | | | $ | 0.18 | | | $ | 2.06 | | | $ | (0.18 | ) | | $ | - | | | $ | - | | | $ | 22.72 | | |
| | 2004 | | | | 18.48 | | | | 0.08 | | | | 2.19 | | | | (0.09 | ) | | | - | | | | - | | | | 20.66 | | |
| | 2003 | | | | 15.13 | | | | 0.08 | | | | 3.35 | | | | (0.08 | ) | | | - | | | | - | | | | 18.48 | | |
| | 2002 | | | | 19.29 | | | | 0.03 | | | | (4.15 | ) | | | (0.04 | ) | | | - | | | | - | | | | 15.13 | | |
| | 2001 | | | | 27.49 | | | | - | | | | (7.35 | ) | | | (0.02 | ) | | | (0.83 | ) | | | - | | | | 19.29 | | |
| Class C | |
| | 2005 | | | $ | 20.78 | | | $ | 0.18 | | | $ | 2.07 | | | $ | (0.18 | ) | | $ | - | | | $ | - | | | $ | 22.85 | | |
| | 2004 | | | | 18.59 | | | | 0.08 | | | | 2.20 | | | | (0.09 | ) | | | - | | | | - | | | | 20.78 | | |
| | 2003 | | | | 15.23 | | | | 0.08 | | | | 3.36 | | | | (0.08 | ) | | | - | | | | - | | | | 18.59 | | |
| | 2002 | | | | 19.41 | | | | 0.03 | | | | (4.17 | ) | | | (0.04 | ) | | | - | | | | - | | | | 15.23 | | |
| | 2001 | | | | 27.66 | | | | - | | | | (7.40 | ) | | | (0.02 | ) | | | (0.83 | ) | | | - | | | | 19.41 | | |
| Class R | |
| | 2005 | | | $ | 20.91 | | | $ | 0.26 | | | $ | 2.11 | | | $ | (0.30 | ) | | $ | - | | | $ | - | | | $ | 22.98 | | |
| | 2004 | (2) | | | 18.70 | | | | 0.23 | | | | 2.20 | | | | (0.22 | ) | | | - | | | | - | | | | 20.91 | | |
| | 2003 | | | | 15.30 | | | | 0.21 | | | | 3.39 | | | | (0.20 | ) | | | - | | | | - | | | | 18.70 | | |
| | 2002 | | | | 19.50 | | | | 0.18 | | | | (4.20 | ) | | | (0.18 | ) | | | - | | | | - | | | | 15.30 | | |
| | 2001 | (3) | | | 18.80 | | | | - | | | | 0.70 | | | | - | | | | - | | | | - | | | | 19.50 | | |
| Class Y | |
| | 2005 | | | $ | 20.91 | | | $ | 0.40 | | | $ | 2.08 | | | $ | (0.40 | ) | | $ | - | | | $ | - | | | $ | 22.99 | | |
| | 2004 | | | | 18.69 | | | | 0.29 | | | | 2.22 | | | | (0.29 | ) | | | - | | | | - | | | | 20.91 | | |
| | 2003 | | | | 15.30 | | | | 0.25 | | | | 3.38 | | | | (0.24 | ) | | | - | | | | - | | | | 18.69 | | |
| | 2002 | | | | 19.49 | | | | 0.23 | | | | (4.19 | ) | | | (0.23 | ) | | | - | | | | - | | | | 15.30 | | |
| | 2001 | | | | 27.74 | | | | 0.23 | | | | (7.42 | ) | | | (0.23 | ) | | | (0.83 | ) | | | - | | | | 19.49 | | |
(1) Per share data calculated using average shares outstanding method.
(2) Prior to July 1, 2004, Class R shares were named Class S shares, which had lower fees and expenses.
(3) Class of shares has been offered since September 24, 2001. All ratios for the period have been annualized, except total return and portfolio turnover.
(4) Includes a tax return of capital of less than $0.01 for the years ended September 30, 2004 and September 30, 2005.
(5) Total return does not reflect sales charges. Total return would have been lower had certain expenses not been waived.
The accompanying notes are an integral part of the financial statements.
FIRST AMERICAN FUNDS Annual Report 2005
42
| | | Total
Return (5) | | Net Assets
End of
Period (000) | | Ratio of
Expenses to
Average
Net Assets | | Ratio of Net
Investment
Income (Loss)
to Average
Net Assets | | Ratio of
Expenses to
Average
Net Assets
(Excluding
Waivers) | | Ratio of Net
Investment
Income (Loss)
to Average Net
Assets (Excluding
Waivers) | | Portfolio
Turnover
Rate | |
| | Equity Index Fund (1) | | |
| Class A | |
| | 2005 | | | | 11.69 | % | | $ | 238,379 | | | | 0.62 | % | | | 1.53 | % | | | 0.79 | % | | | 1.36 | % | | | 4 | % | |
| | 2004 | | | | 13.12 | | | | 234,349 | | | | 0.62 | | | | 1.13 | | | | 0.79 | | | | 0.96 | | | | 1 | | |
| | 2003 | | | | 23.58 | | | | 158,324 | | | | 0.62 | | | | 1.22 | | | | 0.80 | | | | 1.04 | | | | 1 | | |
| | 2002 | | | | (20.75 | ) | | | 139,007 | | | | 0.62 | | | | 0.91 | | | | 0.80 | | | | 0.73 | | | | 8 | | |
| | 2001 | | | | (26.95 | ) | | | 188,410 | | | | 0.60 | | | | 0.74 | | | | 1.14 | | | | 0.20 | | | | 6 | | |
| Class B | |
| | 2005 | | | | 10.86 | % | | $ | 58,857 | | | | 1.37 | % | | | 0.79 | % | | | 1.54 | % | | | 0.62 | % | | | 4 | % | |
| | 2004 | | | | 12.31 | | | | 69,828 | | | | 1.37 | | | | 0.38 | | | | 1.54 | | | | 0.21 | | | | 1 | | |
| | 2003 | | | | 22.72 | | | | 71,624 | | | | 1.37 | | | | 0.47 | | | | 1.55 | | | | 0.29 | | | | 1 | | |
| | 2002 | | | | (21.40 | ) | | | 66,835 | | | | 1.37 | | | | 0.16 | | | | 1.55 | | | | (0.02 | ) | | | 8 | | |
| | 2001 | | | | (27.49 | ) | | | 95,586 | | | | 1.35 | | | | (0.01 | ) | | | 1.89 | | | | (0.55 | ) | | | 6 | | |
| Class C | |
| | 2005 | | | | 10.84 | % | | $ | 26,258 | | | | 1.37 | % | | | 0.79 | % | | | 1.54 | % | | | 0.62 | % | | | 4 | % | |
| | 2004 | | | | 12.28 | | | | 30,111 | | | | 1.37 | | | | 0.38 | | | | 1.54 | | | | 0.21 | | | | 1 | | |
| | 2003 | | | | 22.65 | | | | 31,330 | | | | 1.37 | | | | 0.47 | | | | 1.55 | | | | 0.29 | | | | 1 | | |
| | 2002 | | | | (21.38 | ) | | | 21,637 | | | | 1.37 | | | | 0.16 | | | | 1.55 | | | | (0.02 | ) | | | 8 | | |
| | 2001 | | | | (27.51 | ) | | | 29,560 | | | | 1.35 | | | | (0.01 | ) | | | 1.89 | | | | (0.55 | ) | | | 6 | | |
| Class R | |
| | 2005 | | | | 11.38 | % | | $ | 1,663 | | | | 0.87 | % | | | 1.14 | % | | | 1.19 | % | | | 0.82 | % | | | 4 | % | |
| | 2004 | (2) | | | 13.00 | | | | 333 | | | | 0.62 | | | | 1.13 | | | | 0.79 | | | | 0.96 | | | | 1 | | |
| | 2003 | | | | 23.66 | | | | 52,925 | | | | 0.62 | | | | 1.22 | | | | 0.80 | | | | 1.04 | | | | 1 | | |
| | 2002 | | | | (20.79 | ) | | | 42,964 | | | | 0.62 | | | | 0.93 | | | | 0.80 | | | | 0.75 | | | | 8 | | |
| | 2001 | (3) | | | 3.72 | | | | 38,220 | | | | 0.72 | | | | 0.89 | | | | 1.20 | | | | 0.41 | | | | 6 | | |
| Class Y | |
| | 2005 | | | | 11.92 | % | | $ | 1,940,567 | | | | 0.37 | % | | | 1.78 | % | | | 0.54 | % | | | 1.61 | % | | | 4 | % | |
| | 2004 | | | | 13.45 | | | | 1,979,198 | | | | 0.37 | | | | 1.38 | | | | 0.54 | | | | 1.21 | | | | 1 | | |
| | 2003 | | | | 23.89 | | | | 1,771,795 | | | | 0.37 | | | | 1.46 | | | | 0.55 | | | | 1.28 | | | | 1 | | |
| | 2002 | | | | (20.56 | ) | | | 1,135,653 | | | | 0.37 | | | | 1.16 | | | | 0.55 | | | | 0.98 | | | | 8 | | |
| | 2001 | | | | (26.78 | ) | | | 1,567,607 | | | | 0.35 | | | | 0.99 | | | | 0.89 | | | | 0.45 | | | | 6 | | |
FIRST AMERICAN FUNDS Annual Report 2005
43
Financial Highlights For a share outstanding throughout the periods ended September 30, unless otherwise indicated.
| | | Net Asset
Value
Beginning
of Period | | Net
Investment
Income (Loss) | | Realized and
Unrealized
Gains or
(Losses) on
Investments | | Distributions
from Net
Investment
Income | | Distributions
from Net
Realized Gains | | Net Asset
Value
End of
Period | | Total
Return (9) | |
| Mid Cap Index Fund (1) | |
| Class A | |
| | 2005 | (2) | | $ | 11.84 | | | $ | 0.09 | | | $ | 2.40 | | | $ | (0.09 | ) | | $ | (0.42 | ) | | $ | 13.82 | | | | 21.43 | % | |
| | 2004 | (2) | | | 10.36 | | | | 0.05 | | | | 1.67 | | | | (0.05 | ) | | | (0.19 | ) | | | 11.84 | | | | 16.80 | | |
| | 2003 | (2) | | | 8.51 | | | | 0.04 | | | | 2.08 | | | | (0.04 | ) | | | (0.23 | ) | | | 10.36 | | | | 25.45 | | |
| | 2002 | (2) | | | 9.38 | | | | 0.04 | | | | (0.49 | ) | | | (0.04 | ) | | | (0.38 | ) | | | 8.51 | | | | (5.45 | ) | |
| | 2001 | (2)(3) | | | 12.56 | | | | 0.05 | | | | (2.11 | ) | | | (0.05 | ) | | | (1.07 | ) | | | 9.38 | | | | (17.60 | ) | |
| | 2000 | (4)(5) | | | 10.00 | | | | 0.04 | | | | 2.56 | | | | (0.04 | ) | | | - | | | | 12.56 | | | | 26.48 | | |
| Class B | |
| | 2005 | (2) | | $ | 11.67 | | | $ | (0.01 | ) | | $ | 2.37 | | | $ | (0.02 | ) | | $ | (0.42 | ) | | $ | 13.59 | | | | 20.57 | % | |
| | 2004 | (2) | | | 10.25 | | | | (0.03 | ) | | | 1.64 | | | | - | | | | (0.19 | ) | | | 11.67 | | | | 15.88 | | |
| | 2003 | (2) | | | 8.44 | | | | (0.03 | ) | | | 2.07 | | | | - | | | | (0.23 | ) | | | 10.25 | | | | 24.63 | | |
| | 2002 | (2) | | | 9.33 | | | | (0.03 | ) | | | (0.48 | ) | | | - | | | | (0.38 | ) | | | 8.44 | | | | (6.07 | ) | |
| | 2001 | (2)(3) | | | 12.52 | | | | - | | | | (2.12 | ) | | | - | | | | (1.07 | ) | | | 9.33 | | | | (18.15 | ) | |
| | 2000 | (4)(5) | | | 10.00 | | | | (0.01 | ) | | | 2.56 | | | | (0.03 | ) | | | - | | | | 12.52 | | | | 25.65 | | |
| Class C (2) | |
| | 2005 | | | $ | 11.70 | | | $ | (0.01 | ) | | $ | 2.38 | | | $ | (0.02 | ) | | $ | (0.42 | ) | | $ | 13.63 | | | | 20.60 | % | |
| | 2004 | | | | 10.28 | | | | (0.03 | ) | | | 1.64 | | | | - | | | | (0.19 | ) | | | 11.70 | | | | 15.83 | | |
| | 2003 | | | | 8.47 | | | | (0.03 | ) | | | 2.07 | | | | - | | | | (0.23 | ) | | | 10.28 | | | | 24.55 | | |
| | 2002 | | | | 9.38 | | | | (0.02 | ) | | | (0.51 | ) | | | - | | | | (0.38 | ) | | | 8.47 | | | | (6.22 | ) | |
| | 2001 | (6) | | | 9.07 | | | | - | | | | 0.31 | | | | - | | | | - | | | | 9.38 | | | | 3.42 | | |
| Class R (2) | |
| | 2005 | | | $ | 11.83 | | | $ | 0.04 | | | $ | 2.41 | | | $ | (0.08 | ) | | $ | (0.42 | ) | | $ | 13.78 | | | | 21.09 | % | |
| | 2004 | (7) | | | 10.36 | | | | 0.06 | | | | 1.65 | | | | (0.05 | ) | | | (0.19 | ) | | | 11.83 | | | | 16.62 | | |
| | 2003 | | | | 8.50 | | | | 0.04 | | | | 2.09 | | | | (0.04 | ) | | | (0.23 | ) | | | 10.36 | | | | 25.60 | | |
| | 2002 | | | | 9.38 | | | | 0.04 | | | | (0.50 | ) | | | (0.04 | ) | | | (0.38 | ) | | | 8.50 | | | | (5.56 | ) | |
| | 2001 | (8) | | | 11.07 | | | | 0.04 | | | | (1.67 | ) | | | (0.06 | ) | | | - | | | | 9.38 | | | | (14.77 | ) | |
| Class Y | |
| | 2005 | (2) | | $ | 11.84 | | | $ | 0.12 | | | $ | 2.41 | | | $ | (0.12 | ) | | $ | (0.42 | ) | | $ | 13.83 | | | | 21.82 | % | |
| | 2004 | (2) | | | 10.37 | | | | 0.08 | | | | 1.66 | | | | (0.08 | ) | | | (0.19 | ) | | | 11.84 | | | | 16.97 | | |
| | 2003 | (2) | | | 8.51 | | | | 0.06 | | | | 2.09 | | | | (0.06 | ) | | | (0.23 | ) | | | 10.37 | | | | 25.86 | | |
| | 2002 | (2) | | | 9.38 | | | | 0.06 | | | | (0.49 | ) | | | (0.06 | ) | | | (0.38 | ) | | | 8.51 | | | | (5.23 | ) | |
| | 2001 | (2)(3) | | | 12.55 | | | | 0.08 | | | | (2.11 | ) | | | (0.07 | ) | | | (1.07 | ) | | | 9.38 | | | | (17.34 | ) | |
| | 2000 | (4)(5) | | | 10.00 | | | | 0.08 | | | | 2.55 | | | | (0.08 | ) | | | - | | | | 12.55 | | | | 26.62 | | |
(1) The financial highlights for the Mid Cap Index Fund as set forth herein include the historical financial highlights of the Firstar Mid Cap Index Fund.
The assets of the Firstar Fund were acquired by the First American Mid Cap Index Fund on September 24, 2001. In connection with such acquisition,
(i) Class A shares of the Firstar Mid Cap Index Fund were exchanged for Class A shares of the First American Mid Cap Index Fund, (ii) Firstar Class B shares
were exchanged for Class B shares of the First American Fund, (iii) Firstar Class Y shares were exchanged for Class S shares (now designated Class R shares)
of the First American Fund, and (iv) Firstar Institutional Class shares were exchanged for Class Y shares of the First American Fund.
(2) Per share data calculated using average shares outstanding method.
(3) For the period November 1, 2000 to September 30, 2001. Effective in 2001, the fund's fiscal year end was changed from October 31 to September 30.
All ratios for the period have been annualized, except total return and portfolio turnover.
(4) Commenced operations on November 4, 1999. All ratios for the period have been annualized, except total return and portfolio turnover.
(5) For the fiscal period ended October 31.
(6) Class of shares has been offered since September 24, 2001. All ratios for the period have been annualized, except total return and portfolio turnover.
(7) Prior to July 1, 2004, Class R shares were named Class S shares, which had lower fees and expenses.
(8) Class of shares has been offered since November 27, 2000. All ratios for the period have been annualized, except total return and portfolio turnover.
(9) Total return does not reflect sales charges. Total return would have been lower had certain expenses not been waived.
The accompanying notes are an integral part of the financial statements.
FIRST AMERICAN FUNDS Annual Report 2005
44
| | | Net Assets
End of
Period (000) | | Ratio of
Expenses to
Average
Net Assets | | Ratio of Net
Investment
Income (Loss)
to Average
Net Assets | | Ratio of
Expenses to
Average
Net Assets
(Excluding
Waivers) | | Ratio of Net
Investment
Income (Loss)
to Average Net
Assets (Excluding
Waivers) | | Portfolio
Turnover
Rate | |
| Mid Cap Index Fund (1) | |
| Class A | |
| | 2005 | (2) | | $ | 14,827 | | | | 0.75 | % | | | 0.68 | % | | | 0.82 | % | | | 0.61 | % | | | 15 | % | |
| | 2004 | (2) | | | 11,987 | | | | 0.75 | | | | 0.47 | | | | 0.80 | | | | 0.42 | | | | 14 | | |
| | 2003 | (2) | | | 5,332 | | | | 0.75 | | | | 0.45 | | | | 0.84 | | | | 0.36 | | | | 23 | | |
| | 2002 | (2) | | | 3,581 | | | | 0.75 | | | | 0.37 | | | | 0.83 | | | | 0.29 | | | | 19 | | |
| | 2001 | (2)(3) | | | 2,972 | | | | 0.75 | | | | 0.51 | | | | 0.80 | | | | 0.46 | | | | 43 | | |
| | 2000 | (4)(5) | | | 1,918 | | | | 0.75 | | | | 0.75 | | | | 0.90 | | | | 0.60 | | | | 45 | | |
| Class B | |
| | 2005 | (2) | | $ | 3,546 | | | | 1.50 | % | | | (0.08 | )% | | | 1.57 | % | | | (0.15 | )% | | | 15 | % | |
| | 2004 | (2) | | | 3,133 | | | | 1.50 | | | | (0.27 | ) | | | 1.55 | | | | (0.32 | ) | | | 14 | | |
| | 2003 | (2) | | | 2,419 | | | | 1.50 | | | | (0.30 | ) | | | 1.59 | | | | (0.39 | ) | | | 23 | | |
| | 2002 | (2) | | | 1,475 | | | | 1.50 | | | | (0.37 | ) | | | 1.58 | | | | (0.45 | ) | | | 19 | | |
| | 2001 | (2)(3) | | | 1,265 | | | | 1.50 | | | | (0.24 | ) | | | 1.54 | | | | (0.28 | ) | | | 43 | | |
| | 2000 | (4)(5) | | | 905 | | | | 1.50 | | | | - | | | | 1.65 | | | | (0.15 | ) | | | 45 | | |
| Class C (2) | |
| | 2005 | | | $ | 3,533 | | | | 1.50 | % | | | (0.08 | )% | | | 1.57 | % | | | (0.15 | )% | | | 15 | % | |
| | 2004 | | | | 2,653 | | | | 1.50 | | | | (0.27 | ) | | | 1.55 | | | | (0.32 | ) | | | 14 | | |
| | 2003 | | | | 1,756 | | | | 1.50 | | | | (0.30 | ) | | | 1.59 | | | | (0.39 | ) | | | 23 | | |
| | 2002 | | | | 795 | | | | 1.50 | | | | (0.37 | ) | | | 1.58 | | | | (0.45 | ) | | | 19 | | |
| | 2001 | (6) | | | - | | | | - | | | | - | | | | - | | | | - | | | | 43 | | |
| Class R (2) | |
| | 2005 | | | $ | 122 | | | | 1.00 | % | | | 0.28 | % | | | 1.22 | % | | | 0.06 | % | | | 15 | % | |
| | 2004 | (7) | | | 1 | | | | 0.75 | | | | 0.49 | | | | 0.80 | | | | 0.44 | | | | 14 | | |
| | 2003 | | | | 4,134 | | | | 0.75 | | | | 0.46 | | | | 0.84 | | | | 0.37 | | | | 23 | | |
| | 2002 | | | | 3,393 | | | | 0.75 | | | | 0.37 | | | | 0.83 | | | | 0.29 | | | | 19 | | |
| | 2001 | (8) | | | 4,301 | | | | 0.75 | | | | 0.47 | | | | 0.80 | | | | 0.42 | | | | 43 | | |
| Class Y | |
| | 2005 | (2) | | $ | 353,354 | | | | 0.50 | % | | | 0.92 | % | | | 0.57 | % | | | 0.85 | % | | | 15 | % | |
| | 2004 | (2) | | | 313,403 | | | | 0.50 | | | | 0.73 | | | | 0.55 | | | | 0.68 | | | | 14 | | |
| | 2003 | (2) | | | 239,174 | | | | 0.50 | | | | 0.71 | | | | 0.59 | | | | 0.62 | | | | 23 | | |
| | 2002 | (2) | | | 198,545 | | | | 0.50 | | | | 0.63 | | | | 0.58 | | | | 0.55 | | | | 19 | | |
| | 2001 | (2)(3) | | | 176,857 | | | | 0.50 | | | | 0.75 | | | | 0.53 | | | | 0.72 | | | | 43 | | |
| | 2000 | (4)(5) | | | 125,881 | | | | 0.50 | | | | 1.00 | | | | 0.65 | | | | 0.85 | | | | 45 | | |
FIRST AMERICAN FUNDS Annual Report 2005
45
Financial Highlights For a share outstanding throughout the periods ended September 30, unless otherwise indicated.
| | | Net Asset
Value
Beginning
of Period | | Net
Investment
Income (Loss) | | Realized and
Unrealized
Gains or
(Losses) on
Investments | | Distributions
from Net
Investment
Income | | Distributions
from Net
Realized Gains | | Net Asset
Value
End of
Period | | Total
Return (8) | |
| | Small Cap Index Fund (1) | | | | |
| Class A | |
| | 2005 | (2) | | $ | 13.38 | | | $ | 0.07 | | | $ | 2.17 | | | $ | (0.06 | ) | | $ | (0.99 | ) | | $ | 14.57 | | | | 17.08 | % | |
| | 2004 | (2) | | | 11.47 | | | | 0.04 | | | | 1.98 | | | | (0.03 | ) | | | (0.08 | ) | | | 13.38 | | | | 17.71 | | |
| | 2003 | (2) | | | 8.55 | | | | 0.04 | | | | 2.92 | | | | (0.04 | ) | | | - | | | | 11.47 | | | | 34.77 | | |
| | 2002 | (2) | | | 9.68 | | | | 0.05 | | | | (1.13 | ) | | | (0.05 | ) | | | - | | | | 8.55 | | | | (11.28 | ) | |
| | 2001 | (2)(3) | | | 12.23 | | | | (0.01 | ) | | | (1.49 | ) | | | - | | | | (1.05 | ) | | | 9.68 | | | | (12.76 | ) | |
| | 2000 | (4) | | | 10.18 | | | | (0.01 | ) | | | 2.20 | | | | - | | | | (0.14 | ) | | | 12.23 | | | | 21.81 | | |
| Class B (2) | |
| | 2005 | | | $ | 13.15 | | | $ | (0.03 | ) | | $ | 2.08 | | | $ | - | | | $ | (0.99 | ) | | $ | 14.21 | | | | 15.82 | % | |
| | 2004 | | | | 11.33 | | | | (0.06 | ) | | | 1.96 | | | | - | | | | (0.08 | ) | | | 13.15 | | | | 16.83 | | |
| | 2003 | | | | 8.47 | | | | (0.03 | ) | | | 2.90 | | | | (0.01 | ) | | | - | | | | 11.33 | | | | 33.87 | | |
| | 2002 | | | | 9.63 | | | | (0.03 | ) | | | (1.13 | ) | | | - | | | | - | | | | 8.47 | | | | (12.03 | ) | |
| | 2001 | (5) | | | 10.97 | | | | (0.01 | ) | | | (1.33 | ) | | | - | | | | - | | | | 9.63 | | | | (12.11 | ) | |
| Class C (2) | |
| | 2005 | | | $ | 13.26 | | | $ | (0.03 | ) | | $ | 2.10 | | | $ | - | | | $ | (0.99 | ) | | $ | 14.34 | | | | 15.84 | % | |
| | 2004 | | | | 11.43 | | | | (0.06 | ) | | | 1.97 | | | | - | | | | (0.08 | ) | | | 13.26 | | | | 16.77 | | |
| | 2003 | | | | 8.54 | | | | (0.03 | ) | | | 2.93 | | | | (0.01 | ) | | | - | | | | 11.43 | | | | 33.94 | | |
| | 2002 | | | | 9.68 | | | | (0.03 | ) | | | (1.11 | ) | | | - | | | | - | | | | 8.54 | | | | (11.72 | ) | |
| | 2001 | (6) | | | 9.49 | | | | - | | | | 0.19 | | | | - | | | | - | | | | 9.68 | | | | 2.11 | | |
| Class R | |
| | 2005 | (2) | | $ | 13.31 | | | $ | 0.04 | | | $ | 2.11 | | | $ | (0.04 | ) | | $ | (0.99 | ) | | $ | 14.43 | | | | 16.45 | % | |
| | 2004 | (2)(7) | | | 11.41 | | | | 0.03 | | | | 1.97 | | | | (0.02 | ) | | | (0.08 | ) | | | 13.31 | | | | 17.65 | | |
| | 2003 | (2) | | | 8.52 | | | | 0.05 | | | | 2.88 | | | | (0.04 | ) | | | - | | | | 11.41 | | | | 34.54 | | |
| | 2002 | (2) | | | 9.64 | | | | 0.05 | | | | (1.12 | ) | | | (0.05 | ) | | | - | | | | 8.52 | | | | (11.26 | ) | |
| | 2001 | (2)(3) | | | 12.19 | | | | (0.01 | ) | | | (1.49 | ) | | | - | | | | (1.05 | ) | | | 9.64 | | | | (12.82 | ) | |
| | 2000 | (4) | | | 10.17 | | | | (0.01 | ) | | | 2.18 | | | | (0.01 | ) | | | (0.14 | ) | | | 12.19 | | | | 21.54 | | |
| Class Y | |
| | 2005 | (2) | | $ | 13.43 | | | $ | 0.11 | | | $ | 2.12 | | | $ | (0.10 | ) | | $ | (0.99 | ) | | $ | 14.57 | | | | 16.93 | % | |
| | 2004 | (2) | | | 11.51 | | | | 0.07 | | | | 1.99 | | | | (0.06 | ) | | | (0.08 | ) | | | 13.43 | | | | 18.02 | | |
| | 2003 | (2) | | | 8.57 | | | | 0.07 | | | | 2.94 | | | | (0.07 | ) | | | - | | | | 11.51 | | | | 35.23 | | |
| | 2002 | (2) | | | 9.70 | | | | 0.07 | | | | (1.13 | ) | | | (0.07 | ) | | | - | | | | 8.57 | | | | (11.09 | ) | |
| | 2001 | (2)(3) | | | 12.24 | | | | 0.02 | | | | (1.50 | ) | | | (0.01 | ) | | | (1.05 | ) | | | 9.70 | | | | (12.56 | ) | |
| | 2000 | (4) | | | 10.19 | | | | 0.02 | | | | 2.19 | | | | (0.02 | ) | | | (0.14 | ) | | | 12.24 | | | | 21.93 | | |
(1) The financial highlights for the Small Cap Index Fund as set forth herein include the historical financial highlights of the Firstar Small Cap Index Fund.
The assets of the Firstar Fund were acquired by the First American Small Cap Index Fund on September 24, 2001. In connection with such acquisition,
(I) Class A shares of the Firstar Small Cap Index Fund were exchanged for Class A shares of the First American Fund, (ii) Firstar Class B shares were exchanged
for Class B shares of the First American Fund, (iii) Firstar Class Y shares were exchanged for Class S shares (now designated Class R shares) of the First American
Fund, and (iv) Firstar Institutional Class shares were exchanged for Class Y shares of the First American Fund.
(2) Per share data calculated using average shares outstanding method.
(3) For the period November 1, 2000 to September 30, 2001. Effective in 2001, the fund's fiscal year end was changed from October 31 to September 30.
All ratios for the period have been annualized, except total return and portfolio turnover.
(4) For the period December 1, 1999 to October 31, 2000. Effective in 2000, the fund's fiscal year end was changed from November 30 to October 31.
All ratios for the period have been annualized, except total return and portfolio turnover.
(5) Class of shares has been offered since December 11, 2000. All ratios for the period have been annualized, except total return and portfolio turnover.
(6) Class of shares has been offered since September 24, 2001. All ratios for the period have been annualized, except total return and portfolio turnover.
(7) Prior to July 1, 2004, Class R shares were named Class S shares, which had lower fees and expenses.
(8) Total return does not reflect sales charges. Total return would have been lower had certain expenses not been waived.
The accompanying notes are an integral part of the financial statements.
FIRST AMERICAN FUNDS Annual Report 2005
46
| | | Net Assets
End of
Period (000) | | Ratio of
Expenses to
Average
Net Assets | | Ratio of Net
Investment
Income (Loss)
to Average
Net Assets | | Ratio of
Expenses to
Average
Net Assets
(Excluding
Waivers) | | Ratio of Net
Investment
Income (Loss)
to Average Net
Assets (Excluding
Waivers) | | Portfolio
Turnover
Rate | |
| | Small Cap Index Fund (1) | | |
| Class A | |
| | 2005 | (2) | | $ | 10,323 | | | | 0.90 | % | | | 0.53 | % | | | 1.03 | % | | | 0.40 | % | | | 23 | % | |
| | 2004 | (2) | | | 8,749 | | | | 0.93 | | | | 0.30 | | | | 1.02 | | | | 0.21 | | | | 25 | | |
| | 2003 | (2) | | | 3,480 | | | | 0.93 | | | | 0.42 | | | | 1.05 | | | | 0.30 | | | | 41 | | |
| | 2002 | (2) | | | 1,908 | | | | 0.93 | | | | 0.46 | | | | 1.09 | | | | 0.30 | | | | 49 | | |
| | 2001 | (2)(3) | | | 341 | | | | 0.91 | | | | (0.07 | ) | | | 0.94 | | | | (0.10 | ) | | | 102 | | |
| | 2000 | (4) | | | 177 | | | | 0.99 | | | | (0.11 | ) | | | 1.09 | | | | (0.21 | ) | | | 32 | | |
| Class B (2) | |
| | 2005 | | | $ | 1,555 | | | | 1.65 | % | | | (0.23 | )% | | | 1.78 | % | | | (0.36 | )% | | | 23 | % | |
| | 2004 | | | | 1,494 | | | | 1.68 | | | | (0.46 | ) | | | 1.77 | | | | (0.55 | ) | | | 25 | | |
| | 2003 | | | | 993 | | | | 1.68 | | | | (0.33 | ) | | | 1.80 | | | | (0.45 | ) | | | 41 | | |
| | 2002 | | | | 424 | | | | 1.68 | | | | (0.29 | ) | | | 1.84 | | | | (0.45 | ) | | | 49 | | |
| | 2001 | (5) | | | 107 | | | | 1.65 | | | | (0.84 | ) | | | 1.69 | | | | (0.88 | ) | | | 102 | | |
| Class C (2) | |
| | 2005 | | | $ | 2,256 | | | | 1.65 | % | | | (0.23 | )% | | | 1.78 | % | | | (0.36 | )% | | | 23 | % | |
| | 2004 | | | | 1,939 | | | | 1.68 | | | | (0.46 | ) | | | 1.77 | | | | (0.55 | ) | | | 25 | | |
| | 2003 | | | | 1,268 | | | | 1.68 | | | | (0.33 | ) | | | 1.80 | | | | (0.45 | ) | | | 41 | | |
| | 2002 | | | | 447 | | | | 1.68 | | | | (0.26 | ) | | | 1.84 | | | | (0.42 | ) | | | 49 | | |
| | 2001 | (6) | | | - | | | | - | | | | - | | | | - | | | | - | | | | 102 | | |
| Class R | |
| | 2005 | (2) | | $ | 11 | | | | 1.15 | % | | | 0.30 | % | | | 1.43 | % | | | 0.02 | % | | | 23 | % | |
| | 2004 | (2)(7) | | | 1 | | | | 0.93 | | | | 0.24 | | | | 0.99 | | | | 0.18 | | | | 25 | | |
| | 2003 | (2) | | | 3,210 | | | | 0.93 | | | | 0.52 | | | | 1.05 | | | | 0.40 | | | | 41 | | |
| | 2002 | (2) | | | 13,576 | | | | 0.93 | | | | 0.42 | | | | 1.09 | | | | 0.26 | | | | 49 | | |
| | 2001 | (2)(3) | | | 13,886 | | | | 0.88 | | | | (0.05 | ) | | | 0.91 | | | | (0.08 | ) | | | 102 | | |
| | 2000 | (4) | | | 18,057 | | | | 0.99 | | | | (0.11 | ) | | | 1.09 | | | | (0.21 | ) | | | 32 | | |
| Class Y | |
| | 2005 | (2) | | $ | 164,156 | | | | 0.65 | % | | | 0.78 | % | | | 0.78 | % | | | 0.65 | % | | | 23 | % | |
| | 2004 | (2) | | | 156,411 | | | | 0.68 | | | | 0.54 | | | | 0.77 | | | | 0.45 | | | | 25 | | |
| | 2003 | (2) | | | 119,102 | | | | 0.68 | | | | 0.68 | | | | 0.80 | | | | 0.56 | | | | 41 | | |
| | 2002 | (2) | | | 94,749 | | | | 0.68 | | | | 0.68 | | | | 0.84 | | | | 0.52 | | | | 49 | | |
| | 2001 | (2)(3) | | | 54,169 | | | | 0.66 | | | | 0.19 | | | | 0.68 | | | | 0.17 | | | | 102 | | |
| | 2000 | (4) | | | 60,771 | | | | 0.69 | | | | 0.19 | | | | 1.09 | | | | (0.21 | ) | | | 32 | | |
FIRST AMERICAN FUNDS Annual Report 2005
47
Notes to Financial Statements September 30, 2005
1 > Organization
The Equity Index Fund, Mid Cap Index Fund, and Small Cap Index Fund (each a "fund" and collectively, the "funds") are mutual funds offered by First American Investment Funds, Inc. ("FAIF") which is a member of the First American Family of Funds. As of September 30, 2005, FAIF offered 38 funds, including the funds listed above. FAIF is registered under the Investment Company Act of 1940, as amended, as an open-end management investment company. FAIF's articles of incorporation permit the funds' board of directors to create additional funds in the future. The Equity Index Fund, Mid Cap Index Fund and Small Cap Index Fund are each diversified open-end management investment companies.
FAIF offers Class A, Class B, Class C, Class R, and Class Y shares. Prior to July 1, 2004, Class R shares were named Class S shares. Class A shares are sold with a front-end sales charge. Class B shares are subject to a contingent deferred sales charge for six years and automatically convert to Class A shares after eight years. Class C shares may be subject to a contingent deferred sales charge for 12 months, and will not convert to Class A shares. Class R shares have no sales charge and are offered only through certain tax-deferred retirement plans. Class Y shares have no sales charge and are offered only to qualifying institutional investors and certain other qualifying accounts.
The funds' prospectuses provide descriptions of each fund's investment objective, principal investment strategies, and principal risks. All classes of shares have identical voting, dividend, liquidation, and other rights, and the same terms and conditions, except that certain fees, including distribution and shareholder servicing fees, may differ among classes. Each class has exclusive voting rights on any matters relating to that class' servicing or distribution arrangements.
On June 22, 2005 the funds' board of directors approved a change in the funds' fiscal year-end from September 30 to October 31, effective with the one-month period ending October 31, 2005.
2 > Summary of Significant Accounting Policies
The significant accounting policies followed by the funds are as follows:
SECURITY VALUATIONS – Security valuations for the funds' investments are furnished by one or more independent pricing services that have been approved by the funds' board of directors. Investments in equity securities that are traded on a national securities exchange are stated at the last quoted sales price if readily available for such securities on each business day. For securities traded on the Nasdaq national market system, the funds utilize the Nasdaq Official Closing Price which compares the last trade to the bid/ask range of a security. If the last trade falls within the bid/ask range, then that price will be the closing price. If the last trade is outside the bid/ask rang e, and falls above the ask, the ask will be the closing price. If the last trade is below the bid, the bid will be the closing price. Other equity securities traded in the over-the-counter market and listed equity securities for which no sale was reported on that date are stated at the last quoted bid price. Debt obligations exceeding 60 days to maturity are valued by an independent pricing service. The pricing service may employ methodologies that utilize actual market transactions, broker-dealer supplied valuations, or other formula-driven valuation techniques. These techniques generally consider such factors as yields or prices of bonds of comparable quality, type of issue, coupon, maturity, ratings, and general market conditions. Securities for which prices are not available from an independent pricing service, but where an active market exists, are valued using market quotations obtained from one or more dealers that make markets in the securities or from a widely-used quotation system. When market quot ations are not readily available, securities are valued at fair value as determined in good faith by procedures established and approved by the funds' board of directors. Some of the factors which may be considered in determining fair value are fundamental analytical data relating to the investment; the nature and duration of any restrictions on disposition; trading in similar securities of the same issuer or comparable companies; information from broker-dealers; and an evaluation of the forces that influence the market in which the securities are purchased and sold. If events occur that materially affect the value of securities (including non-U.S. securities) between the close of trading in those securities and the close of regular trading on the New York Stock Exchange, the securities will be valued at fair value. Price movements in futures contracts and ADRs, and various other indices, may be reviewed in the course of making a good faith determination of a security's fair value. The use of fair value pric ing by a fund may cause the net asset value of its shares to differ significantly from net asset value that would be calculated without regard to such considerations. As of September 30, 2005, the Equity Index Fund and Small Cap Index Fund had fair valued securities with a total market value of $0 and $0 or 0.0% and 0.0%, respectively, of total net assets for the fund. Debt obligations with 60 days or less remaining until maturity may be valued at their amortized cost, which approximates market value. Investments in open-end mutual funds are valued at the respective net asset value of each underlying fund on the valuation date.
FIRST AMERICAN FUNDS Annual Report 2005
48
SECURITY TRANSACTIONS AND INVESTMENT INCOME – For financial statement purposes, the funds record security transactions on the trade date of the security purchase or sale. Dividend income is recorded on the ex-dividend date. Interest income, including amortization of bond premium and discount, is recorded on an accrual basis. Security gains and losses are determined on the basis of identified cost, which is the same basis used for federal income tax purposes. The resulting gain/loss is calculated as the difference between the fair value and the underlying cost of the security on the transaction date. Each fund reserves the right to pay part or all of the proceeds from a redemption request in a proportionate share of readily marketable securities in the fund instead of cash.
DISTRIBUTIONS TO SHAREHOLDERS – Distributions from net investment income are declared and paid quarterly for Mid Cap Index Fund and Small Cap Index Fund and monthly for Equity Index Fund, and are payable in cash or reinvested in additional shares of the fund. Any net realized capital gains on sales of a fund's securities are distributed to shareholders at least annually.
FEDERAL TAXES – Each fund is treated as a separate taxable entity. Each fund intends to continue to qualify as a regulated investment company as provided in Subchapter M of the Internal Revenue Code, as amended, and to distribute all taxable income, if any, to its shareholders. Accordingly, no provision for federal income taxes is required.
Net investment income and net realized gains (losses) may differ for financial statement and tax purposes because of temporary or permanent book/tax differences. These differences are primarily due to losses deferred from wash sales, the tax recognition of mark to market gains (losses) on open futures contracts, proceeds from securities litigation, book gains recognized from in-kind distributions and the sale of Real Estate Investment Trust securities. To the extent these differences are permanent, reclassifications are made to the appropriate equity accounts in the period that the differences arise.
On the Statements of Assets and Liabilities the following reclassifications were made (000):
| Fund | | Accumulated
Net Realized
Gain (Loss) | | Undistributed
Net Investment
Income | | Portfolio
Capital | |
| Equity Index Fund | | $ | (115,376 | ) | | $ | (157 | ) | | $ | 115,533 | | |
| Mid Cap Index Fund | | | (2,697 | ) | | | 6 | | | | 2,691 | | |
| Small Cap Index Fund | | | 243 | | | | (256 | ) | | | 13 | | |
The character of distributions made during the year from net investment income or net realized gains may differ from its ultimate characterization for federal income tax purposes. In addition, due to the timing of dividend distributions, the fiscal year in which the amounts are distributed may differ from the year that the income or realized gains (losses) are recorded by the fund. The distributions paid during the fiscal years ended September 30, 2005 and 2004, were characterized as follows (000):
| | | 2005 | |
| Fund | | Ordinary
Income | | Long Term
Gain | | Return
of Capital | | Total | |
| Equity Index Fund | | $ | 40,001 | | | $ | - | | | $ | 133 | | | $ | 40,134 | | |
| Mid Cap Index Fund | | | 4,638 | | | | 10,978 | | | | - | | | | 15,616 | | |
| Small Cap Index Fund | | | 6,571 | | | | 8,072 | | | | - | | | | 14,643 | | |
| | | 2004 | |
| Fund | | Ordinary
Income | | Long Term
Gain | | Return
of Capital | | Total | |
| Equity Index Fund | | $ | 30,594 | | | $ | - | | | $ | 235 | | | $ | 30,829 | | |
| Mid Cap Index Fund | | | 3,008 | | | | 4,099 | | | | - | | | | 7,107 | | |
| Small Cap Index Fund | | | 1,059 | | | | 600 | | | | - | | | | 1,659 | | |
As of September 30, 2005, the components of accumulated earnings (deficit) on a tax basis were as follows (000):
Undistributed
Ordinary
Income | | Undistributed
Long Term
Capital Gains | | Accumulated
Capital and
Post-October
Losses | | Other
Accumulated
Losses | | Unrealized
Appreciation
(Depreciation) | | Total
Accumulated
Earnings
(Deficit) | |
| Equity Index Fund $- | | $ | - | | | $ | (15,453 | ) | | $ | - | | | $ | 591,507 | | | $ | 576,054 | | |
| Mid Cap Index Fund 1,298 | | | 18,121 | | | | - | | | | (14 | ) | | | 70,110 | | | | 89,515 | | |
| Small Cap Index Fund - | | | 4,799 | | | | - | | | | - | | | | 36,417 | | | | 41,216 | | |
FIRST AMERICAN FUNDS Annual Report 2005
49
Notes to Financial Statements September 30, 2005
The difference between book and tax basis unrealized appreciation is primarily due to the tax deferral of losses on wash sales, the amount of gain (loss) recognized for tax purposes due to mark to market adjustments on open futures contracts, and return of capital distributions related to Real Estate Investment Trust investments.
As of September 30, 2005, the following fund had capital loss carryforwards (000):
| | | Expiration Year | |
| Fund | | 2010 | | 2011 | | 2013 | | Total | |
| Equity Index Fund | | $ | 3,112 | | | $ | 10,900 | | | $ | 64 | | | $ | 14,076 | | |
Equity Index Fund incurred a loss of $1,376,053 for tax purposes for the period from November 1, 2004 to September 30, 2005. As permitted by tax regulations, the fund intends to elect to defer and treat this loss as arising in the one-month fiscal period ending October 31, 2005.
FUTURES TRANSACTIONS – In order to gain exposure to or protect against changes in the market, the funds may enter into S&P and Russell Index futures contracts and other stock index futures contracts.
Upon entering into a futures contract, the fund is required to deposit cash or pledge U.S. Government securities in an amount equal to five percent of the purchase price indicated in the futures contract (initial margin). Subsequent payments, which are dependent on the daily fluctuations in the value of the underlying security or securities, are made or received by the fund each day (daily variation margin) and are recorded as unrealized gains (losses) until the contract is closed. When the contract is closed, the fund records a realized gain (loss) equal to the difference between the proceeds from (or cost of) the closing transaction and the fund's basis in the contract.
The funds' investment in stock index futures contracts is designed to maintain sufficient liquidity to meet redemption requests and to increase the level of fund assets devoted to replicating the composition of the S&P and Russell Indices while reducing transaction costs. Risks of entering into futures contracts, in general, include the possibility that there will not be a perfect price correlation between the futures contracts and the underlying securities. Second, it is possible that a lack of liquidity for futures contracts could exist in the secondary market, resulting in an inability to close a futures position prior to its maturity date. Third, the purchase of a futures contract involves the risk that a fund could lose more than the original margin deposit required to initiate a futures transaction. These contracts involve market risk in excess of the amount reflected in the fund's statement of assets and liabilities. Unrealized gains (losses) on outstanding positions in futures contracts held at the close of the year will be recognized as capital gains (losses) for federal income tax purposes.
ILLIQUID OR RESTRICTED SECURITIES – A security may be considered illiquid if it lacks a readily available market. Securities are generally considered liquid if they can be sold or disposed of in the ordinary course of business within seven days at approximately the price at which the security is valued by the fund. Illiquid securities may be valued under methods approved by the funds' board of directors as reflecting fair value. Each fund intends to invest no more than 15% of its net assets (determined at the time of purchase and reviewed periodically) in illiquid securities. Certain restricted securities may be considered illiquid. Restricted securities are often purchased in private placement transactions, are not registered under the Securities Act of 1933, and m ay have contractual restrictions on resale. Certain restricted securities eligible for resale to qualified institutional investors, including Rule 144A securities, are not subject to the limitation on a fund's investment in illiquid securities if they are determined to be liquid in accordance with procedures adopted by the funds' board of directors. At September 30, 2005, Equity Index Fund and Small Cap Index Fund had investments in illiquid securities with a total value of $0 and $0, respectively, or 0.0% and 0.0%, respectively of total net assets.
Information concerning illiquid securities, including restricted securities considered to be illiquid, is as follows:
| Equity Index Fund | |
| Security | | Shares | | Dates Acquired | | Cost Basis (000) | |
| Seagate Escrow Security | | | 44,886 | | | 1/01 | | $ | - | | |
| Small Cap Index Fund | |
| Security | | Shares | | Dates Acquired | | Cost Basis (000) | |
| FirstBank Fractional Shares | | | - | | | 8/05 | | $ | - | | |
| Mascotech Escrow Shares | | | 9,571 | | | 2/99 to 11/00 | | | - | | |
| Neon Communications | | | 34,093 | | | 9/01 to 6/02 | | | 3 | | |
| Petrocorp Escrow Shares | | | 2,040 | | | 6/03 to 8/05 | | | - | | |
| Southern Union Company Fractional Shares | | | - | | | 11/03 to 8/05 | | | - | | |
| Storage Networks | | | 15,089 | | | 6/02 to 6/03 | | | 1 | | |
| USB Holding Company Fractional Shares | | | - | | | 8/05 | | | - | | |
FIRST AMERICAN FUNDS Annual Report 2005
50
SECURITIES LENDING – In order to generate additional income, each fund may lend securities representing up to one-third of the value of its total assets (which includes collateral for securities on loan) to broker-dealers, banks, or other institutional borrowers of securities. Each fund's policy is to maintain collateral in the form of cash, U.S. Government securities, or other high-grade debt obligations equal to at least 100% of the value of securities loaned. The collateral is then "marked-to-market" daily until the securities are returned. As with other extensions of credit, there may be risks of delay in recovery of the securities or even loss of rights in the collateral should the borrower of the security fail financially. As of September 30, 2005, cash collateral invested was as follows (000):
| | | Commercial
Paper | | Corporate
Obligations | | Repurchase
Agreements | | Other
Short-Term
Securities | | Total | |
| Equity Index Fund | | $ | 173,876 | | | $ | 204,715 | | | $ | 318,368 | | | $ | 15,418 | | | $ | 712,377 | | |
| Mid Cap Index Fund | | | 33,162 | | | | 39,044 | | | | 60,720 | | | | 2,941 | | | | 135,867 | | |
| Small Cap Index Fund | | | 10,005 | | | | 11,779 | | | | 18,319 | | | | 887 | | | | 40,990 | | |
U.S. Bancorp Asset Management, Inc. ("USBAM") serves as the securities lending agent for the funds in transactions involving the lending of portfolio securities on behalf of the funds. USBAM acts as the securities lending agent pursuant to, and subject to compliance with conditions contained in, an exemptive order issued by the Securities and Exchange Commission ("SEC"). During the fiscal year ended September 30, 2005, USBAM received fees equal to 35% of each fund's income from securities lending transactions. Effective January 1, 2006, such fees will be lowered to 32% of each fund's income from securities lending transactions. Fees paid to USBAM by the funds for the fiscal year ended September 30, 2005, were as follows (000):
| Fund | | Total | |
| Equity Index Fund | | $ | 337 | | |
| Mid Cap Index Fund | | | 68 | | |
| Small Cap Index Fund | | �� | 75 | | |
SECURITY LITIGATION SETTLEMENTS – Income from settlement proceeds related to portfolio securities is recorded as an adjustment to realized or unrealized gains or losses. For the fiscal year ended September 30, 2005, the Equity Index Fund, Mid Cap Index Fund and the Small Cap Index Fund recorded $102,331, $70,024, and $6,761 respectively, as an adjustment to realized gains or losses for settlement proceeds related to securities no longer included in the portfolios.
EXPENSES – Expenses that are directly related to one of the funds are charged directly to that fund. Other operating expenses are generally allocated to the funds on the basis of relative net assets of all funds within the First American Family of Funds. Class specific expenses, such as distribution fees and shareholder servicing fees are borne by that class. Income, other expenses, and realized and unrealized gains and losses of a fund are allocated to each respective class in proportion to the relative net assets of each class.
INTERFUND LENDING PROGRAM – Pursuant to an exemptive order issued by the SEC, the funds, along with other registered investment companies in the First American Family of Funds, may participate in an interfund lending program. This program provides an alternative credit facility allowing the funds to borrow from, or lend money to, other participating funds. The funds did not have any interfund lending transactions during the fiscal year ended September 30, 2005.
DEFERRED COMPENSATION PLAN – Under a Deferred Compensation Plan (the Plan), non-interested directors of the First American Family of Funds, including First American Investment Funds, Inc., may participate and elect to defer receipt of part or all of their annual compensation. Deferred amounts are treated as though equivalent dollar amounts had been invested in shares of selected open-end First American Funds as designated by the board of directors. All amounts in the Plan are 100% vested and accounts under the plan are obligations of the funds. Deferred amounts remain in the funds until distributed in accordance with the plan.
USE OF ESTIMATES IN PREPARATION OF FINANCIAL STATEMENTS – The preparation of financial statements, in conformity with U. S. generally accepted accounting principles requires management to make estimates and assumptions that affect the reported amounts of assets and liabilities and disclosure of contingent assets and liabilities at the date of the financial statements and the reported results of operations during the reporting period. Actual results could differ from those estimates.
FIRST AMERICAN FUNDS Annual Report 2005
51
Notes to Financial Statements September 30, 2005
3 > Fees and Expenses
INVESTMENT ADVISORY FEES – Pursuant to an investment advisory agreement (the "Agreement"), USBAM, a subsidiary of U.S. Bank National Association ("U.S. Bank"), manages each fund's assets and furnishes related office facilities, equipment, research, and personnel. The Agreement requires each fund to pay USBAM a monthly fee based upon average daily net assets. The annual fee for Equity Index Fund, Mid Cap Index Fund and Small Cap Index Fund is 0.25%, 0.25% and 0.40%, respectively. USBAM has agreed to waive fees and reimburse other fund expenses through June 30, 2006, so that total fund operating expenses, as a percentage of average daily net assets, do not exceed the following amounts:
| | | Share Class | |
| Fund | | A | | B | | C | | R | | Y | |
| Equity Index Fund | | | 0.62 | % | | | 1.37 | % | | | 1.37 | % | | | 0.87 | % | | | 0.37 | % | |
| Mid Cap Index Fund | | | 0.75 | | | | 1.50 | | | | 1.50 | | | | 1.00 | | | | 0.50 | | |
| Small Cap Index Fund | | | 0.83 | | | | 1.58 | | | | 1.58 | | | | 1.08 | | | | 0.58 | | |
Prior to July 1, 2005, USBAM agreed to waive fees and reimburse other fund expenses so that total fund operating expenses, as a percentage of average daily net assets, did not exceed the following amounts:
| | | Share Class | |
| Fund | | A | | B | | C | | R | | Y | |
| Equity Index Fund | | | 0.62 | % | | | 1.37 | % | | | 1.37 | % | | | 0.87 | % | | | 0.37 | % | |
| Mid Cap Index Fund | | | 0.75 | | | | 1.50 | | | | 1.50 | | | | 1.00 | | | | 0.50 | | |
| Small Cap Index Fund | | | 0.93 | | | | 1.68 | | | | 1.68 | | | | 1.18 | | | | 0.68 | | |
The funds may invest in related money market funds that are series of First American Funds, Inc. ("FAF"), subject to certain limitations. In order to avoid the payment of duplicative investment advisory fees to USBAM, which acts as the investment advisor to both the investing funds and the related money market funds, USBAM will reimburse each investing fund an amount equal to that portion of USBAM's investment advisory fee received from the related money market funds that is attributable to the assets of the investing fund. For financial statement purposes, these reimbursements are recorded as investment income.
ADMINISTRATION FEES – Effective July 1, 2005, USBAM serves as the funds' administrator pursuant to an administration agreement between USBAM and the funds. U.S. Bancorp Fund Services, LLC ("USBFS") serves as sub-administrator pursuant to a sub-administration agreement between USBFS and USBAM. Both U.S. Bank and USBFS are direct subsidiaries of U.S. Bancorp. Under the administration agreement, USBAM is compensated to provide, or compensate other entities to provide, services to the funds. These services include various legal, oversight and administrative services and accounting services. Effective July 1, 2005, the funds pay USBAM administration fees, which are calculated daily and paid monthly, equal to each fund's pro rata share of an amount equal, on an annua l basis, to 0.15% of the aggregate average daily net assets of all open-end mutual funds in the First American Family of Funds, up to $8 billion, 0.135% on the next $17 billion of the aggregate average daily net assets, 0.12% on the next $25 billion of the aggregate average daily net assets, and 0.10% of the aggregate average daily net assets in excess of $50 billion. All fees paid to the sub-administrator are paid from the administration fee. In addition to these fees, the funds may reimburse USBAM and, indirectly, the sub-administrator for any out-of-pocket expenses incurred in providing administration services.
Prior to July 1, 2005, USBAM and USBFS served as "co-administrators" pursuant to a co-administration agreement between the co-administrators and the funds. The funds paid the administration fees to the co-administrators, which were calculated daily and paid monthly, equal to each fund's pro rata share of an amount equal, on an annual basis, to 0.25% of the aggregate average daily net assets of all open-end mutual funds in the First American Family of Funds, up to $8 billion, 0.235% of the next $17 billion of the aggregate average daily net assets, 0.22% of the next $25 billion of the aggregate daily net assets, and 0.20% of the aggregate average daily net assets in excess of $50 billion. In addition, the funds paid transfer agent fees under the co-administration agreement of $18,500 per share class plus additional per account fees. In addition to these fees, the funds r eimbursed the co-administrators for any out-of-pocket expenses incurred in providing administration services.
FIRST AMERICAN FUNDS Annual Report 2005
52
For the fiscal year ended September 30, 2005, administration fees paid to USBAM and USBFS by the funds included in this annual report were as follows (000):
| Fund | | Amount | |
| Equity Index Fund | | $ | 4,765 | | |
| Mid Cap Index Fund | | | 738 | | |
| Small Cap Index Fund | | | 371 | | |
TRANSFER AGENT FEES – Effective July 1, 2005, USBFS serves as the funds' transfer agent pursuant to a transfer agent and shareholder servicing agreement with FAIF. FAIF pays transfer agent fees of $18,500 per share class and additional per account fees for transfer agent services. These fees are allocated to each fund based upon the fund's pro rata share of the aggregate average daily net assets of the funds that comprise FAIF. Under the transfer agent and shareholder servicing agreement, FAIF also pays USBFS a fee equal, on an annual basis, to 0.10% of each fund's average daily net assets. This fee compensates USBFS for providing certain shareholder services and reimburses USBFS for its payments to financial institutions that establish and maintain omnibus accounts and provide customary services for such accounts. In addition to these fees, the funds reimburse USBFS for out-of-pocket expenses incurred in providing transfer agent services. Prior to July 1, 2005, these services were provided by USBFS pursuant to the co-administration agreement.
For the fiscal year ended September 30, 2005, transfer agent fees paid to USBFS by the funds included in this annual report were as follows (000):
| Fund | | Amount | |
| Equity Index Fund | | $ | 1,427 | | |
| Mid Cap Index Fund | | | 228 | | |
| Small Cap Index Fund | | | 112 | | |
CUSTODIAN FEES – U.S. Bank serves as the funds' custodian pursuant to a custodian agreement with FAIF. Effective July 1, 2005, the fee for each fund was reduced from an annual rate of 0.01% of average daily net assets to an annual rate of 0.005% of average daily net assets. All fees are computed daily and paid monthly.
Effective July 1, 2005, the funds have entered into an arrangement with their custodian whereby interest earned on uninvested cash balances will be used to reduce a portion of each fund's custodian expenses. For the fiscal year ended September 30, 2005, custodian fees were not reduced as a result of interest earned.
DISTRIBUTION AND SHAREHOLDER SERVICING FEES – Quasar Distributors, LLC ("Quasar"), a subsidiary of U.S. Bancorp, serves as the distributor of the funds pursuant to a distribution agreement with FAIF. Under the distribution agreement, and pursuant to a plan adopted by each fund under rule 12b-1 of the Investment Company Act, each of the funds pays Quasar a monthly distribution and/or shareholder servicing fee equal to an annual rate of 0.25%, 1.00%, 1.00% and 0.50% of each fund's average daily net assets of the Class A shares, Class B shares, Class C shares and Class R shares, respectively. No distribution or shareholder servicing fees are paid by Class&nbs p;Y shares. These fees may be used by Quasar to provide compensation for sales support, distribution activities, or shareholder servicing activities.
FAIF has also adopted and entered into a shareholder servicing plan and agreement with USBAM with respect to the Class R shares. Each fund pays USBAM a monthly shareholder servicing fee equal to an annual rate of 0.15% of each fund's average daily net assets of the Class R shares. USBAM is currently waiving all fees under this plan and agreement. This waiver may be discontinued at any time.
Under these distribution and shareholder servicing agreements, the following amounts were retained by Quasar for the fiscal year ended September 30, 2005 (000):
| Fund | | Amount | |
| Equity Index Fund | | $ | 679 | | |
| Mid Cap Index Fund | | | 47 | | |
| Small Cap Index Fund | | | 31 | | |
OTHER FEES AND EXPENSES – In addition to the investment advisory fees, custodian fees, distribution and shareholder servicing fees, transfer agent fees and administration fees, each fund is responsible for paying other operating expenses including: fees and expenses of independent directors, registration fees, postage and printing of shareholder reports, legal, auditing, insurance, and other miscellaneous expenses. For the fiscal year ended September 30, 2005, legal fees and expenses were paid to a law firm of which an Assistant Secretary of the funds is a partner.
CONTINGENT DEFERRED SALES CHARGES – A contingent deferred sales charge ("CDSC") is imposed on redemptions made in Class B shares. The CDSC varies depending on the number of years from time of payment for the purchase of Class B shares until the redemption of such shares. Class B shares automatically convert to Class A shares after eight years.
| Year Since Purchase | | CDSC as a
Percentage of Dollar
Amount Subject to Charge | |
| First | | | 5.00 | % | |
| Second | | | 5.00 | | |
| Third | | | 4.00 | | |
| Fourth | | | 3.00 | | |
| Fifth | | | 2.00 | | |
| Sixth | | | 1.00 | | |
| Seventh | | | - | | |
| Eighth | | | - | | |
FIRST AMERICAN FUNDS Annual Report 2005
53
Notes to Financial Statements September 30, 2005
A CDSC of 1.00% is imposed on redemptions made in Class C shares for the first twelve months.
The CDSC for Class B shares and Class C shares is imposed on the value of the purchased shares or the value at the time of redemption, whichever is less.
For the fiscal year ended September 30, 2005, total front-end sales charges and CDSCs retained by affiliates of USBAM for distributing the funds' shares were as follows (000):
| Fund | | Amount | |
| Equity Index Fund | | $ | 332 | | |
| Mid Cap Index Fund | | | 42 | | |
| Small Cap Index Fund | | | 20 | | |
4 > Investment In Common Stock Of Affiliate
As disclosed in the Schedule of Investments, Equity Index Fund owns common stock issued by U.S. Bancorp. For the fiscal year ended September 30, 2005, Equity Index Fund recorded net realized gains from the sale of U.S. Bancorp common stock of $513,006 and $469,763 of dividend income from U.S. Bancorp common stock. At September 30, 2005, Equity Index Fund had an unrealized gain of $2,067,054 with respect to its investment in U.S. Bancorp common stock.
5 > Capital Share Transactions
FAIF has 324 billion shares of $0.0001 par value capital stock authorized. Capital share transactions for the funds were as follows (000):
| | | Equity
Index Fund | | Mid Cap
Index Fund | | Small Cap
Index Fund | |
| | | Year
Ended
9/30/05 | | Year
Ended
9/30/04 | | Year
Ended
9/30/05 | | Year
Ended
9/30/04 | | Year
Ended
9/30/05 | | Year
Ended
9/30/04 | |
| Class A: | |
| Shares issued | | | 1,995 | | | | 4,820 | | | | 385 | | | | 763 | | | | 212 | | | | 474 | | |
| Shares issued in lieu of cash distributions | | | 155 | | | | 108 | | | | 42 | | | | 13 | | | | 49 | | | | 3 | | |
| Shares redeemed | | | (2,991 | ) | | | (2,189 | ) | | | (367 | ) | | | (277 | ) | | | (207 | ) | | | (126 | ) | |
| Total Class A transactions | | | (841 | ) | | | 2,739 | | | | 60 | | | | 499 | | | | 54 | | | | 351 | | |
| Class B: | |
| Shares issued | | | 111 | | | | 225 | | | | 24 | | | | 55 | | | | 16 | | | | 34 | | |
| Shares issued in lieu of cash distributions | | | 25 | | | | 16 | | | | 9 | | | | 4 | | | | 8 | | | | 1 | | |
| Shares redeemed | | | (924 | ) | | | (737 | ) | | | (41 | ) | | | (26 | ) | | | (28 | ) | | | (9 | ) | |
| Total Class B transactions | | | (788 | ) | | | (496 | ) | | | (8 | ) | | | 33 | | | | (4 | ) | | | 26 | | |
| Class C: | |
| Shares issued | | | 126 | | | | 214 | | | | 83 | | | | 118 | | | | 51 | | | | 70 | | |
| Shares issued in lieu of cash distributions | | | 10 | | | | 7 | | | | 7 | | | | 3 | | | | 10 | | | | 1 | | |
| Shares redeemed | | | (436 | ) | | | (457 | ) | | | (58 | ) | | | (65 | ) | | | (50 | ) | | | (36 | ) | |
| Total Class C transactions | | | (300 | ) | | | (236 | ) | | | 32 | | | | 56 | | | | 11 | | | | 35 | | |
| Class R: | |
| Shares issued | | | 60 | | | | 564 | | | | 9 | | | | 91 | | | | 1 | | | | 131 | | |
| Shares issued in lieu of cash distributions | | | - | | | | 19 | | | | - | | | | 7 | | | | - | | | | 2 | | |
| Shares redeemed | | | (4 | ) | | | (3,398 | ) | | | - | | | | (497 | ) | | | - | | | | (414 | ) | |
| Total Class R transactions | | | 56 | | | | (2,815 | ) | | | 9 | | | | (399 | ) | | | 1 | | | | (281 | ) | |
| Class Y: | |
| Shares issued | | | 16,348 | | | | 25,834 | | | | 5,681 | | | | 9,346 | | | | 3,545 | | | | 6,867 | | |
| Shares issued in lieu of cash distributions | | | 1,034 | | | | 928 | | | | 684 | | | | 357 | | | | 591 | | | | 80 | | |
| Shares redeemed | | | (27,653 | ) | | | (26,886 | ) | | | (7,277 | ) | | | (6,301 | ) | | | (4,520 | ) | | | (5,648 | ) | |
| Total Class Y transactions | | | (10,271 | ) | | | (124 | ) | | | (912 | ) | | | 3,402 | | | | (384 | ) | | | 1,299 | | |
| Net increase (decrease) in capital shares | | | (12,144 | ) | | | (932 | ) | | | (819 | ) | | | 3,591 | | | | (322 | ) | | | 1,430 | | |
6 > Investment Security Transactions
During the fiscal year ended September 30, 2005, purchases of securities and proceeds from sales of securities other than temporary investments in short-term securities, were as follows (000):
| Fund | | Purchases | | Sales | |
| Equity Index Fund | | $ | 85,835 | | | $ | 363,453 | | |
| Mid Cap Index Fund | | | 51,726 | | | | 72,176 | | |
| Small Cap Index Fund | | | 40,219 | | | | 55,840 | | |
FIRST AMERICAN FUNDS Annual Report 2005
54
The aggregate gross unrealized appreciation and depreciation of securities held by the funds and the total cost of securities (including cost of securities purchased with proceeds from securities lending) for federal income tax purposes at September 30, 2005, were as follows (000):
| Fund | | Aggregate
Gross
Appreciation | | Aggregate
Gross
Depreciation | | Net | | Federal
Income
Tax Cost | |
| Equity Index Fund | | $ | 825,989 | | | $ | (234,482 | ) | | $ | 591,507 | | | $ | 2,388,845 | | |
| Mid Cap Index Fund | | | 107,698 | | | | (37,588 | ) | | | 70,110 | | | | 442,255 | | |
| Small Cap Index Fund | | | 48,909 | | | | (12,492 | ) | | | 36,417 | | | | 182,635 | | |
7 > Indemnifications
The funds enter into contracts that contain a variety of indemnifications. The funds' maximum exposure under these arrangements is unknown. However, the funds have not had prior claims or losses pursuant to these contracts and expect the risk of loss to be remote.
8 > Other
In March 2005, the U.S. Bancorp Pension Plan redeemed $186,709,450 from the First American Equity Index Fund as a redemption-in-kind transaction. In this transaction, the fund distributed a proportionate amount of securities in the fund's portfolio to the US Bancorp Pension Plan. Remaining shareholders in the fund did not recognize any additional capital gains from the transactions.
FIRST AMERICAN FUNDS Annual Report 2005
55
NOTICE TO SHAREHOLDERS September 30, 2005 (unaudited)
TAX INFORMATION
The information set forth below is for each funds's fiscal year as required by federal laws. Most shareholders, however, must report distributions on a calendar year basis for income tax purposes, which may include distributions for portions of two fiscal years of a fund. Accordingly, the information needed for income tax purposes will be sent in early 2006 on Form 1099-DIV. Please consult your tax advisor for proper treatment of this information.
Dear First American Shareholders:
For the fiscal year ended September 30, 2005, each fund has designated long-term capital gains, ordinary income and tax exempt income with regard to distributions paid during the year as follows:
| Fund | | Long Term
Capital Gains
Distributions
(Tax Basis) (a) | | Ordinary
Income
Distributions
(Tax Basis) (b) | | Total
Distributions
(Tax Basis) | | Corporate
Dividends
Received
Deduction (c) | | Qualified
Dividend
Income (c)(d) | |
| Equity Index Fund | | | 0 | % | | | 100 | % | | | 100 | % | | | 100 | % | | | 100 | % | |
| Mid Cap Index Fund | | | 70 | | | | 30 | | | | 100 | | | | 79 | | | | 79 | | |
| Small Cap Index Fund | | | 55 | | | | 45 | | | | 100 | | | | 36 | | | | 36 | | |
(a) and (b) are based on a percentage of the fund's total distributions.
(c) is based on a percentage of ordinary income distributions of the fund.
(d) For the fiscal period ended September 30, 2005, certain dividends paid by the funds may be subject to a maximum tax rate of 15% as provided for by the Internal Revenue Code 1(h). The funds intend to designate the maximum amounts as taxed at the maximum rate of 15%. Complete information will be computed and reported in conjunction with your 2005 Form 1099-DIV. As of September 30, 2005, for the calendar year to date, qualified dividend income as a percentage of ordinary income distributions for each fund was as follows: Equity Income Fund – 100%, Mid Cap Index Fund – 93%, Small Cap Index Fund – 100%.
The Mid Cap Index Fund hereby designates $2,690,633 as long-term capital gain distributions for the purposes of the dividends paid deduction, which include earnings and profits distributed to shareholders on redemption of fund shares.
HOW TO OBTAIN A COPY OF THE FUNDS' PROXY VOTING POLICIES AND PROXY VOTING RECORD
A description of the policies and procedures that the funds use to determine how to vote proxies relating to portfolio securities, as well as information regarding how the funds voted proxies relating to portfolio securities during the most recent 12 month period ended June 30, 2005, is available (1) without charge upon request by calling 800.677.FUND; (2) at firstamericanfunds.com; and (3) on the U.S. Securities and Exchange Commision's website at http://www.sec.gov.
FORM N-Q HOLDINGS INFORMATION
Each fund is required to file its complete schedule of portfolio holdings for the first and third quarters of each fiscal year with the Securities and Exchange Commission on Form N-Q. The funds' Forms N-Q are available (1) without charge upon request by calling 800.677.FUND and (2) on the U.S. Securities and Exchange Commision's website at http://www.sec.gov. In addition, you may review and copy the funds' Forms N-Q at the Commission's Public Reference Room in Washington, D.C. You may obtain information on the operation of the Public Reference Room by calling 1-800-SEC-0330.
APPROVAL OF INVESTMENT ADVISORY AGREEMENTThe Board of Directors of the Funds (the "Board"), which is comprised entirely of independent directors, oversees the management of each Fund and, as required by law, determines annually whether to renew the Funds' advisory agreement with U.S. Bancorp Asset Management, Inc. ("USBAM").
At a meeting on May 3-5 2005, the Board considered information relating to the Funds' investment advisory agreement with USBAM (the "Agreement"). In advance of the meeting, the Board received materials relating to the Agreement, and had the opportunity to ask questions and request further information in connection with their consideration. At a subsequent meeting on June 20-22, 2005, the Board concluded its consideration of and approved the Agreement through June 30, 2006.
Although the Agreement, which is with First American Investment Funds, Inc., relates to all of the Funds, the Board separately considered and approved the Agreement with respect to each Fund. In considering the Agreement, the Board,
FIRST AMERICAN FUNDS Annual Report 2005
56
advised by independent legal counsel, reviewed and considered the factors it deemed relevant, including: (1) the nature, quality and extent of USBAM's services to the Fund, (2) the investment performance of the Fund, (3) the profitability of USBAM related to the Fund, including an analysis of USBAM's cost of providing services and comparative expense information, (4) the extent to which economies of scale are realized as the Fund grows and whether fee levels are adjusted to enable Fund investors to share in these economies of scale, and (5) other benefits that accrue to USBAM through its relationship with the Funds. In its deliberations, the Board did not identify any single factor which alone was responsible for the Board's decision to approve the Agreement.
Before approving the Agreement, the Board met in executive session with its independent counsel on numerous occasions to consider the materials provided by USBAM and the terms of the Agreement. Based on its evaluation of those materials, the Board concluded that the Agreement is fair and in the best interests of the shareholders of each Fund. In reaching its conclusions, the Board considered the following:
Nature, Quality and Extent of Investment Advisory Services
The Board examined the nature, quality and extent of the services provided by USBAM to each Fund. The Board reviewed USBAM's key personnel who provide investment management services to each Fund as well as the fact that, under the Agreement, USBAM has the authority and responsibility to make and execute investment decisions for each Fund within the framework of that Fund's investment policies and restrictions, subject to review by the Board. The Board further considered that USBAM's duties with respect to each Fund include (i) investment research and security selection, (ii) adherence to (and monitoring compliance with) the Fund's investment policies and restrictions and the Investment Company Act of 1940, and (iii) monitoring the performance of the various organizations providing services to the Fund, including the Fund's distributor, sub-administrator, transfer agent and custodian. Final ly, the Board considered USBAM's representation that the services provided by USBAM under the Agreement are the type of services customarily provided by investment advisors in the fund industry.
The Board also considered compliance reports about USBAM from the Funds' Chief Compliance Officer.
Based on the foregoing, the Board concluded that each Fund is likely to benefit from the nature, extent and quality of the services provided by USBAM under the Agreement.
Investment Performance of the Funds
The Board considered the performance of each Fund, including how the Fund performed versus the median performance of a group of comparable funds selected by an independent data service (the "performance universe") and how the Fund performed versus its benchmark index. The performance periods reviewed by the Board all ended on February 28, 2005.
Equity Index Fund. The Board noted that the objective of the Fund is to provide investment results that correspond to the performance of the Standard & Poor's 500 Composite Index. The Board considered that, while the Fund performed slightly below its benchmark index for the one-, three-, five- and ten-year periods, on a gross-of-fees basis, the Fund achieved a correlation with its benchmark index over the past three years of over 99.9%. The Fund's performance was comparable to that of its performance universe for all periods, being generally equal to or slightly above the performance universe for Class Y shares and slightly below the performance universe for Class A shares. The Board concluded that, in light of the Fund's close tracking of its benchmark index and co mpetitive performance vis-à-vis its performance universe, it would be in the interest of the Fund and its shareholders to renew the Agreement.
Mid Cap Index Fund. The Board noted that the objective of the Fund is to provide investment results that correspond to the performance of the Standard & Poor's MidCap 400 Composite Index. The Board considered that, while the Fund performed below its benchmark index for the one-, three-, and five-year periods, on a gross-of-fees basis, the Fund achieved a correlation with its benchmark index over the past three years of over 99.9%. The Fund's performance was equal to or better than that of its performance universe for all periods. The Board concluded that, in light of the Fund's close tracking of its benchmark index and competitive performance vis-à-vis its performance universe, it would be in the interest of the Fund and its shareholders to renew the Agreement.
FIRST AMERICAN FUNDS Annual Report 2005
57
NOTICE TO SHAREHOLDERS September 30, 2005 (unaudited)
Small Cap Index Fund. The Board noted that the objective of the Fund is to provide investment results that correspond to the performance of the Russell 2000 Index. The Board considered that, while the Fund performed slightly below its benchmark index for the one- and three-year periods, on a gross-of-fees basis, the Fund achieved a correlation with its benchmark index over the past three years of over 99.9%. For the five-year period, the Fund performed significantly better than its benchmark index. This performance period, however, included a period of time when the Fund was benchmarked against a different index. The Fund underperformed its performance universe for all periods. The Board considered USBAM's assertion, however, that while the performance universe consists of a very large number of funds, only a small number of funds (the "custom performance universe") appear to track the Russell 2000 Index. The Board noted that the Fund's performance compared favorably to the performance of the custom performance universe, being approximately equal to that of the custom performance universe for the one-year period, and slightly lower for the three-year period. The Board concluded that, in light of the Fund's close tracking of its benchmark index and its competitive performance when compared to other funds that track the Russell 2000 Index, it would be in the interest of the Fund and its shareholders to renew the Agreement.
Costs of Services and Profits Realized by USBAM
The Board reviewed USBAM's estimated costs in serving as the Funds' investment manager, including the costs associated with the personnel and systems necessary to manage each Fund. The Board also considered the reported profitability of USBAM and its affiliates resulting from their relationship with each Fund. For each Fund, the Board reviewed fee and expense information as compared to that of other funds and accounts managed by USBAM and of comparable funds managed by other advisers. The Board found that while the management fees for USBAM's institutional separate accounts are lower than the Funds' management fees, the Funds receive additional services from USBAM that separate accounts do not receive.
Using information provided by an independent data service, the Board also evaluated each Fund's advisory fee compared to the median advisory fee for other mutual funds similar in size, character and investment strategy, and each Fund's expense ratio after waivers compared to the median expense ratio, after waivers, of comparable funds. In connection with its review of Fund fees and expenses, the Board asked USBAM to articulate its pricing philosophy. USBAM responded that it attempts generally to maintain each Fund's total operating expenses at a level that approximates its peer group median expense ratio. In addition, USBAM committed to waive its investment advisory fees to the extent necessary to maintain the Funds' total expense ratios at levels generally in line with their respective peer groups. Consistent with this pricing philosophy, and after discussions with the Board, USBAM proposed certain chan ges to the expense ratios of the Small Cap Index Fund, as discussed in more detail below. The Board concluded that USBAM's pricing philosophy is a reasonable one and, after taking into account USBAM's proposed change to the expense ratio of Small Cap Index Fund, that the Funds' advisory fees and expense ratios are reasonable in light of the services provided.
Further detail considered by the Board regarding the advisory fees and expense ratios of each Fund is set forth below:
Equity Index Fund. The Board considered that the Fund's contractual advisory fee is equal to its peer group median contractual advisory fee and that, after waivers, the Fund's advisory fee is significantly lower and the Fund's expense ratio is slightly lower than the peer group median. The Board concluded that the Fund's advisory fee and expense ratio are reasonable.
Mid Cap Index Fund. The Board considered that both the Fund's contractual advisory fee and its advisory fee after waivers are significantly lower than the peer group median fees. In addition, the Fund's expense ratio after waivers is slightly lower than the peer group median. The Board concluded that the Fund's advisory fee and expense ratio are reasonable.
Small Cap Index Fund. The Board considered that, while the Fund's contractual advisory fee is slightly higher than that of the peer group median, after waivers, the Fund's advisory fee is equal to the peer group's median advisory fee. The Board also noted, however, that the Fund's total expense ratio after waivers of 0.93% was higher than the Lipper expense group median of 0.77%. To bring the Fund's total expense ratio more closely in line with that of its peer group median, USBAM agreed to cap total Fund expenses at 0.83%. The Board concluded that the Fund's advisory fee and expense ratio, after taking into account the new expense cap, are reasonable.
FIRST AMERICAN FUNDS Annual Report 2005
58
Economies of Scale in Providing Investment Advisory Services
The Board considered the extent to which each Fund's investment advisory fee reflects economies of scale for the benefit of Fund shareholders. Based on information provided by USBAM, the Board noted that profitability will likely increase somewhat as assets grow over time. The Board considered that, although the Funds do not have advisory fee breakpoints in place, USBAM has committed to waive advisory fees to the extent necessary to keep each Fund's total expenses generally in line with the median total expenses of a peer group of funds as selected by an independent data service. The median total expense ratio of a Fund's peer group will necessarily reflect the effect of any breakpoints in the advisory fee schedules of the funds in that group. Therefore, by capping a Fund's total expense ratio at a level close to the median, Fund shareholders will effectively receive the benefit of any breakpoints in the comparable funds' advisory fee schedules. In light of USBAM's commitment to keep total Fund expenses competitive, the Board concluded that it would be reasonable and in the best interest of each Fund and its shareholders to renew the Agreement.
Other Benefits to USBAM
In evaluating the benefits that accrue to USBAM through its relationship with the Funds, the Board noted that USBAM and certain of its affiliates serve the Funds in various capacities, including as advisor, administrator, sub-administrator, transfer agent, distributor, custodian and securities lending agent, and receive compensation from the Funds in connection with providing services to the Funds. The Board considered that each service provided to the Funds by USBAM or one of its affiliates is pursuant to a written agreement, which the Board evaluates periodically as required by law.
The Board also considered USBAM's use of the Funds' portfolio brokerage transactions to obtain research. The Board concluded, based on its own review and on representations of USBAM, that USBAM's use of "soft" commission dollars was consistent with regulatory requirements.
After full consideration of these and other factors, the Board concluded that approval of the Agreement was in the best interest of each Fund and its shareholders.
FIRST AMERICAN FUNDS Annual Report 2005
59
NOTICE TO SHAREHOLDERS September 30, 2005 (unaudited)
Directors and Officers of the Funds
Independent Directors
Name,
Address, and
Year of Birth | | Position(s)
Held
with Funds | | Term of Office
and Length of
Time Served | | Principal Occupation(s) During
Past 5 Years | | Number of
Portfolios in Fund
Complex Overseen
by Director | | Other
Directorships
Held by
Director † | |
Benjamin R. Field III
P.O. Box 1329
Minneapolis, MN
55440-1329
(1938) | | Director | | Term expiring earlier of death, resignation, removal, disqualification, or successor duly elected and qualified. Director of FAIF since September 2003. | | Retired; Senior Financial Advisor, Bemis Company, Inc. from May 2002 through June 2004; Senior Vice President, Chief Financial Officer & Treasurer, Bemis, through April 2002. | | First American Funds Complex: eleven registered investment companies, including fifty-five portfolios | | None | |
|
Roger A. Gibson
P.O. Box 1329
Minneapolis, MN
55440-1329
(1946) | | Director | | Term expiring earlier of death, resignation, removal, disqualification, or successor duly elected and qualified. Director of FAIF since October 1997. | | Retired; Vice President, Cargo – United Airlines, from July 2001 through July 2004; Vice President, North America – Mountain Region, United Airlines, prior to July 2001. | | First American Funds Complex: eleven registered investment companies, including fifty-five portfolios | | None | |
|
Victoria J. Herget
P.O. Box 1329
Minneapolis, MN
55440-1329
(1951) | | Director | | Term expiring earlier of death, resignation, removal, disqualification, or successor duly elected and qualified. Director of FAIF since September 2003. | | Investment consultant and non-profit board member since 2001; Managing Director of Zurich Scudder Investments through 2001. | | First American Funds Complex: eleven registered investment companies, including fifty-five portfolios | | None | |
|
Leonard W. Kedrowski
P.O. Box 1329
Minneapolis, MN
55440-1329
(1941) | | Director | | Term expiring earlier of death, resignation, removal, disqualification, or successor duly elected and qualified. Director of FAIF since November 1993. | | Owner and President, Executive and Management Consulting, Inc., a management consulting firm; Board member, GC McGuiggan Corporation (dba Smyth Companies), a label printer; former Chief Executive Officer, Creative Promotions International, LLC, a promotional award programs and products company, through October 2003; Advisory Board member, Designer Doors, manufacturer of designer doors, through 2002. | | First American Funds Complex: eleven registered investment companies, including fifty-five portfolios | | None | |
|
Richard K. Riederer
P.O. Box 1329
Minneapolis, MN 55440-1329
(1944) | | Director | | Term expiring earlier of death, resignation, removal, disqualification, or successor duly elected and qualified. Director of FAIF since August 2001. | | Retired; Director, President and Chief Executive Officer, Weirton Steel, through 2001. | | First American Funds Complex: eleven registered investment companies, including fifty-five portfolios | | Cleveland Cliffs Inc (a producer of iron ore pellets) | |
|
Joseph D. Strauss
P.O. Box 1329
Minneapolis, MN
55440-1329
(1940) | | Director | | Term expiring earlier of death, resignation, removal, disqualification, or successor duly elected and qualified. Director of FAIF since September 1984. | | Attorney At Law, Owner and President, Strauss Management Company, a Minnesota holding company for various organizational management business ventures; Owner, Chairman and Chief Executive Officer, Community Resource Partnerships, Inc., a strategic planning, operations management, government relations, transportation planning and public relations organization; Owner, Chairman and Chief Executive Officer, Excensus(TM) LLC, a strategic demographic planning and application development firm, since 2001. | | First American Funds Complex: eleven registered investment companies, including fifty-five portfolios | | None | |
|
FIRST AMERICAN FUNDS Annual Report 2005
60
Independent Directors - continued
Name,
Address, and
Year of Birth | | Position(s)
Held
with Funds | | Term of Office
and Length of
Time Served | | Principal Occupation(s) During
Past 5 Years | | Number of
Portfolios in Fund
Complex Overseen
by Director | | Other
Directorships
Held by
Director † | |
Virginia L. Stringer
P.O. Box 1329
Minneapolis, MN
55440-1329
(1944) | | Chair; Director | | Chair Term three years. Directors Term expiring earlier of death, resignation, removal, disqualification, or successor duly elected and qualified. Chair of FAIF's Board since September 1997; Director of FAF since June 1991. | | Owner and President, Strategic Management Resources, Inc., a management consulting firm; Executive Consultant to State Farm Insurance Company. | | First American Funds Complex: eleven registered investment companies, including fifty-five portfolios | | None | |
|
James M. Wade
P.O. Box 1329
Minneapolis, MN 55440-1329
(1943) | | Director | | Term expiring earlier of death, resignation, removal, disqualification, or successor duly elected and qualified. Director of FAIF since August 2001. | | Owner and President, Jim Wade Homes, a homebuilding company, since 1999. | | First American Funds Complex: eleven registered investment companies, including fifty-five
portfolios | | None | |
|
† Includes only directorships in a company with a class of securities registered pursuant to Section 12 of the Securities Exchange Act or subject to the requirements of Section 15(d) of the Securities Exchange Act, or any company registered as an investment company under the Investment Company Act.
The Statement of Additional Information (SAI) includes additional information about fund directors and is available upon request without charge by calling 800-677-FUND or writing to First American Funds, P.O. Box 1330, Minneapolis, Minnesota, 55440-1330.
FIRST AMERICAN FUNDS Annual Report 2005
61
NOTICE TO SHAREHOLDERS September 30, 2005 (unaudited)
Officers
Position(s)
Name, Address, and
Year of Birth | | Term of Office
Held
with Funds | | and Length of
Time Served | | Principal Occupation(s) During Past 5 Years | |
Thomas S. Schreier, Jr.
U.S. Bancorp Asset
Management, Inc.
800 Nicollet Mall
Minneapolis, MN 55402
(1962) * | | President | | Re-elected by the Board annually; President of FAIF since February 2001. | | Chief Executive Officer of U.S. Bancorp Asset Management, Inc., since May 2001; prior thereto, Chief Executive Officer of First American Asset Management from December 2000 to May 2001 and of Firstar Investment & Research Management Company ("FIRMCO") from February 2001 to May 2001; prior thereto Senior Managing Director and Head of Equity Research of U.S. Bancorp Piper Jaffray. | |
|
Mark S. Jordahl
U.S. Bancorp Asset
Management, Inc.
800 Nicollet Mall
Minneapolis, MN 55402
(1960) * | | Vice President – Investments | | Re-elected by the Board annually; Vice President – Investments of FAIF since September 2001. | | Chief Investment Officer of U.S. Bancorp Asset Management, Inc., since September 2001; President and Chief Investment Officer, ING Investment Management – Americas, September 2000 to June 2001; Senior Vice President and Chief Investment Officer, ReliaStar Financial Corp., January 1998 to September 2000. | |
|
Jeffery M. Wilson
U.S. Bancorp Asset
Management, Inc.
800 Nicollet Mall
Minneapolis, MN 55402
(1956) * | | Vice President – Administration | | Re-elected by the Board annually; Vice President – Administration of FAIF since March 2000. | | Senior Vice President of U.S. Bancorp Asset Management, Inc., since May 2001; prior thereto, Senior Vice President of First American Asset Management. | |
|
Charles D Gariboldi, Jr.
U.S. Bancorp Asset
Management, Inc.
800 Nicollet Mall
Minneapolis, MN 55402
(1959) * | | Treasurer | | Re-elected by the Board annually; Treasurer of FAIF since October 2004. | | Mutual Fund Treasurer, U.S. Bancorp Asset Management, Inc., since October 2004; prior thereto Vice President of investment accounting and Fund Treasurer for Thrivent Financial for Lutherans. | |
|
Jill M. Stevenson
U.S. Bancorp Asset
Management, Inc.
800 Nicollet Mall
Minneapolis, MN 55402
(1965) * | | Assistant Treasurer | | Re-elected by the Board annually; Assistant Treasurer of FAIF since September 2005. | | Assistant Treasurer, U.S. Bancorp Asset Management, Inc., since September 2005, prior thereto, Director, Senior Project Manager, U.S. Bancorp Asset Management, Inc., from May 2003. Prior to that, Vice President, Director of Operations, Paladin Investment Associates, LLC. | |
|
David H. Lui
U.S. Bancorp Asset
Management, Inc.
800 Nicollet Mall
Minneapolis, MN 55402
(1960) * | | Chief Compliance Officer | | Re-elected by the Board annually; Chief Compliance Officer of FAIF since February 2005. | | Chief Compliance Officer for First American Funds and U.S. Bancorp Asset Management, Inc., since February 2005. Prior thereto, Chief Compliance Officer, Franklin Advisors, Inc. and Chief Compliance Counsel, Franklin Templeton Investments from March 2004. Prior to that Vice President Charles Schwab & Co,. Inc. | |
|
Kathleen L. Prudhomme
U.S. Bancorp Asset
Management, Inc.
800 Nicollet Mall
Minneapolis, MN 55402
(1953) * | | Secretary | | Re-elected by the Board annually; Secretary of FAIF since December 2004; prior thereto, Assistant Secretary of FAIF since September 1998. | | Deputy General Counsel, U.S. Bancorp Asset Management, Inc., since November 2004; prior thereto, Partner, Dorsey & Whitney LLP, a Minneapolis-based law firm. | |
|
James D. Alt,
50 South Sixth Street
Suite 1500,
Minneapolis, MN 55402
(1951) | | Assistant Secretary | | Re-elected by the Board annually; Assistant Secretary of FAIF since December 2004; prior thereto, Secretary of FAIF since June 2002; Assistant Secretary of FAIF from September 1998 through June 2002. | | Partner, Dorsey & Whitney LLP, a Minneapolis-based law firm. | |
|
Brett L. Agnew
U.S. Bancorp Asset
Management, Inc.
800 Nicollet Mall
Minneapolis, MN 55402
(1971) * | | Assistant Secretary | | Re-elected by the Board annually; Assistant Secretary of FAIF since December 2004. | | Attorney for U.S. Bancorp Asset Management, Inc., since August 2004; 2001-2004, Senior Counsel, Thrivent Financial for Lutherans; prior thereto, Consultant, Principal Financial Group. | |
|
FIRST AMERICAN FUNDS Annual Report 2005
62
Officers - continued
Position(s)
Name, Address, and
Year of Birth | | Term of Office
Held
with Fund | | and Length of
Time Served | | Principal Occupation(s) During Past 5 Years | |
James R. Arnold
615 E. Michigan Street
Milwaukee, WI 53202
(1957) * | | Assistant Secretary | | Re-elected by the Board annually; Assistant Secretary of FAIF since June 2003 | | Vice President, U.S. Bancorp Fund Services, LLC since March 2002; prior thereto, Senior Administration Services Manager, UMB Fund Services, Inc. | |
|
Douglas G. Hess
615 E. Michigan Street
Milwaukee, WI 53202
(1967) * | | Assistant Secretary | | Re-elected by the Board annually; Assistant Secretary of FAIF since September 2001 | | Vice President, U.S. Bancorp Fund Services, LLC. | |
|
* Messrs. Schreier, Jordahl, Wilson, Gariboldi, Lui and Agnew, Ms. Stevenson and Ms. Prudhomme are each officers and/or employees of U.S. Bancorp Asset Management, Inc. which serves as investment adviser and administrator for FAIF. Messrs. Hess and Arnold are officers of U.S. Bancorp Fund Services, LLC, which is a subsidiary of U.S. Bancorp and serves as Transfer Agent for FAIF.
FIRST AMERICAN FUNDS Annual Report 2005
63
(This page has been left blank intentionally.)
Board of Directors First American Investment Funds, Inc.
Virginia Stringer
Chairperson of First American Investment Funds, Inc.
Owner and President of Strategic Management Resources, Inc.
Benjamin Field III
Director of First American Investment Funds, Inc.
Retired; former Senior Vice President, Chief Financial Officer,
and Treasurer of Bemis Company, Inc.
Roger Gibson
Director of First American Investment Funds, Inc.
Retired; former Vice President of Cargo-United Airlines
Victoria Herget
Director of First American Investment Funds, Inc.
Investment Consultant; former Managing Director of Zurich Scudder Investments
Leonard Kedrowski
Director of First American Investment Funds, Inc.
Owner and President of Executive and Management Consulting, Inc.
Richard Riederer
Director of First American Investment Funds, Inc.
Retired; former President and Chief Executive Officer of Weirton Steel
Joseph Strauss
Director of First American Investment Funds, Inc.
Owner and President of Strauss Management Company
James Wade
Director of First American Investment Funds, Inc.
Owner and President of Jim Wade Homes
First American Investment Funds’ Board of Directors is comprised entirely of independent directors.
Direct fund correspondence to:
First American Funds
P.O. Box 1330
Minneapolis, MN 55440-1330
This report and the financial statements contained herein are not intended to be a forecast of future events, a guarantee of future results, or investment advice. Further, there is no assurance that certain securities will remain in or out of each fund’s portfolio. The views expressed in this report reflect those of the portfolio managers only through the period ended September 30, 2005. The portfolio managers’ views are subject to change at any time based upon market or other conditions.
This report is for the information of shareholders of the First American Investment Funds, Inc. It may also be used as sales literature when preceded or accompanied by a current prospectus, which contains information concerning investment objectives, risks, and charges and expenses of the Funds. Read the prospectus carefully before investing.
The figures in this report represent past performance and do not guarantee future results. The principal value of an investment and investment return will fluctuate so that an investor’s shares, when redeemed, may be worth more or less than their original cost.
INVESTMENT ADVISOR
U.S. Bancorp Asset Management, Inc.
800 Nicollet Mall
Minneapolis, Minnesota 55402
ADMINISTRATOR
U.S. Bancorp Asset Management, Inc.
800 Nicollet Mall
Minneapolis, Minnesota 55402
TRANSFER AGENT
U.S. Bancorp Fund Services, LLC
615 East Michigan Street
Milwaukee, Wisconsin 53202
CUSTODIAN
U.S. Bank National Association
180 East Fifth Street
St. Paul, Minnesota 55101
DISTRIBUTOR
Quasar Distributors, LLC
615 East Michigan Street
Milwaukee, Wisconsin 53202
INDEPENDENT REGISTERED PUBLIC ACCOUNTING FIRM
Ernst & Young LLP
220 South Sixth Street
Suite 1400
Minneapolis, Minnesota 55402
COUNSEL
Dorsey & Whitney LLP
50 South Sixth Street
Suite 1500
Minneapolis, Minnesota 55402
First American Funds
P.O. Box 1330
Minneapolis, MN 55440-1330
In an attempt to reduce shareholder costs and help eliminate duplication, First American Funds will try to limit their mailing to one report for each address that lists one or more shareholders with the same last name. If you would like additional copies, please call First American Investor Services at 800.677.FUND or visit firstamericanfunds.com.
0286-05 11/2005 AR-INDEX

| 2005
Annual Report |
First American Tax Free Income Funds
First American Tax Free Income Funds are comprised of tax-exempt bonds, which are debt obligations issued by state and local governments, school districts, hospitals, and various other public entities to raise money for projects and services.
Like tax-exempt bonds, tax-free income funds (also known as municipal bond funds) provide income that is typically free from federal taxes. In some cases the income may be exempt from state and local taxes as well.

TABLE OF CONTENTS
Message to Shareholders | 1 |
Report of Independent Registered Public Accounting Firm | 44 |
Schedule of Investments | 45 |
Statements of Assets and Liabilities | 98 |
Statements of Operations | 100 |
Statements of Changes in Net Assets | 102 |
Financial Highlights | 106 |
Notes to Financial Statements | 116 |
Notice to Shareholders | 126 |
Income from tax-exempt funds may be subject to state and local taxes and a portion of income may be subject to the state and/or federal alternative minimum tax for certain investors. Federal income tax rules will apply to any capital gains distributions.
| Mutual fund investing involves risk; principal loss is possible. |
| |
| NOT FDIC INSURED NO BANK GUARANTEE MAY LOSE VALUE |
Message to SHAREHOLDERS November 14, 2005
Dear Shareholders:
We invite you to take a few minutes to review the results of the fiscal year ended September 30, 2005.
This report includes comparative performance graphs and tables, portfolio commentaries, complete listings of portfolio holdings, and additional fund information. We hope you will find this helpful in monitoring your investment portfolio.
Also, through our website, firstamericanfunds.com, we provide quarterly performance fact sheets on all First American funds, the economic outlook as viewed by our senior investment officers, and other information about fund investments and portfolio strategies.
Please contact your financial professional if you have questions about First American Funds or contact First American Investor Services at 800.677.FUND.
We appreciate your investment with First American Funds and look forward to serving your financial needs in the future.
Sincerely,
/s/ Virginia L. Stringer | | /s/ Thomas S. Schreier, Jr. | |
| |
Virginia L. Stringer | Thomas S. Schreier, Jr. |
Chairperson of the Board | President |
First American Investment Funds, Inc. | First American Investment Funds, Inc. |
FIRST AMERICAN FUNDS Annual Report 2004
1
Arizona Tax Free fund
Investment Objective: maximum current income that is exempt from both federal income tax and Arizona state income tax to the extent consistent with prudent investment risk
How did the fund perform for the fiscal year ended September 30, 2005?
The First American Arizona Tax Free Fund (the "fund"), Class Y shares, returned 3.65% for the fiscal year ended September 30, 2005 (Class A shares returned 3.49%, without taking the sales charge into account, for the same period). By comparison, the fund's benchmark, the Lehman Municipal Bond Index*, returned 4.05%. Performance for the fund's peer group, the Lipper Arizona Municipal Debt Funds Category Average, was 2.95%.
What were the general economic and market conditions during the fiscal year?
Economic growth moderated but nevertheless continued at a solid pace over the course of the fiscal year. Solid economic growth, in turn, improved labor market conditions. While core inflation has been basically stable at a relatively low level, overall inflation has risen with the continuing climb of energy prices during the past year. The combination of solid growth, lower unemployment, and the potential for higher energy prices to be reflected by broader inflation measures has kept the Fed incrementally raising the Fed Funds Rate at each Federal Open Market Committee meeting since June 2004.
Despite these short-term measured rate increases, long-term rates for municipals fell, resulting in generally positive price performance for bonds maturing in 15 years or longer. The flattening yield curve (i.e., a greater rise in short-term than in long-term rates) made refunding attractive. Refunding is the refinancing of older, higher-coupon bonds by issuing new, lower-coupon bonds. Heavy refunding volume, in turn, gave rise to the record-breaking supply of new municipal bonds. More than half of these new issues carried insurance. The prevalence of insurance, combined with investor appetite for higher yields, highlighted the scarcity of lower-graded municipals, making them more valuable. Consequently, the difference, or spread, between yields on lower- and higher-rated issues continued to narrow, leading the lower-rated municipals to outperform higher-rated ones.
How did market conditions and investment strategies affect the fund's performance?
Portfolio structure and security selection were primary contributors to the fund's positive performance relative to its peer group. An overweight in bonds with 15-year and longer maturities allowed the fund to limit the effects of rising short-term rates (when interest rates increase, bond prices generally decline). While short-term interest rates continued to rise during the fiscal period, longer-term rates fell, causing longer-maturity bonds to outperform short- and intermediate-maturity bonds in terms of income and price appreciation.
The sectors with the most notably positive effect on performance were healthcare and transportation. Longer-term general obligation bonds also added value.
In terms of credit quality, lower-rated, investment-grade securities outperformed higher-quality, investment-grade municipals. The fund's increased position in A-rated bonds enjoyed strong performance due to narrowing spreads. However, as spreads narrowed and lower-rated bonds outperformed higher-rated ones, the fund was unable to increase its percentage of BBB-rated securities due to limited supply. The fund held a significant position of prefunded bonds, which significantly underperformed the general obligation and revenue issues.
What strategic moves were made by the fund and why?
The fund's duration was shortened. Given the potential for further short-term rate increases and the flattening yield curve, we sold shorter prerefunded bonds and moved the proceeds to bonds with maturities of 20 years and longer. We continued to selectively increase positions in A-rated securities.
*Unlike mutual funds, index returns do not reflect any expenses, transaction costs, or cash flow effects.
| Portfolio Allocation as of September 30, 20051 (% of net assets) | |
| Revenue Bonds3 | | | 67.7 | % | |
| General Obligations3 | | | 20.3 | % | |
| Certificates of Participation3 | | | 5.2 | % | |
| Cash Equivalents | | | 5.6 | % | |
| Other Assets and Liabilities, Net | | | 1.2 | % | |
| | | | 100.0 | % | |
| Credit Quality Distribution as of September 30, 20052 (% of market value) | |
| AAA/Aaa | | | 48.9 | % | |
| AA/Aa | | | 19.0 | % | |
| A/A | | | 8.8 | % | |
| BBB/Baa | | | 14.2 | % | |
| Non-Rated | | | 9.1 | % | |
| | | | 100.0 | % | |
1 Portfolio allocations are subject to change and are not recommendations to buy or sell any security.
2 In the case of split ratings, a security is considered to be rated in the listed category if two of Moody's Investor Service, Standard & Poor's, and Fitch rate the security in that category. If ratings are provided by only two of those rating agencies, the lower rating is used. If only one of those rating agencies provides a rating, that rating is used.
3 These sectors may include bonds that are pre-refunded or escrowed to maturity issues, see the fund's Notes to Schedule of Investments. As of September 30, 2005, 18.8% of the fund's net assets were of pre-refunded and escrowed to maturity issues.
FIRST AMERICAN FUNDS Annual Report 2005
2
Arizona Tax Free fund continued
Annual Performance1 as of September 30, 2005
| | | | | | | Since Inception | |
| | | 1 year | | 5 years | | 2/1/2000 | |
| Average annual return with sales charge (POP) | |
| Class A | | | (0.94 | )% | | | 5.41 | % | | | 6.23 | % | |
| Class C | | | 2.10 | % | | | 5.92 | % | | | 6.63 | % | |
| Average annual return without sales charge (NAV) | |
| Class A | | | 3.49 | % | | | 6.32 | % | | | 7.04 | % | |
| Class C | | | 3.08 | % | | | 5.92 | % | | | 6.63 | % | |
| Class Y | | | 3.65 | % | | | 6.58 | % | | | 7.30 | % | |
| Lehman Municipal Bond Index2 | | | 4.05 | % | | | 6.34 | % | | | 6.93 | % | |
Value of a $10,000 Investment1, 3 as of September 30, 2005
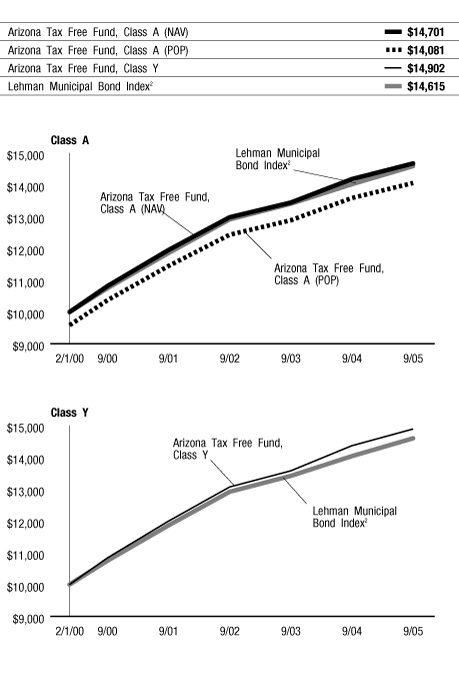
The chart above illustrates the total value of an assumed $10,000 investment in the fund's Class A and Class Y shares (from 2/1/2000 to 9/30/2005) as compared to the Lehman Municipal Bond Index2.
The performance data quoted on this page represents past performance and does not guarantee future results. The investment return and principal value of an investment will fluctuate so that an investor's shares, when redeemed, may be worth more or less than their original cost. Current performance of the fund may be lower or higher than the performance data quoted. Performance data current to the most recent month-end may be obtained by calling 800.677.FUND.
1 Performance does not reflect the deduction of taxes that a shareholder would pay on fund distributions or redemption of fund shares. Investment performance reflects fee waivers that are or were in effect. In the absence of such fee waivers, total returns would be reduced. Index performance is for illustrative purposes only and does not reflect any expenses, transaction costs, or cash flow effects. Direct investment in the index is not available.
Income from tax-exempt funds may be subject to state and local taxes and a portion of income may be subject to the federal alternative minimum tax for certain investors. Capital gains distributions, if any, will be subject to tax.
Total returns at net asset value ("NAV") reflect performance over the time period indicated without including the fund's maximum sales charge and assume reinvestment of all distributions at NAV.
Total returns at public offering price ("POP") reflect performance over the time period indicated including maximum sales charges of 4.25% for Class A shares and the maximum contingent deferred sales charge ("CDSC") for Class C shares for the relevant period. Maximum CDSC is 1.00% for Class C shares. Total returns assume reinvestment of all distributions at NAV.
Investments in debt securities typically decrease in value when interest rates rise. The risk is usually greater for longer-term debt securities.
2 An unmanaged index comprised of fixed-rate, investment-grade tax-exempt bonds with remaining maturities of one year or more.
3 Performance for Class C shares is not presented. Performance for this class is lower due to higher expenses.
FIRST AMERICAN FUNDS Annual Report 2005
3
Arizona Tax Free fund continued
Expense Example
As a shareholder of the Arizona Tax Free Fund (the "fund"), you incur two types of costs: (1) transaction costs, including sales charges (loads) on purchase payments; and (2) ongoing costs, including investment advisory fees; distribution and/or service (12b-1) fees; and other fund expenses. This example is intended to help you understand your ongoing costs (in dollars) of investing in the fund and to compare these costs with the ongoing costs of investing in other mutual funds. The example is based on an investment of $1,000 invested at the beginning of the period and held for the entire period from April 1, 2005, to September 30, 2005.
Actual Expenses
For each class, the first line of the table below provides information about actual account values and actual expenses. You may use the information in this line, together with the amount you invested, to estimate the expenses that you paid over the period. Simply divide your account value by $1,000 (for example, an $8,600 account value divided by $1,000 = 8.6), then multiply the result by the number in the first line under the heading entitled "Expenses Paid During Period" to estimate the expenses you paid on your account during this period.
Hypothetical Example for Comparison Purposes
For each class, the second line of the table below provides information about hypothetical account values and hypothetical expenses based on the fund's actual expense ratio and an assumed rate of return of 5% per year before expenses, which is not the fund's actual return. The hypothetical account values and expenses may not be used to estimate the actual ending account balance or expenses you paid for the period. You may use this information to compare the ongoing costs of investing in the fund and other funds. To do so, compare this 5% hypothetical example with the 5% hypothetical examples that appear in the shareholder reports of the other funds.
Please note that the expenses shown in the table are meant to highlight your ongoing costs only and do not reflect any transactional costs, such as sales charges (loads). Therefore, the second line of the table for each class is useful in comparing ongoing costs only, and will not help you determine the relative total costs of owning different funds. In addition, if these transactional costs were included, your costs would have been higher.
Expense Examples
| | | Beginning Account
Value (4/1/05) | | Ending Account
Value (9/30/05) | | Expenses Paid During
Period1 (4/1/05 to
9/30/05) | |
| Class A Actual2 | | $ | 1,000.00 | | | $ | 1,027.20 | | | $ | 3.81 | | |
| Class A Hypothetical (5% return before expenses) | | $ | 1,000.00 | | | $ | 1,021.31 | | | $ | 3.80 | | |
| Class C Actual2 | | $ | 1,000.00 | | | $ | 1,025.20 | | | $ | 5.84 | | |
| Class C Hypothetical (5% return before expenses) | | $ | 1,000.00 | | | $ | 1,019.30 | | | $ | 5.82 | | |
| Class Y Actual2 | | $ | 1,000.00 | | | $ | 1,027.50 | | | $ | 2.54 | | |
| Class Y Hypothetical (5% return before expenses) | | $ | 1,000.00 | | | $ | 1,022.56 | | | $ | 2.54 | | |
1 Expenses are equal to the fund's annualized expense ratio for the most recent six-month period of 0.75%, 1.15%, and 0.50% for Class A, Class C, and Class Y, respectively, mulitplied by the average account value over the period, multiplied by the number of days in the most recent half-year/365 days (to reflect the one-half year period).
2 Based on the actual returns for the six months ended September 30, 2005, of 2.72%, 2.52%, and 2.75% for Class A, Class C, and Class Y, respectively.
FIRST AMERICAN FUNDS Annual Report 2005
4
California Intermediate Tax Free fund
Investment Objective: current income that is exempt from both federal income tax and California state income tax to the extent consistent with preservation of capital
How did the fund perform for the fiscal year ended September 30, 2005?
The First American California Intermediate Tax Free Fund (the "fund"), Class Y shares, returned 2.66% for the fiscal year ended September 30, 2005 (Class A shares returned 2.51%, without taking the sales charge into account, for the same period). By comparison, the fund's benchmark, the Lehman 7-Year Municipal Bond Index*, returned 2.03%. Performance for the fund's peer group, the Lipper California Intermediate Municipal Debt Funds Category Average, was 1.88%.
What were the general economic and market conditions during the fiscal year?
Economic growth moderated but nevertheless continued at a solid pace over the course of the fiscal year. Solid economic growth, in turn, improved labor market conditions. While core inflation has been basically stable at a relatively low level, overall inflation has risen with the continuing climb of energy prices during the past year. The combination of solid growth, lower unemployment, and the potential for higher energy prices to be reflected by broader inflation measures has kept the Fed incrementally raising the Fed Funds Rate at each Federal Open Market Committee meeting since June 2004.
Despite these short-term measured rate increases, long-term rates for municipals fell, resulting in generally positive price performance for bonds maturing in 15 years or longer. The flattening yield curve (i.e., a greater rise in short-term than in long-term rates) made refunding attractive. Refunding is the refinancing of older, higher-coupon bonds by issuing new, lower-coupon bonds. Heavy refunding volume, in turn, gave rise to the record-breaking supply of new municipal bonds. More than half of these new issues carried insurance. The prevalence of insurance, combined with investor appetite for higher yields, highlighted the scarcity of lower-graded municipals, making them more valuable. Consequently, the difference, or spread, between yields on lower- and higher-rated issues continued to narrow, leading the lower-rated municipals to outperform higher-rated ones.
How did market conditions and investment strategies affect the fund's performance?
Portfolio structure and security selection were primary contributors to the fund outperforming the index. The fund emphasized longer-term securities in order to benefit from the flattening yield curve. Consequently, as short-term interest rates continued to rise while longer-term rates declined, this emphasis on longer-term securities (10 years or more) provided better price appreciation along with higher income. The fund also benefited from an incremental "barbelling" strategy, whereby short- and intermediate-maturity bonds are de-emphasized in favor of cash and longer-maturity issues.
In terms of credit quality, lower-rated, investment-grade securities outperformed higher-quality, investment-grade municipals. Consequently, the fund's holdings in BBB-rated bonds and A-rated bonds had a positive effect on the fund's performance.
Because of the steadily rising short-term interest rates, shorter-maturity bonds, though generating positive returns, nonetheless underperformed longer-maturing bonds. With credit spreads narrowing, the performance of higher-rated bonds was weaker, as was that of prerefunded bonds.
What strategic moves were made by the fund and why?
Given the potential for further short-term rate increases and the flattening yield curve, we increased weighting for bonds with maturities of 10 years or more. The fund's duration was neutral to slightly long to its benchmark throughout most of the fiscal year.
*Unlike mutual funds, index returns do not reflect any expenses, transaction costs, or cash flow effects.
| Portfolio Allocation as of September 30, 20051 (% of net assets) | |
| Revenue Bonds3 | | | 68.2 | % | |
| General Obligations3 | | | 19.8 | % | |
| Certificates of Participation3 | | | 7.0 | % | |
| Cash Equivalents | | | 4.3 | % | |
| Other Assets and Liabilities, Net | | | 0.7 | % | |
| | | | 100.0 | % | |
| Credit Quality Distribution as of September 30, 20052 (% of market value) | |
| AAA/Aaa | | | 51.7 | % | |
| AA/Aa | | | 5.6 | % | |
| A/A | | | 22.6 | % | |
| BBB/Baa | | | 16.8 | % | |
| Non-Rated | | | 3.3 | % | |
| | | | 100.0 | % | |
1 Portfolio allocations are subject to change and are not recommendations to buy or sell any security.
2 In the case of split ratings, a security is considered to be rated in the listed category if two of Moody's Investor Service, Standard & Poor's, and Fitch rate the security in that category. If ratings are provided by only two of those rating agencies, the lower rating is used. If only one of those rating agencies provides a rating, that rating is used.
3 These sectors may include bonds that are pre-refunded or escrowed to maturity issues, see the fund's Notes to Schedule of Investments. As of September 30, 2005, 9.1% of the fund's net assets were of pre-refunded and escrowed to maturity issues.
FIRST AMERICAN FUNDS Annual Report 2005
5
California Intermediate Tax Free fund continued
Annual Performance1 as of September 30, 2005
| | | | | | | Since Inception | |
| | | 1 year | | 5 years | | 8/8/1997 | |
| Average annual return with sales charge (POP) | |
| Class A | | | 0.23 | % | | | 4.47 | % | | | 4.47 | % | |
| Average annual return without sales charge (NAV) | |
| Class A | | | 2.51 | % | | | 4.94 | % | | | 4.76 | % | |
| Class Y | | | 2.66 | % | | | 5.06 | % | | | 4.86 | % | |
| Lehman 7-Year Municipal Bond Index2 | | | 2.03 | % | | | 5.71 | % | | | 5.24 | % | |
Value of a $10,000 Investment1 as of September 30, 2005
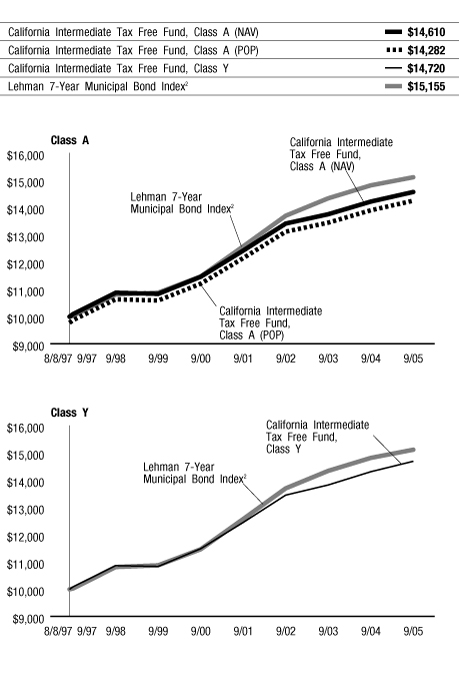
The chart above illustrates the total value of an assumed $10,000 investment in the fund's Class A and Class Y shares (from 8/8/1997 to 9/30/2005) as compared to the Lehman 7-Year Municipal Bond Index2.
The performance data quoted on this page represents past performance and does not guarantee future results. The investment return and principal value of an investment will fluctuate so that an investor's shares, when redeemed, may be worth more or less than their original cost. Current performance of the fund may be lower or higher than the performance data quoted. Performance data current to the most recent month-end may be obtained by calling 800.677.FUND.
1 Performance does not reflect the deduction of taxes that a shareholder would pay on fund distributions or redemption of fund shares. Investment performance reflects fee waivers that are or were in effect. In the absence of such fee waivers, total returns would be reduced. Index performance is for illustrative purposes only and does not reflect any expenses, transaction costs, or cash flow effects. Direct investment in the index is not available.
Income from tax-exempt funds may be subject to state and local taxes and a portion of income may be subject to the federal alternative minimum tax for certain investors. Capital gains distributions, if any, will be subject to tax.
Total returns at net asset value ("NAV") reflect performance over the time period indicated without including the fund's maximum sales charge and assume reinvestment of all distributions at NAV.
Total returns at public offering price ("POP") reflect performance over the time period indicated including maximum sales charges of 2.25% for Class A shares. Total returns assume reinvestment of all distributions at NAV.
Investments in debt securities typically decrease in value when interest rates rise. The risk is usually greater for longer-term debt securities.
2 An unmanaged index comprised of fixed-rate, investment-grade tax-exempt bonds with remaining maturities between six and eight years.
FIRST AMERICAN FUNDS Annual Report 2005
6
California Intermediate Tax Free fund continued
Expense Example
As a shareholder of the California Intermediate Tax Free Fund (the "fund"), you incur two types of costs: (1) transaction costs, including sales charges (loads) on purchase payments; and (2) ongoing costs, including investment advisory fees; distribution and/or service (12b-1) fees; and other fund expenses. This example is intended to help you understand your ongoing costs (in dollars) of investing in the fund and to compare these costs with the ongoing costs of investing in other mutual funds. The example is based on an investment of $1,000 invested at the beginning of the period and held for the entire period from April 1, 2005, to September 30, 2005.
Actual Expenses
For each class, the first line of the table below provides information about actual account values and actual expenses. You may use the information in this line, together with the amount you invested, to estimate the expenses that you paid over the period. Simply divide your account value by $1,000 (for example, an $8,600 account value divided by $1,000 = 8.6), then multiply the result by the number in the first line under the heading entitled "Expenses Paid During Period" to estimate the expenses you paid on your account during this period.
Hypothetical Example for Comparison Purposes
For each class, the second line of the table below provides information about hypothetical account values and hypothetical expenses based on the fund's actual expense ratio and an assumed rate of return of 5% per year before expenses, which is not the fund's actual return. The hypothetical account values and expenses may not be used to estimate the actual ending account balance or expenses you paid for the period. You may use this information to compare the ongoing costs of investing in the fund and other funds. To do so, compare this 5% hypothetical example with the 5% hypothetical examples that appear in the shareholder reports of the other funds.
Please note that the expenses shown in the table are meant to highlight your ongoing costs only and do not reflect any transactional costs, such as sales charges (loads). Therefore, the second line of the table for each class is useful in comparing ongoing costs only, and will not help you determine the relative total costs of owning different funds. In addition, if these transactional costs were included, your costs would have been higher.
Expense Examples
| | | Beginning Account
Value (4/1/05) | | Ending Account
Value (9/30/05) | | Expenses Paid During
Period1 (4/1/05 to
9/30/05) | |
| Class A Actual2 | | $ | 1,000.00 | | | $ | 1,022.50 | | | $ | 4.31 | | |
| Class A Hypothetical (5% return before expenses) | | $ | 1,000.00 | | | $ | 1,020.81 | | | $ | 4.31 | | |
| Class Y Actual2 | | $ | 1,000.00 | | | $ | 1,023.30 | | | $ | 3.55 | | |
| Class Y Hypothetical (5% return before expenses) | | $ | 1,000.00 | | | $ | 1,021.56 | | | $ | 3.55 | | |
1 Expenses are equal to the fund's annualized expense ratio for the most recent six-month period of 0.85% and 0.70% for Class A and Class Y, respectively, mulitplied by the average account value over the period, multiplied by the number of days in the most recent half-year/365 days (to reflect the one-half year period).
2 Based on the actual returns for the six months ended September 30, 2005, of 2.25% and 2.33% for Class A and Class Y, respectively.
FIRST AMERICAN FUNDS Annual Report 2005
7
California Tax Free fund
Investment Objective: maximum current income that is exempt from both federal income tax and California state income tax to the extent consistent with prudent investment risk
How did the fund perform for the fiscal year ended September 30, 2005?
The First American California Tax Free Fund (the "fund"), Class Y shares, returned 3.85% for the fiscal year ended September 30, 2005 (Class A shares returned 3.50%, without taking the sales charge into account, for the same period). By comparison, the fund's benchmark, the Lehman Municipal Bond Index*, returned 4.05%. Performance for the fund's peer group, the Lipper California Municipal Debt Funds Category Average, was 4.52%.
What were the general economic and market conditions during the fiscal year?
Economic growth moderated but nevertheless continued at a solid pace over the course of the fiscal year. Solid economic growth, in turn, improved labor market conditions. While core inflation has been basically stable at a relatively low level, overall inflation has risen with the continuing climb of energy prices during the past year. The combination of solid growth, lower unemployment, and the potential for higher energy prices to be reflected by broader inflation measures has kept the Fed incrementally raising the Fed Funds Rate at each Federal Open Market Committee meeting since June 2004.
Despite these short-term measured rate increases, long-term rates for municipals fell, resulting in generally positive price performance for bonds maturing in 15 years or longer. The flattening yield curve (i.e., a greater rise in short-term than in long-term rates) made refunding attractive. Refunding is the refinancing of older, higher-coupon bonds by issuing new, lower-coupon bonds. Heavy refunding volume, in turn, gave rise to the record-breaking supply of new municipal bonds. More than half of these new issues carried insurance. The prevalence of insurance, combined with investor appetite for higher yields, highlighted the scarcity of lower-graded municipals, making them more valuable. Consequently, the difference, or spread, between yields on lower- and higher-rated issues continued to narrow, leading the lower-rated municipals to outperform higher-rated ones.
How did market conditions and investment strategies affect the fund's performance?
As short-term interest rates continued to rise while longer-term rates declined, shorter-maturity bonds, though generating positive returns, nonetheless underperformed. While the fund emphasized longer-term securities, which provided favorable income with better price appreciation, it would have benefited from a higher allocation at the long end of the yield curve (bond maturities of 22 years or more).
In terms of credit quality, lower-rated, investment-grade securities outperformed higher-quality, investment-grade municipals. The fund's holdings rated BBB outperformed higher-rated bonds as spreads narrowed. Despite the strong performance by these bonds, the fund as a whole underperformed relative to the index, largely because of its relatively lower allocation in bonds with longer maturities.
What strategic moves were made by the fund and why?
Given the potential for further short-term rate increases and the flattening yield curve, we increased weighting for bonds in the maturity range of 15 to 20 years. We were able to slightly increase the weighting for lower-rated bonds. The fund's duration was mostly neutral to the benchmark during the fiscal year.
*Unlike mutual funds, index returns do not reflect any expenses, transaction costs, or cash flow effects.
| Portfolio Allocation as of September 30, 20051 (% of net assets) | |
| Revenue Bonds3 | | | 71.8 | % | |
| General Obligations3 | | | 19.9 | % | |
| Certificates of Participation3 | | | 4.3 | % | |
| Cash Equivalents | | | 4.4 | % | |
| Other Assets and Liabilities, Net | | | (0.4 | )% | |
| | | | 100.0 | % | |
| Credit Quality Distribution as of September 30, 20052 (% of market value) | |
| AAA/Aaa | | | 53.4 | % | |
| AA/Aa | | | 12.6 | % | |
| A/A | | | 12.5 | % | |
| BBB/Baa | | | 17.6 | % | |
| Non-Rated | | | 3.9 | % | |
| | | | 100.0 | % | |
1 Portfolio allocations are subject to change and are not recommendations to buy or sell any security.
2 In the case of split ratings, a security is considered to be rated in the listed category if two of Moody's Investor Service, Standard & Poor's, and Fitch rate the security in that category. If ratings are provided by only two of those rating agencies, the lower rating is used. If only one of those rating agencies provides a rating, that rating is used.
3 These sectors may include bonds that are pre-refunded or escrowed to maturity issues, see the fund's Notes to Schedule of Investments. As of September 30, 2005, 13.2% of the fund's net assets were of pre-refunded and escrowed to maturity issues.
FIRST AMERICAN FUNDS Annual Report 2005
8
California Tax Free fund continued
Annual Performance1 as of September 30, 2005
| | | | | | | Since Inception | |
| | | 1 year | | 5 years | | 2/1/2000 | |
| Average annual return with sales charge (POP) | |
| Class A | | | (0.93 | )% | | | 5.07 | % | | | 6.28 | % | |
| Class C | | | 2.12 | % | | | 5.60 | % | | | 6.70 | % | |
| Average annual return without sales charge (NAV) | |
| Class A | | | 3.50 | % | | | 5.98 | % | | | 7.09 | % | |
| Class C | | | 3.11 | % | | | 5.60 | % | | | 6.70 | % | |
| Class Y | | | 3.85 | % | | | 6.26 | % | | | 7.37 | % | |
| Lehman Municipal Bond Index2 | | | 4.05 | % | | | 6.34 | % | | | 6.93 | % | |
Value of a $10,000 Investment1, 3 as of September 30, 2005
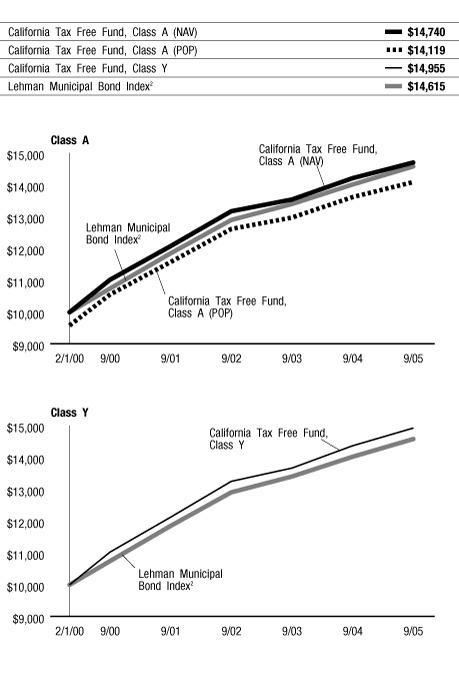
The chart above illustrates the total value of an assumed $10,000 investment in the fund's Class A and Class Y shares (from 2/1/2000 to 9/30/2005) as compared to the Lehman Municipal Bond Index2.
The performance data quoted on this page represents past performance and does not guarantee future results. The investment return and principal value of an investment will fluctuate so that an investor's shares, when redeemed, may be worth more or less than their original cost. Current performance of the fund may be lower or higher than the performance data quoted. Performance data current to the most recent month-end may be obtained by calling 800.677.FUND.
1 Performance does not reflect the deduction of taxes that a shareholder would pay on fund distributions or redemption of fund shares. Investment performance reflects fee waivers that are or were in effect. In the absence of such fee waivers, total returns would be reduced. Index performance is for illustrative purposes only and does not reflect any expenses, transaction costs, or cash flow effects. Direct investment in the index is not available.
Income from tax-exempt funds may be subject to state and local taxes and a portion of income may be subject to the federal alternative minimum tax for certain investors. Capital gains distributions, if any, will be subject to tax.
Total returns at net asset value ("NAV") reflect performance over the time period indicated without including the fund's maximum sales charge and assume reinvestment of all distributions at NAV.
Total returns at public offering price ("POP") reflect performance over the time period indicated including maximum sales charges of 4.25% for Class A shares and the maximum contingent deferred sales charge ("CDSC") for Class C shares for the relevant period. Maximum CDSC is 1.00% for Class C shares. Total returns assume reinvestment of all distributions at NAV.
Investments in debt securities typically decrease in value when interest rates rise. The risk is usually greater for longer-term debt securities.
2 An unmanaged index comprised of fixed-rate, investment-grade tax-exempt bonds with remaining maturities of one year or more.
3 Performance for Class C shares is not presented. Performance for this class is lower due to higher expenses.
FIRST AMERICAN FUNDS Annual Report 2005
9
California Tax Free fund continued
Expense Example
As a shareholder of the California Tax Free Fund (the "fund"), you incur two types of costs: (1) transaction costs, including sales charges (loads) on purchase payments; and (2) ongoing costs including investment advisory fees; distribution and/or service (12b-1) fees; and other fund expenses. This example is intended to help you understand your ongoing costs (in dollars) of investing in the fund and to compare these costs with the ongoing costs of investing in other mutual funds. The example is based on an investment of $1,000 invested at the beginning of the period and held for the entire period from April 1, 2005, to September 30, 2005.
Actual Expenses
For each class, the first line of the table below provides information about actual account values and actual expenses. You may use the information in this line, together with the amount you invested, to estimate the expenses that you paid over the period. Simply divide your account value by $1,000 (for example, an $8,600 account value divided by $1,000 = 8.6), then multiply the result by the number in the first line under the heading entitled "Expenses Paid During Period" to estimate the expenses you paid on your account during this period.
Hypothetical Example for Comparison Purposes
For each class, the second line of the table below provides information about hypothetical account values and hypothetical expenses based on the fund's actual expense ratio and an assumed rate of return of 5% per year before expenses, which is not the fund's actual return. The hypothetical account values and expenses may not be used to estimate the actual ending account balance or expenses you paid for the period. You may use this information to compare the ongoing costs of investing in the fund and other funds. To do so, compare this 5% hypothetical example with the 5% hypothetical examples that appear in the shareholder reports of the other funds.
Please note that the expenses shown in the table are meant to highlight your ongoing costs only and do not reflect any transactional costs, such as sales charges (loads). Therefore, the second line of the table for each class is useful in comparing ongoing costs only, and will not help you determine the relative total costs of owning different funds. In addition, if these transactional costs were included, your costs would have been higher.
Expense Examples
| | | Beginning Account
Value (4/1/05) | | Ending Account
Value (9/30/05) | | Expenses Paid During
Period1 (4/1/05 to
9/30/05) | |
| Class A Actual2 | | $ | 1,000.00 | | | $ | 1,027.50 | | | $ | 3.81 | | |
| Class A Hypothetical (5% return before expenses) | | $ | 1,000.00 | | | $ | 1,021.31 | | | $ | 3.80 | | |
| Class C Actual2 | | $ | 1,000.00 | | | $ | 1,025.70 | | | $ | 5.84 | | |
| Class C Hypothetical (5% return before expenses) | | $ | 1,000.00 | | | $ | 1,019.30 | | | $ | 5.82 | | |
| Class Y Actual2 | | $ | 1,000.00 | | | $ | 1,028.80 | | | $ | 2.54 | | |
| Class Y Hypothetical (5% return before expenses) | | $ | 1,000.00 | | | $ | 1,022.56 | | | $ | 2.54 | | |
1 Expenses are equal to the fund's annualized expense ratio for the most recent six-month period of 0.75%, 1.15%, and 0.50% for Class A, Class C, and Class Y, respectively, mulitplied by the average account value over the period, multiplied by the number of days in the most recent half-year/365 days (to reflect the one-half year period).
2 Based on the actual returns for the six months ended September 30, 2005, of 2.75%, 2.57% and 2.88% for Class A, Class C, and Class Y, respectively.
FIRST AMERICAN FUNDS Annual Report 2005
10
Colorado Intermediate Tax Free fund
Investment Objective: current income that is exempt from both federal income tax and Colorado state income tax to the extent consistent with preservation of capital
How did the fund perform for the fiscal year ended September 30, 2005?
The First American Colorado Intermediate Tax Free Fund (the "fund"), Class Y shares, returned 2.36% for the fiscal year ended September 30, 2005 (Class A shares returned 2.11%, without taking the sales charge into account, for the same period). By comparison, the fund's benchmark, the Lehman 7-Year Municipal Bond Index*, returned 2.03%. Performance for the fund's peer group, the Lipper Other States Intermediate Municipal Debt Funds Category Average, was 1.65%.
What were the general economic and market conditions during the fiscal year?
Economic growth moderated but nevertheless continued at a solid pace over the course of the fiscal year. Solid economic growth, in turn, improved labor market conditions. While core inflation has been basically stable at a relatively low level, overall inflation has risen with the continuing climb of energy prices during the past year. The combination of solid growth, lower unemployment, and the potential for higher energy prices to be reflected by broader inflation measures has kept the Fed incrementally raising the Fed Funds Rate at each Federal Open Market Committee meeting since June 2004.
Despite these short-term measured rate increases, long-term rates for municipals fell, resulting in generally positive price performance for bonds maturing in 15 years or longer. The flattening yield curve (i.e., a greater rise in short-term than in long-term rates) made refunding attractive. Refunding is the refinancing of older, higher-coupon bonds by issuing new, lower-coupon bonds. Heavy refunding volume, in turn, gave rise to the record-breaking supply of new municipal bonds. More than half of these new issues carried insurance. The prevalence of insurance, combined with investor appetite for higher yields, highlighted the scarcity of lower-graded municipals, making them more valuable. Consequently, the difference, or spread, between yields on lower- and higher-rated issues continued to narrow, leading the lower-rated municipals to outperform higher-rated ones.
How did market conditions and investment strategies affect the fund's performance?
Portfolio structure and security selection were primary contributors to the fund outperforming the index. Because of the steadily rising short-term interest rates, shorter-maturity bonds, though generating positive returns, nonetheless underperformed. The fund, however, emphasized longer-term securities in order to benefit from the flattening yield curve and to provide better price appreciation along with higher income.
The fund's emphasis on revenue bonds vs. general obligations bonds was a positive contributor to performance as revenue bonds generally outperformed. The sector with the most notably positive effect on performance was healthcare.
In terms of credit quality, lower-rated, investment-grade securities outperformed higher-quality, investment-grade municipals. The fund's holdings rated A or lower outperformed.
What strategic moves were made by the fund and why?
Given the potential for further short-term rate increases and the flattening yield curve, we increased the weighting for bonds in the maturity range of 10 to 15 years. We also slightly increased the weighting for bonds rated A and BBB. The fund's duration was neutral to slightly long vs. the benchmark during the fiscal year.
*Unlike mutual funds, index returns do not reflect any expenses, transaction costs, or cash flow effects.
| Portfolio Allocation as of September 30, 20051 (% of net assets) | |
| Revenue Bonds3 | | | 71.6 | % | |
| General Obligations3 | | | 19.6 | % | |
| Certificates of Participation3 | | | 7.2 | % | |
| Cash Equivalents | | | 0.3 | % | |
| Other Assets and Liabilities, Net | | | 1.3 | % | |
| | | | 100.0 | % | |
| Credit Quality Distribution as of September 30, 20052 (% of market value) | |
| AAA/Aaa | | | 52.5 | % | |
| AA/Aa | | | 12.7 | % | |
| A/A | | | 9.7 | % | |
| BBB/Baa | | | 19.4 | % | |
| BB/Ba | | | 0.8 | % | |
| Non-Rated | | | 4.9 | % | |
| | | | 100.0 | % | |
1 Portfolio allocations are subject to change and are not recommendations to buy or sell any security.
2 In the case of split ratings, a security is considered to be rated in the listed category if two of Moody's Investor Service, Standard & Poor's, and Fitch rate the security in that category. If ratings are provided by only two of those rating agencies, the lower rating is used. If only one of those rating agencies provides a rating, that rating is used.
3 These sectors may include bonds that are pre-refunded or escrowed to maturity issues, see the fund's Notes to Schedule of Investments. As of September 30, 2005, 11.1% of the fund's net assets were of pre-refunded and escrowed to maturity issues.
FIRST AMERICAN FUNDS Annual Report 2005
11
Colorado Intermediate Tax Free fund continued
Annual Performance1 as of September 30, 2005
| | | 1 year | | 5 years | | 10 years | |
| Average annual return with sales charge (POP) | |
| Class A | | | (0.17 | )% | | | 4.71 | % | | | 4.58 | % | |
| Average annual return without sales charge (NAV) | |
| Class A | | | 2.11 | % | | | 5.20 | % | | | 4.82 | % | |
| Class Y | | | 2.36 | % | | | 5.33 | % | | | 4.87 | % | |
| Lehman 7-Year Municipal Bond Index2 | | | 2.03 | % | | | 5.71 | % | | | 5.47 | % | |
Value of a $10,000 Investment1 as of September 30, 2005
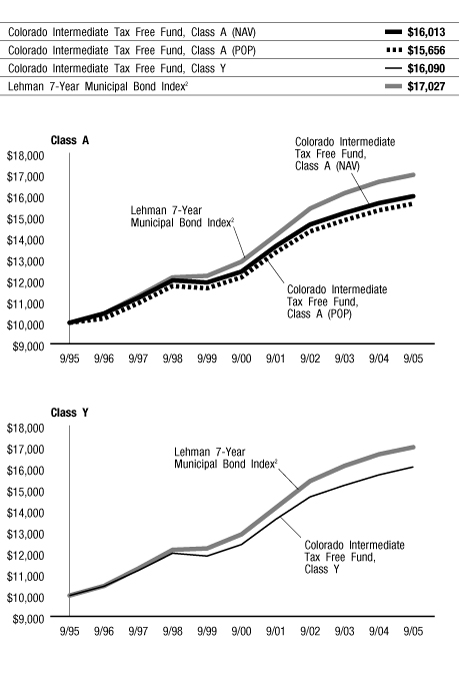
The chart above illustrates the total value of an assumed $10,000 investment in the fund's Class A and Class Y shares (from 9/30/1995 to 9/30/2005) as compared to the Lehman 7-Year Municipal Bond Index2.
The performance data quoted on this page represents past performance and does not guarantee future results. The investment return and principal value of an investment will fluctuate so that an investor's shares, when redeemed, may be worth more or less than their original cost. Current performance of the fund may be lower or higher than the performance data quoted. Performance data current to the most recent month-end may be obtained by calling 800.677.FUND.
1 Performance does not reflect the deduction of taxes that a shareholder would pay on fund distributions or redemption of fund shares. Investment performance reflects fee waivers that are or were in effect. In the absence of such fee waivers, total returns would be reduced. Index performance is for illustrative purposes only and does not reflect any expenses, transaction costs, or cash flow effects. Direct investment in the index is not available.
Income from tax-exempt funds may be subject to state and local taxes and a portion of income may be subject to the federal alternative minimum tax for certain investors. Capital gains distributions, if any, will be subject to tax.
Total returns at net asset value ("NAV") reflect performance over the time period indicated without including the fund's maximum sales charge and assume reinvestment of all distributions at NAV.
Total returns at public offering price ("POP") reflect performance over the time period indicated including maximum sales charges of 2.25% for Class A shares. Total returns assume reinvestment of all distributions at NAV.
Investments in debt securities typically decrease in value when interest rates rise. The risk is usually greater for longer-term debt securities.
2 An unmanaged index comprised of fixed-rate, investment-grade tax-exempt bonds with remaining maturities between six and eight years.
FIRST AMERICAN FUNDS Annual Report 2005
12
Colorado Intermediate Tax Free fund continued
Expense Example
As a shareholder of the Colorado Intermediate Tax Free Fund (the "fund"), you incur two types of costs: (1) transaction costs, including sales charges (loads) on purchase payments; and (2) ongoing costs, including investment advisory fees; distribution and/or service (12b-1) fees; and other fund expenses. This example is intended to help you understand your ongoing costs (in dollars) of investing in the fund and to compare these costs with the ongoing costs of investing in other mutual funds. The example is based on an investment of $1,000 invested at the beginning of the period and held for the entire period from April 1, 2005, to September 30, 2005.
Actual Expenses
For each class, the first line of the table below provides information about actual account values and actual expenses. You may use the information in this line, together with the amount you invested, to estimate the expenses that you paid over the period. Simply divide your account value by $1,000 (for example, an $8,600 account value divided by $1,000 = 8.6), then multiply the result by the number in the first line under the heading entitled "Expenses Paid During Period" to estimate the expenses you paid on your account during this period.
Hypothetical Example for Comparison Purposes
For each class, the second line of the table below provides information about hypothetical account values and hypothetical expenses based on the fund's actual expense ratio and an assumed rate of return of 5% per year before expenses, which is not the fund's actual return. The hypothetical account values and expenses may not be used to estimate the actual ending account balance or expenses you paid for the period. You may use this information to compare the ongoing costs of investing in the fund and other funds. To do so, compare this 5% hypothetical example with the 5% hypothetical examples that appear in the shareholder reports of the other funds.
Please note that the expenses shown in the table are meant to highlight your ongoing costs only and do not reflect any transactional costs, such as sales charges (loads). Therefore, the second line of the table for each class is useful in comparing ongoing costs only, and will not help you determine the relative total costs of owning different funds. In addition, if these transactional costs were included, your costs would have been higher.
Expense Examples
| | | Beginning Account
Value (4/1/05) | | Ending Account
Value (9/30/05) | | Expenses Paid During
Period1 (4/1/05 to
9/30/05) | |
| Class A Actual2 | | $ | 1,000.00 | | | $ | 1,024.70 | | | $ | 4.31 | | |
| Class A Hypothetical (5% return before expenses) | | $ | 1,000.00 | | | $ | 1,020.81 | | | $ | 4.31 | | |
| Class Y Actual2 | | $ | 1,000.00 | | | $ | 1,026.50 | | | $ | 3.56 | | |
| Class Y Hypothetical (5% return before expenses) | | $ | 1,000.00 | | | $ | 1,021.56 | | | $ | 3.55 | | |
1 Expenses are equal to the fund's annualized expense ratio for the most recent six-month period of 0.85% and 0.70% for Class A and Class Y, respectively, mulitplied by the average account value over the period, multiplied by the number of days in the most recent half-year/365 days (to reflect the one-half year period).
2 Based on the actual returns for the six months ended September 30, 2005, of 2.47% and 2.65% for Class A and Class Y, respectively.
FIRST AMERICAN FUNDS Annual Report 2005
13
Colorado Tax Free fund
Investment Objective: maximum current income that is exempt from both federal income tax and Colorado state income tax to the extent consistent with prudent investment risk
How did the fund perform for the fiscal year ended September 30, 2005?
The First American Colorado Tax Free Fund (the "fund"), Class Y shares, returned 3.70% for the fiscal year ended September 30, 2005 (Class A shares returned 3.36%, without taking the sales charge into account, for the same period). By comparison, the fund's benchmark, the Lehman Municipal Bond Index*, returned 4.05%. Performance for the fund's peer group, the Lipper Colorado Municipal Debt Funds Category, was 3.37%.
What were the general economic and market conditions during the fiscal year?
Economic growth moderated but nevertheless continued at a solid pace over the course of the fiscal year. Solid economic growth, in turn, improved labor market conditions. While core inflation has been basically stable at a relatively low level, overall inflation has risen with the continuing climb of energy prices during the past year. The combination of solid growth, lower unemployment, and the potential for higher energy prices to be reflected by broader inflation measures has kept the Fed incrementally raising the Fed Funds Rate at each Federal Open Market Committee meeting since June 2004.
Despite these short-term measured rate increases, long-term rates for municipals fell, resulting in generally positive price performance for bonds maturing in 15 years or longer. The flattening yield curve (i.e., a greater rise in short-term than in long-term rates) made refunding attractive. Refunding is the refinancing of older, higher-coupon bonds by issuing new, lower-coupon bonds. Heavy refunding volume, in turn, gave rise to the record-breaking supply of new municipal bonds. More than half of these new issues carried insurance. The prevalence of insurance, combined with investor appetite for higher yields, highlighted the scarcity of lower-graded municipals, making them more valuable. Consequently, the difference, or spread, between yields on lower- and higher-rated issues continued to narrow, leading the lower-rated municipals to outperform higher-rated ones.
How did market conditions and investment strategies affect the fund's performance?
Portfolio structure and security selection were primary contributors to the fund's positive performance relative to its peer group. In terms of credit quality, lower-rated, investment-grade securities outperformed higher-quality, investment-grade municipals. Consequently, the fund's holdings in BBB-rated bonds and A-rated bonds had a positive effect on the fund's performance. However, due to limited supply in the state, the fund was unable to increase its percentage of nonrated securities, which contributed to its underperformance as spreads narrowed substantially on these securities.
An overweight in bonds with 15-year and longer maturities allowed the fund to limit the effects of rising short-term rates (when interest rates increase, bond prices generally decline). While short-term interest rates continued to rise during the fiscal year, longer-term rates fell, causing longer-maturity bonds to outperform short- and intermediate-maturity bonds in terms of income and price appreciation.
The fund's emphasis on revenue bonds vs. general obligations bonds was a positive contributor to performance as revenue bonds generally outperformed. The sectors with the most notably positive effect on performance were healthcare, housing, and solid waste disposal.
What strategic moves were made by the fund and why?
The fund's duration was shortened from long to the benchmark to neutral to the benchmark. Given the potential for further short-term rate increases and the flattening yield curve, we sold underperforming prerefunded bonds and moved the proceeds to bonds with maturities of 20 years and longer. We continued to selectively increase positions in A/BBB-rated bonds.
*Unlike mutual funds, index returns do not reflect any expenses, transaction costs, or cash flow effects.
| Portfolio Allocation as of September 30, 20051 (% of net assets) | |
| Revenue Bonds3 | | | 68.9 | % | |
| Certificates of Participation3 | | | 18.2 | % | |
| General Obligations3 | | | 10.6 | % | |
| Cash Equivalents | | | 1.0 | % | |
| Other Assets and Liabilities, Net | | | 1.3 | % | |
| | | | 100.0 | % | |
| Credit Quality Distribution as of September 30, 20052 (% of market value) | |
| AAA/Aaa | | | 52.4 | % | |
| AA/Aa | | | 12.6 | % | |
| A/A | | | 13.1 | % | |
| BBB/Baa | | | 20.2 | % | |
| Non-Rated | | | 1.7 | % | |
| | | | 100.0 | % | |
1 Portfolio allocations are subject to change and are not recommendations to buy or sell any security.
2 In the case of split ratings, a security is considered to be rated in the listed category if two of Moody's Investor Service, Standard & Poor's, and Fitch rate the security in that category. If ratings are provided by only two of those rating agencies, the lower rating is used. If only one of those rating agencies provides a rating, that rating is used.
3 These sectors may include bonds that are pre-refunded or escrowed to maturity issues, see the fund's Notes to Schedule of Investments. As of September 30, 2005, 15.9% of the fund's net assets were of pre-refunded and escrowed to maturity issues.
FIRST AMERICAN FUNDS Annual Report 2005
14
Colorado Tax Free fund continued
Annual Performance1 as of September 30, 2005
| | | | | | | Since Inception | |
| | | 1 year | | 5 years | | 2/1/2000 | |
| Average annual return with sales charge (POP) | | | |
| Class A | | | (1.03 | )% | | | 6.56 | % | | | 6.37 | % | |
| Class C | | | 1.97 | % | | | 6.15 | % | | | 6.77 | % | |
| Average annual return without sales charge (NAV) | | | |
| Class A | | | 3.36 | % | | | 5.65 | % | | | 7.18 | % | |
| Class C | | | 2.95 | % | | | 6.15 | % | | | 6.77 | % | |
| Class Y | | | 3.70 | % | | | 6.83 | % | | | 7.47 | % | |
| Lehman Municipal Bond Index2 | | | 4.05 | % | | | 6.34 | % | | | 6.93 | % | |
Value of a $10,000 Investment1, 3 as of September 30, 2005
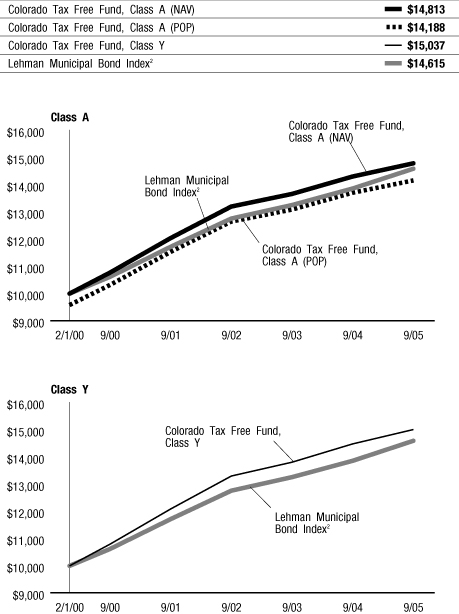
The chart above illustrates the total value of an assumed $10,000 investment in the fund's Class A and Class Y shares (from 2/1/2000 to 9/30/2005) as compared to the Lehman Municipal Bond Index2.
The performance data quoted on this page represents past performance and does not guarantee future results. The investment return and principal value of an investment will fluctuate so that an investor's shares, when redeemed, may be worth more or less than their original cost. Current performance of the fund may be lower or higher than the performance data quoted. Performance data current to the most recent month-end may be obtained by calling 800.677.FUND.
1 Performance does not reflect the deduction of taxes that a shareholder would pay on fund distributions or redemption of fund shares. Investment performance reflects fee waivers that are or were in effect. In the absence of such fee waivers, total returns would be reduced. Index performance is for illustrative purposes only and does not reflect any expenses, transaction costs, or cash flow effects. Direct investment in the index is not available.
Income from tax-exempt funds may be subject to state and local taxes and a portion of income may be subject to the federal alternative minimum tax for certain investors. Capital gains distributions, if any, will be subject to tax.
Total returns at net asset value ("NAV") reflect performance over the time period indicated without including the fund's maximum sales charge and assume reinvestment of all distributions at NAV.
Total returns at public offering price ("POP") reflect performance over the time period indicated including maximum sales charges of 4.25% for Class A shares and the maximum contingent deferred sales charge ("CDSC") for Class C shares for the relevant period. Maximum CDSC is 1.00% for Class C shares. Total returns assume reinvestment of all distributions at NAV.
Investments in debt securities typically decrease in value when interest rates rise. The risk is usually greater for longer-term debt securities.
2 An unmanaged index comprised of fixed-rate, investment-grade tax-exempt bonds with remaining maturities of one year or more.
3 Performance for Class C shares is not presented. Performance for this class is lower due to higher expenses.
FIRST AMERICAN FUNDS Annual Report 2005
15
Colorado Tax Free fund continued
Expense Example
As a shareholder of the Colorado Tax Free Fund (the "fund"), you incur two types of costs: (1) transaction costs, including sales charges (loads) on purchase payments; and (2) ongoing costs, including investment advisory fees; distribution and/or service (12b-1) fees; and other fund expenses. This example is intended to help you understand your ongoing costs (in dollars) of investing in the fund and to compare these costs with the ongoing costs of investing in other mutual funds. The example is based on an investment of $1,000 invested at the beginning of the period and held for the entire period from April 1, 2005, to September 30, 2005.
Actual Expenses
For each class, the first line of the table below provides information about actual account values and actual expenses. You may use the information in this line, together with the amount you invested, to estimate the expenses that you paid over the period. Simply divide your account value by $1,000 (for example, an $8,600 account value divided by $1,000 = 8.6), then multiply the result by the number in the first line under the heading entitled "Expenses Paid During Period" to estimate the expenses you paid on your account during this period.
Hypothetical Example for Comparison Purposes
For each class, the second line of the table below provides information about hypothetical account values and hypothetical expenses based on the fund's actual expense ratio and an assumed rate of return of 5% per year before expenses, which is not the fund's actual return. The hypothetical account values and expenses may not be used to estimate the actual ending account balance or expenses you paid for the period. You may use this information to compare the ongoing costs of investing in the fund and other funds. To do so, compare this 5% hypothetical example with the 5% hypothetical examples that appear in the shareholder reports of the other funds.
Please note that the expenses shown in the table are meant to highlight your ongoing costs only and do not reflect any transactional costs, such as sales charges (loads). Therefore, the second line of the table for each class is useful in comparing ongoing costs only, and will not help you determine the relative total costs of owning different funds. In addition, if these transactional costs were included, your costs would have been higher.
Expense Examples
| | | Beginning Account
Value (4/1/05) | | Ending Account
Value (9/30/05) | | Expenses Paid During
Period1 (4/1/05 to
9/30/05) | |
| Class A Actual2 | | $ | 1,000.00 | | | $ | 1,030.00 | | | $ | 3.82 | | |
| Class A Hypothetical (5% return before expenses) | | $ | 1,000.00 | | | $ | 1,021.31 | | | $ | 3.80 | | |
| Class C Actual2 | | $ | 1,000.00 | | | $ | 1,028.00 | | | $ | 5.85 | | |
| Class C Hypothetical (5% return before expenses) | | $ | 1,000.00 | | | $ | 1,019.30 | | | $ | 5.82 | | |
| Class Y Actual2 | | $ | 1,000.00 | | | $ | 1,032.10 | | | $ | 2.55 | | |
| Class Y Hypothetical (5% return before expenses) | | $ | 1,000.00 | | | $ | 1,022.56 | | | $ | 2.54 | | |
1 Expenses are equal to the fund's annualized expense ratio for the most recent six-month period of 0.75%, 1.15%, and 0.50% for Class A, Class C, and Class Y, respectively, mulitplied by the average account value over the period, multiplied by the number of days in the most recent half-year/365 days (to reflect the one-half year period).
2 Based on the actual returns for the six months ended September 30, 2005, of 3.00%, 2.80%, and 3.21% for Class A, Class C, and Class Y, respectively.
FIRST AMERICAN FUNDS Annual Report 2005
16
Intermediate Tax Free fund
Investment Objective: current income that is exempt from federal income tax to the extent consistent with preservation of capital
How did the fund perform for the fiscal year ended September 30, 2005?
The First American Intermediate Tax Free Fund (the "fund"), Class Y shares, returned 2.47% for the fiscal year ended September 30, 2005 (Class A shares returned 2.31%, without taking the sales charge into account, for the same period). By comparison, the fund's benchmark, the Lehman 7-Year Municipal Bond Index*, returned 2.03%. Performance for the fund's peer group, the Lipper Intermediate Municipal Debt Funds Category Average, was 1.79%.
What were the general economic and market conditions during the fiscal year?
Economic growth moderated but nevertheless continued at a solid pace over the course of the fiscal year. Solid economic growth, in turn, improved labor market conditions. While core inflation has been basically stable at a relatively low level, overall inflation has risen with the continuing climb of energy prices during the past year. The combination of solid growth, lower unemployment, and the potential for higher energy prices to be reflected by broader inflation measures has kept the Fed incrementally raising the Fed Funds Rate at each Federal Open Market Committee meeting since June 2004.
Despite these short-term measured rate increases, long-term rates for municipals fell, resulting in generally positive price performance for bonds maturing in 15 years or longer. The flattening yield curve (i.e., a greater rise in short-term than in long-term rates) made refunding attractive. Refunding is the refinancing of older, higher-coupon bonds by issuing new, lower-coupon bonds. Heavy refunding volume, in turn, gave rise to the record-breaking supply of new municipal bonds. More than half of these new issues carried insurance. The prevalence of insurance, combined with investor appetite for higher yields, highlighted the scarcity of lower-graded municipals, making them more valuable. Consequently, the difference, or spread, between yields on lower- and higher-rated issues continued to narrow, leading the lower-rated municipals to outperform higher-rated ones.
Underlying economic conditions remain generally favorable for the financial markets, although risks have risen with energy prices and the widespread disruption to activity from Hurricanes Katrina and Rita. The fund had well under 1% of its assets in Louisiana and Mississippi combined, the majority of which are insured.
How did market conditions and investment strategies affect the fund's performance?
Portfolio structure and security selection were primary contributors to the fund outperforming the index. The fund emphasized longer-term securities in order to benefit from the flattening yield curve. Consequently, as short-term interest rates continued to rise while longer-term rates declined, this emphasis provided better price appreciation along with higher income.
The fund's emphasis on revenue bonds vs. general obligations bonds was also a positive contributor to performance as revenue bonds generally outperformed. The sectors with the most notably positive effect on performance were healthcare and continuing care retirement community.
In terms of credit quality, lower-rated, investment-grade securities outperformed higher-quality, investment-grade municipals.
What strategic moves were made by the fund and why?
Given the potential for further short-term rate increases and the flattening yield curve, we increased the weighting for bonds in the maturity range of 10 or more years. We slightly increased the fund's weighting for A-rated securities. The fund's duration was mostly neutral to its benchmark throughout the fiscal year.
*Unlike mutual funds, index returns do not reflect any expenses, transaction costs, or cash flow effects.
| Portfolio Allocation as of September 30, 20051 (% of net assets) | |
| Revenue Bonds3 | | | 61.8 | % | |
| General Obligations3 | | | 34.6 | % | |
| Certificate of Participation3 | | | 2.4 | % | |
| Cash Equivalents | | | 0.3 | % | |
| Other Assets and Liabilities, Net | | | 0.9 | % | |
| | | | 100.0 | % | |
| Credit Quality Distribution as of September 30, 20052 (% of market value) | |
| AAA/Aaa | | | 58.2 | % | |
| AA/Aa | | | 13.1 | % | |
| A/A | | | 13.5 | % | |
| BBB/Baa | | | 9.6 | % | |
| BB/Ba | | | 0.9 | % | |
| Non-Rated | | | 4.7 | % | |
| | | | 100.0 | % | |
1 Portfolio allocations are subject to change and are not recommendations to buy or sell any security.
2 In the case of split ratings, a security is considered to be rated in the listed category if two of Moody's Investor Service, Standard & Poor's, and Fitch rate the security in that category. If ratings are provided by only two of those rating agencies, the lower rating is used. If only one of those rating agencies provides a rating, that rating is used.
3 These sectors may include bonds that are pre-refunded or escrowed to maturity issues, see the fund's Notes to Schedule of Investments. As of September 30, 2005, 23.4% of the fund's net assets were of pre-refunded and escrowed to maturity issues.
FIRST AMERICAN FUNDS Annual Report 2005
17
Intermediate Tax Free fund continued
Annual Performance1 as of September 30, 2005
| | | 1 year | | 5 years | | 10 years | |
| Average annual return with sales charge (POP) | |
| Class A | | | (0.01 | )% | | | 4.71 | % | | | 4.59 | % | |
| Average annual return without sales charge (NAV) | |
| Class A | | | 2.31 | % | | | 5.18 | % | | | 4.84 | % | |
| Class Y | | | 2.47 | % | | | 5.32 | % | | | 4.89 | % | |
| Lehman 7-Year Municipal Bond Index2 | | | 2.03 | % | | | 5.71 | % | | | 5.47 | % | |
Value of a $10,000 Investment1 as of September 30, 2005
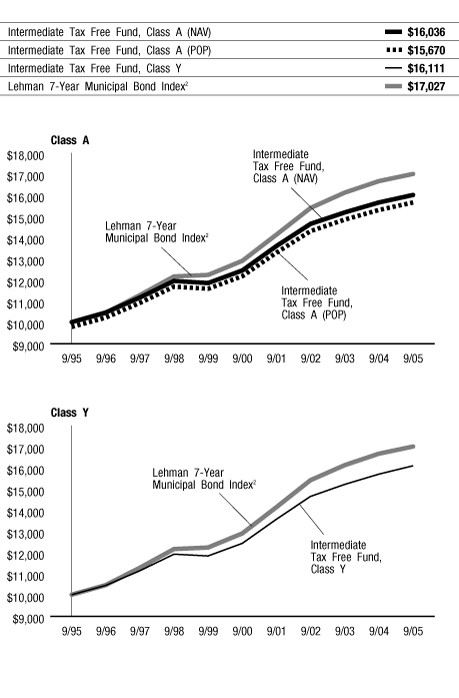
The chart above illustrates the total value of an assumed $10,000 investment in the fund's Class A and Class Y shares (from 9/30/1995 to 9/30/2005) as compared to the Lehman 7-Year Municipal Bond Index2.
The performance data quoted on this page represents past performance and does not guarantee future results. The investment return and principal value of an investment will fluctuate so that an investor's shares, when redeemed, may be worth more or less than their original cost. Current performance of the fund may be lower or higher than the performance data quoted. Performance data current to the most recent month-end may be obtained by calling 800.677.FUND.
1 Performance does not reflect the deduction of taxes that a shareholder would pay on fund distributions or redemption of fund shares. Investment performance reflects fee waivers that are or were in effect. In the absence of such fee waivers, total returns would be reduced. Index performance is for illustrative purposes only and does not reflect any expenses, transaction costs, or cash flow effects. Direct investment in the index is not available.
Income from tax-exempt funds may be subject to state and local taxes and a portion of income may be subject to the federal alternative minimum tax for certain investors. Capital gains distributions, if any, will be subject to tax.
Total returns at net asset value ("NAV") reflect performance over the time period indicated without including the fund's maximum sales charge and assume reinvestment of all distributions at NAV.
Total returns at public offering price ("POP") reflect performance over the time period indicated including maximum sales charges of 2.25% for Class A. Total returns assume reinvestment of all distributions at NAV.
Investments in debt securities typically decrease in value when interest rates rise. The risk is usually greater for longer-term debt securities.
2 An unmanaged index comprised of fixed-rate, investment-grade tax-exempt bonds with remaining maturities between six and eight years.
FIRST AMERICAN FUNDS Annual Report 2005
18
Intermediate Tax Free fund continued
Expense Example
As a shareholder of the Intermediate Tax Free Fund (the "fund"), you incur two types of costs: (1) transaction costs, including sales charges (loads) on purchase payments; and (2) ongoing costs, including investment advisory fees; distribution and/or service (12b-1) fees; and other fund expenses. This example is intended to help you understand your ongoing costs (in dollars) of investing in the fund and to compare these costs with the ongoing costs of investing in other mutual funds. The example is based on an investment of $1,000 invested at the beginning of the period and held for the entire period from April 1, 2005, to September 30, 2005.
Actual Expenses
For each class, the first line of the table below provides information about actual account values and actual expenses. You may use the information in this line, together with the amount you invested, to estimate the expenses that you paid over the period. Simply divide your account value by $1,000 (for example, an $8,600 account value divided by $1,000 = 8.6), then multiply the result by the number in the first line under the heading entitled "Expenses Paid During Period" to estimate the expenses you paid on your account during this period.
Hypothetical Example for Comparison Purposes
For each class, the second line of the table below provides information about hypothetical account values and hypothetical expenses based on the fund's actual expense ratio and an assumed rate of return of 5% per year before expenses, which is not the fund's actual return. The hypothetical account values and expenses may not be used to estimate the actual ending account balance or expenses you paid for the period. You may use this information to compare the ongoing costs of investing in the fund and other funds. To do so, compare this 5% hypothetical example with the 5% hypothetical examples that appear in the shareholder reports of the other funds.
Please note that the expenses shown in the table are meant to highlight your ongoing costs only and do not reflect any transactional costs, such as sales charges (loads). Therefore, the second line of the table for each class is useful in comparing ongoing costs only, and will not help you determine the relative total costs of owning different funds. In addition, if these transactional costs were included, your costs would have been higher.
Expense Examples
| | | Beginning Account
Value (4/1/05) | | Ending Account
Value (9/30/05) | | Expenses Paid During
Period1 (4/1/05 to
9/30/05) | |
| Class A Actual2 | | $ | 1,000.00 | | | $ | 1,025.00 | | | $ | 4.31 | | |
| Class A Hypothetical (5% return before expenses) | | $ | 1,000.00 | | | $ | 1,020.81 | | | $ | 4.31 | | |
| Class Y Actual2 | | $ | 1,000.00 | | | $ | 1,024.90 | | | $ | 3.55 | | |
| Class Y Hypothetical (5% return before expenses) | | $ | 1,000.00 | | | $ | 1,021.56 | | | $ | 3.55 | | |
1 Expenses are equal to the fund's annualized expense ratio for the most recent six-month period of 0.85% and 0.70% for Class A and Class Y, respectively, mulitplied by the average account value over the period, multiplied by the number of days in the most recent half-year/365 days (to reflect the one-half year period).
2 Based on the actual returns for the six months ended September 30, 2005, of 2.50% and 2.49% for Class A and Class Y, respectively.
FIRST AMERICAN FUNDS Annual Report 2005
19
Minnesota Intermediate Tax Free fund
Investment Objective: current income that is exempt from both federal income tax and Minnesota state income tax to the extent consistent with preservation of capital
How did the fund perform for the fiscal year ended September 30, 2005?
The First American Minnesota Intermediate Tax Free Fund (the "fund"), Class Y shares, returned 2.50% for the fiscal year ended September 30, 2005 (Class A shares returned 2.33%, without taking the sales charge into account, for the same period). By comparison, the fund's benchmark, the Lehman 7-Year Municipal Bond Index*, returned 2.03%. Performance for the fund's peer group, the Lipper Other States Intermediate Municipal Debt Funds Category Average, was 1.65%.
What were the general economic and market conditions during the fiscal year?
Economic growth moderated but nevertheless continued at a solid pace over the course of the fiscal year. Solid economic growth, in turn, improved labor market conditions. While core inflation has been basically stable at a relatively low level, overall inflation has risen with the continuing climb of energy prices during the past year. The combination of solid growth, lower unemployment, and the potential for higher energy prices to be reflected by broader inflation measures has kept the Fed incrementally raising the Fed Funds Rate at each Federal Open Market Committee meeting since June 2004.
Despite these short-term measured rate increases, long-term rates for municipals fell, resulting in generally positive price performance for bonds maturing in 15 years or longer. The flattening yield curve (i.e., a greater rise in short-term than in long-term rates) made refunding attractive. Refunding is the refinancing of older, higher-coupon bonds by issuing new, lower-coupon bonds. Heavy refunding volume, in turn, gave rise to the record-breaking supply of new municipal bonds. More than half of these new issues carried insurance. The prevalence of insurance, combined with investor appetite for higher yields, highlighted the scarcity of lower-graded municipals, making them more valuable. Consequently, the difference, or spread, between yields on lower- and higher-rated issues continued to narrow, leading the lower-rated municipals to outperform higher-rated ones.
How did market conditions and investment strategies affect the fund's performance?
Portfolio structure and security selection were primary contributors to the fund outperforming the index. The fund emphasized longer-term securities in order to benefit from the flattening yield curve. Consequently, as short-term interest rates continued to rise while longer-term rates declined, this emphasis on longer-term securities provided better price appreciation along with higher income.
The fund's emphasis on revenue bonds vs. general obligations bonds was also a positive contributor to performance as revenue bonds generally outperformed. The sector with the most notably positive effect on performance was healthcare.
In terms of credit quality, lower-rated, investment-grade securities outperformed higher-quality, investment-grade municipals.
What strategic moves were made by the fund and why?
Given the potential for further short-term rate increases and the flattening yield curve, we decreased the weighting for bonds with maturities of five years or less and increased the weighting for bonds with maturities of 10 years or more. The fund's duration was reduced from neutral to slightly short. We also increased the weighting for bonds rated A or lower and increased our position in the healthcare sector.
*Unlike mutual funds, index returns do not reflect any expenses, transaction costs, or cash flow effects.
| Portfolio Allocation as of September 30, 20051 (% of net assets) | |
| Revenue Bonds3 | | | 56.5 | % | |
| General Obligations3 | | | 39.5 | % | |
| Certificates of Participation3 | | | 2.4 | % | |
| Cash Equivalents | | | 1.9 | % | |
| Other Assets and Liabilities, Net | | | (0.3 | )% | |
| | | | 100.0 | % | |
| Credit Quality Distribution as of September 30, 20052 (% of market value) | |
| AAA/Aaa | | | 48.7 | % | |
| AA/Aa | | | 22.2 | % | |
| A/A | | | 11.4 | % | |
| BBB/Baa | | | 8.0 | % | |
| BB/Ba | | | 1.5 | % | |
| Non-Rated | | | 8.2 | % | |
| | | | 100.0 | % | |
1 Portfolio allocations are subject to change and are not recommendations to buy or sell any security.
2 In the case of split ratings, a security is considered to be rated in the listed category if two of Moody's Investor Service, Standard & Poor's, and Fitch rate the security in that category. If ratings are provided by only two of those rating agencies, the lower rating is used. If only one of those rating agencies provides a rating, that rating is used.
3 These sectors may include bonds that are pre-refunded or escrowed to maturity issues, see the fund's Notes to Schedule of Investments. As of September 30, 2005, 6.2% of the fund's net assets were of pre-refunded and escrowed to maturity issues.
FIRST AMERICAN FUNDS Annual Report 2005
20
Minnesota Intermediate Tax Free fund continued
Annual Performance1 as of September 30, 2005
| | | 1 year | | 5 years | | 10 years | |
| Average annual return with sales charge (POP) | |
| Class A | | | 0.01 | % | | | 4.48 | % | | | 4.51 | % | |
| Average annual return without sales charge (NAV) | |
| Class A | | | 2.33 | % | | | 4.97 | % | | | 4.75 | % | |
| Class Y | | | 2.50 | % | | | 5.09 | % | | | 4.78 | % | |
| Lehman 7-Year Municipal Bond Index2 | | | 2.03 | % | | | 5.71 | % | | | 5.47 | % | |
Value of a $10,000 Investment1 as of September 30, 2005
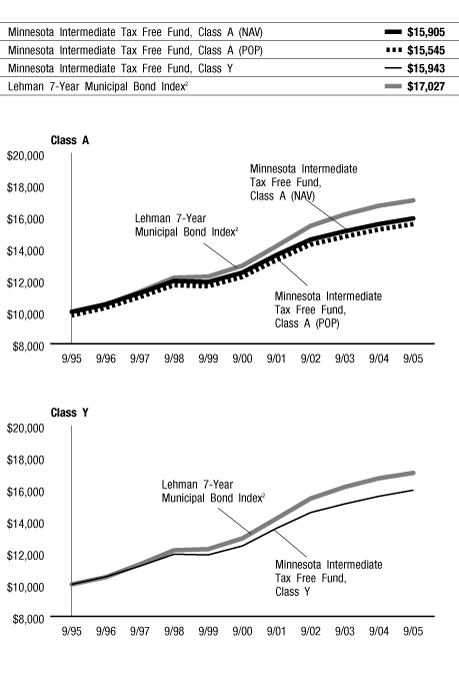
The chart above illustrates the total value of an assumed $10,000 investment in the fund's Class A and Class Y shares (from 9/30/1995 to 9/30/2005) as compared to the Lehman 7-Year Municipal Bond Index2.
The performance data quoted on this page represents past performance and does not guarantee future results. The investment return and principal value of an investment will fluctuate so that an investor's shares, when redeemed, may be worth more or less than their original cost. Current performance of the fund may be lower or higher than the performance data quoted. Performance data current to the most recent month-end may be obtained by calling 800.677.FUND.
1 Performance does not reflect the deduction of taxes that a shareholder would pay on fund distributions or redemption of fund shares. Investment performance reflects fee waivers that are or were in effect. In the absence of such fee waivers, total returns would be reduced. Index performance is for illustrative purposes only and does not reflect any expenses, transaction costs, or cash flow effects. Direct investment in the index is not available.
Income from tax-exempt funds may be subject to state and local taxes and a portion of income may be subject to the Minnesota state and federal alternative minimum tax for certain investors. Capital gains distributions, if any, will be subject to tax.
Total returns at net asset value ("NAV") reflect performance over the time period indicated without including the fund's maximum sales charge and assume reinvestment of all distributions at NAV.
Total returns at public offering price ("POP") reflect performance over the time period indicated including maximum sales charges of 2.25% for Class A shares. Total returns assume reinvestment of all distributions at NAV.
Investments in debt securities typically decrease in value when interest rates rise. The risk is usually greater for longer-term debt securities.
2 An unmanaged index comprised of fixed-rate, investment-grade tax-exempt bonds with remaining maturities between six and eight years.
FIRST AMERICAN FUNDS Annual Report 2005
21
Minnesota Intermediate Tax Free fund continued
Expense Example
As a shareholder of the Minnesota Intermediate Tax Free Fund (the "fund"), you incur two types of costs: (1) transaction costs, including sales charges (loads) on purchase payments; and (2) ongoing costs, including investment advisory fees; distribution and/or service (12b-1) fees; and other fund expenses. This example is intended to help you understand your ongoing costs (in dollars) of investing in the fund and to compare these costs with the ongoing costs of investing in other mutual funds. The example is based on an investment of $1,000 invested at the beginning of the period and held for the entire period from April 1, 2005, to September 30, 2005.
Actual Expenses
For each class, the first line of the table below provides information about actual account values and actual expenses. You may use the information in this line, together with the amount you invested, to estimate the expenses that you paid over the period. Simply divide your account value by $1,000 (for example, an $8,600 account value divided by $1,000 = 8.6), then multiply the result by the number in the first line under the heading entitled "Expenses Paid During Period" to estimate the expenses you paid on your account during this period.
Hypothetical Example for Comparison Purposes
For each class, the second line of the table below provides information about hypothetical account values and hypothetical expenses based on the fund's actual expense ratio and an assumed rate of return of 5% per year before expenses, which is not the fund's actual return. The hypothetical account values and expenses may not be used to estimate the actual ending account balance or expenses you paid for the period. You may use this information to compare the ongoing costs of investing in the fund and other funds. To do so, compare this 5% hypothetical example with the 5% hypothetical examples that appear in the shareholder reports of the other funds.
Please note that the expenses shown in the table are meant to highlight your ongoing costs only and do not reflect any transactional costs, such as sales charges (loads). Therefore, the second line of the table for each class is useful in comparing ongoing costs only, and will not help you determine the relative total costs of owning different funds. In addition, if these transactional costs were included, your costs would have been higher.
Expense Examples
| | | Beginning Account
Value (4/1/05) | | Ending Account
Value (9/30/05) | | Expenses Paid During
Period1 (4/1/05 to
9/30/05) | |
| Class A Actual2 | | $ | 1,000.00 | | | $ | 1,024.10 | | | $ | 4.31 | | |
| Class A Hypothetical (5% return before expenses) | | $ | 1,000.00 | | | $ | 1,020.81 | | | $ | 4.31 | | |
| Class Y Actual2 | | $ | 1,000.00 | | | $ | 1,024.00 | | | $ | 3.55 | | |
| Class Y Hypothetical (5% return before expenses) | | $ | 1,000.00 | | | $ | 1,021.56 | | | $ | 3.55 | | |
1 Expenses are equal to the fund's annualized expense ratio for the most recent six-month period of 0.85% and 0.70% for Class A and Class Y, respectively, mulitplied by the average account value over the period, multiplied by the number of days in the most recent half-year/365 days (to reflect the one-half year period).
2 Based on the actual returns for the six months ended September 30, 2005, of 2.41% and 2.40% for Class A and Class Y, respectively.
FIRST AMERICAN FUNDS Annual Report 2005
22
Minnesota Tax Free fund
Investment Objective: maximum current income that is exempt from both federal income tax and Minnesota state income tax to the extent consistent with prudent investment risk
How did the fund perform for the fiscal year ended September 30, 2005?
The First American Minnesota Tax Free Fund (the "fund"), Class Y shares, returned 4.69% for the fiscal year ended September 30, 2005 (Class A shares returned 4.42%, without taking the sales charge into consideration, for the same period). By comparison, the fund's benchmark, the Lehman Municipal Bond Index*, returned 4.05%. Performance for the fund's peer group, the Lipper Minnesota Municipal Debt Funds Objective Average, was 3.57%.
What were the general economic and market conditions during the fiscal year?
Economic growth moderated but nevertheless continued at a solid pace over the course of the fiscal year. Solid economic growth, in turn, improved labor market conditions. While core inflation has been basically stable at a relatively low level, overall inflation has risen with the continuing climb of energy prices during the past year. The combination of solid growth, lower unemployment, and the potential for higher energy prices to be reflected by broader inflation measures has kept the Fed incrementally raising the Fed Funds Rate at each Federal Open Market Committee meeting since June 2004.
Despite these short-term measured rate increases, long-term rates for municipals fell, resulting in generally positive price performance for bonds maturing in 15 years or longer. The flattening yield curve (i.e., a greater rise in short-term than in long-term rates) made refunding attractive. Refunding is the refinancing of older, higher-coupon bonds by issuing new, lower-coupon bonds. Heavy refunding volume, in turn, gave rise to the record-breaking supply of new municipal bonds. More than half of these new issues carried insurance. The prevalence of insurance, combined with investor appetite for higher yields, highlighted the scarcity of lower-graded municipals, making them more valuable. Consequently, the difference, or spread, between yields on lower- and higher-rated issues continued to narrow, leading the lower-rated municipals to outperform higher-rated ones.
How did market conditions and investment strategies affect the fund's performance?
Portfolio structure and security selection were primary contributors to the fund outperforming the index. An overweight in bonds with 17-year and longer maturities allowed the fund to limit the effects of rising short-term rates (when interest rates increase, bond prices generally decline). While short-term interest rates continued to rise during the fiscal period, longer-term rates fell, causing longer-maturity bonds to outperform short- and intermediate-maturity bonds in terms of income and price appreciation.
The fund's emphasis on revenue bonds vs. general obligations bonds was a positive contributor to performance as revenue bonds generally outperformed. The sectors that had a positive effect on performance were healthcare and electric utility revenue.
The fund held positions in bonds that were advance-refunded during the fiscal year, which also made a positive contribution to performance. They significantly increased in value following news of their refunding because of their relatively high coupons and now shorter maturities. These bonds will now be retired on their call date, which is typically much earlier than original maturity.
The fund's positions in general obligation bonds detracted from overall performance, as these issues underperformed the broad municipal index.
What strategic moves were made by the fund and why?
Given the potential for further short-term rate increases and the flattening yield curve, we sold short and intermediate maturities (two to nine years) and purchased issues with maturities of 15 years or more. We also placed more emphasis on premium coupon structures – bonds with a coupon that is higher than current market rates. If rates rise, this higher coupon can act as a cushion or buffer.
*Unlike mutual funds, index returns do not reflect any expenses, transaction costs, or cash flow effects.
| Portfolio Allocation as of September 30, 20051 (% of net assets) | |
| Revenue Bonds3 | | | 85.1 | % | |
| General Obligations3 | | | 12.1 | % | |
| Cash Equivalents | | | 2.1 | % | |
| Other Assets and Liabilities, Net | | | 0.7 | % | |
| | | | 100.0 | % | |
| Credit Quality Distribution as of September 30, 20052 (% of market value) | |
| AAA/Aaa | | | 33.0 | % | |
| AA/Aa | | | 15.9 | % | |
| A/A | | | 23.4 | % | |
| BBB/Baa | | | 10.2 | % | |
| BB/Ba | | | 1.1 | % | |
| Non-Rated | | | 16.4 | % | |
| | | | 100.0 | % | |
1 Portfolio allocations are subject to change and are not recommendations to buy or sell any security.
2 In the case of split ratings, a security is considered to be rated in the listed category if two of Moody's Investor Service, Standard & Poor's, and Fitch rate the security in that category. If ratings are provided by only two of those rating agencies, the lower rating is used. If only one of those rating agencies provides a rating, that rating is used.
3 These sectors may include bonds that are pre-refunded or escrowed to maturity issues, see the fund's Notes to Schedule of Investments. As of September 30, 2005, 12.5% of the fund's net assets were of pre-refunded and escrowed to maturity issues.
FIRST AMERICAN FUNDS Annual Report 2005
23
Minnesota Tax Free fund continued
Annual Performance1 as of September 30, 2005
| | | | | Since Inception | |
| | | 1 year | | 5 years | | 10 years | | 8/1/1997 | | 2/1/1999 | |
| Average annual return with sales charge (POP) | |
| Class A | | | (0.03 | )% | | | 4.88 | % | | | 5.06 | % | | | - | | | | - | | |
| Class C | | | 3.03 | % | | | 5.37 | % | | | | | | | - | | | | 4.17 | % | |
| Average annual return without sales charge (NAV) | |
| Class A | | | 4.42 | % | | | 5.79 | % | | | 5.52 | % | | | - | | | | - | | |
| Class C | | | 4.02 | % | | | 5.37 | % | | | - | | | | - | | | | 4.17 | % | |
| Class Y | | | 4.69 | % | | | 6.06 | % | | | - | | | | 5.33 | % | | | - | | |
| Lehman Municipal Bond Index2 | | | 4.05 | % | | | 6.34 | % | | | 6.06 | % | | | 5.62 | % | | | 5.28 | % | |
Value of a $10,000 Investment1, 3 as of September 30, 2005
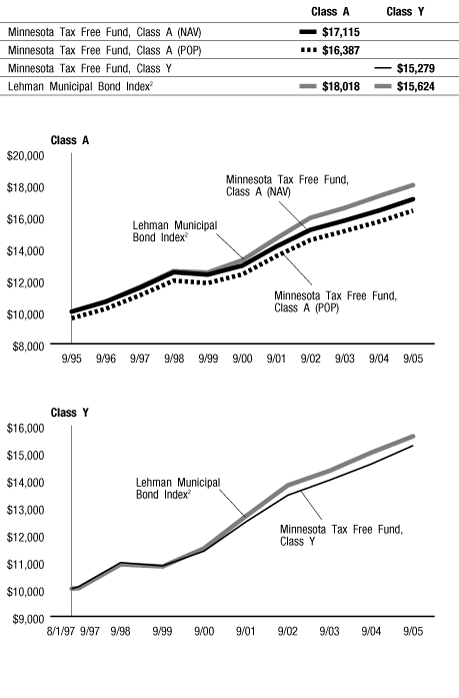
The chart above illustrates the total value of an assumed $10,000 investment in the fund's Class A shares (from 9/30/1995 to 9/30/2005) and Class Y shares (from 8/1/1997 to 9/30/2005) as compared to the Lehman Municipal Bond Index2.
The performance data quoted on this page represents past performance and does not guarantee future results. The investment return and principal value of an investment will fluctuate so that an investor's shares, when redeemed, may be worth more or less than their original cost. Current performance of the fund may be lower or higher than the performance data quoted. Performance data current to the most recent month-end may be obtained by calling 800.677.FUND.
1 Performance does not reflect the deduction of taxes that a shareholder would pay on fund distributions or redemption of fund shares. Investment performance reflects fee waivers that are or were in effect. In the absence of such fee waivers, total returns would be reduced. Index performance is for illustrative purposes only and does not reflect any expenses, transaction costs, or cash flow effects. Direct investment in the index is not available.
Income from tax-exempt funds may be subject to state and local taxes and a portion of income may be subject to the Minnesota state and federal alternative minimum tax for certain investors. Capital gains distributions, if any, will be subject to tax.
Total returns at net asset value ("NAV") reflect performance over the time period indicated without including the fund's maximum sales charge and assume reinvestment of all distributions at NAV.
Total returns at public offering price ("POP") reflect performance over the time period indicated including maximum sales charges of 4.25% for Class A shares and the maximum contingent deferred sales charge ("CDSC") for Class C shares for the relevant period. Maximum CDSC is 1.00% for Class C shares. Total returns assume reinvestment of all distributions at NAV.
Investments in debt securities typically decrease in value when interest rates rise. The risk is usually greater for longer-term debt securities.
On July 31, 1998, the Minnesota Tax Free Fund became the successor by merger to the Piper Minnesota Tax-Exempt Fund, a series of Piper Funds Inc. Prior to the merger, the First American Fund had no assets or liabilities. Performance presented prior to July 31, 1998, represents that of the Piper Minnesota Tax-Exempt Fund.
2 An unmanaged index comprised of fixed-rate, investment-grade tax-exempt bonds with remaining maturities of one year or more.
3 Performance for Class C shares is not presented. Performance of this class is lower due to higher expenses.
FIRST AMERICAN FUNDS Annual Report 2005
24
Minnesota Tax Free fund continued
Expense Example
As a shareholder of the Minnesota Tax Free Fund (the "fund"), you incur two types of costs: (1) transaction costs, including sales charges (loads) on purchase payments; and (2) ongoing costs, including investment advisory fees; distribution and/or service (12b-1) fees; and other fund expenses. This example is intended to help you understand your ongoing costs (in dollars) of investing in the fund and to compare these costs with the ongoing costs of investing in other mutual funds. The example is based on an investment of $1,000 invested at the beginning of the period and held for the entire period from April 1, 2005, to September 30, 2005.
Actual Expenses
For each class, the first line of the table below provides information about actual account values and actual expenses. You may use the information in this line, together with the amount you invested, to estimate the expenses that you paid over the period. Simply divide your account value by $1,000 (for example, an $8,600 account value divided by $1,000 = 8.6), then multiply the result by the number in the first line under the heading entitled "Expenses Paid During Period" to estimate the expenses you paid on your account during this period.
Hypothetical Example for Comparison Purposes
For each class, the second line of the table below provides information about hypothetical account values and hypothetical expenses based on the fund's actual expense ratio and an assumed rate of return of 5% per year before expenses, which is not the fund's actual return. The hypothetical account values and expenses may not be used to estimate the actual ending account balance or expenses you paid for the period. You may use this information to compare the ongoing costs of investing in the fund and other funds. To do so, compare this 5% hypothetical example with the 5% hypothetical examples that appear in the shareholder reports of the other funds.
Please note that the expenses shown in the table are meant to highlight your ongoing costs only and do not reflect any transactional costs, such as sales charges (loads). Therefore, the second line of the table for each class is useful in comparing ongoing costs only, and will not help you determine the relative total costs of owning different funds. In addition, if these transactional costs were included, your costs would have been higher.
Expense Examples
| | | Beginning Account
Value (4/1/05) | | Ending Account
Value (9/30/05) | | Expenses Paid During
Period1 (4/1/05 to
9/30/05) | |
| Class A Actual2 | | $ | 1,000.00 | | | $ | 1,030.60 | | | $ | 4.84 | | |
| Class A Hypothetical (5% return before expenses) | | $ | 1,000.00 | | | $ | 1,020.31 | | | $ | 4.81 | | |
| Class C Actual2 | | $ | 1,000.00 | | | $ | 1,028.70 | | | $ | 6.87 | | |
| Class C Hypothetical (5% return before expenses) | | $ | 1,000.00 | | | $ | 1,018.30 | | | $ | 6.83 | | |
| Class Y Actual2 | | $ | 1,000.00 | | | $ | 1,032.00 | | | $ | 3.57 | | |
| Class Y Hypothetical (5% return before expenses) | | $ | 1,000.00 | | | $ | 1,021.56 | | | $ | 3.55 | | |
1 Expenses are equal to the fund's annualized expense ratio for the most recent six-month period of 0.95%, 1.35%, and 0.70% for Class A, Class C, and Class Y, respectively, mulitplied by the average account value over the period, multiplied by the number of days in the most recent half-year/365 days (to reflect the one-half year period).
2 Based on the actual returns for the six months ended September 30, 2005, of 3.06%, 2.87%, and 3.20% for Class A, Class C, and Class Y, respectively.
FIRST AMERICAN FUNDS Annual Report 2005
25
Missouri Tax Free fund
Investment Objective: maximum current income that is exempt from both federal income tax and Missouri state income tax to the extent consistent with prudent investment risk
How did the fund perform for the fiscal year ended September 30, 2005?
The First American Missouri Tax Free Fund (the "fund"), Class Y shares, returned 3.08% for the fiscal year ended September 30, 2005 (Class A shares returned 2.74%, without taking the sales charge into account, for the same period). By comparison, the fund's benchmark, the Lehman Municipal Bond Index*, returned 4.05%. Performance for the fund's peer group, the Lipper Missouri Municipal Debt Funds Category Average, was 3.53%
What were the general economic and market conditions during the fiscal year?
Economic growth moderated but nevertheless continued at a solid pace over the course of the fiscal year. Solid economic growth, in turn, improved labor market conditions. While core inflation has been basically stable at a relatively low level, overall inflation has risen with the continuing climb of energy prices during the past year. The combination of solid growth, lower unemployment, and the potential for higher energy prices to be reflected by broader inflation measures has kept the Fed incrementally raising the Fed Funds Rate at each Federal Open Market Committee meeting since June 2004.
Despite these short-term measured rate increases, long-term rates for municipals fell, resulting in generally positive price performance for bonds maturing in 15 years or longer. The flattening yield curve (i.e., a greater rise in short-term than in long-term rates) made refunding attractive. Refunding is the refinancing of older, higher-coupon bonds by issuing new, lower-coupon bonds. Heavy refunding volume, in turn, gave rise to the record-breaking supply of new municipal bonds. More than half of these new issues carried insurance. The prevalence of insurance, combined with investor appetite for higher yields, highlighted the scarcity of lower-graded municipals, making them more valuable. Consequently, the difference, or spread, between yields on lower- and higher-rated issues continued to narrow, leading the lower-rated municipals to outperform higher-rated ones.
How did market conditions and investment strategies affect the fund's performance?
As short-term interest rates continued to rise while longer-term rates declined, shorter-maturity bonds, though generating positive returns, nonetheless underperformed. While the fund emphasized longer-term securities, which provided favorable income with better price appreciation, it would have benefited from a higher allocation at the long end of the yield curve (bond maturities of 22 years or more).
In terms of credit quality, lower-rated, investment-grade securities – specifically the fund's holdings rated A or lower – outperformed higher-quality, investment-grade municipals. However, due to limited supply, the fund was unable to increase its position in lower-rated bonds to desired levels.
The fund's emphasis on revenue bonds vs. general obligations bonds was a positive contributor to performance as revenue bonds generally outperformed. The sector with the most notably positive effect on performance was healthcare.
What strategic moves were made by the fund and why?
Given the potential for further short-term rate increases and the flattening yield curve, we increased the weighting for bonds in the maturity range of 17 to 22 years and decreased the weighting for bonds with maturities of 10 years or under.
We also increased the weighting for bonds rated A or lower and decreased the AA-rated allocation. The fund's duration was neutral during most of the fiscal year.
*Unlike mutual funds, index returns do not reflect any expenses, transaction costs, or cash flow effects.
| Portfolio Allocation as of September 30, 20051 (% of net assets) | |
| Revenue Bonds3 | | | 72.4 | % | |
| General Obligations3 | | | 23.9 | % | |
| Certificates of Participation3 | | | 1.9 | % | |
| Cash Equivalents | | | 1.3 | % | |
| Other Assets and Liabilities, Net | | | 0.5 | % | |
| | | | 100.0 | % | |
| Credit Quality Distribution as of September 30, 20052 (% of market value) | |
| AAA/Aaa | | | 52.3 | % | |
| AA/Aa | | | 33.8 | % | |
| A/A | | | 6.8 | % | |
| BBB/Baa | | | 4.8 | % | |
| BB/Ba | | | 1.0 | % | |
| Non-Rated | | | 1.3 | % | |
| | | | 100.0 | % | |
1 Portfolio allocations are subject to change and are not recommendations to buy or sell any security.
2 In the case of split ratings, a security is considered to be rated in the listed category if two of Moody's Investor Service, Standard & Poor's, and Fitch rate the security in that category. If ratings are provided by only two of those rating agencies, the lower rating is used. If only one of those rating agencies provides a rating, that rating is used.
3 These sectors may include bonds that are pre-refunded or escrowed to maturity issues, see the fund's Notes to Schedule of Investments. As of September 30, 2005, 14.2% of the fund's net assets were of pre-refunded and escrowed to maturity issues.
FIRST AMERICAN FUNDS Annual Report 2005
26
Missouri Tax Free fund continued
Annual Performance1 as of September 30, 2005
| | | | | Since Inception | |
| | | 1 year | | 5 years | | 10 years | | 9/24/2001 | |
| Average annual return with sales charge (POP) | |
| Class A | | | (1.65 | )% | | | 4.53 | % | | | 4.57 | % | | | - | | |
| Class C | | | 1.43 | % | | | - | | | | - | | | | 4.04 | % | |
| Average annual return without sales charge (NAV) | |
| Class A | | | 2.74 | % | | | 5.44 | % | | | 5.02 | % | | | - | | |
| Class C | | | 2.42 | % | | | - | | | | - | | | | 4.04 | % | |
| Class Y | | | 3.08 | % | | | 5.79 | % | | | 5.30 | % | | | - | | |
| Lehman Municipal Bond Index2 | | | 4.05 | % | | | 6.34 | % | | | 6.06 | % | | | 5.37 | % | |
Value of a $10,000 Investment1, 3 as of September 30, 2005
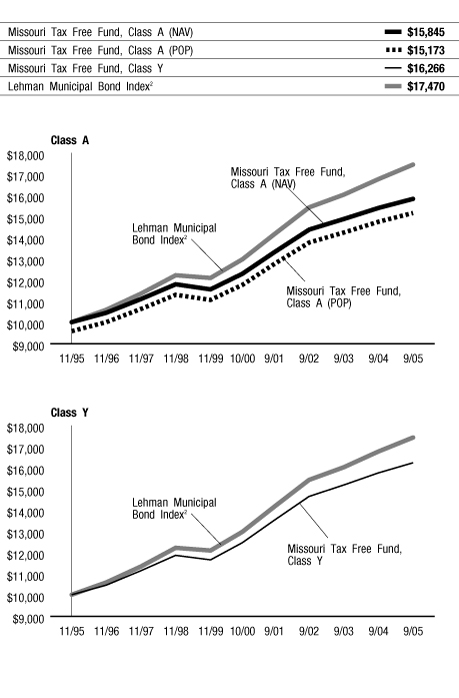
The chart above illustrates the total value of an assumed $10,000 investment in the fund's Class A and Class Y shares (from 11/30/1995 to 9/30/2005) as compared to the Lehman Municipal Bond Index2.
The performance data quoted on this page represents past performance and does not guarantee future results. The investment return and principal value of an investment will fluctuate so that an investor's shares, when redeemed, may be worth more or less than their original cost. Current performance of the fund may be lower or higher than the performance data quoted. Performance data current to the most recent month-end may be obtained by calling 800.677.FUND.
1 Performance does not reflect the deduction of taxes that a shareholder would pay on fund distributions or redemption of fund shares. Investment performance reflects fee waivers that are or were in effect. In the absence of such fee waivers, total returns would be reduced. Index performance is for illustrative purposes only and does not reflect any expenses, transaction costs, or cash flow effects. Direct investment in the index is not available.
Income from tax-exempt funds may be subject to state and local taxes and a portion of income may be subject to the federal alternative minimum tax for certain investors. Capital gains distributions, if any, will be subject to tax.
Total returns at net asset value ("NAV") reflect performance over the time period indicated without including the fund's maximum sales charge and assume reinvestment of all distributions at NAV.
Total returns at public offering price ("POP") reflect performance over the time period indicated including maximum sales charges of 4.25% for Class A shares and the maximum contingent deferred sales charge ("CDSC") for Class C shares for the relevant period. Maximum CDSC is 1.00% for Class C shares. Total returns assume reinvestment of all distributions at NAV.
Investments in debt securities typically decrease in value when interest rates rise. The risk is usually greater for longer-term debt securities.
On September 24, 2001, the Missouri Tax Free Fund became the successor by merger to the Firstar Missouri Tax-Exempt Bond Fund, a series of Firstar Funds, Inc. Prior to the merger, the First American fund had no assets or liabilities. Performance presented prior to September 24, 2001, represents that of the Firstar Missouri Tax-Exempt Bond Fund. The Firstar Missouri Tax-Exempt Bond Fund was organized on December 11, 2000, and, prior to that, was a separate series of Mercantile Mutual Funds, Inc. The Mercantile fund was organized on October 2, 1995, and prior to that, was a separate series of the ARCH Tax-Exempt Trust, which sold shares of the portfolio that were similar to the current Class Y shares of the fund, which have no distribution or shareholder servicing fees. Performance prior to October 2, 1995, reflects performance without such fees.
2 An unmanaged index comprised of fixed-rate, investment-grade tax-exempt bonds with remaining maturities of one year or more.
3 Performance for Class C shares is not presented. Performance for this class is lower due to higher expenses.
FIRST AMERICAN FUNDS Annual Report 2005
27
Missouri Tax Free fund continued
Expense Example
As a shareholder of the Missouri Tax Free Fund (the "fund"), you incur two types of costs: (1) transaction costs, including sales charges (loads) on purchase payments; and (2) ongoing costs, including investment advisory fees; distribution and/or service (12b-1) fees; and other fund expenses. This example is intended to help you understand your ongoing costs (in dollars) of investing in the fund and to compare these costs with the ongoing costs of investing in other mutual funds. The example is based on an investment of $1,000 invested at the beginning of the period and held for the entire period from April 1, 2005, to September 30, 2005.
Actual Expenses
For each class, the first line of the table below provides information about actual account values and actual expenses. You may use the information in this line, together with the amount you invested, to estimate the expenses that you paid over the period. Simply divide your account value by $1,000 (for example, an $8,600 account value divided by $1,000 = 8.6), then multiply the result by the number in the first line under the heading entitled "Expenses Paid During Period" to estimate the expenses you paid on your account during this period.
Hypothetical Example for Comparison Purposes
For each class, the second line of the table below provides information about hypothetical account values and hypothetical expenses based on the fund's actual expense ratio and an assumed rate of return of 5% per year before expenses, which is not the fund's actual return. The hypothetical account values and expenses may not be used to estimate the actual ending account balance or expenses you paid for the period. You may use this information to compare the ongoing costs of investing in the fund and other funds. To do so, compare this 5% hypothetical example with the 5% hypothetical examples that appear in the shareholder reports of the other funds.
Please note that the expenses shown in the table are meant to highlight your ongoing costs only and do not reflect any transactional costs, such as sales charges (loads). Therefore, the second line of the table for each class is useful in comparing ongoing costs only, and will not help you determine the relative total costs of owning different funds. In addition, if these transactional costs were included, your costs would have been higher.
Expense Examples
| | | Beginning Account
Value (4/1/05) | | Ending Account
Value (9/30/05) | | Expenses Paid During
Period1 (4/1/05 to
9/30/05) | |
| Class A Actual2 | | $ | 1,000.00 | | | $ | 1,025.00 | | | $ | 4.82 | | |
| Class A Hypothetical (5% return before expenses) | | $ | 1,000.00 | | | $ | 1,020.31 | | | $ | 4.81 | | |
| Class C Actual2 | | $ | 1,000.00 | | | $ | 1,023.80 | | | $ | 6.85 | | |
| Class C Hypothetical (5% return before expenses) | | $ | 1,000.00 | | | $ | 1,018.30 | | | $ | 6.83 | | |
| Class Y Actual2 | | $ | 1,000.00 | | | $ | 1,027.10 | | | $ | 3.56 | | |
| Class Y Hypothetical (5% return before expenses) | | $ | 1,000.00 | | | $ | 1,021.56 | | | $ | 3.55 | | |
1 Expenses are equal to the fund's annualized expense ratio for the most recent six-month period of 0.95%, 1.35%, and 0.70% for Class A, Class C, and Class Y, respectively, mulitplied by the average account value over the period, multiplied by the number of days in the most recent half-year/365 days (to reflect the one-half year period).
2 Based on the actual returns for the six months ended September 30, 2005, of 2.50%, 2.38%, and 2.71% for Class A, Class C, and Class Y, respectively.
FIRST AMERICAN FUNDS Annual Report 2005
28
Nebraska Tax Free fund
Investment Objective: maximum current income that is exempt from both federal income tax and Nebraska state income tax to the extent consistent with prudent investment risk
How did the fund perform for the fiscal year ended September 30, 2005?
The First American Nebraska Tax Free Fund (the "fund"), Class Y shares, returned 3.45% for the fiscal year ended September 30, 2005 (Class A shares returned 3.20%, without taking the sales charge into account, for the same period). By comparison, the fund's benchmark, the Lehman Municipal Bond Index*, returned 4.05%. Performance for the fund's peer group, the Lipper Other States Municipal Debt Funds Category Average, was 2.73%.
What were the general economic and market conditions during the fiscal year?
Economic growth moderated but nevertheless continued at a solid pace over the course of the fiscal year. Solid economic growth, in turn, improved labor market conditions. While core inflation has been basically stable at a relatively low level, overall inflation has risen with the continuing climb of energy prices during the past year. The combination of solid growth, lower unemployment, and the potential for higher energy prices to be reflected by broader inflation measures has kept the Fed incrementally raising the Fed Funds Rate at each Federal Open Market Committee meeting since June 2004.
Despite these short-term measured rate increases, long-term rates for municipals fell, resulting in generally positive price performance for bonds maturing in 15 years or longer. The flattening yield curve (i.e., a greater rise in short-term than in long-term rates) made refunding attractive. Refunding is the refinancing of older, higher-coupon bonds by issuing new, lower-coupon bonds. Heavy refunding volume, in turn, gave rise to the record-breaking supply of new municipal bonds. More than half of these new issues carried insurance. The prevalence of insurance, combined with investor appetite for higher yields, highlighted the scarcity of lower-graded municipals, making them more valuable. Consequently, the difference, or spread, between yields on lower- and higher-rated issues continued to narrow, leading the lower-rated municipals to outperform higher-rated ones.
How did market conditions and investment strategies affect the fund's performance?
During this fiscal period, as short-term interest rates continued to rise while longer-term rates declined, the fund held a significant position of its assets in securities maturing in 15 years and longer. To take further advantage of the yield curve flattening, the fund's 13% increase in net assets was directed to bonds with maturities of 20 years and longer. However, though longer-term municipals generally posted outstanding performance, an overweight position of the fund's assets were invested in bonds with maturities between 10 and 15 years, which underperformed the bonds with longer maturities.
In terms of credit quality, as spreads narrowed and lower-rated bonds outperformed higher-rated ones, the fund was unable to increase its percentage of BBB-rated securities due to limited supply.
The fund's positions in the electric utilities sector underperformed. The sector with the most notably positive effect on performance was healthcare and longer-term general obligation bond sectors.
The fund held positions in bonds that were advance-refunded during the fiscal period, which also made a positive contribution to performance. They significantly increased in value following news of their refunding because of their relatively high coupons and now shorter maturities. These bonds will now be retired on their call date, which is typically much earlier than original maturity.
What strategic moves were made by the fund and why?
The fund's duration was shortened. Given the potential for further short-term rate increases and the flattening yield curve, we sold shorter prerefunded bonds and purchased issues with maturities of 20 years or more. We continued to selectively increase positions in A-rated securities when available.
*Unlike mutual funds, index returns do not reflect any expenses, transaction costs, or cash flow effects.
| Portfolio Allocation as of September 30, 20051 (% of net assets) | |
| Revenue Bonds3 | | | 73.0 | % | |
| General Obligations3 | | | 20.9 | % | |
| Cash Equivalents | | | 5.7 | % | |
| Certificates of Participation3 | | | 3.2 | % | |
| Other Assets and Liabilities, Net | | | (2.8 | )% | |
| | | | 100.0 | % | |
| Credit Quality Distribution as of September 30, 20052 (% of market value) | |
| AAA/Aaa | | | 41.8 | % | |
| AA/Aa | | | 37.3 | % | |
| A/A | | | 12.5 | % | |
| BBB | | | 1.3 | % | |
| Non-Rated | | | 7.1 | % | |
| | | | 100.0 | % | |
1 Portfolio allocations are subject to change and are not recommendations to buy or sell any security.
2 In the case of split ratings, a security is considered to be rated in the listed category if two of Moody's Investor Service, Standard & Poor's, and Fitch rate the security in that category. If ratings are provided by only two of those rating agencies, the lower rating is used. If only one of those rating agencies provides a rating, that rating is used.
3 These sectors may include bonds that are pre-refunded or escrowed to maturity issues, see the fund's Notes to Schedule of Investments. As of September 30, 2005, 8.9% of the fund's net assets were of pre-refunded and escrowed to maturity issues.
FIRST AMERICAN FUNDS Annual Report 2005
29
Nebraska Tax Free fund continued
Annual Performance1 as of September 30, 2005
| | | | | Since Inception | |
| | | 1 year | | 2/28/2001 | |
| Average annual return with sales charge (POP) | | | |
| Class A | | | (1.16 | )% | | | 4.35 | % | |
| Class C | | | 1.82 | % | | | 4.80 | % | |
| Average annual return without sales charge (NAV) | | | |
| Class A | | | 3.20 | % | | | 5.34 | % | |
| Class C | | | 2.81 | % | | | 4.80 | % | |
| Class Y | | | 3.45 | % | | | 5.59 | % | |
| Lehman Municipal Bond Index2 | | | 4.05 | % | | | 5.64 | % | |
Value of a $10,000 Investment1, 3 as of September 30, 2005
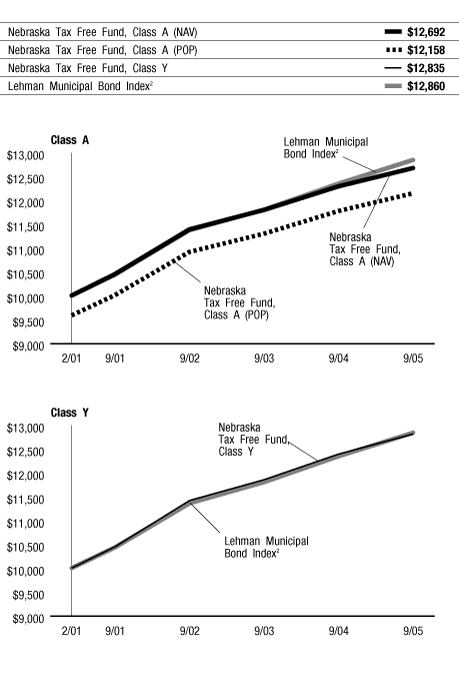
The chart above illustrates the total value of an assumed $10,000 investment in the fund's Class A and Class Y shares (from 2/28/2001 to 9/30/2005) as compared to the Lehman Municipal Bond Index2.
The performance data quoted on this page represents past performance and does not guarantee future results. The investment return and principal value of an investment will fluctuate so that an investor's shares, when redeemed, may be worth more or less than their original cost. Current performance of the fund may be lower or higher than the performance data quoted. Performance data current to the most recent month-end may be obtained by calling 800.677.FUND.
1 Performance does not reflect the deduction of taxes that a shareholder would pay on fund distributions or redemption of fund shares. Investment performance reflects fee waivers that are or were in effect. In the absence of such fee waivers, total returns would be reduced. Index performance is for illustrative purposes only and does not reflect any expenses, transaction costs, or cash flow effects. Direct investment in the index is not available.
Income from tax-exempt funds may be subject to state and local taxes and a portion of income may be subject to the federal alternative minimum tax for certain investors. Capital gains distributions, if any, will be subject to tax.
Total returns at net asset value ("NAV") reflect performance over the time period indicated without including the fund's maximum sales charge and assume reinvestment of all distributions at NAV.
Total returns at public offering price ("POP") reflect performance over the time period indicated including maximum sales charges of 4.25% for Class A shares and the maximum contingent deferred sales charge ("CDSC") for Class C shares for the relevant period. Maximum CDSC is 1.00% for Class C shares. Total returns assume reinvestment of all distributions at NAV.
Investments in debt securities typically decrease in value when interest rates rise. The risk is usually greater for longer-term debt securities.
2 An unmanaged index comprised of fixed-rate, investment-grade tax-exempt bonds with remaining maturities of one year or more.
3 Performance for Class C shares is not presented. Performance of this class is lower due to higher expenses.
FIRST AMERICAN FUNDS Annual Report 2005
30
Nebraska Tax Free fund continued
Expense Example
As a shareholder of the Nebraska Tax Free Fund (the "fund"), you incur two types of costs: (1) transaction costs, including sales charges (loads) on purchase payments; and (2) ongoing costs, including investment advisory fees; distribution and/or service (12b-1) fees; and other fund expenses. This example is intended to help you understand your ongoing costs (in dollars) of investing in the fund and to compare these costs with the ongoing costs of investing in other mutual funds. The example is based on an investment of $1,000 invested at the beginning of the period and held for the entire period from April 1, 2005, to September 30, 2005.
Actual Expenses
For each class, the first line of the table below provides information about actual account values and actual expenses. You may use the information in this line, together with the amount you invested, to estimate the expenses that you paid over the period. Simply divide your account value by $1,000 (for example, an $8,600 account value divided by $1,000 = 8.6), then multiply the result by the number in the first line under the heading entitled "Expenses Paid During Period" to estimate the expenses you paid on your account during this period.
Hypothetical Example for Comparison Purposes
For each class, the second line of the table below provides information about hypothetical account values and hypothetical expenses based on the fund's actual expense ratio and an assumed rate of return of 5% per year before expenses, which is not the fund's actual return. The hypothetical account values and expenses may not be used to estimate the actual ending account balance or expenses you paid for the period. You may use this information to compare the ongoing costs of investing in the fund and other funds. To do so, compare this 5% hypothetical example with the 5% hypothetical examples that appear in the shareholder reports of the other funds.
Please note that the expenses shown in the table are meant to highlight your ongoing costs only and do not reflect any transactional costs, such as sales charges (loads). Therefore, the second line of the table for each class is useful in comparing ongoing costs only, and will not help you determine the relative total costs of owning different funds. In addition, if these transactional costs were included, your costs would have been higher.
Expense Examples
| | | Beginning Account
Value (4/1/05) | | Ending Account
Value (9/30/05) | | Expenses Paid During
Period1 (4/1/05 to
9/30/05) | |
| Class A Actual2 | | $ | 1,000.00 | | | $ | 1,026.60 | | | $ | 3.81 | | |
| Class A Hypothetical (5% return before expenses) | | $ | 1,000.00 | | | $ | 1,021.31 | | | $ | 3.80 | | |
| Class C Actual2 | | $ | 1,000.00 | | | $ | 1,024.70 | | | $ | 5.84 | | |
| Class C Hypothetical (5% return before expenses) | | $ | 1,000.00 | | | $ | 1,019.30 | | | $ | 5.82 | | |
| Class Y Actual2 | | $ | 1,000.00 | | | $ | 1,027.80 | | | $ | 2.54 | | |
| Class Y Hypothetical (5% return before expenses) | | $ | 1,000.00 | | | $ | 1,022.56 | | | $ | 2.54 | | |
1 Expenses are equal to the fund's annualized expense ratio for the most recent six-month period of 0.75%, 1.15%, and 0.50% for Class A, Class C, and Class Y, respectively, mulitplied by the average account value over the period, multiplied by the number of days in the most recent half-year/365 days (to reflect the one-half year period).
2 Based on the actual returns for the six months ended September 30, 2005, of 2.66%, 2.47%, and 2.78% for Class A, Class C, and Class Y, respectively.
FIRST AMERICAN FUNDS Annual Report 2005
31
Ohio Tax Free fund
Investment Objective: maximum current income that is exempt from both federal income tax and Ohio state income tax to the extent consistent with prudent investment risk
How did the fund perform for the fiscal year ended September 30, 2005?
The First American Ohio Tax Free Fund (the "fund"), Class Y shares, returned 3.12% for the fiscal year ended September 30, 2005 (Class A shares returned 2.86%, without taking the sales charge into account, for the same period). By comparison, the fund's benchmark, the Lehman Municipal Bond Index*, returned 4.05%. Performance for the fund's peer group, the Lipper Ohio Municipal Debt Funds Category Average, was 3.13%.
What were the general economic and market conditions during the fiscal year?
Economic growth moderated but nevertheless continued at a solid pace over the course of the fiscal year. Solid economic growth, in turn, improved labor market conditions. While core inflation has been basically stable at a relatively low level, overall inflation has risen with the continuing climb of energy prices during the past year. The combination of solid growth, lower unemployment, and the potential for higher energy prices to be reflected by broader inflation measures has kept the Fed incrementally raising the Fed Funds Rate at each Federal Open Market Committee meeting since June 2004.
Despite these short-term measured rate increases, long-term rates for municipals fell, resulting in generally positive price performance for bonds maturing in 15 years or longer. The flattening yield curve (i.e., a greater rise in short-term than in long-term rates) made refunding attractive. Refunding is the refinancing of older, higher-coupon bonds by issuing new, lower-coupon bonds. Heavy refunding volume, in turn, gave rise to the record-breaking supply of new municipal bonds. More than half of these new issues carried insurance. The prevalence of insurance, combined with investor appetite for higher yields, highlighted the scarcity of lower-graded municipals, making them more valuable. Consequently, the difference, or spread, between yields on lower- and higher-rated issues continued to narrow, leading the lower-rated municipals to outperform higher-rated ones.
How did market conditions and investment strategies affect the fund's performance?
The fund was launched in 2002 in a low-rate environment and has had limited opportunity to take advantage of refundings, which could have initially provided an increase in price, subsequent underperformance notwithstanding. As short-term interest rates continued to rise while longer-term rates declined, the fund emphasized longer-term securities, which provided favorable income with better price appreciation. However, the fund's shorter-maturity bond holdings, though generating positive returns, nonetheless underperformed.
In terms of credit quality, lower-rated, investment-grade securities – namely the fund's holdings rated A and lower – outperformed higher-quality, investment-grade municipals. However, due to limited supply and pricing opportunities, the fund was unable to increase its position in lower-rated bonds to desirable levels, which had a negative impact the fund's performance.
The fund's increase in revenue bond holdings and reduction in general obligations were positive contributors to performance as the former generally outperformed the latter.
What strategic moves were made by the fund and why?
On the basis of their performance, we increased weighting for bonds rated A or lower. We increased exposure to healthcare and reduced exposure to school districts. The fund's duration was slightly lengthened as lower-rated, higher-yielding securities were added in the range of 15 years or more.
*Unlike mutual funds, index returns do not reflect any expenses, transaction costs, or cash flow effects.
| Portfolio Allocation as of September 30, 20051 (% of net assets) | |
| Revenue Bonds3 | | | 49.4 | % | |
| General Obligations3 | | | 46.0 | % | |
| Certificates of Participation3 | | | 3.2 | % | |
| Other Assets and Liabilities, Net | | | 1.4 | % | |
| | | | 100.0 | % | |
| Credit Quality Distribution as of September 30, 20052 (% of market value) | |
| AAA/Aaa | | | 45.1 | % | |
| AA/Aa | | | 37.6 | % | |
| A/A | | | 12.3 | % | |
| BBB/Baa | | | 4.4 | % | |
| Non-Rated | | | 0.6 | % | |
| | | | 100.0 | % | |
1 Portfolio allocations are subject to change and are not recommendations to buy or sell any security.
2 In the case of split ratings, a security is considered to be rated in the listed category if two of Moody's Investor Service, Standard & Poor's, and Fitch rate the security in that category. If ratings are provided by only two of those rating agencies, the lower rating is used. If only one of those rating agencies provides a rating, that rating is used.
3 These sectors may include bonds that are pre-refunded or escrowed to maturity issues, see the fund's Notes to Schedule of Investments. As of September 30, 2005, 8.7% of the fund's net assets were of pre-refunded and escrowed to maturity issues.
FIRST AMERICAN FUNDS Annual Report 2005
32
Ohio Tax Free fund continued
Annual Performance1 as of September 30, 2005
| | | | | Since Inception | |
| | | 1 year | | 4/30/2002 | |
| Average annual return with sales charge (POP) | |
| Class A | | | (1.54 | )% | | | 3.85 | % | |
| Class C | | | 1.59 | % | | | 4.48 | % | |
| Average annual return without sales charge (NAV) | |
| Class A | | | 2.86 | % | | | 5.17 | % | |
| Class C | | | 2.58 | % | | | 4.48 | % | |
| Class Y | | | 3.12 | % | | | 5.45 | % | |
| Lehman Municipal Bond Index2 | | | 4.05 | % | | | 5.59 | % | |
Value of a $10,000 Investment1, 3 as of September 30, 2005
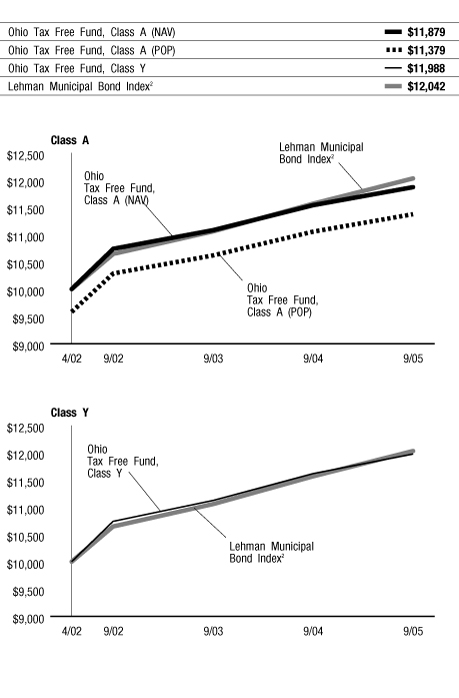
The chart above illustrates the total value of an assumed $10,000 investment in the fund's Class A and Class Y shares (from 4/30/2002 to 9/30/2005) as compared to the Lehman Municipal Bond Index2.
The performance data quoted on this page represents past performance and does not guarantee future results. The investment return and principal value of an investment will fluctuate so that an investor's shares, when redeemed, may be worth more or less than their original cost. Current performance of the fund may be lower or higher than the performance data quoted. Performance data current to the most recent month-end may be obtained by calling 800.677.FUND.
1 Performance does not reflect the deduction of taxes that a shareholder would pay on fund distributions or redemption of fund shares. Investment performance reflects fee waivers that are or were in effect. In the absence of such fee waivers, total returns would be reduced. Index performance is for illustrative purposes only and does not reflect any expenses, transaction costs, or cash flow effects. Direct investment in the index is not available.
Income from tax-exempt funds may be subject to state and local taxes and a portion of income may be subject to the federal alternative minimum tax for certain investors. Capital gains distributions, if any, will be subject to tax.
Total returns at net asset value ("NAV") reflect performance over the time period indicated without including the fund's maximum sales charge and assume reinvestment of all distributions at NAV.
Total returns at public offering price ("POP") reflect performance over the time period indicated including maximum sales charges of 4.25% for Class A shares and the maximum contingent deferred sales charge ("CDSC") for Class C shares for the relevant period. Maximum CDSC is 1.00% for Class C shares. Total returns assume reinvestment of all distributions at NAV.
Investments in debt securities typically decrease in value when interest rates rise. The risk is usually greater for longer-term debt securities.
2 An unmanaged index comprised of fixed-rate, investment-grade tax-exempt bonds with remaining maturities of one year or more.
3 Performance for Class C shares is not presented. Performance of this class is lower due to higher expenses.
FIRST AMERICAN FUNDS Annual Report 2005
33
Ohio Tax Free fund continued
Expense Example
As a shareholder of the Ohio Tax Free Fund (the "fund"), you incur two types of costs: (1) transaction costs, including sales charges (loads) on purchase payments; and (2) ongoing costs, including investment advisory fees; distribution and/or service (12b-1) fees; and other fund expenses. This example is intended to help you understand your ongoing costs (in dollars) of investing in the fund and to compare these costs with the ongoing costs of investing in other mutual funds. The example is based on an investment of $1,000 invested at the beginning of the period and held for the entire period from April 1, 2005, to September 30, 2005.
Actual Expenses
For each class, the first line of the table below provides information about actual account values and actual expenses. You may use the information in this line, together with the amount you invested, to estimate the expenses that you paid over the period. Simply divide your account value by $1,000 (for example, an $8,600 account value divided by $1,000 = 8.6), then multiply the result by the number in the first line under the heading entitled "Expenses Paid During Period" to estimate the expenses you paid on your account during this period.
Hypothetical Example for Comparison Purposes
For each class, the second line of the table below provides information about hypothetical account values and hypothetical expenses based on the fund's actual expense ratio and an assumed rate of return of 5% per year before expenses, which is not the fund's actual return. The hypothetical account values and expenses may not be used to estimate the actual ending account balance or expenses you paid for the period. You may use this information to compare the ongoing costs of investing in the fund and other funds. To do so, compare this 5% hypothetical example with the 5% hypothetical examples that appear in the shareholder reports of the other funds.
Please note that the expenses shown in the table are meant to highlight your ongoing costs only and do not reflect any transactional costs, such as sales charges (loads). Therefore, the second line of the table for each class is useful in comparing ongoing costs only, and will not help you determine the relative total costs of owning different funds. In addition, if these transactional costs were included, your costs would have been higher.
Expense Examples
| | | Beginning Account
Value (4/1/05) | | Ending Account
Value (9/30/05) | | Expenses Paid During
Period1 (4/1/05 to
9/30/05) | |
| Class A Actual2 | | $ | 1,000.00 | | | $ | 1,029.00 | | | $ | 3.81 | | |
| Class A Hypothetical (5% return before expenses) | | $ | 1,000.00 | | | $ | 1,021.31 | | | $ | 3.80 | | |
| Class C Actual2 | | $ | 1,000.00 | | | $ | 1,027.40 | | | $ | 5.84 | | |
| Class C Hypothetical (5% return before expenses) | | $ | 1,000.00 | | | $ | 1,019.30 | | | $ | 5.82 | | |
| Class Y Actual2 | | $ | 1,000.00 | | | $ | 1,030.30 | | | $ | 2.54 | | |
| Class Y Hypothetical (5% return before expenses) | | $ | 1,000.00 | | | $ | 1,022.56 | | | $ | 2.54 | | |
1 Expenses are equal to the fund's annualized expense ratio for the most recent six-month period of 0.75%, 1.15%, and 0.50% for Class A, Class C, and Class Y, respectively, mulitplied by the average account value over the period, multiplied by the number of days in the most recent fiscal half-year/365 days (to reflect the one-half year period).
2 Based on the actual returns for the six months ended September 30, 2005, of 2.90%, 2.74%, and 3.03% for Class A, Class C, and Class Y, respectively.
FIRST AMERICAN FUNDS Annual Report 2005
34
Oregon Intermediate Tax Free fund
Investment Objective: current income that is exempt from both federal income tax and Oregon state income tax to the extent consistent with preservation of capital
How did the fund perform for the fiscal year ended September 30, 2005?
The First American Oregon Intermediate Tax Free Fund (the "fund"), Class Y shares, returned 1.82% for the fiscal year ended September 30, 2005 (Class A shares returned 1.67%, without taking the sales charge into account, for the same period). By comparison, the fund's benchmark, the Lehman 7-Year Municipal Bond Index*, returned 2.03%. Performance for the fund's peer group, the Lipper Other States Intermediate Municipal Debt Funds Category Average, was 1.65%.
What were the general economic and market conditions during the fiscal year?
Economic growth moderated but nevertheless continued at a solid pace over the course of the fiscal year. Solid economic growth, in turn, improved labor market conditions. While core inflation has been basically stable at a relatively low level, overall inflation has risen with the continuing climb of energy prices during the past year. The combination of solid growth, lower unemployment, and the potential for higher energy prices to be reflected by broader inflation measures has kept the Fed incrementally raising the Fed Funds Rate at each Federal Open Market Committee meeting since June 2004.
Despite these short-term measured rate increases, long-term rates for municipals fell, resulting in generally positive price performance for bonds maturing in 15 years or longer. The flattening yield curve (i.e., a greater rise in short-term than in long-term rates) made refunding attractive. Refunding is the refinancing of older, higher-coupon bonds by issuing new, lower-coupon bonds. Heavy refunding volume, in turn, gave rise to the record-breaking supply of new municipal bonds. More than half of these new issues carried insurance. The prevalence of insurance, combined with investor appetite for higher yields, highlighted the scarcity of lower-graded municipals, making them more valuable. Consequently, the difference, or spread, between yields on lower- and higher-rated issues continued to narrow, leading the lower-rated municipals to outperform higher-rated ones.
How did market conditions and investment strategies affect the fund's performance?
Portfolio structure was the primary contributor to the fund's outperformance of its peer group. As short-term interest rates continued to rise while longer-term rates declined, the fund sought to benefit from the yield curve flattening by emphasizing longer-term securities, which provided favorable income with better price appreciation. The fund also reduced its exposure to securities with maturities shorter than five years. These shorter-maturity bond holdings, though generating positive returns, nonetheless detracted from performance.
In terms of credit quality, as spreads narrowed and lower-rated bonds outperformed higher-rated ones, the fund was unable to increase its percentage of lower-rated securities due to very limited supply in the state. This less-than-optimal allocation was the primary contributor to the fund's underperformance relative to the index.
Higher coupon bonds were refunded, which caused an initial increase in price, but the refunded bonds subsequently underperformed. A decrease in revenue bonds in the portfolio also had a negative impact on performance
What strategic moves were made by the fund and why?
Given the potential for further short-term rate increases and the flattening yield curve, we increased our weighting for bonds in the maturity range of 10 or more years. We have increased the fund's weighting for AA-rated securities. The fund's duration was relatively neutral throughout the fiscal year.
*Unlike mutual funds, index returns do not reflect any expenses, transaction costs, or cash flow effects.
| Portfolio Allocation as of September 30, 20051 (% of net assets) | |
| General Obligations3 | | | 61.6 | % | |
| Revenue Bonds3 | | | 31.3 | % | |
| Certificates of Participation3 | | | 5.3 | % | |
| Cash Equivalents | | | 0.5 | % | |
| Other Assets and Liabilities, Net | | | 1.3 | % | |
| | | | 100.0 | % | |
| Credit Quality Distribution as of September 30, 20052 (% of market value) | |
| AAA/Aaa | | | 58.4 | % | |
| AA/Aa | | | 34.2 | % | |
| A/A | | | 1.4 | % | |
| BBB/Baa | | | 3.5 | % | |
| Non-Rated | | | 2.5 | % | |
| | | | 100.0 | % | |
1 Portfolio allocations are subject to change and are not recommendations to buy or sell any security.
2 In the case of split ratings, a security is considered to be rated in the listed category if two of Moody's Investor Service, Standard & Poor's, and Fitch rate the security in that category. If ratings are provided by only two of those rating agencies, the lower rating is used. If only one of those rating agencies provides a rating, that rating is used.
3 These sectors may include bonds that are pre-refunded or escrowed to maturity issues, see the fund's Notes to Schedule of Investments. As of September 30, 2005, 22.4% of the fund's net assets were of pre-refunded and escrowed to maturity issues.
FIRST AMERICAN FUNDS Annual Report 2005
35
Oregon Intermediate Tax Free fund continued
Annual Performance1 as of September 30, 2005
| | | | | Since Inception | |
| | | 1 year | | 5 years | | 10 years | | 2/1/1999 | |
| Average annual return with sales charge (POP) | | | |
| Class A | | | (0.64 | )% | | | 4.39 | % | | | - | | | | 3.64 | % | |
| Average annual return without sales charge (NAV) | | | |
| Class A | | | 1.67 | % | | | 4.86 | % | | | - | | | | 4.01 | % | |
| Class Y | | | 1.82 | % | | | 4.98 | % | | | 4.65 | % | | | - | | |
| Lehman 7-Year Municipal Bond Index2 | | | 2.03 | % | | | 5.71 | % | | | 5.47 | % | | | 4.86 | % | |
Value of a $10,000 Investment1 as of September 30, 2005
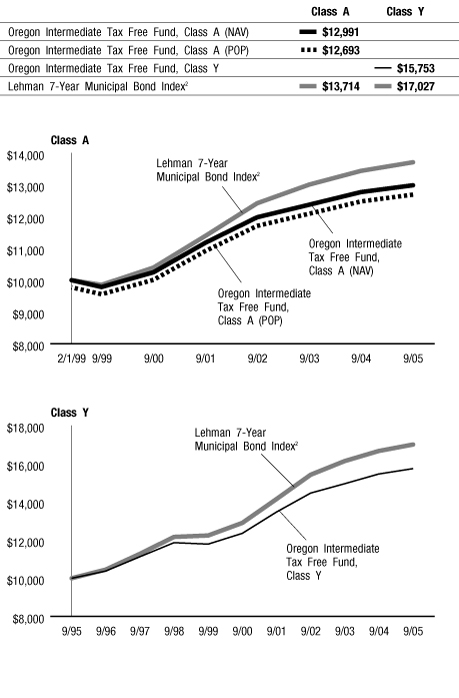
The chart above illustrates the total value of an assumed $10,000 investment in the fund's Class A shares (from 2/1/1999 to 9/30/2005) and Class Y shares (from 9/30/1995 to 9/30/2005) as compared to the Lehman 7-Year Municipal Bond Index2.
The performance data quoted on this page represents past performance and does not guarantee future results. The investment return and principal value of an investment will fluctuate so that an investor's shares, when redeemed, may be worth more or less than their original cost. Current performance of the fund may be lower or higher than the performance data quoted. Performance data current to the most recent month-end may be obtained by calling 800.677.FUND.
1 Performance does not reflect the deduction of taxes that a shareholder would pay on fund distributions or redemption of fund shares. Investment performance reflects fee waivers that are or were in effect. In the absence of such fee waivers, total returns would be reduced. Index performance is for illustrative purposes only and does not reflect any expenses, transaction costs, or cash flow effects. Direct investment in the index is not available.
Income from tax-exempt funds may be subject to state and local taxes and a portion of income may be subject to the federal alternative minimum tax for certain investors. Capital gains distributions, if any, will be subject to tax.
Total returns at net asset value ("NAV") reflect performance over the time period indicated without including the fund's maximum sales charge and assume reinvestment of all distributions at NAV.
Total returns at public offering price ("POP") reflect performance over the time period indicated including maximum sales charges of 2.25% for Class A. Total returns assume reinvestment of all distributions at NAV.
Investments in debt securities typically decrease in value when interest rates rise. The risk is usually greater for longer-term debt securities.
Performance prior to August 8, 1997, is that of Oregon Municipal Bond Trust Fund, a predecessor common trust fund. On August 8, 1997, substantially all of the assets of Oregon Municipal Bond Trust Fund were transferred into Oregon Intermediate Tax Free Fund. The objectives, policies, and guidelines of the two funds were, in all material respects, identical. Oregon Municipal Bond Trust Fund was not registered under the Investment Company Act of 1940 and therefore was not subject to certain investment restrictions that might have adversely affected performance.
2 An unmanaged index comprised of fixed-rate, investment-grade tax-exempt bonds with remaining maturities between six and eight years.
FIRST AMERICAN FUNDS Annual Report 2005
36
Oregon Intermediate Tax Free fund continued
Expense Example
As a shareholder of the Oregon Intermediate Tax Free Fund (the "fund"), you incur two types of costs: (1) transaction costs, including sales charges (loads) on purchase payments; and (2) ongoing costs, including investment advisory fees; distribution and/or service (12b-1) fees; and other fund expenses. This example is intended to help you understand your ongoing costs (in dollars) of investing in the fund and to compare these costs with the ongoing costs of investing in other mutual funds. The example is based on an investment of $1,000 invested at the beginning of the period and held for the entire period from April 1, 2005, to September 30, 2005.
Actual Expenses
For each class, the first line of the table below provides information about actual account values and actual expenses. You may use the information in this line, together with the amount you invested, to estimate the expenses that you paid over the period. Simply divide your account value by $1,000 (for example, an $8,600 account value divided by $1,000 = 8.6), then multiply the result by the number in the first line under the heading entitled "Expenses Paid During Period" to estimate the expenses you paid on your account during this period.
Hypothetical Example for Comparison Purposes
For each class, the second line of the table below provides information about hypothetical account values and hypothetical expenses based on the fund's actual expense ratio and an assumed rate of return of 5% per year before expenses, which is not the fund's actual return. The hypothetical account values and expenses may not be used to estimate the actual ending account balance or expenses you paid for the period. You may use this information to compare the ongoing costs of investing in the fund and other funds. To do so, compare this 5% hypothetical example with the 5% hypothetical examples that appear in the shareholder reports of the other funds.
Please note that the expenses shown in the table are meant to highlight your ongoing costs only and do not reflect any transactional costs, such as sales charges (loads). Therefore, the second line of the table for each class is useful in comparing ongoing costs only, and will not help you determine the relative total costs of owning different funds. In addition, if these transactional costs were included, your costs would have been higher.
Expense Examples
| | | Beginning Account
Value (4/1/05) | | Ending Account
Value (9/30/05) | | Expenses Paid During
Period1 (4/1/05 to
9/30/05) | |
| Class A Actual2 | | $ | 1,000.00 | | | $ | 1,020.70 | | | $ | 4.31 | | |
| Class A Hypothetical (5% return before expenses) | | $ | 1,000.00 | | | $ | 1,020.81 | | | $ | 4.31 | | |
| Class Y Actual2 | | $ | 1,000.00 | | | $ | 1,021.40 | | | $ | 3.55 | | |
| Class Y Hypothetical (5% return before expenses) | | $ | 1,000.00 | | | $ | 1,021.56 | | | $ | 3.55 | | |
1 Expenses are equal to the fund's annualized expense ratio for the most recent six-month period of 0.85% and 0.70% for Class A and Class Y, respectively, mulitplied by the average account value over the period, multiplied by the number of days in the most recent half-year/365 days (to reflect the one-half year period).
2 Based on the actual returns for the six months ended September 30, 2005 of 2.07% and 2.14% for Class A and Class Y, respectively.
FIRST AMERICAN FUNDS Annual Report 2005
37
Short Tax Free fund
Investment Objective: to provide investors with currrent income that is exempt from federal income tax, to the extent consistent with the preservation of capital
How did the fund perform for the fiscal year ended September 30, 2005?
The First American Short Tax Free Fund (the "fund"), Class Y shares, returned 0.83% for the fiscal year ended September 30, 2005 (Class A shares returned 0.67%, without taking the sales charge into account, for the same period). By comparison, the fund's benchmark, the Lehman 3-Year Municipal Bond Index*, returned 0.77%. Performance for the fund's peer group, the Lipper Short Municipal Debt Funds Category Average, was 1.17%.
What were the general economic and market conditions during the fiscal year?
Economic growth moderated but nevertheless continued at a solid pace over the course of the fiscal year. Solid economic growth, in turn, improved labor market conditions. While core inflation has been basically stable at a relatively low level, overall inflation has risen with the continuing climb of energy prices during the past year. The combination of solid growth, lower unemployment, and the potential for higher energy prices to be reflected by broader inflation measures has kept the Fed incrementally raising the Fed Funds Rate at each Federal Open Market Committee meeting since June 2004.
Despite these short-term measured rate increases, long-term rates for municipals fell, resulting in generally positive price performance for bonds maturing in 15 years or longer. The flattening yield curve (i.e., a greater rise in short-term than in long-term rates) made refunding attractive. Refunding is the refinancing of older, higher-coupon bonds by issuing new, lower-coupon bonds. Heavy refunding volume, in turn, gave rise to the record-breaking supply of new municipal bonds. More than half of these new issues carried insurance. The prevalence of insurance, combined with investor appetite for higher yields, highlighted the scarcity of lower-graded municipals, making them more valuable. Consequently, the difference, or spread, between yields on lower- and higher-rated issues continued to narrow, leading the lower-rated municipals to outperform higher-rated ones.
Underlying economic conditions remain generally favorable for the financial markets, although risks have risen with energy prices and the widespread disruption to activity from Hurricanes Katrina and Rita.
How did market conditions and investment strategies affect the fund's performance?
Portfolio structure and security selection were primary contributors to the fund's performance. Selling bonds with the maturities of two and three years and moving to cash and cash equivalents and/or four- to five-year securities gave the portfolio more of a "barbell" structure throughout the year, enabling it to take better advantage of the flattening yield curve (with longer-maturity bonds outperforming short-term issues).
The fund's emphasis on revenue bonds vs. general obligations bonds was a positive contributor to performance as revenue bonds generally outperformed. The sector with the most notably positive effect on performance was healthcare.
In terms of credit quality, lower-rated, investment-grade securities outperformed higher-quality, investment-grade municipals. The fund's increased positions in A-rated and BBB-rated securities had a positive impact on performance.
The fund shortened its duration to 70% of its benchmark through the first and second quarter with a modest extension during the third quarter. With duration shorter than its benchmark for most of the year, the fund outperformed the benchmark but it underperformed its Lipper peer group as a result of being longer than its peers. The fund held a position of 12.7% of the fund's net assets in the prerefunded sector, which underperformed the general obligations and revenue sectors.
What strategic moves were made by the fund and why?
The fund's duration was shortened. To capture the increase in short rates as a result of the Fed tightening, we moved out of the two- to three-year securities and invested in variable rate demand notes. We continued to selectively increase positions in A-rated and BBB-rated securities when available.
*Unlike mutual funds, index returns do not reflect any expenses, transaction costs, or cash flow effects.
| Portfolio Allocation as of September 30, 20051 (% of net assets) | |
| Revenue Bonds3 | | | 74.9 | % | |
| General Obligations3 | | | 23.5 | % | |
| Cash Equivalents | | | 2.0 | % | |
| Certificates of Participation3 | | | 1.1 | % | |
| Other Assets and Liabilities, Net | | | (1.5 | )% | |
| | | | 100.0 | % | |
| Credit Quality Distribution as of September 30, 20052 (% of market value) | |
| AAA/Aaa | | | 34.6 | % | |
| AA/Aa | | | 18.8 | % | |
| A/A | | | 23.0 | % | |
| BBB/Baa | | | 18.8 | % | |
| BB/Ba | | | 0.2 | % | |
| Non-Rated | | | 4.6 | % | |
| | | | 100.0 | % | |
1 Portfolio allocations are subject to change and are not recommendations to buy or sell any security.
2 In the case of split ratings, a security is considered to be rated in the listed category if two of Moody's Investor Service, Standard & Poor's, and Fitch rate the security in that category. If ratings are provided by only two of those rating agencies, the lower rating is used. If only one of those rating agencies provides a rating, that rating is used.
3 These sectors may include bonds that are pre-refunded or escrowed to maturity issues, see the fund's Notes to Schedule of Investments. As of September 30, 2005, 12.7% of the fund's net assets were of pre-refunded and escrowed to maturity issues.
FIRST AMERICAN FUNDS Annual Report 2005
38
Short Tax Free fund continued
Annual Performance1 as of September 30, 2005
| | | | | Since Inception | |
| | | 1 year | | 10/25/2002 | |
| Average annual return with sales charge (POP) | |
| Class A | | | (1.60 | )% | | | 1.28 | % | |
| Average annual return without sales charge (NAV) | |
| Class A | | | 0.67 | % | | | 2.07 | % | |
| Class Y | | | 0.83 | % | | | 2.22 | % | |
| Lehman 3-Year Municipal Bond Index2 | | | 0.77 | % | | | 2.53 | % | |
Value of a $10,000 Investment1 as of September 30, 2005
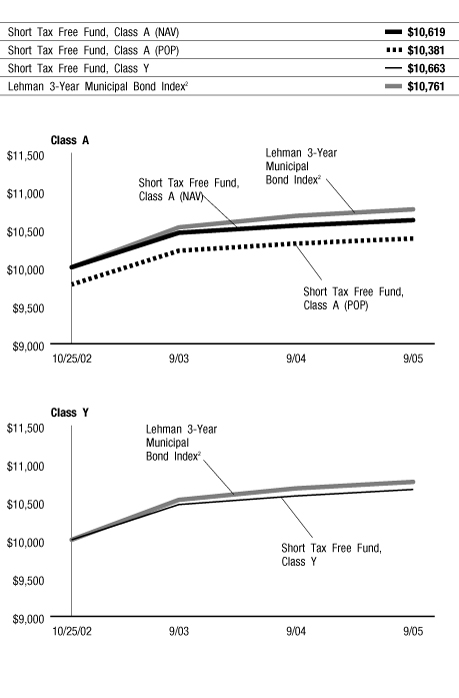
The chart above illustrates the total value of an assumed $10,000 investment in the fund's Class A and Class Y shares (from 10/25/2002 to 9/30/2005) as compared to the Lehman 3-Year Municipal Bond Index2.
The performance data quoted on this page represents past performance and does not guarantee future results. The investment return and principal value of an investment will fluctuate so that an investor's shares, when redeemed, may be worth more or less than their original cost. Current performance of the fund may be lower or higher than the performance data quoted. Performance data current to the most recent month-end may be obtained by calling 800.677.FUND.
1 Performance does not reflect the deduction of taxes that a shareholder would pay on fund distributions or redemption of fund shares. Investment performance reflects fee waivers that are or were in effect. In the absence of such fee waivers, total returns would be reduced. Index performance is for illustrative purposes only and does not reflect any expenses, transaction costs, or cash flow effects. Direct investment in the index is not available.
Income from tax-exempt funds may be subject to state and local taxes and a portion of income may be subject to the federal alternative minimum tax for certain investors. Capital gains distributions, if any, will be subject to tax.
Total returns at net asset value ("NAV") reflect performance over the time period indicated without including the fund's maximum sales charge and assume reinvestment of all distributions at NAV.
Total returns at public offering price ("POP") reflect performance over the time period indicated including maximum sales charges of 2.25% for Class A shares. Total returns assume reinvestment of all distributions at NAV.
Investments in debt securities typically decrease in value when interest rates rise. The risk is usually greater for longer-term debt securities.
2 An unmanaged index comprised of fixed-rate, investment-grade tax-exempt bonds with remaining maturities between two and four years.
FIRST AMERICAN FUNDS Annual Report 2005
39
Short Tax Free fund continued
Expense Example
As a shareholder of the Short Tax Free Fund (the "fund"), you incur two types of costs: (1) transaction costs, including sales charges (loads) on purchase payments; and (2) ongoing costs, including investment advisory fees; distribution and/or service (12b-1) fees; and other fund expenses. This example is intended to help you understand your ongoing costs (in dollars) of investing in the fund and to compare these costs with the ongoing costs of investing in other mutual funds. The example is based on an investment of $1,000 invested at the beginning of the period and held for the entire period from April 1, 2005, to September 30, 2005.
Actual Expenses
For each class, the first line of the table below provides information about actual account values and actual expenses. You may use the information in this line, together with the amount you invested, to estimate the expenses that you paid over the period. Simply divide your account value by $1,000 (for example, an $8,600 account value divided by $1,000 = 8.6), then multiply the result by the number in the first line under the heading entitled "Expenses Paid During Period" to estimate the expenses you paid on your account during this period.
Hypothetical Example for Comparison Purposes
For each class, the second line of the table below provides information about hypothetical account values and hypothetical expenses based on the fund's actual expense ratio and an assumed rate of return of 5% per year before expenses, which is not the fund's actual return. The hypothetical account values and expenses may not be used to estimate the actual ending account balance or expenses you paid for the period. You may use this information to compare the ongoing costs of investing in the fund and other funds. To do so, compare this 5% hypothetical example with the 5% hypothetical examples that appear in the shareholder reports of the other funds.
Please note that the expenses shown in the table are meant to highlight your ongoing costs only and do not reflect any transactional costs, such as sales charges (loads). Therefore, the second line of the table for each class is useful in comparing ongoing costs only, and will not help you determine the relative total costs of owning different funds. In addition, if these transactional costs were included, your costs would have been higher.
Expense Examples
| | | Beginning Account
Value (4/1/05) | | Ending Account
Value (9/30/05) | | Expenses Paid During
Period1 (4/1/05 to
9/30/05) | |
| Class A Actual2 | | $ | 1,000.00 | | | $ | 1,010.60 | | | $ | 3.78 | | |
| Class A Hypothetical (5% return before expenses) | | $ | 1,000.00 | | | $ | 1,021.31 | | | $ | 3.80 | | |
| Class Y Actual2 | | $ | 1,000.00 | | | $ | 1,011.40 | | | $ | 3.03 | | |
| Class Y Hypothetical (5% return before expenses) | | $ | 1,000.00 | | | $ | 1,022.06 | | | $ | 3.04 | | |
1 Expenses are equal to the fund's annualized expense ratio for the most recent six-month period of 0.75% and 0.60% for Class A and Class Y, respectively, mulitplied by the average account value over the period, multiplied by the number of days in the most recent half-year/365 days (to reflect the one-half year period).
2 Based on the actual returns for the six months ended September 30, 2005, of 1.06% and 1.14% for Class A and Class Y, respectively.
FIRST AMERICAN FUNDS Annual Report 2005
40
Tax Free fund
Investment Objective: maximum currrent income that is exempt from federal income tax to the extent consistent with the prudent investment risk
How did the fund perform for the fiscal year ended September 30, 2005?
The First American Tax Free Fund (the "fund"), Class Y shares, returned 4.77% for the fiscal year ended September 30, 2005 (Class A shares returned 4.51%, without taking the sales charge into account, for the same period). By comparison, the fund's benchmark, the Lehman Municipal Bond Index*, returned 4.05%. Performance for the fund's peer group, the Lipper General Municipal Debt Funds Objective Average, was 3.49%
What were the general economic and market conditions during the fiscal year?
Economic growth moderated but nevertheless continued at a solid pace over the course of the fiscal year. Solid economic growth, in turn, improved labor market conditions. While core inflation has been basically stable at a relatively low level, overall inflation has risen with the continuing climb of energy prices during the past year. The combination of solid growth, lower unemployment, and the potential for higher energy prices to be reflected by broader inflation measures has kept the Fed incrementally raising the Fed Funds Rate at each Federal Open Market Committee meeting since June 2004.
Despite these short-term measured rate increases, long-term rates for municipals fell, resulting in generally positive price performance for bonds maturing in 15 years or longer. The flattening yield curve (i.e., a greater rise in short-term than in long-term rates) made refunding attractive. Refunding is the refinancing of older, higher-coupon bonds by issuing new, lower-coupon bonds. Heavy refunding volume, in turn, gave rise to the record-breaking supply of new municipal bonds. More than half of these new issues carried insurance. The prevalence of insurance, combined with investor appetite for higher yields, highlighted the scarcity of lower-graded municipals, making them more valuable. Consequently, the difference, or spread, between yields on lower- and higher-rated issues continued to narrow, leading the lower-rated municipals to outperform higher-rated ones.
Underlying economic conditions remain generally favorable for the financial markets, although risks have risen with energy prices and the disruption to activity from Hurricanes Katrina and Rita. The fund had less than 2% of its assets in Louisiana, all of which were AAA-rated and insured or escrowed in U.S. government securities. The fund had no assets in Mississippi.
How did market conditions and investment strategies affect the fund's performance?
Portfolio structure and security selection were primary contributors to the fund's positive performance relative to the index. An overweight in bonds with 17-year and longer maturities allowed the fund to limit the effects of rising short-term rates (when interest rates increase, bond prices generally decline). While short-term interest rates continued to rise during the fiscal period, longer-term rates fell, causing longer-maturity bonds to outperform short- and intermediate-maturity bonds in terms of income and price appreciation. The fund also benefited from being underweight in shorter-term bonds.
The fund's emphasis on revenue bonds vs. general obligations bonds was a positive contributor to performance as revenue bonds generally outperformed. The sectors that had a positive effect on performance included healthcare and industrial development/pollution control revenue.
Overweighting in Texas, Illinois, Wisconsin, Minnesota, and Colorado, all of which outperformed the broad index, proved beneficial to the fund – as did underweighting in Florida, which underperformed the broad index. The fund's underweighting in California and overweighting in Washington and Indiana detracted from performance.
What strategic moves were made by the fund and why?
Given the potential for further short-term rate increases and the flattening yield curve, we sold short and intermediate maturities (two to nine years) and purchased issues with maturities of 15 years or more. We also placed more emphasis on premium coupon structures – bonds with a coupon that is higher than current market rates. If rates rise, this higher coupon can act as a cushion or buffer.
*Unlike mutual funds, index returns do not reflect any expenses, transaction costs, or cash flow effects.
| Portfolio Allocation as of September 30, 20051 (% of net assets) | |
| Revenue Bonds3 | | | 71.3 | % | |
| General Obligations3 | | | 26.2 | % | |
| Cash Equivalents | | | 1.4 | % | |
| Other Assets and Liabilities, Net | | | 1.1 | % | |
| | | | 100.0 | % | |
| Credit Quality Distribution as of September 30, 20052 (% of market value) | |
| AAA/Aaa | | | 39.2 | % | |
| AA/Aa | | | 9.4 | % | |
| A/A | | | 18.3 | % | |
| BBB/Baa | | | 21.3 | % | |
| BB/Ba | | | 0.9 | % | |
| Non-Rated | | | 10.9 | % | |
| | | | 100.0 | % | |
1 Portfolio allocations are subject to change and are not recommendations to buy or sell any security.
2 In the case of split ratings, a security is considered to be rated in the listed category if two of Moody's Investor Service, Standard & Poor's, and Fitch rate the security in that category. If ratings are provided by only two of those rating agencies, the lower rating is used. If only one of those rating agencies provides a rating, that rating is used.
3 These sectors may include bonds that are pre-refunded or escrowed to maturity issues, see the fund's Notes to Schedule of Investments. As of September 30, 2005, 19.4% of the fund's net assets were of pre-refunded and escrowed to maturity issues.
FIRST AMERICAN FUNDS Annual Report 2005
41
Tax Free fund continued
Annual Performance1 as of September 30, 2005
| | | Since Inception | |
| | | 1 year | | 5 years | | 11/14/1996 | | 9/24/2001 | |
| Average annual return with sales charge (POP) | | | |
| Class A | | | 0.04 | % | | | 5.33 | % | | | 5.11 | % | | | - | | |
| Class C | | | 3.13 | % | | | - | | | | - | | | | 5.00 | % | |
| Class Y | |
| Average annual return without sales charge (NAV) | | | |
| Class A | | | 4.51 | % | | | 6.24 | % | | | 5.62 | % | | | - | | |
| Class C | | | 4.13 | % | | | - | | | | - | | | | 5.00 | % | |
| Class Y | | | 4.77 | % | | | 6.53 | % | | | 5.85 | % | | | - | | |
| Lehman Municipal Bond Index2 | | | 4.05 | % | | | 6.34 | % | | | 6.02 | % | | | 5.37 | % | |
Value of a $10,000 Investment1, 3 as of September 30, 2005
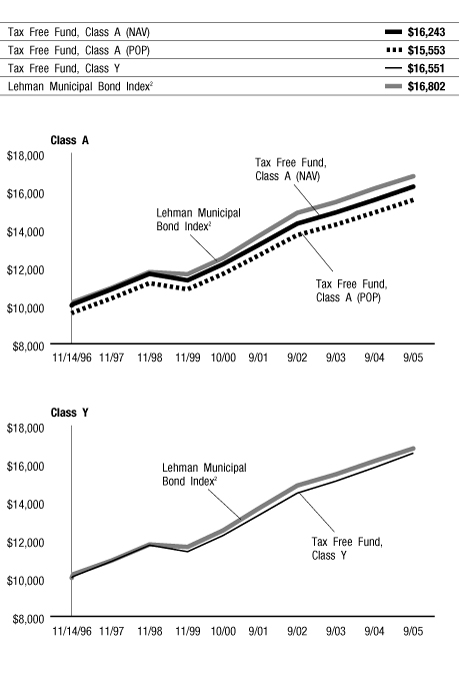
The chart above illustrates the total value of an assumed $10,000 investment in the fund's Class A and Class Y shares (from 11/14/1996 to 9/30/2005) as compared to the Lehman Municipal Bond Index2.
The performance data quoted on this page represents past performance and does not guarantee future results. The investment return and principal value of an investment will fluctuate so that an investor's shares, when redeemed, may be worth more or less than their original cost. Current performance of the fund may be lower or higher than the performance data quoted. Performance data current to the most recent month-end may be obtained by calling 800.677.FUND.
1 Performance does not reflect the deduction of taxes that a shareholder would pay on fund distributions or redemption of fund shares. Investment performance reflects fee waivers that are or were in effect. In the absence of such fee waivers, total returns would be reduced. Index performance is for illustrative purposes only and does not reflect any expenses, transaction costs, or cash flow effects. Direct investment in the index is not available.
Income from tax-exempt funds may be subject to state and local taxes and a portion of income may be subject to the federal alternative minimum tax for certain investors. Capital gains distributions, if any, will be subject to tax.
Total returns at net asset value ("NAV") reflect performance over the time period indicated without including the fund's maximum sales charge and assume reinvestment of all distributions at NAV.
Total returns at public offering price ("POP") reflect performance over the time period indicated including maximum sales charges of 4.25% for Class A shares and the maximum contingent deferred sales charge ("CDSC") for Class C shares for the relevant period. Maximum CDSC is 1.00% for Class C shares. Total returns assume reinvestment of all distributions at NAV.
Investments in debt securities typically decrease in value when interest rates rise. The risk is usually greater for longer-term debt securities.
On September 24, 2001, the First American Tax Free Fund merged with the Firstar National Municipal Bond Fund. Performance history prior to September 24, 2001, represents that of the Firstar National Municipal Bond Fund.
2 An unmanaged index comprised of fixed-rate, investment-grade tax-exempt bonds with remaining maturities of one year or more.
3 Performance for Class C shares is not presented. Performance of this class is lower due to higher expenses.
FIRST AMERICAN FUNDS Annual Report 2005
42
Tax Free fund continued
Expense Example
As a shareholder of the Tax Free Fund (the "fund"), you incur two types of costs: (1) transaction costs, including sales charges (loads) on purchase payments; and (2) ongoing costs, including investment advisory fees; distribution and/or service (12b-1) fees; and other fund expenses. This example is intended to help you understand your ongoing costs (in dollars) of investing in the fund and to compare these costs with the ongoing costs of investing in other mutual funds. The example is based on an investment of $1,000 invested at the beginning of the period and held for the entire period from April 1, 2005, to September 30, 2005.
Actual Expenses
For each class, the first line of the table below provides information about actual account values and actual expenses. You may use the information in this line, together with the amount you invested, to estimate the expenses that you paid over the period. Simply divide your account value by $1,000 (for example, an $8,600 account value divided by $1,000 = 8.6), then multiply the result by the number in the first line under the heading entitled "Expenses Paid During Period" to estimate the expenses you paid on your account during this period.
Hypothetical Example for Comparison Purposes
For each class, the second line of the table below provides information about hypothetical account values and hypothetical expenses based on the fund's actual expense ratio and an assumed rate of return of 5% per year before expenses, which is not the fund's actual return. The hypothetical account values and expenses may not be used to estimate the actual ending account balance or expenses you paid for the period. You may use this information to compare the ongoing costs of investing in the fund and other funds. To do so, compare this 5% hypothetical example with the 5% hypothetical examples that appear in the shareholder reports of the other funds.
Please note that the expenses shown in the table are meant to highlight your ongoing costs only and do not reflect any transactional costs, such as sales charges (loads). Therefore, the second line of the table for each class is useful in comparing ongoing costs only, and will not help you determine the relative total costs of owning different funds. In addition, if these transactional costs were included, your costs would have been higher.
Expense Examples
| | | Beginning Account
Value (4/1/05) | | Ending Account
Value (9/30/05) | | Expenses Paid During
Period1 (4/1/05 to
9/30/05) | |
| Class A Actual2 | | $ | 1,000.00 | | | $ | 1,032.20 | | | $ | 4.84 | | |
| Class A Hypothetical (5% return before expenses) | | $ | 1,000.00 | | | $ | 1,020.31 | | | $ | 4.81 | | |
| Class C Actual2 | | $ | 1,000.00 | | | $ | 1,030.30 | | | $ | 6.87 | | |
| Class C Hypothetical (5% return before expenses) | | $ | 1,000.00 | | | $ | 1,018.30 | | | $ | 6.83 | | |
| Class Y Actual2 | | $ | 1,000.00 | | | $ | 1,033.50 | | | $ | 3.57 | | |
| Class Y Hypothetical (5% return before expenses) | | $ | 1,000.00 | | | $ | 1,021.56 | | | $ | 3.55 | | |
1 Expenses are equal to the fund's annualized expense ratio for the most recent six-month period of 0.95%, 1.35%, and 0.70% for Class A, Class C, and Class Y, respectively, mulitplied by the average account value over the period, multiplied by the number of days in the most recent half-year/365 days (to reflect the one-half year period).
2 Based on the actual returns for the six months ended September 30, 2005 of 3.22%, 3.03%, and 3.35% for Class A, Class C, and Class Y, respectively.
FIRST AMERICAN FUNDS Annual Report 2005
43
Report of Independent Registered Public Accounting Firm
To the Shareholders and Board of Directors
First American Investment Funds, Inc.
We have audited the accompanying statements of assets and liabilities, including the schedules of investments of the Arizona Tax Free, California Intermediate Tax Free, California Tax Free, Colorado Intermediate Tax Free, Colorado Tax Free, Intermediate Tax Free, Minnesota Intermediate Tax Free, Minnesota Tax Free, Missouri Tax Free, Nebraska Tax Free, Ohio Tax Free, Oregon Intermediate Tax Free, Short Tax Free, and Tax Free Funds (series of First American Investment Funds, Inc.) (the "funds") as of September 30, 2005, the related statements of operations for the year then ended, changes in net assets and the financial highlights for each of the periods indicated therein, except as noted below. These financial statements and financial highlights are the responsibility of the funds' management. Our responsibility is to express an opinion on these financial statements and financial highlights based on our audits. The financial highlights of the Missouri Tax Free and Tax Free Funds for the period presented through October 31, 2000, were audited by other auditors whose report dated December 29, 2000 expressed an unqualified opinion on those financial highlights.
We conducted our audits in accordance with the standards of the Public Company Accounting Oversight Board (United States). Those standards require that we plan and perform the audit to obtain reasonable assurance about whether the financial statements and financial highlights are free of material misstatement. We were not engaged to perform an audit of the fund's internal control over financial reporting. Our audits included consideration of internal control over financial reporting as a basis for designating audit procedures that are appropriate in the circumstances, but not for the purpose of expressing an opinion on the effectiveness of the fund's internal control over financial reporting. Accordingly, we express no such opinion. An audit also includes examining, on a test basis, evidence supporting the amounts and disclosures in the financial statements and financial highlights, a ssessing the accounting principles used and significant estimates made by management, and evaluating the overall financial statement presentation. Our procedures included confirmation of securities owned as of September 30, 2005, by correspondence with the custodian and brokers or by other appropriate auditing procedures where replies from brokers were not received. We believe that our audits provide a reasonable basis for our opinion.
In our opinion, the financial statements and financial highlights audited by us as referred to above present fairly, in all material respects, the financial position of the funds listed above of First American Investment Funds, Inc. at September 30, 2005, the results of their operations for the year then ended, the changes in their net assets for each of the two years in the period then ended and their financial highlights for each of the periods indicated herein, in conformity with U.S. generally accepted accounting principles.

Minneapolis, Minnesota
November 18, 2005
FIRST AMERICAN FUNDS Annual Report 2005
44
Schedule of Investments September 30, 2005
Arizona Tax Free Fund
| DESCRIPTION | | PAR (000) | | VALUE (000) | |
| Municipal Bonds – 93.2% | |
| Revenue Bonds – 67.7% | |
| Continuing Care Retirement Communities – 1.7% | |
Arizona Health Facilities Authority,
The Terraces Project, Series A,
Callable 11/15/13 @ 101
7.500%, 11/15/23 | | $ | 200 | | | $ | 225 | | |
Tempe Industrial Development Authority,
Friendship Village Project, Series A
5.375%, 12/01/13 | | | 200 | | | | 203 | | |
| | | | 428 | | |
| Education – 7.3% | | | |
Gilbert Industrial Development Authority,
Southwest Student Services,
Pre-refunded 02/01/09 @ 102
5.850%, 02/01/19 (a) | | | 1,000 | | | | 1,097 | | |
Glendale Industrial Development Authority,
Midwestern University
5.250%, 05/15/14 | | | 140 | | | | 150 | | |
Glendale Industrial Development Authority,
Midwestern University, Series A,
Callable 05/15/11 @ 101
5.750%, 05/15/21 | | | 250 | | | | 270 | | |
University of Arizona Board of Regents,
Series A, Pre-refunded 12/01/09 @ 100 (FGIC)
5.800%, 06/01/24 (a) | | | 150 | | | | 165 | | |
University of Arizona Parking & Student Housing
Authority, Pre-refunded 06/01/09 @ 100 (AMBAC)
5.750%, 06/01/19 (a) | | | 140 | | | | 152 | | |
| | | | 1,834 | | |
| Healthcare – 21.1% | | | |
Arizona Health Facilities Authority,
Blood Systems Inc., Callable 04/01/14 @ 100
4.750%, 04/01/25 | | | 300 | | | | 296 | | |
Arizona Health Facilities Authority,
John C. Lincoln Health Network,
Callable 12/01/12 @ 101
5.750%, 12/01/32 | | | 150 | | | | 158 | | |
Glendale Industrial Development Authority,
Callable 12/01/15 @ 100
4.625%, 12/01/27 | | | 200 | | | | 190 | | |
Johnson City, Tennessee Health & Elderly
Facilities Authority, Callable 07/01/12 @ 103
7.500%, 07/01/25 | | | 100 | | | | 118 | | |
Maricopa County Hospital, Sun Health Corporation,
Callable 04/01/15 @ 100
5.000%, 04/01/25 | | | 200 | | | | 202 | | |
Maricopa County Industrial Development Authority,
Catholic Healthcare West, Series A,
Callable 07/01/14 @ 100
5.375%, 07/01/23 | | | 500 | | | | 525 | | |
Mesa Industrial Development Authority,
Discovery Health Systems, Series A,
Pre-refunded 01/01/10 @ 101 (MBIA)
5.750%, 01/01/25 (a) 500 551
5.625%, 01/01/29 (a) | | | 500 | | | | 548 | | |
Scottsdale Industrial Development Authority,
Scottsdale Healthcare, Callable 12/01/11 @ 101
5.700%, 12/01/21 | | | 1,000 | | | | 1,076 | | |
Show Low Industrial Development Authority,
Hospital Revenue, Navapache Regional
Medical Center, Callable 12/01/15 @ 100 (RAAI)
4.375%, 12/01/20 (b) | | | 400 | | | | 392 | | |
Arizona Tax Free Fund (continued)
| DESCRIPTION | | PAR (000) | | VALUE (000) | |
University Medical Center Corporation,
Callable 07/01/14 @ 100
5.000%, 07/01/24 | | $ | 500 | | | $ | 507 | | |
Yavapai Industrial Development Authority,
Yavapai Regional Medical Center, Series A,
Callable 08/01/13 @ 100 (RAAI)
5.250%, 08/01/21 375 394
6.000%, 08/01/33 | | | 100 | | | | 107 | | |
Yuma Industrial Development Authority,
Yuma Regional Medical Center,
Callable 08/01/07 @ 102, Escrowed to
Maturity (MBIA)
5.500%, 08/01/17 (c) | | | 250 | | | | 265 | | |
| | | | 5,329 | | |
| Housing – 6.1% | | | |
Arizona State University West
Campus Housing LLC,
Callable 07/01/15 @ 100 (AMBAC)
4.500%, 07/01/35 | | | 500 | | | | 485 | | |
Douglas Community Housing Corporation,
Rancho La Perilla,
Callable 01/20/10 @ 102 (GNMA)
5.900%, 07/20/20 500 526
6.000%, 07/20/25 | | | 475 | | | | 499 | | |
Phoenix Industrial Development Authority,
The Phoenix Authority, Series 1A,
Callable 06/01/10 @ 102
(FHLMC) (FNMA) (GNMA)
5.875%, 06/01/16 | | | 20 | | | | 20 | | |
| | | | 1,530 | | |
| Lease Revenue – 3.4% | | | |
Nogales Municipal Development Authority,
Callable 06/01/15 @ 100 (AMBAC)
5.000%, 06/01/27 | | | 500 | | | | 523 | | |
Scottsdale Municipal Property Corporation,
Excise Tax, Series C,
Callable 07/01/17 @ 100 (AMBAC)
0.000%, 07/01/21 (d) | | | 500 | | | | 345 | | |
| | | | 868 | | |
| Miscellaneous – 4.4% | | | |
Arizona Student Loan Acquisition Authority,
Series A, Callable 11/01/09 @ 102 (AMT)
5.900%, 05/01/24 | | | 100 | | | | 107 | | |
Greater Arizona Infrastructure Development Authority,
Series A, Callable 08/01/08 @ 102 (MBIA)
5.625%, 08/01/20 | | | 200 | | | | 216 | | |
Greater Arizona Infrastructure Development
Authority, Series B, Callable 08/01/14 @ 100
5.250%, 08/01/26 | | | 750 | | | | 793 | | |
| | | | 1,116 | | |
| Tax Revenue – 10.1% | | | |
Arizona School Facilities Board,
State School Improvement,
Pre-refunded 07/01/12 @ 100
5.250%, 07/01/16 (a) 750 826
5.250%, 07/01/20 (a) | | | 250 | | | | 275 | | |
Kingman, Excise Tax Revenue,
Callable 07/01/15 @100 (AMBAC)
4.250%, 07/01/19 | | | 245 | | | | 252 | | |
Oro Valley, Excise Tax,
Callable 07/01/10 @ 101 (AMBAC)
5.200%, 07/01/14 | | | 400 | | | | 435 | | |
FIRST AMERICAN FUNDS Annual Report 2005
45
Schedule of Investments September 30, 2005
Arizona Tax Free Fund (continued)
| DESCRIPTION | | PAR (000) | | VALUE (000) | |
Phoenix Civic Improvements, Excise Tax,
Callable 07/01/09 @ 101
5.750%, 07/01/16 | | $ | 300 | | | $ | 327 | | |
Scottsdale Municipal Property Corporation,
Excise Tax Revenue, Series A,
Callable 07/14/14 @ 100
4.500%, 07/01/25 | | | 100 | | | | 100 | | |
Tempe, Excise Tax, Series A,
Callable 07/01/09 @ 100
5.625%, 07/01/20 | | | 300 | | | | 323 | | |
| | | | 2,538 | | |
| Transportation – 7.1% | | | |
Arizona State Transportation Highway Board,
Series A
5.000%, 07/01/09 | | | 400 | | | | 425 | | |
Phoenix Civic Improvements, Series B,
Callable 07/01/12 @ 100 (AMT) (FGIC)
5.250%, 07/01/21 250 262
5.250%, 07/01/27 | | | 750 | | | | 782 | | |
Tucson Street & Highway Improvements,
Series 1994-E,
Pre-refunded 07/01/10 @ 100 (FGIC)
5.000%, 07/01/18 (a) | | | 300 | | | | 322 | | |
| | | | 1,791 | | |
| Utilities – 6.5% | | | |
Chandler Water & Sewer Improvements,
Pre-refunded 07/01/10 @ 101 (FSA)
5.800%, 07/01/17 (a) | | | 250 | | | | 279 | | |
Gilbert Water Municipal Property
Wastewater System & Utility,
Callable 04/01/08 @ 100
5.000%, 04/01/17 | | | 375 | | | | 377 | | |
Mesa Utility System Revenue,
Callable 07/01/15 @ 100 (FSA)
4.125%, 07/01/28 | | | 500 | | | | 472 | | |
Tucson Water, Series 1994-A (MBIA)
6.250%, 07/01/16 | | | 170 | | | | 205 | | |
Yavapai Industrial Development Authority,
Waste Management Project, Series A-2,
Mandatory Put 03/01/08 @ 100 (AMT)
4.450%, 03/01/28 | | | 300 | | | | 304 | | |
| | | | 1,637 | | |
| Total Revenue Bonds | | | | | | | 17,071 | | |
| General Obligations – 20.3% | | | |
Centerra Community Facilities Distributors,
Callable 07/15/15 @ 100
5.500%, 07/15/29 | | | 200 | | | | 201 | | |
Chandler Public & Recreational Improvements,
Callable 07/01/10 @ 101
5.800%, 07/01/18 | | | 250 | | | | 277 | | |
Greenlee County School District #18, Morenci
5.000%, 07/01/12 | | | 165 | | | | 172 | | |
Peoria, Callable 04/01/09 @ 100 (FGIC)
5.400%, 04/01/15 100 107
5.000%, 04/01/18 575 605
5.000%, 04/01/19 | | | 125 | | | | 132 | | |
Phoenix, Callable 07/01/07 @ 102
5.250%, 07/01/20 | | | 250 | | | | 262 | | |
Phoenix, Callable 07/01/10 @ 100
5.250%, 07/01/19 350 376
5.375%, 07/01/25 | | | 750 | | | | 805 | | |
Arizona Tax Free Fund (continued)
| DESCRIPTION | | PAR (000)/SHARES | | VALUE (000) | |
Phoenix, Series B, Callable 07/01/15 @100
4.750%, 07/01/25 | | $ | 750 | | | $ | 771 | | |
Puerto Rico Public Building Authority, Series I,
Callable 07/01/14 @ 100 (COMGTY)
5.250%, 07/01/33 | | | 100 | | | | 106 | | |
Scottsdale, Pre-refunded 07/01/09 @ 100
5.500%, 07/01/22 (a) | | | 250 | | | | 270 | | |
Tucson
5.500%, 07/01/18 | | | 250 | | | | 285 | | |
Yavapai County Community College,
Callable 07/01/14 @ 100 (AMBAC)
4.500%, 07/01/24 | | | 500 | | | | 504 | | |
Yuma & La Paz Counties, Arizona Community
College District, Arizona Western College,
Callable 07/01/15 @ 100 (FSA)
4.250%, 07/01/25 | | | 250 | | | | 244 | | |
| Total General Obligations | | | | | | | 5,117 | | |
| Certificates of Participation – 5.2% | | | |
Northern Arizona University,
Research Projects,
Callable 09/01/15 @ 100 (AMBAC)
4.250%, 09/01/28 | | | 500 | | | | 476 | | |
Pinal County
5.000%, 12/01/14 | | | 400 | | | | 426 | | |
Tucson, Callable 07/01/08 @ 100 (MBIA)
5.500%, 07/01/15 | | | 200 | | | | 212 | | |
University of Arizona,
Callable 06/01/15 @ 100 (AMBAC)
4.250%, 06/01/22 | | | 190 | | | | 183 | | |
| Total Certificates of Participation | | | | | | | 1,297 | | |
Total Municipal Bonds
(Cost $22,148) | | | | | | | 23,485 | | |
| Money Market Fund – 0.9% | | | |
Federated Arizona Municipal
Money Market Fund
(Cost $220) | | | 220,226 | | | | 220 | | |
| Affiliated Money Market Fund – 4.7% | | | |
First American Tax Free Obligations Fund, Class Z (e)
(Cost $1,197) | | | 1,197,170 | | | | 1,197 | | |
Total Investments – 98.8%
(Cost $23,565) | | | | | | | 24,902 | | |
| Other Assets and Liabilities, Net – 1.2% | | | | | | | 308 | | |
| Total Net Assets – 100.0% | | | | | | $ | 25,210 | | |
(a) Pre-refunded issues are typically backed by U.S. Government obligations. These bonds mature at the call date and price indicated.
(b) Security purchased on a when-issued basis. On September 30, 2005, the total cost of investments purchased on a when-issued basis was $396,260 or 1.6% of total net assets. See note 2 in Notes to Financial Statements.
(c) Escrowed to Maturity issues are typically backed by U.S. Government obligations. If callable, these bonds may still be subject to call date and price indicated.
(d) Delayed Interest (Step-Bonds) – Securities for which the coupon rate of interest will adjust on specified future date(s). The rate disclosed is the rate in effect as of September 30, 2005.
(e) Investment in affiliated security. This money market fund is advised by U.S. Bancorp Asset Management, Inc., which also serves as advisor for this fund. See note 3 in Notes to Financial Statements.
AMBAC – American Municipal Bond Assurance Corporation
The accompanying notes are an integral part of the financial statements.
FIRST AMERICAN FUNDS Annual Report 2005
46
Arizona Tax Free Fund (concluded)
AMT – Alternative Minimum Tax. As of September 30, 2005, the aggregate market value of securities subject to AMT was $1,455,377 which represents 5.8% of total net assets.
COMGTY – Commonwealth Guaranty
FGIC – Financial Guaranty Insurance Corporation
FHLMC – Federal Home Loan Mortgage Corporation
FNMA – Federal National Mortgage Association
FSA – Financial Security Assurance
GNMA – Government National Mortgage Association
MBIA – Municipal Bond Insurance Association
RAAI – Radian Asset Assurance Inc.
California Intermediate Tax Free Fund
| DESCRIPTION | | PAR (000) | | VALUE (000) | |
| Municipal Bonds – 95.0% | |
| Revenue Bonds – 68.2% | |
| Continuing Care Retirement Communities – 5.9% | |
ABAG Financial Authority,
O'Connor Woods (ACA)
5.250%, 11/01/05 | | $ | 500 | | | $ | 501 | | |
ABAG Financial Authority,
Odd Fellows Home of California (CMI)
4.950%, 08/15/07 | | | 500 | | | | 515 | | |
California Health Facilities Financing Authority,
Paradise Valley Estates (CMI)
4.125%, 01/01/10 500 510
4.375%, 01/01/12 | | | 540 | | | | 556 | | |
California Statewide Communities
Development Authority,
Los Angeles Jewish Home (CMI)
5.000%, 11/15/12 | | | 500 | | | | 534 | | |
La Verne, Brethren Hillcrest Homes,
Series B, Callable 02/15/13 @ 101 (ACA)
5.600%, 02/15/33 | | | 500 | | | | 528 | | |
| | | | 3,144 | | |
| Education – 10.4% | | | |
ABAG Financial Authority,
Schools of the Sacred Heart, Series A
5.800%, 06/01/08 | | | 200 | | | | 211 | | |
California Educational Facilities Authority,
Golden Gate University,
Callable 10/01/15 @ 100
5.000%, 10/01/20 | | | 505 | | | | 519 | | |
California Educational Facilities Authority,
Lutheran University, Series C,
Callable 10/01/14 @ 100
4.750%, 10/01/15 | | | 675 | | | | 704 | | |
California Educational Facilities Authority,
University of Pacific, Callable 11/01/14 @ 100
5.000%, 11/01/20 | | | 435 | | | | 458 | | |
California Educational Facilities Authority,
University of Redlands, Series A,
Callable 10/01/15 @ 100
5.000%, 10/01/20 | | | 500 | | | | 522 | | |
California State Higher Educational
Facilities Authority, Fresno Pacific University,
Series A
5.650%, 03/01/07 380 391
5.750%, 03/01/08 | | | 400 | | | | 419 | | |
California State Higher Educational
Facilities Authority, Occidental
College Project, Pre-refunded
10/01/07 @ 102 (MBIA)
5.300%, 10/01/10 (a) | | | 500 | | | | 533 | | |
California State Higher Educational
Facilities Authority, University
of La Verne & Western University
of Health Sciences, Series B
6.000%, 06/01/10 | | | 495 | | | | 542 | | |
California State Higher Educational
Facilities Authority, University of Redlands,
Series A, Escrowed to Maturity
5.550%, 06/01/09 (b) | | | 225 | | | | 244 | | |
FIRST AMERICAN FUNDS Annual Report 2005
47
Schedule of Investments September 30, 2005
California Intermediate Tax Free Fund (continued)
| DESCRIPTION | | PAR (000) | | VALUE (000) | |
California State Higher Educational
Facilities Authority, University of
Redlands, Series A, Pre-refunded
06/01/10 @ 101
5.700%, 06/01/11 (a) | | $ | 250 | | | $ | 279 | | |
| 5.750%, 06/01/12 (a) | | | 260 | | | | 291 | | |
California Statewide Communities
Development Authority,
Viewpoint Schools (ACA)
4.125%, 10/01/14 | | | 405 | | | | 401 | | |
| | | | 5,514 | | |
| Healthcare – 15.0% | | | |
California Health Facilities Financing Authority,
Casa Colina, Callable 04/01/12 @ 100
5.500%, 04/01/13 | | | 300 | | | | 320 | | |
California Health Facilities Financing Authority,
Catholic Healthcare West, Series I,
Mandatory Put 07/01/14 @ 100
4.950%, 07/01/26 | | | 450 | | | | 471 | | |
California Health Facilities Financing Authority,
Marshall Medical Center, Series A,
Callable 11/01/14 @ 100 (CMI)
4.750%, 11/01/19 | | | 1,200 | | | | 1,226 | | |
California Health Facilities Financing Authority,
Valleycare Medical Center, Series A,
Callable 05/01/12 @ 100 (CMI)
4.625%, 05/01/13 300 311
4.800%, 05/01/14 | | | 715 | | | | 745 | | |
California State Health Facilities Authority,
Casa de las Campanas, Series A,
Callable 08/01/08 @ 100 (CMI)
5.375%, 08/01/09 | | | 250 | | | | 262 | | |
California Statewide Communities Development
Authority, Daughters of Charity Health,
Series G
5.250%, 07/01/13 | | | 500 | | | | 532 | | |
California Statewide Communities Development
Authority, Elder Care Alliance, Series A
7.250%, 11/15/11 | | | 500 | | | | 505 | | |
California Statewide Communities Development
Authority, Kaiser Permanente, Series C,
Mandatory Put 06/01/12 @ 100
3.850%, 11/01/29 | | | 1,000 | | | | 993 | | |
California Statewide Communities Development
Authority, Los Angeles Orthopedic Hospital
Foundation, Callable 06/01/07 @ 101 (AMBAC)
5.000%, 06/01/12 | | | 150 | | | | 156 | | |
Marysville Hospital, Fremont Rideout
Health Project, Series A,
Callable 07/01/08 @ 103 (AMBAC)
5.000%, 01/01/10 | | | 500 | | | | 530 | | |
Puerto Rico Industrial, Tourist, Educational,
Medical & Environmental Control Facilities,
Hospital de la Concepcion, Series A
5.500%, 11/15/09 | | | 650 | | | | 695 | | |
Rancho Mirage Joint Powers Finance Authority,
Eisenhower Medical Center, Series A,
Callable 07/01/07 @ 102 (MBIA)
5.125%, 07/01/08 | | | 500 | | | | 527 | | |
Turlock California Health Facilities Revenue,
Emanuel Medical Center,
Callable 10/15/14 @ 100
5.000%, 10/15/24 | | | 700 | | | | 709 | | |
| | | | 7,982 | | |
California Intermediate Tax Free Fund (continued)
| DESCRIPTION | | PAR (000) | | VALUE (000) | |
| Housing – 4.1% | |
ABAG Financial Authority, Archstone
Redwood Housing Project, Series A
5.300%, 10/01/08 | | $ | 500 | | | $ | 524 | | |
Aztec Shops, California State Auxiliary
Organization, San Diego State University,
Callable 09/01/10 @ 101
5.400%, 09/01/11 | | | 1,035 | | | | 1,113 | | |
California Rural Home Mortgage Finance
Authority, Single Family Mortgage,
Series D (AMT) (FNMA) (GNMA)
5.250%, 06/01/10 | | | 20 | | | | 20 | | |
California Statewide Communities
Development Authority, Equity Residential,
Series B, Mandatory Put 06/15/09 @ 100
5.200%, 12/01/29 | | | 500 | | | | 526 | | |
| | | | 2,183 | | |
| Lease Revenue – 8.9% | | | |
California State Public Works Board,
California Community Colleges, Series A,
Callable 12/01/09 @ 101 (MLO)
4.875%, 12/01/18 | | | 200 | | | | 207 | | |
California State Public Works Board,
Department of Corrections,
Series A (AMBAC) (MLO)
6.000%, 01/01/06 | | | 545 | | | | 549 | | |
California State Public Works Board,
Department of Health Services,
Callable 11/01/09 @ 101 (MBIA) (MLO)
5.200%, 11/01/12 | | | 500 | | | | 536 | | |
California State Public Works Board,
Department of Mental Health,
Callable 06/01/14 @ 100
5.500%, 06/01/16 | | | 540 | | | | 596 | | |
Golden State Tobacco Securitization
Corportation, California Tobacco Settlement,
Series A, Convertible, Zero Coupon Bond,
Callable 06/01/18 @ 100
4.550%, 06/01/22 (c) | | | 500 | | | | 402 | | |
Long Beach Financing Authority,
Lease Revenue, Temple & Willow
Facilities Refinancing Project, Series A,
Callable 05/01/15 @ 100 (MBIA)
4.000%, 05/01/16 | | | 305 | | | | 305 | | |
Los Angeles Community
Redevelopment Agency, Lease Revenue,
Manchester Social Services Project,
Callable 09/01/15 @ 100 (AMBAC)
5.000%, 09/01/16 | | | 1,500 | | | | 1,613 | | |
Los Angeles Municipal Improvement Corporation,
Sanitation Equipment, Series A (FSA) (MLO)
6.000%, 02/01/07 | | | 500 | | | | 521 | | |
| | | | 4,729 | | |
| Miscellaneous – 3.9% | | | |
Children's Trust Fund, Puerto Rico
Tobacco Settlement Issue,
Escrowed to Maturity
5.000%, 07/01/08 (b) | | | 250 | | | | 263 | | |
Golden West Schools Financing Authority,
Series A, Zero Coupon Bond (MBIA)
5.000%, 02/01/12 (c) | | | 535 | | | | 422 | | |
The accompanying notes are an integral part of the financial statements.
FIRST AMERICAN FUNDS Annual Report 2005
48
California Intermediate Tax Free Fund (continued)
| DESCRIPTION | | PAR (000) | | VALUE (000) | |
Golden West Schools Financing Authority,
Series A (MBIA)
5.700%, 02/01/13 | | $ | 720 | | | $ | 817 | | |
| 5.750%, 02/01/14 | | | 520 | | | | 596 | | |
| | | | 2,098 | | |
| Recreational Facility Authority – 1.1% | | | |
California State University Fresno Association,
Auxiliary Organization Event Center,
Pre-refunded 07/01/12 @ 101
6.000%, 07/01/22 (a) | | | 500 | | | | 576 | | |
| Tax Revenue – 4.3% | | | |
Long Beach Community Facilities District #5,
Towne Center Special Tax,
Callable 10/01/06 @ 102
6.100%, 10/01/12 | | | 165 | | | | 170 | | |
Murrieta Community Facilities District #2,
The Oaks Area, Callable 09/01/14 @ 100
5.750%, 09/01/20 | | | 250 | | | | 266 | | |
Petaluma Community Development Commission,
Tax Allocation, Petaluma Community
Development Project, Series A,
Callable 05/01/15 @ 100 (MBIA)
4.000%, 05/01/18 (d) | | | 250 | | | | 246 | | |
Roseville Special Tax Refunding,
North Roseville Community, Series 1,
Callable 09/01/15 @ 100 (AMBAC)
4.000%, 09/01/18 | | | 860 | | | | 834 | | |
Stockton Public Financing Revenue,
Assessment Districts, Senior Lien, Series A,
Callable 09/02/15 @ 100 (RAAI)
4.300%, 09/02/18 | | | 790 | | | | 772 | | |
| | | | 2,288 | | |
| Transportation – 3.1% | | | |
Alameda Corridor Transportation Authority,
Zero Coupon Bond (AMBAC)
4.650%, 10/01/14 (c) | | | 1,000 | | | | 690 | | |
San Francisco City & County International
Airports Commission, Second Series,
Issue 25 (AMT) (FSA)
5.500%, 05/01/08 | | | 500 | | | | 526 | | |
San Francisco City & County International
Airports Commission, SFO Fuel,
Series A (AMT) (FSA)
5.250%, 01/01/07 | | | 450 | | | | 462 | | |
| | | | 1,678 | | |
| Utilities – 11.5% | | | |
California Municipal Financial Authority,
Solid Waste Disposal Revenue,
Waste Management Project,
Mandatory Put 09/01/09 @ 100 (AMT)
4.100%, 09/01/14 | | | 750 | | | | 752 | | |
California Pollution Control Filing Authority,
Solid Waste Disposal Revenue,
Waste Management Project, Series B,
Callable 07/01/15 @ 100 (AMT)
5.000%, 07/01/27 | | | 250 | | | | 248 | | |
California State Department of Water,
Central Valley Project, Series O,
Pre-refunded 12/01/05 @ 101
5.000%, 12/01/12 (a) | | | 500 | | | | 507 | | |
California Intermediate Tax Free Fund (continued)
| DESCRIPTION | | PAR (000) | | VALUE (000) | |
California State Department of Water,
Central Valley Project, Series P,
Pre-refunded 06/01/06 @ 101
5.300%, 12/01/07 (a) | | $ | 750 | | | $ | 770 | | |
California State Department of Water,
Series A, Callable 05/01/12 @ 101
5.875%, 05/01/16 | | | 500 | | | | 560 | | |
Chino Basin Regional Financing Authority,
Inland Empire Utility Agency Sewer Project,
Pre-refunded 11/01/09 @ 101 (MBIA)
5.200%, 11/01/11 (a) | | | 405 | | | | 442 | | |
Imperial, Wastewater Treatment Facility,
Callable 10/15/11 @ 102 (FGIC)
5.000%, 10/15/20 | | | 1,000 | | | | 1,054 | | |
Metropolitan Water District of Southern California,
Series B, Callable 07/01/06 @ 102 (MBIA)
4.875%, 07/01/10 190 196
5.000%, 07/01/14 | | | 295 | | | | 305 | | |
Metropolitan Water District of Southern California,
Series B, Pre-refunded 07/01/06 @ 102 (MBIA)
4.875%, 07/01/10 (a) 135 140
5.000%, 07/01/14 (a) | | | 205 | | | | 212 | | |
Richmond Wastewater Systems,
Callable 08/01/09 @ 102 (FGIC)
5.200%, 08/01/11 | | | 500 | | | | 538 | | |
Whittier Utility Authority,
Callable 06/01/13 @ 100 (MBIA)
4.400%, 06/01/17 | | | 305 | | | | 311 | | |
| 4.500%, 06/01/18 | | | 65 | | | | 66 | | |
| | | | 6,101 | | |
| Total Revenue Bonds | | | | | | | 36,293 | | |
| General Obligations – 19.8% | |
A B C California Unified School District,
Series A (MBIA)
4.600%, 02/01/16 | | | 400 | | | | 424 | | |
Alisal Unified School District, Series C,
Zero Coupon Bond (FGIC)
5.050%, 08/01/08 (c) | | | 860 | | | | 786 | | |
Bassett Unified School District,
Capital Appreciation-Election 2004-A,
Zero Coupon Bond (FSA)
4.470%, 08/01/16 (c) | | | 450 | | | | 282 | | |
California State, Callable 08/01/13 @ 100
5.000%, 02/01/17 | | | 1,000 | | | | 1,060 | | |
California State, Callable 04/01/14 @ 100
5.125%, 04/01/24 | | | 500 | | | | 527 | | |
Foothill-De Anza Community College District,
Callable 08/01/10 @ 101
6.000%, 08/01/11 | | | 300 | | | | 338 | | |
Franklin McKinley California School District,
Capital Appreciation Election 2004, Series A,
Zero Coupon Bond (FGIC)
4.820%, 08/01/16 (c) | | | 475 | | | | 297 | | |
Fresno Unified School District, Series A (MBIA)
6.050%, 08/01/11 | | | 500 | | | | 571 | | |
Jefferson Union High School District,
San Mateo County, Series A (MBIA)
6.250%, 02/01/14 | | | 300 | | | | 355 | | |
Lemon Grove School District, Election of 1998-B,
Zero Coupon Bond (FSA)
3.329%, 11/01/20 (c) | | | 375 | | | | 189 | | |
FIRST AMERICAN FUNDS Annual Report 2005
49
Schedule of Investments September 30, 2005
California Intermediate Tax Free Fund (continued)
| DESCRIPTION | | PAR (000) | | VALUE (000) | |
Montebello Unified School District,
Zero Coupon Bond (MBIA)
5.680%, 08/01/21 (c) | | $ | 700 | | | $ | 338 | | |
Pomona School District, Series A (MBIA)
5.450%, 02/01/06 250 252
5.500%, 08/01/06 | | | 250 | | | | 256 | | |
Pomona School District, Series A,
Callable 08/01/11 @ 103 (MBIA)
6.150%, 08/01/15 | | | 500 | | | | 582 | | |
Puerto Rico Commonwealth, Series B (FSA)
6.500%, 07/01/15 | | | 1,000 | | | | 1,223 | | |
Roseville Joint Union High School District,
Callable 08/01/11 @ 101
5.200%, 08/01/20 | | | 600 | | | | 636 | | |
San Juan Unified School District,
Zero Coupon Bond (FSA)
5.420%, 08/01/16 (c) | | | 390 | | | | 244 | | |
San Mateo County Community College District,
Series A, Zero Coupon Bond (FGIC)
5.300%, 09/01/17 (c) | | | 760 | | | | 451 | | |
San Mateo Unified High School District,
Series B, Zero Coupon Bond (FGIC)
5.150%, 09/01/17 (c) | | | 1,000 | | | | 593 | | |
Walnut Valley Unified School District,
Series A, Pre-refunded 08/01/10 @ 102 (FSA)
5.000%, 08/01/12 (a) | | | 255 | | | | 281 | | |
West Covina Unified School District,
Series A (MBIA)
5.350%, 02/01/20 | | | 770 | | | | 873 | | |
| Total General Obligations | | | | | | | 10,558 | | |
| Certificates of Participation – 7.0% | |
Bakersfield Convention Center Expansion
Project, Callable 04/01/07 @ 101 (MBIA) (MLO)
5.500%, 04/01/10 | | | 250 | | | | 261 | | |
Grossmont Unified High School District,
Pre-refunded 09/01/08 @ 102 (FSA) (MLO)
5.400%, 09/01/13 (a) | | | 300 | | | | 326 | | |
Kern County Board of Education, Series A,
Callable 05/01/08 @ 102 (MBIA) (MLO)
5.200%, 05/01/12 | | | 905 | | | | 964 | | |
Los Angeles County Schools,
Regionalized Business Services Financing
Project, Series A
5.000%, 09/01/08 | | | 200 | | | | 210 | | |
Los Angeles, Sonnenblick Del Rio,
West Los Angeles (AMBAC) (MLO)
5.375%, 11/01/10 | | | 500 | | | | 549 | | |
Paradise Unified School District,
Measure M Project, Series A,
Callable 03/01/06 @ 102 (AMBAC) (MLO)
5.250%, 09/01/07 | | | 300 | | | | 309 | | |
Poway California, Callable 08/01/15 @ 100
4.500%, 08/01/16 | | | 585 | | | | 610 | | |
San Buenaventura Wastewater Revenue,
Callable 03/01/14 @ 100 (MBIA)
4.000%, 03/01/16 | | | 500 | | | | 500 | | |
| Total Certificates of Participation | | | | | | | 3,729 | | |
Total Municipal Bonds
(Cost $48,317) | | | | | | | 50,580 | | |
California Intermediate Tax Free Fund (concluded)
| DESCRIPTION | | SHARES | | VALUE (000) | |
| Money Market Funds – 4.3% | |
| Federated California Municipal Cash Trust | | | 494,143 | | | $ | 494 | | |
| Provident California Money Fund | | | 1,769,229 | | | | 1,769 | | |
Total Money Market Funds
(Cost $2,263) | | | | | 2,263 | | |
Total Investments – 99.3%
(Cost $50,580) | | | | | 52,843 | | |
| Other Assets and Liabilities, Net – 0.7% | | | | | 395 | | |
| Total Net Assets – 100.0% | | | | $ | 53,238 | | |
(a) Pre-refunded issues are typically backed by U.S. Government obligations. These bonds mature at the call date and price indicated.
(b) Escrowed to Maturity issues are typically backed by U.S. Government obligations. If callable, these bonds may still be subject to call at the call date and price indicated.
(c) The rate shown is the effective yield at the time of purchase.
(d) Security purchased on a when-issued basis. On September 30, 2005, the total cost of investments purchased on a when-issued basis was $246,830 or 0.5% of total net assets. See note 2 in Notes to Financial Statements.
ABAG – Association of Bay Area Governments
ACA – American Capital Access
AMBAC – American Municipal Bond Assurance Corporation
AMT – Alternative Minimum Tax. As of September 30, 2005, the aggregate market value of securities subject to the AMT was $2,007,863 or 3.8% of total net assets.
CMI – California Mortgage Insurance Program
FGIC – Financial Guaranty Insurance Corporation
FNMA – Federal National Mortgage Association
FSA – Financial Security Assurance
GNMA – Government National Mortgage Association
MBIA – Municipal Bond Insurance Association
MLO – Municipal Lease Obligation
RAAI – Radian Asset Assurance Inc.
The accompanying notes are an integral part of the financial statements.
FIRST AMERICAN FUNDS Annual Report 2005
50
California Tax Free Fund
| DESCRIPTION | | PAR (000) | | VALUE (000) | |
| Municipal Bonds – 96.0% | | | |
| Revenue Bonds – 71.8% | | | |
| Continuing Care Retirement Community – 0.8% | | | |
ABAG Finance Authority, Lincoln Glen
Manor Senior Citizens,
Callable 02/15/08 @ 101 (CMI)
6.100%, 02/15/25 | | $ | 250 | | | $ | 264 | | |
| Education – 10.4% | | | |
ABAG Financial Authority, Schools of the
Sacred Heart, Series A
5.900%, 06/01/10 | | | 200 | | | | 218 | | |
California Educational Facilities Authority,
University of Redlands, Series A,
Callable 10/01/15 @ 100
5.000%, 10/01/20 | | | 500 | | | | 522 | | |
California State Higher Educational Facilities
Authority, Fresno Pacific University, Series A
5.550%, 03/01/06 | | | 250 | | | | 252 | | |
California State Higher Educational Facilities
Authority, Fresno Pacific University, Series A,
Callable 03/01/10 @ 101
6.750%, 03/01/19 | | | 380 | | | | 415 | | |
California State Higher Educational Facilities
Authority, University of La Verne & Western
University of Health Sciences, Series B,
Callable 06/01/10 @ 101
6.625%, 06/01/20 | | | 215 | | | | 235 | | |
California State Higher Educational Facilities
Authority, University of Redlands, Series A,
Pre-refunded 06/01/10 @ 101
5.950%, 06/01/15 (a) | | | 310 | | | | 349 | | |
California State University Foundation,
Monterey Bay, Callable 06/01/11 @ 100 (MBIA)
5.300%, 06/01/22 | | | 500 | | | | 538 | | |
University of California, Series K,
Callable 09/01/08 @ 101
5.000%, 09/01/20 | | | 1,000 | | | | 1,049 | | |
| | | | 3,578 | | |
| Healthcare – 11.1% | | | |
California Health Facilities Financing Authority,
Casa Colina, Callable 04/01/12 @ 100
5.500%, 04/01/13 | | | 50 | | | | 53 | | |
California Health Facilities Financing Authority,
Cedars-Sinai Medical Center
5.000%, 11/15/15 | | | 500 | | | | 532 | | |
California Health Facilities Financing Authority,
Marshall Medical Center, Series A,
Callable 11/01/14 @ 100 (CMI)
4.750%, 11/01/19 | | | 560 | | | | 572 | | |
California Statewide Communities
Development Authority, Adventist Health,
Series A, Callable 03/01/15 @ 100
5.000%, 03/01/30 (b) | | | 300 | | | | 305 | | |
California Statewide Communities Development
Authority, Daughters of Charity Health,
Series A, Callable 07/01/15 @ 100
5.250%, 07/01/30 | | | 100 | | | | 103 | | |
California Statewide Communities Development
Authority, Elder Care Alliance, Series A
7.250%, 11/15/11 | | | 250 | | | | 252 | | |
California Statewide Communities Development
Authority, Kaiser Permanente, Series C,
Mandatory Put 06/01/12 @ 100
3.850%, 11/01/29 | | | 400 | | | | 397 | | |
California Tax Free Fund (continued)
| DESCRIPTION | | PAR (000) | | VALUE (000) | |
California Statewide Communities Development
Authority, Los Angeles Orthopedic Hospital
Foundation, Callable 06/01/07 @ 101 (AMBAC)
5.000%, 06/01/12 | | $ | 350 | | | $ | 363 | | |
California Statewide Communities Development
Authority, Redlands Community Hospital,
Series A, (RAAI)
5.000%, 04/01/15 | | | 500 | | | | 532 | | |
Puerto Rico Industrial Tourist, Educational,
Medical & Environmental Control Facilities,
Hospital de La Concepcion, Series A
5.500%, 11/15/08 | | | 400 | | | | 423 | | |
Turlock California Health Facilities Revenue,
Emanuel Medical Center,
Callable 10/15/14 @ 100
5.000%, 10/15/24 | | | 300 | | | | 304 | | |
| | | | 3,836 | | |
| Housing – 4.3% | | | |
Aztec Shops, California State Auxiliary
Organization, San Diego State University
5.200%, 09/01/08 | | | 455 | | | | 475 | | |
California State Department of Veterans Affairs,
Series C, Callable 01/09/11 @ 101 (AMT)
5.500%, 12/01/19 | | | 460 | | | | 485 | | |
California State Housing Finance Agency,
Single Family Mortgage, Series B,
Callable until 05/31/10 @ 100
(AMT) (FNMA) (GNMA)
5.650%, 06/01/10 | | | 15 | | | | 15 | | |
California Statewide Communities Development
Authority, Archstone Seascape,
Mandatory Put 06/01/08 @ 100
5.250%, 06/01/29 | | | 500 | | | | 520 | | |
| | | | 1,495 | | |
| Lease Revenue – 9.9% | | | |
California State Public Works Board,
California Community Colleges, Series B,
Callable 06/01/14 @ 100
5.500%, 06/01/19 | | | 1,035 | | | | 1,140 | | |
Golden State Tobacco Securitization
Corportation, California Tobacco Settlement,
Series A, Convertible, Zero Coupon Bond,
Callable 06/01/18 @ 100
4.550%, 06/01/22 (c) | | | 1,500 | | | | 1,206 | | |
Long Beach Bond Financing Authority,
Lease Revenue, Temple & Willow Facilities
Refinancing Project, Series A,
Callable 05/01/15 @ 100 (MBIA)
4.000%, 05/01/18 | | | 330 | | | | 324 | | |
Los Angeles Community Redevelopment Agency,
Lease Revenue, Manchester Social Services
Project, Callable 09/01/15 @ 100 (AMBAC)
5.000%, 09/01/16 | | | 700 | | | | 753 | | |
| | | | 3,423 | | |
| Miscellaneous – 9.7% | | | |
Golden West Schools Financing Authority,
Glendora Unified School District (MBIA)
5.500%, 09/01/19 | | | 910 | | | | 1,041 | | |
Golden West Schools Financing Authority,
Series A (MBIA)
5.750%, 02/01/14 250 287
5.800%, 08/01/22 320 383
5.800%, 08/01/23 | | | 345 | | | | 414 | | |
FIRST AMERICAN FUNDS Annual Report 2005
51
Schedule of Investments September 30, 2005
California Tax Free Fund (continued)
| DESCRIPTION | | PAR (000) | | VALUE (000) | |
Sacramento City Financing Authority,
Pre-refunded 06/01/10 @ 101 (MLO)
5.400%, 06/01/18 (a) | | $ | 455 | | | $ | 503 | | |
| 5.500%, 06/01/23 (a) | | | 645 | | | | 716 | | |
| | | | 3,344 | | |
| Recreational Facility Authority – 1.7% | | | |
California State University Fresno Association,
Auxiliary Organization Event Center,
Pre-refunded 07/01/12 @ 101
6.000%, 07/01/22 (a) | | | 500 | | | | 576 | | |
| Revolving Fund – 0.7% | |
California Statewide Communities
Development Authority Water &
Wastewater Revenue, Pooled Financiing
Project, Series 2004A,
Callable 10/01/13 @ 101 (FSA)
5.000%, 10/01/16 | | | 215 | | | | 232 | | |
| Tax Revenue – 8.0% | |
Grass Valley Community Redevelopment Agency,
Tax Allocation, Callable 12/01/08 @ 102
6.400%, 12/01/34 | | | 400 | | | | 438 | | |
Long Beach Community Facilities District #5,
Towne Center Special Tax,
Callable 10/01/06 @ 102
6.100%, 10/01/12 | | | 250 | | | | 258 | | |
Los Angeles, Callable 03/01/10 @ 101
5.625%, 03/01/19 | | | 200 | | | | 219 | | |
Los Angeles County Community Facilities
District #3, Series A, Special Tax,
Callable 09/01/10 @ 100 (AMBAC)
5.250%, 09/01/18 | | | 715 | | | | 773 | | |
Murrieta Community Facilities District #2,
The Oaks Area, Callable 09/01/14 @ 100
5.750%, 09/01/20 | | | 125 | | | | 133 | | |
Petaluma Community Development Commission,
Tax Allocation, Petaluma Community
Development Project, Series A,
Callable 05/01/15 @ 100 (MBIA)
4.000%, 05/01/18 (b) | | | 240 | | | | 236 | | |
Stockton Public Financing Revenue, Assessment
Districts, Senior Lien, Series A,
Callable 09/02/15 @ 100 (RAAI)
4.375%, 09/02/20 | | | 740 | | | | 720 | | |
| | | | 2,777 | | |
| Transportation – 1.1% | | | |
Puerto Rico Commonwealth Highway &
Transportation Authority, Series X (MBIA)
5.500%, 07/01/15 | | | 100 | | | | 114 | | |
San Francisco Airport Commission,
SFO Fuel Company,
Callable 01/01/08 @ 102 (AMT) (FSA)
5.625%, 01/01/12 | | | 250 | | | | 266 | | |
| | | | 380 | | |
| Utilities – 14.1% | | | |
California Pollution Control Filing Authority,
Solid Waste Disposal Revenue,
Waste Management Project, Series A-2,
Callable 04/01/15 @ 101 (AMT)
5.400%, 04/01/25 | | | 500 | | | | 518 | | |
California Tax Free Fund (continued)
| DESCRIPTION | | PAR (000) | | VALUE (000) | |
California Pollution Control Filing Authority,
Solid Waste Disposal Revenue, Waste
Management Project, Series B,
Callable 07/01/15 @ 100 (AMT)
5.000%, 07/01/27 | | $ | 250 | | | $ | 248 | | |
California State Department of Water,
Series W (FSA)
5.500%, 12/01/14 | | | 450 | | | | 513 | | |
Compton Sewer Authority,
Callable 09/01/08 @ 102 (MBIA)
5.375%, 09/01/23 | | | 1,150 | | | | 1,233 | | |
Contra Costa Water Authority, Series A,
Callable 10/01/12 @ 100 (FGIC)
5.000%, 10/01/20 | | | 340 | | | | 362 | | |
Los Angeles County Sanitation District's Filing
Authority, Capital Projects, Series A,
Callable 10/01/15 @ 100 (MBIA)
4.000%, 10/01/16 | | | 175 | | | | 176 | | |
Los Angeles Power System, Series A,
Subseries A-1 (MBIA)
5.000%, 07/01/12 | | | 1,225 | | | | 1,336 | | |
South Bayside Waste Management Authority,
Callable 03/01/09 @ 102 (AMBAC)
5.750%, 03/01/20 | | | 150 | | | | 164 | | |
West Kern County Water District,
Callable 06/01/10 @ 101
5.200%, 06/01/14 | | | 320 | | | | 334 | | |
| | | | 4,884 | | |
| Total Revenue Bonds | | | | | | | 24,789 | | |
| General Obligations – 19.9% | | | |
Acalanes Unified High School District,
Zero Coupon Bond,
Pre-refunded 08/01/10 @ 70.92 (FGIC)
5.560%, 08/01/16 (a) (c) | | | 700 | | | | 421 | | |
Bassett Unified School District, Capital
Appreciation-Election 2004-A, Zero
Coupon Bond (FSA)
4.610%, 08/01/18 (c) | | | 550 | | | | 311 | | |
California State, Callable 02/01/13 @ 100
5.000%, 02/01/24 | | | 700 | | | | 727 | | |
California State, Callable 10/01/10 @ 100
5.250%, 10/01/19 | | | 140 | | | | 149 | | |
California State, Pre-refunded 10/01/10 @ 100
5.250%, 10/01/19 (a) | | | 460 | | | | 504 | | |
Glendora Unified School District, Series A,
Pre-refunded 09/01/10 @ 101 (FSA)
5.350%, 09/01/20 (a) | | | 340 | | | | 376 | | |
Jefferson Union High School District,
San Mateo County, Series A (MBIA)
6.250%, 08/01/20 | | | 460 | | | | 566 | | |
Pleasant Valley School District, Ventura County,
Series A (MBIA)
5.850%, 02/01/19 | | | 250 | | | | 295 | | |
Pomona Unified School District, Series A (MBIA)
5.950%, 02/01/17 | | | 855 | | | | 1,007 | | |
Sacramento Unified School District, Series A,
Pre-refunded 07/01/09 @ 102
5.750%, 07/01/17 (a) | | | 400 | | | | 445 | | |
Vallejo City Unified School District,
Series A (MBIA)
5.900%, 08/01/21 | | | 350 | | | | 421 | | |
Ventura County Community College District,
Series A, Callable 08/01/12 @ 101 (MBIA)
5.000%, 08/01/18 | | | 910 | | | | 972 | | |
The accompanying notes are an integral part of the financial statements.
FIRST AMERICAN FUNDS Annual Report 2005
52
California Tax Free Fund (concluded)
| DESCRIPTION | | PAR (000)/SHARES | | VALUE (000) | |
Wiseburn School District, Series A,
Pre-refunded 08/01/10 @ 100 (FGIC)
5.250%, 08/01/22 (a) | | $ | 600 | | | $ | 656 | | |
| Total General Obligations | | | | | | | 6,850 | | |
| Certificates of Participation – 4.3% | |
Escondido, Series A,
Callable 09/01/10 @ 101 (FGIC)
5.625%, 09/01/20 | | | 300 | | | | 330 | | |
Los Angeles, Sonnenblick del Rio Senior Lien,
Callable 11/01/10 @ 101 (AMBAC)
6.000%, 11/01/19 | | | 330 | | | | 373 | | |
Ridgecrest Civic Center Project,
Callable 03/01/09 @ 101
6.250%, 03/01/21 | | | 250 | | | | 265 | | |
Westlands Water District Revenue, Series A,
Callable 03/01/15 @ 100 (MBIA)
5.000%, 09/01/30 | | | 500 | | | | 520 | | |
| Total Certificates of Participation | | | | | | | 1,488 | | |
Total Municipal Bonds
(Cost $31,409) | | | | | | | 33,127 | | |
| Money Market Funds – 4.4% | |
| Federated California Municipal Cash Trust | | | 189,697 | | | | 190 | | |
| Provident California Money Fund | | | 1,327,694 | | | | 1,327 | | |
Total Money Market Funds
(Cost $1,517) | | | | | | | 1,517 | | |
Total Investments – 100.4%
(Cost $32,926) | | | | | | | 34,644 | | |
| Other Assets and Liabilities, Net – (0.4)% | | | | | | | (132 | ) | |
| Total Net Assets – 100.0% | | | | | | $ | 34,512 | | |
(a) Pre-refunded issues are typically backed by U.S. Government obligations. These bonds mature at the call date and price indicated.
(b) Security purchased on a when-issued basis. On September 30, 2005, the total cost of investments purchased on a when issued basis was $542,558 or 1.6% of net assets. See note 2 in Notes to Financial Statements.
(c) The rate shown is the effective yield at the time of purchase.
ABAG – Association of Bay Area Governments
AMBAC – American Municipal Bond Assurance Corporation
AMT – Alternative Minimum Tax. As of September 30, 2005, the aggregate market value of securities subject to the AMT was $1,532,442 or 4.4% of net assets.
CMI – California Mortgage Insurance Program
FGIC – Financial Guaranty Insurance Corporation
FNMA – Federal National Mortgage Association
FSA – Financial Security Assurance
GNMA – Government National Mortgage Association
MBIA – Municipal Bond Insurance Association
MLO – Municipal Lease Obligation
RAAI – Radian Asset Assurance Inc.
Colorado Intermediate Tax Free Fund
| DESCRIPTION | | PAR (000) | | VALUE (000) | |
| Municipal Bonds – 98.4% | |
| Revenue Bonds – 71.6% | |
| Continuing Care Retirement Communities – 1.1% | |
Colorado State Health Facilities Revenue,
Covenant Retirement Communities,
Callable 12/01/15 @ 100
5.000%, 12/01/16 | | $ | 500 | | | $ | 519 | | |
| Education – 5.0% | |
Colorado State Educational & Cultural Facilities
Authority, Bromley East Charter School Project,
Escrowed to Maturity
6.250%, 09/15/11 (a) | | | 330 | | | | 355 | | |
Colorado State Educational & Cultural Facilities
Authority, Classical Academy Charter School
Project, Escrowed to Maturity
6.375%, 12/01/11 (a) | | | 800 | | | | 869 | | |
Colorado State Educational & Cultural Facilities
Authority, Core Knowledge Charter School,
Pre-refunded 11/01/09 @ 100
6.850%, 11/01/16 (b) | | | 440 | | | | 499 | | |
Colorado State Educational & Cultural Facilities
Revenue, Northwest Nazarene Project,
Callable 11/01/10 @ 102
4.500%, 11/01/15 | | | 700 | | | | 692 | | |
| | | | 2,415 | | |
| Healthcare – 21.7% | | | |
Colorado State Health Facilities Authority,
Boulder Hospital (MBIA)
4.875%, 10/01/09 500 528
5.000%, 10/01/10 | | | 500 | | | | 535 | | |
Colorado State Health Facilities Authority,
Catholic Health Initiatives, Series A
5.000%, 03/01/12 | | | 500 | | | | 535 | | |
Colorado State Health Facilities Authority,
Evangelical Lutheran Health Facilities,
Callable 12/01/10 @ 102
6.900%, 12/01/25 | | | 350 | | | | 390 | | |
Colorado State Health Facilities Authority,
Evangelical Lutheran Health Facilities, Series A
4.200%, 06/01/13 | | | 200 | | | | 200 | | |
Colorado State Health Facilities Authority,
National Jewish Medical & Research Center
Project, Callable 01/01/08 @ 100
5.375%, 01/01/16 | | | 700 | | | | 714 | | |
Colorado State Health Facilities Authority,
North Colorado Medical Center Project (FSA)
5.000%, 05/15/09 | | | 1,000 | | | | 1,056 | | |
Colorado State Health Facilities Authority,
Parkview Medical Center
5.500%, 09/01/07 250 260
5.750%, 09/01/08 250 265
5.500%, 09/01/09 | | | 500 | | | | 533 | | |
Colorado State Health Facilities Authority,
Poudre Valley Healthcare,
Pre-refunded 12/01/09 @ 101 (FSA)
5.750%, 12/01/10 (b) | | | 1,000 | | | | 1,104 | | |
Colorado State Health Facilities Authority,
Steamboat Springs Health Project,
Callable 09/15/08 @ 101
5.300%, 09/15/09 | | | 205 | | | | 209 | | |
FIRST AMERICAN FUNDS Annual Report 2005
53
Schedule of Investments September 30, 2005
Colorado Intermediate Tax Free Fund (continued)
| DESCRIPTION | | PAR (000) | | VALUE (000) | |
Colorado State Health Facilities Authority,
The Devereux Foundation,
Callable 11/01/12 @ 100 (RAAI)
4.200%, 11/01/13 | | $ | 80 | | | $ | 81 | | |
Colorado State Health Facilities Authority,
Vail Medical Center, Callable 01/15/12 @ 100
5.750%, 01/15/22 | | | 800 | | | | 848 | | |
Colorado State Health Facilities Authority,
Vail Valley Medical Center Project
5.000%, 01/15/13 | | | 300 | | | | 312 | | |
Delta County Memorial Hospital District,
Callable 09/01/13 @ 100
5.350%, 09/01/17 | | | 500 | | | | 519 | | |
La Junta Hospital, Arkansas Valley Regional
Medical Center Project
5.200%, 04/01/06 300 302
5.300%, 04/01/07 320 325
5.400%, 04/01/08 335 344
5.500%, 04/01/09 | | | 355 | | | | 368 | | |
Montrose Memorial Hospital
5.300%, 12/01/13 | | | 260 | | | | 265 | | |
Montrose Memorial Hospital,
Callable 12/01/13 @ 102
5.450%, 12/01/14 | | | 390 | | | | 400 | | |
University of Colorado Hospital Authority,
Callable 11/15/11 @ 100
5.000%, 11/15/14 | | | 300 | | | | 312 | | |
| | | | 10,405 | | |
| Miscellaneous – 4.6% | | | |
Colorado State Educational & Cultural Facilities
Authority, Colorado Public Radio
4.800%, 07/01/09 250 258
4.900%, 07/01/10 | | | 265 | | | | 276 | | |
Colorado State Educational & Cultural Facilities
Authority, National Conference of State
Legislatures, Callable 06/01/11 @ 100
5.250%, 06/01/13 | | | 700 | | | | 745 | | |
Denver City & County, Helen G. Bonfils
Foundation Project, Series B,
Callable 12/01/07 @ 100
5.125%, 12/01/17 | | | 900 | | | | 932 | | |
| | | | 2,211 | | |
| Recreational Facility Authority – 0.5% | | | |
Hyland Hills Metropolitan Park & Recreational
District, Series A, Callable 12/15/07 @ 101
6.100%, 12/15/09 | | | 210 | | | | 221 | | |
| Tax Revenue – 8.0% | |
Boulder County Sales & Use Tax (FGIC)
5.750%, 12/15/05 | | | 870 | | | | 875 | | |
Boulder County Sales & Use Tax, Escrowed to
Maturity (FGIC)
5.750%, 12/15/05 (a) | | | 130 | | | | 131 | | |
Douglas County Sales & Use Tax (FSA)
6.000%, 10/15/09 | | | 200 | | | | 221 | | |
Larimer County Sales & Use Tax (AMBAC)
5.000%, 12/15/10 | | | 460 | | | | 496 | | |
Longmont Sales & Use Tax,
Callable 11/15/10 @ 100
5.500%, 11/15/15 | | | 500 | | | | 546 | | |
Longmont Sales & Use Tax,
Callable 11/15/10 @ 101 (AMBAC)
4.875%, 11/15/18 | | | 1,000 | | | | 1,054 | | |
Colorado Intermediate Tax Free Fund (continued)
| DESCRIPTION | | PAR (000) | | VALUE (000) | |
Westminster Sales & Use Tax, Series A,
Callable 12/01/07 @ 102 (FGIC)
5.250%, 12/01/11 | | $ | 500 | | | $ | 531 | | |
| | | | 3,854 | | |
| Transportation – 14.7% | | | |
Colorado Department of Transportation (AMBAC)
6.000%, 06/15/10 | | | 1,000 | | | | 1,116 | | |
Northwest Parkway Public Highway Authority,
Convertible, Zero Coupon Bond (AMBAC)
5.250%, 06/15/15 (c) 2,000 1,666
5.350%, 06/15/16 (c) | | | 1,000 | | | | 840 | | |
Northwest Parkway Public Highway Authority,
Convertible, Zero Coupon Bond (FSA)
5.000%, 06/15/14 (c) | | | 750 | | | | 622 | | |
The E-470 Public Highway Authority, Series B,
Zero Coupon Bond (MBIA)
5.250%, 09/01/17 (c) 1,575 928
6.400%, 09/01/19 (c) 960 509
5.650%, 09/01/20 (c) 500 251
5.396%, 09/01/22 (c) | | | 1,620 | | | | 732 | | |
The E-470 Public Highway Authority, Series C,
Zero Coupon Bond (MBIA)
4.250%, 09/01/17 (c) | | | 500 | | | | 399 | | |
| | | | 7,063 | | |
| Utilities – 16.0% | | | |
Adams County Pollution Control, Public Service
Company Project, Series A,
Callable 09/01/15 @ 100
4.375%, 09/01/17 | | | 1,000 | | | | 1,016 | | |
Arapahoe County Water & Wastewater Authority,
Escrowed to Maturity
5.550%, 12/01/06 (a) 140 144
5.650%, 12/01/07 (a) 150 157
5.750%, 12/01/08 (a) | | | 160 | | | | 171 | | |
Arapahoe County Water & Wastewater Authority,
Pre-refunded 12/01/09 @ 100
6.000%, 12/01/11 (b) | | | 185 | | | | 203 | | |
Boulder Water & Sewer
5.750%, 12/01/10 | | | 1,545 | | | | 1,722 | | |
Broomfield Water Activity Enterprise,
Callable 12/01/10 @ 101 (MBIA)
5.500%, 12/01/17 | | | 500 | | | | 550 | | |
Colorado State Water Resources & Power
Development Authority, Drinking Water Revenue,
Revolving Fund, Series A
5.500%, 09/01/17 | | | 500 | | | | 568 | | |
Colorado State Water Resources & Power
Development Authority, Small Water Resources,
Series A, Callable 11/01/10 @ 100 (FGIC)
5.700%, 11/01/15 | | | 100 | | | | 110 | | |
Denver City & County Wastewater,
Callable 11/01/12 @ 100 (FGIC)
5.250%, 11/01/17 | | | 1,260 | | | | 1,377 | | |
Platte River Power Authority, Series DD,
Callable 06/01/07 @ 102 (MBIA)
5.375%, 06/01/17 | | | 875 | | | | 920 | | |
Ute Water Conservancy District (MBIA)
6.000%, 06/15/09 | | | 680 | | | | 745 | | |
| | | | 7,683 | | |
| Total Revenue Bonds | | | | | | | 34,371 | | |
The accompanying notes are an integral part of the financial statements.
FIRST AMERICAN FUNDS Annual Report 2005
54
Colorado Intermediate Tax Free Fund (continued)
| DESCRIPTION | | PAR (000) | | VALUE (000) | |
| General Obligations – 19.6% | |
Arapahoe County School District #5, Cherry Creek,
Pre-refunded 12/15/09 @ 100 (STAID)
5.500%, 12/15/11 (b) | | $ | 1,000 | | | $ | 1,085 | | |
Beacon Metropolitan District,
Series B (LOC: Compass Bank)
4.375%, 12/01/15 | | | 345 | | | | 343 | | |
Denver West Metropolitan School District
4.125%, 12/01/14 150 148
4.200%, 12/01/15 | | | 480 | | | | 470 | | |
Douglas County School District #RE-1,
Douglas & Elbert Counties, Series B,
Zero Coupon Bond (FSA) (STAID)
4.230%, 12/15/15 (c) | | | 1,255 | | | | 815 | | |
Elbert County School District #C-1, Elizabeth
5.150%, 12/01/08 | | | 500 | | | | 531 | | |
Garfield County School District #RE-2,
Callable 12/01/12 @ 100 (FSA) (STAID)
5.250%, 12/01/19 | | | 1,530 | | | | 1,673 | | |
High Plains Metropolitan District,
Series B (LOC: Compass Bank)
4.375%, 12/01/15 | | | 1,000 | | | | 995 | | |
Jefferson County School
District #R-001 (MBIA) (STAID)
6.250%, 12/15/09 | | | 1,000 | | | | 1,117 | | |
SBC Metropolitan School District (ACA)
4.250%, 12/01/15 | | | 445 | | | | 440 | | |
SBC Metropolitan School District,
Callable 12/01/15 @ 100 (ACA)
4.300%, 12/01/16 | | | 490 | | | | 482 | | |
Westglenn Metropolitan District,
Callable 12/01/09 @ 100
6.000%, 12/01/14 | | | 1,220 | | | | 1,289 | | |
| Total General Obligations | | | | | | | 9,388 | | |
| Certificates of Participation – 7.2% | |
Colorado Springs Public Facility Authority,
Old City Hall Project (FSA) (MLO)
5.000%, 12/01/10 | | | 200 | | | | 215 | | |
Englewood Civic Center Project,
Pre-refunded 12/01/08 @ 100 (MBIA) (MLO)
4.900%, 06/01/13 (b) | | | 585 | | | | 611 | | |
Garfield County Building (AMBAC) (MLO)
5.750%, 12/01/09 | | | 400 | | | | 438 | | |
Garfield County Building Corporation,
Callable 12/01/09 @ 101 (AMBAC) (MLO)
5.300%, 12/01/11 | | | 400 | | | | 431 | | |
Pueblo County, Capital Construction
4.300%, 12/01/15 | | | 285 | | | | 283 | | |
Pueblo County, Capital Construction,
Callable 12/01/15 @ 100
4.400%, 12/01/16 | | | 410 | | | | 407 | | |
Westminster Recreational Facilities,
Callable 09/01/09 @ 101 (MBIA) (MLO)
5.200%, 09/01/10 | | | 1,000 | | | | 1,075 | | |
| Total Certificates of Participation | | | | | | | 3,460 | | |
Total Municipal Bonds
(Cost $44,451) | | | | | | | 47,219 | | |
Colorado Intermediate Tax Free Fund (concluded)
| DESCRIPTION | | SHARES | | VALUE (000) | |
| Affiliated Money Market Fund – 0.3% | | | |
First American Tax Free Obligations Fund, Class Z (d)
(Cost $166) | | | 166,389 | | | $ | 166 | | |
Total Investments – 98.7%
(Cost $44,617) | | | | | 47,385 | | |
| Other Assets and Liabilities, Net – 1.3% | | | | | 603 | | |
| Total Net Assets – 100.0% | | | | $ | 47,988 | | |
(a) Escrowed to Maturity issues are typically backed by U.S. Government obligations. If callable, these bonds may still be subject to call at the call date and price indicated.
(b) Pre-refunded issues are typically backed by U.S. Government obligations. These bonds mature at the call date and price indicated.
(c) The rate shown is the effective yield at the time of purchase.
(d) Investment in affiliated security. This money market fund is advised by U.S. Bancorp Asset Management, Inc., which also serves as advisor for this fund. See note 3 in Notes to Financial Statements.
ACA – American Capital Access
AMBAC – American Municipal Bond Assurance Corporation
FGIC – Financial Guaranty Insurance Corporation
FSA – Financial Security Assurance
LOC – Letter of Credit
MBIA – Municipal Bond Insurance Association
MLO – Municipal Lease Obligation
RAAI – Radian Asset Assurance Inc.
STAID – State Aid Withholding
FIRST AMERICAN FUNDS Annual Report 2005
55
Schedule of Investments September 30, 2005
Colorado Tax Free Fund
| DESCRIPTION | | PAR (000) | | VALUE (000) | |
| Municipal Bonds – 97.7% | |
| Revenue Bonds – 68.9% | |
| Continuing Care Retirement Communities – 2.9% | |
Colorado State Health Facilities Authority,
Covenant Retirement Communities, Series B,
Callable 12/01/12 @ 101
6.125%, 12/01/33 | | $ | 350 | | | $ | 374 | | |
Colorado State Health Facilities Revenue,
Covenant Retirement Communities,
Callable 12/01/15 @ 100
5.250%, 12/01/25 | | | 200 | | | | 203 | | |
| | | | 577 | | |
| Education – 11.2% | | | |
Colorado Springs Revenue, Colorado College
Project, Callable 06/01/15 @ 100
4.375%, 06/01/26 | | | 400 | | | | 390 | | |
Colorado State Board of Agriculture, Auxiliary Facility
Systems, Callable 03/01/07 @ 101 (AMBAC)
5.125%, 03/01/17 | | | 200 | | | | 207 | | |
Colorado State Educational & Cultural Facilities
Authority, Ave Marie School Project,
Callable 12/01/10 @ 100 (RAAI)
6.000%, 12/01/16 | | | 200 | | | | 221 | | |
Colorado State Educational & Cultural Facilities
Authority, Classical Academy Charter School
Project, Escrowed to Maturity
6.375%, 12/01/11 (a) | | | 550 | | | | 597 | | |
Colorado State Educational & Cultural Facilities
Authority, University of Denver Project,
Pre-refunded 03/01/11 @ 100 (AMBAC)
5.350%, 03/01/20 (b) | | | 500 | | | | 548 | | |
Colorado State Educational & Cultural Facilities
Revenue, Northwest Nazarene Project,
Callable 11/01/10 @ 102
4.500%, 11/01/15 | | | 300 | | | | 297 | | |
| | | | 2,260 | | |
| Healthcare – 19.4% | | | |
Boulder County Longmont United Hospital
Project (RAAI)
5.300%, 12/01/10 | | | 330 | | | | 354 | | |
Colorado State Health Facilities Authority,
Evangelical Lutheran Health Facilities,
Callable 12/01/10 @ 102
6.900%, 12/01/25 | | | 150 | | | | 167 | | |
Colorado State Health Facilities Authority,
Evangelical Lutheran Health Facilities, Series A,
Callable 06/01/14 @ 100
5.250%, 06/01/34 | | | 230 | | | | 237 | | |
Colorado State Health Facilities Authority,
National Jewish Medical & Research Center
Project, Callable 01/01/08 @ 100
5.375%, 01/01/16 | | | 300 | | | | 306 | | |
Colorado State Health Facilities Authority,
Parkview Medical Center
5.600%, 09/01/11 | | | 300 | | | | 326 | | |
Colorado State Health Facilities Authority,
Portercare Adventist Project, Pre-refunded
11/15/11 @ 101
6.500%, 11/15/23 (b) | | | 600 | | | | 701 | | |
Colorado State Health Facilities Authority, Poudre
Valley Health Care, Series F,
Callable 03/01/15 @ 100
5.000%, 03/01/25 | | | 350 | | | | 356 | | |
Colorado Tax Free Fund (continued)
| DESCRIPTION | | PAR (000) | | VALUE (000) | |
Colorado State Health Facilities Authority,
Steamboat Springs Health Project,
Callable 09/15/08 @ 101
5.300%, 09/15/09 | | $ | 205 | | | $ | 209 | | |
Colorado State Health Facilities Authority,
Vail Valley Medical Center Project,
Callable 01/15/15 @ 100
5.000%, 01/15/20 | | | 250 | | | | 257 | | |
Colorado State Health Facilities Authority,
Vail Valley Medical Center,
Callable 01/15/12 @ 100
5.800%, 01/15/27 | | | 500 | | | | 527 | | |
Delta County Memorial Hospital District,
Callable 09/01/13 @ 100
5.350%, 09/01/17 | | | 220 | | | | 228 | | |
La Junta, Arkansas Valley Regional Medical Center
Project, Callable 04/01/09 @ 101
6.100%, 04/01/24 | | | 100 | | | | 105 | | |
Montrose Memorial Hospital,
Callable 12/01/13 @ 102
6.375%, 12/01/23 | | | 130 | | | | 141 | | |
| | | | 3,914 | | |
| Housing – 4.8% | | | |
Burlingame Housing, Multi Family Revenue,
Housing Project, Callable 11/01/15 @ 100 (MBIA)
4.500%, 11/01/29 | | | 750 | | | | 737 | | |
Colorado State Housing Finance Authority,
Multifamily Project, Class I, Series B-4,
Callable 10/01/10 @ 100
5.900%, 04/01/31 | | | 100 | | | | 105 | | |
Colorado State Housing Finance Authority,
Series E-2, Callable 08/01/10 @ 105 (AMT)
7.000%, 02/01/30 | | | 60 | | | | 65 | | |
Colorado State Housing Finance Authority,
Single Family Housing Program, Series A-2,
Callable 10/01/09 @ 105 (AMT)
7.450%, 10/01/16 | | | 15 | | | | 16 | | |
Colorado State Housing Finance Authority,
Single Family Housing Program, Series B-2,
Callable 04/01/10 @ 105 (AMT)
7.100%, 04/01/17 | | | 40 | | | | 41 | | |
| | | | 964 | | |
| Miscellaneous – 4.4% | | | |
Colorado State Educational & Cultural Facilities
Authority, National Conference of State
Legislatures, Callable 06/01/11 @ 100
5.250%, 06/01/21 | | | 750 | | | | 781 | | |
Denver City & County, Helen G. Bonfils Foundation
Project, Series B, Callable 12/01/07 @ 100
5.125%, 12/01/17 | | | 100 | | | | 104 | | |
| | | | 885 | | |
| Tax Revenue – 3.7% | | | |
Douglas County Sales & Use Tax,
Callable 10/15/10 @ 100 (FSA)
5.625%, 10/15/20 | | | 200 | | | | 219 | | |
Highlands Ranch Metropolitan District #2,
Callable 06/15/06 @ 101 (FSA)
5.000%, 06/15/16 | | | 200 | | | | 204 | | |
Larimer County Sales & Use Tax,
Callable 12/15/10 @ 100 (AMBAC)
5.625%, 12/15/18 | | | 100 | | | | 110 | | |
The accompanying notes are an integral part of the financial statements.
FIRST AMERICAN FUNDS Annual Report 2005
56
Colorado Tax Free Fund (continued)
| DESCRIPTION | | PAR (000) | | VALUE (000) | |
Mountain Village Metropolitan District,
San Miguel County,
Callable 12/01/07 @ 101 (MBIA)
5.200%, 12/01/17 | | $ | 200 | | | $ | 210 | | |
| | | | 743 | | |
| Transportation – 11.9% | | | |
Denver City & County Airport, Series E,
Callable 11/15/07 @ 101 (MBIA)
5.250%, 11/15/23 | | | 500 | | | | 523 | | |
Northwest Parkway Public Highway Authority,
Convertible, Zero Coupon Bond (FSA)
5.000%, 06/15/14 (c) | | | 750 | | | | 623 | | |
Northwest Parkway Public Highway Authority,
Convertible, Zero Coupon Bond (AMBAC)
5.250%, 06/15/15 (c) | | | 500 | | | | 417 | | |
Northwest Parkway Public Highway Authority,
Convertible, Zero Coupon Bond,
Callable 06/15/16 @ 100 (AMBAC)
5.700%, 06/15/21 (c) | | | 1,000 | | | | 838 | | |
| | | | 2,401 | | |
| Utilities – 10.6% | | | |
Arapahoe County Water & Wastewater (MBIA)
5.000%, 12/01/26 | | | 250 | | | | 261 | | |
Boulder Water & Sewer,
Callable 12/01/10 @ 100
5.700%, 12/01/19 | | | 300 | | | | 330 | | |
Broomfield Water Activity Enterprise,
Callable 12/01/10 @ 101 (MBIA)
5.500%, 12/01/19 | | | 400 | | | | 440 | | |
Colorado Housing & Finance Authority, Waste
Disposal Management Income Project (AMT)
5.700%, 07/01/18 | | | 250 | | | | 264 | | |
Fort Collins Wastewater Utility Enterprise,
Callable 12/01/10 @ 100 (FSA)
5.500%, 12/01/20 | | | 300 | | | | 327 | | |
Platte River Power Authority, Series DD,
Callable 06/01/07 @ 102 (MBIA)
5.375%, 06/01/17 | | | 500 | | | | 526 | | |
| | | | 2,148 | | |
| Total Revenue Bonds | | | | | | | 13,892 | | |
| Certificates of Participation – 18.2% | |
Arapahoe County Building Finance Authority,
Callable 02/15/10 @ 100 (AMBAC)
5.250%, 02/15/19 | | | 350 | | | | 373 | | |
| 5.250%, 02/15/21 | | | 650 | | | | 688 | | |
Broomfield Open Space Park & Recreation
Facilities, Callable 12/01/10 @ 100 (AMBAC)
5.500%, 12/01/20 | | | 800 | | | | 870 | | |
Colorado Springs Old City Hall Project,
Callable 12/01/10 @ 100 (FSA)
5.500%, 12/01/17 | | | 200 | | | | 218 | | |
| 5.500%, 12/01/20 | | | 200 | | | | 217 | | |
Denver City & County, Series A,
Pre-refunded 05/01/10 @ 100 (MBIA)
5.500%, 05/01/17 (b) | | | 400 | | | | 437 | | |
Eagle County,
Pre-refunded 12/01/09 @ 101 (MBIA)
5.400%, 12/01/18 (b) | | | 300 | | | | 328 | | |
Garfield County,
Callable 12/01/09 @ 101 (AMBAC)
5.750%, 12/01/19 | | | 300 | | | | 329 | | |
Colorado Tax Free Fund (concluded)
| DESCRIPTION | | PAR (000)/SHARES | | VALUE (000) | |
Pueblo County, Capital Construction,
Callable 12/01/15 @ 100
5.000%, 12/01/24 | | $ | 200 | | | $ | 203 | | |
| Total Certificates of Participation | | | | | | | 3,663 | | |
| General Obligations – 10.6% | | | |
Antelope Water System,
Callable until 12/01/15 @ 100
4.875%, 12/01/25 | | | 175 | | | | 175 | | |
Arapahoe County School District #5,
Cherry Creek,
Pre-refunded 12/15/09 @ 100 (STAID)
5.500%, 12/15/19 (b) | | | 550 | | | | 597 | | |
Beacon Metropolitan District,
Series B (LOC: Compass Bank)
4.375%, 12/01/15 | | | 400 | | | | 398 | | |
Boulder Open Space Acquisition,
Callable 08/15/10 @ 100
5.450%, 08/15/16 | | | 350 | | | | 380 | | |
Dove Valley Metropolitan School District,
Arapahoe County,
Callable 11/01/15 @ 100 (FSA)
4.500%, 11/01/30 | | | 250 | | | | 243 | | |
El Paso County School District #49,
Falcon, Series A,
Callable 12/01/09 @ 105 (FSA) (STAID)
6.000%, 12/01/18 | | | 200 | | | | 229 | | |
SBC Metropolitan School District,
Callable 12/01/15 @ 100 (ACA)
5.000%, 12/01/25 | | | 115 | | | | 117 | | |
| Total General Obligations | | | | | | | 2,139 | | |
Total Municipal Bonds
(Cost $18,120) | | | | | | | 19,694 | | |
| Affiliated Money Market Fund – 1.0% | | | |
First American Tax Free Obligations Fund, Class Z (d)
(Cost $192) | | | 192,320 | | | | 192 | | |
Total Investments – 98.7%
(Cost $18,312) | | | | | | | 19,886 | | |
| Other Assets and Liabilities, Net – 1.3% | | | | | | | 262 | | |
| Total Net Assets – 100.0% | | | | | | $ | 20,148 | | |
(a) Escrowed to Maturity issues are typically backed by U.S. Government obligations. If callable, these bonds may still be subject to call at the call date and price indicated.
(b) Pre-refunded issues are typically backed by U.S. Government obligations. These bonds mature at the call date and price indicated.
(c) The rate shown is the effective yield at the time of purchase.
(d) Investment in affiliated security. This money market fund is advised by U.S. Bancorp Asset Management, Inc., which also serves as advisor for this fund. See note 3 in Notes to Financial Statements.
ACA – American Capital Access
AMBAC – American Municipal Bond Assurance Corporation
AMT – Alternative Minimum Tax. As of September 30, 2005, the aggregate market value of securities subject to the AMT was $385,756, which represents 1.9% of net assets.
FSA – Financial Security Assurance
LOC – Letter of Credit
MBIA – Municipal Bond Insurance Association
RAAI – Radian Asset Assurance Inc.
STAID – State Aid Withholding
FIRST AMERICAN FUNDS Annual Report 2005
57
Schedule of Investments September 30, 2005
Intermediate Tax Free Fund
| DESCRIPTION | | PAR (000) | | VALUE (000) | |
| Municipal Bonds – 98.8% | |
| Alabama – 0.7% | |
Alabama State Docks Department,
Callable 10/01/08 @ 102 (MBIA) (RB)
5.250%, 10/01/10 | | $ | 3,000 | | | $ | 3,219 | | |
Anniston, Regional Medical Center Board,
Northeast Alabama Regional Medical
Center Project, Escrowed to Maturity (RB)
8.000%, 07/01/11 (a) | | | 1,400 | | | | 1,622 | | |
| | | | 4,841 | | |
| Alaska – 0.6% | | | |
Alaska Energy Authority, Bradley Lake,
Third Series (FSA) (RB)
6.000%, 07/01/10 | | | 2,610 | | | | 2,902 | | |
Alaska State Housing Finance Corporation, Series A,
Pre-refunded 12/01/05 @ 102 (MBIA) (RB)
5.400%, 12/01/08 (b) | | | 1,000 | | | | 1,024 | | |
| | | | 3,926 | | |
| Arizona – 2.5% | | | |
Arizona Health Facilities Authority, The Terraces
Project, Series A, Callable 11/15/13 @ 101 (RB)
7.500%, 11/15/23 | | | 3,300 | | | | 3,710 | | |
Arizona State Municipal Financing Program,
Escrowed to Maturity (COP) (MLO)
8.750%, 08/01/07 (a) | | | 1,500 | | | | 1,650 | | |
Arizona State Municipal Financing Program,
Series 15, Escrowed to Maturity (COP) (MLO)
8.750%, 08/01/07 (a) | | | 2,085 | | | | 2,293 | | |
Maricopa County School District #69,
Paradise Valley (GO) (MBIA)
5.300%, 07/01/11 | | | 1,000 | | | | 1,098 | | |
Maricopa County Unified School District #097,
Deer Valley School Improvements
Project of 2004, Series A (FSA) (GO)
4.000%, 07/01/16 | | | 1,500 | | | | 1,513 | | |
Northern Arizona University, Research Projects,
Callable 09/01/15 @ 100 (AMBAC) (COP)
4.250%, 09/01/16 | | | 1,405 | | | | 1,437 | | |
Phoenix Street & Highway User (RB)
6.500%, 07/01/09 | | | 180 | | | | 182 | | |
| 6.250%, 07/01/11 | | | 900 | | | | 907 | | |
Tempe Industrial Development Authority,
Friendship Villiage Project, Series A (RB)
5.375%, 12/01/13 | | | 1,300 | | | | 1,319 | | |
Tucson Airport Authority (FSA) (RB)
5.000%, 06/01/13 | | | 2,760 | | | | 2,985 | | |
| | | | 17,094 | | |
| Arkansas – 0.8% | | | |
Pulaski County, Residential Housing Facilities
Board, Escrowed to Maturity (FHA) (RB) (VA)
7.250%, 06/01/10 (a) | | | 2,030 | | | | 2,157 | | |
University of Arkansas, Fayetteville, Series B,
Callable 11/01/15 @ 100 (FGIC) (RB)
4.500%, 11/01/16 | | | 2,000 | | | | 2,098 | | |
Washington County Hospital Revenue,
Regional Medical Center, Series B,
Callable 02/01/15 @ 100 (RB)
5.000%, 02/01/16 | | | 1,145 | | | | 1,187 | | |
| | | | 5,442 | | |
Intermediate Tax Free Fund (continued)
| DESCRIPTION | | PAR (000) | | VALUE (000) | |
| California – 5.5% | | | |
ABAG Finance Authority for Nonprofit
Corporations, Elder Care Alliance (CMI) (RB)
4.500%, 08/15/12 | | $ | 335 | | | $ | 344 | | |
ABAG Finance Authority for Nonprofit
Corporations, Elder Care Alliance,
Callable 08/15/14 @ 100 (CMI) (RB)
5.000%, 08/15/17 | | | 1,215 | | | | 1,257 | | |
ABAG Financial Authority, Archstone Redwood
Housing Project, Series A (RB)
5.300%, 10/01/08 | | | 290 | | | | 304 | | |
ABC Unified School District, Series A (GO) (MBIA)
4.900%, 02/01/20 | | | 1,615 | | | | 1,752 | | |
Alameda Corridor Transportation Authority,
Zero Coupon Bond (AMBAC) (RB)
4.650%, 10/01/14 (c) | | | 2,000 | | | | 1,380 | | |
California Educational Facilities Authority,
Lutheran University, Series C,
Callable 10/01/14 @ 100 (RB)
5.000%, 10/01/24 | | | 1,000 | | | | 1,026 | | |
California Municipal Financial Authority,
Solid Waste Disposal Revenue, Waste
Management Project, Mandatory
Put 09/01/09 @ 100 (AMT) (RB)
4.100%, 09/01/14 | | | 250 | | | | 251 | | |
California State, Callable 08/01/13 @ 100 (GO)
5.000%, 02/01/16 | | | 1,000 | | | | 1,065 | | |
| 5.000%, 02/01/17 | | | 2,000 | | | | 2,121 | | |
California State, Callable 11/01/11 @ 100 (GO)
5.000%, 11/01/18 | | | 5,000 | | | | 5,232 | | |
California State, Callable 02/01/14 @ 100 (GO)
5.000%, 02/01/21 | | | 1,500 | | | | 1,575 | | |
California State, Callable 04/01/14 @ 100 (GO)
5.125%, 04/01/24 | | | 500 | | | | 527 | | |
California State Department of Water, Series A,
Callable 05/01/12 @ 101 (RB)
5.875%, 05/01/16 | | | 2,000 | | | | 2,242 | | |
California State Economic Recovery,
Series A (FGIC) (GO)
5.250%, 07/01/14 | | | 1,000 | | | | 1,113 | | |
California Statewide Communities Development
Authority, Archstone Seascape,
Mandatory Put 06/01/08 @ 100 (RB)
5.250%, 06/01/29 | | | 1,000 | | | | 1,040 | | |
California Statewide Communities Development
Authority, Elder Care Alliance, Series A (RB)
7.250%, 11/15/11 | | | 1,450 | | | | 1,463 | | |
California Statewide Communities Development
Authority, Health Facilities, Adventist Health,
Series A, Callable 03/01/15 @ 100 (RB)
5.000%, 03/01/30 (d) | | | 700 | | | | 712 | | |
California Statewide Communities Development
Authority, Kaiser Permanente, Series C,
Mandatory Put 06/01/12 @ 100 (RB)
3.850%, 11/01/29 | | | 1,180 | | | | 1,171 | | |
California Statewide Communities Development
Authority, Kaiser Permanente, Series I,
Mandatory Put 05/01/11 @ 100 (RB)
3.450%, 04/01/35 | | | 500 | | | | 490 | | |
California Statewide Communities Development
Authority, Los Angeles Jewish Home (CMI) (RB)
5.000%, 11/15/12 | | | 1,210 | | | | 1,293 | | |
The accompanying notes are an integral part of the financial statements.
FIRST AMERICAN FUNDS Annual Report 2005
58
Intermediate Tax Free Fund (continued)
| DESCRIPTION | | PAR (000) | | VALUE (000) | |
Golden State Tobacco Securitization,
Pre-refunded 06/01/10 @ 100 (GO) (MLO)
5.600%, 06/01/28 (b) | | $ | 2,450 | | | $ | 2,697 | | |
Golden State Tobacco Securitization, Series B,
Escrowed to Maturity (RB) (MLO)
5.000%, 06/01/12 (a) | | | 1,000 | | | | 1,081 | | |
Placentia-Yorba Linda Unified School District,
Callable 08/01/14 @ 100 (FGIC) (GO)
5.000%, 08/01/16 | | | 500 | | | | 541 | | |
Roseville Joint Unified High School District,
Callable 08/01/11 @ 101 (GO)
5.100%, 08/01/19 | | | 390 | | | | 411 | | |
San Marcos, Escrowed to Maturity,
Zero Coupon Bond (COP) (MLO)
4.890%, 02/15/06 (a) (c) | | | 1,085 | | | | 1,074 | | |
San Mateo Unified High School District, Series B,
Zero Coupon Bond (FGIC) (GO)
5.150%, 09/01/17 (c) | | | 1,000 | | | | 593 | | |
Santa Monica Community College, Capital
Appreciation 2002 Election, Series C,
Callable 08/01/15 @ 95.722,
Zero Coupon Bond (GO) (MBIA)
4.420%, 08/01/16 (c) | | | 2,000 | | | | 1,220 | | |
Stockton Public Finance Revenue,
Assessment District Senior Lien, Series A,
Callable 09/02/15 @ 100 (RAAI) (RB)
4.500%, 09/02/25 | | | 1,000 | | | | 969 | | |
Victor Elementary School District, Series A,
Zero Coupon Bond (FGIC) (GO)
5.660%, 08/01/23 (c) | | | 2,030 | | | | 882 | | |
Woodland Financial Authority,
Callable 03/01/13 @ 102 (RB) (MLO) (XLCA)
4.700%, 03/01/19 | | | 815 | | | | 838 | | |
| 4.800%, 03/01/20 | | | 855 | | | | 883 | | |
| | | | 37,547 | | |
| Colorado – 7.8% | | | |
Adams County Pollution Control, Public Service
Company Project, Series A,
Callable 09/01/15 @ 100 (MBIA) (RB)
4.375%, 09/01/17 | | | 5,000 | | | | 5,078 | | |
Arapahoe County, Single Family, Escrowed to
Maturity, Zero Coupon Bond (RB)
3.340%, 09/01/10 (a) (c) | | | 9,320 | | | | 7,807 | | |
Colorado Department of
Transportation (AMBAC) (RB)
6.000%, 06/15/08 | | | 3,000 | | | | 3,224 | | |
Colorado Health Facilities Authority, Parkview
Medical Center, Callable 09/01/13 @ 100 (RB)
5.000%, 09/01/16 | | | 640 | | | | 665 | | |
Colorado State Educational & Cultural Facilities
Authority, Bromley East Charter School Project,
Pre-refunded 09/15/11 @ 100 (RB)
6.750%, 09/15/15 (b) | | | 1,200 | | | | 1,385 | | |
Colorado State Educational & Cultural Facilities
Authority, Classical Academy Charter School
Project, Escrowed to Maturity (RB)
6.375%, 12/01/11 (a) | | | 795 | | | | 863 | | |
Colorado State Educational & Cultural Facilities
Authority, Classical Academy Charter School
Project, Pre-refunded 12/01/11 @ 100 (RB)
6.750%, 12/01/16 (b) | | | 1,500 | | | | 1,765 | | |
| 7.250%, 12/01/21 (b) | | | 1,500 | | | | 1,802 | | |
Intermediate Tax Free Fund (continued)
| DESCRIPTION | | PAR (000) | | VALUE (000) | |
Colorado State Educational & Cultural Facilities
Authority, Pinnacle Charter School Project,
Escrowed to Maturity (RB)
5.250%, 12/01/11 (a) | | $ | 1,335 | | | $ | 1,417 | | |
Colorado State Health Facilities Authority,
Catholic Health Initiatives, Series A (RB)
5.000%, 03/01/12 | | | 745 | | | | 797 | | |
Colorado State Health Facilities Authority,
Retirement Facilities, Escrowed to Maturity,
Zero Coupon Bond (RB)
5.500%, 07/15/20 (a) (c) | | | 10,000 | | | | 5,103 | | |
Colorado State Health Facilities Revenue,
Covenant Retirement Communities,
Callable 12/01/15 @ 100 (RB)
5.000%, 12/01/16 | | | 500 | | | | 519 | | |
Colorado State Housing Finance Authority,
Series A-2, Callable 05/01/06 @ 105 (RB)
7.150%, 11/01/14 | | | 95 | | | | 95 | | |
Colorado Water Resources & Power Development
Authority, Drinking Water,
Revolving Fund, Series A (RB)
5.500%, 09/01/17 | | | 1,000 | | | | 1,137 | | |
Denver City & County School District #1,
Callable 12/01/13 @ 100 (FSA) (GO) (STAID)
4.000%, 12/01/14 | | | 4,545 | | | | 4,619 | | |
El Paso County School District #2, Harrison,
Callable 12/01/11 @ 100 (FGIC) (GO) (STAID)
5.500%, 12/01/16 | | | 1,280 | | | | 1,414 | | |
High Plains Metropolitan District,
Series B (LOC: Compass Bank) (RB)
4.375%, 12/01/15 | | | 385 | | | | 383 | | |
Jefferson County School District #R-1 (GO) (MBIA)
6.500%, 12/15/11 | | | 4,975 | | | | 5,796 | | |
Loveland, Escrowed to Maturity (GO)
8.875%, 11/01/05 (a) | | | 390 | | | | 392 | | |
Mesa County, Escrowed to Maturity,
Zero Coupon Bond (RB)
3.539%, 12/01/11 (a) (c) | | | 5,500 | | | | 4,373 | | |
Montrose Memorial Hospital,
Callable 12/01/13 @ 102 (RB)
5.700%, 12/01/17 | | | 2,170 | | | | 2,247 | | |
University of Northern Colorado,
Callable 06/01/15 @ 100 (FSA) (RB)
4.000%, 06/01/16 | | | 1,505 | | | | 1,515 | | |
| | | | 52,396 | | |
| Connecticut – 0.8% | | | |
Connecticut State Health & Educational Facilities
Authority, Griffin Hospital, Series B (RAAI) (RB)
5.000%, 07/01/14 | | | 1,185 | | | | 1,266 | | |
Mashantucket Western Pequot Tribe, Series A,
Callable 09/01/06 @ 102,
Pre-refunded 09/01/07 @ 101 (RB)
6.400%, 09/01/11 (b) (e) | | | 4,170 | | | | 4,424 | | |
| | | | 5,690 | | |
| Florida – 1.6% | | | |
Celebration Community Development District,
Florida Special Assessment,
Callable 05/01/10 @ 100 (MBIA) (RB)
4.000%, 05/01/16 | | | 1,735 | | | | 1,722 | | |
Clay County School Board, Series B,
Callable 07/01/15 @ 100 (COP) (MBIA)
5.000%, 07/01/18 | | | 2,205 | | | | 2,369 | | |
FIRST AMERICAN FUNDS Annual Report 2005
59
Schedule of Investments September 30, 2005
Intermediate Tax Free Fund (continued)
| DESCRIPTION | | PAR (000) | | VALUE (000) | |
Greater Orlando Aviation Authority,
Airport Facilities (AMT) (FGIC) (RB)
5.250%, 10/01/09 | | $ | 1,815 | | | $ | 1,931 | | |
Lee County Industrial Development Authority,
Shell Point Village Health Project, Series A (RB)
5.500%, 11/15/08 | | | 1,000 | | | | 1,039 | | |
Palm Beach County Health Facilities Authority,
Abbey Delray South, Life Care
Retirement Community (RB)
5.250%, 10/01/13 | | | 1,400 | | | | 1,476 | | |
Tampa Excise Tax, Callable 10/01/05 @ 100 (RB)
6.125%, 04/01/08 | | | 2,000 | | | | 2,076 | | |
| | | | 10,613 | | |
| Georgia – 0.2% | | | |
Cherokee County Water & Sewer Authority,
Escrowed to Maturity,
Callable 02/01/06 @ 101.50 (MBIA) (RB)
11.250%, 08/01/07 (a) | | | 1,045 | | | | 1,155 | | |
| Hawaii – 0.6% | | | |
Hawaii State Airport System,
Series B (AMT) (FGIC) (RB)
6.250%, 07/01/06 | | | 2,000 | | | | 2,047 | | |
Hawaii State Harbor System,
Series A (AMT) (FSA) (RB)
5.250%, 07/01/08 | | | 2,270 | | | | 2,386 | | |
| | | | 4,433 | | |
| Illinois – 18.0% | | | |
Champaign County Community Unit School
District #004 (GO)
8.250%, 01/01/09 | | | 1,315 | | | | 1,509 | | |
Chicago, City Colleges,
Zero Coupon Bond (FGIC) (GO)
5.900%, 01/01/15 (c) | | | 10,000 | | | | 6,752 | | |
Chicago, Midway Airport Project,
Series C (MBIA) (RB)
5.500%, 01/01/14 | | | 1,300 | | | | 1,437 | | |
Chicago, Park District, Parking Facilities Authority,
Escrowed to Maturity (ACA) (RB)
5.500%, 01/01/08 (a) | | | 3,585 | | | | 3,768 | | |
Chicago, Project & Refunding (FSA) (GO)
5.500%, 01/01/13 | | | 1,000 | | | | 1,114 | | |
Chicago, Project & Refunding, Series A (FGIC) (GO)
5.250%, 01/01/11 | | | 5,000 | | | | 5,426 | | |
Chicago, Single Family Mortgages, Series A,
Callable 03/01/06 @ 103 (AMT) (FHLMC) (FNMA)
(GNMA) (RB)
5.250%, 03/01/13 | | | 25 | | | | 25 | | |
Chicago Water, Zero Coupon Bond (FGIC) (RB)
6.776%, 11/01/08 (c) | | | 5,150 | | | | 4,656 | | |
| 5.260%, 11/01/09 (c) | | | 6,450 | | | | 5,606 | | |
Cook County Community Unit School
District #65, Evanston, Series A (FSA) (GO)
6.375%, 05/01/09 | | | 3,000 | | | | 3,311 | | |
Cook County Community Unit School
District #102, Zero Coupon Bond (FGIC) (GO)
5.200%, 12/01/13 (c) | | | 2,440 | | | | 1,750 | | |
Cook County Community High School
District #219, Zero Coupon Bond (FSA) (GO)
4.900%, 12/01/07 (c) | | | 1,560 | | | | 1,457 | | |
Cook County Community Unit School District #401
Elmwood Park, Zero Coupon Bond (FSA) (GO)
5.800%, 12/01/11 (c) | | | 3,625 | | | | 2,870 | | |
Intermediate Tax Free Fund (continued)
| DESCRIPTION | | PAR (000) | | VALUE (000) | |
Cook County, Escrowed to Maturity (MBIA) (GO)
7.250%, 11/01/07 (a) | | $ | 2,000 | | | $ | 2,078 | | |
Cook County High School District #200,
Oak Park, Zero Coupon Bond (FSA) (GO)
4.900%, 12/01/06 (c) | | | 2,265 | | | | 2,189 | | |
Cook County School District #088 Bellwood,
Series B, Callable 12/01/14 @ 100 (FSA) (GO)
5.000%, 12/01/17 | | | 1,675 | | | | 1,800 | | |
Cook County School District #123, Oak Lawn,
Capital Appreciation, Zero Coupon Bond (MBIA) (GO)
5.100%, 12/01/15 (c) | | | 2,250 | | | | 1,453 | | |
Cook County, Series A (MBIA) (GO)
6.250%, 11/15/11 | | | 1,000 | | | | 1,146 | | |
Du Page County Community High School
District #94, West Chicago (FSA) (GO)
7.250%, 11/01/09 | | | 1,780 | | | | 2,038 | | |
Granite Single Family Mortgage,
Escrowed to Maturity (RB)
7.750%, 10/01/11 (a) | | | 700 | | | | 797 | | |
Illinois Development Finance Authority,
Midwestern University, Series B,
Callable 05/15/11 @ 101 (RB)
5.750%, 05/15/16 | | | 350 | | | | 375 | | |
Illinois Finance Authority, Friendship Village,
Schaumburg, Series A (RB)
5.000%, 02/15/15 | | | 2,500 | | | | 2,519 | | |
Illinois Finance Authority, Peoples Gas,
Light, and Coke Co., Series A, Mandatory
Put 06/01/16 @ 100 (AMBAC) (RB)
4.300%, 06/01/35 | | | 2,000 | | | | 2,009 | | |
Illinois Health Facilities Authority, St. Benedict,
Series 2003A-2, Callable 11/15/05 @ 100 (RB)
5.750%, 11/15/15 | | | 2,750 | | | | 2,752 | | |
Illinois State (AMBAC) (COP) (MLO)
6.000%, 07/01/06 | | | 1,000 | | | | 1,023 | | |
Illinois State Development Finance Authority,
Elgin School District, Zero Coupon Bond (RB)
5.210%, 01/01/18 (c) | | | 2,750 | | | | 1,602 | | |
Illinois State Development Finance Authority,
Elmhurst Community School #205,
Pre-refunded 01/01/11 @ 100 (FSA) (RB)
6.375%, 01/01/13 (b) | | | 1,025 | | | | 1,172 | | |
Illinois State Development Finance Authority,
Waste Management Project (AMT) (RB)
5.850%, 02/01/07 | | | 1,000 | | | | 1,029 | | |
Illinois State Educational Facilities Authority,
Loyola University of Chicago, Series A,
Escrowed to Maturity (RB)
7.000%, 07/01/07 (a) | | | 1,000 | | | | 1,048 | | |
Illinois State Educational Facilities Authority,
The Art Institute of Chicago,
Mandatory Put 03/01/06 @ 100 (RB)
4.700%, 03/01/30 | | | 4,500 | | | | 4,526 | | |
Illinois State, First Series,
Callable 08/01/10 @ 100 (GO)
5.500%, 08/01/15 | | | 4,500 | | | | 4,884 | | |
Illinois State Health Facilities Authority (RB)
6.500%, 02/15/06 | | | 1,130 | | | | 1,143 | | |
Illinois State Health Facilities Authority,
Covenant Retirement Communities,
Series A (RAAI) (RB)
3.875%, 12/01/08 | | | 1,000 | | | | 1,010 | | |
| 4.350%, 12/01/10 | | | 1,605 | | | | 1,649 | | |
The accompanying notes are an integral part of the financial statements.
FIRST AMERICAN FUNDS Annual Report 2005
60
Intermediate Tax Free Fund (continued)
| DESCRIPTION | | PAR (000) | | VALUE (000) | |
Illinois State Health Facilities Authority,
Evangelical, Escrowed to Maturity (RB)
6.750%, 04/15/12 (a) | | $ | 1,320 | | | $ | 1,508 | | |
Illinois State Health Facilities Authority,
Mercy Hospital & Medical Center, Escrowed to
Maturity, Callable until 12/31/14 @ 100 (RB)
10.000%, 01/01/15 (a) | | | 740 | | | | 964 | | |
Illinois State Sales Tax (RB)
6.000%, 06/15/09 | | | 2,500 | | | | 2,737 | | |
| 5.100%, 06/15/10 | | | 2,000 | | | | 2,151 | | |
Kane, Cook & Du Page Counties School
District #46, Elgin,
Callable 01/01/15 @ 100 (FSA) (GO)
4.000%, 01/01/16 | | | 1,660 | | | | 1,665 | | |
Kane County School District #129,
Aurora West Side, Series A (GO) (MBIA)
6.500%, 02/01/07 | | | 1,000 | | | | 1,045 | | |
Lake County Community School District #50,
Woodland, Series A,
Pre-refunded 12/01/08 @ 100 (FGIC) (GO)
5.000%, 12/01/09 (b) | | | 1,000 | | | | 1,056 | | |
Lake County Community Unit School District #50,
Woodland (GO) (MBIA)
8.500%, 01/01/07 | | | 1,460 | | | | 1,556 | | |
Lake County Community Unit School District #60,
Waukegan, Series B (FSA) (GO)
6.000%, 12/01/07 | | | 2,785 | | | | 2,956 | | |
| 7.500%, 12/01/08 | | | 3,640 | | | | 4,098 | | |
Lake County School District #56, Gurnee (FGIC) (GO)
8.375%, 01/01/10 | | | 1,290 | | | | 1,538 | | |
Madison & Jersey Counties Unit School
District #11, Alton, Capital Appreciation,
Zero Coupon Bond (FSA) (GO)
5.350%, 12/01/19 (c) | | | 2,100 | | | | 1,101 | | |
Metropolitan Pier & Exposition Authority,
State Sales Tax, Series A,
Callable 06/15/06 @ 102 (AMBAC) (RB)
6.000%, 06/15/07 | | | 750 | | | | 780 | | |
Metropolitan Pier & Exposition Authority,
State Sales Tax, Series A,
Callable 12/15/09 @ 101 (FGIC) (RB)
5.550%, 12/15/11 | | | 675 | | | | 737 | | |
Metropolitan Pier & Exposition Authority,
State Sales Tax, Series A, Escrowed to Maturity,
Zero Coupon Bond (FGIC) (RB)
5.000%, 06/15/09 (a) (c) | | | 1,465 | | | | 1,292 | | |
Metropolitan Pier & Exposition Authority,
State Sales Tax, Series A,
Pre-refunded 06/15/06 @ 102 (AMBAC) (RB)
6.000%, 06/15/07 (b) | | | 250 | | | | 260 | | |
Metropolitan Pier & Exposition Authority,
State Sales Tax, Series A,
Zero Coupon Bond (FGIC) (RB)
5.000%, 06/15/09 (c) | | | 35 | | | | 31 | | |
Morton Grove Residential Housing,
Escrowed to Maturity (MBIA) (RB)
7.350%, 09/01/09 (a) | | | 5,570 | | | | 6,383 | | |
Rockford School District #205 (FGIC) (GO)
5.000%, 02/01/14 | | | 500 | | | | 542 | | |
Springfield Electric Revenue (MBIA) (RB)
6.000%, 03/01/06 | | | 1,050 | | | | 1,064 | | |
St. Clair County,
Callable 10/01/09 @ 102 (FGIC) (GO)
6.000%, 10/01/11 | | | 1,000 | | | | 1,114 | | |
Intermediate Tax Free Fund (continued)
| DESCRIPTION | | PAR (000) | | VALUE (000) | |
Will County School District #86,
Zero Coupon Bond (FSA) (GO)
5.600%, 11/01/17 (c) | | $ | 3,870 | | | $ | 2,263 | | |
Winnebago & Boone Counties School
District #205, Series C, Partially Escrowed to
Maturity (FGIC) (GO)
6.000%, 02/01/08 (a) | | | 5,065 | | | | 5,389 | | |
Winnebago County School District #122,
Harlem-Love Park, Zero Coupon Bond (FSA) (GO)
5.200%, 01/01/17 (c) | | | 3,000 | | | | 1,820 | | |
| | | | 121,973 | | |
| Indiana – 1.8% | | | |
Crown Point Multi-School Building,
First Mortgage (MBIA) (RB) (MLO)
7.625%, 01/15/08 | | | 1,000 | | | | 1,095 | | |
Evansville Vanderburgh, Public Leasing,
Pre-refunded 01/15/12 @ 100 (MBIA) (RB) (MLO)
5.750%, 07/15/18 (b) | | | 1,000 | | | | 1,125 | | |
Franklin Township Independent School Building
Corporation, Escrowed to Maturity (RB)
5.750%, 07/15/09 (a) | | | 1,235 | | | | 1,346 | | |
Gary Sanitation District,
Special Tax District (GO) (RAAI)
3.750%, 02/01/11 | | | 1,260 | | | | 1,260 | | |
Indiana State Housing Authority, Series B-1,
Callable until 07/01/06 @ 102 (RB)
6.150%, 07/01/17 | | | 235 | | | | 236 | | |
Indiana Transportation Finance Authority,
Escrowed to Maturity,
Callable 06/01/11 @ 100 (RB)
5.750%, 06/01/12 (a) | | | 180 | | | | 200 | | |
Indiana Transportation Finance Authority,
Series A (AMBAC) (RB)
5.750%, 06/01/12 | | | 1,820 | | | | 2,053 | | |
Indiana University, Series K,
Zero Coupon Bond (MBIA) (RB)
5.360%, 08/01/11 (c) | | | 750 | | | | 602 | | |
St. Joseph County Hospital,
Callable 02/15/08 @ 101 (MBIA) (RB)
4.750%, 08/15/12 | | | 1,000 | | | | 1,033 | | |
St. Joseph County Independent Hospital
Authority, Health Facilities Revenue,Madison
Center Obligated Group Project,
Callable 02/15/15 @ 100 (RB)
5.250%, 02/15/28 | | | 2,295 | | | | 2,324 | | |
Zionsville Community Schools Building,
First Mortgage Bonds,
Pre-refunded 01/15/12 @ 100 (FGIC) (RB)
(MLO) (STAID)
5.750%, 07/15/15 (b) | | | 775 | | | | 861 | | |
| | | | 12,135 | | |
| Iowa – 0.9% | | | |
Iowa Finance Authority Retirement Community,
Friendship Haven Project, Series A,
Callable 11/15/09 @ 100 (RB)
5.750%, 11/15/19 | | | 500 | | | | 505 | | |
Iowa Higher Education Authority,
Callable 10/01/12 @ 100 (ACA) (RB)
5.500%, 10/01/28 | | | 2,000 | | | | 2,093 | | |
Iowa Higher Education Authority,
Central College (RB)
5.450%, 10/01/26 | | | 1,000 | | | | 1,054 | | |
FIRST AMERICAN FUNDS Annual Report 2005
61
Schedule of Investments September 30, 2005
Intermediate Tax Free Fund (continued)
| DESCRIPTION | | PAR (000) | | VALUE (000) | |
Muscatine Electric, Escrowed to Maturity,
Callable 01/01/06 @ 100 (RB)
9.700%, 01/01/13 (a) | | $ | 1,970 | | | $ | 2,441 | | |
| | | | 6,093 | | |
| Kansas – 1.4% | | | |
Butler County Public Building
Authority (MBIA) (RB) (MLO)
6.375%, 10/01/10 | | | 1,000 | | | | 1,134 | | |
Johnson County Residual Housing,
Escrowed to Maturity, Zero Coupon Bond,
Callable 05/01/12 @ 100 (RB)
3.800%, 05/01/12 (a) (c) | | | 7,500 | | | | 5,866 | | |
La Cygne Environmental Improvement Revenue,
Kansas City Power & Light (RB) (XLCA)
4.050%, 03/01/15 | | | 1,000 | | | | 992 | | |
Sedgwick & Shawnee Counties, Single Family
Mortgages, Series A-2 (GNMA) (RB)
6.700%, 06/01/29 | | | 585 | | | | 588 | | |
Sedgwick County School District #267 (AMBAC) (GO)
5.250%, 11/01/12 | | | 1,045 | | | | 1,157 | | |
| | | | 9,737 | | |
| Kentucky – 0.8% | | | |
Hopkinsville Water & Sewer Revenue, Series A,
Callable 10/15/15 @ 100 (AMBAC) (RB)
4.000%, 10/01/16 | | | 1,275 | | | | 1,283 | | |
Kentucky State Turnpike Authority,
Escrowed to Maturity (RB)
7.200%, 07/01/09 (a) | | | 885 | | | | 958 | | |
Kentucky State Turnpike Authority,
Escrowed to Maturity,
Callable until 06/30/11 @ 100 (RB)
6.000%, 07/01/11 (a) | | | 640 | | | | 690 | | |
Louisville Water, Escrowed to Maturity (RB)
6.000%, 11/15/07 (a) | | | 1,250 | | | | 1,319 | | |
Louisville Water, Escrowed to Maturity,
Callable until 10/31/07 @ 101 (RB)
6.375%, 11/01/07 (a) | | | 1,000 | | | | 1,034 | | |
| | | | 5,284 | | |
| Louisiana – 0.3% | | | |
Louisiana Local Government Environmental
Facilities, Community Development Authority,
Callable 01/01/12 @ 101 (AMT) (RB)
6.650%, 01/01/25 | | | 795 | | | | 845 | | |
St. Tammany Parish Wide School
District #12 (FSA) (GO)
4.000%, 03/01/16 | | | 1,390 | | | | 1,378 | | |
| | | | 2,223 | | |
| Maine – 0.3% | | | |
Maine Municipal Bond Bank, Series B (FSA) (GO)
5.750%, 11/01/10 | | | 2,000 | | | | 2,227 | | |
| Massachusetts – 4.3% | |
Boston Industrial Development Financing Authority,
Crosstown Center Project,
Callable 09/01/12 @ 102 (AMT) (RB)
6.500%, 09/01/35 | | | 2,000 | | | | 2,004 | | |
Massachusetts Bay Transportation Authority,
General Transportation System Project,
Series C (FGIC) (RB)
5.750%, 03/01/10 | | | 2,100 | | | | 2,310 | | |
Intermediate Tax Free Fund (continued)
| DESCRIPTION | | PAR (000) | | VALUE (000) | |
Massachusetts Bay Transportation Authority,
Series A (RB)
6.250%, 03/01/12 | | $ | 1,875 | | | $ | 2,154 | | |
Massachusetts State Commonwealth,
Special Obligation, Series A (RB)
5.500%, 06/01/13 | | | 1,000 | | | | 1,117 | | |
Massachusetts State Health & Educational
Facilities Authority, Berkshire Health System,
Series F (GTY) (RB)
5.000%, 10/01/15 | | | 2,000 | | | | 2,149 | | |
Massachusetts State Health & Educational
Facilities Authority, Partners Healthcare System,
Series A, Callable 07/01/07 @ 101 (MBIA) (RB)
5.100%, 07/01/10 | | | 3,000 | | | | 3,118 | | |
Massachusetts State, Multi-Family Housing,
Escrowed to Maturity,
Callable 10/01/05 @ 100 (FHA) (RB)
6.350%, 04/01/08 (a) | | | 620 | | | | 622 | | |
Massachusetts State Port Authority (RB)
5.750%, 07/01/12 | | | 1,000 | | | | 1,118 | | |
Massachusetts State Port Authority, Escrowed to
Maturity, Callable until 06/30/13 @ 100 (RB)
13.000%, 07/01/13 (a) | | | 3,990 | | | | 5,596 | | |
Massachusetts State, Series A,
Pre-refunded 01/01/11 @ 100 (GO)
5.125%, 01/01/16 (b) | | | 3,000 | | | | 3,253 | | |
Massachusetts State, Series B,
Pre-refunded 05/01/10 @ 100 (GO)
5.000%, 05/01/12 (b) | | | 5,000 | | | | 5,367 | | |
| | | | 28,808 | | |
| Michigan – 4.6% | | | |
Chippewa Valley Schools,
Callable 05/01/12 @ 100 (GO) (MQSBLF)
5.500%, 05/01/14 | | | 1,775 | | | | 1,960 | | |
Constantine Public Schools,
Callable 11/01/12 @ 100 (GO) (MQSBLF)
5.000%, 05/01/16 | | | 1,075 | | | | 1,149 | | |
Detroit (AMT) (FSA) (GO)
5.750%, 04/01/09 | | | 1,255 | | | | 1,353 | | |
Detroit Water Supply, Escrowed to Maturity,
Callable until 06/30/12 @ 100 (FGIC) (RB)
6.250%, 07/01/12 (a) | | | 285 | | | | 316 | | |
Lakeshore Public Schools,
Callable 05/01/11 @ 100 (GO)
5.000%, 05/01/12 | | | 1,160 | | | | 1,245 | | |
Lakeview Public Schools,
Callable 05/01/11 @ 100 (GO)
5.000%, 05/01/14 | | | 1,985 | | | | 2,119 | | |
Michigan State Hospital Finance Authority,
Henry Ford Health Systems, Series A,
Callable 03/01/13 @ 100 (RB)
5.500%, 03/01/15 | | | 3,500 | | | | 3,766 | | |
Michigan State Hospital Finance Authority,
Henry Ford Hospital, Escrowed to Maturity,
Callable until 04/30/08 @ 100 (RB)
9.000%, 05/01/08 (a) | | | 3,540 | | | | 3,852 | | |
Michigan State Housing Development Authority,
Green Hill Project,
Callable until 07/15/06 @ 101 (FNMA) (RB)
5.125%, 07/15/08 | | | 1,245 | | | | 1,259 | | |
Michigan State Strategic Fund, Dow-Chemical
Project, Mandatory Put 06/01/06 @ 100 (RB)
3.800%, 06/01/14 | | | 2,200 | | | | 2,206 | | |
The accompanying notes are an integral part of the financial statements.
FIRST AMERICAN FUNDS Annual Report 2005
62
Intermediate Tax Free Fund (continued)
| DESCRIPTION | | PAR (000) | | VALUE (000) | |
Northville Public Schools, Series II,
Callable 05/15/15 @ 100 (FSA) (GO) (MQSBLF)
4.000%, 05/01/18 | | $ | 1,475 | | | $ | 1,462 | | |
Rochester Community School District, Series 1,
Pre-refunded 05/01/10 @ 100 (FGIC) (GO)
5.375%, 05/01/11 (b) | | | 2,000 | | | | 2,175 | | |
Romulus Economic Development Corporation,
Partnership Project, Escrowed to Maturity,
Callable until 10/31/05 @ 101 (RB)
7.000%, 11/01/15 (a) | | | 1,300 | | | | 1,594 | | |
Wayne Charter County Airport, Series A,
Callable 12/01/08 @ 101 (AMT) (MBIA) (RB)
5.250%, 12/01/09 | | | 5,000 | | | | 5,299 | | |
Wyandotte City School District,
Callable 05/01/15 @ 100 (FSA) (GO) (MQSBLF)
4.125%, 05/01/17 (d) | | | 1,390 | | | | 1,381 | | |
| | | | 31,136 | | |
| Minnesota – 3.8% | | | |
Minneapolis & St. Paul Metropolitan Airports
Commission, Series B (AMT) (FGIC) (RB)
5.750%, 01/01/10 | | | 1,000 | | | | 1,085 | | |
Minneapolis & St. Paul Metropolitan
Airports Commission, Series B,
Callable 01/01/08 @ 101 (AMBAC) (AMT) (RB)
5.375%, 01/01/10 | | | 3,000 | | | | 3,144 | | |
Minneapolis Hospital & Rehabilitation,
Escrowed to Maturity (RB)
10.000%, 06/01/13 (a) | | | 925 | | | | 1,164 | | |
Minnesota Agriculture & Economic Development
Board, Health Care Systems, Series A,
Callable 11/15/10 @ 101 (RB)
5.875%, 11/15/11 | | | 2,135 | | | | 2,348 | | |
Minnesota State Municipal Power Agency,
Electric Revenue, Callable 10/01/15 @ 100 (RB)
4.000%, 10/01/16 | | | 1,000 | | | | 982 | | |
| 4.375%, 10/01/25 | | | 2,000 | | | | 1,934 | | |
Monticello, Big Lake Community Hospital District,
Health Care Facilities, Series C (RB)
5.250%, 12/01/11 | | | 1,940 | | | | 1,995 | | |
Moorhead Independent School District #152,
Callable 04/01/12 @ 100 (FGIC) (GO) (MSDCEP)
5.000%, 04/01/13 | | | 1,270 | | | | 1,370 | | |
Robbinsdale Independent School
District #281 (GO) (MSDCEP)
5.000%, 02/01/09 | | | 1,250 | | | | 1,321 | | |
Robbinsdale Independent School District #281,
Callable 02/01/09 @ 100 (GO) (MSDCEP)
5.250%, 02/01/12 | | | 1,435 | | | | 1,523 | | |
South Washington County Independent School
District #833, Series A,
Callable 02/01/10 @ 100 (GO) (MSDCEP)
5.300%, 02/01/11 | | | 1,000 | | | | 1,076 | | |
St. Paul Housing & Redevelopment Authority,
Callable 08/01/06 @ 102.50 (AMBAC) (RB)
6.400%, 02/01/07 | | | 1,195 | | | | 1,247 | | |
| 6.400%, 08/01/07 | | | 1,205 | | | | 1,268 | | |
| 6.500%, 02/01/09 | | | 1,315 | | | | 1,385 | | |
St. Paul Port Authority Hotel,
Pre-refunded 08/01/08 @ 100 (RB)
8.050%, 08/01/21 (b) | | | 2,335 | | | | 2,624 | | |
St. Paul Port Authority,
Office Building at Cedar St.-03-12 (MLO) (RB)
4.000%, 12/01/11 | | | 1,045 | | | | 1,073 | | |
| | | | 25,539 | | |
Intermediate Tax Free Fund (continued)
| DESCRIPTION | | PAR (000) | | VALUE (000) | |
| Mississippi – 0.3% | | | |
Madison County School District,
Series A (FGIC) (GO)
4.000%, 09/01/15 | | $ | 1,790 | | | $ | 1,792 | | |
| Missouri – 0.2% | | | |
Joplin Individual Development Authority Health
Facilities, Freeman Health System Project (RB)
4.125%, 02/15/09 | | | 750 | | | | 754 | | |
Missouri State Environmental Improvement &
Energy Resourse Authority, Series B (RB)
5.250%, 01/01/16 | | | 675 | | | | 755 | | |
| | | | 1,509 | | |
| Montana – 0.3% | | | |
Montana Facilities Financial Authority,
Health Care Facilities Revenue,
Bozeman Deaconess Health Services,
Callable 12/01/15 @ 100 (RB)
4.125%, 06/01/18 | | | 700 | | | | 680 | | |
| 4.125%, 06/01/19 | | | 940 | | | | 906 | | |
| 4.250%, 06/01/23 | | | 500 | | | | 474 | | |
| | | | 2,060 | | |
| Nebraska – 2.4% | | | |
Douglas County Hospital Authority #1,
Immanuel Medical Center,
Callable 09/01/07 @ 102 (AMBAC) (RB)
4.800%, 09/01/08 | | | 1,400 | | | | 1,460 | | |
Douglas County Hospital Authority #002,
Medical Center (GTY) (RB)
5.000%, 11/15/11 | | | 2,860 | | | | 3,037 | | |
Douglas County Zoo Facilities Revenue,
Omaha's Henry Doorly Zoo Project,
Callable until 08/31/17 @ 100 (RB)
4.750%, 09/01/17 | | | 745 | | | | 769 | | |
Douglas County Zoo Facilities Revenue,
Omaha's Henry Doorly Zoo Project,
Callable until 08/31/18 @ 100 (RB)
4.750%, 09/01/18 | | | 740 | | | | 762 | | |
Lincoln-Lancaster County Public Building,
Tax Supported Lease Rental,
Callable 04/15/15 @ 100 (GO) (MLO)
4.500%, 10/15/15 | | | 1,020 | | | | 1,068 | | |
Nebraska Educational Finance Authority,
Creighton University Project,
Callable 01/01/06 @ 101 (AMBAC) (RB)
5.600%, 01/01/07 | | | 2,500 | | | | 2,541 | | |
Nebraska Educational Telecommunication
Commission, Leasing Project,
Series 2000 (MLO) (RB)
6.000%, 02/01/06 | | | 1,275 | | | | 1,288 | | |
Nebraska Investment Financial Authority,
Great Plains Regional Medical Center (RAAI) (RB)
4.700%, 11/15/11 | | | 500 | | | | 523 | | |
Nebraska Investment Financial Authority,
Great Plains Regional Medical Center,
Callable 05/15/12 @ 100 (RAAI) (RB)
4.800%, 11/15/12 | | | 500 | | | | 524 | | |
| 4.900%, 11/15/13 | | | 600 | | | | 628 | | |
Omaha Northwest Library Facilities,
Pre-refunded 08/15/07 @ 102 (MLO) (RB)
5.250%, 08/15/12 (b) | | | 975 | | | | 1,033 | | |
FIRST AMERICAN FUNDS Annual Report 2005
63
Schedule of Investments September 30, 2005
Intermediate Tax Free Fund (continued)
| DESCRIPTION | | PAR (000) | | VALUE (000) | |
Omaha Tax Allocation, Convention Center Hotel
Redevelopment, Series A,
Callable 12/15/14 @100 (RB)
5.000%, 12/15/19 | | $ | 2,380 | | | $ | 2,408 | | |
| | | | 16,041 | | |
| Nevada – 1.8% | | | |
Carson City, Carson-Tahoe Hospital Project (RB)
5.750%, 09/01/11 | | | 1,000 | | | | 1,079 | | |
| 5.750%, 09/01/12 | | | 1,055 | | | | 1,145 | | |
Clark County School District, Building & Renovation,
Series B, Pre-refunded 06/15/07 @ 101 (FGIC) (GO)
5.750%, 06/15/08 (b) | | | 1,000 | | | | 1,054 | | |
Director of the State of Nevada, Development of
Business & Industry, Las Ventanas Retirement
Project, Series B, Callable 11/15/14 @ 100 (RB)
6.750%, 11/15/23 | | | 2,150 | | | | 2,213 | | |
Nevada State, Pre-refunded 06/01/08 @ 100 (GO)
5.250%, 06/01/11 (b) | | | 3,000 | | | | 3,163 | | |
Washoe County, Escrowed to Maturity,
Callable 02/01/06 @ 100 (GO)
9.875%, 08/01/09 (a) | | | 2,890 | | | | 3,323 | | |
| | | | 11,977 | | |
| New Hampshire – 0.5% | | | |
New Hampshire Health & Educational Facilities
Authority, Callable 07/01/14 @ 100 (RB)
5.375%, 07/01/24 | | | 1,250 | | | | 1,314 | | |
New Hampshire Health & Educational Facilities
Authority, Southern New Hampshire Medical
Center, Series A (RAAI) (RB)
5.000%, 10/01/13 | | | 790 | | | | 841 | | |
New Hampshire State Health & Educational
Facilities Authority, Speare Memorial Hospital,
Callable 07/01/15 @ 100 (RB)
5.500%, 07/01/25 | | | 1,000 | | | | 1,023 | | |
| | | | 3,178 | | |
| New Jersey – 1.0% | | | |
New Jersey Economic Development Authority,
Cigarette Tax (RB)
5.500%, 06/15/16 | | | 2,000 | | | | 2,183 | | |
New Jersey Health Care Facilities, Capital Health
Systems, Series A (RB)
5.500%, 07/01/12 | | | 1,500 | | | | 1,614 | | |
New Jersey State Transportation Trust Fund
Authority, Series A (RB)
5.500%, 06/15/08 | | | 2,000 | | | | 2,115 | | |
New Jersey State Turnpike Authority,
Escrowed to Maturity (RB)
6.750%, 01/01/09 (a) | | | 820 | | | | 827 | | |
| | | | 6,739 | | |
| New York – 2.7% | | | |
Hempstead Town Industrial Development Agency,
Callable 12/01/06 @ 102 (MBIA) (RB)
5.000%, 12/01/08 | | | 2,000 | | | | 2,079 | | |
Long Island Power Authority, Series B (RB)
5.250%, 12/01/13 | | | 4,000 | | | | 4,387 | | |
New York, Series A, Callable 08/01/12 @ 100 (GO)
5.750%, 08/01/15 | | | 3,220 | | | | 3,578 | | |
New York, Series C, Callable 03/15/12 @ 100 (GO)
5.500%, 03/15/14 | | | 3,000 | | | | 3,267 | | |
New York, Series D (GO)
5.500%, 06/01/12 | | | 2,000 | | | | 2,205 | | |
Intermediate Tax Free Fund (continued)
| DESCRIPTION | | PAR (000) | | VALUE (000) | |
New York, Series G (GO) (XLCA)
5.500%, 08/01/12 | | $ | 2,000 | | | $ | 2,223 | | |
New York State Dormitory Authority Revenue,
Supported Debt, 2005 Mental Health,
Series D, Callable until 02/14/11 @ 100 (RB)
5.750%, 02/15/11 | | | 50 | | | | 55 | | |
New York State Environmental Facilities,
Pollution Control, Series D-02,
Callable until 11/14/05 @ 102 (RB)
6.400%, 05/15/06 | | | 225 | | | | 230 | | |
| | | | 18,024 | | |
| North Carolina – 0.8% | | | |
North Carolina Eastern Power Agency,
Series D (RB)
5.375%, 01/01/13 | | | 2,955 | | | | 3,180 | | |
North Carolina Power Agency #1, Series A,
Callable 01/01/13 @ 100 (FSA) (RB)
5.250%, 01/01/16 | | | 2,000 | | | | 2,169 | | |
| | | | 5,349 | | |
| North Dakota – 0.2% | | | |
Fargo Health Systems, Meritcare
Obligated Group, Series A (FSA) (RB)
5.000%, 06/01/09 | | | 715 | | | | 755 | | |
North Dakota State Industrial Commission,
Lignite Program, Series A (RB)
5.750%, 11/15/05 | | | 330 | | | | 331 | | |
| | | | 1,086 | | |
| Ohio – 1.2% | | | |
Akron, Callable 06/01/15 @ 100 (COP) (GTY)
5.000%, 12/01/15 | | | 1,000 | | | | 1,071 | | |
Hamilton Electric Revenue, Series A (FSA) (RB)
4.100%, 10/15/14 | | | 1,500 | | | | 1,532 | | |
Lorain County Hospital Facilities, Catholic
Healthcare Partners, Series B,
Callable 09/01/07 @ 102 (MBIA) (RB)
5.375%, 09/01/09 | | | 1,000 | | | | 1,056 | | |
Ohio State Water Development Authority,
Escrowed to Maturity,
Callable 12/01/05 @ 100 (RB)
9.375%, 12/01/10 (a) | | | 2,010 | | | | 2,244 | | |
Richland County Hospital Facilities, Series A (RB)
5.500%, 11/15/05 | | | 725 | | | | 727 | | |
| 5.550%, 11/15/06 | | | 765 | | | | 785 | | |
| 5.650%, 11/15/08 | | | 595 | | | | 633 | | |
| | | | 8,048 | | |
| Oklahoma – 2.2% | | | |
Cherokee County Economic, Zero Coupon Bond,
Escrowed to Maturity (AMBAC) (RB)
5.610%, 11/01/11 (a) (c) | | | 3,340 | | | | 2,666 | | |
Oklahoma City Industrial & Cultural Facilities,
Oklahoma City Project,
Callable until 09/30/14 @ 101 (AMT) (RB)
5.750%, 01/01/23 | | | 1,430 | | | | 1,439 | | |
Oklahoma County Housing Finance Authority,
Series B, Zero Coupon Bond,
Pre-refunded 03/01/06 @ 56.92 (RB)
5.740%, 07/01/12 (b) (c) | | | 3,690 | | | | 2,075 | | |
Oklahoma Housing Finance Agency, Series A-2,
Callable 11/01/05 @ 100,
Mandatory Put 11/05/05 @ 100 (FNMA) (RB)
5.500%, 11/01/25 | | | 3,000 | | | | 3,005 | | |
The accompanying notes are an integral part of the financial statements.
FIRST AMERICAN FUNDS Annual Report 2005
64
Intermediate Tax Free Fund (continued)
| DESCRIPTION | | PAR (000) | | VALUE (000) | |
South Oklahoma City,
Callable until 01/31/13 @ 100,
Pre-refunded 02/01/10 @ 100 (RB)
9.750%, 02/01/13 (b) | | $ | 3,570 | | | $ | 4,235 | | |
Tulsa Educational Facilities Authority,
Holland Hall School Project, Series B,
Callable 12/01/08 @ 101 (RB)
4.600%, 12/01/09 | | | 1,195 | | | | 1,243 | | |
| | | | 14,663 | | |
| Oregon – 1.8% | | | |
Clackamas County School District #108,
Estacada (FSA) (GO) (SBG)
5.250%, 06/15/17 | | | 1,205 | | | | 1,343 | | |
Clackamas County School District #7J, Lake
Oswego, Pre-refunded 06/01/11 @ 100 (GO)
5.375%, 06/01/14 (b) | | | 3,105 | | | | 3,418 | | |
Lane County School District #52,
Bethel (GO) (SBG)
5.500%, 06/15/09 | | | 1,000 | | | | 1,079 | | |
Linn County Community School District #9,
Lebanon (FGIC) (GO) (SBG)
5.250%, 06/15/22 | | | 1,175 | | | | 1,327 | | |
Morrow County School
District #001 (FSA) (GO) (SGB)
5.250%, 06/15/16 | | | 1,245 | | | | 1,387 | | |
Multnomah County School District #007,
Reynolds (GO) (MBIA) (SBG)
5.000%, 06/15/13 | | | 1,400 | | | | 1,524 | | |
Oregon State Department, Administrative
Services, Series E,
Callable 11/01/12 @ 100 (COP) (FSA) (MLO)
5.000%, 11/01/14 | | | 2,170 | | | | 2,349 | | |
| | | | 12,427 | | |
| Pennsylvania – 0.8% | | | |
Central Greene School District, Capital
Appreciation, Escrowed to Maturity,
Zero Coupon Bond,
Callable 05/31/06 @ 78.123 (GO) (MBIA) (STAID)
4.690%, 12/01/07 (a) (c) | | | 2,000 | | | | 1,867 | | |
Delaware County Hospital Revenue Authority,
Crozer-Chester Medical Center (RAAI) (RB)
5.000%, 12/15/15 | | | 1,275 | | | | 1,355 | | |
Delaware County Hospital Revenue Authority,
Crozer-Chester Medical Center,
Callable 12/15/15 @ 100 (RAAI) (RB)
5.000%, 12/15/17 | | | 1,405 | | | | 1,481 | | |
Montgomery County Industrial Development
Authority, Whitemarsh Continued Care Project,
Callable 02/01/15 @ 100 (RB)
6.125%, 02/01/28 | | | 1,000 | | | | 1,043 | | |
| | | | 5,746 | | |
| Puerto Rico – 0.3% | | | |
Puerto Rico Electric Power Authority,
Escrowed to Maturity, Series AA (MBIA) (RB)
6.000%, 07/01/06 (a) | | | 150 | | | | 154 | | |
Puerto Rico Electric Power Authority,
Un-refunded Balance, Series AA (MBIA) (RB)
6.000%, 07/01/06 | | | 850 | | | | 870 | | |
Puerto Rico Public Building Authority, Series I,
Callable 07/01/14 @ 100 (COMGTY) (GO)
5.250%, 07/01/33 | | | 1,000 | | | | 1,059 | | |
| | | | 2,083 | | |
Intermediate Tax Free Fund (continued)
| DESCRIPTION | | PAR (000) | | VALUE (000) | |
| South Carolina – 1.4% | | | |
Charleston EDL Excellence Finance, Charleston
County School District Project (RB)
5.000%, 12/01/13 | | $ | 2,000 | | | $ | 2,156 | | |
Lexington County Health Services District,
Lexington Medical Center,
Callable 11/01/13 @ 100 (RB)
5.500%, 11/01/23 | | | 2,000 | | | | 2,112 | | |
South Carolina Jobs Economic Development
Authority, Palmetto Health Alliance, Series A (RB)
6.000%, 08/01/13 | | | 1,000 | | | | 1,099 | | |
South Carolina Jobs Economic Development
Authority, Palmetto Health Alliance, Series C (RB)
6.000%, 08/01/13 | | | 2,000 | | | | 2,198 | | |
South Carolina State Public Service Authority,
Series A (MBIA) (RB)
5.500%, 01/01/10 | | | 1,665 | | | | 1,811 | | |
| | | | 9,376 | | |
| South Dakota – 1.0% | | | |
Deadwood (ACA) (COP) (MLO)
5.500%, 11/01/07 | | | 800 | | | | 832 | | |
| 5.600%, 11/01/08 | | | 845 | | | | 894 | | |
South Dakota State Health & Educational
Facilities Authority, Sioux Valley Hospital (RB)
5.250%, 11/01/08 | | | 900 | | | | 946 | | |
South Dakota State Health & Educational
Facilities Authority, Westhills Village
Retirement (RB)
5.800%, 09/01/06 | | | 735 | | | | 746 | | |
| 5.900%, 09/01/07 | | | 755 | | | | 777 | | |
| 4.750%, 09/01/11 | | | 530 | | | | 545 | | |
| 5.000%, 09/01/12 | | | 1,000 | | | | 1,042 | | |
South Dakota State Health & Educational
Facilities Authority, Westhills Village
Retirement Community,
Callable 09/01/12 @ 101 (RB)
5.000%, 09/01/13 | | | 1,000 | | | | 1,038 | | |
| | | | 6,820 | | |
| Tennessee – 2.1% | | | |
Knoxville, Series A (GO)
5.000%, 05/01/16 | | | 1,030 | | | | 1,129 | | |
Memphis (MBIA) (GO)
5.000%, 10/01/16 | | | 2,000 | | | | 2,188 | | |
Metropolitan Government Nashville & Davidson
County, Escrowed to Maturity,
Callable 10/01/05 @ 102 (RB)
6.400%, 04/01/11 (a) | | | 1,030 | | | | 1,186 | | |
Shelby County Health Educational & Housing
Facilities Board,
Pre-refunded 09/01/12 @ 100 (RB)
6.000%, 09/01/16 (b) | | | 565 | | | | 648 | | |
Shelby County Health Educational & Housing
Facilities Board, Pre-refunded 09/01/12 @ 100,
Callable 09/01/12 @ 100 (RB)
6.000%, 09/01/16 (b) | | | 935 | | | | 1,073 | | |
Shelby County Health, Educational & Housing
Facilities Board, St. Jude's Children's
Research (RB)
5.000%, 07/01/09 | | | 400 | | | | 418 | | |
Sullivan County Health, Educational & Housing
Facilities, Wellmont Health Systems Project (RB)
6.250%, 09/01/11 | | | 1,465 | | | | 1,615 | | |
| 6.250%, 09/01/12 | | | 1,085 | | | | 1,206 | | |
FIRST AMERICAN FUNDS Annual Report 2005
65
Schedule of Investments September 30, 2005
Intermediate Tax Free Fund (continued)
| DESCRIPTION | | PAR (000) | | VALUE (000) | |
Sullivan County Health, Educational & Housing
Facilities, Wellmont Health Systems Project,
Callable 09/01/12 @ 101 (RB)
6.500%, 09/01/13 | | $ | 2,215 | | | $ | 2,492 | | |
Sullivan County Health, Educational & Housing
Facilities, Wellmont Health Systems Project,
Callable 09/01/13 @ 100 (RAAI) (RB)
5.000%, 09/01/16 | | | 2,000 | | | | 2,092 | | |
| | | | 14,047 | | |
| Texas – 9.4% | | | |
Abilene Health Facilities Development, Sears
Methodist Retirement, Series A (RB)
5.100%, 11/15/05 | | | 1,115 | | | | 1,116 | | |
| 5.250%, 11/15/06 | | | 1,175 | | | | 1,184 | | |
| 5.300%, 11/15/07 | | | 1,000 | | | | 1,024 | | |
| 5.350%, 11/15/08 | | | 1,300 | | | | 1,343 | | |
Amarillo Independent School District (GO) (PSFG)
7.000%, 02/01/06 | | | 1,035 | | | | 1,049 | | |
Austin, Callable 09/01/11 @ 100 (GO)
5.000%, 09/01/13 | | | 4,510 | | | | 4,852 | | |
Bexar County, Zero Coupon Bond (GO) (MBIA)
3.780%, 06/15/06 (c) | | | 1,000 | | | | 980 | | |
Brazos River Authority, Electric Company
Project, Series 1999-B, Mandatory
Put 04/01/13 @ 100 (AMT) (RB)
6.750%, 09/01/34 | | | 2,000 | | | | 2,275 | | |
Brazos River Authority, Electric Company
Project, Series C, Mandatory
Put 11/01/11 @ 100 (AMT) (RB)
5.750%, 05/01/36 | | | 1,585 | | | | 1,694 | | |
Brazos River Harbor District,
Dow Chemical, Series A-5,
Mandatory Put 05/15/12 @ 100 (AMT) (RB)
5.700%, 05/15/33 | | | 1,000 | | | | 1,082 | | |
Brownsville, Callable 02/15/15 @ 100 (GO) (MBIA)
5.000%, 02/15/17 | | | 2,125 | | | | 2,279 | | |
Cypress-Fairbanks Independent School District,
Pre-refunded 02/15/10 @ 100 (GO) (PSFG)
5.500%, 02/15/18 (b) | | | 4,000 | | | | 4,362 | | |
Donna Independent School District,
Callable 02/15/15 @ 100 (GO) (GTY) (PSFG)
5.000%, 02/15/19 | | | 1,440 | | | | 1,532 | | |
Frisco, Callable 02/05/11 @ 100 (FGIC) (GO)
5.000%, 02/15/18 | | | 1,125 | | | | 1,191 | | |
| 5.000%, 02/15/19 | | | 1,675 | | | | 1,772 | | |
Grapevine Industrial Development, Air Cargo,
Callable 01/01/12 @ 101 (AMT) (RB)
6.500%, 01/01/24 | | | 495 | | | | 516 | | |
Grapevine-Colleyville Independent
School District (GO) (PSFG)
8.250%, 06/15/07 | | | 1,440 | | | | 1,561 | | |
Gregg County Health Facilities Development,
Good Shepherd Medical Center, Series A (RB)
5.750%, 10/01/09 | | | 2,895 | | | | 3,058 | | |
Houston Health Facilities Development,
Buckingham Senior Living Community,
Series A, Callable 02/15/14 @ 101 (RB)
7.000%, 02/15/23 | | | 2,000 | | | | 2,202 | | |
Irving Independent School District, Series A,
Zero Coupon Bond (GO) (PSFG)
5.000%, 02/15/09 (c) | | | 5,000 | | | | 4,464 | | |
Intermediate Tax Free Fund (continued)
| DESCRIPTION | | PAR (000) | | VALUE (000) | |
Kaufman County,
Callable 02/15/12 @ 100 (FSA) (GO)
5.000%, 02/15/17 | | $ | 1,000 | | | $ | 1,059 | | |
Keller Independent School District,
Callable 08/15/11 @ 100 (GO) (PSFG)
5.375%, 08/15/14 | | | 2,000 | | | | 2,185 | | |
Mission Independent
School District (GO) (GTY) (PSFG)
5.000%, 02/15/15 | | | 1,430 | | | | 1,548 | | |
North Harris Montgomery Community College
District, Callable 02/15/12 @ 100 (FGIC) (GO)
5.375%, 02/15/15 | | | 2,535 | | | | 2,767 | | |
Odessa Housing Finance, Escrowed to Maturity,
Zero Coupon Bond, Callable
12/01/05 @ 60.057 (MBIA) (RB)
3.780%, 06/01/12 (a) (c) | | | 1,465 | | | | 1,132 | | |
Port Houston Authority, Harris County, Series B,
Callable 10/01/11 @ 100 (AMT) (FGIC) (GO)
5.500%, 10/01/12 | | | 2,405 | | | | 2,595 | | |
Richardson Hospital Authority (RB)
5.500%, 12/01/13 | | | 1,290 | | | | 1,392 | | |
Richardson Hospital Authority,
Callable 12/01/13 @100 (RB)
5.500%, 12/01/14 | | | 1,310 | | | | 1,404 | | |
Sam Rayburn Municipal Power Agency,
Callable until 08/31/10 @ 100, Partially
Pre-refunded 09/01/09 @ 100 (MBIA) (RB)
6.000%, 09/01/10 (b) | | | 1,420 | | | | 1,561 | | |
San Antonio Electric & Gas, Series A,
Callable 02/01/09 @ 101 (RB)
5.250%, 02/01/13 | | | 2,135 | | | | 2,280 | | |
Santa Fe Independent School District,
Callable 02/15/13 @ 100 (GO) (GTY) (PSFG)
4.250%, 02/15/15 | | | 1,365 | | | | 1,392 | | |
Texas State Public Finance Authority,
Parks & Wildlife Projects,
Callable until 07/31/08 @ 100 (AMBAC)
(RB) (MLO)
6.000%, 08/01/08 | | | 1,000 | | | | 1,058 | | |
Travis County Health Facilities, Development
Retirement Facilities Revenue, Querencia Barton
Creek Project, Callable 11/15/15 @ 100 (RB)
5.250%, 11/15/17 | | | 1,000 | | | | 986 | | |
| 5.500%, 11/15/25 | | | 900 | | | | 884 | | |
Tyler Health Facilities, Mother
Frances Hospital (RB)
5.250%, 07/01/12 | | | 1,000 | | | | 1,066 | | |
United Independent School District (GO) (PSFG)
5.000%, 08/15/15 | | | 1,000 | | | | 1,085 | | |
| | | | 63,930 | | |
| Utah – 0.9% | | | |
Ashley Valley Water & Sewer, Escrowed to
Maturity, Callable 01/01/06 @ 102 (AMBAC) (GO)
10.900%, 01/01/10 (a) | | | 1,310 | | | | 1,534 | | |
Salt Lake & Sandy Metropolitan Water District,
Series A (AMBAC) (RB)
5.000%, 07/01/15 | | | 2,500 | | | | 2,725 | | |
South Jordan, Sales Tax,
Callable 08/15/11 @ 100 (AMBAC) (RB)
5.500%, 08/15/18 | | | 1,000 | | | | 1,098 | | |
The accompanying notes are an integral part of the financial statements.
FIRST AMERICAN FUNDS Annual Report 2005
66
Intermediate Tax Free Fund (continued)
| DESCRIPTION | | PAR (000) | | VALUE (000) | |
Utah State Housing Finance Agency,
Single Family Mortgages, Issue F-1,
Callable until 07/01/06 @ 102 (FHA) (RB) (VA)
6.300%, 01/01/18 | | $ | 65 | | | $ | 65 | | |
Utah State Housing Finance Agency,
Single Family Mortgages, Series III, Class R,
Callable 07/01/06 @ 102 (FHA) (RB) (VA)
5.950%, 07/01/08 | | | 575 | | | | 595 | | |
| | | | 6,017 | | |
| Virginia – 0.6% | | | |
Richmond Industrial Development Authority,
Government Facilities (AMBAC) (RB)
5.000%, 07/15/18 | | | 1,845 | | | | 2,013 | | |
Riverside Regional Jail Authority,
Callable until 07/01/06 @ 102 (MBIA) (RB)
5.700%, 07/01/08 | | | 905 | | | | 925 | | |
Virginia State Peninsula Regional Jail Authority,
Pre-refunded 10/01/05 @ 101 (MBIA) (RB)
5.300%, 10/01/09 (b) | | | 1,000 | | | | 1,010 | | |
| | | | 3,948 | | |
| Washington – 4.5% | | | |
Clark County School District #37,
Vancouver (FSA) (GO)
5.250%, 12/01/14 | | | 1,515 | | | | 1,678 | | |
Energy Northwest, Washington Wind Project,
Series A, Pre-refunded 01/01/07 @ 103 (RB)
5.100%, 07/01/09 (b) | | | 1,850 | | | | 1,948 | | |
| 5.200%, 07/01/10 (b) | | | 1,950 | | | | 2,056 | | |
Energy Northwest, Wind Project,
Callable 07/01/14 @ 100 (MBIA) (RB)
4.500%, 07/01/15 | | | 1,000 | | | | 1,041 | | |
King County (AMBAC) (GO)
5.000%, 12/01/12 | | | 2,000 | | | | 2,173 | | |
King County, Series B,
Pre-refunded 12/01/07 @ 102 (GO)
5.850%, 12/01/13 (b) | | | 2,035 | | | | 2,193 | | |
| 5.850%, 12/01/13 (b) | | | 965 | | | | 1,040 | | |
Pierce County School District #320, Sumner (GO)
6.000%, 12/01/06 | | | 255 | | | | 260 | | |
Port Seattle Passenger Facility Charge,
Series B (AMBAC) (AMT) (RB)
5.000%, 12/01/07 | | | 1,000 | | | | 1,036 | | |
Snohomish County,
Callable 12/01/11 @ 100 (GO) (MBIA)
5.375%, 12/01/19 | | | 5,000 | | | | 5,467 | | |
Snohomish County Housing Authority,
Callable 04/01/06 @ 100 (RB)
6.300%, 04/01/16 | | | 1,035 | | | | 1,042 | | |
Spokane County School District #081,
Callable 06/01/15 @ 100 (GO) (MBIA) (SBG)
0.000%, 06/01/16 (f) | | | 1,000 | | | | 904 | | |
Spokane County School District #356, Central
Valley, Series B, Zero Coupon Bond (FGIC) (GO)
5.030%, 12/01/14 (c) | | | 5,690 | | | | 3,884 | | |
Washington State Public Power Supply System,
Nuclear Project #2, Series A,
Callable 07/01/06 @ 102 (AMBAC) (RB)
5.700%, 07/01/11 | | | 1,000 | | | | 1,039 | | |
Washington State, Series C (GO)
5.500%, 07/01/14 | | | 2,275 | | | | 2,555 | | |
Intermediate Tax Free Fund (continued)
| DESCRIPTION | | PAR (000) | | VALUE (000) | |
Washington State, Series S-5,
Zero Coupon Bond (FGIC) (GO)
5.830%, 01/01/16 (c) | | $ | 3,000 | | | $ | 1,924 | | |
| | | | 30,240 | | |
| West Virginia – 0.3% | | | |
Brooke Pleasants & Tyler Wetzel Counties, Single
Family Mortgage, Escrowed to Maturity (RB)
7.400%, 08/15/10 (a) | | | 1,675 | | | | 1,972 | | |
| Wisconsin – 2.3% | | | |
Door County, Series A,
Callable 09/01/11 @ 100 (FGIC) (GO)
5.125%, 09/01/16 | | | 1,720 | | | | 1,854 | | |
Middleton-Cross Plains Area
School District (FSA) (GO)
5.000%, 04/01/16 | | | 1,195 | | | | 1,301 | | |
Wisconsin State Health & Educational Facilities
Authority, Aurora Health Care, Series A,
Callable 02/15/09 @ 101 (RB)
5.500%, 02/15/20 | | | 1,500 | | | | 1,540 | | |
Wisconsin State Health & Educational Facilities
Authority, Eastcastle Place Income Project,
Callable 12/01/11 @ 100 (RB)
5.750%, 12/01/19 | | | 2,000 | | | | 2,012 | | |
Wisconsin State Health & Educational Facilities
Authority, Fort Healthcare Income Project,
Callable 05/01/14 @ 100 (RB)
5.375%, 05/01/18 | | | 1,250 | | | | 1,315 | | |
Wisconsin State Health & Educational Facilities
Authority, Marshfield Clinic, Series B (RB)
6.250%, 02/15/09 | | | 500 | | | | 535 | | |
Wisconsin State Health & Educational Facilities
Authority, Marshfield Clinic, Series B,
Callable 02/15/12 @ 100 (RB)
5.500%, 02/15/13 | | | 850 | | | | 897 | | |
Wisconsin State Health & Educational Facilities
Authority, Monroe Clinic (RB)
4.450%, 02/15/06 | | | 925 | | | | 929 | | |
Wisconsin State Health & Educational Facilities
Authority, Southwest Health Center, Series A,
Callable 04/01/14 @ 100 (RB)
6.125%, 04/01/24 | | | 1,500 | | | | 1,527 | | |
Wisconsin State Health & Educational
Facilities Authority, Vernon Memorial
Healthcare Project (RB)
4.650%, 03/01/15 | | | 1,150 | | | | 1,146 | | |
Wisconsin State Health & Educational Facilities
Authority, Wheaton Franciscan Services (RB)
5.750%, 08/15/11 | | | 645 | | | | 713 | | |
Wisconsin State Health & Educational Facilities
Authority, Wisconsin Medical College,
Callable 12/01/14 @ 100 (RB)
5.000%, 12/01/15 | | | 1,450 | | | | 1,567 | | |
| | | | 15,336 | | |
| Wyoming – 0.3% | | | |
Lincoln County, Pacificorp Project,
Mandatory Put 06/03/12 @ 100 (AMT) (RB)
4.125%, 11/01/25 | | | 2,250 | | | | 2,196 | | |
| Convertible Bonds – 2.2% | | | |
Chicago, Series A, Convertible,
Zero Coupon Bond (GO) (MBIA)
3.489%, 01/01/16 (c) | | | 2,000 | | | | 1,696 | | |
FIRST AMERICAN FUNDS Annual Report 2005
67
Schedule of Investments September 30, 2005
Intermediate Tax Free Fund (continued)
| DESCRIPTION | | PAR (000)/SHARES | | VALUE (000) | |
Cook County High School District #209,
Proviso Township, Convertible,
Zero Coupon Bond (FSA) (GO)
4.210%, 12/01/16 (c) | | $ | 1,000 | | | $ | 967 | | |
The E-470 Public Highway Authority, Series C,
Zero Coupon Bond (MBIA) (RB)
4.250%, 09/01/17 (c) | | | 1,500 | | | | 1,197 | | |
Fayette County School District (FSA) (GO)
4.150%, 03/01/14 (c) | | | 500 | | | | 408 | | |
| 4.250%, 03/01/15 (c) | | | 265 | | | | 215 | | |
| 4.350%, 03/01/16 (c) | | | 300 | | | | 244 | | |
Golden State Tobacco Securitization,
Tobacco Settlement Revenue, Series A,
Callable 06/01/18 @ 100, Convertible,
Zero Coupon Bond (FSA) (RB)
4.550%, 06/01/22 (c) | | | 1,630 | | | | 1,310 | | |
Illinois Sports Facilities Authority, Convertible,
Zero Coupon Bond (AMBAC) (RB)
4.750%, 06/15/13 (c) | | | 1,405 | | | | 1,206 | | |
Illinois Sports Facilities Authority,
Convertible, Zero Coupon Bond,
Callable 06/15/15 @ 101 (AMBAC) (RB)
5.100%, 06/15/16 (c) | | | 1,620 | | | | 1,410 | | |
Metropolitan Pier & Exposition Authority,
State Sales Tax, Convertible,
Zero Coupon Bond (FGIC) (MBIA) (RB)
5.200%, 06/15/17 (c) | | | 1,000 | | | | 776 | | |
Miami-Dade County Special Obligations,
Capital Appreciation & Income, Series A,
Covertible, Zero Coupon Bond,
Callable 10/01/17 @ 100 (MBIA) (RB)
4.420%, 10/01/21 (c) (f) | | | 1,410 | | | | 1,000 | | |
Montgomery BMC Special Care Facilities Finance
Authority, Series A-2, Convertible, Zero Coupon
Bond, Callable 11/15/14 @ 100 (MBIA) (RB)
4.400%, 11/15/16 (c) | | | 2,000 | | | | 1,895 | | |
Northwest Parkway Public Highway Authority,
Convertible, Zero Coupon Bond (AMBAC) (RB)
5.250%, 06/15/15 (c) | | | 2,750 | | | | 2,291 | | |
| | | | 14,615 | | |
Total Municipal Bonds
(Cost $633,012) | | | | | | | 667,511 | | |
| Affiliated Money Market Fund – 0.3% | |
First American Tax Free Obligations Fund, Class Z (g)
(Cost $2,411) | | | 2,410,819 | | | | 2,411 | | |
Total Investments – 99.1%
(Cost $635,423) | | | | | | | 669,922 | | |
| Other Assets and Liabilities, Net – 0.9% | | | | | | | 5,877 | | |
| Total Net Assets – 100.0% | | | | | | $ | 675,799 | | |
(a) Escrowed to Maturity issues are typically backed by U.S. Government obligations. If callable, these bonds may still be subject to call at the call date and price indicated.
(b) Pre-refunded issues are typically backed by U.S. Government obligations. These bonds mature at the call date and price indicated.
(c) The rate shown is the effective yield at the time of purchase.
(d) Security purchased on a when-issued basis. On September 30, 2005, the total cost of investments purchased on a when-issued basis was $2,096,139 or 0.3% of total net assets. See note 2 in Notes to Financial Statements.
Intermediate Tax Free Fund (concluded)
(e) Security sold within the terms of a private placement memorandum, exempt from registration under Rule 144A of the Securities Act of 1933, as amended, and may be sold only to dealers in that program or other "qualified institutional buyers." These securities have been determined to be liquid under the guidelines established by the funds' board of directors. As of September 30, 2005, the value of these investments was $4,424,120 or 0.7% of total net assets.
(f) Delayed Interest (Step-Bonds) – Securities for which the coupon rate of interest will adjust on specified future date(s). The rate disclosed is the rate in effect as of September 30, 2005.
(g) Investment in affiliated security. This money market fund is advised by U.S. Bancorp Asset Management, Inc., which also serves as advisor for this fund. See note 3 in Notes to Financial Statements.
ACA – American Capital Access
AMBAC – American Municipal Bond Assurance Corporation
AMT – Alternative Minimum Tax. As of September 30, 2005, the aggregate market value of securities subject to the AMT was $34,232,822, which represents 5.1% of net assets.
CMI – California Mortgage Insurance Program
COMGTY – Commonwealth Guaranty
COP – Certificate of Participation
FGIC – Financial Guaranty Insurance Corporation
FHA – Federal Housing Authority
FHLMC – Federal Home Loan Mortgage Corporation
FNMA – Federal National Mortgage Association
FSA – Financial Security Assurance
GNMA – Government National Mortgage Association
GO – General Obligation
GTY – Assured Guaranty
LOC – Letter of Credit
MBIA – Municipal Bond Insurance Association
MLO – Municipal Lease Obligation
MQSBLF – Michigan Qualified School Board Loan Fund Program
MSDCEP – Minnesota School District Credit Enhancement Program
PSFG – Permanent School Fund Guarantee
RAAI – Radian Asset Assurance Inc.
RB – Revenue Bond
SBG – School Board Guaranty
STAID – State Aid Withholding
VA – Veterans Administration
XLCA – XL Capital Assurance Inc.
The accompanying notes are an integral part of the financial statements.
FIRST AMERICAN FUNDS Annual Report 2005
68
Minnesota Intermediate Tax Free Fund
| DESCRIPTION | | PAR (000) | | VALUE (000) | |
| Municipal Bonds – 98.4% | |
| Revenue Bonds – 56.5% | |
| Economic Development – 1.4% | |
Minneapolis Community Development Agency,
Series G-3, Callable 12/01/11 @ 100
5.350%, 12/01/21 | | $ | 1,000 | | | $ | 1,054 | | |
Minnesota State Agricultural & Economic
Development Board, Small Business
Development, Series B (AMT)
6.500%, 08/01/08 | | | 1,030 | | | | 1,079 | | |
Minnesota State Agricultural & Economic
Development Board, Small Business
Development, Series C (AMT)
6.625%, 08/01/08 | | | 940 | | | | 987 | | |
| | | | 3,120 | | |
| Education – 5.9% | | | |
Minneapolis, The Blake School Project,
Callable 09/01/11 @ 100
5.000%, 09/01/12 | | | 445 | | | | 472 | | |
Minnesota State Higher Education Facilities
Authority, Augsburg College, Series 4
4.850%, 10/01/09 | | | 520 | | | | 541 | | |
Minnesota State Higher Education Facilities
Authority, Augsburg College, Series 4,
Callable 10/01/09 @ 100
5.000%, 10/01/11 | | | 500 | | | | 519 | | |
| 5.000%, 10/01/12 | | | 500 | | | | 517 | | |
Minnesota State Higher Education Facilities
Authority, Augsburg College, Series 6-C,
Callable 05/01/14 @ 100
4.750%, 05/01/18 | | | 1,075 | | | | 1,107 | | |
Minnesota State Higher Education Facilities
Authority, Carleton College, Series 3-L1,
Pre-refunded 05/01/06 @ 100
5.750%, 11/01/12 (a) | | | 1,375 | | | | 1,398 | | |
Minnesota State Higher Education Facilities
Authority, Minneapolis College of Art and Design
5.000%, 05/01/11 | | | 250 | | | | 261 | | |
Minnesota State Higher Education Facilities
Authority, St. Benedict College,
Callable 03/01/07 @ 100
4.875%, 03/01/08 | | | 1,000 | | | | 1,016 | | |
| 5.100%, 03/01/11 | | | 2,885 | | | | 2,924 | | |
Minnesota State Higher Education Facilities
Authority, St. Benedict College, Series 5-W
4.200%, 03/01/12 | | | 345 | | | | 352 | | |
Minnesota State Higher Education Facilities
Authority, St. Catherine College, Series 5-N1,
Callable 10/01/12 @ 100
5.250%, 10/01/22 | | | 1,500 | | | | 1,560 | | |
Minnesota State Higher Education Facilities
Authority, St. John's University, Series 5,
Escrowed to Maturity (MBIA)
5.000%, 10/01/11 (b) | | | 255 | | | | 277 | | |
Minnesota State Higher Education Facilities
Authority, St. John's University, Series 5,
Pre-refunded 10/01/11 @ 100 (MBIA)
5.000%, 10/01/12 (a) | | | 480 | | | | 518 | | |
Minnesota State Higher Education Facilities
Authority, St. John's University, Series 6-G
4.000%, 10/01/15 | | | 200 | | | | 198 | | |
Minnesota Intermediate Tax Free Fund (continued)
| DESCRIPTION | | PAR (000) | | VALUE (000) | |
Minnesota State Higher Education Facilities
Authority, St. John's University, Series 6-G,
Callable 10/01/15 @ 100
4.000%, 10/01/16 | | $ | 1,000 | | | $ | 982 | | |
Minnesota State Higher Education Facilities
Authority, University of St. Thomas,
Callable 10/01/14 @ 100
5.250%, 10/01/19 | | | 530 | | | | 571 | | |
Minnesota State Higher Education Facilities
Authority, University of St. Thomas, Series 4,
Callable 04/01/08 @ 100
5.250%, 04/01/12 | | | 385 | | | | 399 | | |
| | | | 13,612 | | |
| Healthcare – 20.5% | | | |
Cuyuna Range Hospital District,
Callable 06/01/13 @ 101
5.000%, 06/01/16 | | | 425 | | | | 431 | | |
| 5.000%, 06/01/19 | | | 1,320 | | | | 1,324 | | |
Cuyuna Range Hospital District, Series A,
Callable 06/01/07 @ 102
5.500%, 06/01/10 | | | 435 | | | | 447 | | |
| 5.650%, 06/01/12 | | | 940 | | | | 967 | | |
Duluth Economic Development Authority,
Benedictine Health System,
Callable 02/15/14 @ 100
5.375%, 02/15/22 | | | 2,045 | | | | 2,154 | | |
Glencoe Health Care Facilities, Regional
Health Services Project
5.000%, 04/01/13 | | | 760 | | | | 789 | | |
Glencoe Health Care Facilities, Regional Health
Services Project, Callable 04/01/13 @ 101
5.000%, 04/01/14 | | | 800 | | | | 833 | | |
| 5.000%, 04/01/15 | | | 845 | | | | 872 | | |
| 5.000%, 04/01/17 | | | 1,815 | | | | 1,854 | | |
Glencoe Health Care Facilities,
Pre-refunded 04/01/11 @ 101
7.400%, 04/01/21 (a) | | | 1,000 | | | | 1,184 | | |
Hastings Health Care Facility, Regina Medical
Center, Callable 09/15/08 @ 100 (ACA)
5.000%, 09/15/13 | | | 500 | | | | 511 | | |
Maple Grove Health Care Facilities,
North Memorial, Callable 09/01/15 @ 100
4.500%, 09/01/17 | | | 1,730 | | | | 1,745 | | |
Minneapolis & St. Paul Housing & Redevelopment
Authority, Healthspan, Series A,
Callable until 11/14/13 @ 101 (AMBAC)
5.000%, 11/15/13 | | | 1,000 | | | | 1,002 | | |
Minneapolis Healthcare System, Allina Health
System, Series A, Callable 11/15/12 @ 100
6.000%, 11/15/23 | | | 2,500 | | | | 2,723 | | |
| 5.750%, 11/15/32 | | | 1,300 | | | | 1,381 | | |
Minneapolis Healthcare System, Fairview Health
Services, Series A, Escrowed to Maturity
5.000%, 05/15/12 (b) | | | 605 | | | | 652 | | |
Minnesota Agricultural & Economic Development
Board, Benedictine Health, Series A (MBIA)
5.000%, 02/15/10 | | | 3,815 | | | | 4,060 | | |
Minnesota Agricultural & Economic Development
Board, Evangelical Lutheran Project
5.500%, 02/01/11 | | | 280 | | | | 298 | | |
| 5.500%, 02/01/12 | | | 200 | | | | 214 | | |
FIRST AMERICAN FUNDS Annual Report 2005
69
Schedule of Investments September 30, 2005
Minnesota Intermediate Tax Free Fund (continued)
| DESCRIPTION | | PAR (000) | | VALUE (000) | |
Minnesota Agricultural & Economic Development
Board, Evangelical Lutheran Project,
Callable 02/01/12 @ 101
5.500%, 02/01/15 | | $ | 730 | | | $ | 775 | | |
Minnesota Agricultural & Economic Development
Board, Fairview Healthcare Systems, Series A,
Pre-refunded 11/15/07 @ 102 (MBIA)
5.500%, 11/15/17 (a) | | | 1,195 | | | | 1,278 | | |
| 5.750%, 11/15/26 (a) | | | 490 | | | | 526 | | |
Minnesota Agricultural & Economic Development
Board, Fairview Hospital Project, Series A,
Callable 11/15/07 @ 102 (MBIA)
5.400%, 11/15/08 | | | 1,000 | | | | 1,063 | | |
Minnesota Agricultural & Economic Development
Board, Healthcare Systems, Series A,
Callable 11/15/07 @ 102 (MBIA)
5.500%, 11/15/17 | | | 305 | | | | 324 | | |
| 5.750%, 11/15/26 | | | 10 | | | | 11 | | |
Monticello, Big Lake Community Hospital,
Series C, Callable 12/01/12 @ 100
5.750%, 12/01/15 | | | 2,320 | | | | 2,391 | | |
Moorhead Economic Development Authority,
Eventide Senior Housing, Series B,
Callable until 05/31/06 @ 101
5.750%, 06/01/16 | | | 1,360 | | | | 1,366 | | |
New Hope Housing & Health Care Facilities,
Masonic Home North Ridge
5.200%, 03/01/06 | | | 645 | | | | 649 | | |
| 5.300%, 03/01/07 | | | 685 | | | | 697 | | |
New Hope Housing & Health Care Facilities,
Masonic Home North Ridge,
Callable 03/01/09 @ 102
5.500%, 03/01/10 | | | 500 | | | | 519 | | |
Plymouth Health Facilities, Westhealth Project,
Series A, Callable until 05/31/06 @ 101 (FSA)
6.200%, 06/01/11 | | | 1,360 | | | | 1,377 | | |
Rochester, St. Mary's Hospital, Escrowed to
Maturity, Callable 10/01/05 @ 100
5.750%, 10/01/07 (b) | | | 825 | | | | 845 | | |
St. Cloud Health Care (FSA)
5.500%, 05/01/07 | | | 500 | | | | 519 | | |
| 5.500%, 05/01/08 | | | 1,450 | | | | 1,531 | | |
St. Paul Housing & Redevelopment Authority,
HealthEast Project, Callable 11/15/15 @ 100
5.150%, 11/15/20 | | | 1,500 | | | | 1,007 | | |
St. Paul Port Authority, Healtheast Midway
Campus, Series A
5.250%, 05/01/15 | | | 1,500 | | | | 1,506 | | |
St. Paul Port Authority, Healtheast Midway
Campus, Series A, Callable 05/01/15 @ 100
5.750%, 05/01/25 | | | 2,000 | | | | 2,032 | | |
Shakopee Health Care Facilities,
St. Francis Regional Medical Center
4.000%, 09/01/12 | | | 305 | | | | 306 | | |
Shakopee Health Care Facilities, St. Francis
Regional Medical Center,
Callable 09/01/14 @ 100
5.000%, 09/01/17 | | | 1,785 | | | | 1,845 | | |
Stillwater Healthcare, Health Systems
Obligation Group
4.250%, 06/01/15 | | | 300 | | | | 302 | | |
Stillwater Healthcare, Health Systems Obligation
Group, Callable 06/01/15 @ 100
4.250%, 06/01/16 | | | 760 | | | | 752 | | |
Minnesota Intermediate Tax Free Fund (continued)
| DESCRIPTION | | PAR (000) | | VALUE (000) | |
Todd, Morrison, Cass & Wadena Counties,
United Hospital District
4.250%, 12/01/12 | | $ | 425 | | | $ | 431 | | |
| 4.000%, 12/01/13 | | | 400 | | | | 398 | | |
Winona Health Care Facilities, Series A,
Callable 07/01/12 @ 102
5.300%, 07/01/17 | | | 525 | | | | 543 | | |
| 5.350%, 07/01/18 | | | 590 | | | | 610 | | |
| | | | 47,044 | | |
| Housing – 0.6% | | | |
Dakota County Housing & Redevelopment
Authority, Single Family Mortgages,
Callable 10/01/07 @ 101.50 (AMT)
(FNMA) (GNMA)
5.125%, 10/01/20 | | | 119 | | | | 120 | | |
Minneapolis Mortgage, Callable 10/01/05 @ 100
3.607%, 10/01/12 | | | 583 | | | | 300 | | |
Minnesota State Housing Finance Agency,
Rental Housing, Series D,
Callable until 01/31/06 @ 102 (MBIA)
5.450%, 08/01/07 | | | 275 | | | | 281 | | |
Minnesota State Housing Finance Agency,
Single Family Mortgages, Series B,
Callable 07/01/09 @ 100
5.550%, 07/01/24 | | | 525 | | | | 539 | | |
South St. Paul Housing & Redevelopment
Authority, Single Family Mortgages,
Callable until 08/31/07 @ 100 (FNMA)
5.100%, 09/01/07 | | | 60 | | | | 60 | | |
| | | | 1,300 | | |
| Lease Revenue – 3.1% | | | |
Andover Economic Development Authority,
Andover Community Center,
Callable 02/01/14 @ 100
5.000%, 02/01/19 | | | 1,225 | | | | 1,276 | | |
Eden Prairie Housing & Redevelopment Authority,
Series A, Callable 12/01/10 @ 100 (MLO)
5.000%, 12/01/11 | | | 255 | | | | 274 | | |
St. Paul Housing & Redevelopment Authority,
Smith Avenue Transit Center,
Callable 06/01/10 @ 100
4.000%, 06/01/12 | | | 1,500 | | | | 1,519 | | |
St. Paul Port Authority, Office Building,
Callable 12/01/12 @ 100 (MLO)
5.000%, 12/01/19 | | | 2,415 | | | | 2,580 | | |
Stearns County Housing & Redevelopment
Authority, Series A,
Callable 02/01/08 @ 100 (FSA) (MLO)
4.950%, 02/01/09 | | | 1,540 | | | | 1,602 | | |
| | | | 7,251 | | |
| Miscellaneous – 0.9% | | | |
Minnesota State Retirement Systems Building,
Callable 06/01/10 @ 100
5.450%, 06/01/12 | | | 550 | | | | 597 | | |
Seaway Port Authority of Duluth,
Cargill Inc. Project
4.200%, 05/01/13 | | | 1,500 | | | | 1,519 | | |
| | | | 2,116 | | |
The accompanying notes are an integral part of the financial statements.
FIRST AMERICAN FUNDS Annual Report 2005
70
Minnesota Intermediate Tax Free Fund (continued)
| DESCRIPTION | | PAR (000) | | VALUE (000) | |
| Recreational Facility Authority – 1.2% | |
St. Paul Port Authority, Hotel Facilities, Radisson
Kellogg Project, Series 2
6.700%, 08/01/07 | | $ | 960 | | | $ | 970 | | |
St. Paul Port Authority, Hotel Facilities, Radisson
Kellogg Project, Series 2,
Callable 08/01/08 @ 103
7.375%, 08/01/10 | | | 1,685 | | | | 1,763 | | |
| | | | 2,733 | | |
| Revolving Funds – 1.8% | | | |
Minnesota State Public Facilities Authority,
Drinking Water, Series B,
Callable 03/01/09 @ 100
5.125%, 03/01/19 | | | 2,000 | | | | 2,108 | | |
Minnesota State Public Facilities Authority,
Water Pollution Control,
Callable 03/01/07 @ 100
5.000%, 03/01/09 | | | 590 | | | | 606 | | |
Minnesota State Public Facilities Authority,
Water Pollution Control,
Pre-refunded 03/01/07 @ 100
5.000%, 03/01/09 (a) | | | 1,410 | | | | 1,449 | | |
| | | | 4,163 | | |
| Tax Revenue – 2.1% | | | |
Bloomington Port Authority, Mall of America
Project, Series A (FSA)
4.900%, 02/01/09 | | | 1,000 | | | | 1,055 | | |
Childrens Trust Fund, Puerto Rico,
Tobacco Settlement
4.000%, 05/15/12 | | | 500 | | | | 501 | | |
Minneapolis, St. Anthony Falls Project,
Callable until 01/31/17 @ 102
5.000%, 02/01/17 | | | 1,040 | | | | 1,035 | | |
St. Paul Port Authority, Energy Park,
Tax Increment, Escrowed to Maturity (FSA)
5.000%, 02/01/08 (b) | | | 2,100 | | | | 2,166 | | |
| | | | 4,757 | | |
| Transportation – 6.0% | | | |
Minneapolis & St. Paul Metropolitan Airports
Commission, Series A,
Callable 01/01/13 @ 100 (MBIA)
5.000%, 01/01/20 | | | 2,200 | | | | 2,329 | | |
Minneapolis & St. Paul Metropolitan Airports
Commission, Series B (AMT) (FGIC)
5.750%, 01/01/10 | | | 2,880 | | | | 3,126 | | |
Minneapolis & St. Paul Metropolitan Airports
Commission, Series B,
Callable 01/01/08 @ 101 (AMBAC) (AMT)
5.500%, 01/01/09 | | | 1,000 | | | | 1,053 | | |
Minneapolis & St. Paul Metropolitan Airports
Commission, Series B,
Callable 01/01/09 @ 101 (AMT) (FGIC)
5.625%, 01/01/14 | | | 1,000 | | | | 1,067 | | |
Minneapolis & St. Paul Metropolitan Airports
Commission, Series C,
Callable 01/01/15 @ 100 (FGIC)
4.000%, 01/01/16 | | | 430 | | | | 431 | | |
Minneapolis & St. Paul Metropolitan Airports
Commission, Series C,
Callable 01/01/11 @ 100 (FGIC)
5.125%, 01/01/20 | | | 3,095 | | | | 3,279 | | |
Minnesota Intermediate Tax Free Fund (continued)
| DESCRIPTION | | PAR (000) | | VALUE (000) | |
Minnesota Public Facilities Authority Tranportation,
Callable 03/01/10 @ 100
5.000%, 03/01/12 | | $ | 970 | | | $ | 1,031 | | |
Puerto Rico Commonwealth, Highway
Transportation Authority, Series X (MBIA)
5.500%, 07/01/13 | | | 1,250 | | | | 1,403 | | |
| | | | 13,719 | | |
| Utilities – 13.0% | | | |
Chaska Electric, Series A
5.600%, 10/01/08 | | | 680 | | | | 722 | | |
| 5.650%, 10/01/09 | | | 720 | | | | 777 | | |
| 5.650%, 10/01/10 | | | 760 | | | | 829 | | |
| 4.000%, 10/01/12 | | | 500 | | | | 505 | | |
| 4.200%, 10/01/15 | | | 1,000 | | | | 1,002 | | |
Chaska Electric, Series A,
Pre-refunded 10/01/10 @ 100
5.400%, 10/01/11 (a) | | | 805 | | | | 879 | | |
| 5.500%, 10/01/12 (a) | | | 845 | | | | 927 | | |
Cohasset Pollution Control, College Allete Project,
Callable 07/01/14 @ 100 (RAAI)
4.950%, 07/01/22 | | | 2,230 | | | | 2,278 | | |
Northern Minnesota Municipal Power Agency,
Electric System (FSA)
5.500%, 01/01/08 | | | 2,090 | | | | 2,200 | | |
Princeton Public Utility System,
Callable 04/01/12 @ 100
4.100%, 04/01/15 | | | 450 | | | | 448 | | |
Rochester Electric Utility,
Callable 12/01/10 @ 100
5.000%, 12/01/16 | | | 1,150 | | | | 1,202 | | |
Southern Minnesota Municipal Power Agency,
Series A (AMBAC)
5.250%, 01/01/14 | | | 3,415 | | | | 3,778 | | |
Southern Minnesota Municipal Power Agency,
Series A, Callable 01/01/09 @ 101 (AMBAC)
5.000%, 01/01/11 | | | 1,270 | | | | 1,345 | | |
Southern Minnesota Municipal Power Agency,
Series A, Zero Coupon Bond (MBIA)
5.257%, 01/01/20 (c) | | | 3,500 | | | | 1,841 | | |
| 5.275%, 01/01/21 (c) | | | 5,000 | | | | 2,502 | | |
Western Minnesota Municipal Power Agency,
Series A, Callable 01/01/06 @ 102 (AMBAC)
5.500%, 01/01/11 | | | 5,000 | | | | 5,131 | | |
| 5.500%, 01/01/13 | | | 2,000 | | | | 2,052 | | |
Western Minnesota Municipal Power Agency,
Series A, Callable 01/01/11 @ 100 (AMBAC)
5.500%, 01/01/12 | | | 1,360 | | | | 1,490 | | |
| | | | 29,908 | | |
| Total Revenue Bonds | | | | | | | 129,723 | | |
| General Obligations – 39.5% | | | |
Anoka County Capital Improvements, Series B
4.550%, 01/01/11 | | | 1,960 | | | | 2,061 | | |
Anoka-Hennepin Independent School District #11,
Callable 02/01/11 @ 100 (MSDCEP)
5.000%, 02/01/14 | | | 2,000 | | | | 2,143 | | |
Anoka-Hennepin Independent School
District #11, Series A, Crossover
Refunded 02/01/10 @ 100 (MSDCEP)
5.300%, 02/01/12 (d) | | | 1,000 | | | | 1,081 | | |
| 5.375%, 02/01/13 (d) | | | 600 | | | | 651 | | |
FIRST AMERICAN FUNDS Annual Report 2005
71
Schedule of Investments September 30, 2005
Minnesota Intermediate Tax Free Fund (continued)
| DESCRIPTION | | PAR (000) | | VALUE (000) | |
Anoka-Hennepin Independent School District #11,
Series A, Callable 02/01/11 @ 100 (MSDCEP)
5.000%, 02/01/12 | | $ | 2,845 | | | $ | 3,049 | | |
Bloomington Independent School District #271,
Series B, Callable 02/01/10 @ 100 (MSDCEP)
5.250%, 02/01/11 | | | 1,000 | | | | 1,074 | | |
Brooklyn Park, Series B
4.000%, 02/01/16 | | | 600 | | | | 615 | | |
Buffalo Independent School District #877,
Series B (FSA) (MSDCEP)
4.500%, 02/01/13 | | | 325 | | | | 344 | | |
Burnsville Independent School District #191,
Series A, Callable 02/01/08 @ 100 (MSDCEP)
5.000%, 02/01/09 | | | 1,225 | | | | 1,275 | | |
Cambridge Independent School District #911,
Series A, Callable 02/01/15 @ 100 (MSDCEP)
4.000%, 02/01/16 | | | 1,060 | | | | 1,068 | | |
Cambridge Independent School District #911,
Series B, Zero Coupon Bond,
Callable 02/01/18 @ 86.965 (MBIA) (MSDCEP)
4.710%, 02/01/21 (c) | | | 645 | | | | 322 | | |
Centennial Independent School
District #12, Series A,
Callable 02/01/12 @ 100 (FSA) (MSDCEP)
5.000%, 02/01/14 | | | 1,040 | | | | 1,121 | | |
Chaska Independent School District #112,
Series A (MSDCEP)
4.800%, 02/01/10 | | | 1,120 | | | | 1,188 | | |
Crow Wing County, Series A (MBIA)
4.500%, 02/01/14 | | | 1,480 | | | | 1,565 | | |
Dakota County Capital Improvements, Series C
4.850%, 02/01/10 | | | 1,000 | | | | 1,065 | | |
Delano Independent School District #879,
Callable 02/01/15 @ 100 (FSA) (MSDCEP)
4.000%, 02/01/17 (e) | | | 985 | | | | 983 | | |
| 4.250%, 02/01/19 (e) | | | 1,350 | | | | 1,358 | | |
Elk River Independent School
District #728, Series A,
Callable 02/01/11 @ 100 (MBIA) (MSDCEP)
5.000%, 02/01/18 | | | 1,000 | | | | 1,064 | | |
Farmington Independent School District #192,
Callable 06/01/13 @ 100 (MBIA) (MSDCEP)
4.000%, 06/01/16 | | | 2,830 | | | | 2,849 | | |
Hastings Independent School
District #200, Series A,
Crossover Refunded 02/01/08 @ 100 (MSDCEP)
5.000%, 02/01/11 (d) | | | 1,095 | | | | 1,142 | | |
Lakeville Independent School District #194,
Callable 02/01/09 @ 100 (MSDCEP)
5.000%, 02/01/16 | | | 2,000 | | | | 2,092 | | |
Lakeville Independent School
District #194, Series A,
Callable 02/01/13 @ 100 (FGIC) (MSDCEP)
5.000%, 02/01/22 | | | 2,435 | | | | 2,575 | | |
Lakeville Independent School
District #194, Series A,
Crossover Refunded 02/01/08 @ 100 (MSDCEP)
5.125%, 02/01/22 (d) | | | 1,000 | | | | 1,043 | | |
Minneapolis & St. Paul Metropolitan Council,
Waste Water Treatment, Series A,
Callable 03/01/11 @ 100
5.000%, 03/01/13 | | | 1,890 | | | | 2,065 | | |
Minneapolis School District #1 (MSDCEP)
4.500%, 02/01/08 | | | 1,450 | | | | 1,497 | | |
Minnesota Intermediate Tax Free Fund (continued)
| DESCRIPTION | | PAR (000) | | VALUE (000) | |
Minnesota State, Callable 08/01/07 @ 100
4.850%, 08/01/12 | | $ | 4,420 | | | $ | 4,556 | | |
Monticello, Series A,
Callable 02/01/13 @ 100 (FSA)
4.000%, 02/01/14 | | | 500 | | | | 508 | | |
Moorhead Independent School
District #152 (MSDCEP)
5.000%, 04/01/12 | | | 1,220 | | | | 1,324 | | |
Moorhead Independent School
District #152, Crossover
Refunded 04/01/12 @ 100 (FGIC) (MSDCEP)
5.000%, 04/01/15 (d) | | | 3,450 | | | | 3,701 | | |
| 5.000%, 04/01/16 (d) | | | 2,510 | | | | 2,686 | | |
Moorhead Independent School District #152,
Callable 04/01/14 @ 100 (MSDCEP)
4.000%, 04/01/15 | | | 1,100 | | | | 1,113 | | |
Mounds View Independent School District #621,
Series A (MSDCEP)
5.250%, 02/01/10 | | | 1,230 | | | | 1,329 | | |
Mounds View Independent School
District #621, Series A,
Callable 02/01/12 @ 100 (MBIA) (MSDCEP)
5.000%, 02/01/18 | | | 2,340 | | | | 2,498 | | |
| 5.000%, 02/01/19 | | | 2,565 | | | | 2,738 | | |
Mounds View Independent School
District #621, Series A, Crossover
Refunded 02/01/11 @ 100 (MSDCEP)
5.250%, 02/01/12 (d) | | | 1,000 | | | | 1,080 | | |
| 5.350%, 02/01/16 (d) | | | 1,000 | | | | 1,085 | | |
Northfield Independent School District #659,
Callable 02/01/11 @ 100 (MSDCEP)
4.600%, 02/01/13 | | | 1,100 | | | | 1,155 | | |
| 5.000%, 02/01/15 | | | 1,295 | | | | 1,387 | | |
Pequot Lakes Independent School District #186,
Callable 02/01/12 @ 100 (FGIC) (MSDCEP)
5.125%, 02/01/18 | | | 500 | | | | 538 | | |
Perham, Callable 05/01/11 @ 100 (AMT)
5.850%, 05/01/15 | | | 1,205 | | | | 1,270 | | |
Pipestone-Jasper Independent School
District #2689, Crossover
Refunded 03/01/09 @ 100 (FGIC) (MSDCEP)
5.400%, 03/01/13 (d) | | | 1,095 | | | | 1,173 | | |
Polk County,
Callable 02/01/15 @ 100 (MBIA) (MCCEP)
4.500%, 02/01/21 (e) | | | 1,025 | | | | 1,037 | | |
Puerto Rico Commonwealth (MBIA)
6.000%, 07/01/14 | | | 1,605 | | | | 1,883 | | |
Puerto Rico Commonwealth, Series A (XLCA)
5.500%, 07/01/17 | | | 1,000 | | | | 1,139 | | |
Ramsey County, Series D
5.000%, 02/01/14 | | | 2,000 | | | | 2,194 | | |
Robbinsdale Independent School District #281,
Callable 02/01/12 @ 100 (FSA) (MSDCEP)
5.000%, 02/01/19 | | | 1,160 | | | | 1,238 | | |
| 5.000%, 02/01/20 | | | 1,215 | | | | 1,286 | | |
Robbinsdale Independent School
District #281, Crossover
Refunded 02/01/09 @ 100 (MBIA) (MSDCEP)
5.000%, 02/01/16 (d) | | | 1,000 | | | | 1,047 | | |
Rochester Independent School District #535,
Series A, Callable 02/01/11 @ 100 (MSDCEP)
5.000%, 02/01/15 | | | 1,595 | | | | 1,706 | | |
The accompanying notes are an integral part of the financial statements.
FIRST AMERICAN FUNDS Annual Report 2005
72
Minnesota Intermediate Tax Free Fund (continued)
| DESCRIPTION | | PAR (000)/SHARES | | VALUE (000) | |
St. Louis Park Independent School District #283,
Crossover Refunded 02/01/09 @ 100 (MSDCEP)
5.250%, 02/01/10 (d) | | $ | 1,500 | | | $ | 1,592 | | |
| 5.600%, 02/01/15 (d) | | | 725 | | | | 774 | | |
St. Michael Independent School District #885,
Callable 02/01/12 @ 100 (FSA) (MSDCEP)
5.000%, 02/01/14 | | | 1,690 | | | | 1,822 | | |
| 5.000%, 02/01/17 | | | 1,000 | | | | 1,068 | | |
St. Paul, Series A, Callable 03/01/09 @ 100
5.000%, 03/01/10 | | | 1,180 | | | | 1,246 | | |
Sauk Rapids Independent School District #47,
Series B, Zero Coupon Bond,
Callable 02/01/11 @ 89.37 (FSA) (MSDCEP)
5.700%, 02/01/13 (c) | | | 1,055 | | | | 763 | | |
Sauk Rapids Independent School District #47,
Series B, Zero Coupon Bond,
Callable 02/01/11 @ 94.63 (FSA)
5.753%, 02/01/12 (c) | | | 1,790 | | | | 1,385 | | |
Savage, Series A, Crossover
Refunded 02/01/06 @ 100 (FGIC)
5.500%, 02/01/08 (d) | | | 1,000 | | | | 1,008 | | |
South Washington County, Independent
School District #833, Series B,
Callable 02/01/12 @ 100 (FSA) (MSDCEP)
5.000%, 02/01/15 | | | 1,030 | | | | 1,104 | | |
Stillwater Independent School District #834,
Callable 02/01/09 @ 100 (MSDCEP)
4.750%, 02/01/11 | | | 2,140 | | | | 2,230 | | |
Watertown Independent School
District #111, Series A,
Callable 08/01/15 @100 (FSA) (MSDCEP)
4.000%, 02/01/16 | | | 1,670 | | | | 1,683 | | |
Worthington Independent School District #518,
Callable 02/01/14 @ 100 (FSA) (MSDCEP)
4.000%, 02/01/16 | | | 1,045 | | | | 1,052 | | |
| Total General Obligations | | | | | | | 90,688 | | |
| Certificates of Participation – 2.4% | | | |
Hennepin County,
Callable 11/15/08 @ 100 (MLO)
5.375%, 11/15/09 | | | 2,280 | | | | 2,418 | | |
Minneapolis Special School
District #1, Series A,
Pre-refunded 02/01/06 @ 100 (MBIA) (MLO)
5.900%, 02/01/11 (a) | | | 2,150 | | | | 2,172 | | |
Northeast Metropolitan Intermediate School
District #916, Callable 01/01/14 @ 100 (MLO)
4.250%, 01/01/15 | | | 1,000 | | | | 999 | | |
| Total Certificates of Participation | | | | | | | 5,589 | | |
Total Municipal Bonds
(Cost $216,478) | | | | | | | 226,000 | | |
| Money Market Fund – 1.9% | | | |
Federated Minnesota Municipal Cash Trust
(Cost $4,378) | | | 4,378,422 | | | | 4,378 | | |
Total Investments – 100.3%
(Cost $220,856) | | | | | | | 230,378 | | |
| Other Assets and Liabilities, Net – (0.3)% | | | | | | | (801 | ) | |
| Total Net Assets – 100.0% | | | | | | $ | 229,577 | | |
Minnesota Intermediate Tax Free Fund (concluded)
(a) Pre-refunded issues are typically backed by U.S. Government obligations. These bonds mature at the call date and price indicated.
(b) Escrowed to Maturity issues are typically backed by U.S. Government obligations. If callable, these bonds may still be subject to call at the call date and price indicated.
(c) The rate shown is the effective yield at the time of purchase.
(d) Crossover Refunded securities are backed by the credit of the refunding issuer. These bonds mature at the call date and price indicated.
(e) Security purchased on a when-issued basis. On September 30, 2005 the total cost of investments purchased on a when-issued basis was $3,379,033 or 1.5% of total net assets. See note 2 in Notes to Financial Statements.
ACA – American Capital Access
AMBAC – American Municipal Bond Assurance Corporation
AMT – Alternative Minimum Tax. As of September 30, 2005, the aggregate market value of securities subject to the AMT was $8,701,820, which represents 3.8% of net assets.
FGIC – Financial Guaranty Insurance Corporation
FNMA – Federal National Mortgage Association
FSA – Financial Security Assurance
GNMA – Government National Mortgage Association
MBIA – Municipal Bond Insurance Association
MCCEP – Minnesota County Credit Enhancement Program
MLO – Municipal Lease Obligation
MSDCEP – Minnesota School District Credit Enhancement Program
RAAI – Radian Asset Assurance Inc.
XLCA – XL Capital Assurance Inc.
FIRST AMERICAN FUNDS Annual Report 2005
73
Schedule of Investments September 30, 2005
Minnesota Tax Free Fund
| DESCRIPTION | | PAR (000) | | VALUE (000) | |
| Municipal Bonds – 97.2% | |
| Revenue Bonds – 85.1% | |
| Continuing Care Retirement Communities – 1.1% | |
Golden Valley, Covenant Retirement Communities,
Series A, Callable 12/01/09 @ 101
5.500%, 12/01/29 | | $ | 1,750 | | | $ | 1,813 | | |
| Economic Development – 4.7% | |
Minneapolis Community Development,
Series G-3, Callable 12/01/11 @ 100
5.450%, 12/01/31 | | | 3,250 | | | | 3,418 | | |
Minnesota Agricultural & Economic Development
Board, Small Business Development, Series B,
Callable 08/01/08 @ 102 (AMT)
7.250%, 08/01/20 | | | 1,000 | | | | 1,068 | | |
Minnesota Agricultural & Economic Development
Board, Small Business Development, Series C,
Callable 08/01/08 @ 102 (AMT)
7.250%, 08/01/20 | | | 1,385 | | | | 1,462 | | |
Minnesota Agricultural & Economic Development
Board, Small Business Development, Series D,
Callable 08/01/08 @ 102 (AMT)
7.250%, 08/01/20 | | | 1,120 | | | | 1,182 | | |
Minnesota Agriculture & Economic Development
Board, Minnesota Small Business Program,
Series A, Callable 08/01/10 @ 100 (AMT)
5.550%, 08/01/16 | | | 500 | | | | 516 | | |
| | | | 7,646 | | |
| Education – 7.1% | | | |
Golden Valley, The Breck School,
Callable 10/01/09 @ 100
5.750%, 10/01/14 | | | 1,000 | | | | 1,079 | | |
Minneapolis, The Blake School Project,
Callable 09/01/11 @ 100
5.450%, 09/01/21 | | | 2,000 | | | | 2,115 | | |
Minnesota State Higher Education Facilities
Authority, Augsburg College, Series 4-F1,
Pre-refunded 05/01/06 @ 102
6.250%, 05/01/23 (a) | | | 1,500 | | | | 1,544 | | |
Minnesota State Higher Education Facilities
Authority, Carleton College,
Pre-refunded 11/01/07 @ 100
5.400%, 11/01/15 (a) | | | 1,500 | | | | 1,571 | | |
Minnesota State Higher Education Facilities
Authority, Carleton College, Series 3-L1,
Pre-refunded 05/01/06 @ 100
5.750%, 11/01/12 (a) | | | 1,050 | | | | 1,068 | | |
Minnesota State Higher Education Facilities
Authority, College of Art & Design, Series 5-D,
Callable 05/01/10 @ 100
6.625%, 05/01/20 | | | 1,000 | | | | 1,086 | | |
Minnesota State Higher Education Facilities
Authority, St. John University, Series 6-G,
Callable 10/01/15 @ 100
5.000%, 10/01/22 | | | 1,000 | | | | 1,051 | | |
| 4.500%, 10/01/26 | | | 1,000 | | | | 985 | | |
Minnesota State Higher Education Facilities
Authority, Vermilion Community College,
Series 3-T, Callable 01/01/06 @ 100
5.750%, 01/01/13 | | | 525 | | | | 527 | | |
University of Minnesota, Series A
5.500%, 07/01/21 | | | 500 | | | | 576 | | |
| | | | 11,602 | | |
Minnesota Tax Free Fund (continued)
| DESCRIPTION | | PAR (000) | | VALUE (000) | |
| Healthcare – 28.9% | | | |
Bemidji Hospital Facilities, North Country Health
Services, Callable 09/01/06 @ 102
5.625%, 09/01/15 | | $ | 1,600 | | | $ | 1,653 | | |
Cuyuna Range Hospital District,
Callable 06/01/13 @ 101
5.500%, 06/01/35 | | | 350 | | | | 351 | | |
Cuyuna Range Hospital District, Series A,
Callable 06/01/07 @ 102
6.000%, 06/01/29 | | | 3,000 | | | | 3,083 | | |
Duluth Economic Development Authority,
Benedictine Health System,
Callable 02/15/14 @ 100
5.250%, 02/15/28 | | | 1,000 | | | | 1,038 | | |
| 5.250%, 02/15/33 | | | 1,000 | | | | 1,032 | | |
Fergus Falls Health Care Facilities Authority,
Broen Memorial Home, Series A,
Callable until 10/31/05 @ 102
7.000%, 11/01/19 | | | 1,000 | | | | 1,010 | | |
Fergus Falls Health Care Facilities Authority,
Lake Region Hospital, Long Term Care Facilities
Project, Callable 12/01/05 @ 102
6.500%, 12/01/25 | | | 2,000 | | | | 2,045 | | |
Glencoe Health Care Services Facilities Project,
Glencoe Regional Health,
Pre-refunded 04/01/11 @ 101
7.500%, 04/01/31 (a) | | | 1,700 | | | | 2,021 | | |
Glencoe Health Care Services Facilities Project,
Glencoe Regional Health,
Callable 04/01/13 @ 101
5.000%, 04/01/20 | | | 500 | | | | 507 | | |
| 5.000%, 04/01/25 | | | 1,000 | | | | 1,005 | | |
| 5.000%, 04/01/31 | | | 1,500 | | | | 1,481 | | |
Maple Grove Health Care Facilities, North
Memorial Health Care, Callable 09/01/15 @ 100
5.000%, 09/01/35 | | | 2,000 | | | | 2,036 | | |
Marshall Medical Center, Weiner Memorial
Medical Center Project, Series A,
Callable 11/01/13 @ 100
5.250%, 11/01/16 | | | 305 | | | | 324 | | |
| 5.850%, 11/01/23 | | | 875 | | | | 951 | | |
Minneapolis Healthcare System, Allina Health
System, Series A, Callable 11/15/12 @ 100
6.000%, 11/15/23 | | | 1,500 | | | | 1,634 | | |
| 5.750%, 11/15/32 | | | 2,400 | | | | 2,549 | | |
Minnesota Agricultural & Economic Development
Board, Benedictine Health, Series A,
Callable 02/15/10 @ 101 (MBIA)
5.250%, 02/15/15 | | | 2,000 | | | | 2,145 | | |
Minnesota Agricultural & Economic Development
Board, Fairview Hospital Project, Series A,
Callable 11/15/07 @ 102 (MBIA)
5.500%, 11/15/11 | | | 500 | | | | 531 | | |
Minnesota Agricultural & Economic Development
Board, Healthcare Systems, Fairview, Series A,
Callable 11/15/07 @ 102 (MBIA)
5.500%, 11/15/17 | | | 205 | | | | 218 | | |
Minnesota Agricultural & Economic Development
Board, Healthcare Systems, Fairview, Series A,
Callable 11/15/10 @ 101
6.375%, 11/15/29 | | | 125 | | | | 136 | | |
The accompanying notes are an integral part of the financial statements.
FIRST AMERICAN FUNDS Annual Report 2005
74
Minnesota Tax Free Fund (continued)
| DESCRIPTION | | PAR (000) | | VALUE (000) | |
Minnesota Agricultural & Economic Development
Board, Healthcare Systems, Fairview, Series A,
Pre-refunded 11/15/07 @ 102 (MBIA)
5.500%, 11/15/17 (a) | | $ | 795 | | | $ | 850 | | |
Minnesota Agricultural & Economic Development
Board, Healthcare Systems, Fairview, Series A,
Pre-refunded 11/15/10 @ 101
6.375%, 11/15/29 (a) | | | 3,875 | | | | 4,440 | | |
Monticello, Big Lake Community Hospital,
Series A, Callable 12/01/09 @ 100
5.750%, 12/01/19 | | | 1,000 | | | | 1,015 | | |
Monticello, Big Lake Community Hospital,
Series C, Callable 12/01/12 @ 100
6.200%, 12/01/22 | | | 1,000 | | | | 1,055 | | |
Moorhead Economic Development Authority,
Eventide Senior Housing, Series B,
Callable until 05/31/06 @ 101
6.000%, 06/01/29 | | | 1,900 | | | | 1,908 | | |
New Hope Housing & Healthcare Facilities
Authority, Masonic Home North Ridge,
Callable 03/01/09 @ 102
5.750%, 03/01/15 | | | 1,600 | | | | 1,659 | | |
St. Louis Park Health Care Facilities,
Park Nicollet Health Services, Series B,
Callable 07/01/14 @ 100
5.500%, 07/01/25 | | | 2,000 | | | | 2,125 | | |
St. Paul Housing & Redevelopment Authority,
HealthEast Project, Callable 11/15/15 @ 100
6.000%, 11/15/30 | | | 800 | | | | 858 | | |
St. Paul Housing & Redevelopment Authority,
Regions Hospital, Callable 05/15/09 @ 100
5.250%, 05/15/18 | | | 500 | | | | 510 | | |
St. Paul Port Authority, Healtheast Midway
Campus, Series A, Callable 05/01/15 @ 100
5.875%, 05/01/30 | | | 900 | | | | 913 | | |
St. Paul Port Authority, Healtheast Midway
Campus, Series B, Callable 05/01/15 @ 100
6.000%, 05/01/30 | | | 1,800 | | | | 1,830 | | |
Shakopee Health Care Facilities,
St. Francis Regional Medical Center,
Callable 09/01/14 @ 100
5.250%, 09/01/34 | | | 2,000 | | | | 2,054 | | |
Stillwater Healthcare, Health Systems
Obligation Group, Callable 06/01/15 @ 100
5.000%, 06/01/35 | | | 1,000 | | | | 1,019 | | |
Winona Health Care Facilities, Series A,
Callable 07/01/12 @ 102
6.000%, 07/01/34 | | | 1,000 | | | | 1,059 | | |
| | | | 47,045 | | |
| Housing – 12.2% | | | |
Austin Housing & Redevelopment Authority,
Courtyard Residence Project, Series A,
Callable 01/01/06 @ 102
7.250%, 01/01/26 | | | 500 | | | | 516 | | |
Dakota County Community Development Agency,
Multifamily Housing, Ebenezer Ridges Project,
Callable 04/20/11 @ 102 (GNMA)
5.900%, 04/20/42 | | | 2,000 | | | | 2,135 | | |
Eden Prairie Multifamily Housing, Parkway
Apartments Project, Series A,
Callable 02/20/07 @ 104
5.700%, 08/20/22 | | | 1,000 | | | | 1,048 | | |
Minnesota Tax Free Fund (continued)
| DESCRIPTION | | PAR (000) | | VALUE (000) | |
Eden Prairie Multifamily Housing, Preserve Place,
Callable 01/20/08 @ 102 (GNMA)
5.500%, 01/20/18 | | $ | 500 | | | $ | 518 | | |
Hennepin County Housing & Redevelopment
Authority, Loring Park Apartments,
Callable 08/15/06 @ 102.50, Mandatory
Put 02/15/09 @ 100 (AMT) (FNMA)
3.050%, 06/15/34 | | | 2,000 | | | | 1,971 | | |
Hopkins Elderly Housing, St. Theresa Project,
Series A, Callable 11/20/07 @ 102 (GNMA)
5.600%, 11/20/17 | | | 500 | | | | 518 | | |
Hopkins Multifamily Housing, Renaissance
Project, Callable 04/01/07 @ 102
6.250%, 04/01/15 | | | 500 | | | | 519 | | |
Maplewood Multifamily Housing,
Carefree Cottages II,
Callable 04/15/14 @ 100 (AMT) (FNMA)
4.800%, 04/15/34 | | | 2,000 | | | | 2,014 | | |
Minnesota State Housing Finance Agency,
Residential Housing, Series B,
Callable 07/01/11 @ 100 (AMT)
5.650%, 07/01/33 | | | 940 | | | | 979 | | |
Minnesota State Housing Finance Agency,
Residential Housing, Series B-1-RMK,
Callable 07/01/11 @ 100 (AMT)
5.350%, 07/01/33 | | | 1,390 | | | | 1,428 | | |
Minnesota State Housing Finance Agency,
Residential Housing, Series F,
Callable 07/01/11 @ 100 (AMT)
5.400%, 07/01/30 | | | 2,715 | | | | 2,798 | | |
Minnesota State Housing Finance Agency,
Series A, Callable 08/01/11 @ 100
3.850%, 02/01/13 | | | 1,430 | | | | 1,436 | | |
Minnesota State Housing Finance Agency,
Single Family Mortgage, Series C,
Callable 07/01/09 @ 100 (AMT)
6.100%, 07/01/30 | | | 435 | | | | 447 | | |
St. Anthony Housing & Redevelopment Authority,
Chandler Place Project,
Callable 05/20/06 @ 102 (FHA) (GNMA)
6.250%, 11/20/25 | | | 1,500 | | | | 1,556 | | |
St. Louis Park, Multifamily Housing, Knollwood
Apartments, Callable 12/01/05 @ 102 (FHA)
6.250%, 12/01/28 | | | 500 | | | | 511 | | |
St. Louis Park, Multifamily Housing,
Park Ridge Apartments,
Callable 11/01/08 @ 102 (FHA) (GNMA)
5.250%, 11/01/20 | | | 500 | | | | 517 | | |
White Bear Lake, Lake Square Housing,
Lake Square, Series A,
Callable 02/01/07 @ 102 (FHA)
6.000%, 08/01/20 | | | 1,020 | | | | 1,055 | | |
| | | | 19,966 | | |
| Lease Revenue – 3.4% | | | |
New Brighton Economic Development Authority,
Public Safety Facility, Leasing Project, Series A,
Callable 02/01/10 @ 100
4.900%, 02/01/15 | | | 850 | | | | 878 | | |
| 5.000%, 02/01/16 | | | 895 | | | | 925 | | |
| 5.100%, 02/01/17 | | | 900 | | | | 932 | | |
Puerto Rico Public Finance, Series A,
Callable 02/01/12 @ 100, Mandatory
Put 02/01/12 @ 100
5.750%, 08/01/27 | | | 1,000 | | | | 1,090 | | |
FIRST AMERICAN FUNDS Annual Report 2005
75
Schedule of Investments September 30, 2005
Minnesota Tax Free Fund (continued)
| DESCRIPTION | | PAR (000) | | VALUE (000) | |
St. Paul Port Authority, Office
Building at Robert St.-3-11
4.000%, 12/01/13 | | $ | 1,695 | | | $ | 1,722 | | |
| | | | 5,547 | | |
| Miscellaneous – 7.1% | | | |
Burnsville,
YMCA Project (LOC: Wells Fargo Bank) (VRDO)
2.710%, 08/01/16 (b) | | | 1,575 | | | | 1,575 | | |
Little Canada Commercial Development,
RLF Minnesota Project,
Callable 10/01/05 @ 100 (MLO)
7.100%, 04/01/13 | | | 1,150 | | | | 1,157 | | |
Minnesota State Retirement Systems Building,
Callable 06/01/10 @ 100
5.875%, 06/01/27 | | | 7,000 | | | | 7,684 | | |
Seaway Port Authority of Duluth,
Cargill Inc. Project
4.200%, 05/01/13 | | | 1,130 | | | | 1,145 | | |
| | | | 11,561 | | |
| Recreational Facility Authority – 2.5% | | | |
Moorhead, Golf Course, Series B,
Callable 12/01/08 @ 100
5.875%, 12/01/21 | | | 2,000 | | | | 2,042 | | |
St. Paul Port Authority, Radisson Kellogg Project,
Series 2, Callable 08/01/08 @ 103
7.375%, 08/01/29 | | | 2,000 | | | | 2,093 | | |
| | | | 4,135 | | |
| Tax Revenue – 0.3% | | | |
Duluth Economic Development Authority
8.000%, 08/01/08 | | | 160 | | | | 167 | | |
Minneapolis, St. Anthony Falls Project,
Callable 03/01/12 @ 102
5.750%, 02/01/27 | | | 300 | | | | 301 | | |
| | | | 468 | | |
| Transportation – 2.7% | | | |
Minneapolis & St. Paul Metropolitan
Airports Commission, Series A,
Pre-refunded 01/01/10 @ 101 (FGIC)
5.750%, 01/01/32 (a) | | | 3,000 | | | | 3,319 | | |
Minneapolis & St. Paul Metropolitan
Airports Commission, Series B,
Callable 01/01/15 @ 100 (AMBAC) (AMT)
5.000%, 01/01/19 | | | 1,000 | | | | 1,066 | | |
| | | | 4,385 | | |
| Utilities – 15.1% | | | |
Chaska Electric, Series A,
Callable 10/01/10 @ 100
6.100%, 10/01/30 | | | 45 | | | | 50 | | |
Chaska Electric, Series A,
Pre-refunded 10/01/10 @ 100
6.100%, 10/01/30 (a) | | | 4,955 | | | | 5,571 | | |
Minnesota Municipal Power Agency,
Electricity Revenue, Callable 10/01/15 @ 100
5.000%, 10/01/35 | | | 1,500 | | | | 1,545 | | |
Southern Minnesota Municipal Power Agency,
Series A, Zero Coupon Bond (MBIA)
6.650%, 01/01/19 (c) | | | 4,000 | | | | 2,212 | | |
| 6.700%, 01/01/24 (c) | | | 12,000 | | | | 5,167 | | |
| 5.800%, 01/01/25 (c) | | | 7,000 | | | | 2,846 | | |
| 5.600%, 01/01/26 (c) | | | 8,300 | | | | 3,195 | | |
| 5.151%, 01/01/27 (c) | | | 3,000 | | | | 1,097 | | |
Minnesota Tax Free Fund (continued)
| DESCRIPTION | | PAR (000) | | VALUE (000) | |
Western Minnesota Municipal Power Agency,
Callable 01/01/11 @ 100 (AMBAC)
5.500%, 01/01/14 | | $ | 1,545 | | | $ | 1,689 | | |
| 5.500%, 01/01/15 | | | 550 | | | | 599 | | |
Western Minnesota Municipal Power Agency,
Escrowed to Maturity (MBIA)
9.750%, 01/01/16 (d) | | | 410 | | | | 603 | | |
| | | | 24,574 | | |
| Total Revenue Bonds | | | | | | | 138,742 | | |
| General Obligations – 12.1% | | | |
Anoka-Hennepin Independent School
District #11, Series A, Crossover
Refunded 02/01/10 @ 100 (MSDCEP)
5.750%, 02/01/17 (e) | | | 1,000 | | | | 1,099 | | |
Becker Independent School
District #726, Series A, Crossover
Refunded 02/01/10 @ 100 (FSA) (MSDCEP)
6.000%, 02/01/21 (e) | | | 1,000 | | | | 1,105 | | |
Chaska Independent School
District #112, Series A, Crossover
Refunded 02/01/09 @ 100 (FSA) (MSDCEP)
5.700%, 02/01/18 (e) | | | 1,000 | | | | 1,079 | | |
Chaska Independent School
District #112, Series B, Crossover
Refunded 02/01/06 @ 100 (MSDCEP)
5.875%, 02/01/11 (e) | | | 1,000 | | | | 1,010 | | |
| 6.000%, 02/01/16 (e) | | | 3,025 | | | | 3,055 | | |
Columbia Heights Independent School
District #13, Crossover
Refunded 02/01/07 @ 100 (MSDCEP)
5.250%, 02/01/15 (e) | | | 1,000 | | | | 1,026 | | |
Delano Independent School
District #879, Series A,
Callable 02/01/11 @ 100 (FSA) (MSDCEP)
5.875%, 02/01/25 | | | 1,000 | | | | 1,103 | | |
Minneapolis Sports Arena,
Callable 04/01/08 @ 100
5.100%, 04/01/13 | | | 500 | | | | 522 | | |
| 5.100%, 10/01/13 | | | 250 | | | | 261 | | |
North St. Paul Independent School
District #622, Series B, Crossover
Refunded 05/01/06 @ 100 (MSDCEP)
5.850%, 05/01/17 (e) | | | 500 | | | | 508 | | |
Perham, Disposal System,
Callable 05/01/11 @ 100 (AMT)
6.000%, 05/01/22 | | | 1,500 | | | | 1,592 | | |
Puerto Rico Public Building Authority, Series I,
Callable 07/01/14 @ 100 (COMGTY)
5.250%, 07/01/33 | | | 1,000 | | | | 1,059 | | |
St. Louis Park Independent School District #283,
Crossover Refunded 02/01/09 @ 100 (MSDCEP)
5.700%, 02/01/17 (e) | | | 2,000 | | | | 2,140 | | |
Sauk Rapids Independent School
District #47, Series A,
Callable 02/01/11 @ 100 (MBIA)
5.750%, 02/01/23 | | | 2,000 | | | | 2,201 | | |
Wayzata Independent School
District #284, Series A, Crossover
Refunded 02/01/07 @ 100
5.500%, 02/01/17 (e) | | | 2,000 | | | | 2,059 | | |
| Total General Obligations | | | | | | | 19,819 | | |
Total Municipal Bonds
(Cost $149,307) | | | | | | | 158,561 | | |
The accompanying notes are an integral part of the financial statements.
FIRST AMERICAN FUNDS Annual Report 2005
76
Minnesota Tax Free Fund (concluded)
| DESCRIPTION | | SHARES | | VALUE (000) | |
| Money Market Fund – 2.1% | | | |
Federated Minnesota Municipal Cash Trust
(Cost $3,377) | | | 3,377,143 | | | $ | 3,377 | | |
Total Investments – 99.3%
(Cost $152,684) | | | | | 161,938 | | |
| Other Assets and Liabilities, Net – 0.7% | | | | | 1,157 | | |
| Total Net Assets – 100.0% | | | | $ | 163,095 | | |
(a) Pre-refunded issues are typically backed by U.S. Government obligations. These bonds mature at the call date and price indicated.
(b) Variable Rate Security – The rate shown is the rate in effect as of September 30, 2005.
(c) The rate shown is the effective yield at the time of purchase.
(d) Escrowed to Maturity issues are typically backed by U.S. Government obligations. If callable, these bonds may still be subject to call at the call date and price indicated.
(e) Crossover Refunded securities are backed by the credit of the refunding issuer. These bonds mature at the call date and price indicated.
AMBAC – American Municipal Bond Assurance Corporation
AMT – Alternative Minimum Tax. As of September 30, 2005, the aggregate market value of securities subject to the AMT was $16,521,055, which represents 10.1% of net assets.
COMGTY – Commonwealth Guaranty
FGIC – Financial Guaranty Insurance Corporation
FHA – Federal Housing Authority
FNMA – Federal National Mortgage Association
FSA – Financial Security Assurance
GNMA – Government National Mortgage Association
LOC – Letter of Credit
MBIA – Municipal Bond Insurance Association
MLO – Municipal Lease Obligation
MSDCEP – Minnesota School District Credit Enhancement Program
VRDO – Variable Rate Demand Obligation. Floating or variable rate obligation maturing in more than one year. The interest rate is based on specific, or an index of, market interest rates, and is subject to change periodically. This instrument may also have a demand feature which allows the recovery of principal at any time, or at specified intervals not exceeding one year, on up to 30 days' notice. Maturity date shown represents final maturity.
Missouri Tax Free Fund
| DESCRIPTION | | PAR (000) | | VALUE (000) | |
| Municipal Bonds – 98.2% | |
| Revenue Bonds – 72.4% | |
| Continuing Care Retirement Community – 3.0% | |
Cole County Industrial Development Authority,
Lutheran Services Heisinger Project,
Callable 02/01/14 @ 100
5.250%, 02/01/24 | | $ | 2,000 | | | $ | 2,068 | | |
Illinois Financing Authority, Friendship Village,
Schaumburg, Series A, Callable 02/15/15 @ 100
5.375%, 02/15/25 | | | 1,800 | | | | 1,816 | | |
Missouri State Health & Educational Facilities
Authority, Senior Living Facilities, Lutheran
Senior, Series A, Callable 02/01/15 @ 100
5.375%, 02/01/35 | | | 1,500 | | | | 1,554 | | |
| | | | 5,438 | | |
| Education – 9.2% | | | |
Missouri State Health & Educational Facilities
Authority, University of Missouri-Columbia Arena
Project, Callable 11/01/11 @ 100
5.000%, 11/01/19 | | | 2,540 | | | | 2,715 | | |
Missouri State Health & Educational Facilities
Authority, Washington University, Series A,
Callable 06/15/11 @ 100
5.125%, 06/15/41 | | | 2,150 | | | | 2,222 | | |
Missouri State Health & Educational Facilities
Authority, Washington University, Series A,
Callable 02/15/13 @ 100
5.000%, 02/15/33 | | | 1,000 | | | | 1,039 | | |
Missouri State Health & Educational Facilities
Authority, Washington University, Series A,
Callable 02/15/15 @ 100
5.000%, 02/15/19 | | | 1,465 | | | | 1,574 | | |
Northwest Missouri State University Housing,
Callable 06/01/13 @ 100 (MBIA)
5.000%, 06/01/16 | | | 650 | | | | 694 | | |
University of Missouri,
Pre-refunded 11/01/07 @ 101
5.500%, 11/01/21 (a) | | | 3,000 | | | | 3,177 | | |
| 5.800%, 11/01/27 (a) | | | 5,000 | | | | 5,325 | | |
| | | | 16,746 | | |
| Healthcare – 13.5% | | | |
Boone County Hospital, Callable 08/01/12 @ 100
5.050%, 08/01/20 | | | 1,200 | | | | 1,237 | | |
Boone County Hospital, Callable 08/01/14 @ 100
5.000%, 08/01/16 | | | 670 | | | | 706 | | |
Cape Girardeau County Authority, Southeast
Missouri Hospital Association,
Callable 06/01/12 @ 100
5.625%, 06/01/22 | | | 1,500 | | | | 1,567 | | |
Joplin Industrial Development Authority
Healthcare Facilities, Freeman Health Systems
Project, Callable 02/15/15 @ 102
5.500%, 02/15/24 | | | 2,000 | | | | 2,112 | | |
Missouri State Health & Educational Facilities
Authority, BJC Health Systems, Series A,
Escrowed to Maturity
6.750%, 05/15/12 (b) | | | 3,310 | | | | 3,915 | | |
Missouri State Health & Educational Facilities
Authority, Jefferson Memorial Hospital (RAAI)
4.250%, 08/15/13 | | | 735 | | | | 752 | | |
FIRST AMERICAN FUNDS Annual Report 2005
77
Schedule of Investments September 30, 2005
Missouri Tax Free Fund (continued)
| DESCRIPTION | | PAR (000) | | VALUE (000) | |
Missouri State Health & Educational Facilities
Authority, Jefferson Memorial Hospital,
Callable 08/15/14 @ 100 (RAAI)
5.000%, 08/15/19 | | $ | 2,300 | | | $ | 2,395 | | |
Missouri State Health & Educational Facilities
Authority, Lake Regional Health System Project
5.000%, 02/15/12 | | | 515 | | | | 535 | | |
Missouri State Health & Educational Facilities
Authority, St. Lukes Health Systems, Series A
5.000%, 11/15/14 | | | 3,000 | | | | 3,233 | | |
Missouri State Health & Educational Facilities
Authority, SSM Health, Series A,
Pre-refunded 06/01/08 @ 101 (MBIA)
5.000%, 06/01/18 (a) | | | 1,555 | | | | 1,644 | | |
Missouri State Health & Educational Facilities
Authority, SSM Health, Series B,
Callable 06/01/08 @ 101 (MBIA)
5.000%, 06/01/18 | | | 445 | | | | 466 | | |
North Kansas City Hospital, Series
A, Callable 11/15/13 @ 100 (FSA)
5.000%, 11/15/21 | | | 250 | | | | 263 | | |
St. Louis County Industrial Development Authority,
Ranken-Jordan Project, Series A,
Callable 11/15/13 @ 100
6.625%, 11/15/35 | | | 500 | | | | 517 | | |
University Health Facilities, University of
Missouri Health System, Series A,
Callable 11/01/06 @ 102 (AMBAC)
5.600%, 11/01/26 | | | 5,000 | | | | 5,205 | | |
| | | | 24,547 | | |
| Housing – 0.8% | | | |
University City Industrial Development Authority,
Multifamily Housing, Series A,
Callable 12/20/05 @ 102
5.950%, 12/20/25 | | | 1,400 | | | | 1,431 | | |
| Lease Revenue – 16.1% | | | |
Clay County, Public Building Authority,
Callable 05/15/08 @ 100 (MLO)
5.125%, 05/15/14 | | | 2,000 | | | | 2,091 | | |
Jackson County, Public Building Corporation,
Callable 12/01/14 @ 100
5.000%, 12/01/19 | | | 2,060 | | | | 2,179 | | |
| 5.000%, 12/01/25 | | | 1,000 | | | | 1,043 | | |
Kansas City Municipal Assistance,
Capital Appreciation Leasehold,
Series B-1, Zero Coupon Bond
5.260%, 04/15/27 (c) | | | 2,000 | | | | 723 | | |
Kansas City Special Facilities Revenue,
MCI Overhaul Base Project, Series G,
Callable 09/01/15 @ 100 (AMT)
4.750%, 09/01/28 | | | 4,000 | | | | 3,932 | | |
Missouri State Board of Public Buildings,
Series A, Callable 10/15/13 @ 100
5.000%, 10/15/27 | | | 1,000 | | | | 1,048 | | |
Missouri State Board of Public Buildings,
State Office Building Special Obligation,
Series A, Callable 05/01/11 @ 100 (MLO)
5.000%, 05/01/17 | | | 1,000 | | | | 1,066 | | |
Missouri State Board of Public Buildings,
State Office Building Special Obligation,
Series A, Callable 05/01/11 @ 100 (MBIA) (MLO)
5.000%, 05/01/23 | | | 2,000 | | | | 2,106 | | |
| 5.000%, 05/01/24 | | | 5,130 | | | | 5,391 | | |
| 5.125%, 05/01/26 | | | 5,000 | | | | 5,224 | | |
Missouri Tax Free Fund (continued)
| DESCRIPTION | | PAR (000) | | VALUE (000) | |
Missouri State Financial Board Infrastructure
Facilities, Branson, Series A,
Callable 12/01/12 @ 100 (MLO)
5.000%, 12/01/17 | | $ | 1,000 | | | $ | 1,027 | | |
| 5.375%, 12/01/22 | | | 750 | | | | 779 | | |
Springfield Public Building , Capital Improvement
Project, Callable 03/01/14 @ 100 (AMBAC)
5.000%, 03/01/24 | | | 2,000 | | | | 2,098 | | |
St. Louis Missouri Junior College District Building
Corporation, Callable 03/01/15 @ 100 (AMBAC)
4.100%, 03/01/16 | | | 600 | | | | 606 | | |
| | | | 29,313 | | |
| Miscellaneous – 1.6% | | | |
Missouri Financial Board Cultural Facilities,
Nelson Gallery Foundation, Series A,
Callable 12/01/11 @ 100
5.250%, 12/01/14 | | | 1,000 | | | | 1,089 | | |
Platte County Industrial Development
Transportation Authority (MLO)
4.000%, 12/01/14 | | | 780 | | | | 788 | | |
Sugar Creek, Lafarge North America, Series A,
Callable 06/01/13 @ 101 (AMT)
5.650%, 06/01/37 | | | 1,000 | | | | 1,039 | | |
| | | | 2,916 | | |
| Revolving Funds – 14.0% | | | |
Missouri State Enviornmental
Improvement & Energy Resources Authority,
Series A, State Revolving Fund,
Pre-refunded 07/01/10 @ 100
5.500%, 07/01/16 (a) | | | 1,875 | | | | 2,057 | | |
Missouri State Environmental
Improvement & Energy Resources Authority,
Water Pollution Control, Series A,
Drinking Water, Callable 07/01/08 @ 101
5.000%, 01/01/19 | | | 2,200 | | | | 2,315 | | |
Missouri State Environmental
Improvement & Energy Resources Authority,
Water Pollution Control, Series A,
State Revolving Fund Program,
Callable 07/01/10 @ 100.
5.500%, 07/01/16 | | | 620 | | | | 673 | | |
Missouri State Environmental
Improvement & Energy Resources Authority,
Water Pollution Control, Series B,
Drinking Water, Callable 01/01/09 @ 101
5.250%, 01/01/15 | | | 2,180 | | | | 2,318 | | |
Missouri State Environmental
Improvement & Energy Resources Authority,
Water Pollution Control, Series B,
Drinking Water, Callable 01/01/13 @ 100
5.500%, 07/01/14 | | | 2,000 | | | | 2,227 | | |
| 5.500%, 07/01/18 | | | 1,400 | | | | 1,552 | | |
Missouri State Environmental
Improvement & Energy Resources Authority,
Water Pollution Control, Series B, State
Revolving Fund Program,
Callable 01/01/13 @ 100
5.000%, 01/01/17 | | | 600 | | | | 643 | | |
The accompanying notes are an integral part of the financial statements.
FIRST AMERICAN FUNDS Annual Report 2005
78
Missouri Tax Free Fund (continued)
| DESCRIPTION | | PAR (000) | | VALUE (000) | |
Missouri State Environmental
Improvement & Energy Resources Authority,
Water Pollution Control, Series C, State
Revolving Fund Program
5.375%, 07/01/14 | | $ | 2,400 | | | $ | 2,702 | | |
| 5.375%, 07/01/15 | | | 1,500 | | | | 1,694 | | |
| 5.375%, 07/01/16 | | | 2,000 | | | | 2,268 | | |
Missouri State Environmental
Improvement & Energy Resources Authority,
Water Pollution Control, Series C, State
Revolving Fund Program,
Callable 07/01/11 @ 100
5.000%, 07/01/23 | | | 6,655 | | | | 7,042 | | |
| | | | 25,491 | | |
| Tax Revenue – 1.8% | | | |
Branson Industrial Development Authority Tax
Increment Revenue, Branson Landing Retail
Project, Callable 06/01/15 @ 100
5.500%, 06/01/29 | | | 1,000 | | | | 1,000 | | |
Branson Tax Increment Revenue,
Brentwood Square Project
4.125%, 05/01/11 | | | 250 | | | | 250 | | |
Riverside Tax Increment Revenue, L-385 Levee
Project, Callable 05/01/15 @ 100
5.250%, 05/01/20 | | | 1,000 | | | | 1,025 | | |
St. Joseph Industrial Development Authority Tax
Increment Revenue, Shoppes at North Village
Project, Callable 11/01/14 @ 100
5.375%, 11/01/23 | | | 1,000 | | | | 985 | | |
| | | | 3,260 | | |
| Transportation – 6.9% | | | |
Missouri State Highways & Transportation Road,
Series A, Callable 02/01/11 @ 100
5.250%, 02/01/20 | | | 5,000 | | | | 5,344 | | |
Missouri State Highways & Transportation Road,
Series A, Callable 02/01/12 @ 100
5.125%, 02/01/17 | | | 1,000 | | | | 1,077 | | |
| 5.000%, 02/01/22 | | | 3,725 | | | | 3,930 | | |
Puerto Rico Commonwealth
Highway & Transportation Authority, Series K,
Callable 07/01/15 @ 100
5.000%, 07/01/17 (d) | | | 1,000 | | | | 1,056 | | |
St. Louis Airport, Capital Improvement Program,
Series A, Callable 07/01/12 @ 100 (MBIA)
5.375%, 07/01/21 | | | 1,000 | | | | 1,082 | | |
| | | | 12,489 | | |
| Utilities – 5.5% | | | |
Kansas City Water, Series A,
Callable 12/01/08 @ 101
5.000%, 12/01/11 | | | 4,390 | | | | 4,642 | | |
Kansas City Water, Series B,
Callable 12/01/06 @ 101
5.000%, 12/01/16 | | | 2,200 | | | | 2,264 | | |
Metropolitan St. Louis Sewer District, Series A,
Callable 05/01/14 @ 100 (MBIA)
5.000%, 05/01/23 | | | 1,075 | | | | 1,136 | | |
Missouri State Development Financial Board,
Independence Water Systems,
Callable 11/01/14 @ 100 (AMBAC)
5.000%, 11/01/24 | | | 1,000 | | | | 1,054 | | |
Missouri Tax Free Fund (continued)
| DESCRIPTION | | PAR (000) | | VALUE (000) | |
Missouri State Environmental
Improvement & Energy Resources Authority,
Water Pollution Control,
Kansas City Power & Light
4.000%, 01/02/12 | | $ | 1,000 | | | $ | 1,009 | | |
| | | | 10,105 | | |
| Total Revenue Bonds | | | | | | | 131,736 | | |
| General Obligations – 23.9% | | | |
Chesterfield, Callable until 02/14/17 @ 100
4.000%, 02/15/17 | | | 1,680 | | | | 1,685 | | |
Columbia School District, Crossover
Refunded 03/01/07 @ 100
6.300%, 03/01/11 (e) | | | 365 | | | | 381 | | |
Hazelwood School District, Missouri:
Direct Deposit Program, Series A,
Callable 03/01/15 @ 100 (FGIC) (STAID)
5.000%, 03/01/17 | | | 1,820 | | | | 1,970 | | |
Independence School District, Missouri
Direct Deposit Program,
Callable 03/01/13 @ 100 (MBIA) (STAID)
5.000%, 03/01/20 | | | 1,240 | | | | 1,317 | | |
Jefferson City School District, Series A
6.700%, 03/01/11 | | | 1,000 | | | | 1,124 | | |
Missouri State, Fourth State Building, Series A,
Pre-refunded 08/01/06 @ 100
5.400%, 08/01/09 (a) | | | 2,000 | | | | 2,042 | | |
Missouri State Water Pollution Control, Series A,
Pre-refunded 08/01/06 @ 100
5.750%, 08/01/18 (a) | | | 2,085 | | | | 2,135 | | |
North Kansas City School District,
Callable 03/01/11 @ 100
5.000%, 03/01/16 | | | 1,265 | | | | 1,348 | | |
North Kansas City School District #74,
Callable 03/01/15 @ 100 (STAID)
5.000%, 03/01/25 | | | 2,245 | | | | 2,371 | | |
Platte County School District #R-3,
Callable 03/01/14 @ 100 (MBIA)
5.000%, 03/01/24 | | | 1,000 | | | | 1,055 | | |
Puerto Rico Municipal Finance Agency,
Callable 08/01/09 @ 101
5.500%, 08/01/23 | | | 3,000 | | | | 3,257 | | |
Puerto Rico Public Building Authority, Series I,
Callable 07/01/14 @ 100 (COMGTY)
5.250%, 07/01/33 | | | 1,000 | | | | 1,059 | | |
St. Charles County, Francis Howell School District,
Missouri Direct Deposit Program (FGIC) (STAID)
5.250%, 03/01/18 | | | 2,095 | | | | 2,341 | | |
St. Joseph School District, Missouri Direct
Deposit Program (FSA) (STAID)
5.250%, 03/01/17 | | | 1,500 | | | | 1,679 | | |
St. Louis County
5.000%, 02/01/12 | | | 3,250 | | | | 3,540 | | |
St. Louis County Rockwood School District #R-6,
Callable 02/01/11 @ 100
5.000%, 02/01/13 | | | 3,000 | | | | 3,215 | | |
St. Louis County Rockwood School District #R-6,
Series A, Callable 02/01/13 @ 100
5.000%, 02/01/14 | | | 2,000 | | | | 2,167 | | |
St. Louis County School District, Series A (FSA)
5.000%, 03/01/14 | | | 2,000 | | | | 2,184 | | |
St. Louis County School District, Series A,
Callable 03/01/14 @ 100
5.000%, 03/01/16 | | | 1,000 | | | | 1,080 | | |
FIRST AMERICAN FUNDS Annual Report 2005
79
Schedule of Investments September 30, 2005
Missouri Tax Free Fund (concluded)
| DESCRIPTION | | PAR (000)/SHARES | | VALUE (000) | |
St. Louis Public Safety,
Pre-refunded 08/15/09 @ 100 (FGIC)
5.125%, 02/15/17 (a) | | $ | 4,185 | | | $ | 4,475 | | |
Wentzville School District #R-4,
Pre-refunded 03/01/08 @ 100 (FSA)
5.100%, 03/01/18 (a) | | | 3,000 | | | | 3,140 | | |
| Total General Obligations | | | | | | | 43,565 | | |
| Certificates of Participation – 1.9% | | | |
Fenton, Callable 09/01/13 @ 100 (MBIA) (MLO)
3.900%, 09/01/15 | | | 1,275 | | | | 1,261 | | |
Mehlville School District #R-9 (FSA)
5.000%, 09/01/15 | | | 2,000 | | | | 2,169 | | |
| Total Certificates of Participation | | | | | | | 3,430 | | |
Total Municipal Bonds
(Cost $170,928) | | | | | | | 178,731 | | |
| Affiliated Money Market Fund – 1.3% | | | |
First American Tax Free Obligations Fund, Class Z (f)
(Cost $2,386) | | | 2,386,485 | | | | 2,386 | | |
Total Investments – 99.5%
(Cost $173,314) | | | | | | | 181,117 | | |
| Other Assets and Liabilities, Net – 0.5% | | | | | | | 971 | | |
| Total Net Assets – 100.0% | | | | | | $ | 182,088 | | |
(a) Pre-refunded issues are typically backed by U.S. Government obligations. These bonds mature at the call date and price indicated.
(b) Escrowed to Maturity issues are typically backed by U.S. Government obligations. If callable, these bonds may still be subject to call at the call date and price indicated.
(c) The rate shown is the effective yield at the time of purchase.
(d) Security purchased on a when-issued basis. On September 30, 2005 the total cost of investments purchased on a when-issued basis was $1,062,530 or 0.6% of total net assets. See note 2 in Notes to Financial Statements.
(e) Crossover Refunded securities are backed by the credit of the refunding issuer. These bonds mature at the call date and price indicated.
(f) Investment in affiliated security. This money market fund is advised by U.S. Bancorp Asset Management, Inc., which also serves as advisor for this fund. See note 3 in Notes to Financial Statements.
AMBAC – American Municipal Bond Assurance Corporation
AMT – Alternative Minimum Tax. As of September 30, 2005, the aggregate market value of securities subject to the AMT was $4,971,500, which represents 2.7% of net assets.
COMGTY – Commonwealth Guaranty
FGIC – Financial Guaranty Insurance Corporation
FSA – Financial Security Assurance
MBIA – Municipal Bond Insurance Association
MLO – Municipal Lease Obligation
RAAI – Radian Asset Assurance Inc.
STAID – State Aid Withholding
Nebraska Tax Free Fund
| DESCRIPTION | | PAR (000) | | VALUE (000) | |
| Municipal Bonds – 95.9% | |
| Revenue Bonds – 73.0% | |
| Education – 16.4% | |
Nebraska Educational Finance Authority,
Concordia University Project,
Callable 12/15/08 @ 100
5.350%, 12/15/18 | | $ | 650 | | | $ | 669 | | |
Nebraska Educational Finance Authority,
Creighton University Project, Series A (AMBAC)
5.000%, 09/01/09 | | | 500 | | | | 526 | | |
Nebraska Educational Finance Authority,
Midland Lutheran College Project,
Callable 10/01/10 @ 100
5.200%, 10/01/20 | | | 350 | | | | 357 | | |
Nebraska Educational Finance Authority,
Wesleyan University Project,
Callable 04/01/12 @ 100 (RAAI)
5.000%, 04/01/17 | | | 605 | | | | 628 | | |
Nebraska Utility Corporation,
University of Nebraska, Lincoln Project,
Callable 01/01/12 @ 100
5.250%, 01/01/15 | | | 1,045 | | | | 1,134 | | |
University of Nebraska Facility Corporation,
Medical Center Research Project,
Callable 02/15/12 @ 100
5.000%, 02/15/15 | | | 500 | | | | 531 | | |
University of Nebraska Facility Corporation,
Deferred Maintenance Project,
Callable 07/15/08 @ 100
5.250%, 07/15/11 | | | 1,000 | | | | 1,050 | | |
University of Nebraska,
Lincoln Memorial Stadium Project,
Series A, Callable 05/01/14 @ 100
5.000%, 11/01/15 | | | 500 | | | | 532 | | |
University of Nebraska, Lincoln Student Fees,
Callable 01/01/13 @ 100
5.000%, 07/01/22 | | | 750 | | | | 783 | | |
University of Nebraska,
Omaha Student Housing Project,
Callable 11/24/13 @ 100
5.000%, 05/15/23 | | | 500 | | | | 526 | | |
| | | | 6,736 | | |
| Healthcare – 17.4% | | | |
Douglas County Hospital Authority #1,
Immanuel Medical Center,
Callable 09/01/07 @ 102 (AMBAC)
4.900%, 09/01/09 | | | 750 | | | | 785 | | |
Douglas County Hospital Authority #2,
Girls & Boys Town Project,
Callable 09/01/15 @ 100
4.500%, 09/01/30 | | | 1,000 | | | | 969 | | |
Douglas County Hospital Authority #2,
Nebraska Medical Center
5.000%, 11/15/16 | | | 700 | | | | 744 | | |
Lancaster County Hospital Authority #1,
BryanLGH Medical Center Project, Series A,
Callable 06/01/11 @ 100 (AMBAC)
5.000%, 06/01/19 | | | 500 | | | | 520 | | |
| 5.125%, 06/01/21 | | | 1,200 | | | | 1,254 | | |
Madison County Hospital Authority #1,
Faith Regional Health Services Project,
Callable 01/01/12 @ 100 (RAAI)
5.500%, 07/01/21 | | | 1,000 | | | | 1,058 | | |
The accompanying notes are an integral part of the financial statements.
FIRST AMERICAN FUNDS Annual Report 2005
80
Nebraska Tax Free Fund (continued)
| DESCRIPTION | | PAR (000) | | VALUE (000) | |
Nebraska Investment Finance Authority,
Great Plains Regional Medical Center,
Callable 05/15/12 @ 100 (RAAI)
5.200%, 11/15/16 | | $ | 250 | | | $ | 263 | | |
| 5.300%, 11/15/17 | | | 805 | | | | 849 | | |
Platte County Hospital Authority #1,
Columbus Community Hospital Project,
Callable 05/01/10 @ 101 (RAAI)
5.850%, 05/01/14 | | | 650 | | | | 701 | | |
| | | | 7,143 | | |
| Housing – 5.5% | | | |
Nebraska Investment Finance Authority,
Multifamily Housing,
Callable 07/01/12 @ 100 (AMT) (GNMA)
4.625%, 07/20/12 | | | 390 | | | | 400 | | |
Nebraska Investment Finance Authority,
Single Family Housing, Series A,
Callable 03/01/11 @ 100 (AMT)
5.150%, 03/01/16 | | | 445 | | | | 457 | | |
Nebraska Investment Finance Authority,
Single Family Housing, Series C,
Callable 03/01/14 @ 100 (AMT)
4.400%, 09/01/20 (a) | | | 680 | | | | 674 | | |
Omaha Housing Authority, Multifamily Housing,
Timbercreek Apartments,
Callable 10/01/11 @ 100 (GNMA)
5.150%, 11/20/22 | | | 695 | | | | 718 | | |
| | | | 2,249 | | |
| Miscellaneous – 0.8% | | | |
Washington County Wastewater Facilities,
Cargill Project, Callable 11/01/12 @ 101 (AMT)
5.900%, 11/01/27 | | | 300 | | | | 326 | | |
| Recreational Facility Authority – 8.7% | |
Douglas County Zoo Facility,
Omaha Henry Doorly Zoo Project,
Pre-refunded 09/01/09 @ 100
5.650%, 09/01/11 (b) | | | 1,000 | | | | 1,087 | | |
Douglas County Zoo Facility,
Omaha Henry Doorly Zoo Project,
Callable 04/13/15 @ 100
4.750%, 09/01/24 | | | 1,115 | | | | 1,116 | | |
Omaha Convention Hotel Corporation,
Series A, Callable 04/01/12 @ 100 (AMBAC)
5.500%, 04/01/16 | | | 275 | | | | 303 | | |
| 5.125%, 04/01/26 | | | 1,000 | | | | 1,058 | | |
| | | | 3,564 | | |
| Revolving Funds – 3.6% | | | |
Nebraska Investment Finance Authority,
Drinking Water System Revolving Fund,
Callable 01/01/09 @ 100
4.500%, 01/01/10 | | | 115 | | | | 119 | | |
| 5.150%, 01/01/16 | | | 580 | | | | 597 | | |
Nebraska Investment Finance Authority,
Drinking Water System Revolving Fund,
Callable 01/01/12 @ 100
4.750%, 07/01/19 | | | 750 | | | | 770 | | |
| | | | 1,486 | | |
| Tax Revenue – 2.2% | | | |
Omaha Special Tax Revenue, Series A,
Callable 02/01/12 @ 101
5.125%, 02/01/32 | | | 500 | | | | 524 | | |
Nebraska Tax Free Fund (continued)
| DESCRIPTION | | PAR (000) | | VALUE (000) | |
Omaha Tax Allocation,
Convention Center Hotel Redevelopment,
Series A, Callable 12/15/14 @100
5.000%, 12/15/19 | | $ | 400 | | | $ | 405 | | |
| | | | 929 | | |
| Utilities – 18.4% | | | |
Alliance Electrical Systems,
Callable 06/15/08 @ 100 (AMBAC)
5.000%, 12/15/14 | | | 260 | | | | 271 | | |
| 5.100%, 12/15/15 | | | 460 | | | | 481 | | |
Cuming County Public Power District,
Pre-refunded 05/15/06 @ 100
5.600%, 05/15/21 (b) | | | 250 | | | | 252 | | |
Elkhorn Rural Public Power District
Electrical Systems,
Callable 03/01/15 @ 100 (AMBAC)
4.750%, 09/01/25 | | | 600 | | | | 625 | | |
Fremont Combined Utility System,
Callable 11/01/10 @ 100 (MBIA)
4.300%, 09/01/26 (a) | | | 500 | | | | 499 | | |
Grand Island Electrical Systems,
Callable 06/27/11 @ 100 (MBIA)
5.125%, 08/15/16 | | | 750 | | | | 807 | | |
Hastings Electrical Systems,
Callable 05/01/11 @ 100 (FSA)
5.000%, 01/01/15 | | | 1,000 | | | | 1,069 | | |
| 5.000%, 01/01/16 | | | 750 | | | | 801 | | |
Lincoln Electrical Systems,
Callable 09/01/11 @ 100
5.000%, 09/01/15 | | | 500 | | | | 537 | | |
Lincoln Electrical Systems,
Callable 09/01/13 @ 100
5.000%, 09/01/26 | | | 250 | | | | 261 | | |
Lincoln Sewer Revenue,
Callable 06/15/15 @ 100
4.500%, 06/15/29 | | | 1,080 | | | | 1,064 | | |
Omaha Public Power District, Series A,
Pre-refunded 02/01/10 @ 100
5.200%, 02/01/22 (b) | | | 630 | | | | 679 | | |
Omaha Public Power Electrical Systems,
Escrowed to Maturity
6.200%, 02/01/17 (c) | | | 210 | | | | 246 | | |
| | | | 7,592 | | |
| Total Revenue Bonds | | | | | | | 30,025 | | |
| General Obligations – 19.7% | |
Dawson County School District #20,
Gothenburg Public Schools,
Pre-refunded 06/15/06 @ 102 (MBIA)
5.100%, 12/15/16 (b) | | | 365 | | | | 378 | | |
Douglas County School District #17,
Millard Public Schools, Series A,
Callable 05/15/10 @100 (FSA)
4.500%, 06/15/25 | | | 750 | | | | 749 | | |
Douglas County School District #54,
Ralston Public Schools,
Callable 08/15/11 @ 100 (FSA)
5.000%, 12/15/16 | | | 845 | | | | 905 | | |
Lancaster County School District #1,
Lincoln Public Schools,
Callable 01/15/11 @ 100
5.250%, 07/15/19 | | | 220 | | | | 237 | | |
FIRST AMERICAN FUNDS Annual Report 2005
81
Schedule of Investments September 30, 2005
Nebraska Tax Free Fund (continued)
| DESCRIPTION | | PAR (000)/SHARES | | VALUE (000) | |
Lancaster County School District #1,
Lincoln Public Schools,
Callable 07/15/12 @ 100
5.000%, 01/15/17 | | $ | 750 | | | $ | 800 | | |
Lincoln County School District #1,
North Platte Public Schools,
Callable 05/04/15 @100 (FSA)
4.250%, 12/15/20 | | | 500 | | | | 500 | | |
Lincoln-Lancaster County Public Building
Community, Tax Supported Lease Rental,
Callable 08/18/14 @ 100
5.000%, 12/01/22 | | | 900 | | | | 955 | | |
Lincoln-Lancaster County Public Building
Community, Tax Supported Lease Rental,
Callable 04/15/15 @ 100
4.500%, 10/15/26 | | | 750 | | | | 747 | | |
Omaha, Series A, Escrowed to Maturity
6.500%, 12/01/18 (c) | | | 825 | | | | 1,038 | | |
Omaha-Douglas Public Building,
Callable 05/01/11 @ 100
4.900%, 05/01/16 | | | 500 | | | | 530 | | |
| 5.100%, 05/01/20 | | | 300 | | | | 319 | | |
Omaha-Douglas Public Building,
Callable 05/01/15 @ 100
4.000%, 05/01/20 | | | 405 | | | | 393 | | |
Puerto Rico Public Building Authority, Series I,
Callable 07/01/14 @ 100 (COMGTY)
5.250%, 07/01/33 | | | 500 | | | | 529 | | |
| Total General Obligations | | | | | | | 8,080 | | |
| Certificates of Participation – 3.2% | |
Western Nebraska Community College,
Callable 10/15/07 @ 100
4.700%, 10/15/10 | | | 295 | | | | 301 | | |
| 4.800%, 10/15/11 | | | 195 | | | | 199 | | |
| 4.900%, 10/15/12 | | | 250 | | | | 255 | | |
| 5.000%, 10/15/13 | | | 300 | | | | 306 | | |
| 5.100%, 10/15/14 | | | 250 | | | | 255 | | |
| Total Certificates of Participation | | | | | | | 1,316 | | |
Total Municipal Bonds
(Cost $37,868) | | | | | | | 39,421 | | |
| Affiliated Money Market Fund – 5.7% | |
First American Tax Free Obligations Fund, Class Z (d)
(Cost $2,371) | | | 2,371,009 | | | | 2,371 | | |
Total Investments – 101.6%
(Cost $40,239) | | | | | | | 41,792 | | |
| Other Assets and Liabilities, Net – (1.6)% | | | | | | | (673 | ) | |
| Total Net Assets – 100.0% | | | | | | $ | 41,119 | | |
(a) Security purchased on a when-issued basis. On September 30, 2005, the total cost of investments purchased on a when-issued basis was $1,173,195 or 2.9% of total net assets. See note 2 in Notes to Financial Statements.
(b) Pre-refunded issues are typically backed by U.S. Government obligations. These bonds mature at the call date and price indicated.
(c) Escrowed to Maturity issues are typically backed by U.S. Government obligations. If callable, these bonds may still be subject to call at the call date and price indicated.
Nebraska Tax Free Fund (concluded)
(d) Investment in affiliated security. This money market fund is advised by U.S. Bancorp Asset Management, Inc., which also serves as advisor for this fund. See note 3 in Notes to Financial Statements.
AMBAC – American Municipal Bond Assurance Corporation
AMT – Alternative Minimum Tax. As of September 30, 2005, the aggregate market value of securities subject to the AMT was $1,856,591, which represents 4.5% of net assets.
COMGTY – Commonwealth Guaranty
FSA – Financial Security Assurance
GNMA – Government National Mortgage Association
MBIA – Municipal Bond Insurance Association
RAAI – Radian Asset Assurance Inc.
The accompanying notes are an integral part of the financial statements.
FIRST AMERICAN FUNDS Annual Report 2005
82
Ohio Tax Free Fund
| DESCRIPTION | | PAR (000) | | VALUE (000) | |
| Municipal Bonds – 98.6% | |
| Revenue Bonds – 49.4% | |
| Continuing Care Retirement Communities – 4.1% | |
Franklin County Health Care Facilities,
Refunding & Improvement, Ohio Presbyterian,
Series A, Callable 07/01/12 @ 100 (RAAI)
5.125%, 07/01/22 | | $ | 500 | | | $ | 517 | | |
Franklin County Health Care Facilities,
Refunding & Improvement, Ohio Presbyterian,
Series A, Callable 07/01/15 @ 100
5.000%, 07/01/26 | | | 800 | | | | 814 | | |
Toledo-Lucas County Port Authority Facilities,
St. Mary Woods Project, Series A,
Callable 05/15/10 @ 100
6.000%, 05/15/24 | | | 400 | | | | 406 | | |
| | | | 1,737 | | |
| Economic Development – 0.6% | | | |
Summit County Port Authority Board Funding
Program, Garfield Heights Project, Series A,
Callable 05/15/14 @ 102
5.250%, 05/15/23 | | | 250 | | | | 252 | | |
| Education – 13.3% | |
Ohio State Higher Educational Facilities,
Baldwin-Wallace College Project
5.000%, 12/01/13 | | | 750 | | | | 789 | | |
Ohio State Higher Educational Facilities,
Ohio Northern University Project,
Callable 05/01/15 @100
5.000%, 05/01/26 | | | 1,000 | | | | 1,041 | | |
Ohio State Higher Educational Facilities,
Wittenburg University Project,
Callable 12/01/15 @100
5.000%, 12/01/24 | | | 505 | | | | 513 | | |
Ohio State Higher Educational Facilities,
Xavier University Project,
Callable 05/01/13 @ 100 (FGIC)
5.250%, 05/01/16 | | | 1,000 | | | | 1,092 | | |
Ohio State University, Series B,
Callable 06/01/13 @ 100
5.250%, 06/01/16 | | | 1,000 | | | | 1,094 | | |
University of Cincinnati, Series A,
Callable 06/01/11 @ 101 (FGIC)
5.500%, 06/01/14 | | | 1,000 | | | | 1,107 | | |
| | | | 5,636 | | |
| Healthcare – 7.8% | | | |
Akron Bath Copley County Hospital Facilities,
Summa Health Services, Series A,
Callable 11/15/14 @ 100 (RAAI)
5.250%, 11/15/16 | | | 800 | | | | 855 | | |
Erie County Hospital Facilities,
Firelands Regional Medical Center,
Series A, Callable 08/15/12 @ 101
5.500%, 08/15/22 | | | 500 | | | | 525 | | |
Fairfield County Hospital Facilities,
Fairfield Medical Center,
Callable 06/15/12 @ 100 (RAAI)
5.000%, 06/15/22 | | | 500 | | | | 513 | | |
Hamilton County Hospital Facilities,
Children's Medical Center, Series F (FGIC)
5.200%, 05/15/09 | | | 1,000 | | | | 1,049 | | |
Lorain County Hospital, Catholic Healthcare,
Callable 10/01/12 @ 100
5.500%, 10/01/17 | | | 350 | | | | 373 | | |
| | | | 3,315 | | |
Ohio Tax Free Fund (continued)
| DESCRIPTION | | PAR (000) | | VALUE (000) | |
| Lease Revenue – 7.1% | | | |
Cleveland-Cuyahoga County Port Authority,
Rita Project, Callable 11/15/14 @100 (RAAI)
5.000%, 11/15/19 | | $ | 750 | | | $ | 785 | | |
Ohio State Building Authority, State Facility,
Administration Building Fund, Series A,
Callable 04/01/12 @ 100 (FSA)
5.500%, 04/01/16 | | | 1,000 | | | | 1,101 | | |
Riversouth Authority Revenue,
Riversouth Area Redevelopment, Series A,
Callable 06/01/14 @ 100
5.250%, 12/01/17 | | | 1,000 | | | | 1,093 | | |
| | | | 2,979 | | |
| Miscellaneous – 2.4% | | | |
Toledo-Lucas County Port Authority Facilities,
Cargill Income Project, Series B
4.500%, 12/01/15 | | | 1,000 | | | | 1,022 | | |
| Revolving Funds – 5.0% | | | |
Ohio State Water Development Authority,
Escrowed to Maturity,
Callable 06/01/06 @ 101 (AMBAC)
5.800%, 12/01/11 (a) | | | 1,000 | | | | 1,022 | | |
Ohio State Water Development Authority,
Water Pollution Control,
Pre-refunded 06/01/12 @ 100
5.050%, 12/01/21 (b) | | | 1,000 | | | | 1,088 | �� | |
| | | | 2,110 | | |
| Tax Revenue – 1.0% | | | |
Toledo-Lucas County Port Authority,
Crocker Park Public Improvement Project,
Callable 12/01/13 @ 102
5.250%, 12/01/23 | | | 400 | | | | 412 | | |
| Transportation – 1.2% | | | |
Ohio State Turnpike Commission, Series A,
Pre-refunded 02/15/06 @ 102 (MBIA)
5.700%, 02/15/13 (b) | | | 500 | | | | 515 | | |
| Utilities – 6.9% | | | |
Butler County Waterworks, Water District,
Callable 12/01/15 @ 100 (AMBAC)
4.000%, 12/01/18 | | | 795 | | | | 789 | | |
Hamilton Electrical Systems, Series A,
Callable 10/15/15 @ 101
4.300%, 10/15/16 | | | 1,000 | | | | 1,029 | | |
Montgomery County Water,
Greater Moraine Beaver,
Callable 11/15/12 @ 100 (AMBAC)
5.375%, 11/15/16 | | | 1,000 | | | | 1,103 | | |
| | | | 2,921 | | |
| Total Revenue Bonds | | | | | | | 20,899 | | |
| General Obligations – 46.0% | | | |
Cincinnati, Callable 12/01/11 @ 100
5.000%, 12/01/16 | | | 1,000 | | | | 1,074 | | |
| 5.000%, 12/01/17 | | | 1,000 | | | | 1,071 | | |
Dayton City School District,
School Facilities Construction & Improvement,
Series D (FGIC)
5.000%, 12/01/11 | | | 1,000 | | | | 1,087 | | |
Dublin City School District,
Callable 12/01/14 @ 100
5.500%, 12/01/16 | | | 1,000 | | | | 1,123 | | |
FIRST AMERICAN FUNDS Annual Report 2005
83
Schedule of Investments September 30, 2005
Ohio Tax Free Fund (concluded)
| DESCRIPTION | | PAR (000) | | VALUE (000) | |
Dublin, Refunding & Improvement, Series A,
Callable 12/01/09 @ 101
5.250%, 12/01/14 | | $ | 1,000 | | | $ | 1,082 | | |
Greater Cleveland Regional Transportation
Authority, Pre-refunded 12/01/06 @ 101 (FGIC)
5.650%, 12/01/16 (b) | | | 1,000 | | | | 1,041 | | |
Ohio State Common Schools, Series A,
Callable 03/15/12 @ 100
5.125%, 09/15/22 | | | 1,750 | | | | 1,868 | | |
Ohio State Higher Education, Series A,
Callable 02/01/11 @ 100
5.000%, 02/01/19 | | | 1,000 | | | | 1,064 | | |
Ohio State Higher Education, Series A,
Callable 02/01/12 @ 100
5.000%, 08/01/22 | | | 1,000 | | | | 1,056 | | |
Ohio State Higher Education, Series B,
Callable 11/01/11 @ 100
5.000%, 11/01/15 | | | 1,000 | | | | 1,074 | | |
Ohio State Infrastructure Improvement, Series A
5.500%, 02/01/20 | | | 1,000 | | | | 1,154 | | |
Ohio State Parks & Recreational Facilities,
Series II-A, Callable 02/01/15 @ 100
5.250%, 02/01/20 | | | 1,000 | | | | 1,091 | | |
Revere Local School District (FSA)
5.000%, 12/01/12 | | | 1,150 | | | | 1,256 | | |
Solon, Callable 12/01/12 @ 100
5.000%, 12/01/21 | | | 1,000 | | | | 1,062 | | |
Springfield City School District,
Callable 12/01/11 @ 102 (FGIC)
5.200%, 12/01/23 | | | 1,000 | | | | 1,083 | | |
Summit County, Series R (FGIC)
5.500%, 12/01/21 | | | 1,000 | | | | 1,159 | | |
Toledo City School District, School Facilities
Improvement, Callable 12/01/13 @ 100 (FSA)
5.000%, 12/01/14 | | | 1,000 | | | | 1,087 | | |
| Total General Obligations | | | | | | | 19,432 | | |
| Certificate of Participation – 3.2% | | | |
Midview Local School District, School Buildings
Facilities Project, Callable 05/01/13 @ 100
5.250%, 11/01/17 | | | 1,270 | | | | 1,359 | | |
Total Municipal Bonds
(Cost $40,333) | | | | | | | 41,690 | | |
Total Investments – 98.6%
(Cost $40,333) | | | | | | | 41,690 | | |
| Other Assets and Liabilities, Net – 1.4% | | | | | | | 576 | | |
| Total Net Assets – 100.0% | | | | | | $ | 42,266 | | |
(a) Escrowed to Maturity issues are typically backed by U.S. Government obligations. If callable, these bonds may still be subject to call at the call date and price indicated.
(b) Pre-refunded issues are typically backed by U.S. Government obligations. These bonds mature at the call date and price indicated.
AMBAC – American Municipal Bond Assurance Corporation
FGIC – Financial Guaranty Insurance Corporation
FSA – Financial Security Assurance
MBIA – Municipal Bond Insurance Association
RAAI – Radian Asset Assurance Inc.
Oregon Intermediate Tax Free Fund
| DESCRIPTION | | PAR (000) | | VALUE (000) | |
| Municipal Bonds – 98.2% | |
| Revenue Bonds – 31.3% | |
| Continuing Care Retirement Communities – 1.4% | |
Clackamas County Hospital Facilities Authority,
Mary's Woods, Series A,
Callable 05/15/09 @ 102
6.125%, 05/15/13 | | $ | 1,000 | | | $ | 1,054 | | |
Oregon State Health, Housing,
Educational & Cultural Facilities Authority,
Oregon Baptist Retirement Homes,
Callable 11/15/05 @ 104
8.000%, 11/15/26 | | | 900 | | | | 933 | | |
| | | | 1,987 | | |
| Economic Development – 1.0% | | | |
Port Morrow, Callable until 05/31/15 @ 100
6.250%, 06/01/15 | | | 1,500 | | | | 1,501 | | |
| Education – 6.2% | |
Forest Grove Campus Improvement,
Pacific University Project, Series A,
Callable 05/01/15 @ 100 (RAAI)
5.000%, 05/01/22 | | | 1,375 | | | | 1,429 | | |
Multnomah County Educational Facilities,
University of Portland,
Callable 04/01/07 @ 102 (AMBAC)
5.750%, 04/01/10 | | | 2,245 | | | | 2,373 | | |
| 5.700%, 04/01/15 | | | 1,000 | | | | 1,063 | | |
Oregon State Facilities Authority,
Linfield College Project, Series A,
Callable 10/01/15 @ 100
5.000%, 10/01/25 | | | 1,000 | | | | 1,016 | | |
Oregon State Health, Housing,
Educational & Cultural Facilities Authority,
George Fox University, Series A,
Pre-refunded 03/01/07 @ 102 (BA)
5.400%, 03/01/09 (a) | | | 395 | | | | 416 | | |
| 5.450%, 03/01/10 (a) | | | 415 | | | | 437 | | |
Oregon State Health, Housing,
Educational & Cultural Facilities Authority,
Reed College, Series A,
Callable 07/01/06 @ 102
5.375%, 07/01/15 | | | 2,000 | | | | 2,059 | | |
| | | | 8,793 | | |
| Healthcare – 5.7% | | | |
Clackamas County Hospital Facilities Authority,
Legacy Health Systems,
Callable 08/15/09 @ 101
5.250%, 02/15/11 | | | 2,000 | | | | 2,133 | | |
| 5.375%, 02/15/12 | | | 1,000 | | | | 1,062 | | |
Medford Hospital Facilities Authority,
Asante Health Systems,
Callable 08/15/08 @ 101 (MBIA)
5.250%, 08/15/11 | | | 1,000 | | | | 1,057 | | |
| 5.375%, 08/15/12 | | | 1,000 | | | | 1,061 | | |
Multnomah County Hospital Facilities Authority,
Providence Health Systems,
Callable 10/01/14 @ 100
5.250%, 10/01/22 | | | 1,000 | | | | 1,073 | | |
Salem Hospital Facilities Authority,
Callable 08/15/08 @ 101
5.250%, 08/15/14 | | | 1,000 | | | | 1,049 | | |
The accompanying notes are an integral part of the financial statements.
FIRST AMERICAN FUNDS Annual Report 2005
84
Oregon Intermediate Tax Free Fund (continued)
| DESCRIPTION | | PAR (000) | | VALUE (000) | |
Umatilla County Hospital Facilities Authority,
Catholic Health Initiatives, Series A
5.000%, 03/01/12 | | $ | 690 | | | $ | 738 | | |
| | | | 8,173 | | |
| Housing – 0.6% | | | |
Oregon State Housing & Community Services,
Series A, Callable until 06/30/06 @ 101
6.400%, 07/01/18 | | | 280 | | | | 283 | | |
Oregon State Housing & Community Services,
Series A, Callable 07/01/06 @ 102
6.000%, 07/01/16 | | | 25 | | | | 26 | | |
Oregon State Housing & Community Services,
Series E, Callable 01/01/10 @ 100 (FHA)
5.750%, 07/01/13 | | | 410 | | | | 412 | | |
Portland Housing Authority, New Market West
Project (LOC: Wells Fargo Bank N.A.)
2.760%, 04/01/34 (b) | | | 150 | | | | 150 | | |
| | | | 871 | | |
| Recreational Facility Authority – 0.8% | | | |
Portland Urban Renewal & Redevelopment,
Convention Center, Series A,
Callable 06/15/10 @ 101 (AMBAC)
5.750%, 06/15/15 | | | 1,000 | | | | 1,109 | | |
| Tax Revenue – 1.9% | |
Medford Urban Renewal Agency,
Callable 01/01/13 @ 101
4.500%, 06/01/13 | | | 1,010 | | | | 1,049 | | |
Oregon State Department of Administrative
Services Lottery, Series A,
Callable 04/01/10 @ 100 (FSA)
5.000%, 04/01/12 | | | 1,050 | | | | 1,117 | | |
Tri-County Metropolitan Transportation District,
Series 1 (MGT)
4.900%, 06/01/09 | | | 500 | | | | 524 | | |
| | | | 2,690 | | |
| Transportation – 5.8% | | | |
Oregon State Department of Transportation,
Highway User Tax, Series A,
Callable 11/15/14 @ 100
5.000%, 11/15/24 | | | 1,325 | | | | 1,401 | | |
Oregon State Department of Transportation,
Highway User Tax,
Pre-refunded 11/15/10 @ 100
5.125%, 11/15/14 (a) | | | 2,260 | | | | 2,453 | | |
Oregon State Department of Transportation,
Highway User Tax, Series A,
Pre-refunded 11/15/12 @ 100
5.500%, 11/15/16 (a) | | | 1,000 | | | | 1,119 | | |
Port Portland Airport, Series 12-A,
Callable 01/01/09 @ 101 (FGIC)
5.250%, 07/01/11 | | | 1,165 | | | | 1,237 | | |
| 5.250%, 07/01/12 | | | 2,000 | | | | 2,119 | | |
| | | | 8,329 | | |
| Utilities – 7.9% | | | |
Eugene Electric Utilities,
Callable 08/01/06 @ 100 (FSA)
5.375%, 08/01/11 | | | 1,195 | | | | 1,218 | | |
Eugene Electric Utilities,
Callable 08/01/07 @ 100 (FSA)
5.000%, 08/01/11 | | | 1,305 | | | | 1,347 | | |
Oregon Intermediate Tax Free Fund (continued)
| DESCRIPTION | | PAR (000) | | VALUE (000) | |
Eugene Electric Utilities,
Callable 08/01/08 @ 100 (FSA)
4.800%, 08/01/13 | | $ | 690 | | | $ | 715 | | |
Port of St. Helens Pollution Control,
Portland General Electric
4.800%, 04/01/10 | | | 2,450 | | | | 2,497 | | |
| 4.800%, 06/01/10 | | | 400 | | | | 408 | | |
Tualatin Valley Water District,
Pre-refunded 06/01/08 @ 100 (FSA)
5.000%, 06/01/12 (a) | | | 1,000 | | | | 1,043 | | |
Washington County Clean Water Services (MBIA)
5.000%, 10/01/14 | | | 1,000 | | | | 1,095 | | |
Washington County Clean Water Services,
Callable 10/01/11 @ 100 (FGIC)
5.125%, 10/01/14 | | | 1,790 | | | | 1,934 | | |
Washington County Unified Sewer Agency,
Series 1 (FGIC)
5.750%, 10/01/08 | | | 1,000 | | | | 1,075 | | |
| | | | 11,332 | | |
| Total Revenue Bonds | | | | | | | 44,785 | | |
| General Obligations – 61.6% | |
Chemeketa Community College District,
Escrowed to Maturity (FGIC)
5.500%, 06/01/13 (c) | | | 2,170 | | | | 2,437 | | |
Clackamas & Washington Counties
School District #3, Linn-Wilsonville District,
Series A, Zero Coupon Bond (FGIC)
4.415%, 06/15/15 (d) | | | 4,000 | | | | 2,649 | | |
Clackamas County School District #7,
Lake Oswego, Pre-refunded 06/01/11 @ 100
5.500%, 06/01/12 (a) | | | 1,240 | | | | 1,373 | | |
Clackamas County School District #7J,
Lake Oswego, (FSA)
5.250%, 06/01/17 | | | 2,000 | | | | 2,233 | | |
Clackamas County School District #86,
Canby, Callable 06/15/15 @ 100 (FSA)
5.000%, 06/15/24 | | | 1,500 | | | | 1,592 | | |
Clackamas County School District #86, Canby,
Pre-refunded 06/15/10 @ 100 (SBG)
5.500%, 06/15/15 (a) | | | 1,835 | | | | 2,011 | | |
Columbia County School District #502,
Zero Coupon Bond (FGIC)
3.900%, 06/01/12 (d) | | | 1,530 | | | | 1,188 | | |
| 5.000%, 06/01/16 (d) | | | 1,000 | | | | 638 | | |
Deschutes & Jefferson Counties School District #2,
Pre-refunded 06/15/11 @ 100
5.500%, 06/15/14 (a) | | | 1,725 | | | | 1,911 | | |
Deschutes & Jefferson Counties School
District #2-J, Redmond, Series A (FGIC) (SBG)
5.000%, 06/15/13 | | | 1,250 | | | | 1,361 | | |
Deschutes & Jefferson Counties School
District #2-J, Redmond, Series B,
Zero Coupon Bond (FGIC) (SBG)
5.090%, 06/15/21 (d) | | | 1,000 | | | | 495 | | |
Deschutes County, Callable 12/01/12 @ 100 (FSA)
5.000%, 12/01/14 | | | 1,755 | | | | 1,900 | | |
Eugene Public Safety Facilities,
Callable 06/01/06 @ 100 (FGIC)
5.700%, 06/01/16 | | | 1,295 | | | | 1,318 | | |
Hood River County School District,
Callable 06/15/11 @ 100 (SBG)
5.250%, 06/15/16 | | | 1,030 | | | | 1,116 | | |
FIRST AMERICAN FUNDS Annual Report 2005
85
Schedule of Investments September 30, 2005
Oregon Intermediate Tax Free Fund (continued)
| DESCRIPTION | | PAR (000) | | VALUE (000) | |
Jackson County School District #6, Central Point,
Callable 06/15/14 @ 100 (FSA) (SBG)
5.250%, 06/15/16 | | $ | 1,140 | | | $ | 1,258 | | |
Jackson County School District #549,
Medford (SBG)
5.000%, 06/15/12 | | | 2,000 | | | | 2,169 | | |
Josephine County Unit School District Three
Rivers (FGIC) (SBG)
5.000%, 12/15/17 | | | 1,000 | | | | 1,094 | | |
Lake Oswego (MBIA)
5.250%, 06/01/13 | | | 1,035 | | | | 1,144 | | |
Lane & Douglas Counties School
District #97-J (FGIC) (SBG)
5.375%, 06/15/16 | | | 1,235 | | | | 1,392 | | |
Lane County School District #4, Eugene (FGIC)
5.000%, 07/01/11 | | | 1,785 | | | | 1,931 | | |
Lane County School District #40, Creswell,
Callable 06/15/10 @ 100 (SBG)
5.000%, 06/15/11 | | | 1,120 | | | | 1,195 | | |
Lane County School District #52, Bethel,
Pre-refunded 06/15/10 @ 100 (SBG)
5.350%, 06/15/11 (a) | | | 1,285 | | | | 1,400 | | |
Linn Benton Community College District,
Zero Coupon Bond (FGIC) (SBG)
4.000%, 06/15/08 (d) | | | 985 | | | | 903 | | |
| 4.210%, 06/15/09 (d) | | | 1,000 | | | | 884 | | |
Linn County Community School District,
Pre-refunded 06/15/13 @ 100 (FGIC) (SBG)
5.550%, 06/15/21 (a) | | | 1,000 | | | | 1,128 | | |
Marion & Polk Counties School District #7-J,
Silverton, Callable until 05/31/06 @ 100.50 (FSA)
5.600%, 06/01/06 | | | 860 | | | | 868 | | |
Marion County School District #103C Woodburn,
Series B, Zero Coupon Bond (FGIC)
3.700%, 11/01/11 (d) | | | 2,210 | | | | 1,764 | | |
McMinnville School District #40 (FSA)
5.500%, 06/15/12 | | | 620 | | | | 692 | | |
| 5.500%, 06/15/13 | | | 1,000 | | | | 1,119 | | |
Metro, Callable 09/01/10 @ 102
5.250%, 09/01/14 | | | 1,000 | | | | 1,097 | | |
Morrow County School District #1 (FSA) (SBG)
5.000%, 06/15/14 | | | 1,155 | | | | 1,259 | | |
Multnomah County, Series A,
Pre-refunded 04/01/10 @ 100
5.000%, 04/01/11 (a) | | | 1,000 | | | | 1,071 | | |
| 5.125%, 04/01/13 (a) | | | 2,445 | | | | 2,632 | | |
Multnomah County School District #7, Reynolds,
Callable 06/01/10 @ 100 (MBIA)
5.000%, 06/01/21 | | | 1,545 | | | | 1,623 | | |
Multnomah County School District #7, Reynolds,
Pre-refunded 06/15/11 @ 100 (SBG)
5.625%, 06/15/15 (a) | | | 1,000 | | | | 1,114 | | |
Multnomah County School District #40,
Callable 12/01/15 @ 100 (FSA)
4.000%, 12/01/18 | | | 1,970 | | | | 1,958 | | |
Multnomah-Clackamas County School District #10,
Gresham-Barlow,
Pre-refunded 06/15/11 @ 100 (FSA) (SBG)
5.500%, 06/15/13 (a) | | | 1,780 | | | | 1,972 | | |
Multnomah-Clackamas County School
District #10JT, Gresham-Barlow, (FSA) (SBG)
5.250%, 06/15/17 | | | 1,000 | | | | 1,117 | | |
Oregon Intermediate Tax Free Fund (continued)
| DESCRIPTION | | PAR (000) | | VALUE (000) | |
Multnomah-Clackamas County School
District #28-302, Centennial,
Pre-refunded 06/15/11 @ 100 (FGIC) (SBG)
5.500%, 06/15/14 (a) | | $ | 1,500 | | | $ | 1,662 | | |
Oregon State, Series 73F,
(LOC: Bayerische Landesbank)
2.750%, 12/01/17 (b) | | | 300 | | | | 300 | | |
Oregon State Board of Higher Education, Series A,
Pre-refunded 08/01/09 @ 101
5.500%, 08/01/15 (a) | | | 1,255 | | | | 1,365 | | |
Oregon State Pollution Control, Series A,
Callable 11/01/07 @ 100
4.875%, 11/01/11 | | | 455 | | | | 470 | | |
Portland Community College Services,
Pre-refunded 06/01/11 @ 100
5.375%, 06/01/15 (a) | | | 1,375 | | | �� | 1,514 | | |
Portland Emergency Facilities, Series A,
Callable 06/01/09 @ 100
5.000%, 06/01/12 | | | 1,060 | | | | 1,119 | | |
Puerto Rico Public Buildings Authority, Series J,
Callable 07/01/12 @ 100 (AMBAC) (COMGTY)
5.000%, 07/01/36 | | | 1,000 | | | | 1,083 | | |
Rogue Community College District,
Callable 06/15/15 @ 100 (MBIA) (SBG)
5.000%, 06/15/22 | | | 1,000 | | | | 1,066 | | |
Salem-Keizer School District #24-J,
Callable 06/01/08 @ 100 (FSA)
5.100%, 06/01/12 | | | 2,000 | | | | 2,092 | | |
Salem-Keizer School District #24-J,
Pre-refunded 06/01/09 @ 100 (SBG)
5.250%, 06/01/12 (a) | | | 1,000 | | | | 1,071 | | |
Tri-County Metropolitan Transportation District,
Light Rail Extension, Series A,
Callable 07/01/09 @ 101
5.250%, 07/01/10 | | | 1,115 | | | | 1,200 | | |
| 5.250%, 07/01/12 | | | 1,000 | | | | 1,074 | | |
Tualatin Hills Park & Recreation District (FGIC)
5.750%, 03/01/13 | | | 870 | | | | 988 | | |
Umatilla County School District #016-R,
Pendleton (FGIC)
5.000%, 07/01/11 | | | 1,000 | | | | 1,082 | | |
| 5.250%, 07/01/14 | | | 1,540 | | | | 1,712 | | |
Wasco County School District #12
5.500%, 06/15/14 | | | 1,080 | | | | 1,219 | | |
Washington, Multnomah & Yamhill Counties
School District #1-J
5.000%, 11/01/14 | | | 1,000 | | | | 1,095 | | |
Washington, Multnomah & Yamhill Counties
School District #1-J (FGIC)
5.250%, 06/15/14 | | | 1,115 | | | | 1,238 | | |
Washington, Multnomah & Yamhill Counties
School District #1-J, Pre-refunded 06/01/09 @ 100
5.250%, 06/01/12 (a) | | | 1,185 | | | | 1,258 | | |
Washington & Clackamas Counties School
District #23-J, Tigard (FGIC)
5.250%, 06/01/11 | | | 1,335 | | | | 1,459 | | |
| 5.500%, 06/01/13 | | | 1,000 | | | | 1,122 | | |
Washington & Clackamas Counties School
District #23-J, Tigard, Zero Coupon Bond
5.820%, 06/15/14 (d) | | | 1,030 | | | | 720 | | |
Washington County, Callable 06/01/11 @ 100
5.500%, 06/01/14 | | | 2,305 | | | | 2,538 | | |
The accompanying notes are an integral part of the financial statements.
FIRST AMERICAN FUNDS Annual Report 2005
86
Oregon Intermediate Tax Free Fund (concluded)
| DESCRIPTION | | PAR (000)/SHARES | | VALUE (000) | |
Washington County School District #48-J,
Beaverton, Pre-refunded 08/01/08 @ 100
5.250%, 08/01/10 (a) | | $ | 2,000 | | | $ | 2,115 | | |
Wilsonville, Callable 06/01/08 @ 100
5.000%, 12/01/10 | | | 255 | | | | 256 | | |
Yamhill County School District #29-J,
Newberg (FGIC) (SBG)
5.250%, 06/15/15 | | | 2,010 | | | | 2,242 | | |
| Total General Obligations | | | | | | | 88,066 | | |
| Certificates of Participation – 5.3% | | | |
Multnomah County,
Callable 08/01/08 @ 101 (MLO)
4.750%, 08/01/11 | | | 1,685 | | | | 1,759 | | |
Multnomah County,
Pre-refunded 08/01/08 @ 101
4.750%, 08/01/11 (a) | | | 515 | | | | 542 | | |
Oregon State Department of Administrative Services,
Series A, Callable 05/01/09 @ 101
(AMBAC) (MLO)
5.000%, 05/01/14 | | | 1,240 | | | | 1,318 | | |
Oregon State Department of Administrative Services,
Series A, Callable 05/01/13 @ 100 (FSA)
5.000%, 05/01/14 | | | 1,200 | | | | 1,296 | | |
Oregon State Department of Administrative Services,
Series B, Callable 11/01/07 @ 101 (AMBAC) (MLO)
5.000%, 11/01/11 | | | 840 | | | | 878 | | |
Oregon State Department of Administrative Services,
Series B, Callable 05/01/14 @ 100 (FSA)
5.000%, 05/01/18 | | | 1,680 | | | | 1,802 | | |
| Total Certificates of Participation | | | | | | | 7,595 | | |
Total Municipal Bonds
(Cost $135,287) | | | | | | | 140,446 | | |
| Affiliated Money Market Fund – 0.5% | | | |
First American Tax Free Obligations Fund, Class Z (e)
(Cost $643) | | | 642,629 | | | | 643 | | |
Total Investments – 98.7%
(Cost $135,930) | | | | | | | 141,089 | | |
| Other Assets and Liabilities, Net – 1.3% | | | | | | | 1,880 | | |
| Total Net Assets – 100.0% | | | | | | $ | 142,969 | | |
(a) Pre-refunded issues are typically backed by U.S. Government obligations. These bonds mature at the call date and price indicated.
(b) Variable Rate Security – The rate shown is the rate in effect as of September 30, 2005.
(c) Escrowed to Maturity issues are typically backed by U.S. Government obligations. If callable, these bonds may still be subject to call at the call date and price indicated.
(d) The rate shown is the effective yield at the time of purchase.
(e) Investment in affiliated security. This money market fund is advised by U.S. Bancorp Asset Management, Inc., which also serves as advisor for this fund. See note 3 in Notes to Financial Statements.
| AMBAC – American Municipal Bond Assurance Corporation | |
| BA – Bank of America | |
| COMGTY – Commonwealth Guaranty | |
| FGIC – Financial Guaranty Insurance Corporation | |
| FHA – Federal Housing Authority | |
| FSA – Financial Security Assurance | |
| LOC – Letter of Credit | |
| MBIA – Municipal Bond Insurance Association | |
| MGT – Morgan Guaranty Trust | |
| MLO – Municipal Lease Obligation | |
| RAAI – Radian Asset Assurance Inc. | |
| SBG – School Board Guaranty | |
Short Tax Free Fund
| DESCRIPTION | | PAR (000) | | VALUE (000) | |
| Municipal Bonds – 99.5% | |
| Alabama – 2.4% | |
Foley Utilities Board, Escrowed to Maturity,
Callable 03/01/06 @ 100 (RB)
6.000%, 03/01/07 (a) | | $ | 1,500 | | | $ | 1,562 | | |
Homewood Warrant, Sewer 7,
Escrowed to Maturity, Callable
until 02/28/07 @ 100
6.125%, 03/01/07 (a) | | | 1,340 | | | | 1,398 | | |
Jefferson County Limited Obligation
School Warrant, Series A (RB)
5.000%, 01/01/08 | | | 3,500 | | | | 3,616 | | |
Mobile Warrant, Escrowed to Maturity,
Callable until 02/14/07 @ 100 (GO)
6.200%, 02/15/07 (a) | | | 1,280 | | | | 1,334 | | |
| | | | 7,910 | | |
| Arizona – 6.6% | | | |
Arizona State Funding Program, Series 15,
Escrowed to Maturity (COP)
8.750%, 08/01/06 (a) | | | 2,115 | | | | 2,215 | | |
| 8.750%, 08/01/06 (a) | | | 1,410 | | | | 1,477 | | |
Glendale Industrial Development Authority (RB)
4.250%, 05/15/08 | | | 1,240 | | | | 1,262 | | |
Maricopa County Hospital, Sun Health Corp. (RB)
5.000%, 04/01/11 | | | 3,815 | | | | 3,997 | | |
Salt River Project, Agricultural
Improvement & Power District (RB)
5.000%, 12/01/09 | | | 5,500 | | | | 5,863 | | |
Scottsdale Water & Sewer, Project of 1989,
Series E (RB)
7.000%, 07/01/08 | | | 1,370 | | | | 1,506 | | |
Tempe Industrial Development Authority,
Series A (RB)
4.500%, 12/01/06 | | | 1,000 | | | | 1,004 | | |
University Medical Center (PUFG) (RB)
5.000%, 07/01/07 | | | 300 | | | | 308 | | |
| 5.000%, 07/01/08 | | | 700 | | | | 727 | | |
| 5.000%, 07/01/09 | | | 500 | | | | 523 | | |
Yavapai County Industrial Development Authority,
Waste Management Project, Series A-1,
Mandatory Put 03/01/06 @ 100 (AMT) (GTY) (RB)
3.650%, 03/01/28 | | | 3,100 | | | | 3,102 | | |
| | | | 21,984 | | |
| California – 3.9% | | | |
California State (GO)
5.000%, 02/01/08 | | | 5,000 | | | | 5,206 | | |
| 5.000%, 02/01/08 | | | 1,000 | | | | 1,041 | | |
California State Public Works Board, Series A (RB)
5.000%, 06/01/09 | | | 3,900 | | | | 4,114 | | |
California Statewide Community Development
Authority, Daughters of Charity Health (RB)
5.000%, 07/01/09 | | | 500 | | | | 521 | | |
Contra Costa Transportation Authority, Series A,
Escrowed to Maturity,
Callable until 02/28/07 @ 100 (RB)
6.875%, 03/01/07 (a) | | | 2,065 | | | | 2,131 | | |
| | | | 13,013 | | |
| Colorado – 1.8% | | | |
Colorado Health Facilities Authority,
Covenant Retirement Communities (RB)
4.500%, 12/01/09 | | | 500 | | | | 511 | | |
FIRST AMERICAN FUNDS Annual Report 2005
87
Schedule of Investments September 30, 2005
Short Tax Free Fund (continued)
| DESCRIPTION | | PAR (000) | | VALUE (000) | |
Colorado Health Facilities Authority, Vail Valley
Medical Center Project (RB)
4.000%, 01/15/07 | | $ | 500 | | | $ | 503 | | |
Denver City & County Airport,
Series E (AMT) (RB) (XLCA)
5.000%, 11/15/07 | | | 5,000 | | | | 5,165 | | |
| | | | 6,179 | | |
| Florida – 1.0% | | | |
Escambia County Health Facilities Authority,
Ascension Health Credit, Series A (RB)
5.000%, 11/15/06 | | | 815 | | | | 833 | | |
Highlands County Health Facilities Authority,
The Adventist Health System, Series B (RB)
3.750%, 11/15/06 | | | 2,605 | | | | 2,621 | | |
| | | | 3,454 | | |
| Georgia – 0.7% | | | |
Cartersville Development Authority,
Sewer Facilities, Anheuser Busch (AMT) (RB)
5.625%, 05/01/09 | | | 2,075 | | | | 2,208 | | |
| Idaho – 0.5% | |
Idaho Falls, Escrowed to Maturity,
Callable 10/01/05 @ 100 (RB)
10.250%, 04/01/06 (a) | | | 375 | | | | 388 | | |
Idaho Falls, Pre-refunded 04/01/07 @ 100,
Callable 10/01/05 @ 100 (RB)
10.375%, 04/01/13 (b) | | | 1,075 | | | | 1,185 | | |
| | | | 1,573 | | |
| Illinois – 7.8% | | | |
Champaign County Community Unit School
District #4 (GO)
8.300%, 01/01/07 | | | 1,120 | | | | 1,190 | | |
Chicago O'Hare International Airport, 2nd Lien,
Passenger Facilities, Series C (MBIA) (RB)
5.750%, 01/01/09 | | | 1,000 | | | | 1,076 | | |
Chicago Sales Tax Revenue (RB)
5.000%, 01/01/11 | | | 3,165 | | | | 3,400 | | |
Cook County Community High School District #218,
Partially Escrowed to Maturity,
Zero Coupon Bond (FSA) (GO)
2.630%, 12/01/05 (a) (c) | | | 1,760 | | | | 1,752 | | |
Cook County Consolidated High School District #200,
Oak Park, Zero Coupon Bond (FSA) (GO)
2.070%, 12/01/05 (c) | | | 2,265 | | | | 2,254 | | |
Cook County High School District #209,
Proviso Township (FSA) (GO)
2.650%, 12/01/08 (d) | | | 1,485 | | | | 1,395 | | |
Illinois Development Finance Authority,
People's Gas, Light & Coke, Series B,
Mandatory Put 02/01/08 @ 100 (AMBAC) (RB)
3.050%, 02/01/33 (e) | | | 3,000 | | | | 2,978 | | |
Illinois Educational Facilities Authority,
The Art Institute of Chicago,
Mandatory Put 03/01/08 @ 100 (RB)
3.100%, 03/01/34 | | | 2,000 | | | | 1,985 | | |
Illinois Finance Authority, DePaul University,
Series A (RB)
5.000%, 10/01/07 | | | 1,000 | | | | 1,031 | | |
| 5.000%, 10/01/09 | | | 1,000 | | | | 1,052 | | |
| 5.000%, 10/01/09 | | | 1,355 | | | | 1,426 | | |
Illinois Health Facilities Authority,
Covenant Retirement Communities,
Series A (RAAI) (RB)
3.375%, 12/01/06 | | | 1,365 | | | | 1,367 | | |
Short Tax Free Fund (continued)
| DESCRIPTION | | PAR (000) | | VALUE (000) | |
Illinois Health Facilities Authority,
University of Chicago,
Hospital & Health (MBIA) (RB)
5.000%, 08/15/07 | | $ | 1,000 | | | $ | 1,034 | | |
Illinois State Toll Highway Authority,
Pre-refunded 07/01/06 @ 100,
Callable until 12/31/09 @ 100 (RB)
6.750%, 01/01/10 (b) | | | 10 | | | | 10 | | |
Lake County Community Unit School District #60,
Waukegan, Series A (FSA) (GO)
6.000%, 12/01/05 | | | 1,115 | | | | 1,121 | | |
Lake County School District #112,
Highland Park (GO)
9.000%, 12/01/06 | | | 1,655 | | | | 1,765 | | |
| 9.000%, 12/01/07 | | | 1,000 | | | | 1,119 | | |
| | | | 25,955 | | |
| Indiana – 3.2% | | | |
Gary Sanitation District,
Special Tax District (GO) (RAAI)
3.500%, 02/01/07 | | | 1,105 | | | | 1,108 | | |
Indiana Health Facility Financing Authority,
Ascension Health Credit (RB)
5.000%, 05/01/09 | | | 7,000 | | | | 7,363 | | |
Indiana State Development Finance Authority,
Waste Management Income Project,
Mandatory Put 10/01/05 @ 100 (AMT) (RB)
2.700%, 10/01/31 | | | 1,000 | | | | 1,000 | | |
New Albany & Floyd County
School Building (FSA) (RB)
5.000%, 01/15/10 | | | 1,310 | | | | 1,394 | | |
| | | | 10,865 | | |
| Iowa – 0.1% | | | |
Scott County, Ridgecrest Village (RB)
4.000%, 11/15/06 | | | 500 | | | | 498 | | |
| Kansas – 0.4% | | | |
Augusta Electric Generating & Distribution
System, Escrowed to Maturity,
Callable 11/15/05 @ 100 (RB)
6.700%, 11/15/07 (a) | | | 1,440 | | | | 1,473 | | |
| Kentucky – 0.2% | | | |
Kentucky State Turnpike Authority,
Escrowed to Maturity,
Callable until 06/30/07 @ 100 (RB)
6.125%, 07/01/07 (a) | | | 225 | | | | 233 | | |
Owensboro Electric, Light & Power,
Escrowed to Maturity,
Callable 01/01/06 @ 100 (RB)
6.850%, 01/01/08 (a) | | | 445 | | | | 464 | | |
| | | | 697 | | |
| Louisiana – 3.5% | | | |
Louisiana State Health & Education Authority,
Lambeth House Project,
Pre-refunded 10/01/06 @ 102 (RB)
9.000%, 10/01/26 (b) | | | 1,000 | | | | 1,078 | | |
Louisiana State, Series A (GO)
5.000%, 08/01/09 | | | 8,000 | | | | 8,453 | | |
Tangipahoa Parish Hospital Service District #1,
North Oaks Medical Center Project (RB)
5.000%, 02/01/11 | | | 2,035 | | | | 2,107 | | |
| | | | 11,638 | | |
The accompanying notes are an integral part of the financial statements.
FIRST AMERICAN FUNDS Annual Report 2005
88
Short Tax Free Fund (continued)
| DESCRIPTION | | PAR (000) | | VALUE (000) | |
| Massachusetts – 2.2% | | | |
Massachusetts State, Series C (GO)
5.000%, 09/01/09 (f) | | $ | 4,000 | | | $ | 4,253 | | |
Massachusetts State, Series E (GO)
5.500%, 01/01/09 | | | 3,000 | | | | 3,210 | | |
| | | | 7,463 | | |
| Michigan – 4.7% | | | |
Michigan Municipal Bond Authority, Series A,
Escrowed to Maturity (RB)
6.150%, 10/01/05 (a) | | | 1,500 | | | | 1,500 | | |
Michigan State Hospital Finance Authority,
Genesys Health System, Series A,
Pre-refunded 10/01/05 @ 100 (RB)
7.500%, 10/01/27 (b) | | | 6,620 | | | | 6,621 | | |
Michigan State Hospital Finance Authority,
Harper-Grace Hospital, Escrowed to Maturity,
Callable until 04/30/09 @ 100 (RB)
7.125%, 05/01/09 (a) | | | 320 | | | | 343 | | |
Michigan State Hospital Finance Authority,
Henry Ford Health System, Series A (RB)
5.000%, 03/01/06 | | | 1,000 | | | | 1,008 | | |
Michigan State Hospital Finance Authority,
Marquette General Hospital Obligated Group (RB)
5.000%, 05/15/10 | | | 1,205 | | | | 1,260 | | |
| 5.000%, 05/15/11 | | | 1,000 | | | | 1,047 | | |
Michigan State Hospital Finance Authority,
Oakwood Obligated Group (RB)
5.000%, 11/01/06 | | | 1,000 | | | | 1,019 | | |
Michigan State Strategic Fund,
Dow-Chemical Project,
Mandatory Put 06/01/06 @ 100 (RB)
3.800%, 06/01/14 (e) | | | 1,800 | | | | 1,805 | | |
Michigan Strategic Fund Limited Obligation,
Ford Motor Company Project, Series A (RB)
7.100%, 02/01/06 | | | 1,085 | | | | 1,087 | | |
| | | | 15,690 | | |
| Minnesota – 5.9% | | | |
Hennepin County, Series A (GO) (SPA)
2.610%, 12/01/25 (e) | | | 1,800 | | | | 1,800 | | |
Hennepin County Housing & Redevelopment
Authority, Loring Park Apartments,
Callable 08/15/06 @ 102.50, Mandatory
Put 02/15/09 @ 100 (AMT) (FNMA) (RB)
3.050%, 06/15/34 (e) | | | 2,000 | | | | 1,971 | | |
Minneapolis Children's Theatre Project,
Callable until 09/30/33 @ 100 (RB)
2.710%, 10/01/33 (e) | | | 2,000 | | | | 2,000 | | |
Minneapolis Convention Center (GO) (SPA)
2.610%, 12/01/18 (e) | | | 1,000 | | | | 1,000 | | |
Minneapolis Convention Center,
Series A (GO) (SPA)
2.610%, 12/01/14 (e) | | | 1,000 | | | | 1,000 | | |
Minneapolis Guthrie Parking Ramp,
Callable until 11/30/28 @ 100 (GO) (SPA)
2.610%, 12/01/28 (e) | | | 300 | | | | 300 | | |
Minneapolis Healthcare System,
Allina Health System, Series A (RB)
5.000%, 11/15/06 | | | 1,895 | | | | 1,932 | | |
Minneapolis Healthcare System,
Fairview Health Services,
Series B (AMBAC) (RB) (SPA)
2.760%, 11/15/29 (e) | | | 400 | | | | 400 | | |
Short Tax Free Fund (continued)
| DESCRIPTION | | PAR (000) | | VALUE (000) | |
Minneapolis Housing, One Ten Grant
Project (FNMA) (RB)
2.610%, 09/01/08 (e) | | $ | 500 | | | $ | 500 | | |
Minneapolis Library (GO)
2.610%, 12/01/32 (e) | | | 1,200 | | | | 1,200 | | |
Minneapolis Multifamily Housing,
Headwigs Assisted Living Project (RB)
2.710%, 12/01/27 (e) | | | 400 | | | | 400 | | |
Minnesota Municipal Power Agency (RB)
4.500%, 10/01/10 | | | 1,000 | | | | 1,044 | | |
Minnesota State Higher Education Facilities
Authority, Carleton College, Series 5-G (RB) (SPA)
2.610%, 11/01/29 (e) | | | 950 | | | | 950 | | |
Minnesota State Higher Education Facilities
Authority, Series 4S,
Mandatory Put 04/01/08 @ 100 (RB)
4.600%, 04/01/28 (e) | | | 1,200 | | | | 1,234 | | |
Minnesota State Higher Education Facilities
Authority, St. Catherine College,
Series 5-N2 (RB) (VRDO)
2.710%, 10/01/32 (e) | | | 900 | | | | 900 | | |
Monticello, Big Lake Community Hospital District,
Series C (RB)
4.250%, 12/01/07 | | | 1,275 | | | | 1,273 | | |
Northwestern Mutual Life Insurance Co.
Tax-Exempt Mortgage Trust #1 (RB)
7.605%, 02/15/09 (e) | | | 23 | | | | 23 | | |
St. Cloud Infrastructure Management (GO) (VRDO)
2.660%, 02/01/16 (e) | | | 400 | | | | 400 | | |
St. Paul Housing & Redevelopment Authority,
Cretin-Derham Project (RB) (VRDO)
2.760%, 02/01/26 (e) | | | 300 | | | | 300 | | |
St. Paul Port Authority Lease Revenue,
Healtheast Midway Campus (RB)
5.000%, 05/01/10 | | | 700 | | | | 706 | | |
University of Minnesota, Series A, (RB) (SPA)
2.820%, 01/01/34 (e) | | | 400 | | | | 400 | | |
| | | | 19,733 | | |
| Mississippi – 1.0% | | | |
Mississippi State, Escrowed to Maturity (GO)
6.200%, 02/01/08 (a) | | | 3,025 | | | | 3,205 | | |
| Missouri – 1.4% | |
Boone County Hospital (RB)
5.000%, 08/01/06 | | | 1,615 | | | | 1,639 | | |
Little Blue Valley Sewer District,
Escrowed to Maturity,
Callable until 09/30/07 @ 100 (RB)
5.500%, 10/01/07 (a) | | | 1,000 | | | | 1,048 | | |
Missouri State Development Finance Board,
Branson, Series A (RB)
5.000%, 12/01/05 | | | 1,000 | | | | 1,003 | | |
St. Louis International Airport, Series A (FSA) (RB)
5.000%, 07/01/07 | | | 1,100 | | | | 1,137 | | |
| | | | 4,827 | | |
| Nebraska – 1.3% | | | |
Douglas County Hospital Authority #002,
Nebraska Medical Center (GTY) (RB)
5.000%, 11/15/07 | | | 1,000 | | | | 1,034 | | |
| 5.000%, 11/15/08 | | | 1,000 | | | | 1,044 | | |
Nebraska Investment Finance Authority,
Catholic Health Initiatives, Series A (RB)
5.500%, 12/01/07 | | | 2,000 | | | | 2,094 | | |
| | | | 4,172 | | |
FIRST AMERICAN FUNDS Annual Report 2005
89
Schedule of Investments September 30, 2005
Short Tax Free Fund (continued)
| DESCRIPTION | | PAR (000) | | VALUE (000) | |
| Nevada – 1.8% | |
Clark County Pollution Control, Series A,
Mandatory Put 03/02/09 @ 100 (AMT) (RB)
3.250%, 06/01/31 (e) | | $ | 3,000 | | | $ | 2,942 | | |
Clark County Pollution Control, Series C,
Mandatory Put 03/02/09 @ 100 (AMT) (RB)
3.250%, 06/01/31 (e) | | | 3,000 | | | | 2,942 | | |
| | | | 5,884 | | |
| New Jersey – 5.3% | | | |
New Jersey Economic Development Authority,
Arbor Glen Project, Series A,
Pre-refunded 05/15/06 @ 102 (RB)
8.000%, 05/15/12 (b) | | | 1,820 | | | | 1,906 | | |
New Jersey Economic Development Authority,
Cigarette Tax (RB)
5.000%, 06/15/07 | | | 2,000 | | | | 2,051 | | |
New Jersey Economic Development Authority,
School Facilities Construction, Series O (RB)
5.000%, 03/01/09 | | | 3,000 | | | | 3,162 | | |
New Jersey Healthcare Facilities Financing Authority,
Capital Health Systems, Series A (RB)
5.000%, 07/01/07 | | | 2,465 | | | | 2,523 | | |
| 5.000%, 07/01/08 | | | 1,585 | | | | 1,636 | | |
New Jersey State Transportation System,
Series C (RB)
5.000%, 06/15/09 | | | 3,490 | | | | 3,685 | | |
New Jersey State Turnpike Authority,
Escrowed to Maturity (RB)
6.750%, 01/01/09 (a) | | | 2,585 | | | | 2,607 | | |
| | | | 17,570 | | |
| New Mexico – 1.5% | | | |
Gallup Pollution Control,
Tri-state Generation (AMBAC) (RB)
5.000%, 08/15/10 | | | 1,910 | | | | 2,035 | | |
Sandoval County Incentive Payment,
Escrowed to Maturity (RB)
4.250%, 12/01/06 (a) | | | 3,000 | | | | 3,047 | | |
| | | | 5,082 | | |
| New York – 7.4% | | | |
Monroe County Airport Authority,
Greater Rochester International (AMT) (MBIA) (RB)
5.000%, 01/01/09 | | | 1,175 | | | | 1,228 | | |
New York, Series G (GO)
5.000%, 08/01/08 | | | 1,615 | | | | 1,697 | | |
New York, Series H (GO)
4.000%, 08/01/08 | | | 1,675 | | | | 1,715 | | |
New York, Series O (GO)
5.000%, 06/01/09 | | | 11,960 | | | | 12,649 | | |
New York State Dormitory Authority, Mental Health,
Series F-1 (RB)
5.000%, 02/15/07 | | | 2,000 | | | | 2,050 | | |
New York State Dormitory Authority,
Rochester General Hospital (RB)
5.000%, 12/01/10 | | | 1,970 | | | | 2,096 | | |
Port Authority of New York & New Jersey (AMT) (RB)
5.000%, 07/15/07 | | | 3,125 | | | | 3,222 | | |
| | | | 24,657 | | |
| North Carolina – 2.4% | | | |
North Carolina Medical Care Commission,
Health Care Facilities, Series A (RB)
2.500%, 11/01/07 | | | 1,000 | | | | 982 | | |
Short Tax Free Fund (continued)
| DESCRIPTION | | PAR (000) | | VALUE (000) | |
North Carolina Medical Care Commission,
Novant Health Obligated Group, Series A (RB)
5.000%, 11/01/07 | | $ | 5,325 | | | $ | 5,519 | | |
University North Carolina Chapel Hill,
University Hospital, Series A (RB)
5.000%, 02/01/10 | | | 1,060 | | | | 1,119 | | |
| 5.000%, 02/01/11 | | | 500 | | | | 531 | | |
| | | | 8,151 | | |
| Ohio – 1.8% | | | |
Allen County Economic Development,
Young Men's Christian Association,
Mandatory Put 04/14/08 @ 100 (RB)
3.000%, 04/15/18 (e) | | | 5,000 | | | | 4,956 | | |
Toledo-Lucas County Port Authority,
Crocker Park Public Improvement Project (RB)
3.000%, 12/01/06 | | | 1,090 | | | | 1,086 | | |
| | | | 6,042 | | |
| Oklahoma – 0.7% | | | |
Oklahoma Development Finance Authority,
Conocophillips Company Project, Mandatory Put
12/01/05 @ 100 (AMT) (GTY) (RB) (VRDO)
2.420%, 12/01/38 (e) | | | 1,000 | | | | 999 | | |
Ponca City Utility Authority, Escrowed to Maturity,
Callable until 06/30/08 @ 100 (RB)
6.000%, 07/01/08 (a) | | | 1,110 | | | | 1,195 | | |
| | | | 2,194 | | |
| Pennsylvania – 2.8% | | | |
Chartiers Valley Industrial & Commercial
Development Authority, Friendship Village South,
Series A (RB)
3.150%, 08/15/06 | | | 400 | | | | 398 | | |
| 3.450%, 08/15/07 | | | 300 | | | | 297 | | |
Hampden Township Sewer Authority,
Escrowed to Maturity,
Callable until 03/31/07 @ 100 (RB)
6.150%, 04/01/07 (a) | | | 905 | | | | 934 | | |
Pennsylvania Higher Education Facilities Authority,
University of Pennsylvania, Health Systems,
Series B (RB)
5.000%, 08/15/08 | | | 5,000 | | | | 5,200 | | |
Pittsburgh, Series A (GO) (MBIA)
5.000%, 09/01/09 | | | 1,515 | | | | 1,607 | | |
Ringgold School District Authority,
Escrowed to Maturity,
Callable until 01/14/08 @ 100 (RB)
6.700%, 01/15/08 (a) | | | 995 | | | | 1,047 | | |
| | | | 9,483 | | |
| Puerto Rico – 3.9% | | | |
Puerto Rico Commonwealth,
Highway Transportation Authority, Series AA (RB)
5.000%, 07/01/07 | | | 7,200 | | | | 7,424 | | |
Puerto Rico Commonwealth, Series C,
Mandatory Put 07/01/08 @ 100 (GO)
5.000%, 07/01/18 (e) | | | 4,250 | | | | 4,419 | | |
Puerto Rico Electric Power Authority, Series 00 (RB)
4.000%, 07/01/07 | | | 1,000 | | | | 1,014 | | |
| | | | 12,857 | | |
| Rhode Island – 0.6% | | | |
Rhode Island Housing & Mortgage Financial,
Homeowner Opportunity, Series 50-C (AMT) (RB)
4.000%, 04/01/08 | | | 2,070 | | | | 2,097 | | |
The accompanying notes are an integral part of the financial statements.
FIRST AMERICAN FUNDS Annual Report 2005
90
Short Tax Free Fund (continued)
| DESCRIPTION | | PAR (000) | | VALUE (000) | |
| South Carolina – 2.8% | | | |
Charleston County Hospital Facilities,
Carealliance Health Services, Series A (RB)
5.000%, 08/15/06 | | $ | 2,210 | | | $ | 2,243 | | |
| 5.000%, 08/15/07 | | | 700 | | | | 720 | | |
Piedmont Municipal Power Agency,
Subseries B-3 (AMBAC) (RB) (VRDO)
2.720%, 01/01/34 | | | 1,000 | | | | 1,000 | | |
Richland-Lexington Columbia
Apartments (AMT) (CIFG) (RB)
4.000%, 01/01/07 (f) | | | 670 | | | | 677 | | |
| 4.000%, 01/01/08 (f) | | | 700 | | | | 710 | | |
South Carolina Jobs Economic Development
Authority, Palmetto Health Alliance, Series C (RB)
4.500%, 08/01/06 | | | 660 | | | | 665 | | |
South Carolina State Ports
Authority (AMT) (FSA) (RB)
5.500%, 07/01/07 | | | 3,330 | | | | 3,465 | | |
| | | | 9,480 | | |
| South Dakota – 0.5% | | | |
Sioux Falls Health Facilities,
Dow Rummel Village Project, Series B,
Mandatory Put 11/15/07 @ 100,
Callable 11/15/07 @ 100 (RB)
4.750%, 11/15/33 | | | 1,675 | | | | 1,678 | | |
| Tennessee – 0.5% | | | |
Sullivan County Health Educational & Housing
Facilities, Wellmont Health Systems Project (RB)
4.500%, 09/01/06 | | | 1,500 | | | | 1,509 | | |
| Texas – 13.7% | | | |
Brazos River Authority,
Utilities Electric Co., Series B,
Mandatory Put 06/19/06 @ 100 (AMT) (RB)
5.050%, 06/01/30 (e) | | | 1,730 | | | | 1,746 | | |
Donna Independent School District (GO)
4.000%, 02/15/11 | | | 1,505 | | | | 1,542 | | |
Gulf Coast Waste Disposal Authority, Series C,
Mandatory Put 05/01/06 @ 100 (AMT) (RB)
3.200%, 05/01/28 | | | 4,000 | | | | 3,991 | | |
Houston Health Facilities Development,
Buckingham Senior Living Community,
Series A, Callable 02/15/09 @ 100 (RB)
4.900%, 02/15/10 | | | 1,020 | | | | 1,023 | | |
Jefferson County Health Facilities Development
Authority, Baptist Hospitals (AMBAC) (FHA) (RB)
4.200%, 08/15/07 | | | 1,450 | | | | 1,475 | | |
Laredo Independent School District (GO) (PSFG)
6.750%, 08/01/08 | | | 2,150 | | | | 2,352 | | |
Lubbock Health Facilities Development,
St. Joseph Health Systems (FSA) (RB)
5.000%, 07/01/07 | | | 7,100 | | | | 7,322 | | |
North Central Taxes Health Facility Development,
Baylor Health Care Systems Project (RB)
5.500%, 05/15/06 | | | 3,500 | | | | 3,549 | | |
| 5.500%, 05/15/07 | | | 1,000 | | | | 1,033 | | |
Northside Independent School District, Series B,
Callable 02/01/06 @ 100,
Mandatory Put 08/01/06 @ 100 (GO) (PSFG)
2.450%, 08/01/33 (e) | | | 6,600 | | | | 6,547 | | |
Pflugerville Independent School District (GO)
5.000%, 08/15/09 | | | 1,595 | | | | 1,692 | | |
Short Tax Free Fund (continued)
| DESCRIPTION | | PAR (000) | | VALUE (000) | |
Richardson Hospital Authority (RB)
4.000%, 12/01/06 | | $ | 1,165 | | | $ | 1,172 | | |
| 5.000%, 12/01/07 | | | 1,230 | | | | 1,265 | | |
Southeast Hospital Financing Agency,
Memorial Hospital System Project,
Escrowed to Maturity,
Callable until 11/30/08 @ 100 (RB)
8.500%, 12/01/08 (a) | | | 670 | | | | 724 | | |
Tarrant Regional Water District (FSA) (RB)
5.000%, 03/01/08 | | | 2,275 | | | | 2,372 | | |
Texas State Turnpike Authority (RB)
5.000%, 06/01/08 | | | 7,000 | | | | 7,325 | | |
Tyler Health Facilities Development,
Mother Frances Hospital (RB)
5.000%, 07/01/07 | | | 575 | | | | 590 | | |
| | | | 45,720 | | |
| Utah – 0.6% | | | |
Utah State Board, University of Utah Hospital,
Series A (MBIA) (RB)
5.000%, 08/01/09 | | | 1,855 | | | | 1,962 | | |
| Virgin Islands – 0.5% | |
Virgin Islands Public Finance Authority (RB)
4.000%, 10/01/05 | | | 1,500 | | | | 1,500 | | |
| Virginia – 0.7% | |
Chesapeake Hospital Authority,
Chesapeake General Hospital, Series A (RB)
5.000%, 07/01/07 | | | 2,300 | | | | 2,354 | | |
| Washington – 1.1% | |
Portland & Seattle Intermediate Lien, Series A (RB)
5.000%, 03/01/10 | | | 2,000 | | | | 2,137 | | |
Washington State Housing Finance Commission,
Presbyterian Ministries, Series A,
Pre-refunded 07/01/06 @ 102 (RB)
6.850%, 07/01/21 (b) | | | 1,390 | | | | 1,458 | | |
| | | | 3,595 | | |
| West Virginia – 0.9% | | | |
Putnam County Pollution Control,
Appalachian Power Company Project, Series E,
Mandatory Put 11/01/06 @ 100 (RB)
2.800%, 05/01/19 (e) | | | 3,000 | | | | 2,963 | | |
| Wisconsin – 1.4% | |
Wisconsin State Health & Educational Facilities
Authority, Children's Hospital of Wisconsin,
Series A (RB)
4.500%, 08/15/08 | | | 1,500 | | | | 1,547 | | |
Wisconsin State Health & Educational
Facilities Authority, Froedert & Community
Health, Series A (RB)
5.000%, 04/01/10 | | | 1,000 | | | | 1,060 | | |
Wisconsin State Health & Educational Facilities
Authority, Gundersen Lutheran,
Series A (FSA) (RB)
5.000%, 02/15/08 | | | 1,000 | | | | 1,040 | | |
Wisconsin State Health & Educational Facilities
Authority, Wheaton Franciscan Services,
Series A (RB)
5.000%, 08/15/07 | | | 1,000 | | | | 1,030 | | |
| | | | 4,677 | | |
Total Municipal Bonds
(Cost $332,791) | | | | | | | 331,992 | | |
FIRST AMERICAN FUNDS Annual Report 2005
91
Schedule of Investments September 30, 2005
Short Tax Free Fund (concluded)
| DESCRIPTION | | SHARES | | VALUE (000) | |
| Affiliated Money Market Fund – 2.0% | | | |
First American Tax Free Obligations Fund, Class Z (g)
(Cost $6,835) | | | 6,835,071 | | | $ | 6,835 | | |
Total Investments – 101.5%
(Cost $339,626) | | | | | 338,827 | | |
| Other Assets and Liabilities, Net – (1.5)% | | | | | (5,077 | ) | |
| Total Net Assets – 100.0% | | | | $ | 333,750 | | |
(a) Escrowed to Maturity issues are typically backed by U.S. Government obligations. If callable, these bonds may still be subject to call at the call date and price indicated.
(b) Pre-refunded issues are typically backed by U.S. Government obligations. These bonds mature at the call date and price indicated.
(c) The rate shown is the effective yield at the time of purchase.
(d) Delayed Interest (Step-Bonds) – Securities for which the coupon rate of interest will adjust on specified future date(s). The rate disclosed represents the coupon rate in effect as of September 30, 2005.
(e) Variable Rate Security – The rate shown is the rate in effect as of September 30, 2005.
(f) Security purchased on a when-issued basis. On September 30, 2005, the total cost of investments purchased on a when-issued basis was $5,636,221 or 1.7% of total net assets. See note 2 in Notes to Financial Statements.
(g) Investment in affiliated security. This money market fund is advised by U.S. Bancorp Asset Management, Inc., which also serves as advisor for this fund. See note 3 in Notes to Financial Statements.
AMBAC – American Municipal Bond Assurance Corporation
AMT – Alternative Minimum Tax. As of September 30, 2005, the aggregate market value of securities subject to the AMT was $37,463,066, which represents 11.2% of net assets.
CIFG – CDC IXIS Financial Guaranty
COP – Certificate of Participation
FHA – Federal Housing Authority
FNMA – Federal National Mortgage Association
FSA – Financial Security Assurance
GO – General Obligation
GTY – Assured Guaranty
MBIA – Municipal Bond Insurance Association
PSFG – Permanent School Fund Guarantee
PUFG – Permanent University Fund Guarantee
RAAI – Radian Asset Assurance Inc.
RB – Revenue Bond
SPA – Standby Purchase Agreement
VRDO – Variable Rate Demand Obligation. Floating or variable rate obligation maturing in more than one year. The interest rate is based on specific, or an index of, market interest rates, and is subject to change periodically. This instrument may also have a demand feature which allows the recovery of principal at any time, or at specific intervals not exceeding one year, on up to 30 days notice. Maturity date shown represents final maturity.
XLCA – XL Capital Assurance Inc.
Tax Free Fund
| DESCRIPTION | | PAR (000) | | VALUE (000) | |
| Municipal Bonds – 97.5% | |
| Alabama – 0.9% | |
Bessemer Water Revenue,
Callable 07/01/06 @ 102 (AMBAC) (RB)
5.750%, 07/01/16 | | $ | 2,500 | | | $ | 2,598 | | |
Camden Industrial Development Board
Weyerhauser Company, Series A,
Callable 12/01/13 @ 100 (RB)
6.125%, 12/01/24 | | | 1,000 | | | | 1,108 | | |
Camden Industrial Development Board
Weyerhauser Company, Series B,
Callable 12/01/13 @ 100 (AMT) (RB)
6.375%, 12/01/24 | | | 350 | | | | 383 | | |
| | | | 4,089 | | |
| Alaska – 1.9% | | | |
Alaska Energy Authority, Bradley Lake,
Third Series (FSA) (RB)
6.000%, 07/01/10 | | | 1,000 | | | | 1,112 | | |
| 6.000%, 07/01/11 | | | 4,040 | | | | 4,551 | | |
Alaska State Housing Finance Corporation,
Series A, Callable 06/01/07 @ 102 (MBIA) (RB)
5.900%, 12/01/19 | | | 695 | | | | 723 | | |
Alaska State Housing Finance
Corporation, Series A,
Pre-refunded 12/01/05 @ 105 (MBIA) (RB)
5.700%, 12/01/11 (a) | | | 505 | | | | 518 | | |
Anchorage, Series B,
Callable 07/01/12 @ 100 (MBIA) (GO)
5.000%, 07/01/22 | | | 2,000 | | | | 2,112 | | |
| | | | 9,016 | | |
| Arizona – 1.9% | | | |
Arizona Health Facilities Authority,
The Terraces Project, Series A,
Callable 11/15/13 @ 101 (RB)
7.500%, 11/15/23 | | | 3,000 | | | | 3,373 | | |
Arizona State Transportation Board,
Pre-refunded 07/01/09 @ 100 (RB)
6.000%, 07/01/12 (a) | | | 3,830 | | | | 4,206 | | |
Tempe Industrial Development Authority,
Friendship Villiage Project, Series A (RB)
5.375%, 12/01/13 | | | 1,300 | | | | 1,319 | | |
| | | | 8,898 | | |
| Arkansas – 0.3% | | | |
Washington County Arkansas Hospital,
Regional Medical Center, Series B,
Callable 02/01/15 @ 100 (RB)
5.000%, 02/01/30 | | | 1,500 | | | | 1,496 | | |
| California – 7.5% | |
Alameda Corridor Transportation Authority,
Series A, Zero Coupon Bond (AMBAC) (RB)
5.720%, 10/01/30 (b) | | | 8,000 | | | | 2,366 | | |
California State, Callable 04/01/09 @ 101 (GO)
4.750%, 04/01/22 | | | 500 | | | | 507 | | |
California State, Callable 02/01/13 @ 100 (GO)
5.000%, 02/01/21 | | | 5,500 | | | | 5,747 | | |
California State, Callable 02/01/14 @ 100 (GO)
5.000%, 02/01/33 | | | 2,000 | | | | 2,066 | | |
California Pollution Control Filing Authority,
Solid Waste Disposal Revenue,
Waste Management Project, Series B,
Callable 07/01/15 @ 101 (AMT) (GTY) (RB)
5.000%, 07/01/27 | | | 2,500 | | | | 2,480 | | |
The accompanying notes are an integral part of the financial statements.
FIRST AMERICAN FUNDS Annual Report 2005
92
Tax Free Fund (continued)
| DESCRIPTION | | PAR (000) | | VALUE (000) | |
California State Department of Water, Series A,
Callable 05/01/12 @ 101 (RB)
5.375%, 05/01/22 | | $ | 4,500 | | | $ | 4,898 | | |
California State Public Works Board
Mental Health-Coalinga, Series A,
Callable 06/01/14 @ 100 (RB)
5.500%, 06/01/19 | | | 3,000 | | | | 3,304 | | |
California Statewide Communities Development
Authority, Los Angeles Jewish Home,
Callable 11/01/13 @ 100 (CMI) (RB)
5.250%, 11/15/23 | | | 4,000 | | | | 4,216 | | |
Chula Vista Industrial Development,
San Diego Gas & Electric, Series A (AMT) (RB)
4.900%, 03/01/23 | | | 2,500 | | | | 2,507 | | |
Golden State Tobacco Securitization, Series B,
Pre-refunded 06/01/13 @ 100 (RB)
5.500%, 06/01/33 (a) | | | 6,940 | | | | 7,756 | | |
| | | | 35,847 | | |
| Colorado – 4.4% | | | |
Antelope Water Systems
General Improvement District,
Callable 12/01/15 @ 100 (GO)
5.125%, 12/01/35 | | | 1,000 | | | | 1,007 | | |
Colorado Housing & Finance Authority, Waste
Disposal Management Income Project (AMT) (RB)
5.700%, 07/01/18 | | | 1,590 | | | | 1,679 | | |
Colorado State Educational & Cultural
Facilities Authority, Classical Academy Charter
School Project,
Pre-refunded 12/01/11 @ 100 (RB)
7.250%, 12/01/21 (a) | | | 1,500 | | | | 1,802 | | |
Colorado State Health Facilities Authority,
Covenant Retirement Communities, Series B,
Callable 12/01/12 @ 101 (RB)
6.125%, 12/01/33 | | | 1,150 | | | | 1,229 | | |
Colorado State Health Facilities Authority,
Evangelical Lutheran Health Facilities,
Callable 10/01/12 @ 100 (RB)
5.900%, 10/01/27 | | | 2,500 | | | | 2,691 | | |
Colorado State Health Facilities Authority,
Parkview Medical Center,
Callable 09/01/11 @ 100 (RB)
6.500%, 09/01/20 | | | 1,000 | | | | 1,108 | | |
Colorado State Health Facilities Authority,
Vail Valley Medical Center,
Callable 01/15/12 @ 100 (RB)
5.800%, 01/15/27 | | | 1,500 | | | | 1,582 | | |
E-470 Public Highway Authority,
Capital Appreciation, Series A,
Zero Coupon Bond (MBIA) (RB)
5.350%, 09/01/34 (b) | | | 10,000 | | | | 2,409 | | |
E 470 Public Highway Authority,
Capital Appreciation, Series B,
Zero Coupon Bond (MBIA) (RB)
5.110%, 09/01/26 (b) | | | 5,385 | | | | 1,957 | | |
La Junta Hospital,
Arkansas Valley Medical Center Project,
Callable 04/01/09 @ 101 (RB)
6.000%, 04/01/19 | | | 1,000 | | | | 1,048 | | |
Montrose Memorial Hospital,
Callable 12/01/13 @ 102 (RB)
6.000%, 12/01/28 | | | 1,000 | | | | 1,039 | | |
| 6.000%, 12/01/33 | | | 1,000 | | | | 1,032 | | |
Tax Free Fund (continued)
| DESCRIPTION | | PAR (000) | | VALUE (000) | |
Northwest Parkway Public Highway Authority,
Zero Coupon Bond (AMBAC) (RB)
6.290%, 06/15/29 (b) | | $ | 10,000 | | | $ | 2,624 | | |
| | | | 21,207 | | |
| Florida – 2.8% | | | |
Capital Trust Agency, Fort Lauderdale Project,
Callable 01/01/14 @ 101 (AMT) (RB)
5.750%, 01/01/32 | | | 1,000 | | | | 1,008 | | |
Florida State Department of Transportation,
Alligator Alley,
Callable 07/01/07 @ 101 (FGIC) (RB)
5.125%, 07/01/13 | | | 1,280 | | | | 1,334 | | |
Florida State Department of Transportation
Right-of-Way, Callable 07/01/06 @ 101 (GO)
5.250%, 07/01/17 | | | 5,525 | | | | 5,661 | | |
Palm Beach County, Park & Recreational Facilities,
Pre-refunded 11/01/06 @ 102 (FSA) (RB)
5.250%, 11/01/16 (a) | | | 5,000 | | | | 5,206 | | |
| | | | 13,209 | | |
| Georgia – 2.7% | | | |
Fulton County Developement Authority,
Maxon Atlantic Station, Series A (AMT) (RB)
5.125%, 03/01/26 | | | 2,300 | | | | 2,294 | | |
Fulton County Residential Care Facilities,
Canterbury Court Project, Series A,
Callable 02/15/14 @ 101 (RB)
6.125%, 02/15/26 | | | 1,500 | | | | 1,560 | | |
| 6.125%, 02/15/34 | | | 2,500 | | | | 2,561 | | |
Gainesville & Hall County Hospital Authority,
Northeast Georgia Health Systems Project,
Callable 05/15/11 @ 100 (RB)
5.500%, 05/15/31 | | | 5,000 | | | | 5,165 | | |
Georgia Municipal Electric Authority Power,
Series BB (MBIA) (RB)
5.250%, 01/01/25 | | | 1,000 | | | | 1,128 | | |
| | | | 12,708 | | |
| Hawaii – 1.8% | | | |
Hawaii State, Series CN,
Pre-refunded 03/01/07 @ 102 (FGIC) (GO)
5.500%, 03/01/14 (a) | | | 8,000 | | | | 8,430 | | |
| Illinois – 11.1% | |
Bolingbrook, Residential Mortgages,
Escrowed to Maturity (FGIC) (RB)
7.500%, 08/01/10 (c) | | | 990 | | | | 1,103 | | |
Cook County, Series A (MBIA) (GO)
6.250%, 11/15/12 | | | 9,090 | | | | 10,541 | | |
Cook County Community School District #97,
Oak Park, Series B (FGIC) (GO)
9.000%, 12/01/11 | | | 2,235 | | | | 2,896 | | |
Illinois Development Finance Authority,
Adventist Health System,
Callable 11/15/09 @ 101 (RB)
5.500%, 11/15/29 | | | 5,000 | | | | 5,180 | | |
Illinois Financial Authority,
Friendship Village Schaumburg, Series A,
Callable 02/15/15 @ 100 (RB)
5.375%, 02/15/25 | | | 1,700 | | | | 1,715 | | |
Illinois Health Facilities Authority,
Condell Medical Center,
Callable 05/15/12 @ 100 (RB)
5.500%, 05/15/32 | | | 2,500 | | | | 2,574 | | |
FIRST AMERICAN FUNDS Annual Report 2005
93
Schedule of Investments September 30, 2005
Tax Free Fund (continued)
| DESCRIPTION | | PAR (000) | | VALUE (000) | |
Illinois Health Facilities Authority,
Covenant Retirement Communities,
Callable 12/01/11 @ 101 (RB)
5.875%, 12/01/31 | | $ | 4,500 | | | $ | 4,687 | | |
Illinois Health Facilities Authority,
Covenant Retirement Communities, Series A,
Callable 12/01/12 @ 100 (RAAI) (RB)
5.500%, 12/01/22 | | | 4,000 | | | | 4,240 | | |
Illinois Health Facilities Authority,
Lutheran Senior Ministries, Series A,
Callable 08/15/11 @ 101 (RB)
7.375%, 08/15/31 | | | 3,000 | | | | 3,235 | | |
Illinois State, Callable 05/01/06 @ 102 (MBIA) (GO)
5.750%, 05/01/21 | | | 1,410 | | | | 1,459 | | |
Illinois State, Callable 02/01/07 @ 101 (FGIC) (GO)
5.250%, 02/01/13 | | | 1,400 | | | | 1,452 | | |
Illinois State Development Finance Authority,
Pollution Control Illinois Power Company Project,
Series A, Pre-refunded 07/01/06 @ 102 (RB)
7.375%, 07/01/21 (a) | | | 500 | | | | 526 | | |
Illinois State Development Finance Authority,
Waste Management Project (AMT) (RB)
5.850%, 02/01/07 | | | 1,000 | | | | 1,029 | | |
Illinois State Educational Facilities Authority,
Augustana College,
Pre-refunded 10/01/07 @ 100 (CLE) (RB)
5.875%, 10/01/17 (a) | | | 500 | | | | 528 | | |
Illinois State Educational Facilities Authority,
Augustana College,
Pre-refunded 10/01/08 @ 100 (RB)
5.250%, 10/01/18 (a) | | | 1,000 | | | | 1,055 | | |
Illinois State Toll Highway Authority, Series A (RB)
6.300%, 01/01/12 | | | 1,000 | | | | 1,147 | | |
McHenry County Community Unit,
School District #20 Woodstock, Series A,
Callable 01/01/08 @ 100 (FSA) (GO)
5.850%, 01/01/16 | | | 560 | | | | 591 | | |
Metropolitan Pier & Exposition Authority,
McCormick Place, Illinois Dedicated State Tax,
Class B, Zero Coupon Bond (MBIA) (RB)
5.650%, 06/15/22 (b) | | | 5,000 | | | | 3,049 | | |
Northern Illinois University,
Auxiliary Facilities Systems, Partially
Pre-refunded 04/01/07 @ 100 (FGIC) (RB)
5.700%, 04/01/16 (a) | | | 1,000 | | | | 1,036 | | |
Rock Island, Friendship Manor Project,
Escrowed to Maturity (RB)
7.000%, 06/01/06 (c) | | | 260 | | | | 260 | | |
Rockford Multifamily Housing,
Rivers Edge Apartments, Series A,
Callable 01/20/08 @ 102 (AMT) (GNMA) (RB)
5.875%, 01/20/38 | | | 1,215 | | | | 1,251 | | |
Southern Illinois University, Housing & Auxiliary,
Series A, Zero Coupon Bond (MBIA) (RB)
5.500%, 04/01/20 (b) | | | 2,280 | | | | 1,174 | | |
St. Clair County,
Callable 10/01/09 @ 102 (FGIC) (GO)
6.000%, 10/01/11 | | | 2,020 | | | | 2,251 | | |
| | | | 52,979 | | |
| Indiana – 3.2% | | | |
Crown Point, Multi-School Building Corporation,
First Mortgage (MBIA) (RB)
7.875%, 01/15/06 | | | 2,630 | | | | 2,667 | | |
Tax Free Fund (continued)
| DESCRIPTION | | PAR (000) | | VALUE (000) | |
Indiana State Municipal Power Agency,
Power Supply, Series B (MBIA) (RB)
6.000%, 01/01/11 | | $ | 1,000 | | | $ | 1,118 | | |
| 6.000%, 01/01/12 | | | 1,000 | | | | 1,131 | | |
Indiana Transportation Finance Authority,
Series A (AMBAC) (RB)
5.750%, 06/01/12 | | | 3,185 | | | | 3,592 | | |
Indianapolis Airport Authority, Special Facilities,
Federal Express Corporation
Project (AMT) (GTY) (RB)
5.100%, 01/15/17 | | | 3,000 | | | | 3,144 | | |
St. Joseph County Industries Hospital Authority,
Madison Center Obligation Group Project,
Callable 02/15/15 @ 100 (RB)
5.250%, 02/15/28 | | | 3,500 | | | | 3,544 | | |
| | | | 15,196 | | |
| Iowa – 1.0% | | | |
Iowa Higher Education Loan Authority,
Central College Project,
Callable 10/01/11 @ 100 (RAAI) (RB)
5.500%, 10/01/31 | | | 1,500 | | | | 1,577 | | |
Iowa Higher Education Loan Authority,
Private College Facility – Simpson College,
Callable 12/01/10 @ 102 (RB)
5.100%, 12/01/35 | | | 2,000 | | | | 1,976 | | |
Muscatine Electric, Escrowed to Maturity,
Callable until 12/31/12 @ 100 (RB)
6.700%, 01/01/13 (c) | | | 920 | | | | 1,023 | | |
| | | | 4,576 | | |
| Louisiana – 1.5% | | | |
Baton Rouge Sales & Use Tax,
Public Improvements, Series A,
Callable 08/01/08 @ 101.50 (FGIC) (RB)
5.250%, 08/01/15 | | | 2,030 | | | | 2,159 | | |
Jefferson Parish, Drain Sales Tax (AMBAC) (RB)
5.000%, 11/01/11 | | | 1,000 | | | | 1,070 | | |
Jefferson Parish, Home Mortgage Authority,
Escrowed to Maturity,
Callable until 07/31/11 @ 100 (FGIC) (FHA) (RB)
7.100%, 08/01/11 (c) | | | 1,000 | | | | 1,161 | | |
Lafayette, Public Improvement Sales Tax,
Series B (FGIC) (RB)
7.000%, 03/01/08 | | | 1,000 | | | | 1,082 | | |
Louisiana Public Facilities Authority,
Tulane University of Louisiana, Series A-1,
Callable 11/15/07 @ 102 (MBIA) (RB)
5.100%, 11/15/14 | | | 1,500 | | | | 1,560 | | |
| | | | 7,032 | | |
| Massachusetts – 0.7% | | | |
Boston Industrial Development Financing Authority,
Crosstown Center Project,
Callable 09/01/12 @ 102 (AMT) (RB)
6.500%, 09/01/35 | | | 2,500 | | | | 2,505 | | |
Massachusetts State Health & Educational
Facilities Authority, Series D,
Callable 07/01/15 @ 100 (RB)
5.000%, 07/01/33 | | | 1,000 | | | | 995 | | |
| | | | 3,500 | | |
| Michigan – 2.1% | | | |
Haslett Public School District,
Pre-refunded 05/01/07 @ 100 (MBIA) (GO)
5.700%, 05/01/16 (a) | | | 1,200 | | | | 1,250 | | |
The accompanying notes are an integral part of the financial statements.
FIRST AMERICAN FUNDS Annual Report 2005
94
Tax Free Fund (continued)
| DESCRIPTION | | PAR (000) | | VALUE (000) | |
Kent Hospital Financial Authority,
Metropolitan Hospital Project, Series A,
Callable 07/01/15 @ 100 (RB)
5.250%, 07/01/30 | | $ | 2,000 | | | $ | 2,018 | | |
Lanse Creuse, Public Schools,
Pre-refunded 05/01/07 @ 100 (AMBAC) (GO)
5.250%, 05/01/16 (a) | | | 1,000 | | | | 1,035 | | |
Thornapple Kellogg School Building & Site,
Callable 11/01/12 @ 100 (MQSBLF) (GO)
5.500%, 05/01/14 | | | 1,485 | | | | 1,644 | | |
| 5.500%, 05/01/16 | | | 1,810 | | | | 2,008 | | |
Ypsilanti School District,
Pre-refunded 05/01/07 @ 100 (FGIC) (GO)
5.600%, 05/01/12 (a) | | | 2,000 | | | | 2,080 | | |
| | | | 10,035 | | |
| Minnesota – 5.1% | | | |
Cuyuna Range Hospital District,
Callable 06/01/13 @ 101 (RB)
5.200%, 06/01/25 | | | 1,000 | | | | 1,000 | | |
Cuyuna Range Hospital District, Series A,
Callable 06/01/07 @ 102 (RB)
6.000%, 06/01/29 | | | 650 | | | | 668 | | |
Fergus Falls Health Care Facilities Authority,
Series A, Callable until 10/31/05 @ 102 (RB)
7.000%, 11/01/19 | | | 150 | | | | 152 | | |
Minneapolis Health Care System,
Fairview Health Services, Series A,
Pre-refunded 05/15/12 @ 101 (RB)
5.625%, 05/15/32 (a) | | | 7,000 | | | | 7,853 | | |
Minnesota Agricultural & Economic Developement
Board, Health Care System, Fairview, Series A,
Callable 11/15/10 @ 101 (RB)
6.375%, 11/15/29 | | | 95 | | | | 103 | | |
Minnesota Agricultural & Economic Developement
Board, Health Care System, Fairview, Series A,
Pre-refunded 11/15/10 @ 101 (RB)
6.375%, 11/15/29 (a) | | | 2,905 | | | | 3,328 | | |
Minnesota State Housing Finance Agency,
Single Family Housing (AMT) (RB)
4.400%, 07/01/07 | | | 1,250 | | | | 1,273 | | |
Monticello, Big Lake Community Hospital, Series C,
Callable 12/01/12 @ 100 (RB)
6.200%, 12/01/22 | | | 2,995 | | | | 3,160 | | |
Shakopee Health Care Facilities
St. Francis Regional Medical Center,
Callable 09/01/14 @100 (RB)
5.250%, 09/01/34 | | | 1,000 | | | | 1,027 | | |
Southern Minnesota Municipal Power Agency,
Capital Appreciation, Series A,
Zero Coupon Bond (MBIA) (RB)
4.550%, 01/01/21 (b) | | | 3,500 | | | | 1,752 | | |
| 4.550%, 01/01/24 (b) | | | 6,745 | | | | 2,904 | | |
St. Anthony Housing & Redevelopment Authority
Chandler Place Project,
Callable 05/20/06 @ 102 (FHA) (GNMA) (RB)
6.250%, 11/20/25 | | | 1,000 | | | | 1,038 | | |
| | | | 24,258 | | |
| Missouri – 0.8% | | | |
Cape Girardeau County Authority,
Southeast Missouri Hospital,
Callable 06/01/12 @ 100 (RB)
5.750%, 06/01/32 | | | 2,500 | | | | 2,602 | | |
Tax Free Fund (continued)
| DESCRIPTION | | PAR (000) | | VALUE (000) | |
Sugar Creek, Lafarge North America, Series A,
Callable 06/01/13 @ 101 (AMT) (RB)
5.650%, 06/01/37 | | $ | 1,000 | | | $ | 1,039 | | |
| | | | 3,641 | | |
| Nebraska – 2.1% | | | |
Douglas County Zoo Facility,
Omaha Henry Doorly Zoo Project,
Callable until 08/31/24 @ 100 (RB)
4.750%, 09/01/24 | | | 3,000 | | | | 3,002 | | |
Hastings Electrical Systems,
Callable 05/01/11 @ 100 (FSA) (RB)
5.000%, 01/01/15 | | | 1,000 | | | | 1,069 | | |
Lincoln Nebraska Sanitation & Sewer,
Callable 06/15/15 @ 100 (RB)
4.500%, 06/15/30 | | | 1,130 | | | | 1,108 | | |
Nebraska Educational Finance Authority,
Concordia University Project,
Callable 12/15/08 @ 100 (RB)
5.250%, 12/15/15 | | | 500 | | | | 517 | | |
| 5.350%, 12/15/18 | | | 540 | | | | 556 | | |
Nebraska Educational Finance Authority,
Midland Lutheran College, Series A,
Callable 09/15/13 @ 100 (RB)
5.600%, 09/15/29 | | | 1,800 | | | | 1,801 | | |
Washington County Wastewater Facilities,
Cargill Project, Callable 11/01/12 @ 101 (RB)
5.900%, 11/01/27 | | | 1,700 | | | | 1,845 | | |
| | | | 9,898 | | |
| Nevada – 2.6% | | | |
Carson City, Carson-Tahoe Hospital Project,
Callable 09/01/12 @ 101 (RB)
5.750%, 09/01/31 | | | 5,000 | | | | 5,223 | | |
Clark County Industrial Development,
Southwest Gas Corporation Project, Series A,
Callable 07/01/14 @ 100 (AMBAC) (AMT) (RB)
5.250%, 07/01/34 | | | 4,000 | | | | 4,181 | | |
Director of the State of Nevada,
Development of Business & Industry,
Las Ventanas Retirement Project, Series B (RB)
6.000%, 11/15/14 | | | 750 | | | | 772 | | |
Director of the State of Nevada,
Development of Business & Industry,
Las Ventanas Retirement Project, Series B,
Callable 11/15/14 @ 100 (RB)
6.750%, 11/15/23 | | | 2,300 | | | | 2,368 | | |
| | | | 12,544 | | |
| New Hampshire – 0.4% | | | |
New Hampshire Health & Educational
Facilities Authority Covenant Health,
Callable 07/01/14 @ 100 (RB)
5.375%, 07/01/24 | | | 1,250 | | | | 1,314 | | |
New Hampshire Health & Educational
Facilities Authority, Speare Memorial Hospital,
Callable 07/01/15 @ 100 (RB)
5.875%, 07/01/34 | | | 800 | | | | 828 | | |
| | | | 2,142 | | |
| New Jersey – 0.8% | | | |
Camden County, Municipal Utilities Authority
Sewer Revenue Refunding, Series C,
Callable 07/15/08 @ 101 (FGIC) (GO)
5.100%, 07/15/12 | | | 3,500 | | | | 3,698 | | |
FIRST AMERICAN FUNDS Annual Report 2005
95
Schedule of Investments September 30, 2005
Tax Free Fund (continued)
| DESCRIPTION | | PAR (000) | | VALUE (000) | |
| New York – 0.8% | | | |
New York, Series C,
Callable 03/15/12 @ 100 (GO)
5.250%, 03/15/32 | | $ | 3,590 | | | $ | 3,764 | | |
| North Dakota – 0.5% | | | |
North Dakota State Board of Higher Education,
Bismark State College,
Callable 05/01/15 @ 100 (RB)
5.350%, 05/01/30 | | | 2,500 | | | | 2,459 | | |
| Ohio – 1.8% | | | |
Cincinnati Water System,
Callable 06/01/11 @ 100 (RB)
5.000%, 12/01/20 | | | 125 | | | | 132 | | |
Cleveland Waterworks, Series H,
Pre-refunded 01/01/06 @ 102 (MBIA) (RB)
5.750%, 01/01/16 (a) | | | 1,460 | | | | 1,500 | | |
Lucas County Port Authority,
Crocker Park Public Improvement Project,
Callable 12/01/13 @ 102 (GO)
5.250%, 12/01/23 | | | 2,000 | | | | 2,059 | | |
Ohio State Higher Education, Series B,
Callable 11/01/11 @ 100 (GO)
5.000%, 11/01/16 | | | 1,500 | | | | 1,610 | | |
Ohio State Higher Educational Facility,
Baldwin-Wallace College Project,
Callable 06/01/14 @ 100 (RB)
5.125%, 12/01/17 | | | 1,490 | | | | 1,556 | | |
| 5.250%, 12/01/19 | | | 1,540 | | | | 1,613 | | |
| | | | 8,470 | | |
| Oregon – 1.4% | | | |
Washington County Unified Sewer Agency,
Series 1 (FGIC) (RB)
5.750%, 10/01/10 | | | 6,110 | | | | 6,791 | | |
| Pennsylvania – 1.8% | | | |
Chester Upland School Authority, Series A,
Callable 09/01/07 @ 100 (FSA) (RB)
5.250%, 09/01/17 | | | 2,000 | | | | 2,073 | | |
Erie County Industrial Development Authority,
International Paper Company Project, Series A,
Callable 11/01/14 @ 100 (AMT) (RB)
5.000%, 11/01/18 | | | 1,350 | | | | 1,366 | | |
Pennsylvania State,
Callable 03/15/07 @ 101.50 (AMBAC) (GO)
5.125%, 09/15/11 | | | 5,000 | | | | 5,212 | | |
| | | | 8,651 | | |
| Puerto Rico – 2.3% | | | |
Puerto Rico Electric Power Authority, Series RR,
Callable 07/01/15 @ 100 (CIFG) (RB)
5.000%, 07/01/29 | | | 5,000 | | | | 5,268 | | |
Puerto Rico Public Building Authority, Series I,
Callable 07/01/14 @ 100 (COMGTY) (RB)
5.250%, 07/01/33 | | | 4,000 | | | | 4,236 | | |
Puerto Rico Public Finance, Series A,
Callable 02/01/12 @ 100,
Mandatory Put 02/01/12 @ 100 (RB)
5.750%, 08/01/27 | | | 1,000 | | | | 1,090 | | |
Puerto Rico Public Improvements,
Pre-refunded 07/01/10 @ 100 (MBIA) (GO)
5.750%, 07/01/26 (a) | | | 500 | | | | 551 | | |
| | | | 11,145 | | |
| Rhode Island – 1.1% | | | |
Rhode Island State, Series A,
Pre-refunded 08/01/07 @ 101 (MBIA) (GO)
5.125%, 08/01/12 (a) | | | 5,055 | | | | 5,291 | | |
Tax Free Fund (continued)
| DESCRIPTION | | PAR (000) | | VALUE (000) | |
| South Carolina – 1.3% | | | |
Lexington County Health Services District,
Lexington Medical Center,
Callable 11/01/13 @ 100 (RB)
5.500%, 11/01/23 | | $ | 2,000 | | | $ | 2,112 | | |
Richland-Lexington South Carolina Airport District,
Columbia Metropolitain Airport,
Callable 01/01/16 @ 100 (AMT)(CIFG)(RB)
4.500%, 01/01/24 (d) | | | 1,400 | | | | 1,371 | | |
South Carolina Jobs Economic Development
Authority, Palmetto Health Alliance, Series A,
Callable 08/01/13 @ 100 (RB)
6.125%, 08/01/23 | | | 1,250 | | | | 1,366 | | |
South Carolina Jobs Economic Development
Authority, Palmetto Health Alliance, Series C,
Callable 08/01/13 @ 100 (RB)
6.375%, 08/01/34 | | | 1,250 | | | | 1,376 | | |
| | | | 6,225 | | |
| South Dakota – 1.1% | | | |
Sioux Falls, Dow Rummel Village Project, Series A,
Callable 11/15/12 @ 100 (RB)
6.625%, 11/15/23 | | | 2,200 | | | | 2,282 | | |
Sioux Falls School District #49-5, Series B,
Callable 07/01/16 @ 100 (GO)
4.750%, 07/01/20 | | | 510 | | | | 533 | | |
South Dakota Economic Development Finance
Authority, DTS Project, Series A,
Callable 04/01/09 @ 102 (AMT) (RB)
5.500%, 04/01/19 | | | 1,055 | | | | 1,101 | | |
South Dakota Economic Development Finance
Authority, Pooled Loan Project – Davis Family,
Series 4-A, Callable 04/01/14 @ 100 (AMT) (RB)
6.000%, 04/01/29 | | | 1,400 | | | | 1,474 | | |
| | | | 5,390 | | |
| Tennessee – 2.6% | | | |
Johnson City Health & Educational Facilities
Authority Mountain States Health, Series A,
Callable 07/01/12 @ 103 (RB)
7.500%, 07/01/33 | | | 2,500 | | | | 2,942 | | |
Shelby County Health, Educational & Housing
Facilities Board Methodist Healthcare,
Pre-refunded 09/01/12 @ 100 (RB)
6.500%, 09/01/21 (a) | | | 1,125 | | | | 1,325 | | |
| 6.500%, 09/01/21 (a) | | | 1,875 | | | | 2,209 | | |
Sullivan County Health, Educational & Housing
Facilities Board, Wellmont Health Systems Project,
Callable 09/01/12 @ 101 (RB)
6.250%, 09/01/32 | | | 5,500 | | | | 5,991 | | |
| | | | 12,467 | | |
| Texas – 15.1% | | | |
Abilene Health Facilities Development,
Sears Methodist Retirement Project,
Callable 05/15/09 @ 101 (RB)
5.875%, 11/15/18 | | | 500 | | | | 512 | | |
| 6.000%, 11/15/29 | | | 2,000 | | | | 2,025 | | |
Abilene Health Facilities Development,
Sears Methodist Retirement Project, Series A,
Callable 11/15/08 @ 101 (RB)
5.875%, 11/15/18 | | | 2,500 | | | | 2,555 | | |
Abilene Health Facilities Development,
Sears Methodist Retirement Project, Series A,
Callable 11/15/13 @ 101 (RB)
7.000%, 11/15/33 | | | 4,000 | | | | 4,340 | | |
The accompanying notes are an integral part of the financial statements.
FIRST AMERICAN FUNDS Annual Report 2005
96
Tax Free Fund (continued)
| DESCRIPTION | | PAR (000) | | VALUE (000) | |
Bexar County Housing Finance Authority,
American Opportunity Housing, Series A,
Callable 01/01/11 @ 102 (MBIA) (RB)
5.800%, 01/01/31 | | $ | 2,000 | | | $ | 2,097 | | |
Brazos River Authority PCR-Texas Utility Company,
Callable 04/01/13 @ 101 (AMT) (RB)
7.700%, 04/01/33 | | | 2,500 | | | | 2,989 | | |
Brazos River Harbor District,
Dow Chemical, Series A-5,
Mandatory Put 05/15/12 @ 100 (AMT) (RB)
5.700%, 05/15/33 | | | 2,500 | | | | 2,706 | | |
Crawford Education Facilities,
University of St. Thomas Project,
Callable 10/01/12 @ 100 (RB)
5.250%, 10/01/22 | | | 1,300 | | | | 1,325 | | |
| 5.375%, 10/01/27 | | | 1,750 | | | | 1,790 | | |
Cypress-Fairbanks Independent School District,
Pre-refunded 02/15/10 @ 100 (PSFG) (GO)
5.500%, 02/15/18 (a) | | | 5,000 | | | | 5,453 | | |
Fort Bend Independent School District,
Escrowed to Maturity,
Callable until 02/15/13 @ 100 (PSFG) (GO)
5.000%, 02/15/14 (c) | | | 500 | | | | 545 | | |
Harris County Health Facilities Development,
Memorial Hospital Systems Project, Series A,
Callable 06/01/07 @ 102 (MBIA) (RB)
5.500%, 06/01/17 | | | 8,000 | | | | 8,416 | | |
Laredo Independent School District (PSFG) (GO)
6.750%, 08/01/09 | | | 2,290 | | | | 2,565 | | |
Red River Authority Sewer & Solidwaste
Disposal Excel Corporation Project,
Callable 02/01/12 @ 101 (AMT) (RB)
6.100%, 02/01/22 | | | 3,775 | | | | 3,997 | | |
Remington Municipal Utility District #1, Series A,
Callable 09/01/08 @ 100 (RAAI) (GO)
5.800%, 09/01/25 | | | 1,000 | | | | 1,053 | | |
Richardson Hospital Authority
Richardson Regional Hospital,
Callable 12/01/13 @ 100 (RB)
6.000%, 12/01/34 | | | 9,500 | | | | 10,140 | | |
San Antonio Independent School District,
Pre-refunded 08/15/08 @ 100 (PSFG) (GO)
5.125%, 08/15/14 (a) | | | 6,000 | | | | 6,329 | | |
Spring Branch Independent School District,
Pre-refunded 02/01/10 @ 100 (PSFG) (GO)
5.750%, 02/01/25 (a) | | | 2,400 | | | | 2,631 | | |
Texas Employment Community,
Callable 01/15/06 @ 100 (MLO) (COP)
8.350%, 02/01/06 | | | 20 | | | | 20 | | |
| 8.350%, 08/01/06 | | | 50 | | | | 51 | | |
| 8.400%, 08/01/07 | | | 25 | | | | 25 | | |
| 8.450%, 08/01/08 | | | 55 | | | | 56 | | |
Texas Employment Community,
Emnora Lane Project (MLO) (COP)
7.900%, 11/01/05 | | | 25 | | | | 25 | | |
| 8.000%, 11/01/06 | | | 30 | | | | 30 | | |
| 8.050%, 05/01/07 | | | 20 | | | | 20 | | |
Texas State, Water Development,
Callable 08/01/06 @ 100 (GO)
5.400%, 08/01/21 | | | 6,750 | | | | 6,861 | | |
Texas Water Development Board, Series A,
Callable 07/15/06 @ 100 (RB)
5.500%, 07/15/10 | | | 2,500 | | | | 2,549 | | |
Travis County Texas Health Facilities,
Querencia Barton Creek Project,
Callable 11/15/15 @ 100 (RB)
5.650%, 11/15/35 | | | 1,100 | | | | 1,081 | | |
| | | | 72,186 | | |
Tax Free Fund (continued)
| DESCRIPTION | | PAR (000) | | VALUE (000) | |
| Utah – 0.2% | | | |
Intermountain Power Agency, Utah Power Supply,
Series A (AMBAC) (RB)
6.500%, 07/01/11 | | $ | 365 | | | $ | 421 | | |
Intermountain Power Agency, Utah Power Supply,
Series A, Escrowed to Maturity (AMBAC) (RB)
6.500%, 07/01/11 (c) | | | 635 | | | | 737 | | |
| | | | 1,158 | | |
| Virginia – 0.2% | | | |
Arlington County Industrial Development Authority,
Berkeley Apartments,
Callable 12/01/10 @ 102 (AMT) (FNMA) (RB)
5.850%, 12/01/20 | | | 1,000 | | | | 1,068 | | |
| Washington – 6.2% | | | |
Energy Northwest, Washington Wind Project,
Pre-refunded 01/01/07 @ 103 (RB)
5.600%, 07/01/15 (a) | | | 4,640 | | | | 4,914 | | |
King County, Series F,
Callable 12/01/07 @ 100 (GO)
5.125%, 12/01/14 | | | 5,000 | | | | 5,197 | | |
King County School District #415,
Pre-refunded 12/01/07 @ 100 (MBIA) (GO)
5.350%, 12/01/16 (a) | | | 4,050 | | | | 4,245 | | |
Snohomish County Public Utilities District #1,
Escrowed to Maturity,
Callable 10/01/05 @ 100 (RB)
6.750%, 01/01/12 (c) | | | 1,000 | | | | 1,123 | | |
Washington State, Series C,
Pre-refunded 01/01/07 @ 100 (GO)
5.500%, 01/01/17 (a) | | | 4,190 | | | | 4,320 | | |
Washington State Motor Vehicle Fuel Tax, Series D,
Pre-refunded 01/01/07 @ 100 (FGIC) (GO)
5.375%, 01/01/22 (a) | | | 8,000 | | | | 8,236 | | |
Washington State Public Power Supply System,
Nuclear Project #3, Series A,
Callable 07/01/07 @ 102 (FSA) (RB)
5.250%, 07/01/16 | | | 1,000 | | | | 1,051 | | |
Washington State Public Power Supply System,
Nuclear Project #3, Series B (RB)
7.125%, 07/01/16 | | | 600 | | | | 755 | | |
| | | | 29,841 | | |
| Wisconsin – 4.7% | | | |
Amery, Apple River Hospital Project,
Callable 06/01/08 @ 100 (RB)
5.700%, 06/01/13 | | | 1,440 | | | | 1,469 | | |
Wisconsin State, Series C,
Pre-refunded 05/01/07 @ 100 (FGIC) (GO)
5.500%, 05/01/10 (a) | | | 2,095 | | | | 2,174 | | |
Wisconsin State Health & Educational Facilities
Authority, Attic Angel Obligation Group,
Callable 11/15/08 @ 102 (RB)
5.750%, 11/15/27 | | | 1,000 | | | | 991 | | |
Wisconsin State Health & Educational Facilities
Authority, Beaver Dam Community Hospitals,
Series A, Callable 08/15/14 @ 100 (RB)
6.750%, 08/15/34 | | | 1,000 | | | | 1,062 | | |
Wisconsin State Health & Educational Facilities
Authority, Beloit Memorial Hospital,
Callable until 07/01/08 @ 100 (RB)
5.800%, 07/01/09 | | | 555 | | | | 556 | | |
Wisconsin State Health & Educational Facilities
Authority, Eastcastle Place Income Project,
Callable 12/01/11 @ 100 (RB)
6.000%, 12/01/24 | | | 1,000 | | | | 1,023 | | |
FIRST AMERICAN FUNDS Annual Report 2005
97
Schedule of Investments September 30, 2005
Tax Free Fund (continued)
| DESCRIPTION | | PAR (000)/SHARES | | VALUE (000) | |
Wisconsin State Health & Educational Facilities
Authority, Franciscan Skemp Medical Center,
Callable 11/15/05 @ 102 (RB)
6.125%, 11/15/15 | | $ | 1,000 | | | $ | 1,023 | | |
Wisconsin State Health & Educational Facilities
Authority, Marshfield Clinic, Series B,
Callable 02/15/12 @ 100 (RB)
6.000%, 02/15/25 | | | 3,500 | | | | 3,712 | | |
Wisconsin State Health & Educational Facilities
Authority, Meriter Hospital,
Callable 12/01/06 @ 102 (MBIA) (RB)
6.000%, 12/01/17 | | | 2,000 | | | | 2,099 | | |
Wisconsin State Health & Educational Facilities
Authority, New Castle Place Project, Series A,
Callable 12/01/11 @ 101 (RB)
7.000%, 12/01/31 | | | 2,000 | | | | 2,069 | | |
Wisconsin State Health & Educational Facilities
Authority, Southwest Health Center, Series A,
Callable 04/01/14 @ 100 (RB)
6.250%, 04/01/34 | | | 2,000 | | | | 2,033 | | |
Wisconsin State Health & Educational Facilities
Authority, Synergy Health,
Callable 08/15/13 @ 100 (RB)
6.000%, 11/15/23 | | | 1,500 | | | | 1,622 | | |
Wisconsin State Health & Educational Facilities
Authority, Wheaton Franciscan Services,
Callable 02/15/12 @ 100 (RB)
5.750%, 08/15/30 | | | 2,500 | | | | 2,666 | | |
| | | | 22,499 | | |
| Wyoming – 0.8% | | | |
Teton County Hospital District,
St. John's Medical Center,
Callable 06/01/12 @ 101 (RB)
6.750%, 12/01/22 | | | 2,100 | | | | 2,198 | | |
| 6.750%, 12/01/27 | | | 1,500 | | | | 1,555 | | |
| | | | 3,753 | | |
Total Municipal Bonds
(Cost $435,308) | | | | | | | 465,557 | | |
| Affiliated Money Market Fund – 1.4% | | | |
First American Tax Free Obligations Fund, Class Z (e)
(Cost $6,628) | | | 6,628,498 | | | | 6,628 | | |
Total Investments – 98.9%
(Cost $441,936) | | | | | | | 472,185 | | |
| Other Assets and Liabilities, Net – 1.1% | | | | | | | 5,035 | | |
| Total Net Assets – 100.0% | | | | | | $ | 477,220 | | |
(a) Pre-refunded issues are typically backed by U.S. Government obligations. These bonds mature at the call date and price indicated.
(b) The rate shown is the effective yield at the time of purchase.
(c) Escrowed to Maturity issues are typically backed by U.S. Government obligations. If callable, these bonds may still be subject to call at the call date and price indicated.
(d) Security purchased on a when-issued basis. On September 30, 2005, the total cost of investments purchased on a when-issued basis was $1,362,508 or 0.3% of total net assets. See note 2 in Notes to Financial Statements.
(e) Investment in affiliated security. This money market fund is advised by U.S. Bancorp Asset Management, Inc., which also serves as advisor for this fund. See note 3 in Notes to Financial Statements.
Tax Free Fund (concluded)
AMBAC – American Municipal Bond Assurance Corporation
AMT – Alternative Minimum Tax. As of September 30, 2005, the aggregate market value of securities subject to the AMT was $40,845,331, which represents 8.6% of net assets.
CIFG – CDC IXIS Financial Guaranty
CLE – Connie Lee Insurance Company
CMI – California Mortgage Insurance Program
COMGTY – Commonwealth Guaranty
COP – Certificate of Participation
FGIC – Financial Guaranty Insurance Corporation
FHA – Federal Housing Authority
FNMA – Federal National Mortgage Association
FSA – Financial Security Assurance
GNMA – Government National Mortgage Association
GO – General Obligation
GTY – Assured Guaranty
MBIA – Municipal Bond Insurance Association
MLO – Municipal Lease Obligation
MQSBLF – Michigan Qualified School Board Loan Fund Program
PSFG – Permanent School Fund Guarantee
RAAI – Radian Asset Assurance Inc.
RB – Revenue Bond
The accompanying notes are an integral part of the financial statements.
FIRST AMERICAN FUNDS Annual Report 2005
98
(This page has been left blank intentionally.)
99
Statements of Assets and Liabilities September 30, 2005, in thousands, except per share data
| | | Arizona
Tax Free Fund | | California
Intermediate
Tax Free Fund | | California
Tax Free Fund | | Colorado
Intermediate
Tax Free Fund | | Colorado
Tax Free Fund | | Intermediate
Tax Free Fund | | Minnesota
Intermediate
Tax Free Fund | |
| Investments in unaffiliated securities, at cost | | $ | 22,368 | | | $ | 50,580 | | | $ | 32,926 | | | $ | 44,451 | | | $ | 18,120 | | | $ | 633,012 | | | $ | 220,856 | | |
| Investments in affiliated money market fund, at cost | | | 1,197 | | | | - | | | | - | | | | 166 | | | | 192 | | | | 2,411 | | | | - | | |
| ASSETS: | |
| Investments in unaffiliated securities, at value (note 2) | | $ | 23,705 | | | $ | 52,843 | | | $ | 34,644 | | | $ | 47,219 | | | $ | 19,694 | | | $ | 667,511 | | | $ | 230,378 | | |
Investments in affiliated money market fund,
at value (note 2) | | | 1,197 | | | | - | | | | - | | | | 166 | | | | 192 | | | | 2,411 | | | | - | | |
| Receivable for dividends and interest | | | 319 | | | | 615 | | | | 360 | | | | 596 | | | | 252 | | | | 8,082 | | | | 2,635 | | |
| Receivable for investment securities sold | | | 359 | | | | - | | | | - | | | | - | | | | - | | | | 568 | | | | - | | |
| Receivable for capital shares sold | | | 29 | | | | 49 | | | | 96 | | | | 36 | | | | 16 | | | | 675 | | | | 158 | | |
| Prepaid expenses and other assets | | | 15 | | | | 15 | | | | 15 | | | | 15 | | | | 15 | | | | 33 | | | | 15 | | |
| Total assets | | | 25,624 | | | | 53,522 | | | | 35,115 | | | | 48,032 | | | | 20,169 | | | | 679,280 | | | | 233,186 | | |
| LIABILITIES: | |
| Bank overdraft | | | - | | | | - | | | | - | | | | - | | | | - | | | | - | | | | - | | |
| Payable for investment securities purchased | | | - | | | | - | | | | - | | | | - | | | | - | | | | 567 | | | | 3 | | |
Payable for investment securities purchased on a
when-issued basis | | | 396 | | | | 247 | | | | 543 | | | | - | | | | - | | | | 2,096 | | | | 3,379 | | |
| Payable for capital shares redeemed | | | - | | | | - | | | | 34 | | | | 8 | | | | 3 | | | | 409 | | | | 78 | | |
| Payable to affiliates (note 3) | | | 9 | | | | 31 | | | | 17 | | | | 28 | | | | 9 | | | | 385 | | | | 135 | | |
| Payable for distribution and shareholder servicing fees | | | 3 | | | | - | | | | 4 | | | | 2 | | | | 4 | | | | 4 | | | | 4 | | |
| Accrued expenses and other liabilities | | | 6 | | | | 6 | | | | 5 | | | | 6 | | | | 5 | | | | 20 | | | | 10 | | |
| Total liabilities | | | 414 | | | | 284 | | | | 603 | | | | 44 | | | | 21 | | | | 3,481 | | | | 3,609 | | |
| Net assets | | $ | 25,210 | | | $ | 53,238 | | | $ | 34,512 | | | $ | 47,988 | | | $ | 20,148 | | | $ | 675,799 | | | $ | 229,577 | | |
| COMPOSITION OF NET ASSETS: | |
| Portfolio capital | | $ | 23,663 | | | $ | 50,784 | | | $ | 32,720 | | | $ | 44,914 | | | $ | 17,981 | | | $ | 640,261 | | | $ | 218,537 | | |
| Undistributed net investment income | | | - | | | | 17 | | | | 9 | | | | 23 | | | | 7 | | | | 46 | | | | 153 | | |
| Accumulated net realized gain (loss) on investments | | | 210 | | | | 174 | | | | 65 | | | | 283 | | | | 586 | | | | 993 | | | | 1,365 | | |
Net unrealized appreciation (depreciation)
of investments | | | 1,337 | | | | 2,263 | | | | 1,718 | | | | 2,768 | | | | 1,574 | | | | 34,499 | | | | 9,522 | | |
| Net assets | | $ | 25,210 | | | $ | 53,238 | | | $ | 34,512 | | | $ | 47,988 | | | $ | 20,148 | | | $ | 675,799 | | | $ | 229,577 | | |
| Class A: | |
| Net assets | | $ | 9,547 | | | $ | 3,946 | | | $ | 11,888 | | | $ | 13,426 | | | $ | 8,362 | | | $ | 34,658 | | | $ | 32,326 | | |
Shares issued and outstanding
($0.0001 par value - 2 billion authorized) | | | 853 | | | | 381 | | | | 1,057 | | | | 1,249 | | | | 740 | | | | 3,174 | | | | 3,183 | | |
| Net asset value and redemption price per share | | $ | 11.19 | | | $ | 10.35 | | | $ | 11.24 | | | $ | 10.74 | | | $ | 11.30 | | | $ | 10.92 | | | $ | 10.16 | | |
| Maximum offering price per share (1) | | $ | 11.69 | | | $ | 10.59 | | | $ | 11.74 | | | $ | 10.99 | | | $ | 11.80 | | | $ | 11.17 | | | $ | 10.39 | | |
| Class C: | |
| Net assets | | $ | 1,628 | | | | - | | | $ | 3,068 | | | | - | | | $ | 3,423 | | | | - | | | | - | | |
Shares issued and outstanding
($0.0001 par value - 2 billion authorized) | | | 146 | | | | - | | | | 273 | | | | - | | | | 304 | | | | - | | | | - | | |
Net asset value, offering price, and redemption
price per share (2) | | $ | 11.18 | | | | - | | | $ | 11.25 | | | | - | | | $ | 11.28 | | | | - | | | | - | | |
| Class Y: | |
| Net assets | | $ | 14,035 | | | $ | 49,292 | | | $ | 19,556 | | | $ | 34,562 | | | $ | 8,363 | | | $ | 641,141 | | | $ | 197,251 | | |
Shares issued and outstanding
($0.0001 par value - 2 billion authorized) | | | 1,254 | | | | 4,752 | | | | 1,739 | | | | 3,224 | | | | 739 | | | | 58,831 | | | | 19,515 | | |
Net asset value, offering price, and redemption
price per share | | $ | 11.19 | | | $ | 10.37 | | | $ | 11.25 | | | $ | 10.72 | | | $ | 11.32 | | | $ | 10.90 | | | $ | 10.11 | | |
| | | Minnesota
Tax Free Fund | | Missouri
Tax Free Fund | | Nebraska
Tax Free Fund | | Ohio
Tax Free Fund | | Oregon
Intermediate
Tax Free Fund | | Short
Tax Free Fund | | Tax Free Fund | |
| Investments in unaffiliated securities, at cost | | $ | 152,684 | | | $ | 170,928 | | | $ | 37,868 | | | $ | 40,333 | | | $ | 135,287 | | | $ | 332,791 | | | $ | 435,308 | | |
| Investments in affiliated money market fund, at cost | | | - | | | | 2,386 | | | | 2,371 | | | | - | | | | 643 | | | | 6,835 | | | | 6,628 | | |
| ASSETS: | |
| Investments in unaffiliated securities, at value (note 2) | | $ | 161,938 | | | $ | 178,731 | | | $ | 39,421 | | | $ | 41,690 | | | $ | 140,446 | | | $ | 331,992 | | | $ | 465,557 | | |
Investments in affiliated money market fund,
at value (note 2) | | | - | | | | 2,386 | | | | 2,371 | | | | - | | | | 643 | | | | 6,835 | | | | 6,628 | | |
| Receivable for dividends and interest | | | 2,161 | | | | 2,196 | | | | 505 | | | | 623 | | | | 1,967 | | | | 4,233 | | | | 6,697 | | |
| Receivable for investment securities sold | | | - | | | | - | | | | - | | | | - | | | | - | | | | - | | | | 1,314 | | |
| Receivable for capital shares sold | | | 181 | | | | 10 | | | | 5 | | | | 20 | | | | - | | | | 56 | | | | 87 | | |
| Prepaid expenses and other assets | | | 15 | | | | 16 | | | | 15 | | | | 15 | | | | 15 | | | | 33 | | | | 35 | | |
| Total assets | | | 164,295 | | | | 183,339 | | | | 42,317 | | | | 42,348 | | | | 143,071 | | | | 343,149 | | | | 480,318 | | |
| LIABILITIES: | |
| Bank overdraft | | | - | | | | - | | | | - | | | | 2 | | | | - | | | | - | | | | - | | |
| Payable for investment securities purchased | | | - | | | | - | | | | - | | | | - | | | | - | | | | 3,173 | | | | 1,311 | | |
Payable for investment securities purchased on a
when-issued basis | | | - | | | | 1,063 | | | | 1,173 | | | | - | | | | - | | | | 5,636 | | | | 1,363 | | |
| Payable for capital shares redeemed | | | 1,075 | | | | 68 | | | | - | | | | 56 | | | | 10 | | | | 407 | | | | 126 | | |
| Payable to affiliates (note 3) | | | 95 | | | | 105 | | | | 17 | | | | 18 | | | | 82 | | | | 168 | | | | 274 | | |
| Payable for distribution and shareholder servicing fees | | | 21 | | | | 6 | | | | 2 | | | | - | | | | 1 | | | | - | | | | 9 | | |
| Accrued expenses and other liabilities | | | 9 | | | | 9 | | | | 6 | | | | 6 | | | | 9 | | | | 15 | | | | 15 | | |
| Total liabilities | | | 1,200 | | | | 1,251 | | | | 1,198 | | | | 82 | | | | 102 | | | | 9,399 | | | | 3,098 | | |
| Net assets | | $ | 163,095 | | | $ | 182,088 | | | $ | 41,119 | | | $ | 42,266 | | | $ | 142,969 | | | $ | 333,750 | | | $ | 477,220 | | |
| COMPOSITION OF NET ASSETS: | |
| Portfolio capital | | $ | 153,260 | | | $ | 172,960 | | | $ | 39,491 | | | $ | 40,839 | | | $ | 137,235 | | | $ | 334,919 | | | $ | 445,842 | | |
| Undistributed net investment income | | | 182 | | | | 66 | | | | 12 | | | | 29 | | | | 19 | | | | 255 | | | | 185 | | |
| Accumulated net realized gain (loss) on investments | | | 399 | | | | 1,259 | | | | 63 | | | | 41 | | | | 556 | | | | (625 | ) | | | 944 | | |
Net unrealized appreciation (depreciation)
of investments | | | 9,254 | | | | 7,803 | | | | 1,553 | | | | 1,357 | | | | 5,159 | | | | (799 | ) | | | 30,249 | | |
| Net assets | | $ | 163,095 | | | $ | 182,088 | | | $ | 41,119 | | | $ | 42,266 | | | $ | 142,969 | | | $ | 333,750 | | | $ | 477,220 | | |
| Class A: | |
| Net assets | | $ | 106,783 | | | $ | 30,188 | | | $ | 7,136 | | | $ | 988 | | | $ | 9,356 | | | $ | 4,103 | | | $ | 38,205 | | |
Shares issued and outstanding
($0.0001 par value - 2 billion authorized) | | | 9,526 | | | | 2,486 | | | | 675 | | | | 95 | | | | 930 | | | | 419 | | | | 3,443 | | |
| Net asset value and redemption price per share | | $ | 11.21 | | | $ | 12.14 | | | $ | 10.58 | | | $ | 10.42 | | | $ | 10.07 | | | $ | 9.78 | | | $ | 11.10 | | |
| Maximum offering price per share (1) | | $ | 11.71 | | | $ | 12.68 | | | $ | 11.05 | | | $ | 10.88 | | | $ | 10.30 | | | $ | 10.01 | | | $ | 11.59 | | |
| Class C: | |
| Net assets | | $ | 9,841 | | | $ | 190 | | | $ | 1,565 | | | $ | 174 | | | | - | | | | - | | | $ | 2,712 | | |
Shares issued and outstanding
($0.0001 par value - 2 billion authorized) | | | 881 | | | | 16 | | | | 149 | | | | 17 | | | | - | | | | - | | | | 245 | | |
Net asset value, offering price, and redemption
price per share (2) | | $ | 11.17 | | | $ | 12.12 | | | $ | 10.50 | | | $ | 10.32 | | | | - | | | | - | | | $ | 11.05 | | |
| Class Y: | |
| Net assets | | $ | 46,471 | | | $ | 151,710 | | | $ | 32,418 | | | $ | 41,104 | | | $ | 133,613 | | | $ | 329,647 | | | $ | 436,303 | | |
Shares issued and outstanding
($0.0001 par value - 2 billion authorized) | | | 4,150 | | | | 12,489 | | | | 3,064 | | | | 3,939 | | | | 13,268 | | | | 33,718 | | | | 39,279 | | |
Net asset value, offering price, and redemption
price per share | | $ | 11.20 | | | $ | 12.15 | | | $ | 10.58 | | | $ | 10.43 | | | $ | 10.07 | | | $ | 9.78 | | | $ | 11.11 | | |
(1) The offering price is calculated by dividing the net asset value by 1 minus the maximum sales charge. For a description of front-end sales charges, see note 1
in Notes to Financial Statements.
(2) Class C has a contingent deferred sales charge. For a description of this sales charge, see notes 1 and 3 in Notes to Financial Statements.
The accompanying notes are an integral part of the financial statements.
FIRST AMERICAN FUNDS Annual Report 2005
100
FIRST AMERICAN FUNDS Annual Report 2005
101
Statements of Operations For the fiscal year ended September 30, 2005, in thousands
| | | Arizona
Tax Free Fund | | California
Intermediate
Tax Free Fund | | California
Tax Free Fund | | Colorado
Intermediate
Tax Free Fund | | Colorado
Tax Free Fund | | Intermediate
Tax Free Fund | | Minnesota
Intermediate
Tax Free Fund | |
| INVESTMENT INCOME: | |
| Interest from unaffiliated securities | | $ | 1,086 | | | $ | 2,378 | | | $ | 1,374 | | | $ | 2,367 | | | $ | 1,090 | | | $ | 32,007 | | | $ | 11,092 | | |
| Dividends from affiliated money market fund | | | 2 | | | | - | | | | - | | | | 14 | | | | 5 | | | | 144 | | | | - | | |
| Total investment income | | | 1,088 | | | | 2,378 | | | | 1,374 | | | | 2,381 | | | | 1,095 | | | | 32,151 | | | | 11,092 | | |
| EXPENSES (note 3): | |
| Investment advisory fees | | | 111 | | | | 261 | | | | 148 | | | | 254 | | | | 110 | | | | 3,326 | | | | 1,199 | | |
| Administration fees | | | 52 | | | | 114 | | | | 68 | | | | 111 | | | | 52 | | | | 1,397 | | | | 509 | | |
| Transfer agent fees | | | 15 | | | | 33 | | | | 20 | | | | 32 | | | | 14 | | | | 425 | | | | 151 | | |
| Professional fees | | | 13 | | | | 15 | | | | 14 | | | | 15 | | | | 14 | | | | 44 | | | | 24 | | |
| Registration fees | | | 8 | | | | 5 | | | | 7 | | | | 5 | | | | 7 | | | | 23 | | | | 5 | | |
| Other expenses | | | 4 | | | | 5 | | | | 4 | | | | 5 | | | | 4 | | | | 16 | | | | 9 | | |
| Custodian fees | | | 2 | | | | 5 | | | | 3 | | | | 4 | | | | 2 | | | | 58 | | | | 21 | | |
| Directors' fees | | | 1 | | | | 1 | | | | 1 | | | | 1 | | | | 1 | | | | 16 | | | | 6 | | |
| Postage and printing fees | | | 1 | | | | 2 | | | | 1 | | | | 2 | | | | 1 | | | | 25 | | | | 9 | | |
| Distribution and shareholder servicing fees – Class A | | | 24 | | | | 10 | | | | 26 | | | | 36 | | | | 23 | | | | 87 | | | | 85 | | |
| Distribution and shareholder servicing fees – Class C | | | 16 | | | | - | | | | 17 | | | | - | | | | 38 | | | | - | | | | - | | |
| Total expenses | | | 247 | | | | 451 | | | | 309 | | | | 465 | | | | 266 | | | | 5,417 | | | | 2,018 | | |
| Less: Fee waivers (note 3) | | | (102 | ) | | | (80 | ) | | | (124 | ) | | | (88 | ) | | | (108 | ) | | | (709 | ) | | �� | (288 | ) | |
| Total net expenses | | | 145 | | | | 371 | | | | 185 | | | | 377 | | | | 158 | | | | 4,708 | | | | 1,730 | | |
| Investment income – net | | | 943 | | | | 2,007 | | | | 1,189 | | | | 2,004 | | | | 937 | | | | 27,443 | | | | 9,362 | | |
REALIZED AND UNREALIZED GAINS (LOSSES) ON
INVESTMENTS – NET (note 5): | |
| Net realized gain (loss) on investments | | | 215 | | | | 174 | | | | 66 | | | | 284 | | | | 586 | | | | 1,758 | | | | 1,370 | | |
Net change in unrealized appreciation or depreciation
of investments | | | (401 | ) | | | (809 | ) | | | (182 | ) | | | (1,134 | ) | | | (804 | ) | | | (13,264 | ) | | | (4,978 | ) | |
| Net gain (loss) on investments | | | (186 | ) | | | (635 | ) | | | (116 | ) | | | (850 | ) | | | (218 | ) | | | (11,506 | ) | | | (3,608 | ) | |
| Net increase in net assets resulting from operations | | $ | 757 | | | $ | 1,372 | | | $ | 1,073 | | | $ | 1,154 | | | $ | 719 | | | $ | 15,937 | | | $ | 5,754 | | |
| | | Minnesota
Tax Free Fund | | Missouri
Tax Free Fund | | Nebraska
Tax Free Fund | | Ohio
Tax Free Fund | | Oregon
Intermediate
Tax Free Fund | | Short
Tax Free Fund | | Tax Free Fund | |
| INVESTMENT INCOME: | |
| Interest from unaffiliated securities | | $ | 8,303 | | | $ | 8,285 | | | $ | 1,726 | | | $ | 1,768 | | | $ | 6,277 | | | $ | 12,331 | | | $ | 23,876 | | |
| Dividends from affiliated money market fund | | | - | | | | 37 | | | | 22 | | | | - | | | | 23 | | | | 170 | | | | 110 | | |
| Total investment income | | | 8,303 | | | | 8,322 | | | | 1,748 | | | | 1,768 | | | | 6,300 | | | | 12,501 | | | | 23,986 | | |
| EXPENSES (note 3): | |
| Investment advisory fees | | | 832 | | | | 905 | | | | 193 | | | | 212 | | | | 715 | | | | 1,942 | | | | 2,330 | | |
| Administration fees | | | 352 | | | | 383 | | | | 85 | | | | 93 | | | | 306 | | | | 824 | | | | 976 | | |
| Transfer agent fees | | | 106 | | | | 116 | | | | 25 | | | | 27 | | | | 91 | | | | 238 | | | | 299 | | |
| Professional fees | | | 21 | | | | 21 | | | | 14 | | | | 15 | | | | 19 | | | | 31 | | | | 35 | | |
| Registration fees | | | 9 | | | | 8 | | | | 8 | | | | 7 | | | | 6 | | | | 23 | | | | 31 | | |
| Other expenses | | | 7 | | | | 7 | | | | 5 | | | | 5 | | | | 6 | | | | 12 | | | | 13 | | |
| Custodian fees | | | 15 | | | | 16 | | | | 3 | | | | 4 | | | | 13 | | | | 35 | | | | 41 | | |
| Directors' fees | | | 4 | | | | 4 | | | | 1 | | | | 1 | | | | 3 | | | | 9 | | | | 11 | | |
| Postage and printing fees | | | 7 | | | | 8 | | | | 2 | | | | 2 | | | | 5 | | | | 15 | | | | 20 | | |
| Distribution and shareholder servicing fees – Class A | | | 278 | | | | 71 | | | | 15 | | | | 3 | | | | 22 | | | | 14 | | | | 97 | | |
| Distribution and shareholder servicing fees – Class C | | | 99 | | | | 2 | | | | 18 | | | | 1 | | | | - | | | | - | | | | 27 | | |
| Total expenses | | | 1,730 | | | | 1,541 | | | | 369 | | | | 370 | | | | 1,186 | | | | 3,143 | | | | 3,880 | | |
| Less: Fee waivers (note 3) | | | (223 | ) | | | (202 | ) | | | (149 | ) | | | (154 | ) | | | (173 | ) | | | (804 | ) | | | (503 | ) | |
| Total net expenses | | | 1,507 | | | | 1,339 | | | | 220 | | | | 216 | | | | 1,013 | | | | 2,339 | | | | 3,377 | | |
| Investment income – net | | | 6,796 | | | | 6,983 | | | | 1,528 | | | | 1,552 | | | | 5,287 | | | | 10,162 | | | | 20,609 | | |
REALIZED AND UNREALIZED GAINS (LOSSES) ON
INVESTMENTS – NET (note 5): | |
| Net realized gain (loss) on investments | | | 399 | | | | 1,283 | | | | 67 | | | | 58 | | | | 590 | | | | (387 | ) | | | 1,085 | | |
Net change in unrealized appreciation or depreciation
of investments | | | 20 | | | | (2,964 | ) | | | (332 | ) | | | (282 | ) | | | (3,269 | ) | | | (6,969 | ) | | | (206 | ) | |
| Net gain (loss) on investments | | | 419 | | | | (1,681 | ) | | | (265 | ) | | | (224 | ) | | | (2,679 | ) | | | (7,356 | ) | | | 879 | | |
| Net increase in net assets resulting from operations | | $ | 7,215 | | | $ | 5,302 | | | $ | 1,263 | | | $ | 1,328 | | | $ | 2,608 | | | $ | 2,806 | | | $ | 21,488 | | |
The accompanying notes are an integral part of the financial statements.
FIRST AMERICAN FUNDS Annual Report 2005
102
FIRST AMERICAN FUNDS Annual Report 2005
103
Statements of Changes in Net Assets in thousands
| | | Arizona
Tax Free Fund | | California
Intermediate
Tax Free Fund | | California
Tax Free Fund | | Colorado
Intermediate
Tax Free Fund | |
| | | Year Ended
9/30/05 | | Year Ended
9/30/04 | | Year Ended
9/30/05 | | Year Ended
9/30/04 | | Year Ended
9/30/05 | | Year Ended
9/30/04 | | Year Ended
9/30/05 | | Year Ended
9/30/04 | |
| OPERATIONS: | |
| Investment income – net | | $ | 943 | | | $ | 902 | | | $ | 2,007 | | | $ | 1,910 | | | $ | 1,189 | | | $ | 1,130 | | | $ | 2,004 | | | $ | 2,441 | | |
| Net realized gain on investments | | | 215 | | | | 230 | | | | 174 | | | | 358 | | | | 66 | | | | 274 | | | | 284 | | | | 631 | | |
| Net change in unrealized appreciation or depreciation of investments | | | (401 | ) | | | 17 | | | | (809 | ) | | | (628 | ) | | | (182 | ) | | | (104 | ) | | | (1,134 | ) | | | (1,415 | ) | |
| Net increase in net assets resulting from operations | | | 757 | | | | 1,149 | | | | 1,372 | | | | 1,640 | | | | 1,073 | | | | 1,300 | | | | 1,154 | | | | 1,657 | | |
| DISTRIBUTIONS TO SHAREHOLDERS FROM: | |
| Investment income – net: | |
| Class A | | | (412 | ) | | | (413 | ) | | | (142 | ) | | | (154 | ) | | | (400 | ) | | | (415 | ) | | | (577 | ) | | | (660 | ) | |
| Class C | | | (64 | ) | | | (60 | ) | | | - | | | | - | | | | (60 | ) | | | (43 | ) | | | - | | | | - | | |
| Class Y | | | (516 | ) | | | (414 | ) | | | (1,860 | ) | | | (1,780 | ) | | | (744 | ) | | | (681 | ) | | | (1,500 | ) | | | (1,748 | ) | |
| Net realized gain on investments: | |
| Class A | | | (99 | ) | | | (50 | ) | | | (25 | ) | | | (13 | ) | | | (89 | ) | | | (84 | ) | | | (44 | ) | | | - | | |
| Class C | | | (18 | ) | | | (8 | ) | | | - | | | | - | | | | (13 | ) | | | (9 | ) | | | - | | | | - | | |
| Class Y | | | (113 | ) | | | (41 | ) | | | (331 | ) | | | (141 | ) | | | (149 | ) | | | (117 | ) | | | (125 | ) | | | - | | |
| Total distributions | | | (1,222 | ) | | | (986 | ) | | | (2,358 | ) | | | (2,088 | ) | | | (1,455 | ) | | | (1,349 | ) | | | (2,246 | ) | | | (2,408 | ) | |
| CAPITAL SHARE TRANSACTIONS (note 4): | |
| Class A: | |
| Proceeds from sales | | | 2,145 | | | | 1,820 | | | | 1,367 | | | | 1,820 | | | | 4,192 | | | | 1,756 | | | | 4,258 | | | | 2,059 | | |
| Reinvestment of distributions | | | 422 | | | | 397 | | | | 120 | | | | 128 | | | | 383 | | | | 413 | | | | 428 | | | | 471 | | |
| Payments for redemptions | | | (1,831 | ) | | | (5,214 | ) | | | (852 | ) | | | (2,787 | ) | | | (2,086 | ) | | | (3,770 | ) | | | (4,917 | ) | | | (10,910 | ) | |
| Increase (decrease) in net assets from Class A transactions | | | 736 | | | | (2,997 | ) | | | 635 | | | | (839 | ) | | | 2,489 | | | | (1,601 | ) | | | (231 | ) | | | (8,380 | ) | |
| Class C: | |
| Proceeds from sales | | | 201 | | | | 372 | | | | - | | | | - | | | | 1,840 | | | | 577 | | | | - | | | | - | | |
| Reinvestment of distributions | | | 65 | | | | 50 | | | | - | | | | - | | | | 65 | | | | 49 | | | | - | | | | - | | |
| Payments for redemptions (note 3) | | | (192 | ) | | | (698 | ) | | | - | | | | - | | | | (109 | ) | | | (439 | ) | | | - | | | | - | | |
| Increase (decrease) in net assets from Class C transactions | | | 74 | | | | (276 | ) | | | - | | | | - | | | | 1,796 | | | | 187 | | | | - | | | | - | | |
| Class Y: | |
| Proceeds from sales | | | 5,175 | | | | 2,320 | | | | 6,384 | | | | 8,208 | | | | 6,071 | | | | 4,068 | | | | 6,325 | | | | 2,159 | | |
| Reinvestment of distributions | | | 73 | | | | 27 | | | | 80 | | | | 29 | | | | 33 | | | | 22 | | | | 53 | | | | 8 | | |
| Payments for redemptions | | | (499 | ) | | | (2,150 | ) | | | (3,209 | ) | | | (5,478 | ) | | | (2,349 | ) | | | (3,260 | ) | | | (8,784 | ) | | | (11,728 | ) | |
| Increase (decrease) in net assets from Class Y transactions | | | 4,749 | | | | 197 | | | | 3,255 | | | | 2,759 | | | | 3,755 | | | | 830 | | | | (2,406 | ) | | | (9,561 | ) | |
| Increase (decrease) in net assets from capital share transactions | | | 5,559 | | | | (3,076 | ) | | | 3,890 | | | | 1,920 | | | | 8,040 | | | | (584 | ) | | | (2,637 | ) | | | (17,941 | ) | |
| Total increase (decrease) in net assets | | | 5,094 | | | | (2,913 | ) | | | 2,904 | | | | 1,472 | | | | 7,658 | | | | (633 | ) | | | (3,729 | ) | | | (18,692 | ) | |
| Net assets at beginning of period | | | 20,116 | | | | 23,029 | | | | 50,334 | | | | 48,862 | | | | 26,854 | | | | 27,487 | | | | 51,717 | | | | 70,409 | | |
| Net assets at end of period | | $ | 25,210 | | | $ | 20,116 | | | $ | 53,238 | | | $ | 50,334 | | | $ | 34,512 | | | $ | 26,854 | | | $ | 47,988 | | | $ | 51,717 | | |
| Undistributed net investment income at end of period | | $ | - | | | $ | 44 | | | $ | 17 | | | $ | 12 | | | $ | 9 | | | $ | 24 | | | $ | 23 | | | $ | 96 | | |
| | | Colorado
Tax Free Fund | | Intermediate
Tax Free Fund | | Minnesota
Intermediate
Tax Free Fund | |
| | | Year Ended
9/30/05 | | Year Ended
9/30/04 | | Year Ended
9/30/05 | | Year Ended
9/30/04 | | Year Ended
9/30/05 | | Year Ended
9/30/04 | |
| OPERATIONS: | |
| Investment income – net | | $ | 937 | | | $ | 1,086 | | | $ | 27,443 | | | $ | 29,117 | | | $ | 9,362 | | | $ | 10,291 | | |
| Net realized gain on investments | | | 586 | | | | 177 | | | | 1,758 | | | | 3,586 | | | | 1,370 | | | | 796 | | |
| Net change in unrealized appreciation or depreciation of investments | | | (804 | ) | | | (145 | ) | | | (13,264 | ) | | | (11,098 | ) | | | (4,978 | ) | | | (3,173 | ) | |
| Net increase in net assets resulting from operations | | | 719 | | | | 1,118 | | | | 15,937 | | | | 21,605 | | | | 5,754 | | | | 7,914 | | |
| DISTRIBUTIONS TO SHAREHOLDERS FROM: | |
| Investment income – net: | |
| Class A | | | (420 | ) | | | (515 | ) | | | (1,423 | ) | | | (1,374 | ) | | | (1,267 | ) | | | (1,251 | ) | |
| Class C | | | (153 | ) | | | (152 | ) | | | - | | | | - | | | | - | | | | - | | |
| Class Y | | | (419 | ) | | | (431 | ) | | | (26,720 | ) | | | (27,568 | ) | | | (8,038 | ) | | | (9,017 | ) | |
| Net realized gain on investments: | |
| Class A | | | (77 | ) | | | (90 | ) | | | (194 | ) | | | (38 | ) | | | (114 | ) | | | (59 | ) | |
| Class C | | | (30 | ) | | | (29 | ) | | | - | | | | - | | | | - | | | | - | | |
| Class Y | | | (70 | ) | | | (68 | ) | | | (3,485 | ) | | | (799 | ) | | | (683 | ) | | | (444 | ) | |
| Total distributions | | | (1,169 | ) | | | (1,285 | ) | | | (31,822 | ) | | | (29,779 | ) | | | (10,102 | ) | | | (10,771 | ) | |
| CAPITAL SHARE TRANSACTIONS (note 4): | |
| Class A: | |
| Proceeds from sales | | | 303 | | | | 879 | | | | 7,869 | | | | 15,334 | | | | 5,677 | | | | 13,308 | | |
| Reinvestment of distributions | | | 421 | | | | 542 | | | | 1,256 | | | | 1,138 | | | | 1,026 | | | | 940 | | |
| Payments for redemptions | | | (2,770 | ) | | | (4,575 | ) | | | (8,912 | ) | | | (14,985 | ) | | | (8,801 | ) | | | (9,940 | ) | |
| Increase (decrease) in net assets from Class A transactions | | | (2,046 | ) | | | (3,154 | ) | | | 213 | | | | 1,487 | | | | (2,098 | ) | | | 4,308 | | |
| Class C: | |
| Proceeds from sales | | | 485 | | | | 273 | | | | - | | | | - | | | | - | | | | - | | |
| Reinvestment of distributions | | | 172 | | | | 172 | | | | - | | | | - | | | | - | | | | - | | |
| Payments for redemptions (note 3) | | | (950 | ) | | | (924 | ) | | | - | | | | - | | | | - | | | | - | | |
| Increase (decrease) in net assets from Class C transactions | | | (293 | ) | | | (479 | ) | | | - | | | | - | | | | - | | | | - | | |
| Class Y: | |
| Proceeds from sales | | | 1,391 | | | | 1,223 | | | | 111,544 | | | | 98,239 | | | | 16,162 | | | | 21,189 | | |
| Reinvestment of distributions | | | 15 | | | | 13 | | | | 3,541 | | | | 2,319 | | | | 335 | | | | 333 | | |
| Payments for redemptions | | | (2,293 | ) | | | (1,255 | ) | | | (96,251 | ) | | | (152,459 | ) | | | (32,427 | ) | | | (41,022 | ) | |
| Increase (decrease) in net assets from Class Y transactions | | | (887 | ) | | | (19 | ) | | | 18,834 | | | | (51,901 | ) | | | (15,930 | ) | | | (19,500 | ) | |
| Increase (decrease) in net assets from capital share transactions | | | (3,226 | ) | | | (3,652 | ) | | | 19,047 | | | | (50,414 | ) | | | (18,028 | ) | | | (15,192 | ) | |
| Total increase (decrease) in net assets | | | (3,676 | ) | | | (3,819 | ) | | | 3,162 | | | | (58,588 | ) | | | (22,376 | ) | | | (18,049 | ) | |
| Net assets at beginning of period | | | 23,824 | | | | 27,643 | | | | 672,637 | | | | 731,225 | | | | 251,953 | | | | 270,002 | | |
| Net assets at end of period | | $ | 20,148 | | | $ | 23,824 | | | $ | 675,799 | | | $ | 672,637 | | | $ | 229,577 | | | $ | 251,953 | | |
| Undistributed net investment income at end of period | | $ | 7 | | | $ | 62 | | | $ | 46 | | | $ | 746 | | | $ | 153 | | | $ | 96 | | |
The accompanying notes are an integral part of the financial statements.
FIRST AMERICAN FUNDS Annual Report 2005
104
FIRST AMERICAN FUNDS Annual Report 2005
105
Statements of Changes in Net Assets in thousands
| | | Minnesota
Tax Free Fund | | Missouri
Tax Free Fund | | Nebraska
Tax Free Fund | | Ohio
Tax Free Fund | |
| | | Year Ended
9/30/05 | | Year Ended
9/30/04 | | Year Ended
9/30/05 | | Year Ended
9/30/04 | | Year Ended
9/30/05 | | Year Ended
9/30/04 | | Year Ended
9/30/05 | | Year Ended
9/30/04 | |
| OPERATIONS: | |
| Investment income – net | | $ | 6,796 | | | $ | 6,945 | | | $ | 6,983 | | | $ | 7,270 | | | $ | 1,528 | | | $ | 1,416 | | | $ | 1,552 | | | $ | 1,477 | | |
| Net realized gain (loss) on investments | | | 399 | | | | 851 | | | | 1,283 | | | | 913 | | | | 67 | | | | (5 | ) | | | 58 | | | | 115 | | |
| Net change in unrealized appreciation or depreciation of investments | | | 20 | | | | (1,049 | ) | | | (2,964 | ) | | | (1,413 | ) | | | (332 | ) | | | 91 | | | | (282 | ) | | | 120 | | |
| Net increase in net assets resulting from operations | | | 7,215 | | | | 6,747 | | | | 5,302 | | | | 6,770 | | | | 1,263 | | | | 1,502 | | | | 1,328 | | | | 1,712 | | |
| DISTRIBUTIONS TO SHAREHOLDERS FROM: | |
| Investment income – net: | |
| Class A | | | (4,455 | ) | | | (4,878 | ) | | | (1,038 | ) | | | (1,014 | ) | | | (239 | ) | | | (178 | ) | | | (36 | ) | | | (38 | ) | |
| Class C | | | (361 | ) | | | (421 | ) | | | (7 | ) | | | (8 | ) | | | (65 | ) | | | (60 | ) | | | (4 | ) | | | (7 | ) | |
| Class Y | | | (1,939 | ) | | | (1,970 | ) | | | (5,959 | ) | | | (6,239 | ) | | | (1,277 | ) | | | (1,153 | ) | | | (1,524 | ) | | | (1,393 | ) | |
| Net realized gain on investments: | |
| Class A | | | (552 | ) | | | (947 | ) | | | (140 | ) | | | (75 | ) | | | - | | | | (17 | ) | | | (3 | ) | | | (8 | ) | |
| Class C | | | (49 | ) | | | (93 | ) | | | (1 | ) | | | (1 | ) | | | - | | | | (6 | ) | | | - | | | | (2 | ) | |
| Class Y | | | (210 | ) | | | (358 | ) | | | (783 | ) | | | (437 | ) | | | - | | | | (99 | ) | | | (130 | ) | | | (358 | ) | |
| Total distributions | | | (7,566 | ) | | | (8,667 | ) | | | (7,928 | ) | | | (7,774 | ) | | | (1,581 | ) | | | (1,513 | ) | | | (1,697 | ) | | | (1,806 | ) | |
| CAPITAL SHARE TRANSACTIONS (note 4): | |
| Class A: | |
| Proceeds from sales | | | 8,058 | | | | 7,430 | | | | 4,587 | | | | 3,852 | | | | 3,144 | | | | 1,430 | | | | 253 | | | | 810 | | |
| Reinvestment of distributions | | | 4,005 | | | | 5,356 | | | | 621 | | | | 564 | | | | 113 | | | | 120 | | | | 25 | | | | 20 | | |
| Payments for redemptions | | | (20,033 | ) | | | (22,419 | ) | | | (1,714 | ) | | | (5,313 | ) | | | (989 | ) | | | (1,516 | ) | | | (480 | ) | | | (469 | ) | |
| Increase (decrease) in net assets from Class A transactions | | | (7,970 | ) | | | (9,633 | ) | | | 3,494 | | | | (897 | ) | | | 2,268 | | | | 34 | | | | (202 | ) | | | 361 | | |
| Class C: | |
| Proceeds from sales | | | 933 | | | | 854 | | | | 2 | | | | 2 | | | | 411 | | | | 547 | | | | 110 | | | | 112 | | |
| Reinvestment of distributions | | | 384 | | | | 480 | | | | 8 | | | | 8 | | | | 47 | | | | 49 | | | | 1 | | | | 2 | | |
| Payments for redemptions (note 3) | | | (1,841 | ) | | | (2,766 | ) | | | (34 | ) | | | (70 | ) | | | (736 | ) | | | (389 | ) | | | (55 | ) | | | (206 | ) | |
| Increase (decrease) in net assets from Class C transactions | | | (524 | ) | | | (1,432 | ) | | | (24 | ) | | | (60 | ) | | | (278 | ) | | | 207 | | | | 56 | | | | (92 | ) | |
| Class Y: | |
| Proceeds from sales | | | 8,746 | | | | 6,064 | | | | 22,140 | | | | 15,823 | | | | 7,132 | | | | 4,887 | | | | 8,183 | | | | 5,782 | | |
| Reinvestment of distributions | | | 211 | | | | 239 | | | | 279 | | | | 269 | | | | 93 | | | | 63 | | | | 238 | | | | 263 | | |
| Payments for redemptions | | | (5,285 | ) | | | (10,775 | ) | | | (21,183 | ) | | | (30,637 | ) | | | (4,286 | ) | | | (3,318 | ) | | | (6,200 | ) | | | (6,189 | ) | |
| Increase (decrease) in net assets from Class Y transactions | | | 3,672 | | | | (4,472 | ) | | | 1,236 | | | | (14,545 | ) | | | 2,939 | | | | 1,632 | | | | 2,221 | | | | (144 | ) | |
| Increase (decrease) in net assets from capital share transactions | | | (4,822 | ) | | | (15,537 | ) | | | 4,706 | | | | (15,502 | ) | | | 4,929 | | | | 1,873 | | | | 2,075 | | | | 125 | | |
| Total increase (decrease) in net assets | | | (5,173 | ) | | | (17,457 | ) | | | 2,080 | | | | (16,506 | ) | | | 4,611 | | | | 1,862 | | | | 1,706 | | | | 31 | | |
| Net assets at beginning of period | | | 168,268 | | | | 185,725 | | | | 180,008 | | | | 196,514 | | | | 36,508 | | | | 34,646 | | | | 40,560 | | | | 40,529 | | |
| Net assets at end of period | | $ | 163,095 | | | $ | 168,268 | | | $ | 182,088 | | | $ | 180,008 | | | $ | 41,119 | | | $ | 36,508 | | | $ | 42,266 | | | $ | 40,560 | | |
| Undistributed net investment income at end of period | | $ | 182 | | | $ | 141 | | | $ | 66 | | | $ | 87 | | | $ | 12 | | | $ | 65 | | | $ | 29 | | | $ | 41 | | |
| | | Oregon
Intermediate
Tax Free Fund | | Short
Tax Free Fund | | Tax Free Fund | |
| | | Year Ended
9/30/05 | | Year Ended
9/30/04 | | Year Ended
9/30/05 | | Year Ended
9/30/04 | | Year Ended
9/30/05 | | Year Ended
9/30/04 | |
| OPERATIONS: | |
| Investment income – net | | $ | 5,287 | | | $ | 5,538 | | | $ | 10,162 | | | $ | 11,631 | | | $ | 20,609 | | | $ | 21,168 | | |
| Net realized gain (loss) on investments | | | 590 | | | | 530 | | | | (387 | ) | | | (238 | ) | | | 1,085 | | | | 4,298 | | |
| Net change in unrealized appreciation or depreciation of investments | | | (3,269 | ) | | | (1,354 | ) | | | (6,969 | ) | | | (6,917 | ) | | | (206 | ) | | | (4,320 | ) | |
| Net increase in net assets resulting from operations | | | 2,608 | | | | 4,714 | | | | 2,806 | | | | 4,476 | | | | 21,488 | | | | 21,146 | | |
| DISTRIBUTIONS TO SHAREHOLDERS FROM: | |
| Investment income – net: | |
| Class A | | | (317 | ) | | | (324 | ) | | | (134 | ) | | | (170 | ) | | | (1,623 | ) | | | (1,741 | ) | |
| Class C | | | - | | | | - | | | | - | | | | - | | | | (105 | ) | | | (142 | ) | |
| Class Y | | | (4,973 | ) | | | (5,228 | ) | | | (10,086 | ) | | | (11,193 | ) | | | (18,782 | ) | | | (19,659 | ) | |
| Net realized gain on investments: | |
| Class A | | | (30 | ) | | | (66 | ) | | | - | | | | (44 | ) | | | (379 | ) | | | (405 | ) | |
| Class C | | | - | | | | - | | | | - | | | | - | | | | (28 | ) | | | (46 | ) | |
| Class Y | | | (481 | ) | | | (1,095 | ) | | | - | | | | (2,391 | ) | | | (4,002 | ) | | | (4,411 | ) | |
| Total distributions | | | (5,801 | ) | | | (6,713 | ) | | | (10,220 | ) | | | (13,798 | ) | | | (24,919 | ) | | | (26,404 | ) | |
| CAPITAL SHARE TRANSACTIONS (note 4): | |
| Class A: | |
| Proceeds from sales | | | 2,055 | | | | 2,426 | | | | 2,110 | | | | 3,312 | | | | 4,259 | | | | 8,839 | | |
| Reinvestment of distributions | | | 226 | | | | 244 | | | | 104 | | | | 164 | | | | 1,669 | | | | 1,855 | | |
| Payments for redemptions | | | (1,426 | ) | | | (2,041 | ) | | | (4,320 | ) | | | (3,434 | ) | | | (7,589 | ) | | | (12,976 | ) | |
| Increase (decrease) in net assets from Class A transactions | | | 855 | | | | 629 | | | | (2,106 | ) | | | 42 | | | | (1,661 | ) | | | (2,282 | ) | |
| Class C: | |
| Proceeds from sales | | | - | | | | - | | | | - | | | | - | | | | 277 | | | | 462 | | |
| Reinvestment of distributions | | | - | | | | - | | | | - | | | | - | | | | 126 | | | | 181 | | |
| Payments for redemptions (note 3) | | | - | | | | - | | | | - | | | | - | | | | (352 | ) | | | (2,823 | ) | |
| Increase (decrease) in net assets from Class C transactions | | | - | | | | - | | | | - | | | | - | | | | 51 | | | | (2,180 | ) | |
| Class Y: | |
| Proceeds from sales | | | 19,409 | | | | 17,962 | | | | 67,779 | | | | 163,207 | | | | 69,526 | | | | 44,937 | | |
| Reinvestment of distributions | | | 405 | | | | 779 | | | | 676 | | | | 3,494 | | | | 1,078 | | | | 1,184 | | |
| Payments for redemptions | | | (21,076 | ) | | | (25,235 | ) | | | (150,873 | ) | | | (135,099 | ) | | | (47,832 | ) | | | (85,368 | ) | |
| Increase (decrease) in net assets from Class Y transactions | | | (1,262 | ) | | | (6,494 | ) | | | (82,418 | ) | | | 31,602 | | | | 22,772 | | | | (39,247 | ) | |
| Increase (decrease) in net assets from capital share transactions | | | (407 | ) | | | (5,865 | ) | | | (84,524 | ) | | | 31,644 | | | | 21,162 | | | | (43,709 | ) | |
| Total increase (decrease) in net assets | | | (3,600 | ) | | | (7,864 | ) | | | (91,938 | ) | | | 22,322 | | | | 17,731 | | | | (48,967 | ) | |
| Net assets at beginning of period | | | 146,569 | | | | 154,433 | | | | 425,688 | | | | 403,366 | | | | 459,489 | | | | 508,456 | | |
| Net assets at end of period | | $ | 142,969 | | | $ | 146,569 | | | $ | 333,750 | | | $ | 425,688 | | | $ | 477,220 | | | $ | 459,489 | | |
| Undistributed net investment income at end of period | | $ | 19 | | | $ | 22 | | | $ | 255 | | | $ | 313 | | | $ | 185 | | | $ | 86 | | |
The accompanying notes are an integral part of the financial statements.
FIRST AMERICAN FUNDS Annual Report 2005
106
FIRST AMERICAN FUNDS Annual Report 2005
107
Financial Highlights For a share outstanding throughout the periods ended September 30, unless otherwise indicated.
| | | Net Asset
Value
Beginning
of Period | | Net
Investment
Income | | Realized and
Unrealized
Gains
(Losses) on
Investments | | Distributions
from Net
Investment
Income | | Distributions
from Net
Realized Gains | | Net Asset
Value
End of
Period | | Total
Return (1) | |
| Arizona Tax Free Fund | |
| Class A | |
| | 2005 | | | $ | 11.42 | | | $ | 0.46 | | | $ | (0.07 | ) | | $ | (0.49 | ) | | $ | (0.13 | ) | | $ | 11.19 | | | | 3.49 | % | |
| | 2004 | | | | 11.33 | | | | 0.49 | | | | 0.12 | | | | (0.47 | ) | | | (0.05 | ) | | | 11.42 | | | | 5.50 | | |
| | 2003 | | | | 11.41 | | | | 0.46 | | | | (0.06 | ) | | | (0.45 | ) | | | (0.03 | ) | | | 11.33 | | | | 3.61 | | |
| | 2002 | | | | 10.99 | | | | 0.48 | | | | 0.44 | | | | (0.48 | ) | | | (0.02 | ) | | | 11.41 | | | | 8.69 | | |
| | 2001 | | | | 10.45 | | | | 0.55 | | | | 0.53 | | | | (0.54 | ) | | | - | | | | 10.99 | | | | 10.50 | | |
| Class C | |
| | 2005 | | | $ | 11.41 | | | $ | 0.42 | | | $ | (0.08 | ) | | $ | (0.44 | ) | | $ | (0.13 | ) | | $ | 11.18 | | | | 3.08 | % | |
| | 2004 | | | | 11.31 | | | | 0.43 | | | | 0.14 | | | | (0.42 | ) | | | (0.05 | ) | | | 11.41 | | | | 5.17 | | |
| | 2003 | | | | 11.40 | | | | 0.42 | | | | (0.08 | ) | | | (0.40 | ) | | | (0.03 | ) | | | 11.31 | | | | 3.10 | | |
| | 2002 | | | | 10.98 | | | | 0.44 | | | | 0.44 | | | | (0.44 | ) | | | (0.02 | ) | | | 11.40 | | | | 8.28 | | |
| | 2001 | | | | 10.44 | | | | 0.53 | | | | 0.51 | | | | (0.50 | ) | | | - | | | | 10.98 | | | | 10.15 | | |
| Class Y | |
| | 2005 | | | $ | 11.43 | | | $ | 0.50 | | | $ | (0.09 | ) | | $ | (0.52 | ) | | $ | (0.13 | ) | | $ | 11.19 | | | | 3.65 | % | |
| | 2004 | | | | 11.33 | | | | 0.50 | | | | 0.15 | | | | (0.50 | ) | | | (0.05 | ) | | | 11.43 | | | | 5.85 | | |
| | 2003 | | | | 11.41 | | | | 0.48 | | | | (0.06 | ) | | | (0.47 | ) | | | (0.03 | ) | | | 11.33 | | | | 3.86 | | |
| | 2002 | | | | 10.99 | | | | 0.51 | | | | 0.44 | | | | (0.51 | ) | | | (0.02 | ) | | | 11.41 | | | | 8.95 | | |
| | 2001 | | | | 10.45 | | | | 0.57 | | | | 0.53 | | | | (0.56 | ) | | | - | | | | 10.99 | | | | 10.76 | | |
| California Intermediate Tax Free Fund | |
| Class A | |
| | 2005 | | | $ | 10.55 | | | $ | 0.39 | | | $ | (0.13 | ) | | $ | (0.39 | ) | | $ | (0.07 | ) | | $ | 10.35 | | | | 2.51 | % | |
| | 2004 | | | | 10.64 | | | | 0.40 | | | | (0.05 | ) | | | (0.41 | ) | | | (0.03 | ) | | | 10.55 | | | | 3.36 | | |
| | 2003 | | | | 10.80 | | | | 0.41 | | | | (0.14 | ) | | | (0.41 | ) | | | (0.02 | ) | | | 10.64 | | | | 2.58 | | |
| | 2002 | | | | 10.41 | | | | 0.42 | | | | 0.39 | | | | (0.42 | ) | | | - | | | | 10.80 | | | | 8.01 | | |
| | 2001 | | | | 10.02 | | | | 0.44 | | | | 0.39 | | | | (0.44 | ) | | | - | | | | 10.41 | | | | 8.41 | | |
| Class Y | |
| | 2005 | | | $ | 10.57 | | | $ | 0.40 | | | $ | (0.13 | ) | | $ | (0.40 | ) | | $ | (0.07 | ) | | $ | 10.37 | | | | 2.66 | % | |
| | 2004 | | | | 10.66 | | | | 0.41 | | | | (0.05 | ) | | | (0.42 | ) | | | (0.03 | ) | | | 10.57 | | | | 3.51 | | |
| | 2003 | | | | 10.81 | | | | 0.43 | | | | (0.14 | ) | | | (0.42 | ) | | | (0.02 | ) | | | 10.66 | | | | 2.83 | | |
| | 2002 | | | | 10.43 | | | | 0.43 | | | | 0.38 | | | | (0.43 | ) | | | - | | | | 10.81 | | | | 8.05 | | |
| | 2001 | | | | 10.04 | | | | 0.44 | | | | 0.39 | | | | (0.44 | ) | | | - | | | | 10.43 | | | | 8.39 | | |
| California Tax Free Fund | |
| Class A | |
| | 2005 | | | $ | 11.40 | | | $ | 0.44 | | | $ | (0.05 | ) | | $ | (0.44 | ) | | $ | (0.11 | ) | | $ | 11.24 | | | | 3.50 | % | |
| | 2004 | | | | 11.40 | | | | 0.46 | | | | 0.08 | | | | (0.46 | ) | | | (0.08 | ) | | | 11.40 | | | | 4.93 | | |
| | 2003 | | | | 11.63 | | | | 0.47 | | | | (0.16 | ) | | | (0.47 | ) | | | (0.07 | ) | | | 11.40 | | | | 2.85 | | |
| | 2002 | | | | 11.17 | | | | 0.48 | | | | 0.50 | | | | (0.47 | ) | | | (0.05 | ) | | | 11.63 | | | | 9.10 | | |
| | 2001 | | | | 10.66 | | | | 0.52 | | | | 0.50 | | | | (0.51 | ) | | | - | | | | 11.17 | | | | 9.73 | | |
| Class C | |
| | 2005 | | | $ | 11.41 | | | $ | 0.40 | | | $ | (0.05 | ) | | $ | (0.40 | ) | | $ | (0.11 | ) | | $ | 11.25 | | | | 3.11 | % | |
| | 2004 | | | | 11.41 | | | | 0.41 | | | | 0.09 | | | | (0.42 | ) | | | (0.08 | ) | | | 11.41 | | | | 4.52 | | |
| | 2003 | | | | 11.64 | | | | 0.43 | | | | (0.16 | ) | | | (0.43 | ) | | | (0.07 | ) | | | 11.41 | | | | 2.45 | | |
| | 2002 | | | | 11.18 | | | | 0.42 | | | | 0.52 | | | | (0.43 | ) | | | (0.05 | ) | | | 11.64 | | | | 8.69 | | |
| | 2001 | | | | 10.66 | | | | 0.47 | | | | 0.51 | | | | (0.46 | ) | | | - | | | | 11.18 | | | | 9.42 | | |
| Class Y | |
| | 2005 | | | $ | 11.40 | | | $ | 0.47 | | | $ | (0.04 | ) | | $ | (0.47 | ) | | $ | (0.11 | ) | | $ | 11.25 | | | | 3.85 | % | |
| | 2004 | | | | 11.40 | | | | 0.48 | | | | 0.09 | | | | (0.49 | ) | | | (0.08 | ) | | | 11.40 | | | | 5.19 | | |
| | 2003 | | | | 11.63 | | | | 0.49 | | | | (0.15 | ) | | | (0.50 | ) | | | (0.07 | ) | | | 11.40 | | | | 3.11 | | |
| | 2002 | | | | 11.17 | | | | 0.49 | | | | 0.52 | | | | (0.50 | ) | | | (0.05 | ) | | | 11.63 | | | | 9.36 | | |
| | 2001 | | | | 10.66 | | | | 0.54 | | | | 0.50 | | | | (0.53 | ) | | | - | | | | 11.17 | | | | 9.99 | | |
| | | Net Assets
End of
Period (000) | | Ratio of
Expenses to
Average
Net Assets | | Ratio of Net
Investment
Income
to Average
Net Assets | | Ratio of
Expenses to
Average
Net Assets
(Excluding
Waivers) | | Ratio of Net
Investment
Income
to Average Net
Assets (Excluding
Waivers) | | Portfolio
Turnover
Rate | |
| Arizona Tax Free Fund | |
| Class A | |
| | 2005 | | | $ | 9,547 | | | | 0.75 | % | | | 4.14 | % | | | 1.18 | % | | | 3.71 | % | | | 20 | % | |
| | 2004 | | | | 9,008 | | | | 0.75 | | | | 4.16 | | | | 1.12 | | | | 3.79 | | | | 21 | | |
| | 2003 | | | | 11,928 | | | | 0.75 | | | | 4.03 | | | | 1.09 | | | | 3.69 | | | | 37 | | |
| | 2002 | | | | 12,413 | | | | 0.75 | | | | 4.40 | | | | 1.37 | | | | 3.78 | | | | 30 | | |
| | 2001 | | | | 13,971 | | | | 0.25 | | | | 5.10 | | | | 1.45 | | | | 3.90 | | | | 19 | | |
| Class C | |
| | 2005 | | | $ | 1,628 | | | | 1.15 | % | | | 3.74 | % | | | 1.93 | % | | | 2.96 | % | | | 20 | % | |
| | 2004 | | | | 1,588 | | | | 1.15 | | | | 3.76 | | | | 1.87 | | | | 3.04 | | | | 21 | | |
| | 2003 | | | | 1,857 | | | | 1.15 | | | | 3.63 | | | | 1.84 | | | | 2.94 | | | | 37 | | |
| | 2002 | | | | 2,910 | | | | 1.15 | | | | 4.00 | | | | 2.12 | | | | 3.03 | | | | 30 | | |
| | 2001 | | | | 2,003 | | | | 0.65 | | | | 4.66 | | | | 1.84 | | | | 3.47 | | | | 19 | | |
| Class Y | |
| | 2005 | | | $ | 14,035 | | | | 0.50 | % | | | 4.39 | % | | | 0.93 | % | | | 3.96 | % | | | 20 | % | |
| | 2004 | | | | 9,520 | | | | 0.50 | | | | 4.42 | | | | 0.87 | | | | 4.05 | | | | 21 | | |
| | 2003 | | | | 9,244 | | | | 0.50 | | | | 4.28 | | | | 0.84 | | | | 3.94 | | | | 37 | | |
| | 2002 | | | | 10,656 | | | | 0.50 | | | | 4.64 | | | | 1.12 | | | | 4.02 | | | | 30 | | |
| | 2001 | | | | 5,822 | | | | - | | | | 5.33 | | | | 1.19 | | | | 4.14 | | | | 19 | | |
| California Intermediate Tax Free Fund | |
| Class A | |
| | 2005 | | | $ | 3,946 | | | | 0.85 | % | | | 3.71 | % | | | 1.10 | % | | | 3.46 | % | | | 29 | % | |
| | 2004 | | | | 3,381 | | | | 0.85 | | | | 3.78 | | | | 1.06 | | | | 3.57 | | | | 20 | | |
| | 2003 | | | | 4,262 | | | | 0.85 | | | | 3.86 | | | | 1.06 | | | | 3.65 | | | | 17 | | |
| | 2002 | | | | 4,870 | | | | 0.85 | | | | 4.01 | | | | 1.14 | | | | 3.72 | | | | 23 | | |
| | 2001 | | | | 3,392 | | | | 0.70 | | | | 4.25 | | | | 1.21 | | | | 3.74 | | | | 12 | | |
| Class Y | |
| | 2005 | | | $ | 49,292 | | | | 0.70 | % | | | 3.86 | % | | | 0.85 | % | | | 3.71 | % | | | 29 | % | |
| | 2004 | | | | 46,953 | | | | 0.70 | | | | 3.93 | | | | 0.81 | | | | 3.82 | | | | 20 | | |
| | 2003 | | | | 44,600 | | | | 0.70 | | | | 4.02 | | | | 0.81 | | | | 3.91 | | | | 17 | | |
| | 2002 | | | | 45,212 | | | | 0.70 | | | | 4.16 | | | | 0.89 | | | | 3.97 | | | | 23 | | |
| | 2001 | | | | 43,647 | | | | 0.70 | | | | 4.26 | | | | 0.96 | | | | 4.00 | | | | 12 | | |
| California Tax Free Fund | |
| Class A | |
| | 2005 | | | $ | 11,888 | | | | 0.75 | % | | | 3.88 | % | | | 1.15 | % | | | 3.48 | % | | | 14 | % | |
| | 2004 | | | | 9,513 | | | | 0.75 | | | | 4.03 | | | | 1.09 | | | | 3.69 | | | | 16 | | |
| | 2003 | | | | 11,143 | | | | 0.75 | | | | 4.16 | | | | 1.08 | | | | 3.83 | | | | 20 | | |
| | 2002 | | | | 12,954 | | | | 0.75 | | | | 4.26 | | | | 1.31 | | | | 3.70 | | | | 33 | | |
| | 2001 | | | | 18,139 | | | | 0.25 | | | | 4.75 | | | | 1.35 | | | | 3.65 | | | | 19 | | |
| Class C | |
| | 2005 | | | $ | 3,068 | | | | 1.15 | % | | | 3.47 | % | | | 1.90 | % | | | 2.72 | % | | | 14 | % | |
| | 2004 | | | | 1,294 | | | | 1.15 | | | | 3.65 | | | | 1.84 | | | | 2.96 | | | | 16 | | |
| | 2003 | | | | 1,101 | | | | 1.15 | | | | 3.75 | | | | 1.83 | | | | 3.07 | | | | 20 | | |
| | 2002 | | | | 1,115 | | | | 1.15 | | | | 3.86 | | | | 2.06 | | | | 2.95 | | | | 33 | | |
| | 2001 | | | | 647 | | | | 0.65 | | | | 4.38 | | | | 1.75 | | | | 3.28 | | | | 19 | | |
| Class Y | |
| | 2005 | | | $ | 19,556 | | | | 0.50 | % | | | 4.12 | % | | | 0.90 | % | | | 3.72 | % | | | 14 | % | |
| | 2004 | | | | 16,047 | | | | 0.50 | | | | 4.29 | | | | 0.84 | | | | 3.95 | | | | 16 | | |
| | 2003 | | | | 15,243 | | | | 0.50 | | | | 4.40 | | | | 0.83 | | | | 4.07 | | | | 20 | | |
| | 2002 | | | | 11,853 | | | | 0.50 | | | | 4.51 | | | | 1.06 | | | | 3.95 | | | | 33 | | |
| | 2001 | | | | 6,726 | | | | - | | | | 5.00 | | | | 1.10 | | | | 3.90 | | | | 19 | | |
(1) Total return does not reflect sales charges. Total return would have been lower had certain expenses not been waived.
The accompanying notes are an integral part of the financial statements.
FIRST AMERICAN FUNDS Annual Report 2005
108
FIRST AMERICAN FUNDS Annual Report 2005
109
Financial Highlights For a share outstanding throughout the periods ended September 30, unless otherwise indicated.
| | | Net Asset
Value
Beginning
of Period | | Net
Investment
Income | | Realized and
Unrealized
Gains
(Losses) on
Investments | | Distributions
from Net
Investment
Income | | Distributions
from Net
Realized Gains | | Distributions
from
Return of
Capital | | Net Asset
Value
End of
Period | |
| | Colorado Intermediate Tax Free Fund | | | | |
| Class A | |
| | 2005 | | | $ | 10.98 | | | $ | 0.42 | | | $ | (0.19 | ) | | $ | (0.43 | ) | | $ | (0.04 | ) | | $ | - | | | $ | 10.74 | | |
| | 2004 | | | | 11.08 | | | | 0.45 | | | | (0.11 | ) | | | (0.44 | ) | | | - | | | | - | | | | 10.98 | | |
| | 2003 | | | | 11.12 | | | | 0.41 | | | | (0.02 | ) | | | (0.43 | ) | | | - | | | | - | | | | 11.08 | | |
| | 2002 | | | | 10.79 | | | | 0.47 | | | | 0.32 | | | | (0.46 | ) | | | - | | | | - | | | | 11.12 | | |
| | 2001 | | | | 10.28 | | | | 0.46 | | | | 0.52 | | | | (0.47 | ) | | | - | | | | - | | | | 10.79 | | |
| Class Y | |
| | 2005 | | | $ | 10.95 | | | $ | 0.43 | | | $ | (0.18 | ) | | $ | (0.44 | ) | | $ | (0.04 | ) | | $ | - | | | $ | 10.72 | | |
| | 2004 | | | | 11.05 | | | | 0.46 | | | | (0.11 | ) | | | (0.45 | ) | | | - | | | | - | | | | 10.95 | | |
| | 2003 | | | | 11.10 | | | | 0.43 | | | | (0.03 | ) | | | (0.45 | ) | | | - | | | | - | | | | 11.05 | | |
| | 2002 | | | | 10.76 | | | | 0.49 | | | | 0.33 | | | | (0.48 | ) | | | - | | | | - | | | | 11.10 | | |
| | 2001 | | | | 10.26 | | | | 0.48 | | | | 0.49 | | | | (0.47 | ) | | | - | | | | - | | | | 10.76 | | |
| | Colorado Tax Free Fund | | | | |
| Class A | |
| | 2005 | | | $ | 11.52 | | | $ | 0.49 | | | $ | (0.11 | ) | | $ | (0.51 | ) | | $ | (0.09 | ) | | $ | - | | | $ | 11.30 | | |
| | 2004 | | | | 11.57 | | | | 0.51 | | | | 0.02 | | | | (0.50 | ) | | | (0.08 | ) | | | - | | | | 11.52 | | |
| | 2003 | | | | 11.65 | | | | 0.50 | | | | (0.10 | ) | | | (0.48 | ) | | | - | | | | - | | | | 11.57 | | |
| | 2002 | | | | 11.09 | | | | 0.48 | | | | 0.56 | | | | (0.47 | ) | | | (0.01 | ) | | | - | | | | 11.65 | | |
| | 2001 | | | | 10.42 | | | | 0.54 | | | | 0.66 | | | | (0.53 | ) | | | - | | | | - | | | | 11.09 | | |
| Class C | |
| | 2005 | | | $ | 11.50 | | | $ | 0.43 | | | $ | (0.10 | ) | | $ | (0.46 | ) | | $ | (0.09 | ) | | $ | - | | | $ | 11.28 | | |
| | 2004 | | | | 11.56 | | | | 0.44 | | | | 0.03 | | | | (0.45 | ) | | | (0.08 | ) | | | - | | | | 11.50 | | |
| | 2003 | | | | 11.63 | | | | 0.44 | | | | (0.08 | ) | | | (0.43 | ) | | | - | | | | - | | | | 11.56 | | |
| | 2002 | | | | 11.08 | | | | 0.44 | | | | 0.56 | | | | (0.44 | ) | | | (0.01 | ) | | | - | | | | 11.63 | | |
| | 2001 | | | | 10.41 | | | | 0.49 | | | | 0.67 | | | | (0.49 | ) | | | - | | | | - | | | | 11.08 | | |
| Class Y | |
| | 2005 | | | $ | 11.53 | | | $ | 0.51 | | | $ | (0.09 | ) | | $ | (0.54 | ) | | $ | (0.09 | ) | | $ | - | | | $ | 11.32 | | |
| | 2004 | | | | 11.59 | | | | 0.52 | | | | 0.03 | | | | (0.53 | ) | | | (0.08 | ) | | | - | | | | 11.53 | | |
| | 2003 | | | | 11.67 | | | | 0.51 | | | | (0.09 | ) | | | (0.50 | ) | | | - | | | | - | | | | 11.59 | | |
| | 2002 | | | | 11.10 | | | | 0.48 | | | | 0.60 | | | | (0.50 | ) | | | (0.01 | ) | | | - | | | | 11.67 | | |
| | 2001 | | | | 10.43 | | | | 0.58 | | | | 0.64 | | | | (0.55 | ) | | | - | | | | - | | | | 11.10 | | |
| | Intermediate Tax Free Fund | | | | |
| Class A | |
| | 2005 | | | $ | 11.18 | | | $ | 0.44 | | | $ | (0.19 | ) | | $ | (0.45 | ) | | $ | (0.06 | ) | | $ | - | | | $ | 10.92 | | |
| | 2004 | | | | 11.30 | | | | 0.44 | | | | (0.10 | ) | | | (0.45 | ) | | | (0.01 | ) | | | - | | | | 11.18 | | |
| | 2003 | | | | 11.32 | | | | 0.44 | | | | (0.03 | ) | | | (0.43 | ) | | | - | | | | - | | | | 11.30 | | |
| | 2002 | | | | 10.95 | | | | 0.43 | | | | 0.40 | | | | (0.43 | ) | | | - | | | | (0.03 | ) | | | 11.32 | | |
| | 2001 | | | | 10.48 | | | | 0.48 | | | | 0.46 | | | | (0.47 | ) | | | - | | | | - | | | | 10.95 | | |
| Class Y | |
| | 2005 | | | $ | 11.16 | | | $ | 0.46 | | | $ | (0.19 | ) | | $ | (0.47 | ) | | $ | (0.06 | ) | | $ | - | | | $ | 10.90 | | |
| | 2004 | | | | 11.28 | | | | 0.46 | | | | (0.11 | ) | | | (0.46 | ) | | | (0.01 | ) | | | - | | | | 11.16 | | |
| | 2003 | | | | 11.30 | | | | 0.46 | | | | (0.03 | ) | | | (0.45 | ) | | | - | | | | - | | | | 11.28 | | |
| | 2002 | | | | 10.93 | | | | 0.44 | | | | 0.40 | | | | (0.44 | ) | | | - | | | | (0.03 | ) | | | 11.30 | | |
| | 2001 | | | | 10.46 | | | | 0.48 | | | | 0.46 | | | | (0.47 | ) | | | - | | | | - | | | | 10.93 | | |
| | | Total
Return (1) | | Net Assets
End of
Period (000) | | Ratio of
Expenses to
Average
Net Assets | | Ratio of Net
Investment
Income
to Average
Net Assets | | Ratio of
Expenses to
Average
Net Assets
(Excluding
Waivers) | | Ratio of Net
Investment
Income
to Average Net
Assets (Excluding
Waivers) | | Portfolio
Turnover
Rate | |
| | Colorado Intermediate Tax Free Fund | | |
| Class A | |
| | 2005 | | | | 2.11 | % | | $ | 13,426 | | | | 0.85 | % | | | 3.85 | % | | | 1.10 | % | | | 3.60 | % | | | 20 | % | |
| | 2004 | | | | 3.12 | | | | 13,969 | | | | 0.85 | | | | 4.00 | | | | 1.06 | | | | 3.79 | | | | 4 | | |
| | 2003 | | | | 3.64 | | | | 22,555 | | | | 0.85 | | | | 3.79 | | | | 1.06 | | | | 3.58 | | | | 14 | | |
| | 2002 | | | | 7.56 | | | | 15,244 | | | | 0.85 | | | | 4.48 | | | | 1.11 | | | | 4.22 | | | | 15 | | |
| | 2001 | | | | 9.75 | | | | 8,320 | | | | 0.70 | | | | 4.55 | | | | 1.34 | | | | 3.91 | | | | 24 | | |
| Class Y | |
| | 2005 | | | | 2.36 | % | | $ | 34,562 | | | | 0.70 | % | | | 4.01 | % | | | 0.85 | % | | | 3.86 | % | | | 20 | % | |
| | 2004 | | | | 3.29 | | | | 37,748 | | | | 0.70 | | | | 4.15 | | | | 0.81 | | | | 4.04 | | | | 4 | | |
| | 2003 | | | | 3.71 | | | | 47,854 | | | | 0.70 | | | | 3.94 | | | | 0.81 | | | | 3.83 | | | | 14 | | |
| | 2002 | | | | 7.83 | | | | 48,398 | | | | 0.70 | | | | 4.60 | | | | 0.86 | | | | 4.44 | | | | 15 | | |
| | 2001 | | | | 9.67 | | | | 47,907 | | | | 0.70 | | | | 4.58 | | | | 1.09 | | | | 4.19 | | | | 24 | | |
| | Colorado Tax Free Fund | | |
| Class A | |
| | 2005 | | | | 3.36 | % | | $ | 8,362 | | | | 0.75 | % | | | 4.23 | % | | | 1.18 | % | | | 3.80 | % | | | 30 | % | |
| | 2004 | | | | 4.71 | | | | 10,598 | | | | 0.75 | | | | 4.25 | | | | 1.09 | | | | 3.91 | | | | 12 | | |
| | 2003 | | | | 3.53 | | | | 13,843 | | | | 0.75 | | | | 4.23 | | | | 1.07 | | | | 3.91 | | | | 14 | | |
| | 2002 | | | | 9.72 | | | | 19,633 | | | | 0.75 | | | | 4.32 | | | | 1.30 | | | | 3.77 | | | | 22 | | |
| | 2001 | | | | 11.78 | | | | 20,550 | | | | 0.25 | | | | 5.03 | | | | 1.42 | | | | 3.86 | | | | 23 | | |
| Class C | |
| | 2005 | | | | 2.95 | % | | $ | 3,423 | | | | 1.15 | % | | | 3.83 | % | | | 1.93 | % | | | 3.05 | % | | | 30 | % | |
| | 2004 | | | | 4.21 | | | | 3,787 | | | | 1.15 | | | | 3.85 | | | | 1.84 | | | | 3.16 | | | | 12 | | |
| | 2003 | | | | 3.23 | | | | 4,284 | | | | 1.15 | | | | 3.83 | | | | 1.82 | | | | 3.16 | | | | 14 | | |
| | 2002 | | | | 9.23 | | | | 3,705 | | | | 1.15 | | | | 3.95 | | | | 2.05 | | | | 3.05 | | | | 22 | | |
| | 2001 | | | | 11.41 | | | | 1,698 | | | | 0.65 | | | | 4.61 | | | | 1.82 | | | | 3.44 | | | | 23 | | |
| Class Y | |
| | 2005 | | | | 3.70 | % | | $ | 8,363 | | | | 0.50 | % | | | 4.48 | % | | | 0.93 | % | | | 4.05 | % | | | 30 | % | |
| | 2004 | | | | 4.87 | | | | 9,439 | | | | 0.50 | | | | 4.51 | | | | 0.84 | | | | 4.17 | | | | 12 | | |
| | 2003 | | | | 3.78 | | | | 9,516 | | | | 0.50 | | | | 4.49 | | | | 0.82 | | | | 4.17 | | | | 14 | | |
| | 2002 | | | | 10.07 | | | | 9,244 | | | | 0.50 | | | | 4.59 | | | | 1.05 | | | | 4.04 | | | | 22 | | |
| | 2001 | | | | 12.02 | | | | 1,923 | | | | - | | | | 5.32 | | | | 1.18 | | | | 4.14 | | | | 23 | | |
| | Intermediate Tax Free Fund | | |
| Class A | |
| | 2005 | | | | 2.31 | % | | $ | 34,658 | | | | 0.85 | % | | | 3.98 | % | | | 1.05 | % | | | 3.78 | % | | | 15 | % | |
| | 2004 | | | | 3.06 | | | | 35,276 | | | | 0.85 | | | | 3.98 | | | | 1.05 | | | | 3.78 | | | | 10 | | |
| | 2003 | | | | 3.74 | | | | 34,231 | | | | 0.85 | | | | 3.91 | | | | 1.05 | | | | 3.71 | | | | 15 | | |
| | 2002 | | | | 7.78 | | | | 29,838 | | | | 0.85 | | | | 3.87 | | | | 1.03 | | | | 3.69 | | | | 28 | | |
| | 2001 | | | | 9.19 | | | | 23,236 | | | | 0.70 | | | | 4.43 | | | | 1.13 | | | | 4.00 | | | | 12 | | |
| Class Y | |
| | 2005 | | | | 2.47 | % | | $ | 641,141 | | | | 0.70 | % | | | 4.13 | % | | | 0.80 | % | | | 4.03 | % | | | 15 | % | |
| | 2004 | | | | 3.22 | | | | 637,361 | | | | 0.70 | | | | 4.13 | | | | 0.80 | | | | 4.03 | | | | 10 | | |
| | 2003 | | | | 3.90 | | | | 696,994 | | | | 0.70 | | | | 4.05 | | | | 0.80 | | | | 3.95 | | | | 15 | | |
| | 2002 | | | | 7.95 | | | | 485,592 | | | | 0.70 | | | | 4.04 | | | | 0.78 | | | | 3.96 | | | | 28 | | |
| | 2001 | | | | 9.21 | | | | 458,743 | | | | 0.70 | | | | 4.43 | | | | 0.87 | | | | 4.26 | | | | 12 | | |
(1) Total return does not reflect sales charges. Total return would have been lower had certain expenses not been waived.
The accompanying notes are an integral part of the financial statements.
FIRST AMERICAN FUNDS Annual Report 2005
110
FIRST AMERICAN FUNDS Annual Report 2005
111
Financial Highlights For a share outstanding throughout the periods ended September 30, unless otherwise indicated.
| | | Net Asset
Value
Beginning
of Period | | Net
Investment
Income | | Realized and
Unrealized
Gains
(Losses) on
Investments | | Distributions
from Net
Investment
Income | | Distributions
from Net
Realized Gains | | Net Asset
Value
End of
Period | | Total
Return (5) | |
| Minnesota Intermediate Tax Free Fund | |
| Class A | |
| | 2005 | | | $ | 10.34 | | | $ | 0.39 | | | $ | (0.15 | ) | | $ | (0.39 | ) | | $ | (0.03 | ) | | $ | 10.16 | | | | 2.33 | % | |
| | 2004 | | | | 10.44 | | | | 0.39 | | | | (0.08 | ) | | | (0.39 | ) | | | (0.02 | ) | | | 10.34 | | | | 3.03 | | |
| | 2003 | | | | 10.51 | | | | 0.40 | | | | (0.04 | ) | | | (0.41 | ) | | | (0.02 | ) | | | 10.44 | | | | 3.55 | | |
| | 2002 | | | | 10.21 | | | | 0.43 | | | | 0.29 | | | | (0.42 | ) | | | - | | | | 10.51 | | | | 7.23 | | |
| | 2001 | | | | 9.80 | | | | 0.44 | | | | 0.41 | | | | (0.44 | ) | | | - | | | | 10.21 | | | | 8.85 | | |
| Class Y | |
| | 2005 | | | $ | 10.29 | | | $ | 0.40 | | | $ | (0.15 | ) | | $ | (0.40 | ) | | $ | (0.03 | ) | | $ | 10.11 | | | | 2.50 | % | |
| | 2004 | | | | 10.40 | | | | 0.41 | | | | (0.10 | ) | | | (0.40 | ) | | | (0.02 | ) | | | 10.29 | | | | 3.10 | | |
| | 2003 | | | | 10.46 | | | | 0.42 | | | | (0.03 | ) | | | (0.43 | ) | | | (0.02 | ) | | | 10.40 | | | | 3.82 | | |
| | 2002 | | | | 10.17 | | | | 0.45 | | | | 0.27 | | | | (0.43 | ) | | | - | | | | 10.46 | | | | 7.31 | | |
| | 2001 | | | | 9.76 | | | | 0.44 | | | | 0.41 | | | | (0.44 | ) | | | - | | | | 10.17 | | | | 8.89 | | |
| Minnesota Tax Free Fund | |
| Class A | |
| | 2005 | | | $ | 11.23 | | | $ | 0.45 | | | $ | 0.03 | | | $ | (0.45 | ) | | $ | (0.05 | ) | | $ | 11.21 | | | | 4.42 | % | |
| | 2004 | | | | 11.34 | | | | 0.44 | | | | (0.01 | ) | | | (0.45 | ) | | | (0.09 | ) | | | 11.23 | | | | 3.94 | | |
| | 2003 | | | | 11.39 | | | | 0.48 | | | | (0.05 | ) | | | (0.45 | ) | | | (0.03 | ) | | | 11.34 | | | | 3.90 | | |
| | 2002 | | | | 11.06 | | | | 0.47 | | | | 0.34 | | | | (0.47 | ) | | | (0.01 | ) | | | 11.39 | | | | 7.23 | | |
| | 2001 | | | | 10.64 | | | | 0.53 | | | | 0.43 | | | | (0.54 | ) | | | - | | | | 11.06 | | | | 9.24 | | |
| Class C | |
| | 2005 | | | $ | 11.19 | | | $ | 0.41 | | | $ | 0.03 | | | $ | (0.41 | ) | | $ | (0.05 | ) | | $ | 11.17 | | | | 4.02 | % | |
| | 2004 | | | | 11.31 | | | | 0.39 | | | | (0.01 | ) | | | (0.41 | ) | | | (0.09 | ) | | | 11.19 | | | | 3.45 | | |
| | 2003 | | | | 11.36 | | | | 0.43 | | | | (0.04 | ) | | | (0.41 | ) | | | (0.03 | ) | | | 11.31 | | | | 3.51 | | |
| | 2002 | | | | 11.04 | | | | 0.43 | | | | 0.33 | | | | (0.43 | ) | | | (0.01 | ) | | | 11.36 | | | | 7.10 | | |
| | 2001 | | | | 10.62 | | | | 0.49 | | | | 0.43 | | | | (0.50 | ) | | | - | | | | 11.04 | | | | 8.88 | | |
| Class Y | |
| | 2005 | | | $ | 11.22 | | | $ | 0.48 | | | $ | 0.03 | | | $ | (0.48 | ) | | $ | (0.05 | ) | | $ | 11.20 | | | | 4.69 | % | |
| | 2004 | | | | 11.33 | | | | 0.47 | | | | (0.01 | ) | | | (0.48 | ) | | | (0.09 | ) | | | 11.22 | | | | 4.20 | | |
| | 2003 | | | | 11.38 | | | | 0.51 | | | | (0.05 | ) | | | (0.48 | ) | | | (0.03 | ) | | | 11.33 | | | | 4.16 | | |
| | 2002 | | | | 11.05 | | | | 0.49 | | | | 0.35 | | | | (0.50 | ) | | | (0.01 | ) | | | 11.38 | | | | 7.84 | | |
| | 2001 | | | | 10.63 | | | | 0.55 | | | | 0.44 | | | | (0.57 | ) | | | - | | | | 11.05 | | | | 9.52 | | |
| Missouri Tax Free Fund | |
| Class A | |
| | 2005 | | | $ | 12.32 | | | $ | 0.45 | | | $ | (0.12 | ) | | $ | (0.45 | ) | | $ | (0.06 | ) | | $ | 12.14 | | | | 2.74 | % | |
| | 2004 | | | | 12.37 | | | | 0.45 | | | | (0.02 | ) | | | (0.45 | ) | | | (0.03 | ) | | | 12.32 | | | | 3.60 | | |
| | 2003 | | | | 12.47 | | | | 0.45 | | | | (0.04 | ) | | | (0.45 | ) | | | (0.06 | ) | | | 12.37 | | | | 3.45 | | |
| | 2002 | | | | 12.05 | | | | 0.46 | | | | 0.47 | | | | (0.47 | ) | | | (0.04 | ) | | | 12.47 | | | | 7.99 | | |
| | 2001 | (1)(2) | | | 11.54 | | | | 0.46 | | | | 0.50 | | | | (0.44 | ) | | | (0.01 | ) | | | 12.05 | | | | 8.44 | | |
| | 2000 | (3) | | | 11.31 | | | | 0.48 | | | | 0.23 | | | | (0.48 | ) | | | - | | | | 11.54 | | | | 6.41 | | |
| Class C | |
| | 2005 | | | $ | 12.29 | | | $ | 0.40 | | | $ | (0.11 | ) | | $ | (0.40 | ) | | $ | (0.06 | ) | | $ | 12.12 | | | | 2.42 | % | |
| | 2004 | | | | 12.35 | | | | 0.40 | | | | (0.03 | ) | | | (0.40 | ) | | | (0.03 | ) | | | 12.29 | | | | 3.11 | | |
| | 2003 | | | | 12.46 | | | | 0.40 | | | | (0.04 | ) | | | (0.41 | ) | | | (0.06 | ) | | | 12.35 | | | | 3.05 | | |
| | 2002 | | | | 12.05 | | | | 0.41 | | | | 0.48 | | | | (0.44 | ) | | | (0.04 | ) | | | 12.46 | | | | 7.58 | | |
| | 2001 | (4) | | | 12.03 | | | | - | | | | 0.02 | | | | - | | | | - | | | | 12.05 | | | | 0.17 | | |
| Class Y | |
| | 2005 | | | $ | 12.32 | | | $ | 0.48 | | | $ | (0.11 | ) | | $ | (0.48 | ) | | $ | (0.06 | ) | | $ | 12.15 | | | | 3.08 | % | |
| | 2004 | | | | 12.38 | | | | 0.48 | | | | (0.03 | ) | | | (0.48 | ) | | | (0.03 | ) | | | 12.32 | | | | 3.77 | | |
| | 2003 | | | | 12.48 | | | | 0.49 | | | | (0.05 | ) | | | (0.48 | ) | | | (0.06 | ) | | | 12.38 | | | | 3.71 | | |
| | 2002 | | | | 12.06 | | | | 0.48 | | | | 0.48 | | | | (0.50 | ) | | | (0.04 | ) | | | 12.48 | | | | 8.25 | | |
| | 2001 | (1)(2) | | | 11.55 | | | | 0.49 | | | | 0.50 | | | | (0.47 | ) | | | (0.01 | ) | | | 12.06 | | | | 8.67 | | |
| | 2000 | (3) | | | 11.32 | | | | 0.50 | | | | 0.23 | | | | (0.50 | ) | | | - | | | | 11.55 | | | | 6.60 | | |
| | | Net Assets
End of
Period (000) | | Ratio of
Expenses to
Average
Net Assets | | Ratio of Net
Investment
Income
to Average
Net Assets | | Ratio of
Expenses to
Average
Net Assets
(Excluding
Waivers) | | Ratio of Net
Investment
Income
to Average Net
Assets (Excluding
Waivers) | | Portfolio
Turnover
Rate | |
| Minnesota Intermediate Tax Free Fund | |
| Class A | |
| | 2005 | | | $ | 32,326 | | | | 0.85 | % | | | 3.78 | % | | | 1.06 | % | | | 3.57 | % | | | 15 | % | |
| | 2004 | | | | 35,047 | | | | 0.85 | | | | 3.77 | | | | 1.05 | | | | 3.57 | | | | 8 | | |
| | 2003 | | | | 31,044 | | | | 0.85 | | | | 3.85 | | | | 1.05 | | | | 3.65 | | | | 15 | | |
| | 2002 | | | | 19,914 | | | | 0.85 | | | | 4.27 | | | | 1.03 | | | | 4.09 | | | | 15 | | |
| | 2001 | �� | | | 12,408 | | | | 0.70 | | | | 4.38 | | | | 1.13 | | | | 3.95 | | | | 13 | | |
| Class Y | |
| | 2005 | | | $ | 197,251 | | | | 0.70 | % | | | 3.93 | % | | | 0.81 | % | | | 3.82 | % | | | 15 | % | |
| | 2004 | | | | 216,906 | | | | 0.70 | | | | 3.92 | | | | 0.80 | | | | 3.82 | | | | 8 | | |
| | 2003 | | | | 238,958 | | | | 0.70 | | | | 4.01 | | | | 0.80 | | | | 3.91 | | | | 15 | | |
| | 2002 | | | | 251,597 | | | | 0.70 | | | | 4.41 | | | | 0.78 | | | | 4.33 | | | | 15 | | |
| | 2001 | | | | 255,939 | | | | 0.70 | | | | 4.38 | | | | 0.88 | | | | 4.20 | | | | 13 | | |
| Minnesota Tax Free Fund | |
| Class A | |
| | 2005 | | | $ | 106,783 | | | | 0.95 | % | | | 4.04 | % | | | 1.06 | % | | | 3.93 | % | | | 16 | % | |
| | 2004 | | | | 114,981 | | | | 0.95 | | | | 3.87 | | | | 1.05 | | | | 3.77 | | | | 25 | | |
| | 2003 | | | | 125,916 | | | | 0.95 | | | | 4.25 | | | | 1.06 | | | | 4.14 | | | | 23 | | |
| | 2002 | | | | 135,607 | | | | 0.95 | | | | 4.22 | | | | 1.09 | | | | 4.08 | | | | 26 | | |
| | 2001 | | | | 107,260 | | | | 0.95 | | | | 4.84 | | | | 1.18 | | | | 4.61 | | | | 15 | | |
| Class C | |
| | 2005 | | | $ | 9,841 | | | | 1.35 | % | | | 3.64 | % | | | 1.81 | % | | | 3.18 | % | | | 16 | % | |
| | 2004 | | | | 10,387 | | | | 1.35 | | | | 3.47 | | | | 1.80 | | | | 3.02 | | | | 25 | | |
| | 2003 | | | | 11,951 | | | | 1.35 | | | | 3.85 | | | | 1.81 | | | | 3.39 | | | | 23 | | |
| | 2002 | | | | 11,703 | | | | 1.35 | | | | 3.80 | | | | 1.84 | | | | 3.31 | | | | 26 | | |
| | 2001 | | | | 6,382 | | | | 1.35 | | | | 4.39 | | | | 1.58 | | | | 4.16 | | | | 15 | | |
| Class Y | |
| | 2005 | | | $ | 46,471 | | | | 0.70 | % | | | 4.29 | % | | | 0.81 | % | | | 4.18 | % | | | 16 | % | |
| | 2004 | | | | 42,900 | | | | 0.70 | | | | 4.12 | | | | 0.80 | | | | 4.02 | | | | 25 | | |
| | 2003 | | | | 47,858 | | | | 0.70 | | | | 4.50 | | | | 0.81 | | | | 4.39 | | | | 23 | | |
| | 2002 | | | | 54,638 | | | | 0.70 | | | | 4.47 | | | | 0.84 | | | | 4.33 | | | | 26 | | |
| | 2001 | | | | 49,078 | | | | 0.70 | | | | 5.09 | | | | 0.93 | | | | 4.86 | | | | 15 | | |
| Missouri Tax Free Fund | |
| Class A | |
| | 2005 | | | $ | 30,188 | | | | 0.95 | % | | | 3.65 | % | | | 1.06 | % | | | 3.54 | % | | | 19 | % | |
| | 2004 | | | | 27,114 | | | | 0.95 | | | | 3.68 | | | | 1.05 | | | | 3.58 | | | | 15 | | |
| | 2003 | | | | 28,141 | | | | 0.95 | | | | 3.69 | | | | 1.06 | | | | 3.58 | | | | 20 | | |
| | 2002 | | | | 26,496 | | | | 0.95 | | | | 3.81 | | | | 1.06 | | | | 3.70 | | | | 25 | | |
| | 2001 | (1)(2) | | | 22,573 | | | | 0.94 | | | | 4.23 | | | | 1.00 | | | | 4.17 | | | | 9 | | |
| | 2000 | (3) | | | 19,876 | | | | 0.87 | | | | 4.59 | | | | 0.98 | | | | 4.48 | | | | 3 | | |
| Class C | |
| | 2005 | | | $ | 190 | | | | 1.35 | % | | | 3.25 | % | | | 1.81 | % | | | 2.79 | % | | | 19 | % | |
| | 2004 | | | | 218 | | | | 1.35 | | | | 3.28 | | | | 1.80 | | | | 2.83 | | | | 15 | | |
| | 2003 | | | | 279 | | | | 1.35 | | | | 3.30 | | | | 1.81 | | | | 2.84 | | | | 20 | | |
| | 2002 | | | | 21 | | | | 1.35 | | | | 3.28 | | | | 1.81 | | | | 2.82 | | | | 25 | | |
| | 2001 | (4) | | | - | | | | - | | | | - | | | | - | | | | - | | | | 9 | | |
| Class Y | |
| | 2005 | | | $ | 151,710 | | | | 0.70 | % | | | 3.90 | % | | | 0.81 | % | | | 3.79 | % | | | 19 | % | |
| | 2004 | | | | 152,676 | | | | 0.70 | | | | 3.93 | | | | 0.80 | | | | 3.83 | | | | 15 | | |
| | 2003 | | | | 168,094 | | | | 0.70 | | | | 3.94 | | | | 0.81 | | | | 3.83 | | | | 20 | | |
| | 2002 | | | | 142,344 | | | | 0.70 | | | | 4.06 | | | | 0.81 | | | | 3.95 | | | | 25 | | |
| | 2001 | (1)(2) | | | 129,715 | | | | 0.69 | | | | 4.48 | | | | 0.75 | | | | 4.42 | | | | 9 | | |
| | 2000 | (3) | | | 126,896 | | | | 0.67 | | | | 4.79 | | | | 1.08 | | | | 4.38 | | | | 3 | | |
(1) The financial highlights for the Missouri Tax Free Fund prior to September 24, 2001 are those of the Firstar Missouri Tax-Exempt Bond Fund Class A shares and Class I
shares. The assets of the Firstar Missouri Tax-Exempt Bond Fund were acquired by Missouri Tax Free Fund on September 24, 2001. In connection with such acquisition,
Class A shares and Class I shares of the Firstar Missouri Tax-Exempt Bond Fund were exchanged for Class A shares and Class Y shares of Missouri Tax Free Fund, respectively.
(2) For the period November 1, 2000 to September 30, 2001. Effective in 2001, the fund's fiscal year-end was changed from October 31 to September 30.
All ratios for the period have been annualized, except total return and portfolio turnover.
(3) For the period December 1, 1999 to October 31, 2000. Effective in 2000, the fund's fiscal year-end was changed from November 30 from October 31.
All ratios for the period have been annualized, except total return and portfolio turnover.
(4) Class of shares has been offered since September 24, 2001. All ratios for the period have been annualized, except total return and portfolio turnover.
(5) Total return does not reflect sales charges. Total return would have been lower had certain expenses not been waived.
The accompanying notes are an integral part of the financial statements.
FIRST AMERICAN FUNDS Annual Report 2005
112
FIRST AMERICAN FUNDS Annual Report 2005
113
Financial Highlights For a share outstanding throughout the periods ended September 30, unless otherwise indicated.
| | | Net Asset
Value
Beginning
of Period | | Net
Investment
Income | | Realized and
Unrealized
Gains
(Losses) on
Investments | | Distributions
from Net
Investment
Income | | Distributions
from Net
Realized Gains | | Net Asset
Value
End of
Period | | Total
Return (3) | |
| Nebraska Tax Free Fund | |
| Class A | |
| | 2005 | | | $ | 10.66 | | | $ | 0.39 | | | $ | (0.05 | ) | | $ | (0.42 | ) | | $ | - | | | $ | 10.58 | | | | 3.20 | % | |
| | 2004 | | | | 10.66 | | | | 0.41 | | | | 0.03 | | | | (0.40 | ) | | | (0.04 | ) | | | 10.66 | | | | 4.18 | | |
| | 2003 | | | | 10.70 | | | | 0.41 | | | | (0.04 | ) | | | (0.40 | ) | | | (0.01 | ) | | | 10.66 | | | | 3.57 | | |
| | 2002 | | | | 10.20 | | | | 0.41 | | | | 0.49 | | | | (0.40 | ) | | | - | | | | 10.70 | | | | 9.09 | | |
| | 2001 | (1) | | | 10.00 | | | | 0.24 | | | | 0.20 | | | | (0.24 | ) | | | - | | | | 10.20 | | | | 4.48 | | |
| Class C | |
| | 2005 | | | $ | 10.58 | | | $ | 0.35 | | | $ | (0.06 | ) | | $ | (0.37 | ) | | $ | - | | | $ | 10.50 | | | | 2.81 | % | |
| | 2004 | | | | 10.58 | | | | 0.35 | | | | 0.04 | | | | (0.35 | ) | | | (0.04 | ) | | | 10.58 | | | | 3.80 | | |
| | 2003 | | | | 10.63 | | | | 0.36 | | | | (0.04 | ) | | | (0.36 | ) | | | (0.01 | ) | | | 10.58 | | | | 3.10 | | |
| | 2002 | | | | 10.14 | | | | 0.36 | | | | 0.50 | | | | (0.37 | ) | | | - | | | | 10.63 | | | | 8.66 | | |
| | 2001 | (1) | | | 10.00 | | | | 0.20 | | | | 0.17 | | | | (0.23 | ) | | | - | | | | 10.14 | | | | 3.71 | | |
| Class Y | |
| | 2005 | | | $ | 10.66 | | | $ | 0.43 | | | $ | (0.07 | ) | | $ | (0.44 | ) | | $ | - | | | $ | 10.58 | | | | 3.45 | % | |
| | 2004 | | | | 10.65 | | | | 0.43 | | | | 0.04 | | | | (0.42 | ) | | | (0.04 | ) | | | 10.66 | | | | 4.54 | | |
| | 2003 | | | | 10.69 | | | | 0.43 | | | | (0.03 | ) | | | (0.43 | ) | | | (0.01 | ) | | | 10.65 | | | | 3.82 | | |
| | 2002 | | | | 10.19 | | | | 0.43 | | | | 0.50 | | | | (0.43 | ) | | | - | | | | 10.69 | | | | 9.37 | | |
| | 2001 | (1) | | | 10.00 | | | | 0.26 | | | | 0.19 | | | | (0.26 | ) | | | - | | | | 10.19 | | | | 4.51 | | |
| Ohio Tax Free Fund | |
| Class A | |
| | 2005 | | | $ | 10.52 | | | $ | 0.36 | | | $ | (0.06 | ) | | $ | (0.36 | ) | | $ | (0.04 | ) | | $ | 10.42 | | | | 2.86 | % | |
| | 2004 | | | | 10.54 | | | | 0.36 | | | | 0.07 | | | | (0.35 | ) | | | (0.10 | ) | | | 10.52 | | | | 4.16 | | |
| | 2003 | | | | 10.58 | | | | 0.36 | | | | (0.03 | ) | | | (0.37 | ) | | | - | | | | 10.54 | | | | 3.22 | | |
| | 2002 | (2) | | | 10.00 | | | | 0.15 | | | | 0.59 | | | | (0.16 | ) | | | - | | | | 10.58 | | | | 7.42 | | |
| Class C | |
| | 2005 | | | $ | 10.41 | | | $ | 0.32 | | | $ | (0.05 | ) | | $ | (0.32 | ) | | $ | (0.04 | ) | | $ | 10.32 | | | | 2.58 | % | |
| | 2004 | | | | 10.44 | | | | 0.29 | | | | 0.09 | | | | (0.31 | ) | | | (0.10 | ) | | | 10.41 | | | | 3.69 | | |
| | 2003 | | | | 10.57 | | | | 0.32 | | | | (0.12 | ) | | | (0.33 | ) | | | - | | | | 10.44 | | | | 1.95 | | |
| | 2002 | (2) | | | 10.00 | | | | 0.13 | | | | 0.58 | | | | (0.14 | ) | | | - | | | | 10.57 | | | | 7.13 | | |
| Class Y | |
| | 2005 | | | $ | 10.53 | | | $ | 0.38 | | | $ | (0.05 | ) | | $ | (0.39 | ) | | $ | (0.04 | ) | | $ | 10.43 | | | | 3.12 | % | |
| | 2004 | | | | 10.55 | | | | 0.38 | | | | 0.07 | | | | (0.37 | ) | | | (0.10 | ) | | | 10.53 | | | | 4.42 | | |
| | 2003 | | | | 10.57 | | | | 0.39 | | | | (0.02 | ) | | | (0.39 | ) | | | - | | | | 10.55 | | | | 3.65 | | |
| | 2002 | (2) | | | 10.00 | | | | 0.16 | | | | 0.58 | | | | (0.17 | ) | | | - | | | | 10.57 | | | | 7.41 | | |
| Oregon Intermediate Tax Free Fund | |
| Class A | |
| | 2005 | | | $ | 10.30 | | | $ | 0.36 | | | $ | (0.19 | ) | | $ | (0.36 | ) | | $ | (0.04 | ) | | $ | 10.07 | | | | 1.67 | % | |
| | 2004 | | | | 10.43 | | | | 0.37 | | | | (0.05 | ) | | | (0.37 | ) | | | (0.08 | ) | | | 10.30 | | | | 3.20 | | |
| | 2003 | | | | 10.49 | | | | 0.37 | | | | (0.03 | ) | | | (0.38 | ) | | | (0.02 | ) | | | 10.43 | | | | 3.31 | | |
| | 2002 | | | | 10.18 | | | | 0.40 | | | | 0.31 | | | | (0.40 | ) | | | - | | | | 10.49 | | | | 7.23 | | |
| | 2001 | | | | 9.74 | | | | 0.43 | | | | 0.44 | | | | (0.43 | ) | | | - | | | | 10.18 | | | | 9.08 | | |
| Class Y | |
| | 2005 | | | $ | 10.30 | | | $ | 0.38 | | | $ | (0.19 | ) | | $ | (0.38 | ) | | $ | (0.04 | ) | | $ | 10.07 | | | | 1.82 | % | |
| | 2004 | | | | 10.43 | | | | 0.39 | | | | (0.05 | ) | | | (0.39 | ) | | | (0.08 | ) | | | 10.30 | | | | 3.35 | | |
| | 2003 | | | | 10.49 | | | | 0.40 | | | | (0.05 | ) | | | (0.39 | ) | | | (0.02 | ) | | | 10.43 | | | | 3.46 | | |
| | 2002 | | | | 10.18 | | | | 0.42 | | | | 0.31 | | | | (0.42 | ) | | | - | | | | 10.49 | | | | 7.39 | | |
| | 2001 | | | | 9.74 | | | | 0.43 | | | | 0.44 | | | | (0.43 | ) | | | - | | | | 10.18 | | | | 9.08 | | |
| | | Net Assets
End of
Period (000) | | Ratio of
Expenses to
Average
Net Assets | | Ratio of Net
Investment
Income
to Average
Net Assets | | Ratio of
Expenses to
Average
Net Assets
(Excluding
Waivers) | | Ratio of Net
Investment
Income
to Average Net
Assets (Excluding
Waivers) | | Portfolio
Turnover
Rate | |
| Nebraska Tax Free Fund | |
| Class A | |
| | 2005 | | | $ | 7,136 | | | | 0.75 | % | | | 3.78 | % | | | 1.12 | % | | | 3.41 | % | | | 21 | % | |
| | 2004 | | | | 4,925 | | | | 0.75 | | | | 3.82 | | | | 1.08 | | | | 3.49 | | | | 17 | | |
| | 2003 | | | | 4,869 | | | | 0.75 | | | | 3.87 | | | | 1.07 | | | | 3.55 | | | | 15 | | |
| | 2002 | | | | 4,904 | | | | 0.75 | | | | 3.98 | | | | 1.29 | | | | 3.44 | | | | 35 | | |
| | 2001 | (1) | | | 5,090 | | | | 0.55 | | | | 4.12 | | | | 1.38 | | | | 3.29 | | | | 30 | | |
| Class C | |
| | 2005 | | | $ | 1,565 | | | | 1.15 | % | | | 3.38 | % | | | 1.87 | % | | | 2.66 | % | | | 21 | % | |
| | 2004 | | | | 1,861 | | | | 1.15 | | | | 3.42 | | | | 1.83 | | | | 2.74 | | | | 17 | | |
| | 2003 | | | | 1,657 | | | | 1.15 | | | | 3.46 | | | | 1.82 | | | | 2.79 | | | | 15 | | |
| | 2002 | | | | 982 | | | | 1.15 | | | | 3.57 | | | | 2.04 | | | | 2.68 | | | | 35 | | |
| | 2001 | (1) | | | 226 | | | | 0.95 | | | | 3.73 | | | | 1.75 | | | | 2.93 | | | | 30 | | |
| Class Y | |
| | 2005 | | | $ | 32,418 | | | | 0.50 | % | | | 4.03 | % | | | 0.87 | % | | | 3.66 | % | | | 21 | % | |
| | 2004 | | | | 29,722 | | | | 0.50 | | | | 4.07 | | | | 0.83 | | | | 3.74 | | | | 17 | | |
| | 2003 | | | | 28,120 | | | | 0.50 | | | | 4.11 | | | | 0.82 | | | | 3.79 | | | | 15 | | |
| | 2002 | | | | 27,348 | | | | 0.50 | | | | 4.22 | | | | 1.04 | | | | 3.68 | | | | 35 | | |
| | 2001 | (1) | | | 22,443 | | | | 0.30 | | | | 4.36 | | | | 1.13 | | | | 3.53 | | | | 30 | | |
| Ohio Tax Free Fund | |
| Class A | |
| | 2005 | | | $ | 988 | | | | 0.75 | % | | | 3.41 | % | | | 1.11 | % | | | 3.05 | % | | | 13 | % | |
| | 2004 | | | | 1,200 | | | | 0.75 | | | | 3.43 | | | | 1.08 | | | | 3.10 | | | | 19 | | |
| | 2003 | | | | 849 | | | | 0.75 | | | | 3.52 | | | | 1.09 | | | | 3.18 | | | | 22 | | |
| | 2002 | (2) | | | 453 | | | | 0.75 | | | | 3.25 | | | | 1.23 | | | | 2.77 | | | | 3 | | |
| Class C | |
| | 2005 | | | $ | 174 | | | | 1.15 | % | | | 3.01 | % | | | 1.86 | % | | | 2.30 | % | | | 13 | % | |
| | 2004 | | | | 120 | | | | 1.15 | | | | 3.03 | | | | 1.83 | | | | 2.35 | | | | 19 | | |
| | 2003 | | | | 215 | | | | 1.15 | | | | 3.08 | | | | 1.84 | | | | 2.39 | | | | 22 | | |
| | 2002 | (2) | | | 1 | | | | 1.15 | | | | 3.01 | | | | 1.98 | | | | 2.18 | | | | 3 | | |
| Class Y | |
| | 2005 | | | $ | 41,104 | | | | 0.50 | % | | | 3.66 | % | | | 0.86 | % | | | 3.30 | % | | | 13 | % | |
| | 2004 | | | | 39,240 | | | | 0.50 | | | | 3.68 | | | | 0.82 | | | | 3.36 | | | | 19 | | |
| | 2003 | | | | 39,465 | | | | 0.50 | | | | 3.78 | | | | 0.84 | | | | 3.44 | | | | 22 | | |
| | 2002 | (2) | | | 38,083 | | | | 0.50 | | | | 3.74 | | | | 0.98 | | | | 3.26 | | | | 3 | | |
| Oregon Intermediate Tax Free Fund | |
| Class A | |
| | 2005 | | | $ | 9,356 | | | | 0.85 | % | | | 3.56 | % | | | 1.06 | % | | | 3.35 | % | | | 20 | % | |
| | 2004 | | | | 8,700 | | | | 0.85 | | | | 3.62 | | | | 1.05 | | | | 3.42 | | | | 12 | | |
| | 2003 | | | | 8,189 | | | | 0.85 | | | | 3.67 | | | | 1.05 | | | | 3.47 | | | | 17 | | |
| | 2002 | | | | 7,030 | | | | 0.85 | | | | 3.95 | | | | 1.05 | | | | 3.75 | | | | 18 | | |
| | 2001 | | | | 5,477 | | | | 0.70 | | | | 4.27 | | | | 1.13 | | | | 3.84 | | | | 20 | | |
| Class Y | |
| | 2005 | | | $ | 133,613 | | | | 0.70 | % | | | 3.71 | % | | | 0.81 | % | | | 3.60 | % | | | 20 | % | |
| | 2004 | | | | 137,869 | | | | 0.70 | | | | 3.77 | | | | 0.80 | | | | 3.67 | | | | 12 | | |
| | 2003 | | | | 146,244 | | | | 0.70 | | | | 3.82 | | | | 0.80 | | | | 3.72 | | | | 17 | | |
| | 2002 | | | | 151,928 | | | | 0.70 | | | | 4.10 | | | | 0.80 | | | | 4.00 | | | | 18 | | |
| | 2001 | | | | 153,951 | | | | 0.70 | | | | 4.28 | | | | 0.89 | | | | 4.09 | | | | 20 | | |
(1) Commenced operations on February 28, 2001. All ratios for the period have been annualized, except total return and portfolio turnover.
(2) Commenced operations on April 30, 2002. All ratios for the period have been annualized, except total return and portfolio turnover.
(3) Total return does not reflect sales charges. Total return would have been lower had certain expenses not been waived.
The accompanying notes are an integral part of the financial statements.
FIRST AMERICAN FUNDS Annual Report 2005
114
FIRST AMERICAN FUNDS Annual Report 2005
115
Financial Highlights For a share outstanding throughout the periods ended September 30, unless otherwise indicated.
| | | Net Asset
Value
Beginning
of Period | | Net
Investment
Income | | Realized and
Unrealized
Gains
(Losses) on
Investments | | Distributions
from Net
Investment
Income | | Distributions
from Net
Realized Gains | | Net Asset
Value
End of
Period | | Total
Return (6) | |
| Short Tax Free Fund | |
| Class A | |
| | 2005 | | | $ | 9.96 | | | $ | 0.24 | | | $ | (0.17 | ) | | $ | (0.25 | ) | | $ | - | | | $ | 9.78 | | | | 0.67 | % | |
| | 2004 | | | | 10.18 | | | | 0.26 | | | | (0.17 | ) | | | (0.25 | ) | | | (0.06 | ) | | | 9.96 | | | | 0.90 | | |
| | 2003 | (1) | | | 10.00 | | | | 0.26 | | | | 0.19 | | | | (0.27 | ) | | | - | | | | 10.18 | | | | 4.54 | | |
| Class Y | |
| | 2005 | | | $ | 9.96 | | | $ | 0.26 | | | $ | (0.18 | ) | | $ | (0.26 | ) | | $ | - | | | $ | 9.78 | | | | 0.83 | % | |
| | 2004 | | | | 10.18 | | | | 0.27 | | | | (0.17 | ) | | | (0.26 | ) | | | (0.06 | ) | | | 9.96 | | | | 1.05 | | |
| | 2003 | (1) | | | 10.00 | | | | 0.28 | | | | 0.18 | | | | (0.28 | ) | | | - | | | | 10.18 | | | | 4.66 | | |
| Tax Free Fund | |
| Class A | |
| | 2005 | | | $ | 11.18 | | | $ | 0.47 | | | $ | 0.03 | | | $ | (0.47 | ) | | $ | (0.11 | ) | | $ | 11.10 | | | | 4.51 | % | |
| | 2004 | | | | 11.28 | | | | 0.47 | | | | 0.02 | | | | (0.48 | ) | | | (0.11 | ) | | | 11.18 | | | | 4.45 | | |
| | 2003 | | | | 11.44 | | | | 0.47 | | | | (0.03 | ) | | | (0.47 | ) | | | (0.13 | ) | | | 11.28 | | | | 4.06 | | |
| | 2002 | | | | 10.99 | | | | 0.47 | | | | 0.44 | | | | (0.46 | ) | | | - | | | | 11.44 | | | | 8.56 | | |
| | 2001 | (2)(3) | | | 10.53 | | | | 0.42 | | | | 0.43 | | | | (0.39 | ) | | | - | | | | 10.99 | | | | 8.22 | | |
| | 2000 | (4) | | | 10.20 | | | | 0.40 | | | | 0.34 | | | | (0.41 | ) | | | - | | | | 10.53 | | | | 7.43 | | |
| Class C | |
| | 2005 | | | $ | 11.13 | | | $ | 0.42 | | | $ | 0.03 | | | $ | (0.42 | ) | | $ | (0.11 | ) | | $ | 11.05 | | | | 4.13 | % | |
| | 2004 | | | | 11.24 | | | | 0.43 | | | | - | | | | (0.43 | ) | | | (0.11 | ) | | | 11.13 | | | | 3.92 | | |
| | 2003 | | | | 11.40 | | | | 0.42 | | | | (0.02 | ) | | | (0.43 | ) | | | (0.13 | ) | | | 11.24 | | | | 3.67 | | |
| | 2002 | | | | 10.96 | | | | 0.42 | | | | 0.45 | | | | (0.43 | ) | | | - | | | | 11.40 | | | | 8.14 | | |
| | 2001 | (5) | | | 10.93 | | | | 0.01 | | | | 0.02 | | | | - | | | | - | | | | 10.96 | | | | 0.27 | | |
| Class Y | |
| | 2005 | | | $ | 11.19 | | | $ | 0.50 | | | $ | 0.02 | | | $ | (0.49 | ) | | $ | (0.11 | ) | | $ | 11.11 | | | | 4.77 | % | |
| | 2004 | | | | 11.29 | | | | 0.50 | | | | 0.01 | | | | (0.50 | ) | | | (0.11 | ) | | | 11.19 | | | | 4.71 | | |
| | 2003 | | | | 11.45 | | | | 0.50 | | | | (0.03 | ) | | | (0.50 | ) | | | (0.13 | ) | | | 11.29 | | | | 4.31 | | |
| | 2002 | | | | 11.00 | | | | 0.49 | | | | 0.45 | | | | (0.49 | ) | | | - | | | | 11.45 | | | | 8.84 | | |
| | 2001 | (2)(3) | | | 10.53 | | | | 0.44 | | | | 0.45 | | | | (0.42 | ) | | | - | | | | 11.00 | | | | 8.59 | | |
| | 2000 | (4) | | | 10.21 | | | | 0.42 | | | | 0.33 | | | | (0.43 | ) | | | - | | | | 10.53 | | | | 7.63 | | |
| | | Net Assets
End of
Period (000) | | Ratio of
Expenses to
Average
Net Assets | | Ratio of Net
Investment
Income
to Average
Net Assets | | Ratio of
Expenses to
Average
Net Assets
(Excluding
Waivers) | | Ratio of Net
Investment
Income
to Average Net
Assets (Excluding
Waivers) | | Portfolio
Turnover
Rate | |
| Short Tax Free Fund | |
| Class A | |
| | 2005 | | | $ | 4,103 | | | | 0.75 | % | | | 2.46 | % | | | 1.06 | % | | | 2.15 | % | | | 37 | % | |
| | 2004 | | | | 6,329 | | | | 0.75 | | | | 2.55 | | | | 1.05 | | | | 2.25 | | | | 30 | | |
| | 2003 | (1) | | | 6,448 | | | | 0.75 | | | | 2.67 | | | | 1.05 | | | | 2.37 | | | | 54 | | |
| Class Y | |
| | 2005 | | | $ | 329,647 | | | | 0.60 | % | | | 2.62 | % | | | 0.81 | % | | | 2.41 | % | | | 37 | % | |
| | 2004 | | | | 419,359 | | | | 0.60 | | | | 2.70 | | | | 0.80 | | | | 2.50 | | | | 30 | | |
| | 2003 | (1) | | | 396,918 | | | | 0.60 | | | | 3.00 | | | | 0.80 | | | | 2.80 | | | | 54 | | |
| Tax Free Fund | |
| Class A | |
| | 2005 | | | $ | 38,205 | | | | 0.95 | % | | | 4.20 | % | | | 1.06 | % | | | 4.09 | % | | | 8 | % | |
| | 2004 | | | | 40,156 | | | | 0.95 | | | | 4.18 | | | | 1.05 | | | | 4.08 | | | | 23 | | |
| | 2003 | | | | 42,942 | | | | 0.95 | | | | 4.21 | | | | 1.05 | | | | 4.11 | | | | 23 | | |
| | 2002 | | | | 43,708 | | | | 0.95 | | | | 4.20 | | | | 1.02 | | | | 4.13 | | | | 39 | | |
| | 2001 | (2)(3) | | | 48,769 | | | | 1.16 | | | | 4.27 | | | | 1.18 | | | | 4.25 | | | | 3 | | |
| | 2000 | (4) | | | 1,526 | | | | 0.98 | | | | 4.34 | | | | 1.09 | | | | 4.23 | | | | 4 | | |
| Class C | |
| | 2005 | | | $ | 2,712 | | | | 1.35 | % | | | 3.80 | % | | | 1.81 | % | | | 3.34 | % | | | 8 | % | |
| | 2004 | | | | 2,682 | | | | 1.35 | | | | 3.77 | | | | 1.80 | | | | 3.32 | | | | 23 | | |
| | 2003 | | | | 4,880 | | | | 1.35 | | | | 3.81 | | | | 1.80 | | | | 3.36 | | | | 23 | | |
| | 2002 | | | | 6,199 | | | | 1.35 | | | | 3.82 | | | | 1.77 | | | | 3.40 | | | | 39 | | |
| | 2001 | (5) | | | 4,494 | | | | 1.04 | | | | 5.61 | | | | 1.04 | | | | 5.61 | | | | 3 | | |
| Class Y | |
| | 2005 | | | $ | 436,303 | | | | 0.70 | % | | | 4.45 | % | | | 0.81 | % | | | 4.34 | % | | | 8 | % | |
| | 2004 | | | | 416,651 | | | | 0.70 | | | | 4.43 | | | | 0.80 | | | | 4.33 | | | | 23 | | |
| | 2003 | | | | 460,634 | | | | 0.70 | | | | 4.46 | | | | 0.80 | | | | 4.36 | | | | 23 | | |
| | 2002 | | | | 497,140 | | | | 0.70 | | | | 4.47 | | | | 0.77 | | | | 4.40 | | | | 39 | | |
| | 2001 | (2)(3) | | | 501,361 | | | | 0.73 | | | | 4.32 | | | | 0.74 | | | | 4.31 | | | | 3 | | |
| | 2000 | (4) | | | 253,803 | | | | 0.78 | | | | 4.54 | | | | 1.19 | | | | 4.13 | | | | 4 | | |
(1) Commenced operations on October 25, 2002. All ratios for the period have been annualized, except total return and portfolio turnover.
(2) The financial highlights for the Tax Free Fund prior to September 24, 2001 are those of the Firstar National Municipal Bond Fund Class A shares and Class I shares.
The assets of the Firstar National Municipal Bond Fund were acquired by Tax Free Fund on September 24, 2001. In connection with such acquisition, Class A shares
and Class I shares of the Firstar National Municipal Bond Fund were exchanged for Class A shares and Class Y shares of Tax Free Fund, respectively. Historical per-share
amounts have been adjusted to reflect the conversion ratios utilized for the merger of the Tax Free Fund and the Firstar National Municipal Bond Fund. Firstar National
Municipal Bond Fund is the accounting survivor.
(3) For the period November 1, 2000 to September 30, 2001. Effective in 2001, the fund's fiscal-year end was changed from October 31 to September 30.
All ratios for the period have been annualized, except total return and portfolio turnover.
(4) For the period December 1, 1999 to October 31, 2000. Effective in 2000, the fund's fiscal year-end was changed from November 30 from October 31.
All ratios for the period have been annualized, except total return and portfolio turnover.
(5) Class of shares has been offered since September 24, 2001. All ratios for the period have been annualized, except total return and portfolio turnover.
(6) Total return does not reflect sales charges. Total return would have been lower had certain expenses not been waived.
The accompanying notes are an integral part of the financial statements.
FIRST AMERICAN FUNDS Annual Report 2005
116
FIRST AMERICAN FUNDS Annual Report 2005
117
Notes to Financial Statements September 30, 2005
1 > Organization
The Arizona Tax Free Fund, California Intermediate Tax Free Fund, California Tax Free Fund, Colorado Intermediate Tax Free Fund, Colorado Tax Free Fund, Intermediate Tax Free Fund, Minnesota Intermediate Tax Free Fund, Minnesota Tax Free Fund, Missouri Tax Free Fund, Nebraska Tax Free Fund, Ohio Tax Free Fund, Oregon Intermediate Tax Free Fund, Short Tax Free Fund, and Tax Free Fund (each a "fund" and collectively, the "funds") are mutual funds offered by First American Investment Funds, Inc. ("FAIF"), which is a member of the First American Family of Funds. As of September 30, 2005, FAIF offered 38 funds, including the funds listed above. FAIF is registered under the Investment Company Act of 1940, as amended, as an open-end investment management company. FAIF's articles of incorporation permit the board of directors to create additional funds in the future. The Intermediate Tax Free Fund, Short Ta x Free Fund, and Tax Free Fund are each diversified open-end management investment companies. The Arizona Tax Free Fund, California Intermediate Tax Free Fund, California Tax Free Fund, Colorado Intermediate Tax Free Fund, Colorado Tax Free Fund, Minnesota Intermediate Tax Free Fund, Minnesota Tax Free Fund, Missouri Tax Free Fund, Nebraska Tax Free Fund, Ohio Tax Free Fund, and Oregon Intermediate Tax Free Fund are each non-diversified open-end management investment companies. Non-diversified funds may invest a large component of their net assets in securities of relatively few issuers.
The funds offer Class A and Class Y shares. The Arizona Tax Free Fund, California Tax Free Fund, Colorado Tax Free Fund, Minnesota Tax Free Fund, Missouri Tax Free Fund, Nebraska Tax Free Fund, Ohio Tax Free Fund, and Tax Free Fund also offer Class C shares. Class A shares of Arizona Tax Free Fund, California Tax Free Fund, Colorado Tax Free Fund, Minnesota Tax Free Fund, Missouri Tax Free Fund, Nebraska Tax Free Fund, Ohio Tax Free Fund, and Tax Free Fund are sold with a maximum front-end sales charge of 4.25%. Class A shares of California Intermediate Tax Free Fund, Colorado Intermediate Tax Free Fund, Intermediate Tax Free Fund, Minnesota Intermediate Tax Free Fund, Oregon Intermediate Tax Free Fund, and Short Tax Free Fund are sold with a maximum front-end sales charge of 2.25%. Class C shares may be subject to a contingent deferred sales charge of 1.00% for 12 months. C lass Y shares have no sales charge and are offered only to qualifying institutional investors and certain other qualifying accounts.
The funds' prospectuses provide a description of each fund's investment objective, principal investment strategies, and principal risks. All classes of shares in a fund have identical voting, dividend, liquidation, and other rights, and the same terms and conditions, except that certain fees, including distribution and shareholder servicing fees, may differ among classes. Each class has exclusive voting rights on any matters relating to that class' servicing or distribution arrangements.
2 > Summary of Significant Accounting Policies
The significant accounting policies followed by the funds are as follows:
SECURITY VALUATIONS – Security valuations for the funds' investments are furnished by one or more independent pricing services that have been approved by the funds' board of directors. Debt obligations exceeding 60 days to maturity are valued by an independent pricing service. The pricing service may employ methodologies that utilize actual market transactions, broker-dealer supplied valuations, or other formula-driven valuation techniques. These techniques generally consider such factors as yields or prices of bonds of comparable quality, type of issue, coupon, maturity, ratings, and general market conditions. Securities for which prices are not available from an independent pricing service, but where an active market exists, are valued using market quotations obtained from one or more dealers that make markets in the securities or from a widely-used quotation system. When market quotations are not readily available, securities are valued at fair value as determined in good faith by procedures established and approved by the funds' board of directors. Some of the factors which may be considered in determining fair value are fundamental analytical data relating to the investment; the nature and duration of any restrictions on disposition; trading in similar securities of the same issuer or comparable companies; information from broker-dealers; and an evaluation of the forces that influence the market in which the securities are purchased and sold. If events occur that materially affect the value of securities between the close of trading in those securities and the close of regular trading on the New York Stock Exchange, the securities will be valued at fair value. The use of fair value pricing by a fund may cause the net asset value of its shares to differ significantly from ne t asset value that would be calculated without regard to such considerations. As of September 30, 2005, the funds held no fair-valued securities. Debt obligations with 60 days or
FIRST AMERICAN FUNDS Annual Report 2005
118
less remaining until maturity will be valued at their amortized cost, which approximates market value. Investments in open-end mutual funds are valued at the respective net asset value of each underlying fund on the valuation date.
SECURITY TRANSACTIONS AND INVESTMENT INCOME – For financial statement purposes, the funds record security transactions on the trade date of the security purchase or sale. Interest income, including amortization of bond premium and discount, is recorded on an accrual basis. Security gains and losses are determined on the basis of identified cost, which is the same basis used for federal income tax purposes. Each fund reserves the right to pay part or all of the proceeds from a redemption request in a proportionate share of readily marketable securities in the fund instead of cash. The resulting gain/loss is calculated as the difference between the fair value and the underlying cost of the security on the transaction date.
DISTRIBUTIONS TO SHAREHOLDERS – Distributions from net investment income are declared and paid monthly and are payable in cash or reinvested in additional shares of each respective fund. Any net realized capital gains on sales of a fund's securities are distributed to shareholders at least annually.
FEDERAL TAXES – Each fund is treated as a separate taxable entity. Each fund intends to continue to qualify as a regulated investment company as provided in Subchapter M of the Internal Revenue Code, as amended, and to distribute all taxable income, if any, to its shareholders. Accordingly, no provision for federal income taxes is required.
Net investment income and net realized gains (losses) may differ for financial statement and tax purposes because of temporary or permanent book/tax differences. These differences are primarily due to book and tax differences for classification of dividends paid by the funds. To the extent these differences are permanent, reclassifications are made to the appropriate equity accounts in the period that the differences arise.
On the Statements of Assets and Liabilities, the following reclassifications were made (000):
| Fund | | Accumulated
Net Realized
Gain | | Undistributed
Net Investment
Income | |
| Arizona Tax Free Fund | | $ | (5 | ) | | $ | 5 | | |
The character of distributions made during the year from net investment income or net realized gains may differ from their ultimate characterization for federal income tax purposes. In addition, due to the timing of dividend distributions, the fiscal year in which the amounts are distributed may differ from the year that the income or realized gains (losses) were recorded by the fund. The distributions paid during the fiscal years ended September 30, 2005 and 2004, were characterized as follows (000):
| | | 2005 | |
| Fund | | Tax Exempt
Income | | Ordinary
Income | | Long Term
Gain | | Total | |
| Arizona Tax Free Fund | | $ | 984 | | | $ | 3 | | | $ | 235 | | | $ | 1,222 | | |
| California Intermediate Tax Free Fund | | | 2,002 | | | | 27 | | | | 329 | | | | 2,358 | | |
| California Tax Free Fund | | | 1,203 | | | | 53 | | | | 199 | | | | 1,455 | | |
| Colorado Intermediate Tax Free Fund | | | 2,077 | | | | - | | | | 169 | | | | 2,246 | | |
| Colorado Tax Free Fund | | | 992 | | | | - | | | | 177 | | | | 1,169 | | |
| Intermediate Tax Free Fund | | | 28,143 | | | | - | | | | 3,679 | | | | 31,822 | | |
| Minnesota Intermediate Tax Free Fund | | | 9,305 | | | | - | | | | 797 | | | | 10,102 | | |
| Minnesota Tax Free Fund | | | 6,755 | | | | - | | | | 811 | | | | 7,566 | | |
| Missouri Tax Free Fund | | | 7,004 | | | | - | | | | 924 | | | | 7,928 | | |
| Nebraska Tax Free Fund | | | 1,581 | | | | - | | | | - | | | | 1,581 | | |
| Ohio Tax Free Fund | | | 1,564 | | | | - | | | | 133 | | | | 1,697 | | |
| Oregon Intermediate Tax Free Fund | | | 5,290 | | | | - | | | | 511 | | | | 5,801 | | |
| Short Tax Free Fund | | | 10,220 | | | | - | | | | - | | | | 10,220 | | |
| Tax Free Fund | | | 20,510 | | | | - | | | | 4,409 | | | | 24,919 | | |
FIRST AMERICAN FUNDS Annual Report 2005
119
Notes to Financial Statements September 30, 2005
| | | 2004 | |
| Fund | | Tax Exempt
Income | | Ordinary
Income | | Long Term
Gain | | Total | |
| Arizona Tax Free Fund | | $ | 884 | | | $ | 39 | | | $ | 63 | | | $ | 986 | | |
| California Intermediate Tax Free Fund | | | 1,931 | | | | 83 | | | | 74 | | | | 2,088 | | |
| California Tax Free Fund | | | 1,139 | | | | - | | | | 210 | | | | 1,349 | | |
| Colorado Intermediate Tax Free Fund | | | 2,396 | | | | 12 | | | | - | | | | 2,408 | | |
| Colorado Tax Free Fund | | | 1,081 | | | | 18 | | | | 186 | | | | 1,285 | | |
| Intermediate Tax Free Fund | | | 28,938 | | | | 100 | | | | 741 | | | | 29,779 | | |
| Minnesota Intermediate Tax Free Fund | | | 10,248 | | | | 56 | | | | 467 | | | | 10,771 | | |
| Minnesota Tax Free Fund | | | 7,250 | | | | 103 | | | | 1,314 | | | | 8,667 | | |
| Missouri Tax Free Fund | | | 7,261 | | | | 5 | | | | 508 | | | | 7,774 | | |
| Nebraska Tax Free Fund | | | 1,391 | | | | 27 | | | | 95 | | | | 1,513 | | |
| Ohio Tax Free Fund | | | 1,438 | | | | 183 | | | | 185 | | | | 1,806 | | |
| Oregon Intermediate Tax Free Fund | | | 5,536 | | | | 97 | | | | 1,080 | | | | 6,713 | | |
| Short Tax Free Fund | | | 11,367 | | | | 172 | | | | 2,259 | | | | 13,798 | | |
| Tax Free Fund | | | 21,461 | | | | 155 | | | | 4,788 | | | | 26,404 | | |
As of September 30, 2005, the components of accumulated earnings (deficit) on a tax basis were as follows (000):
| Fund | | Undistributed
Ordinary
Income | | Undistributed
Tax Exempt
Income | | Undistributed
Long Term
Capital Gains | | Accumulated
Capital and
Post-October
Losses | | Unrealized
Appreciation
(Depreciation) | | Total
Accumulated
Earnings
(Deficit) | |
| Arizona Tax Free Fund | | $ | - | | | $ | - | | | $ | 210 | | | $ | - | | | $ | 1,337 | | | $ | 1,547 | | |
| California Intermediate Tax Free Fund | | | 85 | | | | 16 | | | | 90 | | | | - | | | | 2,263 | | | | 2,454 | | |
| California Tax Free Fund | | | 12 | | | | 9 | | | | 53 | | | | - | | | | 1,718 | | | | 1,792 | | |
| Colorado Intermediate Tax Free Fund | | | 21 | | | | 19 | | | | 266 | | | | - | | | | 2,768 | | | | 3,074 | | |
| Colorado Tax Free Fund | | | 52 | | | | - | | | | 541 | | | | - | | | | 1,574 | | | | 2,167 | | |
| Intermediate Tax Free Fund | | | 6 | | | | 43 | | | | 990 | | | | - | | | | 34,499 | | | | 35,538 | | |
| Minnesota Intermediate Tax Free Fund | | | 23 | | | | 136 | | | | 1,359 | | | | - | | | | 9,522 | | | | 11,040 | | |
| Minnesota Tax Free Fund | | | 28 | | | | 172 | | | | 381 | | | | - | | | | 9,254 | | | | 9,835 | | |
| Missouri Tax Free Fund | | | 2 | | | | 66 | | | | 1,257 | | | | - | | | | 7,803 | | | | 9,128 | | |
| Nebraska Tax Free Fund | | | - | | | | 12 | | | | 63 | | | | - | | | | 1,553 | | | | 1,628 | | |
| Ohio Tax Free Fund | | | - | | | | 29 | | | | 41 | | | | - | | | | 1,357 | | | | 1,427 | | |
| Oregon Intermediate Tax Free Fund | | | 16 | | | | 3 | | | | 556 | | | | - | | | | 5,159 | | | | 5,734 | | |
| Short Tax Free Fund | | | - | | | | 255 | | | | - | | | | (625 | ) | | | (799 | ) | | | (1,169 | ) | |
| Tax Free Fund | | | 28 | | | | 157 | | | | 944 | | | | - | | | | 30,249 | | | | 31,378 | | |
As of September 30, 2005, Short Tax Free Fund had a capital loss carryforward of $238,000 that will expire in 2013.
The Short Tax Free Fund incurred a loss for tax purposes for the period from November 1, 2004 to September 30, 2005. As permitted by tax regulations, the fund intends to elect to defer and treat those losses as arising in the fiscal year ending September 30, 2006. The fund had a deferred loss of $387,000.
SECURITIES PURCHASED ON A WHEN-ISSUED BASIS – Delivery and payment for securities that have been purchased by a fund on a forward-commitment or when-issued basis can take place up to a month or more after the transaction date. During this period, such securities are subject to market fluctuations and the fund maintains, in a segregated account with its custodian, assets with a market value equal to or greater than the amount of its purchase commitments. The purchase of securities on a when-issued or forward-commitment basis may increase the volatility of a fund's net asset value if the fund makes such investments while remaining substantially fully invested. At September 30, 2005, the following funds had outstanding when-issued commitments (000):
| Fund | | Cost | | Segregated
Assets | |
| Arizona Tax Free Fund | | $ | 396 | | | $ | 1,433 | | |
| California Intermediate Tax Free Fund | | | 247 | | | | 2,542 | | |
| California Tax Free Fund | | | 543 | | | | 1,738 | | |
| Intermediate Tax Free Fund | | | 2,096 | | | | 15,966 | | |
| Minnesota Intermediate Tax Free Fund | | | 3,379 | | | | 9,191 | | |
| Missouri Tax Free Fund | | | 1,063 | | | | 10,568 | | |
| Nebraska Tax Free Fund | | | 1,173 | | | | 1,824 | | |
| Short Tax Free Fund | | | 5,636 | | | | 8,380 | | |
| Tax Free Fund | | | 1,363 | | | | 37,713 | | |
FIRST AMERICAN FUNDS Annual Report 2005
120
ILLIQUID OR RESTRICTED SECURITIES – A security may be considered illiquid if it lacks a readily available market. Securities are generally considered liquid if they can be sold or disposed of in the ordinary course of business within seven days at approximately the price at which the security is valued by the fund. Illiquid securities may be valued under methods approved by the funds' board of directors as reflecting fair value. Each fund intends to invest no more than 15% of its net assets (determined at the time of purchase and reviewed periodically) in illiquid securities. Certain restricted securities may be considered illiquid. Restricted securities are often purchased in private placement transactions, are not registered under the Securities Act of 1933, and&n bsp;may have contractual restrictions on resale. Certain restricted securities eligible for resale to qualified institutional investors, including Rule 144A securities, are not subject to the limitation on a fund's investment in illiquid securities if they are determined to be liquid in accordance with procedures adopted by the funds' board of directors. At September 30, 2005, no fund had investments in illiquid securities.
INVERSE FLOATERS – As part of their investment strategy, the funds may invest in certain securities for which the potential income return is inversely related to changes in a floating interest rate ("inverse floaters"). In general, income on inverse floaters will decrease when short-term interest rates increase and increase when short-term interest rates decrease. Inverse floaters may be characterized as derivative securities and may subject a fund to the risks of reduced or eliminated interest payments and losses of invested principal. In addition, inverse floaters have the effect of providing investment leverage and, as a result, the market value of such securities will generally be more volatile than that of fixed-rate, tax-exempt securities. To the extent the funds invest in inverse floaters, the net asset value of the funds' shares may be more volatile than if the funds did not invest in such securities. At September 30, 2005, no fund had investments in inverse floaters.
EXPENSES – Expenses that are directly related to one of the funds are charged directly to that fund. Other operating expenses are generally allocated to the funds on the basis of relative net assets of all funds within the First American Family of Funds. Class specific expenses, such as distribution fees and shareholder servicing fees are borne by that class. Income, other expenses, and realized and unrealized gains and losses of a fund are allocated to each respective class in proportion to the relative net assets of each class.
INTERFUND LENDING PROGRAM – Pursuant to an exemptive order issued by the Securities and Exchange Commission, the funds, along with other registered investment companies in the First American Family of Funds, may participate in an interfund lending program. This program provides an alternative credit facility allowing the funds to borrow from, or lend money to, other participating funds. The funds did not have any interfund lending transactions during the fiscal year ended September 30, 2005.
DEFERRED COMPENSATION PLAN – Under a Deferred Compensation Plan (the "Plan"), non-interested directors of the First American Family of Funds may participate and elect to defer receipt of their annual compensation. Deferred amounts are treated as though equivalent dollar amounts had been invested in shares of selected open-end First American Funds as designated by the board of directors. All amounts in the Plan are 100% vested and accounts under the Plan are obligations of the funds. Deferred amounts remain in the funds until distributed in accordance with the Plan.
USE OF ESTIMATES IN THE PREPARATION OF FINANCIAL STATEMENTS – The preparation of financial statements, in conformity with U.S. generally accepted accounting principles requires management to make estimates and assumptions that affect the reported amounts of net assets and liabilities and disclosure of contingent assets and liabilities at the date of the financial statements and the reported results of operations during the reporting period. Actual results could differ from those estimates.
3 > Fees and Expenses
INVESTMENT ADVISORY FEES – Pursuant to an investment advisory agreement (the "Agreement"), U.S. Bancorp Asset Management, Inc. ("USBAM"), a subsidiary of U.S. Bank National Association ("U.S. Bank"), manages each fund's assets and furnishes related office facilities, equipment, research, and personnel. The Agreement requires each fund to pay USBAM a monthly fee based upon average daily net assets. The annual fee for each fund is 0.50%. USBAM has agreed to waive fees and reimburse other fund expenses through June 30, 2006, so that total fund operating
FIRST AMERICAN FUNDS Annual Report 2005
121
Notes to Financial Statements September 30, 2005
expenses, as a percentage of average daily net assets, do not exceed the following amounts:
| | | Share Class | |
| Fund | | A | | C | | Y | |
| Arizona Tax Free Fund | | | 0.75 | % | | | 1.15 | % | | | 0.50 | % | |
| California Intermediate Tax Free Fund | | | 0.85 | | | | NA | | | | 0.70 | | |
| California Tax Free Fund | | | 0.75 | | | | 1.15 | | | | 0.50 | | |
| Colorado Intermediate Tax Free Fund | | | 0.85 | | | | NA | | | | 0.70 | | |
| Colorado Tax Free Fund | | | 0.75 | | | | 1.15 | | | | 0.50 | | |
| Intermediate Tax Free Fund | | | 0.85 | | | | NA | | | | 0.70 | | |
| Minnesota Intermediate Tax Free Fund | | | 0.85 | | | | NA | | | | 0.70 | | |
| Minnesota Tax Free Fund | | | 0.95 | | | | 1.35 | | | | 0.70 | | |
| Missouri Tax Free Fund | | | 0.95 | | | | 1.35 | | | | 0.70 | | |
| Nebraska Tax Free Fund | | | 0.75 | | | | 1.15 | | | | 0.50 | | |
| Ohio Tax Free Fund | | | 0.75 | | | | 1.15 | | | | 0.50 | | |
| Oregon Intermediate Tax Free Fund | | | 0.85 | | | | NA | | | | 0.70 | | |
| Short Tax Free Fund | | | 0.75 | | | | NA | | | | 0.60 | | |
| Tax Free Fund | | | 0.95 | | | | 1.35 | | | | 0.70 | | |
NA = Not Applicable
The funds may invest in related money market funds that are series of First American Funds, Inc. ("FAF"), subject to certain limitations. In order to avoid the payment of duplicative investment advisory fees to USBAM, which acts as the investment advisor to both the investing funds and the related money market funds, USBAM will reimburse each investing fund an amount equal to that portion of USBAM's investment advisory fee received from the related money market funds that is attributable to the assets of the investing fund. For financial statement purposes, these reimbursements are recorded as investment income.
ADMINISTRATION FEES – Effective July 1, 2005, USBAM serves as the funds' administrator pursuant to an administration agreement between USBAM and the funds. U.S. Bancorp Fund Services, LLC ("USBFS") serves as sub-administrator pursuant to a sub-administration agreement between USBFS and USBAM. Both U.S. Bank and USBFS are direct subsidiaries of U.S. Bancorp. Under the administration agreement, USBAM is compensated to provide, or compensates other entities to provide, services to the funds. These services include various legal, oversight and administrative services and accounting services. Effective July 1, 2005, the funds pay USBAM administration fees, which are calculated daily and paid monthly, equal to each fund's pro rata share of an amount equal, on an annual basis, to 0.15% of the aggregate average daily net assets of all open-end mutual funds in the First American Family of Funds, up to $8 billion, 0.135% on the next $17 billion of the aggregate average daily net assets, 0.12% on the next $25 billion of the aggregate average daily net assets, and 0.10% of the aggregate average daily net assets in excess of $50 billion. All fees paid to the sub-administrator are paid from the administration fee. In addition to these fees, the funds may reimburse USBAM and, indirectly, the sub-administrator for any out-of-pocket expenses incurred in providing administration services.
Prior to July 1, 2005, USBAM and USBFS served as "co-administrators" pursuant to a co-administration agreement between the co-administrators and the funds. The funds paid the administration fees to the co-administrators, which were calculated daily and paid monthly, equal to each fund's pro rata share of an amount equal, on an annual basis, to 0.25% of the aggregate average daily net assets of all open-end mutual funds in the First American Family of Funds, up to $8 billion, 0.235% of the next $17 billion of the aggregate average daily net assets, 0.22% of the next $25 billion of the aggregate daily net assets, and 0.20% of the aggregate average daily net assets in excess of $50 billion. In addition, the funds paid transfer agent fees under the co-administration agreement of $18,500 per share class plus additional per account fees. In addition to these fees, the funds reimbu rsed the co-administrators for any out-of-pocket expenses incurred in providing administration services.
For the fiscal year ended September 30, 2005, administration fees paid to USBAM and USBFS by the funds included in this annual report were as follows (000):
| Fund | | Amount | |
| Arizona Tax Free Fund | | $ | 45 | | |
| California Intermediate Tax Free Fund | | | 106 | | |
| California Tax Free Fund | | | 59 | | |
| Colorado Intermediate Tax Free Fund | | | 103 | | |
| Colorado Tax Free Fund | | | 45 | | |
| Intermediate Tax Free Fund | | | 1,347 | | |
| Minnesota Intermediate Tax Free Fund | | | 488 | | |
| Minnesota Tax Free Fund | | | 338 | | |
| Missouri Tax Free Fund | | | 366 | | |
| Nebraska Tax Free Fund | | | 78 | | |
| Ohio Tax Free Fund | | | 86 | | |
| Oregon Intermediate Tax Free Fund | | | 290 | | |
| Short Tax Free Fund | | | 796 | | |
| Tax Free Fund | | | 942 | | |
TRANSFER AGENT FEES – Effective July 1, 2005, USBFS serves as the funds' transfer agent pursuant to a transfer agent and shareholder servicing agreement with FAIF. FAIF pays transfer agent fees of $18,500 per share class and additional per account fees for transfer agent services. These fees are allocated to each fund based upon the fund's pro rata share of the aggregate average daily net assets of the funds that comprise FAIF. Under the new transfer agent and shareholder servicing agreement, FAIF also pays USBFS a fee equal, on an annual basis, to 0.10% of each fund's
FIRST AMERICAN FUNDS Annual Report 2005
122
average daily net assets. This fee compensates USBFS for providing certain shareholder services and reimburses USBFS for its payments to financial institutions that establish and maintain omnibus accounts and provide customary services for such accounts. In addition to these fees, the funds reimburse USBFS for out-of-pocket expenses incurred in providing transfer agent services. Prior to July 1, 2005, these services were provided by USBFS pursuant to the co-administration agreement.
For the fiscal year ended September 30, 2005, transfer agent fees paid to USBFS by the funds included in this annual report were as follows (000):
| Fund | | Amount | |
| Arizona Tax Free Fund | | $ | 14 | | |
| California Intermediate Tax Free Fund | | | 32 | | |
| California Tax Free Fund | | | 19 | | |
| Colorado Intermediate Tax Free Fund | | | 31 | | |
| Colorado Tax Free Fund | | | 13 | | |
| Intermediate Tax Free Fund | | | 411 | | |
| Minnesota Intermediate Tax Free Fund | | | 146 | | |
| Minnesota Tax Free Fund | | | 102 | | |
| Missouri Tax Free Fund | | | 112 | | |
| Nebraska Tax Free Fund | | | 24 | | |
| Ohio Tax Free Fund | | | 26 | | |
| Oregon Intermediate Tax Free Fund | | | 88 | | |
| Short Tax Free Fund | | | 230 | | |
| Tax Free Fund | | | 290 | | |
CUSTODIAN FEES – U.S. Bank serves as the funds' custodian pursuant to a custodian agreement with FAIF. Effective July 1, 2005, the fee for each fund was reduced from an annual rate of 0.01% of average daily net assets to an annual rate of 0.005% of average daily net assets. All fees are computed daily and paid monthly.
Effective July 1, 2005, the funds have entered into an arrangement with their custodian whereby interest earned on uninvested cash balances will be used to reduce a portion of each fund's custodian expenses. For the fiscal year ended September 30, 2005, custodian fees were not reduced as a result of interest earned.
DISTRIBUTION AND SHAREHOLDER SERVICING FEES – Quasar Distributors, LLC ("Quasar"), a subsidiary of U.S. Bancorp, serves as the distributor of the funds pursuant to distribution agreement with FAIF. Under the distribution agreement and pursuant to a plan adopted by each fund under Rule 12b-1 of the Investment Company Act, each of the funds pays Quasar a monthly distribution and/or shareholder servicing fee equal to an annual rate of 0.25% and 1.00% of each fund's average daily net assets of the Class A and Class C shares, respectively. No distribution or shareholder servicing fees are paid by Class Y shares. These fees may be used by Quasar to provide compe nsation for sales support, distribution activities, or shareholder servicing activities.
Quasar is currently waiving fees equal to an annual rate of 0.10% of average daily net assets for Class A shares in California Intermediate Tax Free Fund, Colorado Intermediate Tax Free Fund, Intermediate Tax Free Fund, Minnesota Intermediate Tax Free Fund, Oregon Intermediate Tax Free Fund, and Short Tax Free Fund. For Class C shares, Quasar is currently waiving fees equal to an annual rate of 0.35% of average daily net assets for Arizona Tax Free Fund, California Tax Free Fund, Colorado Tax Free Fund, Minnesota Tax Free Fund, Missouri Tax Free Fund, Nebraska Tax Free Fund, Ohio Tax Free Fund, and Tax Free Fund.
For the fiscal year ended September 30, 2005, total distribution and shareholder servicing fees waived by Quasar for the funds included in this annual report were as follows (000):
| Fund | | Amount | |
| Arizona Tax Free Fund | | $ | 6 | | |
| California Intermediate Tax Free Fund | | | 4 | | |
| California Tax Free Fund | | | 6 | | |
| Colorado Intermediate Tax Free Fund | | | 14 | | |
| Colorado Tax Free Fund | | | 13 | | |
| Intermediate Tax Free Fund | | | 35 | | |
| Minnesota Intermediate Tax Free Fund | | | 34 | | |
| Minnesota Tax Free Fund | | | 35 | | |
| Missouri Tax Free Fund | | | 1 | | |
| Nebraska Tax Free Fund | | | 6 | | |
| Ohio Tax Free Fund | | | - | * | |
| Oregon Intermediate Tax Free Fund | | | 9 | | |
| Short Tax Free Fund | | | 5 | | |
| Tax Free Fund | | | 10 | | |
* Rounds to zero.
Under these distribution and shareholder servicing agreements, the following amounts were retained by Quasar for the fiscal year ended September 30, 2005 (000):
| Fund | | Amount | |
| Arizona Tax Free Fund | | $ | 5 | | |
| California Intermediate Tax Free Fund | | | 6 | | |
| California Tax Free Fund | | | 25 | | |
| Colorado Intermediate Tax Free Fund | | | 17 | | |
| Colorado Tax Free Fund | | | 15 | | |
| Intermediate Tax Free Fund | | | 40 | | |
| Minnesota Intermediate Tax Free Fund | | | 29 | | |
| Minnesota Tax Free Fund | | | 60 | | |
| Missouri Tax Free Fund | | | 64 | | |
| Nebraska Tax Free Fund | | | 6 | | |
| Ohio Tax Free Fund | | | 4 | | |
| Oregon Intermediate Tax Free Fund | | | 12 | | |
| Short Tax Free Fund | | | 8 | | |
| Tax Free Fund | | | 41 | | |
FIRST AMERICAN FUNDS Annual Report 2005
123
Notes to Financial Statements September 30, 2005
OTHER FEES AND EXPENSES – In addition to the investment advisory fees, custodian fees, distribution and shareholder servicing fees, transfer agent fees and administration fees, each fund is responsible for paying other operating expenses, including: fees and expenses of independent directors, registration fees, postage and printing of shareholder reports, legal, auditing, insurance, and other miscellaneous expenses. For the fiscal year ended September 30, 2005, legal fees and expenses were paid to a law firm of which an Assistant Secretary of the funds is a partner.
CONTINGENT DEFERRED SALES CHARGES – A contingent deferred sales charge ("CDSC") of 1.00% is imposed on redemptions made in the Class C shares for the first 12 months. The CDSC is imposed on the value of the purchased shares, or the value at the time of redemption, whichever is less.
For the fiscal year ended September 30, 2005, total front-end sales charges and CDSCs retained by affiliates of USBAM for distributing the funds' shares were as follows (000):
| Fund | | Amount | |
| Arizona Tax Free Fund | | $ | - | * | |
| California Intermediate Tax Free Fund | | | 19 | | |
| California Tax Free Fund | | | 159 | | |
| Colorado Intermediate Tax Free Fund | | | 46 | | |
| Colorado Tax Free Fund | | | 17 | | |
| Intermediate Tax Free Fund | | | 14 | | |
| Minnesota Intermediate Tax Free Fund | | | 45 | | |
| Minnesota Tax Free Fund | | | 77 | | |
| Missouri Tax Free Fund | | | 110 | | |
| Nebraska Tax Free Fund | | | 22 | | |
| Ohio Tax Free Fund | | | 8 | | |
| Oregon Intermediate Tax Free Fund | | | 29 | | |
| Short Tax Free Fund | | | 12 | | |
| Tax Free Fund | | | 42 | | |
* Rounds to zero.
4 > Capital Share Transactions
FAIF has 324 billion shares of $0.0001 par value capital stock authorized. Capital share transactions for the funds were as follows (000):
| | | Arizona
Tax Free Fund | | California
Intermediate
Tax Free Fund | | California
Tax Free Fund | | Colorado
Intermediate
Tax Free Fund | |
| | | Year
Ended
9/30/05 | | Year
Ended
9/30/04 | | Year
Ended
9/30/05 | | Year
Ended
9/30/04 | | Year
Ended
9/30/05 | | Year
Ended
9/30/04 | | Year
Ended
9/30/05 | | Year
Ended
9/30/04 | |
| Class A: | |
| Shares issued | | | 189 | | | | 162 | | | | 131 | | | | 174 | | | | 373 | | | | 155 | | | | 392 | | | | 187 | | |
| Shares issued in lieu of cash distributions | | | 37 | | | | 35 | | | | 11 | | | | 12 | | | | 33 | | | | 37 | | | | 39 | | | | 43 | | |
| Shares redeemed | | | (162 | ) | | | (461 | ) | | | (81 | ) | | | (267 | ) | | | (184 | ) | | | (335 | ) | | | (454 | ) | | | (994 | ) | |
| Total Class A transactions | | | 64 | | | | (264 | ) | | | 61 | | | | (81 | ) | | | 222 | | | | (143 | ) | | | (23 | ) | | | (764 | ) | |
| Class C: | |
| Shares issued | | | 18 | | | | 33 | | | | - | | | | - | | | | 163 | | | | 51 | | | | - | | | | - | | |
| Shares issued in lieu of cash distributions | | | 6 | | | | 4 | | | | - | | | | - | | | | 6 | | | | 4 | | | | - | | | | - | | |
| Shares redeemed | | | (17 | ) | | | (62 | ) | | | - | | | | - | | | | (9 | ) | | | (38 | ) | | | - | | | | - | | |
| Total Class C transactions | | | 7 | | | | (25 | ) | | | - | | | | - | | | | 160 | | | | 17 | | | | - | | | | - | | |
| Class Y: | |
| Shares issued | | | 459 | | | | 204 | | | | 609 | | | | 777 | | | | 536 | | | | 358 | | | | 583 | | | | 196 | | |
| Shares issued in lieu of cash distributions | | | 6 | | | | 2 | | | | 8 | | | | 3 | | | | 3 | | | | 2 | | | | 5 | | | | 1 | | |
| Shares redeemed | | | (44 | ) | | | (189 | ) | | | (307 | ) | | | (523 | ) | | | (207 | ) | | | (290 | ) | | | (810 | ) | | | (1,081 | ) | |
| Total Class Y transactions | | | 421 | | | | 17 | | | | 310 | | | | 257 | | | | 332 | | | | 70 | | | | (222 | ) | | | (884 | ) | |
| Net increase (decrease) in capital shares | | | 492 | | | | (272 | ) | | | 371 | | | | 176 | | | | 714 | | | | (56 | ) | | | (245 | ) | | | (1,648 | ) | |
FIRST AMERICAN FUNDS Annual Report 2005
124
| | | Colorado
Tax Free Fund | | Intermediate
Tax Free Fund | | Minnesota
Intermediate
Tax Free Fund | | Minnesota
Tax Free Fund | | Missouri
Tax Free Fund | |
| | | Year
Ended
9/30/05 | | Year
Ended
9/30/04 | | Year
Ended
9/30/05 | | Year
Ended
9/30/04 | | Year
Ended
9/30/05 | | Year
Ended
9/30/04 | | Year
Ended
9/30/05 | | Year
Ended
9/30/04 | | Year
Ended
9/30/05 | | Year
Ended
9/30/04 | |
| Class A: | |
| Shares issued | | | 26 | | | | 77 | | | | 714 | | | | 1,364 | | | | 553 | | | | 1,288 | | | | 716 | | | | 664 | | | | 374 | | | | 314 | | |
| Shares issued in lieu of cash distributions | | | 37 | | | | 47 | | | | 114 | | | | 102 | | | | 100 | | | | 91 | | | | 356 | | | | 477 | | | | 51 | | | | 46 | | |
| Shares redeemed | | | (243 | ) | | | (400 | ) | | | (809 | ) | | | (1,341 | ) | | | (859 | ) | | | (963 | ) | | | (1,782 | ) | | | (2,006 | ) | | | (140 | ) | | | (434 | ) | |
| Total Class A transactions | | | (180 | ) | | | (276 | ) | | | 19 | | | | 125 | | | | (206 | ) | | | 416 | | | | (710 | ) | | | (865 | ) | | | 285 | | | | (74 | ) | |
| Class C: | |
| Shares issued | | | 42 | | | | 24 | | | | - | | | | - | | | | - | | | | - | | | | 83 | | | | 76 | | | | - | | | | 1 | | |
| Shares issued in lieu of cash distributions | | | 15 | | | | 15 | | | | - | | | | - | | | | - | | | | - | | | | 34 | | | | 43 | | | | 1 | | | | 1 | | |
| Shares redeemed | | | (83 | ) | | | (80 | ) | | | - | | | | - | | | | - | | | | - | | | | (164 | ) | | | (248 | ) | | | (3 | ) | | | (6 | ) | |
| Total Class C transactions | | | (26 | ) | | | (41 | ) | | | - | | | | - | | | | - | | | | - | | | | (47 | ) | | | (129 | ) | | | (2 | ) | | | (4 | ) | |
| Class Y: | |
| Shares issued | | | 122 | | | | 106 | | | | 10,127 | | | | 8,772 | | | | 1,581 | | | | 2,053 | | | | 779 | | | | 540 | | | | 1,808 | | | | 1,288 | | |
| Shares issued in lieu of cash distributions | | | 1 | | | | 1 | | | | 321 | | | | 208 | | | | 33 | | | | 32 | | | | 19 | | | | 21 | | | | 23 | | | | 22 | | |
| Shares redeemed | | | (202 | ) | | | (110 | ) | | | (8,735 | ) | | | (13,668 | ) | | | (3,175 | ) | | | (3,996 | ) | | | (471 | ) | | | (961 | ) | | | (1,732 | ) | | | (2,503 | ) | |
| Total Class Y transactions | | | (79 | ) | | | (3 | ) | | | 1,713 | | | | (4,688 | ) | | | (1,561 | ) | | | (1,911 | ) | | | 327 | | | | (400 | ) | | | 99 | | | | (1,193 | ) | |
| Net increase (decrease) in capital shares | | | (285 | ) | | | (320 | ) | | | 1,732 | | | | (4,563 | ) | | | (1,767 | ) | | | (1,495 | ) | | | (430 | ) | | | (1,394 | ) | | | 382 | | | | (1,271 | ) | |
| | | Nebraska
Tax Free Fund | | Ohio
Tax Free Fund | | Oregon
Intermediate
Tax Free Fund | | Short
Tax Free Fund | | Tax Free Fund | |
| | | Year
Ended
9/30/05 | | Year
Ended
9/30/04 | | Year
Ended
9/30/05 | | Year
Ended
9/30/04 | | Year
Ended
9/30/05 | | Year
Ended
9/30/04 | | Year
Ended
9/30/05 | | Year
Ended
9/30/04 | | Year
Ended
9/30/05 | | Year
Ended
9/30/04 | |
| Class A: | |
| Shares issued | | | 295 | | | | 137 | | | | 24 | | | | 77 | | | | 202 | | | | 237 | | | | 213 | | | | 330 | | | | 382 | | | | 791 | | |
| Shares issued in lieu of cash distributions | | | 11 | | | | 12 | | | | 2 | | | | 2 | | | | 22 | | | | 24 | | | | 11 | | | | 16 | | | | 150 | | | | 166 | | |
| Shares redeemed | | | (93 | ) | | | (144 | ) | | | (45 | ) | | | (46 | ) | | | (139 | ) | | | (201 | ) | | | (440 | ) | | | (344 | ) | | | (682 | ) | | | (1,170 | ) | |
| Total Class A transactions | | | 213 | | | | 5 | | | | (19 | ) | | | 33 | | | | 85 | | | | 60 | | | | (216 | ) | | | 2 | | | | (150 | ) | | | (213 | ) | |
| Class C: | |
| Shares issued | | | 39 | | | | 51 | | | | 10 | | | | 11 | | | | - | | | | - | | | | - | | | | - | | | | 25 | | | | 42 | | |
| Shares issued in lieu of cash distributions | | | 4 | | | | 5 | | | | - | | | | 1 | | | | - | | | | - | | | | - | | | | - | | | | 11 | | | | 16 | | |
| Shares redeemed | | | (70 | ) | | | (37 | ) | | | (5 | ) | | | (20 | ) | | | - | | | | - | | | | - | | | | - | | | | (32 | ) | | | (251 | ) | |
| Total Class C transactions | | | (27 | ) | | | 19 | | | | 5 | | | | (8 | ) | | | - | | | | - | | | | - | | | | - | | | | 4 | | | | (193 | ) | |
| Class Y: | |
| Shares issued | | | 669 | | | | 461 | | | | 779 | | | | 558 | | | | 1,909 | | | | 1,741 | | | | 6,860 | | | | 16,264 | | | | 6,235 | | | | 4,012 | | |
| Shares issued in lieu of cash distributions | | | 9 | | | | 6 | | | | 22 | | | | 25 | | | | 39 | | | | 76 | | | | 69 | | | | 347 | | | | 97 | | | | 106 | | |
| Shares redeemed | | | (403 | ) | | | (317 | ) | | | (590 | ) | | | (596 | ) | | | (2,067 | ) | | | (2,448 | ) | | | (15,310 | ) | | | (13,499 | ) | | | (4,293 | ) | | | (7,665 | ) | |
| Total Class Y transactions | | | 275 | | | | 150 | | | | 211 | | | | (13 | ) | | | (119 | ) | | | (631 | ) | | | (8,381 | ) | | | 3,112 | | | | 2.039 | | | | (3,547 | ) | |
| Net increase (decrease) in capital shares | | | 461 | | | | 174 | | | | 197 | | | | 12 | | | | (34 | ) | | | (571 | ) | | | (8,597 | ) | | | 3,114 | | | | 1,893 | | | | (3,953 | ) | |
5 > Investment Security Transactions
During the fiscal year ended September 30, 2005, purchases of securities and proceeds from sales of securities other than government securities and temporary investments in short-term securities, were as follows (000):
| Fund | | Purchases | | Sales | |
| Arizona Tax Free Fund | | $ | 8,413 | | | $ | 4,379 | | |
| California Intermediate Tax Free Fund | | | 18,729 | | | | 14,453 | | |
| California Tax Free Fund | | | 11,086 | | | | 4,031 | | |
| Colorado Intermediate Tax Free Fund | | | 9,613 | | | | 12,511 | | |
| Colorado Tax Free Fund | | | 6,545 | | | | 10,205 | | |
| Intermediate Tax Free Fund | | | 110,131 | | | | 98,187 | | |
| Minnesota Intermediate Tax Free Fund | | | 36,449 | | | | 55,211 | | |
| Minnesota Tax Free Fund | | | 27,857 | | | | 25,682 | | |
| Missouri Tax Free Fund | | | 36,849 | | | | 33,451 | | |
| Nebraska Tax Free Fund | | | 11,853 | | | | 7,927 | | |
| Ohio Tax Free Fund | | | 7,576 | | | | 5,253 | | |
| Oregon Intermediate Tax Free Fund | | | 28,400 | | | | 30,866 | | |
| Short Tax Free Fund | | | 136,907 | | | | 217,089 | | |
| Tax Free Fund | | | 61,495 | | | | 37,638 | | |
The aggregate gross unrealized appreciation and depreciation for securities held by the funds and the total cost of securities for federal income tax purposes at September 30, 2005, were as follows (000):
| Fund | | Aggregate
Gross
Appreciation | | Aggregate
Gross
Depreciation | | Net | | Federal
Income
Tax
Cost | |
| Arizona Tax Free Fund | | $ | 1,393 | | | $ | (56 | ) | | $ | 1,337 | | | $ | 23,565 | | |
| California Intermediate Tax Free Fund | | | 2,322 | | | | (59 | ) | | | 2,263 | | | | 50,580 | | |
| California Tax Free Fund | | | 1,776 | | | | (58 | ) | | | 1,718 | | | | 32,926 | | |
| Colorado Intermediate Tax Free Fund | | | 2,975 | | | | (207 | ) | | | 2,768 | | | | 44,617 | | |
| Colorado Tax Free Fund | | | 1,582 | | | | (8 | ) | | | 1,574 | | | | 18,312 | | |
| Intermediate Tax Free Fund | | | 35,291 | | | | (792 | ) | | | 34,499 | | | | 635,423 | | |
| Minnesota Intermediate Tax Free Fund | | | 9,782 | | | | (260 | ) | | | 9,522 | | | | 220,856 | | |
| Minnesota Tax Free Fund | | | 9,412 | | | | (158 | ) | | | 9,254 | | | | 152,684 | | |
| Missouri Tax Free Fund | | | 7,941 | | | | (138 | ) | | | 7,803 | | | | 173,314 | | |
| Nebraska Tax Free Fund | | | 1,594 | | | | (41 | ) | | | 1,553 | | | | 40,239 | | |
| Ohio Tax Free Fund | | | 1,403 | | | | (46 | ) | | | 1,357 | | | | 40,333 | | |
| Oregon Intermediate Tax Free Fund | | | 5,372 | | | | (213 | ) | | | 5,159 | | | | 135,930 | | |
| Short Tax Free Fund | | | 1,293 | | | | (2,092 | ) | | | (799 | ) | | | 339,626 | | |
| Tax Free Fund | | | 30,475 | | | | (226 | ) | | | 30,249 | | | | 441,936 | | |
FIRST AMERICAN FUNDS Annual Report 2005
125
Notes to Financial Statements September 30, 2005
6 > Concentration of Credit Risk
The Arizona Tax Free Fund, California Intermediate Tax Free Fund, California Tax Free Fund, Colorado Intermediate Tax Free Fund, Colorado Tax Free Fund, Minnesota Intermediate Tax Free Fund, Minnesota Tax Free Fund, Missouri Tax Free Fund, Nebraska Tax Free Fund, Ohio Tax Free Fund, and Oregon Intermediate Tax Free Fund invest in debt instruments of municipal issuers in specific states. Although these funds monitor investment concentration, the issuers' ability to meet their obligations may be affected by economic developments in the specific state or region. Additionally, each state has various guidelines relating to the tax treatment of the income distributed from each fund.
The ratings of long-term securities as a percentage of the total value of investments at September 30, 2005, were as follows (unaudited):
Standard &
Poor's/
Moody's/
Fitch's
Ratings: | | Arizona
Tax Free
Fund | | California
Intermediate
Tax Free
Fund | | California
Tax Free
Fund | | Colorado
Intermediate
Tax Free
Fund | |
| AAA/Aaa | | | 48.9 | % | | | 51.7 | % | | | 53.4 | % | | | 52.5 | % | |
| AA/Aa | | | 19.0 | | | | 5.6 | | | | 12.6 | | | | 12.7 | | |
| A/A | | | 8.8 | | | | 22.6 | | | | 12.5 | | | | 9.7 | | |
| BBB/Baa | | | 14.2 | | | | 16.8 | | | | 17.6 | | | | 19.4 | | |
| BB/Ba | | | - | | | | - | | | | - | | | | 0.8 | | |
| Nonrated | | | 9.1 | | | | 3.3 | | | | 3.9 | | | | 4.9 | | |
| | | | 100 | % | | | 100 | % | | | 100 | % | | | 100 | % | |
Standard &
Poor's/
Moody's/
Fitch's
Ratings: | |
Colorado
Tax Free
Fund | |
Intermediate
Tax Free
Fund | | Minnesota
Intermediate
Tax Free
Fund | |
Minnesota
Tax Free
Fund | |
Missouri
Tax Free
Fund | |
| AAA/Aaa | | | 52.4 | % | | | 58.2 | % | | | 48.7 | % | | | 33.0 | % | | | 52.3 | % | |
| AA/Aa | | | 12.6 | | | | 13.1 | | | | 22.2 | | | | 15.9 | | | | 33.8 | | |
| A/A | | | 13.1 | | | | 13.5 | | | | 11.4 | | | | 23.4 | | | | 6.8 | | |
| BBB/Baa | | | 20.2 | | | | 9.6 | | | | 8.0 | | | | 10.2 | | | | 4.8 | | |
| BB/Ba | | | - | | | | 0.9 | | | | 1.5 | | | | 1.1 | | | | 1.0 | | |
| Nonrated | | | 1.7 | | | | 4.7 | | | | 8.2 | | | | 16.4 | | | | 1.3 | | |
| | | | 100 | % | | | 100 | % | | | 100 | % | | | 100 | % | | | 100 | % | |
Standard &
Poor's/
Moody's/
Fitch's
Ratings: | |
Nebraska
Tax Free
Fund | |
Ohio
Tax Free
Fund | | Oregon
Intermediate
Tax Free
Fund | |
Short
Tax Free
Fund | |
Tax Free
Fund | |
| AAA/Aaa | | | 41.8 | % | | | 45.1 | % | | | 58.4 | % | | | 34.6 | % | | | 39.2 | % | |
| AA/Aa | | | 37.3 | | | | 37.6 | | | | 34.2 | | | | 18.8 | | | | 9.4 | | |
| A/A | | | 12.5 | | | | 12.3 | | | | 1.4 | | | | 23.0 | | | | 18.3 | | |
| BBB/Baa | | | 1.3 | | | | 4.4 | | | | 3.5 | | | | 18.8 | | | | 21.3 | | |
| BB/Ba | | | - | | | | - | | | | - | | | | - | | | | 0.9 | | |
| B/B | | | - | | | | - | | | | - | | | | 0.2 | | | | - | | |
| Nonrated | | | 7.1 | | | | 0.6 | | | | 2.5 | | | | 4.6 | | | | 10.9 | | |
| | | | 100 | % | | | 100 | % | | | 100 | % | | | 100 | % | | | 100 | % | |
In the case of split ratings, a security is considered to be rated in the listed category if two of Moody's Investor Service, Standard & Poor's, and Fitch rate the security in that category. If ratings are provided by only two of those rating agencies, the lower rating is used. If only one of those rating agencies provides a rating, that rating is used.
7 > Indemnifications
The funds enter into contracts that contain a variety of indemnifications. The funds' maximum exposure under these arrangements is unknown. However, the funds have not had prior claims or losses pursuant to these contracts and expect the risk of loss to be remote.
FIRST AMERICAN FUNDS Annual Report 2005
126
NOTICE TO SHAREHOLDERS September 30, 2005 (unaudited)
TAX INFORMATION
The information set forth below is for each fund's fiscal year as required by federal laws. Most shareholders, however, must report distributions on a calendar year basis for income tax purposes, which may include distributions for portions of two fiscal years of a fund. Accordingly, the information needed for income tax purposes will be sent in early 2006 on Form 1099-DIV. Please consult your tax advisor for proper treatment of this information.
Dear First American Shareholders:
For the fiscal year ended September 30, 2005, each fund has designated long term capital gains, ordinary income, and tax exempt income with regard to distributions paid during the year as follows:
| Fund | | Long Term
Capital Gains
Distributions
(Tax Basis) | | Tax Exempt
Interest | | Ordinary
Income
Distributions
(Tax Basis) | | Return
of
Capital | | Total
Distributions
(Tax Basis) (a) | |
| Arizona Tax Free Fund | | | 19 | % | | | 81 | % | | | - | % | | | - | % | | | 100 | % | |
| California Intermediate Tax Free Fund | | | 14 | | | | 85 | | | | 1 | | | | - | | | | 100 | | |
| California Tax Free Fund | | | 14 | | | | 83 | | | | 3 | | | | - | | | | 100 | | |
| Colorado Intermediate Tax Free Fund | | | 8 | | | | 92 | | | | - | | | | - | | | | 100 | | |
| Colorado Tax Free Fund | | | 15 | | | | 85 | | | | - | | | | - | | | | 100 | | |
| Intermediate Tax Free Fund | | | 12 | | | | 88 | | | | - | | | | - | | | | 100 | | |
| Minnesota Intermediate Tax Free Fund | | | 8 | | | | 92 | | | | - | | | | - | | | | 100 | | |
| Minnesota Tax Free Fund | | | 11 | | | | 89 | | | | - | | | | - | | | | 100 | | |
| Missouri Tax Free Fund | | | 12 | | | | 88 | | | | - | | | | - | | | | 100 | | |
| Nebraska Tax Free Fund | | | - | | | | 100 | | | | - | | | | - | | | | 100 | | |
| Ohio Tax Free Fund | | | 8 | | | | 92 | | | | - | | | | - | | | | 100 | | |
| Oregon Intermediate Tax Free Fund | | | 9 | | | | 91 | | | | - | | | | - | | | | 100 | | |
| Short Tax Free Fund | | | - | | | | 100 | | | | - | | | | - | | | | 100 | | |
| Tax Free Fund | | | 18 | | | | 82 | | | | - | | | | - | | | | 100 | | |
(a) None of the distributions made by these funds are eligible for the dividends received deduction or are characterized as qualified dividend income.
HOW TO OBTAIN A COPY OF THE FUNDS' PROXY VOTING POLICIES AND PROXY VOTING RECORD
A description of the policies and procedures that the funds use to determine how to vote proxies relating to portfolio securities, as well as information regarding how the funds voted proxies relating to porfolio securities during the most recent 12 month period ended June 30, 2005 is available (1) without charge upon request by calling 800.677.FUND; (2) at firstamericanfunds.com; and (3) on the U.S. Securities and Exchange Commission's website at http://www.sec.gov.
FORM N-Q HOLDINGS INFORMATION
Each fund is required to file its complete schedule of portfolio holdings for the first and third quarters of each fiscal year with the Securities and Exchange Commission on Form N-Q. The funds' Forms N-Q are available (1) without charge upon request by calling 800.677.FUND and (2) on the U.S. Securities and Exchange Commission's website at http://www.sec.gov. In addition, you may review and copy the funds' Forms N-Q at the Commission's Public Reference Room in Washington, D.C. You may obtain information on the operation of the Public Reference Room by calling 1-800-SEC-0330.
QUARTERLY PORTFOLIO HOLDINGS
Each fund will make complete portfolio holdings information publicly available by posting the information at firstamericanfunds.com on a quarterly basis. The funds will attempt to post such information within 10 days of the quarter end.
FIRST AMERICAN FUNDS Annual Report 2005
127
NOTICE TO SHAREHOLDERS September 30, 2005 (unaudited)
APPROVAL OF INVESTMENT ADVISORY AGREEMENT
The Board of Directors of the funds (the "Board"), which is comprised entirely of independent directors, oversees the management of each fund and, as required by law, determines annually whether to renew the funds' advisory agreement with U.S. Bancorp Asset Management, Inc. ("USBAM").
At a meeting on May 3-5 2005, the Board considered information relating to the funds' investment advisory agreement with USBAM (the "Agreement"). In advance of the meeting, the Board received materials relating to the Agreement, and had the opportunity to ask questions and request further information in connection with their consideration. At a subsequent meeting on June 20-22, 2005, the Board concluded its consideration of and approved the Agreement through June 30, 2006.
Although the Agreement, which is with First American Investment Funds, Inc., relates to all of the funds, the Board separately considered and approved the Agreement with respect to each fund. In considering the Agreement, the Board, advised by independent legal counsel, reviewed and considered the factors it deemed relevant, including: (1) the nature, quality, and extent of USBAM's services to the fund, (2) the investment performance of the fund, (3) the profitability of USBAM related to the fund, including an analysis of USBAM's cost of providing services and comparative expense information, (4) the extent to which economies of scale are realized as the fund grows and whether fee levels are adjusted to enable fund investors to share in these economies of scale, and (5) other benefits that accrue to USBAM through its relationship with the funds. In its deliberations, the Board di d not identify any single factor which alone was responsible for the Board's decision to approve the Agreement.
Before approving the Agreement, the Board met in executive session with its independent counsel on numerous occasions to consider the materials provided by USBAM and the terms of the Agreement. Based on its evaluation of those materials, the Board concluded that the Agreement is fair and in the best interests of the shareholders of each fund. In reaching its conclusions, the Board considered the following:
Nature, Quality, and Extent of Investment Advisory Services
The Board examined the nature, quality, and extent of the services provided by USBAM to each fund. The Board reviewed USBAM's key personnel who provide investment management services to each fund as well as the fact that, under the Agreement, USBAM has the authority and responsibility to make and execute investment decisions for each fund within the framework of that fund's investment policies and restrictions, subject to review by the Board. The Board further considered that USBAM's duties with respect to each fund include (i) investment research and security selection, (ii) adherence to (and monitoring compliance with) the fund's investment policies and restrictions and the Investment Company Act of 1940, and (iii) monitoring the performance of the various organizations providing services to the fund, including the fund's distributor, sub-administrator, transfer agent, and custodian. Fin ally, the Board considered USBAM's representation that the services provided by USBAM under the Agreement are the type of services customarily provided by investment advisors in the fund industry.
The Board also considered compliance reports about USBAM from the fund's Chief Compliance Officer.
Based on the foregoing, the Board concluded that each fund is likely to benefit from the nature, extent, and quality of the services provided by USBAM under the Agreement.
Investment Performance of the Funds
The Board considered the performance of each fund, as summarized below, including how the fund performed versus the median performance of a group of comparable funds selected by an independent data service (the "performance universe") and how the fund performed versus its benchmark index. The performance periods reviewed by the Board all ended on February 28, 2005. In the case of each of the state-specific funds, the Board considered that fund's benchmark index is a national municipal index, rather than a state-specific index, and noted USBAM's assertion that the Board should place more weight on the fund's performance compared to its performance universe.
Arizona Tax Free Fund. The fund significantly outperformed its performance universe for the one-, three-, and five-year periods. The fund also outperformed its benchmark index for the three- and five-year periods (although it underperformed the index
FIRST AMERICAN FUNDS Annual Report 2005
128
for the one-year period). The Board concluded that, in light of the fund's strong performance compared to the fund's performance universe and its long-term out-performance of its benchmark, it would be in the interest of the fund and its shareholders to renew the Agreement.
California Intermediate Tax Free Fund. The fund significantly outperformed both its benchmark index and its performance universe for the one-year period. For the three- and five-year periods, the fund outperformed its performance universe, but underperformed its benchmark index. The Board concluded that, in light of the fund's strong performance compared to the fund's performance universe and its recent out-performance of the benchmark index, it would be in the interest of the fund and its shareholders to renew the Agreement.
California Tax Free Fund. The fund outperformed its performance universe for the one-, three-, and five-year periods. The fund's Class Y shares also outperformed the benchmark index for each of these periods; the fund's Class A shares outperformed the benchmark index for the five-year period. The Board concluded that, in light of the fund's strong performance compared to the fund's performance universe and its long-term out-performance of the benchmark index, it would be in the interest of the fund and its shareholders to renew the Agreement.
Colorado Tax Free Fund. The fund's performance was comparable to or better than that of its performance universe for the one-, three-, and five-year periods. Also, the fund outperformed its benchmark for the three- and five-year periods (although it underperformed its benchmark index for the one-year period). The Board concluded that, in light of the fund's strong performance compared to the fund's performance universe and its long-term out-performance of the benchmark index, it would be in the interest of the fund and its shareholders to renew the Agreement.
Colorado Intermediate Tax Free Fund. The fund significantly outperformed both its benchmark index and its performance universe for the one-year period. For the three-, five-, and ten-year periods, the fund outperformed its performance universe, but underperformed its benchmark index. The Board concluded that, in light of the fund's strong performance compared to the fund's performance universe and its recent out-performance of the benchmark index, it would be in the interest of the fund and its shareholders to renew the Agreement.
Intermediate Tax Free Fund. The fund significantly outperformed both its benchmark index and its performance universe for the one-year period. For the three-, five-, and ten-year periods, the fund outperformed its performance universe, but underperformed its benchmark index. The Board concluded that, in light of the fund's strong performance compared to the fund's performance universe and its recent out-performance of the benchmark index, it would be in the interest of the fund and its shareholders to renew the Agreement.
Minnesota Tax Free Fund. The fund significantly outperformed its performance universe for the one-, three-, five-, and ten-year periods, although it underperformed its benchmark index for each of those periods. The Board concluded that, in light of the fund's strong performance compared to the fund's performance universe, it would be in the interest of the fund and its shareholders to renew the Agreement.
Minnesota Intermediate Tax Free Fund. The fund significantly outperformed both its benchmark index and its performance universe for the one-year period. For the three-, five-, and ten-year periods, the fund outperformed its performance universe, but underperformed its benchmark index. The Board concluded that, in light of the fund's strong performance compared to the fund's performance universe and its recent out-performance of the benchmark index, it would be in the interest of the fund and its shareholders to renew the Agreement.
Missouri Tax Free Fund. The fund's performance was slightly below that of its performance universe for the one-year period. For the three- and five-year periods, Class Y shares outperformed the performance universe and Class A shares underperformed, whereas for the ten-year period, both share classes outperformed the performance universe. The fund underperformed its benchmark index for each of the periods. The Board concluded that, in light of the fund's longer-term competitive performance compared to the fund's performance universe, it would be in the interest of the fund and its shareholders to renew the Agreement.
Nebraska Tax Free Fund. The fund outperformed its performance universe for the one- and three-year periods. The fund underperformed its benchmark for the one-year period. For the three-year period, the fund's Class Y shares outperformed the
FIRST AMERICAN FUNDS Annual Report 2005
129
NOTICE TO SHAREHOLDERS September 30, 2005 (unaudited)
benchmark and Class A shares underperformed the benchmark. The Board concluded that, in light of the fund's strong performance compared to the fund's performance universe, it would be in the interest of the fund and its shareholders to renew the Agreement.
Ohio Tax Free Fund. The fund commenced operations in April 2002. For the one-year period, the fund underperformed its benchmark index. For the period since inception, Class Y share performance was in line with the benchmark, while Class A share performance was below that of the benchmark. Class Y share performance was equal to that of the performance universe for the one-year period, while Class A shares underperformed. The Board noted USBAM's assertion that interest rates at the time the fund commenced operations precluded the fund from benefiting from pre-refundings that occurred at that time. USBAM also explained that the fund's performance had been adversely affected by the difficulty of obtaining lower investment grade issues, which have generally ou tperformed since the fund's inception. The Board concluded that, in light of the fund's fairly short operating history and its generally competitive performance, it would be in the interest of the fund and its shareholders to renew the Agreement and to continue to monitor the development of the fund's performance record.
Oregon Intermediate Tax Free Fund. The fund outperformed its performance universe for the one-, three-, five-, and ten-year periods. For each of these periods, the fund underperformed its benchmark index. The Board concluded that, in light of the fund's strong performance compared to the fund's performance universe, it would be in the interest of the fund and its shareholders to renew the Agreement.
Short Tax Free Fund. The fund performed in line with its benchmark index for the period since the fund's inception in October 2002 through February 28, 2005. For the one-year period ended February 28, 2005, the fund underperformed both its performance universe and its benchmark. The Board concluded that, in light of the fund's competitive performance since inception as compared to that of its benchmark, and the fund's fairly limited performance history, it would be in the interest of the fund and its shareholders to renew the Agreement and to continue to monitor the development of the fund's performance record.
Tax Free Fund. The fund significantly outperformed its performance universe for the one-, three-, and five-year periods. The fund outperformed its benchmark for the three-year period (although it underperformed its benchmark for the one- and five-year periods). The Board concluded that, in light of the fund's strong performance compared to the fund's performance universe and its three-year out-performance of the benchmark index, it would be in the interest of the fund and its shareholders to renew the Agreement.
Costs of Services and Profits Realized by USBAM
The Board reviewed USBAM's estimated costs in serving as the funds' investment manager, including the costs associated with the personnel and systems necessary to manage each fund. The Board also considered the reported profitability of USBAM and its affiliates resulting from their relationship with each fund. For each fund, the Board reviewed fee and expense information as compared to that of other funds and accounts managed by USBAM and of comparable funds managed by other advisers. The Board found that while the advisory fees for USBAM's institutional separate accounts are lower than the funds' advisory fees, the funds receive additional services from USBAM that separate accounts do not receive.
Using information provided by an independent data service, the Board also evaluated each fund's advisory fee compared to the median advisory fee for other mutual funds similar in size, character and investment strategy, and each fund's expense ratio after waivers compared to the median expense ratio, after waivers, of comparable funds. In connection with its review of fund fees and expenses, the Board asked USBAM to articulate its pricing philosophy. USBAM responded that it attempts generally to maintain each fund's total operating expenses at a level that approximates its peer group median expense ratio. In addition, USBAM committed to waive its investment advisory fees to the extent necessary to maintain the funds' total expense ratios at levels generally in line with their respective peer groups. The Board concluded that USBAM's pricing philosophy is a reasonable one.
Further detail considered by the Board regarding the advisory fees and expense ratios of each fund is set forth below:
Arizona Tax Free Fund, California Tax Free Fund, Colorado Tax Free Fund, Colorado Intermediate Tax Free Fund, Intermediate Tax Free Fund, Minnesota Tax Free Fund, Missouri Tax Free Fund, Nebraska Tax Free Fund, Ohio Tax Tree Fund, and Oregon Intermediate Tax Free Fund. For
FIRST AMERICAN FUNDS Annual Report 2005
130
each of the foregoing funds, the fund's contractual advisory fee was equal or nearly equal to the peer group median advisory fee and, on an after waivers basis, the fund's advisory fee was lower than the peer group median. Furthermore, each of the foregoing funds had a total expense ratio after waivers that was lower than the peer group median expense ratio, except that the total expense ratios for Minnesota Tax Free Fund and Missouri Tax Free Fund were slightly higher than the peer group median expense ratio.
California Intermediate Tax Free Fund. The fund's advisory fee, both before and after waivers, was slightly higher than the peer group median, as was the fund's total expense ratio after waivers.
Minnesota Intermediate Tax Free Fund. The fund's contractual advisory fee was equal to the peer group median advisory fee. On an after waivers basis, the fund's advisory fee and the peer group's advisory fee were nearly the same. Furthermore, the fund's total expense ratio after waivers was equal to the peer group median.
Short Tax Free Fund. The fund's advisory fee, after waivers, was slightly lower than the peer group median (although, on a contractual basis, it was slightly higher than the peer group median advisory fee). The fund's total expense ratio after waivers was slightly lower than the peer group median.
Tax Free Fund. The fund's advisory fee was slightly higher than the peer group median on a contractual basis, and nearly the same as the peer group median on an after waivers basis. The fund had a total expense ratio after waivers that was slightly higher than the peer group median
As noted above, in most cases the funds' advisory fees and expense ratios were lower than those of the respective peer group. In those instances where fees and expenses were slightly higher, the Board noted that they were nevertheless in a range consistent with USBAM's pricing philosophy. The Board concluded that the funds' advisory fees and expense ratios are reasonable in light of the services provided.
Economies of Scale in Providing Investment Advisory Services
The Board considered the extent to which each fund's investment advisory fee reflects economies of scale for the benefit of fund shareholders. Based on information provided by USBAM, the Board noted that profitability will likely increase somewhat as assets grow over time. The Board considered that, although the funds do not have advisory fee breakpoints in place, USBAM has committed to waive advisory fees to the extent necessary to keep each fund's total expenses generally in line with the median total expenses of a peer group of funds as selected by an independent data service. The median total expense ratio of a fund's peer group will necessarily reflect the effect of any breakpoints in the advisory fee schedules of the funds in that group. Therefore, by capping a fund's total expense ratio at a level close to the median, fund shareholders will effectively receive the benefit of any breakpoints in the comparable funds' advisory fee schedules. In light of USBAM's commitment to keep total fund expenses competitive, the Board concluded that it would be reasonable and in the best interest of each fund and its shareholders to renew the Agreement.
Other Benefits to USBAM
In evaluating the benefits that accrue to USBAM through its relationship with the funds, the Board noted that USBAM and certain of its affiliates serve the funds in various capacities, including as advisor, administrator, sub-administrator, transfer agent, distributor, custodian, and securities lending agent, and receive compensation from the funds in connection with providing services to the funds. The Board considered that each service provided to the funds by USBAM or one of its affiliates is pursuant to a written agreement, which the Board evaluates periodically as required by law.
After full consideration of these and other factors, the Board concluded that approval of the Agreement was in the best interest of each fund and its shareholders.
FIRST AMERICAN FUNDS Annual Report 2005
131
NOTICE TO SHAREHOLDERS September 30, 2005 (unaudited)
Directors and Officers of the Funds
Independent Directors
Name, Address, and
Year of Birth | | Position(s)
Held
with Funds | | Term of Office
and Length of
Time Served | | Principal Occupation(s)
During Past 5 Years | | Number of Portfolios
in Fund Complex
Overseen by Director | | Other
Directorships
Held by
Director † | |
Benjamin R. Field III
P.O. Box 1329
Minneapolis, MN
55440-1329
(1938) | | Director | | Term expiring earlier of death, resignation, removal, disqualification, or successor duly elected and qualified. Director of FAIF since September 2003. | | Retired; Senior Financial Advisor, Bemis Company, Inc. from May 2002 through June 2004; Senior Vice President, Chief Financial Officer & Treasurer, Bemis, through April 2002. | | First American Funds Complex: eleven registered investment companies, including fifty-five portfolios | | None | |
|
Roger A. Gibson
P.O. Box 1329
Minneapolis, MN
55440-1329
(1946) | | Director | | Term expiring earlier of death, resignation, removal, disqualification, or successor duly elected and qualified. Director of FAIF since October 1997. | | Retired; Vice President, Cargo – United Airlines, since July 2001; Vice President, North America – Mountain Region, United Airlines, prior to July 2001. | | First American Funds Complex: eleven registered investment companies, including fifty-five portfolios | | None | |
|
Victoria J. Herget
P.O. Box 1329
Minneapolis, MN
55440-1329
(1951) | | Director | | Term expiring earlier of death, resignation, removal, disqualification, or successor duly elected and qualified. Director of FAIF since September 2003. | | Investment consultant and non-profit board member since 2001; Managing Director of Zurich Scudder Investments through 2001. | | First American Funds Complex: eleven registered investment companies, including fifty-five portfolios | | None | |
|
Leonard W. Kedrowski
P.O. Box 1329
Minneapolis, MN
55440-1329
(1941) | | Director | | Term expiring earlier of death, resignation, removal, disqualification, or successor duly elected and qualified. Director of FAIF since November 1993. | | Owner and President, Executive and Management Consulting, Inc., a management consulting firm; Board member, GC McGuiggan Corporation (dba Smyth Companies), a label printer; former Chief Executive Officer, Creative Promotions International, LLC, a promotional award programs and products company, through October 2003; Advisory Board member, Designer Doors, manufacturer of designer doors, through 2002. | | First American Funds Complex: eleven registered investment companies, including fifty-five portfolios | | None | |
|
Richard K. Riederer
P.O. Box 1329
Minneapolis, MN
55440-1329
(1944) | | Director | | Term expiring earlier of death, resignation, removal, disqualification, or successor duly elected and qualified. Director of FAIF since August 2001. | | Retired; Director, President and Chief Executive Officer, Weirton Steel, through 2001. | | First American Funds Complex: eleven registered investment companies, including fifty-five portfolios | | Cleveland Cliffs Inc (a producer of iron ore pellets) | |
|
Joseph D. Strauss
P.O. Box 1329
Minneapolis, MN
55440-1329
(1940) | | Director | | Term expiring earlier of death, resignation, removal, disqualification, or successor duly elected and qualified. Director of FAIF since April 1991. | | Attorney At Law, Owner and President, Strauss Management Company, a Minnesota holding company for various organizational management business ventures; Owner, Chairman and Chief Executive Officer, Community Resource Partnerships, Inc., a strategic planning, operations management, government relations, transportation planning and public relations organization; Owner, Chairman and Chief Executive Officer, Excensus(TM) LLC, a strategic demographic planning and application development firm, since 2001. | | First American Funds Complex: eleven registered investment companies, including fifty-five portfolios | | None | |
|
FIRST AMERICAN FUNDS Annual Report 2005
132
Independent Directors - continued
Name, Address, and
Year of Birth | | Position(s)
Held
with Funds | | Term of Office
and Length of
Time Served | | Principal Occupation(s)
During Past 5 Years | | Number of Portfolios
in Fund Complex
Overseen by Director | | Other
Directorships
Held by
Director † | |
Virginia L. Stringer
P.O. Box 1329
Minneapolis, MN
55440-1329
(1944) | | Chair; Director | | Chair Term three years. Directors Term expiring earlier of death, resignation, removal, disqualification, or successor duly elected and qualified. Chair of FAIF's Board since September 1997; Director of FAIF since August 1987. | | Owner and President, Strategic Management Resources, Inc., a management consulting firm; Executive Consultant to State Farm Insurance Company through 2003. | | First American Funds Complex: eleven registered investment companies, including fifty-five portfolios | | None | |
|
James M. Wade
P.O. Box 1329
Minneapolis, MN
55440-1329
(1943) | | Director | | Term expiring earlier of death, resignation, removal, disqualification, or successor duly elected and qualified. Director of FAIF since August 2001. | | Owner and President, Jim Wade Homes, a homebuilding company, since 1999. | | First American Funds Complex: eleven registered investment companies, including fifty-five portfolios | | None | |
|
† Includes only directorships in a company with a class of securities registered pursuant to Section 12 of the Securities Exchange Act or subject to the requirements of Section 15(d) of the Securities Exchange Act, or any company registered as an investment company under the Investment Company Act.
The Statement of Additional Information (SAI) includes additional information about fund directors and is available upon request without charge by calling 800-677-FUND or writing to First American Funds, P.O. Box 1330, Minneapolis, Minnesota, 55440-1330.
FIRST AMERICAN FUNDS Annual Report 2005
133
NOTICE TO SHAREHOLDERS September 30, 2005 (unaudited)
Officers
Name, Address, and
Year of Birth | | Position(s)
Held
with Funds | | Term of Office
and Length of
Time Served | | Principal Occupation(s) During Past 5 Years | |
Thomas S. Schreier, Jr.
U.S. Bancorp Asset
Management, Inc.
800 Nicollet Mall
Minneapolis, MN 55402
(1962)* | | President | | Re-elected by the Board annually; President of FAIF since February 2001. | | Chief Executive Officer of U.S. Bancorp Asset Management, Inc., since May 2001; prior thereto, Chief Executive Officer of First American Asset Management from December 2000 to May 2001 and of Firstar Investment & Research Management Company ("FIRMCO") from February 2001 to May 2001; prior thereto Senior Managing Director and Head of Equity Research of U.S. Bancorp Piper Jaffray. | |
|
Mark S. Jordahl
U.S. Bancorp Asset
Management, Inc.
800 Nicollet Mall
Minneapolis, MN 55402
(1960)* | | Vice President –
Investments | | Re-elected by the Board annually; Vice President – Investments of FAIF since September 2001. | | Chief Investment Officer of U.S. Bancorp Asset Management, Inc., since September 2001; President and Chief Investment Officer, ING Investment Management – Americas, September 2000 to June 2001; Senior Vice President and Chief Investment Officer, ReliaStar Financial Corp., January 1998 to September 2000. | |
|
Jeffery M. Wilson
U.S. Bancorp Asset
Management, Inc.
800 Nicollet Mall
Minneapolis, MN 55402
(1956)* | | Vice
President –
Administration | | Re-elected by the Board annually; Vice President – Administration of FAIF since March 2000. | | Senior Vice President of U.S. Bancorp Asset Management, Inc., since May 2001; prior thereto, Senior Vice President of First American Asset Management. | |
|
Charles D Gariboldi Jr.
U.S. Bancorp Asset
Management, Inc.
800 Nicollet Mall
Minneapolis, MN 55402
(1959)* | | Treasurer | | Re-elected by the Board annually; Treasurer of FAIF since October 2004. | | Mutual Fund Treasurer, U.S. Bancorp Asset Management, Inc., since October 2004; prior thereto Vice President of investment accounting and Fund Treasurer for Thrivent Financial for Lutherans. | |
|
Jill M. Stevenson
U.S. Bancorp Asset
Management, Inc.
800 Nicollet Mall
Minneapolis, MN 55402
(1965)* | | Assistant Treasurer | | Re-elected by the Board annually; Assistant Treasurer of FAIF since September 2005. | | Assistant Treasurer, U.S. Bancorp Asset Management, Inc., since September 2005; prior thereto, Director, Senior Project Manager, U.S. Bancorp Asset Management, Inc., from May 2003. Prior to that, Vice President, Director of Operations, Paladin Investment Associates, LLC. | |
|
David H. Lui
U.S. Bancorp Asset
Management, Inc.
800 Nicollet Mall
Minneapolis, MN 55402
(1960)* | | Chief Compliance Officer | | Re-elected by the Board annually; Chief Compliance Officer of FAIF since February 2005. | | Chief Compliance Officer for First American Funds and U.S. Bancorp Asset Management, Inc., since February 2005. Prior thereto, Chief Compliance Officer, Franklin Advisors, Inc. and Chief Compliance Counsel, Franklin Templeton Investments from March 2004. Prior to that Vice President Charles Schwab & Co,. Inc. | |
|
Kathleen L. Prudhomme
U.S. Bancorp Asset
Management, Inc.
800 Nicollet Mall
Minneapolis, MN 55402
(1953)* | | Secretary | | Re-elected by the Board annually; Secretary of FAIF since December 2004; prior thereto, Assistant Secretary of FAIF since September 1998. | | Deputy General Counsel, U.S. Bancorp Asset Management, Inc., since November 2004; prior thereto, Partner, Dorsey & Whitney LLP, a Minneapolis-based law firm. | |
|
James D. Alt
50 South Sixth Street, Suite 1500
Minneapolis, MN 55402
(1951) | | Assistant Secretary | | Re-elected by the Board annually; Assistant Secretary of FAIF since December 2004; prior thereto, Secretary of FAIF since June 2002; Assistant Secretary of FAIF from September 1998 through June 2002. | | Partner, Dorsey & Whitney LLP, a Minneapolis-based law firm. | |
|
Brett L. Agnew
U.S. Bancorp Asset
Management, Inc.
800 Nicollet Mall
Minneapolis, MN 55402
(1971)* | | Assistant Secretary | | Re-elected by the Board annually; Assistant Secretary of FAIF since December 2004. | | Attorney for U.S. Bancorp Asset Management, Inc., since August 2004; 2001-2004, Senior Counsel, Thrivent Financial for Lutherans; prior thereto, Consultant, Principal Financial Group. | |
|
FIRST AMERICAN FUNDS Annual Report 2005
134
Officers - continued
Name, Address, and
Year of Birth | | Position(s)
Held
with Funds | | Term of Office
and Length of
Time Served | | Principal Occupation(s) During Past 5 Years | |
James R. Arnold
615 E. Michigan Street
Milwaukee, WI 53202
(1957)* | | Assistant Secretary | | Re-elected by the Board annually; Assistant Secretary of FAIF since June 2003. | | Vice President, U.S. Bancorp Fund Services, LLC since March 2002; prior thereto, Senior Administration Services Manager, UMB Fund Services, Inc. | |
|
Douglas G. Hess
615 E. Michigan Street
Milwaukee, WI 53202
(1967)* | | Assistant Secretary | | Re-elected by the Board annually; Assistant Secretary of FAIF since September 2001. | | Vice President, U.S. Bancorp Fund Services, LLC. | |
|
* Messrs. Schreier, Jordahl, Wilson, Gariboldi, Lui and Agnew, Ms. Stevenson and Ms. Prudhomme are each officers and/or employees of U.S. Bancorp Asset Management, Inc. which serves as investment adviser and administrator for FAIF. Messrs. Hess and Arnold are officers of U.S. Bancorp Fund Services, LLC, which is a subsidiary of U.S. Bancorp and which serves as Transfer Agent for FAIF.
FIRST AMERICAN FUNDS Annual Report 2005
135
(This page has been left blank intentionally.)
Board of Directors First American Investment Funds, Inc.
Virginia Stringer
Chairperson of First American Investment Funds, Inc.
Owner and President of Strategic Management Resources, Inc.
Benjamin Field III
Director of First American Investment Funds, Inc.
Retired; former Senior Vice President, Chief Financial Officer,
and Treasurer of Bemis Company, Inc.
Roger Gibson
Director of First American Investment Funds, Inc.
Retired; former Vice President of Cargo-United Airlines
Victoria Herget
Director of First American Investment Funds, Inc.
Investment Consultant; former Managing Director of Zurich Scudder Investments
Leonard Kedrowski
Director of First American Investment Funds, Inc.
Owner and President of Executive and Management Consulting, Inc.
Richard Riederer
Director of First American Investment Funds, Inc.
Retired; former President and Chief Executive Officer of Weirton Steel
Joseph Strauss
Director of First American Investment Funds, Inc.
Owner and President of Strauss Management Company
James Wade
Director of First American Investment Funds, Inc.
Owner and President of Jim Wade Homes
First American Investment Funds’ Board of Directors is comprised entirely of independent directors.
Direct fund correspondence to:
First American Funds
P.O. Box 1330
Minneapolis, MN 55440-1330
This report and the financial statements contained herein are not intended to be a forecast of future events, a guarantee of future results, or investment advice. Further, there is no assurance that certain securities will remain in or out of each fund’s portfolio. The views expressed in this report reflect those of the portfolio managers only through the period ended September 30, 2005. The portfolio managers’ views are subject to change at any time based upon market or other conditions.
This report is for the information of shareholders of the First American Investment Funds, Inc. It may also be used as sales literature when preceded or accompanied by a current prospectus, which contains information concerning investment objectives, risks, and charges and expenses of the Funds. Read the prospectus carefully before investing.
The figures in this report represent past performance and do not guarantee future results. The principal value of an investment and investment return will fluctuate so that an investor’s shares, when redeemed, may be worth more or less than their original cost.
INVESTMENT ADVISOR
U.S. Bancorp Asset Management, Inc.
800 Nicollet Mall
Minneapolis, Minnesota 55402
ADMINISTRATOR
U.S. Bancorp Asset Management, Inc.
800 Nicollet Mall
Minneapolis, Minnesota 55402
TRANSFER AGENT
U.S. Bancorp Fund Services, LLC
615 East Michigan Street
Milwaukee, Wisconsin 53202
CUSTODIAN
U.S. Bank National Association
180 East Fifth Street
St. Paul, Minnesota 55101
DISTRIBUTOR
Quasar Distributors, LLC
615 East Michigan Street
Milwaukee, Wisconsin 53202
INDEPENDENT REGISTERED PUBLIC ACCOUNTING FIRM
Ernst & Young LLP
220 South Sixth Street
Suite 1400
Minneapolis, Minnesota 55402
COUNSEL
Dorsey & Whitney LLP
50 South Sixth Street
Suite 1500
Minneapolis, Minnesota 55402
First American Funds
P.O. Box 1330
Minneapolis, MN 55440-1330
In an attempt to reduce shareholder costs and help eliminate duplication, First American Funds will try to limit their mailing to one report for each address that lists one or more shareholders with the same last name. If you would like additional copies, please call First American Investor Services at 800.677.FUND or visit firstamericanfunds.com.
0287-04 11/2005 AR-TAXFREEINCOME

| 2005
Annual Report |

First American Stock Funds
Stocks are shares of ownership that a company sells in order to raise money to run its business. As an owner or shareholder, you take part in the company’s achievements and failures.
Stocks and stock funds offer you a number of options. Some are defined by the size of the companies they invest in, some by the style of the company, and others by where they invest – by geographic location or by industry. Because the various types of stocks outperform and underperform at different times, dividing your money among several types may help smooth out your portfolio’s returns.

TABLE OF CONTENTS
Message to Shareholders | 1 |
| |
Report of Independent Registered Public | |
Accounting Firm | 41 |
| |
Real Estate Securities Fund | |
Schedule of Investments | 42 |
Statement of Assets and Liabilities | 43 |
Statement of Operations | 44 |
Statement of Changes in Net Assets | 45 |
Financial Highlights | 46 |
International Fund | |
Schedule of Investments | 48 |
Statement of Assets and Liabilities | 50 |
Statement of Operations | 51 |
Statement of Changes in Net Assets | 52 |
Financial Highlights | 54 |
Small Cap Funds | |
Schedule of Investments | 56 |
Statements of Assets and Liabilities | 62 |
Statements of Operations | 63 |
Statements of Changes in Net Assets | 64 |
Financial Highlights | 66 |
Mid Cap Funds | |
Schedule of Investments | 72 |
Statements of Assets and Liabilities | 74 |
Statements of Operations | 75 |
Statements of Changes in Net Assets | 76 |
Financial Highlights | 78 |
Large Cap Funds | |
Schedule of Investments | 82 |
Statements of Assets and Liabilities | 85 |
Statements of Operations | 86 |
Statements of Changes in Net Assets | 88 |
Financial Highlights | 90 |
Growth & Income Funds | |
Schedule of Investments | 94 |
Statements of Assets and Liabilities | 102 |
Statements of Operations | 103 |
Statements of Changes in Net Assets | 104 |
Financial Highlights | 106 |
| |
Notes to Financial Statements | 110 |
| |
Notice to Shareholders | 126 |
| Mutual fund investing involves risk; principal loss is possible. |
| |
| NOT FDIC INSURED NO BANK GUARANTEE MAY LOSE VALUE |
FIRST AMERICAN INVESTMENT FUNDS, INC.
PROSPECTUS SUPPLEMENT DATED JULY 25, 2005
This supplement updates the following Prospectuses dated January 31, 2005, as previously supplemented May 23, July 1, and July 20, 2005:
First American Stock Funds Class A, Class B and Class C Shares Prospectus
First American Stock Funds Class R Shares Prospectus
First American Stock Funds Class Y Shares Prospectus
For each share class, this supplement, the supplements dated May 23, July 1, and July 20, 2005, and the applicable Prospectus dated January 31, 2005 together constitute a current Prospectus. To request a copy of a Prospectus, please call 800-677-FUND.
Information regarding the portfolio managers primarily responsible for the management of Small Cap Value Fund, which is set forth in each Prospectus under the heading "Additional Information - Management - Portfolio Management," is replaced by the following:
The portfolio managers primarily responsible for the management of Small Cap Value Fund are:
Chad M. Kilmer, Senior Equity Portfolio Manager. Mr. Kilmer has served as the primary portfolio manager for the fund since July 2005. Prior to joining U.S. Bancorp Asset Management in 2004, Mr. Kilmer served as a small-cap investment analyst at Gabelli Woodland Partners, a subsidiary of Gabelli Asset Management. Mr. Kilmer has seven years of financial industry experience.
Karen L. Bowie, CFA, Equity Portfolio Manager. Ms. Bowie has co-managed the fund since July 2005. Ms. Bowie has more than 22 years of financial industry experience, 12 of which have been with U.S. Bancorp Asset Management in portfolio management, equity research, and fund management.
IF YOU HAVE ANY QUESTIONS REGARDING THIS PROSPECTUS SUPPLEMENT, PLEASE CONTACT YOUR INVESTMENT PROFESSIONAL, OR YOU MAY CALL FIRST AMERICAN FUNDS INVESTOR SERVICES AT 800-677-FUND.
This is not part of the annual report.
FIRST AMERICAN INVESTMENT FUNDS, INC.
PROSPECTUS SUPPLEMENT DATED SEPTEMBER 8, 2005
This supplement updates the following Prospectuses dated January 31, 2005, as previously supplemented May 23, July 1, July 20 and July 25, 2005:
First American Stock Funds Class A, Class B and Class C Shares Prospectus
First American Stock Funds Class R Shares Prospectus
First American Stock Funds Class Y Shares Prospectus
For each share class, this supplement, the supplements dated May 23, July 1, July 20 and July 25, 2005, and the applicable Prospectus dated January 31, 2005 together constitute a current Prospectus. To request a copy of a Prospectus, please call 800-677-FUND.
Information regarding the portfolio managers primarily responsible for the management of Mid Cap Growth Opportunities Fund, which is set forth in each Prospectus under the heading "Additional Information - Management - Portfolio Management," is replaced by the following:
The portfolio managers primarily responsible for the management of Mid Cap Growth Opportunities Fund are:
Thomas A. Gunderson, CFA, Senior Equity Portfolio Manager. Mr. Gunderson has served as the primary portfolio manager for the fund since September 2005. He also is the primary portfolio manager for Large Cap Growth Opportunities Fund, a position he has held since December 2003. Prior to joining U.S. Bancorp Asset Management in 2003, Mr. Gunderson managed large cap growth portfolios at Advantus Capital Management. Mr. Gunderson has been a portfolio manager for 17 years and has 22 years of financial industry experience.
Hal Goldstein, Senior Equity Portfolio Manager. Mr. Goldstein has co-managed the fund since September 2005. He also is a co-manager for Large Cap Growth Opportunities Fund, a position he has held since July 2002. Prior to joining U.S. Bancorp Asset Management in 2002, Mr. Goldstein was employed at Lutheran Brotherhood as a portfolio manager, at Shearson Lehman Brothers as manager of institutional equities in Chicago, and at Oppenheimer as an institutional sales person. Mr. Goldstein has 24 years of financial industry experience, including 10 years in portfolio management.
IF YOU HAVE ANY QUESTIONS REGARDING THIS PROSPECTUS SUPPLEMENT, PLEASE CONTACT YOUR INVESTMENT PROFESSIONAL, OR YOU MAY CALL FIRST AMERICAN FUNDS INVESTOR SERVICES AT 800-677-FUND.
This is not part of the annual report.
Message to SHAREHOLDERS November 14, 2005
Dear Shareholders:
We invite you to take a few minutes to review the results of the fiscal year ended September 30, 2005.
This report includes comparative performance graphs and tables, portfolio commentaries, complete listings of portfolio holdings, and additional fund information. We hope you will find this helpful in monitoring your investment portfolio.
Also, through our website, firstamericanfunds.com, we provide quarterly performance fact sheets on all First American Funds, the economic outlook as viewed by our senior investment officers, and other information about fund investments and portfolio strategies.
Please contact your financial professional if you have questions about First American Funds or contact First American Investor Services at 800.677.FUND.
We appreciate your investment with First American Funds and look forward to serving your financial needs in the future.
Sincerely,
/s/ Virginia L. Stringer | | /s/ Thomas S. Schreier, Jr. | |
| |
Virginia L. Stringer | Thomas S. Schreier, Jr. |
Chairperson of the Board | President |
First American Investment Funds, Inc. | First American Investment Funds, Inc. |
FIRST AMERICAN FUNDS Annual Report 2005
1
Real Estate Securities fund
Investment Objective: to provide above-average current income and long-term capital appreciation
How did the fund perform for the fiscal year ended September 30, 2005?
The First American Real Estate Securities Fund (the "fund"), Class Y shares, returned 29.25% for the fiscal year ended September 30, 2005 (Class A shares returned 28.99% without taking the sales charge into account). By comparison, the fund's benchmark, the Morgan Stanley Capital International U.S. Real Estate Investment Trust Index* ("MSCI U.S. REIT Index*"), returned 27.10% for the same period.
What were the general economic and market conditions during the fiscal year?
Economic growth moderated but nevertheless continued at a solid pace over the course of the fiscal year. Solid economic growth, in turn, improved labor market conditions. While core inflation remained basically stable at a relatively low level, overall inflation rose with the continuing climb of energy prices during the past year. The combination of solid growth, lower unemployment, and the potential for higher energy prices to be reflected by broader inflation measures has kept the Fed incrementally raising the Fed Funds Rate at each Federal Open Market Committee meeting since June 2004.
The corporate sector of the economy has performed very well in this economic environment, with operating earnings up sharply through the third quarter of 2005. Underlying economic conditions remain generally favorable for the financial markets, although risks have risen with energy prices and the widespread disruption to activity from Hurricanes Katrina and Rita.
During the fiscal year, sustained employment growth improved the outlook for most commercial property types.
Occupancy levels rose, which should lead to rent growth and improved earnings outlook for the real estate investment trust (REIT) sector.
What worked for the fund and why?
The fund benefited from strong individual stock selection. The portfolio had a definite bias toward growth and quality, and continued to adhere to a bottom-up approach (with focus on individual stocks rather than economic or market cycles) to temper volatility in the REIT market. An emphasis on coastal markets, which experienced better job growth and better supply and demand dynamics, proved beneficial. The fund's best-performing sectors were office, healthcare (due to an underweight), specialty, and diversified.
What did not work for the fund and why?
In what was another year of strong performance for the REIT sector, even an average cash position of 2% was detrimental to the fund's performance. A hotel stock, Great Wolf Resorts, had significant negative performance on weak second-quarter results and forward guidance.
What strategic moves were made by the fund and why?
The fund's emphasis on coastal markets was a successful strategy. The fund was overweight in the hotel sector and industrial sector, given increased employment, sustained GDP growth, and favorable supply/demand characteristics. The fund was underweight in the healthcare sector due to its more bond-like characteristics and the potential for rising interest rates.
*Unlike mutual funds, index returns do not reflect any expenses, transaction costs, or cash flow effects.
| Top 10 Holdings as of September 30, 20051 (% of net assets) | |
| Prologis | | | 6.6 | % | |
| Simon Property Group | | | 5.8 | % | |
| Avalonbay Communities | | | 4.5 | % | |
| Brookfield Properties | | | 4.1 | % | |
| Camden Property Trust | | | 3.9 | % | |
| Boston Properties | | | 3.5 | % | |
| Archstone-Smith Trust | | | 3.4 | % | |
| General Growth Properties | | | 3.1 | % | |
| Developers Diversified Realty | | | 2.8 | % | |
| Equity Residential | | | 2.6 | % | |
| Sector Allocation as of September 30, 20051 (% of net assets) | |
| Office | | | 20.0 | % | |
| Apartments | | | 16.7 | % | |
| Malls | | | 12.3 | % | |
| Hotels | | | 12.2 | % | |
| Industrials | | | 11.7 | % | |
| Community Centers | | | 11.5 | % | |
| Diversified | | | 6.4 | % | |
| Health Care | | | 3.1 | % | |
| Self-Storage | | | 2.6 | % | |
| Specialty | | | 2.6 | % | |
| Short-Term Investments | | | 1.7 | % | |
| Other Assets and Liabilities, Net | | | (0.8 | )% | |
| | | | 100.0 | % | |
1Fund holdings and sector allocations are subject to change at any time and are not recommendations to buy or sell any security.
FIRST AMERICAN FUNDS Annual Report 2005
2
Real Estate Securities fund continued
| Annual Performance1 as of September 30, 2005 | |
| | | | | | | | | Since Inception | |
| | | 1 year | | 5 years | | 10 years | | 2/1/2000 | | 9/24/2001 | |
| Average annual return with sales charge (POP) | | | | | | | | | | | | | | | | | | | | | |
| Class A | | | 21.91 | % | | | 18.07 | % | | | 14.50 | % | | | - | | | | - | | |
| Class B | | | 22.98 | % | | | 18.33 | % | | | 14.27 | % | | | - | | | | - | | |
| Class C | | | 27.00 | % | | | 18.53 | % | | | - | | | | 20.96 | % | | | - | | |
| Average annual return without sales charge (NAV) | | | | | | | | | | | | | | | | | | | | | |
| Class A | | | 28.99 | % | | | 19.42 | % | | | 15.15 | % | | | - | | | | - | | |
| Class B | | | 27.98 | % | | | 18.53 | % | | | 14.27 | % | | | - | | | | - | | |
| Class C | | | 28.00 | % | | | 18.53 | % | | | - | | | | 20.96 | % | | | - | | |
| Class R | | | 28.60 | % | | | - | | | | - | | | | - | | | | 23.48 | % | |
| Class Y | | | 29.25 | % | | | 19.73 | % | | | 15.45 | % | | | - | | | | - | | |
| MSCI U.S. REIT Index2 | | | 27.10 | % | | | 19.19 | % | | | 14.64 | % | | | 20.72 | % | | | 22.73 | % | |
Value of a $10,000 Investment1,3 as of September 30, 2005
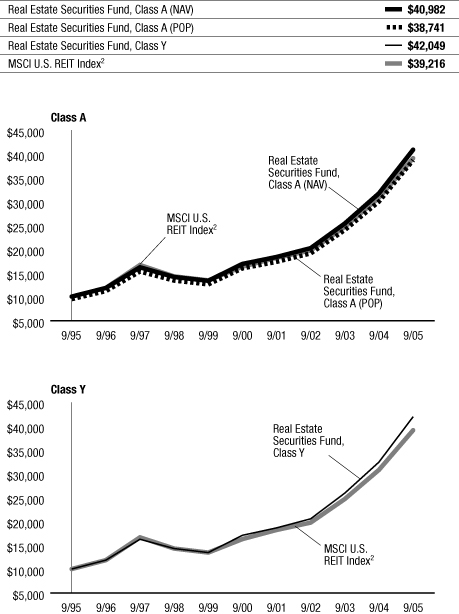
The performance data quoted on this page represents past performance and does not guarantee future results. The investment return and principal value of an investment will fluctuate so that an investor's shares, when redeemed, may be worth more or less than their original cost. Current performance of the fund may be lower or higher than the performance data quoted. Performance data current to the most recent month-end may be obtained by calling 800.677.FUND.
1 Performance does not reflect the deduction of taxes that a shareholder would pay on fund distributions or redemption of fund shares. Investment performance reflects fee waivers that are or were in effect. In the absence of such fee waivers, total returns would be reduced. Index performance is for illustrative purposes only and does not reflect any expenses, transaction costs, or cash flow effects. Direct investment in the index is not available.
Sector funds such as the First American Real Estate Securities Fund are more vulnerable to price fluctuation as a result of events that may affect the industry in which they focus than are funds that invest in multiple industries. Share prices of sector funds also will fluctuate with changing market conditions, as will share prices of other stock funds. Sector funds should not be treated as a core investment; rather, their role is to round out the growth portion of a well-diversified investment portfolio.
Total returns at net asset value ("NAV") reflect performance over the time period indicated without including the fund's maximum sales charge and assume reinvestment of all distributions at NAV.
Total returns at public offering price ("POP") reflect performance over the time period indicated including a maximum front-end sales charge of 5.50% for Class A shares and the maximum contingent deferred sales charge ("CDSC") for Class B and Class C shares for the relevant period. Maximum CDSC is 5.00% for Class B shares in the first year, decreasing annually to 0% in the seventh year following purchase, and 1.00% for Class C shares. Total returns assume reinvestment of all distributions at NAV.
2 An unmanaged index of the most actively traded real estate investment trusts.
3 Performance for Class B, Class C, and Class R shares is not presented. Performance for these classes will vary due to different expense structures.
The chart above illustrates the total value of an assumed $10,000 investment in the fund's Class A and Class Y shares (from 9/30/95 to 9/30/05) as compared to the MSCI U.S. REIT Index2.
FIRST AMERICAN FUNDS Annual Report 2005
3
Real Estate Securities fund continued
Expense Example
As a shareholder of the Real Estate Securities Fund (the "fund"), you incur two types of costs: (1) transaction costs, including sales charges (loads) on purchase payments; and (2) ongoing costs, including advisory fees; distribution and/or service (12b-1) fees; and other fund expenses. This example is intended to help you understand your ongoing costs (in dollars) of investing in the fund and to compare these costs with the ongoing costs of investing in other mutual funds. The example is based on an investment of $1,000 invested at the beginning of the period and held for the entire period from April 1, 2005, to September 30, 2005.
Actual Expenses
For each class, the first line of the table below provides information about actual account values and actual expenses. You may use the information in this line, together with the amount you invested, to estimate the expenses that you paid over the period. Simply divide your account value by $1,000 (for example, an $8,600 account value divided by $1,000 = 8.6), then multiply the result by the number in the first line under the heading entitled "Expenses Paid During Period" to estimate the expenses you paid on your account during this period.
Hypothetical Example for Comparison Purposes
For each class, the second line of the table below provides information about hypothetical account values and hypothetical expenses based on the fund's actual expense ratio and an assumed rate of return of 5% per year before expenses, which is not the fund's actual return. The hypothetical account values and expenses may not be used to estimate the actual ending account balance or expenses you paid for the period. You may use this information to compare the ongoing costs of investing in the fund and other funds. To do so, compare this 5% hypothetical example with the 5% hypothetical examples that appear in the shareholder reports of the other funds.
Please note that the expenses shown in the table are meant to highlight your ongoing costs only and do not reflect any transactional costs, such as sales charges (loads). Therefore, the second line of the table for each class is useful in comparing ongoing costs only, and will not help you determine the relative total costs of owning different funds. In addition, if these transactional costs were included, your costs would have been higher.
Expense Examples
| | | Beginning Account
Value (4/01/05) | | Ending Account
Value (9/30/05) | | Expenses Paid During
Period1 (4/01/05 to
9/30/05) | |
| Class A Actual2,3 | | $ | 1,000.00 | | | $ | 1,177.70 | | | $ | 6.76 | | |
| Class A Hypothetical (5% return before expenses)3 | | $ | 1,000.00 | | | $ | 1,018.86 | | | $ | 6.27 | | |
| Class B Actual2,3 | | $ | 1,000.00 | | | $ | 1,172.90 | | | $ | 10.82 | | |
| Class B Hypothetical (5% return before expenses)3 | | $ | 1,000.00 | | | $ | 1,015.11 | | | $ | 10.04 | | |
| Class C Actual2,3 | | $ | 1,000.00 | | | $ | 1,172.80 | | | $ | 10.82 | | |
| Class C Hypothetical (5% return before expenses)3 | | $ | 1,000.00 | | | $ | 1,015.10 | | | $ | 10.04 | | |
| Class R Actual2,3 | | $ | 1,000.00 | | | $ | 1,176.00 | | | $ | 8.13 | | |
| Class R Hypothetical (5% return before expenses)3 | | $ | 1,000.00 | | | $ | 1,017.59 | | | $ | 7.54 | | |
| Class Y Actual2,3 | | $ | 1,000.00 | | | $ | 1,178.70 | | | $ | 5.39 | | |
| Class Y Hypothetical (5% return before expenses)3 | | $ | 1,000.00 | | | $ | 1,020.12 | | | $ | 5.00 | | |
1Expenses are equal to the fund's annualized expense ratio for the most recent six-month period of 1.24%, 1.99%, 1.99%, 1.49% and 0.99% for Class A, Class B, Class C, Class R and Class Y, respectively, multiplied by the average account value over the period, multiplied by the number of days in the most recent fiscal half-year/365 (to reflect the one-half year period).
2Based on the actual returns for the six months ended September 30, 2005: 17.77% for Class A, 17.29% for Class B, 17.28% for Class C, 17.60% for Class R and 17.87% for Class Y.
3Prior to July 1, 2005, the contractual limitation on annual expenses was 1.23%, 1.98%, 1.98%, 1.48% and 0.98% for Class A, Class B, Class C, Class R and Class Y, respectively. Effective July 1, 2005, the contractual limitation on annual expenses for each class was removed. If this limitation had not been in place during the entire period, actual and hypothetical ending account balances would have been approximately $1,177.58 and $1,018.75 for Class A, $1,172.77 and $1,014.99 for Class B, $1,172.67 and $1,014.99 for Class C, $1,175.87 and $1,017.48 for Class R, and $1,178.57 and $1,020.00 for Class Y and actual and hypothetical expenses paid during the period would have been approximately $6.88 and $6.38 for Class A, $10.95 and $10.15 for Class B, $10.95 and $10.16 for Class C, $8.26 and $7.66 for Class R and $5.52 and $5.12 for Class Y.
FIRST AMERICAN FUNDS Annual Report 2005
4
International fund
Investment Objective: long-term growth of capital
How did the fund perform for the fiscal year ended September 30, 2005?
The First American International Fund (the "fund"), Class Y shares, returned 21.12% for the fiscal year ended September 30, 2005 (Class A shares returned 20.80% without taking the sales charge into account). By comparison, the fund's benchmark, the Morgan Stanley Capital International Europe and Australasia, Far East Equity Index* ("MSCI EAFE Index*"), returned 26.32% for the same period.
What were the general economic and market conditions during the fiscal year?
For the year ending September 30, 2005, equity markets posted extremely attractive returns. International stocks continued to outpace the United States. This strong return reflects both attractive earnings numbers and continued productivity gains. Global growth, driven in large part by Asia, also had a positive effect on performance.
What worked for the fund and why?
Stock selection has been the primary source of performance. The portfolio benefited from holdings in emerging markets, Japan, and the Pacific-Rim. From a sector perspective, energy, telecommunications, and information technology added the most value.
Within the energy sector our two largest positions, Total (French oil company) and ENI (Italian oil and gas producer), contributed positively to performance. Both companies reaped benefits from higher oil prices and remain attractively valued.
Opportunistic exposure to emerging markets proved advantageous, with emerging equities outpacing the developed markets. In particular, our position in CVRD, the Brazilian iron ore producer, proved beneficial, with continued demand for iron ore leading to a very strong pricing environment.
What did not work for the fund and why?
While the portfolio achieved a very attractive absolute return, the fund did lag the benchmark. In a market that, during the period, was dominated by small-cap and value stocks, the portfolio's slight bias toward large capitalization, quality, and growth style was the main cause of underperformance.
At a regional level, stock selection in the United Kingdom was difficult. U.K. consumer stocks – for example, William Morrison (food retailer) and Kingfisher (home improvement retailer) – were affected by negative U.K. consumer sentiment in the wake of rising interest rates. Both companies, however, remain attractively valued. At the sector level, industrials, consumer discretionary, and healthcare held back performance.
What strategic moves were made by the fund and why?
The fund was positioned to focus on larger-capitalization companies growing at a faster pace than their peers yet more attractively priced. In keeping with this general orientation, we reduced a number of holdings in the portfolio. The valuation of small-cap stocks currently looks stretched in relation to their large-cap peers, so a future correction of that valuation is likely to add luster to large-caps.
*Unlike mutual funds, index returns do not reflect any expenses, transaction costs, or cash flow effects.
| Top 10 Holdings as of September 30, 20051 (% of net assets) | |
| Total | | | 4.6 | % | |
| Eni | | | 3.6 | % | |
| Vodafone | | | 3.0 | % | |
| HSBC | | | 2.7 | % | |
| GlaxoSmithKline | | | 2.6 | % | |
| Mitsubishi Tokyo Financial Group | | | 2.4 | % | |
| UBS | | | 2.1 | % | |
| Roche | | | 1.9 | % | |
| Novartis | | | 1.9 | % | |
| Royal Bank of Scotland | | | 1.9 | % | |
| Country Allocation as of September 30, 20051 (% of net assets) | |
| Great Britain | | | 27.0 | % | |
| Japan | | | 20.7 | % | |
| Switzerland | | | 10.9 | % | |
| France | | | 10.6 | % | |
| Germany | | | 5.8 | % | |
| Italy | | | 5.1 | % | |
| Netherlands | | | 4.4 | % | |
| Spain | | | 2.9 | % | |
| Belgium | | | 1.9 | % | |
| Brazil | | | 1.8 | % | |
| Finland | | | 1.4 | % | |
| Australia | | | 1.3 | % | |
| South Korea | | | 1.2 | % | |
| Sweden | | | 1.1 | % | |
| Hong Kong | | | 0.7 | % | |
| Mexico | | | 0.7 | % | |
| Ireland | | | 0.6 | % | |
| Short-Term Investments | | | 1.9 | % | |
| | | | 100.0 | % | |
1Fund holdings and sector allocations are subject to change at any time and are not recommendations to buy or sell any security.
FIRST AMERICAN FUNDS Annual Report 2005
5
International fund continued
| Annual Performance1 as of September 30, 2005 | |
| | | | | Since
Inception | |
| | | 1 year | | 5 years | | 10 years | | 9/24/2001 | |
| Average annual return with sales charge (POP) | | | | | | | | | | | | | | | | | |
| Class A | | | 14.19 | % | | | (2.46 | )% | | | 4.93 | % | | | - | | |
| Class B | | | 14.94 | % | | | (2.43 | )% | | | 4.74 | % | | | - | | |
| Class C | | | 18.88 | % | | | - | | | | - | | | | 8.90 | % | |
| Average annual return without sales charge (NAV) | | | | | | | | | | | | | | | | | |
| Class A | | | 20.80 | % | | | (1.35 | )% | | | 5.52 | % | | | - | | |
| Class B | | | 19.94 | % | | | (2.08 | )% | | | 4.74 | % | | | - | | |
| Class C | | | 19.88 | % | | | - | | | | - | | | | 8.90 | % | |
| Class R | | | 20.38 | % | | | (1.57 | )% | | | 5.40 | % | | | - | | |
| Class Y | | | 21.12 | % | | | (1.10 | )% | | | 5.81 | % | | | - | | |
| MSCI EAFE Index2 | | | 26.32 | % | | | 3.55 | % | | | 6.18 | % | | | 13.50 | % | |
Value of a $10,000 Investment1,3 as of September 30, 2005
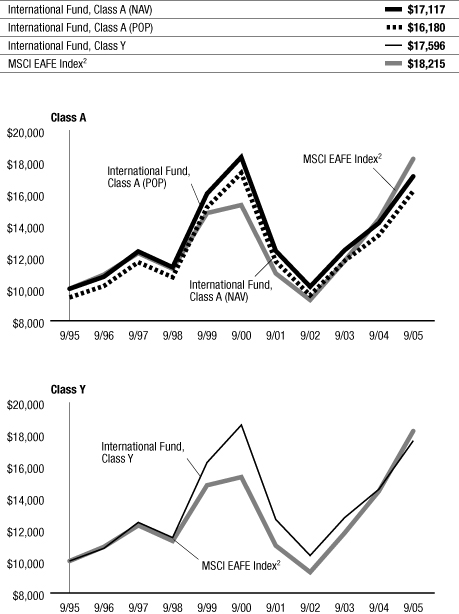
The chart above illustrates the total value of an assumed $10,000 investment in the fund's Class A and Class Y shares (from 9/30/95 to 9/30/05) as compared to the MSCI EAFE Index2.
The performance data quoted on this page represents past performance and does not guarantee future results. The investment return and principal value of an investment will fluctuate so that an investor's shares, when redeemed, may be worth more or less than their original cost. Current performance of the fund may be lower or higher than the performance data quoted. Performance data current to the most recent month-end may be obtained by calling 800.677.FUND.
1 Performance does not reflect the deduction of taxes that a shareholder would pay on fund distributions or redemption of fund shares. Investment performance reflects fee waivers that are or were in effect. In the absence of such fee waivers, total returns would be reduced. Index performance is for illustrative purposes only and does not reflect any expenses, transaction costs, or cash flow effects. Direct investment in the index is not available.
International investing involves risks not typically associated with domestic investing, including risks of adverse currency fluctuations, potential political and economic instability, different accounting standards, foreign government regulations, currency exchange rates, limited liquidity, and volatile prices.
Total returns at net asset value ("NAV") reflect performance over the time period indicated without including the fund's maximum sales charge and assume reinvestment of all distributions at NAV.
Total returns at public offering price ("POP") reflect performance over the time period indicated including a maximum front-end sales charge of 5.50% for Class A shares and the maximum contingent deferred sales charge ("CDSC") for Class B and Class C shares for the relevant period. Maximum CDSC is 5.00% for Class B shares in the first year, decreasing annually to 0% in the seventh year following purchase, and 1.00% for Class C shares. Total returns assume reinvestment of all distributions at NAV.
Effective December 8, 2004, J.P. Morgan was named the fund's subadvisor and began managing the fund's assets. On September 24, 2001, the First American International Fund merged with Firstar International Growth Fund and Firstar International Value Fund, both subadvised by Clay Finlay Inc. Performance history prior to September 24, 2001, represents that of the Firstar International Growth Fund.
2 The MSCI EAFE (Morgan Stanley Capital International, Europe, Australasia, Far East) Index is an unmanaged index including approximately 1,000 companies representing the stock markets of 21 countries in Europe, Australasia, and the Far East.
3 Performance for Class B, Class C, and Class R shares is not presented. Performance for these classes will vary due to different expense structures.
FIRST AMERICAN FUNDS Annual Report 2005
6
International fund continued
Expense Example
As a shareholder of the International Fund (the "fund"), you incur two types of costs: (1) transaction costs, including sales charges (loads) on purchase payments; and (2) ongoing costs, including advisory fees; distribution and/or service (12b-1) fees; and other fund expenses. This example is intended to help you understand your ongoing costs (in dollars) of investing in the fund and to compare these costs with the ongoing costs of investing in other mutual funds. The example is based on an investment of $1,000 invested at the beginning of the period and held for the entire period from April 1, 2005, to September 30, 2005.
Actual Expenses
For each class, the first line of the table below provides information about actual account values and actual expenses. You may use the information in this line, together with the amount you invested, to estimate the expenses that you paid over the period. Simply divide your account value by $1,000 (for example, an $8,600 account value divided by $1,000 = 8.6), then multiply the result by the number in the first line under the heading entitled "Expenses Paid During Period" to estimate the expenses you paid on your account during this period.
Hypothetical Example for Comparison Purposes
For each class, the second line of the table below provides information about hypothetical account values and hypothetical expenses based on the fund's actual expense ratio and an assumed rate of return of 5% per year before expenses, which is not the fund's actual return. The hypothetical account values and expenses may not be used to estimate the actual ending account balance or expenses you paid for the period. You may use this information to compare the ongoing costs of investing in the fund and other funds. To do so, compare this 5% hypothetical example with the 5% hypothetical examples that appear in the shareholder reports of the other funds.
Please note that the expenses shown in the table are meant to highlight your ongoing costs only and do not reflect any transactional costs, such as sales charges (loads). Therefore, the second line of the table for each class is useful in comparing ongoing costs only, and will not help you determine the relative total costs of owning different funds. In addition, if these transactional costs were included, your costs would have been higher.
Expense Examples
| | | Beginning Account
Value (4/01/05) | | Ending Account
Value (9/30/05) | | Expenses Paid During
Period1 (4/01/05 to
9/30/05) | |
| Class A Actual2,3 | | $ | 1,000.00 | | | $ | 1,081.30 | | | $ | 8.14 | | |
| Class A Hypothetical (5% return before expenses)3 | | $ | 1,000.00 | | | $ | 1,017.25 | | | $ | 7.89 | | |
| Class B Actual2,3 | | $ | 1,000.00 | | | $ | 1,077.10 | | | $ | 12.03 | | |
| Class B Hypothetical (5% return before expenses)3 | | $ | 1,000.00 | | | $ | 1,013.49 | | | $ | 11.66 | | |
| Class C Actual2,3 | | $ | 1,000.00 | | | $ | 1,076.40 | | | $ | 12.02 | | |
| Class C Hypothetical (5% return before expenses)3 | | $ | 1,000.00 | | | $ | 1,013.49 | | | $ | 11.66 | | |
| Class R Actual2,3 | | $ | 1,000.00 | | | $ | 1,078.90 | | | $ | 9.43 | | |
| Class R Hypothetical (5% return before expenses)3 | | $ | 1,000.00 | | | $ | 1,015.99 | | | $ | 9.15 | | |
| Class Y Actual2,3 | | $ | 1,000.00 | | | $ | 1,082.10 | | | $ | 6.84 | | |
| Class Y Hypothetical (5% return before expenses)3 | | $ | 1,000.00 | | | $ | 1,018.50 | | | $ | 6.63 | | |
1Expenses are equal to the fund's annualized expense ratio for the most recent six-month period of 1.56%, 2.31%, 2.31%, 1.81%, and 1.31% for Class A, Class B, Class C, Class R, and Class Y, respectively, multiplied by the average account value over the period, multiplied by the number of days in the most recent fiscal half-year/365 (to reflect the one-half year period).
2Based on the actual returns for the six months ended September 30, 2005: 8.13% for Class A, 7.71% for Class B, 7.64% for Class C, 7.89% for Class R and 8.21% for Class Y.
3Prior to July 1, 2005, the contractual limitation on annual expenses was 1.60%, 2.35%, 2.35%, 1.85% and 1.35% for Class A, Class B, Class C, Class R and Class Y, respectively. Effective July 1, 2005, the contractual limitation on annual expenses was lowered to 1.52%, 2.27%, 2.27%, 1.77%, and 1.27% for Class A, Class B, Class C, Class R, and Class Y, respectively. If this new limitation had been in place during the entire period, actual and hypothetical ending account balances would have been approximately $1,081.51 and $1,017.45 for Class A, $1,077.31 and $1,013.69 for Class B, $1,076.61 and $1,013.69 for Class C, $1,079.11 and $1,016.19 for Class R, and $1,082.31 and $1,018.70 for Class Y and actual and hypothetical expenses paid during the period would have been approximately $7.93 and $7.69 for Class A, $11.82 and $11.46 for Class B, $11.82 and $11.46 for Class C, $9.22 and $8.95 for Class R and $6.63 and $6.43 for Class Y.
FIRST AMERICAN FUNDS Annual Report 2005
7
Small Cap Growth Opportunities fund
Investment Objective: growth of capital
How did the fund perform for the fiscal year ended September 30, 2005?
The First American Small Cap Growth Opportunities Fund (the "fund"), Class Y shares, returned 24.47% for the fiscal year ended September 30, 2005 (Class A shares returned 24.21% without taking the sales charge into account). By comparison, the fund's benchmark, the Russell 2000 Growth Index*, returned 17.97% for the same period.
What were the general economic and market conditions during the fiscal year?
Economic growth moderated but nevertheless continued at a solid pace over the course of the fiscal year. Solid economic growth, in turn, improved labor market conditions. While core inflation remained basically stable at a relatively low level, overall inflation rose with the continuing climb of energy prices during the past year. The combination of solid growth, lower unemployment, and the potential for higher energy prices to be reflected by broader inflation measures has kept the Fed incrementally raising the Fed Funds Rate at each Federal Open Market Committee meeting since June 2004.
The corporate sector of the economy has performed very well in this economic environment, with operating earnings up sharply through the third quarter of 2005. Underlying economic conditions remain generally favorable for the financial markets, although risks have risen with energy prices and the widespread disruption to activity from Hurricanes Katrina and Rita.
During most of the fiscal year – except toward the end – the market generally favored small-cap companies, because of stronger-than-expected consumer spending (despite rising gas prices) and readily available financing for small-cap company growth. However, in an economic environment of growing uncertainty, like that produced by Hurricanes Katrina and Rita, smaller companies tend to look riskier to investors and potential creditors. Furthermore, while a year ago the valuations for small caps were cheap relative to their mid- and large-cap counterparts, this gap has closed somewhat because of small caps' strong performance.
What worked for the fund and why?
Technology was the largest contributor to performance, due to both stock selection and an overweight position in the sector. Favorable supply and demand characteristics fueled the performance of energy stocks in the portfolio, and unflagging consumer spending benefited the consumer discretionary sector.
The fund's best performing stock was Energy Conversion, developer of solar cells and hybrid vehicle technology. The company's stock was buoyed by the changing investor attitudes toward alternative energy solutions, which no longer appear cost-prohibitive in view of rising oil prices. In the consumer sector, upscale restaurant chains Cheesecake Factory, P.F. Chang's, and Cosi added value. We believe that demand for upscale dining is less impacted by rising energy prices as higher-income consumers view dining out as a staple, rather than luxury item. Lottery businesses also performed well, as lottery play is largely unaffected by fluctuations in disposable income.
What did not work for the fund and why?
Returns from the fund's healthcare sector lagged those of the Russell 2000 Growth benchmark, led by Xenogen, which sells products that increase the efficiency and productivity of drug discovery. Investor concerns include potential additional funding requirements and questions over the ultimate timing of profitability, despite the company's strong revenue growth and capable management team.
What strategic moves were made by the fund and why?
During the latter part of the fiscal year, we began reducing the fund's energy positions, as solid fundamentals became fully reflected in stock prices. Consumer stocks remain a focus for us, although we are levered primarily to the upper-income consumer. We remain heavily weighted in technology shares, as valuations are attractive and the companies benefit from strong secular trends. We continue to maintain small underweight positions in healthcare and financials, as valuations in those sectors seem fairly priced.
*Unlike mutual funds, index returns do not reflect any expenses, transaction costs, or cash flow effects.
| Top 10 Holdings as of September 30, 20051 (% of net assets) | |
| Compton Petroleum | | | 2.7 | % | |
| Encore Medical | | | 2.5 | % | |
| Quest Software | | | 2.4 | % | |
| East West Bancorp | | | 2.3 | % | |
| Polycom | | | 2.1 | % | |
| Scientific Games, Class A | | | 2.1 | % | |
| Navigant Consulting | | | 2.0 | % | |
| Cullen/Frost Bankers | | | 2.0 | % | |
| Semtech | | | 1.9 | % | |
| Embarcadero Technologies | | | 1.9 | % | |
| Sector Allocation as of September 30, 20051 (% of net assets) | |
| Information Technology | | | 30.3 | % | |
| Health Care | | | 19.5 | % | |
| Consumer Discretionary | | | 16.2 | % | |
| Energy | | | 11.5 | % | |
| Industrials | | | 11.3 | % | |
| Financials | | | 8.6 | % | |
| Short-Term Investments | | | 0.9 | % | |
| Other Assets and Liabilities, Net | | | 1.7 | % | |
| | | | 100.0 | % | |
1Fund holdings and sector allocations are subject to change at any time and are not recommendations to buy or sell any security.
FIRST AMERICAN FUNDS Annual Report 2005
8
Small Cap Growth Opportunities fund continued
| Annual Performance1 as of September 30, 2005 | |
| | | | | Since Inception | |
| | | 1 year | | 5 years | | 10 years | | 3/1/1999 | | 12/11/2000 | | 9/24/2001 | |
| Average annual return with sales charge (POP) | |
| Class A | | | 17.35 | % | | | 1.49 | % | | | 19.96 | % | | | - | | | | - | | | | - | | |
| Class B | | | 18.27 | % | | | 1.63 | % | | | - | | | | 21.37 | % | | | - | | | | - | | |
| Class C | | | 22.28 | % | | | - | | | | - | | | | - | | | | - | | | | 12.71 | % | |
| Average annual return without sales charge (NAV) | |
| Class A | | | 24.21 | % | | | 2.64 | % | | | 20.64 | % | | | - | | | | - | | | | - | | |
| Class B | | | 23.27 | % | | | 1.87 | % | | | - | | | | 21.37 | % | | | - | | | | - | | |
| Class C | | | 23.28 | % | | | - | | | | - | | | | - | | | | - | | | | 12.71 | % | |
| Class R | | | 24.06 | % | | | - | | | | - | | | | - | | | | 6.57 | % | | | - | | |
| Class Y | | | 24.47 | % | | | 2.89 | % | | | 20.95 | % | | | - | | | | - | | | | - | | |
| Russell 2000 Growth Index2 | | | 17.97 | % | | | (2.54 | )% | | | 4.67 | % | | | 3.81 | % | | | 0.71 | % | | | 11.74 | % | |
Value of a $10,000 Investment1,3 as of September 30, 2005
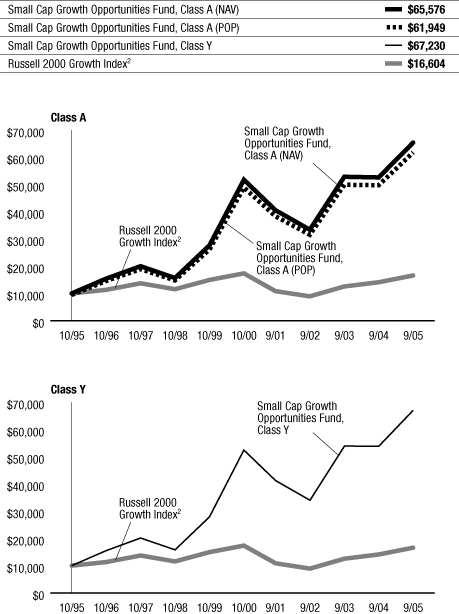
The chart above illustrates the total value of an assumed $10,000 investment in the fund's Class A and Class Y shares (from 10/31/95 to 9/30/05) as compared to the Russell 2000 Growth Index2.
The performance data quoted on this page represents past performance and does not guarantee future results. The investment return and principal value of an investment will fluctuate so that an investor's shares, when redeemed, may be worth more or less than their original cost. Current performance of the fund may be lower or higher than the performance data quoted. Performance data current to the most recent month-end may be obtained by calling 800.677.FUND.
1 Performance does not reflect the deduction of taxes that a shareholder would pay on fund distributions or redemption of fund shares. Investment performance reflects fee waivers that are or were in effect. In the absence of such fee waivers, total returns would be reduced. Index performance is for illustrative purposes only and does not reflect any expenses, transaction costs, or cash flow effects. Direct investment in the index is not available.
Stocks of small-capitalization companies involve substantial risk. These stocks historically have experienced greater price volatility than stocks of larger companies, and they may be expected to do so in the future.
Total returns at net asset value ("NAV") reflect performance over the time period indicated without including the fund's maximum sales charge and assume reinvestment of all distributions at NAV.
Total returns at public offering price ("POP") reflect performance over the time period indicated including a maximum front-end sales charge of 5.50% for Class A shares and the maximum contingent deferred sales charge ("CDSC") for Class B and Class C shares for the relevant period. Maximum CDSC is 5.00% for Class B shares in the first year, decreasing annually to 0% in the seventh year following purchase, and 1.00% for Class C shares. Total returns assume reinvestment of all distributions at NAV.
On December 12, 2002, the fund changed its main investment strategy such that it was permitted to invest in securities of companies with market capitalizations within the range of companies in the Russell 2000 Index. Previously, the fund invested primarily in companies with market capitalizations of below $500 million at the time of purchase.
On September 24, 2001, the First American Small Cap Growth Opportunities Fund became the successor by merger to the Firstar MicroCap Fund, a series of Firstar Funds, Inc. Prior to the merger, the First American fund had no assets or liabilities. Performance presented prior to September 24, 2001, represents that of the Firstar MicroCap Fund.
The First American Small Cap Growth Opportunities Fund's 1999 returns were higher due in substantial part to its strategy of investing in IPOs in a period favorable for IPO investing. Of course, such favorable returns involve accepting the risk of volatility, and there is no assurance that the fund's future investment in IPOs will have the same effect on performance as it did in 1999.
2 An unmanaged index that measures the performance of those companies in the Russell 2000 Index with higher price-to-book ratios and higher forecasted growth values. The Russell 2000 Index is an unmanaged index that measures the performance of the 2,000 smallest companies in the Russell 3000 Index. The Russell 3000 Index measures the performance of the 3,000 largest U.S. companies based on total market capitalization, which represents approximately 98% of the investable U.S. equity market.
3 Performance for Class B, Class C, and Class R shares is not presented. Performance for these classes will vary due to different expense structures.
FIRST AMERICAN FUNDS Annual Report 2005
9
Small Cap Growth Opportunities fund continued
Expense Example
As a shareholder of the Small Cap Growth Opportunities Fund (the "fund"), you incur two types of costs: (1) transaction costs, including sales charges (loads) on purchase payments; and (2) ongoing costs, including advisory fees; distribution and/or service (12b-1) fees; and other fund expenses. This example is intended to help you understand your ongoing costs (in dollars) of investing in the fund and to compare these costs with the ongoing costs of investing in other mutual funds. The example is based on an investment of $1,000 invested at the beginning of the period and held for the entire period from April 1, 2005, to September 30, 2005.
Actual Expenses
For each class, the first line of the table below provides information about actual account values and actual expenses. You may use the information in this line, together with the amount you invested, to estimate the expenses that you paid over the period. Simply divide your account value by $1,000 (for example, an $8,600 account value divided by $1,000 = 8.6), then multiply the result by the number in the first line under the heading entitled "Expenses Paid During Period" to estimate the expenses you paid on your account during this period.
Hypothetical Example for Comparison Purposes
For each class, the second line of the table below provides information about hypothetical account values and hypothetical expenses based on the fund's actual expense ratio and an assumed rate of return of 5% per year before expenses, which is not the fund's actual return. The hypothetical account values and expenses may not be used to estimate the actual ending account balance or expenses you paid for the period. You may use this information to compare the ongoing costs of investing in the fund and other funds. To do so, compare this 5% hypothetical example with the 5% hypothetical examples that appear in the shareholder reports of the other funds.
Please note that the expenses shown in the table are meant to highlight your ongoing costs only and do not reflect any transactional costs, such as sales charges (loads). Therefore, the second line of the table for each class is useful in comparing ongoing costs only, and will not help you determine the relative total costs of owning different funds. In addition, if these transactional costs were included, your costs would have been higher.
Expense Examples
| | | Beginning Account
Value (4/01/05) | | Ending Account
Value (9/30/05) | | Expenses Paid During
Period1 (4/01/05 to
9/30/05) | |
| Class A Actual2,3 | | $ | 1,000.00 | | | $ | 1,090.50 | | | $ | 8.90 | | |
| Class A Hypothetical (5% return before expenses)3 | | $ | 1,000.00 | | | $ | 1,016.55 | | | $ | 8.59 | | |
| Class B Actual2,3 | | $ | 1,000.00 | | | $ | 1,086.30 | | | $ | 12.81 | | |
| Class B Hypothetical (5% return before expenses)3 | | $ | 1,000.00 | | | $ | 1,012.79 | | | $ | 12.36 | | |
| Class C Actual2,3 | | $ | 1,000.00 | | | $ | 1,085.90 | | | $ | 12.80 | | |
| Class C Hypothetical (5% return before expenses)3 | | $ | 1,000.00 | | | $ | 1,012.79 | | | $ | 12.36 | | |
| Class R Actual2,3 | | $ | 1,000.00 | | | $ | 1,089.10 | | | $ | 10.21 | | |
| Class R Hypothetical (5% return before expenses)3 | | $ | 1,000.00 | | | $ | 1,015.30 | | | $ | 9.84 | | |
| Class Y Actual2,3 | | $ | 1,000.00 | | | $ | 1,092.00 | | | $ | 7.60 | | |
| Class Y Hypothetical (5% return before expenses)3 | | $ | 1,000.00 | | | $ | 1,017.81 | | | $ | 7.33 | | |
1Expenses are equal to the fund's expense ratio for the most recent six-month period of 1.70%, 2.45%, 2.45%, 1.95% and 1.45% for Class A, Class B, Class C, Class R and Class Y, respectively, mulitplied by the average account value over the period, multiplied by the number of days in the most recent half-year/365 days (to reflect the one-half year period).
2Based on the actual returns for the six months ended September 30, 2005: 9.05% for Class A, 8.63% for Class B, 8.59% for Class C, 8.91% for Class R and 9.20% for Class Y.
3Prior to July 1, 2005, the contractual limitation on annual expenses was 1.93%, 2.68%, 2.68%, 2.18% and 1.68% for Class A, Class B, Class C, Class R and Class Y, respectively. Effective July 1, 2005, the contractual limitation on annual expenses was lowered to 1.47%, 2.22%, 2.22%, 1.72%, and 1.22% for Class A, Class B, Class C, Class R, and Class Y, respectively. If this new limitation had been in place during the entire period, actual and hypothetical ending account balances would have been approximately $1,091.70 and $1,017.70 for Class A, $1,087.50 and $1,013.94 for Class B, $1,087.09 and $1,013.94 for Class C, $1,090.30 and $1,016.44 for Class R, and $1,093.20 and $1,01 8.95 for Class Y and actual and hypothetical expenses paid during the period would have been approximately $7.70 and $7.44 for Class A, $11.61 and $11.21 for Class B, $11.61 and $11.21 for Class C, $9.01 and $8.69 for Class R and $6.40 and $6.17 for Class Y.
FIRST AMERICAN FUNDS Annual Report 2005
10
Small Cap Select fund
Investment Objective: capital appreciation
How did the fund perform for the fiscal year ended September 30, 2005?
The First American Small Cap Select Fund (the "fund"), Class Y shares, returned 20.73% for the fiscal year ended September 30, 2005 (Class A shares returned 20.46% without taking the sales charge into account). By comparison, the fund's benchmark, the Russell 2000 Index*, returned 17.95% for the same period.
What were the general economic and market conditions during the fiscal year?
Economic growth moderated but nevertheless continued at a solid pace over the course of the fiscal year. Solid economic growth, in turn, improved labor market conditions. While core inflation remained basically stable at a relatively low level, overall inflation rose with the continuing climb of energy prices during the past year. The combination of solid growth, lower unemployment, and the potential for higher energy prices to be reflected by broader inflation measures has kept the Fed incrementally raising the Fed Funds Rate at each Federal Open Market Committee meeting since June 2004.
The corporate sector of the economy has performed very well in this economic environment, with operating earnings up sharply through the third quarter of 2005. Underlying economic conditions remain generally favorable for the financial markets, although risks have risen with energy prices and the widespread disruption to activity from Hurricanes Katrina and Rita.
During most of the fiscal year – except toward the end – the market generally favored small-cap companies because of stronger-than-expected consumer spending (despite rising gas prices) and readily available financing for small-cap company growth. However, in an economic environment of growing uncertainty, like that produced by Hurricanes Katrina and Rita, smaller companies tend to look riskier to investors and potential creditors. Furthermore, while a year ago the valuations for small caps were cheap relative to their mid- and large-cap counterparts, this gap has closed somewhat because of small caps' strong performance.
What worked for the fund and why?
Good stock selection was the driver of fund performance relative to its index for the fiscal year. Stock selection in the healthcare, technology, and industrial sectors was especially good, with each sector adding more than 100 basis points in relative performance. Stock selection was lead by Renal Care Group (a dialysis provider) in the healthcare sector, Logitech International (a hardware manufacturer) in the technology sector, and Chicago Bridge and Iron in the industrial sector. Chicago Bridge and Iron specializes in engineering and construction of refineries and saw demand for its services skyrocket in the current environment of surging energy demand.
What did not work for the fund and why?
The only sector with meaningful underperformance relative to the index was materials. Century Aluminum (an aluminum manufacturer) was the primary culprit in the sector as aluminum prices never saw the strength of some of the other commodity prices like steel. Also, the fact that the fund was underweight in steel stocks over the course of the fiscal year added to weakness in the sectors results. In the financial sector, Investors Financial Services Corp, a bank holding company, saw its shares drop after the firm provided guidance significantly below street expectations primarily due to a flattening yield curve.
What strategic moves were made by the fund and why?
Relative to the index, the fund keeps its sector weights fairly neutral, allowing stock selection to drive portfolio performance. The fund has trimmed its position in Chicago Bridge and Iron and AirTran as these stocks have hit our price targets. We sold our holdings in Investors Financial Services since we believe their operating performance will take a number of quarters to regain its momentum. Our single largest overweight of a specific stock is Sierra Health Services, Inc., a provider of health care services in the booming Las Vegas market.
*Unlike mutual funds, index returns do not reflect any expenses, transaction costs, or cash flow effects.
| Top 10 Holdings as of September 30, 20051 (% of net assets) | |
| Sierra Health Services | | | 2.7 | % | |
| SL Green Realty (REIT) | | | 2.1 | % | |
| Scientific Games, Class A | | | 2.0 | % | |
| Chicago Bridge & Iron | | | 2.0 | % | |
| Pediatrix Medical Group | | | 1.8 | % | |
| Maguire Properties (REIT) | | | 1.8 | % | |
| GATX | | | 1.7 | % | |
| First Republic Bank | | | 1.7 | % | |
| Logitech International | | | 1.6 | % | |
| W-H Energy Services | | | 1.6 | % | |
| Sector Allocation as of September 30, 20051 (% of net assets) | |
| Information Technology | | | 23.0 | % | |
| Financials | | | 18.7 | % | |
| Industrials | | | 16.2 | % | |
| Health Care | | | 15.1 | % | |
| Consumer Discretionary | | | 13.9 | % | |
| Energy | | | 8.5 | % | |
| Materials | | | 3.6 | % | |
| Short-Term Investments | | | 2.2 | % | |
| Telecommunication Services | | | 0.5 | % | |
| Other Assets and Liabilities, Net | | | (1.7 | )% | |
| | | | 100.0 | % | |
1Fund holdings and sector allocations are subject to change at any time and are not recommendations to buy or sell any security.
FIRST AMERICAN FUNDS Annual Report 2005
11
Small Cap Select fund continued
Annual Performance1 as of September 30, 2005
| | | | | Since
Inception | |
| | | 1 year | | 5 years | | 10 years | | 9/24/2001 | |
| Average annual return with sales charge (POP) | |
| Class A | | | 13.82 | % | | | 7.97 | % | | | 9.47 | % | | | - | | |
| Class B | | | 14.63 | % | | | 8.16 | % | | | 9.32 | % | | | - | | |
| Class C | | | 18.60 | % | | | - | | | | - | | | | 16.16 | % | |
| Average annual return without sales charge (NAV) | |
| Class A | | | 20.46 | % | | | 9.20 | % | | | 10.09 | % | | | - | | |
| Class B | | | 19.45 | % | | | 8.40 | % | | | 9.32 | % | | | - | | |
| Class C | | | 19.58 | % | | | - | | | | - | | | | 16.16 | % | |
| Class R | | | 20.16 | % | | | 9.19 | % | | | 10.09 | % | | | - | | |
| Class Y | | | 20.73 | % | | | 9.48 | % | | | 10.41 | % | | | - | | |
| Russell 2000 Index2 | | | 17.95 | % | | | 6.45 | % | | | 9.37 | % | | | 15.51 | % | |
Value of $10,000 Investment1,3 as of September 30, 2005
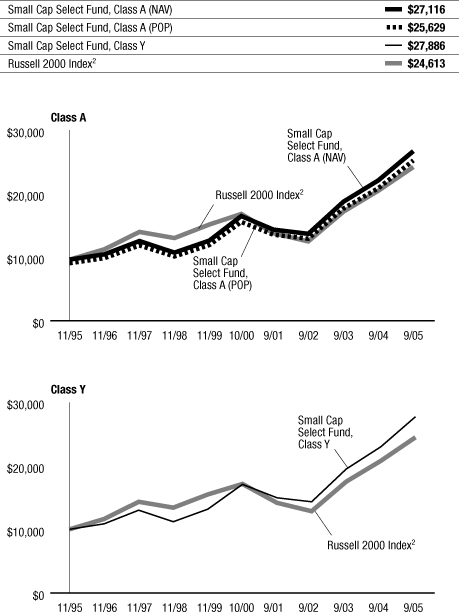
The chart above illustrates the total value of an assumed $10,000 investment in the fund's Class A and Class Y shares (from 11/30/95 to 9/30/05) as compared to the Russell 2000 Index2.
The performance data quoted on this page represents past performance and does not guarantee future results. The investment return and principal value of an investment will fluctuate so that an investor's shares, when redeemed, may be worth more or less than their original cost. Current performance of the fund may be lower or higher than the performance data quoted. Performance data current to the most recent month-end may be obtained by calling 800.677.FUND.
1 Performance does not reflect the deduction of taxes that a shareholder would pay on fund distributions or redemption of fund shares. Investment performance reflects fee waivers that are or were in effect. In the absence of such fee waivers, total returns would be reduced. Index performance is for illustrative purposes only and does not reflect any expenses, transaction costs, or cash flow effects. Direct investment in an index is not available.
Stocks of small-capitalization companies involve substantial risk. These stocks historically have experienced greater price volatility than stocks of larger companies, and they may be expected to do so in the future.
Total returns at net asset value ("NAV") reflect performance over the time period indicated without including the fund's maximum sales charge and assume reinvestment of all distributions at NAV.
Total returns at public offering price ("POP") reflect performance over the time period indicated including a maximum front-end sales charge of 5.50% for Class A shares and the maximum contingent deferred sales charge ("CDSC") for Class B and Class C shares for the relevant period. Maximum CDSC is 5.00% for Class B shares in the first year, decreasing annually to 0% in the seventh year following purchase, and 1.00% for Class C shares. Total returns assume reinvestment of all distributions at NAV.
On September 24, 2001, the First American Small Cap Select Fund became the successor by merger to the Firstar SmallCap Core Equity Fund, a series of Firstar Funds, Inc. Prior to the merger, the First American fund had no assets or liabilities. Performance presented prior to September 24, 2001, represents that of the Firstar SmallCap Core Equity Fund. The Firstar SmallCap Core Equity Fund was organized on November 27, 2000, and prior to that, was a separate series of Mercantile Funds, Inc.
2 An unmanaged index that measures the performance of the 2,000 smallest companies in the Russell 3000 Index. The Russell 3000 Index measures the performance of the 3,000 largest companies based on total market capitalization, which represents approximately 98% of the investable U.S. equity market.
3 Performance for Class B, Class C, and Class R shares is not presented. Performance for these classes will vary due to different expense structures.
FIRST AMERICAN FUNDS Annual Report 2005
12
Small Cap Select fund continued
Expense Example
As a shareholder of the Small Cap Select Fund (the "fund"), you incur two types of costs: (1) transaction costs, including sales charges (loads) on purchase payments; and (2) ongoing costs, including advisory fees; distribution and/or service (12b-1) fees; and other fund expenses. This example is intended to help you understand your ongoing costs (in dollars) of investing in the fund and to compare these costs with the ongoing costs of investing in other mutual funds. The example is based on an investment of $1,000 invested at the beginning of the period and held for the entire period from April 1, 2005, to September 30, 2005.
Actual Expenses
For each class, the first line of the table below provides information about actual account values and actual expenses. You may use the information in this line, together with the amount you invested, to estimate the expenses that you paid over the period. Simply divide your account value by $1,000 (for example, an $8,600 account value divided by $1,000 = 8.6), then multiply the result by the number in the first line under the heading entitled "Expenses Paid During Period" to estimate the expenses you paid on your account during this period.
Hypothetical Example for Comparison Purposes
For each class, the second line of the table below provides information about hypothetical account values and hypothetical expenses based on the fund's actual expense ratio and an assumed rate of return of 5% per year before expenses, which is not the fund's actual return. The hypothetical account values and expenses may not be used to estimate the actual ending account balance or expenses you paid for the period. You may use this information to compare the ongoing costs of investing in the fund and other funds. To do so, compare this 5% hypothetical example with the 5% hypothetical examples that appear in the shareholder reports of the other funds.
Please note that the expenses shown in the table are meant to highlight your ongoing costs only and do not reflect any transactional costs, such as sales charges (loads). Therefore, the second line of the table for each class is useful in comparing ongoing costs only, and will not help you determine the relative total costs of owning different funds. In addition, if these transactional costs were included, your costs would have been higher.
Expense Examples
| | | Beginning Account
Value (4/01/05) | | Ending Account
Value (9/30/05) | | Expenses Paid During
Period1 (4/01/05 to
9/30/05) | |
| Class A Actual2,3 | | $ | 1,000.00 | | | $ | 1,115.70 | | | $ | 6.53 | | |
| Class A Hypothetical (5% return before expenses)3 | | $ | 1,000.00 | | | $ | 1,018.90 | | | $ | 6.23 | | |
| Class B Actual2,3 | | $ | 1,000.00 | | | $ | 1,110.90 | | | $ | 10.48 | | |
| Class B Hypothetical (5% return before expenses)3 | | $ | 1,000.00 | | | $ | 1,015.14 | | | $ | 10.00 | | |
| Class C Actual2,3 | | $ | 1,000.00 | | | $ | 1,111.30 | | | $ | 10.48 | | |
| Class C Hypothetical (5% return before expenses)3 | | $ | 1,000.00 | | | $ | 1,015.14 | | | $ | 10.00 | | |
| Class R Actual2,3 | | $ | 1,000.00 | | | $ | 1,114.00 | | | $ | 7.99 | | |
| Class R Hypothetical (5% return before expenses)3 | | $ | 1,000.00 | | | $ | 1,017.51 | | | $ | 7.62 | | |
| Class Y Actual2,3 | | $ | 1,000.00 | | | $ | 1,116.60 | | | $ | 5.20 | | |
| Class Y Hypothetical (5% return before expenses)3 | | $ | 1,000.00 | | | $ | 1,020.16 | | | $ | 4.96 | | |
1Expenses are equal to the fund's annualized expense ratio for the most recent six-month period of 1.23%, 1.98%, 1.98%, 1.51% and 0.98% for Class A, Class B, Class C, Class R and Class Y, respectively, multiplied by the average account value over the period, multiplied by the number of days in the most recent fiscal half-year/365 (to reflect the one-half year period).
2Based on the actual returns for the six months ended September 30, 2005: 11.57% for Class A, 11.09% for Class B, 11.13% for Class C, 11.40% for Class R and 11.66% for Class Y.
3Prior to July 1, 2005, the contractual limitation on annual expenses was 1.21%, 1.96%, 1.96%, 1.46% and 0.96% for Class A, Class B, Class C, Class R and Class Y, respectively. Effective July 1, 2005, the contractual limitation on annual expenses for each class was removed. If this limitation had not been in place during the entire period, actual and hypothetical ending account balances would have been approximately $1,115.59 and $1,018.79 for Class A, $1,110.79 and $1,015.04 for Class B, $1,111.19 and $1,015.03 for Class C, $1,113.93 and $1,017.44 for Class R, and $1,116.49 and $1,020.05 for Class Y and actual and hypothetical expenses paid during the period would have been approximately $6.64 and $6.33 for Class A, $10.59 and $10.11 for Class B, $10.59 and $10.11 for Class C, $8.06 and $7.69 for Class R and $5.31 and $5.07 for Class Y.
FIRST AMERICAN FUNDS Annual Report 2005
13
Small Cap Value fund
Investment Objective: capital appreciation
Recent changes to the fund:
Effective July 25, 2005, the portfolio managers primarily responsible for the management of the fund have changed. See additional details in the front of this report.
How did the Fund perform for the fiscal year ended September 30, 2005?
The First American Small Cap Value Fund (the "fund"), Class Y shares, returned 17.08% for the fiscal year ended September 30, 2005 (Class A shares returned 16.78% without taking the sales charge into account). By comparison, the fund's benchmark, the Russell 2000 Value Index*, returned 17.75% for the same period.
What were the general economic and market conditions during the fiscal year?
Economic growth moderated but nevertheless continued at a solid pace over the course of the fiscal year. Solid economic growth, in turn, improved labor market conditions. While core inflation remained basically stable at a relatively low level, overall inflation rose with the continuing climb of energy prices during the past year. The combination of solid growth, lower unemployment, and the potential for higher energy prices to be reflected by broader inflation measures has kept the Fed incrementally raising the Fed Funds Rate at each Federal Open Market Committee meeting since June 2004.
The corporate sector of the economy has performed very well in this economic environment, with operating earnings up sharply through the third quarter of 2005. Underlying economic conditions remain generally favorable for the financial markets, although risks have risen with energy prices and the widespread disruption to activity from Hurricanes Katrina and Rita.
During most of the fiscal year – except toward the end – the market generally favored small-cap companies because of stronger-than-expected consumer spending (despite rising gas prices) and readily available financing for small-cap company growth. However, in an economic environment of growing uncertainty, like that produced by Hurricanes Katrina and Rita, smaller companies tend to look riskier to investors and potential creditors. Furthermore, while a year ago the valuations for small caps were cheap relative to their mid- and large-cap counterparts, this gap has closed somewhat because of small caps' strong performance.
What worked for the fund and why?
The fund's overweight in the energy sector benefited the portfolio because of the favorable supply and demand characteristics in the energy market and the resulting rise in energy prices. Healthcare and utilities were strong performers, and an overweight in materials also added value, especially the initial upward pricing in chemicals and the demand for those goods from overseas.
Among individual stocks, CNS, a manufacturer of health and personal care products, proved a true value gem, with a steep rise in sales and profitability, driven by the launch of new products and international expansion. In the energy sector, TODCO, a leading provider of contract oil and gas drilling services, benefited from demand-driven increase in drilling requests and needs. And in technology, NETGEAR, a developer of networking products for small business and home users, enjoyed revenue growth of more than 20%, with healthy profit margins and improving cash flow management.
What did not work for the fund and why?
With the pressure of rising interest rates and commodity costs on consumers' wallets and the squeeze on margins for small industrial players, both the consumer discretionary and industrials sectors underperformed the index. Adverse stock selection in several different sectors also detracted from performance. GrafTech, a manufacturer of carbon and graphite products, saw declining revenue due to pricing pressure and lower-than-expected sales. A chemical stock, Georgia Gulf Corp., was hurt by lower prices in the PVC plastic market, led by overseas PVC price declines on rising capacity in Asia. And NCO Group, a debt-collection firm, saw a rising number of new competitors, which caused investor concerns about margin opportunities and growth, hurting the stock performance.
What strategic moves were made by the fund and why?
Having benefited from last year's move to an overweight position in the energy sector, we began reducing that overweight based on valuations, which reached our target. At the same time, we increased the fund's technology weighting based on historically more reasonable values and better earnings growth outlook.
*Unlike mutual funds, index returns do not reflect any expenses, transaction costs, or cash flow effects.
| Top 10 Holdings as of September 30, 20051 (% of net assets) | |
| BISYS Group | | | 2.4 | % | |
| CLARCOR | | | 2.2 | % | |
| First Republic Bank – California | | | 2.1 | % | |
| ESCO Technologies | | | 2.1 | % | |
| Toro | | | 1.8 | % | |
| Corporate Office Properties Trust (REIT) | | | 1.5 | % | |
| Aeropostale | | | 1.4 | % | |
| Brady, Class A | | | 1.4 | % | |
| Black Hills | | | 1.4 | % | |
| First Niagara Financial Group | | | 1.3 | % | |
| Sector Allocation as of September 30, 20051 (% of net assets) | |
| Financials | | | 29.7 | % | |
| Industrials | | | 17.8 | % | |
| Information Technology | | | 13.1 | % | |
| Consumer Discretionary | | | 12.1 | % | |
| Energy | | | 6.9 | % | |
| Materials | | | 5.4 | % | |
| Utilities | | | 4.9 | % | |
| Health Care | | | 4.8 | % | |
| Consumer Staples | | | 2.8 | % | |
| Short-Term Investments | | | 2.0 | % | |
| Telecommunication Services | | | 0.6 | % | |
| Other Assets and Liabilities, Net | | | (0.1 | )% | |
| | | | 100.0 | % | |
1Fund holdings and sector allocations are subject to change at any time and are not recommendations to buy or sell any security.
FIRST AMERICAN FUNDS Annual Report 2005
14
Small Cap Value fund continued
Annual Performance1 as of September 30, 2005
| | | | | Since Inception | |
| | | 1 year | | 5 years | | 10 years | | 11/24/1997 | | 2/1/1999 | | 9/24/2001 | |
| Average annual return with sales charge (POP) | |
| Class A | | | 10.36 | % | | | 9.49 | % | | | 10.18 | % | | | - | | | | - | | | | - | | |
| Class B | | | 11.00 | % | | | 9.61 | % | | | - | | | | 7.22 | % | | | - | | | | - | | |
| Class C | | | 14.94 | % | | | 9.91 | % | | | - | | | | - | | | | 11.12 | % | | | - | | |
| Average annual return without sales charge (NAV) | |
| Class A | | | 16.78 | % | | | 10.73 | % | | | 10.81 | % | | | - | | | | - | | | | - | | |
| Class B | | | 15.90 | % | | | 9.86 | % | | | - | | | | 7.22 | % | | | - | | | | - | | |
| Class C | | | 15.92 | % | | | 9.91 | % | | | - | | | | - | | | | 11.12 | % | | | - | | |
| Class R | | | 16.60 | % | | | - | | | | - | | | | - | | | | - | | | | 16.58 | % | |
| Class Y | | | 17.08 | % | | | 10.99 | % | | | 11.15 | % | | | - | | | | - | | | | - | | |
| Russell 2000 Value Index2 | | | 17.75 | % | | | 15.18 | % | | | 13.33 | % | | | 10.64 | % | | | 13.57 | % | | | 18.69 | % | |
Value of $10,000 Investment1,3 as of September 30, 2005
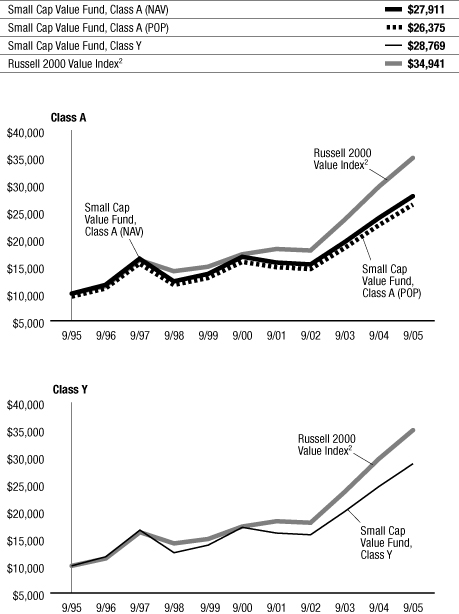
The chart above illustrates the total value of an assumed $10,000 investment in the fund's Class A and Class Y shares (from 9/30/95 to 9/30/05) as compared to the Russell 2000 Value Index2.
The performance data quoted on this page represents past performance and does not guarantee future results. The investment return and principal value of an investment will fluctuate so that an investor's shares, when redeemed, may be worth more or less than their original cost. Current performance of the fund may be lower or higher than the performance data quoted. Performance data current to the most recent month-end may be obtained by calling 800.677.FUND.
1 Performance does not reflect the deduction of taxes that a shareholder would pay on fund distributions or redemption of fund shares. Investment performance reflects fee waivers that are or were in effect. In the absence of such fee waivers, total returns would be reduced. Index performance is for illustrative purposes only and does not reflect any expenses, transaction costs, or cash flow effects. Direct investment in the index is not available.
Stocks of small-capitalization companies involve substantial risk. These stocks have historically experienced greater price volatility than stocks of larger companies, and they may be expected to do so in the future.
Total returns at net asset value ("NAV") reflect performance over the time period indicated without including the fund's maximum sales charge and assume reinvestment of all distributions at NAV.
Total returns at public offering price ("POP") reflect performance over the time period indicated including a maximum front-end sales charge of 5.50% for Class A shares and the maximum contingent deferred sales charge ("CDSC") for Class B and Class C shares for the relevant period. Maximum CDSC is 5.00% for Class B shares in the first year, decreasing annually to 0% in the seventh year following purchase, and 1.00% for Class C shares. Total returns assume reinvestment of all distributions at NAV.
2 An unmanaged index that measures the performance of those Russell 2000 companies with lower price-to-book ratios and lower forecasted growth values. The Russell 2000 Index is an unmanaged index comprised of the smallest 2,000 companies in the Russell 3000 Index. The Russell 3000 Index is composed of 3,000 large U.S. companies based on total market capitalization, representing approximately 98% of the investable U.S. equity market.
3 Performance for Class B, Class C, and Class R shares is not presented. Performance for these classes will vary due to different expense structures.
FIRST AMERICAN FUNDS Annual Report 2005
15
Small Cap Value fund continued
Expense Example
As a shareholder of the Small Cap Value Fund (the "fund"), you incur two types of costs: (1) transaction costs, including sales charges (loads) on purchase payments; and (2) ongoing costs, including advisory fees; distribution and/or service (12b-1) fees; and other fund expenses. This example is intended to help you understand your ongoing costs (in dollars) of investing in the fund and to compare these costs with the ongoing costs of investing in other mutual funds. The example is based on an investment of $1,000 invested at the beginning of the period and held for the entire period from April 1, 2005, to September 30, 2005.
Actual Expenses
For each class, the first line of the table below provides information about actual account values and actual expenses. You may use the information in this line, together with the amount you invested, to estimate the expenses that you paid over the period. Simply divide your account value by $1,000 (for example, an $8,600 account value divided by $1,000 = 8.6), then multiply the result by the number in the first line under the heading entitled "Expenses Paid During Period" to estimate the expenses you paid on your account during this period.
Hypothetical Example for Comparison Purposes
For each class, the second line of the table below provides information about hypothetical account values and hypothetical expenses based on the fund's actual expense ratio and an assumed rate of return of 5% per year before expenses, which is not the fund's actual return. The hypothetical account values and expenses may not be used to estimate the actual ending account balance or expenses you paid for the period. You may use this information to compare the ongoing costs of investing in the fund and other funds. To do so, compare this 5% hypothetical example with the 5% hypothetical examples that appear in the shareholder reports of the other funds.
Please note that the expenses shown in the table are meant to highlight your ongoing costs only and do not reflect any transactional costs, such as sales charges (loads). Therefore, the second line of the table for each class is useful in comparing ongoing costs only, and will not help you determine the relative total costs of owning different funds. In addition, if these transactional costs were included, your costs would have been higher.
Expense Examples
| | | Beginning Account
Value (4/01/05) | | Ending Account
Value (9/30/05) | | Expenses Paid During
Period1 (4/01/05 to
9/30/05) | |
| Class A Actual2,3 | | $ | 1,000.00 | | | $ | 1,060.00 | | | $ | 6.43 | | |
| Class A Hypothetical (5% return before expenses)3 | | $ | 1,000.00 | | | $ | 1,018.83 | | | $ | 6.30 | | |
| Class B Actual2,3 | | $ | 1,000.00 | | | $ | 1,056.20 | | | $ | 10.28 | | |
| Class B Hypothetical (5% return before expenses)3 | | $ | 1,000.00 | | | $ | 1,015.07 | | | $ | 10.07 | | |
| Class C Actual2,3 | | $ | 1,000.00 | | | $ | 1,056.80 | | | $ | 10.28 | | |
| Class C Hypothetical (5% return before expenses)3 | | $ | 1,000.00 | | | $ | 1,015.07 | | | $ | 10.07 | | |
| Class R Actual2,3 | | $ | 1,000.00 | | | $ | 1,059.50 | | | $ | 7.67 | | |
| Class R Hypothetical (5% return before expenses)3 | | $ | 1,000.00 | | | $ | 1,017.62 | | | $ | 7.51 | | |
| Class Y Actual2,3 | | $ | 1,000.00 | | | $ | 1,061.60 | | | $ | 5.14 | | |
| Class Y Hypothetical (5% return before expenses)3 | | $ | 1,000.00 | | | $ | 1,020.08 | | | $ | 5.03 | | |
1Expenses are equal to the fund's annualized expense ratio for the most recent six-month period of 1.24%, 1.99%, 1.99%, 1.49% and 0.99% for Class A, Class B, Class C, Class R and Class Y, respectively, multiplied by the average account value over the period, multiplied by the number of days in the most recent fiscal half-year/365 (to reflect the one-half year period).
2Based on the actual returns for the six months ended September 30, 2005: 6.00% for Class A, 5.62% for Class B, 5.68% for Class C, 5.95% for Class R and 6.16% for Class Y.
3Prior to July 1, 2005, the contractual limitation on annual expenses was 1.23%, 1.98%, 1.98%, 1.48% and 0.98% for Class A, Class B, Class C, Class R and Class Y, respectively. Effective July 1, 2005, the contractual limitation on annual expenses for each class was removed. If this limitation had not been in place during the entire period, actual and hypothetical ending account balances would have been approximately $1,059.92 and $1,018.75 for Class A, $1,056.12 and $1,014.99 for Class B, $1,056.71 and $1,014.99 for Class C, $1,059.45 and $1,017.57 for Class R, and $1,061.52 and $1,020.00 for Class Y and actual and hypothetical expenses paid during the period would have been approximately $6.51 and $6.38 for Class A, $10.36 and $10.16 for Class B, $10.37 and $10.16 for Class C, $7.72 and $7.57 for Class R and $5.22 and $5.12 for Class Y.
FIRST AMERICAN FUNDS Annual Report 2005
16
Small-Mid Cap Core fund (formerly Technology Fund)
Investment Objective: long-term growth of capital
Recent changes to the fund:
On October 3, 2005, the fund's name was changed from the First American Technology Fund to the First American Small-Mid Cap Core Fund (the "fund"), and a new investment strategy was implemented. The fund no longer concentrates its investments solely in the technology sector, although it may continue to make investments in that sector. Instead, the fund now invests primarily in common stocks of small- and mid-capitalization companies. These companies are defined as companies having market capitalizations within the range of market capitalizations of companies constituting the Russell 2500 Index. The discussion below relates to the fund's performance before these changes were implemented, when the fund operated as a technology fund.
How did the fund perform for the fiscal year ended September 30, 2005?
The fund's Class Y shares, returned 12.66% for the fiscal year ended September 30, 2005 (Class A shares returned 12.30% without taking the sales charge into account). By comparison, the fund's benchmark during the fiscal year, the Merrill Lynch 100 Technology Index*, returned 20.42% for the same period.
What were the general economic and market conditions during the fiscal year?
Economic growth moderated but nevertheless continued at a solid pace over the course of the fiscal year. Solid economic growth, in turn, improved labor market conditions. While core inflation remained basically stable at a relatively low level, overall inflation rose with the continuing climb of energy prices during the past year. The combination of solid growth, lower unemployment, and the potential for higher energy prices to be reflected by broader inflation measures has kept the Fed incrementally raising the Fed Funds Rate at each Federal Open Market Committee meeting since June 2004.
The corporate sector of the economy has performed very well in this economic environment, with operating earnings up sharply through the third quarter of 2005. Underlying economic conditions remain generally favorable for the financial markets, although risks have risen with energy prices and the widespread disruption to activity from Hurricanes Katrina and Rita.
What worked for the fund and why?
To a limited extent, the fund benefited from good stock selection. Among the standout performers were NETGEAR (networking solutions for home and business users), aQuantive (digital marketing), Concord Communications (business software service management and application performance management), and Synaptics (custom-designed user interface solutions for mobile computing, communications and entertainment devices).
What did not work for the fund and why?
Poor sector allocation was the primary reason for the fund's underperformance relative to the index. Having adopted a fairly defensive portfolio strategy, the fund held an overweight in aerospace and defense stocks and an underweight in technology. The overall effect of these allocations was detrimental to the fund's performance, since the technology sector, benefiting from solid economic growth, produced strong results during the fiscal year.
Adverse stock selection also detracted from performance. The fund was underweight in Autodesk, a supplier of advanced PC design tools, and Corning, a diversified technology company, at the time when both companies recorded strong revenues. The fund was also hurt by not owning certain other strong-performing stocks. Among such missed opportunities were graphic chipmaker nVidia and data storage card company Sandisk, both of which posted strong results, as well as National Semiconductor, its earnings reflecting increased demand for semiconductor products.
What strategic moves were made by the fund and why?
Continuing last year's defensive strategy relative to technology stocks, the fund allocated a large portion of the portfolio to stocks not associated with the technology market. This approach did not, however, achieve positive results, as technology stocks enjoyed generally strong performance this fiscal year, benefiting from solid economic growth.
*Unlike mutual funds, index returns do not reflect any expenses, transaction costs, or cash flow effects.
| Top 10 Holdings as of September 30, 20051 (% of net assets) | |
| Motorola | | | 3.9 | % | |
| Texas Instruments | | | 3.6 | % | |
| Amphenol, Class A | | | 3.5 | % | |
| Adobe Systems | | | 3.3 | % | |
| Scientific Games | | | 3.1 | % | |
| Intel | | | 3.1 | % | |
| EMC | | | 3.0 | % | |
| Anolog Devices | | | 2.7 | % | |
| Newfield Exploration | | | 2.7 | % | |
| Nasdaq-100 Tracking Stock | | | 2.5 | % | |
| Sector Allocation as of September 30, 20051 (% of net assets) | |
| Semiconductors & Semiconductor Equipment | | | 19.8 | % | |
| Communications Equipment | | | 13.8 | % | |
| Software | | | 13.5 | % | |
| Computers & Peripherals | | | 12.3 | % | |
| Health Care Equipment & Supplies | | | 5.6 | % | |
| Electronic Equipment & Instruments | | | 4.5 | % | |
| Aerospace & Defense | | | 4.0 | % | |
| Internet Software & Services | | | 3.6 | % | |
| Machinery | | | 3.2 | % | |
| Hotels, Restaurants & Leisure | | | 3.1 | % | |
| Oil, Gas & Consumable Fuels | | | 2.7 | % | |
| Investment Company | | | 2.5 | % | |
| Health Care Providers & Services | | | 2.1 | % | |
| Wireless Telecommunications Services | | | 2.0 | % | |
| IT Services | | | 1.9 | % | |
| Commercial Services & Supplies | | | 1.7 | % | |
| Chemicals | | | 1.1 | % | |
| Diversified Telecommunication Services | | | 0.8 | % | |
| Short-Term Investments | | | 3.0 | % | |
| Other Assets and Liabilities, Net | | | (1.2 | )% | |
| | | | 100.0 | % | |
1Fund holdings and sector allocations are subject to change at any time and are not recommendations to buy or sell any security.
FIRST AMERICAN FUNDS Annual Report 2005
17
Small-Mid Cap Core fund continued
| Annual Performance1 as of September 30, 2005 | |
| | | | | Since
Inception | |
| | | 1 year | | 5 years | | 10 years | | 2/1/2000 | |
| Average annual return with sales charge (POP) | | | | | | | | | | | | | | | | | |
| Class A | | | 6.13 | % | | | (27.08 | )% | | | (0.12 | )% | | | - | | |
| Class B | | | 6.60 | % | | | (27.04 | )% | | | (0.29 | )% | | | - | | |
| Class C | | | 10.62 | % | | | (26.79 | )% | | | - | | | | (24.83 | )% | |
| Average annual return without sales charge (NAV) | | | | | | | | | | | | | | | | | |
| Class A | | | 12.30 | % | | | (26.25 | )% | | | 0.44 | % | | | - | | |
| Class B | | | 11.60 | % | | | (26.81 | )% | | | (0.29 | )% | | | - | | |
| Class C | | | 11.62 | % | | | (26.79 | )% | | | - | | | | (24.83 | )% | |
| Class Y | | | 12.66 | % | | | (26.05 | )% | | | 0.73 | % | | | - | | |
| Merrill Lynch 100 Technology Index2 | | | 20.42 | % | | | (15.14 | )% | | | 8.79 | % | | | (12.86 | )% | |
Value of a $10,000 Investment1,3 as of September 30, 2005
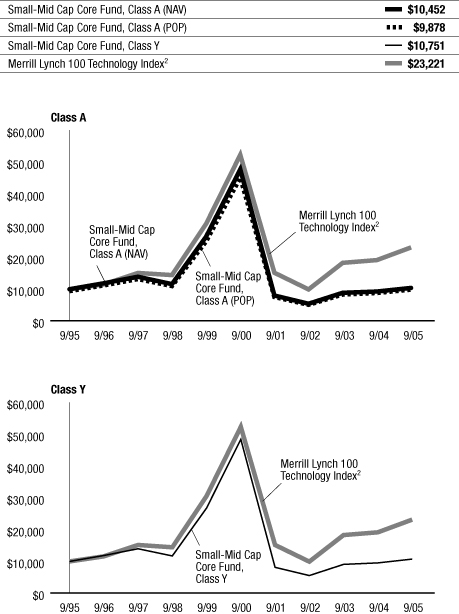
The chart above illustrates the total value of an assumed $10,000 investment in the fund's Class A and Class Y shares (from 9/30/95 to 9/30/05) as compared to the Merrill Lynch 100 Technology Index2.
The performance data quoted on this page represents past performance and does not guarantee future results. The investment return and principal value of an investment will fluctuate so that an investor's shares, when redeemed, may be worth more or less than their original cost. Current performance of the fund may be lower or higher than the performance data quoted. Performance data current to the most recent month-end may be obtained by calling 800.677.FUND.
1 Performance does not reflect the deduction of taxes that a shareholder would pay on fund distributions or redemption of fund shares. Investment performance reflects fee waivers that are or were in effect. In the absence of such fee waivers, total returns would be reduced. Index performance is for illustrative purposes only and does not reflect any expenses, transaction costs, or cash flow effects. Direct investment in the index is not available.
Investments in the First American Technology Fund are more vulnerable to price fluctuation as a result of the narrow focus of technology investing and the fact that the products of companies in which the fund invests may be subject to rapid obsolescence.
Effective October 3, 2005, the fund's investment strategy changed. Stocks of small- and mid-capitalization companies involve substantial risk and may be subject to increased volatility and more price fluctuation than large-capitalization companies.
Total returns at net asset value ("NAV") reflect performance over the time period indicated without including the fund's maximum sales charge and assume reinvestment of all distributions at NAV.
Total returns at public offering price ("POP") reflect performance over the time period indicated including a maximum front-end sales charge of 5.50% for Class A shares and the maximum contingent deferred sales charge ("CDSC") for Class B and Class C shares for the relevant period. Maximum CDSC is 5.00% for Class B shares in the first year, decreasing annually to 0% in the seventh year following purchase, and 1.00% for Class C shares. Total returns assume reinvestment of all distributions at NAV.
The Technology Fund's 1999 returns were higher due in part to its strategy of investing in IPOs and technology-related stocks in a period favorable for IPO and technology stock investing. Of course, such favorable returns involve accepting the risk of volatility, and there is no assurance that the fund's future investment in IPOs and technology stocks will have the same effect on performance as it did in 1999.
2 An equally weighted index of the 100 largest technology companies, as measured by market capitalization.
3 Performance for Class B and Class C shares is not presented. Performance for these classes will vary due to different expense structures.
FIRST AMERICAN FUNDS Annual Report 2005
18
Small-Mid Cap Core fund continued
Expense Example
As a shareholder of the Small-Mid Cap Core Fund (the "fund"), you incur two types of costs: (1) transaction costs, including sales charges (loads) on purchase payments; and (2) ongoing costs, including advisory fees; distribution and/or service (12b-1) fees; and other fund expenses. This example is intended to help you understand your ongoing costs (in dollars) of investing in the fund and to compare these costs with the ongoing costs of investing in other mutual funds. The example is based on an investment of $1,000 invested at the beginning of the period and held for the entire period from April 1, 2005, to September 30, 2005.
Actual Expenses
For each class, the first line of the table below provides information about actual account values and actual expenses. You may use the information in this line, together with the amount you invested, to estimate the expenses that you paid over the period. Simply divide your account value by $1,000 (for example, an $8,600 account value divided by $1,000 = 8.6), then multiply the result by the number in the first line under the heading entitled "Expenses Paid During Period" to estimate the expenses you paid on your account during this period.
Hypothetical Example for Comparison Purposes
For each class, the second line of the table below provides information about hypothetical account values and hypothetical expenses based on the fund's actual expense ratio and an assumed rate of return of 5% per year before expenses, which is not the fund's actual return. The hypothetical account values and expenses may not be used to estimate the actual ending account balance or expenses you paid for the period. You may use this information to compare the ongoing costs of investing in the fund and other funds. To do so, compare this 5% hypothetical example with the 5% hypothetical examples that appear in the shareholder reports of the other funds.
Please note that the expenses shown in the table are meant to highlight your ongoing costs only and do not reflect any transactional costs, such as sales charges (loads). Therefore, the second line of the table for each class is useful in comparing ongoing costs only, and will not help you determine the relative total costs of owning different funds. In addition, if these transactional costs were included, your costs would have been higher.
Expense Examples
| | | Beginning Account
Value (4/01/05) | | Ending Account
Value (9/30/05) | | Expenses Paid During
Period1 (4/01/05 to
9/30/05) | |
| Class A Actual2,3 | | $ | 1,000.00 | | | $ | 1,072.30 | | | $ | 8.47 | | |
| Class A Hypothetical (5% return before expenses)3 | | $ | 1,000.00 | | | $ | 1,016.89 | | | $ | 8.24 | | |
| Class B Actual2,3 | | $ | 1,000.00 | | | $ | 1,068.70 | | | $ | 12.39 | | |
| Class B Hypothetical (5% return before expenses)3 | | $ | 1,000.00 | | | $ | 1,013.09 | | | $ | 12.05 | | |
| Class C Actual2,3 | | $ | 1,000.00 | | | $ | 1,069.80 | | | $ | 12.41 | | |
| Class C Hypothetical (5% return before expenses)3 | | $ | 1,000.00 | | | $ | 1,013.07 | | | $ | 12.07 | | |
| Class Y Actual2,3 | | $ | 1,000.00 | | | $ | 1,074.70 | | | $ | 7.14 | | |
| Class Y Hypothetical (5% return before expenses)3 | | $ | 1,000.00 | | | $ | 1,018.19 | | | $ | 6.95 | | |
1Expenses are equal to the fund's annualized expense ratio for the most recent six-month period of 1.63%, 2.39%, 2.39% and 1.37% for Class A, Class B, Class C and Class Y, respectively, multiplied by the average account value over the period, multiplied by the number of days in the most recent fiscal half-year/365 (to reflect the one-half year period).
2Based on the actual returns for the six months ended September 30, 2005: 7.23% for Class A, 6.87% for Class B, 6.98% for Class C, and 7.47% for Class Y.
3Prior to July 1, 2005, the contractual limitation on annual expenses was 1.23%, 1.98%, 1.98% and 0.98% for Class A, Class B, Class C and Class Y, respectively. Effective July 1, 2005, the contractual limitation on annual expenses for each class was removed. If this limitation had not been in place during the entire period, actual and hypothetical ending account balances would have been approximately $1,071.82 and $1,016.43 for Class A, $1,068.23 and $1,012.63 for Class B, $1,069.32 and $1,012.62 for Class C, and $1,074.21 and $1,017.72 for Class Y and actual and hypothetical expenses paid during the period would have been approximately $8.95 and $8.71 for Class A, $12.86 and $12.51 for Class B , $12.89 and $12.53 for Class C, and $7.63 and $7.42 for Class Y.
FIRST AMERICAN FUNDS Annual Report 2005
19
Mid Cap Growth Opportunities fund
Investment Objective: capital appreciation
Recent changes to the fund:
Effective September 8, 2005, the portfolio managers primarily responsible for the management of the fund have changed. See additional details in the front of this report.
How did the Fund perform for the fiscal year ended September 30, 2005?
The First American Mid Cap Growth Opportunities Fund (the "fund"), Class Y shares, returned 26.57% for the fiscal year ended September 30, 2005 (Class A shares returned 26.25% without taking the sales charge into account). By comparison, the fund's benchmark, the Russell Midcap Growth Index*, returned 23.47% for the same period.
What were the general economic and market conditions during the fiscal year?
Economic growth moderated but nevertheless continued at a solid pace over the course of the fiscal year. Solid economic growth, in turn, improved labor market conditions. While core inflation has been basically stable at a relatively low level, overall inflation rose with the continuing climb of energy prices during the past year. The combination of solid growth, lower unemployment, and the potential for higher energy prices to be reflected by broader inflation measures has kept the Fed incrementally raising the Fed Funds Rate at each Federal Open Market Committee meeting since June 2004.
The corporate sector of the economy has performed very well in this economic environment, with operating earnings up sharply through the third quarter of 2005. Energy was one of the dominant economic considerations throughout the year, and it had a meaningful bearing on the fund's strategy and a positive effect on its performance. Underlying economic conditions remain generally favorable for the financial markets, although risks have risen with energy prices and the widespread disruption to activity from Hurricanes Katrina and Rita.
What worked for the fund and why?
The fund's outperformance relative to the index was in large measure a result of good stock selection in the consumer discretionary, information technology, and healthcare sectors. An overweight in the energy sector also added value, as energy stock prices continued to rise, propelled by unflagging demand for energy and soaring commodity prices. In the consumer discretionary space the top performers were women's clothier Chicos, leisure company Marvel Entertainment (benefiting from various licensing initiatives), and Scientific Games Corp., a service and systems provider for lottery and wagering industries. The technology sector saw gains by Apple Computer, whose profits rose steadily thanks in part to the success of its iPod digital player and iTunes music store. MEMC Electronic Materials, Inc., a supplier of silicone and other semiconductor-grade wafers, also added value. In healthcare, the best-perfo rming stocks belonged to insurers Aetna and Pacificare, as well as pharmacy benefits manager Caremark.
What did not work for the fund and why?
The fund's underweight in the utilities and telecommunications services detracted somewhat form performance. Adverse stock selection in the financial sector also had a negative impact on performance: Investors Financial Services Corp., a service provider for a variety of asset managers, saw its stock price decline following lower-than-expected earnings.
What strategic moves were made by the fund and why?
Having benefited from last year's move to an overweight position in the energy sector, we then took a more defensive approach and began reducing that overweight, based on valuations, which reached our target price.
*Unlike mutual funds, index returns do not reflect any expenses, transaction costs, or cash flow effects.
| Top 10 Holdings as of September 30, 20051 (% of net assets) | |
| NCR | | | 3.5 | % | |
| Scientific Games | | | 2.8 | % | |
| National-Oilwell | | | 2.7 | % | |
| Dun & Bradstreet | | | 2.7 | % | |
| PerkinElmer | | | 2.6 | % | |
| Adobe Systems | | | 2.6 | % | |
| Thermo Electron | | | 2.4 | % | |
| DENTSPLY International | | | 2.3 | % | |
| Weatherford International | | | 2.2 | % | |
| L-3 Communications Holdings | | | 2.2 | % | |
| Sector Allocation as of September 30, 20051 (% of net assets) | |
| Information Technology | | | 23.1 | % | |
| Industrials | | | 18.1 | % | |
| Consumer Discretionary | | | 17.7 | % | |
| Health Care | | | 17.6 | % | |
| Energy | | | 12.3 | % | |
| Financials | | | 4.8 | % | |
| Consumer Staples | | | 3.3 | % | |
| Short-Term Investments | | | 2.4 | % | |
| Other Assets and Liabilities, Net | | | 0.7 | % | |
| | | | 100.0 | % | |
1Fund holdings and sector allocations are subject to change at any time and are not recommendations to buy or sell any security.
FIRST AMERICAN FUNDS Annual Report 2005
20
Mid Cap Growth Opportunities fund continued
Annual Performance1 as of September 30, 2005
| | | | | Since Inception | |
| | | 1 year | | 5 years | | 10 years | | 3/1/1999 | | 12/11/2000 | | 9/24/2001 | |
| Average annual return with sales charge (POP) | | | |
| Class A | | | 19.31 | % | | | 5.10 | % | | | 9.61 | % | | | - | | | | - | | | | - | | |
| Class B | | | 20.29 | % | | | 5.25 | % | | | - | | | | 10.91 | % | | | - | | | | - | | |
| Class C | | | 24.27 | % | | | - | | | | - | | | | - | | | | - | | | | 15.17 | % | |
| Average annual return without sales charge (NAV) | | | |
| Class A | | | 26.25 | % | | | 6.30 | % | | | 10.23 | % | | | - | | | | - | | | | - | | |
| Class B | | | 25.29 | % | | | 5.48 | % | | | - | | | | 10.91 | % | | | - | | | | - | | |
| Class C | | | 25.27 | % | | | - | | | | - | | | | - | | | | - | | | | 15.17 | % | |
| Class R | | | 25.95 | % | | | - | | | | - | | | | - | | | | 7.02 | % | | | - | | |
| Class Y | | | 26.57 | % | | | 6.56 | % | | | 10.50 | % | | | - | | | | - | | | | - | | |
| Russell Midcap Growth Index2 | | | 23.47 | % | | | (4.50 | )% | | | 9.10 | % | | | 5.32 | % | | | (2.08 | )% | | | 13.60 | % | |
Value of $10,000 Investment1,3 as of September 30, 2005

The chart above illustrates the total value of an assumed $10,000 investment in the fund's Class A and Class Y shares (from 10/31/95 to 9/30/05) as compared to the Russell Midcap Growth Index2.
The performance data quoted on this page represents past performance and does not guarantee future results. The investment return and principal value of an investment will fluctuate so that an investor's shares, when redeemed, may be worth more or less than their original cost. Current performance of the fund may be lower or higher than the performance data quoted. Performance data current to the most recent month-end may be obtained by calling 800.677.FUND.
1 Performance does not reflect the deduction of taxes that a shareholder would pay on fund distributions or redemption of fund shares. Investment performance reflects fee waivers that are or were in effect. In the absence of such fee waivers, total returns would be reduced. Index performance is for illustrative purposes only and does not reflect any expenses, transaction costs, or cash flow effects. Direct investment in the index is not available.
Stocks of mid-capitalization companies may be slightly less volatile than those of small-capitalization companies, but they still involve substantial risk and may be subject to increased volatility and more price fluctuation than large-capitalization companies.
Total returns at net asset value ("NAV") reflect performance over the time period indicated without including the fund's maximum sales charge and assume reinvestment of all distributions at NAV.
Total returns at public offering price ("POP") reflect performance over the time period indicated including a maximum front-end sales charge of 5.50% for Class A shares and the maximum contingent deferred sales charge ("CDSC") for Class B and Class C shares for the relevant period. Maximum CDSC is 5.00% for Class B shares in the first year, decreasing annually to 0% in the seventh year following purchase, and 1.00% for Class C shares. Total returns assume reinvestment of all distributions at NAV.
On September 24, 2001, the First American Mid Cap Growth Opportunities Fund became the successor by merger to the Firstar MidCap Core Equity Fund, a series of Firstar Funds, Inc. Prior to the merger, the First American fund had no assets or liabilities. Performance presented prior to September 24, 2001, represents that of the Firstar MidCap Core Equity Fund.
2 An unmanaged index that measures the performance of those Russell mid-cap companies with higher price-to-book ratios and higher forecasted growth values. The Russell Midcap Growth Index is part of the larger Russell 1000 Growth Index. The Russell 1000 Growth Index is an unmanaged index that measures performance of those Russell 1000 companies with higher price-to-book ratios and higher forecasted growth values. Russell 1000 companies include the 1,000 largest companies in the Russell 3000 Index. The Russell 3000 Index measures the performance of the 3,000 largest U.S. companies based on total market capitalization, which represents approximately 98% of the investable U.S. equity market.
3 Performance for Class B, Class C, and Class R shares is not presented. Performance for these classes will vary due to different expense structures.
FIRST AMERICAN FUNDS Annual Report 2005
21
Mid Cap Growth Opportunities fund continued
Expense Example
As a shareholder of the Mid Cap Growth Opportunities Fund (the "fund"), you incur two types of costs: (1) transaction costs, including sales charges (loads) on purchase payments; and (2) ongoing costs, including advisory fees; distribution and/or service (12b-1) fees; and other fund expenses. This example is intended to help you understand your ongoing costs (in dollars) of investing in the fund and to compare these costs with the ongoing costs of investing in other mutual funds. The example is based on an investment of $1,000 invested at the beginning of the period and held for the entire period from April 1, 2005, to September 30, 2005.
Actual Expenses
For each class, the first line of the table below provides information about actual account values and actual expenses. You may use the information in this line, together with the amount you invested, to estimate the expenses that you paid over the period. Simply divide your account value by $1,000 (for example, an $8,600 account value divided by $1,000 = 8.6), then multiply the result by the number in the first line under the heading entitled "Expenses Paid During Period" to estimate the expenses you paid on your account during this period.
Hypothetical Example for Comparison Purposes
For each class, the second line of the table below provides information about hypothetical account values and hypothetical expenses based on the fund's actual expense ratio and an assumed rate of return of 5% per year before expenses, which is not the fund's actual return. The hypothetical account values and expenses may not be used to estimate the actual ending account balance or expenses you paid for the period. You may use this information to compare the ongoing costs of investing in the fund and other funds. To do so, compare this 5% hypothetical example with the 5% hypothetical examples that appear in the shareholder reports of the other funds.
Please note that the expenses shown in the table are meant to highlight your ongoing costs only and do not reflect any transactional costs, such as sales charges (loads). Therefore, the second line of the table for each class is useful in comparing ongoing costs only, and will not help you determine the relative total costs of owning different funds. In addition, if these transactional costs were included, your costs would have been higher.
Expense Examples
| | | Beginning Account
Value (4/01/05) | | Ending Account
Value (9/30/05) | | Expenses Paid During
Period1 (4/01/05 to
9/30/05) | |
| Class A Actual2,3 | | $ | 1,000.00 | | | $ | 1,101.20 | | | $ | 6.43 | | |
| Class A Hypothetical (5% return before expenses)3 | | $ | 1,000.00 | | | $ | 1,018.95 | | | $ | 6.18 | | |
| Class B Actual2,3 | | $ | 1,000.00 | | | $ | 1,096.80 | | | $ | 10.34 | | |
| Class B Hypothetical (5% return before expenses)3 | | $ | 1,000.00 | | | $ | 1,015.20 | | | $ | 9.94 | | |
| Class C Actual2,3 | | $ | 1,000.00 | | | $ | 1,096.80 | | | $ | 10.35 | | |
| Class C Hypothetical (5% return before expenses)3 | | $ | 1,000.00 | | | $ | 1,015.20 | | | $ | 9.94 | | |
| Class R Actual2,3 | | $ | 1,000.00 | | | $ | 1,099.60 | | | $ | 7.78 | | |
| Class R Hypothetical (5% return before expenses)3 | | $ | 1,000.00 | | | $ | 1,017.65 | | | $ | 7.48 | | |
| Class Y Actual2,3 | | $ | 1,000.00 | | | $ | 1,102.60 | | | $ | 5.10 | | |
| Class Y Hypothetical (5% return before expenses)3 | | $ | 1,000.00 | | | $ | 1,020.21 | | | $ | 4.90 | | |
1Expenses are equal to the fund's annualized expense ratio for the most recent six-month period of 1.22%, 1.97%, 1.97%, 1.48% and 0.97% for Class A, Class B, Class C, Class R and Class Y, respectively, multiplied by the average account value over the period, multiplied by the number of days in the most recent fiscal half-year/365 (to reflect the one-half year period).
2Based on the actual returns for the six months ended September 30, 2005: 10.12% for Class A, 9.68% for Class B, 9.68% for Class C, 9.96% for Class R and 10.26% for Class Y.
3Prior to July 1, 2005, the contractual limitation on annual expenses was 1.20%, 1.95%, 1.95%, 1.45% and 0.95% for Class A, Class B, Class C, Class R and Class Y, respectively. Effective July 1, 2005, the contractual limitation on annual expenses for each class was removed. If this limitation had not been in place during the entire period, actual and hypothetical ending account balances would have been approximately $1,101.08 and $1,018.83 for Class A, $1,096.68 and $1,015.07 for Class B, $1,096.67 and $1,015.07 for Class C, $1,099.51 and $1,017.57 for Class R, and $1,102.46 and $1,020.08 for Class Y and actual and hypothetical expenses paid during the period would have been approximately $6.55 and $6.30 for Class A, $10.48 and $10.07 for Class B, $10.48 and $10.07 for Class C, $7.87 and $7.56 for Class R and $5.24 and $5.04 for Class Y.
FIRST AMERICAN FUNDS Annual Report 2005
22
Mid Cap Value fund
Investment Objective: capital appreciation
How did the Fund perform for the fiscal year ended September 30, 2005?
The First American Mid Cap Value Fund (the "fund"), Class Y shares, returned 24.68% for the fiscal year ended September 30, 2005 (Class A shares returned 24.38% without taking the sales charge into account). By comparison, the fund's benchmark, the Russell Midcap Value Index*, returned 26.13% for the same period.
What were the general economic and market conditions during the fiscal year?
Economic growth moderated but nevertheless continued at a solid pace over the course of the fiscal year. Solid economic growth, in turn, improved labor market conditions. While core inflation remained basically stable at a relatively low level, overall inflation rose with the continuing climb of energy prices during the past year. The combination of solid growth, lower unemployment, and the potential for higher energy prices to be reflected by broader inflation measures has kept the Fed incrementally raising the Fed Funds Rate at each Federal Open Market Committee meeting since June 2004.
The corporate sector of the economy has performed very well in this economic environment, with operating earnings up sharply through the third quarter of 2005. Underlying economic conditions remain generally favorable for the financial markets, although risks have risen with energy prices and the widespread disruption to activity from Hurricanes Katrina and Rita.
What worked for the fund and why?
The fund benefited from strong performance in the financials, industrials, energy, and utilities sectors. Strong energy demand boosted the results of the companies involved in oil services and exploration and production: National Oilwell Varco, Newfield Exploration, and EOG Resources. In concert with the energy market, several utility stocks also turned in strong performance, notably TXU, a Texas electricity provider, and Constellation Energy Group, a power wholesaler. Joy Global, a mining equipment and service company, was the top contributor to performance across all sectors. Other notable performers included Norfolk Southern, which enjoyed rising revenues during the period, and technology stocks including National Semiconductor and Harris Corp.
What did not work for the fund and why?
Adverse stock selection in the materials sector, coupled with a slight overweight and unfavorable stock selection in the consumer discretionary area, caused the fund to underperform relative to the index. In the materials sector, chemical companies Cytec Industries and Lyondell, specialty packaging producer Pactiv Corp, and paper company MeadWestvaco, performed below expectations. Most of the weak performance for the stocks in the consumer discretionary space occurred during the second half of the fiscal year, mainly due to concerns about higher energy prices and their impact on consumer spending. In this environment, both paint retailer Sherwin-Williams and power tool maker Black & Decker underperformed.
What strategic moves were made by the fund and why?
In terms of sector positioning, the fund ended the fiscal year as it began. Overweights were maintained in the technology and energy sectors as we continued to feel that technology stocks would benefit from a growing economy and that the continuation of high commodity prices, coupled with favorable supply and demand characteristics, would lead to strong performance in the energy sector. We maintained underweights in the financials and utilities sectors based on our belief that these sectors are enjoying peak fundamental conditions and full valuations.
*Unlike mutual funds, index returns do not reflect any expenses, transaction costs, or cash flow effects.
| Top 10 Holdings as of September 30, 20051 (% of net assets) | |
| Kroger | | | 2.4 | % | |
| Federated Department Stores | | | 2.2 | % | |
| Genworth Financial | | | 2.2 | % | |
| Norfolk Southern | | | 2.2 | % | |
| Constellation Energy | | | 2.1 | % | |
| PG&E | | | 2.1 | % | |
| Bear Stearns | | | 2.1 | % | |
| Newfield Exploration | | | 2.0 | % | |
| PPL | | | 2.0 | % | |
| Sherwin-Williams | | | 1.8 | % | |
| Sector Allocation as of September 30, 20051 (% of net assets) | |
| Financials | | | 26.9 | % | |
| Consumer Discretionary | | | 13.9 | % | |
| Utilities | | | 12.7 | % | |
| Information Technology | | | 9.6 | % | |
| Industrials | | | 8.8 | % | |
| Energy | | | 7.4 | % | |
| Materials | | | 6.7 | % | |
| Health Care | | | 6.3 | % | |
| Consumer Staples | | | 5.5 | % | |
| Short-Term Investments | | | 2.1 | % | |
| Other Assets and Liabilities, Net | | | 0.1 | % | |
| | | | 100.0 | % | |
1Fund holdings and sector allocations are subject to change at any time and are not recommendations to buy or sell any security.
FIRST AMERICAN FUNDS Annual Report 2005
23
Mid Cap Value fund continued
Annual Performance1 as of September 30, 2005
| | | Since Inception | |
| | | 1 year | | 5 years | | 10 years | | 2/1/1999 | | 9/24/2001 | |
| Average annual return with sales charge (POP) | | | |
| Class A | | | 17.54 | % | | | 10.67 | % | | | 9.77 | % | | | - | | | | - | | |
| Class B | | | 18.47 | % | | | 10.82 | % | | | 9.59 | % | | | - | | | | - | | |
| Class C | | | 22.43 | % | | | 11.08 | % | | | - | | | | 9.30 | % | | | - | | |
| Average annual return without sales charge (NAV) | | | |
| Class A | | | 24.38 | % | | | 11.92 | % | | | 10.39 | % | | | - | | | | - | | |
| Class B | | | 23.47 | % | | | 11.09 | % | | | 9.59 | % | | | - | | | | - | | |
| Class C | | | 23.43 | % | | | 11.08 | % | | | - | | | | 9.30 | % | | | - | | |
| Class R | | | 24.04 | % | | | - | | | | - | | | | - | | | | 17.50 | % | |
| Class Y | | | 24.68 | % | | | 12.17 | % | | | 10.68 | % | | | - | | | | - | | |
| Russell Midcap Value Index2 | | | 26.13 | % | | | 13.95 | % | | | 14.01 | % | | | 12.12 | % | | | 18.68 | % | |
Value of $10,000 Investment1,3 as of September 30, 2005
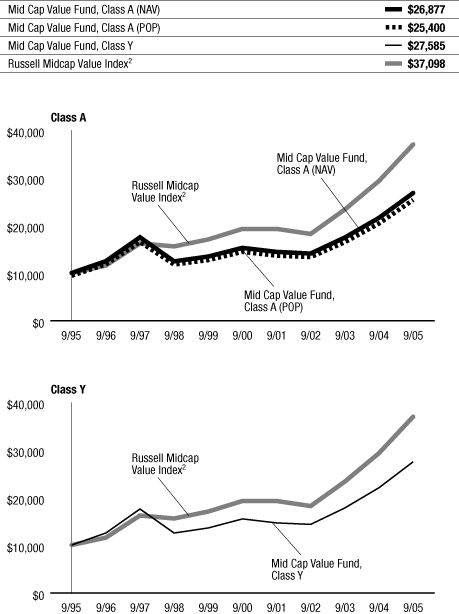
The chart above illustrates the total value of an assumed $10,000 investment in the fund's Class A and Class Y shares (from 9/30/95 to 9/30/05) as compared to the Russell Midcap Value Index2.
The performance data quoted on this page represents past performance and does not guarantee future results. The investment return and principal value of an investment will fluctuate so that an investor's shares, when redeemed, may be worth more or less than their original cost. Current performance of the fund may be lower or higher than the performance data quoted. Performance data current to the most recent month-end may be obtained by calling 800.677.FUND.
1 Performance does not reflect the deduction of taxes that a shareholder would pay on fund distributions or redemption of fund shares. Investment performance reflects fee waivers that are or were in effect. In the absence of such fee waivers, total returns would be reduced. Index performance is for illustrative purposes only and does not reflect any expenses, transaction costs, or cash flow effects. Direct investment in the index is not available.
Stocks of mid-capitalization companies may be slightly less volatile than those of small-capitalization companies, but they still involve substantial risk and may be subject to increased volatility and more price fluctuation than large-capitalization companies.
Total returns at net asset value ("NAV") reflect performance over the time period indicated without including the fund's maximum sales charge and assume reinvestment of all distributions at NAV.
Total returns at public offering price ("POP") reflect performance over the time period indicated including a maximum front-end sales charge of 5.50% for Class A shares and the maximum contingent deferred sales charge ("CDSC") for Class B and Class C shares for the relevant period. Maximum CDSC is 5.00% for Class B shares in the first year, decreasing annually to 0% in the seventh year following purchase, and 1.00% for Class C shares. Total returns assume reinvestment of all distributions at NAV.
2 An unmanaged index that measures the performance of those Russell mid-cap companies with lower price-to-book ratios and lower forecasted growth values. The Russell Midcap Value Index is part of the larger Russell 1000 Value Index. The Russell 1000 Value Index is an unmanaged index that measures performance of those Russell 1000 companies with lower price-to-book ratios and lower forecasted growth values. Russell 1000 companies include the 1,000 largest companies in the Russell 3000 Index. The Russell 3000 Index measures the performance of the 3,000 largest U.S. companies based on total market capitalization, which represents approximately 98% of the investable U.S. equity market.
3 Performance for Class B, Class C, and Class R shares is not presented. Performance for these classes will vary due to different expense structures.
FIRST AMERICAN FUNDS Annual Report 2005
24
Mid Cap Value fund continued
Expense Example
As a shareholder of the Mid Cap Value Fund (the "fund"), you incur two types of costs: (1) transaction costs, including sales charges (loads) on purchase payments; and (2) ongoing costs, including advisory fees; distribution and/or service (12b-1) fees; and other fund expenses. This example is intended to help you understand your ongoing costs (in dollars) of investing in the fund and to compare these costs with the ongoing costs of investing in other mutual funds. The example is based on an investment of $1,000 invested at the beginning of the period and held for the entire period from April 1, 2005, to September 30, 2005.
Actual Expenses
For each class, the first line of the table below provides information about actual account values and actual expenses. You may use the information in this line, together with the amount you invested, to estimate the expenses that you paid over the period. Simply divide your account value by $1,000 (for example, an $8,600 account value divided by $1,000 = 8.6), then multiply the result by the number in the first line under the heading entitled "Expenses Paid During Period" to estimate the expenses you paid on your account during this period.
Hypothetical Example for Comparison Purposes
For each class, the second line of the table below provides information about hypothetical account values and hypothetical expenses based on the fund's actual expense ratio and an assumed rate of return of 5% per year before expenses, which is not the fund's actual return. The hypothetical account values and expenses may not be used to estimate the actual ending account balance or expenses you paid for the period. You may use this information to compare the ongoing costs of investing in the fund and other funds. To do so, compare this 5% hypothetical example with the 5% hypothetical examples that appear in the shareholder reports of the other funds.
Please note that the expenses shown in the table are meant to highlight your ongoing costs only and do not reflect any transactional costs, such as sales charges (loads). Therefore, the second line of the table for each class is useful in comparing ongoing costs only, and will not help you determine the relative total costs of owning different funds. In addition, if these transactional costs were included, your costs would have been higher.
Expense Examples
| | | Beginning Account
Value (4/01/05) | | Ending Account
Value (9/30/05) | | Expenses Paid During
Period1 (4/01/05 to
9/30/05) | |
| Class A Actual2,3 | | $ | 1,000.00 | | | $ | 1,083.30 | | | $ | 6.39 | | |
| Class A Hypothetical (5% return before expenses)3 | | $ | 1,000.00 | | | $ | 1,018.94 | | | $ | 6.19 | | |
| Class B Actual2,3 | | $ | 1,000.00 | | | $ | 1,079.40 | | | $ | 10.26 | | |
| Class B Hypothetical (5% return before expenses)3 | | $ | 1,000.00 | | | $ | 1,015.20 | | | $ | 9.94 | | |
| Class C Actual2,3 | | $ | 1,000.00 | | | $ | 1,078.70 | | | $ | 10.26 | | |
| Class C Hypothetical (5% return before expenses)3 | | $ | 1,000.00 | | | $ | 1,015.19 | | | $ | 9.95 | | |
| Class R Actual2,3 | | $ | 1,000.00 | | | $ | 1,081.50 | | | $ | 7.72 | | |
| Class R Hypothetical (5% return before expenses)3 | | $ | 1,000.00 | | | $ | 1,017.65 | | | $ | 7.49 | | |
| Class Y Actual2,3 | | $ | 1,000.00 | | | $ | 1,084.50 | | | $ | 5.06 | | |
| Class Y Hypothetical (5% return before expenses)3 | | $ | 1,000.00 | | | $ | 1,020.21 | | | $ | 4.91 | | |
1Expenses are equal to the fund's annualized expense ratio for the most recent six-month period of 1.22%, 1.97%, 1.97%, 1.48% and 0.97% for Class A, Class B, Class C, Class R and Class Y, respectively, multiplied by the average account value over the period, multiplied by the number of days in the most recent fiscal half-year/365 (to reflect the one-half year period).
2Based on the actual returns for the six months ended September 30, 2005: 8.33% for Class A, 7.94% for Class B, 7.87% for Class C, 8.15% for Class R and 8.45% for Class Y.
3Prior to July 1, 2005, the contractual limitation on annual expenses was 1.20%, 1.95%, 1.95%, 1.45% and 0.95% for Class A, Class B, Class C, Class R and Class Y, respectively. Effective July 1, 2005, the contractual limitation on annual expenses for each class was removed. If this limitation had not been in place during the entire period, actual and hypothetical ending account balances would have been approximately $1,083.13 and $1,018.77 for Class A, $1,079.21 and $1,015.01 for Class B, $1,078.52 and $1,015.03 for Class C, $1,081.37 and $1,017.52 for Class R, and $1,084.31 and $1,020.03 for Class Y and actual and hypothetical expenses paid during the period would have been approximately $6.56 and $6.36 for Class A, $10.45 and $10.13 for Class B, $10.44 and $10.12 for Class C, $7.85 and $7.61 for Class R and $5.25 and $5.09 for Class Y.
FIRST AMERICAN FUNDS Annual Report 2005
25
Large Cap Growth Opportunities fund
Investment Objective: long-term growth of capital
How did the Fund perform for the fiscal year ended September 30, 2005?
The First American Large Cap Growth Opportunities Fund (the "fund"), Class Y shares, returned 12.58% for the fiscal year ended September 30, 2005 (Class A shares returned 12.30% without taking the sales charge into account). By comparison, the fund's benchmark, the Russell 1000 Growth Index*, returned 11.60% for the same period.
What were the general economic and market conditions during the fiscal year?
Economic growth moderated but nevertheless continued at a solid pace over the course of the fiscal year. Solid economic growth, in turn, improved labor market conditions. While core inflation remained basically stable at a relatively low level, overall inflation rose with the continuing climb of energy prices during the past year. The combination of solid growth, lower unemployment, and the potential for higher energy prices to be reflected by broader inflation measures has kept the Fed incrementally raising the Fed Funds Rate at each Federal Open Market Committee meeting since June 2004.
The corporate sector of the economy has performed very well in this economic environment, with operating earnings up sharply through the third quarter of 2005. Energy was one of the dominant economic considerations throughout the year, and it had a meaningful bearing on the fund's strategy and a positive effect on its performance. Underlying economic conditions remain generally favorable for the financial markets, although risks have increased with energy prices and the widespread disruption to activity from Hurricanes Katrina and Rita.
What worked for the fund and why?
The fund's outperformance relative to the index was in large measure a result of good stock selection in the information technology, healthcare, and consumer discretionary sectors. An overweight in the energy sector also added value, as energy stock prices continued to rise, propelled by unflagging demand for energy and soaring commodity prices. Within the technology sector, the Internet portal Google was a robust performer, continuing to gain market value at a record-breaking pace and quadrupling its share price in the 14 months since going public. NCR Corp., a provider of hardware and software business solutions, was another standout, as was Texas Instruments, its earnings reflecting increased demand for semiconductor products. In healthcare, insurer Aetna and Alcon, a manufacturer of eye-care drugs and d evices, led the way, while in the consumer space, hotel chain Marriott, global information-media services company McGraw-Hill, and women's clothing company Chicos drove performance.
What did not work for the fund and why?
Adverse stock selection in the financials sector detracted from performance relative to the index. Investors Financial Services Corp., a service provider for a variety of asset managers, saw its stock price decline following lower-than-expected earnings. MBNA, a credit card company, also experienced a slump in earnings, reflecting a continued slowdown in the U.S. credit-card business.
What strategic moves were made by the fund and why?
The fund management team gained confidence in specific companies throughout the fiscal year, which led the team to reduce the number of stocks held within the portfolio and increase the weightings of the holdings relative to the fund's benchmark. In its stock selection, the fund continues to focus on companies that demonstrate the potential for sustainable earnings growth.
*Unlike mutual funds, index returns do not reflect any expenses, transaction costs, or cash flow effects.
| Top 10 Holdings as of September 30, 20051 (% of net assets) | |
| Procter & Gamble | | | 3.5 | % | |
| General Electric | | | 3.4 | % | |
| Intel | | | 3.0 | % | |
| Johnson & Johnson | | | 2.9 | % | |
| PepsiCo | | | 2.6 | % | |
| Amgen | | | 2.6 | % | |
| Microsoft | | | 2.5 | % | |
| Lowe's | | | 2.4 | % | |
| Target | | | 2.4 | % | |
| Dell | | | 2.2 | % | |
| Sector Allocation as of September 30, 20051 (% of net assets) | |
| Information Technology | | | 29.1 | % | |
| Health Care | | | 21.6 | % | |
| Consumer Discretionary | | | 13.7 | % | |
| Industrials | | | 10.5 | % | |
| Financials | | | 10.2 | % | |
| Consumer Staples | | | 7.6 | % | |
| Energy | | | 5.9 | % | |
| Short-Term Investments | | | 1.2 | % | |
| Other Assets and Liabilities, Net | | | 0.2 | % | |
| | | | 100.0 | % | |
1Fund holdings and sector allocations are subject to change at any time and are not recommendations to buy or sell any security.
FIRST AMERICAN FUNDS Annual Report 2005
26
Large Cap Growth Opportunities fund continued
Annual Performance1 as of September 30, 2005
| | | | | Since Inception | |
| | | 1 year | | 5 years | | 10 years | | 3/01/1999 | | 11/27/2000 | | 9/24/2001 | |
| Average annual return with sales charge (POP) | |
| Class A | | | 6.10 | % | | | (7.37 | )% | | | 5.13 | % | | | - | | | | - | | | | - | | |
| Class B | | | 6.47 | % | | | (7.35 | )% | | | - | | | | (2.11 | )% | | | - | | | | - | | |
| Class C | | | 10.44 | % | | | - | | | | - | | | | - | | | | - | | | | 3.60 | % | |
| Average annual return without sales charge (NAV) | |
| Class A | | | 12.30 | % | | | (6.32 | )% | | | 5.72 | % | | | - | | | | - | | | | - | | |
| Class B | | | 11.47 | % | | | (7.02 | )% | | | - | | | | (2.11 | )% | | | - | | | | - | | |
| Class C | | | 11.44 | % | | | - | | | | - | | | | - | | | | - | | | | 3.60 | % | |
| Class R | | | 12.04 | % | | | - | | | | - | | | | - | | | | (4.74 | )% | | | - | | |
| Class Y | | | 12.58 | % | | | (6.09 | )% | | | 5.99 | % | | | - | | | | - | | | | - | | |
| Russell 1000 Growth Index2 | | | 11.60 | % | | | (8.64 | )% | | | 6.89 | % | | | (2.84 | )% | | | (6.19 | )% | | | 4.76 | % | |
Value of a $10,000 Investment1,3 as of September 30, 2005
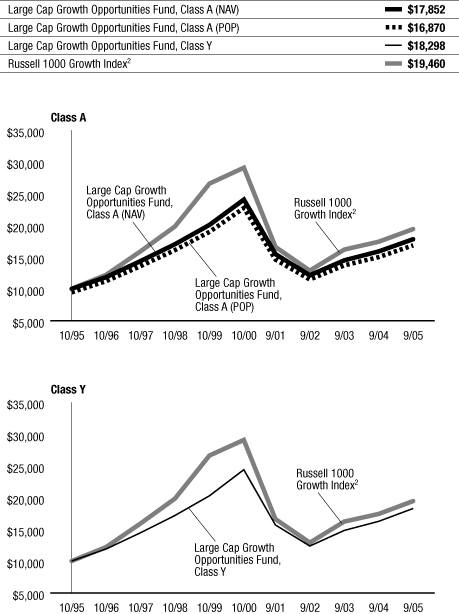
The chart above illustrates the total value of an assumed $10,000 investment in the fund's Class A and Class Y shares (from 10/31/95 to 9/30/05) as compared to the Russell 1000 Growth Index2.
The performance data quoted on this page represents past performance and does not guarantee future results. The investment return and principal value of an investment will fluctuate so that an investor's shares, when redeemed, may be worth more or less than their original cost. Current performance of the fund may be lower or higher than the performance data quoted. Performance data current to the most recent month-end may be obtained by calling 800.677.FUND.
1 Performance does not reflect the deduction of taxes that a shareholder would pay on fund distributions or redemption of fund shares. Investment performance reflects fee waivers that are or were in effect. In the absence of such fee waivers, total returns would be reduced. Index performance is for illustrative purposes only and does not reflect any expenses, transaction costs, or cash flow effects. Direct investment in the index is not available.
Growth stocks typically have more volatility than value stocks; whereas value stocks tend to have slower earnings growth rates.
Total returns at net asset value ("NAV") reflect performance over the time period indicated without including the fund's maximum sales charge and assume reinvestment of all distributions at NAV.
Total returns at public offering price ("POP") reflect performance over the time period indicated including a maximum front-end sales charge of 5.50% for Class A shares, and the maximum contingent deferred sales charge ("CDSC") for Class B and Class C shares for the relevant period. Maximum CDSC is 5.00% for Class B shares in the first year, decreasing annually to 0% in the seventh year following purchase, and 1.00% for Class C shares. Total returns assume reinvestment of all distributions at NAV.
On September 24, 2001, the First American Large Cap Growth Opportunities Fund became the successor by merger to the Firstar Large Cap Core Equity Fund, a series of Firstar Funds, Inc. Prior to the merger, the First American fund had no assets or liabilities. Performance presented prior to September 24, 2001, represents that of the Firstar Large Cap Core Equity Fund. Prior to January 10, 1995, the Firstar fund offered one class of shares to investors without a distribution or shareholder servicing fee. Performance presented prior to January 10, 1995, does not reflect these fees.
2 An unmanaged index that measures the performance of those Russell 1000 companies with higher price-to-book ratios and higher forecasted growth values. Russell 1000 companies include the 1,000 largest companies in the Russell 3000 Index. The Russell 3000 Index measures the performance of the 3,000 largest U.S. companies based on total market capitalization, which represents approximately 98% of the investable U.S. equity market.
3 Performance for Class B, Class C, and Class R shares is not presented. Performance for these classes will vary due to different expense structures.
FIRST AMERICAN FUNDS Annual Report 2005
27
Large Cap Growth Opportunities fund continued
Expense Example
As a shareholder of the Large Cap Growth Opportunities Fund (the "fund"), you incur two types of costs: (1) transaction costs, including sales charges (loads) on purchase payments; and (2) ongoing costs, including advisory fees; distribution and/or service (12b-1) fees; and other fund expenses. This example is intended to help you understand your ongoing costs (in dollars) of investing in the fund and to compare these costs with the ongoing costs of investing in other mutual funds. The example is based on an investment of $1,000 invested at the beginning of the period and held for the entire period from April 1, 2005, to September 30, 2005.
Actual Expenses
For each class, the first line of the table below provides information about actual account values and actual expenses. You may use the information in this line, together with the amount you invested, to estimate the expenses that you paid over the period. Simply divide your account value by $1,000 (for example, an $8,600 account value divided by $1,000 = 8.6), then multiply the result by the number in the first line under the heading entitled "Expenses Paid During Period" to estimate the expenses you paid on your account during this period.
Hypothetical Example for Comparison Purposes
For each class, the second line of the table below provides information about hypothetical account values and hypothetical expenses based on the fund's actual expense ratio and an assumed rate of return of 5% per year before expenses, which is not the fund's actual return. The hypothetical account values and expenses may not be used to estimate the actual ending account balance or expenses you paid for the period. You may use this information to compare the ongoing costs of investing in the fund and other funds. To do so, compare this 5% hypothetical example with the 5% hypothetical examples that appear in the shareholder reports of the other funds.
Please note that the expenses shown in the table are meant to highlight your ongoing costs only and do not reflect any transactional costs, such as sales charges (loads). Therefore, the second line of the table for each class is useful in comparing ongoing costs only, and will not help you determine the relative total costs of owning different funds. In addition, if these transactional costs were included, your costs would have been higher.
Expense Examples
| | | Beginning Account
Value (4/01/05) | | Ending Account
Value (9/30/05) | | Expenses Paid During
Period1 (4/01/05 to
9/30/05) | |
| Class A Actual2,3 | | $ | 1,000.00 | | | $ | 1,060.90 | | | $ | 6.10 | | |
| Class A Hypothetical (5% return before expenses)3 | | $ | 1,000.00 | | | $ | 1,019.15 | | | $ | 5.98 | | |
| Class B Actual2,3 | | $ | 1,000.00 | | | $ | 1,056.90 | | | $ | 9.96 | | |
| Class B Hypothetical (5% return before expenses)3 | | $ | 1,000.00 | | | $ | 1,015.39 | | | $ | 9.76 | | |
| Class C Actual2,3 | | $ | 1,000.00 | | | $ | 1,056.90 | | | $ | 9.96 | | |
| Class C Hypothetical (5% return before expenses)3 | | $ | 1,000.00 | | | $ | 1,015.39 | | | $ | 9.76 | | |
| Class R Actual2,3 | | $ | 1,000.00 | | | $ | 1,059.90 | | | $ | 7.55 | | |
| Class R Hypothetical (5% return before expenses)3 | | $ | 1,000.00 | | | $ | 1,017.74 | | | $ | 7.39 | | |
| Class Y Actual2,3 | | $ | 1,000.00 | | | $ | 1,062.40 | | | $ | 4.82 | | |
| Class Y Hypothetical (5% return before expenses)3 | | $ | 1,000.00 | | | $ | 1,020.40 | | | $ | 4.72 | | |
1Expenses are equal to the fund's annualized expense ratio for the most recent six-month period of 1.18%, 1.93%, 1.93%, 1.46% and 0.93% for Class A, Class B, Class C, Class R and Class Y, respectively, multiplied by the average account value over the period, multiplied by the number of days in the most recent fiscal half-year/365 (to reflect the one-half year period).
2Based on the actual returns for the six months ended September 30, 2005: 6.09% for Class A, 5.69% for Class B, 5.69% for Class C, 5.99% for Class R and 6.24% for Class Y.
3Prior to July 1, 2005, the contractual limitation on annual expenses was 1.15%, 1.90%, 1.90%, 1.40% and 0.90% for Class A, Class B, Class C, Class R and Class Y, respectively. Effective July 1, 2005, the contractual limitation on annual expenses for each class was removed. If this limitation had not been in place during the entire period, actual and hypothetical ending account balances would have been approximately $1,060.80 and $1,019.06 for Class A, $1,056.81 and $1,015.29 for Class B, $1,056.81 and $1,015.29 for Class C, $1,059.90 and $1,017.74 for Class R, and $1,062.31 and $1,020.31 for Class Y and actual and hypothetical expenses paid during the period would have been approximately $6.20 and $6.07 for Class A, $10.05 and $9.85 for Class B, $10.05 and $9.85 for Class C, $7.55 and $7.39 for Class R and $4.91 and $4.81 for Class Y.
FIRST AMERICAN FUNDS Annual Report 2005
28
Large Cap Select fund
Investment Objective: capital appreciation
How did the fund perform for the fiscal year ended September 30, 2005?
The First American Large Cap Select Fund (the "fund"), Class Y shares, returned 18.14% for the fiscal year ended September 30, 2005 (Class A shares returned 17.83% without taking the sales charge into account). By comparison, the fund's benchmark, the Standard & Poor's 500 Composite Index* ("S&P 500 Composite Index*"), returned 12.25% for the same period.
What were the general economic and market conditions during the fiscal year?
Economic growth moderated but nevertheless continued at a solid pace over the course of the fiscal year. Solid economic growth, in turn, improved labor market conditions. While core inflation remained basically stable at a relatively low level, overall inflation rose with the continuing climb of energy prices during the past year. The combination of solid growth, lower unemployment, and the potential for higher energy prices to be reflected by broader inflation measures has kept the Fed incrementally raising the Fed Funds Rate at each Federal Open Market Committee meeting since June 2004.
The corporate sector of the economy has performed very well in this economic environment, with operating earnings up sharply through the third quarter of 2005. Underlying economic conditions remain generally favorable for the financial markets, although risks have risen with energy prices and the widespread disruption to activity from Hurricanes Katrina and Rita.
What worked for the fund and why?
Good stock selection across most sectors, as well as overweights in energy and healthcare and underweights in materials and telecommunications services, caused the fund to outperform relative to the index. In the energy sector, where rising prices made for strong profit growth, standout performers – National Oilwell Varco, Amerada Hess, Halliburton, and Conoco – are engaged either in oil and gas exploration or petroleum production and sales, and their strong performance was spurred by growing demand and higher prices. In healthcare, Wyeth, a pharmaceutical company, produced strong results following a turnaround, while in the technology sector Motorola, a mobile phone and semiconductor manufacturer, and NCR Corp., a provider of hardware and software business solutions, were key drivers of performan ce.
What did not work for the fund and why?
The fund was underweight in utilities, which performed better than expected, but this deficiency had a negligible impact on performance since good stock selection in the sector compensated for it.
What strategic moves were made by the fund and why?
The fund adheres closely to the First American Funds signature approach to the stock selection process, whereby fundamental analysts, quantitative analysts, and portfolio managers collaborate closely in making portfolio decisions. Convinced of the effectiveness of this investment process, we trimmed the number of the names in the portfolio as our investment process increased our conviction. We moved to an overweight in the technology sector, based on historically more reasonable values and better earnings growth outlook. Early in the fiscal year we moved the fund to an overweight in the energy sector, taking advantage of the supply/demand imbalance that brought prices higher and generated strong earnings growth; we have now reduced this overweight based on valuations, which reached our target price. We expect to get most of our return through stock selection.
*Unlike mutual funds, index returns do not reflect any expenses, transaction costs, or cash flow effects.
| Top 10 Holdings as of September 30, 20051 (% of net assets) | |
| Intel | | | 4.4 | % | |
| Goldman Sachs Group | | | 3.7 | % | |
| Bank of America | | | 3.7 | % | |
| Johnson & Johnson | | | 3.7 | % | |
| Wells Fargo | | | 3.6 | % | |
| Wyeth Pharmaceuticals | | | 3.3 | % | |
| Hewlett-Packard | | | 3.1 | % | |
| General Electric | | | 3.0 | % | |
| Microsoft | | | 2.9 | % | |
| Procter & Gamble | | | 2.8 | % | |
| Sector Allocation as of September 30, 20051 (% of net assets) | |
| Information Technology | | | 22.9 | % | |
| Financials | | | 20.9 | % | |
| Health Care | | | 12.4 | % | |
| Energy | | | 11.2 | % | |
| Industrials | | | 10.7 | % | |
| Consumer Discretionary | | | 10.6 | % | |
| Consumer Staples | | | 4.6 | % | |
| Short-Term Investments | | | 3.0 | % | |
| Materials | | | 2.5 | % | |
| Telecommunication Services | | | 2.5 | % | |
| Utilities | | | 1.2 | % | |
| Other Assets and Liabilities, Net | | | (2.5 | )% | |
| | | | 100.0 | % | |
1Fund holdings and sector allocations are subject to change at any time and are not recommendations to buy or sell any security.
FIRST AMERICAN FUNDS Annual Report 2005
29
Large Cap Select fund continued
Annual Performance1 as of September 30, 2005
| | | | | Since Inception | |
| | | 1 year | | 1/31/2003 | |
| Average annual return with sales charge (POP) | | | | | | | | | |
| Class A | | | 11.34 | % | | | 14.02 | % | |
| Class B | | | 12.02 | % | | | 14.33 | % | |
| Class C | | | 15.91 | % | | | 15.55 | % | |
| Average annual return without sales charge (NAV) | |
| Class A | | | 17.83 | % | | | 16.46 | % | |
| Class B | | | 17.02 | % | | | 15.52 | % | |
| Class C | | | 16.91 | % | | | 15.55 | % | |
| Class R | | | 17.54 | % | | | 16.21 | % | |
| Class Y | | | 18.14 | % | | | 16.73 | % | |
| S&P 500 Composite Index2 | | | 12.25 | % | | | 16.61 | % | |
Value of a $10,000 Investment1,3 as of September 30, 2005
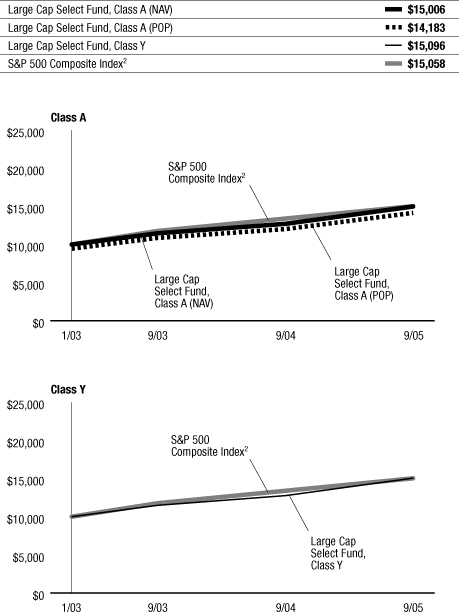
The chart above illustrates the total value of an assumed $10,000 investment in the fund's Class A and Class Y shares (from 1/31/03 to 9/30/05) as compared to the S&P 500 Composite Index2.
The performance data quoted on this page represents past performance and does not guarantee future results. The investment return and principal value of an investment will fluctuate so that an investor's shares, when redeemed, may be worth more or less than their original cost. Current performance of the fund may be lower or higher than the performance data quoted. Performance data current to the most recent month-end may be obtained by calling 800.677.FUND.
1 Performance does not reflect the deduction of taxes that a shareholder would pay on fund distributions or redemption of fund shares. Investment performance reflects fee waivers that are or were in effect. In the absence of such fee waivers, total returns would be reduced. Index performance is for illustrative purposes only and does not reflect any expenses, transaction costs, or cash flow effects. Direct investment in the index is not available.
Mutual fund investing involves risk; principal loss is possible.
Total returns at net asset value ("NAV") reflect performance over the time period indicated without including the fund's maximum sales charge and assume reinvestment of all distributions at NAV.
Total returns at public offering price ("POP") reflect performance over the time period indicated including a maximum front-end sales charge of 5.50% for Class A shares and the maximum contingent deferred sales charge ("CDSC") for Class B and Class C shares for the relevant period. Maximum CDSC is 5.00% for Class B shares in the first year, decreasing annually to 0% in the seventh year following purchase, and 1.00% for Class C shares. Total returns assume reinvestment of all distributions at NAV.
2 An unmanaged index of large-capitalization stocks that includes a representative sample of 500 leading companies in leading industries of the U.S. economy. Although the S&P 500 focuses on the large-cap segment of the market, with over 80% coverage of U.S. equities, it also serves as a proxy for the total market.
3 Performance for Class B, Class C, and Class R shares is not presented. Performance for these classes will vary due to different expense structures.
FIRST AMERICAN FUNDS Annual Report 2005
30
Large Cap Select fund continued
Expense Example
As a shareholder of the Large Cap Select Fund (the "fund"), you incur two types of costs: (1) transaction costs, including sales charges (loads) on purchase payments; and (2) ongoing costs, including advisory fees; distribution and/or service (12b-1) fees; and other fund expenses. This example is intended to help you understand your ongoing costs (in dollars) of investing in the fund and to compare these costs with the ongoing costs of investing in other mutual funds. The example is based on an investment of $1,000 invested at the beginning of the period and held for the entire period from April 1, 2005, to September 30, 2005.
Actual Expenses
For each class, the first line of the table below provides information about actual account values and actual expenses. You may use the information in this line, together with the amount you invested, to estimate the expenses that you paid over the period. Simply divide your account value by $1,000 (for example, an $8,600 account value divided by $1,000 = 8.6), then multiply the result by the number in the first line under the heading entitled "Expenses Paid During Period" to estimate the expenses you paid on your account during this period.
Hypothetical Example for Comparison Purposes
For each class, the second line of the table below provides information about hypothetical account values and hypothetical expenses based on the fund's actual expense ratio and an assumed rate of return of 5% per year before expenses, which is not the fund's actual return. The hypothetical account values and expenses may not be used to estimate the actual ending account balance or expenses you paid for the period. You may use this information to compare the ongoing costs of investing in the fund and other funds. To do so, compare this 5% hypothetical example with the 5% hypothetical examples that appear in the shareholder reports of the other funds.
Please note that the expenses shown in the table are meant to highlight your ongoing costs only and do not reflect any transactional costs, such as sales charges (loads). Therefore, the second line of the table for each class is useful in comparing ongoing costs only, and will not help you determine the relative total costs of owning different funds. In addition, if these transactional costs were included, your costs would have been higher.
Expense Examples
| | | Beginning Account
Value (4/01/05) | | Ending Account
Value (9/30/05) | | Expenses Paid During
Period1 (4/01/05 to
9/30/05) | |
| Class A Actual2,3 | | $ | 1,000.00 | | | $ | 1,068.70 | | | $ | 6.17 | | |
| Class A Hypothetical (5% return before expenses)3 | | $ | 1,000.00 | | | $ | 1,019.10 | | | $ | 6.02 | | |
| Class B Actual2,3 | | $ | 1,000.00 | | | $ | 1,064.00 | | | $ | 9.96 | | |
| Class B Hypothetical (5% return before expenses)3 | | $ | 1,000.00 | | | $ | 1,015.42 | | | $ | 9.73 | | |
| Class C Actual2,3 | | $ | 1,000.00 | | | $ | 1,063.90 | | | $ | 9.99 | | |
| Class C Hypothetical (5% return before expenses)3 | | $ | 1,000.00 | | | $ | 1,015.39 | | | $ | 9.75 | | |
| Class R Actual2,3 | | $ | 1,000.00 | | | $ | 1,066.70 | | | $ | 7.25 | | |
| Class R Hypothetical (5% return before expenses)3 | | $ | 1,000.00 | | | $ | 1,018.05 | | | $ | 7.08 | | |
| Class Y Actual2,3 | | $ | 1,000.00 | | | $ | 1,068.90 | | | $ | 4.84 | | |
| Class Y Hypothetical (5% return before expenses)3 | | $ | 1,000.00 | | | $ | 1,020.39 | | | $ | 4.72 | | |
1 Expenses are equal to the fund's annualized expense ratio for the most recent six-month period of 1.19%, 1.93%, 1.93%, 1.40% and 0.93% for Class A, Class B, Class C, Class R and Class Y, respectively, multiplied by the average account value over the period, multiplied by the number of days in the most recent fiscal half-year/365 (to reflect the one-half year period).
2Based on the actual returns for the six months ended September 30, 2005: 6.87% for Class A, 6.40% for Class B, 6.39% for Class C, 6.67% for Class R and 6.89% for Class Y.
3Prior to July 1, 2005, the contractual limitation on annual expenses was 1.15%, 1.90%, 1.90%, 1.40% and 0.90% for Class A, Class B, Class C, Class R and Class Y, respectively. Effective July 1, 2005, the contractual limitation on annual expenses for each class was removed. If this limitation had not been in place during the entire period, actual and hypothetical ending account balances would have been approximately $1,068.55 and $1,018.96 for Class A, $1,063.78 and $1,015.21 for Class B, $1,063.72 and $1,015.21 for Class C, $1,066.56 and $1,017.91 for Class R, and $1,068.71 and $1,020.20 for Class Y and actual and hypothetical expenses paid during the period would have been approximately $6.32 and $6.16 for Class A, $10.18 and $9.94 for Class B, $10.17 and $9.93 for Class C, $7.39 and $7.22 for Class R and $5.03 and $4.91 for Class Y.
FIRST AMERICAN FUNDS Annual Report 2005
31
Large Cap Value fund
Investment Objective: primary – capital appreciation; secondary – current income
How did the Fund perform for the fiscal year ended September 30, 2005?
The First American Large Cap Value Fund (the "fund"), Class Y shares, returned 17.92% for the fiscal year ended September 30, 2005 (Class A shares returned 17.62% without taking the sales charge into account). By comparison, the fund's benchmark, the Russell 1000 Value Index*, returned 16.69% for the same period.
What were the general economic and market conditions during the fiscal year?
Economic growth moderated but nevertheless continued at a solid pace over the course of the fiscal year. Solid economic growth, in turn, improved labor market conditions. While core inflation remained basically stable at a relatively low level, overall inflation rose with the continuing climb of energy prices during the past year. The combination of solid growth, lower unemployment, and the potential for higher energy prices to be reflected by broader inflation measures has kept the Fed incrementally raising the Fed Funds Rate at each Federal Open Market Committee meeting since June 2004.
The corporate sector of the economy has performed very well in this economic environment, with operating earnings up sharply through the third quarter of 2005. Underlying economic conditions remain generally favorable for the financial markets, although risks have risen with energy prices and the widespread disruption to activity from Hurricanes Katrina and Rita.
What worked for the fund and why?
Strong performance and good stock selection in the energy, technology, consumer discretionary, and utilities sectors contributed to the fund's outperformance relative to the index. High energy demand, coupled with rising prices, boosted the results of the companies involved in crude oil and natural exploration and production – Conoco Phillips and EOG Resources – as well as those in the oil service industry, like Halliburton and National Oilwell Varco. In the technology sector, strong results from Texas Instruments and National Semiconductor were a reflection of increased demand for a broad range of semiconductor products. NCR Corp., a provider of hardware and software business solutions, and Motorola were also strong performers in the technology sector. In the consumer discretionary sector, high o ccupancy levels driven by increased company travel budgets led to positive results from Hilton Hotels. The fund also benefited from positive performance by Lehman Brothers Holdings, Goldman Sachs, and Phelps Dodge.
What did not work for the fund and why?
Weaker performance in the consumer staples, industrials, and materials sectors detracted from the overall performance of the fund. In the consumer staples area, our lack of exposure to grocery store retailers earlier in the fiscal year proved a missed opportunity, as these stocks traded up on speculation of buyout activity. Clorox and General Mills performed below expectations. In the materials sector, Dow Chemical, as well as Weyerhauser and MeadWestvaco (paper companies), produced disappointing results, as did Tyco and Eaton Corp. in the industrial sector.
What strategic moves were made by the fund and why?
In terms of sector positioning, the fund ended the fiscal year as it began. Overweights were maintained in the technology and energy sectors, as we continued to feel that technology stocks would benefit from a growing economy and that the continuation of high commodity prices, coupled with favorable supply and demand characteristics, would lead to strong performance in the energy sector. We maintained underweights in the financials and utilities sectors based on our belief that these sectors are enjoying peak fundamental conditions and full valuations.
*Unlike mutual funds, index returns do not reflect any expenses, transaction costs, or cash flow effects.
| Top 10 Holdings as of September 30, 20051 (% of net assets) | |
| Exxon Mobil | | | 5.1 | % | |
| Bank of America | | | 3.9 | % | |
| Hewlett-Packard | | | 3.6 | % | |
| ConocoPhillips | | | 3.1 | % | |
| Wyeth Pharmaceuticals | | | 3.1 | % | |
| Citigroup | | | 2.9 | % | |
| Time Warner | | | 2.9 | % | |
| Lehman Brothers Holdings | | | 2.7 | % | |
| Goldman Sachs Group | | | 2.7 | % | |
| Wells Fargo | | | 2.7 | % | |
| Sector Allocation as of September 30, 20051 (% of net assets) | |
| Financials | | | 31.5 | % | |
| Energy | | | 16.8 | % | |
| Information Technology | | | 9.5 | % | |
| Consumer Discretionary | | | 9.1 | % | |
| Health Care | | | 9.0 | % | |
| Industrials | | | 7.4 | % | |
| Consumer Staples | | | 5.6 | % | |
| Materials | | | 3.7 | % | |
| Utilities | | | 3.7 | % | |
| Telecommunication Services | | | 3.2 | % | |
| Short-Term Investments | | | 0.6 | % | |
| Other Assets and Liabilities, Net | | | (0.1 | )% | |
| | | | 100.0 | % | |
1Fund holdings and sector allocations are subject to change at any time and are not recommendations to buy or sell any security.
FIRST AMERICAN FUNDS Annual Report 2005
32
Large Cap Value fund continued
Annual Performance1 as of September 30, 2005
| | | | | Since Inception | |
| | | 1 year | | 5 years | | 10 years | | 2/01/1999 | | 9/24/2001 | |
| Average annual return with sales charge (POP) | |
| Class A | | | 11.16 | % | | | 1.26 | % | | | 7.47 | % | | | - | | | | - | | |
| Class B | | | 11.77 | % | | | 1.28 | % | | | 7.29 | % | | | - | | | | - | | |
| Class C | | | 15.75 | % | | | 1.64 | % | | | - | | | | 1.51 | % | | | - | | |
| Average annual return without sales charge (NAV) | |
| Class A | | | 17.62 | % | | | 2.42 | % | | | 8.08 | % | | | - | | | | - | | |
| Class B | | | 16.70 | % | | | 1.65 | % | | | 7.29 | % | | | - | | | | - | | |
| Class C | | | 16.75 | % | | | 1.64 | % | | | - | | | | 1.51 | % | | | - | | |
| Class R | | | 17.34 | % | | | - | | | | - | | | | - | | | | 7.92 | % | |
| Class Y | | | 17.92 | % | | | 2.68 | % | | | 8.37 | % | | | - | | | | - | | |
| Russell 1000 Value Index2 | | | 16.69 | % | | | 5.76 | % | | | 11.52 | % | | | 5.88 | % | | | 10.90 | % | |
Value of a $10,000 Investment1,3 as of September 30, 2005
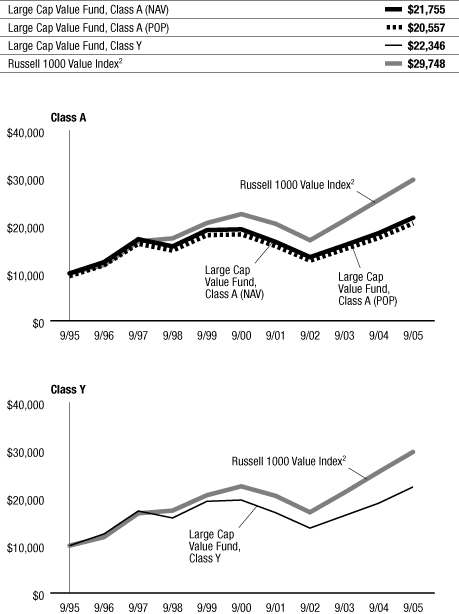
The chart above illustrates the total value of an assumed $10,000 investment in the fund's Class A and Class Y shares (from 9/30/95 to 9/30/05) as compared to the Russell 1000 Value Index2.
The performance data quoted on this page represents past performance and does not guarantee future results. The investment return and principal value of an investment will fluctuate so that an investor's shares, when redeemed, may be worth more or less than their original cost. Current performance of the fund may be lower or higher than the performance data quoted. Performance data current to the most recent month-end may be obtained by calling 800.677.FUND.
1 Performance does not reflect the deduction of taxes that a shareholder would pay on fund distributions or redemption of fund shares. Investment performance reflects fee waivers that are or were in effect. In the absence of such fee waivers, total returns would be reduced. Index performance is for illustrative purposes only and does not reflect any expenses, transaction costs, or cash flow effects. Direct investment in the index is not available.
Mutual fund investing involves risk; principal loss is possible.
Total returns at net asset value ("NAV") reflect performance over the time period indicated without including the fund's maximum sales charge and assume reinvestment of all distributions at NAV.
Total returns at public offering price ("POP") reflect performance over the time period indicated including a maximum front-end sales charge of 5.50% for Class A shares and the maximum contingent deferred sales charge ("CDSC") for Class B and Class C shares for the relevant period. Maximum CDSC is 5.00% for Class B shares in the first year, decreasing annually to 0% in the seventh year following purchase, and 1.00% for Class C shares. Total returns assume reinvestment of all distributions at NAV.
2 An unmanaged index that measures the performance of those Russell 1000 companies with lower price-to-book ratios and lower forecasted growth values. Russell 1000 companies include the 1,000 largest companies in the Russell 3000 Index. The Russell 3000 Index measures the performance of the 3,000 largest U.S. companies based on total market capitalization, which represents approximately 98% of the investable U.S. equity market.
3 Performance for Class B, Class C, and Class R shares is not presented. Performance for these classes will vary due to different expense structures.
FIRST AMERICAN FUNDS Annual Report 2005
33
Large Cap Value fund continued
Expense Example
As a shareholder of the Large Cap Value Fund (the "fund"), you incur two types of costs: (1) transaction costs, including sales charges (loads) on purchase payments; and (2) ongoing costs, including advisory fees; distribution and/or service (12b-1) fees; and other fund expenses. This example is intended to help you understand your ongoing costs (in dollars) of investing in the fund and to compare these costs with the ongoing costs of investing in other mutual funds. The example is based on an investment of $1,000 invested at the beginning of the period and held for the entire period from April 1, 2005, to September 30, 2005.
Actual Expenses
For each class, the first line of the table below provides information about actual account values and actual expenses. You may use the information in this line, together with the amount you invested, to estimate the expenses that you paid over the period. Simply divide your account value by $1,000 (for example, an $8,600 account value divided by $1,000 = 8.6), then multiply the result by the number in the first line under the heading entitled "Expenses Paid During Period" to estimate the expenses you paid on your account during this period.
Hypothetical Example for Comparison Purposes
For each class, the second line of the table below provides information about hypothetical account values and hypothetical expenses based on the fund's actual expense ratio and an assumed rate of return of 5% per year before expenses, which is not the fund's actual return. The hypothetical account values and expenses may not be used to estimate the actual ending account balance or expenses you paid for the period. You may use this information to compare the ongoing costs of investing in the fund and other funds. To do so, compare this 5% hypothetical example with the 5% hypothetical examples that appear in the shareholder reports of the other funds.
Please note that the expenses shown in the table are meant to highlight your ongoing costs only and do not reflect any transactional costs, such as sales charges (loads). Therefore, the second line of the table for each class is useful in comparing ongoing costs only, and will not help you determine the relative total costs of owning different funds. In addition, if these transactional costs were included, your costs would have been higher.
Expense Examples
| | | Beginning Account
Value (4/01/05) | | Ending Account
Value (9/30/05) | | Expenses Paid During
Period1 (4/01/05 to
9/30/05) | |
| Class A Actual2,3 | | $ | 1,000.00 | | | $ | 1,067.50 | | | $ | 6.12 | | |
| Class A Hypothetical (5% return before expenses)3 | | $ | 1,000.00 | | | $ | 1,019.15 | | | $ | 5.98 | | |
| Class B Actual2,3 | | $ | 1,000.00 | | | $ | 1,063.50 | | | $ | 9.98 | | |
| Class B Hypothetical (5% return before expenses)3 | | $ | 1,000.00 | | | $ | 1,015.39 | | | $ | 9.75 | | |
| Class C Actual2,3 | | $ | 1,000.00 | | | $ | 1,063.20 | | | $ | 9.98 | | |
| Class C Hypothetical (5% return before expenses)3 | | $ | 1,000.00 | | | $ | 1,015.39 | | | $ | 9.75 | | |
| Class R Actual2,3 | | $ | 1,000.00 | | | $ | 1,066.50 | | | $ | 7.40 | | |
| Class R Hypothetical (5% return before expenses)3 | | $ | 1,000.00 | | | $ | 1,017.90 | | | $ | 7.23 | | |
| Class Y Actual2,3 | | $ | 1,000.00 | | | $ | 1,069.20 | | | $ | 4.83 | | |
| Class Y Hypothetical (5% return before expenses)3 | | $ | 1,000.00 | | | $ | 1,020.40 | | | $ | 4.72 | | |
1 Expenses are equal to the fund's annualized expense ratio for the most recent six-month period of 1.18%, 1.93%, 1.93%, 1.43% and 0.93% for Class A, Class B, Class C, Class R and Class Y, respectively, multiplied by the average account value over the period, multiplied by the number of days in the most recent fiscal half-year/365 (to reflect the one-half year period).
2Based on the actual returns for the six months ended September 30, 2005: 6.75% for Class A, 6.35% for Class B, 6.32% for Class C, 6.65% for Class R and 6.92% for Class Y.
3Prior to July 1, 2005, the contractual limitation on annual expenses was 1.15%, 1.90%, 1.90%, 1.40% and 0.90% for Class A, Class B, Class C, Class R and Class Y, respectively. Effective July 1, 2005, the contractual limitation on annual expenses for each class was removed. If this limitation had not been in place during the entire period, actual and hypothetical ending account balances would have been approximately $1,067.40 and $1,019.05 for Class A, $1,063.39 and $1,015.29 for Class B, $1,063.09 and $1,015.29 for Class C, $1,066.49 and $1,017.90 for Class R, and $1,069.10 and $1,020.30 for Class Y and actual and hypothetical expenses paid during the period would have been approximately $6.22 and $6.07 for Class A, $10.09 and $9.86 for Class B, $10.09 and $9.85 for Class C, $7.41 and $7.23 for Class R and $4.93 and $4.81 for Class Y.
FIRST AMERICAN FUNDS Annual Report 2005
34
Balanced fund
Investment Objective: maximize total return (capital appreciation plus income)
How did the fund perform for the fiscal year ended September 30, 2005?
The First American Balanced Fund (the "fund"), Class Y shares, returned 14.76% for the fiscal year ended September 30, 2005 (Class A shares returned 14.51% without taking the sales charge into account). By comparison, the fund's benchmarks, the Russell 3000 Index* and the Lehman Aggregate Bond Index*, returned 12.60% and 2.80%, respectively, for the same period.
What were the general economic and market conditions during the fiscal year?
Economic growth moderated but nevertheless continued at a solid pace over the course of the fiscal year. Solid economic growth, in turn, improved labor market conditions. While core inflation remained basically stable at a relatively low level, overall inflation rose with the continuing climb of energy prices during the past year. The combination of solid growth, lower unemployment, and the potential for higher energy prices to be reflected by broader inflation measures has kept the Fed incrementally raising the Fed Funds Rate at each Federal Open Market Committee meeting since June 2004.
While the Fed's measured approach to tightening monetary policy helped foster stability in the bond market, it had little effect on long-term rates, which remained low as short-term rates inched higher. As a result, the flattening yield curve (i.e., a greater rise in short-term rates than in long-term rates) made bonds with maturities of 10 years or longer more attractive than their shorter-term counterparts. The corporate sector of the economy has performed very well, with operating earnings up sharply through the third quarter of 2005. As a result, high-yield credit enjoyed continued strong performance, though increasingly there have been indications that the credit cycle has passed its peak.
Underlying economic conditions remain generally favorable for the financial markets, although risks have risen with energy prices and the widespread disruption to activity from Hurricanes Katrina and Rita.
What worked for the fund and why?
Within the stock portion of the fund, good stock selection across several sectors, as well as overweights in energy and healthcare and underweights in materials and telecommunications services, caused the fund to outperform relative to the index. In the energy sector, where rising prices made for strong profit growth, standout performers – National Oilwell Varco, Amerada Hess, Halliburton, and Conoco Phillips – engaged in oil and gas exploration or petroleum production and sales, and their strong performance was spurred by growing demand and higher prices. In healthcare, Wyeth, a pharmaceutical company, produced strong results following a turnaround, while in the technology sector Motorola and NCR Corp., a provider of hardware and software business solutions, were key drivers of performance.
Within the bond section, the fund's strategic positioning to take advantage of the flattening yield curve was the main driver of performance. Emerging market bonds (issued by national governments) also added value, as did asset-backed and mortgage-backed securities.
What did not work for the fund and why?
In the stock portion, the fund was underweight in utilities, which performed better than expected, but this deficiency had negligible impact on performance since good stock selection in the sector compensated for it. In fixed income, periodic underweights in A- and AA-rated corporate bonds dampened performance as credit continued to rally. On the whole, however, this portion of the portfolio also enjoyed very strong performance.
What strategic moves were made by the fund and why?
Along with maintaining larger-than-normal allocations to equities generally, and to large-capitalization stocks in particular, we established positions in foreign stocks by investing in Exchange Traded Index Funds midway through the reporting period. These investments, which offer fairly broad diversification across developed and emerging markets, currently amount to approximately 10% of the fund's total equity segment. Added to the portfolio in anticipation of good results due to strong growth and reasonable valuations abroad, this portion of the fund produced strong outperformance against domestic equities in the final quarter of the reporting period.
The fixed-income portion of the portfolio was positioned for the flatter yield curve and was modestly short on duration. Having begun the fiscal year with overweights in lower-grade (BBB) corporate bonds and high-yield bonds, we reduced these positions late in the fiscal year, given the maturing credit cycle and less attractive valuations following a year of strong performance.
*Unlike mutual funds, index returns do not reflect any expenses, transaction costs, or cash flow effects.
| Top 10 Holdings as of September 30, 20051 (% of net assets) | |
| iShares MSCI EAFE Index fund | | | 4.7 | % | |
| Intel | | | 2.5 | % | |
| Goldman Sachs | | | 2.1 | % | |
| Bank of America | | | 2.1 | % | |
| Johnson & Johnson | | | 2.1 | % | |
| Wells Fargo | | | 2.0 | % | |
| Wyeth | | | 1.9 | % | |
| Hewlett Packard | | | 1.8 | % | |
| General Electric | | | 1.7 | % | |
| Microsoft | | | 1.6 | % | |
| Proctor & Gamble | | | 1.6 | % | |
| Portfolio Allocation as of September 30, 20051 (% of net assets) | |
| Stocks | | | 62.3 | % | |
| Bonds | | | 29.9 | % | |
| Investment Companies | | | 7.2 | % | |
| Short-Term Investments | | | 1.4 | % | |
| Other Assets and Liabilities, Net | | | (0.8 | )% | |
| | | | 100.0 | % | |
1Fund holdings and sector allocations are subject to change at any time and are not recommendations to buy or sell any security.
FIRST AMERICAN FUNDS Annual Report 2005
35
Balanced fund continued
Annual Performance1 as of September 30, 2005
| | | | | Since Inception | |
| | | 1 year | | 5 years | | 10 years | | 3/1/1999 | | 11/27/2000 | | 9/24/2001 | |
| Average annual return with sales charge (POP) | |
| Class A | | | 8.21 | % | | | (0.17 | )% | | | 6.13 | % | | | - | | | | - | | | | - | | |
| Class B | | | 8.64 | % | | | (0.13 | )% | | | - | | | | 3.10 | % | | | - | | | | - | | |
| Class C | | | 12.61 | % | | | - | | | | - | | | | - | | | | - | | | | 6.18 | % | |
| Average annual return without sales charge (NAV) | |
| Class A | | | 14.51 | % | | | 0.97 | % | | | 6.74 | % | | | - | | | | - | | | | - | | |
| Class B | | | 13.64 | % | | | 0.20 | % | | | - | | | | 3.10 | % | | | - | | | | - | | |
| Class C | | | 13.61 | % | | | - | | | | - | | | | - | | | | - | | | | 6.18 | % | |
| Class R | | | 14.16 | % | | | - | | | | - | | | | - | | | | 2.01 | % | | | - | | |
| Class Y | | | 14.76 | % | | | 1.22 | % | | | 7.02 | % | | | - | | | | - | | | | - | | |
| Russell 3000 Index2 | | | 12.60 | % | | | (2.30 | )% | | | 7.81 | % | | | 1.13 | % | | | (0.71 | )% | | | 6.65 | % | |
| Lehman Aggregate Bond Index3 | | | 2.80 | % | | | 6.62 | % | | | 6.55 | % | | | 6.20 | % | | | 6.51 | % | | | 5.24 | % | |
Value of a $10,000 Investment1,4 as of September 30, 2005
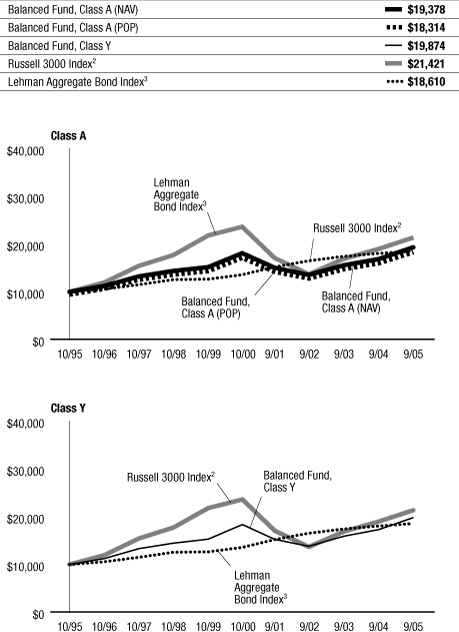
The chart above illustrates the total value of an assumed $10,000 investment in the fund's Class A and Class Y shares (from 10/31/95 to 9/30/05) as compared to the Russell 3000 Index2 and the Lehman Aggregate Bond Index3.
The performance data quoted on this page represents past performance and does not guarantee future results. The investment return and principal value of an investment will fluctuate so that an investor's shares, when redeemed, may be worth more or less than their original cost. Current performance of the fund may be lower or higher than the performance data quoted. Performance data current to the most recent month-end may be obtained by calling 800.677.FUND.
1 Performance does not reflect the deduction of taxes that a shareholder would pay on fund distributions or redemption of fund shares. Investment performance reflects fee waivers that are or were in effect. In the absence of such fee waivers, total returns would be reduced. Index performance is for illustrative purposes only and does not reflect any expenses, transaction costs, or cash flow effects. Direct investment in an index is not available.
Investments in debt securities typically decrease in value when interest rates rise. This risk is usually greater for longer-term debt securities.
Total returns at net asset value ("NAV") reflect performance over the time period indicated without including the fund's maximum sales charge and assume reinvestment of all distributions at NAV.
Total returns at public offering price ("POP") reflect performance over the time period indicated including a maximum front-end sales charge of 5.50% for Class A shares and the maximum contingent deferred sales charge ("CDSC") for Class B and Class C shares for the relevant period. Maximum CDSC is 5.00% for Class B shares in the first year, decreasing annually to 0% in the seventh year following purchase, and 1.00% for Class C shares. Total returns assume reinvestment of all distributions at NAV.
On September 24, 2001, the First American Balanced Fund combined with Firstar Balanced Growth Fund and Firstar Balanced Income Fund. Performance history prior to September 24, 2001, represents that of Firstar Balanced Growth Fund.
2 An unmanaged index that measures the performance of the 3,000 largest U.S. companies based on total market capitalization, which represents approximately 98% of the investable U.S. equity market.
3 An unmanaged index composed of the Lehman Government/Credit Bond Index, the Lehman Mortgage Backed Securities Index, and the Lehman Asset Backed Securities Index. The Lehman Government/Credit Bond Index is comprised of Treasury securities, other securities issued or guaranteed by the U.S. government or its agencies or instrumentalities, including U.S. agency mortgage securities, and investment-grade corporate debt securities. The Lehman Mortgage Backed Securities Index is comprised of the mortgage-backed pass-through securities of Ginnie Mae, Fannie Mae, and Freddie Mac. The Lehman Asset Backed Securities Index is comprised of debt securities rated investment grade or higher that are backed by credit card, auto, and home equity loans.
4 Performance for Class B, Class C, and Class R shares is not presented. Performance for these classes will vary due to different expense structures.
FIRST AMERICAN FUNDS Annual Report 2005
36
Balanced fund continued
Expense Example
As a shareholder of the Balanced Fund (the "fund"), you incur two types of costs: (1) transaction costs, including sales charges (loads) on purchase payments; and (2) ongoing costs, including advisory fees; distribution and/or service (12b-1) fees; and other fund expenses. This example is intended to help you understand your ongoing costs (in dollars) of investing in the fund and to compare these costs with the ongoing costs of investing in other mutual funds. The example is based on an investment of $1,000 invested at the beginning of the period and held for the entire period from April 1, 2005, to September 30, 2005.
Actual Expenses
For each class, the first line of the table below provides information about actual account values and actual expenses. You may use the information in this line, together with the amount you invested, to estimate the expenses that you paid over the period. Simply divide your account value by $1,000 (for example, an $8,600 account value divided by $1,000 = 8.6), then multiply the result by the number in the first line under the heading entitled "Expenses Paid During Period" to estimate the expenses you paid on your account during this period.
Hypothetical Example for Comparison Purposes
For each class, the second line of the table below provides information about hypothetical account values and hypothetical expenses based on the fund's actual expense ratio and an assumed rate of return of 5% per year before expenses, which is not the fund's actual return. The hypothetical account values and expenses may not be used to estimate the actual ending account balance or expenses you paid for the period. You may use this information to compare the ongoing costs of investing in the fund and other funds. To do so, compare this 5% hypothetical example with the 5% hypothetical examples that appear in the shareholder reports of the other funds.
Please note that the expenses shown in the table are meant to highlight your ongoing costs only and do not reflect any transactional costs, such as sales charges (loads). Therefore, the second line of the table for each class is useful in comparing ongoing costs only, and will not help you determine the relative total costs of owning different funds. In addition, if these transactional costs were included, your costs would have been higher.
Expense Examples
| | | Beginning Account
Value (4/01/05) | | Ending Account
Value (9/30/05) | | Expenses Paid During
Period1 (4/01/05 to
9/30/05) | |
| Class A Actual2,3 | | $ | 1,000.00 | | | $ | 1,063.60 | | | $ | 5.56 | | |
| Class A Hypothetical (5% return before expenses)3 | | $ | 1,000.00 | | | $ | 1,019.68 | | | $ | 5.44 | | |
| Class B Actual2,3 | | $ | 1,000.00 | | | $ | 1,059.00 | | | $ | 9.42 | | |
| Class B Hypothetical (5% return before expenses)3 | | $ | 1,000.00 | | | $ | 1,015.92 | | | $ | 9.22 | | |
| Class C Actual2,3 | | $ | 1,000.00 | | | $ | 1,059.90 | | | $ | 9.42 | | |
| Class C Hypothetical (5% return before expenses)3 | | $ | 1,000.00 | | | $ | 1,015.92 | | | $ | 9.22 | | |
| Class R Actual2,3 | | $ | 1,000.00 | | | $ | 1,062.70 | | | $ | 6.85 | | |
| Class R Hypothetical (5% return before expenses)3 | | $ | 1,000.00 | | | $ | 1,018.42 | | | $ | 6.70 | | |
| Class Y Actual2,3 | | $ | 1,000.00 | | | $ | 1,064.80 | | | $ | 4.27 | | |
| Class Y Hypothetical (5% return before expenses)3 | | $ | 1,000.00 | | | $ | 1,020.93 | | | $ | 4.18 | | |
1 Expenses are equal to the fund's annualized expense ratio for the most recent six-month period of 1.08%, 1.83%, 1.83%, 1.33% and 0.83% for Class A, Class B, Class C, Class R and Class Y, respectively, multiplied by the average account value over the period, multiplied by the number of days in the most recent fiscal half-year/365 (to reflect the one-half year period).
2Based on the actual returns for the six months ended September 30, 2005: 6.36% for Class A, 5.90% for Class B, 5.99% for Class C, 6.27% for Class R and 6.48% for Class Y.
3Prior to July 1, 2005, the contractual limitation on annual expenses was 1.05%, 1.80%, 1.80%, 1.30% and 0.80% for Class A, Class B, Class C, Class R and Class Y, respectively. Effective July 1, 2005, the contractual limitation on annual expenses was increased to 1.10%, 1.85%, 1.85%, 1.35%, and 0.85% for Class A, Class B, Class C, Class R, and Class Y, respectively. If this new limitation had been in place during the entire period, actual and hypothetical ending account balances would have been approximately $1,063.47 and $1,019.55 for Class A, $1,058.87 and $1,015.79 for Class B, $1,059.77 and $1,015.79 for Class C, $1,062.57 and $1,018.30 for Class R, and $1,064.67 and $1,020.81 for Class Y and actual and hypothetical expenses paid during the period would have been approximately $5.69 and $5.57 for Class A, $9.55 and $9.35 for Class B, $9.55 and $9.35 for Class C, $6.98 and $6.83 for Class R and $4.40 and $4.31 for Class Y.
FIRST AMERICAN FUNDS Annual Report 2005
37
Equity Income fund
Investment Objective: long-term growth of capital and income
How did the fund perform for the fiscal year ended September 30, 2005?
The First American Equity Income Fund (the "fund"), Class Y shares, returned 10.94% for the fiscal year ended September 30, 2005 (Class A shares returned 10.65% without taking the sales charge into account). By comparison, the fund's benchmark, the Standard and Poor's 500 Composite Index* ("S&P Composite Index*"), returned 12.25% for the same period.
What were the general economic and market conditions during the fiscal year?
Economic growth moderated but nevertheless continued at a solid pace over the course of the fiscal year. Solid economic growth, in turn, improved labor market conditions. While core inflation remained basically stable at a relatively low level, overall inflation rose with the continuing climb of energy prices during the past year. The combination of solid growth, lower unemployment, and the potential for higher energy prices to be reflected by broader inflation measures has kept the Fed incrementally raising the Fed Funds Rate at each Federal Open Market Committee meeting since June 2004.
The corporate sector of the economy has performed very well in this economic environment, with operating earnings up sharply through the third quarter of 2005. Underlying economic conditions remain generally favorable for the financial markets, although risks have risen with energy prices and the widespread disruption to activity from Hurricanes Katrina and Rita.
With its emphasis on companies that pay dividends, the fund is generally expected to perform better in down markets and lag the index in up markets, a tendency that was reflected during this fiscal year's strong market environment.
What worked for the fund and why?
The fund benefited from an overweight and good stock selection in the energy sector, where rising commodity prices made for strong profit growth. Standout performers in this sector – Conoco Phillips, Apache Corporation, Halliburton, Kerr McGee, and British Petroleum – are engaged in oil and gas exploration, production, or refining and their strong performance was spurred by growing demand and higher commodity prices. The fund's underweight in the consumer discretionary sector also proved beneficial, since the sector lagged during the year, with a number of stocks weak, discounting investor concerns about a slowdown in consumer spending trends. In addition, stock selection in the healthcare sector had a positive impact on performance: Baxter International, a medical products and services company, M cKesson, a drug distributor, and Wyeth, a pharmaceutical company, posted strong returns on better-than-expected company earnings growth.
What did not work for the fund and why?
The fund's overweight in the materials sector contributed to the fund's underperformance. Particularly disappointing performance came from Bemis, a packaging materials company and DuPont, a paint and chemical coating producer, where earnings results disappointed investors. Stock selection in the utilities space also detracted from fund performance. The fund continued to focus on higher dividend-paying utilities rather than the stronger performing lower-dividend paying companies. Finally, a few individual stocks took their toll on performance, notably insurance broker Marsh & McLennan, which experienced a management turnover and lower earnings as a result of the New York attorney general's investigation into the firm's pricing practices.
What strategic moves were made by the fund and why?
Earlier in the fiscal year, we moved the fund to an overweight position in the energy sector, taking advantage of investor pullback from energy stocks and following our conviction that the supply/demand imbalance in the energy market would persist, bringing the prices higher and generating strong earnings growth. We also moved to an overweight in the technology sector, based on historically more reasonable values and better earnings growth outlook. We maintained an underweight in the consumer discretionary space out of concern about a decline in the rate of growth in consumer spending.
*Unlike mutual funds, index returns do not reflect any expenses, transaction costs, or cash flow effects.
| Top 10 Holdings as of September 30, 20051 (% of net assets) | |
| Exxon Mobil | | | 4.0 | % | |
| Microsoft | | | 3.3 | % | |
| Citigroup | | | 2.8 | % | |
| General Electric | | | 2.7 | % | |
| Wyeth | | | 2.7 | % | |
| Bank of America | | | 2.3 | % | |
| ConocoPhillips | | | 2.3 | % | |
| BP PLC | | | 2.0 | % | |
| Johnson & Johnson | | | 2.0 | % | |
| Altria Group | | | 2.0 | % | |
| Sector Allocation as of September 30, 20051 (% of net assets) | |
| Financials | | | 19.7 | % | |
| Energy | | | 14.4 | % | |
| Health Care | | | 11.9 | % | |
| Information Technology | | | 11.2 | % | |
| Industrials | | | 11.0 | % | |
| Consumer Discretionary | | | 7.8 | % | |
| Materials | | | 7.0 | % | |
| Consumer Staples | | | 6.6 | % | |
| Telecommunication Services | | | 4.3 | % | |
| Utilities | | | 4.0 | % | |
| Short-Term Investments | | | 1.6 | % | |
| Convertible Preferred Stock | | | 0.6 | % | |
| Convertible Corporate Bond | | | 0.3 | % | |
| Other Assets and Liabilities, Net | | | (0.4 | )% | |
| | | | 100 | % | |
1Fund holdings and sector allocations are subject to change at any time and are not recommendations to buy or sell any security.
FIRST AMERICAN FUNDS Annual Report 2005
38
Equity Income fund continued
Annual Performance1 as of September 30, 2005
| | | | | Since Inception | |
| | | 1 year | | 5 years | | 10 years | | 2/1/1999 | | 9/24/2001 | |
| Average annual return with sales charge (POP) | |
| Class A | | | 4.59 | % | | | 2.22 | % | | | 8.46 | % | | | - | | | | - | | |
| Class B | | | 4.86 | % | | | 2.30 | % | | | 8.30 | % | | | - | | | | - | | |
| Class C | | | 8.84 | % | | | 2.58 | % | | | - | | | | 2.98 | % | | | - | | |
| Average annual return without sales charge (NAV) | |
| Class A | | | 10.65 | % | | | 3.38 | % | | | 9.07 | % | | | - | | | | - | | |
| Class B | | | 9.86 | % | | | 2.60 | % | | | 8.30 | % | | | - | | | | - | | |
| Class C | | | 9.84 | % | | | 2.58 | % | | | - | | | | 2.98 | % | | | - | | |
| Class R | | | 10.33 | % | | | - | | | | - | | | | - | | | | 6.41 | % | |
| Class Y | | | 10.94 | % | | | 3.63 | % | | | 9.38 | % | | | - | | | | - | | |
| S&P 500 Composite Index2 | | | 12.25 | % | | | (1.49 | )% | | | 9.49 | % | | | 1.00 | % | | | 7.00 | % | |
Value of a $10,000 Investment1,3 as of September 30, 2005
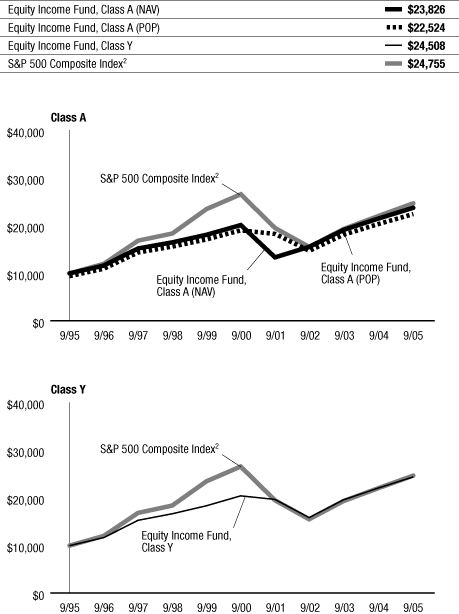
The chart above illustrates the total value of an assumed $10,000 investment in the fund's Class A and Class Y shares (from 9/30/95 to 9/30/05) as compared to the S&P 500 Composite Index2.
The performance data quoted on this page represents past performance and does not guarantee future results. The investment return and principal value of an investment will fluctuate so that an investor's shares, when redeemed, may be worth more or less than their original cost. Current performance of the fund may be lower or higher than the performance data quoted. Performance data current to the most recent month-end may be obtained by calling 800.677.FUND.
1 Performance does not reflect the deduction of taxes that a shareholder would pay on fund distributions or redemption of fund shares. Investment performance reflects fee waivers that are or were in effect. In the absence of such fee waivers, total returns would be reduced. Index performance is for illustrative purposes only and does not reflect any expenses, transaction costs, or cash flow effects. Direct investment in the index is not available.
Mutual fund investing involves risk; principal loss is possible.
Total returns at net asset value ("NAV") reflect performance over the time period indicated without including the fund's maximum sales charge and assume reinvestment of all distributions at NAV.
Total returns at public offering price ("POP") reflect performance over the time period indicated including a maximum front-end sales charge of 5.50% for Class A shares and the maximum contingent deferred sales charge ("CDSC") for Class B and Class C shares for the relevant period. Maximum CDSC is 5.00% for Class B shares in the first year, decreasing annually to 0% in the seventh year following purchase, and 1.00% for Class C shares. Total returns assume reinvestment of all distributions at NAV.
On May 18, 1994, the Equity Income Fund became the successor by merger to the Boulevard Strategic Balance Fund. Prior to the merger, the First American fund had no assets or liabilities. Performance prior to May 18, 1994, is that of the Boulevard Strategic Balance Fund.
2 An unmanaged index of large-capitalization stocks that includes a representative sample of 500 leading companies in leading industries of the U.S. economy. Although the S&P 500 focuses on the large-cap segment of the market, with over 80% coverage of U.S. equities, it also serves as a proxy for the total market.
3 Performance for Class B, Class C, and Class R shares is not presented. Performance for these classes will vary due to different expense structures.
FIRST AMERICAN FUNDS Annual Report 2005
39
Equity Income fund continued
Expense Example
As a shareholder of the Equity Income Fund (the "fund"), you incur two types of costs: (1) transaction costs, including sales charges (loads) on purchase payments; and (2) ongoing costs, including advisory fees; distribution and/or service (12b-1) fees; and other fund expenses. This example is intended to help you understand your ongoing costs (in dollars) of investing in the fund and to compare these costs with the ongoing costs of investing in other mutual funds. The example is based on an investment of $1,000 invested at the beginning of the period and held for the entire period from April 1, 2005, to September 30, 2005.
Actual Expenses
For each class, the first line of the table below provides information about actual account values and actual expenses. You may use the information in this line, together with the amount you invested, to estimate the expenses that you paid over the period. Simply divide your account value by $1,000 (for example, an $8,600 account value divided by $1,000 = 8.6), then multiply the result by the number in the first line under the heading entitled "Expenses Paid During Period" to estimate the expenses you paid on your account during this period.
Hypothetical Example for Comparison Purposes
For each class, the second line of the table below provides information about hypothetical account values and hypothetical expenses based on the fund's actual expense ratio and an assumed rate of return of 5% per year before expenses, which is not the fund's actual return. The hypothetical account values and expenses may not be used to estimate the actual ending account balance or expenses you paid for the period. You may use this information to compare the ongoing costs of investing in the fund and other funds. To do so, compare this 5% hypothetical example with the 5% hypothetical examples that appear in the shareholder reports of the other funds.
Please note that the expenses shown in the table are meant to highlight your ongoing costs only and do not reflect any transactional costs, such as sales charges (loads). Therefore, the second line of the table for each class is useful in comparing ongoing costs only, and will not help you determine the relative total costs of owning different funds. In addition, if these transactional costs were included, your costs would have been higher.
Expense Examples
| | | Beginning Account
Value (4/01/05) | | Ending Account
Value (9/30/05) | | Expenses Paid During
Period1 (4/01/05 to
9/30/05) | |
| Class A Actual2,3 | | $ | 1,000.00 | | | $ | 1,042.20 | | | $ | 6.02 | | |
| Class A Hypothetical (5% return before expenses)3 | | $ | 1,000.00 | | | $ | 1,019.17 | | | $ | 5.95 | | |
| Class B Actual2,3 | | $ | 1,000.00 | | | $ | 1,038.20 | | | $ | 9.84 | | |
| Class B Hypothetical (5% return before expenses)3 | | $ | 1,000.00 | | | $ | 1,015.41 | | | $ | 9.73 | | |
| Class C Actual2,3 | | $ | 1,000.00 | | | $ | 1,038.10 | | | $ | 9.84 | | |
| Class C Hypothetical (5% return before expenses)3 | | $ | 1,000.00 | | | $ | 1,015.41 | | | $ | 9.73 | | |
| Class R Actual2,3 | | $ | 1,000.00 | | | $ | 1,041.20 | | | $ | 7.30 | | |
| Class R Hypothetical (5% return before expenses)3 | | $ | 1,000.00 | | | $ | 1,017.91 | | | $ | 7.22 | | |
| Class Y Actual2,3 | | $ | 1,000.00 | | | $ | 1,043.20 | | | $ | 4.74 | | |
| Class Y Hypothetical (5% return before expenses)3 | | $ | 1,000.00 | | | $ | 1,020.43 | | | $ | 4.69 | | |
1Expenses are equal to the fund's annualized expense ratio for the most recent six-month period of 1.18%, 1.93%, 1.93%, 1.43% and 0.93% for Class A, Class B, Class C, Class R and Class Y, respectively, multiplied by the average account value over the period, multiplied by the number of days in the most recent fiscal half-year/365 (to reflect the one-half year period).
2Based on the actual returns for the six months ended September 30, 2005: 4.22% for Class A, 3.82% for Class B, 3.81% for Class C, 4.12% for Class R and 4.32% for Class Y.
3Prior to July 1, 2005, the contractual limitation on annual expenses was 1.15%, 1.90%, 1.90%, 1.40% and 0.90% for Class A, Class B, Class C, Class R and Class Y, respectively. Effective July 1, 2005, the contractual limitation on annual expenses for each class was removed. If this limitation had not been in place during the entire period, actual and hypothetical ending account balances would have been approximately $1,042.09 and $1,019.06 for Class A, $1,038.09 and $1,015.30 for Class B, $1,037.99 and $1,015.30 for Class C, $1,041.10 and $1,017.82 for Class R, and $1,043.08 and $1,020.32 for Class Y and actual and hypothetical expenses paid during the period would have been approximately $6.13 and $6.06 for Class A, $9.95 and $9.84 for Class B, $9.95 and $9.84 for Class C, $7.40 and $7.32 for Class R and $4.86 and $4.80 for Class Y.
FIRST AMERICAN FUNDS Annual Report 2005
40
Report of Independent Registered Public Accounting Firm
To the Shareholders and Board of Directors
First American Investment Funds, Inc.
We have audited the accompanying statements of assets and liabilities, including the schedules of investments, of the Real Estate Securities, International, Small Cap Growth Opportunities, Small Cap Select, Small Cap Value, Small-Mid Cap Core (formally Technology Fund), Mid Cap Growth Opportunities, Mid Cap Value, Large Cap Growth Opportunities, Large Cap Select, Large Cap Value, Balanced, and Equity Income Funds (series of First American Investment Funds, Inc.) (collectively, the "funds") as of September 30, 2005, and the related statements of operations for the year then ended and changes in net assets for each of the two years in the period then ended and financial highlights for each of the periods indicated therein, except as noted below. These financial statements and the financial highlights are the responsibility of the Funds' management. Our responsibility is to express an opinion on t hese financial statements and financial highlights based on our audits. The financial highlights of the International, Small Cap Growth Opportunities, Small Cap Select, Mid Cap Growth Opportunities, Large Cap Growth Opportunities, Balanced, and Equity Income Funds for the periods presented through October 31, 2000, were audited by other auditors whose report dated December 29, 2000 expressed an unqualified opinion on those financial highlights.
We conducted our audits in accordance with the standards of the Public Company Accounting Oversight Board (United States). Those standards require that we plan and perform the audit to obtain reasonable assurance about whether the financial statements and financial highlights are free of material misstatement. We were not engaged to perform an audit of the funds internal control over financial reporting. Our Audits included consideration of internal control over financial reporting as a basis for designing audit procedures that are appropriate in the circumstances, but not for the purpose of expressing an opinion on the effectiveness of the funds internal control over financial reporting. Accordingly, we express no such opinion. An audit also includes examining, on a test basis, evidence supporting the amounts and disclosures in the financial statements and financial highlights, assessing the accounting principles used and significant estimates made by management, and evaluating the overall financial statement presentation. Our procedures included confirmation of securities owned as of September 30, 2005, by correspondence with the custodian and brokers or by other appropriate auditing procedures where replies from brokers were not received. We believe that our audits provide a reasonable basis for our opinion.
In our opinion, the financial statements and financial highlights audited by us as referred to above present fairly, in all material respects, the financial position of the Funds listed above of First American Investment Funds, Inc. at September 30, 2005, the results of their operations for the year then ended, the changes in their net assets for each of the two years in the period then ended and their financial highlights for each of the periods indicated herein, in conformity with U.S. generally accepted accounting principles.

Minneapolis, Minnesota
November 18, 2005
FIRST AMERICAN FUNDS Annual Report 2005
41
Schedule of Investments September 30, 2005
Real Estate Securities Fund
| DESCRIPTION | | SHARES | | VALUE (000) | |
| Real Estate Investment Trusts (a) – 99.1% | | | |
| Apartments – 16.7% | | | |
| Archstone-Smith Trust (b) | | | 571,385 | | | $ | 22,781 | | |
| Avalonbay Communities (b) | | | 355,170 | | | | 30,438 | | |
| Camden Property Trust | | | 473,514 | | | | 26,398 | | |
| Education Realty Trust | | | 204,110 | | | | 3,409 | | |
| Equity Residential Properties Trust (b) | | | 460,620 | | | | 17,434 | | |
| Essex Property Trust (b) | | | 68,320 | | | | 6,149 | | |
| Mid-America Apartment Communities (b) | | | 124,490 | | | | 5,790 | | |
| | | | 112,399 | | |
| Community Centers – 11.5% | | | |
| Agree Realty | | | 179,580 | | | | 5,073 | | |
| Developers Diversified Realty (b) | | | 394,953 | | | | 18,444 | | |
| Equity One | | | 196,780 | | | | 4,575 | | |
| Kimco Realty (b) | | | 314,070 | | | | 9,868 | | |
| Kite Realty Group Trust | | | 568,620 | | | | 8,484 | | |
| Pan Pacific Retail Properties (b) | | | 147,180 | | | | 9,699 | | |
| Regency Centers (b) | | | 301,310 | | | | 17,310 | | |
| Saul Centers | | | 98,440 | | | | 3,543 | | |
| | | | 76,996 | | |
| Diversified – 6.4% | | | |
| Cousins Properties | | | 168,200 | | | | 5,083 | | |
| Forest City Enterprises, Class A | | | 230,200 | | | | 8,771 | | |
| Trizec Properties (b) | | | 675,550 | | | | 15,578 | | |
| Vornado Realty Trust (b) | | | 154,480 | | | | 13,381 | | |
| | | | 42,813 | | |
| Health Care – 3.1% | | | |
| American Retirement* | | | 187,240 | | �� | | 3,526 | | |
| Healthcare Realty Trust | | | 76,410 | | | | 3,067 | | |
| Ventas | | | 449,610 | | | | 14,477 | | |
| | | | 21,070 | | |
| Hotels – 12.2% | | | |
| Eagle Hospitality Property Trust | | | 532,530 | | | | 5,315 | | |
| Hersha Hospitality Trust | | | 406,220 | | | | 4,034 | | |
| Hilton Hotels | | | 681,970 | | | | 15,222 | | |
| Host Marriott (b) | | | 929,930 | | | | 15,716 | | |
| La Quinta* (b) | | | 1,370,030 | | | | 11,906 | | |
| Marriott International, Class A (b) | | | 149,920 | | | | 9,445 | | |
| Starwood Hotels & Resorts Worldwide | | | 251,120 | | | | 14,356 | | |
| Winston Hotels | | | 557,100 | | | | 5,571 | | |
| | | | 81,565 | | |
| Industrials – 11.7% | | | |
| AMB Property | | | 204,970 | | | | 9,203 | | |
| Centerpoint Properties Trust (b) | | | 152,140 | | | | 6,816 | | |
| First Potomac Realty Trust | | | 285,790 | | | | 7,345 | | |
| Liberty Property Trust (b) | | | 31,020 | | | | 1,320 | | |
| Prologis (b) | | | 991,839 | | | | 43,948 | | |
| PS Business Parks (b) | | | 218,630 | | | | 10,013 | | |
| | | | 78,645 | | |
| Malls – 12.3% | | | |
| General Growth Properties (b) | | | 461,830 | | | | 20,750 | | |
| Macerich | | | 77,990 | | | | 5,065 | | |
| Mills (b) | | | 237,260 | | | | 13,068 | | |
| Simon Property Group (b) | | | 522,190 | | | | 38,705 | | |
| Taubman Centers | | | 149,460 | | | | 4,738 | | |
| | | | 82,326 | | |
| Office – 20.0% | | | |
| Alexandria Real Estate Equities (b) | | | 73,600 | | | | 6,086 | | |
| BioMed Realty Trust | | | 285,290 | | | | 7,075 | | |
Real Estate Securities Fund (concluded)
| DESCRIPTION | | SHARES | | VALUE (000) | |
| Boston Properties (b) | | | 333,200 | | | $ | 23,624 | | |
| Brandywine Realty Trust (b) | | | 127,010 | | | | 3,949 | | |
| Brascan | | | 217,100 | | | | 10,117 | | |
| Brookfield Properties (b) | | | 924,025 | | | | 27,231 | | |
| Corporate Office Properties Trust | | | 94,190 | | | | 3,292 | | |
| Equity Office Properties Trust (b) | | | 265,990 | | | | 8,700 | | |
| Kilroy Realty (b) | | | 180,330 | | | | 10,104 | | |
| Mack-Cali Realty | | | 181,840 | | | | 8,172 | | |
| Maguire Properties | | | 256,930 | | | | 7,721 | | |
| Reckson Associates Realty | | | 217,840 | | | | 7,526 | | |
| SL Green Realty | | | 152,270 | | | | 10,382 | | |
| | | | 133,979 | | |
| Self Storage – 2.6% | | | |
| Public Storage (b) | | | 204,610 | | | | 13,709 | | |
| Sovran Self Storage (b) | | | 73,070 | | | | 3,577 | | |
| | | | 17,286 | | |
| Specialty Real Estate – 2.6% | | | |
| Equity Lifestyle Properties | | | 167,020 | | | | 7,516 | | |
| Newcastle Investment | | | 168,580 | | | | 4,703 | | |
| Northstar Realty Finance | | | 539,130 | | | | 5,062 | | |
| | | | 17,281 | | |
Total Real Estate Investment Trusts
(Cost $551,431) | | | | | | | 664,360 | | |
| Private Real Estate Companies – 0.0% | | | |
| Beacon Capital* (c) (d) | | | 33,750 | | | | 46 | | |
| Newcastle Investment Holdings* (c) (d) | | | 35,000 | | | | 210 | | |
Total Private Real Estate Companies
(Cost $588) | | | | | | | 256 | | |
| Affiliated Money Market Fund – 1.7% | | | |
First American Prime Obligations Fund, Class Z (e)
(Cost $11,143) | | | 11,142,640 | | | | 11,143 | | |
Investments Purchased with Proceeds
from Securities Lending (f) – 46.4% | | | |
| (Cost $311,484) | | | | | | | 311,484 | | |
Total Investments – 147.2%
(Cost $874,646) | | | | | | | 987,243 | | |
| Other Assets and Liabilities, Net – (47.2)% | | | | | | | (316,612 | ) | |
| Total Net Assets – 100.0% | | | | | | $ | 670,631 | | |
* Non-income producing security
(a) The fund is primarily invested in the Real Estate sector and therefore is subject to additional risks. See notes 1 and 7 in Notes to Financials Statements.
(b) This security or a portion of this security is out on loan at September 30, 2005. Total loaned securities had a market value of $310,350,186 at September 30, 2005. See note 2 in Notes to Financial Statements.
(c) Security is considered illiquid or restricted. As of September 30, 2005, the value of these investments was $255,913 or 0.0% of total net assets. See note 2 in Notes to Financial Statements.
(d) Security is fair valued. As of September 30, 2005, the fair value of these investments was $255,913 or 0.0% if total net assets. See note 2 in Notes to Financial Statements.
(e) Investment in affiliated security. This money market fund is advised by U.S. Bancorp Asset Management, Inc., which also serves as advisor to this fund. See note 3 in Notes to Financial Statements.
(f) The fund may loan securities in return for collateral in the form of cash, U.S. Government securities, or other high grade debt obligations. The cash collateral is invested in various short-term fixed income securities, such as repurchase agreements, commercial paper, money market funds and other corporate obligations. See note 2 in Notes to Financial Statements.
The accompanying notes are an integral part of the financial statements.
FIRST AMERICAN FUNDS Annual Report 2005
42
Statement of Assets and Liabilities September 30, 2005, in thousands, except for per share data
| | | Real Estate
Securities Fund | |
| ASSETS: | | | |
| Investments in unaffiliated securities, at value† (cost: $552,019) (note 2) | | $ | 664,616 | | |
| Investments in affiliated money market fund, at value (cost: $11,143) (note 2) | | | 11,143 | | |
| Investments purchased with proceeds from securities lending (cost: $311,484) (note 2) | | | 311,484 | | |
| Cash* | | | 3,089 | | |
| Receivable for dividends and interest | | | 3,688 | | |
| Receivable for investment securities sold | | | 55 | | |
| Receivable for capital shares sold | | | 357 | | |
| Prepaid expenses and other assets | | | 31 | | |
| Total assets | | | 994,463 | | |
| LIABILITIES: | | | |
| Payable for investment securities purchased | | | 5,686 | | |
| Payable upon return of securities loaned (note 2) | | | 314,434 | | |
| Payable for capital shares redeemed | | | 3,111 | | |
| Payable to affiliates (note 3) | | | 542 | | |
| Payable for distribution and shareholder servicing fees | | | 35 | | |
| Accrued expenses and other liabilities | | | 24 | | |
| Total liabilities | | | 323,832 | | |
| Net assets | | $ | 670,631 | | |
| COMPOSITION OF NET ASSETS: | | | |
| Portfolio capital | | $ | 483,371 | | |
| Undistributed net investment income | | | 2,805 | | |
| Accumulated net realized gain on investments | | | 71,858 | | |
| Net unrealized appreciation of investments | | | 112,597 | | |
| Net assets | | $ | 670,631 | | |
| * Includes cash collateral received related to securities loaned (note 2) | | $ | 2,950 | | |
| † Including securities loaned, at value | | $ | 310,350 | | |
| Class A: | | | |
| Net assets | | $ | 135,745 | | |
| Shares issued and outstanding ($0.0001 par value - 2 billion authorized) | | | 6,225 | | |
| Net asset value and redemption price per share | | $ | 21.81 | | |
| Maximum offering price per share (1) | | $ | 23.08 | | |
| Class B: | | | |
| Net assets | | $ | 4,700 | | |
| Shares issued and outstanding ($0.0001 par value - 2 billion authorized) | | | 218 | | |
| Net asset value, offering price and redemption price per share (2) | | $ | 21.53 | | |
| Class C: | | | |
| Net assets | | $ | 4,954 | | |
| Shares issued and outstanding ($0.0001 par value - 2 billion authorized) | | | 229 | | |
| Net asset value, offering price and redemption price per share (2) | | $ | 21.61 | | |
| Class R: | | | |
| Net assets | | $ | 36 | | |
| Shares issued and outstanding ($0.0001 par value - 2 billion authorized) | | | 2 | | |
| Net asset value, offering price, and redemption price per share | | $ | 22.00 | | |
| Class Y: | | | |
| Net assets | | $ | 525,196 | | |
| Shares issued and outstanding ($0.0001 par value - 2 billion authorized) | | | 23,958 | | |
| Net asset value, offering price, and redemption price per share | | $ | 21.92 | | |
(1) The offering price is calculated by dividing the net asset value by 1 minus the maximum sales charge of 5.50%
(2) Class B and C have a contingent deferred sales charge. For a description of this sales charge, see notes 1 and 3 in Notes to Financial Statements.
FIRST AMERICAN FUNDS Annual Report 2005
43
Statement of Operations For the fiscal year ended September 30, 2005, in thousands
| | | Real Estate
Securities Fund | |
| INVESTMENT INCOME: | | | |
| Dividends from affiliated money market fund | | $ | 384 | | |
| Dividends from unaffiliated securities | | | 27,943 | | |
| Less: Foreign taxes withheld | | | (61 | ) | |
| Securities lending income | | | 170 | | |
| Total investment income | | | 28,436 | | |
| EXPENSES (note 3): | | | |
| Investment advisory fees | | | 4,277 | | |
| Administration fees | | | 1,233 | | |
| Transfer agent fees | | | 405 | | |
| Custodian fees | | | 53 | | |
| Professional fees | | | 49 | | |
| Postage and printing fees | | | 45 | | |
| Registration fees | | | 44 | | |
| Directors' fees | | | 14 | | |
| Other expenses | | | 14 | | |
| Distribution and shareholder servicing fees – Class A | | | 284 | | |
| Distribution and shareholder servicing fees – Class B | | | 46 | | |
| Distribution and shareholder servicing fees – Class C | | | 47 | | |
| Distribution and shareholder servicing fees – Class R (1) | | | - | | |
| Total expenses | | | 6,511 | | |
| Less: Fee waivers (note 3) | | | (111 | ) | |
| Total net expenses | | | 6,400 | | |
| Investment income – net | | | 22,036 | | |
| REALIZED AND UNREALIZED GAINS ON INVESTMENTS – NET (note 5): | | | |
| Net realized gain on investments | | | 85,317 | | |
| Net change in unrealized appreciation or depreciation of investments | | | 47,167 | | |
| Net gain on investments | | | 132,484 | | |
| Net increase in net assets resulting from operations | | $ | 154,520 | | |
(1) Due to the presentation of the financial statements in thousands, the numbers round to zero.
The accompanying notes are an integral part of the financial statements.
FIRST AMERICAN FUNDS Annual Report 2005
44
Statement of Changes in Net Assets in thousands
| | | | | Real Estate
Securities Fund | |
| | | Year Ended
9/30/05 | | Year Ended
9/30/04 | |
| OPERATIONS: | | | |
| Investment income – net | | $ | 22,036 | | | $ | 14,500 | | |
| Net realized gain on investments | | | 85,317 | | | | 35,085 | | |
| Net change in unrealized appreciation or depreciation of investments | | | 47,167 | | | | 32,394 | | |
| Net increase in net assets resulting from operations | | | 154,520 | | | | 81,979 | | |
| DISTRIBUTIONS TO SHAREHOLDERS FROM: | | | |
| Investment income – net: | |
| Class A | | | (3,209 | ) | | | (2,018 | ) | |
| Class B | | | (92 | ) | | | (123 | ) | |
| Class C | | | (94 | ) | | | (120 | ) | |
| Class R | | | (1 | ) | | | (56 | ) | |
| Class Y | | | (14,545 | ) | | | (12,334 | ) | |
| Net realized gain on investments: | |
| Class A | | | (7,087 | ) | | | (1,410 | ) | |
| Class B | | | (338 | ) | | | (136 | ) | |
| Class C | | | (326 | ) | | | (131 | ) | |
| Class R | | | - | | | | (97 | ) | |
| Class Y | | | (32,911 | ) | | | (8,059 | ) | |
| Total distributions | | | (58,603 | ) | | | (24,484 | ) | |
| CAPITAL SHARE TRANSACTIONS (note 4): | | | |
| Class A: | |
| Proceeds from sales | | | 45,709 | | | | 50,157 | | |
| Reinvestment of distributions | | | 10,057 | | | | 3,282 | | |
| Payments for redemptions | | | (24,578 | ) | | | (10,941 | ) | |
| Increase in net assets from Class A transactions | | | 31,188 | | | | 42,498 | | |
| Class B: | |
| Proceeds from sales | | | 1,148 | | | | 1,101 | | |
| Reinvestment of distributions | | | 386 | | | | 236 | | |
| Payments for redemptions (note 3) | | | (1,935 | ) | | | (1,051 | ) | |
| Increase (decrease) in net assets from Class B transactions | | | (401 | ) | | | 286 | | |
| Class C: | |
| Proceeds from sales | | | 1,485 | | | | 1,777 | | |
| Reinvestment of distributions | | | 395 | | | | 239 | | |
| Payments for redemptions (note 3) | | | (1,887 | ) | | | (1,533 | ) | |
| Increase (decrease) in net assets from Class C transactions | | | (7 | ) | | | 483 | | |
| Class R: | |
| Proceeds from sales | | | 56 | | | | 1,277 | | |
| Reinvestment of distributions | | | - | | | | 137 | | |
| Payments for redemptions | | | (23 | ) | | | (4,196 | ) | |
| Increase (decrease) in net assets from Class R transactions | | | 33 | | | | (2,782 | ) | |
| Class Y: | |
| Proceeds from sales | | | 124,624 | | | | 228,629 | | |
| Reinvestment of distributions | | | 21,477 | | | | 8,467 | | |
| Payments for redemptions | | | (112,400 | ) | | | (64,875 | ) | |
| Increase in net assets from Class Y transactions | | | 33,701 | | | | 172,221 | | |
| Increase in net assets from capital share transactions | | | 64,514 | | | | 212,706 | | |
| Total increase in net assets | | | 160,431 | | | | 270,201 | | |
| Net assets at beginning of period | | | 510,200 | | | | 239,999 | | |
| Net assets at end of period | | $ | 670,631 | | | $ | 510,200 | | |
| Undistributed net investment income at end of period | | $ | 2,805 | | | $ | 1,227 | | |
The accompanying notes are an integral part of the financial statements.
FIRST AMERICAN FUNDS Annual Report 2005
45
Financial Highlights For a share outstanding throughout the periods ended September 30, unless otherwise indicated.
| | | Net Asset
Value
Beginning
of Period | | Net
Investment
Income | | Realized and
Unrealized
Gains on
Investments | | Distributions
from Net
Investment
Income | | Distributions
from Net
Realized Gains | | Distributions
from
Return of
Capital | | Net Asset
Value
End of
Period | |
| | Real Estate Securities Fund (1) | | | | |
| Class A | |
| | 2005 | | | $ | 18.62 | | | $ | 0.69 | | | $ | 4.47 | | | $ | (0.55 | ) | | $ | (1.42 | ) | | $ | - | | | $ | 21.81 | | |
| | 2004 | | | | 16.00 | | | | 0.63 | | | | 3.21 | | | | (0.62 | ) | | | (0.60 | ) | | | - | | | | 18.62 | | |
| | 2003 | | | | 13.68 | | | | 0.69 | | | | 2.65 | | | | (0.69 | ) | | | (0.33 | ) | | | - | | | | 16.00 | | |
| | 2002 | | | | 13.12 | | | | 0.71 | | | | 0.61 | | | | (0.69 | ) | | | - | | | | (0.07 | ) | | | 13.68 | | |
| | 2001 | | | | 12.71 | | | | 0.76 | | | | 0.32 | | | | (0.64 | ) | | | - | | | | (0.03 | ) | | | 13.12 | | |
| Class B | |
| | 2005 | | | $ | 18.41 | | | $ | 0.54 | | | $ | 4.40 | | | $ | (0.40 | ) | | $ | (1.42 | ) | | $ | - | | | $ | 21.53 | | |
| | 2004 | | | | 15.85 | | | | 0.50 | | | | 3.17 | | | | (0.51 | ) | | | (0.60 | ) | | | - | | | | 18.41 | | |
| | 2003 | | | | 13.55 | | | | 0.57 | | | | 2.64 | | | | (0.58 | ) | | | (0.33 | ) | | | - | | | | 15.85 | | |
| | 2002 | | | | 13.02 | | | | 0.59 | | | | 0.61 | | | | (0.60 | ) | | | - | | | | (0.07 | ) | | | 13.55 | | |
| | 2001 | | | | 12.61 | | | | 0.65 | | | | 0.33 | | | | (0.54 | ) | | | - | | | | (0.03 | ) | | | 13.02 | | |
| Class C | |
| | 2005 | | | $ | 18.47 | | | $ | 0.54 | | | $ | 4.42 | | | $ | (0.40 | ) | | $ | (1.42 | ) | | $ | - | | | $ | 21.61 | | |
| | 2004 | | | | 15.89 | | | | 0.50 | | | | 3.19 | | | | (0.51 | ) | | | (0.60 | ) | | | - | | | | 18.47 | | |
| | 2003 | | | | 13.62 | | | | 0.59 | | | | 2.62 | | | | (0.61 | ) | | | (0.33 | ) | | | - | | | | 15.89 | | |
| | 2002 | | | | 13.08 | | | | 0.62 | | | | 0.59 | | | | (0.60 | ) | | | - | | | | (0.07 | ) | | | 13.62 | | |
| | 2001 | | | | 12.68 | | | | 0.69 | | | | 0.30 | | | | (0.59 | ) | | | - | | | | - | | | | 13.08 | | |
| Class R (2) | |
| | 2005 | | | $ | 18.80 | | | $ | 0.72 | | | $ | 4.43 | | | $ | (0.53 | ) | | $ | (1.42 | ) | | $ | - | | | $ | 22.00 | | |
| | 2004 | | | | 16.00 | | | | 0.61 | | | | 3.24 | | | | (0.45 | ) | | | (0.60 | ) | | | - | | | | 18.80 | | |
| | 2003 | | | | 13.69 | | | | 0.69 | | | | 2.64 | | | | (0.69 | ) | | | (0.33 | ) | | | - | | | | 16.00 | | |
| | 2002 | | | | 13.12 | | | | 0.70 | | | | 0.62 | | | | (0.68 | ) | | | - | | | | (0.07 | ) | | | 13.69 | | |
| | 2001 | (3) | | | 12.52 | | | | 0.11 | | | | 0.49 | | | | - | | | | - | | | | - | | | | 13.12 | | |
| Class Y | |
| | 2005 | | | $ | 18.71 | | | $ | 0.74 | | | $ | 4.49 | | | $ | (0.60 | ) | | $ | (1.42 | ) | | $ | - | | | $ | 21.92 | | |
| | 2004 | | | | 16.06 | | | | 0.69 | | | | 3.22 | | | | (0.66 | ) | | | (0.60 | ) | | | - | | | | 18.71 | | |
| | 2003 | | | | 13.73 | | | | 0.73 | | | | 2.66 | | | | (0.73 | ) | | | (0.33 | ) | | | - | | | | 16.06 | | |
| | 2002 | | | | 13.15 | | | | 0.73 | | | | 0.63 | | | | (0.71 | ) | | | - | | | | (0.07 | ) | | | 13.73 | | |
| | 2001 | | | | 12.73 | | | | 0.84 | | | | 0.28 | | | | (0.68 | ) | | | - | | | | (0.02 | ) | | | 13.15 | | |
The accompanying notes are an integral part of the financial statements.
FIRST AMERICAN FUNDS Annual Report 2005
46
| | | Total
Return (4) | | Net Assets
End of
Period (000) | | Ratio of
Expenses to
Average
Net Assets | | Ratio of Net
Investment
Income to
Average
Net Assets | | Ratio of
Expenses to
Average
Net Assets
(Excluding
Waivers) | | Ratio of Net
Investment
Income to
Average Net
Assets (Excluding
Waivers) | | Portfolio
Turnover
Rate | |
| | Real Estate Securities Fund (1) | | |
| Class A | |
| | 2005 | | | | 28.99 | % | | $ | 135,745 | | | | 1.23 | % | | | 3.43 | % | | | 1.25 | % | | | 3.41 | % | | | 118 | % | |
| | 2004 | | | | 24.98 | | | | 86,996 | | | | 1.23 | | | | 3.63 | | | | 1.26 | | | | 3.60 | | | | 127 | | |
| | 2003 | | | | 25.92 | | | | 35,754 | | | | 1.23 | | | | 4.82 | | | | 1.28 | | | | 4.77 | | | | 69 | | |
| | 2002 | | | | 10.07 | | | | 15,422 | | | | 1.23 | | | | 5.06 | | | | 1.32 | | | | 4.97 | | | | 99 | | |
| | 2001 | | | | 8.69 | | | | 2,421 | | | | 1.04 | | | | 5.89 | | | | 1.25 | | | | 5.68 | | | | 85 | | |
| Class B | |
| | 2005 | | | | 27.98 | % | | $ | 4,700 | | | | 1.98 | % | | | 2.69 | % | | | 2.00 | % | | | 2.67 | % | | | 118 | % | |
| | 2004 | | | | 24.06 | | | | 4,412 | | | | 1.98 | | | | 2.91 | | | | 2.01 | | | | 2.88 | | | | 127 | | |
| | 2003 | | | | 25.03 | | | | 3,559 | | | | 1.98 | | | | 4.10 | | | | 2.03 | | | | 4.05 | | | | 69 | | |
| | 2002 | | | | 9.21 | | | | 2,577 | | | | 1.98 | | | | 4.27 | | | | 2.07 | | | | 4.18 | | | | 99 | | |
| | 2001 | | | | 7.93 | | | | 1,724 | | | | 1.79 | | | | 5.13 | | | | 2.00 | | | | 4.92 | | | | 85 | | |
| Class C | |
| | 2005 | | | | 28.00 | % | | $ | 4,954 | | | | 1.98 | % | | | 2.68 | % | | | 2.00 | % | | | 2.66 | % | | | 118 | % | |
| | 2004 | | | | 24.12 | | | | 4,247 | | | | 1.98 | | | | 2.92 | | | | 2.01 | | | | 2.89 | | | | 127 | | |
| | 2003 | | | | 24.88 | | | | 3,229 | | | | 1.98 | | | | 4.12 | | | | 2.03 | | | | 4.07 | | | | 69 | | |
| | 2002 | | | | 9.27 | | | | 986 | | | | 1.98 | | | | 4.43 | | | | 2.07 | | | | 4.34 | | | | 99 | | |
| | 2001 | | | | 7.93 | | | | 341 | | | | 1.79 | | | | 5.27 | | | | 2.00 | | | | 5.06 | | | | 85 | | |
| Class R (2) | |
| | 2005 | | | | 28.60 | % | | $ | 36 | | | | 1.48 | % | | | 3.37 | % | | | 1.65 | % | | | 3.20 | % | | | 118 | % | |
| | 2004 | | | | 24.94 | | | | 1 | | | | 1.23 | | | | 3.57 | | | | 1.26 | | | | 3.54 | | | | 127 | | |
| | 2003 | | | | 25.80 | | | | 2,524 | | | | 1.23 | | | | 4.87 | | | | 1.28 | | | | 4.82 | | | | 69 | | |
| | 2002 | | | | 10.13 | | | | 1,224 | | | | 1.23 | | | | 5.00 | | | | 1.32 | | | | 4.91 | | | | 99 | | |
| | 2001 | (3) | | | 4.87 | | | | 320 | | | | 0.56 | | | | 43.93 | | | | 1.01 | | | | 43.48 | | | | 85 | | |
| Class Y | |
| | 2005 | | | | 29.25 | % | | $ | 525,196 | | | | 0.98 | % | | | 3.66 | % | | | 1.00 | % | | | 3.64 | % | | | 118 | % | |
| | 2004 | | | | 25.33 | | | | 414,544 | | | | 0.98 | | | | 3.95 | | | | 1.01 | | | | 3.92 | | | | 127 | | |
| | 2003 | | | | 26.19 | | | | 194,933 | | | | 0.98 | | | | 5.13 | | | | 1.03 | | | | 5.08 | | | | 69 | | |
| | 2002 | | | | 10.40 | | | | 120,091 | | | | 0.98 | | | | 5.27 | | | | 1.07 | | | | 5.18 | | | | 99 | | |
| | 2001 | | | | 9.01 | | | | 96,263 | | | | 0.80 | | | | 6.50 | | | | 1.01 | | | | 6.29 | | | | 85 | | |
(1) Per share data calculated using average shares outstanding method.
(2) Prior to July 1, 2004, Class R shares were named Class S shares, which had lower fees and expenses.
(3) Class of shares has been offered since September 24, 2001. All ratios for the period have been annualized, except for total return and portfolio turnover.
(4) Total return does not reflect sales charges. Total return would have been lower had certain expenses not been waived.
FIRST AMERICAN FUNDS Annual Report 2005
47
Schedule of Investments September 30, 2005
International Fund
| DESCRIPTION | | SHARES | | VALUE (000) | |
| Foreign Common Stocks – 98.1% | |
| Australia – 1.3% | |
| BHP Billiton | | | 1,170,000 | | | $ | 19,850 | | |
| Belgium – 1.9% | |
| Dexia | | | 790,000 | | | | 17,777 | | |
| Fortis (a) | | | 450,000 | | | | 13,002 | | |
| | | | 30,779 | | |
| Brazil – 1.8% | | | |
| Companhia Vale do Rio Doce, ADR | | | 620,000 | | | | 27,193 | | |
| Petroleo Brasileiro, ADR* | | | 22,900 | | | | 1,637 | | |
| | | | 28,830 | | |
| Finland – 1.4% | | | |
| Nokia Oyj | | | 1,304,770 | | | | 21,852 | | |
| France – 10.6% | |
| Axa (a) | | | 704,000 | | | | 19,318 | | |
| BNP Paribas (a) | | | 301,900 | | | | 22,941 | | |
| Compagnie de Saint-Gobain (a) | | | 430,000 | | | | 24,725 | | |
| Dassault Systemes (a) | | | 250,000 | | | | 12,915 | | |
| Lafarge (a) | | | 169,600 | | | | 14,915 | | |
| Total (a) | | | 269,490 | | | | 73,528 | | |
| | | | 168,342 | | |
| Germany – 5.8% | | | |
| BASF (a) | | | 160,000 | | | | 12,034 | | |
| Bayerische Motoren Werke (BMW) (a) | | | 459,600 | | | | 21,529 | | |
| Deutsche Post | | | 600,000 | | | | 14,042 | | |
| SAP (a) | | | 71,750 | | | | 12,413 | | |
| Schering (a) | | | 210,600 | | | | 13,342 | | |
| Siemens (a) | | | 231,000 | | | | 17,803 | | |
| | | | 91,163 | | |
| Great Britain – 27.0% | | | |
| Aviva | | | 1,000,000 | | | | 10,974 | | |
| Barclays | | | 2,725,000 | | | | 27,526 | | |
| BG Group | | | 2,750,000 | | | | 26,082 | | |
| British Land | | | 900,000 | | | | 14,922 | | |
| Centrica | | | 3,370,542 | | | | 14,617 | | |
| GlaxoSmithKline | | | 1,625,000 | | | | 41,309 | | |
| HSBC (a) | | | 2,626,800 | | | | 42,672 | | |
| Kingfisher | | | 3,105,000 | | | | 11,823 | | |
| Morrison Supermarket | | | 5,815,000 | | | | 18,222 | | |
| National Grid Transco | | | 1,404,082 | | | | 13,156 | | |
| Reckitt Benckiser | | | 524,378 | | | | 15,965 | | |
| Royal Bank of Scotland | | | 1,064,000 | | | | 30,180 | | |
| Smith & Nephew | | | 1,781,163 | | | | 14,946 | | |
| Standard Chartered | | | 1,213,000 | | | | 26,153 | | |
| Tesco | | | 5,422,000 | | | | 29,583 | | |
| Vodafone | | | 18,435,000 | | | | 47,936 | | |
| Wolseley | | | 1,250,000 | | | | 26,421 | | |
| WPP Group | | | 1,485,503 | | | | 15,110 | | |
| | | | 427,597 | | |
| Hong Kong – 0.7% | | | |
| Esprit Holdings | | | 1,564,500 | | | | 11,680 | | |
| Far East Pharmaceutical Technology* (b) (c) | | | 2,836,000 | | | | - | | |
| Peregrine Investment Holdings* (b) (c) | | | 142,000 | | | | - | | |
| | | | 11,680 | | |
| Ireland – 0.6% | | | |
| Bank of Ireland | | | 650,000 | | | | 10,269 | | |
International Fund (continued)
| DESCRIPTION | | SHARES | | VALUE (000) | |
| Italy – 5.1% | | | |
| Eni (a) | | | 1,925,800 | | | $ | 57,171 | | |
| Mediaset (a) | | | 702,400 | | | | 8,308 | | |
| UniCredito Italiano (a) | | | 2,803,900 | | | | 15,799 | | |
| | | | 81,278 | | |
| Japan – 20.7% | | | |
| Aeon Credit Service | | | 176,400 | | | | 12,820 | | |
| Canon | | | 453,600 | | | | 24,495 | | |
| Chugai Pharmaceutical (a) | | | 378,100 | | | | 7,211 | | |
| Credit Saison | | | 336,900 | | | | 14,780 | | |
| Daikin Industries (a) | | | 430,000 | | | | 11,516 | | |
| Fanuc (a) | | | 130,000 | | | | 10,513 | | |
| Hirose Electric (a) | | | 63,000 | | | | 7,343 | | |
| Honda Motor (a) | | | 232,200 | | | | 13,132 | | |
| Hoya (a) | | | 120,000 | | | | 3,985 | | |
| Hoya W/I | | | 360,000 | | | | 12,242 | | |
| Matsushita Electric Industrial (a) | | | 614,000 | | | | 10,402 | | |
| Mitsubishi (a) | | | 979,800 | | | | 19,335 | | |
| Mitsubishi Tokyo Financial Group (a) | | | 2,843 | | | | 37,317 | | |
| Nidec Corporation (a) | | | 47,100 | | | | 2,801 | | |
| Nidec Corporation W/I | | | 47,100 | | | | 2,797 | | |
| Nikko Cordial (a) | | | 750,000 | | | | 8,675 | | |
| Nippon Oil | | | 925 | | | | 8 | | |
| Nitto Denko (a) | | | 268,700 | | | | 15,126 | | |
| Secom | | | 235,000 | | | | 11,303 | | |
| Sharp (a) | | | 500,000 | | | | 7,241 | | |
| Shin-Etsu Chemical (a) | | | 298,000 | | | | 12,995 | | |
| SMC (a) | | | 100,600 | | | | 13,391 | | |
| Sumitomo (a) | | | 1,902,000 | | | | 20,073 | | |
| Takefuji | | | 110,000 | | | | 8,576 | | |
| Toyota Motor (a) | | | 466,400 | | | | 21,365 | | |
| Yamanouchi Pharmeceutical | | | 498,200 | | | | 18,740 | | |
| | | | 328,182 | | |
| Mexico – 0.7% | | | |
| Fomento Economico Mexicano, ADR | | | 152,000 | | | | 10,628 | | |
| Netherlands – 4.4% | | | |
| ABN AMRO | | | 725,000 | | | | 17,360 | | |
| ING Groep (a) | | | 425,000 | | | | 12,653 | | |
| Philips Electronics | | | 590,000 | | | | 15,672 | | |
| Reed Elsevier | | | 955,000 | | | | 13,172 | | |
| Wolters Kluwer | | | 619,700 | | | | 11,525 | | |
| | | | 70,382 | | |
| South Korea – 1.2% | | | |
| Samsung Electronics | | | 23,830 | | | | 13,424 | | |
| SK Telecom, ADR | | | 250,000 | | | | 5,460 | | |
| | | | 18,884 | | |
| Spain – 2.9% | | | |
| Altadis | | | 335,000 | | | | 15,000 | | |
| Banco Bilbano Vizcaya Argentaria | | | 884,400 | | | | 15,502 | | |
| Telefonica | | | 977,184 | | | | 15,990 | | |
| | | | 46,492 | | |
| Sweden – 1.1% | | | |
| Ericsson* | | | 4,815,000 | | | | 17,576 | | |
| Switzerland – 10.9% | | | |
| Adecco (a) | | | 377,600 | | | | 17,241 | | |
| Holcim | | | 300,000 | | | | 19,921 | | |
| Nestle | | | 95,560 | | | | 27,980 | | |
| Novartis | | | 600,100 | | | | 30,436 | | |
The accompanying notes are an integral part of the financial statements.
FIRST AMERICAN FUNDS Annual Report 2005
48
International Fund (concluded)
| DESCRIPTION | | SHARES | | VALUE (000) | |
| Roche | | | 220,600 | | | $ | 30,643 | | |
| UBS (a) | | | 385,700 | | | | 32,777 | | |
| Zurich Financial Services | | | 84,500 | | | | 14,395 | | |
| | | | 173,393 | | |
Total Foreign Common Stocks
(Cost $1,332,671) | | | | | | | 1,557,177 | | |
| Short-Term Investments – 1.9% | |
State Street GA Prime Fund
(Cost $30,076) | | | 30,076,244 | | | | 30,076 | | |
Investments Purchased with Proceeds
from Securities Lending – 24.7% | |
State Street Navigator Prime
(Cost $390,941) | | | 390,940,688 | | | | 390,941 | | |
Total Investments – 124.7%
(Cost $1,753,688) | | | | | | | 1,978,194 | | |
| Other Assets and Liabilities, Net – (24.7)% | | | | | | | (391,389 | ) | |
| Total Net Assets – 100.0% | | | | | | $ | 1,586,805 | | |
* Non-income producing security
(a) This security or a portion of this security is out on loan at September 30, 2005. Total loaned securities had a market value of $371,692,911 at September 30, 2005. See note 2 in Notes to Financial Statements.
(b) Security considered illiquid investment and is fair valued under guidelines established by the Board of Directors. As of September 30, 2005, the fair value of these investments was $0 or 0.0% of total net assets. See note 2 in Notes to Financial Statements.
(c) Security is fair valued. As of September 30, 2005, the fair value of these investments was $0 or 0.0% of total net assets. See note 2 in Notes to Financial Statements.
ADR – American Depository Receipts
| At September 30, 2005, sector diversification of the fund was as follows: | |
| | | % of
Net Assets | | Value (000) | |
| Foreign Common Stock | |
| Banking | | | 15.8 | % | | $ | 248,972 | | |
| Diversified Financials | | | 11.4 | | | | 182,748 | | |
| Energy | | | 10.8 | | | | 173,043 | | |
| Pharmaceutical & Biotechnology | | | 8.9 | | | | 141,681 | | |
| Consumer Discretionary | | | 7.9 | | | | 127,469 | | |
| Technology | | | 6.6 | | | | 104,215 | | |
| Telecommunication Services | | | 5.7 | | | | 91,238 | | |
| Capital Goods | | | 5.7 | | | | 88,773 | | |
| Materials | | | 5.6 | | | | 87,198 | | |
| Retailing | | | 3.8 | | | | 59,628 | | |
| Automobiles & Components | | | 3.5 | | | | 56,026 | | |
| Commercial Services & Supplies | | | 3.3 | | | | 51,271 | | |
| Health Care | | | 1.7 | | | | 28,118 | | |
| Food & Beverage | | | 1.8 | | | | 27,980 | | |
| Insurance | | | 1.6 | | | | 25,369 | | |
| Manufacturing | | | 1.6 | | | | 24,725 | | |
| Industrials | | | 0.9 | | | | 14,042 | | |
| Utilities | | | 0.8 | | | | 13,156 | | |
| Media | | | 0.7 | | | | 11,525 | | |
| Total Foreign Common Stocks | | | 98.1 | | | | 1,557,177 | | |
| Total Short-Term Investments | | | 1.9 | | | | 30,076 | | |
Total Investments Purchased with
Proceeds from Securities Lending | | | 24.7 | | | | 390,941 | | |
| Total Investments | | | 124.7 | | | | 1,978,194 | | |
| Other Assets and Liabilities, Net | | | (24.7 | ) | | | (391,389 | ) | |
| Net Assets | | | 100.0 | % | | $ | 1,586,805 | | |
FIRST AMERICAN FUNDS Annual Report 2005
49
Statement of Assets and Liabilities September 30, 2005, in thousands, except per share data
| | | International
Fund | |
| ASSETS: | | | |
| Investments in securities, at value† (cost $1,362,747) (note 2) | | $ | 1,587,253 | | |
| Investments purchased with proceeds from securities lending (cost $390,941) (note 2) | | | 390,941 | | |
| Cash denominated in foreign currencies, at value (cost $377) (note 2) | | | 379 | | |
| Cash | | | 396 | | |
| Receivable for dividends and interest | | | 3,413 | | |
| Receivable for investment securities sold | | | 5,888 | | |
| Receivable for capital shares sold | | | 814 | | |
| Receivable for foreign withholding tax reclaim | | | 114 | | |
| Prepaid expenses and other assets | | | 26 | | |
| Total assets | | | 1,989,224 | | |
| LIABILITIES: | | | |
| Payable for investment securities purchased | | | 7,544 | | |
| Payable for capital shares redeemed | | | 2,273 | | |
| Payable upon return of securities loaned (note 2) | | | 390,941 | | |
| Payable for advisory and custodian fees | | | 1,242 | | |
| Payable to affiliates (note 3) | | | 357 | | |
| Payable for distribution and shareholder servicing fees | | | 22 | | |
| Accrued expenses and other liabilities | | | 40 | | |
| Total liabilities | | | 402,419 | | |
| Net assets | | $ | 1,586,805 | | |
| COMPOSITION OF NET ASSETS: | | | |
| Portfolio capital | | $ | 1,421,194 | | |
| Undistributed net investment income | | | 17,074 | | |
| Accumulated net realized loss on investments | | | (75,914 | ) | |
| Net unrealized appreciation of investments | | | 224,506 | | |
| Net unrealized depreciation of foreign currency, and translation of other assets and liabilities in foreign currency | | | (55 | ) | |
| Net assets | | $ | 1,586,805 | | |
| † Including securities loaned, at value | | $ | 371,693 | | |
| Class A: | | | |
| Net assets | | $ | 48,851 | | |
| Shares issued and outstanding ($0.0001 par value - 2 billion authorized) | | | 3,990 | | |
| Net asset value and redemption price per share | | $ | 12.24 | | |
| Maximum offering price per share (1) | | $ | 12.95 | | |
| Class B: | | | |
| Net assets | | $ | 6,819 | | |
| Shares issued and outstanding ($0.0001 par value - 2 billion authorized) | | | 603 | | |
| Net asset value, offering price and redemption price per share (2) | | $ | 11.31 | | |
| Class C: | | | |
| Net assets | | $ | 7,915 | | |
| Shares issued and outstanding ($0.0001 par value - 2 billion authorized) | | | 676 | | |
| Net asset value, offering price and redemption price per share (2) | | $ | 11.70 | | |
| Class R: | | | |
| Net assets | | $ | 163 | | |
| Shares issued and outstanding ($0.0001 par value - 2 billion authorized) | | | 13 | | |
| Net asset value, offering price, and redemption price per share | | $ | 12.17 | | |
| Class Y: | | | |
| Net assets | | $ | 1,523,057 | | |
| Shares issued and outstanding ($0.0001 par value - 2 billion authorized) | | | 122,900 | | |
| Net asset value, offering price, and redemption price per share | | $ | 12.39 | | |
(1) The offering price is calculated by dividing the net asset value by 1 minus the maximum sales charge of 5.50%.
(2) Class B and C have a contingent deferred sales charge. For a description of this sales charge, see notes 1 and 3 in Notes to Financial Statements.
The accompanying notes are an integral part of the financial statements.
FIRST AMERICAN FUNDS Annual Report 2005
50
Statement of Operations For the fiscal year ended September 30, 2005, in thousands
| | | International
Fund | |
| INVESTMENT INCOME: | | | |
| Interest | | $ | 862 | | |
| Dividends | | | 34,786 | | |
| Less: Foreign taxes withheld | | | (3,519 | ) | |
| Securities lending income | | | 1,095 | | |
| Other income | | | 276 | | |
| Total investment income | | | 33,500 | | |
| EXPENSES (note 3): | | | |
| Investment advisory fees | | | 15,077 | | |
| Administration fees | | | 2,865 | | |
| Transfer agent fees | | | 918 | | |
| Custodian fees | | | 194 | | |
| Postage and printing fees | | | 86 | | |
| Professional fees | | | 79 | | |
| Registration fees | | | 37 | | |
| Directors' fees | | | 32 | | |
| Other expenses | | | 28 | | |
| Distribution and shareholder servicing fees – Class A | | | 117 | | |
| Distribution and shareholder servicing fees – Class B | | | 73 | | |
| Distribution and shareholder servicing fees – Class C | | | 84 | | |
| Distribution and shareholder servicing fees – Class R | | | 1 | | |
| Total expenses | | | 19,591 | | |
| Less: Fee waivers (note 3) | | | (525 | ) | |
| Less: Expenses paid indirectly (note 3) | | | (345 | ) | |
| Total net expenses | | | 18,721 | | |
| Investment income – net | | | 14,779 | | |
REALIZED AND UNREALIZED GAINS (LOSSES) ON INVESTMENTS AND
FOREIGN CURRENCY TRANSACTIONS – NET (note 5): | | | |
| Net realized gain on investments | | | 158,132 | | |
| Net realized gain on foreign currency transactions | | | 1,417 | | |
| Net change in unrealized appreciation or depreciation of investments | | | 89,806 | | |
Net change in unrealized appreciation or depreciation of foreign currency, and translation of
other assets and liabilities denominated in foreign currency | | | (35 | ) | |
| Net gain on investments and foreign currency transactions | | | 249,320 | | |
| Net increase in net assets resulting from operations | | $ | 264,099 | | |
FIRST AMERICAN FUNDS Annual Report 2005
51
Statement of Changes in Net Assets in thousands
| | | International
Fund | |
| | | Year Ended
9/30/05 | | Year Ended
9/30/04 | |
| OPERATIONS: | | | |
| Investment income – net | | $ | 14,779 | | | $ | 7,763 | | |
| Net realized gain on investments | | | 158,132 | | | | 135,849 | | |
| Net realized gain (loss) on foreign currency transactions | | | 1,417 | | | | (430 | ) | |
| Net change in unrealized appreciation or depreciation of investments | | | 89,806 | | | | 6,817 | | |
Net change in unrealized appreciation or depreciation of foreign currency, and translation of other assets and liabilities
denominated in foreign currency | | | (35 | ) | | | (278 | ) | |
| Net increase in net assets resulting from operations | | | 264,099 | | | | 149,721 | | |
| DISTRIBUTIONS TO SHAREHOLDERS FROM: | | | |
| Investment income – net: | |
| Class A | | | (273 | ) | | | (212 | ) | |
| Class B | | | - | | | | (4 | ) | |
| Class C | | | - | | | | (5 | ) | |
| Class S | | | - | | | | (43 | ) | |
| Class Y | | | (9,941 | ) | | | (8,556 | ) | |
| Total distributions | | | (10,214 | ) | | | (8,820 | ) | |
| CAPITAL SHARE TRANSACTIONS (note 4): | | | |
| Class A: | |
| Proceeds from sales | | | 10,293 | | | | 20,466 | | |
| Reinvestment of distributions | | | 259 | | | | 202 | | |
| Payments for redemptions | | | (15,029 | ) | | | (20,179 | ) | |
| Increase (decrease) in net assets from Class A transactions | | | (4,477 | ) | | | 489 | | |
| Class B: | |
| Proceeds from sales | | | 594 | | | | 606 | | |
| Reinvestment of distributions | | | - | | | | 4 | | |
| Payments for redemptions | | | (2,481 | ) | | | (2,218 | ) | |
| Decrease in net assets from Class B transactions | | | (1,887 | ) | | | (1,608 | ) | |
| Class C: | |
| Proceeds from sales | | | 755 | | | | 853 | | |
| Reinvestment of distributions | | | - | | | | 5 | | |
| Payments for redemptions | | | (2,929 | ) | | | (4,123 | ) | |
| Decrease in net assets from Class C transactions | | | (2,174 | ) | | | (3,265 | ) | |
| Class R: | |
| Proceeds from sales | | | 400 | | | | 1,377 | | |
| Reinvestment of distributions | | | - | | | | 40 | | |
| Payments for redemptions | | | (244 | ) | | | (11,223 | ) | |
| Increase (decrease) in net assets from Class R transactions | | | 156 | | | | (9,806 | ) | |
| Class Y: | |
| Proceeds from sales | | | 320,811 | | | | 321,648 | | |
| Reinvestment of distributions | | | 6,151 | | | | 5,397 | | |
| Payments for redemptions | | | (191,834 | ) | | | (304,768 | ) | |
| Increase in net assets from Class Y transactions | | | 135,128 | | | | 22,277 | | |
| Increase in net assets from capital share transactions | | | 126,746 | | | | 8,087 | | |
| Total increase in net assets | | | 380,631 | | | | 148,988 | | |
| Net assets at beginning of period | | | 1,206,174 | | | | 1,057,186 | | |
| Net assets at end of period | | $ | 1,586,805 | | | $ | 1,206,174 | | |
| Undistributed net investment income at end of period | | $ | 17,074 | | | $ | 8,800 | | |
The accompanying notes are an integral part of the financial statements.
FIRST AMERICAN FUNDS Annual Report 2005
52
(This page has been left blank intentionally.)
Financial Highlights For a share outstanding throughout the periods ended September 30, unless otherwise indicated.
| | | Net Asset
Value
Beginning
of Period | | Net
Investment
Income (Loss) | | Realized and
Unrealized
Gains
(Losses) on
Investments | | Distributions
from Net
Investment
Income | | Distributions
from Net
Realized Gains | | Net Asset
Value
End of
Period | | Total
Return (7) | |
| | International Fund (1)(2) | | | | |
| Class A | |
| | 2005 | | | $ | 10.19 | | | $ | 0.09 | | | $ | 2.02 | | | $ | (0.06 | ) | | $ | - | | | $ | 12.24 | | | | 20.80 | % | |
| | 2004 | | | | 8.99 | | | | 0.03 | | | | 1.22 | | | | (0.05 | ) | | | - | | | | 10.19 | | | | 13.91 | | |
| | 2003 | | | | 7.33 | | | | 0.06 | | | | 1.60 | | | | - | | | | - | | | | 8.99 | | | | 22.65 | | |
| | 2002 | | | | 8.96 | | | | - | | | | (1.63 | ) | | | - | | | | - | | | | 7.33 | | | | (18.19 | ) | |
| | 2001 | (3) | | | 13.96 | | | | 0.10 | | | | (3.63 | ) | | | (0.10 | ) | | | (1.37 | ) | | | 8.96 | | | | (28.00 | ) | |
| | 2000 | (4) | | | 15.94 | | | | (0.03 | ) | | | (0.42 | ) | | | (0.10 | ) | | | (1.43 | ) | | | 13.96 | | | | (3.59 | ) | |
| Class B | |
| | 2005 | | | $ | 9.43 | | | $ | - | | | $ | 1.88 | | | $ | - | | | $ | - | | | $ | 11.31 | | | | 19.94 | % | |
| | 2004 | | | | 8.34 | | | | (0.05 | ) | | | 1.14 | | | | - | | | | - | | | | 9.43 | | | | 13.12 | | |
| | 2003 | | | | 6.85 | | | | - | | | | 1.49 | | | | - | | | | - | | | | 8.34 | | | | 21.75 | | |
| | 2002 | | | | 8.45 | | | | (0.06 | ) | | | (1.54 | ) | | | - | | | | - | | | | 6.85 | | | | (18.94 | ) | |
| | 2001 | (3) | | | 13.28 | | | | 0.01 | | | | (3.43 | ) | | | (0.07 | ) | | | (1.34 | ) | | | 8.45 | | | | (28.57 | ) | |
| | 2000 | (4) | | | 15.27 | | | | (0.10 | ) | | | (0.42 | ) | | | (0.07 | ) | | | (1.40 | ) | | | 13.28 | | | | (4.22 | ) | |
| Class C | |
| | 2005 | | | $ | 9.76 | | | $ | - | | | $ | 1.94 | | | $ | - | | | $ | - | | | $ | 11.70 | | | | 19.88 | % | |
| | 2004 | | | | 8.63 | | | | (0.05 | ) | | | 1.18 | | | | - | | | | - | | | | 9.76 | | | | 13.14 | | |
| | 2003 | | | | 7.09 | | | | - | | | | 1.54 | | | | - | | | | - | | | | 8.63 | | | | 21.72 | | |
| | 2002 | | | | 8.75 | | | | (0.06 | ) | | | (1.60 | ) | | | - | | | | - | | | | 7.09 | | | | (18.97 | ) | |
| | 2001 | (5) | | | 8.31 | | | | 0.01 | | | | 0.43 | | | | - | | | | - | | | | 8.75 | | | | 5.29 | | |
| Class R (6) | |
| | 2005 | | | $ | 10.11 | | | $ | 0.09 | | | $ | 1.97 | | | $ | - | | | $ | - | | | $ | 12.17 | | | | 20.38 | % | |
| | 2004 | | | | 8.98 | | | | (0.01 | ) | | | 1.19 | | | | (0.05 | ) | | | - | | | | 10.11 | | | | 13.16 | | |
| | 2003 | | | | 7.31 | | | | 0.04 | | | | 1.63 | | | | - | | | | - | | | | 8.98 | | | | 22.85 | (8) | |
| | 2002 | | | | 8.96 | | | | 0.01 | | | | (1.66 | ) | | | - | | | | - | | | | 7.31 | | | | (18.42 | ) | |
| | 2001 | (3) | | | 13.97 | | | | (0.04 | ) | | | (3.50 | ) | | | (0.10 | ) | | | (1.37 | ) | | | 8.96 | | | | (28.03 | ) | |
| | 2000 | (4) | | | 15.95 | | | | (0.03 | ) | | | (0.42 | ) | | | (0.10 | ) | | | (1.43 | ) | | | 13.97 | | | | (3.59 | ) | |
| Class Y | |
| | 2005 | | | $ | 10.31 | | | $ | 0.12 | | | $ | 2.05 | | | $ | (0.09 | ) | | $ | - | | | $ | 12.39 | | | | 21.12 | % | |
| | 2004 | | | | 9.10 | | | | 0.06 | | | | 1.23 | | | | (0.08 | ) | | | - | | | | 10.31 | | | | 14.13 | | |
| | 2003 | | | | 7.40 | | | | 0.09 | | | | 1.61 | | | | - | | | | - | | | | 9.10 | | | | 22.97 | (8) | |
| | 2002 | | | | 9.03 | | | | 0.03 | | | | (1.66 | ) | | | - | | | | - | | | | 7.40 | | | | (18.05 | ) | |
| | 2001 | (3) | | | 14.03 | | | | 0.07 | | | | (3.61 | ) | | | (0.11 | ) | | | (1.35 | ) | | | 9.03 | | | | (27.93 | ) | |
| | 2000 | (4) | | | 15.97 | | | | 0.01 | | | | (0.42 | ) | | | (0.12 | ) | | | (1.41 | ) | | | 14.03 | | | | (3.27 | ) | |
The accompanying notes are an integral part of the financial statements.
FIRST AMERICAN FUNDS Annual Report 2005
54
| | | Net Assets
End of
Period (000) | | Ratio of
Expenses to
Average
Net Assets | | Ratio of Net
Investment
Income (Loss)
to Average
Net Assets | | Ratio of
Expenses to
Average
Net Assets
(Excluding
Waivers) | | Ratio of Net
Investment
Income (Loss)
to Average Net
Assets (Excluding
Waivers) | | Portfolio
Turnover
Rate | |
| | International Fund (1)(2) | | |
| Class A | |
| | 2005 | | | $ | 48,851 | | | | 1.56 | % | | | 0.77 | % | | | 1.61 | % | | | 0.72 | % | | | 74 | % | |
| | 2004 | | | | 44,851 | | | | 1.60 | | | | 0.31 | | | | 1.64 | | | | 0.27 | | | | 77 | | |
| | 2003 | | | | 39,251 | | | | 1.60 | | | | 0.77 | | | | 1.65 | | | | 0.72 | | | | 82 | | |
| | 2002 | | | | 37,232 | | | | 1.60 | | | | 0.04 | | | | 1.66 | | | | (0.02 | ) | | | 72 | | |
| | 2001 | (3) | | | 64,907 | | | | 1.49 | | | | 1.02 | | | | 1.59 | | | | 0.92 | | | | 72 | | |
| | 2000 | (4) | | | 3,591 | | | | 1.58 | | | | (0.26 | ) | | | 1.76 | | | | (0.44 | ) | | | 90 | | |
| Class B | |
| | 2005 | | | $ | 6,819 | | | | 2.31 | % | | | 0.00 | % | | | 2.36 | % | | | (0.05 | )% | | | 74 | % | |
| | 2004 | | | | 7,371 | | | | 2.35 | | | | (0.48 | ) | | | 2.39 | | | | (0.52 | ) | | | 77 | | |
| | 2003 | | | | 7,936 | | | | 2.35 | | | | 0.02 | | | | 2.40 | | | | (0.03 | ) | | | 82 | | |
| | 2002 | | | | 7,459 | | | | 2.35 | | | | (0.68 | ) | | | 2.41 | | | | (0.74 | ) | | | 72 | | |
| | 2001 | (3) | | | 10,857 | | | | 2.17 | | | | 0.06 | | | | 2.27 | | | | (0.04 | ) | | | 72 | | |
| | 2000 | (4) | | | 732 | | | | 2.28 | | | | (0.96 | ) | | | 2.46 | | | | (1.14 | ) | | | 90 | | |
| Class C | |
| | 2005 | | | $ | 7,915 | | | | 2.31 | % | | | (0.01 | )% | | | 2.36 | % | | | (0.06 | )% | | | 74 | % | |
| | 2004 | | | | 8,542 | | | | 2.35 | | | | (0.52 | ) | | | 2.39 | | | | (0.56 | ) | | | 77 | | |
| | 2003 | | | | 10,439 | | | | 2.35 | | | | (0.01 | ) | | | 2.40 | | | | (0.06 | ) | | | 82 | | |
| | 2002 | | | | 11,027 | | | | 2.35 | | | | (0.71 | ) | | | 2.41 | | | | (0.77 | ) | | | 72 | | |
| | 2001 | (5) | | | 17,806 | | | | 1.48 | | | | 4.15 | | | | 1.48 | | | | 4.15 | | | | 72 | | |
| Class R (6) | |
| | 2005 | | | $ | 163 | | | | 1.81 | % | | | 0.77 | % | | | 2.01 | % | | | 0.57 | % | | | 74 | % | |
| | 2004 | | | | 1 | | | | 1.60 | | | | (0.11 | ) | | | 1.64 | | | | (0.15 | ) | | | 77 | | |
| | 2003 | | | | 8,533 | | | | 1.60 | | | | 0.57 | | | | 1.65 | | | | 0.52 | | | | 82 | | |
| | 2002 | | | | 10,817 | | | | 1.60 | | | | 0.16 | | | | 1.66 | | | | 0.10 | | | | 72 | | |
| | 2001 | (3) | | | 9,461 | | | | 1.46 | | | | (0.33 | ) | | | 1.61 | | | | (0.48 | ) | | | 72 | | |
| | 2000 | (4) | | | 16,373 | | | | 1.58 | | | | (0.26 | ) | | | 1.76 | | | | (0.44 | ) | | | 90 | | |
| Class Y | |
| | 2005 | | | $ | 1,523,057 | | | | 1.31 | % | | | 1.07 | % | | | 1.36 | % | | | 1.02 | % | | | 74 | % | |
| | 2004 | | | | 1,145,409 | | | | 1.35 | | | | 0.59 | | | | 1.39 | | | | 0.55 | | | | 77 | | |
| | 2003 | | | | 991,027 | | | | 1.35 | | | | 1.08 | | | | 1.40 | | | | 1.03 | | | | 82 | | |
| | 2002 | | | | 540,495 | | | | 1.35 | | | | 0.36 | | | | 1.41 | | | | 0.30 | | | | 72 | | |
| | 2001 | (3) | | | 661,886 | | | | 1.23 | | | | 0.67 | | | | 1.36 | | | | 0.54 | | | | 72 | | |
| | 2000 | (4) | | | 122,329 | | | | 1.28 | | | | 0.04 | | | | 1.76 | | | | (0.44 | ) | | | 90 | | |
(1) The financial highlights for the International Fund as set forth herein include the historical financial highlights of the Firstar International Growth Fund. The assets of the
Firstar Fund were acquired by the First American International Fund on September 24, 2001. In connection with such acquisition, (i) Class A shares of the Firstar
International Growth Fund were exchanged for Class A shares of the First American International Fund, (ii) Firstar Class B shares were exchanged for Class B shares
of the First American International Fund, (iii) Firstar Class Y shares were exchanged for Class S shares (now designated Class R shares) of the First American Fund, and
(iv) Firstar Institutional Class shares were exchanged for Class Y shares of the First American International Fund. Historical per share amounts have been adjusted to
reflect the conversion ratios utilized for the merger of the International Fund and Firstar International Growth Fund. Firstar International Growth Fund is the accounting survivor.
(2) Per share data calculated using average shares outstanding method.
(3) For the period November 1, 2000 to September 30, 2001. Effective in 2001, the fund's fiscal year end was changed from October 31 to September 30. All ratios for the
period have been annualized, except total return and portfolio turnover.
(4) For the period December 1, 1999 to October 31, 2000. Effective in 2000, the fund's fiscal year end was changed from November 30 to October 31. All ratios for the
period have been annualized, except total return and portfolio turnover.
(5) Class of shares has been offered since September 24, 2001. All ratios for the period have been annualized, except total return and portfolio turnover.
(6) Prior to July 1, 2004, Class R shares were named Class S shares, which had lower fees and expenses.
(7) Total return does not reflect sales charges. Total return would have been lower had certain expenses not been waived.
(8) In 2003, 0.14% of Class S share's and 0.13% of Class Y share's total return was a result of the reimbursement by the adviser related to foreign currency principal trades
between the International Fund and U.S. Bank. Excluding the reimbursement, total return for Class S and Class Y shares would have been 22.71% and 22.84%, respectively.
Excluding the reimbursement, total return for Class S and Class Y shares would have been 22.71% and 22.84%, respectively.
FIRST AMERICAN FUNDS Annual Report 2005
55
Schedule of Investments September 30, 2005
Small Cap Growth Opportunities Fund
| DESCRIPTION | | SHARES | | VALUE (000) | |
| Common Stocks – 97.4% | |
| Consumer Discretionary – 16.2% | |
| Aeropostale* (a) | | | 269,980 | | | $ | 5,737 | | |
| Buffalo Wild Wings* (a) | | | 161,950 | | | | 4,292 | | |
| Cheesecake Factory* (a) | | | 174,210 | | | | 5,442 | | |
| Cosi* | | | 415,027 | | | | 4,076 | | |
| GTECH Holdings | | | 102,480 | | | | 3,285 | | |
| MTR Gaming Group* | | | 273,420 | | | | 2,190 | | |
| P.F. Chang's China Bistro* (a) | | | 63,780 | | | | 2,859 | | |
| Pacific Sunwear of California* (a) | | | 232,830 | | | | 4,992 | | |
| Provide Commerce* (a) | | | 196,540 | | | | 4,770 | | |
| Scientific Games, Class A* | | | 210,850 | | | | 6,536 | | |
| Spanish Broadcasting System* (a) | | | 652,084 | | | | 4,682 | | |
| ValueVision Media* (a) | | | 228,620 | | | | 2,595 | | |
| | | | 51,456 | | |
| Energy – 11.5% | | | |
| Arena Resources* | | | 64,790 | | | | 1,600 | | |
| Cal Dive International* (a) | | | 44,550 | | | | 2,825 | | |
| Compton Petroleum* | | | 639,120 | | | | 8,632 | | |
| GMX Resources* (a) | | | 183,860 | | | | 4,830 | | |
| Helmerich & Payne | | | 35,060 | | | | 2,117 | | |
| Hornbeck Offshore Services* | | | 78,810 | | | | 2,887 | | |
| Hydril* | | | 29,470 | | | | 2,023 | | |
| Oil States International* | | | 60,760 | | | | 2,206 | | |
| Pioneer Drilling* | | | 204,260 | | | | 3,987 | | |
| Plains Exploration & Production* | | | 123,980 | | | | 5,309 | | |
| | | | 36,416 | | |
| Financials – 8.6% | | | |
| Cullen/Frost Bankers (a) | | | 126,820 | | | | 6,257 | | |
| East West Bancorp | | | 218,210 | | | | 7,428 | | |
| Investors Financial Services (a) | | | 140,800 | | | | 4,632 | | |
| Scottish Annuity & Life (a) | | | 91,330 | | | | 2,177 | | |
| Sunstone Hotel Investors* | | | 129,410 | | | | 3,156 | | |
| Triad Guaranty* (a) | | | 90,850 | | | | 3,563 | | |
| | | | 27,213 | | |
| Health Care – 19.5% | | | |
| AMN Healthcare Services* | | | 152,800 | | | | 2,364 | | |
| Andrx Group* (a) | | | 362,070 | | | | 5,587 | | |
| Caliper Life Sciences* | | | 337,280 | | | | 2,371 | | |
| Coley Pharmaceutical Group* (a) | | | 140,710 | | | | 2,561 | | |
| Connetics* (a) | | | 172,030 | | | | 2,909 | | |
| CV Therapeutics* (a) | | | 119,720 | | | | 3,202 | | |
| Cyberonics* (a) | | | 48,980 | | | | 1,462 | | |
| Durect* (a) | | | 365,820 | | | | 2,506 | | |
| Dyax* | | | 746,523 | | | | 4,173 | | |
| Encore Medical* (a) | | | 1,679,250 | | | | 7,892 | | |
| First Horizon Pharmaceutical* (a) | | | 258,790 | | | | 5,142 | | |
| Gentiva Health Services* | | | 282,267 | | | | 5,115 | | |
| I-Flow* (a) | | | 220,690 | | | | 3,026 | | |
| Immucor* | | | 142,450 | | | | 3,909 | | |
| Protein Design Labs* | | | 110,530 | | | | 3,095 | | |
| Rigel Pharmaceuticals* | | | 101,945 | | | | 2,423 | | |
| Salix Pharmaceuticals* (a) | | | 104,830 | | | | 2,228 | | |
| Xenogen* (a) | | | 574,140 | | | | 1,780 | | |
| | | | 61,745 | | |
Small Cap Growth Opportunities Fund (continued)
| DESCRIPTION | | SHARES | | VALUE (000) | |
| Industrials – 11.3% | | | |
| AMETEK (a) | | | 57,730 | | | $ | 2,481 | | |
| Aries Maritime Transport* | | | 198,630 | | | | 2,979 | | |
| Brady, Class A (a) | | | 79,330 | | | | 2,454 | | |
| CLARCOR | | | 104,420 | | | | 2,999 | | |
| Energy Conversion Devices* | | | 79,600 | | | | 3,572 | | |
| ESCO Technologies* (a) | | | 68,100 | | | | 3,410 | | |
| Genco Shipping & Trading* | | | 211,250 | | | | 4,029 | | |
| Mercury Computer Systems* (a) | | | 130,220 | | | | 3,418 | | |
| Navigant Consulting* (a) | | | 337,400 | | | | 6,465 | | |
| Toro | | | 114,630 | | | | 4,214 | | |
| | | | 36,021 | | |
| Information Technology (b) – 30.3% | | | |
| Avocent* (a) | | | 134,770 | | | | 4,264 | | |
| Digitas* (a) | | | 424,037 | | | | 4,817 | | |
| DSP Group* | | | 192,790 | | | | 4,947 | | |
| Embarcadero Technologies* | | | 886,470 | | | | 5,975 | | |
| Emulex* | | | 195,750 | | | | 3,956 | | |
| Extreme Networks* (a) | | | 1,170,550 | | | | 5,209 | | |
| HouseValues* (a) | | | 232,640 | | | | 3,327 | | |
| Hutchinson Technology* (a) | | | 156,220 | | | | 4,080 | | |
| Integrated Device Technology* (a) | | | 237,830 | | | | 2,554 | | |
| Jack Henry & Associates | | | 164,870 | | | | 3,198 | | |
| Kronos* | | | 70,040 | | | | 3,127 | | |
| Maximus | | | 85,050 | | | | 3,041 | | |
| Motive* | | | 550,090 | | | | 3,488 | | |
| M-Systems Flash Disk Pioneers* | | | 106,340 | | | | 3,182 | | |
| NIC* | | | 125,627 | | | | 823 | | |
| Orbotech* | | | 114,050 | | | | 2,853 | | |
| Plantronics | | | 178,840 | | | | 5,510 | | |
| Polycom* (a) | | | 407,180 | | | | 6,584 | | |
| Quest Software* (a) | | | 504,060 | | | | 7,596 | | |
| Sapient* | | | 625,020 | | | | 3,906 | | |
| Semtech* | | | 373,210 | | | | 6,147 | | |
| Tridium, Class B* (c) (d) | | | 278,500 | | | | 123 | | |
| Varian Semiconductor Equipment Associates* | | | 60,140 | | | | 2,548 | | |
| VideoPropulsion* (c) (d) | | | 809,856 | | | | - | | |
| Wind River Systems* | | | 370,370 | | | | 4,789 | | |
| | | | 96,044 | | |
Total Common Stocks
(Cost $293,765) | | | | | | | 308,895 | | |
| Affiliated Money Market Fund – 0.9% | | | |
First American Prime Obligations Fund, Class Z (e)
(Cost $2,860) | | | 2,859,824 | | | | 2,860 | | |
Investments Purchased with Proceeds
from Securities Lending (f) – 27.6% | | | |
| (Cost $87,587) | | | | | | | 87,587 | | |
Total Investments – 125.9%
(Cost $384,212) | | | | | | | 399,342 | | |
| Other Assets and Liabilities, Net – (25.9)% | | | | | | | (82,086 | ) | |
| Total Net Assets – 100.0% | | | | | | $ | 317,256 | | |
The accompanying notes are an integral part of the financial statements.
FIRST AMERICAN FUNDS Annual Report 2005
56
Small Cap Growth Opportunities Fund (concluded)
* Non-income producing security
(a) This security or a portion of this security is out on loan at September 30, 2005. Total loaned securities had a market value of $83,863,031 at September 30, 2005. See note 2 in Notes to Financial Statements.
(b) The fund is significantly invested in this sector and therefore is subject to additional risks. See note 7 in Notes to Financial Statements.
(c) Security is considered illiquid or restricted. As of September 30, 2005, the value of these investments was $122,540 or 0.0% of total net assets. See note 2 in Notes to Financial Statements.
(d) Security is fair valued. As of September 30, 2005, the fair value of these investments was $122,540 or 0.0% of total net assets. See note 2 in Notes to Financial Statements.
(e) Investment in affiliated security. This money market fund is advised by U.S. Bancorp Asset Management, Inc., which also serves as advisor to this fund. See note 3 in Notes to Financial Statements.
(f) The fund may loan securities in return for collateral in the form of cash, U.S. Government securities, or other high grade debt obligations. The cash collateral is invested in various short-term fixed income securities, such as repurchase agreements, commercial paper, money market funds and other corporate obligations. See note 2 in Notes to Financial Statements.
Small Cap Select Fund
| DESCRIPTION | | SHARES | | VALUE (000) | |
| Common Stocks – 99.5% | |
| Consumer Discretionary – 13.9% | |
| Gray Television | | | 161,850 | | | $ | 1,714 | | |
| Kerzner International* (a) | | | 69,450 | | | | 3,858 | | |
| La Quinta* (a) | | | 1,425,810 | | | | 12,390 | | |
| Marvel Enterprises* (a) | | | 599,130 | | | | 10,706 | | |
| Men's Wearhouse* (a) | | | 303,570 | | | | 8,105 | | |
| Nautilus (a) | | | 178,480 | | | | 3,939 | | |
| P.F. Chang's China Bistro* (a) | | | 103,020 | | | | 4,618 | | |
| RARE Hospitality International* | | | 217,280 | | | | 5,584 | | |
| Ruby Tuesday (a) | | | 443,210 | | | | 9,644 | | |
| Ruth's Chris Steak House* | | | 23,690 | | | | 435 | | |
| Scientific Games, Class A* (a) | | | 559,550 | | | | 17,346 | | |
| Sports Authority* (a) | | | 285,330 | | | | 8,400 | | |
| Station Casinos (a) | | | 92,170 | | | | 6,116 | | |
| Thomas Nelson | | | 296,720 | | | | 5,566 | | |
| Too* (a) | | | 471,190 | | | | 12,925 | | |
| WCI Communities* (a) | | | 245,590 | | | | 6,967 | | |
| | | | 118,313 | | |
| Energy – 8.5% | | | |
| Bill Barrett* (a) | | | 138,890 | | | | 5,114 | | |
| Cal Dive International* (a) | | | 39,530 | | | | 2,507 | | |
| Compton Petroleum* (a) | | | 526,690 | | | | 7,113 | | |
| ENSCO International | | | 289,660 | | | | 13,495 | | |
| Hydril* (a) | | | 37,550 | | | | 2,577 | | |
| St. Mary Land & Exploration (a) | | | 75,670 | | | | 2,770 | | |
| Tesoro Petroleum | | | 140,590 | | | | 9,453 | | |
| Ultra Petroleum* (a) | | | 164,560 | | | | 9,360 | | |
| Western Gas Resources (a) | | | 120,800 | | | | 6,189 | | |
| W-H Energy Services* (a) | | | 422,800 | | | | 13,707 | | |
| | | | 72,285 | | |
| Financials – 18.7% | | | |
| Advanta, Class B | | | 218,325 | | | | 6,163 | | |
| Affiliated Managers Group* (a) | | | 145,520 | | | | 10,539 | | |
| Alexandria Real Estate Equities (a) | | | 101,200 | | | | 8,368 | | |
| AmerUS Group, Class A (a) | | | 186,300 | | | | 10,688 | | |
| CoBiz (a) | | | 116,960 | | | | 2,177 | | |
| Columbia Banking System | | | 176,054 | | | | 4,618 | | |
| Cullen/Frost Bankers (a) | | | 259,980 | | | | 12,827 | | |
| East West Bancorp (a) | | | 253,120 | | | | 8,616 | | |
| First Financial Bankshares | | | 90,320 | | | | 3,146 | | |
| First Niagara Financial Group | | | 327,290 | | | | 4,726 | | |
| First Potomac Realty Trust (REIT) | | | 168,550 | | | | 4,332 | | |
| First Republic Bank | | | 416,420 | | | | 14,671 | | |
| GATX (a) | | | 376,420 | | | | 14,887 | | |
| Kite Realty Group Trust (REIT) | | | 377,660 | | | | 5,635 | | |
| Lasalle Hotel Properties (REIT) | | | 125,820 | | | | 4,335 | | |
| Maguire Properties (REIT) (a) | | | 501,140 | | | | 15,059 | | |
| SL Green Realty (REIT) (a) | | | 256,320 | | | | 17,476 | | |
| SVB Financial Group* (a) | | | 225,590 | | | | 10,973 | | |
| | | | 159,236 | | |
| Health Care – 15.1% | | | |
| Alkermes* (a) | | | 74,900 | | | | 1,258 | | |
| American Healthways* (a) | | | 195,360 | | | | 8,283 | | |
| Caliper Life Sciences* (a) | | | 721,800 | | | | 5,074 | | |
| Curis* | | | 685,913 | | | | 3,148 | | |
| ImmunoGen* (a) | | | 430,870 | | | | 3,163 | | |
| Medicis Pharmaceutical, Class A (a) | | | 129,520 | | | | 4,217 | | |
FIRST AMERICAN FUNDS Annual Report 2005
57
Schedule of Investments September 30, 2005
Small Cap Select Fund (continued)
| DESCRIPTION | | SHARES | | VALUE (000) | |
| Neurocrine Biosciences* (a) | | | 159,600 | | | $ | 7,851 | | |
| Pediatrix Medical Group* (a) | | | 198,130 | | | | 15,220 | | |
| Protein Design Labs* | | | 292,960 | | | | 8,203 | | |
| Respironics* | | | 106,060 | | | | 4,474 | | |
| Senomyx* | | | 224,060 | | | | 3,816 | | |
| Sierra Health Services* (a) | | | 330,330 | | | | 22,750 | | |
| SonoSite* (a) | | | 205,470 | | | | 6,098 | | |
| SurModics* (a) | | | 288,800 | | | | 11,174 | | |
| Sybron Dental Specialties* (a) | | | 168,510 | | | | 7,007 | | |
| Symmetry Medical* | | | 348,140 | | | | 8,251 | | |
| United Surgical Partners International* | | | 230,420 | | | | 9,012 | | |
| | | | 128,999 | | |
| Industrials – 16.2% | | | |
| AirTran* (a) | | | 403,970 | | | | 5,114 | | |
| Chicago Bridge & Iron | | | 540,090 | | | | 16,791 | | |
| CLARCOR | | | 138,760 | | | | 3,985 | | |
| EGL* | | | 420,900 | | | | 11,427 | | |
| Energy Conversion Devices* (a) | | | 35,870 | | | | 1,610 | | |
| J.B. Hunt Transport Services (a) | | | 458,270 | | | | 8,712 | | |
| Kennametal (a) | | | 254,760 | | | | 12,493 | | |
| KVH Industries* (a) (d) | | | 858,220 | | | | 8,368 | | |
| Labor Ready* (a) | | | 377,480 | | | | 9,682 | | |
| Lennox International | | | 167,590 | | | | 4,594 | | |
| Manitowoc | | | 97,710 | | | | 4,910 | | |
| Mercury Computer Systems* (a) | | | 292,670 | | | | 7,683 | | |
| NCI Building Systems* (a) | | | 273,250 | | | | 11,146 | | |
| Power-One* (a) | | | 1,617,003 | | | | 8,958 | | |
| Roper Industries (a) | | | 113,780 | | | | 4,470 | | |
| Terex* | | | 193,980 | | | | 9,588 | | |
| Toro (a) | | | 220,180 | | | | 8,094 | | |
| | | | 137,625 | | |
| Information Technology – 23.0% | | | |
| ADC Telecommunications* (a) | | | 201,120 | | | | 4,598 | | |
| Advanced Analogic Technologies* | | | 72,500 | | | | 811 | | |
| Aeroflex* (a) | | | 473,254 | | | | 4,430 | | |
| ATI Technologies* (a) | | | 850,200 | | | | 11,852 | | |
| Benchmark Electronics* (a) | | | 180,120 | | | | 5,425 | | |
| BISYS Group* (a) | | | 908,330 | | | | 12,199 | | |
| Carreker* | | | 614,680 | | | | 4,340 | | |
| Digitas* (a) | | | 794,600 | | | | 9,027 | | |
| Embarcadero Technologies* | | | 694,253 | | | | 4,679 | | |
| Emulex* (a) | | | 422,350 | | | | 8,536 | | |
| Entegris* (a) | | | 770,664 | | | | 8,709 | | |
| EPIQ Systems* | | | 156,090 | | | | 3,406 | | |
| FormFactor* | | | 172,980 | | | | 3,947 | | |
| Hyperion Solutions* (a) | | | 229,801 | | | | 11,180 | | |
| Integrated Device Technology* (a) | | | 1,148,020 | | | | 12,330 | | |
| Ituran Location and Control* | | | 323,190 | | | | 4,250 | | |
| Logitech International* (a) | | | 340,640 | | | | 13,881 | | |
| Micromuse* | | | 682,367 | | | | 5,377 | | |
| M-Systems Flash Disk Pioneer* | | | 106,600 | | | | 3,189 | | |
| Openwave Systems* (a) | | | 286,510 | | | | 5,151 | | |
| Opsware* | | | 420,960 | | | | 2,185 | | |
| Packeteer* | | | 908,971 | | | | 11,408 | | |
| Silicon Image* (a) | | | 1,345,200 | | | | 11,959 | | |
| Sonic Solutions* (a) | | | 415,860 | | | | 8,941 | | |
| Stellent* (a) | | | 1,372,359 | | | | 11,761 | | |
| TIBCO Software* (a) | | | 1,102,890 | | | | 9,220 | | |
Small Cap Select Fund (concluded)
| DESCRIPTION | | SHARES | | VALUE (000) | |
| TNS* | | | 93,580 | | | $ | 2,269 | | |
| ValueClick* (a) | | | 72,480 | | | | 1,239 | | |
| | | | 196,299 | | |
| Materials – 3.6% | | | |
| Century Aluminum* (a) | | | 378,420 | | | | 8,507 | | |
| Headwaters* (a) | | | 56,520 | | | | 2,114 | | |
| Hercules* (a) | | | 169,270 | | | | 2,069 | | |
| Olin (a) | | | 341,680 | | | | 6,489 | | |
| Schnitzer Steel Industries, Class A | | | 65,740 | | | | 2,141 | | |
| Steel Dynamics (a) | | | 202,610 | | | | 6,881 | | |
| Texas Industries | | | 39,040 | | | | 2,124 | | |
| | | | 30,325 | | |
| Telecommunication Services – 0.5% | | | |
| General Communication* (a) | | | 480,630 | | | | 4,758 | | |
Total Common Stocks
(Cost $732,841) | | | | | | | 847,840 | | |
| Affiliated Money Market Fund – 2.2% | | | |
First American Prime Obligations Fund, Class Z (b)
(Cost $18,478) | | | 18,478,008 | | | | 18,478 | | |
Investments Purchased with Proceeds
from Securities Lending (c) – 41.4% | | | |
| (Cost $352,384) | | | | | | | 352,384 | | |
Total Investments – 143.1%
(Cost $1,103,703) | | | | | | | 1,218,702 | | |
| Other Assets and Liabilities, Net – (43.1)% | | | | | | | (367,183 | ) | |
| Total Net Assets – 100.0% | | | | | | $ | 851,519 | | |
* Non-income producing security
(a) This security or a portion of this security is out on loan at September 30, 2005. Total loaned securities had a market value of $344,196,944 at September 30, 2005. See note 2 in Notes to Financial Statements.
(b) Investment in affiliated security. This money market fund is advised by U.S. Bancorp Asset Management, Inc., which also serves as advisor to this fund. See note 3 in Notes to Financial Statements.
(c) The fund may loan securities in return for collateral in the form of cash, U.S. Government securities, or other high grade debt obligations. The cash collateral is invested in various short-term fixed income securities, such as repurchase agreements, commercial paper, money market funds and other corporate obligations. See note 2 in Notes to Financial Statements.
(d) A company is considered to be an affilate of the fund under the Investment Company Act of 1940 if the funds holdings of that company represent 5% or more of the outstanding voting securities of the company. Transactions with companies that are or were affiliates during the fiscal year ended September 30, 2005 are as follows:
| Issuer | | Beginning
Cost | | Purchase
Cost | | Sales
Cost | | Ending
cost | | Dividend
Income | | Value | |
| KVH Industries | | $ | - | | | $ | 9,269,067 | | | $ | - | | | $ | 9,269,067 | | | $ | - | | | $ | 8,367,645 | | |
REIT – Real Estate Investment Trust
The accompanying notes are an integral part of the financial statements.
FIRST AMERICAN FUNDS Annual Report 2005
58
Small Cap Value Fund
| DESCRIPTION | | SHARES | | VALUE (000) | |
| Common Stocks – 98.1% | | | |
| Consumer Discretionary – 12.1% | | | |
| Aeropostale* (a) | | | 281,490 | | | $ | 5,982 | | |
| American Axle & Manufacturing (a) | | | 136,160 | | | | 3,143 | | |
| Aztar* | | | 74,920 | | | | 2,308 | | |
| Charming Shoppes* | | | 304,890 | | | | 3,253 | | |
| Entercom Communications* | | | 98,460 | | | | 3,110 | | |
| Ethan Allen Interiors (a) | | | 149,350 | | | | 4,682 | | |
| La Quinta* (a) | | | 412,970 | | | | 3,589 | | |
| Men's Wearhouse* (a) | | | 148,655 | | | | 3,969 | | |
| Modine Manufacturing | | | 91,010 | | | | 3,338 | | |
| Regis | | | 106,240 | | | | 4,018 | | |
| Ruby Tuesday (a) | | | 217,010 | | | | 4,722 | | |
| Scientific Games, Class A* | | | 70,410 | | | | 2,183 | | |
| Thomas Nelson | | | 200,890 | | | | 3,769 | | |
| WCI Communities* (a) | | | 121,120 | | | | 3,436 | | |
| | | | 51,502 | | |
| Consumer Staples – 2.8% | | | |
| Casey's General Stores | | | 185,220 | | | | 4,297 | | |
| Elizabeth Arden* | | | 126,490 | | | | 2,730 | | |
| Performance Food Group* | | | 74,190 | | | | 2,341 | | |
| Weis Markets | | | 64,700 | | | | 2,589 | | |
| | | | 11,957 | | |
| Energy – 6.9% | | | |
| Brigham Exploration* | | | 359,080 | | | | 4,614 | | |
| Cimarex Energy* (a) | | | 79,400 | | | | 3,599 | | |
| Forest Oil* (a) | | | 49,890 | | | | 2,599 | | |
| Foundation Coal Holdings | | | 62,230 | | | | 2,393 | | |
| Global Industries* (a) | | | 215,220 | | | | 3,172 | | |
| Newfield Exploration* | | | 48,140 | | | | 2,364 | | |
| Range Resources | | | 83,240 | | | | 3,214 | | |
| TODCO* | | | 90,810 | | | | 3,788 | | |
| Tsakos Energy Navigation | | | 97,070 | | | | 3,496 | | |
| | | | 29,239 | | |
| Financials (b) – 29.7% | | | |
| Astoria Financial (a) | | | 166,825 | | | | 4,408 | | |
| BankUnited Financial, Class A | | | 168,810 | | | | 3,861 | | |
| Capitol Bancorp | | | 166,860 | | | | 5,406 | | |
| CBL & Associates Properties (REIT) | | | 103,370 | | | | 4,237 | | |
| City National (a) | | | 61,350 | | | | 4,300 | | |
| Corporate Office Properties Trust (REIT) | | | 182,150 | | | | 6,366 | | |
| Delphi Financial Group, Class A | | | 82,370 | | | | 3,855 | | |
| Donegal Group, Class A | | | 155,466 | | | | 3,374 | | |
| East West Bancorp | | | 127,650 | | | | 4,345 | | |
| Equity One (REIT) | | | 193,140 | | | | 4,490 | | |
| First Midwest Bancorp (a) | | | 73,110 | | | | 2,723 | | |
| First Niagara Financial Group | | | 382,070 | | | | 5,517 | | |
| First Potomac Realty Trust (REIT) | | | 195,930 | | | | 5,035 | | |
| First Republic Bank – California (a) | | | 255,120 | | | | 8,988 | | |
| FPIC Insurance Group* | | | 102,450 | | | | 3,687 | | |
| IBERIABANK | | | 62,212 | | | | 3,307 | | |
| Independent Bank | | | 141,300 | | | | 4,293 | | |
| Lasalle Hotel Properties (REIT) | | | 107,350 | | | | 3,698 | | |
| Lexington Corporate Properties Trust (REIT) | | | 203,456 | | | | 4,791 | | |
| Mid-America Apartment Communities (REIT) (a) | | | 96,940 | | | | 4,509 | | |
| Newcastle Investment (REIT) (a) | | | 102,830 | | | | 2,869 | | |
| Pennsylvania (REIT) | | | 76,290 | | | | 3,218 | | |
Small Cap Value Fund (continued)
| DESCRIPTION | | SHARES | | VALUE (000) | |
| Philadelphia Consolidated Holding* | | | 40,940 | | | $ | 3,476 | | |
| Platinum Underwriter Holdings | | | 125,700 | | | | 3,757 | | |
| Preferred Bank Los Angeles | | | 13,675 | | | | 550 | | |
| Redwood Trust (REIT) (a) | | | 90,160 | | | | 4,383 | | |
| RLI | | | 27,900 | | | | 1,291 | | |
| Sterling Bancshares | | | 276,680 | | | | 4,070 | | |
| Triad Guaranty* | | | 72,970 | | | | 2,862 | | |
| Universal American Financial* (a) | | | 188,780 | | | | 4,293 | | |
| Windrose Medical Properties Trust (REIT) | | | 290,120 | | | | 4,433 | | |
| | | | 126,392 | | |
| Health Care – 4.8% | | | |
| Magellan Health Services* | | | 88,620 | | | | 3,115 | | |
| Pediatrix Medical Group* (a) | | | 48,750 | | | | 3,745 | | |
| Perrigo | | | 146,210 | | | | 2,092 | | |
| Serologicals* (a) | | | 105,290 | | | | 2,375 | | |
| STERIS | | | 134,430 | | | | 3,198 | | |
| Varian* (a) | | | 77,830 | | | | 2,671 | | |
| Vertex Pharmaceuticals* (a) | | | 145,820 | | | | 3,259 | | |
| | | | 20,455 | | |
| Industrials – 17.8% | | | |
| Artesyn Technologies* (a) | | | 298,050 | | | | 2,772 | | |
| Brady, Class A (a) | | | 192,660 | | | | 5,961 | | |
| CLARCOR | | | 329,520 | | | | 9,464 | | |
| ESCO Technologies* | | | 174,800 | | | | 8,752 | | |
| G&K Services, Class A | | | 119,437 | | | | 4,705 | | |
| Genco Shipping & Trading* | | | 125,370 | | | | 2,391 | | |
| Genlyte Group* (a) | | | 80,040 | | | | 3,848 | | |
| Hughes Supply (a) | | | 115,840 | | | | 3,776 | | |
| Kennametal (a) | | | 75,220 | | | | 3,689 | | |
| Landstar | | | 90,830 | | | | 3,636 | | |
| Mercury Computer Systems* (a) | | | 122,380 | | | | 3,212 | | |
| Moog, Class A* (a) | | | 110,695 | | | | 3,268 | | |
| NCO Group* (a) | | | 121,540 | | | | 2,511 | | |
| Pacer International | | | 169,100 | | | | 4,457 | | |
| Pentair | | | 146,930 | | | | 5,363 | | |
| Toro (a) | | | 213,940 | | | | 7,864 | | |
| | | | 75,669 | | |
| Information Technology – 13.1% | | | |
| Aeroflex* (a) | | | 287,740 | | | | 2,693 | | |
| BISYS Group* | | | 761,500 | | | | 10,227 | | |
| Embarcadero Technologies* | | | 287,650 | | | | 1,939 | | |
| Entegris* | | | 272,386 | | | | 3,078 | | |
| Fairchild Semiconductor International* (a) | | | 256,680 | | | | 3,814 | | |
| Hutchinson Technology* (a) | | | 158,540 | | | | 4,141 | | |
| Hypercom* | | | 631,820 | | | | 4,119 | | |
| MKS Instruments* (a) | | | 122,540 | | | | 2,111 | | |
| NETGEAR* (a) | | | 96,670 | | | | 2,326 | | |
| Palm* (a) | | | 108,740 | | | | 3,081 | | |
| Progress Software* | | | 70,190 | | | | 2,230 | | |
| Skyworks Solutions* (a) | | | 322,670 | | | | 2,265 | | |
| TIBCO Software* (a) | | | 333,660 | | | | 2,789 | | |
| Transaction Systems Architects* | | | 85,530 | | | | 2,382 | | |
| United Online | | | 172,040 | | | | 2,383 | | |
| VeriFone Holdings* (a) | | | 105,530 | | | | 2,122 | | |
| Xyratex* | | | 277,900 | | | | 4,088 | | |
| | | | 55,788 | | |
FIRST AMERICAN FUNDS Annual Report 2005
59
Schedule of Investments September 30, 2005
Small Cap Value Fund (concluded)
| DESCRIPTION | | SHARES | | VALUE (000) | |
| Materials – 5.4% | | | |
| Carpenter Technology | | | 56,890 | | | $ | 3,334 | | |
| Commercial Metals (a) | | | 114,500 | | | | 3,863 | | |
| Crown Holdings* | | | 130,860 | | | | 2,086 | | |
| Georgia Gulf | | | 99,930 | | | | 2,406 | | |
| Louisiana Pacific | | | 134,620 | | | | 3,728 | | |
| Minerals Technologies (a) | | | 36,860 | | | | 2,109 | | |
| Silgan Holdings | | | 72,200 | | | | 2,401 | | |
| Steel Dynamics (a) | | | 84,060 | | | | 2,855 | | |
| | | | 22,782 | | |
| Telecommunication Services – 0.6% | | | |
| General Communication* (a) | | | 269,670 | | | | 2,670 | | |
| Utilities – 4.9% | | | |
| Black Hills (a) | | | 137,160 | | | | 5,949 | | |
| New Jersey Resources | | | 61,120 | | | | 2,810 | | |
| NSTAR (a) | | | 146,180 | | | | 4,228 | | |
| PNM Resources | | | 122,745 | | | | 3,519 | | |
| Westar Energy | | | 181,100 | | | | 4,370 | | |
| | | | 20,876 | | |
Total Common Stocks
(Cost $337,645) | | | | | | | 417,330 | | |
| Affiliated Money Market Fund – 2.0% | | | |
First American Prime Obligations Fund, Class Z (c)
(Cost $8,769) | | | 8,768,745 | | | | 8,769 | | |
Investments Purchased with Proceeds
from Securities Lending (d) – 25.2% | | | |
| (Cost $107,113) | | | | | | | 107,113 | | |
Total Investments – 125.3%
(Cost $453,527) | | | | | | | 533,212 | | |
| Other Assets and Liabilities, Net – (25.3)% | | | | | | | (107,686 | ) | |
| Total Net Assets – 100.0% | | | | | | $ | 425,526 | | |
* Non-income producing security
(a) This security or a portion of this security is out on loan at September 30, 2005. Total loaned securities had a market value of $104,166,316 at September 30, 2005. See note 2 in Notes to Financial Statements.
(b) The fund is significantly invested in this sector and therefore is subject to additional risks. See note 7 in Notes to Financial Statements.
(c) Investment in affiliated security. This money market fund is advised by U.S. Bancorp Asset Management, Inc., which also serves as advisor to this fund. See note 3 in Notes to Financial Statements.
(d) The fund may loan securities in return for collateral in the form of cash, U.S. Government securities, or other high grade debt obligations. The cash collateral is invested in various short-term fixed income securities, such as repurchase agreements, commercial paper, money market funds and other corporate obligations. See note 2 in Notes to Financial Statements.
REIT – Real Estate Investment Trust
Small-Mid Cap Core Fund (formerly Technology Fund)
| DESCRIPTION | | SHARES | | VALUE (000) | |
| Common Stocks (a) – 95.7% | |
| Aerospace & Defense – 4.0% | |
| L-3 Communications Holdings (b) | | | 10,040 | | | $ | 794 | | |
| Lockheed Martin (b) | | | 11,700 | | | | 714 | | |
| Mercury Computer Systems* (b) | | | 27,829 | | | | 731 | | |
| Moog, Class A* | | | 20,475 | | | | 604 | | |
| | | | 2,843 | | |
| Chemicals – 1.1% | | | |
| Engelhard | | | 27,459 | | | | 766 | | |
| Commercial Services & Supplies – 1.7% | |
| Monster Worldwide* | | | 39,645 | | | | 1,218 | | |
| Communications Equipment – 13.8% | |
| Cisco Systems* | | | 40,810 | | | | 732 | | |
| Juniper Networks* | | | 33,250 | | | | 791 | | |
| L.M. Ericsson Telephone (b) | | | 21,520 | | | | 793 | | |
| Motorola | | | 125,460 | | | | 2,771 | | |
| NETGEAR* (b) | | | 31,373 | | | | 755 | | |
| Packeteer* | | | 96,137 | | | | 1,207 | | |
| QUALCOMM | | | 38,350 | | | | 1,716 | | |
| Scientific-Atlanta (b) | | | 29,850 | | | | 1,120 | | |
| | | | 9,885 | | |
| Computers & Peripherals – 12.3% | | | |
| Apple Computer* | | | 17,170 | | | | 921 | | |
| EMC* | | | 166,680 | | | | 2,157 | | |
| Hewlett-Packard | | | 54,108 | | | | 1,580 | | |
| Hutchinson Technology* (b) | | | 54,323 | | | | 1,419 | | |
| IBM | | | 8,170 | | | | 655 | | |
| Komag* (b) | | | 32,450 | | | | 1,037 | | |
| Western Digital* (b) | | | 81,070 | | | | 1,048 | | |
| | | | 8,817 | | |
| Diversified Telecommunication Services – 0.8% | | | |
| CenturyTel | | | 16,244 | | | | 568 | | |
| Electronic Equipment & Instruments – 4.5% | |
| Amphenol, Class A | | | 62,669 | | | | 2,528 | | |
| Arrow Electronics* | | | 21,343 | | | | 669 | | |
| | | | 3,197 | | |
| Health Care Equipment & Supplies – 5.6% | | | |
| PerkinElmer | | | 81,170 | | | | 1,653 | | |
| STERIS | | | 29,640 | | | | 705 | | |
| Thermo Electron* (b) | | | 54,481 | | | | 1,683 | | |
| | | | 4,041 | | |
| Health Care Providers & Services – 2.1% | | | |
| Per-Se Technologies* (b) | | | 74,146 | | | | 1,532 | | |
| Hotels, Restaurants & Leisure – 3.1% | |
| Scientific Games, Class A* (b) | | | 71,690 | | | | 2,222 | | |
| Internet Software & Services – 3.6% | |
| Google* (b) | | | 4,682 | | | | 1,482 | | |
| ValueClick* (b) | | | 65,704 | | | | 1,123 | | |
| | | | 2,605 | | |
| IT Services – 1.9% | | | |
| BISYS Group* | | | 99,995 | | | | 1,343 | | |
| Machinery – 3.2% | |
| ESCO Technologies* | | | 34,852 | | | | 1,745 | | |
| Kennametal | | | 10,838 | | | | 532 | | |
| | | | 2,277 | | |
| Oil, Gas & Consumable Fuels – 2.7% | | | |
| Newfield Exploration* (b) | | | 39,780 | | | | 1,953 | | |
The accompanying notes are an integral part of the financial statements.
FIRST AMERICAN FUNDS Annual Report 2005
60
Small-Mid Cap Core Fund (concluded)
| DESCRIPTION | | SHARES | | VALUE (000) | |
| Semiconductors & Semiconductor Equipment – 19.8% | | | |
| Analog Devices (b) | | | 52,810 | | | $ | 1,961 | | |
| Fairchild Semiconductor International, Class A* (b) | | | 98,793 | | | | 1,468 | | |
| Integrated Device Technology* | | | 148,497 | | | | 1,595 | | |
| Intel | | | 89,450 | | | | 2,205 | | |
| Marvell Technology Group* (b) | | | 19,560 | | | | 902 | | |
| Maxim Integrated Products | | | 38,550 | | | | 1,644 | | |
| OmniVision Technologies* (b) | | | 47,634 | | | | 601 | | |
| Silicon Image* (b) | | | 144,270 | | | | 1,283 | | |
| Texas Instruments | | | 75,254 | | | | 2,551 | | |
| | | | 14,210 | | |
| Software – 13.5% | | | |
| Adobe Systems (b) | | | 79,620 | | | | 2,377 | | |
| Compuware* | | | 105,640 | | | | 1,004 | | |
| Intuit* (b) | | | 16,880 | | | | 756 | | |
| Oracle* | | | 85,412 | | | | 1,058 | | |
| Parametric Technology* (b) | | | 134,100 | | | | 935 | | |
| Sybase* | | | 39,030 | | | | 914 | | |
| THQ* | | | 46,486 | | | | 991 | | |
| TIBCO Software* | | | 103,301 | | | | 864 | | |
| Transaction Systems Architects, Class A* | | | 29,023 | | | | 808 | | |
| | | | 9,707 | | |
| Wireless Telecommunications Services – 2.0% | | | |
| ALLTEL (b) | | | 22,543 | | | | 1,468 | | |
Total Common Stocks
(Cost $64,885) | | | | | | | 68,652 | | |
| Investment Company – 2.5% | | | |
Nasdaq-100 Index Tracking Stock
(Cost $1,797) | | | 45,563 | | | | 1,798 | | |
| Affiliated Money Market Fund – 3.0% | | | |
First American Prime Obligations Fund, Class Z (c)
(Cost $2,150) | | | 2,150,195 | | | | 2,150 | | |
Investments Purchased with Proceeds
from Securities Lending (d) – 35.7% | | | |
| (Cost $25,565) | | | | | | | 25,565 | | |
Total Investments – 136.9%
(Cost $94,397) | | | | | | | 98,165 | | |
| Other Assets and Liabilities, Net – (36.9)% | | | | | | | (26,442 | ) | |
| Total Net Assets – 100.0% | | | | | | $ | 71,723 | | |
* Non-income producing security
(a) The fund is primarily invested in the technology industry and therefore is subject to additional risks. See notes 1 and 7 in Notes to Financial Statements.
(b) This security or a portion of this security is out on loan at September 30, 2005. Total loaned securities had a market value of $24,900,414 at September 30, 2005. See note 2 in Notes to Financial Statements.
(c) Investment in affiliated security. This money market fund is advised by U.S. Bancorp Asset Management, Inc., which also serves as advisor to this fund. See note 3 in Notes to Financial Statements.
(d) The fund may loan securities in return for collateral in the form of cash, U.S. Government securities, or other high grade debt obligations. The cash collateral is invested in various short-term fixed income securities, such as repurchase agreements, commercial paper, money market funds and other corporate obligations. See note 2 in Notes to Financial Statements.
FIRST AMERICAN FUNDS Annual Report 2005
61
Statements of Assets and Liabilities September 30, 2005, in thousands, except for per share data
| | | Small Cap Growth
Opportunities Fund | | Small Cap
Select Fund | | Small Cap
Value Fund | | Small-Mid Cap
Core Fund | |
| ASSETS: | | | |
Investments in unaffiliated securities, at value†
(cost $293,765, $732,841, $337,645 and $66,682, respectively) (note 2) | | $ | 308,895 | | | $ | 847,840 | | | $ | 417,330 | | | $ | 70,450 | | |
Investments in affiliated money market fund, at value
(cost $2,860, $18,478, $8,769 and $2,150, respectively) (note 2) | | | 2,860 | | | | 18,478 | | | | 8,769 | | | | 2,150 | | |
Investments purchased with proceeds from securities lending
(cost $87,587, $352,384, $107,113 and $25,565, respectively) (note 2) | | | 87,587 | | | | 352,384 | | | | 107,113 | | | | 25,565 | | |
| Cash* | | | 1,864 | | | | 3,350 | | | | 1,027 | | | | 241 | | |
| Receivable for dividends and interest | | | 74 | | | | 620 | | | | 530 | | | | 34 | | |
| Receivable for investment securities sold | | | 16,505 | | | | 5,473 | | | | 1,059 | | | | 5,711 | | |
| Receivable for capital shares sold | | | 233 | | | | 421 | | | | 164 | | | | 37 | | |
| Prepaid expenses and other assets | | | 30 | | | | 31 | | | | 29 | | | | 25 | | |
| Total assets | | | 418,048 | | | | 1,228,597 | | | | 536,021 | | | | 104,213 | | |
| LIABILITIES: | | | |
| Payable for capital shares redeemed | | | 767 | | | | 2,043 | | | | 1,143 | | | | 5,513 | | |
| Payable upon return of securities loaned (note 2) | | | 88,417 | | | | 355,722 | | | | 108,127 | | | | 25,807 | | |
| Payable for investment securities purchased | | | 11,264 | | | | 18,562 | | | | 835 | | | | 952 | | |
| Payable to affiliates (note 3) | | | 298 | | | | 675 | | | | 347 | | | | 63 | | |
| Payable for distribution and shareholder servicing fees | | | 27 | | | | 45 | | | | 22 | | | | 18 | | |
| Accrued expenses and other liabilities | | | 19 | | | | 31 | | | | 21 | | | | 137 | | |
| Total liabilities | | | 100,792 | | | | 377,078 | | | | 110,495 | | | | 32,490 | | |
| Net assets | | $ | 317,256 | | | $ | 851,519 | | | $ | 425,526 | | | $ | 71,723 | | |
| COMPOSITION OF NET ASSETS: | | | |
| Portfolio capital | | $ | 248,498 | | | $ | 637,512 | | | $ | 266,632 | | | $ | 528,791 | | |
| Distributions in excess of net investment income | | | (1 | ) | | | (1 | ) | | | - | | | | - | | |
| Accumulated net realized gain (loss) on investments | | | 53,629 | | | | 99,009 | | | | 79,209 | | | | (460,836 | ) | |
| Net unrealized appreciation of investments | | | 15,130 | | | | 114,999 | | | | 79,685 | | | | 3,768 | | |
| Net assets | | $ | 317,256 | | | $ | 851,519 | | | $ | 425,526 | | | $ | 71,723 | | |
| * Includes cash collateral received related to securities loaned (note 2) | | $ | 830 | | | $ | 3,338 | | | $ | 1,014 | | | $ | 242 | | |
| † Including securities loaned, at value | | $ | 83,863 | | | $ | 344,197 | | | $ | 104,166 | | | $ | 24,900 | | |
| Class A: | | | |
| Net assets | | $ | 84,567 | | | $ | 107,270 | | | $ | 48,128 | | | $ | 23,016 | | |
| Shares issued and outstanding ($0.0001 par value - 2 billion authorized) | | | 3,560 | | | | 6,781 | | | | 2,867 | | | | 2,768 | | |
| Net asset value and redemption price per share | | $ | 23.75 | | | $ | 15.82 | | | $ | 16.78 | | | $ | 8.31 | | |
| Maximum offering price per share (1) | | $ | 25.13 | | | $ | 16.74 | | | $ | 17.76 | | | $ | 8.79 | | |
| Class B: | | | |
| Net assets | | $ | 8,760 | | | $ | 14,023 | | | $ | 9,325 | | | $ | 10,685 | | |
| Shares issued and outstanding ($0.0001 par value - 2 billion authorized) | | | 393 | | | | 1,000 | | | | 598 | | | | 1,462 | | |
| Net asset value, offering price, and redemption price per share (2) | | $ | 22.27 | | | $ | 14.02 | | | $ | 15.61 | | | $ | 7.31 | | |
| Class C: | | | |
| Net assets | | $ | 3,152 | | | $ | 14,418 | | | $ | 4,808 | | | $ | 4,485 | | |
| Shares issued and outstanding ($0.0001 par value - 2 billion authorized) | | | 137 | | | | 944 | | | | 304 | | | | 563 | | |
| Net asset value, offering price and redemption price per share (2) | | $ | 23.00 | | | $ | 15.28 | | | $ | 15.82 | | | $ | 7.97 | | |
| Class R: | | | |
| Net assets | | $ | 5 | | | $ | 312 | | | $ | 4 | | | | - | | |
| Shares issued and outstanding ($0.0001 par value - 2 billion authorized) | | | - | | | | 20 | | | | - | | | | - | | |
| Net asset value, offering price, and redemption price per share | | $ | 23.72 | | | $ | 15.73 | | | $ | 16.74 | | | | - | | |
| Class Y: | | | |
| Net assets | | $ | 220,772 | | | $ | 715,496 | | | $ | 363,261 | | | $ | 33,537 | | |
| Shares issued and outstanding ($0.0001 par value - 2 billion authorized) | | | 8,900 | | | | 43,178 | | | | 21,289 | | | | 3,888 | | |
| Net asset value, offering price, and redemption price per share | | $ | 24.81 | | | $ | 16.57 | | | $ | 17.06 | | | $ | 8.63 | | |
(1) The offering price is calculated by dividing the net asset value by 1 minus the maximum sales charge of 5.50%
(2) Class B and C have a contingent deferred sales charge. For a description of this sales charge, see notes 1 and 3 in Notes to Financial Statements.
The accompanying notes are an integral part of the financial statements.
FIRST AMERICAN FUNDS Annual Report 2005
62
Statements of Operations For the fiscal year ended September 30, 2005, in thousands
| | | Small Cap Growth
Opportunities Fund | | Small Cap
Select Fund | | Small Cap
Value Fund | | Small-Mid Cap
Core Fund | |
| INVESTMENT INCOME: | | | |
| Dividends from affiliated money market fund | | $ | 220 | | | $ | 501 | | | $ | 90 | | | $ | 41 | | |
| Dividends from unaffiliated securities | | | 891 | | | | 5,045 | | | | 5,966 | | | | 418 | | |
| Less: Foreign taxes withheld | | | - | | | | (13 | ) | | | (2 | ) | | | (24 | ) | |
| Securities lending income | | | 162 | | | | 410 | | | | 89 | | | | 64 | | |
| Total investment income | | | 1,273 | | | | 5,943 | | | | 6,143 | | | | 499 | | |
| EXPENSES (note 3): | | | |
| Investment advisory fees | | | 4,086 | | | | 6,006 | | | | 3,009 | | | | 597 | | |
| Administration fees | | | 644 | | | | 1,752 | | | | 880 | | | | 183 | | |
| Transfer agent fees | | | 200 | | | | 542 | | | | 275 | | | | 60 | | |
| Registration fees | | | 49 | | | | 46 | | | | 40 | | | | 45 | | |
| Professional fees | | | 37 | | | | 66 | | | | 41 | | | | 54 | | |
| Custodian fees | | | 28 | | | | 75 | | | | 38 | | | | 8 | | |
| Postage and printing fees | | | 16 | | | | 45 | | | | 23 | | | | 109 | | |
| Other expenses | | | 11 | | | | 22 | | | | 13 | | | | 6 | | |
| Directors' fees | | | 7 | | | | 20 | | | | 10 | | | | 2 | | |
| Distribution and shareholder servicing fees – Class A | | | 229 | | | | 259 | | | | 117 | | | | 66 | | |
| Distribution and shareholder servicing fees – Class B | | | 91 | | | | 136 | | | | 97 | | | | 124 | | |
| Distribution and shareholder servicing fees – Class C | | | 38 | | | | 145 | | | | 48 | | | | 53 | | |
| Distribution and shareholder servicing fees – Class R (1) | | | - | | | | - | | | | - | | | | - | | |
| Total expenses | | | 5,436 | | | | 9,114 | | | | 4,591 | | | | 1,307 | | |
| Less: Fee waivers (note 3) | | | (159 | ) | | | (245 | ) | | | (84 | ) | | | (71 | ) | |
| Total net expenses | | | 5,277 | | | | 8,869 | | | | 4,507 | | | | 1,236 | | |
| Investment income (loss) – net | | | (4,004 | ) | | | (2,926 | ) | | | 1,636 | | | | (737 | ) | |
REALIZED AND UNREALIZED GAINS (LOSSES) ON
INVESTMENTS – NET (note 5): | | | |
| Net realized gain on investments | | | 70,779 | | | | 184,051 | | | | 94,694 | | | | 8,526 | | |
| Net change in unrealized appreciation or depreciation of investments | | | 3,567 | | | | (17,021 | ) | | | (28,747 | ) | | | 2,726 | | |
| Net gain on investments | | | 74,346 | | | | 167,030 | | | | 65,947 | | | | 11,252 | | |
| Net increase in net assets resulting from operations | | $ | 70,342 | | | $ | 164,104 | | | $ | 67,583 | | | $ | 10,515 | | |
(1) Due to the presentation of the financial statements in thousands, the numbers round to zero. Class R is not offered by the Small-Mid Cap Core Fund.
FIRST AMERICAN FUNDS Annual Report 2005
63
Statements of Changes in Net Assets in thousands
| | | Small Cap Growth
Opportunities Fund | | Small Cap
Select Fund | |
| | | Year
Ended
9/30/05 | | Year
Ended
9/30/04 | | Year
Ended
9/30/05 | | Year
Ended
9/30/04 | |
| OPERATIONS: | |
| Investment income (loss) – net | | $ | (4,004 | ) | | $ | (6,363 | ) | | $ | (2,926 | ) | | $ | (6,173 | ) | |
| Net realized gain on investments | | | 70,779 | | | | 89,817 | | | | 184,051 | | | | 231,411 | | |
| Net realized gain on written options | | | - | | | | - | | | | - | | | | - | | |
| Net change in unrealized appreciation or depreciation of investments | | | 3,567 | | | | (68,591 | ) | | | (17,021 | ) | | | (19,782 | ) | |
| Net change in unrealized appreciation or depreciation of written options | | | - | | | | - | | | | - | | | | - | | |
| Net increase in net assets resulting from operations | | | 70,342 | | | | 14,863 | | | | 164,104 | | | | 205,456 | | |
| DISTRIBUTIONS TO SHAREHOLDERS FROM: | |
| Investment income – net: | |
| Class A | | | - | | | | - | | | | - | | | | - | | |
| Class B | | | - | | | | - | | | | - | | | | - | | |
| Class C | | | - | | | | - | | | | - | | | | - | | |
| Class R | | | - | | | | - | | | | - | | | | - | | |
| Class Y | | | - | | | | - | | | | - | | | | - | | |
| Net realized gain on investments: | |
| Class A | | | (12,315 | ) | | | (611 | ) | | | (19,383 | ) | | | (5,360 | ) | |
| Class B | | | (1,255 | ) | | | (47 | ) | | | (2,778 | ) | | | (900 | ) | |
| Class C | | | (577 | ) | | | (12 | ) | | | (2,801 | ) | | | (821 | ) | |
| Class R | | | - | | | | (23 | ) | | | (5 | ) | | | (862 | ) | |
| Class Y | | | (25,220 | ) | | | (2,392 | ) | | | (133,034 | ) | | | (70,619 | ) | |
| Total distributions | | | (39,367 | ) | | | (3,085 | ) | | | (158,001 | ) | | | (78,562 | ) | |
| CAPITAL SHARE TRANSACTIONS (note 4): | |
| Class A: | |
| Proceeds from sales | | | 17,883 | | | | 79,928 | | | | 24,096 | | | | 47,056 | | |
| Reinvestment of distributions | | | 11,923 | | | | 577 | | | | 18,716 | | | | 5,191 | | |
| Payments for redemptions | | | (54,396 | ) | | | (57,140 | ) | | | (32,858 | ) | | | (35,163 | ) | |
| Increase (decrease) in net assets from Class A transactions | | | (24,590 | ) | | | 23,365 | | | | 9,954 | | | | 17,084 | | |
| Class B: | |
| Proceeds from sales | | | 590 | | | | 6,009 | | | | 1,593 | | | | 2,158 | | |
| Reinvestment of distributions | | | 1,157 | | | | 45 | | | | 2,700 | | | | 873 | | |
| Payments for redemptions | | | (2,716 | ) | | | (2,734 | ) | | | (2,957 | ) | | | (2,565 | ) | |
| Increase (decrease) in net assets from Class B transactions | | | (969 | ) | | | 3,320 | | | | 1,336 | | | | 466 | | |
| Class C: | |
| Proceeds from sales | | | 501 | | | | 4,614 | | | | 3,374 | | | | 3,975 | | |
| Reinvestment of distributions | | | 561 | | | | 11 | | | | 2,745 | | | | 817 | | |
| Payments for redemptions | | | (2,841 | ) | | | (1,012 | ) | | | (5,249 | ) | | | (3,114 | ) | |
| Increase (decrease) in net assets from Class C transactions | | | (1,779 | ) | | | 3,613 | | | | 870 | | | | 1,678 | | |
| Class R: | |
| Proceeds from sales | | | 17 | | | | 976 | | | | 337 | | | | 3,323 | | |
| Reinvestment of distributions | | | - | | | | 23 | | | | 5 | | | | 808 | | |
| Payments for redemptions | | | (15 | ) | | | (5,357 | ) | | | (57 | ) | | | (17,289 | ) | |
| Increase (decrease) in net assets from Class R transactions | | | 2 | | | | (4,358 | ) | | | 285 | | | | (13,158 | ) | |
| Class Y: | |
| Proceeds from sales | | | 38,132 | | | | 101,703 | | | | 102,349 | | | | 132,590 | | |
| Reinvestment of distributions | | | 18,850 | | | | 1,934 | | | | 98,881 | | | | 57,505 | | |
| Payments for redemptions | | | (82,561 | ) | | | (278,211 | ) | | | (263,925 | ) | | | (559,280 | ) | |
| Decrease in net assets from Class Y transactions | | | (25,579 | ) | | | (174,574 | ) | | | (62,695 | ) | | | (369,185 | ) | |
| Decrease in net assets from capital share transactions | | | (52,915 | ) | | | (148,634 | ) | | | (50,250 | ) | | | (363,115 | ) | |
| Total increase (decrease) in net assets | | | (21,940 | ) | | | (136,856 | ) | | | (44,147 | ) | | | (236,221 | ) | |
| Net assets at beginning of period | | | 339,196 | | | | 476,052 | | | | 895,666 | | | | 1,131,887 | | |
| Net assets at end of period | | $ | 317,256 | | | $ | 339,196 | | | $ | 851,519 | | | $ | 895,666 | | |
| Undistributed (distributions in excess of) net investment income at end of period | | $ | (1 | ) | | $ | (2 | ) | | $ | (1 | ) | | $ | (1 | ) | |
The accompanying notes are an integral part of the financial statements.
FIRST AMERICAN FUNDS Annual Report 2005
64
| | | Small Cap
Value Fund | | Small-Mid Cap
Core Fund | |
| | | Year
Ended
9/30/05 | | Year
Ended
9/30/04 | | Year
Ended
9/30/05 | | Year
Ended
9/30/04 | |
| OPERATIONS: | |
| Investment income (loss) – net | | $ | 1,636 | | | $ | 2,056 | | | $ | (737 | ) | | $ | (1,017 | ) | |
| Net realized gain on investments | | | 94,694 | | | | 92,122 | | | | 8,526 | | | | 4,958 | | |
| Net realized gain on written options | | | - | | | | - | | | | - | | | | 104 | | |
| Net change in unrealized appreciation or depreciation of investments | | | (28,747 | ) | | | 7,329 | | | | 2,726 | | | | 3,406 | | |
| Net change in unrealized appreciation or depreciation of written options | | | - | | | | - | | | | - | | | | (72 | ) | |
| Net increase in net assets resulting from operations | | | 67,583 | | | | 101,507 | | | | 10,515 | | | | 7,379 | | |
| DISTRIBUTIONS TO SHAREHOLDERS FROM: | |
| Investment income – net: | |
| Class A | | | (177 | ) | | | (92 | ) | | | - | | | | - | | |
| Class B | | | (23 | ) | | | - | | | | - | | | | - | | |
| Class C | | | (11 | ) | | | - | | | | - | | | | - | | |
| Class R | | | - | | | | (3 | ) | | | - | | | | - | | |
| Class Y | | | (1,626 | ) | | | (1,696 | ) | | | - | | | | - | | |
| Net realized gain on investments: | |
| Class A | | | (6,876 | ) | | | (1,428 | ) | | | - | | | | - | | |
| Class B | | | (1,565 | ) | | | (487 | ) | | | - | | | | - | | |
| Class C | | | (747 | ) | | | (183 | ) | | | - | | | | - | | |
| Class R | | | - | | | | (54 | ) | | | - | | | | - | | |
| Class Y | | | (55,117 | ) | | | (16,522 | ) | | | - | | | | - | | |
| Total distributions | | | (66,142 | ) | | | (20,465 | ) | | | - | | | | - | | |
| CAPITAL SHARE TRANSACTIONS (note 4): | |
| Class A: | |
| Proceeds from sales | | | 8,656 | | | | 19,021 | | | | 5,250 | | | | 18,402 | | |
| Reinvestment of distributions | | | 6,859 | | | | 1,486 | | | | - | | | | - | | |
| Payments for redemptions | | | (10,711 | ) | | | (16,067 | ) | | | (12,848 | ) | | | (20,148 | ) | |
| Increase (decrease) in net assets from Class A transactions | | | 4,804 | | | | 4,440 | | | | (7,598 | ) | | | (1,746 | ) | |
| Class B: | |
| Proceeds from sales | | | 872 | | | | 1,193 | | | | 454 | | | | 884 | | |
| Reinvestment of distributions | | | 1,539 | | | | 481 | | | | - | | | | - | | |
| Payments for redemptions | | | (2,854 | ) | | | (6,346 | ) | | | (4,645 | ) | | | (4,394 | ) | |
| Increase (decrease) in net assets from Class B transactions | | | (443 | ) | | | (4,672 | ) | | | (4,191 | ) | | | (3,510 | ) | |
| Class C: | |
| Proceeds from sales | | | 942 | | | | 1,179 | | | | 405 | | | | 952 | | |
| Reinvestment of distributions | | | 745 | | | | 183 | | | | - | | | | - | | |
| Payments for redemptions | | | (1,441 | ) | | | (1,855 | ) | | | (2,541 | ) | | | (2,394 | ) | |
| Increase (decrease) in net assets from Class C transactions | | | 246 | | | | (493 | ) | | | (2,136 | ) | | | (1,442 | ) | |
| Class R: | |
| Proceeds from sales | | | 3 | | | | 1,145 | | | | - | | | | 1,139 | | |
| Reinvestment of distributions | | | - | | | | 52 | | | | - | | | | - | | |
| Payments for redemptions | | | - | | | | (2,727 | ) | | | - | | | | (5,754 | ) | |
| Increase (decrease) in net assets from Class R transactions | | | 3 | | | | (1,530 | ) | | | - | | | | (4,615 | ) | |
| Class Y: | |
| Proceeds from sales | | | 63,025 | | | | 59,568 | | | | 17,409 | | | | 33,338 | | |
| Reinvestment of distributions | | | 48,592 | | | | 15,745 | | | | - | | | | - | | |
| Payments for redemptions | | | (117,619 | ) | | | (208,150 | ) | | | (32,835 | ) | | | (53,593 | ) | |
| Decrease in net assets from Class Y transactions | | | (6,002 | ) | | | (132,837 | ) | | | (15,426 | ) | | | (20,255 | ) | |
| Decrease in net assets from capital share transactions | | | (1,392 | ) | | | (135,092 | ) | | | (29,351 | ) | | | (31,568 | ) | |
| Total increase (decrease) in net assets | | | 49 | | | | (54,050 | ) | | | (18,836 | ) | | | (24,189 | ) | |
| Net assets at beginning of period | | | 425,477 | | | | 479,527 | | | | 90,559 | | | | 114,748 | | |
| Net assets at end of period | | $ | 425,526 | | | $ | 425,477 | | | $ | 71,723 | | | $ | 90,559 | | |
| Undistributed (distributions in excess of) net investment income at end of period | | $ | - | | | $ | 485 | | | $ | - | | | $ | - | | |
FIRST AMERICAN FUNDS Annual Report 2005
65
Financial Highlights For a share outstanding throughout the periods ended September 30, unless otherwise indicated.
| | | Net Asset
Value
Beginning
of Period | | Net
Investment
Loss | | Realized and
Unrealized
Gains
(Losses) on
Investments | | Distributions
from Net
Realized Gains | | Distributions
from
Return of
Capital | | Net Asset
Value
End of
Period | | Total
Return (8) | |
| Small Cap Growth Opportunities (1) | |
| Class A | |
| | 2005 | (2) | | $ | 21.74 | | | $ | (0.32 | ) | | $ | 5.28 | | | $ | (2.95 | ) | | $ | - | | | $ | 23.75 | | | | 24.21 | % | |
| | 2004 | (2) | | | 21.95 | | | | (0.35 | ) | | | 0.27 | | | | (0.13 | ) | | | - | | | | 21.74 | | | | (0.39 | ) | |
| | 2003 | (2) | | | 13.86 | | | | (0.28 | ) | | | 8.37 | | | | - | | | | - | | | | 21.95 | | | | 58.37 | | |
| | 2002 | | | | 16.89 | | | | (0.26 | ) | | | (2.74 | ) | | | - | | | | (0.03 | ) | | | 13.86 | | | | (17.84 | ) | |
| | 2001 | (2) (3) | | | 31.26 | | | | (0.17 | ) | | | (5.20 | ) | | | (9.00 | ) | | | - | | | | 16.89 | | | | (21.51 | ) | |
| | 2000 | (2) (4) | | | 21.80 | | | | (0.40 | ) | | | 15.99 | | | | (6.13 | ) | | | - | | | | 31.26 | | | | 87.43 | | |
| Class B | |
| | 2005 | (2) | | $ | 20.69 | | | $ | (0.45 | ) | | $ | 4.98 | | | $ | (2.95 | ) | | $ | - | | | $ | 22.27 | | | | 23.27 | % | |
| | 2004 | (2) | | | 21.05 | | | | (0.50 | ) | | | 0.27 | | | | (0.13 | ) | | | - | | | | 20.69 | | | | (1.13 | ) | |
| | 2003 | (2) | | | 13.39 | | | | (0.40 | ) | | | 8.06 | | | | - | | | | - | | | | 21.05 | | | | 57.21 | | |
| | 2002 | | | | 16.44 | | | | (0.39 | ) | | | (2.63 | ) | | | - | | | | (0.03 | ) | | | 13.39 | | | | (18.45 | ) | |
| | 2001 | (2) (3) | | | 30.84 | | | | (0.31 | ) | | | (5.09 | ) | | | (9.00 | ) | | | - | | | | 16.44 | | | | (22.07 | ) | |
| | 2000 | (2) (4) | | | 21.69 | | | | (0.61 | ) | | | 15.89 | | | | (6.13 | ) | | | - | | | | 30.84 | | | | 86.13 | | |
| Class C | |
| | 2005 | (2) | | $ | 21.28 | | | $ | (0.48 | ) | | $ | 5.15 | | | $ | (2.95 | ) | | $ | - | | | $ | 23.00 | | | | 23.28 | % | |
| | 2004 | (2) | | | 21.65 | | | | (0.49 | ) | | | 0.25 | | | | (0.13 | ) | | | - | | | | 21.28 | | | | (1.14 | ) | |
| | 2003 | (2) | | | 13.77 | | | | (0.43 | ) | | | 8.31 | | | | - | | | | - | | | | 21.65 | | | | 57.23 | | |
| | 2002 | | | | 16.90 | | | | (0.19 | ) | | | (2.91 | ) | | | - | | | | (0.03 | ) | | | 13.77 | | | | (18.42 | ) | |
| | 2001 | (2) (5) | | | 16.34 | | | | - | | | | 0.56 | | | | - | | | | - | | | | 16.90 | | | | 3.43 | | |
| Class R (6) | |
| | 2005 | (2) | | $ | 21.74 | | | $ | (0.48 | ) | | $ | 5.41 | | | $ | (2.95 | ) | | $ | - | | | $ | 23.72 | | | | 24.06 | % | |
| | 2004 | (2) | | | 21.95 | | | | (0.42 | ) | | | 0.34 | | | | (0.13 | ) | | | - | | | | 21.74 | | | | (0.39 | ) | |
| | 2003 | (2) | | | 13.86 | | | | (0.28 | ) | | | 8.37 | | | | - | | | | - | | | | 21.95 | | | | 58.37 | | |
| | 2002 | | | | 16.89 | | | | (0.26 | ) | | | (2.74 | ) | | | - | | | | (0.03 | ) | | | 13.86 | | | | (17.84 | ) | |
| | 2001 | (2) (7) | | | 20.01 | | | | (0.19 | ) | | | (2.93 | ) | | | - | | | | - | | | | 16.89 | | | | (15.59 | ) | |
| Class Y | |
| | 2005 | (2) | | $ | 22.55 | | | $ | (0.27 | ) | | $ | 5.48 | | | $ | (2.95 | ) | | $ | - | | | $ | 24.81 | | | | 24.47 | % | |
| | 2004 | (2) | | | 22.70 | | | | (0.32 | ) | | | 0.30 | | | | (0.13 | ) | | | - | | | | 22.55 | | | | (0.11 | ) | |
| | 2003 | (2) | | | 14.30 | | | | (0.25 | ) | | | 8.65 | | | | - | | | | - | | | | 22.70 | | | | 58.74 | | |
| | 2002 | | | | 17.38 | | | | (0.25 | ) | | | (2.80 | ) | | | - | | | | (0.03 | ) | | | 14.30 | | | | (17.62 | ) | |
| | 2001 | (2) (3) | | | 31.83 | | | | (0.12 | ) | | | (5.33 | ) | | | (9.00 | ) | | | - | | | | 17.38 | | | | (21.35 | ) | |
| | 2000 | (2) (4) | | | 22.06 | | | | (0.31 | ) | | | 16.21 | | | | (6.13 | ) | | | - | | | | 31.83 | | | | 87.90 | | |
The accompanying notes are an integral part of the financial statements.
FIRST AMERICAN FUNDS Annual Report 2005
66
| | | Net Assets
End of
Period (000) | | Ratio of
Expenses to
Average
Net Assets | | Ratio of Net
Investment
Income Loss
to Average
Net Assets | | Ratio of
Expenses to
Average
Net Assets
(Excluding
Waivers) | | Ratio of Net
Investment
Loss
to Average Net
Assets (Excluding
Waivers) | | Portfolio
Turnover
Rate | |
| Small Cap Growth Opportunities (1) | |
| Class A | |
| | 2005 | (2) | | $ | 84,567 | | | | 1.82 | % | | | (1.42 | )% | | | 1.87 | % | | | (1.47 | )% | | | 190 | % | |
| | 2004 | (2) | | | 101,031 | | | | 1.93 | | | | (1.42 | ) | | | 1.96 | | | | (1.45 | ) | | | 178 | | |
| | 2003 | (2) | | | 81,999 | | | | 1.93 | | | | (1.63 | ) | | | 1.97 | | | | (1.67 | ) | | | 137 | | |
| | 2002 | | | | 44,834 | | | | 1.93 | | | | (1.53 | ) | | | 1.97 | | | | (1.57 | ) | | | 123 | | |
| | 2001 | (2) (3) | | | 45,233 | | | | 1.93 | | | | (0.91 | ) | | | 1.99 | | | | (0.97 | ) | | | 125 | | |
| | 2000 | (2) (4) | | | 43,031 | | | | 1.96 | | | | (1.31 | ) | | | 1.96 | | | | (1.31 | ) | | | 179 | | |
| Class B | |
| | 2005 | (2) | | $ | 8,760 | | | | 2.57 | % | | | (2.16 | )% | | | 2.62 | % | | | (2.21 | )% | | | 190 | % | |
| | 2004 | (2) | | | 9,063 | | | | 2.68 | | | | (2.16 | ) | | | 2.71 | | | | (2.19 | ) | | | 178 | | |
| | 2003 | (2) | | | 6,441 | | | | 2.68 | | | | (2.38 | ) | | | 2.72 | | | | (2.42 | ) | | | 137 | | |
| | 2002 | | | | 3,779 | | | | 2.68 | | | | (2.28 | ) | | | 2.72 | | | | (2.32 | ) | | | 123 | | |
| | 2001 | (2) (3) | | | 3,165 | | | | 2.68 | | | | (1.68 | ) | | | 2.74 | | | | (1.74 | ) | | | 125 | | |
| | 2000 | (2) (4) | | | 2,136 | | | | 2.71 | | | | (2.06 | ) | | | 2.71 | | | | (2.06 | ) | | | 179 | | |
| Class C | |
| | 2005 | (2) | | $ | 3,152 | | | | 2.57 | % | | | (2.20 | )% | | | 2.62 | % | | | (2.25 | )% | | | 190 | % | |
| | 2004 | (2) | | | 4,669 | | | | 2.68 | | | | (2.07 | ) | | | 2.71 | | | | (2.10 | ) | | | 178 | | |
| | 2003 | (2) | | | 1,529 | | | | 2.68 | | | | (2.38 | ) | | | 2.72 | | | | (2.42 | ) | | | 137 | | |
| | 2002 | | | | 260 | | | | 2.68 | | | | (2.31 | ) | | | 2.72 | | | | (2.35 | ) | | | 123 | | |
| | 2001 | (2) (5) | | | 1 | | | | 1.63 | | | | (0.41 | ) | | | 1.76 | | | | (0.54 | ) | | | 125 | | |
| Class R (6) | |
| | 2005 | (2) | | $ | 5 | | | | 2.07 | % | | | (2.14 | )% | | | 2.27 | % | | | (2.34 | )% | | | 190 | % | |
| | 2004 | (2) | | | 1 | | | | 1.93 | | | | (1.67 | ) | | | 1.96 | | | | (1.70 | ) | | | 178 | | |
| | 2003 | (2) | | | 3,694 | | | | 1.93 | | | | (1.62 | ) | | | 1.97 | | | | (1.66 | ) | | | 137 | | |
| | 2002 | | | | 2,027 | | | | 1.93 | | | | (1.53 | ) | | | 1.97 | | | | (1.57 | ) | | | 123 | | |
| | 2001 | (2) (7) | | | 2,014 | | | | 1.94 | | | | (1.06 | ) | | | 2.00 | | | | (1.12 | ) | | | 125 | | |
| Class Y | |
| | 2005 | (2) | | $ | 220,772 | | | | 1.57 | % | | | (1.15 | )% | | | 1.62 | % | | | (1.20 | )% | | | 190 | % | |
| | 2004 | (2) | | | 224,432 | | | | 1.68 | | | | (1.25 | ) | | | 1.71 | | | | (1.28 | ) | | | 178 | | |
| | 2003 | (2) | | | 382,389 | | | | 1.68 | | | | (1.38 | ) | | | 1.72 | | | | (1.42 | ) | | | 137 | | |
| | 2002 | | | | 208,439 | | | | 1.68 | | | | (1.28 | ) | | | 1.72 | | | | (1.32 | ) | | | 123 | | |
| | 2001 | (2) (3) | | | 266,115 | | | | 1.68 | | | | (0.64 | ) | | | 1.74 | | | | (0.70 | ) | | | 125 | | |
| | 2000 | (2) (4) | | | 322,981 | | | | 1.71 | | | | (1.06 | ) | | | 1.71 | | | | (1.06 | ) | | | 179 | | |
(1) The financial highlights for the Small Cap Growth Opportunities Fund as set forth herein include the historical financial highlights of the Firstar Micro Cap Fund.
The assets of the Firstar Fund were acquired by the First American Small Cap Growth Opportunities Fund on September 24, 2001. In connection with such acquisition,
(i) Class A shares of the Firstar Micro Cap Fund were exchanged for Class A shares of the First American Small Cap Growth Opportunities Fund, (ii) Firstar Class B shares
were exchanged for Class B shares of the First American Fund, (iii) Firstar Class Y shares were exchanged for Class S shares (now designated Class R shares) of the
First American Fund, and (iv) Firstar Institutional Class shares were exchanged for Class Y shares of the First American Fund .
(2) Per share data calculated using average shares outstanding method.
(3) For the period November 1, 2000 to September 30, 2001. Effective in 2001, the fund's fiscal year end was changed from October 31 to September 30. All ratios for the
period have been annualized, except total return and portfolio turnover.
(4) For the fiscal period ended October 31.
(5) Class of shares have been offered since September 24, 2001. All ratios for the period have been annualized, except total return and portfolio turnover.
(6) Prior to July 1, 2004, Class R shares were named Class S shares, which had lower fees and expenses.
(7) Class of shares have been offered since December 11, 2000. All ratios for the period have been annualized, except total return and portfolio turnover.
(8) Total return does not reflect sales charges. Total return would have been lower had certain expenses not been waived.
FIRST AMERICAN FUNDS Annual Report 2005
67
Financial Highlights For a share outstanding throughout the periods ended September 30, unless otherwise indicated.
| | | Net Asset
Value
Beginning
of Period | | Net
Investment
Income (Loss) | | Realized and
Unrealized
Gains
(Losses) on
Investments | | Distributions
from Net
Investment
Income | | Distributions
from Net
Realized Gains | | Net Asset
Value
End of
Period | | Total
Return (7) | |
| Small Cap Select (1)(2) | |
| Class A | |
| | 2005 | | | $ | 15.95 | | | $ | (0.08 | ) | | $ | 3.10 | | | $ | - | | | $ | (3.15 | ) | | $ | 15.82 | | | | 20.46 | % | |
| | 2004 | | | | 14.52 | | | | (0.12 | ) | | | 2.60 | | | | - | | | | (1.05 | ) | | | 15.95 | | | | 17.64 | | |
| | 2003 | | | | 10.68 | | | | (0.09 | ) | | | 3.93 | | | | - | | | | - | | | | 14.52 | | | | 35.96 | | |
| | 2002 | | | | 11.97 | | | | (0.10 | ) | | | (0.30 | ) | | | - | | | | (0.89 | ) | | | 10.68 | | | | (4.56 | ) | |
| | 2001 | (3) | | | 17.60 | | | | (0.03 | ) | | | (1.89 | ) | | | - | | | | (3.71 | ) | | | 11.97 | | | | (12.63 | ) | |
| | 2000 | (4) | | | 13.84 | | | | (0.10 | ) | | | 4.13 | | | | (0.01 | ) | | | (0.26 | ) | | | 17.60 | | | | 29.65 | | |
| Class B | |
| | 2005 | | | $ | 14.56 | | | $ | (0.17 | ) | | $ | 2.78 | | | $ | - | | | $ | (3.15 | ) | | $ | 14.02 | | | | 19.45 | % | |
| | 2004 | | | | 13.42 | | | | (0.22 | ) | | | 2.41 | | | | - | | | | (1.05 | ) | | | 14.56 | | | | 16.88 | | |
| | 2003 | | | | 9.95 | | | | (0.17 | ) | | | 3.64 | | | | - | | | | - | | | | 13.42 | | | | 34.88 | | |
| | 2002 | | | | 11.28 | | | | (0.19 | ) | | | (0.25 | ) | | | - | | | | (0.89 | ) | | | 9.95 | | | | (5.23 | ) | |
| | 2001 | (3) | | | 16.90 | | | | (0.12 | ) | | | (1.79 | ) | | | - | | | | (3.71 | ) | | | 11.28 | | | | (13.21 | ) | |
| | 2000 | (4) | | | 13.38 | | | | (0.13 | ) | | | 3.92 | | | | - | | | | (0.27 | ) | | | 16.90 | | | | 28.81 | | |
| Class C | |
| | 2005 | | | $ | 15.60 | | | $ | (0.19 | ) | | $ | 3.02 | | | $ | - | | | $ | (3.15 | ) | | $ | 15.28 | | | | 19.58 | % | |
| | 2004 | | | | 14.32 | | | | (0.24 | ) | | | 2.57 | | | | - | | | | (1.05 | ) | | | 15.60 | | | | 16.79 | | |
| | 2003 | | | | 10.62 | | | | (0.18 | ) | | | 3.88 | | | | - | | | | - | | | | 14.32 | | | | 34.84 | | |
| | 2002 | | | | 11.97 | | | | (0.20 | ) | | | (0.26 | ) | | | - | | | | (0.89 | ) | | | 10.62 | | | | (5.09 | ) | |
| | 2001 | (5) | | | 11.72 | | | | - | | | | 0.25 | | | | - | | | | - | | | | 11.97 | | | | 2.13 | | |
| Class R (6) | |
| | 2005 | | | $ | 15.91 | | | $ | (0.08 | ) | | $ | 3.05 | | | $ | - | | | $ | (3.15 | ) | | $ | 15.73 | | | | 20.16 | % | |
| | 2004 | | | | 14.49 | | | | (0.13 | ) | | | 2.60 | | | | - | | | | (1.05 | ) | | | 15.91 | | | | 17.60 | | |
| | 2003 | | | | 10.66 | | | | (0.09 | ) | | | 3.92 | | | | - | | | | - | | | | 14.49 | | | | 35.93 | | |
| | 2002 | | | | 11.94 | | | | (0.10 | ) | | | (0.29 | ) | | | - | | | | (0.89 | ) | | | 10.66 | | | | (4.48 | ) | |
| | 2001 | (3) | | | 17.55 | | | | (0.01 | ) | | | (1.89 | ) | | | - | | | | (3.71 | ) | | | 11.94 | | | | (12.52 | ) | |
| | 2000 | (4) | | | 13.80 | | | | (0.01 | ) | | | 4.03 | | | | (0.01 | ) | | | (0.26 | ) | | | 17.55 | | | | 29.67 | | |
| Class Y | |
| | 2005 | | | $ | 16.54 | | | $ | (0.04 | ) | | $ | 3.22 | | | $ | - | | | $ | (3.15 | ) | | $ | 16.57 | | | | 20.73 | % | |
| | 2004 | | | | 14.98 | | | | (0.09 | ) | | | 2.70 | | | | - | | | | (1.05 | ) | | | 16.54 | | | | 17.98 | | |
| | 2003 | | | | 11.00 | | | | (0.06 | ) | | | 4.04 | | | | - | | | | - | | | | 14.98 | | | | 36.18 | | |
| | 2002 | | | | 12.26 | | | | (0.07 | ) | | | (0.30 | ) | | | - | | | | (0.89 | ) | | | 11.00 | | | | (4.19 | ) | |
| | 2001 | (3) | | | 17.92 | | | | - | | | | (1.95 | ) | | | - | | | | (3.71 | ) | | | 12.26 | | | | (12.49 | ) | |
| | 2000 | (4) | | | 14.07 | | | | 0.05 | | | | 4.10 | | | | (0.03 | ) | | | (0.27 | ) | | | 17.92 | | | | 30.01 | | |
The accompanying notes are an integral part of the financial statements.
FIRST AMERICAN FUNDS Annual Report 2005
68
| | | Net Assets
End of
Period (000) | | Ratio of
Expenses to
Average
Net Assets | | Ratio of Net
Investment
Income (Loss)
to Average
Net Assets | | Ratio of
Expenses to
Average
Net Assets
(Excluding
Waivers) | | Ratio of Net
Investment
Loss
to Average Net
Assets (Excluding
Waivers) | | Portfolio
Turnover
Rate | |
| Small Cap Select (1)(2) | |
| Class A | |
| | 2005 | | | $ | 107,270 | | | | 1.22 | % | | | (0.53 | )% | | | 1.25 | % | | | (0.56 | )% | | | 122 | % | |
| | 2004 | | | | 97,775 | | | | 1.21 | | | | (0.76 | ) | | | 1.24 | | | | (0.79 | ) | | | 116 | | |
| | 2003 | | | | 73,445 | | | | 1.21 | | | | (0.73 | ) | | | 1.25 | | | | (0.77 | ) | | | 145 | | |
| | 2002 | | | | 33,586 | | | | 1.21 | | | | (0.81 | ) | | | 1.25 | | | | (0.85 | ) | | | 171 | | |
| | 2001 | (3) | | | 17,351 | | | | 1.19 | | | | (0.24 | ) | | | 1.22 | | | | (0.27 | ) | | | 204 | | |
| | 2000 | (4) | | | 9,538 | | | | 1.28 | | | | (0.01 | ) | | | 1.39 | | | | (0.12 | ) | | | 91 | | |
| Class B | |
| | 2005 | | | $ | 14,023 | | | | 1.97 | % | | | (1.28 | )% | | | 2.00 | % | | | (1.31 | )% | | | 122 | % | |
| | 2004 | | | | 13,050 | | | | 1.96 | | | | (1.51 | ) | | | 1.99 | | | | (1.54 | ) | | | 116 | | |
| | 2003 | | | | 11,541 | | | | 1.96 | | | | (1.48 | ) | | | 2.00 | | | | (1.52 | ) | | | 145 | | |
| | 2002 | | | | 4,613 | | | | 1.96 | | | | (1.56 | ) | | | 2.00 | | | | (1.60 | ) | | | 171 | | |
| | 2001 | (3) | | | 1,979 | | | | 1.93 | | | | (0.99 | ) | | | 1.97 | | | | (1.03 | ) | | | 204 | | |
| | 2000 | (4) | | | 1,331 | | | | 1.98 | | | | (0.71 | ) | | | 2.09 | | | | (0.82 | ) | | | 91 | | |
| Class C | |
| | 2005 | | | $ | 14,418 | | | | 1.97 | % | | | (1.28 | )% | | | 2.00 | % | | | (1.31 | )% | | | 122 | % | |
| | 2004 | | | | 13,841 | | | | 1.96 | | | | (1.50 | ) | | | 1.99 | | | | (1.53 | ) | | | 116 | | |
| | 2003 | | | | 11,128 | | | | 1.96 | | | | (1.47 | ) | | | 2.00 | | | | (1.51 | ) | | | 145 | | |
| | 2002 | | | | 3,096 | | | | 1.96 | | | | (1.61 | ) | | | 2.02 | | | | (1.67 | ) | | | 171 | | |
| | 2001 | (5) | | | - | | | | - | | | | - | | | | - | | | | - | | | | 204 | | |
| Class R (6) | |
| | 2005 | | | $ | 312 | | | | 1.47 | % | | | (0.53 | )% | | | 1.65 | % | | | (0.71 | )% | | | 122 | % | |
| | 2004 | | | | 19 | | | | 1.21 | | | | (0.81 | ) | | | 1.24 | | | | (0.84 | ) | | | 116 | | |
| | 2003 | | | | 11,627 | | | | 1.21 | | | | (0.75 | ) | | | 1.25 | | | | (0.79 | ) | | | 145 | | |
| | 2002 | | | | 7,640 | | | | 1.21 | | | | (0.80 | ) | | | 1.25 | | | | (0.84 | ) | | | 171 | | |
| | 2001 | (3) | | | 3,721 | | | | 1.07 | | | | (0.05 | ) | | | 1.14 | | | | (0.12 | ) | | | 204 | | |
| | 2000 | (4) | | | 4,442 | | | | 1.28 | | | | (0.01 | ) | | | 1.39 | | | | (0.12 | ) | | | 91 | | |
| Class Y | |
| | 2005 | | | $ | 715,496 | | | | 0.97 | % | | | (0.28 | )% | | | 1.00 | % | | | (0.31 | )% | | | 122 | % | |
| | 2004 | | | | 770,981 | | | | 0.96 | | | | (0.52 | ) | | | 0.99 | | | | (0.55 | ) | | | 116 | | |
| | 2003 | | | | 1,024,146 | | | | 0.96 | | | | (0.48 | ) | | | 1.00 | | | | (0.52 | ) | | | 145 | | |
| | 2002 | | | | 403,027 | | | | 0.96 | | | | (0.55 | ) | | | 1.00 | | | | (0.59 | ) | | | 171 | | |
| | 2001 | (3) | | | 291,706 | | | | 0.93 | | | | 0.01 | | | | 0.96 | | | | (0.02 | ) | | | 204 | | |
| | 2000 | (4) | | | 134,617 | | | | 0.98 | | | | 0.29 | | | | 1.39 | | | | (0.12 | ) | | | 91 | | |
(1) The financial highlights for the Small Cap Select Fund as set forth herein include the historical financial highlights of the Firstar Small Cap Core Equity Fund. The assets
of the Firstar Fund were acquired by the First American Small Cap Select Fund on September 24, 2001. In connection with such acquisition, (i) Class A shares
of the Firstar Fund were exchanged for Class A shares of the First American Fund, (ii) Firstar Class B shares were exchanged for Class B shares of the First American Fund,
(iii) Firstar Class Y shares were exchanged for Class S shares (now designated Class R shares) of the First American Fund, and (iv) Firstar Institutional Class shares were
exchanged for Class Y shares of the First American Fund.
(2) Per share data calculated using average shares outstanding method.
(3) For the period November 1, 2000 to September 30, 2001. Effective in 2001, the fund's fiscal year end was changed from October 31 to September 30. All ratios for the
period have been annualized, except total return and portfolio turnover.
(4) For the period December 1, 1999 to October 31, 2000. Effective in 2000, the fund's fiscal year end was changed from November 30 to October 31. All ratios for the
period have been annualized, except total return and portfolio turnover.
(5) Class of shares have been offered since September 24, 2001. All ratios for the period have been annualized, except total return and portfolio turnover.
(6) Prior to July 1, 2004, Class R shares were named Class S shares, which had lower fees and expenses.
(7) Total return does not reflect sales charges. Total return would have been lower had certain expenses not been waived.
FIRST AMERICAN FUNDS Annual Report 2005
69
Financial Highlights For a share outstanding throughout the periods ended September 30, unless otherwise indicated.
| | | Net Asset
Value
Beginning
of Period | | Net
Investment
Income (Loss) | | Realized and
Unrealized
Gains
(Losses) on
Investments | | Distributions
from Net
Investment
Income | | Distributions
from Net
Realized Gains | | Net Asset
Value
End of
Period | | Total
Return (4) | |
| Small Cap Value Fund (1) | |
| Class A | |
| | 2005 | | | $ | 16.84 | | | $ | 0.03 | | | $ | 2.63 | | | $ | (0.06 | ) | | $ | (2.66 | ) | | $ | 16.78 | | | | 16.78 | % | |
| | 2004 | | | | 14.28 | | | | 0.03 | | | | 3.13 | | | | (0.04 | ) | | | (0.56 | ) | | | 16.84 | | | | 22.70 | | |
| | 2003 | | | | 11.26 | | | | - | | | | 3.02 | | | | - | | | | - | | | | 14.28 | | | | 26.86 | | |
| | 2002 | | | | 13.40 | | | | (0.02 | ) | | | (0.13 | ) | | | - | | | | (1.99 | ) | | | 11.26 | | | | (2.19 | ) | |
| | 2001 | | | | 17.09 | | | | 0.02 | | | | (0.97 | ) | | | (0.05 | ) | | | (2.69 | ) | | | 13.40 | | | | (6.36 | ) | |
| Class B | |
| | 2005 | | | $ | 15.92 | | | $ | (0.09 | ) | | $ | 2.47 | | | $ | (0.03 | ) | | $ | (2.66 | ) | | $ | 15.61 | | | | 15.90 | % | |
| | 2004 | | | | 13.60 | | | | (0.08 | ) | | | 2.96 | | | | - | | | | (0.56 | ) | | | 15.92 | | | | 21.76 | | |
| | 2003 | | | | 10.80 | | | | (0.08 | ) | | | 2.88 | | | | - | | | | - | | | | 13.60 | | | | 25.93 | | |
| | 2002 | | | | 13.01 | | | | (0.11 | ) | | | (0.11 | ) | | | - | | | | (1.99 | ) | | | 10.80 | | | | (2.91 | ) | |
| | 2001 | | | | 16.76 | | | | (0.09 | ) | | | (0.97 | ) | | | - | | | | (2.69 | ) | | | 13.01 | | | | (7.24 | ) | |
| Class C | |
| | 2005 | | | $ | 16.10 | | | $ | (0.09 | ) | | $ | 2.50 | | | $ | (0.03 | ) | | $ | (2.66 | ) | | $ | 15.82 | | | | 15.92 | % | |
| | 2004 | | | | 13.74 | | | | (0.08 | ) | | | 3.00 | | | | - | | | | (0.56 | ) | | | 16.10 | | | | 21.83 | | |
| | 2003 | | | | 10.91 | | | | (0.09 | ) | | | 2.92 | | | | - | | | | - | | | | 13.74 | | | | 25.94 | | |
| | 2002 | | | | 13.13 | | | | (0.11 | ) | | | (0.12 | ) | | | - | | | | (1.99 | ) | | | 10.91 | | | | (2.96 | ) | |
| | 2001 | | | | 16.88 | | | | (0.10 | ) | | | (0.95 | ) | | | (0.01 | ) | | | (2.69 | ) | | | 13.13 | | | | (7.08 | ) | |
| Class R (2) | |
| | 2005 | | | $ | 16.83 | | | $ | (0.01 | ) | | $ | 2.64 | | | $ | (0.06 | ) | | $ | (2.66 | ) | | $ | 16.74 | | | | 16.60 | % | |
| | 2004 | | | | 14.27 | | | | 0.03 | | | | 3.12 | | | | (0.03 | ) | | | (0.56 | ) | | | 16.83 | | | | 22.69 | | |
| | 2003 | | | | 11.26 | | | | 0.01 | | | | 3.01 | | | | (0.01 | ) | | | - | | | | 14.27 | | | | 26.79 | | |
| | 2002 | | | | 13.40 | | | | (0.01 | ) | | | (0.14 | ) | | | - | | | | (1.99 | ) | | | 11.26 | | | | (2.19 | ) | |
| | 2001 | (3) | | | 12.84 | | | | - | | | | 0.56 | | | | - | | | | - | | | | 13.40 | | | | 4.36 | | |
| Class Y | |
| | 2005 | | | $ | 17.05 | | | $ | 0.07 | | | $ | 2.67 | | | $ | (0.07 | ) | | $ | (2.66 | ) | | $ | 17.06 | | | | 17.08 | % | |
| | 2004 | | | | 14.44 | | | | 0.08 | | | | 3.16 | | | | (0.07 | ) | | | (0.56 | ) | | | 17.05 | | | | 23.02 | | |
| | 2003 | | | | 11.38 | | | | 0.03 | | | | 3.05 | | | | (0.02 | ) | | | - | | | | 14.44 | | | | 27.10 | | |
| | 2002 | | | | 13.48 | | | | 0.02 | | | | (0.12 | ) | | | (0.01 | ) | | | (1.99 | ) | | | 11.38 | | | | (1.83 | ) | |
| | 2001 | | | | 17.19 | | | | 0.06 | | | | (1.00 | ) | | | (0.08 | ) | | | (2.69 | ) | | | 13.48 | | | | (6.25 | ) | |
| Small-Mid Cap Core Fund (1)(5) | |
| Class A | |
| | 2005 | | | $ | 7.40 | | | $ | (0.07 | ) | | $ | 0.98 | | | $ | - | | | $ | - | | | $ | 8.31 | | | | 12.30 | % | |
| | 2004 | | | | 7.05 | | | | (0.07 | ) | | | 0.42 | | | | - | | | | - | | | | 7.40 | | | | 4.96 | | |
| | 2003 | | | | 4.29 | | | | (0.03 | ) | | | 2.79 | | | | - | | | | - | | | | 7.05 | | | | 64.34 | | |
| | 2002 | | | | 6.36 | | | | (0.07 | ) | | | (2.00 | ) | | | - | | | | - | | | | 4.29 | | | | (32.55 | ) | |
| | 2001 | | | | 47.68 | | | | (0.15 | ) | | | (33.55 | ) | | | - | | | | (7.62 | ) | | | 6.36 | | | | (83.30 | ) | |
| Class B | |
| | 2005 | | | $ | 6.55 | | | $ | (0.11 | ) | | $ | 0.87 | | | $ | - | | | $ | - | | | $ | 7.31 | | | | 11.60 | % | |
| | 2004 | | | | 6.29 | | | | (0.11 | ) | | | 0.37 | | | | - | | | | - | | | | 6.55 | | | | 4.13 | | |
| | 2003 | | | | 3.86 | | | | (0.07 | ) | | | 2.50 | | | | - | | | | - | | | | 6.29 | | | | 62.95 | | |
| | 2002 | | | | 5.77 | | | | (0.11 | ) | | | (1.80 | ) | | | - | | | | - | | | | 3.86 | | | | (33.10 | ) | |
| | 2001 | | | | 44.40 | | | | (0.26 | ) | | | (30.75 | ) | | | - | | | | (7.62 | ) | | | 5.77 | | | | (83.42 | ) | |
| Class C | |
| | 2005 | | | $ | 7.14 | | | $ | (0.12 | ) | | $ | 0.95 | | | $ | - | | | $ | - | | | $ | 7.97 | | | | 11.62 | % | |
| | 2004 | | | | 6.86 | | | | (0.12 | ) | | | 0.40 | | | | - | | | | - | | | | 7.14 | | | | 4.08 | | |
| | 2003 | | | | 4.20 | | | | (0.07 | ) | | | 2.73 | | | | - | | | | - | | | | 6.86 | | | | 63.33 | | |
| | 2002 | | | | 6.28 | | | | (0.12 | ) | | | (1.96 | ) | | | - | | | | - | | | | 4.20 | | | | (33.12 | ) | |
| | 2001 | | | | 47.49 | | | | (0.26 | ) | | | (33.33 | ) | | | - | | | | (7.62 | ) | | | 6.28 | | | | (83.43 | ) | |
| Class Y | |
| | 2005 | | | $ | 7.66 | | | $ | (0.05 | ) | | $ | 1.02 | | | $ | - | | | $ | - | | | $ | 8.63 | | | | 12.66 | % | |
| | 2004 | | | | 7.28 | | | | (0.05 | ) | | | 0.43 | | | | - | | | | - | | | | 7.66 | | | | 5.22 | | |
| | 2003 | | | | 4.42 | | | | (0.01 | ) | | | 2.87 | | | | - | | | | - | | | | 7.28 | | | | 64.71 | | |
| | 2002 | | | | 6.53 | | | | (0.05 | ) | | | (2.06 | ) | | | - | | | | - | | | | 4.42 | | | | (32.31 | ) | |
| | 2001 | | | | 48.60 | | | | (0.11 | ) | | | (34.34 | ) | | | - | | | | (7.62 | ) | | | 6.53 | | | | (83.26 | ) | |
The accompanying notes are an integral part of the financial statements.
FIRST AMERICAN FUNDS Annual Report 2005
70
| | | Net Assets
End of
Period (000) | | Ratio of
Expenses to
Average
Net Assets | | Ratio of Net
Investment
Income (Loss)
to Average
Net Assets | | Expenses to
Average
Net Assets
(Excluding
Waivers) | | Ratio of Net
Investment
Income (Loss)
to Average Net
Assets (Excluding
Waivers) | | Portfolio
Turnover
Rate | |
| Small Cap Value Fund (1) | |
| Class A | |
| | 2005 | | | $ | 48,128 | | | | 1.24 | % | | | 0.19 | % | | | 1.26 | % | | | 0.17 | % | | | 72 | % | |
| | 2004 | | | | 43,192 | | | | 1.23 | | | | 0.21 | | | | 1.25 | | | | 0.19 | | | | 34 | | |
| | 2003 | | | | 32,416 | | | | 1.23 | | | | 0.02 | | | | 1.25 | | | | - | | | | 49 | | |
| | 2002 | | | | 27,205 | | | | 1.23 | | | | (0.12 | ) | | | 1.26 | | | | (0.15 | ) | | | 37 | | |
| | 2001 | | | | 34,292 | | | | 1.15 | | | | 0.11 | | | | 1.15 | | | | 0.11 | | | | 53 | | |
| Class B | |
| | 2005 | | | $ | 9,325 | | | | 1.99 | % | | | (0.56 | )% | | | 2.01 | % | | | (0.58 | )% | | | 72 | % | |
| | 2004 | | | | 9,901 | | | | 1.98 | | | | (0.51 | ) | | | 2.00 | | | | (0.53 | ) | | | 34 | | |
| | 2003 | | | | 12,560 | | | | 1.98 | | | | (0.73 | ) | | | 2.00 | | | | (0.75 | ) | | | 49 | | |
| | 2002 | | | | 12,008 | | | | 1.98 | | | | (0.87 | ) | | | 2.01 | | | | (0.90 | ) | | | 37 | | |
| | 2001 | | | | 12,392 | | | | 1.90 | | | | (0.64 | ) | | | 1.90 | | | | (0.64 | ) | | | 53 | | |
| Class C | |
| | 2005 | | | $ | 4,808 | | | | 1.99 | % | | | (0.56 | )% | | | 2.01 | % | | | (0.58 | )% | | | 72 | % | |
| | 2004 | | | | 4,609 | | | | 1.98 | | | | (0.52 | ) | | | 2.00 | | | | (0.54 | ) | | | 34 | | |
| | 2003 | | | | 4,354 | | | | 1.98 | | | | (0.74 | ) | | | 2.00 | | | | (0.76 | ) | | | 49 | | |
| | 2002 | | | | 4,873 | | | | 1.98 | | | | (0.87 | ) | | | 2.01 | | | | (0.90 | ) | | | 37 | | |
| | 2001 | | | | 4,547 | | | | 1.90 | | | | (0.65 | ) | | | 1.90 | | | | (0.65 | ) | | | 53 | | |
| Class R (2) | |
| | 2005 | | | $ | 4 | | | | 1.49 | % | | | (0.04 | )% | | | 1.66 | % | | | (0.21 | )% | | | 72 | % | |
| | 2004 | | | | 1 | | | | 1.23 | | | | 0.22 | | | | 1.25 | | | | 0.20 | | | | 34 | | |
| | 2003 | | | | 1,351 | | | | 1.23 | | | | 0.04 | | | | 1.25 | | | | 0.02 | | | | 49 | | |
| | 2002 | | | | 424 | | | | 1.24 | | | | (0.11 | ) | | | 1.27 | | | | (0.14 | ) | | | 37 | | |
| | 2001 | (3) | | | - | | | | - | | | | - | | | | - | | | | - | | | | 53 | | |
| Class Y | |
| | 2005 | | | $ | 363,261 | | | | 0.99 | % | | | 0.44 | % | | | 1.01 | % | | | 0.42 | % | | | 72 | % | |
| | 2004 | | | | 367,774 | | | | 0.98 | | | | 0.50 | | | | 1.00 | | | | 0.48 | | | | 34 | | |
| | 2003 | | | | 428,846 | | | | 0.98 | | | | 0.27 | | | | 1.00 | | | | 0.25 | | | | 49 | | |
| | 2002 | | | | 368,092 | | | | 0.98 | | | | 0.13 | | | | 1.01 | | | | 0.10 | | | | 37 | | |
| | 2001 | | | | 434,097 | | | | 0.90 | | | | 0.37 | | | | 0.90 | | | | 0.37 | | | | 53 | | |
| Small-Mid Cap Core Fund (1)(5) | |
| Class A | |
| | 2005 | | | $ | 23,016 | | | | 1.42 | % | | | (0.83 | )% | | | 1.50 | % | | | (0.91 | )% | | | 197 | % | |
| | 2004 | | | | 27,356 | | | | 1.23 | | | | (0.86 | ) | | | 1.28 | | | | (0.91 | ) | | | 51 | | |
| | 2003 | | | | 27,936 | | | | 1.23 | | | | (0.52 | ) | | | 1.29 | | | | (0.58 | ) | | | 110 | | |
| | 2002 | | | | 18,267 | | | | 1.23 | | | | (0.89 | ) | | | 1.70 | | | | (1.36 | ) | | | 288 | | |
| | 2001 | | | | 29,084 | | | | 1.15 | | | | (0.88 | ) | | | 1.22 | | | | (0.95 | ) | | | 269 | | |
| Class B | |
| | 2005 | | | $ | 10,685 | | | | 2.17 | % | | | (1.59 | )% | | | 2.25 | % | | | (1.67 | )% | | | 197 | % | |
| | 2004 | | | | 13,445 | | | | 1.98 | | | | (1.60 | ) | | | 2.03 | | | | (1.65 | ) | | | 51 | | |
| | 2003 | | | | 16,016 | | | | 1.98 | | | | (1.26 | ) | | | 2.04 | | | | (1.32 | ) | | | 110 | | |
| | 2002 | | | | 11,190 | | | | 1.98 | | | | (1.64 | ) | | | 2.45 | | | | (2.11 | ) | | | 288 | | |
| | 2001 | | | | 15,974 | | | | 1.90 | | | | (1.63 | ) | | | 1.97 | | | | (1.70 | ) | | | 269 | | |
| Class C | |
| | 2005 | | | $ | 4,485 | | | | 2.17 | % | | | (1.59 | )% | | | 2.25 | % | | | (1.67 | )% | | | 197 | % | |
| | 2004 | | | | 6,000 | | | | 1.98 | | | | (1.60 | ) | | | 2.03 | | | | (1.65 | ) | | | 51 | | |
| | 2003 | | | | 7,056 | | | | 1.98 | | | | (1.25 | ) | | | 2.04 | | | | (1.31 | ) | | | 110 | | |
| | 2002 | | | | 5,064 | | | | 1.98 | | | | (1.64 | ) | | | 2.45 | | | | (2.11 | ) | | | 288 | | |
| | 2001 | | | | 9,010 | | | | 1.90 | | | | (1.63 | ) | | | 1.98 | | | | (1.71 | ) | | | 269 | | |
| Class Y | |
| | 2005 | | | $ | 33,537 | | | | 1.17 | % | | | (0.58 | )% | | | 1.25 | % | | | (0.66 | )% | | | 197 | % | |
| | 2004 | | | | 43,758 | | | | 0.98 | | | | (0.60 | ) | | | 1.03 | | | | (0.65 | ) | | | 51 | | |
| | 2003 | | | | 59,817 | | | | 0.98 | | | | (0.24 | ) | | | 1.04 | | | | (0.30 | ) | | | 110 | | |
| | 2002 | | | | 44,134 | | | | 0.98 | | | | (0.64 | ) | | | 1.45 | | | | (1.11 | ) | | | 288 | | |
| | 2001 | | | | 59,653 | | | | 0.90 | | | | (0.62 | ) | | | 0.96 | | | | (0.67 | ) | | | 269 | | |
(1) Per share data calculated using average shares outstanding method.
(2) Prior to July 1, 2004, Class R shares were named Class S shares, which had lower fees and expenses.
(3) Class of shares has been offered since September 24, 2001. All ratios for the period have been annualized, except total return and portfolio turnover.
(4) Total return does not reflect sales charges. Total return would have been lower had certain expenses not been waived.
(5) The financial highlights for Small-Mid Cap Core Fund as set forth herein include the historical financial highlights of the First American Technology Fund.
Effective October 3, 2005, the fund's name and strategy changed.
FIRST AMERICAN FUNDS Annual Report 2005
71
Schedule of Investments September 30, 2005
Mid Cap Growth Opportunities Fund
| DESCRIPTION | | SHARES | | VALUE (000) | |
| Common Stocks – 96.9% | |
| Consumer Discretionary – 17.7% | |
| Chico's FAS* (a) | | | 601,630 | | | $ | 22,140 | | |
| Coldwater Creek* (a) | | | 906,464 | | | | 22,861 | | |
| Fortune Brands | | | 234,730 | | | | 19,091 | | |
| Gaylord Entertainment* (a) | | | 610,860 | | | | 29,107 | | |
| Harman International Industries (a) | | | 217,440 | | | | 22,238 | | |
| Harrah's Entertainment | | | 257,870 | | | | 16,810 | | |
| P.F. Chang's China Bistro* (a) | | | 153,310 | | | | 6,873 | | |
| Scientific Games, Class A* (a) | | | 1,453,000 | | | | 45,043 | | |
| Starwood Hotels & Resorts Worldwide (a) | | | 489,300 | | | | 27,973 | | |
| Station Casinos (a) | | | 462,390 | | | | 30,684 | | |
| Texas Roadhouse, Class A* (a) | | | 1,401,760 | | | | 20,886 | | |
| XM Satellite* (a) | | | 677,350 | | | | 24,324 | | |
| | | | 288,030 | | |
| Consumer Staples – 3.3% | | | |
| Bunge Limited (a) | | | 305,970 | | | | 16,100 | | |
| Corn Products International (a) | | | 778,500 | | | | 15,702 | | |
| Hershey Foods (a) | | | 388,120 | | | | 21,855 | | |
| | | | 53,657 | | |
| Energy – 12.3% | | | |
| Apache | | | 195,214 | | | | 14,684 | | |
| BJ Services (a) | | | 532,420 | | | | 19,162 | | |
| Chesapeake Energy (a) | | | 251,950 | | | | 9,637 | | |
| National-Oilwell* | | | 663,690 | | | | 43,671 | | |
| Newfield Exploration* (a) | | | 572,230 | | | | 28,096 | | |
| Smith International (a) | | | 213,740 | | | | 7,120 | | |
| Southwestern Energy* | | | 107,330 | | | | 7,878 | | |
| Valero Energy | | | 100,208 | | | | 11,329 | | |
| Weatherford International* (a) | | | 528,470 | | | | 36,285 | | |
| XTO Energy (a) | | | 497,586 | | | | 22,551 | | |
| | | | 200,413 | | |
| Financials – 4.8% | | | |
| Ameritrade Holding* | | | 838,619 | | | | 18,013 | | |
| Bear Stearns | | | 153,340 | | | | 16,829 | | |
| Calamos Asset Management | | | 344,300 | | | | 8,497 | | |
| Chicago Mercantile Exchage | | | 33,130 | | | | 11,175 | | |
| Legg Mason (a) | | | 180,730 | | | | 19,824 | | |
| Refco* | | | 118,410 | | | | 3,347 | | |
| | | | 77,685 | | |
| Health Care – 17.6% | | | |
| Aetna | | | 256,710 | | | | 22,113 | | |
| American Healthways* (a) | | | 390,420 | | | | 16,554 | | |
| C.R. Bard | | | 97,870 | | | | 6,462 | | |
| Caremark Rx* | | | 348,160 | | | | 17,384 | | |
| Cooper (a) | | | 236,350 | | | | 18,107 | | |
| Coventry Health Care* | | | 267,950 | | | | 23,049 | | |
| DENTSPLY International | | | 679,500 | | | | 36,707 | | |
| Fisher Scientific International* (a) | | | 317,250 | | | | 19,685 | | |
| PerkinElmer | | | 2,093,950 | | | | 42,654 | | |
| Quest Diagnostics (a) | | | 329,390 | | | | 16,647 | | |
| Sierra Health Services* | | | 205,700 | | | | 14,167 | | |
| Thermo Electron* | | | 1,275,770 | | | | 39,421 | | |
| Zimmer Holdings* (a) | | | 206,630 | | | | 14,235 | | |
| | | | 287,185 | | |
| Industrials – 18.1% | | | |
| Dun & Bradstreet* | | | 655,390 | | | | 43,170 | | |
| Dycom Industries* (a) | | | 827,840 | | | | 16,739 | | |
| Hexcel* (a) | | | 426,130 | | | | 7,794 | | |
| Kennametal (a) | | | 350,930 | | | | 17,210 | | |
| L-3 Communications Holdings (a) | | | 447,140 | | | | 35,355 | | |
Mid Cap Growth Opportunities Fund (concluded)
| DESCRIPTION | | SHARES | | VALUE (000) | |
| Monster Worldwide* (a) | | | 1,088,730 | | | $ | 33,435 | | |
| MSC Industrial Direct (a) | | | 736,950 | | | | 24,445 | | |
| Pentair | | | 493,440 | | | | 18,011 | | |
| Precision Castparts | | | 372,480 | | | | 19,779 | | |
| Republic Services | | | 688,755 | | | | 24,306 | | |
| Roper Industries (a) | | | 306,600 | | | | 12,046 | | |
| Stericycle* (a) | | | 282,150 | | | | 16,125 | | |
| UTI Worldwide (a) | | | 337,580 | | | | 26,230 | | |
| | | | 294,645 | | |
| Information Technology – 23.1% | | | |
| Adobe Systems (a) | | | 1,401,780 | | | | 41,843 | | |
| Altera* (a) | | | 1,235,420 | | | | 23,609 | | |
| Amphenol, Class A* | | | 517,260 | | | | 20,866 | | |
| Apple Computer* | | | 530,980 | | | | 28,466 | | |
| Autodesk (a) | | | 360,150 | | | | 16,725 | | |
| Cogent* (a) | | | 554,330 | | | | 13,165 | | |
| Cognizant Technology Solutions* | | | 508,160 | | | | 23,675 | | |
| Cognos* (a) | | | 471,430 | | | | 18,353 | | |
| Freescale Semiconductor* (a) | | | 347,230 | | | | 8,129 | | |
| Hyperion Solutions* (a) | | | 337,760 | | | | 16,432 | | |
| Linear Technology (a) | | | 790,470 | | | | 29,714 | | |
| Macromedia* | | | 213,030 | | | | 8,664 | | |
| Marvell Technology Group* (a) | | | 224,270 | | | | 10,341 | | |
| MEMC Electronic Materials* | | | 784,010 | | | | 17,868 | | |
| Microchip Technology | | | 500,140 | | | | 15,064 | | |
| National Semiconductor | | | 472,240 | | | | 12,420 | | |
| NCR* (a) | | | 1,779,000 | | | | 56,768 | | |
| Research in Motion* (a) | | | 208,870 | | | | 14,287 | | |
| | | | 376,389 | | |
Total Common Stocks
(Cost $1,259,893) | | | | | | | 1,578,004 | | |
| Affiliated Money Market Fund – 2.4% | |
First American Prime Obligations Fund, Class Z (b)
(Cost $39,046) | | | 39,045,603 | | | | 39,046 | | |
Investments Purchased with Proceeds
from Securities Lending (c) – 33.8% | |
| (Cost $551,086) | | | | | | | 551,086 | | |
Total Investments – 133.1%
(Cost $1,850,025) | | | | | | | 2,168,136 | | |
| Other Assets and Liabilities, Net – (33.1)% | | | | | | | (539,408 | ) | |
| Total Net Assets – 100.0% | | | | | | $ | 1,628,728 | | |
* Non-income producing security
(a) This security or a portion of this security is out on loan at September 30, 2005. Total loaned securities had a market value of $544,077,326 at September 30, 2005. See note 2 in Notes to Financial Statements.
(b) Investment in affiliated security. This money market fund is advised by U.S. Bancorp Asset Management, Inc., which also serves as advisor to this fund. See note 3 in Notes to Financial Statements.
(c) The fund may loan securities in return for collateral in the form of cash, U.S. Government securities, or other high grade debt obligations. The cash collateral is invested in various short-term fixed income securities, such as repurchase agreements, commercial paper, money market funds and other corporate obligations. See note 2 in Notes to Financial Statements.
The accompanying notes are an integral part of the financial statements.
FIRST AMERICAN FUNDS Annual Report 2005
72
Mid Cap Value Fund
| DESCRIPTION | | SHARES | | VALUE (000) | |
| Common Stocks – 97.8% | | | |
| Consumer Discretionary – 13.9% | | | |
| Black & Decker (a) | | | 92,930 | | | $ | 7,629 | | |
| BorgWarner (a) | | | 118,370 | | | | 6,683 | | |
| Darden Restaurants (a) | | | 222,650 | | | | 6,762 | | |
| Federated Department Stores | | | 228,200 | | | | 15,260 | | |
| Fortune Brands | | | 109,930 | | | | 8,941 | | |
| Harrah's Entertainment | | | 109,560 | | | | 7,142 | | |
| Knight-Ridder (a) | | | 107,310 | | | | 6,297 | | |
| Lennar (a) | | | 139,060 | | | | 8,310 | | |
| Liz Claiborne (a) | | | 191,030 | | | | 7,511 | | |
| Office Depot* (a) | | | 310,550 | | | | 9,223 | | |
| Sherwin Williams | | | 289,900 | | | | 12,776 | | |
| | | | 96,534 | | |
| Consumer Staples – 5.5% | | | |
| Archer-Daniels-Midland | | | 391,060 | | | | 9,644 | | |
| Kroger* | | | 811,390 | | | | 16,707 | | |
| Molson Coors Brewing (a) | | | 79,330 | | | | 5,078 | | |
| Pepsi Bottling (a) | | | 224,270 | | | | 6,403 | | |
| | | | 37,832 | | |
| Energy – 7.4% | | | |
| GlobalSantaFe (a) | | | 203,320 | | | | 9,275 | | |
| Kerr-McGee | | | 74,260 | | | | 7,211 | | |
| National-Oilwell* | | | 175,440 | | | | 11,544 | | |
| Newfield Exploration* (a) | | | 288,590 | | | | 14,170 | | |
| Noble Energy | | | 200,160 | | | | 9,387 | | |
| | | | 51,587 | | |
| Financials (b) – 26.9% | | | |
| ACE | | | 245,870 | | | | 11,573 | | |
| Ambac Financial Group (a) | | | 99,530 | | | | 7,172 | | |
| AON (a) | | | 232,150 | | | | 7,447 | | |
| Astoria Financial (a) | | | 241,830 | | | | 6,389 | | |
| Bear Stearns (a) | | | 130,030 | | | | 14,271 | | |
| Boston Properties (REIT) (a) | | | 120,560 | | | | 8,548 | | |
| Comerica | | | 200,660 | | | | 11,819 | | |
| Cullen/Frost Bankers | | | 173,150 | | | | 8,543 | | |
| Developers Diversified Realty (REIT) (a) | | | 181,640 | | | | 8,483 | | |
| Equity Office Properties Trust (REIT) (a) | | | 249,770 | | | | 8,170 | | |
| Genworth Financial (a) | | | 470,980 | | | | 15,184 | | |
| KeyCorp (a) | | | 281,410 | | | | 9,075 | | |
| Lincoln National (a) | | | 161,680 | | | | 8,411 | | |
| Marshall & Ilsley (a) | | | 218,630 | | | | 9,513 | | |
| MGIC Investment (a) | | | 132,080 | | | | 8,480 | | |
| Northern Trust (a) | | | 208,990 | | | | 10,564 | | |
| Principal Financial Group (a) | | | 156,250 | | | | 7,402 | | |
| Synovus Financial | | | 280,200 | | | | 7,767 | | |
| Vornado Realty Trust (REIT) (a) | | | 86,150 | | | | 7,462 | | |
| W.R. Berkley | | | 251,692 | | | | 9,937 | | |
| | | | 186,210 | | |
| Health Care – 6.3% | | | |
| CIGNA | | | 105,350 | | | | 12,417 | | |
| Community Health Systems* (a) | | | 271,050 | | | | 10,519 | | |
| Health Net* (a) | | | 235,730 | | | | 11,155 | | |
| PerkinElmer | | | 466,880 | | | | 9,510 | | |
| | | | 43,601 | | |
| Industrials – 8.8% | | | |
| American Standard* | | | 155,030 | | | | 7,217 | | |
| Eaton | | | 193,100 | | | | 12,271 | | |
| Joy Global (a) | | | 144,365 | | | | 7,285 | | |
| Kennametal (a) | | | 178,920 | | | | 8,774 | | |
| Norfolk Southern | | | 370,950 | | | | 15,046 | | |
| Republic Services | | | 299,150 | | | | 10,557 | | |
| | | | 61,150 | | |
Mid Cap Value Fund (concluded)
| DESCRIPTION | | SHARES | | VALUE (000) | |
| Information Technology – 9.6% | | | |
| Amphenol, Class A | | | 233,330 | | | $ | 9,413 | | |
| Arrow Electronics* | | | 235,640 | | | | 7,390 | | |
| Electronic Data Systems | | | 305,560 | | | | 6,857 | | |
| Harris | | | 258,490 | | | | 10,805 | | |
| Ingram Micro* | | | 463,870 | | | | 8,600 | | |
| Lucent Technologies* (a) | | | 1,098,920 | | | | 3,572 | | |
| National Semiconductor (a) | | | 439,250 | | | | 11,552 | | |
| Xerox* (a) | | | 639,750 | | | | 8,733 | | |
| | | | 66,922 | | |
| Materials – 6.7% | | | |
| Ashland | | | 126,110 | | | | 6,966 | | |
| Eastman Chemical | | | 89,130 | | | | 4,186 | | |
| Engelhard | | | 234,890 | | | | 6,556 | | |
| Lyondell Chemical (a) | | | 130,780 | | | | 3,743 | | |
| MeadWestvaco | | | 224,490 | | | | 6,200 | | |
| Pactiv* | | | 73,850 | | | | 1,294 | | |
| Phelps Dodge (a) | | | 76,060 | | | | 9,882 | | |
| Rohm & Haas (a) | | | 178,800 | | | | 7,354 | | |
| | | | 46,181 | | |
| Utilities – 12.7% | | | |
| Alliant Energy | | | 194,050 | | | | 5,653 | | |
| Constellation Energy | | | 234,920 | | | | 14,471 | | |
| DPL (a) | | | 225,550 | | | | 6,270 | | |
| DTE Energy (a) | | | 111,710 | | | | 5,123 | | |
| Edison International | | | 248,020 | | | | 11,726 | | |
| PG&E (a) | | | 364,990 | | | | 14,326 | | |
| PNM Resources | | | 200,270 | | | | 5,742 | | |
| PPL (a) | | | 435,390 | | | | 14,076 | | |
| Sempra Energy | | | 77,240 | | | | 3,635 | | |
| Wisconsin Energy | | | 177,360 | | | | 7,080 | | |
| | | | 88,102 | | |
Total Common Stocks
(Cost $567,014) | | | | | | | 678,119 | | |
| Affiliated Money Market Fund – 2.1% | | | |
First American Prime Obligations Fund, Class Z (c)
(Cost $14,475) | | | 14,475,448 | | | | 14,475 | | |
Investments Purchased with Proceeds
from Securities Lending (d) – 34.6% | | | |
| (Cost $239,898) | | | | | | | 239,898 | | |
Total Investments – 134.5%
(Cost $821,387) | | | | | | | 932,492 | | |
| Other Assets and Liabilities, Net – (34.5)% | | | | | | | (238,997 | ) | |
| Total Net Assets – 100.0% | | | | | | $ | 693,495 | | |
* Non-income producing security
(a) This security or a portion of this security is out on loan at September 30, 2005. Total loaned securities had a market value of $235,239,778 at September 30, 2005. See note 2 in Notes to Financial Statements.
(b) The fund is significantly invested in this industry and therefore is subject to additional risks. See note 7 in Notes to Financial Statements.
(c) Investment in affiliated security. This money market is advised by U.S. Bancorp Asset Management, Inc., which also serves as advisor to this fund. See note 3 in Notes to Financial Statements.
(d) The fund may loan securities in return for collateral in the form of cash, U.S. Government securities, or other high grade debt obligations. The cash collateral is invested in various short-term fixed income securities, such as repurchase agreements, commercial paper, money market funds and other corporate obligations. See note 2 in Notes to Financial Statements.
REIT – Real Estate Investment Trust
The accompanying notes are an integral part of the financial statements.
FIRST AMERICAN FUNDS Annual Report 2005
73
Statements of Assets and Liabilities September 30, 2005, in thousands, except for per share data
| | | Mid Cap Growth
Opportunities Fund | | Mid Cap
Value Fund | |
| ASSETS: | | | |
| Investments in unaffiliated securities, at value† (cost: $1,259,893 and $567,014, respectively) (note 2) | | $ | 1,578,004 | | | $ | 678,119 | | |
| Investments in affiliated money market fund, at value (cost: $39,046 and $14,475, respectively) (note 2) | | | 39,046 | | | | 14,475 | | |
| Investments purchased with proceeds from securities lending (cost: $551,086 and $239,898, respectively) (note 2) | | | 551,086 | | | | 239,898 | | |
| Cash* | | | 5,220 | | | | 2,272 | | |
| Receivable for dividends and interest | | | 477 | | | | 1,548 | | |
| Receivable for investment securities sold | | | 29,533 | | | | - | | |
| Receivable for capital shares sold | | | 1,265 | | | | 896 | | |
| Prepaid expenses and other assets | | | 33 | | | | 29 | | |
| Total assets | | | 2,204,664 | | | | 937,237 | | |
| LIABILITIES: | | | |
| Payable for investment securities purchased | | | 12,129 | | | | - | | |
| Payable upon return of securities loaned (note 2) | | | 556,306 | | | | 242,170 | | |
| Payable for capital shares redeemed | | | 6,077 | | | | 979 | | |
| Payable to affiliates (note 3) | | | 1,292 | | | | 544 | | |
| Payable for distribution and shareholder servicing fees | | | 91 | | | | 25 | | |
| Accrued expenses and other liabilities | | | 41 | | | | 24 | | |
| Total liabilities | | | 575,936 | | | | 243,742 | | |
| Net assets | | $ | 1,628,728 | | | $ | 693,495 | | |
| COMPOSITION OF NET ASSETS: | | | |
| Portfolio capital | | $ | 1,236,388 | | | $ | 552,050 | | |
| Undistributed (distributions in excess of) net investment income | | | (1 | ) | | | 186 | | |
| Accumulated net realized gain on investments | | | 74,230 | | | | 30,154 | | |
| Net unrealized appreciation of investments | | | 318,111 | | | | 111,105 | | |
| Net assets | | $ | 1,628,728 | | | $ | 693,495 | | |
| * Includes cash collateral received related to securities loaned (note 2) | | $ | 5,220 | | | $ | 2,272 | | |
| † Including securities loaned, at value | | $ | 544,077 | | | $ | 235,240 | | |
| Class A: | |
| Net assets | | $ | 317,906 | | | $ | 54,360 | | |
| Shares issued and outstanding ($0.0001 par value - 2 billion authorized) | | | 7,652 | | | | 2,185 | | |
| Net asset value and redemption price per share | | $ | 41.55 | | | $ | 24.88 | | |
| Maximum offering price per share (1) | | $ | 43.97 | | | $ | 26.33 | | |
| Class B: | | | |
| Net assets | | $ | 14,922 | | | $ | 10,157 | | |
| Shares issued and outstanding ($0.0001 par value - 2 billion authorized) | | | 384 | | | | 424 | | |
| Net asset value, offering price and redemption price per share (2) | | $ | 38.87 | | | $ | 23.94 | | |
| Class C: | | | |
| Net assets | | $ | 17,079 | | | $ | 7,426 | | |
| Shares issued and outstanding ($0.0001 par value - 2 billion authorized) | | | 424 | | | | 304 | | |
| Net asset value, offering price and redemption price per share (2) | | $ | 40.23 | | | $ | 24.40 | | |
| Class R: | | | |
| Net assets | | $ | 5,501 | | | $ | 380 | | |
| Shares issued and outstanding ($0.0001 par value - 2 billion authorized) | | | 133 | | | | 15 | | |
| Net asset value, offering price, and redemption price per share | | $ | 41.40 | | | $ | 24.83 | | |
| Class Y: | | | |
| Net assets | | $ | 1,273,320 | | | $ | 621,172 | | |
| Shares issued and outstanding ($0.0001 par value - 2 billion authorized) | | | 29,326 | | | | 24,871 | | |
| Net asset value, offering price, and redemption price per share | | $ | 43.42 | | | $ | 24.98 | | |
(1) The offering price is calculated by dividing the net asset value by 1 minus the maximum sales charge of 5.50%
(2) Class B and C have a contingent deferred sales charge. For a description of this sales charge, see notes 1 and 3 in Notes to Financial Statements.
The accompanying notes are an integral part of the financial statements.
FIRST AMERICAN FUNDS Annual Report 2005
74
Statements of Operations For the fiscal year ended September 30, 2005, in thousands
| | | Mid Cap Growth
Opportunities Fund | | Mid Cap
Value Fund | |
| INVESTMENT INCOME: | | | |
| Dividends from affiliated money market fund | | $ | 916 | | | $ | 328 | | |
| Dividends from unaffiliated securities | | | 6,858 | | | | 9,742 | | |
| Less: Foreign taxes withheld | | | (5 | ) | | | (6 | ) | |
| Securities lending income | | | 495 | | | | 166 | | |
| Total investment income | | | 8,264 | | | | 10,230 | | |
| EXPENSES (note 3): | | | |
| Investment advisory fees | | | 10,195 | | | | 4,051 | | |
| Administration fees | | | 2,931 | | | | 1,163 | | |
| Transfer agent fees | | | 955 | | | | 387 | | |
| Custodian fees | | | 126 | | | | 49 | | |
| Professional fees | | | 91 | | | | 48 | | |
| Postage and printing fees | | | 76 | | | | 31 | | |
| Registration fees | | | 40 | | | | 41 | | |
| Directors' fees | | | 34 | | | | 13 | | |
| Other expenses | | | 30 | | | | 14 | | |
| Distribution and shareholder servicing fees – Class A | | | 549 | | | | 87 | | |
| Distribution and shareholder servicing fees – Class B | | | 132 | | | | 101 | | |
| Distribution and shareholder servicing fees – Class C | | | 144 | | | | 46 | | |
| Distribution and shareholder servicing fees – Class R | | | 7 | | | | 1 | | |
| Total expenses | | | 15,310 | | | | 6,032 | | |
| Less: Fee waivers (note 3) | | | (478 | ) | | | (231 | ) | |
| Total net expenses | | | 14,832 | | | | 5,801 | | |
| Investment income (loss) – net | | | (6,568 | ) | | | 4,429 | | |
| REALIZED AND UNREALIZED GAINS ON INVESTMENTS – NET (note 5): | | | |
| Net realized gain on investments | | | 180,742 | | | | 88,747 | | |
| Net change in unrealized appreciation or depreciation of investments | | | 166,265 | | | | 30,399 | | |
| Net gain on investments | | | 347,007 | | | | 119,146 | | |
| Net increase in net assets resulting from operations | | $ | 340,439 | | | $ | 123,575 | | |
The accompanying notes are an integral part of the financial statements.
FIRST AMERICAN FUNDS Annual Report 2005
75
Statements of Changes in Net Assets in thousands
| | | Mid Cap Growth
Opportunities Fund | | Mid Cap
Value Fund | |
| | | Year Ended
9/30/05 | | Year Ended
9/30/04 | | Year Ended
9/30/05 | | Year Ended
9/30/04 | |
| OPERATIONS: | | | |
| Investment income (loss) – net | | $ | (6,568 | ) | | $ | (8,420 | ) | | $ | 4,429 | | | $ | 2,640 | | |
| Net realized gain on investments | | | 180,742 | | | | 222,462 | | | | 88,747 | | | | 47,402 | | |
| Net change in unrealized appreciation or depreciation of investments | | | 166,265 | | | | 10,165 | | | | 30,399 | | | | 37,910 | | |
| Net increase in net assets resulting from operations | | | 340,439 | | | | 224,207 | | | | 123,575 | | | | 87,952 | | |
| DISTRIBUTIONS TO SHAREHOLDERS FROM: | | | |
| Investment income – net: | |
| Class A | | | - | | | | - | | | | (164 | ) | | | (65 | ) | |
| Class B | | | - | | | | - | | | | (1 | ) | | | (4 | ) | |
| Class C | | | - | | | | - | | | | - | | | | (1 | ) | |
| Class R | | | - | | | | - | | | | - | | | | (3 | ) | |
| Class Y | | | - | | | | - | | | | (3,591 | ) | | | (2,029 | ) | |
| Net realized gain on investments: | |
| Class A | | | (26,799 | ) | | | (4,797 | ) | | | - | | | | - | | |
| Class B | | | (1,832 | ) | | | (306 | ) | | | - | | | | - | | |
| Class C | | | (1,996 | ) | | | (393 | ) | | | - | | | | - | | |
| Class R | | | (2 | ) | | | (322 | ) | | | - | | | | - | | |
| Class Y | | | (164,469 | ) | | | (34,963 | ) | | | - | | | | - | | |
| Tax return of capital: | |
| Class A | | | - | | | | - | | | | - | | | | (2 | ) | |
| Class B | | | - | | | | - | | | | - | | | | - | | |
| Class C | | | - | | | | - | | | | - | | | | - | | |
| Class R | | | - | | | | - | | | | - | | | | - | | |
| Class Y | | | - | | | | - | | | | - | | | | (55 | ) | |
| Total distributions | | | (195,098 | ) | | | (40,781 | ) | | | (3,756 | ) | | | (2,159 | ) | |
| CAPITAL SHARE TRANSACTIONS (note 4): | | | |
| Class A: | |
| Proceeds from sales | | | 141,968 | | | | 29,575 | | | | 29,979 | | | | 13,198 | | |
| Reinvestment of distributions | | | 25,770 | | | | 4,705 | | | | 156 | | | | 65 | | |
| Payments for redemptions | | | (44,583 | ) | | | (35,852 | ) | | | (11,836 | ) | | | (5,352 | ) | |
| Increase (decrease) in net assets from Class A transactions | | | 123,155 | | | | (1,572 | ) | | | 18,299 | | | | 7,911 | | |
| Class B: | |
| Proceeds from sales | | | 3,307 | | | | 2,328 | | | | 2,023 | | | | 1,051 | | |
| Reinvestment of distributions | | | 1,767 | | | | 291 | | | | 1 | | | | 4 | | |
| Payments for redemptions | | | (2,148 | ) | | | (1,842 | ) | | | (3,940 | ) | | | (3,446 | ) | |
| Increase (decrease) in net assets from Class B transactions | | | 2,926 | | | | 777 | | | | (1,916 | ) | | | (2,391 | ) | |
| Class C: | |
| Proceeds from sales | | | 6,924 | | | | 1,776 | | | | 4,164 | | | | 1,189 | | |
| Reinvestment of distributions | | | 1,992 | | | | 392 | | | | - | | | | 1 | | |
| Payments for redemptions | | | (5,357 | ) | | | (4,056 | ) | | | (994 | ) | | | (1,405 | ) | |
| Increase (decrease) in net assets from Class C transactions | | | 3,559 | | | | (1,888 | ) | | | 3,170 | | | | (215 | ) | |
| Class R: | |
| Proceeds from sales | | | 5,771 | | | | 1,017 | | | | 366 | | | | 776 | | |
| Reinvestment of distributions | | | 2 | | | | 285 | | | | - | | | | 2 | | |
| Payments for redemptions | | | (481 | ) | | | (13,131 | ) | | | (5 | ) | | | (1,919 | ) | |
| Increase (decrease) in net assets from Class R transactions | | | 5,292 | | | | (11,829 | ) | | | 361 | | | | (1,141 | ) | |
| Class Y: | |
| Proceeds from sales | | | 217,915 | | | | 142,884 | | | | 155,251 | | | | 101,305 | | |
| Reinvestment of distributions | | | 131,612 | | | | 29,145 | | | | 2,282 | | | | 1,435 | | |
| Payments for redemptions | | | (366,059 | ) | | | (316,100 | ) | | | (79,482 | ) | | | (79,863 | ) | |
| Increase (decrease) in net assets from Class Y transactions | | | (16,532 | ) | | | (144,071 | ) | | | 78,051 | | | | 22,877 | | |
| Increase (decrease) in net assets from capital share transactions | | | 118,400 | | | | (158,583 | ) | | | 97,965 | | | | 27,041 | | |
| Total increase in net assets | | | 263,741 | | | | 24,843 | | | | 217,784 | | | | 112,834 | | |
| Net assets at beginning of period | | | 1,364,987 | | | | 1,340,144 | | | | 475,711 | | | | 362,877 | | |
| Net assets at end of period | | $ | 1,628,728 | | | $ | 1,364,987 | | | $ | 693,495 | | | $ | 475,711 | | |
| Undistributed (distributions in excess of) net investment income at end of period | | $ | (1 | ) | | $ | (2 | ) | | $ | 186 | | | $ | 153 | | |
The accompanying notes are an integral part of the financial statements.
FIRST AMERICAN FUNDS Annual Report 2005
76
(This page has been left blank intentionally.)
Financial Highlights For a share outstanding throughout the periods ended September 30, unless otherwise indicated.
| | | Net Asset
Value
Beginning
of Period | | Net
Investment
Income (Loss) | | Realized and
Unrealized
Gains
(Losses) on
Investments | | Distributions
from Net
Investment
Income | | Distributions
from Net
Realized Gains | | Net Asset
Value
End of
Period | | Total
Return (8) | |
| Mid Cap Growth Opportunities (1) | |
| Class A | |
| | 2005 | (2) | | $ | 38.19 | | | $ | (0.24 | ) | | $ | 9.65 | | | $ | - | | | $ | (6.05 | ) | | $ | 41.55 | | | | 26.25 | % | |
| | 2004 | (2) | | | 33.68 | | | | (0.30 | ) | | | 5.88 | | | | - | | | | (1.07 | ) | | | 38.19 | | | | 16.88 | | |
| | 2003 | (2) | | | 26.45 | | | | (0.18 | ) | | | 7.41 | | | | - | | | | - | | | | 33.68 | | | | 27.33 | | |
| | 2002 | | | | 28.33 | | | | (0.11 | ) | | | (1.77 | ) | | | - | | | | - | | | | 26.45 | | | | (6.64 | ) | |
| | 2001 | (2) (3) | | | 54.63 | | | | (0.06 | ) | | | (8.40 | ) | | | - | | | | (17.84 | ) | | | 28.33 | | | | (20.00 | ) | |
| | 2000 | (2) (4) | | | 37.80 | | | | (0.18 | ) | | | 17.80 | | | | - | | | | (0.79 | ) | | | 54.63 | | | | 47.23 | | |
| Class B | |
| | 2005 | (2) | | $ | 36.31 | | | $ | (0.51 | ) | | $ | 9.12 | | | $ | - | | | $ | (6.05 | ) | | $ | 38.87 | | | | 25.29 | % | |
| | 2004 | (2) | | | 32.30 | | | | (0.55 | ) | | | 5.63 | | | | - | | | | (1.07 | ) | | | 36.31 | | | | 16.03 | | |
| | 2003 | (2) | | | 25.56 | | | | (0.39 | ) | | | 7.13 | | | | - | | | | - | | | | 32.30 | | | | 26.37 | | |
| | 2002 | | | | 27.59 | | | | (0.18 | ) | | | (1.85 | ) | | | - | | | | - | | | | 25.56 | | | | (7.36 | ) | |
| | 2001 | (2) (3) | | | 53.97 | | | | (0.29 | ) | | | (8.25 | ) | | | - | | | | (17.84 | ) | | | 27.59 | | | | (20.60 | ) | |
| | 2000 | (2) (4) | | | 37.63 | | | | (0.53 | ) | | | 17.66 | | | | - | | | | (0.79 | ) | | | 53.97 | | | | 46.13 | | |
| Class C | |
| | 2005 | (2) | | $ | 37.40 | | | $ | (0.53 | ) | | $ | 9.41 | | | $ | - | | | $ | (6.05 | ) | | $ | 40.23 | | | | 25.27 | % | |
| | 2004 | (2) | | | 33.24 | | | | (0.57 | ) | | | 5.80 | | | | - | | | | (1.07 | ) | | | 37.40 | | | | 16.03 | | |
| | 2003 | (2) | | | 26.29 | | | | (0.40 | ) | | | 7.35 | | | | - | | | | - | | | | 33.24 | | | | 26.43 | | |
| | 2002 | | | | 28.33 | | | | (0.10 | ) | | | (1.94 | ) | | | - | | | | - | | | | 26.29 | | | | (7.20 | ) | |
| | 2001 | (2) (5) | | | 27.40 | | | | - | | | | 0.93 | | | | - | | | | - | | | | 28.33 | | | | 3.39 | | |
| Class R (6) | |
| | 2005 | (2) | | $ | 38.15 | | | $ | (0.31 | ) | | $ | 9.61 | | | $ | - | | | $ | (6.05 | ) | | $ | 41.40 | | | | 25.95 | % | |
| | 2004 | (2) | | | 33.66 | | | | (0.30 | ) | | | 5.86 | | | | - | | | | (1.07 | ) | | | 38.15 | | | | 16.83 | | |
| | 2003 | (2) | | | 26.43 | | | | (0.17 | ) | | | 7.40 | | | | - | | | | - | | | | 33.66 | | | | 27.36 | | |
| | 2002 | | | | 28.29 | | | | (0.07 | ) | | | (1.79 | ) | | | - | | | | - | | | | 26.43 | | | | (6.58 | ) | |
| | 2001 | (2) (7) | | | 35.75 | | | | (0.06 | ) | | | (7.40 | ) | | | - | | | | - | | | | 28.29 | | | | (20.87 | ) | |
| Class Y | |
| | 2005 | (2) | | $ | 39.58 | | | $ | (0.16 | ) | | $ | 10.05 | | | $ | - | | | $ | (6.05 | ) | | $ | 43.42 | | | | 26.57 | % | |
| | 2004 | (2) | | | 34.78 | | | | (0.21 | ) | | | 6.08 | | | | - | | | | (1.07 | ) | | | 39.58 | | | | 17.18 | | |
| | 2003 | (2) | | | 27.25 | | | | (0.09 | ) | | | 7.62 | | | | - | | | | - | | | | 34.78 | | | | 27.68 | | |
| | 2002 | | | | 29.11 | | | | (0.05 | ) | | | (1.81 | ) | | | - | | | | - | | | | 27.25 | | | | (6.39 | ) | |
| | 2001 | (2) (3) | | | 55.52 | | | | 0.02 | | | | (8.59 | ) | | | - | | | | (17.84 | ) | | | 29.11 | | | | (19.84 | ) | |
| | 2000 | (2) (4) | | | 38.32 | | | | (0.05 | ) | | | 18.04 | | | | - | | | | (0.79 | ) | | | 55.52 | | | | 47.56 | | |
The accompanying notes are an integral part of the financial statements.
FIRST AMERICAN FUNDS Annual Report 2005
78
| | | Net Assets
End of
Period (000) | | Ratio of
Expenses to
Average
Net Assets | | Ratio of Net
Investment
Income (Loss)
to Average
Net Assets | | Ratio of
Expenses to
Average
Net Assets
(Excluding
Waivers) | | Ratio of Net
Investment
Income (Loss)
to Average Net
Assets (Excluding
Waivers) | | Portfolio
Turnover
Rate | |
| Mid Cap Growth Opportunities (1) | |
| Class A | |
| | 2005 | (2) | | $ | 317,906 | | | | 1.21 | % | | | (0.62 | )% | | | 1.24 | % | | | (0.65 | )% | | | 107 | % | |
| | 2004 | (2) | | | 173,436 | | | | 1.20 | | | | (0.79 | ) | | | 1.24 | | | | (0.83 | ) | | | 135 | | |
| | 2003 | (2) | | | 154,499 | | | | 1.20 | | | | (0.58 | ) | | | 1.25 | | | | (0.63 | ) | | | 145 | | |
| | 2002 | | | | 75,002 | | | | 1.20 | | | | (0.34 | ) | | | 1.26 | | | | (0.40 | ) | | | 162 | | |
| | 2001 | (2) (3) | | | 82,043 | | | | 1.20 | | | | (0.19 | ) | | | 1.22 | | | | (0.21 | ) | | | 204 | | |
| | 2000 | (2) (4) | | | 108,326 | | | | 1.20 | | | | (0.38 | ) | | | 1.22 | | | | (0.40 | ) | | | 205 | | |
| Class B | |
| | 2005 | (2) | | $ | 14,922 | | | | 1.96 | % | | | (1.40 | )% | | | 1.99 | % | | | (1.43 | )% | | | 107 | % | |
| | 2004 | (2) | | | 10,974 | | | | 1.95 | | | | (1.54 | ) | | | 1.99 | | | | (1.58 | ) | | | 135 | | |
| | 2003 | (2) | | | 9,055 | | | | 1.95 | | | | (1.33 | ) | | | 2.00 | | | | (1.38 | ) | | | 145 | | |
| | 2002 | | | | 4,227 | | | | 1.95 | | | | (1.08 | ) | | | 2.01 | | | | (1.14 | ) | | | 162 | | |
| | 2001 | (2) (3) | | | 2,606 | | | | 1.94 | | | | (0.95 | ) | | | 1.97 | | | | (0.98 | ) | | | 204 | | |
| | 2000 | (2) (4) | | | 666 | | | | 1.95 | | | | (1.13 | ) | | | 1.97 | | | | (1.15 | ) | | | 205 | | |
| Class C | |
| | 2005 | (2) | | $ | 17,079 | | | | 1.96 | % | | | (1.40 | )% | | | 1.99 | % | | | (1.43 | )% | | | 107 | % | |
| | 2004 | (2) | | | 12,356 | | | | 1.95 | | | | (1.54 | ) | | �� | 1.99 | | | | (1.58 | ) | | | 135 | | |
| | 2003 | (2) | | | 12,649 | | | | 1.95 | | | | (1.33 | ) | | | 2.00 | | | | (1.38 | ) | | | 145 | | |
| | 2002 | | | | 1,136 | | | | 1.95 | | | | (1.07 | ) | | | 2.01 | | | | (1.13 | ) | | | 162 | | |
| | 2001 | (2) (5) | | | - | | | | - | | | | - | | | | - | | | | - | | | | 204 | | |
| Class R (6) | |
| | 2005 | (2) | | $ | 5,501 | | | | 1.46 | % | | | (0.77 | )% | | | 1.64 | % | | | (0.95 | )% | | | 107 | % | |
| | 2004 | (2) | | | 1 | | | | 1.20 | | | | (0.81 | ) | | | 1.24 | | | | (0.85 | ) | | | 135 | | |
| | 2003 | (2) | | | 10,284 | | | | 1.20 | | | | (0.56 | ) | | | 1.25 | | | | (0.61 | ) | | | 145 | | |
| | 2002 | | | | 5,869 | | | | 1.20 | | | | (0.33 | ) | | | 1.26 | | | | (0.39 | ) | | | 162 | | |
| | 2001 | (2) (7) | | | 1,484 | | | | 1.19 | | | | (0.24 | ) | | | 1.23 | | | | (0.28 | ) | | | 204 | | |
| Class Y | |
| | 2005 | (2) | | $ | 1,273,320 | | | | 0.96 | % | | | (0.40 | )% | | | 0.99 | % | | | (0.43 | )% | | | 107 | % | |
| | 2004 | (2) | | | 1,168,220 | | | | 0.95 | | | | (0.54 | ) | | | 0.99 | | | | (0.58 | ) | | | 135 | | |
| | 2003 | (2) | | | 1,153,657 | | | | 0.95 | | | | (0.30 | ) | | | 1.00 | | | | (0.35 | ) | | | 145 | | |
| | 2002 | | | | 477,210 | | | | 0.95 | | | | (0.08 | ) | | | 1.01 | | | | (0.14 | ) | | | 162 | | |
| | 2001 | (2) (3) | | | 406,349 | | | | 0.95 | | | | 0.06 | | | | 0.97 | | | | 0.04 | | | | 204 | | |
| | 2000 | (2) (4) | | | 435,613 | | | | 0.95 | | | | (0.13 | ) | | | 0.97 | | | | (0.15 | ) | | | 205 | | |
(1) The financial highlights for the Mid Cap Growth Opportunities Fund as set forth herein include the historical financial highlights of the Firstar Mid Cap Core Equity Fund.
The assets of the Firstar Fund were acquired by the First American Mid Cap Growth Opportunities Fund on September 24, 2001. In connection with such acquisition,
(i) Class A shares of the Firstar Mid Cap Core Equity Fund were exchanged for Class A shares of the First American Mid Cap Growth Opportunities Fund, (ii) Firstar
Class B shares were exchanged for Class B shares of the First American Fund, (iii) Firstar Class Y shares were exchanged for Class S shares (now designated Class R
shares) of the First American Fund, and (iv) Firstar Class Institutional shares were exchanged for Class Y shares of the First American Fund.
(2) Per share data calculated using average shares outstanding method.
(3) For the period November 1, 2000 to September 30, 2001. Effective in 2001, the fund's fiscal year end was changed from October 31 to September 30. All ratios for the
period have been annualized, except total return and portfolio turnover.
(4) For the fiscal year ended October 31.
(5) Class of shares has been offered since September 24, 2001. All ratios for the period have been annualized, except total return and portfolio turnover.
(6) Prior to July 1, 2004, Class R shares were named Class S shares, which had lower fees and expenses.
(7) Class of shares has been offered since December 11, 2000. All ratios for the period have been annualized, except total return and portfolio turnover.
(8) Total return does not include sales charges. Total return would have been lower had certain expenses not been waived.
FIRST AMERICAN FUNDS Annual Report 2005
79
Financial Highlights For a share outstanding throughout the periods ended September 30, unless otherwise indicated.
| | | Net Asset
Value
Beginning
of Period | | Net
Investment
Income (Loss) | | Realized and
Unrealized
Gains
(Losses) on
Investments | | Distributions
from Net
Investment
Income | | Distributions
from Net
Realized Gains | | Distributions
from Return
of Capital | | Net Asset
Value
End of
Period | |
| Mid Cap Value Fund (1) | |
| Class A | |
| | 2005 | | | $ | 20.09 | | | $ | 0.13 | | | $ | 4.76 | | | $ | (0.10 | ) | | $ | - | | | $ | - | | | $ | 24.88 | | |
| | 2004 | | | | 16.30 | | | | 0.08 | | | | 3.77 | | | | (0.06 | ) | | | - | | | | - | (4) | | | 20.09 | | |
| | 2003 | | | | 13.29 | | | | 0.18 | | | | 2.96 | | | | (0.12 | ) | | | - | | | | (0.01 | ) | | | 16.30 | | |
| | 2002 | | | | 13.74 | | | | 0.13 | | | | (0.44 | ) | | | (0.10 | ) | | | - | | | | (0.04 | ) | | | 13.29 | | |
| | 2001 | | | | 14.62 | | | | 0.10 | | | | (0.88 | ) | | | (0.10 | ) | | | - | | | | - | | | | 13.74 | | |
| Class B | |
| | 2005 | | | $ | 19.39 | | | $ | (0.05 | ) | | $ | 4.60 | | | $ | - | | | $ | - | | | $ | - | | | $ | 23.94 | | |
| | 2004 | | | | 15.81 | | | | (0.06 | ) | | | 3.65 | | | | (0.01 | ) | | | - | | | | - | (4) | | | 19.39 | | |
| | 2003 | | | | 12.92 | | | | 0.07 | | | | 2.87 | | | | (0.04 | ) | | | - | | | | (0.01 | ) | | | 15.81 | | |
| | 2002 | | | | 13.37 | | | | 0.01 | | | | (0.41 | ) | | | (0.01 | ) | | | - | | | | (0.04 | ) | | | 12.92 | | |
| | 2001 | | | | 14.28 | | | | (0.01 | ) | | | (0.88 | ) | | | (0.02 | ) | | | - | | | | - | | | | 13.37 | | |
| Class C | |
| | 2005 | | | $ | 19.77 | | | $ | (0.03 | ) | | $ | 4.66 | | | $ | - | | | $ | - | | | $ | - | | | $ | 24.40 | | |
| | 2004 | | | | 16.12 | | | | (0.06 | ) | | | 3.72 | | | | (0.01 | ) | | | - | | | | - | (4) | | | 19.77 | | |
| | 2003 | | | | 13.17 | | | | 0.07 | | | | 2.93 | | | | (0.04 | ) | | | - | | | | (0.01 | ) | | | 16.12 | | |
| | 2002 | | | | 13.63 | | | | 0.01 | | | | (0.43 | ) | | | - | | | | - | | | | (0.04 | ) | | | 13.17 | | |
| | 2001 | | | | 14.55 | | | | (0.01 | ) | | | (0.89 | ) | | | (0.02 | ) | | | - | | | | - | | | | 13.63 | | |
| Class R (2) | |
| | 2005 | | | $ | 20.09 | | | $ | 0.12 | | | $ | 4.70 | | | $ | (0.08 | ) | | $ | - | | | $ | - | | | $ | 24.83 | | |
| | 2004 | | | | 16.31 | | | | 0.07 | | | | 3.76 | | | | (0.05 | ) | | | - | | | | - | (4) | | | 20.09 | | |
| | 2003 | | | | 13.29 | | | | 0.16 | | | | 2.99 | | | | (0.12 | ) | | | - | | | | (0.01 | ) | | | 16.31 | | |
| | 2002 | | | | 13.74 | | | | 0.13 | | | | (0.44 | ) | | | (0.10 | ) | | | - | | | | (0.04 | ) | | | 13.29 | | |
| | 2001 | (3) | | | 13.31 | | | | 0.01 | | | | 0.42 | | | | - | | | | - | | | | - | | | | 13.74 | | |
| Class Y | |
| | 2005 | | | $ | 20.17 | | | $ | 0.18 | | | $ | 4.78 | | | $ | (0.15 | ) | | $ | - | | | $ | - | | | $ | 24.98 | | |
| | 2004 | | | | 16.36 | | | | 0.12 | | | | 3.79 | | | | (0.10 | ) | | | - | | | | - | (4) | | | 20.17 | | |
| | 2003 | | | | 13.33 | | | | 0.21 | | | | 2.98 | | | | (0.15 | ) | | | - | | | | (0.01 | ) | | | 16.36 | | |
| | 2002 | | | | 13.77 | | | | 0.17 | | | | (0.44 | ) | | | (0.13 | ) | | | - | | | | (0.04 | ) | | | 13.33 | | |
| | 2001 | | | | 14.68 | | | | 0.14 | | | | (0.92 | ) | | | (0.13 | ) | | | - | | | | - | | | | 13.77 | | |
The accompanying notes are an integral part of the financial statements.
FIRST AMERICAN FUNDS Annual Report 2005
80
| | | Total
Return (5) | | Net Assets
End of
Period (000) | | Ratio of
Expenses to
Average
Net Assets | | Ratio of Net
Investment
Income (Loss)
to Average
Net Assets | | Ratio of
Expenses to
Average
Net Assets
(Excluding
Waivers) | | Ratio of Net
Investment
Income (Loss)
to Average Net
Assets (Excluding
Waivers) | | Portfolio
Turnover
Rate | |
| Mid Cap Value Fund (1) | |
| Class A | |
| | 2005 | | | | 24.38 | % | | $ | 54,360 | | | | 1.21 | % | | | 0.59 | % | | | 1.25 | % | | | 0.55 | % | | | 101 | % | |
| | 2004 | | | | 23.65 | | | | 28,561 | | | | 1.20 | | | | 0.41 | | | | 1.25 | | | | 0.36 | | | | 83 | | |
| | 2003 | | | | 23.71 | | | | 16,598 | | | | 1.20 | | | | 1.21 | | | | 1.25 | | | | 1.16 | | | | 102 | | |
| | 2002 | | | | (2.41 | ) | | | 13,083 | | | | 1.20 | | | | 0.83 | | | | 1.26 | | | | 0.77 | | | | 90 | | |
| | 2001 | | | | (5.41 | ) | | | 13,583 | | | | 1.15 | | | | 0.67 | | | | 1.15 | | | | 0.67 | | | | 104 | | |
| Class B | |
| | 2005 | | | | 23.47 | % | | $ | 10,157 | | | | 1.96 | % | | | (0.21 | )% | | | 2.00 | % | | | (0.25 | )% | | | 101 | % | |
| | 2004 | | | | 22.69 | | | | 9,928 | | | | 1.95 | | | | (0.35 | ) | | | 2.00 | | | | (0.40 | ) | | | 83 | | |
| | 2003 | | | | 22.84 | | | | 10,154 | | | | 1.95 | | | | 0.50 | | | | 2.00 | | | | 0.45 | | | | 102 | | |
| | 2002 | | | | (3.07 | ) | | | 10,410 | | | | 1.95 | | | | 0.08 | | | | 2.01 | | | | 0.02 | | | | 90 | | |
| | 2001 | | | | (6.21 | ) | | | 11,311 | | | | 1.90 | | | | (0.08 | ) | | | 1.90 | | | | (0.08 | ) | | | 104 | | |
| Class C | |
| | 2005 | | | | 23.43 | % | | $ | 7,426 | | | | 1.96 | % | | | (0.15 | )% | | | 2.00 | % | | | (0.19 | )% | | | 101 | % | |
| | 2004 | | | | 22.69 | | | | 3,342 | | | | 1.95 | | | | (0.33 | ) | | | 2.00 | | | | (0.38 | ) | | | 83 | | |
| | 2003 | | | | 22.84 | | | | 2,916 | | | | 1.95 | | | | 0.51 | | | | 2.00 | | | | 0.46 | | | | 102 | | |
| | 2002 | | | | (3.09 | ) | | | 3,207 | | | | 1.95 | | | | 0.08 | | | | 2.01 | | | | 0.02 | | | | 90 | | |
| | 2001 | | | | (6.17 | ) | | | 3,312 | | | | 1.90 | | | | (0.04 | ) | | | 1.90 | | | | (0.04 | ) | | | 104 | | |
| Class R (2) | |
| | 2005 | | | | 24.04 | % | | $ | 380 | | | | 1.46 | % | | | 0.52 | % | | | 1.65 | % | | | 0.33 | % | | | 101 | % | |
| | 2004 | | | | 23.51 | | | | 1 | | | | 1.20 | | | | 0.37 | | | | 1.25 | | | | 0.32 | | | | 83 | | |
| | 2003 | | | | 23.80 | | | | 966 | | | | 1.20 | | | | 1.07 | | | | 1.25 | | | | 1.02 | | | | 102 | | |
| | 2002 | | | | (2.40 | ) | | | 158 | | | | 1.20 | | | | 0.87 | | | | 1.26 | | | | 0.81 | | | | 90 | | |
| | 2001 | (3) | | | 3.23 | | | | 44 | | | | 0.85 | | | | 5.19 | | | | 0.85 | | | | 5.19 | | | | 104 | | |
| Class Y | |
| | 2005 | | | | 24.68 | % | | $ | 621,172 | | | | 0.96 | % | | | 0.80 | % | | | 1.00 | % | | | 0.76 | % | | | 101 | % | |
| | 2004 | | | | 23.95 | | | | 433,879 | | | | 0.95 | | | | 0.66 | | | | 1.00 | | | | 0.61 | | | | 83 | | |
| | 2003 | | | | 24.06 | | | | 332,243 | | | | 0.95 | | | | 1.45 | | | | 1.00 | | | | 1.40 | | | | 102 | | |
| | 2002 | | | | (2.12 | ) | | | 259,990 | | | | 0.95 | | | | 1.08 | | | | 1.01 | | | | 1.02 | | | | 90 | | |
| | 2001 | | | | (5.37 | ) | | | 291,932 | | | | 0.90 | | | | 0.92 | | | | 0.90 | | | | 0.92 | | | | 104 | | |
(1) Per share data calculated using average shares outstanding method.
(2) Prior to July 1, 2004, Class R shares were named Class S shares, which had lower fees and expenses.
(3) Class of shares has been offered since September 24, 2001. All ratios for the period have been annualized, except total return and portfolio turnover.
(4) Includes a tax return of capital less than $0.01.
(5) Total return does not include sales charges. Total return would have been lower had certain expenses not been waived.
FIRST AMERICAN FUNDS Annual Report 2005
81
Schedule of Investments September 30, 2005
Large Cap Growth Opportunities Fund
| DESCRIPTION | | SHARES | | VALUE (000) | |
| Common Stocks – 98.6% | |
| Consumer Discretionary – 13.7% | |
| Harrah's Entertainment | | | 72,910 | | | $ | 4,753 | | |
| Kohl's* | | | 138,040 | | | | 6,927 | | |
| Lowe's (a) | | | 369,540 | | | | 23,798 | | |
| McGraw-Hill | | | 245,560 | | | | 11,797 | | |
| Nike, Class B | | | 120,440 | | | | 9,838 | | |
| Omnicom Group (a) | | | 207,400 | | | | 17,345 | | |
| Staples | | | 812,245 | | | | 17,317 | | |
| Starbucks* | | | 186,920 | | | | 9,365 | | |
| Station Casinos (a) | | | 161,850 | | | | 10,740 | | |
| Target (a) | | | 447,210 | | | | 23,224 | | |
| | | | 135,104 | | |
| Consumer Staples – 7.6% | | | |
| Altria Group (a) | | | 143,240 | | | | 10,558 | | |
| Gillette | | | 63,010 | | | | 3,667 | | |
| PepsiCo | | | 457,520 | | | | 25,946 | | |
| Procter & Gamble (a) | | | 584,550 | | | | 34,757 | | |
| | | | 74,928 | | |
| Energy – 5.9% | | | |
| Apache | | | 200,400 | | | | 15,074 | | |
| ConocoPhillips | | | 251,820 | | | | 17,605 | | |
| Exxon Mobil | | | 206,060 | | | | 13,093 | | |
| Halliburton (a) | | | 96,770 | | | | 6,631 | | |
| National-Oilwell Varco* (a) | | | 86,880 | | | | 5,717 | | |
| | | | 58,120 | | |
| Financials – 10.2% | | | |
| Allstate | | | 197,920 | | | | 10,943 | | |
| American Express | | | 355,610 | | | | 20,426 | | |
| American International Group | | | 232,100 | | | | 14,381 | | |
| Capital One Financial (a) | | | 79,300 | | | | 6,306 | | |
| Goldman Sachs Group | | | 147,270 | | | | 17,905 | | |
| Legg Mason (a) | | | 85,550 | | | | 9,384 | | |
| Lehman Brothers Holdings (a) | | | 67,980 | | | | 7,918 | | |
| Wells Fargo | | | 241,230 | | | | 14,129 | | |
| | | | 101,392 | | |
| Health Care – 21.6% | | | |
| Aetna | | | 242,760 | | | | 20,911 | | |
| Alcon* (a) | | | 88,180 | | | | 11,276 | | |
| Amgen* | | | 321,660 | | | | 25,627 | | |
| Caremark Rx* (a) | | | 302,356 | | | | 15,097 | | |
| Genentech* (a) | | | 135,190 | | | | 11,384 | | |
| Guidant (a) | | | 122,760 | | | | 8,457 | | |
| Johnson & Johnson | | | 448,660 | | | | 28,391 | | |
| Medtronic | | | 400,010 | | | | 21,449 | | |
| PacifiCare Health Systems* (a) | | | 93,670 | | | | 7,473 | | |
| PerkinElmer | | | 445,400 | | | | 9,073 | | |
| St. Jude Medical* | | | 356,140 | | | | 16,667 | | |
| Teva Pharmaceutical Industries, ADR (a) | | | 222,020 | | | | 7,420 | | |
| UnitedHealth Group (a) | | | 332,660 | | | | 18,696 | | |
| Zimmer Holdings* (a) | | | 164,899 | | | | 11,360 | | |
| | | | 213,281 | | |
| Industrials – 10.5% | | | |
| Danaher (a) | | | 223,650 | | | | 12,039 | | |
| Dun & Bradstreet* | | | 135,690 | | | | 8,938 | | |
| General Electric | | | 996,490 | | | | 33,552 | | |
| Pentair | | | 316,620 | | | | 11,557 | | |
Large Cap Growth Opportunities Fund (concluded)
| DESCRIPTION | | SHARES | | VALUE (000) | |
| United Parcel Service, Class B (a) | | | 166,360 | | | $ | 11,500 | | |
| United Technologies | | | 359,240 | | | | 18,623 | | |
| UTi Worldwide (a) | | | 103,170 | | | | 8,016 | | |
| | | | 104,225 | | |
| Information Technology (b) – 29.1% | | | |
| Adobe Systems (a) | | | 449,480 | | | | 13,417 | | |
| Altera* (a) | | | 323,710 | | | | 6,186 | | |
| Amphenol, Class A (a) | | | 208,610 | | | | 8,415 | | |
| Apple Computer* | | | 275,690 | | | | 14,780 | | |
| Autodesk (a) | | | 170,530 | | | | 7,919 | | |
| Dell* | | | 631,720 | | | | 21,605 | | |
| eBay* | | | 311,880 | | | | 12,849 | | |
| EMC* | | | 980,910 | | | | 12,693 | | |
| Google* (a) | | | 49,480 | | | | 15,658 | | |
| Hewlett-Packard | | | 360,150 | | | | 10,516 | | |
| Intel | | | 1,193,500 | | | | 29,420 | | |
| Linear Technology (a) | | | 217,850 | | | | 8,189 | | |
| Marvell Technology Group* (a) | | | 116,510 | | | | 5,372 | | |
| Microchip Technology (a) | | | 279,660 | | | | 8,423 | | |
| Microsoft | | | 978,290 | | | | 25,171 | | |
| Motorola (a) | | | 792,190 | | | | 17,500 | | |
| NCR* (a) | | | 446,770 | | | | 14,256 | | |
| Paychex (a) | | | 228,210 | | | | 8,462 | | |
| QUALCOMM | | | 280,550 | | | | 12,555 | | |
| Research in Motion* (a) | | | 111,910 | | | | 7,655 | | |
| Texas Instruments | | | 582,380 | | | | 19,743 | | |
| Yahoo!* (a) | | | 192,510 | | | | 6,515 | | |
| | | | 287,299 | | |
Total Common Stocks
(Cost $869,907) | | | | | | | 974,349 | | |
| Affiliated Money Market Fund – 1.2% | | | |
First American Prime Obligations Fund, Class Z (c)
(Cost $12,078) | | | 12,077,705 | | | | 12,078 | | |
Investments Purchased with Proceeds
from Securities Lending (d) – 29.1% | | | |
| (Cost $287,524) | | | | | | | 287,524 | | |
Total Investments – 128.9%
(Cost $1,169,509) | | | | | | | 1,273,951 | | |
| Other Assets and Liabilities, Net – (28.9)% | | | | | | | (285,814 | ) | |
| Total Net Assets – 100.0% | | | | | | $ | 988,137 | | |
* Non-income producing security
(a) This security or a portion of this security is out on loan at September 30, 2005. Total loaned securities had a market value of $284,098,540 at September 30, 2005. See note 2 in Notes to Financial Statements.
(b) The fund is significantly invested in this sector and therefore is subject to additional risks. See note 7 in Notes to Financial Statements.
(c) Investment in affiliated security. This money market fund is advised by U.S. Bancorp Asset Management, Inc., which also serves as advisor to this fund. See note 3 in Notes to Financial Statements.
(d) The fund may loan securities in return for collateral in the form of cash, U.S. Government securities, or other high grade debt obligations. The cash collateral is invested in various short-term fixed income securities, such as repurchase agreements, commercial paper, money market funds and other corporate obligations. See note 2 in Notes to Financial Statements.
ADR – American Depository Receipt
The accompanying notes are an integral part of the financial statements.
FIRST AMERICAN FUNDS Annual Report 2005
82
Schedule of Investments September 30, 2005
Large Cap Select Fund
| DESCRIPTION | | SHARES | | VALUE (000) | |
| Common Stocks – 99.5% | |
| Consumer Discretionary – 10.6% | |
| Chico's FAS* (a) | | | 99,260 | | | $ | 3,653 | | |
| Coach* | | | 108,050 | | | | 3,388 | | |
| Harrah's Entertainment | | | 62,900 | | | | 4,100 | | |
| J.C. Penney (a) | | | 107,660 | | | | 5,105 | | |
| Omnicom Group (a) | | | 67,200 | | | | 5,620 | | |
| Sherwin Williams (a) | | | 99,200 | | | | 4,372 | | |
| Station Casinos | | | 56,100 | | | | 3,723 | | |
| Time Warner | | | 310,914 | | | | 5,631 | | |
| | | | 35,592 | | |
| Consumer Staples – 4.6% | | | |
| PepsiCo | | | 110,657 | | | | 6,275 | | |
| Procter & Gamble (a) | | | 155,418 | | | | 9,241 | | |
| | | | 15,516 | | |
| Energy – 11.2% | | | |
| Amerada Hess (a) | | | 52,060 | | | | 7,158 | | |
| Apache | | | 112,716 | | | | 8,479 | | |
| ConocoPhillips | | | 110,110 | | | | 7,698 | | |
| Exxon Mobil | | | 55,450 | | | | 3,523 | | |
| Halliburton (a) | | | 51,546 | | | | 3,532 | | |
| National-Oilwell Varco* | | | 107,030 | | | | 7,043 | | |
| | | | 37,433 | | |
| Financials – 20.9% | | | |
| ACE | | | 151,970 | | | | 7,153 | | |
| Allstate | | | 91,885 | | | | 5,080 | | |
| American International Group | | | 135,140 | | | | 8,373 | | |
| Bank of America (a) | | | 293,518 | | | | 12,357 | | |
| Capital One Financial (a) | | | 50,624 | | | | 4,026 | | |
| Goldman Sachs Group | | | 102,927 | | | | 12,514 | | |
| Lehman Brothers Holdings (a) | | | 73,180 | | | | 8,524 | | |
| Wells Fargo | | | 204,870 | | | | 11,999 | | |
| | | | 70,026 | | |
| Health Care – 12.4% | | | |
| Amgen* | | | 115,200 | | | | 9,178 | | |
| Johnson & Johnson | | | 194,419 | | | | 12,303 | | |
| Teva Pharmaceutical Industries, ADR (a) | | | 91,460 | | | | 3,057 | | |
| UnitedHealth Group (a) | | | 107,268 | | | | 6,029 | | |
| Wyeth Pharmaceuticals | | | 240,160 | | | | 11,112 | | |
| | | | 41,679 | | |
| Industrials – 10.7% | | | |
| Eaton | | | 44,930 | | | | 2,855 | | |
| Emerson Electric | | | 74,700 | | | | 5,363 | | |
| General Electric | | | 302,483 | | | | 10,185 | | |
| Illinois Tool Works | | | 41,500 | | | | 3,417 | | |
| Pentair | | | 132,190 | | | | 4,825 | | |
| United Parcel Service, Class B (a) | | | 132,660 | | | | 9,171 | | |
| | | | 35,816 | | |
| Information Technology – 22.9% | | | |
| Amphenol, Class A | | | 133,070 | | | | 5,368 | | |
| Autodesk (a) | | | 97,860 | | | | 4,545 | | |
| EMC* | | | 433,930 | | | | 5,615 | | |
| Hewlett-Packard | | | 359,520 | | | | 10,498 | | |
| Intel | | | 603,209 | | | | 14,869 | | |
| Microsoft | | | 372,710 | | | | 9,590 | | |
| Motorola (a) | | | 361,530 | | | | 7,986 | | |
| Oracle* | | | 618,540 | | | | 7,664 | | |
Large Cap Select Fund (concluded)
| DESCRIPTION | | SHARES | | VALUE (000) | |
| QUALCOMM | | | 122,288 | | | $ | 5,472 | | |
| Texas Instruments | | | 159,770 | | | | 5,416 | | |
| | | | 77,023 | | |
| Materials – 2.5% | | | |
| Dow Chemical (a) | | | 199,990 | | | | 8,334 | | |
| Telecommunication Services – 2.5% | | | |
| Verizon Communications (a) | | | 259,858 | | | | 8,495 | | |
| Utilities – 1.2% | | | |
| PG&E (a) | | | 103,090 | | | | 4,046 | | |
Total Common Stocks
(Cost $313,111) | | | | | | | 333,960 | | |
| Affiliated Money Market Fund – 3.0% | | | |
First American Prime Obligations Fund, Class Z (b)
(Cost $10,188) | | | 10,188,381 | | | | 10,188 | | |
Investments Purchased with Proceeds
from Securities Lending (c) – 24.0% | | | |
| (Cost $80,406) | | | | | | | 80,406 | | |
Total Investments – 126.5%
(Cost $403,705) | | | | | | | 424,554 | | |
| Other Assets and Liabilities, Net – (26.5)% | | | | | | | (88,848 | ) | |
| Total Net Assets – 100.0% | | | | | | $ | 335,706 | | |
* Non-income producing security
(a) This security or a portion of this security is out on loan at September 30, 2005. Total loaned securities had a market value of $79,049,139 at September 30, 2005. See note 2 in Notes to Financial Statements.
(b) Investment in affiliated security. This money market fund is advised by U.S. Bancorp Asset Management, Inc., which also serves as advisor to this fund. See note 3 in Notes to Financial Statements.
(c) The fund may loan securities in return for collateral in the form of cash, U.S. Government securities, or other high grade debt obligations. The cash collateral is invested in various short-term fixed income securities, such as repurchase agreements, commercial paper, money market funds and other corporate obligations. See note 2 in Notes to Financial Statements.
ADR – American Depository Receipt
FIRST AMERICAN FUNDS Annual Report 2005
83
Schedule of Investments September 30, 2005
Large Cap Value Fund
| DESCRIPTION | | SHARES | | VALUE (000) | |
| Common Stocks – 99.5% | |
| Consumer Discretionary – 9.1% | |
| Comcast, Class A* (a) | | | 496,070 | | | $ | 14,575 | | |
| Federated Department Stores | | | 227,000 | | | | 15,179 | | |
| Harrah's Entertainment | | | 136,650 | | | | 8,908 | | |
| Sherwin Williams (a) | | | 395,090 | | | | 17,412 | | |
| Time Warner | | | 1,450,910 | | | | 26,276 | | |
| | | | 82,350 | | |
| Consumer Staples – 5.6% | | | |
| Altria Group | | | 238,180 | | | | 17,556 | | |
| Colgate-Palmolive | | | 164,840 | | | | 8,702 | | |
| General Mills (a) | | | 221,030 | | | | 10,654 | | |
| Kroger* | | | 691,690 | | | | 14,242 | | |
| | | | 51,154 | | |
| Energy – 16.8% | | | |
| Apache | | | 222,044 | | | | 16,702 | | |
| BP, ADR | | | 288,390 | | | | 20,432 | | |
| ConocoPhillips | | | 398,500 | | | | 27,859 | | |
| Exxon Mobil | | | 722,824 | | | | 45,928 | | |
| Halliburton (a) | | | 200,300 | | | | 13,725 | | |
| National-Oilwell Varco* | | | 166,950 | | | | 10,985 | | |
| Valero Energy | | | 144,950 | | | | 16,388 | | |
| | | | 152,019 | | |
| Financials (b) – 31.5% | | | |
| ACE | | | 350,060 | | | | 16,477 | | |
| Allstate | | | 251,720 | | | | 13,918 | | |
| American International Group | | | 387,810 | | | | 24,029 | | |
| Bank of America (a) | | | 850,266 | | | | 35,796 | | |
| Capital One Financial (a) | | | 150,770 | | | | 11,989 | | |
| Citigroup | | �� | 579,012 | | | | 26,357 | | |
| Comerica (a) | | | 187,900 | | | | 11,067 | | |
| Freddie Mac | | | 102,610 | | | | 5,793 | | |
| Genworth Financial (a) | | | 550,350 | | | | 17,743 | | |
| Goldman Sachs Group | | | 200,860 | | | | 24,421 | | |
| Lehman Brothers Holdings (a) | | | 209,890 | | | | 24,448 | | |
| Marshall & Ilsley (a) | | | 183,970 | | | | 8,005 | | |
| Merrill Lynch | | | 216,480 | | | | 13,281 | | |
| MGIC Investment (a) | | | 137,910 | | | | 8,854 | | |
| Northern Trust (a) | | | 230,040 | | | | 11,629 | | |
| Wachovia (a) | | | 171,260 | | | | 8,150 | | |
| Wells Fargo | | | 412,330 | | | | 24,150 | | |
| | | | 286,107 | | |
| Health Care – 9.0% | | | |
| CIGNA | | | 96,950 | | | | 11,427 | | |
| HCA | | | 207,510 | | | | 9,944 | | |
| Johnson & Johnson | | | 103,320 | | | | 6,538 | | |
| Merck | | | 308,040 | | | | 8,382 | | |
| Pfizer | | | 690,460 | | | | 17,241 | | |
| Wyeth Pharmaceuticals | | | 598,680 | | | | 27,701 | | |
| | | | 81,233 | | |
| Industrials – 7.4% | | | |
| Eaton | | | 160,190 | | | | 10,180 | | |
| Emerson Electric | | | 289,490 | | | | 20,785 | | |
| General Electric | | | 380,950 | | | | 12,827 | | |
| Norfolk Southern | | | 245,550 | | | | 9,960 | | |
| Tyco International (a) | | | 492,000 | | | | 13,702 | | |
| | | | 67,454 | | |
Large Cap Value Fund (concluded)
| DESCRIPTION | | SHARES | | VALUE (000) | |
| Information Technology – 9.5% | | | |
| Hewlett-Packard | | | 1,123,010 | | | $ | 32,792 | | |
| Motorola (a) | | | 740,260 | | | | 16,352 | | |
| National Semiconductor (a) | | | 429,100 | | | | 11,285 | | |
| Oracle* | | | 997,700 | | | | 12,361 | | |
| Texas Instruments | | | 387,500 | | | | 13,136 | | |
| | | | 85,926 | | |
| Materials – 3.7% | | | |
| Dow Chemical | | | 545,290 | | | | 22,722 | | |
| Phelps Dodge (a) | | | 84,010 | | | | 10,915 | | |
| | | | 33,637 | | |
| Telecommunication Services – 3.2% | | | |
| BellSouth (a) | | | 451,780 | | | | 11,882 | | |
| Verizon Communications (a) | | | 526,302 | | | | 17,205 | | |
| | | | 29,087 | | |
| Utilities – 3.7% | | | |
| Entergy (a) | | | 230,770 | | | | 17,151 | | |
| PG&E (a) | | | 420,240 | | | | 16,494 | | |
| | | | 33,645 | | |
Total Common Stocks
(Cost $761,398) | | | | | | | 902,612 | | |
| Affiliated Money Market Fund – 0.6% | | | |
First American Prime Obligations Fund, Class Z (c)
(Cost $5,453) | | | 5,452,796 | | | | 5,453 | | |
Investments Purchased with Proceeds
from Securities Lending (d) – 27.0% | | | |
| (Cost $244,907) | | | | | | | 244,907 | | |
Total Investments – 127.1%
(Cost $1,011,758) | | | | | | | 1,152,972 | | |
| Other Assets and Liabilities, Net – (27.1)% | | | | | | | (245,891 | ) | |
| Total Net Assets – 100.0% | | | | | | $ | 907,081 | | |
* Non-income producing security
(a) This security or a portion of this security is out on loan at September 30, 2005. Total loaned securities had a market value of $240,234,151 at September 30, 2005. See note 2 in Notes to Financial Statements.
(b) The fund is significantly invested in this sector and therefore is subject to additional risks. See note 7 in Notes to Financial Statements.
(c) Investment in affiliated security. This money market fund is advised by U.S. Bancorp Asset Management, Inc., which also serves as advisor to this fund. See note 3 in Notes to Financial Statements.
(d) The fund may loan securities in return for collateral in the form of cash, U.S. Government securities, or other high grade debt obligations. The cash collateral is invested in various short-term fixed income securities, such as repurchase agreements, commercial paper, money market funds and other corporate obligations. See note 2 in Notes to Financial Statements.
ADR – American Depository Receipt
The accompanying notes are an integral part of the financial statements.
FIRST AMERICAN FUNDS Annual Report 2005
84
Statements of Assets and Liabilities September 30, 2005, in thousands, except for per share data
| | | Large Cap Growth
Opportunities Fund | | Large Cap
Select Fund | | Large Cap
Value Fund | |
| ASSETS: | | | |
Investments in unaffiliated securities, at value† (cost: $869,907, $313,111 and
$761,398, respectively) (note 2) | | $ | 974,349 | | | $ | 333,960 | | | $ | 902,612 | | |
Investments in affiliated money market fund, at value (cost: $12,078, $10,188 and
$5,453, respectively) (note 2) | | | 12,078 | | | | 10,188 | | | | 5,453 | | |
Investments purchased with proceeds from securities lending, at value (cost: $287,524,
$80,406 and $244,907, respectively) (note 2) | | | 287,524 | | | | 80,406 | | | | 244,907 | | |
| Cash* | | | 2,723 | | | | 762 | | | | 2,320 | | |
| Receivable for dividends and interest | | | 561 | | | | 306 | | | | 1,284 | | |
| Receivable for investment securities sold | | | 10,625 | | | | 3,231 | | | | - | | |
| Receivable for capital shares sold | | | 454 | | | | 1,029 | | | | 256 | | |
| Prepaid expenses and other assets | | | 28 | | | | 23 | | | | 28 | | |
| Total assets | | | 1,288,342 | | | | 429,905 | | | | 1,156,860 | | |
| LIABILITIES: | | | |
| Payable for investment securities purchased | | | 4,972 | | | | 12,599 | | | | - | | |
| Payable upon return of securities loaned (note 2) | | | 290,247 | | | | 81,168 | | | | 247,227 | | |
| Payable for capital shares redeemed | | | 4,142 | | | | 168 | | | | 1,781 | | |
| Payable to affiliates (note 3) | | | 757 | | | | 245 | | | | 694 | | |
| Payable for distribution and shareholder servicing fees | | | 48 | | | | 1 | | | | 42 | | |
| Accrued expenses and other liabilities | | | 39 | | | | 18 | | | | 35 | | |
| Total liabilities | | | 300,205 | | | | 94,199 | | | | 249,779 | | |
| Net assets | | $ | 988,137 | | | $ | 335,706 | | | $ | 907,081 | | |
| COMPOSITION OF NET ASSETS: | | | |
| Portfolio capital | | $ | 1,015,061 | | | $ | 300,149 | | | $ | 743,958 | | |
| Undistributed (distributions in excess of) net investment income | | | (1 | ) | | | 142 | | | | 137 | | |
| Accumulated net realized gain (loss) on investments | | | (131,365 | ) | | | 14,566 | | | | 21,772 | | |
| Net unrealized appreciation of investments | | | 104,442 | | | | 20,849 | | | | 141,214 | | |
| Net assets | | $ | 988,137 | | | $ | 335,706 | | | $ | 907,081 | | |
| * Includes cash collateral received related to securities loaned (note 2) | | $ | 2,723 | | | $ | 762 | | | $ | 2,320 | | |
| † Including securities loaned, at value | | $ | 284,099 | | | $ | 79,049 | | | $ | 240,234 | | |
| Class A: | | | |
| Net assets | | $ | 107,079 | | | $ | 5,299 | | | $ | 121,809 | | |
| Shares issued and outstanding ($0.0001 par value - 2 billion authorized) | | | 3,822 | | | | 366 | | | | 6,072 | | |
| Net asset value and redemption price per share | | $ | 28.02 | | | $ | 14.47 | | | $ | 20.06 | | |
| Maximum offering price per share (1) | | $ | 29.65 | | | $ | 15.31 | | | $ | 21.23 | | |
| Class B: | | | |
| Net assets | | $ | 20,239 | | | $ | 567 | | | $ | 14,876 | | |
| Shares issued and outstanding ($0.0001 par value - 2 billion authorized) | | | 757 | | | | 40 | | | | 758 | | |
| Net asset value, offering price and redemption price per share (2) | | $ | 26.75 | | | $ | 14.30 | | | $ | 19.62 | | |
| Class C: | | | |
| Net assets | | $ | 11,147 | | | $ | 182 | | | $ | 5,710 | | |
| Shares issued and outstanding ($0.0001 par value - 2 billion authorized) | | | 408 | | | | 13 | | | | 288 | | |
| Net asset value, offering price and redemption price per share (2) | | $ | 27.29 | | | $ | 14.31 | | | $ | 19.85 | | |
| Class R: | | | |
| Net assets | | $ | 290 | | | $ | 2 | | | $ | 7 | | |
| Shares issued and outstanding ($0.0001 par value - 2 billion authorized) | | | 10 | | | | - | | | | - | | |
| Net asset value, offering price, and redemption price per share | | $ | 27.94 | | | $ | 14.43 | | | $ | 20.06 | | |
| Class Y: | | | |
| Net assets | | $ | 849,382 | | | $ | 329,656 | | | $ | 764,679 | | |
| Shares issued and outstanding ($0.0001 par value - 2 billion authorized) | | | 29,501 | | | | 22,746 | | | | 38,008 | | |
| Net asset value, offering price, and redemption price per share | | $ | 28.79 | | | $ | 14.49 | | | $ | 20.12 | | |
(1) The offering price is calculated by dividing the net asset value by 1 minus the maximum sales charge of 5.50%
(2) Class B and C have a contingent deferred sales charge. For a description of this sales charge, see notes 1 and 3 in Notes to Financial Statements.
FIRST AMERICAN FUNDS Annual Report 2005
85
Statements of Operations For the fiscal year ended September 30, 2005, in thousands
| | | Large Cap Growth
Opportunities Fund | | Large Cap
Select Fund | | Large Cap
Value Fund | |
| INVESTMENT INCOME: | |
| Interest from unaffiliated securities | | $ | - | | | $ | 3 | | | $ | - | | |
| Dividends from affiliated money market fund | | | 434 | | | | 256 | | | | 207 | | |
| Dividends from unaffiliated securities | | | 12,714 | | | | 4,316 | | | | 21,039 | | |
| Less: Foreign taxes withheld | | | (44 | ) | | | (12 | ) | | | (4 | ) | |
| Securities lending income | | | 319 | | | | 61 | | | | 220 | | |
| Total investment income | | | 13,423 | | | | 4,624 | | | | 21,462 | | |
| EXPENSES (note 3): | |
| Investment advisory fees | | | 7,471 | | | | 1,894 | | | | 6,703 | | |
| Administration fees | | | 2,376 | | | | 595 | | | | 2,130 | | |
| Transfer agent fees | | | 689 | | | | 185 | | | | 623 | | |
| Custodian fees | | | 103 | | | | 25 | | | | 92 | | |
| Professional fees | | | 79 | | | | 35 | | | | 73 | | |
| Postage and printing fees | | | 60 | | | | 16 | | | | 54 | | |
| Registration fees | | | 40 | | | | 40 | | | | 39 | | |
| Other expenses | | | 29 | | | | 10 | | | | 26 | | |
| Directors' fees | | | 28 | | | | 7 | | | | 25 | | |
| Distribution and shareholder servicing fees – Class A | | | 276 | | | | 5 | | | | 297 | | |
| Distribution and shareholder servicing fees – Class B | | | 232 | | | | 4 | | | | 182 | | |
| Distribution and shareholder servicing fees – Class C | | | 122 | | | | 1 | | | | 62 | | |
| Distribution and shareholder servicing fees – Class R (1) | | | - | | | | - | | | | - | | |
| Total expenses | | | 11,505 | | | | 2,817 | | | | 10,306 | | |
| Less: Fee waivers (note 3) | | | (370 | ) | | | (135 | ) | | | (341 | ) | |
| Total net expenses | | | 11,135 | | | | 2,682 | | | | 9,965 | | |
| Investment income – net | | | 2,288 | | | | 1,942 | | | | 11,497 | | |
REALIZED AND UNREALIZED GAINS (LOSSES) ON
INVESTMENTS AND FUTURES CONTRACTS – NET (note 5): | |
| Net realized gain on investments | | | 54,623 | | | | 16,321 | | | | 84,365 | | |
| Net realized gain on in-kind distribution (note 11) | | | 76,740 | | | | 24,162 | | | | 70,893 | | |
| Net realized loss on futures contracts | | | - | | | | (201 | ) | | | - | | |
| Net change in unrealized appreciation or depreciation of investments | | | 8,655 | | | | 8,570 | | | | 17,537 | | |
| Net change in unrealized appreciation or depreciation of futures contracts | | | - | | | | 165 | | | | - | | |
| Net gain on investments and futures contracts | | | 140,018 | | | | 49,017 | | | | 172,795 | | |
| Net increase in net assets resulting from operations | | $ | 142,306 | | | $ | 50,959 | | | $ | 184,292 | | |
(1) Due to the presentation of the financial statements in thousands, the numbers round to zero.
The accompanying notes are an integral part of the financial statements.
FIRST AMERICAN FUNDS Annual Report 2005
86
(This page has been left blank intentionally.)
Statements of Changes in Net Assets in thousands
| | | Large Cap Growth
Opportunities Fund | | Large Cap
Select Fund | | Large Cap
Value Fund | |
| | | Year
Ended
9/30/05 | | Year
Ended
9/30/04 | | Year
Ended
9/30/05 | | Year
Ended
9/30/04 | | Year
Ended
9/30/05 | | Year
Ended
9/30/04 | |
| OPERATIONS: | | | |
| Investment income – net | | $ | 2,288 | | | $ | 975 | | | $ | 1,942 | | | $ | 1,294 | | | $ | 11,497 | | | $ | 12,916 | | |
| Net realized gain on investments | | | 54,623 | | | | 81,430 | | | | 16,321 | | | | 2,068 | | | | 84,365 | | | | 109,490 | | |
| Net realized gain on in-kind distributions | | | 76,740 | | | | - | | | | 24,162 | | | | - | | | | 70,893 | | | | - | | |
| Net realized gain (loss) on futures | | | - | | | | - | | | | (201 | ) | | | 1,671 | | | | - | | | | - | | |
| Net change in unrealized appreciation or depreciation of investments | | | 8,655 | | | | 36,383 | | | | 8,570 | | | | 9,176 | | | | 17,537 | | | | 44,184 | | |
| Net change in unrealized appreciation or depreciation of futures contracts | | | - | | | | - | | | | 165 | | | | (50 | ) | | | - | | | | - | | |
| Net increase in net assets resulting from operations | | | 142,306 | | | | 118,788 | | | | 50,959 | | | | 14,159 | | | | 184,292 | | | | 166,590 | | |
| DISTRIBUTIONS TO SHAREHOLDERS FROM: | | | |
| Investment income – net: | |
| Class A | | | (169 | ) | | | (50 | ) | | | (10 | ) | | | (2 | ) | | | (1,072 | ) | | | (930 | ) | |
| Class B | | | (19 | ) | | | - | | | | - | | | | - | | | | (62 | ) | | | (107 | ) | |
| Class C | | | (9 | ) | | | - | | | | - | | | | - | | | | (21 | ) | | | (25 | ) | |
| Class R | | | - | | | | (7 | ) | | | - | | | | - | | | | - | | | | (126 | ) | |
| Class Y | | | (2,091 | ) | | | (1,127 | ) | | | (1,808 | ) | | | (1,279 | ) | | | (10,036 | ) | | | (11,517 | ) | |
| Net realized gain on investments: | |
| Class A | | | - | | | | - | | | | (17 | ) | | | (3 | ) | | | - | | | | - | | |
| Class B | | | - | | | | - | | | | (4 | ) | | | (1 | ) | | | - | | | | - | | |
| Class C | | | - | | | | - | | | | (1 | ) | | | - | | | | - | | | | - | | |
| Class R | | | - | | | | - | | | | - | | | | - | | | | - | | | | - | | |
| Class Y | | | - | | | | - | | | | (4,604 | ) | | | (1,552 | ) | | | - | | | | - | | |
| Return of capital: | |
| Class A | | | (56 | ) | | | (11 | ) | | | - | | | | - | | | | - | | | | - | | |
| Class B (1) | | | (6 | ) | | | - | | | | - | | | | - | | | | - | | | | - | | |
| Class C (1) | | | (3 | ) | | | - | | | | - | | | | - | | | | - | | | | - | | |
| Class R | | | - | | | | (1 | ) | | | - | | | | - | | | | - | | | | - | | |
| Class Y | | | (692 | ) | | | (249 | ) | | | - | | | | - | | | | - | | | | - | | |
| Total distributions | | | (3,045 | ) | | | (1,445 | ) | | | (6,444 | ) | | | (2,837 | ) | | | (11,191 | ) | | | (12,705 | ) | |
| CAPITAL SHARE TRANSACTIONS (note 4): | | | |
| Class A: | |
| Proceeds from sales | | | 15,121 | | | | 40,942 | | | | 4,711 | | | | 973 | | | | 17,717 | | | | 38,252 | | |
| Reinvestment of distributions | | | 217 | | | | 59 | | | | 18 | | | | 5 | | | | 1,012 | | | | 878 | | |
| Payments for redemptions | | | (33,271 | ) | | | (30,173 | ) | | | (362 | ) | | | (501 | ) | | | (28,635 | ) | | | (26,540 | ) | |
| Increase (decrease) in net assets from Class A transactions | | | (17,933 | ) | | | 10,828 | | | | 4,367 | | | | 477 | | | | (9,906 | ) | | | 12,590 | | |
| Class B: | |
| Proceeds from sales | | | 1,151 | | | | 2,182 | | | | 341 | | | | 204 | | | | 698 | | | | 909 | | |
| Reinvestment of distributions | | | 25 | | | | - | | | | 5 | | | | 1 | | | | 61 | | | | 106 | | |
| Payments for redemptions | | | (9,138 | ) | | | (18,001 | ) | | | (98 | ) | | | (57 | ) | | | (10,604 | ) | | | (14,541 | ) | |
| Increase (decrease) in net assets from Class B transactions | | | (7,962 | ) | | | (15,819 | ) | | | 248 | | | | 148 | | | | (9,845 | ) | | | (13,526 | ) | |
| Class C: | |
| Proceeds from sales | | | 1,190 | | | | 1,418 | | | | 144 | | | | 49 | | | | 666 | | | | 808 | | |
| Reinvestment of distributions | | | 12 | | | | - | | | | 1 | | | | - | | | | 20 | | | | 25 | | |
| Payments for redemptions | | | (4,197 | ) | | | (5,343 | ) | | | (31 | ) | | | (19 | ) | | | (2,263 | ) | | | (2,322 | ) | |
| Increase (decrease) in net assets from Class C transactions | | | (2,995 | ) | | | (3,925 | ) | | | 114 | | | | 30 | | | | (1,577 | ) | | | (1,489 | ) | |
| Class R: | |
| Proceeds from sales | | | 286 | | | | 1,810 | | | | - | | | | 1 | | | | 5 | | | | 2,695 | | |
| Reinvestment of distributions | | | - | | | | 7 | | | | - | | | | - | | | | - | | | | 125 | | |
| Payments for redemptions | | | - | | | | (19,633 | ) | | | - | | | | (1 | ) | | | - | | | | (29,940 | ) | |
| Increase (decrease) in net assets from Class R transactions | | | 286 | | | | (17,816 | ) | | | - | | | | - | | | | 5 | | | | (27,120 | ) | |
| Class Y: | |
| Proceeds from sales | | | 165,303 | | | | 312,207 | | | | 229,583 | | | | 169,597 | | | | 88,145 | | | | 216,890 | | |
| Reinvestment of distributions | | | 1,595 | | | | 725 | | | | 4,810 | | | | 2,310 | | | | 6,324 | | | | 7,917 | | |
| Payments for redemptions | | | (628,503 | ) | | | (299,071 | ) | | | (240,782 | ) | | | (17,779 | ) | | | (502,220 | ) | | | (210,060 | ) | |
| Increase (decrease) in net assets from Class Y transactions | | | (461,605 | ) | | | 13,861 | | | | (6,389 | ) | | | 154,128 | | | | (407,751 | ) | | | 14,747 | | |
| Increase (decrease) in net assets from capital share transactions | | | (490,209 | ) | | | (12,871 | ) | | | (1,660 | ) | | | 154,783 | | | | (429,074 | ) | | | (14,798 | ) | |
| Total increase (decrease) in net assets | | | (350,948 | ) | | | 104,472 | | | | 42,855 | | | | 166,105 | | | | (255,973 | ) | | | 139,087 | | |
| Net assets at beginning of period | | | 1,339,085 | | | | 1,234,613 | | | | 292,851 | | | | 126,746 | | | | 1,163,054 | | | | 1,023,967 | | |
| Net assets at end of period | | $ | 988,137 | | | $ | 1,339,085 | | | $ | 335,706 | | | $ | 292,851 | | | $ | 907,081 | | | $ | 1,163,054 | | |
| Undistributed (distributions in excess of) net investment income at end of period | | $ | (1 | ) | | $ | (2 | ) | | $ | 142 | | | $ | 18 | | | $ | 137 | | | $ | 119 | | |
(1) Due to the presentation of the financial statements in thousands, the numbers round to zero.
The accompanying notes are an integral part of the financial statements.
FIRST AMERICAN FUNDS Annual Report 2005
88
FIRST AMERICAN FUNDS Annual Report 2005
89
Financial Highlights For a share outstanding throughout the periods ended September 30, unless otherwise indicated.
| | | Net Asset
Value
Beginning
of Period | | Net
Investment
Income (Loss) | | Realized and
Unrealized
Gains
(Losses) on
Investments | | Distributions
from Net
Investment
Income | | Distributions
from Net
Realized Gains | | Distributions
from Return
of Capital | | Net Asset
Value
End of
Period | |
| Large Cap Growth Opportunities (1) (2) | |
| Class A | |
| | 2005 | | | $ | 25.00 | | | $ | (0.01 | ) | | $ | 3.08 | | | $ | (0.04 | ) | | $ | - | | | $ | (0.01 | ) | | $ | 28.02 | | |
| | 2004 | | | | 22.84 | | | | (0.03 | ) | | | 2.20 | | | | (0.01 | ) | | | - | | | | - | (9) | | | 25.00 | | |
| | 2003 | | | | 19.16 | | | | - | | | | 3.73 | | | | (0.05 | ) | | | - | | | | - | | | | 22.84 | | |
| | 2002 | | | | 24.44 | | | | - | | | | (5.23 | ) | | | (0.05 | ) | | | - | | | | - | | | | 19.16 | | |
| | 2001 | (3) | | | 43.33 | | | | (0.01 | ) | | | (14.00 | ) | | | - | | | | (4.88 | ) | | | - | | | | 24.44 | | |
| | 2000 | (4) | | | 37.96 | | | | (0.15 | ) | | | 7.55 | | | | - | | | | (2.03 | ) | | | - | | | | 43.33 | | |
| Class B | |
| | 2005 | | | $ | 24.02 | | | $ | (0.20 | ) | | $ | 2.96 | | | $ | (0.02 | ) | | $ | - | | | $ | (0.01 | ) | | $ | 26.75 | | |
| | 2004 | | | | 22.10 | | | | (0.21 | ) | | | 2.13 | | | | - | | | | - | | | | - | (9) | | | 24.02 | | |
| | 2003 | | | | 18.64 | | | | (0.18 | ) | | | 3.64 | | | | - | | | | - | | | | - | | | | 22.10 | | |
| | 2002 | | | | 23.94 | | | | (0.18 | ) | | | (5.09 | ) | | | (0.03 | ) | | | - | | | | - | | | | 18.64 | | |
| | 2001 | (3) | | | 42.80 | | | | (0.22 | ) | | | (13.76 | ) | | | - | | | | (4.88 | ) | | | - | | | | 23.94 | | |
| | 2000 | (4) | | | 37.78 | | | | (0.47 | ) | | | 7.52 | | | | - | | | | (2.03 | ) | | | - | | | | 42.80 | | |
| Class C | |
| | 2005 | | | $ | 24.51 | | | $ | (0.20 | ) | | $ | 3.00 | | | $ | (0.01 | ) | | $ | - | | | $ | (0.01 | ) | | $ | 27.29 | | |
| | 2004 | | | | 22.55 | | | | (0.21 | ) | | | 2.17 | | | | - | | | | - | | | | - | (9) | | | 24.51 | | |
| | 2003 | | | | 19.03 | | | | (0.18 | ) | | | 3.72 | | | | (0.02 | ) | | | - | | | | - | | | | 22.55 | | |
| | 2002 | | | | 24.44 | | | | (0.18 | ) | | | (5.19 | ) | | | (0.04 | ) | | | - | | | | - | | | | 19.03 | | |
| | 2001 | (5) | | | 23.75 | | | | - | | | | 0.69 | | | | - | | | | - | | | | - | | | | 24.44 | | |
| Class R (6) | |
| | 2005 | | | $ | 24.98 | | | $ | (0.16 | ) | | $ | 3.17 | | | $ | (0.05 | ) | | $ | - | | | $ | - | (9) | | $ | 27.94 | | |
| | 2004 | | | | 22.85 | | | | (0.02 | ) | | | 2.16 | | | | (0.01 | ) | | | - | | | | - | (9) | | | 24.98 | | |
| | 2003 | | | | 19.17 | | | | - | | | | 3.73 | | | | (0.05 | ) | | | - | | | | - | | | | 22.85 | | |
| | 2002 | | | | 24.45 | | | | - | | | | (5.23 | ) | | | (0.05 | ) | | | - | | | | - | | | | 19.17 | | |
| | 2001 | (7) | | | 35.53 | | | | (0.01 | ) | | | (11.07 | ) | | | - | | | | - | | | | - | | | | 24.45 | | |
| Class Y | |
| | 2005 | | | $ | 25.63 | | | $ | 0.07 | | | $ | 3.15 | | | $ | (0.04 | ) | | $ | - | | | $ | (0.02 | ) | | $ | 28.79 | | |
| | 2004 | | | | 23.38 | | | | 0.03 | | | | 2.25 | | | | (0.02 | ) | | | - | | | | (0.01 | ) | | | 25.63 | | |
| | 2003 | | | | 19.59 | | | | 0.07 | | | | 3.80 | | | | (0.08 | ) | | | - | | | | - | | | | 23.38 | | |
| | 2002 | | | | 24.93 | | | | 0.06 | | | | (5.33 | ) | | | (0.07 | ) | | | - | | | | - | | | | 19.59 | | |
| | 2001 | (3) | | | 44.00 | | | | 0.06 | | | | (14.25 | ) | | | - | | | | (4.88 | ) | | | - | | | | 24.93 | | |
| | 2000 | (4) | | | 38.42 | | | | (0.04 | ) | | | 7.65 | | | | - | | | | (2.03 | ) | | | - | | | | 44.00 | | |
| Large Cap Select (2) | |
| Class A | |
| | 2005 | | | $ | 12.52 | | | $ | 0.06 | | | $ | 2.15 | | | $ | (0.06 | ) | | $ | (0.20 | ) | | $ | - | | | $ | 14.47 | | |
| | 2004 | | | | 11.45 | | | | 0.04 | | | | 1.19 | | | | (0.05 | ) | | | (0.11 | ) | | | - | | | | 12.52 | | |
| | 2003 | (8) | | | 10.00 | | | | 0.03 | | | | 1.46 | | | | (0.04 | ) | | | - | | | | - | | | | 11.45 | | |
| Class B | |
| | 2005 | | | $ | 12.41 | | | $ | (0.05 | ) | | $ | 2.15 | | | $ | (0.01 | ) | | $ | (0.20 | ) | | $ | - | | | $ | 14.30 | | |
| | 2004 | | | | 11.41 | | | | (0.06 | ) | | | 1.18 | | | | (0.01 | ) | | | (0.11 | ) | | | - | | | | 12.41 | | |
| | 2003 | (8) | | | 10.00 | | | | (0.03 | ) | | | 1.45 | | | | (0.01 | ) | | | - | | | | - | | | | 11.41 | | |
| Class C | |
| | 2005 | | | $ | 12.43 | | | $ | (0.05 | ) | | $ | 2.14 | | | $ | (0.01 | ) | | $ | (0.20 | ) | | $ | - | | | $ | 14.31 | | |
| | 2004 | | | | 11.42 | | | | (0.06 | ) | | | 1.19 | | | | (0.01 | ) | | | (0.11 | ) | | | - | | | | 12.43 | | |
| | 2003 | | | | 10.00 | | | | (0.02 | ) | | | 1.45 | | | | (0.01 | ) | | | - | | | | - | | | | 11.42 | | |
| Class R (6) | |
| | 2005 | | | $ | 12.49 | | | $ | 0.02 | | | $ | 2.15 | | | $ | (0.03 | ) | | $ | (0.20 | ) | | $ | - | | | $ | 14.43 | | |
| | 2004 | | | | 11.44 | | | | 0.02 | | | | 1.18 | | | | (0.04 | ) | | | (0.11 | ) | | | - | | | | 12.49 | | |
| | 2003 | (8) | | | 10.00 | | | | 0.03 | | | | 1.44 | | | | (0.03 | ) | | | - | | | | - | | | | 11.44 | | |
| Class Y | |
| | 2005 | | | $ | 12.53 | | | $ | 0.09 | | | $ | 2.16 | | | $ | (0.09 | ) | | $ | (0.20 | ) | | $ | - | | | $ | 14.49 | | |
| | 2004 | | | | 11.45 | | | | 0.07 | | | | 1.19 | | | | (0.07 | ) | | | (0.11 | ) | | | - | | | | 12.53 | | |
| | 2003 | (8) | | | 10.00 | | | | 0.05 | | | | 1.45 | | | | (0.05 | ) | | | - | | | | - | | | | 11.45 | | |
The accompanying notes are an integral part of the financial statements.
FIRST AMERICAN FUNDS Annual Report 2005
90
| | | Total
Return (10) | | Net Assets
End of
Period (000) | | Ratio of
Expenses to
Average
Net Assets | | Ratio of Net
Investment
Income (Loss)
to Average
Net Assets | | Ratio of
Expenses to
Average
Net Assets
(Excluding
Waivers) | | Ratio of Net
Investment
Income (Loss)
to Average Net
Assets (Excluding
Waivers) | | Portfolio
Turnover
Rate | |
| Large Cap Growth Opportunities (1) (2) | |
| Class A | |
| | 2005 | | | | 12.30 | % | | $ | 107,079 | | | | 1.17 | % | | | (0.03 | )% | | | 1.20 | % | | | (0.06 | )% | | | 103 | % | |
| | 2004 | | | | 9.52 | | | | 112,379 | | | | 1.15 | | | | (0.13 | ) | | | 1.19 | | | | (0.17 | ) | | | 113 | | |
| | 2003 | | | | 19.50 | | | | 93,331 | | | | 1.15 | | | | (0.02 | ) | | | 1.19 | | | | (0.06 | ) | | | 83 | | |
| | 2002 | | | | (21.46 | ) | | | 24,647 | | | | 1.15 | | | | (0.02 | ) | | | 1.22 | | | | (0.09 | ) | | | 43 | | |
| | 2001 | (3) | | | (35.83 | ) | | | 34,330 | | | | 1.20 | | | | (0.04 | ) | | | 1.24 | | | | (0.08 | ) | | | 40 | | |
| | 2000 | (4) | | | 19.92 | | | | 51,232 | | | | 1.20 | | | | (0.35 | ) | | | 1.21 | | | | (0.36 | ) | | | 60 | | |
| Class B | |
| | 2005 | | | | 11.47 | % | | $ | 20,239 | | | | 1.92 | % | | | (0.77 | )% | | | 1.95 | % | | | (0.80 | )% | | | 103 | % | |
| | 2004 | | | | 8.69 | | | | 25,633 | | | | 1.90 | | | | (0.87 | ) | | | 1.94 | | | | (0.91 | ) | | | 113 | | |
| | 2003 | | | | 18.58 | | | | 37,853 | | | | 1.90 | | | | (0.84 | ) | | | 1.94 | | | | (0.88 | ) | | | 83 | | |
| | 2002 | | | | (22.06 | ) | | | 2,928 | | | | 1.90 | | | | (0.75 | ) | | | 1.97 | | | | (0.82 | ) | | | 43 | | |
| | 2001 | (3) | | | (36.28 | ) | | | 2,954 | | | | 1.93 | | | | (0.79 | ) | | | 1.97 | | | | (0.83 | ) | | | 40 | | |
| | 2000 | (4) | | | 19.06 | | | | 1,483 | | | | 1.95 | | | | (1.10 | ) | | | 1.96 | | | | (1.11 | ) | | | 60 | | |
| Class C | |
| | 2005 | | | | 11.44 | % | | $ | 11,147 | | | | 1.92 | % | | | (0.78 | )% | | | 1.95 | % | | | (0.81 | )% | | | 103 | % | |
| | 2004 | | | | 8.69 | | | | 12,811 | | | | 1.90 | | | | (0.87 | ) | | | 1.94 | | | | (0.91 | ) | | | 113 | | |
| | 2003 | | | | 18.60 | | | | 15,365 | | | | 1.90 | | | | (0.81 | ) | | | 1.94 | | | | (0.85 | ) | | | 83 | | |
| | 2002 | | | | (22.03 | ) | | | 476 | | | | 1.90 | | | | (0.73 | ) | | | 1.97 | | | | (0.80 | ) | | | 43 | | |
| | 2001 | (5) | | | 2.95 | | | | - | | | | - | | | | - | | | | - | | | | - | | | | 40 | | |
| Class R (6) | |
| | 2005 | | | | 12.04 | % | | $ | 290 | | | | 1.42 | % | | | (0.57 | )% | | | 1.60 | % | | | (0.75 | )% | | | 103 | % | |
| | 2004 | | | | 9.38 | | | | 1 | | | | 1.15 | | | | (0.08 | ) | | | 1.19 | | | | (0.12 | ) | | | 113 | | |
| | 2003 | | | | 19.51 | | | | 15,890 | | | | 1.15 | | | | (0.01 | ) | | | 1.19 | | | | (0.05 | ) | | | 83 | | |
| | 2002 | | | | (21.45 | ) | | | 2,376 | | | | 1.15 | | | | - | | | | 1.22 | | | | (0.07 | ) | | | 43 | | |
| | 2001 | (7) | | | (31.16 | ) | | | 2,802 | | | | 1.18 | | | | (0.03 | ) | | | 1.22 | | | | (0.07 | ) | | | 40 | | |
| Class Y | |
| | 2005 | | | | 12.58 | % | | $ | 849,382 | | | | 0.92 | % | | | 0.26 | % | | | 0.95 | % | | | 0.23 | % | | | 103 | % | |
| | 2004 | | | | 9.76 | | | | 1,188,261 | | | | 0.90 | | | | 0.13 | | | | 0.94 | | | | 0.09 | | | | 113 | | |
| | 2003 | | | | 19.78 | | | | 1,072,174 | | | | 0.90 | | | | 0.31 | | | | 0.94 | | | | 0.27 | | | | 83 | | |
| | 2002 | | | | (21.23 | ) | | | 255,311 | | | | 0.90 | | | | 0.24 | | | | 0.97 | | | | 0.17 | | | | 43 | | |
| | 2001 | (3) | | | (35.70 | ) | | | 316,213 | | | | 0.94 | | | | 0.20 | | | | 0.98 | | | | 0.16 | | | | 40 | | |
| | 2000 | (4) | | | 20.24 | | | | 339,166 | | | | 0.95 | | | | (0.10 | ) | | | 0.96 | | | | (0.11 | ) | | | 60 | | |
| Large Cap Select (2) | |
| Class A | |
| | 2005 | | | | 17.83 | % | | $ | 5,299 | | | | 1.17 | % | | | 0.41 | % | | | 1.22 | % | | | 0.36 | % | | | 176 | % | |
| | 2004 | | | | 10.82 | | | | 714 | | | | 1.15 | | | | 0.30 | | | | 1.21 | | | | 0.24 | | | | 67 | | |
| | 2003 | (8) | | | 14.91 | | | | 215 | | | | 1.15 | | | | 0.42 | | | | 1.24 | | | | 0.33 | | | | 65 | | |
| Class B | |
| | 2005 | | | | 17.02 | % | | $ | 567 | | | | 1.92 | % | | | (0.36 | )% | | | 1.97 | % | | | (0.41 | )% | | | 176 | % | |
| | 2004 | | | | 9.89 | | | | 270 | | | | 1.90 | | | | (0.44 | ) | | | 1.96 | | | | (0.50 | ) | | | 67 | | |
| | 2003 | (8) | | | 14.18 | | | | 113 | | | | 1.90 | | | | (0.35 | ) | | | 1.99 | | | | (0.44 | ) | | | 65 | | |
| Class C | |
| | 2005 | | | | 16.91 | % | | $ | 182 | | | | 1.92 | % | | | (0.35 | )% | | | 1.97 | % | | | (0.40 | )% | | | 176 | % | |
| | 2004 | | | | 9.98 | | | | 59 | | | | 1.90 | | | | (0.45 | ) | | | 1.96 | | | | (0.51 | ) | | | 67 | | |
| | 2003 | | | | 14.27 | | | | 26 | | | | 1.90 | | | | (0.32 | ) | | | 1.99 | | | | (0.41 | ) | | | 65 | | |
| Class R (6) | |
| | 2005 | | | | 17.54 | % | | $ | 2 | | | | 1.42 | % | | | 0.14 | % | | | 1.62 | % | | | (0.06 | )% | | | 176 | % | |
| | 2004 | | | | 10.60 | | | | 1 | | | | 1.32 | | | | 0.18 | | | | 1.38 | | | | 0.12 | | | | 67 | | |
| | 2003 | (8) | | | 14.76 | | | | 1 | | | | 1.15 | | | | 0.39 | | | | 1.24 | | | | 0.30 | | | | 65 | | |
| Class Y | |
| | 2005 | | | | 18.14 | % | | $ | 329,656 | | | | 0.92 | % | | | 0.67 | % | | | 0.97 | % | | | 0.62 | % | | | 176 | % | |
| | 2004 | | | | 11.10 | | | | 291,807 | | | | 0.90 | | | | 0.57 | | | | 0.96 | | | | 0.51 | | | | 67 | | |
| | 2003 | (8) | | | 15.02 | | | | 126,391 | | | | 0.90 | | | | 0.71 | | | | 0.99 | | | | 0.62 | | | | 65 | | |
(1) The financial highlights for the Large Cap Growth Opportunities Fund as set forth herein include the historical financial highlights of the Firstar Large Cap Core Equity Fund.
The assets of the Firstar Fund were acquired by the First American Large Cap Growth Opportunities Fund on September 24, 2001. In connection with such acquisition,
(i) Class A shares of the Firstar Large Cap Core Fund were exchanged for Class A shares of the First American Large Cap Growth Opportunities Fund, (ii) Firstar Class B
shares were exchanged for Class B shares of the First American Fund, (iii) Firstar Class Y shares were exchanged for Class S shares (now designated Class R shares) of
the First American Fund, and (iv) Firstar Class Institutional shares were exchanged for Class Y shares of the First American Fund.
(2) Per share data calculated using average shares outstanding method.
(3) For the period November 1, 2000 to September 30, 2001. Effective in 2001, the fund's fiscal year end was changed from October 31 to September 30. All ratios for the period
have been annualized, except total return and portfolio turnover.
(4) For the fiscal period ended October 31.
(5) Class of shares has been offered since September 24, 2001. All ratios for the period have been annualized, except total return and
portfolio turnover.
(6) Prior to July 1, 2004, Class R shares were named Class S shares, which had lower fees and expenses.
(7) Class of shares has been offered since November 27, 2000. All ratios for the period have been annualized, except total return and
portfolio turnover.
(8) Commenced operations on January 31, 2003. All ratios for the period have been annualized, except total return and portfolio turnover.
(9) Includes a tax return of capital of less than $0.01.
(10) Total return does not reflect sales charges. Total return would have been lower had certain expenses not been waived.
FIRST AMERICAN FUNDS Annual Report 2005
91
Financial Highlights For a share outstanding throughout the periods ended September 30, unless otherwise indicated.
| | | Net Asset
Value
Beginning
of Period | | Net
Investment
Income | | Realized and
Unrealized
Gains
(Losses) on
Investments | | Distributions
from Net
Investment
Income | | Distributions
from Net
Realized Gains | | Net Asset
Value
End of
Period | | Total
Return (4) | |
| Large Cap Value Fund (1) | |
| Class A | |
| | 2005 | | | $ | 17.21 | | | $ | 0.17 | | | $ | 2.85 | | | $ | (0.17 | ) | | $ | - | | | $ | 20.06 | | | | 17.62 | % | |
| | 2004 | | | | 14.97 | | | | 0.15 | | | | 2.24 | | | | (0.15 | ) | | | - | | | | 17.21 | | | | 16.01 | | |
| | 2003 | | | | 12.77 | | | | 0.18 | | | | 2.20 | | | | (0.18 | ) | | | - | | | | 14.97 | | | | 18.71 | | |
| | 2002 | | | | 15.98 | | | | 0.14 | | | | (3.21 | ) | | | (0.14 | ) | | | - | | | | 12.77 | | | | (19.37 | ) | |
| | 2001 | | | | 20.59 | | | | 0.16 | | | | (2.67 | ) | | | (0.16 | ) | | | (1.94 | ) | | | 15.98 | | | | (13.72 | ) | |
| Class B | |
| | 2005 | | | $ | 16.87 | | | $ | 0.03 | | | $ | 2.78 | | | $ | (0.06 | ) | | $ | - | | | $ | 19.62 | | | | 16.70 | % | |
| | 2004 | | | | 14.70 | | | | 0.03 | | | | 2.20 | | | | (0.06 | ) | | | - | | | | 16.87 | | | | 15.19 | | |
| | 2003 | | | | 12.55 | | | | 0.08 | | | | 2.15 | | | | (0.08 | ) | | | - | | | | 14.70 | | | | 17.83 | | |
| | 2002 | | | | 15.71 | | | | 0.02 | | | | (3.15 | ) | | | (0.03 | ) | | | - | | | | 12.55 | | | | (19.96 | ) | |
| | 2001 | | | | 20.30 | | | | 0.02 | | | | (2.63 | ) | | | (0.04 | ) | | | (1.94 | ) | | | 15.71 | | | | (14.42 | ) | |
| Class C | |
| | 2005 | | | $ | 17.07 | | | $ | 0.03 | | | $ | 2.81 | | | $ | (0.06 | ) | | $ | - | | | $ | 19.85 | | | | 16.75 | % | |
| | 2004 | | | | 14.87 | | | | 0.03 | | | | 2.23 | | | | (0.06 | ) | | | - | | | | 17.07 | | | | 15.21 | | |
| | 2003 | | | | 12.70 | | | | 0.08 | | | | 2.17 | | | | (0.08 | ) | | | - | | | | 14.87 | | | | 17.76 | | |
| | 2002 | | | | 15.90 | | | | 0.02 | | | | (3.19 | ) | | | (0.03 | ) | | | - | | | | 12.70 | | | | (19.97 | ) | |
| | 2001 | | | | 20.51 | | | | 0.02 | | | | (2.65 | ) | | | (0.04 | ) | | | (1.94 | ) | | | 15.90 | | | | (14.36 | ) | |
| Class R (2) | |
| | 2005 | | | $ | 17.22 | | | $ | 0.12 | | | $ | 2.85 | | | $ | (0.13 | ) | | $ | - | | | $ | 20.06 | | | | 17.34 | % | |
| | 2004 | | | | 14.96 | | | | 0.17 | | | | 2.23 | | | | (0.14 | ) | | | - | | | | 17.22 | | | | 16.05 | | |
| | 2003 | | | | 12.77 | | | | 0.18 | | | | 2.19 | | | | (0.18 | ) | | | - | | | | 14.96 | | | | 18.63 | | |
| | 2002 | | | | 15.97 | | | | 0.13 | | | | (3.18 | ) | | | (0.15 | ) | | | - | | | | 12.77 | | | | (19.36 | ) | |
| | 2001 | (3) | | | 15.32 | | | | - | | | | 0.65 | | | | - | | | | - | | | | 15.97 | | | | 4.24 | | |
| Class Y | |
| | 2005 | | | $ | 17.26 | | | $ | 0.22 | | | $ | 2.86 | | | $ | (0.22 | ) | | $ | - | | | $ | 20.12 | | | | 17.92 | % | |
| | 2004 | | | | 15.01 | | | | 0.20 | | | | 2.24 | | | | (0.19 | ) | | | - | | | | 17.26 | | | | 16.31 | | |
| | 2003 | | | | 12.80 | | | | 0.22 | | | | 2.20 | | | | (0.21 | ) | | | - | | | | 15.01 | | | | 19.04 | | |
| | 2002 | | | | 16.02 | | | | 0.18 | | | | (3.22 | ) | | | (0.18 | ) | | | - | | | | 12.80 | | | | (19.22 | ) | |
| | 2001 | | | | 20.64 | | | | 0.21 | | | | (2.68 | ) | | | (0.21 | ) | | | (1.94 | ) | | | 16.02 | | | | (13.53 | ) | |
The accompanying notes are an integral part of the financial statements.
FIRST AMERICAN FUNDS Annual Report 2005
92
| | | Net Assets
End of
Period (000) | | Ratio of
Expenses to
Average
Net Assets | | Ratio of Net
Investment
Income
to Average
Net Assets | | Ratio of
Expenses to
Average
Net Assets
(Excluding
Waivers) | | Ratio of Net
Investment
Income
to Average Net
Assets (Excluding
Waivers) | | Portfolio
Turnover
Rate | |
| Large Cap Value Fund (1) | |
| Class A | |
| | 2005 | | | $ | 121,809 | | | | 1.17 | % | | | 0.90 | % | | | 1.20 | % | | | 0.87 | % | | | 61 | % | |
| | 2004 | | | | 113,683 | | | | 1.15 | | | | 0.91 | | | | 1.19 | | | | 0.87 | | | | 104 | | |
| | 2003 | | | | 88,024 | | | | 1.15 | | | | 1.30 | | | | 1.20 | | | | 1.25 | | | | 94 | | |
| | 2002 | | | | 85,182 | | | | 1.15 | | | | 0.86 | | | | 1.20 | | | | 0.81 | | | | 82 | | |
| | 2001 | | | | 94,064 | | | | 1.05 | | | | 0.88 | | | | 1.15 | | | | 0.78 | | | | 64 | | |
| Class B | |
| | 2005 | | | $ | 14,876 | | | | 1.92 | % | | | 0.15 | % | | | 1.95 | % | | | 0.12 | % | | | 61 | % | |
| | 2004 | | | | 21,829 | | | | 1.90 | | | | 0.19 | | | | 1.94 | | | | 0.15 | | | | 104 | | |
| | 2003 | | | | 30,987 | | | | 1.90 | | | | 0.56 | | | | 1.95 | | | | 0.51 | | | | 94 | | |
| | 2002 | | | | 33,720 | | | | 1.90 | | | | 0.11 | | | | 1.95 | | | | 0.06 | | | | 82 | | |
| | 2001 | | | | 38,108 | | | | 1.80 | | | | 0.13 | | | | 1.90 | | | | 0.03 | | | | 64 | | |
| Class C | |
| | 2005 | | | $ | 5,710 | | | | 1.92 | % | | | 0.15 | % | | | 1.95 | % | | | 0.12 | % | | | 61 | % | |
| | 2004 | | | | 6,344 | | | | 1.90 | | | | 0.18 | | | | 1.94 | | | | 0.14 | | | | 104 | | |
| | 2003 | | | | 6,844 | | | | 1.90 | | | | 0.56 | | | | 1.95 | | | | 0.51 | | | | 94 | | |
| | 2002 | | | | 7,524 | | | | 1.90 | | | | 0.11 | | | | 1.95 | | | | 0.06 | | | | 82 | | |
| | 2001 | | | | 10,141 | | | | 1.80 | | | | 0.12 | | | | 1.90 | | | | 0.02 | | | | 64 | | |
| Class R (2) | |
| | 2005 | | | $ | 7 | | | | 1.42 | % | | | 0.61 | % | | | 1.60 | % | | | 0.43 | % | | | 61 | % | |
| | 2004 | | | | 1 | | | | 1.15 | | | | 1.00 | | | | 1.19 | | | | 0.96 | | | | 104 | | |
| | 2003 | | | | 23,845 | | | | 1.15 | | | | 1.30 | | | | 1.20 | | | | 1.25 | | | | 94 | | |
| | 2002 | | | | 24,129 | | | | 1.15 | | | | 0.90 | | | | 1.20 | | | | 0.85 | | | | 82 | | |
| | 2001 | (3) | | | - | | | | - | | | | - | | | | - | | | | - | | | | 64 | | |
| Class Y | |
| | 2005 | | | $ | 764,679 | | | | 0.92 | % | | | 1.17 | % | | | 0.95 | % | | | 1.14 | % | | | 61 | % | |
| | 2004 | | | | 1,021,197 | | | | 0.90 | | | | 1.17 | | | | 0.94 | | | | 1.13 | | | | 104 | | |
| | 2003 | | | | 874,267 | | | | 0.90 | | | | 1.55 | | | | 0.95 | | | | 1.50 | | | | 94 | | |
| | 2002 | | | | 825,179 | | | | 0.90 | | | | 1.11 | | | | 0.95 | | | | 1.06 | | | | 82 | | |
| | 2001 | | | | 970,190 | | | | 0.80 | | | | 1.13 | | | | 0.90 | | | | 1.03 | | | | 64 | | |
(1) Per share data calculated using average shares outstanding method.
(2) Prior to July 1, 2004, Class R shares were named Class S shares, which had lower fees and expenses.
(3) Class of shares has been offered since September 24, 2001. All ratios for the period have been annualized, except total return and portfolio turnover.
(4) Total return does not reflect sales charges. Total return would have been lower had certain expenses not been waived.
FIRST AMERICAN FUNDS Annual Report 2005
93
Schedule of Investments September 30, 2005
Balanced Fund
| DESCRIPTION | | SHARES | | VALUE (000) | |
| Common Stocks – 62.3% | | | |
| Consumer Discretionary – 6.8% | | | |
| Chico's FAS* (a) | | | 67,570 | | | $ | 2,487 | | |
| Coach* | | | 73,550 | | | | 2,307 | | |
| Gray Television | | | 4,540 | | | | 48 | | |
| Harrah's Entertainment | | | 42,820 | | | | 2,791 | | |
| J.C. Penney | | | 73,290 | | | | 3,475 | | |
| Kerzner International* (a) | | | 1,930 | | | | 107 | | |
| La Quinta (REIT)* (a) | | | 39,700 | | | | 345 | | |
| Marvel Entertainment* (a) | | | 16,685 | | | | 298 | | |
| Men's Wearhouse* (a) | | | 8,445 | | | | 226 | | |
| Nautilus Group (a) | | | 4,970 | | | | 110 | | |
| Omnicom Group (a) | | | 45,740 | | | | 3,825 | | |
| P.F. Chang's China Bistro* (a) | | | 2,890 | | | | 130 | | |
| RARE Hospitality International* | | | 6,040 | | | | 155 | | |
| Ruby Tuesday (a) | | | 12,330 | | | | 268 | | |
| Ruth's Chris Steak House* | | | 670 | | | | 12 | | |
| Scientific Games, Class A* (a) | | | 15,580 | | | | 483 | | |
| Sherwin Williams (a) | | | 67,534 | | | | 2,976 | | |
| Sports Authority* (a) | | | 7,940 | | | | 234 | | |
| Station Casinos (a) | | | 40,750 | | | | 2,704 | | |
| Thomas Nelson | | | 8,250 | | | | 155 | | |
| Time Warner | | | 211,647 | | | | 3,833 | | |
| Too* | | | 13,120 | | | | 360 | | |
| WCI Communities* (a) | | | 6,840 | | | | 194 | | |
| | | | 27,523 | | |
| Consumer Staples – 2.6% | | | |
| PepsiCo | | | 75,327 | | | | 4,272 | | |
| Procter & Gamble (a) | | | 105,794 | | | | 6,291 | | |
| | | | 10,563 | | |
| Energy – 6.8% | | | |
| Amerada Hess (a) | | | 35,440 | | | | 4,873 | | |
| Apache | | | 76,728 | | | | 5,772 | | |
| Bill Barrett* (a) | | | 3,870 | | | | 143 | | |
| Cal Dive International* (a) | | | 1,110 | | | | 70 | | |
| Compton Petroleum* (a) | | | 14,630 | | | | 198 | | |
| ConocoPhillips | | | 74,960 | | | | 5,240 | | |
| ENSCO International (a) | | | 8,050 | | | | 375 | | |
| Exxon Mobil | | | 37,745 | | | | 2,398 | | |
| Halliburton (a) | | | 35,088 | | | | 2,404 | | |
| Hydril* (a) | | | 1,060 | | | | 73 | | |
| National-Oilwell* (a) | | | 72,857 | | | | 4,794 | | |
| St. Mary Land & Exploration (a) | | | 2,110 | | | | 77 | | |
| Tesoro Petroleum | | | 3,910 | | | | 263 | | |
| Ultra Petroleum* (a) | | | 4,586 | | | | 261 | | |
| Western Gas Resources | | | 3,360 | | | | 172 | | |
| W-H Energy Services* (a) | | | 11,770 | | | | 382 | | |
| | | | 27,495 | | |
| Financials – 12.9% | | | |
| ACE | | | 103,450 | | | | 4,869 | | |
| Advanta, Class B | | | 6,075 | | | | 172 | | |
| Affiliated Managers Group* (a) | | | 4,110 | | | | 298 | | |
| Alexandria Real Estate Equities (REIT) | | | 2,830 | | | | 234 | | |
| Allstate (a) | | | 62,550 | | | | 3,458 | | |
| American International Group | | | 91,990 | | | | 5,700 | | |
| AmerUS Group, Class A (a) | | | 5,180 | | | | 297 | | |
| Bank of America (a) | | | 199,810 | | | | 8,412 | | |
| Capital One Financial (a) | | | 34,460 | | | | 2,740 | | |
Balanced Fund (continued)
| DESCRIPTION | | SHARES | | VALUE (000) | |
| CoBiz (a) | | | 3,260 | | | $ | 61 | | |
| Columbia Banking System | | | 4,929 | | | | 129 | | |
| Cullen/Frost Bankers | | | 7,230 | | | | 357 | | |
| East West Bancorp | | | 7,040 | | | | 240 | | |
| First Financial Bankshares | | | 2,516 | | | | 88 | | |
| First Niagara Financial Group | | | 9,110 | | | | 132 | | |
| First Potomac Realty Trust (REIT) | | | 4,750 | | | | 122 | | |
| First Republic Bank (a) | | | 11,620 | | | | 409 | | |
| GATX (a) | | | 10,470 | | | | 414 | | |
| Goldman Sachs Group | | | 70,062 | | | | 8,518 | | |
| Kite Realty Group Trust | | | 10,520 | | | | 157 | | |
| Lasalle Hotel Properties (REIT) | | | 3,500 | | | | 121 | | |
| Lehman Brothers Holdings (a) | | | 49,810 | | | | 5,802 | | |
| Maguire Properties | | | 13,950 | | | | 419 | | |
| SL Green Realty | | | 7,140 | | | | 487 | | |
| SVB Financial Group* (a) | | | 6,280 | | | | 305 | | |
| Wells Fargo | | | 139,470 | | | | 8,169 | | |
| | | | 52,110 | | |
| Health Care – 8.0% | | | |
| Alkermes* (a) | | | 2,110 | | | | 35 | | |
| American Healthways* (a) | | | 5,440 | | | | 231 | | |
| Amgen* (a) | | | 78,420 | | | | 6,248 | | |
| Caliper Life Sciences* (a) | | | 20,090 | | | | 141 | | |
| Curis* | | | 18,958 | | | | 87 | | |
| ImmunoGen* (a) | | | 12,230 | | | | 90 | | |
| Johnson & Johnson | | | 132,350 | | | | 8,375 | | |
| Medicis Pharmaceutical, Class A | | | 3,600 | | | | 117 | | |
| Neurocrine Biosciences* (a) | | | 4,480 | | | | 220 | | |
| Pediatrix Medical Group* (a) | | | 5,510 | | | | 423 | | |
| Protein Design Labs* | | | 8,150 | | | | 228 | | |
| Respironics* | | | 2,990 | | | | 126 | | |
| Senomyx* | | | 6,220 | | | | 106 | | |
| Sierra Health Services* (a) | | | 9,260 | | | | 638 | | |
| SonoSite* (a) | | | 5,720 | | | | 170 | | |
| SurModics* (a) | | | 8,090 | | | | 313 | | |
| Sybron Dental Specialties* (a) | | | 4,690 | | | | 195 | | |
| Symmetry Medical* | | | 9,670 | | | | 229 | | |
| Teva Pharmaceutical Industries, ADR (a) | | | 62,259 | | | | 2,081 | | |
| United Surgical Partners* | | | 6,490 | | | | 254 | | |
| UnitedHealth Group (a) | | | 73,016 | | | | 4,104 | | |
| Wyeth | | | 163,491 | | | | 7,565 | | |
| | | | 31,976 | | |
| Industrials – 7.0% | | | |
| AirTran Holdings* (a) | | | 11,130 | | | | 141 | | |
| Chicago Bridge & Iron | | | 15,040 | | | | 468 | | |
| CLARCOR | | | 3,950 | | | | 113 | | |
| Eaton | | | 30,581 | | | | 1,943 | | |
| EGL* | | | 12,000 | | | | 326 | | |
| Emerson Electric | | | 50,847 | | | | 3,651 | | |
| Energy Conversion Devices* (a) | | | 1,010 | | | | 45 | | |
| General Electric | | | 205,914 | | | | 6,933 | | |
| Illinois Tool Works | | | 28,250 | | | | 2,326 | | |
| J.B. Hunt Transport Services (a) | | | 13,010 | | | | 247 | | |
| Kennametal (a) | | | 7,090 | | | | 348 | | |
| KVH Industries* (a) | | | 23,890 | | | | 233 | | |
| Labor Ready* (a) | | | 10,510 | | | | 270 | | |
| Lennox International | | | 4,750 | | | | 130 | | |
| Manitowoc | | | 2,710 | | | | 136 | | |
| Mercury Computer Systems* (a) | | | 8,150 | | | | 214 | | |
The accompanying notes are an integral part of the financial statements.
FIRST AMERICAN FUNDS Annual Report 2005
94
Balanced Fund (continued)
| DESCRIPTION | | SHARES | | VALUE (000) | |
| NCI Building Systems* (a) | | | 7,600 | | | $ | 310 | | |
| Pentair | | | 89,990 | | | | 3,285 | | |
| Power-One* (a) | | | 45,028 | | | | 249 | | |
| Roper Industries | | | 3,160 | | | | 124 | | |
| Terex* | | | 5,390 | | | | 266 | | |
| Toro | | | 6,150 | | | | 226 | | |
| United Parcel Service, Class B (a) | | | 90,300 | | | | 6,242 | | |
| | | | 28,226 | | |
| Information Technology – 14.4% | | | |
| A D C Telecommunications* (a) | | | 5,600 | | | | 128 | | |
| Advanced Analogic Technologies* | | | 2,030 | | | | 23 | | |
| Aeroflex* | | | 13,170 | | | | 123 | | |
| Amphenol, Class A (a) | | | 90,580 | | | | 3,654 | | |
| ATI Technologies* (a) | | | 23,660 | | | | 330 | | |
| Autodesk (a) | | | 66,620 | | | | 3,094 | | |
| Benchmark Electronics* (a) | | | 5,020 | | | | 151 | | |
| BISYS Group* (a) | | | 25,310 | | | | 340 | | |
| Carreker* | | | 17,110 | | | | 121 | | |
| Digitas* (a) | | | 22,120 | | | | 251 | | |
| Embarcadero Technologies* | | | 19,341 | | | | 130 | | |
| EMC* | | | 295,400 | | | | 3,823 | | |
| Emulex* (a) | | | 11,830 | | | | 239 | | |
| Entegris* (a) | | | 21,436 | | | | 242 | | |
| EPIQ Systems* | | | 4,420 | | | | 96 | | |
| FormFactor* | | | 4,810 | | | | 110 | | |
| Hewlett-Packard | | | 244,740 | | | | 7,146 | | |
| Hyperion Solutions* (a) | | | 6,392 | | | | 311 | | |
| Integrated Device Technology* (a) | | | 31,902 | | | | 343 | | |
| Intel | | | 410,633 | | | | 10,122 | | |
| Ituran Location and Control* | | | 9,150 | | | | 120 | | |
| Logitech International* (a) | | | 9,480 | | | | 386 | | |
| Micromuse* | | | 19,009 | | | | 150 | | |
| Microsoft | | | 253,720 | | | | 6,528 | | |
| Motorola (a) | | | 246,105 | | | | 5,436 | | |
| M-Systems Flash Disk Pioneer* | | | 3,020 | | | | 90 | | |
| Openwave Systems* (a) | | | 7,970 | | | | 143 | | |
| Opsware* | | | 11,960 | | | | 62 | | |
| Oracle* | | | 421,073 | | | | 5,217 | | |
| Packeteer* | | | 25,311 | | | | 318 | | |
| QUALCOMM | | | 83,247 | | | | 3,725 | | |
| Silicon Image* (a) | | | 37,450 | | | | 333 | | |
| Sonic Solutions* (a) | | | 11,500 | | | | 247 | | |
| Stellent* (a) | | | 38,208 | | | | 327 | | |
| Texas Instruments | | | 108,766 | | | | 3,687 | | |
| TIBCO Software* (a) | | | 30,700 | | | | 257 | | |
| TNS* | | | 2,650 | | | | 64 | | |
| ValueClick* (a) | | | 2,030 | | | | 35 | | |
| | | | 57,902 | | |
| Materials – 1.6% | | | |
| Century Aluminum* (a) | | | 10,530 | | | | 237 | | |
| Dow Chemical | | | 136,140 | | | | 5,673 | | |
| Headwaters* (a) | | | 1,600 | | | | 60 | | |
| Hercules* | | | 4,710 | | | | 58 | | |
| Olin (a) | | | 9,530 | | | | 181 | | |
| Schnitzer Steel Industries, Class A | | | 1,860 | | | | 61 | | |
| Steel Dynamics | | | 5,650 | | | | 192 | | |
| Texas Industries | | | 1,110 | | | | 60 | | |
| | | | 6,522 | | |
Balanced Fund (continued)
| DESCRIPTION | | SHARES/PAR (000) | | VALUE (000) | |
| Telecommunication Services – 1.5% | |
| General Communication* (a) | | | 13,373 | | | $ | 132 | | |
| Verizon Communications | | | 176,892 | | | | 5,783 | | |
| | | | 5,915 | | |
| Utilities – 0.7% | | | |
| PG&E | | | 70,177 | | | | 2,754 | | |
Total Common Stocks
(Cost $219,191) | | | | | | | 250,986 | | |
| Investment Companies – 7.2% | |
| iShares MSCI EAFE Index Fund (a) | | | 327,100 | | | | 19,005 | | |
iShares MSCI Emerging Markets
Index Fund (a) | | | 44,000 | | | | 3,735 | | |
| iShares MSCI EMU Index Fund | | | 8,300 | | | | 638 | | |
| iShares MSCI Japan Index Fund (a) | | | 270,000 | | | | 3,291 | | |
| iShares MSCI Pacific ex-Japan Index Fund | | | 10,600 | | | | 1,093 | | |
| iShares S&P Europe 350 Index Fund (a) | | | 15,800 | | | | 1,273 | | |
Total Investment Companies
(Cost $25,446) | | | | | | | 29,035 | | |
U.S. Government Agency
Mortgage-Backed Securities – 10.2% | |
| Adjustable Rate (b) – 0.4% | |
| Federal Home Loan Mortgage Corporation Pool | |
| 4.614%, 01/01/28, #786281 | | $ | 426 | | | | 438 | | |
| Federal National Mortgage Association Pool | |
| 4.333%, 04/01/18, #070009 | | | 58 | | | | 59 | | |
| 4.700%, 09/01/33, #725553 (a) | | | 1,036 | | | | 1,057 | | |
| | | | 1,554 | | |
| Fixed Rate – 9.8% | | | |
| Federal Home Loan Mortgage Corporation Pool | |
| 6.500%, 04/01/08, #E00225 | | | 17 | | | | 17 | | |
| 7.000%, 04/01/08, #E46044 | | | 10 | | | | 10 | | |
| 4.000%, 10/01/10, #M80855 | | | 1,017 | | | | 1,003 | | |
| 5.500%, 03/01/13, #E00546 | | | 164 | | | | 167 | | |
| 4.500%, 05/01/18, #P10032 | | | 489 | | | | 486 | | |
| 6.500%, 11/01/28, #C00676 | | | 645 | | | | 664 | | |
| 7.000%, 12/01/29, #G01091 | | | 133 | | | | 139 | | |
| 6.500%, 07/01/31, #A17212 | | | 490 | | | | 505 | | |
| 6.000%, 05/01/32, #C01361 | | | 144 | | | | 147 | | |
| Federal National Mortgage Association Pool | |
| 5.500%, 03/01/06, #424411 | | | 53 | | | | 53 | | |
| 3.790%, 07/01/13, #386314 (a) | | | 1,375 | | | | 1,295 | | |
| 6.000%, 09/01/17, #653368 | | | 355 | | | | 365 | | |
| 5.000%, 07/01/18, #555621 | | | 1,479 | | | | 1,477 | | |
| 5.000%, 12/01/18, #725012 | | | 2,035 | | | | 2,030 | | |
| 4.500%, 06/01/19, #045181 | | | 412 | | | | 404 | | |
| 5.000%, 11/01/19, #725934 | | | 347 | | | | 346 | | |
| 4.500%, 06/01/20, #828929 (a) | | | 1,034 | | | | 1,013 | | |
| 6.000%, 10/01/22, #254513 (a) | | | 594 | | | | 607 | | |
| 5.500%, 10/01/24, #255456 (a) | | | 1,152 | | | | 1,158 | | |
| 5.500%, 12/01/24, #357662 | | | 934 | | | | 939 | | |
| 5.500%, 02/01/25, #255628 (a) | | | 1,132 | | | | 1,138 | | |
| 7.000%, 04/01/29, #323681 | | | 146 | | | | 153 | | |
| 6.500%, 12/01/31, #254169 (a) | | | 571 | | | | 588 | | |
| 6.500%, 05/01/32, #640032 | | | 975 | | | | 1,004 | | |
| 7.000%, 07/01/32, #545815 (a) | | | 282 | | | | 296 | | |
| 6.000%, 09/01/32, #254447 (a) | | | 479 | | | | 487 | | |
| 6.000%, 01/01/33, #676647 | | | 903 | | | | 919 | | |
| 5.500%, 04/01/33, #694605 (a) | | | 1,228 | | | | 1,229 | | |
| 5.500%, 07/01/33, #728667 | | | 693 | | | | 693 | | |
| 5.500%, 08/01/33, #733380 (a) | | | 1,407 | | | | 1,407 | | |
FIRST AMERICAN FUNDS Annual Report 2005
95
Schedule of Investments September 30, 2005
Balanced Fund (continued)
| DESCRIPTION | | PAR (000) | | VALUE (000) | |
| 5.000%, 10/01/33, #741897 (a) | | $ | 3,345 | | | $ | 3,278 | | |
| 6.000%, 11/01/33, #772130 | | | 223 | | | | 227 | | |
| 6.000%, 11/01/33, #772256 | | | 285 | | | | 290 | | |
| 5.500%, 12/01/33, #756202 (a) | | | 828 | | | | 828 | | |
| 5.000%, 03/01/34, #725205 (a) | | | 1,052 | | | | 1,031 | | |
| 5.000%, 03/01/34, #725250 (a) | | | 933 | | | | 914 | | |
| 5.500%, 04/01/34, #725424 (a) | | | 529 | | | | 530 | | |
| 5.500%, 05/01/34, #357571 | | | 928 | | | | 928 | | |
| 5.000%, 06/01/34, #782909 | | | 448 | | | | 438 | | |
| 6.500%, 06/01/34, #735273 (a) | | | 1,103 | | | | 1,135 | | |
| 6.000%, 10/01/34, #781776 | | | 861 | | | | 876 | | |
| 5.289%, 11/01/34, #735054 | | | 951 | | | | 954 | | |
| 4.500%, 03/01/35, #819357 | | | 1,089 | | | | 1,040 | | |
| Federal National Mortgage Association TBA (c) | |
| 6.000%, 10/13/35 | | | 3,070 | | | | 3,120 | | |
| 5.500%, 10/15/35 | | | 1,870 | | | | 1,869 | | |
| Government National Mortgage Association Pool | |
| 6.500%, 10/20/10, #002108 | | | 32 | | | | 34 | | |
| 7.500%, 06/15/27, #447728 | | | 18 | | | | 19 | | |
| 7.500%, 09/15/27, #455516 | | | 13 | | | | 13 | | |
| 7.000%, 04/15/29, #506639 | | | 219 | | | | 231 | | |
| 6.000%, 11/15/33, #00GNMA (a) | | | 969 | | | | 993 | | |
| | | | 39,487 | | |
Total U.S. Government Agency
Mortgage-Backed Securities
(Cost $41,453) | | | | | | | 41,041 | | |
U.S. Government & Agency
Securities – 6.2% | | | |
| U.S. Agency Debentures – 0.8% | | | |
| Federal Home Loan Bank | |
4.430%, 04/07/08,
Callable 04/07/06 @ 100 (a) | | | 2,400 | | | | 2,387 | | |
| Federal National Mortgage Association | |
| 6.125%, 03/15/12 (a) | | | 280 | | | | 303 | | |
| 5.250%, 08/01/12 | | | 720 | | | | 733 | | |
| | | | 3,423 | | |
| U.S. Treasuries – 5.4% | | | |
| U.S. Inflation Index Bonds (TIPS) | |
| 1.625%, 01/15/15 (a) (d) | | | 1,269 | | | | 1,254 | | |
| 2.375%, 01/15/25 (a) (d) | | | 1,130 | | | | 1,209 | | |
| U.S. Treasury Bonds | |
| 9.000%, 11/15/18 (a) | | | 800 | | | | 1,152 | | |
| 6.250%, 08/15/23 (a) | | | 1,500 | | | | 1,793 | | |
| 7.625%, 02/15/25 (a) | | | 390 | | | | 538 | | |
| 6.875%, 08/15/25 (a) | | | 1,600 | | | | 2,062 | | |
| 5.500%, 08/15/28 (a) | | | 210 | | | | 236 | | |
| 5.250%, 11/15/28 (a) | | | 1,400 | | | | 1,526 | | |
| 5.250%, 02/15/29 (a) | | | 1,460 | | | | 1,592 | | |
| 5.375%, 02/15/31 (a) | | | 2,020 | | | | 2,263 | | |
| U.S. Treasury Notes | |
| 1.500%, 03/31/06 | | | 735 | | | | 726 | | |
| 3.875%, 09/15/10 | | | 1,430 | | | | 1,410 | | |
| 4.250%, 08/15/15 (a) | | | 5,925 | | | | 5,888 | | |
| | | | 21,649 | | |
Total U.S. Government & Agency Securities
(Cost $24,804) | | | | | | | 25,072 | | |
| Asset-Backed Securities – 4.9% | | | |
| Automobiles – 0.5% | | | |
Bank One Auto Receivable
Series 2003-1, Class A3
1.820%, 09/20/07 | | | 776 | | | | 771 | | |
Balanced Fund (continued)
| DESCRIPTION | | PAR (000) | | VALUE (000) | |
Ford Credit Auto Trust
Series 2005-B, Class A3
4.170%, 01/15/09 | | $ | 780 | | | $ | 777 | | |
Nissan Auto Receivables Trust
Series 2005-B, Class A2
3.750%, 09/17/07 | | | 430 | | | | 429 | | |
| | | | 1,977 | | |
| Commercial – 2.1% | | | |
Bank of America Commercial Mortgage
Series 2004-5, Class A3
4.561%, 11/10/41 | | | 710 | | | | 700 | | |
Bear Stearns Asset Backed Securities
Series 2004-T14, Class A4
5.200%, 01/12/41 | | | 205 | | | | 209 | | |
Commercial Mortgage
Series 2004-CNL, Class A1
3.791%, 09/15/14 (e) | | | 780 | | | | 780 | | |
Series 2005-LP5, Class A2
4.630%, 05/10/43 | | | 925 | | | | 918 | | |
Deutsche Mortgage and Asset Receiving
Series 1998-C1, Class A2
6.538%, 06/15/31 | | | 543 | | | | 558 | | |
Global Signal Trust
Series 2004-2A, Class A
4.232%, 12/15/14 (e) | | | 750 | | | | 730 | | |
GMAC Commercial Mortgage
Series 2004-C2, Class A1
3.896%, 08/10/38 | | | 690 | | | | 678 | | |
GS Mortgage Securities
Series 2004-G62, Class A3
4.602%, 08/10/38 | | | 1,500 | | | | 1,496 | | |
LB-UBS
Series 2003-C3, Class A2
3.086%, 05/15/27 | | | 1,280 | | | | 1,228 | | |
Merrill Lynch Mortgage Investors
Series 1998-C1, Class A1
6.310%, 11/15/26 | | | 209 | | | | 209 | | |
Nomura Asset Securities
Series 1998-D6, Class A1B
6.590%, 03/15/30 | | | 750 | | | | 781 | | |
| | | | 8,287 | | |
| Credit Cards – 1.1% | | | |
Chase Credit Card Master Trust
Series 2003-2, Class A
3.878%, 07/15/10 (b) | | | 735 | | | | 737 | | |
Citibank Credit Card Issuance Trust
Series 2003-A2
2.700%, 01/15/08 | | | 400 | | | | 398 | | |
Series 2003-A5, Class A5
2.500%, 04/07/08 | | | 625 | | | | 620 | | |
MBNA Master Trust
Series 2001-A1, Class A1
5.750%, 10/15/08 | | | 635 | | | | 641 | | |
Series 2005-A1, Class A1
4.200%, 09/15/10 | | | 1,130 | | | | 1,122 | | |
Providian Gateway Master Trust
Series 2004-DA, Class A
3.350%, 09/15/11 (e) | | | 975 | | | | 951 | | |
| | | | 4,469 | | |
The accompanying notes are an integral part of the financial statements.
FIRST AMERICAN FUNDS Annual Report 2005
96
Balanced Fund (continued)
| DESCRIPTION | | PAR (000) | | VALUE (000) | |
| Equipment Leases – 0.3% | |
Caterpillar Financial Trust
Series 2005-A, Class A2
3.660%, 12/26/07 | | $ | 410 | | | $ | 409 | | |
CNH
Series 2003-B, Class A3B
2.470%, 01/15/08 | | | 970 | | | | 962 | | |
| | | | 1,371 | | |
| Home Equity – 0.4% | | | |
Contimortgage
7.120%, 08/15/28 | | | 10 | | | | 10 | | |
Countrywide Financial
Series 2003-BC1, Class A1
4.230%, 03/25/33 (b) | | | 108 | | | | 110 | | |
First Franklin Mortgage
Series 2004-FFB, Class A3
4.264%, 06/25/24 | | | 240 | | | | 238 | | |
New Century Home Equity Loan Trust
Series 2004-4, Class A4
4.110%, 02/25/35 (b) | | | 950 | | | | 951 | | |
Saxon Asset Securities Trust
Series 2004-1, Class A
4.100%, 03/25/35 (b) | | | 92 | | | | 93 | | |
| | | | 1,402 | | |
| Other – 0.5% | | | |
GRP/AG Real Estate Asset Trust
Series 2004-1, Class A
3.960%, 03/25/09 (e) (f) | | | 84 | | | | 83 | | |
Series 2005-1, Class A
4.850%, 01/25/35 (e) (f) | | | 310 | | | | 308 | | |
William Street Funding
Series 2004-4, Class A
1.930%, 09/23/10 (e) | | | 1,200 | | | | 1,201 | | |
Series 2005-1, Class A (e)
3.041%, 01/23/11 | | | 465 | | | | 464 | | |
| | | | 2,056 | | |
Total Asset-Backed Securities
(Cost $19,775) | | | | | | | 19,562 | | |
CMO – Private Mortgage-Backed
Securities – 3.8% | |
| Adjustable Rate (b) – 1.6% | |
Adjustable Rate Mortgage Trust
Series 2005-10, Class 1A21
4.765%, 01/25/36 | | | 825 | | | | 820 | | |
IMPAC CMB Trust
Series 2003-12, Class A1
4.210%, 12/25/33 | | | 530 | | | | 532 | | |
MLCC Mortgage Investors
Series 2003-H, Class A3A
4.949%, 01/25/29 | | | 279 | | | | 284 | | |
Series 2004-B, Class A3
4.854%, 05/25/29 | | | 519 | | | | 531 | | |
Morgan Stanley Loan Trust
Series 2004-9, Class 1A
6.282%, 11/25/34 | | | 636 | | | | 644 | | |
Sequoia Mortgage Trust
Series 2004-5, Class A1
4.688%, 06/20/34 | | | 612 | | | | 626 | | |
Series 2004-7, Class A2
4.840%, 08/20/34 | | | 489 | | | | 495 | | |
Balanced Fund (continued)
| DESCRIPTION | | PAR (000) | | VALUE (000) | |
Structured Adjustable Rate
Mortgage Loan Trust
Series 2044-11, Class A
5.321%, 08/25/34 | | $ | 294 | | | $ | 300 | | |
Thornburg Mortgage Trust
Series 2005-2, Class A 1
3.861%, 07/25/45 | | | 775 | | | | 774 | | |
Wells Fargo Mortgage Backed Securities
Series 2003-D, Class A1
4.836%, 02/25/33 | | | 523 | | | | 524 | | |
Series 2004-N, Class A3
4.111%, 08/25/34 | | | 1,080 | | | | 1,069 | | |
| | | | 6,599 | | |
| Fixed Rate – 2.2% | | | |
Bank of America Mortgage Backed Securities
Series 2003-6, Class 1 A30
4.750%, 08/25/33 | | | 585 | | | | 576 | | |
Series 2004-G, Class 2A3
4.232%, 08/25/34 | | | 810 | | | | 802 | | |
Citicorp Mortgage Securities
Series 2005-4, Class 1A6
5.500%, 07/25/35 | | | 845 | | | | 840 | | |
Countrywide Alternative Loan Trust
Series 2004-2CB, Class 1A1
4.250%, 03/25/34 | | | 614 | | | | 608 | | |
Series 2004-24CB, Class 1A1
6.000%, 11/25/34 | | | 542 | | | | 546 | | |
GMAC Commercial Mortgage
Series 2004-J5, Class A7
6.500%, 01/25/35 | | | 655 | | | | 669 | | |
GSR Mortgage Loan Trust
Series 2004-10F, Class 3A1
5.500%, 08/25/19 | | | 544 | | | | 550 | | |
Master Alternative Loans Trust
Series 2005-2, Class 1 1A3
6.500%, 03/25/35 | | | 536 | | | | 548 | | |
Master Asset Securitization Trust
Series 2003-6, Class 1A3
5.000%, 07/25/18 | | | 865 | | | | 855 | | |
Residential Asset Mortgage Products
Series 2004-SL4, Class A3
6.500%, 07/25/32 | | | 424 | | | | 433 | | |
Residential Asset Security Trust
Series 2002-A12, Class 1A1
5.200%, 11/25/32 | | | 118 | | | | 117 | | |
Washington Mutual
Series 2003-S10, Class A2
5.000%, 10/25/18 | | | 1,080 | | | | 1,071 | | |
Wells Fargo Mortgage Backed Securities
Series 2003-14, Class A1
4.750%, 12/25/18 | | | 700 | | | | 689 | | |
Series 2004-EE, Class B1
3.989%, 01/25/35 | | | 610 | | | | 587 | | |
Westam Mortgage Financial
Series 11, Class A
6.360%, 08/26/20 | | | 2 | | | | 2 | | |
| | | | 8,893 | | |
Total CMO – Private Mortgage-Backed Securities
(Cost $15,676) | | | | | | | 15,492 | | |
FIRST AMERICAN FUNDS Annual Report 2005
97
Schedule of Investments September 30, 2005
Balanced Fund (continued)
| DESCRIPTION | | PAR (000) | | VALUE (000) | |
| Corporate Bonds – 3.7% | | | |
| Banking – 0.1% | | | |
Chuo Mitsui Trust & Banking
Callable 4/15/15 @ 100
5.506%, 12/31/49 (e) (f) | | $ | 365 | | | $ | 347 | | |
JP Morgan Chase XVII
5.850%, 08/01/35 | | | 295 | | | | 287 | | |
| | | | 634 | | |
| Basic Industry – 0.4% | | | |
Allegheny Technologies
8.375%, 12/15/11 | | | 275 | | | | 296 | | |
Celulosa Arauco Y Constitucion
5.625%, 04/20/15 (e) | | | 230 | | | | 228 | | |
Falconbridge
7.350%, 06/05/12 | | | 320 | | | | 353 | | |
PolyOne
10.625%, 05/15/10 | | | 300 | | | | 310 | | |
Southern Peru Copper
7.500%, 07/27/35 (e) | | | 390 | | | | 380 | | |
| | | | 1,567 | | |
| Brokerage – 0.2% | | | |
Lazard
7.125%, 05/15/15 (e) | | | 245 | | | | 242 | | |
Merrill Lynch, Series B
5.360%, 02/01/07 | | | 420 | | | | 424 | | |
| | | | 666 | | |
| Capital Goods – 0.2% | | | |
Hutchison Whampoa International
7.450%, 11/24/33 (a) (e) | | | 260 | | | | 300 | | |
Owens-Illinois
8.100%, 05/15/07 (a) | | | 325 | | | | 334 | | |
| | | | 634 | | |
| Communications – 0.5% | | | |
America Movil SA De CV
6.375%, 03/01/35 | | | 235 | | | | 228 | | |
British Telecommunications PLC
8.875%, 12/15/30 | | | 170 | | | | 231 | | |
Clear Channel Communications
5.500%, 09/15/14 (a) | | | 435 | | | | 419 | | |
Dex Media West
9.875%, 08/15/13 | | | 221 | | | | 244 | | |
News American
7.700%, 10/30/25 | | | 600 | | | | 696 | | |
Time Warner
8.375%, 07/15/33 | | | 270 | | | | 338 | | |
| | | | 2,156 | | |
| Consumer Cyclical – 0.5% | | | |
Centex
5.450%, 08/15/12 | | | 445 | | | | 442 | | |
DaimlerChrysler
4.875%, 06/15/10 (a) | | | 230 | | | | 226 | | |
| 6.500%, 11/15/13 (a) | | | 240 | | | | 254 | | |
Duty Free International
7.000%, 10/01/05 (g) (h) (i) | | | 605 | | | | 24 | | |
Ford Motor Credit
7.000%, 10/01/13 (a) | | | 195 | | | | 180 | | |
Harrah's
5.625%, 06/01/15 (e) | | | 350 | | | | 345 | | |
| 5.750%, 10/01/17 (e) | | | 210 | | | | 206 | | |
Balanced Fund (continued)
| DESCRIPTION | | PAR (000) | | VALUE (000) | |
MGM Mirage
6.625%, 07/15/15 (e) | | $ | 290 | | | $ | 287 | | |
| | | | 1,964 | | |
| Consumer Non-Cyclical – 0.3% | | | |
Albertson's
7.500%, 02/15/11 | | | 300 | | | | 296 | | |
Kraft Foods
4.625%, 11/01/06 | | | 670 | | | | 670 | | |
RJ Reynolds Tobacco Holdings
6.500%, 07/15/10 (e) | | | 460 | | | | 459 | | |
| | | | 1,425 | | |
| Electric – 0.2% | | | |
Exelon
4.900%, 06/15/15 | | | 540 | | | | 509 | | |
TXU Energy
7.000%, 03/15/13 (a) | | | 260 | | | | 282 | | |
| | | | 791 | | |
| Energy – 0.6% | | | |
Bluewater Financial
Callable 02/15/07 @ 105.125
10.250%, 02/15/12 | | | 300 | | | | 327 | | |
Gazprom International
7.201%, 02/01/20 (e) | | | 350 | | | | 382 | | |
Kerr McGee
6.950%, 07/01/24 | | | 435 | | | | 450 | | |
Nexen
5.875%, 03/10/35 | | | 270 | | | | 265 | | |
Petrobras International Finance
7.750%, 09/15/14 | | | 310 | | | | 336 | | |
Petro-Canada
5.350%, 07/15/33 | | | 190 | | | | 174 | | |
Tengizcheveroil
6.124%, 11/15/14 (e) | | | 370 | | | | 376 | | |
| | | | 2,310 | | |
| Finance Companies – 0.1% | | | |
American General Finance
5.875%, 07/14/06 | | | 400 | | | | 404 | | |
| Sovereigns – 0.4% | |
Republic of Turkey
9.000%, 06/30/11 | | | 340 | | | | 391 | | |
| 7.375%, 02/05/25 | | | 275 | | | | 275 | | |
United Mexican States
5.875%, 01/15/14 (a) | | | 830 | | | | 859 | | |
| | | | 1,525 | | |
| Technology – 0.2% | | | |
Chartered Semiconductor
6.375%, 08/03/15 (a) | | | 250 | | | | 244 | | |
Ciena
3.750%, 02/01/08 | | | 120 | | | | 110 | | |
Corning
Zero Coupon Bond
2.000%, 11/08/15 (j) | | | 260 | | | | 211 | | |
LG Electronics
5.000%, 06/17/10 (e) | | | 340 | | | | 333 | | |
| | | | 898 | | |
Total Corporate Bonds
(Cost $15,611) | | | | | | | 14,974 | | |
The accompanying notes are an integral part of the financial statements.
FIRST AMERICAN FUNDS Annual Report 2005
98
Balanced Fund (continued)
| DESCRIPTION | | PAR (000)/SHARES | | VALUE (000) | |
CMO – U.S. Government Agency
Mortgage-Backed Securities – 1.1% | | | |
| Fixed Rate – 1.1% | | | |
Federal Home Loan Mortgage Association
Series 85, Class C
8.600%, 01/15/21 | | $ | 113 | | | $ | 113 | | |
Series 1136, Class H
6.000%, 09/15/21 | | | 98 | | | | 97 | | |
| Series 2763, Class TA | |
| 4.000%, 03/15/11 | | | 760 | | | | 743 | | |
Series T-060, Class 1A4B
5.343%, 03/25/44 | | | 765 | | | | 767 | | |
Federal National Mortgage Association
Series 1989-2, Class D
8.800%, 01/25/19 | | | 7 | | | | 8 | | |
Series 1989-37, Class G
8.000%, 07/25/19 | | | 118 | | | | 124 | | |
Series 1990-30, Class E
6.500%, 03/25/20 | | | 49 | | | | 50 | | |
Series 1990-63, Class H
9.500%, 06/25/20 | | | 24 | | | | 26 | | |
Series 1990-89, Class K
6.500%, 07/25/20 | | | 6 | | | | 6 | | |
Series 1990-105, Class J
6.500%, 09/25/20 | | | 82 | | | | 84 | | |
Series 1996-21, Class PK
6.000%, 02/25/11 | | | 333 | | | | 336 | | |
Series 2005-44, Class PC
5.000%, 11/25/27 | | | 1,139 | | | | 1,137 | | |
Series 2005-47, Class HK
4.500%, 06/25/20 | | | 985 | | | | 939 | | |
Government National Mortgage Association
Series 3, Class F
6.500%, 06/17/20 | | | 10 | | | | 10 | | |
Total CMO – U.S. Government Agency
Mortgage-Backed Securities
(Cost $4,529) | | | | | | | 4,440 | | |
| Short-Term Investments – 1.4% | | | |
| Affiliated Money Market Fund – 1.4% | | | |
| First American Prime Obligations Fund, Class Z (l) | | | 5,848,662 | | | | 5,849 | | |
| U.S. Treasury Obligation – 0.0% | | | |
U.S. Treasury Bill
3.374%, 11/10/05 (k) | | | 75 | | | | 75 | | |
Total Short-Term Investments
(Cost $5,924) | | | | | | | 5,924 | | |
Investments Purchased with Proceeds
from Securities Lending (m) – 37.5% | | | |
| | | | (Cost $151,188) | | | | 151,188 | | |
Total Investments – 138.3%
(Cost $523,597) | | | | | | | 557,714 | | |
| Other Assets and Liabilities, Net – (38.3)% | | | | | | | (154,583 | ) | |
| Total Net Assets – 100.0% | | | | | | $ | 403,131 | | |
* Non-income producing security
(a) This security or a portion of this security is out on loan at September 30, 2005. Total loaned securities had a market value of $148,273,158 at September 30, 2005. See note 2 in Notes to financial Statements.
(b) Variable Rate Security – The rate shown is the rate in effect as of September 30, 2005.
Balanced Fund (concluded)
(c) Security purchased on a when-issued basis (TBA). On September 30, the total cost of investments purchased on a when-issued basis was $4,997,487 or 1.2% of net assets. See note 2 in Notes to Financial Statements.
(d) U.S. Treasury inflation-protected securities (TIPS) are securities in which the principal amount is adjusted for inflation and the semi-annual interest payments equal a fixed percentage of the inflation-adjusted principal amount.
(e) Security sold within the terms of a private placement memorandum, exempt from registration under Rule 144A of the Securities Act of 1933, as amended, and may be sold only to dealers in that program or other "qualified institutional buyers." These securities have been determined to be liquid under the guidelines established by the funds' board of directors. As of September 30, 2005, the value of these investments was $8,400,556 or 2.1% of total net assets.
(f) Delayed Interest (Step-Bonds) – Securities for which the coupon rate of interest will adjust on specified future date(s). The rate disclosed is the rate in effect as of September 30, 2005.
(g) Security considered illiquid or restricted. As of September 30,2005 the value of these investments was $24,215 or 0.0% of total net assets. See note 2 in Notes to Financial Statements.
(h) Security is in default at September 30, 2005.
(i) Security is fair valued. As of September 30, 2005, the fair value of this investment was $24,215 or 0.0% of total net assets. See note 2 in Notes to Financial Statements.
(j) The rate shown is the effective yield at time of purchase.
(k) Security has been deposited as initial margin on open futures contracts. Yield shown is effective yield at September 20, 2005.
(l) Investment in affiliated security. This money market fund is advised by U.S. Bancorp Asset Management, Inc., which also serves as advisor to this fund. See note 3 in Notes to Financial Statements.
(m) The fund may loan securities in return for collateral in the form of cash, U.S. Government securities, or other high grade debt obligations. The cash collateral is invested in various short-term fixed income securities, such as repurchase agreements, commercial paper, money market funds and other corporate obligations. See note 2 in Notes to Financial Statements.
ADR – American Depository Receipt
CMO – Collateralized Mortgage Obligation
PLC – Public Limited Company
REIT – Real Estate Investment Trust
Schedule of Open Futures Contracts
| Description | | Number of
Contracts
Purchased
(Sold) | | Notional
Contract
Value
(000) | | Settlement
Month | | Unrealized
Appreciation
(Depreciation)
(000) | |
| Euro Dollar 90 Day Futures | | | (16 | ) | | $ | 15,272 | | | March 06 | | $ | 21 | | |
| U.S. Treasury 2 year Futures | | | 20 | | | | 4,118 | | | December 05 | | | (31 | ) | |
| U.S. Treasury 5 year Futures | | | (14 | ) | | | (1,496 | ) | | December 05 | | | 23 | | |
| U.S. Treasury 10 year Futures | | | (19 | ) | | | (2,089 | ) | | December 05 | | | 44 | | |
| U.S. Treasury Long Bond Futures | | | 8 | | | | 915 | | | December 05 | | | (11 | ) | |
| | | $ | 46 | | |
Credit Default Swap Agreements
| Counterparty | | Reference
Entity | | Buy/Sell
Protection | | Pay/Receive
Fixed Rate | | Expiration
Date | | Notional
Amount
(000) | | Unrealized
(Depreciation)
(000) | |
| Citigroup | | Dow Jones CDX
IG Hvol5 Index | | Buy | | | 0.85 | % | | | 12/20/10 | | | | 1,000 | | | $ | | (2) | |
FIRST AMERICAN FUNDS Annual Report 2005
99
Schedule of Investments September 30, 2005
Equity Income Fund
| DESCRIPTION | | SHARES | | VALUE (000) | |
| Common Stocks – 97.9% | |
| Consumer Discretionary – 7.8% | |
| Gannett (a) | | | 205,550 | | | $ | 14,148 | | |
| Harrah's Entertainment | | | 312,980 | | | | 20,403 | | |
| Home Depot (a) | | | 408,600 | | | | 15,584 | | |
| McDonald's (a) | | | 606,620 | | | | 20,316 | | |
| Starwood Hotels & Resorts Worldwide (a) | | | 453,270 | | | | 25,913 | | |
| Time Warner | | | 790,860 | | | | 14,322 | | |
| | | | 110,686 | | |
| Consumer Staples – 6.6% | | | |
| Altria Group | | | 378,170 | | | | 27,875 | | |
| Colgate-Palmolive (a) | | | 404,780 | | | | 21,368 | | |
| General Mills (a) | | | 301,920 | | | | 14,553 | | |
| PepsiCo | | | 267,690 | | | | 15,181 | | |
| Procter & Gamble (a) | | | 256,950 | | | | 15,278 | | |
| | | | 94,255 | | |
| Energy – 14.4% | | | |
| Apache (a) | | | 239,880 | | | | 18,044 | | |
| Baker Hughes (a) | | | 206,540 | | | | 12,326 | | |
| BP, ADR | | | 409,286 | | | | 28,998 | | |
| ChevronTexaco (a) | | | 359,480 | | | | 23,269 | | |
| ConocoPhillips | | | 458,700 | | | | 32,068 | | |
| Exxon Mobil | | | 887,562 | | | | 56,396 | | |
| Halliburton | | | 204,840 | | | | 14,036 | | |
| Royal Dutch Petroleum, ADR | | | 142,030 | | | | 9,323 | | |
| Schlumberger (a) | | | 112,970 | | | | 9,532 | | |
| | | | 203,992 | | |
| Financials – 19.7% | | | |
| Alliance Capital Management Holding | | | 382,280 | | | | 18,292 | | |
| AMB Property (REIT) | | | 206,440 | | | | 9,269 | | |
| American International Group | | | 267,910 | | | | 16,600 | | |
| Apartment Investment & Management (REIT) (a) | | | 330,640 | | | | 12,822 | | |
| Bank of America (a) | | | 779,478 | | | | 32,816 | | |
| Citigroup (a) | | | 871,691 | | | | 39,679 | | |
| Duke Realty (REIT) (a) | | | 177,922 | | | | 6,028 | | |
| Fannie Mae | | | 33,260 | | | | 1,491 | | |
| Goldman Sachs Group (a) | | | 144,370 | | | | 17,552 | | |
| J.P. Morgan Chase | | | 717,950 | | | | 24,360 | | |
| Merrill Lynch (a) | | | 248,310 | | | | 15,234 | | |
| Morgan Stanley | | | 206,490 | | | | 11,138 | | |
| Northern Trust (a) | | | 157,905 | | | | 7,982 | | |
| Partners Trust Financial Group | | | 400,240 | | | | 4,611 | | |
| State Street | | | 428,580 | | | | 20,966 | | |
| Wachovia | | | 555,785 | | | | 26,450 | | |
| Wells Fargo | | | 254,210 | | | | 14,889 | | |
| | | | 280,179 | | |
| Health Care – 11.9% | | | |
| Abbott Laboratories | | | 521,660 | | | | 22,118 | | |
| Baxter International | | | 476,640 | | | | 19,004 | | |
| HCA | | | 210,090 | | | | 10,068 | | |
| Johnson & Johnson | | | 446,090 | | | | 28,229 | | |
| McKesson HBOC | | | 164,800 | | | | 7,820 | | |
| Medtronic | | | 151,790 | | | | 8,139 | | |
| Pfizer | | | 1,070,232 | | | | 26,724 | | |
| Teva Pharmaceutical Industries, ADR (a) | | | 271,310 | | | | 9,067 | | |
| Wyeth | | | 831,540 | | | | 38,475 | | |
| | | | 169,644 | | |
Equity Income Fund (continued)
| DESCRIPTION | | SHARES/PAR (000) | | VALUE (000) | |
| Industrials – 11.0% | | | |
| 3M (a) | | | 254,910 | | | $ | 18,700 | | |
| Avery Dennison (a) | | | 151,834 | | | | 7,955 | | |
| Emerson Electric | | | 234,580 | | | | 16,843 | | |
| General Dynamics | | | 162,250 | | | | 19,397 | | |
| General Electric | | | 1,147,640 | | | | 38,641 | | |
| Honeywell International | | | 517,250 | | | | 19,397 | | |
| Ingersoll-Rand, Class A (a) | | | 437,340 | | | | 16,720 | | |
| United Parcel Service, Class B (a) | | | 267,260 | | | | 18,476 | | |
| | | | 156,129 | | |
| Information Technology – 11.2% | | | |
| Hewlett-Packard | | | 883,420 | | | | 25,796 | | |
| Intel | | | 1,071,450 | | | | 26,411 | | |
| Microsoft | | | 1,819,160 | | | | 46,807 | | |
| Motorola (a) | | | 1,189,810 | | | | 26,283 | | |
| QUALCOMM (a) | | | 333,350 | | | | 14,917 | | |
| SAP, ADR | | | 179,650 | | | | 7,784 | | |
| Texas Instruments (a) | | | 331,860 | | | | 11,250 | | |
| | | | 159,248 | | |
| Materials – 7.0% | | | |
| Bemis (a) | | | 550,280 | | | | 13,592 | | |
| Dow Chemical | | | 208,450 | | | | 8,686 | | |
| E.I. DuPont de Nemours (a) | | | 302,060 | | | | 11,832 | | |
| Ecolab | | | 223,770 | | | | 7,145 | | |
| Engelhard | | | 647,650 | | | | 18,076 | | |
| Praxair (a) | | | 581,420 | | | | 27,867 | | |
| Weyerhaeuser | | | 176,639 | | | | 12,144 | | |
| | | | 99,342 | | |
| Telecommunication Services – 4.3% | | | |
| ALLTEL (a) | | | 282,480 | | | | 18,392 | | |
| BellSouth (a) | | | 506,710 | | | | 13,326 | | |
| SBC Communications (a) | | | 642,190 | | | | 15,393 | | |
| Verizon Communications | | | 442,540 | | | | 14,467 | | |
| | | | 61,578 | | |
| Utilities – 4.0% | | | |
| Alliant Energy (a) | | | 593,830 | | | | 17,298 | | |
| Cinergy | | | 409,590 | | | | 18,190 | | |
| ITC Holdings | | | 23,490 | | | | 681 | | |
| Xcel Energy (a) | | | 1,049,960 | | | | 20,590 | | |
| | | | 56,759 | | |
Total Common Stocks
(Cost $1,083,729) | | | | | | | 1,391,812 | | |
| Convertible Corporate Bond – 0.3% | | | |
Medarex
Callable 05/20/09 @ 100.64
2.250%, 05/15/11 (a)
(Cost $3,371) | | $ | 3,934 | | | | 3,613 | | |
| Convertible Preferred Stock – 0.6% | | | |
Freeport-McMoran Copper & Gold
5.500%, 12/31/49
(Cost $7,248) | | | 7,483 | | | | 8,265 | | |
The accompanying notes are an integral part of the financial statements.
FIRST AMERICAN FUNDS Annual Report 2005
100
Equity Income Fund (concluded)
| DESCRIPTION | | SHARES | | VALUE (000) | |
| Affiliated Money Market Fund – 1.6% | |
First American Prime Obligations Fund, Class Z (b)
(Cost $22,835) | | | 22,835,262 | | | $ | 22,835 | | |
Investments Purchased with Proceeds
from Securities Lending (c) – 22.7% | |
| | | (Cost $323,274) | | | 323,274 | | |
Total Investments – 123.1%
(Cost $1,440,457) | | | | | 1,749,799 | | |
| Other Assets and Liabilities, Net – (23.1)% | | | | | (328,256 | ) | |
| Total Net Assets – 100.0% | | | | $ | 1,421,543 | | |
(a) This security or a portion of this security is out on loan at September 30, 2005. Total loaned securities had a market value of $316,720,783 at September 30, 2005. See note 2 in Notes to Financial Statements.
(b) Investment in affiliated security. This money market fund is advised by U.S. Bancorp Asset Management, Inc., which also serves as advisor to this fund. See note 3 in Notes to Financial Statements.
(c) The fund may loan securities in return for collateral in the form of cash, U.S. Government securities, or other high grade debt obligations. The cash collateral is invested in various short-term fixed income securities, such as repurchase agreements, commercial paper, money market funds and other corporate obligations. See note 2 in Notes to Financial Statements.
ADR – American Depository Receipt
REIT – Real Estate Investment Trust
FIRST AMERICAN FUNDS Annual Report 2005
101
Statements of Assets and Liabilities September 30, 2005, in thousands, except per share data
| | | Balanced
Fund | | Equity
Income Fund | |
| ASSETS: | | | |
| Investments in unaffiliated securities, at value† (cost $366,560 and $1,094,348, respectively) (note 2) | | $ | 400,677 | | | $ | 1,403,690 | | |
| Investments in affiliated money market fund, at value (cost $5,849 and $22,835, respectively) (note 2 ) | | | 5,849 | | | | 22,835 | | |
| Investments purchased with proceeds from security lending (cost $151,188 and $323,274, respectively) (note 2) | | | 151,188 | | | | 323,274 | | |
| Cash* | | | 5,577 | | | | 3,062 | | |
| Receivable for dividends and interest | | | 983 | | | | 1,335 | | |
| Receivable for investment securities sold | | | 7,053 | | | | - | | |
| Receivable for variation margin | | | 5 | | | | - | | |
| Receivable for capital shares sold | | | 184 | | | | 589 | | |
| Receivable for swap contracts | | | 5 | | | | - | | |
| Prepaid expenses and other assets | | | 28 | | | | 27 | | |
| Total assets | | | 571,549 | | | | 1,754,812 | | |
| LIABILITIES: | | | |
| Payable for investment securities purchased | | | 6,820 | | | | - | | |
| Payable for security purchased on when-issued basis | | | 4,997 | | | | - | | |
| Payable upon return of securities loaned (note 2) | | | 152,620 | | | | 326,336 | | |
| Payable for capital shares redeemed | | | 3,644 | | | | 5,714 | | |
| Payable to affiliates (note 3) | | | 272 | | | | 1,104 | | |
| Payable for distribution and shareholder servicing fees | | | 45 | | | | 68 | | |
| Accrued expenses and other liabilities | | | 20 | | | | 47 | | |
| Total liabilities | | | 168,418 | | | | 333,269 | | |
| Net assets | | $ | 403,131 | | | $ | 1,421,543 | | |
| COMPOSITION OF NET ASSETS: | | | |
| Portfolio capital | | $ | 369,617 | | | $ | 1,104,576 | | |
| Undistributed (distributions in excess of) net investment income | | | 270 | | | | (1 | ) | |
| Accumulated net realized gain (loss) on investments and options written | | | (917 | ) | | | 7,626 | | |
| Net unrealized appreciation of investments | | | 34,117 | | | | 309,342 | | |
| Net unrealized appreciation of futures contracts | | | 46 | | | | - | | |
| Net unrealized depreciation of swap agreements | | | (2 | ) | | | - | | |
| Net assets | | $ | 403,131 | | | $ | 1,421,543 | | |
| * Includes cash collateral received related to securities loaned (note 2) | | $ | 1,432 | | | $ | 3,062 | | |
| † Including securities loaned, at value | | $ | 148,273 | | | $ | 316,721 | | |
| Class A: | | | |
| Net assets | | $ | 114,388 | | | $ | 176,878 | | |
| Shares issued and outstanding ($0.0001 par value - 2 billion authorized) | | | 10,009 | | | | 12,737 | | |
| Net asset value and redemption price per share | | $ | 11.43 | | | $ | 13.89 | | |
| Maximum offering price per share (1) | | $ | 12.10 | | | $ | 14.70 | | |
| Class B: | | | |
| Net assets | | $ | 20,657 | | | $ | 21,639 | | |
| Shares issued and outstanding ($0.0001 par value - 2 billion authorized) | | | 1,821 | | | | 1,570 | | |
| Net asset value, offering price, and redemption price per share (2) | | $ | 11.34 | | | $ | 13.79 | | |
| Class C: | | | |
| Net assets | | $ | 5,528 | | | $ | 16,128 | | |
| Shares issued and outstanding ($0.0001 par value - 2 billion authorized) | | | 486 | | | | 1,168 | | |
| Net asset value, offering price and redemption price per share (2) | | $ | 11.38 | | | $ | 13.81 | | |
| Class R: | | | |
| Net assets | | $ | 1 | | | $ | 415 | | |
| Shares issued and outstanding ($0.0001 par value - 2 billion authorized) | | | - | | | | 30 | | |
| Net asset value, offering price, and redemption price per share | | $ | 11.45 | | | $ | 13.88 | | |
| Class Y: | | | |
| Net assets | | $ | 262,557 | | | $ | 1,206,483 | | |
| Shares issued and outstanding ($0.0001 par value - 2 billion authorized) | | | 22,912 | | | | 86,324 | | |
| Net asset value, offering price, and redemption price per share | | $ | 11.46 | | | $ | 13.98 | | |
(1) The offering price is calculated by dividing the net asset value by 1 minus the maximum sales charge of 5.50%
(2) Class B and C have a contingent deferred sales charge. For a description of this sales charge, see notes 1 and 3 in Notes to Financial Statements.
The accompanying notes are an integral part of the financial statements.
FIRST AMERICAN FUNDS Annual Report 2005
102
Statements of Operations For the fiscal year end September 30, 2005, in thousands
| | | Balanced
Fund | | Equity
Income Fund | |
| INVESTMENT INCOME: | | | |
| Interest from unaffliliated securities | | $ | 6,017 | | | $ | 222 | | |
| Dividends from affliliated money market fund | | | 167 | | | | 294 | | |
| Dividends from unaffiliated securities | | | 3,863 | | | | 42,040 | | |
| Less: Foreign taxes withheld | | | (12 | ) | | | (76 | ) | |
| Securities lending income | | | 141 | | | | 294 | | |
| Total investment income | | | 10,176 | | | | 42,774 | | |
| EXPENSES (note 3): | | | |
| Investment advisory fees | | | 2,747 | | | | 10,284 | | |
| Administration fees | | | 886 | | | | 3,246 | | |
| Transfer agent fees | | | 266 | | | | 979 | | |
| Professional fees | | | 43 | | | | 99 | | |
| Registration fees | | | 43 | | | | 43 | | |
| Custodian fees | | | 37 | | | | 140 | | |
| Postage & printing fees | | | 23 | | | | 82 | | |
| Other expenses | | | 13 | | | | 35 | | |
| Directors' fees | | | 10 | | | | 37 | | |
| Distribution and shareholder servicing fees – Class A | | | 297 | | | | 462 | | |
| Distribution and shareholder servicing fees – Class B | | | 246 | | | | 231 | | |
| Distribution and shareholder servicing fees – Class C | | | 59 | | | | 181 | | |
| Distribution and shareholder servicing fees – Class R (1) | | | - | | | | 1 | | |
| Total expenses | | | 4,670 | | | | 15,820 | | |
| Less: Fee waivers (note 3) | | | (637 | ) | | | (516 | ) | |
| Total net expenses | | | 4,033 | | | | 15,304 | | |
| Investment income – net | | | 6,143 | | | | 27,470 | | |
REALIZED AND UNREALIZED GAINS (LOSSES) ON INVESTMENTS, FUTURES CONTRACTS,
WRITTEN OPTIONS AND SWAP AGREEMENTS – NET (note 5): | | | |
| Net realized gain on investments | | | 44,140 | | | | 43,644 | | |
| Net realized gain on in-kind distribution (note 11) | | | - | | | | 45,141 | | |
| Net realized loss on futures contracts | | | (21 | ) | | | - | | |
| Net realized gain on swap agreements | | | 47 | | | | - | | |
| Net realized gain on written options | | | 132 | | | | - | | |
| Net change in unrealized appreciation or depreciation of investments | | | 7,744 | | | | 50,906 | | |
| Net change in unrealized appreciation or depreciation of futures contracts | | | 158 | | | | - | | |
| Net change in unrealized appreciation or depreciation of swap agreements | | | (2 | ) | | | - | | |
| Net gain on investments, futures contracts, written options, and swap agreements | | | 52,198 | | | | 139,691 | | |
| Net increase in net assets resulting from operations | | $ | 58,341 | | | $ | 167,161 | | |
(1) Due to the presentation of the Financial Statements in thousands, the numbers round to zero.
The accompanying notes are an integral part of the financial statements.
FIRST AMERICAN FUNDS Annual Report 2005
103
Statements of Changes in Net Assets in thousands
| | | Balanced
Fund | | Equity
Income Fund | |
| | | Year Ended
9/30/05 | | Year Ended
9/30/04 | | Year Ended
9/30/05 | | Year Ended
9/30/04 | |
| OPERATIONS: | | | |
| Investment income – net | | $ | 6,143 | | | $ | 7,045 | | | $ | 27,470 | | | $ | 26,113 | | |
| Net realized gain on investments | | | 44,187 | | | | 26,114 | | | | 43,644 | | | | 22,327 | | |
| Net realized gain on in-kind distribution | | | - | | | | - | | | | 45,141 | | | | - | | |
| Net realized gain (loss) on futures contracts | | | (21 | ) | | | 923 | | | | - | | | | - | | |
| Net realized gain on written options | | | 132 | | | | 214 | | | | - | | | | - | | |
| Net change in unrealized appreciation or depreciation of investments | | | 7,744 | | | | 8,139 | | | | 50,906 | | | | 134,451 | | |
| Net change in unrealized appreciation or depreciation of futures contracts | | | 158 | | | | 202 | | | | - | | | | - | | |
| Net change in unrealized appreciation or depreciation of swap agreements | | | (2 | ) | | | - | | | | - | | | | - | | |
| Net change in unrealized appreciation or depreciation of written options | | | - | | | | 28 | | | | - | | | | - | | |
| Net increase in net assets resulting from operations | | | 58,341 | | | | 42,665 | | | | 167,161 | | | | 182,891 | | |
| DISTRIBUTIONS TO SHAREHOLDERS FROM: | | | |
| Investment income – net: | |
| Class A | | | (1,628 | ) | | | (1,535 | ) | | | (3,048 | ) | | | (2,721 | ) | |
| Class B | | | (148 | ) | | | (228 | ) | | | (222 | ) | | | (224 | ) | |
| Class C | | | (37 | ) | | | (47 | ) | | | (176 | ) | | | (183 | ) | |
| Class R | | | - | | | | (237 | ) | | | (2 | ) | | | (196 | ) | |
| Class Y | | | (4,412 | ) | | | (5,588 | ) | | | (25,969 | ) | | | (25,834 | ) | |
| Net realized gain on investments: | |
| Class A | | | - | | | | - | | | | (160 | ) | | | - | | |
| Class B | | | - | | | | - | | | | (21 | ) | | | - | | |
| Class C | | | - | | | | - | | | | (17 | ) | | | - | | |
| Class Y | | | - | | | | - | | | | (1,245 | ) | | | - | | |
| Total distributions | | | (6,225 | ) | | | (7,635 | ) | | | (30,860 | ) | | | (29,158 | ) | |
| CAPITAL SHARE TRANSACTIONS (note 4): | | | |
| Class A: | |
| Proceeds from sales | | | 13,247 | | | | 33,852 | | | | 21,141 | | | | 53,380 | | |
| Reinvestment of distributions | | | 1,585 | | | | 1,487 | | | | 2,988 | | | | 2,528 | | |
| Payments for redemptions | | | (34,236 | ) | | | (20,593 | ) | | | (47,176 | ) | | | (31,031 | ) | |
| Increase (decrease) in net assets from Class A transactions | | | (19,404 | ) | | | 14,746 | | | | (23,047 | ) | | | 24,877 | | |
| Class B: | |
| Proceeds from sales | | | 1,081 | | | | 1,605 | | | | 1,913 | | | | 4,986 | | |
| Reinvestment of distributions | | | 142 | | | | 219 | | | | 229 | | | | 209 | | |
| Payments for redemptions | | | (11,765 | ) | | | (8,962 | ) | | | (6,332 | ) | | | (5,788 | ) | |
| Decrease in net assets from Class B transactions | | | (10,542 | ) | | | (7,138 | ) | | | (4,190 | ) | | | (593 | ) | |
| Class C: | |
| Proceeds from sales | | | 860 | | | | 858 | | | | 1,226 | | | | 2,790 | | |
| Reinvestment of distributions | | | 36 | | | | 47 | | | | 192 | | | | 183 | | |
| Payments for redemptions | | | (1,977 | ) | | | (2,596 | ) | | | (6,129 | ) | | | (5,027 | ) | |
| Decrease in net assets from Class C transactions | | | (1,081 | ) | | | (1,691 | ) | | | (4,711 | ) | | | (2,054 | ) | |
| Class R: | |
| Proceeds from sales | | | - | | | | 3,496 | | | | 422 | | | | 2,328 | | |
| Reinvestment of distributions | | | - | | | | 237 | | | | 2 | | | | 191 | | |
| Payments for redemptions | | | - | | | | (29,325 | ) | | | (25 | ) | | | (21,497 | ) | |
| Increase (decrease) in net assets from Class R transactions | | | - | | | | (25,592 | ) | | | 399 | | | | (18,978 | ) | |
| Class Y: | |
| Proceeds from sales | | | 38,526 | | | | 61,896 | | | | 172,670 | | | | 300,945 | | |
| Reinvestment of distributions | | | 4,180 | | | | 5,332 | | | | 9,228 | | | | 9,109 | | |
| Payments for redemptions | | | (96,953 | ) | | | (171,415 | ) | | | (497,089 | ) | | | (316,521 | ) | |
| Decrease in net assets from Class Y transactions | | | (54,247 | ) | | | (104,187 | ) | | | (315,191 | ) | | | (6,467 | ) | |
| Decrease in net assets from capital share transactions | | | (85,274 | ) | | | (123,862 | ) | | | (346,740 | ) | | | (3,215 | ) | |
| Total increase (decrease) in net assets | | | (33,158 | ) | | | (88,832 | ) | | | (210,439 | ) | | | 150,518 | | |
| Net assets at beginning of period | | | 436,289 | | | | 525,121 | | | | 1,631,982 | | | | 1,481,464 | | |
| Net assets at end of period | | $ | 403,131 | | | $ | 436,289 | | | $ | 1,421,543 | | | $ | 1,631,982 | | |
| Undistributed (distributions in excess of) net investment income at end of period | | $ | 270 | | | $ | 89 | | | $ | (1 | ) | | $ | (4,922 | ) | |
The accompanying notes are an integral part of the financial statements.
FIRST AMERICAN FUNDS Annual Report 2005
104
(This page has been left blank intentionally.)
Financial Highlights For a share outstanding throughout the periods ended September 30, unless otherwise indicated.
| | | Net Asset
Value
Beginning
of Period | | Net
Investment
Income | | Realized and
Unrealized
Gains
(Losses) on
Investments | | Distributions
from Net
Investment
Income | | Distributions
from Net
Realized Gains | | Net Asset
Value
End of
Period | | Total
Return (8) | |
| | Balanced Fund (1) | | | | |
| Class A | |
| | 2005 | (2) | | $ | 10.12 | | | $ | 0.15 | | | $ | 1.31 | | | $ | (0.15 | ) | | $ | - | | | $ | 11.43 | | | | 14.51 | % | |
| | 2004 | (2) | | | 9.47 | | | | 0.13 | | | | 0.66 | | | | (0.14 | ) | | | - | | | | 10.12 | | | | 8.39 | | |
| | 2003 | | | | 8.38 | | | | 0.17 | | | | 1.08 | | | | (0.16 | ) | | | - | | | | 9.47 | | | | 14.98 | | |
| | 2002 | (2) | | | 9.50 | | | | 0.20 | | | | (1.12 | ) | | | (0.20 | ) | | | - | | | | 8.38 | | | | (9.90 | ) | |
| | 2001 | (2)(3) | | | 13.83 | | | | 0.18 | | | | (2.24 | ) | | | (0.20 | ) | | | (2.07 | ) | | | 9.50 | | | | (17.03 | ) | |
| | 2000 | (4) | | | 12.39 | | | | 0.23 | | | | 2.12 | | | | (0.22 | ) | | | (0.69 | ) | | | 13.83 | | | | 19.46 | | |
| Class B | |
| | 2005 | (2) | | $ | 10.04 | | | $ | 0.07 | | | $ | 1.30 | | | $ | (0.07 | ) | | $ | - | | | $ | 11.34 | | | | 13.64 | % | |
| | 2004 | (2) | | | 9.41 | | | | 0.05 | | | | 0.65 | | | | (0.07 | ) | | | - | | | | 10.04 | | | | 7.46 | | |
| | 2003 | | | | 8.32 | | | | 0.10 | | | | 1.08 | | | | (0.09 | ) | | | - | | | | 9.41 | | | | 14.25 | | |
| | 2002 | (2) | | | 9.44 | | | | 0.13 | | | | (1.12 | ) | | | (0.13 | ) | | | - | | | | 8.32 | | | | (10.64 | ) | |
| | 2001 | (2)(3) | | | 13.75 | | | | 0.17 | | | | (2.29 | ) | | | (0.13 | ) | | | (2.06 | ) | | | 9.44 | | | | (17.64 | ) | |
| | 2000 | (4) | | | 12.33 | | | | 0.13 | | | | 2.11 | | | | (0.14 | ) | | | (0.68 | ) | | | 13.75 | | | | 18.77 | | |
| Class C | |
| | 2005 | (2) | | $ | 10.08 | | | $ | 0.07 | | | $ | 1.30 | | | $ | (0.07 | ) | | $ | - | | | $ | 11.38 | | | | 13.61 | % | |
| | 2004 | (2) | | | 9.44 | | | | 0.05 | | | | 0.66 | | | | (0.07 | ) | | | - | | | | 10.08 | | | | 7.53 | | |
| | 2003 | | | | 8.35 | | | | 0.09 | | | | 1.10 | | | | (0.10 | ) | | | - | | | | 9.44 | | | | 14.24 | | |
| | 2002 | (2) | | | 9.49 | | | | 0.13 | | | | (1.14 | ) | | | (0.13 | ) | | | - | | | | 8.35 | | | | (10.77 | ) | |
| | 2001 | (2)(5) | | | 9.29 | | | | - | | | | 0.20 | | | | - | | | | - | | | | 9.49 | | | | 2.15 | | |
| Class R (6) | |
| | 2005 | (2) | | $ | 10.14 | | | $ | 0.11 | | | $ | 1.32 | | | $ | (0.12 | ) | | $ | - | | | $ | 11.45 | | | | 14.16 | % | |
| | 2004 | (2) | | | 9.49 | | | | 0.14 | | | | 0.64 | | | | (0.13 | ) | | | - | | | | 10.14 | | | | 8.22 | | |
| | 2003 | | | | 8.39 | | | | 0.15 | | | | 1.10 | | | | (0.15 | ) | | | - | | | | 9.49 | | | | 15.08 | | |
| | 2002 | (2) | | | 9.50 | | | | 0.20 | | | | (1.12 | ) | | | (0.19 | ) | | | - | | | | 8.39 | | | | (9.90 | ) | |
| | 2001 | (2)(7) | | | 11.27 | | | | 0.18 | | | | (1.74 | ) | | | (0.21 | ) | | | - | | | | 9.50 | | | | (14.03 | ) | |
| Class Y | |
| | 2005 | (2) | | $ | 10.15 | | | $ | 0.17 | | | $ | 1.32 | | | $ | (0.18 | ) | | $ | - | | | $ | 11.46 | | | | 14.76 | % | |
| | 2004 | (2) | | | 9.50 | | | | 0.16 | | | | 0.66 | | | | (0.17 | ) | | | - | | | | 10.15 | | | | 8.62 | | |
| | 2003 | | | | 8.40 | | | | 0.19 | | | | 1.09 | | | | (0.18 | ) | | | - | | | | 9.50 | | | | 15.35 | | |
| | 2002 | (2) | | | 9.53 | | | | 0.23 | | | | (1.13 | ) | | | (0.23 | ) | | | - | | | | 8.40 | | | | (9.74 | ) | |
| | 2001 | (2)(3) | | | 13.87 | | | | 0.16 | | | | (2.20 | ) | | | (0.23 | ) | | | (2.07 | ) | | | 9.53 | | | | (16.84 | ) | |
| | 2000 | (4) | | | 12.43 | | | | 0.26 | | | | 2.13 | | | | (0.26 | ) | | | (0.69 | ) | | | 13.87 | | | | 19.94 | | |
The accompanying notes are an integral part of the financial statements.
FIRST AMERICAN FUNDS Annual Report 2005
106
| | | Net Assets
End of
Period (000) | | Ratio of
Expenses to
Average
Net Assets | | Ratio of Net
Investment
Income
to Average
Net Assets | | Ratio of
Expenses to
Average
Net Assets
(Excluding
Waivers) | | Ratio of Net
Investment
Income
to Average Net
Assets (Excluding
Waivers) | | Portfolio
Turnover
Rate | |
| | Balanced Fund (1) | | |
| Class A | |
| | 2005 | (2) | | $ | 114,388 | | | | 1.06 | % | | | 1.35 | % | | | 1.21 | % | | | 1.20 | % | | | 147 | % | |
| | 2004 | (2) | | | 119,292 | | | | 1.05 | | | | 1.27 | | | | 1.19 | | | | 1.13 | | | | 110 | | |
| | 2003 | | | | 98,016 | | | | 1.05 | | | | 1.75 | | | | 1.23 | | | | 1.57 | | | | 156 | | |
| | 2002 | (2) | | | 98,557 | | | | 1.05 | | | | 2.07 | | | | 1.23 | | | | 1.89 | | | | 79 | | |
| | 2001 | (2)(3) | | | 127,590 | | | | 1.22 | | | | 1.96 | | | | 1.28 | | | | 1.90 | | | | 54 | | |
| | 2000 | (4) | | | 54,380 | | | | 1.22 | | | | 1.66 | | | | 1.28 | | | | 1.60 | | | | 79 | | |
| Class B | |
| | 2005 | (2) | | $ | 20,657 | | | | 1.81 | % | | | 0.60 | % | | | 1.96 | % | | | 0.45 | % | | | 147 | % | |
| | 2004 | (2) | | | 28,101 | | | | 1.80 | | | | 0.54 | | | | 1.94 | | | | 0.40 | | | | 110 | | |
| | 2003 | | | | 33,015 | | | | 1.80 | | | | 1.00 | | | | 1.98 | | | | 0.82 | | | | 156 | | |
| | 2002 | (2) | | | 35,641 | | | | 1.80 | | | | 1.32 | | | | 1.98 | | | | 1.14 | | | | 79 | | |
| | 2001 | (2)(3) | | | 47,150 | | | | 1.93 | | | | 1.22 | | | | 1.99 | | | | 1.16 | | | | 54 | | |
| | 2000 | (4) | | | 2,243 | | | | 1.97 | | | | 0.91 | | | | 2.03 | | | | 0.85 | | | | 79 | | |
| Class C | |
| | 2005 | (2) | | $ | 5,528 | | | | 1.81 | % | | | 0.60 | % | | | 1.96 | % | | | 0.45 | % | | | 147 | % | |
| | 2004 | (2) | | | 5,890 | | | | 1.80 | | | | 0.55 | | | | 1.94 | | | | 0.41 | | | | 110 | | |
| | 2003 | | | | 7,089 | | | | 1.80 | | | | 0.99 | | | | 1.98 | | | | 0.81 | | | | 156 | | |
| | 2002 | (2) | | | 2,233 | | | | 1.80 | | | | 1.32 | | | | 1.98 | | | | 1.14 | | | | 79 | | |
| | 2001 | (2)(5) | | | 2,351 | | | | 0.94 | | | | 2.20 | | | | 0.94 | | | | 2.20 | | | | 54 | | |
| Class R (6) | |
| | 2005 | (2) | | $ | 1 | | | | 1.31 | % | | | 1.06 | % | | | 1.61 | % | | | 0.76 | % | | | 147 | % | |
| | 2004 | (2) | | | 1 | | | | 1.05 | | | | 1.39 | | | | 1.19 | | | | 1.25 | | | | 110 | | |
| | 2003 | | | | 23,844 | | | | 1.05 | | | | 1.76 | | | | 1.23 | | | | 1.58 | | | | 156 | | |
| | 2002 | (2) | | | 36,194 | | | | 1.05 | | | | 2.07 | | | | 1.23 | | | | 1.89 | | | | 79 | | |
| | 2001 | (2)(7) | | | 39,527 | | | | 1.22 | | | | 1.94 | | | | 1.28 | | | | 1.88 | | | | 54 | | |
| Class Y | |
| | 2005 | (2) | | $ | 262,557 | | | | 0.81 | % | | | 1.60 | % | | | 0.96 | % | | | 1.45 | % | | | 147 | % | |
| | 2004 | (2) | | | 283,005 | | | | 0.80 | | | | 1.55 | | | | 0.94 | | | | 1.41 | | | | 110 | | |
| | 2003 | | | | 363,157 | | | | 0.80 | | | | 2.00 | | | | 0.98 | | | | 1.82 | | | | 156 | | |
| | 2002 | (2) | | | 290,288 | | | | 0.80 | | | | 2.32 | | | | 0.98 | | | | 2.14 | | | | 79 | | |
| | 2001 | (2)(3) | | | 375,983 | | | | 0.97 | | | | 2.21 | | | | 1.04 | | | | 2.14 | | | | 54 | | |
| | 2000 | (4) | | | 163,158 | | | | 0.97 | | | | 1.91 | | | | 1.03 | | | | 1.85 | | | | 79 | | |
(1) The financial highlights for the Balanced Fund as set forth herein include the historical financial highlights of the Firstar Balanced Growth Fund. The assets of the Firstar
Fund were acquired by the First American Balanced Fund on September 24, 2001. In connection with such acquisition, (i) Class A shares of the Firstar Balanced Growth
Fund were exchanged for Class A shares of the First American Balanced Fund, (ii) Firstar Class B shares were exchanged for Class B shares of the First American Fund,
(iii) Firstar Class Y shares were exchanged for Class S shares (now designated Class R shares) of the First American Fund, and (iv) Firstar Class Institutional shares were
exchanged for Class Y shares of the First American Fund.
(2) Per share data calculated using average shares outstanding method.
(3) For the period November 1, 2000 to September 30, 2001. Effective in 2001, the fund's fiscal year end was changed from October 31 to September 30. All ratios for the
period have been annualized, except total return and portfolio turnover.
(4) For the fiscal period ended October 31.
(5) Class of shares has been offered since September 24, 2001. All ratios for the period have been annualized, except total return and portfolio turnover.
(6) Prior to July 1, 2004, Class R shares were named Class S shares, which had lower fees and expenses.
(7) Class of shares has been offered since November 27, 2000. All ratios for the period have been annualized, except total return and portfolio turnover.
(8) Total return does not include sales charges. Total return would have been lower had certain expenses not been waived.
FIRST AMERICAN FUNDS Annual Report 2005
107
Financial Highlights For a share outstanding throughout the periods ended September 30, unless otherwise indicated.
| | | Net Asset
Value
Beginning
of Period | | Net
Investment
Income | | Realized and
Unrealized
Gains
(Losses) on
Investments | | Distributions
from Net
Investment
Income | | Distributions
from Net
Realized Gains | | Net Asset
Value
End of
Period | | Total
Return (4) | |
| | Equity Income Fund (1) | | | | |
| Class A | |
| | 2005 | | | $ | 12.77 | | | $ | 0.20 | | | $ | 1.15 | | | $ | (0.22 | ) | | $ | (0.01 | ) | | $ | 13.89 | | | | 10.65 | % | |
| | 2004 | | | | 11.56 | | | | 0.18 | | | | 1.23 | | | | (0.20 | ) | | | - | | | | 12.77 | | | | 12.26 | | |
| | 2003 | | | | 9.58 | | | | 0.18 | | | | 1.99 | | | | (0.19 | ) | | | - | | | | 11.56 | | | | 22.81 | | |
| | 2002 | | | | 12.13 | | | | 0.16 | | | | (2.48 | ) | | | (0.19 | ) | | | (0.04 | ) | | | 9.58 | | | | (19.51 | ) | |
| | 2001 | | | | 16.29 | | | | 0.29 | | | | (0.74 | ) | | | (0.32 | ) | | | (3.39 | ) | | | 12.13 | | | | (3.89 | ) | |
| Class B | |
| | 2005 | | | $ | 12.68 | | | $ | 0.10 | | | $ | 1.14 | | | $ | (0.12 | ) | | $ | (0.01 | ) | | $ | 13.79 | | | | 9.86 | % | |
| | 2004 | | | | 11.49 | | | | 0.08 | | | | 1.22 | | | | (0.11 | ) | | | - | | | | 12.68 | | | | 11.37 | | |
| | 2003 | | | | 9.52 | | | | 0.10 | | | | 1.98 | | | | (0.11 | ) | | | - | | | | 11.49 | | | | 21.97 | | |
| | 2002 | | | | 12.07 | | | | 0.09 | | | | (2.49 | ) | | | (0.11 | ) | | | (0.04 | ) | | | 9.52 | | | | (20.10 | ) | |
| | 2001 | | | | 16.24 | | | | 0.18 | | | | (0.75 | ) | | | (0.21 | ) | | | (3.39 | ) | | | 12.07 | | | | (4.64 | ) | |
| Class C | |
| | 2005 | | | $ | 12.70 | | | $ | 0.11 | | | $ | 1.13 | | | $ | (0.12 | ) | | $ | (0.01 | ) | | $ | 13.81 | | | | 9.84 | % | |
| | 2004 | | | | 11.51 | | | | 0.08 | | | | 1.22 | | | | (0.11 | ) | | | - | | | | 12.70 | | | | 11.34 | | |
| | 2003 | | | | 9.54 | | | | 0.10 | | | | 1.98 | | | | (0.11 | ) | | | - | | | | 11.51 | | | | 21.95 | | |
| | 2002 | | | | 12.09 | | | | 0.10 | | | | (2.50 | ) | | | (0.11 | ) | | | (0.04 | ) | | | 9.54 | | | | (20.08 | ) | |
| | 2001 | | | | 16.28 | | | | 0.18 | | | | (0.76 | ) | | | (0.22 | ) | | | (3.39 | ) | | | 12.09 | | | | (4.74 | ) | |
| Class R (2) | |
| | 2005 | | | $ | 12.78 | | | $ | 0.11 | | | $ | 1.20 | | | $ | (0.20 | ) | | $ | (0.01 | ) | | $ | 13.88 | | | | 10.33 | % | |
| | 2004 | | | | 11.56 | | | | 0.19 | | | | 1.22 | | | | (0.19 | ) | | | - | | | | 12.78 | | | | 12.18 | | |
| | 2003 | | | | 9.57 | | | | 0.19 | | | | 1.99 | | | | (0.19 | ) | | | - | | | | 11.56 | | | | 22.91 | | |
| | 2002 | | | | 12.12 | | | | 0.15 | | | | (2.47 | ) | | | (0.19 | ) | | | (0.04 | ) | | | 9.57 | | | | (19.47 | ) | |
| | 2001 | (3) | | | 11.57 | | | | 0.01 | | | | 0.54 | | | | - | | | | - | | | | 12.12 | | | | 4.75 | | |
| Class Y | |
| | 2005 | | | $ | 12.85 | | | $ | 0.24 | | | $ | 1.15 | | | $ | (0.25 | ) | | $ | (0.01 | ) | | $ | 13.98 | | | | 10.94 | % | |
| | 2004 | | | | 11.63 | | | | 0.21 | | | | 1.24 | | | | (0.23 | ) | | | - | | | | 12.85 | | | | 12.54 | | |
| | 2003 | | | | 9.63 | | | | 0.21 | | | | 2.00 | | | | (0.21 | ) | | | - | | | | 11.63 | | | | 23.20 | | |
| | 2002 | | | | 12.20 | | | | 0.21 | | | | (2.52 | ) | | | (0.22 | ) | | | (0.04 | ) | | | 9.63 | | | | (19.30 | ) | |
| | 2001 | | | | 16.37 | | | | 0.33 | | | | (0.76 | ) | | | (0.35 | ) | | | (3.39 | ) | | | 12.20 | | | | (3.71 | ) | |
The accompanying notes are an integral part of the financial statements.
FIRST AMERICAN FUNDS Annual Report 2005
108
| | | Net Assets
End of
Period (000) | | Ratio of
Expenses to
Average
Net Assets | | Ratio of Net
Investment
Income
to Average
Net Assets | | Ratio of
Expenses to
Average
Net Assets
(Excluding
Waivers) | | Ratio of Net
Investment
Income
to Average Net
Assets (Excluding
Waivers) | | Portfolio
Turnover
Rate | |
| | Equity Income Fund (1) | | |
| Class A | |
| | 2005 | | | $ | 176,878 | | | | 1.16 | % | | | 1.51 | % | | | 1.19 | % | | | 1.48 | % | | | 27 | % | |
| | 2004 | | | | 184,381 | | | | 1.15 | | | | 1.39 | | | | 1.19 | | | | 1.35 | | | | 12 | | |
| | 2003 | | | | 144,282 | | | | 1.15 | | | | 1.70 | | | | 1.20 | | | | 1.65 | | | | 43 | | |
| | 2002 | | | | 128,142 | | | | 1.15 | | | | 1.43 | | | | 1.20 | | | | 1.38 | | | | 38 | | |
| | 2001 | | | | 24,557 | | | | 1.00 | | | | 1.97 | | | | 1.15 | | | | 1.82 | | | | 33 | | |
| Class B | |
| | 2005 | | | $ | 21,639 | | | | 1.91 | % | | | 0.78 | % | | | 1.94 | % | | | 0.75 | % | | | 27 | % | |
| | 2004 | | | | 23,869 | | | | 1.90 | | | | 0.65 | | | | 1.94 | | | | 0.61 | | | | 12 | | |
| | 2003 | | | | 22,156 | | | | 1.90 | | | | 0.95 | | | | 1.95 | | | | 0.90 | | | | 43 | | |
| | 2002 | | | | 18,699 | | | | 1.90 | | | | 0.80 | | | | 1.95 | | | | 0.75 | | | | 38 | | |
| | 2001 | | | | 11,516 | | | | 1.75 | | | | 1.20 | | | | 1.90 | | | | 1.05 | | | | 33 | | |
| Class C | |
| | 2005 | | | $ | 16,128 | | | | 1.91 | % | | | 0.79 | % | | | 1.94 | % | | | 0.76 | % | | | 27 | % | |
| | 2004 | | | | 19,300 | | | | 1.90 | | | | 0.66 | | | | 1.94 | | | | 0.62 | | | | 12 | | |
| | 2003 | | | | 19,386 | | | | 1.90 | | | | 0.95 | | | | 1.95 | | | | 0.90 | | | | 43 | | |
| | 2002 | | | | 11,171 | | | | 1.90 | | | | 0.86 | | | | 1.95 | | | | 0.81 | | | | 38 | | |
| | 2001 | | | | 8,028 | | | | 1.75 | | | | 1.20 | | | | 1.90 | | | | 1.05 | | | | 33 | | |
| Class R (2) | |
| | 2005 | | | $ | 415 | | | | 1.41 | % | | | 0.83 | % | | | 1.59 | % | | | 0.65 | % | | | 27 | % | |
| | 2004 | | | | 1 | | | | 1.15 | | | | 1.52 | | | | 1.19 | | | | 1.48 | | | | 12 | | |
| | 2003 | | | | 17,170 | | | | 1.15 | | | | 1.80 | | | | 1.20 | | | | 1.75 | | | | 43 | | |
| | 2002 | | | | 36,522 | | | | 1.15 | | | | 1.34 | | | | 1.20 | | | | 1.29 | | | | 38 | | |
| | 2001 | (3) | | | 328 | | | | 1.23 | | | | 4.08 | | | | 1.42 | | | | 3.89 | | | | 33 | | |
| Class Y | |
| | 2005 | | | $ | 1,206,483 | | | | 0.91 | % | | | 1.80 | % | | | 0.94 | % | | | 1.77 | % | | | 27 | % | |
| | 2004 | | | | 1,404,431 | | | | 0.90 | | | | 1.65 | | | | 0.94 | | | | 1.61 | | | | 12 | | |
| | 2003 | | | | 1,278,470 | | | | 0.90 | | | | 1.95 | | | | 0.95 | | | | 1.90 | | | | 43 | | |
| | 2002 | | | | 678,352 | | | | 0.90 | | | | 1.80 | | | | 0.95 | | | | 1.75 | | | | 38 | | |
| | 2001 | | | | 267,361 | | | | 0.75 | | | | 2.21 | | | | 0.90 | | | | 2.06 | | | | 33 | | |
(1) Per share data calculated using average shares outstanding method.
(2) Prior to July 1, 2004, Class R shares were named Class S shares, which had lower fees and expenses.
(3) Class of shares has been offered since September 24, 2001. All ratios for the period have been annualized, except total return and portfolio turnover.
(4) Total return does not include sales charges. Total return would have been lower had certain expenses not been waived.
FIRST AMERICAN FUNDS Annual Report 2005
109
Notes to Financial Statements September 30, 2005
1 > Organization
The Real Estate Securities Fund, International Fund, Small Cap Growth Opportunities Fund, Small Cap Select Fund, Small Cap Value Fund, Small-Mid Cap Core Fund (named Technology Fund prior to October 3, 2005), Mid Cap Growth Opportunities Fund, Mid Cap Value Fund, Large Cap Growth Opportunities Fund, Large Cap Select Fund, Large Cap Value Fund, Balanced Fund and Equity Income Fund (each a "fund" and collectively, the "funds") are mutual funds offered by First American Investment Funds, Inc. ("FAIF"), which is a member of the First American Family of Funds. As of September 30, 2005, FAIF offered 38 funds, including the funds listed above. FAIF is registered under the Investment Company Act of 1940, as amended, as an open-end management investment company. FAIF's articles of incorporation permit the fund's board of directors to create additional funds in the future. Each Fund other than Real Estate Sec urities Fund is a diversified open-end management investment company. The Real Estate Securities Fund is a non-diversified open-end management investment company. Prior to October 3, 2005, Small-Mid Cap Core Fund had different investment strategies, was named Technology Fund and also was non-diversified (see Note 12). Non-diversified funds may invest a large component of their net assets in securities of relatively few issuers.
FAIF offers Class A, Class B, Class C, Class R, and Class Y shares. Prior to July 1, 2004, Class R shares were named Class S shares. Class A shares are sold with a front-end sales charge. Class B shares are subject to a contingent deferred sales charge for six years and automatically convert to Class A shares after eight years. Class C shares may be subject to a contingent deferred sales charge for 12 months, and will not convert to Class A shares. Class R shares have no sales charge and are offered only through certain tax-deferred retirement plans. Class Y shares have no sales charge and are offered only to qualifying institutional investors and certain other qualifying accounts. Class R shares are not offered by the Small-Mid Cap Core Fund.
The funds' prospectuses provide descriptions of each fund's investment objective, principal investment strategies and principal risks. All classes of shares of a fund have identical voting, dividend, liquidation and other rights, and the same terms and conditions, except that certain fees, including distribution and shareholder servicing fees, may differ among classes. Each class has exclusive voting rights on any matters relating to that class' servicing or distribution arrangements.
On June 22, 2005, the funds' board of directors approved a change in the funds' fiscal year end from September 30 to October 31, effective with the one month period ended October 31, 2005.
2 > Summary of Significant Accounting Policies
The significant accounting policies followed by the funds are as follows:
SECURITY VALUATIONS – Security valuations for the funds' investments are furnished by one or more independent pricing services that have been approved by the funds' board of directors. Investments in equity securities that are traded on a national securities exchange (or reported on the Nasdaq national market system) are stated at the last quoted sales price if readily available for such securities on each business day. For securities traded on the Nasdaq national market system, the funds utilize the Nasdaq Official Closing Price which compares the last trade to the bid/ask range of a security. If the last trade falls within the bid/ask range, then that price will be the closing price. If the last trade is outside the bid/ask range, and falls above the ask, the ask will be th e closing price. If the last trade is below the bid, the bid will be the closing price. Other equity securities traded in the over-the-counter market and listed equity securities for which no sale was reported on that date are stated at the last quoted bid price. Debt obligations exceeding 60 days to maturity are valued by an independent pricing service. The pricing service may employ methodologies that utilize actual market transactions, broker-dealer supplied valuations, or other formula-driven valuation techniques. These techniques generally consider such factors as yields or prices of bonds of comparable quality, type of issue, coupon, maturity, ratings and general market conditions. Securities for which prices are not available from an independent pricing service but where an active market exists are valued using market quotations obtained from one or more dealers that make markets in the securities or from a widely-used quotation system. When market quotations are not readily available, securities are valued at fair value as determined in good faith by procedures established and approved by the funds' board of directors. Some of the factors which may be considered in determining fair value are fundamental analytical data relating to the investment; the nature and duration of any restrictions on disposition; trading in similar securities of the same issuer or comparable companies; information from broker-dealers; and an evaluation of the forces that influence the market in which
FIRST AMERICAN FUNDS Annual Report 2005
110
the securities are purchased and sold. If events occur that materially affect the value of securities (including non-U.S. securities) between the close of trading in those securities and the close of regular trading on the New York Stock Exchange, the securities will be valued at fair value. The International Fund is supplied with information from an unaffiliated third party with respect to the fair value of foreign securities. Price movements in futures contracts and American Depository Receipts, and various other indices, may be reviewed in the course of making a good faith determination of a security's fair value. The use of fair value pricing by a fund may cause the net asset value of its shares to differ significantly from the net asset value that would be calculated without regard to such considerations. As of September 30, 2005, Real Estate Securities Fund, International Fund, Small Cap Growt h Opportunities Fund, and Balanced Fund held fair valued securities with a market value of $255,913, $0, $122,540, and $24,215, respectively, or 0.0%, 0.0%, 0.0%, and 0.0% of total net assets, respectively. Debt obligations with 60 days or less remaining until maturity may be valued at their amortized cost, which approximates market value. Foreign securities are valued at the closing prices on the principal exchange on which they trade. The prices for foreign securities are reported in local currency and converted to U.S. dollars using currency exchange rates. Exchange rates are provided daily by recognized independent pricing agents. Investments in open-end mutual funds are valued at the respective net asset value of each underlying fund on the valuation date.
SECURITY TRANSACTIONS AND INVESTMENT INCOME – For financial statement purposes, the funds record security transactions on the trade date of the security purchase or sale. Dividend income is recorded on the ex-dividend date. Interest income, including amortization of bond premium and discount, is recorded on an accrual basis. Security gains and losses are determined on the basis of identified cost, which is the same basis used for federal income-tax purposes.
DISTRIBUTIONS TO SHAREHOLDERS – Equity Income Fund and Large Cap Value Fund declare and pay income dividends monthly. Balanced Fund, Large Cap Select Fund, Mid Cap Value Fund and Real Estate Securities Fund declare and pay income dividends quarterly. Large Cap Growth Opportunities Fund, Mid Cap Growth Opportunites Fund, Small Cap Growth Opportunites Fund, Small Cap Select Fund, Small Cap Value Fund, Small-Mid Cap Core Fund and the International Fund declare and pay income dividends annually. Distributions are payable in cash or reinvested in additional shares of the funds. Any net realized capital gains on sales of a fund's securities are distributed to shareholders at l east annually.
The Real Estate Securities Fund receives substantial distributions from holdings in Real Estate Investment Trusts ("REITs"). Distributions from REITs may be characterized as ordinary income, net capital gain, or a return of capital to the REIT shareholder. The proper characterization of REIT distributions is generally not known until after the end of each calendar year. As such, Real Estate Securities Fund must use estimates in reporting the character of its income and distributions for financial statement purposes. The actual character of distributions to fund shareholders will be reflected on the Form 1099 received by shareholders after the end of the calendar year. Due to the nature of REIT investments, a portion of the distributions received by a fund shareholder may represent a return of capital.
FEDERAL TAXES – Each fund is treated as a separate taxable entity. Each fund intends to continue to qualify as a regulated investment company as provided in Subchapter M of the Internal Revenue Code, as amended, and to distribute all taxable income, if any, to its shareholders. Accordingly, no provision for federal income taxes is required.
Net investment income and net realized gains (losses) may differ for financial statement and tax purposes because of temporary or permanent book/tax differences. These differences are primarily due to post-October losses, losses deferred due to wash sales, proceeds from securities litigation, book gains recognized from in-kind distributions, foreign currency gains and losses, investments in limited partnerships and REITs, decreases in undistributed amounts due to shareholder redemptions and the "mark-to-market" of certain Passive Foreign Investment Companies ("PFICs") for tax purposes. To the extent these differences are permanent, reclassifications are made to the appropriate equity accounts in the period that the differences arise.
FIRST AMERICAN FUNDS Annual Report 2005
111
Notes to Financial Statements September 30, 2005
On the Statement of Assets and Liabilities the following reclassifications were made (000):
| Fund | | Accumulated
Net Realized
Gain (Loss) | | Undistributed
Net Investment
Income | | Portfolio
Capital | |
| Real Estate Securities Fund | | $ | (1,816 | ) | | $ | (2,517 | ) | | $ | 4,333 | | |
| International Fund | | | (3,711 | ) | | | 3,709 | | | | 2 | | |
| Small Cap Growth Opportunities Fund | | | (12,778 | ) | | | 4,005 | | | | 8,773 | | |
| Small Cap Select Fund | | | (15,455 | ) | | | 2,926 | | | | 12,529 | | |
| Small Cap Value Fund | | | (11,441 | ) | | | (284 | ) | | | 11,725 | | |
| Small-Mid Cap Core Fund | | | - | | | | 737 | | | | (737 | ) | |
| Mid Cap Growth Opportunities Fund | | | (31,544 | ) | | | 6,569 | | | | 24,975 | | |
| Mid Cap Value Fund | | | (225 | ) | | | (640 | ) | | | 865 | | |
| Large Cap Growth Opportunities Fund | | | (76,740 | ) | | | 758 | | | | 75,982 | | |
| Large Cap Select Fund | | | (24,162 | ) | | | - | | | | 24,162 | | |
| Large Cap Value Fund | | | (72,078 | ) | | | (288 | ) | | | 72,366 | | |
| Balanced Fund | | | (263 | ) | | | 263 | | | | - | | |
| Equity Income Fund | | | (51,947 | ) | | | 6,868 | | | | 45,079 | | |
The character of distributions made during the year from net investment income or net realized gains may differ from its ultimate characterization for federal income tax purposes. In addition, due to the timing of dividend distributions, the fiscal year in which the amounts are distributed may differ from the year that the income or realized gains(losses) were recorded by the fund. The distributions paid during the fiscal years ended September 30, 2005, and 2004, were characterized as follows (000):
| | | 2005 | |
| Fund | | Ordinary
Income | | Long Term
Gain | | Return
of Capital | | Total | |
| Real Estate Securities Fund | | $ | 17,941 | | | $ | 40,662 | | | $ | - | | | $ | 58,603 | | |
| International Fund | | | 10,214 | | | | - | | | | - | | | | 10,214 | | |
| Small Cap Growth Opportunities Fund | | | 12,908 | | | | 26,459 | | | | - | | | | 39,367 | | |
| Small Cap Select Fund | | | 62,270 | | | | 95,731 | | | | - | | | | 158,001 | | |
| Small Cap Value Fund | | | 9,040 | | | | 57,102 | | | | - | | | | 66,142 | | |
| Mid Cap Growth Opportunities Fund | | | 79,521 | | | | 115,577 | | | | - | | | | 195,098 | | |
| Mid Cap Value Fund | | | 3,756 | | | | - | | | | - | | | | 3,756 | | |
| Large Cap Growth Opportunities Fund | | | 2,288 | | | | - | | | | 757 | | | | 3,045 | | |
| Large Cap Select Fund | | | 4,919 | | | | 1,525 | | | | - | | | | 6,444 | | |
| Large Cap Value Fund | | | 11,191 | | | | - | | | | - | | | | 11,191 | | |
| Balanced Fund | | | 6,225 | | | | - | | | | - | | | | 6,225 | | |
| Equity Income Fund | | | 22,731 | | | | 8,129 | | | | - | | | | 30,860 | | |
| | | 2004 | |
| Fund | | Ordinary
Income | | Long Term
Gain | | Return
of Capital | | Total | |
| Real Estate Securities Fund | | $ | 17,709 | | | $ | 6,775 | | | $ | - | | | $ | 24,484 | | |
| International Fund | | | 8,820 | | | | - | | | | - | | | | 8,820 | | |
| Small Cap Growth Opportunities Fund | | | - | | | | 3,085 | | | | - | | | | 3,085 | | |
| Small Cap Select Fund | | | 62,602 | | | | 15,960 | | | | - | | | | 78,562 | | |
| Small Cap Value Fund | | | 6,941 | | | | 13,524 | | | | - | | | | 20,465 | | |
| Mid Cap Growth Opportunities Fund | | | 19,503 | | | | 21,278 | | | | - | | | | 40,781 | | |
| Mid Cap Value Fund | | | 2,102 | | | | - | | | | 57 | | | | 2,159 | | |
| Large Cap Growth Opportunities Fund | | | 1,184 | | | | - | | | | 261 | | | | 1,445 | | |
| Large Cap Select Fund | | | 2,504 | | | | 333 | | | | - | | | | 2,837 | | |
| Large Cap Value Fund | | | 12,705 | | | | - | | | | - | | | | 12,705 | | |
| Balanced Fund | | | 7,635 | | | | - | | | | - | | | | 7,635 | | |
| Equity Income Fund | | | 29,158 | | | | - | | | | - | | | | 29,158 | | |
FIRST AMERICAN FUNDS Annual Report 2005
112
As of September 30, 2005, the components of accumulated earnings (deficit) on a tax basis were as follows (000):
| Fund | | Undistributed
Ordinary
Income | | Undistributed
Long Term
Capital Gains | | Accumulated
Capital and
Post-October
Losses | | Unrealized
Appreciation | | Other
Accumulated
Gains (Losses) | | Total
Accumulated
Earnings
(Deficit) | |
| Real Estate Securities Fund | | $ | 25,505 | | | $ | 46,363 | | | $ | - | | | $ | 115,391 | | | $ | 1 | | | $ | 187,259 | | |
| International Fund | | | 17,368 | | | | - | | | | (74,685 | ) | | | 222,929 | | | | (1 | ) | | | 165,611 | | |
| Small Cap Growth Opportunities Fund | | | 46,281 | | | | 8,237 | | | | - | | | | 14,254 | | | | (14 | ) | | | 68,758 | | |
| Small Cap Select Fund | | | 50,757 | | | | 98,409 | | | | (48,604 | ) | | | 113,552 | | | | (107 | ) | | | 214,007 | | |
| Small Cap Value Fund | | | 6,453 | | | | 73,456 | | | | - | | | | 78,994 | | | | (9 | ) | | | 158,894 | | |
| Small-Mid Cap Core Fund | | | - | | | | - | | | | (460,504 | ) | | | 3,436 | | | | - | | | | (457,068 | ) | |
| Mid Cap Growth Opportunities Fund | | | 47,679 | | | | 76,989 | | | | (50,420 | ) | | | 318,092 | | | | (1 | ) | | | 392,340 | | |
| Mid Cap Value Fund | | | 186 | | | | 30,897 | | | | - | | | | 110,362 | | | | - | | | | 141,445 | | |
| Large Cap Growth Opportunities Fund | | | - | | | | - | | | | (129,848 | ) | | | 102,925 | | | | (1 | ) | | | (26,924 | ) | |
| Large Cap Select Fund | | | 8,114 | | | | 7,247 | | | | - | | | | 20,215 | | | | (19 | ) | | | 35,557 | | |
| Large Cap Value Fund | | | 137 | | | | 23,071 | | | | - | | | | 139,915 | | | | - | | | | 163,123 | | |
| Balanced Fund | | | 269 | | | | - | | | | (41 | ) | | | 33,715 | | | | (429 | ) | | | 33,514 | | |
| Equity Income Fund | | | - | | | | 7,683 | | | | - | | | | 309,284 | | | | - | | | | 316,967 | | |
The difference between book and tax basis unrealized appreciation (depreciation) is primarily due to the tax deferral of losses on wash sales and investments in limited partnerships and REITs, and the amount of gain (loss) recognized for tax purposes due to mark to market adjustments on open futures contracts and the mark to market for certain PFICs for tax purposes.
As of September 30, 2005, the following funds had capital loss carryforwards (000):
| | | Expiration Year | |
| Fund | | 2007 | | 2008 | | 2009 | | 2010 | | 2011 | | 2012 | | Total | |
| International Fund | | $ | 1,708 | | | $ | 2,509 | | | $ | 1,069 | | | $ | 2,439 | | | $ | 66,960 | | | $ | - | | | $ | 74,685 | | |
| Small Cap Select Fund | | | - | | | | - | | | | - | | | | 48,604 | | | | - | | | | - | | | | 48,604 | | |
| Small-Mid Cap Core Fund | | | - | | | | 12,002 | | | | 6,095 | | | | 335,981 | | | | 102,106 | | | | 4,320 | | | | 460,504 | | |
| Mid Cap Growth Opportunities Fund | | | - | | | | - | | | | - | | | | 50,420 | | | | - | | | | - | | | | 50,420 | | |
| Large Cap Growth Opportunities Fund | | | - | | | | - | | | | - | | | | 119,702 | | | | 10,146 | | | | - | | | | 129,848 | | |
| Balanced Fund | | | - | | | | - | | | | - | | | | - | | | | 41 | | | | - | | | | 41 | | |
In accordance with Section 382 of the Internal Revenue Code, utilization of all or a portion of the above capital loss carryovers is limited on an annual basis for International Fund, Large Cap Growth Opportunities Fund, Mid Cap Growth Opportunities Fund, Small Cap Select Fund, and Small-Mid Cap Core Fund to (000) $4,046, $24,385, $10,084, $9,721 and $1,524, respectively.
FUTURES TRANSACTIONS – In order to gain exposure to or protect against changes in the market and to maintain sufficient liquidity to meet redemption requests, certain funds may enter into S&P stock index futures contracts and other stock index futures contracts. The Balanced Fund may also enter into interest rate index futures contracts.
Upon entering into a futures or currency contract, the fund is required to deposit cash or pledge U.S. Government securities in an amount equal to five percent of the purchase price indicated in the futures or currency contract (initial margin). Subsequent payments, which are dependent on the daily fluctuations in the value of the underlying security or securities, are made or received by the fund each day (daily variation margin) and are recorded as unrealized gains (losses) until the contract is closed. When the contract is closed, the fund records a realized gain (loss) equal to the difference between the proceeds from (or cost of) the closing transaction and the fund's basis in the contract.
Risks of entering into futures contracts, in general, include the possibility that there will not be a perfect price correlation between the futures contracts and the underlying securities. Second, it is possible that a lack of liquidity for futures contracts could exist, resulting in an inability to close a futures position prior to its maturity date. Third, the purchase of a futures contract involves the risk that a fund could lose more than the original margin deposit required to initiate a futures transaction. These
FIRST AMERICAN FUNDS Annual Report 2005
113
Notes to Financial Statements September 30, 2005
contracts involve market risk in excess of the amount reflected in the fund's statement of assets and liabilities. Unrealized gains (losses) on outstanding positions in futures contracts held at the close of the year will be recognized as capital gains (losses) for federal income tax purposes.
OPTIONS TRANSACTIONS – The funds may utilize options in an attempt to manage market or business risk or enhance their yield. When a call or put option is written, an amount equal to the premium received is recorded as a liability. The liability is marked-to-market daily to reflect the current market value of the option written. When a written option expires, a gain is realized in the amount of the premium originally received. If a closing purchase contract is entered into, a gain or loss is realized in the amount of the original premium less the cost of the closing transaction. If a written call option is exercised, a gain or loss is realized from the sale of the underlying security, and the proceeds from such sale are increased by the premium originally received. If a writte n put option is exercised, the amount of the premium originally received reduces the cost of the security which is purchased upon exercise of the option.
Purchased options are recorded as investments and marked-to-market daily to reflect the current market value of the option contract. If a purchased option expires, a loss is realized in the amount of the cost of the option. If a closing transaction is entered into, a gain or loss is realized, to the extent that the proceeds from the sale are greater or less than the cost of the option. If a put option is exercised, a gain or loss is realized from the sale of the underlying security by adjusting the proceeds from such sale by the amount of the premium originally paid. If a call option is exercised, the cost of the security purchased upon exercise is increased by the premium originally paid.
FOREIGN CURRENCY TRANSLATION – The books and records of the International Fund relating to the fund's non-U.S. dollar denominated investments are maintained in U.S. dollars on the following basis:
• market value of investment securities, assets, and liabilities are translated at the current rate of exchange; and
• purchases and sales of investment securities, income, and expenses are translated at the relevant rates of exchange prevailing on the respective dates of such transactions.
The International Fund does not isolate the portion of gains and losses on investments in equity securities that is due to changes in the foreign exchange rates from that which is due to changes in market prices of equity securities.
The International Fund reports certain foreign currency-related transactions as components of realized gains for financial reporting purposes, whereas such components are treated as ordinary income for federal income tax purposes. At September 30, 2005, foreign currency holdings consisted of multiple denominations, primarily European Monetary Units and Australian Dollar.
FORWARD FOREIGN CURRENCY CONTRACTS – The International Fund may enter into forward foreign currency contracts as hedges against either specific transactions or fund positions. The aggregate principal amount of the contracts are not recorded because the International Fund intends to settle the contracts prior to delivery. All commitments are "marked-to-market" daily at the applicable foreign exchange rate, and any resulting unrealized gains or losses are recorded currently. The International Fund realizes gains or losses at the time the forward contracts are extinguished. Unrealized gains or losses on outstanding positions in forward foreign currency contracts held at the close of the period are recognized as ordinary income or loss for federal income tax purposes.
The use of forward foreign currency contracts does not eliminate fluctuations in the underlying prices of the securities, but it does establish a rate of exchange that can be achieved in the future. Although forward foreign currency contracts limit the risk of loss due to a decline in the value of the hedged currency, they also limit a potential gain that might result should the value of the currency increase. These contracts involve market risk in excess of the amount reflected in the fund's statement of assets and liabilities. The face or contract amount in U.S. dollars reflects the total exposure the fund has in that particular currency contract. In addition, there could be exposure to risks (limited to the amount of unrealized gains) if the counterparties to the contracts are unable to meet the terms of their contracts. There were no outstanding forward foreign currency contracts at September 30 , 2005.
FIRST AMERICAN FUNDS Annual Report 2005
114
SECURITIES PURCHASED ON A WHEN-ISSUED BASIS – Delivery and payment for securities that have been purchased by a fund on a forward-commitment or when-issued basis can take place up to a month or more after the transaction date. During this period, such securities are subject to market fluctuations and the portfolio maintains, in a segregated account with its custodian, assets with a market value equal to or greater than the amount of its purchase commitments. The purchase of securities on a when-issued or forward-commitment basis may increase the volatility of the fund's net asset value if the fund makes such purchases while remaining substantially fully invested. At September 30, 2005, the following fund had outstanding when-issued commitments (000):
| Fund | | Cost | | Segregated
Assets | |
| Balanced Fund | | $ | 4,997 | | | $ | 6,317 | | |
In connection with the ability to purchase securities on a when-issued basis, each fund may also enter into dollar rolls in which the fund sells securities purchased on a forward-commitment basis and simultaneously contracts with a counterparty to repurchase similar (same type, coupon, and maturity), but not identical securities on a specified future date. As an inducement for the fund to "roll over" its purchase commitments, the fund receives negotiated amounts in the form of reductions of the purchase price of the commitment. Dollar rolls are considered a form of leverage.
ILLIQUID OR RESTRICTED SECURITIES – A security may be considered illiquid if it lacks a readily available market. Securities are generally considered liquid if they can be sold or disposed of in the ordinary course of business within seven days at approximately the price at which the security is valued by the fund. Illiquid securities may be valued under methods approved by the funds' board of directors as reflecting fair value. Each fund intends to invest no more than 15% of its net assets (determined at the time of purchase and reviewed periodically) in illiquid securities. Certain restricted securities may be considered illiquid. Restricted securities are often purchased in private placement transactions, are not registered under the Securities Act of 1933, and m ay have contractual restrictions on resale. Certain restricted securities eligible for resale to qualified institutional investors, including Rule 144A securities, are not subject to the limitation on a fund's investment in illiquid securities if they are determined to be liquid in accordance with procedures adopted by the funds' board of directors. At September 30, 2005, Real Estate Securities Fund, International Fund, Small Cap Growth Opportunities Fund, and Balanced Fund had investments in illiquid securities with a total value of $255,913, $0, $122,540, and $24,215, respectively, or 0.0%, 0.0%, 0.0%, and 0.0%, respectively, of total net assets.
Information concerning illiquid securities, including restricted securities considered to be illiquid, is as follows:
| Real Estate Securities Fund | | | |
| Security | | Shares | | Dates
Acquired | | Cost Basis
(000) | |
| Beacon Capital | | | 33,750 | | | 3/98 | | $ | 435 | | |
| Newcastle Investment Holdings | | | 35,000 | | | 6/98 | | | 153 | | |
| International Fund | | | |
| Security | | Shares | | Dates
Acquired | | Cost Basis
(000) | |
| Far East Pharmaceutical Technology | | | 2,836,000 | | | 4/04 | | $ | 423 | | |
| Peregrine Investment Holdings | | | 142,000 | | | 12/94-8/97 | | | 288 | | |
| Small Cap Growth Opportunities Fund | | | |
| Security | | Shares | | Dates
Acquired | | Cost Basis
(000) | |
| Tridium, Class B | | | 278,500 | | | 4/99-8/99 | | $ | 1,524 | | |
| VideoPropulsion | | | 809,856 | | | 12/99 | | | - | * | |
*Rounds to zero.
| Balanced Fund | |
| Security | | Par (000) | | Dates
Acquired | | Cost Basis
(000) | |
| Duty Free International | | $ | 605 | | | | 1/99-11/02 | | | $ | 605 | | |
SECURITIES LENDING – In order to generate additional income, a fund may lend securities representing up to one-third of the value of its total assets (which includes collateral for securities on loan) to broker-dealers, banks, or other institutional borrowers of securities. Each fund's policy is to maintain collateral in the form of cash, U.S. Government securities, or other high-grade debt obligations equal to at least 100% of the value of securities loaned. The collateral is then "marked-to-market" daily
FIRST AMERICAN FUNDS Annual Report 2005
115
Notes to Financial Statements September 30, 2005
until the securities are returned. As with other extensions of credit, there may be risks of delay in recovery of the securities or even loss of rights in the collateral should the borrower of the security fail financially. As of September 30, 2005, cash collateral invested was as follows (000):
| | | Commercial
Paper | | Corporate
Obligations | | Repurchase
Agreements | | Money
Market Fund | | Other Short-Term
Securities | | Total | |
| Real Estate Securities Fund | | $ | 76,027 | | | $ | 89,511 | | | $ | 139,205 | | | $ | - | | | $ | 6,741 | | | $ | 311,484 | | |
| International Fund | | | - | | | | - | | | | - | | | | 390,941 | | | | - | | | | 390,941 | | |
| Small Cap Growth Opportunities Fund | | | 21,378 | | | | 25,170 | | | | 39,143 | | | | - | | | | 1,896 | | | | 87,587 | | |
| Small Cap Select Fund | | | 86,010 | | | | 101,264 | | | | 157,484 | | | | - | | | | 7,626 | | | | 352,384 | | |
| Small Cap Value Fund | | | 26,144 | | | | 30,781 | | | | 47,870 | | | | - | | | | 2,318 | | | | 107,113 | | |
| Small-Mid Cap Core Fund | | | 6,240 | | | | 7,347 | | | | 11,425 | | | | - | | | | 553 | | | | 25,565 | | |
| Mid Cap Growth Opportunities Fund | | | 134,508 | | | | 158,365 | | | | 246,286 | | | | - | | | | 11,927 | | | | 551,086 | | |
| Mid Cap Value Fund | | | 58,554 | | | | 68,939 | | | | 107,213 | | | | - | | | | 5,192 | | | | 239,898 | | |
| Large Cap Growth Opportunities Fund | | | 70,179 | | | | 82,625 | | | | 128,497 | | | | - | | | | 6,223 | | | | 287,524 | | |
| Large Cap Select Fund | | | 19,625 | | | | 23,107 | | | | 35,934 | | | | - | | | | 1,740 | | | | 80,406 | | |
| Large Cap Value Fund | | | 59,777 | | | | 70,378 | | | | 109,451 | | | | - | | | | 5,301 | | | | 244,907 | | |
| Balanced Fund | | | 36,902 | | | | 43,447 | | | | 67,567 | | | | - | | | | 3,272 | | | | 151,188 | | |
| Equity Income Fund | | | 78,904 | | | | 92,899 | | | | 144,474 | | | | - | | | | 6,997 | | | | 323,274 | | |
U.S. Bancorp Asset Management, Inc. ("USBAM") serves as the securities lending agent for the funds in transactions involving the lending of portfolio securities on behalf of the funds. USBAM acts as the securities lending agent pursuant to, and subject to compliance with conditions contained in, an exemptive order issued by the Securities and Exchange Commission ("SEC"). During the fiscal year ended September 30, 2005, USBAM received fees equal to 35% of each fund's income from securities lending transactions. Effective January 1, 2006, such fees will be lowered to 32% of each fund's income from securities lending transactions. With respect to International Fund, a portion of this amount was paid to State Street Bank and Trust for acting as sub-lending agent. Fees paid to USBAM by the funds for the fiscal year ended September 30, 2005, were as follows (000):
| Fund | | Amount | |
| Real Estate Securities Fund | | $ | 99 | | |
| International Fund | | | 408 | | |
| Small Cap Growth Opportunities Fund | | | 89 | | |
| Small Cap Select Fund | | | 214 | | |
| Small Cap Value Fund | | | 48 | | |
| Small-Mid Cap Core Fund | | | 34 | | |
| Mid Cap Growth Opportunities Fund | | | 269 | | |
| Mid Cap Value Fund | | | 92 | | |
| Large Cap Growth Opportunities Fund | | | 171 | | |
| Large Cap Select Fund | | | 33 | | |
| Large Cap Value Fund | | | 121 | | |
| Balanced Fund | | | 80 | | |
| Equity Income Fund | | | 159 | | |
SWAP AGREEMENTS – The Balanced fund may invest in swap agreements. A swap is an agreement to exchange the return generated by one instrument for the return generated by another instrument. The fund may enter into interest rate and credit default swap agreements to manage its exposure to interest rates and credit risk.
Interest rate swap agreements involve the exchange by the fund with another party of their respective commitments to pay or receive interest (i.e., an exchange of floating rate payments for fixed rate payments with respect to the notional amount of principal). At September 30, 2005, Balanced Fund had not entered into any interest rate swap agreements.
In a credit default swap, one party makes a stream of payments to another party in exchange for the right to receive a specified return in the event of a default by a specified issuer on its obligation (typically a corporate issue or sovereign issue of an emerging country). The fund may use credit default swaps to provide a measure of protection against defaults of sovereign issuers (i.e., to reduce risk where the fund owns an issuance of or otherwise has exposure to the sovereign issuer) or to take an active long or short position with respect to the likelihood of a particular issuer's default.
Swaps are marked to market daily based upon quotations from market makers and the change in value, if any, is recorded as unrealized gain or loss in the Statement of Operations. Payments received or made at the beginning of the measurement period are reflected on the Statement of
FIRST AMERICAN FUNDS Annual Report 2005
116
Assets and Liabilities. A liquidation payment received or made at the termination of the swap is recorded as realized gain or loss in the Statement of Operations. Net periodic payments received by the fund are included as part of miscellaneous income on the Statement of Operations. Entering into these agreements involves, to varying degrees, elements of credit, market and documentation risk in excess of the amounts recognized on the Statement of Assets and Liabilities. Such risks involve the possibility that there will be no liquid market for these agreements, that the counterparty to the agreements may default on its obligation to perform or disagree as to the meaning of contractual terms in the agreements, and that there may be unfavorable changes in interest rates.
SECURITY LITIGATION SETTLEMENTS – Income from settlement proceeds related to portfolio securities is recorded as an adjustment to realized or unrealized gains or losses. For the fiscal year ended September 30, 2005, Real Estate Securities Fund, Small Cap Growth Opportunities, Small Cap Select, Small-Mid Cap Core Fund, Mid Cap Growth Opportunities Fund, Mid Cap Value Fund, Large Cap Growth Opportunities Fund, Large Cap Value Fund, Balanced Fund and Equity Income Fund received settlement proceeds of $942, $1,063,765, $40,402, $84,326, $140,115, $8,035, $72,577, $152,053, $31,571 and $25,533 respectively, as an adjustment to realized gains or losses for settlement proceeds related to securities no longer included in the portfolio.
EXPENSES – Expenses that are directly related to one of the funds are charged directly to that fund. Other operating expenses generally are allocated to the funds on the basis of relative net assets of all funds within the First American Family of Funds. Class specific expenses, such as distribution fees and servicing fees, are borne by that class. Income, other expenses, and realized and unrealized gains and losses of a fund are allocated to each respective class in proportion to the relative net assets of each class.
INTERFUND LENDING PROGRAM – Pursuant to an exemptive order issued by the SEC, the funds, along with other registered investment companies in the First American Family of Funds, may participate in an interfund lending program. This program provides an alternative credit facility allowing the funds to borrow from, or lend money to, other participating funds. The funds did not have any interfund lending transactions during the fiscal year ended September 30, 2005.
DEFERRED COMPENSATION PLAN – Under a Deferred Compensation Plan (the "Plan"), non-interested directors of the First American Family of Funds may participate and elect to defer receipt of part or all of their annual compensation. Deferred amounts are treated as though equivalent dollar amounts had been invested in shares of selected open-end First American Funds as designated by the board of directors. All amounts in the Plan are 100% vested and accounts under the Plan are obligations of the funds. Deferred amounts remain in the funds until distributed in accordance with the Plan.
USE OF ESTIMATES IN PREPARATION OF FINANCIAL STATEMENTS – The preparation of financial statements, in conformity with U.S. generally accepted accounting principles, requires management to make estimates and assumptions that affect the reported amount of net assets and liabilities and disclosure of contingent assets and liabilities at the date of the financial statements and the reported results of operations during the reporting period. Actual results could differ from those estimates.
3 > Fees and Expenses
INVESTMENT ADVISORY FEES – Pursuant to an investment advisory agreement (the "Agreement"), USBAM, a subsidiary of U.S. Bank National Association ("U.S. Bank"), manages each fund's assets and furnishes related office facilities, equipment, research, and personnel. The Agreement requires each fund to pay USBAM a monthly fee based upon average daily net assets. The annual fee for each fund is as follows:
| Fund | | Advisory fee
as a % of average
daily net assets | |
| Real Estate Securities Fund | | | 0.70 | % | |
| International Fund1 | | | 1.00 | | |
| Small Cap Growth Opportunities Fund2 | | | 1.00 | | |
| Small Cap Select Fund | | | 0.70 | | |
| Small Cap Value Fund | | | 0.70 | | |
| Small-Mid Cap Core Fund | | | 0.70 | | |
| Mid Cap Growth Opportunities Fund | | | 0.70 | | |
| Mid Cap Value Fund | | | 0.70 | | |
| Large Cap Growth Opportunities Fund3 | | | 0.65 | | |
| Large Cap Select Fund3 | | | 0.65 | | |
| Large Cap Value Fund3 | | | 0.65 | | |
| Balanced Fund3 | | | 0.65 | | |
| Equity Income Fund3 | | | 0.65 | | |
(1) Effective July 1, 2005. Prior to July 1, 2005, the advisory fee paid to USBAM by International Fund was equal to a rate of 1.10% of the average daily net assets up to $1.5 billion, 1.05% of the average daily net assets on the next $1 billion, and 1.00% of the average daily net assets in excess of $2.5 billion.
(2) Effective July 1, 2005. Prior to July 1, 2005, the advisory fee paid to USBAM by Small Cap Growth Opportunities Fund was equal to a rate of 1.40% of the average daily net assets.
(3) The advisory fees paid by Large Cap Growth Opportunities Fund, Large Cap Select Fund, Large Cap Value Fund, Balanced Fund, and Equity Income Fund are equal to an annual rate of 0.65% of the average daily net assets up to $3 billion, 0.625% of the average daily net assets on the next $2 billion, and 0.60% of the average daily net assets in excess of $5 billion.
FIRST AMERICAN FUNDS Annual Report 2005
117
Notes to Financial Statements September 30, 2005
USBAM has agreed to waive fees and reimburse other fund expenses through June 30, 2006, so that total fund operating expenses, as a percentage of average daily net assets, do not exceed the following amounts:
| | | Share Class | |
| Fund | | | A | | | | B | | | | C | | | | R | | | | Y | | |
| International Fund | | | 1.52 | % | | | 2.27 | % | | | 2.27 | % | | | 1.77 | % | | | 1.27 | % | |
Small Cap Growth
Opportunities Fund | | | 1.47 | | | | 2.22 | | | | 2.22 | | | | 1.72 | | | | 1.22 | | |
| Balanced Fund | | | 1.10 | | | | 1.85 | | | | 1.85 | | | | 1.35 | | | | 0.85 | | |
Prior to July 1, 2005, USBAM agreed to waive fees and reimburse other fund expenses so that total fund operating expenses, as a percentage of average daily net assets, did not exceed the following amounts:
| | | Share Class | |
| Fund | | | A | | | | B | | | | C | | | | R | | | | Y | | |
Real Estate
Securities Fund | | | 1.23 | % | | | 1.98 | % | | | 1.98 | % | | | 1.48 | % | | | 0.98 | % | |
| International Fund | | | 1.60 | | | | 2.35 | | | | 2.35 | | | | 1.85 | | | | 1.35 | | |
Small Cap Growth
Opportunities Fund | | | 1.93 | | | | 2.68 | | | | 2.68 | | | | 2.18 | | | | 1.68 | | |
| Small Cap Select Fund | | | 1.21 | | | | 1.96 | | | | 1.96 | | | | 1.46 | | | | 0.96 | | |
| Small Cap Value Fund | | | 1.23 | | | | 1.98 | | | | 1.98 | | | | 1.48 | | | | 0.98 | | |
| Small-Mid Cap Core Fund | | | 1.23 | | | | 1.98 | | | | 1.98 | | | | NA | | | | 0.98 | | |
Mid Cap Growth
Opportunities Fund | | | 1.20 | | | | 1.95 | | | | 1.95 | | | | 1.45 | | | | 0.95 | | |
| Mid Cap Value Fund | | | 1.20 | | | | 1.95 | | | | 1.95 | | | | 1.45 | | | | 0.95 | | |
Large Cap Growth
Opportunities Fund | | | 1.15 | | | | 1.90 | | | | 1.90 | | | | 1.40 | | | | 0.90 | | |
| Large Cap Select Fund | | | 1.15 | | | | 1.90 | | | | 1.90 | | | | 1.40 | | | | 0.90 | | |
| Large Cap Value Fund | | | 1.15 | | | | 1.90 | | | | 1.90 | | | | 1.40 | | | | 0.90 | | |
| Balanced Fund | | | 1.05 | | | | 1.80 | | | | 1.80 | | | | 1.30 | | | | 0.80 | | |
| Equity Income Fund | | | 1.15 | | | | 1.90 | | | | 1.90 | | | | 1.40 | | | | 0.90 | | |
NA = not applicable
The funds may invest in related money market funds that are series of First American Funds, Inc. ("FAF"), subject to certain limitations. In order to avoid the payment of duplicative investment advisory fees to USBAM, which acts as the investment advisor to both the investing funds and the related money market funds, USBAM will reimburse each investing fund an amount equal to that portion of USBAM's investment advisory fee received from the related money market funds that is attributable to the assets of the investing fund. For financial statement purposes, these reimbursements are recorded as investment income.
SUB-ADVISORY FEES – Effective December 8, 2004, J.P. Morgan Investment Management Inc. ("J.P. Morgan") serves as investment sub-advisor to the International Fund, pursuant to a Sub-Advisory Agreement with USBAM. For its services under the Sub-Advisory Agreement with USBAM, J.P. Morgan is paid a monthly fee by USBAM calculated on an annual basis equal to 0.34% of the first $100 million of the fund's average daily net assets, 0.30% of the next $250 million of the fund's average daily net assets, 0.24% of the next $1,250 million of the fund's average daily net assets and 0.22% of the fund's average daily net assets in excess of $1,600 million.
Prior to December 8, 2004, Clay Finlay, Inc. ("Clay Finlay") served as investment sub-advisor to the International Fund. For its services under the Sub-Advisory Agreement with USBAM, Clay Finlay was paid a monthly fee by USBAM calculated on an annual basis equal to 0.25% of the first $500 million of the fund's average daily net assets and 0.10% of the fund's average daily net assets in excess of $500 million.
ADMINISTRATION FEES – Effective July 1, 2005, USBAM serves as the funds' administrator pursuant to an administration agreement between USBAM and the funds. U.S. Bancorp Fund Services, LLC ("USBFS") serves as sub-administrator pursuant to a sub-administration agreement between USBFS and USBAM. Both U.S. Bank and USBFS are direct subsidiaries of U.S. Bancorp. Under the administration agreement, USBAM is compensated to provide, or compensate other entities to provide, services to the funds. These services include various legal, oversight and administrative services and accounting services. Effective July��1, 2005, the funds pay USBAM administration fees which are calculated daily and paid monthly, equal to each fund's pro rata share of an amount equal, on an annual basis, to 0.15% of the aggregate average daily net assets of all open-end mutual funds in the First American Family of Funds, up to $8 billion, 0.135% on the next $17 billion of the aggregate average daily net assets, 0.12% on the next $25 billion of the aggregate average daily net assets, and 0.10% of the aggregate average daily net assets in excess of $50 billion. All fees paid to the sub-administrator are paid from the administration fee. In addition to these fees, the funds may reimburse USBAM and, indirectly, the sub-administrator for any out-of-pocket expenses incurred in providing administration services.
Prior to July 1, 2005, USBAM and USBFS served as "co-administrators" pursuant to a co-administration agreement between the co-administrators and the funds. The funds paid the administration fees to the co-administrators, which were calculated daily and paid monthly, equal to each fund's pro rata share of an amount equal, on an annual basis, to 0.25% of the aggregate average daily net
FIRST AMERICAN FUNDS Annual Report 2005
118
assets of all open-end mutual funds in the First American Family of Funds, up to $8 billion, 0.235% of the next $17 billion of the aggregate average daily assets, 0.22% of the next $25 billion of the aggregate average daily net assets, and 0.20% of the aggregate average daily net assets in excess of $50 billion. In addition, the funds paid transfer agent fees under the co-administration agreement of $18,500 per share class plus additional per account fees. In addition to these fees, the funds reimbursed the co-administrators for any out-of-pocket expenses incurred in providing administration services.
For the fiscal year ended September 30, 2005, administration fees paid to USBAM and USBFS by the funds included in this annual report were as follows (000):
| Fund | | Amount | |
| Real Estate Securities Fund | | $ | 1,224 | | |
| International Fund | | | 2,820 | | |
| Small Cap Growth Opportunities Fund | | | 637 | | |
| Small Cap Select Fund | | | 1,743 | | |
| Small Cap Value Fund | | | 870 | | |
| Small-Mid Cap Core Fund | | | 175 | | |
| Mid Cap Growth Opportunities Fund | | | 2,921 | | |
| Mid Cap Value Fund | | | 1,154 | | |
| Large Cap Growth Opportunities Fund | | | 2,368 | | |
| Large Cap Select Fund | | | 588 | | |
| Large Cap Value Fund | | | 2,120 | | |
| Balanced Fund | | | 859 | | |
| Equity Income Fund | | | 3,235 | | |
TRANSFER AGENT FEES – Effective July 1, 2005, USBFS serves as the funds' transfer agent pursuant to a transfer agent and shareholder servicing agreement with FAIF. FAIF pays transfer agent fees of $18,500 per share class and additional per account fees for transfer agent services. These fees are allocated to each fund based upon the fund's pro rata share of the aggregate average daily net assets of the funds that comprise FAIF. Under the new transfer agent and shareholder servicing agreement, FAIF also pays USBFS a fee equal, on an annual basis, to 0.10% of each fund's average daily net assets. This fee compensates USBFS for providing certain shareholder services and reimburses USBFS for its payments to financial institutions that establish and maintain omnibus acco unts and provide customary services for such accounts. In addition to these fees, the funds reimburse USBFS for out-of-pocket expenses incurred in providing transfer agent services. Prior to July 1, 2005, these services were provided by USBFS pursuant to the co-administration agreement.
For the fiscal year ended September 30, 2005, transfer agent fees paid to USBFS by the funds included in this annual report were as follows (000):
| Fund | | Amount | |
| Real Estate Securities Fund | | $ | 392 | | |
| International Fund | | | 896 | | |
| Small Cap Growth Opportunities Fund | | | 194 | | |
| Small Cap Select Fund | | | 524 | | |
| Small Cap Value Fund | | | 266 | | |
| Small-Mid Cap Core Fund | | | 51 | | |
| Mid Cap Growth Opportunities Fund | | | 929 | | |
| Mid Cap Value Fund | | | 377 | | |
| Large Cap Growth Opportunities Fund | | | 665 | | |
| Large Cap Select Fund | | | 181 | | |
| Large Cap Value Fund | | | 602 | | |
| Balanced Fund | | | 257 | | |
| Equity Income Fund | | | 945 | | |
CUSTODIAN FEES – U.S. Bank serves as the funds' custodian pursuant to a custodian agreement with FAIF for all funds except the International Fund. Effective July 1, 2005, the fee for each fund (except the International Fund) was reduced from an annual rate of 0.01% of average daily net assets to an annual rate of 0.005% of average daily net assets. Effective July 1, 2005, State Street Bank ("SSB") serves as International Fund's custodian pursuant to a custodian agreement with the fund. International Fund pays SSB various asset-based fees and transaction charges based on the issuer's country. All fees are computed daily and paid monthly.
Effective July 1, 2005, the funds have entered into an agreement with their custodians whereby interest earned on uninvested cash balances will be used to reduce a portion of each fund's custodian expenses. For the fiscal year ended September 30, 2005, custodian fees were not reduced as a result of interest earned. The International Fund has also entered into an agreement with its custodian to receive certain credits to reduce the amount of custody fees incurred. These credits are disclosed as Expenses paid indirectly in the Statement of Operations.
DISTRIBUTION AND SHAREHOLDER SERVICING FEES – Quasar Distributors LLC ("Quasar"), a subsidiary of U.S. Bancorp, serves as the distributor of the funds pursuant to a distribution agreement with FAIF. Under the distribution agreement, and pursuant to a plan adopted by each fund under rule 12b-1 of the Investment Company Act, each fund pays Quasar a monthly distribution and/or shareholder servicing fee equal to an annual rate of 0.25%, 1.00%, 1.00% and 0.50% of each fund's average daily net assets of the Class A shares, Class B shares, Class C shares, and Class R shares, respectively. No distribution or
FIRST AMERICAN FUNDS Annual Report 2005
119
Notes to Financial Statements September 30, 2005
shareholder servicing fees are paid by Class Y shares. These fees may be used by Quasar to provide compensation for sales support, distribution activities, or shareholder servicing activities.
FAIF has also adopted and entered into a shareholder servicing plan and agreement with USBAM with respect to the Class R shares. Each fund, except Small-Mid Cap Core Fund, pays USBAM a monthly shareholder servicing fee equal to an annual rate of 0.15% of each fund's average daily net assets of the Class R shares. USBAM is currently waiving all fees under this plan and agreement. This waiver may be discontinued at any time.
Under these distribution and shareholder servicing agreements, the following amounts were retained by Quasar for the fiscal year ended September 30, 2005 (000):
| Fund | | Amount | |
| Real Estate Securities Fund | | $ | 297 | | |
| International Fund | | | 85 | | |
| Small Cap Growth Opportunities Fund | | | 191 | | |
| Small Cap Select Fund | | | 269 | | |
| Small Cap Value Fund | | | 106 | | |
| Small-Mid Cap Core Fund | | | 65 | | |
| Mid Cap Growth Opportunities Fund | | | 479 | | |
| Mid Cap Value Fund | | | 88 | | |
| Large Cap Growth Opportunities Fund | | | 272 | | |
| Large Cap Select Fund | | | 6 | | |
| Large Cap Value Fund | | | 238 | | |
| Balanced Fund | | | 347 | | |
| Equity Income Fund | | | 525 | | |
OTHER FEES AND EXPENSES – In addition to the investment advisory fees, custodian fees, distribution and shareholder servicing fees, transfer agent fees and administration fees, each fund is responsible for paying other operating expenses, including: fees and expenses of independent directors, registration fees, postage and printing of shareholder reports, legal, auditing, insurance, and other miscellaneous expenses. For the fiscal year ended September 30, 2005, legal fees and expenses were paid to a law firm of which an Assistant Secretary of the funds is a partner.
CONTINGENT DEFERRED SALES CHARGES – A contingent deferred sales charge ("CDSC") is imposed on redemptions made in the Class B shares. The CDSC varies depending on the number of years from time of payment for the purchase of Class B shares until the redemption of such shares. Class B shares automatically convert to Class A shares after eight years.
| Year Since Purchase | | CDSC as a
Percentage of Dollar
Amount Subject to Charge | |
| First | | | 5.00 | % | |
| Second | | | 5.00 | | |
| Third | | | 4.00 | | |
| Fourth | | | 3.00 | | |
| Fifth | | | 2.00 | | |
| Sixth | | | 1.00 | | |
| Seventh | | | - | | |
| Eighth | | | - | | |
A CDSC of 1.00% is imposed on redemptions made in Class C shares for the first twelve months.
The CDSC for Class B shares and Class C shares is imposed on the value of the purchased shares or the value at the time of redemption, whichever is less.
For the fiscal year ended September 30, 2005, total front-end sales charges and CDSCs retained by affiliates of USBAM for distributing the funds' shares were as follows (000):
| Fund | | Amount | |
| Real Estate Securities Fund | | $ | 218 | | |
| International Fund | | | 76 | | |
| Small Cap Growth Opportunities Fund | | | 109 | | |
| Small Cap Select Fund | | | 205 | | |
| Small Cap Value Fund | | | 86 | | |
| Small-Mid Cap Core Fund | | | 36 | | |
| Mid Cap Growth Opportunities Fund | | | 375 | | |
| Mid Cap Value Fund | | | 165 | | |
| Large Cap Growth Opportunities Fund | | | 164 | | |
| Large Cap Select Fund | | | 34 | | |
| Large Cap Value Fund | | | 104 | | |
| Balanced Fund | | | 156 | | |
| Equity Income Fund | | | 406 | | |
FIRST AMERICAN FUNDS Annual Report 2005
120
4 > Capital Share Transactions
FAIF has 324 billion shares of $0.0001 par value capital stock authorized. Capital share transactions for the funds were as follows (000):
| | | Real Estate
Securities Fund | | International
Fund | | Small Cap Growth
Opportunities Fund | |
| | | Year
ended
9/30/05 | | Year
ended
9/30/04 | | Year
ended
9/30/05 | | Year
ended
9/30/04 | | Year
ended
9/30/05 | | Year
ended
9/30/04 | |
| Class A: | |
| Shares issued | | | 2,268 | | | | 2,885 | | | | 900 | | | | 1,986 | | | | 805 | | | | 3,228 | | |
| Shares issued in lieu of cash distributions | | | 504 | | | | 192 | | | | 23 | | | | 20 | | | | 553 | | | | 25 | | |
| Shares redeemed | | | (1,219 | ) | | | (640 | ) | | | (1,335 | ) | | | (1,969 | ) | | | (2,445 | ) | | | (2,342 | ) | |
| Total Class A transactions | | | 1,553 | | | | 2,437 | | | | (412 | ) | | | 37 | | | | (1,087 | ) | | | 911 | | |
| Class B: | |
| Shares issued | | | 57 | | | | 64 | | | | 56 | | | | 64 | | | | 28 | | | | 251 | | |
| Shares issued in lieu of cash distributions | | | 19 | | | | 14 | | | | - | | | | 1 | | | | 57 | | | | 2 | | |
| Shares redeemed | | | (98 | ) | | | (63 | ) | | | (235 | ) | | | (234 | ) | | | (130 | ) | | | (121 | ) | |
| Total Class B transactions | | | (22 | ) | | | 15 | | | | (179 | ) | | | (169 | ) | | | (45 | ) | | | 132 | | |
| Class C: | |
| Shares issued | | | 75 | | | | 104 | | | | 70 | | | | 87 | | | | 23 | | | | 191 | | |
| Shares issued in lieu of cash distributions | | | 20 | | | | 14 | | | | - | | | | 1 | | | | 27 | | | | - | | |
| Shares redeemed | | | (96 | ) | | | (91 | ) | | | (269 | ) | | | (422 | ) | | | (132 | ) | | | (43 | ) | |
| Total Class C transactions | | | (1 | ) | | | 27 | | | | (199 | ) | | | (334 | ) | | | (82 | ) | | | 148 | | |
| Class R: | |
| Shares issued | | | 3 | | | | 75 | | | | 35 | | | | 135 | | | | 1 | | | | 39 | | |
| Shares issued in lieu of cash distributions | | | - | | | | 8 | | | | - | | | | 4 | | | | - | | | | 1 | | |
| Shares redeemed | | | (1 | ) | | | (241 | ) | | | (22 | ) | | | (1,090 | ) | | | (1 | ) | | | (208 | ) | |
| Total Class R transactions | | | 2 | | | | (158 | ) | | | 13 | | | | (951 | ) | | | - | | | | (168 | ) | |
| Class Y: | |
| Shares issued | | | 6,209 | | | | 13,274 | | | | 28,181 | | | | 31,294 | | | | 1,632 | | | | 4,004 | | |
| Shares issued in lieu of cash distributions | | | 1,073 | | | | 499 | | | | 542 | | | | 526 | | | | 839 | | | | 79 | | |
| Shares redeemed | | | (5,485 | ) | | | (3,750 | ) | | | (16,895 | ) | | | (29,700 | ) | | | (3,522 | ) | | | (10,975 | ) | |
| Total Class Y transactions | | | 1,797 | | | | 10,023 | | | | 11,828 | | | | 2,120 | | | | (1,051 | ) | | | (6,892 | ) | |
| Net increase (decrease) in capital shares | | | 3,329 | | | | 12,344 | | | | 11,051 | | | | 703 | | | | (2,265 | ) | | | (5,869 | ) | |
| | | Small Cap
Select Fund | | Small Cap
Value Fund | | Small-Mid Cap Core
Fund | |
| | | Year
ended
9/30/05 | | Year
ended
9/30/04 | | Year
ended
9/30/05 | | Year
ended
9/30/04 | | Year
ended
9/30/05 | | Year
ended
9/30/04 | |
| Class A: | |
| Shares issued | | | 1,586 | | | | 2,909 | | | | 526 | | | | 1,192 | | | | 653 | | | | 2,255 | | |
| Shares issued in lieu of cash distributions | | | 1,274 | | | | 352 | | | | 432 | | | | 100 | | | | - | | | | - | | |
| Shares redeemed | | | (2,207 | ) | | | (2,193 | ) | | | (656 | ) | | | (997 | ) | | | (1,583 | ) | | | (2,520 | ) | |
| Total Class A transactions | | | 653 | | | | 1,068 | | | | 302 | | | | 295 | | | | (930 | ) | | | (265 | ) | |
| Class B: | |
| Shares issued | | | 118 | | | | 146 | | | | 57 | | | | 77 | | | | 64 | | | | 123 | | |
| Shares issued in lieu of cash distributions | | | 206 | | | | 65 | | | | 104 | | | | 34 | | | | - | | | | - | | |
| Shares redeemed | | | (221 | ) | | | (174 | ) | | | (185 | ) | | | (413 | ) | | | (655 | ) | | | (616 | ) | |
| Total Class B transactions | | | 103 | | | | 37 | | | | (24 | ) | | | (302 | ) | | | (591 | ) | | | (493 | ) | |
| Class C: | |
| Shares issued | | | 229 | | | | 251 | | | | 60 | | | | 77 | | | | 52 | | | | 119 | | |
| Shares issued in lieu of cash distributions | | | 192 | | | | 56 | | | | 50 | | | | 13 | | | | - | | | | - | | |
| Shares redeemed | | | (364 | ) | | | (197 | ) | | | (93 | ) | | | (120 | ) | | | (329 | ) | | | (308 | ) | |
| Total Class C transactions | | | 57 | | | | 110 | | | | 17 | | | | (30 | ) | | | (277 | ) | | | (189 | ) | |
| Class R: | |
| Shares issued | | | 22 | | | | 208 | | | | - | | | | 72 | | | | - | | | | 138 | | |
| Shares issued in lieu of cash distributions | | | 1 | | | | 55 | | | | - | | | | 3 | | | | - | | | | - | | |
| Shares redeemed | | | (4 | ) | | | (1,065 | ) | | | - | | | | (170 | ) | | | | | | | (697 | ) | |
| Total Class R transactions | | | 19 | | | | (802 | ) | | | - | | | | (95 | ) | | | - | | | | (559 | ) | |
| Class Y: | |
| Shares issued | | | 6,525 | | | | 8,030 | | | | 3,781 | | | | 3,675 | | | | 2,087 | | | | 3,912 | | |
| Shares issued in lieu of cash distributions | | | 6,437 | | | | 3,768 | | | | 3,016 | | | | 1,045 | | | | - | | | | - | | |
| Shares redeemed | | | (16,385 | ) | | | (33,562 | ) | | | (7,079 | ) | | | (12,846 | ) | | | (3,915 | ) | | | (6,414 | ) | |
| Total Class Y transactions | | | (3,423 | ) | | | (21,764 | ) | | | (282 | ) | | | (8,126 | ) | | | (1,828 | ) | | | (2,502 | ) | |
| Net increase (decrease) in capital shares | | | (2,591 | ) | | | (21,351 | ) | | | 13 | | | | (8,258 | ) | | | (3,626 | ) | | | (4,008 | ) | |
FIRST AMERICAN FUNDS Annual Report 2005
121
Notes to Financial Statements September 30, 2005
| | | Mid Cap Growth
Opportunities Fund | | Mid Cap
Value Fund | | Large Cap Growth
Opportunities Fund | |
| | | Year
ended
9/30/05 | | Year
ended
9/30/04 | | Year
ended
9/30/05 | | Year
ended
9/30/04 | | Year
ended
9/30/05 | | Year
ended
9/30/04 | |
| Class A: | |
| Shares issued | | | 3,556 | | | | 778 | | | | 1,266 | | | | 682 | | | | 565 | | | | 1,608 | | |
| Shares issued in lieu of cash distributions | | | 683 | | | | 135 | | | | 7 | | | | 4 | | | | 8 | | | | 2 | | |
| Shares redeemed | | | (1,128 | ) | | | (959 | ) | | | (510 | ) | | | (282 | ) | | | (1,246 | ) | | | (1,201 | ) | |
| Total Class A transactions | | | 3,111 | | | | (46 | ) | | | 763 | | | | 404 | | | | (673 | ) | | | 409 | | |
| Class B: | |
| Shares issued | | | 90 | | | | 65 | | | | 91 | | | | 57 | | | | 45 | | | | 89 | | |
| Shares issued in lieu of cash distributions | | | 49 | | | | 9 | | | | - | | | | - | | | | 1 | | | | - | | |
| Shares redeemed | | | (58 | ) | | | (51 | ) | | | (179 | ) | | | (188 | ) | | | (356 | ) | | | (735 | ) | |
| Total Class B transactions | | | 81 | | | | 23 | | | | (88 | ) | | | (131 | ) | | | (310 | ) | | | (646 | ) | |
| Class C: | |
| Shares issued | | | 182 | | | | 48 | | | | 179 | | | | 64 | | | | 45 | | | | 57 | | |
| Shares issued in lieu of cash distributions | | | 54 | | | | 11 | | | | - | | | | - | | | | - | | | | - | | |
| Shares redeemed | | | (142 | ) | | | (110 | ) | | | (44 | ) | | | (76 | ) | | | (160 | ) | | | (216 | ) | |
| Total Class C transactions | | | 94 | | | | (51 | ) | | | 135 | | | | (12 | ) | | | (115 | ) | | | (159 | ) | |
| Class R: | |
| Shares issued | | | 145 | | | | 27 | | | | 15 | | | | 41 | | | | 10 | | | | 72 | | |
| Shares issued in lieu of cash distributions | | | - | | | | 8 | | | | - | | | | - | | | | - | | | | - | | |
| Shares redeemed | | | (12 | ) | | | (341 | ) | | | - | | | | (100 | ) | | | - | | | | (767 | ) | |
| Total Class R transactions | | | 133 | | | | (306 | ) | | | 15 | | | | (59 | ) | | | 10 | | | | (695 | ) | |
| Class Y: | |
| Shares issued | | | 5,339 | | | | 3,700 | | | | 6,771 | | | | 5,379 | | | | 6,018 | | | | 12,178 | | |
| Shares issued in lieu of cash distributions | | | 3,346 | | | | 810 | | | | 99 | | | | 77 | | | | 59 | | | | 29 | | |
| Shares redeemed | | | (8,873 | ) | | | (8,163 | ) | | | (3,514 | ) | | | (4,252 | ) | | | (22,930 | ) | | | (11,718 | ) | |
| Total Class Y transactions | | | (188 | ) | | | (3,653 | ) | | | 3,356 | | | | 1,204 | | | | (16,853 | ) | | | 489 | | |
| Net increase (decrease) in capital shares | | | 3,231 | | | | (4,033 | ) | | | 4,181 | | | | 1,406 | | | | (17,941 | ) | | | (602 | ) | |
| | | Large Cap
Select Fund | | Large Cap
Value Fund | | Balanced
Fund | |
| | | Year
ended
9/30/05 | | Year
ended
9/30/04 | | Year
ended
9/30/05 | | Year
ended
9/30/04 | | Year
ended
9/30/05 | | Year
ended
9/30/04 | |
| Class A: | |
| Shares issued | | | 334 | | | | 78 | | | | 935 | | | | 2,249 | | | | 1,220 | | | | 3,334 | | |
| Shares issued in lieu of cash distributions | | | 1 | | | | - | | | | 54 | | | | 53 | | | | 145 | | | | 148 | | |
| Shares redeemed | | | (26 | ) | | | (40 | ) | | | (1,521 | ) | | | (1,580 | ) | | | (3,146 | ) | | | (2,038 | ) | |
| Total Class A transactions | | | 309 | | | | 38 | | | | (532 | ) | | | 722 | | | | (1,781 | ) | | | 1,444 | | |
| Class B: | |
| Shares issued | | | 25 | | | | 17 | | | | 38 | | | | 55 | | | | 100 | | | | 159 | | |
| Shares issued in lieu of cash distributions | | | - | | | | - | | | | 3 | | | | 6 | | | | 13 | | | | 22 | | |
| Shares redeemed | | | (7 | ) | | | (5 | ) | | | (577 | ) | | | (876 | ) | | | (1,091 | ) | | | (892 | ) | |
| Total Class B transactions | | | 18 | | | | 12 | | | | (536 | ) | | | (815 | ) | | | (978 | ) | | | (711 | ) | |
| Class C: | |
| Shares issued | | | 10 | | | | 4 | | | | 36 | | | | 49 | | | | 79 | | | | 85 | | |
| Shares issued in lieu of cash distributions | | | - | | | | - | | | | 1 | | | | 2 | | | | 4 | | | | 4 | | |
| Shares redeemed | | | (2 | ) | | | (1 | ) | | | (121 | ) | | | (139 | ) | | | (181 | ) | | | (256 | ) | |
| Total Class C transactions | | | 8 | | | | 3 | | | | (84 | ) | | | (88 | ) | | | (98 | ) | | | (167 | ) | |
| Class R: | |
| Shares issued | | | - | | | | - | | | | - | | | | 160 | | | | - | | | | 345 | | |
| Shares issued in lieu of cash distributions | | | - | | | | - | | | | - | | | | 7 | | | | - | | | | 23 | | |
| Shares redeemed | | | - | | | | - | | | | - | | | | (1,761 | ) | | | - | | | | (2,881 | ) | |
| Total Class R transactions | | | - | | | | - | | | | - | | | | (1,594 | ) | | | - | | | | (2,513 | ) | |
| Class Y: | |
| Shares issued | | | 16,640 | | | | 13,492 | | | | 4,666 | | | | 12,949 | | | | 3,524 | | | | 6,123 | | |
| Shares issued in lieu of cash distributions | | | 358 | | | | 191 | | | | 335 | | | | 471 | | | | 382 | | | | 529 | | |
| Shares redeemed | | | (17,545 | ) | | | (1,430 | ) | | | (26,155 | ) | | | (12,532 | ) | | | (8,890 | ) | | | (16,991 | ) | |
| Total Class Y transactions | | | (547 | ) | | | 12,253 | | | | (21,154 | ) | | | 888 | | | | (4,984 | ) | | | (10,339 | ) | |
| Net increase (decrease) in capital shares | | | (212 | ) | | | 12,306 | | | | (22,306 | ) | | | (887 | ) | | | (7,841 | ) | | | (12,286 | ) | |
FIRST AMERICAN FUNDS Annual Report 2005
122
| | | Equity
Income Fund | |
| | | Year
ended
9/30/05 | | Year
ended
9/30/04 | |
| Class A: | |
| Shares issued | | | 1,568 | | | | 4,209 | | |
| Shares issued in lieu of cash distributions | | | 222 | | | | 200 | | |
| Shares redeemed | | | (3,494 | ) | | | (2,448 | ) | |
| Total Class A transactions | | | (1,704 | ) | | | 1,961 | | |
| Class B: | |
| Shares issued | | | 144 | | | | 396 | | |
| Shares issued in lieu of cash distributions | | | 17 | | | | 17 | | |
| Shares redeemed | | | (473 | ) | | | (459 | ) | |
| Total Class B transactions | | | (312 | ) | | | (46 | ) | |
| Class C: | |
| Shares issued | | | 92 | | | | 221 | | |
| Shares issued in lieu of cash distributions | | | 14 | | | | 14 | | |
| Shares redeemed | | | (457 | ) | | | (401 | ) | |
| Total Class C transactions | | | (351 | ) | | | (166 | ) | |
| Class R: | |
| Shares issued | | | 32 | | | | 185 | | |
| Shares issued in lieu of cash distributions | | | - | | | | 15 | | |
| Shares redeemed | | | (2 | ) | | | (1,685 | ) | |
| Total Class R transactions | | | 30 | | | | (1,485 | ) | |
| Class Y: | |
| Shares issued | | | 12,906 | | | | 23,673 | | |
| Shares issued in lieu of cash distributions | | | 681 | | | | 718 | | |
| Shares redeemed | | | (36,568 | ) | | | (25,006 | ) | |
| Total Class Y transactions | | | (22,981 | ) | | | (615 | ) | |
| Net decrease in capital shares | | | (25,318 | ) | | | (351 | ) | |
5 > Investment Security Transactions
During the fiscal year ended September 30, 2005, purchases of securities and proceeds from sales of securities, other than temporary investments in short-term securities, were as follows (000):
| | | U.S. Government
Securities | | Other Investment
Securities | |
| Fund | | Purchases | | Sales | | Purchases | | Sales | |
| Real Estate Securities Fund | | $ | - | | | $ | - | | | $ | 732,503 | | | $ | 704,152 | | |
| International Fund | | | - | | | | - | | | | 1,143,587 | | | | 1,006,658 | | |
| Small Cap Growth Opportunities Fund | | | - | | | | - | | | | 580,171 | | | | 666,069 | | |
| Small Cap Select Fund | | | - | | | | - | | | | 1,021,695 | | | | 1,211,070 | | |
| Small Cap Value Fund | | | - | | | | - | | | | 307,452 | | | | 375,516 | | |
| Small-Mid Cap Core Fund | | | - | | | | - | | | | 162,372 | | | | 192,244 | | |
| Mid Cap Growth Opportunities Fund | | | - | | | | - | | | | 1,513,684 | | | | 1,581,597 | | |
| Mid Cap Value Fund | | | - | | | | - | | | | 673,901 | | | | 572,614 | | |
| Large Cap Growth Opportunities Fund | | | - | | | | - | | | | 1,167,380 | | | | 1,652,947 | | |
| Large Cap Select Fund | | | - | | | | - | | | | 506,853 | | | | 497,038 | | |
| Large Cap Value Fund | | | - | | | | - | | | | 629,829 | | | | 1,043,816 | | |
| Balanced Fund | | | 209,598 | | | | 203,768 | | | | 401,629 | | | | 461,813 | | |
| Equity Income Fund | | | - | | | | - | | | | 425,021 | | | | 788,092 | | |
FIRST AMERICAN FUNDS Annual Report 2005
123
Notes to Financial Statements September 30, 2005
The aggregate gross unrealized appreciation and depreciation of securities held by the funds and the total cost of securities (including cost of securities purchased with proceeds from securities lending) for federal tax purposes at September 30, 2005, were as follows (000):
| Fund | | Aggregate
Gross
Appreciation | | Aggregate
Gross
Depreciation | | Net | | Federal
Income
Tax
Cost | |
| Real Estate Securities Fund | | $ | 120,411 | | | $ | (5,020 | ) | | $ | 115,391 | | | $ | 871,852 | | |
| International Fund | | | 257,180 | | | | (34,196 | ) | | | 222,984 | | | | 1,755,210 | | |
Small Cap Growth
Opportunities Fund | | | 30,491 | | | | (16,237 | ) | | | 14,254 | | | | 385,088 | | |
| Small Cap Select Fund | | | 136,797 | | | | (23,245 | ) | | | 113,552 | | | | 1,105,150 | | |
| Small Cap Value Fund | | | 89,020 | | | | (10,026 | ) | | | 78,994 | | | | 454,218 | | |
| Small-Mid Cap Core Fund | | | 6,420 | | | | (2,984 | ) | | | 3,436 | | | | 94,729 | | |
Mid Cap Growth
Opportunities Fund | | | 339,639 | | | | (21,547 | ) | | | 318,092 | | | | 1,850,044 | | |
| Mid Cap Value Fund | | | 117,022 | | | | (6,660 | ) | | | 110,362 | | | | 822,130 | | |
Large Cap Growth
Opportunities Fund | | | 120,955 | | | | (18,030 | ) | | | 102,925 | | | | 1,171,026 | | |
| Large Cap Select Fund | | | 28,458 | | | | (8,243 | ) | | | 20,215 | | | | 404,339 | | |
| Large Cap Value Fund | | | 159,097 | | | | (19,182 | ) | | | 139,915 | | | | 1,013,057 | | |
| Balanced Fund | | | 41,343 | | | | (7,628 | ) | | | 33,715 | | | | 523,999 | | |
| Equity Income Fund | | | 322,365 | | | | (13,081 | ) | | | 309,284 | | | | 1,440,515 | | |
The difference between cost for financial statement purposes and federal tax purposes is primarily due to losses deferred from wash sales, investments in limited partnerships and REITs, the amount of gain (loss) recognized for tax purposes due to mark to market adjustments on open futures contracts and the mark to market of certain Passive Foreign Investments Companies (PFICs) for tax purposes.
6 > Options Written
Transactions in options written for the fiscal year ended September 30, 2005, were as follows:
| | | Number of
Contracts | | Premium
Amount (000) | |
| Put Options Written | |
| Balanced Fund: | |
| Balance at September 30, 2004 | | | - | | | $ | - | | |
| Opened | | | 168 | | | | 71 | | |
| Expired | | | (91 | ) | | | (38 | ) | |
| Closed | | | (77 | ) | | | (33 | ) | |
| Balance at September 30, 2005 | | | - | | | $ | - | | |
| Call Options Written | |
| Balanced Fund: | |
| Balance at September 30, 2004 | | | - | | | $ | - | | |
| Opened | | | 167 | | | | 77 | | |
| Expired | | | (33 | ) | | | (15 | ) | |
| Closed | | | (134 | ) | | | (62 | ) | |
| Balance at September 30, 2005 | | | - | | | $ | - | | |
7 > Concentration of Risks
Portfolios that primarily invest in a particular sector may experience greater volatility than portfolios investing in a broad range of industry sectors. Real Estate Securities Fund primarily invests in income-producing common stocks of publicly traded companies engaged in the real estate industry. The real estate industry has been subject to substantial fluctuations and declines on a local, regional and national basis in the past and may continue to in the future. Through the fiscal year-end, the Small-Mid Cap Core Fund primarily invested in the technology industry. Competitive pressures may have a significant effect on the financial condition of companies in this industry. For example, if technology continues to advance at an accelerate rate and the number of companies could become offerings continue to expand these companies and because increasingly sensitive to short production cycles and aggressive pricing. Prior to October 3, 2005, Small-Mid Cap Core Fund, operating as the Technology Fund primarily invests in equity securities of companies in the technology industry. Competitive pressures may have a significant effect on the financial condition of companies in this industry. For example, if technology continues to advance at an accelerated rate and the number of companies and product offerings continues to expand, these companies could become increasingly sensitive to short product cycles and aggressive pricing. As of September 30, 2005, Large Cap Growth Opportunities Fund and Small Cap Growth Opportunities Fund had a significant portion of their assets invested in the information technology sector, which could be more sensitive to short product cycles and aggressive pricing than the technology industry as a whole. As of the same date, Small Cap Value Fund, Large Cap Value Fund, and Mid Cap Value Fund had significant portions of their assets invested in the fina ncials sector. The financials sector may be more greatly impacted by the performance of the overall economy, interest rates, competition and consumer confidence and spending.
8 > Indemnifications
The funds enter into contracts that contain a variety of indemnifications. The funds' maximum exposure under these arrangements is unknown. However, the funds have not had prior claims of losses pursuant to these contracts and expect the risk of loss to be remote.
FIRST AMERICAN FUNDS Annual Report 2005
124
9> Additional Information Related to Small Cap Growth Opportunities Fund
As a result of an internal review, USBAM uncovered an action involving potentially improper trading of a portfolio security held in the First American Small Cap Growth Opportunities Fund. USBAM engaged an outside law firm to conduct a review of those trades, and, as a result of this review, the law firm concluded that no USBAM employee violated the applicable securities laws. USBAM has reported this to the Fund's board of directors and to the Securities and Exchange Commission (SEC). The SEC is investigating the matter, and USBAM is cooperating fully with the investigation.
10> Replacement of Investment Sub-Advisor
On September 16, 2004, the funds' board of directors approved the appointment of J.P. Morgan ("JPMorgan") to replace Clay Finlay, Inc. as the investment sub-advisor to International Fund. At a special meeting of International Fund's shareholders held on December 8, 2004, shareholders approved the appointment of JPMorgan.
11> Other
In March 2005, the U.S. Bancorp Pension Plan redeemed $302,966,587, $395,010,013, $200,889,108 and $132,582,404 from the First American Large Cap Value Fund, Large Cap Growth Opportunities Fund, Large Cap Select Fund and Equity Income Fund, respectively, as redemption-in-kind transactions. In these transactions, each fund paid redemption proceeds to U.S. Bancorp Pension Plan by distributing a proportionate amount of securities in the fund's portfolio to the Plan. Remaining shareholders in the funds did not recognize any additional capital gains from the transactions.
12> Investment Strategy Changes and Name Change for Technology Fund
On September 26, 2005, Technology Fund's shareholders approved a change to the fundamental investment policies of the Technology Fund. This change took effect on October 3, 2005, along with a number of other investment strategy changes and a change in the fund's name to Small-Mid Cap Core Fund.
FIRST AMERICAN FUNDS Annual Report 2005
125
NOTICE TO SHAREHOLDERS September 30, 2005 (unaudited)
TAX INFORMATION
The information set forth below is for each fund's fiscal year as required by federal laws. Shareholders, however, must report distributions on a calendar year basis for income tax purposes, which may include distributions for portions of two fiscal years of a fund. Accordingly, the information needed by shareholders for income tax purposes will be sent in early 2006 on Form 1099-DIV. Please consult your tax advisor for proper treatment of this information.
For the fiscal year ended September 30, 2005, each fund has designated long-term capital gains, ordinary income, dividends qualifying for the corporate received deduction, and qualified dividend income with regard to distributions paid during the year as follows:
| | | Long Term
Capital Gains
Distributions
(Tax Basis)(a) | | Ordinary
Income
Distributions
(Tax Basis)(a) | | Return of
Capital (Tax
Basis)(a) | | Total
Distributions
(Tax Basis) | | Dividends
Received
Deduction(b) | | Corporate
Qualified
Dividend
Income (000) | | Qualified
Dividend
Income(b)(c) | |
| Real Estate Securities Fund | | | 69 | % | | | 31 | % | | | - | % | | | 100 | % | | | 0.46 | % | | $ | 715 | | | | 1.26 | % | |
| International Fund | | | - | | | | 100 | | | | - | | | | 100 | | | | - | | | | 33,621 | | | | 100 | | |
| Small Cap Growth Opportunities Fund | | | 67 | | | | 33 | | | | - | | | | 100 | | | | 1.30 | | | | 605 | | | | 1.30 | | |
| Small Cap Select Fund | | | 61 | | | | 39 | | | | - | | | | 100 | | | | 2.60 | | | | 3,467 | | | | 2.68 | | |
| Small Cap Value Fund | | | 86 | | | | 14 | | | | - | | | | 100 | | | | 23.70 | | | | 3,349 | | | | 23.97 | | |
| Small-Mid Cap Core Fund | | | - | | | | - | | | | - | | | | - | | | | - | | | | 256 | | | | - | | |
| Mid Cap Growth Opportunities Fund | | | 59 | | | | 41 | | | | - | | | | 100 | | | | 4.9 | | | | 6,798 | | | | 5.07 | | |
| Mid Cap Value Fund | | | - | | | | 100 | | | | - | | | | 100 | | | | 100 | | | | 7,738 | | | | 100 | | |
| Large Cap Growth Opportunities Fund | | | - | | | | 75 | | | | 25 | | | | 100 | | | | 100 | | | | 12,600 | | | | 100 | | |
| Large Cap Select Fund | | | 24 | | | | 76 | | | | - | | | | 100 | | | | 42.4 | | | | 4,216 | | | | 45.55 | | |
| Large Cap Value Fund | | | - | | | | 100 | | | | - | | | | 100 | | | | 100 | | | | 20,920 | | | | 100 | | |
| Balanced Fund | | | - | | | | 100 | | | | - | | | | 100 | | | | 56.3 | | | | 3,791 | | | | 59.15 | | |
| Equity Income Fund | | | 26 | | | | 74 | | | | - | | | | 100 | | | | 100 | | | | 39,204 | | | | 100 | | |
(a) Based on a percentage of the fund's total distributions.
(b) Based on a percentage of ordinary income distributions of the fund.
(c) For the fiscal year ended September 30, 2005 certain dividends paid by the funds may be subject to a maximum tax rate of 15%, as provided by the Internal Revenue Code 1(h). The funds intend to designate the maximum amounts as taxed at a maximum rate of 15%. Complete information was computed and reported in conjunction with your 2004 Form 1099-Div. As of September 30, 2005, for the calendar year to date, qualified dividend income as a percentage of ordinary income distributions for each Fund was as follows: Real Estate Securities, International, Small Cap Growth Opportunities, Small Cap Select, Small Cap Value, Small-Mid Cap Core, Mid Cap Growth Opportunities, Mid Cap Value, Large Cap Growth Opportunities, Large Cap Select, Large Cap Value, Balanced and Equity Income Funds were 0%, 0%, 0%, 0%, 0%, 0%, 100%, 0%, 100%,100%, 59 % and 100%, respectively.
(d) The International Fund has elected to pass through to shareholders foreign taxes under Section 853 of the Internal Revenue Code. Foreign taxes paid and foreign source income for the fund were $3,215,745 and $35,073,032, respectively.
The following funds hereby designate the following as long-term capital gain distributions for the purposes of the dividends paid deduction, which include earnings and profits distributed to shareholders on redemptions of fund shares (unaudited):
| Fund | | Long-Term
Capital Gain
Distributions | |
| Real Estate Securities Fund | | $ | 46,287,027 | | |
| Small Cap Growth Opportunities Fund | | | 35,232,980 | | |
| Small Cap Select Fund | | | 108,259,597 | | |
| Small Cap Value Fund | | | 68,826,377 | | |
| Mid Cap Growth Opportunities Fund | | | 127,989,776 | | |
| Mid Cap Value Fund | | | 865,733 | | |
| Large Cap Select Fund | | | 1,525,005 | | |
| Large Cap Value Fund | | | 1,472,523 | | |
| Equity Income Fund | | | 8,129,359 | | |
SHAREHOLDER MEETING
At a special meeting of the Shareholders of the Technology Fund (now called the Small-Mid Cap Core Fund) on September 26, 2005, the shareholders voted to approve the following proposal:
Approval of a change in the fund's policy of concentrating its investments in the technology industry, to a policy of not concentrating its investments in a particular industry.
At the meeting, shareholders approved this proposal as follows:
Shared
Voted For | | Shares
Voted Against | | Shares
Abstained | |
| | 4,111,930 | | | | 370,813 | | | | 451,816 | | |
FIRST AMERICAN FUNDS Annual Report 2005
126
HOW TO OBTAIN A COPY OF THE FUNDS' PROXY VOTING POLICIES AND PROXY VOTING RECORD
A description of the policies and procedures that the funds use to determine how to vote proxies relating to portfolio securities, as well as information regarding how the funds voted proxies relating to portfolio securities during the most recent 12 month period ended June 30, 2005, is available (1) without charge upon request by calling 800.677.FUND; (2) at firstamericanfunds.com; and (3) on the U.S. Securities and Exchange Commision's website at http://www.sec.gov.
FORM N-Q HOLDINGS INFORMATION
Each fund is required to file its complete schedule of portfolio holdings for the first and third quarters of each fiscal year with the Securities and Exchange Commission on Form N-Q. The funds' Forms N-Q are available (1) without charge upon request by calling 800.677.FUND and (2) on the U.S. Securities and Exchange Commision's website at http://www.sec.gov. In addition, you may review and copy the funds' Forms N-Q at the Commission's Public Reference Room in Washington, D.C. You may obtain information on the operation of the Public Reference Room by calling 1-800-SEC-0330.
QUARTERLY PORTFOLIO HOLDINGS
Each fund will make complete portfolio holdings information publicly available by posting the information at firstamericanfunds.com on a quarterly basis. The funds will attempt to post such information within 10 days of the quarter end.
APPROVAL OF THE FUNDS' INVESTMENT ADVISORY AND SUB-ADVISORY AGREEMENTS
The Board of Directors of the Funds (the "Board"), which is comprised entirely of independent directors, oversees the management of each Fund and, as required by law, determines annually whether to renew the Funds' advisory agreement with U.S. Bancorp Asset Management, Inc. ("USBAM"). In addition to determining whether to renew the agreement with USBAM, the Board also is responsible for determining whether to approve subadvisory agreements for the Funds.
At a meeting on May 3-5 2005, the Board considered information relating to the Funds' investment advisory agreement with USBAM (the "Agreement") and, with respect to the International Fund, information relating to the sub-advisory agreement between USBAM and J.P. Morgan Investment Management Inc. ("JP Morgan") (the "Sub-Advisory Agreement"). In advance of the meeting, the Board received materials relating to the agreements, and had the opportunity to ask questions and request further information in connection with their consideration. At a subsequent meeting on June 20-22, 2005, the Board concluded its consideration of and approved the Agreement and the Sub-Advisory Agreement through June 30, 2006.
Although the Agreement, which is with First American Investment Funds, Inc., relates to all of the Funds, the Board separately considered and approved the Agreement with respect to each Fund. In considering the Agreement, the Board, advised by independent legal counsel, reviewed and considered the factors it deemed relevant, including: (1) the nature, quality and extent of USBAM's services to the Fund, (2) the investment performance of the Fund, (3) the profitability of USBAM related to the Fund, including an analysis of USBAM's cost of providing services and comparative expense information, (4) the extent to which economies of scale are realized as the Fund grows and whether fee levels are adjusted to enable Fund investors to share in these economies of scale, and (5) other benefits that accrue to USBAM through its relationship with the Funds. In its deliberations, the Board did not identify any single factor which alone was responsible for the Board's decision to approve the Agreements.
Before approving the Agreement and the Sub-Advisory Agreement, the Board met in executive session with its independent counsel on numerous occasions to consider the materials provided by USBAM and the terms of the Agreement and the Sub-Advisory Agreement. Based on its evaluation of those materials, the Board concluded that the Agreement is fair and in the best interests of the shareholders of each Fund and that the Sub-Advisory Agreement is fair and in the interests of the shareholders of the International Fund. In reaching its conclusions, the Board considered the following:
Nature, Quality and Extent of Investment Advisory Services
The Board examined the nature, quality and extent of the services provided by USBAM to each Fund, and the nature, quality and extent of the services provided by JP Morgan to the International Fund.
FIRST AMERICAN FUNDS Annual Report 2005
127
NOTICE TO SHAREHOLDERS September 30, 2005 (unaudited)
For the Funds other than the International Fund, the Board reviewed USBAM's key personnel who provide investment management services to each Fund as well as the fact that, under the Agreement, USBAM has the authority and responsibility to make and execute investment decisions for each Fund within the framework of that Fund's investment policies and restrictions, subject to review by the Board. The Board further considered that USBAM's duties with respect to each Fund include (i) investment research and security selection, (ii) adherence to (and monitoring compliance with) the Fund's investment policies and restrictions and the Investment Company Act of 1940, and (iii) monitoring the performance of the various organizations providing services to the Fund, including the Fund's distributor, sub-administrator, transfer agent and custodian. Finally, the Board considered USBAM's representation t hat the services provided by USBAM under the Agreement are the type of services customarily provided by investment advisors in the fund industry.
With respect to the International Fund, the Board examined the nature, quality and extent of the services provided by JP Morgan and reviewed JP Morgan's key personnel who provide investment management services to the Fund. The Board noted that, under the Sub-Advisory Agreement, JP Morgan has the authority and responsibility to make and execute investment decisions for the Fund within the framework of the Fund's investment policies and restrictions, subject to the supervision of USBAM and review by the Board. The Board further considered that JP Morgan's duties with respect to the International Fund include investment research and stock selection and adherence to the Fund's investment policies and restrictions. The Board noted that, under the Agreement, USBAM is responsible for monitoring the performance of JP Morgan as well as various organizations providing services to the International Fund, including the Fund's distributor, sub-administrator, transfer agent and custodian. Finally, the Board considered USBAM's representation that the services provided by JP Morgan under the Sub-Advisory Agreement are the type of services customarily provided by investment advisors in the fund industry.
The Board considered compliance reports about USBAM and JP Morgan from the Fund's Chief Compliance Officer (CCO).
Based on the foregoing, the Board concluded that (i) each Fund is likely to benefit from the nature, extent and quality of the services provided by USBAM under the Agreement and (ii) the International Fund is likely to benefit from the nature, extent and quality of the services provided by JP Morgan under the Sub-Advisory Agreement.
Investment Performance of the Funds
The Board considered the performance of each Fund, including how the Fund performed versus the median performance of a group of comparable funds selected by an independent data service (the "performance universe") and how the Fund performed versus its benchmark index.
Balanced Fund. The Board considered that the Fund significantly outperformed both its benchmark index and its performance universe for the year ended February 28, 2005. For longer periods, the Fund generally underperformed both its benchmark index and the performance universe. The Board noted, however, that the Fund's current management team has been in place only since 2004. Thus, the underperformance for longer time periods is attributable to a former management team. The Board concluded that, in light of the Fund's good relative performance over the last year, which was achieved by its new management team, it would be in the interest of the Fund and its shareholder s to renew the Agreement and to continue to allow the current management team to develop its performance record with the Fund.
Equity Income Fund. The Board considered that the Fund's performance was comparable to that of its benchmark for the one-year period ended February 28, 2005 and that the Fund outperformed the benchmark for the five-year period ended February 28, 2005. While the Fund's performance was below the median of its performance universe for the one-, three-, five- and ten-year periods ended February 28, 2005, the Board considered USBAM's assertion that the performance universe included a number of funds which had different investment restrictions and styles than those of the Fund. USBAM represented to the Board that this difference contributed to the Fund's underperf ormance compared to its performance universe. In light of this discrepancy, the Board compared the Fund's performance to the performance of a custom performance universe which USBAM indicated provided a more meaningful comparison. The Board noted that the Fund's performance compared favorably to this custom performance universe for the five- and ten-year periods, although it still lagged for the more recent periods The Board concluded that, in light of the Fund's positive long-term performance vis-à-vis
FIRST AMERICAN FUNDS Annual Report 2005
128
its benchmark and the custom performance universe, it would be in the interest of the Fund and its shareholders to renew the Agreement, while continuing to monitor the Fund's performance closely.
International Fund. The Board noted that the Fund has underperformed both its benchmark and its performance universe for the one-, three- and five-year periods ended February 28, 2005. The Board considered, however, that the Fund's new sub-adviser, JP Morgan, did not begin managing the Fund until December 2004 and that JP Morgan, therefore, is not responsible for the performance record reviewed by the Board. The Board concluded that, in light of JP Morgan's very limited period of managing the Fund, it would be in the interest of the Fund and its shareholders to renew the Agreement and the Sub-Advisory Agreement and to closely monitor the performance record that JP Morgan develops as subadviser to the Fund.
Large Cap Growth Opportunities Fund. The Board considered that the Fund significantly outperformed both its benchmark index and its performance universe for the one-, three- and five-year periods ended February 28, 2005. The Fund underperformed both its benchmark index and its performance universe for the ten-year period ended February 28, 2005, but the Board noted that this underperformance could be attributed to a former management team. The Board concluded that, in light of the Fund's strong performance, it would be in the interest of the Fund and its shareholders to renew the Agreement.
Large Cap Select Fund. The Board considered that the Fund significantly outperformed both its benchmark index and its performance universe for the one-year period ended February 28, 2005, and that the Fund's performance since inception (January 31, 2003) through February 28, 2005 was only slightly below that of its benchmark. The Board concluded that, in light of the Fund's recent strong performance, it would be in the interest of the Fund and its shareholders to renew the Agreement.
Large Cap Value Fund. The Board noted that the Fund significantly outperformed its performance universe for the one-year period ended February 28, 2005, although it did underperform its benchmark. The Board also noted that the Fund's performance was below that of its performance universe and its benchmark for the three-, five- and ten-year periods ended February 28, 2005. The Board, however, also considered the management transitions that have occurred during the past five years, and that USBAM is currently seeking a new manager. The Board concluded that, in light of these facts, it would be in the interest of the Fund and its shareholders to renew the Agreement, while continuing to closely monitor USBAM's search for a new team and the performance of the Fund.
Mid Cap Growth Opportunities Fund. The Board considered that the Fund significantly outperformed both its benchmark index and its performance universe for the one-, three-, five- and ten-year periods ended February 28, 2005. The Board concluded that, in light of this performance, it would be in the interest of the Fund and its shareholders to renew the Agreement with respect to the Fund.
Mid Cap Value Fund. The Board considered that the Fund outperformed both its benchmark index and its performance universe for the one-year period ended February 28, 2005. In addition, the Board noted that the Fund's three- and five-year performance also was strong, although somewhat below the benchmark for the five-year period. While the Fund underperformed both its benchmark index and its performance universe for the ten-year period ended February 28, 2005, the Board noted that this underperformance could be attributed primarily to a former management team. The Board concluded that, in light of the Fund's strong recent performance, it would be in the interest of the Fund and its shareholders to renew the Agreement.
Real Estate Securities Fund. The Board considered that the Fund's performance was better than or comparable to that of its benchmark index and its performance universe for the one-, three- and five-year periods ended February 28, 2005 and for the period since inception in 1995 through February 28, 2005. The Board concluded that, in light of this performance, it would be in the interest of the Fund and its shareholders to renew the Agreement.
Small Cap Growth Opportunities Fund. The Board noted that the Fund outperformed its benchmark for the three- and five-year periods ended February 28, 2005 and for the period since inception in 1995 through February 28, 2005. The Board also considered that the Fund's performance was below that of its performance universe for the one-, three- and five-year periods ended February 28, 2005. The Board considered, however, USBAM's assertion that the Fund's performance should
FIRST AMERICAN FUNDS Annual Report 2005
129
NOTICE TO SHAREHOLDERS September 30, 2005 (unaudited)
be compared to a universe of small-cap growth funds, rather than the universe of small-cap core funds provided by the independent data service, because the new portfolio management team does not manage the Fund as a micro-cap fund (which the prior management team did). When compared to a small- cap growth universe, the Fund outperformed for the three- and five-year periods ended February 28, 2005. Finally, the Board considered that the current portfolio management team has been in place for less than one year, and that any underperformance for that one-year period could be attributed to the transition to that new management team. The Board concluded that, in light of the Fund's outperformance of both its benchmark and the small-cap growth fund universe for the three- and five-year periods, and the Fund's new management team, it would be in the interest of the Fund and its shareholders to renew the A greement and to closely monitor the performance record that the new management team develops.
Small Cap Select Fund. The Board noted that the Fund's performance was in line with its benchmark and performance universe for the three-, five- and ten-year periods ended February 28, 2005. The Board also considered that, while the Fund's performance was significantly below that of its benchmark and its performance universe for the one-year period ended February 28, 2005, the Fund significantly exceeded its benchmark for the five-year period. The Board considered that current Fund management has been in place for less than one year, and that the underperformance for that first year could be attributed to the transition to the new management team. The Board concl uded that, in light of the Fund's new management team and the Fund's competitive long-term performance, it would be in the interest of the Fund and its shareholders to renew the Agreement and to monitor the performance record that the new management team develops.
Small Cap Value Fund. The Board noted that the Fund outperformed both its benchmark and its performance universe for the year ended February 28, 2005. Furthermore, the Fund outperformed its performance universe for the three-, five- and ten-year periods, although it underperformed the benchmark for each of these periods. The Board concluded that, in light of the Fund's strong recent performance, it would be in the interest of the Fund and its shareholders to renew the Agreement.
Small-Mid Cap Core Fund. The Board noted that the Fund's performance was below that of its benchmark and its performance universe for the one-, five- and ten-year periods ended February 28, 2005. The Board also considered, however, that the Fund soon would be converted to a small- and mid-cap core fund, with a different management team and different investment objectives and policies. In light of the impending change, the Board concluded it would be in the interest of the Fund and its shareholders to renew the Agreement and to closely monitor the performance record developed by the Fund in its new form.
Costs of Services and Profits Realized by USBAM
The Board reviewed USBAM's estimated costs in serving as the Funds' investment manager, including the costs associated with the personnel and systems necessary to manage each Fund. The Board also considered the reported profitability of USBAM and its affiliates resulting from their relationship with each Fund. For each Fund, the Board reviewed fee and expense information as compared to that of other funds and accounts managed by USBAM and of comparable funds managed by other advisers. The Board found that while the management fees for USBAM's institutional separate accounts are lower than the Funds' management fees, the Funds receive additional services from USBAM that separate accounts do not receive.
Using information provided by an independent data service, the Board also evaluated each Fund's advisory fee compared to the median advisory fee for other mutual funds similar in size, character and investment strategy, and each Fund's expense ratio after waivers compared to the median expense ratio, after waivers, of comparable funds. In connection with its review of Fund fees and expenses, the Board asked USBAM to articulate its pricing philosophy. USBAM responded that it attempts generally to maintain each Fund's total operating expenses at a level that approximates its peer group median expense ratio. In addition, USBAM committed to waive its investment advisory fees to the extent necessary to maintain the Funds' total expense ratios at levels generally in line with their respective peer groups. Consistent with this pricing philosophy, and after discussions with the Board, USBAM proposed certain chan ges to the advisory fees and expense ratios of the Funds, as discussed in more detail below. The Board concluded that USBAM's pricing philosophy is a reasonable one and, after taking into account USBAM's proposed changes to advisory fees and expense ratios, that the Funds' advisory fees and expense ratios are reasonable in light of the services provided.
FIRST AMERICAN FUNDS Annual Report 2005
130
Further detail considered by the Board regarding the advisory fees and expense ratios of each Fund is set forth below:
Balanced Fund. The Board considered that, after waivers, the Fund's advisory fee is significantly lower and the Fund's expense ratio is slightly lower than the peer group median (even though, ignoring the waivers, the Fund's contractual advisory fee is slightly higher than that of its peer group median) The Board then considered USBAM's proposal to increase its voluntary expense cap for the Fund by 0.05%, which would lower the Fund's expense ratio from 1.15% to 1.10%. The Board noted that this change would bring the Fund to within 3 basis points of the peer group median expense ratio of 1.07%. The Board concluded that the Fund's advisory fee and expense ratio, after taking into account the expense cap change, are reasonable.
Equity Income Fund. The Board considered that, after waivers, the Fund's advisory fee is close to the peer group median advisory fee and the Fund's expense ratio is slightly lower than the peer group median expense ratio. The Board also considered that the Fund's contractual advisory fee is slightly higher than the peer group median advisory fee. The Board then considered USBAM's proposal to remove the expense cap for the Fund. The Board noted that, absent the expense cap, the Fund's total expense ratio for its last fiscal year would have remained competitive. The Board concluded that the Fund's advisory fee and expense ratio, after taking into account the expense cap remo val, are reasonable.
International Fund. The Board noted that the Fund's advisory fee, both before and after waivers, is higher than that of its peer group median, as is the Fund's total expense ratio after waivers. To bring the Fund's total expense ratio more closely in line that of its peer group median, the Board and USBAM agreed to contractually decrease the advisory fee from 1.10% to 1.00% and to cap total Fund expenses at 1.52%. The Board noted that although the Fund's advisory fee will continue to be higher than that of its peer group median, the expense cap change would bring the Fund to within 10 basis points of the peer group median expense ratio of 1.42%. The Board concluded that th e Fund's advisory fee and expense ratio, after taking into account the contractual decrease in the advisory fee and the expense cap change, are reasonable.
Large Cap Growth Opportunities Fund. The Board considered that the Fund's contractual advisory fee is equal to the peer group median advisory fee. The Board also considered that, after waivers, the Fund's advisory fee and expense ratio are lower than the peer group median expense ratio. The Board then considered USBAM's proposal to remove the expense cap for the Fund. The Board noted that, absent the expense cap, the Fund's total expense ratio for its last fiscal year would have still been lower than the peer group median expense ratio. The Board concluded that the Fund's advisory fee and expense ratio, after taking into account the expense cap removal, are reasonable.
Large Cap Select Fund. The Board considered that the Fund's advisory fee, both contractual and after waivers, and its expense ratio after waivers are lower than the peer group median. The Board then considered USBAM's proposal to remove the expense cap for the Fund. The Board noted that, absent the expense cap, the Fund's total expense ratio for its last fiscal year would still have been lower than the peer group median expense ratio. The Board concluded that the Fund's advisory fee and expense ratio, after taking into account the expense cap removal, are reasonable.
Large Cap Value Fund. The Board considered that, after waivers the Fund's advisory fee and expense ratio are lower than the peer group median (even though, if the waivers were ignored, the Fund's contractual advisory fee is slightly higher than that of its peer group median). The Board then considered USBAM's proposal to remove the expense cap for the Fund. The Board noted that, absent the expense cap, the Fund's total expense ratio for its last fiscal year would have continued to be competitive. The Board concluded that the Fund's advisory fee and expense ratio, after taking into account the expense cap removal, are reasonable.
Mid Cap Growth Opportunities Fund. The Board considered that the Fund's advisory fee, both contractual and after waivers, and its expense ratio after waivers are lower than the peer group median. The Board then considered USBAM's proposal to remove the expense cap for the Fund. The Board noted that, absent the expense cap, the Fund's total expense ratio for its last fiscal year would still have been lower than the peer group median expense ratio. The Board concluded that the Fund's advisory fee and expense ratio, after taking into account the expense cap removal, are reasonable.
Mid Cap Value Fund. The Board considered that the Fund's advisory fee, both contractual and after waivers, and its expense ratio after waivers are lower than the peer group median. The Board then considered USBAM's proposal to remove
FIRST AMERICAN FUNDS Annual Report 2005
131
NOTICE TO SHAREHOLDERS September 30, 2005 (unaudited)
the expense cap for the Fund. The Board noted that, absent the expense cap, the Fund's total expense ratio for its last fiscal year would still have been lower than the peer group median expense ratio. The Board concluded that the Fund's advisory fee and expense ratio, after taking into account the expense cap removal, are reasonable.
Real Estate Securities Fund. The Board considered that the Fund's advisory fee, both contractual and after waivers, and its expense ratio after waivers are lower than the peer group median. The Board then considered USBAM's proposal to remove the expense cap for the Fund. The Board noted that, absent the expense cap, the Fund's total expense ratio for its last fiscal year would still have been lower than the peer group median expense ratio. The Board concluded that the Fund's advisory fee and expense ratio, after taking into account the expense cap removal, are reasonable.
Small Cap Growth Opportunities Fund. The Board considered that the Fund's advisory fee, both contractual and after waivers, and its expense ratio after waivers are higher than the peer group median. To bring the Fund's total expense ratio more closely in line with that of its peer group median, the Board and USBAM agreed to contractually decrease the advisory fee from 1.40% to 1.00% and to cap total Fund expenses at 1.47%. The Board noted that although the Fund's advisory fee would continue to be higher than the peer group median, the expense cap change would bring the Fund to within 10 basis points of the peer group median expense ratio of 1.37%. The Board concluded that the Fund's advisory fee and expense ratio, after taking into account the contractual decrease in the advisory fee and the expense cap change, are reasonable.
Small Cap Select Fund. The Board considered that the Fund's advisory fee, both contractual and after waivers, and its expense ratio after waivers are lower than the peer group median. The Board then considered USBAM's proposal to remove the expense cap for the Fund. The Board noted that, absent the expense cap, the Fund's total expense ratio for its last fiscal year would still have been lower than the peer group median expense ratio. The Board concluded that the Fund's advisory fee and expense ratio, after taking into account the expense cap removal, are reasonable.
Small Cap Value Fund. The Board considered that the Fund's advisory fee, both contractual and after waivers, and its expense ratio after waivers are lower than the peer group median. The Board then considered USBAM's proposal to remove the expense cap for the Fund. The Board noted that, absent the expense cap, the Fund's total expense ratio for its last fiscal year would still have been lower than the peer group median expense ratio. The Board concluded that the Fund's advisory fee and expense ratio, after taking into account the expense cap removal, are reasonable.
Small-Mid Cap Core Fund. The Board considered that the Fund's contractual advisory fee and its expense ratio after waivers are lower than the peer group median. The Board also considered that the Fund's advisory fee after waivers is approximately equal to the peer group median. The Board then considered USBAM's proposal to remove the expense cap for the Fund. Absent the expense cap, the Fund's total expense ratio for its last fiscal year would still have been lower than the peer group median expense ratio. The Board concluded that the Fund's advisory fee and expense ratio, after taking into account the expense cap removal, are reasonable.
Economies of Scale in Providing Investment Advisory Services
The Board considered the extent to which each Fund's investment advisory fee reflects economies of scale for the benefit of Fund shareholders. Based on information provided by USBAM, the Board noted that profitability will likely increase somewhat as assets grow over time. The Board considered that, although most Funds do not have advisory fee breakpoints in place, USBAM has committed to waive advisory fees to the extent necessary to keep each Fund's total expenses generally in line with the median total expenses of a peer group of funds as selected by an independent data service. The median total expense ratio of a Fund's peer group will necessarily reflect the effect of any breakpoints in the advisory fee schedules of the funds in that group. Therefore, by capping a Fund's total expense ratio at a level close to the median, Fund shareholders will effectively receive the benefit of any breakpoints in th e comparable funds' advisory fee schedules. In light of USBAM's commitment to keep total Fund expenses competitive, the Board concluded that it would be reasonable and in the best interest of each Fund and its shareholders to renew the Agreement.
FIRST AMERICAN FUNDS Annual Report 2005
132
Other Benefits to USBAM
In evaluating the benefits that accrue to USBAM through its relationship with the Funds, the Board noted that USBAM and certain of its affiliates serve the Funds in various capacities, including as advisor, administrator, transfer agent, distributor, custodian and securities lending agent, and receive compensation from the Funds in connection with providing services to the Funds. The Board considered that each service provided to the Funds by USBAM or one of its affiliates is pursuant to a written agreement, which the Board evaluates periodically as required by law.
The Board also considered USBAM's use of the Funds' portfolio brokerage transactions to obtain research. The Board concluded, based on its own review and on representations of USBAM, that USBAM's use of "soft" commission dollars was consistent with regulatory requirements.
After full consideration of these and other factors, the Board concluded that approval of the Agreement was in the best interest of each Fund and its shareholders.
FIRST AMERICAN FUNDS Annual Report 2005
133
NOTICE TO SHAREHOLDERS September 30, 2005 (unaudited)
Directors and Officers of the Funds
Independent Directors
Name, Address, and
Year of Birth | | Position(s)
Held
with Funds | | Term of Office
and Length of
Time Served | | Principal Occupation(s)
During Past 5 Years | | Number of Portfolios
in Fund Complex
Overseen by Director | | Other
Directorships
Held by
Director † | |
Benjamin R. Field III P.O. Box 1329
Minneapolis, MN 55440-1329
(1938) | | Director | | Term expiring earlier of death, resignation, removal, disqualification, or successor duly elected and qualified. Director of FAIF, since September 2003. | | Retired; Senior Financial Advisor, Bemis Company, Inc. from May 2002 through June 2004; Senior Vice President, Chief Financial Officer & Treasurer, Bemis, through April 2002. | | First American Funds Complex: eleven registered investment companies, including fifty-five portfolios | | None | |
|
Roger A. Gibson
P.O. Box 1329
Minneapolis, MN 55440-1329
(1946) | | Director | | Term expiring earlier of death, resignation, removal, disqualification, or successor duly elected and qualified. Director of FAIF since October 1997. | | Retired; Vice President, Cargo – United Airlines, from July 2001 through July 2004; Vice President, North America – Mountain Region, United Airlines, prior to July 2001. | | First American Funds Complex: eleven registered investment companies, including fifty-five portfolios | | None | |
|
Victoria J. Herget
P.O. Box 1329
Minneapolis, MN 55440-1329
(1951) | | Director | | Term expiring earlier of death, resignation, removal, disqualification, or successor duly elected and qualified. Director of FAIF since September 2003. | | Investment consultant and non-profit board member since 2001; Managing Director of Zurich Scudder Investments through 2001. | | First American Funds Complex: eleven registered investment companies, including fifty-five portfolios | | None | |
|
Leonard W. Kedrowski P.O. Box 1329
Minneapolis, MN 55440-1329
(1941) | | Director | | Term expiring earlier of death, resignation, removal, disqualification, or successor duly elected and qualified. Director of FAIF since November 1993. | | Owner and President, Executive and Management Consulting, Inc., a management consulting firm; Board member, GC McGuiggan Corporation (dba Smyth Companies), a label printer; former Chief Executive Officer, Creative Promotions International, LLC, a promotional award programs and products company, through October 2003; Advisory Board member, Designer Doors, manufacturer of designer doors, through 2002. | | First American Funds Complex: eleven registered investment companies, including fifty-five portfolios | | None | |
|
Richard K. Riederer
P.O. Box 1329
Minneapolis, MN 55440-1329
(1944) | | Director | | Term expiring earlier of death, resignation, removal, disqualification, or successor duly elected and qualified. Director of FAIF since August 2001. | | Retired; Director, President and Chief Executive Officer, Weirton Steel through 2001. | | First American Funds Complex: eleven registered investment companies, including fifty-five portfolios | | Cleveland-Cliffs Inc (a producer of iron ore pellets) | |
|
FIRST AMERICAN FUNDS Annual Report 2005
134
Independent Directors - continued
Name, Address, and
Year of Birth | | Position(s)
Held
with Funds | | Term of Office
and Length of
Time Served | | Principal Occupation(s)
During Past 5 Years | | Number of Portfolios
in Fund Complex
Overseen by Director | | Other
Directorships
Held by
Director † | |
Joseph D. Strauss
P.O. Box 1329
Minneapolis, MN 55440-1329
(1940) | | Director | | Term expiring earlier of death, resignation, removal, disqualification, or successor duly elected and qualified. Director of FAIF since September 1984. | | Attorney At Law, Owner and President, Strauss Management Company, a Minnesota holding company for various organizational management business ventures; Owner, Chairman and Chief Executive Officer, Community Resource Partnerships, Inc., a strategic planning, operations management, government relations, transportation planning and public relations organization; Owner, Chairman and Chief Executive Officer, Excensus(TM) LLC, a strategic demographic planning and application development firm, since 2001. | | First American Funds Complex: eleven registered investment companies, including fifty-five portfolios | | None | |
|
Virginia L. Stringer
P.O. Box 1329
Minneapolis, MN 55440-1329
(1944) | | Chair; Director | | Chair Term three years. Directors Term expiring earlier of death, resignation, removal, disqualification, or successor duly elected and qualified. Chair of FAIF's Board since September 1997; Director of FAIF since June 1991. | | Owner and President, Strategic Management Resources, Inc., a management consulting firm; Executive Consultant to State Farm Insurance Company through 2003. | | First American Funds Complex: eleven registered investment companies, including fifty-five portfolios | | None | |
|
James M. Wade
P.O. Box 1329
Minneapolis, MN 55440-1329
(1943) | | Director | | Term expiring earlier of death, resignation, removal, disqualification, or successor duly elected and qualified. Director of FAIF since August 2001. | | Owner and President, Jim Wade Homes, a homebuilding company, since 1999. | | First American Funds Complex; eleven registered investment companies, including fifty-five portfolios. | | None | |
|
† Includes only directorships in a company with a class of securities registered pursuant to Section 12 of the Securities Exchange Act or subject to the requirements of Section 15(d) of the Securities Exchange Act, or any company registered as an investment company under the Investment Company Act.
The Statement of Additional Information (SAI) includes additional information about fund directors and is available upon request without charge by calling 800-677-FUND or writing to First American Funds, P.O. Box 1330, Minneapolis, Minnesota, 55440-1330.
FIRST AMERICAN FUNDS Annual Report 2005
135
NOTICE TO SHAREHOLDERS September 30, 2005 (unaudited)
Officers
Name, Address, and
Year of Birth | | Position(s)
Held
with Funds | | Term of Office
and Length of
Time Served | | Principal Occupation(s) During Past 5 Years | |
Thomas S. Schreier, Jr.
U.S. Bancorp Asset
Management, Inc.
800 Nicollet Mall
Minneapolis, MN 55402
(1962)* | | President | | Re-elected by the Board annually; President of FAIF since February 2001. | | Chief Executive Officer of U.S. Bancorp Asset Management, Inc., since May 2001; prior thereto, Chief Executive Officer of First American Asset Management from December 2000 to May 2001 and of Firstar Investment & Research Management Company ("FIRMCO") from February 2001 to May 2001; prior to that, Senior Managing Director and Head of Equity Research of U.S. Bancorp Piper Jaffray. | |
|
Mark S. Jordahl
U.S. Bancorp Asset
Management, Inc.
800 Nicollet Mall
Minneapolis, MN 55402
(1960)* | | Vice President – Investments | | Re-elected by the Board annually; Vice President – Investments of FAIF since September 2001. | | Chief Investment Officer of U.S. Bancorp Asset Management, Inc., since September 2001; prior thereto, President and Chief Investment Officer, ING Investment Management–Americas, from September 2000 to June 2001; prior to that, Senior Vice President and Chief Investment Officer, ReliaStar Financial Corp. | |
|
Jeffery M. Wilson
U.S. Bancorp Asset
Management, Inc.
800 Nicollet Mall
Minneapolis, MN 55402
(1956)* | | Vice President – Administration | | Re-elected by the Board annually; Vice President – Administration of FAIF since March 2000. | | Senior Vice President of U.S. Bancorp Asset Management, Inc., since May 2001; prior thereto, Senior Vice President of First American Asset Management. | |
|
Charles D Gariboldi, Jr.
U.S. Bancorp Asset
Management, Inc.
800 Nicollet Mall
Minneapolis, MN 55402
(1959)* | | Treasurer | | Re-elected by the Board annually; Treasurer of FAIF since October 2004. | | Mutual Fund Treasurer, U.S. Bancorp Asset Management, Inc., since October 2004; prior thereto, Vice President of investment accounting and Fund Treasurer for Thrivent Financial for Lutherans. | |
|
Jill M. Stevenson
U.S. Bancorp Asset
Management, Inc.
800 Nicollet Mall
Minneapolis, MN 55402
(1965) * | | Assistant Treasurer | | Re-elected by the Board annually; Assistant Treasurer of FAIF since September 2005. | | Assistant Treasurer, U.S. Bancorp Asset Management, Inc., since September 2005; prior thereto, Director, Senior Project Manager, U.S. Bancorp Asset Management, Inc., from May 2003; prior to that, Vice President, Director of Operations, Paladin Investment Associates, LLC. | |
|
David H. Lui
U.S. Bancorp Asset
Management, Inc.
800 Nicollet Mall
Minneapolis, MN 55402
(1960)* | | Chief Compliance Officer | | Re-elected by the Board annually; Chief Compliance Officer of FAIF since February 2005. | | Chief Compliance Officer for First American Funds and U.S. Bancorp Asset Management, Inc., since February 2005; prior thereto, Chief Compliance Officer, Franklin Advisors, Inc. and Chief Compliance Counsel, Franklin Templeton Investments from March 2004; prior to that, Vice President Charles Schwab & Co,. Inc | |
|
Kathleen L. Prudhomme
U.S. Bancorp Asset
Management, Inc.
800 Nicollet Mall
Minneapolis, MN 55402
(1953)* | | Secretary | | Re-elected by the Board annually; Secretary of FAIF since December 2004; prior thereto, Assistant Secretary of FAIF since September 1998. | | Deputy General Counsel, U.S. Bancorp Asset Management, Inc., since November 2004; prior thereto, Partner, Dorsey & Whitney LLP, a Minneapolis-based law firm. | |
|
James D. Alt
50 South Sixth Street
Suite 1500
Minneapolis, MN 55402
(1951) | | Assistant Secretary | | Re-elected by the Board annually; Assistant Secretary of FAIF since December 2004; prior thereto, Secretary of FAIF since June 2002; Assistant Secretary of FAIF from September 1998 through June 2002. | | Partner, Dorsey & Whitney LLP, a Minneapolis-based law firm. | |
|
Brett L. Agnew,
U.S. Bancorp Asset
Management, Inc.
800 Nicollet Mall
Minneapolis, MN 55402
(1971)* | | Assistant Secretary | | Re-elected by the Board annually; Assistant Secretary of FAIF since December 2004. | | Attorney for U.S. Bancorp Asset Management, Inc., since August 2004; prior thereto, Senior Counsel, Thrivent Financial for Lutherans from 2001 to 2004; prior to that, Consultant, Principal Financial Group. | |
|
FIRST AMERICAN FUNDS Annual Report 2005
136
Officers - continued
Name, Address, and
Year of Birth | | Position(s)
Held
with Funds | | Term of Office
and Length of
Time Served | | Principal Occupation(s) During Past 5 Years | |
James R. Arnold
615 E. Michigan Street Milwaukee, WI 53202
(1957)* | | Assistant Secretary | | Re-elected by the Board annually; Assistant Secretary of FAIF since June 2003. | | Vice President, U.S. Bancorp Fund Services, LLC since March 2002; prior thereto, Senior Administration Services Manager, UMB Fund Services, Inc. | |
|
Douglas G. Hess
615 E. Michigan Street Milwaukee, WI 53202
(1967)* | | Assistant Secretary | | Re-elected by the Board annually; Assistant Secretary of FAIF since September 2001. | | Vice President, U.S. Bancorp Fund Services, LLC. | |
|
* Messrs. Schreier, Jordahl, Wilson, Gariboldi, Lui and Agnew, Ms. Stevenson and Ms. Prudhomme are each officers and/or employees of U.S. Bancorp Asset Management, Inc., which serves as investment adviser and administrator for FAIF. Messrs. Hess and Arnold are officers of U.S. Bancorp Fund Services, LLC, which is a subsidiary of U.S. Bancorp and serves as Transfer Agent for FAIF.
FIRST AMERICAN FUNDS Annual Report 2005
137
(This page has been left blank intentionally.)
Board of Directors First American Investment Funds, Inc.
Virginia Stringer
Chairperson of First American Investment Funds, Inc.
Owner and President of Strategic Management Resources, Inc.
Benjamin Field III
Director of First American Investment Funds, Inc.
Retired; former Senior Vice President, Chief Financial Officer, and Treasurer of Bemis Company, Inc.
Roger Gibson
Director of First American Investment Funds, Inc.
Retired; former Vice President of Cargo-United Airlines
Victoria Herget
Director of First American Investment Funds, Inc.
Investment Consultant; former Managing Director of Zurich Scudder Investments
Leonard Kedrowski
Director of First American Investment Funds, Inc.
Owner and President of Executive and Management Consulting, Inc.
Richard Riederer
Director of First American Investment Funds, Inc.
Retired; former President and Chief Executive Officer of Weirton Steel
Joseph Strauss
Director of First American Investment Funds, Inc.
Owner and President of Strauss Management Company
James Wade
Director of First American Investment Funds, Inc.
Owner and President of Jim Wade Homes
First American Investment Funds’ Board of Directors is comprised entirely of independent directors.
Direct fund correspondence to:
First American Funds
P.O. Box 1330
Minneapolis, MN 55440-1330
This report and the financial statements contained herein are not intended to be a forecast of future events, a guarantee of future results, or investment advice. Further, there is no assurance that certain securities will remain in or out of each fund’s portfolio. The views expressed in this report reflect those of the portfolio managers only through the period ended September 30, 2005. The portfolio managers’ views are subject to change at any time based upon market or other conditions.
This report is for the information of shareholders of the First American Investment Funds, Inc. It may also be used as sales literature when preceded or accompanied by a current prospectus, which contains information concerning investment objectives, risks, and charges and expenses of the funds. Read the prospectus carefully before investing.
The figures in this report represent past performance and do not guarantee future results. The principal value of an investment and investment return will fluctuate so that an investor’s shares, when redeemed, may be worth more or less than their original cost.
INVESTMENT ADVISOR
U.S. Bancorp Asset Management, Inc.
800 Nicollet Mall
Minneapolis, Minnesota 55402
ADMINISTRATOR
U.S. Bancorp Asset Management, Inc.
800 Nicollet Mall
Minneapolis, Minnesota 55402
TRANSFER AGENT
U.S. Bancorp Fund Services, LLC
615 East Michigan Street
Milwaukee, Wisconsin 53202
CUSTODIAN
U.S. Bank National Association
60 Livingston Avenue
St. Paul, Minnesota 55107
DISTRIBUTOR
Quasar Distributors, LLC
615 East Michigan Street
Milwaukee, Wisconsin 53202
INDEPENDENT REGISTERED PUBLIC ACCOUNTING FIRM
Ernst & Young LLP
220 South Sixth Street
Suite 1400
Minneapolis, Minnesota 55402
COUNSEL
Dorsey & Whitney LLP
50 South Sixth Street
Suite 1500
Minneapolis, Minnesota 55402
First American Funds
P.O. Box 1330
Minneapolis, MN 55440-1330
In an attempt to reduce shareholder costs and help eliminate duplication, First American Funds will try to limit their mailing to one report for each address that lists one or more shareholders with the same last name. If you would like additional copies, please call First American Investor Services at 800.677.FUND or visit firstamericanfunds.com.
0288-05 11/2005 AR-EQUITY

| 2005
Annual Report |

First American Income Funds
First American Income Funds invest in taxable bonds, which are debt obligations issued by a government, federal agency, or corporation to raise money. Investors lend money to the issuer until the bond matures and, in exchange, receive regular interest payments at a predetermined rate. Income funds generate income that is normally subject to federal, state, and local taxes.

TABLE OF CONTENTS
Message to Shareholders | 1 |
Report of Independent Registered Public Accounting Firm | 26 |
Schedule of Investments | 27 |
Statements of Assets and Liabilities | 56 |
Statements of Operations | 60 |
Statements of Changes in Net Assets | 62 |
Financial Highlights | 64 |
Notes to Financial Statements | 74 |
Notice to Shareholders | 86 |
| Mutual fund investing involves risk; principal loss is possible. |
| |
| NOT FDIC INSURED NO BANK GUARANTEE MAY LOSE VALUE |
FIRST AMERICAN INVESTMENT FUNDS, INC.
PROSPECTUS SUPPLEMENT DATED NOVEMBER 7, 2005
This supplement updates the following Prospectuses dated January 31, 2005:
First American Income Funds Class A, Class B and Class C Shares Prospectus (as previously supplemented July 1, 2005)
First American Income Funds Class R Shares Prospectus
First American Income Funds Class Y Shares Prospectus (as previously supplemented July 1, 2005)
Selected First American Funds Class A Shares Prospectus
For each share class, this supplement, any previous supplement, and the applicable Prospectus dated January 31, 2005 together constitute a current Prospectus. To request a copy of a Prospectus, please call 800-677-FUND.
Information regarding the portfolio managers primarily responsible for the management of High Income Bond Fund, which is set forth in each Prospectus under the heading "Additional Information - Management - Portfolio Management," is supplemented by the following:
John T. Fruit, CFA, Senior Fixed-Income Portfolio Manager, has been appointed as an additional co-manager of High Income Bond Fund. Prior to joining U.S. Bancorp Asset Management as a senior credit research analyst in 2001, Mr. Fruit was employed at Aid Association for Lutherans as a fixed-income analyst/trader. He also previously did analysis and institutional trading for Arbor Research and Trading and worked in sales and trading in securities lending and fixed income for the firm. Mr. Fruit has more than 17 years of financial industry experience. Douglas P. Hedberg will continue to act as the fund's primary portfolio manager and Philip A. Melville will continue to act as a co-manager.
IF YOU HAVE ANY QUESTIONS REGARDING THIS PROSPECTUS SUPPLEMENT, PLEASE CONTACT YOUR INVESTMENT PROFESSIONAL, OR YOU MAY CALL FIRST AMERICAN FUNDS INVESTOR SERVICES AT 800-677-FUND.
This is not part of the annual report.
(This page has been left blank intentionally.)
Message to SHAREHOLDERS November 14, 2005
Dear Shareholders:
We invite you to take a few minutes to review the results of the fiscal year ended September 30, 2005.
This report includes comparative performance graphs and tables, portfolio commentaries, complete listings of portfolio holdings, and additional fund information. We hope you will find this helpful in monitoring your investment portfolio.
Also, through our website, firstamericanfunds.com, we provide quarterly performance fact sheets on all First American Funds, the economic outlook as viewed by our senior investment officers, and other information about fund investments and portfolio strategies.
Please contact your financial professional if you have questions about First American Funds or contact First American Investor Services at 800.677.FUND.
We appreciate your investment with First American Funds and look forward to serving your financial needs in the future.
Sincerely,
/s/ Virginia L. Stringer | | /s/ Thomas S. Schreier, Jr. | |
| |
Virginia L. Stringer | Thomas S. Schreier, Jr. |
Chairperson of the Board | President |
First American Investment Funds, Inc. | First American Investment Funds, Inc. |
FIRST AMERICAN FUNDS Annual Report 2005 |
1
Core Bond fund
Investment Objective: high current income consistent with limited risk to capital
How did the fund perform for the fiscal year ended September 30, 2005?
The First American Core Bond Fund (the "fund"), Class Y shares, returned 3.01% for the fiscal year ended September 30, 2005 (Class A shares returned 2.75% without taking the sales charge into account). By comparison, the fund's benchmark, the Lehman Aggregate Bond Index*, returned 2.80% for the same period.
What were the general economic and market conditions during the fiscal year?
Economic growth moderated but nevertheless continued at a solid pace over the course of the fiscal year. Solid economic growth, in turn, improved labor market conditions. While core inflation remained basically stable at a relatively low level, overall inflation rose with the continuing climb of energy prices during the past year. The combination of solid growth, lower unemployment, and the potential for higher energy prices to be reflected by broader inflation measures has kept the Fed incrementally raising the Fed Funds Rate at each Federal Open Market Committee meeting since June 2004.
While the Fed's measured approach to tightening monetary policy helped foster stability in the bond market, it had little effect on long-term rates, which remained low as short-term rates inched higher. As a result, the flattening yield curve (i.e., a greater rise in short-term than in long-term rates) made bonds with maturities of 10 years or longer more attractive than their shorter-term counterparts. Given strong corporate profits, corporate bonds enjoyed continued strong performance, though increasingly there have been indications that the credit cycle has passed its peak.
Underlying economic conditions remain generally favorable for the financial markets, although risks have risen with energy prices and the widespread disruption to activity from Hurricanes Katrina and Rita.
How did market conditions and investment strategies affect the fund's performance?
The fund's strategic positioning to take advantage of the flattening yield curve by underweights in intermediate-term bonds accounted for a significant portion of the fund's outperformance relative to the index. With lower-quality issues outperforming higher-rated bonds, the fund benefited from an overweight in BBB-rated credit throughout most of the fiscal year. An overweight in mortgage-backed securities, as well as overweights in asset-backed securities and commercial mortgage-backed securities, also added value.
What strategic moves were made by the fund and why?
The fund gradually trimmed its overweight in BBB-rated bonds, as these issues performed increasingly well. By the end of the reporting period, the fund shifted to a modest underweight in BBB-rated bonds and remained underweight in higher-quality corporate issues as well. Though this transition was driven chiefly by less attractive valuations rather than the fundamental economic developments, we believe that the credit cycle has peaked and that an increase in shareholder friendly activity (mergers and acquisitions, leveraged buyouts, share buybacks, etc,) makes corporate bonds less appealing. Although we believe rates will continue to increase, we view current valuations on mortgage-backed securities as attractive and are overweight in this position. We continue to emphasize high-quality collateral in the mortgage-backed and asset-backed markets as the economic expansion matures and credit risk for consu mers increases. We believe the continued economic growth and mounting inflationary pressures will drive the interest rates upward; accordingly the fund's duration is shorter than the benchmark.
*Unlike mutual funds, index returns do not reflect any expenses, transaction costs, or cash flow effects.
Portfolio Allocation as of September 30, 20051 (% of net assets)
| Mortgage-Backed | | | 48.6 | % | |
| U.S. Treasury | | | 19.1 | | |
| Asset-Backed | | | 16.7 | | |
| Corporate Bond | | | 8.9 | | |
| U.S. Government Agency | | | 4.9 | | |
| Cash Equivalents | | | 2.9 | | |
| Other Assets and Liabilities, Net | | | (1.1 | ) | |
| | | | 100 | % | |
Credit Quality Distribution as of September 30, 20052 (% of market value)
| AAA/Aaa | | | 88.0 | % | |
| AA/Aa | | | 1.9 | | |
| A/A | | | 1.8 | | |
| BBB/Baa | | | 8.3 | | |
| | | | 100 | % | |
1Portfolio allocations are subject to change and are not recommendations to buy or sell any security.
2In the case of split ratings, a security is considered to be rated in the listed category if two of Moody's Investor Service, Standard & Poor's, and Fitch rate the security in that category. If ratings are provided by only two of those rating agencies, the lower rating is used. If only one of those rating agencies provides a rating, that rating is used.
FIRST AMERICAN FUNDS Annual Report 2005
2
Core Bond fund continued
Annual Performance1 as of September 30, 2005
| | | | | | | | | Since Inception | |
| | | 1 year | | 5 years | | 10 years | | 2/1/1999 | | 9/24/2001 | |
| Average annual return with sales charge (POP) | | | |
| Class A | | | (1.61 | )% | | | 4.78 | % | | | 5.21 | % | | | - | | | | - | | |
| Class B | | | (2.94 | )% | | | 4.56 | % | | | 4.90 | % | | | - | | | | - | | |
| Class C | | | 1.00 | % | | | 4.90 | % | | | - | | | | 4.05 | % | | | - | | |
| Average annual return without sales charge (NAV) | | | |
| Class A | | | 2.75 | % | | | 5.68 | % | | | 5.67 | % | | | - | | | | - | | |
| Class B | | | 2.00 | % | | | 4.89 | % | | | 4.90 | % | | | - | | | | - | | |
| Class C | | | 1.99 | % | | | 4.90 | % | | | - | | | | 4.05 | % | | | - | | |
| Class R | | | 2.51 | % | | | - | | | | - | | | | - | | | | 4.15 | % | |
| Class Y | | | 3.01 | % | | | 5.95 | % | | | 5.94 | % | | | - | | | | - | | |
| Lehman Aggregate Bond Index2 | | | 2.80 | % | | | 6.62 | % | | | 6.55 | % | | | 5.83 | % | | | 5.24 | % | |
Value of $10,000 Investment1,3 as of September 30, 2005
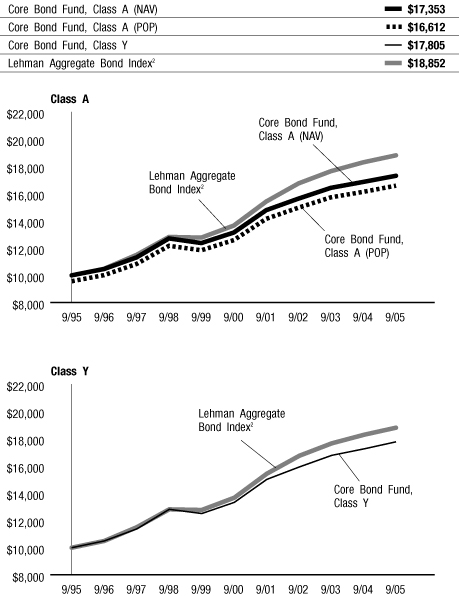
The chart above illustrates the total value of an assumed $10,000 investment in the fund's Class A and Class Y shares (from 9/30/1995 to 9/30/2005) as compared to the Lehman Aggregate Bond Index.2
The performance data quoted on this page represents past performance and does not guarantee future results. The investment return and principal value of an investment will fluctuate so that an investor's shares, when redeemed, may be worth more or less than their original cost. Current performance of the fund may be lower or higher than the performance data quoted. Performance data current to the most recent month-end may be obtained by calling 800.677.FUND.
1 Performance does not reflect the deduction of taxes that a shareholder would pay on fund distributions or redemption of fund shares. Investment performance reflects fee waivers that are or were in effect. In the absence of such fee waivers, total returns would be reduced. Index performance is for illustrative purposes only and does not reflect any expenses, transaction costs, or cash flow effects. Direct investment in the index is not available.
Total returns at net asset value ("NAV") reflect performance over the time period indicated without including the fund's maximum sales charge and assume reinvestment of all distributions at NAV.
Total returns at public offering price ("POP") reflect performance over the time period indicated including maximum sales charges of 4.25% for Class A shares and the maximum contingent deferred sales charge ("CDSC") for Class B and Class C shares for the relevant period. Maximum CDSC is 5.00% for Class B shares, decreasing annually to 0% in the seventh year following purchase, and 1.00% for Class C shares. Total returns assume reinvestment of all distributions at NAV.
Investments in debt securities typically decrease in value when interest rates rise. This risk is usually greater for longer-term debt securities.
2 An unmanaged index comprised of the Lehman Government/Credit Bond Index, the Lehman Mortgage Backed Securities Index, and the Lehman Asset Backed Securities Index. The Lehman Government/Credit Bond Index is comprised of Treasury securities, other securities issued or guaranteed by the U.S. government or its agencies or instrumentalities, including U.S. agency mortgage securities, and investment-grade corporate debt securities. The Lehman Mortgage Backed Securities Index is comprised of the mortgage-backed pass-through securities of Ginnie Mae, Fannie Mae, and Freddie Mac. The Lehman Asset Backed Securities Index is comprised of debt securities rated investment grade or higher that are backed by credit card, auto, and home equity loans.
3 Performance for Class B, Class C, and Class R shares is not presented. Performance for these classes will vary due to different expense structures.
FIRST AMERICAN FUNDS Annual Report 2005
3
Core Bond fund continued
Expense Example
As a shareholder of the Core Bond Fund (the "fund"), you incur two types of costs: (1) transaction costs, including sales charges (loads) on purchase payments; and (2) ongoing costs, including advisory fees; distribution and/or service (12b-1) fees; and other fund expenses. This example is intended to help you understand your ongoing costs (in dollars) of investing in the fund and to compare these costs with the ongoing costs of investing in other mutual funds. The example is based on an investment of $1,000 invested at the beginning of the period and held for the entire period from April 1, 2005, to September 30, 2005.
Actual Expenses
For each class, the first line of the table below provides information about actual account values and actual expenses. You may use the information in this line, together with the amount you invested, to estimate the expenses that you paid over the period. Simply divide your account value by $1,000 (for example, an $8,600 account value divided by $1,000 = 8.6), then multiply the result by the number in the first line under the heading entitled "Expenses Paid During Period" to estimate the expenses you paid on your account during this period.
Hypothetical Example for Comparison Purposes
For each class, the second line of the table below provides information about hypothetical account values and hypothetical expenses based on the fund's actual expense ratio and an assumed rate of return of 5% per year before expenses, which is not the fund's actual return. The hypothetical account values and expenses may not be used to estimate the actual ending account balance or expenses you paid for the period. You may use this information to compare the ongoing costs of investing in the fund and other funds. To do so, compare this 5% hypothetical example with the 5% hypothetical examples that appear in the shareholder reports of the other funds.
Please note that the expenses shown in the table are meant to highlight your ongoing costs only and do not reflect any transactional costs, such as sales charges (loads). Therefore, the second line of the table for each class is useful in comparing ongoing costs only, and will not help you determine the relative total costs of owning different funds. In addition, if these transactional costs were included, your costs would have been higher.
Expense Examples
| | | Beginning Account
Value (4/01/05) | | Ending Account
Value (9/30/05) | | Expenses Paid During
Period1 (4/01/05 to
9/30/05) | |
| Class A Actual2 | | $ | 1,000.00 | | | $ | 1,019.00 | | | $ | 4.81 | | |
| Class A Hypothetical (5% return before expenses) | | $ | 1,000.00 | | | $ | 1,020.31 | | | $ | 4.81 | | |
| Class B Actual2 | | $ | 1,000.00 | | | $ | 1,015.30 | | | $ | 8.59 | | |
| Class B Hypothetical (5% return before expenses) | | $ | 1,000.00 | | | $ | 1,016.55 | | | $ | 8.59 | | |
| Class C Actual2 | | $ | 1,000.00 | | | $ | 1,016.20 | | | $ | 8.59 | | |
| Class C Hypothetical (5% return before expenses) | | $ | 1,000.00 | | | $ | 1,016.55 | | | $ | 8.59 | | |
| Class R Actual2 | | $ | 1,000.00 | | | $ | 1,018.40 | | | $ | 6.07 | | |
| Class R Hypothetical (5% return before expenses) | | $ | 1,000.00 | | | $ | 1,019.05 | | | $ | 6.07 | | |
| Class Y Actual2 | | $ | 1,000.00 | | | $ | 1,021.20 | | | $ | 3.55 | | |
| Class Y Hypothetical (5% return before expenses) | | $ | 1,000.00 | | | $ | 1,021.56 | | | $ | 3.55 | | |
1Expenses are equal to the fund's annualized expense ratio for the most recent six-month period of 0.95%, 1.70%, 1.70%, 1.20% and 0.70% for Class A, Class B, Class C, Class R and Class Y, respectively, multiplied by the average account value over the period, multiplied by the number of days in the most recent fiscal half-year/365 (to reflect the one-half year period).
2Based on the actual returns for the six months ended September 30, 2005: 1.90% for Class A, 1.53% for Class B, 1.62% for Class C, 1.84% for Class R, and 2.12% for Class Y.
FIRST AMERICAN FUNDS Annual Report 2005
4
High Income Bond fund
Investment Objective: high current income
How did the fund perform for the fiscal year ended September 30, 2005?
The First American High Income Bond Fund (the "fund"), Class Y shares, returned 7.01% for the fiscal year ended September 30, 2005 (Class A shares returned 6.74% without taking the sales charge into account). By comparison, the fund's benchmark, the Lehman Corporate High Yield Index*, returned 6.71% for the same period.
What were the general economic and market conditions during the fiscal year?
Economic growth moderated but nevertheless continued at a solid pace over the course of the fiscal year. Solid economic growth, in turn, improved labor market conditions. While core inflation remained basically stable at a relatively low level, overall inflation has risen with the continuing climb of energy prices during the past year. The combination of solid growth, lower unemployment, and the potential for higher energy prices to be reflected by broader inflation measures has kept the Fed incrementally raising the Fed Funds Rate at each Federal Open Market Committee meeting since June 2004.
While the Fed's measured approach to tightening monetary policy helped foster stability in the bond market, it had little effect on long-term rates, which remained low as short-term rates inched higher. As a result, the flattening yield curve (i.e., a greater rise in short-term than in long-term rates) made bonds with maturities of 10 years or longer more attractive than their shorter-term counterparts. Given strong corporate profits, high-yield credit enjoyed continued strong performance, though increasingly there have been indications that the credit cycle has passed its peak.
Underlying economic conditions remain generally favorable for the financial markets, although risks have risen with energy prices and the widespread disruption to activity from Hurricanes Katrina and Rita.
How did market conditions and investment strategies affect the fund's performance?
Most of the decisions that affected the fund during the fiscal year were related to individual security selections. Benefiting the fund were overweights in corporate bonds that outperformed the benchmark through much of the reporting period: Allegheny Technologies, Case New Holland, Dobson Cellular, McDermott International, North American Energy, Roundy's, and Witco Chemical.
In terms of credit quality, the fund benefited from an overweight to CCC-rated securities in the fall of 2004, when these issues handily outperformed others in the high-yield area. Later on during the fiscal year, the fund's position in BBB-rated securities helped us weather the weak spell in the high-yield market. Also contributing to the good returns were positions taken in emerging markets.
On the downside, adverse security selection detracted somewhat from the fund's performance, with overweights to bonds that underperformed, including Calpine, Collins & Aikman, Delphi, Elan, Intelsat, Mercer, and Tembec.
What strategic moves were made by the fund and why?
Due to increasing concern about the maturing credit cycle, we improved the overall quality of the fund by eliminating the overweight in CCC-rated debt early in 2005. Similarly, we began to shift emphasis from idiosyncratic risk (large positions in single names) to market risk, reducing a number of large overweights in individual names while increasing our exposure to derivative products where the underlying credit risk is diversified among a large number of corporate issuers. During the year, we tactically invested in emerging market debt, specifically sovereign debt (issued by national governments).
*Unlike mutual funds, index returns do not reflect any expenses, transaction costs, or cash flow effects.
Portfolio Allocation as of September 30, 20051 (% of net assets)
| Corporate Bond | | | 93.8 | % | |
| Asset-Backed | | | 2.6 | | |
| Cash Equivalents | | | 1.4 | | |
| Preferred Stock | | | 0.9 | | |
| Common Stock | | | 0.1 | | |
| Other Assets and Liabilities, Net | | | 1.2 | | |
| | | | 100 | % | |
Credit Quality Distribution as of September 30, 20052 (% of market value)
| AAA/Aaa | | | 2.9 | % | |
| BBB/Baa | | | 4.1 | | |
| BB/Ba | | | 31.2 | | |
| B/B | | | 44.5 | | |
| CCC/Caa | | | 15.3 | | |
| CC/Ca | | | 0.3 | | |
| C/C | | | 0.1 | | |
| Non-Rated | | | 1.6 | | |
| | | | 100 | % | |
1Portfolio allocations are subject to change and are not recommendations to buy or sell any security.
2In the case of split ratings, a security is considered to be rated in the listed category if two of Moody's Investor Service, Standard & Poor's, and Fitch rate the security in that category. If ratings are provided by only two of those rating agencies, the lower rating is used. If only one of those rating agencies provides a rating, that rating is used.
FIRST AMERICAN FUNDS Annual Report 2005
5
High Income Bond fund continued
Annual Performance1 as of September 30, 2005
| | | | | Since Inception | |
| | | 1 year | | 8/30/2001 | | 9/24/2001 | |
| Average annual return with sales charge (POP) | |
| Class A | | | 2.20 | % | | | 5.46 | % | | | - | | |
| Class B | | | 0.99 | % | | | 5.48 | % | | | - | | |
| Class C | | | 4.97 | % | | | 5.81 | % | | | - | | |
| Average annual return without sales charge (NAV) | |
| Class A | | | 6.74 | % | | | 6.58 | % | | | - | | |
| Class B | | | 5.97 | % | | | 5.87 | % | | | - | | |
| Class C | | | 5.96 | % | | | 5.81 | % | | | - | | |
| Class R | | | 6.23 | % | | | - | | | | 7.85 | % | |
| Class Y | | | 7.01 | % | | | 6.89 | % | | | - | | |
| Lehman Corporate High Yield Index2 | | | 6.71 | % | | | 8.96 | % | | | 11.13 | % | |
Value of $10,000 Investment1,3 as of September 30, 2005
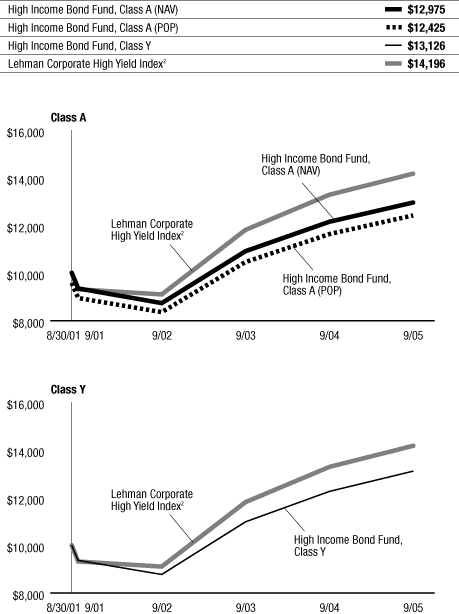
The chart above illustrates the total value of an assumed $10,000 investment in the fund's Class A and Class Y shares (from 8/30/2001 to 9/30/2005) as compared to the Lehman Corporate High Yield Index.2
The performance data quoted on this page represents past performance and does not guarantee future results. The investment return and principal value of an investment will fluctuate so that an investor's shares, when redeemed, may be worth more or less than their original cost. Current performance of the fund may be lower or higher than the performance data quoted. Performance data current to the most recent month-end may be obtained by calling 800.677.FUND.
1 Performance does not reflect the deduction of taxes that a shareholder would pay on fund distributions or redemption of fund shares. Investment performance reflects fee waivers that are or were in effect. In the absence of such fee waivers, total returns would be reduced. Index performance is for illustrative purposes only and does not reflect any expenses, transaction costs, or cash flow effects. Direct investment in the index is not available.
The fund invests in lower-rated and non-rated securities which present a greater risk of loss to principal and interest than higher-rated securities.
Total returns at net asset value ("NAV") reflect performance over the time period indicated without including the fund's maximum sales charge and assume reinvestment of all distributions at NAV.
Total returns at public offering price ("POP") reflect performance over the time period indicated including maximum sales charges of 4.25% for Class A shares and the maximum contingent deferred sales charge ("CDSC") for Class B and Class C shares for the relevant period. Maximum CDSC is 5.00% for Class B shares, decreasing annually to 0% in the seventh year following purchase, and 1.00% for Class C shares. Total returns assume reinvestment of all distributions at NAV.
2 An unmanaged index that covers the universe of fixed-rate, dollar-denominated, below-investment-grade debt with at least one year to final maturity. Payment-in-kind bonds, Eurobonds, and emerging markets debt securities are excluded, but SEC-registered Canadian and global bonds of issuers in non-emerging countries are included. Original issue zero coupon bonds, step-up coupon structures, and Rule 144A securities are also included.
3 Performance for Class B, Class C, and Class R shares is not presented. Performance for these classes will vary due to different expense structures.
FIRST AMERICAN FUNDS Annual Report 2005
6
High Income Bond fund continued
Expense Example
As a shareholder of the High Income Bond Fund (the "fund"), you incur two types of costs: (1) transaction costs, including sales charges (loads) on purchase payments; and (2) ongoing costs, including advisory fees; distribution and/or service (12b-1) fees; and other fund expenses. This example is intended to help you understand your ongoing costs (in dollars) of investing in the fund and to compare these costs with the ongoing costs of investing in other mutual funds. The example is based on an investment of $1,000 invested at the beginning of the period and held for the entire period from April 1, 2005, to September 30, 2005.
Actual Expenses
For each class, the first line of the table below provides information about actual account values and actual expenses. You may use the information in this line, together with the amount you invested, to estimate the expenses that you paid over the period. Simply divide your account value by $1,000 (for example, an $8,600 account value divided by $1,000 = 8.6), then multiply the result by the number in the first line under the heading entitled "Expenses Paid During Period" to estimate the expenses you paid on your account during this period.
Hypothetical Example for Comparison Purposes
For each class, the second line of the table below provides information about hypothetical account values and hypothetical expenses based on the fund's actual expense ratio and an assumed rate of return of 5% per year before expenses, which is not the fund's actual return. The hypothetical account values and expenses may not be used to estimate the actual ending account balance or expenses you paid for the period. You may use this information to compare the ongoing costs of investing in the fund and other funds. To do so, compare this 5% hypothetical example with the 5% hypothetical examples that appear in the shareholder reports of the other funds.
Please note that the expenses shown in the table are meant to highlight your ongoing costs only and do not reflect any transactional costs, such as sales charges (loads). Therefore, the second line of the table for each class is useful in comparing ongoing costs only, and will not help you determine the relative total costs of owning different funds. In addition, if these transactional costs were included, your costs would have been higher.
Expense Examples
| | | Beginning Account
Value (4/01/05) | | Ending Account
Value (9/30/05) | | Expenses Paid During
Period1 (4/01/05 to
9/30/05) | |
| Class A Actual2, 3 | | $ | 1,000.00 | | | $ | 1,038.40 | | | $ | 5.37 | | |
| Class A Hypothetical (5% return before expenses) | | $ | 1,000.00 | | | $ | 1,019.80 | | | $ | 5.32 | | |
| Class B Actual2, 3 | | $ | 1,000.00 | | | $ | 1,034.70 | | | $ | 9.18 | | |
| Class B Hypothetical (5% return before expenses) | | $ | 1,000.00 | | | $ | 1,016.04 | | | $ | 9.10 | | |
| Class C Actual2, 3 | | $ | 1,000.00 | | | $ | 1,034.70 | | | $ | 9.18 | | |
| Class C Hypothetical (5% return before expenses) | | $ | 1,000.00 | | | $ | 1,016.04 | | | $ | 9.10 | | |
| Class R Actual2, 3 | | $ | 1,000.00 | | | $ | 1,036.60 | | | $ | 6.64 | | |
| Class R Hypothetical (5% return before expenses) | | $ | 1,000.00 | | | $ | 1,018.55 | | | $ | 6.58 | | |
| Class Y Actual2, 3 | | $ | 1,000.00 | | | $ | 1,039.70 | | | $ | 4.09 | | |
| Class Y Hypothetical (5% return before expenses) | | $ | 1,000.00 | | | $ | 1,021.06 | | | $ | 4.05 | | |
1Expenses are equal to the fund's annualized expense ratio for the most recent six-month period of 1.05%, 1.80%, 1.80%, 1.30% and 0.80% for Class A, Class B, Class C, Class R and Class Y, respectively, multiplied by the average account value over the period, multiplied by the number of days in the most recent fiscal half-year/365 (to reflect the one-half year period).
2Based on the actual returns for the six months ended September 30, 2005: 3.84% for Class A, 3.47% for Class B, 3.47% for Class C, 3.66% for Class R, and 3.97% for Class Y.
3Prior to July 1, 2005, the contractual limitation on annual expenses was 1.00%, 1.75%, 1.75%, 1.25% and 0.75% for Class A, Class B, Class C, Class R and Class Y, respectively. Effective July 1, 2005, the contractual limitation on annual expenses for each class was increased to 1.10%, 1.85%, 1.85%, 1.35%, and .085% for Class A, Class B, Class C, Class R, and Class Y respectively. If this new limitation had been in place during the entire period, actual and hypothetical ending account balances would have been $1,038.15 and $1,019.55 for Class A, $1,034.44 and $1,015.79 for Class B, $1,034.44 and $1,015.79 for Class C, $1,036.35 and $1,018.30 for Class R, and $1,039.44 and $1,020.81 for Class Y and actual and hypothetical expenses paid during the period would have been $5.62 and $5.57 for Class A, $9.44 and $ 9.35 for Class B, $9.44 and $9.35 for Class C, $6.89 and $6.83 for Class R and $4.35 and $4.31 for Class Y.
FIRST AMERICAN FUNDS Annual Report 2005
7
Inflation Protected Securities fund
Investment Objective: provide investors with total return while providing protection against inflation
How did the fund perform for the fiscal year ended September 30, 2005?
The First American Inflation Protected Securities Fund (the "fund") Class Y shares, returned 5.24% for the fiscal year ended September 30, 2005 (Class A shares returned 4.93% without taking the sales charge into account). By comparison, the fund's benchmark, the Lehman Treasury Inflation Protected Securities Index*, returned 5.90% for the same period.
What were the general economic and market conditions during the fiscal year?
Economic growth moderated but nevertheless continued at a solid pace over the course of the fiscal year. Solid economic growth, in turn, improved labor market conditions. While core inflation remained basically stable at a relatively low level, overall inflation rose with the continuing climb of energy prices during the past year. The combination of solid growth, lower unemployment, and the potential for higher energy prices to be reflected by broader inflation measures has kept the Fed incrementally raising the Fed Funds Rate at each Federal Open Market Committee meeting since June 2004.
The Fed's measured approach to tightening monetary policy helped foster stability in the bond market, keeping long-term rates anchored while short-term rates moved higher. As a result, the yield curve flattened. Given strong corporate profits, corporate bonds enjoyed continued strong performance, though increasingly there have been indications that the credit cycle has passed its peak.
Underlying economic conditions remain generally favorable for the financial markets, although risks have risen with energy prices and the widespread disruption to activity from Hurricanes Katrina and Rita.
How did market conditions and investment strategies affect the fund's performance?
Treasury Inflation-Protected Securities (TIPS) did not enjoy particularly strong performance during this fiscal year, underperforming dramatically during the second quarter and recovering thereafter. As yield spreads between five-year and 30-year Treasuries narrowed dramatically throughout the reporting period, the fund's overweight in longer maturities was a positive contributor to performance. The non-TIPS allocation was beneficial to the fund in the second quarter, when TIPS underperformed, but non-TIPS bonds gave back gains when TIPS recovered in the third quarter. The fund's underweight in short-maturity TIPS detracted from performance, as these bonds – especially the two-year sector – outperformed other Treasuries, their principal value increasing as a result of the inflationary change triggered by rising energy prices. We adjusted the fund's duration tactically as rates moved up or down within the market range throughout the fiscal year.
What strategic moves were made by the fund and why?
With yield curve spreads much compressed, we've reduced our position in longer-maturity TIPS, increasing our holdings in bonds with five-year maturities. Because of tight spreads, we eliminated our exposure to emerging market and high-yield bonds (which accounted for 5% of the portfolio), and we are looking for a more advantageous point at which to resume holding these securities. We continue to hold short-duration asset-backed and commercial mortgage-backed securities, a good alternative to holding short-end TIPS, which tend to be volatile with energy price movements.
*Unlike mutual funds, index returns do not reflect any expenses, transaction costs, or cash flow effects.
Portfolio Allocation as of September 30, 20051 (% of net assets)
| U.S. Treasury | | | 89.6 | % | |
| U.S. Government Agency | | | 4.9 | | |
| Asset-Backed | | | 2.1 | | |
| Corporate Bond | | | 1.1 | | |
| Cash Equivalent | | | 0.7 | | |
| Mortgage-Backed | | | 0.5 | | |
| Other Assets and Liabilities, Net | | | 1.1 | | |
| | | | 100 | % | |
Credit Quality Distribution as of September 30, 20052 (% of market value)
| AAA/Aaa | | | 97.6 | % | |
| AA/Aa | | | 1.9 | | |
| A/A | | | 0.3 | | |
| BB/Ba | | | 0.2 | | |
| | | | 100 | % | |
1Portfolio allocations are subject to change and are not recommendations to buy or sell any security.
2In the case of split ratings, a security is considered to be rated in the listed category if two of Moody's Investor Service, Standard & Poor's, and Fitch rate the security in that category. If ratings are provided by only two of those rating agencies, the lower rating is used. If only one of those rating agencies provides a rating, that rating is used.
FIRST AMERICAN FUNDS Annual Report 2005
8
Inflation Protected Securities fund continued
Annual Performance1 as of September 30, 2005
| | | Since Inception | |
| | | 10/1/2004 | |
| Average annual return with sales charge (POP) | |
| Class A | | | 0.51 | % | |
| Class C | | | 3.18 | % | |
| Average annual return without sales charge (NAV) | |
| Class A | | | 4.93 | % | |
| Class C | | | 4.18 | % | |
| Class R | | | 4.81 | % | |
| Class Y | | | 5.24 | % | |
| Lehman TIPS (Treasury Inflation Protected Securities) Index2 | | | 5.90 | % | |
Value of $10,000 Investment1,3 as of September 30, 2005
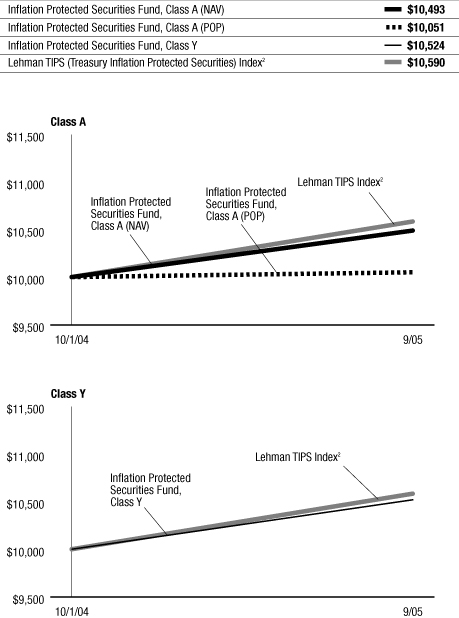
The chart above illustrates the total value of an assumed $10,000 investment in the fund's Class A and Class Y shares (from 10/01/2004 to 9/30/2005) as compared to the Lehman TIPS Index.2
The performance data quoted on this page represents past performance and does not guarantee future results. The investment return and principal value of an investment will fluctuate so that an investor's shares, when redeemed, may be worth more or less than their original cost. Current performance of the fund may be lower or higher than the performance data quoted. Performance data current to the most recent month-end may be obtained by calling 800.677.FUND.
1 Performance does not reflect the deduction of taxes that a shareholder would pay on fund distributions or redemption of fund shares. Investment performance reflects fee waivers that are or were in effect. In the absence of such fee waivers, total returns would be reduced. Index performance is for illustrative purposes only and does not reflect any expenses, transaction costs, or cash flow effects. Direct investment in the index is not available.
Total returns at net asset value ("NAV") reflect performance over the time period indicated without including the fund's maximum sales charge and assume reinvestment of all distributions at NAV.
Total returns at public offering price ("POP") reflect performance over the time period indicated including maximum sales charges of 4.25% for Class A Shares and the maximum contingent deferred sales charge ("CDSC") for Class C shares for the relevant period. Maximum CDSC is 1.00% for Class C shares. Total returns assume reinvestment of all distributions at NAV.
Investments in debt securities typically decrease in value when interest rates rise. This risk is usually greater for longer-term debt securities.
2 An unmanaged index comprised of inflation-protected securities issued by the US Treasury that have at least one year to final maturity, at least $250 million par amount outstanding, and are investment-grade rated (Baa or better).
3 Performance for Class C and Class R shares is not presented. Performance for these classes will vary due to different expense structures.
FIRST AMERICAN FUNDS Annual Report 2005
9
Inflation Protected Securities fund continued
Expense Example
As a shareholder of the Inflation Protected Securities Fund (the "fund"), you incur two types of costs: (1) transaction costs, including sales charges (loads) on purchase payments; and (2) ongoing costs, including advisory fees; distribution and/or service (12b-1) fees; and other fund expenses. This example is intended to help you understand your ongoing costs (in dollars) of investing in the fund and to compare these costs with the ongoing costs of investing in other mutual funds. The example is based on an investment of $1,000 invested at the beginning of the period and held for the entire period from April 1, 2005, to September 30, 2005.
Actual Expenses
For each class, the first line of the table below provides information about actual account values and actual expenses. You may use the information in this line, together with the amount you invested, to estimate the expenses that you paid over the period. Simply divide your account value by $1,000 (for example, an $8,600 account value divided by $1,000 = 8.6), then multiply the result by the number in the first line under the heading entitled "Expenses Paid During Period" to estimate the expenses you paid on your account during this period.
Hypothetical Example for Comparison Purposes
For each class, the second line of the table below provides information about hypothetical account values and hypothetical expenses based on the fund's actual expense ratio and an assumed rate of return of 5% per year before expenses, which is not the fund's actual return. The hypothetical account values and expenses may not be used to estimate the actual ending account balance or expenses you paid for the period. You may use this information to compare the ongoing costs of investing in the fund and other funds. To do so, compare this 5% hypothetical example with the 5% hypothetical examples that appear in the shareholder reports of the other funds.
Please note that the expenses shown in the table are meant to highlight your ongoing costs only and do not reflect any transactional costs, such as sales charges (loads). Therefore, the second line of the table for each class is useful in comparing ongoing costs only, and will not help you determine the relative total costs of owning different funds. In addition, if these transactional costs were included, your costs would have been higher.
Expense Examples
| | | Beginning Account
Value (4/01/05) | | Ending Account
Value (9/30/05) | | Expenses Paid During
Period1 (4/01/05 to
9/30/05) | |
| Class A Actual2 | | $ | 1,000.00 | | | $ | 1,027.70 | | | $ | 4.32 | | |
| Class A Hypothetical (5% return before expenses) | | $ | 1,000.00 | | | $ | 1,020.81 | | | $ | 4.31 | | |
| Class C Actual2 | | $ | 1,000.00 | | | $ | 1,024.10 | | | $ | 8.12 | | |
| Class C Hypothetical (5% return before expenses) | | $ | 1,000.00 | | | $ | 1,017.05 | | | $ | 8.09 | | |
| Class R Actual2 | | $ | 1,000.00 | | | $ | 1,026.80 | | | $ | 5.59 | | |
| Class R Hypothetical (5% return before expenses) | | $ | 1,000.00 | | | $ | 1,019.55 | | | $ | 5.57 | | |
| Class Y Actual2 | | $ | 1,000.00 | | | $ | 1,028.90 | | | $ | 3.05 | | |
| Class Y Hypothetical (5% return before expenses) | | $ | 1,000.00 | | | $ | 1,022.06 | | | $ | 3.04 | | |
1Expenses are equal to the fund's annualized expense ratio for the most recent six-month period of 0.85%, 1.60%, 1.10% and 0.60% for Class A, Class C, Class R and Class Y, respectively, multiplied by the average account value over the period, multiplied by the number of days in the most recent fiscal half-year/365 (to reflect the one-half year period).
2Based on the actual returns for the six months ended September 30, 2005: 2.77% for Class A, 2.41% for Class C, 2.68% for Class R, and 2.89% for Class Y.
FIRST AMERICAN FUNDS Annual Report 2005
10
Intermediate Government Bond fund
Investment Objective: provide investors with current income that is exempt from state income tax, to the extent consistent with the preservation of capital
How did the fund perform for the fiscal year ended September 30, 2005?
The First American Intermediate Government Bond Fund (the "fund"), Class Y shares, returned 1.43% for the fiscal year ended September 30, 2005 (Class A shares returned 1.40% without taking the sales charge into account). By comparison, the fund's benchmark, the Lehman Intermediate Treasury Bond Index*, returned 1.00% for the same period.
What were the general economic and market conditions during the fiscal year?
Economic growth moderated but nevertheless continued at a solid pace over the course of the fiscal year. Solid economic growth, in turn, improved labor market conditions. While core inflation has been basically stable at a relatively low level, overall inflation rose with the continuing climb of energy prices during the past year. The combination of solid growth, lower unemployment, and the potential for higher energy prices to be reflected by broader inflation measures has kept the Fed incrementally raising the Fed Funds Rate at each Federal Open Market Committee meeting since June 2004.
While the Fed's measured approach to tightening monetary policy helped foster stability in the bond market, it had little effect on long-term rates, which remained low as short-term rates inched higher. As a result, the flattening yield curve (i.e., a greater rise in short-term than in long-term rates) made bonds with maturities of 10 years or longer more attractive than their shorter-term counterparts.
Underlying economic conditions remain generally favorable for the financial markets, although risks have risen with energy prices and the widespread disruption to activity from Hurricanes Katrina and Rita.
How did market conditions and investment strategies affect the fund's performance?
The fund's strategic positioning to take advantage of the flattening yield curve was the main contributor to performance: as the yield spread between the two-year and 10-year Treasury bonds collapsed throughout the fiscal year, the fund benefited from an overweight in longer maturities (mainly 10-year and, to a lesser extent, 10- to 15-year Treasuries). An overweight to agency bonds, which are not included in the fund's benchmark index, was another significant contributor to performance. On average, 50% of the portfolio was composed of agency bonds, which provided good returns. We adjusted the fund's duration tactically as rates moved up or down within the market range throughout the fiscal year.
What strategic moves were made by the fund and why?
During most of the fiscal year, the fund maintained an overweight in longer-maturity bonds in order to take advantage of the flattening yield curve. As yield curve spreads compressed, we reduced out overweight in long-maturity bonds, looking for further curve flattening to come more slowly. In line with this more defensive position, we also reduced the fund's overweight to agency bonds, particularly ones with longer maturities. We continue to approach the fund's duration tactically, remaining neutral relative to the index.
*Unlike mutual funds, index returns do not reflect any expenses, transaction costs, or cash flow effects.
Portfolio Allocation as of September 30, 20051 (% of net assets)
| U.S. Government Agency | | | 97.9 | % | |
| Other Assets and Liabilities, Net | | | 2.1 | | |
| | | | 100 | % | |
Credit Quality Distribution as of September 30, 20052 (% of market value)
1Portfolio allocations are subject to change and are not recommendations to buy or sell any security.
2In the case of split ratings, a security is considered to be rated in the listed category if two of Moody's Investor Service, Standard & Poor's, and Fitch rate the security in that category. If ratings are provided by only two of those rating agencies, the lower rating is used. If only one of those rating agencies provides a rating, that rating is used.
FIRST AMERICAN FUNDS Annual Report 2005
11
Intermediate Government Bond fund continued
Annual Performance1 as of September 30, 2005
| | | | | Since Inception | |
| | | 1 year | | 10/25/2002 | |
| Average annual return with sales charge (POP) | |
| Class A | | | (0.85 | )% | | | 1.22 | % | |
| Average annual return without sales charge (NAV) | |
| Class A | | | 1.40 | % | | | 2.01 | % | |
| Class Y | | | 1.43 | % | | | 2.11 | % | |
| Lehman Intermediate Treasury Bond Index2 | | | 1.00 | % | | | 2.34 | % | |
Value of $10,000 Investment1 as of September 30, 2005
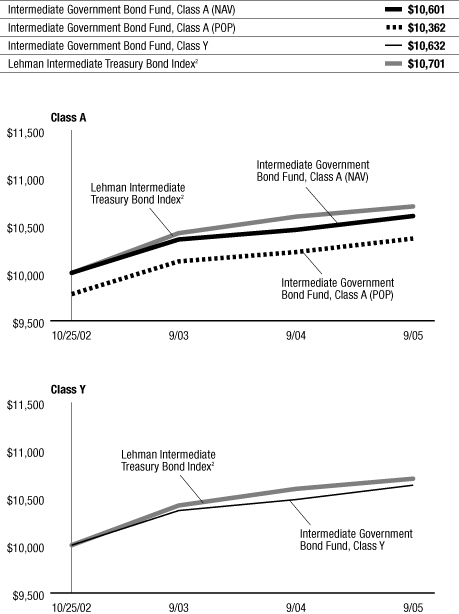
The chart above illustrates the total value of an assumed $10,000 investment in the fund's Class A and Class Y shares (from 10/25/2002 to 9/30/2005) as compared to the Lehman Intermediate Treasury Bond Index.2
The performance data quoted on this page represents past performance and does not guarantee future results. The investment return and principal value of an investment will fluctuate so that an investor's shares, when redeemed, may be worth more or less than their original cost. Current performance of the fund may be lower or higher than the performance data quoted. Performance data current to the most recent month-end may be obtained by calling 800.677.FUND.
1 Performance does not reflect the deduction of taxes that a shareholder would pay on fund distributions or redemption of fund shares. Investment performance reflects fee waivers that are or were in effect. In the absence of such fee waivers, total returns would be reduced. Index performance is for illustrative purposes only and does not reflect any expenses, transaction costs, or cash flow effects. Direct investment in the index is not available.
Total returns at net asset value ("NAV") reflect performance over the time period indicated without including the fund's maximum sales charge and assume reinvestment of all distributions at NAV.
Total returns at public offering price ("POP") reflect performance over the time period indicated including maximum sales charges of 2.25% for Class A Shares. Total returns assume reinvestment of all distributions at NAV.
Investments in debt securities typically decrease in value when interest rates rise. This risk is usually greater for longer-term debt securities.
2 An unmanaged index comprised of public obligations of the U.S. Treasury with a remaining maturity between one and 10 years.
FIRST AMERICAN FUNDS Annual Report 2005
12
Intermediate Government Bond fund continued
Expense Example
As a shareholder of the Intermediate Government Bond Fund (the "fund"), you incur two types of costs: (1) transaction costs, including sales charges (loads) on purchase payments; and (2) ongoing costs, including advisory fees; distribution and/or service (12b-1) fees; and other fund expenses. This example is intended to help you understand your ongoing costs (in dollars) of investing in the fund and to compare these costs with the ongoing costs of investing in other mutual funds. The example is based on an investment of $1,000 invested at the beginning of the period and held for the entire period from April 1, 2005, to September 30, 2005.
Actual Expenses
For each class, the first line of the table below provides information about actual account values and actual expenses. You may use the information in this line, together with the amount you invested, to estimate the expenses that you paid over the period. Simply divide your account value by $1,000 (for example, an $8,600 account value divided by $1,000 = 8.6), then multiply the result by the number in the first line under the heading entitled "Expenses Paid During Period" to estimate the expenses you paid on your account during this period.
Hypothetical Example for Comparison Purposes
For each class, the second line of the table below provides information about hypothetical account values and hypothetical expenses based on the fund's actual expense ratio and an assumed rate of return of 5% per year before expenses, which is not the fund's actual return. The hypothetical account values and expenses may not be used to estimate the actual ending account balance or expenses you paid for the period. You may use this information to compare the ongoing costs of investing in the fund and other funds. To do so, compare this 5% hypothetical example with the 5% hypothetical examples that appear in the shareholder reports of the other funds.
Please note that the expenses shown in the table are meant to highlight your ongoing costs only and do not reflect any transactional costs, such as sales charges (loads). Therefore, the second line of the table for each class is useful in comparing ongoing costs only, and will not help you determine the relative total costs of owning different funds. In addition, if these transactional costs were included, your costs would have been higher.
Expense Examples
| | | Beginning Account
Value (4/01/05) | | Ending Account
Value (9/30/05) | | Expenses Paid During
Period1 (4/01/05 to
9/30/05) | |
| Class A Actual2 | | $ | 1,000.00 | | | $ | 1,016.30 | | | $ | 3.77 | | |
| Class A Hypothetical (5% return before expenses) | | $ | 1,000.00 | | | $ | 1,021.19 | | | $ | 3.78 | | |
| Class Y Actual2 | | $ | 1,000.00 | | | $ | 1,017.10 | | | $ | 3.02 | | |
| Class Y Hypothetical (5% return before expenses) | | $ | 1,000.00 | | | $ | 1,021.94 | | | $ | 3.02 | | |
1Expenses are equal to the fund's annualized expense ratio for the most recent six-month period of 0.75% and 0.60% for Class A and Class Y, respectively, multiplied by the average account value over the period, multiplied by the number of days in the most recent fiscal half-year/365 (to reflect the one-half year period).
2Based on the actual returns for the six months ended September 30, 2005: 1.63% for Class A and 1.71% for Class Y.
FIRST AMERICAN FUNDS Annual Report 2005
13
Intermediate Term Bond fund
Investment Objective: current income to the extent consistent with preservation of capital
How did the fund perform for the fiscal year ended September 30, 2005?
The First American Intermediate Term Bond Fund (the "fund"), Class Y shares, returned 1.85% for the fiscal year ended September 30, 2005 (Class A shares returned 1.69% without taking the sales charge into account). By comparison, the fund's benchmark, the Lehman Intermediate Government/Credit Bond Index*, returned 1.50% for the same period.
What were the general economic and market conditions during the fiscal year?
Economic growth moderated but nevertheless continued at a solid pace over the course of the fiscal year. Solid economic growth, in turn, improved labor market conditions. While core inflation remained basically stable at a relatively low level, overall inflation rose with the continuing climb of energy prices during the past year. The combination of solid growth, lower unemployment, and the potential for higher energy prices to be reflected by broader inflation measures has kept the Fed incrementally raising the Fed Funds Rate at each Federal Open Market Committee meeting since June 2004.
The Fed's measured approach to tightening monetary policy helped foster stability in the bond market, keeping long-term rates anchored while short-term rates moved higher. As a result, the yield curve flattened. Given strong corporate profits, corporate bonds enjoyed continued strong performance, though increasingly there have been indications that the credit cycle has passed its peak.
Underlying economic conditions remain generally favorable for the financial markets, although risks have risen with energy prices and the widespread disruption to activity from Hurricanes Katrina and Rita.
How did market conditions and investment strategies affect the fund's performance?
The fund's strategic positioning to take advantage of the flattening yield curve was the main contributor to performance: as the yield spread between the two-year and 10-year Treasury bonds collapsed throughout the fiscal year, the fund benefited from an overweight in longer maturities (mainly 10-year and, to a lesser extent, 10- to 15-year Treasuries). In general, our duration was neutral or short relative to the index – a fairly defensive position we assumed in view of the rising short-term interest rates. The fund's investments in nonindex securities (mainly structured products like mortgage-backed, commercial mortgage-backed, and asset-backed securities) paid off, as these sectors performed well for most of the reporting period. Our overweight in BBB-rated securities brought strong gains early in the fiscal period, but their performance declined later on, especially following the downgrades of Ford and General Motors bonds to junk status, which caused BBB-rated issues to underperform.
What strategic moves were made by the fund and why?
We moved to a sizeable underweight in corporate bonds because, while corporate earnings growth remains strong, the reward for credit risk is not compelling, especially in an environment increasingly characterized by shareholder friendly activity on the part of issuers (leveraged buyouts, share buybacks, etc.). The fund maintained an overweight in structured securities, principally asset-backed and commercial mortgage-backed. As we monitor the effects of rising interest rates, we continue to approach the fund's duration tactically, remaining modestly defensive relative to the index.
*Unlike mutual funds, index returns do not reflect any expenses, transaction costs, or cash flow effects.
Portfolio Allocation as of September 30, 20051 (% of net assets)
| U.S. Treasury | | | 30.1 | % | |
| Asset-Backed | | | 21.4 | | |
| Mortgage-Backed | | | 20.8 | | |
| Corporate Bond | | | 14.8 | | |
| U.S. Government Agency | | | 11.8 | | |
| Cash Equivalents | | | 0.4 | | |
| Other Assets and Liabilities, Net | | | 0.7 | | |
| | | | 100 | % | |
Credit Quality Distribution as of September 30, 20052 (% of market value)
| AAA/Aaa | | | 82.6 | % | |
| AA/Aa | | | 2.0 | | |
| A/A | | | 4.1 | | |
| BBB/Baa | | | 11.3 | | |
| | | | 100 | % | |
1Portfolio allocations are subject to change and are not recommendations to buy or sell any security.
2In the case of split ratings, a security is considered to be rated in the listed category if two of Moody's Investor Service, Standard & Poor's, and Fitch rate the security in that category. If ratings are provided by only two of those rating agencies, the lower rating is used. If only one of those rating agencies provides a rating, that rating is used.
FIRST AMERICAN FUNDS Annual Report 2005
14
Intermediate Term Bond fund continued
Annual Performance1 as of September 30, 2005
| | | 1 year | | 5 years | | 10 years | |
| Average annual return with sales charge (POP) | |
| Class A | | | (0.64 | )% | | | 4.85 | % | | | 5.31 | % | |
| Average annual return without sales charge (NAV) | |
| Class A | | | 1.69 | % | | | 5.33 | % | | | 5.54 | % | |
| Class Y | | | 1.85 | % | | | 5.47 | % | | | 5.76 | % | |
| Lehman Intermediate Government/Credit Bond Index2 | | | 1.50 | % | | | 6.16 | % | | | 6.12 | % | |
Value of $10,000 Investment1 as of September 30, 2005

The chart above illustrates the total value of an assumed $10,000 investment in the fund's Class A and Class Y shares (from 10/31/1995 to 9/30/2005) as compared to the Lehman Intermediate Government/Credit Bond Index.2
The performance data quoted on this page represents past performance and does not guarantee future results. The investment return and principal value of an investment will fluctuate so that an investor's shares, when redeemed, may be worth more or less than their original cost. Current performance of the fund may be lower or higher than the performance data quoted. Performance data current to the most recent month-end may be obtained by calling 800.677.FUND.
1 Performance does not reflect the deduction of taxes that a shareholder would pay on fund distributions or redemption of fund shares. Investment performance reflects fee waivers that are or were in effect. In the absence of such fee waivers, total returns would be reduced. Index performance is for illustrative purposes only and does not reflect any expenses, transaction costs, or cash flow effects. Direct investment in the index is not available.
Total returns at net asset value ("NAV") reflect performance over the time period indicated without including the fund's maximum sales charge and assume reinvestment of all distributions at NAV.
Total returns at public offering price ("POP") reflect performance over the time period indicated including maximum sales charges of 2.25% for Class A shares for the relevant period. Total returns assume reinvestment of all distributions at NAV.
Investments in debt securities typically decrease in value when interest rates rise. This risk is usually greater for longer-term debt securities.
2 An unmanaged index of Treasury Securities, other securities issued or guaranteed by the U.S. Government or its agencies or instrumentalities, and investment-grade corporate debt securities. In each case with maturities of one to 10 years.
FIRST AMERICAN FUNDS Annual Report 2005
15
Intermediate Term Bond fund continued
Expense Example
As a shareholder of the Intermediate Term Bond Fund (the "fund"), you incur two types of costs: (1) transaction costs, including sales charges (loads) on purchase payments; and (2) ongoing costs, including advisory fees; distribution and/or service (12b-1) fees; and other fund expenses. This example is intended to help you understand your ongoing costs (in dollars) of investing in the fund and to compare these costs with the ongoing costs of investing in other mutual funds. The example is based on an investment of $1,000 invested at the beginning of the period and held for the entire period from April 1, 2005, to September 30, 2005.
Actual Expenses
For each class, the first line of the table below provides information about actual account values and actual expenses. You may use the information in this line, together with the amount you invested, to estimate the expenses that you paid over the period. Simply divide your account value by $1,000 (for example, an $8,600 account value divided by $1,000 = 8.6), then multiply the result by the number in the first line under the heading entitled "Expenses Paid During Period" to estimate the expenses you paid on your account during this period.
Hypothetical Example for Comparison Purposes
For each class, the second line of the table below provides information about hypothetical account values and hypothetical expenses based on the fund's actual expense ratio and an assumed rate of return of 5% per year before expenses, which is not the fund's actual return. The hypothetical account values and expenses may not be used to estimate the actual ending account balance or expenses you paid for the period. You may use this information to compare the ongoing costs of investing in the fund and other funds. To do so, compare this 5% hypothetical example with the 5% hypothetical examples that appear in the shareholder reports of the other funds.
Please note that the expenses shown in the table are meant to highlight your ongoing costs only and do not reflect any transactional costs, such as sales charges (loads). Therefore, the second line of the table for each class is useful in comparing ongoing costs only, and will not help you determine the relative total costs of owning different funds. In addition, if these transactional costs were included, your costs would have been higher.
Expense Examples
| | | Beginning Account
Value (4/01/05) | | Ending Account
Value (9/30/05) | | Expenses Paid During
Period1 (4/01/05 to
9/30/05) | |
| Class A Actual2 | | $ | 1,000.00 | | | $ | 1,016.20 | | | $ | 3.79 | | |
| Class A Hypothetical (5% return before expenses) | | $ | 1,000.00 | | | $ | 1,021.31 | | | $ | 3.80 | | |
| Class Y Actual2 | | $ | 1,000.00 | | | $ | 1,017.10 | | | $ | 3.03 | | |
| Class Y Hypothetical (5% return before expenses) | | $ | 1,000.00 | | | $ | 1,022.06 | | | $ | 3.04 | | |
1Expenses are equal to the fund's annualized expense ratio for the most recent six-month period of 0.75% and 0.60% for Class A and Class Y, respectively, multiplied by the average account value over the period, multiplied by the number of days in the most recent fiscal half-year/365 (to reflect the one-half year period).
2Based on the actual returns for the six months ended September 30, 2005: 1.62% for Class A and 1.71% for Class Y.
FIRST AMERICAN FUNDS Annual Report 2005
16
Short Term Bond fund
Investment Objective: current income while maintaining a high degree of principal stability
How did the fund perform for the fiscal year ended September 30, 2005?
The First American Short Term Bond Fund (the "fund") Class Y shares returned 1.23% for the fiscal year ended September 30, 2005 (Class A shares returned 1.08% without taking the sales charge into account). By comparison, the fund's benchmark, the Lehman 1-3 Year Government/Credit Bond Index*, returned 1.19% for the same period.
What were the general economic and market conditions during the fiscal year?
Economic growth moderated but nevertheless continued at a solid pace over the course of the fiscal year. Solid economic growth, in turn, improved labor market conditions. While core inflation remained basically stable at a relatively low level, overall inflation rose with the continuing climb of energy prices during the past year. The combination of solid growth, lower unemployment, and the potential for higher energy prices to be reflected by broader inflation measures has kept the Fed incrementally raising the Fed Funds Rate at each Federal Open Market Committee meeting since June 2004.
While the Fed's measured approach to tightening monetary policy helped foster stability in the bond market, it had little effect on long-term rates, which remained low as short-term rates inched higher. As a result, the flattening yield curve (i.e., a greater rise in short-term than in long-term rates) made bonds with longer maturities more attractive, helping five-year issues outperform their two-year counterparts.
Underlying economic conditions remain generally favorable for the financial markets, although risks have risen with energy prices and the widespread disruption to activity from Hurricanes Katrina and Rita.
How did market conditions and investment strategies affect the fund's performance?
With its emphasis on short-term securities, fund's strategy is defensive, seeking to minimize risk to income from rate changes over the long term. Therefore, in an environment characterized by rising short-term rates, which adversely affect short-term bond yields, returns tend to be modest, as they indeed were during this fiscal year. The fund's positive performance came from a combination of sector weighting, duration strategy, and yield-curve positioning. The fund focused on generating income by overweighting sectors not included in its benchmark index; in this space, an overweight to asset-backed securities proved beneficial, as they performed very well during the fiscal year. An overweight to short-term mortgage products also added value. In terms of duration, we were defensively positioned (80% to 90% of the benchmark), which added to performance. An underweight in short-term Treasury bonds helped the fund benefit from the flattening yield curve, as the fund held a combination short reset-floating-rate securities and three- to five-year securities as a substitute. An overweight to BBB-rated corporate bonds held back performance during the spring months, when Ford and General Motors bonds were downgraded to junk status; but, in the context of the entire fiscal year, this period of underperformance had a negligible effect.
What strategic moves were made by the fund and why?
Because of the increase in shareholder friendly activity (mergers and acquisitions, leveraged buyouts, stock buybacks) in the corporate sector, we trimmed the fund's overweight position in BBB-rated corporate bonds, moving instead to asset-backed securities and to mortgage-backed securities. Generally, we have been reducing lower-quality risk and ensuring that the fund is well diversified by keeping allocations to individual names small. While we believe the Fed will continue to raise short-term rates, the tightening cycle is, in our view, nearing the end; accordingly, we have moved the fund's duration from short to neutral.
*Unlike mutual funds, index returns do not reflect any expenses, transaction costs, or cash flow effects.
Portfolio Allocation as of September 30, 20051 (% of net assets)
| Asset-Backed | | | 33.5 | % | |
| Mortgage-Backed | | | 28.2 | | |
| Corporate Bond | | | 21.0 | | |
| U.S. Treasury | | | 11.1 | | |
| U.S. Government Agency | | | 4.9 | | |
| Cash Equivalents | | | 1.1 | | |
| Other Assets and Liabilities, Net | | | 0.2 | | |
| | | | 100 | % | |
Credit Quality Distribution as of September 30, 20052 (% of market value)
| AAA/Aaa | | | 71.8 | % | |
| AA/Aa | | | 3.7 | | |
| A/A | | | 8.8 | | |
| BBB/Baa | | | 15.7 | | |
| | | | 100 | % | |
1Portfolio allocations are subject to change and are not recommendations to buy or sell any security.
2In the case of split ratings, a security is considered to be rated in the listed category if two of Moody's Investor Service, Standard & Poor's, and Fitch rate the security in that category. If ratings are provided by only two of those rating agencies, the lower rating is used. If only one of those rating agencies provides a rating, that rating is used.
FIRST AMERICAN FUNDS Annual Report 2005
17
Short Term Bond fund continued
Annual Performance1 as of September 30, 2005
| | | 1 year | | 5 years | | 10 years | |
| Average annual return with sales charge (POP) | |
| Class A | | | (1.17 | )% | | | 3.39 | % | | | 4.51 | % | |
| Average annual return without sales charge (NAV) | |
| Class A | | | 1.08 | % | | | 3.86 | % | | | 4.75 | % | |
| Class Y | | | 1.23 | % | | | 4.02 | % | | | 4.84 | % | |
| Lehman 1-3 Year Government/Credit Index2 | | | 1.19 | % | | | 4.55 | % | | | 5.25 | % | |
Value of $10,000 Investment1 as of September 30, 2005
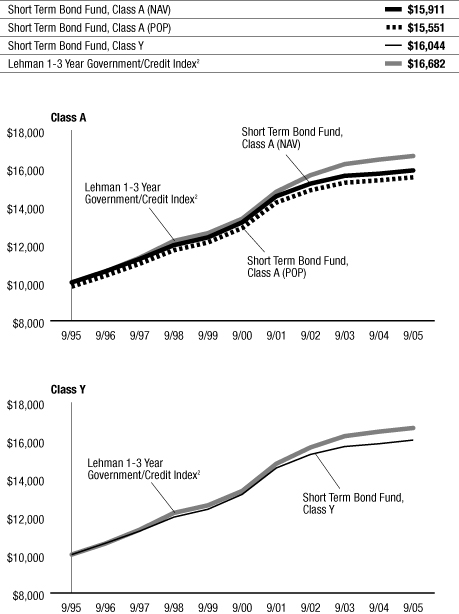
The chart above illustrates the total value of an assumed $10,000 investment in the fund's Class A and Class Y shares (from 9/30/1995 to 9/30/2005) as compared to the Lehman 1-3 Year Government/Credit Index.2
The performance data quoted on this page represents past performance and does not guarantee future results. The investment return and principal value of an investment will fluctuate so that an investor's shares, when redeemed, may be worth more or less than their original cost. Current performance of the fund may be lower or higher than the performance data quoted. Performance data current to the most recent month-end may be obtained by calling 800.677.FUND.
1 Performance does not reflect the deduction of taxes that a shareholder would pay on fund distributions or redemption of fund shares. Investment performance reflects fee waivers that are or were in effect. In the absence of such fee waivers, total returns would be reduced. Index performance is for illustrative purposes only and does not reflect any expenses, transaction costs, or cash flow effects. Direct investment in the index is not available.
Total returns at net asset value ("NAV") reflect performance over the time period indicated without including the fund's maximum sales charge and assume reinvestment of all distributions at NAV.
Total returns at public offering price ("POP") reflect performance over the time period indicated including maximum sales charges of 2.25% for Class A shares for the relevant period. Total returns assume reinvestment of all distributions at NAV.
Investments in debt securities typically decrease in value when interest rates rise. This risk is usually greater for longer-term debt securities.
2 An unmanaged index of one-to-three-year Treasury securities, other securities issued or guaranteed by the U.S. Government or its agencies or Instrumentalities, and investment-grade corporate debt securities.
FIRST AMERICAN FUNDS Annual Report 2005
18
Short Term Bond fund continued
Expense Example
As a shareholder of the Short Term Bond Fund (the "fund"), you incur two types of costs: (1) transaction costs, including sales charges (loads) on purchase payments; and (2) ongoing costs, including advisory fees; distribution and/or service (12b-1) fees; and other fund expenses. This example is intended to help you understand your ongoing costs (in dollars) of investing in the fund and to compare these costs with the ongoing costs of investing in other mutual funds. The example is based on an investment of $1,000 invested at the beginning of the period and held for the entire period from April 1, 2005, to September 30, 2005.
Actual Expenses
For each class, the first line of the table below provides information about actual account values and actual expenses. You may use the information in this line, together with the amount you invested, to estimate the expenses that you paid over the period. Simply divide your account value by $1,000 (for example, an $8,600 account value divided by $1,000 = 8.6), then multiply the result by the number in the first line under the heading entitled "Expenses Paid During Period" to estimate the expenses you paid on your account during this period.
Hypothetical Example for Comparison Purposes
For each class, the second line of the table below provides information about hypothetical account values and hypothetical expenses based on the fund's actual expense ratio and an assumed rate of return of 5% per year before expenses, which is not the fund's actual return. The hypothetical account values and expenses may not be used to estimate the actual ending account balance or expenses you paid for the period. You may use this information to compare the ongoing costs of investing in the fund and other funds. To do so, compare this 5% hypothetical example with the 5% hypothetical examples that appear in the shareholder reports of the other funds.
Please note that the expenses shown in the table are meant to highlight your ongoing costs only and do not reflect any transactional costs, such as sales charges (loads). Therefore, the second line of the table for each class is useful in comparing ongoing costs only, and will not help you determine the relative total costs of owning different funds. In addition, if these transactional costs were included, your costs would have been higher.
Expense Examples
| | | Beginning Account
Value (4/01/05) | | Ending Account
Value (9/30/05) | | Expenses Paid During
Period1 (4/01/05 to
9/30/05) | |
| Class A Actual2 | | $ | 1,000.00 | | | $ | 1,013.30 | | | $ | 3.79 | | |
| Class A Hypothetical (5% return before expenses) | | $ | 1,000.00 | | | $ | 1,021.31 | | | $ | 3.80 | | |
| Class Y Actual2 | | $ | 1,000.00 | | | $ | 1,013.10 | | | $ | 3.03 | | |
| Class Y Hypothetical (5% return before expenses) | | $ | 1,000.00 | | | $ | 1,022.06 | | | $ | 3.04 | | |
1Expenses are equal to the fund's annualized expense ratio for the most recent six-month period of 0.75% and 0.60% for Class A and Class Y, respectively, multiplied by the average account value over the period, multiplied by the number of days in the most recent fiscal half-year/365 (to reflect the one-half year period).
2Based on the actual returns for the six months ended September 30, 2005: 1.33% for Class A and 1.31% for Class Y.
FIRST AMERICAN FUNDS Annual Report 2005
19
Total Return Bond fund
Investment Objective: high current income consistent with prudent risk to capital
Change of fund name, strategy and index:
In May 2005, the fund changed its name from the First American Corporate Bond Fund to the First American Total Return Bond Fund (the "fund"). The new name reflects the key change in the fund's investment strategy: to expand risk-adjusted return opportunities, the fund now provides tactical allocation to nontraditional fixed-income sectors. These allocations, which can constitute up to 30% of the portfolio, include high yield (below-investment-grade corporate bonds with none rated lower than CCC), nondollar denominated bonds, and emerging market bonds (dollar-denominated bonds issued by governments and corporations in emerging markets such as Latin America, Asia, and Eastern Europe). At least 70% of the portfolio is composed of actively managed mortgage-backed, corporate, asset-backed, and U.S. Government securities. The benchmark for the fund was cha nged to the Lehman Aggregate Bond Index.
How did the fund perform for the fiscal year ended September 30, 2005?
The First American Total Return Fund, Class Y shares, returned 3.83% for the fiscal year ended September 30, 2005 (Class A shares returned 3.57% without taking the sales charge into account). By comparison, the fund's benchmark, the Lehman Aggregate Bond Index*, returned 2.80% for the same period. The fund's benchmark prior to its investment strategy changes, the Lehman U.S. Credit A/Baa Index*, returned 2.85% for the same period.
What were the general economic and market conditions during the fiscal year?
Economic growth moderated but nevertheless continued at a solid pace over the course of the fiscal period. Solid economic growth, in turn, improved labor market conditions. While core inflation remained basically stable at a relatively low level, overall inflation rose with the continuing climb of energy prices during the past year. The combination of solid growth, lower unemployment, and the potential for higher energy prices to be reflected by broader inflation measures has kept the Fed incrementally raising the Fed Funds Rate at each Federal Open Market Committee meeting since June 2004.
While the Fed's measured approach to tightening monetary policy helped foster stability in the bond market, it had little effect on long-term rates, which remained low as short-term rates inched higher. As a result, the flattening yield curve (i.e., a greater rise in short-term than in long-term rates) made bonds with maturities of 10 years or longer more attractive than their shorter-term counterparts. Given strong corporate pr ofits, both investment-grade and high-yield credit enjoyed continued strong performance, though increasingly there have been indications that the credit cycle has passed its peak.
Underlying economic conditions remain generally favorable for the financial markets, although risks have risen with energy prices and the widespread disruption to activity from Hurricanes Katrina and Rita.
How did market conditions and investment strategies affect the fund's performance?
The fund's strategic positioning to benefit from the flattening yield curve was a positive contributor to performance, as were the fund's positions in all three of its noncore sectors during the latter part of the period: emerging markets, high yield, and nondollar denominated bonds. Emerging markets enjoyed a particularly strong year, boosted both by fundamental improvements (notably improved public finances and improving credit ratings) and by the economic cycle, with growing demand for commodities and continued global growth making for positive trade flow and exports. An overweight in high-yield corporate bonds proved beneficial, as these issues enjoyed strong performance. The fund's positioning in asset-backed and mortgage-backed sectors, as well as issue selection within corporate bonds and mortgage-backed securities also added value.
What strategic moves were made by the fund and why?
With high-yield corporate bonds and, to a lesser extent, emerging market bonds becoming more expensive later in the second half of the fiscal year, we reduced their weights in the portfolio. This was primarily driven by less attractive valuations and, in the case of corporate bonds, increased risk to bondholders from the issuers' shareholder friendly activities (mergers and acquisitions, leveraged buyouts, share buybacks, etc.). In keeping with this more defensive position, we increased our holdings in U.S. Treasuries and high-quality mortgage-backed securities. We continue to view foreign bond markets as attractive relative to the United States, and although we expect some strength in the U.S. dollar in the near term, our longer-term outlook for the dollar is marginally negative.
*Unlike mutual funds, index returns do not reflect any expenses, transaction costs, or cash flow effects.
Portfolio Allocation as of September 30, 20051 (% of net assets)
| Mortgage-Backed | | | 37.7 | % | |
| U.S. Treasury | | | 19.2 | | |
| Asset-Backed | | | 19.0 | | |
| Corporate Bond | | | 18.2 | | |
| Cash Equivalents | | | 4.8 | | |
| U.S. Government Agency | | | 1.7 | | |
| Other Assets and Liabilities, Net | | | (0.6 | ) | |
| | | | 100 | % | |
Credit Quality Distribution as of September 30, 20052 (% of market value)
| AAA/Aaa | | | 80.1 | % | |
| AA/Aa | | | 1.0 | | |
| A/A | | | 5.3 | | |
| BBB/Baa | | | 9.2 | | |
| BB/Ba | | | 3.5 | | |
| B/B | | | 0.9 | | |
| | | | 100 | % | |
1Portfolio allocations are subject to change and are not recommendations to buy or sell any security.
2In the case of split ratings, a security is considered to be rated in the listed category if two of Moody's Investor Service, Standard & Poor's, and Fitch rate the security in that category. If ratings are provided by only two of those rating agencies, the lower rating is used. If only one of those rating agencies provides a rating, that rating is used.
FIRST AMERICAN FUNDS Annual Report 2005
20
Total Return Bond fund continued
Annual Performance1 as of September 30, 2005
| | | | | | | Since Inception | |
| | | 1 year | | 5 years | | 2/1/2000 | | 9/24/2001 | |
| Average annual return with sales charge (POP) | |
| Class A | | | (0.79 | )% | | | 5.69 | % | | | 5.96 | % | | | - | | |
| Class B | | | (2.16 | )% | | | 5.47 | % | | | 5.82 | % | | | - | | |
| Class C | | | 1.72 | % | | | 5.80 | % | | | 5.93 | % | | | - | | |
| Average annual return without sales charge (NAV) | |
| Class A | | | 3.57 | % | | | 6.62 | % | | | 6.77 | % | | | - | | |
| Class B | | | 2.81 | % | | | 5.79 | % | | | 5.95 | % | | | - | | |
| Class C | | | 2.71 | % | | | 5.80 | % | | | 5.93 | % | | | - | | |
| Class R | | | 3.40 | % | | | - | | | | - | | | | 5.69 | % | |
| Class Y | | | 3.83 | % | | | 6.86 | % | | | 7.01 | % | | | - | | |
| Lehman U.S. Credit A/Baa Bond Index2 | | | 2.85 | % | | | 7.82 | % | | | 7.96 | % | | | 6.66 | % | |
| Lehman Aggregate Bond Index3 | | | 2.80 | % | | | 6.62 | % | | | 7.18 | % | | | 5.24 | % | |
Value of $10,000 Investment1,4 as of September 30, 2005
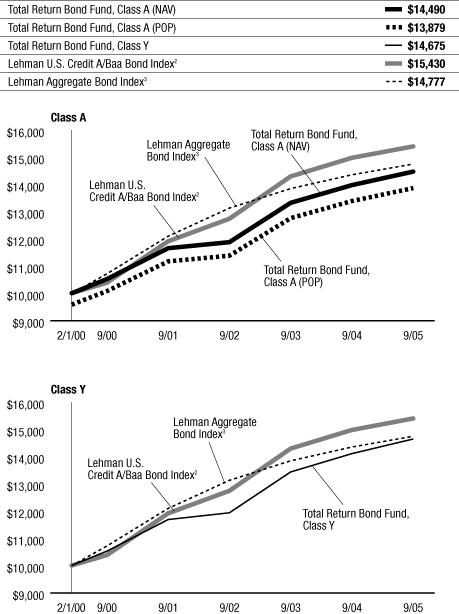
The chart above illustrates the total value of an assumed $10,000 investment in the fund's Class A and Class Y shares (from 2/01/2000 to 9/30/2005) as compared to the Lehman U.S. Credit A/Baa Bond Index2 and the Lehman Aggregate Bond Index.3
The performance data quoted on this page represents past performance and does not guarantee future results. The investment return and principal value of an investment will fluctuate so that an investor's shares, when redeemed, may be worth more or less than their original cost. Current performance of the fund may be lower or higher than the performance data quoted. Performance data current to the most recent month-end may be obtained by calling 800.677.FUND.
1 Performance does not reflect the deduction of taxes that a shareholder would pay on fund distributions or redemption of fund shares. Investment performance reflects fee waivers that are or were in effect. In the absence of such fee waivers, total returns would be reduced. Index performance is for illustrative purposes only and does not reflect any expenses, transaction costs, or cash flow effects. Direct investment in the index is not available.
A significant portion of the Fund's portfolio may consist of lower-rated debt obligations, which are commonly called "high-yield" securities or "junk bonds." High-yield securities generally have more volatile prices and carry more risk to principal than investment-grade securities. The Fund may also invest in foreign securities. International investing involves risks not typically associated with domestic investing including risks of adverse currency fluctuations, potential political and economic instability, different accounting standards, limited liquidity, and volatile prices. Performance reflects voluntary fee waivers in effect. In the absence of such fee waivers, total returns would be reduced.
Total returns at net asset value ("NAV") reflect performance over the time period indicated without including the fund's maximum sales charge and assume reinvestment of all distributions at NAV.
Total returns at public offering price ("POP") reflect performance over the time period indicated including maximum sales charges of 4.25% for Class A shares and the maximum contingent deferred sales charge ("CDSC") for Class B and Class C shares for the relevant period. Maximum CDSC is 5.00% for Class B shares, decreasing annually to 0% in the seventh year following purchase, and 1.00% for Class C shares. Total returns assume reinvestment of all distributions at NAV.
Investments in debt securities typically decrease in value when interest rates rise. This risk is usually greater for longer-term debt securities.
2 An unmanaged index comprised of fixed-rate, dollar-denominated U.S. corporate securities with at least one year to final maturity. Securities must be rated Baa or A based on the lower of Moody's and Standard & Poor's ratings, and must have a minimum issue size of $250 million. Rule 144A securities with registration rights are included in the index.
3 An unmanaged index comprised of the Lehman Government/Credit Bond Index, the Lehman Mortgage Backed Securities Index, and the Lehman Asset Backed Securities Index. The Lehman Government/Credit Bond Index is comprised of Treasury securities, other securities issued or guaranteed by the U.S. government or its agencies or instrumentalities, including U.S. agency mortgage securities, and investment-grade corporate debt securities. The Lehman Mortgage Backed Securities Index is comprised of the mortgage-backed pass-through securities of Ginnie Mae, Fannie Mae, and Freddie Mac. The Lehman Asset Backed Securities Index is comprised of debt securities rated investment grade or higher that are backed by credit card, auto, and home equity loans. Previously, th e fund used the Lehman U.S. Credit A/Baa Bond Index as a benchmark. Going forward, the fund will use the Lehman Aggregate Bond Index as a comparison, because its composition better matches the fund's investment strategies.
4 Performance for Class B, Class C, and Class R shares is not presented. Performance for these classes will vary due to different expense structures.
FIRST AMERICAN FUNDS Annual Report 2005
21
Total Return Bond fund continued
Expense Example
As a shareholder of the Total Return Bond Fund (the "fund"), you incur two types of costs: (1) transaction costs, including sales charges (loads) on purchase payments; and (2) ongoing costs, including advisory fees; distribution and/or service (12b-1) fees; and other fund expenses. This example is intended to help you understand your ongoing costs (in dollars) of investing in the fund and to compare these costs with the ongoing costs of investing in other mutual funds. The example is based on an investment of $1,000 invested at the beginning of the period and held for the entire period from April 1, 2005, to September 30, 2005.
Actual Expenses
For each class, the first line of the table below provides information about actual account values and actual expenses. You may use the information in this line, together with the amount you invested, to estimate the expenses that you paid over the period. Simply divide your account value by $1,000 (for example, an $8,600 account value divided by $1,000 = 8.6), then multiply the result by the number in the first line under the heading entitled "Expenses Paid During Period" to estimate the expenses you paid on your account during this period.
Hypothetical Example for Comparison Purposes
For each class, the second line of the table below provides information about hypothetical account values and hypothetical expenses based on the fund's actual expense ratio and an assumed rate of return of 5% per year before expenses, which is not the fund's actual return. The hypothetical account values and expenses may not be used to estimate the actual ending account balance or expenses you paid for the period. You may use this information to compare the ongoing costs of investing in the fund and other funds. To do so, compare this 5% hypothetical example with the 5% hypothetical examples that appear in the shareholder reports of the other funds.
Please note that the expenses shown in the table are meant to highlight your ongoing costs only and do not reflect any transactional costs, such as sales charges (loads). Therefore, the second line of the table for each class is useful in comparing ongoing costs only, and will not help you determine the relative total costs of owning different funds. In addition, if these transactional costs were included, your costs would have been higher.
Expense Examples
| | | Beginning Account
Value (4/01/05) | | Ending Account
Value (9/30/05) | | Expenses Paid During
Period1 (4/01/05 to
9/30/05) | |
| Class A Actual2 | | $ | 1,000.00 | | | $ | 1,024.30 | | | $ | 5.07 | | |
| Class A Hypothetical (5% return before expenses) | | $ | 1,000.00 | | | $ | 1,020.05 | | | $ | 5.06 | | |
| Class B Actual2 | | $ | 1,000.00 | | | $ | 1,019.50 | | | $ | 8.86 | | |
| Class B Hypothetical (5% return before expenses) | | $ | 1,000.00 | | | $ | 1,016.29 | | | $ | 8.85 | | |
| Class C Actual2 | | $ | 1,000.00 | | | $ | 1,019.50 | | | $ | 8.86 | | |
| Class C Hypothetical (5% return before expenses) | | $ | 1,000.00 | | | $ | 1,016.29 | | | $ | 8.85 | | |
| Class R Actual2 | | $ | 1,000.00 | | | $ | 1,022.60 | | | $ | 6.34 | | |
| Class R Hypothetical (5% return before expenses) | | $ | 1,000.00 | | | $ | 1,018.80 | | | $ | 6.33 | | |
| Class Y Actual2 | | $ | 1,000.00 | | | $ | 1,024.60 | | | $ | 3.81 | | |
| Class Y Hypothetical (5% return before expenses) | | $ | 1,000.00 | | | $ | 1,021.31 | | | $ | 3.80 | | |
1Expenses are equal to the fund's annualized expense ratio for the most recent six-month period of 1.00%, 1.75%, 1.75%, 1.25% and 0.75% for Class A, Class B, Class C, Class R and Class Y, respectively, multiplied by the average account value over the period, multiplied by the number of days in the most recent fiscal half-year/365 (to reflect the one-half year period).
2Based on the actual returns for the six months ended September 30, 2005: 2.43% for Class A, 1.95% for Class B, 1.95% for Class C, 2.26% for Class R, and 2.46% for Class Y.
FIRST AMERICAN FUNDS Annual Report 2005
22
U.S. Government Mortgage fund
Investment Objective: high current income to the extent consistent with the preservation of capital
How did the fund perform for the fiscal year ended September 30, 2005?
The First American U.S. Government Mortgage Fund (the "fund"), Class Y shares returned 2.75% for the fiscal year ended September 30, 2005 (Class A shares returned 2.59% without taking the sales charge into account). By comparison, the fund's benchmark, the Lehman Mortgage-Backed Securities Index*, returned 3.29% for the same period.
What were the general economic and market conditions during the fiscal year?
Economic growth moderated but nevertheless continued at a solid pace over the course of the fiscal year. Solid economic growth, in turn, improved labor market conditions. While core inflation remained basically stable at a relatively low level, overall inflation rose with the continuing climb of energy prices during the past year. The combination of solid growth, lower unemployment, and the potential for higher energy prices to be reflected by broader inflation measures has kept the Fed incrementally raising the Fed Funds Rate at each Federal Open Market Committee meeting since June 2004.
While the Fed's measured approach to tightening monetary policy helped foster stability in the bond market, it had little effect on long-term rates, which remained low as short-term rates inched higher. The low, long-term rates boosted the housing market, which, along with the low-volatility environment promoted by the Fed's measured tightening, created a favorable market climate for mortgage-backed securities.
Underlying economic conditions remain generally favorable for the financial markets, although risks have risen with energy prices and the widespread disruption to activity from Hurricanes Katrina and Rita.
How did market conditions and investment strategies affect the fund's performance?
Mortgages performed reasonably well in the final quarter of 2004 and the first quarter of 2005, but their performance flagged thereafter, so in aggregate the returns were positive but unspectacular during the fiscal year. Rising interest rates, the flatter yield curve, and a lack of sufficient sponsorship from traditional mortgage investors like banks or government-sponsored enterprises all contributed to the somewhat lackluster sector performance. An overweight in the fund's nonagency mortgage position also added value, as these securities outperformed agency issues.
What strategic moves were made by the fund and why?
In view of the rising rates and slowing growth in the housing market, the fund has been making a transition to a more defensive posture, with emphasis on higher-quality mortgage-backed securities. Motivated by concern about extension risk (i.e., a lengthening in a security's duration due to the deceleration of prepayments), we have been focusing on higher-coupon issues and underweighting discount securities, which pose the greatest extension risk. To bolster stability, we have increased our position in seasoned paper (mortgages that have been outstanding for three to four years). We have also been acquiring higher-quality, nonagency securities in order to minimize potential risk. While we believe the Fed will continue to raise short-term rates, the tightening cycle is, in our view, nearing the end; accordingly, we have moved the fund's duration from short to neutral.
*Unlike mutual funds, index returns do not reflect any expenses, transaction costs, or cash flow effects.
Portfolio Allocation as of September 30, 20051 (% of net assets)
| Mortgage-Backed | | | 112.4 | % | |
| Asset-Backed | | | 0.5 | | |
| Cash Equivalent | | | 3.1 | | |
| Other Assets and Liabilities, Net | | | (16.0 | ) | |
| | | | 100 | % | |
Credit Quality Distribution as of September 30, 20052 (% of market value)
| AAA/Aaa | | | 97.4 | % | |
| AA/Aa | | | 2.4 | | |
| A/A | | | 0.2 | | |
| | | | 100 | % | |
1Portfolio allocations are subject to change and are not recommendations to buy or sell any security.
2In the case of split ratings, a security is considered to be rated in the listed category if two of Moody's Investor Service, Standard & Poor's, and Fitch rate the security in that category. If ratings are provided by only two of those rating agencies, the lower rating is used. If only one of those rating agencies provides a rating, that rating is used.
FIRST AMERICAN FUNDS Annual Report 2005
23
U.S. Government Mortgage fund continued
Annual Performance1 as of September 30, 2005
| | | | | | | Since Inception | |
| | | 1 year | | 5 years | | 10 years | | 9/24/2001 | |
| Average annual return with sales charge (POP) | |
| Class A | | | (1.81 | )% | | | 4.35 | % | | | 4.69 | % | | | - | | |
| Class B | | | (3.18 | )% | | | 3.87 | % | | | 4.37 | % | | | - | | |
| Class C | | | 0.83 | % | | | - | | | | - | | | | 2.90 | % | |
| Average annual return without sales charge (NAV) | |
| Class A | | | 2.59 | % | | | 5.25 | % | | | 5.15 | % | | | - | | |
| Class B | | | 1.72 | % | | | 4.38 | % | | | 4.37 | % | | | - | | |
| Class C | | | 1.82 | % | | | - | | | | - | | | | 2.90 | % | |
| Class R | | | 2.18 | % | | | 5.08 | % | | | 5.06 | % | | | - | | |
| Class Y | | | 2.75 | % | | | 5.41 | % | | | 5.39 | % | | | - | | |
| Lehman Mortgage-Backed Securites Index2 | | | 3.29 | % | | | 6.12 | % | | | 6.46 | % | | | 4.72 | % | |
Value of $10,000 Investment1,3 as of September 30, 2005
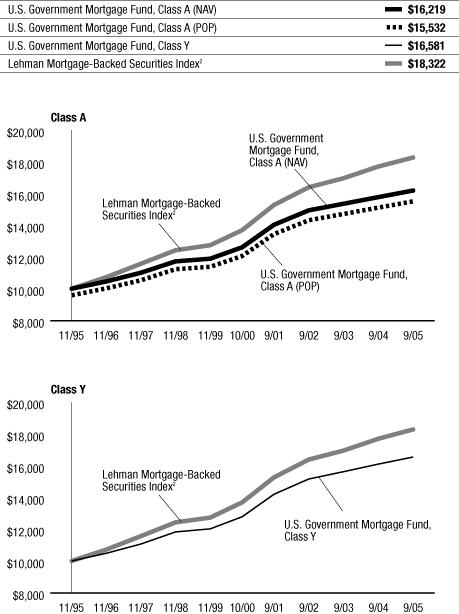
The chart above illustrates the total value of an assumed $10,000 investment in the fund's Class A and Class Y shares from (11/30/1995 to 9/30/2005) as compared to the Lehman Mortgage-Backed Securities Index.2
The performance data quoted on this page represents past performance and does not guarantee future results. The investment return and principal value of an investment will fluctuate so that an investor's shares, when redeemed, may be worth more or less than their original cost. Current performance of the fund may be lower or higher than the performance data quoted. Performance data current to the most recent month-end may be obtained by calling 800.677.FUND.
1 Performance does not reflect the deduction of taxes that a shareholder would pay on fund distributions or redemption of fund shares. Investment performance reflects fee waivers that are or were in effect. In the absence of such fee waivers, total returns would be reduced. Index is for illustrative purposes only and does not reflect any expenses, transaction costs, or cash flow effects. Direct investment in the index is not available.
Total returns at net asset value ("NAV") reflect performance over the time period indicated without including the fund's maximum sales charge and assume reinvestment of all distributions at NAV.
Total returns at public offering price ("POP") reflect performance over the time period indicated including maximum sales charges of 4.25% for Class A shares and the maximum contingent deferred sales charge ("CDSC") for Class B and Class C shares for the relevant period. Maximum CDSC is 5.00% for Class B shares, decreasing annually to 0% in the seventh year following purchase, and 1.00% for Class C shares. Total returns assume reinvestment of all distributions at NAV.
On September 24, 2001, the U.S. Government Mortgage Fund became the successor by merger to the Firstar U.S. Government Securities Fund, a series of Firstar Funds, Inc. Prior to the merger, the First American fund had no assets or liabilities. Performance presented prior to September 24, 2001, represents that of the Firstar U.S. Government Securities Fund. The Firstar U.S. Government Securities Fund was organized on November 27, 2000, and, prior to that, was a separate series of Mercantile Mutual Funds, Inc.
Investments in debt securities typically decrease in value when interest rates rise. This risk is usually greater for longer-term debt securities.
2 An unmanaged index comprised of the mortgage-backed pass-through securities of Ginnie Mae, Fannie Mae, and Freddie Mac. It is formed by grouping the universe of more than 600,000 individual fixed-rate MBS pools into approximately 3,500 generic aggregates. The aggregates included are priced daily using a matrix pricing routine based on trade price quotations by agency, program, coupon, and degree of seasoning.
3 Performance for Class B, Class C, and Class R shares is not presented. Performance for these classes will vary due to different expense structures.
FIRST AMERICAN FUNDS Annual Report 2005
24
U.S. Government Mortgage fund continued
Expense Example
As a shareholder of the U.S. Government Mortgage Fund (the "fund"), you incur two types of costs: (1) transaction costs, including sales charges (loads) on purchase payments; and (2) ongoing costs, including advisory fees; distribution and/or service (12b-1) fees; and other fund expenses. This example is intended to help you understand your ongoing costs (in dollars) of investing in the fund and to compare these costs with the ongoing costs of investing in other mutual funds. The example is based on an investment of $1,000 invested at the beginning of the period and held for the entire period from April 1, 2005, to September 30, 2005.
Actual Expenses
For each class, the first line of the table below provides information about actual account values and actual expenses. You may use the information in this line, together with the amount you invested, to estimate the expenses that you paid over the period. Simply divide your account value by $1,000 (for example, an $8,600 account value divided by $1,000 = 8.6), then multiply the result by the number in the first line under the heading entitled "Expenses Paid During Period" to estimate the expenses you paid on your account during this period.
Hypothetical Example for Comparison Purposes
For each class, the second line of the table below provides information about hypothetical account values and hypothetical expenses based on the fund's actual expense ratio and an assumed rate of return of 5% per year before expenses, which is not the fund's actual return. The hypothetical account values and expenses may not be used to estimate the actual ending account balance or expenses you paid for the period. You may use this information to compare the ongoing costs of investing in the fund and other funds. To do so, compare this 5% hypothetical example with the 5% hypothetical examples that appear in the shareholder reports of the other funds.
Please note that the expenses shown in the table are meant to highlight your ongoing costs only and do not reflect any transactional costs, such as sales charges (loads). Therefore, the second line of the table for each class is useful in comparing ongoing costs only, and will not help you determine the relative total costs of owning different funds. In addition, if these transactional costs were included, your costs would have been higher.
Expense Examples
| | | Beginning Account
Value (4/01/05) | | Ending Account
Value (9/30/05) | | Expenses Paid During
Period1 (4/01/05 to
9/30/05) | |
| Class A Actual2 | | $ | 1,000.00 | | | $ | 1,016.90 | | | $ | 4.80 | | |
| Class A Hypothetical (5% return before expenses) | | $ | 1,000.00 | | | $ | 1,020.31 | | | $ | 4.81 | | |
| Class B Actual2 | | $ | 1,000.00 | | | $ | 1,012.10 | | | $ | 8.57 | | |
| Class B Hypothetical (5% return before expenses) | | $ | 1,000.00 | | | $ | 1,016.55 | | | $ | 8.59 | | |
| Class C Actual2 | | $ | 1,000.00 | | | $ | 1,013.10 | | | $ | 8.58 | | |
| Class C Hypothetical (5% return before expenses) | | $ | 1,000.00 | | | $ | 1,016.55 | | | $ | 8.59 | | |
| Class R Actual2 | | $ | 1,000.00 | | | $ | 1,014.70 | | | $ | 6.06 | | |
| Class R Hypothetical (5% return before expenses) | | $ | 1,000.00 | | | $ | 1,019.05 | | | $ | 6.07 | | |
| Class Y Actual2 | | $ | 1,000.00 | | | $ | 1,018.20 | | | $ | 3.54 | | |
| Class Y Hypothetical (5% return before expenses) | | $ | 1,000.00 | | | $ | 1,021.56 | | | $ | 3.55 | | |
1Expenses are equal to the fund's annualized expense ratio for the most recent six-month period of 0.95%, 1.70%, 1.70%, 1.20% and 0.70% for Class A, Class B, Class C, Class R and Class Y, respectively, multiplied by the average account value over the period, multiplied by the number of days in the most recent fiscal half-year/365 (to reflect the one-half year period).
2Based on the actual returns for the six months ended September 30, 2005: 1.69% for Class A, 1.21% for Class B, 1.31% for Class C, 1.47% for Class R, and 1.82% for Class Y.
FIRST AMERICAN FUNDS Annual Report 2005
25
Report of Independent Registered Public Accounting Firm
To the Shareholders and Board of Directors
First American Investment Funds, Inc.
We have audited the accompanying statements of assets and liabilities, including the schedules of investments, of the Core Bond, High Income Bond, Inflation Protected Securities, Intermediate Government Bond, Intermediate Term Bond, Short Term Bond, Total Return Bond, and U.S. Government Mortgage Funds (series of First American Investment Funds, Inc.) (the "funds") as of September 30, 2005, and the related statements of operations for the year then ended and changes in net assets for each of the two years in the period then ended and financial highlights for each of the periods indicated therein, except as noted below. These financial statements and the financial highlights are the responsibility of the funds' management. Our responsibility is to express an opinion on these financial statements and financial highlights based on our audits. The financial highlights of the Intermediate Term Bond and U.S. G overnment Mortgage Funds for the periods presented through October 31, 2000, were audited by other auditors whose report dated December 29, 2000 expressed an unqualified opinion on those financial highlights.
We conducted our audits in accordance with the standards of the Public Company Accounting Oversight Board (United States). Those standards require that we plan and perform the audit to obtain reasonable assurance about whether the financial statements and financial highlights are free of material misstatement. We were not engaged to perform an audit of the funds' internal control over financial reporting. Our audits included consideration of internal control over financial reporting as a basis for designing audit procedures that are appropriate in the circumstances, but not for the purpose of expressing an opinion on the effectiveness of the funds' internal control of financial reporting. Accordingly, we express no such opinion. An audit also includes examining, on a test basis, evidence supporting the amounts and disclosures in the financial statements and financial highlights, assessing the accounting principles used and significant estimates made by management, and evaluating the overall financial statement presentation. Our procedures included confirmation of securities owned as of September 30, 2005, by correspondence with the custodian and brokers or by other appropriate auditing procedures where replies from brokers were not received. We believe that our audits provide a reasonable basis for our opinion.
In our opinion, the financial statements and financial highlights audited by us as referred to above present fairly, in all material respects, the financial position of the funds listed above of First American Investment Funds, Inc. at September 30, 2005, the results of their operations for the year then ended, the changes in their net assets for each of the two years in the period then ended and their financial highlights for each of the periods indicated herein, in conformity with U.S. generally accepted accounting principles.

Minneapolis, Minnesota
November 18, 2005
FIRST AMERICAN FUNDS Annual Report 2005
26
Schedule of Investments September 30, 2005
Core Bond Fund
| DESCRIPTION | | PAR (000) | | VALUE (000) | |
| U.S. Government Agency Mortgage-Backed Securities – 31.7% | | | |
| Adjustable Rate (a) – 4.5% | | | |
FHLMC
4.917%, 05/01/25 #846757 | | $ | 418 | | | $ | 428 | | |
| 4.743%, 04/01/29 #847190 (b) | | | 3,606 | | | | 3,690 | | |
| 4.997%, 03/01/30 #847180 (b) | | | 4,791 | | | | 4,918 | | |
| 4.833%, 07/01/30 #847240 (b) | | | 5,012 | | | | 5,130 | | |
| 4.728%, 06/01/31 #846984 (b) | | | 2,345 | | | | 2,375 | | |
FNMA Pool
4.835%, 08/01/30 #555843 (b) | | | 11,577 | | | | 11,875 | | |
| 4.921%, 03/01/31 #545359 | | | 1,711 | | | | 1,747 | | |
| 4.700%, 09/01/33 #725553 (b) | | | 4,070 | | | | 4,149 | | |
| 5.289%, 11/01/34 #735054 (b) | | | 14,052 | | | | 14,095 | | |
| 5.000%, 05/01/35 #357883 | | | 20,464 | | | | 20,054 | | |
| 5.500%, 08/01/35 #255814 (b) | | | 18,664 | | | | 18,664 | | |
| | | | 87,125 | | |
| Fixed Rate – 27.2% | | | |
FHLMC Gold Pool
4.000%, 10/01/10 #M80855 | | | 13,545 | | | | 13,349 | | |
| 4.500%, 03/01/18 #P10023 | | | 3,273 | | | | 3,257 | | |
| 4.500%, 05/01/18 #P10032 | | | 6,992 | | | | 6,950 | | |
| 5.000%, 05/01/18 #E96700 | | | 12,793 | | | | 12,767 | | |
| 6.500%, 01/01/28 #G00876 | | | 1,829 | | | | 1,887 | | |
| 6.500%, 11/01/28 #G00676 | | | 3,355 | | | | 3,456 | | |
| 6.500%, 12/01/28 #C00689 | | | 2,365 | | | | 2,437 | | |
| 6.500%, 04/01/29 #C00742 | | | 1,430 | | | | 1,472 | | |
| 6.500%, 07/01/31 #A17212 | | | 7,583 | | | | 7,808 | | |
| 6.000%, 11/01/33 #A15521 | | | 5,538 | | | | 5,634 | | |
FNMA Pool
7.750%, 06/01/08 #001464 | | | 9 | | | | 9 | | |
| 3.790%, 07/01/13 #386314 (b) | | | 25,782 | | | | 24,290 | | |
| 5.500%, 02/01/14 #440780 (b) | | | 3,660 | | | | 3,719 | | |
| 7.000%, 02/01/15 #535206 | | | 964 | | | | 1,006 | | |
| 7.000%, 08/01/16 #591038 (b) | | | 2,318 | | | | 2,420 | | |
| 5.500%, 12/01/17 #673010 | | | 6,524 | | | | 6,623 | | |
| 5.000%, 06/01/18 #555545 (b) | | | 9,345 | | | | 9,329 | | |
| 5.000%, 11/01/18 #750989 | | | 22,481 | | | | 22,443 | | |
| 4.500%, 01/01/19 #755666 (b) | | | 5,208 | | | | 5,104 | | |
| 5.000%, 11/01/19 #725934 | | | 4,420 | | | | 4,410 | | |
| 4.500%, 06/01/20 #828929 (b) | | | 6,591 | | | | 6,453 | | |
| 6.000%, 10/01/22 #254513 (b) | | | 6,180 | | | | 6,318 | | |
| 5.500%, 10/01/24 #255456 (b) | | | 15,322 | | | | 15,409 | | |
| 5.500%, 01/01/25 #255575 (b) | | | 13,192 | | | | 13,262 | | |
| 5.500%, 02/01/25 #255628 (b) | | | 17,928 | | | | 18,023 | | |
| 7.000%, 04/01/26 #340798 | | | 669 | | | | 701 | | |
| 7.000%, 05/01/26 #250551 | | | 700 | | | | 734 | | |
| 6.500%, 02/01/29 #252255 | | | 2,837 | | | | 2,924 | | |
| 6.500%, 12/01/31 #254169 (b) | | | 9,050 | | | | 9,318 | | |
| 7.000%, 07/01/32 #254379 (b) | | | 4,476 | | | | 4,684 | | |
| 7.000%, 07/01/32 #545813 (b) | | | 1,962 | | | | 2,053 | | |
| 7.000%, 07/01/32 #545815 (b) | | | 1,255 | | | | 1,314 | | |
| 6.000%, 09/01/32 #254447 (b) | | | 6,864 | | | | 6,986 | | |
| 6.000%, 03/01/33 #688330 | | | 10,451 | | | | 10,636 | | |
| 5.500%, 04/01/33 #694605 (b) | | | 12,282 | | | | 12,293 | | |
| 6.500%, 05/01/33 #555798 | | | 9,362 | | | | 9,639 | | |
| 5.500%, 07/01/33 #709446 (b) | | | 15,293 | | | | 15,298 | | |
| 5.500%, 07/01/33 #728667 | | | 5,889 | | | | 5,891 | | |
| 5.500%, 08/01/33 #733380 (b) | | | 14,067 | | | | 14,072 | | |
| 5.000%, 10/01/33 #741897 (b) | | | 30,169 | | | | 29,566 | | |
| 6.000%, 11/01/33 #772130 | | | 1,024 | | | | 1,041 | | |
| 6.000%, 11/01/33 #772256 | | | 1,610 | | | | 1,638 | | |
| 5.500%, 12/01/33 #756202 (b) | | | 10,011 | | | | 10,015 | | |
Core Bond Fund (continued)
| DESCRIPTION | | PAR (000) | | VALUE (000) | |
| 6.000%, 12/01/33 #756200 | | $ | 6,178 | | | $ | 6,281 | | |
| 5.000%, 03/01/34 #725205 (b) | | | 9,490 | | | | 9,301 | | |
| 5.000%, 03/01/34 #725248 (b) | | | 4,731 | | | | 4,637 | | |
| 5.000%, 03/01/34 #725250 (b) | | | 8,416 | | | | 8,248 | | |
| 5.500%, 04/01/34 #725424 (b) | | | 13,080 | | | | 13,084 | | |
| 5.000%, 05/01/34 #725456 | | | 15,100 | | | | 14,788 | | |
| 5.500%, 05/01/34 #357571 (b) | | | 16,045 | | | | 16,046 | | |
| 5.000%, 06/01/34 #782909 | | | 6,784 | | | | 6,644 | | |
| 6.500%, 06/01/34 #735273 (b) | | | 14,549 | | | | 14,975 | | |
| 5.500%, 10/01/34 #255411 | | | 2,924 | | | | 2,924 | | |
| 6.000%, 10/01/34 #781776 | | | 2,851 | | | | 2,899 | | |
| 6.500%, 10/01/34 #803797 (b) | | | 9,172 | | | | 9,441 | | |
| 4.500%, 03/01/35 #819357 | | | 13,790 | | | | 13,162 | | |
FNMA TBA (c)
5.500%, 10/01/34 | | | 19,020 | | | | 19,008 | | |
| 6.000%, 10/13/35 | | | 28,155 | | | | 28,613 | | |
GNMA Pool
3.750%, 08/20/23 #008259 (a) | | | 3 | | | | 3 | | |
| 7.500%, 11/15/30 #537699 (b) | | | 947 | | | | 1,003 | | |
| 6.000%, 11/15/33 #612374 (b) | | | 11,395 | | | | 11,670 | | |
| | | | 519,365 | | |
Total U.S. Government Agency
Mortgage-Backed Securities
(Cost $613,218) | | | | | | | 606,490 | | |
U.S. Government & Agency
Securities – 24.0% | |
| U.S. Agency Debentures – 4.9% | |
FHLB
4.430%, 04/07/08, Callable 04/07/06 @ 100 (b) | | | 37,210 | | | | 37,006 | | |
FHLMC
4.375%, 03/01/10, Callable 03/01/06 @ 100 (b) | | | 19,000 | | | | 18,725 | | |
FNMA
4.750%, 08/25/08, Callable 08/25/06 @ 100 (b) | | | 18,990 | | | | 18,995 | | |
| 6.125%, 03/15/12 (b) | | | 9,200 | | | | 9,972 | | |
| 5.250%, 08/01/12 (b) | | | 9,065 | | | | 9,223 | | |
| | | | 93,921 | | |
| U.S. Treasuries – 19.1% | | | |
U.S. Inflation Index Bonds (TIPS)
1.625%, 01/15/15 (b) (d) | | | 19,594 | | | | 19,361 | | |
| 2.375%, 01/15/25 (b) (d) | | | 17,666 | | | | 18,903 | | |
U.S. Treasury Bonds
9.000%, 11/15/18 (b) | | | 12,440 | | | | 17,916 | | |
| 8.750%, 08/15/20 (b) | | | 6,300 | | | | 9,117 | | |
| 6.250%, 08/15/23 (b) | | | 33,500 | | | | 40,054 | | |
| 7.625%, 02/15/25 (b) | | | 6,055 | | | | 8,359 | | |
| 5.500%, 08/15/28 (b) | | | 15,000 | | | | 16,856 | | |
| 5.250%, 11/15/28 | | | 14,170 | | | | 15,445 | | |
| 5.250%, 02/15/29 (b) | | | 35,155 | | | | 38,325 | | |
| 5.375%, 02/15/31 (b) | | | 22,655 | | | | 25,377 | | |
U.S. Treasury Notes
1.625%, 02/28/06 (b) | | | 11,890 | | | | 11,782 | | |
| 1.500%, 03/31/06 | | | 11,795 | | | | 11,656 | | |
| 4.125%, 08/15/08 (b) | | | 9,145 | | | | 9,131 | | |
| 4.125%, 08/15/10 (b) | | | 16,325 | | | | 16,246 | | |
| 3.875%, 09/15/10 | | | 14,500 | | | | 14,294 | | |
| 4.250%, 08/15/15 (b) | | | 93,235 | | | | 92,652 | | |
| | | | 365,474 | | |
Total U.S. Government & Agency Securities
(Cost $456,608) | | | | | | | 459,395 | | |
FIRST AMERICAN FUNDS Annual Report 2005
27
Schedule of Investments September 30, 2005
Core Bond Fund (continued)
| DESCRIPTION | | PAR (000) | | VALUE (000) | |
| Asset-Backed Securities – 16.7% | | | |
| Automotive – 0.9% | | | |
Ford Credit Auto Owner Trust
Series 2005-B, Class A3
4.170%, 01/15/09 | | $ | 9,825 | | | $ | 9,789 | | |
Nissan Auto Receivables Owner Trust
Series 2005-B, Class A2
3.750%, 09/15/07 | | | 6,765 | | | | 6,743 | | |
| | | | 16,532 | | |
| Commercial – 7.6% | | | |
Bank of America Commercial Mortgage
Series 2004-5, Class A3
4.561%, 11/10/41 | | | 14,830 | | | | 14,622 | | |
Bank of America - First Union NB
Commercial Mortgages
Series 2001-3, Class A1
4.890%, 04/11/37 | | | 5,973 | | | | 5,970 | | |
Commercial Mortgage
Series 2004-CNL, Class A1
3.988%, 09/15/14 (a) (e) | | | 11,740 | | | | 11,737 | | |
Series 2005-LP5, Class A2
4.630%, 05/10/43 | | | 14,180 | | | | 14,076 | | |
Deutsche Mortgage and Asset Receiving
Series 1998-C1, Class A2
6.538%, 06/15/31 | | | 8,005 | | | | 8,232 | | |
Global Signal Trust
Series 2004-2A, Class A
4.232%, 12/15/14 (e) | | | 11,480 | | | | 11,173 | | |
GMAC Commercial Mortgage Securities
Series 2004-C2, Class A1
3.896%, 08/10/38 | | | 10,169 | | | | 9,995 | | |
Greenwich Capital Commercial Funding
Series 2003-C1, Class A2
3.285%, 07/05/35 | | | 14,170 | | | | 13,532 | | |
LB-UBS Commercial Mortgage Trust
Series 2003-C3, Class A2
3.086%, 05/15/27 | | | 19,520 | | | | 18,730 | | |
Morgan Stanley Capital Investments
Series 1999-FNV1, Class A1
6.120%, 03/15/31 | | | 3,816 | | | | 3,871 | | |
Nomura Asset Securities
Series 1998-D6, Class A1B
6.590%, 03/15/30 | | | 12,400 | | | | 12,914 | | |
Wachovia Bank Commercial Mortgage Trust
Series 2005-C19, Class A5
4.661%, 05/15/44 | | | 21,080 | | | | 20,941 | | |
| | | | 145,793 | | |
| Credit Card – 4.1% | | | |
American Express Credit Account
Series 2004-4, Class C
4.238%, 03/15/12 (a) (e) | | | 4,500 | | | | 4,509 | | |
Chase Issuance Trust
Series 2005-A9, Class A9
3.816%, 11/15/11 (a) | | | 31,335 | | | | 31,396 | | |
MBNA Credit Card Master Note Trust
Series 2001-A1, Class A1
5.750%, 10/15/08 | | | 9,124 | | | | 9,206 | | |
Series 2003-C6, Class C6
4.948%, 12/15/10 (a) | | | 4,800 | | | | 4,893 | | |
Series 2005-A1, Class A1
4.200%, 09/15/10 | | | 14,285 | | | | 14,184 | | |
Core Bond Fund (continued)
| DESCRIPTION | | PAR (000) | | VALUE (000) | |
Providian Gateway Master Trust
Series 2004-DA, Class A
3.350%, 09/15/11 (e) | | $ | 15,310 | | | $ | 14,934 | | |
| | | | 79,122 | | |
| Equipment Leases – 1.2% | | | |
Caterpillar Financial Asset Trust
Series 2005-A, Class A2
3.660%, 12/26/07 | | | 10,545 | | | | 10,510 | | |
CNH Equipment Trust
Series 2003-B, Class A3B
2.470%, 01/15/08 | | | 11,536 | | | | 11,437 | | |
| | | | 21,947 | | |
| Home Equity – 1.3% | | | |
Amresco Residential Security Mortgage
Series 1997-3, Class A9
6.960%, 03/25/27 | | | 1,020 | | | | 982 | | |
Contimortgage Home Equity Loan Trust
Series 1997-3, Class A8
7.580%, 08/15/28 | | | 951 | | | | 950 | | |
Countrywide Asset-Backed Certificates
Series 2003-BC1, Class A1
4.230%, 03/25/33 (a) (f) | | | 1,593 | | | | 1,633 | | |
Series 2003-SC1, Class M2
5.330%, 09/25/23 (a) (f) | | | 5,000 | | | | 5,020 | | |
First Franklin Mortgage Loan
Series 2004-FFB, Class A3
4.264%, 06/25/24 | | | 4,265 | | | | 4,239 | | |
Residential Asset Securities
2004-KS3, Class A2B2
4.040%, 04/25/34 (a) (f) | | | 8,308 | | | | 8,324 | | |
Saxon Asset Securities Trust
Series 2004-1, Class A
4.100%, 03/25/35 (a) (f) | | | 3,842 | | | | 3,855 | | |
| | | | 25,003 | | |
| Other – 1.6% | | | |
GRP/AG Real Estate Asset Trust
Series 2004-1, Class A
3.960%, 03/25/09 (e) (f) | | | 261 | | | | 257 | | |
Series 2004-2, Class A
4.210%, 07/25/34 (e) (f) | | | 1,854 | | | | 1,821 | | |
Series 2005-1, Class A
4.850%, 01/25/35 (e) (f) | | | 4,982 | | | | 4,955 | | |
Small Business Administration
Series 2005-P10B, Class 1
4.940%, 08/10/15 | | | 10,965 | | | | 11,052 | | |
William Street Funding
Series 2004-4, Class A
4.320%, 09/23/10 (a) (e) | | | 6,390 | | | | 6,394 | | |
Series 2005-1, Class A
3.920%, 01/23/11 (a) (e) | | | 5,870 | | | | 5,857 | | |
| | | | 30,336 | | |
Total Asset-Backed Securities
(Cost $322,149) | | | | | | | 318,733 | | |
CMO – Private Mortgage-Backed
Securities – 12.8% | |
| Adjustable Rate (a) – 5.5% | |
Adjustable Rate Mortgage Trust
Series 2005-10, Class 1A21
4.765%, 01/25/36 | | | 12,947 | | | | 12,874 | | |
Granite Mortgages
Series 2003-1, Class 1C
5.070%, 01/20/43 (f) | | | 7,000 | | | | 7,145 | | |
The accompanying notes are an integral part of the financial statements.
FIRST AMERICAN FUNDS Annual Report 2005
28
Core Bond Fund (continued)
| DESCRIPTION | | PAR (000) | | VALUE (000) | |
MLCC Mortgage Investors
Series 2003-G, Class A3
4.963%, 01/25/29 | | $ | 8,775 | | | $ | 8,984 | | |
Series 2003-H, Class A3A
5.057%, 01/25/29 | | | 2,555 | | | | 2,606 | | |
Series 2004-B, Class A3
5.203%, 05/25/29 | | | 7,467 | | | | 7,628 | | |
Morgan Stanley Mortgage Loan Trust
Series 2004-9, Class 1A
6.274%, 11/25/34 | | | 10,814 | | | | 10,959 | | |
Sequoia Mortgage Trust
Series 2004-4, Class X1
0.800%, 05/20/34 (h) | | | 206,346 | | | | 760 | | |
Series 2004-5, Class A1
4.734%, 06/20/34 | | | 8,911 | | | | 9,112 | | |
Series 2004-7, Class A2
4.847%, 08/20/34 | | | 7,504 | | | | 7,596 | | |
Structured Mortgage Loan Trust
Series 2004-11, Class A
5.352%, 08/25/34 | | | 4,318 | | | | 4,404 | | |
Thornburg Mortgage Securities Trust
Series 2005-2, Class A1
4.050%, 07/25/45 | | | 10,728 | | | | 10,714 | | |
Wells Fargo Mortgage Backed Securities Trust
Series 2003-D, Class A1
4.839%, 02/25/33 | | | 6,691 | | | | 6,703 | | |
Series 2004-N, Class A3
4.108%, 08/25/34 | | | 16,045 | | | | 15,875 | | |
| | | | 105,360 | | |
| Fixed Rate – 7.3% | | | |
Bank of America Mortgage Securities
Series 2003-6, Class 1A30
4.750%, 08/25/33 | | | 7,350 | | | | 7,239 | | |
Series 2004-G, Class 2A3
4.232%, 08/25/34 | | | 12,370 | | | | 12,248 | | |
Citicorp Mortgage Securities
Series 2005-4, Class 1A6
5.500%, 07/25/35 | | | 13,732 | | | | 13,651 | | |
Countrywide Alternative Loan Trust
Series 2004-2CB, Class 1A1
4.250%, 03/25/34 | | | 8,056 | | | | 7,978 | | |
Series 2004-24CB, Class 1A1
6.000%, 11/25/34 | | | 8,526 | | | | 8,593 | | |
GMAC Mortgage Corporation Loan Trust
Series 2004-J5, Class A7
6.500%, 01/25/35 | | | 10,263 | | | | 10,488 | | |
GSR Mortgage Loan Trust
Series 2004-10F, Class 3A1
5.500%, 08/25/19 | | | 8,658 | | | | 8,759 | | |
Master Alternative Loans Trust
Series 2005-2, Class 1A3
6.500%, 03/25/35 | | | 6,436 | | | | 6,592 | | |
Master Asset Securitization Trust
Series 2003-6, Class 3A1
5.000%, 07/25/18 | | | 10,908 | | | | 10,779 | | |
Residential Asset Mortgage Products
Series 2003-SL1, Class M1
7.320%, 04/25/31 | | | 8,726 | | | | 9,013 | | |
Series 2004-SL4, Class A3
6.500%, 07/25/32 | | | 5,285 | | | | 5,398 | | |
Residential Asset Securitization Trust
Series 2002-A12, Class 1A1
5.200%, 11/25/32 | | | 1,405 | | | | 1,391 | | |
Core Bond Fund (continued)
| DESCRIPTION | | PAR (000) | | VALUE (000) | |
Washington Mutual
Series 2003-S10, Class A2
5.000%, 10/25/18 | | $ | 11,980 | | | $ | 11,877 | | |
Series 2004-S3, Class 3A3
6.000%, 07/25/34 | | | 7,000 | | | | 7,122 | | |
Wells Fargo Mortgage Backed Securities Trust
Series 2003-14, Class A1
4.750%, 12/25/18 | | | 10,764 | | | | 10,590 | | |
Series 2004-EE, Class B1
3.988%, 01/25/35 | | | 8,670 | | | | 8,340 | | |
Westam Mortgage Financial
Series 11, Class A
6.360%, 08/26/20 | | | 98 | | | | 98 | | |
| | | | 140,156 | | |
Total CMO – Private Mortgage-Backed Securities
(Cost $249,637) | | | | | | | 245,516 | | |
| Corporate Bonds – 8.9% | | | |
| Banking – 0.5% | | | |
Chuo Mitsui Trust & Bank,
Callable 04/15/15 @ 100
5.506%, 12/31/49 (e) (f) | | | 4,345 | | | | 4,127 | | |
First National Bank of Chicago
8.080%, 01/05/18 | | | 1,442 | | | | 1,693 | | |
JP Morgan Chase XVII
5.850%, 08/01/35 | | | 4,300 | | | | 4,188 | | |
| | | | 10,008 | | |
| Basic Industry – 0.5% | | | |
Celulosa Arauco Constitucion
5.625%, 04/20/15 (e) | | | 3,000 | | | | 2,975 | | |
Falconbridge
7.350%, 06/05/12 | | | 5,135 | | | | 5,665 | | |
| | | | 8,640 | | |
| Brokerage – 0.3% | | | |
Merrill Lynch, Series B
5.360%, 02/01/07 | | | 6,355 | | | | 6,424 | | |
| Capital Goods – 0.2% | | | |
Hutchison Whampoa International
7.450%, 11/24/33 (b) (e) | | | 3,900 | | | | 4,493 | | |
| Communications – 1.7% | | | |
America Movil S A De C V
6.375%, 03/01/35 | | | 2,980 | | | | 2,891 | | |
AT&T Broadband
8.375%, 03/15/13 | | | 6,165 | | | | 7,294 | | |
British Telecommunications PLC
8.875%, 12/15/30 | | | 2,145 | | | | 2,909 | | |
Clear Channel Communications
5.500%, 09/15/14 (b) | | | 6,875 | | | | 6,622 | | |
News America Holdings
7.700%, 10/30/25 | | | 4,015 | | | | 4,654 | | |
Time Warner Entertainment
8.375%, 07/15/33 | | | 4,200 | | | | 5,258 | | |
Verizon Wireless
5.375%, 12/15/06 | | | 3,300 | | | | 3,329 | | |
| | | | 32,957 | | |
| Consumer Cyclical – 1.3% | | | |
Centex
5.450%, 08/15/12 | | | 6,990 | | | | 6,949 | | |
DaimlerChrysler
4.875%, 06/15/10 (b) | | | 3,735 | | | | 3,664 | | |
| 6.500%, 11/15/13 (b) | | | 3,450 | | | | 3,648 | | |
FIRST AMERICAN FUNDS Annual Report 2005
29
Schedule of Investments September 30, 2005
Core Bond Fund (continued)
| DESCRIPTION | | PAR (000) | | VALUE (000) | |
Duty Free International
7.000%, 10/01/05 (g) (i) (j) | | $ | 2,256 | | | $ | 90 | | |
Ford Motor Credit
7.000%, 10/01/13 (b) | | | 2,130 | | | | 1,971 | | |
Harrah's
5.625%, 06/01/15 (e) | | | 5,670 | | | | 5,585 | | |
| 5.750%, 10/01/17 (e) | | | 3,345 | | | | 3,280 | | |
| | | | 25,187 | | |
| Consumer NonCyclical – 0.8% | | | |
Albertson's
7.500%, 02/15/11 | | | 4,595 | | | | 4,531 | | |
Kraft Foods
4.625%, 11/01/06 | | | 9,850 | | | | 9,856 | | |
| | | | 14,387 | | |
| Electric – 1.2% | | | |
Exelon
4.900%, 06/15/15 (b) | | | 8,200 | | | | 7,729 | | |
MidAmerican Energy Holdings
5.875%, 10/01/12 (b) | | | 8,845 | | | | 9,307 | | |
TXU Energy
7.000%, 03/15/13 (b) | | | 5,170 | | | | 5,613 | | |
| | | | 22,649 | | |
| Energy – 0.9% | | | |
Gazprom International
7.201%, 02/01/20 (e) | | | 5,170 | | | | 5,647 | | |
Nexen
5.875%, 03/10/35 | | | 4,140 | | | | 4,058 | | |
Petro-Canada
5.350%, 07/15/33 | | | 3,310 | | | | 3,033 | | |
Tengizcheveroil Finance
6.124%, 11/15/14 (e) | | | 4,655 | | | | 4,734 | | |
| | | | 17,472 | | |
| Finance Companies – 0.3% | | | |
American General
5.875%, 07/14/06 (b) | | | 6,105 | | | | 6,172 | | |
| Natural Gas – 0.2% | |
Duke Energy Field Services
7.875%, 08/16/10 | | | 4,200 | | | | 4,716 | | |
| Sovereigns – 0.8% | |
United Mexican States
5.875%, 01/15/14 (b) | | | 14,100 | | | | 14,601 | | |
| Technology – 0.1% | |
Chartered Semiconductor
6.375%, 08/03/15 | | | 1,715 | | | | 1,675 | | |
| Transportation – 0.0% | |
Northwest Airlines Series 1997-1, Class 1C
7.039%, 01/02/06 (g) (j) | | | 55 | | | | 5 | | |
Total Corporate Bonds
(Cost $172,856) | | | | | | | 169,386 | | |
CMO – U.S. Government Agency
Mortgage-Backed Securities – 4.1% | |
| Fixed Rate – 4.0% | |
FHLMC REMIC
Series 6, Class C
9.050%, 06/15/19 | | | 45 | | | | 46 | | |
Core Bond Fund (continued)
| DESCRIPTION | | PAR (000) | | VALUE (000) | |
Series 162, Class F
7.000%, 05/15/21 | | $ | 193 | | | $ | 193 | | |
Series 188, Class H
7.000%, 09/15/21 | | | 389 | | | | 388 | | |
Series 1022, Class J
6.000%, 12/15/20 | | | 56 | | | | 56 | | |
Series 1723, Class PJ
7.000%, 02/15/24 | | | 1,197 | | | | 1,200 | | |
Series 1790, Class A
7.000%, 04/15/22 | | | 158 | | | | 162 | | |
Series 1998-M1, Class A2
6.250%, 01/25/08 | | | 3,208 | | | | 3,262 | | |
Series 2763, Class TA
4.000%, 03/15/11 | | | 11,973 | | | | 11,701 | | |
Series 2910, Class BE
4.500%, 12/15/19 | | | 10,702 | | | | 10,233 | | |
Series 2981, Class BC
4.500%, 05/15/20 | | | 5,000 | | | | 4,772 | | |
Series 2987, Class KE
5.000%, 12/15/34 | | | 12,850 | | | | 12,771 | | |
Series T-60, Class 1A4B
5.343%, 03/25/44 | | | 10,716 | | | | 10,732 | | |
FNMA REMIC
Series 1988-24, Class G
7.000%, 10/25/18 | | | 91 | | | | 94 | | |
| Series 1989-44, Class H | |
| 9.000%, 07/25/19 | | | 82 | | | | 87 | | |
Series 1989-90, Class E
8.700%, 12/25/19 | | | 14 | | | | 15 | | |
Series 1990-30, Class E
6.500%, 03/25/20 | | | 50 | | | | 51 | | |
Series 1990-61, Class H
7.000%, 06/25/20 | | | 55 | | | | 57 | | |
Series 1990-72, Class B
9.000%, 07/25/20 | | | 47 | | | | 51 | | |
Series 1990-102, Class J
6.500%, 08/25/20 | | | 60 | | | | 62 | | |
Series 1990-105, Class J
6.500%, 09/25/20 | | | 624 | | | | 640 | | |
Series 1991-56, Class M
6.750%, 06/25/21 | | | 248 | | | | 255 | | |
Series 1992-120, Class C
6.500%, 07/25/22 | | | 93 | | | | 95 | | |
Series 2005-44, Class PC
5.000%, 11/25/27 | | | 18,520 | | | | 18,494 | | |
| | | | 75,417 | | |
| Z-Bonds (k) – 0.1% | | | |
FHLMC REMIC
Series 1118, Class Z
8.250%, 07/15/21 | | | 90 | | | | 90 | | |
FNMA REMIC
Series 1991-134, Class Z
7.000%, 10/25/21 | | | 415 | | | | 429 | | |
Series 1996-35, Class Z
7.000%, 07/25/26 | | | 1,838 | | | | 1,871 | | |
| | | | 2,390 | | |
Total CMO – U.S. Government Agency
Mortgage-Backed Securities
(Cost $79,155) | | | | | | | 77,807 | | |
The accompanying notes are an integral part of the financial statements.
FIRST AMERICAN FUNDS Annual Report 2005
30
Core Bond Fund (continued)
| DESCRIPTION | | SHARES/PAR (000) | | VALUE (000) | |
| Short-Term Investments – 2.9% | |
| Affiliated Money Market Fund – 2.9% | |
First American Prime
Obligations Fund, Class Z (l) | | | 54,924,545 | | | $ | 54,925 | | |
| U.S. Treasury Obligation – 0.0% | |
U.S. Treasury Bill
3.387%, 11/10/05 (m) | | $ | 315 | | | | 315 | | |
Total Short-Term Investments
(Cost $55,240) | | | | | 55,420 | | |
Investments Purchased with Proceeds
from Securities Lending (n) – 44.2% | |
| (Cost $844,992) | | | | | 844,992 | | |
Total Investments – 145.3%
(Cost $2,793,855) | | | | | 2,777,559 | | |
| Other Assets and Liabilities, Net – (45.3)% | | | | | (865,939 | ) | |
| Total Net Assets – 100.0% | | | | $ | 1,911,620 | | |
(a) Variable Rate Security – The rate shown is the rate in effect as of September 30, 2005.
(b) This security or a portion of this security is out on loan at September 30, 2005. Total loaned securities had a value of $831,476,342 at September 30, 2005. See note 2 in Notes to Financial Statements.
(c) Security purchased on a when-issued basis. On September 30, 2005, the total cost of investments purchased on a when-issued basis was $47,703,854 or 2.5% of total net assets. See note 2 in Notes to Financial Statements.
(d) U.S. Treasury inflation-protection securities (TIPS) are securities in which the principal amount is adjusted for inflation and the semiannual interest payments equal a fixed percentage of the inflation-adjusted principal amount.
(e) Security purchased within the terms of a private placement memorandum, exempt from registration under Rule 144A of the Securities Act of 1933, as amended, and may be sold only to dealers in that program or other "qualified institutional buyers." These securities have been determined to be liquid under guidelines established by the funds' board of directors. As of September 30, 2005, the value of these investments was $92,481,044 or 4.8% of total net assets. See note 2 to Notes to Financial Statements.
(f) Delayed Interest (Step Bonds) – Securities for which the coupon rate of interest will adjust on specified future date(s). The rate disclosed represents the coupon rate in effect as of September 30, 2005.
(g) Security considered illiquid. As of September 30, 2005, the value of this investment was $95,215 or 0.0% of total net assets. See note 2 in Notes to Financial Statements.
(h) Interest only – Represents securities that entitle holders to receive only interest payments on the underlying mortgages. The yield to maturity of an interest only is extremely sensitive to the rate of principal payments on the underlying mortgage assets. A rapid (slow) rate of principal repayments may have an adverse (positive) effect on yield to maturity. The principal amount shown is the notional amount of the underlying mortgages. Interest rate disclosed represents the coupoon rate in effect as of September 30, 2005.
(i) Security is fair valued. As of September 30, 2005, the fair value of this investment was $90,227 or 0.0% of net assets. See note 2 in Notes to Financial Statements.
(j) Security in default at September 30, 2005.
(k) Z-Bonds – Represents securities that pay no interest or principal during their accrual periods, but accrue additional principal at specified rates. Interest rate shown represents current yield based upon the cost basis and estimated future cash flows.
(l) Investment in affiliated security.This money market fund is advised by U.S. Bancorp Asset Management, Inc., which also serves as advisor for this fund. See note 3 in Notes to Financial Statements.
Core Bond Fund (concluded)
(m) Security has been deposited as initial margin on open futures contracts. Yield shown is effective yield as of September 30, 2005. See note 2 in Notes to Financial Statements.
(n) The fund may loan securities in return for collateral in the form of cash, U.S. Government securities, or other high grade debt obligations. The cash collateral is invested in various short term fixed income securities, such as repurchase agreements, commercial paper, money market funds and other corporate obligations. See note 2 in Notes to Financial Statements.
CMO – Collateralized Mortgage Obligation
FHLB – Federal Home Loan Bank
FHLMC – Federal Home Loan Mortgage Corporation
FNMA – Federal National Mortgage Association
GNMA – Government National Mortgage Association
PLC – Public Limited Company
REIMC – Real Estate Mortgage Investment Conduit
TBA – To Be Announced
TIPS – Treasury Inflation Protected Securities
Schedule of Open Futures Contracts
| Description | | Number of
Contracts
Purchased
(Sold) | | Notional
Contract
Value
(000) | | Settlement
Month | | Unrealized
Appreciation
(Depreciation)
(000) | |
U.S. Treasury
2 year Futures | | | 174 | | | $ | 35,825 | | | December 05 | | $ | (272 | ) | |
U.S. Treasury
5 year Futures | | | (213 | ) | | | (22,761 | ) | | December 05 | | | 175 | | |
U.S. Treasury
10 year Futures | | | 42 | | | | 4,617 | | | December 05 | | | (22 | ) | |
U.S. Treasury
Long Bond Futures | | | 108 | | | | 12,356 | | | December 05 | | | (101 | ) | |
Euro Dollar
90 Day Futures | | | (243 | ) | | | (231,944 | ) | | March 06 | | | 322 | | |
| | | $ | 102 | | |
Credit Default Swap Agreements
| Counterparty | |
Reference
Entity | |
Buy/Sell
Protection | |
Pay/
Receive
Fixed Rate | |
Expiration
Date | |
Notional
Amount
(000) | |
Unrealized
(Depreciation)
(000) | |
| Citigroup | | Dow Jones CDX
IG Hvol5 Index | | Buy | | | 0.85 | % | | | 12/20/10 | | | $ | 20,000 | | | $ | (49 | ) | |
FIRST AMERICAN FUNDS Annual Report 2005
31
Schedule of Investments September 30, 2005
High Income Bond Fund
| DESCRIPTION | | PAR (000) | | VALUE (000) | |
| High Yield Corporate Bonds – 91.4% | |
| Banking – 0.2% | |
Chevy Chase Bank,
Callable 12/01/08 @ 103.44
6.875%, 12/01/13 | | $ | 500 | | | $ | 517 | | |
| Basic Industry – 11.6% | |
Abitibi-Consolidated
8.550%, 08/01/10 (a) (b) | | | 1,750 | | | | 1,781 | | |
Allegheny Technologies
8.375%, 12/15/11 | | | 1,550 | | | | 1,666 | | |
Caraustar Industries,
Callable 04/01/06 @ 105.25
9.875%, 04/01/11 | | | 1,000 | | | | 1,001 | | |
Chaparral Steel,
Callable 07/15/09 @ 105
10.000%, 07/15/13 (c) | | | 1,000 | | | | 1,055 | | |
Equistar Chemicals,
Callable 05/01/07 @ 105.31
10.625%, 05/01/11 | | | 2,000 | | | | 2,180 | | |
Freeport-McMoran Copper & Gold
5.500%, 12/31/49 | | | 298 | | | | 329 | | |
Callable 02/01/09 @ 103.44
6.875%, 02/01/14 | | | 1,000 | | | | 985 | | |
Geon
7.500%, 12/15/15 | | | 1,000 | | | | 910 | | |
Georgia-Pacific
8.875%, 05/15/31 | | | 1,975 | | | | 2,350 | | |
Gerdau Ameristeel,
Callable 07/15/07 @ 105.38
10.375%, 07/15/11 (a) | | | 1,000 | | | | 1,110 | | |
Huntsman ICI Chemicals,
Callable 07/15/08 @ 105.75
11.500%, 07/15/12 | | | 1,320 | | | | 1,505 | | |
IMC Global, Series B
10.875%, 06/01/08 | | | 1,000 | | | | 1,122 | | |
International Wire Group,
Callable 10/15/07 @ 105.38
10.000%, 10/15/11 | | | 546 | | | | 541 | | |
Invista,
Callable 05/01/08 @ 104.63
9.250%, 05/01/12 (a) (c) | | | 1,000 | | | | 1,090 | | |
James River Coal,
Callable 06/01/09 @ 104.69
9.375%, 06/01/12 | | | 1,000 | | | | 1,070 | | |
Mercer International,
Callable 02/15/09 @ 104.63
9.250%, 02/15/13 (a) | | | 1,000 | | | | 850 | | |
Neenah Paper,
Callable 11/15/09 @ 103.69
7.375%, 11/15/14 | | | 1,000 | | | | 962 | | |
Newark Group,
Callable 03/15/09 @ 104.88
9.750%, 03/15/14 | | | 800 | | | | 712 | | |
Norske Skog Canada, Series D,
Callable 06/15/06 @ 104.31
8.625%, 06/15/11 (a) | | | 700 | | | | 707 | | |
OM Group,
Callable 12/15/06 @ 104.63
9.250%, 12/15/11 | | | 1,000 | | | | 1,020 | | |
Polyone,
Callable 05/15/07 @ 105.31
10.625%, 05/15/10 | | | 500 | | | | 516 | | |
High Income Bond Fund (continued)
| DESCRIPTION | | PAR (000) | | VALUE (000) | |
Resolution Performance,
Callable 11/15/05 @ 106.75
13.500%, 11/15/10 | | $ | 1,000 | | | $ | 1,062 | | |
Rhodia
10.250%, 06/01/10 (a) (b) | | | 1,000 | | | | 1,066 | | |
Southern Peru Copper
6.375%, 07/27/15 (a) (c) | | | 1,000 | | | | 996 | | |
Stone Container,
Callable 07/01/07 @ 104.19
8.375%, 07/01/12 (b) | | | 2,000 | | | | 1,910 | | |
Tembec Industries
8.500%, 02/01/11 (a) | | | 570 | | | | 373 | | |
Witco
6.875%, 02/01/26 | | | 1,500 | | | | 1,537 | | |
| | | | 30,406 | | |
| Brokerage – 0.7% | | | |
E*Trade Financial,
Callable 06/15/08 @ 104
8.000%, 06/15/11 | | | 750 | | | | 774 | | |
Lazard
7.125%, 05/15/15 (c) | | | 1,250 | | | | 1,234 | | |
| | | | 2,008 | | |
| Capital Goods – 7.1% | | | |
Allied Waste North America,
Callable 04/15/08 @ 103.94
7.875%, 04/15/13 | | | 1,000 | | | | 1,026 | | |
Callable 02/15/09 @ 103.06
6.125%, 02/15/14 (b) | | | 1,000 | | | | 927 | | |
Callable 03/15/10 @ 103.63
7.250%, 03/15/15 (b) (c) | | | 1,000 | | | | 985 | | |
Bombardier
6.750%, 05/01/12 (a) (b) (c) | | | 1,000 | | | | 937 | | |
Case New Holland,
Callable 08/01/07 @ 104.62
9.250%, 08/01/11 | | | 1,000 | | | | 1,057 | | |
Chart Industries,
Callable 10/15/10 @ 104.56
9.125%, 10/15/15 (c) | | | 1,200 | | | | 1,219 | | |
Compression Polymers,
Callable 07/01/09 @ 105.25
10.500%, 07/01/13 (c) | | | 1,000 | | | | 927 | | |
Crown Cork & Seal
7.375%, 12/15/26 | | | 1,000 | | | | 950 | | |
Crown European Holdings,
Callable 03/01/07 @ 104.75
9.500%, 03/01/11 (a) | | | 1,000 | | | | 1,096 | | |
Graham Packaging,
Callable 10/15/09 @ 104.94
9.875%, 10/15/14 (b) | | | 1,000 | | | | 960 | | |
Graphic Packaging International,
Callable 08/15/08 @ 104.75
9.500%, 08/15/13 (b) | | | 1,000 | | | | 933 | | |
Greif Brothers,
Callable 08/01/07 @ 104.44
8.875%, 08/01/12 | | | 700 | | | | 745 | | |
L-3 Communications,
Callable 01/15/10 @ 102.94
5.875%, 01/15/15 | | | 2,000 | | | | 1,930 | | |
Nortek,
Callable 09/01/09 @ 104.25
8.500%, 09/01/14 | | | 500 | | | | 462 | | |
The accompanying notes are an integral part of the financial statements.
FIRST AMERICAN FUNDS Annual Report 2005
32
High Income Bond Fund (continued)
| DESCRIPTION | | PAR (000) | | VALUE (000) | |
Owens-Brockway Glass Container,
Callable 02/15/06 @ 104.44
8.875%, 02/15/09 | | $ | 1,000 | | | $ | 1,052 | | |
Owens-Illinois
8.100%, 05/15/07 (b) | | | 1,000 | | | | 1,026 | | |
Sequa
9.000%, 08/01/09 | | | 1,000 | | | | 1,062 | | |
Terex,
Callable 01/15/09 @ 103.69
7.375%, 01/15/14 | | | 500 | | | | 507 | | |
United Rentals of North America,
Callable 02/15/08 @ 103.25
6.500%, 02/15/12 | | | 1,000 | | | | 962 | | |
| | | | 18,763 | | |
| Communications – 16.9% | | | |
Alamosa Delaware,
Callable 07/31/07 @ 105.50
11.000%, 07/31/10 | | | 650 | | | | 733 | | |
AT&T
9.050%, 11/15/11 (d) | | | 1,947 | | | | 2,194 | | |
CCH,
Callable 10/01/10 @ 105.50
11.000%, 10/01/15 (c) | | | 1,000 | | | | 975 | | |
CCO Holdings,
Callable 12/15/06 @ 102
7.995%, 12/15/10 (b) (e) | | | 1,000 | | | | 990 | | |
Centennial Communications,
Callable 06/15/08 @ 105.06
10.125%, 06/15/13 | | | 500 | | | | 559 | | |
Charter Communications Holdings
8.000%, 04/30/12 (b) (c) | | | 2,000 | | | | 2,010 | | |
Callable 09/15/08 @ 105.12
10.250%, 09/15/10 (b) | | | 1,000 | | | | 1,027 | | |
Citizens Communications
9.250%, 05/15/11 | | | 1,000 | | | | 1,100 | | |
CSC Holdings
7.875%, 02/15/18 | | | 500 | | | | 476 | | |
Series B
7.625%, 04/01/11 | | | 1,000 | | | | 985 | | |
Dex Media West,
Callable 08/15/08 @ 104.94
9.875%, 08/15/13 | | | 500 | | | | 552 | | |
DirecTV Holdings,
Callable 03/15/08 @ 104.19
8.375%, 03/15/13 | | | 298 | | | | 326 | | |
Callable 06/15/10 @ 103.19
6.375%, 06/15/15 (b) (c) | | | 1,000 | | | | 985 | | |
Dobson Cellular Systems,
Callable 11/01/08 @ 104.94
9.875%, 11/01/12 | | | 1,000 | | | | 1,097 | | |
Echostar
6.625%, 10/01/14 (b) | | | 2,000 | | | | 1,985 | | |
Horizon PCS,
Callable 07/15/08 @ 105.69
11.375%, 07/15/12 | | | 900 | | | | 1,035 | | |
Houghton Mifflin,
Callable 02/01/08 @ 104.94
9.875%, 02/01/13 (b) | | | 1,000 | | | | 1,061 | | |
Callable 10/15/08 @ 105.75
0.000%, 10/15/13 (f) | | | 1,000 | | | | 755 | | |
Iesy Repository,
Callable 02/15/10 @ 105.19
10.375%, 02/15/15 (a) (b) (c) | | | 500 | | | | 529 | | |
High Income Bond Fund (continued)
| DESCRIPTION | | PAR (000) | | VALUE (000) | |
Insight Midwest,
Callable 11/01/05 @ 105.25
10.500%, 11/01/10 | | $ | 500 | | | $ | 525 | | |
Intelsat Bermuda,
Callable until 7/14/06 @ 102
8.695%, 01/15/12 (a) (c) (e) | | | 1,000 | | | | 1,020 | | |
Liberty Media,
Callable until 02/15/30 @ 100
3.750%, 02/15/30 (g) | | | 1,000 | | | | 558 | | |
MCI,
Callable until 04/30/06 @ 102.45
5.908%, 05/01/07 (f) | | | 1,000 | | | | 1,009 | | |
Callable 05/01/09 @ 103.37
8.735%, 05/01/14 (f) | | | 1,500 | | | | 1,678 | | |
Nextel Communications,
Callable 08/01/08 @ 103.69
7.375%, 08/01/15 | | | 500 | | | | 536 | | |
Nextel Partners,
Callable 07/01/07 @ 104.06
8.125%, 07/01/11 | | | 1,000 | | | | 1,080 | | |
Panamsat,
Callable 08/15/09 @ 104.50
9.000%, 08/15/14 | | | 649 | | | | 686 | | |
Paxson Communications,
Callable 01/15/06 @ 106.12
0.000%, 01/15/09 (f) | | | 500 | | | | 485 | | |
Primedia,
Callable 05/15/06 @ 104.44
8.875%, 05/15/11 | | | 800 | | | | 836 | | |
Qwest
8.875%, 03/15/12 | | | 2,000 | | | | 2,180 | | |
Callable until 06/14/06 @ 102.69
7.500%, 06/15/23 | | | 1,000 | | | | 910 | | |
Qwest Capital Funding
7.000%, 08/03/09 (b) | | | 1,000 | | | | 980 | | |
Qwest Services,
Callable 12/15/05 @ 106.50
13.500%, 12/15/10 | | | 2,000 | | | | 2,292 | | |
R. H. Donnelley Finance,
Callable 12/15/07 @ 105.44
10.875%, 12/15/12 (c) | | | 1,000 | | | | 1,122 | | |
Rogers Cable
6.250%, 06/15/13 (a) | | | 1,500 | | | | 1,462 | | |
Rogers Wireless
6.375%, 03/01/14 (a) | | | 1,000 | | | | 1,010 | | |
| 7.500%, 03/15/15 (a) | | | 1,000 | | | | 1,077 | | |
Shaw Communications
8.250%, 04/11/10 (a) | | | 1,000 | | | | 1,082 | | |
Sinclair Broadcast Group,
Callable 03/15/07 @ 104
8.000%, 03/15/12 | | | 1,000 | | | | 1,030 | | |
Sirius Satellite Radio,
Callable 09/01/09 @ 104.81
9.625%, 08/01/13 (b) (c) | | | 1,000 | | | | 960 | | |
Time Warner Telecommunications Holdings,
Callable 02/15/09 @ 104.62
9.250%, 02/15/14 | | | 1,500 | | | | 1,522 | | |
Triton PCS,
Callable 02/01/06 @ 104.69
9.375%, 02/01/11 (b) | | | 1,000 | | | | 825 | | |
| | | | 44,239 | | |
FIRST AMERICAN FUNDS Annual Report 2005
33
Schedule of Investments September 30, 2005
High Income Bond Fund (continued)
| DESCRIPTION | | PAR (000) | | VALUE (000) | |
| Consumer Cyclical – 17.2% | |
AMC Entertainment,
Callable 03/01/09 @ 104
8.000%, 03/01/14 (b) | | $ | 1,000 | | | $ | 880 | | |
Arvinmeritor
8.750%, 03/01/12 (b) | | | 500 | | | | 492 | | |
Asbury Automotive Group,
Callable 06/15/07 @ 104.50
9.000%, 06/15/12 | | | 1,000 | | | | 1,012 | | |
Beazer Homes USA,
Callable 04/15/07 @ 104.19
8.375%, 04/15/12 | | | 1,000 | | | | 1,050 | | |
Buffets,
Callable 07/15/06 @ 105.63
11.250%, 07/15/10 | | | 500 | | | | 506 | | |
D. R. Horton
5.000%, 01/15/09 | | | 500 | | | | 496 | | |
Delphi
6.500%, 08/15/13 (b) (h) | | | 500 | | | | 335 | | |
Dominos, Series B,
Callable 07/01/07 @ 104.13
8.250%, 07/01/11 | | | 547 | | | | 574 | | |
Felcor Lodging (REIT)
8.500%, 06/01/11 | | | 500 | | | | 544 | | |
Ford Motor
7.450%, 07/16/31 (b) | | | 3,000 | | | | 2,340 | | |
General Motors Acceptance
5.625%, 05/15/09 (b) | | | 2,000 | | | | 1,837 | | |
| 6.750%, 12/01/14 (b) | | | 1,000 | | | | 873 | | |
| 8.000%, 11/01/31 | | | 1,000 | | | | 875 | | |
Glenoit,
Callable 11/14/05 @ 100
11.000%, 04/15/07 (i) (j) (k) (l) | | | 100 | | | | - | | |
Goodyear Tire & Rubber
7.857%, 08/15/11 (b) | | | 1,000 | | | | 975 | | |
GSC Holdings,
Callable 10/01/09 @ 104
8.000%, 10/01/12 (b) (c) | | | 1,000 | | | | 995 | | |
Host Marriott, (REIT)
Callable 11/01/08 @ 103.56
7.125%, 11/01/13 (b) | | | 1,000 | | | | 1,025 | | |
IMAX,
Callable 12/01/07 @ 104.81
9.625%, 12/01/10 (a) | | | 1,000 | | | | 1,070 | | |
Inn of the Mountain Gods Resort,
Callable 11/15/07 @ 106
12.000%, 11/15/10 (b) | | | 1,000 | | | | 1,133 | | |
Isle of Capri Casinos,
Callable 03/01/09 @ 103.50
7.000%, 03/01/14 | | | 1,000 | | | | 959 | | |
J.C. Penney
7.950%, 04/01/17 | | | 1,000 | | | | 1,145 | | |
Jean Coutu Group,
Callable 08/01/09 @ 104.25
8.500%, 08/01/14 (a) (b) | | | 1,000 | | | | 995 | | |
KB Home
5.750%, 02/01/14 | | | 1,000 | | | | 953 | | |
Landrys Restaurants,
Callable 12/15/09 @ 103.75
7.500%, 12/15/14 | | | 1,000 | | | | 950 | | |
Levi Strauss & Co.,
Callable 01/15/08 @ 104.88
9.750%, 01/15/15 | | | 1,000 | | | | 1,018 | | |
High Income Bond Fund (continued)
| DESCRIPTION | | PAR (000) | | VALUE (000) | |
M/I Homes
6.875%, 04/01/12 | | $ | 1,000 | | | $ | 930 | | |
Meristar Hospitality
9.125%, 01/15/11 | | | 1,000 | | | | 1,065 | | |
MGM Mirage
8.375%, 02/01/11 (b) | | | 2,000 | | | | 2,150 | | |
Mohegan Tribal Gaming,
Callable 02/15/10 @ 103.44
6.875%, 02/15/15 | | | 750 | | | | 761 | | |
Neiman Marcus Group,
Callable 10/15/10 @ 105.19
10.375%, 10/15/15 (c) | | | 1,700 | | | | 1,692 | | |
Oxford Industries,
Callable 06/01/07 @ 104.44
8.875%, 06/01/11 | | | 500 | | | | 520 | | |
Park Place Entertainment
7.875%, 03/15/10 | | | 1,000 | | | | 1,088 | | |
Penn National Gaming,
Callable 03/15/06 @ 104.44
8.875%, 03/15/10 | | | 1,000 | | | | 1,055 | | |
Royal Caribbean Cruises
8.000%, 05/15/10 (a) | | | 1,000 | | | | 1,086 | | |
Russell,
Callable 05/01/06 @ 104.63
9.250%, 05/01/10 | | | 500 | | | | 509 | | |
Service Corporation International
7.700%, 04/15/09 | | | 1,000 | | | | 1,050 | | |
Six Flags,
Callable 04/15/08 @ 104.88
9.750%, 04/15/13 (b) | | | 1,000 | | | | 988 | | |
Spectrum Brands,
Callable 02/01/10 @ 103.69
7.375%, 02/01/15 (b) | | | 1,000 | | | | 895 | | |
Stanley-Martin,
Callable 08/15/10 @ 104.88
9.750%, 08/15/15 (c) | | | 750 | | | | 735 | | |
Standard Pacific
7.000%, 08/15/15 | | | 250 | | | | 241 | | |
Station Casinos,
Callable 03/01/09 @ 102.58
6.875%, 03/01/16 (c) | | | 500 | | | | 508 | | |
Tenneco Automotive,
Callable 11/15/09 @ 104.31
8.625%, 11/15/14 (b) | | | 1,000 | | | | 1,008 | | |
Toys R Us
7.375%, 10/15/18 | | | 1,000 | | | | 810 | | |
Trump Entertainment Resorts,
Callable 06/01/10 @ 104.25
8.500%, 06/01/15 | | | 1,000 | | | | 968 | | |
Visteon
7.000%, 03/10/14 | | | 500 | | | | 434 | | |
Warnaco,
Callable 06/15/08 @ 104.44
8.875%, 06/15/13 | | | 500 | | | | 543 | | |
Warner Music Group
7.375%, 04/15/14 | | | 1,000 | | | | 1,006 | | |
WCI Communities,
Callable 05/01/07 @ 104.56
9.125%, 05/01/12 | | | 1,000 | | | | 1,035 | | |
Wynn Las Vegas,
Callable 12/01/09 @ 103.31
6.625%, 12/01/14 | | | 1,000 | | | | 953 | | |
| | | | 45,062 | | |
The accompanying notes are an integral part of the financial statements.
FIRST AMERICAN FUNDS Annual Report 2005
34
High Income Bond Fund (continued)
| DESCRIPTION | | PAR (000) | | VALUE (000) | |
| Consumer NonCyclical – 7.2% | |
Amerisourcebergen
5.875%, 09/15/15 (c) | | $ | 1,000 | | | $ | 993 | | |
Del Monte,
Callable 12/15/07 @ 104.31
8.625%, 12/15/12 | | | 1,000 | | | | 1,075 | | |
Delhaize America
9.000%, 04/15/31 (b) | | | 1,000 | | | | 1,169 | | |
Dole Foods,
Callable 03/15/07 @ 104.44
8.875%, 03/15/11 | | | 356 | | | | 368 | | |
Fisher Scientific International,
Callable 08/15/09 @ 103.38
6.750%, 08/15/14 | | | 500 | | | | 523 | | |
HCA
5.750%, 03/15/14 | | | 1,000 | | | | 958 | | |
HCA Columbia Healthcare
8.750%, 09/01/10 | | | 2,000 | | | | 2,215 | | |
Healthsouth
7.625%, 06/01/12 | | | 1,000 | | | | 933 | | |
Iasis Healthcare Capital,
Callable 06/15/09 @ 104.38
8.750%, 06/15/14 | | | 1,000 | | | | 1,040 | | |
R.J. Reynolds Tobacco
6.500%, 07/15/10 (c) | | | 1,000 | | | | 998 | | |
Revlon Consumer Products,
Callable 04/01/08 @ 104.75
9.500%, 04/01/11 | | | 1,000 | | | | 940 | | |
Roundy's,
Callable 06/15/07 @ 104.44
8.875%, 06/15/12 | | | 1,000 | | | | 1,050 | | |
Sealy Mattress,
Callable 06/15/09 @ 104.13
8.250%, 06/15/14 | | | 750 | | | | 746 | | |
Stater Brothers Holdings,
Callable 06/15/08 @ 104.06
8.125%, 06/15/12 (b) | | | 1,000 | | | | 988 | | |
Swift & Co.,
Callable 10/01/06 @ 106.25
12.500%, 01/01/10 | | | 750 | | | | 818 | | |
Tenet Healthcare
6.500%, 06/01/12 (b) | | | 1,000 | | | | 935 | | |
| 9.250%, 02/01/15 (c) | | | 1,000 | | | | 1,013 | | |
Triad Hospitals,
Callable 11/15/08 @ 103.50
7.000%, 11/15/13 | | | 1,000 | | | | 1,013 | | |
U.S. Oncology,
Callable 08/15/08 @ 104.50
9.000%, 08/15/12 | | | 1,000 | | | | 1,080 | | |
| | | | 18,855 | | |
| Electric – 7.7% | | | |
AES Red Oak , Series B
9.200%, 11/30/29 | | | 1,000 | | | | 1,140 | | |
Allegheny Energy Supply
8.250%, 04/15/12 (c) (d) | | | 500 | | | | 561 | | |
Aquila
11.875%, 07/01/12 (f) | | | 500 | | | | 682 | | |
Aventine Renewable Energy,
Callable 12/15/06 @ 103
9.870%, 12/15/11 (c) (e) | | | 1,000 | | | | 1,040 | | |
Calpine,
Callable until 07/14/06 @ 103
9.349%, 07/15/07 (c) (e) | | | 980 | | | | 784 | | |
High Income Bond Fund (continued)
| DESCRIPTION | | PAR (000) | | VALUE (000) | |
Callable until 07/14/07 @ 100
8.750%, 07/15/07 | | $ | 500 | | | $ | 315 | | |
Callable 07/15/07 @ 104.25
8.500%, 07/15/10 (c) | | | 1,000 | | | | 715 | | |
Callable 04/01/08 @ 103.5
9.090%, 04/01/10 (e) | | | 1,000 | | | | 1,010 | | |
CMS Energy
8.500%, 04/15/11 (b) | | | 1,185 | | | | 1,318 | | |
Dynegy-Roseton Danskamme, Series B
7.670%, 11/08/16 | | | 2,000 | | | | 1,983 | | |
Empresa Nacional de Electricidad
8.350%, 08/01/13 (a) | | | 1,000 | | | | 1,149 | | |
Mission Energy Holdings
13.500%, 07/15/08 | | | 1,750 | | | | 2,054 | | |
Reliant Energy,
Callable 07/15/08 @ 104.75
9.500%, 07/15/13 | | | 750 | | | | 829 | | |
Callable 12/15/09 @ 103.38
6.750%, 12/15/14 | | | 500 | | | | 489 | | |
Sierra Pacific Resources,
Callable 03/15/09 @ 104.31
8.625%, 03/15/14 (b) | | | 1,500 | | | | 1,650 | | |
Teco Energy
7.200%, 05/01/11 | | | 1,000 | | | | 1,064 | | |
TXU Corporation
5.550%, 11/15/14 | | | 2,500 | | | | 2,375 | | |
Utilicorp Canada Finance
7.750%, 06/15/11 (a) | | | 1,000 | | | | 1,050 | | |
| | | | 20,208 | | |
| Energy – 5.7% | | | |
Bluewater Finance,
Callable 02/15/07 @ 105.13
10.250%, 02/15/12 (a) | | | 1,000 | | | | 1,090 | | |
Chesapeake Energy,
Callable 08/15/09 @ 103.50
7.000%, 08/15/14 | | | 1,000 | | | | 1,055 | | |
Harvest Operations,
Callable 10/15/08 @ 103.94
7.875%, 10/15/11 (a) | | | 1,250 | | | | 1,238 | | |
J. Ray McDermott,
Callable 12/15/08 @ 105.50
11.000%, 12/15/13 (a) (c) | | | 1,000 | | | | 1,155 | | |
Kerr-McGee
6.950%, 07/01/24 | | | 1,250 | | | | 1,294 | | |
Lone Star Technologies,
Callable 06/01/06 @ 104.50
9.000%, 06/01/11 | | | 1,000 | | | | 1,063 | | |
North American Energy Partners,
Callable 12/01/07 @ 104.38
8.750%, 12/01/11 (a) (b) | | | 1,500 | | | | 1,429 | | |
Ocean Rig Norway,
Callable 07/01/09 @ 104.19
8.375%, 07/01/13 (a) (c) | | | 500 | | | | 541 | | |
Parker Drilling, Series B,
Callable until 11/14/05 @ 105.06
10.125%, 11/15/09 | | | 156 | | | | 163 | | |
Petrobras International Financie
7.750%, 09/15/14 (a) | | | 1,500 | | | | 1,628 | | |
Petroleum Geo-Services,
Callable 11/05/07 @ 105
10.000%, 11/05/10 (a) | | | 1,000 | | | | 1,125 | | |
Range Resources,
Callable 07/15/08 @ 103.69
7.375%, 07/15/13 | | | 1,000 | | | | 1,070 | | |
FIRST AMERICAN FUNDS Annual Report 2005
35
Schedule of Investments September 30, 2005
High Income Bond Fund (continued)
| DESCRIPTION | | PAR (000) | | VALUE (000) | |
United Refining,
Callable 08/15/08 @ 105.25
10.500%, 08/15/12 | | $ | 1,000 | | | $ | 1,060 | | |
Whiting Petroleum
7.000%, 02/01/14 (c) | | | 1,000 | | | | 1,014 | | |
| | | | 14,925 | | |
| Finance – 0.1% | | | |
Finova Group
7.500%, 11/15/09 | | | 580 | | | | 226 | | |
| Industrial Other – 0.3% | |
Amsted Industries,
Callable 10/15/07 @ 105.13
10.250%, 10/15/11 (c) | | | 800 | | | | 870 | | |
Diamond Brands Operating,
Callable until 04/14/06 @ 100
10.125%, 04/15/08 (i) (j) (k) (l) | | | 50 | | | | - | | |
| | | | 870 | | |
| Insurance – 1.1% | | | |
Fairfax Financial Holdings
7.750%, 04/26/12 (a) | | | 1,000 | | | | 960 | | |
First American Capital Trust I
8.500%, 04/15/12 | | | 750 | | | | 821 | | |
Ohio Casualty
7.300%, 06/15/14 | | | 1,000 | | | | 1,076 | | |
| | | | 2,857 | | |
| Miscellaneous – 5.5% | | | |
Dow Jones
Series 3-2
6.375%, 12/29/09 (b) (c) | | | 5,000 | | | | 4,966 | | |
Series 4-T1
8.250%, 06/29/10 (c) | | | 2,970 | | | | 2,944 | | |
Series 4-T2
6.750%, 06/29/10 (c) | | | 4,000 | | | | 3,933 | | |
Series 4-T3
8.000%, 06/29/10 (b) (c) | | | 2,500 | | | | 2,503 | | |
| | | | 14,346 | | |
| Natural Gas – 3.5% | | | |
El Paso
6.375%, 02/01/09 | | | 1,000 | | | | 970 | | |
| 7.750%, 01/15/32 | | | 1,000 | | | | 1,010 | | |
El Paso Natural Gas,
Callable 08/01/07 @ 103.81
7.625%, 08/01/10 | | | 1,400 | | | | 1,460 | | |
Suburban Propane Partners,
Callable 12/15/08 @ 103.44
6.875%, 12/15/13 | | | 1,000 | | | | 935 | | |
Tennessee Gas Pipeline
7.500%, 04/01/17 (b) | | | 1,500 | | | | 1,614 | | |
Williams
6.375%, 10/01/10 (c) | | | 1,000 | | | | 993 | | |
| 7.750%, 06/15/31 (b) | | | 2,000 | | | | 2,170 | | |
| | | | 9,152 | | |
| Sovereigns – 2.2% | | | |
Federal Republic of Brazil
10.250%, 06/17/13 (a) | | | 350 | | | | 417 | | |
Government of Jamaica
10.625%, 06/20/17 (a) (b) | | | 500 | | | | 555 | | |
Republic of Panama
7.250%, 03/15/15 (a) | | | 1,000 | | | | 1,090 | | |
High Income Bond Fund (continued)
| DESCRIPTION | | PAR (000) | | VALUE (000) | |
Republic of Philippines
8.875%, 03/17/15 (a) (b) | | $ | 1,000 | | | $ | 1,064 | | |
| 9.875%, 01/15/19 (a) (b) | | | 600 | | | | 670 | | |
Republic of Turkey
9.000%, 06/30/11 (a) | | | 500 | | | | 575 | | |
| 7.375%, 02/05/25 (a) | | | 1,400 | | | | 1,401 | | |
| | | | 5,772 | | |
| Technology – 3.5% | | | |
Avnet
9.750%, 02/15/08 | | | 1,000 | | | | 1,103 | | |
Freescale Semiconductor,
Callable 07/15/08 @ 103.44
6.875%, 07/15/11 (b) | | | 1,000 | | | | 1,040 | | |
Hynix Semiconductor,
Callable 07/01/09 @ 105.25
9.875%, 07/01/12 (a) (b) (c) | | | 500 | | | | 551 | | |
Iron Mountain,
Callable 04/01/06 @ 104.31
8.625%, 04/01/13 | | | 500 | | | | 525 | | |
Lucent Technologies
5.500%, 11/15/08 (b) | | | 1,000 | | | | 999 | | |
Nortel Networks
6.125%, 02/15/06 (a) | | | 1,000 | | | | 1,003 | | |
Sanmina Sci,
Callable 03/01/09 @ 103.38
6.750%, 03/01/13 (b) | | | 1,000 | | | | 947 | | |
Sungard Data Systems
4.875%, 01/15/14 | | | 500 | | | | 435 | | |
Callable 08/15/09 @ 104.56
9.125%, 08/15/13 (c) | | | 500 | | | | 516 | | |
Callable 08/15/10 @ 105.13
10.250%, 08/15/15 (c) | | | 500 | | | | 506 | | |
Xerox
9.750%, 01/15/09 | | | 500 | | | | 560 | | |
| 7.200%, 04/01/16 | | | 1,000 | | | | 1,075 | | |
| | | | 9,260 | | |
| Transportation – 0.9% | | | |
Air Jamaica
9.375%, 07/08/15 (a) (c) | | | 500 | | | | 498 | | |
Continental Airlines, Series 2001-1, Class B
7.033%, 12/15/12 | | | 668 | | | | 597 | | |
Delta Air Lines
7.900%, 12/15/09 (j) | | | 1,000 | | | | 183 | | |
Delta Air Lines, Series 2000-1, Class B
7.920%, 11/18/10 (j) | | | 1,000 | | | | 690 | | |
Progress Rail Services,
Callable 04/01/08 @ 107.75
7.750%, 04/01/12 (c) | | | 500 | | | | 509 | | |
| | | | 2,477 | | |
Total High Yield Corporate Bonds
(Cost $237,450) | | | | | | | 239,943 | | |
| Asset-Backed Securities – 2.6% | | | |
| Commercial – 2.6% | | | |
GMAC Commercial Mortgage Securities
Series 2003-C3, Class A2
4.223%, 04/10/40 | | | 7,000 | | | | 6,895 | | |
| Manufactured Housing – 0.0% | | | |
Green Tree Financial
Series 1998-1, Class A1
6.040%, 11/01/29 (i) | | | 12 | | | | 12 | | |
Total Asset-Backed Securities
(Cost $7,049) | | | | | | | 6,907 | | |
The accompanying notes are an integral part of the financial statements.
FIRST AMERICAN FUNDS Annual Report 2005
36
High Income Bond Fund (continued)
| DESCRIPTION | | PAR (000)/SHARES | | VALUE (000) | |
| Corporate Bonds – 2.4% | |
| Basic Industry – 0.8% | |
Glencore Funding
6.000%, 04/15/14 (c) | | $ | 1,000 | | | $ | 922 | | |
Vale Overseas
8.250%, 01/17/34 | | | 1,000 | | | | 1,130 | | |
| | | | 2,052 | | |
| Consumer Cyclical – 0.7% | | | |
Ford Motor Credit
5.800%, 01/12/09 (b) | | | 1,000 | | | | 935 | | |
| 7.000%, 10/01/13 (b) | | | 1,000 | | | | 925 | | |
| | | | 1,860 | | |
| Energy – 0.5% | | | |
Tengizcheveroil Finance
6.124%, 11/15/14 (c) | | | 1,250 | | | | 1,271 | | |
| Transportation – 0.4% | |
American Airlines, Series 1999-1, Class A2
7.024%, 04/15/11 | | | 1,000 | | | | 1,013 | | |
Total Corporate Bonds
(Cost $6,327) | | | | | | | 6,196 | | |
| Preferred Stocks – 0.9% | |
| United States – 0.9% | |
Alamosa Holdings, Series B,
Callable 11/10/06 @ 312.50 | | | 1,000 | | | | 1,275 | | |
iStar Financial, Series G,
Callable 12/19/08 @ 25 (REIT) | | | 20,000 | | | | 501 | | |
| Nebco Evans Holdings (PIK) (i) (j) (k) (l) | | | 300 | | | | - | | |
Pegasus Communications Fractional
Shares (i) (k) | | | 15,109 | | | | - | | |
Rural Cellular, Series B,
Callable 11/14/05 @ 1,028.44 (PIK) | | | 500 | | | | 623 | | |
Total Preferred Stocks
(Cost $1,754) | | | | | | | 2,399 | | |
| Common Stocks – 0.1% | |
| Bermuda – 0.0% | |
| Viatel Holdings (i) (k) (l) | | | 338 | | | | - | | |
| Canada – 0.0% | |
| Manitoba Telecom Services | | | 40 | | | | 1 | | |
| United States – 0.1% | |
| NII Holdings, Class B (l) | | | 1,869 | | | | 158 | | |
Total Common Stocks
(Cost $147) | | | | | | | 159 | | |
| Warrant – 0.0% | |
| United States – 0.0% | |
Sterling Chemical Holdings, Expires 08/15/09
(Cost $3) (i) (j) (k) (l) | | | 100 | | | | - | | |
High Income Bond Fund (continued)
| DESCRIPTION | | SHARES/PAR (000) | | VALUE (000) | |
| Short-Term Investments – 1.4% | | | | | |
| Affiliated Money Market Fund – 1.4% | | | |
First American Prime
Obligations Fund, Class Z (m) | | | 3,642,445 | | | $ | 3,642 | | |
| U.S. Treasury Obligation – 0.0% | | | | | |
U.S. Treasury Bill
3.375%, 11/10/05 (n) | | $ | 40 | | | | 40 | | |
Total Short-Term Investments
(Cost $3,682) | | | | | 3,682 | | |
Investments Purchased with Proceeds
from Securities Lending (o) – 22.2%
(Cost $58,210) | | | | | 58,210 | | |
Total Investments – 121.0%
(Cost $314,622) | | | | | 317,496 | | |
| Other Assets and Liabilities, Net – (21.0)% | | | | | (55,144 | ) | |
| Total Net Assets – 100.0% | | | | $ | 262,352 | | |
(a) Represents a foreign high yield (non-investment grade) bond. On September 30, 2005, the value of these investments was $38,525,330, which represents 14.7% of total net assets.
(b) This security or a portion of this security is out on loan at September 30, 2005. Total loaned securities had a value of $56,870,706 at September 30, 2005. See note 2 in Notes to Financial Statements.
(c) Security purchased within the terms of a private placement memorandum, exempt from registration under Rule 144A of the Securities Act of 1933, as amended, and may be sold only to dealers in that program or other "qualified institutional buyers." These securities have been determined to be liquid under guidelines established by the funds' board of directors. As of September 30, 2005, the value of these investments was $49,768,694 or 19.0% of total net assets. See note 2 in Notes to Financial Statements.
(d) Security for which the coupon rate of interest will adjust based on ratings by Standard & Poor's and Moody's Investor Service. The rate disclosed represents the coupon rate in effect as of September 30, 2005.
(e) Variable Rate Security – The rate shown is the rate in effect as of September 30, 2005.
(f) Delayed Interest (Step-Bonds) – Securities for which the coupon rate of interest will adjust on specified future date(s). The rate disclosed represents the coupon rate in effect as of September 30, 2005.
(g) Security is convertible into shares of Sprint PCS common stock.
(h) Security defaulted subsequent to September 30, 2005.
(i) Security considered illiquid. As of September 30, 2005, the value of these investments was $12,458 or 0.0% of total net assets. See note 2 in Notes to Financial Statements.
(j) Security in bankruptcy at September 30, 2005.
(k) Security is fair valued. As of September 30, 2005, the fair value of these investments was $0 or 0.0% of total net assets. See note 2 in Notes to Financial Statements.
(l) Non-income producing security.
(m) Investment in affiliated security. This money market fund is advised by U.S. Bancorp Asset Management, Inc., which also serves as advisor for this fund. See note 3 in Notes to Financial Statements.
(n) Security has been deposited as initial margin on open futures contracts. Yield shown is effective yield as of September 30, 2005. See note 2 in Notes to Financial Statements.
(o) The fund may loan securities in return for collateral in the form of cash, U.S. Government securities, or other high grade debt obligations. The cash collateral is invested in various short-term fixed income securities, such as repurchase agreements, commercial paper, money market funds and other corporate obligations. See note 2 in Notes to Financial Statements.
PIK – Payment-in-kind interest is generally paid by issuing additional par of the security rather than paying cash.
REIT – Real Estate Investment Trust
FIRST AMERICAN FUNDS Annual Report 2005
37
Schedule of Investments September 30, 2005
High Income Bond Fund (concluded)
Schedule of Open Futures Contracts
| Description | | Number of
Contracts
Purchased
(Sold) | | Notional
Contract
Value
(000) | | Settlement
Month | | Unrealized
Appreciation
(Depreciation)
(000) | |
U.S. Treasury
5 year Futures | | | (34 | ) | | $ | (3,633 | ) | | December 05 | | $ | 29 | | |
U.S. Treasury
10 year Futures | | | (85 | ) | | | (9,343 | ) | | December 05 | | | 165 | | |
U.S. Treasury
Long Bond Futures | | | 46 | | | | 5,263 | | | December 05 | | | (122 | ) | |
| | | $ | 72 | | |
Credit Default Swap Agreements
| Counterparty | | Reference
Entity | | Buy/Sell
Protection | | Pay/
Receive
Fixed Rate | | Expiration
Date | | Notional
Amount
(000) | | Unrealized
Appreciation
(000) | |
| Citigroup | | Dow Jones CDX
NA HY4 Index | | Sell | | | 3.60 | % | | 6/20/10 | | $ | 4,950 | | | $ | 71 | | |
| J.P. Morgan | | Dow Jones CDX
NA HY4 Index | | Sell | | | 3.60 | | | 6/20/10 | | | 1,980 | | | | 19 | | |
| | | $ | 90 | | |
Inflation Protected Securities Fund
| DESCRIPTION | | PAR (000) | | VALUE (000) | |
U.S. Government & Agency
Securities – 94.4% | | | |
| U.S. Agency Debentures – 4.9% | | | |
BECCS
Callable 05/15/06 @ 100,
0.000%, 05/15/11 (a) | | $ | 1,000 | | | $ | 977 | | |
FHLMC
Callable 08/22/06 @ 100, 4.500%, 08/22/07 | | | 2,500 | | | | 2,497 | | |
| Callable 11/05/07 @ 100, 5.250%, 11/05/12 (b) | | | 5,120 | | | | 5,106 | | |
FNMA
Callable 03/24/06 @ 100, 4.200%, 03/24/08 (b) | | | 5,000 | | | | 4,955 | | |
| | | | 13,535 | | |
| U.S. Treasuries – 89.5% | | | |
U.S. Treasury Bonds
8.125%, 08/15/21 | | | 1,500 | | | | 2,092 | | |
| 2.375%, 01/15/25 (c) | | | 29,228 | | | | 31,274 | | |
| 7.625%, 02/15/25 (b) | | | 1,900 | | | | 2,623 | | |
| 3.625%, 04/15/28 (b) (c) | | | 21,260 | | | | 27,827 | | |
| 3.875%, 04/15/29 (c) | | | 16,371 | | | | 22,407 | | |
| U.S. Treasury Notes | |
| 3.375%, 01/15/07 (c) | | | 13,009 | | | | 13,452 | | |
| 3.625%, 01/15/08 (c) | | | 18,442 | | | | 19,523 | | |
| 3.875%, 01/15/09 (b) (c) | | | 16,201 | | | | 17,576 | | |
| 4.250%, 01/15/10 (b) (c) | | | 13,877 | | | | 15,522 | | |
| 0.875%, 04/15/10 (c) | | | 12,891 | | | | 12,563 | | |
| 3.500%, 01/15/11 (c) | | | 3,732 | | | | 4,111 | | |
| 3.000%, 07/15/12 (b) (c) | | | 9,236 | | | | 10,051 | | |
| 1.875%, 07/15/13 (b) (c) | | | 5,585 | | | | 5,659 | | |
| 2.000%, 01/15/14 (b) (c) | | | 8,987 | | | | 9,176 | | |
| 2.000%, 07/15/14 (c) | | | 17,957 | | | | 18,344 | | |
| 1.625%, 01/15/15 (b) (c) | | | 29,032 | | | | 28,688 | | |
| 4.125%, 05/15/15 (b) | | | 1,250 | | | | 1,228 | | |
| 1.875%, 07/15/15 (b) (c) | | | 6,027 | | | | 6,081 | | |
| | | | 248,197 | | |
Total U.S. Government & Agency Securities
(Cost $263,045) | | | | | | | 261,732 | | |
| Asset-Backed Securities – 2.1% | | | |
| Commercial – 1.9% | | | |
Deutsche Mortgage and Asset Recieving
Series 1998-C1, Class A2
6.538%, 06/15/31 | | | 393 | | | | 404 | | |
GMAC Commercial Mortgage Securities
Series 2003-C3, Class A2
4.223%, 04/10/40 | | | 2,000 | | | | 1,970 | | |
Greenwich Capital Commercial Funding
Series 2005-GG3, Class A2
4.305%, 08/10/42 | | | 2,000 | | | | 1,968 | | |
GS Mortgage Securities II
Series 2003-C1, Class A2A
3.590%, 01/10/40 | | | 500 | | | | 487 | | |
Nomura Asset Securities
Series 1998-D6, Class A1B
6.590%, 03/15/30 | | | 500 | | | | 521 | | |
| | | | 5,350 | | |
| Other – 0.2% | | | |
GRP/AG Real Estate Asset Trust
Series 2004-1, Class A
3.960%, 03/25/09 (a) (d) | | | 63 | | | | 62 | | |
Series 2005-1, Class A
4.850%, 01/25/35 (d) | | | 616 | | | | 613 | | |
| | | | 675 | | |
Total Asset-Backed Securities
(Cost $6,141) | | | | | | | 6,025 | | |
The accompanying notes are an integral part of the financial statements.
FIRST AMERICAN FUNDS Annual Report 2005
38
Inflation Protected Securities Fund (continued)
| DESCRIPTION | | PAR (000)/SHARES | | VALUE (000) | |
| Corporate Bonds – 1.1% | |
| Miscellaneous – 0.9% | |
Dow Jones, Series 3-1
8.250%, 06/29/10 (d) | | $ | 2,475 | | | $ | 2,453 | | |
| Sovereigns – 0.2% | |
Republic of Turkey
9.000%, 06/30/11 | | | 500 | | | | 575 | | |
Total Corporate Bonds
(Cost $2,982) | | | | | | | 3,028 | | |
CMO – U.S. Government Agency
Mortgage-Backed Securities – 0.5% | |
| Fixed Rate – 0.5% | |
FHLMC Gold Pool
4.000%, 10/01/10, #M80855 | | | 869 | | | | 857 | | |
FHLMC REMIC
Series 2763, Class TA
4.000%, 03/15/11 | | | 417 | | | | 408 | | |
Total CMO – U.S. Government Agency
Mortgage-Backed Securities
(Cost $1,287) | | | | | | | 1,265 | | |
| Short-Term Investments – 0.8% | |
| Affiliated Money Market Fund – 0.7% | |
First American Prime
Obligations Fund, Class Z (e) | | | 1,989,860 | | | | 1,990 | | |
| U.S. Treasury Obligation – 0.1% | |
U.S. Treasury Bill
2.520%, 11/10/05 (f) | | $ | 250 | | | | 249 | | |
Total Short-Term Investments
(Cost $2,239) | | | | | | | 2,239 | | |
Investments Purchased with Proceeds
from Securities Lending (g) – 43.8%
(Cost $121,305) | | | | | | | 121,305 | | |
Total Investments – 142.7%
(Cost $396,999) | | | | | | | 395,594 | | |
| Other Assets and Liabilities, Net – (42.7)% | | | | | | | (118,409 | ) | |
| Total Net Assets – 100.0% | | | | | | $ | 277,185 | | |
(a) Securities for which the coupon rate of interest will adjust on specified future date(s). The rate disclosed represents the coupon rate in effect as of September 30, 2005.
(b) This security or a portion of this security is out on loan at September 30, 2005. Total loaned securities had a value of $119,460,086 at September 30, 2005. See note 2 in Notes to Financial Statements.
(c) U.S. Treasury inflation-protection securities (TIPS) are securities in which the principal amount is adjusted for inflation and the semiannual interest payments equal a fixed percentage of the inflation-adjusted principal amount.
(d) Security purchased within the terms of a private placement memorandum, exempt from registration under Rule 144A of the Securities Act of 1933, as amended, and may be sold only to dealers in that program or other "qualified institutional buyers." These securities have been determined to be liquid under guidelines established by the funds' board of directors. As of September 30, 2005, the value of these investments was $3,128,122 or 1.1% of total net assets. See note 2 in Notes to Financial Statements.
(e) Investment in affiliated security.This money market fund is advised by U.S. Bancorp Asset Management, Inc., which also serves as advisor for this fund. See note 3 in Notes to Financial Statements.
Inflation Protected Securities Fund (concluded)
(f) Security has been deposited as inital margin on open futures contracts. Yield shown is the effective yield as of September 30, 2005. See note 2 in Notes to Financial Statements.
(g) The fund may loan securities in return for collateral in the form of cash, U.S. Government securities, or other high grade debt obligations. The cash collateral is invested in various short-term fixed income securities, such as repurchase agreements, commercial paper, money market funds and other corporate obligations. See note 2 in Notes to Financial Statements.
BECCS – Bearer Corporate Conversion System
CMO – Collateralized Mortgage Obligation
FHLMC – Federal Home Loan Mortgage Corporation
FNMA – Federal National Mortgage Association
REMIC – Real Estate Mortgage Investment Conduit
Schedule of Open Futures Contract
| Description | | Number of
Contracts
Purchased/
(Sold) | | Notional
Contract
Value
(000) | | Settlement
Month | | Unrealized
(Depreciation)
(000) | |
Euro Dollar
90 Day Futures | | | (33 | ) | | $ | (31,500 | ) | | March 06 | | $ | 43 | | |
| Euro FX Futures | | | (14 | ) | | | (2,110 | ) | | December 05 | | | (1 | ) | |
| Japanese Yen FX Futures | | | 40 | | | | 4,439 | | | December 05 | | | (89 | ) | |
U.S. Treasury
Long Bond Futures | | | 5 | | | | 572 | | | December 05 | | | (17 | ) | |
| | | $ | (64 | ) | |
Credit Default Swap Agreement
| Counterparty | | Reference
Entity | | Buy/Sell
Protection | | Pay/
Receive
Fixed Rate | | Expiration
Date | | Notional
Amount
(000) | | Unrealized
Appreciation
(000) | |
| Citigroup | | Dow Jones CDX
EM 3 Index | | Sell | | | 2.10 | % | | | 6/20/10 | | | $ | 2,000 | | | $ | 90 | | |
FIRST AMERICAN FUNDS Annual Report 2005
39
Schedule of Investments September 30, 2005
Intermediate Government Bond Fund
| DESCRIPTION | | PAR (000) | | VALUE (000) | |
U.S. Government & Agency
Securities – 97.9% | |
| U.S. Agency Debentures – 61.3% | |
FFCB
2.375%, 10/02/06 | | $ | 3,750 | | | $ | 3,679 | | |
| 1.875%, 01/16/07 | | | 1,895 | | | | 1,837 | | |
| 3.250%, 06/15/07 | | | 2,865 | | | | 2,812 | | |
| 2.625%, 09/17/07 | | | 3,750 | | | | 3,627 | | |
| 3.000%, 12/17/07 | | | 1,805 | | | | 1,752 | | |
| 4.125%, 07/17/09 | | | 1,100 | | | | 1,086 | | |
| 5.750%, 01/18/11 | | | 1,800 | | | | 1,900 | | |
| FHLB | |
| 2.125%, 05/15/06 | | | 600 | | | | 593 | | |
| 3.000%, 05/15/06 | | | 1,900 | | | | 1,887 | | |
| 2.875%, 05/22/06 | | | 2,550 | | | | 2,530 | | |
| 5.250%, 08/15/06 | | | 3,000 | | | | 3,026 | | |
| 2.875%, 02/15/07 | | | 3,100 | | | | 3,039 | | |
| Callable 04/07/06 @ 100, 4.430%, 04/07/08 | | | 2,000 | | | | 1,989 | | |
| Callable 05/16/06 @ 100, 4.250%, 05/16/08 | | | 1,600 | | | | 1,585 | | |
| Callable 06/13/06 @ 100, 4.100%, 06/13/08 | | | 1,590 | | | | 1,570 | | |
| TVA | |
| 5.375%, 11/13/08 | | | 2,455 | | | | 2,521 | | |
| 5.625%, 01/18/11 | | | 3,450 | | | | 3,621 | | |
| 6.790%, 05/23/12 | | | 3,175 | | | | 3,568 | | |
| 4.375%, 06/15/15 | | | 1,150 | | | | 1,126 | | |
| | | | 43,748 | | |
| U.S. Treasuries – 36.6% | | | |
U.S. Inflation Index Bond
1.625%, 01/15/15 (a) | | | 1,448 | | | | 1,431 | | |
U.S. Treasury Bond (STRIPS)
0.000%, 11/15/11 (b) | | | 1,670 | | | | 1,598 | | |
U.S. Treasury Bonds
12.750%, 11/15/10 | | | 2,335 | | | | 2,359 | | |
| 13.250%, 05/15/14 | | | 2,400 | | | | 3,122 | | |
| 11.750%, 11/15/14 | | | 2,575 | | | | 3,300 | | |
| 9.250%, 02/15/16 | | | 600 | | | | 839 | | |
| 7.250%, 05/15/16 | | | 1,275 | | | | 1,577 | | |
| 9.125%, 05/15/18 | | | 1,250 | | | | 1,802 | | |
| 9.000%, 11/15/18 | | | 510 | | | | 734 | | |
| 8.125%, 08/15/19 | | | 1,075 | | | | 1,468 | | |
| 8.750%, 05/15/20 | | | 1,350 | | | | 1,948 | | |
| U.S. Treasury Notes | |
| 3.875%, 05/15/10 | | | 2,715 | | | | 2,675 | | |
| 3.625%, 06/15/10 | | | 1,925 | | | | 1,876 | | |
| 3.875%, 07/15/10 | | | 1,100 | | | | 1,083 | | |
| 4.000%, 02/15/15 | | | 265 | | | | 258 | | |
| | | | 26,070 | | |
Total U.S. Government & Agency Securities
(Cost $71,110) | | | | | | | 69,818 | | |
Total Investments – 97.9%
(Cost $71,110) | | | | | | | 69,818 | | |
| Other Assets and Liabilities, Net – 2.1% | | | | | | | 1,501 | | |
| Total Net Assets – 100.0% | | | | | | $ | 71,319 | | |
(a) U.S. Treasury inflation-protection securities (TIPS) are securities in which the principal amount is adjusted for inflation and the semiannual interest payments equal a fixed percentage of the inflation-adjusted principal amount.
(b) Principal only – Represents securities that entitle holders to receive only principal payments on the underlying mortgages. The yield to maturity of a principal only is sensitive to the rate of principal payments on the underlying mortgage assets. A slow (rapid) rate of principal repayments may have an adverse (positive) effect on yield to maturity. The zero coupon rate represents the lack of interest as part of payments received.
Intermediate Government Bond Fund (concluded)
FFCB – Federal Farm Credit Bank
FHLB – Federal Home Loan Bank
TVA – Tennesse Valley Authority
STRIPS – Separate Trading of Registered Interest and Principal of Securities
The accompanying notes are an integral part of the financial statements.
FIRST AMERICAN FUNDS Annual Report 2005
40
Intermediate Term Bond Fund
| DESCRIPTION | | PAR (000) | | VALUE (000) | |
U.S. Government & Agency
Securities – 41.9% | |
| U.S. Agency Debentures – 11.8% | |
FHLB
Callable 04/07/06 @ 100,
4.430%, 04/07/08 (a) | | $ | 24,000 | | | $ | 23,868 | | |
FHLMC
Callable 06/23/06 @ 100, 4.250%, 06/23/08 (a) | | | 11,800 | | | | 11,689 | | |
| Callable 08/04/06 @ 100, 4.500%, 08/04/08 (a) | | | 11,420 | | | | 11,362 | | |
| Callable 03/01/06 @ 100, 4.375%, 03/01/10 (a) | | | 12,260 | | | | 12,083 | | |
| FNMA | |
| Callable 11/22/05 @ 100, 3.000%, 11/22/06 (a) | | | 23,845 | | | | 23,484 | | |
| Callable 08/25/06 @ 100, 4.750%, 08/25/08 (a) | | | 11,345 | | | | 11,348 | | |
| Callable 11/17/05 @ 100, 3.875%, 11/17/08 | | | 13,000 | | | | 12,765 | | |
| 7.250%, 01/15/10 (a) | | | 11,170 | | | | 12,346 | | |
| 6.125%, 03/15/12 (a) | | | 7,020 | | | | 7,609 | | |
| 5.250%, 08/01/12 (a) | | | 5,990 | | | | 6,094 | | |
| | | | 132,648 | | |
| U.S. Treasuries – 30.1% | | | |
| U.S. Treasury Bonds | |
| 9.250%, 02/15/16 (a) | | | 8,725 | | | | 12,204 | | |
| 7.250%, 05/15/16 (a) | | | 10,200 | | | | 12,616 | | |
| 9.125%, 05/15/18 (a) | | | 8,685 | | | | 12,524 | | |
| 9.000%, 11/15/18 (a) | | | 8,620 | | | | 12,414 | | |
| 8.750%, 05/15/20 (a) | | | 18,000 | | | | 25,979 | | |
| U.S. Treasury Notes | |
| 1.625%, 02/28/06 (a) | | | 5,645 | | | | 5,594 | | |
| 1.500%, 03/31/06 | | | 10,500 | | | | 10,376 | | |
| 3.875%, 07/31/07 (a) | | | 4,245 | | | | 4,222 | | |
| 3.750%, 05/15/08 (a) | | | 85 | | | | 84 | | |
| 4.125%, 08/15/08 (a) | | | 14,225 | | | | 14,203 | | |
| 3.875%, 07/15/10 (a) | | | 50,360 | | | | 49,581 | | |
| 4.125%, 08/15/10 (a) | | | 57,280 | | | | 57,003 | | |
| 3.875%, 09/15/10 (a) | | | 9,945 | | | | 9,804 | | |
| 1.625%, 01/15/15 (a) (b) | | | 23,635 | | | | 23,355 | | |
| 4.125%, 05/15/15 (a) | | | 7,000 | | | | 6,880 | | |
| 4.250%, 08/15/15 (a) | | | 81,310 | | | | 80,802 | | |
| | | | 337,641 | | |
Total U.S. Government & Agency Securities
(Cost $473,361) | | | | | | | 470,289 | | |
| Asset-Backed Securities – 21.4% | |
| Automotive – 2.2% | |
Nissan Auto Receivables Owner Trust
Series 2005-A, Class A2
3.220%, 07/16/07 | | | 10,432 | | | | 10,394 | | |
Series 2005-B, Class A2
3.750%, 09/17/07 | | | 4,255 | | | | 4,241 | | |
USAA Auto Owner Trust
Series 2003-1, Class A4
2.040%, 02/16/10 | | | 1,495 | | | | 1,470 | | |
WFS Financial Owner Trust
Series 2004-4, Class A3
2.980%, 09/17/09 | | | 9,170 | | | | 8,994 | | |
| | | | 25,099 | | |
| Commercial – 5.9% | | | |
Banc of America Commercial Mortgage
Series 2004-4, Class A3
4.128%, 07/10/42 | | | 8,715 | | | | 8,546 | | |
Commercial Mortgage
Series 2004-CNL, Class A1
3.988%, 09/15/14 (c) (d) | | | 7,455 | | | | 7,453 | | |
Intermediate Term Bond Fund (continued)
| DESCRIPTION | | PAR (000) | | VALUE (000) | |
Deutsche Mortgage and Asset Receiving
Series 1998-C1, Class A2
6.538%, 06/15/31 | | $ | 5,550 | | | $ | 5,708 | | |
GMAC Commercial Mortgage Securities
Series 2004-C2, Class A1
3.896%, 08/10/38 | | | 7,031 | | | | 6,910 | | |
Greenwich Capital Commercial Funding
Series 2003-C1, Class A2
3.285%, 07/05/35 | | | 5,000 | | | | 4,775 | | |
GS Mortgage Securities II
Series 2003-C1, Class A2A
3.590%, 01/10/40 | | | 13,840 | | | | 13,479 | | |
Series 2004-GG2, Class A1
3.109%, 08/10/38 | | | 5,788 | | | | 5,737 | | |
Morgan Stanley Capital Investments
Series 1999-FNV1, Class A1
6.120%, 03/15/31 | | | 1,869 | | | | 1,896 | | |
Nomura Asset Securities
Series 1998-D6, Class A1B
6.590%, 03/15/30 | | | 11,675 | | | | 12,159 | | |
| | | | 66,663 | | |
| Credit Card – 7.3% | | | |
American Express Credit Account
Series 2004-4, Class C
4.238%, 03/15/12 (c) (d) | | | 3,100 | | | | 3,106 | | |
Capital One Multi-Asset Execution Trust
Series 2003-A6, Class A6
2.950%, 08/17/09 | | | 7,500 | | | | 7,391 | | |
Chase Issuance Trust
Series 2005-A9, Class A9
3.816%, 11/15/11 (d) | | | 18,475 | | | | 18,511 | | |
Citibank Credit Card Issuance Trust
Series 2004-A4, Class A4
3.200%, 08/24/09 | | | 10,065 | | | | 9,822 | | |
Fleet Credit Card Master Trust
Series 2001-B, Class A
5.600%, 12/15/08 | | | 10,820 | | | | 10,903 | | |
MBNA Credit Card Master Note Trust
Series 2001-A1, Class A1
5.750%, 10/15/08 | | | 5,830 | | | | 5,882 | | |
Series 2003-A1, Class A1
3.300%, 07/15/10 12,560 12,220
Series 2003-C6, Class C6
4.948%, 12/15/10 (d) | | | 3,200 | | | | 3,262 | | |
Providian Gateway Master Trust
Series 2004-DA, Class A
3.350%, 09/15/11 (c) | | | 10,355 | | | | 10,100 | | |
| | | | 81,197 | | |
| Equipment Leases – 1.3% | | | |
Caterpillar Financial Asset Trust
Series 2005-A, Class A2
3.660%, 12/26/07 | | | 6,725 | | | | 6,703 | | |
CNH Equipment Trust
Series 2003-B, Class A3B
2.470%, 01/15/08 | | | 7,298 | | | | 7,236 | | |
| | | | 13,939 | | |
| Home Equity – 3.1% | | | |
Amresco Residential Security Mortgage
Series 1997-3, Class A9
6.960%, 03/25/27 | | | 696 | | | | 670 | | |
FIRST AMERICAN FUNDS Annual Report 2005
41
Schedule of Investments September 30, 2005
Intermediate Term Bond Fund (continued)
| DESCRIPTION | | PAR (000) | | VALUE (000) | |
Contimortgage Home Equity Loan Trust
Series 1997-2, Class A9
7.090%, 04/15/28 | | $ | 398 | | | $ | 398 | | |
Series 1997-3, Class A9
7.120%, 08/15/28 | | | 138 | | | | 137 | | |
Countrywide
Series 2003-BC1, Class A1
4.230%, 03/25/33 (d) (e) | | | 1,104 | | | | 1,132 | | |
Equity One
Series 2003-4, Class AF3
3.531%, 10/25/34 | | | 12,168 | | | | 12,106 | | |
First Franklin Mortgage Loan
Series 2004-FFB, Class A3
4.264%, 06/25/24 | | | 3,090 | | | | 3,071 | | |
Household Home Equity Loan Trust
Series 2002-3, Class A
4.246%, 07/20/32 (d) | | | 5,161 | | | | 5,164 | | |
Residential Asset Mortgage Products
Series 2004-RS4, Class AI2
3.247%, 09/25/25 | | | 3,866 | | | | 3,842 | | |
Residential Funding Mortgage Securities
Series 2004-HI2, Class A3
4.270%, 11/25/16 | | | 5,435 | | | | 5,397 | | |
Saxon Asset Securities Trust
Series 2004-1, Class A
4.100%, 03/25/35 (d) (e) | | | 3,056 | | | | 3,066 | | |
| | | | 34,983 | | |
| Manufactured Housing – 0.0% | | | |
Green Tree Financial
Series 1996-9, Class A5
7.200%, 01/15/28 | | | 260 | | | | 260 | | |
| Other – 1.6% | |
GRP/AG Real Estate Asset Trust
Series 2004-1, Class A
3.960%, 03/25/09 (c) (e) 345 340
Series 2004-2, Class A
4.210%, 07/25/34 (c) (e) | | | 927 | | | | 911 | | |
Series 2005-1, Class A
4.850%, 01/25/35 (c) (e) | | | 3,105 | | | | 3,089 | | |
Global Signal Trust
Series 2004-2A, Class A
4.232%, 12/15/14 (c) | | | 7,390 | | | | 7,192 | | |
Small Business Administration
Series 2005-P10B, Class 1
4.940%, 08/01/15 | | | 6,540 | | | | 6,592 | | |
| | | | 18,124 | | |
Total Asset-Backed Securities
(Cost $244,159) | | | | | | | 240,265 | | |
| Corporate Bonds – 14.8% | |
| Banking – 0.8% | |
Chuo Mitsui Trust & Bank,
Callable 04/15/15 @ 100
5.506%, 12/31/49 (c) (e) | | | 2,840 | | | | 2,698 | | |
Credit Suisse First Boston
3.875%, 01/15/09 (a) | | | 6,270 | | | | 6,122 | | |
| | | | 8,820 | | |
| Basic Industry – 0.2% | | | |
Celulosa Arauco Constitucion
5.625%, 04/20/15 (c) | | | 2,000 | | | | 1,984 | | |
| Brokerage – 0.4% | |
Merrill Lynch, Series B
5.360%, 02/01/07 | | | 4,280 | | | | 4,326 | | |
Intermediate Term Bond Fund (continued)
| DESCRIPTION | | PAR (000) | | VALUE (000) | |
| Capital Goods – 0.2% | | | |
Hutchison Whampoa International
6.250%, 01/24/14 (c) | | $ | 2,680 | | | $ | 2,825 | | |
| Communications – 2.6% | | | |
America Movil SA
5.750%, 01/15/15 | | | 3,255 | | | | 3,279 | | |
AT&T Broadband
8.375%, 03/15/13 | | | 4,345 | | | | 5,141 | | |
Clear Channel Communications
5.500%, 09/15/14 | | | 4,360 | | | | 4,200 | | |
Deutsche Telecom
8.500%, 06/15/10 | | | 3,690 | | | | 4,168 | | |
Telecom De Puerto Rico
6.650%, 05/15/06 | | | 4,000 | | | | 4,048 | | |
Verizon Global Funding
7.250%, 12/01/10 | | | 3,750 | | | | 4,140 | | |
| 6.875%, 06/15/12 | | | 3,925 | | | | 4,332 | | |
| | | | 29,308 | | |
| Consumer Cyclical – 1.2% | | | |
Centex
5.450%, 08/15/12 | | | 4,045 | | | | 4,021 | | |
DaimlerChrysler
6.500%, 11/15/13 (a) | | | 2,230 | | | | 2,358 | | |
Ford Motor Credit
7.000%, 10/01/13 (a) | | | 1,295 | | | | 1,198 | | |
Harrah's
5.625%, 06/01/15 (c) | | | 3,535 | | | | 3,482 | | |
| 5.750%, 10/01/17 (c) | | | 1,950 | | | | 1,912 | | |
| | | | 12,971 | | |
| Consumer NonCyclical – 1.6% | | | |
Albertson's
7.500%, 02/15/11 | | | 2,730 | | | | 2,692 | | |
Conagra Foods
7.875%, 09/15/10 | | | 4,260 | | | | 4,758 | | |
Kraft Foods
4.625%, 11/01/06 | | | 6,750 | | | | 6,754 | | |
Kroger
7.450%, 03/01/08 | | | 4,000 | | | | 4,227 | | |
| | | | 18,431 | | |
| Electric – 2.7% | | | |
DTE Energy
7.050%, 06/01/11 | | | 4,600 | | | | 5,034 | | |
Exelon
4.900%, 06/15/15 | | | 5,000 | | | | 4,713 | | |
FPL Group Capital
7.625%, 09/15/06 | | | 4,540 | | | | 4,669 | | |
MidAmerican Energy Holdings
3.500%, 05/15/08 | | | 4,600 | | | | 4,443 | | |
National Rural Utilities
5.750%, 08/28/09 | | | 3,850 | | | | 3,989 | | |
Pacific Gas & Electric
4.200%, 03/01/11 | | | 2,065 | | | | 1,988 | | |
Southern California Edison
5.000%, 01/15/14 (a) | | | 2,000 | | | | 2,003 | | |
TXU Energy
7.000%, 03/15/13 (a) | | | 3,075 | | | | 3,338 | | |
| | | | 30,177 | | |
The accompanying notes are an integral part of the financial statements.
FIRST AMERICAN FUNDS Annual Report 2005
42
Intermediate Term Bond Fund (continued)
| DESCRIPTION | | PAR (000) | | VALUE (000) | |
| Energy – 0.6% | | | |
Gazprom International
7.201%, 02/01/20 (c) | | $ | 3,500 | | | $ | 3,824 | | |
Tengizcheveroil Finance
6.124%, 11/15/14 (c) | | | 3,095 | | | | 3,148 | | |
| | | | 6,972 | | |
| Finance Companies – 0.4% | | | |
American General
5.875%, 07/14/06 (a) | | | 4,085 | | | | 4,130 | | |
| Insurance – 0.2% | | | |
Fund American Companies
5.875%, 05/15/13 | | | 1,915 | | | | 1,906 | | |
| Miscellaneous – 1.1% | | | |
Core Investment Grade Trust
4.659%, 11/30/07 (e) | | | 12,712 | | | | 12,645 | | |
| Natural Gas – 1.0% | | | |
Duke Energy Field Services
7.875%, 08/16/10 | | | 10,000 | | | | 11,229 | | |
| REITS – 0.9% | | | |
Colonial Realty
4.750%, 02/01/10 | | | 4,915 | | | | 4,777 | | |
Mack-Cali Realty
7.250%, 03/15/09 | | | 4,500 | | | | 4,820 | | |
| | | | 9,597 | | |
| Sovereigns – 0.8% | | | |
United Mexican States
5.875%, 01/15/14 (a) | | | 8,760 | | | | 9,071 | | |
| Technology – 0.1% | | | |
Chartered Semiconductor
5.750%, 08/03/10 | | | 1,500 | | | | 1,483 | | |
Total Corporate Bonds
(Cost $166,908) | | | | | | | 165,875 | | |
CMO – Private Mortgage-Backed
Securities – 12.2% | | | |
| Adjustable Rate (d) – 10.2% | | | |
Adjustable Rate Mortgage Trust
Series 2005-10, Class 1A21
4.765%, 01/25/36 | | | 7,665 | | | | 7,622 | | |
CS First Boston Mortgage Securities
Series 2003-AR24, Class 2A4
4.058%, 10/25/33 | | | 13,390 | | | | 13,232 | | |
Granite Mortgages
Series 2003-1, Class 1C
5.070%, 01/20/43 (e) | | | 4,500 | | | | 4,593 | | |
IMPAC CMB Trust
Series 2003-12, Class A1
4.210%, 12/25/33 (e) | | | 3,973 | | | | 3,985 | | |
MLCC Mortgage Investors
Series 2003-G, Class A3
4.963%, 01/25/29 | | | 6,453 | | | | 6,607 | | |
Series 2003-H, Class A3A
5.057%, 01/25/29 | | | 3,553 | | | | 3,624 | | |
Series 2004-B, Class A3
5.203%, 05/25/29 | | | 5,032 | | | | 5,141 | | |
Sequoia Mortgage Trust
Series 2004-5, Class A1
4.734%, 06/20/34 | | | 6,110 | | | | 6,247 | | |
Series 2004-7, Class A2
4.847%, 08/20/34 | | | 5,162 | | | | 5,226 | | |
Intermediate Term Bond Fund (continued)
| DESCRIPTION | | PAR (000) | | VALUE (000) | |
Structured Mortgage Loan Trust
Series 2004-11, Class A
5.352%, 08/25/34 | | $ | 2,984 | | | $ | 3,043 | | |
Thornburg Mortgage Securities Trust
Series 2005-2, Class A1
4.050%, 07/25/45 | | | 7,483 | | | | 7,473 | | |
Washington Mutual
Series 2003-AR10, Class A6
4.069%, 10/25/33 | | | 10,560 | | | | 10,459 | | |
Wells Fargo Mortgage Backed Securities Trust
Series 2003-J, Class 2A5
4.450%, 10/25/33 | | | 11,500 | | | | 11,231 | | |
Series 2004-E, Class A5
3.662%, 05/25/34 | | | 9,010 | | | | 8,811 | | |
Series 2004-EE, Class B1
3.988%, 01/25/35 | | | 5,737 | | | | 5,519 | | |
Series 2004-N, Class A3
4.108%, 08/25/34 | | | 11,108 | | | | 10,991 | | |
| | | | 113,804 | | |
| Fixed Rate – 2.0% | | | |
Bank of America Mortgage Securities
Series 2003-6, Class 1A29
4.250%, 08/25/33 | | | 9,000 | | | | 8,899 | | |
Countrywide Alternative Loan Trust
Series 2004-2CB, Class 1A1
4.250%, 03/25/34 | | | 5,469 | | | | 5,416 | | |
Salomon Brothers Mortgage Securities
Series 1986-1, Class A
6.000%, 12/25/11 | | | 147 | | | | 147 | | |
Sequoia Mortgage Trust
Series 2004-4, Class X1
0.800%, 05/20/34 (f) | | | 116,185 | | | | 428 | | |
Structured Asset Securities Corporation
Series 2005-6, Class 5A6
5.000%, 05/25/35 | | | 8,241 | | | | 8,184 | | |
Westam Mortgage Financial
Series 11, Class A
6.360%, 08/26/20 | | | 57 | | | | 57 | | |
| | | | 23,131 | | |
Total CMO – Private Mortgage-Backed Securities
(Cost $138,778) | | | | | | | 136,935 | | |
CMO – U.S. Government Agency
Mortgage-Backed Securities – 5.0% | |
| Fixed Rate – 5.0% | |
FHLMC REMIC
Series 1167, Class E
7.500%, 11/15/21 | | | 38 | | | | 38 | | |
Series 1286, Class A
6.000%, 05/15/22 | | | 134 | | | | 134 | | |
Series 1634, Class PH
6.000%, 11/15/22 | | | 293 | | | | 293 | | |
Series 2763, Class TA
4.000%, 03/15/11 | | | 8,035 | | | | 7,852 | | |
Series 2893
5.000%, 12/15/27 | | | 11,590 | | | | 11,615 | | |
Series 2987, Class KE
5.000%, 12/15/34 | | | 7,785 | | | | 7,737 | | |
Series 2991, Class QD
5.000%, 08/15/34 | | | 11,705 | | | | 11,542 | | |
Series T-60, Class 1A4B
5.343%, 03/25/44 | | | 7,267 | | | | 7,279 | | |
FIRST AMERICAN FUNDS Annual Report 2005
43
Schedule of Investments September 30, 2005
Intermediate Term Bond Fund (continued)
| DESCRIPTION | | PAR (000)/SHARES | | VALUE (000) | |
FNMA REMIC
Series 1990-89, Class K
6.500%, 07/25/20 | | $ | 29 | | | $ | 29 | | |
Series 2004-76, Class CE
4.500%, 02/25/21 | | | 9,670 | | | | 9,538 | | |
Total CMO – U.S. Government Agency
Mortgage-Backed Securities
(Cost $57,062) | | | | | | | 56,057 | | |
| U.S. Government Agency Mortgage-Backed Securities – 3.6% | | | |
| Adjustable Rate (d) – 2.1% | | | |
FHLMC
4.577%, 04/01/29, #847190 | | | 3,375 | | | | 3,454 | | |
FHLMC Pool
4.614%, 01/01/28, #786281 | | | 3,014 | | | | 3,096 | | |
| 4.797%, 10/01/30, #847209 (a) | | | 6,111 | | | | 6,283 | | |
| 4.693%, 05/01/31, #847161 | | | 1,624 | | | | 1,666 | | |
| 4.741%, 09/01/33, #847210 (a) | | | 4,946 | | | | 5,094 | | |
FNMA Pool
4.818%, 09/01/33, #725111 (a) | | | 4,197 | | | | 4,324 | | |
| | | | 23,917 | | |
| Fixed Rate – 1.5% | | | |
FHLMC Gold Pool
5.500%, 09/01/06, #G40394 | | | 239 | | | | 240 | | |
| 4.000%, 10/01/10, #M80855 | | | 7,399 | | | | 7,293 | | |
FNMA Pool
6.000%, 07/01/06, #252632 | | | 100 | | | | 100 | | |
| 3.790%, 07/01/13, #386314 (a) | | | 9,907 | | | | 9,334 | | |
| | | | 16,967 | | |
Total U.S. Government Agency
Mortgage-Backed Securities
(Cost $41,691) | | | | | | | 40,884 | | |
| Short-Term Investments – 0.4% | | | |
| Affiliated Money Market Fund – 0.4% | | | |
First American Prime
Obligations Fund, Class Z (g) | | | 4,131,921 | | | | 4,132 | | |
| Treasury Obligation – 0.0% | | | |
U.S. Treasury Bill
3.389%, 11/10/05 (h) | | $ | 195 | | | | 194 | | |
Total Short-Term Investments
(Cost $4,326) | | | | | | | 4,326 | | |
| Investments Purchased with Proceeds from Securities Lending (i) – 45.6% | | | |
| (Cost $512,452) | | | | | | | 512,452 | | |
Total Investments – 144.9%
(Cost $1,638,737) | | | | | | | 1,627,083 | | |
| Other Assets and Liabilities, Net – (44.9)% | | | | | | | (504,033 | ) | |
| Total Net Assets – 100.0% | | | | | | $ | 1,123,050 | | |
(a) This security or a portion of this security is out on loan at September 30, 2005. Total loaned securities had a value of $503,024,391 at September 30, 2005. See note 2 in Notes to Financial Statements.
(b) U.S. Treasury inflation-protection securities (TIPS) are securities in which the principal amount is adjusted for inflation and the semiannual interest payments equal a fixed percentage of the inflation-adjusted principal amount.
(c) Security purchased within the terms of a private placement memorandum, exempt from registration under Rule 144A of the Securities Act of 1933, as amended, and may be sold only to dealers in that program or other "qualified institutional buyers."
Intermediate Term Bond Fund (concluded)
These securities have been determined to be liquid under guidelines established by the funds' board of directors. As of September 30, 2005, the value of these investments was $52,063,334 or 4.6% of total net assets. See note 2 in Notes to Financial Statements.
(d) Variable Rate Security – The rate shown is the rate in effect as of September 30, 2005.
(e) Delayed Interest (Step-Bonds) – Securities for which the coupon rate of interest will adjust on specified future dates. The rate disclosed represents the coupon rate in effect as of September 30, 2005.
(f) Interest only – Represents securities that entitle holders to receive only interest payments on the underlying mortgages. The yield to maturity of an interest only is extremely sensitive to the rate of principal payments on the underlying mortgage assets. A rapid (slow) rate of principal repayments may have an adverse (positive) effect on yield to maturity. The principal amount shown is the notional amount of the underlying mortgages. Interest rate disclosed represents the coupon rate in effect as of September 30, 2005
(g) Investment in affiliated security.This money market fund is advised by U.S. Bancorp Asset Management, Inc., which also serves as advisor for this fund. See note 3 in Notes to Financial Statements.
(h) Security has been deposited as initial margin on open futures contracts. Yield shown is effective yield as of September 30, 2005. See note 2 in Notes to Financial Statements.
(i) The fund may loan securities in return for collateral in the form of cash, U.S. Government securities, or other high grade debt obligations. The cash collateral is invested in various short-term fixed income securities, such as repurchase agreements, commercial paper, money market funds and other corporate obligations. See note 2 to Notes to Financial Statements.
CMO – Collateralized Mortgage Obligation
FHLB – Federal Home Loan Bank
FHLMC – Federal Home Loan Mortgage Corporation
FNMA – Federal National Mortgage Association
REIT – Real Estate Investment Trust
REMIC – Real Estate Mortgage Investment Conduit
Schedule of Open Futures Contracts
| Description | | Number of
Contracts
Purchased
(Sold) | | Notional
Contract
Value
(000) | | Settlement
Month | | Unrealized
Appreciation
(Depreciation)
(000) | |
Euro Dollar
90 Day Futures | | | (145 | ) | | $ | (138,404 | ) | | March 06 | | $ | 192 | | |
U.S. Treasury
2 year Futures | | | 103 | | | | 21,207 | | | December 05 | | | (28 | ) | |
U.S. Treasury
10 year Futures | | | (1 | ) | | | (110 | ) | | December 05 | | | 1 | | |
U.S. Treasury
Long Bond Futures | | | 17 | | | | 1,945 | | | December 05 | | | (58 | ) | |
| | | $ | 107 | | |
Credit Default Swap Agreements
| Counterparty | | Reference
Entity | | Buy/Sell
Protection | | Pay/
Receive
Fixed Rate | | Expiration
Date | | Notional
Amount
(000) | | Unrealized
(Depreciation)
(000) | |
| Citigroup | | Dow Jones CDX
IG Hvol5 Index | | Buy | | | 0.85 | % | | | 12/20/10 | | | | 11,000 | | | $ | (27 | ) | |
The accompanying notes are an integral part of the financial statements.
FIRST AMERICAN FUNDS Annual Report 2005
44
Short Term Bond Fund
| DESCRIPTION | | PAR (000) | | VALUE (000) | |
| Asset-Backed Securities – 33.5% | |
| Automotive – 8.3% | |
AESOP Funding II
Series 2003-2A, Class A1
2.740%, 06/20/07 (a) | | $ | 10,000 | | | $ | 9,921 | | |
Auto Bond Receivables Trust
Series 1993-I, Class A
6.125%, 11/15/21 (b) (c) (d) | | | 106 | | | | - | | |
Capital One Auto Finance Trust
Series 2003-A, Class A4A
2.470%, 01/15/10 | | | 7,000 | | | | 6,877 | | |
Ford Credit Auto Owner Trust
Series 2005-B, Class A3
4.170%, 01/15/09 | | | 10,000 | | | | 9,963 | | |
Harley-Davidson Motorcycle Trust
Series 2003-2, Class A2
2.070%, 02/15/11 | | | 7,000 | | | | 6,843 | | |
Honda Auto Receivables Owner Trust
Series 2002-4, Class A4
2.700%, 03/17/08 | | | 2,982 | | | | 2,965 | | |
Nissan Auto Receivables Owner Trust
Series 2005-A, Class A2
3.220%, 07/16/07 | | | 8,629 | | | | 8,598 | | |
Series 2002-C, Class A4
3.330%, 01/15/08 | | | 3,761 | | | | 3,742 | | |
Toyota Auto Receivables Owner Trust
Series 2003-B, Class A4
2.790%, 01/15/10 | | | 2,000 | | | | 1,957 | | |
Series 2003-A, Class A4
2.200%, 03/15/10 | | | 4,000 | | | | 3,955 | | |
WFS Financial Owner Trust
Series 2004-3, Class A3
3.300%, 03/17/09 | | | 5,000 | | | | 4,957 | | |
| | | | 59,778 | | |
| Commercial – 6.5% | | | |
Banc of America Commercial Mortgage
Series 2004-2, Class A1
2.764%, 11/10/38 | | | 6,364 | | | | 6,116 | | |
Series 2004-4, Class A2
4.041%, 07/10/42 | | | 7,475 | | | | 7,324 | | |
Bear Stearns Commercial Mortgage Securities
Series 2004-T14, Class A1
3.570%, 01/12/41 | | | 4,969 | | | | 4,835 | | |
Commercial Mortgage
Series 2004-LB3A, Class A1
3.765%, 07/10/37 | | | 6,328 | | | | 6,234 | | |
GMAC Commercial Mortgage Securities
Series 2004-C1, Class A2
4.100%, 03/10/38 | | | 4,000 | | | | 3,895 | | |
Greenwich Capital Commercial Funding
Series 2004-GG1, Class A2
3.835%, 06/10/36 | | | 6,118 | | | | 6,012 | | |
GS Mortgage Securities
Series 2004-C1, Class A1
3.659%, 10/10/28 | | | 5,910 | | | | 5,726 | | |
LB-UBS Commercial Mortgage Trust
Series 2004-C2, Class A1
2.946%, 03/15/29 | | | 7,142 | | | | 6,814 | | |
| | | | 46,956 | | |
| Credit Cards – 9.1% | | | |
American Express Credit Account
Series 2004-4, Class C
4.238%, 03/15/12 (a) (e) | | | 2,400 | | | | 2,405 | | |
Short Term Bond Fund (continued)
| DESCRIPTION | | PAR (000) | | VALUE (000) | |
Capital One Master Trust
Series 2001-3A, Class C
4.918%, 03/16/09 (a) (e) | | $ | 2,000 | | | $ | 2,008 | | |
Series 2001-5, Class A
5.300%, 06/15/09 | | | 4,000 | | | | 4,032 | | |
Series 2001-8A, Class A
4.600%, 08/17/09 | | | 6,000 | | | | 6,011 | | |
Capital One Multi-Asset Execution Trust
Series 2003-A6, Class A6
2.950%, 08/17/09 | | | 7,000 | | | | 6,898 | | |
Citibank Credit Card Issuance Trust
Series 2004-A1, Class A1
2.550%, 01/20/09 | | | 800 | | | | 781 | | |
Discover Card Master Trust I
Series 2000-9, Class A
6.350%, 07/15/08 | | | 2,000 | | | | 2,012 | | |
Series 2001-6, Class A
5.750%, 12/15/08 | | | 5,000 | | | | 5,050 | | |
Series 2005-1, Class B
3.918%, 09/15/10 | | | 9,000 | | | | 9,013 | | |
Fleet Credit Card Master Trust
Series 2001-B, Class A
5.600%, 12/15/08 | | | 3,000 | | | | 3,023 | | |
Fleet Credit Card Master Trust II
Series 2003-A, Class A
2.400%, 07/15/08 | | | 8,500 | | | | 8,461 | | |
MBNA Credit Card Master Note Trust
Series 2001-A1, Class A1
5.750%, 10/15/08 | | | 3,500 | | | | 3,531 | | |
Series 2005-A1, Class A1
4.200%, 09/15/10 | | | 10,000 | | | | 9,929 | | |
Providian Gateway Master Trust
Series 2004-DA, Class A
3.350%, 09/15/11 (a) | | | 2,625 | | | | 2,560 | | |
Sears Credit Account Master Trust
Series 1999-3, Class A
6.450%, 11/17/09 | | | 167 | | | | 167 | | |
| | | | 65,881 | | |
| Equipment Leases – 1.4% | | | |
CIT Equipment Collateral
Series 2004-VT1, Class A3
2.200%, 03/20/08 | | | 6,023 | | | | 5,937 | | |
CNH Equipment Trust
Series 2004-A, Class A3B
2.940%, 10/15/08 | | | 4,700 | | | | 4,625 | | |
| | | | 10,562 | | |
| Home Equity – 4.2% | | | |
Centex Home Equity
Series 2003-C, Class AV
4.130%, 09/25/33 (e) | | | 211 | | | | 211 | | |
Equivantage Home Equity Loan Trust
Series 1996-1, Class A
6.550%, 10/25/25 | | | 241 | | | | 238 | | |
Series 1996-4, Class A
7.250%, 01/25/28 | | | 701 | | | | 700 | | |
First Franklin Mortgage Loan
Series 2004-FFB, Class A3
4.264%, 06/25/24 | | | 2,530 | | | | 2,515 | | |
GMAC Mortgage Corporation Loan Trust
Series 2004-HE2, Class M1
3.950%, 10/25/33 (f) | | | 4,850 | | | | 4,659 | | |
FIRST AMERICAN FUNDS Annual Report 2005
45
Schedule of Investments September 30, 2005
Short Term Bond Fund (continued)
| DESCRIPTION | | PAR (000) | | VALUE (000) | |
Home Equity Mortgage Trust
Series 2004-2, Class B1
5.730%, 08/25/34 (e) (f) | | $ | 2,200 | | | $ | 2,208 | | |
Series 2004-6, Class M2
5.321%, 04/25/35 (f) | | | 1,500 | | | | 1,446 | | |
Household Home Equity Loan Trust
Series 2003-1, Class A
4.146%, 10/20/32 (e) | | | 1,014 | | | | 1,017 | | |
IMC Home Equity Loan Trust
Series 1998-3, Class A7
6.720%, 08/20/29 (f) | | | 2,602 | | | | 2,601 | | |
New Century Home Equity Loan Trust
Series 1997-NC6, Class A7
7.190%, 01/25/29 (f) | | | 1,451 | | | | 1,450 | | |
Residential Funding Mortgage Securities
Series 2004-HI2, Class A3
4.270%, 11/25/16 | | | 5,000 | | | | 4,965 | | |
Saxon Asset Securities Trust
Series 2004-1, Class M1
4.360%, 03/25/35 (e)(f) | | | 8,000 | | | | 8,046 | | |
| | | | 30,056 | | |
| Other – 1.3% | | | |
GRP/AG Real Estate Asset Trust
Series 2004-1, Class A
3.960%, 03/25/09 (a) (f) | | | 168 | | | | 166 | | |
Series 2004-2, Class A
4.210%, 07/25/34 (a) (f) | | | 927 | | | | 911 | | |
Series 2005-1, Class A
4.850%, 01/25/35 (a) | | | 2,230 | | | | 2,218 | | |
Global Signal Trust
Series 2004-2A, Class A
4.232%, 12/15/14 (a) | | | 6,380 | | | | 6,209 | | |
| | | | 9,504 | | |
| Utilities – 2.7% | | | |
Detroit Edison Securitization Funding
Series 2001-1, Class A3
5.875%, 03/01/10 | | | 4,279 | | | | 4,358 | | |
Massachusetts RRB Special Purpose Trust
Series 1999-1, Class A4
6.910%, 09/15/09 | | | 4,173 | | | | 4,285 | | |
Peco Energy Transition Trust
Series 1999-A, Class A6
6.050%, 03/01/09 | | | 7,437 | | | | 7,543 | | |
Public Service New Hampshire Funding
Series 2001-1, Class A2
5.730%, 11/01/10 | | | 3,158 | | | | 3,219 | | |
| | | | 19,405 | | |
Total Asset-Backed Securities
(Cost $246,496) | | | | | | | 242,142 | | |
| Corporate Bonds – 21.0% | | | |
| Banking – 1.6% | | | |
Credit Suisse First Boston
7.750%, 05/15/06 (a) | | | 7,350 | | | | 7,490 | | |
Key Bank
7.125%, 08/15/06 | | | 4,000 | | | | 4,083 | | |
| | | | 11,573 | | |
| Basic Industry – 0.3% | | | |
Potash
7.125%, 06/15/07 | | | 2,075 | | | | 2,155 | | |
Short Term Bond Fund (continued)
| DESCRIPTION | | PAR (000) | | VALUE (000) | |
| Brokerage – 1.3% | | | |
Bear Stearns
6.500%, 05/01/06 | | $ | 5,900 | | | $ | 5,969 | | |
Merrill Lynch, Series B
6.130%, 05/16/06 | | | 3,655 | | | | 3,693 | | |
| | | | 9,662 | | |
| Capital Goods – 0.5% | | | |
Boeing Capital
5.650%, 05/15/06 | | | 3,483 | | | | 3,511 | | |
| Communications – 3.1% | | | |
Alltel
4.656%, 05/17/07 | | | 3,500 | | | | 3,497 | | |
Comcast Cable Communications
6.200%, 11/15/08 (g) | | | 4,000 | | | | 4,157 | | |
Telecom De Puerto Rico
6.650%, 05/15/06 | | | 10,000 | | | | 10,119 | | |
Telefonos De Mexico SA
4.750%, 01/27/10 (a) | | | 5,000 | | | | 4,988 | | |
| | | | 22,761 | | |
| Consumer Cyclical – 3.1% | | | |
Caesars Entertainment
8.500%, 11/15/06 | | | 5,000 | | | | 5,200 | | |
Ford Motor Credit
6.875%, 02/01/06 (g) | | | 4,000 | | | | 4,017 | | |
| 6.625%, 06/16/08 | | | 2,500 | | | | 2,450 | | |
Harrah's
5.750%, 10/01/17 (a) | | | 1,265 | | | | 1,241 | | |
Lennar
7.625%, 03/01/09 | | | 3,500 | | | | 3,754 | | |
May Department Stores
3.950%, 07/15/07 | | | 2,000 | | | | 1,970 | | |
Time Warner
6.150%, 05/01/07 (g) | | | 4,000 | | | | 4,086 | | |
| | | | 22,718 | | |
| Consumer NonCyclical – 1.2% | | | |
Kraft Foods
4.625%, 11/01/06 | | | 5,500 | | | | 5,504 | | |
Wellpoint
3.750%, 12/14/07 | | | 3,000 | | | | 2,933 | | |
| | | | 8,437 | | |
| Electric – 3.9% | | | |
Calenergy
7.630%, 10/15/07 | | | 6,255 | | | | 6,594 | | |
Constellation Energy Group
6.350%, 04/01/07 | | | 4,275 | | | | 4,372 | | |
Empresa Nacional Electric
7.750%, 07/15/08 | | | 5,984 | | | | 6,364 | | |
National Rural Utilities
6.000%, 05/15/06 (g) | | | 4,000 | | | | 4,039 | | |
Pepco Holdings
3.750%, 02/15/06 | | | 4,600 | | | | 4,588 | | |
PSEG Funding Trust
5.381%, 11/16/07 | | | 2,000 | | | | 2,013 | | |
| | | | 27,970 | | |
| Energy – 0.6% | | | |
PEMEX Project Funding Master Trust
6.125%, 08/15/08 | | | 4,000 | | | | 4,120 | | |
The accompanying notes are an integral part of the financial statements.
FIRST AMERICAN FUNDS Annual Report 2005
46
Short Term Bond Fund (continued)
| DESCRIPTION | | PAR (000) | | VALUE (000) | |
| Finance Companies – 1.6% | |
American General Finance
5.910%, 06/12/06 | | $ | 1,000 | | | $ | 1,010 | | |
Countrywide Home Loans
2.875%, 02/15/07 | | | 4,000 | | | | 3,906 | | |
International Lease Finance
3.125%, 05/03/07 | | | 4,000 | | | | 3,909 | | |
Residential Capital
6.375%, 06/30/10 (a) | | | 3,000 | | | | 3,035 | | |
| | | | 11,860 | | |
| Natural Gas – 1.5% | | | |
Atmos Energy
4.000%, 10/15/09 | | | 3,995 | | | | 3,844 | | |
Duke Energy Field Services
5.750%, 11/15/06 | | | 4,915 | | | | 4,964 | | |
Ras Laffan Liquid Natural Gas
7.628%, 09/15/06 (a) | | | 1,662 | | | | 1,680 | | |
| | | | 10,488 | | |
| REITS – 1.4% | | | |
Istar Financial
6.000%, 12/15/10 | | | 4,500 | | | | 4,621 | | |
Simon Property Group
6.375%, 11/15/07 | | | 5,000 | | | | 5,156 | | |
| | | | 9,777 | | |
| Supranationals – 0.7% | | | |
Corporacion Andina De Fomento
7.250%, 03/01/07 | | | 5,000 | | | | 5,161 | | |
| Technology – 0.2% | |
Chartered Semiconductor
5.750%, 08/03/10 | | | 1,500 | | | | 1,483 | | |
Total Corporate Bonds
(Cost $153,400) | | | | | | | 151,676 | | |
CMO – Private Mortgage-Backed
Securities – 14.7% | |
| Adjustable Rate (e) – 10.4% | |
Adjustable Rate Mortgage Trust
Series 2005-10, Class 1A21
4.765%, 01/25/36 | | | 4,970 | | | | 4,942 | | |
Merrill Lynch Mortgage Investors
Series 2003-C, Class A1
4.160%, 06/25/28 (f) | | | 7,668 | | | | 7,668 | | |
MLCC Mortgage Investors
Series 2004-B, Class A1
4.080%, 05/25/29 (f) | | | 2,376 | | | | 2,370 | | |
Series 2004-B, Class A3
5.203%, 05/25/29 | | | 5,260 | | | | 5,373 | | |
Sequoia Mortgage Trust
Series 2003-2, Class A1
4.126%, 06/20/33 (f) (g) | | | 4,526 | | | | 4,529 | | |
Series 2004-4, Class B2
4.696%, 05/20/34 (f) | | | 4,350 | | | | 4,328 | | |
Series 2004-7, Class A2
4.842%, 08/20/34 | | | 3,079 | | | | 3,117 | | |
Structured Mortgage Loan Trust
Series 2004-11, Class A
5.352%, 08/25/34 | | | 2,353 | | | | 2,400 | | |
Thornburg Mortgage Securities Trust
Series 2005-3, Class A2
3.500%, 09/01/10 | | | 6,855 | | | | 6,855 | | |
Short Term Bond Fund (continued)
| DESCRIPTION | | PAR (000) | | VALUE (000) | |
Washington Mutual
Series 2003-AR3, Class A5
3.927%, 04/25/33 | | $ | 7,807 | | | $ | 7,784 | | |
Series 2003-AR10, Class A6
4.069%, 10/25/33 | | | 5,000 | | | | 4,952 | | |
Wells Fargo Mortgage Backed Securities Trust
Series 2004-E, Class A5
3.662%, 05/25/34 | | | 5,868 | | | | 5,738 | | |
Series 2004-N, Class A3
4.108%, 08/25/34 | | | 7,000 | | | | 6,926 | | |
Series 2004-EE, Class 3A1
3.988%, 12/25/34 | | | 8,678 | | | | 8,506 | | |
| | | | 75,488 | | |
| Fixed Rate – 4.3% | | | |
Bank of America Mortgage Securities
Series 2004-F, Class 2A2
4.021%, 07/25/34 | | | 7,200 | | | | 7,160 | | |
Citigroup Mortgage Loan Trust
Series 2005-WF1, Class A2
4.490%, 02/25/35 | | | 6,650 | | | | 6,543 | | |
IMPAC Secured Assets
Series 2004-2, Class A2
3.926%, 08/25/34 | | | 4,574 | | | | 4,556 | | |
Merrill Lynch Mortgage Investors
Series 2003-A5, Class 2A3
3.246%, 08/25/33 | | | 341 | | | | 341 | | |
Mortgage Capital Funding
Series 1997-MC1, Class A3
7.288%, 07/20/27 | | | 1,158 | | | | 1,184 | | |
Residential Accredited Loans
Series 2003-QS17, Class CB7
5.500%, 09/25/33 | | | 2,732 | | | | 2,738 | | |
Residential Asset Securitization Trust
Series 2002-A12, Class 1A1
5.200%, 11/25/32 | | | 1,258 | | | | 1,246 | | |
Structured Asset Securities Corporation
Series 2005-6, Class 5A6
5.000%, 05/25/35 | | | 7,000 | | | | 6,952 | | |
| | | | 30,720 | | |
Total CMO – Private Mortgage-Backed Securities
(Cost $107,152) | | | | | | | 106,208 | | |
U.S. Government & Agency
Securities – 15.9% | |
| U.S. Agency Debentures – 4.9% | |
FHLMC
Callable 12/02/05 @ 100
2.280%, 06/02/06 (g) | | | 7,000 | | | | 6,914 | | |
Callable 11/02/05 @ 100
3.250%, 11/02/07 (g) | | | 11,000 | | | | 10,752 | | |
FNMA
4.000%, 09/02/08 (g) | | | 10,000 | | | | 9,843 | | |
| 4.250%, 05/15/09 (g) | | | 7,500 | | | | 7,442 | | |
| | | | 34,951 | | |
| U.S. Treasuries – 11.0% | | | |
U.S. Treasury Bond (STRIPS)
0.000%, 11/15/11 (g) (h) | | | 11,200 | | | | 10,715 | | |
FIRST AMERICAN FUNDS Annual Report 2005
47
Schedule of Investments September 30, 2005
Short Term Bond Fund (continued)
| DESCRIPTION | | PAR (000) | | VALUE (000) | |
U.S. Treasury Notes
3.875%, 07/31/07 (g) | | $ | 13,620 | | | $ | 13,546 | | |
| 3.750%, 05/15/08 (g) | | | 22,035 | | | | 21,797 | | |
| 4.125%, 08/15/08 (g) | | | 2,250 | | | | 2,246 | | |
| 3.125%, 10/15/08 (g) | | | 15,000 | | | | 14,543 | | |
| 3.875%, 01/15/09 (g) (i) | | | 10,722 | | | | 11,631 | | |
| 4.125%, 08/15/10 (g) | | | 5,320 | | | | 5,294 | | |
| | | | 79,772 | | |
Total U.S. Government & Agency Securities
(Cost $116,020) | | | | | | | 114,723 | | |
| U.S. Government Agency Mortgage-Backed Securities – 8.5% | |
| Adjustable Rate (e) – 6.8% | |
| FHLMC Pool | |
| 5.225%, 12/01/26, #786591 (g) | | | 1,511 | | | | 1,539 | | |
| 4.691%, 01/01/29, #846946 (g) | | | 1,088 | | | | 1,117 | | |
| 4.207%, 10/01/29, #786853 | | | 945 | | | | 970 | | |
| 5.439%, 04/01/30, #972055 (g) | | | 878 | | | | 901 | | |
| 4.088%, 05/01/30, #847014 (g) | | | 925 | | | | 937 | | |
| 4.622%, 06/01/31, #847367 | | | 504 | | | | 517 | | |
| 4.655%, 08/01/32, #847331 (g) | | | 8,278 | | | | 8,490 | | |
| 4.602%, 10/01/32, #847063 (g) | | | 1,115 | | | | 1,136 | | |
| 4.236%, 05/01/33, #780456 (g) | | | 2,776 | | | | 2,778 | | |
| FNMA Pool | |
| 4.737%, 11/01/25, #433988 (g) | | | 1,226 | | | | 1,255 | | |
| 4.338%, 02/01/28, #415285 | | | 481 | | | | 490 | | |
| 4.639%, 10/01/30, #847241 (g) | | | 4,733 | �� | | | 4,856 | | |
| 4.864%, 06/01/31, #625338 (g) | | | 873 | | | | 889 | | |
| 5.299%, 12/01/31, #535363 (g) | | | 2,476 | | | | 2,524 | | |
| 5.057%, 03/01/32, #545791 | | | 429 | | | | 437 | | |
| 5.062%, 05/01/32, #545717 | | | 2,328 | | | | 2,369 | | |
| 5.437%, 05/01/32, #634948 (g) | | | 616 | | | | 628 | | |
| 4.490%, 10/01/32, #661645 (g) | | | 1,803 | | | | 1,802 | | |
| 4.635%, 12/01/32, #671884 (g) | | | 3,429 | | | | 3,416 | | |
| 5.078%, 04/01/34, #775389 (g) | | | 1,647 | | | | 1,669 | | |
| 4.278%, 07/01/34, #795242 (g) | | | 4,609 | | | | 4,572 | | |
| 3.886%, 08/01/36, #555369 (g) | | | 2,335 | | | | 2,368 | | |
| GNMA Pool | |
| 3.750%, 08/20/21, #8824 | | | 374 | | | | 379 | | |
| 3.750%, 07/20/22, #8006 (g) | | | 409 | | | | 414 | | |
| 3.750%, 09/20/25, #8699 | | | 228 | | | | 231 | | |
| 4.375%, 04/20/26, #8847 | | | 234 | | | | 236 | | |
| 3.750%, 08/20/27, #80106 | | | 75 | | | | 76 | | |
| 4.375%, 01/20/28, #80154 | | | 121 | | | | 122 | | |
| 4.375%, 05/20/29, #80283 (g) | | | 638 | | | | 643 | | |
| 4.375%, 06/20/29, #80291 (g) | | | 1,076 | | | | 1,085 | | |
| 4.375%, 04/20/31, #80507 (g) | | | 373 | | | | 375 | | |
| 4.500%, 02/20/32, #80580 (g) | | | 363 | | | | 368 | | |
| | | | 49,589 | | |
| Fixed Rate – 1.7% | | | |
FHLMC Gold Pool
5.500%, 10/01/06 | | | 119 | | | | 119 | | |
FHLMC Pool
7.750%, 07/01/09 | | | 9 | | | | 10 | | |
FNMA Pool
6.195%, 06/01/07 (g) | | | 4,901 | | | | 4,966 | | |
| 6.625%, 09/15/09 (g) | | | 2,900 | | | | 3,118 | | |
| 5.500%, 05/01/12 (g) | | | 1,718 | | | | 1,754 | | |
Short Term Bond Fund (continued)
| DESCRIPTION | | PAR (000)/SHARES | | VALUE (000) | |
GNMA Pool
3.875%, 11/20/30(g) | | $ | 682 | | | $ | 687 | | |
| 3.500%, 08/20/31(g) | | | 1,419 | | | | 1,425 | | |
| | | | 12,079 | | |
Total U.S. Government Agency
Mortgage-Backed Securities
(Cost $62,477) | | | | | | | 61,668 | | |
CMO – U.S. Government Agency
Mortgage-Backed Securities – 5.0% | |
| Fixed Rate – 5.0% | |
FHLMC REMIC
Series 2822, Class VM
5.000%, 04/15/10 | | | 4,091 | | | | 4,076 | | |
Series 2763, Class TA
4.000%, 03/15/11 | | | 5,829 | | | | 5,696 | | |
Series 1022, Class J
6.000%, 12/15/20 | | | 55 | | | | 55 | | |
Series 2738, Class UA
3.570%, 12/15/23 (g) | | | 5,283 | | | | 5,177 | | |
Series 2589, Class GK
4.000%, 03/15/26 (g) | | | 4,030 | | | | 4,000 | | |
Series 2731, Class PU
4.500%, 05/15/26 | | | 5,000 | | | | 4,916 | | |
Series 2893
5.000%, 12/15/27 | | | 6,367 | | | | 6,381 | | |
FNMA REMIC
Series 2004-76, Class CE
4.500%, 02/25/21 | | | 6,000 | | | | 5,918 | | |
Series 1992-150, Class MA
5.500%, 09/25/22 | | | 170 | | | | 168 | | |
Total CMO – U.S. Government Agency
Mortgage-Backed Securities
(Cost $37,186) | | | | | | | 36,387 | | |
| Short-Term Investments – 1.2% | |
| Affiliated Money Market Fund – 1.1% | |
First American Prime
Obligations Fund, Class Z (j) | | | 8,235,157 | | | | 8,235 | | |
| U.S. Treasury Obligation – 0.1% | |
U.S. Treasury Bill
3.375%, 11/10/05 (k) | | $ | 395 | | | | 393 | | |
Total Short-Term Investments
(Cost $8,629) | | | | | | | 8,628 | | |
Investments Purchased with Proceeds
from Securities Lending (l) – 26.7% | |
| | | | (Cost $193,160) | | | | 193,160 | | |
Total Investments – 126.5%
(Cost $924,520) | | | | | | | 914,592 | | |
| Other Assets and Liabilities, Net – (26.5)% | | | | | | | (191,337 | ) | |
| Total Net Assets – 100.0% | | | | | | $ | 723,255 | | |
(a) Security purchased within the terms of a private placement memorandum, exempt from registration under Rule 144A of the Securities Act of 1933, as amended, and may be sold only to dealers in that program or other "qualified institutional buyers." These securities have been determined to be liquid under guidelines established by the funds' board of directors. As of September 30, 2005, the value of these investments was $44,830,741 or 6.2% of total net assets. See note 2 in Notes to Financial Statements.
(b) Security considered illiquid. As of September 30, 2005, the value of these investments was $0 or 0.0% of total net assets. See note 2 in Notes to Financial Statements.
The accompanying notes are an integral part of the financial statements.
FIRST AMERICAN FUNDS Annual Report 2005
48
Short Term Bond Fund (concluded)
(c) Security is fair valued. As of September 30, 2005, the fair value of these investments was $0 or 0% of total net assets. See note 2 in Notes to Financial Statements.
(d) Security currently in default.
(e) Variable Rate Security – The rate shown is the rate in effect as of September 30, 2005.
(f) Delayed Interest (Step-Bonds) – Securities for which the coupon rate of interest will adjust on specified future date(s). The rate disclosed represents the coupon rate in effect as of September 30, 2005.
(g) This security or a portion of this security is out on loan at September 30, 2005. Total loaned securities had a value of $189,691,554 at September 30, 2005. See note 2 in Notes to Financial Statements.
(h) Principal only – Represents securities that entitle holders to receive only principal payments on the underlying mortgages. The yield to maturity of a principal only is sensitive to the rate of principal payments on the underlying mortgage assets. A slow (rapid) rate of principal repayments may have an adverse (positive) effect on yield to maturity. The zero coupon rate represents the lack of interest as part of payments received.
(i) U.S. Treasury inflation-protected securities (TIPS) are securities in which the principal amount is adjusted for inflation and the semiannual interest payments equal a fixed percentage of the inflation-adjusted principal amount.
(j) Investment in affiliated security. This money market fund is advised by U.S. Bancorp Asset Management, Inc., which also serves as advisor for this fund. See note 3 in Notes to Financial Statements.
(k) Security has been deposited as initial margin on open futures contracts. Yield shown is the effective yield as of September 30, 2005. See note 2 in Notes to Financial Statements.
(l) The fund may loan securities in return for collateral in the form of cash, U.S. Government securities, or other high grade debt obligations. The cash collateral is invested in various short-term fixed income securities, such as repurchase agreements, commercial paper, money market funds and other corporate obligations. See note 2 in Notes to Financial Statements.
CMO – Collateralized Mortgage Obligation
FHLMC – Federal Home Loan Mortgage Corporation
FNMA – Federal National Mortgage Corporation
GNMA – Government National Mortgage Association
REITS – Real Estate Investment Trusts
REMIC – Real Estate Mortgage Investment Conduit
STRIPS – Separate Trading of Registered Interest and Principal of Securities
Schedule of Open Futures Contracts
| Description | | Number of
Contracts
Purchased
(Sold) | | Notional
Contract
Value
(000) | | Settlement
Month | | Unrealized
Appreciation
(Depreciation)
(000) | |
U.S. Treasury
2 year Futures | | | 364 | | | $ | 37,472 | | | December 05 | | $ | (58 | ) | |
U.S. Treasury
5 year Futures | | | (690 | ) | | | (73,733 | ) | | December 05 | | | 1027 | | |
U.S. Treasury
10 year Futures | | | (1 | ) | | | (110 | ) | | December 05 | | | 1 | | |
| | | $ | 970 | | |
Interest Rate Swap Agreements
| Counterparty | | Floating
Rate
Index | | Pay/
Receive
Floating
Rate | | Fixed
Rate | | Expiration
Date | | Notional
Amount
(000) | | Unrealized
Depreciation
(000) | |
| Citigroup | | 3-Month
LIBOR | | Pay | | | 3.568 | % | | 1/11/07 | | $ | 140,303 | | | $ | (1,697 | ) | |
| UBS | | 3-Month
LIBOR | | Pay | | | 3.806 | % | | 1/13/08 | | | 36,969 | | | | (31 | ) | |
| UBS | | 3-Month
LIBOR | | Pay | | | 3.806 | % | | 1/13/08 | | | 24,579 | | | | (421 | ) | |
| | | $ | (2,149 | ) | |
Total Return Bond Fund
| DESCRIPTION | | PAR (000) | | VALUE (000) | |
| U.S. Government Agency Mortgage-Backed Securities – 27.2% | | | |
| Adjustable Rate (a) – 4.3% | | | |
| FHLMC Pool | |
| 4.918%, 10/01/29, #1L0117 | | $ | 1,739 | | | $ | 1,809 | | |
| 4.695%, 07/01/30, #847240 (b) | | | 2,125 | | | | 2,175 | | |
| 4.454%, 05/01/33, #847411 | | | 1,339 | | | | 1,371 | | |
| FNMA Pool | |
| 5.289%, 11/01/34, #735054 (b) | | | 2,092 | | | | 2,098 | | |
| 5.000%, 05/01/35, #357883 | | | 2,952 | | | | 2,893 | | |
| 5.500%, 08/01/35, #255814 (b) | | | 2,760 | | | | 2,760 | | |
| | | | 13,106 | | |
| Fixed Rate – 22.9% | | | |
| FHLMC Pool | |
| 5.000%, 09/01/18, #E99575 | | | 1,386 | | | | 1,383 | | |
| 6.500%, 07/01/31, #A17212 | | | 5,131 | | | | 5,283 | | |
| FNMA Pool | |
| 5.500%, 12/01/18, #735575 (b) | | | 2,464 | | | | 2,501 | | |
| 4.500%, 06/01/20, #828929 (b) | | | 10,584 | | | | 10,363 | | |
| 5.500%, 02/01/25, #255628 (b) | | | 3,696 | | | | 3,715 | | |
| 5.000%, 10/01/33, #741897 (b) | | | 4,879 | | | | 4,781 | | |
| 5.500%, 11/01/33, #555967 (b) | | | 8,505 | | | | 8,507 | | |
| 5.000%, 03/01/34, #725205 (b) | | | 1,535 | | | | 1,504 | | |
| 5.000%, 03/01/34, #725250 (b) | | | 1,361 | | | | 1,334 | | |
| 5.500%, 04/01/34, #725424 (b) | | | 4,021 | | | | 4,022 | | |
| 5.000%, 05/01/34, #725456 | | | 1,369 | | | | 1,341 | | |
| 5.000%, 06/01/34, #782909 | | | 1,038 | | | | 1,017 | | |
| 5.500%, 09/01/34, #725773 | | | 2,775 | | | | 2,775 | | |
| 4.500%, 03/01/35, #819357 | | | 1,954 | | | | 1,865 | | |
| 6.000%, 04/01/35, #735503 (b) | | | 4,968 | | | | 5,051 | | |
| 5.500%, 08/01/35, #829679 (b) | | | 5,344 | | | | 5,344 | | |
| FNMA TBA (c) | |
| 5.500%, 10/01/34, #28229 | | | 4,520 | | | | 4,517 | | |
| 6.000%, 10/13/35, #36237 | | | 4,460 | | | | 4,532 | | |
| | | | 69,835 | | |
Total U.S. Government Agency
Mortgage-Backed Securities
(Cost $83,657) | | | | | | | 82,941 | | |
U.S. Government & Agency
Securities – 20.7% | | | |
| U.S. Agency Debentures – 1.7% | | | |
FHLB
Callable 04/07/06 @ 100, 4.430%, 04/07/08, (b) | | | 5,000 | | | | 4,973 | | |
| U.S. Treasuries – 19.0% | | | |
| U.S. Inflation Index Bond | |
| 1.625%, 01/15/15 (b) | | | 2,870 | | | | 2,836 | | |
| 2.375%, 01/15/25 (b) | | | 2,850 | | | | 3,050 | | |
| U.S. Treasury Bonds | |
| 9.000%, 11/15/18 (b) | | | 1,825 | | | | 2,628 | | |
| 6.250%, 08/15/23 (b) | | | 5,900 | | | | 7,054 | | |
| 7.625%, 02/15/25 (b) | | | 950 | | | | 1,311 | | |
| 6.875%, 08/15/25 (b) | | | 740 | | | | 954 | | |
| 5.500%, 08/15/28 (b) | | | 3,685 | | | | 4,141 | | |
| 5.250%, 02/15/29 (b) | | | 4,900 | | | | 5,342 | | |
| 5.375%, 02/15/31 (b) | | | 3,820 | | | | 4,279 | | |
| U.S. Treasury Notes | |
| 1.625%, 02/28/06 (b) | | | 1,775 | | | | 1,759 | | |
| 1.500%, 03/31/06 | | | 1,800 | | | | 1,779 | | |
| 3.500%, 05/31/07 (b) | | | 195 | | | | 193 | | |
| 3.875%, 07/31/07 (b) | | | 5,000 | | | | 4,973 | | |
| 4.125%, 08/15/08 (b) | | | 1,585 | | | | 1,583 | | |
FIRST AMERICAN FUNDS Annual Report 2005
49
Schedule of Investments September 30, 2005
Total Return Bond Fund (continued)
| DESCRIPTION | | PAR (000) | | VALUE (000) | |
| 3.875%, 07/15/10 (b) | | $ | 415 | | | $ | 409 | | |
| 4.125%, 08/15/10 (b) | | | 2,240 | | | | 2,229 | | |
| 3.875%, 09/15/10 | | | 3,445 | | | | 3,396 | | |
| 4.250%, 08/15/15 (b) | | | 10,230 | | | | 10,166 | | |
| | | | 58,082 | | |
Total U.S. Government & Agency Securities
(Cost $64,137) | | | | | | | 63,055 | | |
| Corporate Bonds – 18.2% | |
| Banking – 2.5% | |
CBA Capital Trust I,
Callable 06/30/15 @ 100
5.805%, 12/31/49 (d) | | | 985 | | | | 1,019 | | |
Chuo Mitsui Trust & Bank,
Callable 04/15/15 @ 100
5.506%, 12/31/49 (d) (e) | | | 575 | | | | 546 | | |
ING Capital Funding Trust III,
Callable 12/31/10 @ 100
8.439%, 12/12/49 | | | 1,500 | | | | 1,726 | | |
J.P. Morgan Chase XVII
5.850%, 08/01/35 | | | 650 | | | | 633 | | |
SOC General Real Estate,
Callable 09/30/07 @ 100
7.640%, 12/29/49 (a) (d) | | | 1,465 | | | | 1,535 | | |
Wells Fargo,
Callable 12/15/06 @ 103.98
7.960%, 12/15/26 | | | 2,000 | | | | 2,138 | | |
| | | | 7,597 | | |
| Basic Industry – 1.5% | | | |
Allegheny Technologies
8.375%, 12/15/11 | | | 500 | | | | 538 | | |
Celulosa Arauco Y Constitucion
8.625%, 08/15/10 | | | 1,500 | | | | 1,717 | | |
Falconbridge
7.350%, 06/05/12 | | | 755 | | | | 833 | | |
Polyone
8.875%, 05/01/12 (b) | | | 500 | | | | 475 | | |
Southern Peru
7.500%, 07/27/35 (d) | | | 900 | | | | 878 | | |
| | | | 4,441 | | |
| Brokerage – 0.4% | | | |
Lazard Group
7.125%, 05/15/15 (d) | | | 1,325 | | | | 1,308 | | |
| Capital Goods – 0.5% | |
Hutchinson Whamp International
7.450%, 11/24/33 (d) | | | 750 | | | | 864 | | |
Owens-Illinois
8.100%, 05/15/07 | | | 500 | | | | 513 | | |
| | | | 1,377 | | |
| Communications – 3.6% | | | |
Alltel
4.656%, 05/17/07 | | | 2,000 | | | | 1,998 | | |
AT&T
7.300%, 11/15/11 | | | 473 | | | | 533 | | |
AT&T Broadband
8.375%, 03/15/13 | | | 1,000 | | | | 1,183 | | |
Clear Channel Communications
5.500%, 09/15/14 | | | 1,000 | | | | 963 | | |
Dex Media West,
Callable 08/15/08 @ 104.94
9.875%, 08/15/13 | | | 500 | | | | 552 | | |
Total Return Bond Fund (continued)
| DESCRIPTION | | PAR (000) | | VALUE (000) | |
News America Holdings
7.750%, 01/20/24 | | $ | 680 | | | $ | 786 | | |
Telefonos De Mexico SA de CV (Telmex),
Series L
4.750%, 01/27/10 | | | 1,000 | | | | 998 | | |
Time Warner Entertainment
8.375%, 07/15/33 | | | 720 | | | | 901 | | |
Verizon Wireless
5.375%, 12/15/06 | | | 2,980 | | | | 3,006 | | |
| | | | 10,920 | | |
| Consumer Cyclical – 1.3% | | | |
Centex
5.450%, 08/15/12 | | | 1,035 | | | | 1,029 | | |
DaimlerChrysler
4.875%, 06/15/10 (b) | | | 550 | | | | 540 | | |
Ford Motor Credit
7.000%, 10/01/13 (b) | | | 315 | | | | 291 | | |
Harrah's
5.625%, 06/01/15 (d) | | | 835 | | | | 823 | | |
| 5.750%, 10/01/17 (d) | | | 520 | | | | 510 | | |
MGM Mirage
6.625%, 07/15/15 | | | 725 | | | | 717 | | |
| | | | 3,910 | | |
| Consumer Non Cyclical – 1.5% | | | |
Albertson's
7.500%, 02/15/11 | | | 720 | | | | 710 | | |
CIGNA
7.400%, 05/15/07 | | | 2,500 | | | | 2,601 | | |
R.J. Reynolds Tobacco
6.500%, 07/15/10 (d) | | | 1,250 | | | | 1,247 | | |
| | | | 4,558 | | |
| Electric – 1.6% | | | |
Exelon
4.900%, 06/15/15 | | | 1,290 | | | | 1,216 | | |
FPL Group Capital
7.625%, 09/15/06 | | | 1,975 | | | | 2,031 | | |
MidAmerican Energy Holdings
5.875%, 10/01/12 (b) | | | 990 | | | | 1,042 | | |
TXU Energy
7.000%, 03/15/13 (b) | | | 550 | | | | 597 | | |
| | | | 4,886 | | |
| Energy – 1.4% | | | |
Gazprom International
7.201%, 02/01/20 (d) | | | 1,000 | | | | 1,093 | | |
Kerr-McGee
6.950%, 07/01/24 | | | 800 | | | | 828 | | |
Petrobras International Finance
7.750%, 09/15/14 | | | 730 | | | | 792 | | |
Petro-Canada
5.350%, 07/15/33 | | | 500 | | | | 458 | | |
Tengizcheveroil Finance
6.124%, 11/15/14 (d) | | | 1,250 | | | | 1,271 | | |
| | | | 4,442 | | |
| Miscellaneous – 0.8% | | | |
Dow Jones, Series 4-T1
8.250%, 06/29/10 (d) | | | 2,465 | | | | 2,444 | | |
| Natural Gas – 0.9% | | | |
Duke Energy Field Services
7.875%, 08/16/10 | | | 980 | | | | 1,100 | | |
The accompanying notes are an integral part of the financial statements.
FIRST AMERICAN FUNDS Annual Report 2005
50
Total Return Bond Fund (continued)
| DESCRIPTION | | PAR (000) | | VALUE (000) | |
El Paso Natural Gas
Series A,
Callable 08/01/07 @ 103.81
7.625%, 08/01/10 | | $ | 500 | | | $ | 521 | | |
Teppco Partners
7.625%, 02/15/12 | | | 1,000 | | | | 1,118 | | |
| | | | 2,739 | | |
| Sovereigns – 1.8% | | | |
Republic of Philippines
8.250%, 01/15/14 (f) | | | 1,000 | | | | 1,037 | | |
Republic of Turkey
7.250%, 03/15/15 (f) | | | 1,500 | | | | 1,579 | | |
| 7.375%, 02/05/25 (f) | | | 925 | | | | 926 | | |
United Mexican States
5.875%, 01/15/14 | | | 1,950 | | | | 2,019 | | |
| | | | 5,561 | | |
| Technology – 0.4% | | | |
Chartered Semiconductor
6.375%, 08/03/15 | | | 590 | | | | 576 | | |
LG Electronics
5.000%, 06/17/10 (d) | | | 785 | | | | 768 | | |
| | | | 1,344 | | |
Total Corporate Bonds
(Cost $55,314) | | | | | | | 55,527 | | |
| Asset-Backed Securities – 19.0% | |
| Automotive – 2.1% | |
Nissan Auto Receivables Owner Trust
Series 2005-B, Class A2
3.750%, 09/17/07 | | | 960 | | | | 957 | | |
USAA Auto Owner Trust
Series 2003-1, Class A4
2.040%, 02/16/10 | | | 5,500 | | | | 5,408 | | |
| | | | 6,365 | | |
| Commercial – 6.3% | | | |
Commercial Mortgage Pass-Through Certificates
Series 2004-CNL, Class A1
3.988%, 09/15/14 (c) (a) | | | 1,930 | | | | 1,929 | | |
Series 2005-LP5, Class A2
4.630%, 05/10/43 | | | 2,750 | | | | 2,730 | | |
Deutsche Mortgage & Asset Receiving
Series 1998-C1, Class A2
6.538%, 06/15/31 | | | 2,093 | | | | 2,152 | | |
GE Capital Commercial Mortgage Corporation
Series 2004-C1, Class A2
3.915%, 11/10/38 | | | 3,000 | | | | 2,897 | | |
GMAC Commercial Mortgage Securities
Series 2003-C3, Class A2
4.223%, 04/10/40 | | | 3,000 | | | | 2,955 | | |
Greenwich Capital Commercial Funding
Series 2003-C1, Class A2
3.285%, 07/05/35 | | | 1,500 | | | | 1,432 | | |
GS Mortgage Securities Corporation II
Series 2004-GG2, Class A6
5.396%, 08/10/38 | | | 1,250 | | | | 1,297 | | |
GSR Mortgage Loan Trust
Series 2004-10F, Class 3A1
5.500%, 08/25/19 | | | 1,297 | | | | 1,313 | | |
Nomura Asset Securities
Series 1998-D6, Class A1B
6.590%, 03/15/30 | | | 2,325 | | | | 2,421 | | |
| | | | 19,126 | | |
Total Return Bond Fund (continued)
| DESCRIPTION | | PAR (000) | | VALUE (000) | |
| Credit Cards – 7.0% | | | |
Chase Issuance Trust
Series 2005-A3, Class A
3.788%, 10/17/11 (a) | | $ | 6,000 | | | $ | 6,011 | | |
Series 2005-A9, Class A9
3.816%, 11/15/11 | | | 6,000 | | | | 6,012 | | |
Citibank Credit Card Issuance Trust
Series 2003-A5, Class A5
2.500%, 04/07/08 | | | 1,885 | | | | 1,869 | | |
MBNA Credit Card Master Note Trust
Series 2001-A1, Class A1
5.750%, 10/15/08 | | | 5,630 | | | | 5,680 | | |
Series 2003-A1, Class A1
3.300%, 07/15/10 | | | 405 | | | | 394 | | |
Series 2005-A1, Class A1
4.200%, 09/15/10 | | | 825 | | | | 819 | | |
Providian Gateway Master Trust
Series 2004-DA, Class A
3.350%, 09/15/11 (d) | | | 620 | | | | 605 | | |
| | | | 21,390 | | |
| Equipment Leases – 0.6% | | | |
Caterpillar Financial Asset Trust
Series 2004-A, Class A3
3.130%, 01/26/09 | | | 1,900 | | | | 1,876 | | |
| Home Equity – 2.5% | | | |
Ace Securities
Series 2003-OP1, Class M3
5.480%, 12/25/33 (a) | | | 1,500 | | | | 1,510 | | |
GRMT Mortgage Loan Trust
Series 2001-1A, Class M1
7.772%, 07/20/31 (d) | | | 435 | | | | 446 | | |
Residential Asset Securities
Series 2004-KS3, Class A2B2
4.040%, 04/25/34 (a) | | | 5,816 | | | | 5,827 | | |
| | | | 7,783 | | |
| Manufactured Housing – 0.2% | | | |
Green Tree Financial
Series 1996-8, Class A7
8.050%, 10/15/27 | | | 545 | | | | 577 | | |
| Other – 0.3% | | | |
GRP/AG Real Estate Asset Trust
Series 2004-1, Class A
3.960%, 03/25/09 (d) (e) | | | 189 | | | | 186 | | |
Series 2005-1, Class A
4.850%, 01/25/35 (d) | | | 729 | | | | 725 | | |
| | | | 911 | | |
Total Asset-Backed Securities
(Cost $58,310) | | | | | | | 58,028 | | |
CMO – Private Mortgage-Backed
Securities – 7.3% | | | |
| Adjustable Rate (a) – 2.5% | | | |
Adjustable Rate Mortgage Trust
Series 2005-10, Class 1A21
4.765%, 01/25/36 | | | 2,045 | | | | 2,034 | | |
MLCC Mortgage Investors
Series 2003-H, Class A3A
5.057%, 01/25/29 | | | 1,799 | | | | 1,835 | | |
Series 2005-A, Class A1
4.060%, 03/25/30 | | | 1,761 | | | | 1,759 | | |
FIRST AMERICAN FUNDS Annual Report 2005
51
Schedule of Investments September 30, 2005
Total Return Bond Fund (continued)
| DESCRIPTION | | PAR (000)/SHARES | | VALUE (000) | |
Thornburg Mortgage Securities Trust
Series 2005-2, Class A1
4.050%, 07/25/45 | | $ | 1,800 | | | $ | 1,798 | | |
| | | | 7,426 | | |
| Fixed Rate – 4.8% | | | |
Bank of America Mortgage Securities
Series 2004-11, Class 1A8
5.500%, 01/25/35 | | | 4,250 | | | | 4,256 | | |
Citigroup Mortgage Loan Trust
Series 2005-WF1, Class A2
4.490%, 02/25/35 | | | 2,000 | | | | 1,968 | | |
Citigroup Mortgage Securities
Series 2005-4, Class 1A6
5.500%, 07/25/35 | | | 2,010 | | | | 1,998 | | |
Countrywide Alternative Loan Trust
Series 2004-24CB, Class 2A1
5.000%, 11/25/19 | | | 2,720 | | | | 2,696 | | |
Wells Fargo Mortgage Backed Securities Trust
Series 2004-8, Class A1
5.000%, 08/25/19 | | | 3,865 | | | | 3,835 | | |
| | | | 14,753 | | |
Total CMO – Private Mortgage-Backed Securities
(Cost $22,356) | | | | | | | 22,179 | | |
CMO – U.S. Government Agency
Mortgage-Backed Securities – 3.2% | |
| Fixed Rate – 3.2% | |
FHLMC REMIC
Series 2893, Class PB
5.000%, 12/15/27 | | | 3,000 | | | | 3,006 | | |
Series 2987, Class KE
5.000%, 12/15/34 | | | 1,920 | | | | 1,908 | | |
FNMA REMIC
Series 2005-44, Class PC
5.000%, 11/25/27 | | | 2,750 | | | | 2,746 | | |
Series 2005-47, Class HK
4.500%, 06/25/20 | | | 2,252 | | | | 2,148 | | |
Total CMO – U.S. Government Agency
Mortgage-Backed Securities
(Cost $9,972) | | | | | | | 9,808 | | |
| Short-Term Investments – 5.0% | |
| Affiliated Money Market Fund – 4.8% | |
First American Prime
Obligations Fund, Class Z (g) | | | 14,778,081 | | | | 14,778 | | |
| U.S. Treasury Obligation – 0.2% | |
U.S. Treasury Bill
3.370%, 11/10/05 (h) | | $ | 725 | | | | 722 | | |
Total Short-Term Investments
(Cost $15,500) | | | | | | | 15,500 | | |
Investments Purchased with Proceeds
from Securities Lending (i) – 39.0% | |
| (Cost $118,983) | | | | | | | 118,983 | | |
Total Investments – 139.6%
(Cost $428,229) | | | | | | | 426,021 | | |
| Other Assets and Liabilities, Net – (39.6)% | | | | | | | (120,875 | ) | |
| Total Net Assets – 100.0% | | | | | | $ | 305,146 | | |
Total Return Bond Fund (concluded)
(a) Variable Rate Security – The rate shown is the rate in effect as of September 30, 2005.
(b) This security or a portion of this security is out on loan at September 30, 2005. Total loaned securities had a market value of $117,009,393 at September 30, 2005. See note 2 in Notes to Financial Statements.
(c) Security purchased on a when-issued basis. On September 30, 2005, the total cost of investments purchased on a when-issued basis was $9,065,070 or 3.0% of total net assets. See note 2 in Notes to Financial Statements.
(d) Security purchased within the terms of a private placement memorandum, exempt from registration under Rule 144A of the Securities Act of 1933, as amended, and may be sold only to dealers in that program or other "qualified institutional buyers." These securities have been determined to be liquid under guidelines established by the funds' board of directors. As of September 30, 2005, the value of these investments was $18,196,224 or 6.0% of total net assets. See note 2 in Notes to Financial Statements.
(e) Delayed Interest (Step-Bonds) – Securities for which the coupon rate of interest will adjust on specified future dates. The rate disclosed represents the coupon rate in effect as of September 30, 2005.
(f) Represents a foreign high yield (non-investment grade) bond. On September 30, 2005, the value of these investments was $3,541,175, which represents 1.2% of total net assets.
(g) Investment in affiliated security. This money market fund is advised by U.S. Bancorp Asset Management, Inc., which also serves as advisor to this fund. See note 3 in Notes to Financial Statements.
(h) Security has been deposited as initial margin on open futures contracts. Yield shown is the effective yield as of September 30, 2005. See note 2 in Notes to Financial Statements.
(i) The fund may loan securities in return for collateral in the form of cash, U.S. Government securities, or other high grade debt obligations. The cash collateral is invested in various short-term fixed income securities, such as repurchase agreements, commercial paper, money market funds and other corporate obligations. See note 2 in Notes to Financial Statements.
CMO – Collateralized Mortgage Obligation
FHLB – Federal Home Loan Bank
FHLMC – Federal Home Loan Mortgage Corporation
FNMA – Federal National Mortgage Association
REMIC – Real Estate Mortgage Investment Conduit
TBA – To Be Announced
Schedule of Open Futures Contracts
| Description | | Number of
Contracts
Purchased
(Sold) | | Notional
Contract
Value
(000) | | Settlement
Month | | Unrealized
Appreciation
(Depreciation)
(000) | |
Euro Dollar
90 Day Futures | | | (37 | ) | | $ | (35,316 | ) | | March 06 | | $ | 49 | | |
| Euro Currency Futures | | | (29 | ) | | | (3,919 | ) | | December 06 | | | (2 | ) | |
| Japan Currency Futures | | | 76 | | | | 8,433 | | | December 05 | | | (170 | ) | |
| Long Gilt Futures | | | 36 | | | | 7,154 | | | December 05 | | | (45 | ) | |
U.S. Treasury
2 Year Futures | | | 47 | | | | 9,677 | | | December 05 | | | (74 | ) | |
U.S. Treasury
5 Year Futures | | | (124 | ) | | | 13,251 | | | December 05 | | | 165 | | |
U.S. Treasury
10 Year Futures | | | 22 | | | | 2,418 | | | December 05 | | | (7 | ) | |
U.S. Treasury
Long Bond Futures | | | 21 | | | | 2,403 | | | December 05 | | | (14 | ) | |
| | | $ | (98 | ) | |
Credit Default Swap Agreements
| Counterparty | | Reference
Entity | | Buy/Sell
Protection | | Pay/
Receive
Fixed Rate | | Expiration
Date | | Notional
Amount
(000) | | Unrealized
Depreciation
(000) | |
| Citigroup | | Dow Jones CDX
IG Hvol5 Index | | Buy | | | 0.85 | % | | | 12/20/10 | | | $ | 3,000 | | | $ | (7 | ) | |
The accompanying notes are an integral part of the financial statements.
FIRST AMERICAN FUNDS Annual Report 2005
52
U.S. Government Mortgage Fund
| DESCRIPTION | | PAR (000) | | VALUE (000) | |
| U.S. Government Agency Mortgage-Backed Securities – 91.6% | | | |
| Adjustable Rate (a) – 1.7% | | | |
| FNMA Pool | |
| 4.852%, 08/01/27, #545271 | | $ | 2,225 | | | $ | 2,290 | | |
| 5.078%, 04/01/34, #775389 (b) | | | 1,066 | | | | 1,080 | | |
| | | | 3,370 | | |
| Fixed Rate – 89.9% | | | |
| FHLMC Gold Pool | |
| 8.500%, 03/01/06, #E00022 | | | 2 | | | | 2 | | |
| 7.500%, 04/01/08, #E45929 | | | 16 | | | | 16 | | |
| 7.000%, 07/01/11, #E20252 | | | 45 | | | | 47 | | |
| 7.000%, 11/01/11, #E65619 | | | 4 | | | | 4 | | |
| 7.500%, 09/01/12, #G10735 | | | 209 | | | | 219 | | |
| 5.500%, 05/01/13, #G10814 | | | 240 | | | | 244 | | |
| 6.000%, 10/01/13, #E72802 | | | 380 | | | | 390 | | |
| 5.500%, 01/01/14, #E00617 | | | 1,273 | | | | 1,293 | | |
| 7.000%, 09/01/14, #E00746 | | | 230 | | | | 240 | | |
| 5.000%, 04/01/20, #B18125 | | | 4,627 | | | | 4,613 | | |
| 6.000%, 03/01/21, #CP0428 | | | 564 | | | | 577 | | |
| 6.000%, 09/01/22, #C90580 | | | 858 | | | | 877 | | |
| 6.500%, 01/01/28, #G00876 | | | 582 | | | | 600 | | |
| 6.500%, 11/01/28, #C00676 | | | 1,187 | | | | 1,223 | | |
| 7.500%, 01/01/30, #C35768 | | | 94 | | | | 99 | | |
| 6.500%, 03/01/31, #G01244 | | | 895 | | | | 922 | | |
| 7.000%, 06/01/32, #C68248 | | | 376 | | | | 393 | | |
| 5.000%, 09/01/33, #C01622 | | | 2,439 | | | | 2,390 | | |
| FNMA Pool | |
| 7.000%, 11/01/11, #250738 | | | 21 | | | | 22 | | |
| 7.000%, 11/01/11, #349630 | | | 16 | | | | 17 | | |
| 7.000%, 11/01/11, #351122 | | | 23 | | | | 24 | | |
| 6.000%, 04/01/13, #425550 | | | 239 | | | | 245 | | |
| 6.500%, 08/01/13, #251901 | | | 203 | | | | 209 | | |
| 6.000%, 11/01/13, #556195 | | | 330 | | | | 339 | | |
| 7.000%, 07/01/14, #252637 | | | 344 | | | | 359 | | |
| 7.000%, 10/01/14, #252799 | | | 153 | | | | 160 | | |
| 5.500%, 04/01/16, #580516 (b) | | | 1,002 | | | | 1,018 | | |
| 6.500%, 07/01/17, #254373 | | | 1,248 | | | | 1,291 | | |
| 7.000%, 07/01/17, #254414 | | | 1,259 | | | | 1,315 | | |
| 5.500%, 12/01/17, #673010 (b) | | | 913 | | | | 927 | | |
| 5.500%, 04/01/18, #695765 | | | 1,113 | | | | 1,130 | | |
| 4.500%, 05/01/18, #254720 | | | 5,001 | | | | 4,912 | | |
| 5.000%, 07/01/18, #555621 (b) | | | 1,775 | | | | 1,772 | | |
| 5.000%, 11/01/18, #750989 | | | 3,724 | | | | 3,717 | | |
| 4.500%, 06/01/20, #828929 (b) | | | 4,282 | | | | 4,192 | | |
| 6.000%, 12/01/21, #254138 | | | 827 | | | | 846 | | |
| 6.000%, 01/01/22, #254179 | | | 952 | | | | 974 | | |
| 6.500%, 06/01/22, #254344 | | | 928 | | | | 960 | | |
| 6.000%, 10/01/22, #254513 | | | 1,070 | | | | 1,094 | | |
| 5.500%, 10/01/24, #255456 | | | 2,607 | | | | 2,622 | | |
| 5.500%, 12/01/24, #357662 | | | 2,417 | | | | 2,430 | | |
| 5.500%, 02/01/25, #255628 (b) | | | 4,619 | | | | 4,644 | | |
| 7.000%, 12/01/27, #313941 | | | 706 | | | | 740 | | |
| 7.000%, 09/01/31, #596680 | | | 1,581 | | | | 1,655 | | |
| 6.500%, 12/01/31, #254169 | | | 1,810 | | | | 1,864 | | |
| 6.500%, 06/01/32, #596712 | | | 3,948 | | | | 4,063 | | |
| 6.500%, 07/01/32, #545759 | | | 1,943 | | | | 2,001 | | |
| 7.000%, 07/01/32, #545813 | | | 490 | | | | 513 | | |
| 7.000%, 07/01/32, #545815 (b) | | | 439 | | | | 460 | | |
| 6.000%, 08/01/32, #656269 (b) | | | 1,301 | | | | 1,333 | | |
| 5.500%, 03/01/33, #689109 (b) | | | 3,192 | | | | 3,195 | | |
| 5.500%, 04/01/33, #703392 (b) | | | 3,648 | | | | 3,651 | | |
| 5.500%, 05/01/33, #704523 | | | 2,738 | | | | 2,739 | | |
| 5.500%, 07/01/33, #726520 (b) | | | 3,583 | | | | 3,584 | | |
U.S. Government Mortgage Fund (continued)
| DESCRIPTION | | PAR (000) | | VALUE (000) | |
| 5.500%, 07/01/33, #728667 | | $ | 2,252 | | | $ | 2,252 | | |
| 4.500%, 08/01/33, #555680 (b) | | | 2,448 | | | | 2,342 | | |
| 5.000%, 08/01/33, #736158 | | | 3,218 | | | | 3,154 | | |
| 5.500%, 08/01/33, #728855 | | | 2,185 | | | | 2,186 | | |
| 5.500%, 08/01/33, #733380 (b) | | | 2,813 | | | | 2,814 | | |
| 5.000%, 09/01/33, #734566 | | | 3,834 | | | | 3,757 | | |
| 5.000%, 10/01/33, #747533 (b) | | | 3,395 | | | | 3,327 | | |
| 5.500%, 11/01/33, #555967 (b) | | | 4,082 | | | | 4,083 | | |
| 5.500%, 12/01/33, #756202 (b) | | | 2,257 | | | | 2,258 | | |
| 6.000%, 01/01/34, #763687 | | | 3,074 | | | | 3,126 | | |
| 5.500%, 04/01/34, #774999 | | | 1,293 | | | | 1,293 | | |
| 5.000%, 05/01/34, #780889 (b) | | | 7,083 | | | | 6,937 | | |
| 6.500%, 06/01/34, #735273 (b) | | | 2,757 | | | | 2,838 | | |
| 4.500%, 09/01/34, #725866 | | | 1,415 | | | | 1,350 | | |
| 5.000%, 05/01/35, #357883 | | | 5,933 | | | | 5,814 | | |
| 5.500%, 08/01/35, #830953 | | | 3,500 | | | | 3,500 | | |
| FNMA TBA | |
| 5.500%, 10/01/34 (c) | | | 20,300 | | | | 20,287 | | |
| 6.000%, 10/13/35 (c) | | | 11,655 | | | | 11,844 | | |
| GNMA Pool | |
| 8.000%, 01/15/07, #315126 | | | 5 | | | | 5 | | |
| 9.000%, 11/15/09, #359559 | | | 33 | | | | 35 | | |
| 8.000%, 10/15/10, #414750 | | | 83 | | | | 87 | | |
| 6.500%, 07/15/13, #462638 | | | 534 | | | | 555 | | |
| 7.500%, 12/15/22, #347332 | | | 110 | | | | 117 | | |
| 7.000%, 09/15/27, #455304 | | | 29 | | | | 31 | | |
| 6.500%, 07/15/28, #780825 | | | 987 | | | | 1,032 | | |
| 6.500%, 08/20/31, #003120 | | | 447 | | | | 464 | | |
| 7.500%, 12/15/31, #570134 | | | 377 | | | | 400 | | |
| 6.500%, 02/15/32, #569621 | | | 611 | | | | 635 | | |
| 6.000%, 03/15/33, #603520 | | | 1,340 | | | | 1,373 | | |
| 6.000%, 06/15/33, #553314 (b) | | | 2,308 | | | | 2,364 | | |
| 5.500%, 07/15/33, #553367 (b) | | | 1,198 | | | | 1,210 | | |
| 5.500%, 08/15/33, #604567 (b) | | | 4,733 | | | | 4,783 | | |
| 6.000%, 11/15/33, #612374 (b) | | | 1,523 | | | | 1,560 | | |
| 6.000%, 07/15/34, #631574 (b) | | | 1,488 | | | | 1,524 | | |
| 6.000%, 09/15/34, #633605 (b) | | | 2,692 | | | | 2,756 | | |
| | | | 177,259 | | |
Total U.S. Government Agency
Mortgage-Backed Securities
(Cost $181,821) | | | | | | | 180,629 | | |
CMO – Private Mortgage-Backed
Securities – 18.8% | | | |
| Adjustable Rate (a) – 1.7% | | | |
Morgan Stanley Mortgage Loan Trust
Series 2004-9, Class 1A
6.274%, 11/25/34 | | | 2,326 | | | | 2,357 | | |
Wells Fargo Mortgage Backed Securities Trust
Series 2003-D, Class A1
4.839%, 02/25/33 | | | 1,045 | | | | 1,047 | | |
| | | | 3,404 | | |
| Fixed Rate – 17.1% | | | |
Bank of America Mortgage Securities
Series 2004-11 Class 1A8
5.500%, 01/25/35 | | | 980 | | | | 981 | | |
Chase Mortgage Finance Corporation
Series 2003-S10, Class A1
4.750%, 11/25/18 | | | 3,472 | | | | 3,415 | | |
Countrywide Alternative Loan Trust
Series 2004-24CB, Class 1A1
6.000%, 11/25/34 | | | 2,291 | | | | 2,309 | | |
FIRST AMERICAN FUNDS Annual Report 2005
53
Schedule of Investments September 30, 2005
U.S. Government Mortgage Fund (continued)
| DESCRIPTION | | PAR (000) | | VALUE (000) | |
GMAC Mortgage Corporation Loan Trust
Series 2004-J5, Class A7
6.500%, 01/25/35 | | $ | 2,206 | | | $ | 2,255 | | |
Master Alternative Loans Trust
Series 2005-2, Class 1A3
6.500%, 03/25/35 | | | 1,541 | | | | 1,578 | | |
Master Asset Securitization Trust
Series 2003-6, Class 3A1
5.000%, 07/25/18 | | | 1,206 | | | | 1,192 | | |
Residential Asset Mortgage Products
Series 2003-SL1, Class M1
7.320%, 04/25/31 | | | 2,854 | | | | 2,947 | | |
Series 2004-SL4, Class A3
6.500%, 07/25/32 | | | 2,758 | | | | 2,817 | | |
Residential Funding Mortgage Securitization Trust
Series 2003-S8, Class A1
5.000%, 05/25/18 | | | 3,177 | | | | 3,150 | | |
Sequoia Mortgage Trust
Series 2004-5, Class X1
0.800%, 06/20/34 (d) | | | 76,584 | | | | 574 | | |
Washington Mutual
Series 2003-S10, Class A2
5.000%, 10/25/18 | | | 2,880 | | | | 2,855 | | |
Series 2003-S13, Class 21A1
4.500%, 12/25/18 | | | 2,437 | | | | 2,389 | | |
Series 2004-S3, Class 3A3
6.000%, 07/25/34 | | | 1,200 | | | | 1,221 | | |
Washington Mutual MSC Mortgage
Series 2003-MS9, Class CB1
7.444%, 04/25/33 | | | 1,680 | | | | 1,731 | | |
Wells Fargo Mortgage Backed Securities Trust
Series 2003-14, Class A1
4.750%, 12/25/18 | | | 4,271 | | | | 4,202 | | |
| | | | 33,616 | | |
Total CMO – Private Mortgage-Backed Securities
(Cost $37,762) | | | | | | | 37,020 | | |
CMO – U.S. Government Agency
Mortgage-Backed Securities – 2.0% | |
| Fixed Rate – 2.0% | |
FHLMC REMIC
Series 2382, Class DA
5.500%, 10/15/30 | | | 460 | | | | 463 | | |
FNMA REMIC
Series 2004-29, Class WG
4.500%, 05/25/19 | | | 2,000 | | | | 1,878 | | |
Series 2002-W1, Class 2A
7.500%, 02/25/42 | | | 1,528 | | | | 1,588 | | |
Total CMO – U.S. Government Agency
Mortgage-Backed Securities
(Cost $3,943) | | | | | | | 3,929 | | |
| Asset-Backed Securities – 0.5% | |
| Home Equity – 0.1% | |
GRMT Mortgage Loan Trust
Series 2001-1A, Class M1
7.772%, 07/20/31 (e) | | | 145 | | | | 148 | | |
| Manufactured Housing – 0.3% | |
Vanderbilt Mortgage Finance
Series 1999-B, Class 1A4
6.545%, 04/07/18 | | | 631 | | | | 635 | | |
U.S. Government Mortgage Fund (continued)
| DESCRIPTION | | PAR (000)/SHARES | | VALUE (000) | |
| Other – 0.1% | | | |
GRP/AG Real Estate Asset Trust
Series 2004-1, Class A
3.960%, 03/25/09 (e) (f) | | $ | 168 | | | $ | 166 | | |
Total Asset-Backed Securities
(Cost $971) | | | | | | | 949 | | |
| Short-Term Investments – 3.1% | | | |
| Affiliated Money Market Fund – 3.1% | | | |
First American Government Obligations
Fund, Class Z (g) | | | 6,160,728 | | | | 6,161 | | |
| U.S. Treasury Obligation – 0.0% | | | |
U.S. Treasury Bill
3.400%, 11/10/05 (h) | | $ | 100 | | | | 100 | | |
Total Short-Term Investments
(Cost $6,261) | | | | | | | 6,261 | | |
Investments Purchased with Proceeds
from Securities Lending (i) – 33.6% | | | |
| | | | (Cost $66,368) | | | | 66,368 | | |
Total Investments – 149.6%
(Cost $297,126) | | | | | | | 295,156 | | |
| Other Assets and Liabilities, Net – (49.6)% | | | | | | | (97,908 | ) | |
| Total Net Assets – 100.0% | | | | | | $ | 197,248 | | |
(a) Variable Rate Security – The rate shown is the rate in effect as of September 30, 2005.
(b) This security or a portion of this security is out on loan at September 30, 2005. Total loaned securities had a value of $64,690,388 at September 30, 2005. See note 2 in Notes to Financial Statements.
(c) Security purchased on a when-issued basis. On September 30, 2005, the total cost of investments purchased on a when-issued basis was $32,293,913 or 16.4% of total net assets. See note 2 in Notes to Financial Statements.
(d) Interest only – Represents securities that entitle holders to receive only interest payments on the underlying mortgages. The yield to maturity of an interest only is extremely sensitive to the rate of principal payments on the underlying mortgage assets. A rapid (slow) rate of principal repayments may have an adverse (positive) effect on yield to maturity. The principal amount shown is the notional amount of the underlying mortgages. Interest rate disclosed represents the coupon rate in effect as of September 30, 2005.
(e) Security purchased within the terms of a private placement memorandum, exempt from registration under Rule 144A of the Securities Act of 1933, as amended, and may be sold only to dealers in that program or other "qualified institutional buyers." These securities have been determined to be liquid under guidelines established by the funds' board of directors. As of September 30, 2005, the value of these investments was $314,479 or 0.2% of total net assets. See note 2 in Notes to Financials.
(f) Delayed Interest (Step-Bonds) – Securities for which the coupon rate of interest will adjust on specified future date(s). The rate disclosed represents the coupon rate in effect as of September 30, 2005.
(g) Investment in affiliated security. This money market fund is advised by U.S. Bancorp Asset Management, Inc., which also serves as advisor for this fund. See note 3 in Notes to Financial Statements.
(h) Security has been deposited as initial margin on open futures contracts. Yield shown is the effective yield as of September 30, 2005. See note 2 in Notes to Financial Statements.
(i) The fund may loan securities in return for collateral in the form of cash, U.S. Government securities, or other high grade debt obligations. The cash collateral is invested in various short-term fixed income securities, such as repurchase agreements, commercial paper, money market funds and other corporate obligations. See note 2 in Notes to Financial Statements.
The accompanying notes are an integral part of the financial statements.
FIRST AMERICAN FUNDS Annual Report 2005
54
U.S. Government Mortgage Fund (concluded)
CMO – Collateralized Mortgage Obligation
FHLMC – Federal Home Loan Mortgage Corporation
FNMA – Federal National Mortgage Corporation
GNMA – Government National Mortgage Association
REMIC – Real Estate Mortgage Investment Conduit
TBA – To Be Announced
Schedule of Open Futures Contracts
| Description | | Number of
Contracts
Purchased
(Sold) | | Notional
Contract
Value
(000) | | Settlement
Month | | Unrealized
Appreciation
(Depreciation)
(000) | |
Euro Dollar
90 Day Futures | | | (65 | ) | | $ | (62,043 | ) | | March 06 | | $ | 35 | | |
U.S. Treasury
Long Bond Futures | | | 4 | | | | 458 | | | December 05 | | | (14 | ) | |
U.S. Treasury
2 year Futures | | | (120 | ) | | | (12,353 | ) | | December 05 | | | 77 | | |
U.S. Treasury
5 year Futures | | | (35 | ) | | | (3,740 | ) | | December 05 | | | 52 | | |
U.S. Treasury
10 year Futures | | | 29 | | | | 3,188 | | | December 05 | | | (44 | ) | |
| | | $ | 106 | | |
FIRST AMERICAN FUNDS Annual Report 2005
55
Statements of Assets and Liabilities September 30, 2005, in thousands
| | | Core Bond
Fund | | High Income
Bond Fund | | Inflation
Protected
Securities Fund | | Intermediate
Government
Bond Fund | | Intermediate Term
Bond Fund | | Short Term
Bond Fund | | Total Return
Bond Fund | | U.S. Government
Mortgage Fund | |
| Investments in unaffiliated securities, at cost | | $ | 1,893,938 | | | $ | 252,770 | | | $ | 273,704 | | | $ | 71,110 | | | $ | 1,122,153 | | | $ | 723,125 | | | $ | 294,468 | | | $ | 224,597 | | |
Investments in affiliated money market fund,
at cost | | | 54,925 | | | | 3,642 | | | | 1,990 | | | | - | | | | 4,132 | | | | 8,235 | | | | 14,778 | | | | 6,161 | | |
Investments purchased with proceeds from
securities lending, at cost (note 2) | | | 844,992 | | | | 58,210 | | | | 121,305 | | | | - | | | | 512,452 | | | | 193,160 | | | | 118,983 | | | | 66,368 | | |
| Cash denominated in foreign currencies, at cost | | | - | | | | - | | | | - | | | | - | | | | - | | | | - | | | | 100 | | | | - | | |
| ASSETS: | |
| Investments in unaffiliated securities, at value* (note 2) | | $ | 1,877,642 | | | $ | 255,644 | | | $ | 272,299 | | | $ | 69,818 | | | $ | 1,110,499 | | | $ | 713,197 | | | $ | 292,260 | | | $ | 222,627 | | |
Investments in affiliated money market fund,
at value (note 2) | | | 54,925 | | | | 3,642 | | | | 1,990 | | | | - | | | | 4,132 | | | | 8,235 | | | | 14,778 | | | | 6,161 | | |
Investments purchased with proceeds from
securities lending, at value (note 2) | | | 844,992 | | | | 58,210 | | | | 121,305 | | | | - | | | | 512,452 | | | | 193,160 | | | | 118,983 | | | | 66,368 | | |
| Cash** | | | 45,159 | | | | 555 | | | | 1,149 | | | | 473 | | | | 8,770 | | | | 1,830 | | | | 10,738 | | | | 629 | | |
| Cash denominated in foreign currencies, at value | | | - | | | | - | | | | - | | | | - | | | | - | | | | - | | | | 98 | | | | - | | |
| Receivable for dividends and interest | | | 10,986 | | | | 5,402 | | | | 2,016 | | | | 1,064 | | | | 8,366 | | | | 5,346 | | | | 1,967 | | | | 940 | | |
| Receivable for investment securities sold | | | 49,968 | | | | 3,803 | | | | 1,248 | | | | 10 | | | | 10,517 | | | | - | | | | 6,332 | | | | - | | |
| Receivable for capital shares sold | | | 770 | | | | 158 | | | | 1,227 | | | | - | | | | 361 | | | | 159 | | | | 410 | | | | 749 | | |
| Receivable for swap contracts | | | 90 | | | | - | | | | 64 | | | | - | | | | - | | | | - | | | | 13 | | | | - | | |
| Receivable for variation margin | | | 5 | | | | 45 | | | | - | | | | - | | | | - | | | | - | | | | - | | | | 16 | | |
| Prepaid expenses and other assets | | | 40 | | | | 37 | | | | 41 | | | | 31 | | | | 83 | | | | 32 | | | | 46 | | | | 38 | | |
| Total assets | | | 2,884,577 | | | | 327,496 | | | | 401,339 | | | | 71,396 | | | | 1,655,180 | | | | 921,959 | | | | 445,625 | | | | 297,528 | | |
| LIABILITIES: | |
| Payable upon return of securities loaned (note 2) | | | 852,996 | | | | 58,761 | | | | 122,454 | | | | - | | | | 517,306 | | | | 194,990 | | | | 120,110 | | | | 66,997 | | |
| Payable for investment securities purchased | | | 64,190 | | | | 5,907 | | | | - | | | | - | | | | 10,379 | | | | - | | | | 10,943 | | | | 354 | | |
| Payable for investment securities purchased on a when-issued basis | | | 47,704 | | | | - | | | | - | | | | - | | | | - | | | | - | | | | 9,065 | | | | 32,294 | | |
| Payable for capital shares redeemed | | | 6,868 | | | | 224 | | | | 1,544 | | | | 36 | | | | 3,835 | | | | 1,284 | | | | 124 | | | | 496 | | |
| Payable for variation margin | | | - | | | | - | | | | 11 | | | | - | | | | 2 | | | | 50 | | | | 38 | | | | - | | |
| Payable for swap contracts | | | - | | | | 38 | | | | - | | | | - | | | | - | | | | 1,967 | | | | - | | | | - | | |
| Payable to affiliates (note 3) | | | 1,091 | | | | 176 | | | | 134 | | | | 33 | | | | 558 | | | | 364 | | | | 182 | | | | 111 | | |
| Payable for distribution and shareholder servicing fees | | | 47 | | | | 24 | | | | 2 | | | | - | | | | 6 | | | | 12 | | | | 10 | | | | 17 | | |
| Accrued expenses and other liabilities | | | 61 | | | | 14 | | | | 9 | | | | 8 | | | | 44 | | | | 37 | | | | 7 | | | | 11 | | |
| Total liabilities | | | 972,957 | | | | 65,144 | | | | 124,154 | | | | 77 | | | | 532,130 | | | | 198,704 | | | | 140,479 | | | | 100,280 | | |
| Net assets | | $ | 1,911,620 | | | $ | 262,352 | | | $ | 277,185 | | | $ | 71,319 | | | $ | 1,123,050 | | | $ | 723,255 | | | $ | 305,146 | | | $ | 197,248 | | |
| COMPOSITION OF NET ASSETS: | |
| Portfolio capital | | $ | 1,919,152 | | | $ | 269,134 | | | $ | 277,187 | | | $ | 72,331 | | | $ | 1,133,862 | | | $ | 745,327 | | | $ | 327,296 | | | $ | 204,015 | | |
| Undistributed net investment income | | | 868 | | | | 19 | | | | 1,292 | | | | 77 | | | | 1,447 | | | | 2,148 | | | | 117 | | | | 132 | | |
| Accumulated net realized gain (loss) on investments | | | 7,843 | | | | (9,837 | ) | | | 85 | | | | 203 | | | | (685 | ) | | | (13,113 | ) | | | (19,952 | ) | | | (5,035 | ) | |
| Net unrealized appreciation (depreciation) of investments | | | (16,296 | ) | | | 2,874 | | | | (1,405 | ) | | | (1,292 | ) | | | (11,654 | ) | | | (9,928 | ) | | | (2,208 | ) | | | (1,970 | ) | |
| Net unrealized appreciation (depreciation) on futures contracts | | | 102 | | | | 72 | | | | (64 | ) | | | - | | | | 107 | | | | 970 | | | | (98 | ) | | | 106 | | |
Net unrealized depreciation of forward foreign currency contracts,
foreign currency, and translation of other assets and liabilities
denominated in foreign currency | | | - | | | | - | | | | - | | | | - | | | | - | | | | - | | | | (2 | ) | | | - | | |
| Net unrealized appreciation (depreciation) on swap agreements | | | (49 | ) | | | 90 | | | | 90 | | | | - | | | | (27 | ) | | | (2,149 | ) | | | (7 | ) | | | - | | |
| Net assets | | $ | 1,911,620 | | | $ | 262,352 | | | $ | 277,185 | | | $ | 71,319 | | | $ | 1,123,050 | | | $ | 723,255 | | | $ | 305,146 | | | $ | 197,248 | | |
| *Including securities loaned, at value | | $ | 831,476 | | | $ | 56,871 | | | $ | 119,460 | | | | - | | | $ | 503,024 | | | $ | 189,692 | | | $ | 117,009 | | | $ | 64,690 | | |
| **Includes cash collateral received related to securities loaned (note 2) | | $ | 8,004 | | | $ | 551 | | | $ | 1,149 | | | | - | | | $ | 4,854 | | | $ | 1,830 | | | $ | 1,127 | | | $ | 629 | | |
The accompanying notes are an integral part of the financial statements.
FIRST AMERICAN FUNDS Annual Report 2005
56
FIRST AMERICAN FUNDS Annual Report 2005
57
Statements of Assets and Liabilities September 30, 2005, in thousands, except for per share data (continued)
| | | Core Bond
Fund | | High Income
Bond Fund | | Inflation
Protected
Securities Fund | | Intermediate
Government
Bond Fund | | Intermediate Term
Bond Fund | | Short Term
Bond Fund | | Total Return
Bond Fund | | U.S. Government
Mortgage Fund | |
| Class A: | | | |
| Net assets | | $ | 161,410 | | | $ | 34,144 | | | $ | 6,917 | | | $ | 1,970 | | | $ | 48,426 | | | $ | 97,863 | | | $ | 19,113 | | | $ | 24,504 | | |
Shares issued and outstanding
($0.0001 par value - 2 billion authorized) | | | 14,476 | | | | 3,628 | | | | 683 | | | | 239 | | | | 4,847 | | | | 9,857 | | | | 1,878 | | | | 2,328 | | |
| Net asset value and redemption price per share | | $ | 11.15 | | | $ | 9.41 | | | $ | 10.12 | | | $ | 8.26 | | | $ | 9.99 | | | $ | 9.93 | | | $ | 10.18 | | | $ | 10.53 | | |
| Maximum offering price per share (1) | | $ | 11.64 | | | $ | 9.83 | | | $ | 10.57 | | | $ | 8.45 | | | $ | 10.22 | | | $ | 10.16 | | | $ | 10.63 | | | $ | 11.00 | | |
| Class B: | | | |
| Net assets | | $ | 17,078 | | | $ | 7,191 | | | | - | | | | - | | | | - | | | | - | | | $ | 4,395 | | | $ | 7,926 | | |
Shares issued and outstanding
($0.0001 par value - 2 billion authorized) | | | 1,543 | | | | 767 | | | | - | | | | - | | | | - | | | | - | | | | 434 | | | | 752 | | |
Net asset value, offering price, and redemption
price per share (2) | | $ | 11.07 | | | $ | 9.37 | | | | - | | | | - | | | | - | | | | - | | | $ | 10.14 | | | $ | 10.54 | | |
| Class C: | | | |
| Net assets | | $ | 7,266 | | | $ | 13,403 | | | $ | 855 | | | | - | | | | - | | | | - | | | $ | 2,858 | | | $ | 6,585 | | |
Shares issued and outstanding
($0.0001 par value - 2 billion authorized) | | | 654 | | | | 1,429 | | | | 85 | | | | - | | | | - | | | | - | | | | 283 | | | | 628 | | |
| Net asset value per share (2) | | $ | 11.12 | | | $ | 9.38 | | | $ | 10.11 | | | | - | | | | - | | | | - | | | $ | 10.12 | | | $ | 10.49 | | |
| Class R: | | | |
| Net assets | | $ | 16 | | | $ | 4 | | | $ | 1 | | | | - | | | | - | | | | - | | | $ | 3 | | | $ | 3 | | |
Shares issued and outstanding
($0.0001 par value - 2 billion authorized) | | | 1 | | | | - | | | | - | | | | - | | | | - | | | | - | | | | - | | | | - | | |
| Net asset value, offering price, and redemption price per share | | $ | 11.17 | | | $ | 9.53 | | | $ | 10.13 | | | | - | | | | - | | | | - | | | $ | 10.23 | | | $ | 10.51 | | |
| Class Y: | | | |
| Net assets | | $ | 1,725,850 | | | $ | 207,610 | | | $ | 269,412 | | | $ | 69,349 | | | $ | 1,074,624 | | | $ | 625,392 | | | $ | 278,777 | | | $ | 158,230 | | |
Shares issued and outstanding
($0.0001 par value - 2 billion authorized) | | | 154,814 | | | | 22,047 | | | | 26,595 | | | | 8,401 | | | | 107,895 | | | | 62,965 | | | | 27,408 | | | | 15,029 | | |
| Net asset value, offering price, and redemption price per share | | $ | 11.15 | | | $ | 9.42 | | | $ | 10.13 | | | $ | 8.25 | | | $ | 9.96 | | | $ | 9.93 | | | $ | 10.17 | | | $ | 10.53 | | |
(1) The offering price is calculated by dividing the net asset value by 1 minus the maximum sales charge. For a description of front-end sales charges,
see note 1 in Notes to Financial Statements.
(2) Class B and C have a contingent deferred sales charge. For a description of this sales charge, see notes 1 and 3 in Notes to Financial Statements.
The accompanying notes are an integral part of the financial statements.
FIRST AMERICAN FUNDS Annual Report 2005
58
FIRST AMERICAN FUNDS Annual Report 2005
59
Statements of Operations for the fiscal year ended September 30, 2005, in thousands
| | | Core Bond
Fund | | High Income
Bond Fund | | Inflation
Protected
Securites Fund | | Intermediate
Government
Bond Fund | | Intermediate Term
Bond Fund | | Short Term
Bond Fund | | Total Return
Bond Fund | | U.S. Government
Mortgage Fund | |
| INVESTMENT INCOME: | | | |
| Interest from unaffiliated securities | | $ | 83,761 | | | $ | 21,756 | | | $ | 9,511 | | | $ | 3,623 | | | $ | 48,761 | | | $ | 31,398 | | | $ | 14,221 | | | $ | 9,743 | �� | |
| Dividends from affiliated money market fund | | | 1,058 | | | | 77 | | | | 88 | | | | 15 | | | | 222 | | | | 169 | | | | 365 | | | | 151 | | |
| Dividends from unaffiliated securities | | | - | | | | 64 | | | | - | | | | - | | | | - | | | | - | | | | 24 | | | | - | | |
| Securities lending income | | | 871 | | | | 165 | | | | 40 | | | | - | | | | 553 | | | | 146 | | | | 67 | | | | 34 | | |
| Total investment income | | | 85,690 | | | | 22,062 | | | | 9,639 | | | | 3,638 | | | | 49,536 | | | | 31,713 | | | | 14,677 | | | | 9,928 | | |
| EXPENSES (note 3): | | | |
| Investment advisory fees | | | 9,590 | | | | 1,955 | | | | 851 | | | | 463 | | | | 6,091 | | | | 4,630 | | | | 1,906 | | | | 1,045 | | |
| Administration fees | | | 3,962 | | | | 598 | | | | 335 | | | | 199 | | | | 2,541 | | | | 1,960 | | | | 594 | | | | 445 | | |
| Transfer agent fees | | | 1,223 | | | | 173 | | | | 131 | | | | 54 | | | | 760 | | | | 555 | | | | 183 | | | | 132 | | |
| Custodian fees | | | 168 | | | | 25 | | | | 14 | | | | 8 | | | | 107 | | | | 83 | | | | 25 | | | | 18 | | |
| Professional fees | | | 119 | | | | 27 | | | | 63 | | | | 17 | | | | 74 | | | | 59 | | | | 27 | | | | 23 | | |
| Postage and printing fees | | | 65 | | | | 14 | | | | 6 | | | | 3 | | | | 43 | | | | 33 | | | | 21 | | | | 7 | | |
| Directors' fees | | | 44 | | | | 6 | | | | 4 | | | | 2 | | | | 28 | | | | 22 | | | | 7 | | | | 5 | | |
| Registration fees | | | 41 | | | | 41 | | | | 30 | | | | 24 | | | | 21 | | | | 22 | | | | 41 | | | | 43 | | |
| Other expenses | | | 41 | | | | 10 | | | | 6 | | | | 6 | | | | 28 | | | | 23 | | | | 10 | | | | 9 | | |
| Distribution and shareholder servicing fees – Class A | | | 431 | | | | 100 | | | | 8 | | | | 5 | | | | 138 | | | | 282 | | | | 50 | | | | 71 | | |
| Distribution and shareholder servicing fees – Class B | | | 192 | | | | 80 | | | | - | | | | - | | | | - | | | | - | | | | 48 | | | | 87 | | |
| Distribution and shareholder servicing fees – Class C | | | 81 | | | | 151 | | | | 5 | | | | - | | | | - | | | | - | | | | 34 | | | | 84 | | |
| Distribution and shareholder servicing fees – Class R | | | - | | | | - | | | | - | | | | - | | | | - | | | | - | | | | - | | | | - | | |
| Total expenses | | | 15,957 | | | | 3,180 | | | | 1,453 | | | | 781 | | | | 9,831 | | | | 7,669 | | | | 2,946 | | | | 1,969 | | |
| Less: Fee waivers (note 3) | | | (1,827 | ) | | | (690 | ) | | | (419 | ) | | | (223 | ) | | | (2,439 | ) | | | (1,945 | ) | | | (691 | ) | | | (264 | ) | |
| Total net expenses | | | 14,130 | | | | 2,490 | | | | 1,034 | | | | 558 | | | | 7,392 | | | | 5,724 | | | | 2,255 | | | | 1,705 | | |
| Investment income – net | | | 71,560 | | | | 19,572 | | | | 8,605 | | | | 3,080 | | | | 42,144 | | | | 25,989 | | | | 12,422 | | | | 8,223 | | |
REALIZED AND UNREALIZED GAINS (LOSSES) ON
INVESTMENTS, FUTURES CONTRACTS, WRITTEN
OPTIONS, FOREIGN CURRENCY TRANSACTIONS | | | |
| AND SWAP AGREEMENTS – NET (note 5): | | | |
| Net realized gain (loss) on investments | | | 13,556 | | | | 7,856 | | | | (139 | ) | | | 54 | | | | (2,596 | ) | | | (6,244 | ) | | | 5,824 | | | | 696 | | |
| Net realized gain (loss) on futures contracts | | | (4,532 | ) | | | 573 | | | | 11 | | | | 64 | | | | (730 | ) | | | (2,529 | ) | | | (465 | ) | | | 43 | | |
| Net realized gain (loss) on options written | | | 1,881 | | | | - | | | | 94 | | | | 63 | | | | 1,217 | | | | 142 | | | | 157 | | | | (102 | ) | |
| Net realized gain (loss) on swap agreements | | | 727 | | | | 272 | | | | 133 | | | | - | | | | 639 | | | | 783 | | | | 857 | | | | - | | |
Net realized loss on forward foreign currency contracts,
foreign currency, and translation of other assets
and liabilities denominated in foreign currency | | | - | | | | - | | | | - | | | | - | | | | - | | | | - | | | | (6 | ) | | | - | | |
| Net change in unrealized appreciation or depreciation of investments | | | (28,161 | ) | | | (9,575 | ) | | | (1,405 | ) | | | (2,006 | ) | | | (18,673 | ) | | | (7,121 | ) | | | (8,750 | ) | | | (3,451 | ) | |
Net change in unrealized appreciation or depreciation
of futures contracts | | | 1,442 | | | | 27 | | | | (64 | ) | | | 53 | | | | 624 | | | | 1,494 | | | | 165 | | | | 112 | | |
Net change in unrealized appreciation or depreciation of forward
foreign currency contracts, foreign currency, and translation of
other assets and liabilities denominated in foreign currency | | | - | | | | - | | | | - | | | | - | | | | - | | | | - | | | | (2 | ) | | | - | | |
| Net change in unrealized appreciation or depreciation of swap agreements | | | (49 | ) | | | 90 | | | | 90 | | | | - | | | | (27 | ) | | | (2,149 | ) | | | (7 | ) | | | - | | |
Net loss on investments, futures contracts, written options,
foreign currency transactions and swap agreements | | | (15,136 | ) | | | (757 | ) | | | (1,280 | ) | | | (1,772 | ) | | | (19,546 | ) | | | (15,624 | ) | | | (2,227 | ) | | | (2,702 | ) | |
| Net increase in net assets resulting from operations | | $ | 56,424 | | | $ | 18,815 | | | $ | 7,325 | | | $ | 1,308 | | | $ | 22,598 | | | $ | 10,365 | | | $ | 10,195 | | | $ | 5,521 | | |
The accompanying notes are an integral part of the financial statements.
FIRST AMERICAN FUNDS Annual Report 2005
60
FIRST AMERICAN FUNDS Annual Report 2005
61
Statements of Changes in Net Assets in thousands
| | | Core
Bond Fund | | High Income
Bond Fund | | Inflation
Protected
Securities Fund | | Intermediate
Government
Bond Fund | |
| | | Year Ended
9/30/05 | | Year Ended
9/30/04 | | Year Ended
9/30/05 | | Year Ended
9/30/04 | | Year Ended(1)
9/30/05 | | Year Ended
9/30/05 | | Year Ended
9/30/04 | |
| OPERATIONS: | |
| Investment income – net | | $ | 71,560 | | | $ | 73,461 | | | $ | 19,572 | | | $ | 20,792 | | | $ | 8,605 | | | $ | 3,080 | | | $ | 5,648 | | |
| Net realized gain (loss) on investments | | | 13,556 | | | | 18,668 | | | | 7,856 | | | | 12,424 | | | | (139 | ) | | | 54 | | | | 5,815 | | |
| Net realized gain (loss) on futures contracts | | | (4,532 | ) | | | (4,060 | ) | | | 573 | | | | (261 | ) | | | 11 | | | | 64 | | | | (293 | ) | |
| Net realized gain (loss) on options written | | | 1,881 | | | | 2,256 | | | | - | | | | 75 | | | | 94 | | | | 63 | | | | 279 | | |
| Net realized gain (loss) on swap agreements | | | 727 | | | | - | | | | 272 | | | | - | | | | 133 | | | | - | | | | - | | |
Net realized gain (loss) on forward foreign currency contracts,
foreign currency, and translation of other assets and liabilities
denominated in foreign currency | | | - | | | | - | | | | - | | | | 62 | | | | - | | | | - | | | | - | | |
| Net change in unrealized appreciation or depreciation of investments | | | (28,161 | ) | | | (35,329 | ) | | | (9,575 | ) | | | (2,836 | ) | | | (1,405 | ) | | | (2,006 | ) | | | (10,413 | ) | |
| Net change in unrealized appreciation or depreciation of futures contracts | | | 1,442 | | | | (1,340 | ) | | | 27 | | | | 45 | | | | (64 | ) | | | 53 | | | | (53 | ) | |
| Net change in unrealized appreciation or depreciation of written options | | | - | | | | 343 | | | | - | | | | - | | | | - | | | | - | | | | 51 | | |
Net change in unrealized appreciation or depreciation of foreign currency,
and translation of other assets and liabilities denominated in foreign currency | | | - | | | | - | | | | - | | | | (4 | ) | | | - | | | | - | | | | - | | |
| Net change in unrealized appreciation or depreciation of swap agreements | | | (49 | ) | | | - | | | | 90 | | | | - | | | | 90 | | | | - | | | | - | | |
| Net increase in net assets resulting from operations | | | 56,424 | | | | 53,999 | | | | 18,815 | | | | 30,297 | | | | 7,325 | | | | 1,308 | | | | 1,034 | | |
| DISTRIBUTIONS TO SHAREHOLDERS FROM: | |
| Investment income – net: | |
| Class A | | | (6,383 | ) | | | (6,707 | ) | | | (2,729 | ) | | | (3,109 | ) | | | (138 | ) | | | (64 | ) | | | (55 | ) | |
| Class B | | | (572 | ) | | | (691 | ) | | | (494 | ) | | | (601 | ) | | | - | | | | - | | | | - | | |
| Class C | | | (240 | ) | | | (311 | ) | | | (929 | ) | | | (1,260 | ) | | | (17 | ) | | | - | | | | - | | |
| Class R | | | - | | | | (773 | ) | | | (1 | ) | | | (30 | ) | | | - | | | | - | | | | - | | |
| Class Y | | | (68,228 | ) | | | (70,747 | ) | | | (15,519 | ) | | | (15,894 | ) | | | (7,166 | ) | | | (3,114 | ) | | | (5,443 | ) | |
| Net realized gain on investments: | |
| Class A | | | (120 | ) | | | (2,811 | ) | | | - | | | | - | | | | - | | | | (84 | ) | | | (258 | ) | |
| Class B | | | (14 | ) | | | (404 | ) | | | - | | | | - | | | | - | | | | - | | | | - | | |
| Class C | | | (6 | ) | | | (191 | ) | | | - | | | | - | | | | - | | | | - | | | | - | | |
| Class R | | | - | | | | (591 | ) | | | - | | | | - | | | | - | | | | - | | | | - | | |
| Class Y | | | (1,148 | ) | | | (28,710 | ) | | | - | | | | - | | | | (6 | ) | | | (4,844 | ) | | | (29,444 | ) | |
| Return of capital: | |
| Class A | | | - | | | | - | | | | (3 | ) | | | - | | | | - | | | | - | | | | - | | |
| Class B | | | - | | | | - | | | | (1 | ) | | | - | | | | - | | | | - | | | | - | | |
| Class C | | | - | | | | - | | | | (1 | ) | | | - | | | | - | | | | - | | | | - | | |
| Class R | | | - | | | | - | | | | - | (2) | | | - | | | | - | | | | - | | | | - | | |
| Class Y | | | - | | | | - | | | | (15 | ) | | | - | | | | - | | | | - | | | | - | | |
| Total distributions | | | (76,711 | ) | | | (111,936 | ) | | | (19,692 | ) | | | (20,894 | ) | | | (7,327 | ) | | | (8,106 | ) | | | (35,200 | ) | |
| CAPITAL SHARE TRANSACTIONS (note 4): | |
| Class A: | |
| Proceeds from sales | | | 23,283 | | | | 64,537 | | | | 6,693 | | | | 10,439 | | | | 7,676 | | | | 1,284 | | | | 799 | | |
| Reinvestment of distributions | | | 5,127 | | | | 7,247 | | | | 2,001 | | | | 2,352 | | | | 100 | | | | 134 | | | | 221 | | |
| Payments for redemptions | | | (50,134 | ) | | | (73,658 | ) | | | (18,399 | ) | | | (12,507 | ) | | | (869 | ) | | | (1,194 | ) | | | (1,360 | ) | |
| Increase (decrease) in net assets from Class A transactions | | | (21,724 | ) | | | (1,874 | ) | | | (9,705 | ) | | | 284 | | | | 6,907 | | | | 224 | | | | (340 | ) | |
| Class B: | |
| Proceeds from sales | | | 1,003 | | | | 1,965 | | | | 760 | | | | 2,346 | | | | - | | | | - | | | | - | | |
| Reinvestment of distributions | | | 514 | | | | 948 | | | | 310 | | | | 365 | | | | - | | | | - | | | | - | | |
| Payments for redemptions | | | (5,294 | ) | | | (9,240 | ) | | | (2,383 | ) | | | (3,441 | ) | | | - | | | | - | | | | - | | |
| Decrease in net assets from Class B transactions | | | (3,777 | ) | | | (6,327 | ) | | | (1,313 | ) | | | (730 | ) | | | - | | | | - | | | | - | | |
| Class C: | |
| Proceeds from sales | | | 884 | | | | 1,348 | | | | 521 | | | | 2,087 | | | | 886 | | | | - | | | | - | | |
| Reinvestment of distributions | | | 239 | | | | 491 | | | | 828 | | | | 1,109 | | | | 17 | | | | - | | | | - | | |
| Payments for redemptions | | | (2,913 | ) | | | (5,799 | ) | | | (5,303 | ) | | | (6,143 | ) | | | (44 | ) | | | - | | | | - | | |
| Increase (decrease) in net assets from Class C transactions | | | (1,790 | ) | | | (3,960 | ) | | | (3,954 | ) | | | (2,947 | ) | | | 859 | | | | - | | | | - | | |
| Class R: | |
| Proceeds from sales | | | 15 | | | | 6,356 | | | | 45 | | | | 308 | | | | 1 | | | | - | | | | - | | |
| Reinvestment of distributions | | | - | | | | 1,329 | | | | 1 | | | | 20 | | | | - | | | | - | | | | - | | |
| Payments for redemptions | | | - | | | | (46,072 | ) | | | (43 | ) | | | (1,112 | ) | | | - | | | | - | | | | - | | |
| Increase (decrease) in net assets from Class R transactions | | | 15 | | | | (38,387 | ) | | | 3 | | | | (784 | ) | | | 1 | | | | - | | | | - | | |
| Class Y: | |
| Proceeds from sales | | | 403,595 | | | | 394,559 | | | | 75,166 | | | | 94,505 | | | | 294,003 | | | | 14,803 | | | | 21,991 | | |
| Reinvestment of distributions | | | 22,339 | | | | 40,091 | | | | 1,986 | | | | 2,351 | | | | 2,104 | | | | 4,328 | | | | 26,896 | | |
| Payments for redemptions | | | (422,205 | ) | | | (599,130 | ) | | | (103,437 | ) | | | (48,429 | ) | | | (26,687 | ) | | | (72,879 | ) | | | (220,111 | ) | |
| Increase (decrease) in net assets from Class Y transactions | | | 3,729 | | | | (164,480 | ) | | | (26,285 | ) | | | 48,427 | | | | 269,420 | | | | (53,748 | ) | | | (171,224 | ) | |
| Increase (decrease) in net assets from capital share transactions | | | (23,547 | ) | | | (215,028 | ) | | | (41,254 | ) | | | 44,250 | | | | 277,187 | | | | (53,524 | ) | | | (171,564 | ) | |
| Total increase (decrease) in net assets | | | (43,834 | ) | | | (272,965 | ) | | | (42,131 | ) | | | 53,653 | | | | 277,185 | | | | (60,322 | ) | | | (205,730 | ) | |
| Net assets at beginning of period | | | 1,955,454 | | | | 2,228,419 | | | | 304,483 | | | | 250,830 | | | | - | | | | 131,641 | | | | 337,371 | | |
| Net assets at end of period | | $ | 1,911,620 | | | $ | 1,955,454 | | | $ | 262,352 | | | $ | 304,483 | | | $ | 277,185 | | | $ | 71,319 | | | $ | 131,641 | | |
| Undistributed net investment income | | $ | 868 | | | $ | 380 | | | $ | 19 | | | $ | 148 | | | $ | 1,292 | | | $ | 77 | | | $ | 165 | | |
(1) No prior period presentation as fund commenced operations on 10/1/04. (2) Due to the presentation of the financial statements in thousands, the number rounds to zero.
The accompanying notes are an integral part of the financial statements.
FIRST AMERICAN FUNDS Annual Report 2005
62
| | | Intermediate Term
Bond Fund | | Short Term
Bond Fund | | Total Return
Bond Fund | | U.S. Government
Mortgage Fund | |
| | | Year Ended
9/30/05 | | Year Ended
9/30/04 | | Year Ended
9/30/05 | | Year Ended
9/30/04 | | Year Ended
9/30/05 | | Year Ended
9/30/04 | | Year Ended
9/30/05 | | Year Ended
9/30/04 | |
| OPERATIONS: | |
| Investment income – net | | $ | 42,144 | | | $ | 42,757 | | | $ | 25,989 | | | $ | 23,756 | | | $ | 12,422 | | | $ | 13,096 | | | $ | 8,223 | | | $ | 9,612 | | |
| Net realized gain (loss) on investments | | | (2,596 | ) | | | 18,776 | | | | (6,244 | ) | | | 3,167 | | | | 5,824 | | | | 6,006 | | | | 696 | | | | 616 | | |
| Net realized gain (loss) on futures contracts | | | (730 | ) | | | (1,075 | ) | | | (2,529 | ) | | | (1,911 | ) | | | (465 | ) | | | (735 | ) | | | 43 | | | | (630 | ) | |
| Net realized gain (loss) on options written | | | 1,217 | | | | 1,321 | | | | 142 | | | | - | | | | 157 | | | | 104 | | | | (102 | ) | | | 269 | | |
| Net realized gain (loss) on swap agreements | | | 639 | | | | - | | | | 783 | | | | - | | | | 857 | | | | - | | | | - | | | | - | | |
Net realized gain (loss) on forward foreign currency contracts,
foreign currency, and translation of other assets and liabilities
denominated in foreign currency | | | - | | | | - | | | | - | | | | - | | | | (6 | ) | | | - | | | | - | | | | - | | |
| Net change in unrealized appreciation or depreciation of investments | | | (18,673 | ) | | | (32,178 | ) | | | (7,121 | ) | | | (14,832 | ) | | | (8,750 | ) | | | (5,034 | ) | | | (3,451 | ) | | | (3,225 | ) | |
| Net change in unrealized appreciation or depreciation of futures contracts | | | 624 | | | | (517 | ) | | | 1,494 | | | | (524 | ) | | | 165 | | | | (263 | ) | | | 112 | | | | (6 | ) | |
| Net change in unrealized appreciation or depreciation of written options | | | - | | | | 206 | | | | - | | | | - | | | | - | | | | - | | | | - | | | | 40 | | |
Net change in unrealized appreciation or depreciation of foreign currency,
and translation of other assets and liabilities denominated in foreign currency | | | - | | | | - | | | | - | | | | - | | | | (2 | ) | | | - | | | | - | | | | - | | |
| Net change in unrealized appreciation or depreciation of swap agreements | | | (27 | ) | | | - | | | | (2,149 | ) | | | - | | | | (7 | ) | | | - | | | | - | | | | - | | |
| Net increase in net assets resulting from operations | | | 22,598 | | | | 29,290 | | | | 10,365 | | | | 9,656 | | | | 10,195 | | | | 13,174 | | | | 5,521 | | | | 6,676 | | |
| DISTRIBUTIONS TO SHAREHOLDERS FROM: | |
| Investment income – net: | |
| Class A | | | (1,797 | ) | | | (2,199 | ) | | | (3,144 | ) | | | (3,287 | ) | | | (841 | ) | | | (787 | ) | | | (1,230 | ) | | | (1,210 | ) | |
| Class B | | | - | | | | - | | | | - | | | | - | | | | (167 | ) | | | (390 | ) | | | (312 | ) | | | (354 | ) | |
| Class C | | | - | | | | - | | | | - | | | | - | | | | (118 | ) | | | (186 | ) | | | (300 | ) | | | (525 | ) | |
| Class R | | | - | | | | (220 | ) | | | - | | | | (108 | ) | | | - | | | | (59 | ) | | | - | | | | (385 | ) | |
| Class Y | | | (40,236 | ) | | | (40,500 | ) | | | (23,671 | ) | | | (21,857 | ) | | | (11,336 | ) | | | (11,683 | ) | | | (7,495 | ) | | | (9,087 | ) | |
| Net realized gain on investments: | |
| Class A | | | (561 | ) | | | (840 | ) | | | - | | | | - | | | | - | | | | - | | | | - | | | | - | | |
| Class B | | | - | | | | - | | | | - | | | | - | | | | - | | | | - | | | | - | | | | - | | |
| Class C | | | - | | | | - | | | | - | | | | - | | | | - | | | | - | | | | - | | | | - | | |
| Class R | | | - | | | | (131 | ) | | | - | | | | - | | | | - | | | | - | | | | - | | | | - | | |
| Class Y | | | (11,243 | ) | | | (13,807 | ) | | | - | | | | - | | | | - | | | | - | | | | - | | | | - | | |
| Return of capital: | |
| Class A | | | - | | | | - | | | | (43 | ) | | | - | | | | - | | | | (1 | ) | | | - | | | | - | | |
| Class B | | | - | | | | - | | | | - | (2) | | | - | | | | - | | | | (1 | ) | | | - | | | | - | | |
| Class C | | | - | | | | - | | | | - | (2) | | | - | | | | - | | | | - | (2) | | | - | | | | - | | |
| Class R | | | - | | | | - | | | | - | (2) | | | - | | | | - | | | | - | (2) | | | - | | | | - | | |
| Class Y | | | - | | | | - | | | | (328 | ) | | | - | | | | - | | | | (17 | ) | | | - | | | | - | | |
| Total distributions | | | (53,837 | ) | | | (57,697 | ) | | | (27,186 | ) | | | (25,252 | ) | | | (12,462 | ) | | | (13,124 | ) | | | (9,337 | ) | | | (11,561 | ) | |
| CAPITAL SHARE TRANSACTIONS (note 4): | |
| Class A: | |
| Proceeds from sales | | | 8,671 | | | | 26,236 | | | | 6,342 | | | | 29,602 | | | | 2,495 | | | | 12,203 | | | | 5,292 | | | | 18,795 | | |
| Reinvestment of distributions | | | 2,041 | | | | 1,995 | | | | 2,512 | | | | 2,563 | | | | 686 | | | | 624 | | | | 1,097 | | | | 1,048 | | |
| Payments for redemptions | | | (24,078 | ) | | | (42,101 | ) | | | (39,475 | ) | | | (58,743 | ) | | | (4,969 | ) | | | (5,431 | ) | | | (14,192 | ) | | | (11,208 | ) | |
| Increase (decrease) in net assets from Class A transactions | | | (13,366 | ) | | | (13,870 | ) | | | (30,621 | ) | | | (26,578 | ) | | | (1,788 | ) | | | 7,396 | | | | (7,803 | ) | | | 8,635 | | |
| Class B: | |
| Proceeds from sales | | | - | | | | - | | | | - | | | | - | | | | 240 | | | | 687 | | | | 742 | | | | 1,290 | | |
| Reinvestment of distributions | | | - | | | | - | | | | - | | | | - | | | | 125 | | | | 278 | | | | 275 | | | | 313 | | |
| Payments for redemptions | | | - | | | | - | | | | - | | | | - | | | | (1,417 | ) | | | (8,920 | ) | | | (2,090 | ) | | | (3,679 | ) | |
| Decrease in net assets from Class B transactions | | | - | | | | - | | | | - | | | | - | | | | (1,052 | ) | | | (7,955 | ) | | | (1,073 | ) | | | (2,076 | ) | |
| Class C: | |
| Proceeds from sales | | | - | | | | - | | | | - | | | | - | | | | 90 | | | | 323 | | | | 309 | | | | 1,119 | | |
| Reinvestment of distributions | | | - | | | | - | | | | - | | | | - | | | | 105 | | | | 172 | | | | 284 | | | | 508 | | |
| Payments for redemptions | | | - | | | | - | | | | - | | | | - | | | | (1,107 | ) | | | (2,434 | ) | | | (4,390 | ) | | | (9,603 | ) | |
| Increase (decrease) in net assets from Class C transactions | | | - | | | | - | | | | - | | | | - | | | | (912 | ) | | | (1,939 | ) | | | (3,797 | ) | | | (7,976 | ) | |
| Class R: | |
| Proceeds from sales | | | - | | | | 4,442 | | | | - | | | | 1,901 | | | | 2 | | | | 90 | | | | 1 | | | | 1,517 | | |
| Reinvestment of distributions | | | - | | | | 323 | | | | - | | | | 92 | | | | - | | | | 59 | | | | - | | | | 359 | | |
| Payments for redemptions | | | - | | | | (16,683 | ) | | | - | | | | (10,658 | ) | | | - | | | | (2,840 | ) | | | - | | | | (19,037 | ) | |
| Increase (decrease) in net assets from Class R transactions | | | - | | | | (11,918 | ) | | | - | | | | (8,665 | ) | | | 2 | | | | (2,691 | ) | | | 1 | | | | (17,161 | ) | |
| Class Y: | |
| Proceeds from sales | | | 245,371 | | | | 386,218 | | | | 149,034 | | | | 462,268 | | | | 94,268 | | | | 55,561 | | | | 35,129 | | | | 43,758 | | |
| Reinvestment of distributions | | | 20,576 | | | | 23,314 | | | | 7,911 | | | | 7,197 | | | | 1,633 | | | | 1,623 | | | | 960 | | | | 1,090 | | |
| Payments for redemptions | | | (381,218 | ) | | | (459,895 | ) | | | (459,960 | ) | | | (345,341 | ) | | | (58,054 | ) | | | (60,124 | ) | | | (45,987 | ) | | | (84,443 | ) | |
| Increase (decrease) in net assets from Class Y transactions | | | (115,271 | ) | | | (50,363 | ) | | | (303,015 | ) | | | 124,124 | | | | 37,847 | | | | (2,940 | ) | | | (9,898 | ) | | | (39,595 | ) | |
| Increase (decrease) in net assets from capital share transactions | | | (128,637 | ) | | | (76,151 | ) | | | (333,636 | ) | | | 88,881 | | | | 34,097 | | | | (8,129 | ) | | | (22,570 | ) | | | (58,173 | ) | |
| Total increase (decrease) in net assets | | | (159,876 | ) | | | (104,558 | ) | | | (350,457 | ) | | | 73,285 | | | | 31,830 | | | | (8,079 | ) | | | (26,386 | ) | | | (63,058 | ) | |
| Net assets at beginning of period | | | 1,282,926 | | | | 1,387,484 | | | | 1,073,712 | | | | 1,000,427 | | | | 273,316 | | | | 281,395 | | | | 223,634 | | | | 286,692 | | |
| Net assets at end of period | | $ | 1,123,050 | | | $ | 1,282,926 | | | $ | 723,255 | | | $ | 1,073,712 | | | $ | 305,146 | | | $ | 273,316 | | | $ | 197,248 | | | $ | 223,634 | | |
| Undistributed net investment income | | $ | 1,447 | | | $ | 380 | | | $ | 2,148 | | | $ | 548 | | | $ | 117 | | | $ | - | | | $ | 132 | | | $ | 242 | | |
FIRST AMERICAN FUNDS Annual Report 2005
63
Financial Highlights For a share outstanding throughout the periods ended September 30, unless otherwise indicated.
| | | Net Asset
Value
Beginning
of Period | | Net
Investment
Income | | Realized and
Unrealized
Gains or
(Losses) on
Investments | | Distributions
from Net
Investment
Income | | Distributions
from Net
Realized Gains | | Net Asset
Value
End of
Period | | Total
Return (4) | |
| Core Bond Fund | |
| Class A | |
| | 2005 | (1) | | $ | 11.27 | | | $ | 0.40 | | | $ | (0.09 | ) | | $ | (0.42 | ) | | $ | (0.01 | ) | | $ | 11.15 | | | | 2.75 | % | |
| | 2004 | (1) | | | 11.56 | | | | 0.38 | | | | (0.09 | ) | | | (0.41 | ) | | | (0.17 | ) | | | 11.27 | | | | 2.60 | | |
| | 2003 | | | | 11.45 | | | | 0.42 | | | | 0.15 | | | | (0.46 | ) | | | - | | | | 11.56 | | | | 5.08 | | |
| | 2002 | | | | 11.37 | | | | 0.55 | | | | 0.08 | | | | (0.55 | ) | | | - | | | | 11.45 | | | | 5.77 | | |
| | 2001 | (1) | | | 10.69 | | | | 0.61 | | | | 0.69 | | | | (0.62 | ) | | | - | | | | 11.37 | | | | 12.50 | | |
| Class B | |
| | 2005 | (1) | | $ | 11.19 | | | $ | 0.31 | | | $ | (0.09 | ) | | $ | (0.33 | ) | | $ | (0.01 | ) | | $ | 11.07 | | | | 2.00 | % | |
| | 2004 | (1) | | | 11.48 | | | | 0.29 | | | | (0.09 | ) | | | (0.32 | ) | | | (0.17 | ) | | | 11.19 | | | | 1.83 | | |
| | 2003 | | | | 11.38 | | | | 0.35 | | | | 0.12 | | | | (0.37 | ) | | | - | | | | 11.48 | | | | 4.23 | | |
| | 2002 | �� | | | 11.29 | | | | 0.47 | | | | 0.09 | | | | (0.47 | ) | | | - | | | | 11.38 | | | | 5.12 | | |
| | 2001 | (1) | | | 10.63 | | | | 0.52 | | | | 0.68 | | | | (0.54 | ) | | | - | | | | 11.29 | | | | 11.59 | | |
| Class C | |
| | 2005 | (1) | | $ | 11.24 | | | $ | 0.31 | | | $ | (0.09 | ) | | $ | (0.33 | ) | | $ | (0.01 | ) | | $ | 11.12 | | | | 1.99 | % | |
| | 2004 | (1) | | | 11.53 | | | | 0.29 | | | | (0.09 | ) | | | (0.32 | ) | | | (0.17 | ) | | | 11.24 | | | | 1.81 | | |
| | 2003 | | | | 11.42 | | | | 0.34 | | | | 0.14 | | | | (0.37 | ) | | | - | | | | 11.53 | | | | 4.30 | | |
| | 2002 | | | | 11.34 | | | | 0.47 | | | | 0.08 | | | | (0.47 | ) | | | - | | | | 11.42 | | | | 5.02 | | |
| | 2001 | (1) | | | 10.66 | | | | 0.52 | | | | 0.70 | | | | (0.54 | ) | | | - | | | | 11.34 | | | | 11.68 | | |
| Class R (2) | |
| | 2005 | (1) | | $ | 11.30 | | | $ | 0.38 | | | $ | (0.10 | ) | | $ | (0.40 | ) | | $ | (0.01 | ) | | $ | 11.17 | | | | 2.51 | % | |
| | 2004 | (1) | | | 11.56 | | | | 0.38 | | | | (0.10 | ) | | | (0.37 | ) | | | (0.17 | ) | | | 11.30 | | | | 2.53 | | |
| | 2003 | | | | 11.45 | | | | 0.42 | | | | 0.15 | | | | (0.46 | ) | | | - | | | | 11.56 | | | | 5.08 | | |
| | 2002 | | | | 11.37 | | | | 0.55 | | | | 0.08 | | | | (0.55 | ) | | | - | | | | 11.45 | | | | 5.77 | | |
| | 2001 | (1) (3) | | | 11.28 | | | | 0.01 | | | | 0.08 | | | | - | | | | - | | | | 11.37 | | | | 0.80 | | |
| Class Y | |
| | 2005 | (1) | | $ | 11.27 | | | $ | 0.42 | | | $ | (0.08 | ) | | $ | (0.45 | ) | | $ | (0.01 | ) | | $ | 11.15 | | | | 3.01 | % | |
| | 2004 | (1) | | | 11.56 | | | | 0.40 | | | | (0.08 | ) | | | (0.44 | ) | | | (0.17 | ) | | | 11.27 | | | | 2.87 | | |
| | 2003 | | | | 11.45 | | | | 0.45 | | | | 0.15 | | | | (0.49 | ) | | | - | | | | 11.56 | | | | 5.34 | | |
| | 2002 | | | | 11.37 | | | | 0.58 | | | | 0.08 | | | | (0.58 | ) | | | - | | | | 11.45 | | | | 6.04 | | |
| | 2001 | (1) | | | 10.69 | | | | 0.63 | | | | 0.70 | | | | (0.65 | ) | | | - | | | | 11.37 | | | | 12.76 | | |
(1) Per share data calculated using average shares outstanding method.
(2) Prior to July 1, 2004, Class R shares were named Class S shares, which had lower fees and expenses.
(3) Class of shares has been offered since September 24, 2001. All ratios for the period have been annualized, except total return and portfolio turnover.
(4) Total returns do not reflect sales charges. Total return would have been lower had certain expenses not been waived.
The accompanying notes are an integral part of the financial statements.
FIRST AMERICAN FUNDS Annual Report 2005
64
| | | Net Assets
End of
Period (000) | | Ratio of
Expenses to
Average
Net Assets | | Ratio of Net
Investment
Income
to Average
Net Assets | | Ratio of
Expenses to
Average
Net Assets
(Excluding
Waivers) | | Ratio of Net
Investment
Income
to Average Net
Assets (Excluding
Waivers) | | Portfolio
Turnover
Rate | |
| Core Bond Fund | |
| Class A | |
| | 2005 | (1) | | $ | 161,410 | | | | 0.95 | % | | | 3.51 | % | | | 1.05 | % | | | 3.41 | % | | | 208 | % | |
| | 2004 | (1) | | | 184,805 | | | | 0.95 | | | | 3.30 | | | | 1.05 | | | | 3.20 | | | | 182 | | |
| | 2003 | | | | 191,754 | | | | 0.95 | | | | 3.58 | | | | 1.05 | | | | 3.48 | | | | 196 | | |
| | 2002 | | | | 122,354 | | | | 0.95 | | | | 4.93 | | | | 1.03 | | | | 4.85 | | | | 115 | | |
| | 2001 | (1) | | | 119,067 | | | | 0.95 | | | | 5.50 | | | | 1.13 | | | | 5.32 | | | | 81 | | |
| Class B | |
| | 2005 | (1) | | $ | 17,078 | | | | 1.70 | % | | | 2.76 | % | | | 1.80 | % | | | 2.66 | % | | | 208 | % | |
| | 2004 | (1) | | | 21,046 | | | | 1.70 | | | | 2.58 | | | | 1.80 | | | | 2.48 | | | | 182 | | |
| | 2003 | | | | 28,096 | | | | 1.70 | | | | 2.83 | | | | 1.80 | | | | 2.73 | | | | 196 | | |
| | 2002 | | | | 16,741 | | | | 1.70 | | | | 4.17 | | | | 1.78 | | | | 4.09 | | | | 115 | | |
| | 2001 | (1) | | | 15,071 | | | | 1.70 | | | | 4.75 | | | | 1.88 | | | | 4.57 | | | | 81 | | |
| Class C | |
| | 2005 | (1) | | $ | 7,266 | | | | 1.70 | % | | | 2.76 | % | | | 1.80 | % | | | 2.66 | % | | | 208 | % | |
| | 2004 | (1) | | | 9,132 | | | | 1.70 | | | | 2.58 | | | | 1.80 | | | | 2.48 | | | | 182 | | |
| | 2003 | | | | 13,424 | | | | 1.70 | | | | 2.85 | | | | 1.80 | | | | 2.75 | | | | 196 | | |
| | 2002 | | | | 9,672 | | | | 1.70 | | | | 4.18 | | | | 1.78 | | | | 4.10 | | | | 115 | | |
| | 2001 | (1) | | | 7,148 | | | | 1.70 | | | | 4.65 | | | | 1.88 | | | | 4.47 | | | | 81 | | |
| Class R (2) | |
| | 2005 | (1) | | $ | 16 | | | | 1.20 | % | | | 3.37 | % | | | 1.45 | % | | | 3.12 | % | | | 208 | % | |
| | 2004 | (1) | | | 1 | | | | 0.95 | | | | 3.37 | | | | 1.05 | | | | 3.27 | | | | 182 | | |
| | 2003 | | | | 39,236 | | | | 0.95 | | | | 3.58 | | | | 1.05 | | | | 3.48 | | | | 196 | | |
| | 2002 | | | | 33,270 | | | | 0.95 | | | | 4.93 | | | | 1.03 | | | | 4.85 | | | | 115 | | |
| | 2001 | (1) (3) | | | 35,062 | | | | 1.58 | | | | 6.36 | | | | 1.76 | | | | 6.18 | | | | 81 | | |
| Class Y | |
| | 2005 | (1) | | $ | 1,725,850 | | | | 0.70 | % | | | 3.77 | % | | | 0.80 | % | | | 3.67 | % | | | 208 | % | |
| | 2004 | (1) | | | 1,740,470 | | | | 0.70 | | | | 3.58 | | | | 0.80 | | | | 3.48 | | | | 182 | | |
| | 2003 | | | | 1,955,909 | | | | 0.70 | | | | 3.83 | | | | 0.80 | | | | 3.73 | | | | 196 | | |
| | 2002 | | | | 1,204,555 | | | | 0.70 | | | | 5.18 | | | | 0.78 | | | | 5.10 | | | | 115 | | |
| | 2001 | (1) | | | 1,368,812 | | | | 0.70 | | | | 5.76 | | | | 0.88 | | | | 5.58 | | | | 81 | | |
FIRST AMERICAN FUNDS Annual Report 2005
65
Financial Highlights For a share outstanding throughout the periods ended September 30, unless otherwise indicated.
| | | Net Asset
Value
Beginning
of Period | | Net
Investment
Income | | Realized and
Unrealized
Gains
(Losses) on
Investments | | Distributions
from Net
Investment
Income | | Distributions
from Net
Realized Gains | | Distributions
from
Return of
Capital | | Net Asset
Value
End of
Period | |
| High Income Bond Fund (1) | |
| Class A | |
| | 2005 | (2) | | $ | 9.45 | | | $ | 0.66 | | | $ | (0.04 | ) | | $ | (0.66 | ) | | $ | - | | | $ | - | (7) | | $ | 9.41 | | |
| | 2004 | (2) | | | 9.13 | | | | 0.68 | | | | 0.32 | | | | (0.68 | ) | | | - | | | | - | | | | 9.45 | | |
| | 2003 | (2) | | | 7.90 | | | | 0.68 | | | | 1.24 | | | | (0.69 | ) | | | - | | | | - | | | | 9.13 | | |
| | 2002 | | | | 9.23 | | | | 0.65 | | | | (1.21 | ) | | | (0.70 | ) | | | - | | | | (0.07 | ) | | | 7.90 | | |
| | 2001 | (2) (3) | | | 9.93 | | | | 0.02 | | | | (0.68 | ) | | | (0.04 | ) | | | - | | | | - | | | | 9.23 | | |
| Class B | |
| | 2005 | (2) | | $ | 9.41 | | | $ | 0.58 | | | $ | (0.03 | ) | | $ | (0.59 | ) | | $ | - | | | $ | - | (7) | | $ | 9.37 | | |
| | 2004 | (2) | | | 9.09 | | | | 0.61 | | | | 0.32 | | | | (0.61 | ) | | | - | | | | - | | | | 9.41 | | |
| | 2003 | (2) | | | 7.87 | | | | 0.61 | | | | 1.24 | | | | (0.63 | ) | | | - | | | | - | | | | 9.09 | | |
| | 2002 | | | | 9.19 | | | | 0.69 | | | | (1.31 | ) | | | (0.63 | ) | | | - | | | | (0.07 | ) | | | 7.87 | | |
| | 2001 | (2) (3) | | | 9.88 | | | | 0.02 | | | | (0.67 | ) | | | (0.04 | ) | | | - | | | | - | | | | 9.19 | | |
| Class C | |
| | 2005 | (2) | | $ | 9.42 | | | $ | 0.58 | | | $ | (0.03 | ) | | $ | (0.59 | ) | | $ | - | | | $ | - | (7) | | $ | 9.38 | | |
| | 2004 | (2) | | | 9.10 | | | | 0.61 | | | | 0.32 | | | | (0.61 | ) | | | - | | | | - | | | | 9.42 | | |
| | 2003 | (2) | | | 7.89 | | | | 0.61 | | | | 1.23 | | | | (0.63 | ) | | | - | | | | - | | | | 9.10 | | |
| | 2002 | | | | 9.21 | | | | 0.64 | | | | (1.27 | ) | | | (0.62 | ) | | | - | | | | (0.07 | ) | | | 7.89 | | |
| | 2001 | (2) (3) | | | 9.90 | | | | 0.05 | | | | (0.70 | ) | | | (0.04 | ) | | | - | | | | - | | | | 9.21 | | |
| Class R (4) | |
| | 2005 | (2) | | $ | 9.60 | | | $ | 0.62 | | | $ | (0.04 | ) | | $ | (0.65 | ) | | $ | - | | | $ | - | (7) | | $ | 9.53 | | |
| | 2004 | (2) | | | 9.21 | | | | 0.69 | | | | 0.32 | | | | (0.62 | ) | | | - | | | | - | | | | 9.60 | | |
| | 2003 | (2) | | | 7.98 | | | | 0.71 | | | | 1.22 | | | | (0.70 | ) | | | - | | | | - | | | | 9.21 | | |
| | 2002 | | | | 9.32 | | | | 0.73 | | | | (1.30 | ) | | | (0.70 | ) | | | - | | | | (0.07 | ) | | | 7.98 | | |
| | 2001 | (2) (5) | | | 9.50 | | | | 0.01 | | | | (0.19 | ) | | | - | | | | - | | | | - | | | | 9.32 | | |
| Class Y | |
| | 2005 | (2) | | $ | 9.46 | | | $ | 0.68 | | | $ | (0.03 | ) | | $ | (0.69 | ) | | $ | - | | | $ | - | (7) | | $ | 9.42 | | |
| | 2004 | (2) | | | 9.13 | | | | 0.70 | | | | 0.34 | | | | (0.71 | ) | | | - | | | | - | | | | 9.46 | | |
| | 2003 | (2) | | | 7.92 | | | | 0.69 | | | | 1.24 | | | | (0.72 | ) | | | - | | | | - | | | | 9.13 | | |
| | 2002 | | | | 9.24 | | | | 0.74 | | | | (1.28 | ) | | | (0.71 | ) | | | - | | | | (0.07 | ) | | | 7.92 | | |
| | 2001 | (2) (3) | | | 9.92 | | | | 0.05 | | | | (0.69 | ) | | | (0.04 | ) | | | - | | | | - | | | | 9.24 | | |
| Inflation Protected Securities Fund (2) (6) | |
| Class A | |
| | 2005 | | | $ | 10.00 | | | $ | 0.51 | | | $ | (0.02 | ) | | $ | (0.37 | ) | | $ | - | | | $ | - | | | $ | 10.12 | | |
| Class C | |
| | 2005 | | | $ | 10.00 | | | $ | 0.40 | | | $ | 0.02 | | | $ | (0.31 | ) | | $ | - | | | $ | - | | | $ | 10.11 | | |
| Class R | |
| | 2005 | | | $ | 10.00 | | | $ | 0.43 | | | $ | 0.05 | | | $ | (0.35 | ) | | $ | - | | | $ | - | | | $ | 10.13 | | |
| Class Y | |
| | 2005 | | | $ | 10.00 | | | $ | 0.51 | | | $ | 0.01 | | | $ | (0.39 | ) | | $ | - | | | $ | - | | | $ | 10.13 | | |
(1) The financial highlights for the High Income Bond Fund prior to March 14, 2003, are those of the First American High Yield Bond Fund Class A shares, Class B shares,
Class C shares, Class S shares, and Class Y shares. The assets of the First American High Yield Bond Fund were acquired by High Income Bond Fund on March 14, 2003.
In connection with such acquisition, Class A shares, Class B shares, Class C shares, Class S shares, and Class Y shares of the First American High Yield Bond Fund were
exchanged for Class A shares, Class B shares, Class C shares, Class S shares, (now designated Class R shares) and Class Y shares of High Income Bond Fund respectively.
Historical per-share amounts have been adjusted to reflect the conversion ratios utilized for the merger o f the High Income Bond Fund and the First American High Yield Bond Fund.
(2) Per share data calculated using average shares outstanding method.
(3) Commenced operations on August 30, 2001. All ratios for the period have been annualized, except total return and portfolio turnover.
(4) Prior to July 1, 2004, Class R shares were named Class S shares, which had lower fees and expenses.
(5) Class of shares has been offered since September 24, 2001. All ratios for the period have been annualized, except total return and portfolio turnover.
(6) Commenced operations on October 1, 2004.
(7) Includes a tax return of capital of less than $0.01.
(8) Total return does not reflect sales charges. Total return would have been lower had certain expenses not been waived.
The accompanying notes are an integral part of the financial statements.
FIRST AMERICAN FUNDS Annual Report 2005
66
| | | Total
Return (8) | | Net Assets
End of
Period (000) | | Ratio of
Expenses to
Average
Net Assets | | Ratio of Net
Investment
Income
to Average
Net Assets | | Ratio of
Expenses to
Average
Net Assets
(Excluding
Waivers) | | Ratio of Net
Investment
Income
to Average Net
Assets (Excluding
Waivers) | | Portfolio
Turnover
Rate | |
| High Income Bond Fund (1) | |
| Class A | |
| | 2005 | (2) | | | 6.74 | % | | $ | 34,144 | | | | 1.02 | % | | | 6.88 | % | | | 1.27 | % | | | 6.63 | % | | | 77 | % | |
| | 2004 | (2) | | | 11.30 | | | | 43,842 | | | | 1.00 | | | | 7.25 | | | | 1.26 | | | | 6.99 | | | | 80 | | |
| | 2003 | (2) | | | 25.30 | | | | 42,013 | | | | 1.06 | | | | 7.72 | | | | 1.24 | | | | 7.54 | | | | 122 | | |
| | 2002 | | | | (6.66 | ) | | | 23,900 | | | | 1.10 | | | | 7.64 | | | | 1.47 | | | | 7.27 | | | | 86 | | |
| | 2001 | (2) (3) | | | (6.55 | ) | | | 161 | | | | 1.10 | | | | 6.53 | | | | 1.33 | | | | 6.30 | | | | 53 | | |
| Class B | |
| | 2005 | (2) | | | 5.97 | % | | $ | 7,191 | | | | 1.77 | % | | | 6.13 | % | | | 2.02 | % | | | 5.88 | % | | | 77 | % | |
| | 2004 | (2) | | | 10.52 | | | | 8,521 | | | | 1.75 | | | | 6.50 | | | | 2.01 | | | | 6.24 | | | | 80 | | |
| | 2003 | (2) | | | 24.33 | | | | 8,939 | | | | 1.81 | | | | 7.00 | | | | 1.99 | | | | 6.82 | | | | 122 | | |
| | 2002 | | | | (7.26 | ) | | | 774 | | | | 1.80 | | | | 7.49 | | | | 2.28 | | | | 7.01 | | | | 86 | | |
| | 2001 | (2) (3) | | | (6.47 | ) | | | 40 | | | | 1.77 | | | | 6.02 | | | | 2.02 | | | | 5.77 | | | | 53 | | |
| Class C | |
| | 2005 | (2) | | | 5.96 | % | | $ | 13,403 | | | | 1.77 | % | | | 6.13 | % | | | 2.02 | % | | | 5.88 | % | | | 77 | % | |
| | 2004 | (2) | | | 10.51 | | | | 17,349 | | | | 1.75 | | | | 6.50 | | | | 2.01 | | | | 6.24 | | | | 80 | | |
| | 2003 | (2) | | | 24.14 | | | | 19,685 | | | | 1.80 | | | | 7.01 | | | | 1.98 | | | | 6.83 | | | | 122 | | |
| | 2002 | | | | (7.34 | ) | | | 7,213 | | | | 1.83 | | | | 7.08 | | | | 2.26 | | | | 6.65 | | | | 86 | | |
| | 2001 | (2) (3) | | | (6.50 | ) | | | 3,749 | | | | 1.94 | | | | 5.53 | | | | 2.21 | | | | 5.26 | | | | 53 | | |
| Class R (4) | |
| | 2005 | (2) | | | 6.23 | % | | $ | 4 | | | | 1.33 | % | | | 6.31 | % | | | 1.73 | % | | | 5.91 | % | | | 77 | % | |
| | 2004 | (2) | | | 11.29 | | | | 1 | | | | 1.00 | | | | 7.33 | | | | 1.26 | | | | 7.07 | | | | 80 | | |
| | 2003 | (2) | | | 25.11 | | | | 777 | | | | 1.00 | | | | 7.86 | | | | 1.18 | | | | 7.68 | | | | 122 | | |
| | 2002 | | | | (6.66 | ) | | | 87 | | | | 1.01 | | | | 8.46 | | | | 1.57 | | | | 7.90 | | | | 86 | | |
| | 2001 | (2) (5) | | | (1.90 | ) | | | - | | | | - | | | | 1.23 | | | | - | | | | 1.23 | | | | 53 | | |
| Class Y | |
| | 2005 | (2) | | | 7.01 | % | | $ | 207,610 | | | | 0.77 | % | | | 7.13 | % | | | 1.02 | % | | | 6.88 | % | | | 77 | % | |
| | 2004 | (2) | | | 11.69 | | | | 234,770 | | | | 0.75 | | | | 7.49 | | | | 1.01 | | | | 7.23 | | | | 80 | | |
| | 2003 | (2) | | | 25.29 | | | | 179,416 | | | | 0.83 | | | | 7.97 | | | | 1.01 | | | | 7.79 | | | | 122 | | |
| | 2002 | | | | (6.33 | ) | | | 21,157 | | | | 0.82 | | | | 8.19 | | | | 1.27 | | | | 7.74 | | | | 86 | | |
| | 2001 | (2) (3) | | | (6.47 | ) | | | 8,308 | | | | 0.96 | | | | 6.06 | | | | 1.23 | | | | 5.79 | | | | 53 | | |
| Inflation Protected Securities Fund (2) (6) | |
| Class A | |
| | 2005 | | | | 4.93 | % | | $ | 6,917 | | | | 0.85 | % | | | 5.04 | % | | | 1.09 | % | | | 4.80 | % | | | 23 | % | |
| Class C | |
| | 2005 | | | | 4.18 | % | | $ | 855 | | | | 1.60 | % | | | 3.98 | % | | | 1.84 | % | | | 3.74 | % | | | 23 | % | |
| Class R | |
| | 2005 | | | | 4.81 | % | | $ | 1 | | | | 1.10 | % | | | 4.22 | % | | | 1.49 | % | | | 3.83 | % | | | 23 | % | |
| Class Y | |
| | 2005 | | | | 5.24 | % | | $ | 269,412 | | | | 0.60 | % | | | 5.05 | % | | | 0.84 | % | | | 4.81 | % | | | 23 | % | |
FIRST AMERICAN FUNDS Annual Report 2005
67
Financial Highlights For a share outstanding throughout the periods ended September 30, unless otherwise indicated.
| | | Net Asset
Value
Beginning
of Period | | Net
Investment
Income | | Realized and
Unrealized
Gains
(Losses) on
Investments | | Distributions
from Net
Investment
Income | | Distributions
from Net
Realized Gains | | Distributions
from
Return of
Capital | | Net Asset
Value
End of
Period | |
| Intermediate Government Bond Fund | |
| Class A | |
| | 2005 | (1) | | $ | 8.82 | | | $ | 0.27 | | | $ | (0.15 | ) | | $ | (0.28 | ) | | $ | (0.40 | ) | | $ | - | | | $ | 8.26 | | |
| | 2004 | (1) | | | 10.01 | | | | 0.24 | | | | (0.16 | ) | | | (0.24 | ) | | | (1.03 | ) | | | - | | | | 8.82 | | |
| | 2003 | (2) | | | 10.00 | | | | 0.32 | | | | 0.02 | | | | (0.33 | ) | | | - | | | | - | | | | 10.01 | | |
| Class Y | |
| | 2005 | (1) | | $ | 8.82 | | | $ | 0.28 | | | $ | (0.16 | ) | | $ | (0.29 | ) | | $ | (0.40 | ) | | $ | - | | | $ | 8.25 | | |
| | 2004 | (1) | | | 10.01 | | | | 0.26 | | | | (0.17 | ) | | | (0.25 | ) | | | (1.03 | ) | | | - | | | | 8.82 | | |
| | 2003 | (2) | | | 10.00 | | | | 0.34 | | | | 0.01 | | | | (0.34 | ) | | | - | | | | - | | | | 10.01 | | |
| Intermediate Term Bond Fund (3) | |
| Class A | |
| | 2005 | (1) | | $ | 10.25 | | | $ | 0.34 | | | $ | (0.17 | ) | | $ | (0.33 | ) | | $ | (0.10 | ) | | $ | - | | | $ | 9.99 | | |
| | 2004 | (1) | | | 10.46 | | | | 0.31 | | | | (0.10 | ) | | | (0.31 | ) | | | (0.11 | ) | | | - | | | | 10.25 | | |
| | 2003 | | | | 10.35 | | | | 0.39 | | | | 0.12 | | | | (0.40 | ) | | | - | | | | - | | | | 10.46 | | |
| | 2002 | | | | 10.26 | | | | 0.50 | | | | 0.10 | | | | (0.50 | ) | | | - | | | | (0.01 | ) | | | 10.35 | | |
| | 2001 | (1) (4) | | | 9.70 | | | | 0.54 | | | | 0.55 | | | | (0.51 | ) | | | (0.02 | ) | | | - | | | | 10.26 | | |
| | 2000 | (5) | | | 9.68 | | | | 0.58 | | | | 0.02 | | | | (0.58 | ) | | | - | | | | - | | | | 9.70 | | |
| Class Y | |
| | 2005 | (1) | | $ | 10.22 | | | $ | 0.36 | | | $ | (0.17 | ) | | $ | (0.35 | ) | | $ | (0.10 | ) | | $ | - | | | $ | 9.96 | | |
| | 2004 | (1) | | | 10.43 | | | | 0.33 | | | | (0.11 | ) | | | (0.32 | ) | | | (0.11 | ) | | | - | | | | 10.22 | | |
| | 2003 | | | | 10.32 | | | | 0.41 | | | | 0.12 | | | | (0.42 | ) | | | - | | | | - | | | | 10.43 | | |
| | 2002 | | | | 10.23 | | | | 0.52 | | | | 0.10 | | | | (0.52 | ) | | | - | | | | (0.01 | ) | | | 10.32 | | |
| | 2001 | (1) (4) | | | 9.68 | | | | 0.56 | | | | 0.54 | | | | (0.53 | ) | | | (0.02 | ) | | | - | | | | 10.23 | | |
| | 2000 | (5) | | | 9.66 | | | | 0.60 | | | | 0.02 | | | | (0.60 | ) | | | - | | | | - | | | | 9.68 | | |
(1) Per share data calculated using average shares outstanding method.
(2) Commenced operations on October 25, 2002. All ratios for the period have been annualized, except total return and portfolio turnover.
(3) The financial highlights for the Intermediate Term Bond Fund prior to September 24, 2001, are those of the Firstar Intermediate Bond Fund Class A shares, Class Y shares,
and Class I shares. The assets of the Firstar Intermediate Bond Fund were acquired by Intermediate Term Bond Fund on September 24, 2001. In connection with such
acquisition, Class A shares, Class Y shares, and Class I shares of the Firstar Intermediate Bond Fund were exchanged for Class A shares, Class S shares, and
Class Y shares of Intermediate Term Bond Fund, respectively. Historical per-share amounts have been adjusted to reflect the conversion ratios utilized for the merger of
the Intermediate Term Bond Fund and the Firstar Intermediate Bond Fund.
(4) For the period November 1, 2000 to September 30, 2001. Effective in 2001, the fund's fiscal year end was changed from October 31 to September 30. All ratios for the
period have been annualized, except total return and portfolio turnover.
(5) For the fiscal year ended October 31.
(6) Total return does not reflect sales charges. Total return would have been lower had certain expenses not been waived.
The accompanying notes are an integral part of the financial statements.
FIRST AMERICAN FUNDS Annual Report 2005
68
| | | Total
Return (6) | | Net Assets
End of
Period (000) | | Ratio of
Expenses to
Average
Net Assets | | Ratio of Net
Investment
Income
to Average
Net Assets | | Ratio of
Expenses to
Average
Net Assets
(Excluding
Waivers) | | Ratio of Net
Investment
Income
to Average Net
Assets (Excluding
Waivers) | | Portfolio
Turnover
Rate | |
| Intermediate Government Bond Fund | |
| Class A | |
| | 2005 | (1) | | | 1.40 | % | | $ | 1,970 | | | | 0.75 | % | | | 3.21 | % | | | 1.09 | % | | | 2.87 | % | | | 161 | % | |
| | 2004 | (1) | | | 0.98 | | | | 1,872 | | | | 0.75 | | | | 2.69 | | | | 1.03 | | | | 2.41 | | | | 53 | | |
| | 2003 | (2) | | | 3.53 | | | | 2,502 | | | | 0.75 | | | | 3.22 | | | | 1.05 | | | | 2.92 | | | | 74 | | |
| Class Y | |
| | 2005 | (1) | | | 1.43 | % | | $ | 69,349 | | | | 0.60 | % | | | 3.34 | % | | | 0.84 | % | | | 3.10 | % | | | 161 | % | |
| | 2004 | (1) | | | 1.14 | | | | 129,769 | | | | 0.60 | | | | 2.84 | | | | 0.78 | | | | 2.66 | | | | 53 | | |
| | 2003 | (2) | | | 3.64 | | | | 334,869 | | | | 0.60 | | | | 3.68 | | | | 0.80 | | | | 3.48 | | | | 74 | | |
| Intermediate Term Bond Fund (3) | |
| Class A | |
| | 2005 | (1) | | | 1.69 | % | | $ | 48,426 | | | | 0.75 | % | | | 3.39 | % | | | 1.05 | % | | | 3.09 | % | | | 118 | % | |
| | 2004 | (1) | | | 2.06 | | | | 63,219 | | | | 0.75 | | | | 2.97 | | | | 1.04 | | | | 2.68 | | | | 169 | | |
| | 2003 | | | | 5.09 | | | | 78,682 | | | | 0.75 | | | | 3.89 | | | | 1.05 | | | | 3.59 | | | | 133 | | |
| | 2002 | | | | 6.11 | | | | 65,291 | | | | 0.75 | | | | 4.96 | | | | 1.02 | | | | 4.69 | | | | 40 | | |
| | 2001 | (1) (4) | | | 11.46 | | | | 61,225 | | | | 0.85 | | | | 5.62 | | | | 0.96 | | | | 5.51 | | | | 30 | | |
| | 2000 | (5) | | | 6.41 | | | | 27,431 | | | | 0.82 | | | | 6.08 | | | | 0.95 | | | | 5.95 | | | | 18 | | |
| Class Y | |
| | 2005 | (1) | | | 1.85 | % | | $ | 1,074,624 | | | | 0.60 | % | | | 3.55 | % | | | 0.80 | % | | | 3.35 | % | | | 118 | % | |
| | 2004 | (1) | | | 2.22 | | | | 1,219,707 | | | | 0.60 | | | | 3.12 | | | | 0.79 | | | | 2.93 | | | | 169 | | |
| | 2003 | | | | 5.25 | | | | 1,296,529 | | | | 0.60 | | | | 4.05 | | | | 0.80 | | | | 3.85 | | | | 133 | | |
| | 2002 | | | | 6.29 | | | | 978,406 | | | | 0.60 | | | | 5.11 | | | | 0.77 | | | | 4.94 | | | | 40 | | |
| | 2001 | (1) (4) | | | 11.61 | | | | 878,695 | | | | 0.60 | | | | 5.83 | | | | 0.70 | | | | 5.73 | | | | 30 | | |
| | 2000 | (5) | | | 6.67 | | | | 408,708 | | | | 0.57 | | | | 6.33 | | | | 0.70 | | | | 6.20 | | | | 18 | | |
FIRST AMERICAN FUNDS Annual Report 2005
69
Financial Highlights For a share outstanding throughout the periods ended September 30, unless otherwise indicated.
| | | Net Asset
Value
Beginning
of Period | | Net
Investment
Income | | Realized and
Unrealized
Gains
(Losses) on
Investments | | Distributions
from Net
Investment
Income | | Distributions
from Net
Realized Gains | | Distributions
from
Return of
Capital | | Net Asset
Value
End of
Period | |
| Short Term Bond Fund | |
| Class A | |
| | 2005 | (1) | | $ | 10.11 | | | $ | 0.27 | | | $ | (0.16 | ) | | $ | (0.29 | ) | | $ | - | | | $ | - | (4) | | $ | 9.93 | | |
| | 2004 | (1) | | | 10.26 | | | | 0.23 | | | | (0.15 | ) | | | (0.23 | ) | | | - | | | | - | | | | 10.11 | | |
| | 2003 | | | | 10.29 | | | | 0.28 | | | | (0.01 | ) | | | (0.30 | ) | | | - | | | | - | | | | 10.26 | | |
| | 2002 | | | | 10.27 | | | | 0.42 | | | | 0.04 | | | | (0.43 | ) | | | - | | | | (0.01 | ) | | | 10.29 | | |
| | 2001 | (1) | | | 9.91 | | | | 0.61 | | | | 0.40 | | | | (0.65 | ) | | | - | | | | - | | | | 10.27 | | |
| Class Y | |
| | 2005 | (1) | | $ | 10.11 | | | $ | 0.28 | | | $ | (0.16 | ) | | $ | (0.29 | ) | | $ | - | | | $ | (0.01 | ) | | $ | 9.93 | | |
| | 2004 | (1) | | | 10.26 | | | | 0.25 | | | | (0.16 | ) | | | (0.24 | ) | | | - | | | | - | | | | 10.11 | | |
| | 2003 | | | | 10.30 | | | | 0.30 | | | | (0.02 | ) | | | (0.32 | ) | | | - | | | | - | | | | 10.26 | | |
| | 2002 | | | | 10.27 | | | | 0.43 | | | | 0.05 | | | | (0.44 | ) | | | - | | | | (0.01 | ) | | | 10.30 | | |
| | 2001 | (1) | | | 9.91 | | | | 0.63 | | | | 0.39 | | | | (0.66 | ) | | | - | | | | - | | | | 10.27 | | |
| Total Return Bond Fund (6) | |
| Class A | |
| | 2005 | (1) | | $ | 10.25 | | | $ | 0.43 | | | $ | (0.07 | ) | | $ | (0.43 | ) | | $ | - | | | $ | - | | | $ | 10.18 | | |
| | 2004 | (1) | | | 10.23 | | | | 0.46 | | | | 0.03 | | | | (0.47 | ) | | | - | | | | - | (4) | | | 10.25 | | |
| | 2003 | | | | 9.60 | | | | 0.51 | | | | 0.63 | | | | (0.51 | ) | | | - | | | | - | | | | 10.23 | | |
| | 2002 | | | | 10.01 | | | | 0.57 | | | | (0.39 | ) | | �� | (0.58 | ) | | | (0.01 | ) | | | - | | | | 9.60 | | |
| | 2001 | (1) | | | 10.03 | | | | 0.72 | | | | 0.35 | | | | (0.73 | ) | | | (0.36 | ) | | | - | | | | 10.01 | | |
| Class B | |
| | 2005 | (1) | | $ | 10.21 | | | $ | 0.35 | | | $ | (0.07 | ) | | $ | (0.35 | ) | | $ | - | | | $ | - | | | $ | 10.14 | | |
| | 2004 | (1) | | | 10.20 | | | | 0.39 | | | | 0.01 | | | | (0.39 | ) | | | - | | | | - | (4) | | | 10.21 | | |
| | 2003 | | | | 9.57 | | | | 0.44 | | | | 0.63 | | | | (0.44 | ) | | | - | | | | - | | | | 10.20 | | |
| | 2002 | | | | 9.98 | | | | 0.49 | | | | (0.38 | ) | | | (0.51 | ) | | | (0.01 | ) | | | - | | | | 9.57 | | |
| | 2001 | (1) | | | 10.02 | | | | 0.66 | | | | 0.32 | | | | (0.66 | ) | | | (0.36 | ) | | | - | | | | 9.98 | | |
| Class C | |
| | 2005 | (1) | | $ | 10.20 | | | $ | 0.35 | | | $ | (0.07 | ) | | $ | (0.36 | ) | | $ | - | | | $ | - | | | $ | 10.12 | | |
| | 2004 | (1) | | | 10.18 | | | | 0.39 | | | | 0.02 | | | | (0.39 | ) | | | - | | | | - | (4) | | | 10.20 | | |
| | 2003 | | | | 9.55 | | | | 0.44 | | | | 0.63 | | | | (0.44 | ) | | | - | | | | - | | | | 10.18 | | |
| | 2002 | | | | 9.97 | | | | 0.49 | | | | (0.40 | ) | | | (0.50 | ) | | | (0.01 | ) | | | - | | | | 9.55 | | |
| | 2001 | (1) | | | 10.01 | | | | 0.63 | | | | 0.35 | | | | (0.66 | ) | | | (0.36 | ) | | | - | | | | 9.97 | | |
| Class R (2) | |
| | 2005 | (1) | | $ | 10.29 | | | $ | 0.41 | | | $ | (0.07 | ) | | $ | (0.40 | ) | | $ | - | | | $ | - | | | $ | 10.23 | | |
| | 2004 | (1) | | | 10.23 | | | | 0.48 | | | | - | | | | (0.42 | ) | | | - | | | | - | (4) | | | 10.29 | | |
| | 2003 | | | | 9.60 | | | | 0.51 | | | | 0.63 | | | | (0.51 | ) | | | - | | | | - | | | | 10.23 | | |
| | 2002 | | | | 10.01 | | | | 0.56 | | | | (0.38 | ) | | | (0.58 | ) | | | (0.01 | ) | | | - | | | | 9.60 | | |
| | 2001 | (1) (3) | | | 9.93 | | | | 0.01 | | | | 0.07 | | | | - | | | | - | | | | - | | | | 10.01 | | |
| Class Y | |
| | 2005 | (1) | | $ | 10.24 | | | $ | 0.46 | | | $ | (0.07 | ) | | $ | (0.46 | ) | | $ | - | | | $ | - | | | $ | 10.17 | | |
| | 2004 | (1) | | | 10.23 | | | | 0.49 | | | | 0.01 | | | | (0.49 | ) | | | - | | | | - | (4) | | | 10.24 | | |
| | 2003 | | | | 9.59 | | | | 0.54 | | | | 0.64 | | | | (0.54 | ) | | | - | | | | - | | | | 10.23 | | |
| | 2002 | | | | 10.00 | | | | 0.59 | | | | (0.39 | ) | | | (0.60 | ) | | | (0.01 | ) | | | - | | | | 9.59 | | |
| | 2001 | (1) | | | 10.03 | | | | 0.75 | | | | 0.33 | | | | (0.75 | ) | | | (0.36 | ) | | | - | | | | 10.00 | | |
(1) Per share data calculated using average shares outstanding method.
(2) Prior to July 1, 2004, Class R shares were named Class S shares, which had lower fees and expenses.
(3) Class of shares have been offered since September, 24, 2001. All ratios for the period have been annualized, except total return and portfolio turnover.
(4) Includes a tax return of capital of less than $0.01.
(5) Total returns do not reflect sales charges. Total return would have been lower had certain expenses not been waived.
(6) The financial highlights for Total Return Bond Fund as set forth herein include the historical financial highlights of the First American Corporate Bond Fund. Effective
May 16, 2005 the fund's name and strategy changed.
The accompanying notes are an integral part of the financial statements.
FIRST AMERICAN FUNDS Annual Report 2005
70
| | | Total
Return (5) | | Net Assets
End of
Period (000) | | Ratio of
Expenses to
Average
Net Assets | | Ratio of Net
Investment
Income
to Average
Net Assets | | Ratio of
Expenses to
Average
Net Assets
(Excluding
Waivers) | | Ratio of Net
Investment
Income
to Average Net
Assets (Excluding
Waivers) | | Portfolio
Turnover
Rate | |
| Short Term Bond Fund | |
| Class A | |
| | 2005 | (1) | | | 1.08 | % | | $ | 97,863 | | | | 0.75 | % | | | 2.68 | % | | | 1.05 | % | | | 2.38 | % | | | 64 | % | |
| | 2004 | (1) | | | 0.76 | | | | 130,531 | | | | 0.75 | | | | 2.28 | | | | 1.05 | | | | 1.98 | | | | 89 | | |
| | 2003 | | | | 2.71 | | | | 159,451 | | | | 0.75 | | | | 2.75 | | | | 1.05 | | | | 2.45 | | | | 60 | | |
| | 2002 | | | | 4.59 | | | | 163,358 | | | | 0.75 | | | | 4.06 | | | | 1.04 | | | | 3.77 | | | | 59 | | |
| | 2001 | (1) | | | 10.48 | | | | 133,177 | | | | 0.60 | | | | 6.04 | | | | 1.15 | | | | 5.49 | | | | 69 | | |
| Class Y | |
| | 2005 | (1) | | | 1.23 | % | | $ | 625,392 | | | | 0.60 | % | | | 2.83 | % | | | 0.80 | % | | | 2.63 | % | | | 64 | % | |
| | 2004 | (1) | | | 0.91 | | | | 943,181 | | | | 0.60 | | | | 2.43 | | | | 0.80 | | | | 2.23 | | | | 89 | | |
| | 2003 | | | | 2.76 | | | | 832,266 | | | | 0.60 | | | | 2.84 | | | | 0.80 | | | | 2.64 | | | | 60 | | |
| | 2002 | | | | 4.85 | | | | 484,583 | | | | 0.60 | | | | 4.18 | | | | 0.79 | | | | 3.99 | | | | 59 | | |
| | 2001 | (1) | | | 10.64 | | | | 277,244 | | | | 0.46 | | | | 6.24 | | | | 1.02 | | | | 5.68 | | | | 69 | | |
| Total Return Bond Fund (6) | |
| Class A | |
| | 2005 | (1) | | | 3.57 | % | | $ | 19,113 | | | | 1.00 | % | | | 4.20 | % | | | 1.25 | % | | | 3.95 | % | | | 285 | % | |
| | 2004 | (1) | | | 4.89 | | | | 21,034 | | | | 1.00 | | | | 4.54 | | | | 1.25 | | | | 4.29 | | | | 132 | | |
| | 2003 | | | | 12.26 | | | | 13,522 | | | | 1.00 | | | | 5.15 | | | | 1.26 | | | | 4.89 | | | | 91 | | |
| | 2002 | | | | 1.83 | | | | 8,663 | | | | 1.00 | | | | 5.77 | | | | 1.27 | | | | 5.50 | | | | 117 | | |
| | 2001 | (1) | | | 10.94 | | | | 9,820 | | | | 0.75 | | | | 6.95 | | | | 1.20 | | | | 6.50 | | | | 187 | | |
| Class B | |
| | 2005 | (1) | | | 2.81 | % | | $ | 4,395 | | | | 1.75 | % | | | 3.45 | % | | | 2.00 | % | | | 3.20 | % | | | 285 | % | |
| | 2004 | (1) | | | 3.97 | | | | 5,474 | | | | 1.75 | | | | 3.83 | | | | 2.00 | | | | 3.58 | | | | 132 | | |
| | 2003 | | | | 11.46 | | | | 13,576 | | | | 1.75 | | | | 4.46 | | | | 2.01 | | | | 4.20 | | | | 91 | | |
| | 2002 | | | | 1.07 | | | | 18,728 | | | | 1.75 | | | | 5.02 | | | | 2.02 | | | | 4.75 | | | | 117 | | |
| | 2001 | (1) | | | 10.06 | | | | 22,608 | | | | 1.65 | | | | 6.45 | | | | 2.11 | | | | 5.99 | | | | 187 | | |
| Class C | |
| | 2005 | (1) | | | 2.71 | % | | $ | 2,858 | | | | 1.75 | % | | | 3.46 | % | | | 2.00 | % | | | 3.21 | % | | | 285 | % | |
| | 2004 | (1) | | | 4.11 | | | | 3,789 | | | | 1.75 | | | | 3.81 | | | | 2.00 | | | | 3.56 | | | | 132 | | |
| | 2003 | | | | 11.50 | | | | 5,752 | | | | 1.75 | | | | 4.43 | | | | 2.01 | | | | 4.17 | | | | 91 | | |
| | 2002 | | | | 0.98 | | | | 5,283 | | | | 1.75 | | | | 5.02 | | | | 2.02 | | | | 4.75 | | | | 117 | | |
| | 2001 | (1) | | | 10.10 | | | | 5,209 | | | | 1.50 | | | | 6.07 | | | | 1.94 | | | | 5.63 | | | | 187 | | |
| Class R (2) | |
| | 2005 | (1) | | | 3.40 | % | | $ | 3 | | | | 1.25 | % | | | 3.98 | % | | | 1.65 | % | | | 3.58 | % | | | 285 | % | |
| | 2004 | (1) | | | 4.83 | | | | 1 | | | | 1.00 | | | | 4.64 | | | | 1.25 | | | | 4.39 | | | | 132 | | |
| | 2003 | | | | 12.25 | | | | 2,668 | | | | 1.00 | | | | 5.21 | | | | 1.26 | | | | 4.95 | | | | 91 | | |
| | 2002 | | | | 1.84 | | | | 3,557 | | | | 1.00 | | | | 5.77 | | | | 1.27 | | | | 5.50 | | | | 117 | | |
| | 2001 | (1) (3) | | | 0.81 | | | | 3,237 | | | | 0.89 | | | | 7.60 | | | | 1.36 | | | | 7.13 | | | | 187 | | |
| Class Y | |
| | 2005 | (1) | | | 3.83 | % | | $ | 278,777 | | | | 0.75 | % | | | 4.43 | % | | | 1.00 | % | | | 4.18 | % | | | 285 | % | |
| | 2004 | (1) | | | 5.05 | | | | 243,018 | | | | 0.75 | | | | 4.80 | | | | 1.00 | | | | 4.55 | | | | 132 | | |
| | 2003 | | | | 12.65 | | | | 245,877 | | | | 0.75 | | | | 5.42 | | | | 1.01 | | | | 5.16 | | | | 91 | | |
| | 2002 | | | | 2.08 | | | | 204,801 | | | | 0.75 | | | | 6.03 | | | | 1.02 | | | | 5.76 | | | | 117 | | |
| | 2001 | (1) | | | 11.09 | | | | 185,392 | | | | 0.51 | | | | 7.26 | | | | 0.95 | | | | 6.82 | | | | 187 | | |
FIRST AMERICAN FUNDS Annual Report 2005
71
Financial Highlights For a share outstanding throughout the periods ended September 30, unless otherwise indicated.
| | | Net Asset
Value
Beginning
of Period | | Net
Investment
Income | | Realized and
Unrealized
Gains or
(Losses) on
Investments | | Distributions
from Net
Investment
Income | | Distributions
from Net
Realized Gains | | Net Asset
Value
End of
Period | | Total
Return (7) | |
| | U.S. Government Mortgage Fund | | | | |
| Class A (1) | |
| | 2005 | (2) | | $ | 10.72 | | | $ | 0.41 | | | $ | (0.14 | ) | | $ | (0.46 | ) | | $ | - | | | $ | 10.53 | | | | 2.59 | % | |
| | 2004 | (2) | | | 10.89 | | | | 0.38 | | | | (0.09 | ) | | | (0.46 | ) | | | - | | | | 10.72 | | | | 2.74 | | |
| | 2003 | | | | 11.16 | | | | 0.35 | | | | (0.05 | ) | | | (0.45 | ) | | | (0.12 | ) | | | 10.89 | | | | 2.79 | | |
| | 2002 | | | | 11.01 | | | | 0.50 | | | | 0.20 | | | | (0.55 | ) | | | - | | | | 11.16 | | | | 6.53 | | |
| | 2001 | (2) (3) | | | 10.44 | | | | 0.51 | | | | 0.60 | | | | (0.54 | ) | | | - | | | | 11.01 | | | | 10.88 | | |
| | 2000 | (4) | | | 10.34 | | | | 0.53 | | | | 0.08 | | | | (0.51 | ) | | | - | | | | 10.44 | | | | 6.05 | | |
| Class B (1) | |
| | 2005 | (2) | | $ | 10.74 | | | $ | 0.33 | | | $ | (0.15 | ) | | $ | (0.38 | ) | | $ | - | | | $ | 10.54 | | | | 1.72 | % | |
| | 2004 | (2) | | | 10.90 | | | | 0.30 | | | | (0.08 | ) | | | (0.38 | ) | | | - | | | | 10.74 | | | | 2.02 | | |
| | 2003 | | | | 11.18 | | | | 0.28 | | | | (0.06 | ) | | | (0.38 | ) | | | (0.12 | ) | | | 10.90 | | | | 1.96 | | |
| | 2002 | | | | 11.03 | | | | 0.42 | | | | 0.20 | | | | (0.47 | ) | | | - | | | | 11.18 | | | | 5.79 | | |
| | 2001 | (2) (3) | | | 10.45 | | | | 0.43 | | | | 0.62 | | | | (0.47 | ) | | | - | | | | 11.03 | | | | 10.25 | | |
| | 2000 | (4) | | | 10.36 | | | | 0.45 | | | | 0.08 | | | | (0.44 | ) | | | - | | | | 10.45 | | | | 5.27 | | |
| Class C | |
| | 2005 | (2) | | $ | 10.68 | | | $ | 0.33 | | | $ | (0.14 | ) | | $ | (0.38 | ) | | $ | - | | | $ | 10.49 | | | | 1.82 | % | |
| | 2004 | (2) | | | 10.84 | | | | 0.30 | | | | (0.09 | ) | | | (0.37 | ) | | | - | | | | 10.68 | | | | 2.02 | | |
| | 2003 | | | | 11.13 | | | | 0.29 | | | | (0.08 | ) | | | (0.38 | ) | | | (0.12 | ) | | | 10.84 | | | | 1.91 | | |
| | 2002 | | | | 11.00 | | | | 0.46 | | | | 0.15 | | | | (0.48 | ) | | | - | | | | 11.13 | | | | 5.78 | | |
| | 2001 | (2) (5) | | | 10.98 | | | | 0.05 | | | | (0.03 | ) | | | - | | | | - | | | | 11.00 | | | | 0.18 | | |
| Class R (1) (6) | |
| | 2005 | (2) | | $ | 10.72 | | | $ | 0.37 | | | $ | (0.14 | ) | | $ | (0.44 | ) | | $ | - | | | $ | 10.51 | | | | 2.18 | % | |
| | 2004 | (2) | | | 10.85 | | | | 0.39 | | | | (0.10 | ) | | | (0.42 | ) | | | - | | | | 10.72 | | | | 2.74 | | |
| | 2003 | | | | 11.12 | | | | 0.30 | | | | - | | | | (0.45 | ) | | | (0.12 | ) | | | 10.85 | | | | 2.79 | | |
| | 2002 | | | | 10.97 | | | | 0.49 | | | | 0.20 | | | | (0.54 | ) | | | - | | | | 11.12 | | | | 6.55 | | |
| | 2001 | (2) (3) | | | 10.40 | | | | 0.62 | | | | 0.49 | | | | (0.54 | ) | | | - | | | | 10.97 | | | | 10.94 | | |
| | 2000 | (4) | | | 10.31 | | | | 0.53 | | | | 0.07 | | | | (0.51 | ) | | | - | | | | 10.40 | | | | 5.96 | | |
| Class Y (1) | |
| | 2005 | (2) | | $ | 10.73 | | | $ | 0.43 | | | $ | (0.14 | ) | | $ | (0.49 | ) | | $ | - | | | $ | 10.53 | | | | 2.75 | % | |
| | 2004 | (2) | | | 10.89 | | | | 0.41 | | | | (0.08 | ) | | | (0.49 | ) | | | - | | | | 10.73 | | | | 3.09 | | |
| | 2003 | | | | 11.16 | | | | 0.37 | | | | (0.04 | ) | | | (0.48 | ) | | | (0.12 | ) | | | 10.89 | | | | 3.03 | | |
| | 2002 | | | | 11.01 | | | | 0.53 | | | | 0.19 | | | | (0.57 | ) | | | - | | | | 11.16 | | | | 6.79 | | |
| | 2001 | (2) (3) | | | 10.44 | | | | 0.53 | | | | 0.60 | | | | (0.56 | ) | | | - | | | | 11.01 | | | | 11.14 | | |
| | 2000 | (4) | | | 10.34 | | | | 0.55 | | | | 0.08 | | | | (0.53 | ) | | | - | | | | 10.44 | | | | 6.34 | | |
(1) The financial highlights for the U.S. Government Mortgage Fund prior to September 24, 2001, are those of the Firstar U. S. Government Securities Fund Class A shares,
Class B shares, Class Y shares, and Class I shares. The assets of the Firstar U.S. Government Securities Fund were acquired by the U. S. Government Mortgage Fund on
September 24, 2001. In connection with such acquisition, Class A shares, Class B shares, Class Y shares, and Class I shares of the Firstar U.S. Government Securities Fund
were exchanged for Class A shares, Class B shares, Class S shares (now designated Class R shares), and Class Y shares of U.S. Government Mortgage Fund,respectively.
(2) Per share data calculated using average shares outstanding method.
(3) For the period November 1, 2000 to September 30, 2001. Effective in 2001, the fund's fiscal year end was changed from October 31 to September 30. All ratios for the
period have been annualized, except total return and portofolio turnover.
(4) For the period December 1, 1999 to October 31, 2000. Effective in 2000, the fund's fiscal year end was changed from November 30 to October 31. All ratios for the period
have been annualized, except total return and portfolio turnover.
(5) Class of shares has been offered since September 24, 2001. All ratios for the period have been annualized, except total return and portfolio turnover.
(6) Prior to July 1, 2004, Class R shares were named Class S shares, which had lower fees and expenses.
(7) Total return does not reflect sales charges. Total return would have been lower had certain expenses not been waived.
The accompanying notes are an integral part of the financial statements.
FIRST AMERICAN FUNDS Annual Report 2005
72
| | | Net Assets
End of
Period (000) | | Ratio of
Expenses to
Average
Net Assets | | Ratio of Net
Investment
Income
to Average
Net Assets | | Ratio of
Expenses to
Average
Net Assets
(Excluding
Waivers) | | Ratio of Net
Investment
Income
to Average Net
Assets (Excluding
Waivers) | | Portfolio
Turnover
Rate | |
| | U.S. Government Mortgage Fund | | |
| Class A (1) | |
| | 2005 | (2) | | $ | 24,504 | | | | 0.95 | % | | | 3.80 | % | | | 1.08 | % | | | 3.67 | % | | | 251 | % | |
| | 2004 | (2) | | | 32,815 | | | | 0.95 | | | | 3.53 | | | | 1.05 | | | | 3.43 | | | | 127 | | |
| | 2003 | | | | 24,667 | | | | 0.95 | | | | 2.98 | | | | 1.06 | | | | 2.87 | | | | 175 | | |
| | 2002 | | | | 16,985 | | | | 0.95 | | | | 4.61 | | | | 1.08 | | | | 4.48 | | | | 197 | | |
| | 2001 | (2) (3) | | | 7,751 | | | | 1.04 | | | | 5.15 | | | | 1.19 | | | | 5.00 | | | | 22 | | |
| | 2000 | (4) | | | 3,644 | | | | 1.04 | | | | 5.36 | | | | 1.15 | | | | 5.25 | | | | 23 | | |
| Class B (1) | |
| | 2005 | (2) | | $ | 7,926 | | | | 1.70 | % | | | 3.05 | % | | | 1.83 | % | | | 2.92 | % | | | 251 | % | |
| | 2004 | (2) | | | 9,155 | | | | 1.70 | | | | 2.79 | | | | 1.80 | | | | 2.69 | | | | 127 | | |
| | 2003 | | | | 11,397 | | | | 1.70 | | | | 2.22 | | | | 1.81 | | | | 2.11 | | | | 175 | | |
| | 2002 | | | | 6,235 | | | | 1.70 | | | | 3.85 | | | | 1.83 | | | | 3.72 | | | | 197 | | |
| | 2001 | (2) (3) | | | 2,039 | | | | 1.71 | | | | 4.37 | | | | 1.86 | | | | 4.22 | | | | 22 | | |
| | 2000 | (4) | | | 139 | | | | 1.74 | | | | 4.66 | | | | 1.85 | | | | 4.55 | | | | 23 | | |
| Class C | |
| | 2005 | (2) | | $ | 6,585 | | | | 1.70 | % | | | 3.05 | % | | | 1.83 | % | | | 2.92 | % | | | 251 | % | |
| | 2004 | (2) | | | 10,520 | | | | 1.70 | | | | 2.79 | | | | 1.80 | | | | 2.69 | | | | 127 | | |
| | 2003 | | | | 18,801 | | | | 1.70 | | | | 2.19 | | | | 1.81 | | | | 2.08 | | | | 175 | | |
| | 2002 | | | | 5,834 | | | | 1.70 | | | | 3.92 | | | | 1.83 | | | | 3.79 | | | | 197 | | |
| | 2001 | (2) (5) | | | 105 | | | | 0.82 | | | | 5.26 | | | | 1.12 | | | | 4.96 | | | | 22 | | |
| Class R (1) (6) | |
| | 2005 | (2) | | $ | 3 | | | | 1.20 | % | | | 3.42 | % | | | 1.48 | % | | | 3.14 | % | | | 251 | % | |
| | 2004 | (2) | | | 1 | | | | 0.95 | | | | 3.58 | | | | 1.05 | | | | 3.48 | | | | 127 | | |
| | 2003 | | | | 17,296 | | | | 0.95 | | | | 3.04 | | | | 1.06 | | | | 2.93 | | | | 175 | | |
| | 2002 | | | | 21,355 | | | | 0.95 | | | | 4.59 | | | | 1.08 | | | | 4.46 | | | | 197 | | |
| | 2001 | (2) (3) | | | 19,092 | | | | 0.97 | | | | 6.52 | | | | 1.15 | | | | 6.34 | | | | 22 | | |
| | 2000 | (4) | | | 5,145 | | | | 1.04 | | | | 5.36 | | | | 1.15 | | | | 5.25 | | | | 23 | | |
| Class Y (1) | |
| | 2005 | (2) | | $ | 158,230 | | | | 0.70 | % | | | 4.05 | % | | | 0.83 | % | | | 3.92 | % | | | 251 | % | |
| | 2004 | (2) | | | 171,143 | | | | 0.70 | | | | 3.79 | | | | 0.80 | | | | 3.69 | | | | 127 | | |
| | 2003 | | | | 214,531 | | | | 0.70 | | | | 3.27 | | | | 0.81 | | | | 3.16 | | | | 175 | | |
| | 2002 | | | | 181,046 | | | | 0.70 | | | | 4.84 | | | | 0.83 | | | | 4.71 | | | | 197 | | |
| | 2001 | (2) (3) | | | 183,883 | | | | 0.71 | | | | 5.37 | | | | 0.85 | | | | 5.23 | | | | 22 | | |
| | 2000 | (4) | | | 53,896 | | | | 0.74 | | | | 5.66 | | | | 1.15 | | | | 5.25 | | �� | | 23 | | |
FIRST AMERICAN FUNDS Annual Report 2005
73
Notes to Financial Statements September 30, 2005
1 > Organization
The Core Bond Fund, High Income Bond Fund, Inflation Protected Securities Fund, Intermediate Government Bond Fund, Intermediate Term Bond Fund, Short Term Bond Fund, Total Return Bond Fund (formerly Corporate Bond Fund), and U.S. Government Mortgage Fund (each a "fund" and collectively, the "funds") are mutual funds offered by First American Investment Funds, Inc. ("FAIF"), which is a member of the First American Family of Funds. Inflation Protected Securities Fund commenced operations on October 1, 2004. As of September 30, 2005, FAIF offered 38 funds, including the funds listed above. FAIF is registered under the Investment Company Act of 1940, as amended, as an open-end management investment company. FAIF's articles of incorporation permit the funds' board of directors to create additional funds in the future. Each fund is a diversified open-end management investment company.
FAIF offers Class A, Class B, Class C, Class R, and Class Y shares. Prior to July 1, 2004, Class R shares were named Class S shares. Class A shares of Intermediate Government Bond Fund, Intermediate Term Bond Fund, and Short Term Bond Fund are sold with a front-end sales charge of 2.25%. Class A shares of Core Bond Fund, High Income Bond Fund, Inflation Protected Securities Fund, Total Return Bond Fund, and U.S. Government Mortgage Fund are sold with a front-end sales charge of 4.25%. Class B shares are subject to a contingent deferred sales charge for six years and automatically convert to Class A shares after eight years. Class C shares may be subject to a contingent deferred sales charge for 12 months, and will not convert to Class A shares. Class R shares have no sales charge and are offered only through certain tax-deferred r etirement plans. Class Y shares have no sales charge and are offered only to qualifying institutional investors and certain other qualifying accounts. Class B, Class C, and Class R shares are not offered by Intermediate Government Bond Fund, Intermediate Term Bond Fund, or Short Term Bond Fund. Class B shares are not offered by Inflation Protected Securities Fund.
The funds' prospectuses provide descriptions of each fund's investment objective, principal investment strategies and principal risks. All classes of shares in a fund have identical voting, dividend, liquidation, and other rights, and the same terms and conditions, except that certain fees, including distribution and shareholder servicing fees, may differ among classes. Each class has exclusive voting rights on any matters relating to that class' servicing or distribution arrangements.
2 > Summary of Significant Accounting Policies
The significant accounting policies followed by the funds are as follows:
SECURITY VALUATIONS – Security valuations for the funds' investments are furnished by one or more independent pricing services that have been approved by the funds' board of directors. Investments in equity securities that are traded on a national securities exchange (or reported on the Nasdaq national market system) are stated at the last quoted sales price if readily available for such securities on each business day. For securities traded on the Nasdaq national market system, the funds utilize the Nasdaq Official Closing Price which compares the last trade to the bid/ask range of a security. If the last trade falls within the bid/ask range, then that price will be the closing price. If the last trade is outside the bid/ask range, and falls above the ask, the ask price will be the closing price. If the last trade is below the bid, the bid will be the closing price. Other equity securities traded in the over-the-counter market and listed equity securities for which no sale was reported on that date are stated at the last quoted bid price. Debt obligations exceeding 60 days to maturity are valued by an independent pricing service. The pricing service may employ methodologies that utilize actual market transactions, broker-dealer supplied valuations, or other formula driven valuation techniques. These techniques generally consider such factors as yields or prices of bonds of comparable quality, type of issue, coupon, maturity, ratings, and general market conditions. Securities for which prices are not available from an independent pricing service, but where an active market exists, are valued using market quotations obtained from one or more dealers that make markets in the securities or from a widely used quotation system. When market quotations are not readily available, securi ties are valued at fair value as determined in good faith by procedures established and approved by the funds' board of directors. Some of the factors which may be considered in determining fair value are fundamental analytical data relating to the investment; the nature and duration of any restrictions on disposition; trading in similar securities of the same issuer or comparable companies; information from broker-dealers; and an evaluation of the forces that influence the market in which the securities are purchased and sold. If events occur that materially affect the value of securities (including non-U.S. securities) between the close of trading in those securities and the close of regular trading on the New York Stock Exchange, the securities will be valued at fair value. Price movements in futures contracts
FIRST AMERICAN FUNDS Annual Report 2005
74
and ADRs (American Depositary Receipts), and various other indices, may be reviewed in the course of making a good faith determination of a security's fair value. The use of fair value pricing by a fund may cause the net asset value of its shares to differ significantly from net asset value that would be calculated without regard to such considerations. As of September 30, 2005, Core Bond Fund, High Income Bond Fund, and Short Term Bond Fund held fair value securities with a value of $90,227, $0, and $0, respectively, or 0.0%, 0.0%, and 0.0% of total net assets, respectively. Debt obligations with 60 days or less remaining until maturity will be valued at their amortized cost, which approximates market value. Foreign securities are valued at the closing prices on the principal exchanges on which they trade. The prices for foreign securities are reported in local currency and converted to U.S. dollar s using currency exchange rates. Exchange rates are provided daily by recognized independent pricing agents. Investments in open-end mutual funds are valued at the respective net asset value of each underlying fund on the valuation date.
SECURITY TRANSACTIONS AND INVESTMENT INCOME – For financial statement purposes, the funds record security transactions on the trade date of the security purchase or sale. Dividend income is recorded on the ex-dividend date. Interest income, including amortization of bond premium and discount, is recorded on an accrual basis. Security gains and losses are determined on the basis of identified cost, which is the same basis used for federal income tax purposes. The resulting gain/loss is calculated as the difference between the fair value and the underlying cost of the security on the transaction date. Each fund reserves the right to pay part or all of the proceeds from a redemption request in a proportionate share of readily marketable securities in the fund instead of cash.
DISTRIBUTIONS TO SHAREHOLDERS – Distributions from net investment income are declared and paid monthly and are payable in cash or reinvested in additional shares of the fund. Any net realized capital gains on sales of a fund's securities are distributed to shareholders at least annually.
FEDERAL TAXES – Each fund is treated as a separate taxable entity. Each fund intends to continue to qualify as a regulated investment company as provided in Subchapter M of the Internal Revenue Code, as amended, and to distribute all taxable income, if any, to its shareholders. Accordingly, no provision for federal income taxes is required.
Net investment income and net realized gains (losses) may differ for financial statement and tax purposes because of temporary or permanent book/tax differences. These differences are primarily due to deferred wash sale losses, paydowns on pass through obligations, return of capital distributions and tax mark to market adjustments under Section 311(e) of the Taxpayer Relief Act of 1997. To the extent these differences are permanent, reclassifications are made to the appropriate equity accounts in the period that the differences arise.
On the Statements of Assets and Liabilities, the following reclassifications were made (000):
| Fund | | Accumulated
Net Realized
Gain (Loss) | | Undistributed
Net Investment
Income | | Portfolio
Capital | |
| Core Bond Fund | | $ | (4,335 | ) | | $ | 4,351 | | | $ | (16 | ) | |
| High Income Bond Fund | | | 13 | | | | (9 | ) | | | (4 | ) | |
| Inflation Protected Securities Fund | | | (8 | ) | | | 8 | | | | - | | |
| Intermediate Government Bond Fund | | | (9 | ) | | | 10 | | | | (1 | ) | |
| Intermediate Term Bond Fund | | | (1,019 | ) | | | 956 | | | | 63 | | |
| Short Term Bond Fund | | | (2,409 | ) | | | 2,797 | | | | (388 | ) | |
| Total Return Bond Fund | | | (157 | ) | | | 157 | | | | - | | |
| U.S. Government Mortgage Fund | | | (1,004 | ) | | | 1,004 | | | | - | | |
The character of distributions made during the year from net investment income or net realized gains may differ from its ultimate characterization for federal income tax purposes. In addition, due to the timing of dividend distributions, the fiscal year in which the amounts are distributed may differ from the year that the income or realized gains (losses) were recorded by the fund. The distributions paid during the fiscal years ended September 30, 2005 and 2004, were characterized as follows (000):
| | | 2005 | |
| Fund | | Ordinary
Income | | Long Term
Gain | | Return
of Capital | | Total | |
| Core Bond Fund | | $ | 75,437 | | | $ | 1,274 | | | | - | | | $ | 76,711 | | |
| High Income Bond Fund | | | 19,672 | | | | - | | | | 20 | | | | 19,692 | | |
| Inflation Protected Securities Fund* | | | 7,327 | | | | - | | | | - | | | | 7,327 | | |
| Intermediate Government Bond Fund | | | 3,179 | | | | 4,927 | | | | - | | | | 8,106 | | |
| Intermediate Term Bond Fund | | | 42,052 | | | | 11,785 | | | | - | | | | 53,837 | | |
| Short Term Bond Fund | | | 26,815 | | | | - | | | | 371 | | | | 27,186 | | |
| Total Return Bond Fund | | | 12,462 | | | | - | | | | - | | | | 12,462 | | |
| U.S. Government Mortgage Fund | | | 9,337 | | | | - | | | | - | | | | 9,337 | | |
| | | 2004 | |
| Fund | | Ordinary
Income | | Long Term
Gain | | Return
of Capital | | Total | |
| Core Bond Fund | | $ | 79,871 | | | $ | 32,065 | | | | - | | | $ | 111,936 | | |
| High Income Bond Fund | | | 20,894 | | | | - | | | | - | | | | 20,894 | | |
| Intermediate Government Bond Fund | | | 7,590 | | | | 27,610 | | | | - | | | | 35,200 | | |
| Intermediate Term Bond Fund | | | 43,278 | | | | 14,419 | | | | - | | | | 57,697 | | |
| Short Term Bond Fund | | | 25,252 | | | | - | | | | - | | | | 25,252 | | |
| Total Return Bond Fund | | | 13,105 | | | | - | | | | 19 | | | | 13,124 | | |
| U.S. Government Mortgage Fund | | | 11,561 | | | | - | | | | - | | | | 11,561 | | |
* Fund commenced operations on October 1, 2004.
FIRST AMERICAN FUNDS Annual Report 2005
75
Notes to Financial Statements September 30, 2005
As of September 30, 2005, the components of accumulated earnings (deficit) on a tax basis were (000):
| Fund | | Undistributed
Ordinary
Income | | Undistributed
Long Term
Capital Gains | | Accumulated
Capital and
Post-October
Losses | | Unrealized
Appreciation
(Depreciation) | | Other
Accumulated
Gains (Losses) | | Total
Accumulated
Earnings (Deficit) | |
| Core Bond Fund | | $ | 12,336 | | | $ | - | | | $ | (354 | ) | | $ | (18,997 | ) | | $ | (517 | ) | | $ | (7,532 | ) | |
| High Income Bond Fund | | | - | | | | - | | | | (9,644 | ) | | | 2,862 | | | | - | | | | (6,782 | ) | |
| Inflation Protected Securities Fund | | | 1,622 | | | | - | | | | (99 | ) | | | (1,450 | ) | | | (75 | ) | | | (2 | ) | |
| Intermediate Government Bond Fund | | | 295 | | | | 186 | | | | - | | | | (1,303 | ) | | | (190 | ) | | | (1,012 | ) | |
| Intermediate Term Bond Fund | | | 5,299 | | | | - | | | | (3,873 | ) | | | (11,922 | ) | | | (316 | ) | | | (10,812 | ) | |
| Short Term Bond Fund | | | - | | | | - | | | | (11,950 | ) | | | (9,927 | ) | | | (195 | ) | | | (22,072 | ) | |
| Total Return Bond Fund | | | 174 | | | | - | | | | (19,946 | ) | | | (2,369 | ) | | | (9 | ) | | | (22,150 | ) | |
| U.S. Government Mortgage Fund | | | 132 | | | | - | | | | (4,888 | ) | | | (2,011 | ) | | | - | | | | (6,767 | ) | |
The difference between book and tax basis unrealized appreciation (depreciation) is primarily due to the tax deferral of losses on wash sales, tax mark to market adjustments for certain derivatives in accordance with IRC Section 1256, and tax mark to market adjustments made under Section 311(e) of the Taxpayer Relief Act of 1997.
As of September 30, 2005, the following funds had capital loss carryforwards (000):
| | | Expiration Year | |
| Fund | | 2006 | | 2007 | | 2008 | | 2009 | | 2010 | | 2011 | | 2012 | | 2013 | | Total | |
| High Income Bond Fund | | $ | - | | | $ | - | | | $ | - | | | $ | - | | | $ | 149 | | | $ | 9,495 | | | $ | - | | | $ | - | | | $ | 9,644 | | |
| Short Term Bond Fund | | | 604 | | | | 135 | | | | 642 | | | | - | | | | - | | | | 4 | | | | - | | | | 2,223 | | | | 3,608 | | |
| Total Return Bond Fund | | | 8,799 | | | | 7,439 | | | | - | | | | - | | | | - | | | | 3,708 | | | | - | | | | - | | | | 19,946 | | |
| U.S. Government Mortgage Fund | | | - | | | | - | | | | - | | | | - | | | | - | | | | - | | | | 3,145 | | | | 1,293 | | | | 4,438 | | |
In accordance with Section 382 of the Internal Revenue Code, utilization of all or a portion of the above capital loss carryovers is limited on an annual basis for Total Return Bond Fund to $6,352,310 per tax year for a portion of their capital loss carryover.
Certain funds incurred a loss for tax purposes for the period from November 1, 2004 to September 30, 2005. As permitted by tax regulations, the funds intend to elect to defer and treat these losses as arising in the fiscal year ending September 30, 2006. The following funds had deferred losses (000):
| Fund | | Amount | |
| Core Bond Fund | | $ | 354 | | |
| Inflation Protected Securities Fund | | | 100 | | |
| Intermediate Term Bond Fund | | | 3,873 | | |
| Short Term Bond Fund | | | 8,342 | | |
| U.S. Government Mortgage Fund | | | 450 | | |
FUTURES TRANSACTIONS – In order to protect against changes in the market and to maintain sufficient liquidity to meet redemption requests, each fund may enter into futures contracts. Upon entering into a futures contract, the fund is required to deposit cash or pledge U.S. Government securities in an amount equal to five percent of the purchase price indicated in the futures contract (initial margin). Subsequent payments, which are dependent on the daily fluctuations in the value of the underlying security or securities, are made or received by the fund each day (daily variation margin) and are recorded as unrealized gains (losses) until the contract is closed. When the contract i s closed, the fund records a realized gain (loss) equal to the difference between the proceeds from (or cost of) the closing transaction and the fund's basis in the contract.
Risks of entering into futures contracts, in general, include the possibility that there will not be a perfect price correlation between the futures contracts and the underlying securities. Second, it is possible that a lack of liquidity for futures contracts could exist in the secondary market, resulting in an inability to close a futures position prior to its maturity date. Third, the purchase of a futures contract involves the risk that a fund could lose more than the original margin deposit required to initiate a futures transaction. These contracts involve market risk in excess of the amount reflected in the fund's statement of assets and liabilities. Unrealized gains (losses) on outstanding positions in futures contracts held at the close of the year will be recognized as capital gains (losses) for federal income tax purposes.
FIRST AMERICAN FUNDS Annual Report 2005
76
OPTIONS TRANSACTIONS – The funds may utilize options in an attempt to manage market or business risk or enhance their yield. When a call or put option is written, an amount equal to the premium received is recorded as a liability. The liability is marked-to-market daily to reflect the current market value of the option written. When a written option expires, a gain is realized in the amount of the premium originally received. If a closing purchase contract is entered into, a gain or loss is realized in the amount of the original premium less the cost of the closing transaction. If a written call is exercised, a gain or loss is realized from the sale of the underlying security, and the proceeds from such sale are increased by the premium originally received. If a written put o ption is exercised, the amount of the premium originally received reduces the cost of the security that is purchased upon exercise of the option.
Purchased options are recorded as investments and marked-to-market daily to reflect the current market value of the option contract. If a purchased option expires, a loss is realized in the amount of the cost of the option. If a closing transaction is entered into, a gain or loss is realized, to the extent that the proceeds from the sale are greater or less than the cost of the option. If a put option is exercised, a gain or loss is realized from the sale of the underlying security by adjusting the proceeds from such sale by the amount of the premium originally paid. If a call option is exercised, the cost of the security purchased upon exercise is increased by the premium originally paid.
INFLATION-INDEXED BONDS – The funds may invest in inflation-indexed bonds. Inflation-indexed bonds are fixed income securities whose principal value is periodically adjusted to the rate of inflation. The interest rate on these bonds is generally fixed at issuance at a rate lower than typical bonds. Over the life of an inflation-indexed bond however, interest will be paid based on a principal value which is adjusted for inflation. Any increase in the principal amount of an inflation-indexed bond will be included as interest income in the Statement of Operations, even though investors do not receive their principal until maturity.
FOREIGN CURRENCY TRANSLATION – The books and records of the High Income Bond Fund relating to the fund's non-U.S. dollar denominated investments are maintained in U.S. dollars on the following basis:
• market value of investment securities, assets, and liabilities are translated at the current rate of exchange; and
• purchases and sales of investment securities, income, and expenses are translated at the relevant rates of exchange prevailing on the respective dates of such transactions.
The High Income Bond Fund does not isolate the portion of gains and losses on investments in debt securities that is due to changes in the foreign exchange rates from that which is due to changes in market prices of debt securities. The High Income Bond Fund does isolate the effect of fluctuations in foreign currency rates when determining the gain or loss upon sale or maturity of foreign currency denominated debt obligations pursuant to the federal income tax regulations. Such amounts are categorized as foreign currency gain or loss for both financial reporting and income tax reporting purposes.
The High Income Bond Fund reports certain foreign currency-related transactions as components of realized gains for financial reporting purposes, whereas such components are treated as ordinary income for federal income tax purposes.
SECURITIES PURCHASED ON A WHEN-ISSUED BASIS – Delivery and payment for securities that have been purchased by a fund on a forward-commitment or when-issued basis can take place up to a month or more after the transaction date. During this period, such securities are subject to market fluctuations and the portfolio maintains, in a segregated account with its custodian, assets with a market value equal to or greater than the amount of its purchase commitments. The purchase of securities on a when-issued or forward-commitment basis may increase the volatility of the fund's net asset value if the fund makes such purchases while remaining substantially fully invested. At September 30, 2005, the following funds had outstanding when-issued commitments (000):
| Fund | | Cost | | Segregated
Assets | |
| Core Bond Fund | | $ | 47,704 | | | $ | 110,827 | | |
| Total Return Bond Fund | | | 9,065 | | | | 32,245 | | |
| U.S. Government Mortgage Fund | | | 32,294 | | | | 49,604 | | |
In connection with the ability to purchase securities on a when-issued basis, each fund may also enter into dollar rolls in which the fund sells securities purchased on a forward-commitment basis and simultaneously contracts with a counterparty to repurchase similar (same type, coupon, and maturity), but not identical securities on a specified future date. As an inducement for the fund to "rollover" its purchase commitments, the fund receives negotiated amounts in the form of reductions of the purchase price of the commitment. Dollar rolls are considered a form of leverage.
FIRST AMERICAN FUNDS Annual Report 2005
77
Notes to Financial Statements September 30, 2005
ILLIQUID OR RESTRICTED SECURITIES – A security may be considered illiquid if it lacks a readily available market. Securities are generally considered liquid if they can be sold or disposed of in the ordinary course of business within seven days at approximately the price at which the security is valued by the fund. Illiquid securities may be valued under methods approved by the funds' board of directors as reflecting fair value. Each fund intends to invest no more than 15% of its net assets (determined at the time of purchase and reviewed periodically) in illiquid securities. Certain restricted securities may be considered illiquid. Restricted securities are often purchased in private placement transactions, are not registered under the Securities Act of 1933, may have c ontractual restrictions on resale, and may be valued under methods approved by the funds' board of directors as reflecting fair value. Certain restricted securities eligible for resale to qualified institutional investors, including Rule 144A securities, are not subject to the limitation on a funds' investment in illiquid securities if they are determined to be liquid in accordance with procedures adopted by the funds' board of directors. At September 30, 2005, Core Bond Fund, High Income Bond Fund, and Short Term Bond Fund had investments in illiquid securities with a total value of $95,215, $12,458, and $0, respectively, or 0.0%, 0.0%, and 0.0%, respectively, of total net assets.
Information concerning illiquid securities, including restricted securities considered to be illiquid, is as follows (000):
| Core Bond Fund | |
| Security | | Par | | Dates Acquired | | Cost Basis | |
| Duty Free International | | $ | 2,256 | | | 1/99-7/99 | | $ | 2,252 | | |
| Northwest Airlines, Series 1997-1, Cl 1C | | | 55 | | | 1/99 | | | 55 | | |
| High Income Bond Fund | |
| Security | | Shares/Par (000) | | Dates Acquired | | Cost Basis | |
| Diamond Brands | | $ | 50 | | | 4/98 | | $ | 46 | | |
| Glenoit | | | 100 | | | 3/97-8/97 | | | 101 | | |
| Green Tree Financial | | | 12 | | | 5/99 | | | 12 | | |
| Nebco Evans Holdings | | | 300 | | | 3/98-11/98 | | | - | | |
Pegasus Communications
Fractional Shares | | | 15,109 | | | 10/97 | | | - | | |
| Sterling Chemicals Holdings | | | 100 | | | 10/96 | | | - | | |
| Viatel Holdings | | | 338 | | | 9/02 | | | - | | |
| Short Term Bond Fund | |
| Security | | Par | | Dates Acquired | | Cost Basis | |
| Auto Bond Receivables Trust | | $ | 106 | | | 11/98-11/00 | | $ | 106 | | |
SECURITIES LENDING – In order to generate additional income, a fund may lend securities representing up to one-third of the value of its total assets (which includes collateral for securities on loan) to broker-dealers, banks, or other institutional borrowers of securities. Each fund's policy is to maintain collateral in the form of cash, U.S. Government securities, or other high-grade debt obligations equal to at least 100% of the value of securities loaned. The collateral is then "marked to market" daily until the securities are returned. As with other extensions of credit, there may be risks of delay in recovery of the securities or even loss of rights in the collateral should the borrower of the security fail financially. As of September 30, 2005, cash collatera l invested was as follows (000):
| | | Commercial
Paper | | Corporate
Obligations | | Repurchase
Agreements | | Other
Short-Term
Securities | | Total | |
| Core Bond Fund | | $ | 206,245 | | | $ | 242,824 | | | $ | 377,635 | | | $ | 18,288 | | | $ | 844,992 | | |
| High Income Bond Fund | | | 14,208 | | | | 16,728 | | | | 26,014 | | | | 1,260 | | | | 58,210 | | |
| Inflation Protected Securities Fund | | | 29,608 | | | | 34,859 | | | | 54,213 | | | | 2,625 | | | | 121,305 | | |
| Intermediate Term Bond Fund | | | 125,079 | | | | 147,262 | | | | 229,020 | | | | 11,091 | | | | 512,452 | | |
| Short Term Bond Fund | | | 47,146 | | | | 55,508 | | | | 86,325 | | | | 4,181 | | | | 193,160 | | |
| Total Return Bond Fund | | | 29,041 | | | | 34,192 | | | | 53,175 | | | | 2,575 | | | | 118,983 | | |
| U.S. Government Mortgage Fund | | | 16,199 | | | | 19,072 | | | | 29,661 | | | | 1,436 | | | | 66,368 | | |
FIRST AMERICAN FUNDS Annual Report 2005
78
U.S. Bancorp Asset Management, Inc. ("USBAM") serves as the securities lending agent for the funds in transactions involving the lending of portfolio securities on behalf of the funds. USBAM acts as the securities lending agent pursuant to, and subject to compliance with conditions contained in an exemptive order issued by the Securities and Exchange Commission ("SEC"). During the fiscal year ended September 30 2005, USBAM received fees equal to 35% of each fund's income from securities lending transactions. Effective January 1, 2006, such fees will be lowered to 32% of each fund's income from security lending transactions. Fees paid to USBAM by the funds for the fiscal year ended September 30, 2005 were as follows (000):
| Fund | | Amount | |
| Core Bond Fund | | $ | 519 | | |
| High Income Bond Fund | | | 89 | | |
| Inflation Protected Securities Fund | | | 26 | | |
| Intermediate Term Bond Fund | | | 341 | | |
| Short Term Bond Fund | | | 82 | | |
| Total Return Bond Fund | | | 42 | | |
| U.S. Government Mortgage Fund | | | 19 | | |
SWAP AGREEMENTS – The funds may invest in swap agreements. A swap is an agreement to exchange the return generated by one instrument for the return generated by another instrument. The funds may enter into interest rate and credit default swap agreements to manage exposure to interest rates and credit risk.
Interest rate swap agreements involve the exchange by the fund with another party of their respective commitments to pay or receive interest, (i.e., an exchange of floating rate payments for fixed rate payments) with respect to the notional amount of principal.
In a credit default swap, one party makes a stream of payments to another party in exchange for the right to receive a specified return in the event of a default by a specified issuer on its obligation (typically corporate issues or sovereign issues of an emerging country). The fund may use credit default swaps to provide a measure of protection against defaults of sovereign issuers (i.e., to reduce risk where the fund owns or has exposure to the sovereign issuer) or to take an active long or short position with respect to the likelihood of a particular issuer's default.
Swaps are marked to market daily based upon quotations from market makers and the change in value, if any, is recorded as unrealized gain or loss in the Statement of Operations. Payments received or made at the beginning of the measurement period are reflected on the Statement of Assets and Liabilities. A liquidation payment received or made at the termination of the swap is recorded as realized gain or loss in the Statement of Operations. Net periodic payments received by the fund are included as part of miscellaneous income on the Statement of Operations. Entering into these agreements involves, to varying degrees, elements of credit, market and documentation risk in excess of the amounts recognized on the Statement of Assets and Liabilities. Such risks involve the possibility that there will be no liquid m arket for these agreements, that the counterparty to the agreements may default on its obligation to perform or disagree as to the meaning of contractual terms in the agreements, and that there may be unfavorable changes in interest rates.
EXPENSES – Expenses that are directly related to one of the funds are charged directly to that fund. Other operating expenses are generally allocated to the funds on the basis of relative net assets of all funds within the First American Family of Funds. Class specific expenses, such as distribution fees and servicing fees, are borne by that class. Income, other expenses, and realized and unrealized gains and losses of a fund are allocated to each respective class in proportion to the relative net assets of each class.
INTERFUND LENDING PROGRAM – Pursuant to an exemptive order issued by the SEC, the funds, along with other registered investment companies in the First American Family of Funds, may participate in an interfund lending program. This program provides an alternative credit facility allowing the funds to borrow from, or lend money to, other participating funds. The funds did not have any interfund lending transactions during the fiscal year ended September 30, 2005.
DEFERRED COMPENSATION PLAN – Under a Deferred Compensation Plan (the "Plan"), non-interested directors of the First American Family of Funds may participate and elect to defer receipt of their annual compensation. Deferred amounts are treated as though equivalent dollar amounts had been invested in shares of selected open-end First American Funds as designated by the Directors. All amounts in the Plan are 100% vested and accounts under the Plan are obligations of the funds. Deferred amounts remain in the funds until distributed in accordance with the Plan.
USE OF ESTIMATES IN THE PREPARATION OF FINANCIAL STATEMENTS – The preparation of financial statements, in conformity with U.S. generally accepted accounting principles, requires management to make estimates and assumptions that affect the reported amount of assets and liabilities and disclosure of contingent assets and liabilities at the date of the financial statements and the reported results of operations during the reporting period. Actual results could differ from those estimates.
FIRST AMERICAN FUNDS Annual Report 2005
79
Notes to Financial Statements September 30, 2005
3 > Fees and Expenses
INVESTMENT ADVISORY FEES – Pursuant to an investment advisory agreement (the "Agreement"), USBAM, a subsidiary of U.S. Bank National Association ("U.S. Bank"), manages each fund's assets and furnishes related office facilities, equipment, research, and personnel. The Agreement requires each fund to pay USBAM a monthly fee based upon average daily net assets. The annual fee for each fund is as follows:
| Fund | |
| Core Bond Fund | | | 0.50 | % | |
| High Income Bond Fund | | | 0.70 | | |
| Inflation Protected Securities Fund | | | 0.50 | | |
| Intermediate Government Bond Fund | | | 0.50 | | |
| Intermediate Term Bond Fund | | | 0.50 | | |
| Short Term Bond Fund | | | 0.50 | | |
| Total Return Bond Fund1 | | | 0.60 | | |
| U.S. Government Mortgage Fund | | | 0.50 | | |
1 Effective July 1, 2005. Prior to July 1, 2005 the advisory fee paid to USBAM by Total Return Bond Fund was equal to a rate of 0.70% of the average daily net assets.
USBAM has agreed to waive fees and reimburse other fund expenses through June 30, 2006, so that total fund operating expenses, as a percentage of average daily net assets, do not exceed the following amounts:
| | | Share Class | |
| Fund | | A | | B | | C | | R | | Y | |
| Core Bond Fund | | | 0.95 | % | | | 1.70 | % | | | 1.70 | % | | | 1.20 | % | | | 0.70 | % | |
| High Income Bond Fund | | | 1.10 | | | | 1.85 | | | | 1.85 | | | | 1.35 | | | | 0.85 | | |
Inflation Protected
Securities Fund | | | 0.85 | | | | NA | | | | 1.60 | | | | 1.10 | | | | 0.60 | | |
Intermediate Government
Bond Fund | | | 0.75 | | | | NA | | | | NA | | | | NA | | | | 0.60 | | |
| Intermediate Term Bond Fund | | | 0.75 | | | | NA | | | | NA | | | | NA | | | | 0.60 | | |
| Short Term Bond Fund | | | 0.75 | | | | NA | | | | NA | | | | NA | | | | 0.60 | | |
| Total Return Bond Fund | | | 1.00 | | | | 1.75 | | | | 1.75 | | | | 1.25 | | | | 0.75 | | |
| U.S. Government Mortgage Fund | | | 0.95 | | | | 1.70 | | | | 1.70 | | | | 1.20 | | | | 0.70 | | |
NA = Not Applicable
Prior to July 1, 2005, USBAM agreed to waive fees and reimburse other fund expenses so that total fund operating expenses, as a percentage of average daily net assets, did not exceed the following amounts:
| | | Share Class | |
| Fund | | A | | B | | C | | R | | Y | |
| Core Bond Fund | | | 0.95 | % | | | 1.70 | % | | | 1.70 | % | | | 1.20 | % | | | 0.70 | % | |
| High Income Bond Fund | | | 1.00 | | | | 1.75 | | | | 1.75 | | | | 1.25 | | | | 0.75 | | |
Inflation Protected
Securities Fund | | | 0.85 | | | | NA | | | | 1.60 | | | | 1.10 | | | | 0.60 | | |
Intermediate Government
Bond Fund | | | 0.75 | | | | NA | | | | NA | | | | NA | | | | 0.60 | | |
| Intermediate Term Bond Fund | | | 0.75 | | | | NA | | | | NA | | | | NA | | | | 0.60 | | |
| Short Term Bond Fund | | | 0.75 | | | | NA | | | | NA | | | | NA | | | | 0.60 | | |
| Total Return Bond Fund | | | 1.00 | | | | 1.75 | | | | 1.75 | | | | 1.25 | | | | 0.75 | | |
| U.S. Government Mortgage Fund | | | 0.95 | | | | 1.70 | | | | 1.70 | | | | 1.20 | | | | 0.70 | | |
NA = Not Applicable
The funds may invest in related money market funds that are series of First American Funds, Inc. ("FAF"), subject to certain limitations. In order to avoid the payment of duplicative investment advisory fees to USBAM, which acts as the investment advisor to both the investing funds and the related money market funds, USBAM will reimburse each investing fund an amount equal to that portion of USBAM's investment advisory fee received from the related money market funds that is attributable to the assets of the investing fund. For financial statement purposes, these reimbursements are recorded as investment income.
ADMINISTRATION FEES – Effective July 1, 2005, USBAM serves as the funds' administrator pursuant to an administration agreement between USBAM and the funds. U.S. Bancorp Fund Services, LLC ("USBFS") serves as sub-administrator pursuant to a sub-administration agreement between USBFS and USBAM. Both U.S. Bank and USBFS are direct subsidiaries of U.S. Bancorp. Under the administration agreement, USBAM is compensated to provide, or compensate other entities to provide, services to the funds. These services include various legal, oversight and administrative services and accounting services. Effective July 1, 2005, the funds pay USBAM administration fees, which are calculated daily and paid monthly, equal to each fund's pro rata share of an amount equal, on an annual bas is, to 0.15% of the aggregate average daily net assets of all open-end mutual funds in the First American Family of Funds up to $8 billion, 0.135% on the next $17 billion of the aggregate average daily net assets, 0.12% on the next $25 billion of the aggregate average daily net assets, and 0.10% of the aggregate average daily net assets in excess of $50 billion. All fees paid to the sub-administrator are paid from the administration fee. In addition to these fees, the funds may reimburse USBAM and, indirectly, the sub-administrator for any out-of-pocket expenses incurred in providing administration services.
Prior to July 1, 2005, USBAM and USBFS served as "co-administrators" pursuant to a co-administration agreement between the co-administrators and the funds. The funds paid the administration fees to the co-administrators, which were calculated daily and paid monthly, equal to each fund's pro rata share of an amount equal, on an annual basis, to 0.25% of the aggregate average daily net assets of all open-end mutual funds in the First American Family of Funds up to $8 billion, 0.235% of the next $17 billion of the aggregate average daily net assets, 0.22% of the next $25 billion of the aggregate daily net assets, and 0.20% of
FIRST AMERICAN FUNDS Annual Report 2005
80
the aggregate average daily net assets in excess of $50 billion. In addition, the funds paid transfer agent fees under the co-administration agreement of $18,500 per share class plus additional per account fees. In addition to these fees, the funds reimbursed the co-administrators for any out-of-pocket expenses incurred in providing administration services.
For the fiscal year ended September 30, 2005, administration fees paid to USBAM and USBFS by the funds included in this annual report were as follows (000):
| Fund | | Amount | |
| Core Bond Fund | | $ | 3,886 | | |
| High Income Bond Fund | | | 571 | | |
| Inflation Protected Securities Fund | | | 324 | | |
| Intermediate Government Bond Fund | | | 192 | | |
| Intermediate Term Bond Fund | | | 2,486 | | |
| Short Term Bond Fund | | | 1,912 | | |
| Total Return Bond Fund | | | 571 | | |
| U.S. Government Mortgage Fund | | | 425 | | |
TRANSFER AGENT FEES – Effective July 1, 2005, USBFS serves as the funds' transfer agent pursuant to a transfer agent and shareholder servicing agreement with FAIF. FAIF pays transfer agent fees of $18,500 per share class and additional per account fees for transfer agent services. These fees are allocated to each fund based upon the fund's pro rata share of the aggregate average daily net assets of the funds that comprise FAIF. Under the new transfer agent and shareholder servicing agreement, FAIF also pays USBFS a fee equal, on an annual basis, to 0.10% of each fund's average daily net assets. This fee compensates USBFS for providing certain shareholder services and reimburses USBFS for its payments to financial institutions that establish and maintain omnibus acco unts and provide customary services for such accounts. In addition to these fees, the funds reimburse USBFS for out-of-pocket expenses incurred in providing transfer agent services. Prior to July 1, 2005, these services were provided by USBFS pursuant to the co-administration agreement.
For the fiscal year ended September 30, 2005, transfer agent fees paid to USBFS by the funds included in this annual report were as follows (000):
| Fund | | Amount | |
| Core Bond Fund | | $ | 1,183 | | |
| High Income Bond Fund | | | 167 | | |
| Inflation Protected Securities Fund | | | 127 | | |
| Intermediate Government Bond Fund | | | 53 | | |
| Intermediate Term Bond Fund | | | 733 | | |
| Short Term Bond Fund | | | 532 | | |
| Total Return Bond Fund | | | 177 | | |
| U.S. Government Mortgage Fund | | | 127 | | |
CUSTODIAN FEES – U.S. Bank serves as the funds' custodian pursuant to a custodian agreement with FAIF. Effective July 1, 2005, the fee for each fund was reduced from an annual rate of 0.01% of average daily net assets to an annual rate of 0.005% of average daily net assets. All fees are computed daily and paid monthly.
Effective July 1, 2005, the funds have entered into an arrangement with their custodian whereby interest earned on uninvested cash balances will be used to reduce a portion of each funds's custodian expenses. For the fiscal year ended September 30, 2005, custodian fees were not reduced as a result of interest earned.
DISTRIBUTION AND SHAREHOLDER SERVICING FEES – Quasar Distributors, LLC ("Quasar"), a subsidiary of U.S. Bancorp, serves as the distributor of the funds pursuant to a distribution agreement with FAIF. Under the distribution agreement, and pursuant to a plan adopted by each fund under rule 12b-1 of the Investment Company Act, each fund pays Quasar a monthly distribution and/or shareholder servicing fee equal to an annual rate of 0.25%, 1.00%, 1.00% and 0.50% of each fund's average daily net assets of the Class A shares, Class B shares, Class C shares, and Class R shares, respectively. No distribution or shareholder servicing fees are paid by Class Y shares. These fees may be used by Quasar to provide compensation for sales support, distribution activiti es, or shareholder servicing activities.
Quasar is currently waiving fees equal to an annual rate of 0.10% of average daily net assets for Class A shares of the Intermediate Government Bond Fund, Intermediate Term Bond Fund and Short Term Bond Fund.
For the fiscal year ended September 30, 2005, total distribution and shareholder servicing fees waived by Quasar for the funds included in this annual report were as follows (000):
| Fund | | Amount | |
| Intermediate Government Bond Fund | | $ | 2 | | |
| Intermediate Term Bond Fund | | | 55 | | |
| Short Term Bond Fund | | | 113 | | |
FAIF has also adopted and entered into a shareholder servicing plan and agreement with USBAM with respect to the Class R shares. Core Bond Fund, High Income Bond Fund, Inflation Protected Securities Fund, Total Return Bond Fund, and U. S. Government Mortgage Fund pay USBAM a monthly shareholder servicing fee equal to an annual rate of 0.15% of each fund's average daily net
FIRST AMERICAN FUNDS Annual Report 2005
81
Notes to Financial Statements September 30, 2005
assets of the Class R shares. USBAM is currently waiving all fees under this plan and agreement. This waiver may be discontinued at any time.
Under these distribution and shareholder servicing agreements, the following amounts were retained by Quasar for the fiscal year ended September 30, 2005 (000):
| Fund | | Amount | |
| Core Bond Fund | | $ | 378 | | |
| High Income Bond Fund | | | 68 | | |
| Inflation Protected Securities Fund | | | 12 | | |
| Intermediate Government Bond Fund | | | 2 | | |
| Intermediate Term Bond Fund | | | 60 | | |
| Short Term Bond Fund | | | 110 | | |
| Total Return Bond Fund | | | 61 | | |
| U.S. Government Mortgage Fund | | | 104 | | |
OTHER FEES AND EXPENSES – In addition to the investment advisory fees, custodian fees, distribution and shareholder servicing fees, transfer agent fees and administration fees, each fund is responsible for paying other operating expenses, including: fees and expenses of independent directors, registration fees, postage and printing of shareholder reports, legal, auditing, insurance, and other miscellaneous expenses. For the fiscal year ended September 30, 2005, legal fees and expenses were paid to a law firm of which an Assistant Secretary of the funds is a partner.
CONTINGENT DEFERRED SALES CHARGES – A contingent deferred sales charge ("CDSC") is imposed on redemptions made in the Class B shares. The CDSC varies depending on the number of years from time of payment for the purchase of Class B shares until the redemption of such shares.
Class B shares automatically convert to Class A shares after eight years.
| Year Since Purchase | | Contingent Deferred Sales Charge
as a Percentage of Dollar
Amount Subject to Charge | |
| First | | | 5.00 | % | |
| Second | | | 5.00 | | |
| Third | | | 4.00 | | |
| Fourth | | | 3.00 | | |
| Fifth | | | 2.00 | | |
| Sixth | | | 1.00 | | |
| Seventh | | | 0.00 | | |
| Eighth | | | 0.00 | | |
A CDSC of 1.00% is imposed on redemptions made in Class C shares for the first 12 months.
The CDSC for Class B and Class C shares is imposed on the value of the purchased shares, or the value at the time of redemption, whichever is less.
For the fiscal year ended September 30, 2005, total front-end sales charges and CDSCs retained by affiliates of USBAM for distributing the funds' shares were as follows (000):
| Fund | | Amount | |
| Core Bond Fund | | $ | 213 | | |
| High Income Bond Fund | | | 72 | | |
| Inflation Protected Securities Fund | | | 173 | | |
| Intermediate Government Bond Fund | | | 12 | | |
| Intermediate Term Bond Fund | | | 30 | | |
| Short Term Bond Fund | | | 42 | | |
| Total Return Bond Fund | | | 48 | | |
| U.S. Government Mortgage Fund | | | 158 | | |
FIRST AMERICAN FUNDS Annual Report 2005
82
4 > Capital Share Transactions
FAIF has 324 billion shares of $0.0001 par value capital stock authorized. Capital share transactions for the funds were as follows (000):
| | |
Core
Bond Fund | |
High Income
Bond Fund | |
Inflation Protected
Securities Fund | | Intermediate
Government
Bond Fund | |
| | | Year
Ended
9/30/05 | | Year
Ended
9/30/04 | | Year
Ended
9/30/05 | | Year
Ended
9/30/04 | |
| | Year
Ended
9/30/05 | | Year
Ended
9/30/05 | | Year
Ended
9/30/04 | |
| Class A: | |
| Shares issued | | | 2,069 | | | | 5,711 | | | | 702 | | | | 1,128 | | | | | | 759 | | | | 154 | | | | 88 | | |
| Shares issued in lieu of cash distributions | | | 456 | | | | 642 | | | | 210 | | | | 252 | | | | | | 10 | | | | 16 | | | | 25 | | |
| Shares redeemed | | | (4,450 | ) | | | (6,534 | ) | | | (1,924 | ) | | | (1,343 | ) | | | | | (86 | ) | | | (143 | ) | | | (151 | ) | |
| Total Class A transactions | | | (1,925 | ) | | | (181 | ) | | | (1,012 | ) | | | 37 | | | | | | 683 | | | | 27 | | | | (38 | ) | |
| Class B: | |
| Shares issued | | | 90 | | | | 175 | | | | 80 | | | | 251 | | | | | | - | | | | - | | | | - | | |
| Shares issued in lieu of cash distributions | | | 46 | | | | 85 | | | | 32 | | | | 39 | | | | | | - | | | | - | | | | - | | |
| Shares redeemed | | | (474 | ) | | | (825 | ) | | | (250 | ) | | | (368 | ) | | | | | - | | | | - | | | | - | | |
| Total Class B transactions | | | (338 | ) | | | (565 | ) | | | (138 | ) | | | (78 | ) | | | | | - | | | | - | | | | - | | |
| Class C: | |
| Shares issued | | | 79 | | | | 119 | | | | 55 | | | | 222 | | | | | | 87 | | | | - | | | | - | | |
| Shares issued in lieu of cash distributions | | | 21 | | | | 43 | | | | 87 | | | | 119 | | | | | | 2 | | | | - | | | | - | | |
| Shares redeemed | | | (259 | ) | | | (514 | ) | | | (555 | ) | | | (662 | ) | | | | | (4 | ) | | | - | | | | - | | |
| Total Class C transactions | | | (159 | ) | | | (352 | ) | | | (413 | ) | | | (321 | ) | | | | | 85 | | | | - | | | | - | | |
| Class R: | |
| Shares issued | | | 1 | | | | 559 | | | | 4 | | | | 33 | | | | | | - | | | | - | | | | - | | |
| Shares issued in lieu of cash distributions | | | - | | | | 117 | | | | - | | | | 2 | | | | | | - | | | | - | | | | - | | |
| Shares redeemed | | | - | | | | (4,070 | ) | | | (5 | ) | | | (119 | ) | | | | | - | | | | - | | | | - | | |
| Total Class R transactions | | | 1 | | | | (3,394 | ) | | | (1 | ) | | | (84 | ) | | | | | - | | | | - | | | | - | | |
| Class Y: | |
| Shares issued | | | 35,837 | | | | 34,846 | | | | 7,861 | | | | 10,084 | | | | | | 29,019 | | | | 1,733 | | | | 2,458 | | |
| Shares issued in lieu of cash distributions | | | 1,987 | | | | 3,549 | | | | 209 | | | | 251 | | | | | | 207 | | | | 514 | | | | 3,028 | | |
| Shares redeemed | | | (37,508 | ) | | | (53,065 | ) | | | (10,853 | ) | | | (5,149 | ) | | | | | (2,631 | ) | | | (8559 | ) | | | (24,241 | ) | |
| Total Class Y transactions | | | 316 | | | | (14,670 | ) | | | (2,783 | ) | | | 5,186 | | | | | | 26,595 | | | | (6,312 | ) | | | (18,755 | ) | |
| Net increase (decrease) in capital shares | | | (2,105 | ) | | | (19,162 | ) | | | (4,347 | ) | | | 4,740 | | | | | | 27,363 | | | | (6,285 | ) | | | (18,793 | ) | |
| | | Intermediate Term
Bond Fund | | Short Term
Bond Fund | | Total Return
Bond Fund | | U.S. Government
Mortgage Fund | |
| | | Year
Ended
9/30/05 | | Year
Ended
9/30/04 | | Year
Ended
9/30/05 | | Year
Ended
9/30/04 | | Year
Ended
9/30/05 | | Year
Ended
9/30/04 | | Year
Ended
9/30/05 | | Year
Ended
9/30/04 | |
| Class A: | |
| Shares issued | | | 856 | | | | 2,566 | | | | 632 | | | | 2,907 | | | | 243 | | | | 1,206 | | | | 496 | | | | 1,742 | | |
| Shares issued in lieu of cash distributions | | | 202 | | | | 195 | | | | 251 | | | | 252 | | | | 67 | | | | 61 | | | | 103 | | | | 97 | | |
| Shares redeemed | | | (2,379 | ) | | | (4,118 | ) | | | (3,940 | ) | | | (5,787 | ) | | | (484 | ) | | | (536 | ) | | | (1,331 | ) | | | (1,045 | ) | |
| Total Class A transactions | | | (1,321 | ) | | | (1,357 | ) | | | (3,057 | ) | | | (2,628 | ) | | | (174 | ) | | | 731 | | | | (732 | ) | | | 794 | | |
| Class B: | |
| Shares issued | | | - | | | | - | | | | - | | | | - | | | | 24 | | | | 68 | | | | 69 | | | | 119 | | |
| Shares issued in lieu of cash distributions | | | - | | | | - | | | | - | | | | - | | | | 12 | | | | 27 | | | | 26 | | | | 29 | | |
| Shares redeemed | | | - | | | | - | | | | - | | | | - | | | | (138 | ) | | | (890 | ) | | | (196 | ) | | | (341 | ) | |
| Total Class B transactions | | | - | | | | - | | | | - | | | | - | | | | (102 | ) | | | (795 | ) | | | (101 | ) | | | (193 | ) | |
| Class C: | |
| Shares issued | | | - | | | | - | | | | - | | | | - | | | | 9 | | | | 32 | | | | 29 | | | | 104 | | |
| Shares issued in lieu of cash distributions | | | - | | | | - | | | | - | | | | - | | | | 10 | | | | 17 | | | | 27 | | | | 47 | | |
| Shares redeemed | | | - | | | | - | | | | - | | | | - | | | | (108 | ) | | | (242 | ) | | | (413 | ) | | | (900 | ) | |
| Total Class C transactions | | | - | | | | - | | | | - | | | | - | | | | (89 | ) | | | (193 | ) | | | (357 | ) | | | (749 | ) | |
| Class R: | |
| Shares issued | | | - | | | | 430 | | | | - | | | | 186 | | | | - | | | | 9 | | | | - | | | | 140 | | |
| Shares issued in lieu of cash distributions | | | - | | | | 31 | | | | - | | | | 9 | | | | - | | | | 5 | | | | - | | | | 33 | | |
| Shares redeemed | | | - | | | | (1,635 | ) | | | - | | | | (1,045 | ) | | | - | | | | (275 | ) | | | - | | | | (1,768 | ) | |
| Total Class R transactions | | | - | | | | (1,174 | ) | | | - | | | | (850 | ) | | | - | | | | (261 | ) | | | - | | | | (1,595 | ) | |
| Class Y: | |
| Shares issued | | | 24,296 | | | | 37,708 | | | | 14,851 | | | | 45,435 | | | | 9,193 | | | | 5,441 | | | | 3,291 | | | | 4,048 | | |
| Shares issued in lieu of cash distributions | | | 2,038 | | | | 2,280 | | | | 791 | | | | 709 | | | | 159 | | | | 160 | | | | 91 | | | | 101 | | |
| Shares redeemed | | | (37,799 | ) | | | (44,985 | ) | | | (45,948 | ) | | | (33,963 | ) | | | (5,666 | ) | | | (5,916 | ) | | | (4,309 | ) | | | (7,894 | ) | |
| Total Class Y transactions | | | (11,465 | ) | | | (4,997 | ) | | | (30,306 | ) | | | 12,181 | | | | 3,686 | | | | (315 | ) | | | (927 | ) | | | (3,745 | ) | |
| Net increase (decrease) in capital shares | | | (12,786 | ) | | | (7,528 | ) | | | (33,363 | ) | | | 8,703 | | | | 3,321 | | | | (833 | ) | | | (2,117 | ) | | | (5,488 | ) | |
FIRST AMERICAN FUNDS Annual Report 2005
83
Notes to Financial Statements September 30, 2005
5 > Investment Security Transactions
During the fiscal year ended September 30, 2005, purchases of securities and proceeds from sales of securities, other than temporary investments in short-term securities, were as follows (000):
| | | U.S. Government
Securities | | Other Investment
Securities | |
| Fund | | Purchases | | Sales | | Purchases | | Sales | |
| Core Bond Fund | | $ | 3,269,726 | | | $ | 3,077,899 | | | $ | 677,147 | | | $ | 1,079,311 | | |
| High Income Bond Fund | | | 1,731 | | | | 3,294 | | | | 206,681 | | | | 237,508 | | |
Inflation Protected
Securities Fund | | | 287,668 | | | | 29,825 | | | | 19,012 | | | | 7,242 | | |
Intermediate Government
Bond Fund | | | 147,177 | | | | 201,986 | | | | - | | | | - | | |
| Intermediate Term Bond Fund | | | 1,051,573 | | | | 769,114 | | | | 372,564 | | | | 705,756 | | |
| Short Term Bond Fund | | | 262,151 | | | | 288,061 | | | | 320,408 | | | | 495,937 | | |
| Total Return Bond Fund | | | 518,777 | | | | 368,910 | | | | 317,305 | | | | 428,470 | | |
U.S. Government
Mortgage Fund | | | 544,678 | | | | 516,170 | | | | 73,758 | | | | 57,516 | | |
The aggregate gross unrealized appreciation and depreciation of securities held by the funds and the total cost of securities (including cost of securities purchased with proceeds from securities lending) for federal income tax purposes at September 30, 2005, were as follows (000):
| Fund | | Aggregate
Gross
Appreciation | | Aggregate
Gross
Depreciation | | Net | | Federal
Income
Tax Cost | |
| Core Bond Fund | | $ | 7,002 | | | $ | (26,027 | ) | | $ | (19,025 | ) | | $ | 2,796,584 | | |
| High Income Bond Fund | | | 8,164 | | | | (5,411 | ) | | | 2,753 | | | | 314,743 | | |
Inflation Protected
Securities Fund | | | 1,455 | | | | (2,865 | ) | | | (1,410 | ) | | | 397,004 | | |
Intermediate Government
Bond Fund | | | 259 | | | | (1,562 | ) | | | (1,303 | ) | | | 71,121 | | |
| Intermediate Term Bond Fund | | | 2,889 | | | | (14,823 | ) | | | (11,934 | ) | | | 1,639,017 | | |
| Short Term Bond Fund | | | 2,595 | | | | (12,543 | ) | | | (9,948 | ) | | | 924,540 | | |
| Total Return Bond Fund | | | 1,241 | | | | (3,499 | ) | | | (2,258 | ) | | | 428,279 | | |
| U.S. Government Mortgage Fund | | | 660 | | | | (2,582 | ) | | | (1,992 | ) | | | 297,148 | | |
6 > Options Written
Put Options Written
Transactions in written options for the fiscal year ended September 30, 2005, were as follows (000):
| | | Put Options Written | | Call Options Written | |
| | | Number of
Contracts | | Premium
Amount | | Number of
Contracts | | Premium
Amount | |
| Core Bond Fund | | | |
| Balance at September 30, 2004 | | | - | | | $ | - | | | | - | | | $ | - | | |
| Opened | | | 2,432 | | | | 1,037 | | | | 2,412 | | | | 1,096 | | |
| Expired | | | (1,308 | ) | | | (559 | ) | | | (437 | ) | | | (200 | ) | |
| Closed | | | (1,124 | ) | | | (478 | ) | | | (1,975 | ) | | | (896 | ) | |
| Balance at September 30, 2005 | | | - | | | $ | - | | | | - | | | $ | - | | |
| | | Put Options Written | | Call Options Written | |
| | | Number of
Contracts | | Premium
Amount | | Number of
Contracts | | Premium
Amount | |
| Inflation Protected Securities Fund | | | |
| Balance at September 30, 2004 | | | - | | | $ | - | | | | - | | | $ | - | | |
| Opened | | | 150 | | | | 60 | | | | 149 | | | | 59 | | |
| Expired | | | (36 | ) | | | (15 | ) | | | (16 | ) | | | (7 | ) | |
| Closed | | | (114 | ) | | | (45 | ) | | | (133 | ) | | | (52 | ) | |
| Balance at September 30, 2005 | | | - | | | $ | - | | | | - | | | $ | - | | |
| Intermediate Government Bond Fund | | | |
| Balance at September 30, 2004 | | | - | | | $ | - | | | | - | | | $ | - | | |
| Opened | | | 71 | | | | 31 | | | | 71 | | | | 34 | | |
| Expired | | | (71 | ) | | | (31 | ) | | | (23 | ) | | | (10 | ) | |
| Closed | | | - | | | | - | | | | (48 | ) | | | (24 | ) | |
| Balance at September 30, 2005 | | | - | | | $ | - | | | | - | | | $ | - | | |
| Intermediate Term Bond Fund | | | |
| Balance at September 30, 2004 | | | - | | | $ | - | | | | - | | | $ | - | | |
| Opened | | | 1,563 | | | | 668 | | | | 1,548 | | | | 707 | | |
| Expired | | | (851 | ) | | | (364 | ) | | | (284 | ) | | | (130 | ) | |
| Closed | | | (712 | ) | | | (304 | ) | | | (1,264 | ) | | | (577 | ) | |
| Balance at September 30, 2005 | | | - | | | $ | - | | | | - | | | $ | - | | |
| Short Term Bond Fund | | | |
| Balance at September 30, 2004 | | | - | | | $ | - | | | | - | | | $ | - | | |
| Opened | | | 316 | | | | 120 | | | | 316 | | | | 99 | | |
| Expired | | | - | | | | - | | | | - | | | | - | | |
| Closed | | | (316 | ) | | | (120 | ) | | | (316 | ) | | | (99 | ) | |
| Balance at September 30, 2005 | | | - | | | $ | - | | | | - | | | $ | - | | |
| Total Return Bond Fund | | | |
| Balance at September 30, 2004 | | | - | | | $ | - | | | | - | | | $ | - | | |
| Opened | | | 341 | | | | 121 | | | | 411 | | | | 162 | | |
| Expired | | | (25 | ) | | | (7 | ) | | | (100 | ) | | | (33 | ) | |
| Closed | | | (316 | ) | | | (114 | ) | | | (311 | ) | | | (129 | ) | |
| Balance at September 30, 2005 | | | - | | | $ | - | | | | - | | | $ | - | | |
| U.S. Government Mortgage Fund | | | |
| Balance at September 30, 2004 | | | - | | | $ | - | | | | - | | | $ | - | | |
| Opened | | | 189 | | | | 84 | | | | 187 | | | | 96 | | |
| Expired | | | (147 | ) | | | (63 | ) | | | (49 | ) | | | (22 | ) | |
| Closed | | | (42 | ) | | | (21 | ) | | | (138 | ) | | | (74 | ) | |
| Balance at September 30, 2005 | | | - | | | $ | - | | | | - | | | $ | - | | |
7 > Concentration of Risks
Each fund (other than Intermediate Government Bond Fund and U.S. Government Mortgage Fund) may invest in foreign securities. A fund's investment in foreign securities subjects it to special risks associated with foreign investing and to a decline in net asset value resulting from changes in exchange rates between the United States dollar and foreign currencies. Because of the special risks associated with foreign investing, a fund investing in foreign securities may be subject to greater volatility than most mutual funds which invest primarily in domestic securities.
Core Bond Fund, High Income Bond Fund and Total Return Bond Fund invest in lower-rated (i.e., rated Ba or lower by Moody's or BB or lower by Standard & Poor's) corporate and foreign debt obligations, which are
FIRST AMERICAN FUNDS Annual Report 2005
84
commonly referred to as "junk bonds." Lower-rated securities will usually offer higher yields than higher-rated securities. However, there is more risk associated with these investments. These lower-rated bonds may be more susceptible to real or perceived adverse economic conditions than investment grade bonds. Lower-rated securities tend to have more price volatility and carry more risk to principal than higher-rated securities.
The rating of long-term securities as a percentage of total value of investments at the fiscal year ended September 30, 2005, were as follows (unaudited):
Standard & Poor's/
Moody's Ratings | | Core
Bond Fund | | High Income
Bond Fund | | Total Return
Bond Fund | |
| AAA/Aaa | | | 88.0 | % | | | 2.9 | % | | | 80.1 | % | |
| AA/Aa | | | 1.9 | | | | - | | | | 1.0 | | |
| A/A | | | 1.8 | | | | - | | | | 5.3 | | |
| BBB/Baa | | | 8.3 | | | | 4.1 | | | | 9.2 | | |
| BB/Ba | | | - | | | | 31.2 | | | | 3.5 | | |
| B/B | | | - | | | | 44.5 | | | | 0.9 | | |
| CCC/Caa | | | - | | | | 15.3 | | | | - | | |
| CC/Ca | | | - | | | | 0.3 | | | | - | | |
| C/C | | | - | | | | 0.1 | | | | - | | |
| NR | | | - | | | | 1.6 | | | | - | | |
In the case of split ratings, a security is considered to be rated in the listed category if two of Moody's Investor Service, Standard & Poor's, and Fitch rate the security in that category. If ratings are provided by only two of those rating agencies, the lower rating is used. If only one of those rating agencies provides a rating, that rating is used.
8 > Indemnifications
The funds enter into contracts that contain a variety of indemnifications. The funds' maximum exposure under these arrangements is unknown. However, the funds have not had prior claims or losses pursuant to these contracts and expect the risk of loss to be remote.
9 > Investment Strategy Changes and Name Change for Corporate Bond Fund
On March 7, 2005, the funds' board of directors approved a number of changes to the investment strategies of Corporate Bond Fund and a corresponding change of the fund's name to Total Return Bond Fund. These changes took effect on May 16, 2005.
FIRST AMERICAN FUNDS Annual Report 2005
85
NOTICE TO SHAREHOLDERS September 30, 2005 (unaudited)
TAX INFORMATION
The information set forth below is for each funds's fiscal year as required by federal laws. Most shareholders, however, must report distributions on a calendar year basis for income tax purposes, which may include distributions for portions of two fiscal years of a fund. Accordingly, the information needed for income tax purposes will be sent in early 2006 on Form 1099-DIV. Please consult your tax advisor for proper treatment of this information.
Dear First American Shareholders:
For the fiscal year ended September 30, 2005, each fund has designated long-term capital gains, ordinary income and tax exempt income with regard to distributions paid during the year as follows:
| Fund | | Long Term
Capital Gains
Distributions
(Tax Basis) (a) | | Ordinary
Income
Distributions
(Tax Basis) (a) | | Return of
Capital
(Tax Basis) (a) | | Total
Distributions
(Tax Basis) (b) | |
| Core Bond Fund | | | 1.7 | % | | | 98.3 | % | | | - | % | | | 100.0 | % | |
| High Income Bond Fund | | | - | | | | 99.9 | | | | 0.1 | | | | 100.0 | | |
| Inflation Protected Securities Fund | | | - | | | | 100.0 | | | | - | | | | 100.0 | | |
| Intermediate Government Bond Fund | | | 60.8 | | | | 39.2 | | | | - | | | | 100.0 | | |
| Intermediate Term Bond Fund | | | 21.9 | | | | 78.1 | | | | - | | | | 100.0 | | |
| Short Term Bond Fund | | | - | | | | 98.6 | | | | 1.4 | | | | 100.0 | | |
| Total Return Bond Fund | | | - | | | | 100.0 | | | | - | | | | 100.0 | | |
| U.S. Government Mortgage Fund | | | - | | | | 100.0 | | | | - | | | | 100.0 | | |
(a) Based on a percentage of the fund's total distributions.
(b) None of the dividends paid by the funds are eligible for the dividends received deduction or are characterized as qualified dividend income.
HOW TO OBTAIN A COPY OF THE FUNDS' PROXY VOTING POLICIES AND PROXY VOTING RECORD
A description of the policies and procedures that the funds use to determine how to vote proxies relating to portfolio securities, as well as information regarding how the funds voted proxies relating to portfolio securities during the most recent 12 month period ended June 30, 2005, is available (1) without charge upon request by calling 800.677.FUND; (2) at firstamericanfunds.com; and (3) on the U.S. Securities and Exchange Commision's website at http://www.sec.gov.
FORM N-Q HOLDINGS INFORMATION
Each fund is required to file its complete schedule of portfolio holdings for the first and third quarters of each fiscal year with the Securities and Exchange Commission on Form N-Q. The funds' Forms N-Q are available (1) without charge upon request by calling 800.677.FUND and (2) on the U.S. Securities and Exchange Commision's website at http://www.sec.gov. In addition, you may review and copy the funds' Forms N-Q at the Commission's Public Reference Room in Washington, D.C. You may obtain information on the operation of the Public Reference Room by calling 1-800-SEC-0330.
QUARTERLY PORTFOLIO HOLDINGS
Each fund will make complete portfolio holdings information publicly available by posting the information at firstamericanfunds.com on a quarterly basis. The funds will attempt to post such information within 10 days of the calendar quarter end.
APPROVAL OF INVESTMENT ADVISORY AGREEMENT
The Board of Directors of the Funds (the "Board"), which is comprised entirely of independent directors, oversees the management of each Fund and, as required by law, determines annually whether to renew the Funds' advisory agreement with U.S. Bancorp Asset Management, Inc. ("USBAM").
At a meeting on May 3-5 2005, the Board considered information relating to the Funds' investment advisory agreement with USBAM (the "Agreement"). In advance of the meeting, the Board received materials relating to the Agreement, and had the opportunity to ask questions and request further information in connection with their consideration. At a subsequent meeting on June 20-22, 2005, the Board concluded its consideration of and approved the Agreement through June 30, 2006.
FIRST AMERICAN FUNDS Annual Report 2005
86
Although the Agreement, which is with First American Investment Funds, Inc., relates to all of the Funds, the Board separately considered and approved the Agreement with respect to each Fund. In considering the Agreement, the Board, advised by independent legal counsel, reviewed and considered the factors it deemed relevant, including: (1) the nature, quality and extent of USBAM's services to the Fund, (2) the investment performance of the Fund, (3) the profitability of USBAM related to the Fund, including an analysis of USBAM's cost of providing services and comparative expense information, (4) the extent to which economies of scale are realized as the Fund grows and whether fee levels are adjusted to enable Fund investors to share in these economies of scale, and (5) other benefits that accrue to USBAM through its relationship with the Funds. In its deliberations, the Board did not identify any single factor which alone was responsible for the Board's decision to approve the Agreement.
Before approving the Agreement, the Board met in executive session with its independent counsel on numerous occasions to consider the materials provided by USBAM and the terms of the Agreement. Based on its evaluation of those materials, the Board concluded that the Agreement is fair and in the best interests of the shareholders of each Fund. In reaching its conclusions, the Board considered the following:
Nature, Quality and Extent of Investment Advisory Services
The Board examined the nature, quality and extent of the services provided by USBAM to each Fund. The Board reviewed USBAM's key personnel who provide investment management services to each Fund as well as the fact that, under the Agreement, USBAM has the authority and responsibility to make and execute investment decisions for each Fund within the framework of that Fund's investment policies and restrictions, subject to review by the Board. The Board further considered that USBAM's duties with respect to each Fund include (i) investment research and security selection, (ii) adherence to (and monitoring compliance with) the Fund's investment policies and restrictions and the Investment Company Act of 1940, and (iii) monitoring the performance of the various organizations providing services to the Fund, including the Fund's distributor, sub-administrator, transfer agent and custodian. Finally, t he Board considered USBAM's representation that the services provided by USBAM under the Agreement are the type of services customarily provided by investment advisors in the fund industry.
The Board also considered compliance reports about USBAM from the Fund's Chief Compliance Officer.
Based on the foregoing, the Board concluded that each Fund is likely to benefit from the nature, extent and quality of the services provided by USBAM under the Agreement.
Investment Performance of the Funds
The Board considered the performance of each Fund, as summarized below, including how the Fund performed versus the median performance of a group of comparable funds selected by an independent data service (the "performance universe") and how the Fund performed versus its benchmark index. The Board also considered that, in reviewing the comparative performance of income funds, the different expense levels of a fund's share classes can result in different net performance results for each of those classes. Thus, while the Board considered the performance of all classes, it focused on Class Y shares, which, because they have the lowest expense ratios, offered the most meaningful data on performance alone. The performance periods reviewed by the Board all ended on February 28, 2005.
Core Bond Fund. The Fund's Class Y shares outperformed the Fund's performance universe for the one- and five-year periods. The Class Y shares underperformed the performance universe for the three- and five year periods and the benchmark index for all periods. The Board noted that the Fund's performance had improved since a new, team-based sector specialist management model was implemented by USBAM in early 2003. The Board concluded that, in light of the change to the fixed-income model implemented in 2003, it would be in the interest of the Fund and its shareholders to renew the Agreement, but to continue to closely monitor the performance record being developed under the changed model.
High Income Bond Fund. The Fund outperformed its performance universe for the one- and three-year periods. In addition, for the one-year period, the Fund's Class Y shares outperformed the Fund's benchmark index, though they underperformed it for
FIRST AMERICAN FUNDS Annual Report 2005
87
NOTICE TO SHAREHOLDERS September 30, 2005 (unaudited)
the three-year period. The Board concluded that, in light of the strong performance compared to the performance universe and benchmark index, it would be in the interest of the Fund and its shareholders to renew the Agreement.
Inflation Protected Securities Fund. The Board did not receive any comparative performance information from the independent data service because the Fund had not been offered for a full calendar year.
Intermediate Government Bond Fund. The Fund's Class Y shares outperformed the Fund's benchmark index for the one-year period and for the period since the Fund's inception in October 2002. While the Board considered that, for the one-year period, the Fund underperformed its performance universe, the Board also noted USBAM's assertion that the Fund has a stricter investment policy than that of its peers. As a result, the Fund can investment only in U.S. Treasury securities and certain state tax-exempt agency securities, whereas most of the Fund's peers also may invest in mortgage-backed securities. Thus, USBAM asked that the Board give more weight to the Fund's performance compared to that of its benchmark index. The Board concluded that, in light of the Fund's strong performance compar ed to that of its benchmark index, it would be in the interest of the Fund and its shareholders to renew the Agreement.
Intermediate Term Bond Fund. The Fund outperformed its performance universe for the one-, three-, five- and ten-year periods. The Fund also outperformed its benchmark index for the one-year period (though it underperformed its benchmark index for the longer periods). The Board concluded that, in light of the Fund's strong performance compared to its performance universe and its recent strong performance versus its benchmark index, it would be in the interest of the Fund and its shareholders to renew the Agreement.
Short Term Bond Fund. The Fund's Class Y shares outperformed the performance universe for the three-, five- and ten-year periods (although they did not outperform the universe for the one-year period). The Fund underperformed its benchmark index for each of the periods. The Board concluded that, in light of the long-term performance compared to that of the performance universe, it would be in the interest of the Fund and its shareholders to renew the Agreement.
Total Return Bond Fund. The Fund outperformed its performance universe for the one-, three- and five-year periods. In addition, the Fund outperformed its benchmark index for the one-year period, although it underperformed the index for the other periods. The Board noted that, effective May 13, 2005, the Fund changed its name from Corporate Bond Fund to Total Return Bond Fund. In conjunction with that change, the Fund changed its investment strategies and benchmark. The Board concluded that, in light of the Fund's strong performance compared to its performance universe, its recent out-performance of the benchmark index and in light of the recent changes to the Fund's investment strategies, it would be in the interest of the Fund and its shareholders to renew the Agreement. The Board al so concluded it would continue to monitor the Fund's performance record as it operates pursuant to the changed investment strategies.
U.S. Government Mortgage Fund. The Fund's Class Y shares outperformed the Fund's performance universe for the one-, three- and five-year periods. The Fund underperformed its performance universe for the ten-year period and underperformed its benchmark index for all periods. The Board concluded that, in light of the competitive performance compared that of the performance universe, it would be in the interest of the Fund and its shareholders to renew the Agreement. The Board also concluded that it would continue to closely monitor the performance of this Fund compared to that of its benchmark index.
Costs of Services and Profits Realized by USBAM
The Board reviewed USBAM's estimated costs in serving as the Funds' investment manager, including the costs associated with the personnel and systems necessary to manage each Fund. The Board also considered the reported profitability of USBAM and its affiliates resulting from their relationship with each Fund. For each Fund, the Board reviewed fee and expense information as compared to that of other funds and accounts managed by USBAM and of comparable funds managed by other advisers. The Board found that while the management fees for USBAM's institutional separate accounts are lower than the Funds' management fees, the Funds receive additional services from USBAM that separate accounts do not receive.
Using information provided by an independent data service, the Board also evaluated each Fund's advisory fee compared to the median advisory fee for other mutual funds similar in size, character and investment strategy, and each Fund's expense
FIRST AMERICAN FUNDS Annual Report 2005
88
ratio after waivers compared to the median expense ratio, after waivers, of comparable funds. In connection with its review of Fund fees and expenses, the Board asked USBAM to articulate its pricing philosophy. USBAM responded that it attempts generally to maintain each Fund's total operating expenses at a level that approximates its peer group median expense ratio. In addition, USBAM committed to waive its investment advisory fees to the extent necessary to maintain the Funds' total expense ratios at levels generally in line with their respective peer groups. Consistent with this pricing philosophy, and after discussions with the Board, USBAM proposed changes to the advisory fees and expense ratios of certain Funds, as discussed in more detail below. The Board concluded that USBAM's pricing philosophy is a reasonable one and, after taking into account USBAM's proposed changes to advisory fees and expens e ratios, that the Funds' advisory fees and expense ratios are reasonable in light of the services provided. Further detail considered by the Board regarding the advisory fees and expense ratios of each Fund is set forth below:
Core Bond Fund. The Fund's contractual advisory fee equaled the peer group median advisory fee and, after waivers, the Fund's advisory fee was lower than the peer group median. Furthermore, the Fund had a total expense ratio after waivers that was lower than the peer group median expense ratio. The Board concluded that the Fund's advisory fee and expense ratio are reasonable in light of the services provided.
High Income Bond Fund. After waivers, the Fund's advisory fee and expense ratio were lower than the peer group median. (Without waivers, the advisory fee was higher than the median). The Board considered USBAM's proposal to change the expense cap for the Fund from 1.00% to 1.10%. The Board noted that, even with this new expense cap, the Fund's total expense ratio for its last fiscal year would have continued to be competitive with the peer group median expense ratio of 1.08%. The Board concluded that the Fund's advisory fee and expense ratio, after taking into account the expense cap increase, are reasonable in light of the services provided.
Inflation Protected Securities Fund. The Fund's advisory fee was lower than the peer group median advisory fee, both before and after waivers. Further, the Fund's total expense ratio after waivers was lower than the peer group median expense ratio. The Board concluded that the Fund's advisory fee and expense ratio are reasonable in light of the services provided.
Intermediate Government Bond Fund. The Fund's contractual advisory fee equaled the peer group median advisory fee and, after waivers, the Fund's advisory fee was lower than the peer group median. Further, the Fund had a total expense ratio after waivers that was lower than the peer group median expense ratio. The Board concluded that the Fund's advisory fee and expense ratio are reasonable in light of the services provided.
Intermediate Term Bond Fund. The Fund's advisory fee was lower than the peer group median advisory fee, both before and after waivers. Further, the Fund's total expense ratio after waivers was lower than the peer group median expense ratio. The Board concluded that the Fund's advisory fee and expense ratio are reasonable in light of the services provided.
Short Term Bond Fund. Although the Fund's contractual advisory fee was higher than its peer group median advisory fee, after waivers, the Fund's advisory fee and expense ratio were lower than the peer group median. The Board concluded that the Fund's advisory fee and expense ratio are reasonable in light of the services provided.
Total Return Bond Fund. After waivers, the Fund's advisory fee was slightly lower than the peer group median. (Without the waiver it was higher). Though the Fund's total expense ratio after waivers was close to the peer group median, USBAM proposed to (1) contractually reduce its advisory fee from 0.70% to 0.60% and (2) decrease the amount of its expense waiver for the Fund by 0.10%. The Board considered that, implemented together, USBAM's proposals resulted in no net change to the Fund's total expense ratio. The Board concluded that the Fund's advisory fee and expense ratio, after taking into account USBAM's proposals, are reasonable in light of the services provided.
U.S. Government Mortgage Fund. The Fund's advisory fee was lower than the peer group median advisory fee, both before and after waivers. Further, the Fund's total expense ratio after waivers was lower than the peer group median expense ratio. The Board concluded that the Fund's advisory fee and expense ratio are reasonable in light of the services provided.
FIRST AMERICAN FUNDS Annual Report 2005
89
NOTICE TO SHAREHOLDERS September 30, 2005 (unaudited)
Economies of Scale in Providing Investment Advisory Services
The Board considered the extent to which each Fund's investment advisory fee reflects economies of scale for the benefit of Fund shareholders. Based on information provided by USBAM, the Board noted that profitability will likely increase somewhat as assets grow over time. The Board considered that, although the Funds do not have advisory fee breakpoints in place, USBAM has committed to waive advisory fees to the extent necessary to keep each Fund's total expenses generally in line with the median total expenses of a peer group of funds as selected by an independent data service. The median total expense ratio of a Fund's peer group will necessarily reflect the effect of any breakpoints in the advisory fee schedules of the funds in that group. Therefore, by capping a Fund's total expense ratio at a level close to the median, Fund shareholders will effectively receive the benefit of any breakpoints in the comparable funds' advisory fee schedules. In light of USBAM's commitment to keep total Fund expenses competitive, the Board concluded that it would be reasonable and in the best interest of each Fund and its shareholders to renew the Agreement.
Other Benefits to USBAM
In evaluating the benefits that accrue to USBAM through its relationship with the Funds, the Board noted that USBAM and certain of its affiliates serve the Funds in various capacities, including as adviser, administrator, sub-administrator, transfer agent, distributor, custodian and securities lending agent, and receive compensation from the Funds in connection with providing services to the Funds. The Board considered that each service provided to the Funds by USBAM or one of its affiliates is pursuant to a written agreement, which the Board evaluates periodically as required by law.
After full consideration of these and other factors, the Board concluded that approval of the Agreement was in the best interest of each Fund and its shareholders.
FIRST AMERICAN FUNDS Annual Report 2005
90
Directors and Officers of the Funds
Independent Directors
Name, Address, and
Year of Birth | | Position(s)
Held
with Funds | | Term of Office
and Length of
Time Served | | Principal Occupation(s)
During Past 5 Years | | Number of Portfolios
in Fund Complex
Overseen by Director | | Other
Directorships
Held by
Director † | |
Benjamin R. Field III
P.O. Box 1329
Minneapolis, MN
55440-1329
(1938) | | Director | | Term expiring earlier of death, resignation, removal, disqualification, or successor duly elected and qualified. Director of FAIF, since September 2003. | | Retired; Senior Financial Advisor, Bemis Company, Inc. from May 2002 through June 2004; Senior Vice President, Chief Financial Officer & Treasurer, Bemis, through April 2002. | | First American Funds Complex: eleven registered investment companies, including fifty-five portfolios | | None | |
|
Roger A. Gibson
P.O. Box 1329
Minneapolis, MN
55440-1329
(1946) | | Director | | Term expiring earlier of death, resignation, removal, disqualification, or successor duly elected and qualified. Director of FAIF since October 1997. | | Retired; Vice President – Cargo – United Airlines, from July 2001 to July 2004; Vice President, North America – Mountain Region, United Airlines, prior to July 2001. | | First American Funds Complex: eleven registered investment companies, including fifty-five portfolios | | None | |
|
Victoria J. Herget
P.O. Box 1329
Minneapolis, MN
55440-1329
(1951) | | Director | | Term expiring earlier of death, resignation, removal, disqualification, or successor duly elected and qualified. Director of FAIF since September 2003. | | Investment consultant and non-profit board member since 2001; Managing Director of Zurich Scudder Investments through 2001. | | First American Funds Complex: eleven registered investment companies, including fifty-five portfolios | | None | |
|
Leonard W. Kedrowski
P.O. Box 1329
Minneapolis, MN
55440-1329
(1941) | | Director | | Term expiring earlier of death, resignation, removal, disqualification, or successor duly elected and qualified. Director of FAIF since November 1993. | | Owner and President, Executive and Management Consulting, Inc., a management consulting firm; Board member, GC McGuiggan Corporation (dba Smyth Companies), a label printer; former Chief Executive Officer, Creative Promotions International, LLC, a promotional award programs and products company, through October 2003; Advisory Board member, Designer Doors, manufacturer of designer doors, through 2002. | | First American Funds Complex: eleven registered investment companies, including fifty-five portfolios | | None | |
|
Richard K. Riederer
P.O. Box 1329
Minneapolis, MN
55440-1329
(1944) | | Director | | Term expiring earlier of death, resignation, removal, disqualification, or successor duly elected and qualified. Director of FAIF since August 2001. | | Retired; Director, President and Chief Executive Officer, Weirton Steel through 2001. | | First American Funds Complex: eleven registered investment companies, including fifty-five portfolios | | Cleveland Cliffs Inc (a producer of iron ore pellets) | |
|
Joseph D. Strauss
P.O. Box 1329
Minneapolis, MN
55440-1329
(1940) | | Director | | Term expiring earlier of death, resignation, removal, disqualification, or successor duly elected and qualified. Director of FAIF since April 1991. | | Attorney At Law, Owner and President, Strauss Management Company, a Minnesota holding company for various organizational management business ventures; Owner, Chairman and Chief Executive Officer, Community Resource Partnerships, Inc., a strategic planning, operations management, government relations, transportation planning and public relations organization; Owner, Chairman and Chief Executive Officer, Excensus(TM) LLC, a strategic demographic planning and application development firm, since 2001. | | First American Funds Complex: eleven registered investment companies, including fifty-five portfolios | | None | |
|
FIRST AMERICAN FUNDS Annual Report 2005
91
NOTICE TO SHAREHOLDERS September 30, 2005 (unaudited)
Independent Directors - continued
Name, Address, and
Year of Birth | | Position(s)
Held
with Funds | | Term of Office
and Length of
Time Served | | Principal Occupation(s)
During Past 5 Years | | Number of Portfolios
in Fund Complex
Overseen by Director | | Other
Directorships
Held by
Director † | |
Virginia L. Stringer
P.O. Box 1329
Minneapolis, MN
55440-1329
(1944) | | Chair; Director | | Chair Term three years. Directors Term expiring earlier of death, resignation, removal, disqualification, or successor duly elected and qualified. Chair of FAIF's Board since September 1997; Director of FAIF since August 1987. | | Owner and President, Strategic Management Resources, Inc., a management consulting firm; Executive Consultant to State Farm Insurance Company through 2003. | | First American Funds Complex: eleven registered investment companies, including fifty-five portfolios | | None | |
|
James M. Wade
P.O. Box 1329
Minneapolis, MN
55440-1329
(1943) | | Director | | Term expiring earlier of death, resignation, removal, disqualification, or successor duly elected and qualified. Director of FAIF since August 2001. | | Owner and President, Jim Wade Homes, a homebuilding company, since 1999. | | First American Funds Complex: eleven registered investment companies, including fifty-five portfolios | | None | |
|
† Includes only directorships in a company with a class of securities registered pursuant to Section 12 of the Securities Exchange Act or subject to the requirements of Section 15(d) of the Securities Exchange Act, or any company registered as an investment company under the Investment Company Act.
The Statement of Additional Information (SAI) includes additional information about fund directors and is available upon request without charge by calling 800-677-FUND or writing to First American Funds, P.O. Box 1330, Minneapolis, Minnesota, 55440-1330.
FIRST AMERICAN FUNDS Annual Report 2005
92
Officers
Name, Address, and
Year of Birth | | Position(s)
Held
with Funds | | Term of Office
and Length of
Time Served | | Principal Occupation(s) During Past 5 Years | |
Thomas S. Schreier, Jr.
U.S. Bancorp Asset
Management, Inc.
800 Nicollet Mall
Minneapolis, MN
55402
(1962)* | | President | | Re-elected by the Board annually; President of FAIF since February 2001. | | Chief Executive Officer of U.S. Bancorp Asset Management, Inc., since May 2001; prior thereto, Chief Executive Officer of First American Asset Management from December 2000 to May 2001 and of Firstar Investment & Research Management Company ("FIRMCO") from February 2001 to May 2001; prior thereto Senior Managing Director and Head of Equity Research of U.S. Bancorp Piper Jaffray. | |
|
Mark S. Jordahl
U.S. Bancorp Asset
Management, Inc.
800 Nicollet Mall
Minneapolis, MN
55402
(1960)* | | Vice President –
Investments | | Re-elected by the Board annually; Vice President – Investments of FAIF since September 2001. | | Chief Investment Officer of U.S. Bancorp Asset Management, Inc., since September 2001; President and Chief Investment Officer, ING Investment Management – Americas, September 2000 to June 2001; Senior Vice President and Chief Investment Officer, ReliaStar Financial Corp., January 1998 to September 2000. | |
|
Jeffery M. Wilson
U.S. Bancorp Asset
Management, Inc.
800 Nicollet Mall
Minneapolis, MN
55402
(1956)* | | Vice
President –
Administration | | Re-elected by the Board annually; Vice President – Administration of FAIF since March 2000. | | Senior Vice President of U.S. Bancorp Asset Management, Inc., since May 2001; prior thereto, Senior Vice President of First American Asset Management. | |
|
Charles D Gariboldi Jr.
U.S. Bancorp Asset
Management, Inc.
800 Nicollet Mall
Minneapolis, MN
55402
(1959)* | | Treasurer | | Re-elected by the Board annually; Treasurer of FAIF since October 2004. | | Mutual Fund Treasurer, U.S. Bancorp Asset Management, Inc., since October 2004; prior thereto Vice President of investment accounting and Fund Treasurer for Thrivent Financial for Lutherans. . | |
|
Jill M. Stevenson
U.S. Bancorp Asset
Management, Inc.
800 Nicollet Mall
Minneapolis, MN
55402
(1965)* | | Assistant Treasurer | | Re-elected by the Board annually; Assistant Treasurer of FAIF since September 2005. | | Assistant Treasurer, U.S. Bancorp Asset Management, Inc., since September 2005; prior thereto, Director, Senior Project Manager, U.S. Bancorp Asset Management from May 2003. Prior to that, Vice President, Director of Operations, Paladin Investment Associates, LLC. | |
|
David H. Lui
U.S. Bancorp Asset
Management, Inc.
800 Nicollet Mall
Minneapolis, MN
55402
(1960)* | | Chief Compliance Officer | | Re-elected by the Board annually; Chief Compliance Officer of FAIF since February 2005. | | Chief Compliance Officer for First American Funds and U.S. Bancorp Asset Management, Inc., since February 2005. Prior thereto, Chief Compliance Officer, Franklin Advisors, Inc. and Chief Compliance Counsel, Franklin Templeton Investments from March 2004. Prior to that Vice President Charles Schwab & Co,. Inc. | |
|
Kathleen L. Prudhomme
U.S. Bancorp Asset
Management, Inc.
800 Nicollet Mall
Minneapolis, MN
55402
(1953)* | | Secretary | | Re-elected by the Board annually; Secretary of FAIF since December 2004; prior thereto, Assistant Secretary of FAIF since September 1998. | | Deputy General Counsel, U.S. Bancorp Asset Management, Inc., since November 2004; prior thereto, Partner, Dorsey & Whitney LLP, a Minneapolis-based law firm. | |
|
James D. Alt
50 South Sixth Street, Suite 1500
Minneapolis, MN
55402
(1951) | | Assistant Secretary | | Re-elected by the Board annually; Assistant Secretary of FAIF since December 2004; prior thereto, Secretary of FAIF since June 2002; Assistant Secretary of FAIF from September 1998 through June 2002. | | Partner, Dorsey & Whitney LLP, a Minneapolis-based law firm. | |
|
FIRST AMERICAN FUNDS Annual Report 2005
93
NOTICE TO SHAREHOLDERS September 30, 2005 (unaudited)
Officers - continued
Name, Address, and
Year of Birth | | Position(s)
Held
with Fund | | Term of Office
and Length of
Time Served | | Principal Occupation(s) During Past 5 Years | |
Brett L. Agnew
U.S. Bancorp Asset
Management, Inc.
800 Nicollet Mall
Minneapolis, MN
55402
(1971)* | | Assistant Secretary | | Re-elected by the Board annually; Assistant Secretary of FAIF since December 2004 | | Attorney for U.S. Bancorp Asset Management, Inc. since August 2004; 2001-2004, Senior Counsel, Thrivent Financial for Lutherans; prior thereto, Consultant, Principal Financial Group. | |
|
James R. Arnold,
615 E. Michigan Street,
Milwaukee, WI
53202 (1957)* | | Assistant Secretary | | Re-elected by the Board annually; Assistant Secretary of FAIF since June 2003 | | Vice President, U.S. Bancorp Fund Services, LLC since March 2002; prior thereto, Senior Administration Services Manager, UMB Fund Services, Inc. | |
|
Douglas G. Hess,
615 E. Michigan Street,
Milwaukee, WI
53202 (1967)* | | Assistant Secretary | | Re-elected by the Board annually; Assistant Secretary of FAIF since September 2001 | | Vice President, U.S. Bancorp Fund Services, LLC. | |
|
* Messrs. Schreier, Jordahl, Wilson, Gariboldi, Lui and Agnew, Ms. Stevenson and Ms. Prudhomme are each officers and/or employees of U.S. Bancorp Asset Management, Inc. which serves as investment adviser and administrator for FAIF. Messrs. Hess and Arnold are officers of U.S. Bancorp Fund Services, LLC, which is a subsidiary of U.S. Bancorp and which serves as Transfer Agent for FAIF.
FIRST AMERICAN FUNDS Annual Report 2005
94
Board of Directors First American Investment Funds, Inc.
Virginia Stringer
Chairperson of First American Investment Funds, Inc.
Owner and President of Strategic Management Resources, Inc.
Benjamin Field III
Director of First American Investment Funds, Inc.
Retired; former Senior Vice President, Chief Financial Officer, and Treasurer of Bemis Company, Inc.
Roger Gibson
Director of First American Investment Funds, Inc.
Retired; former Vice President of Cargo-United Airlines
Victoria Herget
Director of First American Investment Funds, Inc.
Investment Consultant; former Managing Director of Zurich Scudder Investments
Leonard Kedrowski
Director of First American Investment Funds, Inc.
Owner and President of Executive and Management Consulting, Inc.
Richard Riederer
Director of First American Investment Funds, Inc.
Retired; former President and Chief Executive Officer of Weirton Steel
Joseph Strauss
Director of First American Investment Funds, Inc.
Owner and President of Strauss Management Company
James Wade
Director of First American Investment Funds, Inc.
Owner and President of Jim Wade Homes
First American Investment Funds’ Board of Directors is comprised entirely of independent directors.
Direct fund correspondence to:
First American Funds
P.O. Box 1330
Minneapolis, MN 55440-1330
This report and the financial statements contained herein are not intended to be a forecast of future events, a guarantee of future results, or investment advice. Further, there is no assurance that certain securities will remain in or out of each fund’s portfolio. The views expressed in this report reflect those of the portfolio managers only through the period ended September 30, 2005. The portfolio managers’ views are subject to change at any time based upon market or other conditions.
This report is for the information of shareholders of the First American Investment Funds, Inc. It may also be used as sales literature when preceded or accompanied by a current prospectus, which contains information concerning investment objectives, risks, and charges and expenses of the funds. Read the prospectus carefully before investing.
The figures in this report represent past performance and do not guarantee future results. The principal value of an investment and investment return will fluctuate so that an investor’s shares, when redeemed, may be worth more or less than their original cost.
INVESTMENT ADVISOR
U.S. Bancorp Asset Management, Inc.
800 Nicollet Mall
Minneapolis, Minnesota 55402
ADMINISTRATOR
U.S. Bancorp Asset Management, Inc.
800 Nicollet Mall
Minneapolis, Minnesota 55402
TRANSFER AGENT
U.S. Bancorp Fund Services, LLC
615 East Michigan Street
Milwaukee, Wisconsin 53202
CUSTODIAN
U.S. Bank National Association
60 Livingston Avenue
St. Paul, Minnesota 55107
DISTRIBUTOR
Quasar Distributors, LLC
615 East Michigan Street
Milwaukee, Wisconsin 53202
INDEPENDENT REGISTERED PUBLIC ACCOUNTING FIRM
Ernst & Young LLP
220 South Sixth Street
Suite 1400
Minneapolis, Minnesota 55402
COUNSEL
Dorsey & Whitney LLP
50 South Sixth Street
Suite 1500
Minneapolis, Minnesota 55402
First American Funds
P.O. Box 1330
Minneapolis, MN 55440-1330
In an attempt to reduce shareholder costs and help eliminate duplication, First American Funds will try to limit their mailing to one report for each address that lists one or more shareholders with the same last name. If you would like additional copies, please call First American Investor Services at 800.677.FUND or visit firstamericanfunds.com.
0289-05 11/2005 AR-INCOME
Item 2—Code of Ethics
(a) The registrant has adopted a code of ethics that applies to its Principal Executive Officer and Principal Financial Officer.
(b) During the period covered by this report, there were no amendments to the provisions of the registrant’s code of ethics that apply to the registrant’s Principal Executive Officer and Principal Financial Officer and that relate to any element of the code of ethics definition enumerated in this Item.
(c) During the period covered by this report, the registrant did not grant any waivers, including implicit waivers, from any provisions of its code of ethics.
(d) The registrant undertakes to furnish a copy of its code of ethics to any person upon request, without charge, by calling
1-800-677-3863.
Item 3—Audit Committee Financial Expert
The registrant’s Board of Directors has determined that Leonard W. Kedrowski, Benjamin R. Field III, and Richard K. Riederer, members of the registrant’s Audit Committee, are each an “audit committee financial expert” and are “independent,” as these terms are defined in this Item.
Item 4—Principal Accountant Fees and Services
(a) Audit Fees - Ernst & Young LLP (“E&Y”) billed the registrant audit fees totaling $608,819 in the fiscal year ended September 30, 2005 and $391,795 in the fiscal year ended September 30, 2004, including fees associated with the annual audit, SEC Rule 17f-2 security count filings and filings of the registrant’s Form N-CSR.
(b) Audit-Related Fees – E&Y billed the registrant audit-related fees totaling $13,759 in the fiscal year ended September 30, 2005 and $36,134 in the fiscal year ended September, 2004, including fees associated with the semi-annual review of fund disclosures.
(c) Tax Fees - E&Y billed the registrant fees of $105,382 in the fiscal year ended September 30, 2005 and $115,034 in the fiscal year ended September 30, 2004 for tax services, including tax compliance, tax advice and tax planning. Tax compliance, tax advice and tax planning services primarily related to preparation of original and amended tax returns, timely RIC qualification reviews, and tax distribution analysis and planning.
(d) All Other Fees - There were no fees billed by E&Y for other services to the registrant during the fiscal year ended September 30, 2005 and the fiscal year ended September 30, 2004.
(e)(1) The audit committee’s pre-approval policies and procedures pursuant to paragraph (c)(7) of Rule 2-01 of Regulation S-X are set forth below:
Audit Committee policy regarding pre-approval of services provided by the Independent Auditor
The Audit Committee of the First American Funds (“Committee”) has responsibility for ensuring that all services performed by the independent audit firm for the funds do not impair the firm’s independence. This review is intended to provide reasonable oversight without removing management from its responsibility for day-to-day operations. In this regard, the Committee should:
• Understand the nature of the professional services expected to be provided and their impact on auditor independence and audit quality
• Examine and evaluate the safeguards put into place by the Company and the auditor to safeguard independence
• Meet quarterly with the partner of the independent audit firm
• Consider approving categories of service that are not deemed to impair independence for a one-year period
It is important that a qualitative rather than a mere quantitative evaluation be performed by the Committee in discharging its responsibilities.
Policy for Audit and Non-Audit Services Provided to the Funds
On an annual basis, the Committee will review and consider whether to pre-approve the financial plan for audit fees as well as categories of audit-related and non-audit services that may be performed by the funds’ independent audit firm directly for the funds. At least annually the Committee will receive a report from the independent audit firm of all audit and non-audit services, which were approved during the year.
The engagement of the independent audit firm for any non-audit service requires the written pre-approval of the Treasurer of the funds and all non-audit services performed by the independent audit firm will be disclosed in the required SEC periodic filings.
In connection with the Committee review and pre-approval responsibilities, the review by the Committee will consist of the following:
Audit Services
The categories of audit services and related fees to be reviewed and considered for pre-approval annually by the Committee or its delegate include the following:
• Annual Fund financial statement audits
• Seed audits (related to new product filings, as required)
• SEC and regulatory filings and consents
Audit-related Services
In addition, the following categories of audit-related services are deemed to be consistent with the role of the independent audit firm and, as such, will be considered for pre-approval by the Committee or its delegate, on an annual basis.
• Accounting consultations
• Fund merger support services
• Other accounting related matters
• Agreed Upon Procedure Reports
• Attestation Reports
• Other Internal Control Reports
Notwithstanding any annual pre-approval of these categories of services, individual projects with an estimated fee in excess of $25,000 are subject to pre-approval by the Committee Chair or its delegate on a case-by-case basis. Individual projects with an estimated fee in excess of $50,000 are subject to pre-approval by the Committee or its delegate on a case-by-case basis.
Tax Services
The following categories of tax services are deemed to be consistent with the role of the independent audit firm and, as such, will be considered for pre-approval by the Committee or its delegate, on an annual basis.
• Tax compliance services related to the filing or amendment of the following:
• Federal, state and local income tax compliance, and
• Sales and use tax compliance
• Timely RIC qualification reviews
• Tax distribution analysis and planning
• Tax authority examination services
• Tax appeals support services
• Accounting methods studies
• Fund merger support services
• Tax consulting services and related projects
Notwithstanding any annual pre-approval of these categories of services, individual projects with an estimated fee in excess of $25,000 are subject to pre-approval by the Committee Chair or its delegate on a case-by-case basis. Individual projects with an estimated fee in excess of $50,000 are subject to pre-approval by the Committee or its delegate on a case-by-case basis.
Other Non-audit Services
The SEC auditor independence rules adopted in response to the Sarbanes-Oxley Act specifically allow certain non-audit services. Because of the nature of these services, none of these services may be commenced by the independent audit firm without the prior approval of the Committee. The Committee may delegate this responsibility to one or more of the Committee members, with the decisions presented to the full Committee at the next scheduled meeting.
Proscribed Services
In accordance with SEC rules on independence, the independent audit firm is prohibited from performing services in the following categories of non-audit services:
• Management functions
• Accounting and bookkeeping services
• Internal audit services
• Financial information systems design and implementation
• Valuation services supporting the financial statements
• Actuarial services supporting the financial statements
• Executive recruitment
• Expert services (e.g., litigation support)
• Investment banking
Policy for Pre-approval of Non-Audit Services Provided to Other Entities within the Investment Company Complex
The Committee is also responsible for pre-approving certain non-audit services provided to U.S. Bancorp Asset Management, Inc., U.S. Bank N.A., Quasar Distributors, U.S. Bancorp Fund Services, LLC and any other entity under common control with U.S. Bancorp Asset Management,��Inc., that provides ongoing services to the funds. The only non-audit services provided to these entities which require pre-approval are those services that relate directly to the operations and financial reporting of the funds.
Although the Committee is not required to pre-approve all services provided to U.S. Bancorp Asset Management, Inc. and other affiliated service providers, the Committee will annually receive a report from the independent audit firm on the aggregate fees for all services provided to U.S. Bancorp and affiliates.
(e)(2) All of the services described in paragraphs (b) through (d) of this Item 4 that were provided to the registrant on or after May 6, 2003, the effective date of SEC rules relating to the pre-approval of non-audit services, were pre-approved by the audit committee.
(f) All services performed on the engagement to audit the registrant’s financial statements for the most recent fiscal year end were performed by the principal accountant’s full-time, permanent employees.
(g) The aggregate non-audit fees billed by E&Y to the registrant, the registrant’s investment adviser, and any entity controlling, controlled by, or under common control with the adviser that provides ongoing services to the registrant, totaled $144,841 in the fiscal year ended September 30, 2005 and $181,918 in the fiscal year ended September 30, 2004, including services provided prior to May 6, 2003, the effective date of SEC rules relating to the pre-approval of non-audit services.
(h) The registrant’s audit committee has determined that the provision of non-audit services to the registrant’s investment adviser, and any entity controlling, controlled by, or under common control with the investment adviser that provides ongoing services to the registrant, that were not pre-approved and that were rendered on or after May 6, 2003 (the effective date of SEC rules relating to the pre-approval of non-audit services), is compatible with maintaining E&Y’s independence.
Item 5—Audit Committee of Listed Registrants
Not applicable.
Item 6—Schedule of Investments
The schedule is included as part of the report to shareholders filed under Item 1 of this Form.
Item 7—Disclosure of Proxy Voting Policies and Procedures for Closed-End Management Investment Companies
Not applicable.
Item 8—Portfolio Managers of Closed-End Management Investment Companies
Not applicable.
Item 9—Purchases of Equity Securities by Closed-End Management Investment Company and Affiliated Purchasers
Not applicable.
Item 10—Submission of Matters to a Vote of Security Holders
There have been no material changes to the procedures by which shareholders may recommend nominees to the registrant’s board of directors, where those changes were implemented after the registrant last provided disclosure in response to the requirements of
Item 7(d)(2)(ii)(G) of Schedule 14A (17 CFR 240.14a-101), or this item.
Item 11—Controls and Procedures
(a) The registrant’s Principal Executive Officer and Principal Financial Officer have evaluated the registrant’s disclosure controls and procedures within 90 days of the date of this filing and have concluded that the registrant’s disclosure controls and procedures were effective, as of that date, in ensuring that information required to be disclosed by the registrant in this Form N-CSR was recorded, processed, summarized and reported timely.
(b) There were no changes in the registrant’s internal control over financial reporting that occurred during the second fiscal quarter of the period covered by this report that have materially affected, or are reasonably likely to materially affect, the registrant’s internal control over financial reporting.
Item 12—Exhibits
(a)(1) Not applicable. Registrant’s code of ethics is provided to any person upon request without charge.
(a)(2) Certifications of the Principal Executive Officer and Principal Financial Officer of the registrant as required by
Rule 30a-2(a) under the Investment Company Act are filed as exhibits hereto.
(a)(3) Not applicable.
(b) Certifications of the Principal Executive Officer and Principal Financial Officer of the registrant as required by
Rule 30a-2(b) under the Investment Company Act are filed as exhibits hereto.
Signatures
Pursuant to the requirements of the Securities Exchange Act of 1934 and the Investment Company Act of 1940, the registrant has duly caused this report to be signed on its behalf by the undersigned, thereunto duly authorized.
First American Investment Funds, Inc. |
|
By: | |
| /s/ Thomas S. Schreier, Jr. | |
| Thomas S. Schreier, Jr. |
| President |
Date: December 9, 2005
Pursuant to the requirements of the Securities Exchange Act of 1934 and the Investment Company Act of 1940, this report has been signed below by the following persons on behalf of the registrant and in the capacities and on the dates indicated.
By: |
| /s/ Thomas S. Schreier, Jr. | |
| Thomas S. Schreier, Jr. | |
| President | |
| | |
Date: December 9, 2005 | |
| | |
By: | | |
| /s/ Charles D. Gariboldi | |
| Charles D. Gariboldi | |
| Treasurer |
| |
Date: December 9, 2005 |