| | OMB APPROVAL |
| | OMB Number: 3235-0570 |
| | Expires: November 30, 2005 |
| | Estimated average burden
hours per response. . . . 5.0 |
UNITED STATES
SECURITIES AND EXCHANGE COMMISSION
Washington, D.C. 20549
FORM N-CSR
CERTIFIED SHAREHOLDER REPORT OF REGISTERED
MANAGEMENT INVESTMENT COMPANIES
Investment Company Act file number 811-05309
First American Investment Funds, Inc.
(Exact name of registrant as specified in charter)
800 Nicollet Mall, Minneapolis, MN | | 55402 |
(Address of principal executive offices) | | (Zip code) |
Charles D. Gariboldi 800 Nicollet Mall, Minneapolis, MN 55402
(Name and address of agent for service)
Registrant’s telephone number, including area code: 800-677-3863
Date of fiscal year end: October 31
Date of reporting period: October 31, 2005
Form N-CSR is to be used by management investment companies to file reports with the Commission not later than 10 days after the transmission to stockholders of any report that is required to be transmitted to stockholders under Rule 30e-1 under the Investment Company Act of 1940 (17 CFR 270.30e-1). The Commission may use the information provided on Form N-CSR in its regulatory, disclosure review, inspection, and policymaking roles.
A registrant is required to disclose the information specified by Form N-CSR, and the Commission will make this information public. A registrant is not required to respond to the collection of information contained in Form N-CSR unless the Form displays a currently valid Office of Management and Budget (“OMB”) control number. Please direct comments concerning the accuracy of the information collection burden estimate and any suggestions for reducing the burden to Secretary, Securities and Exchange Commission, 450 Fifth Street, NW, Washington, DC 20549-0609. The OMB has reviewed this collection of information under the clearance requirements of 44 U.S.C. Section 3507.
Item 1. Report to Shareholders

|
FIRST AMERICAN FUNDS®
|
2005
Annual Report
|
|
| INDEX |
| FUNDS |

TABLE OF CONTENTS
Message to Shareholders | 1 | |
Report of Independent Registered Public Accounting Firm | 11 | |
Schedule of Investments | 12 | |
Statements of Assets and Liabilities | 40 | |
Statements of Operations | 41 | |
Statements of Changes in Net Assets | 42 | |
Financial Highlights | 44 | |
Notes to Financial Statements | 50 | |
Notice to Shareholders | 59 | |

Mutual fund investing involves risk; principal loss is possible.
NOT FDIC INSURED NO BANK GUARANTEE MAY LOSE VALUE
Message to SHAREHOLDERS December 12, 2005
Dear Shareholders:
We invite you to take a few minutes to review the results of the funds’ most recent fiscal period. Because the funds have changed their fiscal year-end from September 30 to October 31, this report covers the one-month time period from October 1, 2005, through October 31, 2005.
This report includes comparative performance graphs and tables, portfolio commentaries, complete listings of portfolio holdings, and additional fund information. We hope you will find this helpful in monitoring your investment portfolio.
Also, through our website, firstamericanfunds.com, we provide quarterly performance fact sheets on all First American Funds, the economic outlook as viewed by our senior investment officers, and other information about fund investments and portfolio strategies.
Please contact your financial professional if you have questions about First American Funds or contact First American Investor Services at 800.677.FUND.
We appreciate your investment with First American Funds and look forward to serving your financial needs in the future.
Sincerely,
| |
/s/ Virginia L. Stringer | | /s/ Thomas S. Schreier, Jr. | |
| |
Virginia L. Stringer | Thomas S. Schreier, Jr. |
Chairperson of the Board | President |
First American Investment Funds, Inc. | First American Investment Funds, Inc. |
| | | |
1
Equity Index fund
Investment Objective: to provide investment results that correspond to the performance of the Standard & Poor's 500 Index* ("S&P 500 Index")
How did the fund perform for the fiscal period ended October 31, 2005?
The First American Equity Index Fund (the "fund"), Class Y shares, returned -1.69% for the one-month period ended October 31, 2005 (Class A shares returned -1.70% without taking the sales charge into account). By comparison, the fund's benchmark, the S&P 500 Index, returned -1.67% for the same period.
General economic and market conditions
Broader economic growth continued at a relatively solid pace in October. Indicators for the manufacturing sector suggested robust growth as inventories remained low and recovery and reconstruction activity proceeded following the hurricanes. Companies indicated continued cost pressures from energy and other raw material prices, keeping Fed concerns about inflation intact. This led to an additional 25-basis-point tightening at the November 1 Federal Open Market Committee meeting, giving support to expectations for further short-term rate increases. While activity in the industrial sector remained robust, consumer confidence continued to slump despite gasoline prices falling sharply during the month. Auto sales fell to their lowest monthly pace in more than seven years as the employee discount sales promotions expired. Forward-looking housing market indicators such as mortgage applications for home purchases moved lower, and emplo yment cost data for the third quarter showed the slowest gain in wages in 25 years. Subdued compensation gains suggest that broader inflation should remain well contained in the coming quarters, which will be a key to bringing an eventual end to Fed tightening and should provide a supportive backdrop to the financial markets.
Fund Overview
The fund is invested to replicate the S&P 500 Index as closely as possible with consideration to turnover costs and fees. As a result, the fund performed very similarly to the index. The index includes 500 leading companies in the leading industries of the U.S. economy and covers about 75% of the dollar value of all traded stocks in the U.S. market.
In October, the sectors that performed best during the past 12 months gave back some of their appreciation. Energy stocks fell by more than 9% and utilities by around 6% during this fiscal period. The best performing sector was financials.
*Unlike mutual funds, index returns do not reflect any expenses, transaction costs, or cash flow effects.
| Top 10 Holdings as of October 31, 20051 (% of net assets) | |
| General Electric | | | 3.3 | % | |
| Exxon Mobil | | | 3.2 | % | |
| Microsoft | | | 2.2 | % | |
| Citigroup | | | 2.1 | % | |
| Proctor & Gamble | | | 1.7 | % | |
| Johnson & Johnson | | | 1.7 | % | |
| Bank of America | | | 1.6 | % | |
| American International Group | | | 1.5 | % | |
| Pfizer | | | 1.5 | % | |
| Altria Group | | | 1.4 | % | |
| Sector Allocation as of October 31, 20051 (% of net assets) | |
| Financials | | | 20.6 | % | |
| Information Technology | | | 15.5 | % | |
| Health Care | | | 12.9 | % | |
| Industrials | | | 11.2 | % | |
| Consumer Discretionary | | | 10.2 | % | |
| Consumer Staples | | | 9.7 | % | |
| Energy | | | 9.4 | % | |
| Utilities | | | 3.4 | % | |
| Telecommunication Services | | | 3.0 | % | |
| Materials | | | 2.9 | % | |
| Short-Term Investments | | | 0.2 | % | |
| Other Assets and Liabilities, Net | | | 1.0 | % | |
| | | | 100.0 | % | |
1Fund holdings and sector allocations are subject to change at any time and are not recommendations to buy or sell any security.
FIRST AMERICAN FUNDS Annual Report 2005
2
Equity Index fund continued
Annual Performance1
| | | October 31, 2005 | | September 30, 2005** | |
| | | One- | | | | | | | | Since Inception | | | | | | | | Since Inception | |
| | | Month* | | 1 year | | 5 years | | 10 years | | 2/01/99 | | 9/24/01 | | 1 year | | 5 years | | 10 years | | 2/01/99 | | 9/24/01 | |
| Average annual return with sales charge (POP) | |
| Class A | | | (7.11 | )% | | | 2.26 | % | | | (3.35 | )% | | | 8.10 | % | | | — | | | | — | | | | 5.54 | % | | | (3.11 | )% | | | 8.25 | % | | | — | | | | — | | |
| Class B | | | (6.69 | )% | | | 2.34 | % | | | (3.35 | )% | | | 7.90 | % | | | — | | | | — | | | | 5.86 | % | | | (3.10 | )% | | | 8.06 | % | | | — | | | | — | | |
| Class C | | | (2.76 | )% | | | 6.34 | % | | | (3.00 | )% | | | — | | | | (0.63 | )% | | | — | | | | 9.84 | % | | | (2.75 | )% | | | — | | | | (0.37 | )% | | | — | | |
| Average annual return without sales charge (NAV) | |
| Class A | | | (1.70 | )% | | | 8.19 | % | | | (2.25 | )% | | | 8.71 | % | | | — | | | | — | | | | 11.69 | % | | | (2.00 | )% | | | 8.86 | % | | | — | | | | — | | |
| Class B | | | (1.78 | )% | | | 7.34 | % | | | (2.98 | )% | | | 7.90 | % | | | — | | | | — | | | | 10.86 | % | | | (2.73 | )% | | | 8.06 | % | | | — | | | | — | | |
| Class C | | | (1.78 | )% | | | 7.34 | % | | | (3.00 | )% | | | — | | | | (0.63 | )% | | | — | | | | 10.84 | % | | | (2.75 | )% | | | — | | | | (0.37 | )% | | | — | | |
| Class R | | | (1.72 | )% | | | 7.90 | % | | | — | | | | — | | | | — | | | | 5.73 | % | | | 11.38 | % | | | — | | | | — | | | | — | | | | 6.31 | % | |
| Class Y | | | (1.69 | )% | | | 8.41 | % | | | (2.01 | )% | | | 8.98 | % | | | — | | | | — | | | | 11.92 | % | | | (1.76 | )% | | | 9.13 | % | | | — | | | | — | | |
| S&P 500 Index2 | | | (1.67 | )% | | | 8.72 | % | | | (1.74 | )% | | | 9.34 | % | | | 0.74 | % | | | 6.41 | % | | | 12.25 | % | | | (1.49 | )% | | | 9.49 | % | | | 1.00 | % | | | 7.00 | % | |
Value of $10,000 Investment1, 3 as of October 31, 2005
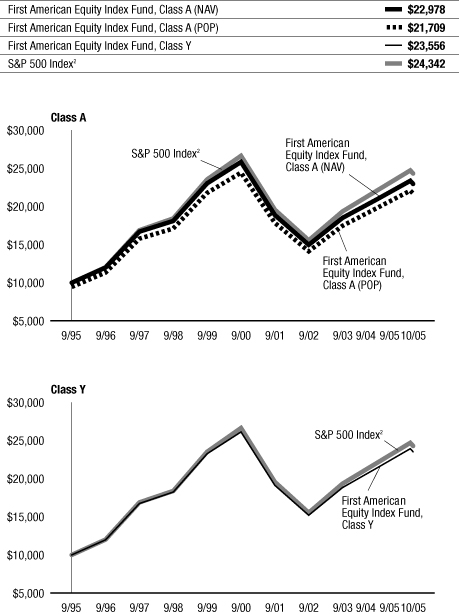
The charts above illustrate the total value of an assumed $10,000 investment in the fund's Class A and Class Y shares (from 9/30/95 to 10/31/05) as compared to the S&P 500 Index2.
The performance data quoted on this page represents past performance and does not guarantee future results. The investment return and principal value of an investment will fluctuate so that an investor's shares, when redeemed, may be worth more or less than their original cost. Current performance of the fund may be lower or higher than the performance data quoted. Performance data current to the most recent month-end may be obtained by calling 800.677.FUND.
* Total returns have not been annualized.
** This table represents average annual total returns through the latest calendar quarter—rather than through the end of the fiscal period.
1 Performance does not reflect the deduction of taxes that a shareholder would pay on fund distributions or redemption of fund shares. Investment performance reflects fee waivers that are or were in effect. In the absence of such fee waivers, total returns would be reduced. Index performance is for illustrative purposes only and does not reflect any expenses, transaction costs, or cash flow effects. Direct investment in the index is not available.
Mutual fund investing involves risk; principal loss is possible.
Total returns at net asset value ("NAV") reflect performance over the time period indicated without including the fund's maximum sales charge and assume reinvestment of all distributions at NAV.
Total returns at public offering price ("POP") reflect performance over the time period indicated including a maximum front-end sales charge of 5.50% for Class A shares and the maximum contingent deferred sales charge ("CDSC") for Class B and Class C shares for the relevant period. Maximum CDSC is 5.00% for Class B shares, decreasing annually to 0% in the seventh year following purchase, and 1.00% for Class C shares. Total returns assume reinvestment of all distributions at NAV.
2 An unmanaged market capitalization-weighted index based on the average weighted performance of 500 widely held large-cap common stocks.
3 Performance for Class B, Class C, and Class R shares is not presented. Performance for these classes will vary due to different expense structures.
FIRST AMERICAN FUNDS Annual Report 2005
3
Equity Index fund continued
Expense Example
As a shareholder of the Equity Index Fund (the "fund"), you incur two types of costs: (1) transaction costs, including sales charges (loads) on purchase payments; and (2) ongoing costs, including investment advisory fees; distribution and/or service (12b-1) fees; and other fund expenses. This example is intended to help you understand your ongoing costs (in dollars) of investing in the fund and to compare these costs with the ongoing costs of investing in other mutual funds. The example is based on an investment of $1,000 invested at the beginning of the period and held for the entire period from May 1, 2005, to October 31, 2005.
Actual Expenses
For each class, the first line of the table below provides information about actual account values and actual expenses. You may use the information in this line, together with the amount you invested, to estimate the expenses that you paid over the period. Simply divide your account value by $1,000 (for example, an $8,600 account value divided by $1,000 = 8.6), then multiply the result by the number in the first line under the heading entitled "Expenses Paid During Period" to estimate the expenses you paid on your account during this period.
Hypothetical Example for Comparison Purposes
For each class, the second line of the table below provides information about hypothetical account values and hypothetical expenses based on the fund's actual expense ratio and an assumed rate of return of 5% per year before expenses, which is not the fund's actual return. The hypothetical account values and expenses may not be used to estimate the actual ending account balance or expenses you paid for the period. You may use this information to compare the ongoing costs of investing in the fund and other funds. To do so, compare this 5% hypothetical example with the 5% hypothetical examples that appear in the shareholder reports of the other funds.
Please note that the expenses shown in the table are meant to highlight your ongoing costs only and do not reflect any transactional costs, such as sales charges (loads). Therefore, the second line of the table for each class is useful in comparing ongoing costs only, and will not help you determine the relative total costs of owning different funds. In addition, if these transactional costs were included, your costs would have been higher.
Expense Examples
| | | Beginning Account
Value (5/01/05) | | Ending Account
Value (10/31/05) | | Expenses Paid During
Period1 (5/01/05 to
10/31/05) | |
| Class A Actual2 | | $ | 1,000.00 | | | $ | 1,050.10 | | | $ | 3.20 | | |
| Class A Hypothetical (5% return before expenses) | | $ | 1,000.00 | | | $ | 1,022.08 | | | $ | 3.16 | | |
| Class B Actual2 | | $ | 1,000.00 | | | $ | 1,045.80 | | | $ | 7.06 | | |
| Class B Hypothetical (5% return before expenses) | | $ | 1,000.00 | | | $ | 1,018.30 | | | $ | 6.97 | | |
| Class C Actual2 | | $ | 1,000.00 | | | $ | 1,046.00 | | | $ | 7.07 | | |
| Class C Hypothetical (5% return before expenses) | | $ | 1,000.00 | | | $ | 1,018.30 | | | $ | 6.97 | | |
| Class R Actual2 | | $ | 1,000.00 | | | $ | 1,048.50 | | | $ | 4.49 | | |
| Class R Hypothetical (5% return before expenses) | | $ | 1,000.00 | | | $ | 1,020.82 | | | $ | 4.43 | | |
| Class Y Actual2 | | $ | 1,000.00 | | | $ | 1,051.00 | | | $ | 1.91 | | |
| Class Y Hypothetical (5% return before expenses) | | $ | 1,000.00 | | | $ | 1,023.34 | | | $ | 1.89 | | |
1 Expenses are equal to the fund's annualized expense ratio for the most recent six-month period of 0.62%, 1.37%, 1.37%, 0.87%, and 0.37% for Class A, Class B, Class C, Class R, and Class Y, respectively, multiplied by the average account value over the period, multiplied by the number of days in the most recent half-year/365 days (to reflect the one-half year period).
2 Based on the actual returns for the six months ended October 31, 2005, of 5.01%, 4.58%, 4.60%, 4.85%, and 5.10% for Class A, Class B, Class C, Class R, and Class Y, respectively.
FIRST AMERICAN FUNDS Annual Report 2005
4
Mid Cap Index fund
Investment Objective: to provide investment results that correspond to the performance of the Standard & Poor's MidCap 400 Index* ("S&P MidCap 400 Index")
How did the fund perform for the fiscal period ended October 31, 2005?
The First American Mid Cap Index Fund (the "fund"), Class Y shares, returned -2.17% for the one-month period ended October 31, 2005 (Class A shares returned -2.17% without taking the sales charge into account). By comparison, the fund's benchmark, the S&P MidCap 400 Index, returned -2.15% for the same period.
General economic and market conditions
Broader economic growth continued at a relatively solid pace in October. Indicators for the manufacturing sector suggested robust growth as inventories remained low and recovery and reconstruction activity proceeded following the hurricanes. Companies indicated continued cost pressures from energy and other raw material prices, keeping Fed concerns about inflation intact. This led to an additional 25-basis-point tightening at the November 1 Federal Open Market Committee meeting, giving support to expectations for further short-term rate increases. While activity in the industrial sector remained robust, consumer confidence continued to slump despite gasoline prices falling sharply during the month. Auto sales fell to their lowest monthly pace in more than seven years as the employee discount sales promotions expired. Forward-looking housing market indicators such as mortgage applications for home purchases moved lower, and emplo yment cost data for the third quarter showed the slowest gain in wages in 25 years. Subdued compensation gains suggest that broader inflation should remain well contained in the coming quarters, which will be a key to bringing an eventual end to Fed tightening and should provide a supportive backdrop to the financial markets.
Fund Overview
The fund is invested to replicate the S&P MidCap 400 Index as closely as possible with consideration to turnover costs and fees. As a result, the fund performed very similarly to the index. The index includes stocks that reflect the risk and return characteristics of the broader mid-cap universe. Mid-cap stocks are now being recognized as an independent asset class and the capitalization range of this index covers about 10% of the U.S. equities market.
October saw a reversal in fortunes for the sectors that had performed best during the past 12 months. Utilities fell by more than 7% and the larger energy sector by slightly less than 7% during the fiscal period. The best performing sector was financials – with a barely positive return of 0.5%. In general, mid-cap stocks underperformed large-cap stocks in October, in contrast to their outperformance during the past 12 months.
*Unlike mutual funds, index returns do not reflect any expenses, transaction costs, or cash flow effects.
| Top 10 Holdings as of October 31, 20051 (% of net assets) | |
| Legg Mason | | | 1.1 | % | |
| SanDisk | | | 1.0 | % | |
| Peabody Energy | | | 0.9 | % | |
| Whole Foods Market | | | 0.9 | % | |
| PacifiCare Health Systems | | | 0.7 | % | |
| Chico's FAS | | | 0.7 | % | |
| Pioneer Natural Resources | | | 0.7 | % | |
| Noble Energy | | | 0.7 | % | |
| ENSCO International | | | 0.7 | % | |
| Smith International | | | 0.7 | % | |
| Sector Allocation as of October 31, 20051 (% of net assets) | |
| Financials | | | 18.7 | % | |
| Information Technology | | | 15.1 | % | |
| Consumer Discretionary | | | 14.9 | % | |
| Industrials | | | 13.8 | % | |
| Health Care | | | 11.7 | % | |
| Utilities | | | 7.6 | % | |
| Energy | | | 7.3 | % | |
| Materials | | | 5.7 | % | |
| Consumer Staples | | | 3.4 | % | |
| Telecommunication Services | | | 0.5 | % | |
| Short-Term Investments | | | 1.4 | % | |
| Other Assets and Liabilities, Net | | | (0.1 | )% | |
| | | | 100.0 | % | |
1Fund holdings and sector allocations are subject to change at any time and are not recommendations to buy or sell any security.
FIRST AMERICAN FUNDS Annual Report 2005
5
Mid Cap Index fund continued
Annual Performance1
| | | October 31, 2005 | | September 30, 2005** | |
| | | One- | | | | | | Since Inception | | | | | | Since Inception | |
| | | Month* | | 1 year | | 5 years | | 11/04/99 | | 11/27/00 | | 9/24/01 | | 1 year | | 5 years | | 11/04/99 | | 11/27/00 | | 9/24/01 | |
| Average annual return with sales charge (POP) | |
| Class A | | | (7.52 | )% | | | 10.63 | % | | | 5.09 | % | | | 8.40 | % | | | — | | | | — | | | | 14.75 | % | | | 4.79 | % | | | 8.93 | % | | | — | | | | — | | |
| Class B | | | (7.17 | )% | | | 11.12 | % | | | 5.20 | % | | | 8.54 | % | | | — | | | | — | | | | 15.57 | % | | | 4.92 | % | | | 9.09 | % | | | — | | | | — | | |
| Class C | | | (3.25 | )% | | | 15.17 | % | | | — | | | | — | | | | — | | | | 12.97 | % | | | 19.60 | % | | | — | | | | — | | | | — | | | | 13.91 | % | |
| Average annual return without sales charge (NAV) | |
| Class A | | | (2.17 | )% | | | 17.08 | % | | | 6.28 | % | | | 9.42 | % | | | — | | | | — | | | | 21.43 | % | | | 5.99 | % | | | 9.97 | % | | | — | | | | — | | |
| Class B | | | (2.28 | )% | | | 16.12 | % | | | 5.52 | % | | | 8.65 | % | | | — | | | | — | | | | 20.57 | % | | | 5.25 | % | | | 9.20 | % | | | — | | | | — | | |
| Class C | | | (2.27 | )% | | | 16.17 | % | | | — | | | | — | | | | — | | | | 12.97 | % | | | 20.60 | % | | | — | | | | — | | | | — | | | | 13.91 | % | |
| Class R | | | (2.18 | )% | | | 16.66 | % | | | — | | | | — | | | | 7.01 | % | | | — | | | | 21.09 | % | | | — | | | | — | | | | 7.63 | % | | | — | | |
| Class Y | | | (2.17 | )% | | | 17.33 | % | | | 6.57 | % | | | 9.69 | % | | | — | | | | — | | | | 21.82 | % | | | 6.27 | % | | | 10.24 | % | | | — | | | | — | | |
| S&P MidCap 400 Index2 | | | (2.15 | )% | | | 17.65 | % | | | 7.32 | % | | | 10.60 | % | | | 8.10 | % | | | 14.73 | % | | | 22.16 | % | | | 7.05 | % | | | 11.17 | % | | | 8.73 | % | | | 15.69 | % | |
Value of $10,000 Investment1, 3 as of October 31, 2005
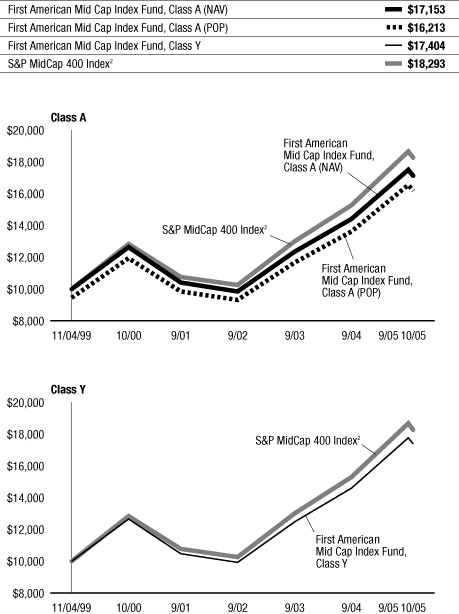
The charts above illustrate the total value of an assumed $10,000 investment in the fund's Class A and Class Y shares (from 11/04/99 to 10/31/05) as compared to the S&P MidCap 400 Index2.
The performance data quoted on this page represents past performance and does not guarantee future results. The investment return and principal value of an investment will fluctuate so that an investor's shares, when redeemed, may be worth more or less than their original cost. Current performance of the fund may be lower or higher than the performance data quoted. Performance data current to the most recent month-end may be obtained by calling 800.677.FUND.
* Total returns have not been annualized.
** This table represents average annual total returns through the latest calendar quarter—rather than through the end of the fiscal period.
1 Performance does not reflect the deduction of taxes that a shareholder would pay on fund distributions or redemption of fund shares. Investment performance reflects fee waivers that are or were in effect. In the absence of such fee waivers, total returns would be reduced. Index performance is for illustrative purposes only and does not reflect any expenses, transaction costs, or cash flow effects. Direct investment in the index is not available.
Stocks of mid-capitalization companies may be slightly less volatile than those of small-capitalization companies, but they still involve substantial risk and may be subject to increased volatility and more price fluctuation than large-capitalization companies.
Total returns at net asset value ("NAV") reflect performance over the time period indicated without including the fund's maximum sales charge and assume reinvestment of all distributions at NAV.
Total returns at public offering price ("POP") reflect performance over the time period indicated including a maximum front-end sales charge of 5.50% for Class A shares and the maximum contingent deferred sales charge ("CDSC") for Class B and Class C shares for the relevant period. Maximum CDSC is 5.00% for Class B shares, decreasing annually to 0% in the seventh year following purchase, and 1.00% for Class C shares. Total returns assume reinvestment of all distributions at NAV.
On September 24, 2001, the Mid Cap Index Fund became the successor by merger to the Firstar MidCap Index Fund, a series of the Firstar Funds, Inc. Prior to the merger, the First American Fund had no assets or liabilities. Performance presented prior to September 24, 2001, represents that of the Firstar MidCap Index Fund.
2 An unmanaged, market value-weighted index of 400 mid-cap companies.
3 Performance for Class B, Class C, and Class R shares is not presented. Performance for these classes will vary due to different expense structures.
FIRST AMERICAN FUNDS Annual Report 2005
6
Mid Cap Index fund continued
Expense Example
As a shareholder of the Mid Cap Index Fund (the "fund"), you incur two types of costs: (1) transaction costs, including sales charges (loads) on purchase payments; and (2) ongoing costs, including investment advisory fees; distribution and/or service (12b-1) fees; and other fund expenses. This example is intended to help you understand your ongoing costs (in dollars) of investing in the fund and to compare these costs with the ongoing costs of investing in other mutual funds. The example is based on an investment of $1,000 invested at the beginning of the period and held for the entire period from May 1, 2005, to October 31, 2005.
Actual Expenses
For each class, the first line of the table below provides information about actual account values and actual expenses. You may use the information in this line, together with the amount you invested, to estimate the expenses that you paid over the period. Simply divide your account value by $1,000 (for example, an $8,600 account value divided by $1,000 = 8.6), then multiply the result by the number in the first line under the heading entitled "Expenses Paid During Period" to estimate the expenses you paid on your account during this period.
Hypothetical Example for Comparison Purposes
For each class, the second line of the table below provides information about hypothetical account values and hypothetical expenses based on the fund's actual expense ratio and an assumed rate of return of 5% per year before expenses, which is not the fund's actual return. The hypothetical account values and expenses may not be used to estimate the actual ending account balance or expenses you paid for the period. You may use this information to compare the ongoing costs of investing in the fund and other funds. To do so, compare this 5% hypothetical example with the 5% hypothetical examples that appear in the shareholder reports of the other funds.
Please note that the expenses shown in the table are meant to highlight your ongoing costs only and do not reflect any transactional costs, such as sales charges (loads). Therefore, the second line of the table for each class is useful in comparing ongoing costs only, and will not help you determine the relative total costs of owning different funds. In addition, if these transactional costs were included, your costs would have been higher.
Expense Examples
| | | Beginning Account
Value (5/01/05) | | Ending Account
Value (10/31/05) | | Expenses Paid During
Period1 (5/01/05 to
10/31/05) | |
| Class A Actual2 | | $ | 1,000.00 | | | $ | 1,111.20 | | | $ | 3.99 | | |
| Class A Hypothetical (5% return before expenses) | | $ | 1,000.00 | | | $ | 1,021.42 | | | $ | 3.82 | | |
| Class B Actual2 | | $ | 1,000.00 | | | $ | 1,107.00 | | | $ | 7.97 | | |
| Class B Hypothetical (5% return before expenses) | | $ | 1,000.00 | | | $ | 1,017.64 | | | $ | 7.63 | | |
| Class C Actual2 | | $ | 1,000.00 | | | $ | 1,106.70 | | | $ | 7.97 | | |
| Class C Hypothetical (5% return before expenses) | | $ | 1,000.00 | | | $ | 1,017.64 | | | $ | 7.63 | | |
| Class R Actual2 | | $ | 1,000.00 | | | $ | 1,109.60 | | | $ | 5.26 | | |
| Class R Hypothetical (5% return before expenses) | | $ | 1,000.00 | | | $ | 1,020.21 | | | $ | 5.04 | | |
| Class Y Actual2 | | $ | 1,000.00 | | | $ | 1,112.40 | | | $ | 2.66 | | |
| Class Y Hypothetical (5% return before expenses) | | $ | 1,000.00 | | | $ | 1,022.68 | | | $ | 2.55 | | |
1 Expenses are equal to the fund's annualized expense ratio for the most recent six-month period of 0.75%, 1.50%, 1.50%, 0.99%, and 0.50% for Class A, Class B, Class C, Class R, and Class Y, respectively, multiplied by the average account value over the period, multiplied by the number of days in the most recent half-year/365 days (to reflect the one-half year period).
2 Based on the actual returns for the six months ended October 31, 2005, of 11.12%, 10.70%, 10.67%, 10.96%, and 11.24 for Class A, Class B, Class C, Class R, and Class Y, respectively.
FIRST AMERICAN FUNDS Annual Report 2005
7
Small Cap Index fund
Investment Objective: to provide investment results that correspond to the performance of the Russell 2000 Index*
How did the fund perform for the fiscal period ended October 31, 2005?
The First American Small Cap Index Fund (the "fund"), Class Y shares, returned -3.09% for the one-month period ended October 31, 2005 (Class A shares returned -3.09% without taking the sales charge into account). By comparison, the fund's benchmark, the Russell 2000 Index*, returned -3.10% for the same period.
General economic and market conditions
Broader economic growth continued at a relatively solid pace in October. Indicators for the manufacturing sector suggested robust growth as inventories remained low and recovery and reconstruction activity proceeded following the hurricanes. Companies indicated continued cost pressures from energy and other raw material prices, keeping Fed concerns about inflation intact. This led to an additional 25-basis-point tightening at the November 1 Federal Open Market Committee meeting, giving support to expectations for further short-term rate increases. While activity in the industrial sector remained robust, consumer confidence continued to slump despite gasoline prices falling sharply during the month. Auto sales fell to their lowest monthly pace in more than seven years as the employee discount sales promotions expired. Forward-looking housing market indicators such as mortgage applications for home purchases moved lower, and emplo yment cost data for the third quarter showed the slowest gain in wages in 25 years. Subdued compensation gains suggest that broader inflation should remain well contained in the coming quarters, which will be a key to bringing an eventual end to Fed tightening and should provide a supportive backdrop to the financial markets.
Fund Overview
The fund is invested to replicate the Russell 2000 Index* as closely as possible with consideration to turnover costs and fees. The index includes the traded shares of U.S. companies ranked 1,001 through 3,000 in size, thereby skipping large- and mid-capitalization names in the list of investable companies.
October saw a reversal in fortunes for the sectors that had performed best during the past 12 months. The relatively small (less than 1.5% of the index) telecommunications sector managed a positive return; the best performing sector in October was financials – with a barely positive return of 0.5%. Utilities fell by more than 5% and the larger energy sector by almost 10% during the fiscal period (Of the 90 firms in the energy sector, half lost more the 10%).
*Unlike mutual funds, index returns do not reflect any expenses, transaction costs, or cash flow effects.
| Top 10 Holdings as of October 31, 20051 (% of net assets) | |
| Amylin Pharmaceuticals | | | 0.3 | % | |
| Cimarex Energy | | | 0.3 | % | |
| Intuitive Surgical | | | 0.3 | % | |
| Cal Dive International | | | 0.2 | % | |
| York International | | | 0.2 | % | |
| Cabot Oil & Gas | | | 0.2 | % | |
| Hughes Supply | | | 0.2 | % | |
| Vertex Pharmaceuticals | | | 0.2 | % | |
| MoneyGram International | | | 0.2 | % | |
| Level 3 Communications | | | 0.2 | % | |
| Sector Allocation as of October 31, 20051 (% of net assets) | |
| Financials | | | 22.1 | % | |
| Information Technology | | | 18.0 | % | |
| Industrials | | | 15.2 | % | |
| Consumer Discretionary | | | 14.1 | % | |
| Health Care | | | 12.6 | % | |
| Energy | | | 6.2 | % | |
| Materials | | | 4.6 | % | |
| Consumer Staples | | | 2.8 | % | |
| Utilities | | | 2.6 | % | |
| Telecommunication Services | | | 1.4 | % | |
| Short-Term Investments | | | 0.5 | % | |
| Other Assets and Liabilities, Net | | | (0.1 | )% | |
| | | | 100.0 | % | |
1Fund holdings and sector allocations are subject to change at any time and are not recommendations to buy or sell any security.
FIRST AMERICAN FUNDS Annual Report 2005
8
Small Cap Index fund continued
Annual Performance1
| | | October 31, 2005 | | September 30, 2005** | |
| | | One- | | | | | | Since Inception | | | | | | Since Inception | |
| | | Month* | | 1 year | | 5 years | | 12/30/98 | | 12/11/00 | | 9/24/01 | | 1 year | | 5 years | | 12/30/98 | | 12/11/00 | | 9/24/01 | |
| Average annual return with sales charge (POP) | |
| Class A | | | (8.43 | )% | | | 5.29 | % | | | 5.63 | % | | | 7.43 | % | | | — | | | | — | | | | 10.63 | % | | | 6.40 | % | | | 8.03 | % | | | — | | | | — | | |
| Class B | | | (8.01 | )% | | | 5.14 | % | | | — | | | | — | | | | 6.09 | % | | | — | | | | 10.82 | % | | | — | | | | — | | | | 6.92 | % | | | — | | |
| Class C | | | (4.18 | )% | | | 9.13 | % | | | — | | | | — | | | | — | | | | 11.78 | % | | | 14.84 | % | | | — | | | | — | | | | — | | | | 12.96 | % | |
| Average annual return without sales charge (NAV) | |
| Class A | | | (3.09 | )% | | | 11.39 | % | | | 6.83 | % | | | 8.32 | % | | | — | | | | — | | | | 17.08 | % | | | 7.61 | % | | | 8.93 | % | | | — | | | | — | | |
| Class B | | | (3.17 | )% | | | 10.14 | % | | | — | | | | — | | | | 6.41 | % | | | — | | | | 15.82 | % | | | — | | | | — | | | | 7.24 | % | | | — | | |
| Class C | | | (3.21 | )% | | | 10.13 | % | | | — | | | | — | | | | — | | | | 11.78 | % | | | 15.84 | % | | | — | | | | — | | | | — | | | | 12.96 | % | |
| Class R | | | (3.19 | )% | | | 10.60 | % | | | 6.64 | % | | | 8.12 | % | | | — | | | | — | | | | 16.45 | % | | | 7.44 | % | | | 8.75 | % | | | — | | | | — | | |
| Class Y | | | (3.09 | )% | | | 11.24 | % | | | 7.03 | % | | | 8.50 | % | | | — | | | | — | | | | 16.93 | % | | | 7.81 | % | | | 9.12 | % | | | — | | | | — | | |
| Russell 2000 Index2 | | | (3.10 | )% | | | 12.08 | % | | | 6.75 | % | | | 8.20 | % | | | 7.34 | % | | | 14.28 | % | | | 17.95 | % | | | 6.44 | % | | | 8.81 | % | | | 8.18 | % | | | 15.51 | % | |
Value of $10,000 Investment1, 3 as of October 31, 2005
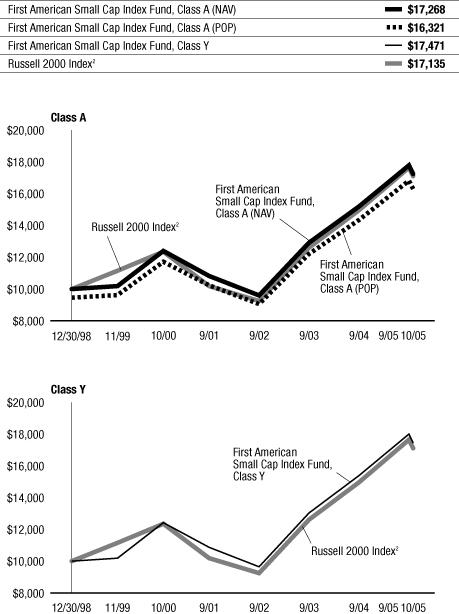
The charts above illustrate the total value of an assumed $10,000 investment in the funds Class A and Class Y shares (from 12/30/98 to 10/31/05) as compared to the Russell 2000 Index2.
The performance data quoted on this page represents past performance and does not guarantee future results. The investment return and principal value of an investment will fluctuate so that an investor's shares, when redeemed, may be worth more or less than their original cost. Current performance of the fund may be lower or higher than the performance data quoted. Performance data current to the most recent month-end may be obtained by calling 800.677.FUND.
* Total returns have not been annualized.
** This table represents average annual total returns through the latest calendar quarter—rather than through the end of the fiscal period.
1 Performance does not reflect the deduction of taxes that a shareholder would pay on fund distributions or redemption of fund shares. Investment performance reflects fee waivers that are or were in effect. In the absence of such fee waivers, total returns would be reduced. Index performance is for illustrative purposes only and does not reflect any expenses, transaction costs, or cash flow effects. Direct investment in the index is not available.
Stocks of small-capitalization companies involve substantial risk. These stocks historically have experienced greater price volatility than stocks of larger companies, and they may be expected to do so in the future.
Total returns at net asset value ("NAV") reflect performance over the time period indicated without including the fund's maximum sales charge and assume reinvestment of all distributions at NAV.
Total returns at public offering price ("POP") reflect performance over the time period indicated including a maximum front-end sales charge of 5.50% for Class A shares and the maximum contingent deferred sales charge ("CDSC") for Class B and Class C shares for the relevant period. Maximum CDSC is 5.00% for Class B shares, decreasing annually to 0% in the seventh year following purchase, and 1.00% for Class C shares. Total returns assume reinvestment of all distributions at NAV.
On September 24, 2001, the Small Cap Index Fund became the successor by merger to the Firstar Small Cap Index Fund, a series of the Firstar Funds, Inc. Prior to the merger, the First American Fund had no assets or liabilities. Performance presented prior to September 24, 2001, represents that of the Firstar Small Cap Index Fund. The Firstar Small Cap Index Fund was organized on December 11, 2000, and, prior to that, was a separate series of Mercantile Mutual Funds, Inc.
2 An unmanaged index that measures the performance of the 2,000 smallest companies in the Russell 3000 Index.
3 Performance for Class B, Class C, and Class R shares is not presented. Performance for these classes will vary due to different expense structures.
FIRST AMERICAN FUNDS Annual Report 2005
9
Small Cap Index fund continued
Expense Example
As a shareholder of the Small Cap Index Fund (the "fund"), you incur two types of costs: (1) transaction costs, including sales charges (loads) on purchase payments; and (2) ongoing costs, including investment advisory fees; distribution and/or service (12b-1) fees; and other fund expenses. This example is intended to help you understand your ongoing costs (in dollars) of investing in the fund and to compare these costs with the ongoing costs of investing in other mutual funds. The example is based on an investment of $1,000 invested at the beginning of the period and held for the entire period from May 1, 2005, to October 31, 2005.
Actual Expenses
For each class, the first line of the table below provides information about actual account values and actual expenses. You may use the information in this line, together with the amount you invested, to estimate the expenses that you paid over the period. Simply divide your account value by $1,000 (for example, an $8,600 account value divided by $1,000 = 8.6), then multiply the result by the number in the first line under the heading entitled "Expenses Paid During Period" to estimate the expenses you paid on your account during this period.
Hypothetical Example for Comparison Purposes
For each class, the second line of the table below provides information about hypothetical account values and hypothetical expenses based on the fund's actual expense ratio and an assumed rate of return of 5% per year before expenses, which is not the fund's actual return. The hypothetical account values and expenses may not be used to estimate the actual ending account balance or expenses you paid for the period. You may use this information to compare the ongoing costs of investing in the fund and other funds. To do so, compare this 5% hypothetical example with the 5% hypothetical examples that appear in the shareholder reports of the other funds.
Please note that the expenses shown in the table are meant to highlight your ongoing costs only and do not reflect any transactional costs, such as sales charges (loads). Therefore, the second line of the table for each class is useful in comparing ongoing costs only, and will not help you determine the relative total costs of owning different funds. In addition, if these transactional costs were included, your costs would have been higher.
Expense Examples
| | | Beginning Account
Value (5/01/05) | | Ending Account
Value (10/31/05) | | Expenses Paid During
Period1 (5/01/05 to
10/31/05) | |
| Class A Actual2,3 | | $ | 1,000.00 | | | $ | 1,117.00 | | | $ | 4.59 | | |
| Class A Hypothetical (5% return before expenses)3 | | $ | 1,000.00 | | | $ | 1,020.85 | | | $ | 4.38 | | |
| Class B Actual2,3 | | $ | 1,000.00 | | | $ | 1,112.40 | | | $ | 8.57 | | |
| Class B Hypothetical (5% return before expenses)3 | | $ | 1,000.00 | | | $ | 1,017.07 | | | $ | 8.19 | | |
| Class C Actual2,3 | | $ | 1,000.00 | | | $ | 1,112.20 | | | $ | 8.57 | | |
| Class C Hypothetical (5% return before expenses)3 | | $ | 1,000.00 | | | $ | 1,017.07 | | | $ | 8.19 | | |
| Class R Actual2,3 | | $ | 1,000.00 | | | $ | 1,115.00 | | | $ | 5.81 | | |
| Class R Hypothetical (5% return before expenses)3 | | $ | 1,000.00 | | | $ | 1,019.59 | | | $ | 5.55 | | |
| Class Y Actual2,3 | | $ | 1,000.00 | | | $ | 1,117.40 | | | $ | 3.26 | | |
| Class Y Hypothetical (5% return before expenses)3 | | $ | 1,000.00 | | | $ | 1,022.11 | | | $ | 3.11 | | |
1 Expenses are equal to the fund's annualized expense ratio for the most recent six-month period of 0.86%, 1.61%, 1.61%, 1.09%, and 0.61% for Class A, Class B, Class C, Class R, and Class Y, respectively, multiplied by the average account value over the period, multiplied by the number of days in the most recent fiscal half-year/365 (to reflect the one-half year period).
2 Based on the actual returns for the six months ended October 31, 2005, of 11.70%, 11.24%, 11.22%, 11.50%, and 11.74% for Class A, Class B, Class C, Class R, and Class Y, respectively.
3 Prior to July 1, 2005, the contractual limitation on annual expenses was 0.93%, 1.68%, 1.68%, 1.18%, and 0.68% for Class A, Class B, Class C, Class R, and Class Y, respectively. Effective July 1, 2005, the contractual limitation on annual expenses for Class A, Class B, Class C, Class R, and Class Y was lowered to 0.83%, 1.58%, 1.58%, 1.08%, and 0.58%, respectively. If this new limitation had been in place during the entire period, actual and hypothetical ending account balances would have been approximately $1,117.16 and $1,021.02 for Class A, $1,112.56 and $1,017.24 for Class B, $1,112.36 and $1,017.24 for Class C, $1,115.05 and $1,019.76 for Class R, and $1,117.56 and $1,022.28 for Class Y, and the actual and hypothetical expenses paid during the period would have been approximately $4.43 and $4.23 for Class A, $8.41 and $8.03 for Class B, $8. 41 and $8.03 for Class C, $5.76 and $5.50 for Class R, and $3.10 and $2.96 for Class Y.
FIRST AMERICAN FUNDS Annual Report 2005
10
Report of Independent Registered Public Accounting Firm
To the Shareholders and Board of Directors
First American Investment Funds, Inc.
We have audited the accompanying statements of assets and liabilities, including the schedules of investments, of the Equity Index, Mid Cap Index, and Small Cap Index Funds (series of First American Investment Funds, Inc.) (the "funds") as of October 31, 2005, and the related statements of operations, statements of changes in net assets and the financial highlights for each of the periods indicated therein. These financial statements and financial highlights are the responsibility of the funds' management. Our responsibility is to express an opinion on these financial statements and financial highlights based on our audits.
We conducted our audits in accordance with the standards of the Public Company Accounting Oversight Board (United States). Those standards require that we plan and perform the audit to obtain reasonable assurance about whether the financial statements and financial highlights are free of material misstatement. We were not engaged to perform an audit of the funds' internal control over financial reporting. Our audits included consideration of internal control over financial reporting as a basis for designating audit procedures that are appropriate in the circumstances, but not for the purpose of expressing an opinion on the effectiveness of the funds' internal control over financial reporting. Accordingly, we express no such opinion. An audit also includes examining, on a test basis, evidence supporting the amounts and disclosures in the financial statements and financial highlights, assessing the accounting principles used and s ignificant estimates made by management, and evaluating the overall financial statement presentation. Our procedures included verification by examination of securities held by the custodian as of October 31, 2005 and confirmation of the securities held by correspondence with the custodian and brokers or by other appropriate auditing procedures where replies from brokers were not received. We believe that our audits provide a reasonable basis for our opinion.
In our opinion, the financial statements and financial highlights audited by us as referred to above present fairly, in all material respects, the financial position of the funds listed above of the First American Investment Funds, Inc. at October 31, 2005, the results of their operations, the changes in their net assets, and their financial highlights for the periods indicated therein in conformity with U.S. generally accepted accounting principles.

Minneapolis, Minnesota
December 9, 2005
FIRST AMERICAN FUNDS Annual Report 2005
11
Schedule of Investments October 31, 2005
Equity Index Fund
| DESCRIPTION | | SHARES | | VALUE (000) | |
| Common Stocks – 98.8% | |
| Consumer Discretionary – 10.2% | |
| AutoNation* (a) | | | 36,173 | | | $ | 719 | | |
| Autozone* | | | 13,125 | | | | 1,062 | | |
| Bed Bath & Beyond* (a) | | | 58,819 | | | | 2,383 | | |
| Best Buy (a) | | | 85,593 | | | | 3,788 | | |
| Big Lots* (a) | | | 22,835 | | | | 264 | | |
| Black & Decker | | | 15,533 | | | | 1,276 | | |
| Brunswick | | | 18,388 | | | | 701 | | |
| Carnival (a) | | | 100,095 | | | | 4,972 | | |
| Centex | | | 25,027 | | | | 1,610 | | |
| Circuit City Stores | | | 40,995 | | | | 729 | | |
| Clear Channel Communications (a) | | | 94,110 | | | | 2,863 | | |
| Coach* | | | 74,427 | | | | 2,395 | | |
| Comcast, Class A* (a) | | | 440,567 | | | | 12,261 | | |
| Cooper Tire & Rubber | | | 12,787 | | | | 175 | | |
| D.R. Horton | | | 53,291 | | | | 1,636 | | |
| Dana (a) | | | 30,018 | | | | 225 | | |
| Darden Restaurants (a) | | | 27,598 | | | | 895 | | |
| Dillards, Class A | | | 14,083 | | | | 292 | | |
| Dollar General (a) | | | 59,313 | | | | 1,153 | | |
| Dow Jones & Company | | | 13,986 | | | | 474 | | |
| Eastman Kodak | | | 55,997 | | | | 1,226 | | |
| Family Dollar Stores | | | 33,457 | | | | 741 | | |
| Federated Department Stores | | | 52,901 | | | | 3,247 | | |
| Ford Motor | | | 367,911 | | | | 3,061 | | |
| Fortune Brands | | | 28,387 | | | | 2,157 | | |
| Gannett (a) | | | 49,620 | | | | 3,109 | | |
| Gap (a) | | | 122,611 | | | | 2,119 | | |
| General Motors (a) | | | 112,952 | | | | 3,095 | | |
| Genuine Parts | | | 34,205 | | | | 1,518 | | |
| Goodyear Tire & Rubber* (a) | | | 35,146 | | | | 550 | | |
| Harley-Davidson (a) | | | 58,037 | | | | 2,875 | | |
| Harrah's Entertainment | | | 31,087 | | | | 1,880 | | |
| Hasbro | | | 31,383 | | | | 591 | | |
| Hilton Hotels | | | 74,700 | | | | 1,453 | | |
| Home Depot (a) | | | 432,577 | | | | 17,753 | | |
| International Game Technology | | | 68,211 | | | | 1,807 | | |
| Interpublic Group of Companies* (a) | | | 83,383 | | | | 861 | | |
| J.C. Penney (a) | | | 52,733 | | | | 2,700 | | |
| Johnson Controls | | | 37,051 | | | | 2,521 | | |
| Jones Apparel Group | | | 24,075 | | | | 657 | | |
| KB HOME | | | 15,477 | | | | 1,011 | | |
| Knight-Ridder (a) | | | 13,573 | | | | 725 | | |
| Kohl's* (a) | | | 61,656 | | | | 2,968 | | |
| Leggett & Platt | | | 37,301 | | | | 748 | | |
| Lennar | | | 26,660 | | | | 1,482 | | |
| Limited (a) | | | 71,115 | | | | 1,423 | | |
| Liz Claiborne (a) | | | 21,466 | | | | 756 | | |
| Lowe's (a) | | | 152,088 | | | | 9,242 | | |
| Marriott International, Class A (a) | | | 39,875 | | | | 2,377 | | |
| Mattel | | | 80,991 | | | | 1,195 | | |
| Maytag | | | 16,057 | | | | 277 | | |
| McDonald's | | | 249,367 | | | | 7,880 | | |
| McGraw-Hill | | | 74,788 | | | | 3,660 | | |
| New York Times, Class A (a) | | | 29,239 | | | | 796 | | |
| Newell Rubbermaid (a) | | | 53,621 | | | | 1,233 | | |
| News | | | 517,445 | | | | 7,374 | | |
| Nike, Class B (a) | | | 41,507 | | | | 3,489 | | |
Equity Index Fund (continued)
| DESCRIPTION | | SHARES | | VALUE (000) | |
| Nordstrom | | | 43,084 | | | $ | 1,493 | | |
| Office Depot* | | | 60,512 | | | | 1,666 | | |
| Officemax (a) | | | 13,152 | | | | 369 | | |
| Omnicom Group (a) | | | 37,010 | | | | 3,070 | | |
| Pulte (a) | | | 46,584 | | | | 1,760 | | |
| RadioShack | | | 27,952 | | | | 618 | | |
| Reebok International | | | 11,811 | | | | 674 | | |
| Sears* (a) | | | 20,424 | | | | 2,456 | | |
| Sherwin Williams (a) | | | 30,109 | | | | 1,281 | | |
| Snap-On | | | 11,404 | | | | 411 | | |
| Stanley Works (a) | | | 16,251 | | | | 779 | | |
| Staples (a) | | | 147,352 | | | | 3,349 | | |
| Starbucks* | | | 158,175 | | | | 4,473 | | |
| Starwood Hotels & Resorts Worldwide (a) | | | 40,317 | | | | 2,356 | | |
| Target | | | 176,529 | | | | 9,831 | | |
| Tiffany & Company | | | 28,852 | | | | 1,137 | | |
| Time Warner (a) | | | 920,283 | | | | 16,409 | | |
| TJX (a) | | | 93,977 | | | | 2,023 | | |
| Tribune (a) | | | 58,698 | | | | 1,850 | | |
| Univision Communications, Class A* (a) | | | 50,761 | | | | 1,327 | | |
| V.F. (a) | | | 17,291 | | | | 903 | | |
| Viacom, Class B (a) | | | 323,512 | | | | 10,019 | | |
| Visteon* | | | 25,759 | | | | 215 | | |
| Walt Disney (a) | | | 399,525 | | | | 9,736 | | |
| Wendy's International (a) | | | 22,220 | | | | 1,038 | | |
| Whirlpool (a) | | | 13,104 | | | | 1,029 | | |
| Yum! Brands (a) | | | 57,004 | | | | 2,900 | | |
| | | | 223,602 | | |
| Consumer Staples – 9.7% | |
| Alberto-Culver, Class B | | | 16,772 | | | | 728 | | |
| Albertson's (a) | | | 73,730 | | | | 1,851 | | |
| Altria Group (a) | | | 408,822 | | | | 30,682 | | |
| Anheuser-Busch (a) | | | 156,504 | | | | 6,457 | | |
| Archer-Daniels-Midland | | | 122,249 | | | | 2,979 | | |
| Avon Products (a) | | | 92,777 | | | | 2,504 | | |
| Brown-Forman, Class B | | | 9,654 | | | | 611 | | |
| Campbell Soup | | | 55,386 | | | | 1,612 | | |
| Clorox | | | 30,272 | | | | 1,638 | | |
| Coca-Cola | | | 427,830 | | | | 18,303 | | |
| Coca-Cola Enterprises | | | 46,810 | | | | 885 | | |
| Colgate-Palmolive | | | 104,531 | | | | 5,536 | | |
| ConAgra Foods | | | 103,675 | | | | 2,413 | | |
| Constellation Brands, CIass A* (a) | | | 32,747 | | | | 771 | | |
| Costco Wholesale | | | 98,152 | | | | 4,747 | | |
| CVS | | | 156,640 | | | | 3,824 | | |
| General Mills | | | 65,169 | | | | 3,145 | | |
| H.J. Heinz | | | 68,762 | | | | 2,441 | | |
| Hershey Foods (a) | | | 42,740 | | | | 2,429 | | |
| Kellogg | | | 56,760 | | | | 2,507 | | |
| Kimberly-Clark | | | 93,956 | | | | 5,340 | | |
| Kroger* | | | 144,504 | | | | 2,876 | | |
| McCormick | | | 27,290 | | | | 827 | | |
| Molson Coors Brewing | | | 15,534 | | | | 958 | | |
| Pepsi Bottling (a) | | | 38,562 | | | | 1,096 | | |
| PepsiCo | | | 332,799 | | | | 19,662 | | |
| Procter & Gamble | | | 671,627 | | | | 37,604 | | |
| Reynolds American (a) | | | 16,952 | | | | 1,441 | | |
| Safeway (a) | | | 89,557 | | | | 2,083 | | |
| Sara Lee (a) | | | 154,470 | | | | 2,757 | | |
The accompanying notes are an integral part of the financial statements.
FIRST AMERICAN FUNDS Annual Report 2005
12
Equity Index Fund (continued)
| DESCRIPTION | | SHARES | | VALUE (000) | |
| SUPERVALU | | | 26,157 | | | $ | 822 | | |
| Sysco | | | 130,666 | | | | 4,170 | | |
| Tyson Foods, Class A | | | 49,569 | | | | 882 | | |
| UST (a) | | | 33,096 | | | | 1,370 | | |
| Walgreen (a) | | | 201,148 | | | | 9,138 | | |
| Wal-Mart Stores (a) | | | 514,891 | | | | 24,359 | | |
| Wrigley, William Jr. (a) | | | 32,787 | | | | 2,279 | | |
| | | | 213,727 | | |
| Energy – 9.4% | |
| Amerada Hess (a) | | | 15,864 | | | | 1,985 | | |
| Anadarko Petroleum | | | 47,077 | | | | 4,270 | | |
| Apache | | | 65,558 | | | | 4,185 | | |
| Baker Hughes | | | 68,088 | | | | 3,742 | | |
| BJ Services (a) | | | 64,691 | | | | 2,248 | | |
| Burlington Resources | | | 77,013 | | | | 5,562 | | |
| ChevronTexaco | | | 448,754 | | | | 25,610 | | |
| ConocoPhillips | | | 278,109 | | | | 18,183 | | |
| Devon Energy (a) | | | 94,644 | | | | 5,715 | | |
| El Paso (a) | | | 128,712 | | | | 1,527 | | |
| EOG Resources (a) | | | 47,887 | | | | 3,246 | | |
| Exxon Mobil | | | 1,264,462 | | | | 70,987 | | |
| Halliburton (a) | | | 101,020 | | | | 5,970 | | |
| Kerr-McGee | | | 23,258 | | | | 1,978 | | |
| Kinder Morgan | | | 19,005 | | | | 1,728 | | |
| Marathon Oil | | | 69,832 | | | | 4,201 | | |
| Murphy Oil | | | 30,960 | | | | 1,450 | | |
| Nabors Industries* (a) | | | 29,196 | | | | 2,004 | | |
| National-Oilwell Varco* | | | 34,364 | | | | 2,147 | | |
| Noble (a) | | | 27,137 | | | | 1,747 | | |
| Occidental Petroleum (a) | | | 79,549 | | | | 6,275 | | |
| Rowan* (a) | | | 21,631 | | | | 714 | | |
| Schlumberger (a) | | | 117,694 | | | | 10,683 | | |
| Sunoco (a) | | | 26,998 | | | | 2,011 | | |
| Transocean* | | | 68,702 | | | | 3,950 | | |
| Valero Energy | | | 60,103 | | | | 6,325 | | |
| Weatherford International* (a) | | | 28,560 | | | | 1,788 | | |
| Williams | | | 114,019 | | | | 2,543 | | |
| XTO Energy | | | 72,095 | | | | 3,133 | | |
| | | | 205,907 | | |
| Financials – 20.6% | |
| ACE | | | 55,207 | | | | 2,876 | | |
| AFLAC | | | 100,427 | | | | 4,798 | | |
| Allstate (a) | | | 137,048 | | | | 7,235 | | |
| Ambac Financial Group | | | 21,282 | | | | 1,509 | | |
| American Express | | | 229,598 | | | | 11,427 | | |
| American International Group | | | 518,329 | | | | 33,588 | | |
| Ameriprise Financial | | | 45,895 | | | | 1,708 | | |
| AmSouth Bancorp (a) | | | 68,536 | | | | 1,729 | | |
| AON | | | 63,480 | | | | 2,149 | | |
| Apartment Investment & Management (a) | | | 19,317 | | | | 742 | | |
| Archstone-Smith Trust (a) | | | 39,720 | | | | 1,611 | | |
| Bank of America (a) | | | 805,161 | | | | 35,218 | | |
| Bank of New York | | | 151,739 | | | | 4,748 | | |
| BB&T | | | 106,710 | | | | 4,518 | | |
| Bear Stearns (a) | | | 21,331 | | | | 2,257 | | |
| Capital One Financial (a) | | | 57,625 | | | | 4,400 | | |
| Charles Schwab | | | 199,891 | | | | 3,038 | | |
| Chubb (a) | | | 36,589 | | | | 3,402 | | |
Equity Index Fund (continued)
| DESCRIPTION | | SHARES | | VALUE (000) | |
| Cincinnati Financial | | | 31,228 | | | $ | 1,329 | | |
| CIT Group | | | 40,266 | | | | 1,841 | | |
| Citigroup | | | 1,027,779 | | | | 47,052 | | |
| Comerica | | | 34,303 | | | | 1,982 | | |
| Compass Bancshares | | | 9,642 | | | | 470 | | |
| Countrywide Financial | | | 111,943 | | | | 3,556 | | |
| E*TRADE Financial* (a) | | | 73,763 | | | | 1,368 | | |
| Equity Office Properties Trust | | | 81,948 | | | | 2,524 | | |
| Equity Residential Properties Trust (a) | | | 56,582 | | | | 2,221 | | |
| Fannie Mae | | | 191,614 | | | | 9,106 | | |
| Federated Investors, Class B | | | 18,964 | | | | 664 | | |
| Fifth Third Bancorp (a) | | | 110,109 | | | | 4,423 | | |
| First Horizon National | | | 24,596 | | | | 951 | | |
| Franklin Resources | | | 35,302 | | | | 3,120 | | |
| Freddie Mac | | | 135,159 | | | | 8,292 | | |
| Golden West Financial (a) | | | 52,873 | | | | 3,105 | | |
| Goldman Sachs Group (a) | | | 88,823 | | | | 11,225 | | |
| Hartford Financial Services Group (a) | | | 57,246 | | | | 4,565 | | |
| Huntington Bancshares | | | 44,678 | | | | 1,039 | | |
| J.P. Morgan Chase | | | 702,878 | | | | 25,739 | | |
| Janus Capital Group | | | 46,866 | | | | 823 | | |
| Jefferson-Pilot | | | 26,621 | | | | 1,461 | | |
| KeyCorp (a) | | | 80,940 | | | | 2,610 | | |
| Lehman Brothers Holdings (a) | | | 54,418 | | | | 6,512 | | |
| Lincoln National (a) | | | 34,766 | | | | 1,760 | | |
| Loew's | | | 29,363 | | | | 2,730 | | |
| M & T Bank | | | 16,353 | | | | 1,759 | | |
| Marsh & McLennan | | | 104,034 | | | | 3,033 | | |
| Marshall & Ilsley | | | 41,898 | | | | 1,800 | | |
| MBIA (a) | | | 28,399 | | | | 1,654 | | |
| MBNA | | | 253,234 | | | | 6,475 | | |
| Mellon Financial | | | 84,229 | | | | 2,669 | | |
| Merrill Lynch | | | 185,474 | | | | 12,008 | | |
| Metlife | | | 150,264 | | | | 7,425 | | |
| MGIC Investment | | | 19,423 | | | | 1,151 | | |
| Moody's (a) | | | 53,164 | | | | 2,832 | | |
| Morgan Stanley | | | 215,911 | | | | 11,748 | | |
| National City | | | 116,950 | | | | 3,769 | | |
| North Fork Bancorp (a) | | | 92,911 | | | | 2,354 | | |
| Northern Trust | | | 43,317 | | | | 2,322 | | |
| Plum Creek Timber (a) | | | 36,341 | | | | 1,414 | | |
| PNC Financial Services | | | 54,709 | | | | 3,321 | | |
| Principal Financial Group (a) | | | 63,493 | | | | 3,151 | | |
| Progressive (a) | | | 39,262 | | | | 4,547 | | |
| Prologis (a) | | | 36,299 | | | | 1,561 | | |
| Prudential Financial | | | 100,934 | | | | 7,347 | | |
| Public Storage (a) | | | 17,769 | | | | 1,176 | | |
| Regions Financial | | | 91,917 | | | | 2,992 | | |
| SAFECO | | | 24,496 | | | | 1,364 | | |
| Simon Property Group (a) | | | 43,883 | | | | 3,143 | | |
| SLM | | | 82,404 | | | | 4,576 | | |
| Sovereign Bancorp | | | 68,386 | | | | 1,475 | | |
| St. Paul Travelers Companies | | | 134,584 | | | | 6,060 | | |
| State Street (a) | | | 69,670 | | | | 3,848 | | |
| SunTrust Banks | | | 63,926 | | | | 4,633 | | |
| Synovus Financial | | | 58,838 | | | | 1,616 | | |
| T. Rowe Price Group | | | 24,746 | | | | 1,621 | | |
| Torchmark | | | 20,486 | | | | 1,082 | | |
| U.S. Bancorp (a) (b) | | | 367,688 | | | | 10,876 | | |
FIRST AMERICAN FUNDS Annual Report 2005
13
Schedule of Investments October 31, 2005
Equity Index Fund (continued)
| DESCRIPTION | | SHARES | | VALUE (000) | |
| UnumProvident | | | 59,458 | | | $ | 1,206 | | |
| Vornado Realty Trust | | | 19,107 | | | | 1,548 | | |
| Wachovia | | | 316,250 | | | | 15,977 | | |
| Washington Mutual | | | 195,376 | | | | 7,737 | | |
| Wells Fargo | | | 331,745 | | | | 19,971 | | |
| XL Capital Limited, Class A (a) | | | 26,674 | | | | 1,709 | | |
| Zions Bancorporation (a) | | | 17,532 | | | | 1,288 | | |
| | | | 453,659 | | |
| Health Care – 12.9% | |
| Abbott Laboratories | | | 306,584 | | | | 13,198 | | |
| Aetna | | | 58,044 | | | | 5,140 | | |
| Allergan (a) | | | 25,514 | | | | 2,278 | | |
| AmerisourceBergen (a) | | | 20,704 | | | | 1,579 | | |
| Amgen* (a) | | | 247,700 | | | | 18,766 | | |
| Applied Biosystems Group - Applera | | | 38,586 | | | | 936 | | |
| Bausch & Lomb (a) | | | 10,168 | | | | 754 | | |
| Baxter International | | | 119,933 | | | | 4,585 | | |
| Becton, Dickinson & Company | | | 49,645 | | | | 2,519 | | |
| Biogen IDEC* (a) | | | 67,810 | | | | 2,755 | | |
| Biomet | | | 49,780 | | | | 1,734 | | |
| Boston Scientific* (a) | | | 138,618 | | | | 3,482 | | |
| Bristol-Myers Squibb | | | 381,561 | | | | 8,078 | | |
| C.R. Bard | | | 18,857 | | | | 1,176 | | |
| Cardinal Health | | | 87,096 | | | | 5,444 | | |
| Caremark Rx* | | | 88,299 | | | | 4,627 | | |
| Chiron* (a) | | | 23,308 | | | | 1,029 | | |
| CIGNA | | | 26,371 | | | | 3,056 | | |
| Coventry Health Care* | | | 31,518 | | | | 1,702 | | |
| Eli Lilly (a) | | | 221,442 | | | | 11,026 | | |
| Express Scripts* (a) | | | 30,156 | | | | 2,274 | | |
| Fisher Scientific International* (a) | | | 23,391 | | | | 1,322 | | |
| Forest Laboratories, Class A* | | | 68,307 | | | | 2,590 | | |
| Genzyme* (a) | | | 48,953 | | | | 3,539 | | |
| Gilead Sciences* (a) | | | 84,956 | | | | 4,014 | | |
| Guidant | | | 63,551 | | | | 4,004 | | |
| HCA | | | 82,102 | | | | 3,956 | | |
| Health Management Associates, Class A | | | 46,829 | | | | 1,003 | | |
| Hospira* | | | 31,890 | | | | 1,271 | | |
| Humana* (a) | | | 31,592 | | | | 1,402 | | |
| IMS Health | | | 45,701 | | | | 1,062 | | |
| Johnson & Johnson (a) | | | 584,020 | | | | 36,571 | | |
| King Pharmaceuticals* | | | 48,290 | | | | 745 | | |
| Laboratory Corporation of America Holdings* (a) | | | 27,269 | | | | 1,316 | | |
| Manor Care | | | 17,445 | | | | 650 | | |
| McKesson HBOC | | | 57,815 | | | | 2,627 | | |
| Medco Health Solutions* | | | 60,219 | | | | 3,402 | | |
| MedImmune* (a) | | | 48,848 | | | | 1,709 | | |
| Medtronic | | | 239,778 | | | | 13,586 | | |
| Merck | | | 440,096 | | | | 12,420 | | |
| Millipore* | | | 9,798 | | | | 600 | | |
| Mylan Laboratories | | | 42,821 | | | | 823 | | |
| Patterson Companies* (a) | | | 10,601 | | | | 439 | | |
| PerkinElmer | | | 24,887 | | | | 549 | | |
| Pfizer | | | 1,483,911 | | | | 32,260 | | |
| Quest Diagnostics (a) | | | 35,801 | | | | 1,672 | | |
| Schering-Plough | | | 289,049 | | | | 5,879 | | |
| St. Jude Medical* | | | 71,755 | | | | 3,449 | | |
| Stryker (a) | | | 72,226 | | | | 2,966 | | |
| Tenet Healthcare* (a) | | | 90,624 | | | | 763 | | |
Equity Index Fund (continued)
| DESCRIPTION | | SHARES | | VALUE (000) | |
| Thermo Electron* | | | 31,731 | | | $ | 958 | | |
| UnitedHealth Group (a) | | | 254,017 | | | | 14,705 | | |
| Watson Pharmaceuticals* (a) | | | 21,406 | | | | 740 | | |
| WellPoint Health Networks* (a) | | | 117,353 | | | | 8,764 | | |
| Wyeth Pharmaceuticals | | | 262,121 | | | | 11,680 | | |
| Zimmer Holdings* (a) | | | 49,354 | | | | 3,147 | | |
| | | | 282,721 | | |
| Industrials – 11.2% | |
| 3M (a) | | | 154,501 | | | | 11,739 | | |
| Allied Waste Industries* (a) | | | 42,300 | | | | 344 | | |
| American Power Conversion | | | 34,006 | | | | 727 | | |
| American Standard | | | 35,133 | | | | 1,336 | | |
| Apollo Group, Class A* | | | 28,655 | | | | 1,806 | | |
| Avery Dennison (a) | | | 21,060 | | | | 1,193 | | |
| Boeing (a) | | | 166,087 | | | | 10,736 | | |
| Burlington Northern Santa Fe | | | 74,084 | | | | 4,598 | | |
| Caterpillar (a) | | | 134,269 | | | | 7,061 | | |
| Cendant (a) | | | 208,158 | | | | 3,626 | | |
| Cintas | | | 27,037 | | | | 1,097 | | |
| Cooper Industries | | | 18,266 | | | | 1,295 | | |
| CSX | | | 41,792 | | | | 1,914 | | |
| Cummins (a) | | | 8,163 | | | | 697 | | |
| Danaher (a) | | | 54,213 | | | | 2,825 | | |
| Deere & Company (a) | | | 48,137 | | | | 2,921 | | |
| Dover | | | 33,994 | | | | 1,325 | | |
| Eaton | | | 29,365 | | | | 1,728 | | |
| Emerson Electric | | | 82,646 | | | | 5,748 | | |
| Equifax | | | 27,496 | | | | 948 | | |
| FedEx (a) | | | 59,331 | | | | 5,454 | | |
| Fluor (a) | | | 15,930 | | | | 1,013 | | |
| General Dynamics | | | 38,518 | | | | 4,480 | | |
| General Electric | | | 2,112,277 | | | | 71,627 | | |
| Goodrich (a) | | | 23,494 | | | | 847 | | |
| H & R Block | | | 70,435 | | | | 1,751 | | |
| Honeywell International | | | 168,145 | | | | 5,751 | | |
| Illinois Tool Works (a) | | | 55,320 | | | | 4,689 | | |
| Ingersoll-Rand, Class A | | | 67,828 | | | | 2,563 | | |
| ITT Industries | | | 18,052 | | | | 1,834 | | |
| L-3 Communications Holdings (a) | | | 20,387 | | | | 1,587 | | |
| Lockheed Martin (a) | | | 78,702 | | | | 4,766 | | |
| Masco (a) | | | 91,661 | | | | 2,612 | | |
| Monster Worldwide* (a) | | | 23,223 | | | | 762 | | |
| Navistar International* | | | 13,099 | | | | 360 | | |
| Norfolk Southern | | | 78,653 | | | | 3,162 | | |
| Northrop Grumman | | | 70,478 | | | | 3,781 | | |
| Paccar | | | 34,736 | | | | 2,432 | | |
| Pall | | | 24,257 | | | | 635 | | |
| Parker Hannifin | | | 23,076 | | | | 1,446 | | |
| Pitney Bowes | | | 38,108 | | | | 1,604 | | |
| R.R. Donnelley & Sons (a) | | | 41,885 | | | | 1,467 | | |
| Raytheon | | | 87,167 | | | | 3,221 | | |
| Robert Half International (a) | | | 31,248 | | | | 1,152 | | |
| Rockwell Automation | | | 33,716 | | | | 1,792 | | |
| Rockwell Collins (a) | | | 34,730 | | | | 1,591 | | |
| Ryder System | | | 12,363 | | | | 490 | | |
| Southwest Airlines | | | 152,814 | | | | 2,447 | | |
| Textron | | | 26,777 | | | | 1,929 | | |
| Tyco International | | | 403,395 | | | | 10,646 | | |
| Union Pacific | | | 51,566 | | | | 3,567 | | |
The accompanying notes are an integral part of the financial statements.
FIRST AMERICAN FUNDS Annual Report 2005
14
Equity Index Fund (continued)
| DESCRIPTION | | SHARES | | VALUE (000) | |
| United Parcel Service, Class B (a) | | | 219,781 | | | $ | 16,031 | | |
| United Technologies (a) | | | 207,356 | | | | 10,633 | | |
| W.W. Grainger | | | 17,868 | | | | 1,197 | | |
| Waste Management | | | 112,710 | | | | 3,326 | | |
| | | | 246,309 | | |
| Information Technology – 15.5% | |
| ADC Telecommunications* (a) | | | 23,217 | | | | 405 | | |
| Adobe Systems (a) | | | 98,097 | | | | 3,164 | | |
| Advanced Micro Devices* (a) | | | 76,375 | | | | 1,773 | | |
| Affiliated Computer Services, Class A* (a) | | | 25,740 | | | | 1,393 | | |
| Agilent Technologies* | | | 96,324 | | | | 3,083 | | |
| Altera* (a) | | | 74,820 | | | | 1,246 | | |
| Analog Devices (a) | | | 74,042 | | | | 2,575 | | |
| Andrew* | | | 31,199 | | | | 331 | | |
| Apple Computer* (a) | | | 165,635 | | | | 9,539 | | |
| Applied Materials (a) | | | 329,846 | | | | 5,403 | | |
| Applied Micro Circuits* | | | 61,906 | | | | 151 | | |
| Autodesk | | | 45,864 | | | | 2,070 | | |
| Automatic Data Processing | | | 116,989 | | | | 5,459 | | |
| Avaya* | | | 95,407 | | | | 1,099 | | |
| BMC Software* | | | 44,700 | | | | 876 | | |
| Broadcom, Class A* (a) | | | 56,426 | | | | 2,396 | | |
| Ciena* | | | 115,533 | | | | 274 | | |
| Cisco Systems* (a) | | | 1,279,161 | | | | 22,321 | | |
| Citrix Systems* (a) | | | 33,949 | | | | 936 | | |
| Computer Associates International (a) | | | 93,331 | | | | 2,610 | | |
| Computer Sciences* (a) | | | 36,594 | | | | 1,875 | | |
| Compuware* | | | 77,929 | | | | 630 | | |
| Comverse Technology* (a) | | | 38,364 | | | | 963 | | |
| Convergys* (a) | | | 31,836 | | | | 517 | | |
| Corning* | | | 289,799 | | | | 5,822 | | |
| Dell* | | | 478,446 | | | | 15,253 | | |
| eBay* (a) | | | 218,579 | | | | 8,656 | | |
| Electronic Arts* (a) | | | 61,506 | | | | 3,498 | | |
| Electronic Data Systems | | | 96,418 | | | | 2,248 | | |
| EMC* (a) | | | 480,506 | | | | 6,708 | | |
| First Data | | | 159,775 | | | | 6,463 | | |
| Fiserv* (a) | | | 37,851 | | | | 1,653 | | |
| Freescale Semiconductor* (a) | | | 78,430 | | | | 1,873 | | |
| Gateway* (a) | | | 58,312 | | | | 166 | | |
| Hewlett-Packard (a) | | | 569,309 | | | | 15,963 | | |
| IBM | | | 326,579 | | | | 26,740 | | |
| Intel | | | 1,233,240 | | | | 28,981 | | |
| Intuit* (a) | | | 36,844 | | | | 1,692 | | |
| Jabil Circuit* (a) | | | 38,249 | | | | 1,142 | | |
| JDS Uniphase* (a) | | | 329,218 | | | | 691 | | |
| KLA-Tencor (a) | | | 38,047 | | | | 1,761 | | |
| Lexmark International Group, Class A* (a) | | | 25,030 | | | | 1,039 | | |
| Linear Technology | | | 60,190 | | | | 1,999 | | |
| LSI Logic* (a) | | | 76,004 | | | | 616 | | |
| Lucent Technologies* (a) | | | 884,895 | | | | 2,522 | | |
| Maxim Integrated Products | | | 64,240 | | | | 2,228 | | |
| Mercury Interactive* | | | 17,732 | | | | 617 | | |
| Micron Technology* (a) | | | 119,166 | | | | 1,548 | | |
| Microsoft | | | 1,856,818 | | | | 47,720 | | |
| Molex | | | 29,071 | | | | 736 | | |
| Motorola (a) | | | 479,739 | | | | 10,631 | | |
| National Semiconductor (a) | | | 69,884 | | | | 1,581 | | |
| NCR* (a) | | | 37,426 | | | | 1,131 | | |
Equity Index Fund (continued)
| DESCRIPTION | | SHARES | | VALUE (000) | |
| Network Appliance* (a) | | | 70,964 | | | $ | 1,942 | | |
| Novell* (a) | | | 76,416 | | | | 582 | | |
| Novellus Systems* (a) | | | 29,490 | | | | 645 | | |
| NVIDIA* (a) | | | 32,761 | | | | 1,099 | | |
| Oracle* (a) | | | 739,278 | | | | 9,374 | | |
| Parametric Technology* (a) | | | 54,499 | | | | 355 | | |
| Paychex | | | 73,835 | | | | 2,862 | | |
| PMC-Sierra* (a) | | | 34,930 | | | | 248 | | |
| QLogic* | | | 18,443 | | | | 556 | | |
| QUALCOMM | | | 322,664 | | | | 12,829 | | |
| Sabre Holdings, Class A (a) | | | 28,147 | | | | 550 | | |
| Sanmina - SCI* (a) | | | 105,697 | | | | 386 | | |
| Scientific-Atlanta (a) | | | 29,991 | | | | 1,063 | | |
| Seagate Escrow Security (c) (d) | | | 44,866 | | | | — | | |
| Siebel Systems (a) | | | 103,647 | | | | 1,073 | | |
| Solectron* | | | 192,285 | | | | 679 | | |
| Sun Microsystems* (a) | | | 665,489 | | | | 2,662 | | |
| Symantec* (a) | | | 239,086 | | | | 5,702 | | |
| Symbol Technologies | | | 47,601 | | | | 395 | | |
| Tektronix | | | 16,575 | | | | 381 | | |
| Tellabs* | | | 89,731 | | | | 858 | | |
| Teradyne* (a) | | | 38,181 | | | | 517 | | |
| Texas Instruments | | | 332,787 | | | | 9,501 | | |
| Unisys* | | | 65,180 | | | | 333 | | |
| Waters* | | | 23,743 | | | | 860 | | |
| Xerox* (a) | | | 188,312 | | | | 2,555 | | |
| Xilinx (a) | | | 67,993 | | | | 1,628 | | |
| Yahoo!* (a) | | | 242,586 | | | | 8,968 | | |
| | | | 341,370 | | |
| Materials – 2.9% | |
| Air Products and Chemicals | | | 44,423 | | | | 2,543 | | |
| Alcoa | | | 174,127 | | | | 4,230 | | |
| Allegheny Technologies (a) | | | 17,391 | | | | 499 | | |
| Ashland | | | 13,167 | | | | 705 | | |
| Ball | | | 21,770 | | | | 857 | | |
| Bemis (a) | | | 20,893 | | | | 552 | | |
| Dow Chemical (a) | | | 191,999 | | | | 8,805 | | |
| E.I. DuPont de Nemours | | | 198,969 | | | | 8,295 | | |
| Eastman Chemical (a) | | | 14,859 | | | | 784 | | |
| Ecolab | | | 43,970 | | | | 1,455 | | |
| Engelhard | | | 24,105 | | | | 656 | | |
| Freeport-McMoran Copper & Gold, Class B (a) | | | 35,901 | | | | 1,774 | | |
| Georgia-Pacific | | | 51,964 | | | | 1,690 | | |
| Hercules* | | | 21,657 | | | | 241 | | |
| International Flavors & Fragrances | | | 14,130 | | | | 466 | | |
| International Paper (a) | | | 98,176 | | | | 2,865 | | |
| Louisiana Pacific | | | 21,379 | | | | 533 | | |
| MeadWestvaco | | | 35,976 | | | | 943 | | |
| Monsanto (a) | | | 53,572 | | | | 3,376 | | |
| Newmont Mining (a) | | | 88,941 | | | | 3,789 | | |
| NuCor (a) | | | 32,019 | | | | 1,916 | | |
| Pactiv* | | | 30,833 | | | | 607 | | |
| Phelps Dodge (a) | | | 18,882 | | | | 2,275 | | |
| PPG Industries | | | 33,674 | | | | 2,019 | | |
| Praxair (a) | | | 64,612 | | | | 3,192 | | |
| Rohm & Haas (a) | | | 38,077 | | | | 1,657 | | |
| Sealed Air* | | | 16,604 | | | | 835 | | |
| Sigma-Aldrich | | | 13,857 | | | | 883 | | |
| Temple-Inland | | | 22,847 | | | | 841 | | |
FIRST AMERICAN FUNDS Annual Report 2005
15
Schedule of Investments October 31, 2005
Equity Index Fund (continued)
| DESCRIPTION | | SHARES | | VALUE (000) | |
| United States Steel (a) | | | 22,810 | | | $ | 833 | | |
| Vulcan Materials (a) | | | 19,855 | | | | 1,291 | | |
| Weyerhaeuser | | | 46,442 | | | | 2,942 | | |
| | | | 64,349 | | |
| Telecommunication Services – 3.0% | |
| ALLTEL (a) | | | 65,349 | | | | 4,042 | | |
| AT&T (a) | | | 160,037 | | | | 3,166 | | |
| BellSouth (a) | | | 363,337 | | | | 9,454 | | |
| CenturyTel (a) | | | 26,282 | | | | 860 | | |
| Citizens Communications (a) | | | 68,497 | | | | 838 | | |
| Qwest Communications International* | | | 329,271 | | | | 1,436 | | |
| SBC Communications (a) | | | 659,456 | | | | 15,728 | | |
| Sprint | | | 574,122 | | | | 13,383 | | |
| Verizon Communications | | | 543,993 | | | | 17,141 | | |
| | | | 66,048 | | |
| Utilities – 3.4% | |
| AES* | | | 130,474 | | | | 2,073 | | |
| Allegheny Energy* (a) | | | 31,974 | | | | 904 | | |
| Ameren (a) | | | 37,666 | | | | 1,981 | | |
| American Electric Power (a) | | | 77,252 | | | | 2,932 | | |
| Calpine* (a) | | | 129,180 | | | | 307 | | |
| CenterPoint Energy (a) | | | 59,827 | | | | 792 | | |
| Cinergy | | | 35,544 | | | | 1,418 | | |
| CMS Energy* (a) | | | 43,702 | | | | 652 | | |
| Consolidated Edison (a) | | | 44,910 | | | | 2,043 | | |
| Constellation Energy | | | 32,556 | | | | 1,784 | | |
| Dominion Resources (a) | | | 68,015 | | | | 5,175 | | |
| DTE Energy (a) | | | 32,839 | | | | 1,419 | | |
| Duke Energy (a) | | | 189,585 | | | | 5,020 | | |
| Dynegy* (a) | | | 65,194 | | | | 289 | | |
| Edison International (a) | | | 63,684 | | | | 2,787 | | |
| Entergy | | | 44,663 | | | | 3,159 | | |
| Exelon (a) | | | 133,653 | | | | 6,954 | | |
| FirstEnergy | | | 64,475 | | | | 3,063 | | |
| FPL Group (a) | | | 77,659 | | | | 3,344 | | |
| KeySpan | | | 33,653 | | | | 1,163 | | |
| NICOR (a) | | | 8,836 | | | | 346 | | |
| NiSource | | | 51,307 | | | | 1,213 | | |
| People's Energy | | | 2,982 | | | | 111 | | |
| PG&E (a) | | | 82,671 | | | | 3,008 | | |
| Pinnacle West Capital | | | 17,804 | | | | 743 | | |
| PPL | | | 71,590 | | | | 2,244 | | |
| Progress Energy (a) | | | 48,150 | | | | 2,099 | | |
| Progress Energy-CVO* | | | 7,906 | | | | 1 | | |
| Public Service Enterprises | | | 46,418 | | | | 2,919 | | |
| Sempra Energy | | | 47,503 | | | | 2,104 | | |
| Southern (a) | | | 146,395 | | | | 5,122 | | |
| TECO Energy | | | 39,081 | | | | 676 | | |
| TXU | | | 50,597 | | | | 5,098 | | |
| Xcel Energy (a) | | | 77,029 | | | | 1,412 | | |
| | | | 74,355 | | |
Total Common Stocks
(Cost $1,593,052) | | | | | | | 2,172,047 | | |
| Short-Term Investments – 0.2% | |
| Affiliated Money Market Fund – 0.1% | |
First American Prime
Obligations Fund, Class Z (b) (e) | | | 2,911,322 | | | | 2,911 | | |
Equity Index Fund (concluded)
| DESCRIPTION | | PAR (000) | | VALUE (000) | |
| U.S. Treasury Obligation – 0.1% | |
U.S. Treasury Bill
3.945%, 03/02/06 (f) | | $ | 2,000 | | | $ | 1,974 | | |
Total Short-Term Investments
(Cost $4,888) | | | | | 4,885 | | |
Investments Purchased with Proceeds
from Securities Lending (g) – 22.2%
(Cost $487,770) | | | | | 487,770 | | |
Total Investments – 121.2%
(Cost $2,085,710) | | | | | 2,664,702 | | |
| Other Assets and Liabilities, Net – (21.2)% | | | | | (465,549 | ) | |
| Total Net Assets – 100.0% | | | | $ | 2,199,153 | | |
* Non-income producing security
(a) This security or a portion of this security is out on loan at October 31, 2005. Total loaned securities had a market value of $478,324,792 at October 31, 2005. See note 2 in Notes to Financial Statements.
(b) Investment in affiliated security. As of October 31, 2005, the market value of these investments was $13,787,533 or 0.6% of total net assets. See notes 3 and 4 in Notes to Financial Statements.
(c) Security considered illiquid or restricted. As of October 31, 2005, the market value of this investment was $0 or 0.0% of total net assets. See note 2 in Notes to Financial Statements.
(d) Security is fair valued. As of October 31, 2005, the fair value of this investment was $0 or 0.0% of total net assets. See note 2 in Notes to Financial Statements.
(e) This money market fund is advised by U.S. Bancorp Asset Management, Inc., which also serves as advisor to this fund. See note 3 in Notes to Financial Statements.
(f) Security has been deposited as initial margin on open futures contracts. Yield shown is the effective yield as of October 31, 2005. See note 2 in Notes to Financial Statements.
(g) The fund may loan securities in return for collateral in the form of cash, U.S. Government securities, or other high grade debt obligations. The cash collateral is invested in various short-term fixed income securities, such as repurchase agreements, commercial paper, money market funds and other corporate obligations. See note 2 in Notes to Financial Statements.
CVO – Contingent Value Obligation
Schedule of Open Futures Contracts
| Description | | Number of
Contracts
Purchased
(Sold) | | Notional
Contract
Value
(000) | | Settlement
Month | | Unrealized
Appreciation
(000) | |
S&P 500 Index
Futures Contracts | | | 88 | | | $ | 26,616 | | | December-05 | | $ | 563 | | |
The accompanying notes are an integral part of the financial statements.
FIRST AMERICAN FUNDS Annual Report 2005
16
Schedule of Investments October 31, 2005
Mid Cap Index Fund
| DESCRIPTION | | SHARES | | VALUE (000) | |
| Common Stocks – 98.7% | |
| Consumer Discretionary – 14.9% | |
| 99 Cents Only Stores* | | | 16,863 | | | $ | 163 | | |
| Abercrombie & Fitch | | | 30,352 | | | | 1,578 | | |
| Advanced Auto Parts* (a) | | | 37,785 | | | | 1,417 | | |
| Aeropostale* (a) | | | 19,492 | | | | 381 | | |
| American Eagle Outfitters (a) | | | 45,330 | | | | 1,068 | | |
| American Greetings, Class A (a) | | | 23,170 | | | | 585 | | |
| AnnTaylor Stores* | | | 25,120 | | | | 610 | | |
| Applebee's International | | | 27,790 | | | | 609 | | |
| ArvinMeritor | | | 24,153 | | | | 387 | | |
| Bandag | | | 4,042 | | | | 172 | | |
| Barnes & Noble | | | 20,314 | | | | 735 | | |
| Beazer Homes USA (a) | | | 13,800 | | | | 800 | | |
| Belo, Class A (a) | | | 36,539 | | | | 789 | | |
| BLYTH | | | 9,189 | | | | 168 | | |
| Bob Evans Farms | | | 11,877 | | | | 266 | | |
| Borders Group | | | 25,715 | | | | 505 | | |
| BorgWarner (a) | | | 19,252 | | | | 1,116 | | |
| Boyd Gaming | | | 14,978 | | | | 618 | | |
| Brinker International (a) | | | 29,758 | | | | 1,134 | | |
| Callaway Golf (a) | | | 24,017 | | | | 342 | | |
| CarMax* | | | 36,639 | | | | 984 | | |
| Catalina Marketing, Class C (a) | | | 13,847 | | | | 361 | | |
| CBRL Group (a) | | | 16,491 | | | | 572 | | |
| Cheesecake Factory* (a) | | | 26,650 | | | | 915 | | |
| Chico's FAS* | | | 62,310 | | | | 2,464 | | |
| Claire's Stores | | | 33,880 | | | | 883 | | |
| Corinthian Colleges* (a) | | | 30,990 | | | | 386 | | |
| DeVry* (a) | | | 20,186 | | | | 456 | | |
| Dollar Tree Stores* (a) | | | 36,964 | | | | 797 | | |
| Emmis Communications, Class A* | | | 10,421 | | | | 204 | | |
| Entercom Communications* (a) | | | 13,690 | | | | 395 | | |
| Foot Locker (a) | | | 53,822 | | | | 1,046 | | |
| Furniture Brands International | | | 18,185 | | | | 330 | | |
| Gamestop* | | | 19,530 | | | | 693 | | |
| Gentex | | | 54,928 | | | | 1,034 | | |
| GTECH Holdings | | | 39,950 | | | | 1,272 | | |
| Harman International Industries (a) | | | 22,200 | | | | 2,217 | | |
| Harte-Hanks | | | 20,053 | | | | 513 | | |
| Hovnanian Enterprises, Class A* | | | 12,690 | | | | 571 | | |
| International Speedway, Class A | | | 12,364 | | | | 639 | | |
| Lear (a) | | | 23,140 | | | | 705 | | |
| Lee Enterprises | | | 15,684 | | | | 615 | | |
| Media General, Class A | | | 8,204 | | | | 433 | | |
| Michaels Stores (a) | | | 46,482 | | | | 1,538 | | |
| Modine Manufacturing | | | 11,023 | | | | 364 | | |
| Mohawk Industries* (a) | | | 18,214 | | | | 1,422 | | |
| O'Reilly Automotive* | | | 35,890 | | | | 1,012 | | |
| Outback Steakhouse | | | 22,593 | | | | 851 | | |
| Pacific Sunwear of California* (a) | | | 26,190 | | | | 655 | | |
| Payless ShoeSource* | | | 23,694 | | | | 435 | | |
| PETsMART (a) | | | 49,748 | | | | 1,169 | | |
| Pier 1 Imports (a) | | | 29,414 | | | | 304 | | |
| Polo Ralph Lauren Corp. (a) | | | 20,770 | | | | 1,022 | | |
| Reader's Digest Association, Class A | | | 34,190 | | | | 524 | | |
| Regis | | | 15,200 | | | | 583 | | |
| Rent-A-Center* | | | 24,400 | | | | 440 | | |
| Ross Stores (a) | | | 50,378 | | | | 1,362 | | |
Mid Cap Index Fund (continued)
| DESCRIPTION | | SHARES | | VALUE (000) | |
| Ruby Tuesday (a) | | | 22,240 | | | $ | 487 | | |
| Ryland Group (a) | | | 16,600 | | | | 1,117 | | |
| Saks* | | | 49,120 | | | | 892 | | |
| Scholastic* (a) | | | 12,806 | | | | 417 | | |
| Thor Industries (a) | | | 11,910 | | | | 389 | | |
| Timberland, Class A* | | | 19,286 | | | | 543 | | |
| Toll Brothers* (a) | | | 39,328 | | | | 1,452 | | |
| Tupperware | | | 18,820 | | | | 432 | | |
| Urban Outfitters* (a) | | | 37,520 | | | | 1,063 | | |
| Valassis Communications* (a) | | | 17,561 | | | | 549 | | |
| Washington Post, Class B | | | 1,789 | | | | 1,333 | | |
| Westwood One | | | 23,329 | | | | 432 | | |
| Williams-Sonoma* (a) | | | 39,953 | | | | 1,563 | | |
| | | | 54,278 | | |
| Consumer Staples – 3.4% | |
| BJ's Wholesale Club* (a) | | | 23,792 | | | | 678 | | |
| Church and Dwight | | | 21,394 | | | | 750 | | |
| Dean Foods* | | | 51,546 | | | | 1,863 | | |
| Energizer Holdings* | | | 24,780 | | | | 1,251 | | |
| Hormel Foods | | | 25,120 | | | | 799 | | |
| JM Smucker (a) | | | 20,145 | | | | 921 | | |
| Lancaster Colony | | | 8,844 | | | | 355 | | |
| PepsiAmericas | | | 24,128 | | | | 563 | | |
| Ruddick | | | 12,808 | | | | 282 | | |
| Smithfield Foods* | | | 30,925 | | | | 915 | | |
| Tootsie Roll Industries | | | 8,686 | | | | 263 | | |
| Universal | | | 8,756 | | | | 328 | | |
| Whole Foods Market (a) | | | 22,934 | | | | 3,305 | | |
| | | | 12,273 | | |
| Energy – 7.3% | |
| Cooper Cameron* (a) | | | 19,318 | | | | 1,424 | | |
| Denbury Resources* | | | 19,960 | | | | 871 | | |
| ENSCO International (a) | | | 52,641 | | | | 2,400 | | |
| FMC Technologies* | | | 24,325 | | | | 887 | | |
| Forest Oil* (a) | | | 19,011 | | | | 830 | | |
| Grant Prideco* (a) | | | 43,840 | | | | 1,705 | | |
| Hanover Compressor* | | | 28,440 | | | | 366 | | |
| Helmerich & Payne | | | 18,116 | | | | 1,004 | | |
| Newfield Exploration* | | | 43,974 | | | | 1,993 | | |
| Noble Energy | | | 60,574 | | | | 2,426 | | |
| Overseas Shipholding Group | | | 10,958 | | | | 522 | | |
| Patterson-UTI Energy | | | 59,430 | | | | 2,028 | | |
| Pioneer Natural Resources | | | 48,933 | | | | 2,449 | | |
| Plains Exploration & Production* (a) | | | 27,050 | | | | 1,055 | | |
| Pogo Producing (a) | | | 20,588 | | | | 1,040 | | |
| Pride International* | | | 50,171 | | | | 1,408 | | |
| Smith International (a) | | | 73,224 | | | | 2,372 | | |
| Tidewater (a) | | | 21,358 | | | | 982 | | |
| Western Gas Resources (a) | | | 19,312 | | | | 836 | | |
| | | | 26,598 | | |
| Financials – 18.7% | |
| A.G. Edwards (a) | | | 26,189 | | | | 1,108 | | |
| Allmerica Financial | | | 18,230 | | | | 695 | | |
| AMB Property | | | 28,426 | | | | 1,256 | | |
| American Financial Group (a) | | | 16,124 | | | | 551 | | |
| AmeriCredit* (a) | | | 48,102 | | | | 1,075 | | |
| AmerUS Group, Class A (a) | | | 13,404 | | | | 792 | | |
| Arthur J. Gallagher (a) | | | 30,243 | | | | 890 | | |
FIRST AMERICAN FUNDS Annual Report 2005
17
Schedule of Investments October 31, 2005
Mid Cap Index Fund (continued)
| DESCRIPTION | | SHARES | | VALUE (000) | |
| Associated Banc-Corp (a) | | | 44,336 | | | $ | 1,384 | | |
| Astoria Financial (a) | | | 33,362 | | | | 932 | | |
| Bank of Hawaii | | | 18,139 | | | | 932 | | |
| Brown & Brown | | | 19,600 | | | | 1,065 | | |
| Cathay General Bancorp | | | 13,580 | | | | 529 | | |
| City National (a) | | | 14,301 | | | | 1,049 | | |
| Colonial BancGroup | | | 49,114 | | | | 1,196 | | |
| Commerce Bancorp (a) | | | 57,084 | | | | 1,739 | | |
| Cullen/Frost Bankers (a) | | | 16,770 | | | | 886 | | |
| Developers Diversified Realty (a) | | | 38,180 | | | | 1,668 | | |
| Eaton Vance | | | 45,950 | | | | 1,144 | | |
| Everest Re Group | | | 20,041 | | | | 1,993 | | |
| Fidelity National Financial | | | 59,767 | | | | 2,239 | | |
| First American (a) | | | 29,573 | | | | 1,296 | | |
| FirstMerit (a) | | | 28,888 | | | | 762 | | |
| GATX | | | 17,586 | | | | 657 | | |
| Greater Bay Bancorp | | | 17,819 | | | | 447 | | |
| HCC Insurance Holdings | | | 34,843 | | | | 1,045 | | |
| Highwoods Properties (a) | | | 18,150 | | | | 512 | | |
| Horace Mann Educators | | | 14,785 | | | | 287 | | |
| Hospitality Properties Trust | | | 24,250 | | | | 963 | | |
| Independence Community Bank | | | 25,416 | | | | 1,005 | | |
| IndyMac Bancorp (a) | | | 21,230 | | | | 793 | | |
| Investors Financial Services (a) | | | 23,520 | | | | 898 | | |
| Jefferies Group (a) | | | 17,640 | | | | 749 | | |
| LaBranche* (a) | | | 19,428 | | | | 185 | | |
| Legg Mason | | | 38,404 | | | | 4,121 | | |
| Leucadia National | | | 28,693 | | | | 1,233 | | |
| Liberty Property Trust (a) | | | 30,120 | | | | 1,256 | | |
| Macerich (a) | | | 20,970 | | | | 1,348 | | |
| Mack-Cali Realty | | | 19,170 | | | | 818 | | |
| Mercantile Bankshares | | | 27,125 | | | | 1,529 | | |
| Mercury General | | | 11,470 | | | | 693 | | |
| MoneyGram International | | | 30,315 | | | | 737 | | |
| New Plan Excel Realty Trust | | | 35,150 | | | | 808 | | |
| New York Community Bancorp (a) | | | 81,582 | | | | 1,319 | | |
| Ohio Casualty | | | 21,274 | | | | 580 | | |
| Old Republic International | | | 62,498 | | | | 1,619 | | |
| PMI Group (a) | | | 32,620 | | | | 1,301 | | |
| Protective Life | | | 23,800 | | | | 1,043 | | |
| Radian Group (a) | | | 30,486 | | | | 1,588 | | |
| Raymond James Financial | | | 21,750 | | | | 740 | | |
| Rayonier (a) | | | 26,497 | | | | 1,013 | | |
| Regency Centers (a) | | | 21,530 | | | | 1,199 | | |
| SEI Investments | | | 22,215 | | | | 862 | | |
| StanCorp Financial Group | | | 9,733 | | | | 896 | | |
| SVB Financial Group* (a) | | | 12,430 | | | | 618 | | |
| TCF Financial | | | 43,286 | | | | 1,173 | | |
| Texas Regional Bancshares, Class A | | | 12,890 | | | | 378 | | |
| United Dominion Realty Trust (a) | | | 47,830 | | | | 1,058 | | |
| Unitrin (a) | | | 17,984 | | | | 827 | | |
| W.R. Berkley | | | 40,889 | | | | 1,787 | | |
| Waddell & Reed Financial | | | 28,794 | | | | 552 | | |
| Washington Federal (a) | | | 30,122 | | | | 693 | | |
| Webster Financial | | | 18,185 | | | | 840 | | |
| Weingarten Realty Investors | | | 29,353 | | | | 1,044 | | |
| Westamerica Bancorporation | | | 10,941 | | | | 583 | | |
| Wilmington Trust | | | 21,947 | | | | 832 | | |
| | | | 67,810 | | |
Mid Cap Index Fund (continued)
| DESCRIPTION | | SHARES | | VALUE (000) | |
| Health Care – 11.7% | |
| Advanced Medical Optics* (a) | | | 22,177 | | | $ | 791 | | |
| Apria Healthcare Group* | | | 16,668 | | | | 385 | | |
| Barr Pharmaceuticals* | | | 35,621 | | | | 2,046 | | |
| Beckman Coulter | | | 21,003 | | | | 1,035 | | |
| Cephalon* (a) | | | 19,750 | | | | 900 | | |
| Charles River Laboratories International* (a) | | | 24,781 | | | | 1,084 | | |
| Community Health Systems* (a) | | | 30,867 | | | | 1,145 | | |
| Covance* | | | 21,479 | | | | 1,045 | | |
| Cytyc* (a) | | | 39,854 | | | | 1,010 | | |
| DENTSPLY International | | | 25,104 | | | | 1,384 | | |
| Edwards Lifesciences* | | | 20,354 | | | | 842 | | |
| Gen-Probe* (a) | | | 17,780 | | | | 726 | | |
| Health Net* (a) | | | 38,533 | | | | 1,805 | | |
| Henry Schein* | | | 29,468 | | | | 1,168 | | |
| Hillenbrand Industries | | | 19,856 | | | | 915 | | |
| INAMED* | | | 12,520 | | | | 890 | | |
| Intuitive Surgical* (a) | | | 12,220 | | | | 1,084 | | |
| Invitrogen* (a) | | | 18,301 | | | | 1,164 | | |
| IVAX* | | | 74,182 | | | | 2,118 | | |
| Lifepoint Hospitals* (a) | | | 19,650 | | | | 768 | | |
| Lincare Holdings* (a) | | | 34,366 | | | | 1,404 | | |
| Martek Biosciences* (a) | | | 11,160 | | | | 345 | | |
| Millennium Pharmaceuticals* (a) | | | 106,361 | | | | 970 | | |
| Mine Safety Appliances | | | 7,230 | | | | 303 | | |
| Omnicare (a) | | | 36,333 | | | | 1,966 | | |
| PacifiCare Health Systems* | | | 30,004 | | | | 2,471 | | |
| Par Pharmaceutical Companies* (a) | | | 12,020 | | | | 311 | | |
| Perrigo (a) | | | 29,660 | | | | 397 | | |
| Protein Design Labs* (a) | | | 37,136 | | | | 1,041 | | |
| Renal Care* | | | 23,190 | | | | 1,086 | | |
| Sepracor* (a) | | | 36,829 | | | | 2,072 | | |
| STERIS | | | 23,670 | | | | 540 | | |
| Techne* | | | 13,300 | | | | 721 | | |
| Triad Hospitals* (a) | | | 30,046 | | | | 1,236 | | |
| Universal Health Services (a) | | | 19,976 | | | | 942 | | |
| Valeant Pharmaceuticals International | | | 32,304 | | | | 554 | | |
| Varian* (a) | | | 11,882 | | | | 437 | | |
| Varian Medical Systems* (a) | | | 46,526 | | | | 2,120 | | |
| VCA Antech* | | | 26,448 | | | | 682 | | |
| Vertex Pharmaceuticals* (a) | | | 32,708 | | | | 744 | | |
| | | | 42,647 | | |
| Industrials – 13.8% | |
| Adesa | | | 31,399 | | | | 672 | | |
| AGCO* (a) | | | 30,713 | | | | 491 | | |
| AirTran Holdings* (a) | | | 30,760 | | | | 460 | | |
| Alaska Air Group* (a) | | | 8,724 | | | | 275 | | |
| Alexander & Baldwin (a) | | | 14,917 | | | | 730 | | |
| Alliant Techsystems* (a) | | | 12,570 | | | | 883 | | |
| AMETEK (a) | | | 24,494 | | | | 998 | | |
| Banta | | | 8,610 | | | | 433 | | |
| Brinks | | | 19,431 | | | | 763 | | |
| C.H. Robinson Worldwide (a) | | | 58,378 | | | | 2,058 | | |
| Career Education* (a) | | | 35,136 | | | | 1,250 | | |
| Carlisle Companies | | | 10,660 | | | | 711 | | |
| ChoicePoint* | | | 30,645 | | | | 1,295 | | |
| CNF | | | 17,705 | | | | 996 | | |
| Copart* | | | 25,450 | | | | 595 | | |
| Corporate Executive Board | | | 14,050 | | | | 1,161 | | |
The accompanying notes are an integral part of the financial statements.
FIRST AMERICAN FUNDS Annual Report 2005
18
Mid Cap Index Fund (continued)
| DESCRIPTION | | SHARES | | VALUE (000) | |
| Crane | | | 18,100 | | | $ | 560 | | |
| Deluxe (a) | | | 17,460 | | | | 582 | | |
| Donaldson (a) | | | 24,418 | | | | 763 | | |
| Dun & Bradstreet* | | | 23,119 | | | | 1,464 | | |
| Dycom Industries* (a) | | | 13,479 | | | | 269 | | |
| Education Management* | | | 23,168 | | | | 715 | | |
| Expeditors International of Washington (a) | | | 36,508 | | | | 2,215 | | |
| Fastenal (a) | | | 21,709 | | | | 1,522 | | |
| Federal Signal | | | 15,707 | | | | 255 | | |
| Flowserve* (a) | | | 19,462 | | | | 681 | | |
| Graco (a) | | | 23,680 | | | | 812 | | |
| Granite Construction | | | 11,784 | | | | 402 | | |
| Harsco | | | 14,737 | | | | 947 | | |
| Herman Miller | | | 24,723 | | | | 678 | | |
| HNI (a) | | | 17,548 | | | | 858 | | |
| Hubbell, Class B | | | 21,555 | | | | 1,038 | | |
| ITT Educational Services* | | | 13,080 | | | | 723 | | |
| J.B. Hunt Transport Services | | | 45,586 | | | | 885 | | |
| Jacobs Engineering Group* | | | 19,944 | | | | 1,271 | | |
| JetBlue Airways* (a) | | | 33,082 | | | | 616 | | |
| Joy Global (a) | | | 28,110 | | | | 1,289 | | |
| Kelly Services, Class A | | | 7,153 | | | | 198 | | |
| Kennametal | | | 13,025 | | | | 666 | | |
| Korn/Ferry International* | | | 12,737 | | | | 219 | | |
| Laureate Education* (a) | | | 16,793 | | | | 830 | | |
| Manpower | | | 30,039 | | | | 1,360 | | |
| MSC Industrial Direct | | | 15,920 | | | | 608 | | |
| Nordson | | | 10,882 | | | | 404 | | |
| Pentair | | | 35,790 | | | | 1,163 | | |
| Precision Castparts | | | 45,032 | | | | 2,133 | | |
| Quanta Services* (a) | | | 40,679 | | | | 467 | | |
| Republic Services | | | 42,366 | | | | 1,498 | | |
| Rollins | | | 10,986 | | | | 209 | | |
| Sequa, Class A* | | | 2,380 | | | | 147 | | |
| Sotheby's Holdings, Class A* | | | 13,064 | | | | 203 | | |
| SPX (a) | | | 25,226 | | | | 1,085 | | |
| Stericycle* (a) | | | 15,330 | | | | 882 | | |
| Swift Transportation* (a) | | | 18,038 | | | | 329 | | |
| Tecumseh Products, Class A | | | 5,452 | | | | 110 | | |
| Teleflex | | | 13,111 | | | | 868 | | |
| Thomas & Betts* | | | 19,201 | | | | 747 | | |
| Timken | | | 28,400 | | | | 805 | | |
| Trinity Industries (a) | | | 13,319 | | | | 507 | | |
| United Rentals* (a) | | | 24,599 | | | | 481 | | |
| Werner Enterprises | | | 17,805 | | | | 319 | | |
| Yellow Roadway* (a) | | | 19,490 | | | | 886 | | |
| York International | | | 14,784 | | | | 830 | | |
| | | | 50,270 | | |
| Information Technology – 15.1% | |
| 3Com* (a) | | | 129,950 | | | | 500 | | |
| Activision* | | | 93,009 | | | | 1,467 | | |
| Acxiom | | | 26,966 | | | | 575 | | |
| ADTRAN | | | 21,584 | | | | 653 | | |
| Advent Software* (a) | | | 6,834 | | | | 210 | | |
| Alliance Data Systems* (a) | | | 21,150 | | | | 752 | | |
| Amphenol, Class A | | | 31,020 | | | | 1,240 | | |
| Anteon International* | | | 10,170 | | | | 460 | | |
| Arrow Electronics* (a) | | | 41,384 | | | | 1,221 | | |
| Atmel* (a) | | | 150,797 | | | | 371 | | |
Mid Cap Index Fund (continued)
| DESCRIPTION | | SHARES | | VALUE (000) | |
| Avnet* (a) | | | 50,883 | | | $ | 1,173 | | |
| Avocent* (a) | | | 17,064 | | | | 523 | | |
| BISYS Group* | | | 41,173 | | | | 522 | | |
| Cabot Microelectronics* (a) | | | 8,490 | | | | 250 | | |
| Cadence Design Systems* (a) | | | 94,390 | | | | 1,508 | | |
| CDW (a) | | | 21,661 | | | | 1,221 | | |
| Ceridian* | | | 50,939 | | | | 1,116 | | |
| Certegy | | | 21,413 | | | | 802 | | |
| CheckFree* | | | 30,239 | | | | 1,285 | | |
| Cognizant Technology Solutions* | | | 47,470 | | | | 2,088 | | |
| CommScope* (a) | | | 17,277 | | | | 337 | | |
| Credence Systems* (a) | | | 32,645 | | | | 251 | | |
| Cree* (a) | | | 26,465 | | | | 636 | | |
| CSG Systems International* (a) | | | 17,797 | | | | 418 | | |
| Cypress Semiconductor* (a) | | | 46,339 | | | | 630 | | |
| Diebold | | | 24,250 | | | | 876 | | |
| DST Systems* | | | 24,069 | | | | 1,351 | | |
| F5 Networks* | | | 13,110 | | | | 682 | | |
| Fair Isaac (a) | | | 23,285 | | | | 972 | | |
| Fairchild Semiconductor International, Class A* (a) | | | 41,327 | | | | 636 | | |
| Gartner, Class A* (a) | | | 21,308 | | | | 257 | | |
| Harris | | | 46,842 | | | | 1,925 | | |
| Imation | | | 10,443 | | | | 447 | | |
| Ingram Micro* | | | 37,670 | | | | 682 | | |
| Integrated Device Technology* (a) | | | 67,855 | | | | 670 | | |
| International Rectifier* | | | 22,958 | | | | 679 | | |
| Intersil, Class A | | | 52,893 | | | | 1,204 | | |
| Jack Henry & Associates | | | 27,580 | | | | 496 | | |
| KEMET* | | | 29,836 | | | | 206 | | |
| Lam Research* | | | 47,048 | | | | 1,587 | | |
| Lattice Semiconductor* (a) | | | 38,846 | | | | 170 | | |
| Macromedia* | | | 26,486 | | | | 1,163 | | |
| Macrovision* | | | 17,037 | | | | 321 | | |
| McAfee* | | | 57,208 | | | | 1,718 | | |
| McDATA, Class A* | | | 55,552 | | | | 267 | | |
| MEMC Electronic Materials* (a) | | | 54,150 | | | | 971 | | |
| Mentor Graphics* (a) | | | 26,152 | | | | 216 | | |
| Micrel* (a) | | | 22,694 | | | | 227 | | |
| Microchip Technology (a) | | | 72,134 | | | | 2,176 | | |
| MPS Group* | | | 35,725 | | | | 445 | | |
| National Instruments | | | 19,082 | | | | 456 | | |
| Newport* | | | 14,040 | | | | 183 | | |
| Plantronics | | | 16,557 | | | | 494 | | |
| Plexus* | | | 14,781 | | | | 261 | | |
| Polycom* (a) | | | 33,289 | | | | 509 | | |
| Powerwave Technologies* (a) | | | 38,570 | | | | 432 | | |
| Reynolds & Reynolds, Class A | | | 17,782 | | | | 472 | | |
| RF Micro Devices* | | | 66,156 | | | | 347 | | |
| RSA Security* | | | 23,832 | | | | 272 | | |
| SanDisk* (a) | | | 62,926 | | | | 3,706 | | |
| Semtech* (a) | | | 25,564 | | | | 386 | | |
| Silicon Laboratories* (a) | | | 13,190 | | | | 424 | | |
| SRA International, Class A* | | | 12,080 | | | | 396 | | |
| Sybase* (a) | | | 31,310 | | | | 697 | | |
| Synopsys* (a) | | | 49,616 | | | | 940 | | |
| Tech Data* (a) | | | 19,903 | | | | 689 | | |
| Transaction Systems Architects, Class A* (a) | | | 11,893 | | | | 321 | | |
| TriQuint Semiconductor* | | | 47,131 | | | | 198 | | |
| UTStarcom* (a) | | | 35,010 | | | | 193 | | |
FIRST AMERICAN FUNDS Annual Report 2005
19
Schedule of Investments October 31, 2005
Mid Cap Index Fund (continued)
| DESCRIPTION | | SHARES | | VALUE (000) | |
| Vishay Intertechnology* | | | 62,241 | | | $ | 706 | | |
| Western Digital* (a) | | | 74,630 | | | | 903 | | |
| Wind River Systems* (a) | | | 26,493 | | | | 347 | | |
| Zebra Technology, Class A* (a) | | | 24,880 | | | | 1,073 | | |
| | | | 54,958 | | |
| Materials – 5.7% | |
| Airgas | | | 24,400 | | | | 690 | | |
| Albemarle | | | 13,177 | | | | 462 | | |
| Arch Coal (a) | | | 22,050 | | | | 1,699 | | |
| Bowater (a) | | | 19,061 | | | | 505 | | |
| Cabot | | | 21,389 | | | | 730 | | |
| Chemtura Corp. | | | 83,200 | | | | 890 | | |
| Cytec Industries | | | 14,081 | | | | 582 | | |
| Ferro | | | 14,467 | | | | 258 | | |
| FMC* (a) | | | 13,213 | | | | 719 | | |
| Glatfelter | | | 10,670 | | | | 145 | | |
| Longview Fibre | | | 17,660 | | | | 332 | | |
| Lubrizol | | | 23,465 | | | | 976 | | |
| Lyondell Chemical (a) | | | 68,383 | | | | 1,833 | | |
| Martin Marietta Materials (a) | | | 15,961 | | | | 1,259 | | |
| Minerals Technologies (a) | | | 7,081 | | | | 379 | | |
| Olin (a) | | | 24,060 | | | | 430 | | |
| Packaging Corporation of America | | | 23,124 | | | | 469 | | |
| Peabody Energy (a) | | | 44,158 | | | | 3,451 | | |
| Potlatch (a) | | | 10,253 | | | | 459 | | |
| RPM | | | 40,190 | | | | 748 | | |
| Scotts | | | 7,780 | | | | 683 | | |
| Sensient Technologies | | | 16,739 | | | | 296 | | |
| Sonoco Products (a) | | | 33,805 | | | | 957 | | |
| Steel Dynamics | | | 13,890 | | | | 430 | | |
| Valspar (a) | | | 35,216 | | | | 777 | | |
| Worthington Industries (a) | | | 24,570 | | | | 494 | | |
| | | | 20,653 | | |
| Telecommunication Services – 0.5% | |
| Cincinnati Bell* | | | 83,996 | | | | 333 | | |
| Telephone & Data Systems | | | 17,052 | | | | 645 | | |
| Telephone & Data Systems Special Shares (a) | | | 18,332 | | | | 663 | | |
| | | | 1,641 | | |
| Utilities – 7.6% | |
| AGL Resources | | | 25,680 | | | | 904 | | |
| Alliant Energy | | | 39,572 | | | | 1,047 | | |
| Aqua America | | | 33,740 | | | | 1,143 | | |
| Aquila* (a) | | | 130,647 | | | | 463 | | |
| Black Hills (a) | | | 11,210 | | | | 466 | | |
| DPL (a) | | | 44,490 | | | | 1,147 | | |
| Duquesne Light Holdings (a) | | | 26,329 | | | | 439 | | |
| Energy East | | | 51,876 | | | | 1,237 | | |
| Equitable Resources | | | 41,582 | | | | 1,607 | | |
| Great Plains Energy (a) | | | 25,678 | | | | 737 | | |
| Hawaiian Electric Industries | | | 27,838 | | | | 734 | | |
| IDACORP (a) | | | 14,406 | | | | 416 | | |
| MDU Resources Group (a) | | | 41,542 | | | | 1,370 | | |
| National Fuel Gas | | | 25,823 | | | | 778 | | |
| Northeast Utilities | | | 43,974 | | | | 800 | | |
| NSTAR | | | 37,522 | | | | 1,021 | | |
| OGE Energy (a) | | | 27,980 | | | | 721 | | |
| ONEOK (a) | | | 35,420 | | | | 1,018 | | |
| Pepco Holdings | | | 65,450 | | | | 1,407 | | |
Mid Cap Index Fund (concluded)
| DESCRIPTION | | SHARES/PAR (000) | | VALUE (000) | |
| PNM Resources (a) | | | 24,307 | | | $ | 616 | | |
| Puget Energy | | | 34,240 | | | | 734 | | |
| Questar | | | 28,889 | | | | 2,275 | | |
| SCANA | | | 38,501 | | | | 1,527 | | |
| Sierra Pacific Resources* | | | 63,240 | | | | 819 | | |
| Vectren | | | 26,242 | | | | 712 | | |
| Westar Energy (a) | | | 29,748 | | | | 657 | | |
| WGL Holdings | | | 15,725 | | | | 489 | | |
| Wisconsin Energy (a) | | | 40,913 | | | | 1,548 | | |
| WPS Resources (a) | | | 13,302 | | | | 726 | | |
| | | | 27,558 | | |
Total Common Stocks
(Cost $297,980) | | | | | | | 358,686 | | |
| Short-Term Investments – 1.4% | |
| Affiliated Money Market Fund – 1.0% | |
First American Prime
Obligations Fund, Class Z (b) | | | 3,641,260 | | | | 3,641 | | |
| U.S. Treasury Obligation – 0.4% | |
U.S. Treasury Bill
3.945%, 03/02/06 (c) | | $ | 1,500 | | | | 1,480 | | |
Total Short-Term Investments
(Cost $5,121) | | | | | | | 5,121 | | |
Investments Purchased with Proceeds
from Securities Lending (d) – 37.1%
(Cost $134,979) | | | | | | | 134,979 | | |
Total Investments – 137.2%
(Cost $438,080) | | | | | | | 498,786 | | |
| Other Assets and Liabilities, Net – (37.2)% | | | | | | | (135,392 | ) | |
| Total Net Assets – 100.0% | | | | | | $ | 363,394 | | |
* Non-income producing security
(a) This security or a portion of this security is out on loan at October 31, 2005. Total loaned securities had a market value of $132,363,422 at October 31, 2005. See note 2 in Notes to Financial Statements.
(b) Investment in affiliated security. This money market fund is advised by U.S. Bancorp Asset Management, Inc., which also serves as advisor to this fund. See note 3 in Notes to Financial Statements.
(c) Security has been deposited as initial margin on open futures contracts. Yield shown is effective yield as of October 31, 2005. See note 2 in Notes to Financial Statements.
(d) The fund may loan securities in return for collateral in the form of cash, U.S. Government securities, or other high grade debt obligations. The cash collateral is invested in various short-term fixed income securities, such as repurchase agreements, commercial paper, money market funds and other corporate obligations. See note 2 in Notes to Financial Statements.
Schedule of Open Futures Contracts
| Description | | Number of
Contracts
Purchased
(Sold) | | Notional
Contract
Value
(000) | | Settlement
Month | | Unrealized
Depreciation
(000) | |
S&P Mid Cap 400
Futures Contracts | | | 11 | | | $ | 3,867 | | | December-05 | | $ | (11 | ) | |
The accompanying notes are an integral part of the financial statements.
FIRST AMERICAN FUNDS Annual Report 2005
20
Schedule of Investments October 31, 2005
Small Cap Index Fund
| DESCRIPTION | | SHARES | | VALUE (000) | |
| Common Stocks – 99.6% | |
| Consumer Discretionary – 14.1% | |
| 1-800 Contacts* | | | 1,234 | | | $ | 22 | | |
| 1-800 Flowers* | | | 3,802 | | | | 26 | | |
| 4Kids Entertainment* | | | 2,378 | | | | 41 | | |
| 99 Cents Only Stores* | | | 6,630 | | | | 64 | | |
| A.C. Moore Arts & Crafts* | | | 2,361 | | | | 32 | | |
| Aaron Rents (a) | | | 5,756 | | | | 113 | | |
| ADVO | | | 4,703 | | | | 116 | | |
| Aeropostale* (a) | | | 8,223 | | | | 161 | | |
| AFC Enterprises | | | 3,130 | | | | 36 | | |
| Aftermarket Technology* | | | 2,299 | | | | 42 | | |
| Alliance Gaming* (a) | | | 7,707 | | | | 83 | | |
| Alloy* (a) | | | 5,567 | | | | 26 | | |
| Ambassadors Group | | | 2,736 | | | | 71 | | |
| American Axle & Manufacturing Holdings (a) | | | 5,800 | | | | 126 | | |
| America's Car-Mart* | | | 1,455 | | | | 24 | | |
| Ameristar Casinos | | | 3,556 | | | | 76 | | |
| Andersons | | | 1,050 | | | | 37 | | |
| Arbitron | | | 4,749 | | | | 178 | | |
| Arctic Cat | | | 2,013 | | | | 38 | | |
| ArvinMeritor | | | 10,190 | | | | 163 | | |
| Asbury Automotive Group* | | | 1,925 | | | | 33 | | |
| Audible* (a) | | | 3,730 | | | | 39 | | |
| Avatar Holdings* | | | 796 | | | | 45 | | |
| Aztar* (a) | | | 5,061 | | | | 152 | | |
| Bandag | | | 1,669 | | | | 71 | | |
| Bassett Furniture | | | 1,509 | | | | 28 | | |
| Beasley Broadcast Group* | | | 593 | | | | 9 | | |
| Big 5 Sporting Goods | | | 3,057 | | | | 68 | | |
| Big Lots* (a) | | | 16,090 | | | | 186 | | |
| BJs Restaurants* | | | 1,863 | | | | 40 | | |
| Blair | | | 372 | | | | 14 | | |
| Blockbuster, Class A (a) | | | 27,580 | | | | 126 | | |
| Blount International* | | | 3,390 | | | | 54 | | |
| Blue Nile* | | | 1,720 | | | | 62 | | |
| Bluegreen* | | | 2,940 | | | | 45 | | |
| BLYTH | | | 3,320 | | | | 61 | | |
| Bob Evans Farms | | | 5,325 | | | | 119 | | |
| Bombay Company* (a) | | | 6,108 | | | | 25 | | |
| Bon-Ton Stores | | | 630 | | | | 13 | | |
| Brookfield Homes | | | 2,105 | | | | 105 | | |
| Brown Shoe | | | 2,753 | | | | 89 | | |
| Buckle | | | 1,128 | | | | 42 | | |
| Buffalo Wild Wings* (a) | | | 980 | | | | 27 | | |
| Build-A-Bear Workshop* (a) | | | 1,550 | | | | 37 | | |
| Building Materials Holding | | | 2,097 | | | | 178 | | |
| Burlington Coat Factory | | | 2,412 | | | | 93 | | |
| Cabelas* (a) | | | 3,740 | | | | 61 | | |
| Cache* | | | 1,640 | | | | 26 | | |
| California Coastal Communities* | | | 1,240 | | | | 44 | | |
| California Pizza Kitchen* | | | 3,232 | | | | 103 | | |
| Callaway Golf (a) | | | 10,952 | | | | 156 | | |
| Carmike Cinemas | | | 1,501 | | | | 33 | | |
| Carters* (a) | | | 2,460 | | | | 155 | | |
| Casual Male Retail Group* | | | 4,826 | | | | 28 | | |
| Catalina Marketing, Class C (a) | | | 7,506 | | | | 196 | | |
| Cato, Class A | | | 4,527 | | | | 90 | | |
| CEC Entertainment* (a) | | | 5,045 | | | | 171 | | |
Small Cap Index Fund (continued)
| DESCRIPTION | | SHARES | | VALUE (000) | |
| Champion Enterprise* (a) | | | 10,995 | | | $ | 153 | | |
| Charles & Colvard (a) | | | 1,852 | | | | 43 | | |
| Charlotte Russe Holding* (a) | | | 1,995 | | | | 35 | | |
| Charming Shoppes* (a) | | | 17,197 | | | | 193 | | |
| Charter Communications, Class A* (a) | | | 45,385 | | | | 54 | | |
| Cherokee | | | 1,176 | | | | 41 | | |
| Children's Place Retail Stores* | | | 3,012 | | | | 129 | | |
| Christopher & Banks | | | 5,402 | | | | 72 | | |
| Churchill Downs | | | 1,126 | | | | 36 | | |
| Citadel Broadcasting | | | 6,440 | | | | 89 | | |
| Citi Trends* (a) | | | 600 | | | | 17 | | |
| CKE Restaurants | | | 8,892 | | | | 113 | | |
| Coachmen Industries | | | 2,427 | | | | 29 | | |
| Coldwater Creek* (a) | | | 5,166 | | | | 139 | | |
| Comstock Homebuilding, Class A* | | | 680 | | | | 11 | | |
| Conns* (a) | | | 720 | | | | 21 | | |
| Cooper Tire & Rubber | | | 9,293 | | | | 127 | | |
| Corinthian Colleges* | | | 13,220 | | | | 164 | | |
| Cost Plus* | | | 3,300 | | | | 51 | | |
| Courier | | | 1,652 | | | | 54 | | |
| Cox Radio* (a) | | | 4,160 | | | | 59 | | |
| Crown Media Holdings, Class A* | | | 2,509 | | | | 27 | | |
| CSK Auto* | | | 6,812 | | | | 103 | | |
| CSS Industries | | | 972 | | | | 33 | | |
| Cumulus Media, Class A* | | | 8,412 | | | | 102 | | |
| Dave & Busters* | | | 1,905 | | | | 26 | | |
| Deb Shops | | | 297 | | | | 8 | | |
| Deckers Outdoor* (a) | | | 1,540 | | | | 26 | | |
| Denny's* | | | 14,060 | | | | 56 | | |
| Design Within Reach* | | | 730 | | | | 6 | | |
| DeVry* (a) | | | 8,280 | | | | 187 | | |
| DHB Industries* | | | 4,093 | | | | 12 | | |
| Dixie Group* | | | 1,700 | | | | 23 | | |
| Dominos Pizza | | | 3,770 | | | | 90 | | |
| Dover Downs Gaming & Entertainment | | | 1,201 | | | | 15 | | |
| Dover Motorsports | | | 2,461 | | | | 15 | | |
| Dress Barn* (a) | | | 3,171 | | | | 84 | | |
| Drew Industries* | | | 2,448 | | | | 71 | | |
| Drugstore.com* | | | 10,574 | | | | 34 | | |
| DSW* | | | 1,050 | | | | 22 | | |
| Earle M. Jorgensen* | | | 2,810 | | | | 24 | | |
| Emmis Communications, Class A* | | | 4,845 | | | | 95 | | |
| Entercom Communications* | | | 5,180 | | | | 150 | | |
| Entravision Communications* | | | 9,400 | | | | 77 | | |
| Escala Group* (a) | | | 870 | | | | 14 | | |
| Escalade | | | 1,350 | | | | 18 | | |
| Ethan Allen Interiors (a) | | | 5,250 | | | | 178 | | |
| Finish Line, Class A | | | 6,036 | | | | 94 | | |
| Fisher Communications* | | | 1,039 | | | | 51 | | |
| Fleetwood Enterprises* (a) | | | 8,977 | | | | 99 | | |
| Fossil* | | | 7,030 | | | | 110 | | |
| Fred's (a) | | | 6,004 | | | | 89 | | |
| FTD Group* | | | 2,270 | | | | 25 | | |
| Furniture Brands International | | | 7,120 | | | | 129 | | |
| Gamestop, Class A* | | | 1,392 | | | | 49 | | |
| Gamestop, Class B* | | | 6,350 | | | | 205 | | |
| Gaylord Entertainment* | | | 5,591 | | | | 221 | | |
| Gemstar-TV Guide International* | | | 35,330 | | | | 92 | | |
| Genesco* | | | 3,344 | | | | 123 | | |
FIRST AMERICAN FUNDS Annual Report 2005
21
Schedule of Investments October 31, 2005
Small Cap Index Fund (continued)
| DESCRIPTION | | SHARES | | VALUE (000) | |
| Goody's Family Clothing | | | 2,726 | | | $ | 26 | | |
| Gray Television | | | 6,555 | | | | 59 | | |
| Great Wolf Resorts* | | | 3,890 | | | | 34 | | |
| Group 1 Automotive* | | | 3,042 | | | | 84 | | |
| GSI Commerce* | | | 4,025 | | | | 64 | | |
| Guess?* | | | 2,557 | | | | 69 | | |
| Guitar Center* (a) | | | 3,708 | | | | 193 | | |
| Gymboree* | | | 4,474 | | | | 79 | | |
| Handleman (a) | | | 3,444 | | | | 41 | | |
| Harris Interactive* | | | 7,435 | | | | 31 | | |
| Hartmarx* | | | 3,910 | | | | 27 | | |
| Haverty Furniture | | | 2,794 | | | | 34 | | |
| Hayes Lemmerz International* (a) | | | 4,690 | | | | 18 | | |
| Hibbett Sporting Goods* | | | 5,268 | | | | 138 | | |
| Hollinger International | | | 9,630 | | | | 84 | | |
| Hooker Furniture | | | 1,180 | | | | 17 | | |
| Hot Topic* | | | 6,762 | | | | 101 | | |
| IHOP | | | 3,022 | | | | 143 | | |
| Innovo Group* | | | 3,980 | | | | 5 | | |
| Insight Communications* | | | 7,513 | | | | 86 | | |
| Insight Enterprises* | | | 7,028 | | | | 144 | | |
| Interface, Class A* | | | 6,548 | | | | 51 | | |
| Isle of Capri Casinos* (a) | | | 2,049 | | | | 44 | | |
| J. Jill Group* | | | 3,049 | | | | 39 | | |
| Jack in the Box* (a) | | | 5,500 | | | | 163 | | |
| JAKKS Pacific* | | | 3,844 | | | | 71 | | |
| Jarden* (a) | | | 7,590 | | | | 256 | | |
| Jo-Ann Stores* | | | 3,244 | | | | 47 | | |
| JOS A Bank Clothiers* | | | 1,761 | | | | 72 | | |
| Journal Communications | | | 3,490 | | | | 49 | | |
| Journal Register | | | 6,317 | | | | 101 | | |
| K2* | | | 6,823 | | | | 68 | | |
| Kellwood (a) | | | 3,984 | | | | 87 | | |
| Kenneth Cole Productions | | | 1,433 | | | | 36 | | |
| Keystone Automotive Industries* | | | 2,470 | | | | 71 | | |
| Kimball International | | | 1,208 | | | | 13 | | |
| Krispy Kreme Doughnuts* (a) | | | 8,330 | | | | 39 | | |
| K-Swiss, Class A | | | 3,774 | | | | 115 | | |
| La Quinta* (a) | | | 28,164 | | | | 235 | | |
| Landry's Restaurants | | | 2,484 | | | | 68 | | |
| La-Z-Boy (a) | | | 7,720 | | | | 91 | | |
| LeapFrog Enterprises* (a) | | | 4,720 | | | | 71 | | |
| Levitt, Class A | | | 2,640 | | | | 52 | | |
| Libbey | | | 2,088 | | | | 24 | | |
| Liberty | | | 2,221 | | | | 103 | | |
| Life Time Fitness* | | | 2,940 | | | | 109 | | |
| Lifetime Brands | | | 1,090 | | | | 25 | | |
| Lin TV, Class A* | | | 4,085 | | | | 52 | | |
| Linens 'N Things* (a) | | | 6,655 | | | | 167 | | |
| Lithia Motors | | | 2,214 | | | | 60 | | |
| LKQ* | | | 2,340 | | | | 71 | | |
| LodgeNet Entertainment* | | | 2,502 | | | | 33 | | |
| Lodgian* | | | 3,520 | | | | 36 | | |
| Lone Star Steakhouse & Saloon | | | 1,914 | | | | 49 | | |
| Luby's* | | | 3,540 | | | | 45 | | |
| M/I Homes | | | 1,782 | | | | 80 | | |
| Magna Entertainment* (a) | | | 5,503 | | | | 37 | | |
| Maidenform Brands* | | | 750 | | | | 9 | | |
| Marcus | | | 3,007 | | | | 66 | | |
Small Cap Index Fund (continued)
| DESCRIPTION | | SHARES | | VALUE (000) | |
| Marine Products | | | 2,229 | | | $ | 21 | | |
| MarineMax* | | | 2,002 | | | | 49 | | |
| Martha Stewart Living* (a) | | | 3,029 | | | | 52 | | |
| Maytag | | | 11,470 | | | | 198 | | |
| McCormick & Schmicks Seafood Restaurant* | | | 1,220 | | | | 27 | | |
| Media General, Class A | | | 2,750 | | | | 145 | | |
| Mediacom Communications* | | | 9,314 | | | | 54 | | |
| Mestek* | | | 30 | | | | — | | |
| Midas* | | | 2,657 | | | | 52 | | |
| Mikohn Gaming* | | | 3,550 | | | | 37 | | |
| Modine Manufacturing | | | 4,111 | | | | 136 | | |
| Monaco Coach (a) | | | 4,491 | | | | 55 | | |
| Monarch Casino & Resort* | | | 1,370 | | | | 27 | | |
| Monro Muffler Brake | | | 1,607 | | | | 48 | | |
| Morningstar* | | | 1,340 | | | | 39 | | |
| Movado Group | | | 2,616 | | | | 46 | | |
| Movie Gallery (a) | | | 3,778 | | | | 26 | | |
| MTR Gaming Group* | | | 3,988 | | | | 27 | | |
| Multimedia Games* (a) | | | 4,058 | | | | 40 | | |
| National Presto Industries | | | 683 | | | | 30 | | |
| Nautilus Group (a) | | | 4,937 | | | | 90 | | |
| Navarre* (a) | | | 3,820 | | | | 17 | | |
| Netflix* (a) | | | 5,320 | | | | 141 | | |
| New York & Company* | | | 1,740 | | | | 24 | | |
| Noble International | | | 1,090 | | | | 26 | | |
| NutriSystems* (a) | | | 3,430 | | | | 103 | | |
| Oakley (a) | | | 3,555 | | | | 53 | | |
| O'Charley's* | | | 3,646 | | | | 50 | | |
| Outdoor Channel Holdings* | | | 1,080 | | | | 17 | | |
| Overstock.com* (a) | | | 1,674 | | | | 56 | | |
| Oxford Industries (a) | | | 2,004 | | | | 99 | | |
| P.F. Chang's China Bistro* (a) | | | 4,120 | | | | 188 | | |
| Pacific Sunwear of California* (a) | | | 10,910 | | | | 273 | | |
| Palm Harbor Homes* | | | 1,631 | | | | 30 | | |
| Papa John's International* (a) | | | 1,868 | | | | 97 | | |
| Party City* | | | 1,966 | | | | 32 | | |
| Payless ShoeSource* | | | 9,632 | | | | 177 | | |
| Pep Boys – Manny, Moe & Jack | | | 8,033 | | | | 111 | | |
| Perry Ellis International* | | | 915 | | | | 19 | | |
| PETCO Animal Supplies* | | | 8,270 | | | | 157 | | |
| Phillips Van-Heusen | | | 4,153 | | | | 118 | | |
| Pier 1 Imports (a) | | | 11,840 | | | | 122 | | |
| Pinnacle Entertainment* | | | 5,808 | | | | 110 | | |
| Playboy Enterprises, Class B* | | | 3,361 | | | | 51 | | |
| Prestige Brand Holdings* | | | 4,070 | | | | 49 | | |
| Priceline.com* | | | 3,705 | | | | 70 | | |
| PRIMEDIA* | | | 22,870 | | | | 48 | | |
| ProQuest* | | | 3,687 | | | | 109 | | |
| Provide Commerce* (a) | | | 1,240 | | | | 30 | | |
| Quantum Fuel Systems Technologies Worldwide* (a) | | | 7,070 | | | | 24 | | |
| R&B* | | | 1,580 | | | | 18 | | |
| Radio One* | | | 12,150 | | | | 143 | | |
| RARE Hospitality International* | | | 5,647 | | | | 173 | | |
| RC2* | | | 2,611 | | | | 91 | | |
| RCN* | | | 3,540 | | | | 72 | | |
| Reader's Digest Association, Class A | | | 14,290 | | | | 219 | | |
| Red Robin Gourmet Burgers* | | | 2,055 | | | | 99 | | |
| Regent Communication* | | | 5,086 | | | | 26 | | |
| Regis | | | 6,320 | | | | 242 | | |
The accompanying notes are an integral part of the financial statements.
FIRST AMERICAN FUNDS Annual Report 2005
22
Small Cap Index Fund (continued)
| DESCRIPTION | | SHARES | | VALUE (000) | |
| Rent-Way* | | | 4,504 | | | $ | 28 | | |
| Restoration Hardware* | | | 4,524 | | | | 27 | | |
| Retail Ventures* (a) | | | 2,280 | | | | 24 | | |
| Riviera Holdings* | | | 1,310 | | | | 22 | | |
| Ruby Tuesday (a) | | | 8,800 | | | | 193 | | |
| Russ Berrie and Company | | | 525 | | | | 7 | | |
| Russell | | | 4,921 | | | | 67 | | |
| Ruth's Chris Steak House* | | | 810 | | | | 14 | | |
| Ryans Restaurant Group* | | | 6,026 | | | | 64 | | |
| Saga Communications, Class A* | | | 2,553 | | | | 32 | | |
| Salem Communications* | | | 1,648 | | | | 31 | | |
| Sauer-Danfoss | | | 1,467 | | | | 28 | | |
| Scholastic* (a) | | | 4,830 | | | | 157 | | |
| Select Comfort* | | | 5,442 | | | | 119 | | |
| Sharper Image* (a) | | | 2,014 | | | | 21 | | |
| Shoe Carnival* | | | 1,267 | | | | 21 | | |
| Shopko* | | | 4,346 | | | | 125 | | |
| Shuffle Master* (a) | | | 5,099 | | | | 129 | | |
| Sinclair Broadcast Group, Class A | | | 6,614 | | | | 55 | | |
| Six Flags* (a) | | | 13,799 | | | | 102 | | |
| Skechers USA* | | | 3,409 | | | | 43 | | |
| Skyline | | | 994 | | | | 40 | | |
| Sonic Automotive, Class A | | | 4,270 | | | | 94 | | |
| Source Interlink Companies* | | | 3,422 | | | | 35 | | |
| Spanish Broadcasting System* (a) | | | 5,530 | | | | 34 | | |
| Speedway Motorsports | | | 2,240 | | | | 79 | | |
| Sports Authority* (a) | | | 3,770 | | | | 105 | | |
| Stage Stores | | | 3,984 | | | | 110 | | |
| Stamps.com* | | | 2,350 | | | | 47 | | |
| Standard Motor Products | | | 2,075 | | | | 17 | | |
| Stanley Furniture | | | 1,924 | | | | 41 | | |
| Steak 'N Shake* | | | 4,109 | | | | 76 | | |
| Stein Mart | | | 3,746 | | | | 69 | | |
| Steinway Musical Instruments* | | | 1,153 | | | | 31 | | |
| Steven Madden* | | | 1,987 | | | | 51 | | |
| Strattec Security* | | | 639 | | | | 30 | | |
| Stride Rite | | | 5,369 | | | | 70 | | |
| Sturm, Ruger & Company | | | 2,228 | | | | 16 | | |
| Sunterra* (a) | | | 2,790 | | | | 34 | | |
| Superior Industries International | | | 3,222 | | | | 66 | | |
| SYMS | | | 30 | | | | — | | |
| Systemax* | | | 1,656 | | | | 12 | | |
| Talbots | | | 2,900 | | | | 76 | | |
| TBC* | | | 3,221 | | | | 111 | | |
| Technical Olympic USA | | | 1,981 | | | | 42 | | |
| Tenneco Automotive* | | | 6,681 | | | | 110 | | |
| Texas Roadhouse, Class A* (a) | | | 5,040 | | | | 79 | | |
| Thomas Nelson | | | 1,724 | | | | 37 | | |
| Thor Industries (a) | | | 5,128 | | | | 167 | | |
| TiVo* (a) | | | 8,821 | | | | 43 | | |
| Too* | | | 4,930 | | | | 140 | | |
| Tractor Supply* (a) | | | 4,714 | | | | 229 | | |
| Trans World Entertainment* | | | 2,939 | | | | 19 | | |
| Triarc, Class B | | | 6,144 | | | | 91 | | |
| Tuesday Morning | | | 3,901 | | | | 94 | | |
| Tupperware | | | 7,614 | | | | 175 | | |
| UniFirst | | | 1,348 | | | | 47 | | |
| United Auto Group | | | 3,319 | | | | 112 | | |
| Universal Electronics* | | | 2,396 | | | | 42 | | |
Small Cap Index Fund (continued)
| DESCRIPTION | | SHARES | | VALUE (000) | |
| Vail Resorts* | | | 3,909 | | | $ | 131 | | |
| Valassis Communications* (a) | | | 7,050 | | | | 220 | | |
| ValueVision Media* (a) | | | 3,124 | | | | 31 | | |
| Visteon | | | 18,479 | | | | 154 | | |
| Warnaco Group, Class A* | | | 7,092 | | | | 161 | | |
| WCI Communities* (a) | | | 4,981 | | | | 125 | | |
| WESCO International* (a) | | | 4,792 | | | | 190 | | |
| West Marine* | | | 1,959 | | | | 27 | | |
| Wet Seal, Class A* | | | 6,680 | | | | 35 | | |
| Weyco Group | | | 36 | | | | 1 | | |
| William Lyon Homes* (a) | | | 382 | | | | 45 | | |
| Wilsons The Leather Experts* | | | 2,930 | | | | 15 | | |
| Winnebago Industries (a) | | | 4,498 | | | | 132 | | |
| WMS Industries* (a) | | | 3,334 | | | | 84 | | |
| Wolverine World Wide | | | 8,301 | | | | 174 | | |
| World Wrestling Entertainment | | | 471 | | | | 6 | | |
| Worldspace* | | | 800 | | | | 10 | | |
| WPT Enterprises* | | | 890 | | | | 6 | | |
| Xerium Technologies | | | 2,130 | | | | 22 | | |
| Yankee Candle | | | 6,640 | | | | 150 | | |
| Zale* (a) | | | 7,332 | | | | 206 | | |
| Zumiez* | | | 490 | | | | 17 | | |
| | | | 23,599 | | |
| Consumer Staples – 2.8% | |
| Alico | | | 606 | | | | 27 | | |
| Alliance One International | | | 12,262 | | | | 31 | | |
| American Italian Pasta (a) | | | 2,754 | | | | 18 | | |
| Arden Group, Class A | | | 224 | | | | 17 | | |
| Boston Beer, Class A* (a) | | | 450 | | | | 12 | | |
| Casey's General Stores (a) | | | 7,364 | | | | 159 | | |
| Central European Distribution* (a) | | | 2,009 | | | | 80 | | |
| Central Garden & Pet* | | | 2,771 | | | | 119 | | |
| Chattem* | | | 2,677 | | | | 88 | | |
| Chiquita Brands International (a) | | | 6,366 | | | | 176 | | |
| Coca-Cola Bottling | | | 678 | | | | 31 | | |
| Corn Products International (a) | | | 10,862 | | | | 259 | | |
| Darling International* | | | 11,339 | | | | 39 | | |
| Delta & Pine Land | | | 5,387 | | | | 134 | | |
| Elizabeth Arden* | | | 3,848 | | | | 83 | | |
| Farmer Brothers | | | 1,160 | | | | 23 | | |
| Flowers Foods | | | 7,508 | | | | 220 | | |
| Gold Kist* | | | 7,080 | | | | 122 | | |
| Great Atlantic & Pacific Tea* | | | 2,715 | | | | 76 | | |
| Green Mountain Coffee Roasters* | | | 680 | | | | 29 | | |
| Hain Celestial Group* (a) | | | 4,433 | | | | 86 | | |
| Hansen Natural* (a) | | | 2,060 | | | | 104 | | |
| Ingles Markets, Class A | | | 1,760 | | | | 28 | | |
| Inter Parfums (a) | | | 654 | | | | 10 | | |
| J&J Snack Foods | | | 1,076 | | | | 61 | | |
| John B. Sanfilippo & Son* | | | 1,075 | | | | 20 | | |
| Lancaster Colony | | | 3,750 | | | | 150 | | |
| Lance | | | 4,410 | | | | 77 | | |
| Longs Drug Stores | | | 4,466 | | | | 186 | | |
| M & F Worldwide* | | | 1,545 | | | | 26 | | |
| Mannatech (a) | | | 2,440 | | | | 22 | | |
| Maui Land & Pineapple* | | | 562 | | | | 15 | | |
| Nash-Finch | | | 1,921 | | | | 60 | | |
| National Beverage* | | | 1,340 | | | | 10 | | |
| Natures Sunshine Product | | | 1,657 | | | | 32 | | |
FIRST AMERICAN FUNDS Annual Report 2005
23
Schedule of Investments October 31, 2005
Small Cap Index Fund (continued)
| DESCRIPTION | | SHARES | | VALUE (000) | |
| NBTY* (a) | | | 7,940 | | | $ | 159 | | |
| Nu Skin Enterprises (a) | | | 8,072 | | | | 136 | | |
| Pantry* | | | 2,249 | | | | 87 | | |
| Parlux Fragrances* (a) | | | 980 | | | | 23 | | |
| Pathmark Stores* | | | 6,213 | | | | 61 | | |
| Peets Coffee & Tea* (a) | | | 2,026 | | | | 67 | | |
| Performance Food Group* (a) | | | 5,590 | | | | 154 | | |
| Playtex Products* | | | 5,970 | | | | 80 | | |
| Ralcorp Holdings* | | | 4,467 | | | | 174 | | |
| Reddy Ice Holdings | | | 300 | | | | 7 | | |
| Revlon* | | | 21,882 | | | | 64 | | |
| Ruddick | | | 5,005 | | | | 110 | | |
| Sanderson Farms | | | 2,226 | | | | 77 | | |
| Seaboard | | | 52 | | | | 74 | | |
| Smart & Final* | | | 2,148 | | | | 27 | | |
| Spartan Stores* | | | 3,220 | | | | 32 | | |
| Star Scientific* | | | 5,069 | | | | 14 | | |
| Tiens Biotech Group USA* | | | 720 | | | | 3 | | |
| Tootsie Roll Industries | | | 2,950 | | | | 89 | | |
| Topps | | | 6,087 | | | | 44 | | |
| United Natural Foods* (a) | | | 6,462 | | | | 182 | | |
| Universal | | | 3,622 | | | | 136 | | |
| Usana Health Sciences* (a) | | | 1,546 | | | | 68 | | |
| Vector Group | | | 3,937 | | | | 79 | | |
| WD-40 Company | | | 2,524 | | | | 69 | | |
| Weis Markets | | | 1,140 | | | | 44 | | |
| Wild Oats Markets* | | | 4,815 | | | | 54 | | |
| | | | 4,744 | | |
| Energy – 6.2% | |
| Alon USA Energy* | | | 890 | | | | 17 | | |
| Atlas America* | | | 1,731 | | | | 81 | | |
| ATP Oil & Gas* (a) | | | 2,810 | | | | 89 | | |
| Atwood Oceanics* (a) | | | 2,024 | | | | 143 | | |
| Berry Petroleum, Class A | | | 2,459 | | | | 147 | | |
| Bill Barrett* (a) | | | 1,490 | | | | 47 | | |
| Bois D' Arc Energy* | | | 2,100 | | | | 30 | | |
| Brigham Exploration* | | | 4,350 | | | | 62 | | |
| Bronco Drilling* | | | 290 | | | | 7 | | |
| Cabot Oil & Gas | | | 7,216 | | | | 330 | | |
| Cal Dive International* (a) | | | 5,554 | | | | 342 | | |
| Callon Petroleum* | | | 2,150 | | | | 39 | | |
| Carbo Ceramics | | | 3,069 | | | | 182 | | |
| Carrizo Oil & Gas* | | | 2,910 | | | | 75 | | |
| Cheniere Energy* (a) | | | 6,920 | | | | 258 | | |
| Cimarex Energy* (a) | | | 11,806 | | | | 464 | | |
| Clayton Williams Energy* | | | 869 | | | | 33 | | |
| Comstock Resources* | | | 5,988 | | | | 180 | | |
| Crosstex Energy | | | 360 | | | | 24 | | |
| Delta Petroleum* (a) | | | 3,480 | | | | 61 | | |
| Dril-Quip* | | | 1,115 | | | | 46 | | |
| Edge Petroleum* | | | 2,240 | | | | 54 | | |
| Encore Acquisition* | | | 6,200 | | | | 213 | | |
| Endeavour International* (a) | | | 8,740 | | | | 34 | | |
| Energy Partners* | | | 4,303 | | | | 109 | | |
| Foundation Coal Holdings (a) | | | 3,410 | | | | 128 | | |
| Frontier Oil | | | 8,120 | | | | 299 | | |
| FX Energy* | | | 5,310 | | | | 56 | | |
| Gasco Energy* (a) | | | 9,940 | | | | 60 | | |
| Giant Industries* | | | 1,860 | | | | 106 | | |
| Global Industries* (a) | | | 12,275 | | | | 156 | | |
Small Cap Index Fund (continued)
| DESCRIPTION | | SHARES | | VALUE (000) | |
| Goodrich Petroleum* | | | 1,580 | | | $ | 35 | | |
| Grey Wolf* | | | 28,354 | | | | 218 | | |
| Gulf Island Fabrication | | | 724 | | | | 19 | | |
| GulfMark Offshore* | | | 2,481 | | | | 71 | | |
| Hanover Compressor* | | | 11,897 | | | | 153 | | |
| Harvest Natural Resources* | | | 5,398 | | | | 52 | | |
| Holly | | | 3,348 | | | | 193 | | |
| Hornbeck Offshore Services* | | | 1,470 | | | | 47 | | |
| Houston Exploration* | | | 3,818 | | | | 197 | | |
| Hydril* (a) | | | 2,732 | | | | 181 | | |
| Input/Output* (a) | | | 10,151 | | | | 78 | | |
| James River Coal* | | | 1,850 | | | | 79 | | |
| KCS Energy* | | | 7,507 | | | | 181 | | |
| KFX* (a) | | | 8,542 | | | | 124 | | |
| Lone Star Technologies* (a) | | | 4,653 | | | | 213 | | |
| Lufkin Industries | | | 2,130 | | | | 99 | | |
| Maritrans | | | 1,320 | | | | 39 | | |
| MarkWest Hydrocarbon | | | 880 | | | | 21 | | |
| Maverick Tube* (a) | | | 6,227 | | | | 193 | | |
| McMoRan Exploration* (a) | | | 3,083 | | | | 52 | | |
| Meridian Resource* | | | 10,579 | | | | 48 | | |
| Newpark Resources* | | | 12,374 | | | | 100 | | |
| NGP Capital Resources | | | 2,790 | | | | 40 | | |
| NS Group* | | | 3,233 | | | | 112 | | |
| Oceaneering International* (a) | | | 3,775 | | | | 182 | | |
| Offshore Logistics* | | | 3,478 | | | | 118 | | |
| Oil States International* | | | 5,044 | | | | 167 | | |
| Pacific Ethanol* (a) | | | 500 | | | | 4 | | |
| Parallel Petroleum* | | | 4,830 | | | | 64 | | |
| Parker Drilling* | | | 14,426 | | | | 128 | | |
| Penn Virginia | | | 2,688 | | | | 146 | | |
| Petrocorp Escrow Shares (b) (c) | | | 2,040 | | | | — | | |
| Petrohawk Energy* | | | 6,917 | | | | 86 | | |
| Petroleum Developement* | | | 2,664 | | | | 89 | | |
| PetroQuest Energy* (a) | | | 6,330 | | | | 61 | | |
| Pioneer Drilling Company* | | | 3,090 | | | | 53 | | |
| Remington Oil & Gas* | | | 3,519 | | | | 123 | | |
| Resource America, Class A | | | 2,547 | | | | 41 | | |
| RPC | | | 2,457 | | | | 67 | | |
| St. Mary Land & Exploration (a) | | | 8,482 | | | | 288 | | |
| SEACOR Holdings* | | | 2,662 | | | | 191 | | |
| Spinnaker Exploration* | | | 3,605 | | | | 222 | | |
| Stone Energy* | | | 3,554 | | | | 163 | | |
| Superior Energy Services* | | | 10,591 | | | | 216 | | |
| Superior Well Services* | | | 140 | | | | 3 | | |
| Swift Energy* | | | 4,070 | | | | 178 | | |
| Syntroleum* | | | 6,060 | | | | 43 | | |
| Tetra Technologies* | | | 4,770 | | | | 133 | | |
| TODCO | | | 6,310 | | | | 282 | | |
| Toreador Resources* (a) | | | 2,200 | | | | 61 | | |
| TransMontaigne* (a) | | | 5,125 | | | | 28 | | |
| Tri Valley* (a) | | | 4,050 | | | | 33 | | |
| Universal Compression Holdings* | | | 2,579 | | | | 92 | | |
| Veritas DGC* (a) | | | 5,108 | | | | 165 | | |
| W&T Offshore | | | 1,480 | | | | 43 | | |
| Warren Resources* (a) | | | 2,920 | | | | 45 | | |
| W-H Energy Services* | | | 4,226 | | | | 128 | | |
| Whiting Petroleum* | | | 4,270 | | | | 173 | | |
| World Fuel Services | | | 3,452 | | | | 110 | | |
| | | | 10,343 | | |
The accompanying notes are an integral part of the financial statements.
FIRST AMERICAN FUNDS Annual Report 2005
24
Small Cap Index Fund (continued)
| DESCRIPTION | | SHARES | | VALUE (000) | |
| Financials – 22.1% | |
| 1st Source | | | 1,794 | | | $ | 43 | | |
| 21st Century Insurance Group | | | 3,817 | | | | 61 | | |
| Aames Investment | | | 7,090 | | | | 42 | | |
| ABC Bancorp | | | 2,019 | | | | 39 | | |
| Acadia Realty Trust | | | 4,569 | | | | 87 | | |
| Accredited Home Lenders Holdings* (a) | | | 2,611 | | | | 94 | | |
| Ace Cash Express* (a) | | | 1,550 | | | | 32 | | |
| Advance America Cash Advance Centers | | | 9,790 | | | | 119 | | |
| Advanta, Class B | | | 2,863 | | | | 81 | | |
| Affirmative Insurance | | | 1,620 | | | | 23 | | |
| Affordable Residential Communities | | | 3,910 | | | | 39 | | |
| Agree Realty | | | 40 | | | | 1 | | |
| Alabama National | | | 1,952 | | | | 126 | | |
| Alexander's* | | | 341 | | | | 82 | | |
| Alexandria Real Estate Equities (a) | | | 3,340 | | | | 270 | | |
| Alfa | | | 4,719 | | | | 79 | | |
| AMCORE Financial | | | 3,035 | | | | 90 | | |
| Amegy Bancorp | | | 10,066 | | | | 233 | | |
| American Campus Communities (a) | | | 2,070 | | | | 51 | | |
| American Equity Investment Life Holding (a) | | | 3,750 | | | | 44 | | |
| American Home Mortgage Investment | | | 5,381 | | | | 145 | | |
| American Physicians Capital* | | | 1,162 | | | | 49 | | |
| American West Bancorp* | | | 1,757 | | | | 40 | | |
| Ames National (a) | | | 420 | | | | 11 | | |
| AMLI Residential Properties Trust | | | 3,980 | | | | 151 | | |
| Anchor Bancorp | | | 3,388 | | | | 107 | | |
| Anthracite Capital | | | 8,246 | | | | 87 | | |
| Anworth Mortgage Asset | | | 6,800 | | | | 55 | | |
| Apollo Investment | | | 9,050 | | | | 169 | | |
| Arbor Realty Trust | | | 1,220 | | | | 32 | | |
| Archipelago Holdings* | | | 4,100 | | | | 197 | | |
| Ares Capital | | | 3,880 | | | | 59 | | |
| Argonaut Group* | | | 3,963 | | | | 116 | | |
| Arrow Financial | | | 1,575 | | | | 42 | | |
| Ashford Hospitality Trust | | | 4,700 | | | | 49 | | |
| Asta Funding (a) | | | 1,600 | | | | 43 | | |
| Baldwin & Lyons, Class B | | | 1,091 | | | | 28 | | |
| Banc – Alabama* | | | 2,070 | | | | 23 | | |
| BancFirst | | | 552 | | | | 46 | | |
| Bancorp Bank* | | | 1,356 | | | | 24 | | |
| BancorpSouth | | | 11,370 | | | | 252 | | |
| BancTrust Financial Group | | | 1,470 | | | | 27 | | |
| Bank Mutual | | | 8,917 | | | | 92 | | |
| Bank of Granite | | | 1,995 | | | | 41 | | |
| Bank of the Ozarks | | | 1,830 | | | | 64 | | |
| BankAtlantic Bancorp (a) | | | 6,363 | | | | 88 | | |
| BankUnited Financial (a) | | | 3,914 | | | | 93 | | |
| Banner | | | 1,726 | | | | 52 | | |
| Bedford Property Investors | | | 2,179 | | | | 49 | | |
| Berkshire Hills Bancorp | | | 919 | | | | 32 | | |
| Beverly Hills Bancorp | | | 1,970 | | | | 20 | | |
| BFC Financial* | | | 1,476 | | | | 8 | | |
| Bimini Mortgage Management | | | 3,250 | | | | 32 | | |
| BioMed Realty Trust | | | 5,400 | | | | 135 | | |
| BKF Capital Group | | | 1,050 | | | | 18 | | |
| Boston Private Financial | | | 4,231 | | | | 122 | | |
| Boykin Lodging* | | | 1,810 | | | | 20 | | |
| Brandywine Realty Trust | | | 8,171 | | | | 224 | | |
Small Cap Index Fund (continued)
| DESCRIPTION | | SHARES | | VALUE (000) | |
| Bristol West Holdings | | | 2,600 | | | $ | 50 | | |
| Brookline Bancorp | | | 8,954 | | | | 126 | | |
| Calamos Asset Management | | | 3,470 | | | | 84 | | |
| Camden National | | | 1,322 | | | | 46 | | |
| Capital Automotive | | | 5,932 | | | | 229 | | |
| Capital City Bank Group (a) | | | 1,752 | | | | 64 | | |
| Capital Corporation of the West | | | 1,538 | | | | 51 | | |
| Capital Crossing Bank* | | | 730 | | | | 25 | | |
| Capital Lease Funding | | | 3,890 | | | | 38 | | |
| Capital Southwest | | | 410 | | | | 36 | | |
| Capital Trust | | | 1,780 | | | | 55 | | |
| Capitol Bancorp | | | 1,751 | | | | 61 | | |
| Cardinal Financial | | | 2,070 | | | | 21 | | |
| Cascade Bancorp | | | 2,858 | | | | 65 | | |
| Cash America International | | | 4,345 | | | | 95 | | |
| Cathay General Bancorp | | | 6,224 | | | | 243 | | |
| Cedar Shopping Centers | | | 3,270 | | | | 46 | | |
| Center Financial | | | 1,654 | | | | 42 | | |
| Central Coast Bancorp* | | | 1,916 | | | | 47 | | |
| Central Pacific Financial | | | 4,405 | | | | 159 | | |
| Ceres Group* | | | 5,180 | | | | 29 | | |
| Charter Financial | | | 689 | | | | 25 | | |
| CharterMac | | | 5,865 | | | | 121 | | |
| Chemical Financial | | | 3,616 | | | | 116 | | |
| Chittenden | | | 6,742 | | | | 194 | | |
| Citizens* | | | 4,768 | | | | 27 | | |
| Citizens Banking | | | 6,196 | | | | 181 | | |
| Citizens Northern | | | 350 | | | | 10 | | |
| City Bank | | | 1,322 | | | | 49 | | |
| City Holdings | | | 2,611 | | | | 96 | | |
| Clark | | | 2,771 | | | | 42 | | |
| Clifton Savings Bancorp | | | 2,360 | | | | 25 | | |
| CNA Surety* | | | 2,674 | | | | 38 | | |
| Coastal Financial | | | 2,668 | | | | 40 | | |
| CoBiz (a) | | | 2,207 | | | | 39 | | |
| Cohen & Steers | | | 1,290 | | | | 24 | | |
| Collegiate Funding Services* | | | 1,400 | | | | 21 | | |
| Colonial Properties Trust | | | 4,860 | | | | 212 | | |
| Colony Bankcorp (a) | | | 850 | | | | 21 | | |
| Columbia Bancorp – Maryland | | | 996 | | | | 40 | | |
| Columbia Banking System | | | 2,324 | | | | 67 | | |
| Commercial Bankshares | | | 20 | | | | 1 | | |
| Commercial Capital Bancorp | | | 6,278 | | | | 101 | | |
| Commercial Federal | | | 5,787 | | | | 198 | | |
| Commercial Net Lease Realty | | | 7,844 | | | | 152 | | |
| Community Bancorp – Nevada* | | | 20 | | | | 1 | | |
| Community Bank System | | | 4,412 | | | | 105 | | |
| Community Banks | | | 3,251 | | | | 94 | | |
| Community Trust Bancorp | | | 2,012 | | | | 69 | | |
| CompuCredit* (a) | | | 2,813 | | | | 123 | | |
| Consolidated-Tomoka Land | | | 841 | | | | 50 | | |
| Corporate Office Properties Trust | | | 4,527 | | | | 157 | | |
| Correctional Properties Trust | | | 1,631 | | | | 46 | | |
| Corus Bankshares (a) | | | 2,678 | | | | 147 | | |
| Cousins Properties | | | 6,170 | | | | 182 | | |
| Covanta Holding* | | | 15,318 | | | | 178 | | |
| Crawford & Company | | | 2,204 | | | | 15 | | |
| Criimi Mae* | | | 2,240 | | | | 44 | | |
| CVB Financial | | | 6,976 | | | | 138 | | |
FIRST AMERICAN FUNDS Annual Report 2005
25
Schedule of Investments October 31, 2005
Small Cap Index Fund (continued)
| DESCRIPTION | | SHARES | | VALUE (000) | |
| Deerfield Triarc Capital | | | 1,340 | | | $ | 17 | | |
| Delphi Financial Group | | | 4,044 | | | | 189 | | |
| Delta Financial | | | 1,670 | | | | 13 | | |
| DiamondRock Hospitality Company (a) | | | 2,010 | | | | 22 | | |
| Digital Realty Trust | | | 1,430 | | | | 27 | | |
| Dime Community Bancshares | | | 4,034 | | | | 58 | | |
| Direct General (a) | | | 2,500 | | | | 48 | | |
| Donegal Group, Class A | | | 1,444 | | | | 32 | | |
| Doral Financial (a) | | | 12,350 | | | | 106 | | |
| EastGroup Properties | | | 3,302 | | | | 144 | | |
| ECC Capital | | | 9,870 | | | | 26 | | |
| Education Realty Trust | | | 3,280 | | | | 51 | | |
| EMC Insurance Group | | | 1,053 | | | | 19 | | |
| Encore Capital Group* | | | 2,080 | | | | 36 | | |
| Enstar Group* | | | 583 | | | | 39 | | |
| Enterprise Financial Services | | | 1,200 | | | | 27 | | |
| Entertainment Properties Trust | | | 3,789 | | | | 152 | | |
| Equity Inns | | | 8,687 | | | | 113 | | |
| Equity Lifestyle Properties | | | 2,949 | | | | 125 | | |
| Equity One (a) | | | 5,368 | | | | 126 | | |
| eSPEED, Class A* | | | 3,008 | | | | 23 | | |
| EuroBancshares* | | | 1,390 | | | | 14 | | |
| Extra Space Storage | | | 4,720 | | | | 69 | | |
| F.N.B. | | | 8,070 | | | | 145 | | |
| F.N.B. – Virginia | | | 1,245 | | | | 35 | | |
| Farmers Capital Bank | | | 1,033 | | | | 33 | | |
| FBL Financial Group, Class A | | | 1,861 | | | | 58 | | |
| Federal Agricultural Mortgage, Class C | | | 1,449 | | | | 38 | | |
| FelCor Lodging Trust* (a) | | | 7,780 | | | | 116 | | |
| Fidelity Bankshares | | | 3,490 | | | | 98 | | |
| Fieldstone Investment | | | 7,353 | | | | 75 | | |
| Financial Federal | | | 2,582 | | | | 99 | | |
| Financial Institutions | | | 1,382 | | | | 25 | | |
| First Acceptance* | | | 3,510 | | | | 36 | | |
| First Bancorp – North Carolina | | | 1,916 | | | | 40 | | |
| First Bancorp of Puerto Rico | | | 10,140 | | | | 116 | | |
| First Busey | | | 2,284 | | | | 46 | | |
| First Cash Financial Services* | | | 2,020 | | | | 53 | | |
| First Charter | | | 4,585 | | | | 117 | | |
| First Citizens Bancshares, Class A | | | 651 | | | | 109 | | |
| First Commonwealth Financial – Pennsylvania | | | 10,155 | | | | 134 | | |
| First Community Bancorp | | | 1,938 | | | | 98 | | |
| First Community Bancshares – Nevada | | | 1,493 | | | | 45 | | |
| First Defiance Financial | | | 30 | | | | 1 | | |
| First Financial – Indiana | | | 2,040 | | | | 56 | | |
| First Financial Bancorp – Ohio | | | 5,054 | | | | 94 | | |
| First Financial Bankshares | | | 2,772 | | | | 100 | | |
| First Financial Holdings | | | 2,073 | | | | 60 | | |
| First Indiana | | | 1,750 | | | | 61 | | |
| First Industrial Realty Trust (a) | | | 6,160 | | | | 250 | | |
| First Merchants | | | 2,791 | | | | 70 | | |
| First Midwest Bancorp (a) | | | 6,560 | | | | 249 | | |
| First Niagara Financial Group | | | 16,797 | | | | 247 | | |
| First Oak Brook Bancshares | | | 1,154 | | | | 31 | | |
| First Place Financial | | | 2,345 | | | | 53 | | |
| First Potomac Realty Trust | | | 2,590 | | | | 66 | | |
| First Regional Bancorp* | | | 370 | | | | 25 | | |
| First Republic Bank – California (a) | | | 3,342 | | | | 127 | | |
Small Cap Index Fund (continued)
| DESCRIPTION | | SHARES | | VALUE (000) | |
| First South Bancorp | | | 20 | | | $ | 1 | | |
| First State Bancorp – New Mexico | | | 2,628 | | | | 59 | | |
| FirstBank Fractional Shares (b) (c) | | | — | | | | — | | |
| FirstFed Financial* (a) | | | 2,791 | | | | 149 | | |
| Flagstar Bancorp (a) | | | 5,402 | | | | 73 | | |
| Flushing Financial | | | 2,904 | | | | 47 | | |
| FPIC Insurance Group* | | | 1,380 | | | | 52 | | |
| Franklin Bank* | | | 1,820 | | | | 31 | | |
| Fremont General (a) | | | 9,430 | | | | 205 | | |
| Frontier Financial | | | 3,711 | | | | 120 | | |
| GAMCO Investors | | | 1,137 | | | | 53 | | |
| GATX | | | 6,524 | | | | 244 | | |
| GB&T Bancshares | | | 1,764 | | | | 39 | | |
| Getty Realty | | | 2,599 | | | | 71 | | |
| GFI Group* | | | 540 | | | | 24 | | |
| Glacier Bancorp | | | 4,627 | | | | 136 | | |
| Gladstone Capital | | | 1,631 | | | | 35 | | |
| Gladstone Investment | | | 2,375 | | | | 34 | | |
| Glenborough Realty Trust | | | 2,974 | | | | 57 | | |
| Glimcher Realty Trust | | | 5,395 | | | | 124 | | |
| GMH Communities Trust | | | 4,970 | | | | 74 | | |
| Gold Banc | | | 5,909 | | | | 88 | | |
| Government Properties Trust | | | 3,320 | | | | 30 | | |
| Gramercy Capital | | | 1,640 | | | | 39 | | |
| Great American Financial Resources | | | 1,230 | | | | 25 | | |
| Great Southern Bancorp | | | 1,774 | | | | 51 | | |
| Greater Bay Bancorp | | | 7,438 | | | | 187 | | |
| Greene County Bancshares | | | 30 | | | | 1 | | |
| Greenhill & Company (a) | | | 1,650 | | | | 79 | | |
| Hancock Holding | | | 4,032 | | | | 144 | | |
| Hanmi Financial | | | 5,110 | | | | 94 | | |
| Harbor Florida Bancshares | | | 3,084 | | | | 109 | | |
| Harleysville Group | | | 2,220 | | | | 54 | | |
| Harleysville National | | | 4,160 | | | | 85 | | |
| Harris & Harris Group* | | | 2,670 | | | | 30 | | |
| Heartland Financial USA | | | 1,710 | | | | 35 | | |
| Heritage Commerce | | | 1,840 | | | | 40 | | |
| Heritage Property Investment Trust | | | 3,710 | | | | 121 | | |
| Hersha Hospitality Trust | | | 3,140 | | | | 31 | | |
| Highland Hospitality | | | 5,940 | | | | 62 | | |
| Highwoods Properties | | | 7,971 | | | | 225 | | |
| Hilb, Rogal & Hobbs (a) | | | 4,661 | | | | 175 | | |
| Home Properties | | | 4,899 | | | | 190 | | |
| HomeBanc | | | 7,220 | | | | 52 | | |
| Horace Mann Educators | | | 6,458 | | | | 125 | | |
| Horizon Financial | | | 1,800 | | | | 39 | | |
| Hudson United Bancorp | | | 3,750 | | | | 156 | | |
| IBERIABANK | | | 1,356 | | | | 72 | | |
| IMPAC Mortgage Holdings (a) | | | 11,265 | | | | 113 | | |
| Independence Holdings | | | 786 | | | | 14 | | |
| Independent Bank | | | 2,527 | | | | 76 | | |
| Independent Bank – Michigan | | | 3,350 | | | | 96 | | |
| Infinity Property & Casualty | | | 3,123 | | | | 116 | | |
| Inland Real Estate | | | 8,420 | | | | 120 | | |
| Innkeepers USA Trust | | | 6,378 | | | | 100 | | |
| Integra Bank | | | 2,204 | | | | 45 | | |
| Interchange Financial Services | | | 2,832 | | | | 48 | | |
| International Securities Exchange* | | | 1,740 | | | | 43 | | |
| Investment Technology Group* | | | 5,693 | | | | 185 | | |
The accompanying notes are an integral part of the financial statements.
FIRST AMERICAN FUNDS Annual Report 2005
26
Small Cap Index Fund (continued)
| DESCRIPTION | | SHARES | | VALUE (000) | |
| Investors Real Estate Trust | | | 7,311 | | | $ | 68 | | |
| Irwin Financial | | | 2,641 | | | | 55 | | |
| ITLA Capital* | | | 911 | | | | 45 | | |
| Jones Lang LaSalle | | | 5,042 | | | | 254 | | |
| Kansas City Life Insurance | | | 152 | | | | 8 | | |
| Kearny Financial | | | 3,379 | | | | 40 | | |
| Kilroy Realty (a) | | | 4,470 | | | | 251 | | |
| Kite Realty Group Trust | | | 3,330 | | | | 49 | | |
| KMG America* | | | 3,340 | | | | 29 | | |
| KNBT Bancorp | | | 5,250 | | | | 84 | | |
| Knight Capital Group* | | | 15,603 | | | | 149 | | |
| LaBranche* (a) | | | 8,130 | | | | 78 | | |
| Lakeland Bancorp | | | 3,085 | | | | 47 | | |
| Lakeland Financial | | | 995 | | | | 41 | | |
| LandAmerica Financial Group (a) | | | 2,723 | | | | 172 | | |
| Lasalle Hotel Properties (a) | | | 4,303 | | | | 152 | | |
| Lexington Corporate Properties Trust | | | 7,527 | | | | 164 | | |
| LTC Properties | | | 2,539 | | | | 52 | | |
| Luminent Mortgage Capital | | | 5,750 | | | | 40 | | |
| Macatawa Bank | | | 1,715 | | | | 62 | | |
| MAF Bancorp | | | 4,090 | | | | 170 | | |
| Maguire Properties | | | 4,970 | | | | 149 | | |
| Main Street Banks | | | 2,242 | | | | 61 | | |
| MainSource Financial Group | | | 1,685 | | | | 31 | | |
| MarketAxess Holdings* | | | 3,570 | | | | 44 | | |
| Marlin Business Services* | | | 1,020 | | | | 24 | | |
| MB Financial | | | 3,312 | | | | 123 | | |
| MBT Financial | | | 2,476 | | | | 46 | | |
| MCG Capital | | | 5,712 | | | | 94 | | |
| Mercantile Bank | | | 1,296 | | | | 49 | | |
| MeriStar Hospitality* | | | 13,582 | | | | 118 | | |
| Metris* | | | 8,421 | | | | 124 | | |
| MFA Mortgage Investments | | | 12,409 | | | | 71 | | |
| Mid-America Apartment Communities | | | 2,332 | | | | 109 | | |
| Midland | | | 1,561 | | | | 59 | | |
| Mid-State Bancshares | | | 3,459 | | | | 94 | | |
| Midwest Banc Holdings | | | 1,852 | | | | 42 | | |
| MoneyGram International | | | 12,550 | | | | 305 | | |
| MortgageIT Holdings | | | 2,530 | | | | 32 | | |
| Nara Bancorp | | | 3,160 | | | | 57 | | |
| NASB Financial | | | 522 | | | | 20 | | |
| Nasdaq Stock Market* | | | 6,400 | | | | 198 | | |
| National Financial Partners | | | 5,210 | | | | 236 | | |
| National Health Investors | | | 3,527 | | | | 95 | | |
| National Health Realty | | | 30 | | | | 1 | | |
| National Interstate | | | 60 | | | | 1 | | |
| National Penn Bancshares (a) | | | 6,207 | | | | 122 | | |
| National Penn Fractional Shares (b) (c) | | | — | | | | — | | |
| National Western Life Insurance, Class A | | | 330 | | | | 67 | | |
| Nationwide Health Properties | | | 9,628 | | | | 223 | | |
| Navigators Group* | | | 1,471 | | | | 57 | | |
| NBC Capital | | | 32 | | | | 1 | | |
| NBT Bancorp | | | 4,650 | | | | 110 | | |
| NetB@nk | | | 6,636 | | | | 52 | | |
| NewAlliance Bancshares | | | 15,080 | | | | 217 | | |
| Newcastle Investment | | | 6,219 | | | | 164 | | |
| Northern Empire Bancshares* | | | 1,240 | | | | 31 | | |
| Northstar Realty Finance | | | 2,960 | | | | 28 | | |
| Northwest Bancorp | | | 3,241 | | | | 73 | | |
Small Cap Index Fund (continued)
| DESCRIPTION | | SHARES | | VALUE (000) | |
| NovaStar Financial (a) | | | 4,086 | | | $ | 120 | | |
| OceanFirst Financial | | | 1,535 | | | | 35 | | |
| Ocwen Financial* (a) | | | 4,998 | | | | 39 | | |
| Odyssey Re Holdings | | | 100 | | | | 3 | | |
| Ohio Casualty | | | 8,986 | | | | 245 | | |
| Old National Bancorp (a) | | | 9,799 | | | | 215 | | |
| Old Second Bancorp | | | 1,934 | | | | 60 | | |
| Omega Financial | | | 1,957 | | | | 57 | | |
| OMEGA Healthcare Investors (a) | | | 8,264 | | | | 102 | | |
| One Liberty Properties (a) | | | 40 | | | | 1 | | |
| optionsXpress Holdings | | | 3,540 | | | | 67 | | |
| Oriental Financial Group | | | 3,336 | | | | 41 | | |
| Origen Financial | | | 1,410 | | | | 10 | | |
| Orleans Homebuilders | | | 413 | | | | 8 | | |
| Pacific Capital Bancorp | | | 6,656 | | | | 240 | | |
| Park National | | | 1,767 | | | | 191 | | |
| Parkway Properties | | | 1,944 | | | | 91 | | |
| Partners Trust Financial Group (a) | | | 5,350 | | | | 62 | | |
| Peapack-Gladstone Financial | | | 1,257 | | | | 34 | | |
| PennFed Financial Services | | | 1,498 | | | | 29 | | |
| Pennsylvania | | | 5,406 | | | | 208 | | |
| Pennsylvania Commerce Bancorp* | | | 680 | | | | 24 | | |
| Peoples Bancorp – Ohio | | | 1,459 | | | | 42 | | |
| PFF Bancorp | | | 2,824 | | | | 85 | | |
| Phoenix Companies (a) | | | 12,299 | | | | 159 | | |
| Pinnacle Financial Partners* | | | 1,130 | | | | 26 | | |
| Piper Jaffray Companies* | | | 3,090 | | | | 106 | | |
| Placer Sierra Bancshares | | | 1,000 | | | | 27 | | |
| PMA Capital* | | | 4,644 | | | | 41 | | |
| Post Properties | | | 6,002 | | | | 245 | | |
| Preferred Bank Los Angeles | | | 20 | | | | 1 | | |
| Premierwest Bancorp* | | | 2,030 | | | | 29 | | |
| Prentiss Properties Trust | | | 6,702 | | | | 264 | | |
| Presidential Life | | | 3,092 | | | | 59 | | |
| PrivateBancorp | | | 2,470 | | | | 84 | | |
| ProAssurance* | | | 4,167 | | | | 195 | | |
| Prosperity Bancshares | | | 2,864 | | | | 87 | | |
| Provident Bankshares | | | 4,787 | | | | 167 | | |
| Provident Financial Holdings | | | 868 | | | | 23 | | |
| Provident Financial Services | | | 10,550 | | | | 186 | | |
| Provident New York Bancorp | | | 5,832 | | | | 64 | | |
| PS Business Parks | | | 2,425 | | | | 113 | | |
| QC Holdings* | | | 850 | | | | 10 | | |
| R&G Financial | | | 4,198 | | | | 41 | | |
| RAIT Investment Trust | | | 3,962 | | | | 105 | | |
| Ramco-Gershenson Properties Trust | | | 2,448 | | | | 68 | | |
| Redwood Trust (a) | | | 3,050 | | | | 142 | | |
| Renasant | | | 1,542 | | | | 48 | | |
| Republic Bancorp | | | 10,177 | | | | 139 | | |
| Republic Bancorp – Kentucky, Class A | | | 1,062 | | | | 22 | | |
| RLI | | | 3,484 | | | | 187 | | |
| Rockville Financial* | | | 1,390 | | | | 18 | | |
| Royal Bancshares of Pennsylvania, Class A | | | 17 | | | | — | | |
| S&T Bancorp | | | 3,865 | | | | 144 | | |
| Safety Insurance Group | | | 1,715 | | | | 65 | | |
| Sanders Morris Harris Group | | | 2,069 | | | | 35 | | |
| Sandy Spring Bancorp | | | 2,168 | | | | 76 | | |
| Santander Bancorp | | | 904 | | | | 23 | | |
| Saul Centers (a) | | | 1,919 | | | | 67 | | |
FIRST AMERICAN FUNDS Annual Report 2005
27
Schedule of Investments October 31, 2005
Small Cap Index Fund (continued)
| DESCRIPTION | | SHARES | | VALUE (000) | |
| Saxon Capital | | | 7,520 | | | $ | 75 | | |
| SCBT Financial | | | 1,396 | | | | 45 | | |
| SeaBright Insurance Holdings* | | | 1,310 | | | | 17 | | |
| Seacoast Banking | | | 1,987 | | | | 45 | | |
| Security Bank | | | 1,606 | | | | 40 | | |
| Selective Insurance Group | | | 4,277 | | | | 235 | | |
| Senior Housing Properties Trust (a) | | | 8,677 | | | | 154 | | |
| Sierra Bancorp | | | 580 | | | | 14 | | |
| Signature Bank* | | | 1,090 | | | | 32 | | |
| Simmons First National, Class A | | | 2,174 | | | | 61 | | |
| Sizeler Property Investors | | | 2,860 | | | | 33 | | |
| Sound Federal Bancorp | | | 50 | | | | 1 | | |
| Southside Bancshares | | | 1,682 | | | | 33 | | |
| Southwest Bancorp – Oklahoma | | | 1,834 | | | | 43 | | |
| Sovran Self Storage (a) | | | 2,556 | | | | 119 | | |
| Spirit Finance | | | 9,830 | | | | 110 | | |
| State Auto Financial | | | 2,315 | | | | 76 | | |
| State Bancorp | | | 1,664 | | | | 31 | | |
| Sterling Bancorp | | | 2,776 | | | | 54 | | |
| Sterling Bancshares | | | 6,811 | | | | 101 | | |
| Sterling Financial – Pennsylvania | | | 3,863 | | | | 81 | | |
| Sterling Financial – Washington | | | 5,121 | | | | 128 | | |
| Stewart Information Services | | | 2,584 | | | | 132 | | |
| Stifel Financial* | | | 1,246 | | | | 47 | | |
| Strategic Hotel Capital | | | 4,620 | | | | 79 | | |
| Suffolk Bancorp | | | 1,578 | | | | 52 | | |
| Summit Bancshares | | | 50 | | | | 1 | | |
| Summit Financial Group | | | 790 | | | | 19 | | |
| Sun Bancorp – New Jersey* | | | 1,748 | | | | 35 | | |
| Sun Communities | | | 2,507 | | | | 76 | | |
| Sunstone Hotel Investors | | | 3,400 | | | | 76 | | |
| Susquehanna Bancshares | | | 6,774 | | | | 156 | | |
| SVB Financial Group* (a) | | | 5,218 | | | | 259 | | |
| SWS Group | | | 2,615 | | | | 46 | | |
| SY Bancorp | | | 2,034 | | | | 48 | | |
| Tanger Factory Outlet Centers | | | 4,676 | | | | 126 | | |
| Tarragon Realty Investors* | | | 1,514 | | | | 28 | | |
| Taubman Centers | | | 7,852 | | | | 259 | | |
| Taylor Capital Group | | | 670 | | | | 28 | | |
| Technology Investment Capital | | | 410 | | | | 6 | | |
| Tejon Ranch* | | | 1,304 | | | | 58 | | |
| Texas Capital Bancshares* | | | 3,650 | | | | 78 | | |
| Texas Regional Bancshares, Class A | | | 5,906 | | | | 173 | | |
| TierOne | | | 2,684 | | | | 76 | | |
| Tompkins Trustco | | | 964 | | | | 43 | | |
| Tower Group | | | 2,590 | | | | 50 | | |
| Town & Country Trust (a) | | | 2,650 | | | | 78 | | |
| Tradestation Group* | | | 3,229 | | | | 32 | | |
| Trammell Crow* | | | 5,174 | | | | 132 | | |
| Triad Guaranty* (a) | | | 1,491 | | | | 63 | | |
| TriCo Bancshares | | | 1,926 | | | | 43 | | |
| TrustCo Bank Corporation of New York (a) | | | 11,331 | | | | 146 | | |
| Trustmark | | | 6,790 | | | | 190 | | |
| Trustreet Properties | | | 9,250 | | | | 139 | | |
| UCBH Holdings (a) | | | 12,520 | | | | 218 | | |
| UICI | | | 5,335 | | | | 193 | | |
| UMB Financial | | | 2,265 | | | | 152 | | |
| Umpqua Holdings (a) | | | 6,461 | | | | 172 | | |
| Union Bankshares | | | 1,259 | | | | 56 | | |
Small Cap Index Fund (continued)
| DESCRIPTION | | SHARES | | VALUE (000) | |
| United Bankshares | | | 5,440 | | | $ | 199 | | |
| United Community Banks (a) | | | 4,535 | | | | 134 | | |
| United Community Financial | | | 3,885 | | | | 45 | | |
| United Fire & Casualty | | | 2,484 | | | | 112 | | |
| United PanAm Financial* | | | 801 | | | | 18 | | |
| United Security Bancshares | | | 900 | | | | 25 | | |
| Universal American Financial* (a) | | | 3,770 | | | | 56 | | |
| Universal Health Realty Income Trust | | | 1,747 | | | | 57 | | |
| Univest Corporation of Pennsylvania | | | 1,645 | | | | 43 | | |
| Unizan Financial | | | 3,324 | | | | 87 | | |
| Urstadt Biddle Properties, Class A | | | 3,237 | | | | 54 | | |
| USB Holding | | | 2,053 | | | | 44 | | |
| USB Holding Company Fractional Shares (b) (c) | | | — | | | | — | | |
| USI Holdings* | | | 6,079 | | | | 80 | | |
| U-Store-It-Trust | | | 4,100 | | | | 86 | | |
| Vineyard National Bancorp | | | 1,210 | | | | 35 | | |
| Virginia Commerce Bancorp* | | | 1,467 | | | | 40 | | |
| Virginia Financial Group | | | 1,237 | | | | 45 | | |
| W Holding Company (a) | | | 14,590 | | | | 113 | | |
| Waddell & Reed Financial | | | 10,230 | | | | 196 | | |
| Washington Real Estate Investment Trust | | | 6,337 | | | | 189 | | |
| Washington Trust Bancorp | | | 1,792 | | | | 51 | | |
| WesBanco | | | 3,246 | | | | 100 | | |
| West Bancorp | | | 2,896 | | | | 54 | | |
| West Coast Bancorp – Oregon | | | 2,120 | | | | 56 | | |
| Westamerica Bancorporation | | | 4,230 | | | | 226 | | |
| Western Sierra Bancorp* | | | 1,108 | | | | 37 | | |
| Westfield Financial | | | 561 | | | | 13 | | |
| Wilshire Bancorp | | | 2,390 | | | | 39 | | |
| Winston Hotels | | | 3,986 | | | | 41 | | |
| Wintrust Financial | | | 3,363 | | | | 181 | | |
| World Acceptance* | | | 2,765 | | | | 78 | | |
| WSFS Financial | | | 1,033 | | | | 64 | | |
| Yardville National Bancorp | | | 1,494 | | | | 54 | | |
| Zenith National Insurance | | | 2,779 | | | | 125 | | |
| ZipRealty* | | | 790 | | | | 10 | | |
| | | | 36,977 | | |
| Health Care – 12.6% | |
| Aastrom Biosciences* (a) | | | 15,760 | | | | 36 | | |
| Abaxis* | | | 3,000 | | | | 52 | | |
| Abgenix* (a) | | | 12,868 | | | | 134 | | |
| ABIOMED* | | | 2,620 | | | | 23 | | |
| ACADIA Pharmaceuticals* | | | 2,530 | | | | 27 | | |
| Adams Respiratory Therapeutics* | | | 720 | | | | 27 | | |
| Adeza Biomedical* | | | 650 | | | | 11 | | |
| Adolor* | | | 6,513 | | | | 69 | | |
| Advanced Neuromodulation Systems* | | | 2,850 | | | | 174 | | |
| Advisory Board* | | | 2,752 | | | | 133 | | |
| Albany Molecular Research* (a) | | | 3,583 | | | | 48 | | |
| Alderwoods Group* | | | 5,750 | | | | 91 | | |
| Alexion Pharmaceuticals* | | | 4,212 | | | | 115 | | |
| Align Technology* (a) | | | 8,984 | | | | 66 | | |
| Alkermes* | | | 12,963 | | | | 211 | | |
| Alliance Imaging* | | | 2,171 | | | | 15 | | |
| Allied Healthcare International* | | | 4,780 | | | | 29 | | |
| Allscripts Healthcare Solutions* (a) | | | 4,731 | | | | 76 | | |
| Alpharma, Class A | | | 5,681 | | | | 141 | | |
| AMEDISYS* (a) | | | 2,230 | | | | 85 | | |
| America Service Group* | | | 1,830 | | | | 28 | | |
The accompanying notes are an integral part of the financial statements.
FIRST AMERICAN FUNDS Annual Report 2005
28
Small Cap Index Fund (continued)
| DESCRIPTION | | SHARES | | VALUE (000) | |
| American Dental Partners* | | | 1,845 | | | $ | 39 | | |
| American Healthways* | | | 4,908 | | | | 199 | | |
| American Medical Systems* | | | 9,410 | | | | 154 | | |
| American Retirement* | | | 3,980 | | | | 76 | | |
| AMICAS* | | | 6,960 | | | | 31 | | |
| AMN Healthcare Services* | | | 1,968 | | | | 32 | | |
| Amsurg, Class A* (a) | | | 4,450 | | | | 106 | | |
| Amylin Pharmaceuticals* (a) | | | 15,780 | | | | 530 | | |
| Analogic | | | 1,940 | | | | 91 | | |
| Andrx Group* | | | 10,630 | | | | 164 | | |
| AngioDynamics* | | | 380 | | | | 8 | | |
| Animas* (a) | | | 1,110 | | | | 18 | | |
| Antigenetics* (a) | | | 4,358 | | | | 23 | | |
| Applera* | | | 10,713 | | | | 127 | | |
| Apria Healthcare Group* | | | 7,210 | | | | 166 | | |
| Arena Pharmaceuticals* (a) | | | 5,460 | | | | 57 | | |
| Ariad Pharmaceuticals* | | | 7,960 | | | | 55 | | |
| ArQule* | | | 4,880 | | | | 35 | | |
| Array Biopharma* | | | 4,510 | | | | 32 | | |
| Arrow International | | | 3,034 | | | | 88 | | |
| Arthrocare* | | | 3,626 | | | | 133 | | |
| Aspect Medical Systems* | | | 2,128 | | | | 69 | | |
| AtheroGenics* (a) | | | 5,685 | | | | 85 | | |
| AVANIR Pharmaceuticals* | | | 16,650 | | | | 51 | | |
| Barrier Therapeutics* | | | 1,460 | | | | 11 | | |
| Bentley Pharmaceuticals* | | | 2,639 | | | | 32 | | |
| Beverly Enterprises* (a) | | | 15,712 | | | | 184 | | |
| Bioenvision* | | | 5,270 | | | | 32 | | |
| BioMarin Pharmaceutical* | | | 11,070 | | | | 93 | | |
| Bio-Rad Laboratories, Class A* | | | 2,520 | | | | 147 | | |
| Bio-Reference Labs* | | | 1,440 | | | | 27 | | |
| BioScrip* | | | 5,790 | | | | 35 | | |
| Biosite* (a) | | | 2,238 | | | | 124 | | |
| Bruker BioSciences* | | | 3,747 | | | | 16 | | |
| Caliper Life Sciences* (a) | | | 4,240 | | | | 28 | | |
| Candela* | | | 3,302 | | | | 31 | | |
| Cantel Medical* | | | 1,770 | | | | 34 | | |
| Caraco Pharmaceutical Laboratories* | | | 1,560 | | | | 14 | | |
| Cell Genesys* | | | 6,839 | | | | 37 | | |
| Cell Therapeutics* (a) | | | 10,577 | | | | 25 | | |
| Centene* | | | 6,270 | | | | 126 | | |
| Cepheid* | | | 6,392 | | | | 41 | | |
| Chemed | | | 3,746 | | | | 180 | | |
| CNS | | | 2,210 | | | | 58 | | |
| Coley Pharmaceuticals Group* | | | 190 | | | | 3 | | |
| Computer Programs & Systems | | | 1,119 | | | | 41 | | |
| CONMED* | | | 4,349 | | | | 104 | | |
| Connetics* | | | 5,318 | | | | 69 | | |
| Conor Medsystems* | | | 1,370 | | | | 31 | | |
| Corvel* | | | 1,088 | | | | 24 | | |
| Cotherix* | | | 1,940 | | | | 28 | | |
| Cross Country Healthcare* | | | 3,984 | | | | 72 | | |
| Cubist Pharmaceuticals* (a) | | | 7,643 | | | | 154 | | |
| CuraGen* | | | 7,404 | | | | 34 | | |
| Curis* | | | 8,210 | | | | 34 | | |
| CV Therapeutics* (a) | | | 6,089 | | | | 153 | | |
| Cyberonics* (a) | | | 3,252 | | | | 98 | | |
| Cypress Biosciences* | | | 5,050 | | | | 26 | | |
| Datascope | | | 1,734 | | | | 55 | | |
Small Cap Index Fund (continued)
| DESCRIPTION | | SHARES | | VALUE (000) | |
| deCODE Genetics* | | | 8,248 | | | $ | 72 | | |
| Dendreon* | | | 8,500 | | | | 52 | | |
| Dendrite International* | | | 6,134 | | | | 108 | | |
| DexCom* | | | 740 | | | | 10 | | |
| Diagnostic Products | | | 3,281 | | | | 138 | | |
| Digene* | | | 2,416 | | | | 73 | | |
| Discovery Laboratories* | | | 8,060 | | | | 57 | | |
| Diversa* | | | 4,068 | | | | 22 | | |
| DJ Orthopedics* | | | 3,087 | | | | 90 | | |
| DOV Pharmaceutical* | | | 3,523 | | | | 55 | | |
| Durect* (a) | | | 5,212 | | | | 33 | | |
| DUSA Pharmaceuticals* | | | 2,580 | | | | 26 | | |
| Eclipsys* | | | 5,564 | | | | 89 | | |
| Emageon* | | | 1,380 | | | | 18 | | |
| Encore Medical* (a) | | | 6,470 | | | | 32 | | |
| Encysive Pharmaceuticals* (a) | | | 8,755 | | | | 92 | | |
| Enzo Biochem* | | | 4,356 | | | | 59 | | |
| Enzon* | | | 6,621 | | | | 46 | | |
| EPIX Medical* | | | 3,924 | | | | 27 | | |
| eResearch Technology* | | | 7,543 | | | | 108 | | |
| EV3* | | | 710 | | | | 11 | | |
| Exelixis* | | | 11,323 | | | | 88 | | |
| Eyetech Pharmaceuticals* | | | 4,920 | | | | 87 | | |
| First Horizon Pharmaceutical* (a) | | | 4,013 | | | | 58 | | |
| FoxHollow Technologies* (a) | | | 2,000 | | | | 91 | | |
| Genesis HealthCare* | | | 2,876 | | | | 117 | | |
| Genitope* | | | 3,730 | | | | 26 | | |
| Gentiva Health Services* | | | 3,528 | | | | 52 | | |
| Geron* (a) | | | 8,353 | | | | 75 | | |
| Greatbatch* | | | 3,252 | | | | 85 | | |
| GTx* | | | 940 | | | | 8 | | |
| Haemonetics* | | | 3,486 | | | | 169 | | |
| HealthExtras* | | | 3,065 | | | | 65 | | |
| HealthTronics* | | | 5,000 | | | | 45 | | |
| Hi-Tech Pharmaceutical* | | | 810 | | | | 30 | | |
| Hologic* | | | 3,225 | | | | 179 | | |
| Hooper Holmes | | | 9,836 | | | | 28 | | |
| Horizon Health* | | | 830 | | | | 16 | | |
| Human Genome Sciences* (a) | | | 18,980 | | | | 158 | | |
| ICOS* | | | 9,070 | | | | 245 | | |
| ICU Medical* (a) | | | 1,831 | | | | 64 | | |
| Idenix Pharmaceuticals* | | | 1,040 | | | | 22 | | |
| IDX Systems* | | | 3,509 | | | | 152 | | |
| I-Flow* (a) | | | 3,120 | | | | 38 | | |
| Illumina* | | | 5,020 | | | | 78 | | |
| Immucor* (a) | | | 6,517 | | | | 169 | | |
| ImmunoGen* | | | 6,293 | | | | 35 | | |
| Incyte* | | | 11,749 | | | | 59 | | |
| Inspire Pharmaceuticals* | | | 6,038 | | | | 38 | | |
| Integra LifeSciences* (a) | | | 2,987 | | | | 103 | | |
| InterMune* | | | 3,795 | | | | 52 | | |
| IntraLase* (a) | | | 1,350 | | | | 21 | | |
| Introgen Therapeutics* (a) | | | 2,850 | | | | 15 | | |
| Intuitive Surgical* (a) | | | 5,050 | | | | 448 | | |
| Invacare | | | 4,442 | | | | 150 | | |
| Inverness Medical Innovations* | | | 2,447 | | | | 58 | | |
| IRIS International* | | | 2,560 | | | | 60 | | |
| Isis Pharmaceuticals* | | | 8,906 | | | | 39 | | |
| ISTA Pharmaceuticals* | | | 1,810 | | | | 11 | | |
FIRST AMERICAN FUNDS Annual Report 2005
29
Schedule of Investments October 31, 2005
Small Cap Index Fund (continued)
| DESCRIPTION | | SHARES | | VALUE (000) | |
| Kensey Nash* (a) | | | 1,638 | | | $ | 38 | | |
| Keryx Biopharmaceuticals* | | | 3,720 | | | | 54 | | |
| Kindred Healthcare* (a) | | | 4,134 | | | | 116 | | |
| K-V Pharmaceutical, Class A* | | | 5,413 | | | | 93 | | |
| Kyphon* | | | 4,019 | | | | 161 | | |
| LabOne* | | | 2,539 | | | | 111 | | |
| Laserscope* (a) | | | 3,118 | | | | 84 | | |
| LCA-Vision | | | 2,845 | | | | 120 | | |
| Lexicon Genetics* | | | 9,590 | | | | 38 | | |
| LifeCell* | | | 4,670 | | | | 76 | | |
| Lifeline Systems* | | | 1,906 | | | | 63 | | |
| Luminex* | | | 3,858 | | | | 40 | | |
| Magellan Health Services* | | | 4,050 | | | | 120 | | |
| MannKind* | | | 3,060 | | | | 35 | | |
| Marshall Edwards* (a) | | | 1,240 | | | | 9 | | |
| Martek Biosciences* (a) | | | 4,560 | | | | 141 | | |
| Matria Healthcare* | | | 2,658 | | | | 89 | | |
| Matthews International, Class A | | | 4,642 | | | | 167 | | |
| Maxygen* | | | 3,869 | | | | 34 | | |
| Medarex* (a) | | | 15,881 | | | | 139 | | |
| MedCath* | | | 1,040 | | | | 19 | | |
| Medicines* (a) | | | 7,324 | | | | 126 | | |
| Medicis Pharmaceutical, Class A (a) | | | 7,970 | | | | 235 | | |
| Mentor (a) | | | 4,722 | | | | 213 | | |
| Merge Technologies* | | | 1,890 | | | | 44 | | |
| Meridian Bioscience | | | 2,640 | | | | 55 | | |
| Merit Medical Systems* | | | 4,025 | | | | 48 | | |
| MGI Pharma* (a) | | | 10,350 | | | | 194 | | |
| Micro Therapeutics* | | | 2,025 | | | | 14 | | |
| Mine Safety Appliances | | | 4,006 | | | | 168 | | |
| Molecular Devices* | | | 2,672 | | | | 60 | | |
| Molina Healthcare* | | | 1,780 | | | | 37 | | |
| Momenta Pharmaceuticals* (a) | | | 1,430 | | | | 31 | | |
| Monogram Biosciences* | | | 18,980 | | | | 42 | | |
| MWI Veterinary Supply* | | | 110 | | | | 2 | | |
| Myogen* (a) | | | 2,740 | | | | 55 | | |
| Myriad Genetics* (a) | | | 4,636 | | | | 90 | | |
| NABI Biopharmaceuticals* | | | 8,446 | | | | 109 | | |
| Nanogen* | | | 7,200 | | | | 20 | | |
| Nastech Pharmaceutical* | | | 2,790 | | | | 37 | | |
| National Healthcare | | | 907 | | | | 33 | | |
| NDCHealth | | | 5,341 | | | | 101 | | |
| Nektar Therapeutics* (a) | | | 12,190 | | | | 184 | | |
| NeoPharm* | | | 2,961 | | | | 28 | | |
| Neurocrine Biosciences* (a) | | | 5,160 | | | | 273 | | |
| Neurogen* | | | 3,440 | | | | 24 | | |
| NeuroMetrix* | | | 890 | | | | 33 | | |
| New River Pharmaceuticals* | | | 870 | | | | 41 | | |
| Nitromed* (a) | | | 2,550 | | | | 41 | | |
| Northfield Laboratories* (a) | | | 3,540 | | | | 44 | | |
| Noven Pharmaceuticals* | | | 3,553 | | | | 50 | | |
| NPS Pharmaceuticals* | | | 6,299 | | | | 62 | | |
| NuVasive* | | | 1,360 | | | | 24 | | |
| Nuvelo* | | | 6,268 | | | | 53 | | |
| OCA* (a) | | | 7,257 | | | | 8 | | |
| Occulogix* | | | 1,450 | | | | 10 | | |
| Odyssey Healthcare* | | | 5,051 | | | | 87 | | |
| Onyx Pharmaceuticals* (a) | | | 5,137 | | | | 132 | | |
| Option Care (a) | | | 3,415 | | | | 43 | | |
Small Cap Index Fund (continued)
| DESCRIPTION | | SHARES | | VALUE (000) | |
| OraSure Technologies* | | | 6,826 | | | $ | 75 | | |
| Orchid Cellmark* | | | 3,790 | | | | 22 | | |
| Owens & Minor | | | 5,677 | | | | 167 | | |
| Pain Therapeutics* | | | 4,225 | | | | 24 | | |
| PainCare Holdings* | | | 6,690 | | | | 24 | | |
| Palomar Medical Technologies* (a) | | | 2,420 | | | | 66 | | |
| Par Pharmaceutical Companies* (a) | | | 5,110 | | | | 132 | | |
| PAREXEL International* | | | 3,873 | | | | 85 | | |
| Pediatrix Medical Group* (a) | | | 3,375 | | | | 260 | | |
| Penwest Pharmaceuticals* | | | 3,364 | | | | 53 | | |
| Perrigo (a) | | | 12,048 | | | | 161 | | |
| Per-Se Technologies* (a) | | | 3,274 | | | | 73 | | |
| Pharmion* (a) | | | 3,800 | | | | 72 | | |
| PolyMedica | | | 2,796 | | | | 92 | | |
| POZEN* | | | 3,425 | | | | 33 | | |
| PRA International* | | | 1,430 | | | | 38 | | |
| Progenics Pharmaceutical* | | | 2,270 | | | | 53 | | |
| PSS World Medical* | | | 9,275 | | | | 129 | | |
| Psychiatric Solutions* (a) | | | 3,410 | | | | 187 | | |
| Radiation Therapy Services* (a) | | | 1,230 | | | | 37 | | |
| Regeneron Pharmaceutical* | | | 5,251 | | | | 66 | | |
| RehabCare Group* | | | 2,783 | | | | 59 | | |
| Renovis* (a) | | | 2,990 | | | | 42 | | |
| Res-Care* | | | 3,000 | | | | 48 | | |
| Rigel Pharmaceuticals* | | | 2,840 | | | | 64 | | |
| Salix Pharmaceuticals* | | | 5,912 | | | | 106 | | |
| Savient Pharmaceuticals* | | | 9,410 | | | | 35 | | |
| Seattle Genetics* | | | 4,010 | | | | 22 | | |
| Senomyx* (a) | | | 3,260 | | | | 46 | | |
| Serologicals* (a) | | | 5,053 | | | | 98 | | |
| SFBC International* (a) | | | 2,408 | | | | 103 | | |
| Somanetics* | | | 1,600 | | | | 49 | | |
| SonoSite* (a) | | | 2,211 | | | | 65 | | |
| Specialty Laboratories* | | | 1,368 | | | | 18 | | |
| StemCells* (a) | | | 9,680 | | | | 44 | | |
| Stereotaxis* | | | 1,870 | | | | 13 | | |
| STERIS | | | 10,070 | | | | 230 | | |
| Stewart Enterprises, Class A | | | 15,439 | | | | 79 | | |
| Stratagene* | | | 1,160 | | | | 11 | | |
| Sunrise Senior Living* (a) | | | 4,746 | | | | 153 | | |
| SuperGen* | | | 7,348 | | | | 42 | | |
| SurModics* (a) | | | 2,171 | | | | 86 | | |
| Sybron Dental Specialties* | | | 5,754 | | | | 247 | | |
| Symbion* (a) | | | 1,870 | | | | 42 | | |
| Symmetry Medical* | | | 1,380 | | | | 31 | | |
| Tanox* | | | 3,513 | | | | 49 | | |
| Telik* (a) | | | 7,644 | | | | 114 | | |
| Tercica* (a) | | | 980 | | | | 10 | | |
| Thoratec* | | | 6,924 | | | | 137 | | |
| Threshold Pharmaceutical* | | | 30 | | | | — | | |
| Trimeris* | | | 2,685 | | | | 34 | | |
| TriPath Imaging* | | | 4,342 | | | | 30 | | |
| TriZetto Group* | | | 5,451 | | | | 77 | | |
| U.S. Physical Therapy* | | | 1,840 | | | | 33 | | |
| United Surgical Partners* | | | 6,282 | | | | 225 | | |
| United Therapeutics* (a) | | | 3,291 | | | | 243 | | |
| Varian* (a) | | | 4,656 | | | | 171 | | |
| Ventana Medical Systems* (a) | | | 4,640 | | | | 178 | | |
| Ventiv Health* (a) | | | 3,340 | | | | 84 | | |
The accompanying notes are an integral part of the financial statements.
FIRST AMERICAN FUNDS Annual Report 2005
30
Small Cap Index Fund (continued)
| DESCRIPTION | | SHARES | | VALUE (000) | |
| Vertex Pharmaceuticals* (a) | | | 13,590 | | | $ | 309 | | |
| ViaCell* | | | 1,280 | | | | 6 | | |
| Viasys Healthcare* | | | 4,623 | | | | 110 | | |
| VistaCare, Class A* | | | 1,550 | | | | 18 | | |
| Vital Images* (a) | | | 1,900 | | | | 44 | | |
| Vital Signs | | | 799 | | | | 38 | | |
| VNUS Medical Technologies* | | | 940 | | | | 10 | | |
| WellCare Group* | | | 2,310 | | | | 73 | | |
| West Pharmaceutical Services | | | 4,462 | | | | 107 | | |
| Wright Medical Group* | | | 4,164 | | | | 78 | | |
| Young Innovations | | | 806 | | | | 26 | | |
| Zoll Medical* | | | 1,375 | | | | 34 | | |
| ZymoGenetics* | | | 3,339 | | | | 59 | | |
| | | | 21,090 | | |
| Industrials – 15.2% | |
| 3D Systems* | | | 1,880 | | | | 34 | | |
| A.O. Smith | | | 2,406 | | | | 78 | | |
| A.S.V.* (a) | | | 2,694 | | | | 63 | | |
| AAON* | | | 1,510 | | | | 26 | | |
| AAR* | | | 4,893 | | | | 78 | | |
| ABM Industries | | | 5,739 | | | | 114 | | |
| ABX Air* | | | 9,040 | | | | 72 | | |
| Accuride* | | | 1,730 | | | | 22 | | |
| Actuant, Class A | | | 4,038 | | | | 197 | | |
| Acuity Brands | | | 6,336 | | | | 176 | | |
| Administaff (a) | | | 2,821 | | | | 119 | | |
| AGCO* (a) | | | 12,970 | | | | 207 | | |
| AirTran Holdings* (a) | | | 13,075 | | | | 196 | | |
| Alamo Group | | | 950 | | | | 18 | | |
| Alaska Air Group* (a) | | | 4,213 | | | | 133 | | |
| Albany International, Class A | | | 4,245 | | | | 164 | | |
| Amerco | | | 1,490 | | | | 87 | | |
| American Ecology | | | 1,870 | | | | 30 | | |
| American Reprographics* | | | 1,010 | | | | 17 | | |
| American Science & Engineering* | | | 1,280 | | | | 74 | | |
| American Superconductor* (a) | | | 4,300 | | | | 35 | | |
| American Woodmark | | | 1,838 | | | | 57 | | |
| Ameron International | | | 1,218 | | | | 52 | | |
| Angelica | | | 1,537 | | | | 22 | | |
| Apogee Enterprises | | | 4,193 | | | | 69 | | |
| Applied Industrial Technology | | | 4,416 | | | | 146 | | |
| Applied Signal Technology | | | 1,704 | | | | 29 | | |
| ARGON ST* | | | 1,370 | | | | 36 | | |
| Arkansas Best | | | 3,722 | | | | 144 | | |
| Armor Holdings* (a) | | | 4,982 | | | | 223 | | |
| Artesyn Technologies* (a) | | | 5,377 | | | | 47 | | |
| Asset Acceptance Capital* | | | 1,350 | | | | 36 | | |
| Astec Industries* | | | 2,372 | | | | 67 | | |
| Aviall* | | | 4,390 | | | | 139 | | |
| Badger Meter | | | 870 | | | | 29 | | |
| Baldor Electric | | | 4,873 | | | | 118 | | |
| Banta | | | 3,608 | | | | 182 | | |
| Barnes Group | | | 2,585 | | | | 90 | | |
| BE Aerospace* | | | 8,180 | | | | 148 | | |
| Beacon Roofing Supply* | | | 2,370 | | | | 65 | | |
| BlueLinx Holdings | | | 1,010 | | | | 12 | | |
| Bowne & Company | | | 4,909 | | | | 70 | | |
| Brady, Class A | | | 6,106 | | | | 176 | | |
| Briggs & Stratton | | | 6,670 | | | | 213 | | |
Small Cap Index Fund (continued)
| DESCRIPTION | | SHARES | | VALUE (000) | |
| Bright Horizons Family Solutions* | | | 3,890 | | | $ | 155 | | |
| Bucyrus International | | | 2,670 | | | | 111 | | |
| Builders FirstSource* | | | 1,010 | | | | 20 | | |
| C&D Technologies | | | 3,826 | | | | 35 | | |
| Cascade | | | 1,836 | | | | 89 | | |
| Casella Waste Systems* | | | 3,373 | | | | 43 | | |
| CBIZ* | | | 8,728 | | | | 50 | | |
| CDI | | | 1,190 | | | | 33 | | |
| Central Parking | | | 2,546 | | | | 38 | | |
| Cenveo* | | | 7,600 | | | | 75 | | |
| Ceradyne* | | | 3,514 | | | | 138 | | |
| Circor International | | | 2,267 | | | | 64 | | |
| CLARCOR | | | 7,484 | | | | 206 | | |
| Clean Harbors* (a) | | | 2,430 | | | | 82 | | |
| Coinstar* | | | 3,821 | | | | 97 | | |
| Color Kinetics* | | | 1,050 | | | | 16 | | |
| Comfort Systems USA* | | | 5,730 | | | | 49 | | |
| Commercial Vehicle Group* | | | 1,700 | | | | 33 | | |
| CompX International | | | 20 | | | | — | | |
| COMSYS IT Partners* | | | 1,950 | | | | 27 | | |
| Consolidated Graphics* | | | 1,753 | | | | 68 | | |
| Continental Airlines, Class B* (a) | | | 9,603 | | | | 124 | | |
| Corrections Corporation of America* | | | 5,687 | | | | 227 | | |
| CoStar Group* | | | 2,415 | | | | 116 | | |
| Covenant Transport, Class A* | | | 1,223 | | | | 13 | | |
| CRA International* | | | 1,747 | | | | 77 | | |
| Crane | | | 6,880 | | | | 213 | | |
| Cubic | | | 2,683 | | | | 44 | | |
| Curtiss-Wright | | | 3,176 | | | | 182 | | |
| DiamondCluster, Class A* | | | 4,040 | | | | 26 | | |
| Dollar Thrifty Automotive* | | | 3,722 | | | | 140 | | |
| DRS Technologies (a) | | | 3,916 | | | | 193 | | |
| Duratek* | | | 1,748 | | | | 25 | | |
| Dycom Industries* (a) | | | 5,989 | | | | 119 | | |
| Dynamex* | | | 1,800 | | | | 30 | | |
| Dynamic Materials | | | 840 | | | | 17 | | |
| EDO | | | 2,345 | | | | 68 | | |
| Educate* | | | 2,630 | | | | 31 | | |
| EGL* | | | 4,047 | | | | 113 | | |
| Electro Rent* | | | 2,609 | | | | 34 | | |
| ElkCorp | | | 3,044 | | | | 96 | | |
| EMCOR Group* (a) | | | 2,266 | | | | 138 | | |
| Encore Wire* | | | 2,727 | | | | 59 | | |
| Energy Conversion Devices* (a) | | | 2,932 | | | | 91 | | |
| EnerSys* (a) | | | 5,580 | | | | 84 | | |
| Engineered Support Systems | | | 5,773 | | | | 234 | | |
| Ennis Business Forms | | | 3,770 | | | | 64 | | |
| EnPro Industries* | | | 3,005 | | | | 84 | | |
| ESCO Technologies* (a) | | | 3,693 | | | | 160 | | |
| Essex* | | | 2,450 | | | | 44 | | |
| Esterline Technologies* | | | 3,647 | | | | 137 | | |
| Evergreen Solar* | | | 6,110 | | | | 50 | | |
| Exponent* | | | 1,030 | | | | 30 | | |
| ExpressJet Holdings* (a) | | | 6,572 | | | | 59 | | |
| Federal Signal | | | 6,944 | | | | 113 | | |
| First Advantage* | | | 20 | | | | 1 | | |
| Flanders* | | | 2,250 | | | | 25 | | |
| Florida East Coast Industries, Class A | | | 3,916 | | | | 171 | | |
| Flowserve* (a) | | | 8,026 | | | | 281 | | |
FIRST AMERICAN FUNDS Annual Report 2005
31
Schedule of Investments October 31, 2005
Small Cap Index Fund (continued)
| DESCRIPTION | | SHARES | | VALUE (000) | |
| Forward Air | | | 4,873 | | | $ | 173 | | |
| Franklin Electric | | | 2,738 | | | | 119 | | |
| Freightcar America (a) | | | 1,240 | | | | 54 | | |
| Frontier Airlines* | | | 5,380 | | | | 51 | | |
| Frozen Food Express Industries* | | | 2,370 | | | | 27 | | |
| FTI Consulting* | | | 6,391 | | | | 175 | | |
| FuelCell Energy* (a) | | | 7,169 | | | | 63 | | |
| G&K Services, Class A | | | 2,646 | | | | 100 | | |
| Gardner Denver* | | | 3,616 | | | | 176 | | |
| Gehl Company* | | | 1,575 | | | | 36 | | |
| GenCorp* (a) | | | 8,170 | | | | 150 | | |
| General Cable* | | | 5,817 | | | | 95 | | |
| Genesee & Wyoming, Class A* (a) | | | 3,076 | | | | 99 | | |
| Genlyte Group* (a) | | | 3,444 | | | | 176 | | |
| Geo Group* | | | 1,427 | | | | 31 | | |
| GEVITY HR | | | 4,074 | | | | 105 | | |
| Global Power Equipment Group* | | | 5,814 | | | | 36 | | |
| Gorman-Rupp | | | 1,428 | | | | 33 | | |
| Granite Construction | | | 5,035 | | | | 172 | | |
| Greenbrier Companies | | | 979 | | | | 27 | | |
| Griffon* (a) | | | 4,213 | | | | 93 | | |
| Healthcare Services Group (a) | | | 4,059 | | | | 76 | | |
| Heartland Express (a) | | | 6,603 | | | | 130 | | |
| HEICO (a) | | | 3,130 | | | | 69 | | |
| Heidrick & Struggles International* | | | 2,881 | | | | 93 | | |
| Herley Industries* | | | 1,972 | | | | 33 | | |
| Hexcel* (a) | | | 7,730 | | | | 122 | | |
| Hub Group* | | | 2,640 | | | | 96 | | |
| Hudson Highland Group* | | | 3,432 | | | | 82 | | |
| Hughes Supply (a) | | | 9,430 | | | | 315 | | |
| Huron Consulting Group* | | | 970 | | | | 26 | | |
| Huttig Building Products* | | | 2,230 | | | | 19 | | |
| II-VI* | | | 3,314 | | | | 59 | | |
| IKON Office Solutions | | | 15,060 | | | | 150 | | |
| Imagistics International* | | | 2,293 | | | | 96 | | |
| Innovative Solutions and Support* | | | 1,800 | | | | 26 | | |
| Insituform Technologies, Class A* | | | 4,041 | | | | 73 | | |
| Interline Brands* | | | 1,790 | | | | 35 | | |
| Intermagnetics General* | | | 4,157 | | | | 119 | | |
| Interpool | | | 1,290 | | | | 25 | | |
| Ionatron* (a) | | | 3,780 | | | | 40 | | |
| Jackson Hewitt Tax Service | | | 5,580 | | | | 138 | | |
| Jacuzzi Brands* | | | 11,560 | | | | 85 | | |
| JLG Industries | | | 7,314 | | | | 281 | | |
| John H. Harland | | | 3,940 | | | | 164 | | |
| K&F Industries Holdings* | | | 1,170 | | | | 18 | | |
| Kadant* | | | 2,092 | | | | 35 | | |
| Kaman | | | 3,214 | | | | 75 | | |
| Kansas City Southern Industries* | | | 12,170 | | | | 270 | | |
| Kaydon (a) | | | 4,247 | | | | 126 | | |
| Kelly Services, Class A (a) | | | 2,667 | | | | 74 | | |
| Kennametal | | | 5,451 | | | | 279 | | |
| Kforce* | | | 4,390 | | | | 47 | | |
| Kirby* | | | 3,243 | | | | 168 | | |
| Knight Transportation | | | 5,540 | | | | 151 | | |
| Knoll | | | 670 | | | | 11 | | |
| Korn/Ferry International* | | | 4,941 | | | | 85 | | |
| LaBarge* | | | 1,560 | | | | 23 | | |
| Labor Ready* (a) | | | 7,286 | | | | 170 | | |
Small Cap Index Fund (continued)
| DESCRIPTION | | SHARES | | VALUE (000) | |
| Lawson Products | | | 680 | | | $ | 23 | | |
| Layne Christensen* | | | 1,370 | | | | 29 | | |
| Learning Tree International* (a) | | | 1,507 | | | | 20 | | |
| LECG* | | | 2,250 | | | | 50 | | |
| Lennox International | | | 7,228 | | | | 202 | | |
| Lincoln Electric Holdings | | | 5,291 | | | | 209 | | |
| Lindsay Manufacturing | | | 1,953 | | | | 40 | | |
| LSI Industries | | | 2,933 | | | | 53 | | |
| MAIR Holdings* (a) | | | 60 | | | | — | | |
| Manitowoc (a) | | | 4,313 | | | | 230 | | |
| Marten Transport* | | | 1,580 | | | | 42 | | |
| Mascotech Escrow Shares (b) (c) | | | 9,571 | | | | — | | |
| MasTec* | | | 4,033 | | | | 41 | | |
| McGrath Rentcorp | | | 2,950 | | | | 84 | | |
| Medis Technologies* (a) | | | 2,236 | | | | 38 | | |
| Mercury Computer Systems* (a) | | | 3,001 | | | | 57 | | |
| Mesa Air Group* (a) | | | 4,311 | | | | 49 | | |
| Middleby* | | | 630 | | | | 46 | | |
| Mobile Mini* (a) | | | 2,191 | | | | 102 | | |
| Moog, Class A* (a) | | | 4,919 | | | | 146 | | |
| MTC Technologies* | | | 1,242 | | | | 40 | | |
| Mueller Industries | | | 5,318 | | | | 146 | | |
| NACCO Industries, Class A | | | 644 | | | | 75 | | |
| Navigant Consulting* | | | 7,259 | | | | 152 | | |
| NCI Building Systems* | | | 3,144 | | | | 129 | | |
| NCO Group* (a) | | | 4,649 | | | | 84 | | |
| Nordson | | | 3,660 | | | | 136 | | |
| NuCo2* | | | 1,420 | | | | 33 | | |
| Odyssey Marine Exploration* | | | 5,540 | | | | 18 | | |
| Old Dominion Freight Lines* | | | 2,834 | | | | 100 | | |
| Omega Flex* | | | 30 | | | | — | | |
| Orbital Sciences* | | | 8,074 | | | | 94 | | |
| Pacer International | | | 4,770 | | | | 123 | | |
| PAM Transportation Services* | | | 29 | | | | 1 | | |
| Perini* | | | 1,811 | | | | 37 | | |
| PHH* | | | 7,250 | | | | 204 | | |
| Pico Holdings* | | | 1,369 | | | | 46 | | |
| Pike Electric* | | | 1,360 | | | | 26 | | |
| Pinnacle Airlines* | | | 3,330 | | | | 21 | | |
| Plug Power* | | | 6,639 | | | | 39 | | |
| Portfolio Recovery Associates* (a) | | | 2,096 | | | | 82 | | |
| Powell Industries* | | | 1,172 | | | | 25 | | |
| Power-One* (a) | | | 10,805 | | | | 61 | | |
| Preformed Line Products | | | 20 | | | | 1 | | |
| Pre-Paid Legal Services (a) | | | 1,680 | | | | 72 | | |
| PRG-Schultz International* | | | 7,044 | | | | 6 | | |
| Quanta Services* (a) | | | 16,077 | | | | 185 | | |
| RailAmerica* | | | 5,415 | | | | 64 | | |
| Raven Industries | | | 2,314 | | | | 73 | | |
| Regal-Beloit (a) | | | 3,560 | | | | 113 | | |
| Reliance Steel & Aluminum | | | 3,796 | | | | 216 | | |
| Republic Airways Holdings* | | | 880 | | | | 14 | | |
| Resources Connection* | | | 7,056 | | | | 201 | | |
| Robbins & Myers | | | 1,664 | | | | 36 | | |
| Rollins | | | 4,182 | | | | 80 | | |
| Rush Enterprises* | | | 3,240 | | | | 49 | | |
| Schawk | | | 1,564 | | | | 31 | | |
| School Specialty* | | | 3,267 | | | | 111 | | |
| SCS Transportation* | | | 2,205 | | | | 44 | | |
The accompanying notes are an integral part of the financial statements.
FIRST AMERICAN FUNDS Annual Report 2005
32
Small Cap Index Fund (continued)
| DESCRIPTION | | SHARES | | VALUE (000) | |
| Sequa, Class A* | | | 930 | | | $ | 57 | | |
| Shaw Group* (a) | | | 11,137 | | | | 298 | | |
| SI International* | | | 1,140 | | | | 33 | | |
| Simpson Manufacturing | | | 5,344 | | | | 211 | | |
| SIRVA* | | | 3,630 | | | | 26 | | |
| SkyWest | | | 8,428 | | | | 247 | | |
| Sotheby's Holdings, Class A* | | | 5,582 | | | | 87 | | |
| SOURCECORP* | | | 2,365 | | | | 54 | | |
| Spherion* | | | 9,285 | | | | 83 | | |
| Standard Register | | | 2,031 | | | | 31 | | |
| Standex International | | | 2,032 | | | | 55 | | |
| Stewart & Stevenson Services | | | 4,356 | | | | 104 | | |
| Strayer Education | | | 2,099 | | | | 188 | | |
| Sun Hydraulics | | | 1,035 | | | | 23 | | |
| Sypris Solutions | | | 1,163 | | | | 12 | | |
| Tecumseh Products, Class A | | | 2,485 | | | | 50 | | |
| Teledyne Technologies* | | | 4,776 | | | | 168 | | |
| Teletech Holdings* | | | 5,384 | | | | 56 | | |
| Tennant | | | 920 | | | | 40 | | |
| Tetra Tech* | | | 7,907 | | | | 122 | | |
| The Providence Service* | | | 1,490 | | | | 46 | | |
| Titan International (a) | | | 2,010 | | | | 36 | | |
| Tredegar | | | 4,315 | | | | 54 | | |
| Trex* (a) | | | 1,769 | | | | 37 | | |
| Trinity Industries (a) | | | 6,048 | | | | 230 | | |
| Triumph Group* | | | 2,388 | | | | 83 | | |
| TRM* | | | 1,690 | | | | 23 | | |
| TurboChef Technologies* (a) | | | 2,000 | | | | 27 | | |
| U.S. Xpress Enterprises* | | | 1,003 | | | | 12 | | |
| UAP Holding | | | 4,790 | | | | 92 | | |
| Ultralife Batteries* | | | 2,410 | | | | 29 | | |
| United Capital* | | | 40 | | | | 1 | | |
| United Industrial | | | 1,450 | | | | 51 | | |
| United Rentals* | | | 9,486 | | | | 186 | | |
| United Stationers* | | | 4,761 | | | | 216 | | |
| Universal Forest Products | | | 2,363 | | | | 131 | | |
| Universal Technical Institute* | | | 2,730 | | | | 86 | | |
| Universal Truckload Services* | | | 20 | | | | — | | |
| URS* (a) | | | 5,698 | | | | 230 | | |
| USA Truck* | | | 790 | | | | 18 | | |
| Valence Technology* (a) | | | 6,557 | | | | 15 | | |
| Valmont Industries | | | 2,354 | | | | 77 | | |
| Vertrue* (a) | | | 882 | | | | 33 | | |
| Viad | | | 2,730 | | | | 79 | | |
| Vicor | | | 2,750 | | | | 46 | | |
| Volcom* | | | 100 | | | | 3 | | |
| Volt Information Sciences* | | | 1,366 | | | | 26 | | |
| Wabash National | | | 4,608 | | | | 85 | | |
| Wabtec | | | 6,772 | | | | 184 | | |
| Walter Industries | | | 5,265 | | | | 240 | | |
| Washington Group International* (a) | | | 3,781 | | | | 188 | | |
| Waste Connections* (a) | | | 5,511 | | | | 184 | | |
| Waste Industries USA | | | 880 | | | | 12 | | |
| Waste Services* | | | 9,880 | | | | 37 | | |
| Water Pik Technologies* | | | 1,710 | | | | 34 | | |
| Watsco | | | 3,115 | | | | 177 | | |
| Watson Wyatt & Company Holdings | | | 4,688 | | | | 124 | | |
| Watts Water Technologies, Class A | | | 3,708 | | | | 103 | | |
| Werner Enterprises | | | 7,580 | | | | 136 | | |
Small Cap Index Fund (continued)
| DESCRIPTION | | SHARES | | VALUE (000) | |
| Woodward Governor | | | 1,479 | | | $ | 118 | | |
| World Air Holdings* | | | 3,640 | | | | 38 | | |
| York International | | | 6,029 | | | | 338 | | |
| | | | 25,366 | | |
| Information Technology – 18.0% | |
| 3Com* (a) | | | 55,250 | | | | 213 | | |
| Actel* | | | 3,801 | | | | 53 | | |
| Acxiom | | | 12,770 | | | | 273 | | |
| Adaptec* (a) | | | 16,006 | | | | 66 | | |
| ADE* | | | 1,630 | | | | 33 | | |
| ADTRAN | | | 9,490 | | | | 287 | | |
| Advanced Analogic Technologies* | | | 460 | | | | 5 | | |
| Advanced Digital Information* (a) | | | 9,273 | | | | 85 | | |
| Advanced Energy Industries* | | | 3,579 | | | | 38 | | |
| Advent Software* (a) | | | 3,132 | | | | 96 | | |
| Aeroflex* | | | 10,839 | | | | 98 | | |
| Agile Software* | | | 7,738 | | | | 55 | | |
| Agilysys | | | 4,434 | | | | 66 | | |
| Airspan Networks* (a) | | | 5,290 | | | | 26 | | |
| Altiris* (a) | | | 3,162 | | | | 53 | | |
| AMIS Holdings* | | | 5,420 | | | | 60 | | |
| Amkor Technology* (a) | | | 14,380 | | | | 76 | | |
| Anaren* | | | 2,517 | | | | 36 | | |
| Anixter International | | | 4,349 | | | | 161 | | |
| Ansoft* | | | 1,127 | | | | 36 | | |
| ANSYS* | | | 4,686 | | | | 175 | | |
| Anteon International* | | | 4,114 | | | | 186 | | |
| Applied Digital Solutions* (a) | | | 9,660 | | | | 30 | | |
| Applied Films* | | | 2,384 | | | | 46 | | |
| Applied Micro Circuits* | | | 44,210 | | | | 108 | | |
| aQuantive* | | | 8,072 | | | | 175 | | |
| Ariba* | | | 9,491 | | | | 74 | | |
| Arris Group* | | | 14,171 | | | | 117 | | |
| AsiaInfo Holdings* | | | 4,823 | | | | 19 | | |
| Aspen Technology* | | | 7,098 | | | | 43 | | |
| Asyst Technologies* | | | 8,076 | | | | 35 | | |
| Atari* | | | 7,518 | | | | 10 | | |
| Atheros Communications* (a) | | | 3,910 | | | | 34 | | |
| Atmel* (a) | | | 61,080 | | | | 150 | | |
| ATMI* | | | 5,470 | | | | 149 | | |
| Audiovox* | | | 2,451 | | | | 35 | | |
| August Technology* | | | 2,660 | | | | 27 | | |
| Autobytel* | | | 6,211 | | | | 27 | | |
| Avocent* (a) | | | 7,040 | | | | 216 | | |
| Axcelis Technologies* | | | 15,013 | | | | 65 | | |
| Bankrate* (a) | | | 1,360 | | | | 36 | | |
| BearingPoint* | | | 27,000 | | | | 190 | | |
| Bel Fuse | | | 1,644 | | | | 49 | | |
| Belden CDT (a) | | | 6,756 | | | | 135 | | |
| Bell Microproducts* | | | 4,480 | | | | 31 | | |
| Benchmark Electronics* (a) | | | 5,976 | | | | 168 | | |
| Black Box | | | 2,448 | | | | 98 | | |
| Blackbaud | | | 1,278 | | | | 18 | | |
| Blackboard* | | | 2,100 | | | | 59 | | |
| Blue Coat Systems* | | | 1,510 | | | | 71 | | |
| Borland Software* | | | 12,003 | | | | 61 | | |
| Bottomline Technologies* | | | 1,990 | | | | 25 | | |
| Brightpoint* | | | 4,050 | | | | 87 | | |
| Brocade Communications Systems* | | | 38,530 | | | | 143 | | |
FIRST AMERICAN FUNDS Annual Report 2005
33
Schedule of Investments October 31, 2005
Small Cap Index Fund (continued)
| DESCRIPTION | | SHARES | | VALUE (000) | |
| Brooks Automation* (a) | | | 10,870 | | | $ | 127 | | |
| Cabot Microelectronics* (a) | | | 3,545 | | | | 104 | | |
| Catapult Communications* | | | 1,223 | | | | 22 | | |
| CCC Information Services Group* | | | 1,349 | | | | 35 | | |
| C-COR.net* | | | 7,199 | | | | 38 | | |
| Checkpoint Systems* | | | 5,428 | | | | 130 | | |
| China Energy Savings Technology* | | | 10 | | | | — | | |
| CIBER* | | | 7,731 | | | | 49 | | |
| Ciena* | | | 82,110 | | | | 195 | | |
| Cirrus Logic* | | | 12,823 | | | | 84 | | |
| Click Commerce* | | | 1,280 | | | | 23 | | |
| CMGI* | | | 70,076 | | | | 111 | | |
| CNET Networks* (a) | | | 18,572 | | | | 252 | | |
| Cogent* (a) | | | 3,130 | | | | 83 | | |
| Cognex | | | 5,945 | | | | 170 | | |
| Coherent* | | | 4,414 | | | | 131 | | |
| Cohu | | | 3,208 | | | | 74 | | |
| CommScope* (a) | | | 7,920 | | | | 155 | | |
| Comtech Telecommunications* | | | 3,149 | | | | 121 | | |
| Concur Technologies* | | | 4,502 | | | | 61 | | |
| Conexant Systems* (a) | | | 68,470 | | | | 133 | | |
| Covansys* | | | 3,770 | | | | 60 | | |
| Credence Systems* | | | 12,092 | | | | 93 | | |
| CSG Systems International* (a) | | | 7,596 | | | | 179 | | |
| CTS | | | 5,272 | | | | 62 | | |
| CyberGuard* | | | 2,945 | | | | 25 | | |
| CyberSource* | | | 3,890 | | | | 26 | | |
| Cymer* | | | 5,209 | | | | 182 | | |
| Cypress Semiconductor* (a) | | | 18,910 | | | | 257 | | |
| Daktronics | | | 2,151 | | | | 46 | | |
| Digi International* | | | 3,240 | | | | 34 | | |
| Digital Insight* | | | 4,999 | | | | 149 | | |
| Digital River* (a) | | | 4,969 | | | | 139 | | |
| Digitas* (a) | | | 12,343 | | | | 133 | | |
| Diodes* | | | 1,223 | | | | 44 | | |
| Dionex* | | | 2,944 | | | | 143 | | |
| Ditech Communications* | | | 4,823 | | | | 31 | | |
| Dot Hill Systems* | | | 6,599 | | | | 46 | | |
| DSP Group* | | | 3,744 | | | | 92 | | |
| DTS* | | | 2,600 | | | | 42 | | |
| EarthLink* | | | 18,343 | | | | 202 | | |
| Echelon* | | | 4,372 | | | | 34 | | |
| eCollege.com* | | | 2,562 | | | | 41 | | |
| eFunds* | | | 6,497 | | | | 134 | | |
| Electro Scientific Industries* | | | 4,277 | | | | 94 | | |
| Electronics for Imaging* | | | 7,863 | | | | 197 | | |
| EMCORE* | | | 5,730 | | | | 32 | | |
| Emulex* (a) | | | 11,930 | | | | 221 | | |
| Endwave* (a) | | | 1,050 | | | | 13 | | |
| Entegris* (a) | | | 16,057 | | | | 157 | | |
| Entrust* | | | 9,343 | | | | 42 | | |
| Epicor Software* | | | 7,184 | | | | 88 | | |
| EPIQ Systems* | | | 1,926 | | | | 37 | | |
| Equinix* | | | 2,240 | | | | 83 | | |
| Euronet Worldwide* | | | 4,448 | | | | 125 | | |
| Exar* | | | 5,114 | | | | 64 | | |
| Excel Technologies* | | | 1,815 | | | | 47 | | |
| Extreme Networks* (a) | | | 18,265 | | | | 88 | | |
| FactSet Research Systems | | | 5,180 | | | | 182 | | |
Small Cap Index Fund (continued)
| DESCRIPTION | | SHARES | | VALUE (000) | |
| Fairchild Semiconductor International, Class A* (a) | | | 17,000 | | | $ | 262 | | |
| FalconStor Software* (a) | | | 3,577 | | | | 24 | | |
| Fargo Electronics* | | | 1,960 | | | | 37 | | |
| FARO Technologies* | | | 1,650 | | | | 34 | | |
| FEI* | | | 3,510 | | | | 66 | | |
| FileNet* | | | 6,017 | | | | 169 | | |
| Finisar* | | | 28,416 | | | | 43 | | |
| FormFactor* | | | 4,790 | | | | 118 | | |
| Forrester Research* | | | 1,918 | | | | 37 | | |
| Foundry Networks* (a) | | | 17,280 | | | | 206 | | |
| Gartner, Class A* (a) | | | 8,416 | | | | 101 | | |
| Gateway* (a) | | | 37,823 | | | | 108 | | |
| Genesis Microchip* | | | 4,952 | | | | 95 | | |
| Glenayre Technologies* | | | 9,600 | | | | 36 | | |
| Global Imaging Systems* | | | 3,378 | | | | 120 | | |
| GlobeTel Communications* (a) | | | 9,880 | | | | 20 | | |
| Greenfield Online* | | | 1,610 | | | | 8 | | |
| Harmonic* | | | 10,485 | | | | 48 | | |
| Homestore* | | | 19,786 | | | | 72 | | |
| HouseValues* (a) | | | 980 | | | | 14 | | |
| Hutchinson Technology* (a) | | | 3,621 | | | | 90 | | |
| Hypercom* | | | 7,912 | | | | 47 | | |
| Identix* | | | 13,401 | | | | 59 | | |
| iGATE* | | | 3,583 | | | | 13 | | |
| Imation | | | 4,820 | | | | 206 | | |
| Infocrossing* (a) | | | 2,700 | | | | 19 | | |
| Informatica* | | | 12,459 | | | | 148 | | |
| InfoSpace* | | | 4,822 | | | | 121 | | |
| infoUSA | | | 4,691 | | | | 50 | | |
| Integral Systems | | | 1,610 | | | | 35 | | |
| Integrated Device Technology* | | | 28,135 | | | | 278 | | |
| Integrated Silicon Solution* | | | 5,352 | | | | 41 | | |
| InterDigital Communications* | | | 7,760 | | | | 149 | | |
| Intergraph* | | | 4,103 | | | | 199 | | |
| International DisplayWorks* (a) | | | 4,790 | | | | 28 | | |
| Internet Capital Group* | | | 5,510 | | | | 47 | | |
| Internet Security Systems* | | | 5,689 | | | | 140 | | |
| Inter-Tel | | | 3,114 | | | | 58 | | |
| Intervideo* | | | 1,470 | | | | 14 | | |
| InterVoice* | | | 5,436 | | | | 51 | | |
| Interwoven* | | | 6,121 | | | | 58 | | |
| Intevac* | | | 2,870 | | | | 26 | | |
| Intrado* | | | 2,966 | | | | 57 | | |
| iPass* | | | 7,630 | | | | 42 | | |
| iPayment* | | | 1,809 | | | | 65 | | |
| Itron* | | | 3,339 | | | | 145 | | |
| iVillage* | | | 6,120 | | | | 45 | | |
| Ixia* | | | 4,569 | | | | 58 | | |
| IXYS* | | | 3,241 | | | | 33 | | |
| J2 Global Communications* | | | 3,202 | | | | 142 | | |
| Jack Henry & Associates | | | 9,810 | | | | 176 | | |
| JAMDAT Mobile* (a) | | | 1,420 | | | | 26 | | |
| JDA Software* | | | 4,426 | | | | 72 | | |
| Jupitermedia* (a) | | | 2,910 | | | | 49 | | |
| Kanbay International* | | | 3,070 | | | | 45 | | |
| Keane* (a) | | | 7,234 | | | | 82 | | |
| Keithley Instruments | | | 1,890 | | | | 30 | | |
| KEMET* | | | 12,412 | | | | 86 | | |
| Keynote Systems* | | | 2,645 | | | | 34 | | |
The accompanying notes are an integral part of the financial statements.
FIRST AMERICAN FUNDS Annual Report 2005
34
Small Cap Index Fund (continued)
| DESCRIPTION | | SHARES | | VALUE (000) | |
| Komag* (a) | | | 4,205 | | | $ | 113 | | |
| Kopin* | | | 10,434 | | | | 59 | | |
| Kronos* | | | 4,598 | | | | 211 | | |
| Kulicke & Soffa* | | | 8,378 | | | | 53 | | |
| Landauer | | | 1,132 | | | | 57 | | |
| Lattice Semiconductor* (a) | | | 16,301 | | | | 71 | | |
| Lawson Software* (a) | | | 8,905 | | | | 68 | | |
| Leadis Technology* | | | 1,070 | | | | 6 | | |
| LeCroy* | | | 1,420 | | | | 22 | | |
| Lexar Media* | | | 11,974 | | | | 90 | | |
| Lionbridge Technologies* | | | 6,443 | | | | 44 | | |
| Littelfuse* | | | 3,214 | | | | 79 | | |
| Lo-Jack* | | | 2,430 | | | | 46 | | |
| LTX* | | | 9,246 | | | | 32 | | |
| Macrovision* | | | 7,235 | | | | 136 | | |
| Magma Design Automation* | | | 4,284 | | | | 37 | | |
| Majesco Entertainment Company* | | | 2,550 | | | | 4 | | |
| Manhattan Associates* | | | 4,541 | | | | 101 | | |
| ManTech International* | | | 2,365 | | | | 66 | | |
| MapInfo* (a) | | | 3,380 | | | | 42 | | |
| Marchex* (a) | | | 3,070 | | | | 52 | | |
| MatrixOne* | | | 7,488 | | | | 38 | | |
| Mattson Technology* | | | 6,107 | | | | 48 | | |
| Maximus | | | 2,840 | | | | 103 | | |
| Maxtor* | | | 36,790 | | | | 129 | | |
| McDATA, Class A* | | | 20,340 | | | | 98 | | |
| Measurement Specialties* | | | 1,830 | | | | 44 | | |
| Mentor Graphics* (a) | | | 11,767 | | | | 97 | | |
| Methode Electronics, Class A | | | 5,391 | | | | 55 | | |
| Metrologic Instruments* | | | 1,796 | | | | 35 | | |
| Micrel* (a) | | | 9,404 | | | | 94 | | |
| Micromuse* | | | 11,958 | | | | 86 | | |
| Micros Systems* (a) | | | 5,470 | | | | 251 | | |
| Microsemi* (a) | | | 8,956 | | | | 208 | | |
| MicroStrategy* (a) | | | 2,002 | | | | 142 | | |
| Microtune* | | | 7,460 | | | | 29 | | |
| Midway Games* (a) | | | 2,800 | | | | 52 | | |
| MIPS Technologies, Class A* | | | 6,290 | | | | 35 | | |
| MKS Instruments* (a) | | | 4,744 | | | | 90 | | |
| Mobility Electronics* | | | 4,240 | | | | 38 | | |
| Monolithic Power Systems* | | | 2,670 | | | | 34 | | |
| Motive* | | | 1,890 | | | | 7 | | |
| MPS Group* | | | 15,056 | | | | 187 | | |
| MRO Software* | | | 2,904 | | | | 48 | | |
| MRV Communications* | | | 15,725 | | | | 30 | | |
| MTS Systems | | | 2,877 | | | | 115 | | |
| Multi-Fineline Electronix* | | | 1,030 | | | | 27 | | |
| Ness Technologies* | | | 2,340 | | | | 21 | | |
| NETGEAR* (a) | | | 4,800 | | | | 94 | | |
| NetIQ* | | | 7,866 | | | | 94 | | |
| Netlogic Microsystems* (a) | | | 1,620 | | | | 32 | | |
| NetRatings* | | | 2,128 | | | | 32 | | |
| NetScout Systems* | | | 4,077 | | | | 23 | | |
| Newport* | | | 5,290 | | | | 69 | | |
| NIC* | | | 4,809 | | | | 29 | | |
| Novatel Wireless* (a) | | | 4,160 | | | | 53 | | |
| Nuance Communications* | | | 14,581 | | | | 75 | | |
| OmniVision Technologies* (a) | | | 8,160 | | | | 105 | | |
| ON Semiconductor* (a) | | | 20,838 | | | | 97 | | |
Small Cap Index Fund (continued)
| DESCRIPTION | | SHARES | | VALUE (000) | |
| Online Resources* | | | 3,290 | | | $ | 39 | | |
| Open Solutions* | | | 2,280 | | | | 49 | | |
| Openwave Systems* (a) | | | 9,874 | | | | 176 | | |
| Oplink Communications* | | | 15,512 | | | | 25 | | |
| Opsware* (a) | | | 9,974 | | | | 51 | | |
| Optical Communication Products* | | | 89 | | | | — | | |
| OSI Systems* (a) | | | 2,269 | | | | 38 | | |
| Packeteer* | | | 5,017 | | | | 40 | | |
| Palm* (a) | | | 5,995 | | | | 154 | | |
| PAR Technology* | | | 620 | | | | 15 | | |
| Parametric Technology* | | | 38,977 | | | | 254 | | |
| Park Electrochemical | | | 2,898 | | | | 73 | | |
| Paxar* | | | 5,289 | | | | 91 | | |
| PDF Solutions* | | | 2,516 | | | | 37 | | |
| Pegasus Solutions* | | | 3,011 | | | | 26 | | |
| Pegasystems* | | | 1,940 | | | | 12 | | |
| Pericom Semiconductor* | | | 3,801 | | | | 30 | | |
| Perot Systems, Class A* | | | 11,891 | | | | 165 | | |
| Phase Forward* (a) | | | 2,110 | | | | 23 | | |
| Phoenix Technologies* | | | 3,850 | | | | 23 | | |
| Photon Dynamics* | | | 2,555 | | | | 44 | | |
| Photronics* (a) | | | 5,607 | | | | 101 | | |
| Pixelworks* | | | 6,959 | | | | 38 | | |
| Plantronics | | | 7,020 | | | | 210 | | |
| Plexus* | | | 6,302 | | | | 111 | | |
| PLX Technology* | | | 3,700 | | | | 28 | | |
| PMC-Sierra* | | | 25,880 | | | | 184 | | |
| Polycom* (a) | | | 14,130 | | | | 216 | | |
| PortalPlayer* (a) | | | 1,740 | | | | 35 | | |
| Power Integrations* | | | 4,273 | | | | 90 | | |
| Powerwave Technologies* (a) | | | 14,763 | | | | 166 | | |
| Presstek* | | | 4,417 | | | | 45 | | |
| Progress Software* | | | 4,787 | | | | 149 | | |
| QAD | | | 1,744 | | | | 14 | | |
| Quality Systems | | | 1,152 | | | | 77 | | |
| Quantum* | | | 26,314 | | | | 79 | | |
| Quest Software* (a) | | | 8,474 | | | | 118 | | |
| Radiant Systems* | | | 3,550 | | | | 40 | | |
| RadiSys* | | | 2,953 | | | | 47 | | |
| Rambus* | | | 14,490 | | | | 185 | | |
| RealNetworks* | | | 16,530 | | | | 129 | | |
| Redback Networks* | | | 5,410 | | | | 57 | | |
| Renaissance Learning | | | 1,314 | | | | 20 | | |
| RF Micro Devices* | | | 26,912 | | | | 141 | | |
| RightNow Technologies* | | | 1,080 | | | | 16 | | |
| Rimage* | | | 1,470 | | | | 43 | | |
| Rofin-Sinar Technologies* | | | 2,295 | | | | 85 | | |
| Rogers* | | | 2,363 | | | | 88 | | |
| RSA Security* | | | 10,216 | | | | 116 | | |
| Rudolph Technologies* (a) | | | 1,950 | | | | 24 | | |
| S1* | | | 10,580 | | | | 46 | | |
| SAFENET* (a) | | | 3,575 | | | | 119 | | |
| Sapient* (a) | | | 12,367 | | | | 64 | | |
| ScanSource* | | | 1,880 | | | | 106 | | |
| SeaChange International* | | | 4,205 | | | | 26 | | |
| Secure Computing* | | | 5,222 | | | | 63 | | |
| Semitool* | | | 2,792 | | | | 25 | | |
| Semtech* (a) | | | 10,140 | | | | 153 | | |
| SERENA Software* (a) | | | 3,929 | | | | 86 | | |
FIRST AMERICAN FUNDS Annual Report 2005
35
Schedule of Investments October 31, 2005
Small Cap Index Fund (continued)
| DESCRIPTION | | SHARES | | VALUE (000) | |
| SigmaTel* | | | 5,180 | | | $ | 71 | | |
| Silicon Image* (a) | | | 11,908 | | | | 109 | | |
| Silicon Laboratories* (a) | | | 6,150 | | | | 198 | | |
| Silicon Storage Technology* (a) | | | 12,761 | | | | 64 | | |
| SiRF Technology Holdings* | | | 4,670 | | | | 120 | | |
| Skyworks Solutions* (a) | | | 22,600 | | | | 121 | | |
| Sohu.com* | | | 3,561 | | | | 54 | | |
| Sonic Solutions* (a) | | | 3,241 | | | | 62 | | |
| SonicWALL* | | | 7,929 | | | | 55 | | |
| Sonus Networks* (a) | | | 35,610 | | | | 155 | | |
| Spatialight* (a) | | | 4,040 | | | | 18 | | |
| SpectraLink | | | 2,885 | | | | 36 | | |
| SPSS* | | | 2,439 | | | | 56 | | |
| SS&C Technologies | | | 2,337 | | | | 84 | | |
| SSA Global Technologies* | | | 1,460 | | | | 23 | | |
| Standard Microsystems* | | | 3,172 | | | | 90 | | |
| StarTek | | | 876 | | | | 11 | | |
| Stellent* | | | 3,520 | | | | 32 | | |
| Stratasys* (a) | | | 1,581 | | | | 38 | | |
| Superior Essex* | | | 2,300 | | | | 39 | | |
| Supertex* | | | 1,531 | | | | 56 | | |
| Supportsoft* | | | 6,235 | | | | 25 | | |
| Sycamore Networks* | | | 22,747 | | | | 88 | | |
| Sykes Enterprises* | | | 3,698 | | | | 53 | | |
| Symmetricom* (a) | | | 6,951 | | | | 55 | | |
| Synaptics* (a) | | | 3,149 | | | | 73 | | |
| SYNNEX* | | | 1,130 | | | | 20 | | |
| Syntel | | | 1,257 | | | | 26 | | |
| TALX | | | 2,954 | | | | 117 | | |
| TASER International* (a) | | | 9,460 | | | | 58 | | |
| Technitrol | | | 5,875 | | | | 99 | | |
| Tekelec* | | | 8,214 | | | | 113 | | |
| Telkonet* (a) | | | 5,500 | | | | 27 | | |
| Terayon Communications* | | | 11,477 | | | | 31 | | |
| Terremark Worldwide* | | | 4,299 | | | | 12 | | |
| Tessera Technologies* | | | 6,460 | | | | 180 | | |
| ThermoGenesis* | | | 6,800 | | | | 34 | | |
| THQ* | | | 8,880 | | | | 206 | | |
| TIBCO Software* | | | 31,390 | | | | 238 | | |
| TNS* | | | 1,150 | | | | 20 | | |
| Transaction Systems Architects, Class A* (a) | | | 5,408 | | | | 146 | | |
| TranSwitch* (a) | | | 16,040 | | | | 26 | | |
| Travelzoo* | | | 360 | | | | 7 | | |
| Trident Microsystems* | | | 3,720 | | | | 113 | | |
| TriQuint Semiconductor* | | | 20,579 | | | | 86 | | |
| TTM Technologies* | | | 5,917 | | | | 47 | | |
| Tyler Technologies* | | | 5,322 | | | | 43 | | |
| Ulticom* | | | 1,784 | | | | 19 | | |
| Ultimate Software Group* | | | 2,820 | | | | 48 | | |
| Ultratech* | | | 3,639 | | | | 50 | | |
| United Online | | | 8,793 | | | | 118 | | |
| Universal Display* | | | 3,578 | | | | 38 | | |
| UNOVA* (a) | | | 7,115 | | | | 221 | | |
| UTStarcom* (a) | | | 14,550 | | | | 80 | | |
| ValueClick* | | | 12,465 | | | | 218 | | |
| Varian Semiconductor Equipment Associates* (a) | | | 5,352 | | | | 202 | | |
| Vasco Data Security International* | | | 3,710 | | | | 40 | | |
| Veeco Instruments* | | | 3,900 | | | | 62 | | |
| VeriFone Holdings* (a) | | | 3,650 | | | | 85 | | |
Small Cap Index Fund (continued)
| DESCRIPTION | | SHARES | | VALUE (000) | |
| Verint Systems* | | | 2,001 | | | $ | 77 | | |
| Verity* | | | 4,739 | | | | 47 | | |
| ViaSat* | | | 3,134 | | | | 78 | | |
| Vignette* | | | 4,384 | | | | 73 | | |
| Viisage Technology* | | | 5,250 | | | | 24 | | |
| Virage Logic* | | | 2,110 | | | | 17 | | |
| Vitesse Semiconductor* | | | 32,897 | | | | 54 | | |
| Volterra Semiconductor* | | | 1,470 | | | | 18 | | |
| WebEx Communications* (a) | | | 4,867 | | | | 112 | | |
| webMethods* | | | 7,944 | | | | 55 | | |
| Websense* | | | 3,430 | | | | 203 | | |
| WebSideStory* | | | 1,390 | | | | 24 | | |
| Westell Technologies, Class A* | | | 7,750 | | | | 36 | | |
| Wind River Systems* | | | 10,180 | | | | 133 | | |
| Witness Systems* | | | 3,790 | | | | 74 | | |
| Wright Express* | | | 5,770 | | | | 125 | | |
| X-Rite | | | 3,187 | | | | 33 | | |
| Zhone Technologies* | | | 12,450 | | | | 28 | | |
| Zoran* | | | 6,558 | | | | 96 | | |
| | | | 30,013 | | |
| Materials – 4.6% | |
| A. Schulman | | | 4,815 | | | | 98 | | |
| A.M. Castle & Company* | | | 1,620 | | | | 32 | | |
| AK Steel Holdings* | | | 16,274 | | | | 114 | | |
| Aleris International* | | | 4,440 | | | | 115 | | |
| Alpha Natural Resources* (a) | | | 4,230 | | | | 100 | | |
| AMCOL International | | | 3,104 | | | | 63 | | |
| American Vanguard (a) | | | 1,720 | | | | 36 | | |
| Arch Chemicals | | | 3,558 | | | | 93 | | |
| Balchem | | | 1,210 | | | | 33 | | |
| Bowater (a) | | | 7,830 | | | | 208 | | |
| Brush Engineered Metals* (a) | | | 2,760 | | | | 42 | | |
| Buckeye Technologies* | | | 4,966 | | | | 37 | | |
| Calgon Carbon | | | 5,838 | | | | 32 | | |
| Cambrex | | | 3,925 | | | | 75 | | |
| Caraustar Industries* | | | 4,267 | | | | 37 | | |
| Carpenter Technology | | | 3,527 | | | | 213 | | |
| Century Aluminum* (a) | | | 3,186 | | | | 58 | | |
| CF Industries Holdings (a) | | | 4,660 | | | | 64 | | |
| Chaparral Steel Company* | | | 3,250 | | | | 81 | | |
| Chesapeake | | | 2,740 | | | | 55 | | |
| Cleveland-Cliffs (a) | | | 3,138 | | | | 256 | | |
| Coeur D'Alene Mines* (a) | | | 35,324 | | | | 133 | | |
| Commercial Metals | | | 8,680 | | | | 276 | | |
| Compass Minerals International | | | 2,600 | | | | 58 | | |
| Deltic Timber | | | 1,694 | | | | 78 | | |
| Eagle Materials (a) | | | 2,636 | | | | 281 | | |
| Ferro | | | 6,317 | | | | 113 | | |
| Georgia Gulf | | | 4,848 | | | | 141 | | |
| Gibraltar Industries | | | 3,453 | | | | 70 | | |
| Glatfelter | | | 4,939 | | | | 67 | | |
| GrafTech International* | | | 14,718 | | | | 72 | | |
| Graphic Packaging* | | | 9,820 | | | | 26 | | |
| Greif, Class A | | | 2,209 | | | | 135 | | |
| H.B. Fuller | | | 4,272 | | | | 128 | | |
| Headwaters* (a) | | | 6,228 | | | | 198 | | |
| Hecla Mining* (a) | | | 17,989 | | | | 61 | | |
| Hercules* | | | 17,016 | | | | 190 | | |
| Kronos Worldwide | | | 544 | | | | 17 | | |
The accompanying notes are an integral part of the financial statements.
FIRST AMERICAN FUNDS Annual Report 2005
36
Small Cap Index Fund (continued)
| DESCRIPTION | | SHARES | | VALUE (000) | |
| Longview Fibre | | | 7,333 | | | $ | 138 | | |
| MacDermid | | | 4,646 | | | | 130 | | |
| Mercer International* | | | 4,510 | | | | 35 | | |
| Metal Management | | | 2,980 | | | | 72 | | |
| Metals USA* | | | 2,950 | | | | 61 | | |
| Minerals Technologies (a) | | | 3,041 | | | | 163 | | |
| Myers Industries | | | 4,130 | | | | 47 | | |
| Neenah Paper | | | 1,510 | | | | 44 | | |
| NewMarket Group* | | | 2,353 | | | | 44 | | |
| NL Industries | | | 1,367 | | | | 23 | | |
| NN | | | 2,894 | | | | 30 | | |
| Octel | | | 1,881 | | | | 28 | | |
| Olin (a) | | | 10,212 | | | | 183 | | |
| OM Group* | | | 4,291 | | | | 69 | | |
| Oregon Steel Mills* (a) | | | 5,150 | | | | 131 | | |
| Pioneer Companies* | | | 1,750 | | | | 41 | | |
| PolyOne* | | | 13,882 | | | | 80 | | |
| Potlatch (a) | | | 4,161 | | | | 186 | | |
| Quanex | | | 3,604 | | | | 209 | | |
| Roanoke Electric Steel | | | 1,590 | | | | 35 | | |
| Rock-Tenn, Class A | | | 4,442 | | | | 62 | | |
| Rockwood Holdings* | | | 180 | | | | 4 | | |
| Royal Gold (a) | | | 2,745 | | | | 63 | | |
| RTI International Metals* | | | 3,181 | | | | 107 | | |
| Ryerson Tull (a) | | | 3,643 | | | | 74 | | |
| Schnitzer Steel Industries, Class A | | | 3,180 | | | | 101 | | |
| Schweitzer-Mauduit International | | | 2,253 | | | | 55 | | |
| Sensient Technologies | | | 7,110 | | | | 126 | | |
| Silgan Holdings | | | 3,234 | | | | 104 | | |
| Spartech | | | 4,345 | | | | 82 | | |
| Steel Dynamics (a) | | | 5,816 | | | | 180 | | |
| Steel Technologies | | | 1,600 | | | | 42 | | |
| Stepan | | | 274 | | | | 7 | | |
| Stillwater Mining* | | | 6,142 | | | | 62 | | |
| Symyx Technologies* | | | 4,772 | | | | 128 | | |
| Terra Industries* | | | 11,790 | | | | 72 | | |
| Texas Industries | | | 3,300 | | | | 164 | | |
| Titanium Metals* (a) | | | 1,620 | | | | 76 | | |
| USEC | | | 12,515 | | | | 125 | | |
| W.R. Grace & Company* | | | 10,075 | | | | 76 | | |
| Wausau-Mosinee Paper | | | 6,418 | | | | 70 | | |
| Wellman | | | 5,482 | | | | 36 | | |
| Westlake Chemical | | | 2,040 | | | | 59 | | |
| Wheeling-Pittsburgh* | | | 1,320 | | | | 17 | | |
| Worthington Industries (a) | | | 9,230 | | | | 186 | | |
| Zoltek Companies* | | | 1,690 | | | | 15 | | |
| | | | 7,728 | | |
| Telecommunication Services – 1.4% | |
| Alaska Communications Systems Holdings | | | 1,730 | | | | 19 | | |
| Arbinet-thexchange* | | | 510 | | | | 3 | | |
| Broadwing* (a) | | | 9,469 | | | | 60 | | |
| Centennial Communications, Class A* | | | 3,063 | | | | 45 | | |
| Cincinnati Bell* (a) | | | 37,047 | | | | 147 | | |
| Cogent Communications Group* | | | 860 | | | | 5 | | |
| Commonwealth Telephone Enterprises | | | 3,190 | | | | 115 | | |
| Consolidated Communications Holdings | | | 910 | | | | 12 | | |
| CT Communications | | | 2,816 | | | | 32 | | |
| Dobson Communications, Class A* | | | 16,098 | | | | 117 | | |
| FairPoint Communications | | | 4,020 | | | | 55 | | |
Small Cap Index Fund (continued)
| DESCRIPTION | | SHARES | | VALUE (000) | |
| General Communication* (a) | | | 7,810 | | | $ | 75 | | |
| Golden Telecom (a) | | | 2,820 | | | | 82 | | |
| Hungarian Telephone & Cable* | | | 630 | | | | 11 | | |
| IDT* | | | 8,630 | | | | 103 | | |
| InPhonic* | | | 2,390 | | | | 35 | | |
| Iowa Telecommunications Services | | | 3,320 | | | | 55 | | |
| Level 3 Communications* (a) | | | 104,020 | | | | 302 | | |
| NeuStar* | | | 2,260 | | | | 69 | | |
| North Pittsburgh | | | 2,197 | | | | 44 | | |
| Premiere Global Services* | | | 10,455 | | | | 89 | | |
| Price Communications* | | | 6,089 | | | | 93 | | |
| SBA Communications* | | | 10,706 | | | | 158 | | |
| Shenandoah Telecommunications | | | 1,016 | | | | 43 | | |
| SureWest Communications | | | 2,202 | | | | 62 | | |
| Syniverse Holdings* | | | 1,740 | | | | 32 | | |
| Talk America Holdings* | | | 4,098 | | | | 40 | | |
| Time Warner Telecom, Class A* | | | 7,565 | | | | 63 | | |
| UbiquiTel* | | | 10,900 | | | | 94 | | |
| USA Mobility* (a) | | | 3,898 | | | | 98 | | |
| Valor Communications Group | | | 4,430 | | | | 56 | | |
| Wireless Facilities* (a) | | | 8,179 | | | | 55 | | |
| | | | 2,269 | | |
| Utilities – 2.6% | |
| ALLETE (a) | | | 3,820 | | | | 168 | | |
| American States Water | | | 2,594 | | | | 81 | | |
| Aquila* | | | 51,082 | | | | 181 | | |
| Avista | | | 7,184 | | | | 126 | | |
| Black Hills (a) | | | 4,909 | | | | 204 | | |
| California Water Service | | | 2,473 | | | | 88 | | |
| Calpine* (a) | | | 82,520 | | | | 196 | | |
| Cascade Natural Gas | | | 1,244 | | | | 26 | | |
| Central Vermont Public Service | | | 1,838 | | | | 29 | | |
| CH Energy Group | | | 2,382 | | | | 111 | | |
| CLECO | | | 7,515 | | | | 159 | | |
| Connecticut Water Service | | | 1,363 | | | | 34 | | |
| Duquesne Light Holdings (a) | | | 11,130 | | | | 186 | | |
| El Paso Electric* (a) | | | 7,191 | | | | 156 | | |
| Empire District Electric | | | 3,823 | | | | 77 | | |
| EnergySouth | | | 1,168 | | | | 33 | | |
| IDACORP (a) | | | 6,133 | | | | 177 | | |
| Infrasource Services* | | | 1,490 | | | | 19 | | |
| ITC Holdings | | | 500 | | | | 14 | | |
| Laclede Group | | | 3,072 | | | | 92 | | |
| MGE Energy | | | 3,078 | | | | 109 | | |
| Middlesex Water | | | 1,944 | | | | 41 | | |
| New Jersey Resources | | | 3,984 | | | | 172 | | |
| NICOR (a) | | | 5,550 | | | | 218 | | |
| Northwest Natural Gas | | | 2,983 | | | | 103 | | |
| NorthWestern | | | 5,360 | | | | 159 | | |
| Ormat Technologies | | | 1,250 | | | | 25 | | |
| Otter Tail | | | 4,182 | | | | 125 | | |
| People's Energy | | | 5,100 | | | | 190 | | |
| Sierra Pacific Resources* | | | 17,449 | | | | 226 | | |
| SJW | | | 1,117 | | | | 55 | | |
| South Jersey Industries | | | 4,172 | | | | 117 | | |
| Southern Union Company Fractional Shares (b) (c) | | | — | | | | — | | |
| Southwest Gas | | | 5,467 | | | | 149 | | |
| Southwest Water (a) | | | 3,306 | | | | 45 | | |
| UIL Holdings | | | 1,857 | | | | 92 | | |
FIRST AMERICAN FUNDS Annual Report 2005
37
Schedule of Investments October 31, 2005
Small Cap Index Fund (concluded)
| DESCRIPTION | | SHARES/PAR (000) | | VALUE (000) | |
| UniSource Energy Holding | | | 5,351 | | | $ | 171 | | |
| WGL Holdings | | | 7,070 | | | | 220 | | |
| | | | 4,374 | | |
Total Common Stocks
(Cost $135,075) | | | | | | | 166,503 | | |
| Short-Term Investments – 0.5% | |
| Affiliated Money Market Fund – 0.3% | |
First American Prime
Obligations Fund, Class Z (d) | | | 505,669 | | | | 506 | | |
| U.S. Treasury Obligation – 0.2% | |
U.S. Treasury Bill (e)
3.490%, 03/02/06 | | $ | 300 | | | | 296 | | |
Total Short-Term Investments
(Cost $802) | | | | | | | 802 | | |
Investments Purchased with Proceeds
from Securities Lending (f) – 25.4%
(Cost $42,591) | | | | | | | 42,591 | | |
Total Investments – 125.5%
(Cost $178,468) | | | | | | | 209,896 | | |
| Other Assets and Liabilities, Net – (25.5)% | | | | | | | (42,668 | ) | |
| Total Net Assets – 100.0% | | | | | | $ | 167,228 | | |
* Non-income producing security
(a) This security or a portion of this security is out on loan at October 31, 2005. Total loaned securities had a market value of $41,322,582 at October 31, 2005. See note 2 in Notes to Financial Statements.
(b) Security is fair valued. As of October 31, 2005, the fair value of these investments was $0 or 0.0% to total net assets. See note 2 in Notes to Financial Statements.
(c) Security considered illiquid or restricted. As of October 31, 2005, the value of these investments was $0 or 0.0% of total net assets. See note 2 in Notes to Financial Statements.
(d) Investment in affiliated security. This money market fund is advised by U.S. Bancorp Asset Management, Inc., which also serves as advisor to this fund. See note 3 in Notes to Financial Statements.
(e) Security has been deposited as initial margin on open futures contracts. Yield shown is effective yield as of October 31, 2005. See note 2 in Notes to Financial Statements.
(f) The fund may loan securities in return for collateral in the form of cash, U.S. Government securities, or other high grade debt obligations. The cash collateral is invested in various short-term fixed income securities, such as repurchase agreements, commercial paper, money market funds and other corporate obligations. See note 2 in Notes to Financial Statements.
Schedule of Open Futures Contracts
| Description | | Number of
Contracts
Purchased
(Sold) | | Notional
Contract
Value
(000) | | Settlement
Month | | Unrealized
Appreciation
(000) | |
Russell 2000 Index
Futures Contracts | | | 1 | | | $ | 325 | | | December-05 | | $ | 7 | | |
The accompanying notes are an integral part of the financial statements.
FIRST AMERICAN FUNDS Annual Report 2005
38
(This page has been left blank intentionally.)
39
Statements of Assets and Liabilities October 31, 2005, in thousands, except for per share data
| | | Equity
Index Fund | | Mid Cap
Index Fund | | Small Cap
Index Fund | |
| ASSETS: | |
Investments in unaffiliated securities, at value*
(cost: $1,586,781, $299,460, and $135,371, respectively) (note 2) | | $ | 2,163,145 | | | $ | 360,166 | | | $ | 166,799 | | |
Investments in affiliated securities, at value
(cost: $11,159, $3,641, and $506, respectively) (note 2) | | | 13,787 | | | | 3,641 | | | | 506 | | |
Investments purchased with proceeds from securities lending
(cost: $487,770, $134,979, and $42,591, respectively) (note2) | | | 487,770 | | | | 134,979 | | | | 42,591 | | |
| Cash** | | | 565 | | | | 155 | | | | 51 | | |
| Receivable for dividends and interest | | | 2,035 | | | | 198 | | | | 84 | | |
| Receivable for investment securities sold | | | 24,625 | | | | — | | | | 57 | | |
| Receivable for capital shares sold | | | 532 | | | | 249 | | | | 162 | | |
| Receivable for variation margin | | | 231 | | | | 79 | | | | 7 | | |
| Prepaid expenses and other assets | | | 52 | | | | 50 | | | | 47 | | |
| Total assets | | | 2,692,742 | | | | 499,517 | | | | 210,304 | | |
| LIABILITIES: | |
| Payable for investment securities purchased | | | — | | | | 423 | | | | — | | |
| Payable upon return of securities loaned (note 2) | | | 488,331 | | | | 135,134 | | | | 42,640 | | |
| Payable for capital shares redeemed | | | 4,399 | | | | 387 | | | | 326 | | |
| Payable to affiliates (note 3) | | | 673 | | | | 147 | | | | 83 | | |
| Payable for distribution and shareholder servicing fees | | | 119 | | | | 9 | | | | 5 | | |
| Accrued expenses and other liabilities | | | 67 | | | | 23 | | | | 22 | | |
| Total liabilities | | | 493,589 | | | | 136,123 | | | | 43,076 | | |
| Net assets | | $ | 2,199,153 | | | $ | 363,394 | | | $ | 167,228 | | |
| COMPOSITION OF NET ASSETS: | |
| Portfolio capital | | $ | 1,663,525 | | | $ | 282,031 | | | $ | 131,670 | | |
| Undistributed net investment income | | | — | | | | 245 | | | | 65 | | |
| Accumulated net realized gain (loss) on investments | | | (43,927 | ) | | | 20,423 | | | | 4,058 | | |
| Net unrealized appreciation of investments | | | 578,992 | | | | 60,706 | | | | 31,428 | | |
| Net unrealized appreciation (depreciation) of futures contracts | | | 563 | | | | (11 | ) | | | 7 | | |
| Net assets | | $ | 2,199,153 | | | $ | 363,394 | | | $ | 167,228 | | |
| * Including securities loaned, at value | | $ | 478,325 | | | $ | 132,363 | | | $ | 41,323 | | |
| ** Includes cash collateral received related to securities loaned (note 2) | | $ | 561 | | | $ | 155 | | | $ | 49 | | |
| Class A: | |
| Net assets | | $ | 234,629 | | | $ | 14,318 | | | $ | 10,067 | | |
| Shares issued and outstanding ($0.0001 par value — 2 billion authorized) | | | 10,387 | | | | 1,059 | | | | 713 | | |
| Net asset value and redemption price per share | | $ | 22.59 | | | $ | 13.52 | | | $ | 14.12 | | |
| Maximum offering price per share (1) | | $ | 23.90 | | | $ | 14.31 | | | $ | 14.94 | | |
| Class B: | |
| Net assets | | $ | 56,097 | | | $ | 3,485 | | | $ | 1,498 | | |
| Shares issued and outstanding ($0.0001 par value — 2 billion authorized) | | | 2,514 | | | | 262 | | | | 109 | | |
| Net asset value, offering price, and redemption price per share (2) | | $ | 22.31 | | | $ | 13.28 | | | $ | 13.76 | | |
| Class C: | |
| Net assets | | $ | 24,195 | | | $ | 3,388 | | | $ | 2,068 | | |
| Shares issued and outstanding ($0.0001 par value — 2 billion authorized) | | | 1,078 | | | | 254 | | | | 149 | | |
| Net asset value, offering price, and redemption price per share (2) | | $ | 22.44 | | | $ | 13.32 | | | $ | 13.88 | | |
| Class R: | |
| Net assets | | $ | 1,715 | | | $ | 131 | | | $ | 23 | | |
| Shares issued and outstanding ($0.0001 par value — 2 billion authorized) | | | 76 | | | | 10 | | | | 2 | | |
| Net asset value, offering price, and redemption price per share | | $ | 22.57 | | | $ | 13.48 | | | $ | 13.97 | | |
| Class Y: | |
| Net assets | | $ | 1,882,517 | | | $ | 342,072 | | | $ | 153,572 | | |
| Shares issued and outstanding ($0.0001 par value — 2 billion authorized) | | | 83,359 | | | | 25,281 | | | | 10,876 | | |
| Net asset value, offering price, and redemption price per share | | $ | 22.58 | | | $ | 13.53 | | | $ | 14.12 | | |
(1) The offering price is calculated by dividing the net asset value by 1 minus the maximum sales charge of 5.50%.
(2) Class B and C have a contingent deferred sales charge. For a description of this sales charge, see notes 1 and 3 in Notes to Financial Statements.
The accompanying notes are an integral part of the financial statements.
FIRST AMERICAN FUNDS Annual Report 2005
40
Statements of Operations in thousands
| | | Equity
Index Fund | | Mid Cap
Index Fund | | Small Cap
Index Fund | |
| | | One-Month
Period Ended
10/31/05 | | Year
Ended
9/30/05 | | One-Month
Period Ended
10/31/05 | | Year
Ended
9/30/05 | | One-Month
Period Ended
10/31/05 | | Year
Ended
9/30/05 | |
| INVESTMENT INCOME: | |
| Dividends from unaffiliated securities | | $ | 2,352 | | | $ | 48,778 | | | $ | 279 | | | $ | 4,788 | | | $ | 134 | | | $ | 2,379 | | |
| Dividends from affiliated securities | | | 38 | | | | 933 | | | | 13 | | | | 241 | | | | 4 | | | | 90 | | |
| Interest from unaffiliated securities | | | 12 | | | | 152 | | | | 5 | | | | 46 | | | | 1 | | | | 14 | | |
| Securities lending income | | | 43 | | | | 612 | | | | 11 | | | | 121 | | | | 14 | | | | 134 | | |
| Total investment income | | | 2,445 | | | | 50,475 | | | | 308 | | | | 5,196 | | | | 153 | | | | 2,617 | | |
| EXPENSES (note 3): | |
| Investment advisory fees | | | 466 | | | | 5,859 | | | | 76 | | | | 913 | | | | 57 | | | | 732 | | |
| Transfer agent fees | | | 265 | | | | 1,478 | | | | 42 | | | | 236 | | | | 20 | | | | 116 | | |
| Administration fees | | | 239 | | | | 4,793 | | | | 40 | | | | 759 | | | | 25 | | | | 451 | | |
| Other expenses | | | 11 | | | | 89 | | | | 2 | | | | 24 | | | | 1 | | | | 32 | | |
| Custodian fees | | | 9 | | | | 206 | | | | 1 | | | | 32 | | | | 1 | | | | 16 | | |
| Professional fees | | | 9 | | | | 136 | | | | 2 | | | | 38 | | | | 1 | | | | 29 | | |
| Directors' fees | | | 5 | | | | 55 | | | | 1 | | | | 8 | | | | — | | | | 4 | | |
| Postage and printing fees | | | 4 | | | | 78 | | | | 1 | | | | 12 | | | | — | | | | 9 | | |
| Registration fees | | | 4 | | | | 44 | | | | 4 | | | | 44 | | | | 4 | | | | 43 | | |
| Distribution and shareholder servicing fees – Class A | | | 49 | | | | 603 | | | | 3 | | | | 35 | | | | 2 | | | | 25 | | |
| Distribution and shareholder servicing fees – Class B | | | 48 | | | | 665 | | | | 3 | | | | 34 | | | | 1 | | | | 16 | | |
| Distribution and shareholder servicing fees – Class C | | | 21 | | | | 291 | | | | 3 | | | | 30 | | | | 2 | | | | 21 | | |
| Distribution and shareholder servicing fees – Class R | | | 1 | | | | 5 | | | | — | (1) | | | — | (1) | | | — | (1) | | | — | (1) | |
| Total expenses | | | 1,131 | | | | 14,302 | | | | 178 | | | | 2,165 | | | | 114 | | | | 1,494 | | |
| Less: Fee waivers (note 3) | | | (323 | ) | | | (4,067 | ) | | | (16 | ) | | | (239 | ) | | | (26 | ) | | | (234 | ) | |
| Total net expenses | | | 808 | | | | 10,235 | | | | 162 | | | | 1,926 | | | | 88 | | | | 1,260 | | |
| Investment income – net | | | 1,637 | | | | 40,240 | | | | 146 | | | | 3,270 | | | | 65 | | | | 1,357 | | |
REALIZED AND UNREALIZED GAINS (LOSSES) ON
INVESTMENTS AND FUTURES CONTRACTS – NET (note 6): | |
| Net realized gain (loss) on unaffiliated investments | | | (10,825 | ) | | | (5,937 | ) | | | 2,372 | | | | 21,217 | | | | 19 | | | | 9,562 | | |
| Net realized gain (loss) on affiliated investments | | | (7 | ) | | | 513 | | | | — | | | | — | | | | — | | | | — | | |
| Net realized gain on in-kind distribution (note 8) | | | — | | | | 115,666 | | | | — | | | | — | | | | — | | | | — | | |
| Net realized gain (loss) on futures contracts | | | (622 | ) | | | (787 | ) | | | (122 | ) | | | 1,346 | | | | (135 | ) | | | 740 | | |
Net change in unrealized appreciation or depreciation
of unaffiliated investments | | | (32,021 | ) | | | 111,289 | | | | (10,517 | ) | | | 45,063 | | | | (5,614 | ) | | | 16,613 | | |
Net change in unrealized appreciation or depreciation
of affiliated investments | | | 2,629 | | | | (819 | ) | | | — | | | | — | | | | — | | | | — | | |
Net change in unrealized appreciation or depreciation
of future contracts | | | 420 | | | | 277 | | | | (31 | ) | | | (1 | ) | | | 7 | | | | (11 | ) | |
| Net gain (loss) on investments and futures contracts | | | (40,426 | ) | | | 220,202 | | | | (8,298 | ) | | | 67,625 | | | | (5,723 | ) | | | 26,904 | | |
| Net increase (decrease) in net assets resulting from operations | | $ | (38,789 | ) | | $ | 260,442 | | | $ | (8,152 | ) | | $ | 70,895 | | | $ | (5,658 | ) | | $ | 28,261 | | |
(1) Due to the presentation of the financial statements in thousands, the numbers round to zero.
The accompanying notes are an integral part of the financial statements.
FIRST AMERICAN FUNDS Annual Report 2005
41
Statements of Changes in Net Assets in thousands
| | | Equity
Index Fund | | Mid Cap
Index Fund | |
| | | One-Month
Period Ended
10/31/05 | | Year
Ended
9/30/05 | | Year
Ended
9/30/04 | | One-Month
Period Ended
10/31/05 | | Year
Ended
9/30/05 | | Year
Ended
9/30/04 | |
| OPERATIONS: | |
| Investment income – net | | $ | 1,637 | | | $ | 40,240 | | | $ | 30,485 | | | $ | 146 | | | $ | 3,270 | | | $ | 2,246 | | |
| Net realized gain (loss) on unaffiliated investments | | | (10,825 | ) | | | (5,937 | ) | | | 4,194 | | | | 2,372 | | | | 21,217 | | | | 9,956 | | |
| Net realized gain (loss) on affiliated investments | | | (7 | ) | | | 513 | | | | — | | | | — | | | | — | | | | — | | |
| Net realized gain on in-kind distributions | | | — | | | | 115,666 | | | | — | | | | — | | | | — | | | | — | | |
| Net realized gain (loss) on futures contracts | | | (622 | ) | | | (787 | ) | | | 7,968 | | | | (122 | ) | | | 1,346 | | | | 1,639 | | |
| Net change in unrealized appreciation or depreciation of unaffiliated investments | | | (32,021 | ) | | | 111,289 | | | | 233,457 | | | | (10,517 | ) | | | 45,063 | | | | 30,236 | | |
| Net change in unrealized appreciation or depreciation of affiliated investments | | | 2,629 | | | | (819 | ) | | | 2,166 | | | | — | | | | — | | | | — | | |
| Net change in unrealized appreciation or depreciation of futures contracts | | | 420 | | | | 277 | | | | 1,118 | | | | (31 | ) | | | (1 | ) | | | 152 | | |
| Net increase (decrease) in net assets resulting from operations | | | (38,789 | ) | | | 260,442 | | | | 279,388 | | | | (8,152 | ) | | | 70,895 | | | | 44,229 | | |
| DISTRIBUTIONS TO SHAREHOLDERS FROM: | |
| Investment income – net: | |
| Class A | | | (147 | ) | | | (3,686 | ) | | | (2,311 | ) | | | — | | | | (93 | ) | | | (42 | ) | |
| Class B | | | (9 | ) | | | (543 | ) | | | (335 | ) | | | — | | | | (4 | ) | | | (1 | ) | |
| Class C | | | (3 | ) | | | (235 | ) | | | (141 | ) | | | — | | | | (3 | ) | | | (1 | ) | |
| Class R | | | (1 | ) | | | (10 | ) | | | (391 | ) | | | — | | | | — | | | | (13 | ) | |
| Class Y | | | (1,477 | ) | | | (35,527 | ) | | | (27,416 | ) | | | — | | | | (3,117 | ) | | | (2,153 | ) | |
| Net realized gain on investments: | |
| Class A | | | — | | | | — | | | | — | | | | — | | | | (453 | ) | | | (99 | ) | |
| Class B | | | — | | | | — | | | | — | | | | — | | | | (114 | ) | | | (46 | ) | |
| Class C | | | — | | | | — | | | | — | | | | — | | | | (95 | ) | | | (33 | ) | |
| Class R | | | — | | | | — | | | | — | | | | — | | | | — | | | | (76 | ) | |
| Class Y | | | — | | | | — | | | | — | | | | — | | | | (11,737 | ) | | | (4,643 | ) | |
| Return of capital: | |
| Class A | | | (35 | ) | | | (12 | ) | | | (18 | ) | | | — | | | | — | | | | — | | |
| Class B | | | (2 | ) | | | (2 | ) | | | (3 | ) | | | — | | | | — | | | | — | | |
| Class C | | | (1 | ) | | | (1 | ) | | | (1 | ) | | | — | | | | — | | | | — | | |
| Class R | | | — | (1) | | | — | (1) | | | (3 | ) | | | — | | | | — | | | | — | | |
| Class Y | | | (347 | ) | | | (118 | ) | | | (210 | ) | | | — | | | | — | | | | — | | |
| Total distributions | | | (2,022 | ) | | | (40,134 | ) | | | (30,829 | ) | | | — | | | | (15,616 | ) | | | (7,107 | ) | |
| CAPITAL SHARE TRANSACTIONS (note 5): | |
| Class A: | |
| Proceeds from sales | | | 4,409 | | | | 44,458 | | | | 101,208 | | | | 189 | | | | 4,932 | | | | 9,000 | | |
| Reinvestment of distributions | | | 156 | | | | 3,435 | | | | 2,238 | | | | — | | | | 532 | | | | 139 | | |
| Payments for redemptions | | | (4,029 | ) | | | (66,590 | ) | | | (45,584 | ) | | | (374 | ) | | | (4,723 | ) | | | (3,198 | ) | |
| Increase (decrease) in net assets from Class A transactions | | | 536 | | | | (18,697 | ) | | | 57,862 | | | | (185 | ) | | | 741 | | | | 5,941 | | |
| Class B: | |
| Proceeds from sales | | | 119 | | | | 2,433 | | | | 4,621 | | | | 25 | | | | 306 | | | | 628 | | |
| Reinvestment of distributions | | | 11 | | | | 531 | | | | 329 | | | | — | | | | 116 | | | | 46 | | |
| Payments for redemptions (note 3) | | | (1,831 | ) | | | (20,370 | ) | | | (15,132 | ) | | | (7 | ) | | | (523 | ) | | | (304 | ) | |
| Increase (decrease) in net assets from Class B transactions | | | (1,701 | ) | | | (17,406 | ) | | | (10,182 | ) | | | 18 | | | | (101 | ) | | | 370 | | |
| Class C: | |
| Proceeds from sales | | | 145 | | | | 2,768 | | | | 4,397 | | | | 194 | | | | 1,082 | | | | 1,356 | | |
| Reinvestment of distributions | | | 4 | | | | 228 | | | | 138 | | | | — | | | | 92 | | | | 33 | | |
| Payments for redemptions (note 3) | | | (1,727 | ) | | | (9,668 | ) | | | (9,413 | ) | | | (258 | ) | | | (747 | ) | | | (753 | ) | |
| Increase (decrease) in net assets from Class C transactions | | | (1,578 | ) | | | (6,672 | ) | | | (4,878 | ) | | | (64 | ) | | | 427 | | | | 636 | | |
| Class R: | |
| Proceeds from sales | | | 85 | | | | 1,362 | | | | 11,681 | | | | 12 | | | | 119 | | | | 1,049 | | |
| Reinvestment of distributions | | | 1 | | | | 10 | | | | 389 | | | | — | | | | — | | | | 79 | | |
| Payments for redemptions | | | (6 | ) | | | (99 | ) | | | (71,464 | ) | | | — | | | | — | | | | (5,895 | ) | |
| Increase (decrease) in net assets from Class R transactions | | | 80 | | | | 1,273 | | | | (59,394 | ) | | | 12 | | | | 119 | | | | (4,767 | ) | |
| Class Y: | |
| Proceeds from sales | | | 16,558 | | | | 363,331 | | | | 533,400 | | | | 3,157 | | | | 73,080 | | | | 108,384 | | |
| Reinvestment of distributions | | | 1,126 | | | | 22,938 | | | | 19,144 | | | | — | | | | 8,661 | | | | 3,958 | | |
| Payments for redemptions | | | (40,781 | ) | | | (613,170 | ) | | | (556,690 | ) | | | (6,774 | ) | | | (93,999 | ) | | | (73,284 | ) | |
| Increase (decrease) in net assets from Class Y transactions | | | (23,097 | ) | | | (226,901 | ) | | | (4,146 | ) | | | (3,617 | ) | | | (12,258 | ) | | | 39,058 | | |
| Increase (decrease) in net assets from capital share transactions | | | (25,760 | ) | | | (268,403 | ) | | | (20,738 | ) | | | (3,836 | ) | | | (11,072 | ) | | | 41,238 | | |
| Total increase (decrease) in net assets | | | (66,571 | ) | | | (48,095 | ) | | | 227,821 | | | | (11,988 | ) | | | 44,207 | | | | 78,360 | | |
| Net assets at beginning of period | | | 2,265,724 | | | | 2,313,819 | | | | 2,085,998 | | | | 375,382 | | | | 331,175 | | | | 252,815 | | |
| Net assets at end of period | | $ | 2,199,153 | | | $ | 2,265,724 | | | $ | 2,313,819 | | | $ | 363,394 | | | $ | 375,382 | | | $ | 331,175 | | |
| Undistributed net investment income at end of period | | $ | — | | | $ | — | | | $ | 51 | | | $ | 245 | | | $ | 99 | | | $ | 40 | | |
(1) Due to the presentation of the financial statements in thousands, the number rounds to zero.
The accompanying notes are an integral part of the financial statements.
FIRST AMERICAN FUNDS Annual Report 2005
42
| | | Small Cap
Index Fund | |
| | | One-Month
Period Ended
10/31/05 | | Year
Ended
9/30/05 | | Year
Ended
9/30/04 | |
| OPERATIONS: | |
| Investment income – net | | $ | 65 | | | $ | 1,357 | | | $ | 785 | | |
| Net realized gain (loss) on unaffiliated investments | | | 19 | | | | 9,562 | | | | 6,383 | | |
| Net realized gain (loss) on affiliated investments | | | — | | | | — | | | | — | | |
| Net realized gain on in-kind distributions | | | — | | | | — | | | | — | | |
| Net realized gain (loss) on futures contracts | | | (135 | ) | | | 740 | | | | 1,070 | | |
| Net change in unrealized appreciation or depreciation of unaffiliated investments | | | (5,614 | ) | | | 16,613 | | | | 15,627 | | |
| Net change in unrealized appreciation or depreciation of affiliated investments | | | — | | | | — | | | | — | | |
| Net change in unrealized appreciation or depreciation of futures contracts | | | 7 | | | | (11 | ) | | | 228 | | |
| Net increase (decrease) in net assets resulting from operations | | | (5,658 | ) | | | 28,261 | | | | 24,093 | | |
| DISTRIBUTIONS TO SHAREHOLDERS FROM: | |
| Investment income – net: | |
| Class A | | | — | | | | (46 | ) | | | (15 | ) | |
| Class B | | | — | | | | — | | | | — | | |
| Class C | | | — | | | | — | | | | — | | |
| Class R | | | — | | | | — | | | | (7 | ) | |
| Class Y | | | — | | | | (1,212 | ) | | | (717 | ) | |
| Net realized gain on investments: | |
| Class A | | | — | | | | (657 | ) | | | (25 | ) | |
| Class B | | | — | | | | (112 | ) | | | (7 | ) | |
| Class C | | | — | | | | (140 | ) | | | (10 | ) | |
| Class R | | | — | | | | — | | | | (23 | ) | |
| Class Y | | | — | | | | (12,476 | ) | | | (855 | ) | |
| Return of capital: | |
| Class A | | | — | | | | — | | | | — | | |
| Class B | | | — | | | | — | | | | — | | |
| Class C | | | — | | | | — | | | | — | | |
| Class R | | | — | | | | — | | | | — | | |
| Class Y | | | — | | | | — | | | | — | | |
| Total distributions | | | — | | | | (14,643 | ) | | | (1,659 | ) | |
| CAPITAL SHARE TRANSACTIONS (note 5): | |
| Class A: | |
| Proceeds from sales | | | 143 | | | | 2,981 | | | | 6,263 | | |
| Reinvestment of distributions | | | — | | | | 694 | | | | 39 | | |
| Payments for redemptions | | | (77 | ) | | | (2,870 | ) | | | (1,649 | ) | |
| Increase (decrease) in net assets from Class A transactions | | | 66 | | | | 805 | | | | 4,653 | | |
| Class B: | |
| Proceeds from sales | | | 5 | | | | 215 | | | | 446 | | |
| Reinvestment of distributions | | | — | | | | 108 | | | | 7 | | |
| Payments for redemptions (note 3) | | | (12 | ) | | | (379 | ) | | | (118 | ) | |
| Increase (decrease) in net assets from Class B transactions | | | (7 | ) | | | (56 | ) | | | 335 | | |
| Class C: | |
| Proceeds from sales | | | 24 | | | | 705 | | | | 917 | | |
| Reinvestment of distributions | | | — | | | | 133 | | | | 10 | | |
| Payments for redemptions (note 3) | | | (137 | ) | | | (676 | ) | | | (476 | ) | |
| Increase (decrease) in net assets from Class C transactions | | | (113 | ) | | | 162 | | | | 451 | | |
| Class R: | |
| Proceeds from sales | | | 12 | | | | 11 | | | | 1,722 | | |
| Reinvestment of distributions | | | — | | | | — | | | | 29 | | |
| Payments for redemptions | | | — | | | | (2 | ) | | | (5,464 | ) | |
| Increase (decrease) in net assets from Class R transactions | | | 12 | | | | 9 | | | | (3,713 | ) | |
| Class Y: | |
| Proceeds from sales | | | 1,010 | | | | 49,781 | | | | 91,307 | | |
| Reinvestment of distributions | | | — | | | | 8,310 | | | | 1,001 | | |
| Payments for redemptions | | | (6,383 | ) | | | (62,922 | ) | | | (75,927 | ) | |
| Increase (decrease) in net assets from Class Y transactions | | | (5,373 | ) | | | (4,831 | ) | | | 16,381 | | |
| Increase (decrease) in net assets from capital share transactions | | | (5,415 | ) | | | (3,911 | ) | | | 18,107 | | |
| Total increase (decrease) in net assets | | | (11,073 | ) | | | 9,707 | | | | 40,541 | | |
| Net assets at beginning of period | | | 178,301 | | | | 168,594 | | | | 128,053 | | |
| Net assets at end of period | | $ | 167,228 | | | $ | 178,301 | | | $ | 168,594 | | |
| Undistributed net investment income at end of period | | $ | 65 | | | $ | — | | | $ | 157 | | |
FIRST AMERICAN FUNDS Annual Report 2005
43
Financial Highlights For a share outstanding throughout the indicated periods.
| | | Net Asset
Value
Beginning
of Period | | Net
Investment
Income | | Realized and
Unrealized
Gains or
(Losses) on
Investments | | Distributions
from Net
Investment
Income | | Distributions
from Net
Realized Gains | | Distributions
from Return
of Capital | | Net Asset
Value
End of
Period | |
| Equity Index Fund (1) | |
| Class A | |
| | 2005 | (2) | | $ | 23.00 | | | $ | 0.01 | | | $ | (0.40 | ) | | $ | (0.02 | ) | | $ | — | | | $ | — | (6) | | $ | 22.59 | | |
| | 2005 | (3) | | | 20.91 | | | | 0.34 | | | | 2.09 | | | | (0.34 | ) | | | — | | | | — | (6) | | | 23.00 | | |
| | 2004 | (3) | | | 18.70 | | | | 0.23 | | | | 2.22 | | | | (0.24 | ) | | | — | | | | — | (6) | | | 20.91 | | |
| | 2003 | (3) | | | 15.31 | | | | 0.21 | | | | 3.38 | | | | (0.20 | ) | | | — | | | | — | | | | 18.70 | | |
| | 2002 | (3) | | | 19.50 | | | | 0.18 | | | | (4.19 | ) | | | (0.18 | ) | | | — | | | | — | | | | 15.31 | | |
| | 2001 | (3) | | | 27.75 | | | | 0.18 | | | | (7.43 | ) | | | (0.17 | ) | | | (0.83 | ) | | | — | | | | 19.50 | | |
| Class B | |
| | 2005 | (2) | | $ | 22.72 | | | $ | — | | | $ | (0.40 | ) | | $ | (0.01 | ) | | $ | — | | | $ | — | (6) | | $ | 22.31 | | |
| | 2005 | (3) | | | 20.66 | | | | 0.18 | | | | 2.06 | | | | (0.18 | ) | | | — | | | | — | (6) | | | 22.72 | | |
| | 2004 | (3) | | | 18.48 | | | | 0.08 | | | | 2.19 | | | | (0.09 | ) | | | — | | | | — | (6) | | | 20.66 | | |
| | 2003 | (3) | | | 15.13 | | | | 0.08 | | | | 3.35 | | | | (0.08 | ) | | | — | | | | — | | | | 18.48 | | |
| | 2002 | (3) | | | 19.29 | | | | 0.03 | | | | (4.15 | ) | | | (0.04 | ) | | | — | | | | — | | | | 15.13 | | |
| | 2001 | (3) | | | 27.49 | | | | — | | | | (7.35 | ) | | | (0.02 | ) | | | (0.83 | ) | | | — | | | | 19.29 | | |
| Class C | |
| | 2005 | (2) | | $ | 22.85 | | | $ | — | | | $ | (0.40 | ) | | $ | (0.01 | ) | | $ | — | | | $ | — | (6) | | $ | 22.44 | | |
| | 2005 | (3) | | | 20.78 | | | | 0.18 | | | | 2.07 | | | | (0.18 | ) | | | — | | | | — | (6) | | | 22.85 | | |
| | 2004 | (3) | | | 18.59 | | | | 0.08 | | | | 2.20 | | | | (0.09 | ) | | | — | | | | — | (6) | | | 20.78 | | |
| | 2003 | (3) | | | 15.23 | | | | 0.08 | | | | 3.36 | | | | (0.08 | ) | | | — | | | | — | | | | 18.59 | | |
| | 2002 | (3) | | | 19.41 | | | | 0.03 | | | | (4.17 | ) | | | (0.04 | ) | | | — | | | | — | | | | 15.23 | | |
| | 2001 | (3) | | | 27.66 | | | | — | | | | (7.40 | ) | | | (0.02 | ) | | | (0.83 | ) | | | — | | | | 19.41 | | |
| Class R (4) | |
| | 2005 | (2) | | $ | 22.98 | | | $ | 0.01 | | | $ | (0.40 | ) | | $ | (0.02 | ) | | $ | — | | | $ | — | (6) | | $ | 22.57 | | |
| | 2005 | (3) | | | 20.91 | | | | 0.26 | | | | 2.11 | | | | (0.30 | ) | | | — | | | | — | (6) | | | 22.98 | | |
| | 2004 | (3) | | | 18.70 | | | | 0.23 | | | | 2.20 | | | | (0.22 | ) | | | — | | | | — | (6) | | | 20.91 | | |
| | 2003 | (3) | | | 15.30 | | | | 0.21 | | | | 3.39 | | | | (0.20 | ) | | | — | | | | — | | | | 18.70 | | |
| | 2002 | (3) | | | 19.50 | | | | 0.18 | | | | (4.20 | ) | | | (0.18 | ) | | | — | | | | — | | | | 15.30 | | |
| | 2001 | (5) | | | 18.80 | | | | — | | | | 0.70 | | | | — | | | | — | | | | — | | | | 19.50 | | |
| Class Y | |
| | 2005 | (2) | | $ | 22.99 | | | $ | 0.02 | | | $ | (0.41 | ) | | $ | (0.02 | ) | | $ | — | | | $ | — | (6) | | $ | 22.58 | | |
| | 2005 | (3) | | | 20.91 | | | | 0.40 | | | | 2.08 | | | | (0.40 | ) | | | — | | | | — | (6) | | | 22.99 | | |
| | 2004 | (3) | | | 18.69 | | | | 0.29 | | | | 2.22 | | | | (0.29 | ) | | | — | | | | — | (6) | | | 20.91 | | |
| | 2003 | (3) | | | 15.30 | | | | 0.25 | | | | 3.38 | | | | (0.24 | ) | | | — | | | | — | | | | 18.69 | | |
| | 2002 | (3) | | | 19.49 | | | | 0.23 | | | | (4.19 | ) | | | (0.23 | ) | | | — | | | | — | | | | 15.30 | | |
| | 2001 | (3) | | | 27.74 | | | | 0.23 | | | | (7.42 | ) | | | (0.23 | ) | | | (0.83 | ) | | | — | | | | 19.49 | | |
The accompanying notes are an integral part of the financial statements.
FIRST AMERICAN FUNDS Annual Report 2005
44
| | | Total
Return (7) | | Net Assets
End of
Period (000) | | Ratio of
Expenses to
Average
Net Assets | | Ratio of Net
Investment
Income (Loss)
to Average
Net Assets | | Ratio of
Expenses to
Average
Net Assets
(Excluding
Waivers) | | Ratio of Net
Investment
Income (Loss)
to Average Net
Assets (Excluding
Waivers) | | Portfolio
Turnover
Rate | |
| Equity Index Fund (1) | |
| Class A | |
| | 2005 | (2) | | | (1.70 | )% | | $ | 234,629 | | | | 0.62 | % | | | 0.69 | % | | | 0.79 | % | | | 0.52 | % | | | — | % | |
| | 2005 | (3) | | | 11.69 | | | | 238,379 | | | | 0.62 | | | | 1.53 | | | | 0.79 | | | | 1.36 | | | | 4 | | |
| | 2004 | (3) | | | 13.12 | | | | 234,349 | | | | 0.62 | | | | 1.13 | | | | 0.79 | | | | 0.96 | | | | 1 | | |
| | 2003 | (3) | | | 23.58 | | | | 158,324 | | | | 0.62 | | | | 1.22 | | | | 0.80 | | | | 1.04 | | | | 1 | | |
| | 2002 | (3) | | | (20.75 | ) | | | 139,007 | | | | 0.62 | | | | 0.91 | | | | 0.80 | | | | 0.73 | | | | 8 | | |
| | 2001 | (3) | | | (26.95 | ) | | | 188,410 | | | | 0.60 | | | | 0.74 | | | | 1.14 | | | | 0.20 | | | | 6 | | |
| Class B | |
| | 2005 | (2) | | | (1.78 | )% | | $ | 56,097 | | | | 1.37 | % | | | (0.06 | )% | | | 1.54 | % | | | (0.23 | )% | | | — | % | |
| | 2005 | (3) | | | 10.86 | | | | 58,857 | | | | 1.37 | | | | 0.79 | | | | 1.54 | | | | 0.62 | | | | 4 | | |
| | 2004 | (3) | | | 12.31 | | | | 69,828 | | | | 1.37 | | | | 0.38 | | | | 1.54 | | | | 0.21 | | | | 1 | | |
| | 2003 | (3) | | | 22.72 | | | | 71,624 | | | | 1.37 | | | | 0.47 | | | | 1.55 | | | | 0.29 | | | | 1 | | |
| | 2002 | (3) | | | (21.40 | ) | | | 66,835 | | | | 1.37 | | | | 0.16 | | | | 1.55 | | | | (0.02 | ) | | | 8 | | |
| | 2001 | (3) | | | (27.49 | ) | | | 95,586 | | | | 1.35 | | | | (0.01 | ) | | | 1.89 | | | | (0.55 | ) | | | 6 | | |
| Class C | |
| | 2005 | (2) | | | (1.78 | )% | | $ | 24,195 | | | | 1.37 | % | | | (0.05 | )% | | | 1.54 | % | | | (0.22 | )% | | | — | % | |
| | 2005 | (3) | | | 10.84 | | | | 26,258 | | | | 1.37 | | | | 0.79 | | | | 1.54 | | | | 0.62 | | | | 4 | | |
| | 2004 | (3) | | | 12.28 | | | | 30,111 | | | | 1.37 | | | | 0.38 | | | | 1.54 | | | | 0.21 | | | | 1 | | |
| | 2003 | (3) | | | 22.65 | | | | 31,330 | | | | 1.37 | | | | 0.47 | | | | 1.55 | | | | 0.29 | | | | 1 | | |
| | 2002 | (3) | | | (21.38 | ) | | | 21,637 | | | | 1.37 | | | | 0.16 | | | | 1.55 | | | | (0.02 | ) | | | 8 | | |
| | 2001 | (3) | | | (27.51 | ) | | | 29,560 | | | | 1.35 | | | | (0.01 | ) | | | 1.89 | | | | (0.55 | ) | | | 6 | | |
| Class R (4) | |
| | 2005 | (2) | | | (1.72 | )% | | $ | 1,715 | | | | 0.87 | % | | | 0.44 | % | | | 1.19 | % | | | 0.12 | % | | | — | % | |
| | 2005 | (3) | | | 11.38 | | | | 1,663 | | | | 0.87 | | | | 1.14 | | | | 1.19 | | | | 0.82 | | | | 4 | | |
| | 2004 | (3) | | | 13.00 | | | | 333 | | | | 0.62 | | | | 1.13 | | | | 0.79 | | | | 0.96 | | | | 1 | | |
| | 2003 | (3) | | | 23.66 | | | | 52,925 | | | | 0.62 | | | | 1.22 | | | | 0.80 | | | | 1.04 | | | | 1 | | |
| | 2002 | (3) | | | (20.79 | ) | | | 42,964 | | | | 0.62 | | | | 0.93 | | | | 0.80 | | | | 0.75 | | | | 8 | | |
| | 2001 | (5) | | | 3.72 | | | | 38,220 | | | | 0.72 | | | | 0.89 | | | | 1.20 | | | | 0.41 | | | | 6 | | |
| Class Y | |
| | 2005 | (2) | | | (1.69 | )% | | $ | 1,882,517 | | | | 0.37 | % | | | 0.94 | % | | | 0.54 | % | | | 0.77 | % | | | — | % | |
| | 2005 | (3) | | | 11.92 | | | | 1,940,567 | | | | 0.37 | | | | 1.78 | | | | 0.54 | | | | 1.61 | | | | 4 | | |
| | 2004 | (3) | | | 13.45 | | | | 1,979,198 | | | | 0.37 | | | | 1.38 | | | | 0.54 | | | | 1.21 | | | | 1 | | |
| | 2003 | (3) | | | 23.89 | | | | 1,771,795 | | | | 0.37 | | | | 1.46 | | | | 0.55 | | | | 1.28 | | | | 1 | | |
| | 2002 | (3) | | | (20.56 | ) | | | 1,135,653 | | | | 0.37 | | | | 1.16 | | | | 0.55 | | | | 0.98 | | | | 8 | | |
| | 2001 | (3) | | | (26.78 | ) | | | 1,567,607 | | | | 0.35 | | | | 0.99 | | | | 0.89 | | | | 0.45 | | | | 6 | | |
(1) Per share data calculated using average shares outstanding method.
(2) For the period October 1, 2005 to October 31, 2005. Effective October 1, 2005, the fund's fiscal year-end was changed from September 30 to October 31. All ratios for the period have been
annualized, except total return and portfolio turnover.
(3) For the period October 1 to September 30 in the year indicated.
(4) Prior to July 1, 2004, Class R shares were named Class S shares, which had lower fees and expenses.
(5) For the period from September 24, 2001, when the class of shares was first offered, to September 30, 2001. All ratios for the period have been annualized, except total return and
portfolio turnover.
(6) Includes a tax return of capital of less than $0.01.
(7) Total return does not reflect sales charges. Total return would have been lower had certain expenses not been waived.
FIRST AMERICAN FUNDS Annual Report 2005
45
Financial Highlights For a share outstanding throughout the indicated periods.
| | | Net Asset
Value
Beginning
of Period | | Net
Investment
Income (Loss) | | Realized and
Unrealized
Gains or
(Losses) on
Investments | | Distributions
from Net
Investment
Income | | Distributions
from Net
Realized Gains | | Net Asset
Value
End of
Period | | Total
Return (9) | |
| Mid Cap Index Fund (1)(2) | |
| Class A | |
| | 2005 | (3) | | $ | 13.82 | | | $ | — | | | $ | (0.30 | ) | | $ | — | | | $ | — | | | $ | 13.52 | | | | (2.17 | )% | |
| | 2005 | (4) | | | 11.84 | | | | 0.09 | | | | 2.40 | | | | (0.09 | ) | | | (0.42 | ) | | | 13.82 | | | | 21.43 | | |
| | 2004 | (4) | | | 10.36 | | | | 0.05 | | | | 1.67 | | | | (0.05 | ) | | | (0.19 | ) | | | 11.84 | | | | 16.80 | | |
| | 2003 | (4) | | | 8.51 | | | | 0.04 | | | | 2.08 | | | | (0.04 | ) | | | (0.23 | ) | | | 10.36 | | | | 25.45 | | |
| | 2002 | (4) | | | 9.38 | | | | 0.04 | | | | (0.49 | ) | | | (0.04 | ) | | | (0.38 | ) | | | 8.51 | | | | (5.45 | ) | |
| | 2001 | (5) | | | 12.56 | | | | 0.05 | | | | (2.11 | ) | | | (0.05 | ) | | | (1.07 | ) | | | 9.38 | | | | (17.60 | ) | |
| Class B | |
| | 2005 | (3) | | $ | 13.59 | | | $ | (0.01 | ) | | $ | (0.30 | ) | | $ | — | | | $ | — | | | $ | 13.28 | | | | (2.28 | )% | |
| | 2005 | (4) | | | 11.67 | | | | (0.01 | ) | | | 2.37 | | | | (0.02 | ) | | | (0.42 | ) | | | 13.59 | | | | 20.57 | | |
| | 2004 | (4) | | | 10.25 | | | | (0.03 | ) | | | 1.64 | | | | — | | | | (0.19 | ) | | | 11.67 | | | | 15.88 | | |
| | 2003 | (4) | | | 8.44 | | | | (0.03 | ) | | | 2.07 | | | | — | | | | (0.23 | ) | | | 10.25 | | | | 24.63 | | |
| | 2002 | (4) | | | 9.33 | | | | (0.03 | ) | | | (0.48 | ) | | | — | | | | (0.38 | ) | | | 8.44 | | | | (6.07 | ) | |
| | 2001 | (5) | | | 12.52 | | | | — | | | | (2.12 | ) | | | — | | | | (1.07 | ) | | | 9.33 | | | | (18.15 | ) | |
| Class C | |
| | 2005 | (3) | | $ | 13.63 | | | $ | (0.01 | ) | | $ | (0.30 | ) | | $ | — | | | $ | — | | | $ | 13.32 | | | | (2.27 | )% | |
| | 2005 | (4) | | | 11.70 | | | | (0.01 | ) | | | 2.38 | | | | (0.02 | ) | | | (0.42 | ) | | | 13.63 | | | | 20.60 | | |
| | 2004 | (4) | | | 10.28 | | | | (0.03 | ) | | | 1.64 | | | | — | | | | (0.19 | ) | | | 11.70 | | | | 15.83 | | |
| | 2003 | (4) | | | 8.47 | | | | (0.03 | ) | | | 2.07 | | | | — | | | | (0.23 | ) | | | 10.28 | | | | 24.55 | | |
| | 2002 | (4) | | | 9.38 | | | | (0.02 | ) | | | (0.51 | ) | | | — | | | | (0.38 | ) | | | 8.47 | | | | (6.22 | ) | |
| | 2001 | (6) | | | 9.07 | | | | — | | | | 0.31 | | | | — | | | | — | | | | 9.38 | | | | 3.42 | | |
| Class R (7) | |
| | 2005 | (3) | | $ | 13.78 | | | $ | — | | | $ | (0.30 | ) | | $ | — | | | $ | — | | | $ | 13.48 | | | | (2.18 | )% | |
| | 2005 | (4) | | | 11.83 | | | | 0.04 | | | | 2.41 | | | | (0.08 | ) | | | (0.42 | ) | | | 13.78 | | | | 21.09 | | |
| | 2004 | (4) | | | 10.36 | | | | 0.06 | | | | 1.65 | | | | (0.05 | ) | | | (0.19 | ) | | | 11.83 | | | | 16.62 | | |
| | 2003 | (4) | | | 8.50 | | | | 0.04 | | | | 2.09 | | | | (0.04 | ) | | | (0.23 | ) | | | 10.36 | | | | 25.60 | | |
| | 2002 | (4) | | | 9.38 | | | | 0.04 | | | | (0.50 | ) | | | (0.04 | ) | | | (0.38 | ) | | | 8.50 | | | | (5.56 | ) | |
| | 2001 | (8) | | | 11.07 | | | | 0.04 | | | | (1.67 | ) | | | (0.06 | ) | | | — | | | | 9.38 | | | | (14.77 | ) | |
| Class Y | |
| | 2005 | (3) | | $ | 13.83 | | | $ | 0.01 | | | $ | (0.31 | ) | | $ | — | | | $ | — | | | $ | 13.53 | | | | (2.17 | )% | |
| | 2005 | (4) | | | 11.84 | | | | 0.12 | | | | 2.41 | | | | (0.12 | ) | | | (0.42 | ) | | | 13.83 | | | | 21.82 | | |
| | 2004 | (4) | | | 10.37 | | | | 0.08 | | | | 1.66 | | | | (0.08 | ) | | | (0.19 | ) | | | 11.84 | | | | 16.97 | | |
| | 2003 | (4) | | | 8.51 | | | | 0.06 | | | | 2.09 | | | | (0.06 | ) | | | (0.23 | ) | | | 10.37 | | | | 25.86 | | |
| | 2002 | (4) | | | 9.38 | | | | 0.06 | | | | (0.49 | ) | | | (0.06 | ) | | | (0.38 | ) | | | 8.51 | | | | (5.23 | ) | |
| | 2001 | (5) | | | 12.55 | | | | 0.08 | | | | (2.11 | ) | | | (0.07 | ) | | | (1.07 | ) | | | 9.38 | | | | (17.34 | ) | |
The accompanying notes are an integral part of the financial statements.
FIRST AMERICAN FUNDS Annual Report 2005
46
| | | Net Assets
End of
Period (000) | | Ratio of
Expenses to
Average
Net Assets | | Ratio of Net
Investment
Income (Loss)
to Average
Net Assets | | Ratio of
Expenses to
Average
Net Assets
(Excluding
Waivers) | | Ratio of Net
Investment
Income (Loss)
to Average Net
Assets (Excluding
Waivers) | | Portfolio
Turnover
Rate | |
| Mid Cap Index Fund (1)(2) | |
| Class A | |
| | 2005 | (3) | | $ | 14,318 | | | | 0.75 | % | | | 0.26 | % | | | 0.80 | % | | | 0.21 | % | | | 1 | % | |
| | 2005 | (4) | | | 14,827 | | | | 0.75 | | | | 0.68 | | | | 0.82 | | | | 0.61 | | | | 15 | | |
| | 2004 | (4) | | | 11,987 | | | | 0.75 | | | | 0.47 | | | | 0.80 | | | | 0.42 | | | | 14 | | |
| | 2003 | (4) | | | 5,332 | | | | 0.75 | | | | 0.45 | | | | 0.84 | | | | 0.36 | | | | 23 | | |
| | 2002 | (4) | | | 3,581 | | | | 0.75 | | | | 0.37 | | | | 0.83 | | | | 0.29 | | | | 19 | | |
| | 2001 | (5) | | | 2,972 | | | | 0.75 | | | | 0.51 | | | | 0.80 | | | | 0.46 | | | | 43 | | |
| Class B | |
| | 2005 | (3) | | $ | 3,485 | | | | 1.50 | % | | | (0.49 | )% | | | 1.55 | % | | | (0.54 | )% | | | 1 | % | |
| | 2005 | (4) | | | 3,546 | | | | 1.50 | | | | (0.08 | ) | | | 1.57 | | | | (0.15 | ) | | | 15 | | |
| | 2004 | (4) | | | 3,133 | | | | 1.50 | | | | (0.27 | ) | | | 1.55 | | | | (0.32 | ) | | | 14 | | |
| | 2003 | (4) | | | 2,419 | | | | 1.50 | | | | (0.30 | ) | | | 1.59 | | | | (0.39 | ) | | | 23 | | |
| | 2002 | (4) | | | 1,475 | | | | 1.50 | | | | (0.37 | ) | | | 1.58 | | | | (0.45 | ) | | | 19 | | |
| | 2001 | (5) | | | 1,265 | | | | 1.50 | | | | (0.24 | ) | | | 1.54 | | | | (0.28 | ) | | | 43 | | |
| Class C | |
| | 2005 | (3) | | $ | 3,388 | | | | 1.50 | % | | | (0.49 | )% | | | 1.55 | % | | | (0.54 | )% | | | 1 | % | |
| | 2005 | (4) | | | 3,533 | | | | 1.50 | | | | (0.08 | ) | | | 1.57 | | | | (0.15 | ) | | | 15 | | |
| | 2004 | (4) | | | 2,653 | | | | 1.50 | | | | (0.27 | ) | | | 1.55 | | | | (0.32 | ) | | | 14 | | |
| | 2003 | (4) | | | 1,756 | | | | 1.50 | | | | (0.30 | ) | | | 1.59 | | | | (0.39 | ) | | | 23 | | |
| | 2002 | (4) | | | 795 | | | | 1.50 | | | | (0.37 | ) | | | 1.58 | | | | (0.45 | ) | | | 19 | | |
| | 2001 | (6) | | | — | | | | — | | | | — | | | | — | | | | — | | | | 43 | | |
| Class R (7) | |
| | 2005 | (3) | | $ | 131 | | | | 1.00 | % | | | 0.01 | % | | | 1.20 | % | | | (0.19 | )% | | | 1 | % | |
| | 2005 | (4) | | | 122 | | | | 1.00 | | | | 0.28 | | | | 1.22 | | | | 0.06 | | | | 15 | | |
| | 2004 | (4) | | | 1 | | | | 0.75 | | | | 0.49 | | | | 0.80 | | | | 0.44 | | | | 14 | | |
| | 2003 | (4) | | | 4,134 | | | | 0.75 | | | | 0.46 | | | | 0.84 | | | | 0.37 | | | | 23 | | |
| | 2002 | (4) | | | 3,393 | | | | 0.75 | | | | 0.37 | | | | 0.83 | | | | 0.29 | | | | 19 | | |
| | 2001 | (8) | | | 4,301 | | | | 0.75 | | | | 0.47 | | | | 0.80 | | | | 0.42 | | | | 43 | | |
| Class Y | |
| | 2005 | (3) | | $ | 342,072 | | | | 0.50 | % | | | 0.51 | % | | | 0.55 | % | | | 0.46 | % | | | 1 | % | |
| | 2005 | (4) | | | 353,354 | | | | 0.50 | | | | 0.92 | | | | 0.57 | | | | 0.85 | | | | 15 | | |
| | 2004 | (4) | | | 313,403 | | | | 0.50 | | | | 0.73 | | | | 0.55 | | | | 0.68 | | | | 14 | | |
| | 2003 | (4) | | | 239,174 | | | | 0.50 | | | | 0.71 | | | | 0.59 | | | | 0.62 | | | | 23 | | |
| | 2002 | (4) | | | 198,545 | | | | 0.50 | | | | 0.63 | | | | 0.58 | | | | 0.55 | | | | 19 | | |
| | 2001 | (5) | | | 176,857 | | | | 0.50 | | | | 0.75 | | | | 0.53 | | | | 0.72 | | | | 43 | | |
(1) The financial highlights for the Mid Cap Index Fund as set forth herein include the historical financial highlights of the Firstar Mid Cap Index Fund. The assets of the
Firstar Fund were acquired by the First American Mid Cap Index Fund on September 24, 2001. In connection with such acquisition, (i) Class A shares of the Firstar
Mid Cap Index Fund were exchanged for Class A shares of the First American Mid Cap Index Fund, (ii) Firstar Class B shares were exchanged for Class B shares of the
First American Fund, (iii) Firstar Class Y shares were exchanged for Class S shares of the First American Fund, and (iv) Firstar Institutional Class shares were exchanged
for Class Y shares of the First American Fund.
(2) Per share data calculated using average shares outstanding method.
(3) For the period October 1, 2005 to October 31, 2005. Effective October 1, 2005, the fund's fiscal year-end was changed from September 30 to October 31. All ratios for the
period have been annualized, except total return and portfolio turnover.
(4) For the period October 1 to September 30 in the year indicated.
(5) For the period November 1, 2000 to September 30, 2001. Effective in 2001, the fund's fiscal year-end was changed from October 31 to September 30. All ratios for the
period have been annualized, except total return and portfolio turnover.
(6) For the period from September 24, 2001, when the class of shares was first offered, to September 30, 2001. All ratios for the period have been annualized, except total
return and portfolio turnover.
(7) Prior to July 1, 2004, Class R shares were named Class S shares, which had lower fees and expenses.
(8) For the period from November 27, 2000, when the class of shares was first offered, to September 30, 2001. All ratios for the period have been annualized, except total
return and portfolio turnover.
(9) Total return does not reflect sales charges. Total return would have been lower had certain expenses not been waived.
FIRST AMERICAN FUNDS Annual Report 2005
47
Financial Highlights For a share outstanding throughout the indicated periods.
| | | Net Asset
Value
Beginning
of Period | | Net
Investment
Income (Loss) | | Realized and
Unrealized
Gains or
(Losses) on
Investments | | Distributions
from Net
Investment
Income | | Distributions
from Net
Realized Gains | | Net Asset
Value
End of
Period | | Total
Return (9) | |
| Small Cap Index Fund (1)(2) | |
| Class A | |
| | 2005 | (3) | | $ | 14.57 | | | $ | — | | | $ | (0.45 | ) | | $ | — | | | $ | — | | | $ | 14.12 | | | | (3.09 | )% | |
| | 2005 | (4) | | | 13.38 | | | | 0.07 | | | | 2.17 | | | | (0.06 | ) | | | (0.99 | ) | | | 14.57 | | | | 17.08 | | |
| | 2004 | (4) | | | 11.47 | | | | 0.04 | | | | 1.98 | | | | (0.03 | ) | | | (0.08 | ) | | | 13.38 | | | | 17.71 | | |
| | 2003 | (4) | | | 8.55 | | | | 0.04 | | | | 2.92 | | | | (0.04 | ) | | | — | | | | 11.47 | | | | 34.77 | | |
| | 2002 | (4) | | | 9.68 | | | | 0.05 | | | | (1.13 | ) | | | (0.05 | ) | | | — | | | | 8.55 | | | | (11.28 | ) | |
| | 2001 | (5) | | | 12.23 | | | | (0.01 | ) | | | (1.49 | ) | | | — | | | | (1.05 | ) | | | 9.68 | | | | (12.76 | ) | |
| Class B | |
| | 2005 | (3) | | $ | 14.21 | | | $ | (0.01 | ) | | $ | (0.44 | ) | | $ | — | | | $ | — | | | $ | 13.76 | | | | (3.17 | )% | |
| | 2005 | (4) | | | 13.15 | | | | (0.03 | ) | | | 2.08 | | | | — | | | | (0.99 | ) | | | 14.21 | | | | 15.82 | | |
| | 2004 | (4) | | | 11.33 | | | | (0.06 | ) | | | 1.96 | | | | — | | | | (0.08 | ) | | | 13.15 | | | | 16.83 | | |
| | 2003 | (4) | | | 8.47 | | | | (0.03 | ) | | | 2.90 | | | | (0.01 | ) | | | — | | | | 11.33 | | | | 33.87 | | |
| | 2002 | (4) | | | 9.63 | | | | (0.03 | ) | | | (1.13 | ) | | | — | | | | — | | | | 8.47 | | | | (12.03 | ) | |
| | 2001 | (6) | | | 10.97 | | | | (0.01 | ) | | | (1.33 | ) | | | — | | | | — | | | | 9.63 | | | | (12.11 | ) | |
| Class C | |
| | 2005 | (3) | | $ | 14.34 | | | $ | (0.01 | ) | | $ | (0.45 | ) | | $ | — | | | $ | — | | | $ | 13.88 | | | | (3.21 | )% | |
| | 2005 | (4) | | | 13.26 | | | | (0.03 | ) | | | 2.10 | | | | — | | | | (0.99 | ) | | | 14.34 | | | | 15.84 | | |
| | 2004 | (4) | | | 11.43 | | | | (0.06 | ) | | | 1.97 | | | | — | | | | (0.08 | ) | | | 13.26 | | | | 16.77 | | |
| | 2003 | (4) | | | 8.54 | | | | (0.03 | ) | | | 2.93 | | | | (0.01 | ) | | | — | | | | 11.43 | | | | 33.94 | | |
| | 2002 | (4) | | | 9.68 | | | | (0.03 | ) | | | (1.11 | ) | | | — | | | | — | | | | 8.54 | | | | (11.72 | ) | |
| | 2001 | (7) | | | 9.49 | | | | — | | | | 0.19 | | | | — | | | | — | | | | 9.68 | | | | 2.11 | | |
| Class R (8) | |
| | 2005 | (3) | | $ | 14.43 | | | $ | — | | | $ | (0.46 | ) | | $ | — | | | $ | — | | | $ | 13.97 | | | | (3.19 | )% | |
| | 2005 | (4) | | | 13.31 | | | | 0.04 | | | | 2.11 | | | | (0.04 | ) | | | (0.99 | ) | | | 14.43 | | | | 16.45 | | |
| | 2004 | (4) | | | 11.41 | | | | 0.03 | | | | 1.97 | | | | (0.02 | ) | | | (0.08 | ) | | | 13.31 | | | | 17.65 | | |
| | 2003 | (4) | | | 8.52 | | | | 0.05 | | | | 2.88 | | | | (0.04 | ) | | | — | | | | 11.41 | | | | 34.54 | | |
| | 2002 | (4) | | | 9.64 | | | | 0.05 | | | | (1.12 | ) | | | (0.05 | ) | | | — | | | | 8.52 | | | | (11.26 | ) | |
| | 2001 | (5) | | | 12.19 | | | | (0.01 | ) | | | (1.49 | ) | | | — | | | | (1.05 | ) | | | 9.64 | | | | (12.82 | ) | |
| Class Y | |
| | 2005 | (3) | | $ | 14.57 | | | $ | 0.01 | | | $ | (0.46 | ) | | $ | — | | | $ | — | | | $ | 14.12 | | | | (3.09 | )% | |
| | 2005 | (4) | | | 13.43 | | | | 0.11 | | | | 2.12 | | | | (0.10 | ) | | | (0.99 | ) | | | 14.57 | | | | 16.93 | | |
| | 2004 | (4) | | | 11.51 | | | | 0.07 | | | | 1.99 | | | | (0.06 | ) | | | (0.08 | ) | | | 13.43 | | | | 18.02 | | |
| | 2003 | (4) | | | 8.57 | | | | 0.07 | | | | 2.94 | | | | (0.07 | ) | | | — | | | | 11.51 | | | | 35.23 | | |
| | 2002 | (4) | | | 9.70 | | | | 0.07 | | | | (1.13 | ) | | | (0.07 | ) | | | — | | | | 8.57 | | | | (11.09 | ) | |
| | 2001 | (5) | | | 12.24 | | | | 0.02 | | | | (1.50 | ) | | | (0.01 | ) | | | (1.05 | ) | | | 9.70 | | | | (12.56 | ) | |
The accompanying notes are an integral part of the financial statements.
FIRST AMERICAN FUNDS Annual Report 2005
48
| | | Net Assets
End of
Period (000) | | Ratio of
Expenses to
Average
Net Assets | | Ratio of Net
Investment
Income (Loss)
to Average
Net Assets | | Ratio of
Expenses to
Average
Net Assets
(Excluding
Waivers) | | Ratio of Net
Investment
Income (Loss)
to Average Net
Assets (Excluding
Waivers) | | Portfolio
Turnover
Rate | |
| Small Cap Index Fund (1)(2) | |
| Class A | |
| | 2005 | (3) | | $ | 10,067 | | | | 0.83 | % | | | 0.27 | % | | | 1.01 | % | | | 0.09 | % | | | — | % | |
| | 2005 | (4) | | | 10,323 | | | | 0.90 | | | | 0.53 | | | | 1.03 | | | | 0.40 | | | | 23 | | |
| | 2004 | (4) | | | 8,749 | | | | 0.93 | | | | 0.30 | | | | 1.02 | | | | 0.21 | | | | 25 | | |
| | 2003 | (4) | | | 3,480 | | | | 0.93 | | | | 0.42 | | | | 1.05 | | | | 0.30 | | | | 41 | | |
| | 2002 | (4) | | | 1,908 | | | | 0.93 | | | | 0.46 | | | | 1.09 | | | | 0.30 | | | | 49 | | |
| | 2001 | (5) | | | 341 | | | | 0.91 | | | | (0.07 | ) | | | 0.94 | | | | (0.10 | ) | | | 102 | | |
| Class B | |
| | 2005 | (3) | | $ | 1,498 | | | | 1.58 | % | | | (0.48 | )% | | | 1.76 | % | | | (0.66 | )% | | | — | % | |
| | 2005 | (4) | | | 1,555 | | | | 1.65 | | | | (0.23 | ) | | | 1.78 | | | | (0.36 | ) | | | 23 | | |
| | 2004 | (4) | | | 1,494 | | | | 1.68 | | | | (0.46 | ) | | | 1.77 | | | | (0.55 | ) | | | 25 | | |
| | 2003 | (4) | | | 993 | | | | 1.68 | | | | (0.33 | ) | | | 1.80 | | | | (0.45 | ) | | | 41 | | |
| | 2002 | (4) | | | 424 | | | | 1.68 | | | | (0.29 | ) | | | 1.84 | | | | (0.45 | ) | | | 49 | | |
| | 2001 | (6) | | | 107 | | | | 1.65 | | | | (0.84 | ) | | | 1.69 | | | | (0.88 | ) | | | 102 | | |
| Class C | |
| | 2005 | (3) | | $ | 2,068 | | | | 1.58 | % | | | (0.48 | )% | | | 1.76 | % | | | (0.66 | )% | | | — | % | |
| | 2005 | (4) | | | 2,256 | | | | 1.65 | | | | (0.23 | ) | | | 1.78 | | | | (0.36 | ) | | | 23 | | |
| | 2004 | (4) | | | 1,939 | | | | 1.68 | | | | (0.46 | ) | | | 1.77 | | | | (0.55 | ) | | | 25 | | |
| | 2003 | (4) | | | 1,268 | | | | 1.68 | | | | (0.33 | ) | | | 1.80 | | | | (0.45 | ) | | | 41 | | |
| | 2002 | (4) | | | 447 | | | | 1.68 | | | | (0.26 | ) | | | 1.84 | | | | (0.42 | ) | | | 49 | | |
| | 2001 | (7) | | | — | | | | — | | | | — | | | | — | | | | — | | | | 102 | | |
| Class R (8) | |
| | 2005 | (3) | | $ | 23 | | | | 1.08 | % | | | 0.02 | % | | | 1.41 | % | | | (0.31 | )% | | | — | % | |
| | 2005 | (4) | | | 11 | | | | 1.15 | | | | 0.30 | | | | 1.43 | | | | 0.02 | | | | 23 | | |
| | 2004 | (4) | | | 1 | | | | 0.93 | | | | 0.24 | | | | 0.99 | | | | 0.18 | | | | 25 | | |
| | 2003 | (4) | | | 3,210 | | | | 0.93 | | | | 0.52 | | | | 1.05 | | | | 0.40 | | | | 41 | | |
| | 2002 | (4) | | | 13,576 | | | | 0.93 | | | | 0.42 | | | | 1.09 | | | | 0.26 | | | | 49 | | |
| | 2001 | (5) | | | 13,886 | | | | 0.88 | | | | (0.05 | ) | | | 0.91 | | | | (0.08 | ) | | | 102 | | |
| Class Y | |
| | 2005 | (3) | | $ | 153,572 | | | | 0.58 | % | | | 0.52 | % | | | 0.76 | % | | | 0.34 | % | | | — | % | |
| | 2005 | (4) | | | 164,156 | | | | 0.65 | | | | 0.78 | | | | 0.78 | | | | 0.65 | | | | 23 | | |
| | 2004 | (4) | | | 156,411 | | | | 0.68 | | | | 0.54 | | | | 0.77 | | | | 0.45 | | | | 25 | | |
| | 2003 | (4) | | | 119,102 | | | | 0.68 | | | | 0.68 | | | | 0.80 | | | | 0.56 | | | | 41 | | |
| | 2002 | (4) | | | 94,749 | | | | 0.68 | | | | 0.68 | | | | 0.84 | | | | 0.52 | | | | 49 | | |
| | 2001 | (5) | | | 54,169 | | | | 0.66 | | | | 0.19 | | | | 0.68 | | | | 0.17 | | | | 102 | | |
(1) The financial highlights for the Small Cap Index Fund as set forth herein include the historical financial highlights of the Firstar Small Cap Index Fund. The assets of the
Firstar Fund were acquired by the First American Small Cap Index Fund on September 24, 2001. In connection with such acquisition, (I) Class A shares of the Firstar
Small Cap Index Fund were exchanged for Class A shares of the First American Fund, (ii) Firstar Class B shares were exchanged for Class B shares of the First
American Fund, (iii) Firstar Class Y shares were exchanged for Class S shares (now designated Class R shares) of the First American Fund, and (iv) Firstar Institutional
Class shares were exchanged for Class Y shares of the First American Fund.
(2) Per share data calculated using average shares outstanding method.
(3) For the period October 1, 2005 to October 31, 2005. Effective October 1, 2005, the fund's fiscal year-end was changed from September 30 to October 31. All ratios for the period
have been annualized, except total return and portfolio turnover.
(4) For the period October 1 to September 30 in the year indicated.
(5) For the period November 1, 2000 to September 30, 2001. Effective in 2001, the fund's fiscal year-end was changed from October 31 to September 30. All ratios for the
period have been annualized, except total return and portfolio turnover.
(6) For the period from December 11, 2000, when the class of shares was first offered, to September 30, 2001. All ratios for the period have been annualized, except total
return and portfolio turnover.
(7) For the period from September 24, 2001, when the class of shares was first offered, to September 30, 2001. All ratios for the period have been annualized, except total
return and portfolio turnover.
(8) Prior to July 1, 2004, Class R shares were named Class S shares, which had lower fees and expenses.
(9) Total return does not reflect sales charges. Total return would have been lower had certain expenses not been waived.
FIRST AMERICAN FUNDS Annual Report 2005
49
Notes to Financial Statements October 31, 2005
1 > Organization
The Equity Index Fund, Mid Cap Index Fund, and Small Cap Index Fund (each a "fund" and collectively, the "funds") are mutual funds offered by First American Investment Funds, Inc. ("FAIF") which is a member of the First American Family of Funds. As of October 31, 2005, FAIF offered 38 funds, including the funds listed above. FAIF is registered under the Investment Company Act of 1940, as amended, as an open-end management investment company. FAIF's articles of incorporation permit the funds' board of directors to create additional funds in the future. The Equity Index Fund, Mid Cap Index Fund and Small Cap Index Fund are each diversified open-end management investment companies.
FAIF offers Class A, Class B, Class C, Class R, and Class Y shares. Prior to July 1, 2004, Class R shares were named Class S shares. Class A shares are sold with a front-end sales charge. Class B shares are subject to a contingent deferred sales charge for six years and automatically convert to Class A shares after eight years. Class C shares may be subject to a contingent deferred sales charge for 12 months, and will not convert to Class A shares. Class R shares have no sales charge and are offered only through certain tax-deferred retirement plans. Class Y shares have no sales charge and are offered only to qualifying institutional investors and certain other qualifying accounts.
The funds' prospectuses provide descriptions of each fund's investment objective, principal investment strategies, and principal risks. All classes of shares have identical voting, dividend, liquidation, and other rights, and the same terms and conditions, except that certain fees, including distribution and shareholder servicing fees, may differ among classes. Each class has exclusive voting rights on any matters relating to that class' servicing or distribution arrangements.
On June 22, 2005 the funds' board of directors approved a change in the funds' fiscal year-end from September 30 to October 31, effective with the one-month period ending October 31, 2005 (the "fiscal period").
2 > Summary of Significant Accounting Policies
The significant accounting policies followed by the funds are as follows:
SECURITY VALUATIONS – Security valuations for the funds' investments are furnished by one or more independent pricing services that have been approved by the funds' board of directors. Investments in equity securities that are traded on a national securities exchange are stated at the last quoted sales price if readily available for such securities on each business day. For securities traded on the Nasdaq national market system, the funds utilize the Nasdaq Official Closing Price which compares the last trade to the bid/ask range of a security. If the last trade falls within the bid/ask range, then that price will be the closing price. If the last trade is outside the bid/ask range, and falls above the ask, the ask will be the closing price. If the last trade is below the bid , the bid will be the closing price. Other equity securities traded in the over-the-counter market and listed equity securities for which no sale was reported on that date are stated at the last quoted bid price. Debt obligations exceeding 60 days to maturity are valued by an independent pricing service. The pricing service may employ methodologies that utilize actual market transactions, broker-dealer supplied valuations, or other formula-driven valuation techniques. These techniques generally consider such factors as yields or prices of bonds of comparable quality, type of issue, coupon, maturity, ratings, and general market conditions. Securities for which prices are not available from an independent pricing service, but where an active market exists, are valued using market quotations obtained from one or more dealers that make markets in the securities or from a widely-used quotation system. When market quotations are not readily available, securities are valued at fair value as determined in good faith by procedures established and approved by the funds' board of directors. Some of the factors which may be considered in determining fair value are fundamental analytical data relating to the investment; the nature and duration of any restrictions on disposition; trading in similar securities of the same issuer or comparable companies; information from broker-dealers; and an evaluation of the forces that influence the market in which the securities are purchased and sold. If events occur that materially affect the value of securities (including non-U.S. securities) between the close of trading in those securities and the close of regular trading on the New York Stock Exchange, the securities will be valued at fair value. Price movements in futures contracts and ADRs, and various other indices, may be reviewed in the course of making a good faith determination of a security's fair value. The use of fair value pricing by a fund may cause the net asset value of its shares to differ significantly from net asset value that would be calculated without regard to such considerations. As of October 31, 2005, the Equity Index Fund and Small Cap Index Fund had fair valued securities with a
FIRST AMERICAN FUNDS Annual Report 2005
50
total market value of $0 and $0 or 0.0% and 0.0%, respectively, of total net assets for the fund. Debt obligations with 60 days or less remaining until maturity may be valued at their amortized cost, which approximates market value. Investments in open-end mutual funds are valued at the respective net asset value of each underlying fund on the valuation date.
SECURITY TRANSACTIONS AND INVESTMENT INCOME – For financial statement purposes, the funds record security transactions on the trade date of the security purchase or sale. Dividend income is recorded on the ex-dividend date. Interest income, including amortization of bond premium and discount, is recorded on an accrual basis. Security gains and losses are determined on the basis of identified cost, which is the same basis used for federal income tax purposes. The resulting gain/loss is calculated as the difference between the fair value and the underlying cost of the security on the transaction date. Each fund reserves the right to pay part or all of the proceeds from a redemption request in a proportionate share of readily marketable securities in the fund instead of cash.
DISTRIBUTIONS TO SHAREHOLDERS – Distributions from net investment income are declared and paid quarterly for Mid Cap Index Fund and Small Cap Index Fund and monthly for Equity Index Fund, and are payable in cash or reinvested in additional shares of the fund. Any net realized capital gains on sales of a fund's securities are distributed to shareholders at least annually.
FEDERAL TAXES – Each fund is treated as a separate taxable entity. Each fund intends to continue to qualify as a regulated investment company as provided in Subchapter M of the Internal Revenue Code, as amended, and to distribute all taxable income, if any, to its shareholders. Accordingly, no provision for federal income taxes is required.
Net investment income and net realized gains (losses) may differ for financial statement and tax purposes because of temporary or permanent book/tax differences. These differences are primarily due to losses deferred from wash sales, the tax recognition of mark to market gains (losses) on open futures contracts, proceeds from securities litigation, book gains recognized from in-kind distributions, and the sale of real estate investment trust securities. To the extent these differences are permanent, reclassifications are made to the appropriate equity accounts in the period that the differences arise.
On the Statements of Assets and Liabilities the following reclassifications were made (000):
| Fund | | Undistributed
Net Investment
Income | | Portfolio
Capital | |
| Equity Index Fund | | $ | 385 | | | $ | (385 | ) | |
The character of distributions made during the period from net investment income or net realized gains may differ from its ultimate characterization for federal income tax purposes. In addition, due to the timing of dividend distributions, the fiscal period in which the amounts are distributed may differ from the period that the income or realized gains (losses) are recorded by the fund. The distributions paid during the fiscal period ended October 31, 2005 and the fiscal years ended September 30, 2005 and 2004, were characterized as follows (000):
| | | October 31, 2005 | |
| Fund | | | | Ordinary
Income | | Return
of Capital | | Total | |
| Equity Index Fund | | | | | | $ | 1,637 | | | $ | 385 | | | $ | 2,022 | | |
| | | September 30, 2005 | |
| Fund | | Ordinary
Income | | Long Term
Gain | | Return
of Capital | | Total | |
| Equity Index Fund | | $ | 40,001 | | | $ | — | | | $ | 133 | | | $ | 40,134 | | |
| Mid Cap Index Fund | | | 4,638 | | | | 10,978 | | | | — | | | | 15,616 | | |
| Small Cap Index Fund | | | 6,571 | | | | 8,072 | | | | — | | | | 14,643 | | |
| | | September 30, 2004 | |
| Fund | | Ordinary
Income | | Long Term
Gain | | Return
of Capital | | Total | |
| Equity Index Fund | | $ | 30,594 | | | $ | — | | | $ | 235 | | | $ | 30,829 | | |
| Mid Cap Index Fund | | | 3,008 | | | | 4,099 | | | | — | | | | 7,107 | | |
| Small Cap Index Fund | | | 1,059 | | | | 600 | | | | — | | | | 1,659 | | |
FIRST AMERICAN FUNDS Annual Report 2005
51
Notes to Financial Statements October 31, 2005
As of October 31, 2005, the components of accumulated earnings on a tax basis were as follows (000):
| | |
Undistributed
Ordinary
Income | | Undistributed
Long Term
Capital Gains | | Accumulated
Capital and
Post-October
Losses | |
Unrealized
Appreciation | |
Total
Accumulated
Earnings | |
| Equity Index Fund | | $ | — | | | $ | — | | | $ | (26,481 | ) | | $ | 562,109 | | | $ | 535,628 | | |
| Mid Cap Index Fund | | | 1,444 | | | | 20,343 | | | | — | | | | 59,576 | | | | 81,363 | | |
| Small Cap Index Fund | | | 65 | | | | 4,799 | | | | (118 | ) | | | 30,812 | | | | 35,558 | | |
The difference between book and tax basis unrealized appreciation is primarily due to the tax deferral of losses on wash sales, the amount of gain (loss) recognized for tax purposes due to mark to market adjustments on open futures contracts, and return of capital distributions related to real estate investment trust investments.
As of October 31, 2005, the following funds had capital loss carryforwards (000):
| | | Expiration Year | |
| Fund | | 2009 | | 2010 | | 2012 | | 2013 | | Total | |
| Equity Index Fund | | $ | 3,112 | | | $ | 10,901 | | | $ | 64 | | | $ | 12,404 | | | $ | 26,481 | | |
| Small Cap Index Fund | | | — | | | | — | | | | — | | | | 118 | | | | 118 | | |
FUTURES TRANSACTIONS – In order to gain exposure to or protect against changes in the market, the funds may enter into S&P and Russell Index futures contracts and other stock index futures contracts.
Upon entering into a futures contract, the fund is required to deposit cash or pledge U.S. government securities in an amount equal to five percent of the purchase price indicated in the futures contract (initial margin). Subsequent payments, which are dependent on the daily fluctuations in the value of the underlying security or securities, are made or received by the fund each day (daily variation margin) and are recorded as unrealized gains (losses) until the contract is closed. When the contract is closed, the fund records a realized gain (loss) equal to the difference between the proceeds from (or cost of) the closing transaction and the fund's basis in the contract.
The funds' investment in stock index futures contracts is designed to maintain sufficient liquidity to meet redemption requests and to increase the level of fund assets devoted to replicating the composition of the S&P and Russell Indices while reducing transaction costs. Risks of entering into futures contracts, in general, include the possibility that there will not be a perfect price correlation between the futures contracts and the underlying securities. Second, it is possible that a lack of liquidity for futures contracts could exist in the secondary market, resulting in an inability to close a futures position prior to its maturity date. Third, the purchase of a futures contract involves the risk that a fund could lose more than the original margin deposit required to initiate a futures transaction. These contracts involve market risk in excess of the amount reflected in the fund's statement of assets and liabilities. Unrealized gains (losses) on outstanding positions in futures contracts held at the close of the year will be recognized as capital gains (losses) for federal income tax purposes.
ILLIQUID OR RESTRICTED SECURITIES – A security may be considered illiquid if it lacks a readily available market. Securities are generally considered liquid if they can be sold or disposed of in the ordinary course of business within seven days at approximately the price at which the security is valued by the fund. Illiquid securities may be valued under methods approved by the funds' board of directors as reflecting fair value. Each fund intends to invest no more than 15% of its net assets (determined at the time of purchase and reviewed periodically) in illiquid securities. Certain restricted securities may be considered illiquid. Restricted securities are often purchased in private placement transactions, are not registered under the Securities Act of 1933, and may have contractual restrictions on resale. Certain restricted securities eligible for resale to qualified institutional investors, including Rule 144A securities, are not subject to the limitation on a fund's investment in illiquid securities if they are determined to be liquid in accordance with procedures adopted by the funds' board of directors. At October 31, 2005, Equity Index Fund and Small Cap Index Fund had investments in illiquid securities with a total value of $0 and $0, respectively, or 0.0% and 0.0%, respectively of total net assets.
FIRST AMERICAN FUNDS Annual Report 2005
52
Information concerning illiquid securities, including restricted securities considered to be illiquid, is as follows:
| Equity Index Fund | |
| Security | | Shares | | Dates
Acquired | | Cost Basis
(000) | |
| Seagate Escrow Security | | | 44,866 | | | 1/01 | | $ | — | | |
| Small Cap Index Fund | |
| Security | | Shares | | Dates
Acquired | | Cost Basis
(000) | |
| FirstBank Fractional Shares | | | — | | | 8/05 | | $ | — | | |
| Mascotech Escrow Shares | | | 9,571 | | | 2/99 to 11/00 | | | — | | |
| National Penn Fractional Shares | | | — | | | 10/05 | | | — | | |
| Petrocorp Escrow Shares | | | 2,040 | | | 6/03 to 8/05 | | | — | | |
| Southern Union Company Fractional Shares | | | — | | | 11/03 to 8/05 | | | — | | |
| USB Holding Company Fractional Shares | | | — | | | 8/05 | | | — | | |
SECURITIES LENDING – In order to generate additional income, each fund may lend securities representing up to one-third of the value of its total assets (which includes collateral for securities on loan) to broker-dealers, banks, or other institutional borrowers of securities. Each fund's policy is to maintain collateral in the form of cash, U.S. government securities, or other high-grade debt obligations equal to at least 100% of the value of securities loaned. The collateral is then "marked-to-market" daily until the securities are returned. As with other extensions of credit, there may be risks of delay in recovery of the securities or even loss of rights in the collateral should the borrower of the security fail financially. As of October 31, 2005, cash collateral invested was as follows (000):
| Fund | | Commercial
Paper | | Corporate
Obligations | | Repurchase
Agreements | | Other
Short-Term
Securities | | Total | |
| Equity Index Fund | | $ | 141,918 | | | $ | 146,742 | | | $ | 187,791 | | | $ | 11,319 | | | $ | 487,770 | | |
| Mid Cap Index Fund | | | 39,273 | | | | 40,608 | | | | 51,966 | | | | 3,132 | | | | 134,979 | | |
| Small Cap Index Fund | | | 12,392 | | | | 12,813 | | | | 16,397 | | | | 989 | | | | 42,591 | | |
U.S. Bancorp Asset Management, Inc. ("USBAM") serves as the securities lending agent for the funds in transactions involving the lending of portfolio securities on behalf of the funds. USBAM acts as the securities lending agent pursuant to, and subject to compliance with conditions contained in, an exemptive order issued by the Securities and Exchange Commission ("SEC"). During the fiscal period ended October 31, 2005 and the fiscal year ended September 30, 2005, USBAM received fees equal to 35% of each fund's income from securities lending transactions. Effective January 1, 2006, such fees will be lowered to 32% of each fund's income from securities lending transactions. Fees paid to USBAM by the funds for the fiscal period ended October 31, 2005 and the fiscal year ended September 30, 2005, were as follows (000):
| Fund | | 10/31/05 | | 9/30/05 | |
| Equity Index Fund | | $ | 24 | | | $ | 337 | | |
| Mid Cap Index Fund | | | 6 | | | | 68 | | |
| Small Cap Index Fund | | | 8 | | | | 75 | | |
SECURITY LITIGATION SETTLEMENTS – Income from settlement proceeds related to portfolio securities is recorded as an adjustment to realized or unrealized gains or losses. For the fiscal period ended October 31, 2005, the Small Cap Index Fund recorded $2,428 as an adjustment to realized gains or losses for settlement proceeds related to securities no longer included in the portfolios. For the fiscal year ended September 30, 2005, the Equity Index Fund, Mid Cap Index Fund, and the Small Cap Index Fund recorded $102,331, $70,024, and $6,761 respectively, as an adjustment to realized gains or losses for settlement proceeds related to securities no longer included in the portfolios.
EXPENSES – Expenses that are directly related to one of the funds are charged directly to that fund. Other operating expenses are generally allocated to the funds on the basis of relative net assets of all funds within the First American Family of Funds. Class specific expenses, such as distribution fees and shareholder servicing fees are borne by that class. Income, other expenses, and realized and unrealized gains and losses of a fund are allocated to each
FIRST AMERICAN FUNDS Annual Report 2005
53
Notes to Financial Statements October 31, 2005
respective class in proportion to the relative net assets of each class.
INTERFUND LENDING PROGRAM – Pursuant to an exemptive order issued by the SEC, the funds, along with other registered investment companies in the First American Family of Funds, may participate in an interfund lending program. This program provides an alternative credit facility allowing the funds to borrow from, or lend money to, other participating funds. The funds did not have any interfund lending transactions during the fiscal period ended October 31, 2005 and the fiscal year ended September 30, 2005.
DEFERRED COMPENSATION PLAN – Under a Deferred Compensation Plan (the "Plan"), non-interested directors of the First American Family of Funds, including First American Investment Funds, Inc., may participate and elect to defer receipt of part or all of their annual compensation. Deferred amounts are treated as though equivalent dollar amounts had been invested in shares of selected open-end First American Funds as designated by the board of directors. All amounts in the Plan are 100% vested and accounts under the Plan are obligations of the funds. Deferred amounts remain in the funds until distributed in accordance with the Plan.
USE OF ESTIMATES IN PREPARATION OF FINANCIAL STATEMENTS – The preparation of financial statements, in conformity with U. S. generally accepted accounting principles requires management to make estimates and assumptions that affect the reported amounts of assets and liabilities and disclosure of contingent assets and liabilities at the date of the financial statements and the reported results of operations during the reporting period. Actual results could differ from those estimates.
3 > Fees and Expenses
INVESTMENT ADVISORY FEES – Pursuant to an investment advisory agreement (the "Agreement"), USBAM manages each fund's assets and furnishes related office facilities, equipment, research, and personnel. USBAM is a subsidiary of U.S. Bank National Association ("U.S. Bank"), which is in turn a subsidiary of U.S. Bancorp. The Agreement requires each fund to pay USBAM a monthly fee based upon average daily net assets. The annual fee for Equity Index Fund, Mid Cap Index Fund, and Small Cap Index Fund is 0.25%, 0.25%, and 0.40%, respectively. USBAM has agreed to waive fees and reimburse other fund expenses through June 30, 2006, so that total fund operating expenses, as a percentage of average daily net assets, do not exceed the following amounts:
| | | Share Class | |
| Fund | | A | | B | | C | | R | | Y | |
| Equity Index Fund | | | 0.62 | % | | | 1.37 | % | | | 1.37 | % | | | 0.87 | % | | | 0.37 | % | |
| Mid Cap Index Fund | | | 0.75 | | | | 1.50 | | | | 1.50 | | | | 1.00 | | | | 0.50 | | |
| Small Cap Index Fund | | | 0.83 | | | | 1.58 | | | | 1.58 | | | | 1.08 | | | | 0.58 | | |
Prior to July 1, 2005, USBAM agreed to waive fees and reimburse other fund expenses so that total fund operating expenses, as a percentage of average daily net assets, did not exceed the following amounts:
| | | Share Class | |
| Fund | | A | | B | | C | | R | | Y | |
| Equity Index Fund | | | 0.62 | % | | | 1.37 | % | | | 1.37 | % | | | 0.87 | % | | | 0.37 | % | |
| Mid Cap Index Fund | | | 0.75 | | | | 1.50 | | | | 1.50 | | | | 1.00 | | | | 0.50 | | |
| Small Cap Index Fund | | | 0.93 | | | | 1.68 | | | | 1.68 | | | | 1.18 | | | | 0.68 | | |
The funds may invest in related money market funds that are series of First American Funds, Inc. ("FAF"), subject to certain limitations. In order to avoid the payment of duplicative investment advisory fees to USBAM, which acts as the investment advisor to both the investing funds and the related money market funds, USBAM will reimburse each investing fund an amount equal to that portion of USBAM's investment advisory fee received from the related money market funds that is attributable to the assets of the investing fund. For financial statement purposes, these reimbursements are recorded as investment income.
TRANSFER AGENT FEES – Effective July 1, 2005, U.S. Bancorp Fund Services, LLC ("USBFS"), a subsidiary of U.S. Bancorp, serves as the funds' transfer agent pursuant to a transfer agent and shareholder servicing agreement with FAIF. FAIF pays transfer agent fees of $18,500 per share class and additional per account fees for transfer agent services. These fees are allocated to each fund based upon the fund's pro rata share of the aggregate average daily net assets of the funds that comprise FAIF. Under the transfer agent and shareholder servicing agreement, FAIF also pays USBFS a fee equal, on an annual basis, to 0.10% of each fund's average daily net assets. This fee compensates USBFS for providing certain shareholder services and reimburses USBFS for its payments to financial institutions that establish and maintain omnibus accounts and provide cu stomary services for such accounts. In addition to these fees, the funds may reimburse USBFS for any out-of-pocket expenses incurred in providing transfer agent services. Prior to July 1, 2005, these services were provided by USBFS pursuant to the co-administration agreement.
FIRST AMERICAN FUNDS Annual Report 2005
54
For the fiscal period ended October 31, 2005 and the fiscal year ended September 30, 2005, transfer agent fees paid under the transfer agent and shareholder servicing agreement to USBFS by the funds included in this annual report were as follows (000):
| Fund | | 10/31/05 | | 9/30/05 | |
| Equity Index Fund | | $ | 254 | | | $ | 1,427 | | |
| Mid Cap Index Fund | | | 42 | | | | 228 | | |
| Small Cap Index Fund | | | 19 | | | | 112 | | |
ADMINISTRATION FEES – Effective July 1, 2005, USBAM serves as the funds' administrator pursuant to an administration agreement between USBAM and the funds. USBFS serves as sub-administrator pursuant to a sub-administration agreement between USBFS and USBAM. Under the administration agreement, USBAM is compensated to provide, or compensate other entities to provide, services to the funds. These services include various legal, oversight and administrative services and accounting services. Effective July 1, 2005, the funds pay USBAM administration fees, which are calculated daily and paid monthly, equal to each fund's pro rata share of an amount equal, on an annual basis, to 0.15% of the aggregate average daily net assets of all open-end mutual funds in the First American Family of Funds, up to $8 billion, 0.135% on the next $17 billion of the aggre gate average daily net assets, 0.12% on the next $25 billion of the aggregate average daily net assets, and 0.10% of the aggregate average daily net assets in excess of $50 billion. All fees paid to the sub-administrator are paid from the administration fee. In addition to these fees, the funds may reimburse USBAM and, indirectly, the sub-administrator for any out-of-pocket expenses incurred in providing administration services.
Prior to July 1, 2005, USBAM and USBFS served as "co-administrators" pursuant to a co-administration agreement between the co-administrators and the funds. The funds paid administration fees to the co-administrators, which were calculated daily and paid monthly, equal to each fund's pro rata share of an amount equal, on an annual basis, to 0.25% of the aggregate average daily net assets of all open-end mutual funds in the First American Family of Funds, up to $8 billion, 0.235% of the next $17 billion of the aggregate average daily net assets, 0.22% of the next $25 billion of the aggregate daily net assets, and 0.20% of the aggregate average daily net assets in excess of $50 billion. In addition, the funds paid transfer agent fees under the co-administration agreement of $18,500 per share class plus additional per account fees. In addition to these fees, the funds reimbursed the co-administrators for any out-of-pocket expenses incurred in providing administration services.
Administration fees paid by the funds included in this annual report to USBAM for the fiscal period ended October 31, 2005 and to USBAM and USBFS for the fiscal year ended September 30, 2005 were as follows (000):
| Fund | | 10/31/05 | | 9/30/05 | |
| Equity Index Fund | | $ | 237 | | | $ | 4,765 | | |
| Mid Cap Index Fund | | | 39 | | | | 738 | | |
| Small Cap Index Fund | | | 18 | | | | 371 | | |
CUSTODIAN FEES – U.S. Bank serves as the funds' custodian pursuant to a custodian agreement with FAIF. Effective July 1, 2005, the fee for each fund was reduced from an annual rate of 0.01% of average daily net assets to an annual rate of 0.005% of average daily net assets. All fees are computed daily and paid monthly.
Effective July 1, 2005, the funds entered into an arrangement with their custodian whereby interest earned on uninvested cash balances is used to reduce a portion of each fund's custodian expenses. For the fiscal period ended October 31, 2005 and the fiscal year ended September 30, 2005, custodian fees were not reduced as a result of interest earned.
DISTRIBUTION AND SHAREHOLDER SERVICING FEES – Quasar Distributors, LLC ("Quasar"), a subsidiary of U.S. Bancorp, serves as distributor of the funds pursuant to a distribution agreement with FAIF. Under the distribution agreement, and pursuant to a plan adopted by each fund under rule 12b-1 of the Investment Company Act, each fund pays Quasar a monthly distribution and/or shareholder servicing fee equal to an annual rate of 0.25%, 1.00%, 1.00%, and 0.50% of each fund's average daily net assets of the Class A shares, Class B shares, Class C shares, and Class R shares, respectively. No distribution or shareholder servicing fees are paid by Class Y shares. These fees may be used by Quasar to provide compensation for sales support distribution activities, or shareholder servicing activities.
FAIF has also adopted and entered into a shareholder servicing plan and agreement with USBAM with respect to the Class R shares. Each fund pays USBAM a monthly shareholder servicing fee equal to an annual rate of 0.15% of each fund's average daily net assets of the Class R shares. USBAM is currently waiving all fees under this plan and agreement. This waiver may be discontinued at any time.
FIRST AMERICAN FUNDS Annual Report 2005
55
Notes to Financial Statements October 31, 2005
Under these distribution and shareholder servicing agreements, the following amounts were retained by Quasar for the fiscal period ended October 31, 2005 and the fiscal year ended September 30, 2005 (000):
| Fund | | 10/31/05 | | 9/30/05 | |
| Equity Index Fund | | $ | 57 | | | $ | 679 | | |
| Mid Cap Index Fund | | | 5 | | | | 47 | | |
| Small Cap Index Fund | | | 3 | | | | 31 | | |
OTHER FEES AND EXPENSES – In addition to the investment advisory fees, custodian fees, distribution and shareholder servicing fees, transfer agent fees and administration fees, each fund is responsible for paying other operating expenses including: fees and expenses of independent directors, registration fees, postage and printing of shareholder reports, legal, auditing, insurance, and other miscellaneous expenses. For the fiscal period ended October 31, 2005 and the fiscal year ended September 30, 2005, legal fees and expenses were paid to a law firm of which an Assistant Secretary of the funds is a partner.
CONTINGENT DEFERRED SALES CHARGES – A contingent deferred sales charge ("CDSC") is imposed on redemptions made in Class B shares. The CDSC varies depending on the number of years from time of payment for the purchase of Class B shares until the redemption of such shares. Class B shares automatically convert to Class A shares after eight years.
| Year Since Purchase | | CDSC as a
Percentage of Dollar
Amount Subject to Charge | |
| First | | | 5.00 | % | |
| Second | | | 5.00 | | |
| Third | | | 4.00 | | |
| Fourth | | | 3.00 | | |
| Fifth | | | 2.00 | | |
| Sixth | | | 1.00 | | |
| Seventh | | | — | | |
| Eighth | | | — | | |
A CDSC of 1.00% is imposed on redemptions made in Class C shares for the first 12 months.
The CDSC for Class B shares and Class C shares is imposed on the value of the purchased shares or the value at the time of redemption, whichever is less.
For the fiscal period ended October 31, 2005 and the fiscal year ended September 30, 2005, total front-end sales charges and CDSCs retained by affiliates of USBAM for distributing the funds' shares were as follows (000):
| Fund | | 10/31/05 | | 9/30/05 | |
| Equity Index Fund | | $ | 15 | | | $ | 332 | | |
| Mid Cap Index Fund | | | 3 | | | | 42 | | |
| Small Cap Index Fund | | | 1 | | | | 20 | | |
4 > Investment in Common Stock of Affiliate
As disclosed in the Schedule of Investments, Equity Index Fund owns common stock issued by U.S. Bancorp. For the fiscal period ended October 31, 2005, Equity Index Fund recorded a net realized loss from the sale of U.S. Bancorp common stock of $6,858 and $0 of dividend income from U.S. Bancorp common stock. For the fiscal year ended September 30, 2005, Equity Index Fund recorded net realized gains from the sale of U.S. Bancorp common stock of $513,006 and $469,763 of dividend income from U.S. Bancorp common stock. At October 31, 2005, Equity Index Fund had an unrealized gain of $2,628,820 with respect to its investment in U.S. Bancorp common stock.
FIRST AMERICAN FUNDS Annual Report 2005
56
5 > Capital Share Transactions
FAIF has 324 billion shares of $0.0001 par value capital stock authorized. Capital share transactions for the funds were as follows (000):
| | | Equity
Index Fund | | Mid Cap
Index Fund | | Small Cap
Index Fund | |
| | | One-Month
Period Ended
10/31/05 | | Year
Ended
9/30/05 | | Year
Ended
9/30/04 | | One-Month
Period Ended
10/31/05 | | Year
Ended
9/30/05 | | Year
Ended
9/30/04 | | One-Month
Period Ended
10/31/05 | | Year
Ended
9/30/05 | | Year
Ended
9/30/04 | |
| Class A: | |
| Shares issued | | | 196 | | | | 1,995 | | | | 4,820 | | | | 14 | | | | 385 | | | | 763 | | | | 10 | | | | 212 | | | | 474 | | |
| Shares issued in lieu of cash distributions | | | 7 | | | | 155 | | | | 108 | | | | — | | | | 42 | | | | 13 | | | | — | | | | 49 | | | | 3 | | |
| Shares redeemed | | | (180 | ) | | | (2,991 | ) | | | (2,189 | ) | | | (28 | ) | | | (367 | ) | | | (277 | ) | | | (5 | ) | | | (207 | ) | | | (126 | ) | |
| Total Class A transactions | | | 23 | | | | (841 | ) | | | 2,739 | | | | (14 | ) | | | 60 | | | | 499 | | | | 5 | | | | 54 | | | | 351 | | |
| Class B: | |
| Shares issued | | | 5 | | | | 111 | | | | 225 | | | | 2 | | | | 24 | | | | 55 | | | | — | | | | 16 | | | | 34 | | |
| Shares issued in lieu of cash distributions | | | — | | | | 25 | | | | 16 | | | | — | | | | 9 | | | | 4 | | | | — | | | | 8 | | | | 1 | | |
| Shares redeemed | | | (82 | ) | | | (924 | ) | | | (737 | ) | | | (1 | ) | | | (41 | ) | | | (26 | ) | | | (1 | ) | | | (28 | ) | | | (9 | ) | |
| Total Class B transactions | | | (77 | ) | | | (788 | ) | | | (496 | ) | | | 1 | | | | (8 | ) | | | 33 | | | | (1 | ) | | | (4 | ) | | | 26 | | |
| Class C: | |
| Shares issued | | | 7 | | | | 126 | | | | 214 | | | | 15 | | | | 83 | | | | 118 | | | | 2 | | | | 51 | | | | 70 | | |
| Shares issued in lieu of cash distributions | | | — | | | | 10 | | | | 7 | | | | — | | | | 7 | | | | 3 | | | | — | | | | 10 | | | | 1 | | |
| Shares redeemed | | | (78 | ) | | | (436 | ) | | | (457 | ) | | | (20 | ) | | | (58 | ) | | | (65 | ) | | | (10 | ) | | | (50 | ) | | | (36 | ) | |
| Total Class C transactions | | | (71 | ) | | | (300 | ) | | | (236 | ) | | | (5 | ) | | | 32 | | | | 56 | | | | (8 | ) | | | 11 | | | | 35 | | |
| Class R: | |
| Shares issued | | | 4 | | | | 60 | | | | 564 | | | | 1 | | | | 9 | | | | 91 | | | | 1 | | | | 1 | | | | 131 | | |
| Shares issued in lieu of cash distributions | | | — | | | | — | | | | 19 | | | | — | | | | — | | | | 7 | | | | — | | | | — | | | | 2 | | |
| Shares redeemed | | | — | | | | (4 | ) | | | (3,398 | ) | | | — | | | | — | | | | (497 | ) | | | — | | | | — | | | | (414 | ) | |
| Total Class R transactions | | | 4 | | | | 56 | | | | (2,815 | ) | | | 1 | | | | 9 | | | | (399 | ) | | | 1 | | | | 1 | | | | (281 | ) | |
| Class Y: | |
| Shares issued | | | 741 | | | | 16,348 | | | | 25,834 | | | | 237 | | | | 5,681 | | | | 9,346 | | | | 73 | | | | 3,545 | | | | 6,867 | | |
| Shares issued in lieu of cash distributions | | | 51 | | | | 1,034 | | | | 928 | | | | — | | | | 684 | | | | 357 | | | | — | | | | 591 | | | | 80 | | |
| Shares redeemed | | | (1,825 | ) | | | (27,653 | ) | | | (26,886 | ) | | | (506 | ) | | | (7,277 | ) | | | (6,301 | ) | | | (460 | ) | | | (4,520 | ) | | | (5,648 | ) | |
| Total Class Y transactions | | | (1,033 | ) | | | (10,271 | ) | | | (124 | ) | | | (269 | ) | | | (912 | ) | | | 3,402 | | | | (387 | ) | | | (384 | ) | | | 1,299 | | |
| Net increase (decrease) in capital shares | | | (1,154 | ) | | | (12,144 | ) | | | (932 | ) | | | (286 | ) | | | (819 | ) | | | 3,591 | | | | (390 | ) | | | (322 | ) | | | 1,430 | | |
6 > Investment Security Transactions
During the fiscal period ended October 31, 2005, purchases of securities and proceeds from sales of securities other than temporary investments in short-term securities, were as follows (000):
| Fund | | Purchases | | Sales | |
| Equity Index Fund | | $ | 2,381 | | | $ | 25,059 | | |
| Mid Cap Index Fund | | | 3,821 | | | | 7,421 | | |
| Small Cap Index Fund | | | 31 | | | | 4,717 | | |
During the fiscal year ended September 30, 2005, purchases of securities and proceeds from sales of securities other than temporary investments in short-term securities, were as follows (000):
| Fund | | Purchases | | Sales | |
| Equity Index Fund | | $ | 85,835 | | | $ | 363,453 | | |
| Mid Cap Index Fund | | | 51,726 | | | | 72,176 | | |
| Small Cap Index Fund | | | 40,219 | | | | 55,840 | | |
The aggregate gross unrealized appreciation and depreciation of securities held by the funds and the total cost of securities (including cost of securities purchased with proceeds from securities lending) for federal income tax purposes at October 31, 2005, were as follows (000):
| Fund | | Aggregate
Gross
Appreciation | | Aggregate
Gross
Depreciation | | Net | | Federal
Income
Tax Cost | |
| Equity Index Fund | | $ | 797,108 | | | $ | (234,999 | ) | | $ | 562,109 | | | $ | 2,102,593 | | |
| Mid Cap Index Fund | | | 98,577 | | | | (39,001 | ) | | | 59,576 | | | | 439,210 | | |
| Small Cap Index Fund | | | 44,992 | | | | (14,180 | ) | | | 30,812 | | | | 179,084 | | |
FIRST AMERICAN FUNDS Annual Report 2005
57
Notes to Financial Statements October 31, 2005
7 > Indemnifications
The funds enter into contracts that contain a variety of indemnifications. The funds' maximum exposure under these arrangements is unknown. However, the funds have not had prior claims or losses pursuant to these contracts and expect the risk of loss to be remote.
8 > Other
In March 2005, the U.S. Bancorp Pension Plan redeemed $186,709,450 from the First American Equity Index Fund as a redemption-in-kind transaction. In this transaction, the fund distributed a proportionate amount of securities in the fund's portfolio to the U.S. Bancorp Pension Plan. Remaining shareholders in the funds did not recognize any additional capital gains from the transactions.
FIRST AMERICAN FUNDS Annual Report 2005
58
NOTICE TO SHAREHOLDERS October 31, 2005 (unaudited)
TAX INFORMATION
The information set forth below is for each funds's fiscal period as required by federal laws. Most shareholders, however, must report distributions on a calendar year basis for income tax purposes, which may include distributions for portions of the funds' fiscal periods ending September 30, 2004, September 30, 2005 and October 31, 2005 of a fund. Accordingly, the information needed for income tax purposes will be sent in early 2006 on Form 1099-DIV. Please consult your tax advisor for proper treatment of this information.
Dear First American Shareholders:
For the fiscal period ended October 31, 2005, each fund has designated long-term capital gains, ordinary income dividends qualify for the corporate received deduction, and qualified dividend income with regard to distributions paid during the year as follows:
| Fund | | Long Term
Capital Gains
Distributions
(Tax Basis) (a) | | Ordinary
Income
Distributions
(Tax Basis) (b) | | Return of
Capital
Distributions | | Total
Distributions
(Tax Basis) | | Corporate
Dividends
Received
Deduction (c) | | Qualified
Dividend
Income (c)(d) | |
| Equity Index Fund | | | — | % | | | 81 | % | | | 19 | % | | | 100 | % | | | 100 | % | | | 100 | % | |
| Mid Cap Index Fund | | | — | | | | — | | | | — | | | | — | | | | — | | | | — | | |
| Small Cap Index Fund | | | — | | | | — | | | | — | | | | — | | | | — | | | | — | | |
(a) and (b) are based on a percentage of the fund's total distributions.
(c) is based on a percentage of ordinary income distributions of the fund.
(d) For the fiscal period ended October 31, 2005, certain dividends paid by the funds may be subject to a maximum tax rate of 15% as provided for by the Internal Revenue Code 1(h). The funds intend to designate the maximum amounts as taxed at the maximum rate of 15%. Complete information will be computed and reported in conjunction with your 2005 Form 1099-DIV. As of October 31, 2005, for the calendar year to date, qualified dividend income as a percentage of ordinary income distributions for each fund was as follows: Equity Income Fund – 100%, Mid Cap Index Fund – 93%, Small Cap Index Fund – 100%.
HOW TO OBTAIN A COPY OF THE FUNDS' PROXY VOTING POLICIES AND PROXY VOTING RECORD
A description of the policies and procedures that the funds use to determine how to vote proxies relating to portfolio securities, as well as information regarding how the funds voted proxies relating to portfolio securities during the most recent 12 month period ended June 30, 2005, is available (1) without charge upon request by calling 800.677.FUND; (2) at firstamericanfunds.com; and (3) on the U.S. Securities and Exchange Commision's website at http://www.sec.gov.
FORM N-Q HOLDINGS INFORMATION
Each fund is required to file its complete schedule of portfolio holdings for the first and third quarters of each fiscal year with the Securities and Exchange Commission on Form N-Q. The funds' Forms N-Q are available (1) without charge upon request by calling 800.677.FUND and (2) on the U.S. Securities and Exchange Commision's website at http://www.sec.gov. In addition, you may review and copy the funds' Forms N-Q at the Commission's Public Reference Room in Washington, D.C. You may obtain information on the operation of the Public Reference Room by calling 1-800-SEC-0330.
FIRST AMERICAN FUNDS Annual Report 2005
59
NOTICE TO SHAREHOLDERS October 31, 2005 (unaudited)
Directors and Officers of the Funds
Independent Directors
Name,
Address, and
Year of Birth | | Position(s)
Held
with Funds | | Term of Office
and Length of
Time Served | | Principal Occupation(s) During
Past 5 Years | | Number of
Portfolios in Fund
Complex Overseen
by Director | | Other
Directorships
Held by
Director † | |
Benjamin R. Field III
P.O. Box 1329
Minneapolis, MN
55440-1329
(1938) | | Director | | Term expiring earlier of death, resignation, removal, disqualification, or successor duly elected and qualified. Director of FAIF since September 2003. | | Retired; Senior Financial Advisor, Bemis Company, Inc. from May 2002 through June 2004; Senior Vice President, Chief Financial Officer & Treasurer, Bemis, through April 2002. | | First American Funds Complex: eleven registered investment companies, including fifty-five portfolios. | | None | |
|
Roger A. Gibson
P.O. Box 1329
Minneapolis, MN
55440-1329
(1946) | | Director | | Term expiring earlier of death, resignation, removal, disqualification, or successor duly elected and qualified. Director of FAIF since October 1997. | | Retired; Vice President, Cargo – United Airlines, from July 2001 through July 2004; Vice President, North America – Mountain Region, United Airlines, prior to July 2001. | | First American Funds Complex: eleven registered investment companies, including fifty-five portfolios. | | None | |
|
Victoria J. Herget
P.O. Box 1329
Minneapolis, MN
55440-1329
(1951) | | Director | | Term expiring earlier of death, resignation, removal, disqualification, or successor duly elected and qualified. Director of FAIF since September 2003. | | Investment consultant and non-profit board member since 2001; Managing Director of Zurich Scudder Investments through 2001. | | First American Funds Complex: eleven registered investment companies, including fifty-five portfolios. | | None | |
|
Leonard W. Kedrowski
P.O. Box 1329
Minneapolis, MN
55440-1329
(1941) | | Director | | Term expiring earlier of death, resignation, removal, disqualification, or successor duly elected and qualified. Director of FAIF since November 1993. | | Owner and President, Executive and Management Consulting, Inc., a management consulting firm; Board member, GC McGuiggan Corporation (dba Smyth Companies), a label printer; former Chief Executive Officer, Creative Promotions International, LLC, a promotional award programs and products company, through October 2003; Advisory Board member, Designer Doors, manufacturer of designer doors, through 2002. | | First American Funds Complex: eleven registered investment companies, including fifty-five portfolios. | | None | |
|
Richard K. Riederer
P.O. Box 1329
Minneapolis, MN 55440-1329
(1944) | | Director | | Term expiring earlier of death, resignation, removal, disqualification, or successor duly elected and qualified. Director of FAIF since August 2001. | | Retired; Director, President and Chief Executive Officer, Weirton Steel, through 2001. | | First American Funds Complex: eleven registered investment companies, including fifty-five portfolios. | | Cleveland Cliffs Inc (a producer of iron ore pellets) | |
|
Joseph D. Strauss
P.O. Box 1329
Minneapolis, MN
55440-1329
(1940) | | Director | | Term expiring earlier of death, resignation, removal, disqualification, or successor duly elected and qualified. Director of FAIF since September 1984. | | Attorney At Law, Owner and President, Strauss Management Company, a Minnesota holding company for various organizational management business ventures; Owner, Chairman and Chief Executive Officer, Community Resource Partnerships, Inc., a strategic planning, operations management, government relations, transportation planning and public relations organization; Owner, Chairman and Chief Executive Officer, Excensus(TM) LLC, a strategic demographic planning and application development firm, since 2001. | | First American Funds Complex: eleven registered investment companies, including fifty-five portfolios. | | None | |
|
FIRST AMERICAN FUNDS Annual Report 2005
60
Independent Directors — continued
Name,
Address, and
Year of Birth | | Position(s)
Held
with Funds | | Term of Office
and Length of
Time Served | | Principal Occupation(s) During
Past 5 Years | | Number of
Portfolios in Fund
Complex Overseen
by Director | | Other
Directorships
Held by
Director † | |
Virginia L. Stringer
P.O. Box 1329
Minneapolis, MN
55440-1329
(1944) | | Chair; Director | | Chair Term three years. Directors Term expiring earlier of death, resignation, removal, disqualification, or successor duly elected and qualified. Chair of FAIF's Board since September 1997; Director of FAF since June 1991. | | Owner and President, Strategic Management Resources, Inc., a management consulting firm; Executive Consultant to State Farm Insurance Company. | | First American Funds Complex: eleven registered investment companies, including fifty-five portfolios. | | None | |
|
James M. Wade
P.O. Box 1329
Minneapolis, MN 55440-1329
(1943) | | Director | | Term expiring earlier of death, resignation, removal, disqualification, or successor duly elected and qualified. Director of FAIF since August 2001. | | Owner and President, Jim Wade Homes, a homebuilding company, since 1999. | | First American Funds Complex: eleven registered investment companies, including fifty-five portfolios. | | None | |
|
† Includes only directorships in a company with a class of securities registered pursuant to Section 12 of the Securities Exchange Act or subject to the requirements of Section 15(d) of the Securities Exchange Act, or any company registered as an investment company under the Investment Company Act.
The Statement of Additional Information (SAI) includes additional information about fund directors and is available upon request without charge by calling 800-677-FUND or writing to First American Funds, P.O. Box 1330, Minneapolis, Minnesota, 55440-1330.
FIRST AMERICAN FUNDS Annual Report 2005
61
NOTICE TO SHAREHOLDERS October 31, 2005 (unaudited)
Officers
Name, Address, and
Year of Birth | | Position(s)
Held
with Funds | | Term of Office
and Length of
Time Served | | Principal Occupation(s) During Past 5 Years | |
Thomas S. Schreier, Jr.
U.S. Bancorp Asset
Management, Inc.
800 Nicollet Mall
Minneapolis, MN 55402
(1962) * | | President | | Re-elected by the Board annually; President of FAIF since February 2001. | | Chief Executive Officer of U.S. Bancorp Asset Management, Inc., since May 2001; prior thereto, Chief Executive Officer of First American Asset Management from December 2000 to May 2001 and of Firstar Investment & Research Management Company ("FIRMCO") from February 2001 to May 2001; prior to that, Senior Managing Director and Head of Equity Research of U.S. Bancorp Piper Jaffray. | |
|
Mark S. Jordahl
U.S. Bancorp Asset
Management, Inc.
800 Nicollet Mall
Minneapolis, MN 55402
(1960) * | | Vice President – Investments | | Re-elected by the Board annually; Vice President – Investments of FAIF since September 2001. | | Chief Investment Officer of U.S. Bancorp Asset Management, Inc., since September 2001; prior thereto, President and Chief Investment Officer, ING Investment Management – Americas from September 2000 to June 2001; prior to that, Senior Vice President and Chief Investment Officer, ReliaStar Financial Corp. | |
|
Jeffery M. Wilson
U.S. Bancorp Asset
Management, Inc.
800 Nicollet Mall
Minneapolis, MN 55402
(1956) * | | Vice President – Administration | | Re-elected by the Board annually; Vice President – Administration of FAIF since March 2000. | | Senior Vice President of U.S. Bancorp Asset Management, Inc., since May 2001; prior thereto, Senior Vice President of First American Asset Management. | |
|
Charles D. Gariboldi, Jr.
U.S. Bancorp Asset
Management, Inc.
800 Nicollet Mall
Minneapolis, MN 55402
(1959) * | | Treasurer | | Re-elected by the Board annually; Treasurer of FAIF since October 2004. | | Mutual Fund Treasurer, U.S. Bancorp Asset Management, Inc., since October 2004; prior thereto, Vice President of Investment Accounting and Fund Treasurer for Thrivent Financial for Lutherans. | |
|
Jill M. Stevenson
U.S. Bancorp Asset
Management, Inc.
800 Nicollet Mall
Minneapolis, MN 55402
(1965) * | | Assistant Treasurer | | Re-elected by the Board annually; Assistant Treasurer of FAIF since September 2005. | | Assistant Treasurer, U.S. Bancorp Asset Management, Inc., since September 2005; prior thereto, Director, Senior Project Manager, U.S. Bancorp Asset Management, Inc., from May 2003 to September 2005; prior to that, Vice President, Director of Operations, Paladin Investment Associates, LLC. | |
|
David H. Lui
U.S. Bancorp Asset
Management, Inc.
800 Nicollet Mall
Minneapolis, MN 55402
(1960) * | | Chief Compliance Officer | | Re-elected by the Board annually; Chief Compliance Officer of FAIF since February 2005. | | Chief Compliance Officer for First American Funds and U.S. Bancorp Asset Management, Inc., since February 2005; prior thereto, Chief Compliance Officer, Franklin Advisors, Inc. and Chief Compliance Counsel, Franklin Templeton Investments from March 2004 to February 2005; prior to that, Vice President, Charles Schwab & Co., Inc. | |
|
Kathleen L. Prudhomme
U.S. Bancorp Asset
Management, Inc.
800 Nicollet Mall
Minneapolis, MN 55402
(1953) * | | Secretary | | Re-elected by the Board annually; Secretary of FAIF since December 2004; prior thereto, Assistant Secretary of FAIF since September 1998. | | Deputy General Counsel, U.S. Bancorp Asset Management, Inc., since November 2004; prior thereto, Partner, Dorsey & Whitney LLP, a Minneapolis-based law firm. | |
|
James D. Alt
50 South Sixth Street
Suite 1500,
Minneapolis, MN 55402
(1951) | | Assistant Secretary | | Re-elected by the Board annually; Assistant Secretary of FAIF since December 2004; prior thereto, Secretary of FAIF since June 2002; Assistant Secretary of FAIF from September 1998 through June 2002. | | Partner, Dorsey & Whitney LLP, a Minneapolis-based law firm. | |
|
Brett L. Agnew
U.S. Bancorp Asset
Management, Inc.
800 Nicollet Mall
Minneapolis, MN 55402
(1971) * | | Assistant Secretary | | Re-elected by the Board annually; Assistant Secretary of FAIF since December 2004. | | Attorney for U.S. Bancorp Asset Management, Inc., since August 2004; prior thereto, Senior Counsel, Thrivent Financial for Lutherans from May 2001 to August 2004; prior to that, Consultant, Principal Financial Group. | |
|
FIRST AMERICAN FUNDS Annual Report 2005
62
Officers — continued
Name, Address, and
Year of Birth | | Position(s)
Held
with Funds | | Term of Office
and Length of
Time Served | | Principal Occupation(s) During Past 5 Years | |
James R. Arnold
615 E. Michigan Street
Milwaukee, WI 53202
(1957) * | | Assistant Secretary | | Re-elected by the Board annually; Assistant Secretary of FAIF since June 2003 | | Vice President, U.S. Bancorp Fund Services, LLC, since March 2002; prior thereto, Senior Administration Services Manager, UMB Fund Services, Inc. | |
|
Douglas G. Hess
615 E. Michigan Street
Milwaukee, WI 53202
(1967) * | | Assistant Secretary | | Re-elected by the Board annually; Assistant Secretary of FAIF since September 2001 | | Vice President, U.S. Bancorp Fund Services, LLC. | |
|
* Messrs. Schreier, Jordahl, Wilson, Gariboldi, Lui and Agnew, Ms. Stevenson and Ms. Prudhomme are each officers and/or employees of U.S. Bancorp Asset Management, Inc. which serves as investment adviser and administrator for FAIF. Messrs. Hess and Arnold are officers of U.S. Bancorp Fund Services, LLC, which is a subsidiary of U.S. Bancorp and serves as Transfer Agent for FAIF.
FIRST AMERICAN FUNDS Annual Report 2005
63
(This page has been left blank intentionally.)
Board of Directors First American Investment Funds, Inc.
Virginia Stringer
Chairperson of First American Investment Funds, Inc.
Owner and President of Strategic Management Resources, Inc.
Benjamin Field III
Director of First American Investment Funds, Inc.
Retired; former Senior Vice President, Chief Financial Officer,
and Treasurer of Bemis Company, Inc.
Roger Gibson
Director of First American Investment Funds, Inc.
Retired; former Vice President of Cargo-United Airlines
Victoria Herget
Director of First American Investment Funds, Inc.
Investment Consultant; former Managing Director of Zurich Scudder Investments
Leonard Kedrowski
Director of First American Investment Funds, Inc.
Owner and President of Executive and Management Consulting, Inc.
Richard Riederer
Director of First American Investment Funds, Inc.
Retired; former President and Chief Executive Officer of Weirton Steel
Joseph Strauss
Director of First American Investment Funds, Inc.
Owner and President of Strauss Management Company
James Wade
Director of First American Investment Funds, Inc.
Owner and President of Jim Wade Homes
First American Investment Funds’ Board of Directors is comprised entirely of independent directors.

|
FIRST AMERICAN FUNDS®
| |
Direct fund correspondence to:
First American Funds
P.O. Box 1330
Minneapolis, MN 55440-1330
This report and the financial statements contained herein are not intended to be a forecast of future events, a guarantee of future results, or investment advice. Further, there is no assurance that certain securities will remain in or out of each fund’s portfolio. The views expressed in this report reflect those of the portfolio managers only through the period ended October 31, 2005. The portfolio managers’ views are subject to change at any time based upon market or other conditions.
This report is for the information of shareholders of the First American Investment Funds, Inc. It may also be used as sales literature when preceded or accompanied by a current prospectus, which contains information concerning investment objectives, risks, and charges and expenses of the funds. Read the prospectus carefully before investing.
The figures in this report represent past performance and do not guarantee future results. The principal value of an investment and investment return will fluctuate so that an investor’s shares, when redeemed, may be worth more or less than their original cost.
INVESTMENT ADVISOR
U.S. Bancorp Asset Management, Inc.
800 Nicollet Mall
Minneapolis, Minnesota 55402
ADMINISTRATOR
U.S. Bancorp Asset Management, Inc.
800 Nicollet Mall
Minneapolis, Minnesota 55402
TRANSFER AGENT
U.S. Bancorp Fund Services, LLC
615 East Michigan Street
Milwaukee, Wisconsin 53202
CUSTODIAN
U.S. Bank National Association
60 Livingston Avenue
St. Paul, Minnesota 55107
DISTRIBUTOR
Quasar Distributors, LLC
615 East Michigan Street
Milwaukee, Wisconsin 53202
INDEPENDENT REGISTERED PUBLIC ACCOUNTING FIRM
Ernst & Young LLP
220 South Sixth Street
Suite 1400
Minneapolis, Minnesota 55402
COUNSEL
Dorsey & Whitney LLP
50 South Sixth Street
Suite 1500
Minneapolis, Minnesota 55402
First American Funds
P.O. Box 1330
Minneapolis, MN 55440-1330
In an attempt to reduce shareholder costs and help eliminate duplication, First American Funds will try to limit their mailing to one report for each address that lists one or more shareholders with the same last name. If you would like additional copies, please call First American Investor Services at 800.677.FUND or visit firstamericanfunds.com.

|
FIRST AMERICAN FUNDS®
|
2005
Annual Report
|
|
| STOCK |
| FUNDS |
| |

TABLE OF CONTENTS
Message to Shareholders | 1 |
Report of Independent Registered Public Accounting Firm | 41 |
| |
Real Estate Securities Fund | |
Schedule of Investments | 42 |
Statement of Assets and Liabilities | 43 |
Statement of Operations | 44 |
Statement of Changes in Net Assets | 45 |
Financial Highlights | 46 |
| |
International Fund | |
Schedule of Investments | 48 |
Statement of Assets and Liabilities | 50 |
Statement of Operations | 51 |
Statement of Changes in Net Assets | 52 |
Financial Highlights | 54 |
| |
Small Cap Funds | |
Schedule of Investments | 56 |
Statements of Assets and Liabilities | 61 |
Statements of Operations | 62 |
Statements of Changes in Net Assets | 64 |
Financial Highlights | 66 |
| |
Mid Cap Funds | |
Schedule of Investments | 72 |
Statements of Assets and Liabilities | 75 |
Statements of Operations | 76 |
Statements of Changes in Net Assets | 77 |
Financial Highlights | 78 |
| |
Large Cap Funds | |
Schedule of Investments | 82 |
Statements of Assets and Liabilities | 85 |
Statements of Operations | 86 |
Statements of Changes in Net Assets | 88 |
Financial Highlights | 90 |
| |
Growth & Income Funds | |
Schedule of Investments | 94 |
Statements of Assets and Liabilities | 102 |
Statements of Operations | 103 |
Statements of Changes in Net Assets | 104 |
Financial Highlights | 106 |
| |
Notes to Financial Statements | 110 |
Notice to Shareholders | 126 |

Mutual fund investing involves risk; principal loss is possible.
NOT FDIC INSURED NO BANK GUARANTEE MAY LOSE VALUE
Message to SHAREHOLDERS December 12, 2005
Dear Shareholders:
We invite you to take a few minutes to review the results of the funds’ most recent fiscal period. Because the funds have changed their fiscal year-end from September 30 to October 31, this report covers the one-month time period from October 1, 2005, through October 31, 2005.
This report includes comparative performance graphs and tables, portfolio commentaries, complete listings of portfolio holdings, and additional fund information. We hope you will find this helpful in monitoring your investment portfolio.
Also, through our website, firstamericanfunds.com, we provide quarterly performance fact sheets on all First American Funds, the economic outlook as viewed by our senior investment officers, and other information about fund investments and portfolio strategies.
Please contact your financial professional if you have questions about First American Funds or contact First American Investor Services at 800.677.FUND.
We appreciate your investment with First American Funds and look forward to serving your financial needs in the future.
Sincerely,
/s/ Virginia L. Stringer | | /s/ Thomas S. Schreier, Jr. | |
| |
Virginia L. Stringer | Thomas S. Schreier, Jr. |
Chairperson of the Board | President |
First American Investment Funds, Inc. | First American Investment Funds, Inc. |
1
Real Estate Securities fund
Investment Objective: to provide above-average current income and long-term capital appreciation
How did the fund perform the fiscal period ended October 31, 2005?
The First American Real Estate Securities Fund (the "fund"), Class Y shares, returned -1.73% for the one-month period ended October 31, 2005 (Class A shares returned -1.79% without taking the sales charge into account). By comparison, the fund's benchmark, the Morgan Stanley Capital International U.S. Real Estate Investment Trust Index* ("MSCI U.S. REIT Index"), returned -2.38% for the same period.
What were the general economic and market conditions during the fiscal period?
Broader economic growth continued at a relatively solid pace in October. Indicators for the manufacturing sector suggested robust growth as inventories remained low and recovery and reconstruction activity proceeded following the hurricanes. Companies indicated continued cost pressures from energy and other raw material prices, keeping Fed concerns about inflation intact. This led to an additional 25-basis-point tightening at the November 1 Federal Open Market Committee meeting, giving support to expectations for further short-term rate increases. While activity in the industrial sector remained robust, consumer confidence continued to slump despite gasoline prices falling sharply during the month. Auto sales fell to their lowest monthly pace in more than seven years as the employee discount sales promotions expired. Forward-looking housing market indicators such as mortgage applications for home purchases moved lower, and emplo yment cost data for the third quarter showed the slowest gain in wages in 25 years. Subdued compensation gains suggest that broader inflation should remain well contained in the coming quarters, which will be a key to bringing an eventual end to Fed tightening and should provide a supportive backdrop to the financial markets.
What worked for the fund and why?
The fund benefited from strong individual stock selection. The portfolio had a definite bias toward growth and quality, and continued to adhere to a bottom-up approach (with focus on individual stocks rather than economic or market cycles) to temper volatility in the real estate investment trust (REIT) market. An emphasis on coastal markets, which experienced better job growth and better supply and demand dynamics, proved beneficial. The fund's best-performing sectors were office, health care, specialty, and diversified.
What did not work for the fund and why?
Fund performance across all property sectors was quite stable. Although the REIT sector experienced a mild selloff during the reporting period, the fund's emphasis on quality helped us outperform the index.
*Unlike mutual funds, index returns do not reflect any expenses, transaction costs, or cash flow effects.
| Top 10 Holdings as of October 31, 20051 (% of net assets) | |
| Prologis | | | 6.5 | % | |
| Simon Property Group | | | 5.8 | % | |
| Avalonbay Communities | | | 4.6 | % | |
| Archstone-Smith Trust | | | 4.1 | % | |
| Brookfield Properties | | | 3.9 | % | |
| Camden Property Trust | | | 3.8 | % | |
| Developers Diversified Realty | | | 3.3 | % | |
| Boston Properties | | | 3.3 | % | |
| Regency Centers | | | 3.1 | % | |
| General Growth Properties | | | 3.1 | % | |
| Sector Allocation as of October 31, 20051 (% of net assets) | |
| Office | | | 21.6 | % | |
| Apartments | | | 17.6 | % | |
| Malls | | | 12.1 | % | |
| Community Centers | | | 12.1 | % | |
| Industrials | | | 11.5 | % | |
| Hotels | | | 9.1 | % | |
| Diversified | | | 5.8 | % | |
| Self-Storage | | | 3.0 | % | |
| Short-Term Investments | | | 3.0 | % | |
| Health Care | | | 2.6 | % | |
| Specialty Real Estate | | | 2.5 | % | |
| Private Real Estate Companies | | | 0.1 | % | |
| Other Assets and Liabilities, Net | | | (1.0 | )% | |
| | | | 100.0 | % | |
1Fund holdings and sector allocations are subject to change at any time and are not recommendations to buy or sell any security.
FIRST AMERICAN FUNDS Annual Report 2005
2
Real Estate Securities fund continued
Annual Performance1
| | | October 31, 2005 | | September 30, 2005** | |
| | | One- | | | | | | | | Since Inception | | | | | | | | Since Inception | |
| | | month* | | 1 year | | 5 years | | 10 years | | 2/01/00 | | 9/24/01 | | 1 year | | 5 years | | 10 years | | 2/01/00 | | 9/24/01 | |
| Average annual return with sales charge (POP) | |
| Class A | | | (7.19 | )% | | | 12.92 | % | | | 18.58 | % | | | 14.55 | % | | | — | | | | — | | | | 21.91 | % | | | 18.07 | % | | | 14.50 | % | | | — | | | | — | | |
| Class B | | | (6.72 | )% | | | 13.58 | % | | | 18.86 | % | | | 14.35 | % | | | — | | | | — | | | | 22.98 | % | | | 18.33 | % | | | 14.27 | % | | | — | | | | — | | |
| Class C | | | (2.83 | )% | | | 17.57 | % | | | 19.03 | % | | | — | | | | 20.23 | % | | | — | | | | 27.00 | % | | | 18.53 | % | | | — | | | | 20.96 | % | | | — | | |
| Average annual return without sales charge (NAV) | |
| Class A | | | (1.79 | )% | | | 19.50 | % | | | 19.93 | % | | | 15.20 | % | | | — | | | | — | | | | 28.99 | % | | | 19.42 | % | | | 15.15 | % | | | — | | | | — | | |
| Class B | | | (1.81 | )% | | | 18.58 | % | | | 19.06 | % | | | 14.35 | % | | | — | | | | — | | | | 27.98 | % | | | 18.53 | % | | | 14.27 | % | | | — | | | | — | | |
| Class C | | | (1.85 | )% | | | 18.57 | % | | | 19.03 | % | | | — | | | | 20.23 | % | | | — | | | | 28.00 | % | | | 18.53 | % | | | — | | | | 20.96 | % | | | — | | |
| Class R | | | (1.77 | )% | | | 19.16 | % | | | — | | | | — | | | | — | | | | 22.40 | % | | | 28.60 | % | | | — | | | | — | | | | — | | | | 23.48 | % | |
| Class Y | | | (1.73 | )% | | | 19.77 | % | | | 20.23 | % | | | 15.50 | % | | | — | | | | — | | | | 29.25 | % | | | 19.73 | % | | | 15.45 | % | | | — | | | | — | | |
| MSCI U.S. REIT Index2 | | | (2.38 | )% | | | 17.64 | % | | | 19.78 | % | | | 14.73 | % | | | 19.88 | % | | | 21.49 | % | | | 27.10 | % | | | 19.19 | % | | | 14.64 | % | | | 20.72 | % | | | 22.73 | % | |
Value of a $10,000 Investment1,3 as of October 31, 2005
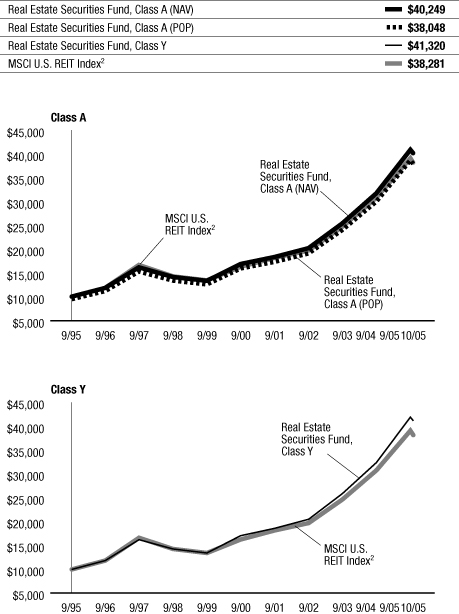
The chart above illustrates the total value of an assumed $10,000 investment in the fund's Class A and Class Y shares (from 9/30/95 to 10/31/05) as compared to the MSCI U.S. REIT Index2.
The performance data quoted on this page represents past performance and does not guarantee future results. The investment return and principal value of an investment will fluctuate so that an investor's shares, when redeemed, may be worth more or less than their original cost. Current performance of the fund may be lower or higher than the performance data quoted. Performance data current to the most recent month-end may be obtained by calling 800.677.FUND.
* Total returns have not been annualized.
** This table represents average annual total returns through the latest calendar quarter—rather than through the end of the fiscal period.
1 Performance does not reflect the deduction of taxes that a shareholder would pay on fund distributions or redemption of fund shares. Investment performance reflects fee waivers that are or were in effect. In the absence of such fee waivers, total returns would be reduced. Index performance is for illustrative purposes only and does not reflect any expenses, transaction costs, or cash flow effects. Direct investment in the index is not available.
Sector funds such as the First American Real Estate Securities Fund are more vulnerable to price fluctuation as a result of events that may affect the industry in which they focus than are funds that invest in multiple industries. Share prices of sector funds also will fluctuate with changing market conditions, as will share prices of other stock funds. Sector funds should not be treated as a core investment; rather, their role is to round out the growth portion of a well-diversified investment portfolio.
Total returns at net asset value ("NAV") reflect performance over the time period indicated without including the fund's maximum sales charge and assume reinvestment of all distributions at NAV.
Total returns at public offering price ("POP") reflect performance over the time period indicated including a maximum front-end sales charge of 5.50% for Class A shares and the maximum contingent deferred sales charge ("CDSC") for Class B and Class C shares for the relevant period. Maximum CDSC is 5.00% for Class B shares in the first year, decreasing annually to 0% in the seventh year following purchase, and 1.00% for Class C shares. Total returns assume reinvestment of all distributions at NAV.
2 An unmanaged index of the most actively traded real estate investment trusts.
3 Performance for Class B, Class C, and Class R shares is not presented. Performance for these classes will vary due to different expense structures.
FIRST AMERICAN FUNDS Annual Report 2005
3
Real Estate Securities fund continued
Expense Example
As a shareholder of the Real Estate Securities Fund (the "fund"), you incur two types of costs: (1) transaction costs, including sales charges (loads) on purchase payments; and (2) ongoing costs, including investment advisory fees; distribution and/or service (12b-1) fees; and other fund expenses. This example is intended to help you understand your ongoing costs (in dollars) of investing in the fund and to compare these costs with the ongoing costs of investing in other mutual funds. The example is based on an investment of $1,000 invested at the beginning of the period and held for the entire period from May 1, 2005, to October 31, 2005.
Actual Expenses
For each class, the first line of the table below provides information about actual account values and actual expenses. You may use the information in this line, together with the amount you invested, to estimate the expenses that you paid over the period. Simply divide your account value by $1,000 (for example, an $8,600 account value divided by $1,000 = 8.6), then multiply the result by the number in the first line under the heading entitled "Expenses Paid During Period" to estimate the expenses you paid on your account during this period.
Hypothetical Example for Comparison Purposes
For each class, the second line of the table below provides information about hypothetical account values and hypothetical expenses based on the fund's actual expense ratio and an assumed rate of return of 5% per year before expenses, which is not the fund's actual return. The hypothetical account values and expenses may not be used to estimate the actual ending account balance or expenses you paid for the period. You may use this information to compare the ongoing costs of investing in the fund and other funds. To do so, compare this 5% hypothetical example with the 5% hypothetical examples that appear in the shareholder reports of the other funds.
Please note that the expenses shown in the table are meant to highlight your ongoing costs only and do not reflect any transactional costs, such as sales charges (loads). Therefore, the second line of the table for each class is useful in comparing ongoing costs only, and will not help you determine the relative total costs of owning different funds. In addition, if these transactional costs were included, your costs would have been higher.
Expense Examples
| | | Beginning Account
Value (5/01/05) | | Ending Account
Value (10/31/05) | | Expenses Paid During
Period1 (5/01/05 to
10/31/05) | |
| Class A Actual2,3 | | $ | 1,000.00 | | | $ | 1,115.70 | | | $ | 6.61 | | |
| Class A Hypothetical (5% return before expenses)3 | | $ | 1,000.00 | | | $ | 1,018.95 | | | $ | 6.31 | | |
| Class B Actual2,3 | | $ | 1,000.00 | | | $ | 1,111.40 | | | $ | 10.59 | | |
| Class B Hypothetical (5% return before expenses)3 | | $ | 1,000.00 | | | $ | 1,015.17 | | | $ | 10.11 | | |
| Class C Actual2,3 | | $ | 1,000.00 | | | $ | 1,111.10 | | | $ | 10.59 | | |
| Class C Hypothetical (5% return before expenses)3 | | $ | 1,000.00 | | | $ | 1,015.17 | | | $ | 10.11 | | |
| Class R Actual2,3 | | $ | 1,000.00 | | | $ | 1,114.00 | | | $ | 7.94 | | |
| Class R Hypothetical (5% return before expenses)3 | | $ | 1,000.00 | | | $ | 1,017.69 | | | $ | 7.58 | | |
| Class Y Actual2,3 | | $ | 1,000.00 | | | $ | 1,116.80 | | | $ | 5.28 | | |
| Class Y Hypothetical (5% return before expenses)3 | | $ | 1,000.00 | | | $ | 1,020.21 | | | $ | 5.04 | | |
1Expenses are equal to the fund's annualized expense ratio for the most recent six-month period of 1.24%, 1.99%, 1.99%, 1.49% and 0.99% for Class A, Class B, Class C, Class R and Class Y, respectively, multiplied by the average account value over the period, multiplied by the number of days in the most recent fiscal half-year/365 (to reflect the one-half year period).
2Based on the actual returns for the six months ended October 31, 2005, of 11.57%, 11.14%, 11.11%, 11.40% and 11.68% for Class A, Class B, Class C, Class R and Class Y, respectively.
3Prior to July 1, 2005, the contractual limitation on annual expenses was 1.23%, 1.98%, 1.98%, 1.48% and 0.98% for Class A, Class B, Class C, Class R and Class Y, respectively. Effective July 1, 2005, the contractual limitation on annual expenses for each class was removed. If this limitation had not been in place during the entire period, actual and hypothetical ending account balances would have been approximately $1,115.59 and $1,018.85 for Class A, $1,111.29 and 1,015.07 for Class B, $1,110.99 and $1,015.07 for Class C, $1,113.95 and $1,017.64 for Class R and $1,116.69 and $1,020.11 for Class Y. Actual and hypothetical expenses paid during the period would have been approximately $6.72 and $6.41 for Class A, $10.70 and $10.21 for Class B, $10.70 and $10.21 for Class C, $7.99 and $7.63 for Class R and $5.39 and $5.14 for Class Y.
FIRST AMERICAN FUNDS Annual Report 2005
4
International fund
Investment Objective: long-term growth of capital
How did the fund perform the fiscal period ended October 31, 2005?
The First American International Fund (the "fund"), Class Y shares, returned -1.86% for the one-month period ended October 31, 2005 (Class A shares returned -1.88% without taking the sales charge into account). By comparison, the fund's benchmark, the Morgan Stanley Capital International Europe and Australasia, Far East Equity Index* ("MSCI EAFE Index"), returned -2.91% for the same period.
What were the general economic and market conditions during the fiscal period?
Rising oil and commodity prices, as well as the outlook for the consumer, have dominated the investment agenda. Even though energy was one of the best performing sectors, it had the effect of leading to concerns over potentially inflationary pressures and the effect of diminishing purchasing power for consumers, particularly at the low end. The high demand for both commodities and oil was in a large part driven by the Asian markets. Consequently, the Far East, Japan, and emerging markets all outperformed the broader EAFE benchmark. Japan's performance is also reflecting early signs of reform and an improving domestic economy; these signs have been perhaps most notable in the financial services arena.
What worked for the fund and why?
Stock selection has been the primary source of positive performance. The portfolio benefited from holdings in emerging markets, Japan and the Pacific Rim. From a sector
perspective, energy, telecommunications and information technology added value. Our two largest positions within the energy sector, Total (a French oil company) and ENI (an Italian oil and gas producer), contributed positively to performance. Both companies benefited from higher oil prices, and remain attractively valued.
Opportunistic exposure to emerging markets proved beneficial, with emerging equities outpacing the developed markets. In particular, the fund's position in CVRD (the Brazilian iron ore producer) proved beneficial with continued demand for iron ore leading to a very strong pricing environment.
What did not work for the fund and why?
At a regional level, stock selection in the United Kingdom was difficult. At the sector level, industrials, financials, and the consumer sectors held back performance. U.K. consumer stocks, for example William Morrison (U.K. food retailer), Kingfisher (home improvement retailer) and Tesco (U.K. food retailer) have been impacted by negative U.K. consumer sentiment in the wake of rising interest rates. These companies remain attractively valued.
*Unlike mutual funds, index returns do not reflect any expenses, transaction costs, or cash flow effects.
| Top 10 Holdings as of October 31, 20051 (% of net assets) | |
| Total | | | 4.3 | % | |
| Eni | | | 3.3 | % | |
| Vodafone | | | 3.1 | % | |
| GlaxoSmithKline | | | 2.7 | % | |
| HSBC | | | 2.6 | % | |
| Mitsubishi Tokyo Financial Group | | | 2.3 | % | |
| Roche | | | 2.1 | % | |
| UBS | | | 2.1 | % | |
| Novartis | | | 2.0 | % | |
| Royal Bank of Scotland | | | 1.9 | % | |
| Country Allocation as of October 31, 20051 (% of net assets) | |
| Great Britain | | | 26.6 | % | |
| Japan | | | 20.6 | % | |
| Switzerland | | | 11.1 | % | |
| France | | | 10.2 | % | |
| Germany | | | 5.5 | % | |
| Italy | | | 4.8 | % | |
| Short-Term Investments | | | 4.7 | % | |
| Netherlands | | | 4.4 | % | |
| Spain | | | 1.9 | % | |
| Belgium | | | 1.9 | % | |
| Brazil | | | 1.7 | % | |
| Finland | | | 1.4 | % | |
| Australia | | | 1.1 | % | |
| South Korea | | | 1.1 | % | |
| Sweden | | | 1.0 | % | |
| Hong Kong | | | 0.7 | % | |
| Mexico | | | 0.7 | % | |
| Ireland | | | 0.6 | % | |
| | | | 100.0 | % | |
1Fund holdings and country allocations are subject to change at any time and are not recommendations to buy or sell any security.
FIRST AMERICAN FUNDS Annual Report 2005
5
International fund continued
Annual Performance1
| | | October 31, 2005 | | September 30, 2005** | |
| | | One- | | | | | | | | Since Inception | | | | | | | | Since Inception | |
| | | month* | | 1 year | | 5 years | | 10 years | | 9/24/01 | | 1 year | | 5 years | | 10 years | | 9/24/01 | |
| Average annual return with sales charge (POP) | |
| Class A | | | (7.26 | )% | | | 8.72 | % | | | (1.64 | )% | | | 4.91 | % | | | — | | | | 14.19 | % | | | (2.46 | )% | | | 4.93 | % | | | — | | |
| Class B | | | (6.85 | )% | | | 9.21 | % | | | (1.63 | )% | | | 4.72 | % | | | — | | | | 14.94 | % | | | (2.43 | )% | | | 4.74 | % | | | — | | |
| Class C | | | (2.95 | )% | | | 13.13 | % | | | — | | | | — | | | | 8.19 | % | | | 18.88 | % | | | — | | | | — | | | | 8.90 | % | |
| Average annual return without sales charge (NAV) | |
| Class A | | | (1.88 | )% | | | 15.03 | % | | | (0.52 | )% | | | 5.50 | % | | | — | | | | 20.80 | % | | | (1.35 | )% | | | 5.52 | % | | | — | | |
| Class B | | | (1.95 | )% | | | 14.21 | % | | | (1.28 | )% | | | 4.72 | % | | | — | | | | 19.94 | % | | | (2.08 | )% | | | 4.74 | % | | | — | | |
| Class C | | | (1.97 | )% | | | 14.13 | % | | | — | | | | — | | | | 8.19 | % | | | 19.88 | % | | | — | | | | — | | | | 8.90 | % | |
| Class R | | | (1.89 | )% | | | 14.48 | % | | | (0.75 | )% | | | 5.38 | % | | | — | | | | 20.38 | % | | | (1.57 | )% | | | 5.40 | % | | | — | | |
| Class Y | | | (1.86 | )% | | | 15.29 | % | | | (0.29 | )% | | | 5.78 | % | | | — | | | | 21.12 | % | | | (1.10 | )% | | | 5.81 | % | | | — | | |
| MSCI EAFE Index2 | | | (2.91 | )% | | | 18.59 | % | | | 3.42 | % | | | 6.15 | % | | | 12.39 | % | | | 26.32 | % | | | 3.55 | % | | | 6.18 | % | | | 13.50 | % | |
Value of a $10,000 Investment1,3 as of October 31, 2005
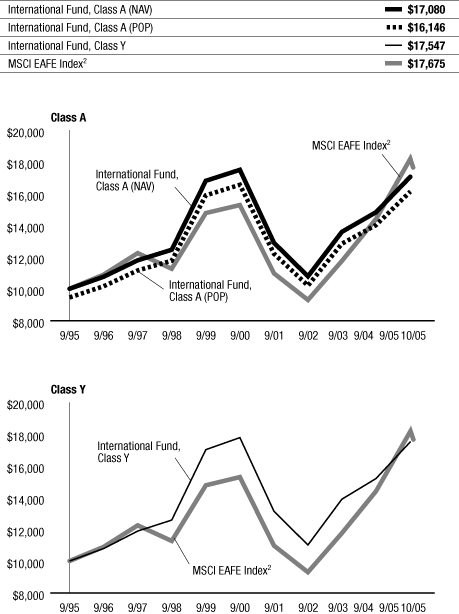
The chart above illustrates the total value of an assumed $10,000 investment in the fund's Class A and Class Y shares (from 9/30/95 to 10/31/05) as compared to the MSCI EAFE Index2.
The performance data quoted on this page represents past performance and does not guarantee future results. The investment return and principal value of an investment will fluctuate so that an investor's shares, when redeemed, may be worth more or less than their original cost. Current performance of the fund may be lower or higher than the performance data quoted. Performance data current to the most recent month-end may be obtained by calling 800.677.FUND.
* Total returns have not been annualized.
** This table represents average annual total returns through the latest calendar quarter—rather than through the end of the fiscal period.
1 Performance does not reflect the deduction of taxes that a shareholder would pay on fund distributions or redemption of fund shares. Investment performance reflects fee waivers that are or were in effect. In the absence of such fee waivers, total returns would be reduced. Index performance is for illustrative purposes only and does not reflect any expenses, transaction costs, or cash flow effects. Direct investment in the index is not available.
International investing involves risks not typically associated with domestic investing, including risks of adverse currency fluctuations, potential political and economic instability, different accounting standards, foreign government regulations, currency exchange rates, limited liquidity, and volatile prices.
Total returns at net asset value ("NAV") reflect performance over the time period indicated without including the fund's maximum sales charge and assume reinvestment of all distributions at NAV.
Total returns at public offering price ("POP") reflect performance over the time period indicated including a maximum front-end sales charge of 5.50% for Class A shares and the maximum contingent deferred sales charge ("CDSC") for Class B and Class C shares for the relevant period. Maximum CDSC is 5.00% for Class B shares in the first year, decreasing annually to 0% in the seventh year following purchase, and 1.00% for Class C shares. Total returns assume reinvestment of all distributions at NAV.
Effective December 8, 2004, J.P. Morgan was named the fund's subadvisor and began managing the fund's assets. On September 24, 2001, the First American International Fund merged with Firstar International Growth Fund and Firstar International Value Fund, both subadvised by Clay Finlay Inc. Performance history prior to September 24, 2001, represents that of the Firstar International Growth Fund.
2 An unmanaged index of common stocks in Europe, Australasia, and the Far East.
3 Performance for Class B, Class C, and Class R shares is not presented. Performance for these classes will vary due to different expense structures.
FIRST AMERICAN FUNDS Annual Report 2005
6
International fund continued
Expense Example
As a shareholder of the International Fund (the "fund"), you incur two types of costs: (1) transaction costs, including sales charges (loads) on purchase payments; and (2) ongoing costs, including investment advisory fees; distribution and/or service (12b-1) fees; and other fund expenses. This example is intended to help you understand your ongoing costs (in dollars) of investing in the fund and to compare these costs with the ongoing costs of investing in other mutual funds. The example is based on an investment of $1,000 invested at the beginning of the period and held for the entire period from May 1, 2005, to October 31, 2005.
Actual Expenses
For each class, the first line of the table below provides information about actual account values and actual expenses. You may use the information in this line, together with the amount you invested, to estimate the expenses that you paid over the period. Simply divide your account value by $1,000 (for example, an $8,600 account value divided by $1,000 = 8.6), then multiply the result by the number in the first line under the heading entitled "Expenses Paid During Period" to estimate the expenses you paid on your account during this period.
Hypothetical Example for Comparison Purposes
For each class, the second line of the table below provides information about hypothetical account values and hypothetical expenses based on the fund's actual expense ratio and an assumed rate of return of 5% per year before expenses, which is not the fund's actual return. The hypothetical account values and expenses may not be used to estimate the actual ending account balance or expenses you paid for the period. You may use this information to compare the ongoing costs of investing in the fund and other funds. To do so, compare this 5% hypothetical example with the 5% hypothetical examples that appear in the shareholder reports of the other funds.
Please note that the expenses shown in the table are meant to highlight your ongoing costs only and do not reflect any transactional costs, such as sales charges (loads). Therefore, the second line of the table for each class is useful in comparing ongoing costs only, and will not help you determine the relative total costs of owning different funds. In addition, if these transactional costs were included, your costs would have been higher.
Expense Examples
| | | Beginning Account
Value (5/01/05) | | Ending Account
Value (10/31/05) | | Expenses Paid During
Period1 (5/01/05 to
10/31/05) | |
| Class A Actual2,3 | | $ | 1,000.00 | | | $ | 1,079.10 | | | $ | 8.07 | | |
| Class A Hypothetical (5% return before expenses)3 | | $ | 1,000.00 | | | $ | 1,017.44 | | | $ | 7.83 | | |
| Class B Actual2,3 | | $ | 1,000.00 | | | $ | 1,075.70 | | | $ | 11.98 | | |
| Class B Hypothetical (5% return before expenses)3 | | $ | 1,000.00 | | | $ | 1,013.66 | | | $ | 11.62 | | |
| Class C Actual2,3 | | $ | 1,000.00 | | | $ | 1,075.00 | | | $ | 11.98 | | |
| Class C Hypothetical (5% return before expenses)3 | | $ | 1,000.00 | | | $ | 1,013.66 | | | $ | 11.62 | | |
| Class R Actual2,3 | | $ | 1,000.00 | | | $ | 1,076.60 | | | $ | 9.58 | | |
| Class R Hypothetical (5% return before expenses)3 | | $ | 1,000.00 | | | $ | 1,015.98 | | | $ | 9.30 | | |
| Class Y Actual2,3 | | $ | 1,000.00 | | | $ | 1,080.90 | | | $ | 6.77 | | |
| Class Y Hypothetical (5% return before expenses)3 | | $ | 1,000.00 | | | $ | 1,018.70 | | | $ | 6.56 | | |
1Expenses are equal to the fund's annualized expense ratio for the most recent six-month period of 1.54%, 2.29%, 2.29%, 1.83% and 1.29% for Class A, Class B, Class C, Class R and Class Y, respectively, multiplied by the average account value over the period, multiplied by the number of days in the most recent fiscal half-year/365 (to reflect the one-half year period).
2Based on the actual returns for the six months ended October 31, 2005, of 7.91%, 7.57%, 7.50%, 7.66% and 8.09% for Class A, Class B, Class C, Class R, and Class Y, respectively.
3Prior to July 1, 2005, the contractual limitation on annual expenses was 1.60%, 2.35%, 2.35%, 1.85% and 1.35% for Class A, Class B, Class C, Class R and Class Y, respectively. Effective July 1, 2005, the contractual limitation on annual expenses was lowered to 1.52%, 2.27%, 2.27%, 1.77%, and 1.27% for Class A, Class B, Class C, Class R, and Class Y, respectively. If this new limitation had been in place during the entire period, actual and hypothetical ending account balances would have been approximately $1,079.20 and $1,017.54 for Class A, $1,075.80 and $1,013.76 for Class B, $1,075.11 and $1,013.76 for Class C, $1,076.92 and $1,016.28 for Class R and $1,081.01 and $1,018.80 for Class Y. Actual and hypothetical expenses paid during the period would have been approximately $7.97 and $7.73 for Class A, $11.88 and $11.52 for Class B, $11.87 and $1 1.52 for Class C, $9.26 and $9.00 for Class R and $6.66 and $6.46 for Class Y.
FIRST AMERICAN FUNDS Annual Report 2005
7
Small Cap Growth Opportunities fund
Investment Objective: growth of capital
How did the fund perform the fiscal period ended October 31, 2005?
The First American Small Cap Growth Opportunities Fund (the "fund"), Class Y shares, returned -4.03% for the one-month period ended October 31, 2005 (Class A shares returned -4.04% without taking the sales charge into account). By comparison, the fund's benchmark, the Russell 2000 Growth Index*, returned -3.70% for the same period.
What were the general economic and market conditions during the fiscal period?
Broader economic growth continued at a relatively solid pace in October. Indicators for the manufacturing sector suggested robust growth as inventories remained low and recovery and reconstruction activity proceeded following the hurricanes. Companies indicated continued cost pressures from energy and other raw material prices, keeping Fed concerns about inflation intact. This led to an additional 25-basis-point tightening at the November 1 Federal Open Market Committee meeting, giving support to expectations for further short-term rate increases. While activity in the industrial sector remained robust, consumer confidence continued to slump despite gasoline prices falling sharply during the month. Auto sales fell to their lowest monthly pace in more than seven years as the employee discount sales promotions expired. Forward-looking housing market indicators such as mortgage applications for home purchases moved lower, and emplo yment cost data for the third quarter showed the slowest gain in wages in 25 years. Subdued compensation gains suggest that broader inflation should remain well contained in the coming quarters, which will be a key to bringing an eventual end to Fed tightening and should provide a supportive backdrop to the financial markets.
What worked for the fund and why?
Financials were our best performing sector due to stock selection. In particular, East West Bancorp, a Southern California-based bank catering to the fast-growing Chinese-American population, made a substantial contribution to performance. Other outstanding performers during this fiscal period were Pacific Sunwear (a clothing retailer) and Embarcadero Technologies (a provider of database tools for enterprise software).
What did not work for the fund and why?
The energy sector was the main detractor from the fund's performance as energy stocks traded down along with the commodity prices. The weakest-performing individual stocks were Compton Petroleum (an oil and gas exploration company), First Horizon Pharmaceuticals, and Motive, Inc. (a provider of subscriber management software to telecom and cable service providers).
*Unlike mutual funds, index returns do not reflect any expenses, transaction costs, or cash flow effects.
| Top 10 Holdings as of October 31, 20051 (% of net assets) | |
| Encore Medical | | | 2.8 | % | |
| Polycom | | | 2.6 | % | |
| Semtech | | | 2.5 | % | |
| Plantronics | | | 2.3 | % | |
| Quest Software | | | 2.3 | % | |
| Scientific Games, Class A | | | 2.1 | % | |
| East West Bancorp | | | 2.0 | % | |
| Navigant Consulting | | | 2.0 | % | |
| Extreme Networks | | | 1.9 | % | |
| Andrx Group | | | 1.9 | % | |
| Sector Allocation as of October 31, 20051 (% of net assets) | |
| Information Technology | | | 31.7 | % | |
| Health Care | | | 19.9 | % | |
| Consumer Discretionary | | | 18.5 | % | |
| Industrials | | | 11.0 | % | |
| Energy | | | 9.3 | % | |
| Financials | | | 8.0 | % | |
| Short-Term Investments | | | 3.0 | % | |
| Other Assets and Liabilities, Net | | | (1.4 | )% | |
| | | | 100.0 | % | |
1Fund holdings and sector allocations are subject to change at any time and are not recommendations to buy or sell any security.
FIRST AMERICAN FUNDS Annual Report 2005
8
Small Cap Growth Opportunities fund continued
Annual Performance1
| | | October 31, 2005 | | September 30, 2005** | |
| | | One- | | | | | | | | Since Inception | | | | | | | | Since Inception | |
| | | month* | | 1 year | | 5 years | | 10 years | | 3/01/99 | | 12/11/00 | | 9/24/01 | | 1 year | | 5 years | | 10 years | | 3/01/99 | | 12/11/00 | | 9/24/01 | |
Average annual return with
sales charge (POP) | |
| Class A | | | (9.31 | )% | | | 7.92 | % | | | 2.76 | % | | | 19.51 | % | | | — | | | | — | | | | — | | | | 17.35 | % | | | 1.49 | % | | | 19.96 | % | | | — | | | | — | | | | — | | |
| Class B | | | (8.88 | )% | | | 8.46 | % | | | 2.91 | % | | | — | | | | 20.31 | % | | | — | | | | — | | | | 18.27 | % | | | 1.63 | % | | | — | | | | 21.37 | % | | | — | | | | — | | |
| Class C | | | (5.09 | )% | | | 12.35 | % | | | — | | | | — | | | | — | | | | — | | | | 11.28 | % | | | 22.28 | % | | | — | | | | — | | | | — | | | | — | | | | 12.71 | % | |
Average annual return without
sales charge (NAV) | |
| Class A | | | (4.04 | )% | | | 14.20 | % | | | 3.93 | % | | | 20.19 | % | | | — | | | | — | | | | — | | | | 24.21 | % | | | 2.64 | % | | | 20.64 | % | | | — | | | | — | | | | — | | |
| Class B | | | (4.09 | )% | | | 13.41 | % | | | 3.15 | % | | | — | | | | 20.31 | % | | | — | | | | — | | | | 23.27 | % | | | 1.87 | % | | | — | | | | 21.37 | % | | | — | | | | — | | |
| Class C | | | (4.13 | )% | | | 13.34 | % | | | — | | | | — | | | | — | | | | — | | | | 11.28 | % | | | 23.28 | % | | | — | | | | — | | | | — | | | | — | | | | 12.71 | % | |
| Class R | | | (4.09 | )% | | | 14.06 | % | | | — | | | | — | | | | — | | | | 5.54 | % | | | — | | | | 24.06 | % | | | — | | | | — | | | | — | | | | 6.57 | % | | | — | | |
| Class Y | | | (4.03 | )% | | | 14.43 | % | | | 4.18 | % | | | 20.50 | % | | | — | | | | — | | | | — | | | | 24.47 | % | | | 2.89 | % | | | 20.95 | % | | | — | | | | — | | | | — | | |
| Russell 2000 Growth Index2 | | | (3.70 | )% | | | 10.91 | % | | | (1.62 | )% | | | 4.81 | % | | | 3.18 | % | | | (0.07 | )% | | | 10.46 | % | | | 17.97 | % | | | (2.54 | )% | | | 4.67 | % | | | 3.81 | % | | | 0.71 | % | | | 11.74 | % | |
Value of a $10,000 Investment1,3 as of October 31, 2005
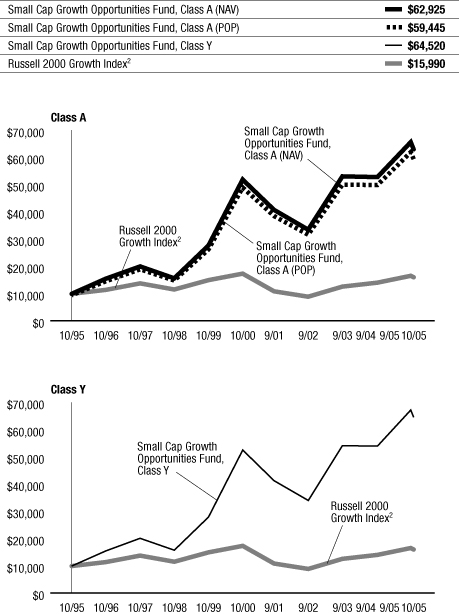
The chart above illustrates the total value of an assumed $10,000 investment in the fund's Class A and Class Y shares (from 10/31/95 to 10/31/05) as compared to the Russell 2000 Growth Index2.
The performance data quoted on this page represents past performance and does not guarantee future results. The investment return and principal value of an investment will fluctuate so that an investor's shares, when redeemed, may be worth more or less than their original cost. Current performance of the fund may be lower or higher than the performance data quoted. Performance data current to the most recent month-end may be obtained by calling 800.677.FUND.
* Total returns have not been annualized.
** This table represents average annual total returns through the latest calendar quarter—rather than through the end of the fiscal period.
1 Performance does not reflect the deduction of taxes that a shareholder would pay on fund distributions or redemption of fund shares. Investment performance reflects fee waivers that are or were in effect. In the absence of such fee waivers, total returns would be reduced. Index performance is for illustrative purposes only and does not reflect any expenses, transaction costs, or cash flow effects. Direct investment in the index is not available.
Stocks of small-capitalization companies involve substantial risk. These stocks historically have experienced greater price volatility than stocks of larger companies, and they may be expected to do so in the future.
Total returns at net asset value ("NAV") reflect performance over the time period indicated without including the fund's maximum sales charge and assume reinvestment of all distributions at NAV.
Total returns at public offering price ("POP") reflect performance over the time period indicated including a maximum front-end sales charge of 5.50% for Class A shares and the maximum contingent deferred sales charge ("CDSC") for Class B and Class C shares for the relevant period. Maximum CDSC is 5.00% for Class B shares in the first year, decreasing annually to 0% in the seventh year following purchase, and 1.00% for Class C shares. Total returns assume reinvestment of all distributions at NAV.
On December 12, 2002, the fund changed its main investment strategy such that it was permitted to invest in securities of companies with market capitalizations within the range of companies in the Russell 2000 Index. Previously, the fund invested primarily in companies with market capitalizations of below $500 million at the time of purchase.
On September 24, 2001, the First American Small Cap Growth Opportunities Fund became the successor by merger to the Firstar MicroCap Fund, a series of Firstar Funds, Inc. Prior to the merger, the First American fund had no assets or liabilities. Performance presented prior to September 24, 2001, represents that of the Firstar MicroCap Fund.
The First American Small Cap Growth Opportunities Fund's 1999 returns were higher due in substantial part to its strategy of investing in IPOs in a period favorable for IPO investing. Of course, such favorable returns involve accepting the risk of volatility, and there is no assurance that the fund's future investment in IPOs will have the same effect on performance as it did in 1999.
2 An unmanaged index that measures the performance of those companies in the Russell 2000 Index (a small-cap index) with higher price-to-book ratios and higher forecasted growth values.
3 Performance for Class B, Class C, and Class R shares is not presented. Performance for these classes will vary due to different expense structures.
FIRST AMERICAN FUNDS Annual Report 2005
9
Small Cap Growth Opportunities fund continued
Expense Example
As a shareholder of the Small Cap Growth Opportunities Fund (the "fund"), you incur two types of costs: (1) transaction costs, including sales charges (loads) on purchase payments; and (2) ongoing costs, including investment advisory fees; distribution and/or service (12b-1) fees; and other fund expenses. This example is intended to help you understand your ongoing costs (in dollars) of investing in the fund and to compare these costs with the ongoing costs of investing in other mutual funds. The example is based on an investment of $1,000 invested at the beginning of the period and held for the entire period from May 1, 2005, to October 31, 2005.
Actual Expenses
For each class, the first line of the table below provides information about actual account values and actual expenses. You may use the information in this line, together with the amount you invested, to estimate the expenses that you paid over the period. Simply divide your account value by $1,000 (for example, an $8,600 account value divided by $1,000 = 8.6), then multiply the result by the number in the first line under the heading entitled "Expenses Paid During Period" to estimate the expenses you paid on your account during this period.
Hypothetical Example for Comparison Purposes
For each class, the second line of the table below provides information about hypothetical account values and hypothetical expenses based on the fund's actual expense ratio and an assumed rate of return of 5% per year before expenses, which is not the fund's actual return. The hypothetical account values and expenses may not be used to estimate the actual ending account balance or expenses you paid for the period. You may use this information to compare the ongoing costs of investing in the fund and other funds. To do so, compare this 5% hypothetical example with the 5% hypothetical examples that appear in the shareholder reports of the other funds.
Please note that the expenses shown in the table are meant to highlight your ongoing costs only and do not reflect any transactional costs, such as sales charges (loads). Therefore, the second line of the table for each class is useful in comparing ongoing costs only, and will not help you determine the relative total costs of owning different funds. In addition, if these transactional costs were included, your costs would have been higher.
Expense Examples
| | | Beginning Account
Value (5/01/05) | | Ending Account
Value (10/31/05) | | Expenses Paid During
Period1 (5/01/05 to
10/31/05) | |
| Class A Actual2,3 | | $ | 1,000.00 | | | $ | 1,121.00 | | | $ | 8.66 | | |
| Class A Hypothetical (5% return before expenses)3 | | $ | 1,000.00 | | | $ | 1,017.04 | | | $ | 8.24 | | |
| Class B Actual2,3 | | $ | 1,000.00 | | | $ | 1,116.60 | | | $ | 12.64 | | |
| Class B Hypothetical (5% return before expenses)3 | | $ | 1,000.00 | | | $ | 1,013.26 | | | $ | 12.03 | | |
| Class C Actual2,3 | | $ | 1,000.00 | | | $ | 1,115.90 | | | $ | 12.64 | | |
| Class C Hypothetical (5% return before expenses)3 | | $ | 1,000.00 | | | $ | 1,013.26 | | | $ | 12.03 | | |
| Class R Actual2,3 | | $ | 1,000.00 | | | $ | 1,119.00 | | | $ | 10.42 | | |
| Class R Hypothetical (5% return before expenses)3 | | $ | 1,000.00 | | | $ | 1,015.38 | | | $ | 9.91 | | |
| Class Y Actual2,3 | | $ | 1,000.00 | | | $ | 1,122.00 | | | $ | 7.27 | | |
| Class Y Hypothetical (5% return before expenses)3 | | $ | 1,000.00 | | | $ | 1,018.35 | | | $ | 6.92 | | |
1Expenses are equal to the fund's annualized expense ratio for the most recent six-month period of 1.62%, 2.37%, 2.37%, 1.95% and 1.36% for Class A, Class B, Class C, Class R and Class Y, respectively, multiplied by the average account value over the period, multiplied by the number of days in the most recent half-year/365 days (to reflect the one-half year period).
2Based on the actual returns for the six months ended October 31, 2005, of 12.10%, 11.66%, 11.59%, 11.90% and 12.20% for Class A, Class B, Class C, Class R and Class Y, respectively.
3Prior to July 1, 2005, the contractual limitation on annual expenses was 1.93%, 2.68%, 2.68%, 2.18% and 1.68% for Class A, Class B, Class C, Class R and Class Y, respectively. Effective July 1, 2005, the contactual limitation on annual expenses was lowered to 1.47%, 2.22%, 2.22%, 1.72%, and 1.22% for Class A, Class B, Class C, Class R and Class Y, respectively. If this new limitation had been in place during the entire period, actual and hypothetical ending account balances would have been approximately $1,121.80 and $1,017.80 for Class A, $1,117.40 and $1,014.01 for Class B, $1,116.70 and $1,014.01 for Class C, $1,120.23 and $1,016.53 for Class R and $1,122.74 and $1,019.06 for Class Y. Actual and hypothetical expenses paid during the period would have been approximately $7.86 and $7.48 for Class A, $11.84 and $11.27 for Class B, $11.84 and $11. 27 for Class C, $9.19 and $8.74 for Class R and $6.53 and $6.21 for Class Y.
FIRST AMERICAN FUNDS Annual Report 2005
10
Small Cap Select fund
Investment Objective: capital appreciation
How did the fund perform for the fiscal period ended October 31, 2005?
The First American Small Cap Select Fund (the "fund"), Class Y shares, returned -3.08% for the one-month period ended October 31, 2005 (Class A shares returned -3.10% without taking the sales charge into account). By comparison, the fund's benchmark, the Russell 2000 Index*, returned -3.10% for the same period.
What were the general economic and market conditions during the fiscal period?
Broader economic growth continued at a relatively solid pace in October. Indicators for the manufacturing sector suggested robust growth as inventories remained low and recovery and reconstruction activity proceeded following the hurricanes. Companies indicated continued cost pressures from energy and other raw material prices, keeping Fed concerns about inflation intact. This led to an additional 25-basis-point tightening at the November 1 Federal Open Market Committee meeting, giving support to expectations for further short-term rate increases. While activity in the industrial sector remained robust, consumer confidence continued to slump despite gasoline prices falling sharply during the month. Auto sales fell to their lowest monthly pace in more than seven years as the employee discount sales promotions expired. Forward-looking housing market indicators such as mortgage applications for home purchases moved lower, and emplo yment cost data for the third quarter showed the slowest gain in wages in 25 years. Subdued compensation gains suggest that broader inflation should remain well contained in the coming quarters, which will be a key to bringing an eventual end to Fed tightening and should provide a supportive backdrop to the financial markets.
What worked for the fund and why?
Good stock selection in the financial, healthcare, and consumer sectors was the primary driver of fund performance relative to its index during the fiscal period. Leading performers were First Republic Bank (a California bank) in the financial sector, Sierra Healthcare Services (a managed care provider) in the health care sector, and Rare Hospitality (a restaurant company) in the consumer sector. In the financial sector, a bias toward banks with low-cost core deposits (savings and checking accounts) helped performance as rising interest rates pinched the profit margins at banks with higher-cost deposits (CDs and money market accounts).
What did not work for the fund and why?
During October, the only area of significant underperformance was the technology sector, and this was due primarily to just one stock, Packeteer, Inc. Packeteer is a provider of wide area network traffic management systems. The company's shares sold off sharply in mid-October when it announced a significant sales shortfall due to delayed sales in Asia. With strong U.S. revenues, better-than-expected profitability, and a compelling valuation, we took the opportunity to augment our Packeteer position despite the topline miss. While this move helped in the latter half of October, it did not offset the intial underperformance.
*Unlike mutual funds, index returns do not reflect any expenses, transaction costs, or cash flow effects.
| Top 10 Holdings as of October 31, 20051 (% of net assets) | |
| Sierra Health Services | | | 2.3 | % | |
| First Republic Bank | | | 2.3 | % | |
| SL Green Realty | | | 2.1 | % | |
| Cullen/Frost Bankers | | | 1.7 | % | |
| BISYS Group | | | 1.7 | % | |
| La Quinta | | | 1.7 | % | |
| Scientific Games, Class A | | | 1.6 | % | |
| W-H Energy Services | | | 1.6 | % | |
| Stellent | | | 1.5 | % | |
| ENSCO International | | | 1.4 | % | |
| Sector Allocation as of October 31, 20051 (% of net assets) | |
| Information Technology | | | 21.3 | % | |
| Financials | | | 20.8 | % | |
| Consumer Discretionary | | | 16.0 | % | |
| Industrials | | | 14.0 | % | |
| Health Care | | | 13.2 | % | |
| Energy | | | 8.0 | % | |
| Materials | | | 3.0 | % | |
| Short-Term Investments | | | 1.2 | % | |
| Telecommunication Services | | | 0.4 | % | |
| Other Assets and Liabilities, Net | | | 2.1 | % | |
| | | | 100.0 | % | |
1Fund holdings and sector allocations are subject to change at any time and are not recommendations to buy or sell any security.
FIRST AMERICAN FUNDS Annual Report 2005
11
Small Cap Select fund continued
Annual Performance1
| | | October 31, 2005 | | September 30, 2005** | |
| | | One- | | | | | | | | Since Inception | | | | | | | | Since Inception | |
| | | month* | | 1 year | | 5 years | | 10 years | | 9/24/01 | | 1 year | | 5 years | | 10 years | | 9/24/01 | |
| Average annual return with sales charge (POP) | |
| Class A | | | (8.42 | )% | | | 6.45 | % | | | 8.03 | % | | | 9.94 | % | | | — | | | | 13.82 | % | | | 7.97 | % | | | 9.47 | % | | | — | | |
| Class B | | | (7.98 | )% | | | 7.28 | % | | | 8.22 | % | | | 9.79 | % | | | — | | | | 14.63 | % | | | 8.16 | % | | | 9.32 | % | | | — | | |
| Class C | | | (4.17 | )% | | | 10.88 | % | | | — | | | | — | | | | 14.89 | % | | | 18.60 | % | | | — | | | | — | | | | 16.16 | % | |
| Average annual return without sales charge (NAV) | |
| Class A | | | (3.10 | )% | | | 12.63 | % | | | 9.26 | % | | | 10.56 | % | | | — | | | | 20.46 | % | | | 9.20 | % | | | 10.09 | % | | | — | | |
| Class B | | | (3.14 | )% | | | 11.79 | % | | | 8.45 | % | | | 9.79 | % | | | — | | | | 19.45 | % | | | 8.40 | % | | | 9.32 | % | | | — | | |
| Class C | | | (3.21 | )% | | | 11.80 | % | | | — | | | | — | | | | 14.89 | % | | | 19.58 | % | | | — | | | | — | | | | 16.16 | % | |
| Class R | | | (3.11 | )% | | | 12.39 | % | | | 9.23 | % | | | 10.56 | % | | | — | | | | 20.16 | % | | | 9.19 | % | | | 10.09 | % | | | — | | |
| Class Y | | | (3.08 | )% | | | 12.92 | % | | | 9.53 | % | | | 10.88 | % | | | — | | | | 20.73 | % | | | 9.48 | % | | | 10.41 | % | | | — | | |
| Russell 2000 Index2 | | | (3.10 | )% | | | 12.08 | % | | | 6.75 | % | | | 9.53 | % | | | 14.28 | % | | | 17.95 | % | | | 6.45 | % | | | 9.37 | % | | | 15.51 | % | |
Value of $10,000 Investment1,3 as of October 31, 2005
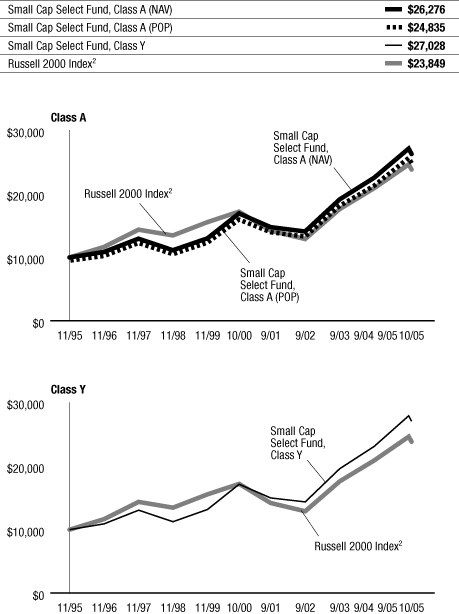
The chart above illustrates the total value of an assumed $10,000 investment in the fund's Class A and Class Y shares (from 11/30/95 to 10/31/05) as compared to the Russell 2000 Index2.
The performance data quoted on this page represents past performance and does not guarantee future results. The investment return and principal value of an investment will fluctuate so that an investor's shares, when redeemed, may be worth more or less than their original cost. Current performance of the fund may be lower or higher than the performance data quoted. Performance data current to the most recent month-end may be obtained by calling 800.677.FUND.
* Total returns have not been annualized.
** This table represents average annual total returns through the latest calendar quarter—rather than through the end of the fiscal period.
1 Performance does not reflect the deduction of taxes that a shareholder would pay on fund distributions or redemption of fund shares. Investment performance reflects fee waivers that are or were in effect. In the absence of such fee waivers, total returns would be reduced. Index performance is for illustrative purposes only and does not reflect any expenses, transaction costs, or cash flow effects. Direct investment in an index is not available.
Stocks of small-capitalization companies involve substantial risk. These stocks historically have experienced greater price volatility than stocks of larger companies, and they may be expected to do so in the future.
Total returns at net asset value ("NAV") reflect performance over the time period indicated without including the fund's maximum sales charge and assume reinvestment of all distributions at NAV.
Total returns at public offering price ("POP") reflect performance over the time period indicated including a maximum front-end sales charge of 5.50% for Class A shares and the maximum contingent deferred sales charge ("CDSC") for Class B and Class C shares for the relevant period. Maximum CDSC is 5.00% for Class B shares in the first year, decreasing annually to 0% in the seventh year following purchase, and 1.00% for Class C shares. Total returns assume reinvestment of all distributions at NAV.
On September 24, 2001, the First American Small Cap Select Fund became the successor by merger to the Firstar SmallCap Core Equity Fund, a series of Firstar Funds, Inc. Prior to the merger, the First American fund had no assets or liabilities. Performance presented prior to September 24, 2001, represents that of the Firstar SmallCap Core Equity Fund. The Firstar SmallCap Core Equity Fund was organized on November 27, 2000, and prior to that, was a separate series of Mercantile Funds, Inc.
2 An unmanaged small-cap index that measures the performance of the 2,000 smallest companies in the Russell 3000 Index.
3 Performance for Class B, Class C, and Class R shares is not presented. Performance for these classes will vary due to different expense structures.
FIRST AMERICAN FUNDS Annual Report 2005
12
Small Cap Select fund continued
Expense Example
As a shareholder of the Small Cap Select Fund (the "fund"), you incur two types of costs: (1) transaction costs, including sales charges (loads) on purchase payments; and (2) ongoing costs, including investment advisory fees; distribution and/or service (12b-1) fees; and other fund expenses. This example is intended to help you understand your ongoing costs (in dollars) of investing in the fund and to compare these costs with the ongoing costs of investing in other mutual funds. The example is based on an investment of $1,000 invested at the beginning of the period and held for the entire period from May 1, 2005, to October 31, 2005.
Actual Expenses
For each class, the first line of the table below provides information about actual account values and actual expenses. You may use the information in this line, together with the amount you invested, to estimate the expenses that you paid over the period. Simply divide your account value by $1,000 (for example, an $8,600 account value divided by $1,000 = 8.6), then multiply the result by the number in the first line under the heading entitled "Expenses Paid During Period" to estimate the expenses you paid on your account during this period.
Hypothetical Example for Comparison Purposes
For each class, the second line of the table below provides information about hypothetical account values and hypothetical expenses based on the fund's actual expense ratio and an assumed rate of return of 5% per year before expenses, which is not the fund's actual return. The hypothetical account values and expenses may not be used to estimate the actual ending account balance or expenses you paid for the period. You may use this information to compare the ongoing costs of investing in the fund and other funds. To do so, compare this 5% hypothetical example with the 5% hypothetical examples that appear in the shareholder reports of the other funds.
Please note that the expenses shown in the table are meant to highlight your ongoing costs only and do not reflect any transactional costs, such as sales charges (loads). Therefore, the second line of the table for each class is useful in comparing ongoing costs only, and will not help you determine the relative total costs of owning different funds. In addition, if these transactional costs were included, your costs would have been higher.
Expense Examples
| | | Beginning Account
Value (5/01/05) | | Ending Account
Value (10/31/05) | | Expenses Paid During
Period1 (5/01/05 to
10/31/05) | |
| Class A Actual2,3 | | $ | 1,000.00 | | | $ | 1,139.80 | | | $ | 6.69 | | |
| Class A Hypothetical (5% return before expenses)3 | | $ | 1,000.00 | | | $ | 1,018.95 | | | $ | 6.31 | | |
| Class B Actual2,3 | | $ | 1,000.00 | | | $ | 1,135.50 | | | $ | 10.71 | | |
| Class B Hypothetical (5% return before expenses)3 | | $ | 1,000.00 | | | $ | 1,015.17 | | | $ | 10.11 | | |
| Class C Actual2,3 | | $ | 1,000.00 | | | $ | 1,135.10 | | | $ | 10.71 | | |
| Class C Hypothetical (5% return before expenses)3 | | $ | 1,000.00 | | | $ | 1,015.17 | | | $ | 10.11 | | |
| Class R Actual2,3 | | $ | 1,000.00 | | | $ | 1,139.00 | | | $ | 8.14 | | |
| Class R Hypothetical (5% return before expenses)3 | | $ | 1,000.00 | | | $ | 1,017.59 | | | $ | 7.68 | | |
| Class Y Actual2,3 | | $ | 1,000.00 | | | $ | 1,141.40 | | | $ | 5.34 | | |
| Class Y Hypothetical (5% return before expenses)3 | | $ | 1,000.00 | | | $ | 1,020.21 | | | $ | 5.04 | | |
1Expenses are equal to the fund's annualized expense ratio for the most recent six-month period of 1.24%, 1.99%, 1.99%, 1.51% and 0.99% for Class A, Class B, Class C, Class R and Class Y, respectively, multiplied by the average account value over the period, multiplied by the number of days in the most recent fiscal half-year/365 (to reflect the one-half year period).
2Based on the actual returns for the six months ended October 31, 2005, of 13.98%, 13.55%, 13.51%, 13.90% and 14.14% for Class A, Class B, Class C, Class R and Class Y, respectively.
3Prior to July 1, 2005, the contractual limitation on annual expenses was 1.21%, 1.96%, 1.96%, 1.46% and 0.96% for Class A, Class B, Class C, Class R and Class Y, respectively. Effective July 1, 2005, the contractual limitation on annual expenses for each class was removed. If this limitation had not been in place during the entire period, actual and hypothetical ending account balances would have been approximately $1,139.75 and $1,018.90 for Class A, $1,135.44 and $1,015.12 for Class B, $1,135.05 and $1,015.12 for Class C, $1,139.00 and $1,017.59 for Class R and $1,141.34 and $1,020.15 for Class Y. Actual and hypothetical expenses paid during the period would have been approximately $6.74 and $6.36 for Class A, $10.77 and $10.16 for Class B, $10.76 and $10.16 for Class C, $8.14 and $7.68 for Class R and $5.40 and $5.09 for Class Y.
FIRST AMERICAN FUNDS Annual Report 2005
13
Small Cap Value fund
Investment Objective: capital appreciation
How did the fund perform the fiscal period ended October 31, 2005?
The First American Small Cap Value Fund (the "fund"), Class Y shares, returned -2.58% for the one-month period ended October 31, 2005 (Class A shares returned -2.62% without taking the sales charge into account). By comparison, the fund's benchmark, the Russell 2000 Value Index*, returned -2.51% for the same period.
What were the general economic and market conditions during the fiscal period?
Broader economic growth continued at a relatively solid pace in October. Indicators for the manufacturing sector suggested robust growth as inventories remained low and recovery and reconstruction activity proceeded following the hurricanes. Companies indicated continued cost pressures from energy and other raw material prices, keeping Fed concerns about inflation intact. This led to an additional 25-basis-point tightening at the November 1 Federal Open Market Committee meeting, giving support to expectations for further short-term rate increases. While activity in the industrial sector remained robust, consumer confidence continued to slump despite gasoline prices falling sharply during the month. Auto sales fell to their lowest monthly pace in more than seven years as the employee discount sales promotions expired. Forward-looking housing market indicators such as mortgage applications for home purchases moved lower, and emplo yment cost data for the third quarter showed the slowest gain in wages in 25 years. Subdued compensation gains suggest that broader inflation should remain well contained in the coming quarters, which will be a key to bringing an eventual end to Fed tightening and should provide a supportive backdrop to the financial markets.
What worked for the fund and why?
During the reporting period, the main drivers of the fund's performance were the financial and consumer discretionary sectors, both benefiting from the expectation that the Fed's tightening cycle is approaching the end. In the financial sector, two California banks, First Republic Bank and East West Bancorp, were standout performers due to the volume of their low-cost core deposits (savings and checking accounts). Publisher Thomas Nelson, Inc., buoyed up by the announcement of promising new titles in their catalogue, also added value.
What did not work for the fund and why?
The information technology and industrials sectors were the weakest performers in October. Among individual stocks, Mercury Computer Systems and Magellan Health Services (a behavioral health and employee services company) detracted from performance, as did ESCO Technologies (a supplier of engineered filtration products) weakened by a cautious response from investors while awaiting the signing of a sizeable new contract.
*Unlike mutual funds, index returns do not reflect any expenses, transaction costs, or cash flow effects.
| Top 10 Holdings as of October 31, 20051 (% of net assets) | |
| First Republic Bank – California | | | 2.4 | % | |
| Toro | | | 2.0 | % | |
| CLARCOR | | | 2.0 | % | |
| ESCO Technologies | | | 2.0 | % | |
| BISYS Group | | | 2.0 | % | |
| East West Bancorp | | | 1.5 | % | |
| Capitol Bancorp | | | 1.4 | % | |
| First Niagra Financial Group | | | 1.4 | % | |
| Ethan Allen Interiors | | | 1.4 | % | |
| Ruby Tuesday | | | 1.4 | % | |
| Sector Allocation as of October 31, 20051 (% of net assets) | |
| Financials | | | 31.2 | % | |
| Industrials | | | 16.8 | % | |
| Information Technology | | | 14.5 | % | |
| Consumer Discretionary | | | 14.4 | % | |
| Energy | | | 6.4 | % | |
| Health Care | | | 5.6 | % | |
| Materials | | | 4.8 | % | |
| Utilities | | | 3.3 | % | |
| Short-Term Investments | | | 3.3 | % | |
| Consumer Staples | | | 1.2 | % | |
| Telecommunication Services | | | 0.6 | % | |
| Other Assets and Liabilities, Net | | | (2.1 | )% | |
| | | | 100.0 | % | |
1Fund holdings and sector allocations are subject to change at any time and are not recommendations to buy or sell any security.
FIRST AMERICAN FUNDS Annual Report 2005
14
Small Cap Value fund continued
Annual Performance1
| | | October 31, 2005 | | September 30, 2005** | |
| | | One- | | | | | | | | Since Inception | | | | | | | | Since Inception | |
| | | month* | | 1 year | | 5 years | | 10 years | | 11/24/97 | | 2/01/99 | | 9/24/01 | | 1 year | | 5 years | | 10 years | | 11/24/97 | | 2/01/99 | | 9/24/01 | |
Average annual return with
sales charge (POP) | |
| Class A | | | (8.00 | )% | | | 5.57 | % | | | 9.22 | % | | | 10.44 | % | | | — | | | | — | | | | — | | | | 10.36 | % | | | 9.49 | % | | | 10.18 | % | | | — | | | | — | | | | — | | |
| Class B | | | (7.56 | )% | | | 6.21 | % | | | 9.33 | % | | | — | | | | 6.77 | % | | | — | | | | — | | | | 11.00 | % | | | 9.61 | % | | | — | | | | 7.22 | % | | | — | | | | — | | |
| Class C | | | (3.69 | )% | | | 9.90 | % | | | 9.62 | % | | | — | | | | — | | | | 10.52 | % | | | — | | | | 14.94 | % | | | 9.91 | % | | | — | | | | — | | | | 11.12 | % | | | — | | |
Average annual return without
sales charge (NAV) | |
| Class A | | | (2.62 | )% | | | 11.73 | % | | | 10.46 | % | | | 11.07 | % | | | — | | | | — | | | | — | | | | 16.78 | % | | | 10.73 | % | | | 10.81 | % | | | — | | | | — | | | | — | | |
| Class B | | | (2.69 | )% | | | 10.90 | % | | | 9.58 | % | | | — | | | | 6.77 | % | | | — | | | | — | | | | 15.90 | % | | | 9.86 | % | | | — | | | | 7.22 | % | | | — | | | | — | | |
| Class C | | | (2.72 | )% | | | 10.84 | % | | | 9.62 | % | | | — | | | | — | | | | 10.52 | % | | | — | | | | 15.92 | % | | | 9.91 | % | | | — | | | | — | | | | 11.12 | % | | | — | | |
| Class R | | | (2.69 | )% | | | 11.48 | % | | | — | | | | — | | | | — | | | | — | | | | 15.44 | % | | | 16.60 | % | | | — | | | | — | | | | — | | | | — | | | | 16.58 | % | |
| Class Y | | | (2.58 | )% | | | 12.02 | % | | | 10.71 | % | | | 11.36 | % | | | — | | | | — | | | | — | | | | 17.08 | % | | | 10.99 | % | | | 11.15 | % | | | — | | | | — | | | | — | | |
| Russell 2000 Value Index2 | | | (2.51 | )% | | | 13.04 | % | | | 14.68 | % | | | 13.50 | % | | | 10.16 | % | | | 12.96 | % | | | 17.54 | % | | | 17.75 | % | | | 15.18 | % | | | 13.33 | % | | | 10.64 | % | | | 13.57 | % | | | 18.69 | % | |
Value of $10,000 Investment1,3 as of October 31, 2005
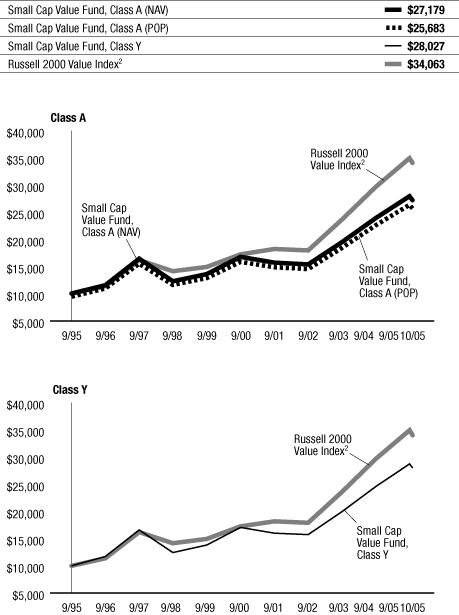
The chart above illustrates the total value of an assumed $10,000 investment in the fund's Class A and Class Y shares (from 9/30/95 to 10/31/05) as compared to the Russell 2000 Value Index2.
The performance data quoted on this page represents past performance and does not guarantee future results. The investment return and principal value of an investment will fluctuate so that an investor's shares, when redeemed, may be worth more or less than their original cost. Current performance of the fund may be lower or higher than the performance data quoted. Performance data current to the most recent month-end may be obtained by calling 800.677.FUND.
* Total returns have not been annualized.
** This table represents average annual total returns through the latest calendar quarter—rather than through the end of the fiscal period.
1 Performance does not reflect the deduction of taxes that a shareholder would pay on fund distributions or redemption of fund shares. Investment performance reflects fee waivers that are or were in effect. In the absence of such fee waivers, total returns would be reduced. Index performance is for illustrative purposes only and does not reflect any expenses, transaction costs, or cash flow effects. Direct investment in the index is not available.
Stocks of small-capitalization companies involve substantial risk. These stocks have historically experienced greater price volatility than stocks of larger companies, and they may be expected to do so in the future.
Total returns at net asset value ("NAV") reflect performance over the time period indicated without including the fund's maximum sales charge and assume reinvestment of all distributions at NAV.
Total returns at public offering price ("POP") reflect performance over the time period indicated including a maximum front-end sales charge of 5.50% for Class A shares and the maximum contingent deferred sales charge ("CDSC") for Class B and Class C shares for the relevant period. Maximum CDSC is 5.00% for Class B shares in the first year, decreasing annually to 0% in the seventh year following purchase, and 1.00% for Class C shares. Total returns assume reinvestment of all distributions at NAV.
2 An unmanaged index that measures the performance of those companies in the Russell 2000 Index (a small-cap index) with lower price-to-book ratios and lower forecasted growth values.
3 Performance for Class B, Class C, and Class R shares is not presented. Performance for these classes will vary due to different expense structures.
FIRST AMERICAN FUNDS Annual Report 2005
15
Small Cap Value fund continued
Expense Example
As a shareholder of the Small Cap Value Fund (the "fund"), you incur two types of costs: (1) transaction costs, including sales charges (loads) on purchase payments; and (2) ongoing costs, including investment advisory fees; distribution and/or service (12b-1) fees; and other fund expenses. This example is intended to help you understand your ongoing costs (in dollars) of investing in the fund and to compare these costs with the ongoing costs of investing in other mutual funds. The example is based on an investment of $1,000 invested at the beginning of the period and held for the entire period from May 1, 2005, to October 31, 2005.
Actual Expenses
For each class, the first line of the table below provides information about actual account values and actual expenses. You may use the information in this line, together with the amount you invested, to estimate the expenses that you paid over the period. Simply divide your account value by $1,000 (for example, an $8,600 account value divided by $1,000 = 8.6), then multiply the result by the number in the first line under the heading entitled "Expenses Paid During Period" to estimate the expenses you paid on your account during this period.
Hypothetical Example for Comparison Purposes
For each class, the second line of the table below provides information about hypothetical account values and hypothetical expenses based on the fund's actual expense ratio and an assumed rate of return of 5% per year before expenses, which is not the fund's actual return. The hypothetical account values and expenses may not be used to estimate the actual ending account balance or expenses you paid for the period. You may use this information to compare the ongoing costs of investing in the fund and other funds. To do so, compare this 5% hypothetical example with the 5% hypothetical examples that appear in the shareholder reports of the other funds.
Please note that the expenses shown in the table are meant to highlight your ongoing costs only and do not reflect any transactional costs, such as sales charges (loads). Therefore, the second line of the table for each class is useful in comparing ongoing costs only, and will not help you determine the relative total costs of owning different funds. In addition, if these transactional costs were included, your costs would have been higher.
Expense Examples
| | | Beginning Account
Value (5/01/05) | | Ending Account
Value (10/31/05) | | Expenses Paid During
Period1 (5/01/05 to
10/31/05) | |
| Class A Actual2,3 | | $ | 1,000.00 | | | $ | 1,082.10 | | | $ | 6.56 | | |
| Class A Hypothetical (5% return before expenses)3 | | $ | 1,000.00 | | | $ | 1,018.90 | | | $ | 6.36 | | |
| Class B Actual2,3 | | $ | 1,000.00 | | | $ | 1,078.10 | | | $ | 10.48 | | |
| Class B Hypothetical (5% return before expenses)3 | | $ | 1,000.00 | | | $ | 1,015.12 | | | $ | 10.16 | | |
| Class C Actual2,3 | | $ | 1,000.00 | | | $ | 1,077.70 | | | $ | 10.47 | | |
| Class C Hypothetical (5% return before expenses)3 | | $ | 1,000.00 | | | $ | 1,015.12 | | | $ | 10.16 | | |
| Class R Actual2,3 | | $ | 1,000.00 | | | $ | 1,081.00 | | | $ | 7.76 | | |
| Class R Hypothetical (5% return before expenses)3 | | $ | 1,000.00 | | | $ | 1,017.74 | | | $ | 7.53 | | |
| Class Y Actual2,3 | | $ | 1,000.00 | | | $ | 1,083.40 | | | $ | 5.25 | | |
| Class Y Hypothetical (5% return before expenses)3 | | $ | 1,000.00 | | | $ | 1,020.16 | | | $ | 5.09 | | |
1Expenses are equal to the fund's annualized expense ratio for the most recent six-month period of 1.25%, 2.00%, 2.00%, 1.48% and 1.00% for Class A, Class B, Class C, Class R and Class Y, respectively, multiplied by the average account value over the period, multiplied by the number of days in the most recent fiscal half-year/365 (to reflect the one-half year period).
2Based on the actual returns for the six months ended October 31, 2005, of 8.21%, 7.81%, 7.77%, 8.10% and 8.34% for Class A, Class B, Class C, Class R and Class Y, respectively.
3Prior to July 1, 2005, the contractual limitation on annual expenses was 1.23%, 1.98%, 1.98%, 1.48% and 0.98% for Class A, Class B, Class C, Class R and Class Y, respectively. Effective July 1, 2005, the contractual limitation on annual expenses for each class was removed. If this limitation had not been in place during the entire period, actual and hypothetical ending account balances would have been approximately $1,082.05 and $1,018.85 for Class A, $1,078.05 and $1,015.07 for Class B, $1,077.64 and $1,015.07 for Class C, $1,080.94 and $1,017.69 for Class R and $1,083.35 and $1,020.11 for Class Y. Actual and hypothetical expenses paid during the period would have been approximately $6.61 and $6.41 for Class A, $10.53 and $10.21 for Class B, $10.53 and $10.21 for Class C, $7.82 and $7.58 for Class R and $5.30 and $5.14 for Class Y.
FIRST AMERICAN FUNDS Annual Report 2005
16
Small-Mid Cap Core fund
Investment Objective: long-term growth of capital
Effective October 3, 2005, based on approval of the fund's board of directors and shareholders, the fund's principal investment strategy was changed from investing primarily in technology stocks (defined as stocks of companies that either have or will develop products, processes, or services that will provide or will benefit significantly from technological innovations, advances, and improvements) to investing primarily in common stocks of small- and mid-capitalization companies. At the same time, the fund's name changed from the First American Technology Fund to the First American Small-Mid Cap Core Fund.
How did the fund perform the fiscal period ended October 31, 2005?
The First American Small-Mid Cap Core Fund ("the fund"), Class Y shares, returned -3.36% for the one-month period ended October 31, 2005 (Class A shares returned -3.37% without taking the sales charge into account). By comparison, the fund's benchmark, the Russell 2500 Index*, returned -3.11% for the same period. The fund's previous benchmark, the Merrill Lynch 100 Technology Index, returned -3.24% for the period.
What were the general economic and market conditions during the fiscal period?
Broader economic growth continued at a relatively solid pace in October. Indicators for the manufacturing sector suggested robust growth as inventories remained low and recovery and reconstruction activity proceeded following the hurricanes. Companies indicated continued cost pressures from energy and other raw material prices, keeping Fed concerns about inflation intact. This led to an additional 25-basis-point tightening at the November 1 Federal Open Market Committee meeting, giving support to expectations for further short-term rate increases. While activity in the industrial sector remained robust, consumer confidence continued to slump despite gasoline prices falling sharply during the month. Auto sales fell to their lowest monthly pace in more than seven years as the employee discount sales promotions expired. Forward-looking housing market indicators such as mortgage applications for home purchases moved lower, and employment cost data for the third quarter showed the slowest gain in wages in 25 years. Subdued compensation gains suggest that broader inflation should remain well contained in the coming quarters, which will be a key to bringing an eventual end to Fed tightening and should provide a supportive backdrop to the financial markets.
What worked for the fund and why?
Stock selection was chiefly responsible for the positive aspects of the fund's performance during the reporting period. In the health care sector, Perkin Elmer (a medical instruments manufacturer) delivered strong results, as did Pacific Sunwear (a clothing retailer) in the customer discretionary space. Strong performance from banking institutions Cullen/Frost Bankers and Astoria Financial reflected the growing strength of the financial sector. W.R. Berkley Corp. (a property casualty company) also added value.
What did not work for the fund and why?
The fund's overweight to the energy sector proved to be a drawback at a time when energy stocks were selling off in response to falling energy prices as investors took profits in the sector. Among individual stocks, Packeteer Inc., a provider of wide area network traffic management systems, detracted significantly from performance: the company's shares sold off sharply in mid-October when it announced a significant sales shortfall due to delayed sales in Asia. Other weak performers included Century Aluminum (a holding company), WCI Communities (a building company), Performance Food Group (a foodservice distributor), and Newfield Exploration (a gas and oil exploration company).
*Unlike mutual funds, index returns do not reflect any expenses, transaction costs, or cash flow effects.
| Top 10 Holdings as of October 31, 20051 (% of net assets) | |
| Scientific Games, Class A | | | 3.2 | % | |
| PerkinElmer | | | 3.2 | % | |
| Kennametal | | | 3.0 | % | |
| Toro | | | 2.8 | % | |
| Astoria Financial | | | 2.8 | % | |
| Newfield Exploration | | | 2.7 | % | |
| Pediatrix Medical Group | | | 2.6 | % | |
| Dun & Bradstreet | | | 2.6 | % | |
| Cullen/Frost Bankers | | | 2.5 | % | |
| Hutchinson Technology | | | 2.4 | % | |
| Sector Allocation as of October 31, 20051 (% of net assets) | |
| Financials | | | 19.7 | % | |
| Information Technology | | | 17.0 | % | |
| Industrials | | | 15.0 | % | |
| Consumer Discretionary | | | 14.9 | % | |
| Health Care | | | 14.5 | % | |
| Energy | | | 7.3 | % | |
| Materials | | | 4.5 | % | |
| Utilities | | | 3.9 | % | |
| Consumer Staples | | | 1.4 | % | |
| Short-Term Investments | | | 1.1 | % | |
| Telecommunication Services | | | 0.9 | % | |
| Other Assets & Liabilities, Net | | | (0.2 | )% | |
| | | | 100.0 | % | |
1Fund holdings and sector allocations are subject to change at any time and are not recommendations to buy or sell any security.
FIRST AMERICAN FUNDS Annual Report 2005
17
Small-Mid Cap Core fund continued
Annual Performance1
| | | October 31, 2005 | | September 30, 2005** | |
| | | One- | | | | | | | | Since Inception | | | | | | | | Since Inception | |
| | | month* | | 1 year | | 5 years | | 10 years | | 2/01/00 | | 1 year | | 5 years | | 10 years | | 2/01/00 | |
| Average annual return with sales charge (POP) | |
| Class A | | | (8.65 | )% | | | (2.43 | )% | | | (25.22 | )% | | | (0.03 | )% | | | — | | | | 6.13 | % | | | (27.08 | )% | | | (0.12 | )% | | | — | | |
| Class B | | | (8.25 | )% | | | (2.53 | )% | | | (25.18 | )% | | | (0.19 | )% | | | — | | | | 6.60 | % | | | (27.04 | )% | | | (0.29 | )% | | | — | | |
| Class C | | | (4.48 | )% | | | 1.40 | % | | | (24.94 | )% | | | — | | | | (24.98 | )% | | | 10.62 | % | | | (26.79 | )% | | | — | | | | (24.83 | )% | |
| Average annual return without sales charge (NAV) | |
| Class A | | | (3.37 | )% | | | 3.21 | % | | | (24.37 | )% | | | 0.54 | % | | | — | | | | 12.30 | % | | | (26.25 | )% | | | 0.44 | % | | | — | | |
| Class B | | | (3.42 | )% | | | 2.47 | % | | | (24.95 | )% | | | (0.19 | )% | | | — | | | | 11.60 | % | | | (26.81 | )% | | | (0.29 | )% | | | — | | |
| Class C | | | (3.51 | )% | | | 2.40 | % | | | (24.94 | )% | | | — | | | | (24.98 | )% | | | 11.62 | % | | | (26.79 | )% | | | — | | | | (24.83 | )% | |
| Class Y | | | (3.36 | )% | | | 3.47 | % | | | (24.17 | )% | | | 0.83 | % | | | — | | | | 12.66 | % | | | (26.05 | )% | | | 0.73 | % | | | — | | |
| Russell 2500 Index2 | | | (3.11 | )% | | | 14.90 | % | | | 7.86 | % | | | 11.63 | % | | | 7.64 | % | | | 21.29 | % | | | 7.94 | % | | | 11.63 | % | | | 8.35 | % | |
| Merrill Lynch 100 Technology Index3 | | | (3.24 | )% | | | 8.63 | % | | | (13.80 | )% | | | 7.92 | % | | | (13.18 | )% | | | 20.42 | % | | | (15.14 | )% | | | 8.79 | % | | | (12.86 | )% | |
Value of a $10,000 Investment1,4 as of October 31, 2005
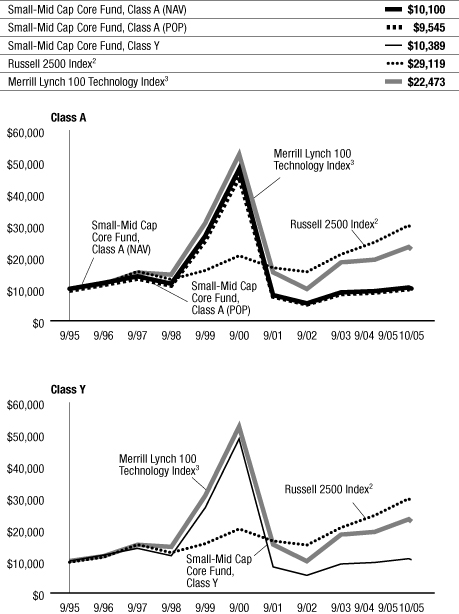
The chart above illustrates the total value of an assumed $10,000 investment in the fund's Class A and Class Y shares (from 9/30/95 to 10/31/05) as compared to the Russell 2500 Index2 and the Merrill Lynch 100 Technology Index3.
The performance data quoted on this page represents past performance and does not guarantee future results. The investment return and principal value of an investment will fluctuate so that an investor's shares, when redeemed, may be worth more or less than their original cost. Current performance of the fund may be lower or higher than the performance data quoted. Performance data current to the most recent month-end may be obtained by calling 800.677.FUND.
* Total returns have not been annualized.
** This table represents average annual total returns through the latest calendar quarter—rather than through the end of the fiscal period.
1 Performance does not reflect the deduction of taxes that a shareholder would pay on fund distributions or redemption of fund shares. Investment performance reflects fee waivers that are or were in effect. In the absence of such fee waivers, total returns would be reduced. Index performance is for illustrative purposes only and does not reflect any expenses, transaction costs, or cash flow effects. Direct investment in the index is not available.
Effective October 3, 2005, the investment strategy of the fund, formerly called the Technology Fund, changed from investing primarily in technology stocks to investing primarily in common stocks of small- and mid-capitalization companies. As a result, performance for the periods prior to October 3, 2005, reflect the performance of a materially different investment portfolio.
Stocks of small- and mid-capitalization companies involve substantial risk and may be subject to increased volatility and more price fluctuation than large-capitalization companies.
Total returns at net asset value ("NAV") reflect performance over the time period indicated without including the fund's maximum sales charge and assume reinvestment of all distributions at NAV.
Total returns at public offering price ("POP") reflect performance over the time period indicated including a maximum front-end sales charge of 5.50% for Class A shares and the maximum contingent deferred sales charge ("CDSC") for Class B and Class C shares for the relevant period. Maximum CDSC is 5.00% for Class B shares in the first year, decreasing annually to 0% in the seventh year following purchase, and 1.00% for Class C shares. Total returns assume reinvestment of all distributions at NAV.
The Small-Mid Cap Core Fund's 1999 returns were higher due in part to its strategy of investing in IPOs and technology-related stocks in a period favorable for IPO and technology stock investing. Of course, such favorable returns involve accepting the risk of volatility, and there is no assurance that the fund's future investment in IPOs and technology stocks will have the same effect on performance as it did in 1999.
2 An unmanaged small and mid-cap index that measures the performance of the 2,500 smallest companies in the Russell 3000 Index.
3 An equally weighted index of the 100 largest technology companies, as measured by market capitalization.
4 Performance for Class B and Class C shares is not presented. Performance for these classes will vary due to different expense structures.
FIRST AMERICAN FUNDS Annual Report 2005
18
Small-Mid Cap Core fund continued
Expense Example
As a shareholder of the Small-Mid Cap Core Fund (the "fund"), you incur two types of costs: (1) transaction costs, including sales charges (loads) on purchase payments; and (2) ongoing costs, including investment advisory fees; distribution and/or service (12b-1) fees; and other fund expenses. This example is intended to help you understand your ongoing costs (in dollars) of investing in the fund and to compare these costs with the ongoing costs of investing in other mutual funds. The example is based on an investment of $1,000 invested at the beginning of the period and held for the entire period from May 1, 2005, to October 31, 2005.
Actual Expenses
For each class, the first line of the table below provides information about actual account values and actual expenses. You may use the information in this line, together with the amount you invested, to estimate the expenses that you paid over the period. Simply divide your account value by $1,000 (for example, an $8,600 account value divided by $1,000 = 8.6), then multiply the result by the number in the first line under the heading entitled "Expenses Paid During Period" to estimate the expenses you paid on your account during this period.
Hypothetical Example for Comparison Purposes
For each class, the second line of the table below provides information about hypothetical account values and hypothetical expenses based on the fund's actual expense ratio and an assumed rate of return of 5% per year before expenses, which is not the fund's actual return. The hypothetical account values and expenses may not be used to estimate the actual ending account balance or expenses you paid for the period. You may use this information to compare the ongoing costs of investing in the fund and other funds. To do so, compare this 5% hypothetical example with the 5% hypothetical examples that appear in the shareholder reports of the other funds.
Please note that the expenses shown in the table are meant to highlight your ongoing costs only and do not reflect any transactional costs, such as sales charges (loads). Therefore, the second line of the table for each class is useful in comparing ongoing costs only, and will not help you determine the relative total costs of owning different funds. In addition, if these transactional costs were included, your costs would have been higher.
Expense Examples
| | | Beginning Account
Value (5/01/05) | | Ending Account
Value (10/31/05) | | Expenses Paid During
Period1 (5/01/05 to
10/31/05) | |
| Class A Actual2,3 | | $ | 1,000.00 | | | $ | 1,088.10 | | | $ | 8.69 | | |
| Class A Hypothetical (5% return before expenses)3 | | $ | 1,000.00 | | | $ | 1,016.89 | | | $ | 8.39 | | |
| Class B Actual2,3 | | $ | 1,000.00 | | | $ | 1,084.50 | | | $ | 12.66 | | |
| Class B Hypothetical (5% return before expenses)3 | | $ | 1,000.00 | | | $ | 1,013.06 | | | $ | 12.23 | | |
| Class C Actual2,3 | | $ | 1,000.00 | | | $ | 1,083.10 | | | $ | 12.65 | | |
| Class C Hypothetical (5% return before expenses)3 | | $ | 1,000.00 | | | $ | 1,013.06 | | | $ | 12.23 | | |
| Class Y Actual2,3 | | $ | 1,000.00 | | | $ | 1,090.20 | | | $ | 7.38 | | |
| Class Y Hypothetical (5% return before expenses)3 | | $ | 1,000.00 | | | $ | 1,018.15 | | | $ | 7.12 | | |
1Expenses are equal to the fund's annualized expense ratio for the most recent six-month period of 1.65%, 2.41%, 2.41% and 1.40% for Class A, Class B, Class C and Class Y, respectively, multiplied by the average account value over the period, multiplied by the number of days in the most recent fiscal half-year/365 (to reflect the one-half year period).
2Based on the actual returns for the six months ended October 31, 2005, of 8.81%, 8.45%, 8.31% and 9.02% for Class A, Class B, Class C and Class Y, respectively.
3Prior to July 1, 2005, the contractual limitation on annual expenses was 1.23%, 1.98%, 1.98% and 0.98% for Class A, Class B, Class C and Class Y, respectively. Effective July 1, 2005, the contractual limitation on annual expenses for each class was removed. If this limitation had not been in place during the entire period, actual and hypothetical ending account balances would have been approximately $1,087.67 and $1,016.48 for Class A, $1,084.08 and 1,012.65 for Class B, $1,082.68 and $1,012.65 for Class C and $1,089.78 and $1,017.74 for Class Y. Actual and hypothetical expenses paid during the period would have been approximately $9.11 and $8.79 for Class A, $13.08 and $12.63 for Class B, $13.08 and $12.63 for Class C and $7.80 and $7.53 for Class Y.
FIRST AMERICAN FUNDS Annual Report 2005
19
Mid Cap Growth Opportunities fund
Investment Objective: capital appreciation
How did the fund perform the fiscal period ended October 31, 2005?
The First American Mid Cap Growth Opportunities Fund (the "fund"), Class Y shares, returned -1.86% for the one-month period ended October 31, 2005 (Class A shares returned -1.88% without taking the sales charge into account). By comparison, the fund's benchmark, the Russell Midcap Growth Index*, returned -2.94% for the same period.
What were the general economic and market conditions during the fiscal period?
Broader economic growth continued at a relatively solid pace in October. Indicators for the manufacturing sector suggested robust growth as inventories remained low and recovery and reconstruction activity proceeded following the hurricanes. Companies indicated continued cost pressures from energy and other raw material prices, keeping Fed concerns about inflation intact. This led to an additional 25-basis-point tightening at the November 1 Federal Open Market Committee meeting, giving support to expectations for further short-term rate increases. While activity in the industrial sector remained robust, consumer confidence continued to slump despite gasoline prices falling sharply during the month. Auto sales fell to their lowest monthly pace in more than seven years as the employee discount sales promotions expired. Forward-looking housing market indicators such as mortgage applications for home purchases moved lower, and emplo yment cost data for the third quarter showed the slowest gain in wages in 25 years. Subdued compensation gains suggest that broader inflation should remain well contained in the coming quarters, which will be a key to bringing an eventual end to Fed tightening and should provide a supportive backdrop to the financial markets.
What worked for the fund and why?
The fund's outperformance relative to the index was in large measure a result of good stock selection in the industrials, information technology, and health care sectors. In the industrials space the top performers were job-placement provider Monster Worldwide, industrial product distributor MSC Industrial Direct, and logistics provider UTI Worldwide. The information technology sector saw gains by Apple Computer, whose profits rose steadily thanks in part to the success of its iPod digital player and iTunes music store. In health care, the best-performing stock was that of Perkin Elmer Group, a medical instruments manufacturer.
What did not work for the fund and why?
The fund's investment in Gaylord Entertainment performed poorly during the quarter as some of its noncore operations experienced weaker-than-expected results.
*Unlike mutual funds, index returns do not reflect any expenses, transaction costs, or cash flow effects.
| Top 10 Holdings as of October 31, 20051 (% of net assets) | |
| PerkinElmer | | | 2.9 | % | |
| Adobe Systems | | | 2.8 | % | |
| Scientific Games, Class A | | | 2.7 | % | |
| Dun & Bradstreet | | | 2.6 | % | |
| Thermo Electron | | | 2.4 | % | |
| DENTSPLY International | | | 2.4 | % | |
| Monster Worldwide | | | 2.2 | % | |
| L-3 Communications Holdings | | | 2.2 | % | |
| Station Casinos | | | 2.1 | % | |
| Weatherford International | | | 2.1 | % | |
| Sector Allocation as of October 31, 20051 (% of net assets) | |
| Information Technology | | | 24.1 | % | |
| Industrials | | | 19.1 | % | |
| Health Care | | | 18.9 | % | |
| Consumer Discretionary | | | 16.5 | % | |
| Energy | | | 10.7 | % | |
| Financials | | | 5.4 | % | |
| Consumer Staples | | | 2.7 | % | |
| Short-Term Investments | | | 1.5 | % | |
| Other Assets and Liabilities, Net | | | 1.1 | % | |
| | | | 100.0 | % | |
1Fund holdings and sector allocations are subject to change at any time and are not recommendations to buy or sell any security.
FIRST AMERICAN FUNDS Annual Report 2005
20
Mid Cap Growth Opportunities fund continued
Annual Performance1
| | | October 31, 2005 | | September 30, 2005** | |
| | | One- | | | | | | | | Since Inception | | | | | | | | Since Inception | |
| | | month* | | 1 year | | 5 years | | 10 years | | 3/01/99 | | 12/11/00 | | 9/24/01 | | 1 year | | 5 years | | 10 years | | 3/01/99 | | 12/11/00 | | 9/24/01 | |
Average annual return with
sales charge (POP) | |
| Class A | | | (7.28 | )% | | | 11.73 | % | | | 5.41 | % | | | 9.62 | % | | | — | | | | — | | | | — | | | | 19.31 | % | | | 5.10 | % | | | 9.61 | % | | | — | | | | — | | | | — | | |
| Class B | | | (6.83 | )% | | | 12.38 | % | | | 5.57 | % | | | — | | | | 10.44 | % | | | — | | | | — | | | | 20.29 | % | | | 5.25 | % | | | — | | | | 10.91 | % | | | — | | | | — | | |
| Class C | | | (2.90 | )% | | | 16.38 | % | | | — | | | | — | | | | — | | | | — | | | | 14.29 | % | | | 24.27 | % | | | — | | | | — | | | | — | | | | — | | | | 15.17 | % | |
Average annual return without
sales charge (NAV) | |
| Class A | | | (1.88 | )% | | | 18.24 | % | | | 6.61 | % | | | 10.24 | % | | | — | | | | — | | | | — | | | | 26.25 | % | | | 6.30 | % | | | 10.23 | % | | | — | | | | — | | | | — | | |
| Class B | | | (1.93 | )% | | | 17.38 | % | | | 5.79 | % | | | — | | | | 10.44 | % | | | — | | | | — | | | | 25.29 | % | | | 5.48 | % | | | — | | | | 10.91 | % | | | — | | | | — | | |
| Class C | | | (1.91 | )% | | | 17.38 | % | | | — | | | | — | | | | — | | | | — | | | | 14.29 | % | | | 25.27 | % | | | — | | | | — | | | | — | | | | — | | | | 15.17 | % | |
| Class R | | | (1.91 | )% | | | 17.95 | % | | | — | | | | — | | | | — | | | | 6.48 | % | | | — | | | | 25.95 | % | | | — | | | | — | | | | — | | | | 7.02 | % | | | — | | |
| Class Y | | | (1.86 | )% | | | 18.55 | % | | | 6.87 | % | | | 10.51 | % | | | — | | | | — | | | | — | | | | 26.57 | % | | | 6.56 | % | | | 10.50 | % | | | — | | | | — | | | | — | | |
| Russell Midcap Growth Index2 | | | (2.94 | )% | | | 15.91 | % | | | (3.71 | )% | | | 9.05 | % | | | 4.78 | % | | | (2.64 | )% | | | 12.48 | % | | | 23.47 | % | | | (4.50 | )% | | | 9.10 | % | | | 5.32 | % | | | (2.08 | )% | | | 13.60 | % | |
Value of $10,000 Investment1,3 as of October 31, 2005
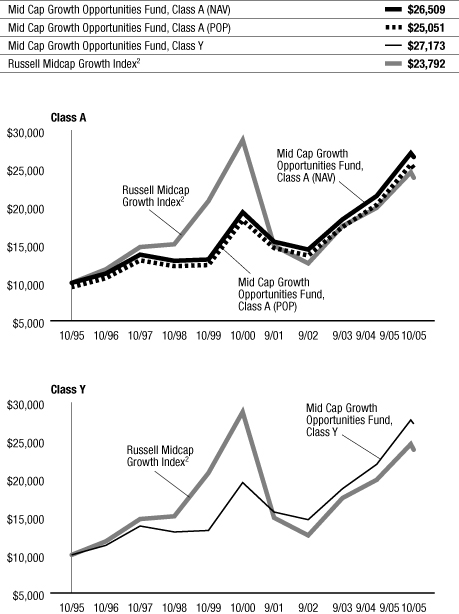
The chart above illustrates the total value of an assumed $10,000 investment in the fund's Class A and Class Y shares (from 10/31/95 to 10/31/05) as compared to the Russell Midcap Growth Index2.
The performance data quoted on this page represents past performance and does not guarantee future results. The investment return and principal value of an investment will fluctuate so that an investor's shares, when redeemed, may be worth more or less than their original cost. Current performance of the fund may be lower or higher than the performance data quoted. Performance data current to the most recent month-end may be obtained by calling 800.677.FUND.
* Total returns have not been annualized.
** This table represents average annual total returns through the latest calendar quarter—rather than through the end of the fiscal period.
1 Performance does not reflect the deduction of taxes that a shareholder would pay on fund distributions or redemption of fund shares. Investment performance reflects fee waivers that are or were in effect. In the absence of such fee waivers, total returns would be reduced. Index performance is for illustrative purposes only and does not reflect any expenses, transaction costs, or cash flow effects. Direct investment in the index is not available.
Stocks of mid-capitalization companies may be slightly less volatile than those of small-capitalization companies, but they still involve substantial risk and may be subject to increased volatility and more price fluctuation than large-capitalization companies.
Total returns at net asset value ("NAV") reflect performance over the time period indicated without including the fund's maximum sales charge and assume reinvestment of all distributions at NAV.
Total returns at public offering price ("POP") reflect performance over the time period indicated including a maximum front-end sales charge of 5.50% for Class A shares and the maximum contingent deferred sales charge ("CDSC") for Class B and Class C shares for the relevant period. Maximum CDSC is 5.00% for Class B shares in the first year, decreasing annually to 0% in the seventh year following purchase, and 1.00% for Class C shares. Total returns assume reinvestment of all distributions at NAV.
On September 24, 2001, the First American Mid Cap Growth Opportunities Fund became the successor by merger to the Firstar MidCap Core Equity Fund, a series of Firstar Funds, Inc. Prior to the merger, the First American fund had no assets or liabilities. Performance presented prior to September 24, 2001, represents that of the Firstar MidCap Core Equity Fund.
2 An unmanaged index that measures the performance of those Russell mid-cap companies with higher price-to-book ratios and higher forecasted growth values.
3 Performance for Class B, Class C, and Class R shares is not presented. Performance for these classes will vary due to different expense structures.
FIRST AMERICAN FUNDS Annual Report 2005
21
Mid Cap Growth Opportunities fund continued
Expense Example
As a shareholder of the Mid Cap Growth Opportunities Fund (the "fund"), you incur two types of costs: (1) transaction costs, including sales charges (loads) on purchase payments; and (2) ongoing costs, including investment advisory fees; distribution and/or service (12b-1) fees; and other fund expenses. This example is intended to help you understand your ongoing costs (in dollars) of investing in the fund and to compare these costs with the ongoing costs of investing in other mutual funds. The example is based on an investment of $1,000 invested at the beginning of the period and held for the entire period from May 1, 2005, to October 31, 2005.
Actual Expenses
For each class, the first line of the table below provides information about actual account values and actual expenses. You may use the information in this line, together with the amount you invested, to estimate the expenses that you paid over the period. Simply divide your account value by $1,000 (for example, an $8,600 account value divided by $1,000 = 8.6), then multiply the result by the number in the first line under the heading entitled "Expenses Paid During Period" to estimate the expenses you paid on your account during this period.
Hypothetical Example for Comparison Purposes
For each class, the second line of the table below provides information about hypothetical account values and hypothetical expenses based on the fund's actual expense ratio and an assumed rate of return of 5% per year before expenses, which is not the fund's actual return. The hypothetical account values and expenses may not be used to estimate the actual ending account balance or expenses you paid for the period. You may use this information to compare the ongoing costs of investing in the fund and other funds. To do so, compare this 5% hypothetical example with the 5% hypothetical examples that appear in the shareholder reports of the other funds.
Please note that the expenses shown in the table are meant to highlight your ongoing costs only and do not reflect any transactional costs, such as sales charges (loads). Therefore, the second line of the table for each class is useful in comparing ongoing costs only, and will not help you determine the relative total costs of owning different funds. In addition, if these transactional costs were included, your costs would have been higher.
Expense Examples
| | | Beginning Account
Value (5/01/05) | | Ending Account
Value (10/31/05) | | Expenses Paid During
Period1 (5/01/05 to
10/31/05) | |
| Class A Actual2,3 | | $ | 1,000.00 | | | $ | 1,121.00 | | | $ | 6.52 | | |
| Class A Hypothetical (5% return before expenses)3 | | $ | 1,000.00 | | | $ | 1,019.06 | | | $ | 6.21 | | |
| Class B Actual2,3 | | $ | 1,000.00 | | | $ | 1,116.60 | | | $ | 10.51 | | |
| Class B Hypothetical (5% return before expenses)3 | | $ | 1,000.00 | | | $ | 1,015.27 | | | $ | 10.01 | | |
| Class C Actual2,3 | | $ | 1,000.00 | | | $ | 1,116.90 | | | $ | 10.51 | | |
| Class C Hypothetical (5% return before expenses)3 | | $ | 1,000.00 | | | $ | 1,015.27 | | | $ | 10.01 | | |
| Class R Actual2,3 | | $ | 1,000.00 | | | $ | 1,119.30 | | | $ | 7.91 | | |
| Class R Hypothetical (5% return before expenses)3 | | $ | 1,000.00 | | | $ | 1,017.74 | | | $ | 7.53 | | |
| Class Y Actual2,3 | | $ | 1,000.00 | | | $ | 1,122.20 | | | $ | 5.19 | | |
| Class Y Hypothetical (5% return before expenses)3 | | $ | 1,000.00 | | | $ | 1,020.32 | | | $ | 4.94 | | |
1Expenses are equal to the fund's annualized expense ratio for the most recent six-month period of 1.22%, 1.97%, 1.97%, 1.48% and 0.97% for Class A, Class B, Class C, Class R and Class Y, respectively, multiplied by the average account value over the period, multiplied by the number of days in the most recent fiscal half-year/365 (to reflect the one-half year period).
2Based on the actual returns for the six months ended October 31, 2005, of 12.10%, 11.66%, 11.69%, 11.93% and 12.22% for Class A, Class B, Class C, Class R and Class Y, respectively.
3Prior to July 1, 2005, the contractual limitation on annual expenses was 1.20%, 1.95%, 1.95%, 1.45% and 0.95% for Class A, Class B, Class C, Class R and Class Y, respectively. Effective July 1, 2005, the contractual limitation on annual expenses for each class was removed. If this limitation had not been in place during the entire period, actual and hypothetical ending account balances would have been approximately $1,120.89 and $1,018.95 for Class A, $1,116.50 and $1,015.17 for Class B, $1,116.80 and $1,015.17 for Class C, $1,119.24 and $1,017.69 for Class R and $1,122.09 and $1,020.21 for Class Y. Actual and hypothetical expenses paid during the period would have been approximately $6.63 and $6.31 for Class A, $10.62 and $10.11 for Class B, $10.62 and $10.11 for Class C, $7.96 and $7.58 for Class R and $5.30 and $5.04 for Class Y.
FIRST AMERICAN FUNDS Annual Report 2005
22
Mid Cap Value fund
Investment Objective: capital appreciation
How did the fund perform the fiscal period ended October 31, 2005?
The First American Mid Cap Value Fund (the "fund"), Class Y shares, returned -3.36% for the one-month period ended October 31, 2005 (Class A shares returned -3.38% without taking the sales charge into account). By comparison, the fund's benchmark, the Russell Midcap Value Index*, returned -3.06% for the same period.
What were the general economic and market conditions during the fiscal period?
Broader economic growth continued at a relatively solid pace in October. Indicators for the manufacturing sector suggested robust growth as inventories remained low and recovery and reconstruction activity proceeded following the hurricanes. Companies indicated continued cost pressures from energy and other raw material prices, keeping Fed concerns about inflation intact. This led to an additional 25-basis-point tightening at the November 1 Federal Open Market Committee meeting, giving support to expectations for further short-term rate increases. While activity in the industrial sector remained robust, consumer confidence continued to slump despite gasoline prices falling sharply during the month. Auto sales fell to their lowest monthly pace in more than seven years as the employee discount sales promotions expired. Forward-looking housing market indicators such as mortgage applications for home purchases moved lower, and emplo yment cost data for the third quarter showed the slowest gain in wages in 25 years. Subdued compensation gains suggest that broader inflation should remain well contained in the coming quarters, which will be a key to bringing an eventual end to Fed tightening and should provide a supportive backdrop to the financial markets.
What worked for the fund and why?
The fund benefited from strong performance in the health care sector, where Perkin Elmer (a medical instruments manufacturer) and Health Net (a managed health care company) led the way. Property casualty stocks also contributed to performance, notably ACE Ltd. and W.R. Berkley Corporation. The financial sector also enjoyed generally robust performance
What did not work for the fund and why?
The fund's overweight in the energy sector and underweight in financials proved detrimental to performance. During the reporting period, energy stocks sold off in response to falling energy prices as investors took profits in the sector. Weaker results from consumer-related stocks like Pilgrim's Pride Corp. (a poultry producer), Liz Claiborne Inc. (clothes retailer), and Federated Department Stores also detracted from performance.
*Unlike mutual funds, index returns do not reflect any expenses, transaction costs, or cash flow effects.
| Top 10 Holdings as of October 31, 20051 (% of net assets) | |
| Kroger | | | 2.7 | % | |
| Norfolk Southern | | | 2.5 | % | |
| Bear Stearns | | | 2.4 | % | |
| Genworth Financial | | | 2.2 | % | |
| Newfield Exploration | | | 2.2 | % | |
| Constellation Energy | | | 2.1 | % | |
| ACE | | | 2.1 | % | |
| PPL | | | 2.0 | % | |
| Sherwin-Williams | | | 1.8 | % | |
| CIGNA | | | 1.8 | % | |
| Sector Allocation as of October 31, 20051 (% of net assets) | |
| Financials | | | 27.4 | % | |
| Consumer Discretionary | | | 13.0 | % | |
| Utilities | | | 11.8 | % | |
| Industrials | | | 9.2 | % | |
| Information Technology | | | 8.8 | % | |
| Energy | | | 7.3 | % | |
| Consumer Staples | | | 7.2 | % | |
| Materials | | | 6.8 | % | |
| Health Care | | | 6.0 | % | |
| Short-Term Investments | | | 2.6 | % | |
| Other Assets and Liabilities, Net | | | (0.1 | )% | |
| | | | 100.0 | % | |
1Fund holdings and sector allocations are subject to change at any time and are not recommendations to buy or sell any security.
FIRST AMERICAN FUNDS Annual Report 2005
23
Mid Cap Value fund continued
Annual Performance1
| | | October 31, 2005 | | September 30, 2005** | |
| | | One- | | | | | | | | Since Inception | | | | | | | | Since Inception | |
| | | month* | | 1 year | | 5 years | | 10 years | | 2/01/99 | | 9/24/01 | | 1 year | | 5 years | | 10 years | | 2/01/99 | | 9/24/01 | |
| Average annual return with sales charge (POP) | |
| Class A | | | (8.70 | )% | | | 10.47 | % | | | 9.30 | % | | | 9.83 | % | | | — | | | | — | | | | 17.54 | % | | | 10.67 | % | | | 9.77 | % | | | — | | | | — | | |
| Class B | | | (8.25 | )% | | | 11.07 | % | | | 9.44 | % | | | 9.65 | % | | | — | | | | — | | | | 18.47 | % | | | 10.82 | % | | | 9.59 | % | | | — | | | | — | | |
| Class C | | | (4.37 | )% | | | 15.06 | % | | | 9.72 | % | | | — | | | | 8.62 | % | | | — | | | | 22.43 | % | | | 11.08 | % | | | — | | | | 9.30 | % | | | — | | |
| Average annual return without sales charge (NAV) | |
| Class A | | | (3.38 | )% | | | 16.88 | % | | | 10.54 | % | | | 10.46 | % | | | — | | | | — | | | | 24.38 | % | | | 11.92 | % | | | 10.39 | % | | | — | | | | — | | |
| Class B | | | (3.43 | )% | | | 16.07 | % | | | 9.72 | % | | | 9.65 | % | | | — | | | | — | | | | 23.47 | % | | | 11.09 | % | | | 9.59 | % | | | — | | | | — | | |
| Class C | | | (3.40 | )% | | | 16.06 | % | | | 9.72 | % | | | — | | | | 8.62 | % | | | — | | | | 23.43 | % | | | 11.08 | % | | | — | | | | 9.30 | % | | | — | | |
| Class R | | | (3.34 | )% | | | 16.62 | % | | | — | | | | — | | | | — | | | | 16.14 | % | | | 24.04 | % | | | — | | | | — | | | | — | | | | 17.50 | % | |
| Class Y | | | (3.36 | )% | | | 17.17 | % | | | 10.78 | % | | | 10.74 | % | | | — | | | | — | | | | 24.68 | % | | | 12.17 | % | | | 10.68 | % | | | — | | | | — | | |
| Russell Midcap Value Index2 | | | (3.06 | )% | | | 19.50 | % | | | 12.82 | % | | | 13.88 | % | | | 11.45 | % | | | 17.37 | % | | | 26.13 | % | | | 13.95 | % | | | 14.01 | % | | | 12.12 | % | | | 18.68 | % | |
Value of $10,000 Investment1,3 as of October 31, 2005
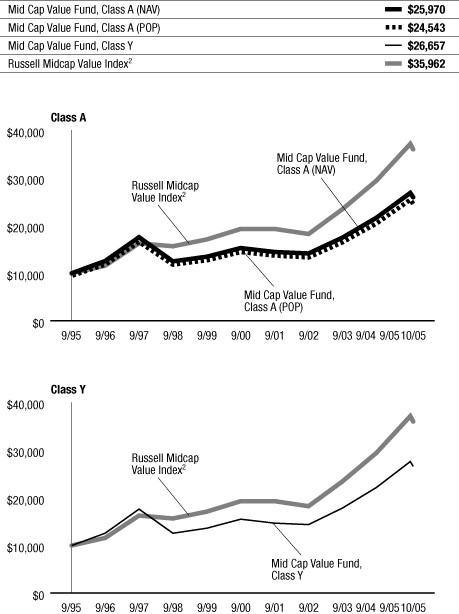
The chart above illustrates the total value of an assumed $10,000 investment in the fund's Class A and Class Y shares (from 9/30/95 to 10/31/05) as compared to the Russell Midcap Value Index2.
The performance data quoted on this page represents past performance and does not guarantee future results. The investment return and principal value of an investment will fluctuate so that an investor's shares, when redeemed, may be worth more or less than their original cost. Current performance of the fund may be lower or higher than the performance data quoted. Performance data current to the most recent month-end may be obtained by calling 800.677.FUND.
* Total returns have not been annualized.
** This table represents average annual total returns through the latest calendar quarter—rather than through the end of the fiscal period.
1 Performance does not reflect the deduction of taxes that a shareholder would pay on fund distributions or redemption of fund shares. Investment performance reflects fee waivers that are or were in effect. In the absence of such fee waivers, total returns would be reduced. Index performance is for illustrative purposes only and does not reflect any expenses, transaction costs, or cash flow effects. Direct investment in the index is not available.
Stocks of mid-capitalization companies may be slightly less volatile than those of small-capitalization companies, but they still involve substantial risk and may be subject to increased volatility and more price fluctuation than large-capitalization companies.
Total returns at net asset value ("NAV") reflect performance over the time period indicated without including the fund's maximum sales charge and assume reinvestment of all distributions at NAV.
Total returns at public offering price ("POP") reflect performance over the time period indicated including a maximum front-end sales charge of 5.50% for Class A shares and the maximum contingent deferred sales charge ("CDSC") for Class B and Class C shares for the relevant period. Maximum CDSC is 5.00% for Class B shares in the first year, decreasing annually to 0% in the seventh year following purchase, and 1.00% for Class C shares. Total returns assume reinvestment of all distributions at NAV.
2 An unmanaged index that measures the performance of those Russell mid-cap companies with lower price-to-book ratios and lower forecasted growth values.
3 Performance for Class B, Class C, and Class R shares is not presented. Performance for these classes will vary due to different expense structures.
FIRST AMERICAN FUNDS Annual Report 2005
24
Mid Cap Value fund continued
Expense Example
As a shareholder of the Mid Cap Value Fund (the "fund"), you incur two types of costs: (1) transaction costs, including sales charges (loads) on purchase payments; and (2) ongoing costs, including investment advisory fees; distribution and/or service (12b-1) fees; and other fund expenses. This example is intended to help you understand your ongoing costs (in dollars) of investing in the fund and to compare these costs with the ongoing costs of investing in other mutual funds. The example is based on an investment of $1,000 invested at the beginning of the period and held for the entire period from May 1, 2005, to October 31, 2005.
Actual Expenses
For each class, the first line of the table below provides information about actual account values and actual expenses. You may use the information in this line, together with the amount you invested, to estimate the expenses that you paid over the period. Simply divide your account value by $1,000 (for example, an $8,600 account value divided by $1,000 = 8.6), then multiply the result by the number in the first line under the heading entitled "Expenses Paid During Period" to estimate the expenses you paid on your account during this period.
Hypothetical Example for Comparison Purposes
For each class, the second line of the table below provides information about hypothetical account values and hypothetical expenses based on the fund's actual expense ratio and an assumed rate of return of 5% per year before expenses, which is not the fund's actual return. The hypothetical account values and expenses may not be used to estimate the actual ending account balance or expenses you paid for the period. You may use this information to compare the ongoing costs of investing in the fund and other funds. To do so, compare this 5% hypothetical example with the 5% hypothetical examples that appear in the shareholder reports of the other funds.
Please note that the expenses shown in the table are meant to highlight your ongoing costs only and do not reflect any transactional costs, such as sales charges (loads). Therefore, the second line of the table for each class is useful in comparing ongoing costs only, and will not help you determine the relative total costs of owning different funds. In addition, if these transactional costs were included, your costs would have been higher.
Expense Examples
| | | Beginning Account
Value (5/01/05) | | Ending Account
Value (10/31/05) | | Expenses Paid During
Period1 (5/01/05 to
10/31/05) | |
| Class A Actual2,3 | | $ | 1,000.00 | | | $ | 1,083.00 | | | $ | 6.46 | | |
| Class A Hypothetical (5% return before expenses)3 | | $ | 1,000.00 | | | $ | 1,019.00 | | | $ | 6.26 | | |
| Class B Actual2,3 | | $ | 1,000.00 | | | $ | 1,078.90 | | | $ | 10.32 | | |
| Class B Hypothetical (5% return before expenses)3 | | $ | 1,000.00 | | | $ | 1,015.27 | | | $ | 10.01 | | |
| Class C Actual2,3 | | $ | 1,000.00 | | | $ | 1,078.70 | | | $ | 10.32 | | |
| Class C Hypothetical (5% return before expenses)3 | | $ | 1,000.00 | | | $ | 1,015.27 | | | $ | 10.01 | | |
| Class R Actual2,3 | | $ | 1,000.00 | | | $ | 1,082.10 | | | $ | 7.77 | | |
| Class R Hypothetical (5% return before expenses)3 | | $ | 1,000.00 | | | $ | 1,017.74 | | | $ | 7.53 | | |
| Class Y Actual2,3 | | $ | 1,000.00 | | | $ | 1,084.20 | | | $ | 5.10 | | |
| Class Y Hypothetical (5% return before expenses)3 | | $ | 1,000.00 | | | $ | 1,020.32 | | | $ | 4.94 | | |
1Expenses are equal to the fund's annualized expense ratio for the most recent six-month period of 1.23%, 1.97%, 1.97%, 1.48% and 0.97% for Class A, Class B, Class C, Class R and Class Y, respectively, multiplied by the average account value over the period, multiplied by the number of days in the most recent fiscal half-year/365 (to reflect the one-half year period).
2Based on the actual returns for the six months ended October 31, 2005, of 8.30%, 7.89%, 7.87%, 8.21% and 8.42% for Class A, Class B, Class C, Class R and Class Y, respectively.
3Prior to July 1, 2005, the contractual limitation on annual expenses was 1.20%, 1.95%, 1.95%, 1.45% and 0.95% for Class A, Class B, Class C, Class R and Class Y, respectively. Effective July 1, 2005, the contractual limitation on annual expenses for each class was removed. If this limitation had not been in place during the entire period, actual and hypothetical ending account balances would have been approximately $1,082.90 and $1,018.90 for Class A, $1,078.74 and $1,015.12 for Class B, $1,078.54 and $1,015.12 for Class C, $1,082.05 and $1,017.69 for Class R and $1,084.05 and $1,020.16 for Class Y. Actual and hypothetical expenses paid during the period would have been approximately $6.56 and $6.36 for Class A, $10.48 and $10.16 for Class B, $10.48 and $10.16 for Class C, $7.82 and $7.58 for Class R and $5.25 and $5.09 for Class Y.
FIRST AMERICAN FUNDS Annual Report 2005
25
Large Cap Growth Opportunities fund
Investment Objective: long-term growth of capital
How did the fund perform the fiscal period ended October 31, 2005?
The First American Large Cap Growth Opportunities Fund (the "fund"), Class Y shares, returned -0.52% for the one-month period ended October 31, 2005 (Class A shares returned -0.57% without taking the sales charge into account). By comparison, the fund's benchmark, the Russell 1000 Growth Index*, returned -0.97% for the same period.
What were the general economic and market conditions during the fiscal period?
Broader economic growth continued at a relatively solid pace in October. Indicators for the manufacturing sector suggested robust growth as inventories remained low and recovery and reconstruction activity proceeded following the hurricanes. Companies indicated continued cost pressures from energy and other raw material prices, keeping Fed concerns about inflation intact. This led to an additional 25-basis-point tightening at the November 1 Federal Open Market Committee meeting, giving support to expectations for further short-term rate increases. While activity in the industrial sector remained robust, consumer confidence continued to slump despite gasoline prices falling sharply during the month. Auto sales fell to their lowest monthly pace in more than seven years as the employee discount sales promotions expired. Forward-looking housing market indicators such as mortgage applications for home purchases moved lower, and emplo yment cost data for the third quarter showed the slowest gain in wages in 25 years. Subdued compensation gains suggest that broader inflation should remain well contained in the coming quarters, which will be a key to bringing an eventual end to Fed tightening and should provide a supportive backdrop to the financial markets.
What worked for the fund and why?
The fund's outperformance relative to the index was in large measure a result of good stock selection in the health care and consumer discretionary sectors. In health care, strong performance came from generic manufacturer Teva Pharmaceuticals as well as medical products maker Medtronic. Starbucks, publisher McGraw-Hill, and retailers Target and Staples all posted strong operating performance and meaningfully contributed to performance during the period.
What did not work for the fund and why?
Adverse stock selection in the energy sector detracted from performance relative to the index. Not owning Wal-Mart when it made gains during a period of declining energy prices was also detrimental.
*Unlike mutual funds, index returns do not reflect any expenses, transaction costs, or cash flow effects.
| Top 10 Holdings as of October 31, 20051 (% of net assets) | |
| Procter & Gamble | | | 3.7 | % | |
| General Electric | | | 3.4 | % | |
| Johnson & Johnson | | | 2.9 | % | |
| Lowe's | | | 2.7 | % | |
| PepsiCo | | | 2.7 | % | |
| Microsoft | | | 2.6 | % | |
| Target | | | 2.5 | % | |
| Amgen | | | 2.5 | % | |
| Intel | | | 2.3 | % | |
| Goldman Sachs Group | | | 2.3 | % | |
| Sector Allocation as of October 31, 20051 (% of net assets) | |
| Information Technology | | | 28.5 | % | |
| Health Care | | | 21.3 | % | |
| Consumer Discretionary | | | 14.6 | % | |
| Industrials | | | 11.0 | % | |
| Financials | | | 10.8 | % | |
| Consumer Staples | | | 7.5 | % | |
| Energy | | | 3.9 | % | |
| Short-Term Investments | | | 2.4 | % | |
| Materials | | | 1.5 | % | |
| Other Assets and Liabilities, Net | | | (1.5 | )% | |
| | | | 100.0 | % | |
1Fund holdings and sector allocations are subject to change at any time and are not recommendations to buy or sell any security.
FIRST AMERICAN FUNDS Annual Report 2005
26
Large Cap Growth Opportunities fund continued
Annual Performance1
| | | October 31, 2005 | | September 30, 2005** | |
| | | One- | | | | | | | | Since Inception | | | | | | | | Since Inception | |
| | | month* | | 1 year | | 5 years | | 10 years | | 3/01/99 | | 11/27/00 | | 9/24/01 | | 1 year | | 5 years | | 10 years | | 3/01/99 | | 11/27/00 | | 9/24/01 | |
Average annual return with
sales charge (POP) | |
| Class A | | | (6.04 | )% | | | 3.54 | % | | | (7.00 | )% | | | 5.31 | % | | | — | | | | — | | | | — | | | | 6.10 | % | | | (7.37 | )% | | | 5.13 | % | | | — | | | | — | | | | — | | |
| Class B | | | (5.60 | )% | | | 3.73 | % | | | (6.98 | )% | | | — | | | | (2.18 | )% | | | — | | | | — | | | | 6.47 | % | | | (7.35 | )% | | | — | | | | (2.11 | )% | | | — | | | | — | | |
| Class C | | | (1.62 | )% | | | 7.75 | % | | | — | | | | — | | | | — | | | | — | | | | 3.37 | % | | | 10.44 | % | | | — | | | | — | | | | — | | | | — | | | | 3.60 | % | |
Average annual return without
sales charge (NAV) | |
| Class A | | | (0.57 | )% | | | 9.55 | % | | | (5.94 | )% | | | 5.91 | % | | | — | | | | — | | | | — | | | | 12.30 | % | | | (6.32 | )% | | | 5.72 | % | | | — | | | | — | | | | — | | |
| Class B | | | (0.64 | )% | | | 8.73 | % | | | (6.65 | )% | | | — | | | | (2.18 | )% | | | — | | | | — | | | | 11.47 | % | | | (7.02 | )% | | | — | | | | (2.11 | )% | | | — | | | | — | | |
| Class C | | | (0.62 | )% | | | 8.75 | % | | | — | | | | — | | | | — | | | | — | | | | 3.37 | % | | | 11.44 | % | | | — | | | | — | | | | — | | | | — | | | | 3.60 | % | |
| Class R | | | (0.57 | )% | | | 9.30 | % | | | — | | | | — | | | | — | | | | (4.77 | )% | | | — | | | | 12.04 | % | | | — | | | | — | | | | — | | | | (4.74 | )% | | | — | | |
| Class Y | | | (0.52 | )% | | | 9.81 | % | | | (5.70 | )% | | | 6.17 | % | | | — | | | | — | | | | — | | | | 12.58 | % | | | (6.09 | )% | | | 5.99 | % | | | — | | | | — | | | | — | | |
| Russell 1000 Growth Index2 | | | (0.97 | )% | | | 8.81 | % | | | (7.93 | )% | | | 6.78 | % | | | (2.94 | )% | | | (6.27 | )% | | | 4.41 | % | | | 11.60 | % | | | (8.64 | )% | | | 6.89 | % | | | (2.84 | )% | | | (6.19 | )% | | | 4.76 | % | |
Value of a $10,000 Investment1,3 as of October 31, 2005
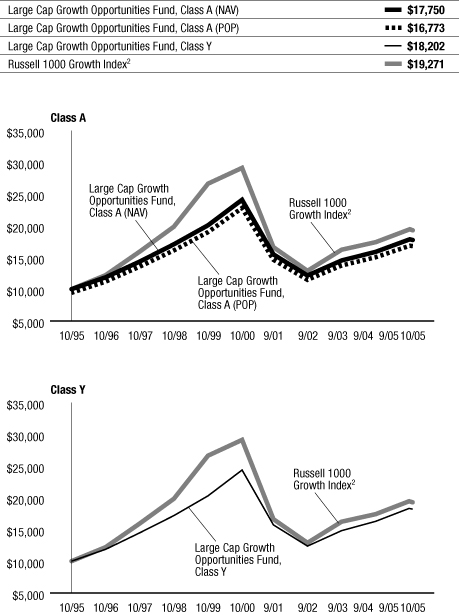
The chart above illustrates the total value of an assumed $10,000 investment in the fund's Class A and Class Y shares (from 10/31/95 to 10/31/05) as compared to the Russell 1000 Growth Index2.
The performance data quoted on this page represents past performance and does not guarantee future results. The investment return and principal value of an investment will fluctuate so that an investor's shares, when redeemed, may be worth more or less than their original cost. Current performance of the fund may be lower or higher than the performance data quoted. Performance data current to the most recent month-end may be obtained by calling 800.677.FUND.
* Total returns have not been annualized.
** This table represents average annual total returns through the latest calendar quarter—rather than through the end of the fiscal period.
1 Performance does not reflect the deduction of taxes that a shareholder would pay on fund distributions or redemption of fund shares. Investment performance reflects fee waivers that are or were in effect. In the absence of such fee waivers, total returns would be reduced. Index performance is for illustrative purposes only and does not reflect any expenses, transaction costs, or cash flow effects. Direct investment in the index is not available.
Growth stocks typically have more volatility than value stocks; whereas value stocks tend to have slower earnings growth rates.
Total returns at net asset value ("NAV") reflect performance over the time period indicated without including the fund's maximum sales charge and assume reinvestment of all distributions at NAV.
Total returns at public offering price ("POP") reflect performance over the time period indicated including a maximum front-end sales charge of 5.50% for Class A shares, and the maximum contingent deferred sales charge ("CDSC") for Class B and Class C shares for the relevant period. Maximum CDSC is 5.00% for Class B shares in the first year, decreasing annually to 0% in the seventh year following purchase, and 1.00% for Class C shares. Total returns assume reinvestment of all distributions at NAV.
On September 24, 2001, the First American Large Cap Growth Opportunities Fund became the successor by merger to the Firstar Large Cap Core Equity Fund, a series of Firstar Funds, Inc. Prior to the merger, the First American fund had no assets or liabilities. Performance presented prior to September 24, 2001, represents that of the Firstar Large Cap Core Equity Fund.
2 An unmanaged index that measures the performance of those companies in the Russell 1000 Index (a large-cap index) with higher price-to-book ratios and higher forecasted growth values.
3 Performance for Class B, Class C, and Class R shares is not presented. Performance for these classes will vary due to different expense structures.
FIRST AMERICAN FUNDS Annual Report 2005
27
Large Cap Growth Opportunities fund continued
Expense Example
As a shareholder of the Large Cap Growth Opportunities Fund (the "fund"), you incur two types of costs: (1) transaction costs, including sales charges (loads) on purchase payments; and (2) ongoing costs, including investment advisory fees; distribution and/or service (12b-1) fees; and other fund expenses. This example is intended to help you understand your ongoing costs (in dollars) of investing in the fund and to compare these costs with the ongoing costs of investing in other mutual funds. The example is based on an investment of $1,000 invested at the beginning of the period and held for the entire period from May 1, 2005, to October 31, 2005.
Actual Expenses
For each class, the first line of the table below provides information about actual account values and actual expenses. You may use the information in this line, together with the amount you invested, to estimate the expenses that you paid over the period. Simply divide your account value by $1,000 (for example, an $8,600 account value divided by $1,000 = 8.6), then multiply the result by the number in the first line under the heading entitled "Expenses Paid During Period" to estimate the expenses you paid on your account during this period.
Hypothetical Example for Comparison Purposes
For each class, the second line of the table below provides information about hypothetical account values and hypothetical expenses based on the fund's actual expense ratio and an assumed rate of return of 5% per year before expenses, which is not the fund's actual return. The hypothetical account values and expenses may not be used to estimate the actual ending account balance or expenses you paid for the period. You may use this information to compare the ongoing costs of investing in the fund and other funds. To do so, compare this 5% hypothetical example with the 5% hypothetical examples that appear in the shareholder reports of the other funds.
Please note that the expenses shown in the table are meant to highlight your ongoing costs only and do not reflect any transactional costs, such as sales charges (loads). Therefore, the second line of the table for each class is useful in comparing ongoing costs only, and will not help you determine the relative total costs of owning different funds. In addition, if these transactional costs were included, your costs would have been higher.
Expense Examples
| | | Beginning Account
Value (5/01/05) | | Ending Account
Value (10/31/05) | | Expenses Paid During
Period1 (5/01/05 to
10/31/05) | |
| Class A Actual2,3 | | $ | 1,000.00 | | | $ | 1,081.50 | | | $ | 6.24 | | |
| Class A Hypothetical (5% return before expenses)3 | | $ | 1,000.00 | | | $ | 1,019.21 | | | $ | 6.06 | | |
| Class B Actual2,3 | | $ | 1,000.00 | | | $ | 1,077.00 | | | $ | 10.16 | | |
| Class B Hypothetical (5% return before expenses)3 | | $ | 1,000.00 | | | $ | 1,015.43 | | | $ | 9.86 | | |
| Class C Actual2,3 | | $ | 1,000.00 | | | $ | 1,077.50 | | | $ | 10.16 | | |
| Class C Hypothetical (5% return before expenses)3 | | $ | 1,000.00 | | | $ | 1,015.43 | | | $ | 9.86 | | |
| Class R Actual2,3 | | $ | 1,000.00 | | | $ | 1,080.50 | | | $ | 7.66 | | |
| Class R Hypothetical (5% return before expenses)3 | | $ | 1,000.00 | | | $ | 1,017.85 | | | $ | 7.43 | | |
| Class Y Actual2,3 | | $ | 1,000.00 | | | $ | 1,082.80 | | | $ | 4.93 | | |
| Class Y Hypothetical (5% return before expenses)3 | | $ | 1,000.00 | | | $ | 1,020.47 | | | $ | 4.79 | | |
1Expenses are equal to the fund's annualized expense ratio for the most recent six-month period of 1.19%, 1.94%, 1.94%, 1.46% and 0.94% for Class A, Class B, Class C, Class R and Class Y, respectively, multiplied by the average account value over the period, multiplied by the number of days in the most recent fiscal half-year/365 (to reflect the one-half year period).
2Based on the actual returns for the six-months ended October 31, 2005, of 8.15%, 7.70%, 7.75%, 8.05% and 8.28% for Class A, Class B, Class C, Class R and Class Y, respectively.
3Prior to July 1, 2005, the contractual limitation on annual expenses was 1.15%, 1.90%, 1.90%, 1.40% and 0.90% for Class A, Class B, Class C, Class R and Class Y, respectively. Effective July 1, 2005, the contractual limitation on annual expenses for each class was removed. If this limitation had not been in place during the entire period, actual and hypothetical ending account balances would have been approximately $1,081.44 and $1,019.16 for Class A, $1,076.95 and $1,015.38 for Class B, $1,077.45 and $1,015.38 for Class C, $1,080.50 and $1,017.85 for Class R and $1,082.74 and $1,020.44 for Class Y. Actual and hypothetical expenses paid during the period would have been approximately $6.30 and $6.11 for Class A, $10.21 and $9.91 for Class B, $10.21 and $9.91 for Class C, $7.66 and $7.43 for Class R and $4.99 and $4.84 for Class Y.
FIRST AMERICAN FUNDS Annual Report 2005
28
Large Cap Select fund
Investment Objective: capital appreciation
How did the fund perform the fiscal period ended October 31, 2005?
The First American Large Cap Select Fund (the "fund"), Class Y shares, returned -1.10% for the one-month period ended October 31, 2005 (Class A shares returned -1.17% without taking the sales charge into account). By comparison, the fund's benchmark, the Standard & Poor's 500 Index* ("S&P 500 Index"), returned -1.67% for the same period.
What were the general economic and market conditions during the fiscal period?
Broader economic growth continued at a relatively solid pace in October. Indicators for the manufacturing sector suggested robust growth as inventories remained low and recovery and reconstruction activity proceeded following the hurricanes. Companies indicated continued cost pressures from energy and other raw material prices, keeping Fed concerns about inflation intact. This led to an additional 25-basis-point tightening at the November 1 Federal Open Market Committee meeting, giving support to expectations for further short-term rate increases. While activity in the industrial sector remained robust, consumer confidence continued to slump despite gasoline prices falling sharply during the month. Auto sales fell to their lowest monthly pace in more than seven years as the employee discount sales promotions expired. Forward-looking housing market indicators such as mortgage applications for home purchases moved lower, and emplo yment cost data for the third quarter showed the slowest gain in wages in 25 years. Subdued compensation gains suggest that broader inflation should remain well contained in the coming quarters, which will be a key to bringing an eventual end to Fed tightening and should provide a supportive backdrop to the financial markets.
What worked for the fund and why?
Good stock selection was the main driver of the fund's outperformance relative to the index. Among the standout performers during this reporting period were ACE Ltd. (a property casualty company) the industrial giant Dow Chemical, and the retail gaint Wal-Mart. The fund's underweight position in the utilities sector was also beneficial.
What did not work for the fund and why?
With energy stocks selling off in response to falling energy prices as investors took profits in the sector, the fund's holdings in gas and oil exploration companies Amerada Hess and Apache detracted from performance. Pentair, Inc. (a water technologies company) was another disappointing performer, as was Texas Instruments, reflecting a more muted performance in the information technology sector.
*Unlike mutual funds, index returns do not reflect any expenses, transaction costs, or cash flow effects.
| Top 10 Holdings as of October 31, 20051 (% of net assets) | |
| Intel | | | 4.2 | % | |
| Dow Chemical | | | 4.0 | % | |
| Bank of America | | | 3.8 | % | |
| Wells Fargo | | | 3.6 | % | |
| Johnson & Johnson | | | 3.6 | % | |
| United Parcel Service, Class B | | | 3.4 | % | |
| Goldman Sachs Group | | | 3.3 | % | |
| Wal-Mart Stores | | | 3.2 | % | |
| Wyeth Pharmaceuticals | | | 3.2 | % | |
| American International Group | | | 3.1 | % | |
| Sector Allocation as of October 31, 20051 (% of net assets) | |
| Information Technology | | | 22.1 | % | |
| Financials | | | 21.3 | % | |
| Health Care | | | 12.2 | % | |
| Consumer Discretionary | | | 10.1 | % | |
| Energy | | | 8.2 | % | |
| Consumer Staples | | | 7.7 | % | |
| Industrials | | | 7.5 | % | |
| Materials | | | 4.0 | % | |
| Telecommunication Services | | | 2.9 | % | |
| Short-Term Investments | | | 2.3 | % | |
| Utilities | | | 1.1 | % | |
| Other Assets and Liabilities, Net | | | 0.6 | % | |
| | | | 100.0 | % | |
1Fund holdings and sector allocations are subject to change at any time and are not recommendations to buy or sell any security.
FIRST AMERICAN FUNDS Annual Report 2005
29
Large Cap Select fund continued
Annual Performance1
| | | October 31, 2005 | | September 30, 2005** | |
| | | One- | | | | Since Inception | | | | Since Inception | |
| | | month* | | 1 year | | 1/31/03 | | 1 year | | 1/31/03 | |
| Average annual return with sales charge (POP) | |
| Class A | | | (6.60 | )% | | | 7.92 | % | | | 13.07 | % | | | 11.34 | % | | | 14.02 | % | |
| Class B | | | (6.20 | )% | | | 8.26 | % | | | 13.32 | % | | | 12.02 | % | | | 14.33 | % | |
| Class C | | | (2.25 | )% | | | 12.25 | % | | | 14.50 | % | | | 15.91 | % | | | 15.55 | % | |
| Average annual return without sales charge (NAV) | |
| Class A | | | (1.17 | )% | | | 14.17 | % | | | 15.42 | % | | | 17.83 | % | | | 16.46 | % | |
| Class B | | | (1.26 | )% | | | 13.26 | % | | | 14.47 | % | | | 17.02 | % | | | 15.52 | % | |
| Class C | | | (1.26 | )% | | | 13.25 | % | | | 14.50 | % | | | 16.91 | % | | | 15.55 | % | |
| Class R | | | (1.18 | )% | | | 13.87 | % | | | 15.17 | % | | | 17.54 | % | | | 16.21 | % | |
| Class Y | | | (1.10 | )% | | | 14.45 | % | | | 15.70 | % | | | 18.14 | % | | | 16.73 | % | |
| S&P 500 Index2 | | | (1.67 | )% | | | 8.72 | % | | | 15.35 | % | | | 12.25 | % | | | 16.61 | % | |
Value of a $10,000 Investment1,3 as of October 31, 2005
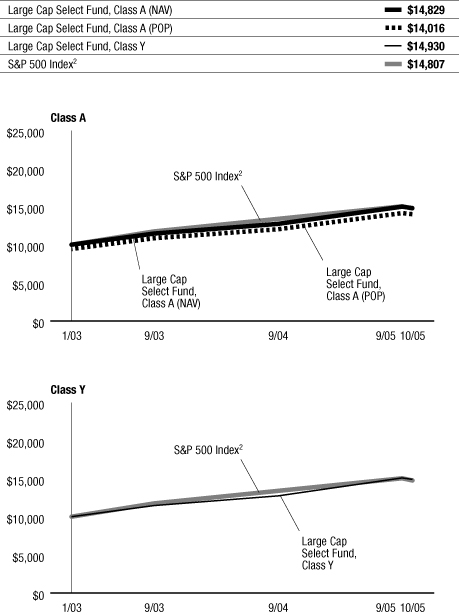
The chart above illustrates the total value of an assumed $10,000 investment in the fund's Class A and Class Y shares (from 1/31/03 to 10/31/05) as compared to the S&P 500 Index2.
The performance data quoted on this page represents past performance and does not guarantee future results. The investment return and principal value of an investment will fluctuate so that an investor's shares, when redeemed, may be worth more or less than their original cost. Current performance of the fund may be lower or higher than the performance data quoted. Performance data current to the most recent month-end may be obtained by calling 800.677.FUND.
* Total returns have not been annualized.
** This table represents average annual total returns through the latest calendar quarter—rather than through the end of the fiscal period.
1 Performance does not reflect the deduction of taxes that a shareholder would pay on fund distributions or redemption of fund shares. Investment performance reflects fee waivers that are or were in effect. In the absence of such fee waivers, total returns would be reduced. Index performance is for illustrative purposes only and does not reflect any expenses, transaction costs, or cash flow effects. Direct investment in the index is not available.
Mutual fund investing involves risk; principal loss is possible.
Total returns at net asset value ("NAV") reflect performance over the time period indicated without including the fund's maximum sales charge and assume reinvestment of all distributions at NAV.
Total returns at public offering price ("POP") reflect performance over the time period indicated including a maximum front-end sales charge of 5.50% for Class A shares and the maximum contingent deferred sales charge ("CDSC") for Class B and Class C shares for the relevant period. Maximum CDSC is 5.00% for Class B shares in the first year, decreasing annually to 0% in the seventh year following purchase, and 1.00% for Class C shares. Total returns assume reinvestment of all distributions at NAV.
2 An unmanaged market capitalization-weighted index based on the average weighted performance of 500 widely held common stocks.
3 Performance for Class B, Class C, and Class R shares is not presented. Performance for these classes will vary due to different expense structures.
FIRST AMERICAN FUNDS Annual Report 2005
30
Large Cap Select fund continued
Expense Example
As a shareholder of the Large Cap Select Fund (the "fund"), you incur two types of costs: (1) transaction costs, including sales charges (loads) on purchase payments; and (2) ongoing costs, including investment advisory fees; distribution and/or service (12b-1) fees; and other fund expenses. This example is intended to help you understand your ongoing costs (in dollars) of investing in the fund and to compare these costs with the ongoing costs of investing in other mutual funds. The example is based on an investment of $1,000 invested at the beginning of the period and held for the entire period from May 1, 2005, to October 31, 2005.
Actual Expenses
For each class, the first line of the table below provides information about actual account values and actual expenses. You may use the information in this line, together with the amount you invested, to estimate the expenses that you paid over the period. Simply divide your account value by $1,000 (for example, an $8,600 account value divided by $1,000 = 8.6), then multiply the result by the number in the first line under the heading entitled "Expenses Paid During Period" to estimate the expenses you paid on your account during this period.
Hypothetical Example for Comparison Purposes
For each class, the second line of the table below provides information about hypothetical account values and hypothetical expenses based on the fund's actual expense ratio and an assumed rate of return of 5% per year before expenses, which is not the fund's actual return. The hypothetical account values and expenses may not be used to estimate the actual ending account balance or expenses you paid for the period. You may use this information to compare the ongoing costs of investing in the fund and other funds. To do so, compare this 5% hypothetical example with the 5% hypothetical examples that appear in the shareholder reports of the other funds.
Please note that the expenses shown in the table are meant to highlight your ongoing costs only and do not reflect any transactional costs, such as sales charges (loads). Therefore, the second line of the table for each class is useful in comparing ongoing costs only, and will not help you determine the relative total costs of owning different funds. In addition, if these transactional costs were included, your costs would have been higher.
Expense Examples
| | | Beginning Account
Value (5/01/05) | | Ending Account
Value (10/31/05) | | Expenses Paid During
Period1 (5/01/05 to
10/31/05) | |
| Class A Actual2,3 | | $ | 1,000.00 | | | $ | 1,078.40 | | | $ | 6.23 | | |
| Class A Hypothetical (5% return before expenses)3 | | $ | 1,000.00 | | | $ | 1,019.21 | | | $ | 6.06 | | |
| Class B Actual2,3 | | $ | 1,000.00 | | | $ | 1,073.80 | | | $ | 10.09 | | |
| Class B Hypothetical (5% return before expenses)3 | | $ | 1,000.00 | | | $ | 1,015.48 | | | $ | 9.80 | | |
| Class C Actual2,3 | | $ | 1,000.00 | | | $ | 1,073.70 | | | $ | 10.14 | | |
| Class C Hypothetical (5% return before expenses)3 | | $ | 1,000.00 | | | $ | 1,015.43 | | | $ | 9.86 | | |
| Class R Actual2,3 | | $ | 1,000.00 | | | $ | 1,076.50 | | | $ | 7.54 | | |
| Class R Hypothetical (5% return before expenses)3 | | $ | 1,000.00 | | | $ | 1,017.95 | | | $ | 7.32 | | |
| Class Y Actual2,3 | | $ | 1,000.00 | | | $ | 1,079.30 | | | $ | 4.93 | | |
| Class Y Hypothetical (5% return before expenses)3 | | $ | 1,000.00 | | | $ | 1,020.47 | | | $ | 4.79 | | |
1Expenses are equal to the fund's annualized expense ratio for the most recent six-month period of 1.19%, 1.93%, 1.94%, 1.44% and 0.94% for Class A, Class B, Class C, Class R and Class Y, respectively, multiplied by the average account value over the period, multiplied by the number of days in the most recent fiscal half-year/365 (to reflect the one-half year period).
2Based on the actual returns for the six-months ended October 31, 2005, of 7.84%, 7.38%, 7.37%, 7.65% and 7.93% for Class A, Class B, Class C, Class R and Class Y, respectively.
3Prior to July 1, 2005, the contractual limitation on annual expenses was 1.15%, 1.90%, 1.90%, 1.40% and 0.90% for Class A, Class B, Class C, Class R and Class Y, respectively. Effective July 1, 2005, the contractual limitation on annual expenses for each class was removed. If this limitation had not been in place during the entire period, actual and hypothetical ending account balances would have been approximately $1,078.29 and $1,019.11 for Class A, $1,073.64 and $1,015.32 for Class B, $1,073.60 and $1,015.32 for Class C, $1,076.40 and $1,017.85 for Class R and $1,079.20 and $1,020.37 for Class Y. Actual and hypothetical expenses paid during the period would have been approximately $6.34 and $6.16 for Class A, $10.25 and $9.96 for Class B, $10.24 and $9.96 for Class C, $7.64 and $7.43 for Class R and $5.03 and $4.89 for Class Y.
FIRST AMERICAN FUNDS Annual Report 2005
31
Large Cap Value fund
Investment Objective: primary – capital appreciation; secondary – current income
How did the Fund perform the fiscal period ended October 31, 2005?
The First American Large Cap Value Fund (the "fund"), Class Y shares, returned -2.47% for the one-month period ended October 31, 2005 (Class A shares returned -2.48% without taking the sales charge into account). By comparison, the fund's benchmark, the Russell 1000 Value Index*, returned -2.54% for the same period.
What were the general economic and market conditions during the fiscal period?
Broader economic growth continued at a relatively solid pace in October. Indicators for the manufacturing sector suggested robust growth as inventories remained low and recovery and reconstruction activity proceeded following the hurricanes. Companies indicated continued cost pressures from energy and other raw material prices, keeping Fed concerns about inflation intact. This led to an additional 25-basis-point tightening at the November 1 Federal Open Market Committee meeting, giving support to expectations for further short-term rate increases. While activity in the industrial sector remained robust, consumer confidence continued to slump despite gasoline prices falling sharply during the month. Auto sales fell to their lowest monthly pace in more than seven years as the employee discount sales promotions expired. Forward-looking housing market indicators such as mortgage applications for home purchases moved lower, and emplo yment cost data for the third quarter showed the slowest gain in wages in 25 years. Subdued compensation gains suggest that broader inflation should remain well contained in the coming quarters, which will be a key to bringing an eventual end to Fed tightening and should provide a supportive backdrop to the financial markets.
What worked for the fund and why?
Strong performance and good stock selection in the health care and materials sectors contributed to the fund's outperformance relative to the index. Standout performers included HCA Inc. (a hospital and health system operator) and the science and technology giant Dow Chemical Co. in the materials sector.
What did not work for the fund and why?
An underweight in the financials sector proved detrimental at a time when the sector enjoyed generally robust performance. Weaker results from information technology companies, notably National Semiconductor Corp. and Texas Instruments, also detracted form the fund's performance.
*Unlike mutual funds, index returns do not reflect any expenses, transaction costs, or cash flow effects.
| Top 10 Holdings as of October 31, 20051 (% of net assets) | |
| Exxon Mobil | | | 4.6 | % | |
| Bank of America | | | 4.2 | % | |
| Hewlett-Packard | | | 3.6 | % | |
| Wyeth Pharmaceuticals | | | 3.0 | % | |
| Citigroup | | | 3.0 | % | |
| Time Warner | | | 2.9 | % | |
| Goldman Sachs Group | | | 2.9 | % | |
| American International Group | | | 2.9 | % | |
| Lehman Brothers Holdings | | | 2.9 | % | |
| Dow Chemical | | | 2.8 | % | |
| Sector Allocation as of October 31, 20051 (% of net assets) | |
| Financials | | | 33.6 | % | |
| Energy | | | 13.5 | % | |
| Consumer Discretionary | | | 10.0 | % | |
| Information Technology | | | 9.3 | % | |
| Health Care | | | 8.9 | % | |
| Industrials | | | 6.5 | % | |
| Consumer Staples | | | 5.8 | % | |
| Materials | | | 3.8 | % | |
| Utilities | | | 3.6 | % | |
| Telecommunication Services | | | 3.2 | % | |
| Short-Term Investments | | | 1.9 | % | |
| Other Assets and Liabilities, Net | | | (0.1 | )% | |
| | | | 100.0 | % | |
1Fund holdings and sector allocations are subject to change at any time and are not recommendations to buy or sell any security.
FIRST AMERICAN FUNDS Annual Report 2005
32
Large Cap Value fund continued
Annual Performance1
| | | October 31, 2005 | | September 30, 2005** | |
| | | One- | | | | | | | | Since Inception | | | | | | | | Since Inception | |
| | | month* | | 1 year | | 5 years | | 10 years | | 2/01/99 | | 9/24/01 | | 1 year | | 5 years | | 10 years | | 2/01/99 | | 9/24/01 | |
| Average annual return with sales charge (POP) | |
| Class A | | | (7.86 | )% | | | 6.28 | % | | | (0.07 | )% | | | 7.36 | % | | | — | | | | — | | | | 11.16 | % | | | 1.26 | % | | | 7.47 | % | | | — | | | | — | | |
| Class B | | | (7.42 | )% | | | 6.61 | % | | | (0.05 | )% | | | 7.17 | % | | | — | | | | — | | | | 11.77 | % | | | 1.28 | % | | | 7.29 | % | | | — | | | | — | | |
| Class C | | | (3.49 | )% | | | 10.65 | % | | | 0.32 | % | | | — | | | | 1.10 | % | | | — | | | | 15.75 | % | | | 1.64 | % | | | — | | | | 1.51 | % | | | — | | |
| Average annual return without sales charge (NAV) | |
| Class A | | | (2.48 | )% | | | 12.45 | % | | | 1.07 | % | | | 7.97 | % | | | — | | | | — | | | | 17.62 | % | | | 2.42 | % | | | 8.08 | % | | | — | | | | — | | |
| Class B | | | (2.55 | )% | | | 11.61 | % | | | 0.31 | % | | | 7.17 | % | | | — | | | | — | | | | 16.70 | % | | | 1.65 | % | | | 7.29 | % | | | — | | | | — | | |
| Class C | | | (2.52 | )% | | | 11.65 | % | | | 0.32 | % | | | — | | | | 1.10 | % | | | — | | | | 16.75 | % | | | 1.64 | % | | | — | | | | 1.51 | % | | | — | | |
| Class R | | | (2.54 | )% | | | 12.14 | % | | | — | | | | — | | | | — | | | | 7.08 | % | | | 17.34 | % | | | — | | | | — | | | | — | | | | 7.92 | % | |
| Class Y | | | (2.47 | )% | | | 12.74 | % | | | 1.32 | % | | | 8.25 | % | | | — | | | | — | | | | 17.92 | % | | | 2.68 | % | | | 8.37 | % | | | — | | | | — | | |
| Russell 1000 Value Index2 | | | (2.54 | )% | | | 11.86 | % | | | 4.71 | % | | | 11.34 | % | | | 5.40 | % | | | 9.97 | % | | | 16.69 | % | | | 5.76 | % | | | 11.52 | % | | | 5.88 | % | | | 10.90 | % | |
Value of a $10,000 Investment1,3 as of October 31, 2005
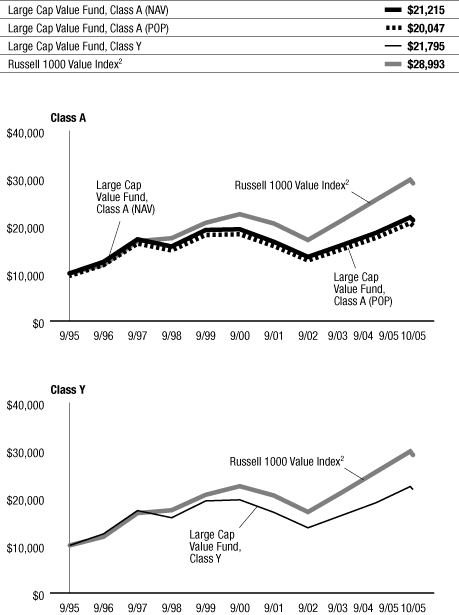
The chart above illustrates the total value of an assumed $10,000 investment in the fund's Class A and Class Y shares (from 9/30/95 to 10/31/05) as compared to the Russell 1000 Value Index2.
The performance data quoted on this page represents past performance and does not guarantee future results. The investment return and principal value of an investment will fluctuate so that an investor's shares, when redeemed, may be worth more or less than their original cost. Current performance of the fund may be lower or higher than the performance data quoted. Performance data current to the most recent month-end may be obtained by calling 800.677.FUND.
* Total returns have not been annualized.
** This table represents average annual total returns through the latest calendar quarter—rather than through the end of the fiscal period.
1 Performance does not reflect the deduction of taxes that a shareholder would pay on fund distributions or redemption of fund shares. Investment performance reflects fee waivers that are or were in effect. In the absence of such fee waivers, total returns would be reduced. Index performance is for illustrative purposes only and does not reflect any expenses, transaction costs, or cash flow effects. Direct investment in the index is not available.
Mutual fund investing involves risk; principal loss is possible.
Total returns at net asset value ("NAV") reflect performance over the time period indicated without including the fund's maximum sales charge and assume reinvestment of all distributions at NAV.
Total returns at public offering price ("POP") reflect performance over the time period indicated including a maximum front-end sales charge of 5.50% for Class A shares and the maximum contingent deferred sales charge ("CDSC") for Class B and Class C shares for the relevant period. Maximum CDSC is 5.00% for Class B shares in the first year, decreasing annually to 0% in the seventh year following purchase, and 1.00% for Class C shares. Total returns assume reinvestment of all distributions at NAV.
2 An unmanaged index that measures the performance of those companies in the Russell 1000 Index (a large-cap index) with lower price-to-book ratios and lower forecasted growth values.
3 Performance for Class B, Class C, and Class R shares is not presented. Performance for these classes will vary due to different expense structures.
FIRST AMERICAN FUNDS Annual Report 2005
33
Large Cap Value fund continued
Expense Example
As a shareholder of the Large Cap Value Fund (the "fund"), you incur two types of costs: (1) transaction costs, including sales charges (loads) on purchase payments; and (2) ongoing costs, including investment advisory fees; distribution and/or service (12b-1) fees; and other fund expenses. This example is intended to help you understand your ongoing costs (in dollars) of investing in the fund and to compare these costs with the ongoing costs of investing in other mutual funds. The example is based on an investment of $1,000 invested at the beginning of the period and held for the entire period from May 1, 2005, to October 31, 2005.
Actual Expenses
For each class, the first line of the table below provides information about actual account values and actual expenses. You may use the information in this line, together with the amount you invested, to estimate the expenses that you paid over the period. Simply divide your account value by $1,000 (for example, an $8,600 account value divided by $1,000 = 8.6), then multiply the result by the number in the first line under the heading entitled "Expenses Paid During Period" to estimate the expenses you paid on your account during this period.
Hypothetical Example for Comparison Purposes
For each class, the second line of the table below provides information about hypothetical account values and hypothetical expenses based on the fund's actual expense ratio and an assumed rate of return of 5% per year before expenses, which is not the fund's actual return. The hypothetical account values and expenses may not be used to estimate the actual ending account balance or expenses you paid for the period. You may use this information to compare the ongoing costs of investing in the fund and other funds. To do so, compare this 5% hypothetical example with the 5% hypothetical examples that appear in the shareholder reports of the other funds.
Please note that the expenses shown in the table are meant to highlight your ongoing costs only and do not reflect any transactional costs, such as sales charges (loads). Therefore, the second line of the table for each class is useful in comparing ongoing costs only, and will not help you determine the relative total costs of owning different funds. In addition, if these transactional costs were included, your costs would have been higher.
Expense Examples
| | | Beginning Account
Value (5/01/05) | | Ending Account
Value (10/31/05) | | Expenses Paid During
Period1 (5/01/05 to
10/31/05) | |
| Class A Actual2,3 | | $ | 1,000.00 | | | $ | 1,064.70 | | | $ | 6.19 | | |
| Class A Hypothetical (5% return before expenses)3 | | $ | 1,000.00 | | | $ | 1,019.21 | | | $ | 6.06 | | |
| Class B Actual2,3 | | $ | 1,000.00 | | | $ | 1,061.00 | | | $ | 10.08 | | |
| Class B Hypothetical (5% return before expenses)3 | | $ | 1,000.00 | | | $ | 1,015.43 | | | $ | 9.86 | | |
| Class C Actual2,3 | | $ | 1,000.00 | | | $ | 1,060.80 | | | $ | 10.08 | | |
| Class C Hypothetical (5% return before expenses)3 | | $ | 1,000.00 | | | $ | 1,015.43 | | | $ | 9.86 | | |
| Class R Actual2,3 | | $ | 1,000.00 | | | $ | 1,063.70 | | | $ | 7.44 | | |
| Class R Hypothetical (5% return before expenses)3 | | $ | 1,000.00 | | | $ | 1,018.00 | | | $ | 7.27 | | |
| Class Y Actual2,3 | | $ | 1,000.00 | | | $ | 1,066.20 | | | $ | 4.90 | | |
| Class Y Hypothetical (5% return before expenses)3 | | $ | 1,000.00 | | | $ | 1,020.47 | | | $ | 4.79 | | |
1Expenses are equal to the fund's annualized expense ratio for the most recent six-month period of 1.19%, 1.94%, 1.94%, 1.43% and 0.94% for Class A, Class B, Class C, Class R and Class Y, respectively, multiplied by the average account value over the period, multiplied by the number of days in the most recent fiscal half-year/365 (to reflect the one-half year period).
2Based on the actual returns for the six-months ended October 31, 2005, of 6.47%, 6.10%, 6.08%, 6.37% and 6.62% for Class A, Class B, Class C, Class R and Class Y, respectively.
3Prior to July 1, 2005, the contractual limitation on annual expenses was 1.15%, 1.90%, 1.90%, 1.40% and 0.90% for Class A, Class B, Class C, Class R and Class Y, respectively. Effective July 1, 2005, the contractual limitation on annual expenses for each class was removed. If this limitation had not been in place during the entire period, actual and hypothetical ending account balances would have been approximately $1,064.64 and $1,019.16 for Class A, $1,060.95 and $1,015.38 for Class B, $1,060.75 and $1,015.38 for Class C, $1,063.70 and $1,080.00 for Class R and $1,066.15 and $1,020.42 for Class Y. Actual and hypothetical expenses paid during the period would have been approximately $6.25 and $6.11 for Class A, $10.13 and $9.91 for Class B, $10.13 and $9.91 for Class C, $7.44 and $7.27 for Class R and $4.95 and $4.84 for Class Y.
FIRST AMERICAN FUNDS Annual Report 2005
34
Balanced fund
Investment Objective: maximize total return (capital appreciation plus income)
How did the fund perform the fiscal period ended October 31, 2005?
The First American Balanced Fund (the "fund"), Class Y shares, returned -1.31% for the one-month period ended October 31, 2005 (Class A shares returned -1.40% without taking the sales charge into account). By comparison, the fund's benchmarks, the Russell 3000 Index* and the Lehman Aggregate Bond Index*, returned -1.98% and -0.79%, respectively, for the same period.
What were the general economic and market conditions during the fiscal period?
Broader economic growth continued at a relatively solid pace in October. Indicators for the manufacturing sector suggested robust growth as inventories remained low and recovery and reconstruction activity proceeded following the hurricanes. Companies indicated continued cost pressures from energy and other raw material prices, keeping Fed concerns about inflation intact. This led to an additional 25-basis-point tightening at the November 1 Federal Open Market Committee meeting, giving support to expectations for further short-term rate increases. While activity in the industrial sector remained robust, consumer confidence continued to slump despite gasoline prices falling sharply during the month. Auto sales fell to their lowest monthly pace in more than seven years as the employee discount sales promotions expired. Forward-looking housing market indicators such as mortgage applications for home purchases moved lower, and emplo yment cost data for the third quarter showed the slowest gain in wages in 25 years. Subdued compensation gains suggest that broader inflation should remain well contained in the coming quarters, which will be a key to bringing an eventual end to Fed tightening and should provide a supportive backdrop to the financial markets.
What worked for the fund and why?
Within the stock portion of the fund, good stock selection was the main driver of the fund's performance. Among the standout performers during this reporting period were ACE Ltd. (a property casualty company), Dow Chemical, and Wal-Mart. The fund's underweight position in the utilities sector was also beneficial.
Within the bond section, the fund's defensive positioning to take advantage of rising interest rates proved the key driver of performance. The fund's underweight to the corporate sector and issue selection within corporate bonds and mortgages also added value.
What did not work for the fund and why?
With energy stocks selling off in response to falling energy prices as investors took profits in the sector, the fund's holdings in gas and oil exploration companies Amerada Hess and Apache detracted from performance. Pentair, Inc. (a water technologies company) was another disappointing performer, as was Texas Instruments, reflecting a more muted performance in the technology sector.
Within the fund's bond allocation, an overweight to mortgage-backed securities was a marginal negative for relative performance.
*Unlike mutual funds, index returns do not reflect any expenses, transaction costs, or cash flow effects.
| Top 10 Holdings as of Ocotber 31, 20051 (% of net assets) | |
| iShares MSCI EAFE Index Fund | | | 4.7 | % | |
| Intel | | | 2.5 | % | |
| Bank of America | | | 2.2 | % | |
| Wells Fargo | | | 2.1 | % | |
| Johnson & Johnson | | | 2.1 | % | |
| Dow Chemical | | | 2.1 | % | |
| Goldman Sachs | | | 2.0 | % | |
| Walmart | | | 1.9 | % | |
| Wyeth | | | 1.9 | % | |
| American International Group | | | 1.8 | % | |
| Portfolio Allocation as of Ocotber 31, 20051 (% of net assets) | |
| Stocks | | | 61.8 | % | |
| Bonds | | | 29.7 | % | |
| Investment Companies | | | 7.2 | % | |
| Short-Term Investments | | | 1.9 | % | |
| Other Assets and Liablities, Net | | | (0.6 | )% | |
| | | | 100.0 | % | |
1Fund holdings and portfolio allocations are subject to change at any time and are not recommendations to buy or sell any security.
FIRST AMERICAN FUNDS Annual Report 2005
35
Balanced fund continued
Annual Performance1
| | | October 31, 2005 | | September 30, 2005** | |
| | | One- | | | | | | | | Since Inception | | | | | | | | Since Inception | |
| | | Month* | | 1 year | | 5 years | | 10 years | | 3/01/99 | | 11/27/00 | | 9/24/01 | | 1 year | | 5 years | | 10 years | | 3/01/99 | | 11/27/00 | | 9/24/01 | |
Average annual return with
sales charge (POP) | |
| Class A | | | (6.86 | )% | | | 4.77 | % | | | (0.11 | )% | | | 6.09 | % | | | — | | | | — | | | | — | | | | 8.21 | % | | | (0.17 | )% | | | 6.13 | % | | | — | | | | — | | | | — | | |
| Class B | | | (6.34 | )% | | | 5.07 | % | | | (0.08 | )% | | | — | | | | 2.84 | % | | | — | | | | — | | | | 8.64 | % | | | (0.13 | )% | | | — | | | | 3.10 | % | | | — | | | | — | | |
| Class C | | | (2.39 | )% | | | 9.05 | % | | | — | | | | — | | | | — | | | | — | | | | 5.68 | % | | | 12.61 | % | | | — | | | | — | | | | — | | | | — | | | | 6.18 | % | |
Average annual return without
sales charge (NAV) | |
| Class A | | | (1.40 | )% | | | 10.88 | % | | | 1.02 | % | | | 6.69 | % | | | — | | | | — | | | | — | | | | 14.51 | % | | | 0.97 | % | | | 6.74 | % | | | — | | | | — | | | | — | | |
| Class B | | | (1.41 | )% | | | 10.07 | % | | | 0.25 | % | | | — | | | | 2.84 | % | | | — | | | | — | | | | 13.64 | % | | | 0.20 | % | | | — | | | | 3.10 | % | | | — | | | | — | | |
| Class C | | | (1.41 | )% | | | 10.05 | % | | | — | | | | — | | | | — | | | | — | | | | 5.68 | % | | | 13.61 | % | | | — | | | | — | | | | — | | | | — | | | | 6.18 | % | |
| Class R | | | (1.40 | )% | | | 10.55 | % | | | — | | | | — | | | | — | | | | 1.69 | % | | | — | | | | 14.16 | % | | | — | | | | — | | | | — | | | | 2.01 | % | | | — | | |
| Class Y | | | (1.31 | )% | | | 11.20 | % | | | 1.27 | % | | | 6.97 | % | | | — | | | | — | | | | — | | | | 14.76 | % | | | 1.22 | % | | | 7.02 | % | | | — | | | | — | | | | — | | |
| Russell 3000 Index2 | | | (1.98 | )% | | | 8.72 | % | | | (2.39 | )% | | | 7.70 | % | | | 0.81 | % | | | (1.10 | )% | | | 6.00 | % | | | 12.60 | % | | | (2.30 | )% | | | 7.81 | % | | | 1.13 | % | | | (0.71 | )% | | | 6.65 | % | |
| Lehman Aggregate Bond Index3 | | | (0.79 | )% | | | 1.13 | % | | | 6.31 | % | | | 6.32 | % | | | 5.99 | % | | | 6.23 | % | | | 4.93 | % | | | 2.80 | % | | | 6.62 | % | | | 6.55 | % | | | 6.20 | % | | | 6.51 | % | | | 5.24 | % | |
Value of a $10,000 Investment1,4 as of October 31, 2005
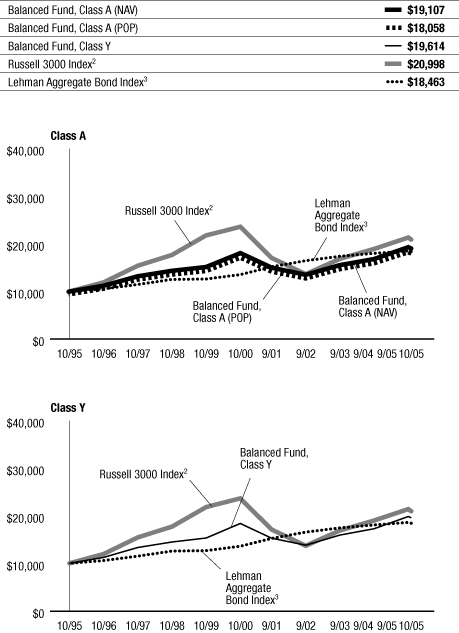
The chart above illustrates the total value of an assumed $10,000 investment in the fund's Class A and Class Y shares (from 10/31/95 to 10/31/05) as compared to the Russell 3000 Index2 and the Lehman Aggregate Bond Index3.
The performance data quoted on this page represents past performance and does not guarantee future results. The investment return and principal value of an investment will fluctuate so that an investor's shares, when redeemed, may be worth more or less than their original cost. Current performance of the fund may be lower or higher than the performance data quoted. Performance data current to the most recent month-end may be obtained by calling 800.677.FUND.
* Total returns have not been annualized.
** This table represents average annual total returns through the latest calendar quarter—rather than through the end of the fiscal period.
1 Performance does not reflect the deduction of taxes that a shareholder would pay on fund distributions or redemption of fund shares. Investment performance reflects fee waivers that are or were in effect. In the absence of such fee waivers, total returns would be reduced. Index performance is for illustrative purposes only and does not reflect any expenses, transaction costs, or cash flow effects. Direct investment in an index is not available.
Mutual fund investing involves risk; principal loss is possible.
Total returns at net asset value ("NAV") reflect performance over the time period indicated without including the fund's maximum sales charge and assume reinvestment of all distributions at NAV.
Total returns at public offering price ("POP") reflect performance over the time period indicated including a maximum front-end sales charge of 5.50% for Class A shares and the maximum contingent deferred sales charge ("CDSC") for Class B and Class C shares for the relevant period. Maximum CDSC is 5.00% for Class B shares in the first year, decreasing annually to 0% in the seventh year following purchase, and 1.00% for Class C shares. Total returns assume reinvestment of all distributions at NAV.
On September 24, 2001, the First American Balanced Fund combined with Firstar Balanced Growth Fund and Firstar Balanced Income Fund. Performance history prior to September 24, 2001, represents that of Firstar Balanced Growth Fund.
2 An unmanaged index that measures the performance of the 3,000 largest U.S. companies (98% of the investable U.S. equity market) based on total market capitalization.
3 An unmanaged fixed income index covering the U.S. investment-grade fixed-rate bond market.
4 Performance for Class B, Class C, and Class R shares is not presented. Performance for these classes will vary due to different expense structures.
FIRST AMERICAN FUNDS Annual Report 2005
36
Balanced fund continued
Expense Example
As a shareholder of the Balanced Fund (the "fund"), you incur two types of costs: (1) transaction costs, including sales charges (loads) on purchase payments; and (2) ongoing costs, including advisory fees; distribution and/or service (12b-1) fees; and other fund expenses. This example is intended to help you understand your ongoing costs (in dollars) of investing in the fund and to compare these costs with the ongoing costs of investing in other mutual funds. The example is based on an investment of $1,000 invested at the beginning of the period and held for the entire period from May 1, 2005, to October 31, 2005.
Actual Expenses
For each class, the first line of the table below provides information about actual account values and actual expenses. You may use the information in this line, together with the amount you invested, to estimate the expenses that you paid over the period. Simply divide your account value by $1,000 (for example, an $8,600 account value divided by $1,000 = 8.6), then multiply the result by the number in the first line under the heading entitled "Expenses Paid During Period" to estimate the expenses you paid on your account during this period.
Hypothetical Example for Comparison Purposes
For each class, the second line of the table below provides information about hypothetical account values and hypothetical expenses based on the fund's actual expense ratio and an assumed rate of return of 5% per year before expenses, which is not the fund's actual return. The hypothetical account values and expenses may not be used to estimate the actual ending account balance or expenses you paid for the period. You may use this information to compare the ongoing costs of investing in the fund and other funds. To do so, compare this 5% hypothetical example with the 5% hypothetical examples that appear in the shareholder reports of the other funds.
Please note that the expenses shown in the table are meant to highlight your ongoing costs only and do not reflect any transactional costs, such as sales charges (loads). Therefore, the second line of the table for each class is useful in comparing ongoing costs only, and will not help you determine the relative total costs of owning different funds. In addition, if these transactional costs were included, your costs would have been higher.
Expense Examples
| | | Beginning Account
Value (5/01/05) | | Ending Account
Value (10/31/05) | | Expenses Paid During
Period1 (5/01/05 to
10/31/05) | |
| Class A Actual2,3 | | $ | 1,000.00 | | | $ | 1,060.50 | | | $ | 5.61 | | |
| Class A Hypothetical (5% return before expenses)3 | | $ | 1,000.00 | | | $ | 1,019.76 | | | $ | 5.50 | | |
| Class B Actual2,3 | | $ | 1,000.00 | | | $ | 1,056.80 | | | $ | 9.49 | | |
| Class B Hypothetical (5% return before expenses)3 | | $ | 1,000.00 | | | $ | 1,015.98 | | | $ | 9.30 | | |
| Class C Actual2,3 | | $ | 1,000.00 | | | $ | 1,056.80 | | | $ | 9.49 | | |
| Class C Hypothetical (5% return before expenses)3 | | $ | 1,000.00 | | | $ | 1,015.98 | | | $ | 9.30 | | |
| Class R Actual2,3 | | $ | 1,000.00 | | | $ | 1,059.60 | | | $ | 6.75 | | |
| Class R Hypothetical (5% return before expenses)3 | | $ | 1,000.00 | | | $ | 1,018.65 | | | $ | 6.61 | | |
| Class Y Actual2,3 | | $ | 1,000.00 | | | $ | 1,062.60 | | | $ | 4.32 | | |
| Class Y Hypothetical (5% return before expenses)3 | | $ | 1,000.00 | | | $ | 1,021.02 | | | $ | 4.23 | | |
1Expenses are equal to the fund's annualized expense ratio for the most recent six-month period of 1.08%, 1.83%, 1.83%, 1.30% and 0.83% for Class A, Class B, Class C, Class R and Class Y, respectively, multiplied by the average account value over the period, multiplied by the number of days in the most recent fiscal half-year/365 (to reflect the one-half year period).
2Based on the actual returns for the six months ended October 31, 2005, of 6.05%, 5.68%, 5.68%, 5.96%, and 6.26% for Class A, Class B, Class C, Class R and Class Y, respectively.
3Prior to July 1, 2005, the contractual limitation on annual expenses was 1.05%, 1.80%, 1.80%, 1.30% and 0.80% for Class A, Class B, Class C, Class R and Class Y, respectively. Effective July 1, 2005, the contractual limitation on annual expenses for Class A, Class B, Class C, Class R, and Class Y has been increased to 1.10%, 1.85%, 1.85%, 1.35%, and 0.85%, respectively. If this new limitation had been in place during the entire period, actual and hypothetical ending account balances would have been approximately $1,060.40 and $1,019.66 for Class A, $1,056.70 and $1,015.88 for Class B, $1,056.70 and $1,015.88 for Class C, $1,059.34 and $1,018.40 for Class R and $1,062.50 and $1,020.92 for Class Y. Actual and hypothetical expenses paid during the period would have been approximately $5.71 and $5.60 for Class A, $9.59 and $9.40 for Class B, $9.59 an d $9.40 for Class C, $7.01 and $6.87 for Class R and $4.42 and $4.33 for Class Y.
FIRST AMERICAN FUNDS Annual Report 2005
37
Equity Income fund
Investment Objective: long-term growth of capital and income
How did the fund perform the fiscal period ended October 31, 2005?
The First American Equity Income Fund (the "fund"), Class Y shares, returned -1.50% for the one-month period ended October 31, 2005 (Class A shares returned -1.53% without taking the sales charge into account). By comparison, the fund's benchmarks, the Standard and Poor's 500 Index* ("S&P 500 Index"), returned -1.67% for the same period, and the Standard and Poor's 500 Dividend Only Stocks Index* ("S&P 500 Dividend Only Stocks Index"), returned -1.66% for the same period.
What were the general economic and market conditions during the fiscal period?
Broader economic growth continued at a relatively solid pace in October. Indicators for the manufacturing sector suggested robust growth as inventories remained low and recovery and reconstruction activity proceeded following the hurricanes. Companies indicated continued cost pressures from energy and other raw material prices, keeping Fed concerns about inflation intact. This led to an additional 25-basis-point tightening at the November 1 Federal Open Market Committee meeting, giving support to expectations for further short-term rate increases. While activity in the industrial sector remained robust, consumer confidence continued to slump despite gasoline prices falling sharply during the month. Auto sales fell to their lowest monthly pace in more than seven years as the employee discount sales promotions expired. Forward-looking housing market indicators such as mortgage applications for home purchases moved lower, and emplo yment cost data for the third quarter showed the slowest gain in wages in 25 years. Subdued compensation gains suggest that broader inflation should
remain well contained in the coming quarters, which will be a key to bringing an eventual end to Fed tightening and should provide a supportive backdrop to the financial markets.
What worked for the fund and why?
The fund benefited from good stock selection in several sectors. In financials, Alliance Capital and State Street were standout performers, their revenue trends strengthening in a rising stock market. In health care, Teva Pharmaceuticals (a generic pharmaceutical company) performed well on strong revenue and earnings reports. Avery Dennison and United Parcel Services led the way in industrials, having delivered strong quarterly earnings reports. Bemis (a packaging materials company) and Praxair (a provider of industrial gases) were outstanding performers in the materials sector. Bemis rose in anticipation of easing cost pressures on raw materials and the resultant improving outlook for profits. Praxair reported strong earning performance for the third quarter.
What did not work for the fund and why?
The fund's modest overweight in the energy sector detracted from performance. Energy stocks sold off in response to falling energy prices as investors took profits in the sector, which has had very strong price appreciation during 2005.
*Unlike mutual funds, index returns do not reflect any expenses, transaction costs, or cash flow effects.
| Top 10 Holdings as of October 31, 20051 (% of net assets) | |
| Exxon Mobil | | | 3.6 | % | |
| Microsoft | | | 3.4 | % | |
| Citigroup | | | 2.9 | % | |
| General Electric | | | 2.8 | % | |
| Wyeth | | | 2.7 | % | |
| Bank of America | | | 2.5 | % | |
| ConocoPhillips | | | 2.2 | % | |
| Praxair | | | 2.1 | % | |
| Altria Group | | | 2.1 | % | |
| Wachovia | | | 2.0 | % | |
| Sector Allocation as of October 31, 20051 (% of net assets) | |
| Financials | | | 21.3 | % | |
| Energy | | | 13.5 | % | |
| Health Care | | | 12.0 | % | |
| Industrials | | | 11.3 | % | |
| Information Technology | | | 11.1 | % | |
| Materials | | | 7.4 | % | |
| Consumer Discretionary | | | 6.9 | % | |
| Consumer Staples | | | 6.9 | % | |
| Telecommunication Services | | | 4.3 | % | |
| Utilities | | | 3.8 | % | |
| Short-Term Investments | | | 0.8 | % | |
| Convertible Preferred Stock | | | 0.6 | % | |
| Convertible Corporate Bond | | | 0.2 | % | |
| Other Assets and Liabilities, Net | | | (0.1 | )% | |
| | | | 100.0 | % | |
1Fund holdings and sector allocations are subject to change at any time and are not recommendations to buy or sell any security.
FIRST AMERICAN FUNDS Annual Report 2005
38
Equity Income fund continued
Annual Performance1
| | | October 31, 2005 | | September 30, 2005** | |
| | | One- | | | | | | | | Since Inception | | | | | | | | Since Inception | |
| | | month* | | 1 year | | 5 years | | 10 years | | 2/01/99 | | 9/24/01 | | 1 year | | 5 years | | 10 years | | 2/01/99 | | 9/24/01 | |
| Average annual return with sales charge (POP) | |
| Class A | | | (6.96 | )% | | | 2.09 | % | | | 1.23 | % | | | 8.53 | % | | | — | | | | — | | | | 4.59 | % | | | 2.22 | % | | | 8.46 | % | | | — | | | | — | | |
| Class B | | | (6.52 | )% | | | 2.17 | % | | | 1.31 | % | | | 8.37 | % | | | — | | | | — | | | | 4.86 | % | | | 2.30 | % | | | 8.30 | % | | | — | | | | — | | |
| Class C | | | (2.58 | )% | | | 6.15 | % | | | 1.60 | % | | | — | | | | 2.70 | % | | | — | | | | 8.84 | % | | | 2.58 | % | | | — | | | | 2.98 | % | | | — | | |
| Average annual return without sales charge (NAV) | |
| Class A | | | (1.53 | )% | | | 8.04 | % | | | 2.38 | % | | | 9.15 | % | | | — | | | | — | | | | 10.65 | % | | | 3.38 | % | | | 9.07 | % | | | — | | | | — | | |
| Class B | | | (1.60 | )% | | | 7.17 | % | | | 1.62 | % | | | 8.37 | % | | | — | | | | — | | | | 9.86 | % | | | 2.60 | % | | | 8.30 | % | | | — | | | | — | | |
| Class C | | | (1.59 | )% | | | 7.15 | % | | | 1.60 | % | | | — | | | | 2.70 | % | | | — | | | | 9.84 | % | | | 2.58 | % | | | — | | | | 2.98 | % | | | — | | |
| Class R | | | (1.55 | )% | | | 7.71 | % | | | — | | | | — | | | | — | | | | 5.87 | % | | | 10.33 | % | | | — | | | | — | | | | — | | | | 6.41 | % | |
| Class Y | | | (1.50 | )% | | | 8.34 | % | | | 2.63 | % | | | 9.45 | % | | | — | | | | — | | | | 10.94 | % | | | 3.63 | % | | | 9.38 | % | | | — | | | | — | | |
| S&P 500 Index2 | | | (1.67 | )% | | | 8.72 | % | | | (1.74 | )% | | | 9.34 | % | | | 0.74 | % | | | 6.41 | % | | | 12.25 | % | | | (1.49 | )% | | | 9.49 | % | | | 1.00 | % | | | 7.00 | % | |
| S&P 500 Dividend Only Stocks Index3 | | | (1.66 | )% | | | 8.73 | % | | | 0.63 | % | | | 9.90 | % | | | 2.49 | % | | | 3.71 | % | | | 11.84 | % | | | 1.22 | % | | | 10.04 | % | | | 2.78 | % | | | 4.22 | % | |
Value of a $10,000 Investment1,4 as of September 30, 2005
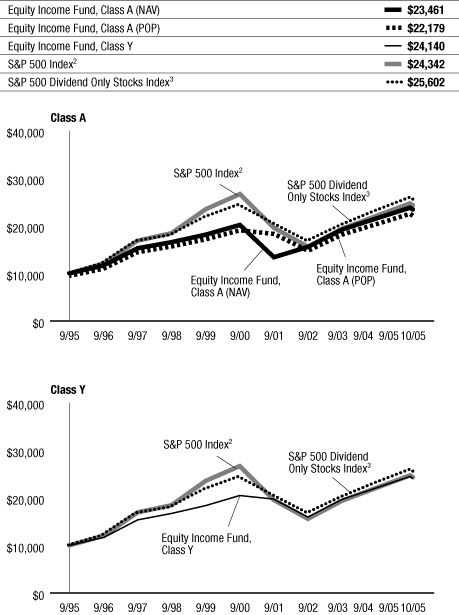
The chart above illustrates the total value of an assumed $10,000 investment in the fund's Class A and Class Y shares (from 9/30/95 to 10/31/05) as compared to the S&P 500 Index2 and the S&P 500 Dividend Only Stocks Index3.
The performance data quoted on this page represents past performance and does not guarantee future results. The investment return and principal value of an investment will fluctuate so that an investor's shares, when redeemed, may be worth more or less than their original cost. Current performance of the fund may be lower or higher than the performance data quoted. Performance data current to the most recent month-end may be obtained by calling 800.677.FUND.
* Total returns have not been annualized.
** This table represents average annual total returns through the latest calendar quarter—rather than through the end of the fiscal period.
1 Performance does not reflect the deduction of taxes that a shareholder would pay on fund distributions or redemption of fund shares. Investment performance reflects fee waivers that are or were in effect. In the absence of such fee waivers, total returns would be reduced. Index performance is for illustrative purposes only and does not reflect any expenses, transaction costs, or cash flow effects. Direct investment in the index is not available.
Mutual fund investing involves risk; principal loss is possible.
Total returns at net asset value ("NAV") reflect performance over the time period indicated without including the fund's maximum sales charge and assume reinvestment of all distributions at NAV.
Total returns at public offering price ("POP") reflect performance over the time period indicated including a maximum front-end sales charge of 5.50% for Class A shares and the maximum contingent deferred sales charge ("CDSC") for Class B and Class C shares for the relevant period. Maximum CDSC is 5.00% for Class B shares in the first year, decreasing annually to 0% in the seventh year following purchase, and 1.00% for Class C shares. Total returns assume reinvestment of all distributions at NAV.
On May 18, 1994, the Equity Income Fund became the successor by merger to the Boulevard Strategic Balance Fund. Prior to the merger, the First American fund had no assets or liabilities. Performance prior to May 18, 1994, is that of the Boulevard Strategic Balance Fund.
2 An unmanaged market capitalization-weighted index based on the average weighted performance of 500 widely held common stocks.
3 The S&P 500 Dividend Only Stocks Index custom benchmark is composed of companies in the S&P 500 Index that have an indicated annual dividend.
4 Performance for Class B, Class C, and Class R shares is not presented. Performance for these classes will vary due to different expense structures.
FIRST AMERICAN FUNDS Annual Report 2005
39
Equity Income fund continued
Expense Example
As a shareholder of the Equity Income Fund (the "fund"), you incur two types of costs: (1) transaction costs, including sales charges (loads) on purchase payments; and (2) ongoing costs, including investment advisory fees; distribution and/or service (12b-1) fees; and other fund expenses. This example is intended to help you understand your ongoing costs (in dollars) of investing in the fund and to compare these costs with the ongoing costs of investing in other mutual funds. The example is based on an investment of $1,000 invested at the beginning of the period and held for the entire period from May 1, 2005, to October 31, 2005.
Actual Expenses
For each class, the first line of the table below provides information about actual account values and actual expenses. You may use the information in this line, together with the amount you invested, to estimate the expenses that you paid over the period. Simply divide your account value by $1,000 (for example, an $8,600 account value divided by $1,000 = 8.6), then multiply the result by the number in the first line under the heading entitled "Expenses Paid During Period" to estimate the expenses you paid on your account during this period.
Hypothetical Example for Comparison Purposes
For each class, the second line of the table below provides information about hypothetical account values and hypothetical expenses based on the fund's actual expense ratio and an assumed rate of return of 5% per year before expenses, which is not the fund's actual return. The hypothetical account values and expenses may not be used to estimate the actual ending account balance or expenses you paid for the period. You may use this information to compare the ongoing costs of investing in the fund and other funds. To do so, compare this 5% hypothetical example with the 5% hypothetical examples that appear in the shareholder reports of the other funds.
Please note that the expenses shown in the table are meant to highlight your ongoing costs only and do not reflect any transactional costs, such as sales charges (loads). Therefore, the second line of the table for each class is useful in comparing ongoing costs only, and will not help you determine the relative total costs of owning different funds. In addition, if these transactional costs were included, your costs would have been higher.
Expense Examples
| | | Beginning Account
Value (5/01/05) | | Ending Account
Value (10/31/05) | | Expenses Paid During
Period1 (5/01/05 to
10/31/05) | |
| Class A Actual2,3 | | $ | 1,000.00 | | | $ | 1,041.20 | | | $ | 6.07 | | |
| Class A Hypothetical (5% return before expenses)3 | | $ | 1,000.00 | | | $ | 1,019.26 | | | $ | 6.01 | | |
| Class B Actual2,3 | | $ | 1,000.00 | | | $ | 1,037.20 | | | $ | 9.91 | | |
| Class B Hypothetical (5% return before expenses)3 | | $ | 1,000.00 | | | $ | 1,015.48 | | | $ | 9.80 | | |
| Class C Actual2,3 | | $ | 1,000.00 | | | $ | 1,037.10 | | | $ | 9.91 | | |
| Class C Hypothetical (5% return before expenses)3 | | $ | 1,000.00 | | | $ | 1,015.48 | | | $ | 9.80 | | |
| Class R Actual2,3 | | $ | 1,000.00 | | | $ | 1,040.00 | | | $ | 7.35 | | |
| Class R Hypothetical (5% return before expenses)3 | | $ | 1,000.00 | | | $ | 1,018.00 | | | $ | 7.27 | | |
| Class Y Actual2,3 | | $ | 1,000.00 | | | $ | 1,042.20 | | | $ | 4.79 | | |
| Class Y Hypothetical (5% return before expenses)3 | | $ | 1,000.00 | | | $ | 1,020.52 | | | $ | 4.74 | | |
1Expenses are equal to the fund's annualized expense ratio for the most recent six-month period of 1.18%, 1.93%, 1.93%, 1.43% and 0.93% for Class A, Class B, Class C, Class R and Class Y, respectively, multiplied by the average account value over the period, multiplied by the number of days in the most recent fiscal half-year/365 (to reflect the one-half year period).
2Based on the actual returns for the six months ended October 31, 2005, of 4.12%, 3.72%, 3.71%, 4.00% and 4.22% for Class A, Class B, Class C, Class R and Class Y, respectively.
3Prior to July 1, 2005, the contractual limitation on annual expenses was 1.15%, 1.90%, 1.90%, 1.40% and 0.90% for Class A, Class B, Class C, Class R and Class Y, respectively. Effective July 1, 2005, the contractual limitation on annual expenses for each class was removed. If this limitation had not been in place during the entire period, actual and hypothetical ending account balances would have been approximately $1,041.10 and $1,019.16 for Class A, $1,037.10 and $1,015.38 for Class B, $1,037.00 and $1,015.38 for Class C, $1,039.89 and $1,017.90 for Class R and $1,042.10 and $1,020.42 for Class Y. Actual and hypothetical expenses paid during the period would have been approximately $6.17 and $6.11 for Class A , $10.01 and $9.91 for Class B, $10.01 and $9.91 for Class C, $7.46 and $7.37 for Class R and $4.89 and $4.84 for Class Y.
FIRST AMERICAN FUNDS Annual Report 2005
40
Report of Independent Registered Public Accounting Firm
To the Shareholders and Board of Directors
First American Investment Funds, Inc.
We have audited the accompanying statements of assets and liabilities, including the schedules of investments, of the Real Estate Securities, International, Small Cap Growth Opportunities, Small Cap Select, Small Cap Value, Small-Mid Cap Core (formally Technology Fund), Mid Cap Growth Opportunities, Mid Cap Value, Large Cap Growth Opportunities, Large Cap Select, Large Cap Value, Balanced, and Equity Income Funds (series of First American Investment Funds, Inc.) (collectively, the "funds") as of October 31, 2005, and the related statements of operations, statements of changes in net assets and financial highlights for each of the periods indicated therein. These financial statements and the financial highlights are the responsibility of the funds' management. Our responsibility is to express an opinion on these financial statements and financial highlights based on our audits.
We conducted our audits in accordance with the standards of the Public Company Accounting Oversight Board (United States). Those standards require that we plan and perform the audit to obtain reasonable assurance about whether the financial statements and financial highlights are free of material misstatement. We were not engaged to perform an audit of the funds internal control over financial reporting. Our audits included consideration of internal control over financial reporting as a basis for designing audit procedures that are appropriate in the circumstances, but not for the purpose of expressing an opinion on the effectiveness of the funds' internal control over financial reporting. Accordingly, we express no such opinion. An audit also includes examining, on a test basis, evidence supporting the amounts and disclosures in the financial statements and financial highlights, assessing the accounting principles used and sign ificant estimates made by management, and evaluating the overall financial statement presentation. Our procedures included verification by examination of securities held by the custodian as of October 31, 2005 and confirmation of the securities held by correspondence with the custodian and brokers or by other appropriate auditing procedures where replies from brokers were not received. We believe that our audits provide a reasonable basis for our opinion.
In our opinion, the financial statements and financial highlights audited by us as referred to above present fairly, in all material respects, the financial position of the funds listed above of First American Investment Funds, Inc. at October 31, 2005, the results of their operations, the changes in their net assets, and their financial highlights for the periods indicated therein, in conformity with U.S. generally accepted accounting principles.

Minneapolis, Minnesota
December 9, 2005
FIRST AMERICAN FUNDS Annual Report 2005
41
Schedule of Investments October 31, 2005
Real Estate Securities Fund
| DESCRIPTION | | SHARES | | VALUE (000) | |
| Real Estate Investment Trusts (a) – 97.9% | |
| Apartments – 17.6% | |
| Archstone-Smith Trust (b) | | | 649,615 | | | $ | 26,355 | | |
| Avalonbay Communities (b) | | | 343,350 | | | | 29,614 | | |
| Camden Property Trust | | | 432,374 | | | | 24,364 | | |
| Education Realty Trust | | | 119,160 | | | | 1,847 | | |
| Equity Residential Properties Trust (b) | | | 444,520 | | | | 17,447 | | |
| Essex Property Trust (b) | | | 80,840 | | | | 7,266 | | |
| Mid-America Apartment Communities | | | 144,420 | | | | 6,737 | | |
| | | | 113,630 | | |
| Community Centers – 12.1% | |
| Agree Realty | | | 200,920 | | | | 5,415 | | |
| Developers Diversified Realty (b) | | | 495,813 | | | | 21,657 | | |
| Kimco Realty (b) | | | 334,640 | | | | 9,912 | | |
| Kite Realty Group Trust | | | 559,930 | | | | 8,276 | | |
| Pan Pacific Retail Properties (b) | | | 142,460 | | | | 9,046 | | |
| Regency Centers (b) | | | 364,630 | | | | 20,299 | | |
| Saul Centers (b) | | | 111,610 | | | | 3,906 | | |
| | | | 78,511 | | |
| Diversified – 5.8% | |
| Cousins Properties | | | 129,960 | | | | 3,839 | | |
| Forest City Enterprises, Class A | | | 102,010 | | | | 3,763 | | |
| Trizec Properties (b) | | | 508,410 | | | | 11,312 | | |
| Vornado Realty Trust (b) | | | 229,880 | | | | 18,620 | | |
| | | | 37,534 | | |
| Health Care – 2.6% | |
| American Retirement* | | | 121,840 | | | | 2,328 | | |
| Healthcare Realty Trust | | | 76,410 | | | | 2,891 | | |
| Ventas | | | 383,500 | | | | 11,747 | | |
| | | | 16,966 | | |
| Hotels – 9.1% | |
| Eagle Hospitality Property Trust | | | 517,450 | | | | 4,921 | | |
| Gaylord Entertainment* | | | 79,330 | | | | 3,132 | | |
| Hersha Hospitality Trust | | | 380,480 | | | | 3,729 | | |
| Hilton Hotels | | | 714,380 | | | | 13,895 | | |
| Host Marriott (b) | | | 469,990 | | | | 7,891 | | |
| La Quinta* (b) | | | 1,322,210 | | | | 11,040 | | |
| Marriott International, Class A (b) | | | 101,720 | | | | 6,065 | | |
| Starwood Hotels & Resorts Worldwide (b) | | | 54,100 | | | | 3,161 | | |
| Winston Hotels | | | 471,780 | | | | 4,864 | | |
| | | | 58,698 | | |
| Industrials – 11.5% | |
| AMB Property | | | 191,210 | | | | 8,448 | | |
| Centerpoint Properties Trust (b) | | | 150,900 | | | | 6,875 | | |
| First Potomac Realty Trust | | | 390,360 | | | | 9,892 | | |
| Liberty Property Trust (b) | | | 31,020 | | | | 1,293 | | |
| Prologis (b) | | | 971,739 | | | | 41,785 | | |
| PS Business Parks (b) | | | 130,460 | | | | 6,072 | | |
| | | | 74,365 | | |
| Malls – 12.1% | |
| General Growth Properties (b) | | | 468,370 | | | | 19,896 | | |
| Macerich (b) | | | 30,000 | | | | 1,928 | | |
| Mills (b) | | | 256,480 | | | | 13,722 | | |
| Simon Property Group (b) | | | 522,190 | | | | 37,399 | | |
| Taubman Centers | | | 173,050 | | | | 5,705 | | |
| | | | 78,650 | | |
| Office – 21.6% | |
| Alexandria Real Estate Equities (b) | | | 76,790 | | | | 6,209 | | |
| Arden Realty | | | 92,670 | | | | 4,183 | | |
Real Estate Securities Fund (concluded)
| DESCRIPTION | | SHARES | | VALUE (000) | |
| BioMed Realty Trust | | | 144,110 | | | $ | 3,604 | | |
| Boston Properties (b) | | | 306,760 | | | | 21,234 | | |
| Brascan | | | 197,410 | | | | 9,035 | | |
| Brookfield Properties (b) | | | 864,625 | | | | 25,334 | | |
| Cogdell Spencer* | | | 473,910 | | | | 8,194 | | |
| Corporate Office Properties Trust | | | 109,820 | | | | 3,817 | | |
| Equity Office Properties Trust (b) | | | 433,490 | | | | 13,352 | | |
| Kilroy Realty (b) | | | 175,820 | | | | 9,872 | | |
| Mack-Cali Realty | | | 205,380 | | | | 8,759 | | |
| Maguire Properties | | | 293,500 | | | | 8,805 | | |
| Reckson Associates Realty (b) | | | 174,210 | | | | 6,115 | | |
| SL Green Realty | | | 164,880 | | | | 11,217 | | |
| | | | 139,730 | | |
| Self Storage – 3.0% | |
| Public Storage (b) | | | 226,530 | | | | 14,996 | | |
| Sovran Self Storage (b) | | | 97,990 | | | | 4,561 | | |
| | | | 19,557 | | |
| Specialty Real Estate – 2.5% | |
| Equity Lifestyle Properties | | | 148,660 | | | | 6,293 | | |
| Newcastle Investment | | | 168,580 | | | | 4,432 | | |
| Northstar Realty Finance | | | 555,150 | | | | 5,252 | | |
| | | | 15,977 | | |
Total Real Estate Investment Trusts
(Cost $540,393) | | | | | | | 633,618 | | |
| Private Real Estate Companies – 0.1% | |
| Beacon Capital* (c) (d) | | | 33,750 | | | | 45 | | |
| Newcastle Investment Holdings* (c) (d) | | | 35,000 | | | | 280 | | |
Total Private Real Estate Companies
(Cost $588) | | | | | | | 325 | | |
| Short-Term Investments – 3.0% | |
First American Prime Obligations Fund, Class Z (e)
(Cost $19,590) | | | 19,590,422 | | | | 19,590 | | |
Investments Purchased with Proceeds
from Securities Lending (f) – 46.3% | |
| (Cost $299,612) | | | | | | | 299,612 | | |
Total Investments – 147.3%
(Cost $860,183) | | | | | | | 953,145 | | |
| Other Assets and Liabilities, Net – (47.3)% | | | | | | | (306,006 | ) | |
| Total Net Assets – 100.0% | | | | | | $ | 647,139 | | |
* Non-income producing security
(a) The fund is primarily invested in the Real Estate sector and therefore is subject to additional risks. See notes 1 and 6 in Notes to Financial Statements.
(b) This security or a portion of this security is out on loan at October 31, 2005. Total loaned securities had a market value of $293,354,985 at October 31, 2005. See note 2 in Notes to Financial Statements.
(c) Security is considered illiquid or restricted. As of October 31, 2005, the value of these investments was $325,212 or 0.1% of total net assets. See note 2 in Notes to Financial Statements.
(d) Security is fair valued. As of October 31, 2005, the fair value of these investments was $325,212 or 0.1% of total net assets. See note 2 in Notes to Financial Statements.
(e) Investment in affiliated security. This money market fund is advised by U.S. Bancorp Asset Management, Inc., which also serves as advisor to this fund. See note 3 in Notes to Financial Statements.
(f) The fund may loan securities in return for collateral in the form of cash, U.S. Government securities, or other high grade debt obligations. The cash collateral is invested in various short-term fixed income securities, such as repurchase agreements, commercial paper, money market funds and other corporate obligations. See note 2 in Notes to Financial Statements.
The accompanying notes are an integral part of the financial statements.
FIRST AMERICAN FUNDS Annual Report 2005
42
Statement of Assets and Liabilities October 31, 2005, in thousands, except for per share data
| | | Real Estate
Securities Fund | |
| ASSETS: | |
| Investments in unaffliated securities, at value† (cost: $540,981) (note 2) | | $ | 633,943 | | |
| Investments in affliated money market fund, at value (cost: $19,590) (note 2) | | | 19,590 | | |
| Investments purchased with proceeds from securities lending (cost: $299,612) (note 2) | | | 299,612 | | |
| Cash* | | | 345 | | |
| Receivable for dividends and interest | | | 431 | | |
| Receivable for investment securities sold | | | 8,972 | | |
| Receivable for capital shares sold | | | 634 | | |
| Prepaid expenses and other assets | | | 56 | | |
| Total assets | | | 963,583 | | |
| LIABILITIES: | |
| Payable for investment securities purchased | | | 15,513 | | |
| Payable upon return of securities loaned (note 2) | | | 299,957 | | |
| Payable for capital shares redeemed | | | 388 | | |
| Payable to affiliates (note 3) | | | 529 | | |
| Payable for distribution and shareholder servicing fees | | | 36 | | |
| Accrued expenses and other liabilities | | | 21 | | |
| Total liabilities | | | 316,444 | | |
| Net assets | | $ | 647,139 | | |
| COMPOSITION OF NET ASSETS: | |
| Portfolio capital | | $ | 472,002 | | |
| Undistributed net investment income | | | 3,478 | | |
| Accumulated net realized gain on investments | | | 78,697 | | |
| Net unrealized appreciation of investments | | | 92,962 | | |
| Net assets | | $ | 647,139 | | |
| * Includes cash collateral received related to securities loaned (note 2) | | $ | 345 | | |
| † Including securities loaned, at value | | $ | 293,355 | | |
| Class A: | |
| Net assets | | $ | 133,339 | | |
| Shares issued and outstanding ($0.0001 par value — 2 billion authorized) | | | 6,225 | | |
| Net asset value and redemption price per share | | $ | 21.42 | | |
| Maximum offering price per share (1) | | $ | 22.67 | | |
| Class B: | |
| Net assets | | $ | 4,419 | | |
| Shares issued and outstanding ($0.0001 par value — 2 billion authorized) | | | 209 | | |
| Net asset value, offering price and redemption price per share (2) | | $ | 21.14 | | |
| Class C: | |
| Net assets | | $ | 4,669 | | |
| Shares issued and outstanding ($0.0001 par value — 2 billion authorized) | | | 220 | | |
| Net asset value, offering price and redemption price per share (2) | | $ | 21.21 | | |
| Class R: | |
| Net assets | | $ | 57 | | |
| Shares issued and outstanding ($0.0001 par value — 2 billion authorized) | | | 3 | | |
| Net asset value, offering price, and redemption price per share | | $ | 21.61 | | |
| Class Y: | |
| Net assets | | $ | 504,655 | | |
| Shares issued and outstanding ($0.0001 par value — 2 billion authorized) | | | 23,430 | | |
| Net asset value, offering price, and redemption price per share | | $ | 21.54 | | |
(1) The offering price is calculated by dividing the net asset value by 1 minus the maximum sales charge of 5.50%
(2) Class B and C have a contingent deferred sales charge. For a description of this sales charge, see notes 1 and 3 in Notes to Financial Statements.
The accompanying notes are an integral part of the financial statements.
FIRST AMERICAN FUNDS Annual Report 2005
43
Statement of Operations in thousands
| | | Real Estate
Securities Fund | |
| | | One-Month
Period Ended
10/31/05 | | Year
Ended
9/30/05 | |
| INVESTMENT INCOME: | |
| Dividends from affiliated money market fund | | $ | 22 | | | $ | 384 | | |
| Dividends from unaffiliated securities | | | 1,443 | | | | 27,943 | | |
| Less: Foreign taxes withheld | | | (6 | ) | | | (61 | ) | |
| Securities lending income | | | 20 | | | | 170 | | |
| Total investment income | | | 1,479 | | | | 28,436 | | |
| EXPENSES (note 3): | |
| Investment advisory fees | | | 382 | | | | 4,277 | | |
| Transfer agent fees | | | 71 | | | | 405 | | |
| Administration fees | | | 70 | | | | 1,233 | | |
| Registration fees | | | 4 | | | | 44 | | |
| Custodian fees | | | 3 | | | | 53 | | |
| Professional fees | | | 2 | | | | 49 | | |
| Postage and printing fees | | | 1 | | | | 45 | | |
| Directors' fees | | | 1 | | | | 14 | | |
| Other expenses | | | 1 | | | | 14 | | |
| Distribution and shareholder servicing fees – Class A | | | 28 | | | | 284 | | |
| Distribution and shareholder servicing fees – Class B | | | 4 | | | | 46 | | |
| Distribution and shareholder servicing fees – Class C | | | 4 | | | | 47 | | |
| Distribution and shareholder servicing fees – Class R (1) | | | — | | | | — | | |
| Total expenses | | | 571 | | | | 6,511 | | |
| Less: Fee waivers (note 3) | | | — | | | | (111 | ) | |
| Total net expenses | | | 571 | | | | 6,400 | | |
| Investment income – net | | | 908 | | | | 22,036 | | |
| REALIZED AND UNREALIZED GAINS (LOSSES) ON INVESTMENTS – NET (note 5): | |
| Net realized gain on investments | | | 6,604 | | | | 85,317 | | |
| Net change in unrealized appreciation or depreciation of investments | | | (19,635 | ) | | | 47,167 | | |
| Net gain (loss) on investments | | | (13,031 | ) | | | 132,484 | | |
| Net increase (decrease) in net assets resulting from operations | | $ | (12,123 | ) | | $ | 154,520 | | |
(1) Due to the presentation of the financial statements in thousands, the numbers round to zero.
The accompanying notes are an integral part of the financial statements.
FIRST AMERICAN FUNDS Annual Report 2005
44
Statement of Changes in Net Assets in thousands
| | | Real Estate
Securities Fund | |
| | | One-Month
Period Ended
10/31/05 | | Year
Ended
9/30/05 | | Year
Ended
9/30/04 | |
| OPERATIONS: | |
| Investment income – net | | $ | 908 | | | $ | 22,036 | | | $ | 14,500 | | |
| Net realized gain on investments | | | 6,604 | | | | 85,317 | | | | 35,085 | | |
| Net change in unrealized appreciation or depreciation of investments | | | (19,635 | ) | | | 47,167 | | | | 32,394 | | |
| Net increase (decrease) in net assets resulting from operations | | | (12,123 | ) | | | 154,520 | | | | 81,979 | | |
| DISTRIBUTIONS TO SHAREHOLDERS FROM: | |
| Investment income – net: | |
| Class A | | | — | | | | (3,209 | ) | | | (2,018 | ) | |
| Class B | | | — | | | | (92 | ) | | | (123 | ) | |
| Class C | | | — | | | | (94 | ) | | | (120 | ) | |
| Class R | | | — | | | | (1 | ) | | | (56 | ) | |
| Class Y | | | — | | | | (14,545 | ) | | | (12,334 | ) | |
| Net realized gain on investments: | |
| Class A | | | — | | | | (7,087 | ) | | | (1,410 | ) | |
| Class B | | | — | | | | (338 | ) | | | (136 | ) | |
| Class C | | | — | | | | (326 | ) | | | (131 | ) | |
| Class R | | | — | | | | — | | | | (97 | ) | |
| Class Y | | | — | | | | (32,911 | ) | | | (8,059 | ) | |
| Total distributions | | | — | | | | (58,603 | ) | | | (24,484 | ) | |
| CAPITAL SHARE TRANSACTIONS (note 4): | |
| Class A: | |
| Proceeds from sales | | | 2,854 | | | | 45,709 | | | | 50,157 | | |
| Reinvestment of distributions | | | — | | | | 10,057 | | | | 3,282 | | |
| Payments for redemptions | | | (2,840 | ) | | | (24,578 | ) | | | (10,941 | ) | |
| Increase in net assets from Class A transactions | | | 14 | | | | 31,188 | | | | 42,498 | | |
| Class B: | |
| Proceeds from sales | | | 61 | | | | 1,148 | | | | 1,101 | | |
| Reinvestment of distributions | | | — | | | | 386 | | | | 236 | | |
| Payments for redemptions (note 3) | | | (253 | ) | | | (1,935 | ) | | | (1,051 | ) | |
| Increase (decrease) in net assets from Class B transactions | | | (192 | ) | | | (401 | ) | | | 286 | | |
| Class C: | |
| Proceeds from sales | | | 66 | | | | 1,485 | | | | 1,777 | | |
| Reinvestment of distributions | | | — | | | | 395 | | | | 239 | | |
| Payments for redemptions (note 3) | | | (257 | ) | | | (1,887 | ) | | | (1,533 | ) | |
| Increase (decrease) in net assets from Class C transactions | | | (191 | ) | | | (7 | ) | | | 483 | | |
| Class R: | |
| Proceeds from sales | | | 22 | | | | 56 | | | | 1,277 | | |
| Reinvestment of distributions | | | — | | | | — | | | | 137 | | |
| Payments for redemptions | | | (1 | ) | | | (23 | ) | | | (4,196 | ) | |
| Increase (decrease) in net assets from Class R transactions | | | 21 | | | | 33 | | | | (2,782 | ) | |
| Class Y: | |
| Proceeds from sales | | | 5,951 | | | | 124,624 | | | | 228,629 | | |
| Reinvestment of distributions | | | — | | | | 21,477 | | | | 8,467 | | |
| Payments for redemptions | | | (16,972 | ) | | | (112,400 | ) | | | (64,875 | ) | |
| Increase (decrease) in net assets from Class Y transactions | | | (11,021 | ) | | | 33,701 | | | | 172,221 | | |
| Increase (decrease) in net assets from capital share transactions | | | (11,369 | ) | | | 64,514 | | | | 212,706 | | |
| Total increase (decrease) in net assets | | | (23,492 | ) | | | 160,431 | | | | 270,201 | | |
| Net assets at beginning of period | | | 670,631 | | | | 510,200 | | | | 239,999 | | |
| Net assets at end of period | | $ | 647,139 | | | $ | 670,631 | | | $ | 510,200 | | |
| Undistributed net investment income at end of period | | $ | 3,478 | | | $ | 2,805 | | | $ | 1,227 | | |
The accompanying notes are an integral part of the financial statements.
FIRST AMERICAN FUNDS Annual Report 2005
45
Financial Highlights For a share outstanding throughout the indicated periods.
| | | Net Asset
Value
Beginning
of Period | | Net
Investment
Income | | Realized and
Unrealized
Gains
(Losses) on
Investments | | Distributions
from Net
Investment
Income | | Distributions
from Net
Realized Gains | | Distributions
from
Return of
Capital | | Net Asset
Value
End of
Period | |
| Real Estate Securities Fund (1) | | | |
| Class A | |
| | 2005 | (2) | | $ | 21.81 | | | $ | 0.03 | | | $ | (0.42 | ) | | $ | — | | | $ | — | | | $ | — | | | $ | 21.42 | | |
| | 2005 | (3) | | | 18.62 | | | | 0.69 | | | | 4.47 | | | | (0.55 | ) | | | (1.42 | ) | | | — | | | | 21.81 | | |
| | 2004 | (3) | | | 16.00 | | | | 0.63 | | | | 3.21 | | | | (0.62 | ) | | | (0.60 | ) | | | — | | | | 18.62 | | |
| | 2003 | (3) | | | 13.68 | | | | 0.69 | | | | 2.65 | | | | (0.69 | ) | | | (0.33 | ) | | | — | | | | 16.00 | | |
| | 2002 | (3) | | | 13.12 | | | | 0.71 | | | | 0.61 | | | | (0.69 | ) | | | — | | | | (0.07 | ) | | | 13.68 | | |
| | 2001 | (3) | | | 12.71 | | | | 0.76 | | | | 0.32 | | | | (0.64 | ) | | | — | | | | (0.03 | ) | | | 13.12 | | |
| Class B | |
| | 2005 | (2) | | $ | 21.53 | | | $ | 0.01 | | | $ | (0.40 | ) | | $ | — | | | $ | — | | | $ | — | | | $ | 21.14 | | |
| | 2005 | (3) | | | 18.41 | | | | 0.54 | | | | 4.40 | | | | (0.40 | ) | | | (1.42 | ) | | | — | | | | 21.53 | | |
| | 2004 | (3) | | | 15.85 | | | | 0.50 | | | | 3.17 | | | | (0.51 | ) | | | (0.60 | ) | | | — | | | | 18.41 | | |
| | 2003 | (3) | | | 13.55 | | | | 0.57 | | | | 2.64 | | | | (0.58 | ) | | | (0.33 | ) | | | — | | | | 15.85 | | |
| | 2002 | (3) | | | 13.02 | | | | 0.59 | | | | 0.61 | | | | (0.60 | ) | | | — | | | | (0.07 | ) | | | 13.55 | | |
| | 2001 | (3) | | | 12.61 | | | | 0.65 | | | | 0.33 | | | | (0.54 | ) | | | — | | | | (0.03 | ) | | | 13.02 | | |
| Class C | |
| | 2005 | (2) | | $ | 21.61 | | | $ | 0.01 | | | $ | (0.41 | ) | | $ | — | | | $ | — | | | $ | — | | | $ | 21.21 | | |
| | 2005 | (3) | | | 18.47 | | | | 0.54 | | | | 4.42 | | | | (0.40 | ) | | | (1.42 | ) | | | — | | | | 21.61 | | |
| | 2004 | (3) | | | 15.89 | | | | 0.50 | | | | 3.19 | | | | (0.51 | ) | | | (0.60 | ) | | | — | | | | 18.47 | | |
| | 2003 | (3) | | | 13.62 | | | | 0.59 | | | | 2.62 | | | | (0.61 | ) | | | (0.33 | ) | | | — | | | | 15.89 | | |
| | 2002 | (3) | | | 13.08 | | | | 0.62 | | | | 0.59 | | | | (0.60 | ) | | | — | | | | (0.07 | ) | | | 13.62 | | |
| | 2001 | (3) | | | 12.68 | | | | 0.69 | | | | 0.30 | | | | (0.59 | ) | | | — | | | | — | | | | 13.08 | | |
| Class R (4) | |
| | 2005 | (2) | | $ | 22.00 | | | $ | 0.02 | | | $ | (0.41 | ) | | $ | — | | | $ | — | | | $ | — | | | $ | 21.61 | | |
| | 2005 | (3) | | | 18.80 | | | | 0.72 | | | | 4.43 | | | | (0.53 | ) | | | (1.42 | ) | | | — | | | | 22.00 | | |
| | 2004 | (3) | | | 16.00 | | | | 0.61 | | | | 3.24 | | | | (0.45 | ) | | | (0.60 | ) | | | — | | | | 18.80 | | |
| | 2003 | (3) | | | 13.69 | | | | 0.69 | | | | 2.64 | | | | (0.69 | ) | | | (0.33 | ) | | | — | | | | 16.00 | | |
| | 2002 | (3) | | | 13.12 | | | | 0.70 | | | | 0.62 | | | | (0.68 | ) | | | — | | | | (0.07 | ) | | | 13.69 | | |
| | 2001 | (5) | | | 12.52 | | | | 0.11 | | | | 0.49 | | | | — | | | | — | | | | — | | | | 13.12 | | |
| Class Y | |
| | 2005 | (2) | | $ | 21.92 | | | $ | 0.03 | | | $ | (0.41 | ) | | $ | — | | | $ | — | | | $ | — | | | $ | 21.54 | | |
| | 2005 | (3) | | | 18.71 | | | | 0.74 | | | | 4.49 | | | | (0.60 | ) | | | (1.42 | ) | | | — | | | | 21.92 | | |
| | 2004 | (3) | | | 16.06 | | | | 0.69 | | | | 3.22 | | | | (0.66 | ) | | | (0.60 | ) | | | — | | | | 18.71 | | |
| | 2003 | (3) | | | 13.73 | | | | 0.73 | | | | 2.66 | | | | (0.73 | ) | | | (0.33 | ) | | | — | | | | 16.06 | | |
| | 2002 | (3) | | | 13.15 | | | | 0.73 | | | | 0.63 | | | | (0.71 | ) | | | — | | | | (0.07 | ) | | | 13.73 | | |
| | 2001 | (3) | | | 12.73 | | | | 0.84 | | | | 0.28 | | | | (0.68 | ) | | | — | | | | (0.02 | ) | | | 13.15 | | |
(1) Per share data calculated using average shares outstanding method.
(2) For the period October 1, 2005 to October 31, 2005. Effective October 1, 2005, the fund's fiscal year-end was changed from September 30 to October 31.
All ratios for the period have been annualized, except total return and portfolio turnover.
(3) For the period October 1 to September 30 in the year indicated.
(4) Prior to July 1, 2004, Class R shares were named Class S shares, which had lower fees and expenses.
(5) For the period from September 24, 2001, when the class of shares was first offered, to September 30, 2001. All ratios for the period have been annualized,
except for total return and portfolio turnover.
(6) Total return does not reflect sales charges. Total return would have been lower had certain expenses not been waived.
The accompanying notes are an integral part of the financial statements.
FIRST AMERICAN FUNDS Annual Report 2005
46
| | | Total
Return (6) | | Net Assets
End of
Period (000) | | Ratio of
Expenses to
Average
Net Assets | | Ratio of Net
Investment
Income
to Average
Net Assets | | Ratio of Net
Expenses to
Average
Net Assets
(Excluding
Waivers) | | Ratio of Net
Investment
Income
to Average Net
Assets (Excluding
Waivers) | | Portfolio
Turnover
Rate | |
| Real Estate Securities Fund (1) | |
| Class A | |
| | 2005 | (2) | | | (1.79 | )% | | $ | 133,339 | | | | 1.23 | % | | | 1.48 | % | | | 1.23 | % | | | 1.48 | % | | | 11 | % | |
| | 2005 | (3) | | | 28.99 | | | | 135,745 | | | | 1.23 | | | | 3.43 | | | | 1.25 | | | | 3.41 | | | | 118 | | |
| | 2004 | (3) | | | 24.98 | | | | 86,996 | | | | 1.23 | | | | 3.63 | | | | 1.26 | | | | 3.60 | | | | 127 | | |
| | 2003 | (3) | | | 25.92 | | | | 35,754 | | | | 1.23 | | | | 4.82 | | | | 1.28 | | | | 4.77 | | | | 69 | | |
| | 2002 | (3) | | | 10.07 | | | | 15,422 | | | | 1.23 | | | | 5.06 | | | | 1.32 | | | | 4.97 | | | | 99 | | |
| | 2001 | (3) | | | 8.69 | | | | 2,421 | | | | 1.04 | | | | 5.89 | | | | 1.25 | | | | 5.68 | | | | 85 | | |
| Class B | |
| | 2005 | (2) | | | (1.81 | )% | | $ | 4,419 | | | | 1.98 | % | | | 0.74 | % | | | 1.98 | % | | | 0.74 | % | | | 11 | % | |
| | 2005 | (3) | | | 27.98 | | | | 4,700 | | | | 1.98 | | | | 2.69 | | | | 2.00 | | | | 2.67 | | | | 118 | | |
| | 2004 | (3) | | | 24.06 | | | | 4,412 | | | | 1.98 | | | | 2.91 | | | | 2.01 | | | | 2.88 | | | | 127 | | |
| | 2003 | (3) | | | 25.03 | | | | 3,559 | | | | 1.98 | | | | 4.10 | | | | 2.03 | | | | 4.05 | | | | 69 | | |
| | 2002 | (3) | | | 9.21 | | | | 2,577 | | | | 1.98 | | | | 4.27 | | | | 2.07 | | | | 4.18 | | | | 99 | | |
| | 2001 | (3) | | | 7.93 | | | | 1,724 | | | | 1.79 | | | | 5.13 | | | | 2.00 | | | | 4.92 | | | | 85 | | |
| Class C | |
| | 2005 | (2) | | | (1.85 | )% | | $ | 4,669 | | | | 1.98 | % | | | 0.75 | % | | | 1.98 | % | | | 0.75 | % | | | 11 | % | |
| | 2005 | (3) | | | 28.00 | | | | 4,954 | | | | 1.98 | | | | 2.68 | | | | 2.00 | | | | 2.66 | | | | 118 | | |
| | 2004 | (3) | | | 24.12 | | | | 4,247 | | | | 1.98 | | | | 2.92 | | | | 2.01 | | | | 2.89 | | | | 127 | | |
| | 2003 | (3) | | | 24.88 | | | | 3,229 | | | | 1.98 | | | | 4.12 | | | | 2.03 | | | | 4.07 | | | | 69 | | |
| | 2002 | (3) | | | 9.27 | | | | 986 | | | | 1.98 | | | | 4.43 | | | | 2.07 | | | | 4.34 | | | | 99 | | |
| | 2001 | (3) | | | 7.93 | | | | 341 | | | | 1.79 | | | | 5.27 | | | | 2.00 | | | | 5.06 | | | | 85 | | |
| Class R (4) | |
| | 2005 | (2) | | | (1.77 | )% | | $ | 57 | | | | 1.48 | % | | | 1.23 | % | | | 1.63 | % | | | 1.08 | % | | | 11 | % | |
| | 2005 | (3) | | | 28.60 | | | | 36 | | | | 1.48 | | | | 3.37 | | | | 1.65 | | | | 3.20 | | | | 118 | | |
| | 2004 | (3) | | | 24.94 | | | | 1 | | | | 1.23 | | | | 3.57 | | | | 1.26 | | | | 3.54 | | | | 127 | | |
| | 2003 | (3) | | | 25.80 | | | | 2,524 | | | | 1.23 | | | | 4.87 | | | | 1.28 | | | | 4.82 | | | | 69 | | |
| | 2002 | (3) | | | 10.13 | | | | 1,224 | | | | 1.23 | | | | 5.00 | | | | 1.32 | | | | 4.91 | | | | 99 | | |
| | 2001 | (5) | | | 4.87 | | | | 320 | | | | 0.56 | | | | 43.93 | | | | 1.01 | | | | 43.48 | | | | 85 | | |
| Class Y | |
| | 2005 | (2) | | | (1.73 | )% | | $ | 504,655 | | | | 0.98 | % | | | 1.74 | % | | | 0.98 | % | | | 1.74 | % | | | 11 | % | |
| | 2005 | (3) | | | 29.25 | | | | 525,196 | | | | 0.98 | | | | 3.66 | | | | 1.00 | | | | 3.64 | | | | 118 | | |
| | 2004 | (3) | | | 25.33 | | | | 414,544 | | | | 0.98 | | | | 3.95 | | | | 1.01 | | | | 3.92 | | | | 127 | | |
| | 2003 | (3) | | | 26.19 | | | | 194,933 | | | | 0.98 | | | | 5.13 | | | | 1.03 | | | | 5.08 | | | | 69 | | |
| | 2002 | (3) | | | 10.40 | | | | 120,091 | | | | 0.98 | | | | 5.27 | | | | 1.07 | | | | 5.18 | | | | 99 | | |
| | 2001 | (3) | | | 9.01 | | | | 96,263 | | | | 0.80 | | | | 6.50 | | | | 1.01 | | | | 6.29 | | | | 85 | | |
FIRST AMERICAN FUNDS Annual Report 2005
47
Schedule of Investments October 31, 2005
International Fund
| DESCRIPTION | | SHARES | | VALUE (000) | |
| Foreign Common Stocks – 95.3% | |
| Australia – 1.1% | |
| BHP Billiton | | | 1,170,000 | | | $ | 18,147 | | |
| Belgium – 1.9% | |
| Dexia | | | 790,000 | | | | 17,063 | | |
| Fortis (a) | | | 450,000 | | | | 12,811 | | |
| | | | 29,874 | | |
| Brazil – 1.7% | |
| Companhia Vale do Rio Doce, ADR | | | 620,000 | | | | 25,625 | | |
| Petroleo Brasileiro, ADR* | | | 22,900 | | | | 1,463 | | |
| | | | 27,088 | | |
| Finland – 1.4% | |
| Nokia Oyj | | | 1,304,770 | | | | 21,864 | | |
| France – 10.2% | |
| Axa (a) | | | 704,000 | | | | 20,392 | | |
| BNP Paribas (a) | | | 301,900 | | | | 22,898 | | |
| Compagnie de Saint-Gobain (a) | | | 430,000 | | | | 23,558 | | |
| Dassault Systemes (a) | | | 250,000 | | | | 12,915 | | |
| Lafarge (a) | | | 169,600 | | | | 13,926 | | |
| Total (a) | | | 269,490 | | | | 67,820 | | |
| | | | 161,509 | | |
| Germany – 5.5% | |
| BASF (a) | | | 160,000 | | | | 11,518 | | |
| Bayerische Motoren Werke (BMW) (a) | | | 459,600 | | | | 19,992 | | |
| Deutsche Post | | | 600,000 | | | | 13,411 | | |
| SAP (a) | | | 71,750 | | | | 12,304 | | |
| Schering (a) | | | 210,600 | | | | 12,986 | | |
| Siemens (a) | | | 231,000 | | | | 17,173 | | |
| | | | 87,384 | | |
| Great Britain – 26.6% | |
| Aviva | | | 1,000,000 | | | | 11,810 | | |
| Barclays | | | 2,725,000 | | | | 27,005 | | |
| BG Group | | | 2,750,000 | | | | 24,193 | | |
| British Land | | | 900,000 | | | | 14,182 | | |
| Centrica | | | 3,370,542 | | | | 14,247 | | |
| GlaxoSmithKline | | | 1,625,000 | | | | 42,266 | | |
| HSBC (a) | | | 2,626,800 | | | | 41,260 | | |
| Kingfisher | | | 3,105,000 | | | | 11,655 | | |
| Morrison Supermarket | | | 5,815,000 | | | | 16,837 | | |
| National Grid Trasco | | | 1,404,082 | | | | 12,843 | | |
| Reckitt Benckiser | | | 524,378 | | | | 15,845 | | |
| Royal Bank of Scotland | | | 1,064,000 | | | | 29,464 | | |
| Smith & Nephew | | | 1,781,163 | | | | 15,067 | | |
| Standard Chartered | | | 1,213,000 | | | | 25,474 | | |
| Tesco | | | 5,422,000 | | | | 28,872 | | |
| Vodafone | | | 18,435,000 | | | | 48,402 | | |
| Wolseley | | | 1,250,000 | | | | 25,430 | | |
| WPP Group | | | 1,485,503 | | | | 14,593 | | |
| | | | 419,445 | | |
| Hong Kong – 0.7% | |
| Esprit Holdings | | | 1,564,500 | | | | 11,083 | | |
| Ireland – 0.6% | |
| Bank of Ireland | | | 650,000 | | | | 9,896 | | |
| Italy – 4.8% | |
| Eni (a) | | | 1,925,800 | | | | 51,550 | | |
| Mediaset (a) | | | 702,400 | | | | 7,716 | | |
| UniCredito Italiano (a) | | | 2,803,900 | | | | 15,658 | | |
| | | | 74,924 | | |
International Fund (continued)
| DESCRIPTION | | SHARES | | VALUE (000) | |
| Japan – 20.6% | |
| Aeon Credit Service | | | 176,400 | | | $ | 13,856 | | |
| Canon | | | 453,600 | | | | 24,009 | | |
| Credit Saison (a) | | | 336,900 | | | | 15,285 | | |
| Daikin Industries (a) | | | 430,000 | | | | 11,219 | | |
| Fanuc | | | 130,000 | | | | 10,245 | | |
| Hirose Electric | | | 63,000 | | | | 7,204 | | |
| Honda Motor | | | 232,200 | | | | 12,914 | | |
| Hoya (a) | | | 120,000 | | | | 4,203 | | |
| Hoya (when-issued shares) | | | 360,000 | | | | 12,463 | | |
| Matsushita Electric Industrial | | | 614,000 | | | | 11,252 | | |
| Mitsubishi | | | 979,800 | | | | 19,053 | | |
| Mitsubishi Tokyo Financial Group | | | 2,843 | | | | 35,732 | | |
| Nidec Corporation (a) | | | 82,000 | | | | 4,811 | | |
| Nidec Corporation (when-issued shares) | | | 47,100 | | | | 2,610 | | |
| Nikko Cordial | | | 750,000 | | | | 9,105 | | |
| Nippon Oil | | | 925 | | | | 8 | | |
| Nitto Denko | | | 268,700 | | | | 16,269 | | |
| Secom | | | 235,000 | | | | 11,725 | | |
| Sharp | | | 500,000 | | | | 6,866 | | |
| Shin-Etsu Chemical (a) | | | 298,000 | | | | 14,287 | | |
| SMC (a) | | | 100,600 | | | | 13,388 | | |
| Sumitomo | | | 1,902,000 | | | | 21,262 | | |
| Takefuji | | | 110,000 | | | | 7,698 | | |
| Toyota Motor | | | 466,400 | | | | 21,627 | | |
| Yamanouchi Pharmeceutical | | | 498,200 | | | | 17,795 | | |
| | | | 324,886 | | |
| Mexico – 0.7% | |
| Fomento Economico Mexicano, ADR | | | 152,000 | | | | 10,334 | | |
| Netherlands – 4.4% | |
| ABN AMRO | | | 725,000 | | | | 17,149 | | |
| ING Groep | | | 425,000 | | | | 12,258 | | |
| Philips Electronics | | | 590,000 | | | | 15,430 | | |
| Reed Elsevier | | | 955,000 | | | | 12,863 | | |
| Wolters Kluwer | | | 619,700 | | | | 11,498 | | |
| | | | 69,198 | | |
| South Korea – 1.1% | |
| Samsung Electronics | | | 23,830 | | | | 12,688 | | |
| SK Telecom, ADR | | | 250,000 | | | | 5,052 | | |
| | | | 17,740 | | |
| Spain – 1.9% | |
| Altadis | | | 335,000 | | | | 14,217 | | |
| Banco Bilbano Vizcaya Argentaria | | | 884,400 | | | | 15,596 | | |
| | | | 29,813 | | |
| Sweden – 1.0% | |
| Ericsson* | | | 4,815,000 | | | | 15,777 | | |
| Switzerland – 11.1% | |
| Adecco (a) | | | 377,600 | | | | 16,109 | | |
| Holcim | | | 300,000 | | | | 18,679 | | |
| Nestle | | | 95,560 | | | | 28,454 | | |
| Novartis | | | 600,100 | | | | 32,276 | | |
| Roche | | | 220,600 | | | | 32,958 | | |
| UBS (a) | | | 385,700 | | | | 32,883 | | |
| Zurich Financial Services | | | 84,500 | | | | 14,409 | | |
| | | | 175,768 | | |
Total Foreign Common Stocks
(Cost $1,314,944) | | | | | | | 1,504,730 | | |
The accompanying notes are an integral part of the financial statements.
FIRST AMERICAN FUNDS Annual Report 2005
48
International Fund (concluded)
| DESCRIPTION | | SHARES | | VALUE (000) | |
| Short-Term Investments – 4.7% | |
State Street GA Prime Fund
(Cost $74,695) | | | 74,695,131 | | | $ | 74,695 | | |
Investments Purchased with Proceeds
from Securities Lending (b) – 18.4% | |
State Street Navigator Prime Fund
(Cost $289,800) | | | 289,800,130 | | | | 289,800 | | |
Total Investments – 118.4%
(Cost $1,679,439) | | | | | 1,869,225 | | |
| Other Assets and Liabilities, Net – (18.4)% | | | | | (290,123 | ) | |
| Total Net Assets – 100.0% | | | | $ | 1,579,102 | | |
* Non-income producing security
(a) This security or a portion of this security is out on loan at October 31, 2005. Total loaned securities had a market value of $280,232,683 at October 31, 2005. See note 2 in Notes to Financial Statements.
(b) The fund may loan securities in return for collateral in the form of cash, U.S. Government securities, or other high grade debt obligations. The cash collateral received is invested as noted above.
ADR – American Depository Receipt
At October 31, 2005, sector diversification of the fund was as follows:
| | | % of
Net Assets | | Value (000) | |
| Foreign Common Stock | |
| Banking | | | 15.4 | % | | $ | 243,001 | | |
| Diversified Financials | | | 11.7 | | | | 184,260 | | |
| Energy | | | 10.1 | | | | 159,281 | | |
| Pharmaceutical & Biotechnology | | | 8.8 | | | | 138,281 | | |
| Consumer Discretionary | | | 6.8 | | | | 107,700 | | |
| Technology | | | 6.5 | | | | 102,765 | | |
| Capital Goods | | | 5.6 | | | | 87,927 | | |
| Materials | | | 5.4 | | | | 85,846 | | |
| Telecommunication Services | | | 4.8 | | | | 75,318 | | |
| Retailing | | | 3.6 | | | | 57,364 | | |
| Automobiles & Components | | | 3.5 | | | | 54,533 | | |
| Commercial Services & Supplies | | | 3.2 | | | | 49,948 | | |
| Food & Beverage | | | 1.8 | | | | 28,454 | | |
| Health Care | | | 1.8 | | | | 27,930 | | |
| Utilities | | | 1.7 | | | | 27,436 | | |
| Insurance | | | 1.7 | | | | 26,219 | | |
| Manufacturing | | | 1.5 | | | | 23,558 | | |
| Industrials | | | 0.7 | | | | 13,411 | | |
| Media | | | 0.7 | | | | 11,498 | | |
| Total Foreign Common Stocks | | | 95.3 | | | | 1,504,730 | | |
| Total Short-Term Investments | | | 4.7 | | | | 74,695 | | |
Total Investments Purchased with
Proceeds from Securities Lending | | | 18.4 | | | | 289,800 | | |
| Total Investments | | | 118.4 | | | | 1,869,225 | | |
| Other Assets and Liabilities, Net | | | (18.4 | ) | | | (290,123 | ) | |
| Net Assets | | | 100.0 | % | | $ | 1,579,102 | | |
FIRST AMERICAN FUNDS Annual Report 2005
49
Statement of Assets and Liabilities October 31, 2005, in thousands, except share data
| | | International
Fund | |
| ASSETS: | |
| Investments in securities, at value† (cost $1,389,639) (note 2) | | $ | 1,579,425 | | |
| Investments purchased with proceeds from securities lending (cost $289,800) (note 2) | | | 289,800 | | |
| Cash denominated in foreign currencies, at value (cost $895) (note 2) | | | 884 | | |
| Cash | | | 1,377 | | |
| Receivable for dividends and interest | | | 3,238 | | |
| Receivable for capital shares sold | | | 733 | | |
| Receivable for foreign withholding tax reclaim | | | 112 | | |
| Prepaid expenses and other assets | | | 45 | | |
| Total assets | | | 1,875,614 | | |
| LIABILITIES: | |
| Payable for investment securities purchased | | | 1,335 | | |
| Payable for capital shares redeemed | | | 3,698 | | |
| Payable upon return of securities loaned (note 2) | | | 289,800 | | |
| Payable for advisory and custodian fees | | | 1,266 | | |
| Payable to affiliates (note 3) | | | 353 | | |
| Payable for distribution and shareholder servicing fees | | | 22 | | |
| Accrued expenses and other liabilities | | | 38 | | |
| Total liabilities | | | 296,512 | | |
| Net assets | | $ | 1,579,102 | | |
| COMPOSITION OF NET ASSETS: | |
| Portfolio capital | | $ | 1,439,816 | | |
| Undistributed net investment income | | | 18,107 | | |
| Accumulated net realized loss on investments | | | (68,544 | ) | |
| Net unrealized appreciation of investments | | | 189,786 | | |
| Net unrealized depreciation of foreign currency, and translation of other assets and liabilities in foreign currency | | | (63 | ) | |
| Net assets | | $ | 1,579,102 | | |
| † Including securities loaned, at value | | $ | 280,233 | | |
| Class A: | |
| Net assets | | $ | 48,439 | | |
| Shares issued and outstanding ($0.0001 par value — 2 billion authorized) | | | 4,033 | | |
| Net asset value and redemption price per share | | $ | 12.01 | | |
| Maximum offering price per share (1) | | $ | 12.71 | | |
| Class B: | |
| Net assets | | $ | 6,632 | | |
| Shares issued and outstanding ($0.0001 par value — 2 billion authorized) | | | 598 | | |
| Net asset value, offering price and redemption price per share (2) | | $ | 11.09 | | |
| Class C: | |
| Net assets | | $ | 7,520 | | |
| Shares issued and outstanding ($0.0001 par value — 2 billion authorized) | | | 655 | | |
| Net asset value, offering price and redemption price per share (2) | | $ | 11.47 | | |
| Class R: | |
| Net assets | | $ | 1 | | |
| Shares issued and outstanding ($0.0001 par value — 2 billion authorized) | | | — | | |
| Net asset value, offering price, and redemption price per share | | $ | 11.94 | | |
| Class Y: | |
| Net assets | | $ | 1,516,510 | | |
| Shares issued and outstanding ($0.0001 par value — 2 billion authorized) | | | 124,702 | | |
| Net asset value, offering price, and redemption price per share | | $ | 12.16 | | |
(1) The offering price is calculated by dividing the net asset value by 1 minus the maximum sales charge of 5.50%.
(2) Class B and C have a contingent deferred sales charge. For a description of this sales charge, see notes 1 and 3 in Notes to Financial Statements.
The accompanying notes are an integral part of the financial statements.
FIRST AMERICAN FUNDS Annual Report 2005
50
Statement of Operations in thousands
| | | International
Fund | |
| | | One-Month
Period Ended
10/31/05 | | Year
Ended
9/30/05 | |
| INVESTMENT INCOME: | |
| Interest | | $ | 135 | | | $ | 862 | | |
| Dividends | | | 2,838 | | | | 34,786 | | |
| Less: Foreign taxes withheld | | | (244 | ) | | | (3,519 | ) | |
| Securities lending income | | | 47 | | | | 1,095 | | |
| Other income | | | — | | | | 276 | | |
| Total investment income | | | 2,776 | | | | 33,500 | | |
| EXPENSES (note 3): | |
| Investment advisory fees | | | 1,325 | | | | 15,077 | | |
| Transfer agent fees | | | 174 | | | | 918 | | |
| Administration fees | | | 173 | | | | 2,865 | | |
| Custodian fees | | | 31 | | | | 194 | | |
| Professional fees | | | 5 | | | | 79 | | |
| Registration fees | | | 4 | | | | 37 | | |
| Other expenses | | | 3 | | | | 28 | | |
| Postage and printing fees | | | 2 | | | | 86 | | |
| Directors' fees | | | 2 | | | | 32 | | |
| Distribution and shareholder servicing fees – Class A | | | 10 | | | | 117 | | |
| Distribution and shareholder servicing fees – Class B | | | 6 | | | | 73 | | |
| Distribution and shareholder servicing fees – Class C | | | 7 | | | | 84 | | |
| Distribution and shareholder servicing fees – Class R (1) | | | — | | | | 1 | | |
| Total expenses | | | 1,742 | | | | 19,591 | | |
| Less: Fee waivers (note 3) | | | — | | | | (525 | ) | |
| Less: Expenses paid indirectly (note 3) | | | (47 | ) | | | (345 | ) | |
| Total net expenses | | | 1,695 | | | | 18,721 | | |
| Investment income – net | | | 1,081 | | | | 14,779 | | |
REALIZED AND UNREALIZED GAINS (LOSSES) ON INVESTMENTS AND FOREIGN
CURRENCY TRANSACTIONS – NET (note 5): | |
| Net realized gain on investments | | | 4,244 | | | | 158,132 | | |
| Net realized gain (loss) on foreign currency transactions | | | (48 | ) | | | 1,417 | | |
| Net change in unrealized appreciation or depreciation of investments | | | (34,720 | ) | | | 89,806 | | |
Net change in unrealized appreciation or depreciation of foreign currency, and translation of
other assets and liabilities denominated in foreign currency | | | (8 | ) | | | (35 | ) | |
| Net gain (loss) on investments and foreign currency transactions | | | (30,532 | ) | | | 249,320 | | |
| Net increase (decrease) in net assets resulting from operations | | $ | (29,451 | ) | | $ | 264,099 | | |
(1) Due to the presentation of the financial statements in thousands, the number rounds to zero.
The accompanying notes are an integral part of the financial statements.
FIRST AMERICAN FUNDS Annual Report 2005
51
Statement of Changes in Net Assets in thousands
| | | International
Fund | |
| | | One-Month
Period Ended
10/31/05 | | Year
Ended
9/30/05 | | Year
Ended
9/30/04 | |
| OPERATIONS: | |
| Investment income – net | | $ | 1,081 | | | $ | 14,779 | | | $ | 7,763 | | |
| Net realized gain on investments | | | 4,244 | | | | 158,132 | | | | 135,849 | | |
| Net realized gain (loss) on foreign currency transactions | | | (48 | ) | | | 1,417 | | | | (430 | ) | |
| Net change in unrealized appreciation or depreciation of investments | | | (34,720 | ) | | | 89,806 | | | | 6,817 | | |
Net change in unrealized appreciation or depreciation of foreign currency, and translation of other
assets and liabilities denominated in foreign currency | | | (8 | ) | | | (35 | ) | | | (278 | ) | |
| Net increase (decrease) in net assets resulting from operations | | | (29,451 | ) | | | 264,099 | | | | 149,721 | | |
| DISTRIBUTIONS TO SHAREHOLDERS FROM: | |
| Investment income – net: | |
| Class A | | | — | | | | (273 | ) | | | (212 | ) | |
| Class B | | | — | | | | — | | | | (4 | ) | |
| Class C | | | — | | | | — | | | | (5 | ) | |
| Class S | | | — | | | | — | | | | (43 | ) | |
| Class Y | | | — | | | | (9,941 | ) | | | (8,556 | ) | |
| Total distributions | | | — | | | | (10,214 | ) | | | (8,820 | ) | |
| CAPITAL SHARE TRANSACTIONS (note 4): | |
| Class A: | |
| Proceeds from sales | | | 1,375 | | | | 10,293 | | | | 20,466 | | |
| Reinvestment of distributions | | | — | | | | 259 | | | | 202 | | |
| Payments for redemptions | | | (874 | ) | | | (15,029 | ) | | | (20,179 | ) | |
| Increase (decrease) in net assets from Class A transactions | | | 501 | | | | (4,477 | ) | | | 489 | | |
| Class B: | |
| Proceeds from sales | | | 142 | | | | 594 | | | | 606 | | |
| Reinvestment of distributions | | | — | | | | — | | | | 4 | | |
| Payments for redemptions | | | (196 | ) | | | (2,481 | ) | | | (2,218 | ) | |
| Decrease in net assets from Class B transactions | | | (54 | ) | | | (1,887 | ) | | | (1,608 | ) | |
| Class C: | |
| Proceeds from sales | | | 28 | | | | 755 | | | | 853 | | |
| Reinvestment of distributions | | | — | | | | — | | | | 5 | | |
| Payments for redemptions | | | (267 | ) | | | (2,929 | ) | | | (4,123 | ) | |
| Decrease in net assets from Class C transactions | | | (239 | ) | | | (2,174 | ) | | | (3,265 | ) | |
| Class R: | |
| Proceeds from sales | | | — | | | | 400 | | | | 1,377 | | |
| Reinvestment of distributions | | | — | | | | — | | | | 40 | | |
| Payments for redemptions | | | (161 | ) | | | (244 | ) | | | (11,223 | ) | |
| Increase (decrease) in net assets from Class R transactions | | | (161 | ) | | | 156 | | | | (9,806 | ) | |
| Class Y: | |
| Proceeds from sales | | | 34,804 | | | | 320,811 | | | | 321,648 | | |
| Reinvestment of distributions | | | — | | | | 6,151 | | | | 5,397 | | |
| Payments for redemptions | | | (13,103 | ) | | | (191,834 | ) | | | (304,768 | ) | |
| Increase in net assets from Class Y transactions | | | 21,701 | | | | 135,128 | | | | 22,277 | | |
| Increase in net assets from capital share transactions | | | 21,748 | | | | 126,746 | | | | 8,087 | | |
| Total increase (decrease) in net assets | | | (7,703 | ) | | | 380,631 | | | | 148,988 | | |
| Net assets at beginning of period | | | 1,586,805 | | | | 1,206,174 | | | | 1,057,186 | | |
| Net assets at end of period | | $ | 1,579,102 | | | $ | 1,586,805 | | | $ | 1,206,174 | | |
| Undistributed net investment income at end of period | | $ | 18,107 | | | $ | 17,074 | | | $ | 8,800 | | |
The accompanying notes are an integral part of the financial statements.
FIRST AMERICAN FUNDS Annual Report 2005
52
(This page has been left blank intentionally.)
Financial Highlights For a share outstanding throughout the indicated periods.
| | | Net Asset
Value
Beginning
of Period | | Net
Investment
Income (Loss) | | Realized and
Unrealized
Gains
(Losses) on
Investments | | Distributions
from Net
Investment
Income | | Distributions
from Net
Realized Gains | | Net Asset
Value
End of
Period | | Total
Return (8) | |
| International Fund (1) (2) | | | |
| Class A | |
| | 2005 | (3) | | $ | 12.24 | | | $ | 0.01 | | | $ | (0.24 | ) | | $ | — | | | $ | — | | | $ | 12.01 | | | | (1.88 | )% | |
| | 2005 | (4) | | | 10.19 | | | | 0.09 | | | | 2.02 | | | | (0.06 | ) | | | — | | | | 12.24 | | | | 20.80 | | |
| | 2004 | (4) | | | 8.99 | | | | 0.03 | | | | 1.22 | | | | (0.05 | ) | | | — | | | | 10.19 | | | | 13.91 | | |
| | 2003 | (4) | | | 7.33 | | | | 0.06 | | | | 1.60 | | | | — | | | | — | | | | 8.99 | | | | 22.65 | | |
| | 2002 | (4) | | | 8.96 | | | | — | | | | (1.63 | ) | | | — | | | | — | | | | 7.33 | | | | (18.19 | ) | |
| | 2001 | (5) | | | 13.96 | | | | 0.10 | | | | (3.63 | ) | | | (0.10 | ) | | | (1.37 | ) | | | 8.96 | | | | (28.00 | ) | |
| Class B | |
| | 2005 | (3) | | $ | 11.31 | | | $ | — | | | $ | (0.22 | ) | | $ | — | | | $ | — | | | $ | 11.09 | | | | (1.95 | )% | |
| | 2005 | (4) | | | 9.43 | | | | — | | | | 1.88 | | | | — | | | | — | | | | 11.31 | | | | 19.94 | | |
| | 2004 | (4) | | | 8.34 | | | | (0.05 | ) | | | 1.14 | | | | — | | | | — | | | | 9.43 | | | | 13.12 | | |
| | 2003 | (4) | | | 6.85 | | | | — | | | | 1.49 | | | | — | | | | — | | | | 8.34 | | | | 21.75 | | |
| | 2002 | (4) | | | 8.45 | | | | (0.06 | ) | | | (1.54 | ) | | | — | | | | — | | | | 6.85 | | | | (18.94 | ) | |
| | 2001 | (5) | | | 13.28 | | | | 0.01 | | | | (3.43 | ) | | | (0.07 | ) | | | (1.34 | ) | | | 8.45 | | | | (28.57 | ) | |
| Class C | |
| | 2005 | (3) | | $ | 11.70 | | | $ | — | | | $ | (0.23 | ) | | $ | — | | | $ | — | | | $ | 11.47 | | | | (1.97 | )% | |
| | 2005 | (4) | | | 9.76 | | | | — | | | | 1.94 | | | | — | | | | — | | | | 11.70 | | | | 19.88 | | |
| | 2004 | (4) | | | 8.63 | | | | (0.05 | ) | | | 1.18 | | | | — | | | | — | | | | 9.76 | | | | 13.14 | | |
| | 2003 | (4) | | | 7.09 | | | | — | | | | 1.54 | | | | — | | | | — | | | | 8.63 | | | | 21.72 | | |
| | 2002 | (4) | | | 8.75 | | | | (0.06 | ) | | | (1.60 | ) | | | — | | | | — | | | | 7.09 | | | | (18.97 | ) | |
| | 2001 | (6) | | | 8.31 | | | | 0.01 | | | | 0.43 | | | | — | | | | — | | | | 8.75 | | | | 5.29 | | |
| Class R (7) | |
| | 2005 | (3) | | $ | 12.17 | | | $ | (0.02 | ) | | $ | (0.21 | ) | | $ | — | | | $ | — | | | $ | 11.94 | | | | (1.89 | )% | |
| | 2005 | (4) | | | 10.11 | | | | 0.09 | | | | 1.97 | | | | — | | | | — | | | | 12.17 | | | | 20.38 | | |
| | 2004 | (4) | | | 8.98 | | | | (0.01 | ) | | | 1.19 | | | | (0.05 | ) | | | — | | | | 10.11 | | | | 13.16 | | |
| | 2003 | (4) | | | 7.31 | | | | 0.04 | | | | 1.63 | | | | — | | | | — | | | | 8.98 | | | | 22.85 | (9) | |
| | 2002 | (4) | | | 8.96 | | | | 0.01 | | | | (1.66 | ) | | | — | | | | — | | | | 7.31 | | | | (18.42 | ) | |
| | 2001 | (5) | | | 13.97 | | | | (0.04 | ) | | | (3.50 | ) | | | (0.10 | ) | | | (1.37 | ) | | | 8.96 | | | | (28.03 | ) | |
| Class Y | |
| | 2005 | (3) | | $ | 12.39 | | | $ | 0.01 | | | $ | (0.24 | ) | | $ | — | | | $ | — | | | $ | 12.16 | | | | (1.86 | )% | |
| | 2005 | (4) | | | 10.31 | | | | 0.12 | | | | 2.05 | | | | (0.09 | ) | | | — | | | | 12.39 | | | | 21.12 | | |
| | 2004 | (4) | | | 9.10 | | | | 0.06 | | | | 1.23 | | | | (0.08 | ) | | | — | | | | 10.31 | | | | 14.13 | | |
| | 2003 | (4) | | | 7.40 | | | | 0.09 | | | | 1.61 | | | | — | | | | — | | | | 9.10 | | | | 22.97 | (9) | |
| | 2002 | (4) | | | 9.03 | | | | 0.03 | | | | (1.66 | ) | | | — | | | | — | | | | 7.40 | | | | (18.05 | ) | |
| | 2001 | (5) | | | 14.03 | | | | 0.07 | | | | (3.61 | ) | | | (0.11 | ) | | | (1.35 | ) | | | 9.03 | | | | (27.93 | ) | |
(1) The financial highlights for the International Fund as set forth herein include the historical financial highlights of the Firstar International Growth Fund. The assets of the
Firstar Fund were acquired by the First American International Fund on September 24, 2001. In connection with such acquisition, (i) Class A shares of the Firstar
International Growth Fund were exchanged for Class A shares of the First American International Fund, (ii) Firstar Class B shares were exchanged for Class B shares
of the First American International Fund, (iii) Firstar Class Y shares were exchanged for Class S shares of the First American Fund, and (iv) Firstar Institutional Class shares
were exchanged for Class Y shares of the First American International Fund. Historical per share amounts have been adjusted to reflect the conversion ratios utilized for the
merger of the International Fund and First ar International Growth Fund. Firstar International Growth Fund is the accounting survivor.
(2) Per share data calculated using average shares outstanding method.
(3) For the period October 1, 2005 to October 31, 2005. Effective October 1, 2005, the fund's fiscal year-end was changed from September 30 to October 31. All ratios for the
period have been annualized, except total return and portfolio turnover.
(4) For the period October 1 to September 30 in the year indicated.
(5) For the period November 1, 2000 to September 30, 2001. Effective in 2001, the fund's fiscal year-end was changed from October 31 to September 30. All ratios for the
period have been annualized, except total return and portfolio turnover.
(6) For the period from September 24, 2001, when the class of shares was first offered, to September 30, 2001. All ratios for the period have been annualized,
except total return and portfolio turnover.
(7) Prior to July 1, 2004, Class R shares were named Class S shares, which had lower fees and expenses.
(8) Total return does not reflect sales charges. Total return would have been lower had certain expenses not been waived.
(9) In 2003, 0.14% of Class R share's and 0.13% of Class Y share's total return was a result of the reimbursement by the adviser related to foreign currency principal trades
between the International Fund and U.S. Bank. Excluding the reimbursement, total return for Class R and Class Y shares would have been 22.71% and 22.84%, respectively.
Excluding the reimbursement, total return for Class R and Class Y shares would have been 22.71% and 22.84%, respectively.
The accompanying notes are an integral part of the financial statements.
FIRST AMERICAN FUNDS Annual Report 2005
54
| | | Net Assets
End of
Period (000) | | Ratio of
Expenses to
Average
Net Assets | | Ratio of Net
Investment
Income (Loss)
to Average
Net Assets | | Ratio of
Expenses to
Average
Net Assets
(Excluding
Waivers) | | Ratio of Net
Investment
Income (Loss)
to Average Net
Assets (Excluding
Waivers) | | Portfolio
Turnover
Rate | |
| International Fund (1) (2) | |
| Class A | |
| | 2005 | (3) | | $ | 48,439 | | | | 1.51 | % | | | 0.58 | % | | | 1.55 | % | | | 0.54 | % | | | — | % | |
| | 2005 | (4) | | | 48,851 | | | | 1.56 | | | | 0.77 | | | | 1.61 | | | | 0.72 | | | | 74 | | |
| | 2004 | (4) | | | 44,851 | | | | 1.60 | | | | 0.31 | | | | 1.64 | | | | 0.27 | | | | 77 | | |
| | 2003 | (4) | | | 39,251 | | | | 1.60 | | | | 0.77 | | | | 1.65 | | | | 0.72 | | | | 82 | | |
| | 2002 | (4) | | | 37,232 | | | | 1.60 | | | | 0.04 | | | | 1.66 | | | | (0.02 | ) | | | 72 | | |
| | 2001 | (5) | | | 64,907 | | | | 1.49 | | | | 1.02 | | | | 1.59 | | | | 0.92 | | | | 72 | | |
| Class B | |
| | 2005 | (3) | | $ | 6,632 | | | | 2.26 | % | | | (0.17 | )% | | | 2.30 | % | | | (0.21 | )% | | | — | % | |
| | 2005 | (4) | | | 6,819 | | | | 2.31 | | | | 0.00 | | | | 2.36 | | | | (0.05 | ) | | | 74 | | |
| | 2004 | (4) | | | 7,371 | | | | 2.35 | | | | (0.48 | ) | | | 2.39 | | | | (0.52 | ) | | | 77 | | |
| | 2003 | (4) | | | 7,936 | | | | 2.35 | | | | 0.02 | | | | 2.40 | | | | (0.03 | ) | | | 82 | | |
| | 2002 | (4) | | | 7,459 | | | | 2.35 | | | | (0.68 | ) | | | 2.41 | | | | (0.74 | ) | | | 72 | | |
| | 2001 | (5) | | | 10,857 | | | | 2.17 | | | | 0.06 | | | | 2.27 | | | | (0.04 | ) | | | 72 | | |
| Class C | |
| | 2005 | (3) | | $ | 7,520 | | | | 2.26 | % | | | (0.17 | )% | | | 2.30 | % | | | (0.21 | )% | | | — | % | |
| | 2005 | (4) | | | 7,915 | | | | 2.31 | | | | (0.01 | ) | | | 2.36 | | | | (0.06 | ) | | | 74 | | |
| | 2004 | (4) | | | 8,542 | | | | 2.35 | | | | (0.52 | ) | | | 2.39 | | | | (0.56 | ) | | | 77 | | |
| | 2003 | (4) | | | 10,439 | | | | 2.35 | | | | (0.01 | ) | | | 2.40 | | | | (0.06 | ) | | | 82 | | |
| | 2002 | (4) | | | 11,027 | | | | 2.35 | | | | (0.71 | ) | | | 2.41 | | | | (0.77 | ) | | | 72 | | |
| | 2001 | (6) | | | 17,806 | | | | 1.48 | | | | 4.15 | | | | 1.48 | | | | 4.15 | | | | 72 | | |
| Class R (7) | |
| | 2005 | (3) | | $ | 1 | | | | 1.76 | % | | | 0.33 | % | | | 1.95 | % | | | 0.14 | % | | | — | % | |
| | 2005 | (4) | | | 163 | | | | 1.81 | | | | 0.77 | | | | 2.01 | | | | 0.57 | | | | 74 | | |
| | 2004 | (4) | | | 1 | | | | 1.60 | | | | (0.11 | ) | | | 1.64 | | | | (0.15 | ) | | | 77 | | |
| | 2003 | (4) | | | 8,533 | | | | 1.60 | | | | 0.57 | | | | 1.65 | | | | 0.52 | | | | 82 | | |
| | 2002 | (4) | | | 10,817 | | | | 1.60 | | | | 0.16 | | | | 1.66 | | | | 0.10 | | | | 72 | | |
| | 2001 | (5) | | | 9,461 | | | | 1.46 | | | | (0.33 | ) | | | 1.61 | | | | (0.48 | ) | | | 72 | | |
| Class Y | |
| | 2005 | (3) | | $ | 1,516,510 | | | | 1.26 | % | | | 0.83 | % | | | 1.30 | % | | | 0.79 | % | | | — | % | |
| | 2005 | (4) | | | 1,523,057 | | | | 1.31 | | | | 1.07 | | | | 1.36 | | | | 1.02 | | | | 74 | | |
| | 2004 | (4) | | | 1,145,409 | | | | 1.35 | | | | 0.59 | | | | 1.39 | | | | 0.55 | | | | 77 | | |
| | 2003 | (4) | | | 991,027 | | | | 1.35 | | | | 1.08 | | | | 1.40 | | | | 1.03 | | | | 82 | | |
| | 2002 | (4) | | | 540,495 | | | | 1.35 | | | | 0.36 | | | | 1.41 | | | | 0.30 | | | | 72 | | |
| | 2001 | (5) | | | 661,886 | | | | 1.23 | | | | 0.67 | | | | 1.36 | | | | 0.54 | | | | 72 | | |
FIRST AMERICAN FUNDS Annual Report 2005
55
Schedule of Investments October 31, 2005
Small Cap Growth Opportunities Fund
| DESCRIPTION | | SHARES | | VALUE (000) | |
| Common Stocks – 98.4% | |
| Consumer Discretionary – 18.5% | |
| Aeropostale* (a) | | | 230,620 | | | $ | 4,506 | | |
| Buffalo Wild Wings* (a) | | | 171,310 | | | | 4,701 | | |
| Cheesecake Factory* (a) | | | 131,020 | | | | 4,497 | | |
| Cosi* | | | 484,237 | | | | 4,237 | | |
| Golf Galaxy* | | | 70,029 | | | | 1,082 | | |
| GTECH Holdings | | | 70,500 | | | | 2,245 | | |
| Guitar Center* | | | 33,858 | | | | 1,764 | | |
| Pacific Sunwear of California* (a) | | | 209,240 | | | | 5,235 | | |
| Penn National Gaming* | | | 152,410 | | | | 4,504 | | |
| Provide Commerce* (a) | | | 214,220 | | | | 5,212 | | |
| Scientific Games, Class A* (a) | | | 215,190 | | | | 6,447 | | |
| Spanish Broadcasting System* (a) | | | 574,014 | | | | 3,501 | | |
| Texas Roadhouse, Class A* | | | 341,977 | | | | 5,383 | | |
| ValueVision Media* (a) | | | 233,550 | | | | 2,293 | | |
| | | | 55,607 | | |
| Energy – 9.3% | |
| Arena Resources* | | | 100,320 | | | | 2,329 | | |
| Cal Dive International* (a) | | | 44,550 | | | | 2,742 | | |
| Compton Petroleum* | | | 457,410 | | | | 4,996 | | |
| GMX Resources* (a) | | | 185,130 | | | | 4,539 | | |
| Hercules Offshore* | | | 83,610 | | | | 1,820 | | |
| Hornbeck Offshore Services* | | | 69,530 | | | | 2,240 | | |
| Hydril* (a) | | | 29,470 | | | | 1,955 | | |
| Oil States International* | | | 60,760 | | | | 2,011 | | |
| Pioneer Drilling* | | | 130,940 | | | | 2,243 | | |
| Plains Exploration & Production* | | | 77,090 | | | | 3,006 | | |
| | | | 27,881 | | |
| Financials – 8.0% | |
| Cullen/Frost Bankers (a) | | | 101,110 | | | | 5,341 | | |
| East West Bancorp | | | 159,860 | | | | 6,121 | | |
| Investors Financial Services (a) | | | 98,760 | | | | 3,771 | | |
| Scottish Annuity & Life (a) | | | 94,820 | | | | 2,328 | | |
| Sunstone Hotel Investors | | | 109,920 | | | | 2,462 | | |
| Triad Guaranty* (a) | | | 94,200 | | | | 3,962 | | |
| | | | 23,985 | | |
| Health Care – 19.9% | |
| AMN Healthcare Services* | | | 152,800 | | | | 2,521 | | |
| Andrx Group* | | | 366,270 | | | | 5,666 | | |
| Caliper Life Sciences* | | | 321,750 | | | | 2,098 | | |
| Coley Pharmaceutical Group* (a) | | | 140,710 | | | | 2,084 | | |
| Connetics* (a) | | | 218,130 | | | | 2,844 | | |
| CV Therapeutics* (a) | | | 99,910 | | | | 2,504 | | |
| Cyberonics* (a) | | | 63,890 | | | | 1,918 | | |
| Durect* (a) | | | 371,220 | | | | 2,354 | | |
| Dyax* | | | 796,933 | | | | 3,387 | | |
| Encore Medical* (a) | | | 1,679,250 | | | | 8,413 | | |
| First Horizon Pharmaceutical* (a) | | | 296,780 | | | | 4,283 | | |
| Gentiva Health Services* | | | 307,364 | | | | 4,515 | | |
| I-Flow* (a) | | | 226,580 | | | | 2,735 | | |
| Immucor* (a) | | | 202,380 | | | | 5,246 | | |
| MGI Pharma* | | | 116,450 | | | | 2,185 | | |
| Protein Design Labs* (a) | | | 111,370 | | | | 3,121 | | |
| Rigel Pharmaceuticals* | | | 101,945 | | | | 2,289 | | |
| Xenogen* (a) | | | 574,140 | | | | 1,556 | | |
| | | | 59,719 | | |
| Industrials – 11.0% | |
| AMETEK | | | 69,150 | | | | 2,816 | | |
| Aries Maritime Transport* (a) | | | 210,880 | | | | 2,935 | | |
| Brady, Class A | | | 120,270 | | | | 3,460 | | |
| CLARCOR | | | 126,170 | | | | 3,470 | | |
Small Cap Growth Opportunities Fund (concluded)
| DESCRIPTION | | SHARES | | VALUE (000) | |
| ESCO Technologies* (a) | | | 78,780 | | | $ | 3,408 | | |
| Genco Shipping & Trading* (a) | | | 213,970 | | | | 3,515 | | |
| Mercury Computer Systems* (a) | | | 132,620 | | | | 2,518 | | |
| Navigant Consulting* | | | 282,550 | | | | 5,925 | | |
| Toro (a) | | | 137,140 | | | | 5,007 | | |
| | | | 33,054 | | |
| Information Technology (b) – 31.7% | |
| Avocent* (a) | | | 159,780 | | | | 4,899 | | |
| Digitas* (a) | | | 512,257 | | | | 5,532 | | |
| DSP Group* | | | 207,210 | | | | 5,093 | | |
| Embarcadero Technologies* | | | 705,340 | | | | 5,488 | | |
| Extreme Networks* (a) | | | 1,199,530 | | | | 5,794 | | |
| HouseValues* (a) | | | 232,640 | | | | 3,424 | | |
| Hutchinson Technology* (a) | | | 156,220 | | | | 3,874 | | |
| Ixia* | | | 405,780 | | | | 5,121 | | |
| Jack Henry & Associates | | | 180,960 | | | | 3,254 | | |
| Kronos* | | | 71,660 | | | | 3,286 | | |
| Maximus | | | 84,280 | | | | 3,055 | | |
| M-Systems Flash Disk Pioneers* (a) | | | 73,590 | | | | 2,332 | | |
| Orbotech* | | | 152,390 | | | | 3,311 | | |
| Plantronics | | | 234,130 | | | | 6,989 | | |
| Polycom* (a) | | | 509,770 | | | | 7,799 | | |
| Quest Software* (a) | | | 490,990 | | | | 6,830 | | |
| Sapient* | | | 625,020 | | | | 3,244 | | |
| Semtech* | | | 504,680 | | | | 7,611 | | |
| Tridium, Class B* (c) (d) | | | 278,500 | | | | — | | |
| Varian Semiconductor Equipment Associates* (a) | | | 77,790 | | | | 2,942 | | |
| VideoPropulsion* (c) (d) | | | 809,856 | | | | — | | |
| Wind River Systems* | | | 409,590 | | | | 5,366 | | |
| | | | 95,244 | | |
Total Common Stocks
(Cost $293,873) | | | | | | | 295,490 | | |
| Short-Term Investments – 3.0% | |
First American Prime Obligations Fund, Class Z (e)
(Cost $9,163) | | | 9,163,072 | | | | 9,163 | | |
Investments Purchased with Proceeds
from Securities Lending (f) – 30.4% | |
| (Cost $91,376) | | | | | | | 91,376 | | |
Total Investments – 131.8%
(Cost $394,412) | | | | | | | 396,029 | | |
| Other Assets and Liabilities, Net – (31.8)% | | | | | | | (95,665 | ) | |
| Total Net Assets – 100.0% | | | | | | $ | 300,364 | | |
* Non-income producing security
(a) This security or a portion of this security is out on loan at October 31, 2005. Total loaned securities had a market value of $88,322,789 at October 31, 2005. See note 2 in Notes to Financial Statements.
(b) The fund is significantly invested in this sector and therefore is subject to additional risks. See note 6 in Notes to Financial Statements.
(c) Security is considered illiquid or restricted. As of October 31, 2005, the value of these investments was $0 or 0.0% of total net assets. See note 2 in Notes to Financial Statements.
(d) Security is fair valued. As of October 31, 2005, the fair value of these investments was $0 or 0.0% of total net assets. See note 2 in Notes to Financial Statements.
(e) Investment in affiliated security. This money market fund is advised by U.S. Bancorp Asset Management, Inc., which also serves as advisor to this fund. See note 3 in Notes to Financial Statements.
(f) The fund may loan securities in return for collateral in the form of cash, U.S. Government securities, or other high grade debt obligations. The cash collateral is invested in various short-term fixed income securities, such as repurchase agreements, commercial paper, money market funds and other corporate obligations. See note 2 in Notes to Financial Statements.
The accompanying notes are an integral part of the financial statements.
FIRST AMERICAN FUNDS Annual Report 2005
56
Small Cap Select Fund
| DESCRIPTION | | SHARES | | VALUE (000) | |
| Common Stocks – 96.7% | |
| Consumer Discretionary – 16.0% | |
| Children's Place Retail Stores* (a) | | | 86,660 | | | $ | 3,720 | | |
| Coldwater Creek* (a) | | | 203,810 | | | | 5,501 | | |
| Kerzner International* (a) | | | 69,450 | | | | 4,052 | | |
| La Quinta* (a) | | | 1,621,210 | | | | 13,537 | | |
| Marvel Enterprises* (a) | | | 368,170 | | | | 6,480 | | |
| Men's Wearhouse* (a) | | | 393,550 | | | | 9,721 | | |
| Nautilus (a) | | | 286,620 | | | | 5,196 | | |
| P.F. Chang's China Bistro* (a) | | | 137,230 | | | | 6,277 | | |
| Pacific Sunwear of California* | | | 119,120 | | | | 2,980 | | |
| RARE Hospitality International* | | | 252,110 | | | | 7,704 | | |
| Ruby Tuesday (a) | | | 443,210 | | | | 9,711 | | |
| Ruth's Chris Steak House* | | | 184,650 | | | | 3,298 | | |
| Scientific Games, Class A* (a) | | | 436,800 | | | | 13,087 | | |
| Sports Authority* (a) | | | 319,160 | | | | 8,885 | | |
| Station Casinos (a) | | | 121,750 | | | | 7,804 | | |
| Thomas Nelson | | | 296,720 | | | | 6,353 | | |
| Too* (a) | | | 333,480 | | | | 9,474 | | |
| WCI Communities* (a) | | | 245,590 | | | | 6,145 | | |
| | | | 129,925 | | |
| Energy – 8.0% | |
| Bill Barrett* (a) | | | 138,890 | | | | 4,421 | | |
| Cal Dive International* (a) | | | 39,530 | | | | 2,433 | | |
| Compton Petroleum* | | | 526,690 | | | | 5,753 | | |
| Comstock Resources* | | | 113,500 | | | | 3,417 | | |
| ENSCO International (a) | | | 247,460 | | | | 11,282 | | |
| Hydril* | | | 37,550 | | | | 2,491 | | |
| St. Mary Land & Exploration (a) | | | 75,670 | | | | 2,574 | | |
| Tesoro Petroleum | | | 128,770 | | | | 7,874 | | |
| Ultra Petroleum* | | | 112,500 | | | | 5,905 | | |
| Western Gas Resources (a) | | | 145,760 | | | | 6,311 | | |
| W-H Energy Services* (a) | | | 422,800 | | | | 12,811 | | |
| | | | 65,272 | | |
| Financials – 20.8% | |
| Advanta, Class B | | | 218,325 | | | | 6,194 | | |
| Affiliated Managers Group* (a) | | | 145,520 | | | | 11,169 | | |
| Alexandria Real Estate Equities (a) | | | 50,370 | | | | 4,072 | | |
| AmerUS Group, Class A (a) | | | 186,300 | | | | 11,014 | | |
| BioMed Realty Trust | | | 165,490 | | | | 4,139 | | |
| CoBiz (a) | | | 116,960 | | | | 2,074 | | |
| Columbia Banking System | | | 251,615 | | | | 7,274 | | |
| Cullen/Frost Bankers (a) | | | 259,980 | | | | 13,732 | | |
| Dime Community Bancshares | | | 178,793 | | | | 2,575 | | |
| East West Bancorp (a) | | | 253,120 | | | | 9,692 | | |
| First Financial Bankshares | | | 90,320 | | | | 3,252 | | |
| First Niagara Financial Group | | | 327,290 | | | | 4,821 | | |
| First Potomac Realty Trust | | | 168,550 | | | | 4,271 | | |
| First Republic Bank | | | 493,020 | | | | 18,690 | | |
| FirstFed Financial* | | | 39,670 | | | | 2,122 | | |
| GATX (a) | | | 212,050 | | | | 7,924 | | |
| Kite Realty Group Trust | | | 411,910 | | | | 6,088 | | |
| Lasalle Hotel Properties | | | 125,820 | | | | 4,453 | | |
| Maguire Properties (a) | | | 207,352 | | | | 6,221 | | |
| Newcastle Investment | | | 150,880 | | | | 3,967 | | |
| Old Second Bancorp | | | 41,712 | | | | 1,296 | | |
| Platinum Underwriter Holdings | | | 359,940 | | | | 10,255 | | |
| SL Green Realty | | | 256,320 | | | | 17,437 | | |
| SVB Financial Group* (a) | | | 124,780 | | | | 6,203 | | |
| | | | 168,935 | | |
| Health Care – 13.2% | |
| American Healthways* (a) | | | 195,360 | | | | 7,924 | | |
| Amylin Pharmaceuticals* (a) | | | 91,520 | | | | 3,075 | | |
Small Cap Select Fund (continued)
| DESCRIPTION | | SHARES | | VALUE (000) | |
| Caliper Life Sciences* (a) | | | 652,642 | | | $ | 4,255 | | |
| Curis* | | | 756,563 | | | | 3,102 | | |
| ImmunoGen* | | | 511,770 | | | | 2,866 | | |
| Medicis Pharmaceutical, Class A (a) | | | 129,520 | | | | 3,821 | | |
| Neurocrine Biosciences* (a) | | | 130,520 | | | | 6,894 | | |
| Pediatrix Medical Group* (a) | | | 107,900 | | | | 8,315 | | |
| Protein Design Labs* (a) | | | 218,940 | | | | 6,135 | | |
| Respironics* | | | 152,970 | | | | 5,487 | | |
| Senomyx* (a) | | | 253,120 | | | | 3,607 | | |
| Sierra Health Services* (a) | | | 249,700 | | | | 18,727 | | |
| SonoSite* (a) | | | 18,740 | | | | 551 | | |
| SurModics* (a) | | | 284,120 | | | | 11,228 | | |
| Sybron Dental Specialties* (a) | | | 168,510 | | | | 7,229 | | |
| Symmetry Medical* | | | 189,360 | | | | 4,192 | | |
| United Surgical Partners International* | | | 213,090 | | | | 7,639 | | |
| Vertex Pharmaceuticals* (a) | | | 109,210 | | | | 2,485 | | |
| | | | 107,532 | | |
| Industrials – 14.0% | |
| AirTran Holdings Inc.* (a) | | | 403,970 | | | | 6,043 | | |
| Chicago Bridge & Iron | | | 487,950 | | | | 10,881 | | |
| CLARCOR | | | 138,760 | | | | 3,816 | | |
| Energy Conversion Devices* (a) | | | 60,630 | | | | 1,876 | | |
| ESCO Technologies* | | | 18,640 | | | | 806 | | |
| J.B. Hunt Transport Services | | | 458,270 | | | | 8,895 | | |
| Kennametal | | | 202,950 | | | | 10,373 | | |
| KVH Industries* (a) (b) | | | 764,924 | | | | 7,068 | | |
| Labor Ready* (a) | | | 377,480 | | | | 8,814 | | |
| Lennox International | | | 167,590 | | | | 4,674 | | |
| Manitowoc (a) | | | 97,710 | | | | 5,199 | | |
| Mercury Computer Systems* (a) | | | 219,770 | | | | 4,173 | | |
| NCI Building Systems* (a) | | | 273,250 | | | | 11,239 | | |
| Power-One* (a) | | | 1,617,003 | | | | 9,185 | | |
| Roper Industries (a) | | | 56,910 | | | | 2,146 | | |
| Terex* | | | 193,980 | | | | 10,663 | | |
| Toro (a) | | | 220,180 | | | | 8,039 | | |
| | | | 113,890 | | |
| Information Technology – 21.3% | |
| 02micro International* | | | 77,718 | | | | 1,018 | | |
| Advanced Analogic Technologies* | | | 254,340 | | | | 2,772 | | |
| Aeroflex* (a) | | | 473,254 | | | | 4,288 | | |
| ATI Technologies* | | | 588,970 | | | | 8,511 | | |
| Benchmark Electronics* (a) | | | 180,120 | | | | 5,060 | | |
| BISYS Group* (a) | | | 1,081,750 | | | | 13,717 | | |
| Carreker* | | | 614,680 | | | | 3,375 | | |
| Cree* (a) | | | 206,050 | | | | 4,953 | | |
| Digitas* (a) | | | 794,600 | | | | 8,582 | | |
| Embarcadero Technologies* | | | 694,253 | | | | 5,401 | | |
| Entegris* (a) | | | 863,874 | | | | 8,431 | | |
| EPIQ Systems* | | | 298,330 | | | | 5,683 | | |
| F5 Networks* | | | 87,030 | | | | 4,528 | | |
| FormFactor* | | | 153,310 | | | | 3,774 | | |
| Hyperion Solutions* (a) | | | 207,361 | | | | 10,028 | | |
| Integrated Device Technology* (a) | | | 434,230 | | | | 4,290 | | |
| Ituran Location and Control* (a) | | | 339,036 | | | | 4,407 | | |
| Logitech International* (a) | | | 216,280 | | | | 8,296 | | |
| Micromuse* | | | 682,367 | | | | 4,893 | | |
| M-Systems Flash Disk Pioneers* (a) | | | 202,980 | | | | 6,432 | | |
| Openwave Systems* (a) | | | 181,210 | | | | 3,238 | | |
| Opsware* (a) | | | 420,960 | | | | 2,164 | | |
| Packeteer* | | | 1,095,191 | | | | 8,641 | | |
| Polycom* | | | 538,610 | | | | 8,241 | | |
| Silicon Image* (a) | | | 482,970 | | | | 4,434 | | |
| Sonic Solutions* (a) | | | 345,370 | | | | 6,610 | | |
| Stellent* (a) | | | 1,372,359 | | | | 12,585 | | |
FIRST AMERICAN FUNDS Annual Report 2005
57
Schedule of Investments October 31, 2005
Small Cap Select Fund (concluded)
| DESCRIPTION | | SHARES | | VALUE (000) | |
| TIBCO Software* (a) | | | 1,074,180 | | | $ | 8,153 | | |
| WebEx Communications* | | | 53,570 | | | | 1,227 | | |
| | | | 173,732 | | |
| Materials – 3.0% | |
| Century Aluminum* (a) | | | 285,030 | | | | 5,182 | | |
| Headwaters* (a) | | | 56,520 | | | | 1,800 | | |
| Hercules* (a) | | | 169,270 | | | | 1,886 | | |
| Olin (a) | | | 220,270 | | | | 3,938 | | |
| Schnitzer Steel Industries, Class A | | | 102,650 | | | | 3,275 | | |
| Steel Dynamics (a) | | | 202,610 | | | | 6,275 | | |
| Texas Industries | | | 39,040 | | | | 1,936 | | |
| | | | 24,292 | | |
| Telecommunication Services – 0.4% | |
| General Communication* (a) | | | 334,970 | | | | 3,219 | | |
Total Common Stocks
(Cost $708,180) | | | | | | | 786,797 | | |
| Short-Term Investments – 1.2% | |
First American Prime Obligations Fund, Class Z (c)
(Cost $10,103) | | | 10,103,393 | | | | 10,103 | | |
Investments Purchased with Proceeds
from Securities Lending (d) – 34.9% | |
| (Cost $283,842) | | | | | | | 283,842 | | |
Total Investments – 132.8%
(Cost $1,002,125) | | | | | | | 1,080,742 | | |
| Other Assets and Liabilities, Net – (32.8)% | | | | | | | (266,894 | ) | |
| Total Net Assets – 100.0% | | | | | | $ | 813,848 | | |
* Non-income producing security
(a) This security or a portion of this security is out on loan at October 31, 2005. Total loaned securities had a market value of $278,157,724 at October 31, 2005. See note 2 in Notes to Financial Statements.
(b) A company is considered to be an affilate of the fund under the Investment Company Act of 1940 if the fund's holdings of that company represent 5% or more of the outstanding voting securities of the company. Transactions with companies that are or were affiliates during the fiscal period ended October 31, 2005 are as follows:
| Issuer | | Beginning
Cost | | Purchase
Cost | | Sales
Cost | | Ending
cost | | Dividend
Income | | Value | |
| KVH Industries | | $ | 9,269,067 | | | $ | — | | | $ | 1,196,848 | | | $ | 8,072,219 | | | $ | — | | | $ | 7,067,898 | | |
(c) Investment in affiliated security. This money market fund is advised by U.S. Bancorp Asset Management, Inc., which also serves as advisor to this fund. See note 3 in Notes to Financial Statements.
(d) The fund may loan securities in return for collateral in the form of cash, U.S. Government securities, or other high grade debt obligations. The cash collateral is invested in various short-term fixed income securities, such as repurchase agreements, commercial paper, money market funds and other corporate obligations. See note 2 in Notes to Financial Statements.
Small Cap Value Fund
| DESCRIPTION | | SHARES | | VALUE (000) | |
| Common Stocks – 98.8% | |
| Consumer Discretionary – 14.4% | |
| Aeropostale* (a) | | | 205,270 | | | $ | 4,011 | | |
| American Axle & Manufacturing (a) | | | 182,440 | | | | 3,977 | | |
| Ameristar Casinos | | | 104,689 | | | | 2,233 | | |
| Aztar* (a) | | | 99,400 | | | | 2,989 | | |
| Charming Shoppes* | | | 359,910 | | | | 4,031 | | |
| Entercom Communications* | | | 105,440 | | | | 3,044 | | |
| Ethan Allen Interiors (a) | | | 164,640 | | | | 5,568 | | |
| Interface, Class A* | | | 150,510 | | | | 1,162 | | |
| La Quinta* (a) | | | 412,970 | | | | 3,448 | | |
| Men's Wearhouse* (a) | | | 207,315 | | | | 5,121 | | |
| Pier 1 Imports (a) | | | 290,150 | | | | 2,994 | | |
| Polaris Industries (a) | | | 97,550 | | | | 4,398 | | |
| Regis | | | 83,130 | | | | 3,189 | | |
| Ruby Tuesday (a) | | | 253,020 | | | | 5,544 | | |
| Thomas Nelson | | | 191,530 | | | | 4,101 | | |
| WCI Communities* (a) | | | 119,850 | | | | 2,999 | | |
| | | | 58,809 | | |
| Consumer Staples – 1.2% | |
| Casey's General Stores | | | 146,280 | | | | 3,157 | | |
| Weis Markets | | | 49,020 | | | | 1,870 | | |
| | | | 5,027 | | |
| Energy – 6.4% | |
| Brigham Exploration* | | | 243,320 | | | | 3,440 | | |
| Cimarex Energy* (a) | | | 103,580 | | | | 4,067 | | |
| Forest Oil* (a) | | | 54,890 | | | | 2,398 | | |
| Global Industries* (a) | | | 232,180 | | | | 2,951 | | |
| Newfield Exploration* | | | 48,140 | | | | 2,182 | | |
| Range Resources | | | 88,770 | | | | 3,168 | | |
| TODCO* | | | 90,810 | | | | 4,064 | | |
| Tsakos Energy Navigation | | | 105,580 | | | | 3,625 | | |
| | | | 25,895 | | |
| Financials (b) – 31.2% | |
| Astoria Financial | | | 166,825 | | | | 4,663 | | |
| BankUnited Financial, Class A (a) | | | 172,040 | | | | 4,081 | | |
| Capitol Bancorp | | | 166,860 | | | | 5,787 | | |
| CBL & Associates Properties | | | 103,370 | | | | 3,861 | | |
| City National (a) | | | 61,350 | | | | 4,502 | | |
| Corporate Office Properties Trust | | | 103,740 | | | | 3,606 | | |
| Delphi Financial Group, Class A | | | 90,730 | | | | 4,250 | | |
| Donegal Group, Class A | | | 155,466 | | | | 3,445 | | |
| East West Bancorp | | | 157,850 | | | | 6,044 | | |
| Equity One (a) | | | 193,140 | | | | 4,529 | | |
| First Midwest Bancorp (a) | | | 84,100 | | | | 3,197 | | |
| First Niagara Financial Group | | | 382,070 | | | | 5,628 | | |
| First Potomac Realty Trust | | | 195,930 | | | | 4,965 | | |
| First Republic Bank – California (a) | | | 255,120 | | | | 9,672 | | |
| FPIC Insurance Group* | | | 104,736 | | | | 3,943 | | |
| Frontier Financial | | | 39,350 | | | | 1,269 | | |
| IBERIABANK | | | 78,952 | | | | 4,220 | | |
| Independent Bank | | | 146,220 | | | | 4,385 | | |
| Lasalle Hotel Properties (a) | | | 126,640 | | | | 4,482 | | |
| Lexington Corporate Properties Trust | | | 180,686 | | | | 3,935 | | |
| Mid-America Apartment Communities | | | 114,720 | | | | 5,352 | | |
| Newcastle Investment | | | 102,830 | | | | 2,703 | | |
| Pennsylvania | | | 76,290 | | | | 2,937 | | |
| Philadelphia Consolidated Holding* (a) | | | 40,940 | | | | 3,941 | | |
| Platinum Underwriter Holdings | | | 125,700 | | | | 3,581 | | |
| Provident Bankshares | | | 101,295 | | | | 3,531 | | |
| Redwood Trust | | | 90,160 | | | | 4,197 | | |
| Sterling Bancshares | | | 276,680 | | | | 4,092 | | |
The accompanying notes are an integral part of the financial statements.
FIRST AMERICAN FUNDS Annual Report 2005
58
Small Cap Value Fund (continued)
| DESCRIPTION | | SHARES | | VALUE (000) | |
| Triad Guaranty* | | | 49,480 | | | $ | 2,081 | | |
| Windrose Medical Properties Trust | | | 290,120 | | | | 4,395 | | |
| | | | 127,274 | | |
| Health Care – 5.6% | |
| Magellan Health Services* | | | 137,350 | | | $ | 4,083 | | |
| Pediatrix Medical Group* (a) | | | 39,350 | | | | 3,032 | | |
| Perrigo | | | 264,420 | | | | 3,535 | | |
| STERIS | | | 185,370 | | | | 4,228 | | |
| Varian* (a) | | | 116,740 | | | | 4,292 | | |
| Vertex Pharmaceuticals* (a) | | | 154,610 | | | | 3,517 | | |
| | | | 22,687 | | |
| Industrials – 16.8% | |
| Artesyn Technologies* (a) | | | 239,570 | | | | 2,106 | | |
| Brady, Class A | | | 192,660 | | | | 5,543 | | |
| CLARCOR | | | 300,540 | | | | 8,265 | | |
| ESCO Technologies* | | | 186,770 | | | | 8,080 | | |
| G&K Services, Class A | | | 119,437 | | | | 4,525 | | |
| Genco Shipping & Trading* | | | 84,310 | | | | 1,385 | | |
| Genlyte Group* (a) | | | 92,240 | | | | 4,701 | | |
| Hughes Supply (a) | | | 124,680 | | | | 4,171 | | |
| Kennametal | | | 80,480 | | | | 4,113 | | |
| Landstar | | | 42,280 | | | | 1,629 | | |
| Mercury Computer Systems* (a) | | | 159,240 | | | | 3,024 | | |
| Moog, Class A* (a) | | | 138,475 | | | | 4,106 | | |
| Pacer International | | | 140,710 | | | | 3,637 | | |
| Pentair | | | 146,930 | | | | 4,774 | | |
| Toro (a) | | | 227,910 | | | | 8,321 | | |
| | | | 68,380 | | |
| Information Technology – 14.5% | |
| Aeroflex* (a) | | | 365,850 | | | | 3,315 | | |
| BISYS Group* | | | 632,600 | | | | 8,021 | | |
| Embarcadero Technologies* | | | 219,090 | | | | 1,704 | | |
| Entegris* | | | 299,546 | | | | 2,924 | | |
| Fairchild Semiconductor International* (a) | | | 260,320 | | | | 4,009 | | |
| Hutchinson Technology* (a) | | | 158,540 | | | | 3,932 | | |
| Hypercom* | | | 631,820 | | | | 3,759 | | |
| Ixia* | | | 166,980 | | | | 2,107 | | |
| NETGEAR* (a) | | | 164,530 | | | | 3,217 | | |
| Palm* (a) | | | 154,160 | | | | 3,960 | | |
| Polycom* | | | 237,310 | | | | 3,631 | | |
| Progress Software* | | | 103,970 | | | | 3,238 | | |
| Skyworks Solutions* (a) | | | 599,070 | | | | 3,211 | | |
| TIBCO Software* (a) | | | 289,950 | | | | 2,201 | | |
| Transaction Systems Architects* (a) | | | 141,070 | | | | 3,810 | | |
| United Online | | | 186,620 | | | | 2,503 | | |
| Xyratex* (a) | | | 277,900 | | | | 3,763 | | |
| | | | 59,305 | | |
| Materials – 4.8% | |
| Carpenter Technology | | | 55,040 | | | | 3,319 | | |
| Commercial Metals | | | 107,990 | | | | 3,433 | | |
| Crown Holdings* | | | 186,270 | | | | 3,021 | | |
| Georgia Gulf | | | 132,430 | | | | 3,854 | | |
| Louisiana Pacific | | | 103,470 | | | | 2,579 | | |
| Steel Dynamics (a) | | | 104,700 | | | | 3,243 | | |
| | | | 19,449 | | |
| Telecommunication Services – 0.6% | |
| General Communication* (a) | | | 269,280 | | | | 2,588 | | |
| Utilities – 3.3% | |
| Black Hills (a) | | | 91,250 | | | | 3,793 | | |
| New Jersey Resources | | | 76,710 | | | | 3,311 | | |
Small Cap Value Fund (concluded)
| DESCRIPTION | | SHARES | | VALUE (000) | |
| NSTAR | | | 119,660 | | | $ | 3,255 | | |
| Westar Energy (a) | | | 147,540 | | | | 3,261 | | |
| | | | 13,620 | | |
Total Common Stocks
(Cost $342,820) | | | | | | | 403,034 | | |
| Short-Term Investments – 3.3% | |
First American Prime Obligations Fund, Class Z (c)
(Cost $13,521) | | | 13,520,961 | | | | 13,521 | | |
Investments Purchased with Proceeds
from Securities Lending (d) – 21.8% | |
| (Cost $89,146) | | | | | | | 89,146 | | |
Total Investments – 123.9%
(Cost $445,487) | | | | | | | 505,701 | | |
| Other Assets and Liabilities, Net – (23.9)% | | | | | | | (97,561 | ) | |
| Total Net Assets – 100.0% | | | | | | $ | 408,140 | | |
* Non-income producing security
(a) This security or a portion of this security is out on loan at October 31, 2005. Total loaned securities had a market value of $87,681,699 at October 31, 2005. See note 2 in Notes to Financial Statements.
(b) The fund is significantly invested in this sector and therefore is subject to additional risks. See note 6 in Notes to Financial Statements.
(c) Investment in affiliated security. This money market fund is advised by U.S. Bancorp Asset Management, Inc., which also serves as advisor to this fund. See note 3 in Notes to Financial Statements.
(d) The fund may loan securities in return for collateral in the form of cash, U.S. Government securities, or other high grade debt obligations. The cash collateral is invested in various short-term fixed income securities, such as repurchase agreements, commercial paper, money market funds and other corporate obligations. See note 2 in Notes to Financial Statements.
FIRST AMERICAN FUNDS Annual Report 2005
59
Schedule of Investments October 31, 2005
Small-Mid Cap Core Fund
| DESCRIPTION | | SHARES | | VALUE (000) | |
| Common Stocks – 99.1% | |
| Consumer Discretionary – 14.9% | |
| BorgWarner (a) | | | 16,710 | | | $ | 969 | | |
| Charming Shoppes* | | | 103,420 | | | | 1,158 | | |
| Entercom Communications* (a) | | | 17,910 | | | | 517 | | |
| Men's Wearhouse* | | | 32,020 | | | | 791 | | |
| Modine Manufacturing | | | 26,330 | | | | 870 | | |
| Pacific Sunwear of California* | | | 61,880 | | | | 1,548 | | |
| Provide Commerce* (a) | | | 24,690 | | | | 601 | | |
| Scientific Games, Class A* (a) | | | 72,440 | | | | 2,170 | | |
| WCI Communities* (a) | | | 61,190 | | | | 1,531 | | |
| | | | 10,155 | | |
| Consumer Staples – 1.4% | |
| Performance Food Group* | | | 35,180 | | | | 971 | | |
| Energy - 7.3% | |
| Global Industries* | | | 45,780 | | | | 582 | | |
| Helmerich & Payne | | | 12,040 | | | | 667 | | |
| Hydril* (a) | | | 19,200 | | | | 1,274 | | |
| Newfield Exploration* | | | 40,200 | | | | 1,822 | | |
| Tesoro | | | 10,180 | | | | 622 | | |
| | | | 4,967 | | |
| Financials – 19.7% | |
| Ameritrade Holding* | | | 34,980 | | | | 736 | | |
| AmerUS Group, Class A (a) | | | 19,710 | | | | 1,165 | | |
| Astoria Financial | | | 67,400 | | | | 1,884 | | |
| Boston Properties | | | 12,900 | | | | 893 | | |
| CBL & Associates Properties | | | 22,080 | | | | 825 | | |
| City National | | | 8,780 | | | | 644 | | |
| Cullen/Frost Bankers | | | 32,700 | | | | 1,727 | | |
| First Republic Bank | | | 16,450 | | | | 624 | | |
| Lasalle Hotel Properties (a) | | | 24,500 | | | | 867 | | |
| MGIC Investment (a) | | | 16,630 | | | | 985 | | |
| Newcastle Investment | | | 24,190 | | | | 636 | | |
| Redwood Trust (a) | | | 18,120 | | | | 843 | | |
| W.R. Berkley | | | 35,480 | | | | 1,550 | | |
| | | | 13,379 | | |
| Health Care – 14.5% | |
| AMN Healthcare Services* | | | 42,230 | | | | 697 | | |
| Medicis Pharmaceutical, Class A (a) | | | 33,220 | | | | 980 | | |
| Pediatrix Medical Group* (a) | | | 22,880 | | | | 1,763 | | |
| PerkinElmer | | | 97,980 | | | | 2,162 | | |
| Protein Design Labs* (a) | | | 22,040 | | | | 618 | | |
| Respironics* | | | 14,660 | | | | 526 | | |
| Serologicals* (a) | | | 24,640 | | | | 480 | | |
| Sierra Health Services* | | | 18,990 | | | | 1,424 | | |
| SurModics* (a) | | | 31,040 | | | | 1,227 | | |
| | | | 9,877 | | |
| Industrials – 15.0% | |
| Dun & Bradstreet* | | | 27,680 | | | | 1,753 | | |
| ESCO Technologies* | | | 11,372 | | | | 492 | | |
| Kennametal | | | 40,258 | | | | 2,058 | | |
| Landstar System | | | 28,350 | | | | 1,092 | | |
| Moog, Class A* | | | 27,125 | | | | 804 | | |
| Navigant Consulting* | | | 30,830 | | | | 646 | | |
| Precision Castparts | | | 10,050 | | | | 476 | | |
| Stericycle* | | | 17,430 | | | | 1,003 | | |
| Toro | | | 52,490 | | | | 1,916 | | |
| | | | 10,240 | | |
| Information Technology – 17.0% | |
| Arrow Electronics* (a) | | | 20,323 | | | | 600 | | |
| BISYS Group* | | | 97,305 | | | | 1,234 | | |
Small-Mid Cap Core Fund (concluded)
| DESCRIPTION | | SHARES | | VALUE (000) | |
| Hutchinson Technology* (a) | | | 66,113 | | | $ | 1,640 | | |
| Hyperion Solutions* | | | 22,020 | | | | 1,065 | | |
| Integrated Device Technology* | | | 164,557 | | | | 1,626 | | |
| Maximus | | | 18,870 | | | | 684 | | |
| Micromuse* | | | 137,760 | | | | 988 | | |
| National Semiconductor (a) | | | 48,191 | | | | 1,091 | | |
| Packeteer* | | | 136,087 | | | | 1,074 | | |
| Polycom* | | | 36,080 | | | | 552 | | |
| Quest Software* | | | 72,650 | | | | 1,011 | | |
| | | | 11,565 | | |
| Materials – 4.5% | |
| Century Aluminum* (a) | | | 38,630 | | | | 702 | | |
| Engelhard | | | 34,869 | | | | 948 | | |
| Steel Dynamics (a) | | | 45,150 | | | | 1,398 | | |
| | | | 3,048 | | |
| Telecommunication Services – 0.9% | |
| CenturyTel | | | 18,944 | | | | 620 | | |
| Utilities – 3.9% | |
| Alliant Energy | | | 39,910 | | | | 1,056 | | |
| New Jersey Resources | | | 12,380 | | | | 534 | | |
| Westar Energy (a) | | | 46,680 | | | | 1,032 | | |
| | | | 2,622 | | |
Total Common Stocks
(Cost $70,056) | | | | | | | 67,444 | | |
| Short-Term Investments – 1.1% | |
First American Prime Obligations Fund, Class Z (b)
(Cost $716) | | | 716,020 | | | | 716 | | |
Investments Purchased with Proceeds
from Securities Lending (c) – 25.8% | |
| (Cost $17,570) | | | | | | | 17,570 | | |
Total Investments – 126.0%
(Cost $88,342) | | | | | | | 85,730 | | |
| Other Assets and Liabilities, Net – (26.0)% | | | | | | | (17,703 | ) | |
| Total Net Assets – 100.0% | | | | | | $ | 68,027 | | |
* Non-income producing security
(a) This security or a portion of this security is out on loan at October 31, 2005. Total loaned securities had a market value of $17,293,916 at October 31, 2005. See note 2 in Notes to Financial Statements.
(b) Investment in affiliated security. This money market fund is advised by U.S. Bancorp Asset Management, Inc., which also serves as advisor to this fund. See note 3 in Notes to Financial Statements.
(c) The fund may loan securities in return for collateral in the form of cash, U.S. Government securities, or other high grade debt obligations. The cash collateral is invested in various short-term fixed income securities, such as repurchase agreements, commercial paper, money market funds and other corporate obligations. See note 2 in Notes to Financial Statements.
The accompanying notes are an integral part of the financial statements.
FIRST AMERICAN FUNDS Annual Report 2005
60
Statements of Assets and Liabilities October 31, 2005, in thousands, except for per share data
| | | Small Cap Growth
Opportunities Fund | | Small Cap
Select Fund | | Small Cap
Value Fund | | Small-Mid Cap
Core Fund | |
| ASSETS: | |
Investments in unaffiliated securities, at value†
(cost: $293,873, $708,180, $342,820, and
$70,056, respectively) (note 2) | | $ | 295,490 | | | $ | 786,797 | | | $ | 403,034 | | | $ | 67,444 | | |
Investments in affiliated money market fund, at value
(cost: $9,163, $10,103, $13,521, and $716, respectively) (note 2) | | | 9,163 | | | | 10,103 | | | | 13,521 | | | | 716 | | |
Investments purchased with proceeds from securities lending
(cost: $91,376, $283,842, $89,146, and $17,570, respectively) (note 2) | | | 91,376 | | | | 283,842 | | | | 89,146 | | | | 17,570 | | |
| Cash* | | | 105 | | | | 327 | | | | 103 | | | | 20 | | |
| Receivable for dividends and interest | | | 30 | | | | 181 | | | | 432 | | | | 34 | | |
| Receivable for investment securities sold | | | 4,630 | | | | 40,068 | | | | 9,113 | | | | — | | |
| Receivable for capital shares sold | | | 83 | | | | 428 | | | | 58 | | | | 146 | | |
| Prepaid expenses and other assets | | | 52 | | | | 51 | | | | 49 | | | | 91 | | |
| Total assets | | | 400,929 | | | | 1,121,797 | | | | 515,456 | | | | 86,021 | | |
| LIABILITIES: | |
| Payable for capital shares redeemed | | | 923 | | | | 2,002 | | | | 528 | | | | 227 | | |
| Payable upon return of securities loaned (note 2) | | | 91,481 | | | | 284,169 | | | | 89,249 | | | | 17,590 | | |
| Payable for investment securities purchased | | | 7,813 | | | | 21,023 | | | | 17,157 | | | | — | | |
| Payable to affiliates (note 3) | | | 303 | | | | 679 | | | | 340 | | | | 61 | | |
| Payable for distribution and shareholder servicing fees | | | 26 | | | | 45 | | | | 21 | | | | 17 | | |
| Accrued expenses and other liabilities | | | 19 | | | | 31 | | | | 21 | | | | 99 | | |
| Total liabilities | | | 100,565 | | | | 307,949 | | | | 107,316 | | | | 17,994 | | |
| Net assets | | $ | 300,364 | | | $ | 813,848 | | | $ | 408,140 | | | $ | 68,027 | | |
| COMPOSITION OF NET ASSETS: | |
| Portfolio capital | | $ | 244,436 | | | $ | 617,320 | | | $ | 260,511 | | | $ | 526,096 | | |
| Undistributed (distributions in excess of) net investment income | | | (1 | ) | | | (1 | ) | | | 335 | | | | — | | |
| Accumulated net realized gain (loss) on investments | | | 54,312 | | | | 117,912 | | | | 87,080 | | | | (455,457 | ) | |
| Net unrealized appreciation (depreciation) of investments | | | 1,617 | | | | 78,617 | | | | 60,214 | | | | (2,612 | ) | |
| Net assets | | $ | 300,364 | | | $ | 813,848 | | | $ | 408,140 | | | $ | 68,027 | | |
| * Includes cash collateral received related to securities loaned (note 2) | | $ | 105 | | | $ | 327 | | | $ | 103 | | | $ | 20 | | |
| † Including securities loaned, at value | | $ | 88,323 | | | $ | 278,158 | | | $ | 87,682 | | | $ | 17,294 | | |
| Class A: | |
| Net assets | | $ | 78,357 | | | $ | 104,568 | | | $ | 46,467 | | | $ | 22,339 | | |
| Shares issued and outstanding ($0.0001 par value — 2 billion authorized) | | | 3,438 | | | | 6,823 | | | | 2,844 | | | | 2,780 | | |
| Net asset value and redemption price per share | | $ | 22.79 | | | $ | 15.33 | | | $ | 16.34 | | | $ | 8.03 | | |
| Maximum offering price per share (1) | | $ | 24.12 | | | $ | 16.22 | | | $ | 17.29 | | | $ | 8.50 | | |
| Class B: | |
| Net assets | | $ | 8,271 | | | $ | 13,406 | | | $ | 8,913 | | | $ | 10,054 | | |
| Shares issued and outstanding ($0.0001 par value — 2 billion authorized) | | | 387 | | | | 987 | | | | 587 | | | | 1,425 | | |
| Net asset value, offering price, and redemption price per share (2) | | $ | 21.36 | | | $ | 13.58 | | | $ | 15.19 | | | $ | 7.06 | | |
| Class C: | |
| Net assets | | $ | 2,962 | | | $ | 13,453 | | | $ | 4,590 | | | $ | 4,253 | | |
| Shares issued and outstanding ($0.0001 par value — 2 billion authorized) | | | 134 | | | | 909 | | | | 298 | | | | 553 | | |
| Net asset value, offering price and redemption price per share (2) | | $ | 22.05 | | | $ | 14.79 | | | $ | 15.39 | | | $ | 7.69 | | |
| Class R: | |
| Net assets | | $ | 5 | | | $ | 333 | | | $ | 4 | | | $ | — | | |
| Shares issued and outstanding ($0.0001 par value — 2 billion authorized) | | | — | | | | 22 | | | | — | | | | — | | |
| Net asset value, offering price, and redemption price per share | | $ | 22.75 | | | $ | 15.24 | | | $ | 16.29 | | | $ | — | | |
| Class Y: | |
| Net assets | | $ | 210,769 | | | $ | 682,088 | | | $ | 348,166 | | | $ | 31,381 | | |
| Shares issued and outstanding ($0.0001 par value — 2 billion authorized) | | | 8,853 | | | | 42,477 | | | | 20,955 | | | | 3,764 | | |
| Net asset value, offering price, and redemption price per share | | $ | 23.81 | | | $ | 16.06 | | | $ | 16.62 | | | $ | 8.34 | | |
(1) The offering price is calculated by dividing the net asset value by 1 minus the maximum sales charge of 5.50%
(2) Class B and C have a contingent deferred sales charge. For a description of this sales charge, see notes 1 and 3 in Notes to Financial Statements.
FIRST AMERICAN FUNDS Annual Report 2005
61
Statements of Operations in thousands
| | | Small Cap Growth
Opportunities Fund | | Small Cap
Select Fund | |
| | | One-Month
Period Ended
10/31/05 | | Year
Ended
9/30/05 | | One-Month
Period Ended
10/31/05 | | Year
Ended
9/30/05 | |
| INVESTMENT INCOME: | |
| Dividends from affiliated money market fund | | $ | 21 | | | $ | 220 | | | $ | 37 | | | $ | 501 | | |
| Dividends from unaffiliated securities | | | 38 | | | | 891 | | | | 170 | | | | 5,045 | | |
| Less: Foreign taxes withheld | | | — | | | | — | | | | — | | | | (13 | ) | |
| Securities lending income | | | 18 | | | | 162 | | | | 20 | | | | 410 | | |
| Total investment income | | | 77 | | | | 1,273 | | | | 227 | | | | 5,943 | | |
| EXPENSES (note 3): | |
| Investment advisory fees | | | 257 | | | | 4,086 | | | | 484 | | | | 6,006 | | |
| Transfer agent fees | | | 37 | | | | 200 | | | | 99 | | | | 542 | | |
| Administration fees | | | 33 | | | | 644 | | | | 89 | | | | 1,752 | | |
| Registration fees | | | 3 | | | | 49 | | | | 3 | | | | 46 | | |
| Professional fees | | | 2 | | | | 37 | | | | 4 | | | | 66 | | |
| Custodian fees | | | 1 | | | | 28 | | | | 3 | | | | 75 | | |
| Postage and printing fees | | | 1 | | | | 16 | | | | 2 | | | | 45 | | |
| Other expenses | | | 1 | | | | 11 | | | | 2 | | | | 22 | | |
| Directors' fees | | | 1 | | | | 7 | | | | 2 | | | | 20 | | |
| Distribution and shareholder servicing fees – Class A | | | 17 | | | | 229 | | | | 22 | | | | 259 | | |
| Distribution and shareholder servicing fees – Class B | | | 7 | | | | 91 | | | | 11 | | | | 136 | | |
| Distribution and shareholder servicing fees – Class C | | | 3 | | | | 38 | | | | 12 | | | | 145 | | |
| Distribution and shareholder servicing fees – Class R (1) | | | — | | | | — | | | | — | | | | — | | |
| Total expenses | | | 363 | | | | 5,436 | | | | 733 | | | | 9,114 | | |
| Less: Fee waivers (note 3) | | | (23 | ) | | | (159 | ) | | | — | | | | (245 | ) | |
| Total net expenses | | | 340 | | | | 5,277 | | | | 733 | | | | 8,869 | | |
| Investment income (loss) – net | | | (263 | ) | | | (4,004 | ) | | | (506 | ) | | | (2,926 | ) | |
REALIZED AND UNREALIZED GAINS (LOSSES) ON
INVESTMENTS – NET (note 5): | |
| Net realized gain on investments | | | 946 | | | | 70,779 | | | | 10,384 | | | | 184,051 | | |
| Net change in unrealized appreciation or depreciation of investments | | | (13,513 | ) | | | 3,567 | | | | (36,382 | ) | | | (17,021 | ) | |
| Net gain (loss) on investments | | | (12,567 | ) | | | 74,346 | | | | (25,998 | ) | | | 167,030 | | |
| Net increase (decrease) in net assets resulting from operations | | $ | (12,830 | ) | | $ | 70,342 | | | $ | (26,504 | ) | | $ | 164,104 | | |
(1) Due to the presentation of the financial statements in thousands, the numbers round to zero. Class R is not offered by the Small-Mid Cap Core Fund.
The accompanying notes are an integral part of the financial statements.
FIRST AMERICAN FUNDS Annual Report 2005
62
| | | Small Cap
Value Fund | | Small-Mid Cap
Core Fund | |
| | | One-Month
Period Ended
10/31/05 | | Year
Ended
9/30/05 | | One-Month
Period Ended
10/31/05 | | Year
Ended
9/30/05 | |
| INVESTMENT INCOME: | |
| Dividends from affiliated money market fund | | $ | 33 | | | $ | 90 | | | $ | 4 | | | $ | 41 | | |
| Dividends from unaffiliated securities | | | 663 | | | | 5,966 | | | | 22 | | | | 418 | | |
| Less: Foreign taxes withheld | | | — | | | | (2 | ) | | | — | | | | (24 | ) | |
| Securities lending income | | | 7 | | | | 89 | | | | 2 | | | | 64 | | |
| Total investment income | | | 703 | | | | 6,143 | | | | 28 | | | | 499 | | |
| EXPENSES (note 3): | |
| Investment advisory fees | | | 242 | | | | 3,009 | | | | 41 | | | | 597 | | |
| Transfer agent fees | | | 49 | | | | 275 | | | | 9 | | | | 60 | | |
| Administration fees | | | 45 | | | | 880 | | | | 8 | | | | 183 | | |
| Registration fees | | | 4 | | | | 40 | | | | 4 | | | | 45 | | |
| Professional fees | | | 2 | | | | 41 | | | | 1 | | | | 54 | | |
| Custodian fees | | | 2 | | | | 38 | | | | — | | | | 8 | | |
| Postage and printing fees | | | 1 | | | | 23 | | | | — | | | | 109 | | |
| Other expenses | | | 1 | | | | 13 | | | | — | | | | 6 | | |
| Directors' fees | | | 1 | | | | 10 | | | | — | | | | 2 | | |
| Distribution and shareholder servicing fees – Class A | | | 10 | | | | 117 | | | | 5 | | | | 66 | | |
| Distribution and shareholder servicing fees – Class B | | | 7 | | | | 97 | | | | 8 | | | | 124 | | |
| Distribution and shareholder servicing fees – Class C | | | 4 | | | | 48 | | | | 4 | | | | 53 | | |
| Distribution and shareholder servicing fees – Class R (1) | | | — | | | | — | | | | — | | | | — | | |
| Total expenses | | | 368 | | | | 4,591 | | | | 80 | | | | 1,307 | | |
| Less: Fee waivers (note 3) | | | — | | | | (84 | ) | | | — | | | | (71 | ) | |
| Total net expenses | | | 368 | | | | 4,507 | | | | 80 | | | | 1,236 | | |
| Investment income (loss) – net | | | 335 | | | | 1,636 | | | | (52 | ) | | | (737 | ) | |
REALIZED AND UNREALIZED GAINS (LOSSES) ON
INVESTMENTS – NET (note 5): | |
| Net realized gain on investments | | | 7,871 | | | | 94,694 | | | | 3,985 | | | | 8,526 | | |
| Net change in unrealized appreciation or depreciation of investments | | | (19,471 | ) | | | (28,747 | ) | | | (6,380 | ) | | | 2,726 | | |
| Net gain (loss) on investments | | | (11,600 | ) | | | 65,947 | | | | (2,395 | ) | | | 11,252 | | |
| Net increase (decrease) in net assets resulting from operations | | $ | (11,265 | ) | | $ | 67,583 | | | $ | (2,447 | ) | | $ | 10,515 | | |
FIRST AMERICAN FUNDS Annual Report 2005
63
Statements of Changes in Net Assets in thousands
| | | Small Cap Growth
Opportunities Fund | | Small Cap
Select Fund | |
| | | One-Month
Period Ended
10/31/05 | | Year
Ended
9/30/05 | | Year
Ended
9/30/04 | | One-Month
Period Ended
10/31/05 | | Year
Ended
9/30/05 | | Year
Ended
9/30/04 | |
| OPERATIONS: | |
| Investment income (loss) – net | | $ | (263 | ) | | $ | (4,004 | ) | | $ | (6,363 | ) | | $ | (506 | ) | | $ | (2,926 | ) | | $ | (6,173 | ) | |
| Net realized gain on investments | | | 946 | | | | 70,779 | | | | 89,817 | | | | 10,384 | | | | 184,051 | | | | 231,411 | | |
| Net gain on written options | | | — | | | | — | | | | — | | | | — | | | | — | | | | — | | |
| Net change in unrealized appreciation or depreciation of investments | | | (13,513 | ) | | | 3,567 | | | | (68,591 | ) | | | (36,382 | ) | | | (17,021 | ) | | | (19,782 | ) | |
| Net change in unrealized appreciation or depreciation of written options | | | — | | | | — | | | | — | | | | — | | | | — | | | | — | | |
| Net increase (decrease) in net assets resulting from operations | | | (12,830 | ) | | | 70,342 | | | | 14,863 | | | | (26,504 | ) | | | 164,104 | | | | 205,456 | | |
| DISTRIBUTIONS TO SHAREHOLDERS FROM: | |
| Investment income – net: | |
| Class A | | | — | | | | — | | | | — | | | | — | | | | — | | | | — | | |
| Class B | | | — | | | | — | | | | — | | | | — | | | | — | | | | — | | |
| Class C | | | — | | | | — | | | | — | | | | — | | | | — | | | | — | | |
| Class R | | | — | | | | — | | | | — | | | | — | | | | — | | | | — | | |
| Class Y | | | — | | | | — | | | | — | | | | — | | | | — | | | | — | | |
| Net realized gain on investments: | |
| Class A | | | — | | | | (12,315 | ) | | | (611 | ) | | | — | | | | (19,383 | ) | | | (5,360 | ) | |
| Class B | | | — | | | | (1,255 | ) | | | (47 | ) | | | — | | | | (2,778 | ) | | | (900 | ) | |
| Class C | | | — | | | | (577 | ) | | | (12 | ) | | | — | | | | (2,801 | ) | | | (821 | ) | |
| Class R | | | — | | | | — | | | | (23 | ) | | | — | | | | (5 | ) | | | (862 | ) | |
| Class Y | | | — | | | | (25,220 | ) | | | (2,392 | ) | | | — | | | | (133,034 | ) | | | (70,619 | ) | |
| Total distributions | | | — | | | | (39,367 | ) | | | (3,085 | ) | | | — | | | | (158,001 | ) | | | (78,562 | ) | |
| CAPITAL SHARE TRANSACTIONS (note 4): | |
| Class A: | |
| Proceeds from sales | | | 922 | | | | 17,883 | | | | 79,928 | | | | 2,296 | | | | 24,096 | | | | 47,056 | | |
| Reinvestment of distributions | | | — | | | | 11,923 | | | | 577 | | | | — | | | | 18,716 | | | | 5,191 | | |
| Payments for redemptions | | | (3,649 | ) | | | (54,396 | ) | | | (57,140 | ) | | | (1,656 | ) | | | (32,858 | ) | | | (35,163 | ) | |
| Increase (decrease) in net assets from Class A transactions | | | (2,727 | ) | | | (24,590 | ) | | | 23,365 | | | | 640 | | | | 9,954 | | | | 17,084 | | |
| Class B: | |
| Proceeds from sales | | | 11 | | | | 590 | | | | 6,009 | | | | 32 | | | | 1,593 | | | | 2,158 | | |
| Reinvestment of distributions | | | — | | | | 1,157 | | | | 45 | | | | — | | | | 2,700 | | | | 873 | | |
| Payments for redemptions | | | (141 | ) | | | (2,716 | ) | | | (2,734 | ) | | | (202 | ) | | | (2,957 | ) | | | (2,565 | ) | |
| Increase (decrease) in net assets from Class B transactions | | | (130 | ) | | | (969 | ) | | | 3,320 | | | | (170 | ) | | | 1,336 | | | | 466 | | |
| Class C: | |
| Proceeds from sales | | | 25 | | | | 501 | | | | 4,614 | | | | 189 | | | | 3,374 | | | | 3,975 | | |
| Reinvestment of distributions | | | — | | | | 561 | | | | 11 | | | | — | | | | 2,745 | | | | 817 | | |
| Payments for redemptions | | | (86 | ) | | | (2,841 | ) | | | (1,012 | ) | | | (690 | ) | | | (5,249 | ) | | | (3,114 | ) | |
| Increase (decrease) in net assets from Class C transactions | | | (61 | ) | | | (1,779 | ) | | | 3,613 | | | | (501 | ) | | | 870 | | | | 1,678 | | |
| Class R: | |
| Proceeds from sales | | | — | | | | 17 | | | | 976 | | | | 119 | | | | 337 | | | | 3,323 | | |
| Reinvestment of distributions | | | — | | | | — | | | | 23 | | | | — | | | | 5 | | | | 808 | | |
| Payments for redemptions | | | — | | | | (15 | ) | | | (5,357 | ) | | | (90 | ) | | | (57 | ) | | | (17,289 | ) | |
| Increase (decrease) in net assets from Class R transactions | | | — | | | | 2 | | | | (4,358 | ) | | | 29 | | | | 285 | | | | (13,158 | ) | |
| Class Y: | |
| Proceeds from sales | | | 3,340 | | | | 38,132 | | | | 101,703 | | | | 3,703 | | | | 102,349 | | | | 132,590 | | |
| Reinvestment of distributions | | | — | | | | 18,850 | | | | 1,934 | | | | — | | | | 98,881 | | | | 57,505 | | |
| Payments for redemptions | | | (4,484 | ) | | | (82,561 | ) | | | (278,211 | ) | | | (14,868 | ) | | | (263,925 | ) | | | (559,280 | ) | |
| Decrease in net assets from Class Y transactions | | | (1,144 | ) | | | (25,579 | ) | | | (174,574 | ) | | | (11,165 | ) | | | (62,695 | ) | | | (369,185 | ) | |
| Decrease in net assets from capital share transactions | | | (4,062 | ) | | | (52,915 | ) | | | (148,634 | ) | | | (11,167 | ) | | | (50,250 | ) | | | (363,115 | ) | |
| Total increase (decrease) in net assets | | | (16,892 | ) | | | (21,940 | ) | | | (136,856 | ) | | | (37,671 | ) | | | (44,147 | ) | | | (236,221 | ) | |
| Net assets at beginning of period | | | 317,256 | | | | 339,196 | | | | 476,052 | | | | 851,519 | | | | 895,666 | | | | 1,131,887 | | |
| Net assets at end of period | | $ | 300,364 | | | $ | 317,256 | | | $ | 339,196 | | | $ | 813,848 | | | $ | 851,519 | | | $ | 895,666 | | |
| Undistributed (distributions in excess of) net investment income at end of period | | $ | (1 | ) | | $ | (1 | ) | | $ | (2 | ) | | $ | (1 | ) | | $ | (1 | ) | | $ | (1 | ) | |
The accompanying notes are an integral part of the financial statements.
FIRST AMERICAN FUNDS Annual Report 2005
64
| | | Small Cap
Value Fund | | Small-Mid Cap
Core Fund | |
| | | One-Month
Period Ended
10/31/05 | | Year
Ended
9/30/05 | | Year
Ended
9/30/04 | | One-Month
Period Ended
10/31/05 | | Year
Ended
9/30/05 | | Year
Ended
9/30/04 | |
| OPERATIONS: | |
| Investment income (loss) – net | | $ | 335 | | | $ | 1,636 | | | $ | 2,056 | | | $ | (52 | ) | | $ | (737 | ) | | $ | (1,017 | ) | |
| Net realized gain on investments | | | 7,871 | | | | 94,694 | | | | 92,122 | | | | 3,985 | | | | 8,526 | | | | 4,958 | | |
| Net gain on written options | | | — | | | | — | | | | — | | | | — | | | | — | | | | 104 | | |
| Net change in unrealized appreciation or depreciation of investments | | | (19,471 | ) | | | (28,747 | ) | | | 7,329 | | | | (6,380 | ) | | | 2,726 | | | | 3,406 | | |
| Net change in unrealized appreciation or depreciation of written options | | | — | | | | — | | | | — | | | | — | | | | — | | | | (72 | ) | |
| Net increase (decrease) in net assets resulting from operations | | | (11,265 | ) | | | 67,583 | | | | 101,507 | | | | (2,447 | ) | | | 10,515 | | | | 7,379 | | |
| DISTRIBUTIONS TO SHAREHOLDERS FROM: | |
| Investment income – net: | |
| Class A | | | — | | | | (177 | ) | | | (92 | ) | | | — | | | | — | | | | — | | |
| Class B | | | — | | | | (23 | ) | | | — | | | | — | | | | — | | | | — | | |
| Class C | | | — | | | | (11 | ) | | | — | | | | — | | | | — | | | | — | | |
| Class R | | | — | | | | — | | | | (3 | ) | | | — | | | | — | | | | — | | |
| Class Y | | | — | | | | (1,626 | ) | | | (1,696 | ) | | | — | | | | — | | | | — | | |
| Net realized gain on investments: | |
| Class A | | | — | | | | (6,876 | ) | | | (1,428 | ) | | | — | | | | — | | | | — | | |
| Class B | | | — | | | | (1,565 | ) | | | (487 | ) | | | — | | | | — | | | | — | | |
| Class C | | | — | | | | (747 | ) | | | (183 | ) | | | — | | | | — | | | | — | | |
| Class R | | | — | | | | — | | | | (54 | ) | | | — | | | | — | | | | — | | |
| Class Y | | | — | | | | (55,117 | ) | | | (16,522 | ) | | | — | | | | — | | | | — | | |
| Total distributions | | | — | | | | (66,142 | ) | | | (20,465 | ) | | | — | | | | — | | | | — | | |
| CAPITAL SHARE TRANSACTIONS (note 4): | |
| Class A: | |
| Proceeds from sales | | | 547 | | | | 8,656 | | | | 19,021 | | | | 784 | | | | 5,250 | | | | 18,402 | | |
| Reinvestment of distributions | | | — | | | | 6,859 | | | | 1,486 | | | | — | | | | — | | | | — | | |
| Payments for redemptions | | | (928 | ) | | | (10,711 | ) | | | (16,067 | ) | | | (676 | ) | | | (12,848 | ) | | | (20,148 | ) | |
| Increase (decrease) in net assets from Class A transactions | | | (381 | ) | | | 4,804 | | | | 4,440 | | | | 108 | | | | (7,598 | ) | | | (1,746 | ) | |
| Class B: | |
| Proceeds from sales | | | 31 | | | | 872 | | | | 1,193 | | | | 22 | | | | 454 | | | | 884 | | |
| Reinvestment of distributions | | | — | | | | 1,539 | | | | 481 | | | | — | | | | — | | | | — | | |
| Payments for redemptions | | | (193 | ) | | | (2,854 | ) | | | (6,346 | ) | | | (290 | ) | | | (4,645 | ) | | | (4,394 | ) | |
| Increase (decrease) in net assets from Class B transactions | | | (162 | ) | | | (443 | ) | | | (4,672 | ) | | | (268 | ) | | �� | (4,191 | ) | | | (3,510 | ) | |
| Class C: | |
| Proceeds from sales | | | 28 | | | | 942 | | | | 1,179 | | | | 50 | | | | 405 | | | | 952 | | |
| Reinvestment of distributions | | | — | | | | 745 | | | | 183 | | | | — | | | | — | | | | — | | |
| Payments for redemptions | | | (114 | ) | | | (1,441 | ) | | | (1,855 | ) | | | (128 | ) | | | (2,541 | ) | | | (2,394 | ) | |
| Increase (decrease) in net assets from Class C transactions | | | (86 | ) | | | 246 | | | | (493 | ) | | | (78 | ) | | | (2,136 | ) | | | (1,442 | ) | |
| Class R: | |
| Proceeds from sales | | | — | | | | 3 | | | | 1,145 | | | | — | | | | — | | | | 1,139 | | |
| Reinvestment of distributions | | | — | | | | — | | | | 52 | | | | — | | | | — | | | | — | | |
| Payments for redemptions | | | — | | | | — | | | | (2,727 | ) | | | — | | | | — | | | | (5,754 | ) | |
| Increase (decrease) in net assets from Class R transactions | | | — | | | | 3 | | | | (1,530 | ) | | | — | | | | — | | | | (4,615 | ) | |
| Class Y: | |
| Proceeds from sales | | | 2,852 | | | | 63,025 | | | | 59,568 | | | | 1,168 | | | | 17,409 | | | | 33,338 | | |
| Reinvestment of distributions | | | — | | | | 48,592 | | | | 15,745 | | | | — | | | | — | | | | — | | |
| Payments for redemptions | | | (8,344 | ) | | | (117,619 | ) | | | (208,150 | ) | | | (2,179 | ) | | | (32,835 | ) | | | (53,593 | ) | |
| Decrease in net assets from Class Y transactions | | | (5,492 | ) | | | (6,002 | ) | | | (132,837 | ) | | | (1,011 | ) | | | (15,426 | ) | | | (20,255 | ) | |
| Decrease in net assets from capital share transactions | | | (6,121 | ) | | | (1,392 | ) | | | (135,092 | ) | | | (1,249 | ) | | | (29,351 | ) | | | (31,568 | ) | |
| Total increase (decrease) in net assets | | | (17,386 | ) | | | 49 | | | | (54,050 | ) | | | (3,696 | ) | | | (18,836 | ) | | | (24,189 | ) | |
| Net assets at beginning of period | | | 425,526 | | | | 425,477 | | | | 479,527 | | | | 71,723 | | | | 90,559 | | | | 114,748 | | |
| Net assets at end of period | | $ | 408,140 | | | $ | 425,526 | | | $ | 425,477 | | | $ | 68,027 | | | $ | 71,723 | | | $ | 90,559 | | |
| Undistributed (distributions in excess of) net investment income at end of period | | $ | 335 | | | $ | — | | | $ | 485 | | | $ | — | | | $ | — | | | $ | — | | |
FIRST AMERICAN FUNDS Annual Report 2005
65
Financial Highlights For a share outstanding throughout the indicated periods.
| | | Net Asset
Value
Beginning
of Period | | Net
Investment
Loss | | Realized and
Unrealized
Gains
(Losses) on
Investments | | Distributions
from Net
Realized Gains | | Distributions
from
Return of
Capital | | Net Asset
Value
End of
Period | | Total
Return (9) | |
| Small Cap Growth Opportunities (1) | | | |
| Class A | |
| | 2005 | (2) (3) | | $ | 23.75 | | | $ | (0.02 | ) | | $ | (0.94 | ) | | $ | — | | | $ | — | | | $ | 22.79 | | | | (4.04 | )% | |
| | 2005 | (3) (4) | | | 21.74 | | | | (0.32 | ) | | | 5.28 | | | | (2.95 | ) | | | — | | | | 23.75 | | | | 24.21 | | |
| | 2004 | (3) (4) | | | 21.95 | | | | (0.35 | ) | | | 0.27 | | | | (0.13 | ) | | | — | | | | 21.74 | | | | (0.39 | ) | |
| | 2003 | (3) (4) | | | 13.86 | | | | (0.28 | ) | | | 8.37 | | | | — | | | | — | | | | 21.95 | | | | 58.37 | | |
| | 2002 | (4) | | | 16.89 | | | | (0.26 | ) | | | (2.74 | ) | | | — | | | | (0.03 | ) | | | 13.86 | | | | (17.84 | ) | |
| | 2001 | (3) (5) | | | 31.26 | | | | (0.17 | ) | | | (5.20 | ) | | | (9.00 | ) | | | — | | | | 16.89 | | | | (21.51 | ) | |
| Class B | |
| | 2005 | (2) (3) | | $ | 22.27 | | | $ | (0.03 | ) | | $ | (0.88 | ) | | $ | — | | | $ | — | | | $ | 21.36 | | | | (4.09 | )% | |
| | 2005 | (3) (4) | | | 20.69 | | | | (0.45 | ) | | | 4.98 | | | | (2.95 | ) | | | — | | | | 22.27 | | | | 23.27 | | |
| | 2004 | (3) (4) | | | 21.05 | | | | (0.50 | ) | | | 0.27 | | | | (0.13 | ) | | | — | | | | 20.69 | | | | (1.13 | ) | |
| | 2003 | (3) (4) | | | 13.39 | | | | (0.40 | ) | | | 8.06 | | | | — | | | | — | | | | 21.05 | | | | 57.21 | | |
| | 2002 | (4) | | | 16.44 | | | | (0.39 | ) | | | (2.63 | ) | | | — | | | | (0.03 | ) | | | 13.39 | | | | (18.45 | ) | |
| | 2001 | (3) (5) | | | 30.84 | | | | (0.31 | ) | | | (5.09 | ) | | | (9.00 | ) | | | — | | | | 16.44 | | | | (22.07 | ) | |
| Class C | |
| | 2005 | (2) (3) | | $ | 23.00 | | | $ | (0.04 | ) | | $ | (0.91 | ) | | $ | — | | | $ | — | | | $ | 22.05 | | | | (4.13 | )% | |
| | 2005 | (3) (4) | | | 21.28 | | | | (0.48 | ) | | | 5.15 | | | | (2.95 | ) | | | — | | | | 23.00 | | | | 23.28 | | |
| | 2004 | (3) (4) | | | 21.65 | | | | (0.49 | ) | | | 0.25 | | | | (0.13 | ) | | | — | | | | 21.28 | | | | (1.14 | ) | |
| | 2003 | (3) (4) | | | 13.77 | | | | (0.43 | ) | | | 8.31 | | | | — | | | | — | | | | 21.65 | | | | 57.23 | | |
| | 2002 | (4) | | | 16.90 | | | | (0.19 | ) | | | (2.91 | ) | | | — | | | | (0.03 | ) | | | 13.77 | | | | (18.42 | ) | |
| | 2001 | (3) (6) | | | 16.34 | | | | — | | | | 0.56 | | | | — | | | | — | | | | 16.90 | | | | 3.43 | | |
| Class R (7) | |
| | 2005 | (2) (3) | | $ | 23.72 | | | $ | (0.03 | ) | | $ | (0.94 | ) | | $ | — | | | $ | — | | | $ | 22.75 | | | | (4.09 | )% | |
| | 2005 | (3) (4) | | | 21.74 | | | | (0.48 | ) | | | 5.41 | | | | (2.95 | ) | | | — | | | | 23.72 | | | | 24.06 | | |
| | 2004 | (3) (4) | | | 21.95 | | | | (0.42 | ) | | | 0.34 | | | | (0.13 | ) | | | — | | | | 21.74 | | | | (0.39 | ) | |
| | 2003 | (3) (4) | | | 13.86 | | | | (0.28 | ) | | | 8.37 | | | | — | | | | — | | | | 21.95 | | | | 58.37 | | |
| | 2002 | (4) | | | 16.89 | | | | (0.26 | ) | | | (2.74 | ) | | | — | | | | (0.03 | ) | | | 13.86 | | | | (17.84 | ) | |
| | 2001 | (3) (8) | | | 20.01 | | | | (0.19 | ) | | | (2.93 | ) | | | — | | | | — | | | | 16.89 | | | | (15.59 | ) | |
| Class Y | |
| | 2005 | (2) (3) | | $ | 24.81 | | | $ | (0.02 | ) | | $ | (0.98 | ) | | $ | — | | | $ | — | | | $ | 23.81 | | | | (4.03 | )% | |
| | 2005 | (3) (4) | | | 22.55 | | | | (0.27 | ) | | | 5.48 | | | | (2.95 | ) | | | — | | | | 24.81 | | | | 24.47 | | |
| | 2004 | (3) (4) | | | 22.70 | | | | (0.32 | ) | | | 0.30 | | | | (0.13 | ) | | | — | | | | 22.55 | | | | (0.11 | ) | |
| | 2003 | (3) (4) | | | 14.30 | | | | (0.25 | ) | | | 8.65 | | | | — | | | | — | | | | 22.70 | | | | 58.74 | | |
| | 2002 | (4) | | | 17.38 | | | | (0.25 | ) | | | (2.80 | ) | | | — | | | | (0.03 | ) | | | 14.30 | | | | (17.62 | ) | |
| | 2001 | (3) (5) | | | 31.83 | | | | (0.12 | ) | | | (5.33 | ) | | | (9.00 | ) | | | — | | | | 17.38 | | | | (21.35 | ) | |
(1) The financial highlights for the Small Cap Growth Opportunities Fund as set forth herein include the historical financial highlights of the Firstar Micro Cap Fund. The assets
of the Firstar Fund were acquired by the First American Small Cap Growth Opportunities Fund on September 24, 2001. In connection with such acquisition, (i) Class A
shares of the Firstar Micro Cap Fund were exchanged for Class A shares of the First American Small Cap Growth Opportunities Fund, (ii) Firstar Class B shares were
exchanged for Class B shares of the First American Fund, (iii) Firstar Class Y shares were exchanged for Class S shares of the First American Fund, and (iv) Firstar
Institutional Class shares were exchanged for Class Y shares of the First American Fund.
(2) For the period October 1, 2005 to October 31, 2005. Effective October 1, 2005, the fund's fiscal year-end was changed from September 30 to October 31. All ratios for the
period have been annualized, except total return and portfolio turnover.
(3) Per share data calculated using average shares outstanding method.
(4) For the period October 1 to September 30 in the year indicated.
(5) For the period November 1, 2000 to September 30, 2001. Effective in 2001, the fund's fiscal year-end was changed from October 31 to September 30. All ratios for the
period have been annualized, except total return and portfolio turnover.
(6) For the period from September 24, 2001, when the class of shares was first offered, to September 30, 2001. All ratios for the period have been annualized,
except total return and portfolio turnover.
(7) Prior to July 1, 2004, Class R shares were named Class S shares, which had lower fees and expenses.
(8) For the period from December 11, 2000, when the class of shares was first offered, to September 30, 2001. All ratios for the period have been annualized, except total
return and portfolio turnover.
(9) Total return does not reflect sales charges. Total return would have been lower had certain expenses not been waived.
The accompanying notes are an integral part of the financial statements.
FIRST AMERICAN FUNDS Annual Report 2005
66
| | | Net Assets
End of
Period (000) | | Ratio of
Expenses to
Average
Net Assets | | Ratio of Net
Investment
Loss
to Average
Net Assets | | Ratio of
Expenses to
Average
Net Assets
(Excluding
Waivers) | | Ratio of Net
Investment
Loss
to Average Net
Assets (Excluding
Waivers) | | Portfolio
Turnover
Rate | |
| Small Cap Growth Opportunities (1) | |
| Class A | |
| | 2005 | (2) (3) | | $ | 78,357 | | | | 1.47 | % | | | (1.17 | )% | | | 1.56 | % | | | (1.26 | )% | | | 14 | % | |
| | 2005 | (3) (4) | | | 84,567 | | | | 1.82 | | | | (1.42 | ) | | | 1.87 | | | | (1.47 | ) | | | 190 | | |
| | 2004 | (3) (4) | | | 101,031 | | | | 1.93 | | | | (1.42 | ) | | | 1.96 | | | | (1.45 | ) | | | 178 | | |
| | 2003 | (3) (4) | | | 81,999 | | | | 1.93 | | | | (1.63 | ) | | | 1.97 | | | | (1.67 | ) | | | 137 | | |
| | 2002 | (4) | | | 44,834 | | | | 1.93 | | | | (1.53 | ) | | | 1.97 | | | | (1.57 | ) | | | 123 | | |
| | 2001 | (3) (5) | | | 45,233 | | | | 1.93 | | | | (0.91 | ) | | | 1.99 | | | | (0.97 | ) | | | 125 | | |
| Class B | |
| | 2005 | (2) (3) | | $ | 8,271 | | | | 2.22 | % | | | (1.93 | )% | | | 2.31 | % | | | (2.02 | )% | | | 14 | % | |
| | 2005 | (3) (4) | | | 8,760 | | | | 2.57 | | | | (2.16 | ) | | | 2.62 | | | | (2.21 | ) | | | 190 | | |
| | 2004 | (3) (4) | | | 9,063 | | | | 2.68 | | | | (2.16 | ) | | | 2.71 | | | | (2.19 | ) | | | 178 | | |
| | 2003 | (3) (4) | | | 6,441 | | | | 2.68 | | | | (2.38 | ) | | | 2.72 | | | | (2.42 | ) | | | 137 | | |
| | 2002 | (4) | | | 3,779 | | | | 2.68 | | | | (2.28 | ) | | | 2.72 | | | | (2.32 | ) | | | 123 | | |
| | 2001 | (3) (5) | | | 3,165 | | | | 2.68 | | | | (1.68 | ) | | | 2.74 | | | | (1.74 | ) | | | 125 | | |
| Class C | |
| | 2005 | (2) (3) | | $ | 2,962 | | | | 2.22 | % | | | (1.93 | )% | | | 2.31 | % | | | (2.02 | )% | | | 14 | % | |
| | 2005 | (3) (4) | | | 3,152 | | | | 2.57 | | | | (2.20 | ) | | | 2.62 | | | | (2.25 | ) | | | 190 | | |
| | 2004 | (3) (4) | | | 4,669 | | | | 2.68 | | | | (2.07 | ) | | | 2.71 | | | | (2.10 | ) | | | 178 | | |
| | 2003 | (3) (4) | | | 1,529 | | | | 2.68 | | | | (2.38 | ) | | | 2.72 | | | | (2.42 | ) | | | 137 | | |
| | 2002 | (4) | | | 260 | | | | 2.68 | | | | (2.31 | ) | | | 2.72 | | | | (2.35 | ) | | | 123 | | |
| | 2001 | (3) (6) | | | 1 | | | | 1.63 | | | | (0.41 | ) | | | 1.76 | | | | (0.54 | ) | | | 125 | | |
| Class R (7) | |
| | 2005 | (2) (3) | | $ | 5 | | | | 1.72 | % | | | (1.43 | )% | | | 1.96 | % | | | (1.67 | )% | | | 14 | % | |
| | 2005 | (3) (4) | | | 5 | | | | 2.07 | | | | (2.14 | ) | | | 2.27 | | | | (2.34 | ) | | | 190 | | |
| | 2004 | (3) (4) | | | 1 | | | | 1.93 | | | | (1.67 | ) | | | 1.96 | | | | (1.70 | ) | | | 178 | | |
| | 2003 | (3) (4) | | | 3,694 | | | | 1.93 | | | | (1.62 | ) | | | 1.97 | | | | (1.66 | ) | | | 137 | | |
| | 2002 | (4) | | | 2,027 | | | | 1.93 | | | | (1.53 | ) | | | 1.97 | | | | (1.57 | ) | | | 123 | | |
| | 2001 | (3) (8) | | | 2,014 | | | | 1.94 | | | | (1.06 | ) | | | 2.00 | | | | (1.12 | ) | | | 125 | | |
| Class Y | |
| | 2005 | (2) (3) | | $ | 210,769 | | | | 1.22 | % | | | (0.92 | )% | | | 1.31 | % | | | (1.01 | )% | | | 14 | % | |
| | 2005 | (3) (4) | | | 220,772 | | | | 1.57 | | | | (1.15 | ) | | | 1.62 | | | | (1.20 | ) | | | 190 | | |
| | 2004 | (3) (4) | | | 224,432 | | | | 1.68 | | | | (1.25 | ) | | | 1.71 | | | | (1.28 | ) | | | 178 | | |
| | 2003 | (3) (4) | | | 382,389 | | | | 1.68 | | | | (1.38 | ) | | | 1.72 | | | | (1.42 | ) | | | 137 | | |
| | 2002 | (4) | | | 208,439 | | | | 1.68 | | | | (1.28 | ) | | | 1.72 | | | | (1.32 | ) | | | 123 | | |
| | 2001 | (3) (5) | | | 266,115 | | | | 1.68 | | | | (0.64 | ) | | | 1.74 | | | | (0.70 | ) | | | 125 | | |
FIRST AMERICAN FUNDS Annual Report 2005
67
Financial Highlights For a share outstanding throughout the indicated periods.
| | | Net Asset
Value
Beginning
of Period | | Net
Investment
Income Loss | | Realized and
Unrealized
Gains
(Losses) on
Investments | | Distributions
from Net
Realized Gains | | Net Asset
Value
End of
Period | | Total
Return (8) | |
| Small Cap Select (1) (2) | | | |
| Class A | |
| | 2005 | (3) | | $ | 15.82 | | | $ | (0.01 | ) | | $ | (0.48 | ) | | $ | — | | | $ | 15.33 | | | | (3.10 | )% | |
| | 2005 | (4) | | | 15.95 | | | | (0.08 | ) | | | 3.10 | | | | (3.15 | ) | | | 15.82 | | | | 20.46 | | |
| | 2004 | (4) | | | 14.52 | | | | (0.12 | ) | | | 2.60 | | | | (1.05 | ) | | | 15.95 | | | | 17.64 | | |
| | 2003 | (4) | | | 10.68 | | | | (0.09 | ) | | | 3.93 | | | | — | | | | 14.52 | | | | 35.96 | | |
| | 2002 | (4) | | | 11.97 | | | | (0.10 | ) | | | (0.30 | ) | | | (0.89 | ) | | | 10.68 | | | | (4.56 | ) | |
| | 2001 | (5) | | | 17.60 | | | | (0.03 | ) | | | (1.89 | ) | | | (3.71 | ) | | | 11.97 | | | | (12.63 | ) | |
| Class B | |
| | 2005 | (3) | | $ | 14.02 | | | $ | (0.02 | ) | | $ | (0.42 | ) | | $ | — | | | $ | 13.58 | | | | (3.14 | )% | |
| | 2005 | (4) | | | 14.56 | | | | (0.17 | ) | | | 2.78 | | | | (3.15 | ) | | | 14.02 | | | | 19.45 | | |
| | 2004 | (4) | | | 13.42 | | | | (0.22 | ) | | | 2.41 | | | | (1.05 | ) | | | 14.56 | | | | 16.88 | | |
| | 2003 | (4) | | | 9.95 | | | | (0.17 | ) | | | 3.64 | | | | — | | | | 13.42 | | | | 34.88 | | |
| | 2002 | (4) | | | 11.28 | | | | (0.19 | ) | | | (0.25 | ) | | | (0.89 | ) | | | 9.95 | | | | (5.23 | ) | |
| | 2001 | (5) | | | 16.90 | | | | (0.12 | ) | | | (1.79 | ) | | | (3.71 | ) | | | 11.28 | | | | (13.21 | ) | |
| Class C | |
| | 2005 | (3) | | $ | 15.28 | | | $ | (0.02 | ) | | $ | (0.47 | ) | | $ | — | | | $ | 14.79 | | | | (3.21 | )% | |
| | 2005 | (4) | | | 15.60 | | | | (0.19 | ) | | | 3.02 | | | | (3.15 | ) | | | 15.28 | | | | 19.58 | | |
| | 2004 | (4) | | | 14.32 | | | | (0.24 | ) | | | 2.57 | | | | (1.05 | ) | | | 15.60 | | | | 16.79 | | |
| | 2003 | (4) | | | 10.62 | | | | (0.18 | ) | | | 3.88 | | | | — | | | | 14.32 | | | | 34.84 | | |
| | 2002 | (4) | | | 11.97 | | | | (0.20 | ) | | | (0.26 | ) | | | (0.89 | ) | | | 10.62 | | | | (5.09 | ) | |
| | 2001 | (6) | | | 11.72 | | | | — | | | | 0.25 | | | | — | | | | 11.97 | | | | 2.13 | | |
| Class R (7) | |
| | 2005 | (3) | | $ | 15.73 | | | $ | (0.01 | ) | | $ | (0.48 | ) | | $ | — | | | $ | 15.24 | | | | (3.11 | )% | |
| | 2005 | (4) | | | 15.91 | | | | (0.08 | ) | | | 3.05 | | | | (3.15 | ) | | | 15.73 | | | | 20.16 | | |
| | 2004 | (4) | | | 14.49 | | | | (0.13 | ) | | | 2.60 | | | | (1.05 | ) | | | 15.91 | | | | 17.60 | | |
| | 2003 | (4) | | | 10.66 | | | | (0.09 | ) | | | 3.92 | | | | — | | | | 14.49 | | | | 35.93 | | |
| | 2002 | (4) | | | 11.94 | | | | (0.10 | ) | | | (0.29 | ) | | | (0.89 | ) | | | 10.66 | | | | (4.48 | ) | |
| | 2001 | (5) | | | 17.55 | | | | (0.01 | ) | | | (1.89 | ) | | | (3.71 | ) | | | 11.94 | | | | (12.52 | ) | |
| Class Y | |
| | 2005 | (3) | | $ | 16.57 | | | $ | (0.01 | ) | | $ | (0.50 | ) | | $ | — | | | $ | 16.06 | | | | (3.08 | )% | |
| | 2005 | (4) | | | 16.54 | | | | (0.04 | ) | | | 3.22 | | | | (3.15 | ) | | | 16.57 | | | | 20.73 | | |
| | 2004 | (4) | | | 14.98 | | | | (0.09 | ) | | | 2.70 | | | | (1.05 | ) | | | 16.54 | | | | 17.98 | | |
| | 2003 | (4) | | | 11.00 | | | | (0.06 | ) | | | 4.04 | | | | — | | | | 14.98 | | | | 36.18 | | |
| | 2002 | (4) | | | 12.26 | | | | (0.07 | ) | | | (0.30 | ) | | | (0.89 | ) | | | 11.00 | | | | (4.19 | ) | |
| | 2001 | (5) | | | 17.92 | | | | — | | | | (1.95 | ) | | | (3.71 | ) | | | 12.26 | | | | (12.49 | ) | |
(1) The financial highlights for the Small Cap Select Fund as set forth herein include the historical financial highlights of the Firstar Small Cap Core Equity Fund. The assets
of the Firstar Fund were acquired by the First American Small Cap Select Fund on September 24, 2001. In connection with such acquisition, (i) Class A shares of the
Firstar Fund were exchanged for Class A shares of the First American Fund, (ii) Firstar Class B shares were exchanged for Class B shares of the First American Fund,
(iii) Firstar Class Y shares were exchanged for Class S shares of the First American Fund, and (iv) Firstar Institutional Class shares were exchanged for Class Y shares of
the First American Fund.
(2) Per share data calculated using average shares outstanding method.
(3) For the period October 1, 2005 to October 31, 2005. Effective October 1, 2005, the fund's fiscal year end was changed from September 30 to October 31. All ratios for the
period have been annualized, except total return and portfolio turnover.
(4) For the period October 1 to September 30 in the year indicated.
(5) For the period November 1, 2000 to September 30, 2001. Effective in 2001, the fund's fiscal year end was changed from October 31 to September 30. All ratios for the
period have been annualized, except total return and portfolio turnover.
(6) For the period from September 24, 2001, when the class of shares was first offered, to September 30, 2001. All ratios for the period have been annualized,
except total return and portfolio turnover.
(7) Prior to July 1, 2004, Class R shares were named Class S shares, which had lower fees and expenses.
(8) Total return does not reflect sales charges. Total return would have been lower had certain expenses not been waived.
The accompanying notes are an integral part of the financial statements.
FIRST AMERICAN FUNDS Annual Report 2005
68
| | | Net Assets
End of
Period (000) | | Ratio of
Expenses to
Average
Net Assets | | Ratio of Net
Investment
Income (Loss)
to Average
Net Assets | | Ratio of
Expenses to
Average
Net Assets
(Excluding
Waivers) | | Ratio of Net
Investment
Loss
to Average Net
Assets (Excluding
Waivers) | | Portfolio
Turnover
Rate | |
| Small Cap Select (1) (2) | |
| Class A | |
| | 2005 | (3) | | $ | 104,568 | | | | 1.25 | % | | | (0.92 | )% | | | 1.25 | % | | | (0.92 | )% | | | 14 | % | |
| | 2005 | (4) | | | 107,270 | | | | 1.22 | | | | (0.53 | ) | | | 1.25 | | | | (0.56 | ) | | | 122 | | |
| | 2004 | (4) | | | 97,775 | | | | 1.21 | | | | (0.76 | ) | | | 1.24 | | | | (0.79 | ) | | | 116 | | |
| | 2003 | (4) | | | 73,445 | | | | 1.21 | | | | (0.73 | ) | | | 1.25 | | | | (0.77 | ) | | | 145 | | |
| | 2002 | (4) | | | 33,586 | | | | 1.21 | | | | (0.81 | ) | | | 1.25 | | | | (0.85 | ) | | | 171 | | |
| | 2001 | (5) | | | 17,351 | | | | 1.19 | | | | (0.24 | ) | | | 1.22 | | | | (0.27 | ) | | | 204 | | |
| Class B | |
| | 2005 | (3) | | $ | 13,406 | | | | 2.00 | % | | | (1.67 | )% | | | 2.00 | % | | | (1.67 | )% | | | 14 | % | |
| | 2005 | (4) | | | 14,023 | | | | 1.97 | | | | (1.28 | ) | | | 2.00 | | | | (1.31 | ) | | | 122 | | |
| | 2004 | (4) | | | 13,050 | | | | 1.96 | | | | (1.51 | ) | | | 1.99 | | | | (1.54 | ) | | | 116 | | |
| | 2003 | (4) | | | 11,541 | | | | 1.96 | | | | (1.48 | ) | | | 2.00 | | | | (1.52 | ) | | | 145 | | |
| | 2002 | (4) | | | 4,613 | | | | 1.96 | | | | (1.56 | ) | | | 2.00 | | | | (1.60 | ) | | | 171 | | |
| | 2001 | (5) | | | 1,979 | | | | 1.93 | | | | (0.99 | ) | | | 1.97 | | | | (1.03 | ) | | | 204 | | |
| Class C | |
| | 2005 | (3) | | $ | 13,453 | | | | 2.00 | % | | | (1.67 | )% | | | 2.00 | % | | | (1.67 | )% | | | 14 | % | |
| | 2005 | (4) | | | 14,418 | | | | 1.97 | | | | (1.28 | ) | | | 2.00 | | | | (1.31 | ) | | | 122 | | |
| | 2004 | (4) | | | 13,841 | | | | 1.96 | | | | (1.50 | ) | | | 1.99 | | | | (1.53 | ) | | | 116 | | |
| | 2003 | (4) | | | 11,128 | | | | 1.96 | | | | (1.47 | ) | | | 2.00 | | | | (1.51 | ) | | | 145 | | |
| | 2002 | (4) | | | 3,096 | | | | 1.96 | | | | (1.61 | ) | | | 2.02 | | | | (1.67 | ) | | | 171 | | |
| | 2001 | (6) | | | — | | | | — | | | | — | | | | — | | | | — | | | | 204 | | |
| Class R (7) | |
| | 2005 | (3) | | $ | 333 | | | | 1.50 | % | | | (1.14 | )% | | | 1.65 | % | | | (1.29 | )% | | | 14 | % | |
| | 2005 | (4) | | | 312 | | | | 1.47 | | | | (0.53 | ) | | | 1.65 | | | | (0.71 | ) | | | 122 | | |
| | 2004 | (4) | | | 19 | | | | 1.21 | | | | (0.81 | ) | | | 1.24 | | | | (0.84 | ) | | | 116 | | |
| | 2003 | (4) | | | 11,627 | | | | 1.21 | | | | (0.75 | ) | | | 1.25 | | | | (0.79 | ) | | | 145 | | |
| | 2002 | (4) | | | 7,640 | | | | 1.21 | | | | (0.80 | ) | | | 1.25 | | | | (0.84 | ) | | | 171 | | |
| | 2001 | (5) | | | 3,721 | | | | 1.07 | | | | (0.05 | ) | | | 1.14 | | | | (0.12 | ) | | | 204 | | |
| Class Y | |
| | 2005 | (3) | | $ | 682,088 | | | | 1.00 | % | | | (0.67 | )% | | | 1.00 | % | | | (0.67 | )% | | | 14 | % | |
| | 2005 | (4) | | | 715,496 | | | | 0.97 | | | | (0.28 | ) | | | 1.00 | | | | (0.31 | ) | | | 122 | | |
| | 2004 | (4) | | | 770,981 | | | | 0.96 | | | | (0.52 | ) | | | 0.99 | | | | (0.55 | ) | | | 116 | | |
| | 2003 | (4) | | | 1,024,146 | | | | 0.96 | | | | (0.48 | ) | | | 1.00 | | | | (0.52 | ) | | | 145 | | |
| | 2002 | (4) | | | 403,027 | | | | 0.96 | | | | (0.55 | ) | | | 1.00 | | | | (0.59 | ) | | | 171 | | |
| | 2001 | (5) | | | 291,706 | | | | 0.93 | | | | 0.01 | | | | 0.96 | | | | (0.02 | ) | | | 204 | | |
FIRST AMERICAN FUNDS Annual Report 2005
69
Financial Highlights For a share outstanding throughout the indicated periods.
| | | Net Asset
Value
Beginning
of Period | | Net
Investment
Income (Loss) | | Realized and
Unrealized
Gains
(Losses) on
Investments | | Distributions
from Net
Investment
Income | | Distributions
from Net
Realized Gains | | Net Asset
Value
End of
Period | | Total
Return (7) | |
| Small Cap Value Fund (1) | | | |
| Class A | |
| | 2005 | (2) | | $ | 16.78 | | | $ | 0.01 | | | $ | (0.45 | ) | | $ | — | | | $ | — | | | $ | 16.34 | | | | (2.62 | )% | |
| | 2005 | (3) | | | 16.84 | | | | 0.03 | | | | 2.63 | | | | (0.06 | ) | | | (2.66 | ) | | | 16.78 | | | | 16.78 | | |
| | 2004 | (3) | | | 14.28 | | | | 0.03 | | | | 3.13 | | | | (0.04 | ) | | | (0.56 | ) | | | 16.84 | | | | 22.70 | | |
| | 2003 | (3) | | | 11.26 | | | | — | | | | 3.02 | | | | — | | | | — | | | | 14.28 | | | | 26.86 | | |
| | 2002 | (3) | | | 13.40 | | | | (0.02 | ) | | | (0.13 | ) | | | — | | | | (1.99 | ) | | | 11.26 | | | | (2.19 | ) | |
| | 2001 | (3) | | | 17.09 | | | | 0.02 | | | | (0.97 | ) | | | (0.05 | ) | | | (2.69 | ) | | | 13.40 | | | | (6.36 | ) | |
| Class B | |
| | 2005 | (2) | | $ | 15.61 | | | $ | — | | | $ | (0.42 | ) | | $ | — | | | $ | — | | | $ | 15.19 | | | | (2.69 | )% | |
| | 2005 | (3) | | | 15.92 | | | | (0.09 | ) | | | 2.47 | | | | (0.03 | ) | | | (2.66 | ) | | | 15.61 | | | | 15.90 | | |
| | 2004 | (3) | | | 13.60 | | | | (0.08 | ) | | | 2.96 | | | | — | | | | (0.56 | ) | | | 15.92 | | | | 21.76 | | |
| | 2003 | (3) | | | 10.80 | | | | (0.08 | ) | | | 2.88 | | | | — | | | | — | | | | 13.60 | | | | 25.93 | | |
| | 2002 | (3) | | | 13.01 | | | | (0.11 | ) | | | (0.11 | ) | | | — | | | | (1.99 | ) | | | 10.80 | | | | (2.91 | ) | |
| | 2001 | (3) | | | 16.76 | | | | (0.09 | ) | | | (0.97 | ) | | | — | | | | (2.69 | ) | | | 13.01 | | | | (7.24 | ) | |
| Class C | |
| | 2005 | (2) | | $ | 15.82 | | | $ | — | | | $ | (0.43 | ) | | $ | — | | | $ | — | | | $ | 15.39 | | | | (2.72 | )% | |
| | 2005 | (3) | | | 16.10 | | | | (0.09 | ) | | | 2.50 | | | | (0.03 | ) | | | (2.66 | ) | | | 15.82 | | | | 15.92 | | |
| | 2004 | (3) | | | 13.74 | | | | (0.08 | ) | | | 3.00 | | | | — | | | | (0.56 | ) | | | 16.10 | | | | 21.83 | | |
| | 2003 | (3) | | | 10.91 | | | | (0.09 | ) | | | 2.92 | | | | — | | | | — | | | | 13.74 | | | | 25.94 | | |
| | 2002 | (3) | | | 13.13 | | | | (0.11 | ) | | | (0.12 | ) | | | — | | | | (1.99 | ) | | | 10.91 | | | | (2.96 | ) | |
| | 2001 | (3) | | | 16.88 | | | | (0.10 | ) | | | (0.95 | ) | | | (0.01 | ) | | | (2.69 | ) | | | 13.13 | | | | (7.08 | ) | |
| Class R (4) | |
| | 2005 | (2) | | $ | 16.74 | | | $ | 0.01 | | | $ | (0.46 | ) | | $ | — | | | $ | — | | | $ | 16.29 | | | | (2.69 | )% | |
| | 2005 | (3) | | | 16.83 | | | | (0.01 | ) | | | 2.64 | | | | (0.06 | ) | | | (2.66 | ) | | | 16.74 | | | | 16.60 | | |
| | 2004 | (3) | | | 14.27 | | | | 0.03 | | | | 3.12 | | | | (0.03 | ) | | | (0.56 | ) | | | 16.83 | | | | 22.69 | | |
| | 2003 | (3) | | | 11.26 | | | | 0.01 | | | | 3.01 | | | | (0.01 | ) | | | — | | | | 14.27 | | | | 26.79 | | |
| | 2002 | (3) | | | 13.40 | | | | (0.01 | ) | | | (0.14 | ) | | | — | | | | (1.99 | ) | | | 11.26 | | | | (2.19 | ) | |
| | 2001 | (5) | | | 12.84 | | | | — | | | | 0.56 | | | | — | | | | — | | | | 13.40 | | | | 4.36 | | |
| Class Y | |
| | 2005 | (2) | | $ | 17.06 | | | $ | 0.01 | | | $ | (0.45 | ) | | $ | — | | | $ | — | | | $ | 16.62 | | | | (2.58 | )% | |
| | 2005 | (3) | | | 17.05 | | | | 0.07 | | | | 2.67 | | | | (0.07 | ) | | | (2.66 | ) | | | 17.06 | | | | 17.08 | | |
| | 2004 | (3) | | | 14.44 | | | | 0.08 | | | | 3.16 | | | | (0.07 | ) | | | (0.56 | ) | | | 17.05 | | | | 23.02 | | |
| | 2003 | (3) | | | 11.38 | | | | 0.03 | | | | 3.05 | | | | (0.02 | ) | | | — | | | | 14.44 | | | | 27.10 | | |
| | 2002 | (3) | | | 13.48 | | | | 0.02 | | | | (0.12 | ) | | | (0.01 | ) | | | (1.99 | ) | | | 11.38 | | | | (1.83 | ) | |
| | 2001 | (3) | | | 17.19 | | | | 0.06 | | | | (1.00 | ) | | | (0.08 | ) | | | (2.69 | ) | | | 13.48 | | | | (6.25 | ) | |
| Small-Mid Cap Core Fund (1) (6) | | | |
| Class A | |
| | 2005 | (2) | | $ | 8.31 | | | $ | (0.01 | ) | | $ | (0.27 | ) | | $ | — | | | $ | — | | | $ | 8.03 | | | | (3.37 | )% | |
| | 2005 | (3) | | | 7.40 | | | | (0.07 | ) | | | 0.98 | | | | — | | | | — | | | | 8.31 | | | | 12.30 | | |
| | 2004 | (3) | | | 7.05 | | | | (0.07 | ) | | | 0.42 | | | | — | | | | — | | | | 7.40 | | | | 4.96 | | |
| | 2003 | (3) | | | 4.29 | | | | (0.03 | ) | | | 2.79 | | | | — | | | | — | | | | 7.05 | | | | 64.34 | | |
| | 2002 | (3) | | | 6.36 | | | | (0.07 | ) | | | (2.00 | ) | | | — | | | | — | | | | 4.29 | | | | (32.55 | ) | |
| | 2001 | (3) | | | 47.68 | | | | (0.15 | ) | | | (33.55 | ) | | | — | | | | (7.62 | ) | | | 6.36 | | | | (83.30 | ) | |
| Class B | |
| | 2005 | (2) | | $ | 7.31 | | | $ | (0.01 | ) | | $ | (0.24 | ) | | $ | — | | | $ | — | | | $ | 7.06 | | | | (3.42 | )% | |
| | 2005 | (3) | | | 6.55 | | | | (0.11 | ) | | | 0.87 | | | | — | | | | — | | | | 7.31 | | | | 11.60 | | |
| | 2004 | (3) | | | 6.29 | | | | (0.11 | ) | | | 0.37 | | | | — | | | | — | | | | 6.55 | | | | 4.13 | | |
| | 2003 | (3) | | | 3.86 | | | | (0.07 | ) | | | 2.50 | | | | — | | | | — | | | | 6.29 | | | | 62.95 | | |
| | 2002 | (3) | | | 5.77 | | | | (0.11 | ) | | | (1.80 | ) | | | — | | | | — | | | | 3.86 | | | | (33.10 | ) | |
| | 2001 | (3) | | | 44.40 | | | | (0.26 | ) | | | (30.75 | ) | | | — | | | | (7.62 | ) | | | 5.77 | | | | (83.42 | ) | |
| Class C | |
| | 2005 | (2) | | $ | 7.97 | | | $ | (0.01 | ) | | $ | (0.27 | ) | | $ | — | | | $ | — | | | $ | 7.69 | | | | (3.51 | )% | |
| | 2005 | (3) | | | 7.14 | | | | (0.12 | ) | | | 0.95 | | | | — | | | | — | | | | 7.97 | | | | 11.62 | | |
| | 2004 | (3) | | | 6.86 | | | | (0.12 | ) | | | 0.40 | | | | — | | | | — | | | | 7.14 | | | | 4.08 | | |
| | 2003 | (3) | | | 4.20 | | | | (0.07 | ) | | | 2.73 | | | | — | | | | — | | | | 6.86 | | | | 63.33 | | |
| | 2002 | (3) | | | 6.28 | | | | (0.12 | ) | | | (1.96 | ) | | | — | | | | — | | | | 4.20 | | | | (33.12 | ) | |
| | 2001 | (3) | | | 47.49 | | | | (0.26 | ) | | | (33.33 | ) | | | — | | | | (7.62 | ) | | | 6.28 | | | | (83.43 | ) | |
| Class Y | |
| | 2005 | (2) | | $ | 8.63 | | | $ | — | | | $ | (0.29 | ) | | $ | — | | | $ | — | | | $ | 8.34 | | | | (3.36 | )% | |
| | 2005 | (3) | | | 7.66 | | | | (0.05 | ) | | | 1.02 | | | | — | | | | — | | | | 8.63 | | | | 12.66 | | |
| | 2004 | (3) | | | 7.28 | | | | (0.05 | ) | | | 0.43 | | | | — | | | | — | | | | 7.66 | | | | 5.22 | | |
| | 2003 | (3) | | | 4.42 | | | | (0.01 | ) | | | 2.87 | | | | — | | | | — | | | | 7.28 | | | | 64.71 | | |
| | 2002 | (3) | | | 6.53 | | | | (0.05 | ) | | | (2.06 | ) | | | — | | | | — | | | | 4.42 | | | | (32.31 | ) | |
| | 2001 | (3) | | | 48.60 | | | | (0.11 | ) | | | (34.34 | ) | | | — | | | | (7.62 | ) | | | 6.53 | | | | (83.26 | ) | |
(1) Per share data calculated using average shares outstanding method.
(2) For the period October 1, 2005 to October 31, 2005. Effective October 1, 2005, the fund's fiscal year end was changed from September 30 to October 31. All ratios for
the period have been annualized, except total return and portfolio turnover.
(3) For the period October 1 to September 30 in the year indicated.
(4) Prior to July 1, 2004, Class R shares were named Class S shares, which had lower fees and expenses.
The accompanying notes are an integral part of the financial statements.
FIRST AMERICAN FUNDS Annual Report 2005
70
| | | Net Assets
End of
Period (000) | | Ratio of
Expenses to
Average
Net Assets | | Ratio of Net
Investment
Income (Loss)
to Average
Net Assets | | Ratio of
Expenses to
Average
Net Assets
(Excluding
Waivers) | | Ratio of Net
Investment
Income (Loss)
to Average Net
Assets (Excluding
Waivers) | | Portfolio
Turnover
Rate | |
| Small Cap Value Fund (1) | |
| Class A | |
| | 2005 | (2) | | $ | 46,467 | | | | 1.25 | % | | | 0.78 | % | | | 1.25 | % | | | 0.78 | % | | | 15 | % | |
| | 2005 | (3) | | | 48,128 | | | | 1.24 | | | | 0.19 | | | | 1.26 | | | | 0.17 | | | | 72 | | |
| | 2004 | (3) | | | 43,192 | | | | 1.23 | | | | 0.21 | | | | 1.25 | | | | 0.19 | | | | 34 | | |
| | 2003 | (3) | | | 32,416 | | | | 1.23 | | | | 0.02 | | | | 1.25 | | | | — | | | | 49 | | |
| | 2002 | (3) | | | 27,205 | | | | 1.23 | | | | (0.12 | ) | | | 1.26 | | | | (0.15 | ) | | | 37 | | |
| | 2001 | (3) | | | 34,292 | | | | 1.15 | | | | 0.11 | | | | 1.15 | | | | 0.11 | | | | 53 | | |
| Class B | |
| | 2005 | (2) | | $ | 8,913 | | | | 2.00 | % | | | 0.03 | % | | | 2.00 | % | | | 0.03 | % | | | 15 | % | |
| | 2005 | (3) | | | 9,325 | | | | 1.99 | | | | (0.56 | ) | | | 2.01 | | | | (0.58 | ) | | | 72 | | |
| | 2004 | (3) | | | 9,901 | | | | 1.98 | | | | (0.51 | ) | | | 2.00 | | | | (0.53 | ) | | | 34 | | |
| | 2003 | (3) | | | 12,560 | | | | 1.98 | | | | (0.73 | ) | | | 2.00 | | | | (0.75 | ) | | | 49 | | |
| | 2002 | (3) | | | 12,008 | | | | 1.98 | | | | (0.87 | ) | | | 2.01 | | | | (0.90 | ) | | | 37 | | |
| | 2001 | (3) | | | 12,392 | | | | 1.90 | | | | (0.64 | ) | | | 1.90 | | | | (0.64 | ) | | | 53 | | |
| Class C | |
| | 2005 | (2) | | $ | 4,590 | | | | 2.00 | % | | | 0.03 | % | | | 2.00 | % | | | 0.03 | % | | | 15 | % | |
| | 2005 | (3) | | | 4,808 | | | | 1.99 | | | | (0.56 | ) | | | 2.01 | | | | (0.58 | ) | | | 72 | | |
| | 2004 | (3) | | | 4,609 | | | | 1.98 | | | | (0.52 | ) | | | 2.00 | | | | (0.54 | ) | | | 34 | | |
| | 2003 | (3) | | | 4,354 | | | | 1.98 | | | | (0.74 | ) | | | 2.00 | | | | (0.76 | ) | | | 49 | | |
| | 2002 | (3) | | | 4,873 | | | | 1.98 | | | | (0.87 | ) | | | 2.01 | | | | (0.90 | ) | | | 37 | | |
| | 2001 | (3) | | | 4,547 | | | | 1.90 | | | | (0.65 | ) | | | 1.90 | | | | (0.65 | ) | | | 53 | | |
| Class R (4) | |
| | 2005 | (2) | | $ | 4 | | | | 1.50 | % | | | 0.59 | % | | | 1.65 | % | | | 0.44 | % | | | 15 | % | |
| | 2005 | (3) | | | 4 | | | | 1.49 | | | | (0.04 | ) | | | 1.66 | | | | (0.21 | ) | | | 72 | | |
| | 2004 | (3) | | | 1 | | | | 1.23 | | | | 0.22 | | | | 1.25 | | | | 0.20 | | | | 34 | | |
| | 2003 | (3) | | | 1,351 | | | | 1.23 | | | | 0.04 | | | | 1.25 | | | | 0.02 | | | | 49 | | |
| | 2002 | (3) | | | 424 | | | | 1.24 | | | | (0.11 | ) | | | 1.27 | | | | (0.14 | ) | | | 37 | | |
| | 2001 | (5) | | | — | | | | — | | | | — | | | | — | | | | — | | | | 53 | | |
| Class Y | |
| | 2005 | (2) | | $ | 348,166 | | | | 1.00 | % | | | 1.03 | % | | | 1.00 | % | | | 1.03 | % | | | 15 | % | |
| | 2005 | (3) | | | 363,261 | | | | 0.99 | | | | 0.44 | | | | 1.01 | | | | 0.42 | | | | 72 | | |
| | 2004 | (3) | | | 367,774 | | | | 0.98 | | | | 0.50 | | | | 1.00 | | | | 0.48 | | | | 34 | | |
| | 2003 | (3) | | | 428,846 | | | | 0.98 | | | | 0.27 | | | | 1.00 | | | | 0.25 | | | | 49 | | |
| | 2002 | (3) | | | 368,092 | | | | 0.98 | | | | 0.13 | | | | 1.01 | | | | 0.10 | | | | 37 | | |
| | 2001 | (3) | | | 434,097 | | | | 0.90 | | | | 0.37 | | | | 0.90 | | | | 0.37 | | | | 53 | | |
| Small-Mid Cap Core Fund (1) (6) | |
| Class A | |
| | 2005 | (2) | | $ | 22,339 | | | | 1.34 | % | | | (0.86 | )% | | | 1.34 | % | | | (0.86 | )% | | | 80 | % | |
| | 2005 | (3) | | | 23,016 | | | | 1.42 | | | | (0.83 | ) | | | 1.50 | | | | (0.91 | ) | | | 197 | | |
| | 2004 | (3) | | | 27,356 | | | | 1.23 | | | | (0.86 | ) | | | 1.28 | | | | (0.91 | ) | | | 51 | | |
| | 2003 | (3) | | | 27,936 | | | | 1.23 | | | | (0.52 | ) | | | 1.29 | | | | (0.58 | ) | | | 110 | | |
| | 2002 | (3) | | | 18,267 | | | | 1.23 | | | | (0.89 | ) | | | 1.70 | | | | (1.36 | ) | | | 288 | | |
| | 2001 | (3) | | | 29,084 | | | | 1.15 | | | | (0.88 | ) | | | 1.22 | | | | (0.95 | ) | | | 269 | | |
| Class B | |
| | 2005 | (2) | | $ | 10,054 | | | | 2.09 | % | | | (1.61 | )% | | | 2.09 | % | | | (1.61 | )% | | | 80 | % | |
| | 2005 | (3) | | | 10,685 | | | | 2.17 | | | | (1.59 | ) | | | 2.25 | | | | (1.67 | ) | | | 197 | | |
| | 2004 | (3) | | | 13,445 | | | | 1.98 | | | | (1.60 | ) | | | 2.03 | | | | (1.65 | ) | | | 51 | | |
| | 2003 | (3) | | | 16,016 | | | | 1.98 | | | | (1.26 | ) | | | 2.04 | | | | (1.32 | ) | | | 110 | | |
| | 2002 | (3) | | | 11,190 | | | | 1.98 | | | | (1.64 | ) | | | 2.45 | | | | (2.11 | ) | | | 288 | | |
| | 2001 | (3) | | | 15,974 | | | | 1.90 | | | | (1.63 | ) | | | 1.97 | | | | (1.70 | ) | | | 269 | | |
| Class C | |
| | 2005 | (2) | | $ | 4,253 | | | | 2.09 | % | | | (1.61 | )% | | | 2.09 | % | | | (1.61 | )% | | | 80 | % | |
| | 2005 | (3) | | | 4,485 | | | | 2.17 | | | | (1.59 | ) | | | 2.25 | | | | (1.67 | ) | | | 197 | | |
| | 2004 | (3) | | | 6,000 | | | | 1.98 | | | | (1.60 | ) | | | 2.03 | | | | (1.65 | ) | | | 51 | | |
| | 2003 | (3) | | | 7,056 | | | | 1.98 | | | | (1.25 | ) | | | 2.04 | | | | (1.31 | ) | | | 110 | | |
| | 2002 | (3) | | | 5,064 | | | | 1.98 | | | | (1.64 | ) | | | 2.45 | | | | (2.11 | ) | | | 288 | | |
| | 2001 | (3) | | | 9,010 | | | | 1.90 | | | | (1.63 | ) | | | 1.98 | | | | (1.71 | ) | | | 269 | | |
| Class Y | |
| | 2005 | (2) | | $ | 31,381 | | | | 1.09 | % | | | (0.61 | )% | | | 1.09 | % | | | (0.61 | )% | | | 80 | % | |
| | 2005 | (3) | | | 33,537 | | | | 1.17 | | | | (0.58 | ) | | | 1.25 | | | | (0.66 | ) | | | 197 | | |
| | 2004 | (3) | | | 43,758 | | | | 0.98 | | | | (0.60 | ) | | | 1.03 | | | | (0.65 | ) | | | 51 | | |
| | 2003 | (3) | | | 59,817 | | | | 0.98 | | | | (0.24 | ) | | | 1.04 | | | | (0.30 | ) | | | 110 | | |
| | 2002 | (3) | | | 44,134 | | | | 0.98 | | | | (0.64 | ) | | | 1.45 | | | | (1.11 | ) | | | 288 | | |
| | 2001 | (3) | | | 59,653 | | | | 0.90 | | | | (0.62 | ) | | | 0.96 | | | | (0.67 | ) | | | 269 | | |
(5) For the period from September 24, 2001, when the class of shares was first offered, to September 30, 2001. All ratios for the period have been annualized,
except total return and portfolio turnover.
(6) The financial highlights for Small-Mid Cap Core Fund as set forth herein include the historical financial highlights of the First American
Technology Fund. Effective October 3, 2005, the fund's name and strategy changed.
(7) Total return does not reflect sales charges. Total return would have been lower had certain expenses not been waived.
FIRST AMERICAN FUNDS Annual Report 2005
71
Schedule of Investments October 31, 2005
Mid Cap Growth Opportunities Fund
| DESCRIPTION | | SHARES | | VALUE (000) | |
| Common Stocks – 97.4% | |
| Consumer Discretionary – 16.5% | |
| Chico's FAS* | | | 225,250 | | | $ | 8,906 | | |
| Coach* | | | 486,770 | | | | 15,664 | | |
| Coldwater Creek* (a) | | | 975,284 | | | | 26,323 | | |
| Fortune Brands | | | 234,730 | | | | 17,832 | | |
| Gaylord Entertainment* (a) | | | 288,030 | | | | 11,371 | | |
| Harman International Industries (a) | | | 234,830 | | | | 23,450 | | |
| Harrah's Entertainment | | | 319,540 | | | | 19,326 | | |
| Scientific Games, Class A* (a) | | | 1,453,000 | | | | 43,532 | | |
| Starwood Hotels & Resorts Worldwide (a) | | | 350,100 | | | | 20,456 | | |
| Station Casinos (a) | | | 528,320 | | | | 33,865 | | |
| Texas Roadhouse, Class A* (a) | | | 1,440,078 | | | | 22,667 | | |
| XM Satellite* (a) | | | 677,350 | | | | 19,528 | | |
| | | | 262,920 | | |
| Consumer Staples – 2.7% | |
| Corn Products International (a) | | | 778,500 | | | | 18,536 | | |
| Hershey Foods (a) | | | 426,470 | | | | 24,236 | | |
| | | | 42,772 | | |
| Energy – 10.7% | |
| Apache | | | 195,214 | | | | 12,461 | | |
| BJ Services (a) | | | 532,420 | | | | 18,502 | | |
| Chesapeake Energy (a) | | | 251,950 | | | | 8,088 | | |
| National-Oilwell* | | | 389,510 | | | | 24,333 | | |
| Newfield Exploration* | | | 572,230 | | | | 25,939 | | |
| Smith International (a) | | | 213,740 | | | | 6,925 | | |
| Southwestern Energy* | | | 107,330 | | | | 7,786 | | |
| Valero Energy | | | 100,208 | | | | 10,546 | | |
| Weatherford International* (a) | | | 528,470 | | | | 33,082 | | |
| XTO Energy | | | 497,586 | | | | 21,625 | | |
| | | | 169,287 | | |
| Financials – 5.4% | |
| Ameritrade Holding* (a) | | | 838,619 | | | | 17,636 | | |
| Bear Stearns (a) | | | 268,430 | | | | 28,400 | | |
| Calamos Asset Management (a) | | | 344,300 | | | | 8,363 | | |
| Chicago Mercantile Exchage (a) | | | 33,130 | | | | 12,097 | | |
| Legg Mason (a) | | | 180,730 | | | | 19,394 | | |
| | | | 85,890 | | |
| Health Care – 18.9% | |
| Aetna | | | 256,710 | | | | 22,734 | | |
| American Healthways* (a) | | | 390,420 | | | | 15,835 | | |
| C.R. Bard | | | 97,870 | | | | 6,105 | | |
| Caremark Rx* | | | 348,160 | | | | 18,244 | | |
| Cooper (a) | | | 236,350 | | | | 16,270 | | |
| Coventry Health Care* | | | 401,925 | | | | 21,700 | | |
| DENTSPLY International (a) | | | 679,500 | | | | 37,468 | | |
| Endo Pharmaceuticals* | | | 458,550 | | | | 12,344 | | |
| Fisher Scientific International* (a) | | | 317,250 | | | | 17,925 | | |
| PerkinElmer | | | 2,093,950 | | | | 46,214 | | |
| Quest Diagnostics (a) | | | 329,390 | | | | 15,386 | | |
| Sierra Health Services* (a) | | | 249,440 | | | | 18,708 | | |
| Thermo Electron* (a) | | | 1,275,770 | | | | 38,516 | | |
| Zimmer Holdings* (a) | | | 206,630 | | | | 13,177 | | |
| | | | 300,626 | | |
| Industrials – 19.1% | |
| Dun & Bradstreet* | | | 655,390 | | | | 41,499 | | |
| Dycom Industries* (a) | | | 827,840 | | | | 16,499 | | |
| Hexcel* (a) | | | 426,130 | | | | 6,741 | | |
| Kennametal (a) | | | 350,930 | | | | 17,936 | | |
Mid Cap Growth Opportunities Fund (concluded)
| DESCRIPTION | | SHARES | | VALUE (000) | |
| L-3 Communications Holdings (a) | | | 447,140 | | | $ | 34,796 | | |
| Monster Worldwide* (a) | | | 1,088,730 | | | | 35,721 | | |
| MSC Industrial Direct | | | 736,950 | | | | 28,137 | | |
| Pentair | | | 372,960 | | | | 12,117 | | |
| Precision Castparts | | | 399,900 | | | | 18,939 | | |
| Republic Services | | | 688,755 | | | | 24,348 | | |
| Roper Industries (a) | | | 519,300 | | | | 19,578 | | |
| Stericycle* (a) | | | 282,150 | | | | 16,241 | | |
| Toro | | | 357,430 | | | | 13,050 | | |
| UTI Worldwide (a) | | | 216,486 | | | | 18,518 | | |
| | | | 304,120 | | |
| Information Technology – 24.1% | |
| Adobe Systems (a) | | | 1,401,780 | | | | 45,207 | | |
| Altera* (a) | | | 850,280 | | | | 14,157 | | |
| Amphenol, Class A | | | 612,190 | | | | 24,469 | | |
| Apple Computer* (a) | | | 276,790 | | | | 15,940 | | |
| Autodesk (a) | | | 360,150 | | | | 16,254 | | |
| Broadcom, Class A* (a) | | | 455,760 | | | | 19,352 | | |
| Cogent* (a) | | | 554,330 | | | | 14,717 | | |
| Cognizant Technology Solutions* (a) | | | 508,160 | | | | 22,349 | | |
| Cognos* (a) | | | 471,430 | | | | 17,693 | | |
| F5 Networks* (a) | | | 183,250 | | | | 9,535 | | |
| Freescale Semiconductor* (a) | | | 347,230 | | | | 8,226 | | |
| Hyperion Solutions* (a) | | | 337,760 | | | | 16,334 | | |
| Linear Technology | | | 790,470 | | | | 26,252 | | |
| Macromedia* | | | 213,030 | | | | 9,356 | | |
| Marvell Technology Group* (a) | | | 224,270 | | | | 10,408 | | |
| MEMC Electronic Materials* (a) | | | 1,036,950 | | | | 18,603 | | |
| Microchip Technology | | | 765,520 | | | | 23,096 | | |
| National Semiconductor (a) | | | 737,470 | | | | 16,689 | | |
| NCR* (a) | | | 816,310 | | | | 24,669 | | |
| Paychex (a) | | | 422,740 | | | | 16,385 | | |
| Research in Motion* (a) | | | 208,870 | | | | 12,843 | | |
| | | | 382,534 | | |
Total Common Stocks
(Cost $1,293,271) | | | | | | | 1,548,149 | | |
| Short-Term Investments – 1.5% | |
First American Prime Obligations Fund, Class Z (b)
(Cost $23,139) | | | 23,138,676 | | | | 23,139 | | |
Investments Purchased with Proceeds
from Securities Lending (c) – 38.3% | |
| (Cost $609,013) | | | | | | | 609,013 | | |
Total Investments – 137.2%
(Cost $1,925,423) | | | | | | | 2,180,301 | | |
| Other Assets and Liabilities, Net – (37.2)% | | | | | | | (591,353 | ) | |
| Total Net Assets – 100.0% | | | | | | $ | 1,588,948 | | |
* Non-income producing security
(a) This security or a portion of this security is out on loan at October 31, 2005. Total loaned securities had a market value of $603,509,844 at October 31, 2005. See note 2 in Notes to Financial Statements.
(b) Investment in affiliated security. This money market fund is advised by U.S. Bancorp Asset Management, Inc., which also serves as advisor to this fund. See note 3 in Notes to Financial Statements.
(c) The fund may loan securities in return for collateral in the form of cash, U.S. Government securities, or other high grade debt obligations. The cash collateral is invested in various short-term fixed income securities, such as repurchase agreements, commercial paper, money market funds and other corporate obligations. See note 2 in Notes to Financial Statements.
The accompanying notes are an integral part of the financial statements.
FIRST AMERICAN FUNDS Annual Report 2005
72
Mid Cap Value Fund
| DESCRIPTION | | SHARES | | VALUE (000) | |
| Common Stocks – 97.5% | |
| Consumer Discretionary – 13.0% | |
| Black & Decker (a) | | | 92,930 | | | $ | 7,632 | | |
| BorgWarner | | | 149,780 | | | | 8,686 | | |
| Darden Restaurants (a) | | | 282,070 | | | | 9,145 | | |
| Federated Department Stores | | | 163,960 | | | | 10,062 | | |
| Fortune Brands | | | 109,930 | | | | 8,351 | | |
| Harrah's Entertainment | | | 109,560 | | | | 6,626 | | |
| Liz Claiborne (a) | | | 191,030 | | | | 6,724 | | |
| Office Depot* | | | 310,550 | | | | 8,549 | | |
| Pulte Homes | | | 250,000 | | | | 9,448 | | |
| Sherwin Williams (a) | | | 289,900 | | | | 12,335 | | |
| | | | 87,558 | | |
| Consumer Staples – 7.2% | |
| Archer-Daniels-Midland | | | 456,600 | | | | 11,127 | | |
| Kroger* | | | 906,490 | | | | 18,039 | | |
| Molson Coors Brewing (a) | | | 79,330 | | | | 4,895 | | |
| Pepsi Bottling (a) | | | 267,480 | | | | 7,605 | | |
| Pilgrim's Pride (a) | | | 205,410 | | | | 6,466 | | |
| | | | 48,132 | | |
| Energy – 7.3% | |
| BJ Services (a) | | | 194,400 | | | | 6,755 | | |
| GlobalSantaFe (a) | | | 152,760 | | | | 6,806 | | |
| Kerr-McGee | | | 74,260 | | | | 6,315 | | |
| National-Oilwell* | | | 104,390 | | | | 6,521 | | |
| Newfield Exploration* | | | 320,370 | | | | 14,522 | | |
| Noble Energy | | | 200,160 | | | | 8,016 | | |
| | | | 48,935 | | |
| Financials (b) – 27.4% | |
| ACE | | | 267,090 | | | | 13,915 | | |
| Ambac Financial Group (a) | | | 99,530 | | | | 7,056 | | |
| AON | | | 285,410 | | | | 9,661 | | |
| Astoria Financial | | | 241,830 | | | | 6,759 | | |
| Bear Stearns (a) | | | 151,180 | | | | 15,995 | | |
| Boston Properties (a) | | | 120,560 | | | | 8,345 | | |
| CIT Group | | | 152,760 | | | | 6,986 | | |
| Comerica | | | 200,660 | | | | 11,594 | | |
| Cullen/Frost Bankers | | | 173,150 | | | | 9,146 | | |
| Developers Diversified Realty (a) | | | 181,640 | | | | 7,934 | | |
| Equity Office Properties Trust (a) | | | 249,770 | | | | 7,693 | | |
| Genworth Financial (a) | | | 470,980 | | | | 14,925 | | |
| KeyCorp (a) | | | 281,410 | | | | 9,073 | | |
| Marshall & Ilsley (a) | | | 218,630 | | | | 9,392 | | |
| MGIC Investment (a) | | | 132,080 | | | | 7,824 | | |
| Northern Trust (a) | | | 167,410 | | | | 8,973 | | |
| Principal Financial Group (a) | | | 66,930 | | | | 3,322 | | |
| Synovus Financial | | | 280,200 | | | | 7,697 | | |
| Vornado Realty Trust (a) | | | 86,150 | | | | 6,978 | | |
| W.R. Berkley | | | 251,692 | | | | 10,999 | | |
| | | | 184,267 | | |
| Health Care – 6.0% | |
| CIGNA | | | 105,350 | | | | 12,207 | | |
| Community Health Systems* (a) | | | 271,050 | | | | 10,059 | | |
| Health Net* (a) | | | 169,930 | | | | 7,960 | | |
| PerkinElmer | | | 466,880 | | | | 10,304 | | |
| | | | 40,530 | | |
Mid Cap Value Fund (continued)
| DESCRIPTION | | SHARES | | VALUE (000) | |
| Industrials – 9.2% | |
| American Standard | | | 194,690 | | | $ | 7,406 | | |
| Eaton (a) | | | 165,550 | | | | 9,739 | | |
| Joy Global (a) | | | 144,365 | | | | 6,622 | | |
| Kennametal | | | 210,950 | | | | 10,782 | | |
| Norfolk Southern | | | 416,590 | | | | 16,747 | | |
| Republic Services | | | 299,150 | | | | 10,575 | | |
| | | | 61,871 | | |
| Information Technology – 8.8% | |
| Amphenol, Class A | | | 146,590 | | | | 5,859 | | |
| Arrow Electronics* (a) | | | 410,910 | | | | 12,126 | | |
| Electronic Data Systems | | | 305,560 | | | | 7,123 | | |
| Harris | | | 167,420 | | | | 6,881 | | |
| Ingram Micro* | | | 570,150 | | | | 10,320 | | |
| Lucent Technologies* (a) | | | 1,098,920 | | | | 3,132 | | |
| National Semiconductor (a) | | | 303,970 | | | | 6,879 | | |
| Xerox* (a) | | | 516,200 | | | | 7,005 | | |
| | | | 59,325 | | |
| Materials – 6.8% | |
| Ashland (a) | | | 126,110 | | | | 6,748 | | |
| Eastman Chemical (a) | | | 139,590 | | | | 7,365 | | |
| Engelhard | | | 303,950 | | | | 8,267 | | |
| Lyondell Chemical (a) | | | 294,000 | | | | 7,879 | | |
| Phelps Dodge (a) | | | 62,670 | | | | 7,550 | | |
| Rohm & Haas (a) | | | 178,800 | | | | 7,783 | | |
| | | | 45,592 | | |
| Utilities – 11.8% | |
| Alliant Energy | | | 194,050 | | | | 5,133 | | |
| Constellation Energy | | | 262,370 | | | | 14,378 | | |
| DPL (a) | | | 155,640 | | | | 4,011 | | |
| DTE Energy (a) | | | 111,710 | | | | 4,826 | | |
| Edison International | | | 248,020 | | | | 10,853 | | |
| PG&E (a) | | | 317,200 | | | | 11,540 | | |
| PNM Resources | | | 200,270 | | | | 5,077 | | |
| PPL | | | 435,390 | | | | 13,645 | | |
| Sempra Energy | | | 77,240 | | | | 3,422 | | |
| Wisconsin Energy (a) | | | 177,360 | | | | 6,710 | | |
| | | | 79,595 | | |
Total Common Stocks
(Cost $572,584) | | | | | | | 655,805 | | |
FIRST AMERICAN FUNDS Annual Report 2005
73
Schedule of Investments October 31, 2005
Mid Cap Value Fund (concluded)
| DESCRIPTION | | SHARES | | VALUE (000) | |
| Short-Term Investments – 2.6% | |
First American Prime Obligations Fund, Class Z (c)
(Cost $17,341) | | | 17,341,190 | | | $ | 17,341 | | |
Investments Purchased with Proceeds
from Securities Lending (d) – 31.6% | |
| (Cost $212,246) | | | | | 212,246 | | |
Total Investments – 131.7%
(Cost $802,171) | | | | | 885,392 | | |
| Other Assets and Liabilities, Net – (31.7)% | | | | | (213,363 | ) | |
| Total Net Assets – 100.0% | | | | $ | 672,029 | | |
* Non-income producing security
(a) This security or a portion of this security is out on loan at October 31, 2005. Total loaned securities had a market value of $207,720,075 at October 31, 2005. See note 2 in Notes to Financial Statements.
(b) The fund significantly invested in this industry and therefore is subject to additional risks. See note 6 in Notes to Financial Statements.
(c) Investment in affiliated security. This money market fund is advised by U.S. Bancorp Asset Management, Inc., which also serves as advisor to this fund. See note 3 in Notes to Financial Statements.
(d) The fund may loan securities in return for collateral in the form of cash, U.S. Government securities, or other high grade debt obligations. The cash collateral is invested in various short-term fixed income securities, such as repurchase agreements, commercial paper, money market funds and other corporate obligations. See note 2 in Notes to Financial Statements.
The accompanying notes are an integral part of the financial statements.
FIRST AMERICAN FUNDS Annual Report 2005
74
Statements of Assets and Liabilities October 31, 2005, in thousands, except for per share data
| | | Mid Cap Growth
Opportunities Fund | | Mid Cap
Value Fund | |
| ASSETS: | |
| Investments in unaffliated securities, at value* (cost: $1,293,271 and $572,584, respectively) (note 2) | | $ | 1,548,149 | | | $ | 655,805 | | |
| Investments in affliated money market fund, at value (cost: $23,139 and $17,341, respectively) (note 2) | | | 23,139 | | | | 17,341 | | |
| Investments purchased with proceeds from securities lending (cost: $609,013 and $212,246, respectively) (note 2) | | | 609,013 | | | | 212,246 | | |
| Cash** | | | 7,845 | | | | 244 | | |
| Receivable for dividends and interest | | | 531 | | | | 338 | | |
| Receivable for investment securities sold | | | 27,606 | | | | 28,557 | | |
| Receivable for capital shares sold | | | 1,934 | | | | 1,082 | | |
| Prepaid expenses and other assets | | | 58 | | | | 50 | | |
| Total assets | | | 2,218,275 | | | | 915,663 | | |
| LIABILITIES: | |
| Payable for investment securities purchased | | | 16,173 | | | | 29,932 | | |
| Payable upon return of securities loaned (note 2) | | | 609,714 | | | | 212,490 | | |
| Payable for capital shares redeemed | | | 2,007 | | | | 619 | | |
| Payable to affiliates (note 3) | | | 1,300 | | | | 545 | | |
| Payable for distribution and shareholder servicing fees | | | 94 | | | | 26 | | |
| Accrued expenses and other liabilities | | | 39 | | | | 22 | | |
| Total liabilities | | | 629,327 | | | | 243,634 | | |
| Net assets | | $ | 1,588,948 | | | $ | 672,029 | | |
| COMPOSITION OF NET ASSETS: | |
| Portfolio capital | | $ | 1,217,823 | | | $ | 553,714 | | |
| Undistributed (distributions in excess of) net investment income | | | (1 | ) | | | 186 | | |
| Accumulated net realized gain on investments | | | 116,248 | | | | 34,908 | | |
| Net unrealized appreciation of investments | | | 254,878 | | | | 83,221 | | |
| Net assets | | $ | 1,588,948 | | | $ | 672,029 | | |
| * Including securities loaned, at value | | $ | 603,510 | | | $ | 207,720 | | |
| ** Includes cash collateral received related to securities loaned (note 2) | | $ | 701 | | | $ | 244 | | |
| Class A: | |
| Net assets | | $ | 314,830 | | | $ | 56,125 | | |
| Shares issued and outstanding ($0.0001 par value — 2 billion authorized) | | | 7,722 | | | | 2,334 | | |
| Net asset value and redemption price per share | | $ | 40.77 | | | $ | 24.04 | | |
| Maximum offering price per share (1) | | $ | 43.14 | | | $ | 25.44 | | |
| Class B: | |
| Net assets | | $ | 14,586 | | | $ | 9,252 | | |
| Shares issued and outstanding ($0.0001 par value — 2 billion authorized) | | | 383 | | | | 400 | | |
| Net asset value, offering price and redemption price per share (2) | | $ | 38.12 | | | $ | 23.12 | | |
| Class C: | |
| Net assets | | $ | 15,435 | | | $ | 7,439 | | |
| Shares issued and outstanding ($0.0001 par value — 2 billion authorized) | | | 391 | | | | 316 | | |
| Net asset value, offering price and redemption price per share (2) | | $ | 39.46 | | | $ | 23.57 | | |
| Class R: | |
| Net assets | | $ | 5,502 | | | $ | 785 | | |
| Shares issued and outstanding ($0.0001 par value — 2 billion authorized) | | | 135 | | | | 33 | | |
| Net asset value, offering price, and redemption price per share | | $ | 40.61 | | | $ | 24.00 | | |
| Class Y: | |
| Net assets | | $ | 1,238,595 | | | $ | 598,428 | | |
| Shares issued and outstanding ($0.0001 par value — 2 billion authorized) | | | 29,065 | | | | 24,785 | | |
| Net asset value, offering price, and redemption price per share | | $ | 42.61 | | | $ | 24.14 | | |
(1) The offering price is calculated by dividing the net asset value by 1 minus the maximum sales charge of 5.50%
(2) Class B and C have a contingent deferred sales charge. For a description of this sales charge, see notes 1 and 3 in Notes to Financial Statements.
FIRST AMERICAN FUNDS Annual Report 2005
75
Statements of Operations
| | | Mid Cap Growth
Opportunities Fund | | Mid Cap
Value Fund | |
| One-Month | | Year
Period Ended
10/31/05 | | One-Month
Ended
9/30/05 | | Year
Period Ended
10/31/05 | | Ended
9/30/05 | |
| INVESTMENT INCOME: | |
| Dividends from affiliated money market fund | | $ | 134 | | | $ | 916 | | | $ | 49 | | | $ | 328 | | |
| Dividends from unaffiliated securities | | | 514 | | | | 6,858 | | | | 359 | | | | 9,742 | | |
| Less: Foreign taxes withheld | | | — | | | | (5 | ) | | | — | | | | (6 | ) | |
| Securities lending income | | | 34 | | | | 495 | | | | 11 | | | | 166 | | |
| Total investment income | | | 682 | | | | 8,264 | | | | 419 | | | | 10,230 | | |
| EXPENSES (note 3): | |
| Investment advisory fees | | | 942 | | | | 10,195 | | | | 397 | | | | 4,051 | | |
| Transfer agent fees | | | 179 | | | | 955 | | | | 72 | | | | 387 | | |
| Administration fees | | | 172 | | | | 2,931 | | | | 73 | | | | 1,163 | | |
| Custodian fees | | | 7 | | | | 126 | | | | 3 | | | | 49 | | |
| Professional fees | | | 5 | | | | 91 | | | | 2 | | | | 48 | | |
| Registration fees | | | 4 | | | | 40 | | | | 4 | | | | 41 | | |
| Postage and printing fees | | | 3 | | | | 76 | | | | 1 | | | | 31 | | |
| Directors' fees | | | 3 | | | | 34 | | | | 1 | | | | 13 | | |
| Other expenses | | | 3 | | | | 30 | | | | 1 | | | | 14 | | |
| Distribution and shareholder servicing fees – Class A | | | 66 | | | | 549 | | | | 12 | | | | 87 | | |
| Distribution and shareholder servicing fees – Class B | | | 12 | | | | 132 | | | | 8 | | | | 101 | | |
| Distribution and shareholder servicing fees – Class C | | | 14 | | | | 144 | | | | 6 | | | | 46 | | |
| Distribution and shareholder servicing fees – Class R | | | 2 | | | | 7 | | | | — | (1) | | | 1 | | |
| Total expenses | | | 1,412 | | | | 15,310 | | | | 580 | | | | 6,032 | | |
| Less: Fee waivers (note 3) | | | (1 | ) | | | (478 | ) | | | — | | | | (231 | ) | |
| Total net expenses | | | 1,411 | | | | 14,832 | | | | 580 | | | | 5,801 | | |
| Investment income (loss) – net | | | (729 | ) | | | (6,568 | ) | | | (161 | ) | | | 4,429 | | |
| REALIZED AND UNREALIZED GAINS (LOSSES) ON INVESTMENTS – NET (note 5): | |
| Net realized gain on investments | | | 33,519 | | | | 180,742 | | | | 4,915 | | | | 88,747 | | |
| Net change in unrealized appreciation or depreciation of investments | | | (63,233 | ) | | | 166,265 | | | | (27,884 | ) | | | 30,399 | | |
| Net gain (loss) on investments | | | (29,714 | ) | | | 347,007 | | | | (22,969 | ) | | | 119,146 | | |
| Net increase (decrease) in net assets resulting from operations | | $ | (30,443 | ) | | $ | 340,439 | | | $ | (23,130 | ) | | $ | 123,575 | | |
(1) Due to the presentation of the financial statements in thousands, the numbers round to zero.
The accompanying notes are an integral part of the financial statements.
FIRST AMERICAN FUNDS Annual Report 2005
76
Statements of Changes in Net Assets in thousands
| | | Mid Cap Growth
Opportunities Fund | | Mid Cap
Value Fund | |
| | | One-Month
Period Ended
10/31/05 | | Year
Ended
9/30/05 | | Year
Ended
9/30/04 | | One-Month
Period Ended
10/31/05 | | Year
Ended
9/30/05 | | Year
Ended
9/30/04 | |
| OPERATIONS: | |
| Investment income (loss) – net | | $ | (729 | ) | | $ | (6,568 | ) | | $ | (8,420 | ) | | $ | (161 | ) | | $ | 4,429 | | | $ | 2,640 | | |
| Net realized gain on investments | | | 33,519 | | | | 180,742 | | | | 222,462 | | | | 4,915 | | | | 88,747 | | | | 47,402 | | |
| Net change in unrealized appreciation or depreciation of investments | | | (63,233 | ) | | | 166,265 | | | | 10,165 | | | | (27,884 | ) | | | 30,399 | | | | 37,910 | | |
| Net increase (decrease) in net assets resulting from operations | | | (30,443 | ) | | | 340,439 | | | | 224,207 | | | | (23,130 | ) | | | 123,575 | | | | 87,952 | | |
| DISTRIBUTIONS TO SHAREHOLDERS FROM: | |
| Investment income – net: | |
| Class A | | | — | | | | — | | | | — | | | | — | | | | (164 | ) | | | (65 | ) | |
| Class B | | | — | | | | — | | | | — | | | | — | | | | (1 | ) | | | (4 | ) | |
| Class C | | | — | | | | — | | | | — | | | | — | | | | — | | | | (1 | ) | |
| Class R | | | — | | | | — | | | | — | | | | — | | | | — | | | | (3 | ) | |
| Class Y | | | — | | | | — | | | | — | | | | — | | | | (3,591 | ) | | | (2,029 | ) | |
| Net realized gain on investments: | |
| Class A | | | — | | | | (26,799 | ) | | | (4,797 | ) | | | — | | | | — | | | | — | | |
| Class B | | | — | | | | (1,832 | ) | | | (306 | ) | | | — | | | | — | | | | — | | |
| Class C | | | — | | | | (1,996 | ) | | | (393 | ) | | | — | | | | — | | | | — | | |
| Class R | | | — | | | | (2 | ) | | | (322 | ) | | | — | | | | — | | | | — | | |
| Class Y | | | — | | | | (164,469 | ) | | | (34,963 | ) | | | — | | | | — | | | | — | | |
| Tax return of capital: | |
| Class A | | | — | | | | — | | | | — | | | | — | | | | — | | | | (2 | ) | |
| Class B | | | — | | | | — | | | | — | | | | — | | | | — | | | | — | | |
| Class C | | | — | | | | — | | | | — | | | | — | | | | — | | | | — | | |
| Class R | | | — | | | | — | | | | — | | | | — | | | | — | | | | — | | |
| Class Y | | | — | | | | — | | | | — | | | | — | | | | — | | | | (55 | ) | |
| Total distributions | | | — | | | | (195,098 | ) | | | (40,781 | ) | | | — | | | | (3,756 | ) | | | (2,159 | ) | |
| CAPITAL SHARE TRANSACTIONS (note 4): | |
| Class A: | |
| Proceeds from sales | | | 7,177 | | | | 141,968 | | | | 29,575 | | | | 4,466 | | | | 29,979 | | | | 13,198 | | |
| Reinvestment of distributions | | | — | | | | 25,770 | | | | 4,705 | | | | — | | | | 156 | | | | 65 | | |
| Payments for redemptions | | | (4,287 | ) | | | (44,583 | ) | | | (35,852 | ) | | | (866 | ) | | | (11,836 | ) | | | (5,352 | ) | |
| Increase (decrease) in net assets from Class A transactions | | | 2,890 | | | | 123,155 | | | | (1,572 | ) | | | 3,600 | | | | 18,299 | | | | 7,911 | | |
| Class B: | |
| Proceeds from sales | | | 139 | | | | 3,307 | | | | 2,328 | | | | 84 | | | | 2,023 | | | | 1,051 | | |
| Reinvestment of distributions | | | — | | | | 1,767 | | | | 291 | | | | — | | | | 1 | | | | 4 | | |
| Payments for redemptions | | | (186 | ) | | | (2,148 | ) | | | (1,842 | ) | | | (662 | ) | | | (3,940 | ) | | | (3,446 | ) | |
| Increase (decrease) in net assets from Class B transactions | | | (47 | ) | | | 2,926 | | | | 777 | | | | (578 | ) | | | (1,916 | ) | | | (2,391 | ) | |
| Class C: | |
| Proceeds from sales | | | 445 | | | | 6,924 | | | | 1,776 | | | | 427 | | | | 4,164 | | | | 1,189 | | |
| Reinvestment of distributions | | | — | | | | 1,992 | | | | 392 | | | | — | | | | — | | | | 1 | | |
| Payments for redemptions | | | (1,748 | ) | | | (5,357 | ) | | | (4,056 | ) | | | (165 | ) | | | (994 | ) | | | (1,405 | ) | |
| Increase (decrease) in net assets from Class C transactions | | | (1,303 | ) | | | 3,559 | | | | (1,888 | ) | | | 262 | | | | 3,170 | | | | (215 | ) | |
| Class R: | |
| Proceeds from sales | | | 198 | | | | 5,771 | | | | 1,017 | | | | 421 | | | | 366 | | | | 776 | | |
| Reinvestment of distributions | | | — | | | | 2 | | | | 285 | | | | — | | | | — | | | | 2 | | |
| Payments for redemptions | | | (94 | ) | | | (481 | ) | | | (13,131 | ) | | | (5 | ) | | | (5 | ) | | | (1,919 | ) | |
| Increase (decrease) in net assets from Class R transactions | | | 104 | | | | 5,292 | | | | (11,829 | ) | | | 416 | | | | 361 | | | | (1,141 | ) | |
| Class Y: | |
| Proceeds from sales | | | 9,636 | | | | 217,915 | | | | 142,884 | | | | 6,506 | | | | 155,251 | | | | 101,305 | | |
| Reinvestment of distributions | | | — | | | | 131,612 | | | | 29,145 | | | | — | | | | 2,282 | | | | 1,435 | | |
| Payments for redemptions | | | (20,617 | ) | | | (366,059 | ) | | | (316,100 | ) | | | (8,542 | ) | | | (79,482 | ) | | | (79,863 | ) | |
| Increase (decrease) in net assets from Class Y transactions | | | (10,981 | ) | | | (16,532 | ) | | | (144,071 | ) | | | (2,036 | ) | | | 78,051 | | | | 22,877 | | |
| Increase (decrease) in net assets from capital share transactions | | | (9,337 | ) | | | 118,400 | | | | (158,583 | ) | | | 1,664 | | | | 97,965 | | | | 27,041 | | |
| Total increase (decrease) in net assets | | | (39,780 | ) | | | 263,741 | | | | 24,843 | | | | (21,466 | ) | | | 217,784 | | | | 112,834 | | |
| Net assets at beginning of period | | | 1,628,728 | | | | 1,364,987 | | | | 1,340,144 | | | | 693,495 | | | | 475,711 | | | | 362,877 | | |
| Net assets at end of period | | $ | 1,588,948 | | | $ | 1,628,728 | | | $ | 1,364,987 | | | $ | 672,029 | | | $ | 693,495 | | | $ | 475,711 | | |
Undistributed (distributions in excess of) net investment income
at end of period | | $ | (1 | ) | | $ | (1 | ) | | $ | (2 | ) | | $ | 186 | | | $ | 186 | | | $ | 153 | | |
FIRST AMERICAN FUNDS Annual Report 2005
77
Financial Highlights For a share outstanding throughout the indicated period.
| | | Net Asset
Value
Beginning
of Period | | Net
Investment
Income (Loss) | | Realized and
Unrealized
Gains
(Losses) on
Investments | | Distributions
from Net
Realized Gains | | Net Asset
Value
End of
Period | | Total
Return (9) | |
| Mid Cap Growth Opportunities (1) | | | |
| Class A | | | |
| | 2005 | (2) (3) | | $ | 41.55 | | | $ | (0.02 | ) | | $ | (0.76 | ) | | $ | — | | | $ | 40.77 | | | | (1.88 | )% | |
| | 2005 | (3) (4) | | | 38.19 | | | | (0.24 | ) | | | 9.65 | | | | (6.05 | ) | | | 41.55 | | | | 26.25 | | |
| | 2004 | (3) (4) | | | 33.68 | | | | (0.30 | ) | | | 5.88 | | | | (1.07 | ) | | | 38.19 | | | | 16.88 | | |
| | 2003 | (3) (4) | | | 26.45 | | | | (0.18 | ) | | | 7.41 | | | | — | | | | 33.68 | | | | 27.33 | | |
| | 2002 | (4) | | | 28.33 | | | | (0.11 | ) | | | (1.77 | ) | | | — | | | | 26.45 | | | | (6.64 | ) | |
| | 2001 | (3) (5) | | | 54.63 | | | | (0.06 | ) | | | (8.40 | ) | | | (17.84 | ) | | | 28.33 | | | | (20.00 | ) | |
| Class B | | | |
| | 2005 | (2) (3) | | $ | 38.87 | | | $ | (0.05 | ) | | $ | (0.70 | ) | | $ | — | | | $ | 38.12 | | | | (1.93 | )% | |
| | 2005 | (3) (4) | | | 36.31 | | | | (0.51 | ) | | | 9.12 | | | | (6.05 | ) | | | 38.87 | | | | 25.29 | | |
| | 2004 | (3) (4) | | | 32.30 | | | | (0.55 | ) | | | 5.63 | | | | (1.07 | ) | | | 36.31 | | | | 16.03 | | |
| | 2003 | (3) (4) | | | 25.56 | | | | (0.39 | ) | | | 7.13 | | | | — | | | | 32.30 | | | | 26.37 | | |
| | 2002 | (4) | | | 27.59 | | | | (0.18 | ) | | | (1.85 | ) | | | — | | | | 25.56 | | | | (7.36 | ) | |
| | 2001 | (3) (5) | | | 53.97 | | | | (0.29 | ) | | | (8.25 | ) | | | (17.84 | ) | | | 27.59 | | | | (20.60 | ) | |
| Class C | | | |
| | 2005 | (2) (3) | | $ | 40.23 | | | $ | (0.05 | ) | | $ | (0.72 | ) | | $ | — | | | $ | 39.46 | | | | (1.91 | )% | |
| | 2005 | (3) (4) | | | 37.40 | | | | (0.53 | ) | | | 9.41 | | | | (6.05 | ) | | | 40.23 | | | | 25.27 | | |
| | 2004 | (3) (4) | | | 33.24 | | | | (0.57 | ) | | | 5.80 | | | | (1.07 | ) | | | 37.40 | | | | 16.03 | | |
| | 2003 | (3) (4) | | | 26.29 | | | | (0.40 | ) | | | 7.35 | | | | — | | | | 33.24 | | | | 26.43 | | |
| | 2002 | (4) | | | 28.33 | | | | (0.10 | ) | | | (1.94 | ) | | | — | | | | 26.29 | | | | (7.20 | ) | |
| | 2001 | (3) (6) | | | 27.40 | | | | — | | | | 0.93 | | | | — | | | | 28.33 | | | | 3.39 | | |
| Class R (7) | | | |
| | 2005 | (2) (3) | | $ | 41.40 | | | $ | (0.03 | ) | | $ | (0.76 | ) | | $ | — | | | $ | 40.61 | | | | (1.91 | )% | |
| | 2005 | (3) (4) | | | 38.15 | | | | (0.31 | ) | | | 9.61 | | | | (6.05 | ) | | | 41.40 | | | | 25.95 | | |
| | 2004 | (3) (4) | | | 33.66 | | | | (0.30 | ) | | | 5.86 | | | | (1.07 | ) | | | 38.15 | | | | 16.83 | | |
| | 2003 | (3) (4) | | | 26.43 | | | | (0.17 | ) | | | 7.40 | | | | — | | | | 33.66 | | | | 27.36 | | |
| | 2002 | (4) | | | 28.29 | | | | (0.07 | ) | | | (1.79 | ) | | | — | | | | 26.43 | | | | (6.58 | ) | |
| | 2001 | (3) (8) | | | 35.75 | | | | (0.06 | ) | | | (7.40 | ) | | | — | | | | 28.29 | | | | (20.87 | ) | |
| Class Y | | | |
| | 2005 | (2) (3) | | $ | 43.42 | | | $ | (0.02 | ) | | $ | (0.79 | ) | | $ | — | | | $ | 42.61 | | | | (1.86 | )% | |
| | 2005 | (3) (4) | | | 39.58 | | | | (0.16 | ) | | | 10.05 | | | | (6.05 | ) | | | 43.42 | | | | 26.57 | | |
| | 2004 | (3) (4) | | | 34.78 | | | | (0.21 | ) | | | 6.08 | | | | (1.07 | ) | | | 39.58 | | | | 17.18 | | |
| | 2003 | (3) (4) | | | 27.25 | | | | (0.09 | ) | | | 7.62 | | | | — | | | | 34.78 | | | | 27.68 | | |
| | 2002 | (4) | | | 29.11 | | | | (0.05 | ) | | | (1.81 | ) | | | — | | | | 27.25 | | | | (6.39 | ) | |
| | 2001 | (3) (5) | | | 55.52 | | | | 0.02 | | | | (8.59 | ) | | | (17.84 | ) | | | 29.11 | | | | (19.84 | ) | |
(1) The financial highlights for the Mid Cap Growth Opportunities Fund as set forth herein include the historical financial highlights of the Firstar Mid Cap Core Equity Fund.
The assets of the Firstar Fund were acquired by the First American Mid Cap Growth Opportunities Fund on September 24, 2001. In connection with such acquisition,
(i) Class A shares of the Fistar Mid Cap Core Equity Fund were exchanged for Class A shares of the First American Mid Cap Growth Opportunities Fund, (ii) Firstar
Class B shares were exchanged for Class B shares of the First American Fund, (iii) Firstar Class Y shares were exchanged for Class S shares of the First American Fund,
and (iv) Firstar Class Institutional shares were exchanged for Class Y shares of the First American Fund.
(2) For the period October 1, 2005 to October 31, 2005. Effective October 1, 2005, the fund's fiscal year-end was changed from September 30 to October 31. All ratios for
the period have been annualized, except total return and portfolio turnover.
(3) Per share data calculated using average shares outstanding method.
(4) For the period October 1 to September 30 in the year indicated.
(5) For the period November 1, 2000 to September 30, 2001. Effective in 2001, the fund's fiscal year-end was changed from October 31 to September 30. All ratios for the
period have been annualized, except total return and portfolio turnover.
(6) For the period from September 24, 2001, when the class of shares was first offered, to September 30, 2001. All ratios for the period have been annualized,
except total return and portfolio turnover.
(7) Prior to July 1, 2004, Class R shares were named Class S shares, which had lower fees and expenses.
(8) For the period from December 11, 2000, when the class of shares was first offered, to September 30, 2001. All ratios for the period have been annualized,
except total return and portfolio turnover.
(9) Total return does not include sales charges. Total return would have been lower had certain expenses not been waived.
The accompanying notes are an integral part of the financial statements.
FIRST AMERICAN FUNDS Annual Report 2005
78
| | | Net Assets
End of
Period (000) | | Ratio of
Expenses to
Average
Net Assets | | Ratio of Net
Investment
Income (Loss)
to Average
Net Assets | | Ratio of
Expenses to
Average
Net Assets
(Excluding
Waivers) | | Ratio of Net
Investment
Income (Loss)
to Average Net
Assets (Excluding
Waivers) | | Portfolio
Turnover
Rate | |
| Mid Cap Growth Opportunities (1) | |
| Class A | |
| | 2005 | (2) (3) | | $ | 314,830 | | | | 1.23 | % | | | (0.72 | )% | | | 1.23 | % | | | (0.72 | )% | | | 9 | % | |
| | 2005 | (3) (4) | | | 317,906 | | | | 1.21 | | | | (0.62 | ) | | | 1.24 | | | | (0.65 | ) | | | 107 | | |
| | 2004 | (3) (4) | | | 173,436 | | | | 1.20 | | | | (0.79 | ) | | | 1.24 | | | | (0.83 | ) | | | 135 | | |
| | 2003 | (3) (4) | | | 154,499 | | | | 1.20 | | | | (0.58 | ) | | | 1.25 | | | | (0.63 | ) | | | 145 | | |
| | 2002 | (4) | | | 75,002 | | | | 1.20 | | | | (0.34 | ) | | | 1.26 | | | | (0.40 | ) | | | 162 | | |
| | 2001 | (3) (5) | | | 82,043 | | | | 1.20 | | | | (0.19 | ) | | | 1.22 | �� | | | (0.21 | ) | | | 204 | | |
| Class B | |
| | 2005 | (2) (3) | | $ | 14,586 | | | | 1.98 | % | | | (1.47 | )% | | | 1.98 | % | | | (1.47 | )% | | | 9 | % | |
| | 2005 | (3) (4) | | | 14,922 | | | | 1.96 | | | | (1.40 | ) | | | 1.99 | | | | (1.43 | ) | | | 107 | | |
| | 2004 | (3) (4) | | | 10,974 | | | | 1.95 | | | | (1.54 | ) | | | 1.99 | | | | (1.58 | ) | | | 135 | | |
| | 2003 | (3) (4) | | | 9,055 | | | | 1.95 | | | | (1.33 | ) | | | 2.00 | | | | (1.38 | ) | | | 145 | | |
| | 2002 | (4) | | | 4,227 | | | | 1.95 | | | | (1.08 | ) | | | 2.01 | | | | (1.14 | ) | | | 162 | | |
| | 2001 | (3) (5) | | | 2,606 | | | | 1.94 | | | | (0.95 | ) | | | 1.97 | | | | (0.98 | ) | | | 204 | | |
| Class C | |
| | 2005 | (2) (3) | | $ | 15,435 | | | | 1.98 | % | | | (1.47 | )% | | | 1.98 | % | | | (1.47 | )% | | | 9 | % | |
| | 2005 | (3) (4) | | | 17,079 | | | | 1.96 | | | | (1.40 | ) | | | 1.99 | | | | (1.43 | ) | | | 107 | | |
| | 2004 | (3) (4) | | | 12,356 | | | | 1.95 | | | | (1.54 | ) | | | 1.99 | | | | (1.58 | ) | | | 135 | | |
| | 2003 | (3) (4) | | | 12,649 | | | | 1.95 | | | | (1.33 | ) | | | 2.00 | | | | (1.38 | ) | | | 145 | | |
| | 2002 | (4) | | | 1,136 | | | | 1.95 | | | | (1.07 | ) | | | 2.01 | | | | (1.13 | ) | | | 162 | | |
| | 2001 | (3) (6) | | | — | | | | — | | | | — | | | | — | | | | — | | | | 204 | | |
| Class R (7) | |
| | 2005 | (2) (3) | | $ | 5,502 | | | | 1.48 | % | | | (0.97 | )% | | | 1.63 | % | | | (1.12 | )% | | | 9 | % | |
| | 2005 | (3) (4) | | | 5,501 | | | | 1.46 | | | | (0.77 | ) | | | 1.64 | | | | (0.95 | ) | | | 107 | | |
| | 2004 | (3) (4) | | | 1 | | | | 1.20 | | | | (0.81 | ) | | | 1.24 | | | | (0.85 | ) | | | 135 | | |
| | 2003 | (3) (4) | | | 10,284 | | | | 1.20 | | | | (0.56 | ) | | | 1.25 | | | | (0.61 | ) | | | 145 | | |
| | 2002 | (4) | | | 5,869 | | | | 1.20 | | | | (0.33 | ) | | | 1.26 | | | | (0.39 | ) | | | 162 | | |
| | 2001 | (3) (8) | | | 1,484 | | | | 1.19 | | | | (0.24 | ) | | | 1.23 | | | | (0.28 | ) | | | 204 | | |
| Class Y | |
| | 2005 | (2) (3) | | $ | 1,238,595 | | | | 0.98 | % | | | (0.47 | )% | | | 0.98 | % | | | (0.47 | )% | | | 9 | % | |
| | 2005 | (3) (4) | | | 1,273,320 | | | | 0.96 | | | | (0.40 | ) | | | 0.99 | | | | (0.43 | ) | | | 107 | | |
| | 2004 | (3) (4) | | | 1,168,220 | | | | 0.95 | | | | (0.54 | ) | | | 0.99 | | | | (0.58 | ) | | | 135 | | |
| | 2003 | (3) (4) | | | 1,153,657 | | | | 0.95 | | | | (0.30 | ) | | | 1.00 | | | | (0.35 | ) | | | 145 | | |
| | 2002 | (4) | | | 477,210 | | | | 0.95 | | | | (0.08 | ) | | | 1.01 | | | | (0.14 | ) | | | 162 | | |
| | 2001 | (3) (5) | | | 406,349 | | | | 0.95 | | | | 0.06 | | | | 0.97 | | | | 0.04 | | | | 204 | | |
FIRST AMERICAN FUNDS Annual Report 2005
79
Financial Highlights For a share outstanding throughout the indicated periods.
| | | Net Asset
Value
Beginning
of Period | | Net
Investment
Income (Loss) | | Realized and
Unrealized
Gains
(Losses) on
Investments | | Distributions
from Net
Investment
Income | | Distributions
from Return
of Capital | | Net Asset
Value
End of
Period | | Total
Return (7) | |
| Mid Cap Value Fund (1) | | | |
| Class A | | | |
| | 2005 | (2) | | $ | 24.88 | | | $ | (0.01 | ) | | $ | (0.83 | ) | | $ | — | | | $ | — | | | $ | 24.04 | | | | (3.38 | )% | |
| | 2005 | (3) | | | 20.09 | | | | 0.13 | | | | 4.76 | | | | (0.10 | ) | | | — | | | | 24.88 | | | | 24.38 | | |
| | 2004 | (3) | | | 16.30 | | | | 0.08 | | | | 3.77 | | | | (0.06 | ) | | | — | (6) | | | 20.09 | | | | 23.65 | | |
| | 2003 | (3) | | | 13.29 | | | | 0.18 | | | | 2.96 | | | | (0.12 | ) | | | (0.01 | ) | | | 16.30 | | | | 23.71 | | |
| | 2002 | (3) | | | 13.74 | | | | 0.13 | | | | (0.44 | ) | | | (0.10 | ) | | | (0.04 | ) | | | 13.29 | | | | (2.41 | ) | |
| | 2001 | (3) | | | 14.62 | | | | 0.10 | | | | (0.88 | ) | | | (0.10 | ) | | | — | | | | 13.74 | | | | (5.41 | ) | |
| Class B | | | |
| | 2005 | (2) | | $ | 23.94 | | | $ | (0.02 | ) | | $ | (0.80 | ) | | $ | — | | | $ | — | | | $ | 23.12 | | | | (3.43 | )% | |
| | 2005 | (3) | | | 19.39 | | | | (0.05 | ) | | | 4.60 | | | | — | | | | — | | | | 23.94 | | | | 23.47 | | |
| | 2004 | (3) | | | 15.81 | | | | (0.06 | ) | | | 3.65 | | | | (0.01 | ) | | | — | (6) | | | 19.39 | | | | 22.69 | | |
| | 2003 | (3) | | | 12.92 | | | | 0.07 | | | | 2.87 | | | | (0.04 | ) | | | (0.01 | ) | | | 15.81 | | | | 22.84 | | |
| | 2002 | (3) | | | 13.37 | | | | 0.01 | | | | (0.41 | ) | | | (0.01 | ) | | | (0.04 | ) | | | 12.92 | | | | (3.07 | ) | |
| | 2001 | (3) | | | 14.28 | | | | (0.01 | ) | | | (0.88 | ) | | | (0.02 | ) | | | — | | | | 13.37 | | | | (6.21 | ) | |
| Class C | | | |
| | 2005 | (2) | | $ | 24.40 | | | $ | (0.02 | ) | | $ | (0.81 | ) | | $ | — | | | $ | — | | | $ | 23.57 | | | | (3.40 | )% | |
| | 2005 | (3) | | | 19.77 | | | | (0.03 | ) | | | 4.66 | | | | — | | | | — | | | | 24.40 | | | | 23.43 | | |
| | 2004 | (3) | | | 16.12 | | | | (0.06 | ) | | | 3.72 | | | | (0.01 | ) | | | — | (6) | | | 19.77 | | | | 22.69 | | |
| | 2003 | (3) | | | 13.17 | | | | 0.07 | | | | 2.93 | | | | (0.04 | ) | | | (0.01 | ) | | | 16.12 | | | | 22.84 | | |
| | 2002 | (3) | | | 13.63 | | | | 0.01 | | | | (0.43 | ) | | | — | | | | (0.04 | ) | | | 13.17 | | | | (3.09 | ) | |
| | 2001 | (3) | | | 14.55 | | | | (0.01 | ) | | | (0.89 | ) | | | (0.02 | ) | | | — | | | | 13.63 | | | | (6.17 | ) | |
| Class R (4) | | | |
| | 2005 | (2) | | $ | 24.83 | | | $ | (0.01 | ) | | $ | (0.82 | ) | | $ | — | | | $ | — | | | $ | 24.00 | | | | (3.34 | )% | |
| | 2005 | (3) | | | 20.09 | | | | 0.12 | | | | 4.70 | | | | (0.08 | ) | | | — | | | | 24.83 | | | | 24.04 | | |
| | 2004 | (3) | | | 16.31 | | | | 0.07 | | | | 3.76 | | | | (0.05 | ) | | | — | (6) | | | 20.09 | | | | 23.51 | | |
| | 2003 | (3) | | | 13.29 | | | | 0.16 | | | | 2.99 | | | | (0.12 | ) | | | (0.01 | ) | | | 16.31 | | | | 23.80 | | |
| | 2002 | (3) | | | 13.74 | | | | 0.13 | | | | (0.44 | ) | | | (0.10 | ) | | | (0.04 | ) | | | 13.29 | | | | (2.40 | ) | |
| | 2001 | (5) | | | 13.31 | | | | 0.01 | | | | 0.42 | | | | — | | | | — | | | | 13.74 | | | | 3.23 | | |
| Class Y | | | |
| | 2005 | (2) | | $ | 24.98 | | | $ | — | | | $ | (0.84 | ) | | $ | — | | | $ | — | | | $ | 24.14 | | | | (3.36 | )% | |
| | 2005 | (3) | | | 20.17 | | | | 0.18 | | | | 4.78 | | | | (0.15 | ) | | | — | | | | 24.98 | | | | 24.68 | | |
| | 2004 | (3) | | | 16.36 | | | | 0.12 | | | | 3.79 | | | | (0.10 | ) | | | — | (6) | | | 20.17 | | | | 23.95 | | |
| | 2003 | (3) | | | 13.33 | | | | 0.21 | | | | 2.98 | | | | (0.15 | ) | | | (0.01 | ) | | | 16.36 | | | | 24.06 | | |
| | 2002 | (3) | | | 13.77 | | | | 0.17 | | | | (0.44 | ) | | | (0.13 | ) | | | (0.04 | ) | | | 13.33 | | | | (2.12 | ) | |
| | 2001 | (3) | | | 14.68 | | | | 0.14 | | | | (0.92 | ) | | | (0.13 | ) | | | — | | | | 13.77 | | | | (5.37 | ) | |
(1) Per share data calculated using average shares outstanding method.
(2) For the period October 1, 2005 to October 31, 2005. Effective October 1, 2005, the fund's fiscal year end was changed from September 30 to October 31. All ratios for the
period have been annualized, except total return and portfolio turnover.
(3) For the period October 1 to September 30 in the year indicated.
(4) Prior to July 1, 2004, Class R shares were named Class S shares, which had lower fees and expenses.
(5) For the period from September 24, 2001, when the class of shares was first offered, to September 30, 2001. All ratios for the period have been annualized,
except total return and portfolio turnover.
(6) Includes a tax return of capital less than $0.01.
(7) Total return does not include sales charges. Total return would have been lower had certain expenses not been waived.
The accompanying notes are an integral part of the financial statements.
FIRST AMERICAN FUNDS Annual Report 2005
80
| | | Net Assets
End of
Period (000) | | Ratio of
Expenses to
Average
Net Assets | | Ratio of Net
Investment
Income (Loss)
to Average
Net Assets | | Ratio of
Expenses to
Average
Net Assets
(Excluding
Waivers) | | Ratio of Net
Investment
Income (Loss)
to Average Net
Assets (Excluding
Waivers) | | Portfolio
Turnover
Rate | |
| Mid Cap Value Fund (1) | |
| Class A | |
| | 2005 | (2) | | $ | 56,125 | | | | 1.23 | % | | | (0.48 | )% | | | 1.23 | % | | | (0.48 | )% | | | 10 | % | |
| | 2005 | (3) | | | 54,360 | | | | 1.21 | | | | 0.59 | | | | 1.25 | | | | 0.55 | | | | 101 | | |
| | 2004 | (3) | | | 28,561 | | | | 1.20 | | | | 0.41 | | | | 1.25 | | | | 0.36 | | | | 83 | | |
| | 2003 | (3) | | | 16,598 | | | | 1.20 | | | | 1.21 | | | | 1.25 | | | | 1.16 | | | | 102 | | |
| | 2002 | (3) | | | 13,083 | | | | 1.20 | | | | 0.83 | | | | 1.26 | | | | 0.77 | | | | 90 | | |
| | 2001 | (3) | | | 13,583 | | | | 1.15 | | | | 0.67 | | | | 1.15 | | | | 0.67 | | | | 104 | | |
| Class B | |
| | 2005 | (2) | | $ | 9,252 | | | | 1.98 | % | | | (1.25 | )% | | | 1.98 | % | | | (1.25 | )% | | | 10 | % | |
| | 2005 | (3) | | | 10,157 | | | | 1.96 | | | | (0.21 | ) | | | 2.00 | | | | (0.25 | ) | | | 101 | | |
| | 2004 | (3) | | | 9,928 | | | | 1.95 | | | | (0.35 | ) | | | 2.00 | | | | (0.40 | ) | | | 83 | | |
| | 2003 | (3) | | | 10,154 | | | | 1.95 | | | | 0.50 | | | | 2.00 | | | | 0.45 | | | | 102 | | |
| | 2002 | (3) | | | 10,410 | | | | 1.95 | | | | 0.08 | | | | 2.01 | | | | 0.02 | | | | 90 | | |
| | 2001 | (3) | | | 11,311 | | | | 1.90 | | | | (0.08 | ) | | | 1.90 | | | | (0.08 | ) | | | 104 | | |
| Class C | |
| | 2005 | (2) | | $ | 7,439 | | | | 1.98 | % | | | (1.24 | )% | | | 1.98 | % | | | (1.24 | )% | | | 10 | % | |
| | 2005 | (3) | | | 7,426 | | | | 1.96 | | | | (0.15 | ) | | | 2.00 | | | | (0.19 | ) | | | 101 | | |
| | 2004 | (3) | | | 3,342 | | | | 1.95 | | | | (0.33 | ) | | | 2.00 | | | | (0.38 | ) | | | 83 | | |
| | 2003 | (3) | | | 2,916 | | | | 1.95 | | | | 0.51 | | | | 2.00 | | | | 0.46 | | | | 102 | | |
| | 2002 | (3) | | | 3,207 | | | | 1.95 | | | | 0.08 | | | | 2.01 | | | | 0.02 | | | | 90 | | |
| | 2001 | (3) | | | 3,312 | | | | 1.90 | | | | (0.04 | ) | | | 1.90 | | | | (0.04 | ) | | | 104 | | |
| Class R (4) | |
| | 2005 | (2) | | $ | 785 | | | | 1.47 | % | | | (0.69 | )% | | | 1.62 | % | | | (0.84 | )% | | | 10 | % | |
| | 2005 | (3) | | | 380 | | | | 1.46 | | | | 0.52 | | | | 1.65 | | | | 0.33 | | | | 101 | | |
| | 2004 | (3) | | | 1 | | | | 1.20 | | | | 0.37 | | | | 1.25 | | | | 0.32 | | | | 83 | | |
| | 2003 | (3) | | | 966 | | | | 1.20 | | | | 1.07 | | | | 1.25 | | | | 1.02 | | | | 102 | | |
| | 2002 | (3) | | | 158 | | | | 1.20 | | | | 0.87 | | | | 1.26 | | | | 0.81 | | | | 90 | | |
| | 2001 | (5) | | | 44 | | | | 0.85 | | | | 5.19 | | | | 0.85 | | | | 5.19 | | | | 104 | | |
| Class Y | |
| | 2005 | (2) | | $ | 598,428 | | | | 0.98 | % | | | (0.24 | )% | | | 0.98 | % | | | (0.24 | )% | | | 10 | % | |
| | 2005 | (3) | | | 621,172 | | | | 0.96 | | | | 0.80 | | | | 1.00 | | | | 0.76 | | | | 101 | | |
| | 2004 | (3) | | | 433,879 | | | | 0.95 | | | | 0.66 | | | | 1.00 | | | | 0.61 | | | | 83 | | |
| | 2003 | (3) | | | 332,243 | | | | 0.95 | | | | 1.45 | | | | 1.00 | | | | 1.40 | | | | 102 | | |
| | 2002 | (3) | | | 259,990 | | | | 0.95 | | | | 1.08 | | | | 1.01 | | | | 1.02 | | | | 90 | | |
| | 2001 | (3) | | | 291,932 | | | | 0.90 | | | | 0.92 | | | | 0.90 | | | | 0.92 | | | | 104 | | |
FIRST AMERICAN FUNDS Annual Report 2005
81
Schedule of Investments October 31, 2005
Large Cap Growth Opportunities Fund
| DESCRIPTION | | SHARES | | VALUE (000) | |
| Common Stocks – 99.1% | |
| Consumer Discretionary – 14.6% | |
| Coach* | | | 224,920 | | | $ | 7,238 | | |
| Harrah's Entertainment | | | 72,910 | | | | 4,410 | | |
| Lowe's (a) | | | 445,230 | | | | 27,057 | | |
| McGraw-Hill | | | 245,560 | | | | 12,018 | | |
| Nike, Class B (a) | | | 120,440 | | | | 10,123 | | |
| Omnicom Group (a) | | | 207,400 | | | | 17,206 | | |
| Staples | | | 812,245 | | | | 18,462 | | |
| Starbucks* | | | 373,840 | | | | 10,572 | | |
| Station Casinos (a) | | | 188,880 | | | | 12,107 | | |
| Target (a) | | | 447,210 | | | | 24,905 | | |
| | | | 144,098 | | |
| Consumer Staples – 7.5% | |
| Altria Group | | | 143,240 | | | | 10,750 | | |
| PepsiCo | | | 457,520 | | | | 27,030 | | |
| Procter & Gamble | | | 645,984 | | | | 36,169 | | |
| | | | 73,949 | | |
| Energy – 3.9% | |
| Apache | | | 200,400 | | | | 12,792 | | |
| ConocoPhillips | | | 115,250 | | | | 7,535 | | |
| Exxon Mobil | | | 123,240 | | | | 6,919 | | |
| Halliburton (a) | | | 96,770 | | | | 5,719 | | |
| National-Oilwell Varco* | | | 86,880 | | | | 5,427 | | |
| | | | 38,392 | | |
| Financials – 10.8% | |
| Allstate | | | 197,920 | | | | 10,448 | | |
| American Express | | | 355,610 | | | | 17,699 | | |
| American International Group | | | 232,100 | | | | 15,040 | | |
| Capital One Financial (a) | | | 79,300 | | | | 6,055 | | |
| Goldman Sachs Group (a) | | | 180,870 | | | | 22,857 | | |
| Legg Mason | | | 85,550 | | | | 9,180 | | |
| Lehman Brothers Holdings (a) | | | 67,980 | | | | 8,135 | | |
| Wells Fargo | | | 280,320 | | | | 16,875 | | |
| | | | 106,289 | | |
| Health Care – 21.3% | |
| Aetna | | | 242,760 | | | | 21,499 | | |
| Alcon* (a) | | | 88,180 | | | | 11,719 | | |
| Amgen* (a) | | | 321,660 | | | | 24,369 | | |
| Caremark Rx* | | | 302,356 | | | | 15,843 | | |
| Genentech* (a) | | | 135,190 | | | | 12,248 | | |
| Johnson & Johnson | | | 448,660 | | | | 28,095 | | |
| Medtronic | | | 400,010 | | | | 22,665 | | |
| PacifiCare Health Systems* | | | 93,670 | | | | 7,715 | | |
| PerkinElmer | | | 445,400 | | | | 9,830 | | |
| St. Jude Medical* | | | 356,140 | | | | 17,120 | | |
| Teva Pharmaceutical Industries, ADR (a) | | | 222,020 | | | | 8,463 | | |
| UnitedHealth Group (a) | | | 332,660 | | | | 19,258 | | |
| Zimmer Holdings* (a) | | | 164,899 | | | | 10,516 | | |
| | | | 209,340 | | |
| Industrials – 11.0% | |
| Danaher (a) | | | 223,650 | | | | 11,652 | | |
| Dun & Bradstreet* | | | 135,690 | | | | 8,592 | | |
| General Electric | | | 996,490 | | | | 33,791 | | |
| Pentair | | | 231,920 | | | | 7,535 | | |
| United Parcel Service, Class B | | | 278,760 | | | | 20,333 | | |
| United Technologies | | | 359,240 | | | | 18,422 | | |
| UTi Worldwide (a) | | | 89,382 | | | | 7,646 | | |
| | | | 107,971 | | |
Large Cap Growth Opportunities Fund (concluded)
| DESCRIPTION | | SHARES | | VALUE (000) | |
| Information Technology (b) – 28.5% | |
| Adobe Systems (a) | | | 449,480 | | | $ | 14,496 | | |
| Amphenol, Class A | | | 263,280 | | | | 10,523 | | |
| Apple Computer* (a) | | | 275,690 | | | | 15,877 | | |
| Autodesk (a) | | | 170,530 | | | | 7,696 | | |
| Corning* | | | 612,810 | | | | 12,311 | | |
| Dell* | | | 482,950 | | | | 15,396 | | |
| eBay* (a) | | | 431,440 | | | | 17,085 | | |
| EMC* | | | 980,910 | | | | 13,694 | | |
| Google* (a) | | | 49,480 | | | | 18,413 | | |
| Hewlett-Packard | | | 360,150 | | | | 10,099 | | |
| Intel | | | 973,800 | | | | 22,884 | | |
| Linear Technology | | | 217,850 | | | | 7,235 | | |
| Marvell Technology Group* (a) | | | 116,510 | | | | 5,407 | | |
| Microchip Technology (a) | | | 279,660 | | | | 8,437 | | |
| Microsoft | | | 978,290 | | | | 25,142 | | |
| Motorola (a) | | | 792,190 | | | | 17,555 | | |
| NCR* | | | 173,230 | | | | 5,235 | | |
| Paychex (a) | | | 228,210 | | | | 8,845 | | |
| QUALCOMM | | | 202,900 | | | | 8,067 | | |
| Research in Motion* (a) | | | 111,910 | | | | 6,881 | | |
| Texas Instruments (a) | | | 766,830 | | | | 21,893 | | |
| Yahoo!* (a) | | | 192,510 | | | | 7,117 | | |
| | | | 280,288 | | |
| Materials – 1.5% | |
| Dow Chemical | | | 324,870 | | | | 14,899 | | |
Total Common Stocks
(Cost $872,499) | | | | | | | 975,226 | | |
| Short-Term Investments – 2.4% | |
First American Prime Obligations Fund, Class Z (c)
(Cost $23,774) | | | 23,773,810 | | | | 23,774 | | |
Investments Purchased with Proceeds
from Securities Lending (d) – 26.1% | |
| (Cost $257,330) | | | | | | | 257,330 | | |
Total Investments – 127.6%
(Cost $1,153,603) | | | | | | | 1,256,330 | | |
| Other Assets and Liabilities, Net – (27.6)% | | | | | | | (271,546 | ) | |
| Total Net Assets – 100.0% | | | | | | $ | 984,784 | | |
* Non-income producing security
(a) This security or a portion of this security is out on loan at October 31, 2005. Total loaned securities had a market value of $254,856,194 at October 31, 2005. See note 2 in Notes to Financial Statements.
(b) The fund is significantly invested in this sector and therefore is subject to additional risks. See note 6 in Notes to Financial Statements.
(c) Investment in affiliated security. This money market fund is advised by U.S. Bancorp Asset Management, Inc., which also serves as advisor to this fund. See note 3 in Notes to Financial Statements.
(d) The fund may loan securities in return for collateral in the form of cash, U.S. Government securities, or other high grade debt obligations. The cash collateral is invested in various short-term fixed income securities, such as repurchase agreements, commercial paper, money market funds and other corporate obligations. See note 2 in Notes in Financial Statements.
ADR – American Depository Receipt
The accompanying notes are an integral part of the financial statements.
FIRST AMERICAN FUNDS Annual Report 2005
82
Schedule of Investments October 31, 2005
Large Cap Select Fund
| DESCRIPTION | | SHARES | | VALUE (000) | |
| Common Stocks – 97.1% | |
| Consumer Discretionary – 10.1% | |
| Coach* | | | 110,800 | | | $ | 3,566 | | |
| Harrah's Entertainment | | | 64,500 | | | | 3,901 | | |
| J.C. Penney (a) | | | 110,400 | | | | 5,652 | | |
| Omnicom Group (a) | | | 68,910 | | | | 5,717 | | |
| Sherwin Williams (a) | | | 158,130 | | | | 6,728 | | |
| Station Casinos (a) | | | 57,530 | | | | 3,688 | | |
| Time Warner | | | 318,814 | | | | 5,684 | | |
| | | | 34,936 | | |
| Consumer Staples – 7.7% | |
| PepsiCo | | | 113,467 | | | | 6,704 | | |
| Procter & Gamble | | | 159,368 | | | | 8,923 | | |
| Wal-Mart Stores (a) | | | 237,700 | | | | 11,246 | | |
| | | | 26,873 | | |
| Energy – 8.2% | |
| Amerada Hess (a) | | | 29,090 | | | | 3,639 | | |
| Apache | | | 115,576 | | | | 7,377 | | |
| ConocoPhillips | | | 112,910 | | | | 7,382 | | |
| Exxon Mobil | | | 56,860 | | | | 3,192 | | |
| Halliburton (a) | | | 52,856 | | | | 3,124 | | |
| National-Oilwell Varco* | | | 60,600 | | | | 3,786 | | |
| | | | 28,500 | | |
| Financials – 21.3% | |
| ACE | | | 152,644 | | | | 7,953 | | |
| Allstate | | | 94,225 | | | | 4,974 | | |
| American International Group | | | 165,030 | | | | 10,694 | | |
| Bank of America (a) | | | 300,978 | | | | 13,165 | | |
| Capital One Financial (a) | | | 51,914 | | | | 3,964 | | |
| Goldman Sachs Group (a) | | | 91,547 | | | | 11,569 | | |
| Lehman Brothers Holdings (a) | | | 75,040 | | | | 8,980 | | |
| Wells Fargo | | | 210,080 | | | | 12,647 | | |
| | | | 73,946 | | |
| Health Care – 12.2% | |
| Amgen* (a) | | | 118,130 | | | | 8,949 | | |
| Johnson & Johnson | | | 199,359 | | | | 12,484 | | |
| Teva Pharmaceutical Industries, ADR (a) | | | 93,780 | | | | 3,575 | | |
| UnitedHealth Group (a) | | | 109,998 | | | | 6,368 | | |
| Wyeth Pharmaceuticals | | | 246,260 | | | | 10,973 | | |
| | | | 42,349 | | |
| Industrials – 7.5% | |
| Eaton (a) | | | 46,070 | | | | 2,710 | | |
| Emerson Electric | | | 76,600 | | | | 5,327 | | |
| Illinois Tool Works (a) | | | 72,250 | | | | 6,124 | | |
| United Parcel Service, Class B | | | 161,560 | | | | 11,784 | | |
| | | | 25,945 | | |
| Information Technology – 22.1% | |
| Amphenol, Class A | | | 136,450 | | | | 5,454 | | |
| Autodesk (a) | | | 100,350 | | | | 4,529 | | |
| EMC* | | | 444,960 | | | | 6,212 | | |
| Hewlett-Packard | | | 368,660 | | | | 10,337 | | |
| Intel | | | 618,539 | | | | 14,536 | | |
| Microsoft | | | 382,180 | | | | 9,822 | | |
| Motorola (a) | | | 370,720 | | | | 8,215 | | |
| Oracle* | | | 634,260 | | | | 8,042 | | |
| QUALCOMM | | | 125,398 | | | | 4,986 | | |
| Texas Instruments | | | 163,830 | | | | 4,677 | | |
| | | | 76,810 | | |
Large Cap Select Fund (concluded)
| DESCRIPTION | | SHARES | | VALUE (000) | |
| Materials – 4.0% | |
| Dow Chemical (a) | | | 306,464 | | | $ | 14,054 | | |
| Telecommunication Services – 2.9% | |
| Verizon Communications (a) | | | 321,098 | | | | 10,118 | | |
| Utilities – 1.1% | |
| PG&E (a) | | | 105,710 | | | | 3,846 | | |
Total Common Stocks
(Cost $319,372) | | | | | | | 337,377 | | |
| Short-Term Investments – 2.3% | |
First American Prime Obligations Fund, Class Z (b)
(Cost $7,944) | | | 7,944,149 | | | | 7,944 | | |
Investments Purchased with Proceeds
from Securities Lending (c) – 30.7% | |
| (Cost $106,665) | | | | | | | 106,665 | | |
Total Investments – 130.1%
(Cost $433,981) | | | | | | | 451,986 | | |
| Other Assets and Liabilities, Net – (30.1)% | | | | | | | (104,488 | ) | |
| Total Net Assets – 100.0% | | | | | | $ | 347,498 | | |
* Non-income producing security
(a) This security or a portion of this security is out on loan at October 31, 2005. Total loaned securities had a market value of $105,590,135 at October 31, 2005. See note 2 in Notes to Financial Statements.
(b) Investment in affiliated security. This money market fund is advised by U.S. Bancorp Asset Management, Inc., which also serves as advisor to this fund. See note 3 in Notes to Financial Statements.
(c) The fund may loan securities in return for collateral in the form of cash, U.S. Government securities, or other high grade debt obligations. The cash collateral is invested in various short-term fixed income securities, such as repurchase agreements, commercial paper, money market funds and other corporate obligations. See note 2 in Notes in Financial Statements.
ADR – American Depository Receipt
FIRST AMERICAN FUNDS Annual Report 2005
83
Schedule of Investments October 31, 2005
Large Cap Value Fund
| DESCRIPTION | | SHARES | | VALUE (000) | |
| Common Stocks – 98.2% | |
| Consumer Discretionary – 10.0% | |
| Comcast, Class A* (a) | | | 496,070 | | | $ | 13,806 | | |
| Federated Department Stores | | | 227,000 | | | | 13,931 | | |
| Harrah's Entertainment | | | 136,650 | | | | 8,265 | | |
| Nike, Class B (a) | | | 107,860 | | | | 9,066 | | |
| Sherwin Williams (a) | | | 395,090 | | | | 16,811 | | |
| Time Warner | | | 1,450,910 | | | | 25,870 | | |
| | | | 87,749 | | |
| Consumer Staples – 5.8% | |
| Altria Group | | | 238,180 | | | | 17,875 | | |
| Colgate-Palmolive (a) | | | 164,840 | | | | 8,730 | | |
| General Mills (a) | | | 221,030 | | | | 10,667 | | |
| Kroger* | | | 691,690 | | | | 13,765 | | |
| | | | 51,037 | | |
| Energy – 13.5% | |
| Apache | | | 222,044 | | | | 14,173 | | |
| BP, ADR | | | 288,390 | | | | 19,149 | | |
| ConocoPhillips | | | 326,550 | | | | 21,350 | | |
| Exxon Mobil | | | 722,824 | | | | 40,579 | | |
| Halliburton (a) | | | 126,910 | | | | 7,500 | | |
| National-Oilwell Varco* | | | 101,160 | | | | 6,319 | | |
| Valero Energy | | | 91,410 | | | | 9,620 | | |
| | | | 118,690 | | |
| Financials (b) – 33.6% | |
| ACE | | | 394,140 | | | | 20,535 | | |
| Allstate | | | 251,720 | | | | 13,288 | | |
| American International Group | | | 387,810 | | | | 25,130 | | |
| Bank of America (a) | | | 850,266 | | | | 37,191 | | |
| Capital One Financial (a) | | | 150,770 | | | | 11,511 | | |
| Citigroup | | | 579,012 | | | | 26,507 | | |
| Comerica | | | 187,900 | | | | 10,857 | | |
| Freddie Mac | | | 102,610 | | | | 6,295 | | |
| Genworth Financial (a) | | | 550,350 | | | | 17,441 | | |
| Goldman Sachs Group (a) | | | 200,860 | | | | 25,383 | | |
| Lehman Brothers Holdings (a) | | | 209,890 | | | | 25,118 | | |
| Marshall & Ilsley (a) | | | 183,970 | | | | 7,903 | | |
| Merrill Lynch (a) | | | 216,480 | | | | 14,015 | | |
| MGIC Investment (a) | | | 137,910 | | | | 8,170 | | |
| Northern Trust (a) | | | 230,040 | | | | 12,330 | | |
| Wachovia | | | 171,260 | | | | 8,652 | | |
| Wells Fargo | | | 412,330 | | | | 24,822 | | |
| | | | 295,148 | | |
| Health Care – 8.9% | |
| CIGNA | | | 96,950 | | | | 11,234 | | |
| HCA (a) | | | 207,510 | | | | 10,000 | | |
| Johnson & Johnson | | | 103,320 | | | | 6,470 | | |
| Merck | | | 308,040 | | | | 8,693 | | |
| Pfizer | | | 690,460 | | | | 15,011 | | |
| Wyeth Pharmaceuticals | | | 598,680 | | | | 26,677 | | |
| | | | 78,085 | | |
| Industrials – 6.5% | |
| American Standard | | | 115,620 | | | | 4,398 | | |
| Eaton (a) | | | 160,190 | | | | 9,424 | | |
| Emerson Electric | | | 289,490 | | | | 20,134 | | |
| General Electric | | | 380,950 | | | | 12,918 | | |
| Norfolk Southern | | | 245,550 | | | | 9,871 | | |
| | | | 56,745 | | |
Large Cap Value Fund (concluded)
| DESCRIPTION | | SHARES | | VALUE (000) | |
| Information Technology – 9.3% | |
| Hewlett-Packard | | | 1,123,010 | | | $ | 31,489 | | |
| Motorola (a) | | | 740,260 | | | | 16,404 | | |
| National Semiconductor (a) | | | 429,100 | | | | 9,710 | | |
| Oracle* | | | 997,700 | | | | 12,651 | | |
| Texas Instruments | | | 387,500 | | | | 11,063 | | |
| | | | 81,317 | | |
| Materials – 3.8% | |
| Dow Chemical | | | 545,290 | | | | 25,007 | | |
| Phelps Dodge (a) | | | 68,870 | | | | 8,297 | | |
| | | | 33,304 | | |
| Telecommunication Services – 3.2% | |
| BellSouth (a) | | | 451,780 | | | | 11,755 | | |
| Verizon Communications (a) | | | 526,302 | | | | 16,584 | | |
| | | | 28,339 | | |
| Utilities – 3.6% | |
| Entergy | | | 230,770 | | | | 16,320 | | |
| PG&E (a) | | | 420,240 | | | | 15,288 | | |
| | | | 31,608 | | |
Total Common Stocks
(Cost $747,947) | | | | | | | 862,022 | | |
| Short-Term Investments – 1.9% | |
First American Prime Obligations Fund, Class Z (c)
(Cost $16,729) | | | 16,729,449 | | | | 16,729 | | |
Investments Purchased with Proceeds
from Securities Lending (d) – 27.7% | |
| (Cost $243,683) | | | | | | | 243,683 | | |
Total Investments – 127.8%
(Cost $1,008,359) | | | | | | | 1,122,434 | | |
| Other Assets and Liabilities, Net – (27.8)% | | | | | | | (244,248 | ) | |
| Total Net Assets – 100.0% | | | | | | $ | 878,186 | | |
* Non-income producing security
(a) This security or a portion of this security is out on loan at October 31, 2005. Total loaned securities had a market value of $239,711,929 at October 31, 2005. See note 2 in Notes to Financial Statements.
(b) The fund is significantly invested in this sector and therefore is subject to additional risks. See note 6 in Notes to Financial Statements.
(c) Investment in affiliated security. This money market fund is advised by U.S. Bancorp Asset Management, Inc., which also serves as advisor to this fund. See note 3 in Notes to Financial Statements.
(d) The fund may loan securities in return for collateral in the form of cash, U.S. Government securities, or other high grade debt obligations. The cash collateral is invested in various short-term fixed income securities, such as repurchase agreements, commercial paper, money market funds and other corporate obligations. See note 2 in Notes in Financial Statements.
ADR – American Depository Receipt
The accompanying notes are an integral part of the financial statements.
FIRST AMERICAN FUNDS Annual Report 2005
84
Statements of Assets and Liabilities October 31, 2005, in thousands, except for per share data
| | | Large Cap Growth
Opportunities Fund | | Large Cap
Select Fund | | Large Cap
Value Fund | |
| ASSETS: | |
Investments in unaffiliated securities, at value* (cost: $872,499, $319,372 and
$747,947, respectively)(note 2) | | $ | 975,226 | | | $ | 337,377 | | | $ | 862,022 | | |
Investments in affiliated money market fund, at value (cost: $23,774, $7,944 and
$16,729, respectively)(note 2) | | | 23,774 | | | | 7,944 | | | | 16,729 | | |
Investments purchased with proceeds from securities lending, at value (cost: $257,330,
$106,665 and $243,683, respectively)(note 2) | | | 257,330 | | | | 106,665 | | | | 243,683 | | |
| Cash** | | | 296 | | | | 123 | | | | 280 | | |
| Receivable for dividends and interest | | | 530 | | | | 278 | | | | 764 | | |
| Receivable for investment securities sold | | | 23,367 | | | | 7,372 | | | | — | | |
| Receivable for capital shares sold | | | 307 | | | | 767 | | | | 364 | | |
| Prepaid expenses and other assets | | | 47 | | | | 43 | | | | 46 | | |
| Total assets | | | 1,280,877 | | | | 460,569 | | | | 1,123,888 | | |
| LIABILITIES: | |
| Payable for investment securities purchased | | | 36,512 | | | | 5,936 | | | | — | | |
| Payable upon return of securities loaned (note 2) | | | 257,626 | | | | 106,788 | | | | 243,963 | | |
| Payable for capital shares redeemed | | | 1,084 | | | | 68 | | | | 959 | | |
| Payable to affiliates (note 3) | | | 781 | | | | 259 | | | | 701 | | |
| Payable for distribution and shareholder servicing fees | | | 48 | | | | 2 | | | | 41 | | |
| Accrued expenses and other liabilities | | | 42 | | | | 18 | | | | 38 | | |
| Total liabilities | | | 296,093 | | | | 113,071 | | | | 245,702 | | |
| Net assets | | $ | 984,784 | | | $ | 347,498 | | | $ | 878,186 | | |
| COMPOSITION OF NET ASSETS: | |
| Portfolio capital | | $ | 995,088 | | | $ | 315,502 | | | $ | 737,583 | | |
| Undistributed (distributions in excess of) net investment income | | | (1 | ) | | | 156 | | | | — | | |
| Accumulated net realized gain (loss) on investments | | | (113,030 | ) | | | 13,835 | | | | 26,528 | | |
| Net unrealized appreciation of investments | | | 102,727 | | | | 18,005 | | | | 114,075 | | |
| Net assets | | $ | 984,784 | | | $ | 347,498 | | | $ | 878,186 | | |
| * Including securities loaned, at value | | $ | 254,856 | | | $ | 105,590 | | | $ | 239,712 | | |
| ** Includes cash collateral received related to securities loaned (note 2) | | $ | 296 | | | $ | 123 | | | $ | 280 | | |
| Class A: | |
| Net assets | | $ | 104,960 | | | $ | 5,682 | | | $ | 118,443 | | |
| Shares issued and outstanding ($0.0001 par value — 2 billion authorized) | | | 3,767 | | | | 397 | | | | 6,054 | | |
| Net asset value and redemption price per share | | $ | 27.86 | | | $ | 14.30 | | | $ | 19.56 | | |
| Maximum offering price per share (1) | | $ | 29.48 | | | $ | 15.13 | | | $ | 20.70 | | |
| Class B: | |
| Net assets | | $ | 19,601 | | | $ | 573 | | | $ | 13,826 | | |
| Shares issued and outstanding ($0.0001 par value — 2 billion authorized) | | | 737 | | | | 41 | | | | 723 | | |
| Net asset value, offering price and redemption price per share (2) | | $ | 26.58 | | | $ | 14.12 | | | $ | 19.12 | | |
| Class C: | |
| Net assets | | $ | 10,739 | | | $ | 180 | | | $ | 5,399 | | |
| Shares issued and outstanding ($0.0001 par value — 2 billion authorized) | | | 396 | | | | 13 | | | | 279 | | |
| Net asset value, offering price and redemption price per share (2) | | $ | 27.12 | | | $ | 14.13 | | | $ | 19.35 | | |
| Class R: | |
| Net assets | | $ | 290 | | | $ | 2 | | | $ | 7 | | |
| Shares issued and outstanding ($0.0001 par value — 2 billion authorized) | | | 11 | | | | — | | | | — | | |
| Net asset value, offering price, and redemption price per share | | $ | 27.78 | | | $ | 14.26 | | | $ | 19.55 | | |
| Class Y: | |
| Net assets | | $ | 849,194 | | | $ | 341,061 | | | $ | 740,511 | | |
| Shares issued and outstanding ($0.0001 par value — 2 billion authorized) | | | 29,652 | | | | 23,803 | | | | 37,741 | | |
| Net asset value, offering price, and redemption price per share | | $ | 28.64 | | | $ | 14.33 | | | $ | 19.62 | | |
(1) The offering price is calculated by dividing the net asset value by 1 minus the maximum sales charge of 5.50%
(2) Class B and C have a contingent deferred sales charge. For a description of this sales charge, see notes 1 and 3 in Notes to Financial Statements.
FIRST AMERICAN FUNDS Annual Report 2005
85
Statements of Operations in thousands
| | | Large Cap Growth
Opportunities Fund | | Large Cap
Select Fund | | Large Cap
Value Fund | |
| One-Month | | Year
Period Ended
10/31/05 | | One-Month
Ended
9/30/05 | | Year
Period Ended
10/31/05 | | One-Month
Ended
9/30/05 | | Year
Period Ended
10/31/05 | | Ended
9/30/05 | |
| INVESTMENT INCOME: | |
| Interest from unaffiliated securities | | $ | — | | | $ | — | | | $ | — | | | $ | 3 | | | $ | — | | | $ | — | | |
| Dividends from affiliated money market fund | | | 53 | | | | 434 | | | | 24 | | | | 256 | | | | 34 | | �� | | 207 | | |
| Dividends from unaffiliated securities | | | 539 | | | | 12,714 | | | | 255 | | | | 4,316 | | | | 723 | | | | 21,039 | | |
| Less: Foreign taxes withheld | | | — | | | | (44 | ) | | | — | | | | (12 | ) | | | — | | | | (4 | ) | |
| Securities lending income | | | 17 | | | | 319 | | | | 4 | | | | 61 | | | | 14 | | | | 220 | | |
| Total investment income | | | 609 | | | | 13,423 | | | | 283 | | | | 4,624 | | | | 771 | | | | 21,462 | | |
| EXPENSES (note 3): | |
| Investment advisory fees | | | 534 | | | | 7,471 | | | | 184 | | | | 1,894 | | | | 482 | | | | 6,703 | | |
| Transfer agent fees | | | 127 | | | | 689 | | | | 38 | | | | 185 | | | | 113 | | | | 623 | | |
| Administration fees | | | 105 | | | | 2,376 | | | | 37 | | | | 595 | | | | 95 | | | | 2,130 | | |
| Professional fees | | | 5 | | | | 79 | | | | 2 | | | | 35 | | | | 5 | | | | 73 | | |
| Custodian fees | | | 4 | | | | 103 | | | | 1 | | | | 25 | | | | 4 | | | | 92 | | |
| Postage and printing fees | | | 3 | | | | 60 | | | | — | | | | 16 | | | | 2 | | | | 54 | | |
| Registration fees | | | 3 | | | | 40 | | | | 4 | | | | 40 | | | | 4 | | | | 39 | | |
| Other expenses | | | 3 | | | | 29 | | | | 1 | | | | 10 | | | | 2 | | | | 26 | | |
| Directors' fees | | | 3 | | | | 28 | | | | 1 | | | | 7 | | | | 2 | | | | 25 | | |
| Distribution and shareholder servicing fees – Class A | | | 22 | | | | 276 | | | | 1 | | | | 5 | | | | 25 | | | | 297 | | |
| Distribution and shareholder servicing fees – Class B | | | 17 | | | | 232 | | | | — | | | | 4 | | | | 12 | | | | 182 | | |
| Distribution and shareholder servicing fees – Class C | | | 9 | | | | 122 | | | | — | | | | 1 | | | | 5 | | | | 62 | | |
| Distribution and shareholder servicing fees – Class R (1) | | | — | | | | — | | | | — | | | | — | | | | — | | | | — | | |
| Total expenses | | | 835 | | | | 11,505 | | | | 269 | | | | 2,817 | | | | 751 | | | | 10,306 | | |
| Less: Fee waivers (note 3) | | | — | | | | (370 | ) | | | — | | | | (135 | ) | | | — | | | | (341 | ) | |
| Total net expenses | | | 835 | | | | 11,135 | | | | 269 | | | | 2,682 | | | | 751 | | | | 9,965 | | |
| Investment income (loss) – net | | | (226 | ) | | | 2,288 | | | | 14 | | | | 1,942 | | | | 20 | | | | 11,497 | | |
REALIZED AND UNREALIZED GAINS (LOSSES)
ON INVESTMENTS, IN-KIND DISTRIBUTIONS
AND FUTURES CONTRACTS – NET (note 5): | |
| Net realized gain (loss) on investments | | | (3,309 | ) | | | 54,623 | | | | (731 | ) | | | 16,321 | | | | 4,760 | | | | 84,365 | | |
| Net realized gain on in-kind distribution (note 10) | | | — | | | | 76,740 | | | | — | | | | 24,162 | | | | — | | | | 70,893 | | |
| Net realized loss on futures contracts | | | — | | | | — | | | | — | | | | (201 | ) | | | — | | | | — | | |
Net change in unrealized appreciation or depreciation
of investments | | | (1,715 | ) | | | 8,655 | | | | (2,844 | ) | | | 8,570 | | | | (27,139 | ) | | | 17,537 | | |
Net change in unrealized appreciation or depreciation of
futures contracts | | | — | | | | — | | | | — | | | | 165 | | | | — | | | | — | | |
Net gain (loss) on investments, in-kind distributions
and futures contracts | | | (5,024 | ) | | | 140,018 | | | | (3,575 | ) | | | 49,017 | | | | (22,379 | ) | | | 172,795 | | |
Net increase (decrease) in net assets resulting
from operations | | $ | (5,250 | ) | | $ | 142,306 | | | $ | (3,561 | ) | | $ | 50,959 | | | $ | (22,359 | ) | | $ | 184,292 | | |
(1) Due to the presentation of the financial statements in thousands, the numbers round to zero.
The accompanying notes are an integral part of the financial statements.
FIRST AMERICAN FUNDS Annual Report 2005
86
(This page has been left blank intentionally.)
Statements of Changes in Net Assets in thousands
| | | Large Cap Growth
Opportunities Fund | | Large Cap
Select Fund | |
| OPERATIONS: | |
| Investment income (loss) – net | | $ | (226 | ) | | $ | 2,288 | | | $ | 975 | | | $ | 14 | | | $ | 1,942 | | | $ | 1,294 | | |
| Net realized gain (loss) on investments | | | (3,309 | ) | | | 54,623 | | | | 81,430 | | | | (731 | ) | | | 16,321 | | | | 2,068 | | |
| Net realized gain on in-kind distributions | | | — | | | | 76,740 | | | | — | | | | — | | | | 24,162 | | | | — | | |
| Net realized gain (loss) on futures | | | — | | | | — | | | | — | | | | — | | | | (201 | ) | | | 1,671 | | |
| Net change in unrealized appreciation or depreciation of investments | | | (1,715 | ) | | | 8,655 | | | | 36,383 | | | | (2,844 | ) | | | 8,570 | | | | 9,176 | | |
| Net change in unrealized appreciation or depreciation of futures contracts | | | — | | | | — | | | | — | | | | — | | | | 165 | | | | (50 | ) | |
| Net increase (decrease) in net assets resulting from operations | | | (5,250 | ) | | | 142,306 | | | | 118,788 | | | | (3,561 | ) | | | 50,959 | | | | 14,159 | | |
| DISTRIBUTIONS TO SHAREHOLDERS FROM: | |
| Investment income – net: | |
| Class A | | | — | | | | (169 | ) | | | (50 | ) | | | — | | | | (10 | ) | | | (2 | ) | |
| Class B | | | — | | | | (19 | ) | | | — | | | | — | | | | — | | | | — | | |
| Class C | | | — | | | | (9 | ) | | | — | | | | — | | | | — | | | | — | | |
| Class R | | | — | | | | — | | | | (7 | ) | | | — | | | | — | | | | — | | |
| Class Y | | | — | | | | (2,091 | ) | | | (1,127 | ) | | | — | | | | (1,808 | ) | | | (1,279 | ) | |
| Net realized gain on investments: | |
| Class A | | | — | | | | — | | | | — | | | | — | | | | (17 | ) | | | (3 | ) | |
| Class B | | | — | | | | — | | | | — | | | | — | | | | (4 | ) | | | (1 | ) | |
| Class C | | | — | | | | — | | | | — | | | | — | | | | (1 | ) | | | — | | |
| Class R | | | — | | | | — | | | | — | | | | — | | | | — | | | | — | | |
| Class Y | | | — | | | | — | | | | — | | | | — | | | | (4,604 | ) | | | (1,552 | ) | |
| Return of capital: | |
| Class A | | | — | | | | (56 | ) | | | (11 | ) | | | — | | | | — | | | | — | | |
| Class B | | | — | | | | (6 | ) | | | — | (1) | | | — | | | | — | | | | — | | |
| Class C | | | — | | | | (3 | ) | | | — | (1) | | | — | | | | — | | | | — | | |
| Class R | | | — | | | | — | (1) | | | (1 | ) | | | — | | | | — | | | | — | | |
| Class Y | | | — | | | | (692 | ) | | | (249 | ) | | | — | | | | — | | | | — | | |
| Total distributions | | | — | | | | (3,045 | ) | | | (1,445 | ) | | | — | | | | (6,444 | ) | | | (2,837 | ) | |
| CAPITAL SHARE TRANSACTIONS (note 4): | |
| Class A: | |
| Proceeds from sales | | | 945 | | | | 15,121 | | | | 40,942 | | | | 488 | | | | 4,711 | | | | 973 | | |
| Reinvestment of distributions | | | — | | | | 217 | | | | 59 | | | | — | | | | 18 | | | | 5 | | |
| Payments for redemptions | | | (2,433 | ) | | | (33,271 | ) | | | (30,173 | ) | | | (49 | ) | | | (362 | ) | | | (501 | ) | |
| Increase (decrease) in net assets from Class A transactions | | | (1,488 | ) | | | (17,933 | ) | | | 10,828 | | | | 439 | | | | 4,367 | | | | 477 | | |
| Class B: | |
| Proceeds from sales | | | 48 | | | | 1,151 | | | | 2,182 | | | | 16 | | | | 341 | | | | 204 | | |
| Reinvestment of distributions | | | — | | | | 25 | | | | — | | | | — | | | | 5 | | | | 1 | | |
| Payments for redemptions | | | (557 | ) | | | (9,138 | ) | | | (18,001 | ) | | | (3 | ) | | | (98 | ) | | | (57 | ) | |
| Increase (decrease) in net assets from Class B transactions | | | (509 | ) | | | (7,962 | ) | | | (15,819 | ) | | | 13 | | | | 248 | | | | 148 | | |
| Class C: | |
| Proceeds from sales | | | 57 | | | | 1,190 | | | | 1,418 | | | | — | | | | 144 | | | | 49 | | |
| Reinvestment of distributions | | | — | | | | 12 | | | | — | | | | — | | | | 1 | | | | — | | |
| Payments for redemptions | | | (392 | ) | | | (4,197 | ) | | | (5,343 | ) | | | — | | | | (31 | ) | | | (19 | ) | |
| Increase (decrease) in net assets from Class C transactions | | | (335 | ) | | | (2,995 | ) | | | (3,925 | ) | | | — | | | | 114 | | | | 30 | | |
| Class R: | |
| Proceeds from sales | | | 2 | | | | 286 | | | | 1,810 | | | | — | | | | — | | | | 1 | | |
| Reinvestment of distributions | | | — | | | | — | | | | 7 | | | | — | | | | — | | | | — | | |
| Payments for redemptions | | | — | | | | — | | | | (19,633 | ) | | | — | | | | — | | | | (1 | ) | |
| Increase (decrease) in net assets from Class R transactions | | | 2 | | | | 286 | | | | (17,816 | ) | | | — | | | | — | | | | — | | |
| Class Y: | |
| Proceeds from sales | | | 14,066 | | | | 165,303 | | | | 312,207 | | | | 17,143 | | | | 229,583 | | | | 169,597 | | |
| Reinvestment of distributions | | | — | | | | 1,595 | | | | 725 | | | | — | | | | 4,810 | | | | 2,310 | | |
| Payments for redemptions | | | (9,839 | ) | | | (628,503 | ) | | | (299,071 | ) | | | (2,242 | ) | | | (240,782 | ) | | | (17,779 | ) | |
| Increase (decrease) in net assets from Class Y transactions | | | 4,227 | | | | (461,605 | ) | | | 13,861 | | | | 14,901 | | | | (6,389 | ) | | | 154,128 | | |
| Increase (decrease) in net assets from capital share transactions | | | 1,897 | | | | (490,209 | ) | | | (12,871 | ) | | | 15,353 | | | | (1,660 | ) | | | 154,783 | | |
| Total increase (decrease) in net assets | | | (3,353 | ) | | | (350,948 | ) | | | 104,472 | | | | 11,792 | | | | 42,855 | | | | 166,105 | | |
| Net assets at beginning of period | | | 988,137 | | | | 1,339,085 | | | | 1,234,613 | | | | 335,706 | | | | 292,851 | | | | 126,746 | | |
| Net assets at end of period | | $ | 984,784 | | | $ | 988,137 | | | $ | 1,339,085 | | | $ | 347,498 | | | $ | 335,706 | | | $ | 292,851 | | |
| Undistributed (distributions in excess of) net investment income at end of period | | $ | (1 | ) | | $ | (1 | ) | | $ | (2 | ) | | $ | 156 | | | $ | 142 | | | $ | 18 | | |
(1) Due to the presentation of the financial statements in thousands, the numbers round to zero.
The accompanying notes are an integral part of the financial statements.
FIRST AMERICAN FUNDS Annual Report 2005
88
| | | Large Cap
Value Fund | |
| OPERATIONS: | |
| Investment income (loss) – net | | $ | 20 | | | $ | 11,497 | | | $ | 12,916 | | |
| Net realized gain (loss) on investments | | | 4,760 | | | | 84,365 | | | | 109,490 | | |
| Net realized gain on in-kind distributions | | | — | | | | 70,893 | | | | — | | |
| Net realized gain (loss) on futures | | | — | | | | — | | | | — | | |
| Net change in unrealized appreciation or depreciation of investments | | | (27,139 | ) | | | 17,537 | | | | 44,184 | | |
| Net change in unrealized appreciation or depreciation of futures contracts | | | — | | | | — | | | | — | | |
| Net increase (decrease) in net assets resulting from operations | | | (22,359 | ) | | | 184,292 | | | | 166,590 | | |
| DISTRIBUTIONS TO SHAREHOLDERS FROM: | |
| Investment income – net: | |
| Class A | | | (13 | ) | | | (1,072 | ) | | | (930 | ) | |
| Class B | | | — | | | | (62 | ) | | | (107 | ) | |
| Class C | | | — | | | | (21 | ) | | | (25 | ) | |
| Class R | | | — | | | | — | | | | (126 | ) | |
| Class Y | | | (148 | ) | | | (10,036 | ) | | | (11,517 | ) | |
| Net realized gain on investments: | |
| Class A | | | — | | | | — | | | | — | | |
| Class B | | | — | | | | — | | | | — | | |
| Class C | | | — | | | | — | | | | — | | |
| Class R | | | — | | | | — | | | | — | | |
| Class Y | | | — | | | | — | | | | — | | |
| Return of capital: | |
| Class A | | | — | | | | — | | | | — | | |
| Class B | | | — | | | | — | | | | — | | |
| Class C | | | — | | | | — | | | | — | | |
| Class R | | | — | | | | — | | | | — | | |
| Class Y | | | — | | | | — | | | | — | | |
| Total distributions | | | (161 | ) | | | (11,191 | ) | | | (12,705 | ) | |
| CAPITAL SHARE TRANSACTIONS (note 4): | |
| Class A: | |
| Proceeds from sales | | | 1,048 | | | | 17,717 | | | | 38,252 | | |
| Reinvestment of distributions | | | 12 | | | | 1,012 | | | | 878 | | |
| Payments for redemptions | | | (1,369 | ) | | | (28,635 | ) | | | (26,540 | ) | |
| Increase (decrease) in net assets from Class A transactions | | | (309 | ) | | | (9,906 | ) | | | 12,590 | | |
| Class B: | |
| Proceeds from sales | | | 20 | | | | 698 | | | | 909 | | |
| Reinvestment of distributions | | | — | | | | 61 | | | | 106 | | |
| Payments for redemptions | | | (705 | ) | | | (10,604 | ) | | | (14,541 | ) | |
| Increase (decrease) in net assets from Class B transactions | | | (685 | ) | | | (9,845 | ) | | | (13,526 | ) | |
| Class C: | |
| Proceeds from sales | | | 60 | | | | 666 | | | | 808 | | |
| Reinvestment of distributions | | | — | | | | 20 | | | | 25 | | |
| Payments for redemptions | | | (226 | ) | | | (2,263 | ) | | | (2,322 | ) | |
| Increase (decrease) in net assets from Class C transactions | | | (166 | ) | | | (1,577 | ) | | | (1,489 | ) | |
| Class R: | |
| Proceeds from sales | | | — | | | | 5 | | | | 2,695 | | |
| Reinvestment of distributions | | | — | | | | — | | | | 125 | | |
| Payments for redemptions | | | — | | | | — | | | | (29,940 | ) | |
| Increase (decrease) in net assets from Class R transactions | | | — | | | | 5 | | | | (27,120 | ) | |
| Class Y: | |
| Proceeds from sales | | | 4,449 | | | | 88,145 | | | | 216,890 | | |
| Reinvestment of distributions | | | 85 | | | | 6,324 | | | | 7,917 | | |
| Payments for redemptions | | | (9,749 | ) | | | (502,220 | ) | | | (210,060 | ) | |
| Increase (decrease) in net assets from Class Y transactions | | | (5,215 | ) | | | (407,751 | ) | | | 14,747 | | |
| Increase (decrease) in net assets from capital share transactions | | | (6,375 | ) | | | (429,074 | ) | | | (14,798 | ) | |
| Total increase (decrease) in net assets | | | (28,895 | ) | | | (255,973 | ) | | | 139,087 | | |
| Net assets at beginning of period | | | 907,081 | | | | 1,163,054 | | | | 1,023,967 | | |
| Net assets at end of period | | $ | 878,186 | | | $ | 907,081 | | | $ | 1,163,054 | | |
| Undistributed (distributions in excess of) net investment income at end of period | | $ | — | | | $ | 137 | | | $ | 119 | | |
FIRST AMERICAN FUNDS Annual Report 2005
89
Financial Highlights For a share outstanding throughout the indicated periods.
| | | Net Asset
Value
Beginning
of Period | | Net
Investment
Income (Loss) | | Realized and
Unrealized
Gains
(Losses) on
Investments | | Distributions
from Net
Investment
Income | | Distributions
from Net
Realized Gains | | Distributions
from Return
of Capital | | Net Asset
Value
End of
Period | |
| Large Cap Growth Opportunities (1) (2) | | | |
| Class A | |
| | 2005 | (3) | | $ | 28.02 | | | $ | (0.01 | ) | | $ | (0.15 | ) | | $ | — | | | $ | — | | | $ | — | | | $ | 27.86 | | |
| | 2005 | (4) | | | 25.00 | | | | (0.01 | ) | | | 3.08 | | | | (0.04 | ) | | | — | | | | (0.01 | ) | | | 28.02 | | |
| | 2004 | (4) | | | 22.84 | | | | (0.03 | ) | | | 2.20 | | | | (0.01 | ) | | | — | | | | — | (10) | | | 25.00 | | |
| | 2003 | (4) | | | 19.16 | | | | — | | | | 3.73 | | | | (0.05 | ) | | | — | | | | — | | | | 22.84 | | |
| | 2002 | (4) | | | 24.44 | | | | — | | | | (5.23 | ) | | | (0.05 | ) | | | — | | | | — | | | | 19.16 | | |
| | 2001 | (5) | | | 43.33 | | | | (0.01 | ) | | | (14.00 | ) | | | — | | | | (4.88 | ) | | | — | | | | 24.44 | | |
| Class B | |
| | 2005 | (3) | | $ | 26.75 | | | $ | (0.03 | ) | | $ | (0.14 | ) | | $ | — | | | $ | — | | | $ | — | | | $ | 26.58 | | |
| | 2005 | (4) | | | 24.02 | | | | (0.20 | ) | | | 2.96 | | | | (0.02 | ) | | | — | | | | (0.01 | ) | | | 26.75 | | |
| | 2004 | (4) | | | 22.10 | | | | (0.21 | ) | | | 2.13 | | | | — | | | | — | | | | — | (10) | | | 24.02 | | |
| | 2003 | (4) | | | 18.64 | | | | (0.18 | ) | | | 3.64 | | | | — | | | | — | | | | — | | | | 22.10 | | |
| | 2002 | (4) | | | 23.94 | | | | (0.18 | ) | | | (5.09 | ) | | | (0.03 | ) | | | — | | | | — | | | | 18.64 | | |
| | 2001 | (5) | | | 42.80 | | | | (0.22 | ) | | | (13.76 | ) | | | — | | | | (4.88 | ) | | | — | | | | 23.94 | | |
| Class C | |
| | 2005 | (3) | | $ | 27.29 | | | $ | (0.03 | ) | | $ | (0.14 | ) | | $ | — | | | $ | — | | | $ | — | | | $ | 27.12 | | |
| | 2005 | (4) | | | 24.51 | | | | (0.20 | ) | | | 3.00 | | | | (0.01 | ) | | | — | | | | (0.01 | ) | | | 27.29 | | |
| | 2004 | (4) | | | 22.55 | | | | (0.21 | ) | | | 2.17 | | | | — | | | | — | | | | — | (10) | | | 24.51 | | |
| | 2003 | (4) | | | 19.03 | | | | (0.18 | ) | | | 3.72 | | | | (0.02 | ) | | | — | | | | — | | | | 22.55 | | |
| | 2002 | (4) | | | 24.44 | | | | (0.18 | ) | | | (5.19 | ) | | | (0.04 | ) | | | — | | | | — | | | | 19.03 | | |
| | 2001 | (6) | | | 23.75 | | | | — | | | | 0.69 | | | | — | | | | — | | | | — | | | | 24.44 | | |
| Class R (7) | |
| | 2005 | (3) | | $ | 27.94 | | | $ | (0.02 | ) | | $ | (0.14 | ) | | $ | — | | | $ | — | | | $ | — | | | $ | 27.78 | | |
| | 2005 | (4) | | | 24.98 | | | | (0.16 | ) | | | 3.17 | | | | (0.05 | ) | | | — | | | | — | (10) | | | 27.94 | | |
| | 2004 | (4) | | | 22.85 | | | | (0.02 | ) | | | 2.16 | | | | (0.01 | ) | | | — | | | | — | (10) | | | 24.98 | | |
| | 2003 | (4) | | | 19.17 | | | | — | | | | 3.73 | | | | (0.05 | ) | | | — | | | | — | | | | 22.85 | | |
| | 2002 | (4) | | | 24.45 | | | | — | | | | (5.23 | ) | | | (0.05 | ) | | | — | | | | — | | | | 19.17 | | |
| | 2001 | (8) | | | 35.53 | | | | (0.01 | ) | | | (11.07 | ) | | | — | | | | — | | | | — | | | | 24.45 | | |
| Class Y | |
| | 2005 | (3) | | $ | 28.79 | | | $ | (0.01 | ) | | $ | (0.14 | ) | | $ | — | | | $ | — | | | $ | — | | | $ | 28.64 | | |
| | 2005 | (4) | | | 25.63 | | | | 0.07 | | | | 3.15 | | | | (0.04 | ) | | | — | | | | (0.02 | ) | | | 28.79 | | |
| | 2004 | (4) | | | 23.38 | | | | 0.03 | | | | 2.25 | | | | (0.02 | ) | | | — | | | | (0.01 | ) | | | 25.63 | | |
| | 2003 | (4) | | | 19.59 | | | | 0.07 | | | | 3.80 | | | | (0.08 | ) | | | — | | | | — | | | | 23.38 | | |
| | 2002 | (4) | | | 24.93 | | | | 0.06 | | | | (5.33 | ) | | | (0.07 | ) | | | — | | | | — | | | | 19.59 | | |
| | 2001 | (5) | | | 44.00 | | | | 0.06 | | | | (14.25 | ) | | | — | | | | (4.88 | ) | | | — | | | | 24.93 | | |
| Large Cap Select (2) | | | |
| Class A | |
| | 2005 | (3) | | $ | 14.47 | | | $ | — | | | $ | (0.17 | ) | | $ | — | | | $ | — | | | $ | — | | | $ | 14.30 | | |
| | 2005 | (4) | | | 12.52 | | | | 0.06 | | | | 2.15 | | | | (0.06 | ) | | | (0.20 | ) | | | — | | | | 14.47 | | |
| | 2004 | (4) | | | 11.45 | | | | 0.04 | | | | 1.19 | | | | (0.05 | ) | | | (0.11 | ) | | | — | | | | 12.52 | | |
| | 2003 | (9) | | | 10.00 | | | | 0.03 | | | | 1.46 | | | | (0.04 | ) | | | — | | | | — | | | | 11.45 | | |
| Class B | |
| | 2005 | (3) | | $ | 14.30 | | | $ | (0.01 | ) | | $ | (0.17 | ) | | $ | — | | | $ | — | | | $ | — | | | $ | 14.12 | | |
| | 2005 | (4) | | | 12.41 | | | | (0.05 | ) | | | 2.15 | | | | (0.01 | ) | | | (0.20 | ) | | | — | | | | 14.30 | | |
| | 2004 | (4) | | | 11.41 | | | | (0.06 | ) | | | 1.18 | | | | (0.01 | ) | | | (0.11 | ) | | | — | | | | 12.41 | | |
| | 2003 | (9) | | | 10.00 | | | | (0.03 | ) | | | 1.45 | | | | (0.01 | ) | | | — | | | | — | | | | 11.41 | | |
| Class C | |
| | 2005 | (3) | | $ | 14.31 | | | $ | (0.01 | ) | | $ | (0.17 | ) | | $ | — | | | $ | — | | | $ | — | | | $ | 14.13 | | |
| | 2005 | (4) | | | 12.43 | | | | (0.05 | ) | | | 2.14 | | | | (0.01 | ) | | | (0.20 | ) | | | — | | | | 14.31 | | |
| | 2004 | (4) | | | 11.42 | | | | (0.06 | ) | | | 1.19 | | | | (0.01 | ) | | | (0.11 | ) | | | — | | | | 12.43 | | |
| | 2003 | (9) | | | 10.00 | | | | (0.02 | ) | | | 1.45 | | | | (0.01 | ) | | | — | | | | — | | | | 11.42 | | |
| Class R (7) | |
| | 2005 | (3) | | $ | 14.43 | | | $ | (0.01 | ) | | $ | (0.16 | ) | | $ | — | | | $ | — | | | $ | — | | | $ | 14.26 | | |
| | 2005 | (4) | | | 12.49 | | | | 0.02 | | | | 2.15 | | | | (0.03 | ) | | | (0.20 | ) | | | — | | | | 14.43 | | |
| | 2004 | (4) | | | 11.44 | | | | 0.02 | | | | 1.18 | | | | (0.04 | ) | | | (0.11 | ) | | | — | | | | 12.49 | | |
| | 2003 | (9) | | | 10.00 | | | | 0.03 | | | | 1.44 | | | | (0.03 | ) | | | — | | | | — | | | | 11.44 | | |
| Class Y | |
| | 2005 | (3) | | $ | 14.49 | | | $ | — | | | $ | (0.16 | ) | | $ | — | | | $ | — | | | $ | — | | | $ | 14.33 | | |
| | 2005 | (4) | | | 12.53 | | | | 0.09 | | | | 2.16 | | | | (0.09 | ) | | | (0.20 | ) | | | — | | | | 14.49 | | |
| | 2004 | (4) | | | 11.45 | | | | 0.07 | | | | 1.19 | | | | (0.07 | ) | | | (0.11 | ) | | | — | | | | 12.53 | | |
| | 2003 | (9) | | | 10.00 | | | | 0.05 | | | | 1.45 | | | | (0.05 | ) | | | — | | | | — | | | | 11.45 | | |
(1) The financial highlights for the Large Cap Growth Opportunities Fund as set forth herein include the historical financial highlights of the Firstar Large Cap Core Equity Fund.
The assets of the Firstar Fund were acquired by the First American Large Cap Growth Opportunities Fund on September 24, 2001. In connection with such acquisition,
(i) Class A shares of the Firstar Large Cap Core Fund were exchanged for Class A shares of the First American Large Cap Growth Opportunities Fund, (ii) Firstar Class B
shares were exchanged for Class B shares of the First American Fund, (iii) Firstar Class Y shares were exchanged for Class S shares of the First American Fund, and
(iv) Firstar Class Institutional shares were exchanged for Class Y shares of the First American Fund.
(2) Per share data calculated using average shares outstanding method.
(3) For the period October 1, 2005 to October 31, 2005. Effective in 2005, the fund's fiscal year-end was changed from September 30 to October 31. All ratios for the period
have been annualized, except total return and portfolio turnover.
(4) For the period October 1 to September 30 in the year indicated.
The accompanying notes are an integral part of the financial statements.
FIRST AMERICAN FUNDS Annual Report 2005
90
| | | Total
Return (11) | | Net Assets
End of
Period (000) | | Ratio of
Expenses to
Average
Net Assets | | Ratio of Net
Investment
Income (Loss)
to Average
Net Assets | | Ratio of
Expenses to
Average
Net Assets
(Excluding
Waivers) | | Ratio of Net
Investment
Income (Loss)
to Average Net
Assets (Excluding
Waivers) | | Portfolio
Turnover
Rate | |
| Large Cap Growth Opportunities (1) (2) | |
| Class A | |
| | 2005 | (3) | | | (0.57 | )% | | $ | 104,960 | | | | 1.21 | % | | | (0.47 | )% | | | 1.21 | % | | | (0.47 | )% | | | 6 | % | |
| | 2005 | (4) | | | 12.30 | | | | 107,079 | | | | 1.17 | | | | (0.03 | ) | | | 1.20 | | | | (0.06 | ) | | | 103 | | |
| | 2004 | (4) | | | 9.52 | | | | 112,379 | | | | 1.15 | | | | (0.13 | ) | | | 1.19 | | | | (0.17 | ) | | | 113 | | |
| | 2003 | (4) | | | 19.50 | | | | 93,331 | | | | 1.15 | | | | (0.02 | ) | | | 1.19 | | | | (0.06 | ) | | | 83 | | |
| | 2002 | (4) | | | (21.46 | ) | | | 24,647 | | | | 1.15 | | | | (0.02 | ) | | | 1.22 | | | | (0.09 | ) | | | 43 | | |
| | 2001 | (5) | | | (35.83 | ) | | | 34,330 | | | | 1.20 | | | | (0.04 | ) | | | 1.24 | | | | (0.08 | ) | | | 40 | | |
| Class B | |
| | 2005 | (3) | | | (0.64 | )% | | $ | 19,601 | | | | 1.96 | % | | | (1.22 | )% | | | 1.96 | % | | | (1.22 | )% | | | 6 | % | |
| | 2005 | (4) | | | 11.47 | | | | 20,239 | | | | 1.92 | | | | (0.77 | ) | | | 1.95 | | | | (0.80 | ) | | | 103 | | |
| | 2004 | (4) | | | 8.69 | | | | 25,633 | | | | 1.90 | | | | (0.87 | ) | | | 1.94 | | | | (0.91 | ) | | | 113 | | |
| | 2003 | (4) | | | 18.58 | | | | 37,853 | | | | 1.90 | | | | (0.84 | ) | | | 1.94 | | | | (0.88 | ) | | | 83 | | |
| | 2002 | (4) | | | (22.06 | ) | | | 2,928 | | | | 1.90 | | | | (0.75 | ) | | | 1.97 | | | | (0.82 | ) | | | 43 | | |
| | 2001 | (5) | | | (36.28 | ) | | | 2,954 | | | | 1.93 | | | | (0.79 | ) | | | 1.97 | | | | (0.83 | ) | | | 40 | | |
| Class C | |
| | 2005 | (3) | | | (0.62 | )% | | $ | 10,739 | | | | 1.96 | % | | | (1.22 | )% | | | 1.96 | % | | | (1.22 | )% | | | 6 | % | |
| | 2005 | (4) | | | 11.44 | | | | 11,147 | | | | 1.92 | | | | (0.78 | ) | | | 1.95 | | | | (0.81 | ) | | | 103 | | |
| | 2004 | (4) | | | 8.69 | | | | 12,811 | | | | 1.90 | | | | (0.87 | ) | | | 1.94 | | | | (0.91 | ) | | | 113 | | |
| | 2003 | (4) | | | 18.60 | | | | 15,365 | | | | 1.90 | | | | (0.81 | ) | | | 1.94 | | | | (0.85 | ) | | | 83 | | |
| | 2002 | (4) | | | (22.03 | ) | | | 476 | | | | 1.90 | | | | (0.73 | ) | | | 1.97 | | | | (0.80 | ) | | | 43 | | |
| | 2001 | (6) | | | 2.95 | | | | — | | | | — | | | | — | | | | — | | | | — | | | | 40 | | |
| Class R (7) | |
| | 2005 | (3) | | | (0.57 | )% | | $ | 290 | | | | 1.46 | % | | | (0.72 | )% | | | 1.61 | % | | | (0.87 | )% | | | 6 | % | |
| | 2005 | (4) | | | 12.04 | | | | 290 | | | | 1.42 | | | | (0.57 | ) | | | 1.60 | | | | (0.75 | ) | | | 103 | | |
| | 2004 | (4) | | | 9.38 | | | | 1 | | | | 1.15 | | | | (0.08 | ) | | | 1.19 | | | | (0.12 | ) | | | 113 | | |
| | 2003 | (4) | | | 19.51 | | | | 15,890 | | | | 1.15 | | | | (0.01 | ) | | | 1.19 | | | | (0.05 | ) | | | 83 | | |
| | 2002 | (4) | | | (21.45 | ) | | | 2,376 | | | | 1.15 | | | | — | | | | 1.22 | | | | (0.07 | ) | | | 43 | | |
| | 2001 | (8) | | | (31.16 | ) | | | 2,802 | | | | 1.18 | | | | (0.03 | ) | | | 1.22 | | | | (0.07 | ) | | | 40 | | |
| Class Y | |
| | 2005 | (3) | | | (0.52 | )% | | $ | 849,194 | | | | 0.96 | % | | | (0.22 | )% | | | 0.96 | % | | | (0.22 | )% | | | 6 | % | |
| | 2005 | (4) | | | 12.58 | | | | 849,382 | | | | 0.92 | | | | 0.26 | | | | 0.95 | | | | 0.23 | | | | 103 | | |
| | 2004 | (4) | | | 9.76 | | | | 1,188,261 | | | | 0.90 | | | | 0.13 | | | | 0.94 | | | | 0.09 | | | | 113 | | |
| | 2003 | (4) | | | 19.78 | | | | 1,072,174 | | | | 0.90 | | | | 0.31 | | | | 0.94 | | | | 0.27 | | | | 83 | | |
| | 2002 | (4) | | | (21.23 | ) | | | 255,311 | | | | 0.90 | | | | 0.24 | | | | 0.97 | | | | 0.17 | | | | 43 | | |
| | 2001 | (5) | | | (35.70 | ) | | | 316,213 | | | | 0.94 | | | | 0.20 | | | | 0.98 | | | | 0.16 | | | | 40 | | |
| Large Cap Select (2) | |
| Class A | |
| | 2005 | (3) | | | (1.17 | )% | | $ | 5,682 | | | | 1.19 | % | | | (0.20 | )% | | | 1.19 | % | | | (0.20 | )% | | | 8 | % | |
| | 2005 | (4) | | | 17.83 | | | | 5,299 | | | | 1.17 | | | | 0.41 | | | | 1.22 | | | | 0.36 | | | | 176 | | |
| | 2004 | (4) | | | 10.82 | | | | 714 | | | | 1.15 | | | | 0.30 | | | | 1.21 | | | | 0.24 | | | | 67 | | |
| | 2003 | (9) | | | 14.91 | | | | 215 | | | | 1.15 | | | | 0.42 | | | | 1.24 | | | | 0.33 | | | | 65 | | |
| Class B | |
| | 2005 | (3) | | | (1.26 | )% | | $ | 573 | | | | 1.94 | % | | | (0.95 | )% | | | 1.94 | % | | | (0.95 | )% | | | 8 | % | |
| | 2005 | (4) | | | 17.02 | | | | 567 | | | | 1.92 | | | | (0.36 | ) | | | 1.97 | | | | (0.41 | ) | | | 176 | | |
| | 2004 | (4) | | | 9.89 | | | | 270 | | | | 1.90 | | | | (0.44 | ) | | | 1.96 | | | | (0.50 | ) | | | 67 | | |
| | 2003 | (9) | | | 14.18 | | | | 113 | | | | 1.90 | | | | (0.35 | ) | | | 1.99 | | | | (0.44 | ) | | | 65 | | |
| Class C | |
| | 2005 | (3) | | | (1.26 | )% | | $ | 180 | | | | 1.94 | % | | | (0.95 | )% | | | 1.94 | % | | | (0.95 | )% | | | 8 | % | |
| | 2005 | (4) | | | 16.91 | | | | 182 | | | | 1.92 | | | | (0.35 | ) | | | 1.97 | | | | (0.40 | ) | | | 176 | | |
| | 2004 | (4) | | | 9.98 | | | | 59 | | | | 1.90 | | | | (0.45 | ) | | | 1.96 | | | | (0.51 | ) | | | 67 | | |
| | 2003 | (9) | | | 14.27 | | | | 26 | | | | 1.90 | | | | (0.32 | ) | | | 1.99 | | | | (0.41 | ) | | | 65 | | |
| Class R (7) | |
| | 2005 | (3) | | | (1.18 | )% | | $ | 2 | | | | 1.44 | % | | | (0.45 | )% | | | 1.59 | % | | | (0.60 | )% | | | 8 | % | |
| | 2005 | (4) | | | 17.54 | | | | 2 | | | | 1.42 | | | | 0.14 | | | | 1.62 | | | | (0.06 | ) | | | 176 | | |
| | 2004 | (4) | | | 10.60 | | | | 1 | | | | 1.32 | | | | 0.18 | | | | 1.38 | | | | 0.12 | | | | 67 | | |
| | 2003 | (9) | | | 14.76 | | | | 1 | | | | 1.15 | | | | 0.39 | | | | 1.24 | | | | 0.30 | | | | 65 | | |
| Class Y | |
| | 2005 | (3) | | | (1.10 | )% | | $ | 341,061 | | | | 0.94 | % | | | 0.05 | % | | | 0.94 | % | | | 0.05 | % | | | 8 | % | |
| | 2005 | (4) | | | 18.14 | | | | 329,656 | | | | 0.92 | | | | 0.67 | | | | 0.97 | | | | 0.62 | | | | 176 | | |
| | 2004 | (4) | | | 11.10 | | | | 291,807 | | | | 0.90 | | | | 0.57 | | | | 0.96 | | | | 0.51 | | | | 67 | | |
| | 2003 | (9) | | | 15.02 | | | | 126,391 | | | | 0.90 | | | | 0.71 | | | | 0.99 | | | | 0.62 | | | | 65 | | |
(5) For the period November 1, 2000 to September 30, 2001. Effective in 2001, the fund's fiscal year-end was changed from October 31 to September 30. All ratios
for the period have been annualized, except total return and portfolio turnover.
(6) For the period from September 24, 2001, when the class of shares was first offered, to September 30, 2001. All ratios for the period have been annualized,
except total return and portfolio turnover.
(7) Prior to July 1, 2004, Class R shares were named Class S shares, which had lower fees and expenses.
(8) For the period from November 27, 2000, when the class of shares was first offered, to September 30, 2001. All ratios for the period have been annualized,
except total return and portfolio turnover.
(9) Commenced operations on January 31, 2003. All ratios for the period have been annualized, except total return and portfolio turnover.
(10) Includes a tax return of capital of less than $0.01.
(11) Total return does not reflect sales charges. Total return would have been lower had certain expenses not been waived.
FIRST AMERICAN FUNDS Annual Report 2005
91
Financial Highlights For a share outstanding throughout the indicated periods.
| | | Net Asset
Value
Beginning
of Period | | Net
Investment
Income (Loss) | | Realized and
Unrealized
Gains
(Losses) on
Investments | | Distributions
from Net
Investment
Income | | Distributions
from Net
Realized Gains | | Net Asset
Value
End of
Period | | Total
Return (6) | |
| Large Cap Value Fund (1) | | | |
| Class A | |
| | 2005 | (2) | | $ | 20.06 | | | $ | — | | | $ | (0.50 | ) | | $ | — | | | $ | — | | | $ | 19.56 | | | | (2.48 | )% | |
| | 2005 | (3) | | | 17.21 | | | | 0.17 | | | | 2.85 | | | | (0.17 | ) | | | — | | | | 20.06 | | | | 17.62 | | |
| | 2004 | (3) | | | 14.97 | | | | 0.15 | | | | 2.24 | | | | (0.15 | ) | | | — | | | | 17.21 | | | | 16.01 | | |
| | 2003 | (3) | | | 12.77 | | | | 0.18 | | | | 2.20 | | | | (0.18 | ) | | | — | | | | 14.97 | | | | 18.71 | | |
| | 2002 | (3) | | | 15.98 | | | | 0.14 | | | | (3.21 | ) | | | (0.14 | ) | | | — | | | | 12.77 | | | | (19.37 | ) | |
| | 2001 | (3) | | | 20.59 | | | | 0.16 | | | | (2.67 | ) | | | (0.16 | ) | | | (1.94 | ) | | | 15.98 | | | | (13.72 | ) | |
| Class B | |
| | 2005 | (2) | | $ | 19.62 | | | $ | (0.01 | ) | | $ | (0.49 | ) | | $ | — | | | $ | — | | | $ | 19.12 | | | | (2.55 | )% | |
| | 2005 | (3) | | | 16.87 | | | | 0.03 | | | | 2.78 | | | | (0.06 | ) | | | — | | | | 19.62 | | | | 16.70 | | |
| | 2004 | (3) | | | 14.70 | | | | 0.03 | | | | 2.20 | | | | (0.06 | ) | | | — | | | | 16.87 | | | | 15.19 | | |
| | 2003 | (3) | | | 12.55 | | | | 0.08 | | | | 2.15 | | | | (0.08 | ) | | | — | | | | 14.70 | | | | 17.83 | | |
| | 2002 | (3) | | | 15.71 | | | | 0.02 | | | | (3.15 | ) | | | (0.03 | ) | | | — | | | | 12.55 | | | | (19.96 | ) | |
| | 2001 | (3) | | | 20.30 | | | | 0.02 | | | | (2.63 | ) | | | (0.04 | ) | | | (1.94 | ) | | | 15.71 | | | | (14.42 | ) | |
| Class C | |
| | 2005 | (2) | | $ | 19.85 | | | $ | (0.01 | ) | | $ | (0.49 | ) | | $ | — | | | $ | — | | | $ | 19.35 | | | | (2.52 | )% | |
| | 2005 | (3) | | | 17.07 | | | | 0.03 | | | | 2.81 | | | | (0.06 | ) | | | — | | | | 19.85 | | | | 16.75 | | |
| | 2004 | (3) | | | 14.87 | | | | 0.03 | | | | 2.23 | | | | (0.06 | ) | | | — | | | | 17.07 | | | | 15.21 | | |
| | 2003 | (3) | | | 12.70 | | | | 0.08 | | | | 2.17 | | | | (0.08 | ) | | | — | | | | 14.87 | | | | 17.76 | | |
| | 2002 | (3) | | | 15.90 | | | | 0.02 | | | | (3.19 | ) | | | (0.03 | ) | | | — | | | | 12.70 | | | | (19.97 | ) | |
| | 2001 | (3) | | | 20.51 | | | | 0.02 | | | | (2.65 | ) | | | (0.04 | ) | | | (1.94 | ) | | | 15.90 | | | | (14.36 | ) | |
| Class R (4) | |
| | 2005 | (2) | | $ | 20.06 | | | $ | (0.01 | ) | | $ | (0.50 | ) | | $ | — | | | $ | — | | | $ | 19.55 | | | | (2.54 | )% | |
| | 2005 | (3) | | | 17.22 | | | | 0.12 | | | | 2.85 | | | | (0.13 | ) | | | — | | | | 20.06 | | | | 17.34 | | |
| | 2004 | (3) | | | 14.96 | | | | 0.17 | | | | 2.23 | | | | (0.14 | ) | | | — | | | | 17.22 | | | | 16.05 | | |
| | 2003 | (3) | | | 12.77 | | | | 0.18 | | | | 2.19 | | | | (0.18 | ) | | | — | | | | 14.96 | | | | 18.63 | | |
| | 2002 | (3) | | | 15.97 | | | | 0.13 | | | | (3.18 | ) | | | (0.15 | ) | | | — | | | | 12.77 | | | | (19.36 | ) | |
| | 2001 | (5) | | | 15.32 | | | | — | | | | 0.65 | | | | — | | | | — | | | | 15.97 | | | | 4.24 | | |
| Class Y | |
| | 2005 | (2) | | $ | 20.12 | | | $ | — | | | $ | (0.50 | ) | | $ | — | | | $ | — | | | $ | 19.62 | | | | (2.47 | )% | |
| | 2005 | (3) | | | 17.26 | | | | 0.22 | | | | 2.86 | | | | (0.22 | ) | | | — | | | | 20.12 | | | | 17.92 | | |
| | 2004 | (3) | | | 15.01 | | | | 0.20 | | | | 2.24 | | | | (0.19 | ) | | | — | | | | 17.26 | | | | 16.31 | | |
| | 2003 | (3) | | | 12.80 | | | | 0.22 | | | | 2.20 | | | | (0.21 | ) | | | — | | | | 15.01 | | | | 19.04 | | |
| | 2002 | (3) | | | 16.02 | | | | 0.18 | | | | (3.22 | ) | | | (0.18 | ) | | | — | | | | 12.80 | | | | (19.22 | ) | |
| | 2001 | (3) | | | 20.64 | | | | 0.21 | | | | (2.68 | ) | | | (0.21 | ) | | | (1.94 | ) | | | 16.02 | | | | (13.53 | ) | |
(1) Per share data calculated using average shares outstanding method.
(2) For the period October 1, 2005 to October 31, 2005. Effective in 2005, the fund's fiscal year end was changed from September 30 to October 31. All ratios for the period
have been annualized, except total return and portfolio turnover.
(3) For the period October 1 to September 30 in the year indicated.
(4) Prior to July 1, 2004, Class R shares were named Class S shares, which had lower fees and expenses.
(5) For the period from September 24, 2001, when the class of shares was first offered, to September 30, 2001. All ratios for the period have been annualized,
except total return and portfolio turnover.
(6) Total return does not reflect sales charges. Total return would have been lower had certain expenses not been waived.
The accompanying notes are an integral part of the financial statements.
FIRST AMERICAN FUNDS Annual Report 2005
92
| | | Net Assets
End of
Period (000) | | Ratio of
Expenses to
Average
Net Assets | | Ratio of Net
Investment
Income (Loss)
to Average
Net Assets | | Ratio of
Expenses to
Average
Net Assets
(Excluding
Waivers) | | Ratio of Net
Investment
Income (Loss)
to Average Net
Assets (Excluding
Waivers) | | Portfolio
Turnover
Rate | |
| Large Cap Value Fund (1) | |
| Class A | |
| | 2005 | (2) | | $ | 118,443 | | | | 1.21 | % | | | (0.17 | )% | | | 1.21 | % | | | (0.17 | )% | | | 2 | % | |
| | 2005 | (3) | | | 121,809 | | | | 1.17 | | | | 0.90 | | | | 1.20 | | | | 0.87 | | | | 61 | | |
| | 2004 | (3) | | | 113,683 | | | | 1.15 | | | | 0.91 | | | | 1.19 | | | | 0.87 | | | | 104 | | |
| | 2003 | (3) | | | 88,024 | | | | 1.15 | | | | 1.30 | | | | 1.20 | | | | 1.25 | | | | 94 | | |
| | 2002 | (3) | | | 85,182 | | | | 1.15 | | | | 0.86 | | | | 1.20 | | | | 0.81 | | | | 82 | | |
| | 2001 | (3) | | | 94,064 | | | | 1.05 | | | | 0.88 | | | | 1.15 | | | | 0.78 | | | | 64 | | |
| Class B | |
| | 2005 | (2) | | $ | 13,826 | | | | 1.96 | % | | | (0.92 | )% | | | 1.96 | % | | | (0.92 | )% | | | 2 | % | |
| | 2005 | (3) | | | 14,876 | | | | 1.92 | | | | 0.15 | | | | 1.95 | | | | 0.12 | | | | 61 | | |
| | 2004 | (3) | | | 21,829 | | | | 1.90 | | | | 0.19 | | | | 1.94 | | | | 0.15 | | | | 104 | | |
| | 2003 | (3) | | | 30,987 | | | | 1.90 | | | | 0.56 | | | | 1.95 | | | | 0.51 | | | | 94 | | |
| | 2002 | (3) | | | 33,720 | | | | 1.90 | | | | 0.11 | | | | 1.95 | | | | 0.06 | | | | 82 | | |
| | 2001 | (3) | | | 38,108 | | | | 1.80 | | | | 0.13 | | | | 1.90 | | | | 0.03 | | | | 64 | | |
| Class C | |
| | 2005 | (2) | | $ | 5,399 | | | | 1.96 | % | | | (0.92 | )% | | | 1.96 | % | | | (0.92 | )% | | | 2 | % | |
| | 2005 | (3) | | | 5,710 | | | | 1.92 | | | | 0.15 | | | | 1.95 | | | | 0.12 | | | | 61 | | |
| | 2004 | (3) | | | 6,344 | | | | 1.90 | | | | 0.18 | | | | 1.94 | | | | 0.14 | | | | 104 | | |
| | 2003 | (3) | | | 6,844 | | | | 1.90 | | | | 0.56 | | | | 1.95 | | | | 0.51 | | | | 94 | | |
| | 2002 | (3) | | | 7,524 | | | | 1.90 | | | | 0.11 | | | | 1.95 | | | | 0.06 | | | | 82 | | |
| | 2001 | (3) | | | 10,141 | | | | 1.80 | | | | 0.12 | | | | 1.90 | | | | 0.02 | | | | 64 | | |
| Class R (4) | |
| | 2005 | (2) | | $ | 7 | | | | 1.46 | % | | | (0.42 | )% | | | 1.61 | % | | | (0.57 | )% | | | 2 | % | |
| | 2005 | (3) | | | 7 | | | | 1.42 | | | | 0.61 | | | | 1.60 | | | | 0.43 | | | | 61 | | |
| | 2004 | (3) | | | 1 | | | | 1.15 | | | | 1.00 | | | | 1.19 | | | | 0.96 | | | | 104 | | |
| | 2003 | (3) | | | 23,845 | | | | 1.15 | | | | 1.30 | | | | 1.20 | | | | 1.25 | | | | 94 | | |
| | 2002 | (3) | | | 24,129 | | | | 1.15 | | | | 0.90 | | | | 1.20 | | | | 0.85 | | | | 82 | | |
| | 2001 | (5) | | | — | | | | — | | | | — | | | | — | | | | — | | | | 64 | | |
| Class Y | |
| | 2005 | (2) | | $ | 740,511 | | | | 0.96 | % | | | 0.08 | % | | | 0.96 | % | | | 0.08 | % | | | 2 | % | |
| | 2005 | (3) | | | 764,679 | | | | 0.92 | | | | 1.17 | | | | 0.95 | | | | 1.14 | | | | 61 | | |
| | 2004 | (3) | | | 1,021,197 | | | | 0.90 | | | | 1.17 | | | | 0.94 | | | | 1.13 | | | | 104 | | |
| | 2003 | (3) | | | 874,267 | | | | 0.90 | | | | 1.55 | | | | 0.95 | | | | 1.50 | | | | 94 | | |
| | 2002 | (3) | | | 825,179 | | | | 0.90 | | | | 1.11 | | | | 0.95 | | | | 1.06 | | | | 82 | | |
| | 2001 | (3) | | | 970,190 | | | | 0.80 | | | | 1.13 | | | | 0.90 | | | | 1.03 | | | | 64 | | |
FIRST AMERICAN FUNDS Annual Report 2005
93
Schedule of Investments October 31, 2005
Balanced Fund
| DESCRIPTION | | SHARES | | VALUE (000) | |
| Common Stocks – 61.8% | |
| Consumer Discretionary – 6.8% | |
| Children's Place Retail Stores* | | | 2,300 | | | $ | 99 | | |
| Coach* | | | 73,550 | | | | 2,367 | | |
| Coldwater Creek* (a) | | | 5,370 | | | | 145 | | |
| Harrah's Entertainment | | | 42,820 | | | | 2,590 | | |
| J.C. Penney (a) | | | 73,290 | | | | 3,752 | | |
| Kerzner International* (a) | | | 1,810 | | | | 106 | | |
| La Quinta* (a) | | | 42,490 | | | | 355 | | |
| Marvel Entertainment* (a) | | | 9,635 | | | | 170 | | |
| Men's Wearhouse* (a) | | | 10,305 | | | | 255 | | |
| Nautilus Group (a) | | | 7,510 | | | | 136 | | |
| Omnicom Group (a) | | | 45,740 | | | | 3,795 | | |
| P.F. Chang's China Bistro* (a) | | | 3,580 | | | | 164 | | |
| Pacific Sunwear of California* (a) | | | 3,160 | | | | 79 | | |
| RARE Hospitality International* | | | 6,600 | | | | 202 | | |
| Ruby Tuesday (a) | | | 11,600 | | | | 254 | | |
| Ruth's Chris Steak House* | | | 5,320 | | | | 95 | | |
| Scientific Games, Class A* (a) | | | 11,430 | | | | 342 | | |
| Sherwin Williams (a) | | | 103,754 | | | | 4,415 | | |
| Sports Authority* (a) | | | 8,360 | | | | 233 | | |
| Station Casinos | | | 41,370 | | | | 2,652 | | |
| Thomas Nelson | | | 7,760 | | | | 166 | | |
| Time Warner | | | 211,647 | | | | 3,774 | | |
| Too* | | | 8,730 | | | | 248 | | |
| WCI Communities* (a) | | | 6,430 | | | | 161 | | |
| | | | 26,555 | | |
| Consumer Staples – 4.6% | |
| PepsiCo | | | 75,327 | | | | 4,450 | | |
| Procter & Gamble | | | 105,794 | | | | 5,923 | | |
| Wal-Mart Stores (a) | | | 157,800 | | | | 7,466 | | |
| | | | 17,839 | | |
| Energy – 5.3% | |
| Amerada Hess (a) | | | 19,310 | | | | 2,416 | | |
| Apache | | | 76,728 | | | | 4,898 | | |
| Bill Barrett* (a) | | | 3,630 | | | | 116 | | |
| Cal Dive International* (a) | | | 1,030 | | | | 63 | | |
| Compton Petroleum* | | | 13,790 | | | | 151 | | |
| Comstock Resources* | | | 3,260 | | | | 98 | | |
| ConocoPhillips | | | 74,960 | | | | 4,901 | | |
| ENSCO International (a) | | | 6,480 | | | | 295 | | |
| Exxon Mobil | | | 37,745 | | | | 2,119 | | |
| Halliburton (a) | | | 35,088 | | | | 2,074 | | |
| Hydril* (a) | | | 980 | | | | 65 | | |
| National-Oilwell* | | | 40,227 | | | | 2,513 | | |
| St. Mary Land & Exploration | | | 1,970 | | | | 67 | | |
| Tesoro Petroleum | | | 3,360 | | | | 205 | | |
| Ultra Petroleum* | | | 2,936 | | | | 154 | | |
| Western Gas Resources (a) | | | 3,800 | | | | 165 | | |
| W-H Energy Services* (a) | | | 11,070 | | | | 335 | | |
| | | | 20,635 | | |
| Financials – 13.6% | |
| ACE | | | 100,046 | | | | 5,212 | | |
| Advanta, Class B | | | 5,715 | | | | 162 | | |
| Affiliated Managers Group* (a) | | | 3,810 | | | | 292 | | |
| Alexandria Real Estate Equities (a) | | | 1,300 | | | | 105 | | |
| Allstate (a) | | | 62,550 | | | | 3,302 | | |
| American International Group | | | 108,170 | | | | 7,009 | | |
| AmerUS Group, Class A (a) | | | 4,870 | | | | 288 | | |
| Bank of America (a) | | | 199,810 | | | | 8,740 | | |
| BioMed Realty Trust | | | 4,370 | | | | 109 | | |
| Capital One Financial | | | 34,460 | | | | 2,631 | | |
| CoBiz | | | 3,050 | | | | 54 | | |
Balanced Fund (continued)
| DESCRIPTION | | SHARES | | VALUE (000) | |
| Columbia Banking System | | | 6,589 | | | $ | 191 | | |
| Cullen/Frost Bankers | | | 6,800 | | | | 359 | | |
| Dime Community Bancshares | | | 5,139 | | | | 74 | | |
| East West Bancorp | | | 6,630 | | | | 254 | | |
| First Financial Bankshares | | | 2,356 | | | | 85 | | |
| First Niagara Financial Group | | | 8,570 | | | | 126 | | |
| First Potomac Realty Trust | | | 4,410 | | | | 112 | | |
| First Republic Bank (a) | | | 12,910 | | | | 489 | | |
| FirstFed Financial* | | | 1,140 | | | | 61 | | |
| GATX (a) | | | 5,550 | | | | 207 | | |
| Goldman Sachs Group | | | 60,772 | | | | 7,680 | | |
| Kite Realty Group Trust | | | 10,780 | | | | 159 | | |
| Lasalle Hotel Properties | | | 3,290 | | | | 116 | | |
| Lehman Brothers Holdings (a) | | | 49,810 | | | | 5,961 | | |
| Maguire Properties (a) | | | 5,431 | | | | 163 | | |
| Newcastle Investment | | | 4,340 | | | | 114 | | |
| Old Second Bancorp | | | 1,226 | | | | 38 | | |
| Platinum Underwriter Holdings | | | 10,490 | | | | 299 | | |
| SL Green Realty | | | 6,710 | | | | 456 | | |
| SVB Financial Group* | | | 3,260 | | | | 162 | | |
| Wells Fargo | | | 139,470 | | | | 8,396 | | |
| | | | 53,406 | | |
| Health Care – 7.9% | |
| American Healthways* (a) | | | 5,110 | | | | 207 | | |
| Amgen* (a) | | | 78,420 | | | | 5,941 | | |
| Amylin Pharmaceuticals* (a) | | | 2,410 | | | | 81 | | |
| Caliper Life Sciences* (a) | | | 17,213 | | | | 112 | | |
| Curis* | | | 19,818 | | | | 81 | | |
| ImmunoGen* | | | 13,460 | | | | 75 | | |
| Johnson & Johnson | | | 132,350 | | | | 8,288 | | |
| Medicis Pharmaceutical, Class A (a) | | | 3,380 | | | | 100 | | |
| Neurocrine Biosciences* (a) | | | 3,410 | | | | 180 | | |
| Pediatrix Medical Group* (a) | | | 2,830 | | | | 218 | | |
| Protein Design Labs* | | | 5,730 | | | | 161 | | |
| Respironics* | | | 4,010 | | | | 144 | | |
| Senomyx* (a) | | | 6,630 | | | | 94 | | |
| Sierra Health Services* (a) | | | 6,540 | | | | 491 | | |
| SonoSite* (a) | | | 490 | | | | 14 | | |
| SurModics* (a) | | | 7,440 | | | | 294 | | |
| Sybron Dental Specialties* (a) | | | 4,410 | | | | 189 | | |
| Symmetry Medical* | | | 4,960 | | | | 110 | | |
| Teva Pharmaceutical Industries, ADR (a) | | | 62,259 | | | | 2,373 | | |
| United Surgical Partners* | | | 5,590 | | | | 200 | | |
| UnitedHealth Group (a) | | | 73,016 | | | | 4,227 | | |
| Vertex Pharmaceuticals* (a) | | | 2,880 | | | | 66 | | |
| Wyeth | | | 163,491 | | | | 7,285 | | |
| | | | 30,931 | | |
| Industrials – 4.8% | |
| AirTran Holdings* (a) | | | 10,580 | | | | 158 | | |
| Chicago Bridge & Iron | | | 12,780 | | | | 285 | | |
| CLARCOR | | | 3,660 | | | | 101 | | |
| Eaton | | | 30,581 | | | | 1,799 | | |
| Emerson Electric | | | 50,847 | | | | 3,536 | | |
| Energy Conversion Devices* (a) | | | 1,590 | | | | 49 | | |
| ESCO Technologies* | | | 540 | | | | 23 | | |
| Illinois Tool Works (a) | | | 47,960 | | | | 4,065 | | |
| J.B. Hunt Transport Services | | | 12,060 | | | | 234 | | |
| Kennametal | | | 5,300 | | | | 271 | | |
| KVH Industries* (a) | | | 20,043 | | | | 185 | | |
| Labor Ready* (a) | | | 9,870 | | | | 230 | | |
| Lennox International | | | 4,400 | | | | 123 | | |
| Manitowoc (a) | | | 2,560 | | | | 136 | | |
| Mercury Computer Systems* (a) | | | 5,750 | | | | 109 | | |
| NCI Building Systems* (a) | | | 7,150 | | | | 294 | | |
The accompanying notes are an integral part of the financial statements.
FIRST AMERICAN FUNDS Annual Report 2005
94
Balanced Fund (continued)
| DESCRIPTION | | SHARES | | VALUE (000) | |
| Power-One* (a) | | | 42,378 | | | $ | 241 | | |
| Roper Industries (a) | | | 1,490 | | | | 56 | | |
| Terex* | | | 5,070 | | | | 279 | | |
| Toro | | | 5,760 | | | | 210 | | |
| United Parcel Service, Class B | | | 90,300 | | | | 6,586 | | |
| | | | 18,970 | | |
| Information Technology – 14.2% | |
| 02micro International* | | | 2,243 | | | | 29 | | |
| Advanced Analogic Technologies* | | | 7,300 | | | | 80 | | |
| Aeroflex* (a) | | | 12,390 | | | | 112 | | |
| Amphenol, Class A | | | 90,580 | | | | 3,620 | | |
| ATI Technologies* | | | 15,430 | | | | 223 | | |
| Autodesk (a) | | | 66,620 | | | | 3,007 | | |
| Benchmark Electronics* (a) | | | 4,710 | | | | 132 | | |
| BISYS Group* (a) | | | 31,140 | | | | 395 | | |
| Carreker* | | | 16,090 | | | | 88 | | |
| Cree* (a) | | | 5,920 | | | | 142 | | |
| Digitas* | | | 20,810 | | | | 225 | | |
| Embarcadero Technologies* | | | 18,341 | | | | 143 | | |
| EMC* | | | 295,400 | | | | 4,124 | | |
| Entegris* (a) | | | 22,626 | | | | 221 | | |
| EPIQ Systems* | | | 7,840 | | | | 149 | | |
| F5 Networks* | | | 2,300 | | | | 120 | | |
| FormFactor* | | | 4,010 | | | | 99 | | |
| Hewlett-Packard | | | 244,740 | | | | 6,863 | | |
| Hyperion Solutions* | | | 5,442 | | | | 263 | | |
| Integrated Device Technology* (a) | | | 11,372 | | | | 112 | | |
| Intel | | | 410,633 | | | | 9,650 | | |
| Ituran Location and Control* (a) | | | 8,886 | | | | 116 | | |
| Logitech International* (a) | | | 5,660 | | | | 217 | | |
| Micromuse* | | | 17,859 | | | | 128 | | |
| Microsoft | | | 253,720 | | | | 6,521 | | |
| Motorola (a) | | | 246,105 | | | | 5,454 | | |
| M-Systems Flash Disk Pioneer* | | | 5,860 | | | | 186 | | |
| Openwave Systems* (a) | | | 4,740 | | | | 85 | �� | |
| Opsware* (a) | | | 11,070 | | | | 57 | | |
| Oracle* | | | 421,073 | | | | 5,339 | | |
| Packeteer* | | | 31,531 | | | | 249 | | |
| Polycom* | | | 15,540 | | | | 238 | | |
| QUALCOMM | | | 83,247 | | | | 3,310 | | |
| Silicon Image* (a) | | | 12,645 | | | | 116 | | |
| Sonic Solutions* (a) | | | 9,050 | | | | 173 | | |
| Stellent* (a) | | | 35,948 | | | | 330 | | |
| Texas Instruments | | | 108,766 | | | | 3,105 | | |
| TIBCO Software* (a) | | | 28,130 | | | | 214 | | |
| WebEx Communications* | | | 1,400 | | | | 32 | | |
| | | | 55,667 | | |
| Materials – 2.2% | |
| Century Aluminum* (a) | | | 7,460 | | | | 136 | | |
| Dow Chemical | | | 175,715 | | | | 8,058 | | |
| Headwaters* (a) | | | 1,480 | | | | 47 | | |
| Hercules* | | | 4,430 | | | | 49 | | |
| Olin | | | 5,760 | | | | 103 | | |
| Schnitzer Steel Industries, Class A | | | 2,680 | | | | 86 | | |
| Steel Dynamics (a) | | | 5,300 | | | | 164 | | |
| Texas Industries | | | 1,030 | | | | 51 | | |
| | | | 8,694 | | |
| Telecommunication Services – 1.7% | |
| General Communication* (a) | | | 8,773 | | | | 84 | | |
| Verizon Communications | | | 210,692 | | | | 6,639 | | |
| | | | 6,723 | | |
Balanced Fund (continued)
| DESCRIPTION | | SHARES/PAR (000) | | VALUE (000) | |
| Utilities – 0.7% | |
| PG&E | | | 70,177 | | | $ | 2,553 | | |
Total Common Stocks
(Cost $213,247) | | | | | | | 241,973 | | |
| Investment Companies – 7.2% | |
| iShares MSCI EAFE Index Fund | | | 327,100 | | | | 18,399 | | |
| iShares MSCI Emerging Markets Index Fund (a) | | | 44,000 | | | | 3,498 | | |
| iShares MSCI EMU Index Fund | | | 8,300 | | | | 614 | | |
| iShares MSCI Japan Index Fund (a) | | | 270,000 | | | | 3,270 | | |
| iShares MSCI Pacific ex-Japan Index Fund (a) | | | 10,600 | | | | 1,035 | | |
| iShares S&P Europe 350 Index Fund (a) | | | 15,800 | | | | 1,234 | | |
Total Investment Companies
(Cost $25,446) | | | | | | | 28,050 | | |
U.S. Government Agency
Mortgage-Backed Securities – 9.0% | |
| Adjustable Rate (b) – 0.4% | |
Federal Home Loan Mortgage Corporation Pool
4.614%, 01/01/28, #786281 | | $ | 418 | | | | 427 | | |
Federal National Mortgage Association Pool
4.674%, 04/01/18, #070009 | | | 57 | | | | 59 | | |
| 5.083%, 09/01/33, #725553 (a) | | | 1,004 | | | | 1,029 | | |
| | | | 1,515 | | |
| Fixed Rate – 8.6% | |
Federal Home Loan Mortgage Corporation Pool
6.500%, 04/01/08, #E00225 | | | 16 | | | | 16 | | |
| 7.000%, 04/01/08, #E46044 | | | 8 | | | | 8 | | |
| 4.000%, 10/01/10, #M80855 | | | 995 | | | | 973 | | |
| 5.500%, 03/01/13, #E00546 | | | 158 | | | | 159 | | |
| 4.500%, 05/01/18, #P10032 | | | 485 | | | | 477 | | |
| 6.500%, 11/01/28, #C00676 | | | 628 | | | | 645 | | |
| 7.000%, 12/01/29, #G01091 | | | 124 | | | | 130 | | |
| 6.500%, 07/01/31, #A17212 | | | 468 | | | | 480 | | |
| 6.000%, 05/01/32, #C01361 | | | 141 | | | | 143 | | |
Federal National Mortgage Association Pool
5.500%, 03/01/06, #424411 | | | 46 | | | | 46 | | |
| 3.790%, 07/01/13, #386314 (a) | | | 1,372 | | | | 1,275 | | |
| 6.000%, 09/01/17, #653368 | | | 349 | | | | 357 | | |
| 5.000%, 07/01/18, #555621 | | | 1,447 | | | | 1,429 | | |
| 5.000%, 12/01/18, #725012 | | | 1,166 | | | | 1,151 | | |
| 4.500%, 06/01/19, #045181 | | | 405 | | | | 392 | | |
| 5.000%, 11/01/19, #725934 | | | 341 | | | | 336 | | |
| 4.500%, 06/01/20, #828929 | | | 356 | | | | 345 | | |
| 6.000%, 10/01/22, #254513 | | | 572 | | | | 580 | | |
| 5.500%, 10/01/24, #255456 (a) | | | 1,132 | | | | 1,124 | | |
| 5.500%, 12/01/24, #357662 | | | 898 | | | | 891 | | |
| 5.500%, 02/01/25, #255628 | | | 1,115 | | | | 1,107 | | |
| 7.000%, 04/01/29, #323681 | | | 144 | | | | 151 | | |
| 6.500%, 12/01/31, #254169 (a) | | | 553 | | | | 568 | | |
| 6.500%, 05/01/32, #640032 | | | 923 | | | | 947 | | |
| 7.000%, 07/01/32, #545815 (a) | | | 270 | | | | 282 | | |
| 6.000%, 09/01/32, #254447 (a) | | | 465 | | | | 470 | | |
| 6.000%, 01/01/33, #676647 | | | 866 | | | | 875 | | |
| 5.500%, 04/01/33, #694605 (a) | | | 1,194 | | | | 1,179 | | |
| 5.500%, 07/01/33, #728667 | | | 672 | | | | 663 | | |
| 5.500%, 08/01/33, #733380 (a) | | | 1,379 | | | | 1,361 | | |
| 5.000%, 10/01/33, #741897 | | | 959 | | | | 924 | | |
| 6.000%, 11/01/33, #772130 | | | 223 | | | | 225 | | |
| 6.000%, 11/01/33, #772256 | | | 259 | | | | 261 | | |
| 5.500%, 12/01/33, #756202 (a) | | | 814 | | | | 803 | | |
| 5.000%, 03/01/34, #725205 (a) | | | 1,037 | | | | 999 | | |
| 5.000%, 03/01/34, #725250 (a) | | | 920 | | | | 886 | | |
| 5.500%, 04/01/34, #725424 (a) | | | 518 | | | | 511 | | |
FIRST AMERICAN FUNDS Annual Report 2005
95
Schedule of Investments October 31, 2005
Balanced Fund (continued)
| DESCRIPTION | | PAR (000) | | VALUE (000) | |
| 5.500%, 05/01/34, #357571 | | $ | 915 | | | $ | 903 | | |
| 5.000%, 06/01/34, #782909 | | | 441 | | | | 425 | | |
| 6.500%, 06/01/34, #735273 (a) | | | 1,083 | | | | 1,111 | | |
| 5.290%, 11/01/34, #735054 (a) | | | 934 | | | | 929 | | |
| 4.500%, 03/01/35, #819357 | | | 1,084 | | | | 1,014 | | |
| 6.000%, 11/01/35, #REL06N (c) | | | 1,230 | | | | 1,237 | | |
Federal National Mortgage Association (c)
5.500%, 11/01/33 | | | 1,445 | | | | 1,425 | | |
| 5.000%, 11/01/35 | | | 2,460 | | | | 2,367 | | |
Government National Mortgage Association Pool
6.500%, 10/20/10, #002108 | | | 26 | | | | 27 | | |
| 7.500%, 06/15/27, #447728 | | | 16 | | | | 17 | | |
| 7.500%, 09/15/27, #455516 | | | 12 | | | | 13 | | |
| 7.000%, 04/15/29, #506639 | | | 202 | | | | 212 | | |
| 6.000%, 11/15/33, #00GNMA (a) | | | 932 | | | | 950 | | |
| | | | 33,799 | | |
Total U.S. Government Agency
Mortgage-Backed Securities
(Cost $35,954) | | | | | | | 35,314 | | |
U.S. Government & Agency
Securities – 6.8% | |
| U.S. Agency Debentures – 0.9% | |
Federal Home Loan Bank
4.430%, 04/07/08, Callable 04/07/06 @ 100 (a) | | | 2,400 | | | | 2,380 | | |
Federal National Mortgage Association
6.125%, 03/15/12 (a) | | | 280 | | | | 299 | | |
| 5.250%, 08/01/12 | | | 720 | | | | 722 | | |
| | | | 3,401 | | |
| U.S. Treasuries (a) – 5.9% | |
U.S. Inflation Index Bonds (TIPS)
2.375%, 01/15/25 (d) | | | 1,136 | | | | 1,181 | | |
U.S. Treasury Bonds
9.000%, 11/15/18 | | | 800 | | | | 1,128 | | |
| 8.125%, 08/15/21 | | | 200 | | | | 273 | | |
| 6.250%, 08/15/23 | | | 1,500 | | | | 1,751 | | |
| 7.625%, 02/15/25 | | | 390 | | | | 525 | | |
| 6.875%, 08/15/25 | | | 1,600 | | | | 2,013 | | |
| 5.500%, 08/15/28 | | | 210 | | | | 230 | | |
| 5.250%, 11/15/28 | | | 1,400 | | | | 1,485 | | |
| 5.250%, 02/15/29 | | | 1,460 | | | | 1,548 | | |
| 5.375%, 02/15/31 | | | 890 | | | | 970 | | |
U.S. Treasury Notes
4.125%, 08/15/08 | | | 1,870 | | | | 1,856 | | |
| 3.875%, 09/15/10 | | | 4,770 | | | | 4,646 | | |
| 4.250%, 10/15/10 | | | 10 | | | | 10 | | |
| 4.250%, 08/15/15 | | | 5,580 | | | | 5,443 | | |
| | | | 23,059 | | |
Total U.S. Government & Agency Securities
(Cost $26,589) | | | | | | | 26,460 | | |
CMO – Private Mortgage-Backed
Securities – 4.7% | |
| Adjustable Rate (b) – 1.6% | |
Adjustable Rate Mortgage Trust
Series 2005-10, Class 1A21
4.765%, 01/25/36 | | | 807 | | | | 800 | | |
IMPAC CMB Trust
Series 2003-12, Class A1
4.418%, 12/25/33 | | | 504 | | | | 506 | | |
MLCC Mortgage Investors
Series 2003-H, Class A3A
5.057%, 01/25/29 | | | 252 | | | | 255 | | |
Balanced Fund (continued)
| DESCRIPTION | | PAR (000) | | VALUE (000) | |
Series 2004-B, Class A3
5.203%, 05/25/29 | | $ | 485 | | | $ | 492 | | |
Morgan Stanley Loan Trust
Series 2004-9, Class 1A
6.273%, 11/25/34 | | | 604 | | | | 609 | | |
Sequoia Mortgage Trust
Series 2004-5, Class A1
4.734%, 06/20/34 | | | 575 | | | | 582 | | |
Series 2004-7, Class A2
4.847%, 08/20/34 | | | 455 | | | | 459 | | |
Structured Adjustable Rate Mortgage Loan Trust
Series 2044-11, Class A
5.352%, 08/25/34 | | | 261 | | | | 263 | | |
Thornburg Mortgage Trust
Series 2005-2, Class A1
4.258%, 07/25/45 | | | 746 | | | | 745 | | |
Wells Fargo Mortgage Backed Securities
Series 2003-D, Class A1
4.839%, 02/25/33 | | | 511 | | | | 512 | | |
Series 2004-N, Class A3
4.108%, 08/25/34 | | | 1,080 | | | | 1,067 | | |
| | | | 6,290 | | |
| Fixed Rate – 3.1% | |
Bank of America Mortgage Backed Securities
Series 2003-6, Class 1 A30
4.750%, 08/25/33 | | | 585 | | | | 572 | | |
Series 2004-G, Class 2A3
4.232%, 08/25/34 | | | 810 | | | | 802 | | |
Citicorp Mortgage Securities
Series 2005-4, Class 1A6
5.500%, 07/25/35 | | | 845 | | | | 825 | | |
Citigroup/Deutsche Bank Commercial Mortgage
Series 2005-CD1, Class A4
5.225%, 09/15/20 | | | 1,495 | | | | 1,494 | | |
Countrywide Alternative Loan Trust
Series 2004-2CB, Class 1A1
4.250%, 03/25/34 | | | 598 | | | | 590 | | |
Series 2004-24CB, Class 1A1
6.000%, 11/25/34 | | | 521 | | | | 523 | | |
GMAC Commercial Mortgage
Series 2004-J5, Class A7
6.500%, 01/25/35 | | | 641 | | | | 649 | | |
Greenwich Capital Commercial Funding
Series 2005-GG5, Class A5
5.225%, 04/10/37 | | | 875 | | | | 871 | | |
GSR Mortgage Loan Trust
Series 2004-10F, Class 3A1
5.500%, 08/25/19 | | | 534 | | | | 535 | | |
Master Alternative Loans Trust
Series 2005-2, Class 1 1A3
6.500%, 03/25/35 | | | 508 | | | | 517 | | |
Master Asset Securitization Trust
Series 2003-6, Class 1 1A3
5.000%, 07/25/18 | | | 853 | | | | 839 | | |
Residential Asset Mortgage Products
Series 2004-SL4, Class A3
6.500%, 07/25/32 | | | 418 | | | | 425 | | |
Residential Asset Security Trust
Series 2002-A12, Class 1A1
5.200%, 11/25/32 | | | 89 | | | | 88 | | |
Washington Mutual
Series 2003-S10, Class A2
5.000%, 10/25/18 | | | 1,071 | | | | 1,055 | | |
Wells Fargo Mortgage Backed Securities
Series 2003-14, Class A1
4.750%, 12/25/18 | | | 693 | | | | 677 | | |
The accompanying notes are an integral part of the financial statements.
FIRST AMERICAN FUNDS Annual Report 2005
96
Balanced Fund (continued)
| DESCRIPTION | | PAR (000) | | VALUE (000) | |
Series 2004-EE, Class B1
3.989%, 01/25/35 | | $ | 609 | | | $ | 580 | | |
Series 2005-12, Class 1A2
5.500%, 11/25/35 | | | 990 | | | | 954 | | |
Westam Mortgage Financial
Series 11, Class A
6.360%, 08/26/20 | | | 2 | | | | 2 | | |
| | | | 11,998 | | |
Total CMO – Private
Mortgage-Backed Securities
(Cost $18,578) | | | | | | | 18,288 | | |
| Asset-Backed Securities – 4.5% | |
| Automobiles – 0.5% | |
Bank One Auto Receivable
Series 2003-1, Class A3
1.820%, 09/20/07 | | | 672 | | | | 668 | | |
Ford Credit Auto Trust
Series 2005-B, Class A3
4.170%, 01/15/09 | | | 780 | | | | 775 | | |
Nissan Auto Receivables Trust
Series 2005-B, Class A2
3.750%, 09/15/07 | | | 430 | | | | 428 | | |
| | | | 1,871 | | |
| Commercial – 2.1% | |
Bank of America Commericial Mortgage
Series 2004-5, Class A3
4.561%, 11/10/41 | | | 710 | | | | 691 | | |
Bear Stearns Asset Backed Securities
Series 2004-T14, Class A4
5.200%, 01/12/41 | | | 205 | | | | 206 | | |
Commercial Mortgage
Series 2004-CNL, Class A1
4.190%, 09/15/14 (b) | | | 780 | | | | 780 | | |
Series 2005-LP5, Class A2
4.630%, 05/10/43 (e) | | | 925 | | | | 910 | | |
Deutsche Mortgage and Asset Receiving
Series 1998-C1, Class A2
6.538%, 06/15/31 | | | 533 | | | | 546 | | |
Global Signal Trust
Series 2004-2A, Class A
4.232%, 12/15/14 (e) | | | 750 | | | | 723 | | |
GMAC Commercial Mortgage
Series 2004-C2, Class A1
3.896%, 08/10/38 | | | 680 | | | | 665 | | |
GS Mortgage Securities
Series 2004-G62, Class A3
4.602%, 08/10/38 | | | 1,500 | | | | 1,485 | | |
LB-UBS
Series 2003-C3, Class A2
3.086%, 05/15/27 | | | 1,280 | | | | 1,223 | | |
Merrill Lynch Mortgage Investors
Series 1998-C1, Class A1
6.310%, 11/15/26 | | | 190 | | | | 190 | | |
Nomura Asset Securities
Series 1998-D6, Class A 1B
6.590%, 03/15/30 | | | 750 | | | | 776 | | |
| | | | 8,195 | | |
| Credit Cards – 0.8% | |
Citibank Credit Card Issuance Trust
Series 2003-A5, Class A5
2.500%, 04/07/08 | | | 625 | | | | 620 | | |
MBNA Master Trust
Series 2001-A1, Class A1
5.750%, 10/15/08 | | | 635 | | | | 640 | | |
Balanced Fund (continued)
| DESCRIPTION | | PAR (000) | | VALUE (000) | |
Series 2005-A1, Class A1
4.200%, 09/15/10 | | $ | 1,130 | | | $ | 1,116 | | |
Providian Gateway Master Trust
Series 2004-DA, Class A
3.350%, 09/15/11 (e) | | | 975 | | | | 948 | | |
| | | | 3,324 | | |
| Equipment Leases – 0.3% | |
Caterpillar Financial Trust
Series 2005-A, Class A2
3.660%, 12/25/07 | | | 410 | | | | 404 | | |
CNH
Series 2003-B, Class A3B
2.470%, 01/15/08 | | | 866 | | | | 859 | | |
| | | | 1,263 | | |
| Home Equity – 0.4% | |
Countrywide Financial
Series 2003-BC1, Class A1
4.438%, 03/25/33 (b) | | | 98 | | | | 100 | | |
First Franklin Mortgage
Series 2004-FFB, Class A3
4.264%, 06/25/24 | | | 240 | | | | 238 | | |
New Century Home Equity Loan Trust
Series 2004-4, Class A4
4.110%, 02/25/35 (b) | | | 950 | | | | 951 | | |
Saxon Asset Securities Trust
Series 2004-1, Class A
4.308%, 03/25/35 (b) | | | 86 | | | | 86 | | |
| | | | 1,375 | | |
| Other – 0.4% | |
GRP/AG Real Estate Asset Trust
Series 2004-1, Class A
3.960%, 03/25/09 (e) (f) | | | 58 | | | | 57 | | |
Series 2005-1, Class A
4.850%, 01/25/35 (e) (f) | | | 286 | | | | 284 | | |
William Street Funding
Series 2004-4, Class A
4.320%, 09/23/10 (b) (e) | | | 1,200 | | | | 1,189 | | |
| | | | 1,530 | | |
Total Asset-Backed Securities
(Cost $17,852) | | | | | | | 17,558 | | |
| Corporate Bonds – 3.6% | |
| Banking – 0.2% | |
Chuo Mitsui Trust & Banking
Callable 04/15/15 @ 100
5.506%, 12/31/49 (e) (f) | | | 365 | | | | 346 | | |
JP Morgan Chase XVII
5.850%, 08/01/35 | | | 295 | | | | 279 | | |
| | | | 625 | | |
| Basic Industry – 0.4% | |
Allegheny Technologies
8.375%, 12/15/11 | | | 275 | | | | 294 | | |
Celulosa Arauco Y Constitucion
5.625%, 04/20/15 (e) | | | 230 | | | | 223 | | |
Falconbridge
7.350%, 06/05/12 | | | 320 | | | | 347 | | |
PolyOne
10.625%, 05/15/10 | | | 300 | | | | 296 | | |
Southern Peru Copper
7.500%, 07/27/35 (a) (e) | | | 390 | | | | 379 | | |
| | | | 1,539 | | |
FIRST AMERICAN FUNDS Annual Report 2005
97
Schedule of Investments October 31, 2005
Balanced Fund (continued)
| DESCRIPTION | | PAR (000) | | VALUE (000) | |
| Brokerage – 0.2% | |
Lazard
7.125%, 05/15/15 (e) | | $ | 245 | | | $ | 238 | | |
Merrill Lynch, Series B
5.360%, 02/01/07 | | | 420 | | | | 423 | | |
| | | | 661 | | |
| Capital Goods – 0.1% | |
Hutchison Whampoa International
7.450%, 11/24/33 (a) (e) | | | 260 | | | | 288 | | |
Owens-Illinois
8.100%, 05/15/07 (a) | | | 325 | | | | 330 | | |
| | | | 618 | | |
| Communications – 0.6% | |
America Movil SA De CV
6.375%, 03/01/35 | | | 235 | | | | 219 | | |
AT&T
9.050%, 11/15/11 (f) | | | 380 | | | | 420 | | |
British Telecommunications PLC
8.875%, 12/15/30 | | | 170 | | | | 222 | | |
Clear Channel Communications
5.500%, 09/15/14 | | | 435 | | | | 408 | | |
Dex Media West
9.875%, 08/15/13 | | | 221 | | | | 245 | | |
News American
7.700%, 10/30/25 | | | 600 | | | | 670 | | |
Time Warner
8.375%, 07/15/33 | | | 270 | | | | 325 | | |
| | | | 2,509 | | |
| Consumer Cyclical – 0.5% | |
Centex
5.450%, 08/15/12 | | | 445 | | | | 434 | | |
DaimlerChrysler
4.875%, 06/15/10 (a) | | | 230 | | | | 223 | | |
| 6.500%, 11/15/13 (a) | | | 240 | | | | 249 | | |
Duty Free International
7.000%, 11/01/05 (g) (h) (i) | | | 605 | | | | 17 | | |
Ford Motor Credit
7.000%, 10/01/13 (a) | | | 195 | | | | 179 | | |
Harrah's
5.625%, 06/01/15 (e) | | | 350 | | | | 339 | | |
| 5.750%, 10/01/17 (e) | | | 210 | | | | 199 | | |
MGM Mirage
6.625%, 07/15/15 (e) | | | 290 | | | | 281 | | |
| | | | 1,921 | | |
| Consumer Non-Cyclical – 0.4% | |
Albertson's
7.500%, 02/15/11 | | | 300 | | | | 298 | | |
Kraft Foods
4.625%, 11/01/06 | | | 670 | | | | 669 | | |
RJ Reynolds Tobacco Holdings
6.500%, 07/15/10 (e) | | | 460 | | | | 453 | | |
| | | | 1,420 | | |
| Electric – 0.1% | |
Oncor Electric Delivery
7.000%, 05/01/32 | | | 325 | | | | 359 | | |
| Energy – 0.5% | |
Bluewater Financial
Callable 02/15/07 @ 105.125
10.250%, 02/15/12 | | | 300 | | | | 320 | | |
Gazprom International
7.201%, 02/01/20 (e) | | | 350 | | | | 372 | | |
Balanced Fund (continued)
| DESCRIPTION | | PAR (000) | | VALUE (000) | |
Kerr McGee
6.950%, 07/01/24 (a) | | $ | 285 | | | $ | 291 | | |
Nexen
5.875%, 03/10/35 | | | 270 | | | | 258 | | |
Petrobras International Finance
7.750%, 09/15/14 | | | 310 | | | | 330 | | |
Petro-Canada
5.350%, 07/15/33 | | | 190 | | | | 171 | | |
Tengizcheveroil
6.124%, 11/15/14 (e) | | | 370 | | | | 369 | | |
| | | | 2,111 | | |
| Finance Companies – 0.1% | |
American General Finance
5.875%, 07/14/06 | | | 400 | | | | 403 | | |
| Sovereigns – 0.3% | |
Republic of Turkey
9.000%, 06/30/11 | | | 340 | | | | 384 | | |
United Mexican States
5.875%, 01/15/14 (a) | | | 830 | | | | 840 | | |
| | | | 1,224 | | |
| Technology – 0.2% | |
Chartered Semiconductor
6.375%, 08/03/15 | | | 250 | | | | 239 | | |
Ciena
3.750%, 02/01/08 | | | 120 | | | | 109 | | |
Corning
Zero Coupon Bond
2.000%, 11/08/15 (j) | | | 260 | | | | 212 | | |
LG Electronics
5.000%, 06/17/10 (e) | | | 340 | | | | 329 | | |
| | | | 889 | | |
Total Corporate Bonds
(Cost $15,157) | | | | | | | 14,279 | | |
CMO – U.S. Government Agency
Mortgage-Backed Securities – 1.1% | |
| Fixed Rate – 1.1% | |
Federal Home Loan Mortgage Corporation
Series 85, Class C
8.600%, 01/15/21 | | | 110 | | | | 110 | | |
Series 1136, Class H
6.000%, 09/15/21 | | | 93 | | | | 93 | | |
Series 2763, Class TA
4.000%, 03/15/11 | | | 745 | | | | 724 | | |
Series T-060, Class 1A4B
5.343%, 03/25/44 | | | 717 | | | | 717 | | |
Federal National Mortgage Association
Series 1989-2, Class D
8.800%, 01/25/19 | | | 7 | | | | 7 | | |
Series 1989-37, Class G
8.000%, 07/25/19 | | | 117 | | | | 122 | | |
Series 1990-30, Class E
6.500%, 03/25/20 | | | 48 | | | | 49 | | |
Series 1990-63, Class H
9.500%, 06/25/20 | | | 24 | | | | 25 | | |
Series 1990-89, Class K
6.500%, 07/25/20 | | | 6 | | | | 6 | | |
Series 1990-105, Class J
6.500%, 09/25/20 | | | 78 | | | | 79 | | |
Series 1996-21, Class PK
6.000%, 02/25/11 | | | 333 | | | | 335 | | |
Series 2005-44, Class PC
5.000%, 11/25/27 | | | 1,139 | | | | 1,124 | | |
The accompanying notes are an integral part of the financial statements.
FIRST AMERICAN FUNDS Annual Report 2005
98
Balanced Fund (continued)
| DESCRIPTION | | PAR (000)/CONTRACTS/SHARES | | VALUE (000) | |
Series 2005-47, Class HK
4.500%, 06/25/20 | | $ | 985 | | | $ | 922 | | |
Government National Mortgage Association
Series 3, Class F
6.500%, 06/17/20 | | | 10 | | | | 10 | | |
| | | | 4,323 | | |
Total CMO – U.S. Government Agency
Mortgage-Backed Securities
(Cost $4,449) | | | | | | | 4,323 | | |
| Purchased Options – 0.0% | |
U.S. Treasury 10 Year Note Future
Put @ 107 12/05
(Cost $3) | | | 26 | | | | 3 | | |
| Short-Term Investments – 1.9% | |
| Affiliated Money Market Fund – 1.9% | |
First American Prime Obligations Fund, Class Z (k)
(Cost $7,434) | | | 7,434,365 | | | | 7,434 | | |
| U.S. Treasury Obligation – 0.0% | |
U.S. Treasury Bill
3.360%, 11/10/05 (l)
(Cost $75) | | | 75 | | | | 75 | | |
Total Short-Term Investments
(Cost $7,509) | | | | | | | 7,509 | | |
Investments Purchased with Proceeds
from Securities Lending (m) – 30.8% | |
| (Cost $120,355) | | | | | | | 120,355 | | |
Total Investments – 131.4%
(Cost $485,139) | | | | | | | 514,112 | | |
| Other Assets and Liabilities, Net – (31.4)% | | | | | | | (122,824 | ) | |
| Total Net Assets – 100.0% | | | | | | $ | 391,288 | | |
* Non-income producing security
(a) This security or a portion of this security is out on loan at October 31, 2005. Total loaned securities had a market value of $118,276,782 at October 31, 2005. See note 2 in Notes to financial Statements.
(b) Variable Rate Security – The rate shown is the rate in effect as of October 31, 2005.
(c) Security purchased on a when-issued basis. On October 31, 2005, the total cost of investments purchased on a when-issued basis was $5,059,884 or 1.3% of net assets. See note 2 in Notes to Financial Statements.
(d) U.S. Treasury inflation-protected securities (TIPS) are securities in which the principal amount is adjusted for inflation and the semi-annual interest payments equal a fixed percentage of the inflation-adjusted principal amount.
(e) Security purchased within the terms of a private placement memorandum, exempt from registration under Rule 144A of the Securities Act of 1933, as amended, and may be sold only to dealers in that program or other "qualified institutional buyers." These securities have been determined to be liquid under guidelines established by the funds' board of directors. As of October 31, 2005, the value of these investments was $7,926,898 or 2.0% of total net assets.
(f) Delayed Interest (Step-Bonds) – Securities for which the coupon rate of interest will adjust on specified future date(s). The rate disclosed is the rate in effect as of October 31, 2005.
(g) Securities considered illiquid or restricted. As of October 31, 2005 the value of these investments was $16,709 or 0% of total net assets. See note 2 in Notes to Financial Statements.
(h) Security is in default at October 31, 2005.
(i) Security is fair valued. As of October 31, 2005, the fair value of this investment was $16,709 or 0% of total net assets. See note 2 in Notes to Financial Statements.
(j) The rate shown is the effective yield at time of purchase.
Balanced Fund (concluded)
(k) Investment in affiliated security. This money market fund is advised by U.S. Bancorp Asset Management, Inc., which also serves as advisor to this fund. See note 3 in Notes to Financial Statements.
(l) Security has been deposited as initial margin on open futures contracts. Yield shown is effective yield as of October 31, 2005.
(m) The fund may loan securities in return for collateral in the form of cash, U.S. Government securities, or other high grade debt obligations. The cash collateral is invested in various short-term fixed income securities, such as repurchase agreements, commercial paper, money market funds and other corporate obligations.
ADR – American Depository Receipt
CMO – Collateralized Mortgage Obligation
PLC – Public Limited Company
Schedule of Open Futures Contracts
| Description | | Number of
Contracts
Purchased
(Sold) | | Notional
Contract
Value
(000) | | Settlement
Month | | Unrealized
Appreciation
(Depreciation)
(000) | |
| U.S. Treasury 2 year Futures | | | 20 | | | $ | 4,104 | | | December-05 | | $ | (45 | ) | |
| U.S. Treasury 5 year Futures | | | (14 | ) | | | (1,482 | ) | | December-05 | | | 37 | | |
| U.S. Treasury 10 year Futures | | | (49 | ) | | | (5,314 | ) | | December-05 | | | 105 | | |
| | | $ | 97 | | |
Credit Default Swap Agreements
| Counterparty | | Reference
Entity | | Buy/Sell
Protection | | Pay/Receive
Fixed Rate | | Expiration
Date | | Notional
Amount
(000) | | Unrealized
Appreciation
(000) | |
| Citigroup | | Dow Jones CDX
IG Hvol5 Index | | Buy | | | 0.85 | % | | | 12/20/10 | | | | 1,000 | | | $ | 2 | | |
Interest Rate Swap Agreements
| Counterparty | | Floating
Rate
Index | | Pay/Receive
Floating Rate | | Fixed Rate | | Expiration
Date | | Notional
Amount
(000) | | Unrealized
Depreciation
(000) | |
| Citigroup | | 3-Month
LIBOR | | Pay | | | 4.856 | % | | | 10/06/15 | | | $ | 2,500 | | | $ | (41 | ) | |
FIRST AMERICAN FUNDS Annual Report 2005
99
Schedule of Investments October 31, 2005
Equity Income Fund
| DESCRIPTION | | SHARES | | VALUE (000) | |
| Common Stocks – 98.5% | |
| Consumer Discretionary – 6.9% | |
| Harrah's Entertainment | | | 312,980 | | | $ | 18,929 | | |
| Home Depot (a) | | | 408,600 | | | | 16,769 | | |
| McDonald's | | | 606,620 | | | | 19,169 | | |
| Starwood Hotels & Resorts Worldwide (a) | | | 453,270 | | | | 26,485 | | |
| Time Warner | | | 790,860 | | | | 14,101 | | |
| | | | 95,453 | | |
| Consumer Staples – 6.9% | |
| Altria Group (a) | | | 378,170 | | | | 28,382 | | |
| Colgate-Palmolive | | | 404,780 | | | | 21,437 | | |
| General Mills (a) | | | 301,920 | | | | 14,571 | | |
| PepsiCo | | | 267,690 | | | | 15,815 | | |
| Procter & Gamble | | | 256,950 | | | | 14,387 | | |
| | | | 94,592 | | |
| Energy – 13.5% | |
| Apache (a) | | | 239,880 | | | | 15,312 | | |
| Baker Hughes | | | 206,540 | | | | 11,351 | | |
| BP, ADR | | | 409,286 | | | | 27,177 | | |
| ChevronTexaco (a) | | | 359,480 | | | | 20,516 | | |
| ConocoPhillips | | | 458,700 | | | | 29,990 | | |
| Exxon Mobil | | | 887,562 | | | | 49,828 | | |
| Halliburton (a) | | | 204,840 | | | | 12,106 | | |
| Royal Dutch Petroleum, ADR (a) | | | 142,030 | | | | 8,812 | | |
| Schlumberger (a) | | | 112,970 | | | | 10,254 | | |
| | | | 185,346 | | |
| Financials – 21.3% | |
| Alliance Capital Management Holding | | | 382,280 | | | | 20,234 | | |
| AMB Property (a) | | | 206,440 | | | | 9,121 | | |
| American International Group (a) | | | 267,910 | | | | 17,361 | | |
| Apartment Investment & Management (a) | | | 330,640 | | | | 12,697 | | |
| Bank of America (a) | | | 779,478 | | | | 34,094 | | |
| Citigroup | | | 871,691 | | | | 39,906 | | |
| Duke Realty (a) | | | 177,922 | | | | 6,067 | | |
| Fannie Mae | | | 33,260 | | | | 1,581 | | |
| Goldman Sachs Group (a) | | | 144,370 | | | | 18,244 | | |
| J.P. Morgan Chase | | | 717,950 | | | | 26,291 | | |
| Merrill Lynch (a) | | | 248,310 | | | | 16,076 | | |
| Morgan Stanley | | | 206,490 | | | | 11,235 | | |
| Northern Trust (a) | | | 157,905 | | | | 8,464 | | |
| Partners Trust Financial Group | | | 400,240 | | | | 4,663 | | |
| State Street (a) | | | 428,580 | | | | 23,670 | | |
| Wachovia (a) | | | 555,785 | | | | 28,078 | | |
| Wells Fargo | | | 254,210 | | | | 15,303 | | |
| | | | 293,085 | | |
| Health Care – 12.0% | |
| Abbott Laboratories | | | 521,660 | | | | 22,457 | | |
| Baxter International | | | 476,640 | | | | 18,222 | | |
| HCA | | | 210,090 | | | | 10,124 | | |
| Johnson & Johnson (a) | | | 446,090 | | | | 27,934 | | |
| McKesson HBOC | | | 164,800 | | | | 7,487 | | |
| Medtronic | | | 151,790 | | | | 8,600 | | |
| Pfizer | | | 1,070,232 | | | | 23,267 | | |
| Teva Pharmaceutical Industries, ADR (a) | | | 271,310 | | | | 10,342 | | |
| Wyeth | | | 831,540 | | | | 37,053 | | |
| | | | 165,486 | | |
| Industrials – 11.3% | |
| 3M (a) | | | 254,910 | | | | 19,368 | | |
| Avery Dennison (a) | | | 151,834 | | | | 8,601 | | |
| Emerson Electric (a) | | | 234,580 | | | | 16,315 | | |
| General Dynamics | | | 162,250 | | | | 18,870 | | |
Equity Income Fund (continued)
| DESCRIPTION | | SHARES/PAR (000) | | VALUE (000) | |
| General Electric | | | 1,147,640 | | | $ | 38,916 | | |
| Honeywell International | | | 517,250 | | | | 17,690 | | |
| Ingersoll-Rand, Class A | | | 437,340 | | | | 16,527 | | |
| United Parcel Service, Class B (a) | | | 267,260 | | | | 19,494 | | |
| | | | 155,781 | | |
| Information Technology – 11.1% | |
| Hewlett-Packard | | | 883,420 | | | | 24,771 | | |
| Intel | | | 1,071,450 | | | | 25,179 | | |
| Microsoft | | | 1,819,160 | | | | 46,752 | | |
| Motorola (a) | | | 1,189,810 | | | | 26,366 | | |
| QUALCOMM (a) | | | 333,350 | | | | 13,254 | | |
| SAP, ADR | | | 179,650 | | | | 7,714 | | |
| Texas Instruments | | | 331,860 | | | | 9,475 | | |
| | | | 153,511 | | |
| Materials – 7.4% | |
| Bemis (a) | | | 550,280 | | | | 14,538 | | |
| Dow Chemical (a) | | | 208,450 | | | | 9,560 | | |
| E.I. DuPont de Nemours (a) | | | 302,060 | | | | 12,593 | | |
| Ecolab | | | 223,770 | | | | 7,402 | | |
| Engelhard | | | 647,650 | | | | 17,616 | | |
| Praxair (a) | | | 581,420 | | | | 28,728 | | |
| Weyerhaeuser | | | 176,639 | | | | 11,188 | | |
| | | | 101,625 | | |
| Telecommunication Services – 4.3% | |
| ALLTEL (a) | | | 282,480 | | | | 17,474 | | |
| BellSouth (a) | | | 506,710 | | | | 13,185 | | |
| SBC Communications (a) | | | 642,190 | | | | 15,316 | | |
| Verizon Communications | | | 442,540 | | | | 13,944 | | |
| | | | 59,919 | | |
| Utilities – 3.8% | |
| Alliant Energy | | | 593,830 | | | | 15,707 | | |
| Cinergy | | | 409,590 | | | | 16,343 | | |
| ITC Holdings (a) | | | 23,490 | | | | 646 | | |
| Xcel Energy (a) | | | 1,049,960 | | | | 19,246 | | |
| | | | 51,942 | | |
Total Common Stocks
(Cost $1,068,866) | | | | | | | 1,356,740 | | |
| Convertible Corporate Bond – 0.2% | |
Medarex
Callable 05/20/09 @ 100.64
2.250%, 05/15/11 (a)
(Cost $3,378) | | | 3,934 | | | | 3,443 | | |
| Convertible Preferred Stock – 0.6% | |
Freeport-McMoran Copper & Gold
5.500%,12/31/49
(Cost $7,248) | | | 7,483 | | | | 8,227 | | |
The accompanying notes are an integral part of the financial statements.
FIRST AMERICAN FUNDS Annual Report 2005
100
Equity Income Fund (concluded)
| DESCRIPTION | | SHARES | | VALUE (000) | |
| Short-Term Investments – 0.8% | |
First American Prime Obligations Fund, Class Z (b)
(Cost $11,168) | | | 11,168,132 | | | $ | 11,168 | | |
Investments Purchased with Proceeds
from Securities Lending (c) – 25.2% | |
| (Cost $346,553) | | | | | 346,553 | | |
Total Investments – 125.3%
(Cost $1,437,213) | | | | | 1,726,131 | | |
| Other Assets and Liabilities, Net – (25.3)% | | | | | (348,132 | ) | |
| Total Net Assets – 100.0% | | | | $ | 1,377,999 | | |
(a) This security or a portion of this security is out on loan at October 31, 2005. Total loaned securities had a market value of $339,875,080 at October 31, 2005. See note 2 in Notes to Financial Statements.
(b) Investment in affiliated security. This money market fund is advised by U.S. Bancorp Asset Management, Inc., which also serves as advisor to this fund. See note 3 in Notes to Financial Statements.
(c) The fund may loan securities in return for collateral in the form of cash, U.S. Government securities, or other high grade debt obligations. The cash collateral is invested in various short-term fixed income securities, such as repurchase agreements, commercial paper, money market funds and other corporate obligations.
ADR – American Depository Receipt
FIRST AMERICAN FUNDS Annual Report 2005
101
Statements of Assets and Liabilities October 31, 2005, in thousands, except per share data
| | | Balanced
Fund | | Equity
Income Fund | |
| ASSETS: | |
| Investments in unaffiliated securities, at value* (cost $357,350 and $1,079,492, repectively) (note 2) | | $ | 386,323 | | | $ | 1,368,410 | | |
| Investments in affiliated money market fund, at value (cost $7,434 and $11,168, respectively) (note 2 ) | | | 7,434 | | | | 11,168 | | |
| Investments purchased with proceeds from security lending (cost $120,355 and $346,553, respectively) (note 2) | | | 120,355 | | | | 346,553 | | |
| Cash** | | | 575 | | | | 399 | | |
| Receivable for dividends and interest | | | 1,010 | | | | 1,814 | | |
| Receivable for investment securities sold | | | 14,361 | | | | — | | |
| Receivable for capital shares sold | | | 381 | | | | 307 | | |
| Prepaid expenses and other assets | | | 46 | | | | 45 | | |
| Total assets | | | 530,485 | | | | 1,728,696 | | |
| LIABILITIES: | |
| Payable for investment securities purchased | | | 11,728 | | | | — | | |
| Payable for investment securities purchased on a when-issued basis | | | 5,060 | | | | — | | |
| Payable upon return of securities loaned (note 2) | | | 120,493 | | | | 346,952 | | |
| Payable for capital shares redeemed | | | 1,538 | | | | 2,526 | | |
| Payable to affiliates (note 3) | | | 278 | | | | 1,101 | | |
| Payable for distribution and shareholder servicing fees | | | 45 | | | | 68 | | |
| Payable for swap contracts | | | 31 | | | | — | | |
| Payable for variation margin | | | 3 | | | | — | | |
| Accrued expenses and other liabilities | | | 21 | | | | 50 | | |
| Total liabilities | | | 139,197 | | | | 350,697 | | |
| Net assets | | $ | 391,288 | | | $ | 1,377,999 | | |
| COMPOSITION OF NET ASSETS: | |
| Portfolio capital | | $ | 363,196 | | | $ | 1,083,269 | | |
| Undistributed net investment income | | | 634 | | | | 124 | | |
| Accumulated net realized gain (loss) on investments and futures contracts | | | (1,573 | ) | | | 5,688 | | |
| Net unrealized appreciation of investments | | | 28,973 | | | | 288,918 | | |
| Net unrealized appreciation of futures contracts | | | 97 | | | | — | | |
| Net unrealized depreciation of swap agreements | | | (39 | ) | | | — | | |
| Net assets | | $ | 391,288 | | | $ | 1,377,999 | | |
| * Including securities loaned, at value | | $ | 118,277 | | | $ | 339,875 | | |
| ** Includes cash collateral received related to securities loaned (note 2) | | $ | 138 | | | $ | 399 | | |
| Class A: | |
| Net assets | | $ | 112,557 | | | $ | 171,998 | | |
| Shares issued and outstanding ($0.0001 par value — 2 billion authorized) | | | 9,983 | | | | 12,581 | | |
| Net asset value and redemption price per share | | $ | 11.27 | | | $ | 13.67 | | |
| Maximum offering price per share (1) | | $ | 11.93 | | | $ | 14.47 | | |
| Class B: | |
| Net assets | | $ | 19,409 | | | $ | 21,003 | | |
| Shares issued and outstanding ($0.0001 par value — 2 billion authorized) | | | 1,736 | | | | 1,548 | | |
| Net asset value, offering price, and redemption price per share (2) | | $ | 11.18 | | | $ | 13.57 | | |
| Class C: | |
| Net assets | | $ | 4,787 | | | $ | 15,313 | | |
| Shares issued and outstanding ($0.0001 par value — 2 billion authorized) | | | 427 | | | | 1,126 | | |
| Net asset value, offering price and redemption price per share (2) | | $ | 11.22 | | | $ | 13.59 | | |
| Class R: | |
| Net assets | | $ | 1 | | | $ | 418 | | |
| Shares issued and outstanding ($0.0001 par value — 2 billion authorized) | | | — | | | | 31 | | |
| Net asset value, offering price, and redemption price per share | | $ | 11.29 | | | $ | 13.66 | | |
| Class Y: | |
| Net assets | | $ | 254,534 | | | $ | 1,169,267 | | |
| Shares issued and outstanding ($0.0001 par value — 2 billion authorized) | | | 22,510 | | | | 84,973 | | |
| Net asset value, offering price, and redemption price per share | | $ | 11.31 | | | $ | 13.76 | | |
(1) The offering price is calculated by dividing the net asset value by 1 minus the maximum sales charge of 5.50%
(2) Class B and C have a contingent deferred sales charge. For a description of this sales charge, see notes 1 and 3 in Notes to Financial Statements.
The accompanying notes are an integral part of the financial statements.
FIRST AMERICAN FUNDS Annual Report 2005
102
Statements of Operations in thousands
| | | Balanced
Fund | | Equity
Income Fund | |
| One-Month | | Year
Period Ended
10/31/05 | | One-Month
Ended
9/30/05 | | Year
Period Ended
10/31/05 | | Ended
9/30/05 | |
| INVESTMENT INCOME: | |
| Interest from unaffliliated securities | | $ | 461 | | | $ | 6,017 | | | $ | 15 | | | $ | 222 | | |
| Dividends from affliliated money market fund | | | 18 | | | | 167 | | | | 36 | | | | 294 | | |
| Dividends from unaffiliated securities | | | 175 | | | | 3,863 | | | | 2,144 | | | | 42,040 | | |
| Less: Foreign taxes withheld | | | — | | | | (12 | ) | | | 4 | | | | (76 | ) | |
| Securities lending income | | | 14 | | | | 141 | | | | 19 | | | | 294 | | |
| Total investment income | | | 668 | | | | 10,176 | | | | 2,218 | | | | 42,774 | | |
| EXPENSES (note 3): | |
| Investment advisory fees | | | 217 | | | | 2,747 | | | | 759 | | | | 10,284 | | |
| Transfer agent fees | | | 49 | | | | 266 | | | | 173 | | | | 979 | | |
| Administration fees | | | 45 | | | | 886 | | | | 149 | | | | 3,246 | | |
| Registration fees | | | 4 | | | | 43 | | | | 4 | | | | 43 | | |
| Professional fees | | | 2 | | | | 43 | | | | 7 | | | | 99 | | |
| Custodian fees | | | 2 | | | | 37 | | | | 6 | | | | 140 | | |
| Postage & printing fees | | | 1 | | | | 23 | | | | 3 | | | | 82 | | |
| Other expenses | | | 1 | | | | 13 | | | | 4 | | | | 35 | | |
| Directors' fees | | | 1 | | | | 10 | | | | 3 | | | | 37 | | |
| Distribution and shareholder servicing fees – Class A | | | 24 | | | | 297 | | | | 36 | | | | 462 | | |
| Distribution and shareholder servicing fees – Class B | | | 16 | | | | 246 | | | | 18 | | | | 231 | | |
| Distribution and shareholder servicing fees – Class C | | | 4 | | | | 59 | | | | 13 | | | | 181 | | |
| Distribution and shareholder servicing fees – Class R (1) | | | — | | | | — | | | | — | | | | 1 | | |
| Total expenses | | | 366 | | | | 4,670 | | | | 1,175 | | | | 15,820 | | |
| Less: Fee waivers (note 3) | | | (38 | ) | | | (637 | ) | | | — | | | | (516 | ) | |
| Total net expenses | | | 328 | | | | 4,033 | | | | 1,175 | | | | 15,304 | | |
| Investment income – net | | | 340 | | | | 6,143 | | | | 1,043 | | | | 27,470 | | |
| REALIZED AND UNREALIZED GAINS (LOSSES) – NET (note 5): | |
| Net realized gain (loss) on investments | | | (634 | ) | | | 44,140 | | | | (1,938 | ) | | | 43,644 | | |
| Net realized gain on in-kind distribution (note 10) | | | — | | | | — | | | | — | | | | 45,141 | | |
| Net realized gain (loss) on futures contracts | | | 2 | | | | (21 | ) | | | — | | | | — | | |
| Net realized gain on swap agreements | | | — | | | | 47 | | | | — | | | | — | | |
| Net realized gain on written options | | | — | | | | 132 | | | | — | | | | — | | |
| Net change in unrealized appreciation or depreciation of investments | | | (5,144 | ) | | | 7,744 | | | | (20,424 | ) | | | 50,906 | | |
| Net change in unrealized appreciation or depreciation of futures contracts | | | 51 | | | | 158 | | | | — | | | | — | | |
| Net change in unrealized appreciation or depreciation of swap agreements | | | (37 | ) | | | (2 | ) | | | — | | | | — | | |
| Net gain (loss) | | | (5,762 | ) | | | 52,198 | | | | (22,362 | ) | | | 139,691 | | |
| Net increase (decrease) in net assets resulting from operations | | $ | (5,422 | ) | | $ | 58,341 | | | $ | (21,319 | ) | | $ | 167,161 | | |
(1) Due to the presentation of the finanacial statements in thousands, the numbers round to zero.
The accompanying notes are an integral part of the financial statements.
FIRST AMERICAN FUNDS Annual Report 2005
103
Statements of Changes in Net Assets in thousands
| | | Balanced
Fund | | Equity
Income Fund | |
| | | One-Month
Period Ended
10/31/05 | | Year
Ended
9/30/05 | | Year
Ended
9/30/04 | | One-Month
Period Ended
10/31/05 | | Year
Ended
9/30/05 | | Year
Ended
9/30/04 | |
| OPERATIONS: | |
| Investment income – net | | $ | 340 | | | $ | 6,143 | | | $ | 7,045 | | | $ | 1,043 | | | $ | 27,470 | | | $ | 26,113 | | |
| Net realized gain (loss) on investments | | | (634 | ) | | | 44,140 | | | | 26,114 | | | | (1,938 | ) | | | 43,644 | | | | 22,327 | | |
| Net realized gain on in-kind distribution | | | — | | | | — | | | | — | | | | — | | | | 45,141 | | | | — | | |
| Net realized gain (loss) on futures contracts | | | 2 | | | | (21 | ) | | | 923 | | | | — | | | | — | | | | — | | |
| Net realized gain on swap agreements | | | — | | | | 47 | | | | — | | | | — | | | | — | | | | — | | |
| Net realized gain on written options | | | — | | | | 132 | | | | 214 | | | | — | | | | — | | | | — | | |
| Net change in unrealized appreciation or depreciation of investments | | | (5,144 | ) | | | 7,744 | | | | 8,139 | | | | (20,424 | ) | | | 50,906 | | | | 134,451 | | |
| Net change in unrealized appreciation or depreciation of futures contracts | | | 51 | | | | 158 | | | | 202 | | | | — | | | | — | | | | — | | |
| Net change in unrealized appreciation or depreciation of swap agreements | | (37) | | (2) | |
| Net change in unrealized appreciation or depreciation of written options | | | — | | | | — | | | | 28 | | | | — | | | | — | | | | — | | |
| Net increase (decrease) in net assets resulting from operations | | | (5,422 | ) | | | 58,341 | | | | 42,665 | | | | (21,319 | ) | | | 167,161 | | | | 182,891 | | |
| DISTRIBUTIONS TO SHAREHOLDERS FROM: | |
| Investment income – net: | |
| Class A | | | — | | | | (1,628 | ) | | | (1,535 | ) | | | (89 | ) | | | (3,048 | ) | | | (2,721 | ) | |
| Class B | | | — | | | | (148 | ) | | | (228 | ) | | | — | | | | (222 | ) | | | (224 | ) | |
| Class C | | | — | | | | (37 | ) | | | (47 | ) | | | — | | | | (176 | ) | | | (183 | ) | |
| Class R | | | — | | | | — | | | | (237 | ) | | | — | | | | (2 | ) | | | (196 | ) | |
| Class Y | | | — | | | | (4,412 | ) | | | (5,588 | ) | | | (829 | ) | | | (25,969 | ) | | | (25,834 | ) | |
| Net realized gain on investments: | |
| Class A | | | — | | | | — | | | | — | | | | — | | | | (160 | ) | | | — | | |
| Class B | | | — | | | | — | | | | — | | | | — | | | | (21 | ) | | | — | | |
| Class C | | | — | | | | — | | | | — | | | | — | | | | (17 | ) | | | — | | |
| Class Y | | | — | | | | — | | | | — | | | | — | | | | (1,245 | ) | | | — | | |
| Total distributions | | | — | | | | (6,225 | ) | | | (7,635 | ) | | | (918 | ) | | | (30,860 | ) | | | (29,158 | ) | |
| CAPITAL SHARE TRANSACTIONS (note 4): | |
| Class A: | |
| Proceeds from sales | | | 1,355 | | | | 13,247 | | | | 33,852 | | | | 862 | | | | 21,141 | | | | 53,380 | | |
| Reinvestment of distributions | | | — | | | | 1,585 | | | | 1,487 | | | | 82 | | | | 2,988 | | | | 2,528 | | |
| Payments for redemptions | | | (1,628 | ) | | | (34,236 | ) | | | (20,593 | ) | | | (3,060 | ) | | | (47,176 | ) | | | (31,031 | ) | |
| Increase (decrease) in net assets from Class A transactions | | | (273 | ) | | | (19,404 | ) | | | 14,746 | | | | (2,116 | ) | | | (23,047 | ) | | | 24,877 | | |
| Class B: | |
| Proceeds from sales | | | 40 | | | | 1,081 | | | | 1,605 | | | | 70 | | | | 1,913 | | | | 4,986 | | |
| Reinvestment of distributions | | | — | | | | 142 | | | | 219 | | | | — | | | | 229 | | | | 209 | | |
| Payments for redemptions | | | (1,003 | ) | | | (11,765 | ) | | | (8,962 | ) | | | (367 | ) | | | (6,332 | ) | | | (5,788 | ) | |
| Decrease in net assets from Class B transactions | | | (963 | ) | | | (10,542 | ) | | | (7,138 | ) | | | (297 | ) | | | (4,190 | ) | | | (593 | ) | |
| Class C: | |
| Proceeds from sales | | | 29 | | | | 860 | | | | 858 | | | | 107 | | | | 1,226 | | | | 2,790 | | |
| Reinvestment of distributions | | | — | | | | 36 | | | | 47 | | | | — | | | | 192 | | | | 183 | | |
| Payments for redemptions | | | (685 | ) | | | (1,977 | ) | | | (2,596 | ) | | | (663 | ) | | | (6,129 | ) | | | (5,027 | ) | |
| Decrease in net assets from Class C transactions | | | (656 | ) | | | (1,081 | ) | | | (1,691 | ) | | | (556 | ) | | | (4,711 | ) | | | (2,054 | ) | |
| Class R: | |
| Proceeds from sales | | | — | | | | — | | | | 3,496 | | | | 9 | | | | 422 | | | | 2,328 | | |
| Reinvestment of distributions | | | — | | | | — | | | | 237 | | | | — | | | | 2 | | | | 191 | | |
| Payments for redemptions | | | — | | | | — | | | | (29,325 | ) | | | (1 | ) | | | (25 | ) | | | (21,497 | ) | |
| Increase (decrease) in net assets from Class R transactions | | | — | | | | — | | | | (25,592 | ) | | | 8 | | | | 399 | | | | (18,978 | ) | |
| Class Y: | |
| Proceeds from sales | | | 2,780 | | | | 38,526 | | | | 61,896 | | | | 4,504 | | | | 172,670 | | | | 300,945 | | |
| Reinvestment of distributions | | | — | | | | 4,180 | | | | 5,332 | | | | 233 | | | | 9,228 | | | | 9,109 | | |
| Payments for redemptions | | | (7,309 | ) | | | (96,953 | ) | | | (171,415 | ) | | | (23,083 | ) | | | (497,089 | ) | | | (316,521 | ) | |
| Decrease in net assets from Class Y transactions | | | (4,529 | ) | | | (54,247 | ) | | | (104,187 | ) | | | (18,346 | ) | | | (315,191 | ) | | | (6,467 | ) | |
| Decrease in net assets from capital share transactions | | | (6,421 | ) | | | (85,274 | ) | | | (123,862 | ) | | | (21,307 | ) | | | (346,740 | ) | | | (3,215 | ) | |
| Total increase (decrease) in net assets | | | (11,843 | ) | | | (33,158 | ) | | | (88,832 | ) | | | (43,544 | ) | | | (210,439 | ) | | | 150,518 | | |
| Net assets at beginning of period | | | 403,131 | | | | 436,289 | | | | 525,121 | | | | 1,421,543 | | | | 1,631,982 | | | | 1,481,464 | | |
| Net assets at end of period | | $ | 391,288 | | | $ | 403,131 | | | $ | 436,289 | | | $ | 1,377,999 | | | $ | 1,421,543 | | | $ | 1,631,982 | | |
Undistributed (distributions in excess of ) net investment
income at end of period | | $ | 634 | | | $ | 270 | | | $ | 89 | | | $ | 124 | | | $ | (1 | ) | | $ | (4,922 | ) | |
The accompanying notes are an integral part of the financial statements.
FIRST AMERICAN FUNDS Annual Report 2005
104
(This page has been left blank intentionally.)
Financial Highlights For a share outstanding throughout the indicated periods.
| | | Net Asset
Value
Beginning
of Period | | Net
Investment
Income | | Realized and
Unrealized
Gains
(Losses) on
Investments | | Distributions
from Net
Investment
Income | | Distributions
from Net
Realized Gains | | Net Asset
Value
End of
Period | | Total
Return (9) | |
| Balanced Fund (1) | | | |
| Class A | | | |
| | 2005 | (2) (3) | | $ | 11.43 | | | $ | 0.01 | | | $ | (0.17 | ) | | $ | — | | | $ | — | | | $ | 11.27 | | | | (1.40 | )% | |
| | 2005 | (3) (4) | | | 10.12 | | | | 0.15 | | | | 1.31 | | | | (0.15 | ) | | | — | | | | 11.43 | | | | 14.51 | | |
| | 2004 | (3) (4) | | | 9.47 | | | | 0.13 | | | | 0.66 | | | | (0.14 | ) | | | — | | | | 10.12 | | | | 8.39 | | |
| | 2003 | (4) | | | 8.38 | | | | 0.17 | | | | 1.08 | | | | (0.16 | ) | | | — | | | | 9.47 | | | | 14.98 | | |
| | 2002 | (3) (4) | | | 9.50 | | | | 0.20 | | | | (1.12 | ) | | | (0.20 | ) | | | — | | | | 8.38 | | | | (9.90 | ) | |
| | 2001 | (3) (5) | | | 13.83 | | | | 0.18 | | | | (2.24 | ) | | | (0.20 | ) | | | (2.07 | ) | | | 9.50 | | | | (17.03 | ) | |
| Class B | | | |
| | 2005 | (2) (3) | | $ | 11.34 | | | $ | — | | | $ | (0.16 | ) | | $ | — | | | $ | — | | | $ | 11.18 | | | | (1.41 | )% | |
| | 2005 | (3) (4) | | | 10.04 | | | | 0.07 | | | | 1.30 | | | | (0.07 | ) | | | — | | | | 11.34 | | | | 13.64 | | |
| | 2004 | (3) (4) | | | 9.41 | | | | 0.05 | | | | 0.65 | | | | (0.07 | ) | | | — | | | | 10.04 | | | | 7.46 | | |
| | 2003 | (4) | | | 8.32 | | | | 0.10 | | | | 1.08 | | | | (0.09 | ) | | | — | | | | 9.41 | | | | 14.25 | | |
| | 2002 | (3) (4) | | | 9.44 | | | | 0.13 | | | | (1.12 | ) | | | (0.13 | ) | | | — | | | | 8.32 | | | | (10.64 | ) | |
| | 2001 | (3) (5) | | | 13.75 | | | | 0.17 | | | | (2.29 | ) | | | (0.13 | ) | | | (2.06 | ) | | | 9.44 | | | | (17.64 | ) | |
| Class C | | | |
| | 2005 | (2) (3) | | $ | 11.38 | | | $ | — | | | $ | (0.16 | ) | | $ | — | | | $ | — | | | $ | 11.22 | | | | (1.41 | )% | |
| | 2005 | (3) (4) | | | 10.08 | | | | 0.07 | | | | 1.30 | | | | (0.07 | ) | | | — | | | | 11.38 | | | | 13.61 | | |
| | 2004 | (3) (4) | | | 9.44 | | | | 0.05 | | | | 0.66 | | | | (0.07 | ) | | | — | | | | 10.08 | | | | 7.53 | | |
| | 2003 | (4) | | | 8.35 | | | | 0.09 | | | | 1.10 | | | | (0.10 | ) | | | — | | | | 9.44 | | | | 14.24 | | |
| | 2002 | (3) (4) | | | 9.49 | | | | 0.13 | | | | (1.14 | ) | | | (0.13 | ) | | | — | | | | 8.35 | | | | (10.77 | ) | |
| | 2001 | (3) (6) | | | 9.29 | | | | — | | | | 0.20 | | | | — | | | | — | | | | 9.49 | | | | 2.15 | | |
| Class R (6) | | | |
| | 2005 | (2) (3) | | $ | 11.45 | | | $ | 0.01 | | | $ | (0.17 | ) | | $ | — | | | $ | — | | | $ | 11.29 | | | | (1.40 | )% | |
| | 2005 | (3) (4) | | | 10.14 | | | | 0.11 | | | | 1.32 | | | | (0.12 | ) | | | — | | | | 11.45 | | | | 14.16 | | |
| | 2004 | (3) (4) | | | 9.49 | | | | 0.14 | | | | 0.64 | | | | (0.13 | ) | | | — | | | | 10.14 | | | | 8.22 | | |
| | 2003 | (4) | | | 8.39 | | | | 0.15 | | | | 1.10 | | | | (0.15 | ) | | | — | | | | 9.49 | | | | 15.08 | | |
| | 2002 | (3) (4) | | | 9.50 | | | | 0.20 | | | | (1.12 | ) | | | (0.19 | ) | | | — | | | | 8.39 | | | | (9.90 | ) | |
| | 2001 | (3) (8) | | | 11.27 | | | | 0.18 | | | | (1.74 | ) | | | (0.21 | ) | | | — | | | | 9.50 | | | | (14.03 | ) | |
| Class Y | | | |
| | 2005 | (2) (3) | | $ | 11.46 | | | $ | 0.01 | | | $ | (0.16 | ) | | $ | — | | | $ | — | | | $ | 11.31 | | | | (1.31 | )% | |
| | 2005 | (3) (4) | | | 10.15 | | | | 0.17 | | | | 1.32 | | | | (0.18 | ) | | | — | | | | 11.46 | | | | 14.76 | | |
| | 2004 | (3) (4) | | | 9.50 | | | | 0.16 | | | | 0.66 | | | | (0.17 | ) | | | — | | | | 10.15 | | | | 8.62 | | |
| | 2003 | (4) | | | 8.40 | | | | 0.19 | | | | 1.09 | | | | (0.18 | ) | | | — | | | | 9.50 | | | | 15.35 | | |
| | 2002 | (3) (4) | | | 9.53 | | | | 0.23 | | | | (1.13 | ) | | | (0.23 | ) | | | — | | | | 8.40 | | | | (9.74 | ) | |
| | 2001 | (3) (5) | | | 13.87 | | | | 0.16 | | | | (2.20 | ) | | | (0.23 | ) | | | (2.07 | ) | | | 9.53 | | | | (16.84 | ) | |
(1) The financial highlights for the Balanced Fund as set forth herein include the historical financial highlights of the Firstar Balanced Growth Fund. The assets of the
Firstar Fund were acquired by the First American Balanced Fund on September 24, 2001. In connection with such acquisition, (i) Class A shares of the Firstar
Balanced Growth Fund were exchanged for Class A shares of the First American Balanced Fund, (ii) Firstar Class B shares were exchanged for Class B shares
of the First American Fund, (iii) Firstar Class Y shares were exchanged for Class S shares of the First American Fund, and (iv) Firstar Class Institutional shares
were exchanged for Class Y shares of the First American Fund.
(2) For the period October 1, 2005 to October 31, 2005. Effective October 1, 2005, the fund's fiscal year end was changed from September 30 to October 31. All ratios for the
period have been annualized, except total return and portfolio turnover.
(3) Per share data calculated using average shares outstanding method.
(4) For the period October 1 to September 30 in the year indicated.
(5) For the period November 1, 2000 to September 30, 2001. Effective in 2001, the fund's fiscal year end was changed from October 31 to September 30. All ratios for the
period have been annualized, except total return and portfolio turnover.
(6) For the period from September 24, 2001, when the class of shares was first offered, to September 30, 2001. All ratios for the period have been annualized,
except total return and portfolio turnover.
(7) Prior to July 1, 2004, Class R shares were named Class S shares.
(8) For the period from November 27, 2000, when the class of shares was first offered, to September 30, 2001. All ratios for the period have been annualized,
except total return and portfolio turnover.
(9) Total return does not include sales charges. Total return would have been lower had certain expenses not been waived.
The accompanying notes are an integral part of the financial statements.
FIRST AMERICAN FUNDS Annual Report 2005
106
| | | Net Assets
End of
Period (000) | | Ratio of
Expenses to
Average
Net Assets | | Ratio of Net
Investment
Income
to Average
Net Assets | | Ratio of
Expenses to
Average
Net Assets
(Excluding
Waivers) | | Ratio of Net
Investment
Income
to Average Net
Assets (Excluding
Waivers) | | Portfolio
Turnover
Rate | |
| Balanced Fund (1) | |
| Class A | |
| | 2005 | (2) (3) | | $ | 112,557 | | | | 1.10 | % | | | 0.90 | % | | | 1.21 | % | | | 0.79 | % | | | 12 | % | |
| | 2005 | (3) (4) | | | 114,388 | | | | 1.06 | | | | 1.35 | | | | 1.21 | | | | 1.20 | | | | 147 | | |
| | 2004 | (3) (4) | | | 119,292 | | | | 1.05 | | | | 1.27 | | | | 1.19 | | | | 1.13 | | | | 110 | | |
| | 2003 | (4) | | | 98,016 | | | | 1.05 | | | | 1.75 | | | | 1.23 | | | | 1.57 | | | | 156 | | |
| | 2002 | (3) (4) | | | 98,557 | | | | 1.05 | | | | 2.07 | | | | 1.23 | | | | 1.89 | | | | 79 | | |
| | 2001 | (3) (5) | | | 127,590 | | | | 1.22 | | | | 1.96 | | | | 1.28 | | | | 1.90 | | | | 54 | | |
| Class B | |
| | 2005 | (2) (3) | | $ | 19,409 | | | | 1.85 | % | | | 0.15 | % | | | 1.96 | % | | | 0.04 | % | | | 12 | % | |
| | 2005 | (3) (4) | | | 20,657 | | | | 1.81 | | | | 0.60 | | | | 1.96 | | | | 0.45 | | | | 147 | | |
| | 2004 | (3) (4) | | | 28,101 | | | | 1.80 | | | | 0.54 | | | | 1.94 | | | | 0.40 | | | | 110 | | |
| | 2003 | (4) | | | 33,015 | | | | 1.80 | | | | 1.00 | | | | 1.98 | | | | 0.82 | | | | 156 | | |
| | 2002 | (3) (4) | | | 35,641 | | | | 1.80 | | | | 1.32 | | | | 1.98 | | | | 1.14 | | | | 79 | | |
| | 2001 | (3) (5) | | | 47,150 | | | | 1.93 | | | | 1.22 | | | | 1.99 | | | | 1.16 | | | | 54 | | |
| Class C | |
| | 2005 | (2) (3) | | $ | 4,787 | | | | 1.85 | % | | | 0.15 | % | | | 1.96 | % | | | 0.04 | % | | | 12 | % | |
| | 2005 | (3) (4) | | | 5,528 | | | | 1.81 | | | | 0.60 | | | | 1.96 | | | | 0.45 | | | | 147 | | |
| | 2004 | (3) (4) | | | 5,890 | | | | 1.80 | | | | 0.55 | | | | 1.94 | | | | 0.41 | | | | 110 | | |
| | 2003 | (4) | | | 7,089 | | | | 1.80 | | | | 0.99 | | | | 1.98 | | | | 0.81 | | | | 156 | | |
| | 2002 | (3) (4) | | | 2,233 | | | | 1.80 | | | | 1.32 | | | | 1.98 | | | | 1.14 | | | | 79 | | |
| | 2001 | (3) (6) | | | 2,351 | | | | 0.94 | | | | 2.20 | | | | 0.94 | | | | 2.20 | | | | 54 | | |
| Class R (6) | |
| | 2005 | (2) (3) | | $ | 1 | | | | 1.35 | % | | | 0.65 | % | | | 1.61 | % | | | 0.39 | % | | | 12 | % | |
| | 2005 | (3) (4) | | | 1 | | | | 1.31 | | | | 1.06 | | | | 1.61 | | | | 0.76 | | | | 147 | | |
| | 2004 | (3) (4) | | | 1 | | | | 1.05 | | | | 1.39 | | | | 1.19 | | | | 1.25 | | | | 110 | | |
| | 2003 | (4) | | | 23,844 | | | | 1.05 | | | | 1.76 | | | | 1.23 | | | | 1.58 | | | | 156 | | |
| | 2002 | (3) (4) | | | 36,194 | | | | 1.05 | | | | 2.07 | | | | 1.23 | | | | 1.89 | | | | 79 | | |
| | 2001 | (3) (8) | | | 39,527 | | | | 1.22 | | | | 1.94 | | | | 1.28 | | | | 1.88 | | | | 54 | | |
| Class Y | |
| | 2005 | (2) (3) | | $ | 254,534 | | | | 0.85 | % | | | 1.15 | % | | | 0.96 | % | | | 1.04 | % | | | 12 | % | |
| | 2005 | (3) (4) | | | 262,557 | | | | 0.81 | | | | 1.60 | | | | 0.96 | | | | 1.45 | | | | 147 | | |
| | 2004 | (3) (4) | | | 283,005 | | | | 0.80 | | | | 1.55 | | | | 0.94 | | | | 1.41 | | | | 110 | | |
| | 2003 | (4) | | | 363,157 | | | | 0.80 | | | | 2.00 | | | | 0.98 | | | | 1.82 | | | | 156 | | |
| | 2002 | (3) (4) | | | 290,288 | | | | 0.80 | | | | 2.32 | | | | 0.98 | | | | 2.14 | | | | 79 | | |
| | 2001 | (3) (5) | | | 375,983 | | | | 0.97 | | | | 2.21 | | | | 1.04 | | | | 2.14 | | | | 54 | | |
FIRST AMERICAN FUNDS Annual Report 2005
107
Financial Highlights For a share outstanding throughout the indicated periods
| | | Net Asset
Value
Beginning
of Period | | Net
Investment
Income | | Realized and
Unrealized
Gains
(Losses) on
Investments | | Distributions
from Net
Investment
Income | | Distributions
from Net
Realized Gains | | Net Asset
Value
End of
Period | | Total
Return (6) | |
| Equity Income Fund (1) | | | |
| Class A | | | |
| | 2005 | (2) | | $ | 13.89 | | | $ | 0.01 | | | $ | (0.22 | ) | | $ | (0.01 | ) | | $ | — | | | $ | 13.67 | | | | (1.53 | )% | |
| | 2005 | (3) | | | 12.77 | | | | 0.20 | | | | 1.15 | | | | (0.22 | ) | | | (0.01 | ) | | | 13.89 | | | | 10.65 | | |
| | 2004 | (3) | | | 11.56 | | | | 0.18 | | | | 1.23 | | | | (0.20 | ) | | | — | | | | 12.77 | | | | 12.26 | | |
| | 2003 | (3) | | | 9.58 | | | | 0.18 | | | | 1.99 | | | | (0.19 | ) | | | — | | | | 11.56 | | | | 22.81 | | |
| | 2002 | (3) | | | 12.13 | | | | 0.16 | | | | (2.48 | ) | | | (0.19 | ) | | | (0.04 | ) | | | 9.58 | | | | (19.51 | ) | |
| | 2001 | (3) | | | 16.29 | | | | 0.29 | | | | (0.74 | ) | | | (0.32 | ) | | | (3.39 | ) | | | 12.13 | | | | (3.89 | ) | |
| Class B | | | |
| | 2005 | (2) | | $ | 13.79 | | | $ | — | | | $ | (0.22 | ) | | $ | — | | | $ | — | | | $ | 13.57 | | | | (1.60 | )% | |
| | 2005 | (3) | | | 12.68 | | | | 0.10 | | | | 1.14 | | | | (0.12 | ) | | | (0.01 | ) | | | 13.79 | | | | 9.86 | | |
| | 2004 | (3) | | | 11.49 | | | | 0.08 | | | | 1.22 | | | | (0.11 | ) | | | — | | | | 12.68 | | | | 11.37 | | |
| | 2003 | (3) | | | 9.52 | | | | 0.10 | | | | 1.98 | | | | (0.11 | ) | | | — | | | | 11.49 | | | | 21.97 | | |
| | 2002 | (3) | | | 12.07 | | | | 0.09 | | | | (2.49 | ) | | | (0.11 | ) | | | (0.04 | ) | | | 9.52 | | | | (20.10 | ) | |
| | 2001 | (3) | | | 16.24 | | | | 0.18 | | | | (0.75 | ) | | | (0.21 | ) | | | (3.39 | ) | | | 12.07 | | | | (4.64 | ) | |
| Class C | | | |
| | 2005 | (2) | | $ | 13.81 | | | $ | — | | | $ | (0.22 | ) | | $ | — | | | $ | — | | | $ | 13.59 | | | | (1.59 | )% | |
| | 2005 | (3) | | | 12.70 | | | | 0.11 | | | | 1.13 | | | | (0.12 | ) | | | (0.01 | ) | | | 13.81 | | | | 9.84 | | |
| | 2004 | (3) | | | 11.51 | | | | 0.08 | | | | 1.22 | | | | (0.11 | ) | | | — | | | | 12.70 | | | | 11.34 | | |
| | 2003 | (3) | | | 9.54 | | | | 0.10 | | | | 1.98 | | | | (0.11 | ) | | | — | | | | 11.51 | | | | 21.95 | | |
| | 2002 | (3) | | | 12.09 | | | | 0.10 | | | | (2.50 | ) | | | (0.11 | ) | | | (0.04 | ) | | | 9.54 | | | | (20.08 | ) | |
| | 2001 | (3) | | | 16.28 | | | | 0.18 | | | | (0.76 | ) | | | (0.22 | ) | | | (3.39 | ) | | | 12.09 | | | | (4.74 | ) | |
| Class R (4) | | | |
| | 2005 | (2) | | $ | 13.88 | | | $ | 0.01 | | | $ | (0.23 | ) | | $ | — | | | $ | — | | | $ | 13.66 | | | | (1.55 | )% | |
| | 2005 | (3) | | | 12.78 | | | | 0.11 | | | | 1.20 | | | | (0.20 | ) | | | (0.01 | ) | | | 13.88 | | | | 10.33 | | |
| | 2004 | (3) | | | 11.56 | | | | 0.19 | | | | 1.22 | | | | (0.19 | ) | | | — | | | | 12.78 | | | | 12.18 | | |
| | 2003 | (3) | | | 9.57 | | | | 0.19 | | | | 1.99 | | | | (0.19 | ) | | | — | | | | 11.56 | | | | 22.91 | | |
| | 2002 | (3) | | | 12.12 | | | | 0.15 | | | | (2.47 | ) | | | (0.19 | ) | | | (0.04 | ) | | | 9.57 | | | | (19.47 | ) | |
| | 2001 | (5) | | | 11.57 | | | | 0.01 | | | | 0.54 | | | | — | | | | — | | | | 12.12 | | | | 4.75 | | |
| Class Y | | | |
| | 2005 | (2) | | $ | 13.98 | | | $ | 0.01 | | | $ | (0.21 | ) | | $ | (0.01 | ) | | $ | (0.01 | ) | | $ | 13.76 | | | | (1.50 | )% | |
| | 2005 | (3) | | | 12.85 | | | | 0.24 | | | | 1.15 | | | | (0.25 | ) | | | (0.01 | ) | | | 13.98 | | | | 10.94 | | |
| | 2004 | (3) | | | 11.63 | | | | 0.21 | | | | 1.24 | | | | (0.23 | ) | | | — | | | | 12.85 | | | | 12.54 | | |
| | 2003 | (3) | | | 9.63 | | | | 0.21 | | | | 2.00 | | | | (0.21 | ) | | | — | | | | 11.63 | | | | 23.20 | | |
| | 2002 | (3) | | | 12.20 | | | | 0.21 | | | | (2.52 | ) | | | (0.22 | ) | | | (0.04 | ) | | | 9.63 | | | | (19.30 | ) | |
| | 2001 | (3) | | | 16.37 | | | | 0.33 | | | | (0.76 | ) | | | (0.35 | ) | | | (3.39 | ) | | | 12.20 | | | | (3.71 | ) | |
(1) Per share data calculated using average shares outstanding method.
(2) For the period October 1, 2005 to October 31, 2005. Effective October 1, 2005, the fund's fiscal year end was changed from September 30 to October 31. All ratios for the
period have been annualized, except total return and portfolio turnover.
(3) For the period October 1 to September 30 in the year indicated.
(4) Prior to July 1, 2004, Class R shares were named Class S shares, which had lower fees and expenses.
(5) For the period from September 24, 2001, when the class of shares was first offered, to September 30, 2001. All ratios for the period have been annualized,
except total return and portfolio turnover.
(6) Total return does not include sales charges. Total return would have been lower had certain expenses not been waived.
The accompanying notes are an integral part of the financial statements.
FIRST AMERICAN FUNDS Annual Report 2005
108
| | | Net Assets
End of
Period (000) | | Ratio of
Expenses to
Average
Net Assets | | Ratio of Net
Investment
Income
to Average
Net Assets | | Ratio of
Expenses to
Average
Net Assets
(Excluding
Waivers) | | Ratio of Net
Investment
Income
to Average Net
Assets (Excluding
Waivers) | | Portfolio
Turnover
Rate | |
| Equity Income Fund (1) | |
| Class A | |
| | 2005 | (2) | | $ | 171,998 | | | | 1.20 | % | | | 0.70 | % | | | 1.20 | % | | | 0.70 | % | | | — | % | |
| | 2005 | (3) | | | 176,878 | | | | 1.16 | | | | 1.51 | | | | 1.19 | | | | 1.48 | | | | 27 | | |
| | 2004 | (3) | | | 184,381 | | | | 1.15 | | | | 1.39 | | | | 1.19 | | | | 1.35 | | | | 12 | | |
| | 2003 | (3) | | | 144,282 | | | | 1.15 | | | | 1.70 | | | | 1.20 | | | | 1.65 | | | | 43 | | |
| | 2002 | (3) | | | 128,142 | | | | 1.15 | | | | 1.43 | | | | 1.20 | | | | 1.38 | | | | 38 | | |
| | 2001 | (3) | | | 24,557 | | | | 1.00 | | | | 1.97 | | | | 1.15 | | | | 1.82 | | | | 33 | | |
| Class B | |
| | 2005 | (2) | | $ | 21,003 | | | | 1.95 | % | | | (0.05 | )% | | | 1.95 | % | | | (0.05 | )% | | | — | % | |
| | 2005 | (3) | | | 21,639 | | | | 1.91 | | | | 0.78 | | | | 1.94 | | | | 0.75 | | | | 27 | | |
| | 2004 | (3) | | | 23,869 | | | | 1.90 | | | | 0.65 | | | | 1.94 | | | | 0.61 | | | | 12 | | |
| | 2003 | (3) | | | 22,156 | | | | 1.90 | | | | 0.95 | | | | 1.95 | | | | 0.90 | | | | 43 | | |
| | 2002 | (3) | | | 18,699 | | | | 1.90 | | | | 0.80 | | | | 1.95 | | | | 0.75 | | | | 38 | | |
| | 2001 | (3) | | | 11,516 | | | | 1.75 | | | | 1.20 | | | | 1.90 | | | | 1.05 | | | | 33 | | |
| Class C | |
| | 2005 | (2) | | $ | 15,313 | | | | 1.95 | % | | | (0.05 | )% | | | 1.95 | % | | | (0.05 | )% | | | — | % | |
| | 2005 | (3) | | | 16,128 | | | | 1.91 | | | | 0.79 | | | | 1.94 | | | | 0.76 | | | | 27 | | |
| | 2004 | (3) | | | 19,300 | | | | 1.90 | | | | 0.66 | | | | 1.94 | | | | 0.62 | | | | 12 | | |
| | 2003 | (3) | | | 19,386 | | | | 1.90 | | | | 0.95 | | | | 1.95 | | | | 0.90 | | | | 43 | | |
| | 2002 | (3) | | | 11,171 | | | | 1.90 | | | | 0.86 | | | | 1.95 | | | | 0.81 | | | | 38 | | |
| | 2001 | (3) | | | 8,028 | | | | 1.75 | | | | 1.20 | | | | 1.90 | | | | 1.05 | | | | 33 | | |
| Class R (4) | |
| | 2005 | (2) | | $ | 418 | | | | 1.45 | % | | | 0.45 | % | | | 1.60 | % | | | 0.30 | % | | | — | % | |
| | 2005 | (3) | | | 415 | | | | 1.41 | | | | 0.83 | | | | 1.59 | | | | 0.65 | | | | 27 | | |
| | 2004 | (3) | | | 1 | | | | 1.15 | | | | 1.52 | | | | 1.19 | | | | 1.48 | | | | 12 | | |
| | 2003 | (3) | | | 17,170 | | | | 1.15 | | | | 1.80 | | | | 1.20 | | | | 1.75 | | | | 43 | | |
| | 2002 | (3) | | | 36,522 | | | | 1.15 | | | | 1.34 | | | | 1.20 | | | | 1.29 | | | | 38 | | |
| | 2001 | (5) | | | 328 | | | | 1.23 | | | | 4.08 | | | | 1.42 | | | | 3.89 | | | | 33 | | |
| Class Y | |
| | 2005 | (2) | | $ | 1,169,267 | | | | 0.95 | % | | | 0.95 | % | | | 0.95 | % | | | 0.95 | % | | | — | % | |
| | 2005 | (3) | | | 1,206,483 | | | | 0.91 | | | | 1.80 | | | | 0.94 | | | | 1.77 | | | | 27 | | |
| | 2004 | (3) | | | 1,404,431 | | | | 0.90 | | | | 1.65 | | | | 0.94 | | | | 1.61 | | | | 12 | | |
| | 2003 | (3) | | | 1,278,470 | | | | 0.90 | | | | 1.95 | | | | 0.95 | | | | 1.90 | | | | 43 | | |
| | 2002 | (3) | | | 678,352 | | | | 0.90 | | | | 1.80 | | | | 0.95 | | | | 1.75 | | | | 38 | | |
| | 2001 | (3) | | | 267,361 | | | | 0.75 | | | | 2.21 | | | | 0.90 | | | | 2.06 | | | | 33 | | |
FIRST AMERICAN FUNDS Annual Report 2005
109
Notes to Financial Statements October 31, 2005
1 > Organization
The Real Estate Securities Fund, International Fund, Small Cap Growth Opportunities Fund, Small Cap Select Fund, Small Cap Value Fund, Small-Mid Cap Core Fund (named Technology Fund prior to October 3, 2005), Mid Cap Growth Opportunities Fund, Mid Cap Value Fund, Large Cap Growth Opportunities Fund, Large Cap Select Fund, Large Cap Value Fund, Balanced Fund and Equity Income Fund (each a "fund" and collectively, the "funds") are mutual funds offered by First American Investment Funds, Inc. ("FAIF"), which is a member of the First American Family of Funds. As of October 31, 2005, FAIF offered 38 funds, including the funds listed above. FAIF is registered under the Investment Company Act of 1940, as amended, as an open-end management investment company. FAIF's articles of incorporation permit the fund's board of directors to create additional funds in the future. Each fund other than Real Estate Securities Fund is a diversified op en-end management investment company. The Real Estate Securities Fund is a non-diversified open-end management investment company. Prior to October 3, 2005, Small-Mid Cap Core Fund had different investment strategies, was named Technology Fund and also was non-diversified. Non-diversified funds may invest a large component of their net assets in securities of relatively few issuers.
FAIF offers Class A, Class B, Class C, Class R, and Class Y shares. Prior to July 1, 2004, Class R shares were named Class S shares. Class A shares are sold with a front-end sales charge. Class B shares are subject to a contingent deferred sales charge for six years and automatically convert to Class A shares after eight years. Class C shares may be subject to a contingent deferred sales charge for 12 months, and will not convert to Class A shares. Class R shares have no sales charge and are offered only through certain tax-deferred retirement plans. Class Y shares have no sales charge and are offered only to qualifying institutional investors and certain other qualifying accounts. Class R shares are not offered by the Small-Mid Cap Core Fund.
The funds' prospectuses provide descriptions of each fund's investment objective, principal investment strategies and principal risks. All classes of shares of a fund have identical voting, dividend, liquidation and other rights, and the same terms and conditions, except that certain fees, including distribution and shareholder servicing fees, may differ among classes. Each class has exclusive voting rights on any matters relating to that class' servicing or distribution arrangements.
On June 22, 2005, the funds' board of directors approved a change in the funds' fiscal year end from September 30 to October 31, effective with the one month period ended October 31, 2005 (the "fiscal period").
2 > Summary of Significant Accounting Policies
The significant accounting policies followed by the funds are as follows:
SECURITY VALUATIONS – Security valuations for the funds' investments are furnished by one or more independent pricing services that have been approved by the funds' board of directors. Investments in equity securities that are traded on a national securities exchange (or reported on the Nasdaq national market system) are stated at the last quoted sales price if readily available for such securities on each business day. For securities traded on the Nasdaq national market system, the funds utilize the Nasdaq Official Closing Price which compares the last trade to the bid/ask range of a security. If the last trade falls within the bid/ask range, then that price will be the closing price. If the last trade is outside the bid/ask range, and falls above the ask, the ask will be the closing price. If the last trade is below the bid, the bid will be the closing price. Other equity securities traded in the over-the-counter market and listed equity securities for which no sale was reported on that date are stated at the last quoted bid price. Debt obligations exceeding 60 days to maturity are valued by an independent pricing service. The pricing service may employ methodologies that utilize actual market transactions, broker-dealer supplied valuations, or other formula-driven valuation techniques. These techniques generally consider such factors as yields or prices of bonds of comparable quality, type of issue, coupon, maturity, ratings and general market conditions. Securities for which prices are not available from an independent pricing service but where an active market exists are valued using market quotations obtained from one or more dealers that make markets in the securities or from a widely-used quotation system. When market quotations are not readily available, securities are valued at fair value as determined in good faith by procedures establish ed and approved by the funds' board of directors. Some of the factors which may be considered in determining fair value are fundamental analytical data relating to the investment; the nature and duration of any restrictions on disposition; trading in similar securities of the same issuer or comparable companies; information from broker-dealers; and an evaluation of the forces that influence the market in which
FIRST AMERICAN FUNDS Annual Report 2005
110
the securities are purchased and sold. If events occur that materially affect the value of securities (including non-U.S. securities) between the close of trading in those securities and the close of regular trading on the New York Stock Exchange, the securities will be valued at fair value. The International Fund is supplied with information from an unaffiliated third party with respect to the fair value of foreign securities. Price movements in futures contracts and American Depository Receipts, and various other indices, may be reviewed in the course of making a good faith determination of a security's fair value. The use of fair value pricing by a fund may cause the net asset value of its shares to differ significantly from the net asset value that would be calculated without regard to such considerations. As of October 31, 2005, Real Estate Securities Fund, Small Cap Growth Opportunities Fund, and Balanced Fund held fair va lued securities with a total value of $325,212, $0, and $16,709, respectively, or 0.1%, 0.0%, and 0.0% of total net assets, respectively. Debt obligations with 60 days or less remaining until maturity may be valued at their amortized cost, which approximates market value. Foreign securities are valued at the closing prices on the principal exchange on which they trade unless they are fair valued as described above. The prices for foreign securities are reported in local currency and converted to U.S. dollars using currency exchange rates. Exchange rates are provided daily by recognized independent pricing agents. Investments in open-end mutual funds are valued at the respective net asset value of each underlying fund on the valuation date.
SECURITY TRANSACTIONS AND INVESTMENT INCOME – For financial statement purposes, the funds record security transactions on the trade date of the security purchase or sale. Dividend income is recorded on the ex-dividend date. Interest income, including amortization of bond premium and discount, is recorded on an accrual basis. Security gains and losses are determined on the basis of identified cost, which is the same basis used for federal income-tax purposes.
DISTRIBUTIONS TO SHAREHOLDERS – Equity Income Fund and Large Cap Value Fund declare and pay income dividends monthly. Balanced Fund, Large Cap Select Fund, Mid Cap Value Fund and Real Estate Securities Fund declare and pay income dividends quarterly. Large Cap Growth Opportunities Fund, Mid Cap Growth Opportunites Fund, Small Cap Growth Opportunites Fund, Small Cap Select Fund, Small Cap Value Fund, Small-Mid Cap Core Fund and the International Fund declare and pay income dividends annually. Distributions are payable in cash or reinvested in additional shares of the funds. Any net realized capital gains on sales of a fund's securities are distributed to shareholders at least annually.
The Real Estate Securities Fund receives substantial distributions from holdings in real estate investment trusts ("REITs"). Distributions from REITs may be characterized as ordinary income, net capital gain, or a return of capital to the REIT shareholder. The proper characterization of REIT distributions is generally not known until after the end of each calendar year. As such, Real Estate Securities Fund must use estimates in reporting the character of its income and distributions for financial statement purposes. The actual character of distributions to fund shareholders will be reflected on the Form 1099 received by shareholders after the end of the calendar year. Due to the nature of REIT investments, a portion of the distributions received by a fund shareholder may represent a return of capital.
FEDERAL TAXES – Each fund is treated as a separate taxable entity. Each fund intends to continue to qualify as a regulated investment company as provided in Subchapter M of the Internal Revenue Code, as amended, and to distribute all taxable income, if any, to its shareholders. Accordingly, no provision for federal income taxes is required.
Net investment income and net realized gains (losses) may differ for financial statement and tax purposes because of temporary or permanent book/tax differences. These differences are primarily due to losses deferred due to wash sales, foreign currency gains and losses, investments in limited partnerships and REITs, and the "mark-to-market" of certain passive foreign investment companies ("PFICs") for tax purposes. To the extent these differences are permanent, reclassifications are made to the appropriate equity accounts in the period that the differences arise.
FIRST AMERICAN FUNDS Annual Report 2005
111
Notes to Financial Statements October 31, 2005
On the Statement of Assets and Liabilities the following reclassifications were made (000):
| Fund | | Accumulated
Net Realized
Gain (Loss) | | Undistributed
Net Investment
Income | | Portfolio
Capital | |
| Real Estate Securities Fund | | $ | 235 | | | $ | (235 | ) | | $ | — | | |
| International Fund | | | 3,174 | | | | (48 | ) | | | (3,126 | ) | |
| Small Cap Growth Opportunities Fund | | | (263 | ) | | | 263 | | | | — | | |
| Small Cap Select Fund | | | 8,519 | | | | 506 | | | | (9,025 | ) | |
| Small-Mid Cap Core Fund | | | 1,394 | | | | 52 | | | | (1,446 | ) | |
| Mid Cap Growth Opportunities Fund | | | 8,499 | | | | 729 | | | | (9,228 | ) | |
| Mid Cap Value Fund | | | (161 | ) | | | 161 | | | | — | | |
| Large Cap Growth Opportunities Fund | | | 21,644 | | | | 226 | | | | (21,870 | ) | |
| Large Cap Value Fund | | | (4 | ) | | | 4 | | | | — | | |
| Balanced Fund | | | (24 | ) | | | 24 | | | | — | | |
The character of distributions made during the period from net investment income or net realized gains may differ from its ultimate characterization for federal income tax purposes. In addition, due to the timing of dividend distributions, the fiscal period in which the amounts are distributed may differ from the period that the income or realized gains (losses) were recorded by the fund. The distributions paid during the fiscal period ended October 31, 2005 and the fiscal years ended September 30, 2005 and 2004, were characterized as follows (000):
| | | October 31, 2005 | |
| Fund | | Ordinary
Income | | Long Term
Gain | | Return
of Capital | | Total | |
| Large Cap Value Fund | | $ | 161 | | | $ | — | | | $ | — | | | $ | 161 | | |
| Equity Income Fund | | | 918 | | | | — | | | | — | | | | 918 | | |
| | | September 30, 2005 | |
| Fund | | Ordinary
Income | | Long Term
Gain | | Return
of Capital | | Total | |
| Real Estate Securities Fund | | $ | 17,941 | | | $ | 40,662 | | | $ | — | | | $ | 58,603 | | |
| International Fund | | | 10,214 | | | | — | | | | — | | | | 10,214 | | |
| Small Cap Growth Opportunities Fund | | | 12,908 | | | | 26,459 | | | | — | | | | 39,367 | | |
| Small Cap Select Fund | | | 62,270 | | | | 95,731 | | | | — | | | | 158,001 | | |
| Small Cap Value Fund | | | 9,040 | | | | 57,102 | | | | — | | | | 66,142 | | |
| Mid Cap Growth Opportunities Fund | | | 79,521 | | | | 115,577 | | | | — | | | | 195,098 | | |
| Mid Cap Value Fund | | | 3,756 | | | | — | | | | — | | | | 3,756 | | |
| Large Cap Growth Opportunities Fund | | | 2,288 | | | | — | | | | 757 | | | | 3,045 | | |
| Large Cap Select Fund | | | 4,919 | | | | 1,525 | | | | — | | | | 6,444 | | |
| Large Cap Value Fund | | | 11,191 | | | | — | | | | — | | | | 11,191 | | |
| Balanced Fund | | | 6,225 | | | | — | | | | — | | | | 6,225 | | |
| Equity Income Fund | | | 22,731 | | | | 8,129 | | | | — | | | | 30,860 | | |
FIRST AMERICAN FUNDS Annual Report 2005
112
| | | September 30, 2004 | |
| Fund | | Ordinary
Income | | Long Term
Gain | | Return
of Capital | | Total | |
| Real Estate Securities Fund | | $ | 17,709 | | | $ | 6,775 | | | $ | — | | | $ | 24,484 | | |
| International Fund | | | 8,820 | | | | — | | | | — | | | | 8,820 | | |
| Small Cap Growth Opportunities Fund | | | — | | | | 3,085 | | | | — | | | | 3,085 | | |
| Small Cap Select Fund | | | 62,602 | | | | 15,960 | | | | — | | | | 78,562 | | |
| Small Cap Value Fund | | | 6,941 | | | | 13,524 | | | | — | | | | 20,465 | | |
| Mid Cap Growth Opportunities Fund | | | 19,503 | | | | 21,278 | | | | — | | | | 40,781 | | |
| Mid Cap Value Fund | | | 2,102 | | | | — | | | | 57 | | | | 2,159 | | |
| Large Cap Growth Opportunities Fund | | | 1,184 | | | | — | | | | 261 | | | | 1,445 | | |
| Large Cap Select Fund | | | 2,504 | | | | 333 | | | | — | | | | 2,837 | | |
| Large Cap Value Fund | | | 12,705 | | | | — | | | | — | | | | 12,705 | | |
| Balanced Fund | | | 7,635 | | | | — | | | | — | | | | 7,635 | | |
| Equity Income Fund | | | 29,158 | | | | — | | | | — | | | | 29,158 | | |
As of October 31, 2005, the components of accumulated earnings (deficit) on a tax basis were as follows (000):
| Fund | | Undistributed
Ordinary
Income | | Undistributed
Long Term
Capital Gains | | Accumulated
Capital and
Post-October
Losses | | Unrealized
Appreciation/
(Depreciation) | | Other
Accumulated
Losses | | Total
Accumulated
Earnings
(Deficit) | |
| Real Estate Securities Fund | | $ | 27,040 | | | $ | 52,223 | | | $ | — | | | $ | 95,874 | | | $ | — | | | $ | 175,137 | | |
| International Fund | | | 18,401 | | | | — | | | | (67,315 | ) | | | 188,233 | | | | (33 | ) | | | 139,286 | | |
| Small Cap Growth Opportunities Fund | | | 47,283 | | | | 8,237 | | | | — | | | | 460 | | | | (52 | ) | | | 55,928 | | |
| Small Cap Select Fund | | | 50,757 | | | | 107,691 | | | | (38,883 | ) | | | 77,143 | | | | (180 | ) | | | 196,528 | | |
| Small Cap Value Fund | | | 9,967 | | | | 80,010 | | | | — | | | | 57,759 | | | | (107 | ) | | | 147,629 | | |
| Small-Mid Cap Core Fund | | | — | | | | — | | | | (455,395 | ) | | | (2,612 | ) | | | (62 | ) | | | (458,069 | ) | |
| Mid Cap Growth Opportunities Fund | | | 52,862 | | | | 104,609 | | | | (40,336 | ) | | | 253,990 | | | | — | | | | 371,125 | | |
| Mid Cap Value Fund | | | 247 | | | | 35,553 | | | | — | | | | 82,515 | | | | — | | | | 118,315 | | |
| Large Cap Growth Opportunities Fund | | | — | | | | — | | | | (111,594 | ) | | | 101,291 | | | | (1 | ) | | | (10,304 | ) | |
| Large Cap Select Fund | | | 8,129 | | | | 7,247 | | | | (680 | ) | | | 17,323 | | | | (23 | ) | | | 31,996 | | |
| Large Cap Value Fund | | | 851 | | | | 26,976 | | | | — | | | | 112,776 | | | | — | | | | 140,603 | | |
| Balanced Fund | | | 638 | | | | — | | | | (654 | ) | | | 28,417 | | | | (309 | ) | | | 28,092 | | |
| Equity Income Fund | | | 124 | | | | 7,683 | | | | (1,938 | ) | | | 288,861 | | | | — | | | | 294,730 | | |
The difference between book and tax basis unrealized appreciation (depreciation) is primarily due to the tax deferral of losses on wash sales and investments in limited partnerships and REITs, and the amount of gain (loss) recognized for tax purposes due to mark to market adjustments on open futures contracts and the mark to market for certain PFICs for tax purposes.
As of October 31, 2005, the following funds had capital loss carryforwards (000):
| | | Expiration Year | |
| Fund | | 2007 | | 2008 | | 2009 | | 2010 | | 2011 | | 2012 | | 2013 | | Total | |
| International Fund | | $ | 3,524 | | | $ | — | | | $ | 6,853 | | | $ | 56,938 | | | $ | — | | | $ | — | | | $ | — | | | $ | 67,315 | | |
| Small Cap Select Fund | | | — | | | | — | | | | 38,883 | | | | — | | | | — | | | | — | | | | — | | | | 38,883 | | |
| Small-Mid Cap Core Fund | | | 124 | | | | 9,840 | | | | 339,005 | | | | 102,106 | | | | 4,320 | | | | — | | | | — | | | | 455,395 | | |
| Mid Cap Growth Opportunities Fund | | | — | | | | — | | | | 40,336 | | | | — | | | | — | | | | — | | | | — | | | | 40,336 | | |
| Large Cap Growth Opportunities Fund | | | — | | | | — | | | | 108,204 | | | | — | | | | — | | | | — | | | | 3,390 | | | | 111,594 | | |
| Large Cap Select Fund | | | — | | | | — | | | | — | | | | — | | | | — | | | | — | | | | 680 | | | | 680 | | |
| Balanced Fund | | | — | | | | — | | | | — | | | | 41 | | | | — | | | | — | | | | 613 | | | | 654 | | |
| Equity Income Fund | | | — | | | | — | | | | — | | | | — | | | | — | | | | — | | | | 1,938 | | | | 1,938 | | |
In accordance with Section 382 of the Internal Revenue Code, utilization of all or a portion of the above capital loss carryovers is limited on an annual basis for International Fund, Large Cap Growth Opportunities Fund, Mid Cap Growth Opportunities Fund, Small Cap Select Fund, and Small-Mid Cap Core Fund to (000) $4,046, $24,385, $10,084, $9,721 and $1,524, respectively. For the short period ended October 31, 2005, this is further limited to a pro-rata portion of this amount.
FUTURES TRANSACTIONS – In order to gain exposure to or protect against changes in the market and to maintain sufficient liquidity to meet redemption requests, certain funds may enter into S&P stock index futures contracts and other stock index futures contracts. The Balanced Fund may also enter into interest rate index futures contracts.
FIRST AMERICAN FUNDS Annual Report 2005
113
Notes to Financial Statements October 31, 2005
Upon entering into a futures or currency contract, the fund is required to deposit cash or pledge U.S. Government securities in an amount equal to five percent of the purchase price indicated in the futures or currency contract (initial margin). Subsequent payments, which are dependent on the daily fluctuations in the value of the underlying security or securities, are made or received by the fund each day (daily variation margin) and are recorded as unrealized gains (losses) until the contract is closed. When the contract is closed, the fund records a realized gain (loss) equal to the difference between the proceeds from (or cost of) the closing transaction and the fund's basis in the contract.
Risks of entering into futures contracts, in general, include the possibility that there will not be a perfect price correlation between the futures contracts and the underlying securities. Second, it is possible that a lack of liquidity for futures contracts could exist, resulting in an inability to close a futures position prior to its maturity date. Third, the purchase of a futures contract involves the risk that a fund could lose more than the original margin deposit required to initiate a futures transaction. These contracts involve market risk in excess of the amount reflected in the fund's statement of assets and liabilities. Unrealized gains (losses) on outstanding positions in futures contracts held at the close of the year will be recognized as capital gains (losses) for federal income tax purposes.
OPTIONS TRANSACTIONS – The funds may utilize options in an attempt to manage market or business risk or enhance returns. When a call or put option is written, an amount equal to the premium received is recorded as a liability. The liability is marked-to-market daily to reflect the current market value of the option written. When a written option expires, a gain is realized in the amount of the premium originally received. If a closing purchase contract is entered into, a gain or loss is realized in the amount of the original premium less the cost of the closing transaction. If a written call option is exercised, a gain or loss is realized from the sale of the underlying security, and the proceeds from such sale are increased by the premium originally received. If a written put option is exercised, the amount of the premium originally received red uces the cost of the security which is purchased upon exercise of the option. At October 31, 2005, the funds held no outstanding written options.
Purchased options are recorded as investments and marked-to-market daily to reflect the current market value of the option contract. If a purchased option expires, a loss is realized in the amount of the cost of the option. If a closing transaction is entered into, a gain or loss is realized, to the extent that the proceeds from the sale are greater or less than the cost of the option. If a put option is exercised, a gain or loss is realized from the sale of the underlying security by adjusting the proceeds from such sale by the amount of the premium originally paid. If a call option is exercised, the cost of the security purchased upon exercise is increased by the premium originally paid.
FOREIGN CURRENCY TRANSLATION – The books and records of the International Fund relating to the fund's non-U.S. dollar denominated investments are maintained in U.S. dollars on the following basis:
• market value of investment securities, assets, and liabilities are translated at the current rate of exchange; and
• purchases and sales of investment securities, income, and expenses are translated at the relevant rates of exchange prevailing on the respective dates of such transactions.
The International Fund does not isolate the portion of gains and losses on investments in equity securities that is due to changes in the foreign exchange rates from that which is due to changes in market prices of equity securities.
The International Fund reports certain foreign currency-related transactions as components of realized gains for financial reporting purposes, whereas such components are treated as ordinary income for federal income tax purposes. At October 31, 2005, foreign currency holdings consisted of multiple denominations, primarily European Monetary Units and Australian Dollars.
FORWARD FOREIGN CURRENCY CONTRACTS – The International Fund may enter into forward foreign currency contracts as hedges against either specific transactions or fund positions. The aggregate principal amount of the contracts are not recorded because the International Fund intends to settle the contracts prior to delivery. All commitments are "marked-to-market" daily at the applicable foreign exchange rate, and any resulting unrealized gains or losses are recorded currently. The International Fund realizes gains or losses at the time the forward contracts are extinguished. Unrealized gains or losses on outstanding positions in forward foreign currency contracts held at the close of the period are recognized as ordinary income or loss for federal income tax purposes.
The use of forward foreign currency contracts does not eliminate fluctuations in the underlying prices of the
FIRST AMERICAN FUNDS Annual Report 2005
114
securities, but it does establish a rate of exchange that can be achieved in the future. Although forward foreign currency contracts limit the risk of loss due to a decline in the value of the hedged currency, they also limit a potential gain that might result should the value of the currency increase. These contracts involve market risk in excess of the amount reflected in the fund's statement of assets and liabilities. The face or contract amount in U.S. dollars reflects the total exposure the fund has in that particular currency contract. In addition, there could be exposure to risks (limited to the amount of unrealized gains) if the counterparties to the contracts are unable to meet the terms of their contracts. At October 31, 2005, the International Fund had no outstanding forward currency contracts.
SECURITIES PURCHASED ON A WHEN-ISSUED BASIS – Delivery and payment for securities that have been purchased by a fund on a forward-commitment or when-issued basis can take place up to a month or more after the transaction date. During this period, such securities are subject to market fluctuations and the portfolio maintains, in a segregated account with its custodian, assets with a market value equal to or greater than the amount of its purchase commitments. The purchase of securities on a when-issued or forward-commitment basis may increase the volatility of the fund's net asset value if the fund makes such purchases while remaining substantially fully invested. At October 31, 2005, the following fund had outstanding when-issued commitments (000):
| Fund | | Cost | | Segregated
Assets | |
| Balanced Fund | | $ | 5,060 | | | $ | 7,713 | | |
In connection with the ability to purchase securities on a when-issued basis, each fund may also enter into dollar rolls in which the fund sells securities purchased on a forward-commitment basis and simultaneously contracts with a counterparty to repurchase similar (same type, coupon, and maturity), but not identical securities on a specified future date. As an inducement for the fund to "roll over" its purchase commitments, the fund receives negotiated amounts in the form of reductions of the purchase price of the commitment. Dollar rolls are considered a form of leverage. At October 31, 2005, the funds did not have any dollar rolls.
ILLIQUID OR RESTRICTED SECURITIES – A security may be considered illiquid if it lacks a readily available market. Securities are generally considered liquid if they can be sold or disposed of in the ordinary course of business within seven days at approximately the price at which the security is valued by the fund. Illiquid securities may be valued under methods approved by the funds' board of directors as reflecting fair value. Each fund intends to invest no more than 15% of its net assets (determined at the time of purchase and reviewed periodically) in illiquid securities. Certain restricted securities may be considered illiquid. Restricted securities are often purchased in private placement transactions, are not registered under the Securities Act of 1933, and may have co ntractual restrictions on resale. Certain restricted securities eligible for resale to qualified institutional investors, including Rule 144A securities, are not subject to the limitation on a fund's investment in illiquid securities if they are determined to be liquid in accordance with procedures adopted by the funds' board of directors. At October 31, 2005, Real Estate Securities Fund, Small Cap Growth Opportunities Fund, and Balanced Fund had investments in illiquid securities with a total value of $325,212, $0, and $16,709, respectively, or 0.1%, 0.0%, and 0.0%, respectively, of total net assets.
Information concerning illiquid securities, including restricted securities considered to be illiquid, is as follows:
| Real Estate Securities Fund | |
| Security | | Shares | | Dates
Acquired | | Cost Basis
(000) | |
| Beacon Capital | | | 33,750 | | | 3/98 | | $ | 435 | | |
| Newcastle Investment Holdings | | | 35,000 | | | 6/98 | | | 153 | | |
| Small Cap Growth Opportunities Fund | |
| Security | | Shares | | Dates
Acquired | | Cost Basis
(000) | |
| Tridium, Class B | | | 278,500 | | | 4/99-8/99 | | $ | 1,524 | | |
| VideoPropulsion | | | 809,856 | | | 12/99 | | | — | * | |
* Rounds to zero.
| Balanced Fund | |
| Security | | Par (000) | | Dates
Acquired | | Cost Basis
(000) | |
| Duty Free International | | $ | 605 | | | | 1/99-11/02 | | | $ | 605 | | |
SECURITIES LENDING – In order to generate additional income, a fund may lend securities representing up to one-third of the value of its total assets (which includes collateral for securities on loan) to broker-dealers, banks, or other institutional borrowers of securities. Each fund's policy is to maintain collateral in the form of cash, U.S. Government securities, or other high-grade debt obligations equal to at least 100% of the value of securities loaned. The collateral is then "marked-to-market" daily until the securities are returned. As with other extensions
FIRST AMERICAN FUNDS Annual Report 2005
115
Notes to Financial Statements October 31, 2005
of credit, there may be risks of delay in recovery of the securities or even loss of rights in the collateral should the borrower of the security fail financially. As of October 31, 2005, cash collateral invested was as follows (000):
| | | Commercial
Paper | | Corporate
Obligations | | Repurchase
Agreements | | Money
Market Fund | | Other Short-Term
Securities | | Total | |
| Real Estate Securities Fund | | $ | 87,173 | | | $ | 90,136 | | | $ | 115,350 | | | $ | — | | | $ | 6,953 | | | $ | 299,612 | | |
| International Fund | | | — | | | | — | | | | — | | | | 289,800 | | | | — | | | | 289,800 | | |
| Small Cap Growth Opportunities Fund | | | 26,586 | | | | 27,490 | | | | 35,180 | | | | — | | | | 2,120 | | | | 91,376 | | |
| Small Cap Select Fund | | | 82,585 | | | | 85,392 | | | | 109,279 | | | | — | | | | 6,586 | | | | 283,842 | | |
| Small Cap Value Fund | | | 25,937 | | | | 26,819 | | | | 34,321 | | | | — | | | | 2,069 | | | | 89,146 | | |
| Small-Mid Cap Core Fund | | | 5,112 | | | | 5,286 | | | | 6,764 | | | | — | | | | 408 | | | | 17,570 | | |
| Mid Cap Growth Opportunities Fund | | | 177,194 | | | | 183,217 | | | | 234,469 | | | | — | | | | 14,133 | | | | 609,013 | | |
| Mid Cap Value Fund | | | 61,754 | | | | 63,853 | | | | 81,714 | | | | — | | | | 4,925 | | | | 212,246 | | |
| Large Cap Growth Opportunities Fund | | | 74,871 | | | | 77,416 | | | | 99,072 | | | | — | | | | 5,971 | | | | 257,330 | | |
| Large Cap Select Fund | | | 31,035 | | | | 32,089 | | | | 41,066 | | | | — | | | | 2,475 | | | | 106,665 | | |
| Large Cap Value Fund | | | 70,900 | | | | 73,310 | | | | 93,818 | | | | — | | | | 5,655 | | | | 243,683 | | |
| Balanced Fund | | | 35,018 | | | | 36,208 | | | | 46,336 | | | | — | | | | 2,793 | | | | 120,355 | | |
| Equity Income Fund | | | 100,831 | | | | 104,258 | | | | 133,422 | | | | — | | | | 8,042 | | | | 346,553 | | |
U.S. Bancorp Asset Management, Inc. ("USBAM") serves as the securities lending agent for the funds in transactions involving the lending of portfolio securities on behalf of the funds. USBAM acts as the securities lending agent pursuant to, and subject to compliance with conditions contained in, an exemptive order issued by the Securities and Exchange Commission ("SEC"). During the fiscal period ended October 31, 2005 and the fiscal year ended September 30, 2005, USBAM received fees equal to 35% of each fund's income from securities lending transactions. Effective January 1, 2006, such fees will be lowered to 32% of each fund's income from securities lending transactions. With respect to International Fund, a portion of this amount was paid to State Street Bank and Trust for acting as sub-lending agent. Fees paid to USBAM by the funds for the fiscal period ended October 31, 2005 and the fiscal year ended September 30, 2005, were as follows (000):
| Fund | | 10/31/05 | | 9/30/05 | |
| Real Estate Securities Fund | | $ | 11 | | | $ | 99 | | |
| International Fund | | | 26 | | | | 408 | | |
| Small Cap Growth Opportunities Fund | | | 11 | | | | 89 | | |
| Small Cap Select Fund | | | 12 | | | | 214 | | |
| Small Cap Value Fund | | | 3 | | | | 48 | | |
| Small-Mid Cap Core Fund | | | 1 | | | | 34 | | |
| Mid Cap Growth Opportunities Fund | | | 18 | | | | 269 | | |
| Mid Cap Value Fund | | | 7 | | | | 92 | | |
| Large Cap Growth Opportunities Fund | | | 9 | | | | 171 | | |
| Large Cap Select Fund | | | 3 | | | | 33 | | |
| Large Cap Value Fund | | | 9 | | | | 121 | | |
| Balanced Fund | | | 12 | | | | 80 | | |
| Equity Income Fund | | | 13 | | | | 159 | | |
SWAP AGREEMENTS – The Balanced fund may invest in swap agreements. A swap is an agreement to exchange the return generated by one instrument for the return generated by another instrument. The fund may enter into interest rate and credit default swap agreements to manage its exposure to interest rates and credit risk.
Interest rate swap agreements involve the exchange by the fund with another party of their respective commitments to pay or receive interest (e.g., an exchange of floating rate payments for fixed rate payments with respect to the notional amount of principal).
In a credit default swap, one party makes a stream of payments to another party in exchange for the right to receive a specified return in the event of a default by a specified issuer on its obligation (typically a corporate issue or sovereign issue of an emerging country). The fund may use credit default swaps to provide a measure of protection against defaults of sovereign issuers (i.e., to reduce risk where the fund owns an issuance of or otherwise has exposure to the sovereign issuer) or to take an active long or short position with respect to the likelihood of a particular issuer's default.
Swaps are marked to market daily based upon quotations from market makers and the change in value, if any, is recorded as unrealized gain or loss in the Statement of Operations. Payments received or made at the beginning of the measurement period are reflected on the Statement of Assets and Liabilities. A liquidation payment received or made at the termination of the swap is recorded as realized gain or loss in the Statement of Operations. Net periodic payments received by the fund are included as part of miscellaneous income on the Statement of Operations. Entering into these agreements involves, to varying degrees, elements of credit, market and documentation risk in excess of the amounts recognized on the Statement of Assets and Liabilities. Such risks involve the possibility that there will be no liquid market for these agreements, that
FIRST AMERICAN FUNDS Annual Report 2005
116
the counterparty to the agreements may default on its obligation to perform or disagree as to the meaning of contractual terms in the agreements, and that there may be unfavorable changes in interest rates.
SECURITY LITIGATION SETTLEMENTS – Income from settlement proceeds related to portfolio securities is recorded as an adjustment to realized or unrealized gains or losses. For the fiscal period ended October 31, 2005, Mid Cap Growth Opportunities Fund and Mid Cap Value Fund, received settlement proceeds of $20,447 and $8,035 respectively, as an adjustment to realized gains or losses for settlement proceeds related to securities no longer included in the portfolio. For the fiscal year ended September 30, 2005, Real Estate Securities Fund, Small Cap Growth Opportunities, Small Cap Select, Small-Mid Cap Core Fund, Mid Cap Growth Opportunities Fund, Large Cap Growth Opportunities Fund, Large Cap Value Fund, Balanced Fund and Equity Income Fund received settlement proceeds of $942, $1,063,765, $40,402, $84,326, $140,115, $72,577, $152,053, $31,571 and $ 25,533 respectively, as an adjustment to realized gains or losses for settlement proceeds related to securities no longer included in the portfolio.
EXPENSES – Expenses that are directly related to one of the funds are charged directly to that fund. Other operating expenses generally are allocated to the funds on the basis of relative net assets of all funds within the First American Family of Funds. Class specific expenses, such as distribution fees and servicing fees, are borne by that class. Income, other expenses, and realized and unrealized gains and losses of a fund are allocated to each respective class in proportion to the relative net assets of each class.
INTERFUND LENDING PROGRAM – Pursuant to an exemptive order issued by the SEC, the funds, along with other registered investment companies in the First American Family of Funds, may participate in an interfund lending program. This program provides an alternative credit facility allowing the funds to borrow from, or lend money to, other participating funds. The funds did not have any interfund lending transactions during the fiscal period ended October 31, 2005 and the fiscal year ended September 30, 2005.
DEFERRED COMPENSATION PLAN – Under a Deferred Compensation Plan (the "Plan"), non-interested directors of the First American Family of Funds may participate and elect to defer receipt of part or all of their annual compensation. Deferred amounts are treated as though equivalent dollar amounts had been invested in shares of selected open-end First American Funds as designated by the board of directors. All amounts in the Plan are 100% vested, and accounts under the Plan are obligations of the funds. Deferred amounts remain in the funds until distributed in accordance with the Plan.
USE OF ESTIMATES IN PREPARATION OF FINANCIAL STATEMENTS – The preparation of financial statements, in conformity with U.S. generally accepted accounting principles, requires management to make estimates and assumptions that affect the reported amount of net assets and liabilities and disclosure of contingent assets and liabilities at the date of the financial statements and the reported results of operations during the reporting period. Actual results could differ from those estimates.
3 > Fees and Expenses
INVESTMENT ADVISORY FEES – Pursuant to an investment advisory agreement (the "Agreement"), USBAM manages each fund's assets and furnishes related office facilities, equipment, research, and personnel. USBAM is a subsidiary of U.S. Bank National Association ("U.S. Bank"), which is in turn a subsidiary of U.S. Bancorp. The Agreement requires each fund to pay USBAM a monthly fee based upon average daily net assets. The annual fee for each fund is as follows:
| Fund | | Adivsory Fee
as a % of Average
Daily Net Assets | |
| Real Estate Securities Fund | | | 0.70 | % | |
| International Fund (1) | | | 1.00 | | |
| Small Cap Growth Opportunities Fund (2) | | | 1.00 | | |
| Small Cap Select Fund | | | 0.70 | | |
| Small Cap Value Fund | | | 0.70 | | |
| Small-Mid Cap Core Fund | | | 0.70 | | |
| Mid Cap Growth Opportunities Fund | | | 0.70 | | |
| Mid Cap Value Fund | | | 0.70 | | |
| Large Cap Growth Opportunities Fund (3) | | | 0.65 | | |
| Large Cap Select Fund (3) | | | 0.65 | | |
| Large Cap Value Fund (3) | | | 0.65 | | |
| Balanced Fund (3) | | | 0.65 | | |
| Equity Income Fund (3) | | | 0.65 | | |
(1) Effective July 1, 2005. Prior to July 1, 2005, the advisory fee paid to USBAM by International Fund was equal to a rate of 1.10% of the average daily net assets up to $1.5 billion, 1.05% of the average daily net assets on the next $1 billion, and 1.00% of the average daily net assets in excess of $2.5 billion.
(2) Effective July 1, 2005. Prior to July 1, 2005, the advisory fee paid to USBAM by Small Cap Growth Opportunities Fund was equal to a rate of 1.40% of the average daily net assets.
(3) The advisory fees paid by Large Cap Growth Opportunities Fund, Large Cap Select Fund, Large Cap Value Fund, Balanced Fund, and Equity Income Fund are equal to an annual rate of 0.65% of the average daily net assets up to $3 billion, 0.625% of the average daily net assets on the next $2 billion, and 0.60% of the average daily net assets in excess of $5 billion.
FIRST AMERICAN FUNDS Annual Report 2005
117
Notes to Financial Statements October 31, 2005
USBAM has agreed to waive fees and reimburse other fund expenses for certain funds through June 30, 2006, so that total fund operating expenses, as a percentage of average daily net assets, do not exceed the following amounts:
| | | Share Class | |
| Fund | | | A | | | | B | | | | C | | | | R | | | | Y | | |
| International Fund | | | 1.52 | % | | | 2.27 | % | | | 2.27 | % | | | 1.77 | % | | | 1.27 | % | |
Small Cap Growth
Opportunities Fund | | | 1.47 | | | | 2.22 | | | | 2.22 | | | | 1.72 | | | | 1.22 | | |
| Balanced Fund | | | 1.10 | | | | 1.85 | | | | 1.85 | | | | 1.35 | | | | 0.85 | | |
Prior to July 1, 2005, USBAM agreed to waive fees and reimburse other fund expenses so that total fund operating expenses, as a percentage of average daily net assets, did not exceed the following amounts:
| | | Share Class | |
| Fund | | | A | | | | B | | | | C | | | | R | | | | Y | | |
| Real Estate Securities Fund | | | 1.23 | % | | | 1.98 | % | | | 1.98 | % | | | 1.48 | % | | | 0.98 | % | |
| International Fund | | | 1.60 | | | | 2.35 | | | | 2.35 | | | | 1.85 | | | | 1.35 | | |
Small Cap Growth
Opportunities Fund | | | 1.93 | | | | 2.68 | | | | 2.68 | | | | 2.18 | | | | 1.68 | | |
| Small Cap Select Fund | | | 1.21 | | | | 1.96 | | | | 1.96 | | | | 1.46 | | | | 0.96 | | |
| Small Cap Value Fund | | | 1.23 | | | | 1.98 | | | | 1.98 | | | | 1.48 | | | | 0.98 | | |
| Small-Mid Cap Core Fund | | | 1.23 | | | | 1.98 | | | | 1.98 | | | | NA | | | | 0.98 | | |
Mid Cap Growth
Opportunities Fund | | | 1.20 | | | | 1.95 | | | | 1.95 | | | | 1.45 | | | | 0.95 | | |
| Mid Cap Value Fund | | | 1.20 | | | | 1.95 | | | | 1.95 | | | | 1.45 | | | | 0.95 | | |
Large Cap Growth
Opportunities Fund | | | 1.15 | | | | 1.90 | | | | 1.90 | | | | 1.40 | | | | 0.90 | | |
| Large Cap Select Fund | | | 1.15 | | | | 1.90 | | | | 1.90 | | | | 1.40 | | | | 0.90 | | |
| Large Cap Value Fund | | | 1.15 | | | | 1.90 | | | | 1.90 | | | | 1.40 | | | | 0.90 | | |
| Balanced Fund | | | 1.05 | | | | 1.80 | | | | 1.80 | | | | 1.30 | | | | 0.80 | | |
| Equity Income Fund | | | 1.15 | | | | 1.90 | | | | 1.90 | | | | 1.40 | | | | 0.90 | | |
NA = not applicable
The funds may invest in related money market funds that are series of First American Funds, Inc. ("FAF"), subject to certain limitations. In order to avoid the payment of duplicative investment advisory fees to USBAM, which acts as the investment advisor to both the investing funds and the related money market funds, USBAM will reimburse each investing fund an amount equal to that portion of USBAM's investment advisory fee received from the related money market funds that is attributable to the assets of the investing fund. For financial statement purposes, these reimbursements are recorded as investment income.
SUB-ADVISORY FEES – Since December 8, 2004, J.P. Morgan Investment Management Inc. ("J.P. Morgan") has served as investment sub-advisor to the International Fund, pursuant to a Sub-Advisory Agreement with USBAM. For its services under the Sub-Advisory Agreement with USBAM, J.P. Morgan is paid a monthly fee by USBAM calculated on an annual basis equal to 0.34% of the first $100 million of the fund's average daily net assets, 0.30% of the next $250 million of the fund's average daily net assets, 0.24% of the next $1,250 million of the fund's average daily net assets and 0.22% of the fund's average daily net assets in excess of $1,600 million.
Prior to December 8, 2004, Clay Finlay, Inc. ("Clay Finlay") served as investment sub-advisor to the International Fund. For its services under the Sub-Advisory Agreement with USBAM, Clay Finlay was paid a monthly fee by USBAM calculated on an annual basis equal to 0.25% of the first $500 million of the fund's average daily net assets and 0.10% of the fund's average daily net assets in excess of $500 million.
TRANSFER AGENT FEES – Effective July 1, 2005, U.S. Bancorp Fund Services, LLC ("USBFS"), a subsidiary of U.S. Bancorp, serves as the funds' transfer agent pursuant to a transfer agent and shareholder servicing agreement with FAIF. FAIF pays transfer agent fees of $18,500 per share class and additional per account fees for transfer agent services. These fees are allocated to each fund based upon the fund's pro rata share of the aggregate average daily net assets of the funds that comprise FAIF. Under the new transfer agent and shareholder servicing agreement, FAIF also pays USBFS a fee equal, on an annual basis, to 0.10% of each fund's average daily net assets. This fee compensates USBFS for providing certain shareholder services and reimburses USBFS for its payments to financial institutions that establish and maintain omnibus accounts and provid e customary services for such accounts. In addition to these fees, the funds reimburse USBFS for out-of-pocket expenses incurred in providing transfer agent services. Prior to July 1, 2005, these services were provided by USBFS pursuant to the co-administration agreement.
For the fiscal period ended October 31, 2005 and the fiscal year ended September 30, 2005, transfer agent fees paid under the transfer agent and shareholder servicing agreement to USBFS by the funds included in this annual report were as follows (000):
| Fund | | 10/31/05 | | 9/30/05 | |
| Real Estate Securities Fund | | $ | 74 | | | $ | 392 | | |
| International Fund | | | 181 | | | | 896 | | |
| Small Cap Growth Opportunities Fund | | | 35 | | | | 194 | | |
| Small Cap Select Fund | | | 94 | | | | 524 | | |
| Small Cap Value Fund | | | 47 | | | | 266 | | |
| Small-Mid Cap Core Fund | | | 8 | | | | 51 | | |
| Mid Cap Growth Opportunities Fund | | | 183 | | | | 929 | | |
| Mid Cap Value Fund | | | 77 | | | | 377 | | |
| Large Cap Growth Opportunities Fund | | | 112 | | | | 665 | | |
| Large Cap Select Fund | | | 39 | | | | 181 | | |
| Large Cap Value Fund | | | 101 | | | | 602 | | |
| Balanced Fund | | | 45 | | | | 257 | | |
| Equity Income Fund | | | 159 | | | | 945 | | |
FIRST AMERICAN FUNDS Annual Report 2005
118
ADMINISTRATION FEES – Effective July 1, 2005, USBAM serves as the funds' administrator pursuant to an administration agreement between USBAM and the funds. USBFS serves as sub-administrator pursuant to a sub-administration agreement between USBFS and USBAM. Under the administration agreement, USBAM is compensated to provide, or compensate other entities to provide, services to the funds. These services include various legal, oversight and administrative services and accounting services. Effective July 1, 2005, the funds pay USBAM administration fees which are calculated daily and paid monthly, equal to each fund's pro rata share of an amount equal, on an annual basis, to 0.15% of the aggregate average daily net assets of all open-end mutual funds in the First American Family of Funds, up to $8 billion, 0.135% on the next $17 billion of the aggreg ate average daily net assets, 0.12% on the next $25 billion of the aggregate average daily net assets, and 0.10% of the aggregate average daily net assets in excess of $50 billion. All fees paid to the sub-administrator are paid from the administration fee. In addition to these fees, the funds may reimburse USBAM and, indirectly, the sub-administrator for any out-of-pocket expenses incurred in providing administration services.
Prior to July 1, 2005, USBAM and USBFS served as "co-administrators" pursuant to a co-administration agreement between the co-administrators and the funds. The funds paid administration fees to the co-administrators, which were calculated daily and paid monthly, equal to each fund's pro rata share of an amount equal, on an annual basis, to 0.25% of the aggregate average daily net assets of all open-end mutual funds in the First American Family of Funds, up to $8 billion, 0.235% of the next $17 billion of the aggregate average daily assets, 0.22% of the next $25 billion of the aggregate average daily net assets, and 0.20% of the aggregate average daily net assets in excess of $50 billion. In addition, the funds paid transfer agent fees under the co-administration agreement of $18,500 per share class plus additional per account fees. In addition to these fees, the funds reimbursed the co-administrators for any out-of-pocket expens es incurred in providing administration services.
Administration fees paid by the funds included in this annual report to USBAM for the fiscal period ended October 31, 2005 and to USBAM and USBFS for the fiscal year ended September 30, 2005 were as follows (000):
| Fund | | 10/31/05 | | 9/30/05 | |
| Real Estate Securities Fund | | $ | 69 | | | $ | 1,224 | | |
| International Fund | | | 169 | | | | 2,820 | | |
| Small Cap Growth Opportunities Fund | | | 33 | | | | 637 | | |
| Small Cap Select Fund | | | 88 | | | | 1,743 | | |
| Small Cap Value Fund | | | 44 | | | | 870 | | |
| Small-Mid Cap Core Fund | | | 7 | | | | 175 | | |
| Mid Cap Growth Opportunities Fund | | | 171 | | | | 2,921 | | |
| Mid Cap Value Fund | | | 72 | | | | 1,154 | | |
| Large Cap Growth Opportunities Fund | | | 105 | | | | 2,368 | | |
| Large Cap Select Fund | | | 36 | | | | 588 | | |
| Large Cap Value Fund | | | 94 | | | | 2,120 | | |
| Balanced Fund | | | 42 | | | | 859 | | |
| Equity Income Fund | | | 149 | | | | 3,235 | | |
CUSTODIAN FEES – U.S. Bank serves as the funds' custodian pursuant to a custodian agreement with FAIF for all funds except the International Fund. Effective July 1, 2005, the fee for each fund (except the International Fund) was reduced from an annual rate of 0.01% of average daily net assets to an annual rate of 0.005% of average daily net assets. State Street Bank ("SSB") has served as International Fund's custodian since July 1, 2005, pursuant to a custodian agreement with the fund. International Fund pays SSB various asset-based fees and transaction charges based on the issuer's country. All fees are computed daily and paid monthly.
Effective July 1, 2005, the funds entered into an agreement with their custodians whereby interest earned on uninvested cash balances is used to reduce a portion of each fund's custodian expenses. For the fiscal period ended October 31, 2005 and the fiscal year ended September 30, 2005, custodian fees were not reduced as a result of interest earned. The International Fund has also entered into an agreement with its custodian to receive credits to reduce the amount of custody fees incurred. These credits are disclosed as "Expenses paid indirectly" in the Statement of Operations.
DISTRIBUTION AND SHAREHOLDER SERVICING FEES – Quasar Distributors LLC ("Quasar"), a subsidiary of U.S. Bancorp, serves as the distributor of the funds pursuant to a distribution agreement with FAIF. Under the distribution agreement, and pursuant to a plan adopted by each fund under rule 12b-1 of the Investment Company Act, each fund pays Quasar a monthly distribution and/or shareholder servicing fee equal to an annual rate of 0.25%, 1.00%, 1.00% and 0.50% of each fund's average daily net
FIRST AMERICAN FUNDS Annual Report 2005
119
Notes to Financial Statements October 31, 2005
assets of the Class A shares, Class B shares, Class C shares, and Class R shares, respectively. No distribution or shareholder servicing fees are paid by Class Y shares. These fees may be used by Quasar to provide compensation for sales support, distribution activities, or shareholder servicing activities.
FAIF has also adopted and entered into a shareholder servicing plan and agreement with USBAM with respect to the Class R shares. Each fund, except Small-Mid Cap Core Fund, pays USBAM a monthly shareholder servicing fee equal to an annual rate of 0.15% of each fund's average daily net assets of the Class R shares. USBAM is currently waiving all fees under this plan and agreement. This waiver may be discontinued at any time.
Under these distribution and shareholder servicing agreements, the following amounts were retained by Quasar for the fiscal period ended October 31, 2005 and the fiscal year ended September 30, 2005 (000):
| Fund | | 10/31/05 | | 9/30/05 | |
| Real Estate Securities Fund | | $ | 13 | | | $ | 97 | | |
| International Fund | | | 10 | | | | 85 | | |
| Small Cap Growth Opportunities Fund | | | 9 | | | | 191 | | |
| Small Cap Select Fund | | | 24 | | | | 269 | | |
| Small Cap Value Fund | | | 10 | | | | 106 | | |
| Small-Mid Cap Core Fund | | | 5 | | | | 65 | | |
| Mid Cap Growth Opportunities Fund | | | 42 | | | | 479 | | |
| Mid Cap Value Fund | | | 12 | | | | 88 | | |
| Large Cap Growth Opportunities Fund | | | 25 | | | | 272 | | |
| Large Cap Select Fund | | | 1 | | | | 8 | | |
| Large Cap Value Fund | | | 21 | | | | 238 | | |
| Balanced Fund | | | 27 | | | | 347 | | |
| Equity Income Fund | | | 46 | | | | 525 | | |
OTHER FEES AND EXPENSES – In addition to the investment advisory fees, custodian fees, distribution and shareholder servicing fees, transfer agent fees and administration fees, each fund is responsible for paying other operating expenses, including: fees and expenses of independent directors, registration fees, postage and printing of shareholder reports, legal, auditing, insurance, and other miscellaneous expenses. For the fiscal period ended October 31, 2005 and the fiscal year ended September 30, 2005, legal fees and expenses were paid to a law firm of which an Assistant Secretary of the funds is a partner.
CONTINGENT DEFERRED SALES CHARGES – A contingent deferred sales charge ("CDSC") is imposed on redemptions made in the Class B shares. The CDSC varies depending on the number of years from time of payment for the purchase of Class B shares until the redemption of such shares.
Class B shares automatically convert to Class A shares after eight years.
| Year Since Purchase | | CDSC as a
Percentage of Dollar
Amount Subject to Charge | |
| First | | | 5.00 | % | |
| Second | | | 5.00 | | |
| Third | | | 4.00 | | |
| Fourth | | | 3.00 | | |
| Fifth | | | 2.00 | | |
| Sixth | | | 1.00 | | |
| Seventh | | | — | | |
| Eighth | | | — | | |
A CDSC of 1.00% is imposed on redemptions made in Class C shares for the first twelve months.
The CDSC for Class B shares and Class C shares is imposed on the value of the purchased shares or the value at the time of redemption, whichever is less.
For the fiscal period ended October 31, 2005 and the fiscal year ended September 30, 2005, total front-end sales charges and CDSCs retained by affiliates of USBAM for distributing the funds' shares were as follows (000):
| Fund | | 10/31/05 | | 9/30/05 | |
| Real Estate Securities Fund | | $ | 6 | | | $ | 218 | | |
| International Fund | | | 6 | | | | 76 | | |
| Small Cap Growth Opportunities Fund | | | 6 | | | | 109 | | |
| Small Cap Select Fund | | | 12 | | | | 205 | | |
| Small Cap Value Fund | | | 8 | | | | 86 | | |
| Small-Mid Cap Core Fund | | | 2 | | | | 36 | | |
| Mid Cap Growth Opportunities Fund | | | 25 | | | | 375 | | |
| Mid Cap Value Fund | | | 16 | | | | 165 | | |
| Large Cap Growth Opportunities Fund | | | 8 | | | | 164 | | |
| Large Cap Select Fund | | | 6 | | | | 34 | | |
| Large Cap Value Fund | | | 10 | | | | 104 | | |
| Balanced Fund | | | 7 | | | | 156 | | |
| Equity Income Fund | | | 17 | | | | 406 | | |
FIRST AMERICAN FUNDS Annual Report 2005
120
4 > Capital Share Transactions
FAIF has 324 billion shares of $0.0001 par value capital stock authorized. Capital share transactions for the funds were as follows (000):
| | | Real Estate
Securities Fund | | International
Fund | | Small Cap Growth
Opportunities Fund | |
| | | One-Month
Period Ended
10/31/05 | | Year
Ended
9/30/05 | | Year
Ended
9/30/04 | | One-Month
Period Ended
10/31/05 | | Year
Ended
9/30/05 | | Year
Ended
9/30/04 | | One-Month
Period Ended
10/31/05 | | Year
Ended
9/30/05 | | Year
Ended
9/30/04 | |
| Class A: | |
| Shares issued | | | 136 | | | | 2,268 | | | | 2,885 | | | | 116 | | | | 900 | | | | 1,986 | | | | 41 | | | | 805 | | | | 3,228 | | |
| Shares issued in lieu of cash distributions | | | — | | | | 504 | | | | 192 | | | | 0 | | | | 23 | | | | 20 | | | | — | | | | 553 | | | | 25 | | |
| Shares redeemed | | | (136 | ) | | | (1,219 | ) | | | (640 | ) | | | (73 | ) | | | (1,335 | ) | | | (1,969 | ) | | | (163 | ) | | | (2,445 | ) | | | (2,342 | ) | |
| Total Class A transactions | | | — | | | | 1,553 | | | | 2,437 | | | | 43 | | | | (412 | ) | | | 37 | | | | (122 | ) | | | (1,087 | ) | | | 911 | | |
| Class B: | |
| Shares issued | | | 3 | | | | 57 | | | | 64 | | | | 13 | | | | 56 | | | | 64 | | | | 1 | | | | 28 | | | | 251 | | |
| Shares issued in lieu of cash distributions | �� | | — | | | | 19 | | | | 14 | | | | 0 | | | | — | | | | 1 | | | | — | | | | 57 | | | | 2 | | |
| Shares redeemed | | | (12 | ) | | | (98 | ) | | | (63 | ) | | | (18 | ) | | | (235 | ) | | | (234 | ) | | | (7 | ) | | | (130 | ) | | | (121 | ) | |
| Total Class B transactions | | | (9 | ) | | | (22 | ) | | | 15 | | | | (5 | ) | | | (179 | ) | | | (169 | ) | | | (6 | ) | | | (45 | ) | | | 132 | | |
| Class C: | |
| Shares issued | | | 3 | | | | 75 | | | | 104 | | | | 2 | | | | 70 | | | | 87 | | | | 1 | | | | 23 | | | | 191 | | |
| Shares issued in lieu of cash distributions | | | — | | | | 20 | | | | 14 | | | | 0 | | | | — | | | | 1 | | | | — | | | | 27 | | | | — | | |
| Shares redeemed | | | (12 | ) | | | (96 | ) | | | (91 | ) | | | (23 | ) | | | (269 | ) | | | (422 | ) | | | (4 | ) | | | (132 | ) | | | (43 | ) | |
| Total Class C transactions | | | (9 | ) | | | (1 | ) | | | 27 | | | | (21 | ) | | | (199 | ) | | | (334 | ) | | | (3 | ) | | | (82 | ) | | | 148 | | |
| Class R: | |
| Shares issued | | | 1 | | | | 3 | | | | 75 | | | | 0 | | | | 35 | | | | 135 | | | | — | | | | 1 | | | | 39 | | |
| Shares issued in lieu of cash distributions | | | — | | | | — | | | | 8 | | | | 0 | | | | — | | | | 4 | | | | — | | | | — | | | | 1 | | |
| Shares redeemed | | | — | | | | (1 | ) | | | (241 | ) | | | (13 | ) | | | (22 | ) | | | (1,090 | ) | | | — | | | | (1 | ) | | | (208 | ) | |
| Total Class R transactions | | | 1 | | | | 2 | | | | (158 | ) | | | (13 | ) | | | 13 | | | | (951 | ) | | | — | | | | — | | | | (168 | ) | |
| Class Y: | |
| Shares issued | | | 283 | | | | 6,209 | | | | 13,274 | | | | 2,883 | | | | 28,181 | | | | 31,294 | | | | 143 | | | | 1,632 | | | | 4,004 | | |
| Shares issued in lieu of cash distributions | | | — | | | | 1,073 | | | | 499 | | | | 0 | | | | 542 | | | | 526 | | | | — | | | | 839 | | | | 79 | | |
| Shares redeemed | | | (811 | ) | | | (5,485 | ) | | | (3,750 | ) | | | (1,081 | ) | | | (16,895 | ) | | | (29,700 | ) | | | (190 | ) | | | (3,522 | ) | | | (10,975 | ) | |
| Total Class Y transactions | | | (528 | ) | | | 1,797 | | | | 10,023 | | | | 1,802 | | | | 11,828 | | | | 2,120 | | | | (47 | ) | | | (1,051 | ) | | | (6,892 | ) | |
| Net increase (decrease) in capital shares | | | (545 | ) | | | 3,329 | | | | 12,344 | | | | 1,806 | | | | 11,051 | | | | 703 | | | | (178 | ) | | | (2,265 | ) | | | (5,869 | ) | |
FIRST AMERICAN FUNDS Annual Report 2005
121
Notes to Financial Statements October 31, 2005
| | | Small Cap
Select Fund | | Small Cap
Value Fund | | Small-Mid Cap Core
Fund | |
| | | One-Month
Period Ended
10/31/05 | | Year
Ended
9/30/05 | | Year
Ended
9/30/04 | | One-Month
Period Ended
10/31/05 | | Year
Ended
9/30/05 | | Year
Ended
9/30/04 | | One-Month
Period Ended
10/31/05 | | Year
Ended
9/30/05 | | Year
Ended
9/30/04 | |
| Class A: | |
| Shares issued | | | 151 | | | | 1,586 | | | | 2,909 | | | | 34 | | | | 526 | | | | 1,192 | | | | 97 | | | | 653 | | | | 2,255 | | |
| Shares issued in lieu of cash distributions | | | — | | | | 1,274 | | | | 352 | | | | — | | | | 432 | | | | 100 | | | | — | | | | — | | | | — | | |
| Shares redeemed | | | (109 | ) | | | (2,207 | ) | | | (2,193 | ) | | | (57 | ) | | | (656 | ) | | | (997 | ) | | | (85 | ) | | | (1,583 | ) | | | (2,520 | ) | |
| Total Class A transactions | | | 42 | | | | 653 | | | | 1,068 | | | | (23 | ) | | | 302 | | | | 295 | | | | 12 | | | | (930 | ) | | | (265 | ) | |
| Class B: | |
| Shares issued | | | 2 | | | | 118 | | | | 146 | | | | 2 | | | | 57 | | | | 77 | | | | 3 | | | | 64 | | | | 123 | | |
| Shares issued in lieu of cash distributions | | | — | | | | 206 | | | | 65 | | | | — | | | | 104 | | | | 34 | | | | — | | | | — | | | | — | | |
| Shares redeemed | | | (15 | ) | | | (221 | ) | | | (174 | ) | | | (13 | ) | | | (185 | ) | | | (413 | ) | | | (40 | ) | | | (655 | ) | | | (616 | ) | |
| Total Class B transactions | | | (13 | ) | | | 103 | | | | 37 | | | | (11 | ) | | | (24 | ) | | | (302 | ) | | | (37 | ) | | | (591 | ) | | | (493 | ) | |
| Class C: | |
| Shares issued | | | 12 | | | | 229 | | | | 251 | | | | 2 | | | | 60 | | | | 77 | | | | 7 | | | | 52 | | | | 119 | | |
| Shares issued in lieu of cash distributions | | | — | | | | 192 | | | | 56 | | | | — | | | | 50 | | | | 13 | | | | — | | | | — | | | | — | | |
| Shares redeemed | | | (47 | ) | | | (364 | ) | | | (197 | ) | | | (8 | ) | | | (93 | ) | | | (120 | ) | | | (17 | ) | | | (329 | ) | | | (308 | ) | |
| Total Class C transactions | | | (35 | ) | | | 57 | | | | 110 | | | | (6 | ) | | | 17 | | | | (30 | ) | | | (10 | ) | | | (277 | ) | | | (189 | ) | |
| Class R: | |
| Shares issued | | | 8 | | | | 22 | | | | 208 | | | | — | | | | — | | | | 72 | | | | — | | | | — | | | | 138 | | |
| Shares issued in lieu of cash distributions | | | — | | | | 1 | | | | 55 | | | | — | | | | — | | | | 3 | | | | — | | | | — | | | | — | | |
| Shares redeemed | | | (6 | ) | | | (4 | ) | | | (1,065 | ) | | | — | | | | — | | | | (170 | ) | | | — | | | | — | | | | (697 | ) | |
| Total Class R transactions | | | 2 | | | | 19 | | | | (802 | ) | | | — | | | | — | | | | (95 | ) | | | — | | | | — | | | | (559 | ) | |
| Class Y: | |
| Shares issued | | | 233 | | | | 6,525 | | | | 8,030 | | | | 175 | | | | 3,781 | | | | 3,675 | | | | 140 | | | | 2,087 | | | | 3,912 | | |
| Shares issued in lieu of cash distributions | | | — | | | | 6,437 | | | | 3,768 | | | | — | | | | 3,016 | | | | 1,045 | | | | — | | | | — | | | | — | | |
| Shares redeemed | | | (934 | ) | | | (16,385 | ) | | | (33,562 | ) | | | (509 | ) | | | (7,079 | ) | | | (12,846 | ) | | | (264 | ) | | | (3,915 | ) | | | (6,414 | ) | |
| Total Class Y transactions | | | (701 | ) | | | (3,423 | ) | | | (21,764 | ) | | | (334 | ) | | | (282 | ) | | | (8,126 | ) | | | (124 | ) | | | (1,828 | ) | | | (2,502 | ) | |
| Net increase (decrease) in capital shares | | | (705 | ) | | | (2,591 | ) | | | (21,351 | ) | | | (374 | ) | | | 13 | | | | (8,258 | ) | | | (159 | ) | | | (3,626 | ) | | | (4,008 | ) | |
| | | Mid Cap Growth
Opportunities Fund | | Mid Cap
Value Fund | | Large Cap Growth
Opportunities Fund | |
| | | One-Month
Period Ended
10/31/05 | | Year
Ended
9/30/05 | | Year
Ended
9/30/04 | | One-Month
Period Ended
10/31/05 | | Year
Ended
9/30/05 | | Year
Ended
9/30/04 | | One-Month
Period Ended
10/31/05 | | Year
Ended
9/30/05 | | Year
Ended
9/30/04 | |
| Class A: | |
| Shares issued | | | 176 | | | | 3,556 | | | | 778 | | | | 186 | | | | 1,266 | | | | 682 | | | | 34 | | | | 565 | | | | 1,608 | | |
| Shares issued in lieu of cash distributions | | | — | | | | 683 | | | | 135 | | | | — | | | | 7 | | | | 4 | | | | — | | | | 8 | | | | 2 | | |
| Shares redeemed | | | (106 | ) | | | (1,128 | ) | | | (959 | ) | | | (37 | ) | | | (510 | ) | | | (282 | ) | | | (89 | ) | | | (1,246 | ) | | | (1,201 | ) | |
| Total Class A transactions | | | 70 | | | | 3,111 | | | | (46 | ) | | | 149 | | | | 763 | | | | 404 | | | | (55 | ) | | | (673 | ) | | | 409 | | |
| Class B: | |
| Shares issued | | | 3 | | | | 90 | | | | 65 | | | | 4 | | | | 91 | | | | 57 | | | | 2 | | | | 45 | | | | 89 | | |
| Shares issued in lieu of cash distributions | | | — | | | | 49 | | | | 9 | | | | — | | | | — | | | | — | | | | — | | | | 1 | | | | — | | |
| Shares redeemed | | | (4 | ) | | | (58 | ) | | | (51 | ) | | | (28 | ) | | | (179 | ) | | | (188 | ) | | | (22 | ) | | | (356 | ) | | | (735 | ) | |
| Total Class B transactions | | | (1 | ) | | | 81 | | | | 23 | | | | (24 | ) | | | (88 | ) | | | (131 | ) | | | (20 | ) | | | (310 | ) | | | (646 | ) | |
| Class C: | |
| Shares issued | | | 11 | | | | 182 | | | | 48 | | | | 19 | | | | 179 | | | | 64 | | | | 2 | | | | 45 | | | | 57 | | |
| Shares issued in lieu of cash distributions | | | — | | | | 54 | | | | 11 | | | | — | | | | — | | | | — | | | | — | | | | — | | | | — | | |
| Shares redeemed | | | (44 | ) | | | (142 | ) | | | (110 | ) | | | (7 | ) | | | (44 | ) | | | (76 | ) | | | (14 | ) | | | (160 | ) | | | (216 | ) | |
| Total Class C transactions | | | (33 | ) | | | 94 | | | | (51 | ) | | | 12 | | | | 135 | | | | (12 | ) | | | (12 | ) | | | (115 | ) | | | (159 | ) | |
| Class R: | |
| Shares issued | | | 4 | | | | 145 | | | | 27 | | | | 18 | | | | 15 | | | | 41 | | | | 1 | | | | 10 | | | | 72 | | |
| Shares issued in lieu of cash distributions | | | — | | | | — | | | | 8 | | | | — | | | | — | | | | — | | | | — | | | | — | | | | — | | |
| Shares redeemed | | | (2 | ) | | | (12 | ) | | | (341 | ) | | | — | | | | — | | | | (100 | ) | | | — | | | | — | | | | (767 | ) | |
| Total Class R transactions | | | 2 | | | | 133 | | | | (306 | ) | | | 18 | | | | 15 | | | | (59 | ) | | | 1 | | | | 10 | | | | (695 | ) | |
| Class Y: | |
| Shares issued | | | 228 | | | | 5,339 | | | | 3,700 | | | | 271 | | | | 6,771 | | | | 5,379 | | | | 501 | | | | 6,018 | | | | 12,178 | | |
| Shares issued in lieu of cash distributions | | | — | | | | 3,346 | | | | 810 | | | | — | | | | 99 | | | | 77 | | | | — | | | | 59 | | | | 29 | | |
| Shares redeemed | | | (489 | ) | | | (8,873 | ) | | | (8,163 | ) | | | (357 | ) | | | (3,514 | ) | | | (4,252 | ) | | | (350 | ) | | | (22,930 | ) | | | (11,718 | ) | |
| Total Class Y transactions | | | (261 | ) | | | (188 | ) | | | (3,653 | ) | | | (86 | ) | | | 3,356 | | | | 1,204 | | | | 151 | | | | (16,853 | ) | | | 489 | | |
| Net increase (decrease) in capital shares | | | (223 | ) | | | 3,231 | | | | (4,033 | ) | | | 69 | | | | 4,181 | | | | 1,406 | | | | 65 | | | | (17,941 | ) | | | (602 | ) | |
FIRST AMERICAN FUNDS Annual Report 2005
122
| | | Large Cap
Select Fund | | Large Cap
Value Fund | | Balanced
Fund | |
| | | One-Month
Period Ended
10/31/05 | | Year
Ended
9/30/05 | | Year
Ended
9/30/04 | | One-Month
Period Ended
10/31/05 | | Year
Ended
9/30/05 | | Year
Ended
9/30/04 | | One-Month
Period Ended
10/31/05 | | Year
Ended
9/30/05 | | Year
Ended
9/30/04 | |
| Class A: | |
| Shares issued | | | 35 | | | | 334 | | | | 78 | | | | 53 | | | | 935 | | | | 2,249 | | | | 120 | | | | 1,220 | | | | 3,334 | | |
| Shares issued in lieu of cash distributions | | | — | | | | 1 | | | | — | | | | — | | | | 54 | | | | 53 | | | | — | | | | 145 | | | | 148 | | |
| Shares redeemed | | | (4 | ) | | | (26 | ) | | | (40 | ) | | | (71 | ) | | | (1,521 | ) | | | (1,580 | ) | | | (146 | ) | | | (3,146 | ) | | | (2,038 | ) | |
| Total Class A transactions | | | 31 | | | | 309 | | | | 38 | | | | (18 | ) | | | (532 | ) | | | 722 | | | | (26 | ) | | | (1,781 | ) | | | 1,444 | | |
| Class B: | |
| Shares issued | | | 1 | | | | 25 | | | | 17 | | | | 1 | | | | 38 | | | | 55 | | | | 4 | | | | 100 | | | | 159 | | |
| Shares issued in lieu of cash distributions | | | — | | | | — | | | | — | | | | — | | | | 3 | | | | 6 | | | | — | | | | 13 | | | | 22 | | |
| Shares redeemed | | | — | | | | (7 | ) | | | (5 | ) | | | (36 | ) | | | (577 | ) | | | (876 | ) | | | (89 | ) | | | (1,091 | ) | | | (892 | ) | |
| Total Class B transactions | | | 1 | | | | 18 | | | | 12 | | | | (35 | ) | | | (536 | ) | | | (815 | ) | | | (85 | ) | | | (978 | ) | | | (711 | ) | |
| Class C: | |
| Shares issued | | | — | | | | 10 | | | | 4 | | | | 3 | | | | 36 | | | | 49 | | | | 3 | | | | 79 | | | | 85 | | |
| Shares issued in lieu of cash distributions | | | — | | | | — | | | | — | | | | — | | | | 1 | | | | 2 | | | | — | | | | 4 | | | | 4 | | |
| Shares redeemed | | | — | | | | (2 | ) | | | (1 | ) | | | (12 | ) | | | (121 | ) | | | (139 | ) | | | (62 | ) | | | (181 | ) | | | (256 | ) | |
| Total Class C transactions | | | — | | | | 8 | | | | 3 | | | | (9 | ) | | | (84 | ) | | | (88 | ) | | | (59 | ) | | | (98 | ) | | | (167 | ) | |
| Class R: | |
| Shares issued | | | — | | | | — | | | | — | | | | — | | | | — | | | | 160 | | | | — | | | | — | | | | 345 | | |
| Shares issued in lieu of cash distributions | | | — | | | | — | | | | — | | | | — | | | | — | | | | 7 | | | | — | | | | — | | | | 23 | | |
| Shares redeemed | | | — | | | | — | | | | — | | | | — | | | | — | | | | (1,761 | ) | | | — | | | | — | | | | (2,881 | ) | |
| Total Class R transactions | | | — | | | | — | | | | — | | | | — | | | | — | | | | (1,594 | ) | | | — | | | | — | | | | (2,513 | ) | |
| Class Y: | |
| Shares issued | | | 1,217 | | | | 16,640 | | | | 13,492 | | | | 230 | | | | 4,666 | | | | 12,949 | | | | 248 | | | | 3,524 | | | | 6,123 | | |
| Shares issued in lieu of cash distributions | | | — | | | | 358 | | | | 191 | | | | 5 | | | | 335 | | | | 471 | | | | — | | | | 382 | | | | 529 | | |
| Shares redeemed | | | (160 | ) | | | (17,545 | ) | | | (1,430 | ) | | | (502 | ) | | | (26,155 | ) | | | (12,532 | ) | | | (650 | ) | | | (8,890 | ) | | | (16,991 | ) | |
| Total Class Y transactions | | | 1,057 | | | | (547 | ) | | | 12,253 | | | | (267 | ) | | | (21,154 | ) | | | 888 | | | | (402 | ) | | | (4,984 | ) | | | (10,339 | ) | |
| Net increase (decrease) in capital shares | | | 1,089 | | | | (212 | ) | | | 12,306 | | | | (329 | ) | | | (22,306 | ) | | | (887 | ) | | | (572 | ) | | | (7,841 | ) | | | (12,286 | ) | |
| | | Equity
Income Fund | |
| | | One-Month
Period Ended
10/31/05 | | Year
Ended
9/30/05 | | Year
Ended
9/30/04 | |
| Class A: | |
| Shares issued | | | 64 | | | | 1,568 | | | | 4,209 | | |
| Shares issued in lieu of cash distributions | | | 6 | | | | 222 | | | | 200 | | |
| Shares redeemed | | | (226 | ) | | | (3494 | ) | | | (2,448 | ) | |
| Total Class A transactions | | | (156 | ) | | | (1,704 | ) | | | 1,961 | | |
| Class B: | |
| Shares issued | | | 5 | | | | 144 | | | | 396 | | |
| Shares issued in lieu of cash distributions | | | — | | | | 17 | | | | 17 | | |
| Shares redeemed | | | (27 | ) | | | (473 | ) | | | (459 | ) | |
| Total Class B transactions | | | (22 | ) | | | (312 | ) | | | (46 | ) | |
| Class C: | |
| Shares issued | | | 8 | | | | 92 | | | | 221 | | |
| Shares issued in lieu of cash distributions | | | — | | | | 14 | | | | 14 | | |
| Shares redeemed | | | (50 | ) | | | (457 | ) | | | (401 | ) | |
| Total Class C transactions | | | (42 | ) | | | (351 | ) | | | (166 | ) | |
| Class R: | |
| Shares issued | | | 1 | | | | 32 | | | | 185 | | |
| Shares issued in lieu of cash distributions | | | — | | | | — | | | | 15 | | |
| Shares redeemed | | | — | | | | (2 | ) | | | (1,685 | ) | |
| Total Class R transactions | | | 1 | | | | 30 | | | | (1,485 | ) | |
| Class Y: | |
| Shares issued | | | 333 | | | | 12,906 | | | | 23,673 | | |
| Shares issued in lieu of cash distributions | | | 17 | | | | 681 | | | | 718 | | |
| Shares redeemed | | | (1,701 | ) | | | (36,568 | ) | | | (25,006 | ) | |
| Total Class Y transactions | | | (1,351 | ) | | | (22,981 | ) | | | (615 | ) | |
| Net decrease in capital shares | | | (1,570 | ) | | | (25,318 | ) | | | (351 | ) | |
FIRST AMERICAN FUNDS Annual Report 2005
123
Notes to Financial Statements October 31, 2005
5 > Investment Security Transactions
During the fiscal period ended October 31, 2005, purchases of securities and proceeds from sales of securities, other than temporary investments in short-term securities, were as follows (000):
| | | U.S. Government
Securities | | Other Investment
Securities | |
| Fund | | Purchases | | Sales | | Purchases | | Sales | |
| Real Estate Securities Fund | | $ | — | | | $ | — | | | $ | 69,760 | | | $ | 87,402 | | |
| International Fund | | | — | | | | — | | | | 2,040 | | | | 24,013 | | |
| Small Cap Growth Opportunities Fund | | | — | | | | — | | | | 43,720 | | | | 44,558 | | |
| Small Cap Select Fund | | | — | | | | — | | | | 112,657 | | | | 147,702 | | |
| Small Cap Value Fund | | | — | | | | — | | | | 59,515 | | | | 62,211 | | |
| Small-Mid Cap Core Fund | | | — | | | | — | | | | 54,859 | | | | 55,469 | | |
| Mid Cap Growth Opportunities Fund | | | — | | | | — | | | | 146,773 | | | | 146,914 | | |
| Mid Cap Value Fund | | | — | | | | — | | | | 67,291 | | | | 66,636 | | |
| Large Cap Growth Opportunities Fund | | | — | | | | — | | | | 66,130 | | | | 60,229 | | |
| Large Cap Select Fund | | | — | | | | — | | | | 33,998 | | | | 27,006 | | |
| Large Cap Value Fund | | | — | | | | — | | | | 15,228 | | | | 33,439 | | |
| Balanced Fund | | | 23,288 | | | | 26,073 | | | | 22,766 | | | | 26,140 | | |
| Equity Income Fund | | | — | | | | — | | | | — | | | | 12,953 | | |
During the fiscal year ended September 30, 2005, purchases of securities and proceeds from sales of securities, other than temporary investments in short-term securities, were as follows (000):
| | | U.S. Government
Securities | | Other Investment
Securities | |
| Fund | | Purchases | | Sales | | Purchases | | Sales | |
| Real Estate Securities Fund | | $ | — | | | $ | — | | | $ | 732,503 | | | $ | 704,152 | | |
| International Fund | | | — | | | | — | | | | 1,143,587 | | | | 1,006,657 | | |
| Small Cap Growth Opportunities Fund | | | — | | | | — | | | | 580,171 | | | | 666,069 | | |
| Small Cap Select Fund | | | — | | | | — | | | | 1,021,695 | | | | 1,211,070 | | |
| Small Cap Value Fund | | | — | | | | — | | | | 307,452 | | | | 375,516 | | |
| Small-Mid Cap Core Fund | | | — | | | | — | | | | 162,372 | | | | 192,244 | | |
| Mid Cap Growth Opportunities Fund | | | — | | | | — | | | | 1,513,684 | | | | 1,581,597 | | |
| Mid Cap Value Fund | | | — | | | | — | | | | 673,901 | | | | 572,614 | | |
| Large Cap Growth Opportunities Fund | | | — | | | | — | | | | 1,167,380 | | | | 1,652,947 | | |
| Large Cap Select Fund | | | — | | | | — | | | | 506,853 | | | | 497,038 | | |
| Large Cap Value Fund | | | — | | | | — | | | | 629,829 | | | | 1,043,816 | | |
| Balanced Fund | | | 209,598 | | | | 203,768 | | | | 401,629 | | | | 461,813 | | |
| Equity Income Fund | | | — | | | | — | | | | 425,021 | | | | 788,092 | | |
The aggregate gross unrealized appreciation and depreciation of securities held by the funds and the total cost of securities (including cost of securities purchased with proceeds from securities lending) for federal tax purposes at October 31, 2005, were as follows (000):
| Fund | | Aggregate
Gross
Appreciation | | Aggregate
Gross
Depreciation | | Net | | Federal
Income
Tax Cost | |
| Real Estate Securities Fund | | $ | 104,042 | | | $ | (8,168 | ) | | $ | 95,874 | | | $ | 857,271 | | |
| International Fund | | | 188,122 | | | | (753 | ) | | | 187,369 | | | | 1,681,856 | | |
| Small Cap Growth Opportunities Fund | | | 21,566 | | | | (21,106 | ) | | | 460 | | | | 395,569 | | |
| Small Cap Select Fund | | | 109,963 | | | | (32,820 | ) | | | 77,143 | | | | 1,003,599 | | |
| Small Cap Value Fund | | | 70,221 | | | | (12,462 | ) | | | 57,759 | | | | 447,942 | | |
| Small-Mid Cap Core Fund | | | 1,468 | | | | (4,080 | ) | | | (2,612 | ) | | | 88,342 | | |
| Mid Cap Growth Opportunities Fund | | | 284,271 | | | | (30,281 | ) | | | 253,990 | | | | 1,926,311 | | |
| Mid Cap Value Fund | | | 93,104 | | | | (10,589 | ) | | | 82,515 | | | | 802,877 | | |
| Large Cap Growth Opportunities Fund | | | 120,898 | | | | (19,607 | ) | | | 101,291 | | | | 1,155,039 | | |
| Large Cap Select Fund | | | 24,758 | | | | (7,435 | ) | | | 17,323 | | | | 434,663 | | |
| Large Cap Value Fund | | | 134,722 | | | | (21,946 | ) | | | 112,776 | | | | 1,009,658 | | |
| Balanced Fund | | | 34,805 | | | | (6,348 | ) | | | 28,457 | | | | 485,655 | | |
| Equity Income Fund | | | 305,910 | | | | (17,049 | ) | | | 288,861 | | | | 1,437,270 | | |
FIRST AMERICAN FUNDS Annual Report 2005
124
The difference between cost for financial statement purposes and federal tax purposes is primarily due to losses deferred from wash sales, investments in limited partnerships and REITs, the amount of gain (loss) recognized for tax purposes due to mark to market adjustments on open futures contracts and the mark to market of certain PFICs for tax purposes.
6 > Concentration of Risks
Portfolios that primarily invest in a particular sector may experience greater volatility than portfolios investing in a broad range of industry sectors. Real Estate Securities Fund primarily invests in income-producing common stocks of publicly traded companies engaged in the real estate industry. The real estate industry has been subject to substantial fluctuations and declines on a local, regional and national basis in the past and may continue to in the future. As of October 31, 2005, Large Cap Growth Opportunities Fund and Small Cap Growth Opportunities Fund each had a significant portion of their assets invested in the information technology sector, which could be more sensitive to short product cycles and aggressive pricing than the technology industry as a whole. As of the same date, Small Cap Value Fund, Large Cap Value Fund, and Mid Cap Value Fund had significant portions of their assets invested in the financials sect or. The financials sector may be more greatly impacted by the performance of the overall economy, interest rates, competition and consumer confidence and spending.
7 > Indemnifications
The funds enter into contracts that contain a variety of indemnifications. The funds' maximum exposure under these arrangements is unknown. However, the funds have not had prior claims of losses pursuant to these contracts and expect the risk of loss to be remote.
8 > Replacement of Investment Sub-Advisor
On September 16, 2004, the funds' board of directors approved the appointment of J.P. Morgan to replace Clay Finley, Inc. as the investment sub-advisor to International Fund. At a special meeting of International Fund's shareholders held on December 8, 2004, shareholders aproved the appointment of J.P. Morgan.
9 > Additional Information Related to Small Cap Growth Opportunities Fund
As a result of an internal review, USBAM uncovered an action involving potentially improper trading of a portfolio security held in the First American Small Cap Growth Opportunities Fund. USBAM engaged an outside law firm to conduct a review of those trades, and, as a result of this review, the law firm concluded that no USBAM employee violated the applicable securities laws. USBAM has reported this to the Fund's board to directors and to the Securities and Exchange Commission (SEC). The SEC is investigating the matter, and USBAM is cooperating fully with the investigation.
10 > Other
In March 2005, the U.S. Bancorp Pension Plan redeemed $302,966,587, $395,010,013, $200,889,108 and $132,582,404 from the First American Large Cap Value Fund, Large Cap Growth Opportunities Fund, Large Cap Select Fund and Equity Income Fund, respectively, as redemption-in-kind transactions. In these transactions, each fund paid redemption proceeds to U.S. Bancorp Pension Plan by distributing a proportionate amount of securities in the fund's portfolio to the Plan. Remaining shareholders in the funds did not recognize any additional capital gains from the transactions.
11 > Investment Strategy Changes and Name Change for Technology Fund
On September 26, 2005, Technology Fund's shareholders approved a change to the fundamental investment policies of the Technology Fund. This change took effect on October 3, 2005, along with a number of other investment strategy changes and a change in the fund's name to Small-Mid Cap Core Fund.
FIRST AMERICAN FUNDS Annual Report 2005
125
NOTICE TO SHAREHOLDERS October 31, 2005 (unaudited)
TAX INFORMATION
The information set forth below is for each fund's fiscal period as required by federal laws. Shareholders, however, must report distributions on a calendar year basis for income tax purposes, which may include distributions for portions of the fund's fiscal periods ending September 30, 2004, September 30, 2005 and October 31, 2005. Accordingly, the information needed by shareholders for income tax purposes will be sent in early 2006 on Form 1099-DIV. Please consult your tax advisor for proper treatment of this information.
For the fiscal period ended October 31, 2005, each fund has designated long-term capital gains, ordinary income, dividends qualifying for the corporate received deduction, and qualified dividend income with regard to distributions paid during the period as follows:
| | | Long Term
Capital Gains
Distributions
(Tax Basis)(a) | | Ordinary
Income
Distributions
(Tax Basis)(a) | | Total
Distributions
(Tax Basis) | | Corporate
Dividends
Received
Deduction(b) | | Qualified
Dividend
Income (000) | | Qualified
Dividend
Income(b)(c) | |
| International Fund (d) | | | — | % | | | — | % | | | — | % | | | — | % | | $ | — | | | | — | % | |
| Large Cap Value Fund | | | 0 | | | | 100 | | | | 100 | | | | 100 | | | | 723 | | | | 97 | | |
| Equity Income Fund | | | 0 | | | | 100 | | | | 100 | | | | 100 | | | | 2,053 | | | | 100 | | |
(a) Based on a percentage of the fund's total distributions.
(b) Based on a percentage of ordinary income distributions of the fund.
(c) For the fiscal period ended October 31, 2005 certain dividends paid by the funds may be subject to a maximum tax rate of 15%, as provided by the Internal Revenue Code 1(h). The funds intend to designate the maximum amounts as taxed at a maximum rate of 15%. Complete information was computed and reported in conjunction with your 2004 Form 1099-Div. As of October 31, 2005, for the calendar year to date, qualified dividend income as a percentage of ordinary income distributions for each fund was as follows: Real Estate Securities, International, Small Cap Growth Opportunities, Small Cap Select, Small Cap Value, Small-Mid Cap Core, Mid Cap Growth Opportunities, Mid Cap Value, Large Cap Growth Opportunities, Large Cap Select, Large Cap Value, Balanced and Equity Income Funds were 0%, 0%, 0%, 0%, 0%, 0%, 0%, 100%, 0%, 100%, 59% and 100%, respectively.
(d) The International Fund has elected to pass through to shareholders foreign taxes under Section 853 of the Internal Revenue Code. Foreign taxes paid and foreign source income for the fund were $243,736 and $2,845,421, respectively.
FIRST AMERICAN FUNDS Annual Report 2005
126
HOW TO OBTAIN A COPY OF THE FUNDS' PROXY VOTING POLICIES AND PROXY VOTING RECORD
A description of the policies and procedures that the funds use to determine how to vote proxies relating to portfolio securities, as well as information regarding how the funds voted proxies relating to portfolio securities during the most recent 12 month period ended June 30, 2005, is available (1) without charge upon request by calling 800.677.FUND; (2) at firstamericanfunds.com; and (3) on the U.S. Securities and Exchange Commision's website at http://www.sec.gov.
FORM N-Q HOLDINGS INFORMATION
Each fund is required to file its complete schedule of portfolio holdings for the first and third quarters of each fiscal year with the Securities and Exchange Commission on Form N-Q. The funds' Forms N-Q are available (1) without charge upon request by calling 800.677.FUND and (2) on the U.S. Securities and Exchange Commision's website at http://www.sec.gov. In addition, you may review and copy the funds' Forms N-Q at the Commission's Public Reference Room in Washington, D.C. You may obtain information on the operation of the Public Reference Room by calling 1-800-SEC-0330.
QUARTERLY PORTFOLIO HOLDINGS
Each fund will make complete portfolio holdings information publicly available by posting the information at firstamericanfunds.com on a quarterly basis. The funds will attempt to post such information within 10 days of the calendar quarter end.
FIRST AMERICAN FUNDS Annual Report 2005
127
NOTICE TO SHAREHOLDERS October 31, 2005 (unaudited)
Directors and Officers of the Funds
Independent Directors
Name, Address, and
Year of Birth | | Position(s)
Held
with Funds | | Term of Office
and Length of
Time Served | | Principal Occupation(s)
During Past 5 Years | | Number of Portfolios
in Fund Complex
Overseen by Director | | Other
Directorships
Held by
Director † | |
Benjamin R. Field III P.O. Box 1329
Minneapolis, MN 55440-1329
(1938) | | Director | | Term expiring earlier of death, resignation, removal, disqualification, or successor duly elected and qualified. Director of FAIF, since September 2003. | | Retired; Senior Financial Advisor, Bemis Company, Inc. from May 2002 through June 2004; Senior Vice President, Chief Financial Officer & Treasurer, Bemis, through April 2002. | | First American Funds Complex: eleven registered investment companies, including fifty-five portfolios. | | None | |
|
Roger A. Gibson
P.O. Box 1329
Minneapolis, MN 55440-1329
(1946) | | Director | | Term expiring earlier of death, resignation, removal, disqualification, or successor duly elected and qualified. Director of FAIF since October 1997. | | Retired; Vice President, Cargo – United Airlines, from July 2001 through July 2004; Vice President, North America – Mountain Region, United Airlines, prior to July 2001. | | First American Funds Complex: eleven registered investment companies, including fifty-five portfolios. | | None | |
|
Victoria J. Herget
P.O. Box 1329
Minneapolis, MN 55440-1329
(1951) | | Director | | Term expiring earlier of death, resignation, removal, disqualification, or successor duly elected and qualified. Director of FAIF since September 2003. | | Investment consultant and non-profit board member since 2001; Managing Director of Zurich Scudder Investments through 2001. | | First American Funds Complex: eleven registered investment companies, including fifty-five portfolios. | | None | |
|
Leonard W. Kedrowski P.O. Box 1329
Minneapolis, MN 55440-1329
(1941) | | Director | | Term expiring earlier of death, resignation, removal, disqualification, or successor duly elected and qualified. Director of FAIF since November 1993. | | Owner and President, Executive and Management Consulting, Inc., a management consulting firm; Board member, GC McGuiggan Corporation (dba Smyth Companies), a label printer; former Chief Executive Officer, Creative Promotions International, LLC, a promotional award programs and products company, through October 2003; Advisory Board member, Designer Doors, manufacturer of designer doors, through 2002. | | First American Funds Complex: eleven registered investment companies, including fifty-five portfolios. | | None | |
|
Richard K. Riederer
P.O. Box 1329
Minneapolis, MN 55440-1329
(1944) | | Director | | Term expiring earlier of death, resignation, removal, disqualification, or successor duly elected and qualified. Director of FAIF since August 2001. | | Retired; Director, President and Chief Executive Officer, Weirton Steel through 2001. | | First American Funds Complex: eleven registered investment companies, including fifty-five portfolios. | | Cleveland-Cliffs Inc (a producer of iron ore pellets) | |
|
Joseph D. Strauss
P.O. Box 1329
Minneapolis, MN 55440-1329
(1940) | | Director | | Term expiring earlier of death, resignation, removal, disqualification, or successor duly elected and qualified. Director of FAIF since September 1984. | | Attorney At Law, Owner and President, Strauss Management Company, a Minnesota holding company for various organizational management business ventures; Owner, Chairman and Chief Executive Officer, Community Resource Partnerships, Inc., a strategic planning, operations management, government relations, transportation planning and public relations organization; Owner, Chairman and Chief Executive Officer, Excensus(TM) LLC, a strategic demographic planning and application development firm, since 2001. | | First American Funds Complex: eleven registered investment companies, including fifty-five portfolios. | | None | |
|
FIRST AMERICAN FUNDS Annual Report 2005
128
Independent Directors — continued
Name, Address, and
Year of Birth | | Position(s)
Held
with Funds | | Term of Office
and Length of
Time Served | | Principal Occupation(s)
During Past 5 Years | | Number of Portfolios
in Fund Complex
Overseen by Director | | Other
Directorships
Held by
Director † | |
Virginia L. Stringer
P.O. Box 1329
Minneapolis, MN 55440-1329
(1944) | | Chair; Director | | Chair Term three years. Directors Term expiring earlier of death, resignation, removal, disqualification, or successor duly elected and qualified. Chair of FAIF's Board since September 1997; Director of FAIF since June 1991. | | Owner and President, Strategic Management Resources, Inc., a management consulting firm; Executive Consultant to State Farm Insurance Company through 2003. | | First American Funds Complex: eleven registered investment companies, including fifty-five portfolios. | | None | |
|
James M. Wade
P.O. Box 1329
Minneapolis, MN 55440-1329
(1943) | | Director | | Term expiring earlier of death, resignation, removal, disqualification, or successor duly elected and qualified. Director of FAIF since August 2001. | | Owner and President, Jim Wade Homes, a homebuilding company, since 1999. | | First American Funds Complex; eleven registered investment companies, including fifty-five portfolios. | | None | |
|
† Includes only directorships in a company with a class of securities registered pursuant to Section 12 of the Securities Exchange Act or subject to the requirements of Section 15(d) of the Securities Exchange Act, or any company registered as an investment company under the Investment Company Act.
The Statement of Additional Information (SAI) includes additional information about fund directors and is available upon request without charge by calling 800-677-FUND or writing to First American Funds, P.O. Box 1330, Minneapolis, Minnesota, 55440-1330.
FIRST AMERICAN FUNDS Annual Report 2005
129
NOTICE TO SHAREHOLDERS October 31, 2005 (unaudited)
Officers
Name, Address, and
Year of Birth | | Position(s)
Held
with Funds | | Term of Office
and Length of
Time Served | | Principal Occupation(s) During Past 5 Years | |
Thomas S. Schreier, Jr.
U.S. Bancorp Asset
Management, Inc.
800 Nicollet Mall
Minneapolis, MN 55402
(1962)* | | President | | Re-elected by the Board annually; President of FAIF since February 2001. | | Chief Executive Officer of U.S. Bancorp Asset Management, Inc., since May 2001; prior thereto, Chief Executive Officer of First American Asset Management from December 2000 to May 2001 and of Firstar Investment & Research Management Company ("FIRMCO") from February 2001 to May 2001; prior to that, Senior Managing Director and Head of Equity Research of U.S. Bancorp Piper Jaffray. | |
|
Mark S. Jordahl
U.S. Bancorp Asset
Management, Inc.
800 Nicollet Mall
Minneapolis, MN 55402
(1960)* | | Vice President – Investments | | Re-elected by the Board annually; Vice President – Investments of FAIF since September 2001. | | Chief Investment Officer of U.S. Bancorp Asset Management, Inc., since September 2001; prior thereto, President and Chief Investment Officer, ING Investment Management–Americas from September 2000 to June 2001; prior to that, Senior Vice President and Chief Investment Officer, ReliaStar Financial Corp. | |
|
Jeffery M. Wilson
U.S. Bancorp Asset
Management, Inc.
800 Nicollet Mall
Minneapolis, MN 55402
(1956)* | | Vice President – Administration | | Re-elected by the Board annually; Vice President – Administration of FAIF since March 2000. | | Senior Vice President of U.S. Bancorp Asset Management, Inc., since May 2001; prior thereto, Senior Vice President of First American Asset Management. | |
|
Charles D. Gariboldi, Jr.
U.S. Bancorp Asset
Management, Inc.
800 Nicollet Mall
Minneapolis, MN 55402
(1959)* | | Treasurer | | Re-elected by the Board annually; Treasurer of FAIF since October 2004. | | Mutual Fund Treasurer, U.S. Bancorp Asset Management, Inc., since October 2004; prior thereto, Vice President of Investment Accounting and Fund Treasurer for Thrivent Financial for Lutherans. | |
|
Jill M. Stevenson
U.S. Bancorp Asset
Management, Inc.
800 Nicollet Mall
Minneapolis, MN 55402
(1965) * | | Assistant Treasurer | | Re-elected by the Board annually; Assistant Treasurer of FAIF since September 2005. | | Assistant Treasurer, U.S. Bancorp Asset Management, Inc., since September 2005; prior thereto, Director, Senior Project Manager, U.S. Bancorp Asset Management, Inc., from May 2003 to September 2005; prior to that, Vice President, Director of Operations, Paladin Investment Associates, LLC. | |
|
David H. Lui
U.S. Bancorp Asset
Management, Inc.
800 Nicollet Mall
Minneapolis, MN 55402
(1960)* | | Chief Compliance Officer | | Re-elected by the Board annually; Chief Compliance Officer of FAIF since February 2005. | | Chief Compliance Officer for First American Funds and U.S. Bancorp Asset Management, Inc., since February 2005; prior thereto, Chief Compliance Officer, Franklin Advisors, Inc. and Chief Compliance Counsel, Franklin Templeton Investments from March 2004 to February 2005; prior to that, Vice President, Charles Schwab & Co., Inc. | |
|
Kathleen L. Prudhomme
U.S. Bancorp Asset
Management, Inc.
800 Nicollet Mall
Minneapolis, MN 55402
(1953)* | | Secretary | | Re-elected by the Board annually; Secretary of FAIF since December 2004; prior thereto, Assistant Secretary of FAIF since September 1998. | | Deputy General Counsel, U.S. Bancorp Asset Management, Inc., since November 2004; prior thereto, Partner, Dorsey & Whitney LLP, a Minneapolis-based law firm. | |
|
James D. Alt
50 South Sixth Street
Suite 1500
Minneapolis, MN 55402
(1951) | | Assistant Secretary | | Re-elected by the Board annually; Assistant Secretary of FAIF since December 2004; prior thereto, Secretary of FAIF since June 2002; Assistant Secretary of FAIF from September 1998 through June 2002. | | Partner, Dorsey & Whitney LLP, a Minneapolis-based law firm. | |
|
Brett L. Agnew
U.S. Bancorp Asset
Management, Inc.
800 Nicollet Mall
Minneapolis, MN 55402
(1971)* | | Assistant Secretary | | Re-elected by the Board annually; Assistant Secretary of FAIF since December 2004. | | Attorney for U.S. Bancorp Asset Management, Inc., since August 2004; prior thereto, Senior Counsel, Thrivent Financial for Lutherans from May 2001 to August 2004; prior to that, Consultant, Principal Financial Group. | |
|
FIRST AMERICAN FUNDS Annual Report 2005
130
Officers — continued
Name, Address, and
Year of Birth | | Position(s)
Held
with Funds | | Term of Office
and Length of
Time Served | | Principal Occupation(s) During Past 5 Years | |
James R. Arnold
615 E. Michigan Street Milwaukee, WI 53202
(1957)* | | Assistant Secretary | | Re-elected by the Board annually; Assistant Secretary of FAIF since June 2003. | | Vice President, U.S. Bancorp Fund Services, LLC, since March 2002; prior thereto, Senior Administration Services Manager, UMB Fund Services, Inc. | |
|
Douglas G. Hess
615 E. Michigan Street Milwaukee, WI 53202
(1967)* | | Assistant Secretary | | Re-elected by the Board annually; Assistant Secretary of FAIF since September 2001. | | Vice President, U.S. Bancorp Fund Services, LLC. | |
|
* Messrs. Schreier, Jordahl, Wilson, Gariboldi, Lui and Agnew, Ms. Stevenson and Ms. Prudhomme are each officers and/or employees of U.S. Bancorp Asset Management, Inc., which serves as investment adviser and administrator for FAIF. Messrs. Hess and Arnold are officers of U.S. Bancorp Fund Services, LLC, which is a subsidiary of U.S. Bancorp and serves as Transfer Agent for FAIF.
FIRST AMERICAN FUNDS Annual Report 2005
131
(This page has been left blank intentionally.)
Board of Directors First American Investment Funds, Inc.
Virginia Stringer
Chairperson of First American Investment Funds, Inc.
Owner and President of Strategic Management Resources, Inc.
Benjamin Field III
Director of First American Investment Funds, Inc.
Retired; former Senior Vice President, Chief Financial Officer,
and Treasurer of Bemis Company, Inc.
Roger Gibson
Director of First American Investment Funds, Inc.
Retired; former Vice President of Cargo-United Airlines
Victoria Herget
Director of First American Investment Funds, Inc.
Investment Consultant; former Managing Director of Zurich Scudder Investments
Leonard Kedrowski
Director of First American Investment Funds, Inc.
Owner and President of Executive and Management Consulting, Inc.
Richard Riederer
Director of First American Investment Funds, Inc.
Retired; former President and Chief Executive Officer of Weirton Steel
Joseph Strauss
Director of First American Investment Funds, Inc.
Owner and President of Strauss Management Company
James Wade
Director of First American Investment Funds, Inc.
Owner and President of Jim Wade Homes
First American Investment Funds’ Board of Directors is comprised entirely of independent directors.

|
FIRST AMERICAN FUNDS®
| |
Direct fund correspondence to:
First American Funds
P.O. Box 1330
Minneapolis, MN 55440-1330
This report and the financial statements contained herein are not intended to be a forecast of future events, a guarantee of future results, or investment advice. Further, there is no assurance that certain securities will remain in or out of each fund’s portfolio. The views expressed in this report reflect those of the portfolio managers only through the period ended October 31, 2005. The portfolio managers’ views are subject to change at any time based upon market or other conditions.
This report is for the information of shareholders of the First American Investment Funds, Inc. It may also be used as sales literature when preceded or accompanied by a current prospectus, which contains information concerning investment objectives, risks, and charges and expenses of the funds. Read the prospectus carefully before investing.
The figures in this report represent past performance and do not guarantee future results. The principal value of an investment and investment return will fluctuate so that an investor’s shares, when redeemed, may be worth more or less than their original cost.
INVESTMENT ADVISOR
U.S. Bancorp Asset Management, Inc.
800 Nicollet Mall
Minneapolis, Minnesota 55402
ADMINISTRATOR
U.S. Bancorp Asset Management, Inc.
800 Nicollet Mall
Minneapolis, Minnesota 55402
TRANSFER AGENT
U.S. Bancorp Fund Services, LLC
615 East Michigan Street
Milwaukee, Wisconsin 53202
CUSTODIAN
U.S. Bank National Association
60 Livingston Avenue
St. Paul, Minnesota 55107
DISTRIBUTOR
Quasar Distributors, LLC
615 East Michigan Street
Milwaukee, Wisconsin 53202
INDEPENDENT REGISTERED PUBLIC ACCOUNTING FIRM
Ernst & Young LLP
220 South Sixth Street
Suite 1400
Minneapolis, Minnesota 55402
COUNSEL
Dorsey & Whitney LLP
50 South Sixth Street
Suite 1500
Minneapolis, Minnesota 55402
First American Funds
P.O. Box 1330
Minneapolis, MN 55440-1330
In an attempt to reduce shareholder costs and help eliminate duplication, First American Funds will try to limit their mailing to one report for each address that lists one or more shareholders with the same last name. If you would like additional copies, please call First American Investor Services at 800.677.FUND or visit firstamericanfunds.com.
Item 2—Code of Ethics
(a) The registrant has adopted a code of ethics that applies to its Principal Executive Officer and Principal Financial Officer.
(b) During the period covered by this report, there were no amendments to the provisions of the registrant’s code of ethics that apply to the registrant’s Principal Executive Officer and Principal Financial Officer and that relate to any element of the code of ethics definition enumerated in this Item.
(c) During the period covered by this report, the registrant did not grant any waivers, including implicit waivers, from any provisions of its code of ethics.
(d) The registrant undertakes to furnish a copy of its code of ethics to any person upon request, without charge, by calling 1-800-677-3863.
Item 3—Audit Committee Financial Expert
The registrant’s Board of Directors has determined that Leonard W. Kedrowski, Benjamin R. Field III, and Richard K. Riederer, members of the registrant’s Audit Committee, are each an “audit committee financial expert” and are “independent,” as these terms are defined in this Item.
Item 4—Principal Accountant Fees and Services
(a) Audit Fees - Ernst & Young LLP (“E&Y”) billed the registrant audit fees totaling $74,027 in the fiscal period ended October 31, 2005, $608,819 in the fiscal year ended September 30, 2005, and $391,795 in the fiscal year ended September 30, 2004, including fees associated with the annual audit, SEC Rule 17f-2 security count filings and filings of the registrant’s Form N-CSR.
(b) Audit-Related Fees – E&Y billed the registrant audit-related fees totaling $184 in the fiscal period ended October 31, 2005, $13,759 in the fiscal year ended September 30, 2005, and $36,134 in the fiscal year ended September 30, 2004, including fees associated with the semi-annual review of fund disclosures.
(c) Tax Fees - E&Y billed the registrant fees of $10,628 in the fiscal period ended October 31, 2005, $105,382 in the fiscal year ended September 30, 2005, and $115,034 in the fiscal year ended September 30, 2004 for tax services, including tax compliance, tax advice and tax planning. Tax compliance, tax advice and tax planning services primarily related to preparation of original and amended tax returns, timely RIC qualification reviews, and tax distribution analysis and planning.
(d) All Other Fees - There were no fees billed by E&Y for other services to the registrant during the fiscal period ended October 31, 2005, the fiscal year ended September 30, 2005, and the fiscal year ended September 30, 2004.
(e)(1) The audit committee’s pre-approval policies and procedures pursuant to paragraph (c)(7) of Rule 2-01 of Regulation S-X are set forth below:
Audit Committee policy regarding pre-approval of services provided by the Independent Auditor
The Audit Committee of the First American Funds (“Committee”) has responsibility for ensuring that all services performed by the independent audit firm for the funds do not impair the firm’s independence. This review is intended to provide reasonable oversight without removing management from its responsibility for day-to-day operations. In this regard, the Committee should:
• Understand the nature of the professional services expected to be provided and their impact on auditor independence and audit quality
• Examine and evaluate the safeguards put into place by the Company and the auditor to safeguard independence
• Meet quarterly with the partner of the independent audit firm
• Consider approving categories of service that are not deemed to impair independence for a one-year period
It is important that a qualitative rather than a mere quantitative evaluation be performed by the Committee in discharging its responsibilities.
Policy for Audit and Non-Audit Services Provided to the Funds
On an annual basis, the Committee will review and consider whether to pre-approve the financial plan for audit fees as well as categories of audit-related and non-audit services that may be performed by the funds’ independent audit firm directly for the funds. At least annually, the Committee will receive a report from the independent audit firm of all audit and non-audit services, which were approved during the year.
The engagement of the independent audit firm for any non-audit service requires the written pre-approval of the Treasurer of the funds and all non-audit services performed by the independent audit firm will be disclosed in the required SEC periodic filings.
In connection with the Committee review and pre-approval responsibilities, the review by the Committee will consist of the following:
Audit Services
The categories of audit services and related fees to be reviewed and considered for pre-approval annually by the Committee or its delegate include the following:
• Annual Fund financial statement audits
• Seed audits (related to new product filings, as required)
• SEC and regulatory filings and consents
Audit-related Services
In addition, the following categories of audit-related services are deemed to be consistent with the role of the independent audit firm and, as such, will be considered for pre-approval by the Committee or its delegate, on an annual basis.
• Accounting consultations
• Fund merger support services
• Other accounting related matters
• Agreed Upon Procedure Reports
• Attestation Reports
• Other Internal Control Reports
Notwithstanding any annual pre-approval of these categories of services, individual projects with an estimated fee in excess of $25,000 are subject to pre-approval by the Committee Chair or its delegate on a case-by-case basis. Individual projects with an estimated fee in excess of $50,000 are subject to pre-approval by the Committee or its delegate on a case-by-case basis.
Tax Services
The following categories of tax services are deemed to be consistent with the role of the independent audit firm and, as such, will be considered for pre-approval by the Committee or its delegate, on an annual basis.
• Tax compliance services related to the filing or amendment of the following:
• Federal, state and local income tax compliance, and
• Sales and use tax compliance
• Timely RIC qualification reviews
• Tax distribution analysis and planning
• Tax authority examination services
• Tax appeals support services
• Accounting methods studies
• Fund merger support services
• Tax consulting services and related projects
Notwithstanding any annual pre-approval of these categories of services, individual projects with an estimated fee in excess of $25,000 are subject to pre-approval by the Committee Chair or its delegate on a case-by-case basis. Individual projects with an estimated fee in excess of $50,000 are subject to pre-approval by the Committee or its delegate on a case-by-case basis.
Other Non-audit Services
The SEC auditor independence rules adopted in response to the Sarbanes-Oxley Act specifically allow certain non-audit services. Because of the nature of these services, none of these services may be commenced by the independent audit firm without the prior approval of the Committee. The Committee may delegate this responsibility to one or more of the Committee members, with the decisions presented to the full Committee at the next scheduled meeting.
Proscribed Services
In accordance with SEC rules on independence, the independent audit firm is prohibited from performing services in the following categories of non-audit services:
• Management functions
• Accounting and bookkeeping services
• Internal audit services
• Financial information systems design and implementation
• Valuation services supporting the financial statements
• Actuarial services supporting the financial statements
• Executive recruitment
• Expert services (e.g., litigation support)
• Investment banking
Policy for Pre-approval of Non-Audit Services Provided to Other Entities within the Investment Company Complex
The Committee is also responsible for pre-approving certain non-audit services provided to U.S. Bancorp Asset Management, Inc., U.S. Bank N.A., Quasar Distributors, U.S. Bancorp Fund Services, LLC and any other entity under common control with U.S. Bancorp Asset Management, Inc., that provides ongoing services to the funds. The only non-audit services provided to these entities which require pre-approval are those services that relate directly to the operations and financial reporting of the funds.
Although the Committee is not required to pre-approve all services provided to U.S. Bancorp Asset Management, Inc. and other affiliated service providers, the Committee will annually receive a report from the independent audit firm on the aggregate fees for all services provided to U.S. Bancorp and affiliates.
(e)(2) All of the services described in paragraphs (b) through (d) of this Item 4 that were provided to the registrant on or after May 6, 2003, the effective date of SEC rules relating to the pre-approval of non-audit services, were pre-approved by the audit committee.
(f) All services performed on the engagement to audit the registrant’s financial statements for the most recent fiscal year-end were performed by the principal accountant’s full-time, permanent employees.
(g) The aggregate non-audit fees billed by E&Y to the registrant, the registrant’s investment adviser, and any entity controlling, controlled by, or under common control with the adviser that provides ongoing services to the registrant, totaled $10,812 in the fiscal period ended October 31, 2005, $144,841 in the fiscal year ended September 30, 2005, and $181,918 in the fiscal year ended September 30, 2004, including services provided prior to May 6, 2003, the effective date of SEC rules relating to the pre-approval of non-audit services.
(h) The registrant’s audit committee has determined that the provision of non-audit services to the registrant’s investment adviser, and any entity controlling, controlled by, or under common control with the investment adviser that provides ongoing services to the registrant, that were not pre-approved and that were rendered on or after May 6, 2003 (the effective date of SEC rules relating to the pre-approval of non-audit services), is compatible with maintaining E&Y’s independence.
Item 5—Audit Committee of Listed Registrants
Not applicable.
Item 6—Schedule of Investments
The schedule is included as part of the report to shareholders filed under Item 1 of this Form.
Item 7—Disclosure of Proxy Voting Policies and Procedures for Closed-End Management Investment Companies
Not applicable.
Item 8—Portfolio Managers of Closed-End Management Investment Companies
Not applicable.
Item 9—Purchases of Equity Securities by Closed-End Management Investment Company and Affiliated Purchasers
Not applicable.
Item 10—Submission of Matters to a Vote of Security Holders
There have been no material changes to the procedures by which shareholders may recommend nominees to the registrant’s board of directors, where those changes were implemented after the registrant last provided disclosure in response to the requirements of Item 7(d)(2)(ii)(G) of Schedule 14A (17 CFR 240.14a-101), or this item.
Item 11—Controls and Procedures
(a) The registrant’s Principal Executive Officer and Principal Financial Officer have evaluated the registrant’s disclosure controls and procedures within 90 days of the date of this filing and have concluded that the registrant’s disclosure controls and procedures were effective, as of that date, in ensuring that information required to be disclosed by the registrant in this Form N-CSR was recorded, processed, summarized and reported timely.
(b) There were no changes in the registrant’s internal control over financial reporting that occurred during the period covered by this report that have materially affected, or are reasonably likely to materially affect, the registrant’s internal control over financial reporting.
Item 12—Exhibits
(a)(1) Not applicable. Registrant’s code of ethics is provided to any person upon request without charge.
(a)(2) Certifications of the Principal Executive Officer and Principal Financial Officer of the registrant as required by Rule 30a-2(a) under the Investment Company Act are filed as exhibits hereto.
(a)(3) Not applicable.
(b) Certifications of the Principal Executive Officer and Principal Financial Officer of the registrant as required by Rule 30a-2(b) under the Investment Company Act are filed as exhibits hereto.
Signatures
Pursuant to the requirements of the Securities Exchange Act of 1934 and the Investment Company Act of 1940, the registrant has duly caused this report to be signed on its behalf by the undersigned, thereunto duly authorized.
First American Investment Funds, Inc. |
|
By: |
| /s/ Thomas S. Schreier, Jr. | |
| Thomas S. Schreier, Jr. | |
| President | |
Date: January 6, 2006
Pursuant to the requirements of the Securities Exchange Act of 1934 and the Investment Company Act of 1940, this report has been signed below by the following persons on behalf of the registrant and in the capacities and on the dates indicated.
By: |
| /s/ Thomas S. Schreier, Jr. | |
| Thomas S. Schreier, Jr. | |
| President | |
Date: January 6, 2006
By: | |
| /s/ Charles D. Gariboldi | |
| Charles D. Gariboldi | |
| Treasurer | |
Date: January 6, 2006