As filed with the Securities and Exchange Commission on December 9, 2013
UNITED STATES
SECURITIES AND EXCHANGE COMMISSION
Washington, D.C. 20549
FORM N-CSR
CERTIFIED SHAREHOLDER REPORT OF REGISTERED
MANAGEMENT INVESTMENT COMPANIES
Investment Company Act file number (811-05339)
Concorde Fund, Inc.
(Exact name of registrant as specified in charter)
1000 Three Lincoln Centre
5430 LBJ Freeway LB3
Dallas, TX 75240-2650
(Address of principal executive offices) (Zip code)
Gary B. Wood
1000 Three Lincoln Centre, 5430 LBJ Freeway LB3, Dallas, TX 75240-2650
(Name and address of agent for service)
(972)-701-5400
Registrant's telephone number, including area code
Date of fiscal year end: 9/30/2013
Date of reporting period: 9/30/2013
Item 1. Reports to Stockholders.
A NO-LOAD
MUTUAL FUND
ANNUAL REPORT
Dated September 30, 2013
November 13, 2013
Dear Shareholders,
We are pleased to present the Annual report of Concorde Funds, Inc. for the fiscal year ended September 30, 2013.
Concorde Value Fund
Concorde Value Fund, managed by Concorde Investment Management, produced a net return of 15.46% for the fiscal year ending September 30, 2013 following on a 23.77% for the last fiscal year. The fund maintained a larger than typical cash position and focused on more large companies as a reflection of the defensive mindset for the Fund’s current investment stance. In our opinion, the current economic and political environment requires a more risk adverse policy and the wide variation in performance among individual companies and industry categories confirms that perspective.
| Annualized | Annualized | |||
| 6 Months* | Full Fiscal Year* | 5 Years Ending* | 10 Years Ending* | |
| April 2013-Sept 2013 | Oct 2012-Sept 2013 | Sept 2013 | Sept 2013 | |
| Concorde Value Fund | 7.56% | 15.46% | 3.60% | 3.92% |
| S&P 500 | 8.31% | 19.34% | 10.02% | 7.57% |
| Russell 3000 Value Total Return | 7.50% | 22.67% | 8.89% | 8.09% |
| Russell 2000 Total Return | 13.61% | 30.06% | 11.15% | 9.64% |
| Lipper Multi-Cap Value | 9.31% | 25.58% | 9.50% | 7.16% |
| NASDAQ Global Select Market | 15.16% | 20.70% | 12.77% | 8.08% |
* Source – Morningstar, Inc.; US Bancorp Fund Services, LLC
Sector and individual stock performances varied widely for the year, yet combined provided the overall positive returns. A few individual weak performances, in addition to more focus on very large cap holdings, contributed to the larger performance gap between smaller and multi-cap indices (Russell 2000 and Lipper Multi-Cap Value). The average cash position in the Fund also added to the differential in performance from indices in the generally rising market. Two sectors with relatively lower fund exposure which had negative performance were basic materials and energy. The one holding in materials was Potash Corporation of Saskatchewan, Inc., which dropped significantly in late July as another potash consortium decision impacted pricing. We believe this is likely to be temporary and continue to hold the position. Many energy related stocks have lagged the overall markets over the last year including several fund holdings. Canadian Oil Sands, Devon Energy and Exxon Mobil Corp. all posted low single digit negative returns, while Kinder Morgan and Occidental Petroleum Corporation, a new holding, contributed modest positive total returns.
The sectors contributing most to the Fund’s double digit gain for this year were consumer cyclicals, financial services and healthcare. Among consumer cyclicals, Walt Disney Co., and Viacom rose as reported results, along with the increasing recognition of the value of superior media content,
drove investor interest. Fortune Brands Home & Security and Lowe’s Companies both continue to benefit from the recovery in the domestic residential market, particularly in the increased turnover in pre-owned houses. Hanesbrands stock almost doubled during the year as continued good revenue growth, significant balance sheet improvement and the initiation of a dividend all drew attention to the stock which we have held for several years.
All of the holdings in the financial services sector are insurance related and each contributed positively to performance. Aon PLC and The Travelers Companies, both long term holdings, had significant double digit total return gains as Aon benefited from improved growth in their business brokerage and employee benefits consulting segments. They are also getting revenue from consulting work on some of the new domestic healthcare exchanges. American International Group and Travelers are both participating in the improving business climate and firming of commercial property and casualty pricing. First American Financial, a previous portfolio holding, is a new position that should benefit from a continued stabilization in residential and commercial real estate activity and therefore the title policy business where they hold a leading position. Reported results for all four of these insurance leaders have been improving. In healthcare, Agilent, HCA Holdings and Johnson & Johnson all rose for the year and Quest Diagnostics contributed a single digit total return decrease. HCA and Johnson & Johnson have benefitted from increasing demand and superior service and product offerings both at home in the US and internationally for Johnson & Johnson. Agilent is a leader in life sciences testing products and services and has recently announced they will separate the remaining electronic measurement business, which has been greeted positively by the investment community. Quest Diagnostics continues to struggle with sluggish demand for some testing segments and weak reimbursement pricing for standard tests; however the company still generates impressive earnings and cash flow.
The remaining sectors which contributed smaller positive returns for the year include consumer defensive, industrials and technology. Within consumer defensive, AB Inbev and General Mills both generated approximately 20% total returns for the year. These companies have been reporting good earnings and are increasing inroads into international markets by way of internal product growth and acquisitions. Valuations of these types of defensive product companies have become less compelling and we have taken profits in rebalancing these holdings. In the industrial sector, the current largest percentage group in the fund, returns varied by stock but produced an overall double digit gain. Among the weaker performers, Deere and Hertz Global Holdings were flat to modest negative contributors. Deere, where we have reduced our position, is still generating good results but investors are increasingly concerned regarding slower sales growth in North America. Hertz Global is a new holding that we believe has yet to reflect the positive industry impact of consolidation and the upside potential from their equipment rental business. Fiserv, Union Pacific, United Parcel Service and Waste Management were the best performers of the group. Union Pacific and Waste Management are benefiting from the continued economic recovery, their leading domestic industry positions and strong operating management. We believe both are still undervalued with respect to long term prospects. Fiserv continues to dominate their product offering areas for financial institutions and business has improved as banks in particular are recovering from the financial stress several years ago. United Parcel continues to be a worldwide leader in package delivery and corporate logistics and their investment in international infrastructure is beginning to pay dividends.
2
Lastly in the technology group, Microsoft and Oracle continue as leaders in many of their product and software offerings. Although internal growth is more difficult in these large companies, the stock valuations continue to reflect only modest investor expectations for the future. The financial metrics for both are excellent and worthy of higher valuations in our opinion.
Although sacrificing some short term performance for the sake of risk mitigation, the Fund’s solid 15.46% performance for fiscal year 2013 was reflective of the recovery in equities that has been underway for several years. Generally, stock valuations are no longer a bargain, as perhaps they were shortly after the economic collapse of the great recession, but nevertheless they are also not out of line with long term trends. Slow economic growth has likely been discounted into the broad market’s pricing but good opportunities for the disciplined value style investment strategy remain. We will continue to manage the fund with an eye to capital preservation during the current transitory environment as we remain concerned about the awkward political process and its impact on the macro economic backdrop for the markets.
Thank you for your continued support. We will continue to strive for the highest professional standards of performance and stewardship in the management of the Value Fund.
| Best regards, | |
 | |
| Gary B. Wood, Ph.D. | |
| President |
3
| Concorde Value Fund |
| Performance Comparison |
| 9/30/2013 Value of $10,000 Invested on 9/30/2003 |
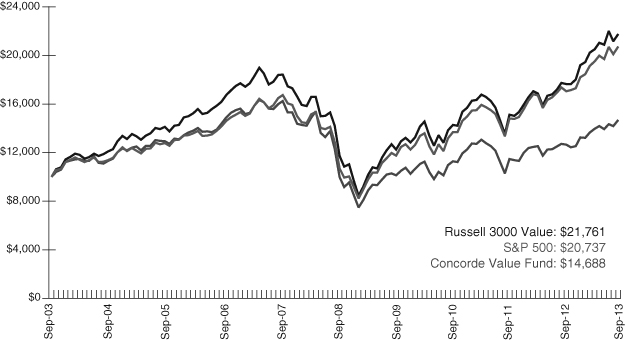
| AVERAGE ANNUAL TOTAL RETURN | |
| 1 Year | 15.46% |
| 3 Years | 10.19% |
| 5 Years | 3.60% |
| 10 Years | 3.92% |
| NOTE: | The Russell 3000 Value Index measures the performance of the Russell 3000 Index companies with lower price-to-book ratios and lower forecasted growth values. The S&P 500 consists of 500 selected stocks, most of which are listed on the New York Stock Exchange. It is a widely recognized unmanaged index of stock prices. Past performance is not predictive of future performance. The graph and table do not reflect the deduction of taxes that a shareholder would pay on fund distributions or the redemption of fund shares. |
4
CONCORDE VALUE FUND
PORTFOLIO HOLDINGS BY SECTOR
September 30, 2013
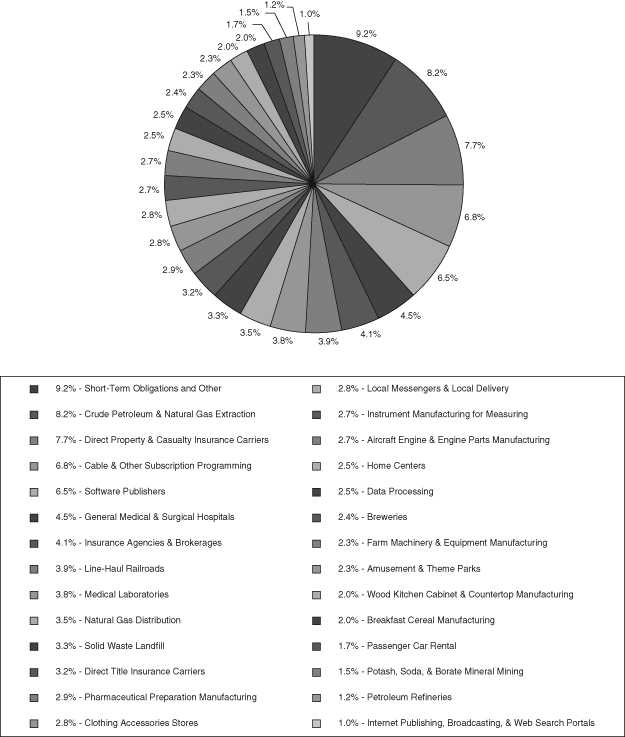
The portfolio’s holdings and allocations are subject to change. The percentages are of net assets as of September 30, 2013.
5
CONCORDE VALUE FUND
SCHEDULE OF INVESTMENTS IN SECURITIES
September 30, 2013
| Fair | Percent of | |||||||||||
| Shares | Value | Net Assets | ||||||||||
| COMMON STOCKS - 88.08% | ||||||||||||
| AMUSEMENT & THEME PARKS | ||||||||||||
| The Walt Disney Co. | 4,000 | $ | 257,960 | 2.29 | % | |||||||
| BREAKFAST CEREAL MANUFACTURING | ||||||||||||
| General Mills, Inc. | 4,600 | 220,432 | 1.95 | |||||||||
| BREWERIES | ||||||||||||
| Anheuser-Busch InBev NV/SA - ADR (b) | 2,700 | 267,840 | 2.37 | |||||||||
| CABLE AND OTHER SUBSCRIPTION PROGRAMMING | ||||||||||||
| DIRECTV (a) | 5,200 | 310,700 | 2.75 | |||||||||
| Viacom, Inc. | 5,500 | 459,690 | 4.08 | |||||||||
| 770,390 | 6.83 | |||||||||||
| CLOTHING ACCESSORIES STORES | ||||||||||||
| Hanesbrands, Inc. | 5,000 | 311,550 | 2.76 | |||||||||
| CRUDE PETROLEUM & NATURAL GAS EXTRACTION | ||||||||||||
| Canadian Oil Sands Ltd. (c) | 9,500 | 184,300 | 1.63 | |||||||||
| Devon Energy Corp. | 7,000 | 404,320 | 3.58 | |||||||||
| Occidental Petroleum Corp. | 3,600 | 336,744 | 2.99 | |||||||||
| 925,364 | 8.20 | |||||||||||
| DATA PROCESSING | ||||||||||||
| Fiserv, Inc. (a) | 2,800 | 282,940 | 2.51 | |||||||||
| DIRECT PROPERTY & CASUALTY | ||||||||||||
| INSURANCE CARRIERS | ||||||||||||
| American International Group, Inc. | 11,400 | 554,382 | 4.92 | |||||||||
| Travelers Companies, Inc. | 3,700 | 313,649 | 2.78 | |||||||||
| 868,031 | 7.70 | |||||||||||
| DIRECT TITLE INSURANCE CARRIERS | ||||||||||||
| First American Financial Corp. | 15,000 | 365,250 | 3.24 | |||||||||
| FARM MACHINERY & EQUIPMENT MANUFACTURING | ||||||||||||
| Deere & Co. | 3,200 | 260,448 | 2.31 | |||||||||
| GENERAL MEDICAL & SURGICAL HOSPITALS | ||||||||||||
| HCA Holdings, Inc. | 12,000 | 513,000 | 4.55 | |||||||||
| HOME CENTERS | ||||||||||||
| Lowe’s Companies, Inc. | 6,000 | 285,660 | 2.53 | |||||||||
| INSTRUMENT MANUFACTURING FOR MEASURING | ||||||||||||
| Agilent Technologies, Inc. | 6,000 | 307,500 | 2.73 | |||||||||
| INSURANCE AGENCIES & BROKERAGES | ||||||||||||
| Aon Plc (c) | 6,200 | 461,528 | 4.09 | |||||||||
The accompanying notes are an integral part of these financial statements.
6
CONCORDE VALUE FUND
SCHEDULE OF INVESTMENTS IN SECURITIES (continued)
September 30, 2013
| Fair | Percent of | |||||||||||
| Shares | Value | Net Assets | ||||||||||
| COMMON STOCKS (continued) | ||||||||||||
| INTERNET PUBLISHING, BROADCASTING, & | ||||||||||||
| WEB SEARCH PORTALS | ||||||||||||
| Blucora, Inc. (a) | 5,000 | $ | 114,900 | 1.02 | % | |||||||
| LINE-HAUL RAILROADS | ||||||||||||
| Union Pacific Corp. | 2,800 | 434,952 | 3.86 | |||||||||
| LOCAL MESSENGERS & LOCAL DELIVERY | ||||||||||||
| United Parcel Service, Inc. | 3,400 | 310,658 | 2.75 | |||||||||
| MEDICAL LABORATORIES | ||||||||||||
| Quest Diagnostics, Inc. | 7,000 | 432,530 | 3.83 | |||||||||
| NATURAL GAS DISTRIBUTION | ||||||||||||
| Kinder Morgan, Inc. | 11,000 | 391,270 | 3.47 | |||||||||
| PASSENGER CAR RENTAL | ||||||||||||
| Hertz Global Holdings, Inc. (a) | 8,400 | 186,144 | 1.65 | |||||||||
| PETROLEUM REFINERIES | ||||||||||||
| Exxon Mobil Corp. | 1,600 | 137,664 | 1.22 | |||||||||
| PHARMACEUTICAL PREPARATION MANUFACTURING | ||||||||||||
| Johnson & Johnson | 3,800 | 329,422 | 2.92 | |||||||||
| POTASH, SODA, & BORATE MINERAL MINING | ||||||||||||
| Potash Corp. Saskatchewan - ADR (b) | 5,500 | 172,040 | 1.53 | |||||||||
| SOFTWARE PUBLISHERS | ||||||||||||
| Microsoft Corp. | 11,500 | 383,065 | 3.40 | |||||||||
| Oracle Corp. | 10,600 | 351,602 | 3.12 | |||||||||
| 734,667 | 6.52 | |||||||||||
| SOLID WASTE LANDFILL | ||||||||||||
| Waste Management, Inc. | 9,000 | 371,160 | 3.29 | |||||||||
| WOOD KITCHEN CABINET & | ||||||||||||
| COUNTERTOP MANUFACTURING | ||||||||||||
| Fortune Brands Home & Security, Inc. | 5,300 | 220,639 | 1.96 | |||||||||
| TOTAL COMMON STOCKS (Cost $6,329,088) | 9,933,939 | 88.08 | ||||||||||
| PREFERRED STOCKS - 2.68% | ||||||||||||
| AIRCRAFT ENGINE & ENGINE | ||||||||||||
| PARTS MANUFACTURING | ||||||||||||
| United Technologies Corp., 7.50%, 08/01/2015 | 4,668 | 302,440 | 2.68 | |||||||||
| TOTAL PREFERRED STOCKS (Cost $277,020) | 302,440 | 2.68 | ||||||||||
The accompanying notes are an integral part of these financial statements.
7
CONCORDE VALUE FUND
SCHEDULE OF INVESTMENTS IN SECURITIES (continued)
September 30, 2013
| Fair | Percent of | |||||||||||
| Shares | Value | Net Assets | ||||||||||
| SHORT-TERM INVESTMENTS - 9.60% | ||||||||||||
| First American Prime Obligations Fund - Class Y, 0.02% (d) | 233,056 | $ | 233,056 | 2.06 | % | |||||||
| The STIC Prime Portolfio - Institutional Class, 0.02% (d) | 425,000 | 425,000 | 3.77 | |||||||||
| Fidelity Institutional Money Market - | ||||||||||||
| Select Class, 0.01% (d) | 425,000 | 425,000 | 3.77 | |||||||||
| TOTAL SHORT-TERM INVESTMENTS | ||||||||||||
| (Cost $1,083,056) | 1,083,056 | 9.60 | ||||||||||
| Total Investments (Cost $7,689,164) - 100.36% | 11,319,435 | 100.36 | ||||||||||
| Liabilities in Excess of Other Assets - (0.36)% | (40,214 | ) | (0.36 | ) | ||||||||
| NET ASSETS - 100.00% | $ | 11,279,221 | 100.00 | % | ||||||||
Notes:
ADR American Depository Receipt
| (a) | Presently non-income producing. |
| (b) | Foreign issued security listed directly on a U.S. securities exchange. |
| (c) | Foreign issued security traded over-the-counter in the U.S. |
| (d) | Rate shown is the 7-day yield as of September 30, 2013. |
The accompanying notes are an integral part of these financial statements.
8
CONCORDE VALUE FUND
STATEMENT OF ASSETS AND LIABILITIES
September 30, 2013
| ASSETS | ||||
| Investments in securities, at fair value (cost $7,689,164) | $ | 11,319,435 | ||
| Receivables | ||||
| Investment securities sold | 40,409 | |||
| Dividends | 10,618 | |||
| Interest | 13 | |||
| Prepaid expense | 2,260 | |||
| Other asset | 3,346 | |||
| TOTAL ASSETS | 11,376,081 | |||
| LIABILITIES | ||||
| Payable for investment securities purchased | 61,456 | |||
| Investment advisory fee payable | 8,299 | |||
| Accrued expenses | 27,105 | |||
| TOTAL LIABILITIES | 96,860 | |||
| NET ASSETS | $ | 11,279,221 | ||
| Composition of Net Assets: | ||||
| Net capital paid in on shares of capital stock | $ | 8,408,681 | ||
| Undistributed net investment income | 25,654 | |||
| Accumulated net realized loss | (785,385 | ) | ||
| Net unrealized appreciation on investments | 3,630,271 | |||
| NET ASSETS | $ | 11,279,221 | ||
| Capital shares outstanding | 793,472 | |||
| Net asset value, offering price and redemption price per share | $ | 14.22 | ||
The accompanying notes are an integral part of these financial statements.
9
CONCORDE VALUE FUND
STATEMENT OF OPERATIONS
For the Year Ended September 30, 2013
| Investment income | ||||
| Dividends (net of foreign withholding taxes of $6,047) | $ | 252,382 | ||
| Interest | 446 | |||
| Total investment income | 252,828 | |||
| Expenses | ||||
| Investment advisory fees (Note 5) | 97,986 | |||
| Administration fees | 35,875 | |||
| Fund accounting fees | 27,452 | |||
| Professional fees | 20,383 | |||
| Transfer agent fees | 16,903 | |||
| Printing, postage and delivery | 10,026 | |||
| Other expenses | 9,808 | |||
| Custodian fees | 2,679 | |||
| Directors fees | 2,275 | |||
| Federal and state registration fees | 2,040 | |||
| Insurance expense | 1,664 | |||
| Total expenses | 227,091 | |||
| NET INVESTMENT INCOME | 25,737 | |||
| REALIZED AND UNREALIZED | ||||
| GAIN FROM INVESTMENTS | ||||
| Net realized gain from investments in securities | 999,028 | |||
| Net increase in unrealized appreciation on investments in securities | 528,754 | |||
| NET REALIZED AND UNREALIZED GAIN FROM INVESTMENTS | 1,527,782 | |||
| NET INCREASE IN NET ASSETS RESULTING FROM OPERATIONS | $ | 1,553,519 | ||
The accompanying notes are an integral part of these financial statements.
10
CONCORDE VALUE FUND
STATEMENTS OF CHANGES IN NET ASSETS
| Year Ended | Year Ended | |||||||
| Sept. 30, 2013 | Sept. 30, 2012 | |||||||
| INCREASE (DECREASE) IN NET ASSETS FROM OPERATIONS | ||||||||
| Net investment income | $ | 25,737 | $ | 20,361 | ||||
| Net realized gain (loss) from investments | 999,028 | (12,359 | ) | |||||
| Net unrealized appreciation on investments | 528,754 | 2,179,786 | ||||||
| Net increase in net assets resulting from operations | 1,553,519 | 2,187,788 | ||||||
| DISTRIBUTIONS TO SHAREHOLDERS FROM | ||||||||
| Net investment income | (20,358 | ) | — | |||||
| Total distributions to shareholders | (20,358 | ) | — | |||||
| CAPITAL SHARE TRANSACTIONS – NET (Note 3) | (1,281,372 | ) | (491,112 | ) | ||||
| Total increase in net assets | 251,789 | 1,696,676 | ||||||
| NET ASSETS | ||||||||
| Beginning of year | 11,027,432 | 9,330,756 | ||||||
| End of year (including undistributed net investment | ||||||||
| income of $25,654 and $20,358, respectively) | $ | 11,279,221 | $ | 11,027,432 | ||||
The accompanying notes are an integral part of these financial statements.
11
CONCORDE VALUE FUND
FINANCIAL HIGHLIGHTS
| Year ended September 30, | ||||||||||||||||||||
| 2013 | 2012 | 2011 | 2010 | 2009 | ||||||||||||||||
| PER SHARE OPERATING | ||||||||||||||||||||
PERFORMANCE(1): | ||||||||||||||||||||
| Net asset value, beginning of year | $ | 12.34 | $ | 9.97 | $ | 10.65 | $ | 9.98 | $ | 12.74 | ||||||||||
| Income (loss) from investment operations: | ||||||||||||||||||||
| Net investment income (loss) | 0.03 | 0.02 | (0.03 | ) | (0.03 | ) | (0.02 | ) | ||||||||||||
| Net realized and unrealized gain (loss) | ||||||||||||||||||||
| on investments | 1.87 | 2.35 | (0.65 | ) | 0.70 | (2.14 | ) | |||||||||||||
| Total from investment operations | 1.90 | 2.37 | (0.68 | ) | 0.67 | (2.16 | ) | |||||||||||||
| Less distributions: | ||||||||||||||||||||
| From net investment income | (0.02 | ) | — | — | — | — | ||||||||||||||
| From net realized gains | — | — | — | — | (0.60 | ) | ||||||||||||||
| Total distributions | (0.02 | ) | — | — | — | (0.60 | ) | |||||||||||||
| Net asset value, end of year | $ | 14.22 | $ | 12.34 | $ | 9.97 | $ | 10.65 | $ | 9.98 | ||||||||||
| TOTAL RETURN | 15.46 | % | 23.77 | % | (6.38 | %) | 6.71 | % | (16.40 | %) | ||||||||||
| RATIOS/SUPPLEMENTAL DATA: | ||||||||||||||||||||
| Net assets, end of year (in thousands) | $ | 11,279 | $ | 11,027 | $ | 9,331 | $ | 10,495 | $ | 12,487 | ||||||||||
| Ratio of expenses to average net assets | 2.09 | % | 2.12 | % | 2.07 | % | 2.02 | % | 2.00 | % | ||||||||||
| Ratio of net investment income (loss) | ||||||||||||||||||||
| to average net assets | 0.24 | % | 0.19 | % | (0.24 | %) | (0.32 | %) | (0.24 | %) | ||||||||||
| Portfolio turnover rate | 34 | % | 19 | % | 37 | % | 33 | % | 51 | % | ||||||||||
| (1) | Per share information has been calculated using the average number of shares outstanding. |
The accompanying notes are an integral part of these financial highlights.
12
CONCORDE VALUE FUND
NOTES TO FINANCIAL STATEMENTS
Note 1 – Nature of Business and Summary of Significant Accounting Policies
NATURE OF BUSINESS
Concorde Value Fund (Fund) is a separate series of shares of common stock of Concorde Funds, Inc. (Company). The Company was incorporated in the state of Texas in September of 1987, and is registered under the Investment Company Act of 1940, as a diversified, open-end management investment company. The Fund is subject to various investment restrictions as set forth in the Statement of Additional Information. The effective date of the Fund’s Registration Statement under the Securities Act of 1933 was December 4, 1987. The primary investment objective of the Fund is to produce long-term growth of capital. The Company may designate one or more series of common stock. The Company presently has no series other than the Fund. Each capital share in the Fund represents an equal, proportionate interest in the net assets of the Fund with each other capital share in such series and no interest in any other series.
SIGNIFICANT ACCOUNTING POLICIES
The following is a summary of significant accounting policies followed by the Fund in the preparation of its financial statements. These policies are in conformity with accounting principles generally accepted in the United States.
VALUATION OF SECURITIES
All investments in securities are recorded at their estimated fair value, as described in note 2.
FEDERAL INCOME TAXES
The Fund’s policy is to continue to comply with the requirements of the Internal Revenue Code that are applicable to regulated investment companies and to distribute substantially all its taxable income to its shareholders. The Fund also intends to distribute sufficient net investment income and net realized capital gains, if any, so that it will not be subject to excise tax on undistributed income and gains. Therefore, no federal income or excise tax provision is required.
Net investment income (loss), net realized gains (losses) and the cost of investments in securities may differ for financial statement and income tax purposes. The character of distributions from net investment income or net realized gains may differ from their ultimate characterization for income tax purposes. Permanent book and tax differences, if any, result in reclassifications to certain components of net assets. For the year ended September 30, 2013, the Fund decreased undistributed net investment income by $83, and decreased accumulated net realized loss by $83. These reclassifications have no effect on net assets, results of operations or net asset value per share. The permanent differences primarily relate to foreign currency losses. Also, due to the timing of dividend distributions, the fiscal year in which amounts are distributed may differ from the year that the income or realized gains were recorded by the Fund.
13
CONCORDE VALUE FUND
NOTES TO FINANCIAL STATEMENTS
Note 1 – Nature of Business and Summary of Significant Accounting Policies (continued)
FEDERAL INCOME TAXES (CONTINUED)
Management has reviewed all open tax years and major jurisdictions and concluded that there is no impact on the Fund’s net assets and no tax liability resulting from unrecognized tax benefits relating to uncertain income tax positions taken or expected to be taken on a tax return. As of September 30, 2013, open Federal tax years include the tax years ended September 30, 2010 through 2012.
SECURITY TRANSACTIONS AND RELATED INCOME
Security transactions are accounted for on the date the securities are purchased or sold. Realized gains and losses from securities transactions are reported on an identified cost basis. Dividend income is recognized on the ex-dividend date, and interest income is recognized on an accrual basis. Discounts and premiums on securities purchased are amortized, over the life of the respective securities.
DIVIDENDS AND DISTRIBUTIONS
Distributions to shareholders are determined in accordance with income tax regulations, and are recorded on the ex-dividend date. The Fund intends to distribute substantially all of its net investment income as dividends to its shareholders on an annual basis. The Fund intends to distribute substantially all of its net realized long-term capital gains and its net realized short-term capital gains at least once a year. The treatment for financial reporting purposes of distributions made to shareholders during the year from net investment income or net realized capital gains may differ from their ultimate treatment for federal income tax purposes. These differences are caused primarily by differences in the timing of the recognition of certain components of income, expense or realized capital gain for federal income tax purposes. Where such differences are permanent in nature, they are reclassified in the components of net assets based on their ultimate characterization for federal income tax purposes. Any such reclassifications will have no effect on net assets, results of operations or net asset value per share.
USE OF ESTIMATES
The preparation of financial statements in conformity with U.S. generally accepted accounting principles (“GAAP”) requires management to make estimates and assumptions that affect the reported amounts of the assets and liabilities and disclosure of contingent assets and liabilities at the date of the financial statements and the reported amounts of increases and decreases in net assets from operations during the reporting period. Actual results could differ from those estimates.
14
CONCORDE VALUE FUND
NOTES TO FINANCIAL STATEMENTS
Note 1 – Nature of Business and Summary of Significant Accounting Policies (continued)
OPTION WRITING
When the Fund writes an option, an amount equal to the premium received by the Fund is recorded as a liability and is subsequently adjusted to the current fair value of the option written. The Fund treats premiums received from writing options that expire unexercised on the expiration date as realized gains from investments. The difference between the premium and amount paid on effecting a closing purchase transaction, including brokerage commissions, is also treated as a realized gain, or, if the premium is less than the amount paid for the closing purchase transaction, as a realized loss. If a call option is exercised, the premium is added to the proceeds from the sale of the underlying security or currency in determining whether the Fund has realized a gain or loss. The Fund as writer of an option bears the market risk of an unfavorable change in the price of the security underlying the written option.
NEW ACCOUNTING PRONOUNCEMENT
In December 2011, the Financial Accounting Standards Board (“FASB”) issued ASU No. 2011-11 related to disclosures about offsetting assets and liabilities. The amendments in this ASU require an entity to disclose information about offsetting and related arrangements to enable users of its financial statements to understand the effect of those arrangements on its financial position. The ASU is effective for annual reporting periods beginning on or after January 1, 2013, and interim periods within those annual periods. The guidance requires retrospective applications for all comparative periods presented. Management is currently evaluating the impact ASU 2011-11, but does not expect it will have an impact on the Fund’s financial statement disclosures.
Note 2 – Fair Value Measurements
The Fund utilizes various methods to measure the fair value of its investments on a recurring basis. GAAP establishes a hierarchy that prioritizes inputs to valuation techniques used to measure fair value. The three levels of inputs are as follows:
| Level 1 – | Quoted unadjusted prices in active markets for identical instruments to which the Fund has access at the date of measurement. | |
| Level 2 – | Quoted prices for similar instruments in active markets; quoted prices for identical or similar instruments in markets that are not active; and model-derived valuations in which all significant inputs and significant value drivers are observable in active markets. Level 2 inputs are those in markets for which there are few transactions, the prices are not current, little public information exists or instances where prices vary substantially over time or among brokered market makers. | |
| Level 3 – | Model derived valuations in which one or more significant inputs or significant value drivers are unobservable. Unobservable inputs are those inputs that reflect the Fund’s own assumptions that market participants would use to price the asset or liability based on the best available information. |
15
NOTES TO FINANCIAL STATEMENTS
Note 2 – Fair Value Measurements (continued)
Following is a description of the valuation techniques applied to the Fund’s major categories of assets and liabilities measured at fair value on a recurring basis.
Equity Securities (common and preferred stock) – Securities traded on a national securities exchange are valued at the last sale price on the exchange on which such securities are traded, as of the close of business on the day the securities are being valued or, lacking any reported sales, at the mean between the last available bid and asked price, except for call options written for which the last quoted bid price is used. To the extent these securities are actively traded and valuation adjustments are not applied, they are categorized in level 1 of the fair value hierarchy.
Mutual Funds – Mutual funds are generally priced at the ending net asset value provided by the service agent of the Funds and will be classified as Level 1 securities.
Bonds & Notes – Bonds and notes are valued at the last quoted bid price obtained from independent pricing services. Short-term demand notes and certificates of deposit are stated at amortized cost, which approximates fair value. Short-term debt obligations with remaining maturities in excess of 60 days are valued at current market prices.
Short-Term Debt Securities – Fixed income securities with maturities of less than 60 days when acquired, or which subsequently are within 60 days of maturity, are valued by using the amortized cost method of valuation, which the Board has determined will represent fair value. Short-term securities with 60 days or less remaining to maturity are, unless conditions indicate otherwise, amortized to maturity based on their cost to the Fund if acquired within 60 days of maturity or, if already held by the Fund on the 60th day, based on the value determined on the 61st day.
All other assets of the Fund are valued in such manner as the Board in good faith deems appropriate to reflect their fair value.
Securities for which market quotations are not readily available or if the closing price does not represent fair value, are valued at fair value as determined in good faith following procedures approved by the Board. Factors used in determining fair value vary by investment type and may include: trading volume of security and markets, value of other like securities and news events with direct bearing to security or market. Depending on the valuation inputs, these securities may be classified in either level 2 or level 3 of the fair value hierarchy.
16
CONCORDE VALUE FUND
NOTES TO FINANCIAL STATEMENTS
Note 2 – Fair Value Measurements (continued)
The following is a summary of the inputs used to value the Fund’s investments as of September 30, 2013:
| Level 1 | Level 2 | Level 3 | Total | |||||||||||||
| Common Stocks | ||||||||||||||||
| Amusement & Theme Parks | $ | 257,960 | $ | — | $ | — | $ | 257,960 | ||||||||
| Breakfast Cereal Manufacturing | 220,432 | — | — | 220,432 | ||||||||||||
| Breweries | 267,840 | — | — | 267,840 | ||||||||||||
| Cable & Other Subscription Programming | 770,390 | — | — | 770,390 | ||||||||||||
| Clothing Accessories Stores | 311,550 | — | — | 311,550 | ||||||||||||
| Crude Petroleum & Natural Gas Extraction | 925,364 | — | — | 925,364 | ||||||||||||
| Data Processing | 282,940 | — | — | 282,940 | ||||||||||||
| Direct Property & Casualty Insurance Carriers | 868,031 | — | — | 868,031 | ||||||||||||
| Direct Title Insurance Carriers | 365,250 | — | — | 365,250 | ||||||||||||
| Farm Machinery & Equipment Manufacturing | 260,448 | — | — | 260,448 | ||||||||||||
| General Medical & Surgical Hospitals | 513,000 | — | — | 513,000 | ||||||||||||
| Home Centers | 285,660 | — | — | 285,660 | ||||||||||||
| Instrument Manufacturing for Measuring | 307,500 | — | — | 307,500 | ||||||||||||
| Insurance Agencies & Brokerages | 461,528 | — | — | 461,528 | ||||||||||||
| Internet Publishing, Broadcasting, & | ||||||||||||||||
| Web Search Portals | 114,900 | — | — | 114,900 | ||||||||||||
| Line-Haul Railroads | 434,952 | — | — | 434,952 | ||||||||||||
| Local Messengers & Local Delivery | 310,658 | — | — | 310,658 | ||||||||||||
| Medical Laboratories | 432,530 | — | — | 432,530 | ||||||||||||
| Natural Gas Distribution | 391,270 | — | — | 391,270 | ||||||||||||
| Passenger Car Rental | 186,144 | — | — | 186,144 | ||||||||||||
| Petroleum Refineries | 137,664 | — | — | 137,664 | ||||||||||||
| Pharmaceutical Preparation Manufacturing | 329,422 | — | — | 329,422 | ||||||||||||
| Potash, Soda, & Borate Mineral Mining | 172,040 | — | — | 172,040 | ||||||||||||
| Software Publishers | 734,667 | — | — | 734,667 | ||||||||||||
| Solid Waste Landfill | 371,160 | — | — | 371,160 | ||||||||||||
| Wood Kitchen Cabinet & Countertop | ||||||||||||||||
| Manufacturing | 220,639 | — | — | 220,639 | ||||||||||||
| Total Common Stocks | 9,933,939 | — | — | 9,933,939 | ||||||||||||
| Preferred Stocks | ||||||||||||||||
| Aircraft Engine & Engine Parts Manufacturing | 302,440 | — | — | 302,440 | ||||||||||||
| Total Preferred Stocks | 302,440 | — | — | 302,440 | ||||||||||||
| Short-Term Investments | 1,083,056 | — | — | 1,083,056 | ||||||||||||
| Total Investments | $ | 11,319,435 | $ | — | $ | — | $ | 11,319,435 | ||||||||
Transfers between levels are recognized at the end of the reporting period. There were no transfers between level 1 and level 2 during the year. There were no level 3 securities held in the Fund during the year ended September 30, 2013.
17
CONCORDE VALUE FUND
NOTES TO FINANCIAL STATEMENTS
Note 3 – Capital Share Transactions
As of September 30, 2013, there were 30,000,000 shares of $1 par value capital stock authorized of which 9,841,293 shares are classified as the Fund’s series and the remaining balance is unallocated for future use. As of September 30, 2013, capital paid-in aggregated $8,408,681.
Transactions in shares of capital stock for the year ended September 30, 2013 and September 30, 2012 were as follows:
| Year Ended | Year Ended | |||||||||||||||
| September 30, 2013 | September 30, 2012 | |||||||||||||||
| Shares | Amount | Shares | Amount | |||||||||||||
| Shares sold | 5,270 | $ | 70,000 | 5,519 | $ | 66,000 | ||||||||||
| Shares issued in reinvestment of dividends | 1,670 | 20,358 | — | — | ||||||||||||
| 6,940 | 90,358 | 5,519 | 66,000 | |||||||||||||
| Shares redeemed | (107,373 | ) | (1,371,730 | ) | (47,704 | ) | (557,112 | ) | ||||||||
| Net increase (decrease) | (100,433 | ) | $ | (1,281,372 | ) | (42,185 | ) | $ | (491,112 | ) | ||||||
On November 14, 2012, a distribution of $0.02 per share was declared from net investment income. The dividend was paid on December 12, 2012, to shareholders of record on December 11, 2012.
Note 4 – Investment Transactions
The aggregate cost of purchases and proceeds from sales of investment securities, excluding short-term investments, were $3,413,572 and $4,870,118, respectively. The cost of purchases and proceeds from sales of short-term securities aggregated $4,239,297 and $4,040,834, respectively, for the year ended September 30, 2013.
Note 5 – Investment Advisory Fees and Other Transactions with Affiliates
The Fund has an Investment Advisory Agreement (Advisory Agreement) with Concorde Financial Corporation dba Concorde Investment Management (Concorde) to act as the Fund’s investment advisor. Concorde provides the Fund with investment advice and recommendations consistent with the Fund’s investment objectives, policies and restrictions, and supervises the purchase and sale of investment transactions on behalf of the Fund. For such services, Concorde receives an annual fee of 0.90% of the Fund’s average daily net assets, computed daily and paid on a monthly basis. The investment advisory fee was $97,986 for the year ended September 30, 2013, of which $8,299 was payable at September 30, 2013.
Certain directors and officers of the Company are also directors, officers and/or employees of Concorde.
18
CONCORDE VALUE FUND
NOTES TO FINANCIAL STATEMENTS
Note 6 – Federal Tax Information
As of September 30, 2013, the cost of investments and components of accumulated or distributable earnings (losses) on a tax basis were as follows:
| Cost of Investments | $ | 7,689,164 | ||
| Gross tax unrealized appreciation | $ | 3,775,491 | ||
| Gross tax unrealized depreciation | (145,220 | ) | ||
| Net tax unrealized appreciation | $ | 3,630,271 | ||
| Undistributed ordinary income | $ | 25,654 | ||
| Undistributed long-term capital gain | — | |||
| Total distributable earnings | $ | 25,654 | ||
| Other accumulated losses | $ | (785,385 | ) | |
| Total accumulated earnings | $ | 2,870,540 |
As of September 30, 2013, the Fund had accumulated tax basis capital losses of $785,385, which may be carried over to offset future capital gains and expires on September 30, 2018. The Fund utilized a capital loss carryover in the amount of $970,102 during the year ended September 30, 2013. Additionally, the Fund had no post-October capital loss.
The tax character of distributions paid during the years ended September 30, 2013 and September 30, 2012 was as follows:
| September 30, 2013 | September 30, 2012 | |||||||
| Ordinary income | $ | 20,358 | $ | — | ||||
| Long-term capital gain | — | — | ||||||
| Return of capital | — | — | ||||||
Note 7 – Subsequent Events
Management has evaluated the Fund’s events and transactions that occurred subsequent to September 30, 2013, through November 13, 2013, the date of issuance of the Fund’s financial statements. There were no events or transactions that occurred during this period that materially impacted the amounts or disclosures in the Fund’s financial statements.
19
REPORT OF INDEPENDENT REGISTERED PUBLIC ACCOUNTING FIRM
To the Shareholders and
Board of Directors of
Concorde Funds, Inc.
We have audited the accompanying statement of assets and liabilities of Concorde Value Fund, a series of Concorde Funds, Inc. (Fund), including the schedule of investments in securities, as of September 30, 2013, and the related statements of operations for the year then ended, the statements of changes in net assets for each of the two years in the period then ended, and the financial highlights for each of the five years in the period then ended. These financial statements and financial highlights are the responsibility of the Fund’s management. Our responsibility is to express an opinion on these financial statements and financial highlights based on our audits.
We conducted our audits in accordance with the standards of the Public Company Accounting Oversight Board (United States). Those standards require that we plan and perform the audit to obtain reasonable assurance about whether the financial statements and financial highlights are free of material misstatement. The Fund is not required to have, nor were we engaged to perform, an audit of its internal control over financial reporting. Our audits included consideration of internal control over financial reporting as a basis for designing audit procedures that are appropriate in the circumstances, but not for the purpose of expressing an opinion on the effectiveness of the Fund’s internal control over financial reporting. Accordingly, we express no such opinion. An audit also includes examining, on a test basis, evidence supporting the amounts and disclosures in the financial statements, assessing the accounting principles used and significant estimates made by management, as well as evaluating the overall financial statement presentation. Our procedures included confirmation of securities owned as of September 30, 2013, by correspondence with the custodian and brokers. We believe that our audits provide a reasonable basis for our opinion.
In our opinion, the financial statements and financial highlights referred to above present fairly, in all material respects, the financial position of the Concorde Value Fund, a series of Concorde Funds, Inc. as of September 30, 2013, the results of its operations for the year then ended, the changes in its net assets for each of the two years in the period then ended, and the financial highlights for each of the five years in the period then ended, in conformity with accounting principles generally accepted in the United States of America.
 | |
| BRAD A. KINDER, CPA |
Flower Mound, Texas
November 13, 2013
20
PROXY VOTING POLICIES AND PROCEDURES
For a description of the policies and procedures that the Fund uses to determine how to vote proxies relating to the portfolio securities, please call (972) 701-5400 and request a Statement of Additional Information. One will be mailed to you free of charge. The Statement of Additional Information is also available on the website of the Securities and Exchange Commission at http://www.sec.gov.
PROXY VOTING RECORDS
Information on how the Fund voted proxies relating to portfolio securities during the twelve month period ending June 30, 2013 is available without charge, upon request, by calling (972) 701-5400. Furthermore, you can obtain the Fund’s proxy voting records on the Securities and Exchange Commission’s website at http://www.sec.gov.
QUARTERLY FILINGS ON FORM N-Q
The Fund files its complete schedule of portfolio holdings with the Securities and Exchange Commission for the first and third quarters of each fiscal quarter on Form N-Q. The Fund’s Form N-Q is available (i) without charge, upon request, by calling (972) 701-5400, (ii) on the Securities and Exchange Commission’s website at http://www.sec.gov, or (iii) at the Securities and Exchange Commission’s public reference room.
HOUSEHOLD DELIVERY OF SHAREHOLDER DOCUMENTS
In an effort to decrease costs, the FUND intends to reduce the number of duplicate prospectuses and Annual and Semi-Annual Reports you receive by sending only one copy of each to those addresses shared by two or more accounts and to shareholders we reasonably believe are from the same family or household. Once implemented, if you would like to discontinue householding for your accounts, please call toll-free at 1-800-294-1699 to request individual copies of these documents. One the FUND receives notice to stop householding, we will begin sending individual copies thirty days after receiving your request. This policy does not apply to account statements.
FEDERAL TAX DISTRIBUTION INFORMATION
The Fund has designated 100% of the dividends declared from net investment income during the year ended September 30, 2013, as qualified dividend income under the Jobs Growth and Tax Reconciliation Act of 2003. Additionally, for corporate shareholders, the percent of ordinary income distributions qualifying for the corporate dividends received deduction for the fiscal year ended September 30, 2013 was 100%.
21
As a shareholder of the FUND, you incur two types of costs: (1) transaction costs and exchange fees; and (2) ongoing costs, including management fees and other FUND expenses. This Example is intended to help you understand your ongoing costs (in dollars) of investing in the FUND and to compare these costs with the ongoing costs of investing in other mutual funds.
The Example is based on an investment of $1,000 invested at the beginning of the period and held for the entire six month period ended September 30, 2013.
Actual Expenses
The first line of the table below provides information about actual account values and actual expenses. You may use the information in this line, together with the amount you invested, to estimate the expenses that you paid over the period. Simply divide your account value by $1,000 (for example, an $8,600 account value divided by $1,000 = 8.6), then multiply the result by the number in the first line under the heading entitled “Expenses Paid During Period” to estimate the expenses you paid on your account during this period.
Hypothetical Example for Comparison Purposes
The second line of the table below provides information about hypothetical account values and hypothetical expenses based on the FUND’s actual expense ratio and an assumed rate of return of 5% per year before expenses, which is not the FUND’s actual return. The hypothetical account values and expenses may not be used to estimate the actual ending account balance or expenses you paid for the period. You may use this information to compare the ongoing costs of investing in the FUND and other funds. To do so, compare this 5% hypothetical example with the 5% hypothetical examples that appear in the shareholder reports of the other funds.
Please note that the expenses shown in the table are meant to highlight your ongoing costs only and do not reflect any transactional costs or exchange fees. While the FUND does not currently assess sales charges, redemption or exchange fees, other funds do, and those costs will not be reflected in their expense tables. Therefore, the second line of the table is useful in comparing ongoing costs only, and will not help you determine the relative total costs of owning different funds.
| Beginning Account | Ending Account | Expenses Paid During Period* – | |
| Value – 4/1/13 | Value – 9/30/13 | Six Months Ended 9/30/13 | |
| Actual | $1,000.00 | $1,075.60 | $10.67 |
| Hypothetical (5% return before expenses) | $1,000.00 | $1,014.79 | $10.35 |
| * | Expenses are equal to the FUND’s annualized expense ratio of 2.05%, multiplied by the average account value over the period, multiplied by 183/365 (to reflect the one-half year period ended September 30, 2013). |
22
DIRECTORS AND OFFICERS
The Fund’s Statement of Additional Information includes additional information about the Fund’s Directors and Officers and is available, without charge, upon request by calling (972) 701-5400.
| Position(s) | Term of Office | Other | ||
| Name, | Held with | and Length | Principal Occupation(s) | Directorships |
| Address and Age | the Fund | of Time Served | During Past 5 Years | Held by Director |
| “Disinterested Persons” | ||||
| William Marcy | Director | Indefinite, until | Executive Director of the Murdough | None |
| Age: 71 | successor elected | Center for Engineering Professionalism | ||
| Address: | and the National Institute for | |||
| Box 709, High Rolls, | Since 2006 | Engineering Ethics, Texas Tech | ||
| New Mexico 88325 | University. He is a former Provost | |||
| and Senior Vice President for Academic | ||||
| Affairs, Texas Tech University. | ||||
| John H. Wilson | Chairman | Indefinite, until | President of U.S. Equity Corporation, | Capital Southwest |
| Age: 70 | and Director | successor elected | a venture capital firm since 1983. | Corporation, Encore |
| Address: | Wire Corporation. | |||
| 1000 Three Lincoln Centre | Since 1992 | |||
| 5430 LBJ Freeway LB3 | ||||
| Dallas, Texas 75240 | ||||
| “Interested Persons” | ||||
| Gary B. Wood, Ph.D.* | President, | Indefinite, until | President, Secretary, Treasurer and | OmniMed Corporation |
| Age: 63 | Chief | successor elected | a Director of the Advisor and | eOriginal, Inc., |
| Address: | Compliance | (as Director) | Concorde Capital Corporation, an | Concorde Capital |
| 1000 Three Lincoln Centre | Officer, | exempt reporting advisor to private | Corporation, | |
| 5430 LBJ Freeway LB3 | Treasurer | One-year term | funds affiliated with the Advisor. He | International Hospital |
| Dallas, Texas 75240 | and Director | (as officer) | is also Chairman of the Board and | Corporation Holding, |
| Interim CEO of International | NV. | |||
| Since 1987 | Hospital Corporation Holding, NV | |||
| and its subsidiaries, which owns, | ||||
| develops and manages private | ||||
| healthcare facilities in Mexico, | ||||
| Central America and Brazil. | ||||
| John A. Stetter | Secretary | One-year term | Vice President and Portfolio | |
| Age: 58 | Manager for the Advisor. | |||
| Address: | Since 1998 | |||
| 1000 Three Lincoln Centre | ||||
| 5430 LBJ Freeway LB3 | ||||
| Dallas, Texas 75240 |
| * | Dr. Wood is a director who is an “interested person” of FUND as that term is defined in the Investment Company Act of 1940. |
23
(This Page Intentionally Left Blank.)
CONCORDE FUNDS, INC.
PRIVACY POLICY
We collect the following nonpublic personal information about you:
| • | Information we receive from you or in applications or other forms, correspondence, or conversations, including, but not limited to, your name, address, phone number, social security number, assets, income and date of birth; and |
| • | Information about your transactions with us, our affiliates, or others, including, but not limited to, your account number and balance, payments history, parties to transactions, cost basis information, and other financial information. |
We do not disclose any nonpublic personal information about our current or former shareholders to nonaffiliated third parties, except as permitted by law. For example, we are permitted by law to disclose all the information we collect, as described above, to our transfer agent to process your transactions. Furthermore, we restrict access to your nonpublic personal information to those persons who require such information to provide products and services to you. We maintain physical, electronic, and procedural safeguards that comply with federal standards to guard your nonpublic personal information.
In the event that you hold shares of the fund(s) through a financial intermediary, including, but not limited to, a broker-dealer, bank or trust company, the privacy policy of your financial intermediary would govern how your nonpublic personal information would be shared with nonaffiliated third parties.
Concorde Investment Management
1000 Three Lincoln Centre
5430 LBJ Freeway LB3
Dallas, Texas 75240
OFFICERS
Gary B. Wood, Ph.D.
President and Treasurer
John A. Stetter
Secretary
DIRECTORS
William Marcy
John H. Wilson
Gary B. Wood, Ph.D.
CUSTODIAN
U.S. Bank, N.A.
Custody Operations
1555 North RiverCenter Drive, Suite 302
Milwaukee, Wisconsin 53212
TRANSFER AGENT AND
DIVIDEND DISBURSING AGENT
U.S. Bancorp Fund Services, LLC
Mutual Fund Services, 3rd Floor
615 East Michigan Street
Milwaukee, Wisconsin 53202
INDEPENDENT REGISTERED
PUBLIC ACCOUNTING FIRM
Brad A. Kinder, CPA
815 Parker Square
Flower Mound, Texas 75028
LEGAL COUNSEL
Foley & Lardner LLP
777 East Wisconsin Avenue
Milwaukee, Wisconsin 53202
TELEPHONE
(972) 701-5400
(Fund information)
(800) 294-1699
(Shareholder account information)

Item 2. Code of Ethics.
The registrant has adopted a code of ethics that applies to the registrant’s principal executive officer and principal financial officer. The registrant has not made any amendments to its code of ethics during the period covered by this report. The registrant has not granted any waivers from any provisions of the code of ethics during the period covered by this report. The registrant undertakes to provide to any person without charge, upon request, a copy of its code of ethics by mail when they call the registrant at 1-800-294-1699.
Item 3. Audit Committee Financial Expert.
The registrant’s board of directors has determined that it does not have an audit committee financial expert serving on its audit committee. At this time, the registrant believes that the experience provided by each member of the audit committee together offers the registrant adequate oversight for the registrant’s level of financial complexity.
Item 4. Principal Accountant Fees and Services.
The registrant has engaged its principal accountant to perform audit services, audit-related services, tax services and other services during the past two fiscal years. “Audit services” refer to performing an audit of the registrant's annual financial statements or services that are normally provided by the accountant in connection with statutory and regulatory filings or engagements for those fiscal years. “Audit-related services” refer to the assurance and related services by the principal accountant that are reasonably related to the performance of the audit. “Tax services” refer to professional services rendered by the principal accountant for tax compliance, tax advice, and tax planning. There were no “other services” provided by the principal accountant. The following table details the aggregate fees billed or expected to be billed for each of the last two fiscal years for audit fees, audit-related fees, tax fees and other fees by the principal accountant.
| FYE 09/30/2013 | FYE 09/30/2012 | |
| Audit Fees | $17,000 | $17,000 |
| Audit-Related Fees | None | None |
| Tax Fees | $1,000 | $1,000 |
| All Other Fees | None | None |
The audit committee has adopted pre-approval policies and procedures that require the audit committee to pre-approve all audit and non-audit services of the registrant, including services provided to any entity affiliated with the registrant.
The percentage of fees billed by Brad A. Kinder, CPA applicable to non-audit services pursuant to waiver of pre-approval requirement were as follows:
| FYE 09/30/2013 | FYE 09/30/2012 | |
| Audit-Related Fees | 0% | 0% |
| Tax Fees | 0% | 0% |
| All Other Fees | 0% | 0% |
All of the principal accountant’s hours spent on auditing the registrant’s financial statements were attributed to work performed by full-time permanent employees of the principal accountant. (If more than 50 percent of the accountant’s hours were spent to audit the registrant's financial statements for the most recent fiscal year, state how many hours were attributed to work performed by persons other than the principal accountant's full-time, permanent employees.)
The following table indicates the non-audit fees billed or expected to be billed by the registrant’s accountant for services to the registrant and to the registrant’s investment adviser (and any other controlling entity, etc.—not sub-adviser) for the last two years. The audit committee of the board of trustees/directors has considered whether the provision of non-audit services that were rendered to the registrant's investment adviser is compatible with maintaining the principal accountant's independence and has concluded that the provision of such non-audit services by the accountant has not compromised the accountant’s independence.
| Non-Audit Related Fees | FYE 09/30/2013 | FYE 09/30/2012 |
| Registrant | None | None |
| Registrant’s Investment Adviser | $1,500 | $1,250 |
Item 5. Audit Committee of Listed Registrants.
Not applicable to registrants who are not listed issuers (as defined in Rule 10A-3 under the Securities Exchange Act of 1934).
Item 6. Investments.
| (a) | Schedule of Investments is included as part of the report to shareholders filed under Item 1 of this Form. |
| (b) | Not Applicable. |
Item 7. Disclosure of Proxy Voting Policies and Procedures for Closed-End Management Investment Companies.
Not applicable to open-end investment companies.
Item 8. Portfolio Managers of Closed-End Management Investment Companies.
Not applicable to open-end investment companies.
Item 9. Purchases of Equity Securities by Closed-End Management Investment Company and Affiliated Purchasers.
Not applicable to open-end investment companies.
Item 10. Submission of Matters to a Vote of Security Holders.
Not Applicable.
Item 11. Controls and Procedures.
| (a) | The Registrant’s President and Treasurer have reviewed the Registrant's disclosure controls and procedures (as defined in Rule 30a-3(c) under the Investment Company Act of 1940 (the “Act”)) as of a date within 90 days of the filing of this report, as required by Rule 30a-3(b) under the Act and Rules 13a-15(b) or 15d-15(b) under the Securities Exchange Act of 1934. Based on their review, such officers have concluded that the disclosure controls and procedures are effective in ensuring that information required to be disclosed in this report is appropriately recorded, processed, summarized and reported and made known to them by others within the Registrant and by the Registrant’s service provider. |
| (b) | There were no changes in the Registrant's internal control over financial reporting (as defined in Rule 30a-3(d) under the Act) that occurred during the second fiscal quarter of the period covered by this report that has materially affected, or is reasonably likely to materially affect, the Registrant's internal control over financial reporting. |
Item 12. Exhibits.
| (a) | (1) Any code of ethics or amendment thereto, that is the subject of the disclosure required by Item 2, to the extent that the registrant intends to satisfy Item 2 requirements through filing an exhibit. Incorporated by reference to previous Form N-CSR filed November 18, 2004. |
(2) A separate certification for each principal executive and principal financial officer pursuant to Section 302 of the Sarbanes-Oxley Act of 2002. Filed herewith.
(3) Any written solicitation to purchase securities under Rule 23c-1 under the Act sent or given during the period covered by the report by or on behalf of the registrant to 10 or more persons. Not applicable to open-end investment companies.
| (b) | Certifications pursuant to Section 906 of the Sarbanes-Oxley Act of 2002. Furnished herewith. |
SIGNATURES
Pursuant to the requirements of the Securities Exchange Act of 1934 and the Investment Company Act of 1940, the registrant has duly caused this report to be signed on its behalf by the undersigned, thereunto duly authorized.
(Registrant) Concorde Funds, Inc.
By (Signature and Title)* /s/Gary B. Wood
Gary B. Wood, President
Date December 6, 2013
Pursuant to the requirements of the Securities Exchange Act of 1934 and the Investment Company Act of 1940, this report has been signed below by the following persons on behalf of the registrant and in the capacities and on the dates indicated.
By (Signature and Title)* /s/Gary B. Wood
Gary B. Wood, Principal Executive Officer
Date December 6, 2013
By (Signature and Title)* /s/Gary B. Wood
Gary B. Wood, Principal Financial Officer
Date December 6, 2013