UNITED STATES
SECURITIES AND EXCHANGE COMMISSION
Washington, D.C. 20549
SECURITIES AND EXCHANGE COMMISSION
Washington, D.C. 20549
FORM N-CSR
CERTIFIED SHAREHOLDER REPORT OF REGISTERED
MANAGEMENT INVESTMENT COMPANIES
Investment Company Act file number (811-05339)
Concorde Funds, Inc.
(Exact name of registrant as specified in charter)
(Exact name of registrant as specified in charter)
8383 Preston Center Plaza
Suite 360
Dallas, TX 75225
(Address of principal executive offices) (Zip code)
(Address of principal executive offices) (Zip code)
Gary B. Wood, President
8383 Preston Center Plaza, Suite 360 Dallas, TX 75225
(Name and address of agent for service)
(972)-701-5400
Registrant's telephone number, including area code
Date of fiscal year end: September 30
Date of reporting period: March 31, 2021
Item 1. Reports to Stockholders.
| (a) |
A NO-LOAD
MUTUAL FUND
SEMI-ANNUAL REPORT
Dated March 31, 2021
(Unaudited)

Dear Shareholders,
Concorde Wealth Management Fund (the “Fund” or “CONWX”), managed by Concorde Investment Management, produced a net return of 23.97% for the six months ended March 31, 2021 and 45.67% for the 12 months ending that same date. Of note, in the Moderate Allocation Classification for mutual funds of comparable size established by Morningstar which is defined as 50-70% Equity Holdings, CONWX performance was ranked in the first quartile for the most recent three month, six month, one year, three year and five year time periods as of March 31, 2021. The rankings were the same for that Morningstar category, regardless of size, for the most recent three month, six month, one year, and three year periods as of March 31, 2021. Additionally, this compared to the various equity, fixed income and blended indices below. The Fund continued to transition to the new balanced objective that became effective during late summer 2016, adding new private equity exposure during the last six months. Asset allocations as of March 31, 2021 were approximately 57% equities, including 8.5% in private equity, 24.1% in fixed income and cash equivalents and 18.9% in defensive/non-equity market correlated securities.
| Annualized | Annualized | ||||
| Six Months Ended | 1 Year Ended | 5 Years Ended | 10 Years Ended | ||
| March 31, 2021 | March 31, 2021 | March 31, 2021 | March 31, 2021 | ||
(Unaudited) | (Unaudited) | (Unaudited) | (Unaudited) | ||
| Concorde Wealth Management Fund | 23.97% | 45.67% | 9.82% | 7.33% | |
Concorde Wealth Management | |||||
Blended Index | 12.02% | 23.99% | 7.04% | 6.70% | |
Bloomberg Barclays U.S. Aggregate | |||||
Bond Index | -2.73% | 0.71% | 3.10% | 3.44% | |
Russell 1000 Value Index | 29.34% | 56.09% | 11.74% | 10.99% |
Note: The Concorde Wealth Management Blended Index consists of 45% equities represented by the Russell 1000 Value Index, 45% bonds represented by the Barclays Intermediate Aggregate Bond Index, 5% short-term investments represented by Bank of America Merrill Lynch 1-3 Year Treasuries, and 5% commodities represented by Barclays U.S. Treasury Inflation Protection Security. The Russell 1000 Value Index measures the performance of those Russell 1000 companies with lower price-to-book ratios and lower forecasted growth values. The Barclays Aggregate Bond Index measures the investment grade, U.S. dollar denominated, fixed-rate taxable bond market, including Treasuries, government-related and corporate securities, mortgage-backed securities (agency fixed-rate and hybrid adjustable rate mortgage pass throughs), asset backed securities, and commercial mortgage backed securities.
Sector and Stock Performance Discussion
In this discussion we will highlight sectors and individual holdings which either enhanced or detracted from performance for the Fund during the six months ended March 31, 2021.
Finance & Insurance
JPMorgan Chase & Co. generated a greater than 50% total return as concerns over loan losses dropped and rising longer term bond yields improved profit opportunities.
Health Care
Encompass Health Corp., involved in both inpatient rehabilitation and home health care services, performed well returning approximately 27% as activity that had slowed early in 2020 began to recover. Johnson & Johnson, although listed in the Manufacturing segment, contributed a modest 11% return in their predominantly health care-oriented business lines.
Information
This diverse business segment includes companies in technology, infrastructure, and entertainment. All holdings contributed positive returns. Discovery, Inc. and The Walt Disney Co. had the largest gains (91% and 48%, respectively) as direct to consumer products and the anticipated recovery for live entertainment venues encouraged investors interest in these leaders. Comcast Corp and Microsoft Corp. had positive 18% and 12% gains, respectively, as steady growth and strong market positions were recognized by the market. Lumen Technologies, Inc., formerly CenturyLink, gained 37% as the long-term value of their global fiber network, balance sheet improvements and realization that significant free cash flow should support the current dividend all supported the stock recovery.
Manufacturing
This group including companies across several sectors, performed well with the holdings most correlated with the evolving cyclical recovery performing best. DuPont de Nemours, Inc. and Exxon Mobil Corp. are cyclical holdings with total returns of 40% and 68%, respectively, for the first half reflecting both rising commodity prices and strengthening demand for many products of these industry leaders. DuPont de Nemours, Inc. also made a significant capital allocation transaction with the nutrition and bioscience business segment. Northrop Grumman Corp. contributed a low single digit gain as investors focused on businesses more leveraged to the economy. The Hershey Co. gained 11% as steady growth was reflected in a modest price gain. Fortune Brands Home & Security, Inc., although involved primarily in repair and remodel markets for single family homes, which have been appreciating strongly, rose only 11% despite reporting good results. Hanesbrands, Inc. gained 27% for the period as new executive management highlighted a focused long-term vision and results in the domestic innerwear segment, a problematic area in recent years, stabilized. AbbVie, Inc., a healthcare stalwart, rose 25% as discretionary health procedures began to rebound after pandemic induced slowdowns and investors have become more comfortable with the ability of the company to handle the transition of super drug Humira to off patent status in the next few years.
Mining, Quarrying and Oil & Gas Extraction
Holdings in this segment varied widely for the past six months ranging from a negative 9% for Franco-Nevada Corp. to a positive 86% for Pioneer Natural Resources Co. Martin Marietta Materials, Inc., a leading aggregates supplier in North America, rose 43% as commercial construction along with a very strong residential housing market began to improve along with the prospect of incremental infrastructure activity from a federal proposal. Schlumberger Ltd. rose with most energy related equities as both commodity prices and activity picked up near the end of the calendar year 2020. Franco-Nevada Corp., primarily a holder of royalty interests for a wide variety of minerals with an emphasis on precious metals, fell as the price of gold has been weak in recent months.
The Fund added two positions in this space during the first fiscal quarter of 2021 in Kimbell Royalty Partners, LP and Dorchester Minerals, LP. Kimbell Royalty Partners, LP stated from a single investment in the Permian Basin to one of the largest owners of minerals and royalties nationwide. Their portfolio includes over 13 million gross acres in 28 states and in every major onshore basin in the continental United States, including ownership in more than 97,000 gross wells with over 41,000 wells in the Permian Basin. Its current cash yield is 9.38% and with the increase in oil and gas prices should be a positive performer for the Fund for the year.
Dorchester Minerals, LP is a Dallas-based owner of producing and non-producing oil and natural gas mineral, royalty, overriding royalty, net profits, and leasehold interests. Its common units trade on
2
the Nasdaq Global Select Market under the symbol DMLP. Their business may be described as the acquisition, ownership and administration of Royalty Properties and NPI. The NPI represents a net profits overriding royalty interest burdening various properties owned by the Operating Partnership. They receive monthly payments equaling 96.97% of the net profits realized by the Operating Partnership from these properties in the preceding month. The Royalty Properties consist of producing and nonproducing mineral, royalty, overriding royalty, net profits, and leasehold interests located in 587 counties and parishes in 27 states (“Royalty Properties”) and currently pays a 10.38% cash yield.
Professional, Scientific and Technical Services
Vivendi SA, a conglomerate based in France with interests in music publishing and distribution (Universal Music Group), media and advertising rose 17% as growing cash flow and announced plans to try to maximize shareholder value for the music business were received well by investors.
Real Estate, Rental and Leasing
The Fund holds one non-REIT real estate focused investment, The Howard Hughes Corporation, and its stock appreciated 65% during the first half of the fiscal year. Much of this represents a recovery from the drop in price in early 2020. The outlook for the single family home development part of the business in Nevada and Texas is promising and the commercial and condominium development projects also have good prospects. We believe the stock is still trading at a discount to net asset value.
Retail Trade
The Fund’s holding in retail-oriented businesses had modest results for the period despite good announced results from these companies. Amazon.com, Inc., a true conglomerate with a large commercial cloud business, was down 2% as many of the mega cap consumer, media and technology-oriented stocks that have led the market during the past 2-3 years underperformed the broad market. Lowe’s Companies, Inc. rose 15% as continued strong reports supported gains despite strong stock performance earlier in 2020. The TJX Companies, Inc., which was hit with sales weakness during the height of pandemic influence in North America, gained almost 20% as prospects for their value concept appear strong and activity from consumers increased in the fall and winter.
Transportation and Warehousing
Two holdings in this group were sold, one after a relatively short amount of time and one which was a long-term holding. Southwest Airlines Co. was purchased last year at the height of the pandemic at a price level that we deemed attractive with a long-term horizon. As the stock recovered it reached a level we believe reflected full value for a consensus economic recovery and thus we sold at a very attractive gain. Union Pacific Corp., first purchased in 2011, recovered to a price level that also appeared to reflect a likely economic recovery over the next two year and we decided to sell. Both of these are outstanding businesses in their industries and we would consider purchasing again if valuations reach attractive levels. The remaining holding is Kansas City Southern, a unique operating rail with connections to and track rights in Mexico that was purchased in 2020. The company is now the target of two industry purchase proposals and the stock has appreciated significantly on the likelihood of a consummated transaction. Our position gained 46% for the prior six months.
Closed-End Funds
The PIMCO Flexible Credit Income Fund, a limited liquidity institutional fund, provided a total return of 13% for the period. The current cash distribution yield on current market price is 8.25%.
3
As of March 31, 2021, Pioneer ILS Interval Fund delivered a positive return net of all fees and expenses for the month, year-to-date and for the past twelve months of 0.35%, 0.47% and 6.34%, respectively. The majority of the calendar year return stream in the ILS marketplace has tended to occur in the second half of the year driven by seasonality. In years with limited loss, historically around 60-70% of the annual return has come from the second half of the year. CONWX increased its position in the ILS Interval Fund during the first calendar quarter of 2021 in order to round the Fund’s position back up to $1 Million. The uncorrelated nature of the security and returns have been beneficial to the Fund’s performance since August 2018.
Open-End Funds
The two Fund holdings in this segment, Cohen & Steers Institutional Realty Shares and Morgan Stanley Global Fixed Income Opportunities Fund both provided positive total returns and good cash distributions during a period of rising bond yields. Morgan Stanley Global Fixed Income Opportunities Fund returned 1.9% Cohen & Steers Institutional Realty Shares generated an 18% positive total return including distributions. These two holdings along with the PIMCO Flexible Credit Income Fund all provided stabilizing positive returns during a generally rising bond yield environment, typically difficult on fixed income investing.
Private Funds
The Fund added a new private investment during the period and has requested to exit one of the existing four private investments.
The investment the Fund is exiting is in the Partners Group Private Equity (Master Fund) LLC (“Partners Group”). Partners Group is a $2.5 billion fund diversified by strategy, region, and industry. Partners Group started operations in 2010 and has an 8+ year track record, quarterly tender offers, establishes a new net asset value monthly so that it is able to track performance, has no capital calls, and has immediate exposure to a mature portfolio. Partners Group is 67% allocated towards North America, 25% to Europe, and 6% to Asia-Pacific region. The Fund has invested $500,00 in Partners Group and the investment had a return of 11.8% for the six months ended March 31, 2021. The reason for existing the investment is more to do with allocation limitations than performance. The Fund has allocated to a new investment (discussed below) and has other illiquid investments it is considering.
The new private investment the Fund made during the period is in SPAC Opportunity Partners, LLC. The Fund invested $1 Million at the end of March 2021. SPAC Opportunity Partners, LLC (the “Company”) was formed as a Delaware limited liability company on June 21, 2018 to serve as the parent of SPAC Opportunity Fund I GP, LLC, a Delaware limited liability company (the “General Partner”). The Main Fund invests in various securities and other financial products issued by a number of special purpose acquisition companies, or “SPACs”. The Company is managed by Navigation Capital Partners, Inc out of Atlanta and is known to the managers of CONWX. Navigation Capital manages a private equity fund that has made private equity investments in a wide variety of industries. In addition to its private equity business, through its SPAC Operations Group, Navigation Capital provides research and advice relating to SPACs. Navigation Capital intends to launch and manage the Main Fund, which will focus on making various kinds of investments in SPACs and sponsors to SPACs. When CONWX invested in the SPAC fund, there were 3 initial deals that were in process in the media and education space, technology, and space.
The other 3 private investments are in LLR Equity Partners V, L.P., a lower middle market private equity firm committed to creating long-term value by growing portfolio companies,
4
LRVHealth, L.P., an “Inside Healthcare” venture capital platform, and Moran Tice 20:20 Fund, L.P., a fund dedicated to the dislocation in price between precious metals and the miners of those precious metals. LLR Equity Partners V, L.P., LRVHealth, L.P., and Moran Tice 20:20 Fund, L.P. were down slightly during the period but did not materially impact performance of the Fund.
Corporate Bonds
The primarily short-term corporate bonds and institutional floating rate preferred bonds held in the Fund provided stability and income for the first half of the fiscal year. BP Capital Markets PLC and Freeport-McMoRan, Inc. were both purchased recently and had modest negative total returns. The balance of those positions with AerCap Ireland Capital DAC / AerCap Global Aviation Trust and JPMorgan Chase & Co. posting the best returns at 4.9% and 9.6%, respectively. Our continued strategy in this area is to generate stability and income for the Fund portfolio while seeking opportunistic purchases which can generate modest gains along with income.
U.S. Government Obligations
The Fund’s strategy over the past six months has been to reduce exposure and maintain short average maturities for these holdings in order to limit capital loss in a rising yield environment while still providing quality and liquidity. The US Treasury Note 2.250% due 8/15/27 had a negative total return of 4.6%.
Thank you for your continued support. We will continue to strive for the highest professional standards of performance and stewardship in the management of the Fund.
| Best regards, | |
 | |
| Gregory B. Wood | |
| Treasurer | |
| Concorde Investment Management | |
 | |
| Gary B. Wood | |
| President | |
| Concorde Investment Management | |
 | |
| John A. Stetter | |
| Secretary | |
| Concorde Investment Management |
5
CONCORDE WEALTH MANAGEMENT FUND
PORTFOLIO HOLDINGS BY SECTOR
March 31, 2021 (Unaudited)
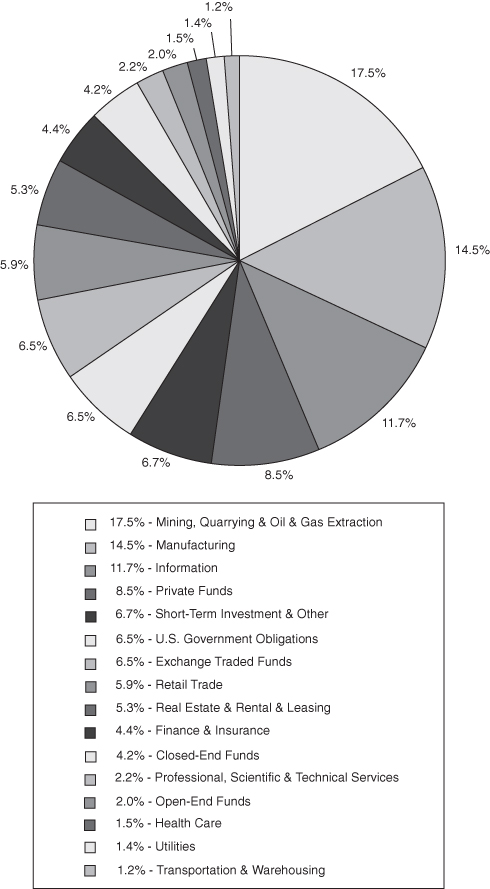
The portfolio’s holdings and allocations are subject to change. The percentages are of net assets as of March 31, 2021.
6
CONCORDE WEALTH MANAGEMENT FUND
SCHEDULE OF INVESTMENTS IN SECURITIES
March 31, 2021 (Unaudited)
| Shares or | Fair | Percent of | ||||||||||
| Principal Amount | Value | Net Assets | ||||||||||
| COMMON STOCKS - 48.66% | ||||||||||||
FINANCE & INSURANCE | ||||||||||||
JPMorgan Chase & Co. | 4,600 | $ | 700,258 | 2.03 | % | |||||||
HEALTH CARE | ||||||||||||
Encompass Health Corp. | 6,500 | 532,350 | 1.54 | |||||||||
INFORMATION | ||||||||||||
Comcast Corp. - Class A | 9,800 | 530,278 | 1.53 | |||||||||
Discovery, Inc. - Class C (a) | 13,000 | 479,570 | 1.39 | |||||||||
Lumen Technologies, Inc. | 39,000 | 520,650 | 1.51 | |||||||||
Microsoft Corp. | 6,100 | 1,438,197 | 4.16 | |||||||||
The Walt Disney Co. (a) | 4,600 | 848,792 | 2.45 | |||||||||
3,817,487 | 11.04 | |||||||||||
MANUFACTURING | ||||||||||||
AbbVie, Inc. | 5,700 | 616,854 | 1.78 | |||||||||
DuPont de Nemours, Inc. | 9,000 | 695,520 | 2.01 | |||||||||
Exxon Mobil Corp. | 7,600 | 424,308 | 1.23 | |||||||||
Fortune Brands Home & Security, Inc. | 7,000 | 670,740 | 1.94 | |||||||||
Hanesbrands, Inc. | 30,000 | 590,100 | 1.71 | |||||||||
Hubbell, Inc. | 1,900 | 355,091 | 1.03 | |||||||||
Johnson & Johnson | 3,300 | 542,355 | 1.57 | |||||||||
Moderna, Inc. (a) | 2,400 | 314,280 | 0.91 | |||||||||
Northrop Grumman Corp. | 1,000 | 323,640 | 0.93 | |||||||||
The Hershey Co. | 2,990 | 472,898 | 1.37 | |||||||||
5,005,786 | 14.48 | |||||||||||
MINING, QUARRYING & OIL & GAS EXTRACTION | ||||||||||||
Dorchester Minerals, LP | 16,000 | 218,560 | 0.63 | |||||||||
Franco-Nevada Corp. (b) | 5,600 | 701,624 | 2.03 | |||||||||
Kimbell Royalty Partners, LP | 23,000 | 233,220 | 0.67 | |||||||||
Martin Marietta Materials, Inc. | 1,100 | 369,402 | 1.07 | |||||||||
Pioneer Natural Resources Co. | 4,750 | 754,395 | 2.18 | |||||||||
Schlumberger Ltd. (b) | 14,200 | 386,098 | 1.12 | |||||||||
2,663,299 | 7.70 | |||||||||||
PROFESSIONAL, SCIENTIFIC & TECHNICAL SERVICES | ||||||||||||
Vivendi SA - ADR (b) | 16,500 | 542,355 | 1.57 | |||||||||
REAL ESTATE & RENTAL & LEASING | ||||||||||||
The Howard Hughes Corp. (a) | 7,500 | 713,475 | 2.06 | |||||||||
The accompanying notes are an integral part of these financial statements.
7
CONCORDE WEALTH MANAGEMENT FUND
SCHEDULE OF INVESTMENTS IN SECURITIES (continued)
March 31, 2021 (Unaudited)
| Shares or | Fair | Percent of | ||||||||||
| Principal Amount | Value | Net Assets | ||||||||||
| COMMON STOCKS (continued) | ||||||||||||
RETAIL TRADE | ||||||||||||
Amazon.com, Inc. (a) | 220 | $ | 680,698 | 1.97 | % | |||||||
Lowe’s Companies, Inc. | 4,000 | 760,720 | 2.20 | |||||||||
The TJX Companies, Inc. | 7,500 | 496,125 | 1.43 | |||||||||
1,937,543 | 5.60 | |||||||||||
TRANSPORTATION & WAREHOUSING | ||||||||||||
Kansas City Southern | 1,600 | 422,272 | 1.22 | |||||||||
UTILITIES | ||||||||||||
Kinder Morgan, Inc. | 29,500 | 491,175 | 1.42 | |||||||||
TOTAL COMMON STOCKS (Cost $9,902,853) | 16,826,000 | 48.66 | ||||||||||
| PREFERRED STOCK - 0.59% | ||||||||||||
PROFESSIONAL, SCIENTIFIC | ||||||||||||
& TECHNICAL SERVICES | ||||||||||||
Qurate Retail, Inc. - Class B, 8.000% | 2,000 | 203,300 | 0.59 | |||||||||
TOTAL PREFERRED STOCK (Cost $198,612) | 203,300 | 0.59 | ||||||||||
| EXCHANGE TRADED FUNDS - 6.49% | ||||||||||||
JPMorgan Ultra-Short Income ETF | 14,500 | 735,948 | 2.13 | |||||||||
PIMCO Enhanced Short Maturity Active | ||||||||||||
Exchange-Traded Fund | 5,000 | 509,550 | 1.47 | |||||||||
Sprott Physical Gold Trust (a)(b) | 74,500 | 999,045 | 2.89 | |||||||||
TOTAL EXCHANGE TRADED FUNDS (Cost $1,999,236) | 2,244,543 | 6.49 | ||||||||||
| CLOSED-END FUNDS - 4.20% | ||||||||||||
PIMCO Flexible Credit Income Fund - Institutional Class (e) | 47,619 | 448,099 | 1.30 | |||||||||
Pioneer ILS Interval Fund (e) | 117,583 | 1,002,981 | 2.90 | |||||||||
TOTAL CLOSED-END FUNDS (Cost $1,640,000) | 1,451,080 | 4.20 | ||||||||||
| OPEN-END FUNDS - 1.99% | ||||||||||||
Cohen & Steers Institutional Realty Shares | 6,629 | 310,371 | 0.90 | |||||||||
Morgan Stanley Global Fixed Income | ||||||||||||
Opportunities Fund - Institutional Class | 65,333 | 378,276 | 1.09 | |||||||||
TOTAL OPEN-END FUNDS (Cost $630,435) | 688,647 | 1.99 | ||||||||||
The accompanying notes are an integral part of these financial statements.
8
CONCORDE WEALTH MANAGEMENT FUND
SCHEDULE OF INVESTMENTS IN SECURITIES (continued)
March 31, 2021 (Unaudited)
| Shares or | Fair | Percent of | ||||||||||
| Principal Amount | Value | Net Assets | ||||||||||
| PRIVATE FUNDS - 8.54% | ||||||||||||
LLR Equity Partners V, L.P. (d)(e) | 920,000 | $ | 907,942 | 2.63 | % | |||||||
LRVHealth, L.P. (d)(e) | 200,000 | 170,846 | 0.54 | |||||||||
Moran Tice 20:20 Fund, L.P. (a)(d)(e) | 250,000 | 228,463 | 0.66 | |||||||||
Partners Group Private Equity | ||||||||||||
(Master Fund) LLC - Class I (d)(e) | 89,425 | 645,145 | 1.87 | |||||||||
SPAC Opportunity Partners, LLC - Class A (a)(d)(e) | 1,000,000 | 1,000,000 | 2.89 | |||||||||
TOTAL PRIVATE FUNDS (Cost $2,761,268) | 2,952,396 | 8.54 | ||||||||||
| REITS - 3.29% | ||||||||||||
REAL ESTATE & RENTAL & LEASING | ||||||||||||
First Industrial Realty Trust, Inc. | 7,000 | 320,530 | 0.93 | |||||||||
Medical Properties Trust, Inc. | 22,000 | 468,160 | 1.35 | |||||||||
VEREIT, Inc. | 9,000 | 347,580 | 1.01 | |||||||||
TOTAL REITS (Cost $817,827) | 1,136,270 | 3.29 | ||||||||||
| ROYALTY TRUST - 8.85% | ||||||||||||
MINING, QUARRYING & OIL & GAS EXTRACTION | ||||||||||||
Texas Pacific Land Corp. | 1,925 | 3,059,653 | 8.85 | |||||||||
TOTAL ROYALTY TRUST (Cost $252,826) | 3,059,653 | 8.85 | ||||||||||
| CORPORATE BONDS - 4.19% | ||||||||||||
FINANCE & INSURANCE | ||||||||||||
AerCap Ireland Capital DAC / AerCap Global Aviation Trust - | ||||||||||||
Class B, 3.300%, 01/23/2023 (b) | 100,000 | 103,680 | 0.30 | |||||||||
Discover Financial Services, 3.850%, 11/21/2022 | 200,000 | 210,142 | 0.61 | |||||||||
Ford Motor Credit Co. LLC, 3.550%, 05/20/2021 | 150,000 | 149,458 | 0.43 | |||||||||
JPMorgan Chase & Co., 3.558% to 04/01/2021 then | ||||||||||||
3 Month LIBOR USD + 3.522%, Perpetual (f)(g) | 175,000 | 174,213 | 0.50 | |||||||||
U.S. Bancorp, 3.727% to 04/15/2021 then | ||||||||||||
3 Month LIBOR USD + 3.486%, Perpetual (f)(g) | 180,000 | 180,225 | 0.52 | |||||||||
817,718 | 2.36 | |||||||||||
INFORMATION | ||||||||||||
Fiserv, Inc., 3.500%, 10/01/2022 | 200,000 | 207,516 | 0.60 | |||||||||
The accompanying notes are an integral part of these financial statements.
9
CONCORDE WEALTH MANAGEMENT FUND
SCHEDULE OF INVESTMENTS IN SECURITIES (continued)
March 31, 2021 (Unaudited)
| Shares or | Fair | Percent of | ||||||||||
| Principal Amount | Value | Net Assets | ||||||||||
| CORPORATE BONDS (Continued) | ||||||||||||
MINING, QUARRYING & OIL & GAS EXTRACTION | ||||||||||||
BP Capital Markets PLC, 4.875% to 06/22/2030 then | ||||||||||||
5 Year Treasury Note + 4.398%, Perpetual (b)(f) | 150,000 | $ | 160,687 | 0.47 | % | |||||||
Freeport-McMoRan, Inc., 3.550%, 03/01/2028 | 150,000 | 157,680 | 0.45 | |||||||||
318,367 | 0.92 | |||||||||||
RETAIL TRADE | ||||||||||||
CVS Health Corp., 3.700%, 03/09/2023 | 100,000 | 106,123 | 0.31 | |||||||||
TOTAL CORPORATE BONDS (Cost $1,425,280) | 1,449,724 | 4.19 | ||||||||||
| U.S. GOVERNMENT OBLIGATIONS - 6.54% | ||||||||||||
United States Treasury Notes | ||||||||||||
1.875%, 01/31/2022 | 1,600,000 | 1,624,000 | 4.70 | |||||||||
2.250%, 08/15/2027 | 600,000 | 635,578 | 1.84 | |||||||||
TOTAL U.S. GOVERNMENT OBLIGATIONS | ||||||||||||
(Cost $2,271,077) | 2,259,578 | 6.54 | ||||||||||
| SHORT-TERM INVESTMENT - 6.74% | ||||||||||||
MONEY MARKET FUND | ||||||||||||
Invesco Government & Agency Portfolio, 0.03% (c) | 631,944 | 631,944 | 1.83 | |||||||||
Morgan Stanley Institutional Liquidity Funds - | ||||||||||||
Government Portfolio, 0.03% (c) | 1,700,000 | 1,700,000 | 4.91 | |||||||||
TOTAL SHORT-TERM INVESTMENT (Cost $2,331,944) | 2,331,944 | 6.74 | ||||||||||
Total Investments (Cost $24,231,358) - 100.08% | 34,603,135 | 100.08 | ||||||||||
Liabilities in Excess of Other Assets - (0.08)% | (28,418 | ) | (0.08 | ) | ||||||||
TOTAL NET ASSETS - 100.00% | $ | 34,574,717 | 100.00 | % | ||||||||
______________
ADR American Depositary Receipt
REIT Real Estate Investment Trust
| (a) | Presently non-income producing. |
| (b) | Foreign issued security listed directly on a U.S. securities exchange. |
| (c) | This security has a fluctuating yield; rate disclosed is the 7-day yield as of March 31, 2021. |
| (d) | Securities for which market quotations are not readily available are valued at fair value determined by the Advisor. Such values are approved on a quarterly basis by the Board of Directors. |
| (e) | Restricted securities may be subject to restrictions on disposition imposed by the issuer. At March 31, 2021, restricted securities represented 12.74% of net assets of the Fund. |
| (f) | Variable rate security; the coupon is based on a reference index and spread. The rate reported is the current rate as of March 31, 2021. After January 1, 2022, LIBOR (London InterBank Offered Rate) may no longer be available or no longer deemed an appropriate reference rate upon which to determine the interest rate. In light of this eventuality, public and private sector industry initiatives are currently underway to identify new or alternative reference rates to be used in place of LIBOR. |
| (g) | Security is a perpetual bond and has no definite maturity date. |
The accompanying notes are an integral part of these financial statements.
10
CONCORDE WEALTH MANAGEMENT FUND
STATEMENT OF ASSETS AND LIABILITIES
March 31, 2021 (Unaudited)
| ASSETS | ||||
| Investments in securities, at fair value (cost $24,231,358) | $ | 34,603,135 | ||
| Dividends and interest receivable | 54,151 | |||
| Prepaid expenses | 7,264 | |||
| TOTAL ASSETS | 34,664,550 | |||
| LIABILITIES | ||||
| Investment advisory fee payable | 22,986 | |||
| Investment securities purchased | 18,263 | |||
| Accrued audit fees | 15,207 | |||
| Accrued directors fees and expenses | 519 | |||
| Accrued other expenses | 32,858 | |||
| TOTAL LIABILITIES | 89,833 | |||
| NET ASSETS | $ | 34,574,717 | ||
| Composition of Net Assets: | ||||
| Net capital paid in on shares of capital stock | $ | 23,785,060 | ||
| Total distributable earnings | 10,789,657 | |||
| NET ASSETS | $ | 34,574,717 | ||
Capital shares outstanding | 1,832,262 | |||
Net asset value, offering price and redemption price per share | $ | 18.87 | ||
The accompanying notes are an integral part of these financial statements.
11
CONCORDE WEALTH MANAGEMENT FUND
STATEMENT OF OPERATIONS
For the Six Month Period Ended March 31, 2021 (Unaudited)
| Investment Income | ||||
| Dividends (net of foreign withholding taxes of $437) | $ | 302,812 | ||
| Interest | 38,465 | |||
| Total investment income | 341,277 | |||
| Expenses | ||||
| Investment advisory fees (Note 6) | 116,547 | |||
| Professional fees | 20,775 | |||
| Administration fees (Note 7) | 26,601 | |||
| Sub-transfer agent fees (Note 7) | 15,723 | |||
| Fund accounting fees (Note 7) | 12,736 | |||
| Transfer agent fees (Note 7) | 8,026 | |||
| Printing, postage and delivery | 7,119 | |||
| Insurance expense | 3,497 | |||
| Custody fees (Note 7) | 3,105 | |||
| Directors fees and expenses | 968 | |||
| Federal and state registration fees | 1,510 | |||
| Other expenses | 6,496 | |||
| Total expenses | 223,103 | |||
| NET INVESTMENT INCOME | 118,174 | |||
| REALIZED AND UNREALIZED GAIN (LOSS) | ||||
| Net realized gain from: | ||||
| Investments | 1,174,622 | |||
| Capital gain distribution from investment companies | 6,376 | |||
1,180,998 | ||||
| Net change in unrealized appreciation on: | ||||
| Investments | 5,081,288 | |||
| NET REALIZED AND UNREALIZED GAIN | 6,262,286 | |||
| NET INCREASE IN NET ASSETS RESULTING FROM OPERATIONS | $ | 6,380,460 | ||
The accompanying notes are an integral part of these financial statements.
12
CONCORDE WEALTH MANAGEMENT FUND
STATEMENTS OF CHANGES IN NET ASSETS
| Six Months Ended | ||||||||
| March 31, 2021 | Year Ended | |||||||
| (Unaudited) | Sep. 30, 2020 | |||||||
| INCREASE IN NET ASSETS FROM OPERATIONS | ||||||||
| Net investment income | $ | 118,174 | $ | 195,978 | ||||
| Net realized gain from investments and capital gain | ||||||||
| distributions from investment companies | 1,180,998 | 257,788 | ||||||
| Unrealized appreciation on investments | 5,081,288 | 403,358 | ||||||
| Net increase in net assets resulting from operations | 6,380,460 | 857,124 | ||||||
| DISTRIBUTIONS TO SHAREHOLDERS | (1,051,477 | ) | (564,224 | ) | ||||
| CAPITAL SHARE TRANSACTIONS | ||||||||
| Proceeds from shares sold | 3,888,959 | 1,117,253 | ||||||
| Dividends reinvested | 1,051,477 | 564,224 | ||||||
| Cost of shares redeemed | (1,619,723 | ) | (1,505,916 | ) | ||||
| Net increase in net assets derived from capital share transactions | 3,320,713 | 175,561 | ||||||
| Total increase in net assets | 8,649,696 | 468,461 | ||||||
| NET ASSETS | ||||||||
| Beginning of period | 25,925,021 | 25,456,560 | ||||||
| End of period | $ | 34,574,717 | $ | 25,925,021 | ||||
| CHANGES IN SHARES OUTSTANDING | ||||||||
| Shares sold | 220,776 | 70,708 | ||||||
| Shares issued in reinvestment of distributions | 62,925 | 35,089 | ||||||
| Shares redeemed | (93,622 | ) | (97,855 | ) | ||||
| Net increase | 190,079 | 7,942 | ||||||
The accompanying notes are an integral part of these financial statements.
13
CONCORDE WEALTH MANAGEMENT FUND
FINANCIAL HIGHLIGHTS
| Six Months | ||||||||||||||||||||||||
| Ended | ||||||||||||||||||||||||
| March 31, | Year Ended September 30, | |||||||||||||||||||||||
2021(1) | ||||||||||||||||||||||||
| (Unaudited) | 2020 | 2019 | 2018 | 2017 | 2016(2) | |||||||||||||||||||
| PER SHARE OPERATING | ||||||||||||||||||||||||
| PERFORMANCE: | ||||||||||||||||||||||||
| (for a share of capital stock outstanding | ||||||||||||||||||||||||
| throughout the period): | ||||||||||||||||||||||||
Net asset value, beginning of period | $ | 15.79 | $ | 15.58 | $ | 16.49 | $ | 15.13 | $ | 14.29 | $ | 13.79 | ||||||||||||
Income (loss) from investment operations: | ||||||||||||||||||||||||
Net investment income (loss)(3) | 0.07 | 0.12 | 0.09 | 0.06 | (0.04 | ) | (0.06 | ) | ||||||||||||||||
| Net realized and unrealized gain (loss) | ||||||||||||||||||||||||
| on investment transactions | 3.66 | 0.44 | (0.29 | ) | 1.67 | 0.91 | 1.40 | |||||||||||||||||
| Total from investment operations | 3.73 | 0.56 | (0.20 | ) | 1.73 | 0.87 | 1.34 | |||||||||||||||||
Less distributions from: | ||||||||||||||||||||||||
| Net investment income | (0.17 | ) | (0.22 | ) | (0.06 | ) | — | — | — | |||||||||||||||
| Net realized gains | (0.48 | ) | (0.13 | ) | (0.65 | ) | (0.37 | ) | (0.03 | ) | (0.84 | ) | ||||||||||||
| Total distributions | (0.65 | ) | (0.35 | ) | (0.71 | ) | (0.37 | ) | (0.03 | ) | (0.84 | ) | ||||||||||||
Net asset value, end of period | $ | 18.87 | $ | 15.79 | $ | 15.58 | $ | 16.49 | $ | 15.13 | $ | 14.29 | ||||||||||||
TOTAL RETURN(4) | 23.97 | % | 3.54 | % | (0.91 | )% | 11.75 | % | 6.07 | % | 10.12 | % | ||||||||||||
| RATIOS/SUPPLEMENTAL DATA: | ||||||||||||||||||||||||
Net assets, end of period (in thousands) | $ | 34,575 | $ | 25,925 | $ | 25,457 | $ | 25,623 | $ | 20,591 | $ | 17,982 | ||||||||||||
Ratio of expenses to average net assets | 1.53 | % | 1.68 | % | 1.68 | % | 1.70 | % | 1.83 | % | 2.48 | % | ||||||||||||
Ratio of net investment income (loss) | ||||||||||||||||||||||||
to average net assets | 0.82 | % | 0.77 | % | 0.60 | % | 0.39 | % | (0.25 | )% | (0.44 | )% | ||||||||||||
Portfolio turnover rate | 9 | % | 36 | % | 24 | % | 20 | % | 40 | % | 28 | % | ||||||||||||
______________
| (1) | Other than the ratios of expenses and net investment income (loss) to average net assets, financial highlights have not been annualized. |
| (2) | For periods prior to July 23, 2016, financial and other information shown herein for the Fund is that of the Concorde Value Fund, the “Predecessor Fund” (See Note 1 in the accompanying notes to these financial statements). |
| (3) | Based on average shares outstanding during the year. |
| (4) | The return for the period does not include adjustments made related to valuation information obtained subsequent to period end. |
The accompanying notes are an integral part of these financial highlights.
14
CONCORDE WEALTH MANAGEMENT FUND
NOTES TO FINANCIAL STATEMENTS (Unaudited)
Note 1 – Nature of Business and Reorganization and Summary of Significant Accounting Policies
NATURE OF BUSINESS AND REORGANIZATION
Concorde Wealth Management Fund (the “Fund”), is a diversified separate series of Concorde Funds, Inc. (the “Company”). Each series of the Company is organized as a class of common stock under the Company’s articles of incorporation. The Company was incorporated in the state of Texas in September of 1987, and is registered under the Investment Company Act of 1940, as amended, as an open-end management investment company. Each capital share in the Fund represents an equal, proportionate interest in the net assets of the Fund with each other capital share in such series and no interest in any other series. The Company may establish multiple series, each of which would be organized as a class of common stock under the Company’s articles of incorporation. The Company presently has no series other than the Fund.
The primary investment objective of the Fund is to seek total return, from both appreciation of value and generation of current income, within the context of preservation of capital. The Fund is subject to various investment restrictions as set forth in the Statement of Additional Information.
On July 22, 2016, the shareholders of the Concorde Value Fund, a diversified former separate series of the Company, (the “Predecessor Fund”), approved a Plan of Acquisition and Liquidation (the “Reorganization”) between the Fund and the Predecessor Fund. Pursuant to the Reorganization, the Fund acquired all of the assets and liabilities of the Predecessor Fund in exchange for shares of the Fund after the close of business on July 22, 2016. The Fund issued 681,656 shares in exchange for the net assets of the Predecessor Fund valued at $9,666,396. The Fund had no assets, liabilities, shares issued or operations prior to the Reorganization. As a result of the Reorganization, the Predecessor Fund ceased to operate and its shareholders became shareholders of the Fund. The primary investment objective of the Predecessor Fund was to produce long-term growth of capital. As a result of the Reorganization, the Fund is the accounting successor of the Predecessor Fund. For periods prior to July 23, 2016, financial and other information shown herein for the Fund is that of the Predecessor Fund.
SIGNIFICANT ACCOUNTING POLICIES
The following is a summary of significant accounting policies followed by the Fund. These policies are in conformity with accounting principles generally accepted in the United States of America (“U.S. GAAP”). The Fund follows the investment company accounting and reporting guidance of the Financial Accounting Standards Board (“FASB”) Accounting Standards Codification (“ASC”) Topic 946, Financial Services – Investment Companies.
VALUATION OF SECURITIES
All investments in securities are recorded at their estimated fair value, as described in Note 2.
FEDERAL INCOME TAXES
The Company’s policy is to continue to comply with the requirements of the Internal Revenue Code that are applicable to regulated investment companies and to distribute all its taxable income
15
CONCORDE WEALTH MANAGEMENT FUND
NOTES TO FINANCIAL STATEMENTS (Unaudited)
Note 1 – Nature of Business and Reorganization and Summary of Significant Accounting Policies (continued)
to its shareholders. The Company also intends to distribute sufficient net investment income and net capital gains, if any, so that it will not be subject to excise tax on undistributed income and gains. Therefore, no federal income tax or excise provision is required.
Net investment income (loss), net realized gains (losses) and the cost of investments in securities may differ for financial statement and income tax purposes. The character of distributions from net investment income or net realized gains may differ from their ultimate characterization for income tax purposes. Also, due to the timing of dividend distributions, the year in which amounts are distributed may differ from the year that the income or realized gains were recorded by the Fund. Permanent book and tax basis differences, if any, result in reclassifications to certain components of net assets. These reclassifications have no effect on net assets, results of operations or net asset value (“NAV”) per share.
Management has reviewed all open tax years and major tax jurisdictions and concluded that no liability for unrecognized tax benefits should be recorded related to uncertain tax positions taken on returns filed or expected to be taken on a tax return. The tax returns of the Company for the prior three years are open for examination.
SECURITY TRANSACTIONS AND RELATED INCOME
Security transactions are accounted for on the trade date, the day securities are purchased or sold. Realized gains and losses from securities transactions are reported on the specific identification basis. Dividend income is recognized on the ex-dividend date, and interest income is recognized on an accrual basis. Discounts and premiums on securities purchased are accreted and amortized over the lives of the respective securities. Withholding taxes on foreign dividends have been provided for in accordance with the Fund’s understanding of the applicable country’s tax rules and rates.
NEW ACCOUNTING PRONOUNCEMENTS
In March 2020, FASB issued ASU 2020-04, Reference Rate Reform: Facilitation of the Effects of Reference Rate Reform on Financial Reporting. The main objective of the new guidance is to provide relief to companies that will be impacted by the expected change in benchmark interest rates at the end of 2021, when participating banks will no longer be required to submit London Interbank Offered Rate (“LIBOR”) quotes by the UK Financial Conduct Authority. The new guidance allows companies to, provided the only change to existing contracts are a change to an approved benchmark interest rate, account for modifications as a continuance of the existing contract without additional analysis. In addition, derivative contracts that qualified for hedge accounting prior to modification, will be allowed to continue to receive such treatment, even if critical terms change due to a change in the benchmark interest rate. For new and existing contracts, the Fund may elect to apply the amendments as of March 12, 2020 through December 31, 2022. Management is currently assessing the impact of the ASU’s adoption to the Fund’s financial statements and various filings.
16
CONCORDE WEALTH MANAGEMENT FUND
NOTES TO FINANCIAL STATEMENTS (Unaudited)
Note 1 – Nature of Business and Reorganization and Summary of Significant Accounting Policies (continued)
DIVIDENDS AND DISTRIBUTIONS TO SHAREHOLDERS
Distributions to shareholders are determined in accordance with Federal income tax regulations and recorded on the ex-dividend date. The Fund intends to distribute all of its net investment income, if any, as dividends to its shareholders on an annual basis. The Fund intends to distribute all of its capital gains, if any, as dividends to its shareholders on an annual basis. Distributions from net investment income and capital gains are generally declared and paid annually in December. The treatment for financial reporting purposes of distributions made to shareholders during the year from net investment income or capital gains may differ from their ultimate treatment for Federal income tax purposes. These differences are caused primarily by differences in the timing of the recognition of certain components of income, expense or realized capital gain for Federal income tax purposes. Where such differences are permanent in nature, they are reclassified in the components of net assets based on their ultimate characterization for federal income tax purposes. Any such reclassifications will have no effect on net assets, results of operations or NAV per share.
USE OF ESTIMATES
The preparation of financial statements in conformity with U.S. GAAP requires management to make estimates and assumptions that affect the reported amounts of assets and liabilities and disclosure of contingent assets and liabilities at the date of the financial statements and the reported amounts of increases and decreases in net assets from operations during the reporting period. Actual results could differ from those estimates.
OPTION WRITING
To generate additional income or hedge against a possible decline in the value of securities it holds, the Fund may write covered call options and write put options. When the Fund writes an option, an amount equal to the premium received by the Fund is recorded as a liability and subsequently adjusted to the current fair value of the option written. Premiums received from writing options that expire unexercised are treated by the Fund on the expiration date as realized gains from options written. The difference between the premium and amount paid on effecting a closing purchase transaction, including brokerage commissions, is also treated as a realized gain or, if the premium is less than the amount paid for the closing purchase transaction, as a realized loss. If a call option is exercised, the premium is added to the proceeds from the sale of the underlying security in determining whether the Fund has realized a gain or loss. If a put option is exercised, the premium reduces the cost basis of the securities purchased by the Fund. The Fund as writer of an option bears the market risk of an unfavorable change in the price of the security underlying the written option.
17
CONCORDE WEALTH MANAGEMENT FUND
NOTES TO FINANCIAL STATEMENTS (Unaudited)
Note 1 – Nature of Business and Reorganization and Summary of Significant Accounting Policies (continued)
The objective, as stated above, is to hedge against a possible decline in the value of securities it holds or to generate additional income when certain securities are locked in a trading range. With regards to hedging against a possible decline, the Fund may sell covered calls with strike prices below the price of a security at the time of writing the call. Regarding additional income, the Fund may sell calls on certain securities that are within a trading range, generally selling calls on securities where the strike prices are above the fair value price of the subject security.
COMMITMENTS
On February 23, 2018, the Fund executed an agreement to invest in LLR Equity Partners V, L.P., a limited partnership. The capital commitment of this investment is $1,000,000. The remaining commitment as of March 31, 2021, is $80,000 and distributions subject to recall total $124,692.
On March 15, 2019, the Fund executed an agreement to invest in LRVHealth, L.P., a limited partnership. The capital commitment of this investment is $500,000. The remaining commitment as of March 31, 2021, is $300,000.
Note 2 – Securities Valuation
The Company’s Board of Directors (the “Board”) has adopted methods for valuing securities and other derivative instruments including in circumstances in which market quotes are not readily available, and has delegated authority to the Company’s investment advisor, Concorde Financial Corporation d/b/a Concorde Investment Management (“Concorde” or the “Advisor”) to apply those methods in making fair value determinations. All fair value determinations made by the Advisor are subject to oversight by the Board.
The Fund utilizes various methods to measure the fair value of most of its investments on a recurring basis. FASB ASC Topic 820, Fair Value Measurements and Disclosures (“ASC 820”) defines fair value, establishes a hierarchy that prioritizes inputs to valuation techniques used to measure fair value in accordance with U.S. GAAP and requires disclosure about fair value measurements. Under ASC 820, various inputs are used in determining the value of the Fund’s investments. The three levels of inputs are as follows:
| Level 1 – | Unadjusted quoted prices in active markets for identical assets or liabilities that the Fund has the ability to access at the date of measurement. | |
| Level 2 – | Observable inputs other than quoted prices included in Level 1 that are observable for the asset or liability, either directly or indirectly. These inputs may include quoted prices for the identical instrument on an inactive market, prices for similar instruments in active markets, interest rates, credit risk, yield curves, default rates and similar data. | |
| Level 3 – | Model derived valuations in which one or more significant inputs or significant value drivers are unobservable. Unobservable inputs are those inputs that reflect the Fund’s own assumptions that market participants would use in valuing the asset or liability at the measurement date and would be based on the best available information. |
18
CONCORDE WEALTH MANAGEMENT FUND
NOTES TO FINANCIAL STATEMENTS (Unaudited)
Note 2 – Securities Valuation (continued)
The availability of observable inputs can vary from security to security and is affected by a wide variety of factors, including, for example, the type of security, whether the security is new and not yet established in the marketplace, the liquidity of markets, and other characteristics particular to the security. To the extent that valuation is based on models or inputs that are less observable or unobservable in the market, the determination of fair value requires more judgment. Accordingly, the degree of judgment exercised in determining fair value is greatest for instruments categorized in Level 3.
The inputs used to measure fair value may fall into different levels of the fair value hierarchy. In such cases, for disclosure purposes, the level in the fair value hierarchy within which the fair value measurement falls in its entirety is determined based on the lowest level input that is significant to the fair value measurement in its entirety.
Following is a description of the valuation techniques applied to the Fund’s major categories of assets and liabilities measured at fair value on a recurring basis.
Equity Securities – Equity securities, usually common stocks, foreign issued common stocks, exchange traded funds (“ETFs”), real estate investment trusts (“REITs”), royalty trusts, master limited partnerships and preferred stocks traded on a national securities exchange are valued at the last sale price on the exchange on which such securities are traded, as of the close of business on the day the securities are being valued or, lacking any reported sales, at the mean between the last available bid and asked price. To the extent these securities are actively traded and valuation adjustments are not applied, they are categorized in Level 1 of the fair value hierarchy.
Mutual Funds – Mutual funds, including open and closed-end funds, are generally priced at the ending NAV provided by the service agent of the mutual funds and are categorized in Level 1 of the fair value hierarchy.
Investment Funds – Investment funds that are private funds can be difficult to value, particularly to the extent that their underlying investments are not publicly traded. In the event a private fund does not report a value to the Fund on a timely basis, the Advisor, acting under the Board’s supervision and pursuant to policies implemented by the Board, will determine the fair value of the Fund’s investment based on the most recent NAV reported by the private fund, as well as any other relevant information available at the time the Fund values its investments. It is anticipated that fair value, portfolio holdings and other value information of the private funds could be available on no more than a semi-annual basis, with up to a 90 day lag. Following procedures adopted by the Board, in the absence of specific transaction activity in a particular investment fund, the Advisor will consider whether it is appropriate, in light of all relevant circumstances, to value the Fund’s investment at the NAV reported by the private fund at the time of valuation or to adjust the value to reflect a premium or discount. Certain investment funds may include adjustments made subsequent to period end related to subsequent valuation information obtained. Therefore, the net assets and NAV reflected for financial statement purposes may differ from the reported NAV of the Fund as of March 31, 2021. Investment funds are categorized in Level 3 of the fair value hierarchy unless measured at fair value using the NAV per share (or its equivalent), in which case, practical expedient is used for private funds and are not categorized in the fair value hierarchy.
19
CONCORDE WEALTH MANAGEMENT FUND
NOTES TO FINANCIAL STATEMENTS (Unaudited)
Note 2 – Securities Valuation (continued)
Debt Securities – Bonds, notes, and U.S. government obligations are valued at an evaluated bid price obtained from an independent pricing service that uses a matrix pricing method or other analytical models. Demand notes are valued at amortized cost, which approximates fair value. These securities will generally be categorized in Level 2 of the fair value hierarchy.
Short-Term Securities – Short-term equity investments, including money market funds, are valued in the manner specified above for equity securities. Fixed income securities with maturities of less than 60 days when acquired, or which subsequently are within 60 days of maturity, are valued by an independent pricing service that uses a matrix pricing method or other analytical models. Short-term securities are generally classified in Level 1 or Level 2 of the fair value hierarchy depending on the inputs used and market activity levels for specific securities.
Derivative Instruments – Listed derivatives, including options, rights, and warrants that are actively traded are valued based on quoted prices from the exchange. If there is no such reported sale on the valuation date, the mean between the highest bid and lowest asked quotations at the close of the exchanges will be used. These securities will generally be categorized in Level 1 of the fair value hierarchy.
All other assets of the Fund are valued in such manner as the Board in good faith deems appropriate to reflect their fair value.
As a general matter, the fair value of the Fund’s interest in investment funds that are private funds (“Non-Traded Funds”), will represent the amount that the Fund could reasonably expect to receive from the Non-Traded Fund if the Fund’s interest was redeemed at the time of valuation, based on information reasonably available at the time the valuation is made and that the Fund believes to be reliable. Investments in Non-Traded Funds are recorded at fair value, using the Non-Traded Fund’s net asset value as a practical expedient. Based on guidance provided by FASB, investments for which fair value is measured using the NAV practical expedient are not required to be categorized in the fair value hierarchy. In the event a Non-Traded Fund does not report a value to the Fund on a timely basis, the Advisor, acting under the Board’s supervision and pursuant to policies implemented by the Board, will determine the fair value of the Fund’s investment based on the most recent value reported by the Non-Traded Fund, as well as any other relevant information available at the time the Fund values its investments. Following procedures adopted by the Board, in the absence of specific transaction activity in a particular investment fund, the Advisor will consider whether it is appropriate, in light of all relevant circumstances, to value the Fund’s investment at the NAV reported by the Non-Traded Fund at the time of valuation or to adjust the value to reflect a fair value.
Securities for which market quotations are not readily available or if the closing price does not represent fair value, are valued at fair value as determined in good faith following procedures approved by the Board. Factors used in determining fair value vary by investment type and may include: trading volume of security and markets, value of other like securities and news events with direct bearing to security or market. Depending on the relative significance of the valuation inputs, these securities may be categorized in either Level 2 or Level 3 of the fair value hierarchy.
20
CONCORDE WEALTH MANAGEMENT FUND
NOTES TO FINANCIAL STATEMENTS (Unaudited)
Note 2 – Securities Valuation (continued)
Certain restricted securities may be considered illiquid. Restricted securities are often purchased in private placement transactions, are not registered under the Securities Act of 1933, may have contractual restrictions on resale, and may be valued under methods approved by the Board as reflecting fair value. Certain restricted securities eligible for resale to qualified institutional investors, including Rule 144A securities, are not subject to the limitation on the Funds’ investments in illiquid securities if they are determined to be liquid in accordance with procedures adopted by the Board.
Additional information on each illiquid restricted security held by the Fund on March 31, 2021 is as follows:
| Initial | % of | ||||||||||||||||
| Acquisition | Net | ||||||||||||||||
| Security | Date | Shares | Cost | Fair Value | Assets | ||||||||||||
| Partners Group Private Equity | |||||||||||||||||
| (Master Fund) LLC – Class I | December 1, 2017 | 89,425 | $ | 500,000 | $ | 645,145 | 1.87 | % | |||||||||
| LLR Equity Partners V, L.P. | March 14, 2018 | 920,000 | 818,583 | 907,942 | 2.63 | ||||||||||||
| PIMCO Flexible Credit Income | |||||||||||||||||
| Fund – Institutional Class | March 15, 2018 | 47,619 | 500,000 | 448,099 | 1.30 | ||||||||||||
| Pioneer ILS Interval Fund | August 27, 2018 | 117,583 | 1,140,000 | 1,002,981 | 2.90 | ||||||||||||
| LRVHealth, L.P. | July 16, 2019 | 200,000 | 192,684 | 170,846 | 0.49 | ||||||||||||
| Moran Tice 20:20 Fund, L.P. | July 31, 2020 | 250,000 | 250,000 | 228,463 | 0.66 | ||||||||||||
| SPAC Opportunity | |||||||||||||||||
| Partners, LLC – Class A | March 25, 2021 | 1,000,000 | 1,000,000 | 1,000,000 | 2.89 | ||||||||||||
$ | 4,401,267 | $ | 4,403,476 | 12.74 | % | ||||||||||||
21
CONCORDE WEALTH MANAGEMENT FUND
NOTES TO FINANCIAL STATEMENTS (Unaudited)
Note 2 – Securities Valuation (continued)
The following table summarizes the inputs used to value the Fund’s investments measured at fair value as of March 31, 2021.
| Practical | Total | ||||||||||||||||||||
Categories | Expedient* | Level 1 | Level 2 | Level 3 | Fair Value | ||||||||||||||||
| Common Stocks | |||||||||||||||||||||
Finance & Insurance | $ | — | $ | 700,258 | $ | — | $ | — | $ | 700,258 | |||||||||||
Health Care | — | 532,350 | — | — | 532,350 | ||||||||||||||||
Information | — | 3,817,487 | — | — | 3,817,487 | ||||||||||||||||
Manufacturing | — | 5,005,786 | — | — | 5,005,786 | ||||||||||||||||
Mining, Quarrying | |||||||||||||||||||||
& Oil & Gas Extraction | — | 2,663,299 | — | — | 2,663,299 | ||||||||||||||||
Professional, Scientific | |||||||||||||||||||||
& Technical Services | — | 542,355 | — | — | 542,355 | ||||||||||||||||
Real Estate & Rental & Leasing | — | 713,475 | — | — | 713,475 | ||||||||||||||||
Retail Trade | — | 1,937,543 | — | — | 1,937,543 | ||||||||||||||||
Transportation & Warehousing | — | 422,272 | — | — | 422,272 | ||||||||||||||||
Utilities | — | 491,175 | — | — | 491,175 | ||||||||||||||||
| Total Common Stocks | — | 16,826,000 | — | — | 16,826,000 | ||||||||||||||||
| Preferred Stock | |||||||||||||||||||||
Professional, Scientific | |||||||||||||||||||||
& Technical Services | — | 203,300 | — | — | 203,300 | ||||||||||||||||
| Total Preferred Stock | — | 203,300 | — | — | 203,300 | ||||||||||||||||
| Exchange Traded Funds | — | 2,244,543 | — | — | 2,244,543 | ||||||||||||||||
| Closed-End Funds | — | 1,451,080 | — | — | 1,451,080 | ||||||||||||||||
| Open-End Funds | — | 688,647 | — | — | 688,647 | ||||||||||||||||
| Private Funds | 2,952,396 | ^ | — | — | — | 2,952,396 | |||||||||||||||
| REITs | |||||||||||||||||||||
Real Estate & Rental & Leasing | — | 1,136,270 | — | — | 1,136,270 | ||||||||||||||||
| Total REITs | — | 1,136,270 | — | — | 1,136,270 | ||||||||||||||||
| Royalty Trust | |||||||||||||||||||||
Mining, Quarrying & | |||||||||||||||||||||
Oil & Gas Extraction | — | 3,059,653 | — | — | 3,059,653 | ||||||||||||||||
| Total Royalty Trust | — | 3,059,653 | — | — | 3,059,653 | ||||||||||||||||
| Corporate Bonds | |||||||||||||||||||||
Finance & Insurance | — | — | 817,718 | — | 817,718 | ||||||||||||||||
Information | — | — | 207,516 | — | 207,516 | ||||||||||||||||
Mining, Quarrying & | |||||||||||||||||||||
Oil & Gas Extraction | — | — | 318,367 | — | 318,367 | ||||||||||||||||
Retail Trade | — | — | 106,123 | — | 106,123 | ||||||||||||||||
| Total Corporate Bonds | — | — | 1,449,724 | — | 1,449,724 | ||||||||||||||||
| U.S. Government Obligations | — | — | 2,259,578 | — | 2,259,578 | ||||||||||||||||
| Short-Term Investment | — | 2,331,944 | — | — | 2,331,944 | ||||||||||||||||
| Total Investments | $ | 2,952,396 | $ | 27,941,437 | $ | 3,709,302 | $ | — | $ | 34,603,135 | |||||||||||
| * | Certain investments that are measured at fair value using the net asset value per share (or its equivalent) practical expedient have not been categorized in the fair value hierarchy. The fair value amounts presented in this table are intended to permit reconciliation of the fair value hierarchy to the amounts present in the schedule of investments. |
22
CONCORDE WEALTH MANAGEMENT FUND
NOTES TO FINANCIAL STATEMENTS (Unaudited)
Note 2 – Securities Valuation (continued)
| Withdrawals | Redemption | Investment | Investment | Lock Up | ||||
| ^Security | Permitted | Notice Period | Objective | Strategy | Period | |||
| Partners Group | Not | Not | Capital | Globally diversified portfolio | None | |||
| Private Equity | Applicable(1) | Applicable | Appreciation | of private equity investments | ||||
| (Master Fund) | ||||||||
| LLC – Class I | ||||||||
| LLR Equity | No | Not | Capital | Diversified portfolio of | Not | |||
| Partners V, L.P. | Applicable | Appreciation | equity investments in | Applicable | ||||
lower middle market growth | ||||||||
companies primarily focused | ||||||||
on software and services | ||||||||
| LRVHealth, L.P. | No | Not | Capital | Non-diversified portfolio of | Not | |||
| Applicable | Appreciation | insurance-linked securities | Applicable | |||||
| Moran Tice 20:20 | Yes | 30 days | Value | Diversified portfolio of | None | |||
| Fund L.P. | investments the Investment | |||||||
Manager believes will be | ||||||||
influenced by macro-economic | ||||||||
trends and/or event-driven situations. | ||||||||
| SPAC Opportunity | Yes | 93 days | Capital | Diversified portfolio of special | 2 years | |||
| Partners, LLC – Class A | Appreciation | purpose acquisition companies, | ||||||
or “SPACs”. |
| (1) | Up to 5% of the Fund’s net asset value per quarter via tender offer. The tender offer is subject to board approval and not a guarantee of future liquidity. A 2% early repurchase fee will be imposed for repurchases made within one year of investment. |
Note 3 – Derivative Instruments
The average monthly value outstanding of options written during the period ended March 31, 2021 for the Fund was $7,758.
The Fund did not hold any derivatives as of March 31, 2021.
Note 4 – Investment Transactions
Purchases and sales of investment securities, excluding U.S. government obligations and short-term investments, for the Fund during the six month period ended March 31, 2021, were $3,742,790 and $2,342,717, respectively.
The Fund did not have any Purchases or sales/maturities of long-term U.S. government obligations during the six month period ended March 31, 2021.
23
CONCORDE WEALTH MANAGEMENT FUND
NOTES TO FINANCIAL STATEMENTS (Unaudited)
Note 5 – Principal Risks
The Fund in the normal course of business makes investments in financial instruments and derivatives where the risk of potential loss exists due to changes in the market (market risk), or failure or inability of the counterparty to a transaction to perform (credit and counterparty risk). See below for a detailed description of select principal risks.
American Depositary Receipts (“ADRs”) and Global Depository Receipts (“GDRs”) Risk. ADRs and GDRs may be subject to some of the same risks as direct investment in foreign companies, which includes international trade, currency, political, regulatory and diplomatic risks. In a sponsored ADR arrangement, the foreign issuer assumes the obligation to pay some or all of the depositary’s transaction fees. Under an unsponsored ADR arrangement, the foreign issuer assumes no obligations and the depositary’s transaction fees are paid directly by the ADR holders. Because unsponsored ADR arrangements are organized independently and without the cooperation of the issuer of the underlying securities, available information concerning the foreign issuer may not be as current as for sponsored ADRs and voting rights with respect to the deposited securities are not passed through. GDRs can involve currency risk since, unlike ADRs, they may not be U.S. dollar-denominated.
Convertible Securities Risk. A convertible security is a fixed-income security (a debt instrument or a preferred stock) which may be converted at a stated price within a specified period of time into a certain quantity of the common stock of the same or a different issuer. Convertible securities are senior to common stock in an issuer’s capital structure, but they are subordinated to any senior debt securities. While providing a fixed-income stream (generally higher in yield than the income derivable from common stock but lower than that afforded by a similar non-convertible security), a convertible security also gives an investor the opportunity, through its conversion feature, to participate in the capital appreciation of the issuing company depending upon a market price advance in the convertible security’s underlying common stock.
Counterparty Risk. When the Fund enters into an investment contract, such as a derivative or a repurchase agreement, the Fund is exposed to the risk that the other party may be unable or unwilling to fulfill its obligations, which could adversely impact the value of the Fund. Contractual provisions and applicable law may prevent or delay the Fund from exercising its rights to terminate an investment or transaction with a financial institution experiencing financial difficulties, or to realize on collateral, and another institution may be substituted for that financial institution without the consent of the Fund. If the credit rating of a derivatives counterparty declines, the Fund may nonetheless choose or be required to keep existing transactions in place with the counterparty, in which event the Fund would be subject to any increased credit risk associated with those transactions.
Credit Risk. In connection with the Fund’s investments in fixed income securities, the value of the Fund may change in response to the credit ratings of the Fund’s portfolio securities. The degree of risk for a particular security may be reflected in its credit rating. Generally, investment risk and price volatility increase as a security’s credit rating declines. Credit risk is the risk that the issuer of a bond will fail to make payments when due or default completely. If the issuer of the bond experiences an actual or anticipated deterioration in credit quality, the price of the bond may be negatively impacted. The degree of credit risk depends on the financial condition of the issuer and the terms of the bond.
24
CONCORDE WEALTH MANAGEMENT FUND
NOTES TO FINANCIAL STATEMENTS (Unaudited)
Note 5 – Principal Risks (continued)
Novel Coronavirus (“COVID-19”) Risk. The global outbreak of COVID-19 has disrupted economic markets and the prolonged economic impact is uncertain. The ultimate economic fallout from the pandemic, and the long-term impact on economies, markets, industries and individual issuers, are not known. The operational and financial performance of the issuers of securities in which the Funds invest depends on future developments, including the duration and spread of the outbreak, and such uncertainty may in turn adversely affect the value and liquidity of the Fund’s investments, impair the Funds’ ability to satisfy redemption requests, and negatively impact the Fund’s performance.
Debt/Fixed Income Securities Risk. An increase in interest rates typically causes a fall in the value of the debt securities in which the Fund may invest. The value of your investment in the Fund may change in response to changes in the credit ratings of the Fund’s portfolio of debt securities. Interest rates in the United States are at, or near, historic lows, which may increase the Fund’s exposure to risks associated with rising interest rates. Moreover, rising interest rates or lack of market participants may lead to decreased liquidity in the bond and loan markets, making it more difficult for the Fund to sell its holdings at a time when the Fund’s manager might wish to sell. Lower rated securities (“junk bonds”) are generally subject to greater risk of loss of your money than higher rated securities. Debt securities are also subject to prepayment risk when interest rates decrease. Prepayment risk is the risk that the borrower will prepay some or all of the principal owed to the issuer. If prepayment occurs, the Fund may have to replace the security by investing the proceeds in a less attractive security. Many debt securities utilize LIBOR as the reference or benchmark rate for variable interest rate calculations. However, the use of LIBOR has come under pressure following manipulation allegations. If LIBOR in its current form does not survive or if an alternative index is chosen, the market value and/or liquidity of securities with distributions or interest rates based on LIBOR could be adversely affected.
Emerging Markets Risk. The Fund may invest in emerging markets, which may carry more risk than investing in developed foreign markets. Risks associated with investing in emerging markets include limited information about companies in these countries, greater political and economic uncertainties compared to developed foreign markets, underdeveloped securities markets and legal systems, potentially high inflation rates, and the influence of foreign governments over the private sector.
Equity and General Market Risk. Equities, such as common stocks, or other equity related investments are susceptible to general stock market fluctuations and to volatile increases and decreases in value. The stock market may experience declines or stocks in the Fund’s portfolio may not increase their earnings at the rate anticipated. The Fund’s NAV and investment return will fluctuate based upon changes in the value of its portfolio securities. A rise in protectionist trade policies, slowing global economic growth, risks associated with the United Kingdom’s exit from the European Union, the trade dispute between the United States and China, the risk of trade disputes with other countries, and the possibility of changes to some international trade agreements, could affect the economies of many nations, including the United States, in ways that cannot necessarily be foreseen at the present time, and may negatively impact the financial markets.
25
CONCORDE WEALTH MANAGEMENT FUND
NOTES TO FINANCIAL STATEMENTS (Unaudited)
Note 5 – Principal Risks (continued)
These developments as well as other events could result in further market volatility and negatively affect financial asset prices, the liquidity of fixed income or other securities held by the Fund and the normal operations of securities exchanges and other markets, despite government efforts to address market disruptions. In addition, the Fund may face challenges with respect to its day-to-day operations if key personnel of the investment adviser or other service providers are unavailable due to quarantines and restrictions on travel related to the recent COVID-19 outbreak. As a result, the risk environment remains elevated. The investment adviser will monitor developments and seek to manage the Fund in a manner consistent with achieving the Fund’s investment objective, but there can be no assurance that it will be successful in doing so.
Exchange Traded Fund Risk. ETFs may trade at a discount to the aggregate value of the underlying securities and although expense ratios for ETFs are generally low, frequent trading of ETFs by the Fund can generate brokerage expenses. Shareholders of the Fund will indirectly be subject to the fees and expenses of the individual ETFs in which the Fund invests, in addition to the Fund’s own fees and expenses.
Foreign Securities Risk. The Fund may invest in foreign securities and, if so, it will be subject to risks associated with foreign markets, such as adverse political, currency, social and economic developments; accounting standards or governmental supervision that are not consistent with that to which U.S. companies are subject; limited information about foreign companies; less liquidity in foreign markets; and less protection. In addition, policy and legislative changes in foreign countries and other events affecting global markets, such as the United Kingdom’s exit from the European Union (or Brexit), may contribute to decreased liquidity and increased volatility in the financial markets.
High Yield Risk. The Fund’s investment program permits it to invest in non-investment grade debt obligations, sometimes referred to as “junk bonds” (hereinafter referred to as “lower-quality securities”). Lower-quality securities are those securities that are rated lower than investment grade and unrated securities believed by the Advisor to be of comparable quality. Although these securities generally offer higher yields than investment grade securities with similar maturities, lower-quality securities involve greater risks, including the possibility of default or bankruptcy. In general, they are regarded to be more speculative with respect to the issuer’s capacity to pay interest and repay principal.
Investments in Other Investment Companies Risk. Shareholders of the Fund will indirectly be subject to the fees and expenses of the other investment companies in which the Fund invests and these fees and expenses are in addition to the fees and expenses that Fund shareholders directly bear in connection with the Fund’s own operations. In addition, shareholders will be exposed to the investment risks associated with investments in other investment companies.
Liquidity Risk. Certain securities held by the Fund may be difficult (or impossible) to sell at the time and at the price the Fund would like. As a result, the Fund may have to hold these securities longer than it would like and may forego other investment opportunities. There is the possibility that the Fund may lose money or be prevented from realizing capital gains if it cannot sell a security at a particular time and price.
26
CONCORDE WEALTH MANAGEMENT FUND
NOTES TO FINANCIAL STATEMENTS (Unaudited)
Note 5 – Principal Risks (continued)
Private Funds Risk. The sale or transfer of investments in private funds may be limited or prohibited by contract or law. Private funds are generally fair valued in good faith following procedures approved by the Board as they are not traded frequently. The Fund may be required to hold such positions for several years, if not longer, regardless of valuation, which may cause the Fund to be less liquid.
Private Placement Risk. The Fund may invest in privately issued securities of domestic common and preferred stock, convertible debt securities, ADRs and REITs, including those which may be resold only in accordance with Rule 144A under the Securities Act of 1933, as amended. Privately issued securities are restricted securities that are not publicly traded. Delay or difficulty in selling such securities may result in a loss to the Fund. Privately issued securities and other restricted securities will have the effect of increasing the level of Fund illiquidity to the extent that the Fund finds it difficult to sell these securities when the Advisor believes it is desirable to do so, especially under adverse market or economic conditions or in the event of adverse changes in the financial condition of the issuer, and the prices realized could be less than those originally paid or less than the fair market value. At times, the illiquidity of the market, as well as the lack of publicly available information regarding these securities also may make it difficult to determine the fair value of such securities for purposes of computing the NAV of the Fund.
Real Estate Investment Trust and Real Estate Risk. The value of the Fund’s investments in REITS may change in response to changes in the real estate market such as declines in the value of real estate, lack of available capital or financing opportunities, and increases in property taxes or operating costs.
Royalty Trust Risk. Royalty trusts are subject to cash-flow fluctuations and revenue decreases due to a sustained decline in demand for crude oil, natural gas and refined petroleum products, risks related to economic conditions, higher taxes or other regulatory actions that increase costs for royalty trusts. Furthermore, royalty trusts do not guarantee minimum distributions or even return of capital. If the assets underlying a royalty trust do not perform as expected, the royalty trust may reduce or even eliminate distributions. The declaration of such distributions generally depends upon various factors, including operating performance and financial condition of the royalty trust and general economic conditions.
Security Selection Risk. The Advisor may misjudge the risk and/or return potential of a security. This misjudgment can result in a loss or a significant deviation relative to its benchmarks.
Smaller and Medium Capitalization Company Risk. Securities of smaller and medium-sized companies may be more volatile and more difficult to liquidate during market downturns than securities of larger companies. Additionally, the price of smaller companies may decline more in response to selling pressures.
Style Risk. The Advisor generally follows an investing style that favors value investments. The value investing style may, over time, go in and out of favor. At time when the value investing style is out of favor, the Fund may underperform other funds that use different investing styles. Investors should be prepared to tolerate volatility in Fund returns.
27
CONCORDE WEALTH MANAGEMENT FUND
NOTES TO FINANCIAL STATEMENTS (Unaudited)
Note 6 – Investment Advisory Fees and Transactions with Affiliate
The Company has an Investment Advisory Agreement with Concorde to act as the Fund’s investment advisor. The Advisor provides the Fund with investment management and advisory services consistent with the Fund’s investment objectives, policies and restrictions, supervises the purchase and sale of investment transactions and administers the business and administrative operations of the Fund. For such services, for the six months ended March 31, 2021, Concorde received an annual fee of 0.80% of the Fund’s average daily net assets, computed daily and paid on a monthly basis. The investment advisory fee was $116,547 for the six months ended March 31, 2021, of which $22,986 was payable at March 31, 2021. Certain officers and directors of the Company are also officers and directors of Concorde.
Note 7 – Service Organizations
U.S. Bancorp Fund Services, LLC, doing business as U.S. Bank Global Fund Services (“Fund Services”), provides the Fund with administrative, fund accounting, and transfer agent services. U.S. Bank, N.A., (“USB”) an affiliate of Fund Services, serves as the Fund’s custodian. Fees incurred by the Fund to Fund Services and USB during the six months ended March 31, 2021, were $47,362 and $3,105, respectively, of which $16,104 and $999, respectively, were payable at March 31, 2021.
The Company has an administrative agreement with National Financial Services, LLC (“NFS”). The agreement provides for monthly payments by the Fund to NFS for providing certain shareholder services (sub-transfer agent fees). Sub-transfer agent fees incurred by the Fund to NFS for the six months ended March 31, 2021 were $15,723, of which $1,395 was payable at March 31, 2021.
Note 8 – Federal Tax Information
At September 30, 2020, the Fund’s most recent fiscal year end, the Fund’s investments and components of total distributable earnings on a tax basis were as follows:
| Federal Tax Cost of Investments | $ | 20,940,979 | |||
| Gross Tax Unrealized Appreciation | 6,275,270 | ||||
| Gross Tax Unrealized Depreciation | (1,272,595 | ) | |||
| Net Tax Unrealized Appreciation | 5,002,675 | ||||
| Undistributed Ordinary Income | 169,606 | ||||
| Undistributed Long-Term Gains | 288,393 | ||||
| Total Distributable Earnings | $ | 5,460,674 |
The difference between book-basis and tax-basis unrealized appreciation is primarily attributable to the realization for tax purposes of the unrealized gains on an investment in a passive foreign investment company and adjustments to the tax basis of investments in partnerships.
28
CONCORDE WEALTH MANAGEMENT FUND
NOTES TO FINANCIAL STATEMENTS (Unaudited)
Note 8 – Federal Tax Information (continued)
At September 30, 2020, the Fund’s most recent fiscal year end, the Fund had no tax basis capital loss carryovers to offset future capital gains. The Fund did not utilize a capital loss carryover during the year ended September 30, 2020, the Fund’s most recent fiscal year end. The Fund had no late year loss deferrals and no post-October loss.
The tax character of distributions paid during the six months ended March 31, 2021 and year ended September 30, 2020 was as follows:
| Six Months Ended | |||||||||
| March 31, 2021 | |||||||||
| (Unaudited) | September 30, 2020 | ||||||||
Ordinary income(1) | $ | 364,457 | $ | 367,746 | |||||
| | Long-term capital gain | 687,020 | 196,478 | ||||||
$ | 1,051,477 | $ | 564,224 | ||||||
| (1) Ordinary income includes short-term capital gains. | |||||||||
Note 9 – Subsequent Events
Management has evaluated the Fund’s events and transactions that occurred subsequent March 31, 2021, through the date of issuance of the Fund’s financial statements. There were no events or transactions that occurred during this period that materially impacted the amounts or disclosures in the Fund’s financial statements.
29
ADDITIONAL INFORMATION (Unaudited)
PROXY VOTING POLICIES AND PROCEDURES
For a description of the policies and procedures that the Fund uses to determine how to vote proxies relating to the portfolio securities, please call (972) 701-5400 and request a Statement of Additional Information. One will be mailed to you free of charge. The Statement of Additional Information is also available on the website of the Securities and Exchange Commission (“SEC”) at http://www.sec.gov.
PROXY VOTING RECORDS
Information on how the Fund voted proxies relating to portfolio securities during the twelve-month period ending June 30, 2020 is available without charge, upon request, by calling (972) 701-5400. Furthermore, you can obtain the Fund’s proxy voting records on the SEC’s website at http://www.sec.gov.
QUARTERLY PORTFOLIO HOLDINGS INFORMATION
The Fund files its complete schedule of portfolio holdings with the SEC for the first and third fiscal quarters on Part F of Form N-PORT. The Fund’s Part F of Form N-PORT is available (i) without charge, upon request, by calling (972) 701-5400, (ii) on the SEC’s website at http://www.sec.gov.
HOUSEHOLD DELIVERY OF SHAREHOLDER DOCUMENTS
In an effort to decrease costs, the Fund intends to reduce the number of duplicate prospectuses and Annual and Semi-Annual Reports you receive by sending only one copy of each to those addresses shared by two or more accounts and to shareholders we reasonably believe are from the same family or household. Once implemented, if you would like to discontinue householding for your accounts, please call toll-free at 1-800-294-1699 to request individual copies of these documents. Once the Fund receives notice to stop householding, we will begin sending individual copies thirty days after receiving your request. This policy does not apply to account statements.
FEDERAL TAX DISTRIBUTION INFORMATION
The Fund has designated 80.80% of the dividends declared from net investment income during the year ended September 30, 2020, as qualified dividend income under the Jobs Growth and Tax Reconciliation Act of 2003. Additionally, for corporate shareholders, the percent of ordinary income distributions qualifying for the corporate dividends received deduction for the fiscal year ended September 30, 2020 was 48.37%.
30
FUND EXPENSES (Unaudited)
As a shareholder of the Fund, you incur two types of costs: (1) transaction costs and exchange fees; and (2) ongoing costs, including management fees and other Fund expenses. This Example is intended to help you understand your ongoing costs (in dollars) of investing in the Fund and to compare these costs with the ongoing costs of investing in other mutual Funds.
The Example is based on an investment of $1,000 invested at the beginning of the period and held for the entire six month period ended March 31, 2021.
Actual Expenses
The first line of the table below provides information about actual account values and actual expenses. You may use the information in this line, together with the amount you invested, to estimate the expenses that you paid over the period. Simply divide your account value by $1,000 (for example, an $8,600 account value divided by $1,000 = 8.6), then multiply the result by the number in the first line under the heading entitled “Expenses Paid During Period” to estimate the expenses you paid on your account during this period.
Hypothetical Example for Comparison Purposes
The second line of the table below provides information about hypothetical account values and hypothetical expenses based on the Fund’s actual expense ratio and an assumed rate of return of 5% per year before expenses, which is not the Fund’s actual return. The hypothetical account values and expenses may not be used to estimate the actual ending account balance or expenses you paid for the period. You may use this information to compare the ongoing costs of investing in the Fund and other Funds. To do so, compare this 5% hypothetical example with the 5% hypothetical examples that appear in the shareholder reports of the other Funds.
Please note that the expenses shown in the table are meant to highlight your ongoing costs only and do not reflect any transactional costs or exchange fees. While the Fund does not currently assess sales charges, redemption or exchange fees, other funds do, and those costs will not be reflected in their expense tables. Therefore, the second line of the table is useful in comparing ongoing costs only, and will not help you determine the relative total costs of owning different Funds. In addition, if these transaction costs were included, your costs would have been higher.
| Beginning Account | Ending Account | Expenses Paid During Period* – | |
Value – 10/1/20 | Value – 3/31/21 | Six Months Ended 3/31/21 | |
| Actual | $1,000.00 | $1,239.70 | $8.54 |
Hypothetical | |||
(5% return before expenses) | $1,000.00 | $1,017.30 | $7.70 |
______________
| * | Expenses are equal to the Fund’s annualized expense ratio of 1.53%, multiplied by the average account value over the period, multiplied by 182/365 (to reflect the one-half year period ended March 31, 2021). |
31
INVESTMENT ADVISOR
Concorde Investment Management
8383 Preston Center Plaza
Suite 360
Dallas, Texas 75225
OFFICERS
Gary B. Wood, Ph.D.
President
Gregory B. Wood
Treasurer
John A. Stetter
Secretary
DIRECTORS
William Marcy, P.E., Ph.D.
Harold E. Schneider
Gary B. Wood, Ph.D.
CUSTODIAN
U.S. Bank, N.A.
Custody Operations
1555 North RiverCenter Drive, Suite 302
Milwaukee, Wisconsin 53212
TRANSFER AGENT AND
DIVIDEND DISBURSING AGENT
U.S. Bancorp Fund Services, LLC
doing business as
U.S. Bank Global Fund Services
Mutual Fund Services, 3rd Floor
615 East Michigan Street
Milwaukee, Wisconsin 53202
INDEPENDENT REGISTERED
PUBLIC ACCOUNTING FIRM
Brad A. Kinder, CPA
815 Parker Square
Flower Mound, Texas 75028
LEGAL COUNSEL
Foley & Lardner LLP
777 East Wisconsin Avenue
Milwaukee, Wisconsin 53202
TELEPHONE
(972) 701-5400
(Fund information)
(800) 294-1699
(Shareholder account information)
| (b) | Not applicable. |
Item 2. Code of Ethics.
Not applicable for semi-annual reports.
Item 3. Audit Committee Financial Expert.
Not applicable for semi-annual reports.
Item 4. Principal Accountant Fees and Services.
Not applicable for semi-annual reports.
Item 5. Audit Committee of Listed Registrants.
Not applicable to registrants who are not listed issuers (as defined in Rule 10A-3 under the Securities Exchange Act of 1934).
(b) Not applicable.
Item 6. Investments.
Schedule of Investments is included as part of the report to shareholders filed under Item 1 of this Form.
(a) | Not Applicable. |
Item 7. Disclosure of Proxy Voting Policies and Procedures for Closed-End Management Investment Companies.
Not applicable to open-end investment companies.
Item 8. Portfolio Managers of Closed-End Management Investment Companies.
Not applicable to open-end investment companies.
Item 9. Purchases of Equity Securities by Closed‑End Management Investment Company and Affiliated Purchasers.
Not applicable to open-end investment companies.
Item 10. Submission of Matters to a Vote of Security Holders.
There were no material changes to the procedures by which shareholders may recommend nominees to the Registrant’s Board of Directors.
Item 11. Controls and Procedures.
(a) | The Registrant’s President and Treasurer have reviewed the Registrant's disclosure controls and procedures (as defined in Rule 30a-3(c) under the Investment Company Act of 1940 (the “Act”)) as of a date within 90 days of the filing of this report, as required by Rule 30a-3(b) under the Act and Rules 13a-15(b) or 15d‑15(b) under the Securities Exchange Act of 1934. Based on their review, such officers have concluded that the disclosure controls and procedures are effective in ensuring that information required to be disclosed in this report is appropriately recorded, processed, summarized and reported and made known to them by others within the Registrant and by the Registrant’s service provider. |
(b) | There were no changes in the Registrant's internal control over financial reporting (as defined in Rule 30a-3(d) under the Act) that occurred during the period covered by this report that have materially affected, or are reasonably likely to materially affect, the Registrant's internal control over financial reporting. |
Item 12. Disclosure of Securities Lending Activities for Closed-End Management Investment Companies
Not applicable to open-end investment companies.
Item 13. Exhibits.
(a) | (1) Any code of ethics or amendment thereto, that is the subject of the disclosure required by Item 2, to the extent that the registrant intends to satisfy Item 2 requirements through filing an exhibit. Not applicable for semi-annual reports. |
(3) Any written solicitation to purchase securities under Rule 23c‑1 under the Act sent or given during the period covered by the report by or on behalf of the registrant to 10 or more persons. Not applicable to open-end investment companies.
(4) Change in the registrant’s independent public accountant. There was no change in the registrant’s independent public accountant for the period covered by this report.
SIGNATURES
Pursuant to the requirements of the Securities Exchange Act of 1934 and the Investment Company Act of 1940, the registrant has duly caused this report to be signed on its behalf by the undersigned, thereunto duly authorized.
(Registrant) Concorde Funds, Inc.
By (Signature and Title)* /s/ Gary B. Wood
Gary B. Wood, President/Principal Executive Officer
Date 06/03/2021
Pursuant to the requirements of the Securities Exchange Act of 1934 and the Investment Company Act of 1940, this report has been signed below by the following persons on behalf of the registrant and in the capacities and on the dates indicated.
By (Signature and Title)* /s/ Gary B. Wood
Gary B. Wood, President/Principal Executive Officer
Date 06/03/2021
By (Signature and Title)* /s/ Gregory B. Wood
Gregory B. Wood, Treasurer/ Principal Financial Officer
Date 06/03/2021
* Print the name and title of each signing officer under his or her signature.