| | |
| UNITED STATES
SECURITIES AND EXCHANGE COMMISSION |
| | |
| CERTIFIED SHAREHOLDER REPORT OF REGISTERED
MANAGEMENT INVESTMENT COMPANIES
|
| | |
| Investment Company Act file number: | (811-05346) |
| | |
| Exact name of registrant as specified in charter: | Putnam Variable Trust |
| | |
| Address of principal executive offices: | 100 Federal Street, Boston, Massachusetts 02110 |
| | |
| Name and address of agent for service: | Robert T. Burns, Vice President
100 Federal Street
Boston, Massachusetts 02110 |
| | |
| Copy to: | Bryan Chegwidden, Esq.
Ropes & Gray LLP
1211 Avenue of the Americas
New York, New York 10036 |
| | |
| Registrant’s telephone number, including area code: | (617) 292-1000 |
| | |
| Date of fiscal year end: | December 31, 2018 |
| | |
| Date of reporting period : | January 1, 2018 — December 31, 2018 |
| | |
|
Item 1. Report to Stockholders: | |
| | |
| The following is a copy of the report transmitted to stockholders pursuant to Rule 30e-1 under the Investment Company Act of 1940: | |
Prior to April 30, 2018, the fund was known as Putnam VT Absolute Return 500 Fund.
Message from the Trustees
February 13, 2019
Dear Shareholder:
Global financial markets encountered challenges in the final months of 2018. December was difficult for stock markets worldwide, and most major indexes finished the year with losses. Among the issues that contributed to the downturn were uncertainty about monetary policy, a slowing Chinese economy, and the U.S.–China trade dispute. Fixed-income markets were less volatile than stocks, and higher quality bonds benefited from a flight to safety amid the turmoil.
Although no one can predict the direction of the markets in the months ahead, Putnam’s experienced investment professionals actively seek to position their fund portfolios for all types of conditions. They take a research-intensive approach to investing that includes risk management strategies designed to serve investors through changing markets. In all environments, we believe investors should remain focused on time-tested approaches: maintain a well-diversified portfolio, think about long-term goals, and speak regularly with a financial advisor.
Thank you for investing with Putnam.
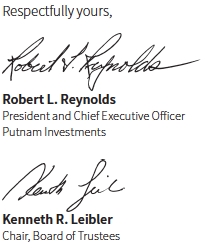
Performance summary(as of 12/31/18)
Investment objective
Positive total return
| |
| Net asset valueDecember 31, 2018 |
| Class IA: $9.61 | Class IB: $9.47 |
| | | | | |
| Total return at net asset value | | | |
| | | | | Bloomberg | |
| | | | | Barclays | |
| | | | ICE BofAML | U.S. | |
| | | | U.S. | Aggregate | |
| (as of | Class IA | Class IB | Treasury | Bond | |
| 12/31/18) | shares* | shares* | Bill Index | Index | S&P 500 |
| 1 year | –7.57% | –7.84% | 1.88% | 0.01% | –4.38% |
| 5 years | 3.88 | 2.56 | 3.23 | 13.26 | 50.33 |
| Annualized | 0.76 | 0.51 | 0.64 | 2.52 | 8.49 |
| Life | 9.27 | 7.06 | 3.51 | 22.63 | 116.16 |
| Annualized | 1.16 | 0.89 | 0.45 | 2.69 | 10.57 |
For a portion of the periods, the fund had expense limitations, without which returns would have been lower.
* Class inception date: May 2, 2011.
Before April 30, 2018, the fund was managed with a materially different investment strategy and may have achieved materially different performance results under its current investment strategy from that shown for periods before this date.
The S&P 500 Index is an unmanaged index of common stock performance. The ICEBofAML U.S. Treasury Bill Index is an unmanaged index that tracks the performance of U.S. dollar denominated U.S. Treasury bills publicly issued in the U.S. domestic market. Qualifying securities must have a remaining term of at least one month to final maturity and a minimum amount outstanding of $1 billion. The Bloomberg Barclays U.S. Aggregate Bond Index is an unmanaged index of U.S. investment-grade fixed-income securities.
ICE Data Indices, LLC (“ICE BofAML”), used with permission. ICE BofAML permits use of the ICE BofAML indices and related data on an “as is” basis; makes no warranties regarding same; does not guarantee the suitability, quality, accuracy, timeliness, and/or completeness of the ICE BofAML indices or any data included in, related to, or derived therefrom; assumes no liability in connection with the use of the foregoing; and does not sponsor, endorse, or recommend Putnam Investments, or any of its products or services.
Data represent past performance. Past performance does not guarantee future results. More recent returns may be less or more than those shown. Investment return and principal value will fluctuate, and you may have a gainor a loss when you sell your shares. Performance information does not reflect any deduction for taxes a shareholder may owe on fund distributions or on the redemption of fund shares. All total return figures are at net asset value and exclude contract charges and expenses, which are added to the variable annuity contracts to determine total return at unit value. Had these charges and expenses been reflected, performance would have been lower. For more recent performance, contact your variable annuity provider who can provide you with performance that reflects the charges and expenses at your contract level.
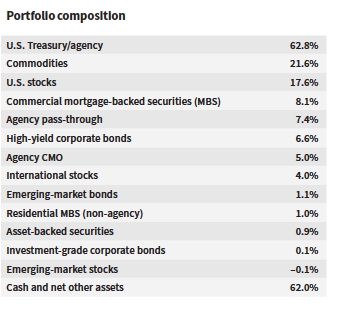
Allocations are shown as a percentage of the fund’s net assets as of 12/31/18. Cash and net other assets, if any, represent the market value weights of cash, derivatives, short-term securities, and other unclassified assets in the portfolio. Summary information may differ from the portfolio schedule included in the financial statements due to the inclusion of derivative securities, any interest accruals, the use of different classifications of securities for presentation purposes, and rounding. Allocations may not total 100% because the table includes the notional value of certain derivatives (the economic value for purposes of calculating periodic payment obligations), in addition to the market value of securities. Holdings and allocations may vary over time.
Negative weights may result from timing differences between trade and settlement dates of securities, such as TBAs, or by the use of derivatives.
| |
| Putnam VT Multi-Asset Absolute Return Fund1 |
Report from your fund’s manager
How was the investment environment for the 12-month reporting period ended December 31, 2018?
Global markets were marked by a series of ups and downs during the 12-month period. Falling stock prices, a strong U.S. dollar, weakening global growth, rising interest rates, and concerns about President Donald Trump’s trade and economic policies set investors on edge. The MSCI World Index, a broad global equity index composed of large and mid-cap stocks, finished the period down 8.71%, and the S&P 500 Index dropped 4.38%. Volatility also increased across all financial markets.
Treasury yields moved higher on the short end of the yield curve and lower on the intermediate and long end. The widely watched spread between two- and 10-year Treasury yields narrowed following the Federal Reserve’s rate hikes in 2018. The decline in long-term yields is a sign that bond investors expect the economy to slow. The Fed raised its benchmark rate to a range of 2.25% to 2.50% in December, rounding out four rate hikes in 2018. As a result, the U.S. dollar appreciated against many global currencies. However, the European Central Bank left rates unchanged in 2018 and ended its multi-trillion bond-buying program in December.
Economic indicators deteriorated globally, including in China and the eurozone. But the U.S. economy held steady; the economy grew at a 3.5% annual rate in the third quarter of 2018 after expanding 4.2% in the second quarter, buoyed by government spending and tax cuts. Markets in Europe struggled due to political concerns, including Brexit. The Trump administration’s approach to trade, including an escalation in trade disputes with China, rattled global financial markets and businesses.
How did the fund perform?
For the 12-month period, the fund’s class IA shares declined 7.57%, underperforming the benchmark ICE BofAML U.S. Treasury Bill Index, which returned 1.88%.
What strategies influenced the fund’s performance?
The fund’s directional positions detracted, with long exposures to equities and commodities the primary factors. Non-directional strategies were also a significant driver of underperformance. Equity long-short positions were the primary cause of non-directional weakness, including the U.S., developed international, and emerging markets. Active currency decisions and a short-term S&P 500 Index mean-reversion strategy also detracted from the fund’s performance. With regard to positive contributors, a regional fixed-income country selection strategy helped. Despite a difficult calendar year, our long-term track record for non-directional strategies remains strong.
How did the fund use derivatives?
Futures were used in an effort to manage the fund’s exposure to market risk, to hedge prepayment and interest-rate risks, gain exposure to interest rates, and to equitize cash. Interest-rate swaps were used to hedge interest-rate risk, gain exposure on interest rates, and mitigate prepayment risks. Forward currency contracts were also used to hedge foreign exchange risk and to gain exposure to currencies. Total return swaps were used in an effort to hedge sectorexposure, and also to manage and gain exposure to specific sectors, industries, securities, or a basket of securities.
What is your outlook for 2019?
We believe economic growth in the United States is likely to slow in 2019. Fed Chair Jerome H. Powell said in January that low inflation would allow the Fed to be “patient” in deciding whether to continue raising interest rates. Overall, the combination of a peak in global growth momentum, mounting trade risks, and a more restrictive Fed is a good recipe for higher volatility in markets, in our view. We expect bond yields to continue to drift higher in 2019 as interest-rate normalization continues in the United States and globally.
Although we believe stock and bond market volatility are likely to persist this year, we increased our exposure to equity, inflation [commodities], and credit risks, looking to take advantage of any short-term market weakness. The portfolio has an overweight position in U.S. equities and commodities. We are neutral on high-yield credit and slightly underweight position in interest-rate-sensitive fixed-income assets. For U.S. stocks, valuations are more appealing, and companies may return to buying back their own shares, in our view. We are constructive on commodities. In terms of credit, we recently upgraded our position due to positive indications from our quantitative model. We believe fundamentals are better in this sector following third-quarter 2018 earnings reports.
The views expressed in this report are exclusively those of Putnam Management and are subject to change. They are not meant as investment advice. Please note that the holdings discussed in this report may not have been held by the fund for the entire period. Portfolio composition is subject to review in accordance with the fund’s investment strategy and may vary in the future.
Consider these risks before investing:Allocation of assets among asset classes may hurt performance. The value of investments in the fund’s portfolio may fall or fail to rise over extended periods of time for a variety of reasons, including general economic, political or financial market conditions, investor sentiment and market perceptions, government actions, geopolitical events or changes, and factors related to a specific issuer, asset class, geography, industry, or sector. These and other factors may also lead to increased volatility and reduced liquidity in the fund’s portfolio holdings. Growth stocks may be more susceptible to earnings disappointments, and value stocks may fail to rebound. Bond investments are subject to interest-rate risk (the risk of bond prices falling if interest rates rise) and credit risk (the risk of an issuer defaulting on interest or principal payments). Interest-rate risk is greater for longer-term bonds, and credit risk is greater for below-investment-grade bonds. Unlike bonds, funds that invest in bonds have fees and expenses. Lower-rated bonds may offer higher yields in return for more risk. Funds that invest in government securities are not guaranteed. Mortgage-backed securities are subject to prepayment risk and the risk that they may increase in value less when interest rates decline and decline in value more when interest rates rise. International investing involves currency, economic, and political risks. Emerging-market securities have illiquidity and volatility risks. Our alpha strategy may lose money or not earn a return sufficient to cover associated trading and other costs. Our use of leverage obtained through derivatives increases these risks by increasing investment
| |
| 2Putnam VT Multi-Asset Absolute Return Fund |
exposure. Risks associated with derivatives include increased investment exposure (which may be considered leverage) and, in the case of over-the-counter instruments, the potential inability to terminate or sell derivatives positions and the potential failure of the other party to the instrument to meet its obligations. The fund’s efforts to produce lower-volatility returns may not be successful and may make it more difficult at times for the fund to achieve its targeted return. Under certain market conditions, the fund may accept greater-than typical volatility to seek its targeted return. The fund may not achieve its goal, and it is not intended to be a complete investment program. You can lose money by investing in the fund. The fund’s prospectus lists additional risks.
The fund is not intended to outperform stocks and bonds during strong market rallies.
Your fund’s managers

Portfolio ManagerJames A. Fetchis Co-Head of Global Asset Allocation. He has been in the investment industry since he joined Putnam in 1994.
Robert J. Schoen and Jason R. Vaillancourt, CFA, are also Portfolio Managers of the fund.
Your fund’s managers also manage other accounts advised by Putnam Management or an affiliate, including retail mutual fund counterparts to the funds in Putnam Variable Trust.
ABOUT DERIVATIVES
Derivatives are an increasingly common type of investment instrument, the performance of which isderivedfrom an underlying security, index, currency, or other area of the capital markets. Derivatives employed by the fund’s managers generally serve one of two main purposes: to implement a strategy that may be difficult or more expensive to invest in through traditional securities, or to hedge unwanted risk associated with a particular position.
For example, the fund’s managers might use currency forward contracts to capitalize on an anticipated change in exchange rates between two currencies. This approach would require a significantly smaller outlay of capital than purchasing traditional bonds denominated in the underlying currencies. In another example, the managers may identify a bond that they believe is undervalued relative to its risk of default but may seek to reduce the interest-rate risk of that bond by using interest-rate swaps, a derivative through which two parties “swap” payments based on the movement of certain rates. In other examples, the managers may use options and futures contracts to hedge against a variety of risks by establishing a combination of long and short exposures to specific equity markets or sectors.
Like any other investment, derivatives may not appreciate in value and may lose money. Derivatives may amplify traditional investment risks through the creation of leverage and may be less liquid than traditional securities. And because derivatives typically represent contractual agreements between two financial institutions, derivatives entail “counterparty risk,” which is the risk that the other party is unable or unwilling to pay. Putnam monitors the counterparty risks we assume. For example, Putnam often enters into collateral agreements that require the counterparties to post collateral on a regular basis to cover their obligations to the fund. Counterparty risk for exchange-traded futures and centrally cleared swaps is mitigated by the daily exchange of margin and other safeguards against default through their respective clearinghouses.
| |
| Putnam VT Multi-Asset Absolute Return Fund3 |
Understanding your fund’s expenses
As an investor in a variable annuity product that invests in a registered investment company, you pay ongoing expenses, such as management fees, distribution fees (12b-1 fees), and other expenses. In the most recent six-month period, your fund’s expenses were limited; had expenses not been limited, they would have been higher. Using the following information, you can estimate how these expenses affect your investment and compare them with the expenses of other funds. You may also pay onetime transaction expenses, which are not shown in this section and would result in higher total expenses. Charges and expenses at the insurance company separate account level are not reflected. For more information, see your fund’s prospectus or talk to your financial representative.
Review your fund’s expenses
The two left-hand columns of the Expenses per $1,000 table show the expenses you would have paid on a $1,000 investment in your fund from 7/1/18 to 12/31/18. They also show how much a $1,000 investment would be worth at the close of the period,assuming actual returns and expenses. To estimate the ongoing expenses you paid over the period, divide your account value by $1,000, then multiply the result by the number in the first line for the class of shares you own.
Compare your fund’s expenses with those of other funds
The two right-hand columns of the Expenses per $1,000 table show your fund’s expenses based on a $1,000 investment,assuming a hypothetical 5% annualized return. You can use this information to compare the ongoing expenses (but not transaction expenses or total costs) of investing in the fund with those of other funds. All shareholder reports of mutual funds and funds serving as variable annuity vehicles will provide this information to help you make this comparison. Please note that you cannot use this information to estimate your actual ending account balance and expenses paid during the period.
| | |
| Expense ratios | | |
| | Class IA | Class IB |
| Net expenses for the fiscal year ended | | |
| 12/31/17* | 0.94% | 1.19% |
| Total annual operating expenses for the fiscal | | |
| year ended 12/31/17 | 1.39% | 1.64% |
| Annualized expense ratio for the six-month | | |
| period ended 12/31/18† | 0.90% | 1.15% |
Fiscal-year expense information in this table is taken from the most recent prospectus, is subject to change, and may differ from that shown for the annualized expense ratio and in the financial highlights of this report.
Prospectus expense information also includes the impact of acquired fund fees and expenses of 0.04%, which is not included in the financial highlights or annualized expense ratios. Expenses are shown as a percentage of average net assets.
*Reflects Putnam Management’s contractual obligation to limit certain fund expenses through 4/30/19.
†For the fund’s most recent fiscal half year; may differ from expense ratios based on one-year data in the financial highlights.
| | | | | |
| Expenses per $1,000 | | | | |
| | | | | Expenses and value for a |
| | Expenses and value for a | | $1,000 investment, assuming |
| | $1,000 investment, assuming | | a hypothetical 5% annualized |
| | actual returns for the | | return for the 6 months |
| | 6 months ended 12/31/18 | | ended 12/31/18 | |
| | Class IA | Class IB | | Class IA | Class IB |
| Expenses paid | | | | | |
| per $1,000*† | $4.41 | $5.63 | | $4.58 | $5.85 |
| Ending value | | | | | |
| (after | | | | | |
| expenses) | $944.00 | $942.30 | | $1,020.67 | $1,019.41 |
*Expenses for each share class are calculated using the fund’s annualized expense ratio for each class, which represents the ongoing expenses as a percentage of average net assets for the six months ended 12/31/18. The expense ratio may differ for each share class.
†Expenses based on actual returns are calculated by multiplying the expense ratio by the average account value for the period; then multiplying the result by the number of days in the period; and then dividing that result by the number of days in the year. Expenses based on a hypothetical 5% return are calculated by multiplying the expense ratio by the average account value for the six-month period; then multiplying the result by the number of days in the six-month period; and then dividing that result by the number of days in the year.
| |
| 4Putnam VT Multi-Asset Absolute Return Fund |
Report of Independent Registered Public Accounting Firm
To the Trustees of Putnam Variable Trust
and Shareholders of Putnam VT Multi-Asset Absolute Return Fund
Opinion on the Financial Statements
We have audited the accompanying statement of assets and liabilities, including the fund’s portfolio, of Putnam VT Multi-Asset Absolute Return Fund (formerly known as Putnam VT Absolute Return 500 Fund) (one of the funds constituting Putnam Variable Trust, referred to hereafter as the “Fund”) as of December 31, 2018, the related statement of operations for the year ended December 31, 2018, the statement of changes in net assets for each of the two years in the period ended December 31, 2018, including the related notes, and the financial highlights for each of the five years in the period ended December 31, 2018 (collectively referred to as the “financial statements”). In our opinion, the financial statements present fairly, in all material respects, the financial position of the Fund as of December 31, 2018, the results of its operations for the year then ended, the changes in its net assets for each of the two years in the period ended December 31, 2018 and the financial highlights for each of the five years in the period ended December 31, 2018 in conformity with accounting principles generally accepted in the United States of America.
Basis for Opinion
These financial statements are the responsibility of the Fund’s management. Our responsibility is to express an opinion on the Fund’s financial statements based on our audits. We are a public accounting firm registered with the Public Company Accounting Oversight Board (United States) (“PCAOB”) and are required to be independent with respect to the Fund in accordance with the U.S. federal securities laws and the applicable rules and regulations of the Securities and Exchange Commission and the PCAOB.
We conducted our audits of these financial statements in accordance with the standards of the PCAOB. Those standards require that we plan and perform the audit to obtain reasonable assurance about whether the financial statements are free of material misstatement, whether due to error or fraud.
Our audits included performing procedures to assess the risks of material misstatement of the financial statements, whether due to error or fraud, and performing procedures that respond to those risks. Such procedures included examining, on a test basis, evidence regarding the amounts and disclosures in the financial statements. Our audits also included evaluating the accounting principles used and significant estimates made by management, as well as evaluating the overall presentation of the financial statements. Our procedures included confirmation of securities owned as of December 31, 2018 by correspondence with the custodian, transfer agent and brokers; when replies were not received from brokers, we performed other auditing procedures. We believe that our audits provide a reasonable basis for our opinion.
PricewaterhouseCoopers LLP
Boston, Massachusetts
February 13, 2019
We have served as the auditor of one or more investment companies in the Putnam Investments family of mutual funds since at least 1957. We have not been able to determine the specific year we began serving as auditor.
| |
| Putnam VT Multi-Asset Absolute Return Fund5 |
The fund’s portfolio12/31/18
| | |
| COMMON STOCKS (10.0%)* | Shares | Value |
| Basic materials (1.1%) | | |
| Anhui Conch Cement Co., Ltd. (China) | 10,000 | $47,984 |
| Astral Foods, Ltd. (South Africa) | 353 | 3,924 |
| Catcher Technology Co., Ltd. (Taiwan) | 5,000 | 36,048 |
| China Oriental Group Co., Ltd. (China) | 18,000 | 10,613 |
| Evraz PLC (Russia) | 6,306 | 38,621 |
| Formosa Chemicals & Fibre Corp. (Taiwan) | 15,000 | 50,828 |
| Formosa Plastics Corp. (Taiwan) | 12,000 | 39,111 |
| Kumba Iron Ore, Ltd. (South Africa) | 784 | 15,424 |
| Lotte Chemical Corp. (South Korea) | 49 | 12,135 |
| PTT Global Chemical PCL (Thailand) | 21,700 | 47,485 |
| Sinopec Shanghai Petrochemical Co., Ltd. (China) | 34,000 | 14,792 |
| | | 316,965 |
| Capital goods (0.3%) | | |
| China Railway Group, Ltd. (China) | 42,000 | 38,355 |
| Daelim Industrial Co., Ltd. (South Korea) | 242 | 22,179 |
| United Tractors Tbk PT (Indonesia) | 3,100 | 5,899 |
| Weichai Power Co., Ltd. Class H (China) | 23,000 | 26,082 |
| | | 92,515 |
| Communication services (0.8%) | | |
| Advanced Info Service PCL (Thailand) | 1,900 | 10,066 |
| China Mobile, Ltd. (China) | 5,000 | 48,186 |
| KT Corp. (South Korea) | 247 | 6,598 |
| LG Uplus Corp. (South Korea) | 3,674 | 58,024 |
| SK Telecom Co., Ltd. (South Korea) | 220 | 53,177 |
| Telkom SA SOC, Ltd. (South Africa) | 2,698 | 11,868 |
| TIM Participacoes SA (Brazil) | 10,000 | 30,575 |
| | | 218,494 |
| Consumer cyclicals (1.2%) | | |
| Astro Malaysia Holdings Bhd (Malaysia) | 3,900 | 1,233 |
| Dongfeng Motor Group Co., Ltd. (China) | 28,000 | 25,229 |
| Ford Otomotiv Sanayi AS (Turkey) | 1,034 | 9,769 |
| Geely Automobile Holdings, Ltd. (China) | 11,000 | 19,470 |
| Genting Bhd (Malaysia) | 8,300 | 12,259 |
| Guangzhou Automobile Group Co., Ltd. Class H | | |
| (China) | 10,000 | 9,881 |
| Haier Electronics Group Co., Ltd. (China) | 3,000 | 7,316 |
| Itausa - Investimentos Itau SA | | |
| (Preference) (Brazil) | 1,320 | 4,114 |
| Motus Holdings, Ltd. (South Africa) † | 2,240 | 13,702 |
| Mr Price Group, Ltd. (South Africa) | 2,101 | 35,945 |
| Pou Chen Corp. (Taiwan) | 3,000 | 3,166 |
| President Chain Store Corp. (Taiwan) | 4,000 | 40,414 |
| Qualicorp SA (Brazil) | 7,900 | 26,274 |
| Sinotruk Hong Kong, Ltd. (China) | 24,500 | 37,062 |
| Tekfen Holding AS (Turkey) | 1,492 | 5,841 |
| Wal-Mart de Mexico SAB de CV (Mexico) | 23,515 | 59,805 |
| Zhongsheng Group Holdings, Ltd. (China) | 7,000 | 13,914 |
| | | 325,394 |
| Consumer staples (0.5%) | | |
| Cia Cervecerias Unidas SA ADR (Chile) | 421 | 10,580 |
| Estacio Participacoes SA (Brazil) | 400 | 2,452 |
| Indofood Sukses Makmur Tbk PT (Indonesia) | 17,500 | 9,080 |
| LG Corp. (South Korea) | 192 | 12,036 |
| Sao Martinho SA (Brazil) | 1,700 | 7,979 |
| Smiles Fidelidade SA (Brazil) | 2,100 | 23,716 |
| Turkiye Sise ve Cam Fabrikalari AS (Turkey) | 4,781 | 5,122 |
| | |
| COMMON STOCKS (10.0%)*cont. | Shares | Value |
| Consumer staplescont. | | |
| Uni-President Enterprises Corp. (Taiwan) | 21,000 | $47,527 |
| Want Want China Holdings, Ltd. (China) | 38,000 | 26,435 |
| | | 144,927 |
| Energy (0.7%) | | |
| China Petroleum & Chemical Corp. (Sinopec) (China) | 74,000 | 52,871 |
| Ecopetrol SA ADR (Colombia) | 2,421 | 38,445 |
| Jastrzebska Spolka Weglowa SA (Poland) † | 489 | 8,789 |
| Petronas Dagangan Bhd (Malaysia) | 1,100 | 7,044 |
| PTT PCL (Foreign depositary shares) (Thailand) | 38,900 | 54,957 |
| Surgutneftegas OJSC (Russia) | 12,177 | 6,915 |
| Thai Oil PCL (Thailand) | 4,900 | 9,970 |
| | | 178,991 |
| Financials (2.7%) | | |
| Agile Group Holdings, Ltd. (China) | 20,000 | 23,269 |
| Banco de Chile ADR (Chile) | 306 | 8,752 |
| Banco do Brasil SA (Brazil) | 2,700 | 32,387 |
| Banco Santander (Brasil) S.A. (Units) (Brazil) | 4,000 | 44,069 |
| Banco Santander Chile ADR (Chile) | 722 | 21,588 |
| Banco Santander Mexico SA Institucion de Banca | | |
| Multiple Grupo Financiero Santand Class B | | |
| (Mexico) | 12,175 | 15,092 |
| Bank of China, Ltd. (China) | 82,000 | 35,232 |
| Bank of Communications Co., Ltd. (China) | 63,000 | 49,013 |
| China Construction Bank Corp. (China) | 5,000 | 4,099 |
| Country Garden Holdings co., Ltd. (China) | 33,000 | 39,752 |
| FirstRand, Ltd. (South Africa) | 7,418 | 33,802 |
| Fosun International, Ltd. (China) | 23,500 | 34,379 |
| Grupo Financiero Banorte SAB de CV (Mexico) | 7,740 | 37,783 |
| Guangzhou R&F Properties Co., Ltd. (China) | 16,400 | 24,564 |
| Hana Financial Group, Inc. (South Korea) | 919 | 29,822 |
| Industrial & Commercial Bank of China, Ltd. | | |
| (China) | 116,000 | 82,324 |
| Industrial Bank of Korea (South Korea) | 1,724 | 21,707 |
| IRB Brasil Resseguros SA (Brazil) | 2,000 | 43,068 |
| Itau Unibanco Holding SA (Preference) (Brazil) | 5,100 | 46,714 |
| KB Financial Group, Inc. (South Korea) | 68 | 2,838 |
| Korea Investment Holdings Co., Ltd. (South Korea) | 513 | 27,231 |
| Ping An Insurance (Group) Co. of China, Ltd. | | |
| Class H (China) | 2,500 | 21,951 |
| Sberbank of Russia PJSC ADR (Russia) | 2,148 | 23,542 |
| Shinhan Financial Group Co., Ltd. (South Korea) | 483 | 17,140 |
| Yuanta Financial Holding Co., Ltd. (Taiwan) | 48,000 | 24,030 |
| | | 744,148 |
| Health care (0.2%) | | |
| China Shineway Pharmaceutical Group, Ltd. (China) | 4,000 | 3,861 |
| Guangzhou Baiyunshan Pharmaceutical Holdings Co. , | |
| Ltd. (China) | 4,000 | 14,416 |
| Hypermarcas SA (Brazil) | 3,882 | 30,249 |
| | | 48,526 |
| Technology (1.9%) | | |
| Alibaba Group Holding, Ltd. ADR (China) †S | 443 | 60,722 |
| AU Optronics Corp. (Taiwan) | 5,000 | 1,985 |
| HannStar Display Corp. (Taiwan) | 22,000 | 4,997 |
| Naspers, Ltd. Class N (South Africa) | 45 | 9,046 |
| Radiant Opto-Electronics Corp. (Taiwan) | 7,000 | 19,123 |
| Samsung Electronics Co., Ltd. (South Korea) | 4,930 | 170,581 |
| SK Hynix, Inc. (South Korea) | 1,140 | 61,621 |
| Taiwan Semiconductor Manufacturing Co., Ltd. ADR | | |
| (Taiwan) | 1,987 | 73,340 |
| |
| 6Putnam VT Multi-Asset Absolute Return Fund |
| | |
| COMMON STOCKS (10.0%)*cont. | Shares | Value |
| Technologycont. | | |
| Tencent Holdings, Ltd. (China) | 2,500 | $99,098 |
| Tianneng Power International, Ltd. (China) | 12,000 | 9,953 |
| Tripod Technology Corp. (Taiwan) | 5,000 | 13,007 |
| | | 523,473 |
| Transportation (0.2%) | | |
| AirAsia Bhd (Malaysia) | 22,100 | 15,837 |
| Grupo Aeroportuario del Centro Norte SAB de CV | | |
| (Mexico) | 4,955 | 23,648 |
| Imperial Holdings, Ltd. (South Africa) | 2,240 | 10,587 |
| | | 50,072 |
| Utilities and power (0.4%) | | |
| Cia de Saneamento Basico do Estado de Sao Paulo | | |
| (Brazil) | 3,700 | 30,072 |
| Glow Energy PCL (Thailand) | 3,200 | 8,747 |
| Inter RAO UES PJSC (Russia) | 207,594 | 11,609 |
| Manila Electric Co. (Philippines) | 550 | 3,974 |
| Tenaga Nasional Bhd (Malaysia) | 15,300 | 50,187 |
| | | 104,589 |
| Total common stocks (cost $2,783,835) | | $2,748,094 |
| | |
| COMMODITY LINKED NOTES (9.7%)* ††† Principal amount | Value |
| |
| Bank of America Corp. 144A sr. unsec. | | |
| unsub. notes 1-month LIBOR less 0.17%, 2019 | | |
| (Indexed to the BofA Merrill Lynch Commodity | | |
| MLBX4SX6 Excess Return Strategy multiplied by 3) | $300,000 | $416,947 |
| Bank of America Corp. 144A unsub. notes 1-month | | |
| LIBOR less 0.22%, 2019 (Indexed to the BofA | | |
| Merrill Lynch Commodity MLBX4SX6 Excess Return | | |
| Strategy multiplied by 3) | 100,000 | 125,177 |
| Citigroup Global Markets Holdings, Inc. | | |
| sr. notes Ser. N, 1-month USD LIBOR less 0.15%, | | |
| 2019 (Indexed to the Citi Commodities F3 vs F0 | | |
| -4x Leveraged CVIC4X30 Index multiplied by 3) | 224,000 | 310,412 |
| Citigroup Global Markets Holdings, Inc. 144A | | |
| sr. notes 1-month USD LIBOR less 0.18%, 2019 | | |
| (Indexed to the Citi Cross-Asset Trend 10% Vol | | |
| Index multiplied by 3) | 312,000 | 299,381 |
| UBS AG/London 144A sr. notes 1-month LIBOR less | | |
| 0.25%, 2020 (Indexed to the UBSIF3AT Index | | |
| multiplied by 3) (United Kingdom) | 241,000 | 245,050 |
| Goldman Sachs International 144A notes zero %, | | |
| 2019 (Indexed to the S&P GSCI Excess Return | | |
| Index multiplied by 3) | 532,000 | 532,429 |
| UBS AG/London 144A sr. notes, 1-month LIBOR less | | |
| 0.25%, 2020 (Indexed to the S&P GSCI Total | | |
| Return Index multiplied by 3) (United Kingdom) | 90,000 | 90,105 |
| Deutsche Bank AG/London 144A sr. unsec. notes, | | |
| 1-month LIBOR less 0.35%, 2020 (Indexed to the | | |
| S&P GSCI Total Return Index multiplied by | | |
| 3) (United Kingdom) | 369,000 | 273,245 |
| UBS AG/London 144A sr. notes 1-month LIBOR less | | |
| 0.25%, 2019 (Indexed to the UBSIF3AT Index | | |
| multiplied by 3) (United Kingdom) | 349,000 | 369,416 |
| Total commodity Linked Notes (cost $2,517,000) | | $2,662,162 |
| |
| INVESTMENT COMPANIES (9.1%)* | Shares | Value |
| |
| Communication Services Select Sector SPDR Fund | 8,935 | $368,837 |
| Consumer Discretionary Select Sector SPDR Fund | 3,824 | 378,614 |
| Energy Select Sector SPDR Fund | 5,453 | 312,730 |
| Health Care Select Sector SPDR Fund | 4,378 | 378,741 |
| Industrial Select Sector SPDR Fund | 5,640 | 363,272 |
| | |
| INVESTMENT COMPANIES (9.1%)*cont. | Shares | Value |
| iShares MSCI India ETF (India) | 9,097 | $303,294 |
| Technology Select Sector SPDR Fund | 6,058 | 375,475 |
| Total investment companies (cost $2,568,775) | $2,480,963 |
| |
| U.S. GOVERNMENT AND AGENCY | | |
| MORTGAGE OBLIGATIONS (7.4%)* | Principal amount | Value |
| U.S. Government Agency Mortgage Obligations (7.4%) | |
| Federal National Mortgage Association | | |
| Pass-Through Certificates | | |
| 4.00%, TBA, 1/1/49 | $1,000,000 | $1,019,297 |
| 3.50%, TBA, 1/1/49 | 1,000,000 | 999,531 |
| Total U.S. government and agency mortgage | |
| obligations (cost $1,987,187) | | $2,018,828 |
| |
| U.S. TREASURY OBLIGATIONS (0.6%)* | Principal amount | Value |
| U.S. Treasury Notes | | |
| 1.625%, 4/30/19i | $111,000 | $110,998 |
| 1.00%, 9/30/19i | 43,000 | 42,600 |
| Total U.S. treasury obligations (cost $153,598) | $153,598 |
| | |
| MORTGAGE-BACKED SECURITIES (6.6%)* | Principal amount | Value |
| Agency collateralized mortgage obligations (4.9%) | |
| Federal Home Loan Mortgage Corporation | | |
| IFB Ser. 3747, Class SA, IO, ((-1 x 1 Month US | |
| LIBOR) + 6.50%), 4.045%, 10/15/40 | $22,419 | $3,575 |
| Ser. 4568, Class MI, IO, 4.00%, 4/15/46 | 77,912 | 15,193 |
| Ser. 4259, Class DI, IO, 4.00%, 6/15/43 | 123,667 | 20,849 |
| Ser. 4193, Class PI, IO, 4.00%, 3/15/43 | 37,260 | 5,070 |
| IFB Ser. 4073, Class AS, IO, ((-1 x 1 Month US | |
| LIBOR) + 6.05%), 3.595%, 8/15/38 | 105,996 | 6,527 |
| Ser. 4097, Class PI, IO, 3.50%, 11/15/40 | 77,119 | 8,268 |
| Ser. 4099, Class BI, IO, 3.50%, 6/15/39 | 82,993 | 7,054 |
| Ser. 4801, Class IG, IO, 3.00%, 6/15/48 | 101,052 | 18,407 |
| Ser. 4134, Class PI, IO, 3.00%, 11/15/42 | 158,231 | 17,983 |
| Ser. 4206, Class IP, IO, 3.00%, 12/15/41 | 70,147 | 6,134 |
| Federal National Mortgage Association | | |
| Connecticut Avenue Securities FRB Ser. 15-C02, | |
| Class 2M2, (1 Month US LIBOR + 4.00%), 6.506%, | |
| 5/25/25 | 3,659 | 3,890 |
| Ser. 18-51, Class IO, IO, 6.50%, 7/25/48 | 198,784 | 41,621 |
| Ser. 16-3, Class NI, IO, 6.00%, 2/25/46 | 55,756 | 13,452 |
| Ser. 16-3, Class MI, IO, 5.50%, 2/25/46 | 231,797 | 48,659 |
| Ser. 15-30, IO, 5.50%, 5/25/45 | 201,470 | 43,622 |
| IFB Ser. 13-130, Class SD, IO, ((-1 x 1 Month US | |
| LIBOR) + 6.60%), 4.094%, 1/25/44 | 94,401 | 16,017 |
| Ser. 17-2, Class KI, IO, 4.00%, 2/25/47 | 93,600 | 18,431 |
| IFB Ser. 17-8, Class SB, IO, ((-1 x 1 Month US | |
| LIBOR) + 6.10%), 3.594%, 2/25/47 | 127,471 | 18,973 |
| IFB Ser. 16-65, Class CS, IO, ((-1 x 1 Month US | |
| LIBOR) + 6.10%), 3.594%, 9/25/46 | 93,195 | 12,838 |
| Ser. 12-136, Class PI, IO, 3.50%, 11/25/42 | 42,258 | 4,063 |
| IFB Ser. 17-74, Class SA, IO, ((-1 x 1 Month US | |
| LIBOR) + 5.75%), 3.244%, 10/25/47 | 400,381 | 46,302 |
| Ser. 12-151, Class PI, IO, 3.00%, 1/25/43 | 45,618 | 4,619 |
| Ser. 13-35, Class PI, IO, 3.00%, 2/25/42 | 167,950 | 10,838 |
| Ser. 13-31, Class NI, IO, 3.00%, 6/25/41 | 53,674 | 3,240 |
| Government National Mortgage Association | | |
| Ser. 14-184, Class DI, IO, 5.50%, 12/16/44 | 182,236 | 44,839 |
| Ser. 16-150, Class I, IO, 5.00%, 11/20/46 | 121,487 | 24,613 |
| Ser. 18-127, Class ID, IO, 5.00%, 7/20/45 | 92,010 | 12,664 |
| Ser. 14-163, Class NI, IO, 5.00%, 2/20/44 | 42,731 | 8,524 |
| Ser. 11-116, Class IB, IO, 5.00%, 10/20/40 | 1,138 | 86 |
| |
| Putnam VT Multi-Asset Absolute Return Fund7 |
| | |
| MORTGAGE-BACKED | | |
| SECURITIES (6.6%)*cont. | Principal amount | Value |
| Agency collateralized mortgage obligationscont. | | |
| Government National Mortgage Association | | |
| Ser. 10-20, Class UI, IO, 5.00%, 2/20/40 | $38,659 | $8,644 |
| Ser. 10-9, Class UI, IO, 5.00%, 1/20/40 | 55,578 | 12,249 |
| Ser. 09-121, Class UI, IO, 5.00%, 12/20/39 | 40,316 | 9,202 |
| Ser. 15-105, Class LI, IO, 5.00%, 10/20/39 | 60,648 | 13,679 |
| Ser. 16-37, Class IW, IO, 4.50%, 2/20/46 | 70,691 | 13,873 |
| Ser. 15-80, Class IA, IO, 4.50%, 6/20/45 | 80,756 | 16,880 |
| Ser. 18-127, Class IB, IO, 4.50%, 6/20/45 | 167,795 | 21,005 |
| Ser. 15-167, Class BI, IO, 4.50%, 4/16/45 | 56,878 | 12,344 |
| Ser. 13-20, Class QI, IO, 4.50%, 12/16/42 | 64,777 | 10,107 |
| Ser. 10-35, Class QI, IO, 4.50%, 3/20/40 | 15,688 | 3,238 |
| IFB Ser. 10-125, Class SD, ((-1 x 1 Month US | | |
| LIBOR) + 6.68%), 4.225%, 1/16/40 | 244,349 | 32,071 |
| IFB Ser. 10-68, Class SD, IO, ((-1 x 1 Month US | | |
| LIBOR) + 6.58%), 4.11%, 6/20/40 | 120,471 | 20,438 |
| Ser. 16-135, Class PI, IO, 4.00%, 5/20/46 | 193,932 | 33,748 |
| Ser. 15-99, Class LI, IO, 4.00%, 7/20/45 | 39,933 | 5,802 |
| Ser. 17-57, Class AI, IO, 4.00%, 6/20/45 | 83,431 | 13,463 |
| Ser. 15-53, Class MI, IO, 4.00%, 4/16/45 | 66,107 | 13,492 |
| Ser. 15-187, Class JI, IO, 4.00%, 3/20/45 | 91,009 | 16,601 |
| Ser. 13-24, Class PI, IO, 4.00%, 11/20/42 | 38,847 | 6,582 |
| Ser. 14-133, Class AI, IO, 4.00%, 10/20/36 | 82,696 | 5,586 |
| IFB Ser. 18-91, Class SJ, IO, ((-1 x 1 Month US | | |
| LIBOR) + 6.25%), 3.78%, 7/20/48 | 161,822 | 23,060 |
| IFB Ser. 18-104, Class SD, IO, ((-1 x 1 Month US | | |
| LIBOR) + 6.20%), 3.73%, 8/20/48 | 120,378 | 16,767 |
| IFB Ser. 13-129, Class SN, IO, ((-1 x 1 Month US | | |
| LIBOR) + 6.15%), 3.68%, 9/20/43 | 26,172 | 3,878 |
| IFB Ser. 11-17, Class S, IO, ((-1 x 1 Month US | | |
| LIBOR) + 6.05%), 3.58%, 2/20/41 | 56,718 | 7,947 |
| IFB Ser. 10-134, Class ES, IO, ((-1 x 1 Month US | | |
| LIBOR) + 6.00%), 3.53%, 11/20/39 | 93,901 | 6,798 |
| Ser. 18-127, Class IE, IO, 3.50%, 1/20/46 | 97,441 | 15,431 |
| Ser. 16-75, Class EI, IO, 3.50%, 8/20/45 | 95,562 | 16,014 |
| Ser. 15-24, Class IA, IO, 3.50%, 2/20/45 | 62,816 | 7,921 |
| Ser. 13-102, Class IP, IO, 3.50%, 6/20/43 | 33,350 | 4,039 |
| Ser. 13-100, Class MI, IO, 3.50%, 2/20/43 | 33,050 | 4,835 |
| Ser. 12-141, Class WI, IO, 3.50%, 11/20/41 | 29,626 | 3,436 |
| Ser. 13-157, Class IA, IO, 3.50%, 4/20/40 | 73,426 | 5,128 |
| Ser. 13-90, Class HI, IO, 3.50%, 4/20/40 | 17,249 | 664 |
| Ser. 13-79, Class XI, IO, 3.50%, 11/20/39 | 56,312 | 6,484 |
| Ser. 13-6, Class AI, IO, 3.50%, 8/20/39 | 134,652 | 15,485 |
| Ser. 15-124, Class NI, IO, 3.50%, 6/20/39 | 149,388 | 10,278 |
| Ser. 15-96, Class NI, IO, 3.50%, 1/20/39 | 59,452 | 4,807 |
| Ser. 15-82, Class GI, IO, 3.50%, 12/20/38 | 103,322 | 6,110 |
| Ser. 13-23, Class IK, IO, 3.00%, 9/20/37 | 48,323 | 3,948 |
| Ser. 15-H22, Class GI, IO, 2.574%, 9/20/65W | 112,545 | 13,622 |
| Ser. 17-H02, Class BI, IO, 2.504%, 1/20/67W | 135,088 | 16,832 |
| Ser. 17-H06, Class BI, IO, 2.373%, 2/20/67W | 112,207 | 13,286 |
| Ser. 15-H20, Class CI, IO, 2.18%, 8/20/65W | 154,074 | 16,078 |
| FRB Ser. 15-H16, Class XI, IO, 2.151%, 7/20/65W | 90,317 | 8,966 |
| FRB Ser. 16-H16, Class DI, IO, 2.129%, 6/20/66W | 92,419 | 10,859 |
| Ser. 15-H25, Class BI, IO, 2.12%, 10/20/65W | 250,708 | 22,579 |
| Ser. 16-H02, Class BI, IO, 2.103%, 11/20/65W | 283,536 | 25,526 |
| Ser. 17-H11, Class NI, IO, 2.097%, 5/20/67W | 216,538 | 22,751 |
| Ser. 15-H24, Class HI, IO, 2.028%, 9/20/65W | 388,656 | 27,007 |
| Ser. 18-H05, Class AI, IO, 1.983%, 2/20/68W | 121,976 | 16,486 |
| Ser. 15-H15, Class JI, IO, 1.944%, 6/20/65W | 239,389 | 22,721 |
| Ser. 15-H19, Class NI, IO, 1.898%, 7/20/65W | 169,991 | 15,397 |
| Ser. 14-H21, Class AI, IO, 1.859%, 10/20/64W | 180,499 | 14,556 |
| Ser. 15-H18, Class IA, IO, 1.806%, 6/20/65W | 84,526 | 5,382 |
| Ser. 15-H10, Class CI, IO, 1.80%, 4/20/65W | 141,861 | 12,913 |
| | |
| MORTGAGE-BACKED | | |
| SECURITIES (6.6%)*cont. | Principal amount | Value |
| Agency collateralized mortgage obligationscont. | | |
| Government National Mortgage Association | | |
| Ser. 15-H26, Class GI, IO, 1.783%, 10/20/65W | $188,964 | $16,604 |
| Ser. 17-H14, Class DI, IO, 1.695%, 6/20/67W | 302,252 | 20,932 |
| Ser. 15-H09, Class BI, IO, 1.683%, 3/20/65W | 197,611 | 15,503 |
| Ser. 15-H10, Class EI, IO, 1.616%, 4/20/65W | 120,218 | 6,004 |
| Ser. 15-H24, Class BI, IO, 1.602%, 8/20/65W | 385,045 | 16,863 |
| Ser. 15-H25, Class AI, IO, 1.599%, 9/20/65W | 257,605 | 19,493 |
| Ser. 11-H15, Class AI, IO, 1.521%, 6/20/61W | 94,153 | 5,061 |
| Ser. 16-H08, Class GI, IO, 1.411%, 4/20/66W | 208,705 | 11,646 |
| Ser. 15-H09, Class AI, IO, 1.342%, 4/20/65W | 195,247 | 16,831 |
| Ser. 16-H03, Class AI, IO, 1.252%, 1/20/66W | 139,687 | 13,445 |
| Ser. 16-H04, Class KI, IO, 1.209%, 2/20/66W | 100,401 | 7,530 |
| | | 1,333,258 |
| Commercial mortgage-backed securities (0.7%) | | |
| Bear Stearns Commercial Mortgage Securities Trust | | |
| 144A FRB Ser. 06-PW11, Class C, 5.27%, 3/11/39 W | | |
| (In default) † | 25,000 | 3,157 |
| GE Capital Commercial Mortgage Corp. FRB | | |
| Ser. 05-C1, Class D, 4.415%, 6/10/48W | 13,612 | 11,972 |
| GMAC Commercial Mortgage Securities, Inc. Trust | | |
| 144A FRB Ser. 04-C3, Class X1, IO, 0.902%, | | |
| 12/10/41W | 43,910 | 325 |
| GS Mortgage Securities Trust 144A FRB | | |
| Ser. 14-GC24, Class D, 4.529%, 9/10/47W | 27,000 | 23,609 |
| JPMBB Commercial Mortgage Securities Trust 144A | | |
| FRB Ser. 13-C14, Class E, 4.566%, 8/15/46W | 16,000 | 12,957 |
| ML-CFC Commercial Mortgage Trust Ser. 07-6, | | |
| Class AM, 5.526%, 3/12/51W | 12,203 | 12,202 |
| ML-CFC Commercial Mortgage Trust 144A FRB | | |
| Ser. 06-4, Class XC, IO, 0.604%, 12/12/49W | 18,394 | 163 |
| UBS-Barclays Commercial Mortgage Trust 144A | | |
| Ser. 12-C2, Class F, 4.892%, 5/10/63W | 17,000 | 11,931 |
| Ser. 13-C6, Class E, 3.50%, 4/10/46 | 38,000 | 27,821 |
| WF-RBS Commercial Mortgage Trust 144A | | |
| Ser. 11-C3, Class E, 5.00%, 3/15/44W | 30,000 | 15,727 |
| Ser. 12-C7, Class F, 4.50%, 6/15/45W | 100,000 | 65,447 |
| | | 185,311 |
| Residential mortgage-backed securities (non-agency) (1.0%) | |
| Bear Stearns Alt-A Trust FRB Ser. 04-3, Class B, | | |
| (1 Month US LIBOR + 2.93%), 5.431%, 4/25/34 | 14,681 | 15,674 |
| Citigroup Mortgage Loan Trust, Inc. FRB | | |
| Ser. 07-AR5, Class 1A1A, 4.249%, 4/25/37W | 40,589 | 40,707 |
| Countrywide Alternative Loan Trust FRB | | |
| Ser. 05-27, Class 1A6, (1 Month US LIBOR | | |
| + 0.82%), 3.326%, 8/25/35 | 15,121 | 13,457 |
| Countrywide Home Loans Mortgage Pass-Through | | |
| Trust FRB Ser. 05-3, Class 1A1, (1 Month US | | |
| LIBOR + 0.62%), 3.126%, 4/25/35 | 9,790 | 8,442 |
| Federal National Mortgage Association | | |
| Connecticut Avenue Securities FRB Ser. 16-C02, | | |
| Class 1B, (1 Month US LIBOR + 12.25%), 14.756%, | | |
| 9/25/28 | 59,851 | 85,094 |
| Connecticut Avenue Securities FRB Ser. 15-C04, | | |
| Class 1M2, (1 Month US LIBOR + 5.70%), 8.206%, | | |
| 4/25/28 | 11,567 | 13,022 |
| Connecticut Avenue Securities FRB Ser. 17-C02, | | |
| Class 2B1, (1 Month US LIBOR + 5.50%), 8.006%, | | |
| 9/25/29 | 10,000 | 11,205 |
| Connecticut Avenue Securities FRB Ser. 17-C02, | | |
| Class 2M2, (1 Month US LIBOR + 3.65%), 6.156%, | | |
| 9/25/29 | 10,000 | 10,621 |
| |
| 8Putnam VT Multi-Asset Absolute Return Fund |
| | |
| MORTGAGE-BACKED | | |
| SECURITIES (6.6%)*cont. | Principal amount | Value |
| Residential mortgage-backed securities (non-agency)cont. | |
| Federal National Mortgage Association | | |
| Connecticut Avenue Securities FRB Ser. 17-C06, | | |
| Class 2M2, (1 Month US LIBOR + 2.80%), 5.306%, | | |
| 2/25/30 | $10,000 | $10,198 |
| Connecticut Avenue Securities FRB Ser. 18-C05, | | |
| Class 1M2, (1 Month US LIBOR + 2.35%), 4.856%, | | |
| 1/25/31 | 20,000 | 19,360 |
| WaMu Mortgage Pass-Through Certificates Trust FRB | | |
| Ser. 04-AR12, Class A2B, (1 Month US LIBOR | | |
| + 0.92%), 3.426%, 10/25/44 | 22,873 | 22,159 |
| Wells Fargo Mortgage Backed Securities Trust | | |
| FRB Ser. 06-AR6, Class 7A2, 4.768%, 3/25/36W | 7,424 | 7,267 |
| FRB Ser. 05-AR4, Class 1A3, 4.177%, 4/25/35W | 27,100 | 27,542 |
| | | 284,748 |
| | |
| Total mortgage-backed securities (cost $1,895,369) | $1,803,317 |
| | | | |
| PURCHASED OPTIONS | | | | |
| OUTSTANDING (0.9%)* | Expiration | Notional | Contract | |
| Counterparty | date/strike price | amount | amount | Value |
| Bank of America N.A. | | | | |
| GBP/USD (Call) | Jun-19/$1.34 | 608,175 | GBP 477,150 | $10,131 |
| SPDR S&P 500 ETF | | | | |
| Trust (Put) | Nov-19/240.00 | $640,295 | 2,562 | 34,376 |
| SPDR S&P 500 ETF | | | | |
| Trust (Put) | Oct-19/240.00 | 644,294 | 2,578 | 34,122 |
| Citibank, N.A. | | | | |
| SPDR S&P 500 ETF | | | | |
| Trust (Put) | Aug-19/250.00 | 640,295 | 2,562 | 40,637 |
| SPDR S&P 500 ETF | | | | |
| Trust (Put) | Jul-19/250.00 | 641,295 | 2,566 | 38,574 |
| USD/JPY (Put) | Jan-19/JPY 108.00 | 1,244,300 | 1,244,300 | 6,132 |
| Goldman Sachs International | | | |
| USD/CNH (Call) | Apr-19/CNH 7.00 | 648,800 | 648,800 | 3,434 |
| JPMorgan Chase Bank N.A. | | | |
| EUR/NOK (Put) | Mar-19/NOK 9.80 | 301,103 | EUR 262,800 | 2,410 |
| SPDR S&P 500 ETF | | | | |
| Trust (Put) | Sep-19/260.00 | 639,545 | $2,559 | 52,984 |
| SPDR S&P 500 ETF | | | | |
| Trust (Put) | Dec-19/215.00 | 614,553 | 2,459 | 19,229 |
| Total purchased options outstanding (cost $157,412) | $242,029 |
| | |
| ASSET-BACKED SECURITIES (0.9%)* | Principal amount | Value |
| loanDepot Station Place Agency Securitization | |
| Trust 144A FRB Ser. 17-LD1, Class A, (1 Month US | |
| LIBOR + 0.80%), 3.306%, 11/25/50 | $34,000 | $34,000 |
| Station Place Securitization Trust 144A | | |
| FRB Ser. 18-1, Class A, (1 Month US LIBOR | | |
| + 0.90%), 3.215%, 4/24/19 | 65,000 | 65,000 |
| FRB Ser. 18-5, Class A, (1 Month US LIBOR | | |
| + 0.70%), 3.015%, 9/24/19 | 90,000 | 90,000 |
| FRB Ser. 18-3, Class A, (1 Month US LIBOR | | |
| + 0.70%), 3.015%, 7/24/19 | 51,000 | 51,000 |
| Total asset-backed securities (cost $240,000) | $240,000 |
| | |
| FOREIGN GOVERNMENT AND AGENCY | | |
| BONDS AND NOTES (0.8%)* | Principal amount | Value |
| Buenos Aires (Province of) unsec. FRN | | |
| (Argentina Deposit Rates BADLAR + 3.83%), | | |
| 52.516%, 5/31/22 (Argentina) | ARS 195,000 | $5,023 |
| Buenos Aires (Province of) 144A sr. unsec. | | |
| unsub. notes 10.875%, 1/26/21 (Argentina) | $100,000 | 98,020 |
| | |
| FOREIGN GOVERNMENT AND AGENCY | | |
| BONDS AND NOTES (0.8%)*cont. | Principal amount | Value |
| |
| Mexico (Government of) sr. unsec. bonds 5.55%, | |
| 1/21/45 (Mexico) | $39,000 | $39,426 |
| Uruguay (Republic of) sr. unsec. | | |
| unsub. notes 4.375%, 10/27/27 (Uruguay) | 70,000 | 70,088 |
| Venezuela (Republic of) sr. unsec. notes 7.65%, | |
| 4/21/25 (Venezuela) (in default) † | 12,000 | 2,490 |
| Total foreign government and agency bonds | |
| and notes (cost $226,315) | | $215,047 |
| |
| CORPORATE BONDS AND NOTES (0.4%)* | Principal amount | Value |
| |
| Enbridge, Inc. sr. unsec. unsub. bonds 4.25%, | |
| 12/1/26 (Canada) | $20,000 | $19,776 |
| Petrobras Global Finance BV company | | |
| guaranty sr. unsec. unsub. bonds 7.25%, 3/17/44 | |
| (Brazil) | 4,000 | 3,940 |
| Petrobras Global Finance BV company | | |
| guaranty sr. unsec. unsub. notes 8.75%, 5/23/26 | |
| (Brazil) | 10,000 | 11,200 |
| Petrobras Global Finance BV company | | |
| guaranty sr. unsec. unsub. notes 6.25%, 3/17/24 | |
| (Brazil) | 21,000 | 21,263 |
| Petrobras Global Finance BV company | | |
| guaranty sr. unsec. unsub. notes 6.125%, 1/17/22 | |
| (Brazil) | 12,000 | 12,285 |
| Petrobras Global Finance BV company | | |
| guaranty sr. unsec. unsub. notes 5.999%, 1/27/28 | |
| (Brazil) | 28,000 | 26,320 |
| Petrobras Global Finance BV company | | |
| guaranty sr. unsec. unsub. notes 5.299%, 1/27/25 | |
| (Brazil) | 2,000 | 1,910 |
| Petroleos de Venezuela SA company | | |
| guaranty sr. unsec. unsub. notes 5.375%, 4/12/27 | |
| (Venezuela) (In default) † | 26,000 | 3,863 |
| Petroleos Mexicanos company guaranty sr. unsec. | |
| unsub. notes 6.375%, 1/23/45 (Mexico) | 10,000 | 8,047 |
| Total corporate bonds and notes (cost $115,783) | $108,604 |
| | | | |
| | Expiration | | | |
| WARRANTS (0.4%)* † | date | Strike price | Warrants | Value |
| Bank of Shanghai Co., | | | | |
| Ltd. 144A (China) | 12/12/19 | $0.00 | 28,309 | $46,139 |
| Gree Electric Appliances | | | |
| of Zhuhai, Inc. 144A | | | | |
| (China) | 8/29/19 | 0.00 | 8,696 | 45,204 |
| Guangdong Kangmei | | | | |
| Pharmaceutic 144A | | | | |
| (China) | 12/12/19 | 0.00 | 7,752 | 10,399 |
| Total warrants (cost $116,776) | | | $101,742 |
| | |
| | Principal amount/ | |
| SHORT-TERM INVESTMENTS (64.8%)* | shares | Value |
| |
| Putnam Cash Collateral Pool, LLC 2.58%d | Shares 42,600 | $42,600 |
| Putnam Short Term Investment | | |
| Fund 2.58%L | Shares 6,110,990 | 6,110,990 |
| State Street Institutional U.S. Government | | |
| Money Market Fund, Premier Class 2.27%P | Shares 600,000 | 600,000 |
| Interest in $92,226,000 joint tri-party | | |
| repurchase agreement dated 12/31/18 with | |
| Merrill Lynch, Pierce, Fenner & Smith, Inc. due | |
| 1/2/19 — maturity value of $6,661,110 for an | | |
| effective yield of 3.000% (collateralized by a | | |
| mortgage backed security with a coupon rate | |
| of 3.500% and a due date of 3/20/47, valued | | |
| at $94,070,521) | $6,660,000 | 6,660,000 |
| |
| Putnam VT Multi-Asset Absolute Return Fund9 |
| | |
| | Principal amount/ | |
| SHORT-TERM INVESTMENTS (64.8%)*cont. | shares | Value |
| Bank of Nova Scotia (The) commercial paper | | |
| 2.618%, 2/4/19 | $250,000 | $249,382 |
| CRC Funding, LLC asset backed commercial paper | | |
| 2.842%, 3/20/19 | 250,000 | 248,469 |
| DNB Bank ASA commercial paper 2.719%, 3/1/19 | 275,001 | 273,808 |
| Fairway Finance Co., LLC asset backed commercial | | |
| paper 2.827%, 3/6/19 | 225,001 | 223,898 |
| MetLife Short Term Funding, LLC asset backed | | |
| commercial paper 2.505%, 1/23/19 | 250,000 | 249,598 |
| Old Line Funding, LLC asset backed commercial | | |
| paper 2.580%, 1/22/19 | 154,001 | 153,762 |
| Skandinaviska Enskilda Banken AB commercial paper | |
| 2.819%, 3/19/19 | 250,000 | 248,534 |
| Standard Chartered Bank/New York commercial | | |
| paper 2.614%, 1/16/19 | 275,000 | 274,700 |
| Sumitomo Mitsui Banking Corp. commercial paper | | |
| 2.820%, 3/18/19 | 250,000 | 248,576 |
| Svenska Handelsbanken AB commercial paper | | |
| 2.579%, 1/18/19 | 250,000 | 249,696 |
| Total Capital Canada, Ltd. commercial paper | | |
| 2.502%, 1/4/19 | 280,000 | 279,925 |
| Victory Receivables Corp. asset backed commercial | | |
| paper 2.830%, 3/12/19 | 250,000 | 248,630 |
| U.S. Treasury Bills 2.548%, 6/13/19 # | 264,000 | 261,100 |
U.S. Treasury Bills 2.537%, 6/6/19 #Δ§ | 317,000 | 313,662 |
U.S. Treasury Bills 2.479%, 4/11/19Δ§ | 245,001 | 243,381 |
| U.S. Treasury Bills 2.481%, 4/18/19 # § | 112,000 | 111,211 |
| U.S. Treasury Bills 2.399%, 2/21/19 # | 50,999 | 50,833 |
| U.S. Treasury Bills 2.394%, 3/21/19 § | 150,000 | 149,239 |
U.S. Treasury Bills 2.380%, 3/7/19Δ§ | 151,000 | 150,360 |
| U.S. Treasury Bills 2.271%, 1/10/19 Δ | 92,999 | 92,953 |
| Total short-term investments (cost $17,735,042) | | $17,735,307 |
| | | |
| Total investments (cost $30,497,092) | | $30,509,691 |
| |
| Key to holding’s currency abbreviations |
| | |
| ARS | Argentine Peso |
| AUD | Australian Dollar |
| CAD | Canadian Dollar |
| CHF | Swiss Franc |
| EUR | Euro |
| GBP | British Pound |
| NOK | Norwegian Krone |
| NZD | New Zealand Dollar |
| SEK | Swedish Krona |
| |
| Key to holding’s abbreviations |
| | |
| ADR | American Depository Receipts: represents ownership of foreign |
| | securities on deposit with a custodian bank |
| ETF | Exchange Traded Fund |
| FRB | Floating Rate Bonds: the rate shown is the current interest rate at the |
| | close of the reporting period. Rates may be subject to a cap or floor. |
| | For certain securities, the rate may represent a fixed rate currently in |
| | place at the close of the reporting period. |
| FRN | Floating Rate Notes: the rate shown is the current interest rate or |
| | yield at the close of the reporting period. Rates may be subject to a |
| | cap or floor. For certain securities, the rate may represent a fixed rate |
| | currently in place at the close of the reporting period. |
| IFB | Inverse Floating Rate Bonds, which are securities that pay interest |
| | rates that vary inversely to changes in the market interest rates. As |
| | interest rates rise, inverse floaters produce less current income. The |
| | rate shown is the current interest rate at the close of the reporting |
| | period. Rates may be subject to a cap or floor. |
| |
| IO | Interest Only |
| OJSC | Open Joint Stock Company |
| PJSC | Public Joint Stock Company |
| SPDR | S&P Depository Receipts |
| TBA | To Be Announced Commitments |
Notes to the fund’s portfolio
Unless noted otherwise, the notes to the fund’s portfolio are for the close of the fund’s reporting period, which ran from January 1, 2018 through December 31, 2018 (the reporting period). Within the following notes to the portfolio, references to “Putnam Management” represent Putnam Investment Management, LLC, the fund’s manager, an indirect wholly-owned subsidiary of Putnam Investments, LLC and references to “ASC 820” represent Accounting Standards Codification 820Fair Value Measurements and Disclosures.
* Percentages indicated are based on net assets of $27,371,580.
†††The value of the commodity linked notes, which are marked to market daily, may be based on a multiple of the performance of the index. The multiple (or leverage) will increase the volatility of the note’s value relative to the change in the underlying index.
† This security is non-income-producing.
# This security, in part or in entirety, was pledged and segregated with the broker to cover margin requirements for futures contracts at the close of the reporting period. Collateral at period end totaled $290,344 and is included in Investments in securities on the Statement of assets and liabilities (Notes 1 and 8).
ΔThis security, in part or in entirety, was pledged and segregated with the custodian for collateral on certain derivative contracts at the close of the reporting period. Collateral at period end totaled $398,050 and is included in Investments in securities on the Statement of assets and liabilities (Notes 1 and 8).
§ This security, in part or in entirety, was pledged and segregated with the custodian for collateral on the initial margin on certain centrally cleared derivative contracts at the close of the reporting period. Collateral at period end totaled $230,991 and is included in Investments in securities on the Statement of assets and liabilities (Notes 1 and 8).
dAffiliated company. See Notes 1 and 5 to the financial statements regarding securities lending. The rate quoted in the security description is the annualized 7-day yield of the fund at the close of the reporting period.
iThis security was pledged, or purchased with cash that was pledged, to the fund for collateral on certain derivative contracts (Note 1).
LAffiliated company (Note 5). The rate quoted in the security description is the annualized 7-day yield of the fund at the close of the reporting period.
PThis security was pledged, or purchased with cash that was pledged, to the fund for collateral on certain derivative contracts. The rate quoted in the security description is the annualized 7-day yield of the fund at the close of the reporting period.
SSecurity on loan, in part or in entirety, at the close of the reporting period (Note 1).
WThe rate shown represents the weighted average coupon associated with the underlying mortgage pools. Rates may be subject to a cap or floor.
At the close of the reporting period, the fund maintained liquid assets totaling $3,587,768 to cover certain derivative contracts and delayed delivery securities.
Unless otherwise noted, the rates quoted in Short-term investments security descriptions represent the weighted average yield to maturity.
Debt obligations are considered secured unless otherwise indicated.
144A after the name of an issuer represents securities exempt from registration under Rule 144A of the Securities Act of 1933, as amended. These securities may be resold in transactions exempt from registration, normally to qualified institutional buyers.
See Note 1 to the financial statements regarding TBA commitments.
The dates shown on debt obligations are the original maturity dates.
| |
| 10Putnam VT Multi-Asset Absolute Return Fund |
| | | | | | |
| FORWARD CURRENCY CONTRACTS at 12/31/18 (aggregate face value $8,008,659) | | | | Unrealized |
| | | Contract | Delivery | | Aggregate | appreciation/ |
| Counterparty | Currency | type* | date | Value | face value | (depreciation) |
| Bank of America N.A. | | | | | | |
| | Australian Dollar | Sell | 1/16/19 | $39,173 | $37,298 | $(1,875) |
| | Brazilian Real | Buy | 1/3/19 | 75,727 | 76,452 | (725) |
| | Brazilian Real | Sell | 1/3/19 | 75,727 | 75,016 | (711) |
| | British Pound | Sell | 3/20/19 | 96,847 | 97,130 | 283 |
| | Canadian Dollar | Sell | 1/16/19 | 75,768 | 77,216 | 1,448 |
| | Euro | Sell | 3/20/19 | 59,387 | 59,044 | (343) |
| | Japanese Yen | Sell | 2/20/19 | 117,845 | 115,529 | (2,316) |
| | New Zealand Dollar | Sell | 1/16/19 | 74,318 | 74,354 | 36 |
| | Norwegian Krone | Buy | 3/20/19 | 193,403 | 195,944 | (2,541) |
| | South Korean Won | Buy | 2/20/19 | 78,931 | 79,158 | (227) |
| | South Korean Won | Sell | 2/20/19 | 79,430 | 77,762 | (1,668) |
| Barclays Bank PLC | | | | | | |
| | Australian Dollar | Buy | 1/16/19 | 132,948 | 135,317 | (2,369) |
| | Canadian Dollar | Buy | 1/16/19 | 73,789 | 76,465 | (2,676) |
| | Euro | Sell | 3/20/19 | 77,722 | 77,127 | (595) |
| | Norwegian Krone | Buy | 3/20/19 | 97,595 | 99,768 | (2,173) |
| | Singapore Dollar | Sell | 2/20/19 | 808 | 877 | 69 |
| Citibank, N.A. | | | | | | |
| | Australian Dollar | Buy | 1/16/19 | 79,191 | 80,816 | (1,625) |
| | Canadian Dollar | Buy | 1/16/19 | 179,747 | 185,092 | (5,345) |
| | Euro | Sell | 3/20/19 | 13,261 | 13,175 | (86) |
| | Japanese Yen | Sell | 2/20/19 | 39,136 | 37,837 | (1,299) |
| | Norwegian Krone | Sell | 3/20/19 | 37,762 | 37,314 | (448) |
| | South Korean Won | Sell | 2/20/19 | 701 | 1,365 | 664 |
| Credit Suisse International | | | | | | |
| | Australian Dollar | Buy | 1/16/19 | 298,867 | 304,902 | (6,035) |
| | Canadian Dollar | Buy | 1/16/19 | 78,260 | 85,705 | (7,445) |
| | Euro | Sell | 3/20/19 | 78,990 | 78,533 | (457) |
| | Japanese Yen | Sell | 2/20/19 | 39,794 | 38,595 | (1,199) |
| | New Zealand Dollar | Sell | 1/16/19 | 82,643 | 81,473 | (1,170) |
| Goldman Sachs International | | | | | | |
| | Australian Dollar | Sell | 1/16/19 | 246,520 | 253,680 | 7,160 |
| | Brazilian Real | Buy | 1/3/19 | 150,958 | 151,772 | (814) |
| | Brazilian Real | Sell | 1/3/19 | 150,958 | 150,277 | (681) |
| | Canadian Dollar | Sell | 1/16/19 | 77,307 | 81,773 | 4,466 |
| | Euro | Sell | 3/20/19 | 139,761 | 139,171 | (590) |
| | New Taiwan Dollar | Buy | 2/20/19 | 78,428 | 78,670 | (242) |
| | New Taiwan Dollar | Sell | 2/20/19 | 78,696 | 78,254 | (442) |
| | New Zealand Dollar | Buy | 1/16/19 | 416,708 | 430,179 | (13,471) |
| | Norwegian Krone | Buy | 3/20/19 | 397,645 | 406,385 | (8,740) |
| | South African Rand | Buy | 1/16/19 | 1,069 | 5,506 | (4,437) |
| | Swedish Krona | Sell | 3/20/19 | 117,373 | 115,766 | (1,607) |
| HSBC Bank USA, National Association | | | | | | |
| | Australian Dollar | Sell | 1/16/19 | 29,873 | 24,049 | (5,824) |
| | British Pound | Buy | 3/20/19 | 148,660 | 148,126 | 534 |
| | Canadian Dollar | Sell | 1/16/19 | 74,009 | 74,380 | 371 |
| | Chinese Yuan (Offshore) | Buy | 2/20/19 | 92,046 | 91,795 | 251 |
| | Euro | Sell | 3/20/19 | 52,238 | 51,560 | (678) |
| | Mexican Peso | Sell | 1/16/19 | 1,387 | 806 | (581) |
| | New Zealand Dollar | Buy | 1/16/19 | 199,257 | 196,225 | 3,032 |
| | Norwegian Krone | Buy | 3/20/19 | 74,432 | 75,452 | (1,020) |
| |
| Putnam VT Multi-Asset Absolute Return Fund11 |
| | | | | | |
| FORWARD CURRENCY CONTRACTS at 12/31/18 (aggregate face value $8,008,659)cont. | | | | Unrealized |
| | | Contract | Delivery | | Aggregate | appreciation/ |
| Counterparty | Currency | type* | date | Value | face value | (depreciation) |
| HSBC Bank USA, National Associationcont. | | | | | |
| | Norwegian Krone | Sell | 3/20/19 | $75,511 | $74,618 | $(893) |
| | Swedish Krona | Sell | 3/20/19 | 38,701 | 37,859 | (842) |
| JPMorgan Chase Bank N.A. | | | | | | |
| | Australian Dollar | Buy | 1/16/19 | 52,348 | 52,976 | (628) |
| | British Pound | Buy | 3/20/19 | 75,226 | 75,092 | 134 |
| | Canadian Dollar | Sell | 1/16/19 | 113,212 | 114,834 | 1,622 |
| | Euro | Sell | 3/20/19 | 110,702 | 109,799 | (903) |
| | Japanese Yen | Buy | 2/20/19 | 75,840 | 75,314 | 526 |
| | New Zealand Dollar | Buy | 1/16/19 | 4,766 | 3,611 | 1,155 |
| | Norwegian Krone | Buy | 3/20/19 | 160,434 | 165,918 | (5,484) |
| | Singapore Dollar | Buy | 2/20/19 | 73 | 753 | (680) |
| | Swedish Krona | Sell | 3/20/19 | 141,838 | 141,137 | (701) |
| | Swiss Franc | Sell | 3/20/19 | 24,080 | 23,857 | (223) |
| NatWest Markets PLC | | | | | | |
| | Australian Dollar | Buy | 1/16/19 | 85,320 | 88,033 | (2,713) |
| | Canadian Dollar | Sell | 1/16/19 | 3,005 | 4,111 | 1,106 |
| | Euro | Buy | 3/20/19 | 148,410 | 147,884 | 526 |
| | Japanese Yen | Buy | 2/20/19 | 36,061 | 36,947 | (886) |
| | New Zealand Dollar | Sell | 1/16/19 | 155,552 | 155,650 | 98 |
| | Norwegian Krone | Sell | 3/20/19 | 37,762 | 37,313 | (449) |
| State Street Bank and Trust Co. | | | | | | |
| | Australian Dollar | Buy | 1/16/19 | 6,412 | 7,835 | (1,423) |
| | British Pound | Sell | 3/20/19 | 71,643 | 71,766 | 123 |
| | Canadian Dollar | Sell | 1/16/19 | 281,528 | 290,544 | 9,016 |
| | Euro | Sell | 3/20/19 | 194,997 | 193,655 | (1,342) |
| | Japanese Yen | Buy | 2/20/19 | 14,452 | 15,249 | (797) |
| | New Zealand Dollar | Sell | 1/16/19 | 161,124 | 159,284 | (1,840) |
| | Norwegian Krone | Buy | 3/20/19 | 53,579 | 57,310 | (3,731) |
| | Swedish Krona | Sell | 3/20/19 | 101,934 | 100,951 | (983) |
| UBS AG | | | | | | |
| | Australian Dollar | Sell | 1/16/19 | 184,450 | 189,211 | 4,761 |
| | British Pound | Sell | 3/20/19 | 80,087 | 80,235 | 148 |
| | Canadian Dollar | Buy | 1/16/19 | 36,711 | 37,360 | (649) |
| | Euro | Sell | 3/20/19 | 156,712 | 155,634 | (1,078) |
| | New Zealand Dollar | Sell | 1/16/19 | 123,595 | 123,732 | 137 |
| | Norwegian Krone | Buy | 3/20/19 | 71,113 | 72,668 | (1,555) |
| WestPac Banking Corp. | | | | | | |
| | Australian Dollar | Buy | 1/16/19 | 72,780 | 73,993 | (1,213) |
| | Canadian Dollar | Sell | 1/16/19 | 147,872 | 150,134 | 2,262 |
| | New Zealand Dollar | Buy | 1/16/19 | 29,270 | 30,302 | (1,032) |
| Unrealized appreciation | | | | | | 39,928 |
| Unrealized (depreciation) | | | | | | (112,500) |
| Total | | | | | | $(72,572) |
* The exchange currency for all contracts listed is the United States Dollar.
| |
| 12Putnam VT Multi-Asset Absolute Return Fund |
| | | | | |
| FUTURES | | | | | |
| CONTRACTS | Number | | | | Unrealized |
| OUTSTANDING | of | Notional | | Expiration | appreciation/ |
| at 12/31/18 | contracts | amount | Value | date | (depreciation) |
| S&P 500 Index | | | | | |
| E-Mini (Short) | 10 $1,253,425 | $1,252,600 | Mar-19 | $71,984 |
| S&P Mid Cap | | | | | |
| 400 Index | | | | | |
| E-Mini (Long) | 14 | 2,328,256 | 2,327,080 | Mar-19 | (139,276) |
| Tokyo Price | | | | | |
| Index (Long) | 5 | 681,579 | 681,310 | Mar-19 | (36,584) |
| U.S. Treasury | | | | | |
| Note 10 yr | | | | | |
| (Long) | 141 | 17,204,203 | 17,204,203 | Mar-19 | 378,656 |
| Unrealized appreciation | | | | 450,640 |
| Unrealized (depreciation) | | | (175,860) |
| Total | | | | | $274,780 |
| | | |
| WRITTEN SWAP OPTIONS OUTSTANDING at 12/31/18 (premiums $1,093) | |
| Counterparty | | | |
| Fixed Obligation % to | | Notional/ | |
| receive or (pay)/Floating | Expiration | Contract | |
| rate index/Maturity date | date/strike | amount | Value |
| Barclays Bank PLC | | | |
| 2.813/3 month | | | |
| USD-LIBOR-BBA/Jan-21 | Jan-19/2.813 | $192,000 | $48 |
| Citibank, N.A. | | | |
| 2.663/3 month | | | |
| USD-LIBOR-BBA/Jan-21 | Jan-19/2.663 | 192,000 | 167 |
| JPMorgan Chase Bank N.A. | | | |
| 2.77/3 month | | | |
| USD-LIBOR-BBA/Jan-21 | Jan-19/2.77 | 114,800 | 29 |
| Total | | | $244 |
| | | | | |
| WRITTEN OPTIONS OUTSTANDING at 12/31/18 (premiums $14,533) | |
| | Expiration | Notional | | Contract | |
| Counterparty | date/strike price | Amount | | amount | Value |
| Bank of America N.A. | | | | |
| GBP/USD (Call) | Jun-19/$1.44 | 912,231 | GBP | 715,700 | $3,331 |
| SPDR S&P 500 | | | | | |
| ETF Trust (Call) | Dec-18/290.00 | $619,302 | | $2,478 | — |
| Citibank, N.A. | | | | | |
| SPDR S&P 500 | | | | | |
| ETF Trust (Call) | Jan-19/260.00 | 771,003 | | 3,085 | 4,215 |
| USD/JPY (Put) | Jan-19/JPY 105.00 | 1,244,300 | | 1,244,300 | 1,591 |
| Goldman Sachs International | | | | |
| USD/CNH (Call) | Apr-19/CNH 7.20 | 648,800 | | 648,800 | 1,218 |
| JPMorgan Chase Bank N.A. | | | | |
| EUR/NOK (Put) | Mar-19/NOK 9.60 | 451,655 | EUR | 394,200 | 1,306 |
| Total | | | | | $11,661 |
| | | | |
| FORWARD PREMIUM SWAP OPTION CONTRACTS OUTSTANDING at 12/31/18 | | | | |
| Counterparty | | | Premium | Unrealized |
| Fixed right or obligation % to receive or (pay)/ | Expiration | Contract | receivable/ | appreciation/ |
| Floating rate index/Maturity date | date/strike | amount | (payable) | (depreciation) |
| Bank of America N.A. | | | | |
| (2.647)/3 month USD-LIBOR-BBA/Jun-29 (Purchased) | Jun-24/2.647 | $14,400 | $(563) | $14 |
| (2.785)/3 month USD-LIBOR-BBA/Jan-47 (Purchased) | Jan-27/2.785 | 8,600 | (923) | (36) |
| 2.647/3 month USD-LIBOR-BBA/Jun-29 (Purchased) | Jun-24/2.647 | 14,400 | (563) | (135) |
| 2.785/3 month USD-LIBOR-BBA/Jan-47 (Purchased) | Jan-27/2.785 | 8,600 | (923) | (228) |
| Citibank, N.A. | | | | |
| (2.654)/3 month USD-LIBOR-BBA/Jun-29 (Purchased) | Jun-24/2.654 | 14,400 | (563) | 12 |
| 2.654/3 month USD-LIBOR-BBA/Jun-29 (Purchased) | Jun-24/2.654 | 14,400 | (563) | (133) |
| Goldman Sachs International | | | | |
| (2.8175)/3 month USD-LIBOR-BBA/Mar-47 (Purchased) | Mar-27/2.8175 | 1,700 | (215) | (5) |
| 2.8175/3 month USD-LIBOR-BBA/Mar-47 (Purchased) | Mar-27/2.8175 | 1,700 | (215) | (36) |
| JPMorgan Chase Bank N.A. | | | | |
| (2.8325)/3 month USD-LIBOR-BBA/Feb-52 (Purchased) | Feb-22/2.8325 | 8,600 | (1,201) | (300) |
| 2.8325/3 month USD-LIBOR-BBA/Feb-52 (Purchased) | Feb-22/2.8325 | 8,600 | (1,201) | (378) |
| Unrealized appreciation | | | | 26 |
| Unrealized (depreciation) | | | | (1,251) |
| Total | | | | $(1,225) |
| |
| Putnam VT Multi-Asset Absolute Return Fund13 |
| | | | | | | |
| CENTRALLY CLEARED INTEREST RATE SWAP CONTRACTS OUTSTANDING at 12/31/18 | | |
| | | | Upfront | | | | Unrealized |
| | | | premium | Termination | Payments | Payments | appreciation/ |
| Notional amount | | Value | received (paid) | date | made by fund | received by fund | (depreciation) |
| | $3,000 | $299 | $— | 11/8/48 | 3 month USD-LIBOR-BBA — | 3.312% — Semiannually | $301 |
| | | | | | Quarterly | | |
| | 49,100 | 1,161E | (1,033) | 3/18/49 | 3 month USD-LIBOR-BBA — | 2.95% — Semiannually | 128 |
| | | | | | Quarterly | | |
| | 1,183,100 | 13,868E | (7,809) | 3/18/29 | 3 month USD-LIBOR-BBA — | 2.85% — Semiannually | 6,059 |
| | | | | | Quarterly | | |
| | 3,900,600 | 41,417E | 26,099 | 3/18/24 | 2.80% — Semiannually | 3 month USD-LIBOR- | (15,319) |
| | | | | | | BBA — Quarterly | |
| | 2,452,300 | 5,962E | 4,506 | 3/18/21 | 2.75% — Semiannually | 3 month USD-LIBOR- | (1,455) |
| | | | | | | BBA — Quarterly | |
| | 1,839,000 | 10,959E | (3,788) | 3/20/24 | 2.70% — Semiannually | 3 month USD-LIBOR- | (14,747) |
| | | | | | | BBA — Quarterly | |
| | 1,377,000 | 22,206E | (5,825) | 3/20/29 | 3 month USD-LIBOR-BBA — | 2.90% — Semiannually | 16,381 |
| | | | | | Quarterly | | |
| | 113,000 | 652 | (2) | 1/2/29 | 3 month USD-LIBOR-BBA — | 2.779% — Semiannually | 651 |
| | | | | | Quarterly | | |
| AUD | 3,009,000 | 11,451E | 1,343 | 3/20/24 | 2.35% — Semiannually | 6 month AUD-BBR- | (10,107) |
| | | | | | | BBSW — Semiannually | |
| AUD | 8,000 | 65E | 16 | 3/20/29 | 2.70% — Semiannually | 6 month AUD-BBR- | (49) |
| | | | | | | BBSW — Semiannually | |
| CAD | 2,205,000 | 8,040E | 2,731 | 3/20/24 | 2.40% — Semiannually | 3 month CAD-BA-CDOR — | (5,310) |
| | | | | | | Semiannually | |
| CAD | 386,000 | 1,638E | (1,152) | 3/20/29 | 3 month CAD-BA-CDOR — | 2.55% — Semiannually | 486 |
| | | | | | Semiannually | | |
| CHF | 224,000 | 233E | (392) | 3/20/24 | — | 0.20% plus 6 month | (625) |
| | | | | | | CHF-LIBOR-BBA — | |
| | | | | | | Semiannually | |
| CHF | 842,000 | 1,856E | 2,732 | 3/20/29 | 6 month CHF-LIBOR-BBA — | 0.35% — Annually | 4,588 |
| | | | | | Semiannually | | |
| EUR | 2,999,000 | 8,968E | (267) | 3/20/24 | 6 month EUR-EURIBOR- | 0.30% — Annually | 8,701 |
| | | | | | REUTERS — Semiannually | | |
| EUR | 2,687,000 | 15,008E | (635) | 3/20/29 | 6 month EUR-EURIBOR- | 0.90% — Annually | 14,373 |
| | | | | | REUTERS — Semiannually | | |
| GBP | 444,000 | 2,162E | (1,084) | 3/20/24 | 6 month GBP-LIBOR-BBA — | 1.40% — Semiannually | 1,078 |
| | | | | | Semiannually | | |
| GBP | 869,000 | 10,530E | (5,664) | 3/20/29 | 6 month GBP-LIBOR-BBA — | 1.55% — Semiannually | 4,866 |
| | | | | | Semiannually | | |
| NOK | 11,906,000 | 1,537E | (1,817) | 3/20/24 | 1.85% — Annually | 6 month NOK-NIBOR- | (3,355) |
| | | | | | | NIBR — Semiannually | |
| NOK | 2,574,000 | 803E | 385 | 3/20/29 | 6 month NOK-NIBOR-NIBR — | 2.15% — Annually | 1,188 |
| | | | | | Semiannually | | |
| NZD | 1,775,000 | 6,014E | (691) | 3/20/24 | 2.35% — Semiannually | 3 month NZD-BBR-FRA — | (6,705) |
| | | | | | | Quarterly | |
| NZD | 11,000 | 45E | 17 | 3/20/29 | 2.75% — Semiannually | 3 month NZD-BBR-FRA — | (28) |
| | | | | | | Quarterly | |
| SEK | 12,659,000 | 1,333E | (2,120) | 3/20/24 | 0.55% — Annually | 3 month SEK-STIBOR- | (785) |
| | | | | | | SIDE — Quarterly | |
| SEK | 779,000 | 205E | 267 | 3/20/29 | 3 month SEK-STIBOR-SIDE — | 1.15% — Annually | 63 |
| | | | | | Quarterly | | |
| Total | | | $5,817 | | | | $378 |
EExtended effective date.
| |
| 14Putnam VT Multi-Asset Absolute Return Fund |
| | | | | | |
| OTC TOTAL RETURN SWAP CONTRACTS OUTSTANDING at 12/31/18 | | | | |
| | | Upfront | | Payments | Total return | Unrealized |
| Swap counterparty/ | | premium | Termination | received (paid) | received by | appreciation/ |
| Notional amount | Value | received (paid) | date | by fund | or paid by fund | (depreciation) |
| Bank of America N.A. | | | | | | |
| $11,036,103 | $10,493,137 | $— | 6/13/19 | (3 month USD-LIBOR- | A basket (MLFCF15) | $(548,158) |
| | | | | BBA plus 0.10%) — | of common stocks — | |
| | | | | Quarterly | Quarterly* | |
| 11,038,881 | 10,451,943 | — | 6/13/19 | 3 month USD-LIBOR- | Russell 1000 Total Return | 599,398 |
| | | | | BBA minus 0.07% — | Index — Quarterly | |
| | | | | Quarterly | | |
| 1,616 | 1,542 | — | 1/12/41 | 4.00% (1 month USD- | Synthetic TRS Index | (60) |
| | | | | LIBOR) — Monthly | 4.00% 30 year Fannie Mae | |
| | | | | | pools — Monthly | |
| 1,616 | 1,542 | — | 1/12/41 | 4.00% (1 month USD- | Synthetic TRS Index | (60) |
| | | | | LIBOR) — Monthly | 4.00% 30 year Fannie Mae | |
| | | | | | pools — Monthly | |
| Barclays Bank PLC | | | | | | |
| 1,640,594 | 1,552,815 | — | 7/26/19 | 3 month USD-LIBOR- | Russell 1000 Total Return | 95,773 |
| | | | | BBA plus 0.11% — | Index — Quarterly | |
| | | | | Quarterly | | |
| 3,691 | 3,532 | — | 1/12/43 | (3.50%) 1 month USD- | Synthetic TRS Index | 130 |
| | | | | LIBOR — Monthly | 3.50% 30 year Fannie Mae | |
| | | | | | pools — Monthly | |
| 746 | 712 | — | 1/12/41 | 4.00% (1 month USD- | Synthetic TRS Index | (28) |
| | | | | LIBOR) — Monthly | 4.00% 30 year Fannie Mae | |
| | | | | | pools — Monthly | |
| 1,717 | 1,680 | — | 1/12/38 | 6.50% (1 month USD- | Synthetic TRS Index | (17) |
| | | | | LIBOR) — Monthly | 6.50% 30 year Fannie Mae | |
| | | | | | pools — Monthly | |
| Citibank, N.A. | | | | | | |
| 10,276,926 | 9,749,467 | — | 11/26/19 | (3 month USD-LIBOR- | A basket (CGPUTQL2) | (529,364) |
| | | | | BBA plus 0.34%) — | of common stocks — | |
| | | | | Quarterly | Quarterly* | |
| 316,316 | 317,859 | — | 9/20/19 | 3 month USD-LIBOR- | MSCI Emerging Markets TR | (1,277) |
| | | | | BBA minus 0.27% — | Net USD — Quarterly | |
| | | | | Quarterly | | |
| 26,213 | 26,845 | — | 7/5/22 | 1 month USD-LIBOR- | Aerojet Rocketdyne | (596) |
| | | | | BBA minus 0.35% — | Holdings, Inc. — Monthly | |
| | | | | Monthly | | |
| 38,634 | 39,267 | — | 7/5/22 | 1 month USD-LIBOR- | Jabil, Inc. — Monthly | (579) |
| | | | | BBA minus 0.35% — | | |
| | | | | Monthly | | |
| 17,460 | 17,699 | — | 7/5/22 | 1 month USD-LIBOR- | Allscripts Healthcare | (215) |
| | | | | BBA minus 0.35% — | Solutions, Inc. — Monthly | |
| | | | | Monthly | | |
| 1,036 | 988 | — | 1/12/41 | 4.00% (1 month USD- | Synthetic TRS Index | (39) |
| | | | | LIBOR) — Monthly | 4.00% 30 year Fannie Mae | |
| | | | | | pools — Monthly | |
| 28,688 | 28,695 | — | 7/5/22 | 1 month USD-LIBOR- | Instructure Inc — Monthly | 33 |
| | | | | BBA minus 0.35% — | | |
| | | | | Monthly | | |
| 21,417 | 20,919 | — | 7/5/22 | 1 month USD-LIBOR- | ACI Worldwide, Inc. — | 529 |
| | | | | BBA minus 0.35% — | Monthly | |
| | | | | Monthly | | |
| 82,719 | 74,234 | — | 7/5/22 | 1 month USD-LIBOR- | Ally Financial Inc — | 8,602 |
| | | | | BBA minus 0.35% — | Monthly | |
| | | | | Monthly | | |
| 29,015 | 28,129 | — | 7/5/22 | 1 month USD-LIBOR- | B&G Foods, Inc. — Monthly | 356 |
| | | | | BBA minus 1.85% — | | |
| | | | | Monthly | | |
| 35,496 | 30,283 | — | 7/5/22 | 1 month USD-LIBOR- | Belden, Inc. — Monthly | 5,227 |
| | | | | BBA minus 0.35% — | | |
| | | | | Monthly | | |
| |
| Putnam VT Multi-Asset Absolute Return Fund15 |
| | | | | | |
| OTC TOTAL RETURN SWAP CONTRACTS OUTSTANDING at 12/31/18cont. | | | |
| | | Upfront | | Payments | Total return | Unrealized |
| Swap counterparty/ | | premium | Termination | received (paid) | received by | appreciation/ |
| Notional amount | Value | received (paid) | date | by fund | or paid by fund | (depreciation) |
| Citibank, N.A.cont. | | | | | | |
| $19,916 | $19,202 | $— | 7/5/22 | 1 month USD-LIBOR- | Bruker Corp — Monthly | $738 |
| | | | | BBA minus 0.35% — | | |
| | | | | Monthly | | |
| 81,921 | 78,293 | — | 7/5/22 | 1 month USD-LIBOR- | Cerner Corp. — Monthly | 3,744 |
| | | | | BBA minus 0.35% — | | |
| | | | | Monthly | | |
| 33,272 | 28,457 | — | 7/5/22 | 1 month USD-LIBOR- | Coty, Inc. — Monthly | 4,862 |
| | | | | BBA minus 0.35% — | | |
| | | | | Monthly | | |
| 4,519 | 3,934 | — | 7/5/22 | 1 month USD-LIBOR- | Diebold Nixdorf, Inc. — | 577 |
| | | | | BBA minus 0.35% — | Monthly | |
| | | | | Monthly | | |
| 9,097 | 8,257 | — | 7/5/22 | 1 month USD-LIBOR- | Ebix, Inc. — Monthly | 852 |
| | | | | BBA minus 1.25% — | | |
| | | | | Monthly | | |
| 31,122 | 27,415 | — | 7/5/22 | 1 month USD-LIBOR- | Edgewell Personal Care — | 3,751 |
| | | | | BBA minus 0.35% — | Monthly | |
| | | | | Monthly | | |
| 10,585 | 9,647 | — | 7/5/22 | 1 month USD-LIBOR- | Electronics for Imaging, | 952 |
| | | | | BBA minus 0.35% — | Inc. — Monthly | |
| | | | | Monthly | | |
| 16,526 | 14,326 | — | 7/5/22 | 1 month USD-LIBOR- | Emcor Group Inc. — | 2,224 |
| | | | | BBA minus 0.35% — | Monthly | |
| | | | | Monthly | | |
| 6,699 | 5,016 | — | 7/5/22 | 1 month USD-LIBOR- | GTT Communications | 1,643 |
| | | | | BBA minus 0.35% — | Inc — Monthly | |
| | | | | Monthly | | |
| 58,153 | 46,411 | — | 7/5/22 | 1 month USD-LIBOR- | Hanesbrands, Inc. — | 11,824 |
| | | | | BBA minus 0.35% — | Monthly | |
| | | | | Monthly | | |
| 99,978 | 96,769 | — | 7/5/22 | 1 month USD-LIBOR- | Hasbro, Inc. — Monthly | 3,328 |
| | | | | BBA minus 0.35% — | | |
| | | | | Monthly | | |
| 14,065 | 12,811 | — | 7/5/22 | 1 month USD-LIBOR- | Home BancShares — | 1,274 |
| | | | | BBA minus 0.35% — | Monthly | |
| | | | | Monthly | | |
| 26,045 | 24,392 | — | 7/5/22 | 1 month USD-LIBOR- | HubSpot, Inc. — Monthly | 1,690 |
| | | | | BBA minus 0.35% — | | |
| | | | | Monthly | | |
| 60,191 | 54,785 | — | 7/5/22 | 1 month USD-LIBOR- | ICON PLC — Monthly | 5,491 |
| | | | | BBA minus 0.35% — | | |
| | | | | Monthly | | |
| 28,431 | 24,461 | — | 7/5/22 | 1 month USD-LIBOR- | Inogen, Inc. — Monthly | 4,010 |
| | | | | BBA minus 0.35% — | | |
| | | | | Monthly | | |
| 48,193 | 45,530 | — | 7/5/22 | 1 month USD-LIBOR- | Insulet Corp. — Monthly | 2,731 |
| | | | | BBA minus 0.35% — | | |
| | | | | Monthly | | |
| 123,337 | 114,761 | — | 7/5/22 | 1 month USD-LIBOR- | Kellogg Co. — Monthly | 8,749 |
| | | | | BBA minus 0.35% — | | |
| | | | | Monthly | | |
| 41,531 | 39,505 | — | 7/5/22 | 1 month USD-LIBOR- | MasTec, Inc. — Monthly | 2,085 |
| | | | | BBA minus 0.35% — | | |
| | | | | Monthly | | |
| 29,097 | 26,901 | — | 7/5/22 | 1 month USD-LIBOR- | Medidata Solutions, Inc. — | 2,228 |
| | | | | BBA minus 0.35% — | Monthly | |
| | | | | Monthly | | |
| 695,615 | 693,430 | — | 3/19/19 | 3 month USD-LIBOR- | MSCI Emerging Markets TR | 2,939 |
| | | | | BBA plus 0.20% — | Net USD — Quarterly | |
| | | | | Quarterly | | |
| |
| 16Putnam VT Multi-Asset Absolute Return Fund |
| | | | | | |
| OTC TOTAL RETURN SWAP CONTRACTS OUTSTANDING at 12/31/18cont. | | | |
| | | Upfront | | Payments | Total return | Unrealized |
| Swap counterparty/ | | premium | Termination | received (paid) | received by | appreciation/ |
| Notional amount | Value | received (paid) | date | by fund | or paid by fund | (depreciation) |
| Citibank, N.A.cont. | | | | | | |
| $53,937 | $46,416 | $— | 7/5/22 | 1 month USD-LIBOR- | Mylan NV — Monthly | $7,598 |
| | | | | BBA minus 0.35% — | | |
| | | | | Monthly | | |
| 193,779 | 178,115 | — | 7/5/22 | 1 month USD-LIBOR- | Netapp Inc — Monthly | 15,894 |
| | | | | BBA minus 0.35% — | | |
| | | | | Monthly | | |
| 17,012 | 14,759 | — | 7/5/22 | 1 month USD-LIBOR- | Omnicell, Inc. — Monthly | 2,278 |
| | | | | BBA minus 0.35% — | | |
| | | | | Monthly | | |
| 52,838 | 47,577 | — | 7/5/22 | 1 month USD-LIBOR- | Oshkosh Corp. — Monthly | 5,336 |
| | | | | BBA minus 0.35% — | | |
| | | | | Monthly | | |
| 17,304 | 16,076 | — | 7/5/22 | 1 month USD-LIBOR- | Paylocity Holding Corp. — | 1,253 |
| | | | | BBA minus 0.35% — | Monthly | |
| | | | | Monthly | | |
| 26,110 | 24,202 | — | 7/5/22 | 1 month USD-LIBOR- | Pegasystems, Inc. — | 1,929 |
| | | | | BBA minus 0.35% — | Monthly | |
| | | | | Monthly | | |
| 50,064 | 45,716 | — | 7/5/22 | 1 month USD-LIBOR- | PerkinElmer, Inc. — | 4,418 |
| | | | | BBA minus 0.35% — | Monthly | |
| | | | | Monthly | | |
| 27,905 | 23,963 | — | 7/5/22 | 1 month USD-LIBOR- | Prestige Brands Holdings, | 3,981 |
| | | | | BBA minus 0.35% — | Inc. — Monthly | |
| | | | | Monthly | | |
| 28,444 | 26,943 | — | 7/5/22 | 1 month USD-LIBOR- | PTC, Inc. — Monthly | 1,542 |
| | | | | BBA minus 0.35% — | | |
| | | | | Monthly | | |
| 122,703 | 116,983 | — | 7/5/22 | 1 month USD-LIBOR- | Quintiles IMS Holdings, | 5,893 |
| | | | | BBA minus 0.35% — | Inc. — Monthly | |
| | | | | Monthly | | |
| 157,168 | 154,052 | — | 7/5/22 | 1 month USD-LIBOR- | Ralph Lauren Corp. — | 2,372 |
| | | | | BBA minus 0.35% — | Monthly | |
| | | | | Monthly | | |
| 24,491 | 20,609 | — | 7/5/22 | 1 month USD-LIBOR- | Restoration Hardware | 3,907 |
| | | | | BBA minus 0.65% — | Holdings, Inc. — Monthly | |
| | | | | Monthly | | |
| 86,592 | 67,098 | — | 7/5/22 | 1 month USD-LIBOR- | Signet Jewelers, Ltd. — | 19,679 |
| | | | | BBA minus 1.30% — | Monthly | |
| | | | | Monthly | | |
| 142,320 | 130,458 | — | 7/5/22 | 1 month USD-LIBOR- | Tesla, Inc. — Monthly | 12,037 |
| | | | | BBA minus 1.30% — | | |
| | | | | Monthly | | |
| 111,957 | 97,131 | — | 7/5/22 | 1 month USD-LIBOR- | Textron Inc — Monthly | 14,942 |
| | | | | BBA minus 0.35% — | | |
| | | | | Monthly | | |
| 38,043 | 36,648 | — | 7/5/22 | 1 month USD-LIBOR- | Timken Company — | 1,448 |
| | | | | BBA minus 0.35% — | Monthly | |
| | | | | Monthly | | |
| 42,767 | 31,407 | — | 7/5/22 | 1 month USD-LIBOR- | Triumph Group, Inc. — | 11,421 |
| | | | | BBA minus 0.35% — | Monthly | |
| | | | | Monthly | | |
| 66,827 | 60,044 | — | 7/5/22 | 1 month USD-LIBOR- | Ubiquiti Networks, Inc. — | 6,615 |
| | | | | BBA minus 12.05% — | Monthly | |
| | | | | Monthly | | |
| 19,125 | 13,696 | — | 7/5/22 | 1 month USD-LIBOR- | Under Armour, Inc. | 5,456 |
| | | | | BBA minus 0.35% — | Class C — Monthly | |
| | | | | Monthly | | |
| |
| Putnam VT Multi-Asset Absolute Return Fund17 |
| | | | | | |
| OTC TOTAL RETURN SWAP CONTRACTS OUTSTANDING at 12/31/18cont. | | | |
| | | Upfront | | Payments | Total return | Unrealized |
| Swap counterparty/ | | premium | Termination | received (paid) | received by | appreciation/ |
| Notional amount | Value | received (paid) | date | by fund | or paid by fund | (depreciation) |
| Citibank, N.A.cont. | | | | | | |
| $92,563 | $86,795 | $— | 7/5/22 | 1 month USD-LIBOR- | Varian Medical Systems, | $5,899 |
| | | | | BBA minus 0.35% — | Inc. — Monthly | |
| | | | | Monthly | | |
| 3,606,068 | 3,413,040 | — | 11/26/19 | 3 month USD-LIBOR- | Russell 1000 Total Return | 198,066 |
| | | | | BBA plus 0.25% — | Index — Quarterly | |
| | | | | Quarterly | | |
| Credit Suisse International | | | | | | |
| 192,317 | 192,375 | — | 1/12/41 | 4.50% (1 month USD- | Synthetic MBX Index | 234 |
| | | | | LIBOR) — Monthly | 4.50% 30 year Ginnie Mae II | |
| | | | | | pools — Monthly | |
| 8,891 | 8,510 | — | 1/12/43 | 3.50% (1 month USD- | Synthetic TRS Index | (312) |
| | | | | LIBOR) — Monthly | 3.50% 30 year Fannie Mae | |
| | | | | | pools — Monthly | |
| 5,229 | 4,899 | — | 1/12/45 | 3.50% (1 month USD- | Synthetic TRS Index | (292) |
| | | | | LIBOR) — Monthly | 3.50% 30 year Fannie Mae | |
| | | | | | pools — Monthly | |
| 755 | 723 | — | 1/12/43 | 3.50% (1 month USD- | Synthetic TRS Index | (27) |
| | | | | LIBOR) — Monthly | 3.50% 30 year Fannie Mae | |
| | | | | | pools — Monthly | |
| 11,385 | 10,868 | — | 1/12/45 | 4.00% (1 month USD- | Synthetic TRS Index | (425) |
| | | | | LIBOR) — Monthly | 4.00% 30 year Fannie Mae | |
| | | | | | pools — Monthly | |
| 5,283 | 5,043 | — | 1/12/45 | 4.00% (1 month USD- | Synthetic TRS Index | (197) |
| | | | | LIBOR) — Monthly | 4.00% 30 year Fannie Mae | |
| | | | | | pools — Monthly | |
| 6,339 | 6,048 | — | 1/12/41 | (4.00%) 1 month USD- | Synthetic TRS Index | 237 |
| | | | | LIBOR — Monthly | 4.00% 30 year Fannie Mae | |
| | | | | | pools — Monthly | |
| Goldman Sachs International | | | | | | |
| 6,735,275 | 6,664,922 | — | 12/15/20 | (1 month USD-LIBOR- | A basket (GSCBPUR1) | (71,561) |
| | | | | BBA plus 0.44%) — | of common stocks — | |
| | | | | Monthly | Monthly* | |
| 8,211,579 | 8,082,686 | — | 12/15/20 | (1 month USD-LIBOR- | A basket (GSGLPW2L) | (117,970) |
| | | | | BBA plus 0.45%) — | of common stocks — | |
| | | | | Monthly | Monthly* | |
| 8,201,256 | 8,049,013 | — | 12/15/20 | 1 month USD-LIBOR- | A basket (GSGLPW2S) | 140,195 |
| | | | | BBA minus 0.15% — | of common stocks — | |
| | | | | Monthly | Monthly* | |
| 7,496,798 | 7,391,801 | — | 12/15/20 | (1 month USD-LIBOR- | A basket (GSGLPWDL) | (99,332) |
| | | | | BBA plus 0.50%) — | of common stocks — | |
| | | | | Monthly | Monthly* | |
| 7,091,246 | 6,949,393 | — | 12/15/20 | 1 month USD-LIBOR- | A basket (GSGLPWDS) | 137,769 |
| | | | | BBA minus 0.15% — | of common stocks — | |
| | | | | Monthly | Monthly* | |
| 933,829 | 904,728 | — | 12/15/20 | (0.20%) — Monthly | Goldman Sachs Cross | (29,179) |
| | | | | | Asset Trend Series 27 | |
| | | | | | Excess Return Strategy — | |
| | | | | | Monthly ††† | |
| 354,522 | 359,415 | — | 12/15/20 | (0.30%) — Monthly | Goldman Sachs Volatility | 4,857 |
| | | | | | of Volatility Carry Series 69 | |
| | | | | | Excess Return Strategy — | |
| | | | | | Monthly † | |
| 125,580 | 127,313 | — | 12/15/20 | (0.30%) — Monthly | Goldman Sachs Volatility | 1,717 |
| | | | | | of Volatility Carry Series 69 | |
| | | | | | Excess Return Strategy — | |
| | | | | | Monthly † | |
| 173,518 | 175,912 | — | 12/15/20 | (0.30%) — Monthly | Goldman Sachs Volatility | 2,373 |
| | | | | | of Volatility Carry Series 69 | |
| | | | | | Excess Return Strategy — | |
| | | | | | Monthly † | |
| |
| 18Putnam VT Multi-Asset Absolute Return Fund |
| | | | | | |
| OTC TOTAL RETURN SWAP CONTRACTS OUTSTANDING at 12/31/18cont. | | | |
| | | Upfront | | Payments | Total return | Unrealized |
| Swap counterparty/ | | premium | Termination | received (paid) | received by | appreciation/ |
| Notional amount | Value | received (paid) | date | by fund | or paid by fund | (depreciation) |
| Goldman Sachs Internationalcont. | | | | | |
| $159,433 | $159,029 | $— | 12/15/20 | (0.45%) — Monthly | Goldman Sachs Volatility | $(428) |
| | | | | | Carry US Enhanced 3x | |
| | | | | | Excess Return Strategy — | |
| | | | | | Monthly †† | |
| 153,849 | 153,459 | — | 12/15/20 | (0.45%) — Monthly | Goldman Sachs Volatility | (419) |
| | | | | | Carry US Enhanced 3x | |
| | | | | | Excess Return Strategy — | |
| | | | | | Monthly †† | |
| 88,805 | 88,580 | — | 12/15/20 | (0.45%) — Monthly | Goldman Sachs Volatility | (242) |
| | | | | | Carry US Enhanced 3x | |
| | | | | | Excess Return Strategy — | |
| | | | | | Monthly †† | |
| 103,333 | 104,627 | — | 12/15/20 | (0.30%) — Monthly | Goldman Sachs Volatility | 1,284 |
| | | | | | of Volatility Carry Excess | |
| | | | | | Return Strategy — | |
| | | | | | Monthly † | |
| 67,973 | 68,824 | — | 12/15/20 | (0.30%) — Monthly | Goldman Sachs Volatility | 843 |
| | | | | | of Volatility Carry Excess | |
| | | | | | Return Strategy — | |
| | | | | | Monthly † | |
| 61,522 | 62,292 | — | 12/15/20 | (0.30%) — Monthly | Goldman Sachs Volatility | 763 |
| | | | | | of Volatility Carry Excess | |
| | | | | | Return Strategy — | |
| | | | | | Monthly † | |
| 889,794 | 878,607 | — | 12/15/20 | (0.45%) — Monthly | Goldman Sachs Volatility | (11,353) |
| | | | | | Carry US Series 85 | |
| | | | | | Excess Return Strategy — | |
| | | | | | Monthly †† | |
| 329,113 | 324,975 | — | 12/15/20 | (0.45%) — Monthly | Goldman Sachs Volatility | (4,199) |
| | | | | | Carry US Series 85 | |
| | | | | | Excess Return Strategy — | |
| | | | | | Monthly †† | |
| 135,579 | 133,625 | — | 12/12/19 | 1 month USD-LIBOR- | MSCI Emerging Markets TR | 2,068 |
| | | | | BBA plus 0.21% — | Net USD — Monthly | |
| | | | | Monthly | | |
| 4,838 | 4,755 | — | 1/12/44 | (3.00%) 1 month USD- | Synthetic TRS Index | 47 |
| | | | | LIBOR — Monthly | 3.00% 30 year Fannie Mae | |
| | | | | | pools — Monthly | |
| 5,955 | 5,700 | — | 1/12/43 | (3.50%) 1 month USD- | Synthetic TRS Index | 209 |
| | | | | LIBOR — Monthly | 3.50% 30 year Fannie Mae | |
| | | | | | pools — Monthly | |
| 5,283 | 5,043 | — | 1/12/45 | 4.00% (1 month USD- | Synthetic TRS Index | (197) |
| | | | | LIBOR) — Monthly | 4.00% 30 year Fannie Mae | |
| | | | | | pools — Monthly | |
| JPMorgan Chase Bank N.A. | | | | | | |
| 7,122,444 | 6,780,631 | — | 8/12/19 | 1 month USD-LIBOR- | A basket (JPCMPTSH) | 335,624 |
| | | | | BBA minus 0.50% — | of common stocks — | |
| | | | | Monthly | Monthly* | |
| 634,128 | 675,468 | — | 3/25/19 | (1 month USD-LIBOR- | Energy Select Sector | 41,094 |
| | | | | BBA plus 0.30%) — | SPDR — Monthly | |
| | | | | Monthly | | |
| 1,326 | 1,265 | — | 1/12/41 | 4.00% (1 month USD- | Synthetic TRS Index | (50) |
| | | | | LIBOR) — Monthly | 4.00% 30 year Fannie Mae | |
| | | | | | pools — Monthly | |
| JPMorgan Securities LLC | | | | | | |
| 6,585 | 6,286 | — | 1/12/45 | (4.00%) 1 month USD- | Synthetic TRS Index | 246 |
| | | | | LIBOR — Monthly | 4.00% 30 year Fannie Mae | |
| | | | | | pools — Monthly | |
| 15,365 | 14,667 | — | 1/12/45 | (4.00%) 1 month USD- | Synthetic TRS Index | 574 |
| | | | | LIBOR — Monthly | 4.00% 30 year Fannie Mae | |
| | | | | | pools — Monthly | |
| |
| Putnam VT Multi-Asset Absolute Return Fund19 |
| | | | | | |
| OTC TOTAL RETURN SWAP CONTRACTS OUTSTANDING at 12/31/18cont. | | | |
| | | Upfront | | Payments | Total return | Unrealized |
| Swap counterparty/ | | premium | Termination | received (paid) | received by | appreciation/ |
| Notional amount | Value | received (paid) | date | by fund | or paid by fund | (depreciation) |
| UBS AG | | | | | | |
| $2,028,445 | $2,043,444 | $— | 8/21/19 | 1 month USD-LIBOR- | MSCI Emerging Markets TR | $(13,462) |
| | | | | BBA — Monthly | Net USD — Monthly | |
| Upfront premium received | | — | | Unrealized appreciation | | 1,777,838 |
| Upfront premium (paid) | | — | | Unrealized (depreciation) | | (1,430,038) |
| Total | | $— | | Total | | $347,800 |
† Replicates exposure to the difference between the implied and the realized volatility risk premium in the CBOE Volatility Index option market, with a delta hedge overlay.
Replicates exposure to the difference between the implied and the realized volatility risk premium on the S&P 500 Index, with a delta hedge overlay.
Provides synthetic exposure to assets in several asset classes (equity, credit, foreign exchange and interest rates). The Strategy is calculated on an “excess return” basis and does not include any synthetic interest rate return on a notional cash amount.
* The 50 largest components, and any individual component greater than 1% of basket value, are shown below.
A BASKET (MLFCF15) OF COMMON STOCKS
| | | | |
| | | | | Percentage |
| Common stocks | Sector | Shares | Value | value |
| Alphabet, Inc. Class A | Communication Services | 407 | $425,367 | 4.05% |
| JPMorgan Chase & Co. | Financials | 3,006 | 293,454 | 2.80% |
| Apple, Inc. | Information Technology | 1,669 | 263,265 | 2.51% |
| Verizon Communications, Inc. | Communication Services | 4,682 | 263,213 | 2.51% |
| Home Depot, Inc. (The) | Consumer Discretionary | 1,504 | 258,418 | 2.46% |
| Cisco Systems, Inc. | Information Technology | 5,754 | 249,313 | 2.38% |
| Boeing Co. (The) | Industrials | 771 | 248,684 | 2.37% |
| Chevron Corp. | Energy | 2,042 | 222,125 | 2.12% |
| Starbucks Corp. | Consumer Discretionary | 3,145 | 202,537 | 1.93% |
| Citigroup, Inc. | Financials | 3,731 | 194,226 | 1.85% |
| IBM Corp. | Information Technology | 1,682 | 191,193 | 1.82% |
| Coca-Cola Co. (The) | Consumer Staples | 4,002 | 189,485 | 1.81% |
| Amazon.com, Inc. | Consumer Discretionary | 121 | 181,724 | 1.73% |
| Microsoft Corp. | Information Technology | 1,731 | 175,822 | 1.68% |
| PepsiCo, Inc. | Consumer Staples | 1,519 | 167,871 | 1.60% |
| Oracle Corp. | Information Technology | 3,503 | 158,172 | 1.51% |
| Amgen, Inc. | Health Care | 769 | 149,792 | 1.43% |
| Adobe, Inc. | Information Technology | 654 | 147,878 | 1.41% |
| Lowe’s Cos., Inc. | Consumer Discretionary | 1,558 | 143,899 | 1.37% |
| Johnson & Johnson | Health Care | 1,110 | 143,289 | 1.37% |
| Medtronic PLC | Health Care | 1,547 | 140,673 | 1.34% |
| ConocoPhillips | Energy | 2,047 | 127,639 | 1.22% |
| Merck & Co., Inc. | Health Care | 1,624 | 124,111 | 1.18% |
| Eli Lilly & Co. | Health Care | 1,059 | 122,499 | 1.17% |
| Walgreens Boots Alliance, Inc. | Consumer Staples | 1,707 | 116,648 | 1.11% |
| Facebook, Inc. Class A | Communication Services | 817 | 107,159 | 1.02% |
| Lockheed Martin Corp. | Industrials | 381 | 99,665 | 0.95% |
| Intuit, Inc. | Information Technology | 483 | 94,997 | 0.91% |
| Intel Corp. | Information Technology | 1,998 | 93,787 | 0.89% |
| MetLife, Inc. | Financials | 2,235 | 91,765 | 0.87% |
| Mondelez International, Inc. Class A | Consumer Staples | 2,185 | 87,479 | 0.83% |
| Morgan Stanley | Financials | 2,200 | 87,241 | 0.83% |
| Delta Air Lines, Inc. | Industrials | 1,747 | 87,184 | 0.83% |
| NXP Semiconductors NV | Information Technology | 1,181 | 86,544 | 0.82% |
| Automatic Data Processing, Inc. | Information Technology | 657 | 86,209 | 0.82% |
| Booking Holdings, Inc. | Consumer Discretionary | 48 | 83,082 | 0.79% |
| Ross Stores, Inc. | Consumer Discretionary | 992 | 82,535 | 0.79% |
| Honeywell International, Inc. | Industrials | 615 | 81,276 | 0.77% |
| Pfizer, Inc. | Health Care | 1,862 | 81,256 | 0.77% |
| Cigna Corp. | Health Care | 426 | 80,960 | 0.77% |
| Exelon Corp. | Utilities | 1,702 | 76,747 | 0.73% |
| |
| 20Putnam VT Multi-Asset Absolute Return Fund |
| | | | |
| A BASKET (MLFCF15) OF COMMON STOCKScont. | | | | |
| | | | | Percentage |
| Common stocks | Sector | Shares | Value | value |
| LyondellBasell Industries NV Class A | Materials | 922 | $76,644 | 0.73% |
| United Continental Holdings, Inc. | Industrials | 911 | 76,306 | 0.73% |
| Valero Energy Corp. | Energy | 970 | 72,720 | 0.69% |
| HCA Healthcare, Inc. | Health Care | 581 | 72,294 | 0.69% |
| Procter & Gamble Co. (The) | Consumer Staples | 773 | 71,022 | 0.68% |
| Phillips 66 | Energy | 813 | 70,074 | 0.67% |
| Sysco Corp. | Consumer Staples | 1,099 | 68,862 | 0.66% |
| Agilent Technologies, Inc. | Health Care | 908 | 61,234 | 0.58% |
| Cummins, Inc. | Industrials | 448 | 59,848 | 0.57% |
| | | | |
| A BASKET (CGPUTQL2) OF COMMON STOCKS | | | | |
| | | | | Percentage |
| Common stocks | Sector | Shares | Value | value |
| JPMorgan Chase & Co. | Financials | 2,707 | $264,283 | 2.71% |
| Alphabet, Inc. Class A | Communication Services | 233 | 243,099 | 2.49% |
| Starbucks Corp. | Consumer Discretionary | 2,876 | 185,245 | 1.90% |
| Texas Instruments, Inc. | Information Technology | 1,858 | 175,601 | 1.80% |
| Apple, Inc. | Information Technology | 1,111 | 175,249 | 1.80% |
| Microsoft Corp. | Information Technology | 1,720 | 174,745 | 1.79% |
| Coca-Cola Co. (The) | Consumer Staples | 3,608 | 170,854 | 1.75% |
| TJX Cos., Inc. (The) | Consumer Discretionary | 3,814 | 170,630 | 1.75% |
| Intuit, Inc. | Information Technology | 859 | 169,067 | 1.73% |
| Automatic Data Processing, Inc. | Information Technology | 1,269 | 166,410 | 1.71% |
| Exelon Corp. | Utilities | 3,648 | 164,545 | 1.69% |
| Mondelez International, Inc. Class A | Consumer Staples | 4,085 | 163,525 | 1.68% |
| Walt Disney Co. (The) | Communication Services | 1,468 | 160,950 | 1.65% |
| Humana, Inc. | Health Care | 558 | 159,748 | 1.64% |
| American Electric Power Co., Inc. | Utilities | 2,128 | 159,012 | 1.63% |
| Lowe’s Cos., Inc. | Consumer Discretionary | 1,708 | 157,746 | 1.62% |
| Cognizant Technology Solutions Corp. Class A | Information Technology | 2,306 | 146,378 | 1.50% |
| Raytheon Co. | Industrials | 947 | 145,170 | 1.49% |
| Exxon Mobil Corp. | Energy | 2,088 | 142,410 | 1.46% |
| Occidental Petroleum Corp. | Energy | 2,320 | 142,401 | 1.46% |
| Northrop Grumman Corp. | Industrials | 566 | 138,733 | 1.42% |
| Honeywell International, Inc. | Industrials | 1,025 | 135,453 | 1.39% |
| Johnson & Johnson | Health Care | 1,031 | 133,103 | 1.37% |
| Omnicom Group, Inc. | Communication Services | 1,796 | 131,531 | 1.35% |
| Centene Corp. | Health Care | 1,139 | 131,345 | 1.35% |
| American Express Co. | Financials | 1,356 | 129,286 | 1.33% |
| Norfolk Southern Corp. | Industrials | 824 | 123,169 | 1.26% |
| Pfizer, Inc. | Health Care | 2,790 | 121,805 | 1.25% |
| Citrix Systems, Inc. | Information Technology | 1,157 | 118,558 | 1.22% |
| Verizon Communications, Inc. | Communication Services | 2,099 | 117,996 | 1.21% |
| Comerica, Inc. | Financials | 1,714 | 117,757 | 1.21% |
| Amazon.com, Inc. | Consumer Discretionary | 77 | 115,448 | 1.18% |
| Cisco Systems, Inc. | Information Technology | 2,603 | 112,805 | 1.16% |
| F5 Networks, Inc. | Information Technology | 685 | 110,988 | 1.14% |
| Fidelity National Information Services, Inc. | Information Technology | 1,080 | 110,805 | 1.14% |
| Merck & Co., Inc. | Health Care | 1,350 | 103,189 | 1.06% |
| Allstate Corp. (The) | Financials | 1,246 | 102,948 | 1.06% |
| VICI Properties, Inc. | Real Estate | 5,345 | 100,377 | 1.03% |
| Baxter International, Inc. | Health Care | 1,498 | 98,589 | 1.01% |
| AutoZone, Inc. | Consumer Discretionary | 116 | 96,956 | 0.99% |
| Sysco Corp. | Consumer Staples | 1,543 | 96,710 | 0.99% |
| Marathon Petroleum Corp. | Energy | 1,613 | 95,192 | 0.98% |
| Ross Stores, Inc. | Consumer Discretionary | 1,126 | 93,716 | 0.96% |
| AGNC Investment Corp. | Financials | 5,181 | 90,881 | 0.93% |
| |
| Putnam VT Multi-Asset Absolute Return Fund21 |
| | | | |
| A BASKET (CGPUTQL2) OF COMMON STOCKScont. | | | | |
| | | | | Percentage |
| Common stocks | Sector | Shares | Value | value |
| Waste Management, Inc. | Industrials | 997 | $88,744 | 0.91% |
| UnitedHealth Group, Inc. | Health Care | 337 | 83,978 | 0.86% |
| NXP Semiconductors NV | Information Technology | 1,140 | 83,559 | 0.86% |
| Juniper Networks, Inc. | Information Technology | 3,088 | 83,087 | 0.85% |
| Equity Residential Trust | Real Estate | 1,248 | 82,394 | 0.85% |
| Amgen, Inc. | Health Care | 411 | 80,065 | 0.82% |
| | | | |
| A BASKET (GSCBPUR1) OF COMMON STOCKS | | | | |
| | | | | Percentage |
| Common stocks | Sector | Shares | Value | value |
| Intercontinental Exchange, Inc. | Financials | 2,082 | $156,856 | 2.35% |
| Danaher Corp. | Health Care | 1,499 | 154,597 | 2.32% |
| Visa, Inc. Class A | Information Technology | 1,085 | 143,136 | 2.15% |
| Intuitive Surgical, Inc. | Health Care | 292 | 139,716 | 2.10% |
| Becton Dickinson and Co. (BD) | Health Care | 606 | 136,610 | 2.05% |
| McCormick & Co., Inc. (non-voting shares) | Consumer Staples | 943 | 131,369 | 1.97% |
| BlackRock, Inc. | Financials | 315 | 123,730 | 1.86% |
| Emerson Electric Co. | Industrials | 2,059 | 123,036 | 1.85% |
| Bank of America Corp. | Financials | 4,825 | 118,898 | 1.78% |
| Honeywell International, Inc. | Industrials | 896 | 118,351 | 1.78% |
| Kinder Morgan, Inc. | Energy | 7,179 | 110,406 | 1.66% |
| Citigroup, Inc. | Financials | 2,118 | 110,285 | 1.65% |
| Baxter International, Inc. | Health Care | 1,577 | 103,812 | 1.56% |
| NRG Energy, Inc. | Utilities | 2,423 | 95,964 | 1.44% |
| Amazon.com, Inc. | Consumer Discretionary | 63 | 94,998 | 1.43% |
| Invesco, Ltd. | Financials | 5,246 | 87,824 | 1.32% |
| Fortive Corp. | Industrials | 1,207 | 81,677 | 1.23% |
| Roper Technologies, Inc. | Industrials | 305 | 81,175 | 1.22% |
| O’Reilly Automotive, Inc. | Consumer Discretionary | 231 | 79,494 | 1.19% |
| Bio-Rad Laboratories, Inc. Class A | Health Care | 329 | 76,492 | 1.15% |
| Costco Wholesale Corp. | Consumer Staples | 357 | 72,713 | 1.09% |
| Cooper Cos., Inc. (The) | Health Care | 281 | 71,609 | 1.07% |
| Burlington Stores, Inc. | Consumer Discretionary | 437 | 71,100 | 1.07% |
| Alphabet, Inc. Class C | Communication Services | 68 | 70,263 | 1.05% |
| Vertex Pharmaceuticals, Inc. | Health Care | 421 | 69,831 | 1.05% |
| Assured Guaranty, Ltd. | Financials | 1,814 | 69,455 | 1.04% |
| TJX Cos., Inc. (The) | Consumer Discretionary | 1,460 | 65,321 | 0.98% |
| Penumbra, Inc. | Health Care | 509 | 62,220 | 0.93% |
| Service Corp. International | Consumer Discretionary | 1,517 | 61,071 | 0.92% |
| Ares Capital Corp. | Financials | 3,512 | 54,715 | 0.82% |
| KKR & Co., Inc. Class A | Financials | 2,743 | 53,846 | 0.81% |
| Arthur J. Gallagher & Co. | Financials | 728 | 53,663 | 0.81% |
| Jazz Pharmaceuticals PLC | Health Care | 429 | 53,175 | 0.80% |
| PepsiCo, Inc. | Consumer Staples | 475 | 52,497 | 0.79% |
| Advance Auto Parts, Inc. | Consumer Discretionary | 315 | 49,570 | 0.74% |
| American Financial Group, Inc. | Financials | 547 | 49,518 | 0.74% |
| SunTrust Banks, Inc. | Financials | 981 | 49,504 | 0.74% |
| DTE Energy Co. | Utilities | 422 | 46,600 | 0.70% |
| Investors Bancorp, Inc. | Financials | 4,240 | 44,091 | 0.66% |
| Cincinnati Financial Corp. | Financials | 563 | 43,609 | 0.65% |
| Union Pacific Corp. | Industrials | 314 | 43,340 | 0.65% |
| Kimberly-Clark Corp. | Consumer Staples | 364 | 41,519 | 0.62% |
| ON Semiconductor Corp. | Information Technology | 2,502 | 41,313 | 0.62% |
| Booking Holdings, Inc. | Consumer Discretionary | 24 | 40,841 | 0.61% |
| American Electric Power Co., Inc. | Utilities | 537 | 40,108 | 0.60% |
| CMS Energy Corp. | Utilities | 752 | 37,320 | 0.56% |
| |
| 22Putnam VT Multi-Asset Absolute Return Fund |
| | | | |
| A BASKET (GSCBPUR1) OF COMMON STOCKScont. | | | | |
| | | | | Percentage |
| Common stocks | Sector | Shares | Value | value |
| Exelon Corp. | Utilities | 811 | $36,584 | 0.55% |
| Hilton Worldwide Holdings, Inc. | Consumer Discretionary | 500 | 35,907 | 0.54% |
| Starwood Property Trust, Inc. | Financials | 1,812 | 35,714 | 0.54% |
| Charles Schwab Corp. (The) | Financials | 848 | 35,208 | 0.53% |
| | | | |
| A BASKET (GSGLPW2L) OF COMMON STOCKS | | | | |
| | | | | Percentage |
| Common stocks | Sector | Shares | Value | value |
| BHP Billiton PLC (United Kingdom) | Materials | 3,756 | $79,008 | 0.98% |
| Rio Tinto PLC (United Kingdom) | Materials | 1,601 | 76,036 | 0.94% |
| GlaxoSmithKline PLC (United Kingdom) | Health Care | 3,865 | 73,401 | 0.91% |
| BAE Systems PLC (United Kingdom) | Industrials | 12,490 | 73,044 | 0.90% |
| Compagnie Generale des Etablissements Michelin | Consumer Discretionary | 727 | 72,034 | 0.89% |
| SCA (France) | | | | |
| Kering SA (France) | Consumer Discretionary | 152 | 71,354 | 0.88% |
| Allianz SE (Germany) | Financials | 356 | 71,177 | 0.88% |
| Deutsche Telekom AG (Germany) | Communication Services | 4,188 | 70,956 | 0.88% |
| Dassault Systemes SA (France) | Information Technology | 593 | 70,281 | 0.87% |
| Sumitomo Corp. (Japan) | Industrials | 4,860 | 69,170 | 0.86% |
| Koninklijke Ahold Delhaize NV (Netherlands) | Consumer Staples | 2,741 | 69,168 | 0.86% |
| Mizuho Financial Group, Inc. (Japan) | Financials | 43,925 | 68,180 | 0.84% |
| Macquarie Group, Ltd. (Australia) | Financials | 889 | 67,986 | 0.84% |
| Samsung Electronics Co., Ltd. (South Korea) | Information Technology | 1,927 | 66,843 | 0.83% |
| Fiat Chrysler Automobiles NV (Italy) | Consumer Discretionary | 4,562 | 66,141 | 0.82% |
| Legal & General Group PLC (United Kingdom) | Financials | 22,449 | 66,045 | 0.82% |
| Eni SpA (Italy) | Energy | 4,159 | 65,357 | 0.81% |
| Sandvik AB (Sweden) | Industrials | 4,567 | 65,087 | 0.81% |
| Arkema SA (France) | Materials | 748 | 64,113 | 0.79% |
| ORIX Corp. (Japan) | Financials | 4,355 | 63,725 | 0.79% |
| Galaxy Entertainment Group, Ltd. (Hong Kong) | Consumer Discretionary | 9,885 | 62,874 | 0.78% |
| Shin-Etsu Chemical Co., Ltd. (Japan) | Materials | 806 | 62,744 | 0.78% |
| ABB, Ltd. (Switzerland) | Industrials | 3,265 | 61,918 | 0.77% |
| THK Co., Ltd. (Japan) | Industrials | 3,274 | 61,528 | 0.76% |
| SK Hynix, Inc. (South Korea) | Information Technology | 1,127 | 61,134 | 0.76% |
| Shionogi & Co., Ltd. (Japan) | Health Care | 1,067 | 60,984 | 0.75% |
| Peugeot SA (France) | Consumer Discretionary | 2,847 | 60,676 | 0.75% |
| Shire PLC (United Kingdom) | Health Care | 1,004 | 58,453 | 0.72% |
| Carlsberg A/S Class B (Denmark) | Consumer Staples | 550 | 58,358 | 0.72% |
| Hitachi, Ltd. (Japan) | Information Technology | 2,177 | 58,259 | 0.72% |
| Namco Bandai Holdings, Inc. (Japan) | Consumer Discretionary | 1,294 | 58,100 | 0.72% |
| Sony Corp. (Japan) | Consumer Discretionary | 1,194 | 57,952 | 0.72% |
| Boliden AB (Sweden) | Materials | 2,664 | 57,695 | 0.71% |
| Ashtead Group PLC (United Kingdom) | Industrials | 2,727 | 56,864 | 0.70% |
| BASF SE (Germany) | Materials | 801 | 55,334 | 0.68% |
| ArcelorMittal SA (France) | Materials | 2,650 | 54,955 | 0.68% |
| Porsche Automobil Holding SE (Preference) (Germany) | Consumer Discretionary | 930 | 54,923 | 0.68% |
| Legrand SA (France) | Industrials | 936 | 52,741 | 0.65% |
| Safran SA (France) | Industrials | 436 | 52,533 | 0.65% |
| Sanofi (France) | Health Care | 599 | 51,771 | 0.64% |
| Taisei Corp. (Japan) | Industrials | 1,196 | 51,276 | 0.63% |
| Aena SME SA (Spain) | Industrials | 330 | 51,151 | 0.63% |
| KDDI Corp. (Japan) | Communication Services | 2,116 | 50,597 | 0.63% |
| Astellas Pharma, Inc. (Japan) | Health Care | 3,864 | 49,361 | 0.61% |
| ACS Actividades de Construccion y Servicios SA (Spain) | Industrials | 1,275 | 49,311 | 0.61% |
| Swedish Match AB (Sweden) | Consumer Staples | 1,166 | 45,920 | 0.57% |
| Resona Holdings, Inc. (Japan) | Financials | 9,521 | 45,882 | 0.57% |
| Fuji Electric Co., Ltd. (Japan) | Industrials | 1,536 | 45,438 | 0.56% |
| |
| Putnam VT Multi-Asset Absolute Return Fund23 |
| | | | |
| A BASKET (GSGLPW2L) OF COMMON STOCKScont. | | | | |
| | | | | Percentage |
| Common stocks | Sector | Shares | Value | value |
| InterContinental Hotels Group PLC (United Kingdom) | Consumer Discretionary | 841 | $45,397 | 0.56% |
| Repsol SA (Spain) | Energy | 2,807 | 45,187 | 0.56% |
| | | | |
| A BASKET (GSGLPW2S) OF COMMON STOCKS | | | | |
| | | | | Percentage |
| Common stocks | Sector | Shares | Value | value |
| Air Liquide SA (France) | Materials | 607 | $75,217 | 0.93% |
| Pernod Ricard SA (France) | Consumer Staples | 458 | 75,000 | 0.93% |
| AIA Group, Ltd. (Hong Kong) | Financials | 8,891 | 73,810 | 0.92% |
| Atlas Copco AB Class A (Sweden) | Industrials | 3,108 | 73,783 | 0.92% |
| Bunzl PLC (United Kingdom) | Industrials | 2,438 | 73,547 | 0.91% |
| Commonwealth Bank of Australia (Australia) | Financials | 1,429 | 72,850 | 0.91% |
| HSBC Holdings PLC (United Kingdom) | Financials | 8,837 | 72,804 | 0.90% |
| Royal Dutch Shell PLC Class A (United Kingdom) | Energy | 2,397 | 70,446 | 0.88% |
| LafargeHolcim, Ltd. (Switzerland) | Materials | 1,714 | 70,418 | 0.87% |
| Canon, Inc. (Japan) | Information Technology | 2,570 | 70,289 | 0.87% |
| Telefonica SA (Spain) | Communication Services | 8,307 | 69,693 | 0.87% |
| British Land Co., PLC (The) (United Kingdom) | Real Estate | 10,199 | 69,258 | 0.86% |
| Singapore Telecommunications, Ltd. (Singapore) | Communication Services | 31,986 | 68,759 | 0.85% |
| ITOCHU Corp. (Japan) | Industrials | 4,000 | 68,063 | 0.85% |
| EssilorLuxottica SA (France) | Consumer Discretionary | 535 | 67,513 | 0.84% |
| Orange SA (France) | Communication Services | 4,167 | 67,426 | 0.84% |
| Japan Tobacco, Inc. (Japan) | Consumer Staples | 2,809 | 66,999 | 0.83% |
| Takeda Pharmaceutical Co., Ltd. (Japan) | Health Care | 1,971 | 66,563 | 0.83% |
| Akzo Nobel NV (Netherlands) | Materials | 813 | 65,397 | 0.81% |
| Ferrovial SA (Spain) | Industrials | 3,221 | 65,149 | 0.81% |
| Yara International ASA (Norway) | Materials | 1,685 | 64,891 | 0.81% |
| Danone SA (France) | Consumer Staples | 906 | 63,716 | 0.79% |
| Intesa Sanpaolo SpA (Italy) | Financials | 28,551 | 63,311 | 0.79% |
| Daimler AG (Registered Shares) (Germany) | Consumer Discretionary | 1,199 | 62,912 | 0.78% |
| Assicurazioni Generali SpA (Italy) | Financials | 3,745 | 62,499 | 0.78% |
| Transurban Group (Units) (Australia) | Industrials | 7,505 | 61,549 | 0.76% |
| Prudential PLC (United Kingdom) | Financials | 3,419 | 61,053 | 0.76% |
| FANUC Corp. (Japan) | Industrials | 401 | 60,904 | 0.76% |
| Airbus SE (France) | Industrials | 632 | 60,646 | 0.75% |
| AstraZeneca PLC (United Kingdom) | Health Care | 799 | 59,732 | 0.74% |
| Anheuser-Busch InBev SA/NV (Belgium) | Consumer Staples | 890 | 58,714 | 0.73% |
| Misumi Group, Inc. (Japan) | Industrials | 2,743 | 57,973 | 0.72% |
| Nissan Motor Co., Ltd. (Japan) | Consumer Discretionary | 7,092 | 56,905 | 0.71% |
| Credit Suisse Group AG (Switzerland) | Financials | 5,064 | 55,481 | 0.69% |
| Compagnie Financiere Richemont SA (Switzerland) | Consumer Discretionary | 854 | 54,595 | 0.68% |
| FamilyMart Co., Ltd. (Japan) | Consumer Staples | 430 | 54,468 | 0.68% |
| Deutsche Bank AG (Germany) | Financials | 6,721 | 53,525 | 0.66% |
| Kansai Paint Co., Ltd. (Japan) | Materials | 2,766 | 53,288 | 0.66% |
| Gamesa Corp Tecnologica SA (Spain) | Industrials | 4,249 | 51,678 | 0.64% |
| National Grid PLC (United Kingdom) | Utilities | 5,166 | 50,278 | 0.62% |
| Fresnillo PLC (Mexico) | Materials | 4,574 | 50,095 | 0.62% |
| Vivendi SA (France) | Communication Services | 2,038 | 49,572 | 0.62% |
| Toray Industries, Inc. (Japan) | Materials | 6,678 | 46,992 | 0.58% |
| Casio Computer Co., Ltd. (Japan) | Consumer Discretionary | 3,940 | 46,829 | 0.58% |
| Japan Post Bank Co., Ltd. (Japan) | Financials | 4,120 | 45,438 | 0.56% |
| LVMH Moet Hennessy Louis Vuitton SA (France) | Consumer Discretionary | 153 | 45,289 | 0.56% |
| Siemens AG (Germany) | Industrials | 398 | 44,256 | 0.55% |
| UBS Group AG (Switzerland) | Financials | 3,528 | 43,783 | 0.54% |
| Shimano, Inc. (Japan) | Consumer Discretionary | 309 | 43,761 | 0.54% |
| Thales SA (France) | Industrials | 373 | 43,492 | 0.54% |
| |
| 24Putnam VT Multi-Asset Absolute Return Fund |
| | | | |
| A BASKET (GSGLPWDL) OF COMMON STOCKS | | | | |
| | | | | Percentage |
| Common stocks | Sector | Shares | Value | value |
| Swisscom AG (Switzerland) | Communication Services | 132 | $63,241 | 0.86% |
| Sun Hung Kai Properties, Ltd. (Hong Kong) | Real Estate | 4,386 | 62,513 | 0.85% |
| Swiss Life Holding AG (Switzerland) | Financials | 158 | 60,716 | 0.82% |
| Exelon Corp. | Utilities | 1,319 | 59,466 | 0.80% |
| Amgen, Inc. | Health Care | 305 | 59,312 | 0.80% |
| Citrix Systems, Inc. | Information Technology | 572 | 58,571 | 0.79% |
| Red Electrica Corporacion SA (Spain) | Utilities | 2,615 | 58,413 | 0.79% |
| WEC Energy Group, Inc. | Utilities | 832 | 57,621 | 0.78% |
| OGE Energy Corp. | Utilities | 1,404 | 55,028 | 0.74% |
| National Bank of Canada (Canada) | Financials | 1,336 | 54,849 | 0.74% |
| Toronto-Dominion Bank (Canada) | Financials | 1,101 | 54,711 | 0.74% |
| Sun Life Financial, Inc. (Canada) | Financials | 1,631 | 54,114 | 0.73% |
| Eni SpA (Italy) | Energy | 3,395 | 53,479 | 0.72% |
| Bank of Montreal (Canada) | Financials | 813 | 53,132 | 0.72% |
| Cummins, Inc. | Industrials | 397 | 52,997 | 0.72% |
| People’s United Financial, Inc. | Financials | 3,666 | 52,899 | 0.72% |
| Telia Company AB (Sweden) | Communication Services | 11,151 | 52,818 | 0.71% |
| Canadian Imperial Bank of Commerce (Canada) | Financials | 701 | 52,229 | 0.71% |
| Union Pacific Corp. | Industrials | 377 | 52,175 | 0.71% |
| Annaly Capital Management, Inc. | Financials | 5,181 | 50,877 | 0.69% |
| NN Group NV (Netherlands) | Financials | 1,209 | 48,224 | 0.65% |
| Repsol SA (Spain) | Energy | 2,966 | 47,844 | 0.65% |
| AGNC Investment Corp. | Financials | 2,706 | 47,470 | 0.64% |
| CGI Group, Inc. Class A (Canada) | Information Technology | 766 | 46,853 | 0.63% |
| Xcel Energy, Inc. | Utilities | 947 | 46,653 | 0.63% |
| CH Robinson Worldwide, Inc. | Industrials | 539 | 45,362 | 0.61% |
| Muenchener Rueckversicherungs-Gesellschaft AG in | Financials | 206 | 44,985 | 0.61% |
| Muenchen (Germany) | | | | |
| Rio Tinto PLC (United Kingdom) | Materials | 936 | 44,493 | 0.60% |
| Royal Bank of Canada (Canada) | Financials | 630 | 43,141 | 0.58% |
| Endesa SA (Spain) | Utilities | 1,842 | 42,489 | 0.57% |
| Paychex, Inc. | Information Technology | 650 | 42,340 | 0.57% |
| Pernod Ricard SA (France) | Consumer Staples | 256 | 41,968 | 0.57% |
| Yum! Brands, Inc. | Consumer Discretionary | 448 | 41,173 | 0.56% |
| ResMed, Inc. | Health Care | 360 | 41,048 | 0.56% |
| Ageas (Belgium) | Financials | 887 | 39,933 | 0.54% |
| Dexus Property Group (Australia) | Real Estate | 5,318 | 39,781 | 0.54% |
| Capital One Financial Corp. | Financials | 524 | 39,641 | 0.54% |
| F5 Networks, Inc. | Information Technology | 244 | 39,533 | 0.53% |
| Mizuho Financial Group, Inc. (Japan) | Financials | 25,101 | 39,002 | 0.53% |
| 3i Group PLC (United Kingdom) | Financials | 3,950 | 38,934 | 0.53% |
| AMETEK, Inc. | Industrials | 575 | 38,906 | 0.53% |
| Mazda Motor Corp. (Japan) | Consumer Discretionary | 3,748 | 38,811 | 0.53% |
| Persimmon PLC (United Kingdom) | Consumer Discretionary | 1,572 | 38,666 | 0.52% |
| Expeditors International of Washington, Inc. | Industrials | 559 | 38,080 | 0.52% |
| Enagas SA (Spain) | Energy | 1,396 | 37,753 | 0.51% |
| Raytheon Co. | Industrials | 231 | 35,492 | 0.48% |
| Givaudan SA (Switzerland) | Materials | 15 | 35,075 | 0.47% |
| Klepierre (France) | Real Estate | 1,112 | 34,347 | 0.46% |
| British Land Co., PLC (The) (United Kingdom) | Real Estate | 5,031 | 34,190 | 0.46% |
| Baloise Holding AG (Switzerland) | Financials | 245 | 33,706 | 0.46% |
| |
| Putnam VT Multi-Asset Absolute Return Fund25 |
| | | | |
| A BASKET (GSGLPWDS) OF COMMON STOCKS | | | | |
| | | | | Percentage |
| Common stocks | Sector | Shares | Value | value |
| Salesforce.com, Inc. | Information Technology | 435 | $59,525 | 0.86% |
| AIA Group, Ltd. (Hong Kong) | Financials | 6,747 | 56,008 | 0.81% |
| Banco Santander SA (Spain) | Financials | 12,019 | 54,712 | 0.79% |
| Coca-Cola Co. (The) | Consumer Staples | 1,133 | 53,645 | 0.77% |
| Camden Property Trust | Real Estate | 606 | 53,387 | 0.77% |
| Becton Dickinson and Co. (BD) | Health Care | 237 | 53,305 | 0.77% |
| Daimler AG (Registered Shares) (Germany) | Consumer Discretionary | 1,000 | 52,616 | 0.76% |
| Alexandria Real Estate Equities, Inc. | Real Estate | 455 | 52,383 | 0.75% |
| Mitsubishi Estate Co., Ltd. (Japan) | Real Estate | 3,295 | 51,992 | 0.75% |
| ABB, Ltd. (Switzerland) | Industrials | 2,676 | 50,904 | 0.73% |
| Vornado Realty Trust | Real Estate | 805 | 49,950 | 0.72% |
| Westpac Banking Corp. (Australia) | Financials | 2,682 | 47,302 | 0.68% |
| Akzo Nobel NV (Netherlands) | Materials | 580 | 46,817 | 0.67% |
| Gartner, Inc. | Information Technology | 358 | 45,721 | 0.66% |
| Koninklijke KPN NV (Netherlands) | Communication Services | 15,516 | 45,511 | 0.65% |
| Axalta Coating Systems, Ltd. | Materials | 1,878 | 43,977 | 0.63% |
| Zurich Insurance Group AG (Switzerland) | Financials | 146 | 43,473 | 0.63% |
| Deere & Co. | Industrials | 286 | 42,592 | 0.61% |
| Prologis, Inc. | Real Estate | 723 | 42,427 | 0.61% |
| American Tower Corp. | Real Estate | 264 | 41,694 | 0.60% |
| Danone SA (France) | Consumer Staples | 572 | 40,306 | 0.58% |
| Fidelity National Information Services, Inc. | Information Technology | 389 | 39,865 | 0.57% |
| Svenska Handelsbanken AB (Sweden) | Financials | 3,544 | 39,307 | 0.57% |
| Southern Co. (The) | Utilities | 890 | 39,093 | 0.56% |
| Fortis, Inc. (Canada) | Utilities | 1,165 | 38,826 | 0.56% |
| Telefonica SA (Spain) | Communication Services | 4,612 | 38,785 | 0.56% |
| Hong Kong Exchanges and Clearing, Ltd. (Hong Kong) | Financials | 1,337 | 38,697 | 0.56% |
| Autodesk, Inc. | Information Technology | 299 | 38,425 | 0.55% |
| Welltower, Inc. | Real Estate | 531 | 36,857 | 0.53% |
| Invitation Homes, Inc. | Real Estate | 1,833 | 36,810 | 0.53% |
| SBA Communications Corp. | Real Estate | 227 | 36,780 | 0.53% |
| FirstEnergy Corp. | Utilities | 976 | 36,641 | 0.53% |
| Sumitomo Realty & Development Co., Ltd. (Japan) | Real Estate | 991 | 36,394 | 0.52% |
| Nordea Bank ABP (Finland) | Financials | 4,293 | 36,123 | 0.52% |
| Anheuser-Busch InBev SA/NV (Belgium) | Consumer Staples | 534 | 35,309 | 0.51% |
| DBS Group Holdings, Ltd. (Singapore) | Financials | 2,018 | 35,071 | 0.50% |
| Commonwealth Bank of Australia (Australia) | Financials | 686 | 34,966 | 0.50% |
| Iron Mountain, Inc. | Real Estate | 1,052 | 34,110 | 0.49% |
| Compagnie Financiere Richemont SA (Switzerland) | Consumer Discretionary | 514 | 32,976 | 0.47% |
| Standard Chartered PLC (United Kingdom) | Financials | 4,220 | 32,772 | 0.47% |
| Sydney Airport (Australia) | Industrials | 6,912 | 32,765 | 0.47% |
| Ventas, Inc. | Real Estate | 558 | 32,707 | 0.47% |
| Alleghany Corp. | Financials | 52 | 32,595 | 0.47% |
| Abbott Laboratories | Health Care | 446 | 32,285 | 0.46% |
| Macerich Co. (The) | Real Estate | 743 | 32,162 | 0.46% |
| Mitsui Fudosan Co., Ltd. (Japan) | Real Estate | 1,425 | 31,785 | 0.46% |
| Prudential PLC (United Kingdom) | Financials | 1,779 | 31,783 | 0.46% |
| DowDuPont, Inc. | Materials | 592 | 31,680 | 0.46% |
| Charter Communications, Inc. Class A | Communication Services | 111 | 31,555 | 0.45% |
| Tokyu Corp. (Japan) | Industrials | 1,916 | 31,380 | 0.45% |
| |
| 26Putnam VT Multi-Asset Absolute Return Fund |
| | | | |
| A BASKET (JPCMPTSH) OF COMMON STOCKS | | | | |
| | | | | Percentage |
| Common stocks | Sector | Shares | Value | value |
| CME Group, Inc. | Financials | 932 | $175,278 | 2.58% |
| Abbott Laboratories | Health Care | 2,376 | 171,879 | 2.53% |
| Medtronic PLC | Health Care | 1,685 | 153,277 | 2.26% |
| Thermo Fisher Scientific, Inc. | Health Care | 658 | 147,332 | 2.17% |
| 3M Co. | Industrials | 756 | 143,962 | 2.12% |
| Stryker Corp. | Health Care | 918 | 143,883 | 2.12% |
| Exxon Mobil Corp. | Energy | 1,926 | 131,325 | 1.94% |
| U.S. Bancorp | Financials | 2,867 | 131,044 | 1.93% |
| T Rowe Price Group, Inc. | Financials | 1,300 | 119,976 | 1.77% |
| Hill-Rom Holdings, Inc. | Health Care | 1,235 | 109,342 | 1.61% |
| Fiserv, Inc. | Information Technology | 1,486 | 109,184 | 1.61% |
| Franklin Resources, Inc. | Financials | 3,464 | 102,752 | 1.52% |
| SEI Investments Co. | Financials | 2,013 | 93,006 | 1.37% |
| Xcel Energy, Inc. | Utilities | 1,799 | 88,647 | 1.31% |
| STERIS PLC (United Kingdom) | Health Care | 814 | 86,969 | 1.28% |
| Choice Hotels International, Inc. | Consumer Discretionary | 1,166 | 83,465 | 1.23% |
| Evercore, Inc. Class A | Financials | 1,113 | 79,634 | 1.17% |
| WEC Energy Group, Inc. | Utilities | 1,131 | 78,358 | 1.16% |
| Target Corp. | Consumer Discretionary | 1,149 | 75,907 | 1.12% |
| Aflac, Inc. | Financials | 1,655 | 75,396 | 1.11% |
| Travelers Cos., Inc. (The) | Financials | 608 | 72,803 | 1.07% |
| Kohl’s Corp. | Consumer Discretionary | 1,080 | 71,648 | 1.06% |
| Duke Energy Corp. | Utilities | 818 | 70,621 | 1.04% |
| PerkinElmer, Inc. | Health Care | 890 | 69,898 | 1.03% |
| Banco Bradesco SA ADR (Brazil) | Financials | 7,003 | 69,261 | 1.02% |
| Coca-Cola Co. (The) | Consumer Staples | 1,439 | 68,126 | 1.00% |
| Progressive Corp. (The) | Financials | 1,057 | 63,766 | 0.94% |
| Dominion Energy, Inc. | Utilities | 874 | 62,465 | 0.92% |
| Illinois Tool Works, Inc. | Industrials | 472 | 59,769 | 0.88% |
| Consolidated Edison, Inc. | Utilities | 773 | 59,085 | 0.87% |
| Lockheed Martin Corp. | Industrials | 222 | 58,222 | 0.86% |
| Commerce Bancshares, Inc./MO | Financials | 967 | 54,514 | 0.80% |
| Workday, Inc. | Information Technology | 335 | 53,420 | 0.79% |
| Federated Investors, Inc. | Financials | 1,996 | 52,988 | 0.78% |
| NVIDIA Corp. | Information Technology | 362 | 48,326 | 0.71% |
| Southern Co. (The) | Utilities | 1,064 | 46,744 | 0.69% |
| Varian Medical Systems, Inc. | Health Care | 411 | 46,568 | 0.69% |
| Seattle Genetics, Inc. | Health Care | 811 | 45,944 | 0.68% |
| IBM Corp. | Information Technology | 402 | 45,657 | 0.67% |
| Baker Hughes a GE Co. | Energy | 2,116 | 45,502 | 0.67% |
| Bank of New York Mellon Corp. (The) | Financials | 925 | 43,540 | 0.64% |
| Netflix, Inc. | Communication Services | 158 | 42,247 | 0.62% |
| Invitation Homes, Inc. | Real Estate | 2,029 | 40,747 | 0.60% |
| Home Depot, Inc. (The) | Consumer Discretionary | 236 | 40,530 | 0.60% |
| Advanced Micro Devices, Inc. | Information Technology | 2,173 | 40,120 | 0.59% |
| Hershey Co. (The) | Consumer Staples | 364 | 39,043 | 0.58% |
| IDEXX Laboratories, Inc. | Health Care | 205 | 38,186 | 0.56% |
| Intel Corp. | Information Technology | 781 | 36,658 | 0.54% |
| FedEx Corp. | Industrials | 213 | 34,347 | 0.51% |
| Ecolab, Inc. | Materials | 232 | 34,237 | 0.50% |
| |
| Putnam VT Multi-Asset Absolute Return Fund27 |
| | | | | | | |
| OTC CREDIT DEFAULT CONTRACTS OUTSTANDING — PROTECTION SOLD at 12/31/18 | | | | |
| | | Upfront | | | | | |
| | | premium | | | Termi- | | Unrealized |
| Swap counterparty/ | | received | Notional | | nation | Payments | appreciation/ |
| Referenced debt* | Rating*** | (paid)** | amount | Value | date | received by fund | (depreciation) |
| Bank of America N.A. | | | | | | | |
| CMBX NA BBB–.6 Index | BBB–/P | $68 | $1,000 | $161 | 5/11/63 | 300 bp — Monthly | $(92) |
| CMBX NA BBB–.6 Index | BBB–/P | 121 | 2,000 | 323 | 5/11/63 | 300 bp — Monthly | (201) |
| CMBX NA BBB–.6 Index | BBB–/P | 228 | 4,000 | 645 | 5/11/63 | 300 bp — Monthly | (415) |
| CMBX NA BBB–.6 Index | BBB–/P | 247 | 4,000 | 645 | 5/11/63 | 300 bp — Monthly | (396) |
| Barclays Bank PLC | | | | | | | |
| CMBX NA BBB–.6 Index | BBB–/P | 887 | 8,000 | 1,290 | 5/11/63 | 300 bp — Monthly | (399) |
| CMBX NA BBB–.7 Index | BBB–/P | 141 | 25,000 | 2,128 | 1/17/47 | 300 bp — Monthly | (1,972) |
| Citigroup Global Markets, Inc. | | | | | | | |
| CMBX NA BBB–.6 Index | BBB–/P | 815 | 6,000 | 968 | 5/11/63 | 300 bp — Monthly | (149) |
| CMBX NA BBB–.6 Index | BBB–/P | 1,387 | 13,000 | 2,097 | 5/11/63 | 300 bp — Monthly | (702) |
| CMBX NA BBB–.6 Index | BBB–/P | 13,423 | 95,000 | 15,324 | 5/11/63 | 300 bp — Monthly | (1,846) |
| CMBX NA BBB–.6 Index | BBB–/P | 38,951 | 268,000 | 43,228 | 5/11/63 | 300 bp — Monthly | (4,121) |
| Credit Suisse International | | | | | | | |
| CMBX NA A.6 Index | A/P | 449 | 9,000 | 392 | 5/11/63 | 200 bp — Monthly | 60 |
| CMBX NA A.6 Index | A/P | 1,015 | 20,000 | 872 | 5/11/63 | 200 bp — Monthly | 151 |
| CMBX NA BBB–.6 Index | BBB–/P | 760 | 6,000 | 968 | 5/11/63 | 300 bp — Monthly | (204) |
| CMBX NA BBB–.6 Index | BBB–/P | 802 | 7,000 | 1,129 | 5/11/63 | 300 bp — Monthly | (323) |
| CMBX NA BBB–.6 Index | BBB–/P | 2,065 | 18,000 | 2,903 | 5/11/63 | 300 bp — Monthly | (828) |
| CMBX NA BBB–.6 Index | BBB–/P | 3,807 | 35,000 | 5,646 | 5/11/63 | 300 bp — Monthly | (1,818) |
| CMBX NA BBB–.6 Index | BBB–/P | 24,378 | 228,000 | 36,776 | 5/11/63 | 300 bp — Monthly | (12,265) |
| CMBX NA BBB–.6 Index | BBB–/P | 33,152 | 229,000 | 36,938 | 5/11/63 | 300 bp — Monthly | (3,652) |
| CMBX NA BBB–.6 Index | BBB–/P | 38,943 | 269,000 | 43,390 | 5/11/63 | 300 bp — Monthly | (4,290) |
| CMBX NA BBB–.7 Index | BBB–/P | 3,952 | 50,000 | 4,255 | 1/17/47 | 300 bp — Monthly | (274) |
| CMBX NA BBB–.7 Index | BBB–/P | 14,931 | 202,000 | 17,190 | 1/17/47 | 300 bp — Monthly | (2,142) |
| Goldman Sachs International | | | | | | | |
| CMBX NA A.6 Index | A/P | 309 | 6,000 | 262 | 5/11/63 | 200 bp — Monthly | 50 |
| CMBX NA A.6 Index | A/P | 419 | 8,000 | 349 | 5/11/63 | 200 bp — Monthly | 73 |
| CMBX NA A.6 Index | A/P | 1,170 | 23,000 | 1,003 | 5/11/63 | 200 bp — Monthly | 177 |
| CMBX NA A.6 Index | A/P | 3,977 | 62,000 | 2,703 | 5/11/63 | 200 bp — Monthly | 1,298 |
| CMBX NA BBB–.6 Index | BBB–/P | 260 | 3,000 | 484 | 5/11/63 | 300 bp — Monthly | (222) |
| CMBX NA BBB–.6 Index | BBB–/P | 259 | 3,000 | 484 | 5/11/63 | 300 bp — Monthly | (223) |
| CMBX NA BBB–.6 Index | BBB–/P | 422 | 5,000 | 807 | 5/11/63 | 300 bp — Monthly | (382) |
| CMBX NA BBB–.6 Index | BBB–/P | 661 | 6,000 | 968 | 5/11/63 | 300 bp — Monthly | (303) |
| CMBX NA BBB–.6 Index | BBB–/P | 591 | 7,000 | 1,129 | 5/11/63 | 300 bp — Monthly | (534) |
| CMBX NA BBB–.6 Index | BBB–/P | 365 | 7,000 | 1,129 | 5/11/63 | 300 bp — Monthly | (760) |
| CMBX NA BBB–.6 Index | BBB–/P | 633 | 8,000 | 1,290 | 5/11/63 | 300 bp — Monthly | (653) |
| CMBX NA BBB–.6 Index | BBB–/P | 990 | 9,000 | 1,452 | 5/11/63 | 300 bp — Monthly | (456) |
| CMBX NA BBB–.6 Index | BBB–/P | 435 | 9,000 | 1,452 | 5/11/63 | 300 bp — Monthly | (1,011) |
| CMBX NA BBB–.6 Index | BBB–/P | 1,218 | 10,000 | 1,613 | 5/11/63 | 300 bp — Monthly | (390) |
| CMBX NA BBB–.6 Index | BBB–/P | 1,160 | 14,000 | 2,258 | 5/11/63 | 300 bp — Monthly | (1,090) |
| CMBX NA BBB–.6 Index | BBB–/P | 1,671 | 15,000 | 2,420 | 5/11/63 | 300 bp — Monthly | (739) |
| CMBX NA BBB–.6 Index | BBB–/P | 2,221 | 16,000 | 2,581 | 5/11/63 | 300 bp — Monthly | (350) |
| CMBX NA BBB–.6 Index | BBB–/P | 1,090 | 16,000 | 2,581 | 5/11/63 | 300 bp — Monthly | (1,481) |
| CMBX NA BBB–.6 Index | BBB–/P | 878 | 18,000 | 2,903 | 5/11/63 | 300 bp — Monthly | (2,015) |
| CMBX NA BBB–.6 Index | BBB–/P | 2,923 | 27,000 | 4,355 | 5/11/63 | 300 bp — Monthly | (1,416) |
| CMBX NA BBB–.6 Index | BBB–/P | 3,376 | 36,000 | 5,807 | 5/11/63 | 300 bp — Monthly | (2,409) |
| CMBX NA BBB–.6 Index | BBB–/P | 4,360 | 58,000 | 9,355 | 5/11/63 | 300 bp — Monthly | (4,962) |
| CMBX NA BBB–.7 Index | BBB–/P | 695 | 8,000 | 681 | 1/17/47 | 300 bp — Monthly | 19 |
| CMBX NA BBB–.7 Index | BBB–/P | 1,448 | 17,000 | 1,447 | 1/17/47 | 300 bp — Monthly | 11 |
| CMBX NA BBB–.7 Index | BBB–/P | 1,478 | 20,000 | 1,702 | 1/17/47 | 300 bp — Monthly | (212) |
| JPMorgan Securities LLC | | | | | | | |
| CMBX NA BBB–.6 Index | BBB–/P | 1,189 | 8,000 | 1,290 | 5/11/63 | 300 bp — Monthly | (97) |
| CMBX NA A.6 Index | A/P | 145 | 3,000 | 131 | 5/11/63 | 200 bp — Monthly | 15 |
| |
| 28Putnam VT Multi-Asset Absolute Return Fund |
| | | | | | | |
| OTC CREDIT DEFAULT CONTRACTS OUTSTANDING — PROTECTION SOLD at 12/31/18cont. | | | | |
| | | Upfront | | | | | |
| | | premium | | | Termi- | | Unrealized |
| Swap counterparty/ | | received | Notional | | nation | Payments | appreciation/ |
| Referenced debt* | Rating*** | (paid)** | amount | Value | date | received by fund | (depreciation) |
| JPMorgan Securities LLCcont. | | | | | | | |
| CMBX NA A.6 Index | A/P | $228 | $5,000 | $218 | 5/11/63 | 200 bp — Monthly | $12 |
| CMBX NA A.6 Index | A/P | 253 | 5,000 | 218 | 5/11/63 | 200 bp — Monthly | 37 |
| CMBX NA A.6 Index | A/P | 307 | 6,000 | 262 | 5/11/63 | 200 bp — Monthly | 48 |
| CMBX NA BBB–.6 Index | BBB–/P | 131 | 1,000 | 161 | 5/11/63 | 300 bp — Monthly | (30) |
| CMBX NA BBB–.6 Index | BBB–/P | 375 | 3,000 | 484 | 5/11/63 | 300 bp — Monthly | (107) |
| CMBX NA BBB–.6 Index | BBB–/P | 364 | 3,000 | 484 | 5/11/63 | 300 bp — Monthly | (119) |
| CMBX NA BBB–.6 Index | BBB–/P | 747 | 5,000 | 807 | 5/11/63 | 300 bp — Monthly | (56) |
| CMBX NA BBB–.6 Index | BBB–/P | 660 | 6,000 | 968 | 5/11/63 | 300 bp — Monthly | (304) |
| CMBX NA BBB–.6 Index | BBB–/P | 645 | 6,000 | 968 | 5/11/63 | 300 bp — Monthly | (319) |
| CMBX NA BBB–.6 Index | BBB–/P | 645 | 6,000 | 968 | 5/11/63 | 300 bp — Monthly | (319) |
| CMBX NA BBB–.6 Index | BBB–/P | 945 | 8,000 | 1,290 | 5/11/63 | 300 bp — Monthly | (340) |
| CMBX NA BBB–.6 Index | BBB–/P | 1,554 | 10,000 | 1,613 | 5/11/63 | 300 bp — Monthly | (53) |
| CMBX NA BBB–.6 Index | BBB–/P | 1,138 | 12,000 | 1,936 | 5/11/63 | 300 bp — Monthly | (791) |
| CMBX NA BBB–.6 Index | BBB–/P | 1,737 | 12,000 | 1,936 | 5/11/63 | 300 bp — Monthly | (191) |
| CMBX NA BBB–.6 Index | BBB–/P | 2,952 | 20,000 | 3,226 | 5/11/63 | 300 bp — Monthly | (263) |
| CMBX NA BBB–.6 Index | BBB–/P | 3,242 | 23,000 | 3,710 | 5/11/63 | 300 bp — Monthly | (454) |
| CMBX NA BBB–.6 Index | BBB–/P | 2,837 | 25,000 | 4,033 | 5/11/63 | 300 bp — Monthly | (1,181) |
| CMBX NA BBB–.6 Index | BBB–/P | 3,028 | 27,000 | 4,355 | 5/11/63 | 300 bp — Monthly | (1,311) |
| CMBX NA BBB–.6 Index | BBB–/P | 2,966 | 27,000 | 4,355 | 5/11/63 | 300 bp — Monthly | (1,374) |
| CMBX NA BBB–.6 Index | BBB–/P | 6,782 | 48,000 | 7,742 | 5/11/63 | 300 bp — Monthly | (932) |
| CMBX NA BBB–.6 Index | BBB–/P | 6,108 | 51,000 | 8,226 | 5/11/63 | 300 bp — Monthly | (2,089) |
| CMBX NA BBB–.6 Index | BBB–/P | 6,641 | 55,000 | 8,872 | 5/11/63 | 300 bp — Monthly | (2,198) |
| CMBX NA BBB–.6 Index | BBB–/P | 12,194 | 88,000 | 14,194 | 5/11/63 | 300 bp — Monthly | (1,949) |
| CMBX NA BBB–.6 Index | BBB–/P | 13,423 | 95,000 | 15,324 | 5/11/63 | 300 bp — Monthly | (1,846) |
| CMBX NA BBB–.6 Index | BBB–/P | 38,177 | 217,000 | 35,002 | 5/11/63 | 300 bp — Monthly | 3,301 |
| Merrill Lynch International | | | | | | | |
| CMBX NA BBB–.6 Index | BBB–/P | 21,399 | 191,000 | 30,808 | 5/11/63 | 300 bp — Monthly | (9,298) |
| Morgan Stanley & Co. International PLC | | | | | | |
| CMBX NA BBB–.6 Index | BBB–/P | 5,256 | 38,000 | 6,129 | 5/11/63 | 300 bp — Monthly | (851) |
| CMBX NA BBB–.6 Index | BBB–/P | 229 | 2,000 | 323 | 5/11/63 | 300 bp — Monthly | (92) |
| CMBX NA BBB–.6 Index | BBB–/P | 1,720 | 12,000 | 1,936 | 5/11/63 | 300 bp — Monthly | (209) |
| Upfront premium received | | 351,548 | Unrealized appreciation | | | 5,252 |
| Upfront premium (paid) | | — | Unrealized (depreciation) | | | (82,470) |
| Total | | $351,548 | Total | | | $(77,218) |
* Payments related to the referenced debt are made upon a credit default event.
** Upfront premium is based on the difference between the original spread on issue and the market spread on day of execution.
*** Ratings for an underlying index represent the average of the ratings of all the securities included in that index. The Moody’s, Standard & Poor’s or Fitch ratings are believed to be the most recent ratings available at December 31, 2018. Securities rated by Fitch are indicated by “/F.” Securities rated by Putnam are indicated by “/P.” The Putnam rating categories are comparable to the Standard & Poor’s classifications.
| | | | | | |
| OTC CREDIT DEFAULT CONTRACTS OUTSTANDING — PROTECTION PURCHASED at 12/31/18 | | | | |
| | Upfront | | | | | |
| | premium | | | Termi- | Payments | Unrealized |
| Swap counterparty/ | received | Notional | | nation | (paid) | appreciation/ |
| Referenced debt* | (paid)** | amount | Value | date | by fund | (depreciation) |
| Citigroup Global Markets, Inc. | | | | | | |
| CMBX NA BB.7 Index | $(327) | $2,000 | $364 | 1/17/47 | (500 bp) — Monthly | $35 |
| CMBX NA BB.9 Index | (924) | 6,000 | 1,147 | 9/17/58 | (500 bp) — Monthly | 217 |
| CMBX NA BB.9 Index | (928) | 6,000 | 1,147 | 9/17/58 | (500 bp) — Monthly | 213 |
| CMBX NA BB.9 Index | (470) | 3,000 | 574 | 9/17/58 | (500 bp) — Monthly | 101 |
| Credit Suisse International | | | | | | |
| CMBX NA BB.7 Index | (1,447) | 82,000 | 23,050 | 5/11/63 | (500 bp) — Monthly | 21,523 |
| CMBX NA BB.7 Index | (1,151) | 7,000 | 1,274 | 1/17/47 | (500 bp) — Monthly | 116 |
| CMBX NA BB.9 Index | (1,437) | 9,000 | 1,721 | 9/17/58 | (500 bp) — Monthly | 275 |
| |
| Putnam VT Multi-Asset Absolute Return Fund29 |
| | | | | | |
| OTC CREDIT DEFAULT CONTRACTS OUTSTANDING — PROTECTION PURCHASED at 12/31/18cont. | | | | |
| | Upfront | | | | | |
| | premium | | | Termi- | Payments | Unrealized |
| Swap counterparty/ | received | Notional | | nation | (paid) | appreciation/ |
| Referenced debt* | (paid)** | amount | Value | date | by fund | (depreciation) |
| Credit Suisse Internationalcont. | | | | | | |
| CMBX NA BB.9 Index | $(308) | $2,000 | $382 | 9/17/58 | (500 bp) — Monthly | $72 |
| CMBX NA BB.9 Index | (156) | 1,000 | 191 | 9/17/58 | (500 bp) — Monthly | 34 |
| Goldman Sachs International | | | | | | |
| CMBX NA BB.6 Index | (5,422) | 53,000 | 14,898 | 5/11/63 | (500 bp) — Monthly | 9,425 |
| CMBX NA BB.7 Index | (757) | 5,000 | 910 | 1/17/47 | (500 bp) — Monthly | 149 |
| CMBX NA BB.6 Index | (2,776) | 19,000 | 5,341 | 5/11/63 | (500 bp) — Monthly | 2,546 |
| CMBX NA BB.7 Index | (10,482) | 62,000 | 11,284 | 1/17/47 | (500 bp) — Monthly | 741 |
| CMBX NA BB.7 Index | (3,286) | 18,000 | 3,276 | 1/17/47 | (500 bp) — Monthly | (28) |
| CMBX NA BB.7 Index | (1,638) | 10,000 | 1,820 | 1/17/47 | (500 bp) — Monthly | 172 |
| JPMorgan Securities LLC | | | | | | |
| CMBX NA BB.7 Index | (775) | 4,000 | 728 | 1/17/47 | (500 bp) — Monthly | (51) |
| CMBX NA BB.6 Index | (281) | 2,000 | 562 | 5/11/63 | (500 bp) — Monthly | 279 |
| CMBX NA BB.7 Index | (3,322) | 18,000 | 3,276 | 1/17/47 | (500 bp) — Monthly | (63) |
| CMBX NA BB.7 Index | (1,299) | 8,000 | 1,456 | 1/17/47 | (500 bp) — Monthly | 149 |
| CMBX NA BB.7 Index | (1,096) | 7,000 | 1,274 | 1/17/47 | (500 bp) — Monthly | 171 |
| CMBX NA BB.7 Index | (785) | 5,000 | 910 | 1/17/47 | (500 bp) — Monthly | 120 |
| CMBX NA BBB–.7 Index | (14,260) | 130,000 | 11,063 | 1/17/47 | (300 bp) — Monthly | (3,273) |
| CMBX NA BBB–.7 Index | (2,567) | 23,000 | 1,957 | 1/17/47 | (300 bp) — Monthly | (623) |
| CMBX NA BBB–.7 Index | (592) | 11,000 | 936 | 1/17/47 | (300 bp) — Monthly | 338 |
| CMBX NA BBB–.7 Index | (1,048) | 10,000 | 851 | 1/17/47 | (300 bp) — Monthly | (202) |
| CMBX NA BBB–.7 Index | (441) | 6,000 | 511 | 1/17/47 | (300 bp) — Monthly | 66 |
| CMBX NA BBB–.7 Index | (441) | 6,000 | 511 | 1/17/47 | (300 bp) — Monthly | 66 |
| CMBX NA BBB–.7 Index | (271) | 3,000 | 255 | 1/17/47 | (300 bp) — Monthly | (18) |
| Merrill Lynch International | | | | | | |
| CMBX NA BB.9 Index | (938) | 6,000 | 1,147 | 9/17/58 | (500 bp) — Monthly | 203 |
| Morgan Stanley & Co. International PLC | | | | | | |
| CMBX NA BBB–.7 Index | (3,872) | 38,000 | 3,234 | 1/17/47 | (300 bp) — Monthly | (660) |
| Upfront premium received | — | | Unrealized appreciation | | 37,011 |
| Upfront premium (paid) | (63,497) | | Unrealized (depreciation) | | (4,918) |
| Total | $(63,497) | | Total | | $32,093 |
* Payments related to the referenced debt are made upon a credit default event.
** Upfront premium is based on the difference between the original spread on issue and the market spread on day of execution.
| | | | | | | |
| CENTRALLY CLEARED CREDIT DEFAULT CONTRACTS OUTSTANDING — PROTECTION SOLD at 12/31/18 | | | |
| | | Upfront | | | | | |
| | | premium | | | Termi- | Payments | Unrealized |
| | | received | Notional | | nation | received | appreciation/ |
| Referenced debt* | Rating*** | (paid)** | amount | Value | date | by fund | (depreciation) |
| NA HY Series 31 Index | B+/P | $(246,249) | $4,163,000 | $82,981 | 12/20/23 | 500 bp — | $(156,330) |
| | | | | | | Quarterly | |
| Total | | $(246,249) | | | | | $(156,330) |
* Payments related to the referenced debt are made upon a credit default event.
** Upfront premium is based on the difference between the original spread on issue and the market spread on day of execution.
*** Ratings are presented for credit default contracts in which the fund has sold protection on the underlying referenced debt. Ratings for an underlying index represent the average of the ratings of all the securities included in that index. The Moody’s, Standard & Poor’s or Fitch ratings are believed to be the most recent ratings available at December 31, 2018. Securities rated by Fitch are indicated by “/F.” Securities rated by Putnam are indicated by “/P.” The Putnam rating categories are comparable to the Standard & Poor’s classifications.
| |
| 30Putnam VT Multi-Asset Absolute Return Fund |
| | | | | | |
| CENTRALLY CLEARED CREDIT DEFAULT CONTRACTS OUTSTANDING — PROTECTION PURCHASED at 12/31/18 | | |
| |
| | Upfront | | | | | |
| | premium | | | Termi- | Payments | Unrealized |
| | received | Notional | | nation | (paid) | appreciation/ |
| Referenced debt* | (paid)** | amount | Value | date | by fund | (depreciation) |
| NA HY Series 31 Index | $148,169 | $2,395,000 | $47,740 | 12/20/23 | (500 bp) — Quarterly | $96,438 |
| |
| Total | $148,169 | | | | | $96,438 |
* Payments related to the referenced debt are made upon a credit default event.
** Upfront premium is based on the difference between the original spread on issue and the market spread on day of execution.
ASC 820 establishes a three-level hierarchy for disclosure of fair value measurements. The valuation hierarchy is based upon the transparency of inputs to the valuation of the fund’s investments. The three levels are defined as follows:
Level 1: Valuations based on quoted prices for identical securities in active markets.
Level 2: Valuations based on quoted prices in markets that are not active or for which all significant inputs are observable, either directly or indirectly.
Level 3: Valuations based on inputs that are unobservable and significant to the fair value measurement.
The following is a summary of the inputs used to value the fund’s net assets as of the close of the reporting period:
| | | |
| | | Valuation inputs | |
| Investments in securities: | Level 1 | Level 2 | Level 3 |
| Common stocks*: | | | |
| Basic materials | $105,454 | $211,511 | $— |
| Capital goods | — | 92,515 | — |
| Communication services | 52,509 | 165,985 | — |
| Consumer cyclicals | 155,450 | 169,944 | — |
| Consumer staples | 49,849 | 95,078 | — |
| Energy | 119,076 | 59,915 | — |
| Financials | 306,797 | 437,351 | — |
| Health care | 30,249 | 18,277 | — |
| Technology | 143,108 | 380,365 | — |
| Transportation | 34,235 | 15,837 | — |
| Utilities and power | 50,428 | 54,161 | — |
| Total common stocks | 1,047,155 | 1,700,939 | — |
| Asset-backed securities | — | 240,000 | — |
| Commodity linked notes | — | 2,662,162 | — |
| Corporate bonds and notes | — | 108,604 | — |
| Foreign government and agency bonds and notes | — | 215,047 | — |
| Investment companies | 2,480,963 | — | — |
| Mortgage-backed securities | — | 1,803,317 | — |
| Purchased options outstanding | — | 242,029 | — |
| U.S. government and agency mortgage obligations | — | 2,018,828 | — |
| U.S. treasury obligations | — | 153,598 | — |
| Warrants | — | 101,742 | — |
| Short-term investments | 6,710,990 | 11,024,317 | — |
| Totals by level | $10,239,108 | $20,270,583 | $— |
| |
| | | Valuation inputs | |
| Other financial instruments: | Level 1 | Level 2 | Level 3 |
| Forward currency contracts | $— | $(72,572) | $— |
| Futures contracts | 274,780 | — | — |
| Written options outstanding | — | (11,661) | — |
| Written swap options outstanding | — | (244) | — |
| Forward premium swap option contracts | — | (1,225) | — |
| Interest rate swap contracts | — | (5,439) | — |
| Total return swap contracts | — | 347,800 | — |
| Credit default contracts | — | (294,988) | — |
| Totals by level | $274,780 | $(38,329) | $— |
* Common stock classifications are presented at the sector level, which may differ from the fund’s portfolio presentation.
The accompanying notes are an integral part of these financial statements.
| |
| Putnam VT Multi-Asset Absolute Return Fund31 |
Statement of assets and liabilities
12/31/18
| |
| Assets | |
| Investment in securities, at value, including $41,121 of securities on loan (Notes 1 and 8): | |
| Unaffiliated issuers (identified cost $17,683,502) | $17,696,101 |
| Affiliated issuers (identified cost $6,153,590) (Notes 1 and 5) | 6,153,590 |
| Repurchase agreements (identified cost $6,660,000) | 6,660,000 |
| Cash | 1,546 |
| Foreign currency (cost $17,177) (Note 1) | 17,240 |
| Dividends, interest and other receivables | 76,685 |
| Receivable for shares of the fund sold | 2,390 |
| Receivable for investments sold | 633,285 |
| Receivable from Manager (Note 2) | 14,439 |
| Receivable for variation margin on futures contracts (Note 1) | 68,298 |
| Receivable for variation margin on centrally cleared swap contracts (Note 1) | 46,926 |
| Unrealized appreciation on forward currency contracts (Note 1) | 39,928 |
| Unrealized appreciation on forward premium swap option contracts (Note 1) | 26 |
| Unrealized appreciation on OTC swap contracts (Note 1) | 1,820,101 |
| Premium paid on OTC swap contracts (Note 1) | 63,497 |
| Total assets | 33,294,052 |
| |
| Liabilities | |
| Payable for investments purchased | 863,438 |
| Payable for purchases of TBA securities (Note 1) | 1,989,896 |
| Payable for shares of the fund repurchased | 84,986 |
| Payable for custodian fees (Note 2) | 45,412 |
| Payable for investor servicing fees (Note 2) | 2,780 |
| Payable for Trustee compensation and expenses (Note 2) | 3,235 |
| Payable for administrative services (Note 2) | 294 |
| Payable for distribution fees (Note 2) | 5,804 |
| Payable for variation margin on futures contracts (Note 1) | 196 |
| Payable for variation margin on centrally cleared swap contracts (Note 1) | 45,045 |
| Unrealized depreciation on forward currency contracts (Note 1) | 112,500 |
| Unrealized depreciation on forward premium swap option contracts (Note 1) | 1,251 |
| Unrealized depreciation on OTC swap contracts (Note 1) | 1,517,426 |
| Premium received on OTC swap contracts (Note 1) | 351,548 |
| Written options outstanding, at value (premiums $15,626) (Note 1) | 11,905 |
| Collateral on securities loaned, at value (Note 1) | 42,600 |
| Collateral on certain derivative contracts, at value (Notes 1 and 8) | 753,598 |
| Other accrued expenses | 90,558 |
| Total liabilities | 5,922,472 |
| | |
| Net assets | $27,371,580 |
| |
| Represented by | |
| Paid-in capital (Unlimited shares authorized) (Notes 1 and 4) | $28,836,765 |
| Total distributable earnings (Note 1) | (1,465,185) |
| Total — Representing net assets applicable to capital shares outstanding | $27,371,580 |
| |
| Computation of net asset value Class IA | |
| Net assets | $12,171 |
| Number of shares outstanding | 1,267 |
| Net asset value, offering price and redemption price per share (net assets divided by number of shares outstanding) | $9.61 |
| | |
| Computation of net asset value Class IB | |
| Net assets | $27,359,409 |
| Number of shares outstanding | 2,889,697 |
| Net asset value, offering price and redemption price per share (net assets divided by number of shares outstanding) | $9.47 |
The accompanying notes are an integral part of these financial statements.
| |
| 32Putnam VT Multi-Asset Absolute Return Fund |
Statement of operations
Year ended 12/31/18
| |
| Investment income | |
| Interest (including interest income of $137,068 from investments in affiliated issuers) (Note 5) | $552,584 |
| Dividends (net of foreign tax of $15,786) | 166,509 |
| Securities lending (net of expenses) (Notes 1 and 5) | 3,422 |
| Total investment income | 722,515 |
| |
| Expenses | |
| Compensation of Manager (Note 2) | 220,104 |
| Investor servicing fees (Note 2) | 21,349 |
| Custodian fees (Note 2) | 82,754 |
| Trustee compensation and expenses (Note 2) | 1,589 |
| Distribution fees (Note 2) | 76,188 |
| Administrative services (Note 2) | 863 |
| Auditing and tax fees | 90,929 |
| Other | 40,973 |
| Fees waived and reimbursed by Manager (Note 2) | (183,603) |
| Total expenses | 351,146 |
| | |
| Expense reduction (Note 2) | (1,037) |
| Net expenses | 350,109 |
| | |
| Net investment income | 372,406 |
| | |
| Realized and unrealized gain (loss) | |
| Net realized gain (loss) on: | |
| Securities from unaffiliated issuers (Notes 1 and 3) | (911,553) |
| Foreign currency transactions (Note 1) | (7,888) |
| Forward currency contracts (Note 1) | (138,964) |
| Futures contracts (Note 1) | (533,303) |
| Swap contracts (Note 1) | (936,464) |
| Written options (Note 1) | 93,462 |
| Total net realized loss | (2,434,710) |
| Change in net unrealized appreciation (depreciation) on: | |
| Securities from unaffiliated issuers and TBA sale commitments | (876,108) |
| Assets and liabilities in foreign currencies | (6) |
| Forward currency contracts | (15,963) |
| Futures contracts | 262,995 |
| Swap contracts | 323,629 |
| Written options | (37,780) |
| Total change in net unrealized depreciation | (343,233) |
| | |
| Net loss on investments | (2,777,943) |
| | |
| Net decrease in net assets resulting from operations | $(2,405,537) |
The accompanying notes are an integral part of these financial statements.
| |
| Putnam VT Multi-Asset Absolute Return Fund33 |
Statement of changes in net assets
| | |
| | Year ended | Year ended |
| | 12/31/18 | 12/31/17 |
| Increase (decrease) in net assets | | |
| Operations: | | |
| Net investment income | $372,406 | $249,776 |
| Net realized gain (loss) on investments and foreign currency transactions | (2,434,710) | 1,941,951 |
| Net unrealized appreciation (depreciation) of investments and assets and liabilities in foreign currencies | (343,233) | 20,557 |
| Net increase (decrease) in net assets resulting from operations | (2,405,537) | 2,212,284 |
| Distributions to shareholders (Note 1): | | |
| From ordinary income | | |
| Net investment income | | |
| Class IA | (103) | — |
| Class IB | (98,131) | — |
| From net realized long-term gain on investments | | |
| Class IA | (723) | — |
| Class IB | (1,185,023) | — |
| From return of capital | | |
| Class IA | (36) | — |
| Class IB | (45,771) | — |
| Decrease from capital share transactions (Note 4) | (2,133,707) | (16,614) |
| Total increase (decrease) in net assets | (5,869,031) | 2,195,670 |
| Net assets: | | |
| Beginning of year | 33,240,611 | 31,044,941 |
| End of year(Note 1) | $27,371,580 | $33,240,611 |
The accompanying notes are an integral part of these financial statements.
| |
| 34Putnam VT Multi-Asset Absolute Return Fund |
| | | | | | | | | | | | | | | | | | | | | | | | | | | |
| Financial highlights(For a common share outstanding throughout the period) | | | | | | | | | | | | |
| INVESTMENT OPERATIONS: | | | | | | | | | | LESS DISTRIBUTIONS: | | | | | | RATIOS AND SUPPLEMENTAL DATA: |
| Period ended | Net asset value, beginning of period | | Net investment income (loss)a | | Net realized and unrealized gain (loss) on investments | | Total from investment operations | | From Net investment income | | From net realized gain on investments | | From return of capital | | Total distributions | | Net asset value, end of period | | Total return at net asset value (%)b,c | | Net assets, end of period (in thousands) | | Ratio of expenses to average net assets (%)b,d,e | | Ratio of net investment income (loss) to average net assets (%)e | | Portfolio turnover (%)f |
| Class IA | | | | | | | | | | | | | | | | | | | | | | | | | | | |
| 12/31/18 | $10.88 | | .15 | | (.95) | | (.80) | | (.06) | | (.39) | | (.02) | | (.47) | | $9.61 | | (7.57) | | $12 | | .90 | | 1.45 | | 449 |
| 12/31/17 | 10.15 | | .10 | | .63 | | .73 | | — | | — | | — | | — | | 10.88 | | 7.19 | | 20 | | .90 | | .98 | | 576 |
| 12/31/16 | 10.46 | | .09 | | — | | .09 | | (.38) | | — | | (.02) | | (.40) | | 10.15 | | .93 | | 11 | | .90 | | .86 | | 503 |
| 12/31/15 | 10.78 | | .06 | | (.08) | | (.02) | | (.04) | | (.26) | | — | | (.30) | | 10.46 | | (.22) | | 21 | | .90 | | .58 | | 520 |
| 12/31/14 | 10.49 | | .05 | | .38 | | .43 | | (.14) | | — | | — | | (.14) | | 10.78 | | 4.12 | | 11 | | .90 | | .46 | | 317 |
| Class IB | | | | | | | | | | | | | | | | | | | | | | | | | | | |
| 12/31/18 | $10.73 | | .12 | | (.94) | | (.82) | | (.03) | | (.39) | | (.02) | | (.44) | | $9.47 | | (7.84) | | $27,359 | | 1.15 | | 1.22 | | 449 |
| 12/31/17 | 10.03 | | .08 | | .62 | | .70 | | — | | — | | — | | — | | 10.73 | | 6.98 | | 33,221 | | 1.15 | | .76 | | 576 |
| 12/31/16 | 10.35 | | .06 | | (.01) | | .05 | | (.35) | | — | | (.02) | | (.37) | | 10.03 | | .60 | | 31,034 | | 1.15 | | .61 | | 503 |
| 12/31/15 | 10.67 | | .03 | | (.07) | | (.04) | | (.02) | | (.26) | | — | | (.28) | | 10.35 | | (.44) | | 33,818 | | 1.15 | | .33 | | 520 |
| 12/31/14 | 10.41 | | .02 | | .38 | | .40 | | (.14) | | — | | — | | (.14) | | 10.67 | | 3.86 | | 25,220 | | 1.15 | | .22 | | 317 |
Before April 30, 2018, the fund was managed with a materially different investment strategy and may have achieved materially different performance results under its current investment strategy from that shown for periods before this date.
aPer share net investment income (loss) has been determined on the basis of the weighted average number of shares outstanding during the period.
bThe charges and expenses at the insurance company separate account level are not reflected.
cTotal return assumes dividend reinvestment.
dIncludes amounts paid through expense offset and brokerage/service arrangements, if any (Note 2). Also excludes acquired fund fees and expenses, if any.
eReflects an involuntary contractual expense limitation in effect during the period. As a result of such limitation and/or waivers, the expenses of each class reflect a reduction of the following amounts (Note 2):
| | | |
| | Percentage of | | |
| | average net assets | | |
| 12/31/18 | 0.60% | | |
| 12/31/17 | 0.45 | | |
| 12/31/16 | 0.51 | | |
| 12/31/15 | 0.44 | | |
| 12/31/14 | 0.50 | | |
fPortfolio turnover includes TBA purchase and sale commitments.
The accompanying notes are an integral part of these financial statements.
| |
| Putnam VT Multi-Asset Absolute Return Fund35 |
Notes to financial statements12/31/18
Within the following Notes to financial statements, references to “State Street” represent State Street Bank and Trust Company, references to “the SEC” represent the Securities and Exchange Commission, references to “Putnam Management” represent Putnam Investment Management, LLC, the fund’s manager, an indirect wholly-owned subsidiary of Putnam Investments, LLC and references to “OTC”, if any, represent over-the-counter. Unless otherwise noted, the “reporting period” represents the period from January 1, 2018 through December 31, 2018.
Putnam VT Multi-Asset Absolute Return Fund (formerly known as Putnam VT Absolute Return 500 Fund) (the fund) is a diversified series of Putnam Variable Trust (the Trust), a Massachusetts business trust registered under the Investment Company Act of 1940, as amended, as an open-end management investment company. The goal of the fund is to seek positive total return. The fund is designed to pursue a consistent absolute return by combining two independent investment strategies — a beta strategy, which provides broad exposure to investment markets, and an alpha strategy, which seeks returns from active trading. The beta strategy seeks to balance risk and to provide positive total return by investing, without limit, in many different asset classes, including U.S., international, and emerging markets equity securities (growth or value stocks or both) and fixed-income securities; mortgage- and asset-backed securities; below-investment-grade securities (sometimes referred to as “junk bonds”); inflation-protected securities; commodities; and real estate investment trusts (REITs). The alpha strategy involves the potential use of active trading strategies designed to provide additional total return through active security selection, tactical asset allocation, currency transactions and options transactions. In pursuing a consistent absolute return, the fund’s strategies are also generally intended to produce lower volatility over a reasonable period of time than has been historically associated with traditional asset classes that have earned similar levels of return over long historical periods. These traditional asset classes might include, for example, equities or equity-like investments.
Putnam Management may consider, among other factors, a company’s valuation, financial strength, growth potential, competitive position in its industry, projected future earnings, cash flows and dividends when deciding whether to buy or sell equity investments, and, among other factors, credit, interest rate and prepayment risks when deciding whether to buy or sell fixed-income investments. Putnam Management may also take into account general market conditions when making investment decisions. The fund typically uses derivatives, such as futures, options, certain foreign currency transactions, warrants and swap contracts, to a significant extent for hedging purposes and to increase the fund’s exposure to the asset classes and strategies mentioned above, which may create investment leverage.
The fund offers class IA and class IB shares of beneficial interest. Class IA shares are offered at net asset value and are not subject to a distribution fee. Class IB shares are offered at net asset value and pay an ongoing distribution fee, which is identified in Note 2.
In the normal course of business, the fund enters into contracts that may include agreements to indemnify another party under given circumstances. The fund’s maximum exposure under these arrangements is unknown as this would involve future claims that may be, but have not yet been, made against the fund. However, the fund’s management team expects the risk of material loss to be remote.
The fund has entered into contractual arrangements with an investment adviser, administrator, distributor, shareholder servicing agent and custodian, who each provide services to the fund. Unless expressly stated otherwise, shareholders are not parties to, or intended beneficiaries of these contractual arrangements, and these contractual arrangements are not intended to create any shareholder right to enforce them against the service providers or to seek any remedy under them against the service providers, either directly or on behalf of the fund.
Under the fund’s Amended and Restated Agreement and Declaration of Trust, any claims asserted against or on behalf of the Putnam Funds, including claims against Trustees and Officers, must be brought in state and federal courts located within the Commonwealth of Massachusetts.
Note 1 — Significant accounting policies
The following is a summary of significant accounting policies consistently followed by the fund in the preparation of its financial statements. The preparation of financial statements is in conformity with accounting principles generally accepted in the United States of America and requires management to make estimates and assumptions that affect the reported amounts of assets and liabilities in the financial statements and the reported amounts of increases and decreasesin net assets from operations. Actual results could differ from those estimates. Subsequent events after the Statement of assets and liabilities date through the date that the financial statements were issued have been evaluated in the preparation of the financial statements.
Investment income, realized and unrealized gains and losses and expenses of the fund are borne pro-rata based on the relative net assets of each class to the total net assets of the fund, except that each class bears expenses unique to that class (including the distribution fees applicable to such classes). Each class votes as a class only with respect to its own distribution plan or other matters on which a class vote is required by law or determined by the Trustees. If the fund were liquidated, shares of each class would receive their pro-rata share of the net assets of the fund. In addition, the Trustees declare separate dividends on each class of shares.
Security valuationPortfolio securities and other investments are valued using policies and procedures adopted by the Board of Trustees. The Trustees have formed a Pricing Committee to oversee the implementation of these procedures and have delegated responsibility for valuing the fund’s assets in accordance with these procedures to Putnam Management. Putnam Management has established an internal Valuation Committee that is responsible for making fair value determinations, evaluating the effectiveness of the pricing policies of the fund and reporting to the Pricing Committee.
Investments for which market quotations are readily available are valued at the last reported sales price on their principal exchange, or official closing price for certain markets, and are classified as Level 1 securities under Accounting Standards Codification 820Fair Value Measurements and Disclosures(ASC 820). If no sales are reported, as in the case of some securities that are traded OTC, a security is valued at its last reported bid price and is generally categorized as a Level 2 security.
Investments in open-end investment companies (excluding exchange-traded funds), if any, which can be classified as Level 1 or Level 2 securities, are valued based on their net asset value. The net asset value of such investment companies equals the total value of their assets less their liabilities and divided by the number of their outstanding shares.
Market quotations are not considered to be readily available for certain debt obligations (including short-term investments with remaining maturities of 60 days or less) and other investments; such investments are valued on the basis of valuations furnished by an independent pricing service approved by the Trustees or dealers selected by Putnam Management. Such services or dealers determine valuations for normal institutional-size trading units of such securities using methods based on market transactions for comparable securities and various relationships, generally recognized by institutional traders, between securities (which consider such factors as security prices, yields, maturities and ratings). These securities will generally be categorized as Level 2.
Many securities markets and exchanges outside the U.S. close prior to the scheduled close of the New York Stock Exchange and therefore the closing prices for securities in such markets or on such exchanges may not fully reflect events that occur after such close but before the scheduled close of the New York Stock Exchange. Accordingly, on certain days, the fund will fair value certain foreign equity securities taking into account multiple factors including movements in the U.S. securities markets, currency valuations and comparisons to the valuation of American Depository Receipts, exchange-traded funds and futures contracts. The foreign equity securities, which would generally be classified as Level 1 securities, will be transferred to Level 2 of the fair value hierarchy when they are valued at fair value. The number of days on which fair value prices will be used will depend on market activity and it is possible that fair value prices will be used by the fund to a significant extent. At the close of the reporting period, fair value pricing was used for certain foreign securities in the portfolio. Securities quoted in foreign currencies, if any, are translated into U.S. dollars at the current exchange rate.
To the extent a pricing service or dealer is unable to value a security or provides a valuation that Putnam Management does not believe accurately reflects the security’s fair value, the security will be valued at fair value by Putnam Management in accordance with policies and procedures approved by the Trustees. Certain investments, including certain restricted and illiquid securities and derivatives, are also valued at fair value following procedures approved by the Trustees. These valuations consider such factors as significant market or specific security events such as interest rate or credit quality changes, various relationships with other securities, discount rates, U.S. Treasury, U.S. swap and credit yields, index levels, convexity exposures, recovery rates, sales and other multiples and resale
| |
| 36Putnam VT Multi-Asset Absolute Return Fund |
restrictions. These securities are classified as Level 2 or as Level 3 depending on the priority of the significant inputs.
To assess the continuing appropriateness of fair valuations, the Valuation Committee reviews and affirms the reasonableness of such valuations on a regular basis after considering all relevant information that is reasonably available. Such valuations and procedures are reviewed periodically by the Trustees. Certain securities may be valued on the basis of a price provided by a single source. The fair value of securities is generally determined as the amount that the fund could reasonably expect to realize from an orderly disposition of such securities over a reasonable period of time. By its nature, a fair value price is a good faith estimate of the value of a security in a current sale and does not reflect an actual market price, which may be different by a material amount.
Joint trading accountPursuant to an exemptive order from the SEC, the fund may transfer uninvested cash balances into a joint trading account along with the cash of other registered investment companies and certain other accounts managed by Putnam Management. These balances may be invested in issues of short-term investments having maturities of up to 90 days.
Repurchase agreementsThe fund, or any joint trading account, through its custodian, receives delivery of the underlying securities, the fair value of which at the time of purchase is required to be in an amount at least equal to the resale price, including accrued interest. Collateral for certain tri-party repurchase agreements, which totaled $6,793,200, is held at the counterparty’s custodian in a segregated account for the benefit of the fund and the counterparty. Putnam Management is responsible for determining that the value of these underlying securities is at all times at least equal to the resale price, including accrued interest. In the event of default or bankruptcy by the other party to the agreement, retention of the collateral may be subject to legal proceedings.
Security transactions and related investment incomeSecurity transactions are recorded on the trade date (the date the order to buy or sell is executed). Gains or losses on securities sold are determined on the identified cost basis.
Interest income, net of any applicable withholding taxes, is recorded on the accrual basis. Dividend income, net of any applicable withholding taxes, is recognized on the ex-dividend date except that certain dividends from foreign securities, if any, are recognized as soon as the fund is informed of the ex-dividend date. Non-cash dividends, if any, are recorded at the fair value of the securities received. Dividends representing a return of capital or capital gains, if any, are reflected as a reduction of cost and/or as a realized gain.
All premiums/discounts are amortized/accreted on a yield-to-maturity basis.
Securities purchased or sold on a delayed delivery basis may be settled at a future date beyond customary settlement time; interest income is accrued based on the terms of the securities. Losses may arise due to changes in the fair value of the underlying securities or if the counterparty does not perform under the contract.
Stripped securitiesThe fund may invest in stripped securities which represent a participation in securities that may be structured in classes with rights to receive different portions of the interest and principal. Interest-only securities receive all of the interest and principal-only securities receive all of the principal. If the interest-only securities experience greater than anticipated prepayments of principal, the fund may fail to recoup fully its initial investment in these securities. Conversely, principal-only securities increase in value if prepayments are greater than anticipated and decline if prepayments are slower than anticipated. The fair value of these securities is highly sensitive to changes in interest rates.
Foreign currency translationThe accounting records of the fund are maintained in U.S. dollars. The fair value of foreign securities, currency holdings, and other assets and liabilities is recorded in the books and records of the fund after translation to U.S. dollars based on the exchange rates on that day. The cost of each security is determined using historical exchange rates. Income and withholding taxes are translated at prevailing exchange rates when earned or incurred. The fund does not isolate that portion of realized or unrealized gains or losses resulting from changes in the foreign exchange rate on investments from fluctuations arising from changes in the market prices of the securities. Such gains and losses are included with the net realized and unrealized gain or loss on investments. Net realized gains and losses on foreign currency transactions represent net realized exchange gains or losses on disposition of foreign currencies, currency gains and losses realized between the trade and settlement dates on securities transactions and the difference between the amount of investment income and foreign withholding taxes recorded on the fund’s books and the U.S. dollar equivalent amounts actually received or paid. Net unrealized appreciation and depreciation of assets and liabilities in foreign currencies arise from changes in the value of assets and liabilities other than investments at the period end, resulting from changes in the exchange rate.
Options contractsThe fund uses options contracts to hedge duration and convexity, to isolate prepayment risk, to gain exposure to interest rates, to hedge against changes in values of securities it owns, owned or expects to own, to hedge prepayment risk, to generate additional income for the portfolio, to enhance returns on securities owned, to gain exposure to securities, and to manage downside risks.
The potential risk to the fund is that the change in value of options contracts may not correspond to the change in value of the hedged instruments. In addition, losses may arise from changes in the value of the underlying instruments if there is an illiquid secondary market for the contracts, if interest or exchange rates move unexpectedly or if the counterparty to the contract is unable to perform. Realized gains and losses on purchased options are included in realized gains and losses on investment securities. If a written call option is exercised, the premium originally received is recorded as an addition to sales proceeds. If a written put option is exercised, the premium originally received is recorded as a reduction to the cost of investments.
Exchange-traded options are valued at the last sale price or, if no sales are reported, the last bid price for purchased options and the last ask price for written options. OTC traded options are valued using prices supplied by dealers.
Options on swaps are similar to options on securities except that the premium paid or received is to buy or grant the right to enter into a previously agreed upon interest rate or credit default contract. Forward premium swap option contracts include premiums that have extended settlement dates. The delayed settlement of the premiums is factored into the daily valuation of the option contracts. In the case of interest rate cap and floor contracts, in return for a premium, ongoing payments between two parties are based on interest rates exceeding a specified rate, in the case of a cap contract, or falling below a specified rate in the case of a floor contract.
Written option contracts outstanding at period end, if any, are listed after the fund’s portfolio.
Futures contractsThe fund uses futures contracts to manage exposure to market risk, to hedge prepayment risk, to hedge interest rate risk, to gain exposure to interest rates, and to equitize cash.
The potential risk to the fund is that the change in value of futures contracts may not correspond to the change in value of the hedged instruments. In addition, losses may arise from changes in the value of the underlying instruments, if there is an illiquid secondary market for the contracts, if interest or exchange rates move unexpectedly or if the counterparty to the contract is unable to perform. With futures, there is minimal counterparty credit risk to the fund since futures are exchange traded and the exchange’s clearinghouse, as counterparty to all exchange traded futures, guarantees the futures against default. Risks may exceed amounts recognized on the Statement of assets and liabilities. When the contract is closed, the fund records a realized gain or loss equal to the difference between the value of the contract at the time it was opened and the value at the time it was closed.
Futures contracts are valued at the quoted daily settlement prices established by the exchange on which they trade. The fund and the broker agree to exchange an amount of cash equal to the daily fluctuation in the value of the futures contract. Such receipts or payments are known as “variation margin.”
Futures contracts outstanding at period end, if any, are listed after the fund’s portfolio.
Forward currency contractsThe fund buys and sells forward currency contracts, which are agreements between two parties to buy and sell currencies at a set price on a future date. These contracts are to hedge foreign exchange risk, and to gain exposure to currencies.
The U.S. dollar value of forward currency contracts is determined using current forward currency exchange rates supplied by a quotation service. The fair value of the contract will fluctuate with changes in currency exchange rates. The contract is marked to market daily and the change in fair value is recorded as an unrealized gain or loss. The fund records a realized gain or loss equal to the difference between the value of the contract at the time it was opened and the value at the time it was closed when the contract matures or by delivery of the currency. The fund could be exposed to risk if the value of the currency changes unfavorably, if the counterparties to the contracts are unable to meet the terms of their contracts or if the fund is unable to enter into a closing position. Risks may exceed amounts recognized on the Statement of assets and liabilities.
Forward currency contracts outstanding at period end, if any, are listed after the fund’s portfolio.
| |
| Putnam VT Multi-Asset Absolute Return Fund37 |
Interest rate swap contractsThe fund entered into OTC and/or centrally cleared interest rate swap contracts, which are arrangements between two parties to exchange cash flows based on a notional principal amount, to hedge interest rate risk, to gain exposure on interest rates, and to hedge prepayment risk.
An OTC and centrally cleared interest rate swap can be purchased or sold with an upfront premium. For OTC interest rate swap contracts, an upfront payment received by the fund is recorded as a liability on the fund’s books. An upfront payment made by the fund is recorded as an asset on the fund’s books. OTC and centrally cleared interest rate swap contracts are marked to market daily based upon quotations from an independent pricing service or market makers. Any change is recorded as an unrealized gain or loss on OTC interest rate swaps. Daily fluctuations in the value of centrally cleared interest rate swaps are settled through a central clearing agent and are recorded in variation margin on the Statement of assets and liabilities and recorded as unrealized gain or loss. Payments, including upfront premiums, received or made are recorded as realized gains or losses at the reset date or the closing of the contract. Certain OTC and centrally cleared interest rate swap contracts may include extended effective dates. Payments related to these swap contracts are accrued based on the terms of the contract.
The fund could be exposed to credit or market risk due to unfavorable changes in the fluctuation of interest rates or if the counterparty defaults, in the case of OTC interest rate contracts, or the central clearing agency or a clearing member defaults, in the case of centrally cleared interest rate swap contracts, on its respective obligation to perform under the contract. The fund’s maximum risk of loss from counterparty risk or central clearing risk is the fair value of the contract. This risk may be mitigated for OTC interest rate swap contracts by having a master netting arrangement between the fund and the counterparty and for centrally cleared interest rate swap contracts through the daily exchange of variation margin. There is minimal counterparty risk with respect to centrally cleared interest rate swap contracts due to the clearinghouse guarantee fund and other resources that are available in the event of a clearing member default. Risk of loss may exceed amounts recognized on the Statement of assets and liabilities.
OTC and centrally cleared interest rate swap contracts outstanding, including their respective notional amounts at period end, if any, are listed after the fund’s portfolio.
Total return swap contractsThe fund entered into OTC and/or centrally cleared total return swap contracts, which are arrangements to exchange a market-linked return for a periodic payment, both based on a notional principal amount, to hedge sector exposure, to manage exposure to specific sectors or industries, to manage exposure to specific securities, to gain exposure to a basket of securities, to gain exposure to specific markets or countries, and to gain exposure to specific sectors or industries.
To the extent that the total return of the security, index or other financial measure underlying the transaction exceeds or falls short of the offsetting interest rate obligation, the fund will receive a payment from or make a payment to the coun-terparty. OTC and/or centrally cleared total return swap contracts are marked to market daily based upon quotations from an independent pricing service or market maker. Any change is recorded as an unrealized gain or loss on OTC total return swaps. Daily fluctuations in the value of centrally cleared total return swaps are settled through a central clearing agent and are recorded in variation margin on the Statement of assets and liabilities and recorded as unrealized gain or loss. Payments received or made are recorded as realized gains or losses. Certain OTC and/or centrally cleared total return swap contracts may include extended effective dates. Payments related to these swap contracts are accrued based on the terms of the contract. The fund could be exposed to credit or market risk due to unfavorable changes in the fluctuation of interest rates or in the price of the underlying security or index, the possibility that there is no liquid market for these agreements or that the counterparty may default on its obligation to perform. The fund’s maximum risk of loss from counterparty risk or central clearing risk is the fair value of the contract. This risk may be mitigated for OTC total return swap contracts by having a master netting arrangement between the fund and the counterparty and for centrally cleared total return swap contracts through the daily exchange of variation margin. There is minimal counterparty risk with respect to centrally cleared total return swap contracts due to the clearinghouse guarantee fund and other resources that are available in the event of a clearing member default. Risk of loss may exceed amounts recognized on the Statement of assets and liabilities.
OTC and/or centrally cleared total return swap contracts outstanding, including their respective notional amounts at period end, if any, are listed after the fund’s portfolio.
Credit default contractsThe fund entered into OTC and/or centrally cleared credit default contracts to hedge credit risk, to hedge market risk, and to gain exposure on individual names and/or baskets of securities.
In OTC and centrally cleared credit default contracts, the protection buyer typically makes a periodic stream of payments to a counterparty, the protection seller, in exchange for the right to receive a contingent payment upon the occurrence of a credit event on the reference obligation or all other equally ranked obligations of the reference entity. Credit events are contract specific but may include bankruptcy, failure to pay, restructuring and obligation acceleration. For OTC credit default contracts, an upfront payment received by the fund is recorded as a liability on the fund’s books. An upfront payment made by the fund is recorded as an asset on the fund’s books. Centrally cleared credit default contracts provide the same rights to the protection buyer and seller except the payments between parties, including upfront premiums, are settled through a central clearing agent through variation margin payments. Upfront and periodic payments received or paid by the fund for OTC and centrally cleared credit default contracts are recorded as realized gains or losses at the reset date or close of the contract. The OTC and centrally cleared credit default contracts are marked to market daily based upon quotations from an independent pricing service or market makers. Any change in value of OTC credit default contracts is recorded as an unrealized gain or loss. Daily fluctuations in the value of centrally cleared credit default contracts are recorded in variation margin on the Statement of assets and liabilities and recorded as unrealized gain or loss. Upon the occurrence of a credit event, the difference between the par value and fair value of the reference obligation, net of any proportional amount of the upfront payment, is recorded as a realized gain or loss.
In addition to bearing the risk that the credit event will occur, the fund could be exposed to market risk due to unfavorable changes in interest rates or in the price of the underlying security or index or the possibility that the fund may be unable to close out its position at the same time or at the same price as if it had purchased the underlying reference obligations. In certain circumstances, the fund may enter into offsetting OTC and centrally cleared credit default contracts which would mitigate its risk of loss. Risks of loss may exceed amounts recognized on the Statement of assets and liabilities. The fund’s maximum risk of loss from coun-terparty risk, either as the protection seller or as the protection buyer, is the fair value of the contract. This risk may be mitigated for OTC credit default contracts by having a master netting arrangement between the fund and the counterparty and for centrally cleared credit default contracts through the daily exchange of variation margin. Counterparty risk is further mitigated with respect to centrally cleared credit default swap contracts due to the clearinghouse guarantee fund and other resources that are available in the event of a clearing member default. Where the fund is a seller of protection, the maximum potential amount of future payments the fund may be required to make is equal to the notional amount.
OTC and centrally cleared credit default contracts outstanding, including their respective notional amounts at period end, if any, are listed after the fund’s portfolio.
TBA commitmentsThe fund may enter into TBA (to be announced) commitments to purchase securities for a fixed unit price at a future date beyond customary settlement time. Although the unit price and par amount have been established, the actual securities have not been specified. However, it is anticipated that the amount of the commitments will not significantly differ from the principal amount. The fund holds, and maintains until settlement date, cash or high-grade debt obligations in an amount sufficient to meet the purchase price, or the fund may enter into offsetting contracts for the forward sale of other securities it owns. Income on the securities will not be earned until settlement date.
The fund may also enter into TBA sale commitments to hedge its portfolio positions, to sell mortgage-backed securities it owns under delayed delivery arrangements or to take a short position in mortgage-backed securities. Proceeds of TBA sale commitments are not received until the contractual settlement date. During the time a TBA sale commitment is outstanding, either equivalent deliverable securities or an offsetting TBA purchase commitment deliverable on or before the sale commitment date are held as “cover” for the transaction, or other liquid assets in an amount equal to the notional value of the TBA sale commitment are segregated. If the TBA sale commitment is closed through the acquisition of an offsetting TBA purchase commitment, the fund realizes a gain or loss. If the fund delivers securities under the commitment, the fund realizes a gain or a loss from the sale of the securities based upon the unit price established at the date the commitment was entered into.
TBA commitments, which are accounted for as purchase and sale transactions, may be considered securities themselves, and involve a risk of loss due to changes in the value of the security prior to the settlement date as well as the risk that the counterparty to the transaction will not perform its obligations. Counterparty risk is mitigated by having a master agreement between the fund and the counterparty.
| |
| 38Putnam VT Multi-Asset Absolute Return Fund |
Unsettled TBA commitments are valued at their fair value according to the procedures described under “Security valuation” above. The contract is marked to market daily and the change in fair value is recorded by the fund as an unrealized gain or loss. Based on market circumstances, Putnam Management will determine whether to take delivery of the underlying securities or to dispose of the TBA commitments prior to settlement.
TBA purchase commitments outstanding at period end, if any, are listed within the fund’s portfolio and TBA sale commitments outstanding at period end, if any, are listed after the fund’s portfolio.
Master agreementsThe fund is a party to ISDA (International Swaps and Derivatives Association, Inc.) Master Agreements that govern OTC derivative and foreign exchange contracts and Master Securities Forward Transaction Agreements that govern transactions involving mortgage-backed and other asset-backed securities that may result in delayed delivery (Master Agreements) with certain counterparties entered into from time to time. The Master Agreements may contain provisions regarding, among other things, the parties’ general obligations, representations, agreements, collateral requirements, events of default and early termination. With respect to certain counterparties, in accordance with the terms of the Master Agreements, collateral posted to the fund is held in a segregated account by the fund’s custodian and, with respect to those amounts which can be sold or repledged, are presented in the fund’s portfolio
Collateral pledged by the fund is segregated by the fund’s custodian and identified in the fund’s portfolio. Collateral can be in the form of cash or debt securities issued by the U.S. Government or related agencies or other securities as agreed to by the fund and the applicable counterparty. Collateral requirements are determined based on the fund’s net position with each counterparty.
With respect to ISDA Master Agreements, termination events applicable to the fund may occur upon a decline in the fund’s net assets below a specified threshold over a certain period of time. Termination events applicable to counterparties may occur upon a decline in the counterparty’s long-term or short-term credit ratings below a specified level. In each case, upon occurrence, the other party may elect to terminate early and cause settlement of all derivative and foreign exchange contracts outstanding, including the payment of any losses and costs resulting from such early termination, as reasonably determined by the terminating party. Any decision by one or more of the fund’s counterparties to elect early termination could impact the fund’s future derivative activity.
At the close of the reporting period, the fund had a net liability position of $473,455 on open derivative contracts subject to the Master Agreements.Collateral posted by the fund at period end for these agreements totaled $398,050 and may include amounts related to unsettled agreements.
Securities lendingThe fund may lend securities, through its agent, to qualified borrowers in order to earn additional income. The loans are collateralized by cash in an amount at least equal to the fair value of the securities loaned. The fair value of securities loaned is determined daily and any additional required collateral is allocated to the fund on the next business day. The remaining maturities of the securities lending transactions are considered overnight and continuous. The risk of borrower default will be borne by the fund’s agent; the fund will bear the risk of loss with respect to the investment of the cash collateral. Income from securities lending, net of expenses, is included in investment income on the Statement of operations. Cash collateral is invested in Putnam Cash Collateral Pool, LLC, a limited liability company managed by an affiliate of Putnam Management. Investments in Putnam Cash Collateral Pool, LLC are valued at its closing net asset value each business day. There are no management fees charged to Putnam Cash Collateral Pool, LLC. At the close of the reporting period, the fund received cash collateral of $42,600 and the value of securities loaned amounted to $41,121.
Interfund lendingThe fund, along with other Putnam funds, may participate in an interfund lending program pursuant to an exemptive order issued by the SEC. This program allows the fund to borrow from or lend to other Putnam funds that permit such transactions. Interfund lending transactions are subject to each fund’s investment policies and borrowing and lending limits. Interest earned or paid on the interfund lending transaction will be based on the average of certain current market rates. During the reporting period, the fund did not utilize the program.
Lines of creditThe fund participates, along with other Putnam funds, in a $317.5 million unsecured committed line of credit and a $235.5 million unsecured uncommitted line of credit, both provided by State Street. Borrowings may be made for temporary or emergency purposes, including the funding of shareholder redemption requests and trade settlements. Interest is charged to the fund based on the fund’s borrowing at a rate equal to 1.25% plus the higher of (1) the Federal Funds rate and (2) the overnight LIBOR for the committed line of credit and the Federal Funds rate plus 1.30% for the uncommitted line of credit. A closing feeequal to 0.04% of the committed line of credit and 0.04% of the uncommitted line of credit has been paid by the participating funds. In addition, a commitment fee of 0.21% per annum on any unutilized portion of the committed line of credit is allocated to the participating funds based on their relative net assets and paid quarterly. During the reporting period, the fund had no borrowings against these arrangements.
Federal taxesIt is the policy of the fund to distribute all of its taxable income within the prescribed time period and otherwise comply with the provisions of the Internal Revenue Code of 1986, as amended (the Code), applicable to regulated investment companies. It is also the intention of the fund to distribute an amount sufficient to avoid imposition of any excise tax under Section 4982 of the Code.
The fund is subject to the provisions of Accounting Standards Codification 740Income Taxes(ASC 740). ASC 740 sets forth a minimum threshold for financial statement recognition of the benefit of a tax position taken or expected to be taken in a tax return. The fund did not have a liability to record for any unrecognized tax benefits in the accompanying financial statements. No provision has been made for federal taxes on income, capital gains or unrealized appreciation on securities held nor for excise tax on income and capital gains. Each of the fund’s federal tax returns for the prior three fiscal years remains subject to examination by the Internal Revenue Service.
The fund may also be subject to taxes imposed by governments of countries in which it invests. Such taxes are generally based on either income or gains earned or repatriated. The fund accrues and applies such taxes to net investment income, net realized gains and net unrealized gains as income and/or capital gains are earned. In some cases, the fund may be entitled to reclaim all or a portion of such taxes, and such reclaim amounts, if any, are reflected as an asset on the fund’s books. In many cases, however, the fund may not receive such amounts for an extended period of time, depending on the country of investment.
Under the Regulated Investment Company Modernization Act of 2010, the fund will be permitted to carry forward capital losses incurred for an unlimited period and the carry forwards will retain their character as either short-term or long-term capital losses. At December 31, 2018, the fund had the following capital loss carryovers available, to the extent allowed by the Code, to offset future net capital gain, if any:
| | |
| | Loss carryover | |
| Short-term | Long-term | Total |
| $1,258,297 | $— | $1,258,297 |
Distributions to shareholdersDistributions to shareholders from net investment income are recorded by the fund on the ex-dividend date. Distributions from capital gains, if any, are recorded on the ex-dividend date and paid at least annually. The amount and character of income and gains to be distributed are determined in accordance with income tax regulations, which may differ from generally accepted accounting principles. These differences include temporary and/or permanent differences from foreign currency gains and losses, from unrealized gains and losses on certain futures contracts, , from straddle loss deferrals, from net operating loss, from income on swap contracts, from interest-only securities, and from real estate mortgage investment conduits.
Reclassifications are made to the fund’s capital accounts to reflect income and gains available for distribution (or available capital loss carryovers) under income tax regulations. At the close of the reporting period, the fund reclassified $640,568 to decrease undistributed net investment income, $206,179 to decrease paid-in capital and $846,747 to decrease accumulated net realized loss.
Tax cost of investments includes adjustments to net unrealized appreciation (depreciation) which may not necessarily be final tax cost basis adjustments, but closely approximate the tax basis unrealized gains and losses that may be realized and distributed to shareholders. The tax basis components of distributable earnings and the federal tax cost as of the close of the reporting period were as follows:
| |
| Unrealized appreciation | $2,702,397 |
| Unrealized depreciation | (2,906,222) |
| Net unrealized depreciation | (203,825) |
| Capital loss carryforward | (1.258,297) |
| Cost for federal income tax purposes | $30,949,809 |
For the fiscal year ended December 31, 2017, the fund had undistributed net investment income of $191,561.
Expenses of the TrustExpenses directly charged or attributable to any fund will be paid from the assets of that fund. Generally, expenses of the Trust will
| |
| Putnam VT Multi-Asset Absolute Return Fund39 |
be allocated among and charged to the assets of each fund on a basis that the Trustees deem fair and equitable, which may be based on the relative assets of each fund or the nature of the services performed and relative applicability to each fund.
Beneficial interestAt the close of the reporting period, insurance companies or their separate accounts were record owners of all but a de minimis number of the shares of the fund. Approximately 55.4% of the fund is owned by accounts of one insurance company.
Note 2 — Management fee, administrative services and other transactions
The fund pays Putnam Management a management fee (based on the fund’s average net assets and computed and paid monthly) at annual rates that may vary based on the average of the aggregate net assets of all open-end mutual funds sponsored by Putnam Management (excluding net assets of funds that are invested in, or that are invested in by, other Putnam funds to the extent necessary to avoid “double counting” of those assets). Such annual rates may vary as follows:
| |
| 0.880% | of the first $5 billion, |
| 0.830% | of the next $5 billion, |
| 0.780% | of the next $10 billion, |
| 0.730% | of the next $10 billion, |
| 0.680% | of the next $50 billion, |
| 0.660% | of the next $50 billion, |
| 0.650% | of the next $100 billion and |
| 0.645% | of any excess thereafter. |
For the reporting period, the management fee represented an effective rate (excluding the impact from any expense waivers in effect) of 0.721% of the fund’s average net assets.
Putnam Management has contractually agreed to waive fees (and, to the extent necessary, bear other expenses) of the fund through April 30, 2020, to the extent that total expenses of the fund (excluding brokerage, interest, taxes, investment-related expenses, payments under distribution plans, extraordinary expenses and acquired fund fees and expenses) would exceed an annual rate of 0.90%of thefund’s average net assets. During the reporting period, the fund’s expenses were reduced by $27,866 as a result of this limit.
Putnam Management has also contractually agreed, through April 30, 2020, to waive fees and/or reimburse the fund’s expenses to the extent necessary to limit the cumulative expenses of the fund, exclusive of brokerage, interest, taxes, investment-related expenses, extraordinary expenses, acquired fund fees and expenses and payments under the fund’s investor servicing contract, investment management contract and distribution plans, on a fiscal year-to-date basis to an annual rate of 0.20% of the fund’s average net assets over such fiscal year-to-date period. During the reporting period, the fund’s expenses were reduced by $155,737 as a result of this limit.
Putnam Investments Limited (PIL), an affiliate of Putnam Management, is authorized by the Trustees to manage a separate portion of the assets of the fund as determined by Putnam Management from time to time. PIL did not manage any portion of the assets of the fund during the reporting period. If Putnam Management were to engage the services of PIL, Putnam Management would pay a quarterly sub-management fee to PIL for its services at an annual rate of 0.35% of the average net assets of the portion of the fund managed by PIL.
The Putnam Advisory Company, LLC (PAC), an affiliate of Putnam Management, is authorized by the Trustees to manage a separate portion of the assets of the fund, as designated from time to time by Putnam Management or PIL. PAC did not manage any portion of the assets of the fund during the reporting period. If Putnam Management or PIL were to engage the services of PAC, Putnam Management or PIL, as applicable, would pay a quarterly sub-advisory fee to PAC for its services at the annual rate of 0.35% of the average net assets of the portion of the fund’s assets for which PAC is engaged as sub-adviser.
The fund reimburses Putnam Management an allocated amount for the compensation and related expenses of certain officers of the fund and their staff who provide administrative services to the fund. The aggregate amount of all such reimbursements is determined annually by the Trustees.
Custodial functions for the fund’s assets are provided by State Street. Custody fees are based on the fund’s asset level, the number of its security holdings and transaction volumes.
Putnam Investor Services, Inc., an affiliate of Putnam Management, provides investor servicing agent functions to the fund. Putnam Investor Services, Inc. was paid a monthly fee for investor servicing at an annual rate of 0.07% of the fund’s average daily net assets. During the reporting period, the expenses for each class of shares related to investor servicing fees were as follows:
| |
| Class IA | $12 |
| Class IB | 21,337 |
| Total | $21,349 |
The fund has entered into expense offset arrangements with Putnam Investor Services, Inc. and State Street whereby Putnam Investor Services, Inc.’s and State Street’s fees are reduced by credits allowed on cash balances. The fund also reduced expenses through brokerage/service arrangements. For the reporting period, the fund’s expenses were reduced by $444 under the expense offset arrangements and by $593 under the brokerage/service arrangements.
Each Independent Trustee of the fund receives an annual Trustee fee, of which $21, as a quarterly retainer, has been allocated to the fund, and an additional fee for each Trustees meeting attended. Trustees also are reimbursed for expenses they incur relating to their services as Trustees.
The fund has adopted a Trustee Fee Deferral Plan (the Deferral Plan) which allows the Trustees to defer the receipt of all or a portion of Trustees fees payable on or after July 1, 1995. The deferred fees remain invested in certain Putnam funds until distribution in accordance with the Deferral Plan.
The fund has adopted an unfunded noncontributory defined benefit pension plan (the Pension Plan) covering all Trustees of the fund who have served as a Trustee for at least five years and were first elected prior to 2004. Benefits under the Pension Plan are equal to 50% of the Trustee’s average annual attendance and retainer fees for the three years ended December 31, 2005. The retirement benefit is payable during a Trustee’s lifetime, beginning the year following retirement, for the number of years of service through December 31, 2006. Pension expense for the fund is included in Trustee compensation and expenses in the Statement of operations. Accrued pension liability is included in Payable for Trustee compensation and expenses in the Statement of assets and liabilities. The Trustees have terminated the Pension Plan with respect to any Trustee first elected after 2003.
The fund has adopted a distribution plan (the Plan) with respect to its class IB shares pursuant to Rule 12b–1 under the Investment Company Act of 1940. The purpose of the Plan is to compensate Putnam Retail Management Limited Partnership, an indirect wholly-owned subsidiary of Putnam Investments, LLC, for services provided and expenses incurred in distributing shares of the fund. The Plan provides for payment by the fund to Putnam Retail Management Limited Partnership at an annual rate of up to 0.35% of the average net assets attributable to the fund’s class IB shares. The Trustees have approved payment by the fund at an annual rate of 0.25% of the average net assets attributable to the fund’s class IB shares. The expenses related to distribution fees during the reporting period are included in Distribution fees in the Statement of operations.
Note 3 — Purchases and sales of securities
During the reporting period, the cost of purchases and the proceeds from sales, excluding short-term investments, were as follows:
| | |
| | Cost of | Proceeds |
| | purchases | from sales |
| Investments in securities, including | | |
| TBA commitments (Long-term) | $56,811,090 | $54,867,655 |
| U.S. government securities | | |
| (Long-term) | — | — |
| Total | $56,811,090 | $54,867,655 |
The fund may purchase or sell investments from or to other Putnam funds in the ordinary course of business, which can reduce the fund’s transaction costs, at prices determined in accordance with SEC requirements and policies approved by the Trustees. During the reporting period, purchases or sales of long-term securities from or to other Putnam funds, if any, did not represent more than 5% of the fund’s total cost of purchases and/or total proceeds from sales.
| |
| 40Putnam VT Multi-Asset Absolute Return Fund |
Note 4 — Capital shares
At the close of the reporting period, there were an unlimited number of shares of beneficial interest authorized. Subscriptions and redemptions are presented at the omnibus level. Transactions in capital shares were as follows:
| | | | | | | | |
| | | Class IA shares | | | Class IB shares | |
| | Year ended 12/31/18 | Year ended 12/31/17 | Year ended 12/31/18 | Year ended 12/31/17 |
| | Shares | Amount | Shares | Amount | Shares | Amount | Shares | Amount |
| Shares sold | — | $— | 755 | $8,055 | 349,480 | $3,511,771 | 1,030,038 | $10,629,005 |
| Shares issued in connection with | | | | | | | | |
| reinvestment of distributions | 85 | 862 | — | — | 133,025 | 1,328,925 | — | — |
| | 85 | 862 | 755 | 8,055 | 482,505 | 4,840,696 | 1,030,038 | 10,629,005 |
| Shares repurchased | (654) | (6,593) | (3) | (29) | (689,651) | (6,968,672) | (1,026,459) | (10,653,645) |
| Net increase (decrease) | (569) | $(5,731) | 752 | $8,026 | (207,146) | $(2,127,976) | 3,579 | $(24,640) |
At the close of the reporting period, Putnam Investments, LLC owned the following shares of the fund:
| | | |
| | | Percentage | |
| | Shares owned | of ownership | Value |
| Class IA | 1,134 | 89.50% | $10,898 |
Note 5 — Affiliated transactions
Transactions during the reporting period with any company which is under common ownership or control were as follows:
| | | | | |
| | | | | | Shares outstanding |
| | Fair value as of | | | | and fair value as of |
| Name of affiliate | 12/31/17 | Purchase cost | Sale proceeds | Investment income | 12/31/18 |
| Short-term investments | | | | | |
| Putnam Cash Collateral Pool, LLC* | $708,475 | $26,730,865 | $27,396,740 | $21,267 | $42,600 |
| Putnam Short Term Investment | | | | | |
| Fund** | 5,958,161 | 2,152,829 | 2,000,000 | 137,068 | 6,110,990 |
| Total Short-term investments | $6,666,636 | $28,883,694 | $29,396,740 | $158,335 | $6,153,590 |
*No management fees are charged to Putnam Cash Collateral Pool, LLC (Note 1). Investment income shown is included in securities lending income on the Statement of operations. There were no realized or unrealized gains or losses during the period.
**Management fees charged to Putnam Short Term Investment Fund have been waived by Putnam Management. There were no realized or unrealized gains or losses during the period.
Note 6 — Market, credit and other risks
In the normal course of business, the fund trades financial instruments and enters into financial transactions where risk of potential loss exists due to changes in the market (market risk) or failure of the contracting party to the transaction to perform (credit risk). The fund may be exposed to additional credit risk that an institution or other entity with which the fund has unsettled or open transactions will default. Investments in foreign securities involve certain risks, including those related to economic instability, unfavorable political developments, and currencyfluctuations. The fund may invest in higher-yielding, lower-rated bonds that may have a higher rate of default. The fund may invest a significant portion of its assets in securitized debt instruments, including mortgage-backed and asset-backed investments. The yields and values of these investments are sensitive to changes in interest rates, the rate of principal payments on the underlying assets and the market’s perception of the issuers. The market for these investments may be volatile and limited, which may make them difficult to buy or sell.
Note 7 — Summary of derivative activity
The volume of activity for the reporting period for any derivative type that was held during the period is listed below and was based on an average of the holdings at the end of each fiscal quarter:
| |
| Purchased equity option contracts (contract amount) | $14,000 |
| Purchased currency options (contract amount) | $1,200,000 |
| Purchased swap option contracts (contract amount) | $1,000,000 |
| Written equity option contracts (contract amount) | $150,000 |
| Written currency options (contract amount) | $1,100,000 |
| Written swap option contracts (contract amount) | $1,200,000 |
| Futures contracts (number of contracts) | 100 |
| Forward currency contracts (contract amount) | $17,900,000 |
| OTC interest rate swap contracts (notional) | $—* |
| Centrally cleared interest rate swap contracts (notional) | $28,000,000 |
| OTC total return swap contracts (notional) | $90,500,000 |
| Centrally cleared total return swap contracts (notional) | $—* |
| OTC credit default contracts (notional) | $3,000,000 |
| Centrally cleared credit default contracts (notional) | $4,000,000 |
| Warrants (number of warrants) | 22,000 |
*For the reporting period there were no holdings at the end of each fiscal quarter and the transactions were considered minimal.
| |
| Putnam VT Multi-Asset Absolute Return Fund41 |
The following is a summary of the fair value of derivative instruments as of the close of the reporting period:
Fair value of derivative instruments as of the close of the reporting period
| | | | |
| | Asset derivatives | Liability derivatives |
| Derivatives not accounted for as hedging | Statement of assets and | | Statement of assets and | |
| instruments under ASC 815 | liabilities location | Fair value | liabilities location | Fair value |
| | Receivables, Net assets — | | Payables, Net assets — | |
| Credit contracts | Unrealized appreciation | $185,509* | Unrealized depreciation | $480,497* |
| Foreign exchange contracts | Investments, Receivables | 62,035 | Payables | 119,946 |
| | Investments, Receivables, | | | |
| | Net assets — Unrealized | | Payables, Net assets — | |
| Equity contracts | appreciation | 2,169,809* | Unrealized depreciation | 1,608,409* |
| | Investments, Receivables, | | | |
| | Net assets — Unrealized | | Payables, Net assets — | |
| Interest rate contracts | appreciation | 460,848* | Unrealized depreciation | 89,127* |
| Total | | $2,878,201 | | $2,297,979 |
*Includes cumulative appreciation/depreciation of futures contracts and/or centrally cleared swaps as reported in the fund’s portfolio. Only current day’s variation margin is reported within the Statement of assets and liabilities.
The following is a summary of realized and change in unrealized gains or losses of derivative instruments in the Statement of operations for the reporting period (Note 1):
| | | | | | |
| Amount of realized gain or (loss) on derivatives recognized in net gain or (loss) on investments | | | |
| | | | | Forward | | |
| Derivatives not accounted for as hedging | | | | currency | | |
| instruments under ASC 815 | Warrants | Options | Futures | contracts | Swaps | Total |
| Credit contracts | $— | $— | $— | $— | $3,701 | $3,701 |
| Foreign exchange contracts | — | (16,642) | — | (138,964) | — | (155,606) |
| Equity contracts | (1,428) | (131,262) | (445,952) | — | (807,690) | (1,386,332) |
| Interest rate contracts | — | 34,448 | (87,351) | — | (132,475) | (185,378) |
| Total | $(1,428) | $(113,456) | $(533,303) | $(138,964) | $(936,464) | $(1,723,615) |
| | | | | | |
| Change in unrealized appreciation or (depreciation) on derivatives recognized in net gain or (loss) on investments | | |
| | | | | Forward | | |
| Derivatives not accounted for as hedging | | | | currency | | |
| instruments under ASC 815 | Warrants | Options | Futures | contracts | Swaps | Total |
| Credit contracts | $— | $— | $— | $— | $(69,712) | $(69,712) |
| Foreign exchange contracts | — | 457 | — | (15,963) | — | (15,506) |
| Equity contracts | (16,170) | 123,865 | (137,697) | — | 393,490 | 363,488 |
| Interest rate contracts | — | (37,651) | 400,692 | — | (149) | 362,892 |
| Total | $(16,170) | $86,671 | $262,995 | $(15,963) | $323,629 | $641,162 |
| |
| 42Putnam VT Multi-Asset Absolute Return Fund |
|
| This page intentionally left blank. |
| |
| Putnam VT Multi-Asset Absolute Return Fund43 |
Note 8 — Offsetting of financial and derivative assets and liabilities
The following table summarizes any derivatives, repurchase agreements and reverse repurchase agreements, at the end of the reporting period, that are subject to an enforceable master netting agreement or similar agreement. For securities lending transactions or borrowing transactions associated with securities sold short, if any, see Note 1. For financial reporting purposes, the fund does not offset financial assets and financial liabilities that are subject to the master netting agreements in the Statement of assets and liabilities.
| | | | | | | | | | | | | | | | | | |
| | Bank of
America N.A. | Barclays
Bank PLC | Barclays
Capital, Inc. (clearing
broker) | Citibank,
N.A. | Citigroup
Global
Markets,
Inc. | Credit
Suisse International | Goldman
Sachs International | HSBC Bank
USA,
National Association | JPMorgan
Chase
Bank N.A. | JPMorgan Securities
LLC | Merrill
Lynch International | Merrill
Lynch,
Pierce,
Fenner
& Smith,
Inc. | Morgan
Stanley &
Co.
International PLC | NatWest
Markets
PLC | State
Street
Bank
and
Trust Co. | UBS AG | WestPac Banking
Corp. | Total |
| Assets: | | | | | | | | | | | | | | | | | | |
| Centrally cleared interest rate | | | | | | | | | | | | | | | | | | |
| swap contracts§ | $— | $— | $44,905 | $— | $— | $— | $— | $— | $— | $— | $— | $— | $— | $— | $— | $— | $— | $44,905 |
| OTC Total return | | | | | | | | | | | | | | | | | | |
| swap contracts*# | 599,398 | 95,903 | — | 412,403 | — | 471 | 292,125 | — | 376,718 | 820 | — | — | — | — | — | — | — | 1,777,838 |
| OTC Credit default contracts — | | | | | | | | | | | | | | | | | | |
| protection sold*# | — | — | — | — | — | — | — | — | — | — | — | — | — | — | — | — | — | — |
| OTC Credit default contracts — | | | | | | | | | | | | | | | | | | |
| protection purchased*# | — | — | — | — | 3,215 | 26,519 | 37,366 | — | — | 24,137 | 1,141 | — | 3,212 | — | — | — | — | 95,590 |
| Centrally cleared credit | | | | | | | | | | | | | | | | | | |
| default contracts§ | — | — | 2,021 | — | — | — | — | — | — | — | — | — | — | — | — | — | — | 2,021 |
| Futures contracts§ | — | — | — | — | — | — | — | — | — | — | — | 68,298 | — | — | — | — | — | 68,298 |
| Forward currency contracts# | 1,767 | 69 | — | 664 | — | — | 11,626 | 4,188 | 3,437 | — | — | — | — | 1,730 | 9,139 | 5,046 | 2,262 | 39,928 |
| Forward premium swap | | | | | | | | | | | | | | | | | | |
| option contracts# | 14 | — | — | 12 | — | — | — | — | — | — | — | — | — | — | — | — | — | 26 |
| Purchased options**# | 78,629 | — | — | 85,343 | — | — | 3,434 | — | 74,623 | — | — | — | — | — | — | — | — | 242,029 |
| Repurchase agreements** | — | — | — | — | — | — | — | — | — | — | — | 6,660,000 | — | — | — | — | — | 6,660,000 |
| Total Assets | $679,808 | $95,972 | $46,926 | $498,422 | $3,215 | $26,990 | $344,551 | $4,188 | $454,778 | $24,957 | $1,141 | $6,728,298 | $3,212 | $1,730 | $9,139 | $5,046 | $2,262 | $8,930,635 |
| Liabilities: | | | | | | | | | | | | | | | | | | |
| Centrally cleared interest rate | | | | | | | | | | | | | | | | | | |
| swap contracts§ | — | — | 45,045 | — | — | — | — | — | — | — | — | — | — | — | — | — | — | 45,045 |
| OTC Total return | | | | | | | | | | | | | | | | | | |
| swap contracts*# | 548,278 | 45 | — | 532,070 | — | 1,253 | 334,880 | — | 50 | — | — | — | — | — | — | 13,462 | — | 1,430,038 |
| OTC Credit default contracts — | | | | | | | | | | | | | | | | | | |
| protection sold*# | 1,768 | 3,399 | — | — | 61,394 | 149,839 | 50,989 | — | — | 122,323 | 30,697 | — | 8,357 | — | — | — | — | 428,766 |
| OTC Credit default contracts — | | | | | | | | | | | | | | | | | | |
| protection purchased*# | — | — | — | — | — | — | — | — | — | — | — | — | — | — | — | — | — | — |
| Centrally cleared credit | | | | | | | | | | | | | | | | | | |
| default contracts§ | — | — | — | — | — | — | — | — | — | — | — | — | — | — | — | — | — | — |
| Futures contracts§ | — | — | — | — | — | — | — | — | — | — | — | 196 | — | — | — | — | — | 196 |
| Forward currency contracts# | 10,406 | 7,813 | — | 8,803 | — | 16,306 | 31,024 | 9,838 | 8,619 | — | — | — | — | 4,048 | 10,116 | 3,282 | 2,245 | 112,500 |
| Forward premium swap | | | | | | | | | | | | | | | | | | |
| option contracts# | 399 | — | — | 133 | — | — | 41 | — | 678 | — | — | — | — | — | — | — | — | 1,251 |
| Written swap options# | — | 48 | — | 167 | — | — | — | — | 29 | — | — | — | — | — | — | — | — | 244 |
| Written options# | 3,331 | — | — | 5,806 | — | — | 1,218 | — | 1,306 | — | — | — | — | — | — | — | — | 11,661 |
| Total Liabilities | $564,182 | $11,305 | $45,045 | $546,979 | $61,394 | $167,398 | $418,152 | $9,838 | $10,682 | $122,323 | $30,697 | $196 | $8,357 | $4,048 | $10,116 | $16,744 | $2,245 | $2,029,701 |
| Total Financial and Derivative | | | | | | | | | | | | | | | | | | |
| Net Assets | $115,626 | $84,667 | $1,881 | $(48,557) | $(58,179) | $(140,408) | $(73,601) | $(5,650) | $444,096 | $(97,366) | $(29,556) | $6,728,102 | $(5,145) | $(2,318) | $(977) | $(11,698) | $17 | $6,900,934 |
| Total collateral | | | | | | | | | | | | | | | | | | |
| received (pledged)†## | $115,626 | $84,667 | $— | $(48,557) | $— | $(111,797) | $(73,601) | $— | $444,096 | $— | $— | $6,728,102 | $— | $— | $— | $— | $— | |
| Net amount | $— | $— | $1,881 | $— | $(58,179) | $(28,611) | $— | $(5,650) | $— | $(97,366) | $(29,556) | $— | $(5,145) | $(2,318) | $(977) | $(11,698) | $17 | |
| Controlled collateral received | | | | | | | | | | | | | | | | | | |
| (including TBA commitments)** | $153,598 | $120,000 | $— | $— | $— | $— | $— | $— | $480,000 | $— | $— | $— | $— | $— | $— | $— | $— | $753,598 |
| Uncontrolled collateral received | $— | $— | $— | $— | $— | $— | $— | $— | $— | $— | $— | $6,793,200 | $— | $— | $— | $— | $— | $6,793,200 |
| Collateral (pledged) (including | | | | | | | | | | | | | | | | | | |
| TBA commitments)** | $— | $— | $— | $(71,690) | $— | $(111,797) | $(214,563) | $— | $— | $— | $— | $— | $— | $— | $— | $— | $— | $(398,050) |
* Excludes premiums, if any. Included in unrealized appreciation and depreciation on OTC swap contracts on the Statement of assets and liabilities.
** Included with Investments in securities on the Statement of assets and liabilities.
† Additional collateral may be required from certain brokers based on individual agreements.
#Covered by master netting agreement (Note 1).
##Any over-collateralization of total financial and derivative net assets is not shown. Collateral may include amounts related to unsettled agreements.
§Includes current day’s variation margin only as reported on the Statement of assets and liabilities, which is not collateralized. Cumulative appreciation/(depreciation) for futures contracts and centrally cleared swap contracts is represented in the tables listed after the fund’s portfolio. Collateral pledged for initial margin on futures contracts and centrally cleared swap contracts, which is not included in the table above, amounted to $290,344 and $230,991, respectively.
| | |
| 44 Putnam VT Multi-Asset Absolute Return Fund | Putnam VT Multi-Asset Absolute Return Fund45 |
Note 9 — New accounting pronouncements
In March 2017, the Financial Accounting Standards Board issued Accounting Standards Update (ASU) No. 2017–08,Receivables — Nonrefundable Fees and Other Costs(Subtopic 310–20):Premium Amortization on Purchased Callable Debt Securities.The amendments in the ASU shorten the amortization period forcertain callable debt securities held at a premium, to be amortized to the earliest call date. The ASU is effective for fiscal years and interim periods within those fiscal years beginning after December 15, 2018. Management is currently evaluating the impact, if any, of applying this provision.
Federal tax information(Unaudited)
For the reporting period, a portion of the fund’s distribution represents a return of capital and is therefore not taxable to shareholders.
| |
| 46Putnam VT Multi-Asset Absolute Return Fund |
| |
| Putnam VT Multi-Asset Absolute Return Fund47 |
*Mr. Reynolds is an “interested person” (as defined in the Investment Company Act of 1940) of the fund and Putnam Investments. He is President and Chief Executive Officer of Putnam Investments, as well as the President of your fund and each of the other Putnam funds.
The address of each Trustee is 100 Federal Street, Boston, MA 02110.
As of December 31, 2018, there were 99 Putnam funds. All Trustees serve as Trustees of all Putnam funds.
Each Trustee serves for an indefinite term, until his or her resignation, retirement at age 75, removal, or death.
Officers
In addition to Robert L. Reynolds, the other officers of the fund are shown below:
| | |
| Jonathan S. Horwitz(Born 1955) | Michael J. Higgins(Born 1976) | Mark C. Trenchard(Born 1962) |
| Executive Vice President, Principal Executive | Vice President, Treasurer, and Clerk | Vice President and BSA Compliance Officer |
| Officer, and Compliance Liaison | Since 2010 | Since 2002 |
| Since 2004 | | Director of Operational Compliance, |
| | Janet C. Smith(Born 1965) | Putnam Investments and Putnam |
| Robert T. Burns(Born 1961) | Vice President, Principal Financial Officer, | Retail Management |
| Vice President and Chief Legal Officer | Principal Accounting Officer, and Assistant | |
| Since 2011 | Treasurer | Nancy E. Florek(Born 1957) |
| General Counsel, Putnam Investments, Putnam | Since 2007 | Vice President, Director of Proxy Voting and |
| Management, and Putnam Retail Management | Head of Fund Administration Services, | Corporate Governance, Assistant Clerk, and |
| | Putnam Investments and Putnam Management | Assistant Treasurer |
| James F. Clark(Born 1974) | | Since 2000 |
| Vice President and Chief Compliance Officer | Susan G. Malloy(Born 1957) | |
| Since 2016 | Vice President and Assistant Treasurer | Denere P. Poulack(Born 1968) |
| Chief Compliance Officer, Putnam Investments | Since 2007 | Assistant Vice President, Assistant Clerk, |
| and Putnam Management | Head of Accounting, Middle Office, & Control | and Assistant Treasurer |
| | Services, Putnam Investments and | Since 2004 |
| | Putnam Management | |
The principal occupations of the officers for the past five years have been with the employers as shown above, although in some cases they have held different positions with such employers. The address of each officer is 100 Federal Street, Boston, MA 02110.
| |
| 48Putnam VT Multi-Asset Absolute Return Fund |
Other important information
Proxy voting
Putnam is committed to managing our mutual funds in the best interests of our shareholders. The Putnam funds’ proxy voting guidelines and procedures, as well as information regarding how your fund voted proxies relating to portfolio securities during the 12-month period ended June 30, 2018, are available in the Individual Investors section of putnam.com and on the Securities and Exchange Commission’s (SEC) website, www.sec.gov. If you have questions about finding forms on the SEC’s website, you may call the SEC at 1-800-SEC-0330. You may also obtain the Putnam funds’ proxy voting guidelines and procedures at no charge by calling Putnam’s Shareholder Services at 1-800-225-1581.
Fund portfolio holdings
Each Putnam VT fund will file a complete schedule of its portfolio holdings with the SEC for the first and third quarters of each fiscal year on Form N-Q.Shareholders may obtain the fund’s Form N-Q on the SEC’s website at www.sec.gov.
Fund information
| | |
| Investment Manager | Investor Servicing Agent | Trustees |
| Putnam Investment Management, LLC | Putnam Investments | Kenneth R. Leibler, Chair |
| 100 Federal Street | Mailing address: | Liaquat Ahamed |
| Boston, MA 02110 | P.O. Box 219697 | Ravi Akhoury |
| | Kansas City, MO 64121-9697 | Barbara M. Baumann |
| Investment Sub-Advisors | 1-800-225-1581 | Katinka Domotorffy |
| Putnam Investments Limited | | Catharine Bond Hill |
| 16 St James’s Street | Custodian | Paul L. Joskow |
| London, England SW1A 1ER | State Street Bank and Trust Company | Robert E. Patterson |
| | | George Putnam, III |
| The Putnam Advisory Company, LLC | Legal Counsel | Robert L. Reynolds |
| 100 Federal Street | Ropes & Gray LLP | Manoj P. Singh |
| Boston, MA 02110 | | |
| | Independent Registered | |
| Marketing Services | Public Accounting Firm | |
| Putnam Retail Management | PricewaterhouseCoopers LLP | |
| 100 Federal Street | | |
| Boston, MA 02110 | | |
The fund’s Statement of Additional Information contains additional information about the fund’s Trustees and is available without charge upon request by calling 1-800-225-1581.
| |
| Putnam VT Multi-Asset Absolute Return Fund49 |
| |
| This report has been prepared for the shareholders | |
| of Putnam VT Multi-Asset Absolute Return Fund. | VTAN110 315007 2/19 |
| |
| (a) The fund’s principal executive, financial and accounting officers are employees of Putnam Investment Management, LLC, the Fund’s investment manager. As such they are subject to a comprehensive Code of Ethics adopted and administered by Putnam Investments which is designed to protect the interests of the firm and its clients. The Fund has adopted a Code of Ethics which incorporates the Code of Ethics of Putnam Investments with respect to all of its officers and Trustees who are employees of Putnam Investment Management, LLC. For this reason, the Fund has not adopted a separate code of ethics governing its principal executive, financial and accounting officers. |
| |
| (c) In February 2018, the Code of Ethics of Putnam Investments was amended. The key changes to the Code of Ethics are as follows: (i) Prohibition of investing in public coin offerings or token offerings, (ii) Removal of monetary fines as available sanctions for violations of the Code of Ethics, and (iii) Expanded definition of “Immediate Family Member”. |
| |
| Item 3. Audit Committee Financial Expert: |
| |
| The Funds’ Audit, Compliance and Distributions Committee is comprised solely of Trustees who are “independent” (as such term has been defined by the Securities and Exchange Commission (“SEC”) in regulations implementing Section 407 of the Sarbanes-Oxley Act (the “Regulations”)). The Trustees believe that each of the members of the Audit, Compliance and Distributions Committee also possess a combination of knowledge and experience with respect to financial accounting matters, as well as other attributes, that qualify them for service on the Committee. In addition, the Trustees have determined that each of Mr. Patterson, Ms. Baumann and Mr. Singh qualifies as an “audit committee financial expert” (as such term has been defined by the Regulations) based on their review of his or her pertinent experience and education. The SEC has stated, and the funds’ amended and restated agreement and Declaration of Trust provides, that the designation or identification of a person as an audit committee financial expert pursuant to this Item 3 of Form N-CSR does not impose on such person any duties, obligations or liability that are greater than the duties, obligations and liability imposed on such person as a member of the Audit, Compliance and Distribution Committee and the Board of Trustees in the absence of such designation or identification. |
| |
| Item 4. Principal Accountant Fees and Services: |
| |
| The following table presents fees billed in each of the last two fiscal years for services rendered to the fund by the fund’s independent auditor: |
| | | | | |
| Fiscal year ended | Audit Fees | Audit-Related Fees | Tax Fees | All Other Fees |
|
|
| | | | | |
| December 31, 2018 | $73,326 | $81* | $18,445 | $ — |
| December 31, 2017 | $73,186 | $ — | $11,176 | $45 |
| * | Fees billed to the fund for services relating to a review of certain trading activity that was the subject of a settlement between Putnam Investment Management, LLC and the Securities and Exchange Commission. |
| |
| For the fiscal years ended December 31, 2018 and December 31, 2017, the fund’s independent auditor billed aggregate non-audit fees in the amounts of $635,009 and $393,752 respectively, to the fund, Putnam Management and any entity controlling, controlled by or under common control with Putnam Management that provides ongoing services to the fund. |
| |
| Audit Fees represent fees billed for the fund’s last two fiscal years relating to the audit and review of the financial statements included in annual reports and registration statements, and other services that are normally provided in connection with statutory and regulatory filings or engagements. |
| |
| Audit-Related Fees represent fees billed in the fund’s last two fiscal years for services traditionally performed by the fund’s auditor, including accounting consultation for proposed transactions or concerning financial accounting and reporting standards and other audit or attest services not required by statute or regulation. |
| |
| Tax Fees represent fees billed in the fund’s last two fiscal years for tax compliance, tax planning and tax advice services. Tax planning and tax advice services include assistance with tax audits, employee benefit plans and requests for rulings or technical advice from taxing authorities. |
| |
| All Other Fees represent fees billed for services relating to an analysis of fund profitability |
| |
| Pre-Approval Policies of the Audit, Compliance and Distributions Committee. The Audit, Compliance and Distributions Committee of the Putnam funds has determined that, as a matter of policy, all work performed for the funds by the funds’ independent auditors will be pre-approved by the Committee itself and thus will generally not be subject to pre-approval procedures. |
| |
| The Audit, Compliance and Distributions Committee also has adopted a policy to pre-approve the engagement by Putnam Management and certain of its affiliates of the funds’ independent auditors, even in circumstances where pre-approval is not required by applicable law. Any such requests by Putnam Management or certain of its affiliates are typically submitted in writing to the Committee and explain, among other things, the nature of the proposed engagement, the estimated fees, and why this work should be performed by that particular audit firm as opposed to another one. In reviewing such requests, the Committee considers, among other things, whether the provision of such services by the audit firm are compatible with the independence of the audit firm. |
| |
| The following table presents fees billed by the fund’s independent auditor for services required to be approved pursuant to paragraph (c)(7)(ii) of Rule 2-01 of Regulation S-X. |
| | | | | |
| Fiscal year ended | Audit-Related Fees | Tax Fees | All Other Fees | Total Non-Audit Fees |
|
|
| | | | | |
| December 31, 2018 | $ — | $616,482 | $ — | $ — |
| | | | | |
| December 31, 2017 | $ — | $382,530 | $ — | $ — |
| |
| Item 5. Audit Committee of Listed Registrants |
| |
|
Item 6. Schedule of Investments: |
| |
| The registrant’s schedule of investments in unaffiliated issuers is included in the report to shareholders in Item 1 above. |
| |
| Item 7. Disclosure of Proxy Voting Policies and Procedures For Closed-End Management Investment Companies: |
| |
|
Item 8. Portfolio Managers of Closed-End Investment Companies |
| |
|
Item 9. Purchases of Equity Securities by Closed-End Management Investment Companies and Affiliated Purchasers: |
| |
|
Item 10. Submission of Matters to a Vote of Security Holders: |
| |
|
Item 11. Controls and Procedures: |
| |
| (a) The registrant’s principal executive officer and principal financial officer have concluded, based on their evaluation of the effectiveness of the design and operation of the registrant’s disclosure controls and procedures as of a date within 90 days of the filing date of this report, that the design and operation of such procedures are generally effective to provide reasonable assurance that information required to be disclosed by the registrant in this report is recorded, processed, summarized and reported within the time periods specified in the Commission’s rules and forms. |
| |
| (b) Changes in internal control over financial reporting: Not applicable |
| |
| (a)(1) The Code of Ethics of The Putnam Funds, which incorporates the Code of Ethics of Putnam Investments, is filed herewith. |
| |
| (a)(2) Separate certifications for the principal executive officer and principal financial officer of the registrant as required by Rule 30a-2(a) under the Investment Company Act of 1940, as amended, are filed herewith. |
| |
| (b) The certifications required by Rule 30a-2(b) under the Investment Company Act of 1940, as amended, are filed herewith. |
| |
| Pursuant to the requirements of the Securities Exchange Act of 1934 and the Investment Company Act of 1940, the registrant has duly caused this report to be signed on its behalf by the undersigned, thereunto duly authorized. |
| |
| By (Signature and Title): |
| |
| /s/ Janet C. Smith
Janet C. Smith
Principal Accounting Officer
|
| |
| Pursuant to the requirements of the Securities Exchange Act of 1934 and the Investment Company Act of 1940, this report has been signed below by the following persons on behalf of the registrant and in the capacities and on the dates indicated. |
| |
| By (Signature and Title): |
| |
| /s/ Jonathan S. Horwitz
Jonathan S. Horwitz
Principal Executive Officer
|
| |
| By (Signature and Title): |
| |
| /s/ Janet C. Smith
Janet C. Smith
Principal Financial Officer
|