| | |
| UNITED STATES
SECURITIES AND EXCHANGE COMMISSION |
| | |
| CERTIFIED SHAREHOLDER REPORT OF REGISTERED
MANAGEMENT INVESTMENT COMPANIES
|
| | |
| Investment Company Act file number: | (811–05346) |
| | |
| Exact name of registrant as specified in charter: | Putnam Variable Trust |
| | |
| Address of principal executive offices: | 100 Federal Street, Boston, Massachusetts 02110 |
| | |
| Name and address of agent for service: | Robert T. Burns, Vice President
100 Federal Street
Boston, Massachusetts 02110 |
| | |
| Copy to: | Bryan Chegwidden, Esq.
Ropes & Gray LLP
1211 Avenue of the Americas
New York, New York 10036 |
| | |
| Registrant's telephone number, including area code: | (617) 292–1000 |
| | |
| Date of fiscal year end: | December 31, 2019 |
| | |
| Date of reporting period: | January 1, 2019 — December 31, 2019 |
| | |
|
Item 1. Report to Stockholders: | |
| | |
| The following is a copy of the report transmitted to stockholders pursuant to Rule 30e-1 under the Investment Company Act of 1940: | |

IMPORTANT NOTICE: Delivery of paper fund reports
In accordance with regulations adopted by the Securities and Exchange Commission, beginning on or after January 1, 2021, at the election of your insurance provider, you may not receive paper reports like this one in the mail from the insurance provider that offers your variable annuity contract or variable life insurance policy unless you specifically request it. Instead, they will be available on a website, and your insurance provider will notify you by mail whenever a new one is available, and provide you with a website link to access the report.
If you wish to continue to receive paper reports free of charge after January 1, 2021, please contact your insurance provider.
If you already receive these reports electronically, no action is required.
Message from the Trustees
February 12, 2020
Dear Shareholder:
Global financial markets overcame a number of uncertainties in 2019. Both stock and bond markets experienced bouts of volatility, but performance recovered despite macroeconomic headwinds and risks. Stock markets worldwide delivered solid returns for the calendar year, with all three major U.S. equity indexes reaching record highs in December. The year was also beneficial for bond investors, as global fixed-income markets posted strong returns, thanks in part to policy easing from central banks.
Although no one can predict the direction of the markets in the months ahead, Putnam’s experienced investment professionals actively seek to position their fund portfolios for all types of conditions. They take a research-intensive approach to investing that includes risk management strategies designed to serve investors through changing markets. In all environments, we believe investors should remain focused on time-tested approaches, such as maintaining a well-diversified portfolio, thinking about long-term goals, and speaking regularly with a financial advisor.
Thank you for investing with Putnam.

Performance summary(as of 12/31/19)
Investment objective
As high a level of current income as Putnam Investment Management, LLC, (Putnam Management) believes is consistent with preservation of capital
| |
| Net asset valueDecember 31, 2019 |
| | |
| Class IA: $10.18 | Class IB: $10.16 |
| | | | |
| Total return at net asset value | | |
| | | | | Bloomberg |
| | | | | Barclays |
| | | | | Government |
| | | | | Bond- |
| | | | | Bloomberg |
| | | | Bloomberg | Barclays U.S. |
| (as of | Class IA | Class IB | Barclays U.S. | MBS Linked |
| 12/31/19) | shares* | shares* | MBS Index | Benchmark† |
| 1 year | 13.36% | 13.20% | 6.35% | 6.35% |
| 5 years | 15.24 | 13.86 | 13.59 | 11.62 |
| Annualized | 2.88 | 2.63 | 2.58 | 2.22 |
| 10 years | 38.51 | 35.20 | 36.42 | 33.87 |
| Annualized | 3.31 | 3.06 | 3.15 | 2.96 |
| Life | 164.16 | 151.91 | 157.26 | 143.20 |
| Annualized | 5.00 | 4.75 | 4.86 | 4.56 |
For a portion of the periods, the fund had expense limitations, without which returns would have been lower.
* Class inception date: February 1, 2000.
† The Bloomberg Barclays Government Bond-Bloomberg Barclays U.S. MBS Linked Benchmark represents performance of the Bloomberg Barclays Government Bond Index from inception date of the fund, February 1, 2000, through April 29, 2018, and performance of the Bloomberg Barclays U.S. MBS Index from April 30, 2018 through the current period.
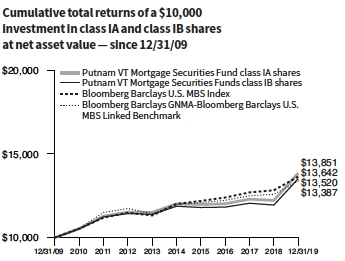
The Bloomberg Barclays U.S. MBS Index is an unmanaged index of agency mortgage-backed pass-through securities (both fixed rate and hybrid ARM) guaranteed by Ginnie Mae (GNMA), Fannie Mae (FNMA), and Freddie Mac (FHLMC).
The Bloomberg Barclays Government Bond Index is an unmanaged index of U.S.Treasury and agency securities.
Data represent past performance. Past performance does not guarantee future results. More recent returns may be less or more than those shown. Investment return and principal value will fluctuate, and you may have a gainor a loss when you sell your shares. Performance information does not reflect any deduction for taxes a shareholder may owe on fund distributions or on the redemption of fund shares. All total return figures are at net asset value and exclude contract charges and expenses, which are added to the variable annuity contracts to determine total return at unit value. Had these charges and expenses been reflected, performance would have been lower. For more recent performance, contact your variable annuity provider who can provide you with performance that reflects the charges and expenses at your contract level.
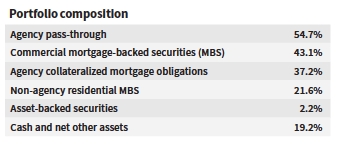
Allocations are shown as a percentage of the fund’s net assets. Cash and net other assets, if any, represent the market value weights of cash, derivatives, short-term securities, and other unclassified assets in the portfolio. Summary information may differ from the portfolio schedule included in the financial statements due to the inclusion of derivative securities, any interest accruals, the use of different classifications of securities for presentation purposes, and rounding. Allocations may not total 100% because the table includes the notional value of certain derivatives (the economic value for purposes of calculating periodic payment obligations), in addition to the market value of securities. Holdings and allocations may vary over time.
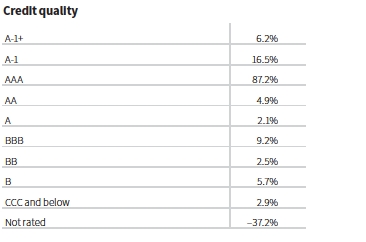
Credit qualities are shown as a percentage of net assets. A bond rated BBB or higher (A-3 or higher, for short-term debt) is considered investment grade. This chart reflects the highest security rating provided by one or more of Standard & Poor’s, Moody’s, and Fitch. To-be-announced (TBA) mortgage commitments, if any, are included based on their issuer ratings. Ratings may vary over time.
Cash, derivative instruments, and net other assets are shown in the not-rated category. Payables and receivables for TBA mortgage commitments are included in the not-rated category and may result in negative weights. The fund itself has not been rated by an independent rating agency.
| |
| Putnam VT Mortgage Securities Fund1 |
Report from your fund’s managers
How was the investment environment for the 12-month reporting period ended December 31, 2019?
U.S. mortgage credit securities performed well, supported by an increasingly dovish Federal Reserve [Fed]. However, the market trajectory was not smooth. Trade talks between the United States and China contributed to bouts of heightened volatility, as investors digested news of progress and setbacks in negotiations. Signs of a slowing global economy also weighed on risk assets.
To support economic growth, the Fed reduced rates in July, September, and October. At its December 2019 policy meeting, Chair Jerome Powell noted that “our outlook remains a favorable one, despite global developments and ongoing risks.” Powell added that the Fed expects to leave rates unchanged in 2020 as long as market conditions remained broadly consistent with the central bank’s outlook. Against this backdrop, the yield on the benchmark 10-year U.S. Treasury bond declined from 2.69% to 1.92% during the 12-month reporting period, contributing to rising bond prices.
How did Putnam VT Mortgage Securities Fund perform in this environment?
For the 12-month period, the fund’s IA shares returned 13.36%, outperforming the benchmark Bloomberg Barclays U.S. MBS Index, which returned 6.35%.
Which strategies and holdings helped fund performance?
Within commercial-backed mortgage-backed securities [CMBS], the fund’s exposure to the CMBX BBB-rated Series 6 [2012 issuance] was a significant contributor for the year. CMBX is an index that references a basket of CMBS issued in a particular year. Spreads tightened meaningfully throughout the year as the market became more confident that bleak retail and shopping mall scenarios might not materialize as soon as previously anticipated. [Yield spreads are the yield advantage credit-sensitive bonds offer over comparable-maturity U.S. Treasuries.]
Exposure to agency credit risk transfer securities was also beneficial. The sector benefited from risk-on sentiment, positive housing fundamentals, and ratings upgrades. Within prepayment risk, our allocation to inverse interest-only securities was positive, as these securities have coupons that move inversely with the direction of interest rates. This proved beneficial in the falling-rate environment. Finally, our relatively long-duration position versus the benchmark for much of 2019 was a contributor, as interest rates fell meaningfully across the curve.
Which strategies detracted from relative performance?
A slightly short position in the mortgage basis detracted, particularly during the months of May and December, when mortgage spreads tightened. Mortgage basis is a strategy that seeks to exploit the yield differential between current-coupon, 30-year agency pass-throughs, and 30-year U.S. Treasuries.
How did you use derivatives during the period?
We utilized credit default swaps in an effort to hedge credit and market risks, and gain exposure to specific sectors.
What is your market outlook for 2020?
The minutes of the Fed’s December 2019 meeting confirmed that the Fed is determinedly on hold, with a high bar to move rates in either direction. There was some concern that the Fed might have done a bit too much easing in 2019. The markets are pricing in one cut later in 2020, which we believe is reasonable given the balance of risks. While the labor market is healthy — consumption spending was solid during the holiday season and the service sector is buoyant — we believe corporate investment is likely to remain weak.
The views expressed in this report are exclusively those of Putnam Management and are subject to change. They are not meant as investment advice. Please note that the holdings discussed in this report may not have been held by the fund for the entire period. Portfolio composition is subject to review in accordance with the fund’s investment strategy and may vary in the future.
Consider these risks before investing:Funds that invest in government securities are not guaranteed. Mortgage- and asset-backed securities are subject to prepayment risk, which means that they may increase in value less than other bonds when interest rates decline and decline in value more than other bonds when interest rates rise. The fund may have to invest the proceeds from prepaid investments, including mortgage- and asset-backed investments, in other investments with less attractive terms and yields. The fund’s investments in mortgage-backed securities and asset-backed securities, and in certain other securities and derivatives, may be or become illiquid. The fund’s exposure to privately issued mortgage-backed securities and mortgage-backed securities issued or guaranteed by the U.S. government or its agencies or instrumentalities may make the fund’s net asset value more susceptible to economic, market, political and other developments affecting the housing or real estate markets. Bond investments are subject to interest-rate risk (the risk of bond prices falling if interest rates rise) and credit risk (the risk of an issuer defaulting on interest or principal payments). Interest-rate risk is generally greater for longer-term bonds, and credit risk is generally greater for below-investment-grade bonds. Default risk is generally higher for non-qualified mortgages. Risks associated with derivatives include increased investment exposure (which may be considered leverage) and, in the case of over-the-counter instruments, the potential inability to terminate or sell derivatives positions and the potential failure of the other party to the instrument to meet its obligations. Unlike bonds, funds that invest in bonds have fees and expenses. The value of investments in the fund’s portfolio may fall or fail to rise over extended periods of time for a variety of reasons, including general economic, political, or financial market conditions; investor sentiment and market perceptions; government actions; geopolitical events or changes; and factors related to a specific issuer, geography (such as a region of the United States), industry, or sector, such as the housing or real estate markets. These and other factors may lead to increased volatility and reduced liquidity in the fund’s portfolio holdings or in relevant markets. You can lose money by investing in the fund.
| |
| 2Putnam VT Mortgage Securities Fund |

Your fund’s managers also manage other accounts advised by Putnam Management or an affiliate, including retail mutual fund counterparts to the funds in Putnam Variable Trust.
ABOUT DERIVATIVES
Derivatives are an increasingly common type of investment instrument, the performance of which isderivedfrom an underlying security, index, currency, or other area of the capital markets. Derivatives employed by the fund’s managers generally serve one of two main purposes: to implement a strategy that may be difficult or more expensive to invest in through traditional securities, or to hedge unwanted risk associated with a particular position.
For example, the fund’s managers might use currency forward contracts to capitalize on an anticipated change in exchange rates between two currencies. This approach would require a significantly smaller outlay of capital than purchasing traditional bonds denominated in the underlying currencies. In another example, the managers may identify a bond that they believe is undervalued relative to its risk of default but may seek to reduce the interest-rate risk of that bond by using interest-rate swaps, a derivative through which two parties “swap” payments based on the movement of certain rates. In other examples, the managers may use options and futures contracts to hedge against a variety of risks by establishing a combination of long and short exposures to specific equity markets or sectors.
Like any other investment, derivatives may not appreciate in value and may lose money. Derivatives may amplify traditional investment risks through the creation of leverage and may be less liquid than traditional securities. And because derivatives typically represent contractual agreements between two financial institutions, derivatives entail “counterparty risk,” which is the risk that the other party is unable or unwilling to pay. Putnam monitors the counterparty risks we assume. For example, Putnam often enters into collateral agreements that require the counterparties to post collateral on a regular basis to cover their obligations to the fund. Counterparty risk for exchange-traded futures and centrally cleared swaps is mitigated by the daily exchange of margin and other safeguards against default through their respective clearinghouses.
| |
| Putnam VT Mortgage Securities Fund3 |
Understanding your fund’s expenses
As an investor in a variable annuity product that invests in a registered investment company, you pay ongoing expenses, such as management fees, distribution fees (12b-1 fees), and other expenses. In the most recent six-month period, your fund’s expenses were limited; had expenses not been limited, they would have been higher. Using the following information, you can estimate how these expenses affect your investment and compare them with the expenses of other funds. You may also pay onetime transaction expenses, which are not shown in this section and would result in higher total expenses. Charges and expenses at the insurance company separate account level are not reflected. For more information, see your fund’s prospectus or talk to your financial representative.
Review your fund’s expenses
The two left-hand columns of the Expenses per $1,000 table show the expenses you would have paid on a $1,000 investment in your fund from 7/1/19 to 12/31/19. They also show how much a $1,000 investment would be worth at the close of the period,assuming actual returns and expenses. To estimate the ongoing expenses you paid over the period, divide your account value by $1,000, then multiply the result by the number in the first line for the class of shares you own.
Compare your fund’s expenses with those of other funds
The two right-hand columns of the Expenses per $1,000 table show your fund’s expenses based on a $1,000 investment,assuming a hypothetical 5% annualized return. You can use this information to compare the ongoing expenses (but not transaction expenses or total costs) of investing in the fund with those of other funds. All shareholder reports of mutual funds and funds serving as variable annuity vehicles will provide this information to help you make this comparison. Please note that you cannot use this information to estimate your actual ending account balance and expenses paid during the period.
| | |
| Expense ratios | | |
| | Class IA | Class IB |
| Net expenses for the fiscal year ended | | |
| 12/31/18*† | 0.50% | 0.75% |
| Total annual operating expenses for the fiscal | | |
| year ended 12/31/18† | 0.73% | 0.98% |
| Annualized expense ratio for the six-month | | |
| period ended 12/31/19‡ | 0.50% | 0.75% |
Fiscal-year expense information in this table is taken from the most recent prospectus, is subject to change, and may differ from that shown for the annualized expense ratio and in the financial highlights of this report.
Expenses are shown as a percentage of average net assets.
*Reflects Putnam Management’s contractual obligation to limit certain fund expenses through 4/30/20.
†Restated to reflect current fees.
‡For the fund’s most recent fiscal half year; may differ from expense ratios based on one-year data in the financial highlights.
| | | | | |
| Expenses per $1,000 | | | | |
| | | | | Expenses and value for a |
| | Expenses and value for a | | $1,000 investment, assuming |
| | $1,000 investment, assuming | | a hypothetical 5% annualized |
| | actual returns for the | | return for the 6 months |
| | 6 months ended 12/31/19 | | ended 12/31/19 | |
| | Class IA | Class IB | | Class IA | Class IB |
| Expenses paid | | | | | |
| per $1,000*† | $2.59 | $3.89 | | $2.55 | $3.82 |
| Ending value | | | | | |
| (after | | | | | |
| expenses) | $1,056.00 | $1,056.10 | | $1,022.68 | $1,021.42 |
*Expenses for each share class are calculated using the fund’s annualized expense ratio for each class, which represents the ongoing expenses as a percentage of average net assets for the six months ended 12/31/19. The expense ratio may differ for each share class.
†Expenses based on actual returns are calculated by multiplying the expense ratio by the average account value for the period; then multiplying the result by the number of days in the period; and then dividing that result by the number of days in the year. Expenses based on a hypothetical 5% return are calculated by multiplying the expense ratio by the average account value for the six-month period; then multiplying the result by the number of days in the six-month period; and then dividing that result by the number of days in the year.
| |
| 4Putnam VT Mortgage Securities Fund |
Report of Independent Registered Public Accounting Firm
To the Trustees of Putnam Variable Trust
and Shareholders of Putnam VT Mortgage Securities Fund
Opinion on the Financial Statements
We have audited the accompanying statement of assets and liabilities, including the fund’s portfolio, of Putnam VT Mortgage Securities Fund (one of the funds constituting Putnam Variable Trust, referred to hereafter as the “Fund”) as of December 31, 2019, the related statement of operations for the year ended December 31, 2019, the statement of changes in net assets for each of the two years in the period ended December 31, 2019, including the related notes, and the financial highlights for each of the five years in the period ended December 31, 2019 (collectively referred to as the “financial statements”). In our opinion, the financial statements present fairly, in all material respects, the financial position of the Fund as of December 31, 2019, the results of its operations for the year then ended, the changes in its net assets for each of the two years in the period ended December 31, 2019 and the financial highlights for each of the five years in the period ended December 31, 2019 in conformity with accounting principles generally accepted in the United States of America.
Basis for Opinion
These financial statements are the responsibility of the Fund’s management. Our responsibility is to express an opinion on the Fund’s financial statements based on our audits. We are a public accounting firm registered with the Public Company Accounting Oversight Board (United States) (“PCAOB”) and are required to be independent with respect to the Fund in accordance with the U.S. federal securities laws and the applicable rules and regulations of the Securities and Exchange Commission and the PCAOB.
We conducted our audits of these financial statements in accordance with the standards of the PCAOB. Those standards require that we plan and perform the audit to obtain reasonable assurance about whether the financial statements are free of material misstatement, whether due to error or fraud.
Our audits included performing procedures to assess the risks of material misstatement of the financial statements, whether due to error or fraud, and performing procedures that respond to those risks. Such procedures included examining, on a test basis, evidence regarding the amounts and disclosures in the financial statements. Our audits also included evaluating the accounting principles used and significant estimates made by management, as well as evaluating the overall presentation of the financial statements. Our procedures included confirmation of securities owned as of December 31, 2019 by correspondence with the custodian and brokers; when replies were not received from brokers, we performed other auditing procedures. We believe that our audits provide a reasonable basis for our opinion.
PricewaterhouseCoopers LLP
Boston, Massachusetts
February 12, 2020
We have served as the auditor of one or more investment companies in the Putnam Investments family of mutual funds since at least 1957. We have not been able to determine the specific year we began serving as auditor.
| | |
| | Putnam VT Mortgage Securities Fund5 |
The fund’s portfolio12/31/19
| | |
| U.S. GOVERNMENT AND AGENCY | | |
| MORTGAGE OBLIGATIONS (65.9%)* | Principal amount | Value |
| | |
| U.S. Government Guaranteed Mortgage Obligations (26.0%) | |
| Government National Mortgage Association | | |
| Pass-Through Certificates | | |
| 6.50%, with due dates from 4/15/28 to 7/20/36 | $31,363 | $36,048 |
| 6.00%, with due dates from 4/15/28 to 11/20/38 | 85,196 | 96,366 |
| 5.50%, 4/20/38 | 123,485 | 138,251 |
| 5.00%, with due dates from 6/20/49 to 8/20/49 | 83,406 | 91,691 |
| 4.70%, 8/20/67 | 103,762 | 114,917 |
| 4.50%, TBA, 1/1/50 | 2,000,000 | 2,091,250 |
| 4.50%, with due dates from 2/20/34 to 5/20/48 | 1,256,811 | 1,368,141 |
| 4.00%, TBA, 1/1/50 | 6,000,000 | 6,210,937 |
| 3.00%, TBA, 1/1/50 | 5,000,000 | 5,137,500 |
| | | 15,285,101 |
| U.S. Government Agency Mortgage Obligations (39.9%) | |
| Federal Home Loan Mortgage Corporation | | |
| Pass-Through Certificates | | |
| 7.50%, with due dates from 9/1/30 to 7/1/31 | 11,205 | 12,963 |
| 7.00%, with due dates from 11/1/26 to 4/1/32 | 67,301 | 76,446 |
| 5.50%, 12/1/33 | 14,523 | 16,185 |
| 4.50%, with due dates from 7/1/44 to 8/1/44 | 140,691 | 151,695 |
| 4.00%, with due dates from 12/1/44 to 9/1/45 | 792,304 | 844,540 |
| 3.00%, 5/1/31i | 103,075 | 106,393 |
| Federal National Mortgage Association | | |
| Pass-Through Certificates | | |
| 7.50%, with due dates from 9/1/30 to 11/1/30 | 8,721 | 10,026 |
| 7.00%, with due dates from 12/1/28 to 12/1/35 | 317,900 | 364,039 |
| 6.50%, 9/1/36 | 7,265 | 8,468 |
| 6.00%, 1/1/38 | 93,789 | 108,079 |
| 5.50%, 1/1/38 | 374,736 | 417,664 |
| 5.00%, 2/1/39 | 9,558 | 10,582 |
| 4.50%, with due dates from 7/1/44 to 5/1/45 | 201,640 | 217,002 |
| 3.50%, 6/1/56 | 721,099 | 763,535 |
| 3.50%, with due dates from 5/1/45 to 1/1/47 | 1,951,723 | 2,057,333 |
| Uniform Mortgage-Backed Securities | | |
| 4.50%, TBA, 1/1/50 | 2,000,000 | 2,105,938 |
| 4.00%, TBA, 1/1/50 | 1,000,000 | 1,040,234 |
| 3.00%, TBA, 2/1/50 | 4,000,000 | 4,055,000 |
| 3.00%, TBA, 1/1/50 | 9,000,000 | 9,129,375 |
| 2.50%, TBA, 2/1/50 | 1,000,000 | 988,438 |
| 2.50%, TBA, 1/1/50 | 1,000,000 | 988,984 |
| | | 23,472,919 |
| Total U.S. government and agency mortgage | | |
| obligations (cost $38,686,838) | | $38,758,020 |
| | |
| U.S. TREASURY OBLIGATIONS (0.4%)* | Principal amount | Value |
| U.S. Treasury Notes 2.125%, 2/29/24i | $240,000 | $246,173 |
| Total U.S. treasury obligations (cost $246,173) | | $246,173 |
| |
| MORTGAGE-BACKED SECURITIES (66.2%)* Principal amount | Value |
| | |
| Agency collateralized mortgage obligations (36.1%) | |
| Federal Home Loan Mortgage Corporation | | |
| REMICs IFB Ser. 3408, Class EK, ((-4.024 x 1 | | |
| Month US LIBOR) + 25.79%), 18.793%, 4/15/37 | $22,149 | $35,456 |
| REMICs IFB Ser. 3072, Class SM, ((-3.667 x 1 | | |
| Month US LIBOR) + 23.80%), 17.418%, 11/15/35 | 30,950 | 48,199 |
| REMICs IFB Ser. 3065, Class DC, ((-3 x 1 Month US | | |
| LIBOR) + 19.86%), 14.641%, 3/15/35 | 154,626 | 204,122 |
| REMICs IFB Ser. 2990, Class LB, ((-2.556 x 1 | | |
| Month US LIBOR) + 16.95%), 12.499%, 6/15/34 | 21,628 | 25,203 |
| | |
| MORTGAGE-BACKED | | |
| SECURITIES (66.2%)*cont. | Principal amount | Value |
| Agency collateralized mortgage obligationscont. | |
| REMICs IFB Ser. 4136, Class ES, IO, ((-1 x 1 | | |
| Month US LIBOR) + 6.25%), 4.51%, 11/15/42 | $265,421 | $23,148 |
| REMICs Ser. 4122, Class TI, IO, 4.50%, 10/15/42 | 230,258 | 39,007 |
| REMICs Ser. 4018, Class DI, IO, 4.50%, 7/15/41 | 272,074 | 29,264 |
| REMICs IFB Ser. 4436, Class SC, IO, ((-1 x 1 | | |
| Month US LIBOR) + 6.15%), 4.41%, 2/15/45 | 832,819 | 140,765 |
| REMICs Ser. 4546, Class PI, IO, 4.00%, 12/15/45 | 490,648 | 67,753 |
| REMICs Ser. 4530, Class HI, IO, 4.00%, 11/15/45 | 272,997 | 36,028 |
| REMICs Ser. 4500, Class GI, IO, 4.00%, 8/15/45 | 376,941 | 60,001 |
| REMICs Ser. 4425, IO, 4.00%, 1/15/45 | 358,328 | 52,979 |
| REMICs Ser. 4425, Class EI, IO, 4.00%, 1/15/45 | 538,412 | 79,060 |
| REMICs Ser. 4452, Class QI, IO, 4.00%, 11/15/44 | 343,156 | 71,716 |
| REMICs Ser. 4213, Class GI, IO, 4.00%, 11/15/41 | 789,605 | 79,625 |
| REMICs Ser. 4019, Class JI, IO, 4.00%, 5/15/41 | 424,262 | 39,282 |
| REMICs Ser. 3996, Class IK, IO, 4.00%, 3/15/39 | 262,297 | 8,134 |
| REMICs Ser. 4621, Class QI, IO, 3.50%, 10/15/46 | 720,408 | 96,268 |
| REMICs Ser. 4165, Class AI, IO, 3.50%, 2/15/43 | 307,542 | 44,341 |
| REMICs Ser. 4136, Class IQ, IO, 3.50%, 11/15/42 | 462,340 | 50,034 |
| REMICs Ser. 4199, Class CI, IO, 3.50%, 12/15/37 | 171,006 | 6,272 |
| Strips Ser. 304, Class C37, IO, 3.50%, 12/15/27 | 226,691 | 16,534 |
| REMICs Ser. 4150, Class DI, IO, 3.00%, 1/15/43 | 388,997 | 38,657 |
| REMICs Ser. 4141, Class PI, IO, 3.00%, 12/15/42 | 342,500 | 31,483 |
| REMICs Ser. 4158, Class TI, IO, 3.00%, 12/15/42 | 809,793 | 64,184 |
| REMICs Ser. 4165, Class TI, IO, 3.00%, 12/15/42 | 840,156 | 64,348 |
| REMICs Ser. 4171, Class NI, IO, 3.00%, 6/15/42 | 520,965 | 39,510 |
| REMICs Ser. 4183, Class MI, IO, 3.00%, 2/15/42 | 278,736 | 18,898 |
| REMICs Ser. 4201, Class JI, IO, 3.00%, 12/15/41 | 366,487 | 20,460 |
| REMICs Ser. 3835, Class FO, PO, zero %, 4/15/41 | 427,010 | 381,303 |
| REMICs Ser. 3391, PO, zero %, 4/15/37 | 5,318 | 4,695 |
| REMICs Ser. 3300, PO, zero %, 2/15/37 | 2,303 | 2,026 |
| REMICs Ser. 3326, Class WF, zero %, 10/15/35W | 1,163 | 955 |
| Strips Ser. 315, PO, zero %, 9/15/43 | 830,037 | 709,731 |
| Federal National Mortgage Association | | |
| REMICs IFB Ser. 06-62, Class PS, ((-6 x 1 Month | | |
| US LIBOR) + 39.90%), 29.148%, 7/25/36 | 17,109 | 30,166 |
| REMICs IFB Ser. 06-8, Class HP, ((-3.667 x 1 | | |
| Month US LIBOR) + 24.57%), 17.996%, 3/25/36 | 30,012 | 48,816 |
| REMICs IFB Ser. 07-53, Class SP, ((-3.667 x 1 | | |
| Month US LIBOR) + 24.20%), 17.629%, 6/25/37 | 34,039 | 52,188 |
| REMICs IFB Ser. 05-122, Class SE, ((-3.5 x 1 | | |
| Month US LIBOR) + 23.10%), 16.828%, 11/25/35 | 28,718 | 38,322 |
| REMICs IFB Ser. 08-24, Class SP, ((-3.667 x 1 | | |
| Month US LIBOR) + 23.28%), 16.713%, 2/25/38 | 125,888 | 163,453 |
| REMICs IFB Ser. 05-75, Class GS, ((-3 x 1 Month | | |
| US LIBOR) + 20.25%), 14.874%, 8/25/35 | 22,459 | 29,774 |
| REMICs IFB Ser. 05-106, Class JC, ((-3.101 x 1 | | |
| Month US LIBOR) + 20.12%), 14.567%, 12/25/35 | 34,638 | 46,405 |
| REMICs IFB Ser. 05-83, Class QP, ((-2.6 x 1 Month | | |
| US LIBOR) + 17.39%), 12.735%, 11/25/34 | 10,716 | 12,372 |
| REMICs IFB Ser. 11-4, Class CS, ((-2 x 1 Month US | | |
| LIBOR) + 12.90%), 9.316%, 5/25/40 | 70,796 | 84,255 |
| REMICs Ser. 15-58, Class KI, IO, 6.00%, 3/25/37 | 646,850 | 141,797 |
| REMICs Ser. 16-3, Class MI, IO, 5.50%, 2/25/46 | 417,540 | 83,834 |
| REMICs Ser. 15-86, Class MI, IO, 5.50%, 11/25/45 | 553,998 | 112,572 |
| REMICs Ser. 10-109, Class IM, IO, 5.50%, 9/25/40 1,211,085 | 215,962 |
| REMICs Ser. 18-51, Class BI, IO, 5.50%, 7/25/38 | 868,507 | 130,959 |
| REMICs Ser. 17-19, Class IH, IO, 5.00%, 3/25/47 | 656,996 | 121,597 |
| REMICs Ser. 12-151, Class IM, IO, 5.00%, 4/25/42 | 730,286 | 122,117 |
| REMICs IFB Ser. 11-123, Class KS, IO, ((-1 x 1 | | |
| Month US LIBOR) + 6.60%), 4.808%, 10/25/41 | 81,915 | 11,942 |
| REMICs Ser. 17-66, IO, 4.50%, 9/25/47 | 1,145,620 | 202,812 |
| REMICs Ser. 17-32, Class IP, IO, 4.50%, 5/25/47 | 964,208 | 190,330 |
| |
| 6Putnam VT Mortgage Securities Fund |
| | | |
| MORTGAGE-BACKED | | | |
| SECURITIES (66.2%)*cont. | Principal amount | Value |
| | |
| Agency collateralized mortgage obligationscont. | |
| Federal National Mortgage Association | | | |
| REMICs IFB Ser. 18-47, Class SA, IO, ((-1 x 1 | | |
| Month US LIBOR) + 6.25%), 4.458%, 7/25/48 | $584,799 | $111,381 |
| REMICs IFB Ser. 18-36, Class SD, IO, ((-1 x 1 | | |
| Month US LIBOR) + 6.25%), 4.458%, 6/25/48 | 1,659,635 | 280,714 |
| REMICs IFB Ser. 18-20, Class SB, IO, ((-1 x 1 | | |
| Month US LIBOR) + 6.25%), 4.458%, 3/25/48 | 863,122 | 149,148 |
| REMICs IFB Ser. 17-104, Class SL, IO, ((-1 x 1 | | |
| Month US LIBOR) + 6.15%), 4.358%, 1/25/48 | 1,659,096 | 263,286 |
| REMICs IFB Ser. 16-81, Class SA, IO, ((-1 x 1 | | |
| Month US LIBOR) + 6.15%), 4.358%, 11/25/46 | 2,538,134 | 456,560 |
| REMICs IFB Ser. 16-83, Class BS, IO, ((-1 x 1 | | |
| Month US LIBOR) + 6.10%), 4.308%, 11/25/46 | 1,789,347 | 320,719 |
| REMICs IFB Ser. 16-85, Class SL, IO, ((-1 x 1 | | |
| Month US LIBOR) + 6.10%), 4.308%, 11/25/46 | 2,681,994 | 419,196 |
| REMICs IFB Ser. 16-50, Class SM, IO, ((-1 x 1 | | |
| Month US LIBOR) + 6.10%), 4.308%, 8/25/46 | 1,213,578 | 198,584 |
| REMICs IFB Ser. 19-58, Class SA, IO, ((-1 x 1 | | |
| Month US LIBOR) + 6.05%), 4.258%, 10/25/49 | 1,191,931 | 209,963 |
| REMICs IFB Ser. 19-45, Class SD, IO, ((-1 x 1 | | |
| Month US LIBOR) + 6.05%), 4.258%, 8/25/49 | 1,237,242 | 218,064 |
| REMICs IFB Ser. 16-8, Class SA, IO, ((-1 x 1 | | |
| Month US LIBOR) + 6.05%), 4.258%, 3/25/46 | 2,018,024 | 342,703 |
| REMICs IFB Ser. 19-71, Class CS, IO, ((-1 x 1 | | |
| Month US LIBOR) + 6.00%), 4.208%, 11/25/49 | 102,219 | 25,760 |
| REMICs Ser. 15-83, IO, 4.00%, 10/25/43 | 847,710 | 115,500 |
| REMICs Ser. 12-118, Class PI, IO, 4.00%, 6/25/42 | 691,370 | 96,950 |
| REMICs Ser. 12-62, Class MI, IO, 4.00%, 3/25/41 | 234,789 | 25,005 |
| REMICs Ser. 12-104, Class HI, IO, 4.00%, 9/25/27 | 431,467 | 37,645 |
| REMICs Ser. 16-70, Class QI, IO, 3.50%, 10/25/46 | 2,002,730 | 277,799 |
| REMICs Ser. 15-10, Class AI, IO, 3.50%, 8/25/43 | 578,306 | 66,299 |
| REMICs Ser. 12-124, Class JI, IO, 3.50%, 11/25/42 | 183,331 | 16,199 |
| REMICs Ser. 13-22, Class PI, IO, 3.50%, 10/25/42 | 524,015 | 83,331 |
| REMICs Ser. 12-114, Class NI, IO, 3.50%, 10/25/41 | 766,719 | 95,697 |
| REMICs Ser. 13-55, Class IK, IO, 3.00%, 4/25/43 | 288,074 | 25,136 |
| REMICs Ser. 13-6, Class JI, IO, 3.00%, 2/25/43 | 637,696 | 55,001 |
| REMICs Ser. 12-151, Class PI, IO, 3.00%, 1/25/43 | 270,324 | 23,486 |
| REMICs Ser. 12-145, Class TI, IO, 3.00%, 11/25/42 | 160,478 | 6,792 |
| REMICs Ser. 13-35, Class IP, IO, 3.00%, 6/25/42 | 266,904 | 13,595 |
| REMICs Ser. 13-55, Class PI, IO, 3.00%, 5/25/42 | 381,716 | 18,820 |
| REMICs Ser. 13-53, Class JI, IO, 3.00%, 12/25/41 | 346,339 | 25,779 |
| REMICs Ser. 13-23, Class PI, IO, 3.00%, 10/25/41 | 209,473 | 6,758 |
| REMICs Ser. 13-30, Class IP, IO, 3.00%, 10/25/41 | 334,374 | 10,776 |
| REMICs Ser. 13-23, Class LI, IO, 3.00%, 6/25/41 | 192,621 | 5,947 |
| REMICs Ser. 14-28, Class AI, IO, 3.00%, 3/25/40 | 425,173 | 32,652 |
| Trust FRB Ser. 03-W8, Class 3F2, (1 Month US | | |
| LIBOR + 0.35%), 2.142%, 5/25/42 | | 3,131 | 3,119 |
| REMICs FRB Ser. 07-95, Class A3, (1 Month US | | |
| LIBOR + 0.25%), 1.958%, 8/27/36 | | 1,868,618 | 1,798,795 |
| REMICs Ser. 08-53, Class DO, PO, zero %, 7/25/38 29,917 | 27,793 |
| REMICs Ser. 07-44, Class CO, PO, zero %, 5/25/37 | 9,936 | 8,531 |
| Government National Mortgage Association | | |
| Ser. 16-75, Class LI, IO, 6.00%, 1/20/40 | 376,597 | 80,498 |
| Ser. 14-137, Class ID, IO, 5.50%, 9/16/44 | 439,877 | 93,006 |
| Ser. 15-89, Class LI, IO, 5.00%, 12/20/44 | 700,200 | 148,330 |
| Ser. 14-133, Class IP, IO, 5.00%, 9/16/44 | 308,388 | 63,136 |
| Ser. 14-76, IO, 5.00%, 5/20/44 | | 386,933 | 80,116 |
| Ser. 13-51, Class QI, IO, 5.00%, 2/20/43 | 283,012 | 45,093 |
| Ser. 13-3, Class IT, IO, 5.00%, 1/20/43 | | 167,233 | 34,350 |
| Ser. 13-6, Class OI, IO, 5.00%, 1/20/43 | 125,486 | 26,460 |
| Ser. 10-35, Class UI, IO, 5.00%, 3/20/40 | 185,925 | 38,319 |
| Ser. 10-9, Class UI, IO, 5.00%, 1/20/40 | 585,456 | 121,365 |
| | | |
| MORTGAGE-BACKED | | | |
| SECURITIES (66.2%)*cont. | Principal amount | Value |
| | |
| Agency collateralized mortgage obligationscont. | |
| Government National Mortgage Association | | |
| Ser. 09-121, Class UI, IO, 5.00%, 12/20/39 | $459,217 | $93,602 |
| IFB Ser. 11-81, Class SB, IO, ((-1 x 1 Month US | | |
| LIBOR) + 6.71%), 4.965%, 11/16/36 | | 81,819 | 1,595 |
| IFB Ser. 13-182, Class SP, IO, ((-1 x 1 Month US | | |
| LIBOR) + 6.70%), 4.935%, 12/20/43 | | 308,645 | 61,754 |
| IFB Ser. 11-156, Class SK, IO, ((-1 x 1 Month US | | |
| LIBOR) + 6.60%), 4.835%, 4/20/38 | | 799,173 | 175,818 |
| Ser. 18-1, IO, 4.50%, 1/20/48 | | 744,195 | 107,266 |
| Ser. 18-127, Class IB, IO, 4.50%, 6/20/45 | 153,143 | 16,449 |
| Ser. 13-34, Class HI, IO, 4.50%, 3/20/43 | 442,865 | 83,295 |
| Ser. 12-129, IO, 4.50%, 11/16/42 | | 349,599 | 72,678 |
| Ser. 12-91, Class IN, IO, 4.50%, 5/20/42 | 598,585 | 126,971 |
| Ser. 10-35, Class AI, IO, 4.50%, 3/20/40 | 427,717 | 64,640 |
| Ser. 10-35, Class DI, IO, 4.50%, 3/20/40 | 255,697 | 49,692 |
| Ser. 10-35, Class QI, IO, 4.50%, 3/20/40 | 153,911 | 28,118 |
| Ser. 10-9, Class QI, IO, 4.50%, 1/20/40 | 125,079 | 23,878 |
| Ser. 09-121, Class BI, IO, 4.50%, 12/16/39 | 138,998 | 29,261 |
| Ser. 09-121, Class CI, IO, 4.50%, 12/16/39 | 529,937 | 109,378 |
| IFB Ser. 18-89, Class LS, IO, ((-1 x 1 Month US | | |
| LIBOR) + 6.20%), 4.435%, 6/20/48 | | 737,828 | 102,374 |
| IFB Ser. 13-87, Class SA, IO, ((-1 x 1 Month US | | |
| LIBOR) + 6.20%), 4.435%, 6/20/43 | | 1,471,321 | 263,362 |
| IFB Ser. 19-35, Class SE, IO, ((-1 x 1 Month US | | |
| LIBOR) + 6.15%), 4.41%, 1/16/44 | | 722,007 | 117,775 |
| IFB Ser. 18-148, Class GS, IO, ((-1 x 1 Month US | | |
| LIBOR) + 6.10%), 4.36%, 2/16/46 | | 735,287 | 131,306 |
| IFB Ser. 19-100, Class JS, IO, ((-1 x 1 Month US | | |
| LIBOR) + 6.10%), 4.335%, 8/20/49 | | 976,056 | 130,565 |
| IFB Ser. 19-83, Class SL, IO, ((-1 x 1 Month US | | |
| LIBOR) + 6.10%), 4.335%, 7/20/49 | | 1,771,714 | 217,248 |
| IFB Ser. 19-125, Class SG, IO, ((-1 x 1 Month US | | |
| LIBOR) + 6.05%), 4.285%, 10/20/49 | | 1,035,184 | 267,854 |
| IFB Ser. 19-121, Class SD, IO, ((-1 x 1 Month US | | |
| LIBOR) + 6.00%), 4.235%, 10/20/49 | | 406,774 | 104,052 |
| Ser. 16-69, IO, 4.00%, 5/20/46 | | 667,149 | 99,632 |
| Ser. 15-53, Class MI, IO, 4.00%, 4/16/45 | 399,096 | 78,223 |
| Ser. 14-100, Class NI, IO, 4.00%, 6/20/43 | 662,344 | 71,598 |
| Ser. 13-67, Class IP, IO, 4.00%, 4/16/43 | 610,437 | 122,826 |
| Ser. 13-165, Class IL, IO, 4.00%, 3/20/43 | 145,478 | 23,742 |
| Ser. 12-56, Class IB, IO, 4.00%, 4/20/42 | 403,876 | 72,031 |
| Ser. 12-38, Class MI, IO, 4.00%, 3/20/42 | 1,460,073 | 272,902 |
| Ser. 12-47, Class CI, IO, 4.00%, 3/20/42 | 179,886 | 30,859 |
| Ser. 14-104, IO, 4.00%, 3/20/42 | | 421,422 | 62,792 |
| Ser. 14-4, Class IK, IO, 4.00%, 7/20/39 | 164,785 | 8,957 |
| Ser. 11-71, Class IK, IO, 4.00%, 4/16/39 | 202,386 | 10,869 |
| Ser. 10-114, Class MI, IO, 4.00%, 3/20/39 | 173,460 | 5,968 |
| Ser. 14-182, Class BI, IO, 4.00%, 1/20/39 | 604,867 | 87,489 |
| Ser. 16-156, Class PI, IO, 3.50%, 11/20/46 | 450,952 | 22,638 |
| Ser. 18-127, Class IE, IO, 3.50%, 1/20/46 | 544,035 | 70,333 |
| Ser. 13-79, Class PI, IO, 3.50%, 4/20/43 | 345,396 | 42,878 |
| Ser. 15-168, Class IG, IO, 3.50%, 3/20/43 | 497,822 | 67,576 |
| Ser. 13-37, Class JI, IO, 3.50%, 1/20/43 | 231,019 | 31,818 |
| Ser. 13-27, Class PI, IO, 3.50%, 12/20/42 | 123,176 | 16,884 |
| Ser. 12-136, IO, 3.50%, 11/20/42 | | 506,273 | 88,577 |
| Ser. 18-127, Class IA, IO, 3.50%, 4/20/42 | 1,057,494 | 83,997 |
| Ser. 14-102, Class IG, IO, 3.50%, 3/16/41 | 162,458 | 12,946 |
| Ser. 15-52, Class KI, IO, 3.50%, 11/20/40 | 516,976 | 50,095 |
| Ser. 15-99, Class TI, IO, 3.50%, 4/20/39 | 396,503 | 17,464 |
| Ser. 15-24, Class AI, IO, 3.50%, 12/20/37 | 466,031 | 31,368 |
| Ser. 16-H18, Class QI, IO, 3.107%, 6/20/66W | 1,289,751 | 141,415 |
| Ser. 14-160, Class IB, IO, 3.00%, 11/20/40 | 637,552 | 26,357 |
| |
| Putnam VT Mortgage Securities Fund7 |
| | | |
| MORTGAGE-BACKED | | | |
| SECURITIES (66.2%)*cont. | Principal amount | Value |
| | |
| Agency collateralized mortgage obligationscont. | |
| Government National Mortgage Association | | |
| Ser. 14-141, Class CI, IO, 3.00%, 3/20/40 | $194,111 | $10,268 |
| Ser. 14-174, Class AI, IO, 3.00%, 11/16/29 | 432,313 | 37,914 |
| Ser. 16-H24, Class KI, IO, 2.991%, 11/20/66W | 734,863 | 89,102 |
| Ser. 17-H03, Class KI, IO, 2.898%, 1/20/67W | 1,498,166 | 187,412 |
| Ser. 16-H13, Class IK, IO, 2.62%, 6/20/66W | 1,240,044 | 153,455 |
| Ser. 16-H17, Class DI, IO, 2.585%, 7/20/66W | 1,297,229 | 122,178 |
| Ser. 15-H22, Class GI, IO, 2.584%, 9/20/65W | 1,327,260 | 150,511 |
| Ser. 16-H14, Class AI, IO, 2.542%, 6/20/66W | 877,389 | 84,286 |
| Ser. 16-H03, Class AI, IO, 2.538%, 1/20/66W | 1,427,655 | 119,566 |
| Ser. 15-H10, Class HI, IO, 2.523%, 4/20/65W | 2,185,551 | 176,593 |
| Ser. 17-H04, Class BI, IO, 2.495%, 2/20/67W | 936,483 | 117,060 |
| Ser. 16-H06, Class AI, IO, 2.486%, 2/20/66 | 750,057 | 62,543 |
| Ser. 17-H08, Class GI, IO, 2.43%, 2/20/67W | 966,925 | 138,995 |
| FRB Ser. 15-H16, Class XI, IO, 2.426%, 7/20/65W | 791,966 | 78,167 |
| Ser. 15-H13, Class AI, IO, 2.407%, 6/20/65W | 1,224,765 | 107,167 |
| Ser. 16-H04, Class HI, IO, 2.38%, 7/20/65W | 847,112 | 66,329 |
| Ser. 17-H08, Class EI, IO, 2.376%, 2/20/67W | 1,256,414 | 146,058 |
| Ser. 17-H20, Class AI, IO, 2.354%, 10/20/67W | 2,280,044 | 280,018 |
| Ser. 16-H27, Class GI, IO, 2.289%, 12/20/66W | 1,505,761 | 189,365 |
| Ser. 16-H07, Class PI, IO, 2.282%, 3/20/66W | 2,369,204 | 263,574 |
| Ser. 17-H14, Class LI, IO, 2.277%, 6/20/67W | 777,785 | 88,473 |
| Ser. 17-H06, Class MI, IO, 2.252%, 2/20/67W | 1,645,813 | 173,882 |
| Ser. 16-H23, Class NI, IO, 2.247%, 10/20/66W | 1,844,540 | 193,861 |
| Ser. 17-H14, Class JI, IO, 2.195%, 6/20/67W | 561,495 | 75,802 |
| Ser. 16-H10, Class AI, IO, 2.193%, 4/20/66W | 1,264,710 | 81,230 |
| Ser. 17-H08, Class NI, IO, 2.189%, 3/20/67W | 959,852 | 101,456 |
| Ser. 16-H04, Class KI, IO, 2.148%, 2/20/66W | 1,556,414 | 105,058 |
| Ser. 18-H05, Class ID, IO, 2.131%, 3/20/68W | 549,333 | 67,293 |
| Ser. 16-H24, IO, 2.131%, 9/20/66W | | 920,921 | 102,452 |
| Ser. 15-H20, Class CI, IO, 2.118%, 8/20/65W | 1,378,836 | 133,540 |
| Ser. 16-H11, Class HI, IO, 2.10%, 1/20/66W | 2,876,629 | 230,130 |
| Ser. 18-H02, IO, 2.096%, 1/20/68W | | 423,797 | 48,719 |
| Ser. 16-H06, Class DI, IO, 2.079%, 7/20/65 | 1,331,785 | 95,368 |
| Ser. 16-H06, Class HI, IO, 2.077%, 2/20/66 | 1,095,321 | 89,309 |
| Ser. 18-H01, Class XI, IO, 2.061%, 1/20/68W | 1,207,992 | 173,649 |
| Ser. 16-H24, Class JI, IO, 2.043%, 11/20/66W | 582,449 | 67,710 |
| Ser. 15-H24, Class HI, IO, 2.037%, 9/20/65W | 1,138,641 | 75,599 |
| Ser. 18-H02, Class IM, IO, 1.993%, 2/20/68W | 814,120 | 112,959 |
| Ser. 17-H03, Class CI, IO, 1.993%, 12/20/66W | 697,900 | 79,386 |
| Ser. 15-H23, Class TI, IO, 1.945%, 9/20/65W | 988,769 | 89,879 |
| Ser. 17-H16, Class HI, IO, 1.944%, 8/20/67W | 850,171 | 75,453 |
| Ser. 17-H09, IO, 1.861%, 4/20/67W | | 898,272 | 81,375 |
| Ser. 15-H22, Class AI, IO, 1.847%, 9/20/65W | 1,498,443 | 136,808 |
| Ser. 15-H04, Class AI, IO, 1.842%, 12/20/64W | 1,067,812 | 81,421 |
| Ser. 17-H25, Class CI, IO, 1.83%, 12/20/67W | 1,628,276 | 221,853 |
| Ser. 17-H10, Class MI, IO, 1.815%, 4/20/67W | 1,060,772 | 93,772 |
| Ser. 15-H25, Class BI, IO, 1.778%, 10/20/65W | 926,715 | 81,829 |
| Ser. 17-H25, Class AI, IO, 1.76%, 12/20/67W | 512,750 | 57,043 |
| Ser. 14-H25, Class BI, IO, 1.724%, 12/20/64W | 1,053,205 | 73,262 |
| Ser. 14-H18, Class CI, IO, 1.629%, 9/20/64W | 953,977 | 68,634 |
| Ser. 17-H06, Class EI, IO, 1.618%, 2/20/67W | 624,940 | 40,041 |
| Ser. 16-H08, Class GI, IO, 1.462%, 4/20/66W | 884,156 | 43,586 |
| Ser. 14-H21, Class AI, IO, 1.449%, 10/20/64W | 1,409,175 | 104,086 |
| FRB Ser. 11-H07, Class FI, IO, 1.274%, 2/20/61W | 3,414,741 | 86,393 |
| Ser. 17-H25, IO, 1.10%, 11/20/67W | | 969,826 | 110,621 |
| Ser. 10-151, Class KO, PO, zero %, 6/16/37 | 24,718 | 21,341 |
| Ser. 06-36, Class OD, PO, zero %, 7/16/36 | 1,376 | 1,186 |
| | | | 21,249,455 |
| | | |
| MORTGAGE-BACKED | | | |
| SECURITIES (66.2%)*cont. | Principal amount | Value |
| | | |
| Commercial mortgage-backed securities (8.5%) | | |
| Bear Stearns Commercial Mortgage Securities Trust | | |
| FRB Ser. 07-T26, Class AJ, 5.45%, 1/12/45W | $71,000 | $61,060 |
| Citigroup Commercial Mortgage Trust 144A FRB | | |
| Ser. 14-GC21, Class D, 4.945%, 5/10/47W | | 108,000 | 107,183 |
| COMM Mortgage Trust 144A | | | |
| FRB Ser. 13-LC13, Class D, 5.287%, 8/10/46W | 101,000 | 102,631 |
| FRB Ser. 14-CR17, Class D, 4.85%, 5/10/47W | 228,000 | 232,097 |
| FRB Ser. 14-CR17, Class E, 4.85%, 5/10/47W | 124,000 | 116,560 |
| FRB Ser. 14-CR19, Class D, 4.747%, 8/10/47W | 133,000 | 132,433 |
| FRB Ser. 13-CR6, Class D, 4.081%, 3/10/46W | 160,000 | 160,762 |
| CSAIL Commercial Mortgage Trust FRB Ser. 15-C1, | | |
| Class C, 4.272%, 4/15/50W | | 101,000 | 105,575 |
| DBUBS Mortgage Trust 144A FRB Ser. 11-LC3A, | | |
| Class D, 5.334%, 8/10/44W | | 167,000 | 173,753 |
| Federal National Mortgage Association 144A | | |
| Multifamily Connecticut Avenue Securities Trust | | |
| FRB Ser. 19-01, Class M10, 5.042%, 10/15/49 | 215,000 | 224,003 |
| Multifamily Connecticut Avenue Securities Trust | | |
| FRB Ser. 19-01, Class M7, 3.492%, 10/15/49 | 89,857 | 90,138 |
| GS Mortgage Securities Trust | | | |
| FRB Ser. 14-GC18, Class C, 4.99%, 1/10/47W | 155,000 | 152,288 |
| FRB Ser. 14-GC22, Class C, 4.691%, 6/10/47W | 85,000 | 88,891 |
| GS Mortgage Securities Trust 144A FRB | | | |
| Ser. 14-GC24, Class D, 4.532%, 9/10/47W | | 329,000 | 276,928 |
| JPMBB Commercial Mortgage Securities Trust FRB | | |
| Ser. 14-C18, Class C, 4.81%, 2/15/47W | | 110,000 | 115,461 |
| JPMBB Commercial Mortgage Securities Trust 144A | | |
| FRB Ser. C14, Class D, 4.702%, 8/15/46W | 229,000 | 225,787 |
| FRB Ser. 14-C23, Class D, 3.969%, 9/15/47W | 127,000 | 126,008 |
| FRB Ser. 14-C25, Class D, 3.951%, 11/15/47W | 139,000 | 126,626 |
| JPMorgan Chase Commercial Mortgage Securities | | |
| Trust | | | |
| Ser. 06-LDP9, Class AMS, 5.337%, 5/15/47 | 178,152 | 164,556 |
| FRB Ser. 13-LC11, Class D, 4.168%, 4/15/46W | 168,000 | 152,220 |
| JPMorgan Chase Commercial Mortgage Securities | | |
| Trust 144A | | | |
| FRB Ser. 11-C3, Class D, 5.664%, 2/15/46W | 245,000 | 243,932 |
| FRB Ser. 10-C2, Class D, 5.599%, 11/15/43W | 131,000 | 132,256 |
| ML-CFC Commercial Mortgage Trust FRB Ser. 06-4, | | |
| Class C, 5.324%, 12/12/49W | | 128,147 | 102,124 |
| Morgan Stanley Bank of America Merrill Lynch | | |
| Trust 144A | | | |
| FRB Ser. 14-C15, Class D, 4.909%, 4/15/47W | 180,000 | 188,764 |
| FRB Ser. 13-C10, Class F, 4.081%, 7/15/46W | 141,000 | 120,019 |
| Morgan Stanley Capital I Trust 144A FRB | | | |
| Ser. 11-C3, Class E, 5.245%, 7/15/49W | | 148,000 | 147,040 |
| UBS Commercial Mortgage Trust 144A | | | |
| FRB Ser. 12-C1, Class D, 5.57%, 5/10/45W | 281,000 | 281,106 |
| FRB Ser. 12-C1, Class E, 5.00%, 5/10/45W | 289,000 | 245,946 |
| UBS-Barclays Commercial Mortgage Trust 144A FRB | | |
| Ser. 12-C4, Class D, 4.48%, 12/10/45W | | 109,000 | 108,497 |
| UBS-Citigroup Commercial Mortgage Trust 144A FRB | | |
| Ser. 11-C1, Class D, 6.05%, 1/10/45W | | 181,000 | 187,307 |
| WF-RBS Commercial Mortgage Trust 144A FRB | | |
| Ser. 12-C9, Class D, 4.811%, 11/15/45W | | 290,000 | 291,683 |
| | | | 4,983,634 |
| |
| 8Putnam VT Mortgage Securities Fund |
| | |
| MORTGAGE-BACKED | | |
| SECURITIES (66.2%)*cont. | Principal amount | Value |
| |
| Residential mortgage-backed securities (non-agency) (21.6%) | |
| American Home Mortgage Investment Trust FRB | |
| Ser. 07-1, Class GA1C, (1 Month US LIBOR | | |
| + 0.19%), 1.982%, 5/25/47 | $550,206 | $352,891 |
| Arroyo Mortgage Trust 144A Ser. 18-1, Class A3, | |
| 4.157%, 4/25/48W | 99,281 | 100,399 |
| Bayview Financial Mortgage Pass-Through Trust | |
| Ser. 06-C, Class 1A3, 6.028%, 11/28/36 | 450,000 | 455,637 |
| Bear Stearns Alt-A Trust FRB Ser. 05-8, | | |
| Class 21A1, 4.164%, 10/25/35W | 202,531 | 187,110 |
| Bellemeade Re, Ltd. 144A | | |
| FRB Ser. 17-1, Class M2, (1 Month US LIBOR | |
| + 3.35%), 5.142%, 10/25/27 (Bermuda) | 150,000 | 152,625 |
| FRB Ser. 18-2A, Class M1C, (1 Month US LIBOR | |
| + 1.60%), 3.392%, 8/25/28 (Bermuda) | 190,000 | 190,475 |
| Carrington Mortgage Loan Trust FRB Ser. 06-NC2, | |
| Class A4, (1 Month US LIBOR + 0.24%), 2.032%, | |
| 6/25/36 | 490,000 | 464,232 |
| Chevy Chase Funding, LLC Mortgage-Backed | |
| Certificates 144A FRB Ser. 06-4A, Class A2, (1 | | |
| Month US LIBOR + 0.18%), 1.972%, 11/25/47 | 271,264 | 234,331 |
| Citigroup Mortgage Loan Trust FRB Ser. 07-AR5, | |
| Class 1A1A, 4.443%, 4/25/37W | 323,556 | 321,755 |
| Countrywide Alternative Loan Trust | | |
| FRB Ser. 06-OA19, Class A1, (1 Month US LIBOR | |
| + 0.18%), 1.945%, 2/20/47 | 286,488 | 225,884 |
| FRB Ser. 07-OA6, Class A1A, (1 Month US LIBOR | |
| + 0.14%), 1.932%, 6/25/37 | 62,023 | 58,959 |
| Countrywide Asset-Backed Certificates FRB | | |
| Ser. 07-10, Class 1A1, (1 Month US LIBOR | | |
| + 0.18%), 1.972%, 6/25/47 | 384,070 | 376,230 |
| Federal Home Loan Mortgage Corporation | | |
| Structured Agency Credit Risk Debt Notes FRB | |
| Ser. 15-HQA1, Class B, (1 Month US LIBOR | |
| + 8.80%), 10.592%, 3/25/28 | 247,825 | 302,683 |
| Structured Agency Credit Risk Debt FRN | | |
| Ser. 16-DNA3, Class M3, (1 Month US LIBOR | |
| + 5.00%), 6.792%, 12/25/28 | 362,000 | 393,782 |
| Structured Agency Credit Risk Debt FRN | | |
| Ser. 14-HQ3, Class M3, (1 Month US LIBOR | |
| + 4.75%), 6.542%, 10/25/24 | 233,842 | 247,048 |
| Structured Agency Credit Risk Debt FRN | | |
| Ser. 14-DN4, Class M3, (1 Month US LIBOR | | |
| + 4.55%), 6.342%, 10/25/24 | 149,166 | 160,086 |
| Structured Agency Credit Risk Debt FRN | | |
| Ser. 15-HQ1, Class M3, (1 Month US LIBOR | |
| + 3.80%), 5.592%, 3/25/25 | 168,807 | 172,806 |
| Structured Agency Credit Risk Debt FRN | | |
| Ser. 17-DNA2, Class M2, (1 Month US LIBOR | |
| + 3.45%), 5.242%, 10/25/29 | 250,000 | 266,336 |
| Structured Agency Credit Risk Debt FRN | | |
| Ser. 18-DNA1, Class B1, (1 Month US LIBOR | |
| + 3.15%), 4.942%, 7/25/30 | 250,000 | 250,846 |
| Seasoned Credit Risk Transfer Trust Ser. 19-3, | |
| Class M, 4.75%, 10/25/58W | 50,000 | 49,689 |
| Structured Agency Credit Risk Debt FRN | | |
| Ser. 17-HQA2, Class M2, (1 Month US LIBOR | |
| + 2.65%), 4.442%, 12/25/29 | 250,000 | 255,965 |
| Structured Agency Credit Risk Debt FRN | | |
| Ser. 18-HQA1, Class M2, (1 Month US LIBOR | |
| + 2.30%), 4.092%, 9/25/30 | 185,000 | 187,084 |
| | |
| MORTGAGE-BACKED | | |
| SECURITIES (66.2%)*cont. | Principal amount | Value |
| |
| Residential mortgage-backed securities (non-agency)cont. | |
| Federal Home Loan Mortgage Corporation 144A | |
| Structured Agency Credit Risk Trust FRB | | |
| Ser. 19-HQA1, Class B2, (1 Month US LIBOR | |
| + 12.25%), 14.042%, 2/25/49 | $50,000 | $66,328 |
| Structured Agency Credit Risk Trust FRB | | |
| Ser. 18-HQA2, Class B2, (1 Month US LIBOR | |
| + 11.00%), 12.792%, 10/25/48 | 93,000 | 121,432 |
| Structured Agency Credit Risk Trust FRB | | |
| Ser. 19-DNA1, Class B2, (1 Month US LIBOR | |
| + 10.75%), 12.542%, 1/25/49 | 32,000 | 42,024 |
| Structured Agency Credit Risk Trust FRB | | |
| Ser. 19-DNA2, Class B2, (1 Month US LIBOR | |
| + 10.50%), 12.292%, 3/25/49 | 62,000 | 80,381 |
| Structured Agency Credit Risk Trust FRB | | |
| Ser. 18-DNA3, Class B2, (1 Month US LIBOR | |
| + 7.75%), 9.542%, 9/25/48 | 330,000 | 360,241 |
| Structured Agency Credit Risk Trust FRB | | |
| Ser. 19-DNA4, Class B2, (1 Month US LIBOR | |
| + 6.25%), 7.958%, 10/25/49 | 90,000 | 92,188 |
| Structured Agency Credit Risk Trust FRB | | |
| Ser. 19-FTR3, Class FTR3, (1 Month US LIBOR | |
| + 4.80%), 6.536%, 9/25/47 | 29,000 | 29,873 |
| Structured Agency Credit Risk Trust FRB | | |
| Ser. 19-DNA1, Class B1, (1 Month US LIBOR | |
| + 4.65%), 6.442%, 1/25/49 | 50,000 | 54,017 |
| Structured Agency Credit Risk Trust FRB | | |
| Ser. 19-DNA2, Class B1, (1 Month US LIBOR | |
| + 4.35%), 6.142%, 3/25/49 | 60,000 | 64,287 |
| Structured Agency Credit Risk Trust FRB | | |
| Ser. 18-HQA2, Class B1, (1 Month US LIBOR | |
| + 4.25%), 6.042%, 10/25/48 | 70,000 | 75,729 |
| Structured Agency Credit Risk Trust FRB | | |
| Ser. 18-DNA2, Class B1, (1 Month US LIBOR | |
| + 3.70%), 5.492%, 12/25/30 | 410,000 | 434,551 |
| Structured Agency Credit Risk Debt FRN | | |
| Ser. 19-HQA3, Class B1, (1 Month US LIBOR | |
| + 3.00%), 4.792%, 9/25/49 | 220,000 | 222,904 |
| Seasoned Credit Risk Transfer Trust Ser. 19-2, | |
| Class M, 4.75%, 8/25/58W | 69,000 | 71,206 |
| Seasoned Credit Risk Transfer Trust FRB | | |
| Ser. 18-3, Class 3, 4.75%, 8/25/57W | 70,000 | 72,819 |
| Structured Agency Credit Risk Trust FRB | | |
| Ser. 19-DNA1, Class M2, (1 Month US LIBOR | |
| + 2.65%), 4.442%, 1/25/49 | 76,000 | 77,286 |
| Structured Agency Credit Risk Trust FRB | | |
| Ser. 19-DNA2, Class M2, (1 Month US LIBOR | |
| + 2.45%), 4.242%, 3/25/49 | 218,752 | 220,998 |
| Structured Agency Credit Risk Trust FRB | | |
| Ser. 19-HQA1, Class M2, (1 Month US LIBOR | |
| + 2.35%), 4.142%, 2/25/49 | 197,000 | 198,965 |
| Structured Agency Credit Risk Trust FRB | | |
| Ser. 18-DNA2, Class M2, (1 Month US LIBOR | |
| + 2.15%), 3.942%, 12/25/30 | 45,000 | 45,439 |
| Federal National Mortgage Association | | |
| Connecticut Avenue Securities FRB Ser. 16-C02, | |
| Class 1B, (1 Month US LIBOR + 12.25%), 14.042%, | |
| 9/25/28 | 51,793 | 74,656 |
| Connecticut Avenue Securities FRB Ser. 16-C03, | |
| Class 1B, (1 Month US LIBOR + 11.75%), 13.542%, | |
| 10/25/28 | 155,525 | 220,818 |
| Connecticut Avenue Securities FRB Ser. 16-C05, | |
| Class 2B, (1 Month US LIBOR + 10.75%), 12.542%, | |
| 1/25/29 | 9,975 | 13,301 |
| |
| Putnam VT Mortgage Securities Fund9 |
| | |
| MORTGAGE-BACKED | | |
| SECURITIES (66.2%)*cont. | Principal amount | Value |
| |
| Residential mortgage-backed securities (non-agency)cont. | |
| Federal National Mortgage Association | | |
| Connecticut Avenue Securities FRB Ser. 16-C02, | |
| Class 1M2, (1 Month US LIBOR + 6.00%), 7.792%, | |
| 9/25/28 | $114,445 | $124,618 |
| Connecticut Avenue Securities FRB Ser. 15-C04, | |
| Class 1M2, (1 Month US LIBOR + 5.70%), 7.492%, | |
| 4/25/28 | 58,489 | 64,857 |
| Connecticut Avenue Securities FRB Ser. 17-C02, | |
| Class 2B1, (1 Month US LIBOR + 5.50%), 7.292%, | |
| 9/25/29 | 44,000 | 51,643 |
| Connecticut Avenue Securities FRB Ser. 16-C03, | |
| Class 1M2, (1 Month US LIBOR + 5.30%), 7.092%, | |
| 10/25/28 | 167,000 | 180,483 |
| Connecticut Avenue Securities FRB Ser. 17-C07, | |
| Class 2B1, (1 Month US LIBOR + 4.45%), 6.242%, | |
| 5/25/30 | 39,000 | 42,536 |
| Connecticut Avenue Securities FRB Ser. 17-C06, | |
| Class 2B1, (1 Month US LIBOR + 4.45%), 6.242%, | |
| 2/25/30 | 60,000 | 65,222 |
| Connecticut Avenue Securities FRB Ser. 16-C05, | |
| Class 2M2, (1 Month US LIBOR + 4.45%), 6.242%, | |
| 1/25/29 | 155,835 | 164,563 |
| Connecticut Avenue Securities FRB Ser. 16-C07, | |
| Class 2M2, (1 Month US LIBOR + 4.35%), 6.142%, | |
| 5/25/29 | 16,775 | 17,638 |
| Connecticut Avenue Securities FRB Ser. 18-C05, | |
| Class 1B1, (1 Month US LIBOR + 4.25%), 6.042%, | |
| 1/25/31 | 90,000 | 98,102 |
| Connecticut Avenue Securities FRB Ser. 17-C06, | |
| Class 1B1, (1 Month US LIBOR + 4.15%), 5.942%, | |
| 2/25/30 | 200,000 | 214,974 |
| Connecticut Avenue Securities FRB Ser. 18-C06, | |
| Class 2B1, (1 Month US LIBOR + 4.10%), 5.892%, | |
| 3/25/31 | 59,000 | 63,529 |
| Connecticut Avenue Securities FRB Ser. 17-C07, | |
| Class 1B1, (1 Month US LIBOR + 4.00%), 5.792%, | |
| 5/25/30 | 220,000 | 237,792 |
| Connecticut Avenue Securities FRB Ser. 17-C05, | |
| Class 1B1, (1 Month US LIBOR + 3.60%), 5.392%, | |
| 1/25/30 | 418,000 | 441,134 |
| Connecticut Avenue Securities FRB Ser. 18-C01, | |
| Class 1B1, (1 Month US LIBOR + 3.55%), 5.342%, | |
| 7/25/30 | 379,000 | 400,482 |
| Connecticut Avenue Securities FRB Ser. 17-C01, | |
| Class 1M2, (1 Month US LIBOR + 3.55%), 5.342%, | |
| 7/25/29 | 196,000 | 207,182 |
| Connecticut Avenue Securities FRB Ser. 17-C06, | |
| Class 1M2, (1 Month US LIBOR + 2.65%), 4.442%, | |
| 2/25/30 | 165,000 | 169,016 |
| Connecticut Avenue Securities FRB Ser. 18-C04, | |
| Class 2M2, (1 Month US LIBOR + 2.55%), 4.342%, | |
| 12/25/30 | 247,000 | 251,337 |
| Connecticut Avenue Securities FRB Ser. 18-C05, | |
| Class 1M2, (1 Month US LIBOR + 2.35%), 4.142%, | |
| 1/25/31 | 84,000 | 85,188 |
| Connecticut Avenue Securities FRB Ser. 18-C01, | |
| Class 1M2, (1 Month US LIBOR + 2.25%), 4.042%, | |
| 7/25/30 | 25,000 | 25,330 |
| Connecticut Avenue Securities FRB Ser. 18-C02, | |
| Class 2M2, (1 Month US LIBOR + 2.20%), 3.992%, | |
| 8/25/30 | 291,601 | 293,624 |
| Connecticut Avenue Securities FRB Ser. 18-C03, | |
| Class 1M2, (1 Month US LIBOR + 2.15%), 3.942%, | |
| 10/25/30 | 151,000 | 152,165 |
| | | |
| MORTGAGE-BACKED | | | |
| SECURITIES (66.2%)*cont. | Principal amount | Value |
| |
| Residential mortgage-backed securities (non-agency)cont. | |
| Federal National Mortgage Association 144A | | |
| Connecticut Avenue Securities Trust FRB | | |
| Ser. 19-R01, Class 2B1, (1 Month US LIBOR | | |
| + 4.35%), 6.142%, 7/25/31 | | $47,000 | $50,576 |
| Connecticut Avenue Securities Trust FRB | | |
| Ser. 19-R02, Class 1M2, (1 Month US LIBOR | | |
| + 2.30%), 4.092%, 8/25/31 | | 42,000 | 42,287 |
| JPMorgan Alternative Loan Trust FRB Ser. 06-A6, | | |
| Class 1A1, (1 Month US LIBOR + 0.16%), 1.952%, | | |
| 11/25/36 | | 124,493 | 121,395 |
| Legacy Mortgage Asset Trust 144A FRB Ser. 19-GS2, | | |
| Class A2, 4.25%, 1/25/59 | | 100,000 | 99,750 |
| Morgan Stanley ABS Capital I, Inc. Trust FRB | | |
| Ser. 04-HE9, Class M2, (1 Month US LIBOR | | |
| + 0.93%), 2.722%, 11/25/34 | | 49,763 | 49,596 |
| Morgan Stanley Re-REMIC Trust 144A FRB | | |
| Ser. 10-R4, Class 4B, (1 Month US LIBOR | | | |
| + 0.23%), 3.027%, 2/26/37 | | 119,992 | 107,333 |
| Oaktown Re II, Ltd. 144A FRB Ser. 18-1A, | | | |
| Class M2, (1 Month US LIBOR + 2.85%), 4.642%, | | |
| 7/25/28 (Bermuda) | | 220,000 | 222,819 |
| Structured Asset Mortgage Investments II Trust | | |
| FRB Ser. 06-AR7, Class A1BG, (1 Month US LIBOR | | |
| + 0.12%), 1.912%, 8/25/36 | | 53,304 | 49,142 |
| WaMu Mortgage Pass-Through Certificates Trust | | |
| FRB Ser. 05-AR12, Class 1A8, 3.884%, 10/25/35W | 86,070 | 86,844 |
| FRB Ser. 05-AR14, Class 1A2, 3.844%, 12/25/35W | 284,694 | 282,409 |
| FRB Ser. 05-AR8, Class 2AC2, (1 Month US LIBOR | | |
| + 0.92%), 2.712%, 7/25/45 | | 106,412 | 106,103 |
| Wells Fargo Home Equity Asset-Backed Securities | | |
| Trust FRB Ser. 07-2, Class A3, (1 Month US LIBOR | | |
| + 0.23%), 2.022%, 4/25/37 | | 88,544 | 86,115 |
| | | | 12,702,080 |
| | |
| Total mortgage-backed securities (cost $38,861,893) | $38,935,169 |
| | | |
| PURCHASED SWAP OPTIONS OUTSTANDING(2.8%)* | | |
| Counterparty | Notional/ | |
| Fixed right % to receive or (pay)/ | Expiration | Contract | |
| Floating rate index/Maturity date | date/strike | amount | Value |
| |
| Bank of America N.A. | | | |
| 2.785/3 month USD- | | | |
| LIBOR-BBA/Jan-47 | Jan-27/2.785 | $1,166,600 | $157,363 |
| (2.785)/3 month USD- | | | |
| LIBOR-BBA/Jan-47 | Jan-27/2.785 | 1,166,600 | 58,423 |
| 2.3075/3 month USD- | | | |
| LIBOR-BBA/Jun-52 | Jun-22/2.3075 | 503,600 | 51,095 |
| (2.3075)/3 month USD- | | | |
| LIBOR-BBA/Jun-52 | Jun-22/2.3075 | 503,600 | 29,999 |
| Citibank, N.A. | | | |
| (1.316)/3 month USD- | | | |
| LIBOR-BBA/Oct-21 | Oct-20/1.316 | 7,210,300 | 26,173 |
| (2.18775)/3 month USD- | | | |
| LIBOR-BBA/Mar-25 | Mar-20/2.18775 | 3,432,600 | 11,980 |
| 1.316/3 month USD- | | | |
| LIBOR-BBA/Oct-21 | Oct-20/1.316 | 7,210,300 | 5,624 |
| 1.621/3 month USD- | | | |
| LIBOR-BBA/Jan-30 | Jan-20/1.621 | 4,413,000 | 44 |
| |
| 10Putnam VT Mortgage Securities Fund |
| | | |
| PURCHASED SWAP OPTIONS OUTSTANDING(2.8%)*cont. | |
| Counterparty Notional/ | |
| Fixed right % to receive or (pay)/ | Expiration | Contract | |
| Floating rate index/Maturity date | date/strike | amount | Value |
| | | | |
| Goldman Sachs International | | | |
| (2.983)/3 month USD- | | | |
| LIBOR-BBA/May-52 | May-22/2.983 | $1,045,200 | $18,385 |
| 1.71875/3 month USD- | | | |
| LIBOR-BBA/Jan-30 | Jan-20/1.71875 | 3,424,400 | 1,541 |
| Morgan Stanley & Co. International PLC | | |
| 2.7725/3 month USD- | | | |
| LIBOR-BBA/Feb-31 | Feb-21/2.7725 | 3,267,200 | 259,122 |
| 2.764/3 month USD- | | | |
| LIBOR-BBA/Feb-31 | Feb-21/2.764 | 3,267,200 | 257,063 |
| 3.00/3 month USD- | | | |
| LIBOR-BBA/Feb-73 | Feb-48/3.00 | 790,100 | 158,779 |
| 3.00/3 month USD- | | | |
| LIBOR-BBA/Apr-72 | Apr-47/3.00 | 790,100 | 158,115 |
| 3.00/3 month USD- | | | |
| LIBOR-BBA/Apr-72 | Apr-47/3.00 | 790,100 | 157,973 |
| 2.75/3 month USD- | | | |
| LIBOR-BBA/May-73 | May-48/2.75 | 790,100 | 132,539 |
| (1.613)/3 month USD- | | | |
| LIBOR-BBA/Aug-34 | Aug-24/1.613 | 951,100 | 68,327 |
| 1.613/3 month USD- | | | |
| LIBOR-BBA/Aug-34 | Aug-24/1.613 | 951,100 | 25,946 |
| (2.7725)/3 month USD- | | | |
| LIBOR-BBA/Feb-31 | Feb-21/2.7725 | 3,267,200 | 12,579 |
| (2.764)/3 month USD- | | | |
| LIBOR-BBA/Feb-31 | Feb-21/2.764 | 3,267,200 | 12,252 |
| (2.904)/3 month USD- | | | |
| LIBOR-BBA/May-51 | May-21/2.904 | 447,900 | 4,954 |
| 1.598/3 month USD- | | | |
| LIBOR-BBA/Jan-30 | Jan-20/1.598 | 2,568,000 | 3 |
| Toronto-Dominion Bank | | | |
| (1.715)/3 month USD- | | | |
| LIBOR-BBA/Jan-22 (Canada) | Jan-20/1.715 | 5,768,300 | 1,557 |
| UBS AG | | | |
| (1.5025)/3 month USD- | | | |
| LIBOR-BBA/Oct-21 | Oct-20/1.5025 | 7,498,800 | 17,472 |
| 1.5025/3 month USD- | | | |
| LIBOR-BBA/Oct-21 | Oct-20/1.5025 | 7,498,800 | 9,823 |
| 1.695/3 month USD- | | | |
| LIBOR-BBA/Jan-30 | Jan-20/1.695 | 3,424,400 | 1,952 |
| Total purchased swap options outstanding (cost $1,406,246) | $1,639,083 |
| | | | |
| PURCHASED OPTIONS | | | | |
| OUTSTANDING (0.2%)* | Expiration | Notional | Contract | |
| Counterparty | date/strike price | amount | amount | Value |
| |
| JPMorgan Chase Bank N.A. | | | |
| Government National | | | | |
| Mortgage Association | | | | |
| 30 yr 3.50% TBA | | | | |
| commitments (Call) | Jan-20/$103.41 | $7,000,000 | $7,000,000 | $3,010 |
| Uniform Mortgage-Backed | | | |
| Securities 30 yr 3.00% | | | | |
| TBA commitments (Call) | Jan-20/101.34 | 29,000,000 | 29,000,000 | 49,764 |
| Uniform Mortgage-Backed | | | |
| Securities 30 yr 3.50% | | | | |
| TBA commitments (Call) | Jan-20/102.81 | 19,000,000 | 19,000,000 | 39,881 |
| Uniform Mortgage-Backed | | | |
| Securities 30 yr 4.00% | | | | |
| TBA commitments (Call) | Jan-20/103.91 | 5,000,000 | 5,000,000 | 8,500 |
| Total purchased options outstanding (cost $154,688) | $101,155 |
| | |
| ASSET-BACKED SECURITIES (2.2%)* | Principal amount | Value |
| Mello Warehouse Securitization Trust 144A | | |
| FRB Ser. 18-W1, Class A, (1 Month US LIBOR | |
| + 0.85%), 2.642%, 11/25/51 | $199,333 | $199,333 |
| FRB Ser. 19-1, Class A, (1 Month US LIBOR | | |
| + 0.80%), 2.592%, 6/25/52 | 152,000 | 152,000 |
| Station Place Securitization Trust 144A | | |
| FRB Ser. 19-11, Class A, (1 Month US LIBOR | |
| + 0.75%), 2.53%, 10/24/20 | 134,000 | 134,000 |
| FRB Ser. 19-7, Class A, (1 Month US LIBOR | | |
| + 0.70%), 2.48%, 9/24/20 | 275,000 | 275,000 |
| FRB Ser. 19-3, Class A, (1 Month US LIBOR | | |
| + 0.70%), 2.48%, 6/24/20 | 275,000 | 275,000 |
| FRB Ser. 18-8, Class A, (1 Month US LIBOR | | |
| + 0.70%), 2.48%, 2/24/20 | 136,000 | 136,000 |
| FRB Ser. 19-WL1, Class A, (1 Month US LIBOR | |
| + 0.65%), 2.442%, 8/25/52 | 143,000 | 143,000 |
| Total asset-backed securities (cost $1,314,333) | $1,314,333 |
| | |
| REPURCHASE AGREEMENTS (16.5%)* | Principal amount | Value |
| |
| Interest in $209,450,000 joint tri-party | | |
| repurchase agreement dated 12/31/19 with HSBC | |
| Bank USA, National Association due 1/2/20 — | |
| maturity value of $9,717,848 for an effective | |
| yield of 1.570% (collateralized by various | |
| mortgage backed securities and a U.S. Treasury | |
| note with coupon rates ranging from 3.000% | |
| to 5.000% and due dates ranging from 5/15/20 | |
| to 11/20/48, valued at $213,657,682) | $9,717,000 | $9,717,000 |
| Total repurchase agreements (cost $9,717,000) | $9,717,000 |
| | |
| SHORT-TERM INVESTMENTS (4.4%)* | Principal amount | Value |
| | | |
| U.S. Treasury Bills 1.564%, 5/7/20 Δ § | $767,000 | $762,909 |
| U.S. Treasury Bills 1.573%, 5/21/20 Δ § | 675,000 | 670,994 |
| U.S. Treasury Bills 1.908%, 3/12/20 Δ § | 450,000 | 448,685 |
| U.S. Treasury Bills 1.618%, 4/16/20 # Δ § | 242,000 | 240,929 |
| U.S. Treasury Bills 1.555%, 6/11/20 Δ § | 159,000 | 157,908 |
| U.S. Treasury Bills 1.562%, 6/4/20 § | 156,000 | 154,975 |
| U.S. Treasury Bills 1.564%, 6/18/20 Δ | 101,000 | 100,274 |
| U.S. Treasury Bills 1.908%, 1/2/20 | 60,000 | 59,999 |
| Total short-term investments (cost $2,596,198) | $2,596,673 |
| | | |
| Total investments (cost $92,983,369) | | $93,307,606 |
| |
| Key to holding’s abbreviations |
| |
| FRB | Floating Rate Bonds: the rate shown is the current interest rate at the |
| | close of the reporting period. Rates may be subject to a cap or floor. |
| | For certain securities, the rate may represent a fixed rate currently in |
| | place at the close of the reporting period. |
| FRN | Floating Rate Notes: the rate shown is the current interest rate or |
| | yield at the close of the reporting period. Rates may be subject to a |
| | cap or floor. For certain securities, the rate may represent a fixed rate |
| | currently in place at the close of the reporting period. |
| IFB | Inverse Floating Rate Bonds, which are securities that pay interest |
| | rates that vary inversely to changes in the market interest rates. As |
| | interest rates rise, inverse floaters produce less current income. The |
| | rate shown is the current interest rate at the close of the reporting |
| | period. Rates may be subject to a cap or floor. |
| IO | Interest Only |
| PO | Principal Only |
| TBA | To Be Announced Commitments |
| |
| Putnam VT Mortgage Securities Fund11 |
Notes to the fund’s portfolio
Unless noted otherwise, the notes to the fund’s portfolio are for the close of the fund’s reporting period, which ran from January 1, 2019 through December 31, 2019 (the reporting period). Within the following notes to the portfolio, references to “Putnam Management” represent Putnam Investment Management, LLC, the fund’s manager, an indirect wholly-owned subsidiary of Putnam Investments, LLC and references to “ASC 820” represent Accounting Standards Codification 820Fair Value Measurements and Disclosures.
* Percentages indicated are based on net assets of $58,786,841.
# This security, in part or in entirety, was pledged and segregated with the broker to cover margin requirements for futures contracts at the close of the reporting period. Collateral at period end totaled $26,879 and is included in Investments in securities on the Statement of assets and liabilities (Notes 1 and 8).
ΔThis security, in part or in entirety, was pledged and segregated with the custodian for collateral on certain derivative contracts at the close of the reporting period. Collateral at period end totaled $1,236,808 and is included in Investments in securities on the Statement of assets and liabilities (Notes 1 and 8).
§ This security, in part or in entirety, was pledged and segregated with the custodian for collateral on the initial margin on certain centrally cleared derivative contracts at the close of the reporting period. Collateral at period end totaled $1,135,367 and is included in Investments in securities on the Statement of assets and liabilities (Notes 1 and 8).
iThis security was pledged, or purchased with cash that was pledged, to the fund for collateral on certain derivative contracts (Note 1).
WThe rate shown represents the weighted average coupon associated with the underlying mortgage pools. Rates may be subject to a cap or floor.
At the close of the reporting period, the fund maintained liquid assets totaling $54,071,431 to cover certain derivative contracts and delayed delivery securities.
Unless otherwise noted, the rates quoted in Short-term investments security descriptions represent the weighted average yield to maturity.
144A after the name of an issuer represents securities exempt from registration under Rule 144A of the Securities Act of 1933, as amended. These securities may be resold in transactions exempt from registration, normally to qualified institutional buyers.
See Note 1 to the financial statements regarding TBA commitments.
The dates shown on debt obligations are the original maturity dates.
| | | | | |
| FUTURES | | | | | |
| CONTRACTS | Number | | | | Unrealized |
| OUTSTANDING | of | Notional | | Expiration | appreciation/ |
| at 12/31/19 | contracts | amount | Value | date | (depreciation) |
| U.S. Treasury | | | | | |
| Bond Ultra 30 yr | | | | | |
| (Long) | 2 | $363,313 | $363,313 | Mar-20 | $(12,255) |
| U.S. Treasury | | | | | |
| Note 2 yr (Long) | 8 | 1,724,000 | 1,724,000 | Mar-20 | (1,205) |
| U.S. Treasury | | | | | |
| Note 5 yr (Short) | 14 | 1,660,531 | 1,660,531 | Mar-20 | 5,984 |
| Unrealized appreciation | | | | 5,984 |
| Unrealized (depreciation) | | | | (13,460) |
| Total | | | | | $(7,476) |
| | | |
| WRITTEN SWAP OPTIONS OUTSTANDING at 12/31/19 (premiums $1,442,410) |
| Counterparty | | | |
| Fixed Obligation % to | | Notional/ | |
| receive or (pay)/Floating | Expiration | Contract | |
| rate index/Maturity date | date/strike | amount | Value |
| Citibank, N.A. | | | |
| (1.706)/3 month | | | |
| USD-LIBOR-BBA/Jan-30 | Jan-20/1.706 | $2,206,500 | $132 |
| 1.999/3 month | | | |
| USD-LIBOR-BBA/Mar-25 | Mar-20/1.999 | 1,716,300 | 12,889 |
| | | |
| WRITTEN SWAP OPTIONS OUTSTANDING at 12/31/19 | | |
| (premiums $1,442,410)cont. | | | |
| Counterparty | | | |
| Fixed Obligation % to | | Notional/ | |
| receive or (pay)/Floating | Expiration | Contract | |
| rate index/Maturity date | date/strike | amount | Value |
| Citibank, N.A.cont. | | | |
| (1.865)/3 month | | | |
| USD-LIBOR-BBA/Oct-39 | Oct-29/1.865 | $721,000 | $31,061 |
| 1.865/3 month | | | |
| USD-LIBOR-BBA/Oct-39 | Oct-29/1.865 | 721,000 | 52,799 |
| Goldman Sachs International | | |
| (1.81875)/3 month | | | |
| USD-LIBOR-BBA/Jan-30 | Jan-20/1.81875 | 1,712,200 | 3,236 |
| 2.823/3 month | | | |
| USD-LIBOR-BBA/May-27 | May-22/2.823 | 4,180,800 | 17,434 |
| Morgan Stanley & Co. | | | |
| International PLC | | | |
| (1.668)/3 month | | | |
| USD-LIBOR-BBA/Jan-30 | Jan-20/1.668 | 1,284,000 | 1 |
| 2.7225/3 month | | | |
| USD-LIBOR-BBA/Feb-30 | Feb-20/2.7225 | 2,376,000 | 48 |
| 2.715/3 month | | | |
| USD-LIBOR-BBA/Feb-30 | Feb-20/2.715 | 2,376,000 | 119 |
| 2.664/3 month | | | |
| USD-LIBOR-BBA/May-26 | May-21/2.664 | 1,791,800 | 3,834 |
| 1.868/3 month | | | |
| USD-LIBOR-BBA/Jan-30 | Jan-20/1.868 | 1,712,000 | 4,194 |
| (1.512)/3 month | | | |
| USD-LIBOR-BBA/Aug-32 | Aug-22/1.512 | 951,100 | 17,652 |
| 3.01/3 month | | | |
| USD-LIBOR-BBA/Feb-36 | Feb-26/3.01 | 891,000 | 20,974 |
| 2.97/3 month | | | |
| USD-LIBOR-BBA/Feb-36 | Feb-26/2.97 | 891,000 | 21,714 |
| 1.512/3 month | | | |
| USD-LIBOR-BBA/Aug-32 | Aug-22/1.512 | 951,100 | 61,508 |
| (2.97)/3 month | | | |
| USD-LIBOR-BBA/Feb-36 | Feb-26/2.97 | 891,000 | 78,693 |
| (3.01)/3 month | | | |
| USD-LIBOR-BBA/Feb-36 | Feb-26/3.01 | 891,000 | 80,716 |
| (2.75)/3 month | | | |
| USD-LIBOR-BBA/May-49 | May-25/2.75 | 790,100 | 117,685 |
| (3.00)/3 month | | | |
| USD-LIBOR-BBA/Apr-48 | Apr-23/3.00 | 790,100 | 145,378 |
| (3.00)/3 month | | | |
| USD-LIBOR-BBA/Apr-48 | Apr-23/3.00 | 790,100 | 145,394 |
| (3.00)/3 month | | | |
| USD-LIBOR-BBA/Jan-49 | Jan-24/3.00 | 790,100 | 145,979 |
| (2.715)/3 month | | | |
| USD-LIBOR-BBA/Feb-30 | Feb-20/2.715 | 2,376,000 | 181,408 |
| (2.7225)/3 month | | | |
| USD-LIBOR-BBA/Feb-30 | Feb-20/2.7225 | 2,376,000 | 183,166 |
| Toronto-Dominion Bank | | | |
| 1.8055/3 month | | | |
| USD-LIBOR-BBA/Jan-30 | Jan-20/1.8055 | 1,153,700 | 10,372 |
| UBS AG | | | |
| (1.80)/3 month | | | |
| USD-LIBOR-BBA/Jan-30 | Jan-20/1.80 | 1,712,200 | 3,459 |
| (1.9875)/3 month | | | |
| USD-LIBOR-BBA/Oct-36 | Oct-26/1.9875 | 836,400 | 36,066 |
| 1.9875/3 month | | | |
| USD-LIBOR-BBA/Oct-36 | Oct-26/1.9875 | 836,400 | 51,405 |
| Total | | | $1,427,316 |
| |
| 12Putnam VT Mortgage Securities Fund |
| | | | |
| WRITTEN OPTIONS OUTSTANDING at 12/31/19 (premiums $154,688) | |
| | Expiration | | | |
| | date/strike | Notional | Contract | |
| Counterparty | price | amount | amount | Value |
| JPMorgan Chase Bank N.A. | | | |
| Government National | | | | |
| Mortgage Association | | | | |
| 30 yr 3.50% TBA | | | | |
| commitments (Put) | Jan-20/$103.41 | $7,000,000 | $7,000,000 | $25,424 |
| Uniform Mortgage- | | | | |
| Backed Securities | | | | |
| 30 yr 3.00% TBA | | | | |
| commitments (Put) | Jan-20/101.34 | 29,000,000 | 29,000,000 | 18,038 |
| | | |
| WRITTEN OPTIONS OUTSTANDING at 12/31/19 (premiums $154,688)cont. |
| | Expiration | | | |
| | date/strike | Notional | Contract | |
| Counterparty | price | amount | amount | Value |
| JPMorgan Chase Bank N.A.cont. | | |
| Uniform Mortgage- | | | |
| Backed Securities | | | |
| 30 yr 3.50% TBA | | | |
| commitments (Put) | Jan-20/$102.81 | $19,000,000 | $19,000,000 | $23,560 |
| Uniform Mortgage- | | | |
| Backed Securities | | | |
| 30 yr 4.00% TBA | | | |
| commitments (Put) | Jan-20/103.91 | 5,000,000 | 5,000,000 | 1,860 |
| Total | | | $68,882 |
| | | | |
| FORWARD PREMIUM SWAP OPTION CONTRACTS OUTSTANDING at 12/31/19 | | | | |
| Counterparty | | | Premium | Unrealized |
| Fixed right or obligation % to receive or (pay)/ | Expiration | Contract | receivable/ | appreciation/ |
| Floating rate index/Maturity date | date/strike | amount | (payable) | (depreciation) |
| Bank of America N.A. | | | | |
| 2.2275/3 month USD-LIBOR-BBA/May-24 (Purchased) | May-22/2.2275 | $4,806,000 | $(44,335) | $19,945 |
| (3.312)/3 month USD-LIBOR-BBA/Nov-38 (Purchased) | Nov-28/3.312 | 4,197,400 | (95,950) | 5,247 |
| 2.027/3 month USD-LIBOR-BBA/Jul-30 (Purchased) | Jul-20/2.027 | 1,058,800 | (24,352) | 720 |
| (2.027)/3 month USD-LIBOR-BBA/Jul-30 (Purchased) | Jul-20/2.027 | 1,058,800 | (24,352) | (11,297) |
| 3.312/3 month USD-LIBOR-BBA/Nov-38 (Purchased) | Nov-28/3.312 | 4,197,400 | (472,139) | (19,056) |
| (2.2275)/3 month USD-LIBOR-BBA/May-24 (Purchased) | May-22/2.2275 | 4,806,000 | (44,335) | (25,424) |
| (3.195)/3 month USD-LIBOR-BBA/Nov-55 (Written) | Nov-25/3.195 | 1,981,700 | 529,234 | 27,427 |
| 3.195/3 month USD-LIBOR-BBA/Nov-55 (Written) | Nov-25/3.195 | 1,981,700 | 64,857 | (2,814) |
| Citibank, N.A. | | | | |
| 2.689/3 month USD-LIBOR-BBA/Nov-49 (Purchased) | Nov-24/2.689 | 237,000 | (30,514) | 6,010 |
| 1.81/3 month USD-LIBOR-BBA/Jan-30 (Purchased) | Jan-20/1.81 | 2,574,500 | (5,149) | 669 |
| (2.689)/3 month USD-LIBOR-BBA/Nov-49 (Purchased) | Nov-24/2.689 | 237,000 | (30,514) | (16,526) |
| 1.765/3 month USD-LIBOR-BBA/Jun-25 (Purchased) | Jun-20/1.765 | 4,505,600 | (60,375) | (17,617) |
| (1.765)/3 month USD-LIBOR-BBA/Jun-25 (Purchased) | Jun-20/1.765 | 4,505,600 | (60,375) | (26,943) |
| (1.245)/3 month USD-LIBOR-BBA/Aug-24 (Written) | Aug-22/1.245 | 3,364,200 | 30,782 | 15,576 |
| 1.99/3 month USD-LIBOR-BBA/Jan-30 (Written) | Jan-20/1.99 | 1,716,300 | 2,060 | (309) |
| 1.245/3 month USD-LIBOR-BBA/Aug-24 (Written) | Aug-22/1.245 | 3,364,200 | 30,782 | (16,821) |
| Goldman Sachs International | | | | |
| 2.8175/3 month USD-LIBOR-BBA/Mar-47 (Purchased) | Mar-27/2.8175 | 233,300 | (29,454) | 5,954 |
| 1.8115/3 month USD-LIBOR-BBA/Jan-30 (Purchased) | Jan-20/1.8115 | 2,574,500 | (5,664) | 953 |
| (2.13)/3 month USD-LIBOR-BBA/Dec-30 (Purchased) | Dec-20/2.13 | 686,500 | (9,697) | 439 |
| (2.7475)/3 month USD-LIBOR-BBA/Feb-30 (Purchased) | Feb-20/2.7475 | 4,128,600 | (64) | 4 |
| 2.7475/3 month USD-LIBOR-BBA/Feb-30 (Purchased) | Feb-20/2.7475 | 4,128,600 | (339,654) | (11,065) |
| (2.8175)/3 month USD-LIBOR-BBA/Mar-47 (Purchased) | Mar-27/2.8175 | 233,300 | (29,454) | (14,838) |
| 1.755/3 month USD-LIBOR-BBA/Jun-25 (Purchased) | Jun-20/1.755 | 4,505,600 | (60,600) | (18,788) |
| (1.755)/3 month USD-LIBOR-BBA/Jun-25 (Purchased) | Jun-20/1.755 | 4,505,600 | (60,600) | (25,952) |
| (2.9425)/3 month USD-LIBOR-BBA/Feb-34 (Written) | Feb-24/2.9425 | 2,064,300 | 190,599 | 10,755 |
| 1.9915/3 month USD-LIBOR-BBA/Jan-30 (Written) | Jan-20/1.9915 | 1,716,300 | 3,141 | 446 |
| 2.9425/3 month USD-LIBOR-BBA/Feb-34 (Written) | Feb-24/2.9425 | 2,064,300 | 34,033 | (826) |
| JPMorgan Chase Bank N.A. | | | | |
| 2.8325/3 month USD-LIBOR-BBA/Feb-52 (Purchased) | Feb-22/2.8325 | 1,166,600 | (162,887) | 52,660 |
| 2.902/3 month USD-LIBOR-BBA/Nov-49 (Purchased) | Nov-24/2.902 | 237,000 | (36,640) | 6,773 |
| 2.50/3 month USD-LIBOR-BBA/Nov-39 (Purchased) | Nov-29/2.50 | 395,400 | (22,854) | 6,769 |
| (3.162)/3 month USD-LIBOR-BBA/Nov-33 (Purchased) | Nov-20/3.162 | 2,042,400 | (2,492) | 143 |
| 3.162/3 month USD-LIBOR-BBA/Nov-33 (Purchased) | Nov-20/3.162 | 2,042,400 | (290,082) | (9,211) |
| (2.902)/3 month USD-LIBOR-BBA/Nov-49 (Purchased) | Nov-24/2.902 | 237,000 | (25,430) | (14,592) |
| (2.50)/3 month USD-LIBOR-BBA/Nov-39 (Purchased) | Nov-29/2.50 | 395,400 | (41,122) | (16,010) |
| (2.8325)/3 month USD-LIBOR-BBA/Feb-52 (Purchased) | Feb-22/2.8325 | 1,166,600 | (162,887) | (134,042) |
| (3.229)/3 month USD-LIBOR-BBA/Nov-33 (Written) | Nov-23/3.229 | 2,042,400 | 231,812 | 8,803 |
| |
| Putnam VT Mortgage Securities Fund13 |
| | | | |
| FORWARD PREMIUM SWAP OPTION CONTRACTS OUTSTANDING at 12/31/19cont. | | | | |
| Counterparty | | | Premium | Unrealized |
| Fixed right or obligation % to receive or (pay)/ | Expiration | Contract | receivable/ | appreciation/ |
| Floating rate index/Maturity date | date/strike | amount | (payable) | (depreciation) |
| JPMorgan Chase Bank N.A.cont. | | | | |
| 2.975/3 month USD-LIBOR-BBA/Nov-23 (Written) | Nov-20/2.975 | $2,042,400 | $204 | $102 |
| (2.975)/3 month USD-LIBOR-BBA/Nov-23 (Written) | Nov-20/2.975 | 2,042,400 | 78,796 | (286) |
| 3.229/3 month USD-LIBOR-BBA/Nov-33 (Written) | Nov-23/3.229 | 2,042,400 | 22,405 | (470) |
| Morgan Stanley & Co. International PLC | | | | |
| 3.27/3 month USD-LIBOR-BBA/Oct-53 (Purchased) | Oct-23/3.27 | 67,100 | (7,656) | 10,372 |
| 2.505/3 month USD-LIBOR-BBA/Nov-49 (Purchased) | Nov-24/2.505 | 237,000 | (25,501) | 5,603 |
| (2.8025)/3 month USD-LIBOR-BBA/Apr-56 (Purchased) | Apr-26/2.8025 | 1,376,200 | (76,160) | 2,642 |
| (1.5775)/3 month USD-LIBOR-BBA/Sep-22 (Purchased) | Sep-20/1.5775 | 3,468,500 | (19,111) | (5,064) |
| (3.27)/3 month USD-LIBOR-BBA/Oct-53 (Purchased) | Oct-23/3.27 | 67,100 | (7,656) | (5,970) |
| 1.5775/3 month USD-LIBOR-BBA/Sep-22 (Purchased) | Sep-20/1.5775 | 3,468,500 | (19,111) | (7,804) |
| 2.8025/3 month USD-LIBOR-BBA/Apr-56 (Purchased) | Apr-26/2.8025 | 1,376,200 | (283,485) | (17,932) |
| (2.505)/3 month USD-LIBOR-BBA/Nov-49 (Purchased) | Nov-24/2.505 | 237,000 | (36,308) | (18,988) |
| (2.7875)/3 month USD-LIBOR-BBA/Apr-59 (Written) | Apr-29/2.7875 | 1,238,600 | 262,693 | 16,114 |
| 2.7875/3 month USD-LIBOR-BBA/Apr-59 (Written) | Apr-29/2.7875 | 1,238,600 | 85,457 | (2,626) |
| UBS AG | | | | |
| (1.6125)/3 month USD-LIBOR-BBA/Aug-34 (Purchased) | Aug-24/1.6125 | 951,100 | (69,549) | 485 |
| 1.6125/3 month USD-LIBOR-BBA/Aug-34 (Purchased) | Aug-24/1.6125 | 951,100 | (26,089) | 476 |
| (1.30)/3 month USD-LIBOR-BBA/Aug-26 (Written) | Aug-21/1.30 | 2,021,100 | 16,157 | 1,718 |
| 1.30/3 month USD-LIBOR-BBA/Aug-26 (Written) | Aug-21/1.30 | 2,021,100 | 60,039 | (2,830) |
| Wells Fargo Bank, N.A. | | | | |
| 2.2775/3 month USD-LIBOR-BBA/Jul-52 (Purchased) | Jul-22/2.2775 | 264,700 | (22,367) | 4,505 |
| (2.2775)/3 month USD-LIBOR-BBA/Jul-52 (Purchased) | Jul-22/2.2775 | 264,700 | (22,367) | (4,740) |
| Unrealized appreciation | | | | 211,310 |
| Unrealized (depreciation) | | | | (448,841) |
| Total | | | | $(237,531) |
| | | |
| TBA SALE COMMITMENTS OUTSTANDING at 12/31/19 | Principal | Settlement | |
| (proceeds receivable $7,101,289) | amount | date | Value |
| Uniform Mortgage-Backed Securities, 3.50%, 1/1/50 | $2,000,000 | 1/14/20 | $2,057,656 |
| Uniform Mortgage-Backed Securities, 3.00%, 1/1/50 | 4,000,000 | 1/14/20 | 4,057,501 |
| Uniform Mortgage-Backed Securities, 2.50%, 1/1/50 | 1,000,000 | 1/14/20 | 988,984 |
| Total | | | $7,104,141 |
| | | | | | |
| CENTRALLY CLEARED INTEREST RATE SWAP CONTRACTS OUTSTANDING at 12/31/19 | | |
| | | Upfront | | | | Unrealized |
| | | premium | Termination | Payments | Payments | appreciation/ |
| Notional amount | Value | received (paid) | date | made by fund | received by fund | (depreciation) |
| $508,000 | $138,846 | $(17) | 11/8/48 | 3 month USD-LIBOR-BBA — | 3.312% — Semiannually | $139,854 |
| | | | | Quarterly | | |
| 2,042,400 | 206,956 | (29) | 1/3/29 | 3.065% — Semiannually | 3 month USD-LIBOR- | (227,273) |
| | | | | | BBA — Quarterly | |
| 1,127,400 | 116,508 | (16) | 3/4/29 | 3 month USD-LIBOR-BBA — | 3.073% — Semiannually | 126,085 |
| | | | | Quarterly | | |
| 1,633,900 | 180,100 | (36,070) | 12/3/29 | 3 month USD-LIBOR-BBA — | 3.096% — Semiannually | 145,457 |
| | | | | Quarterly | | |
| 6,127,200 | 3,186 | (3,078) | 1/22/20 | 3 month USD-LIBOR-BBA — | 2.86% — Semiannually | 53,901 |
| | | | | Quarterly | | |
| 191,900 | 3,165E | (1) | 2/2/24 | 3 month USD-LIBOR-BBA — | 2.5725% — Semiannually | 3,164 |
| | | | | Quarterly | | |
| 496,600 | 7,769E | (3) | 2/2/24 | 2.528% — Semiannually | 3 month USD-LIBOR- | (7,772) |
| | | | | | BBA — Quarterly | |
| 294,100 | 20,401 | (4) | 2/13/29 | 2.6785% — Semiannually | 3 month USD-LIBOR- | (22,662) |
| | | | | | BBA — Quarterly | |
| 1,039,500 | 26,255E | (210) | 12/2/23 | 3 month USD-LIBOR-BBA — | 2.536% — Semiannually | 26,044 |
| | | | | Quarterly | | |
| |
| 14Putnam VT Mortgage Securities Fund |
| | | | | | |
| CENTRALLY CLEARED INTEREST RATE SWAP CONTRACTS OUTSTANDING at 12/31/19cont. | | |
| | | Upfront | | | | Unrealized |
| | | premium | Termination | Payments | Payments | appreciation/ |
| Notional amount | Value | received (paid) | date | made by fund | received by fund | (depreciation) |
| $359,400 | $5,910E | $(61) | 2/2/24 | 3 month USD-LIBOR-BBA — | 2.57% — Semiannually | $5,849 |
| | | | | Quarterly | | |
| 318,200 | 26,500E | (5) | 3/5/30 | 3 month USD-LIBOR-BBA — | 2.806% — Semiannually | 26,496 |
| | | | | Quarterly | | |
| 835,800 | 57,305E | (12) | 3/16/30 | 2.647% — Semiannually | 3 month USD-LIBOR- | (57,316) |
| | | | | | BBA — Quarterly | |
| 271,600 | 32,430E | (9) | 3/28/52 | 2.67% — Semiannually | 3 month USD-LIBOR- | (32,440) |
| | | | | | BBA — Quarterly | |
| 825,700 | 40,814E | (425) | 3/26/30 | 2.44% — Semiannually | 3 month USD-LIBOR- | (41,238) |
| | | | | | BBA — Quarterly | |
| 647,500 | 7,409E | (4) | 2/2/24 | 3 month USD-LIBOR-BBA — | 2.3075% — Semiannually | 7,406 |
| | | | | Quarterly | | |
| 950,400 | 11,065E | (5) | 2/9/24 | 3 month USD-LIBOR-BBA — | 2.32% — Semiannually | 11,059 |
| | | | | Quarterly | | |
| 1,115,200 | 20,301E | (16) | 3/4/30 | 2.098% — Semiannually | 3 month USD-LIBOR- | (20,317) |
| | | | | | BBA — Quarterly | |
| 229,300 | 4,872E | (5) | 11/20/39 | 3 month USD-LIBOR-BBA — | 2.55% — Semiannually | 4,867 |
| | | | | Quarterly | | |
| 705,700 | 15,772E | (10) | 12/7/30 | 2.184% — Semiannually | 3 month USD-LIBOR- | (15,782) |
| | | | | | BBA — Quarterly | |
| 1,219,900 | 28,191E | — | 12/14/30 | 2.1935% — Semiannually | 3 month USD-LIBOR- | (28,191) |
| | | | | | BBA — Quarterly | |
| 514,200 | 31,304E | — | 6/14/52 | 2.4105% — Semiannually | 3 month USD-LIBOR- | (31,304) |
| | | | | | BBA — Quarterly | |
| 658,600 | 5,734E | (7) | 6/5/29 | 3 month USD-LIBOR-BBA — | 2.2225% — Semiannually | 5,727 |
| | | | | Quarterly | | |
| 55,100 | 2,099E | (2) | 6/22/52 | 2.3075% — Semiannually | 3 month USD-LIBOR- | (2,101) |
| | | | | | BBA — Quarterly | |
| 129,800 | 1,767E | (2) | 6/22/30 | 2.0625% — Semiannually | 3 month USD-LIBOR- | (1,769) |
| | | | | | BBA — Quarterly | |
| 199,100 | 925E | (3) | 7/6/30 | 1.9665% — Semiannually | 3 month USD-LIBOR- | (928) |
| | | | | | BBA — Quarterly | |
| 18,000 | 455E | (1) | 7/5/52 | 2.25% — Semiannually | 3 month USD-LIBOR- | (455) |
| | | | | | BBA — Quarterly | |
| 1,364,300 | 643E | (8) | 2/7/24 | 1.733% — Semiannually | 3 month USD-LIBOR- | (650) |
| | | | | | BBA — Quarterly | |
| 210,100 | 1,720E | (3) | 1/22/31 | 2.035% — Semiannually | 3 month USD-LIBOR- | (1,723) |
| | | | | | BBA — Quarterly | |
| 334,100 | 9,732E | (11) | 7/22/52 | 2.2685% — Semiannually | 3 month USD-LIBOR- | (9,744) |
| | | | | | BBA — Quarterly | |
| 561,600 | 26,928E | (19) | 8/8/52 | 1.9185% — Semiannually | 3 month USD-LIBOR- | 26,908 |
| | | | | | BBA — Quarterly | |
| 476,200 | 17,909E | (7) | 8/28/30 | 1.5095% — Semiannually | 3 month USD-LIBOR- | 17,903 |
| | | | | | BBA — Quarterly | |
| 419,900 | 47,159E | (14) | 9/12/52 | 1.626% — Semiannually | 3 month USD-LIBOR- | 47,144 |
| | | | | | BBA — Quarterly | |
| 4,505,600 | 46,565 | (36) | 9/30/24 | 1.50% — Semiannually | 3 month USD-LIBOR- | 29,936 |
| | | | | | BBA — Quarterly | |
| 4,505,600 | 39,884 | (36) | 10/1/24 | 1.53% — Semiannually | 3 month USD-LIBOR- | 46,777 |
| | | | | | BBA — Quarterly | |
| 1,712,200 | 23,520 | (7,128) | 12/27/29 | 1.746% — Semiannually | 3 month USD-LIBOR- | 16,523 |
| | | | | | BBA — Quarterly | |
| 6,860,000 | 2,881 | (17) | 11/29/20 | Federal funds effective rate | Secured overnight | (3,240) |
| | | | | US — Quarterly | funding rate — Quarterly | |
| 856,000 | 18,473 | (11) | 11/29/29 | 1.655% — Semiannually | 3 month USD-LIBOR- | 18,704 |
| | | | | | BBA — Quarterly | |
| 458,800 | 9,624 | (6) | 12/31/29 | 1.6675% — Semiannually | 3 month USD-LIBOR- | 9,643 |
| | | | | | BBA — Quarterly | |
| 517,000 | 10,852E | (7) | 1/6/30 | 1.668% — Semiannually | 3 month USD-LIBOR- | 10,845 |
| | | | | | BBA — Quarterly | |
| |
| Putnam VT Mortgage Securities Fund15 |
| | | | | | |
| CENTRALLY CLEARED INTEREST RATE SWAP CONTRACTS OUTSTANDING at 12/31/19cont. | | |
| | | Upfront | | | | Unrealized |
| | | premium | Termination | Payments | Payments | appreciation/ |
| Notional amount | Value | received (paid) | date | made by fund | received by fund | (depreciation) |
| $6,220,000 | $2,426 | $(15) | 12/5/20 | Federal funds effective rate | Secured overnight | $(2,699) |
| | | | | US — Quarterly | funding rate — Quarterly | |
| 376,700 | 4,342 | (5) | 12/27/29 | 1.77% — Semiannually | 3 month USD-LIBOR- | 4,364 |
| | | | | | BBA — Quarterly | |
| 65,127,500 | 62,718E | (55,528) | 3/18/22 | 1.60% — Semiannually | 3 month USD-LIBOR- | 7,190 |
| | | | | | BBA — Quarterly | |
| 2,516,700 | 54,197E | 14,209 | 3/18/50 | 3 month USD-LIBOR-BBA — | 2.00% — Semiannually | (39,989) |
| | | | | Quarterly | | |
| 11,999,600 | 166,566E | 91,042 | 3/18/30 | 3 month USD-LIBOR-BBA — | 1.75% — Semiannually | (75,525) |
| | | | | Quarterly | | |
| 119,900 | 857E | (2) | 1/13/30 | 1.81875% — Semiannually | 3 month USD-LIBOR- | 855 |
| | | | | | BBA — Quarterly | |
| 1,918,000 | 11,949 | (25) | 12/17/29 | 1.8252% — Semiannually | 3 month USD-LIBOR- | 12,080 |
| | | | | | BBA — Quarterly | |
| 133,600 | 1,186E | (2) | 1/15/30 | 1.80% — Semiannually | 3 month USD-LIBOR- | 1,184 |
| | | | | | BBA — Quarterly | |
| 6,955,900 | 49,846E | 18,480 | 3/18/25 | 3 month USD-LIBOR-BBA — | 1.58% — Semiannually | (31,367) |
| | | | | Quarterly | | |
| 373,100 | 9,749E | (2,060) | 3/18/50 | 3 month USD-LIBOR-BBA — | 1.98% — Semiannually | (11,810) |
| | | | | Quarterly | | |
| 805,600 | 12,662E | (1,822) | 3/18/30 | 1.73% — Semiannually | 3 month USD-LIBOR- | 10,841 |
| | | | | | BBA — Quarterly | |
| 1,912,000 | 17,321 | (25) | 12/18/29 | 3 month USD-LIBOR-BBA — | 1.7945% — Semiannually | (17,519) |
| | | | | Quarterly | | |
| 20,866,000 | 104,580E | (59,943) | 3/18/25 | 1.625% — Semiannually | 3 month USD-LIBOR- | 44,638 |
| | | | | | BBA — Quarterly | |
| 206,000 | 1,120E | (3) | 12/21/30 | 3 month USD-LIBOR-BBA — | 1.88% — Semiannually | (1,123) |
| | | | | Quarterly | | |
| 4,871,000 | 1,724 | (18) | 12/23/21 | 1.7025% — Semiannually | 3 month USD-LIBOR- | (1,238) |
| | | | | | BBA — Quarterly | |
| 583,500 | 1,074 | (8) | 12/31/29 | 1.875% — Semiannually | 3 month USD-LIBOR- | 1,098 |
| | | | | | BBA — Quarterly | |
| 274,600 | 467 | (6) | 12/31/29 | 1.8765% — Semiannually | 3 month USD-LIBOR- | 480 |
| | | | | | BBA — Quarterly | |
| Total | | $(43,029) | | | | $176,847 |
EExtended effective date.
| | | | | | |
| OTC TOTAL RETURN SWAP CONTRACTS OUTSTANDING at 12/31/19 | | | | |
| | | Upfront | | Payments | Total return | Unrealized |
| Swap counterparty/ | | premium | Termination | received (paid) | received by | appreciation/ |
| Notional amount | Value | received (paid) | date | by fund | or paid by fund | (depreciation) |
| Bank of America N.A. | | | | | | |
| $25,055 | $24,748 | $— | 1/12/41 | 4.00% (1 month USD- | Synthetic TRS Index | $(35) |
| | | | | LIBOR) — Monthly | 4.00% 30 year Fannie Mae | |
| | | | | | pools — Monthly | |
| 18,688 | 18,459 | — | 1/12/41 | 4.00% (1 month USD- | Synthetic TRS Index | (26) |
| | | | | LIBOR) — Monthly | 4.00% 30 year Fannie Mae | |
| | | | | | pools — Monthly | |
| Barclays Bank PLC | | | | | | |
| 205,289 | 205,531 | — | 1/12/40 | 4.00% (1 month USD- | Synthetic MBX Index | 455 |
| | | | | LIBOR) — Monthly | 4.00% 30 year Fannie Mae | |
| | | | | | pools — Monthly | |
| 31,037 | 31,074 | — | 1/12/40 | 4.00% (1 month USD- | Synthetic MBX Index | 69 |
| | | | | LIBOR) — Monthly | 4.00% 30 year Fannie Mae | |
| | | | | | pools — Monthly | |
| 145,496 | 145,560 | — | 1/12/40 | 4.50% (1 month USD- | Synthetic MBX Index | 246 |
| | | | | LIBOR) — Monthly | 4.50% 30 year Fannie Mae | |
| | | | | | pools — Monthly | |
| 6,062 | 6,065 | — | 1/12/40 | 4.50% (1 month USD- | Synthetic MBX Index | 10 |
| | | | | LIBOR) — Monthly | 4.50% 30 year Fannie Mae | |
| | | | | | pools — Monthly | |
| |
| 16Putnam VT Mortgage Securities Fund |
| | | | | | |
| OTC TOTAL RETURN SWAP CONTRACTS OUTSTANDING at 12/31/19cont. | | | |
| | | Upfront | | Payments | Total return | Unrealized |
| Swap counterparty/ | | premium | Termination | received (paid) | received by | appreciation/ |
| Notional amount | Value | received (paid) | date | by fund | or paid by fund | (depreciation) |
| Barclays Bank PLCcont. | | | | | | |
| $3,798,633 | $3,791,584 | $— | 1/12/41 | 5.00% (1 month USD- | Synthetic MBX Index | $(1,554) |
| | | | | LIBOR) — Monthly | 5.00% 30 year Fannie Mae | |
| | | | | | pools — Monthly | |
| 234,392 | 234,960 | — | 1/12/40 | 5.00% (1 month USD- | Synthetic MBX Index | 908 |
| | | | | LIBOR) — Monthly | 5.00% 30 year Fannie Mae | |
| | | | | | pools — Monthly | |
| 42,675 | 42,706 | — | 1/12/41 | 5.00% (1 month USD- | Synthetic MBX Index | 94 |
| | | | | LIBOR) — Monthly | 5.00% 30 year Ginnie Mae | |
| | | | | | II pools — Monthly | |
| 194,331 | 195,464 | — | 1/12/39 | (6.00%) 1 month USD- | Synthetic MBX Index | (1,493) |
| | | | | LIBOR — Monthly | 6.00% 30 year Fannie Mae | |
| | | | | | pools — Monthly | |
| 3,168,774 | 3,170,885 | — | 1/12/38 | (6.50%) 1 month USD- | Synthetic MBX Index | (8,327) |
| | | | | LIBOR — Monthly | 6.50% 30 year Fannie Mae | |
| | | | | | pools — Monthly | |
| 1,380 | 1,369 | — | 1/12/43 | 3.50% (1 month USD- | Synthetic TRS Index | 2 |
| | | | | LIBOR) — Monthly | 3.50% 30 year Fannie Mae | |
| | | | | | pools — Monthly | |
| 22,861 | 22,410 | — | 1/12/42 | 4.00% (1 month USD- | Synthetic TRS Index | (208) |
| | | | | LIBOR) — Monthly | 4.00% 30 year Fannie Mae | |
| | | | | | pools — Monthly | |
| 31,009 | 30,630 | — | 1/12/41 | (4.00%) 1 month USD- | Synthetic TRS Index | 43 |
| | | | | LIBOR — Monthly | 4.00% 30 year Fannie Mae | |
| | | | | | pools — Monthly | |
| 16,221 | 16,196 | — | 1/12/41 | (5.00%) 1 month USD- | Synthetic TRS Index | (175) |
| | | | | LIBOR — Monthly | 5.00% 30 year Fannie Mae | |
| | | | | | pools — Monthly | |
| 13,665 | 13,234 | — | 1/12/39 | 6.00% (1 month USD- | Synthetic TRS Index | (276) |
| | | | | LIBOR) — Monthly | 6.00% 30 year Fannie Mae | |
| | | | | | pools — Monthly | |
| 18,290 | 18,279 | — | 1/12/38 | 6.50% (1 month USD- | Synthetic TRS Index | 203 |
| | | | | LIBOR) — Monthly | 6.50% 30 year Fannie Mae | |
| | | | | | pools — Monthly | |
| 1,300 | 1,299 | — | 1/12/38 | 6.50% (1 month USD- | Synthetic TRS Index | 14 |
| | | | | LIBOR) — Monthly | 6.50% 30 year Fannie Mae | |
| | | | | | pools — Monthly | |
| Citibank, N.A. | | | | | | |
| 43,317 | 43,237 | — | 1/12/41 | 5.00% (1 month USD- | Synthetic MBX Index | (18) |
| | | | | LIBOR) — Monthly | 5.00% 30 year Fannie Mae | |
| | | | | | pools — Monthly | |
| Credit Suisse International | | | | | | |
| 22,295 | 21,892 | — | 1/12/44 | 3.50% (1 month USD- | Synthetic TRS Index | (186) |
| | | | | LIBOR) — Monthly | 3.50% 30 year Fannie Mae | |
| | | | | | pools — Monthly | |
| 10,257 | 10,151 | — | 1/12/45 | 3.50% (1 month USD- | Synthetic TRS Index | (2) |
| | | | | LIBOR) — Monthly | 3.50% 30 year Fannie Mae | |
| | | | | | pools — Monthly | |
| 2,949 | 2,925 | — | 1/12/43 | 3.50% (1 month USD- | Synthetic TRS Index | 5 |
| | | | | LIBOR) — Monthly | 3.50% 30 year Fannie Mae | |
| | | | | | pools — Monthly | |
| 46,186 | 45,667 | — | 1/12/44 | 4.00% (1 month USD- | Synthetic TRS Index | (24) |
| | | | | LIBOR) — Monthly | 4.00% 30 year Fannie Mae | |
| | | | | | pools — Monthly | |
| 21,459 | 21,196 | — | 1/12/41 | 4.00% (1 month USD- | Synthetic TRS Index | (30) |
| | | | | LIBOR) — Monthly | 4.00% 30 year Fannie Mae | |
| | | | | | pools — Monthly | |
| 14,097 | 13,961 | — | 1/12/45 | 4.00% (1 month USD- | Synthetic TRS Index | 17 |
| | | | | LIBOR) — Monthly | 4.00% 30 year Fannie Mae | |
| | | | | | pools — Monthly | |
| |
| Putnam VT Mortgage Securities Fund17 |
| | | | | | |
| OTC TOTAL RETURN SWAP CONTRACTS OUTSTANDING at 12/31/19cont. | | | |
| | | Upfront | | Payments | Total return | Unrealized |
| Swap counterparty/ | | premium | Termination | received (paid) | received by | appreciation/ |
| Notional amount | Value | received (paid) | date | by fund | or paid by fund | (depreciation) |
| Credit Suisse Internationalcont. | | | | | | |
| $10,285 | $10,186 | $— | 1/12/45 | 4.00% (1 month USD- | Synthetic TRS Index | $13 |
| | | | | LIBOR) — Monthly | 4.00% 30 year Fannie Mae | |
| | | | | | pools — Monthly | |
| 36,404 | 35,958 | — | 1/12/41 | (4.00%) 1 month USD- | Synthetic TRS Index | 51 |
| | | | | LIBOR — Monthly | 4.00% 30 year Fannie Mae | |
| | | | | | pools — Monthly | |
| 24,525 | 24,487 | — | 1/12/41 | (5.00%) 1 month USD- | Synthetic TRS Index | (264) |
| | | | | LIBOR — Monthly | 5.00% 30 year Fannie Mae | |
| | | | | | pools — Monthly | |
| Goldman Sachs International | | | | | | |
| 11,477 | 11,485 | — | 1/12/38 | (6.50%) 1 month USD- | Synthetic MBX Index | (30) |
| | | | | LIBOR — Monthly | 6.50% 30 year Fannie Mae | |
| | | | | | pools — Monthly | |
| 30,614 | 30,635 | — | 1/12/38 | (6.50%) 1 month USD- | Synthetic MBX Index | (80) |
| | | | | LIBOR — Monthly | 6.50% 30 year Fannie Mae | |
| | | | | | pools — Monthly | |
| 84,946 | 85,002 | — | 1/12/38 | (6.50%) 1 month USD- | Synthetic MBX Index | (223) |
| | | | | LIBOR — Monthly | 6.50% 30 year Fannie Mae | |
| | | | | | pools — Monthly | |
| 226,117 | 226,268 | — | 1/12/38 | (6.50%) 1 month USD- | Synthetic MBX Index | (594) |
| | | | | LIBOR — Monthly | 6.50% 30 year Fannie Mae | |
| | | | | | pools — Monthly | |
| 309,734 | 309,940 | — | 1/12/38 | (6.50%) 1 month USD- | Synthetic MBX Index | (814) |
| | | | | LIBOR — Monthly | 6.50% 30 year Fannie Mae | |
| | | | | | pools — Monthly | |
| 41,321 | 40,334 | — | 1/12/44 | (3.00%) 1 month USD- | Synthetic TRS Index | 610 |
| | | | | LIBOR — Monthly | 3.00% 30 year Fannie Mae | |
| | | | | | pools — Monthly | |
| 56,733 | 55,614 | — | 1/12/42 | 4.00% (1 month USD- | Synthetic TRS Index | (516) |
| | | | | LIBOR) — Monthly | 4.00% 30 year Fannie Mae | |
| | | | | | pools — Monthly | |
| 56,733 | 55,614 | — | 1/12/42 | 4.00% (1 month USD- | Synthetic TRS Index | (516) |
| | | | | LIBOR) — Monthly | 4.00% 30 year Fannie Mae | |
| | | | | | pools — Monthly | |
| 44,807 | 43,924 | — | 1/12/42 | 4.00% (1 month USD- | Synthetic TRS Index | (408) |
| | | | | LIBOR) — Monthly | 4.00% 30 year Fannie Mae | |
| | | | | | pools — Monthly | |
| 41,987 | 41,160 | — | 1/12/42 | 4.00% (1 month USD- | Synthetic TRS Index | (382) |
| | | | | LIBOR) — Monthly | 4.00% 30 year Fannie Mae | |
| | | | | | pools — Monthly | |
| 37,911 | 37,163 | — | 1/12/42 | 4.00% (1 month USD- | Synthetic TRS Index | (345) |
| | | | | LIBOR) — Monthly | 4.00% 30 year Fannie Mae | |
| | | | | | pools — Monthly | |
| 11,379 | 11,197 | — | 1/12/40 | 4.00% (1 month USD- | Synthetic TRS Index | (56) |
| | | | | LIBOR) — Monthly | 4.00% 30 year Fannie Mae | |
| | | | | | pools — Monthly | |
| 35,755 | 35,317 | — | 1/12/41 | (4.00%) 1 month USD- | Synthetic TRS Index | 50 |
| | | | | LIBOR — Monthly | 4.00% 30 year Fannie Mae | |
| | | | | | pools — Monthly | |
| 31,385 | 31,336 | — | 1/12/41 | (5.00%) 1 month USD- | Synthetic TRS Index | (338) |
| | | | | LIBOR — Monthly | 5.00% 30 year Fannie Mae | |
| | | | | | pools — Monthly | |
| 82,420 | 79,818 | — | 1/12/39 | 6.00% (1 month USD- | Synthetic TRS Index | (1,667) |
| | | | | LIBOR) — Monthly | 6.00% 30 year Fannie Mae | |
| | | | | | pools — Monthly | |
| 57,859 | 56,032 | — | 1/12/39 | 6.00% (1 month USD- | Synthetic TRS Index | (1,171) |
| | | | | LIBOR) — Monthly | 6.00% 30 year Fannie Mae | |
| | | | | | pools — Monthly | |
| 34,154 | 33,076 | — | 1/12/39 | 6.00% (1 month USD- | Synthetic TRS Index | (691) |
| | | | | LIBOR) — Monthly | 6.00% 30 year Fannie Mae | |
| | | | | | pools — Monthly | |
| |
| 18Putnam VT Mortgage Securities Fund |
| | | | | | |
| OTC TOTAL RETURN SWAP CONTRACTS OUTSTANDING at 12/31/19cont. | | | |
| | | Upfront | | Payments | Total return | Unrealized |
| Swap counterparty/ | | premium | Termination | received (paid) | received by | appreciation/ |
| Notional amount | Value | received (paid) | date | by fund | or paid by fund | (depreciation) |
| Goldman Sachs Internationalcont. | | | | | | |
| $133 | $129 | $— | 1/12/39 | 6.00% (1 month USD- | Synthetic TRS Index | $(3) |
| | | | | LIBOR) — Monthly | 6.00% 30 year Fannie Mae | |
| | | | | | pools — Monthly | |
| 40,003 | 39,980 | — | 1/12/38 | 6.50% (1 month USD- | Synthetic TRS Index | 445 |
| | | | | LIBOR) — Monthly | 6.50% 30 year Fannie Mae | |
| | | | | | pools — Monthly | |
| 36,501 | 36,480 | — | 1/12/38 | 6.50% (1 month USD- | Synthetic TRS Index | 406 |
| | | | | LIBOR) — Monthly | 6.50% 30 year Fannie Mae | |
| | | | | | pools — Monthly | |
| 35,371 | 35,351 | — | 1/12/38 | 6.50% (1 month USD- | Synthetic TRS Index | 393 |
| | | | | LIBOR) — Monthly | 6.50% 30 year Fannie Mae | |
| | | | | | pools — Monthly | |
| 28,160 | 28,144 | — | 1/12/38 | 6.50% (1 month USD- | Synthetic TRS Index | 313 |
| | | | | LIBOR) — Monthly | 6.50% 30 year Fannie Mae | |
| | | | | | pools — Monthly | |
| 7,976 | 7,971 | — | 1/12/38 | 6.50% (1 month USD- | Synthetic TRS Index | 89 |
| | | | | LIBOR) — Monthly | 6.50% 30 year Fannie Mae | |
| | | | | | pools — Monthly | |
| JPMorgan Chase Bank N.A. | | | | | | |
| 35,018 | 34,589 | — | 1/12/41 | 4.00% (1 month USD- | Synthetic TRS Index | (49) |
| | | | | LIBOR) — Monthly | 4.00% 30 year Fannie Mae | |
| | | | | | pools — Monthly | |
| 2,948 | 2,912 | — | 1/12/41 | 4.00% (1 month USD- | Synthetic TRS Index | (4) |
| | | | | LIBOR) — Monthly | 4.00% 30 year Fannie Mae | |
| | | | | | pools — Monthly | |
| 31,359 | 31,310 | — | 1/12/41 | (5.00%) 1 month USD- | Synthetic TRS Index | (338) |
| | | | | LIBOR — Monthly | 5.00% 30 year Fannie Mae | |
| | | | | | pools — Monthly | |
| JPMorgan Securities LLC | | | | | | |
| 22,295 | 21,892 | — | 1/12/44 | (3.50%) 1 month USD- | Synthetic TRS Index | 186 |
| | | | | LIBOR — Monthly | 3.50% 30 year Fannie Mae | |
| | | | | | pools — Monthly | |
| 24,373 | 24,099 | — | 1/12/44 | 4.00% (1 month USD- | Synthetic TRS Index | (13) |
| | | | | LIBOR) — Monthly | 4.00% 30 year Fannie Mae | |
| | | | | | pools — Monthly | |
| 261,031 | 255,886 | — | 1/12/42 | (4.00%) 1 month USD- | Synthetic TRS Index | 2,374 |
| | | | | LIBOR — Monthly | 4.00% 30 year Fannie Mae | |
| | | | | | pools — Monthly | |
| Upfront premium received | | — | | Unrealized appreciation | | 6,996 |
| Upfront premium (paid) | | — | | Unrealized (depreciation) | | (20,856) |
| Total | | $— | | Total | | $(13,860) |
| | | | | | | |
| OTC CREDIT DEFAULT CONTRACTS OUTSTANDING — PROTECTION SOLD at 12/31/19 | | | | |
| | | Upfront | | | | | |
| | | premium | | | Termi- | | Unrealized |
| Swap counterparty/ | | received | Notional | | nation | Payments | appreciation/ |
| Referenced debt* | Rating*** | (paid)** | amount | Value | date | received by fund | (depreciation) |
| Citigroup Global Markets, Inc. | | | | | | | |
| CMBX NA A.6 Index | A/P | $(421) | $953,000 | $14,772 | 5/11/63 | 200 bp — | $14,721 |
| | | | | | | Monthly | |
| CMBX NA BB.6 Index | BB–/P | 2,783 | 14,000 | 1,585 | 5/11/63 | 500 bp — | 1,211 |
| | | | | | | Monthly | |
| CMBX NA BB.7 Index | BB/P | 1,666 | 12,000 | 461 | 1/17/47 | 500 bp — | 1,217 |
| | | | | | | Monthly | |
| CMBX NA BB.7 Index | BB/P | 2,571 | 20,000 | 768 | 1/17/47 | 500 bp — | 1,822 |
| | | | | | | Monthly | |
| CMBX NA BBB–.6 Index | BBB–/P | 159 | 2,000 | 102 | 5/11/63 | 300 bp — | 58 |
| | | | | | | Monthly | |
| |
| Putnam VT Mortgage Securities Fund19 |
| | | | | | | |
| OTC CREDIT DEFAULT CONTRACTS OUTSTANDING — PROTECTION SOLD at 12/31/19cont. | | | | |
| | | Upfront | | | | | |
| | | premium | | | Termi- | | Unrealized |
| Swap counterparty/ | | received | Notional | | nation | Payments | appreciation/ |
| Referenced debt* | Rating*** | (paid)** | amount | Value | date | received by fund | (depreciation) |
| Citigroup Global Markets, Inc.cont. | | | | | | |
| CMBX NA BBB–.6 Index | BBB–/P | $266 | $3,000 | $153 | 5/11/63 | 300 bp — | $115 |
| | | | | | | Monthly | |
| CMBX NA BBB–.6 Index | BBB–/P | 1,710 | 20,000 | 1,022 | 5/11/63 | 300 bp — | 699 |
| | | | | | | Monthly | |
| CMBX NA BBB–.6 Index | BBB–/P | 1,208 | 20,000 | 1,022 | 5/11/63 | 300 bp — | 198 |
| | | | | | | Monthly | |
| CMBX NA BBB–.6 Index | BBB–/P | 1,384 | 20,000 | 1,022 | 5/11/63 | 300 bp — | 374 |
| | | | | | | Monthly | |
| CMBX NA BBB–.6 Index | BBB–/P | 1,384 | 20,000 | 1,022 | 5/11/63 | 300 bp — | 374 |
| | | | | | | Monthly | |
| CMBX NA BBB–.6 Index | BBB–/P | 2,261 | 25,000 | 1,278 | 5/11/63 | 300 bp — | 998 |
| | | | | | | Monthly | |
| CMBX NA BBB–.6 Index | BBB–/P | 2,665 | 30,000 | 1,533 | 5/11/63 | 300 bp — | 1,150 |
| | | | | | | Monthly | |
| CMBX NA BBB–.6 Index | BBB–/P | 3,427 | 38,000 | 1,942 | 5/11/63 | 300 bp — | 1,507 |
| | | | | | | Monthly | |
| CMBX NA BBB–.6 Index | BBB–/P | 3,834 | 41,000 | 2,095 | 5/11/63 | 300 bp — | 1,763 |
| | | | | | | Monthly | |
| CMBX NA BBB–.6 Index | BBB–/P | 6,614 | 65,000 | 3,322 | 5/11/63 | 300 bp — | 3,331 |
| | | | | | | Monthly | |
| CMBX NA BBB–.6 Index | BBB–/P | 7,673 | 75,000 | 3,833 | 5/11/63 | 300 bp — | 3,885 |
| | | | | | | Monthly | |
| CMBX NA BBB–.6 Index | BBB–/P | 6,923 | 76,000 | 3,884 | 5/11/63 | 300 bp — | 3,084 |
| | | | | | | Monthly | |
| CMBX NA BBB–.6 Index | BBB–/P | 7,086 | 78,000 | 3,986 | 5/11/63 | 300 bp — | 3,146 |
| | | | | | | Monthly | |
| CMBX NA BBB–.6 Index | BBB–/P | 8,270 | 85,000 | 4,344 | 5/11/63 | 300 bp — | 3,976 |
| | | | | | | Monthly | |
| CMBX NA BBB–.6 Index | BBB–/P | 8,228 | 96,000 | 4,906 | 5/11/63 | 300 bp — | 3,378 |
| | | | | | | Monthly | |
| CMBX NA BBB–.6 Index | BBB–/P | 10,672 | 126,000 | 6,439 | 5/11/63 | 300 bp — | 4,307 |
| | | | | | | Monthly | |
| CMBX NA BBB–.6 Index | BBB–/P | 17,274 | 173,000 | 8,840 | 5/11/63 | 300 bp — | 8,535 |
| | | | | | | Monthly | |
| CMBX NA BBB–.6 Index | BBB–/P | 16,418 | 180,000 | 9,198 | 5/11/63 | 300 bp — | 7,325 |
| | | | | | | Monthly | |
| CMBX NA BBB–.6 Index | BBB–/P | 16,737 | 183,000 | 9,351 | 5/11/63 | 300 bp — | 7,492 |
| | | | | | | Monthly | |
| CMBX NA BBB–.6 Index | BBB–/P | 22,001 | 243,000 | 12,417 | 5/11/63 | 300 bp — | 9,725 |
| | | | | | | Monthly | |
| CMBX NA BBB–.6 Index | BBB–/P | 22,985 | 252,000 | 12,877 | 5/11/63 | 300 bp — | 10,255 |
| | | | | | | Monthly | |
| CMBX NA BBB–.6 Index | BBB–/P | 27,781 | 328,000 | 16,761 | 5/11/63 | 300 bp — | 11,212 |
| | | | | | | Monthly | |
| CMBX NA BBB–.6 Index | BBB–/P | 70,404 | 703,000 | 35,923 | 5/11/63 | 300 bp — | 34,891 |
| | | | | | | Monthly | |
| CMBX NA BBB–.6 Index | BBB–/P | 235,761 | 2,490,000 | 127,239 | 5/11/63 | 300 bp — | 109,975 |
| | | | | | | Monthly | |
| Credit Suisse International | | | | | | | |
| CMBX NA BB.7 Index | BB/P | 2,541 | 19,000 | 730 | 1/17/47 | 500 bp — | 1,830 |
| | | | | | | Monthly | |
| CMBX NA BBB–.6 Index | BBB–/P | 300,774 | 3,201,000 | 163,571 | 5/11/63 | 300 bp — | 139,070 |
| | | | | | | Monthly | |
| Deutsche Bank AG | | | | | | | |
| CMBX NA BBB–.6 Index | BBB–/P | 53,946 | 506,000 | 25,857 | 5/11/63 | 300 bp — | 28,385 |
| | | | | | | Monthly | |
| |
| 20Putnam VT Mortgage Securities Fund |
| | | | | | | |
| OTC CREDIT DEFAULT CONTRACTS OUTSTANDING — PROTECTION SOLD at 12/31/19cont. | | | | |
| | | Upfront | | | | | |
| | | premium | | | Termi- | | Unrealized |
| Swap counterparty/ | | received | Notional | | nation | Payments | appreciation/ |
| Referenced debt* | Rating*** | (paid)** | amount | Value | date | received by fund | (depreciation) |
| Goldman Sachs International | | | | | | | |
| CMBX NA A.6 Index | A/P | $(208) | $109,000 | $1,690 | 5/11/63 | 200 bp — | $1,524 |
| | | | | | | Monthly | |
| CMBX NA A.7 Index | A-/P | (54) | 37,000 | 1,073 | 1/17/47 | 200 bp — | 1,033 |
| | | | | | | Monthly | |
| CMBX NA BBB–.6 Index | BBB–/P | 142 | 1,000 | 51 | 5/11/63 | 300 bp — | 92 |
| | | | | | | Monthly | |
| CMBX NA BBB–.6 Index | BBB–/P | 1,140 | 22,000 | 1,124 | 5/11/63 | 300 bp — | 16 |
| | | | | | | Monthly | |
| CMBX NA BBB–.6 Index | BBB–/P | 9,181 | 79,000 | 4,037 | 5/11/63 | 300 bp — | 5,190 |
| | | | | | | Monthly | |
| CMBX NA BBB–.6 Index | BBB–/P | 24,037 | 208,000 | 10,629 | 5/11/63 | 300 bp — | 13,530 |
| | | | | | | Monthly | |
| CMBX NA BBB–.6 Index | BBB–/P | 41,260 | 411,000 | 21,002 | 5/11/63 | 300 bp — | 20,498 |
| | | | | | | Monthly | |
| CMBX NA BBB–.6 Index | BBB–/P | 50,168 | 470,000 | 24,017 | 5/11/63 | 300 bp — | 26,425 |
| | | | | | | Monthly | |
| JPMorgan Securities LLC | | | | | | | |
| CMBX NA BB.10 Index | BB–/P | 2,006 | 25,000 | 1,465 | 5/11/63 | 500 bp — | 565 |
| | | | | | | Monthly | |
| CMBX NA BBB–.6 Index | BBB–/P | 299 | 3,000 | 153 | 5/11/63 | 300 bp — | 148 |
| | | | | | | Monthly | |
| CMBX NA BBB–.6 Index | BBB–/P | 505 | 8,000 | 409 | 5/11/63 | 300 bp — | 101 |
| | | | | | | Monthly | |
| CMBX NA BBB–.6 Index | BBB–/P | 1,198 | 12,000 | 613 | 5/11/63 | 300 bp — | 591 |
| | | | | | | Monthly | |
| CMBX NA BBB–.6 Index | BBB–/P | 1,246 | 14,000 | 715 | 5/11/63 | 300 bp — | 538 |
| | | | | | | Monthly | |
| CMBX NA BBB–.6 Index | BBB–/P | 2,414 | 24,000 | 1,226 | 5/11/63 | 300 bp — | 1,202 |
| | | | | | | Monthly | |
| CMBX NA BBB–.6 Index | BBB–/P | 2,175 | 35,000 | 1,789 | 5/11/63 | 300 bp — | 407 |
| | | | | | | Monthly | |
| CMBX NA BBB–.6 Index | BBB–/P | 4,442 | 45,000 | 2,300 | 5/11/63 | 300 bp — | 2,168 |
| | | | | | | Monthly | |
| CMBX NA BBB–.6 Index | BBB–/P | 6,923 | 76,000 | 3,884 | 5/11/63 | 300 bp — | 3,084 |
| | | | | | | Monthly | |
| CMBX NA BBB–.6 Index | BBB–/P | 7,983 | 83,000 | 4,241 | 5/11/63 | 300 bp — | 3,790 |
| | | | | | | Monthly | |
| CMBX NA BBB–.6 Index | BBB–/P | 76,069 | 575,000 | 29,383 | 5/11/63 | 300 bp — | 47,022 |
| | | | | | | Monthly | |
| Merrill Lynch International | | | | | | | |
| CMBX NA BB.6 Index | BB–/P | 4,683 | 23,000 | 2,604 | 5/11/63 | 500 bp — | 2,102 |
| | | | | | | Monthly | |
| CMBX NA BB.7 Index | BB/P | 1,452 | 12,000 | 461 | 1/17/47 | 500 bp — | 1,003 |
| | | | | | | Monthly | |
| CMBX NA BBB–.6 Index | BBB–/P | 1,754 | 23,000 | 1,175 | 5/11/63 | 300 bp — | 592 |
| | | | | | | Monthly | |
| CMBX NA BBB–.6 Index | BBB–/P | 3,438 | 38,000 | 1,942 | 5/11/63 | 300 bp — | 1,518 |
| | | | | | | Monthly | |
| CMBX NA BBB–.6 Index | BBB–/P | 84,380 | 945,000 | 48,290 | 5/11/63 | 300 bp — | 36,641 |
| | | | | | | Monthly | |
| Morgan Stanley & Co. International PLC | | | | | | |
| CMBX NA A.6 Index | A/P | 1,267 | 466,000 | 7,223 | 5/11/63 | 200 bp — | 8,671 |
| | | | | | | Monthly | |
| CMBX NA A.6 Index | A/P | — | 452,000 | 7,006 | 5/11/63 | 200 bp — | 7,182 |
| | | | | | | Monthly | |
| CMBX NA A.6 Index | A/P | 3,560 | 325,000 | 5,038 | 5/11/63 | 200 bp — | 8,724 |
| | | | | | | Monthly | |
| |
| Putnam VT Mortgage Securities Fund21 |
| | | | | | | |
| OTC CREDIT DEFAULT CONTRACTS OUTSTANDING — PROTECTION SOLD at 12/31/19cont. | | | | |
| | | Upfront | | | | | |
| | | premium | | | Termi- | | Unrealized |
| Swap counterparty/ | | received | Notional | | nation | Payments | appreciation/ |
| Referenced debt* | Rating*** | (paid)** | amount | Value | date | received by fund | (depreciation) |
| Morgan Stanley & Co. International PLCcont. | | | | | | |
| CMBX NA A.6 Index | A/P | $2,940 | $261,000 | $4,046 | 5/11/63 | 200 bp — | $7,087 |
| | | | | | | Monthly | |
| CMBX NA A.6 Index | A/P | 3,457 | 250,000 | 3,875 | 5/11/63 | 200 bp — | 7,429 |
| | | | | | | Monthly | |
| CMBX NA A.6 Index | A/P | 1,939 | 191,000 | 2,961 | 5/11/63 | 200 bp — | 4,974 |
| | | | | | | Monthly | |
| CMBX NA A.6 Index | A/P | 1,277 | 156,000 | 2,418 | 5/11/63 | 200 bp — | 3,755 |
| | | | | | | Monthly | |
| CMBX NA A.6 Index | A/P | 714 | 76,000 | 1,178 | 5/11/63 | 200 bp — | 1,921 |
| | | | | | | Monthly | |
| CMBX NA A.7 Index | A-/P | 656 | 135,000 | 3,915 | 1/17/47 | 200 bp — | 4,623 |
| | | | | | | Monthly | |
| CMBX NA A.7 Index | A-/P | (5) | 11,000 | 319 | 1/17/47 | 200 bp — | 318 |
| | | | | | | Monthly | |
| CMBX NA A.7 Index | A-/P | (2) | 2,000 | 58 | 1/17/47 | 200 bp — | 57 |
| | | | | | | Monthly | |
| CMBX NA BB.6 Index | BB–/P | 1,468 | 7,000 | 792 | 5/11/63 | 500 bp — | 682 |
| | | | | | | Monthly | |
| CMBX NA BB.6 Index | BB–/P | 10,122 | 56,000 | 6,339 | 5/11/63 | 500 bp — | 3,837 |
| | | | | | | Monthly | |
| CMBX NA BBB–.6 Index | BBB–/P | 169 | 2,000 | 102 | 5/11/63 | 300 bp — | 68 |
| | | | | | | Monthly | |
| CMBX NA BBB–.6 Index | BBB–/P | 821 | 7,000 | 358 | 5/11/63 | 300 bp — | 468 |
| | | | | | | Monthly | |
| CMBX NA BBB–.6 Index | BBB–/P | 1,039 | 8,000 | 409 | 5/11/63 | 300 bp — | 635 |
| | | | | | | Monthly | |
| CMBX NA BBB–.6 Index | BBB–/P | 529 | 9,000 | 460 | 5/11/63 | 300 bp — | 74 |
| | | | | | | Monthly | |
| CMBX NA BBB–.6 Index | BBB–/P | 816 | 13,000 | 664 | 5/11/63 | 300 bp — | 159 |
| | | | | | | Monthly | |
| CMBX NA BBB–.6 Index | BBB–/P | 2,007 | 14,000 | 715 | 5/11/63 | 300 bp — | 1,299 |
| | | | | | | Monthly | |
| CMBX NA BBB–.6 Index | BBB–/P | 1,301 | 17,000 | 869 | 5/11/63 | 300 bp — | 442 |
| | | | | | | Monthly | |
| CMBX NA BBB–.6 Index | BBB–/P | 2,678 | 30,000 | 1,533 | 5/11/63 | 300 bp — | 1,163 |
| | | | | | | Monthly | |
| CMBX NA BBB–.6 Index | BBB–/P | 3,987 | 35,000 | 1,789 | 5/11/63 | 300 bp — | 2,219 |
| | | | | | | Monthly | |
| CMBX NA BBB–.6 Index | BBB–/P | 4,238 | 36,000 | 1,840 | 5/11/63 | 300 bp — | 2,419 |
| | | | | | | Monthly | |
| CMBX NA BBB–.6 Index | BBB–/P | 4,560 | 43,000 | 2,197 | 5/11/63 | 300 bp — | 2,388 |
| | | | | | | Monthly | |
| CMBX NA BBB–.6 Index | BBB–/P | 6,441 | 44,000 | 2,248 | 5/11/63 | 300 bp — | 4,218 |
| | | | | | | Monthly | |
| CMBX NA BBB–.6 Index | BBB–/P | 6,984 | 45,000 | 2,300 | 5/11/63 | 300 bp — | 4,711 |
| | | | | | | Monthly | |
| CMBX NA BBB–.6 Index | BBB–/P | 8,118 | 54,000 | 2,759 | 5/11/63 | 300 bp — | 5,390 |
| | | | | | | Monthly | |
| CMBX NA BBB–.6 Index | BBB–/P | 6,536 | 57,000 | 2,913 | 5/11/63 | 300 bp — | 3,656 |
| | | | | | | Monthly | |
| CMBX NA BBB–.6 Index | BBB–/P | 7,344 | 62,000 | 3,168 | 5/11/63 | 300 bp — | 4,212 |
| | | | | | | Monthly | |
| CMBX NA BBB–.6 Index | BBB–/P | 10,094 | 76,000 | 3,884 | 5/11/63 | 300 bp — | 6,255 |
| | | | | | | Monthly | |
| CMBX NA BBB–.6 Index | BBB–/P | 11,268 | 88,000 | 4,497 | 5/11/63 | 300 bp — | 6,822 |
| | | | | | | Monthly | |
| CMBX NA BBB–.6 Index | BBB–/P | 9,983 | 93,000 | 4,752 | 5/11/63 | 300 bp — | 5,284 |
| | | | | | | Monthly | |
| |
| 22Putnam VT Mortgage Securities Fund |
| | | | | | | |
| OTC CREDIT DEFAULT CONTRACTS OUTSTANDING — PROTECTION SOLD at 12/31/19cont. | | | | |
| | | Upfront | | | | | |
| | | premium | | | Termi- | | Unrealized |
| Swap counterparty/ | | received | Notional | | nation | Payments | appreciation/ |
| Referenced debt* | Rating*** | (paid)** | amount | Value | date | received by fund | (depreciation) |
| Morgan Stanley & Co. International PLCcont. | | | | | | |
| CMBX NA BBB–.6 Index | BBB–/P | $8,770 | $94,000 | $4,803 | 5/11/63 | 300 bp — | $4,021 |
| | | | | | | Monthly | |
| CMBX NA BBB–.6 Index | BBB–/P | 8,273 | 98,000 | 5,008 | 5/11/63 | 300 bp — | 3,322 |
| | | | | | | Monthly | |
| CMBX NA BBB–.6 Index | BBB–/P | 17,385 | 124,000 | 6,336 | 5/11/63 | 300 bp — | 11,120 |
| | | | | | | Monthly | |
| CMBX NA BBB–.6 Index | BBB–/P | 15,926 | 130,000 | 6,643 | 5/11/63 | 300 bp — | 9,359 |
| | | | | | | Monthly | |
| CMBX NA BBB–.6 Index | BBB–/P | 20,536 | 135,000 | 6,899 | 5/11/63 | 300 bp — | 13,716 |
| | | | | | | Monthly | |
| CMBX NA BBB–.6 Index | BBB–/P | 12,750 | 139,000 | 7,103 | 5/11/63 | 300 bp — | 5,728 |
| | | | | | | Monthly | |
| CMBX NA BBB–.6 Index | BBB–/P | 22,748 | 211,000 | 10,782 | 5/11/63 | 300 bp — | 12,089 |
| | | | | | | Monthly | |
| CMBX NA BBB–.6 Index | BBB–/P | 23,830 | 223,000 | 11,395 | 5/11/63 | 300 bp — | 12,565 |
| | | | | | | Monthly | |
| CMBX NA BBB–.6 Index | BBB–/P | 34,739 | 282,000 | 14,410 | 5/11/63 | 300 bp — | 20,493 |
| | | | | | | Monthly | |
| CMBX NA BBB–.6 Index | BBB–/P | 17,791 | 289,000 | 14,768 | 5/11/63 | 300 bp — | 3,192 |
| | | | | | | Monthly | |
| CMBX NA BBB–.6 Index | BBB–/P | 41,278 | 390,000 | 19,929 | 5/11/63 | 300 bp — | 21,576 |
| | | | | | | Monthly | |
| CMBX NA BBB–.6 Index | BBB–/P | 48,077 | 419,000 | 21,411 | 5/11/63 | 300 bp — | 26,911 |
| | | | | | | Monthly | |
| CMBX NA BBB–.6 Index | BBB–/P | 50,008 | 470,000 | 24,017 | 5/11/63 | 300 bp — | 26,265 |
| | | | | | | Monthly | |
| CMBX NA BBB–.6 Index | BBB–/P | 49,475 | 470,000 | 24,017 | 5/11/63 | 300 bp — | 25,732 |
| | | | | | | Monthly | |
| CMBX NA BBB–.6 Index | BBB–/P | 64,868 | 610,000 | 31,171 | 5/11/63 | 300 bp — | 34,053 |
| | | | | | | Monthly | |
| CMBX NA BBB–.6 Index | BBB–/P | 224,418 | 1,852,000 | 94,637 | 5/11/63 | 300 bp — | 130,861 |
| | | | | | | Monthly | |
| CMBX NA BBB–.6 Index | BBB–/P | 310,210 | 2,560,000 | 130,816 | 5/11/63 | 300 bp — | 180,888 |
| | | | | | | Monthly | |
| CMBX NA BBB–.7 Index | BBB–/P | 40,697 | 598,000 | 2,751 | 1/17/47 | 300 bp — | 43,797 |
| | | | | | | Monthly | |
| CMBX NA BBB–.7 Index | BBB–/P | 74 | 1,000 | 5 | 1/17/47 | 300 bp — | 80 |
| | | | | | | Monthly | |
| Upfront premium received | | 2,322,467 | Unrealized appreciation | | | 1,286,699 |
| Upfront premium (paid) | | (690) | Unrealized (depreciation) | | | — |
| Total | | $2,321,777 | Total | | | | $1,286,699 |
* Payments related to the referenced debt are made upon a credit default event.
** Upfront premium is based on the difference between the original spread on issue and the market spread on day of execution.
*** Ratings for an underlying index represent the average of the ratings of all the securities included in that index. The Moody’s, Standard & Poor’s or Fitch ratings are believed to be the most recent ratings available at December 31, 2019. Securities rated by Putnam are indicated by “/P.” The Putnam rating categories are comparable to the Standard & Poor’s classifications.
| | | | | | |
| OTC CREDIT DEFAULT CONTRACTS OUTSTANDING — PROTECTION PURCHASED at 12/31/19 | | | | |
| | Upfront | | | | | |
| | premium | | | Termi- | Payments | Unrealized |
| Swap counterparty/ | received | Notional | | nation | (paid) | appreciation/ |
| Referenced debt* | (paid)** | amount | Value | date | by fund | (depreciation) |
| Citigroup Global Markets, Inc. | | | | | | |
| CMBX NA BB.10 Index | $(1,252) | $12,000 | $703 | 11/17/59 | (500 bp) — Monthly | $(561) |
| CMBX NA BB.10 Index | (987) | 9,000 | 527 | 11/17/59 | (500 bp) — Monthly | (468) |
| CMBX NA BB.11 Index | (3,610) | 50,000 | 2,690 | 11/18/54 | (500 bp) — Monthly | (969) |
| CMBX NA BB.11 Index | (4,535) | 35,000 | 1,883 | 11/18/54 | (500 bp) — Monthly | (2,686) |
| CMBX NA BB.11 Index | (1,031) | 15,000 | 807 | 11/18/54 | (500 bp) — Monthly | (239) |
| |
| Putnam VT Mortgage Securities Fund23 |
| | | | | | |
| OTC CREDIT DEFAULT CONTRACTS OUTSTANDING — PROTECTION PURCHASED at 12/31/19cont. | | | | |
| | Upfront | | | | | |
| | premium | | | Termi- | Payments | Unrealized |
| Swap counterparty/ | received | Notional | | nation | (paid) | appreciation/ |
| Referenced debt* | (paid)** | amount | Value | date | by fund | (depreciation) |
| Citigroup Global Markets, Inc.cont. | | | | | | |
| CMBX NA BB.11 Index | $(1,131) | $12,000 | $646 | 11/18/54 | (500 bp) — Monthly | $(497) |
| CMBX NA BB.6 Index | (460) | 4,000 | 453 | 5/11/63 | (500 bp) — Monthly | (11) |
| CMBX NA BB.7 Index | (36,698) | 288,000 | 11,059 | 1/17/47 | (500 bp) — Monthly | (25,919) |
| CMBX NA BB.8 Index | (2,980) | 24,000 | 2,741 | 10/17/57 | (500 bp) — Monthly | (262) |
| CMBX NA BB.9 Index | (10,425) | 101,000 | 4,202 | 9/17/58 | (500 bp) — Monthly | (6,322) |
| CMBX NA BB.9 Index | (2,903) | 45,000 | 1,872 | 9/17/58 | (500 bp) — Monthly | (1,075) |
| CMBX NA BB.9 Index | (1,613) | 25,000 | 1,040 | 9/17/58 | (500 bp) — Monthly | (597) |
| CMBX NA BBB–.7 Index | (2,324) | 56,000 | 258 | 1/17/47 | (300 bp) — Monthly | (2,615) |
| Credit Suisse International | | | | | | |
| CMBX NA BB.10 Index | (3,202) | 24,000 | 1,406 | 11/17/59 | (500 bp) — Monthly | (1,819) |
| CMBX NA BB.10 Index | (2,854) | 24,000 | 1,406 | 11/17/59 | (500 bp) — Monthly | (1,471) |
| CMBX NA BB.10 Index | (1,616) | 13,000 | 762 | 11/17/59 | (500 bp) — Monthly | (867) |
| CMBX NA BB.9 Index | (3,408) | 34,000 | 1,414 | 9/17/58 | (500 bp) — Monthly | (2,027) |
| Goldman Sachs International | | | | | | |
| CMBX NA BB.9 Index | (15,334) | 96,000 | 3,994 | 9/17/58 | (500 bp) — Monthly | (11,434) |
| JPMorgan Securities LLC | | | | | | |
| CMBX NA BB.11 Index | (2,795) | 41,000 | 2,206 | 11/18/54 | (500 bp) — Monthly | (629) |
| CMBX NA BB.11 Index | (1,841) | 27,000 | 1,453 | 11/18/54 | (500 bp) — Monthly | (414) |
| CMBX NA BB.12 Index | (2,280) | 25,000 | 1,448 | 8/17/61 | (500 bp) — Monthly | (857) |
| CMBX NA BB.7 Index | (1,519) | 12,000 | 461 | 1/17/47 | (500 bp) — Monthly | (1,069) |
| CMBX NA BB.9 Index | (22,504) | 159,000 | 6,614 | 9/17/58 | (500 bp) — Monthly | (16,044) |
| CMBX NA BB.9 Index | (17,795) | 126,000 | 5,242 | 9/17/58 | (500 bp) — Monthly | (12,676) |
| CMBX NA BB.9 Index | (4,293) | 28,000 | 1,165 | 9/17/58 | (500 bp) — Monthly | (3,155) |
| CMBX NA BB.9 Index | (1,153) | 20,000 | 832 | 9/17/58 | (500 bp) — Monthly | (341) |
| CMBX NA BB.9 Index | (847) | 20,000 | 832 | 9/17/58 | (500 bp) — Monthly | (35) |
| CMBX NA BBB–.7 Index | (2,178) | 60,000 | 276 | 1/17/47 | (300 bp) — Monthly | (2,489) |
| CMBX NA BBB–.7 Index | (3,832) | 81,000 | 373 | 1/17/47 | (300 bp) — Monthly | (4,251) |
| CMBX NA BBB–.7 Index | (5,730) | 151,000 | 695 | 1/17/47 | (300 bp) — Monthly | (6,512) |
| Merrill Lynch International | | | | | | |
| CMBX NA BB.10 Index | (1,426) | 12,000 | 703 | 11/17/59 | (500 bp) — Monthly | (735) |
| CMBX NA BB.10 Index | (1,265) | 12,000 | 703 | 11/17/59 | (500 bp) — Monthly | (573) |
| CMBX NA BB.9 Index | (1,990) | 930,000 | 38,688 | 9/17/58 | (500 bp) — Monthly | 35,794 |
| CMBX NA BB.9 Index | (979) | 23,000 | 957 | 9/17/58 | (500 bp) — Monthly | (45) |
| CMBX NA BB.9 Index | (1,043) | 21,000 | 874 | 9/17/58 | (500 bp) — Monthly | (189) |
| Morgan Stanley & Co. International PLC | | | | | | |
| CMBX NA BB.10 Index | (1,259) | 12,000 | 703 | 11/17/59 | (500 bp) — Monthly | (567) |
| CMBX NA BB.11 Index | (2,382) | 25,000 | 1,345 | 11/18/54 | (500 bp) — Monthly | (1,062) |
| CMBX NA BB.12 Index | (1,215) | 17,000 | 984 | 8/17/61 | (500 bp) — Monthly | (248) |
| CMBX NA BB.12 Index | (803) | 11,000 | 637 | 8/17/61 | (500 bp) — Monthly | (177) |
| CMBX NA BB.12 Index | (408) | 5,000 | 290 | 9/17/58 | (500 bp) — Monthly | (124) |
| CMBX NA BB.7 Index | (781) | 15,000 | 576 | 1/17/47 | (500 bp) — Monthly | (220) |
| CMBX NA BB.9 Index | (31,748) | 204,000 | 8,486 | 9/17/58 | (500 bp) — Monthly | (23,460) |
| CMBX NA BB.9 Index | (24,315) | 179,000 | 7,446 | 9/17/58 | (500 bp) — Monthly | (17,043) |
| CMBX NA BB.9 Index | (23,827) | 179,000 | 7,446 | 9/17/58 | (500 bp) — Monthly | (16,554) |
| CMBX NA BB.9 Index | (26,620) | 177,000 | 7,363 | 9/17/58 | (500 bp) — Monthly | (19,428) |
| CMBX NA BB.9 Index | (22,969) | 168,000 | 6,989 | 9/17/58 | (500 bp) — Monthly | (16,144) |
| CMBX NA BB.9 Index | (23,840) | 158,000 | 6,573 | 9/17/58 | (500 bp) — Monthly | (17,420) |
| CMBX NA BB.9 Index | (20,169) | 140,000 | 5,824 | 9/17/58 | (500 bp) — Monthly | (14,481) |
| CMBX NA BB.9 Index | (12,260) | 81,000 | 3,370 | 9/17/58 | (500 bp) — Monthly | (8,970) |
| CMBX NA BB.9 Index | (12,260) | 81,000 | 3,370 | 9/17/58 | (500 bp) — Monthly | (8,970) |
| CMBX NA BB.9 Index | (5,109) | 68,000 | 2,829 | 9/17/58 | (500 bp) — Monthly | (2,346) |
| CMBX NA BB.9 Index | (2,462) | 28,000 | 1,165 | 9/17/58 | (500 bp) — Monthly | (1,324) |
| CMBX NA BB.9 Index | (2,309) | 27,000 | 1,123 | 9/17/58 | (500 bp) — Monthly | (1,212) |
| CMBX NA BB.9 Index | (1,415) | 23,000 | 957 | 9/17/58 | (500 bp) — Monthly | (480) |
| |
| 24Putnam VT Mortgage Securities Fund |
| | | | | | |
| OTC CREDIT DEFAULT CONTRACTS OUTSTANDING — PROTECTION PURCHASED at 12/31/19cont. | | | | |
| | Upfront | | | | | |
| | premium | | | Termi- | Payments | Unrealized |
| Swap counterparty/ | received | Notional | | nation | (paid) | appreciation/ |
| Referenced debt* | (paid)** | amount | Value | date | by fund | (depreciation) |
| Morgan Stanley & Co. International PLCcont. | | | | | | |
| CMBX NA BB.9 Index | $(1,398) | $23,000 | $957 | 9/17/58 | (500 bp) — Monthly | $(464) |
| CMBX NA BB.9 Index | (1,169) | 19,000 | 790 | 9/17/58 | (500 bp) — Monthly | (398) |
| CMBX NA BB.9 Index | (892) | 18,000 | 749 | 9/17/58 | (500 bp) — Monthly | (161) |
| CMBX NA BB.9 Index | (972) | 18,000 | 749 | 9/17/58 | (500 bp) — Monthly | (241) |
| CMBX NA BBB–.7 Index | (4,064) | 64,000 | 294 | 1/17/47 | (300 bp) — Monthly | (4,390) |
| Upfront premium received | — | | Unrealized appreciation | 35,794 |
| Upfront premium (paid) | (394,479) | | Unrealized (depreciation) | (265,737) |
| Total | $(394,479) | | Total | | | $(229,943) |
* Payments related to the referenced debt are made upon a credit default event.
** Upfront premium is based on the difference between the original spread on issue and the market spread on day of execution.
ASC 820 establishes a three-level hierarchy for disclosure of fair value measurements. The valuation hierarchy is based upon the transparency of inputs to the valuation of the fund’s investments. The three levels are defined as follows:
Level 1: Valuations based on quoted prices for identical securities in active markets.
Level 2: Valuations based on quoted prices in markets that are not active or for which all significant inputs are observable, either directly or indirectly.
Level 3: Valuations based on inputs that are unobservable and significant to the fair value measurement.
The following is a summary of the inputs used to value the fund’s net assets as of the close of the reporting period:
| | | |
| | | Valuation inputs | |
| Investments in securities: | Level 1 | Level 2 | Level 3 |
| Asset-backed securities | $— | $1,314,333 | $— |
| Mortgage-backed securities | — | 38,935,169 | — |
| Purchased options outstanding | — | 101,155 | — |
| Purchased swap options outstanding | — | 1,639,083 | — |
| U.S. government and agency mortgage obligations | — | 38,758,020 | — |
| U.S. treasury obligations | — | 246,173 | — |
| Repurchase agreements | — | 9,717,000 | — |
| Short-term investments | — | 2,596,673 | — |
| Totals by level | $— | $93,307,606 | $— |
| |
| | | Valuation inputs | |
| Other financial instruments: | Level 1 | Level 2 | Level 3 |
| Futures contracts | $(7,476) | $— | $— |
| Written options outstanding | — | (68,882) | — |
| Written swap options outstanding | — | (1,427,316) | — |
| Forward premium swap option contracts | — | (237,531) | — |
| TBA sale commitments | — | (7,104,141) | — |
| Interest rate swap contracts | — | 219,876 | — |
| Total return swap contracts | — | (13,860) | — |
| Credit default contracts | — | (870,542) | — |
| Totals by level | $(7,476) | $(9,502,396) | $— |
At the start and close of the reporting period, Level 3 investments in securities represented less than 1% of the fund’s net assets and were not considered a significant portion of the fund’s portfolio.
The accompanying notes are an integral part of these financial statements.
| |
| Putnam VT Mortgage Securities Fund25 |
Statement of assets and liabilities
12/31/19
| |
| Assets | |
| Investment in securities, at value (Note 1): | |
| Unaffiliated issuers (identified cost $83,266,369) | $83,590,606 |
| Repurchase agreement (identified cost $9,717,000) (Note 1) | 9,717,000 |
| Interest and other receivables | 442,065 |
| Receivable for shares of the fund sold | 4,948 |
| Receivable for investments sold | 136,026 |
| Receivable for sales of TBA securities (Note 1) | 2,058,973 |
| Receivable from Manager (Note 2) | 13,038 |
| Receivable for variation margin on futures contracts (Note 1) | 747 |
| Unrealized appreciation on forward premium swap option contracts (Note 1) | 211,310 |
| Unrealized appreciation on OTC swap contracts (Note 1) | 1,329,489 |
| Premium paid on OTC swap contracts (Note 1) | 395,169 |
| Total assets | 97,899,371 |
| |
| Liabilities | |
| Payable to custodian | 4,223 |
| Payable for investments purchased | 119,490 |
| Payable for purchases of TBA securities (Note 1) | 26,757,380 |
| Payable for shares of the fund repurchased | 9,178 |
| Payable for custodian fees (Note 2) | 67,102 |
| Payable for investor servicing fees (Note 2) | 6,800 |
| Payable for Trustee compensation and expenses (Note 2) | 60,282 |
| Payable for administrative services (Note 2) | 560 |
| Payable for distribution fees (Note 2) | 5,723 |
| Payable for variation margin on futures contracts (Note 1) | 2,313 |
| Unrealized depreciation on OTC swap contracts (Note 1) | 286,593 |
| Premium received on OTC swap contracts (Note 1) | 2,322,467 |
| Unrealized depreciation on forward premium swap option contracts (Note 1) | 448,841 |
| Written options outstanding, at value (premiums $1,597,098) (Note 1) | 1,496,198 |
| TBA sale commitments, at value (proceeds receivable $7,101,289) (Note 1) | 7,104,141 |
| Collateral on certain derivative contracts, at value (Notes 1 and 8) | 352,566 |
| Other accrued expenses | 68,673 |
| Total liabilities | 39,112,530 |
| | |
| Net assets | $58,786,841 |
| |
| Represented by | |
| Paid-in capital (Unlimited shares authorized) (Notes 1 and 4) | $70,438,957 |
| Total distributable earnings (Note 1) | (11,652,116) |
| Total — Representing net assets applicable to capital shares outstanding | $58,786,841 |
| | |
| Computation of net asset value Class IA | |
| Net assets | $31,821,912 |
| Number of shares outstanding | 3,125,393 |
| Net asset value, offering price and redemption price per share (net assets divided by number of shares outstanding) | $10.18 |
| | |
| Computation of net asset value Class IB | |
| Net assets | $26,964,929 |
| Number of shares outstanding | 2,655,110 |
| Net asset value, offering price and redemption price per share (net assets divided by number of shares outstanding) | $10.16 |
The accompanying notes are an integral part of these financial statements.
| |
| 26Putnam VT Mortgage Securities Fund |
Statement of operations
Year ended 12/31/19
| |
| Investment income | |
| Interest | $2,358,876 |
| Total investment income | 2,358,876 |
| |
| Expenses | |
| Compensation of Manager (Note 2) | 219,668 |
| Investor servicing fees (Note 2) | 39,462 |
| Custodian fees (Note 2) | 53,987 |
| Trustee compensation and expenses (Note 2) | 874 |
| Distribution fees (Note 2) | 62,259 |
| Administrative services (Note 2) | 1,632 |
| Auditing and tax fees | 60,208 |
| Other | 30,115 |
| Fees waived and reimbursed by Manager (Note 2) | (123,434) |
| Total expenses | 344,771 |
| | |
| Expense reduction (Note 2) | (984) |
| Net expenses | 343,787 |
| | |
| Net investment income | 2,015,089 |
| | |
| Realized and unrealized gain (loss) | |
| Net realized gain (loss) on: | |
| Securities from unaffiliated issuers (Notes 1 and 3) | 1,266,264 |
| Futures contracts (Note 1) | 12,784 |
| Swap contracts (Note 1) | 371,132 |
| Written options (Note 1) | 566,850 |
| Total net realized gain | 2,217,030 |
| Change in net unrealized appreciation (depreciation) on: | |
| Securities from unaffiliated issuers and TBA sale commitments | (114,184) |
| Futures contracts | (6,486) |
| Swap contracts | 2,416,330 |
| Written options | 462,295 |
| Total change in net unrealized appreciation | 2,757,955 |
| | |
| Net gain on investments | 4,974,985 |
| | |
| Net increase in net assets resulting from operations | $6,990,074 |
The accompanying notes are an integral part of these financial statements.
| |
| Putnam VT Mortgage Securities Fund27 |
| | |
| Statement of changes in net assets | | |
| | Year ended | Year ended |
| | 12/31/19 | 12/31/18 |
| Increase (decrease) in net assets | | |
| Operations: | | |
| Net investment income | $2,015,089 | $2,183,409 |
| Net realized gain (loss) on investments | 2,217,030 | (829,830) |
| Change in net unrealized appreciation (depreciation) of investments | 2,757,955 | (1,823,084) |
| Net increase (decrease) in net assets resulting from operations | 6,990,074 | (469,505) |
| Distributions to shareholders (Note 1): | | |
| From ordinary income | | |
| Net investment income | | |
| Class IA | (785,112) | (1,036,991) |
| Class IB | (529,481) | (731,746) |
| Decrease from capital share transactions (Note 4) | (1,370,316) | (6,656,496) |
| Total increase (decrease) in net assets | 4,305,165 | (8,894,738) |
| Net assets: | | |
| Beginning of year | 54,481,676 | 63,376,414 |
| End of year | $58,786,841 | $54,481,676 |
The accompanying notes are an integral part of these financial statements.
| 28Putnam VT Mortgage Securities Fund |
|
| | | | | | | | | | | | |
| Financial highlights(For a common share outstanding throughout the period) | | | | | |
| | | | | | LESS | | | | | | | |
| INVESTMENT OPERATIONS: | | | | | DISTRIBUTIONS: | | | RATIOS AND SUPPLEMENTAL DATA: |
| Period ended | Net asset value, beginning of period | Net investment income (loss)a | Net realized and unrealized gain (loss) on investments | Total from investment operations | From net investment income | Total distributions | Net asset value, end of period | Total return at net asset value (%)b,c | Net assets, end of period (in thousands) | Ratio of expenses to average net assets (%)b,d | Ratio of net investment income (loss) to average net assets (%) | Portfolio turnover (%)e |
| Class IA | | | | | | | | | | | | |
| 12/31/19 | $9.21 | .36 | .85 | 1.21 | (.24) | (.24) | $10.18 | 13.36 | $31,822 | .50f | 3.68f | 1,171 |
| 12/31/18 | 9.55 | .35 | (.41) | (.06) | (.28) | (.28) | 9.21 | (.62) | 31,249 | .56f | 3.80f | 1,142 |
| 12/31/17 | 9.59 | .27 | (.06) | .21 | (.25) | (.25) | 9.55 | 2.27 | 35,852 | .66 | 2.85 | 1,188 |
| 12/31/16 | 9.76 | .24 | (.20) | .04 | (.21) | (.21) | 9.59 | .36 | 40,362 | .64g | 2.43g | 1,028 |
| 12/31/15 | 10.02 | .19 | (.22) | (.03) | (.23) | (.23) | 9.76 | (.33) | 44,229 | .62 | 1.92 | 905 |
| Class IB | | | | | | | | | | | | |
| 12/31/19 | $9.18 | .33 | .86 | 1.19 | (.21) | (.21) | $10.16 | 13.20 | $26,965 | .75f | 3.44f | 1,171 |
| 12/31/18 | 9.52 | .33 | (.41) | (.08) | (.26) | (.26) | 9.18 | (.90) | 23,232 | .81f | 3.54f | 1,142 |
| 12/31/17 | 9.56 | .25 | (.07) | .18 | (.22) | (.22) | 9.52 | 1.96 | 27,524 | .91 | 2.60 | 1,188 |
| 12/31/16 | 9.72 | .21 | (.19) | .02 | (.18) | (.18) | 9.56 | .20 | 33,301 | .89g | 2.18g | 1,028 |
| 12/31/15 | 9.99 | .16 | (.22) | (.06) | (.21) | (.21) | 9.72 | (.65) | 35,862 | .87 | 1.67 | 905 |
Before April 30, 2018, the fund was managed with a materially different investment strategy and may have achieved materially different performance results under its current investment strategy from that shown for periods before this date.
aPer share net investment income (loss) has been determined on the basis of the weighted average number of shares outstanding during the period.
bThe charges and expenses at the insurance company separate account level are not reflected.
cTotal return assumes dividend reinvestment.
dIncludes amounts paid through expense offset arrangements, if any (Note 2). Also excludes acquired fund fees and expenses, if any.
ePortfolio turnover includes TBA purchase and sale commitments.
fReflects an involuntary contractual expense limitation in effect during the period. As a result of such limitation, the expenses of each class reflect the following reductions as a percentage of average net assets.
| | | | | |
| | % of average net assets | | | | |
| December 31, 2019 | 0.22% | | | | |
| December 31, 2018 | 0.25 | | | | |
gReflects a voluntary waiver of certain fund expenses in effect during the period. As a result of such waiver, the expenses of each class reflect a reduction of less than 0.01% as a percentage of average net assets.
The accompanying notes are an integral part of these financial statements.
| |
| Putnam VT Mortgage Securities Fund29 |
Notes to financial statements12/31/19
Within the following Notes to financial statements, references to “State Street” represent State Street Bank and Trust Company, references to “the SEC” represent the Securities and Exchange Commission, references to “Putnam Management” represent Putnam Investment Management, LLC, the fund’s manager, an indirect wholly-owned subsidiary of Putnam Investments, LLC and references to “OTC”, if any, represent over-the-counter. Unless otherwise noted, the “reporting period” represents the period from January 1, 2019 through December 31, 2019.
Putnam VT Mortgage Securities Fund (the fund) is a diversified series of Putnam Variable Trust (the Trust), a Massachusetts business trust registered under the Investment Company Act of 1940, as amended, as an open-end management investment company. The goal of the fund is to seek as high a level of current income as Putnam Management believes is consistent with preservation of capital. The fund invests mainly in mortgages, mortgage-related fixed income securities and related derivatives that are either investment-grade or below-investment-grade in quality (sometimes referred to as “junk bonds”). Under normal circumstances, the fund invests at least 80% of its net assets (plus any borrowings for investment purposes) in mortgages, mortgage-related fixed income securities and related derivatives (i.e., derivatives used to acquire exposure to, or whose underlying securities are, mortgages or mortgage-related securities). The fund generally uses the net unrealized gain or loss, or market value, of mortgage-related derivatives for purposes of this policy, but may use the notional value of a derivative if that is determined to be a more appropriate measure of the fund’s investment exposure. This policy may be changed only after 60 days’ notice to shareholders.
The fund expects to invest in mortgage-backed investments that are obligations of U.S. government agencies and instrumentalities and accordingly are backed by the full faith and credit of the United States (e.g., Ginnie Mae mortgage-backed bonds) as well as in mortgage-backed investments that are backed by only the credit of a federal agency or government-sponsored entity (e.g., Fannie Mae and Freddie Mac mortgage-backed bonds), and that have short- to long-term maturities.
The fund also expects to invest in lower-rated, higher-yielding mortgage-backed securities, including non-agency residential mortgage-backed securities (which may be backed by non-qualified or “sub-prime” mortgages), commercial mortgage-backed securities, and collateralized mortgage obligations (including interest only, principal only, and other prepayment derivatives). Non-agency (i.e., privately issued) securities typically are lower-rated and higher yielding than securities issued or backed by agencies such as Ginnie Mae, Fannie Mae or Freddie Mac. While the fund’s emphasis will be on mortgage-backed securities, it may also invest to a lesser extent in other types of asset-backed securities.
Putnam Management may consider, among other factors, credit, interest rate, prepayment and liquidity risks, as well as general market conditions, when deciding whether to buy or sell investments.
The fund typically uses to a significant extent derivatives, including interest rate swaps, swaptions, forward delivery contracts, total return swaps, and options on mortgage-backed securities and indices, for both hedging and non-hedging purposes, including to obtain or adjust exposure to mortgage-backed investments.
The fund offers class IA and class IB shares of beneficial interest. Class IA shares are offered at net asset value and are not subject to a distribution fee. Class IB shares are offered at net asset value and pay an ongoing distribution fee, which is identified in Note 2.
In the normal course of business, the fund enters into contracts that may include agreements to indemnify another party under given circumstances. The fund’s maximum exposure under these arrangements is unknown as this would involve future claims that may be, but have not yet been, made against the fund. However, the fund’s management team expects the risk of material loss to be remote.
The fund has entered into contractual arrangements with an investment adviser, administrator, distributor, shareholder servicing agent and custodian, who each provide services to the fund. Unless expressly stated otherwise, shareholders are not parties to, or intended beneficiaries of these contractual arrangements, and these contractual arrangements are not intended to create any shareholder right to enforce them against the service providers or to seek any remedy under them against the service providers, either directly or on behalf of the fund.
Under the fund’s Amended and Restated Agreement and Declaration of Trust, any claims asserted against or on behalf of the Putnam Funds, including claims against Trustees and Officers, must be brought in state and federal courts located within the Commonwealth of Massachusetts.
Note 1 — Significant accounting policies
The following is a summary of significant accounting policies consistently followed by the fund in the preparation of its financial statements. The preparation of financial statements is in conformity with accounting principles generally accepted in the United States of America and requires management to make estimates and assumptions that affect the reported amounts of assets and liabilities in the financial statements and the reported amounts of increases and decreases in net assets from operations. Actual results could differ from those estimates. Subsequent events after the Statement of assets and liabilities date through the date that the financial statements were issued have been evaluated in the preparation of the financial statements.
Investment income, realized and unrealized gains and losses and expenses of the fund are borne pro-rata based on the relative net assets of each class to the total net assets of the fund, except that each class bears expenses unique to that class (including the distribution fees applicable to such classes). Each class votes as a class only with respect to its own distribution plan or other matters on which a class vote is required by law or determined by the Trustees. If the fund were liquidated, shares of each class would receive their pro-rata share of the net assets of the fund. In addition, the Trustees declare separate dividends on each class of shares.
Security valuationPortfolio securities and other investments are valued using policies and procedures adopted by the Board of Trustees. The Trustees have formed a Pricing Committee to oversee the implementation of these procedures and have delegated responsibility for valuing the fund’s assets in accordance with these procedures to Putnam Management. Putnam Management has established an internal Valuation Committee that is responsible for making fair value determinations, evaluating the effectiveness of the pricing policies of the fund and reporting to the Pricing Committee.
Investments, including mortgage backed securities and short-term investments with remaining maturities of 60 days or less, are valued on the basis of valuations provided by an independent pricing service approved by the Trustees or dealers selected by Putnam Management. Such service providers use information with respect to transactions in bonds, quotations from bond dealers, market transactions in comparable securities and various relationships between securities in determining value. These securities will generally be categorized as Level 2.
Certain investments, including certain restricted and illiquid securities and derivatives, are also valued at fair value following procedures approved by the Trustees. These valuations consider such factors as significant market or specific security events such as interest rate or credit quality changes, various relationships with other securities, discount rates, U.S. Treasury, U.S. swap and credit yields, index levels, convexity exposures, recovery rates, sales and other multiples and resale restrictions. These securities are classified as Level 2 or as Level 3 depending on the priority of the significant inputs.
To assess the continuing appropriateness of fair valuations, the Valuation Committee reviews and affirms the reasonableness of such valuations on a regular basis after considering all relevant information that is reasonably available. Such valuations and procedures are reviewed periodically by the Trustees. Certain securities may be valued on the basis of a price provided by a single source. The fair value of securities is generally determined as the amount that the fund could reasonably expect to realize from an orderly disposition of such securities over a reasonable period of time. By its nature, a fair value price is a good faith estimate of the value of a security in a current sale and does not reflect an actual market price, which may be different by a material amount.
Joint trading accountPursuant to an exemptive order from the SEC, the fund may transfer uninvested cash balances into a joint trading account along with the cash of other registered investment companies and certain other accounts managed by Putnam Management. These balances may be invested in issues of short-term investments having maturities of up to 90 days.
Repurchase agreementsThe fund, or any joint trading account, through its custodian, receives delivery of the underlying securities, the fair value of which at the time of purchase is required to be in an amount at least equal to the resale price, including accrued interest. Collateral for certain tri-party repurchase agreements, which totaled $9,912,207 at the end of the reporting period, is held at the counterparty’s custodian in a segregated account for the benefit of the fund and the counterparty. Putnam Management is responsible for determining that the value of these underlying securities is at all times at least equal to the resale price,
| |
| 30Putnam VT Mortgage Securities Fund |
including accrued interest. In the event of default or bankruptcy by the other party to the agreement, retention of the collateral may be subject to legal proceedings.
Security transactions and related investment incomeSecurity transactions are recorded on the trade date (the date the order to buy or sell is executed). Gains or losses on securities sold are determined on the identified cost basis.
Interest income, net of any applicable withholding taxes and including amortization and accretion of premiums and discounts on debt securities, is recorded on the accrual basis.
Securities purchased or sold on a delayed delivery basis may be settled at a future date beyond customary settlement time; interest income is accrued based on the terms of the securities. Losses may arise due to changes in the fair value of the underlying securities or if the counterparty does not perform under the contract.
Stripped securitiesThe fund may invest in stripped securities which represent a participation in securities that may be structured in classes with rights to receive different portions of the interest and principal. Interest-only securities receive all of the interest and principal-only securities receive all of the principal. If the interest-only securities experience greater than anticipated prepayments of principal, the fund may fail to recoup fully its initial investment in these securities. Conversely, principal-only securities increase in value if prepayments are greater than anticipated and decline if prepayments are slower than anticipated. The fair value of these securities is highly sensitive to changes in interest rates.
Options contractsThe fund uses options contracts to hedge duration and convexity, to isolate prepayment risk and to manage downside risks.
The potential risk to the fund is that the change in value of options contracts may not correspond to the change in value of the hedged instruments. In addition, losses may arise from changes in the value of the underlying instruments if there is an illiquid secondary market for the contracts, if interest or exchange rates move unexpectedly or if the counterparty to the contract is unable to perform. Realized gains and losses on purchased options are included in realized gains and losses on investment securities. If a written call option is exercised, the premium originally received is recorded as an addition to sales proceeds. If a written put option is exercised, the premium originally received is recorded as a reduction to the cost of investments.
Exchange-traded options are valued at the last sale price or, if no sales are reported, the last bid price for purchased options and the last ask price for written options. OTC traded options are valued using prices supplied by dealers.
Options on swaps are similar to options on securities except that the premium paid or received is to buy or grant the right to enter into a previously agreed upon interest rate or credit default contract. Forward premium swap option contracts include premiums that have extended settlement dates. The delayed settlement of the premiums is factored into the daily valuation of the option contracts. In the case of interest rate cap and floor contracts, in return for a premium, ongoing payments between two parties are based on interest rates exceeding a specified rate, in the case of a cap contract, or falling below a specified rate in the case of a floor contract.
Written option contracts outstanding at period end, if any, are listed after the fund’s portfolio.
Futures contractsThe fund uses futures contracts for hedging treasury term structure risk and for yield curve positioning.
The potential risk to the fund is that the change in value of futures contracts may not correspond to the change in value of the hedged instruments. In addition, losses may arise from changes in the value of the underlying instruments, if there is an illiquid secondary market for the contracts, if interest or exchange rates move unexpectedly or if the counterparty to the contract is unable to perform. With futures, there is minimal counterparty credit risk to the fund since futures are exchange traded and the exchange’s clearinghouse, as counterparty to all exchange traded futures, guarantees the futures against default. Risks may exceed amounts recognized on the Statement of assets and liabilities. When the contract is closed, the fund records a realized gain or loss equal to the difference between the value of the contract at the time it was opened and the value at the time it was closed.
Futures contracts are valued at the quoted daily settlement prices established by the exchange on which they trade. The fund and the broker agree to exchange an amount of cash equal to the daily fluctuation in the value of the futures contract. Such receipts or payments are known as “variation margin.”
Futures contracts outstanding at period end, if any, are listed after the fund’s portfolio.
Interest rate swap contractsThe fund entered into OTC and/or centrally cleared interest rate swap contracts, which are arrangements between two parties to exchange cash flows based on a notional principal amount, for hedging term structure risk and for yield curve positioning.
An OTC and centrally cleared interest rate swap can be purchased or sold with an upfront premium. For OTC interest rate swap contracts, an upfront payment received by the fund is recorded as a liability on the fund’s books. An upfront payment made by the fund is recorded as an asset on the fund’s books. OTC and centrally cleared interest rate swap contracts are marked to market daily based upon quotations from an independent pricing service or market makers. Any change is recorded as an unrealized gain or loss on OTC interest rate swaps. Daily fluctuations in the value of centrally cleared interest rate swaps are settled through a central clearing agent and are recorded in variation margin on the Statement of assets and liabilities and recorded as unrealized gain or loss. Payments, including upfront premiums, received or made are recorded as realized gains or losses at the reset date or the closing of the contract. Certain OTC and centrally cleared interest rate swap contracts may include extended effective dates. Payments related to these swap contracts are accrued based on the terms of the contract.
The fund could be exposed to credit or market risk due to unfavorable changes in the fluctuation of interest rates or if the counterparty defaults, in the case of OTC interest rate contracts, or the central clearing agency or a clearing member defaults, in the case of centrally cleared interest rate swap contracts, on its respective obligation to perform under the contract. The fund’s maximum risk of loss from counterparty risk or central clearing risk is the fair value of the contract. This risk may be mitigated for OTC interest rate swap contracts by having a master netting arrangement between the fund and the counterparty and for centrally cleared interest rate swap contracts through the daily exchange of variation margin. There is minimal counterparty risk with respect to centrally cleared interest rate swap contracts due to the clearinghouse guarantee fund and other resources that are available in the event of a clearing member default. Risk of loss may exceed amounts recognized on the Statement of assets and liabilities.
OTC and centrally cleared interest rate swap contracts outstanding, including their respective notional amounts at period end, if any, are listed after the fund’s portfolio.
Total return swap contractsThe fund entered into OTC and/or centrally cleared total return swap contracts, which are arrangements to exchange a market-linked return for a periodic payment, both based on a notional principal amount, to hedge sector exposure and for gaining exposure to specific sectors.
To the extent that the total return of the security, index or other financial measure underlying the transaction exceeds or falls short of the offsetting interest rate obligation, the fund will receive a payment from or make a payment to the coun-terparty. OTC and/or centrally cleared total return swap contracts are marked to market daily based upon quotations from an independent pricing service or market maker. Any change is recorded as an unrealized gain or loss on OTC total return swaps. Daily fluctuations in the value of centrally cleared total return swaps are settled through a central clearing agent and are recorded in variation margin on the Statement of assets and liabilities and recorded as unrealized gain or loss. Payments received or made are recorded as realized gains or losses. Certain OTC and/or centrally cleared total return swap contracts may include extended effective dates. Payments related to these swap contracts are accrued based on the terms of the contract. The fund could be exposed to credit or market risk due to unfavorable changes in the fluctuation of interest rates or in the price of the underlying security or index, the possibility that there is no liquid market for these agreements or that the counterparty may default on its obligation to perform. The fund’s maximum risk of loss from counterparty risk or central clearing risk is the fair value of the contract. This risk may be mitigated for OTC total return swap contracts by having a master netting arrangement between the fund and the counterparty and for centrally cleared total return swap contracts through the daily exchange of variation margin. There is minimal counterparty risk with respect to centrally cleared total return swap contracts due to the clearinghouse guarantee fund and other resources that are available in the event of a clearing member default. Risk of loss may exceed amounts recognized on the Statement of assets and liabilities.
OTC and/or centrally cleared total return swap contracts outstanding, including their respective notional amounts at period end, if any, are listed after the fund’s portfolio.
Credit default contractsThe fund entered into OTC and/or centrally cleared credit default contracts to hedge credit risk, to hedge market risk and for gaining exposure to specific sectors.
| |
| Putnam VT Mortgage Securities Fund31 |
In OTC and centrally cleared credit default contracts, the protection buyer typically makes a periodic stream of payments to a counterparty, the protection seller, in exchange for the right to receive a contingent payment upon the occurrence of a credit event on the reference obligation or all other equally ranked obligations of the reference entity. Credit events are contract specific but may include bankruptcy, failure to pay, restructuring and obligation acceleration. For OTC credit default contracts, an upfront payment received by the fund is recorded as a liability on the fund’s books. An upfront payment made by the fund is recorded as an asset on the fund’s books. Centrally cleared credit default contracts provide the same rights to the protection buyer and seller except the payments between parties, including upfront premiums, are settled through a central clearing agent through variation margin payments. Upfront and periodic payments received or paid by the fund for OTC and centrally cleared credit default contracts are recorded as realized gains or losses at the reset date or close of the contract. The OTC and centrally cleared credit default contracts are marked to market daily based upon quotations from an independent pricing service or market makers. Any change in value of OTC credit default contracts is recorded as an unrealized gain or loss. Daily fluctuations in the value of centrally cleared credit default contracts are recorded in variation margin on the Statement of assets and liabilities and recorded as unrealized gain or loss. Upon the occurrence of a credit event, the difference between the par value and fair value of the reference obligation, net of any proportional amount of the upfront payment, is recorded as a realized gain or loss.
In addition to bearing the risk that the credit event will occur, the fund could be exposed to market risk due to unfavorable changes in interest rates or in the price of the underlying security or index or the possibility that the fund may be unable to close out its position at the same time or at the same price as if it had purchased the underlying reference obligations. In certain circumstances, the fund may enter into offsetting OTC and centrally cleared credit default contracts which would mitigate its risk of loss. Risks of loss may exceed amounts recognized on the Statement of assets and liabilities. The fund’s maximum risk of loss from coun-terparty risk, either as the protection seller or as the protection buyer, is the fair value of the contract. This risk may be mitigated for OTC credit default contracts by having a master netting arrangement between the fund and the counterparty and for centrally cleared credit default contracts through the daily exchange of variation margin. Counterparty risk is further mitigated with respect to centrally cleared credit default swap contracts due to the clearinghouse guarantee fund and other resources that are available in the event of a clearing member default. Where the fund is a seller of protection, the maximum potential amount of future payments the fund may be required to make is equal to the notional amount.
OTC and centrally cleared credit default contracts outstanding, including their respective notional amounts at period end, if any, are listed after the fund’s portfolio.
TBA commitmentsThe fund may enter into TBA (to be announced) commitments to purchase securities for a fixed unit price at a future date beyond customary settlement time. Although the unit price and par amount have been established, the actual securities have not been specified. However, it is anticipated that the amount of the commitments will not significantly differ from the principal amount. The fund holds, and maintains until settlement date, cash or high-grade debt obligations in an amount sufficient to meet the purchase price, or the fund may enter into offsetting contracts for the forward sale of other securities it owns. Income on the securities will not be earned until settlement date.
The fund may also enter into TBA sale commitments to hedge its portfolio positions, to sell mortgage-backed securities it owns under delayed delivery arrangements or to take a short position in mortgage-backed securities. Proceeds of TBA sale commitments are not received until the contractual settlement date. During the time a TBA sale commitment is outstanding, either equivalent deliverable securities or an offsetting TBA purchase commitment deliverable on or before the sale commitment date are held as “cover” for the transaction, or other liquid assets in an amount equal to the notional value of the TBA sale commitment are segregated. If the TBA sale commitment is closed through the acquisition of an offsetting TBA purchase commitment, the fund realizes a gain or loss. If the fund delivers securities under the commitment, the fund realizes a gain or a loss from the sale of the securities based upon the unit price established at the date the commitment was entered into.
TBA commitments, which are accounted for as purchase and sale transactions, may be considered securities themselves, and involve a risk of loss due to changes in the value of the security prior to the settlement date as well as the risk that the counterparty to the transaction will not perform its obligations. Counterparty risk is mitigated by having a master agreement between the fund and the counterparty.
Unsettled TBA commitments are valued at their fair value according to the procedures described under “Security valuation” above. The contract is marked to market daily and the change in fair value is recorded by the fund as an unrealized gain or loss. Based on market circumstances, Putnam Management will determine whether to take delivery of the underlying securities or to dispose of the TBA commitments prior to settlement.
TBA purchase commitments outstanding at period end, if any, are listed within the fund’s portfolio and TBA sale commitments outstanding at period end, if any, are listed after the fund’s portfolio.
Master agreementsThe fund is a party to ISDA (International Swaps and Derivatives Association, Inc.) Master Agreements that govern OTC derivative and foreign exchange contracts and Master Securities Forward Transaction Agreements that govern transactions involving mortgage-backed and other asset-backed securities that may result in delayed delivery (Master Agreements) with certain counterparties entered into from time to time. The Master Agreements may contain provisions regarding, among other things, the parties’ general obligations, representations, agreements, collateral requirements, events of default and early termination. With respect to certain counterparties, in accordance with the terms of the Master Agreements, collateral posted to the fund is held in a segregated account by the fund’s custodian and, with respect to those amounts which can be sold or repledged, are presented in the fund’s portfolio.
Collateral pledged by the fund is segregated by the fund’s custodian and identified in the fund’s portfolio. Collateral can be in the form of cash or debt securities issued by the U.S. Government or related agencies or other securities as agreed to by the fund and the applicable counterparty. Collateral requirements are determined based on the fund’s net position with each counterparty.
With respect to ISDA Master Agreements, termination events applicable to the fund may occur upon a decline in the fund’s net assets below a specified threshold over a certain period of time. Termination events applicable to counterparties may occur upon a decline in the counterparty’s long-term or short-term credit ratings below a specified level. In each case, upon occurrence, the other party may elect to terminate early and cause settlement of all derivative and foreign exchange contracts outstanding, including the payment of any losses and costs resulting from such early termination, as reasonably determined by the terminating party. Any decision by one or more of the fund’s counterparties to elect early termination could impact the fund’s future derivative activity.
At the close of the reporting period, the fund had a net liability position of $1,169,460 on open derivative contracts subject to the Master Agreements. Collateral posted by the fund at period end for these agreements totaled $1,236,808 and may include amounts related to unsettled agreements.
Interfund lendingThe fund, along with other Putnam funds, may participate in an interfund lending program pursuant to an exemptive order issued by the SEC. This program allows the fund to borrow from or lend to other Putnam funds that permit such transactions. Interfund lending transactions are subject to each fund’s investment policies and borrowing and lending limits. Interest earned or paid on the interfund lending transaction will be based on the average of certain current market rates. During the reporting period, the fund did not utilize the program.
Lines of creditThe fund participates, along with other Putnam funds, in a $317.5 million unsecured committed line of credit and a $235.5 million unsecured uncommitted line of credit, both provided by State Street. Borrowings may be made for temporary or emergency purposes, including the funding of shareholder redemption requests and trade settlements. Interest is charged to the fund based on the fund’s borrowing at a rate equal to 1.25% plus the higher of (1) the Federal Funds rate and (2) the overnight LIBOR for the committed line of credit and the Federal Funds rate plus 1.30% for the uncommitted line of credit. A closing fee equal to 0.04% of the committed line of credit and 0.04% of the uncommitted line of credit has been paid by the participating funds. In addition, a commitment fee of 0.21% per annum on any unutilized portion of the committed line of credit is allocated to the participating funds based on their relative net assets and paid quarterly. During the reporting period, the fund had no borrowings against these arrangements.
Federal taxesIt is the policy of the fund to distribute all of its taxable income within the prescribed time period and otherwise comply with the provisions of the Internal Revenue Code of 1986, as amended (the Code), applicable to regulated investment companies.
The fund is subject to the provisions of Accounting Standards Codification 740Income Taxes(ASC 740). ASC 740 sets forth a minimum threshold for financial statement recognition of the benefit of a tax position taken or expected to be taken in a tax return. The fund did not have a liability to record for any unrecognized tax
| |
| 32Putnam VT Mortgage Securities Fund |
benefits in the accompanying financial statements. No provision has been made for federal taxes on income, capital gains or unrealized appreciation on securities held nor for excise tax on income and capital gains. Each of the fund’s federal tax returns for the prior three fiscal years remains subject to examination by the Internal Revenue Service.
Under the Regulated Investment Company Modernization Act of 2010, the fund will be permitted to carry forward capital losses incurred for an unlimited period and the carry forwards will retain their character as either short-term or long-term capital losses. At December 31, 2019, the fund had the following capital loss carryovers available, to the extent allowed by the Code, to offset future net capital gain, if any:
| | |
| | Loss carryover | |
| Short-term | Long-term | Total |
| $14,297,731 | $500,390 | $14,798,121 |
Distributions to shareholdersDistributions to shareholders from net investment income are recorded by the fund on the ex-dividend date. Distributions from capital gains, if any, are recorded on the ex-dividend date and paid at least annually. The amount and character of income and gains to be distributed are determined in accordance with income tax regulations, which may differ from generally accepted accounting principles. These differences include temporary and/or permanent differences from income on swap contracts and from interest-only securities. Reclassifications are made to the fund’s capital accounts to reflect income and gains available for distribution (or available capital loss carryovers) under income tax regulations. At the close of the reporting period, the fund reclassified $670,204 to increase undistributed net investment income and $670,204 to increase accumulated net realized loss.
Tax cost of investments includes adjustments to net unrealized appreciation (depreciation) which may not necessarily be final tax cost basis adjustments, but closely approximate the tax basis unrealized gains and losses that may be realized and distributed to shareholders. The tax basis components of distributable earnings and the federal tax cost as of the close of the reporting period were as follows:
| |
| Unrealized appreciation | $2,660,374 |
| Unrealized depreciation | (4,198,429) |
| Net unrealized depreciation | (1,538,055) |
| Undistributed ordinary income | 4,684,060 |
| Capital loss carryforward | (14,798,121) |
| Cost for federal income tax purposes | $85,335,789 |
Expenses of the TrustExpenses directly charged or attributable to any fund will be paid from the assets of that fund. Generally, expenses of the Trust will be allocated among and charged to the assets of each fund on a basis that the Trustees deem fair and equitable, which may be based on the relative assets of each fund or the nature of the services performed and relative applicability to each fund.
Beneficial interestAt the close of the reporting period, insurance companies or their separate accounts were record owners of all but a de minimis number of the shares of the fund. Approximately 34.5% of the fund is owned by accounts of one insurance company.
Note 2 — Management fee, administrative services and other transactions
The fund pays Putnam Management a management fee (based on the fund’s average net assets and computed and paid monthly) at annual rates that may vary based on the average of the aggregate net assets of all open-end mutual funds sponsored by Putnam Management (excluding net assets of funds that are invested in, or that are invested in by, other Putnam funds to the extent necessary to avoid “double counting” of those assets). Such annual rates may vary as follows:
| | | | | |
| 0.550% | of the first $5 billion, | | | | |
| 0.500% | of the next $5 billion, | | | | |
| 0.450% | of the next $10 billion, | | | | |
| 0.400% | of the next $10 billion, | | | | |
| 0.350% | of the next $50 billion, | | | | |
| 0.330% | of the next $50 billion, | | | | |
| 0.320% | of the next $100 billion and | | | | |
| 0.315% | of any excess thereafter. | | | | |
For the reporting period, the management fee represented an effective rate (excluding the impact from any expense waivers in effect) of 0.390% of the fund’s average net assets.
Putnam Management has contractually agreed to waive fees (and, to the extent necessary, bear other expenses) of the fund through April 30, 2021, to the extent that total expenses of the fund (excluding brokerage, interest, taxes, investment-related expenses, payments under distribution plans, extraordinary expenses and acquired fund fees and expenses) would exceed an annual rate of 0.50% of the fund’s average net assets. During the reporting period, the fund’s expenses were reduced by $89,990 as a result of this limit.
Putnam Management has also contractually agreed, through April 30, 2021, to waive fees and/or reimburse the fund’s expenses to the extent necessary to limit the cumulative expenses of the fund, exclusive of brokerage, interest, taxes, investment-related expenses, extraordinary expenses, acquired fund fees and expenses and payments under the fund’s investor servicing contract, investment management contract and distribution plans, on a fiscal year-to-date basis to an annual rate of 0.20% of the fund’s average net assets over such fiscal year-to-date period. During the reporting period, the fund’s expenses were reduced by $33,444 as a result of this limit.
Putnam Investments Limited (PIL), an affiliate of Putnam Management, is authorized by the Trustees to manage a separate portion of the assets of the fund as determined by Putnam Management from time to time. PIL did not manage any portion of the assets of the fund during the reporting period. If Putnam Management were to engage the services of PIL, Putnam Management would pay a quarterly sub-management fee to PIL for its services at an annual rate of 0.25% of the average net assets of the portion of the fund managed by PIL.
The fund reimburses Putnam Management an allocated amount for the compensation and related expenses of certain officers of the fund and their staff who provide administrative services to the fund. The aggregate amount of all such reimbursements is determined annually by the Trustees.
Custodial functions for the fund’s assets are provided by State Street. Custody fees are based on the fund’s asset level, the number of its security holdings and transaction volumes.
Putnam Investor Services, Inc., an affiliate of Putnam Management, provides investor servicing agent functions to the fund. Putnam Investor Services, Inc. was paid a monthly fee for investor servicing at an annual rate of 0.07% of the fund’s average daily net assets. During the reporting period, the expenses for each class of shares related to investor servicing fees were as follows:
| |
| Class IA | $22,163 |
| Class IB | 17,299 |
| Total | $39,462 |
The fund has entered into expense offset arrangements with Putnam Investor Services, Inc. and State Street whereby Putnam Investor Services, Inc.’s and State Street’s fees are reduced by credits allowed on cash balances. For the reporting period, the fund’s expenses were reduced by $984 under the expense offset arrangements.
Each Independent Trustee of the fund receives an annual Trustee fee, of which $39, as a quarterly retainer, has been allocated to the fund, and an additional fee for each Trustees meeting attended. Trustees also are reimbursed for expenses they incur relating to their services as Trustees.
The fund has adopted a Trustee Fee Deferral Plan (the Deferral Plan) which allows the Trustees to defer the receipt of all or a portion of Trustees fees payable on or after July 1, 1995. The deferred fees remain invested in certain Putnam funds until distribution in accordance with the Deferral Plan.
The fund has adopted an unfunded noncontributory defined benefit pension plan (the Pension Plan) covering all Trustees of the fund who have served as a Trustee for at least five years and were first elected prior to 2004. Benefits under the Pension Plan are equal to 50% of the Trustee’s average annual attendance and retainer fees for the three years ended December 31, 2005. The retirement benefit is payable during a Trustee’s lifetime, beginning the year following retirement, for the number of years of service through December 31, 2006. Pension expense for the fund is included in Trustee compensation and expenses in the Statement of operations. Accrued pension liability is included in Payable for Trustee compensation and expenses in the Statement of assets and liabilities. The Trustees have terminated the Pension Plan with respect to any Trustee first elected after 2003.
The fund has adopted a distribution plan (the Plan) with respect to its class IB shares pursuant to Rule 12b–1 under the Investment Company Act of 1940. The purpose of the Plan is to compensate Putnam Retail Management Limited Partnership, an indirect wholly-owned subsidiary of Putnam Investments, LLC, for services provided and expenses incurred in distributing shares of the fund. The Plan provides for payment by the fund to Putnam Retail Management Limited
| |
| Putnam VT Mortgage Securities Fund33 |
Partnership at an annual rate of up to 0.35% of the average net assets attributable to the fund’s class IB shares. The Trustees have approved payment by the fund at an annual rate of 0.25% of the average net assets attributable to the fund’s class IB shares. The expenses related to distribution fees during the reporting period are included in Distribution fees in the Statement of operations.
The fund may purchase or sell investments from or to other Putnam funds in the ordinary course of business, which can reduce the fund’s transaction costs, at prices determined in accordance with SEC requirements and policies approved by the Trustees. During the reporting period, purchases or sales of long-term securities from or to other Putnam funds, if any, did not represent more than 5% of the fund’s total cost of purchases and/or total proceeds from sales.
Note 3 — Purchases and sales of securities
During the reporting period, the cost of purchases and the proceeds from sales, excluding short-term investments, were as follows:
| | | | |
| | Cost of | Proceeds | | |
| | purchases | from sales | | |
| Investments in securities, including | | | | |
| TBA commitments | | | | |
| (Long-term) | $918,388,353 | $926,464,833 | | |
| U.S. government securities | | | | |
| (Long-term) | — | — | | |
| Total | $918,388,353 | $926,464,833 | | |
Note 4 — Capital shares
At the close of the reporting period, there were an unlimited number of shares of beneficial interest authorized. Subscriptions and redemptions are presented at the omnibus level. Transactions in capital shares were as follows:
| | | | | | | | |
| | | Class IA shares | | | Class IB shares | |
| | Year ended 12/31/19 | Year ended 12/31/18 | Year ended 12/31/19 | Year ended 12/31/18 |
| | Shares | Amount | Shares | Amount | Shares | Amount | Shares | Amount |
| Shares sold | 94,432 | $913,300 | 157,614 | $1,470,417 | 606,756 | $5,914,288 | 329,770 | $3,053,013 |
| Shares issued in connection with | | | | | | | | |
| reinvestment of distributions | 84,330 | 785,112 | 112,472 | 1,036,991 | 56,933 | 529,481 | 79,365 | 731,746 |
| | 178,762 | 1,698,412 | 270,086 | 2,507,408 | 663,689 | 6,443,769 | 409,135 | 3,784,759 |
| Shares repurchased | (446,132) | (4,310,787) | (631,370) | (5,849,650) | (537,961) | (5,201,710) | (770,598) | (7,099,013) |
| Net increase (decrease) | (267,370) | $(2,612,375) | (361,284) | $(3,342,242) | 125,728 | $1,242,059 | (361,463) | $(3,314,254) |
Note 5 — Market, credit and other risks
In the normal course of business, the fund trades financial instruments and enters into financial transactions where risk of potential loss exists due to changes in the market (market risk) or failure of the contracting party to the transaction to perform (credit risk). The fund may be exposed to additional credit risk that an institution or other entity with which the fund has unsettled or open transactions will default. The fund may invest a significant portion of its assets in securitized debt instruments, including mortgage-backed and asset-backed investments. The yields and values of these investments are sensitive to changes in interest rates, the rate of principal payments on the underlying assets and the market’s perception of the issuers. The market for these investments may be volatile and limited, which may make them difficult to buy or sell.
Note 6 — Summary of derivative activity
The volume of activity for the reporting period for any derivative type that was held during the period is listed below and was based on an average of the holdings at the end of each fiscal quarter:
| |
| Purchased TBA commitment option contracts (contract amount) | $50,200,000 |
| Purchased swap option contracts (contract amount) | $136,200,000 |
| Written TBA commitment option contracts (contract amount) | $53,800,000 |
| Written swap option contracts (contract amount) | $96,900,000 |
| Futures contracts (number of contracts) | 70 |
| Centrally cleared interest rate swap contracts (notional) | $139,900,000 |
| OTC total return swap contracts (notional) | $10,700,000 |
| Centrally cleared total return swap contracts (notional) | $750,000 |
| OTC credit default contracts (notional) | $29,900,000 |
| |
| 34Putnam VT Mortgage Securities Fund |
The following is a summary of the fair value of derivative instruments as of the close of the reporting period:
Fair value of derivative instruments as of the close of the reporting period
| | | | |
| | Asset derivatives | Liability derivatives |
| Derivatives not accounted for as hedging | Statement of assets and | | Statement of assets and | |
| instruments under ASC 815 | liabilities location | Fair value | liabilities location | Fair value |
| Credit contracts | Receivables | $226,670 | Payables | $1,097,212 |
| | Investments, | | | |
| | Receivables, Net | | Payables, Net | |
| | assets — Unrealized | | assets — Unrealized | |
| Interest rate contracts | appreciation | 2,991,634* | depreciation | 2,786,585* |
| Total | | $3,218,304 | | $3,883,797 |
*Includes cumulative appreciation/depreciation of futures contracts and/or centrally cleared swaps as reported in the fund’s portfolio. Only current day’s variation margin is reported within the Statement of assets and liabilities.
The following is a summary of realized and change in unrealized gains or losses of derivative instruments in the Statement of operations for the reporting period (see Note 1):
Amount of realized gain or (loss) on derivatives recognized in net gain or (loss) on investments
| | | | |
| Derivatives not accounted for as hedging | | | | |
| instruments under ASC 815 | Options | Futures | Swaps | Total |
| Credit contracts | $— | $— | $585,586 | $585,586 |
| Interest rate contracts | 558,991 | 12,784 | (214,454) | $357,321 |
| Total | $558,991 | $12,784 | $371,132 | $942,907 |
Change in unrealized appreciation or (depreciation) on derivatives recognized in net gain or (loss) on investments
| | | | |
| Derivatives not accounted for as hedging | | | | |
| instruments under ASC 815 | Options | Futures | Swaps | Total |
| Credit contracts | $— | $— | $2,049,081 | $2,049,081 |
| Interest rate contracts | (267,285) | (6,486) | 367,249 | $93,478 |
| Total | $(267,285) | $(6,486) | $2,416,330 | $2,142,559 |
Note 7 — New accounting pronouncements
In March 2017, the Financial Accounting Standards Board issued Accounting Standards Update (ASU) No. 2017–08,Receivables—Nonrefundable Fees and Other Costs(Subtopic 310–20):Premium Amortization on Purchased Callable Debt Securities.The amendments in the ASU shorten the amortization period for certain callable debt securities held at a premium, to be amortized to the earliest call date. The ASU is effective for fiscal years and interim periods within those fiscal years beginning after December 15, 2018. The adoption of these amendments is not material to the financial statements.
| |
| Putnam VT Mortgage Securities Fund35 |
Note 8 — Offsetting of financial and derivative assets and liabilities
The following table summarizes any derivatives, repurchase agreements and reverse repurchase agreements, at the end of the reporting period, that are subject to an enforceable master netting agreement or similar agreement. For securities lending transactions or borrowing transactions associated with securities sold short, if any, see Note 1. For financial reporting purposes, the fund does not offset financial assets and financial liabilities that are subject to the master netting agreements in the Statement of assets and liabilities.
| | | | | | | | | | | | | | | | | |
| | Bank of America N.A. | Barclays Bank PLC | Barclays Capital, Inc. (clearing broker) | Citibank, N.A. | Citigroup Global Markets, Inc. | Credit Suisse International | Deutsche Bank AG | Goldman Sachs International | HSBC Bank USA, National Association | JPMorgan Chase Bank N. A. | JPMorgan Securities LLC | Merrill Lynch International | Morgan Stanley & Co. International PLC | Toronto - Dominion Bank | UBS AG | Wells Fargo Bank, N.A. | Total |
| Assets: | | | | | | | | | | | | | | | | | |
| Centrally cleared interest rate | | | | | | | | | | | | | | | | | |
| swap contracts§ | $— | $— | $— | $— | $— | $— | $— | $— | $— | $— | $— | $— | $— | $— | $— | $— | $— |
| OTC Total return | | | | | | | | | | | | | | | | | |
| swap contracts*# | — | 2,044 | — | — | — | 86 | — | 2,306 | — | — | 2,560 | — | — | — | — | — | 6,996 |
| OTC Credit default contracts — | | | | | | | | | | | | | | | | | |
| protection sold*# | — | — | — | — | 15,142 | — | — | 2,819 | — | — | — | — | 42,044 | — | — | — | 60,005 |
| OTC Credit default contracts — | | | | | | | | | | | | | | | | | |
| protection purchased*# | — | — | — | — | 28,019 | 4,896 | — | 3,900 | — | — | 19,807 | 40,955 | 69,088 | — | — | — | 166,665 |
| Futures contracts§ | — | — | — | — | — | — | — | — | — | — | 747 | — | — | — | — | — | 747 |
| Forward premium swap | | | | | | | | | | | | | | | | | |
| option contracts# | 53,339 | — | — | 22,255 | — | — | — | 18,551 | — | 75,250 | — | — | 34,731 | — | 2,679 | 4,505 | 211,310 |
| Purchased swap options**# | 296,880 | — | — | 43,821 | — | — | — | 19,926 | — | — | — | — | 1,247,652 | 1,557 | 29,247 | — | 1,639,083 |
| Purchased options**# | — | — | — | — | — | — | — | — | — | 101,155 | — | — | — | — | — | — | 101,155 |
| Repurchase agreements** | — | — | — | — | — | — | — | — | 9,717,000 | — | — | — | — | — | — | — | 9,717,000 |
| Total Assets | $350,219 | $2,044 | $— | $66,076 | $43,161 | $4,982 | $— | $47,502 | $9,717,000 | $176,405 | $23,114 | $40,955 | $1,393,515 | $1,557 | $31,926 | $4,505 | $11,902,961 |
| Liabilities: | | | | | | | | | | | | | | | | | |
| Centrally cleared interest rate | | | | | | | | | | | | | | | | | |
| swap contracts§ | — | — | — | — | — | — | — | — | — | — | — | — | — | — | — | — | — |
| OTC Total return | | | | | | | | | | | | | | | | | |
| swap contracts*# | 61 | 12,033 | — | 18 | — | 506 | — | 7,834 | — | 391 | 13 | — | — | — | — | — | 20,856 |
| OTC Credit default contracts — | | | | | | | | | | | | | | | | | |
| protection sold*# | — | — | — | — | 274,142 | 162,415 | 25,561 | 60,177 | — | — | 45,644 | 53,851 | 473,293 | — | — | — | 1,095,083 |
| OTC Credit default contracts — | | | | | | | | | | | | | | | | | |
| protection purchased*# | — | — | — | — | 291 | — | — | — | — | — | 1,512 | — | 326 | — | — | — | 2,129 |
| Futures contracts§ | — | — | — | — | — | — | — | — | — | — | 2,313 | — | — | — | — | — | 2,313 |
| Forward premium swap | | | | | | | | | | | | | | | | | |
| option contracts# | 58,591 | — | — | 78,216 | — | — | — | 71,469 | — | 174,611 | — | — | 58,384 | — | 2,830 | 4,740 | 448,841 |
| Written swap options# | — | — | — | 96,881 | — | — | — | 20,670 | — | — | — | — | 1,208,463 | 10,372 | 90,930 | — | 1,427,316 |
| Written options# | — | — | — | — | — | — | — | — | — | 68,882 | — | — | — | — | — | — | 68,882 |
| Total Liabilities | $58,652 | $12,033 | $— | $175,115 | $274,433 | $162,921 | $25,561 | $160,150 | $— | $243,884 | $49,482 | $53,851 | $1,740,466 | $10,372 | $93,760 | $4,740 | $3,065,420 |
| Total Financial and Derivative | | | | | | | | | | | | | | | | | |
| Net Assets | $291,567 | $(9,989) | $— | $(109,039) | $(231,272) | $(157,939) | $(25,561) | $(112,648) | $9,717,000 | $(67,479) | $(26,368) | $(12,896) | $(346,951) | $(8,815) | $(61,834) | $(235) | $8,837,541 |
| Total collateral received | | | | | | | | | | | | | | | | | |
| (pledged)†## | $291,567 | $— | $— | $(109,039) | $(231,272) | $(157,939) | $— | $(110,474) | $9,717,000 | $(67,479) | $(26,368) | $— | $(346,951) | $— | $— | $— | |
| Net amount | $— | $(9,989) | $— | $— | $— | $— | $(25,561) | $(2,174) | $— | $— | $— | $(12,896) | $— | $(8,815) | $(61,834) | $(235) | |
| Controlled collateral received | | | | | | | | | | | | | | | | | |
| (including TBA commitments)** | $352,566 | $— | $— | $— | $— | $— | $— | $— | $— | $— | $— | $— | $— | $— | $— | $— | $352,566 |
| Uncontrolled collateral received | $— | $— | $— | $— | $— | $— | $— | $— | $9,912,207 | $— | $— | $— | $— | $— | $— | $— | $9,912,207 |
| Collateral (pledged) (including | | | | | | | | | | | | | | | | | |
| TBA commitments)** | $— | $— | $— | $(111,365) | $(303,170) | $(230,724) | $— | $(110,474) | $— | $(72,474) | $(34,843) | $— | $(373,758) | $— | $— | $— | $(1,236,808) |
*Excludes premiums, if any. Included in unrealized appreciation and depreciation on OTC swap contracts on the Statement of assets and liabilities.
**Included with Investments in securities on the Statement of assets and liabilities.
†Additional collateral may be required from certain brokers based on individual agreements.
#Covered by master netting agreement (Note 1).
##Any over-collateralization of total financial and derivative net assets is not shown. Collateral may include amounts related to unsettled agreements.
§Includes current day’s variation margin only as reported on the Statement of assets and liabilities, which is not collateralized. Cumulative appreciation/(depreciation) for futures contracts and centrally cleared swap contracts is represented in the tables listed after the fund’s portfolio. Collateral pledged for initial margin on futures contracts and centrally cleared swap contracts, which is not included in the table above, amounted to $26,879 and $1,135,367, respectively.
| |
| 36Putnam VT Mortgage Securities Fund |
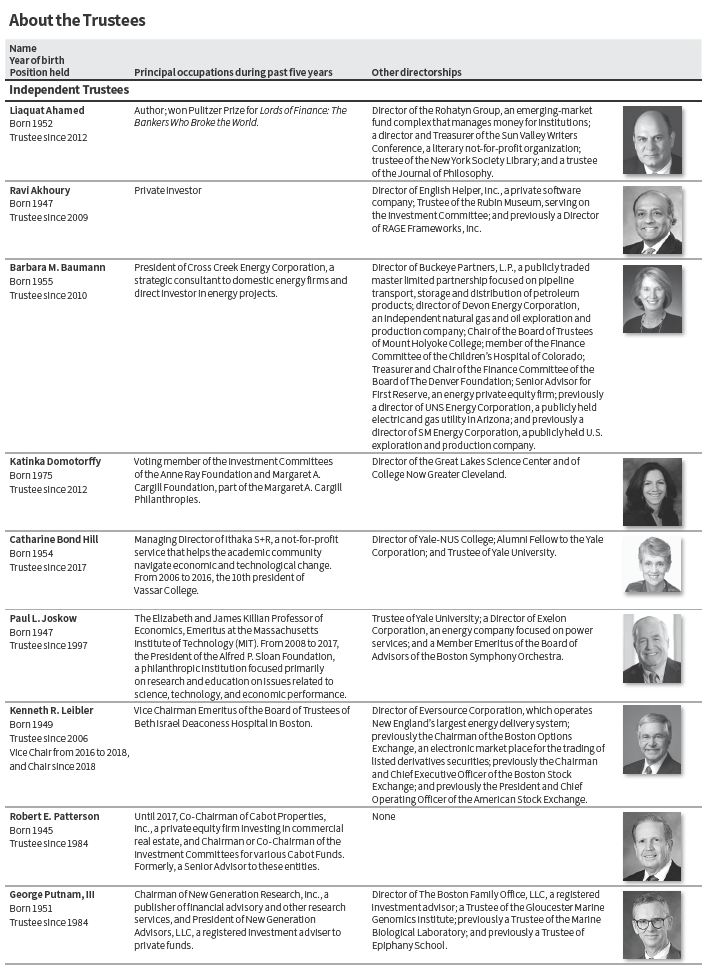
| |
| 38Putnam VT Mortgage Securities Fund |

*Mr. Reynolds is an “interested person” (as defined in the Investment Company Act of 1940) of the fund and Putnam Investments. He is President and Chief Executive Officer of Putnam Investments, as well as the President of your fund and each of the other Putnam funds.
The address of each Trustee is 100 Federal Street, Boston, MA 02110.
As of December 31, 2019, there were 91 Putnam funds. All Trustees serve as Trustees of all Putnam funds.
Each Trustee serves for an indefinite term, until his or her resignation, retirement at age 75, removal, or death.
Officers
In addition to Robert L. Reynolds, the other officers of the fund are shown below:
| | |
| Robert T. Burns(Born 1961) | Michael J. Higgins(Born 1976) | Denere P. Poulack(Born 1968) |
| Vice President and Chief Legal Officer | Vice President, Treasurer, and Clerk | Assistant Vice President, Assistant Clerk, and |
| Since 2011 | Since 2010 | Assistant Treasurer |
| General Counsel, Putnam Investments, Putnam | | Since 2004 |
| Management, and Putnam Retail Management | Jonathan S. Horwitz(Born 1955) | |
| | Executive Vice President, Principal Executive | Janet C. Smith(Born 1965) |
| James F. Clark(Born 1974) | Officer, and Compliance Liaison | Vice President, Principal Financial Officer, |
| Vice President and Chief Compliance Officer | Since 2004 | Principal Accounting Officer, and Assistant |
| Since 2016 | | Treasurer |
| Chief Compliance Officer and Chief Risk Officer, | Richard T. Kircher(Born 1962) | Since 2007 |
| Putnam Investments and Chief Compliance | Vice President and BSA Compliance Officer | Head of Fund Administration Services, Putnam |
| Officer, Putnam Management | Since 2019 | Investments and Putnam Management |
| | Assistant Director, Operational Compliance, | |
| Nancy E. Florek(Born 1957) | Putnam Investments and Putnam | Mark C. Trenchard(Born 1962) |
| Vice President, Director of Proxy Voting and | Retail Management | Vice President |
| Corporate Governance, Assistant Clerk, and | | Since 2002 |
| Assistant Treasurer | Susan G. Malloy(Born 1957) | Director of Operational Compliance,Putnam |
| Since 2000 | Vice President and Assistant Treasurer | Investments and Putnam Retail Management |
| | Since 2007 | |
| Head of Accounting and Middle Office Services, | |
| Putnam Investments and Putnam Management | |
The principal occupations of the officers for the past five years have been with the employers as shown above, although in some cases they have held different positions with such employers. The address of each officer is 100 Federal Street, Boston, MA 02110.
| | |
| | Putnam VT Mortgage Securities Fund39 |
|
| This page intentionally left blank. |
| |
| 40Putnam VT Mortgage Securities Fund |
Other important information
Proxy voting
Putnam is committed to managing our mutual funds in the best interests of our shareholders. The Putnam funds’ proxy voting guidelines and procedures, as well as information regarding how your fund voted proxies relating to portfolio securities during the 12-month period ended June 30, 2019, are available in the Individual Investors section of putnam.com and on the Securities and Exchange Commission’s (SEC) website at www.sec.gov. If you have questions about finding forms on the SEC’s website, you may call the SEC at 1-800-SEC-0330. You may also obtain the Putnam funds’ proxy voting guidelines and procedures at no charge by calling Putnam’s Shareholder Services at 1-800-225-1581.
Fund portfolio holdings
The fund will file a complete schedule of its portfolio holdings with the SEC for the first and third quarters of each fiscal year on Form N-PORT within 60 days of the end of such fiscal quarter. Shareholders may obtain the fund’s Form N-PORT from the SEC’s website at www.sec.gov.
Prior to its use of Form N-PORT, the fund filed its complete schedule of its portfolio holdings with the SEC on Form N-Q, which is available online at www.sec.gov.
Fund information
| | |
| Investment Manager | Investor Servicing Agent | Trustees |
| Putnam Investment Management, LLC | Putnam Investments | Kenneth R. Leibler,Chair |
| 100 Federal Street | Mailing address: | Liaquat Ahamed |
| Boston, MA 02110 | P.O. Box 219697 | Ravi Akhoury |
| | Kansas City, MO 64121-9697 | Barbara M. Baumann |
| Investment Sub-Advisor | 1-800-225-1581 | Katinka Domotorffy |
| Putnam Investments Limited | | Catharine Bond Hill |
| 16 St James’s Street | Custodian | Paul L. Joskow |
| London, England SW1A 1ER | State Street Bank and Trust Company | Robert E. Patterson |
| | | George Putnam, III |
| Marketing Services | Legal Counsel | Robert L. Reynolds |
| Putnam Retail Management | Ropes & Gray LLP | Manoj P. Singh |
| 100 Federal Street | | |
| Boston, MA 02110 | Independent Registered | |
| Public Accounting Firm | |
| | PricewaterhouseCoopers LLP | |
The fund’s Statement of Additional Information contains additional information about the fund’s Trustees and is available without charge upon request by calling 1-800-225-1581.
| |
| Putnam VT Mortgage Securities Fund41 |
| |
| | |
| This report has been prepared for the shareholders | TR500 |
| of Putnam VT Mortgage Securities Fund. | VTAN027 319817 2/20 |
| |
| (a) The fund's principal executive, financial and accounting officers are employees of Putnam Investment Management, LLC, the Fund's investment manager. As such they are subject to a comprehensive Code of Ethics adopted and administered by Putnam Investments which is designed to protect the interests of the firm and its clients. The Fund has adopted a Code of Ethics which incorporates the Code of Ethics of Putnam Investments with respect to all of its officers and Trustees who are employees of Putnam Investment Management, LLC. For this reason, the Fund has not adopted a separate code of ethics governing its principal executive, financial and accounting officers. |
| |
| (c) In October 2019, the Code of Ethics of Putnam Investments was amended. The key changes to the Code of Ethics are as follows: (i) Employee notification to the Code of Ethics Officer before acting as a public official for any government entity (ii) Clarifying changes to the Insider Trading provisions and to the rules for trading in securities issued by Great-West Lifeco. |
| |
| Item 3. Audit Committee Financial Expert: |
| |
| The Funds' Audit, Compliance and Distributions Committee is comprised solely of Trustees who are “independent” (as such term has been defined by the Securities and Exchange Commission (“SEC”) in regulations implementing Section 407 of the Sarbanes-Oxley Act (the “Regulations”)). The Trustees believe that each of the members of the Audit, Compliance and Distributions Committee also possess a combination of knowledge and experience with respect to financial accounting matters, as well as other attributes, that qualify them for service on the Committee. In addition, the Trustees have determined that each of Mr. Patterson, Ms. Baumann and Mr. Singh qualifies as an “audit committee financial expert” (as such term has been defined by the Regulations) based on their review of his or her pertinent experience and education. The SEC has stated, and the funds' amended and restated agreement and Declaration of Trust provides, that the designation or identification of a person as an audit committee financial expert pursuant to this Item 3 of Form N-CSR does not impose on such person any duties, obligations or liability that are greater than the duties, obligations and liability imposed on such person as a member of the Audit, Compliance and Distribution Committee and the Board of Trustees in the absence of such designation or identification. |
| |
| Item 4. Principal Accountant Fees and Services: |
| |
| The following table presents fees billed in each of the last two fiscal years for services rendered to the fund by the fund's independent auditor: |
| | | | | |
| Fiscal year ended | Audit Fees | Audit-Related Fees | Tax Fees | All Other Fees |
|
|
| | | | | |
| December 31, 2019 | $54,434 | $ — | $5,767 | $ — |
| December 31, 2018 | $47,463 | $200* | $7,321 | $ — |
| * | Fees billed to the fund for services relating to a review of certain trading activity that was the subject of a settlement between Putnam Investment Management, LLC and the Securities and Exchange Commission. |
| |
| For the fiscal years ended December 31, 2019 and December 31, 2018, the fund's independent auditor billed aggregate non-audit fees in the amounts of $163,442 and $624,002 respectively, to the fund, Putnam Management and any entity controlling, controlled by or under common control with Putnam Management that provides ongoing services to the fund. |
| |
| Audit Fees represent fees billed for the fund's last two fiscal years relating to the audit and review of the financial statements included in annual reports and registration statements, and other services that are normally provided in connection with statutory and regulatory filings or engagements. |
| |
| Audit-Related Fees represent fees billed in the fund's last two fiscal years for services traditionally performed by the fund's auditor, including accounting consultation for proposed transactions or concerning financial accounting and reporting standards and other audit or attest services not required by statute or regulation. |
| |
| Tax Fees represent fees billed in the fund's last two fiscal years for tax compliance, tax planning and tax advice services. Tax planning and tax advice services include assistance with tax audits, employee benefit plans and requests for rulings or technical advice from taxing authorities. |
| |
| Pre-Approval Policies of the Audit, Compliance and Distributions Committee. The Audit, Compliance and Distributions Committee of the Putnam funds has determined that, as a matter of policy, all work performed for the funds by the funds' independent auditors will be pre-approved by the Committee itself and thus will generally not be subject to pre-approval procedures. |
| |
| The Audit, Compliance and Distributions Committee also has adopted a policy to pre-approve the engagement by Putnam Management and certain of its affiliates of the funds' independent auditors, even in circumstances where pre-approval is not required by applicable law. Any such requests by Putnam Management or certain of its affiliates are typically submitted in writing to the Committee and explain, among other things, the nature of the proposed engagement, the estimated fees, and why this work should be performed by that particular audit firm as opposed to another one. In reviewing such requests, the Committee considers, among other things, whether the provision of such services by the audit firm are compatible with the independence of the audit firm. |
| |
| The following table presents fees billed by the fund's independent auditor for services required to be approved pursuant to paragraph (c)(7)(ii) of Rule 2–01 of Regulation S-X. |
| | | | | |
| Fiscal year ended | Audit-Related Fees | Tax Fees | All Other Fees | Total Non-Audit Fees |
|
|
| December 31, 2019 | $ — | $157,675 | $ — | $ — |
| December 31, 2018 | $ — | $616,482 | $ — | $ — |
| |
| Item 5. Audit Committee of Listed Registrants |
| |
|
Item 6. Schedule of Investments: |
| |
| The registrant's schedule of investments in unaffiliated issuers is included in the report to shareholders in Item 1 above. |
| |
| Item 7. Disclosure of Proxy Voting Policies and Procedures For Closed-End Management Investment Companies: |
| |
|
Item 8. Portfolio Managers of Closed-End Investment Companies |
| |
|
Item 9. Purchases of Equity Securities by Closed-End Management Investment Companies and Affiliated Purchasers: |
| |
|
Item 10. Submission of Matters to a Vote of Security Holders: |
| |
|
Item 11. Controls and Procedures: |
| |
|
(a) The registrant's principal executive officer and principal financial officer have concluded, based on their evaluation of the effectiveness of the design and operation of the registrant's disclosure controls and procedures as of a date within 180 days of the filing date of this report, that the design and operation of such procedures are generally effective to provide reasonable assurance that information required to be disclosed by the registrant in this report is recorded, processed, summarized and reported within the time periods specified in the Commission's rules and forms. |
| |
| (b) Changes in internal control over financial reporting: Not applicable |
| |
|
Item 12. Disclosures of Securities Lending Activities for Closed-End Management Investment Companies: |
| |
|
(a)(1) The Code of Ethics of The Putnam Funds, which incorporates the Code of Ethics of Putnam Investments, is filed herewith. |
| |
| Pursuant to the requirements of the Securities Exchange Act of 1934 and the Investment Company Act of 1940, the registrant has duly caused this report to be signed on its behalf by the undersigned, thereunto duly authorized. |
| |
| By (Signature and Title): |
| |
| /s/ Janet C. Smith
Janet C. Smith
Principal Accounting Officer
|
| |
| Pursuant to the requirements of the Securities Exchange Act of 1934 and the Investment Company Act of 1940, this report has been signed below by the following persons on behalf of the registrant and in the capacities and on the dates indicated. |
| |
| By (Signature and Title): |
| |
| /s/ Jonathan S. Horwitz
Jonathan S. Horwitz
Principal Executive Officer
|
| |
| By (Signature and Title): |
| |
| /s/ Janet C. Smith
Janet C. Smith
Principal Financial Officer
|