UNITED STATES
SECURITIES AND EXCHANGE COMMISSION
Washington, D.C. 20549
FORM N-CSR
CERTIFIED SHAREHOLDER REPORT OF REGISTERED
MANAGEMENT INVESTMENT COMPANIES
Investment Company Act file number 811-05349
Goldman Sachs Trust
(Exact name of registrant as specified in charter)71 South Wacker Drive, Chicago, Illinois 60606
(Address of principal executive offices) (Zip code)| | | |
| Peter V. Bonanno, Esq. | | Copies to: |
| Goldman, Sachs & Co. | | Jack W. Murphy, Esq. |
| One New York Plaza | | Dechert LLP |
| New York, New York 10004 | | 1775 I Street, NW |
| | | Washington, D.C. 20006 |
|
(Name and address of agents for service)
|
Registrant’s telephone number, including area code: (312) 655-4400
Date of fiscal year end: December 31
Date of reporting period: June 30, 2009
| | | |
| ITEM 1. | | REPORTS TO STOCKHOLDERS. |
| | | |
| | | The Semi-Annual Report to Stockholders is filed herewith. |
Goldman Sachs Funds
| | | | |
| | | | |
Semi-Annual Report | | | June 30, 2009 |
| | | | |
| | | | |
| | | | |
| | | | Select Satellite Funds |
| | | | Absolute Return Tracker Fund |
| | | | Commodity Strategy Fund |
| | | | International Real Estate Securities Fund |
| | | | Real Estate Securities Fund |
| | | | |
Goldman Sachs Select Satellite Funds
| | |
| n | GOLDMAN SACHS ABSOLUTE RETURN TRACKER FUND | |
| |
| n | GOLDMAN SACHS COMMODITY STRATEGY FUND | |
| |
| n | GOLDMAN SACHS INTERNATIONAL REAL ESTATE SECURITIES FUND | |
| |
| n | GOLDMAN SACHS REAL ESTATE SECURITIES FUND | |
TABLE OF CONTENTS
| | | |
| Principal Investment Strategies and Risks | | 1 |
| Portfolio Review and Results | | 3 |
| Schedules of Investments | | 25 |
| Financial Statements | | 36 |
| Notes to the Financial Statements | | 40 |
| Financial Highlights | | 62 |
| Other Information | | 70 |
| | | | | | | |
NOT FDIC-INSURED | | | May Lose Value | | | No Bank Guarantee |
| | | | | | | |
GOLDMAN SACHS SELECT SATELLITE FUNDS
Principal Investment Strategies and Risks
This is not a complete list of risks that may affect the Funds. For additional information concerning the risks applicable to the Funds, please see the Funds’ Prospectuses.
The Goldman Sachs Absolute Return Tracker Fund seeks to achieve investment results that approximate the performance of the GS-ART Index. The GS-ART Index is a benchmark index that seeks to replicate the investment returns of hedge fund betas (i.e., that portion of the returns of hedge funds, as a broad asset class, that results from market exposure rather than manager skill). The Fund intends to invest in financial instruments that may provide short or long exposure to the various indices that comprise the GS-ART Index. The Fund’s performance may not match, and may vary substantially from, that of the GS-ART Index. The Fund may make investments in swaps, futures and forward contracts, structured notes and other derivative instruments. Derivative instruments may involve a high degree of financial risk. These risks include the risk that a small movement in the price of the underlying security or benchmark may result in a disproportionately large movement, unfavorable or favorable, in the price of the derivative instrument; risks of default by a counterparty, and the risks that the instruments may not be liquid. The Fund is subject to the risks associated with short selling of securities. Short selling involves leverage of the Fund’s assets and presents various other risks. Because the Fund must first borrow a security to establish a short position, there is a risk that a security will not be available at a particular time or an acceptable price and therefore the Fund may not be able to implement its investment strategy. In addition, the Fund may be obligated to cover its short position at a higher price than the short price, resulting in a loss. Losses on short sales are potentially unlimited as a loss occurs when the value of a security sold short increases. Note that short selling involves sophisticated investment techniques that have the potential to add additional risk to a portfolio. The Fund is not appropriate for all investors.
The Goldman Sachs Commodity Strategy Fund invests primarily in a portfolio of commodity index-linked securities (including leveraged and unleveraged structured roles), other commodity-linked securities and derivative instruments that provide exposure to the performance of the commodities markets, and other fixed income and debt instruments. The Fund may also gain exposure to the performance of the commodity markets through investments in a wholly-owned subsidiary of the Fund organized as a company under the laws of the Cayman Islands (the “Subsidiary”). The Subsidiary has the same investment objective as the Fund. The Fund invests a significant percentage of its assets in the Subsidiary and is subject to the risks associated with the Subsidiary’s investments. The Fund is subject to the risk that exposure to the commodities markets may subject the Fund to greater volatility than investments in traditional securities. Derivative instruments may involve a high degree of financial risk. These risks include the risks that a small movement in the price of the underlying security or benchmark may result in a disproportionately large movement, unfavorable or favorable, in the price of the derivative instrument; risks of default by a counterparty; and the risks that the instruments may not be liquid. The Fund may also invest in foreign securities, which may be more volatile than investments in U.S. securities and will be subject to the risks of currency fluctuations and sudden economic or political developments. The Fund may also invest in non-investment grade fixed income securities, which are considered speculative. Non-investment grade fixed income securities and unrated securities of comparable credit quality are subject to the increased risk of an issuer’s inability to meet principal and interest payment obligations. The Fund is non-diversified and may invest more of its assets in fewer issuers than diversified funds. Accordingly, the Fund may be more susceptible to adverse developments affecting any single issuer held in its portfolio and to greater losses resulting from these developments.
GOLDMAN SACHS SELECT SATELLITE FUNDS
The Goldman Sachs International Real Estate Securities Fund invests primarily in a portfolio of equity investments in issuers that are primarily engaged in or related to the real estate industry outside the United States, including Real Estate Investment Trusts (“REITs”). Investing in REITs involves certain unique risks in addition to those risks associated with investing in the real estate industry in general. REITs whose underlying properties are concentrated in a particular industry or geographic region are also subject to risks affecting such industries and regions. The securities of REITs involve greater risks than those associated with larger, more established companies and may be subject to more abrupt or erratic price movements because of interest rate changes, economic conditions and other factors. The Fund’s investments, especially in real estate industry companies that hold mortgages, may be subject to interest rate risks. Foreign and emerging markets securities may be more volatile than U.S. securities and are subject to the risks of currency fluctuations and sudden economic or political developments. Because the Fund concentrates its investments in specific industry sectors, the Fund is subject to greater risk of loss as a result of adverse economic, business or other developments affecting these sectors than if its investments were diversified across different industry sectors. The Fund may be especially subject to the risk that the liquidity of particular portfolio securities will shrink or disappear suddenly and without warning as a result of adverse economic, market or political events, or adverse investor perceptions, whether or not accurate. At times, the Fund may be unable to sell certain of its portfolio securities without a substantial drop in price, if at all. Because the Fund invests primarily in issuers related to the real estate industry, its net asset value may fluctuate substantially over time and its performance may be substantially different from the returns of the broader stock market. The Fund may make investments in derivative instruments, including options and financial futures. Derivative instruments may be illiquid, difficult to price, and leveraged, so that a small movement in the price of an underlying security may result in disproportionate losses to the Fund. The Fund may participate in the Initial Public Offering (IPO) market. The market value of IPO shares may fluctuate considerably due to factors such as the absence of a prior public market, unseasoned trading, the small number of shares available for trading and limited information about the issuer. The Fund is non-diversified and may invest more of its assets in fewer issuers than diversified funds. Accordingly, the Fund may be more susceptible to adverse developments affecting any single issuer held in its portfolio and to greater losses resulting from these developments.
The Goldman Sachs Real Estate Securities Fund invests primarily in a portfolio of equity investments in issuers related to the real estate industry, including Real Estate Investment Trusts (“REITs”). Investing in REITs involves certain unique risks in addition to those risks associated with investing in the real estate industry in general. REITs whose underlying properties are concentrated in a particular industry or geographic region are also subject to risks affecting such industries and regions. The securities of REITs involve greater risks than those associated with larger, more established companies and may be subject to more abrupt or erratic price movements because of interest rate changes, economic conditions and other factors. The Fund’s investments, especially in real estate industry companies that hold mortgages, may be subject to interest rate risks. Because the Fund concentrates its investments in specific industry sectors, the Fund is subject to greater risk of loss as a result of adverse economic, business or other developments affecting these sectors than if its investments were diversified across different industry sectors. The Fund may be especially subject to the risk that the liquidity of particular portfolio securities will shrink or disappear suddenly and without warning as a result of adverse economic, market or political events, or adverse investor perceptions, whether or not accurate. At times, the Fund may be unable to sell certain of its portfolio securities without a substantial drop in price, if at all. Because the Fund invests primarily in issuers related to the real estate industry, its net asset value may fluctuate substantially over time and its performance may be substantially different from the returns of the broader stock market. The Fund may participate in the Initial Public Offering (IPO) market. The market value of IPO shares may fluctuate considerably due to factors such as the absence of a prior public market, unseasoned trading, and the small number of shares available for trading and limited information about the issuer. The Fund is non-diversified and may invest more of its assets in fewer issuers than diversified funds. Accordingly, the Fund may be more susceptible to adverse developments affecting any single issuer held in its portfolio and to greater losses resulting from these developments.
PORTFOLIO RESULTS
Absolute Return Tracker Fund
| |
| | The Fund seeks to achieve investment results that approximate the returns of the GS-ART Index. The GS-ART Index is a benchmark index that seeks to replicate the investment returns of hedge fund betas (i.e., that portion of the returns of hedge funds, as a broad asset class, that results from market exposure rather than manager skill.) |
Portfolio Management Discussion and Analysis
Below, the Goldman Sachs Quantitative Investment Strategies Team discusses the Fund’s performance and positioning for the six months ended June 30, 2009.
| |
| Q | How did the Goldman Sachs Absolute Return Tracker Fund (the “Fund”) perform during the semi-annual period ended June 30, 2009? |
| |
| A | During the six-month period ended June 30, 2009, the Fund’s Class A, C, Institutional, IR and R Shares generated cumulative total returns, without sales charges, of 2.91%, 2.58%, 3.14%, 3.14% and 2.80%, respectively. These returns compare to the 4.08% and 7.18% cumulative total return of the Fund’s benchmarks, the Goldman Sachs Absolute Return Tracker Index (the “GS-ART Index”) and the Credit Suisse/Tremont AllHedge Index, respectively, during the same time period. |
| |
| Q | What key factors were responsible for the Fund’s performance during the six-month reporting period? |
| |
| A | The Fund seeks to attain its objective by investing in various indices that comprise the GS-ART Index, each such index being a “Component Market Factor.” During the reporting period, the Fund’s Component Market Factors were investable indices reflecting the following categories — Equities, Fixed Income, Credit and Commodities. |
As a passive index strategy fund, active management decisions regarding asset class allocation or security selection do not apply nor are investment decisions regarding Component Market Factors made based on any economic or financial market outlooks. That said, positioning in each of the categories contributed positively to the Fund’s absolute returns during the semi-annual period. Further, the Fund’s results from both a risk and return perspective were within expectations, especially in light of both the bear and bull markets experienced during the first half of 2009.
| |
| Q | How was the Fund positioned within Equities during the first half of the fiscal year? |
| |
| A | Pain in the U.S. equity market spilled over from 2008 into the first months of 2009 before equities recovered strongly. Reaching new lows in early March 2009, the U.S. equity markets subsequently rallied sharply, closing the first half of the year up 3.16%, as measured by the Standard & Poor’s 500 Index. During the same six months, international equities had been punished more on the way down, but also rebounded more dramatically, returning 8.42%, as measured by the MSCI EAFE Index. Emerging market equities soared most, as investor risk appetite returned, ending the six-month period up 36.22%, as measured by the MSCI Emerging Markets Index. Equity exposure contributed positively to the Fund’s performance during the first half of the fiscal year, as the Fund had a net long exposure to equities. The Fund has had this net long exposure to equities since its inception in May 2008. |
| |
| Q | What developments within Fixed Income helped the Fund’s absolute return most? |
| |
| A | During the first quarter of 2009, the Federal Reserve Board (the “Fed”) announced unexpectedly that it would purchase $300 billion of Treasury debt, prompting a rally in U.S. Treasury securities. However, during the second quarter, investors’ willingness to seek riskier investments — along with their heightened fears regarding inflation — steepened the yield curve, meaning yields on U.S. Treasury securities rose more at the long-term end of the yield curve than at the short-term end of the yield curve. For the semi-annual period as a whole, U.S. Treasuries underperformed non-Treasury fixed income sectors. The Fund’s performance benefited from these developments, as it was net short fixed income, particularly the 10-year U.S. Treasury note, during the reporting period. This net short exposure to fixed income was a position the Fund had held since its inception. |
PORTFOLIO RESULTS
| |
| Q | How did a rise in corporate defaults impact the Fund’s positioning in Credit? |
| |
| A | Corporate defaults surged during the first half of 2009, continuing the trend of steadily increasing defaults seen during 2008. The Fund benefited, as it was short credit exposure. In other words, the Fund’s exposure behaved as if it had bought protection from default. Notably, the Fund’s position in Credit was linked to a broad index of credit default swaps. Credit default swaps are agreements allowing the transfer of a debt issuer’s credit, or default, risk from one market participant to another. The buyer of the swap might, for example, be a bondholder of a debt issuer, facing the risk that the issuer defaults on the bond payment. The seller, or counterparty, in the credit default swap agrees to insure a certain dollar value of this risk in exchange for regular periodic payments — essentially an insurance premium. In exchange for the periodic payments received from the buyer, if the issuer defaults, the seller is obligated to pay the buyer the agreed-upon dollar value. |
The index of pure default risk to which the Fund was exposed performed differently from another measure of credit risk — the high yield bond market, which actually rallied strongly in 2009 through June, as investors, enticed by attractive coupons, began to return to riskier investments.
| |
| Q | Was the Fund positioned net long or short in Commodities during the semi-annual period? |
| |
| A | The Fund held net long positions in both precious metals and broad commodities during the semi-annual period. Spot prices for oil and other energy commodities rose slightly during the first quarter. However, due to a condition known as contango, futures prices for commodities moved lower, as concerns lingered about energy demand during a global slowdown. Contango is a market situation in which longer dated futures contracts trade at higher prices than near-term contracts, often due to the costs of storing or insuring the underlying commodity or due to heightened uncertainties in the balance between supply and demand. During the second quarter, energy prices moved up substantially and by June, commodities overall, including precious metals, had gained 6.55% for the year to date, as measured by the S&P GSCI Index. As a result of such strong returns, the Fund’s net long positions in both precious metals and broad commodities contributed positively to the Fund’s performance during the period. |
| |
| Q | Did Volatility impact the Fund’s returns during the reporting period? |
| |
| A | The Volatility Index (“VIX”) was still elevated, but trended down toward pre-financial market crisis, but still elevated, levels by the end of June 2009. Although Volatility is a component of the GS-ART Index’s market factor universe, it has so far not been a statistically significant factor in explaining hedge fund performance. As a result, it was not part of the GS-ART Index or the Fund’s portfolio during the reporting period. |
| |
| Q | Was the Fund invested in any other asset classes during the six months ended June 30, 2009? |
| |
| A | The Fund had exposure to cash and foreign currencies during the semi-annual period, which contributed positively to its six-month performance. |
Goldman Sachs Quantitative Investment Strategies Group
New York, July 30, 2009
FUND BASICS
Absolute Return Tracker Fund
as of June 30, 2009
PERFORMANCE REVIEW
| | | | | | | | | | | | | |
January 1, 2009–
| | Fund Total Return
| | | Goldman Sachs Absolute
| | | Credit Suisse/Tremont
| |
| June 30, 2009 | | (based on NAV)1 | | | Return Tracker Index2 | | | AllHedge Index3 | |
| |
| |
| Class A | | | 2.91 | % | | | 4.08 | % | | | 7.18 | % |
| Class C | | | 2.58 | | | | 4.08 | | | | 7.18 | |
| Institutional | | | 3.14 | | | | 4.08 | | | | 7.18 | |
| Class IR | | | 3.14 | | | | 4.08 | | | | 7.18 | |
| Class R | | | 2.80 | | | | 4.08 | | | | 7.18 | |
|
| |
| 1 | The net asset value (NAV) represents the net assets of the class of the Fund (ex-dividend) divided by the total number of shares of the class outstanding. The Fund’s performance assumes the reinvestment of dividends and other distributions. The Fund’s performance does not reflect the deduction of any applicable sales charges. |
| |
| 2 | The Goldman Sachs Absolute Return Tracker Index is a benchmark index that seeks to replicate the investment returns of hedge fund betas (i.e., that portion of the returns of hedge funds, as a broad asset class, that results from market exposure rather than manager skill). |
| |
| 3 | The Credit Suisse/Tremont Hedge Fund Index is comprised of 469 funds as of July 31, 2009. The following six funds are no longer reporting to the Credit Suisse/Tremont Hedge Fund Index: Context/TQA Global Convertible Fund, Catalyst Strategic Event Fund, JLF Offshore Fund Limited, Optima The Platinum Fund Limited (incorporated into Platinum International Fund), Anak European Fund Ltd, Fortis Alpha Strategies Convertible Arbitrage. The Index is constructed using the Credit Suisse/Tremont database of more than 5,000 hedge funds. It includes both open and closed funds located in the U.S. and offshore, but does not include fund of funds. In order to qualify for inclusion in the index selection universe, a fund must have a minimum of USD 50 million under management, a 12-month track record, and audited financial statements. Index funds are selected using a formula based on assets under management, which ensures that the Index represents at least 85% of total assets in each of ten strategy-based sectors in the selection universe. In order to minimize survivorship bias, funds are not excluded until they liquidate or fail to meet the reporting requirements. The Index is calculated as a total return index on a monthly basis, adjusted for asset in- and outflows, including a reselection according to the procedure outlined above, on a quarterly basis. It is not possible to invest directly in an index. |
STANDARDIZED AVERAGE ANNUAL TOTAL RETURNS4
| | | | | | | | | | | |
| For the period ended 6/30/09 | | One Year | | | Since Inception | | | Inception Date |
|
| |
| Class A | | | -14.35 | % | | | -15.32 | % | | 5/30/08 |
| Class C | | | -10.87 | | | | -11.46 | | | 5/30/08 |
| Institutional | | | -8.93 | | | | -10.44 | | | 5/30/08 |
| Class IR | | | -9.03 | | | | -10.53 | | | 5/30/08 |
| Class R | | | -9.55 | | | | -11.00 | | | 5/30/08 |
|
| |
| 4 | The Standardized Average Annual Total Returns are average annual total returns as of the most recent calendar quarter-end. They assume reinvestment of all distributions at NAV. These returns reflect a maximum initial sales charge of 5.5% for Class A Shares, and the assumed contingent deferred sales charge for Class C Shares (1% if redeemed within 12 months of purchase). Because Institutional, Class IR and Class R Shares do not involve a sales charge, such a charge is not applied to their Standardized Average Annual Total Returns. The Fund will charge a 2% redemption fee on the redemption of shares (including by exchange) held for 30 calendar days or less. The performance figures do not reflect the deduction of the redemption fee. If reflected, the redemption fee would reduce the performance quoted. |
The returns represent past performance. Past performance does not guarantee future results. The investment return and principal value of an investment will fluctuate and, therefore, an investor’s shares, when redeemed, may be worth more or less than their original cost. Current performance may be lower or higher than the total return figures in the above charts. Please visit www.goldmansachsfunds.com to obtain the most recent month-end returns. Performance reflects expense limitations in effect. In their absence, performance would be reduced. Returns do not reflect the deduction of taxes that a shareholder would pay on Fund distributions or the redemption of Fund shares.
FUND BASICS
EXPENSE RATIOS5
| | | | | | | | | |
| | | Net Expense Ratio (Current) | | | Gross Expense Ratio (Before Waivers) | |
| |
| |
| Class A | | | 1.60 | % | | | 3.58 | % |
| Class C | | | 2.35 | | | | 4.33 | |
| Institutional | | | 1.20 | | | | 3.18 | |
| Class IR | | | 1.35 | | | | 3.33 | |
| Class R | | | 1.85 | | | | 3.83 | |
|
| |
| 5 | The expense ratios of the Fund, both current (net of applicable fee waivers and/or expense limitations) and before waivers (gross of applicable fee waivers and/or expense limitations), are as set forth above according to the most recent publicly available Prospectuses for the Fund and may differ from the expense ratios disclosed in the Financial Highlights in this report. Applicable waivers and expense limitations are voluntary and may be modified or terminated at any time at the option of the investment adviser. If this occurs, the expense ratios may change without shareholder approval. |
SECTOR ALLOCATION6
Percentage of Net Assets
| |
| 6 | The Fund is actively managed and, as such, its composition may differ over time. The percentage shown for each investment category reflects the value of investments in that category as a percentage of net assets. Short-term investments include time deposits and/or investment companies, if any. Figures in the above graph may not sum to 100% due to the exclusion of other assets and liabilities. |
GOLDMAN SACHS COMMODITY STRATEGY FUND
What Differentiates the Goldman Sachs
Commodity Investment Process?
At Goldman Sachs Asset Management, L.P. (GSAM), the goal of our commodity investment process is to provide consistent, strong performance by actively managing our portfolios within a research-intensive, risk-managed framework.
| | | |
| | | Goldman Sachs’ Commodity Investment Process
Our commodity investment process emphasizes the importance of both short-term, tactical opportunities and long-term investment views. Our team-based approach to managing the Fund ensures continuity and idea sharing among some of the industry’s most experienced fixed income specialists. We pursue strong, consistent performance across commodity markets through:

The Fund invests in a portfolio of commodity index-linked securities (including leveraged and unleveraged structured notes), other commodity-linked securities and derivative instruments that provide exposure to the performance of the commodities markets, and in other fixed income and debt instruments. The Fund may also gain exposure to the performance of the commodity markets through investment in a wholly-owned subsidiary of the Fund organized as a company under the laws of the Cayman Islands (the “Subsidiary”). Its portfolio is designed to provide exposure that corresponds to the investment return of assets that trade in the commodity markets without direct investment in physical commodities.
Enhanced cash strategies capitalize on GSAM’s global fixed income expertise. The Fixed Income Team will employ the full spectrum of capabilities offered, including bottom-up strategies (credit, mortgages, governments /municipals, high yield, and emerging markets debt) and top-down strategies (duration, cross-sector, currency and country) in an attempt to enhance the return of the Fund.
A Commodity Fund that:
n Provides exposure to the commodity markets without direct investment in physical commodities
n Utilizes levered structured notes to seek total return while simultaneously implementing an enhanced cash strategy for additional return potential
|
PORTFOLIO RESULTS
Commodity Strategy Fund
| |
| | The Fund seeks long-term total return. In pursuing its objective, it seeks to maintain substantial economic exposure to the performance of the commodities markets. The Fund invests in a portfolio of commodity index-linked securities (including leveraged and unleveraged structured notes), other commodity-linked securities and derivative instruments that provide exposure to the performance of the commodities markets, and in other fixed income and debt instruments. The Fund may also gain exposure to the commodity markets by investing in the Subsidiary. The Subsidiary will be advised by the Investment Adviser, and will have the same investment objective as the Fund. The Subsidiary (unlike the Fund) may invest without limitation in commodity index-linked securities (including leveraged and unleveraged structured notes) and other commodity-linked securities and derivative instruments, such as swaps and futures, that provide exposure to the performance of the commodity markets. The Fund’s portfolio is designed to provide exposure that corresponds to the investment return of assets that trade in the commodity markets without direct investment in physical commodities. |
Portfolio Management Discussion and Analysis
Below, the Goldman Sachs Commodities Team discusses the Fund’s performance and positioning for the six months ended June 30, 2009.
| |
| Q | How did the Goldman Sachs Commodity Strategy Fund (the “Fund”) perform during the semi-annual period ended June 30, 2009? |
| |
| A | During the six-month period ended June 30, 2009, the Fund’s Class A, C, Institutional, IR and R Shares generated cumulative total returns, without sales charges, of 8.42%, 7.83%, 8.55%, 8.70% and 8.39%, respectively. These returns compare to the 6.55% cumulative total return of the Fund’s benchmark, the S&P GSCI Commodity Index (with dividends reinvested) (the “GSCI”), during the same period. |
| |
| Q | What economic and market factors most influenced the commodities markets as a whole during the semi-annual period? |
| |
| A | The emergence of economic “green shoots,” which refers to early signs of economic improvement following a recession, benefited the commodities markets during the semi-annual period ended June 30, 2009. The improvement in commodity prices, along with a pick-up in equity prices and U.S. Treasury yields, coincided with a decline in the value of the U.S. dollar. |
| |
| Q | Which commodity subsectors were strongest during the reporting period? |
| |
| A | The industrial metals component of the GSCI was the strongest subsector during the first half of the year, posting a gain of 29.91%. Industrial metals rallied from their late 2008 lows, benefiting directly from anticipation of economic recovery and inventory building in China. Prices for copper, the largest industrial metals component in the GSCI, surged 59.87% during the first half of 2009. Lead was the best performing commodity during the semi-annual period, with a price gain of 65.01%. Aluminum prices lagged, advancing only 0.90% during the reporting period. |
Energy, as measured by the S&P GSCI Energy Index, also performed well, gaining 8.05% during the reporting period. Crude oil prices rallied, ending June 2009 at just under $70 per barrel, an increase from approximately $45 per barrel at the end of 2008. The primary drivers of the rally in crude oil prices were an improved fundamental outlook, which lent support to most risky assets during the reporting period, and OPEC production cuts, which succeeded in reducing supply. Inventories remained high, but declined toward the end of the reporting period.
| |
| Q | How did precious metals perform during the reporting period? |
| |
| A | Precious metals, as measured by the S&P GSCI Precious Metals Index, returned 5.70% during the first half of the year. For the six-month period, gold bullion prices advanced $44.55 per ounce, or 5.05%, to close on June 30, 2009 at $926.60. During the first quarter, fears over the fate of the economy were high, the government was devising ways to repair a sick financial system, and the stock market plunged to new lows. Investors sought ways to preserve wealth through vehicles historically considered safe havens, including U.S. Treasury securities and gold. |
By the second quarter of 2009, the decline in many economic indicators slowed. The equity markets, as mentioned earlier, rebounded, with the second quarter enjoying
PORTFOLIO RESULTS
the best quarterly gain for the Dow Jones Industrial Index since the second quarter of 2003 and the biggest gain for the Standard & Poor’s 500 Index since the fourth quarter of 1998. Precious metals remained supported by a move lower in the U.S. dollar. Silver prices soared even more than gold, gaining nearly 24% to end the reporting period at $13.60 per troy ounce.
| |
| Q | Which commodity subsectors were weakest during the semi-annual period? |
| |
| A | Livestock was the worst performing subsector year-to-date through June 30, with the S&P GSCI Livestock Index down 11.49% during the reporting period. It was the only commodity subsector to post a loss, as swine flu weakened demand and higher feed costs pushed lean hog prices lower. |
In the agriculture subsector, soybean prices posted gains on the back of diminishing supplies, including a poor Argentine harvest, and strong export sales, notably to Asia. However, wheat and corn prices were down significantly, as an abundance of rain during the second quarter led to better than expected conditions. This, along with more planted acres than previously estimated, led to an increase in supply. All told, the S&P GSCI Agriculture Index fell 4.94% during the semi-annual period.
| |
| Q | What key factors were responsible for the Fund’s performance during the six-month reporting period? |
| |
| A | During the reporting period, the Fund generated a positive absolute return and outperformed its benchmark index. This outperformance was due primarily to the effective implementation of our enhanced roll-timing strategies and our enhanced cash management strategy. |
| |
| Q | How did the Fund’s enhanced roll-timing strategies add value to the Fund’s returns? |
| |
| A | Our enhanced roll-timing strategies added value to the Fund via exposure to commodity index-linked structured notes. We employ an approach whereby we do not take active views on individual commodities but rather gain exposure to commodities through investments whose performance is linked to commodity indices. |
We often implement commodity roll-timing strategies by deviating from the GSCI roll convention, which typically calls for rolling forward exposure at the front, or near-month, end of the futures curve on a monthly basis. The roll occurs during business days 5 through 9. During the first half of 2009, we employed a roll-timing strategy that rolled commodity exposures underlying the GSCI a couple of months out on the futures curve instead of rolling at the very front of the futures curve. This enhanced roll-timing strategy enabled us to generate excess returns over the GSCI during the reporting period.
| |
| Q | In what way did the Fund’s enhanced cash management strategy prove effective? |
| |
| A | In addition to seeking value through management of the commodities portion of the Fund’s portfolio, we also attempt to add excess return through thoughtful management of collateral held by the Fund. The cash portion of the Fund’s portfolio may be allocated to collateral that includes U.S. Treasury securities, agency debentures, mortgage-backed securities, corporate bonds and other fixed income instruments. During the first half of 2009, exposure to corporate bonds and short-dated agency debentures contributed modestly to the Fund’s outperformance of the GSCI. |
| |
| Q | Did you make any changes in the Fund’s strategy or allocations during the reporting period? |
| |
| A | Within the commodities management portion of the Fund’s portfolio, the Fund continued to hold exposure to commodities in the form of structured notes. As of June 2009, the Fund may invest up to 25% of its total assets in the Subsidiary. |
For the cash management portion of the mandate, the Fund increased its weighting in U.S. Treasury securities and government-sponsored debt during the six-month period. As credit markets rallied during the first half of the year, we decided to take advantage of better liquidity conditions and generally improving credit valuations by reducing the Fund’s exposure to credit-sensitive fixed income sectors, such as corporate bonds, non-agency residential mortgage-backed securities and commercial mortgage-backed securities.
| |
| Q | How was the Fund positioned at the end of the reporting period? |
| |
| A | The Fund generally targets 100% notional exposure to commodities. At the end of the reporting period, the Fund’s overall commodity positioning was generally in line with the weightings of the GSCI. The cash portion of the Fund’s portfolio was allocated across various fixed income sectors, with an emphasis on the higher quality, lower |
PORTFOLIO RESULTS
| |
| volatility segments of the market, such as U.S. government and government-sponsored bonds. |
| |
| Q | What is the Fund’s tactical view and strategy going forward? |
| |
| A | We are quite positive in our view for commodities going forward, as geopolitical, demographic, economic and other trends may support higher prices across much of the commodities complex. For example, we believe that over the long term, there will be increasing demand from emerging economies for commodities, such as oil, agriculture and metals for industrial use. We believe factors such as geopolitical risk and limited oil supply are likely to remain supportive of higher energy prices over the medium to longer term. In our opinion, precious metals prices should continue to be inversely related to the U.S. dollar, given gold’s ability to hedge inflation and its similar characteristics to that of a currency, including its being a store of value and a medium of exchange. |
Goldman Sachs Asset Management’s Commodities Group
New York, July 30, 2009
FUND BASICS
Commodity Strategy Fund
as of June 30, 2009
PERFORMANCE REVIEW
| | | | | | | | | | | |
January 1, 2009–
| | Fund Total Return
| | | S&P GSCI
| | | |
| June 30, 2009 | | (based on NAV)1 | | | Commodity Index2 | | | |
|
| |
| Class A | | | 8.42 | % | | | 6.55 | % | | |
| Class C | | | 7.83 | | | | 6.55 | | | |
| Institutional | | | 8.55 | | | | 6.55 | | | |
| Class IR | | | 8.70 | | | | 6.55 | | | |
| Class R | | | 8.39 | | | | 6.55 | | | |
|
| |
| 1 | The net asset value (NAV) represents the net assets of the class of the Fund (ex-dividend) divided by the total number of shares of the class outstanding. The Fund’s performance assumes the reinvestment of dividends and other distributions. The Fund’s performance does not reflect the deduction of any applicable sales charges. |
| |
| 2 | The S&P GSCI Commodity Index is a composite index of commodity sector returns, representing an unleveraged, long-only investment in commodity futures that is broadly diversified across the spectrum of commodities. Individual components qualify for inclusion in the GSCI on the basis of liquidity and are weighted by their respective world production quantities. The Index is unmanaged and the figures for the Index do not include any deduction for fees, expenses or taxes. It is not possible to invest directly in an index. |
STANDARDIZED AVERAGE ANNUAL TOTAL RETURNS3
| | | | | | | | | | | | | |
| For the period ended 6/30/09 | | One Year | | | Since Inception | | | Inception Date | | |
|
| |
| Class A | | | -62.49 | % | | | -17.25 | % | | 3/30/07 | | |
| Class C | | | -61.52 | | | | -16.26 | | | 3/30/07 | | |
| Institutional | | | -60.60 | | | | -15.11 | | | 3/30/07 | | |
| Class IR | | | -60.63 | | | | -28.80 | | | 11/30/07 | | |
| Class R | | | -60.82 | | | | -29.17 | | | 11/30/07 | | |
|
| |
| 3 | The Standardized Average Annual Total Returns are average annual total returns as of the most recent calendar quarter-end. They assume reinvestment of all distributions at NAV. These returns reflect a maximum initial sales charge of 4.5% for Class A Shares and the assumed contingent deferred sales charge for Class C Shares (1% if redeemed within 12 months of purchase). Because Institutional, Class IR and Class R Shares do not involve a sales charge, such a charge is not applied to their Standardized Average Annual Total Returns. The Fund will charge a 2% redemption fee on the redemption of shares (including by exchange) held for 30 calendar days or less. The performance figures do not reflect the deduction of the redemption fee. If reflected, the redemption fee would reduce the performance quoted. |
| |
| | The returns represent past performance. Past performance does not guarantee future results. The investment return and principal value of an investment will fluctuate and, therefore, an investor’s shares, when redeemed, may be worth more or less than their original cost. Current performance may be lower or higher than the total return figures in the above charts. Please visit www.goldmansachsfunds.com to obtain the most recent month-end returns. Performance reflects expense limitations in effect. In their absence, performance would be reduced. Returns do not reflect the deduction of taxes that a shareholder would pay on Fund distributions or the redemption of Fund shares. |
FUND BASICS
EXPENSE RATIOS4
| | | | | | | | | | | |
| | | Net Expense Ratio (Current) | | | Gross Expense Ratio (Before Waivers) | | | |
|
| |
| Class A | | | 0.93 | % | | | 1.13 | % | | |
| Class C | | | 1.68 | | | | 1.88 | | | |
| Institutional | | | 0.59 | | | | 0.79 | | | |
| Class IR | | | 0.68 | | | | 0.88 | | | |
| Class R | | | 1.18 | | | | 1.38 | | | |
|
| |
| 4 | The expense ratios of the Fund, both current (net of applicable fee waivers and/or expense limitations) and before waivers (gross of applicable fee waivers and/or expense limitations), are as set forth above according to the most recent publicly available Prospectuses for the Fund and may differ from the expense ratios disclosed in the Financial Highlights in this report. The Fund’s management fee waiver may not be discontinued by the investment adviser as long as its contract with the Subsidiary is in place. However, the expense limitations are voluntary and may be modified or terminated at any time at the option of the investment adviser. If this occurs, the expense ratios may change without shareholder approval. |
SECTOR ALLOCATION5
| |
| 5 | The Fund is actively managed and, as such, its composition may differ over time. The percentage shown for each investment category reflects the value of investments in that category as a percentage of net assets. Short-term investments include time deposits and/or investment companies, if any. Figures in the above graph may not sum to 100% due to the exclusion of other assets and liabilities. Decrease in Commodity Index Linked Structured Notes is due to an increase in commodity exposure through the purchase of total return swaps on a commodity index which are not depicted in the above graph. |
GOLDMAN SACHS REAL ESTATE SECURITIES FUND
What Differentiates the Goldman Sachs
Real Estate Securities Investment Process?
The Goldman Sachs International Real Estate Securities and Real Estate Securities Funds seek to generate long-term growth of capital and dividend income by investing primarily in real estate investment trusts (REITs) on either a domestic or international basis. REITs which offer daily liquidity have historically generated strong returns, low volatility and low correlation to traditional asset classes.
| | | |
| | | |
| | | |
| | | Goldman Sachs’ Real Estate Securities Investment Process |
| | | |
| | |  |
| | | Buy high quality companies. |
| | | We seek to purchase those companies that combine the best market exposures, management teams, capital structures and growth prospects. |
| | | Buy at a reasonable price. |
| | | We seek to consistently select securities that are trading at discounts to their intrinsic value. |
| | | Diversification reduces risk. |
| | | We seek to diversify the portfolio holdings based on property type and geographic markets to manage risk without compromising returns. |
| | | |
| | |  |
| | | Team Based: |
| | | Portfolio decisions are made by the entire team. |
| | | Continuous Scrutiny: |
| | | Daily review of market, industry and company developments. |
| | | Fundamental Analysis: |
| | | Portfolio holdings are determined by the risk reward characteristics and the team’s conviction in the overall business and management’s ability to create value. |
| | | |
| | |  |
| | | Real estate securities portfolio that: |
| | | n is a high quality portfolio that is strategically positioned for long-term growth potential |
| | | n is a result of bottom-up stock selection with a focus on long-term investing |
PORTFOLIO RESULTS
International Real Estate Securities Fund
| |
| | The Fund seeks total return comprised of long-term growth of capital and dividend income. The Fund seeks to achieve its objective by primarily investing in issuers that are REITs and real estate operating companies organized outside the United States or whose securities are principally traded outside the United States. |
Portfolio Management Discussion and Analysis
Below, the Goldman Sachs Real Estate Securities Investment Team discusses the Fund’s performance and positioning for the six months ended June 30, 2009.
| |
| Q | How did the Goldman Sachs International Real Estate Securities Fund (the “Fund”) perform during the semi-annual period ended June 30, 2009? |
| |
| A | During the six-month period ended June 30, 2009, the Fund’s Class A, C, Institutional and IR Shares generated cumulative total returns, without sales charges, of 9.41%, 9.09%, 9.49% and 9.54%, respectively. These returns compare to the 18.20% cumulative total return of the Fund’s benchmark, the FTSE EPRA/NAREIT Developed ex-US Real Estate Index (with dividends reinvested) (the “Real Estate Index”) during the same period. |
| |
| Q | What economic and market factors most influenced the international real estate securities market as a whole during the semi-annual period? |
| |
| A | For the semi-annual period overall, the international real estate securities market, as measured by the Real Estate Index, outpaced the broad international equity market, as measured by the MSCI EAFE Index (net) by nearly 10%. Such strong relative performance, however, masks what were truly two distinct periods during the six months ended June 30, 2009 for the international real estate securities market. |
During the first quarter, a multitude of headwinds weighed on the sector, such that the Real Estate Index modestly underperformed the broad international equity market, as measured by the MSCI EAFE Index (net). The deteriorating global economic environment and rising unemployment led to downward pressure on occupancies, rents and property values. Further, despite efforts by governments around the world to boost lending, the credit markets in most countries remained dislocated with access to capital not only limited, but costly. This resulted in investors placing even greater scrutiny on balance sheet risk and penalized companies with high leverage levels and near-term refinancing risks. In response to the challenging environment, companies reacted by pulling back on development pipelines, selling assets and/ or reducing their dividends. Some companies not only cut their dividends but were also paying out a portion in equity rather than cash, especially in the U.S.
During the second quarter, international real estate securities posted a remarkable comeback, outperforming the MSCI EAFE Index (net) by a significant margin. The main drivers of REITs’ strong performance during these months included an improved macroeconomic environment. More specifically, fears of a systemic collapse in the banking sector calmed; deterioration in most major economies slowed; and signs of modest improvement in the capital markets appeared. Additionally, successful REIT equity offerings that totaled more than $30 billion globally largely removed the prospect of looming liquidity issues for many companies.
For the semi-annual period as a whole, China was the best performing market in the Fund’s Portfolio followed by Hong Kong. The U.K., Continental Europe, Japan and Australia underperformed during the six-month period.
| |
| Q | What key factors were responsible for the Fund’s performance during the six-month reporting period? |
| |
| A | The primary factor driving the Fund’s underperformance of the Real Estate Index was its defensive positioning during what proved to be a low-quality rally in the international real estate securities market during the second quarter. We believe maintaining this stance was prudent, however, for several reasons. First, early in 2009, the credit markets were effectively shut down. Second, we, like everyone else, had limited visibility on the global economic outlook. Third, real estate fundamentals were deteriorating at a faster pace than expected, at least in the shorter-duration lease term subsectors. Fourth, bankruptcies or major |
PORTFOLIO RESULTS
| |
| defaults ensued in both the private and public real estate markets. Still, as a result of such Fund positioning, security selection overall detracted from Fund performance during the reporting period, as companies with defensive attributes lagged lower quality companies. Regional allocation overall also detracted from the Fund’s six-month performance. |
| |
| Q | Which regions most significantly affected Fund performance? |
| |
| A | Security selection in the Asia ex-Pacific region, which includes Hong Kong, Singapore and Japan, detracted most from the Fund’s results relative to the Real Estate Index. Having an underweighted exposure to China also hurt materially, as China was the best performing market in the Real Estate Index during the semi-annual period, buoyed by government measures to stimulate the property market. To a far more modest degree, security selection within Canada and Australia detracted as well. On the positive side, effective security selection within both Continental Europe and the U.K. added value to the Fund’s results. |
| |
| Q | What were some of the Fund’s best-performing individual holdings? |
| |
| A | The Fund benefited most relative to the Real Estate Index from overweighted positions in U.K. office REIT Derwent London, Austrian residential property company Conwert Immobilien Invest and several Hong Kong diversified companies, including Hysan Development, Wharf Holdings, and Sun Hung Kai Properties. |
Derwent London performed well, with the stock outperforming its global peers by a significant margin, despite pressures on the U.K. property market due to an influx of equity offerings. The Fund profited when we sold its position in Conwert Immobilien toward the end of the first quarter, after it hit our price target following a 40% rally during the first months of 2009. The Hong Kong market significantly outperformed the Real Estate Index during the reporting period due to relative balance sheet strength with average leverage levels of just 10% to 20%, far lower than the global average. Also, Hong Kong, being the gateway to China, was a key beneficiary of the Chinese government’s stimulus programs and liquidity measures.
| |
| Q | Which positions detracted significantly from the Fund’s performance during the semi-annual period? |
| |
| A | Detracting most from the Fund’s results relative to its benchmark index were overweighted positions in Australian office REIT ING Office Fund and Swedish diversified company Hufvudstaden, which significantly underperformed the Real Estate Index, and underweighted positions in Hong Kong retail real estate company Link Real Estate Investment Trust, Chinese residential property company China Overseas Land & Investment and Singapore’s CapitaLand, which each significantly outperformed the Real Estate Index. |
Although ING Office Fund completed an equity offering during the second quarter that dispelled concerns and drove a strong rally in its stock, this was not enough to offset its underperformance during the first quarter caused by balance sheet concerns, including its high leverage level and near-term refinancing risks. Hufvudstaden struggled not due to any company-specific factor but because it is considered a high quality, defensive company, which lagged lower quality, less defensive companies during the second quarter rally. Link Real Estate Investment Trust, CapitaLand and China Overseas Land & Investment each rallied during the second quarter, and so the Fund’s underweighted positions hurt performance.
| |
| Q | Did the Fund make any significant purchases or sales during the first half of the fiscal year? |
| |
| A | In addition to those sales and purchases mentioned above, a newly established position in Commonwealth Property Office Fund, one of the largest owners of high-quality office assets in Australia, was among the Fund’s other trades made during the first half of the fiscal year. We believe Commonwealth Property Office Fund’s market exposure is better positioned from a supply/demand perspective than many of its peers and that it has a strong balance sheet. In Japan, we added Japan Logistics, an industrial company with limited debt and stable fundamentals, and NTT Urban Development, an owner and manager of prime office and residential assets, which was trading at our time of purchase at an attractive valuation. In China, we added Shimao Property Holdings, a property developer already past its equity offering. The company achieved good sales volume year-to-date though June 2009. Plus, with a solid pipeline of projects coming up, we believe they should be able to take advantage of the recovery in the market. In the Netherlands, we established a Fund position in Vastned Offices/Industrial, which owns and manages office and industrial assets. We like Vastned Offices/Industrial because we believe its balance sheet is comparatively safer after renegotiating its debt covenants and because the stock was trading at extremely attractive valuations compared to its European peers. Also in Europe, |
PORTFOLIO RESULTS
| |
| we eliminated the Fund’s position in Finland’s Citycon due to balance sheet concerns and better positioned alternatives with higher growth opportunities. |
| |
| Q | Were there any changes made in the Fund’s investment strategy during the six-month period? |
| |
| A | During the first months of the period, we remained defensively positioned in the Fund with a focus on companies with strong balance sheets with below average leverage levels and limited near-term refinancing risk; quality assets that we believe should be less susceptible to weakening fundamentals; long-term leases tied to high credit quality tenants; limited development exposure; niche business models where demand is less sensitive to the economy; and quality, cycle-tested management teams. In the latter months of the period, we took a slightly more aggressive stance at the margin, while still maintaining the Fund’s defensive positioning. We particularly sought companies that had already recapitalized their balance sheets and that possessed quality attributes in their business model, asset exposure and management team. |
| |
| Q | How was the Fund positioned relative to its benchmark index at the end of June 2009? |
| |
| A | From a regional perspective, the Fund was modestly overweighted relative to the Real Estate Index in China, the U.K., Australia and Continental Europe. The Fund was modestly underweighted compared to the benchmark index in Japan, Canada and Asia (ex-Japan). |
| |
| Q | What is the Fund’s tactical view and strategy for the months ahead? |
| |
| A | Due to weak economic growth and ongoing job losses, real estate fundamentals remained strained at the end of the semi-annual period, and we do not expect them to improve any time soon. However, we believe there are several key factors that point to a recovery over the longer term, making a strategic allocation to the asset class prudent today, in our view. First, it appears that macroeconomic and financing conditions are stabilizing. Second, new construction is at the lowest level seen in the past two decades and may continue to diminish, as construction financing was still virtually non-existent as of the end of June. Such limited new supply may position the industry well whenever the recovery does materialize. Third, following the second quarter’s equity recapitalizations, most REITs, we believe, are better positioned than the private real estate market. Indeed, REITs have the ability to be opportunistic and may gain massive market share from the private players who often have relied upon excess leverage in their business models. With public REITs owning only about 6% of commercial real estate globally, we believe there is substantial room for them to expand. Finally, we believe much of the expected declines in fundamentals and asset values were already priced into REITs at the end of June. As fundamental investors, we believe these combined factors represent a fertile environment in which to generate potential excess returns relative to the Real Estate Index as we look ahead. |
Goldman Sachs Real Estate Securities Investment Group
New York, July 30, 2009
FUND BASICS
International Real Estate Securities Fund
as of June 30, 2009
PERFORMANCE REVIEW
| | | | | | | | | | | |
January 1, 2009–
| | Fund Total Return
| | | FTSE EPRA/NAREIT Developed
| | | |
| June 30, 2009 | | (based on NAV)1 | | | ex US Real Estate Index (Gross)2 | | | |
|
| |
| Class A | | | 9.41 | % | | | 18.20 | % | | |
| Class C | | | 9.09 | | | | 18.20 | | | |
| Institutional | | | 9.49 | | | | 18.20 | | | |
| Class IR | | | 9.54 | | | | 18.20 | | | |
|
| |
| 1 | The net asset value (NAV) represents the net assets of the class of the Fund (ex-dividend) divided by the total number of shares of the class outstanding. The Fund’s performance reflects the reinvestment of dividends and other distributions. The Fund’s performance does not reflect the deduction of any applicable sales charges. |
| |
| 2 | The FTSE EPRA/NAREIT Developed ex US Real Estate Index is a market capitalization weighted index comprised of REITs and non-REITs within the international (global ex us) real estate securities market. The market capitalization for each constituent is adjusted for free float. It is not possible to invest directly in an index. |
STANDARDIZED AVERAGE ANNUAL TOTAL RETURNS3
| | | | | | | | | | | | | |
| For the period ended 6/30/09 | | One Year | | | Since Inception | | | Inception Date | | |
|
| |
| Class A | | | -39.34 | % | | | -16.81 | % | | 7/31/06 | | |
| Class C | | | -36.76 | | | | -15.74 | | | 7/31/06 | | |
| Institutional | | | -36.18 | | | | -15.15 | | | 7/31/06 | | |
| Class IR | | | -35.43 | | | | -35.86 | | | 11/30/07 | | |
|
| |
| 3 | The Standardized Average Annual Total Returns are average annual total returns as of the most recent calendar quarter-end. They assume reinvestment of all distributions at NAV. These returns reflect a maximum initial sales charge of 5.5% for Class A Shares and the assumed contingent deferred sales charge for Class C Shares (1% if redeemed within 12 months of purchase). Because Institutional and Class IR Shares do not involve a sales charge, such a charge is not applied to their Standardized Average Annual Total Returns. The Fund will charge a 2% redemption fee on the redemption of shares (including by exchange) held for 30 calendar days or less. The performance figures do not reflect the deduction of the redemption fee. If reflected, the redemption fee would reduce the performance quoted. |
The returns represent past performance. Past performance does not guarantee future results. The investment return and principal value of an investment will fluctuate and, therefore, an investor’s shares, when redeemed, may be worth more or less than their original cost. Current performance may be lower or higher than the total return figures in the above charts. Please visit www.goldmansachsfunds.com to obtain the most recent month-end returns. Performance reflects expense limitations in effect. In their absence, performance would be reduced. Returns do not reflect the deduction of taxes that a shareholder would pay on Fund distributions or the redemption of Fund shares.
EXPENSE RATIOS4
| | | | | | | | | | | |
| | | Net Expense Ratio (Current) | | | Gross Expense Ratio (Before Waivers) | | | |
|
| |
| Class A | | | 1.53 | % | | | 1.60 | % | | |
| Class C | | | 2.28 | | | | 2.35 | | | |
| Institutional | | | 1.13 | | | | 1.20 | | | |
| Class IR | | | 1.28 | | | | 1.35 | | | |
|
| |
| 4 | The expense ratios of the Fund, both current (net of applicable fee waivers and/or expense limitations) and before waivers (gross of applicable fee waivers and/or expense limitations), are as set forth above according to the most recent publicly available Prospectuses for the Fund and may differ from the expense ratios disclosed in the Financial Highlights in this report. Applicable waivers and expense limitations are voluntary and may be modified or terminated at any time at the option of the investment adviser. If this occurs, the expense ratios may change without shareholder approval. |
FUND BASICS
TOP 10 PORTFOLIO HOLDINGS AS OF 6/30/095
| | | | | | | | | | | |
| | | % of Total
| | | Line of Real
| | | | |
| Holding | | Net Assets | | | Estate Business | | Country | | |
|
| |
| Sun Hung Kai Properties Ltd. | | | 8.9 | % | | Diversified | | Hong Kong | | |
| Mitsui Fudosan Co. Ltd. | | | 7.7 | | | Office | | Japan | | |
| Unibail-Rodamco SE | | | 7.0 | | | Diversified | | France | | |
| Mitsubishi Estate Co. Ltd. | | | 4.8 | | | Diversified | | Japan | | |
| Sumitomo Realty & Development Co. Ltd. | | | 3.9 | | | Office | | Japan | | |
| Westfield Group | | | 3.3 | | | Retail | | Australia | | |
| Henderson Land Development Co. Ltd. | | | 3.3 | | | Diversified | | Hong Kong | | |
| CFS Retail Property Trust | | | 2.8 | | | Retail | | Australia | | |
| Land Securities Group PLC | | | 2.8 | | | Diversified | | United Kingdom | | |
| Dexus Property Group | | | 2.7 | | | Diversified | | Australia | | |
|
| |
| 5 | The top 10 holdings may not be representative of the Fund’s future or current investments. |
SECTOR ALLOCATION AS OF 6/30/096
Percentage of Investment Portfolio
| |
| 6 | The Fund is actively managed and, as such, its composition may differ over time. The percentage shown for each investment category reflects the value of investments in that category as a percentage of total value of investments (excluding investments in the securities lending investment vehicle, if any). Securities lending reinvestment vehicle represented 1.6% of the Fund’s net assets at June 30, 2009. Short-term investments include investment companies. |
PORTFOLIO RESULTS
Real Estate Securities Fund
| |
| | The Fund seeks total return comprised of long-term growth of capital and dividend income. The Fund seeks to achieve its objective by primarily investing in issuers that are REITs, real estate industry companies and other real estate related investments. |
Portfolio Management Discussion and Analysis
Below, the Goldman Sachs Real Estate Securities Investment Team discusses the Fund’s performance and positioning for the six months ended June 30, 2009.
| |
| Q | How did the Goldman Sachs Real Estate Securities Fund (the “Fund”) perform during the semi-annual period ended June 30, 2009? |
| |
| A | During the six-month period ended June 30, 2009, the Fund’s Class A, B, C, Institutional, Service, IR and R Shares generated cumulative total returns, without sales charges, of −13.99%, −14.25%, −14.39%, −13.89%, −14.04%, −13.96% and −14.08%, respectively. These returns compare to the −12.73% cumulative total return of the Fund’s benchmark, the Wilshire Real Estate Securities Index (with dividends reinvested) (the “Wilshire Index”) during the same period. |
| |
| Q | What economic and market factors most influenced the U.S. real estate securities market as a whole during the semi-annual period? |
| |
| A | For the semi-annual period overall, the U.S. real estate securities market, as measured by the Wilshire Index, trailed the broad equity market, as measured by the Standard & Poor’s 500 Index (the “S&P 500 Index”), by more than 15%. Such relative underperformance, however, masks what were truly two distinct periods during the six months ended June 30, 2009 for the U.S. real estate securities market. |
During the first quarter, a multitude of headwinds weighed on the sector, such that the Wilshire Index underperformed the S&P 500 Index by nearly 23%. The deteriorating economic environment and rising unemployment led to downward pressure on occupancies, rents and property values. Further, despite efforts by the government to boost lending, the credit markets remained dislocated with access to capital not only limited, but costly. This resulted in investors placing even greater scrutiny on balance sheet risk and penalized companies with high leverage levels and near-term refinancing risks. In response to the challenging environment, companies reacted by pulling back on development pipelines, selling assets and/or reducing their dividends. Some companies not only cut their dividends but were also paying out a portion in equity rather than cash.
During the second quarter, U.S. real estate securities posted a remarkable comeback, outperforming the S&P 500 Index by nearly 16%. The main drivers of REITs’ strong performance during these months included an improved macroeconomic environment. More specifically, fears of a systemic collapse in the banking sector calmed; deterioration in most major economies slowed; and signs of modest improvement in the capital markets appeared. Additionally, successful REIT equity offerings that totaled approximately $13 billion in the U.S. largely removed the prospect of looming liquidity issues for many companies.
For the semi-annual period as a whole, only hotels generated positive returns. The hotel subsector rallied particularly strongly during the second quarter, as it has the shortest lease term of any real estate subsector and its demand drivers are highly economically sensitive. All other subsectors lost ground, although the office subsector outpaced the Wilshire Index. Retail and multifamily performed in line with the market. The industrial subsector lagged most during the six-month period, followed by diversified and self-storage. The industrial subsector was the worst performer due primarily to business model concerns, largely development related and higher refinancing risks than other subsectors.
| |
| Q | What key factors were responsible for the Fund’s performance during the six-month reporting period? |
| |
| A | The primary factor driving the Fund’s underperformance of the Wilshire Index was its defensive positioning during what proved to be a low-quality rally in the U.S. real estate securities market. We believe maintaining this stance was prudent, however, for several reasons. First, early in 2009, the credit markets were effectively shut down. Second, we, like everyone else, had limited visibility on the economic outlook. Third, real estate fundamentals were deteriorating |
PORTFOLIO RESULTS
| |
| at a faster pace than expected, at least in the shorter-duration lease term subsectors. Fourth, bankruptcies or major defaults ensued in both the private and public real estate markets. Still, as a result of such Fund positioning, security selection overall detracted from Fund performance during the reporting period, as companies with defensive attributes lagged lower quality companies. Subsector allocation overall had a rather neutral impact on the Fund’s six-month performance. |
| |
| Q | Which real estate subsectors most significantly affected Fund performance? |
| |
| A | Security selection in the diversified and office real estate subsectors detracted most from the Fund’s results relative to the Wilshire Index. Having an underweighted exposure to hotels also hurt materially, as hotels was the best performing subsector in the Wilshire Index during the semi-annual period. On the positive side, effective security selection within the retail subsectors added value to the Fund’s results. To a more modest degree, solid security selection within the industrial subsector also helped. |
| |
| Q | What were some of the Fund’s best-performing individual holdings? |
| |
| A | The Fund benefited most relative to the Wilshire Index from overweighted positions in American Tower, American Campus Communities, Starwood Hotels & Resorts Worldwide and Digital Realty Trust as well as from having an underweighted position in Kimco Realty. |
American Tower, a niche company that owns cell towers that it leases to wireless providers, was an outstanding performer during the semi-annual period. We believe tower demand has been highly resilient during the economic downturn given the critical nature of the locations to wireless networks and the importance of quality networks to the providers. American Campus Communities, one of the largest owners, managers and developers of high quality student housing communities, was another strong performer during the period. Based on our analysis, its strong management team is highly experienced with a solid track record in producing superior net operating income growth. The Fund’s overweighted position in Starwood Hotels & Resorts Worldwide contributed positively to its results, as the hotel sector broadly rallied 75% during the second quarter alone, as measured by the Wilshire Index. Digital Realty Trust operates in the data center segment of the market, which has shown to be more resilient in the economic downturn relative to traditional office space. Digital Realty Trust also performed well, as it has what we consider to be one of the best balance sheets among the commercial REITs and management that has proven to be conservative and financially responsible.
Toward the end of the first quarter, we sold the Fund’s position in retail REIT Kimco Realty, which significantly underperformed the Wilshire Index, due to balance sheet concerns and its development-oriented business model. During the second quarter, we re-established a position in Kimco Realty, as it had raised over $1 billion in capital during the quarter. These actions eliminated our balance sheet concerns, and we believe its strategy of re-focusing its efforts on core operations is prudent in this environment.
| |
| Q | Which positions detracted significantly from the Fund’s performance during the semi-annual period? |
| |
| A | Detracting most from the Fund’s results relative to its benchmark index were underweighted positions in Host Hotels & Resorts and SL Green Realty and overweighted positions in Equity Lifestyle Properties and Vornado Realty Trust. |
Having sold the Fund’s position in Host Hotels & Resorts during the first quarter on concerns about the cyclicality of the hotel business amidst weak economic conditions and the potential for significant declines in cash flows, we reestablished a position in the hotel REIT during the second quarter. It is the largest hotel REIT by market capitalization in the U.S. and focuses on luxury and upper-upscale hotels. The company has over $1 billion of liquidity on its balance sheet and has exposure to high quality brands in top locations. Despite hotels’ strong performance during the period, fundamentals in the hotel industry have been bleak. That said, we believe much of this is already reflected in valuations and the company is well positioned for an eventual economic recovery.
We sold the Fund’s position in SL Green Realty by the end of the first quarter due to its meaningful exposure to the New York office market. However, during the second quarter, the stock rallied over 100% as fears of a systemic collapse in the financial sector subsided, and so the Fund’s underweighted position detracted from results. Equity Lifestyle Properties, a multifamily REIT with a majority of its revenues coming from manufactured home land-leases primarily in retirement communities, was another newly-established holding for the Fund during the period. We believe its tenant base is less economically sensitive and that the company has stable cash flows, ample liquidity
PORTFOLIO RESULTS
and high inside ownership. The Fund’s overweighted position in Equity Lifestyle Properties detracted, because its stock underperformed during the rally of lower quality companies during the second quarter. Vornado Realty Trust underperformed its suburban focused peers since it has meaningful exposure to the New York office market, which has disproportionately suffered from the financial services industry’s consolidation.
| |
| Q | Did the Fund make any significant purchases or sales during the first half of the fiscal year? |
| |
| A | In addition to those purchases mentioned above, we added Mid-America Apartment Communities, as this multifamily company has exposure to low-cost housing options in defensive markets and limited development and debt maturities. We also added Corporate Office Properties, an office REIT focused on specialized tenants such as the U.S. government, defense IT and data centers. Nearly 90% of the company’s cash flows are generated from the greater Washington D.C. region, which we believe should be one of the more stable office markets in the downturn. We also established a Fund position in National Retail Properties, a retail REIT that has a strong balance sheet, a tenant base that is generally non-discretionary and a triple-net lease structure where the lessee pays all expenses associated with ownership, such as utilities, insurance and taxes. We added Camden Property Trust to the Fund’s portfolio, an apartment REIT with exposure to the Sunbelt, a region that entered the recession first. We believe the Sunbelt’s real estate market should recover earlier in the cycle than its coastal peers because its markets have been depressed for six to twelve months longer than the general economy. |
| |
| Q | Were there any changes made in the Fund’s investment strategy during the six-month period? |
| |
| A | During the first months of the period, we remained defensively positioned in the Fund with a focus on companies with strong balance sheets with below average leverage levels and limited near-term refinancing risk; quality assets that should be less susceptible to weakening fundamentals; long-term leases tied to high credit quality tenants; limited development exposure; niche business models where demand is less sensitive to the economy; and quality, cycle-tested management teams. In the latter months of the period, we took a slightly more aggressive stance at the margin, while still maintaining the Fund’s defensive positioning. We particularly sought companies that had already recapitalized their balance sheets and that possessed quality attributes in their business model, asset exposure and management team. |
| |
| Q | How was the Fund positioned relative to its benchmark index at the end of June 2009? |
| |
| A | From a subsector perspective, the Fund had modestly overweighted exposures compared to the Wilshire Index in the health care and multifamily subsectors at the end of the semi-annual period. The Fund was most underweighted compared to its benchmark index in the industrial and self-storage subsectors with more moderate underweighted allocations to the office and diversified subsectors. |
| |
| Q | What is the Fund’s tactical view and strategy for the months ahead? |
| |
| A | Due to weak economic growth and ongoing job losses, real estate fundamentals remained strained at the end of the semi-annual period, and we do not expect them to improve any time soon. However, we believe there are several key factors that point to a recovery over the longer term, making a strategic allocation to the asset class prudent today, in our view. First, it appears that macroeconomic and financing conditions are stabilizing. Second, new construction is at the lowest level seen in the past two decades and may continue to diminish, as construction financing was still virtually non-existent as of the end of June. Such limited new supply may position the industry well whenever the recovery does materialize. Third, following the second quarter’s equity recapitalizations, most REITs, we believe, are better positioned than the private real estate market. Indeed, REITs have the ability to be opportunistic and may gain massive market share from the private players who often have relied upon excess leverage in their business models. With public REITs owning only about 6% of commercial real estate globally, we believe there is substantial room for them to expand. Finally, we believe much of the expected declines in fundamentals and asset values were already priced into REITs at the end of June. As fundamental investors, we believe these combined factors represent a fertile environment in which to generate potential excess returns relative to the Wilshire Index as we look ahead. |
Goldman Sachs Real Estate Securities Investment Group
New York, July 30, 2009
FUND BASICS
Real Estate Securities Fund
as of June 30, 2009
PERFORMANCE REVIEW
| | | | | | | | | | | |
January 1, 2009–
| | Fund Total Return
| | | Wilshire Real Estate
| | | |
| June 30, 2009 | | (based on NAV)1 | | | Securities Index2 | | | |
|
| |
| Class A | | | -13.99 | % | | | -12.73 | % | | |
| Class B | | | -14.25 | | | | -12.73 | | | |
| Class C | | | -14.39 | | | | -12.73 | | | |
| Institutional | | | -13.89 | | | | -12.73 | | | |
| Service | | | -14.04 | | | | -12.73 | | | |
| Class IR | | | -13.96 | | | | -12.73 | | | |
| Class R | | | -14.08 | | | | -12.73 | | | |
|
| |
| 1 | The net asset value (NAV) represents the net assets of the class of the Fund (ex-dividend) divided by the total number of shares of the class outstanding. The Fund’s performance reflects the reinvestment of dividends and other distributions. The Fund’s performance does not reflect the deduction of any applicable sales charges. |
| |
| 2 | The Wilshire Real Estate Securities Index (with dividends reinvested) is a market capitalization-weighted index comprised of publicly traded real estate investment trusts (REITs) and real estate operating companies. The Index is unmanaged and does not reflect any fees or expenses. It is not possible to invest directly in an index. |
STANDARDIZED AVERAGE ANNUAL TOTAL RETURNS3
| | | | | | | | | | | | | | | | | | | | | |
| For the period ended 6/30/09 | | One Year | | | Five Years | | | Ten Years | | | Since Inception | | | Inception Date | | |
|
| |
| Class A | | | -49.49 | % | | | -5.04 | % | | | 4.16 | % | | | 3.97 | % | | 7/27/98 | | |
| Class B | | | -49.55 | | | | -5.02 | | | | 4.00 | | | | 3.76 | | | 7/27/98 | | |
| Class C | | | -47.47 | | | | -4.66 | | | | 4.00 | | | | 3.76 | | | 7/27/98 | | |
| Institutional | | | -46.30 | | | | -3.54 | | | | 5.18 | | | | 4.94 | | | 7/27/98 | | |
| Service | | | -46.57 | | | | -4.03 | | | | 4.70 | | | | 4.46 | | | 7/27/98 | | |
| Class IR | | | -46.41 | | | | N/A | | | | N/A | | | | -36.54 | | | 11/30/07 | | |
| Class R | | | -46.65 | | | | N/A | | | | N/A | | | | -36.84 | | | 11/30/07 | | |
|
| |
| 3 | The Standardized Average Annual Total Returns are average annual total returns as of the most recent calendar quarter-end. They assume reinvestment of all distributions at NAV. These returns reflect a maximum initial sales charge of 5.5% for Class A Shares and the assumed contingent deferred sales charge for Class B Shares (5% maximum declining to 0% after six years) and the assumed contingent deferred sales charge for Class C Shares (1% if redeemed within 12 months of purchase). Because Institutional, Service, Class IR and Class R Shares do not involve a sales charge, such a charge is not applied to their Standardized Average Annual Total Returns. |
The returns represent past performance. Past performance does not guarantee future results. The investment return and principal value of an investment will fluctuate and, therefore, an investor’s shares, when redeemed, may be worth more or less than their original cost. Current performance may be lower or higher than the total return figures in the above charts. Please visit www.goldmansachsfunds.com to obtain the most recent month-end returns. Performance reflects expense limitations in effect. In their absence, performance would be reduced. Returns do not reflect the deduction of taxes that a shareholder would pay on Fund distributions or the redemption of Fund shares.
FUND BASICS
EXPENSE RATIOS4
| | | | | | | | | | | |
| | | Net Expense Ratio (Current) | | Gross Expense Ratio (Before Waivers) | | |
|
| |
| Class A | | | 1.44 | % | | | 1.51 | % | | |
| Class B | | | 2.19 | | | | 2.26 | | | |
| Class C | | | 2.19 | | | | 2.26 | | | |
| Institutional | | | 1.04 | | | | 1.11 | | | |
| Service | | | 1.54 | | | | 1.61 | | | |
| Class IR | | | 1.19 | | | | 1.26 | | | |
| Class R | | | 1.69 | | | | 1.76 | | | |
|
| |
| 4 | The expense ratios of the Fund, both current (net of applicable fee waivers and/or expense limitations) and before waivers (gross of applicable fee waivers and/or expense limitations), are as set forth above according to the most recent publicly available Prospectuses for the Fund and may differ from the expense ratios disclosed in the Financial Highlights in this report. Applicable waivers and expense limitations are voluntary and may be modified or terminated at any time at the option of the investment adviser. If this occurs, the expense ratios may change without shareholder approval. |
TOP 10 PORTFOLIO HOLDINGS AS OF 6/30/095
| | | | | | | | | |
| Holding | | % of Total Net Assets | | Line of Business | | |
|
| |
| Simon Property Group, Inc. | | | 11.8 | % | | Retail | | |
| Vornado Realty Trust | | | 6.8 | | | Diversified | | |
| Boston Properties, Inc. | | | 6.6 | | | Office | | |
| Public Storage, Inc. | | | 6.0 | | | Self Storage | | |
| Ventas, Inc. | | | 4.9 | | | Healthcare | | |
| HCP, Inc. | | | 3.8 | | | Healthcare | | |
| Health Care REIT, Inc. | | | 3.6 | | | Healthcare | | |
| ProLogis | | | 3.4 | | | Industrial | | |
| Digital Realty Trust, Inc. | | | 3.2 | | | Office | | |
| Host Hotels & Resorts, Inc. | | | 3.2 | | | Hotels | | |
|
| |
| 5 | The top 10 holdings may not be representative of the Fund’s future or current investments. |
FUND BASICS
SECTOR ALLOCATION AS OF 6/30/096
Percentage of Investment Portfolio
| |
| 6 | This Fund is actively managed and, as such, its composition may differ over time. The percentage shown for each investment category reflects the value of investments in that category as a percentage of total value of investments (excluding investments in the securities lending reinvestment vehicle, if any). Securities lending reinvestment vehicle represented 25.1% of the Fund’s net assets at June 30, 2009. Short-term investments include investment companies. |
GOLDMAN SACHS ABSOLUTE RETURN TRACKER FUND
Schedule of Investments
June 30, 2009 (Unaudited)
| | | | | | | | | | | | | | | | | |
| | | Principal
| | Interest
| | Maturity
| | |
| | | Amount | | Rate | | Date | | Value |
| |
Commodity Index Linked Structured Notes(a)(b)(c) – 5.7% |
| | | | | | | | | | | | | | | | | |
| | | | | | | | | | | | | | | | | |
| | | Barclays Bank PLC |
| | | $ | 750,000(d | ) | | | 0.210 | % | | | 01/13/10 | | | $ | 878,244 | |
| | | | 700,000(d | ) | | | 0.216 | | | | 01/13/10 | | | | 869,023 | |
| | | | 1,570,000(e | ) | | | 0.210 | | | | 02/26/10 | | | | 1,654,399 | |
| | | | 3,500,000(e | ) | | | 0.210 | | | | 05/13/10 | | | | 3,522,733 | |
| | | | 1,000,000(e | ) | | | 0.210 | | | | 06/29/10 | | | | 1,031,004 | |
| | | | 1,100,000(e | ) | | | 0.210 | | | | 07/28/10 | | | | 1,050,853 | |
| | | | 1,000,000(e | ) | | | 0.210 | | | | 08/04/10 | | | | 933,934 | |
| | | | 500,000(d | ) | | | 0.210 | | | | 08/24/10 | | | | 499,827 | |
| | | | 2,000,000(e | ) | | | 0.210 | | | | 08/24/10 | | | | 2,001,764 | |
| | | Merrill Lynch & Co., Inc.(e) |
| | | | 1,910,000 | | | | 0.571 | | | | 12/09/09 | | | | 3,505,270 | |
| | | |
| | | |
| | | TOTAL COMMODITY INDEX LINKED
STRUCTURED NOTES |
| | | (Cost $14,030,000) | | $ | 15,947,051 | |
| | | |
| | | |
| | | | | | | | | | | |
| | | Shares | | Description | | Value |
| |
Exchange Traded Fund – 1.3% |
| | | | | | | | | | | |
| | | | | | | | | | | |
| | | | 119,431 | | | iShares MSCI Emerging Markets Index Fund | | $ | 3,849,261 | |
| | | (Cost $2,992,797) | | | | |
| | | |
| | | |
| | | | | | | | | | | | | | | | | |
| | | Principal
| | Interest
| | Maturity
| | |
| | | Amount | | Rate | | Date | | Value |
| |
Short-Term Obligations(f) – 9.5% |
| | | | | | | | | | | | | | | | | |
| | | | | | | | | | | | | | | | | |
| | | Foreign Sovereign Debt Obligations – 5.2% |
| | | France – 5.2% |
| | | French Treasury Bills |
| | | EUR | 5,200,000 | | | | 0.759 | % | | | 07/02/09 | | | $ | 7,287,525 | |
| | | | 5,200,000 | | | | 0.597 | | | | 10/01/09 | | | | 7,281,689 | |
| | | | | | | | | | | | | | | | | |
| | | | | | | | | | | | | | | | 14,569,214 | |
| | | |
| | | |
| | | Discount Note(g) – 4.3% |
| | | FHLB |
| | | $ | 12,000,000 | | | | 0.160 | | | | 07/29/09 | | | | 11,999,160 | |
| | | |
| | | |
| | | TOTAL SHORT-TERM OBLIGATIONS |
| | | (Cost $26,298,108) | | $ | 26,568,374 | |
| | | |
| | | |
| | | | | | | | | | | | | |
| | | Shares | | Rate | | Value |
| |
Investment Company(b) – 82.5% |
| | | | | | | | | | | | | |
| | | | | | | | | | | | | |
| | | JPMorgan U.S. Government Money Market Fund –
Capital Shares |
| | | | 231,358,253 | | | | 0.236 | % | | $ | 231,358,253 | |
| | | (Cost $231,358,253) | | | | |
| | | |
| | | |
| | | TOTAL INVESTMENTS – 99.0% |
| | | (Cost $274,679,158) | | $ | 277,722,939 | |
| | | |
| | | |
| | | OTHER ASSETS IN EXCESS OF
LIABILITIES – 1.0% | | | 2,698,797 | |
| | | |
| | | |
| | | NET ASSETS – 100.0% | | $ | 280,421,736 | |
| | | |
| | | |
The percentage shown for each investment category reflects the value of investments in that category as a percentage of net assets.
| | |
| (a) | | Securities are exempt from registration under Rule 144A of the Securities Act of 1933. Under procedures approved by the Board of Trustees, such securities have been determined to be liquid by the investment adviser. Total market value of Rule 144A securities amounts to $15,947,051, which represents approximately 5.7% of net assets as of June 30, 2009. |
| |
| (b) | | Variable rate security. Interest rate disclosed is that which is in effect at June 30, 2009. |
| |
| (c) | | The Structured Notes take into consideration a leverage factor of 300% on the return of the underlying linked index. |
| |
| (d) | | Security is linked to the S&P GSCI Total Return Index (“the GSCI Total Return Index”). The GSCI Total Return Index is a composite of commodity sector returns, representing an unleveraged, long-only investment in commodity futures that is diversified across the spectrum of commodities. The GSCI Total Return Index currently includes twenty-four commodities in five broad sectors: energy, industrial metals, precious metals, agricultural products and livestock products. |
| |
| (e) | | Security is linked to the S&P GSCI Precious Metals Total Return Index (“the GSCI Precious Metals Index”). The GSCI Precious Metals Index represents an unleveraged, long-only investment in commodity futures. The GSCI Precious Metals Index is a part of a series of sub-indices calculated by Standard and Poor’s that represents components of the S&P GSCI from a number of commodity sectors. The GSCI Precious Metals Index comprises gold and silver. |
| |
| (f) | | Interest rates represent the annualized yield on date of purchase. |
| |
| (g) | | All or a portion of security is segregated as collateral for initial margin requirements on futures transactions. |
| | | | | | | |
| | | |
| | | |
| | | Investment Abbreviation: |
| | | FHLB | | — | | Federal Home Loan Bank |
| | | |
| | | |
The accompanying notes are an integral part of these financial statements.
GOLDMAN SACHS ABSOLUTE RETURN TRACKER FUND
Schedule of Investments (continued)
June 30, 2009 (Unaudited)
ADDITIONAL INVESTMENT INFORMATION
CREDIT DEFAULT SWAP CONTRACTS — At June 30, 2009, the Fund had outstanding swap contracts with the following terms:
| | | | | | | | | | | | | | | | | | | | | | | | | |
| | | | | | | | | | | | | | | | Upfront
| | | | |
| | | | | Notional
| | | Rates
| | | | | | | | Payments
| | | | |
| | | | | Amount
| | | Paid by
| | | Termination
| | Market
| | | Made by
| | | Unrealized
| |
| Swap Counterparty | | Reference Obligation | | (000’s) | | | the Fund | | | Date | | Value | | | the Fund(a) | | | Loss | |
| | |
Protection Purchased: | | | | | | | | | | | | | | | | | | | | | | | | |
| Morgan Stanley Co., Inc. | | CDX North America
High Yield 12 Index | | $ | 10,272 | | | | 5.000 | % | | 06/20/14 | | $ | 1,593,650 | | | $ | 2,001,167 | | | $ | (407,517 | ) |
| UBS AG | | CDX North America
High Yield 12 Index | | | 17,184 | | | | 5.000 | | | 06/20/14 | | | 2,665,645 | | | | 4,702,629 | | | | (2,036,984 | ) |
| |
| |
TOTAL | | | | | | | | | | | | | | $ | 4,259,295 | | | $ | 6,703,796 | | | $ | (2,444,501 | ) |
| |
| |
FORWARD FOREIGN CURRENCY EXCHANGE CONTRACTS — At June 30, 2009, the Fund had outstanding forward foreign currency exchange contracts, both to purchase and sell foreign currencies:
| | | | | | | | | | | | | | | | | |
| | | | | | | Value on
| | | | | | | |
Open Forward Foreign Currency Exchange
| | Contract
| | Expiration
| | Settlement
| | | Current
| | | Unrealized
| |
| Contracts with Unrealized Gain | | Type | | Date | | Date | | | Value | | | Gain | |
| | |
| British Pound | | Purchase | | 9/16/09 | | $ | 2,863,745 | | | $ | 2,878,832 | | | $ | 15,087 | |
| British Pound | | Sale | | 9/16/09 | | | 1,343,428 | | | | 1,336,600 | | | | 6,828 | |
| Euro | | Purchase | | 9/16/09 | | | 2,596,132 | | | | 2,630,144 | | | | 34,012 | |
| Euro | | Sale | | 9/16/09 | | | 526,624 | | | | 526,029 | | | | 595 | |
| Japanese Yen | | Purchase | | 9/16/09 | | | 2,723,566 | | | | 2,727,269 | | | | 3,703 | |
| Japanese Yen | | Sale | | 9/16/09 | | | 1,572,914 | | | | 1,558,440 | | | | 14,474 | |
| |
| |
TOTAL | | | | | | | | | | | | | | $ | 74,699 | |
| |
| |
| | | | | | | | | | | | | | | | | | | |
| | | | | | | | Value on
| | | | | | | |
Open Forward Foreign Currency Exchange
| | Contract
| | | Expiration
| | Settlement
| | | Current
| | | Unrealized
| |
| Contracts with Unrealized Loss | | Type | | | Date | | Date | | | Value | | | Loss | |
| | |
| British Pound | | | Purchase | | | 9/16/09 | | $ | 20,453,400 | | | $ | 20,357,453 | | | $ | (95,947 | ) |
| Euro | | | Purchase | | | 9/16/09 | | | 12,488,000 | | | | 12,274,004 | | | | (213,996 | ) |
| Japanese Yen | | | Purchase | | | 9/16/09 | | | 22,831,255 | | | | 22,727,243 | | | | (104,012 | ) |
| |
| |
TOTAL | | | | | | | | | | | | | | | | $ | (413,955 | ) |
| |
| |
The accompanying notes are an integral part of these financial statements.
GOLDMAN SACHS ABSOLUTE RETURN TRACKER FUND
| |
| ADDITIONAL INVESTMENT INFORMATION (continued) | |
FUTURES CONTRACTS — At June 30, 2009, the following futures contracts were open:
| | | | | | | | | | | | | | | |
| | | Number of
| | | | | | | | | |
| | | Contracts
| | | Settlement
| | Notional
| | | Unrealized
| |
| Type | | Long (Short) | | | Month | | Value | | | Gain (Loss) | |
| | |
| Dow Jones EURO STOXX 50 Index | | | 640 | | | September 2009 | | $ | 21,529,819 | | | $ | (192,516 | ) |
| FTSE 100 Index | | | 313 | | | September 2009 | | | 21,720,490 | | | | (471,342 | ) |
| Russell 2000 Mini Index | | | (189 | ) | | September 2009 | | | (9,586,080 | ) | | | 284,210 | |
| TSE TOPIX Index | | | 250 | | | September 2009 | | | 23,991,799 | | | | 12,543 | |
| 10 Year U.S. Treasury Notes | | | (363 | ) | | September 2009 | | | (42,204,422 | ) | | | 346,719 | |
| |
| |
TOTAL | | | | | | | | | | | | $ | (20,386 | ) |
| |
| |
The accompanying notes are an integral part of these financial statements.
GOLDMAN SACHS COMMODITY STRATEGY FUND
Consolidated Schedule of Investments
June 30, 2009 (Unaudited)
| | | | | | | | | | | | | | | | | |
| | | Principal
| | Interest
| | Maturity
| | |
| | | Amount | | Rate | | Date | | Value |
| |
Commodity Index Linked Structured Notes(a)(b)(c) – 16.1% |
| | | | | | | | | | | | | | | | | |
| | | | | | | | | | | | | | | | | |
| | | Eksportfinans ASA(d) |
| | | $ | 12,800,000 | | | | 0.978 | % | | | 04/30/10 | | | $ | 18,478,080 | |
| | | Landesbank Baden-Wuerttemberg(d) |
| | | | 7,000,000 | | | | 0.158 | | | | 01/27/10 | | | | 11,562,740 | |
| | | Morgan Stanley & Co., Inc(e) |
| | | | 10,000,000 | | | | 0.323 | | | | 05/10/10 | | | | 13,790,000 | |
| | | Svensk Exportkredit AB(d) |
| | | | 9,300,000 | | | | 0.861 | | | | 01/15/10 | | | | 14,954,586 | |
| | | | 10,000,000 | | | | 0.386 | | | | 07/01/10 | | | | 11,599,400 | |
| | | |
| | | |
| | | TOTAL COMMODITY INDEX LINKED
STRUCTURED NOTES |
| | | (Cost $49,100,000) | | $ | 70,384,806 | |
| | | |
| | | |
| | | | | | | | | | | | | | | | | |
| | | | | | | | | | | | | | | | | |
Mortgage-Backed Obligations – 6.9% |
| | | | | | | | | | | | | | | | | |
| | | | | | | | | | | | | | | | | |
| | | Adjustable Rate FHLMC(b) – 0.9% |
| | | $ | 3,803,294 | | | | 5.178 | % | | | 01/01/37 | | | $ | 3,939,531 | |
| | | |
| | | |
| | | Adjustable Rate Non-Agency(b) – 1.4% |
| | | Adjustable Rate Mortgage Trust Series 2004-5, Class 2A1 |
| | | | 250,346 | | | | 4.987 | | | | 04/25/35 | | | | 176,900 | |
| | | Bear Stearns Adjustable Rate Mortgage Trust Series 2004-1, Class 21A1 |
| | | | 315,225 | | | | 4.271 | | | | 04/25/34 | | | | 223,432 | |
| | | Bear Stearns Adjustable Rate Mortgage Trust Series 2005-10, Class A3 |
| | | | 2,000,000 | | | | 4.650 | | | | 10/25/35 | | | | 1,101,164 | |
| | | Countrywide Home Loan Mortgage Pass-Through Trust
Series 2004-HYB5, Class 2A1 |
| | | | 570,745 | | | | 4.789 | | | | 04/20/35 | | | | 436,899 | |
| | | Countrywide Home Loan Mortgage Pass-Through Trust
Series 2004-HYB6, Class A2 |
| | | | 329,658 | | | | 4.515 | | | | 11/20/34 | | | | 241,870 | |
| | | First Horizon Asset Securities, Inc. Series 2004-AR6, Class 2A1 |
| | | | 129,929 | | | | 4.750 | | | | 12/25/34 | | | | 110,692 | |
| | | Morgan Stanley Mortgage Loan Trust Series 2007-15AR, Class 2A1 |
| | | | 3,475,062 | | | | 6.242 | | | | 11/25/37 | | | | 1,737,531 | |
| | | Structured Adjustable Rate Mortgage Loan Trust
Series 2004-12, Class 3A2 |
| | | | 198,772 | | | | 5.192 | | | | 09/25/34 | | | | 128,117 | |
| | | Structured Adjustable Rate Mortgage Loan Trust
Series 2004-5, Class 3A1 |
| | | | 452,992 | | | | 3.766 | | | | 05/25/34 | | | | 361,465 | |
| | | Washington Mutual Mortgage Pass-Through Certificates Series 2004-AR3, Class A2 |
| | | | 543,443 | | | | 3.144 | | | | 06/25/34 | | | | 435,521 | |
| | | Washington Mutual Mortgage Pass-Through Certificates Series 2005-AR11, Class A1A |
| | | | 2,525,998 | | | | 0.634 | | | | 08/25/45 | | | | 1,414,690 | |
| | | | | | | | | | | | | | | | | |
| | | | | | | | | | | | | | | | 6,368,281 | |
| | | |
| | | |
| | | Collateralized Mortgage Obligations – 0.3% |
| | | Interest Only(b)(f) – 0.0% |
| | | FNMA Series 2005-105, Class IH |
| | | | 20,856 | | | | 0.000 | | | | 11/25/33 | | | | 34 | |
| | | |
| | | |
| | | Planned Amortization Class – 0.3% |
| | | FHLMC Series 2005-2911, Class BU |
| | | | 1,201,655 | | | | 5.000 | | | | 09/15/23 | | | | 1,202,337 | |
| | | |
| | | |
| | | TOTAL COLLATERALIZED MORTGAGE OBLIGATIONS | | | 1,202,371 | |
| | | |
| | | |
| | | Federal Agencies – 4.3% |
| | | FHLMC – 0.2% |
| | | | 815,202 | | | | 5.000 | | | | 09/01/38 | | | | 830,281 | |
| | | |
| | | |
| | | FNMA – 4.1% |
| | | | 1,552,614 | | | | 4.000 | | | | 08/01/13 | | | | 1,579,878 | |
| | | | 180,003 | | | | 4.000 | | | | 10/01/13 | | | | 183,152 | |
| | | | 216,925 | | | | 4.000 | | | | 05/01/14 | | | | 220,479 | |
| | | | 1,292,002 | | | | 4.000 | | | | 06/01/14 | | | | 1,312,730 | |
| | | | 974,700 | | | | 4.000 | | | | 12/01/14 | | | | 987,934 | |
| | | | 1,278,119 | | | | 4.000 | | | | 02/01/15 | | | | 1,294,888 | |
| | | | 2,141,910 | | | | 4.000 | | | | 03/01/15 | | | | 2,168,966 | |
| | | | 8,610,214 | | | | 5.500 | | | | 06/01/20 | | | | 9,099,382 | |
| | | | 51,116 | | | | 4.500 | | | | 04/01/23 | | | | 52,261 | |
| | | | 82,866 | | | | 4.500 | | | | 11/01/23 | | | | 84,723 | |
| | | | 435,830 | | | | 5.000 | | | | 03/01/38 | | | | 444,417 | |
| | | | 429,179 | | | | 5.000 | | | | 04/01/38 | | | | 437,612 | |
| | | | | | | | | | | | | | | | | |
| | | | | | | | | | | | | | | | 17,866,422 | |
| | | |
| | | |
| | | TOTAL FEDERAL AGENCIES | | | 18,696,703 | |
| | | |
| | | |
| | | TOTAL MORTGAGE-BACKED OBLIGATIONS |
| | | (Cost $33,250,832) | | $ | 30,206,886 | |
| | | |
| | | |
| | | | | | | | | | | | | | | | | |
| | | | | | | | | | | | | | | | | |
Agency Debentures – 13.3% |
| | | | | | | | | | | | | | | | | |
| | | | | | | | | | | | | | | | | |
| | | FHLB(g) |
| | | $ | 9,100,000 | | | | 3.100 | % | | | 02/04/10 | | | $ | 9,241,550 | |
| | | FHLB |
| | | | 12,000,000 | | | | 1.375 | | | | 05/16/11 | | | | 12,013,295 | |
| | | FHLMC |
| | | | 5,700,000 | | | | 2.875 | | | | 11/23/10 | | | | 5,861,145 | |
| | | | 16,200,000 | | | | 2.000 | | | | 03/16/11 | | | | 16,332,022 | |
| | | FNMA |
| | | | 8,500,000 | | | | 2.000 | | | | 04/01/11 | | | | 8,549,846 | |
| | | | 6,000,000 | | | | 2.050 | | | | 04/01/11 | | | | 6,038,869 | |
| | | |
| | | |
| | | TOTAL AGENCY DEBENTURES |
| | | (Cost $57,667,939) | | $ | 58,036,727 | |
| | | |
| | | |
| | | | | | | | | | | | | | | | | |
| | | | | | | | | | | | | | | | | |
Asset-Backed Securities – 0.4% |
| | | | | | | | | | | | | | | | | |
| | | | | | | | | | | | | | | | | |
| | | Home Equity – 0.4% |
| | | CIT Mortgage Loan Trust Series 2007-1, Class 2A1(a)(b) |
| | | $ | 868,350 | | | | 1.314 | % | | | 10/25/37 | | | $ | 651,262 | |
| | | CIT Mortgage Loan Trust Series 2007-1, Class 2A2(a)(b) |
| | | | 430,000 | | | | 1.564 | | | | 10/25/37 | | | | 121,475 | |
| | | CIT Mortgage Loan Trust Series 2007-1, Class 2A3(a)(b) |
| | | | 800,000 | | | | 1.764 | | | | 10/25/37 | | | | 216,000 | |
| | | GMAC Mortgage Corp. Loan Trust Series 2007-HE3, Class 1A1 |
| | | | 260,755 | | | | 7.000 | | | | 09/25/37 | | | | 116,860 | |
| | | |
| | | |
The accompanying notes are an integral part of these financial statements.
GOLDMAN SACHS COMMODITY STRATEGY FUND
| | | | | | | | | | | | | | | | | |
| | | Principal
| | Interest
| | Maturity
| | |
| | | Amount | | Rate | | Date | | Value |
| |
Asset-Backed Securities – (continued) |
| | | Home Equity – (continued) |
| | | | | | | | | | | | | | | | | |
| | | GMAC Mortgage Corp. Loan Trust Series 2007-HE3, Class 2A1 |
| | | $ | 287,480 | | | | 7.000 | % | | | 09/25/37 | | | $ | 94,930 | |
| | | HFC Home Equity Loan Asset Backed Certificates Series 2007-3, Class APT(b) |
| | | | 1,185,162 | | | | 1.515 | | | | 11/20/36 | | | | 776,581 | |
| | | |
| | | |
| | | TOTAL ASSET-BACKED SECURITIES |
| | | (Cost $3,832,774) | | $ | 1,977,108 | |
| | | |
| | | |
| | | | | | | | | | | | | | | | | |
| | | | | | | | | | | | | | | | | |
Government Guarantee Obligation(b)(h) – 1.0% |
| | | | | | | | | | | | | | | | | |
| | | | | | | | | | | | | | | | | |
| | | General Electric Corp. |
| | | $ | 4,300,000 | | | | 1.207 | % | | | 07/08/10 | | | $ | 4,313,382 | |
| | | (Cost $4,300,000) | | | | |
| | | |
| | | |
| | | | | | | | | | | | | | | | | |
| | | | | | | | | | | | | | | | | |
U.S. Treasury Obligation – 3.1% |
| | | | | | | | | | | | | | | | | |
| | | | | | | | | | | | | | | | | |
| | | United States Treasury Note |
| | | $ | 13,500,000 | | | | 3.250 | % | | | 05/31/16 | | | $ | 13,556,700 | |
| | | (Cost $13,458,112) | | | | |
| | | |
| | | |
| | | | | | | | | | | | | | | | | |
| | | | | | | | | | | | | | | | | |
Short-Term Obligation(i) – 4.9% |
| | | | | | | | | | | | | | | | | |
| | | | | | | | | | | | | | | | | |
| | | Discount Note – 4.9% |
| | | FHLMC |
| | | $ | 21,300,000 | | | | 0.603 | % | | | 01/06/10 | | | $ | 21,263,108 | |
| | | (Cost $21,232,905) | | | | |
| | | |
| | | |
| | | | | | | | | | | | | |
| | | Shares | | Rate | | Value |
| |
Investment Company(b) – 8.6% |
| | | | | | | | | | | | | |
| | | | | | | | | | | | | |
| | | JPMorgan U.S. Government Money Market Fund –
Capital Shares |
| | | | 37,476,732 | | | | 0.236 | % | | $ | 37,476,732 | |
| | | (Cost $37,476,732) | | | | |
| | | |
| | | |
| | | TOTAL INVESTMENTS – 54.3% |
| | | (Cost $220,319,294) | | $ | 237,215,449 | |
| | | |
| | | |
| | | OTHER ASSETS IN EXCESS OF LIABILITIES – 45.7% | | | 199,953,593 | |
| | | |
| | | |
| | | NET ASSETS – 100.0% | | $ | 437,169,042 | |
| | | |
| | | |
The percentage shown for each investment category reflects the value of investments in that category as a percentage of net assets.
| | |
| (a) | | Securities are exempt from registration under Rule 144A of the Securities Act of 1933. Under procedures approved by the Board of Trustees, such securities have been determined to be liquid by the investment adviser. Total market value of Rule 144A securities amounts to $71,373,543, which represents approximately 16.3% of net assets as of June 30, 2009. |
| |
| (b) | | Variable rate security. Interest rate disclosed is that which is in effect at June 30, 2009. |
| |
| (c) | | The Structured Notes take into consideration a leverage factor of 300% on the return of the underlying linked index. |
| |
| (d) | | Security is linked to the MLCX — Enhanced Benchmark B04 Total Return Index (“the MLCX”). The MLCX is fully collateralized because it combines the returns of the Index with the returns on cash collateral invested in U.S. Treasury Bills. The Index is a composite of commodity sector returns which is comprised of futures contracts. Futures contracts track the returns of rolling commodities. The MLCX currently includes twenty-four commodities in five broad sectors: energy, industrial metals, precious metals, agricultural products and livestock products. |
| |
| (e) | | Security is linked to the S&P GSCI Total Return Index (“the GSCI Total Return Index”). The GSCI Total Return Index is a composite of commodity sector returns, representing an unleveraged, long-only investment in commodity futures that is diversified across the spectrum of commodities. The GSCI Total Return Index currently includes twenty-four commodities in five broad sectors: energy, industrial metals, precious metals, agricultural products and livestock products. |
| |
| (f) | | Security is issued with a zero coupon, and interest rate is contingent upon LIBOR reaching a predetermined level. |
| |
| (g) | | All or a portion of security is segregated as collateral for initial margin requirements on futures transactions. |
| |
| (h) | | This debt is guaranteed under the Federal Deposit Insurance Corporation’s Temporary Liquidity Guarantee Program and is backed by the full faith and credit of the United States. The expiration date of the FDIC’s guarantee is the earlier of the maturity date of the debt or June 30, 2012. Total market value of these securities amounts to $4,313,382, which represents approximately 1.0% of net assets as of June 30, 2009. |
| |
| (i) | | Interest rates represent the annualized yield on date of purchase. |
| | | | | | | |
| | | |
| | | |
| | | Investment Abbreviations: |
| | | FDIC | | — | | Federal Deposit Insurance Corp. |
| | | FHLB | | — | | Federal Home Loan Bank |
| | | FHLMC | | — | | Federal Home Loan Mortgage Corp. |
| | | FNMA | | — | | Federal National Mortgage Association |
| | | LIBOR | | — | | London Inter Bank Offered Rate |
| | | |
| | | |
The accompanying notes are an integral part of these financial statements.
GOLDMAN SACHS COMMODITY STRATEGY FUND
Consolidated Schedule of Investments (continued)
June 30, 2009 (Unaudited)
ADDITIONAL INVESTMENT INFORMATION
FUTURES CONTRACTS — At June 30, 2009, the following futures contracts were open:
| | | | | | | | | | | | | | | |
| | | Number of
| | | | | | | | | |
| | | Contracts
| | | Settlement
| | Notional
| | | Unrealized
| |
| Type | | Long (Short) | | | Month | | Value | | | Gain (Loss) | |
| | |
| Eurodollars | | | (55 | ) | | September 2009 | | $ | (13,657,875 | ) | | $ | (138,876 | ) |
| Eurodollars | | | 43 | | | December 2009 | | | 10,652,713 | | | | 34,933 | |
| Eurodollars | | | (34 | ) | | March 2010 | | | (8,400,125 | ) | | | (181,735 | ) |
| Eurodollars | | | 14 | | | September 2010 | | | 3,432,800 | | | | 2,850 | |
| U.S. Treasury Bond | | | (71 | ) | | September 2009 | | | (8,403,516 | ) | | | (157,903 | ) |
| 2 Year U.S. Treasury Notes | | | (53 | ) | | September 2009 | | | (11,459,594 | ) | | | 2,009 | |
| 5 Year U.S. Treasury Notes | | | (126 | ) | | September 2009 | | | (14,454,562 | ) | | | 83,080 | |
| 10 Year U.S. Treasury Notes | | | 34 | | | September 2009 | | | 3,953,031 | | | | 6,318 | |
| |
| |
TOTAL | | | | | | | | | | | | $ | (349,324 | ) |
| |
| |
SWAP CONTRACTS — At June 30, 2009, the Fund had an outstanding swap contracts with the following terms:
CREDIT DEFAULT SWAP CONTRACT
| | | | | | | | | | | | | | | | | | | |
| | | | | Notional
| | | | | | | | | | |
| | | | | Amount
| | | Rate Paid
| | | Termination
| | | Market
| |
| Swap Counterparty | | Reference Obligation | | (000’s) | | | by the Fund | | | Date | | | Value(a) | |
| | |
Protection Purchased: | | | | | | | | | | | | | | | | | | |
| Bank of America | | Landesbank Baden-Wuerttemberg | | $ | 14,000 | | | | 0.900 | % | | | 09/20/09 | | | $ | 2,776 | |
| |
| |
| |
| (a) | There are no upfront payments on the swap contract listed above, therefore the unrealized gain on the swap contract is equal to its market value. |
INTEREST RATE SWAP CONTRACTS
| | | | | | | | | | | | | | | | | | | | | | | | | |
| | | | | | | | | Rates Exchanged | | | | | | | | | |
| | | Notional
| | | | | | Payments
| | Payments
| | | | | Upfront Payments
| | | | |
| | | Amount
| | | Termination
| | | received by
| | made by
| | Market
| | | made (received)
| | | Unrealized
| |
| Swap Counterparty | | (000’s)(a) | | | Date | | | the Fund | | the Fund | | Value | | | by the Fund | | | Gain (Loss) | |
| | |
| Bank of America | | $ | 2,900 | | | | 12/16/19 | | | 3 Month LIBOR | | 3.500% | | $ | 109,952 | | | $ | 191,897 | | | $ | (81,945 | ) |
| | | | 300 | | | | 12/17/29 | | | 3 Month LIBOR | | 4.000 | | | 8,966 | | | | 20,227 | | | | (11,261 | ) |
| | | | 2,700 | | | | 12/17/29 | | | 4.000% | | 3 Month LIBOR | | | (80,695 | ) | | | (194,102 | ) | | | 113,407 | |
| Credit Suisse International | | | 400 | | | | 12/17/29 | | | 3 Month LIBOR | | 4.000 | | | 11,955 | | | | 11,284 | | | | 671 | |
| Deutsche Bank Securities, Inc. | | | 100 | | | | 12/17/29 | | | 3 Month LIBOR | | 4.000 | | | 2,989 | | | | 2,315 | | | | 674 | |
| | | | 400 | | | | 12/17/29 | | | 4.000 | | 3 Month LIBOR | | | (11,955 | ) | | | (27,830 | ) | | | 15,875 | |
| J.P.Morgan Securities, Inc. | | | 11,600 | | | | 12/16/16 | | | 3 Month LIBOR | | 3.250 | | | 317,318 | | | | (11,153 | ) | | | 328,471 | |
| | | | 4,700 | | | | 12/16/19 | | | 3.500 | | 3 Month LIBOR | | | (178,199 | ) | | | (56,237 | ) | | | (121,962 | ) |
| | | | 200 | | | | 12/17/29 | | | 3 Month LIBOR | | 4.000 | | | 5,978 | | | | (3,546 | ) | | | 9,524 | |
| | | | 500 | | | | 12/17/29 | | | 4.000 | | 3 Month LIBOR | | | (14,944 | ) | | | (34,000 | ) | | | 19,056 | |
| |
| |
TOTAL | | | | | | | | | | | | | | $ | 171,365 | | | $ | (101,145 | ) | | $ | 272,510 | |
| |
| |
| |
| (a) | Represents forward starting interest rate swaps whose effective dates of commencement of accruals and cash flows occur subsequent to June 30, 2009. |
The accompanying notes are an integral part of these financial statements.
GOLDMAN SACHS COMMODITY STRATEGY FUND
| |
| ADDITIONAL INVESTMENT INFORMATION (continued) | |
TOTAL RETURN SWAP CONTRACTS(a)
| | | | | | | | | | | | | | | | | | | |
| | | | | Notional
| | | | | | | | | | |
| | | | | Amount
| | | Rate Paid
| | | Termination
| | | Market
| |
| Swap Counterparty | | Reference Obligation | | (000s) | | | by the Fund | | | Date | | | Value(b) | |
| | |
| UBS AG | | S&P GSCI Total Return Index | | $ | 19,998 | | | | 0.280 | % | | | 06/24/10 | | | $ | (3,276 | ) |
| | | S&P GSCI Total Return Index 2 Month Forward | | | 31,627 | | | | 0.420 | | | | 06/25/10 | | | | (375,461 | ) |
| | | S&P GSCI Total Return Index 2 Month Forward | | | 76,375 | | | | 0.420 | | | | 07/30/10 | | | | (1,626,206 | ) |
| | | S&P GSCI Total Return Index 2 Month Forward | | | 139,000 | | | | 0.420 | | | | 07/30/10 | | | | — | |
| |
| |
TOTAL | | | | | | | | | | | | | | | | $ | (2,004,943 | ) |
| |
| |
| |
| (a) | The Fund receives monthly payments based on any positive monthly return of the Reference Obligation. The Fund makes payments on any negative monthly return of such Reference Obligation. |
| |
| (b) | There are no upfront payments on the swap contracts listed above, therefore the unrealized losses on the swap contracts are equal to their market value. |
The accompanying notes are an integral part of these financial statements.
GOLDMAN SACHS INTERNATIONAL REAL ESTATE SECURITIES FUND
Schedule of Investments
June 30, 2009 (Unaudited)
| | | | | | | | | | | |
| | | Shares | | Description | | Value |
| |
Common Stocks – 98.7% |
| | | | | | | | | | | |
| | | | | | | | | | | |
| | | Australia – 13.7% |
| | | | 6,211,252 | | | CFS Retail Property Trust (REIT) (Retail) | | $ | 8,228,615 | |
| | | | 10,353,255 | | | Commonwealth Property Office Fund (REIT) (Office) | | | 6,914,382 | |
| | | | 12,951,625 | | | Dexus Property Group (REIT) (Diversified) | | | 7,792,405 | |
| | | | 11,575,515 | | | ING Office Fund (REIT) (Office) | | | 4,277,120 | |
| | | | 16,105,064 | | | Macquarie Office Trust (REIT) (Office) | | | 2,706,579 | |
| | | | 273,845 | | | Stockland (REIT) (Diversified) | | | 706,390 | |
| | | | 1,063,475 | | | Westfield Group (REIT) (Retail) | | | 9,733,232 | |
| | | | | | | | | | | |
| | | | | | | | | | 40,358,723 | |
| | | |
| | | |
| | | Canada – 3.8% |
| | | | 98,200 | | | Allied Properties Real Estate Investment Trust (REIT) (Office) | | | 1,245,282 | |
| | | | 95,710 | | | Boardwalk Real Estate Investment Trust (REIT) (Residential) | | | 2,690,725 | |
| | | | 118,144 | | | Cominar Real Estate Investment Trust (Office) | | | 1,572,342 | |
| | | | 129,150 | | | First Capital Realty, Inc. (Retail) | | | 1,849,838 | |
| | | | 906,200 | | | InnVest Real Estate Investment Trust (REIT) (Hotels) | | | 3,077,411 | |
| | | | 46,600 | | | RioCan Real Estate Investment Trust (REIT) (Retail) | | | 612,172 | |
| | | | | | | | | | | |
| | | | | | | | | | 11,047,770 | |
| | | |
| | | |
| | | China – 8.3% |
| | | | 2,820,000 | | | China Overseas Land & Investment Ltd. (Diversified) | | | 6,508,532 | |
| | | | 3,310,000 | | | China Resources Land Ltd. (Diversified) | | | 7,290,730 | |
| | | | 2,754,000 | | | Hopson Development Holdings Ltd. (Diversified) | | | 4,225,249 | |
| | | | 2,973,500 | | | Shimao Property Holdings Ltd. (Diversified) | | | 5,732,914 | |
| | | | 1,084,500 | | | Shui On Land Ltd. (Diversified) | | | 737,507 | |
| | | | | | | | | | | |
| | | | | | | | | | 24,494,932 | |
| | | |
| | | |
| | | France – 10.2% |
| | | | 260,640 | | | Klepierre (REIT) (Retail)(a) | | | 6,754,369 | |
| | | | 81,664 | | | Mercialys SA (REIT) (Retail)(a) | | | 2,523,091 | |
| | | | 137,827 | | | Unibail-Rodamco SE (REIT) (Diversified) | | | 20,606,975 | |
| | | | | | | | | | | |
| | | | | | | | | | 29,884,435 | |
| | | |
| | | |
| | | Hong Kong – 20.3% |
| | | | 1,426,000 | | | Hang Lung Properties Ltd. (Retail) | | | 4,695,863 | |
| | | | 1,675,000 | | | Henderson Land Development Co. Ltd. (Diversified) | | | 9,557,924 | |
| | | | 810,000 | | | Hongkong Land Holdings Ltd. (Office) | | | 2,852,799 | |
| | | | 2,406,153 | | | Hysan Development Co. Ltd. (Diversified) | | | 6,161,241 | |
| | | | 2,103,000 | | | Sun Hung Kai Properties Ltd. (Diversified) | | | 26,114,641 | |
| | | | 2,264,500 | | | The Link Real Estate Investment Trust (REIT) (Retail) | | | 4,812,762 | |
| | | | 1,279,000 | | | The Wharf (Holdings) Ltd. (Diversified) | | | 5,392,609 | |
| | | | | | | | | | | |
| | | | | | | | | | 59,587,839 | |
| | | |
| | | |
| | | Japan – 20.3% |
| | | | 218 | | | Frontier Real Estate Investment Corp. (REIT) (Diversified) | | �� | 1,393,227 | |
| | | | 342 | | | Japan Real Estate Investment Corp. (REIT) (Office) | | | 2,836,864 | |
| | | | 856,000 | | | Mitsubishi Estate Co. Ltd. (Diversified) | | | 14,211,033 | |
| | | | 1,305,000 | | | Mitsui Fudosan Co. Ltd. (Office) | | | 22,634,135 | |
| | | | 403 | | | Nippon Building Fund, Inc. (REIT) (Office) | | | 3,444,832 | |
| | | | 32,140 | | | Sumitomo Real Estate Sales Co. Ltd. (Residential) | | | 1,554,505 | |
| | | | 633,000 | | | Sumitomo Realty & Development Co. Ltd. (Office) | | | 11,557,756 | |
| | | | 384 | | | Tokyu REIT, Inc. (REIT) (Office) | | | 2,075,485 | |
| | | | | | | | | | | |
| | | | | | | | | | 59,707,837 | |
| | | |
| | | |
| | | Netherlands – 1.8% |
| | | | 367,321 | | | VastNed Offices/Industrial NV (REIT) (Office) | | | 5,421,699 | |
| | | |
| | | |
| | | Singapore – 5.9% |
| | | | 4,908,466 | | | Ascendas Real Estate Investment Trust (REIT) (Industrial) | | | 5,351,400 | |
| | | | 2,898,000 | | | CapitaLand Ltd. (Residential) | | | 7,368,299 | |
| | | | 4,691,800 | | | CapitaMall Trust (REIT) (Retail) | | | 4,512,450 | |
| | | | | | | | | | | |
| | | | | | | | | | 17,232,149 | |
| | | |
| | | |
| | | Sweden – 3.8% |
| | | | 595,235 | | | Castellum AB (Diversified) | | | 3,800,919 | |
| | | | 993,076 | | | Hufvudstaden AB Class A (Diversified) | | | 6,178,643 | |
| | | | 89,024 | | | Wihlborgs Fastigheter AB (Diversified) | | | 1,199,758 | |
| | | | | | | | | | | |
| | | | | | | | | | 11,179,320 | |
| | | |
| | | |
| | | United Kingdom – 10.1% |
| | | | 110,827 | | | Berkeley Group Holdings PLC (Residential)* | | | 1,469,192 | |
| | | | 390,887 | | | Derwent London PLC (REIT) (Office) | | | 6,020,718 | |
| | | | 1,641,546 | | | Great Portland Estates PLC (REIT) (Office) | | | 5,948,810 | |
| | | | 942,429 | | | Hammerson PLC (REIT) (Retail) | | | 4,778,837 | |
| | | | 88,872 | | | Helical Bar PLC (Diversified)* | | | 482,392 | |
| | | | 1,064,022 | | | Land Securities Group PLC (REIT) (Diversified) | | | 8,274,423 | |
| | | |
| | | |
The accompanying notes are an integral part of these financial statements.
GOLDMAN SACHS INTERNATIONAL REAL ESTATE SECURITIES FUND
| | | | | | | | | | | |
| | | Shares | | Description | | Value |
| |
Common Stocks – (continued) |
| | | United Kingdom – (continued) |
| | | | | | | | | | | |
| | | | 114,039 | | | Liberty International PLC (REIT) (Retail) | | $ | 747,590 | |
| | | | 315,543 | | | The British Land Co. PLC (REIT) (Diversified) | | | 1,986,930 | |
| | | | | | | | | | | |
| | | | | | | | | | 29,708,892 | |
| | | |
| | | |
| | | United States – 0.5% |
| | | | 41,152 | | | Jones Lang LaSalle, Inc. (Other) | | | 1,346,905 | |
| | | |
| | | |
| | | TOTAL COMMON STOCKS |
| | | (Cost $276,467,334) | | $ | 289,970,501 | |
| | | |
| | | |
| | | | | | | | | | | |
| | | | | | | Expiration
| | |
| | | Units | | Description | | Month | | Value |
| |
Right* – 0.0% |
| | | | | | | | | | | |
| | | | | | | | | | | |
| | | Australia – 0.0% |
| | | 4,010,504 | | ING Office Fund
(REIT) (Office) | | 07/09 | | $ | 27,621 | |
| | | (Cost $0) | | | | |
| | | |
| | | |
| | | | | | | | | | | |
| | | Shares | | Rate | | Value |
| |
Investment Company(b) – 0.3% |
| | | | | | | | | | | |
| | | | | | | | | | | |
| | | JPMorgan U.S. Government Money Market Fund – Capital Shares |
| | | 923,679 | | | 0.236 | % | | $ | 923,679 | |
| | | (Cost $923,679) | | | | |
| | | |
| | | |
| | | TOTAL INVESTMENTS BEFORE SECURITIES LENDING REINVESTMENT VEHICLE |
| | | (Cost $277,391,013) | | $ | 290,921,801 | |
| | | |
| | | |
| | | | | | | | | | | |
| | | Shares | | Rate | | Value |
| |
Securities Lending Reinvestment Vehicle(b)(c) – 1.6% |
| | | | | | | | | | | |
| | | | | | | | | | | |
| | | Boston Global Investment Trust – Enhanced Portfolio |
| | | 4,722,408 | | | 0.267 | % | | $ | 4,708,241 | |
| | | (Cost $4,645,918) | | | | |
| | | |
| | | |
| | | TOTAL INVESTMENTS – 100.6% |
| | | (Cost $282,036,931) | | $ | 295,630,042 | |
| | | |
| | | |
| | | | | | | | | | | |
| | | LIABILITIES IN EXCESS OF
OTHER ASSETS – (0.6)% | | | (1,649,978 | ) |
| | | |
| | | |
| | | | | | | | | | | |
| | | NET ASSETS – 100.0% | | $ | 293,980,064 | |
| | | |
| | | |
The percentage shown for each investment category reflects the value of investments in that category as a percentage of net assets.
| | |
| * | | Non-income producing security. |
| |
| (a) | | All or a portion of security is on loan. |
| |
| (b) | | Variable rate security. Interest rate disclosed is that which is in effect at June 30, 2009. |
| |
| (c) | | Represents an affiliated issuer. |
| | | | | | | |
| | | |
| | | |
| | | Investment Abbreviation: |
| | | REIT | | — | | Real Estate Investment Trust |
| | | |
| | | |
The accompanying notes are an integral part of these financial statements.
GOLDMAN SACHS REAL ESTATE SECURITIES FUND
Schedule of Investments
June 30, 2009 (Unaudited)
| | | | | | | | | | | |
| | | Shares | | Description | | Value |
| |
Common Stocks – 99.4% |
| | | | | | | | | | | |
| | | | | | | | | | | |
| | | Diversified – 10.2% |
| | | | 744,892 | | | Duke Realty Corp. (REIT) | | $ | 6,532,703 | |
| | | | 222,512 | | | Liberty Property Trust (REIT)(a) | | | 5,126,676 | |
| | | | 514,454 | | | Vornado Realty Trust (REIT)(a) | | | 23,165,850 | |
| | | | | | | | | | | |
| | | | | | | | | | 34,825,229 | |
| | | |
| | | |
| | | Healthcare – 14.4% |
| | | | 609,518 | | | HCP, Inc. (REIT)(a) | | | 12,915,686 | |
| | | | 363,845 | | | Health Care REIT, Inc. (REIT) | | | 12,407,115 | |
| | | | 285,238 | | | Nationwide Health Properties, Inc. (REIT)(a) | | | 7,342,026 | |
| | | | 560,833 | | | Ventas, Inc. (REIT) | | | 16,746,473 | |
| | | | | | | | | | | |
| | | | | | | | | | 49,411,300 | |
| | | |
| | | |
| | | Hotels – 5.9% |
| | | | 434,005 | | | Hospitality Properties Trust (REIT) | | | 5,160,320 | |
| | | | 1,304,882 | | | Host Hotels & Resorts, Inc. (REIT) | | | 10,947,960 | |
| | | | 187,207 | | | Starwood Hotels & Resorts Worldwide, Inc. | | | 4,155,995 | |
| | | | | | | | | | | |
| | | | | | | | | | 20,264,275 | |
| | | |
| | | |
| | | Industrial – 4.4% |
| | | | 187,301 | | | AMB Property Corp. (REIT)(a) | | | 3,523,132 | |
| | | | 1,438,625 | | | ProLogis (REIT)(a) | | | 11,595,317 | |
| | | | | | | | | | | |
| | | | | | | | | | 15,118,449 | |
| | | |
| | | |
| | | Multifamily – 16.0% |
| | | | 347,935 | | | American Campus Communities, Inc. (REIT) | | | 7,717,198 | |
| | | | 144,750 | | | AvalonBay Communities, Inc. (REIT)(a) | | | 8,097,315 | |
| | | | 341,807 | | | Camden Property Trust (REIT) | | | 9,433,873 | |
| | | | 188,781 | | | Equity Lifestyle Properties, Inc. (REIT) | | | 7,018,878 | |
| | | | 416,861 | | | Equity Residential (REIT)(a) | | | 9,266,820 | |
| | | | 125,029 | | | Essex Property Trust, Inc. (REIT)(a) | | | 7,780,555 | |
| | | | 155,500 | | | Home Properties, Inc. (REIT)(a) | | | 5,302,550 | |
| | | | | | | | | | | |
| | | | | | | | | | 54,617,189 | |
| | | |
| | | |
| | | Office – 16.2% |
| | | | 182,878 | | | Alexandria Real Estate Equities, Inc. (REIT)(a) | | | 6,545,204 | |
| | | | 473,414 | | | Boston Properties, Inc. (REIT)(a) | | | 22,581,848 | |
| | | | 225,792 | | | Brandywine Realty Trust (REIT) | | | 1,682,150 | |
| | | | 168,093 | | | Corporate Office Properties Trust (REIT)(a) | | | 4,930,168 | |
| | | | 306,558 | | | Digital Realty Trust, Inc. (REIT)(a) | | | 10,990,104 | |
| | | | 972,913 | | | Douglas Emmett, Inc. (REIT) | | | 8,746,488 | |
| | | | 5,867 | | | SL Green Realty Corp. (REIT) | | | 134,589 | |
| | | | | | | | | | | |
| | | | | | | | | | 55,610,551 | |
| | | |
| | | |
| | | Other – 3.2% |
| | | | 157,001 | | | Corrections Corp of America* | | | 2,667,447 | |
| | | | 141,232 | | | Cypress Sharpridge Investments, Inc. (REIT)* | | | 1,680,661 | |
| | | | 246,686 | | | Entertainment Properties Trust (REIT) | | | 5,081,731 | |
| | | | 48,668 | | | Jones Lang LaSalle, Inc. | | | 1,592,904 | |
| | | | | | | | | | | |
| | | | | | | | | | 11,022,743 | |
| | | |
| | | |
| | | Retail – 23.1% |
| | | | 335,735 | | | Acadia Realty Trust (REIT) | | | 4,381,342 | |
| | | | 193,166 | | | Federal Realty Investment Trust (REIT)(a) | | | 9,951,912 | |
| | | | 862,950 | | | Kimco Realty Corp. (REIT) | | | 8,672,647 | |
| | | | 99,315 | | | Regency Centers Corp. (REIT) | | | 3,467,087 | |
| | | | 789,585 | | | Simon Property Group, Inc. (REIT)(a) | | | 40,608,357 | |
| | | | 131,663 | | | Tanger Factory Outlet Centers, Inc. (REIT)(a) | | | 4,269,831 | |
| | | | 227,628 | | | Taubman Centers, Inc. (REIT)(a) | | | 6,114,088 | |
| | | | 89,262 | | | The Macerich Co. (REIT)(a) | | | 1,571,904 | |
| | | | | | | | | | | |
| | | | | | | | | | 79,037,168 | |
| | | |
| | | |
| | | Self Storage – 6.0% |
| | | | 314,647 | | | Public Storage, Inc. (REIT) | | | 20,603,085 | |
| | | |
| | | |
| | | TOTAL COMMON STOCKS |
| | | (Cost $400,725,656) | | $ | 340,509,989 | |
| | | |
| | | |
| | | | | | | | | | | |
| | | Shares | | Rate | | Value |
| |
Investment Company(b) – 1.7% |
| | | | | | | | | | | |
| | | | | | | | | | | |
| | | JPMorgan U.S. Government Money Market Fund – Capital Shares |
| | | 5,810,054 | | | 0.236 | % | | $ | 5,810,054 | |
| | | (Cost $5,810,054) | | | | |
| | | |
| | | |
| | | TOTAL INVESTMENTS BEFORE SECURITIES LENDING REINVESTMENT VEHICLE |
| | | (Cost $406,535,710) | | $ | 346,320,043 | |
| | | |
| | | |
| | | | | | | | | | | |
| | | | | | | | | | | |
Securities Lending Reinvestment Vehicle(b)(c) – 25.1% |
| | | | | | | | | | | |
| | | | | | | | | | | |
| | | Boston Global Investment Trust – Enhanced Portfolio |
| | | 86,304,589 | | | 0.267 | % | | $ | 86,045,676 | |
| | | (Cost $85,025,679) | | | | |
| | | |
| | | |
| | | TOTAL INVESTMENTS – 126.2% |
| | | (Cost $491,561,389) | | $ | 432,365,719 | |
| | | |
| | | |
| | | | | | | | | | | |
| | | LIABILITIES IN EXCESS OF OTHER ASSETS – (26.2)% | | | (89,662,974 | ) |
| | | |
| | | |
| | | | | | | | | | | |
| | | NET ASSETS – 100.0% | | $ | 342,702,745 | |
| | | |
| | | |
The accompanying notes are an integral part of these financial statements.
GOLDMAN SACHS REAL ESTATE SECURITIES FUND
The percentage shown for each investment category reflects the value of investments in that category as a percentage of net assets.
| | |
| * | | Non-income producing security. |
| |
| (a) | | All or a portion of security is on loan. |
| |
| (b) | | Variable rate security. Interest rate disclosed is that which is in effect at June 30, 2009. |
| |
| (c) | | Represents an affiliated issuer. |
| | | | | | | |
| | | |
| | | |
| | | Investment Abbreviation: |
| | | REIT | | — | | Real Estate Investment Trust |
| | | |
| | | |
The accompanying notes are an integral part of these financial statements.
GOLDMAN SACHS SELECT SATELLITE FUNDS
Statements of Assets and Liabilities
June 30, 2009 (Unaudited)
| | | | | | | | | | | | | | | | | | | | | |
| | | | | Absolute
| | | | | | International
| | | | | | |
| | | | | Return
| | | Commodity
| | | Real Estate
| | | Real Estate
| | | |
| | | | | Tracker
| | | Strategy
| | | Securities
| | | Securities
| | | |
| | | | | Fund | | | Fund(a) | | | Fund | | | Fund | | | |
|
| | | Assets: |
| | | | | | | | | | | | | | | | | | | | | |
| | | Investments in securities of unaffiliated issuers, at value (identified cost $274,679,158, $220,319,294, $277,391,013 and $406,535,710, respectively)(b) | | $ | 277,722,939 | | | $ | 237,215,449 | | | $ | 290,921,801 | | | $ | 346,320,043 | | | |
| | | Investments in affiliated securities lending reinvestment vehicle, at value (identified cost $0, $0, $4,645,918 and $85,025,679, respectively) | | | — | | | | — | | | | 4,708,241 | | | | 86,045,676 | | | |
| | | Cash | | | 4,507,845 | | | | 20,292,880 | | | | — | | | | — | | | |
| | | Foreign currencies, at value (identified cost $156,914, $0, $930,232 and $0, respectively) | | | 157,067 | | | | — | | | | 1,041,027 | | | | — | | | |
| | | Receivables: | | | | | | | | | | | | | | | | | | |
| | | Fund shares sold | | | 4,473,184 | | | | 139,105,189 | | | | 32,801,515 | | | | 25,079,992 | | | |
| | | Swap contracts, at value (includes upfront payments made of $6,703,796 and $211,024 for Absolute Return Tracker and Commodity Strategy Funds, respectively) | | | 4,259,295 | | | | 459,934 | | | | — | | | | — | | | |
| | | Investment securities sold, at value | | | 1,925,296 | | | | 52,655,171 | | | | 2,910,396 | | | | 1,280,952 | | | |
| | | Due from custodian | | | 500,000 | | | | — | | | | — | | | | — | | | |
| | | Reimbursement from adviser | | | 165,264 | | | | 180,593 | | | | — | | | | 15,560 | | | |
| | | Forward foreign currency exchange contracts, at value | | | 74,699 | | | | — | | | | — | | | | — | | | |
| | | Dividends and interest, at value | | | 49,657 | | | | 559,730 | | | | 1,599,079 | | | | 1,507,936 | | | |
| | | Due from broker — variation margin, at value | | | — | | | | 29,480 | | | | — | | | | — | | | |
| | | Securities lending income | | | — | | | | — | | | | 6,457 | | | | 15,482 | | | |
| | | Foreign tax reclaims, at value | | | — | | | | — | | | | 144,057 | | | | — | | | |
| | | Other assets | | | 748 | | | | 671 | | | | 203 | | | | 1,433 | | | |
| | | |
| | | Total assets | | | 293,835,994 | | | | 450,499,097 | | | | 334,132,776 | | | | 460,267,074 | | | |
| | | |
| | | | | | | | | | | | | | | | | | | | | |
| | | | | | | | | | | | | | | | | | | | | |
|
| | | Liabilities: |
| | | | | | | | | | | | | | | | | | | | | |
| | | Due to custodian | | | — | | | | — | | | | 47,452 | | | | — | | | |
| | | Payables: | | | | | | | | | | | | | | | | | | |
| | | Investment securities purchased, at value | | | 9,128,191 | | | | 10,060,448 | | | | 29,832,878 | | | | 25,931,215 | | | |
| | | Payable upon return of securities loaned | | | — | | | | — | | | | 4,427,652 | | | | 89,084,741 | | | |
| | | Due to broker | | | 3,120,781 | | | | 297,980 | | | | — | | | | — | | | |
| | | Forward foreign currency exchange contracts, at value | | | 413,955 | | | | — | | | | — | | | | — | | | |
| | | Amounts owed to affiliates | | | 287,169 | | | | 148,784 | | | | 427,356 | | | | 325,169 | | | |
| | | Due to broker — variation margin, at value | | | 257,270 | | | | — | | | | — | | | | — | | | |
| | | Fund shares redeemed | | | 121,676 | | | | 273,634 | | | | 5,253,312 | | | | 2,120,696 | | | |
| | | Swap contracts, at value (includes upfront payments received of $312,169 for Commodity Strategy Fund) | | | — | | | | 2,290,736 | | | | — | | | | — | | | |
| | | Accrued expenses | | | 85,216 | | | | 258,473 | | | | 164,062 | | | | 102,508 | | | |
| | | |
| | | Total liabilities | | | 13,414,258 | | | | 13,330,055 | | | | 40,152,712 | | | | 117,564,329 | | | |
| | | |
| | | | | | | | | | | | | | | | | | | | | |
| | | | | | | | | | | | | | | | | | | | | |
|
| | | Net Assets: |
| | | | | | | | | | | | | | | | | | | | | |
| | | Paid-in capital | | | 279,255,848 | | | | 532,044,498 | | | | 902,847,604 | | | | 680,864,808 | | | |
| | | Accumulated undistributed (distributions in excess of) net investment income | | | (1,265,807 | ) | | | 69,234 | | | | (100,304 | ) | | | 2,031,778 | | | |
| | | Accumulated net realized gain (loss) from investment, futures, swap contracts and foreign currency related transactions | | | 2,190,207 | | | | (109,761,864 | ) | | | (622,435,625 | ) | | | (280,998,171 | ) | | |
| | | Net unrealized gain (loss) on investments, futures, swap contracts and translation of assets and liabilities denominated in foreign currencies | | | 241,488 | | | | 14,817,174 | | | | 13,668,389 | | | | (59,195,670 | ) | | |
| | | |
| | | NET ASSETS | | $ | 280,421,736 | | | $ | 437,169,042 | | | $ | 293,980,064 | | | $ | 342,702,745 | | | |
| |
| |
| | | | | | | | | | | | | | | | | | | | | |
| | | | | | | | | | | | | | | | | | | | | |
| | | Net Assets: | | | | | | | | | | | | | | | | | | |
| | | Class A | | $ | 134,732,804 | | | $ | 53,423,458 | | | $ | 109,994,891 | | | $ | 92,098,097 | | | |
| | | Class B | | | — | | | | — | | | | — | | | | 3,262,287 | | | |
| | | Class C | | | 11,659,382 | | | | 3,905,385 | | | | 3,797,301 | | | | 5,740,499 | | | |
| | | Institutional | | | 134,011,874 | | | | 379,808,562 | | | | 180,182,925 | | | | 237,799,803 | | | |
| | | Service | | | — | | | | — | | | | — | | | | 3,724,409 | | | |
| | | Class IR | | | 8,857 | | | | 6,991 | | | | 4,947 | | | | 4,861 | | | |
| | | Class R | | | 8,819 | | | | 24,646 | | | | — | | | | 72,789 | | | |
| |
| |
| | | Total Net Assets | | $ | 280,421,736 | | | $ | 437,169,042 | | | $ | 293,980,064 | | | $ | 342,702,745 | | | |
| |
| |
| | | | | | | | | | | | | | | | | | | | | |
| | | Shares outstanding $0.001 par value (unlimited shares authorized): | | | | | | | | | | | | | | | | | | |
| | | Class A | | | 15,255,109 | | | | 9,095,412 | | | | 19,765,710 | | | | 13,334,840 | | | |
| | | Class B | | | — | | | | — | | | | — | | | | 471,895 | | | |
| | | Class C | | | 1,330,635 | | | | 668,761 | | | | 687,488 | | | | 841,769 | | | |
| | | Institutional | | | 15,104,057 | | | | 64,750,762 | | | | 32,774,204 | | | | 34,067,075 | | | |
| | | Service | | | — | | | | — | | | | — | | | | 535,730 | | | |
| | | Class IR | | | 1,000 | | | | 1,189 | | | | 889 | | | | 702 | | | |
| | | Class R | | | 1,001 | | | | 4,201 | | | | — | | | | 10,549 | | | |
| |
| |
| | | | | | | | | | | | | | | | | | | | | |
| | | Net asset value, offering and redemption price per share:(c) | | | | | | | | | | | | | | | | | | |
| | | Class A | | | $8.83 | | | | $5.87 | | | | $5.56 | | | | $6.91 | | | |
| | | Class B | | | — | | | | — | | | | — | | | | 6.91 | | | |
| | | Class C | | | 8.76 | | | | 5.84 | | | | 5.52 | | | | 6.82 | | | |
| | | Institutional | | | 8.87 | | | | 5.87 | | | | 5.50 | | | | 6.98 | | | |
| | | Service | | | — | | | | — | | | | — | | | | 6.95 | | | |
| | | Class IR | | | 8.86 | | | | 5.88 | | | | 5.56 | | | | 6.92 | | | |
| | | Class R | | | 8.81 | | | | 5.87 | | | | — | | | | 6.90 | | | |
| |
| |
| |
| (a) | Statement of Assets and Liabilities for Commodity Strategy Fund is consolidated and includes the balances of Goldman Sachs Cayman Commodity Fund, Ltd. (wholly-owned subsidiary). Accordingly, all interfund balances have been eliminated. |
| (b) | Includes loaned securities having a market value of $4,193,042 and $87,382,870 for the International Real Estate Securities and Real Estate Securities Funds, respectively. |
| |
| (c) | Maximum public offering price per share (NAV per share multiplied by 1.0582) for Class A Shares of the Absolute Return Tracker, International Real Estate Securities, Real Estate Securities and (NAV per share multiplied by 1.0471) for Commodity Strategy Funds is $9.34, $5.88, $7.31 and $6.15, respectively. At redemption, Class B and Class C Shares may be subject to a contingent deferred sales charge assessed on the amount equal to the lesser of the current net asset value or the original purchase price of the shares. |
The accompanying notes are an integral part of these financial statements.
GOLDMAN SACHS SELECT SATELLITE FUNDS
Statements of Operations
For the Six Months Ended June 30, 2009 (Unaudited)
| | | | | | | | | | | | | | | | | | | |
| | | | | Absolute
| | | | | | International
| | | | |
| | | | | Return
| | | Commodity
| | | Real Estate
| | | Real Estate
| |
| | | | | Tracker
| | | Strategy
| | | Securities
| | | Securities
| |
| | | | | Fund | | | Fund(a) | | | Fund | | | Fund | |
| |
|
| | | Investment income: |
| | | | | | | | | | | | | | | | | | | |
| | | Dividends(b) | | $ | 246,160 | | | $ | 71,939 | | | $ | 6,290,135 | | | $ | 9,269,213 | |
| | | Interest | | | 153,163 | | | | 1,946,449 | | | | — | | | | — | |
| | | Securities lending income — affiliated issuer | | | — | | | | — | | | | 150,023 | | | | 186,338 | |
| | | |
| | | |
| | | Total investment income | | | 399,323 | | | | 2,018,388 | | | | 6,440,158 | | | | 9,455,551 | |
| | | |
| | | |
| | | | | | | | | | | | | | | | | | | |
| | | | | | | | | | | | | | | | | | | |
|
| | | Expenses: |
| | | | | | | | | | | | | | | | | | | |
| | | Management fees | | | 1,003,263 | | | | 517,190 | | | | 1,287,555 | | | | 1,521,319 | |
| | | Distribution and Service fees(c) | | | 116,848 | | | | 62,234 | | | | 148,021 | | | | 159,961 | |
| | | Transfer Agent fees(c) | | | 93,366 | | | | 60,296 | | | | 128,863 | | | | 136,606 | |
| | | Amortization of offering costs | | | 398,592 | | | | — | | | | — | | | | — | |
| | | Professional fees | | | 131,252 | | | | 60,413 | | | | 43,085 | | | | 35,482 | |
| | | Registration fees | | | 71,031 | | | | 56,271 | | | | 30,042 | | | | 47,421 | |
| | | Custody and accounting fees | | | 33,168 | | | | 21,989 | | | | 55,533 | | | | 20,013 | |
| | | Printing fees | | | 30,529 | | | | 27,911 | | | | 26,445 | | | | 38,792 | |
| | | Trustee fees | | | 8,460 | | | | 8,460 | | | | 8,460 | | | | 8,460 | |
| | | Organization costs(d) | | | — | | | | 150,000 | | | | — | | | | — | |
| | | Service share fees — Service Plan | | | — | | | | — | | | | — | | | | 4,459 | |
| | | Service share fees — Shareholder Administration Plan | | | — | | | | — | | | | — | | | | 4,459 | |
| | | Other | | | 9,121 | | | | 52,290 | | | | 36,842 | | | | 48,861 | |
| | | |
| | | |
| | | Total expenses | | | 1,895,630 | | | | 1,017,054 | | | | 1,764,846 | | | | 2,025,833 | |
| | | |
| | | |
| | | Less — expense reductions | | | (669,877 | ) | | | (331,810 | ) | | | (146,547 | ) | | | (194,120 | ) |
| | | |
| | | |
| | | Net expenses | | | 1,225,753 | | | | 685,244 | | | | 1,618,299 | | | | 1,831,713 | |
| | | |
| | | |
| | | NET INVESTMENT INCOME (LOSS) | | | (826,430 | ) | | | 1,333,144 | | | | 4,821,859 | | | | 7,623,838 | |
| | | |
| | | |
| | | | | | | | | | | | | | | | | | | |
| | | | | | | | | | | | | | | | | | | |
|
| | | Realized and unrealized gain (loss) from investment, futures, swap contracts and foreign currency related transactions: |
| | | | | | | | | | | | | | | | | | | |
| | | Net realized gain (loss) from: | | | | | | | | | | | | | | | | |
| | | Investment transactions — unaffiliated issuers | | | (549,160 | ) | | | 5,312,108 | | | | (137,715,470 | ) | | | (166,350,067 | ) |
| | | Securities lending reinvestment vehicle transactions — affiliated issuer | | | — | | | | — | | | | 79,106 | | | | 209,377 | |
| | | Futures transactions | | | 4,931,266 | | | | 65,294 | | | | — | | | | — | |
| | | Swap contracts | | | 2,699,502 | | | | 312,869 | | | | — | | | | — | |
| | | Foreign currency related transactions | | | 2,539,693 | | | | — | | | | (321,409 | ) | | | — | |
| | | Net change in unrealized gain (loss) on: | | | | | | | | | | | | | | | | |
| | | Investments — unaffiliated issuers | | | 1,936,072 | | | | 21,239,281 | | | | 148,789,839 | | | | 99,548,333 | |
| | | Securities lending reinvestment vehicle — affiliated issuer | | | — | | | | — | | | | 36,875 | | | | 618,780 | |
| | | Futures | | | 32,937 | | | | (4,607 | ) | | | — | | | | — | |
| | | Swap contracts | | | (2,920,262 | ) | | | (1,685,850 | ) | | | — | | | | — | |
| | | Translation of asset and liabilities denominated in foreign currencies | | | (106,266 | ) | | | — | | | | 3,349 | | | | — | |
| | | |
| | | |
| | | Net realized and unrealized gain (loss) from investment, futures, swap contracts and foreign currency related transactions | | | 8,563,782 | | | | 25,239,095 | | | | 10,872,290 | | | | (65,973,577 | ) |
| | | |
| | | |
| | | NET INCREASE (DECREASE) IN NET ASSETS RESULTING FROM OPERATIONS | | $ | 7,737,352 | | | $ | 26,572,239 | | | $ | 15,694,149 | | | $ | (58,349,739 | ) |
| | | |
| | | |
| |
| (a) | Statement of Operations for Commodity Strategy Fund is consolidated and includes the balances of Goldman Sachs Cayman Commodity Fund, Ltd (wholly-owned subsidiary). Accordingly, all interfund balances and transactions have been eliminated. |
| (b) | Foreign taxes withheld on dividends were $632,296 for the International Real Estate Securities Fund. |
| (c) | Class specific Distribution and Service, and Transfer Agent fees were as follows: |
| | | | | | | | | | | | | | | | | | | | | | | | | | | | | | | | | | | | | | | | | | | | | |
| | | Distribution and Service Fees | | | Transfer Agent Fees | |
Fund | | Class A | | | Class B | | | Class C | | | Class R | | | Class A | | | Class B | | | Class C | | | Institutional | | | Service | | | Class R | | | Class IR | |
| Absolute Return Tracker | | $ | 90,962 | | | $ | — | | | $ | 25,865 | | | $ | 21 | | | $ | 69,132 | | | $ | — | | | $ | 4,914 | | | $ | 19,304 | | | $ | — | | | $ | 8 | | | $ | 8 | |
| Commodity Strategy | | | 49,294 | | | | — | | | | 12,902 | | | | 38 | | | | 25,633 | | | | — | | | | 1,677 | | | | 32,966 | | | | — | | | | 10 | | | | 10 | |
| International Real Estate Securities | | | 128,014 | | | | — | | | | 20,007 | | | | — | | | | 97,291 | | | | — | | | | 3,801 | | | | 27,767 | | | | — | | | | — | | | | 4 | |
| Real Estate Securities | | | 114,977 | | | | 16,829 | | | | 28,053 | | | | 102 | | | | 87,383 | | | | 3,198 | | | | 5,330 | | | | 39,939 | | | | 713 | | | | 39 | | | | 4 | |
| |
| (d) | Organization costs relate to the formation of the Goldman Sachs Cayman Commodity Fund, Ltd. |
The accompanying notes are an integral part of these financial statements.
GOLDMAN SACHS SELECT SATELLITE FUNDS
Statements of Changes in Net Assets
| | | | | | | | | | | |
| | | | | Absolute Return Tracker Fund | |
| | | | | For the
| | | | |
| | | | | Six Months Ended
| | | For the
| |
| | | | | June 30, 2009
| | | Period Ended
| |
| | | | | (Unaudited) | | | December 31, 2008(b) | |
| |
|
| | | From operations: |
| | | | | | | | | | | |
| | | Net investment income (loss) | | $ | (826,430 | ) | | $ | 177,263 | |
| | | Net realized gain (loss) from investment, futures, swap contracts and foreign currency related transactions | | | 9,621,301 | | | | (10,321,676 | ) |
| | | Net change in unrealized gain (loss) on investments, futures, swap contracts and translation of assets and liabilities denominated in foreign currencies | | | (1,057,519 | ) | | | 1,299,007 | |
| | | |
| | | |
| | | Net increase (decrease) in net assets resulting from operations | | | 7,737,352 | | | | (8,845,406 | ) |
| | | |
| | | |
| | | | | | | | | | | |
| | | | | | | | | | | |
|
| | | Distributions to shareholders: |
| | | | | | | | | | | |
| | | From net investment income | | | | | | | | |
| | | Class A Shares | | | — | | | | — | |
| | | Class B Shares | | | — | | | | — | |
| | | Class C Shares | | | — | | | | — | |
| | | Institutional Shares | | | — | | | | — | |
| | | Service Shares | | | — | | | | — | |
| | | Class IR | | | — | | | | — | |
| | | Class R | | | — | | | | — | |
| | | From net realized gains | | | | | | | | |
| | | Class A Shares | | | — | | | | — | |
| | | Class B Shares | | | — | | | | — | |
| | | Class C Shares | | | — | | | | — | |
| | | Institutional Shares | | | — | | | | — | |
| | | Service Shares | | | — | | | | — | |
| | | Class IR | | | — | | | | — | |
| | | Class R | | | — | | | | — | |
| | | From capital | | | | | | | | |
| | | Class A Shares | | | — | | | | — | |
| | | Class B Shares | | | — | | | | — | |
| | | Class C Shares | | | — | | | | — | |
| | | Institutional Shares | | | — | | | | — | |
| | | Service Shares | | | — | | | | — | |
| | | Class IR | | | — | | | | — | |
| | | Class R | | | — | | | | — | |
| | | |
| | | |
| | | Total distributions to shareholders | | | — | | | | — | |
| | | |
| | | |
| | | | | | | | | | | |
| | | | | | | | | | | |
|
| | | From share transactions: |
| | | | | | | | | | | |
| | | Proceeds from sales of shares | | | 200,803,607 | | | | 135,450,993 | |
| | | Reinvestments of distributions | | | — | | | | — | |
| | | Cost of shares redeemed | | | (45,924,820 | )(c) | | | (8,799,990 | )(d) |
| | | |
| | | |
| | | Net increase (decrease) in net assets resulting from share transactions | | | 154,878,787 | | | | 126,651,003 | |
| | | |
| | | |
| | | TOTAL INCREASE (DECREASE) | | | 162,616,139 | | | | 117,805,597 | |
| | | |
| | | |
| | | | | | | | | | | |
| | | | | | | | | | | |
|
| | | Net assets: |
| | | | | | | | | | | |
| | | Beginning of period | | | 117,805,597 | | | | — | |
| | | |
| | | |
| | | End of period | | $ | 280,421,736 | | | $ | 117,805,597 | |
| | | |
| | | |
| | | Accumulated undistributed (distributions in excess of) net investment income | | $ | (1,265,807 | ) | | $ | (439,377 | ) |
| | | |
| | | |
| |
| (a) | Statement of Changes in Net Assets for Commodity Strategy Fund is consolidated and includes the balances of Goldman Sachs Cayman Commodity Fund, Ltd. (wholly-owned subsidiary). Accordingly, all interfund balances and transactions have been eliminated. |
| (b) | Commenced operations on May 30, 2008. |
| (c) | Net of $44,112, $7,093 and $2,358 of redemption fees remitted to the Absolute Return Tracker, Commodity Strategy and International Real Estate Securities Funds, respectively. |
| (d) | Net of $9,242, $46,497 and $57,146 of redemption fees remitted to the Absolute Return Tracker, Commodity Strategy and International Real Estate Securities Funds, respectively. |
The accompanying notes are an integral part of these financial statements.
GOLDMAN SACHS SELECT SATELLITE FUNDS
| | | | | | | | | | | | | | | | | | | | | | | | | |
| | | Commodity Strategy Fund(a) | | | International Real Estate Securities Fund | | | Real Estate Securities Fund | |
| | | For the
| | | | | | For the
| | | | | | For the
| | | | |
| | | Six Months Ended
| | | For the
| | | Six Months Ended
| | | For the
| | | Six Months Ended
| | | For the
| |
| | | June 30, 2009
| | | Fiscal Year Ended
| | | June 30, 2009
| | | Fiscal Year Ended
| | | June 30, 2009
| | | Fiscal Year Ended
| |
| | | (Unaudited) | | | December 31, 2008 | | | (Unaudited) | | | December 31, 2008 | | | (Unaudited) | | | December 31, 2008 | |
| |
|
| | | |
| | | | | | | | | | | | | | | | | | | | | | | | | |
| | | $ | 1,333,144 | | | $ | 7,276,024 | | | $ | 4,821,859 | | | $ | 15,940,878 | | | $ | 7,623,838 | | | $ | 12,632,335 | |
| | | | 5,690,271 | | | | (114,445,055 | ) | | | (137,957,773 | ) | | | (431,461,610 | ) | | | (166,140,690 | ) | | | (112,889,950 | ) |
| | | | | | | | | | | | | | | | | | | | | | | | | |
| | | | 19,548,824 | | | | (52,651,285 | ) | | | 148,830,063 | | | | (119,559,595 | ) | | | 100,167,113 | | | | (205,345,654 | ) |
| | | |
| | | |
| | | | 26,572,239 | | | | (159,820,316 | ) | | | 15,694,149 | | | | (535,080,327 | ) | | | (58,349,739 | ) | | | (305,603,269 | ) |
| | | |
| | | |
| | | | | | | | | | | | | | | | | | | | | | | | | |
| | | | | | | | | | | | | | | | | | | | | | | | | |
|
| | | |
| | | | | | | | | | | | | | | | | | | | | | | | | |
| | | | | | | | | | | | | | | | | | | | | | | | | |
| | | | (159,193 | ) | | | (1,520,932 | ) | | | (1,273,913 | ) | | | — | | | | (2,089,553 | ) | | | (4,936,378 | ) |
| | | | — | | | | — | | | | — | | | | — | | | | (63,334 | ) | | | (128,289 | ) |
| | | | (4,735 | ) | | | (45,893 | ) | | | (30,372 | ) | | | — | | | | (113,744 | ) | | | (190,855 | ) |
| | | | (1,066,940 | ) | | | (5,902,541 | ) | | | (2,063,448 | ) | | | — | | | | (5,235,607 | ) | | | (7,953,608 | ) |
| | | | — | | | | — | | | | — | | | | — | | | | (84,388 | ) | | | (118,661 | ) |
| | | | (74 | ) | | | (520 | ) | | | (63 | ) | | | — | | | | (115 | ) | | | (176 | ) |
| | | | (68 | ) | | | (260 | ) | | | — | | | | — | | | | (1,572 | ) | | | (163 | ) |
| | | | | | | | | | | | | | | | | | | | | | | | | |
| | | | — | | | | (3,905,699 | ) | | | — | | | | — | | | | — | | | | (8,950,639 | ) |
| | | | — | | | | — | | | | — | | | | — | | | | — | | | | (326,976 | ) |
| | | | — | | | | (233,889 | ) | | | — | | | | — | | | | — | | | | (495,479 | ) |
| | | | — | | | | (12,888,349 | ) | | | — | | | | — | | | | — | | | | (16,760,636 | ) |
| | | | — | | | | — | | | | — | | | | — | | | | — | | | | (284,605 | ) |
| | | | — | | | | (1,748 | ) | | | — | | | | — | | | | — | | | | (372 | ) |
| | | | — | | | | (906 | ) | | | — | | | | — | | | | — | | | | (480 | ) |
| | | | | | | | | | | | | | | | | | | | | | | | | |
| | | | — | | | | (22,790 | ) | | | — | | | | (4,050,970 | ) | | | — | | | | (2,147,339 | ) |
| | | | — | | | | — | | | | — | | | | — | | | | — | | | | (55,806 | ) |
| | | | — | | | | (688 | ) | | | — | | | | (129,643 | ) | | | — | | | | (83,023 | ) |
| | | | — | | | | (88,444 | ) | | | — | | | | (6,256,822 | ) | | | — | | | | (3,459,842 | ) |
| | | | — | | | | — | | | | — | | | | — | | | | — | | | | (51,618 | ) |
| | | | — | | | | (8 | ) | | | — | | | | (91 | ) | | | — | | | | (76 | ) |
| | | | — | | | | (4 | ) | | | — | | | | — | | | | — | | | | (71 | ) |
| | | |
| | | |
| | | | (1,231,010 | ) | | | (24,612,671 | ) | | | (3,367,796 | ) | | | (10,437,526 | ) | | | (7,588,313 | ) | | | (45,945,092 | ) |
| | | |
| | | |
| | | | | | | | | | | | | | | | | | | | | | | | | |
| | | | | | | | | | | | | | | | | | | | | | | | | |
|
| | | |
| | | | | | | | | | | | | | | | | | | | | | | | | |
| | | | 278,606,010 | | | | 211,301,984 | | | | 57,062,814 | | | | 275,427,686 | | | | 84,693,551 | | | | 238,464,837 | |
| | | | 1,106,637 | | | | 23,076,929 | | | | 2,836,281 | | | | 9,168,334 | | | | 6,882,207 | | | | 41,503,482 | |
| | | | (37,867,132 | )(c) | | | (257,696,399 | )(d) | | | (73,631,487 | )(c) | | | (680,372,892 | )(d) | | | (76,837,455 | ) | | | (300,240,389 | ) |
| | | |
| | | |
| | | | | | | | | | | | | | | | | | | | | | | | | |
| | | | 241,845,515 | | | | (23,317,486 | ) | | | (13,732,392 | ) | | | (395,776,872 | ) | | | 14,738,303 | | | | (20,272,070 | ) |
| | | |
| | | |
| | | | 267,186,744 | | | | (207,750,473 | ) | | | (1,406,039 | ) | | | (941,294,725 | ) | | | (51,199,749 | ) | | | (371,820,431 | ) |
| | | |
| | | |
| | | | | | | | | | | | | | | | | | | | | | | | | |
| | | | | | | | | | | | | | | | | | | | | | | | | |
|
| | | |
| | | | | | | | | | | | | | | | | | | | | | | | | |
| | | | 169,982,298 | | | | 377,732,771 | | | | 295,386,103 | | | | 1,236,680,828 | | | | 393,902,494 | | | | 765,722,925 | |
| | | |
| | | |
| | | $ | 437,169,042 | | | $ | 169,982,298 | | | $ | 293,980,064 | | | $ | 295,386,103 | | | $ | 342,702,745 | | | $ | 393,902,494 | |
| | | |
| | | |
| | | $ | 69,234 | | | $ | (32,900 | ) | | $ | (100,304 | ) | | $ | (1,554,367 | ) | | $ | 2,031,778 | | | $ | 1,996,253 | |
| | | |
| | | |
The accompanying notes are an integral part of these financial statements.
GOLDMAN SACHS SELECT SATELLITE FUNDS
Notes to Financial Statements
June 30, 2009 (Unaudited)
1. ORGANIZATION
Goldman Sachs Trust (the “Trust”) is a Delaware statutory trust registered under the Investment Company Act of 1940, as amended (the “Act”), as an open-end management investment company. The following table lists those series of the Trust that are included in this report (collectively, the “Funds” or individually a “Fund”), along with their corresponding share classes and respective diversification status under the Act:
| | | | | |
| Fund | | Share Classes Offered | | Diversified/Non-diversified |
| |
| Absolute Return Tracker and Commodity Strategy | | A, C, Institutional, IR and R Shares | | Non-diversified |
| |
| |
| International Real Estate Securities | | A, C, Institutional and IR Shares | | Non-diversified |
| |
| |
| Real Estate Securities | | A, B, C, Institutional, Service, IR and R Shares | | Non-diversified |
| |
| |
Class A Shares of the Absolute Return Tracker, International Real Estate Securities and Real Estate Securities Funds are sold with a front-end sales charge of up to 5.50%. Class A Shares of Commodity Strategy Fund are sold with a front-end sales charge of up to 4.50%. Class B Shares of the Real Estate Securities Fund are sold with a contingent deferred sales charge that declines from 5.00% to zero, depending upon the period of time the shares are held. Class C Shares of the Funds are sold with a contingent deferred sales charge of 1.00% during the first 12 months. Institutional and Class IR Shares of the Funds and Service Shares of Real Estate Securities Fund are not subject to a sales charge. Class R Shares of the Absolute Return Tracker, Commodity Strategy and Real Estate Securities Funds are not subject to a sales charge. Goldman, Sachs & Co. (“Goldman Sachs” or the “Distributor”) serves as distributor of the shares of the Funds pursuant to a Distribution Agreement. Goldman Sachs may retain a portion of such sales charges it receives as Distributor.
Goldman Sachs Asset Management, L.P. (“GSAM”), an affiliate of Goldman Sachs, serves as investment adviser pursuant to a Management Agreement (the “Agreement”) with the Trust on behalf of the Funds.
2. BASIS FOR CONSOLIDATION FOR THE COMMODITY STRATEGY FUND
Goldman Sachs Cayman Commodity Fund, Ltd. (the “Subsidiary”), a Cayman Islands exempted company, was incorporated on April 2, 2009 and is currently a wholly-owned subsidiary of the Commodity Strategy Fund. The Subsidiary acts as an investment vehicle for the Fund in order to effect certain investments on behalf of the Fund consistent with the Fund’s investment objectives and policies specified in the Fund’s prospectus and statement of additional information. The Fund is the sole shareholder of the Subsidiary pursuant to a subscription agreement dated as of June 17, 2009, and it is intended that the Fund will remain the sole shareholder and, as a result, will continue to control the Subsidiary. Under the Articles of Association of the Subsidiary, shares issued by the Subsidiary confer upon a shareholder the right to vote at general meetings of the Subsidiary and certain rights in connection with any winding-up or repayment of capital, as well as the right to participate in the profits or assets of the Subsidiary. As of June 30, 2009, net assets of the Fund were approximately $437,169,000, of which approximately $88,306,000, or approximately 20%, represented the Fund’s ownership of the shares of the Subsidiary.
GOLDMAN SACHS SELECT SATELLITE FUNDS
3. SIGNIFICANT ACCOUNTING POLICIES
The following is a summary of the significant accounting policies consistently followed by the Funds. The preparation of financial statements in conformity with accounting principles generally accepted in the United States of America (“GAAP”) requires management to make estimates and assumptions that may affect the amounts and disclosures on the financial statements. Actual results could differ from those estimates and assumptions.
A. Investment Valuation — The investment valuation policy of the Funds is to value investments at market value. Investments in equity securities traded on a foreign securities exchange are valued daily at fair value determined by an independent fair value service (if available) under valuation procedures approved by the trustees consistent with applicable regulatory guidance. The independent fair value service takes into account multiple factors including, but not limited to, movements in the U.S. securities markets, certain depositary receipts, futures contracts and foreign currency exchange rates that have occurred subsequent to the close of the foreign securities exchanges. While the independent service may not take into account market or security specific information, under the valuation procedures, these securities might also be fair valued by GSAM by taking into consideration market or security specific information as discussed below.
Investments in equity securities and investment companies traded on a United States (“U.S.”) securities exchange or the NASDAQ system are valued daily at their last sale price or official closing price on the principal exchange or system on which they are traded. Investments in equity securities and investment companies traded on a foreign securities exchange for which an independent fair value service cannot provide a quote are valued daily at their last sale price or official closing price on the principal exchange on which they are traded. If no sale occurs, such securities and investment companies are valued at the last bid price for long positions and at the last ask price for short positions. Debt securities for which market quotations are readily available are valued on the basis of quotations furnished by an independent pricing service approved by the trustees or provided by securities dealers. The pricing services may use valuation models or matrix pricing, which consider either (i) yield or price with respect to bonds that are considered comparable in characteristics such as rating, interest rate and maturity date or (ii) quotations from bond dealers, to determine current value. If accurate quotations are not readily available, or if GSAM believes that such quotations do not accurately reflect fair value, the fair value of the Funds’ investments may be determined based on yield equivalents, a pricing matrix or other sources, under valuation procedures established by the trustees. Unlisted equity securities for which market quotations are available are valued at the last sale price on valuation date, or if no sale occurs, at the last bid price. In the absence of market quotations, broker quotes will be utilized or the security will be fair valued. Investments in investment companies (other than those that are exchange traded) are valued at the net asset value per share (“NAV”) on the valuation date. Short-term debt obligations that mature in sixty days or less and that do not exhibit signs of credit deterioration are valued at amortized cost, which approximates market value.
GSAM, consistent with its procedures and applicable regulatory guidance, may make an adjustment to the previous closing prices of either domestic or foreign securities in light of significant events to reflect what it believes to be the fair value of the securities at the time of determining the Funds’ NAV. Significant events that could affect a large number of securities in a particular market may include, but are not limited to: situations relating to one or more single issuers in a market sector; significant fluctuations in U.S. or foreign markets; market dislocations; market disruptions or market closings; equipment failures; natural or man-made disasters or acts of God; armed conflicts; government actions or other developments; as well as the same or similar events which may affect specific issuers or the securities markets even though not tied directly to the securities markets. Other significant events that could relate to a single issuer may include, but are not limited to: corporate actions such as reorganizations, mergers and buy-outs; corporate announcements, including those relating to earnings, products and regulatory news; significant litigation; low trading volume; and trading limits or suspensions.
GOLDMAN SACHS SELECT SATELLITE FUNDS
Notes to Financial Statements (continued)
June 30, 2009 (Unaudited)
| |
| 3. SIGNIFICANT ACCOUNTING POLICIES (continued) | |
B. Security and Investor Share Transactions and Investment Income — Security and investor share transactions are reflected for financial reporting purposes as of the trade date which may cause the NAV as stated in the accompanying financial statements to be different than the official closing NAV. Realized gains and losses on sales of portfolio securities are calculated using the identified cost basis. Dividend income is recognized on the ex-dividend date, net of foreign withholding taxes, if any, which are reduced by any amounts reclaimable by the Funds, where applicable. Interest income is recorded on the basis of interest accrued, premium amortized and discount accreted. In addition, it is the Funds’ policy to accrue for foreign capital gains taxes, if applicable, on certain foreign securities held by the Funds, which are subject to such taxes. An estimated foreign capital gains tax is recorded daily on net unrealized gains on these securities and is payable upon the sale of such securities when a gain is realized.
Net investment income (other than class specific expenses) and unrealized and realized gains or losses are allocated daily to each class of shares of the respective Fund based upon the relative proportion of net assets of each class.
In addition, distributions received from the Funds’ investments in real estate investment trusts (“REITs”) often include a “return of capital” which is recorded by the Funds as a reduction of the cost basis of the securities held. The Internal Revenue Code of 1986, as amended (the “Code”) requires a REIT to distribute at least 95% of its taxable income to investors. In many cases, however, because of “non-cash” expenses such as property depreciation, a REIT’s cash flow will exceed its taxable income. The REIT may distribute this excess cash to offer a more competitive yield. This portion of the Funds’ distributions is deemed a return of capital and is generally not taxable to shareholders.
C. Expenses — Expenses incurred by the Trust that do not specifically relate to an individual Fund of the Trust are allocated to the Funds on a straight-line and/or “pro-rata” basis depending upon the nature of the expense.
D. Federal Taxes and Distributions to Shareholders — It is each Fund’s policy to comply with the requirements of the Code applicable to regulated investment companies (mutual funds) and to distribute each year substantially all of its investment company taxable income and capital gains to its shareholders. Accordingly, no federal income tax provisions are required. Distributions to shareholders are recorded on the ex-dividend date. Income and capital gains distributions, if any, are declared and paid according to the following schedule:
| | | | | |
| | | Income Distribution
| | Capital Gains Distribution
|
| Fund | | Declared and Paid | | Declared and Paid |
| |
| Absolute Return Tracker | | Annually | | Annually |
| |
| |
| Commodity Strategy and Real Estate Securities | | Quarterly | | Annually |
| |
| |
| International Real Estate Securities | | Semi-Annually | | Annually |
| |
| |
Net capital losses are carried forward to future fiscal years and may be used to the extent allowed by the Code to offset any future capital gains. Utilization of capital loss carryforwards will reduce the requirement of future capital gains distributions.
The characterization of distributions to shareholders for financial reporting purposes is determined in accordance with federal income tax rules, which may differ from GAAP. The source of each Fund’s distributions may be shown in the accompanying financial statements as either from net investment income, net realized gain or capital. Financial statements are adjusted for permanent book/tax differences to reflect the appropriate tax character, and are not adjusted for temporary differences.
GOLDMAN SACHS SELECT SATELLITE FUNDS
| |
| 3. SIGNIFICANT ACCOUNTING POLICIES (continued) | |
GSAM has reviewed the Funds’ tax positions for all open tax years (the current and prior three tax years) and has concluded that no provision for income tax is required in the Funds’ financial statements. Such open tax years remain subject to examination by tax authorities.
E. Foreign Currency Translations — The books and records of the Funds are accounted for in U.S. dollars. Amounts denominated in foreign currencies are translated into U.S. dollars on the following basis: (i) investment valuations, foreign currency and other assets and liabilities initially expressed in foreign currencies are converted into U.S. dollars based upon 4:00 p.m. Eastern Time exchange rates; and (ii) purchases and sales of foreign investments, income and expenses are converted into U.S. dollars based upon currency exchange rates prevailing on the respective dates of such transactions as of 4:00 p.m. Eastern Time.
Net realized and unrealized gain (loss) on foreign currency transactions represents: (i) foreign exchange gains and losses from the sale and holdings of foreign currencies; (ii) currency gains and losses between trade date and settlement date on investment security transactions and forward exchange contracts; and (iii) gains and losses from the difference between amounts of dividends, interest and foreign withholding taxes recorded and the amounts actually received. The effect of changes in foreign currency exchange rates on equity securities and derivative instruments are not segregated in the Statements of Operations from the effects of changes in market prices of those investments, but are included with the net realized and unrealized gain (loss) on investments. The effect of changes in foreign currency exchange rates on fixed income securities are segregated in the Statements of Operations from the effects of changes in market prices of those investments, and are included with the net realized and unrealized gain (loss) on foreign currency related transactions. Net unrealized foreign exchange gains and losses arising from changes in the value of other assets and liabilities as a result of changes in foreign exchange rates are included as increases and decreases in unrealized gain (loss) on foreign currency related transactions.
Non U.S. currency symbol utilized throughout the report are defined as follows: EUR — Euro.
F. Commodity Index Linked Structured Notes — The Absolute Return Tracker and Commodity Strategy Funds may invest in structured notes whose values are based on the price movements of a commodity index. Commodity index-linked structured notes are valued daily by the issuing counterparties under procedures approved by the Trustees. The value of these notes will rise and fall in response to changes in the underlying commodity or related index or investment. The structured notes are often leveraged, increasing the volatility of each note’s value relative to the change in the underlying linked index. Commodity linked investments may be more volatile and less liquid than the underlying index and their value may be affected by the performance of commodities as well as other factors including liquidity, quality, maturity and other economic variables. These structured notes are subject to prepayment, credit and interest rate risks. The current contracts held by the Funds have a mandatory put feature if the underlying index declines from the entrance date by the amount noted in the agreement. The Funds have the option to request prepayment from the issuer at any time. Interim payments received are recorded as net realized gains in the Statements of Operations. At maturity, or when a note is sold, the Funds record a realized gain or loss.
G. Mortgage-Backed and Asset-Backed Securities — The Absolute Return Tracker and Commodity Strategy Funds may invest in mortgage-backed and/or asset-backed securities. Mortgage-backed securities represent direct or indirect participations in, or are collateralized by and payable from, mortgage loans secured by residential and/or commercial real property. These securities may include mortgage pass-through securities, collateralized mortgage obligations, real estate mortgage investment conduit pass-through or participation certificates, and stripped mortgage-backed securities. Asset-backed securities include securities whose principal and interest payments are collateralized by pools of assets such as auto
GOLDMAN SACHS SELECT SATELLITE FUNDS
Notes to Financial Statements (continued)
June 30, 2009 (Unaudited)
| |
| 3. SIGNIFICANT ACCOUNTING POLICIES (continued) | |
loans, credit card receivables, leases, installment contracts and personal property. Asset-backed securities also include home equity line of credit loans and other second-lien mortgages.
The value of certain mortgage-backed and asset-backed securities (including adjustable rate mortgage loans) may be particularly sensitive to changes in prevailing interest rates. The value of these securities may also fluctuate in response to the market’s perception of the creditworthiness of the issuers. Early repayment of principal on mortgage-backed or asset-backed securities may expose a Fund to the risk of earning a lower rate of return upon reinvestment of principal. Asset-backed securities may present credit risks that are not presented by mortgage-backed securities because they generally do not have the benefit of a security interest in collateral that is comparable to mortgage assets. Some asset-backed securities may only have a subordinated claim on collateral. In addition, while mortgage-backed and asset-backed securities may be supported by some form of government or private guarantee and/or insurance, there is no assurance that private guarantors or insurers, if any, will meet their obligations.
Stripped mortgage-backed securities are usually structured with two different classes: one that receives substantially all of the interest payments (the interest-only, or “IO” and/or the high coupon rate with relatively low principal amount, or “IOette”), and the other that receives substantially all of the principal payments (the principal-only, or “PO”) from a pool of mortgage loans. Little to no principal will be received at the maturity of an IO; as a result, adjustments are made to the cost of the security on a daily basis until maturity. These adjustments are included in interest income. Payments received for PO’s, typically monthly, are treated as a proportionate reduction to the cost basis of the securities and excess amounts are recorded as gains. All gains and losses resulting from principal payments are classified as interest income in the accompanying Statements of Operations.
H. Offering and Organization Costs — Offering costs paid in connection with the offering of shares of the Absolute Return Tracker Fund were amortized on a straight line basis over 12 months from the date of the commencement of operations. Organization costs paid in connection with the organization of the Subsidiary were expensed on the first day of the Subsidiary’s commencement of operations.
I. Redemption Fees — All classes of the Absolute Return Tracker, Commodity Strategy and International Real Estate Securities Funds charge a 2% redemption fee on the redemption of shares (including by exchange) held for 30 calendar days or less. For this purpose, the Funds use a first-in first-out method so that shares held longest will be treated as being redeemed first and shares held shortest will be treated as being redeemed last. Redemption fees are reimbursed to a Fund and are reflected as a reduction in share redemptions. Redemption fees are credited to Paid-in capital and are allocated to each share class of a Fund on a pro-rata basis at the time of payment.
J. Derivatives — The Funds may make investments in derivative instruments, including, but not limited to, options, futures, swaps and other derivatives relating to foreign currency transactions. A derivative is an instrument whose value is derived from underlying assets, indices, reference rates or a combination of these factors. Derivative instruments may be privately negotiated contracts (often referred to as over the counter (“OTC”) derivatives) or they may be listed and traded on an exchange. Derivative contracts may involve future commitments to purchase or sell financial instruments or commodities at specified terms on a specified date, or to exchange interest payment streams or currencies based on a notional or contractual amount. Derivative instruments may involve a high degree of financial risk. The use of derivatives also involves the risk of loss if the investment adviser is incorrect in its expectation of the timing or level of fluctuations in securities prices, interest rates or currency prices. Investments in derivative instruments also include the risk of default by the counterparty, the risk that the investment may not be liquid and the risk that a small movement in the price of the underlying security or
GOLDMAN SACHS SELECT SATELLITE FUNDS
| |
| 3. SIGNIFICANT ACCOUNTING POLICIES (continued) | |
benchmark may result in a disproportionately large movement, unfavorable or favorable, in the price of the derivative instrument.
Forward Foreign Currency Exchange Contracts — The Funds may enter into forward foreign currency exchange contracts for the purchase or sale of a specific foreign currency at a fixed price on a future date as a hedge or cross-hedge against either specific transactions, portfolio positions or to seek to increase total return. All contracts are “marked-to-market” daily at the applicable forward rate and any resulting unrealized gains or losses are recorded by the Funds. The Funds record realized gains or losses on the settlement date of a contract.
Risks may arise upon entering into these contracts from the potential inability of counterparties to meet the terms of their contracts and from unanticipated movements in the value of a foreign currency relative to the U.S. dollar.
The contractual amounts of forward foreign currency contracts do not necessarily represent the amounts potentially subject to risk. The measurement of the risks associated with these instruments is meaningful only when all related and offsetting transactions are considered. The Funds must set aside liquid assets, or engage in other appropriate measures to cover their obligations under these contracts.
Futures Contracts — The Funds may purchase or sell futures contracts to hedge against changes in interest rates, securities prices, currency exchange rates, or to seek to increase total return. Futures contracts are valued at the last settlement price, or in the absence of a sale, the last bid price, at the end of each day on the board of trade or exchange upon which they are traded. Upon entering into a futures contract, the Funds deposit cash or securities in an account on behalf of the broker in an amount sufficient to meet the initial margin requirement. Subsequent payments are made or received by the Funds equal to the daily change in the contract value and are recorded as variation margin receivable or payable with a corresponding offset in unrealized gains or losses. The Funds recognize a realized gain or loss when a contract is closed or expires.
The use of futures contracts involves, to varying degrees, elements of market and counterparty risk which may exceed the amounts recognized in the Statements of Assets and Liabilities. Futures contracts may be illiquid, and exchanges may limit fluctuations in futures contract prices during a single day. Changes in the value of a futures contract may not directly correlate with changes in the value of the underlying securities. These risks may decrease the effectiveness of the Funds’ strategies and potentially result in a loss. The Funds must set aside liquid assets, or engage in other appropriate measures to cover their obligations under these contracts.
Swap contracts — The Funds may enter into swap transactions for hedging purposes or to seek to increase total return. The Fund may be required to post collateral under the terms of a swap contract. Risks may arise as a result of the failure of the counterparty to the swap contract to comply with the terms of the swap contract. The loss incurred by the failure of a counterparty is generally limited to the net payment to be received by the Fund and/or the termination value at the end of the contract. Therefore, the Fund considers the creditworthiness of each counterparty to a contract in evaluating potential credit risk. Additionally, risks may arise from unanticipated movements in interest rates or in the value of the underlying reference asset or index. Entering into these agreements involves, to varying degrees, market risk, liquidity risk, and elements of credit, legal and documentation risk in excess of amounts recognized in the Statements of Assets and Liabilities. The Fund may pay or receive cash to collateralize these contracts. This cash collateral is recorded as assets/liabilities on the Fund’s books.
Swaps are marked to market daily using either pricing vendor quotations, counterparty prices or model prices and the change in value, if any, is recorded as an unrealized gain or loss in the Statements of Operations. Upfront payments made and/or received by the Fund, are recorded as an asset and/or liability on the Statements of Assets and Liabilities and are recorded as a realized gain or loss ratably over the contract’s term/event, with the exception of forward starting interest rate
GOLDMAN SACHS SELECT SATELLITE FUNDS
Notes to Financial Statements (continued)
June 30, 2009 (Unaudited)
| |
| 3. SIGNIFICANT ACCOUNTING POLICIES (continued) | |
swaps, which are recorded as a realized gain or loss ratably beginning on the effective start date. Periodic payments received or made on swap contracts are recorded as realized gains or losses on the Statements of Operations. Gains or losses are also realized upon early termination of the swap agreements and recorded as realized gains or losses on the Statements of Operations. The Fund may invest in the following types of swaps:
An interest rate swap is an agreement that obligates two parties to exchange a series of cash flows at specified intervals, based upon or calculated by reference to changes in specified prices, rates or indices for a specified amount of an underlying asset or notional principal amount. The payment flows are usually netted against each other, with the difference being paid by one party to the other.
A credit default swap is an agreement that involves one party making a stream of payments to another party in exchange for the right to receive protection on a reference security or obligation. A Fund may use credit default swaps to provide a measure of protection against defaults of the reference security or obligation or to take a short position with respect to the likelihood of default. A Fund’s investment in credit default swaps may involve greater risks than if the Fund had invested in the referenced obligation directly. Credit events are contract specific but may include bankruptcy, failure to pay, restructuring and obligation acceleration. If a Fund buys protection through a credit default swap and no credit event occurs, its payments are limited to the periodic payments previously made to the counterparty. Upon the occurrence of a specified credit event, a Fund, as a buyer of credit protection, is entitled to receive an amount equal to the notional amount of the swap and deliver to the seller the defaulted reference obligation in a physically settled trade. A Fund may also receive a net settlement amount in the form of cash or securities equal to the notional amount of the swap reduced by the recovery value of the reference obligation in a cash settled trade.
As a seller of protection, a Fund generally receives a payment stream throughout the term of the swap, provided that there is no credit event. In addition, if the Funds sell protection through a credit default swap, the Funds could suffer a loss because the value of the referenced obligation may be less than the premium payments received. Upon the occurrence of a specified credit event, the Funds, as sellers of credit protection, may be required to take possession of the defaulted reference obligation and pay the buyer an amount equal to the notional amount of the swap in a physically settled trade. The Funds may also pay a net settlement amount in the form of cash or securities equal to the notional amount of the swap reduced by the recovery value of the reference obligation in a cash settled trade. Recovery values are at times established through the credit event auction process in which market participants are ensured that a trustworthy and transparent price has been set for the defaulted security or obligation. In addition, the Funds are entitled to a return of any assets, which have been pledged as collateral to the counterparty.
The Funds’ credit default swaps are disclosed in the Additional Investment Information section of the Schedules of Investments. The maximum potential amount of future payments (undiscounted) that the Funds as sellers of protection could be required to make under a credit default swap would be an amount equal to the notional amount of the agreement. These potential amounts would be partially offset by any recovery values of the respective referenced obligations or net amounts received from a settlement of a credit default swap for the same reference security or obligation where the Funds bought credit protection.
A total return swap is an agreement that gives a Fund the right to receive the appreciation in the value of a specified security, index or other instrument in return for a fee paid to the counterparty, which will typically be an agreed upon interest rate. If the underlying asset declines in value over the term of the swap, a Fund may also be required to pay the dollar value of that decline to the counterparty.
GOLDMAN SACHS SELECT SATELLITE FUNDS
| |
| 3. SIGNIFICANT ACCOUNTING POLICIES (continued) | |
On June 30, 2009, the Funds adopted Statement of Accounting Standards No. 161, “Disclosures about Derivative Instruments and Hedging Activities” (“FAS 161”) which requires enhanced disclosures about the Funds’ derivatives and hedging activities. The following table sets forth the gross value of the Funds’ derivative contracts by certain risk types as of June 30, 2009. The values in the table below exclude the effects of cash received or posted pursuant to derivative contracts, and therefore are not representative of the Funds’ net exposure.
Absolute Return Tracker
| | | | | | | | | | | | | | | | | | | | | | |
| | | As of June 30, 2009 | |
Derivative contracts
| | Balance Sheet
| | Derivative
| | | Number of
| | | | Balance Sheet
| | Derivative
| | | Number of
| |
| for trading activities | | Location | | Assets | | | Contracts | | | | Location | | Liabilities | | | Contracts | |
| | |
| | | Receivables, Net Assets — | | | | | | | | | | | Payables, Net Assets — | | | | | | | | |
| Interest rates | | Unrealized gain | | $ | 346,719 | | | | 363 | | | | Unrealized loss | | $ | — | | | | — | |
| Credit | | Receivables | | | 4,259,295 | | | | 9 | | | | Payables | | | — | | | | — | |
| Currencies | | Receivables | | | 74,699 | | | | 9 | | | | Payables | | | (413,955 | ) | | | 4 | |
| | | Receivables, Net Assets — | | | | | | | | | | | Payables, Net Assets — | | | | | | | | |
| Equities | | Unrealized gain | | | 296,753 | | | | 439 | | | | Unrealized loss | | | (663,858 | ) | | | 953 | |
| |
| |
Derivative contracts, at value | | $ | 4,977,466 | | | | 820 | | | | | | $ | (1,077,813 | ) | | | 957 | |
| |
| |
Commodity Strategy
| | | | | | | | | | | | | | | | | | | | | | |
| | | As of June 30, 2009 | |
Derivative contracts
| | Balance Sheet
| | Derivative
| | | Number of
| | | | Balance Sheet
| | Derivative
| | | Number of
| |
| for trading activities | | Location | | Assets | | | Contracts | | | | Location | | Liabilities | | | Contracts | |
| | |
| | | Receivables, Net Assets — | | | | | | | | | | | Payables, Net Assets — | | | | | | | | |
| Interest rates | | Unrealized gain | | $ | 586,348 | | | | 276 | | | | Unrealized loss | | $ | (764,307 | ) | | | 164 | |
| Credit | | Receivables | | | 2,776 | | | | 1 | | | | Payables | | | — | | | | — | |
| Commodities | | Receivables | | | — | | | | — | | | | Payables | | | (2,004,943 | ) | | | 4 | |
| |
| |
Derivative contracts, at value | | $ | 589,124 | | | | 277 | | | | | | $ | (2,769,250 | )(a) | | | 168 | |
| |
| |
| | |
| (a) | | Amount includes $2,290,736 which represents the payments to be made pursuant to bilateral agreements should counterparties exercise their “right to terminate” provisions based on among others, the Fund’s performance, its failure to pay on its obligations or failure to pledge collateral. Such amount does not include incremental charges directly associated with the close-out of the agreements. It also does not reflect the fair value of any assets pledged as collateral which, through the daily margining process, substantially offsets the aforementioned amount and for which the Fund is entitled to a full return. |
GOLDMAN SACHS SELECT SATELLITE FUNDS
Notes to Financial Statements (continued)
June 30, 2009 (Unaudited)
| |
| 3. SIGNIFICANT ACCOUNTING POLICIES (continued) | |
The following table sets forth by certain risk types the Funds’ gains (losses) related to derivative activities for the six months ended June 30, 2009 in accordance with FAS No. 161. These gains (losses) should be considered in the context that derivative contracts may have been executed to economically hedge securities and accordingly, gains or losses on derivative contracts may offset gains or losses attributable to securities. These gains (losses) are included in “Net realized or net change in unrealized gain (loss)” in the Statements of Operations:
Absolute Return Tracker
| | | | | | | | | | | |
| | | | | Six Months Ended June 30, 2009 | |
| | | | | | | | Change in
| |
| | | Location of Gain or (Loss) on Derivatives
| | Realized
| | | Unrealized
| |
| | | Recognized on Statement of Operations | | Gains | | | Gains (Losses) | |
| | |
| Interest rates | | Net realized gain from futures transactions/change in unrealized gain on futures | | $ | 282,633 | | | $ | 1,385,501 | |
| Credit | | Net realized gain from swap contracts/change in unrealized loss on swap contracts | | | 2,699,502 | | | | (2,920,262 | ) |
| Currencies | | Net realized gain from foreign currency related transactions/change in unrealized loss on translation of assets and liabilities denominated in foreign currencies | | | 2,729,146 | | | | (109,627 | ) |
| Equities | | Net realized gain from futures transactions/change in unrealized loss on futures | | | 4,648,633 | | | | (1,352,564 | ) |
| |
| |
Total | | | | $ | 10,359,914 | | | $ | (2,996,952 | ) |
| |
| |
Commodity Strategy
| | | | | | | | | | | |
| | | | | Six Months Ended June 30, 2009 | |
| | | | | | | | Change in
| |
| | | Location of Gain or (Loss) on Derivatives
| | Realized
| | | Unrealized
| |
| | | Recognized on Statement of Operations | | Gains | | | Gains (Losses) | |
| | |
| Interest rates | | Net realized gain from futures transactions and swap contracts/change in unrealized gain on futures and swap contracts | | $ | 378,163 | | | $ | 337,523 | |
| Credit | | Net realized gain from swap contracts/change in unrealized loss on swap contracts | | | — | | | | (23,037 | ) |
| Commodities | | Net realized gain from swap contracts/change in unrealized loss on swap contracts | | | — | | | | (2,004,943 | ) |
| |
| |
Total | | | | $ | 378,163 | | | $ | (1,690,457 | ) |
| |
| |
4. AGREEMENTS
A. Management Agreement — Under the Agreement, GSAM manages the Funds, subject to the general supervision of the trustees.
As compensation for the services rendered pursuant to the Agreement, the assumption of the expenses related thereto and administering the Funds’ business affairs, including providing facilities, GSAM is entitled to a management fee computed daily and payable monthly, equal to an annual percentage rate of each Fund’s average daily net assets.
GOLDMAN SACHS SELECT SATELLITE FUNDS
| |
| 4. AGREEMENTS (continued) | |
For the six months ended June 30, 2009, contractual and net management fees with GSAM were at the following rates:
| | | | | | | | | | | | | | | | | | | | | | | | | | | | | |
| | | | | | | | | | | | | | | | | | | | | Effective Net
| |
| | | Contractual Management Rate | | | Management
| |
| | | Up to
| | | Next
| | | Next
| | | Next
| | | Over
| | | Effective
| | | Rate
| |
| Fund | | $1 billion | | | $1 billion | | | $3 billion | | | $3 billion | | | $8 billion | | | Rate | | | (after waiver) | |
| | |
| Absolute Return Tracker | | | 1.15 | % | | | 1.04 | % | | | 0.99 | % | | | 0.97 | % | | | 0.95 | % | | | 1.15 | % | | | 1.15 | % |
| |
| |
| Commodity Strategy | | | 0.50 | | | | 0.50 | | | | 0.45 | | | | 0.43 | | | | 0.42 | | | | 0.50 | | | | 0.50 | |
| |
| |
| International Real Estate Securities | | | 1.05 | | | | 1.05 | | | | 0.95 | | | | 0.90 | | | | 0.88 | | | | 1.05 | | | | 1.03 | * |
| |
| |
| Real Estate Securities | | | 1.00 | | | | 0.90 | | | | 0.86 | | | | 0.84 | | | | 0.82 | | | | 1.00 | | | | 1.00 | |
| |
| |
| | |
| * | | GSAM has voluntarily agreed to waive a portion of its management fee in order to achieve the effective net management rates. |
GSAM also provides management services to the Subsidiary pursuant to a Subsidiary Management Agreement (the “Subsidiary Agreement”) and is entitled to a management fee computed daily and payable monthly, equal to an annual percentage rate of 0.50% of the Subsidiary’s average daily net assets. In consideration of the Subsidiary’s management fee, and for as long as the Subsidiary Agreement remains in effect, GSAM has contractually agreed to waive irrevocably a portion of the Commodity Strategy Fund’s management fee in an amount equal to the management fee paid to GSAM by the Subsidiary under the Subsidiary Agreement. For the period ended June 30, 2009, GSAM waived $1,385 of the Fund’s management fee.
B. Distribution Agreement and Service Plans — The Trust, on behalf of each Fund, has adopted Distribution and Service Plans (the “Plans”). Under the Plans, Goldman Sachs and/or authorized dealers are entitled to a fee accrued daily and paid monthly for distribution services and account maintenance services at the following annual rates calculated on a Fund’s average daily net assets of each respective share class:
| | | | | | | | | | | | | | | | | |
| | | Distribution and Service Plan Rates | |
| | | Class A* | | | Class B | | | Class C | | | Class R* | |
| | |
| Distribution Plan | | | 0.25 | % | | | 0.75 | % | | | 0.75 | % | | | 0.50 | % |
| |
| |
| Service Plan | | | — | | | | 0.25 | | | | 0.25 | | | | — | |
| |
| |
| | |
| * | | With respect to Class A and Class R Shares, the Distributor at its discretion may use compensation for distribution services paid under the Plans to compensate service organizations for personal and account maintenance services and expenses so long as such total compensation under the Plans does not exceed the maximum cap on “service fees” imposed by the Financial Industry Regulatory Authority. |
GOLDMAN SACHS SELECT SATELLITE FUNDS
Notes to Financial Statements (continued)
June 30, 2009 (Unaudited)
| |
| 4. AGREEMENTS (continued) | |
Goldman Sachs may retain a portion of the Class A front end sales load and Class B and Class C contingent deferred sales charges. During the six months ended June 30, 2009, Goldman Sachs advised the Funds that it retained the following approximate amounts:
| | | | | | | | | | | | | |
| | | Front End
| | | Contingent Deferred
| |
| | | Sales Load | | | Sales Charge | |
| Fund | | Class A | | | Class B | | | Class C | |
| | |
| Absolute Return Tracker | | $ | 16,400 | | | | N/A | | | $ | — | * |
| |
| |
| Commodity Strategy | | | 12,600 | | | | N/A | | | | — | * |
| |
| |
| International Real Estate Securities | | | 600 | | | | N/A | | | | — | * |
| |
| |
| Real Estate Securities | | | 2,500 | | | $ | 100 | | | | — | |
| |
| |
| | |
| * | | Amount rounds to less than $100. |
C. Transfer Agency Agreement — Goldman Sachs also serves as the transfer agent for the Funds for a fee pursuant to a Transfer Agency Agreement. The fees charged for such transfer agency services are calculated daily and payable monthly at an annual rate as follows: 0.19% (except for the Commodity Strategy Fund, which charges at an annual rate of 0.13%) of the average daily net assets for Class A, Class B, Class C, Class IR and Class R Shares and 0.04% of the average daily net assets for Institutional and Service Shares.
D. Service Plan and Shareholder Administration Plans — The Trust, on behalf of the Real Estate Securities Fund, has adopted a Service Plan and a Shareholder Administration Plan for Service Shares. These plans allow for Service Shares to compensate service organizations for providing varying levels of personal and account administration and shareholder administration services to their customers who are beneficial owners of such shares. The Service Plan and Shareholder Administration Plan each provide for compensation to the service organizations in an amount equal to, on an annual basis, 0.25% (0.50% in aggregate) of the average daily net assets of the Service Shares.
E. Other Agreements — GSAM has voluntarily agreed to limit certain “Other Expenses” of the Funds (excluding management fees, distribution and service fees, transfer agent fees and expenses, Service Share fees, taxes, interest, brokerage fees and litigation, indemnification, shareholder meetings and other extraordinary expenses, exclusive of any custody and transfer agent fee credit reductions) to the extent such expenses exceed, on an annual basis, a percentage rate of the average daily net assets of each Fund. Such expense reimbursements, if any, are computed daily and paid monthly. In addition, the Funds are not obligated to reimburse GSAM for prior period expense reimbursements, if any. The Other Expenses limitations for Absolute Return Tracker, Commodity Strategy, International Real Estate Securities and Real Estate Securities Funds as an annual percentage rate of average daily net assets are 0.014%, 0.044%, 0.064% and 0.004%, respectively. The Subsidiary also pays certain other expenses, including service and custody fees. GSAM has voluntarily agreed to reduce or limit the Subsidiary’s expenses (excluding management fees) to 0.004% of the Subsidiary’s average daily net assets. In addition, the Funds have entered into certain offset arrangements with the custodian and the transfer agent resulting in a reduction in the Funds’ expenses.
GOLDMAN SACHS SELECT SATELLITE FUNDS
| |
| 4. AGREEMENTS (continued) | |
For the six months ended June 30, 2009, these expense reductions, including any fee waivers and Other Expense reimbursements, were as follows (in thousands):
| | | | | | | | | | | | | | | | | | |
| | | Management
| | | Other Expense
| | | Transfer Agent
| | | | Total Expense
| |
| | | Fee Waiver | | | Reimbursement | | | Fee Credits | | | | Reductions | |
| | |
| Absolute Return Tracker | | $ | — | | | $ | 670 | | | $ | — | | * | | $ | 670 | |
| |
| |
| Commodity Strategy | | | — | | | | 332 | | | | — | | * | | | 332 | |
| |
| |
| International Real Estate Securities | | | 25 | | | | 122 | | | | — | | * | | | 147 | |
| |
| |
| Real Estate Securities | | | — | | | | 193 | | | | 1 | | | | | 194 | |
| |
| |
| | |
| * | | Amount rounds to less than $1,000. |
As of June 30, 2009, the amounts owed to affiliates of the Funds were as follows (in thousands):
| | | | | | | | | | | | | | | | | | | | | |
| | | Management
| | | Distribution and
| | | Transfer
| | | Over
| | | | |
| Fund | | Fees | | | Service Fees | | | Agent Fees | | | Reimbursement | | | Total | |
| | |
| Absolute Return Tracker | | $ | 233 | | | $ | 31 | | | $ | 23 | | | $ | — | | | $ | 287 | |
| |
| |
| Commodity Strategy | | | 121 | | | | 14 | | | | 14 | | | | — | | | | 149 | |
| |
| |
| International Real Estate Securities | | | 224 | | | | 26 | | | | 23 | | | | 154 | | | | 427 | |
| |
| |
| Real Estate Securities | | | 268 | | | | 34 | | | | 23 | | | | — | | | | 325 | |
| |
| |
F. Line of Credit Facility — The Funds participate in a $660,000,000 committed, unsecured revolving line of credit facility (the “facility”) together with other funds of the Trust and registered investment companies having management agreements with GSAM or its affiliates. Pursuant to the terms of the facility, the Funds and other borrowers may increase the credit amount by an additional $340,000,000, for a total of up to $1 billion. This facility is to be used solely for temporary or emergency purposes. The interest rate on borrowings is based on the federal funds rate. The facility also requires a fee to be paid by the Funds based on the amount of the commitment that has not been utilized. For the six months ended June 30, 2009, the Funds did not have any borrowings under the facility. Prior to May 12, 2009, the amount available through the facility was $700,000,000.
GOLDMAN SACHS SELECT SATELLITE FUNDS
Notes to Financial Statements (continued)
June 30, 2009 (Unaudited)
5. FAIR VALUE OF INVESTMENTS
The fair value of a financial instrument is the amount that would be received to sell an asset or paid to transfer a liability in an orderly transaction between market participants at the measurement date (exit price). Fair value measurements do not include transaction costs. GAAP establishes a fair value hierarchy that prioritizes the inputs to valuation techniques used to measure fair value. The hierarchy gives the highest priority to unadjusted quoted prices in active markets for identical assets or liabilities (Level 1 measurements) and the lowest priority to unobservable inputs (Level 3 measurements). The three levels of the fair value hierarchy are described below:
Level 1 — Unadjusted quoted prices in active markets that are accessible at the measurement date for identical, unrestricted assets or liabilities;
Level 2 — Quoted prices in markets that are not active or financial instruments for which all significant inputs are observable, either directly or indirectly;
Level 3 — Prices or valuations that require inputs that are both significant to the fair value measurement and unobservable.
The following is a summary of the Funds’ investments categorized in the fair value hierarchy:
| | | | | | | | | | | | | |
| Absolute Return Tracker | | Level 1 | | | Level 2 | | | Level 3 | |
| | |
Assets | | | | | | | | | | | | |
| Fixed Income | | | | | | | | | | | | |
| Corporate Obligations | | $ | — | | | $ | 15,947,051 | | | $ | — | |
| Foreign Sovereign Debt Obligations | | | 14,569,214 | | | | — | | | | — | |
| U.S. Treasuries and Other U.S. Government Obligations and Agencies | | | — | | | | 11,999,160 | | | | — | |
| Common Stock and Other Equity Investments | | | 3,849,261 | | | | — | | | | — | |
| Short-term Investment | | | 231,358,253 | | | | — | | | | — | |
| Derivatives | | | 643,472 | | | | 4,333,994 | | | | — | |
| |
| |
| Total | | $ | 250,420,200 | | | $ | 32,280,205 | | | $ | — | |
| |
| |
Liabilities | | | | | | | | | | | | |
| Derivatives | | $ | (663,858 | ) | | $ | (413,955 | ) | | $ | — | |
| |
| |
GOLDMAN SACHS SELECT SATELLITE FUNDS
| |
| 5. FAIR VALUE OF INVESTMENTS (continued) | |
| | | | | | | | | | | | | |
| Commodity Strategy | | Level 1 | | | Level 2 | | | Level 3 | |
| | |
Assets | | | | | | | | | | | | |
| Fixed Income | | | | | | | | | | | | |
| Corporate Obligations | | $ | — | | | $ | 70,384,806 | | | $ | — | |
| U.S. Treasuries and Other U.S. Government Obligations and Agencies | | | 13,556,700 | | | | 83,613,217 | | | | — | |
| Other | | | — | | | | 1,977,108 | | | | — | |
| Mortgage-Backed Obligations | | | — | | | | 30,206,886 | | | | — | |
| Short-term Investments | | | 37,476,732 | | | | — | | | | — | |
| Derivatives | | | 129,190 | | | | 459,934 | | | | — | |
| |
| |
| Total | | $ | 51,162,622 | | | $ | 186,641,951 | | | $ | — | |
| |
| |
Liabilities | | | | | | | | | | | | |
| Derivatives | | $ | (478,514 | ) | | $ | (2,290,736 | ) | | $ | — | |
| |
| |
| | | | | | | | | | | | | |
| International Real Estate Securities | | Level 1 | | | Level 2 | | | Level 3 | |
| | |
Assets | | | | | | | | | | | | |
Common Stock and/or Other Equity Investments | | $ | 12,394,675 | | | $ | 277,603,447 | | | $ | — | |
| Short-term Investments | | | 923,679 | | | | 4,708,241 | | | | — | |
| |
| |
| Total | | $ | 13,318,354 | | | $ | 282,311,688 | | | $ | — | |
| |
| |
| | | | | | | | | | | | | |
| Real Estate Securities | | Level 1 | | | Level 2 | | | Level 3 | |
| | |
Assets | | | | | | | | | | | | |
Common Stock and/or Other Equity Investments | | $ | 340,509,989 | | | $ | — | | | $ | — | |
| Short-term Investments | | | 5,810,054 | | | | 86,045,676 | | | | — | |
| |
| |
| Total | | $ | 346,320,043 | | | $ | 86,045,676 | | | $ | — | |
| |
| |
GOLDMAN SACHS SELECT SATELLITE FUNDS
Notes to Financial Statements (continued)
June 30, 2009 (Unaudited)
6. SECURITIES LENDING
Pursuant to exemptive relief granted by the Securities and Exchange Commission and the terms and conditions contained therein, the Funds may lend their securities through a securities lending agent, Goldman Sachs Agency Lending (“GSAL”), a wholly-owned subsidiary of Goldman Sachs, to certain qualified borrowers including Goldman Sachs and affiliates. In accordance with the Funds’ securities lending procedures, the Funds receive cash collateral at least equal to the market value of the securities on loan. The market value of the loaned securities is determined at the close of business of the Funds, at their last sale price or official closing price on the principal exchange or system on which they are traded, and any additional required collateral is delivered to the Funds on the next business day. As with other extensions of credit, the Funds may experience delay in the recovery of their securities or incur a loss should the borrower of the securities breach its agreement with the Funds or become insolvent and the collateral not to be sufficient to cover the cost of repurchasing securities on loan.
The Funds invest the cash collateral received in connection with securities lending transactions in the Enhanced Portfolio of Boston Global Investment Trust (“Enhanced Portfolio”), a Delaware statutory trust. The Enhanced Portfolio, deemed an affiliate of the Trust, is exempt from registration under Section 3(c)(7) of the Act and is managed by GSAM, for which GSAM may receive an investment advisory fee of up to 0.10% on an annualized basis of the average daily net assets of the Enhanced Portfolio. The Enhanced Portfolio invests primarily in short-term investments, but is not a “money market fund” subject to the requirements of Rule 2a-7 of the Act. The Funds’ investment of cash collateral in the Enhanced Portfolio is subject to a net asset value that may fall or rise due to market and credit conditions.
Both the Funds and GSAL receive compensation relating to the lending of the Funds’ securities. The amounts earned by the Funds for the six months ended June 30, 2009, are reported under Investment Income on the Statements of Operations.
The table below details securities lending activity with affiliates of Goldman Sachs as of, and for the six months ended June 30, 2009:
| | | | | | | | | | | | | |
| | | | | | Amounts Received by
| | | | |
| | | Earnings of GSAL
| | | the Funds from
| | | Amounts Payable to
| |
| | | Relating to Securities
| | | Lending to Goldman
| | | Goldman Sachs upon
| |
| | | Loaned for the
| | | Sachs for the
| | | Return of Securities
| |
| | | Six Months Ended
| | | Six Months Ended
| | | Loaned as of
| |
| Fund | | June 30, 2009 | | | June 30, 2009 | | | June 30, 2009 | |
| | |
| International Real Estate Securities | | $ | 16,661 | | | $ | 679 | | | $ | 650,000 | |
| |
| |
| Real Estate Securities | | | 20,478 | | | | 30,703 | | | | 12,629,357 | |
| |
| |
The following table provides information about the Funds’ investment in the Enhanced Portfolio for the six months ended June 30, 2009 (in thousands).
| | | | | | | | | | | | | | | | | | | | | |
| | | Number of
| | | | | | | | | Number of
| | | | |
| | | Shares Held
| | | Shares
| | | Shares
| | | Shares Held
| | | Value at
| |
| Fund | | Beginning of Period | | | Bought | | | Sold | | | End of Period | | | End of Period | |
| | |
| International Real Estate Securities | | | 3,023 | | | | 102,745 | | | | (101,046 | ) | | | 4,722 | | | $ | 4,708 | |
| |
| |
| Real Estate Securities | | | 86,967 | | | | 355,439 | | | | (356,101 | ) | | | 86,305 | | | | 86,046 | |
| |
| |
GOLDMAN SACHS SELECT SATELLITE FUNDS
7. PORTFOLIO SECURITIES TRANSACTIONS
The cost of purchases and proceeds from sales and maturities of long-term securities for the six months ended June 30, 2009, were as follows:
| | | | | | | | | | | | | | | | | |
| | | | | | | | | | | | Sales and
| |
| | | | | | Purchases
| | | Sales and
| | | Maturities
| |
| | | Purchases of
| | | (Excluding
| | | Maturities of
| | | (Excluding
| |
| | | U.S. Government
| | | U.S. Government
| | | U.S. Government
| | | U.S. Government
| |
| | | and Agency
| | | and Agency
| | | and Agency
| | | and Agency
| |
| Fund | | Obligations | | | Obligations) | | | Obligations | | | Obligations) | |
| | |
| Absolute Return Tracker | | $ | — | | | $ | 14,339,978 | | | $ | — | | | $ | 3,313,697 | |
| |
| |
| Commodity Strategy | | | 56,349,362 | | | | 68,406,000 | | | | 5,075,137 | | | | 129,254,498 | |
| |
| |
| International Real Estate Securities | | | — | | | | 181,922,002 | | | | — | | | | 194,070,822 | |
| |
| |
| Real Estate Securities | | | — | | | | 226,109,354 | | | | — | | | | 207,664,527 | |
| |
| |
For the six months ended June 30, 2009, Goldman Sachs and its affiliates earned approximately $4,600 and $4,900 in brokerage commissions from portfolio transactions, including futures transactions executed with Goldman Sachs as the Futures Commission Merchant, executed on behalf of the Absolute Return Tracker and Commodity Strategy Funds. Goldman Sachs did not earn any broker commissions with respect to the International Real Estate Securities and Real Estate Securities Funds.
8. TAX INFORMATION
As of the Funds’ most recent fiscal year end, December 31, 2008, the Funds’ capital loss carryforwards and certain timing differences on a tax basis were as follows:
| | | | | | | | | | | | | | | | | |
| | | Absolute
| | | | | | International
| | | | |
| | | Return
| | | Commodity
| | | Real Estate
| | | Real Estate
| |
| | | Tracker | | | Strategy | | | Securities | | | Securities | |
| | |
Capital loss carryforward:1 | | | | | | | | | | | | | | | | |
| Expiring 2016 | | $ | (1,719,513 | ) | | $ | (43,725,367 | ) | | $ | (336,771,834 | ) | | $ | (26,254,435 | ) |
| |
| |
| Timing differences (post-October losses/deferred REIT Income/deferred straddle losses) | | $ | (6,865,187 | ) | | $ | (72,071,485 | ) | | $ | (90,859,893 | ) | | $ | (54,982,653 | ) |
| |
| |
| | |
| 1 | | Expiration occurs on December 31 of the year indicated. |
GOLDMAN SACHS SELECT SATELLITE FUNDS
Notes to Financial Statements (continued)
June 30, 2009 (Unaudited)
| |
| 8. TAX INFORMATION (continued) | |
At June 30, 2009, the Funds’ aggregate security unrealized gains and losses based on cost for U.S. federal income tax purposes were as follows:
| | | | | | | | | | | | | | | | | |
| | | Absolute
| | | | | | International
| | | | |
| | | Return
| | | Commodity
| | | Real Estate
| | | Real Estate
| |
| | | Tracker | | | Strategy | | | Securities | | | Securities | |
| | |
| Tax cost | | $ | 275,212,237 | | | $ | 220,319,294 | | | $ | 340,437,423 | | | $ | 523,185,529 | |
| |
| |
| Gross unrealized gain | | | 2,633,034 | | | | 23,109,503 | | | | 30,397,653 | | | | 10,801,589 | |
| Gross unrealized loss | | | (122,332 | ) | | | (6,213,348 | ) | | | (75,205,034 | ) | | | (101,621,399 | ) |
| |
| |
| Net unrealized security gain (loss) | | $ | 2,510,702 | | | $ | 16,896,155 | | | $ | (44,807,381 | ) | | $ | (90,819,810 | ) |
| |
| |
The difference between book-basis and tax-basis unrealized gains (losses) is attributable primarily to wash sales, net mark to market gains (losses) on regulated futures, and differences related to the tax treatment of passive foreign investment companies, swap transactions and partnership investments as of the most recent fiscal year end.
9. OTHER RISKS
Funds’ Shareholder Concentration — Certain Goldman Sachs Fund of Funds Portfolios and the Goldman Sachs Profit Sharing Master Trust may invest a significant percentage of their assets in the Funds. In the event the Fund of Funds Portfolios and/or the Profit Sharing Master Trust experience significant redemptions and/or reallocations, the Funds may be exposed to liquidity risk. In particular, the Funds may encounter difficulty meeting redemptions if unusual market conditions create an unfavorable environment in which the Funds are forced to liquidate their securities. As of June 30, 2009, the following Fund of Funds Portfolios and the Profit Sharing Master Trust were the beneficial owners of 5% or more of total outstanding shares of the following Funds:
| | | | | | | | | | | | | | | | | | | | | | | | | |
| | | Goldman Sachs
| | | Goldman Sachs
| | | Goldman Sachs
| | | Goldman Sachs
| | | Goldman Sachs
| | | | |
| | | Balanced
| | | Growth and
| | | Growth
| | | Equity Growth
| | | Satellite
| | | Goldman Sachs
| |
| | | Strategy
| | | Income Strategy
| | | Strategy
| | | Strategy
| | | Strategies
| | | Profit Sharing
| |
| Fund | | Portfolio | | | Portfolio | | | Portfolio | | | Portfolio | | | Portfolio | | | Master Trust | |
| | |
| Commodity Strategy | | | 5 | % | | | 21 | % | | | 16 | % | | | 6 | % | | | 10 | % | | | — | % |
| |
| |
| International Real Estate Securities | | | — | | | | 10 | | | | 8 | | | | — | | | | 12 | | | | — | |
| |
| |
| Real Estate Securities | | | — | | | | 8 | | | | 6 | | | | — | | | | — | | | | 15 | |
| |
| |
Market and Credit Risks — In the normal course of business, the Funds trade financial instruments and enter into financial transactions where risk of potential loss exists due to changes in the market (market risk). Additionally, the Funds may also be exposed to credit risk in the event that an issuer fails to perform or that an institution or entity with which the Funds have unsettled or open transactions defaults.
Investing in foreign markets may involve special risks and considerations not typically associated with investing in the U.S. These risks include revaluation of currencies, high rates of inflation, repatriation restrictions on income and capital, and adverse political and economic developments. Moreover, securities issued in these markets may be less liquid, be subject to
GOLDMAN SACHS SELECT SATELLITE FUNDS
| |
| 9. OTHER RISKS (continued) | |
government ownership controls, have delayed settlements, and their prices may be more volatile than those of comparable securities in the U.S.
Portfolio Concentration Risk — The Real Estate Securities Fund invests primarily in securities of issuers that are primarily engaged in or related to the real estate industry and has a policy of concentrating its investments in the real estate industry. Therefore, an investment in the Real Estate Securities Fund is subject to certain risks associated with the direct ownership of real estate and with the real estate industry in general. Such risks include, but are not limited to, declines in property values, increases in property taxes, operating expenses, interest rates or competition, zoning changes, and losses from casualty and condemnation. The International Real Estate Securities Fund invests primarily in securities of issuers outside the U.S. that are engaged in or related to the real estate industry and has a policy of concentrating its investments in the real estate industry. Therefore, an investment in the International Real Estate Securities Fund is subject to certain risks associated with the direct ownership of real estate and with the real estate industry in general. Such risks include, but are not limited to, declines in property values, increases in property taxes, operating expenses, interest rates or competition, zoning changes, and losses from casualty and condemnation.
Foreign Custody Risk — A Fund that invests in foreign securities may hold such securities and foreign currency with foreign banks, agents, and securities depositories (each a “Foreign Custodian”) appointed by the Fund’s custodian. Investments in emerging markets may be subject to greater custody risks than investments in more developed markets. Custody services in emerging market countries are often undeveloped and may be less regulated than in more developed countries, and thus may not afford the same level of investor protection as would apply in developed countries. In some countries, Foreign Custodians may be subject to little or no regulatory oversight or independent evaluation of their operations. Further, the laws of certain countries may place limitations on a Fund’s ability to recover its assets if a Foreign Custodian enters into bankruptcy.
10. OTHER MATTERS
Indemnifications — Under the Trust’s organizational documents, its trustees, officers, employees and agents are indemnified, to the extent permitted by the Act, against certain liabilities that may arise out of performance of their duties to the Funds. Additionally, in the course of business, the Funds enter into contracts that contain a variety of indemnification clauses. The Funds’ maximum exposure under these arrangements is unknown, as this would involve future claims that may be against the Funds that have not yet occurred. However, the Funds believe the risk of loss under these arrangements to be remote.
New Accounting Pronouncement — In May 2009, the FASB issued Statement of Financial Accounting Standards No. 165, “Subsequent Events” (“FAS 165”). This standard requires disclosure in the financial statements to reflect the effects of subsequent events that provide additional information on conditions about the financial statements as of the balance sheet date (recognized subsequent events) and disclosure of subsequent events that provide additional information about conditions after the balance sheet date if the financial statements would otherwise be misleading (unrecognized subsequent events). FAS 165 is effective for interim and annual financial statements issued for fiscal years ending after June 15, 2009. For purposes of inclusion in the financial statements, GSAM has concluded that subsequent events after the balance sheet date have been evaluated through August 26, 2009, the date that the financial statements were issued.
GOLDMAN SACHS SELECT SATELLITE FUNDS
Notes to Financial Statements (continued)
June 30, 2009 (Unaudited)
11. SUMMARY OF SHARE TRANSACTIONS
Share activity is as follows:
| | | | | | | | | | | | | | | | | |
| | | Absolute Return Tracker Fund | |
| | | | |
| | | For the Six Months Ended
| | | | |
| | | June 30, 2009
| | | For the Period Ended
| |
| | | (Unaudited) | | | December 31, 2008(a) | |
| | | | |
| | | Shares | | | Dollars | | | Shares | | | Dollars | |
| | | | |
Class A Shares | | | | | | | | | | | | | | | | |
| Shares sold | | | 11,694,491 | | | $ | 100,964,798 | | | | 5,542,563 | | | $ | 50,387,576 | |
| Shares redeemed | | | (1,323,903 | ) | | | (11,241,989 | ) | | | (658,042 | ) | | | (5,794,085 | ) |
| |
| |
| | | | 10,370,588 | | | | 89,722,809 | | | | 4,884,521 | | | | 44,593,491 | |
| |
| |
Class C Shares | | | | | | | | | | | | | | | | |
| Shares sold | | | 1,002,071 | | | | 8,647,850 | | | | 378,141 | | | | 3,444,958 | |
| Shares redeemed | | | (20,853 | ) | | | (174,108 | ) | | | (28,724 | ) | | | (245,927 | ) |
| |
| |
| | | | 981,218 | | | | 8,473,742 | | | | 349,417 | | | | 3,199,031 | |
| |
| |
Institutional Shares | | | | | | | | | | | | | | | | |
| Shares sold | | | 10,673,227 | | | | 91,190,881 | | | | 8,791,770 | | | | 81,598,459 | |
| Shares redeemed | | | (4,045,974 | ) | | | (34,508,670 | ) | | | (314,966 | ) | | | (2,759,978 | ) |
| |
| |
| | | | 6,627,253 | | | | 56,682,211 | | | | 8,476,804 | | | | 78,838,481 | |
| |
| |
Class IR | | | | | | | | | | | | | | | | |
| Shares sold | | | 2 | | | | 26 | | | | 1,000 | | | | 10,000 | |
| Shares redeemed | | | (2 | ) | | | (18 | ) | | | — | | | | — | |
| |
| |
| | | | — | | | | 8 | | | | 1,000 | | | | 10,000 | |
| |
| |
Class R | | | | | | | | | | | | | | | | |
| Shares sold | | | 5 | | | | 52 | | | | 1,000 | | | | 10,000 | |
| Shares redeemed | | | (4 | ) | | | (35 | ) | | | — | | | | — | |
| |
| |
| | | | 1 | | | | 17 | | | | 1,000 | | | | 10,000 | |
| |
| |
NET INCREASE | | | 17,979,060 | | | $ | 154,878,787 | | | | 13,712,742 | | | $ | 126,651,003 | |
| |
| |
| | |
| (a) | | Commenced operations on May 30, 2008. |
GOLDMAN SACHS SELECT SATELLITE FUNDS
| |
| 11. SUMMARY OF SHARE TRANSACTIONS (continued) | |
Share activity is as follows:
| | | | | | | | | | | | | | | | | |
| | | Commodity Strategy Fund | |
| | | | |
| | | For the Six Months Ended
| | | | |
| | | June 30, 2009
| | | For the Fiscal Year Ended
| |
| | | (Unaudited) | | | December 31, 2008 | |
| | | | |
| | | Shares | | | Dollars | | | Shares | | | Dollars | |
| | | | |
Class A Shares | | | | | | | | | | | | | | | | |
| Shares sold | | | 4,671,057 | | | $ | 24,985,951 | | | | 6,405,598 | | | $ | 77,941,591 | |
| Reinvestments of distributions | | | 30,364 | | | | 152,335 | | | | 893,643 | | | | 5,319,592 | |
| Shares redeemed | | | (3,032,026 | ) | | | (15,818,290 | ) | | | (6,962,797 | ) | | | (88,236,923 | ) |
| |
| |
| | | | 1,669,395 | | | | 9,319,996 | | | | 336,444 | | | | (4,975,740 | ) |
| |
| |
Class C Shares | | | | | | | | | | | | | | | | |
| Shares sold | | | 327,612 | | | | 1,748,291 | | | | 720,119 | | | | 9,882,383 | |
| Reinvestments of distributions | | | 765 | | | | 3,685 | | | | 38,883 | | | | 216,478 | |
| Shares redeemed | | | (70,133 | ) | | | (353,848 | ) | | | (404,527 | ) | | | (4,510,671 | ) |
| |
| |
| | | | 258,244 | | | | 1,398,128 | | | | 354,475 | | | | 5,588,190 | |
| |
| |
Institutional Shares | | | | | | | | | | | | | | | | |
| Shares sold | | | 45,256,000 | | | | 251,856,663 | | | | 9,912,868 | | | | 123,333,124 | |
| Reinvestments of distributions | | | 184,961 | | | | 950,475 | | | | 2,851,789 | | | | 17,537,413 | |
| Shares redeemed | | | (4,179,785 | ) | | | (21,680,408 | ) | | | (12,967,583 | ) | | | (164,844,900 | ) |
| |
| |
| | | | 41,261,176 | | | | 231,126,730 | | | | (202,926 | ) | | | (23,974,363 | ) |
| |
| |
Class IR Shares | | | | | | | | | | | | | | | | |
| Shares sold | | | 1 | | | | 7 | | | | 8,030 | | | | 130,461 | |
| Reinvestments of distributions | | | 15 | | | | 74 | | | | 399 | | | | 2,276 | |
| Shares redeemed | | | (2,013 | ) | | | (12,218 | ) | | | (6,109 | ) | | | (99,365 | ) |
| |
| |
| | | | (1,997 | ) | | | (12,137 | ) | | | 2,320 | | | | 33,372 | |
| |
| |
Class R Shares | | | | | | | | | | | | | | | | |
| Shares sold | | | 3,013 | | | | 15,098 | | | | 1,125 | | | | 14,425 | |
| Reinvestments of distributions | | | 14 | | | | 68 | | | | 205 | | | | 1,170 | |
| Shares redeemed | | | (483 | ) | | | (2,368 | ) | | | (539 | ) | | | (4,540 | ) |
| |
| |
| | | | 2,544 | | | | 12,798 | | | | 791 | | | | 11,055 | |
| |
| |
NET INCREASE (DECREASE) | | | 43,189,362 | | | $ | 241,845,515 | | | | 491,104 | | | $ | (23,317,486 | ) |
| |
| |
GOLDMAN SACHS SELECT SATELLITE FUNDS
Notes to Financial Statements (continued)
June 30, 2009 (Unaudited)
| |
| 11. SUMMARY OF SHARE TRANSACTIONS (continued) | |
Share activity is as follows:
| | | | | | | | | | | | | | | | | |
| | | International Real Estate Securities Fund | |
| | | | |
| | | For the Six Months Ended
| | | | |
| | | June 30, 2009
| | | For the Fiscal Year Ended
| |
| | | (Unaudited) | | | December 31, 2008 | |
| | | | |
| | | Shares | | | Dollars | | | Shares | | | Dollars | |
| | | | |
Class A Shares | | | | | | | | | | | | | | | | |
| Shares sold | | | 2,328,978 | | | $ | 11,208,117 | | | | 13,452,828 | | | $ | 115,186,616 | |
| Reinvestment of distributions | | | 187,953 | | | | 1,065,694 | | | | 424,727 | | | | 3,712,216 | |
| Shares redeemed | | | (7,612,590 | ) | | | (34,692,261 | ) | | | (44,298,306 | ) | | | (346,001,213 | ) |
| |
| |
| | | | (5,095,659 | ) | | | (22,418,450 | ) | | | (30,420,751 | ) | | | (227,102,381 | ) |
| |
| |
Class C Shares | | | | | | | | | | | | | | | | |
| Shares sold | | | 13,931 | | | | 68,681 | | | | 1,167,519 | | | | 10,866,971 | |
| Reinvestment of distributions | | | 4,248 | | | | 23,876 | | | | 6,865 | | | | 59,722 | |
| Shares redeemed | | | (344,331 | ) | | | (1,667,688 | ) | | | (1,735,225 | ) | | | (11,735,111 | ) |
| |
| |
| | | | (326,152 | ) | | | (1,575,131 | ) | | | (560,841 | ) | | | (808,418 | ) |
| |
| |
Institutional Shares | | | | | | | | | | | | | | | | |
| Shares sold | | | 8,716,634 | | | | 45,786,002 | | | | 16,749,995 | | | | 149,374,099 | |
| Reinvestments of distributions | | | 311,346 | | | | 1,746,648 | | | | 617,426 | | | | 5,396,305 | |
| Shares redeemed | | | (8,113,298 | ) | | | (37,271,524 | ) | | | (42,689,980 | ) | | | (322,636,568 | ) |
| |
| |
| | | | 914,682 | | | | 10,261,126 | | | | (25,322,559 | ) | | | (167,866,164 | ) |
| |
| |
Class IR Shares | | | | | | | | | | | | | | | | |
| Shares sold | | | 3 | | | | 14 | | | | — | | | | — | |
| Reinvestment of distributions | | | 11 | | | | 63 | | | | 11 | | | | 91 | |
| Shares Redeemed | | | (3 | ) | | | (14 | ) | | | — | | | | — | |
| |
| |
| | | | 11 | | | | 63 | | | | 11 | | | | 91 | |
| |
| |
NET DECREASE | | | (4,507,118 | ) | | | (13,732,392 | ) | | | (56,304,140 | ) | | $ | (395,776,872 | ) |
| |
| |
GOLDMAN SACHS SELECT SATELLITE FUNDS
| |
| 11. SUMMARY OF SHARE TRANSACTIONS (continued) | |
Share activity is as follows:
| | | | | | | | | | | | | | | | | |
| | | Real Estate Securities Fund | |
| | | | |
| | | For the Six Months Ended
| | | For the Fiscal Year Ended
| |
| | | June 30, 2009 (Unaudited) | | | December 31, 2008 | |
| | | | |
| | | Shares | | | Dollars | | | Shares | | | Dollars | |
| | | | |
Class A Shares | | | | | | | | | | | | | | | | |
| Shares sold | | | 3,084,380 | | | $ | 20,735,504 | | | | 6,788,483 | | | $ | 91,365,030 | |
Shares converted from Class B(a) | | | 10,072 | | | | 60,208 | | | | 47,340 | | | | 654,604 | |
| Reinvestments of distributions | | | 308,082 | | | | 1,827,867 | | | | 1,479,026 | | | | 13,846,651 | |
| Shares redeemed | | | (5,776,080 | ) | | | (37,298,662 | ) | | | (13,078,235 | ) | | | (159,614,746 | ) |
| |
| |
| | | | (2,373,546 | ) | | | (14,675,083 | ) | | | (4,763,386 | ) | | | (53,748,461 | ) |
| |
| |
Class B Shares | | | | | | | | | | | | | | | | |
| Shares sold | | | 21,641 | | | | 143,179 | | | | 56,868 | | | | 817,743 | |
Shares converted to Class A(a) | | | (10,089 | ) | | | (60,208 | ) | | | (47,378 | ) | | | (654,604 | ) |
| Reinvestments of distributions | | | 9,544 | | | | 56,504 | | | | 51,589 | | | | 457,409 | |
| Shares redeemed | | | (123,907 | ) | | | (777,738 | ) | | | (264,999 | ) | | | (3,548,835 | ) |
| |
| |
| | | | (102,811 | ) | | | (638,263 | ) | | | (203,920 | ) | | | (2,928,287 | ) |
| |
| |
Class C Shares | | | | | | | | | | | | | | | | |
| Shares sold | | | 86,245 | | | | 564,132 | | | | 244,329 | | | | 3,407,105 | |
| Reinvestments of distributions | | | 14,197 | | | | 82,860 | | | | 66,458 | | | | 579,334 | |
| Shares redeemed | | | (143,317 | ) | | | (903,316 | ) | | | (473,676 | ) | | | (6,017,917 | ) |
| |
| |
| | | | (42,875 | ) | | | (256,324 | ) | | | (162,889 | ) | | | (2,031,478 | ) |
| |
| |
Institutional Shares | | | | | | | | | | | | | | | | |
| Shares sold | | | 9,187,584 | | | | 61,931,771 | | | | 11,028,963 | | | | 138,331,072 | |
| Reinvestments of distributions | | | 813,642 | | | | 4,881,434 | | | | 2,877,372 | | | | 26,440,715 | |
| Shares redeemed | | | (5,646,521 | ) | | | (36,599,799 | ) | | | (10,651,327 | ) | | | (127,040,072 | ) |
| |
| |
| | | | 4,354,705 | | | | 30,213,406 | | | | 3,255,008 | | | | 37,731,715 | |
| |
| |
Service Shares | | | | | | | | | | | | | | | | |
| Shares sold | | | 193,735 | | | | 1,262,672 | | | | 356,876 | | | | 4,541,071 | |
| Reinvestments of distributions | | | 5,332 | | | | 31,855 | | | | 19,642 | | | | 178,035 | |
| Shares redeemed | | | (191,814 | ) | | | (1,257,874 | ) | | | (313,902 | ) | | | (4,018,819 | ) |
| |
| |
| | | | 7,253 | | | | 36,653 | | | | 62,616 | | | | 700,287 | |
| |
| |
Class IR Shares | | | | | | | | | | | | | | | | |
| Shares sold | | | 3 | | | | 20 | | | | — | | | | — | |
| Reinvestments of distributions | | | 19 | | | | 115 | | | | 68 | | | | 624 | |
| Shares redeemed | | | (3 | ) | | | (20 | ) | | | — | | | | — | |
| |
| |
| | | | 19 | | | | 115 | | | | 68 | | | | 624 | |
| |
| |
Class R Shares | | | | | | | | | | | | | | | | |
| Shares sold | | | 9,388 | | | | 56,273 | | | | 206 | | | | 2,816 | |
| Reinvestments of distributions | | | 265 | | | | 1,572 | | | | 82 | | | | 714 | |
| Shares redeemed | | | (7 | ) | | | (46 | ) | | | — | | | | — | |
| |
| |
| | | | 9,646 | | | | 57,799 | | | | 288 | | | | 3,530 | |
| |
| |
NET INCREASE (DECREASE) | | | 1,852,391 | | | $ | 14,738,303 | | | | (1,812,215 | ) | | $ | (20,272,070 | ) |
| |
| |
| | |
| (a) | | Class B Shares automatically convert into Class A Shares on or about the fifteenth day of the last month of the calendar quarter that is eight years after the initial purchase date of either the Fund or another Goldman Sachs Fund. |
GOLDMAN SACHS ABSOLUTE RETURN TRACKER FUND
Financial Highlights
Selected Data for a Share Outstanding Throughout Each Period
| | | | | | | | | | | | | | | | | | | | | | | | | |
| | | | | | | | Income (loss) from
| | | | | | |
| | | | | | | | investment operations | | | | | | |
| | | | | Net asset
| | | | | | | | | | | | | | | |
| | | | | value,
| | | Net
| | | Net realized
| | | Total from
| | | | | | |
| | | | | beginning
| | | investment
| | | and unrealized
| | | investment
| | | | | | |
| | | Year - Share Class | | of period | | | income (loss)(a) | | | gain (loss) | | | operations | | | | | | |
| |
| FOR THE SIX MONTHS ENDED JUNE 30, (UNAUDITED) |
| | | | | | | | | | | | | | | | | | | | | | | | | |
| | | | | | | | | | | | | | | | | | | | | | | | | |
| | | 2009 - A | | $ | 8.58 | | | $ | (0.05 | ) | | $ | 0.30 | | | $ | 0.25 | | | | | | | |
| | | 2009 - C | | | 8.54 | | | | (0.08 | ) | | | 0.30 | | | | 0.22 | | | | | | | |
| | | 2009 - Institutional | | | 8.60 | | | | (0.03 | ) | | | 0.30 | | | | 0.27 | | | | | | | |
| | | 2009 - IR | | | 8.59 | | | | (0.04 | ) | | | 0.31 | | | | 0.27 | | | | | | | |
| | | 2009 - R | | | 8.57 | | | | (0.06 | ) | | | 0.30 | | | | 0.24 | | | | | | | |
| | | | | | | | | | | | | | | | | | | | | | | | | |
| | | | | | | | | | | | | | | | | | | | | | | | | |
| FOR THE PERIOD ENDED DECEMBER 31, |
| | | | | | | | | | | | | | | | | | | | | | | | | |
| | | | | | | | | | | | | | | | | | | | | | | | | |
| | | 2008 - A (commenced May 30, 2008) | | | 10.00 | | | | 0.01 | | | | (1.43 | ) | | | (1.42 | ) | | | | | | |
| | | 2008 - C (commenced May 30, 2008) | | | 10.00 | | | | (0.03 | ) | | | (1.43 | ) | | | (1.46 | ) | | | | | | |
| | | 2008 - Institutional (commenced May 30, 2008) | | | 10.00 | | | | 0.04 | | | | (1.44 | ) | | | (1.40 | ) | | | | | | |
| | | 2008 - IR (commenced May 30, 2008) | | | 10.00 | | | | 0.04 | | | | (1.45 | ) | | | (1.41 | ) | | | | | | |
| | | 2008 - R (commenced May 30, 2008) | | | 10.00 | | | | 0.01 | | | | (1.44 | ) | | | (1.43 | ) | | | | | | |
| | | | | | | | | | | | | | | | | | | | | | | | | |
| | | | | | | | | | | | | | | | | | | | | | | | | |
| | | |
| | | |
| | | | | | | | | | | | | | | | | | | | | | | | | |
| |
| (a) | Calculated based on the average shares outstanding methodology. |
| |
| (b) | Assumes investment at the net asset value at the beginning of the period, reinvestment of all distributions, a complete redemption of the investment at the net asset value at the end of the period and no sales or redemption charges. Total returns would be reduced if sales or redemption charges were taken into account. Returns do not reflect the deduction of taxes that a shareholder would pay on Fund distributions or the redemption of Fund shares. Total returns for periods less than one full year are not annualized. |
The accompanying notes are an integral part of these financial statements.
GOLDMAN SACHS ABSOLUTE RETURN TRACKER FUND
| | | | | | | | | | | | | | | | | | | | | | | | | | | | | | | | | | | |
| | | | | | | | | | | | | | | | | | Ratios assuming no
| | | | | | |
| | | | | | | | | | | | | | | | | | expense reductions | | | | | | |
| | | | | | | | | | | | | | | Ratio of
| | | | | | Ratio of
| | | | | | |
| | | | | | | | | Net assets,
| | | Ratio of
| | | net investment
| | | Ratio of
| | | net investment
| | | | | | |
| | | Net asset
| | | | | | end of
| | | net expenses
| | | income (loss)
| | | total expenses
| | | loss
| | | Portfolio
| | | |
| | | value, end
| | | Total
| | | period
| | | to average
| | | to average
| | | to average
| | | to average
| | | turnover
| | | |
| | | of period | | | return(b) | | | (in 000s) | | | net assets(c) | | | net assets(c) | | | net assets(c) | | | net assets(c) | | | rate | | | |
| |
| |
| | | | | | | | | | | | | | | | | | | | | | | | | | | | | | | | | | | |
| | | | | | | | | | | | | | | | | | | | | | | | | | | | | | | | | | | |
| | | $ | 8.83 | | | | 2.91 | % | | $ | 134,733 | | | | 1.60 | % | | | (1.15 | )% | | | 2.36 | % | | | (1.91 | )% | | | 26 | % | | |
| | | | 8.76 | | | | 2.58 | | | | 11,659 | | | | 2.35 | | | | (1.90 | ) | | | 3.11 | | | | (2.66 | ) | | | 26 | | | |
| | | | 8.87 | | | | 3.14 | | | | 134,012 | | | | 1.20 | | | | (0.74 | ) | | | 1.96 | | | | (1.50 | ) | | | 26 | | | |
| | | | 8.86 | | | | 3.14 | | | | 9 | | | | 1.35 | | | | (0.90 | ) | | | 2.11 | | | | (1.66 | ) | | | 26 | | | |
| | | | 8.81 | | | | 2.80 | | | | 9 | | | | 1.85 | | | | (1.39 | ) | | | 2.61 | | | | (2.15 | ) | | | 26 | | | |
| | | | | | | | | | | | | | | | | | | | | | | | | | | | | | | | | | | |
| | | | | | | | | | | | | | | | | | | | | | | | | | | | | | | | | | | |
| |
| | | | | | | | | | | | | | | | | | | | | | | | | | | | | | | | | | | |
| | | | | | | | | | | | | | | | | | | | | | | | | | | | | | | | | | | |
| | | | 8.58 | | | | (14.20 | ) | | | 41,900 | | | | 1.60 | | | | 0.08 | | | | 3.58 | | | | (1.90 | ) | | | 331 | | | |
| | | | 8.54 | | | | (14.60 | ) | | | 2,985 | | | | 2.35 | | | | (0.68 | ) | | | 4.33 | | | | (2.66 | ) | | | 331 | | | |
| | | | 8.60 | | | | (14.00 | ) | | | 72,903 | | | | 1.20 | | | | 0.72 | | | | 3.18 | | | | (1.26 | ) | | | 331 | | | |
| | | | 8.59 | | | | (14.10 | ) | | | 9 | | | | 1.35 | | | | 0.98 | | | | 3.33 | | | | (1.00 | ) | | | 331 | | | |
| | | | 8.57 | | | | (14.30 | ) | | | 9 | | | | 1.85 | | | | 0.48 | | | | 3.83 | | | | (1.50 | ) | | | 331 | | | |
| | | | | | | | | | | | | | | | | | | | | | | | | | | | | | | | | | | |
| | | | | | | | | | | | | | | | | | | | | | | | | | | | | | | | | | | |
| |
| |
The accompanying notes are an integral part of these financial statements.
GOLDMAN SACHS COMMODITY STRATEGY FUND
Consolidated Financial Highlights
Selected Data for a Share Outstanding Throughout Each Period
| | | | | | | | | | | | | | | | | | | | | | | | | | | | | | | | | |
| | | | | | | | Income (loss) from
| | | Distributions
| | | |
| | | | | Net asset
| | | investment operations | | | to shareholders | | | |
| | | | | value,
| | | Net
| | | Net realized
| | | Total from
| | | From net
| | | From net
| | | | | | |
| | | | | beginning
| | | investment
| | | and unrealized
| | | investment
| | | investment
| | | realized
| | | Total
| | | |
| | | Year - Share Class | | of period | | | income(a) | | | gain (loss) | | | operations | | | income | | | gains | | | distributions | | | |
| |
| FOR THE SIX MONTHS ENDED JUNE 30, (UNAUDITED) |
| | | | | | | | | | | | | | | | | | | | | | | | | | | | | | | | | |
| | | | | | | | | | | | | | | | | | | | | | | | | | | | | | | | | |
| | | 2009 - A | | $ | 5.40 | | | $ | 0.03 | | | $ | 0.46 | | | $ | 0.49 | | | $ | (0.02 | ) | | $ | — | | | $ | (0.02 | ) | | |
| | | 2009 - C | | | 5.38 | | | | 0.01 | | | | 0.46 | | | | 0.47 | | | | (0.01 | ) | | | — | | | | (0.01 | ) | | |
| | | 2009 - Institutional | | | 5.43 | | | | 0.04 | | | | 0.43 | | | | 0.47 | | | | (0.03 | ) | | | — | | | | (0.03 | ) | | |
| | | 2009 - IR | | | 5.40 | | | | 0.04 | | | | 0.47 | | | | 0.51 | | | | (0.03 | ) | | | — | | | | (0.03 | ) | | |
| | | 2009 - R | | | 5.40 | | | | 0.02 | | | | 0.47 | | | | 0.49 | | | | (0.02 | ) | | | — | | | | (0.02 | ) | | |
| | | | | | | | | | | | | | | | | | | | | | | | | | | | | | | | | |
| | | | | | | | | | | | | | | | | | | | | | | | | | | | | | | | | |
| FOR THE FISCAL YEAR ENDED DECEMBER 31, |
| | | | | | | | | | | | | | | | | | | | | | | | | | | | | | | | | |
| | | | | | | | | | | | | | | | | | | | | | | | | | | | | | | | | |
| | | 2008 - A | | | 12.22 | | | | 0.20 | | | | (6.19 | ) | | | (5.99 | ) | | | (0.21 | )(d) | | | (0.62 | ) | | | (0.83 | ) | | |
| | | 2008 - C | | | 12.20 | | | | 0.11 | | | | (6.18 | ) | | | (6.07 | ) | | | (0.13 | )(d) | | | (0.62 | ) | | | (0.75 | ) | | |
| | | 2008 - Institutional | | | 12.26 | | | | 0.25 | | | | (6.21 | ) | | | (5.96 | ) | | | (0.25 | )(d) | | | (0.62 | ) | | | (0.87 | ) | | |
| | | 2008 - IR | | | 12.21 | | | | 0.23 | | | | (6.18 | ) | | | (5.95 | ) | | | (0.24 | )(d) | | | (0.62 | ) | | | (0.86 | ) | | |
| | | 2008 - R | | | 12.21 | | | | 0.17 | | | | (6.18 | ) | | | (6.01 | ) | | | (0.18 | )(d) | | | (0.62 | ) | | | (0.80 | ) | | |
| | | | | | | | | | | | | | | | | | | | | | | | | | | | | | | | | |
| | | | | | | | | | | | | | | | | | | | | | | | | | | | | | | | | |
| FOR THE PERIOD ENDED DECEMBER 31, |
| | | | | | | | | | | | | | | | | | | | | | | | | | | | | | | | | |
| | | | | | | | | | | | | | | | | | | | | | | | | | | | | | | | | |
| | | 2007 - A (commenced May 30, 2007) | | | 10.00 | | | | 0.19 | | | | 2.22 | | | | 2.41 | | | | (0.19 | ) | | | — | | | | (0.19 | ) | | |
| | | 2007 - C (commenced May 30, 2007) | | | 10.00 | | | | 0.13 | | | | 2.22 | | | | 2.35 | | | | (0.15 | ) | | | — | | | | (0.15 | ) | | |
| | | 2007 - Institutional (commenced May 30, 2007) | | | 10.00 | | | | 0.23 | | | | 2.24 | | | | 2.47 | | | | (0.21 | ) | | | — | | | | (0.21 | ) | | |
| | | 2007 - IR (commenced November 30, 2007) | | | 11.62 | | | | 0.03 | | | | 0.63 | | | | 0.66 | | | | (0.07 | ) | | | — | | | | (0.07 | ) | | |
| | | 2007 - R (commenced November 30, 2007) | | | 11.62 | | | | 0.02 | | | | 0.64 | | | | 0.66 | | | | (0.07 | ) | | | — | | | | (0.07 | ) | | |
| | | | | | | | | | | | | | | | | | | | | | | | | | | | | | | | | |
| | | | | | | | | | | | | | | | | | | | | | | | | | | | | | | | | |
| | | |
| | | |
| | | | | | | | | | | | | | | | | | | | | | | | | | | | | | | | | |
| |
| (a) | Calculated based on the average shares outstanding methodology. |
| |
| (b) | Assumes investment at the net asset value at the beginning of the period, reinvestment of all distributions, a complete redemption of the investment at the net asset value at the end of the period and no sales or redemption charges. Total returns would be reduced if sales or redemption charges were taken into account. Returns do not reflect the deduction of taxes that a shareholder would pay on Fund distributions or the redemption of Fund shares. Total returns for periods less than one full year are not annualized. |
| |
| (d) | Includes distribution of capital of less than $0.005 per share. |
The accompanying notes are an integral part of these financial statements.
GOLDMAN SACHS COMMODITY STRATEGY FUND
| | | | | | | | | | | | | | | | | | | | | | | | | | | | | | | | | | | |
| | | | | | | | | | | | | | | | | | Ratios assuming no
| | | | | | |
| | | | | | | | | | | | | | | | | | expense reductions | | | | | | |
| | | | | | | | | | | | | | | Ratio of
| | | | | | Ratio of
| | | | | | |
| | | | | | | | | Net assets,
| | | Ratio of
| | | net investment
| | | Ratio of
| | | net investment
| | | | | | |
| | | Net asset
| | | | | | end of
| | | net expenses
| | | income
| | | total expenses
| | | income (loss)
| | | Portfolio
| | | |
| | | value, end
| | | Total
| | | period
| | | to average
| | | to average
| | | to average
| | | to average
| | | turnover
| | | |
| | | of period | | | return(b) | | | (in 000s) | | | net assets | | | net assets | | | net assets | | | net assets | | | rate | | | |
| |
| |
| | | | | | | | | | | | | | | | | | | | | | | | | | | | | | | | | | | |
| | | | | | | | | | | | | | | | | | | | | | | | | | | | | | | | | | | |
| | | $ | 5.87 | | | | 8.42 | % | | $ | 53,423 | | | | 0.92 | %(c) | | | 1.13 | %(c) | | | 1.15 | %(c) | | | 0.90 | %(c) | | | 76 | % | | |
| | | | 5.84 | | | | 7.83 | | | | 3,905 | | | | 1.67 | (c) | | | 0.31 | (c) | | | 1.90 | (c) | | | 0.08 | (c) | | | 76 | | | |
| | | | 5.87 | | | | 8.55 | | | | 379,809 | | | | 0.58 | (c) | | | 1.33 | (c) | | | 0.81 | (c) | | | 1.10 | (c) | | | 76 | | | |
| | | | 5.88 | | | | 8.70 | | | | 7 | | | | 0.67 | (c) | | | 1.47 | (c) | | | 0.90 | (c) | | | 1.24 | (c) | | | 76 | | | |
| | | | 5.87 | | | | 8.39 | | | | 25 | | | | 1.17 | (c) | | | 0.60 | (c) | | | 1.40 | (c) | | | 0.37 | (c) | | | 76 | | | |
| | | | | | | | | | | | | | | | | | | | | | | | | | | | | | | | | | | |
| | | | | | | | | | | | | | | | | | | | | | | | | | | | | | | | | | | |
| |
| | | | | | | | | | | | | | | | | | | | | | | | | | | | | | | | | | | |
| | | | | | | | | | | | | | | | | | | | | | | | | | | | | | | | | | | |
| | | | 5.40 | | | | (49.23 | ) | | | 40,118 | | | | 0.92 | | | | 1.62 | | | | 1.06 | | | | 1.48 | | | | 279 | | | |
| | | | 5.38 | | | | (49.66 | ) | | | 2,208 | | | | 1.67 | | | | 0.91 | | | | 1.81 | | | | 0.77 | | | | 279 | | | |
| | | | 5.43 | | | | (48.96 | ) | | | 127,630 | | | | 0.58 | | | | 1.97 | | | | 0.72 | | | | 1.83 | | | | 279 | | | |
| | | | 5.40 | | | | (49.14 | ) | | | 17 | | | | 0.67 | | | | 1.90 | | | | 0.81 | | | | 1.76 | | | | 279 | | | |
| | | | 5.40 | | | | (49.39 | ) | | | 9 | | | | 1.17 | | | | 1.43 | | | | 1.31 | | | | 1.29 | | | | 279 | | | |
| | | | | | | | | | | | | | | | | | | | | | | | | | | | | | | | | | | |
| | | | | | | | | | | | | | | | | | | | | | | | | | | | | | | | | | | |
| |
| | | | | | | | | | | | | | | | | | | | | | | | | | | | | | | | | | | |
| | | | | | | | | | | | | | | | | | | | | | | | | | | | | | | | | | | |
| | | | 12.22 | | | | 24.27 | | | | 86,648 | | | | 0.93 | (c) | | | 2.36 | (c) | | | 1.09 | (c) | | | 2.20 | (c) | | | 83 | | | |
| | | | 12.20 | | | | 23.66 | | | | 684 | | | | 1.68 | (c) | | | 1.48 | (c) | | | 1.84 | (c) | | | 1.32 | (c) | | | 83 | | | |
| | | | 12.26 | | | | 24.95 | | | | 290,380 | | | | 0.58 | (c) | | | 2.73 | (c) | | | 0.74 | (c) | | | 2.57 | (c) | | | 83 | | | |
| | | | 12.21 | | | | 5.71 | | | | 11 | | | | 0.67 | (c) | | | 2.56 | (c) | | | 0.83 | (c) | | | 2.40 | (c) | | | 83 | | | |
| | | | 12.21 | | | | 5.67 | | | | 11 | | | | 1.17 | (c) | | | 2.08 | (c) | | | 1.33 | (c) | | | 1.92 | (c) | | | 83 | | | |
| | | | | | | | | | | | | | | | | | | | | | | | | | | | | | | | | | | |
| | | | | | | | | | | | | | | | | | | | | | | | | | | | | | | | | | | |
| |
| |
The accompanying notes are an integral part of these financial statements.
GOLDMAN SACHS INTERNATIONAL REAL ESTATE SECURITIES FUND
Financial Highlights
Selected Data for a Share Outstanding Throughout Each Period
| | | | | | | | | | | | | | | | | | | | | | | | | | | | | | | | | | | | | |
| | | | | | | | Income (loss) from
| | | Distributions
| | | |
| | | | | Net asset
| | | investment operations | | | to shareholders | | | |
| | | | | value,
| | | Net
| | | Net realized
| | | Total from
| | | From net
| | | From net
| | | | | | | | | |
| | | | | beginning
| | | investment
| | | and unrealized
| | | investment
| | | investment
| | | realized
| | | From
| | | Total
| | | |
| | | Year - Share Class | | of period | | | income(a) | | | gain (loss) | | | operations | | | income | | | gains | | | capital | | | distributions | | | |
| |
| | | | | | | | | | | | | | | | | | | | | | | | | | | | | | | | | | | | | |
| |
| FOR THE SIX MONTHS ENDED JUNE 30, (UNAUDITED) |
| | | | | | | | | | | | | | | | | | | | | | | | | | | | | | | | | | | | | |
| | | | | | | | | | | | | | | | | | | | | | | | | | | | | | | | | | | | | |
| | | 2009 - A | | $ | 5.14 | | | $ | 0.09 | | | $ | 0.39 | | | $ | 0.48 | | | $ | (0.06 | ) | | $ | — | | | $ | — | | | $ | (0.06 | ) | | |
| | | 2009 - C | | | 5.10 | | | | 0.07 | | | | 0.39 | | | | 0.46 | | | | (0.04 | ) | | | — | | | | — | | | | (0.04 | ) | | |
| | | 2009 - Institutional | | | 5.10 | | | | 0.10 | | | | 0.38 | | | | 0.48 | | | | (0.08 | ) | | | — | | | | — | | | | (0.08 | ) | | |
| | | 2009 - IR | | | 5.14 | | | | 0.10 | | | | 0.39 | | | | 0.49 | | | | (0.07 | ) | | | — | | | | — | | | | (0.07 | ) | | |
| | | | | | | | | | | | | | | | | | | | | | | | | | | | | | | | | | | | | |
| | | | | | | | | | | | | | | | | | | | | | | | | | | | | | | | | | | | | |
| FOR THE FISCAL YEARS ENDED DECEMBER 31, |
| | | | | | | | | | | | | | | | | | | | | | | | | | | | | | | | | | | | | |
| | | | | | | | | | | | | | | | | | | | | | | | | | | | | | | | | | | | | |
| | | 2008 - A | | | 10.85 | | | | 0.15 | | | | (5.77 | ) | | | (5.62 | ) | | | — | | | | — | | | | (0.09 | ) | | | (0.09 | ) | | |
| | | 2008 - C | | | 10.80 | | | | 0.10 | | | | (5.73 | ) | | | (5.63 | ) | | | — | | | | — | | | | (0.07 | ) | | | (0.07 | ) | | |
| | | 2008 - Institutional | | | 10.84 | | | | 0.19 | | | | (5.82 | ) | | | (5.63 | ) | | | — | | | | — | | | | (0.11 | ) | | | (0.11 | ) | | |
| | | 2008 - IR | | | 10.81 | | | | 0.17 | | | | (5.74 | ) | | | (5.57 | ) | | | — | | | | — | | | | (0.10 | ) | | | (0.10 | ) | | |
| | | | | | | | | | | | | | | | | | | | | | | | | | | | | | | | | | | | | |
| | | | | | | | | | | | | | | | | | | | | | | | | | | | | | | | | | | | | |
| | | |
| | | |
| | | 2007 - A | | | 12.01 | | | | 0.16 | | | | (0.44 | ) | | | (0.28 | ) | | | (0.84 | ) | | | (0.04 | ) | | | — | | | | (0.88 | ) | | |
| | | 2007 - C | | | 11.98 | | | | 0.07 | | | | (0.43 | ) | | | (0.36 | ) | | | (0.78 | ) | | | (0.04 | ) | | | — | | | | (0.82 | ) | | |
| | | 2007 - Institutional | | | 12.03 | | | | 0.21 | | | | (0.45 | ) | | | (0.24 | ) | | | (0.91 | ) | | | (0.04 | ) | | | — | | | | (0.95 | ) | | |
| | | 2007 - IR (commenced November 30, 2007) | | | 12.40 | | | | 0.03 | | | | (0.77 | ) | | | (0.74 | ) | | | (0.81 | ) | | | (0.04 | ) | | | — | | | | (0.85 | ) | | |
| | | | | | | | | | | | | | | | | | | | | | | | | | | | | | | | | | | | | |
| | | | | | | | | | | | | | | | | | | | | | | | | | | | | | | | | | | | | |
| FOR THE PERIOD ENDED DECEMBER 31, |
| | | | | | | | | | | | | | | | | | | | | | | | | | | | | | | | | | | | | |
| | | | | | | | | | | | | | | | | | | | | | | | | | | | | | | | | | | | | |
| | | 2006 - A (commenced July 31, 2006) | | | 10.00 | | | | 0.07 | | | | 2.04 | | | | 2.11 | | | | (0.10 | ) | | | — | | | | — | | | | (0.10 | ) | | |
| | | 2006 - C (commenced July 31, 2006) | | | 10.00 | | | | 0.06 | | | | 2.01 | | | | 2.07 | | | | (0.09 | ) | | | — | | | | — | | | | (0.09 | ) | | |
| | | 2006 - Institutional (commenced July 31, 2006) | | | 10.00 | | | | 0.09 | | | | 2.05 | | | | 2.14 | | | | (0.11 | ) | | | — | | | | — | | | | (0.11 | ) | | |
| | | | | | | | | | | | | | | | | | | | | | | | | | | | | | | | | | | | | |
| | | | | | | | | | | | | | | | | | | | | | | | | | | | | | | | | | | | | |
| | | |
| | | |
| | | | | | | | | | | | | | | | | | | | | | | | | | | | | | | | | | | | | |
| |
| (a) | Calculated based on the average shares outstanding methodology. |
| |
| (b) | Assumes investment at the net asset value at the beginning of the period, reinvestment of all distributions, a complete redemption of the investment at the net asset value at the end of the period and no sales or redemption charges. Total returns would be reduced if sales or redemption charges were taken into account. Returns do not reflect the deduction of taxes that a shareholder would pay on Fund distributions or the redemption of Fund shares. Total returns for periods less than one full year are not annualized. |
| |
| (d) | The ratio is not annualized as the Fund’s income for the year ended December 31, 2007 did not correlate to the income earned during the class’s period of operation due to timing of income recognition. |
The accompanying notes are an integral part of these financial statements.
GOLDMAN SACHS INTERNATIONAL REAL ESTATE SECURITIES FUND
| | | | | | | | | | | | | | | | | | | | | | | | | | | | | | | | | | | |
| | | | | | | | | | | | | | | | | | Ratios assuming no
| | | | | | |
| | | | | | | | | | | | | | | | | | expense reductions | | | | | | |
| | | | | | | | | | | | | | | Ratio of
| | | | | | Ratio of
| | | | | | |
| | | | | | | | | Net assets,
| | | Ratio of
| | | net investment
| | | Ratio of
| | | net investment
| | | | | | |
| | | Net asset
| | | | | | end of
| | | net expenses
| | | income
| | | total expenses
| | | income
| | | Portfolio
| | | |
| | | value, end
| | | Total
| | | period
| | | to average
| | | to average
| | | to average
| | | to average
| | | turnover
| | | |
| | | of period | | | return(b) | | | (in 000s) | | | net assets | | | net assets | | | net assets | | | net assets | | | rate | | | |
| |
| |
| | | | | | | | | | | | | | | | | | | | | | | | | | | | | | | | | | | |
| | | | | | | | | | | | | | | | | | | | | | | | | | | | | | | | | | | |
| | | $ | 5.56 | | | | 9.41 | % | | $ | 109,995 | | | | 1.53 | %(c) | | | 3.70 | %(c) | | | 1.65 | %(c) | | | 3.58 | %(c) | | | 73 | % | | |
| | | | 5.52 | | | | 9.09 | | | | 3,797 | | | | 2.28 | (c) | | | 2.88 | (c) | | | 2.40 | (c) | | | 2.76 | (c) | | | 73 | | | |
| | | | 5.50 | | | | 9.49 | | | | 180,183 | | | | 1.13 | (c) | | | 4.13 | (c) | | | 1.25 | (c) | | | 4.01 | (c) | | | 73 | | | |
| | | | 5.56 | | | | 9.54 | | | | 5 | | | | 1.28 | (c) | | | 4.01 | (c) | | | 1.40 | (c) | | | 3.89 | (c) | | | 73 | | | |
| | | | | | | | | | | | | | | | | | | | | | | | | | | | | | | | | | | |
| | | | | | | | | | | | | | | | | | | | | | | | | | | | | | | | | | | |
| |
| | | | | | | | | | | | | | | | | | | | | | | | | | | | | | | | | | | |
| | | | | | | | | | | | | | | | | | | | | | | | | | | | | | | | | | | |
| | | | 5.14 | | | | (52.04 | ) | | | 127,811 | | | | 1.53 | | | | 1.77 | | | | 1.60 | | | | 1.70 | | | | 96 | | | |
| | | | 5.10 | | | | (52.33 | ) | | | 5,175 | | | | 2.28 | | | | 1.20 | | | | 2.35 | | | | 1.13 | | | | 96 | | | |
| | | | 5.10 | | | | (52.25 | ) | | | 162,396 | | | | 1.13 | | | | 2.21 | | | | 1.20 | | | | 2.14 | | | | 96 | | | |
| | | | 5.14 | | | | (51.78 | ) | | | 5 | | | | 1.28 | | | | 2.11 | | | | 1.35 | | | | 2.04 | | | | 96 | | | |
| | | | | | | | | | | | | | | | | | | | | | | | | | | | | | | | | | | |
| | | | | | | | | | | | | | | | | | | | | | | | | | | | | | | | | | | |
| |
| |
| | | | 10.85 | | | | (2.56 | ) | | | 599,660 | | | | 1.54 | | | | 1.24 | | | | 1.58 | | | | 1.20 | | | | 86 | | | |
| | | | 10.80 | | | | (3.22 | ) | | | 16,999 | | | | 2.29 | | | | 0.56 | | | | 2.33 | | | | 0.52 | | | | 86 | | | |
| | | | 10.84 | | | | (2.23 | ) | | | 620,012 | | | | 1.14 | | | | 1.64 | | | | 1.18 | | | | 1.60 | | | | 86 | | | |
| | | | 10.81 | | | | (6.20 | ) | | | 9 | | | | 1.29 | (c) | | | 0.23 | (d) | | | 1.33 | (c) | | | 0.19 | (d) | | | 86 | | | |
| | | | | | | | | | | | | | | | | | | | | | | | | | | | | | | | | | | |
| | | | | | | | | | | | | | | | | | | | | | | | | | | | | | | | | | | |
| |
| | | | | | | | | | | | | | | | | | | | | | | | | | | | | | | | | | | |
| | | | | | | | | | | | | | | | | | | | | | | | | | | | | | | | | | | |
| | | | 12.01 | | | | 21.14 | | | | 283,571 | | | | 1.53 | (c) | | | 1.55 | (c) | | | 1.76 | (c) | | | 1.32 | (c) | | | 13 | | | |
| | | | 11.98 | | | | 20.73 | | | | 833 | | | | 2.28 | (c) | | | 1.19 | (c) | | | 2.51 | (c) | | | 0.96 | (c) | | | 13 | | | |
| | | | 12.03 | | | | 21.33 | | | | 347,684 | | | | 1.13 | (c) | | | 1.89 | (c) | | | 1.36 | (c) | | | 1.66 | (c) | | | 13 | | | |
| | | | | | | | | | | | | | | | | | | | | | | | | | | | | | | | | | | |
| | | | | | | | | | | | | | | | | | | | | | | | | | | | | | | | | | | |
| |
| |
The accompanying notes are an integral part of these financial statements.
GOLDMAN SACHS REAL ESTATE SECURITIES FUND
Financial Highlights
Selected Data for a Share Outstanding Throughout Each Period
| | | | | | | | | | | | | | | | | | | | | | | | | | | | | | | | | | | | | |
| | | | | | | | Income (loss) from
| | | Distributions
| | | |
| | | | | Net asset
| | | investment operations | | | to shareholders | | | |
| | | | | value,
| | | Net
| | | Net realized
| | | Total from
| | | From net
| | | From net
| | | | | | | | | |
| | | | | beginning
| | | investment
| | | and unrealized
| | | investment
| | | investment
| | | realized
| | | From
| | | Total
| | | |
| | | Year - Share Class | | of period | | | income (loss)(a) | | | gain (loss) | | | operations | | | income | | | gains | | | capital | | | distributions | | | |
| |
| | | | | | | | | | | | | | | | | | | | | | | | | | | | | | | | | | | | | |
| |
| FOR THE SIX MONTHS ENDED JUNE 30, (UNAUDITED) |
| | | | | | | | | | | | | | | | | | | | | | | | | | | | | | | | | | | | | |
| | | | | | | | | | | | | | | | | | | | | | | | | | | | | | | | | | | | | |
| | | 2009 - A | | $ | 8.25 | | | $ | 0.15 | | | $ | (1.33 | ) | | $ | (1.18 | ) | | $ | (0.16 | ) | | $ | — | | | $ | — | | | $ | (0.16 | ) | | |
| | | 2009 - B | | | 8.25 | | | | 0.13 | | | | (1.34 | ) | | | (1.21 | ) | | | (0.13 | ) | | | — | | | | — | | | | (0.13 | ) | | |
| | | 2009 - C | | | 8.15 | | | | 0.13 | | | | (1.33 | ) | | | (1.20 | ) | | | (0.13 | ) | | | — | | | | — | | | | (0.13 | ) | | |
| | | 2009 - Institutional | | | 8.34 | | | | 0.17 | | | | (1.36 | ) | | | (1.19 | ) | | | (0.17 | ) | | | — | | | | — | | | | (0.17 | ) | | |
| | | 2009 - Service | | | 8.31 | | | | 0.16 | | | | (1.36 | ) | | | (1.20 | ) | | | (0.16 | ) | | | — | | | | — | | | | (0.16 | ) | | |
| | | 2009 - IR | | | 8.27 | | | | 0.17 | | | | (1.35 | ) | | | (1.18 | ) | | | (0.17 | ) | | | — | | | | — | | | | (0.17 | ) | | |
| | | 2009 - R | | | 8.25 | | | | 0.18 | | | | (1.37 | ) | | | (1.19 | ) | | | (0.16 | ) | | | — | | | | — | | | | (0.16 | ) | | |
| | | | | | | | | | | | | | | | | | | | | | | | | | | | | | | | | | | | | |
| | | | | | | | | | | | | | | | | | | | | | | | | | | | | | | | | | | | | |
| FOR THE FISCAL YEARS ENDED DECEMBER 31, |
| | | | | | | | | | | | | | | | | | | | | | | | | | | | | | | | | | | | | |
| | | | | | | | | | | | | | | | | | | | | | | | | | | | | | | | | | | | | |
| | | 2008 - A | | | 15.50 | | | | 0.22 | | | | (6.50 | ) | | | (6.28 | ) | | | (0.26 | ) | | | (0.59 | ) | | | (0.12 | ) | | | (0.97 | ) | | |
| | | 2008 - B | | | 15.51 | | | | 0.11 | | | | (6.49 | ) | | | (6.38 | ) | | | (0.20 | ) | | | (0.59 | ) | | | (0.09 | ) | | | (0.88 | ) | | |
| | | 2008 - C | | | 15.34 | | | | 0.11 | | | | (6.42 | ) | | | (6.31 | ) | | | (0.20 | ) | | | (0.59 | ) | | | (0.09 | ) | | | (0.88 | ) | | |
| | | 2008 - Institutional | | | 15.61 | | | | 0.29 | | | | (6.55 | ) | | | (6.26 | ) | | | (0.29 | ) | | | (0.59 | ) | | | (0.13 | ) | | | (1.01 | ) | | |
| | | 2008 - Service | | | 15.59 | | | | 0.23 | | | | (6.55 | ) | | | (6.32 | ) | | | (0.26 | ) | | | (0.59 | ) | | | (0.11 | ) | | | (0.96 | ) | | |
| | | 2008 - IR | | | 15.50 | | | | 0.27 | | | | (6.50 | ) | | | (6.23 | ) | | | (0.29 | ) | | | (0.59 | ) | | | (0.12 | ) | | | (1.00 | ) | | |
| | | 2008 - R | | | 15.50 | | | | 0.22 | | | | (6.53 | ) | | | (6.31 | ) | | | (0.24 | ) | | | (0.59 | ) | | | (0.11 | ) | | | (0.94 | ) | | |
| | | | | | | | | | | | | | | | | | | | | | | | | | | | | | | | | | | | | |
| | | | | | | | | | | | | | | | | | | | | | | | | | | | | | | | | | | | | |
| | | |
| | | |
| | | 2007 - A | | | 22.40 | | | | 0.16 | | | | (3.61 | ) | | | (3.45 | ) | | | (0.31 | ) | | | (3.14 | ) | | | — | | | | (3.45 | ) | | |
| | | 2007 - B | | | 22.44 | | | | (0.04 | ) | | | (3.58 | ) | | | (3.62 | ) | | | (0.17 | ) | | | (3.14 | ) | | | — | | | | (3.31 | ) | | |
| | | 2007 - C | | | 22.24 | | | | (0.02 | ) | | | (3.56 | ) | | | (3.58 | ) | | | (0.18 | ) | | | (3.14 | ) | | | — | | | | (3.32 | ) | | |
| | | 2007 - Institutional | | | 22.51 | | | | 0.25 | | | | (3.64 | ) | | | (3.39 | ) | | | (0.37 | ) | | | (3.14 | ) | | | — | | | | (3.51 | ) | | |
| | | 2007 - Service | | | 22.51 | | | | 0.12 | | | | (3.62 | ) | | | (3.50 | ) | | | (0.28 | ) | | | (3.14 | ) | | | — | | | | (3.42 | ) | | |
| | | 2007 - IR (commenced November 30, 2007) | | | 19.47 | | | | (0.11 | ) | | | (0.72 | ) | | | (0.83 | ) | | | — | | | | (3.14 | ) | | | — | | | | (3.14 | ) | | |
| | | 2007 - R (commenced November 30, 2007) | | | 19.47 | | | | (0.11 | ) | | | (0.72 | ) | | | (0.83 | ) | | | — | | | | (3.14 | ) | | | — | | | | (3.14 | ) | | |
| | | | | | | | | | | | | | | | | | | | | | | | | | | | | | | | | | | | | |
| | | | | | | | | | | | | | | | | | | | | | | | | | | | | | | | | | | | | |
| | | |
| | | |
| | | 2006 - A | | | 18.04 | | | | 0.22 | | | | 5.94 | | | | 6.16 | | | | (0.33 | ) | | | (1.47 | ) | | | — | | | | (1.80 | ) | | |
| | | 2006 - B | | | 18.10 | | | | 0.05 | | | | 5.97 | | | | 6.02 | | | | (0.21 | ) | | | (1.47 | ) | | | — | | | | (1.68 | ) | | |
| | | 2006 - C | | | 17.96 | | | | 0.06 | | | | 5.90 | | | | 5.96 | | | | (0.21 | ) | | | (1.47 | ) | | | — | | | | (1.68 | ) | | |
| | | 2006 - Institutional | | | 18.10 | | | | 0.31 | | | | 5.96 | | | | 6.27 | | | | (0.39 | ) | | | (1.47 | ) | | | — | | | | (1.86 | ) | | |
| | | 2006 - Service | | | 18.13 | | | | 0.22 | | | | 5.94 | | | | 6.16 | | | | (0.31 | ) | | | (1.47 | ) | | | — | | | | (1.78 | ) | | |
| | | | | | | | | | | | | | | | | | | | | | | | | | | | | | | | | | | | | |
| | | | | | | | | | | | | | | | | | | | | | | | | | | | | | | | | | | | | |
| | | |
| | | |
| | | 2005 - A | | | 17.29 | | | | 0.25 | | | | 1.93 | | | | 2.18 | | | | (0.34 | ) | | | (1.09 | ) | | | — | | | | (1.43 | ) | | |
| | | 2005 - B | | | 17.34 | | | | 0.10 | | | | 1.96 | | | | 2.06 | | | | (0.21 | ) | | | (1.09 | ) | | | — | | | | (1.30 | ) | | |
| | | 2005 - C | | | 17.22 | | | | 0.12 | | | | 1.93 | | | | 2.05 | | | | (0.22 | ) | | | (1.09 | ) | | | — | | | | (1.31 | ) | | |
| | | 2005 - Institutional | | | 17.34 | | | | 0.34 | | | | 1.92 | | | | 2.26 | | | | (0.41 | ) | | | (1.09 | ) | | | — | | | | (1.50 | ) | | |
| | | 2005 - Service | | | 17.37 | | | | 0.27 | | | | 1.91 | | | | 2.18 | | | | (0.33 | ) | | | (1.09 | ) | | | — | | | | (1.42 | ) | | |
| | | | | | | | | | | | | | | | | | | | | | | | | | | | | | | | | | | | | |
| | | | | | | | | | | | | | | | | | | | | | | | | | | | | | | | | | | | | |
| | | |
| | | |
| | | 2004 - A | | | 13.98 | | | | 0.29 | | | | 4.39 | | | | 4.68 | | | | (0.34 | ) | | | (1.03 | ) | | | — | | | | (1.37 | ) | | |
| | | 2004 - B | | | 14.04 | | | | 0.17 | | | | 4.40 | | | | 4.57 | | | | (0.24 | ) | | | (1.03 | ) | | | — | | | | (1.27 | ) | | |
| | | 2004 - C | | | 13.95 | | | | 0.17 | | | | 4.38 | | | | 4.55 | | | | (0.25 | ) | | | (1.03 | ) | | | — | | | | (1.28 | ) | | |
| | | 2004 - Institutional | | | 14.02 | | | | 0.35 | | | | 4.40 | | | | 4.75 | | | | (0.40 | ) | | | (1.03 | ) | | | — | | | | (1.43 | ) | | |
| | | 2004 - Service | | | 14.05 | | | | 0.33 | | | | 4.35 | | | | 4.68 | | | | (0.33 | ) | | | (1.03 | ) | | | — | | | | (1.36 | ) | | |
| | | | | | | | | | | | | | | | | | | | | | | | | | | | | | | | | | | | | |
| | | | | | | | | | | | | | | | | | | | | | | | | | | | | | | | | | | | | |
| | | |
| | | |
| | | | | | | | | | | | | | | | | | | | | | | | | | | | | | | | | | | | | |
| | | | | | | | | | | | | | | | | | | | | | | | | | | | | | | | | | | | | |
| |
| (a) | Calculated based on the average shares outstanding methodology. |
| |
| (b) | Assumes investment at the net asset value at the beginning of the period, reinvestment of all distributions, a complete redemption of the investment at the net asset value at the end of the period and no sales or redemption charges. Total returns would be reduced if sales or redemption charges were taken into account. Returns do not reflect the deduction of taxes that a shareholder would pay on Fund distributions or the redemption of Fund shares. Total returns for periods less than one full year are not annualized. |
| |
| (d) | The ratio is not annualized as the Fund’s income for the year ended December 31, 2007 did not correlate to the income earned during the class’s period of operation due to timing of income recognition. |
The accompanying notes are an integral part of these financial statements.
GOLDMAN SACHS REAL ESTATE SECURITIES FUND
| | | | | | | | | | | | | | | | | | | | | | | | | | | | | | | | | | | |
| | | | | | | | | | | | | | | | | | Ratios assuming no
| | | | | | |
| | | | | | | | | | | | | | | | | | expense reductions | | | | | | |
| | | | | | | | | | | | | | | Ratio of
| | | | | | Ratio of
| | | | | | |
| | | | | | | | | Net assets,
| | | Ratio of
| | | net investment
| | | Ratio of
| | | net investment
| | | | | | |
| | | Net asset
| | | | | | end of
| | | net expenses
| | | income (loss)
| | | total expenses
| | | income (loss)
| | | Portfolio
| | | |
| | | value, end
| | | Total
| | | period
| | | to average
| | | to average
| | | to average
| | | to average
| | | turnover
| | | |
| | | of period | | | return(b) | | | (in 000s) | | | net assets | | | net assets | | | net assets | | | net assets | | | rate | | | |
| |
| |
| | | | | | | | | | | | | | | | | | | | | | | | | | | | | | | | | | | |
| | | | | | | | | | | | | | | | | | | | | | | | | | | | | | | | | | | |
| | | $ | 6.91 | | | | (13.99 | )% | | $ | 92,098 | | | | 1.44 | %(c) | | | 4.65 | %(c) | | | 1.57 | %(c) | | | 4.52 | %(c) | | | 67 | % | | |
| | | | 6.91 | | | | (14.25 | ) | | | 3,262 | | | | 2.19 | (c) | | | 3.94 | (c) | | | 2.32 | (c) | | | 3.81 | (c) | | | 67 | | | |
| | | | 6.82 | | | | (14.39 | ) | | | 5,740 | | | | 2.19 | (c) | | | 4.03 | (c) | | | 2.32 | (c) | | | 3.90 | (c) | | | 67 | | | |
| | | | 6.98 | | | | (13.89 | ) | | | 237,800 | | | | 1.04 | (c) | | | 5.24 | (c) | | | 1.17 | (c) | | | 5.11 | (c) | | | 67 | | | |
| | | | 6.95 | | | | (14.04 | ) | | | 3,724 | | | | 1.54 | (c) | | | 4.73 | (c) | | | 1.67 | (c) | | | 4.60 | (c) | | | 67 | | | |
| | | | 6.92 | | | | (13.96 | ) | | | 5 | | | | 1.19 | (c) | | | 5.06 | (c) | | | 1.32 | (c) | | | 4.93 | (c) | | | 67 | | | |
| | | | 6.90 | | | | (14.08 | ) | | | 73 | | | | 1.69 | (c) | | | 5.41 | (c) | | | 1.82 | (c) | | | 5.28 | (c) | | | 67 | | | |
| | | | | | | | | | | | | | | | | | | | | | | | | | | | | | | | | | | |
| | | | | | | | | | | | | | | | | | | | | | | | | | | | | | | | | | | |
| |
| | | | | | | | | | | | | | | | | | | | | | | | | | | | | | | | | | | |
| | | | | | | | | | | | | | | | | | | | | | | | | | | | | | | | | | | |
| | | | 8.25 | | | | (40.89 | ) | | | 129,634 | | | | 1.44 | | | | 1.60 | | | | 1.51 | | | | 1.53 | | | | 39 | | | |
| | | | 8.25 | | | | (41.29 | ) | | | 4,742 | | | | 2.19 | | | | 0.81 | | | | 2.26 | | | | 0.74 | | | | 39 | | | |
| | | | 8.15 | | | | (41.27 | ) | | | 7,208 | | | | 2.19 | | | | 0.90 | | | | 2.26 | | | | 0.83 | | | | 39 | | | |
| | | | 8.34 | | | | (40.54 | ) | | | 247,916 | | | | 1.04 | | | | 2.19 | | | | 1.11 | | | | 2.12 | | | | 39 | | | |
| | | | 8.31 | | | | (40.88 | ) | | | 4,389 | | | | 1.54 | | | | 1.72 | | | | 1.61 | | | | 1.65 | | | | 39 | | | |
| | | | 8.27 | | | | (40.64 | ) | | | 6 | | | | 1.19 | | | | 2.04 | | | | 1.26 | | | | 1.97 | | | | 39 | | | |
| | | | 8.25 | | | | (41.00 | ) | | | 7 | | | | 1.69 | | | | 1.76 | | | | 1.76 | | | | 1.69 | | | | 39 | | | |
| | | | | | | | | | | | | | | | | | | | | | | | | | | | | | | | | | | |
| | | | | | | | | | | | | | | | | | | | | | | | | | | | | | | | | | | |
| |
| |
| | | | 15.50 | | | | (15.97 | ) | | | 317,274 | | | | 1.45 | | | | 0.71 | | | | 1.49 | | | | 0.67 | | | | 42 | | | |
| | | | 15.51 | | | | (16.59 | ) | | | 12,074 | | | | 2.20 | | | | (0.20 | ) | | | 2.24 | | | | (0.24 | ) | | | 42 | | | |
| | | | 15.34 | | | | (16.58 | ) | | | 16,065 | | | | 2.20 | | | | (0.12 | ) | | | 2.24 | | | | (0.16 | ) | | | 42 | | | |
| | | | 15.61 | | | | (15.63 | ) | | | 413,030 | | | | 1.05 | | | | 1.12 | | | | 1.09 | | | | 1.08 | | | | 42 | | | |
| | | | 15.59 | | | | (16.07 | ) | | | 7,262 | | | | 1.55 | | | | 0.53 | | | | 1.59 | | | | 0.49 | | | | 42 | | | |
| | | | 15.50 | | | | (4.69 | ) | | | 10 | | | | 1.19 | (c) | | | (0.48 | )(d) | | | 1.23 | (c) | | | (0.52 | )(d) | | | 42 | | | |
| | | | 15.50 | | | | (4.69 | ) | | | 10 | | | | 1.69 | (c) | | | (0.52 | )(d) | | | 1.73 | (c) | | | (0.56 | )(d) | | | 42 | | | |
| | | | | | | | | | | | | | | | | | | | | | | | | | | | | | | | | | | |
| | | | | | | | | | | | | | �� | | | | | | | | | | | | | | | | | | | | | |
| |
| |
| | | | 22.40 | | | | 34.31 | | | | 442,983 | | | | 1.44 | | | | 1.05 | | | | 1.50 | | | | 0.99 | | | | 30 | | | |
| | | | 22.44 | | | | 33.33 | | | | 23,799 | | | | 2.19 | | | | 0.24 | | | | 2.25 | | | | 0.18 | | | | 30 | | | |
| | | | 22.24 | | | | 33.29 | | | | 25,948 | | | | 2.19 | | | | 0.27 | | | | 2.25 | | | | 0.21 | | | | 30 | | | |
| | | | 22.51 | | | | 34.86 | | | | 557,831 | | | | 1.04 | | | | 1.47 | | | | 1.10 | | | | 1.41 | | | | 30 | | | |
| | | | 22.51 | | | | 34.17 | | | | 12,081 | | | | 1.54 | | | | 1.05 | | | | 1.60 | | | | 0.99 | | | | 30 | | | |
| | | | | | | | | | | | | | | | | | | | | | | | | | | | | | | | | | | |
| | | | | | | | | | | | | | | | | | | | | | | | | | | | | | | | | | | |
| |
| |
| | | | 18.04 | | | | 12.83 | | | | 301,360 | | | | 1.44 | | | | 1.42 | | | | 1.53 | | | | 1.33 | | | | 19 | | | |
| | | | 18.10 | | | | 12.03 | | | | 21,597 | | | | 2.19 | | | | 0.58 | | | | 2.28 | | | | 0.50 | | | | 19 | | | |
| | | | 17.96 | | | | 12.03 | | | | 20,020 | | | | 2.19 | | | | 0.65 | | | | 2.28 | | | | 0.56 | | | | 19 | | | |
| | | | 18.10 | | | | 13.30 | | | | 348,872 | | | | 1.04 | | | | 1.89 | | | | 1.13 | | | | 1.80 | | | | 19 | | | |
| | | | 18.13 | | | | 12.76 | | | | 5,778 | | | | 1.54 | | | | 1.49 | | | | 1.64 | | | | 1.40 | | | | 19 | | | |
| | | | | | | | | | | | | | | | | | | | | | | | | | | | | | | | | | | |
| | | | | | | | | | | | | | | | | | | | | | | | | | | | | | | | | | | |
| |
| |
| | | | 17.29 | | | | 34.28 | | | | 277,873 | | | | 1.44 | | | | 1.92 | | | | 1.62 | | | | 1.74 | | | | 30 | | | |
| | | | 17.34 | | | | 33.24 | | | | 24,452 | | | | 2.19 | | | | 1.12 | | | | 2.28 | | | | 1.03 | | | | 30 | | | |
| | | | 17.22 | | | | 33.26 | | | | 18,410 | | | | 2.19 | | | | 1.13 | | | | 2.28 | | | | 1.04 | | | | 30 | | | |
| | | | 17.34 | | | | 34.76 | | | | 232,525 | | | | 1.04 | | | | 2.34 | | | | 1.13 | | | | 2.25 | | | | 30 | | | |
| | | | 17.37 | | | | 34.15 | | | | 2,496 | | | | 1.54 | | | | 2.19 | | | | 1.63 | | | | 2.10 | | | | 30 | | | |
| | | | | | | | | | | | | | | | | | | | | | | | | | | | | | | | | | | |
| | | | | | | | | | | | | | | | | | | | | | | | | | | | | | | | | | | |
| |
| |
The accompanying notes are an integral part of these financial statements.
GOLDMAN SACHS SELECT SATELLITE FUNDS
Statement Regarding Basis for Approval of Management Agreement (Unaudited)
Background
The Goldman Sachs Absolute Return Tracker Fund, Goldman Sachs Real Estate Securities Fund, Goldman Sachs International Real Estate Securities Fund and Goldman Sachs Commodity Strategy Fund (the “Funds”) are investment portfolios of Goldman Sachs Trust (the “Trust”). The Board of Trustees oversees the management of the Trust and reviews the investment performance and expenses of the Funds at regularly scheduled meetings held during the year. In addition, the Board of Trustees determines annually whether to approve and continue the Trust’s investment management agreement (the “Management Agreement”) with Goldman Sachs Asset Management, L.P. (the “Investment Adviser”) on behalf of the Funds.
The Management Agreement was most recently approved for continuation until June 30, 2010 by the Board of Trustees, including those Trustees who are not parties to the Management Agreement or “interested persons” (as defined in the Investment Company Act of 1940, as amended) of any party thereto (the “Independent Trustees”), at a meeting held on June 17, 2009 (the “Annual Contract Meeting”).
To assist the Trustees in their deliberations at the Annual Contract Meeting, and in addition to reports on the Funds’ investment performance, expenses and other matters discussed at regularly scheduled Board meetings during the year, the Trustees have established a Contract Review Committee (the “Committee”), comprised of the Independent Trustees. The Committee held meetings on December 17, 2008, February 11, 2009 and May 20, 2009. At those Committee meetings, the Independent Trustees considered matters relating to the Management Agreement including: (a) the nature and quality of the advisory, administrative and other services provided to the Funds by the Investment Adviser and its affiliates; (b) the Funds’ investment performance; (c) the Funds’ management fee arrangements; (d) the voluntary undertakings of the Investment Adviser to reimburse certain fees and expenses of the Funds that exceed specified levels and the estimated annualized savings realized by the Funds from those undertakings; (e) potential economies of scale and the levels of breakpoints in the fees payable by the Funds under the Management Agreement; (f) the relative expense levels of the Funds as compared to those of comparable funds managed by the Investment Adviser, as well as those managed by other advisers; (g) information relating to the profitability of the Management Agreements and the transfer agency arrangements of each of the Funds and the Trust as a whole to the Investment Adviser and its affiliates; (h) the statutory and regulatory requirements applicable to the approval and continuation of mutual fund investment management agreements; (i) capacity issues relating to the securities in which the Funds invest; (j) to the extent the Investment Adviser manages institutional accounts or collective investment vehicles having investment objectives and policies similar to those of the Funds, comparative information on the advisory fees charged and services provided to those accounts by the Investment Adviser; (k) information on the processes followed by a third party mutual fund data provider engaged as part of the Trustees’ contract review (the “Outside Data Provider”) in producing investment performance (except for the Absolute Return Tracker Fund) and expense comparisons for the Funds; (l) the current pricing of services provided by, and the profitability of, the Funds’ transfer agent, Goldman, Sachs & Co. (“Goldman Sachs”); and (m) the nature and quality of the services provided to the Funds by their unaffiliated service providers and reports on due diligence conducted by the Investment Adviser with respect to those service providers.
At the Annual Contract Meeting, the Trustees reviewed the matters that were considered at the Committee meetings and also considered additional matters, including: (a) the quality of the Investment Adviser’s services; (b) the structure, staff and capabilities of the Investment Adviser and its portfolio management teams; (c) the groups or teams within the Investment Adviser that support the portfolio management teams, including legal, compliance, internal audit, the credit department, fund controllers, tax, product services, valuation oversight, market risk analysis, finance and strategy, operations, shareholder services, risk management and advisory, training and technology; (d) whether certain reductions in headcount were likely to affect the quality of the services provided to the Funds; (e) the Investment Adviser’s business continuity and disaster recovery planning; (f) the Investment Adviser’s financial resources and its ability to hire and retain talented personnel; (g) the fees received by the Investment Adviser’s affiliates from the Funds for transfer agency, securities lending, portfolio brokerage, distribution and other services; (h) the terms of the Management Agreement and agreements with other service providers entered into by the Trust on behalf of the Funds; (i) the administrative services provided under the
GOLDMAN SACHS SELECT SATELLITE FUNDS
Statement Regarding Basis for Approval of Management Agreement (Unaudited) (continued)
Management Agreement, including the nature and extent of the Investment Adviser’s oversight of the Funds’ other service providers, including the custodian and fund accounting agent; an update on the Investment Adviser’s soft dollars practices and other portfolio trading related issues; (k) the Investment Adviser’s processes and policies addressing various types of potential conflicts of interest; (l) the Investment Adviser’s approach to risk management; (m) an overview of the Funds’ distribution plan; and (n) an annual review of the effectiveness of the Funds’ compliance program. At the Annual Contract Meeting, the Trustees also considered further the Investment Adviser’s profitability with respect to each Fund, and each Fund’s investment performance, fees and expenses, including each Fund’s expense trends over time and any breakpoints in the fee rates payable by each Fund under the Management Agreement.
In connection with the Committee meetings and the Annual Contract Meeting, the Trustees attended sessions at which they reviewed information regarding the Funds’ assets, share purchase and redemption activity, the commission rates paid by the Funds on brokerage transactions, the Investment Adviser’s receipt of research services in connection with certain of those transactions, and the payment of Rule 12b-1 distribution and service fees by the Funds and the payment of non-Rule 12b-1 shareholder service and/or administration fees by the Funds. Also, in conjunction with these meetings, the Trustees received written materials and oral presentations on the topics covered, and were advised by their independent legal counsel regarding their responsibilities under applicable law.
Information was also provided to the Trustees relating to revenue sharing payments made by and services provided by the Investment Adviser and its affiliates to intermediaries that promote the sale, distribution and/or servicing of Fund shares; portfolio manager ownership of Fund shares; the manner in which portfolio manager compensation is determined, the alignment of the interests of the Funds and of the portfolio managers and related potential conflicts of interest; the number and types of accounts managed by the portfolio managers; and other matters. During the course of their deliberations, the Independent Trustees met in executive session with their independent legal counsel, without representatives of the Investment Adviser or its affiliates present.
The presentations made at the Committee meetings and at the Annual Contract Meeting encompassed the Funds and other mutual fund portfolios for which the Board of Trustees has responsibility. While the management agreements for all of the Funds and the other mutual fund portfolios for which the Trustees have responsibility were considered at the same Annual Contract Meeting, the Trustees separately considered the Management Agreement as it applied to each Fund.
In evaluating the Management Agreement at the Annual Contract Meeting, the Trustees relied upon their knowledge, resulting from their meetings and other interactions throughout the year, of the Investment Adviser, its affiliates, their services and the Funds. At those meetings the Trustees regularly received materials relating to the Investment Adviser’s investment management and other services provided under the Management Agreement, including: (a) information on the investment performance of the Funds in comparison to the performance of similar mutual funds and benchmark performance indices; (b) general investment outlooks in the markets in which the Funds invest; (c) compliance reports; and (d) expenses borne by the Funds. In addition, the Trustees were provided with copies of disclosure materials regarding the Funds and their expenses, as well as information on the Funds’ competitive universe. The Trustees also discussed the broad range of other investment choices that are available to Fund investors, including the availability of comparable funds managed by other advisers.
Nature, Extent and Quality of the Services Provided Under the Management Agreement
As part of their review, the Trustees considered the nature, extent and quality of the services provided by the Investment Adviser. In this regard, the Trustees considered both the investment advisory services, and the other, non-advisory services, that are provided to the Funds by the Investment Adviser and its affiliates. The Trustees concluded that, during the recent financial crisis, the Investment Adviser had demonstrated a willingness and an ability to commit substantial financial and other resources to the operations of the Funds and had represented that it will continue to commit those resources in multiple areas including portfolio management, trading, technology, human resources, tax, treasury, legal, compliance, valuation oversight, vendor oversight and risk management. The Independent Trustees also observed that the Investment
GOLDMAN SACHS SELECT SATELLITE FUNDS
Statement Regarding Basis for Approval of Management Agreement (Unaudited) (continued)
Adviser had made significant commitments to address regulatory compliance requirements applicable to the Funds and the Investment Adviser, including the implementation and enhancement of compliance systems and education and training initiatives.
Investment Performance
The Independent Trustees also considered the investment performance of the Funds and the Investment Adviser. In this regard, they compared the investment performance of each Fund (with the exception of the Absolute Return Tracker Fund, which commenced operations in 2008) to the performance of other similar SEC-registered funds and to rankings and ratings compiled by the Outside Data Provider. The Independent Trustees also reviewed (with the exception of the Absolute Return Tracker Fund) each Fund’s investment performance over time on a year-by-year basis relative to its performance benchmark. This information on each Fund’s investment performance was provided for the one-, three-, five- and ten-year periods ended December 31, 2008, to the extent that each Fund had been in existence for those periods. In addition, they considered the investment performance trends of the Funds (except for the Absolute Return Tracker Fund) over time, and reviewed the investment performance of each Fund in light of its investment objective and policies, market conditions, and illiquidity in certain market sectors, as well as in light of periodic analyses of its quality and risk profile. The Independent Trustees considered whether each Fund had operated within its investment policies, and had complied with its investment limitations. The Trustees noted that the Absolute Return Tracker Fund commenced operations in 2008 and had provided a reasonable level of performance to investors in light of its investment policies and given prevailing conditions in the markets in which the Fund invests. The Trustees concluded that the Investment Adviser’s continued management likely would benefit this Fund and its shareholders.
In connection with the performance of the Commodity Strategy Fund, the Trustees noted that the Fund’s recent performance challenges were attributable in large part to investments in certain asset classes, such as non-agency mortgage-backed securities or corporate debt issued by financial services companies, that performed poorly in 2008 due to investor aversion to risk and resulting market illiquidity, which depressed the prices of these securities. The Trustees recognized that the market events of 2008 were in many respects unprecedented, and that there was potential for the Fund to recover some of the unrealized losses on certain portfolio holdings in the future. The Trustees concluded that the Investment Adviser’s continued management likely would benefit this Fund and its shareholders.
In connection with the performance of the Real Estate Securities and International Real Estate Securities Funds, the Trustees recognized that 2008 was a difficult year for the real estate asset class generally and more specifically for international markets, and noted that the Investment Adviser had taken a number of steps intended to improve Fund performance, including making changes to the leadership and personnel on the portfolio management team and to the investment process used to manage the Funds (which among other things included organizational changes designed to bring additional resources to bear in managing the Funds). It was also noted that the International Real Estate Securities Fund performed in line with the benchmark in 2008, but had fared poorly relative to funds in the peer group which are predominantly global in orientation. The Trustees concluded that the Investment Adviser’s continued management likely would benefit each of those Funds and its shareholders.
Costs of Services Provided and Competitive Information
The Independent Trustees considered the contractual fee rates payable by each Fund under the Management Agreement. In this regard, the Trustees considered information on the services rendered by the Investment Adviser to the Funds, which included both advisory and administrative services that were directed to the needs and operations of the Funds as registered mutual funds.
In particular, the Trustees reviewed analyses prepared by the Outside Data Provider regarding the expense rankings of the Funds. The analyses provided a comparison of the Funds’ management fees and breakpoints to those of relevant peer groups and category universes; an expense analysis which compared each Fund’s expenses to a peer group and a category
GOLDMAN SACHS SELECT SATELLITE FUNDS
Statement Regarding Basis for Approval of Management Agreement (Unaudited) (continued)
universe; and a five-year history (or, in the case of Funds that commenced investment operations within a shorter period, since the year in which it commenced operations), comparing each Fund’s expenses to the peer and category averages. The analyses also compared each Fund’s transfer agency fees, custody and accounting fees, distribution fees, other expenses and fee waivers/reimbursements to those of other funds in the peer groups and peer group medians. The Independent Trustees believed that the comparisons provided by the Outside Data Provider were useful in evaluating the reasonableness of the management fees and total expenses paid by the Funds.
In addition, the Independent Trustees considered the Investment Adviser’s voluntary undertakings to limit the Funds’ “other expenses” ratios (excluding certain expenses) to certain specified levels and to waive a portion of the management fee for the International Real Estate Securities Fund. They also considered, to the extent that the Investment Adviser manages institutional accounts or collective investment vehicles having investment objectives and policies similar to those of the Funds, comparative fee information for services provided by the Investment Adviser to those accounts, and information that indicated that services provided to the Funds differed in various significant respects from the services provided to institutional accounts, which operated under less stringent legal and regulatory structures, were in some instances subject to different investment guidelines, required fewer services from the Investment Adviser to a smaller number of client contact points, were less time-intensive and paid lower fees.
The Independent Trustees noted the competitive nature of the mutual fund marketplace, and that many of the Funds’ shareholders invested in the Funds in part because of the Funds’ relationship with the Investment Adviser and have a general expectation that the relationship will continue. They also noted that shareholders are able to redeem their Fund shares if they believe that the Fund fees and expenses are too high or if they are dissatisfied with the performance of the Fund.
Profitability
The Independent Trustees reviewed the Investment Adviser’s revenues and pre-tax profit margins with respect to the Trust and each of the Funds. In this regard the Independent Trustees reviewed, among other things, profitability analyses and summaries, revenue and expense schedules by Fund and by function (i.e., investment management, transfer agency and distribution and service) and the Investment Adviser’s expense allocation methodology. The Trustees also reviewed the report of the internal audit group within the Goldman Sachs organization, which included an assessment of the reasonableness and consistency of the Investment Adviser’s expense allocation methodology and an evaluation of the accuracy of the Investment Adviser’s profitability analysis calculations. Profitability data for the Trust and each Fund were provided for 2008 and 2007 (2008 only for the Absolute Return Tracker Fund), and the Independent Trustees considered this information in relation to the Investment Adviser’s overall profitability. The Independent Trustees considered the Investment Adviser’s revenues and pre-tax profit margins both in absolute terms and in comparison to information on the reported pre-tax profit margins earned by certain other asset management firms.
Economies of Scale
The Independent Trustees also considered the breakpoints in the fee rate payable under the Management Agreement for each of the Funds at the following annual percentage rates of the average daily net assets of the Funds:
| | | | | | | | | | | | | | | | | |
| | | Absolute
| | | | | | International
| | | | |
| | | Return
| | | Commodity
| | | Real Estate
| | | Real Estate
| |
| | | Tracker Fund | | | Strategy Fund | | | Securities Fund | | | Securities Fund | |
| | |
| First $1 billion | | | 1.15 | % | | | 0.50 | % | | | 1.05 | % | | | 1.00 | % |
| Next $1 billion | | | 1.04 | % | | | 0.50 | % | | | 1.05 | % | | | 0.90 | % |
| Next $3 billion | | | 0.99 | % | | | 0.45 | % | | | 0.95 | % | | | 0.86 | % |
| Next $3 billion | | | 0.97 | % | | | 0.43 | % | | | 0.90 | % | | | 0.84 | % |
| Over $8 billion | | | 0.95 | % | | | 0.42 | % | | | 0.88 | % | | | 0.82 | % |
GOLDMAN SACHS SELECT SATELLITE FUNDS
Statement Regarding Basis for Approval of Management Agreement (Unaudited) (continued)
The Trustees noted that the breakpoints at the $5 and $8 billion asset levels had been proposed by the Investment Adviser and approved by the Trustees in 2008 to further share potential economies of scale, if any, with the Funds and their shareholders as assets under management reach those asset levels. In approving these fee breakpoints, the Independent Trustees considered the Investment Adviser’s potential economies of scale in managing each Fund, and whether the Funds and their shareholders would participate in the benefits of those economies. In this regard, the Independent Trustees considered the amounts of assets in the Funds; the Funds’ recent share purchase and redemption activity; the information provided by the Investment Adviser relating to the costs of the services provided by the Investment Adviser and its affiliates and their realized profits; information comparing fee rates charged by the Investment Adviser with fee rates charged to other funds in the peer group; and the Investment Adviser’s voluntary undertakings to limit fees and “other expenses” to certain amounts. Upon reviewing these matters at the Annual Contract Meeting, the Independent Trustees concluded that the fee breakpoints represented a means of ensuring that benefits of scalability would be passed along to shareholders at the specified asset levels.
Other Benefits to the Investment Adviser and Its Affiliates
The Independent Trustees also considered the other benefits derived by the Investment Adviser and its affiliates from their relationship with the Funds as stated above, including: (a) transfer agency fees received by Goldman Sachs; (b) brokerage and futures commissions earned by Goldman Sachs for executing securities and futures transactions on behalf of the Funds; (c) soft dollar benefits received by the Investment Adviser from broker-dealers in exchange for executing certain transactions on behalf of the Funds; (d) trading efficiencies resulting from aggregation of orders of the Funds with those for other funds or accounts managed by the Investment Adviser; (e) fees earned by Goldman Sachs Agency Lending, an affiliate of the Investment Adviser, as securities lending agent (and fees earned by the Investment Adviser for managing the portfolio in which the Funds’ cash collateral is invested); (f) the Investment Adviser’s ability to leverage the infrastructure designed to service the Funds on behalf of its other clients; (g) the Investment Adviser’s ability to cross-market other products and services to Fund shareholders; (h) Goldman Sachs’ retention of certain fees as Fund Distributor; (i) the Investment Adviser’s ability to negotiate better pricing with custodians on behalf of its other clients, as a result of the relationship with the Funds; and (j) the Investment Adviser’s ability to leverage relationships with the Funds’ third party service providers to attract more firmwide business.
Other Benefits to the Funds and Their Shareholders
The Independent Trustees also noted that the Funds receive certain potential benefits as a result of their relationship with the Investment Adviser, including: (a) trading efficiencies resulting from aggregation of orders of the Funds with those of other funds or accounts managed by the Investment Adviser; (b) improved servicing and pricing from vendors because of the volume of business generated by the Investment Adviser and its affiliates; (c) improved servicing from broker-dealers because of the volume of business generated by the Investment Adviser and its affiliates; (d) the Investment Adviser’s ability to negotiate favorably with derivatives counterparties as a result of the size and reputation of the Goldman Sachs organization; (e) the advantages received from the Investment Adviser’s knowledge and experience gained from managing other accounts and products; (f) the Investment Adviser’s ability to hire and retain qualified personnel to provide services to the Funds because of the reputation of the Goldman Sachs organization; (g) the Funds’ access, through the Investment Adviser, to certain firmwide resources (e.g., proprietary databases); and (h) the Funds’ access to certain affiliated distribution channels.
GOLDMAN SACHS SELECT SATELLITE FUNDS
Statement Regarding Basis for Approval of Management Agreement (Unaudited) (continued)
Conclusion
In connection with their consideration of the Management Agreement, the Independent Trustees gave weight to each of the factors described above, but did not identify any particular factor as controlling their decision. After deliberation and consideration of all of the information provided, including the factors described above, the Independent Trustees concluded, in the exercise of their business judgment, that the management fees paid by each of the Funds were reasonable in light of the services provided to it by the Investment Adviser, the Investment Adviser’s costs and each Fund’s current and reasonably foreseeable asset levels, and that the Management Agreement should be approved and continued with respect to each Fund until June 30, 2010.
GOLDMAN SACHS SELECT SATELLITE FUNDS
Fund Expenses — Six Month Period Ended June 30, 2009 (Unaudited)
As a shareholder of Class A, Class B, Class C, Institutional, Service, Class IR or Class R Shares of a Fund you incur two types of costs: (1) transaction costs, including sales charges (loads) on purchase payments (with respect to Class A Shares), contingent deferred sales charges (loads) on redemptions (with respect to Class B and Class C Shares), and redemption fees (with respect to Class A, Class B, Class C, Institutional, Service, Class IR and Class R Shares, if any); and (2) ongoing costs, including management fees; distribution and service (12b-1) fees (with respect to Class A, Class B, Class C and Class R Shares); and other Fund expenses. This example is intended to help you understand your ongoing costs (in dollars) of investing in Class A, Class B, Class C, Institutional, Service Class IR and Class R Shares of the Funds and to compare these costs with the ongoing costs of investing in other mutual funds.
The example is based on an investment of $1,000 invested at the beginning of the period and held for the entire period from January 1, 2009 through June 30, 2009.
Actual Expenses — The first line under each share class in the table below provides information about actual account values and actual expenses. You may use the information in this line, together with the amount you invested, to estimate the expenses that you paid over the period. Simply divide your account value by $1,000 (for example, an $8,600 account value divided by $1,000=8.6), then multiply the result by the number in the first line under the heading entitled “Expenses Paid” to estimate the expenses you paid on your account during this period.
Hypothetical Example for Comparison Purposes — The second line under each share class in the table below provides information about hypothetical account values and hypothetical expenses based on the Funds’ actual expense ratio and an assumed rate of return of 5% per year before expenses, which is not the Funds’ actual return. The hypothetical account values and expenses may not be used to estimate the actual ending account balance or expenses you paid for the period. You may use this information to compare the ongoing costs of investing in the Funds and other funds. To do so, compare this 5% hypothetical example with the 5% hypothetical examples that appear in the shareholder reports of the other funds.
Please note that the expenses shown in the table are meant to highlight your ongoing costs only and do not reflect any transactional costs, such as sales charges (loads), redemption fees, or exchange fees. Therefore, the second line of the table is useful in comparing ongoing costs only, and will not help you determine the relative total costs of owning different funds. In addition, if these transactional costs were included, your costs would have been higher.
| | | | | | | | | | | | | | | | | | | | | | | | | | | | | | | | | | | | | | | | | | | | | | | | | | | | | | | | | | | | | |
| | | | Absolute Return Tracker Fund | | | | Commodity Strategy Fund | | | | International Real Estate Securities Fund | | | | | | | | | | | | | |
| | | | | | | | | | | | | | | | Real Estate Securities Fund | |
| | | | | | | | | | | | Expenses
| | | | | | | | | | | | Expenses
| | | | | | | | | | | | Expenses
| | | | | | | | | | | | Expenses
| |
| | | | Beginning
| | | | Ending
| | | | Paid for the
| | | | Beginning
| | | | Ending
| | | | Paid for the
| | | | Beginning
| | | | Ending
| | | | Paid for the
| | | | Beginning
| | | | Ending
| | | | Paid for the
| |
| | | | Account Value
| | | | Account Value
| | | | 6 months ended
| | | | Account Value
| | | | Account Value
| | | | 6 months ended
| | | | Account Value
| | | | Account Value
| | | | 6 months ended
| | | | Account Value
| | | | Account Value
| | | | 6 months ended
| |
| Share Class | | | 1/01/09 | | | | 6/30/09 | | | | 6/30/09* | | | | 1/01/09 | | | | 6/30/09 | | | | 6/30/09* | | | | 1/01/09 | | | | 6/30/09 | | | | 6/30/09* | | | | 1/01/09 | | | | 6/30/09 | | | | 6/30/09* | |
Class A | | | | | | | | | | | | | | | | | | | | | | | | | | | | | | | | | | | | | | | | | | | | | | | | | | | | | | | | | | | | |
| Actual | | | $ | 1,000 | | | | $ | 1,029.10 | | | | $ | 8.00 | | | | $ | 1,000 | | | | $ | 1,084.20 | | | | $ | 4.75 | | | | $ | 1,000 | | | | $ | 1,099.70 | | | | $ | 7.97 | | | | $ | 1,000 | | | | $ | 860.10 | | | | $ | 6.69 | |
| Hypothetical 5% return | | | | 1,000 | | | | | 1,016.91 | + | | | | 7.95 | | | | | 1,000 | | | | | 1,020.23 | + | | | | 4.61 | | | | | 1,000 | | | | | 1,017.21 | + | | | | 7.65 | | | | | 1,000 | | | | | 1,017.60 | + | | | | 7.25 | |
| |
Class B | | | | | | | | | | | | | | | | | | | | | | | | | | | | | | | | | | | | | | | | | | | | | | | | | | | | | | | | | | | | |
| Actual | | | | N/A | | | | | N/A | | | | | N/A | | | | | N/A | | | | | N/A | | | | | N/A | | | | | N/A | | | | | N/A | | | | | N/A | | | | | 1,000 | | | | | 857.50 | | | | | 10.13 | |
| Hypothetical 5% return | | | | N/A | | | | | N/A | | | | | N/A | | | | | N/A | | | | | N/A | | | | | N/A | | | | | N/A | | | | | N/A | | | | | N/A | | | | | 1,000 | | | | | 1,013.88 | + | | | | 10.99 | |
| |
Class C | | | | | | | | | | | | | | | | | | | | | | | | | | | | | | | | | | | | | | | | | | | | | | | | | | | | | | | | | | | | |
| Actual | | | | 1,000 | | | | | 1,025.80 | | | | | 11.75 | | | | | 1,000 | | | | | 1,078.30 | | | | | 8.61 | | | | | 1,000 | | | | | 1,096.50 | | | | | 11.90 | | | | | 1,000 | | | | | 856.10 | | | | | 10.12 | |
| Hypothetical 5% return | | | | 1,000 | | | | | 1,013.19 | + | | | | 11.68 | | | | | 1,000 | | | | | 1,016.51 | + | | | | 8.35 | | | | | 1,000 | | | | | 1,013.44 | + | | | | 11.43 | | | | | 1,000 | | | | | 1,013.88 | + | | | | 10.99 | |
| |
Institutional | | | | | | | | | | | | | | | | | | | | | | | | | | | | | | | | | | | | | | | | | | | | | | | | | | | | | | | | | | | | |
| Actual | | | | 1,000 | | | | | 1,031.40 | | | | | 6.04 | | | | | 1,000 | | | | | 1,085.50 | | | | | 3.00 | | | | | 1,000 | | | | | 1,100.60 | | | | | 5.89 | | | | | 1,000 | | | | | 861.10 | | | | | 4.80 | |
| Hypothetical 5% return | | | | 1,000 | | | | | 1,018.84 | + | | | | 6.01 | | | | | 1,000 | | | | | 1,021.91 | + | | | | 2.91 | | | | | 1,000 | | | | | 1,019.19 | + | | | | 5.66 | | | | | 1,000 | | | | | 1,019.63 | + | | | | 5.21 | |
| |
Service | | | | | | | | | | | | | | | | | | | | | | | | | | | | | | | | | | | | | | | | | | | | | | | | | | | | | | | | | | | | |
| Actual | | | | N/A | | | | | N/A | | | | | N/A | | | | | N/A | | | | | N/A | | | | | N/A | | | | | N/A | | | | | N/A | | | | | N/A | | | | | 1,000 | | | | | 859.60 | | | | | 7.10 | |
| Hypothetical 5% return | | | | N/A | | | | | N/A | | | | | N/A | | | | | N/A | | | | | N/A | �� | | | | N/A | | | | | N/A | | | | | N/A | | | | | N/A | | | | | 1,000 | | | | | 1,017.15 | + | | | | 7.70 | |
| |
Class IR | | | | | | | | | | | | | | | | | | | | | | | | | | | | | | | | | | | | | | | | | | | | | | | | | | | | | | | | | | | | |
| Actual | | | | 1,000 | | | | | 1,031.40 | | | | | 6.75 | | | | | 1,000 | | | | | 1,087.00 | | | | | 3.47 | | | | | 1,000 | | | | | 1,101.10 | | | | | 6.77 | | | | | 1,000 | | | | | 860.40 | | | | | 5.49 | |
| Hypothetical 5% return | | | | 1,000 | | | | | 1,018.15 | + | | | | 6.71 | | | | | 1,000 | | | | | 1,021.47 | + | | | | 3.36 | | | | | 1,000 | | | | | 1,018.35 | + | | | | 6.51 | | | | | 1,000 | | | | | 1,018.89 | + | | | | 5.96 | |
| |
Class R | | | | | | | | | | | | | | | | | | | | | | | | | | | | | | | | | | | | | | | | | | | | | | | | | | | | | | | | | | | | |
| Actual | | | | 1,000 | | | | | 1,028.00 | | | | | 9.25 | | | | | 1,000 | | | | | 1,083.90 | | | | | 6.05 | | | | | N/A | | | | | N/A | | | | | N/A | | | | | 1,000 | | | | | 859.20 | | | | | 7.79 | |
| Hypothetical 5% return | | | | 1,000 | | | | | 1,015.67 | + | | | | 9.20 | | | | | 1,000 | | | | | 1,018.99 | + | | | | 5.86 | | | | | N/A | | | | | N/A | | | | | N/A | | | | | 1,000 | | | | | 1,016.41 | + | | | | 8.45 | |
| |
| |
| * | Expenses are calculated using each Fund’s annualized net expense ratio, which represents the ongoing expenses as a percentage of net assets for the six months ended June 30, 2009. Expenses are calculated by multiplying the annualized net expense ratio by the average account value for the period; then multiplying the result by the number of days in the most recent fiscal half year; and then dividing that result by the number of days in the fiscal year. The annualized net expense ratios for the period were as follows: |
| | | | | | | | | | | | | | | | | | | | | | | | | | | | | |
| Fund | | Class A | | | Class B | | | Class C | | | Institutional | | | Service | | | Class IR | | | Class R | |
| | |
| Absolute Return Tracker | | | 1.60 | % | | | N/A | | | | 2.35 | % | | | 1.20 | % | | | N/A | | | | 1.35 | % | | | 1.85 | % |
| Commodity Strategy | | | 0.92 | | | | N/A | | | | 1.67 | | | | 0.58 | | | | N/A | | | | 0.67 | | | | 1.17 | |
| International Real Estate Securities | | | 1.53 | | | | N/A | | | | 2.28 | | | | 1.13 | | | | N/A | | | | 1.28 | | | | N/A | |
| Real Estate Securities | | | 1.44 | | | | 2.19 | % | | | 2.19 | | | | 1.04 | | | | 1.54 | % | | | 1.19 | | | | 1.69 | |
| |
| |
| |
| + | Hypothetical expenses are based on each Fund’s actual annualized net expense ratios and an assumed rate of return of 5% per year before expenses. |
76
FUNDS PROFILE
Goldman Sachs Funds
Goldman Sachs is a premier financial services firm, known since 1869 for creating thoughtful and customized investment solutions in complex global markets.
Today, the Investment Management Division of Goldman Sachs serves a diverse set of clients worldwide, including private institutions, public entities and individuals. With portfolio management teams located around the world — and $761 billion in assets under management as of June 30, 2009 — our investment professionals bring firsthand knowledge of local markets to every investment decision, making us one of the few truly global asset managers.
GOLDMAN SACHS FUNDS
In building a globally diversified portfolio, you can select from more than 80 Goldman Sachs Funds and gain access to investment opportunities across borders, investment styles, asset classes and security capitalizations.

| | | | | |
Money Market1
Fixed Income
n Enhanced Income Fund
n Ultra-Short Duration
Government Fund
n Short Duration Government
Fund
n Short Duration Tax-Free Fund
n Municipal Income Fund
n Government Income Fund
n Inflation Protected Securities
Fund
n U.S. Mortgages Fund
n Core Fixed Income Fund
n Core Plus Fixed Income Fund
n Investment Grade Credit Fund
n Global Income Fund
n High Yield Municipal Fund
n High Yield Fund
n Emerging Markets Debt Fund
n Local Emerging Markets
Debt Fund | | Domestic Equity
n Balanced Fund
n Growth and Income Fund
n Structured Large Cap Value Fund
n Large Cap Value Fund
n Structured U.S. Equity Fund
n Structured Large Cap Growth Fund
n Capital Growth Fund
n Strategic Growth Fund
n All Cap Growth Fund
n Concentrated Growth Fund
n Tollkeeper FundSM
n Mid Cap Value Fund
n Growth Opportunities Fund
n Small/Mid Cap Growth Fund
n Structured Small Cap Equity Fund
n Structured Small Cap Value Fund
n Structured Small Cap Growth Fund
n Small Cap Value Fund
Fund of Funds2
n Asset Allocation Portfolios
n Income Strategies Portfolio
n Satellite Strategies Portfolio
n Enhanced Dividend Global Equity Portfolio
n Tax-Advantaged Global Equity Portfolio | | Retirement Strategies2
International Equity
n Structured International Equity Fund
n Structured International Equity Flex Fund
n Strategic International Equity Fund
n Concentrated International Equity Fund
n Structured International Small Cap Fund
n International Small Cap Fund
n Asia Equity Fund
n Structured Emerging Markets Equity Fund
n Emerging Markets Equity Fund
n BRIC Fund (Brazil, Russia, India, China)
Specialty2
n U.S. Equity Dividend and Premium Fund
n International Equity Dividend and Premium Fund
n Structured Tax-Managed Equity Fund
n Structured International Tax-Managed
Equity Fund
n Real Estate Securities Fund
n International Real Estate Securities Fund
n Commodity Strategy Fund
n Absolute Return Tracker Fund |
| |
1 | An investment in a money market fund is neither insured nor guaranteed by the Federal Deposit Insurance Corporation or any other government agency. Although the Funds seek to preserve the value of your investment at $1.00 per share, it is possible to lose money by investing in the Funds. |
| |
| 2 | Individual Funds within the Fund of Funds, Retirement Strategies and Specialty categories will have various placement on the risk/return spectrum and may have greater or lesser risk than that indicated by the placement of the general Fund of Funds, Retirement Strategies or Specialty category. |
The Goldman Sachs Tollkeeper FundSM is a registered service mark of Goldman, Sachs & Co.
| | | |
TRUSTEES
Ashok N. Bakhru, Chairman
John P. Coblentz, Jr.
Diana M. Daniels
Patrick T. Harker
James A. McNamara
Jessica Palmer
Alan A. Shuch
Richard P. Strubel | | OFFICERS
James A. McNamara, President
John M. Perlowski, Senior Vice President and Treasurer
Peter V. Bonanno, Secretary |
| | | |
| | | |
GOLDMAN, SACHS & CO.
Distributor and Transfer Agent | | GOLDMAN SACHS ASSET MANAGEMENT, L.P.
Investment Adviser |
Visit our Web site at www.goldmansachsfunds.com to obtain the most recent month-end returns.
Goldman Sachs Asset Management, L.P. 32 Old Slip, 32nd Floor, New York, New York 10005
A prospectus for the Fund containing more complete information may be obtained from your authorized dealer or from Goldman, Sachs & Co. by calling (retail — 1-800-526-7384) (institutional — 1-800-621-2550). Please consider a fund’s objectives, risks, and charges and expenses, and read the prospectus carefully before investing. The prospectus contains this and other information about the Fund.
The reports concerning the Funds included in this shareholder report may contain certain forward-looking statements about the factors that may affect the performance of the Funds in the future. These statements are based on Fund management’s predictions and expectations concerning certain future events and their expected impact on the Funds, such as performance of the economy as a whole and of specific industry sectors, changes in the levels of interest rates, the impact of developing world events, and other factors that may influence the future performance of the Funds. Management believes these forward-looking statements to be reasonable, although they are inherently uncertain and difficult to predict. Actual events may cause adjustments in portfolio management strategies from those currently expected to be employed.
A description of the policies and procedures that the Funds use to determine how to vote proxies relating to portfolio securities and information regarding how a Fund voted proxies relating to portfolio securities during the most recent 12-month period ended June 30 is available (i) without charge, upon request by calling 1-800-526-7384 (for Retail Shareholders) or 1-800-621-2550 (for Institutional Shareholders); and (ii) on the Securities and Exchange Commission Web site at http://www.sec.gov.
The Funds file their complete schedule of portfolio holdings with the Securities and Exchange Commission (”SEC”) for the first and third quarters of each fiscal year on Form N-Q. Forms N-Q will become available on the SEC’s website at http://www.sec.gov within 60 days after the Funds’ first and third fiscal quarters. When available, the Funds’ Forms N-Q may be reviewed and copied at the SEC’s Public Reference Room in Washington, D.C. and information on the operation of the Public Reference Room may also be obtained by calling 1-800-SEC-0330. When available, Forms N-Q may be obtained upon request and without charge by calling 1-800-526-7384 (for Retail Shareholders) or 1-800-621-2550 (for Institutional Shareholders).
Holdings and allocations shown may not be representative of current or future investments. Holdings and allocations may not include the Funds’ entire investment portfolio, which may change at any time. Fund holdings should not be relied on in making investment decisions and should not be construed as research or investment advice regarding particular securities.
This material is not authorized for distribution to prospective investors unless preceded or accompanied by a current Prospectus for the Fund. Please consider a Fund’s objectives, risks, and charges and expenses and read the prospectus carefully before investing. The Prospectus contains this and other information about the Fund.
Copyright 2009 Goldman, Sachs & Co. All rights reserved. 25506.MF.TMPL SELSATSAR / 39K / 08-09
| | (a) | | The information required by this Item is only required in an annual report on this Form N-CSR. |
| | | |
| | (b) | | During the period covered by this report, no amendments were made to the provisions of the Code of Ethics. |
| | | |
| | (c) | | During the period covered by this report, the registrant did not grant any waivers, including an implicit waiver, from any provision of the Code of Ethics. |
| | | |
| | (d) | | A copy of the Code of Ethics is available as provided in Item 12(a)(1) of this report. |
| | | |
| | | |
| ITEM 3. | | AUDIT COMMITTEE FINANCIAL EXPERT. |
The information required by this Item is only required in an annual report on this Form N-CSR.
| | | |
| ITEM 4. | | PRINCIPAL ACCOUNTANT FEES AND SERVICES. |
The information required by this Item is only required in an annual report on this Form N-CSR.
| | | |
| ITEM 5. | | AUDIT COMMITTEE OF LISTED REGISTRANTS. |
| | | |
| | | The information required by this Item is only required in an annual report on this Form N-CSR. |
| | | |
| ITEM 6. | | SCHEDULE OF INVESTMENTS. |
| | | |
| | | The Schedule of Investments is included as part of the Semi-Annual Report to Stockholders filed under Item 1 of this Form N-CSR. |
| | | |
| ITEM 7. | | DISCLOSURE OF PROXY VOTING POLICIES AND PROCEDURES FOR CLOSED-END MANAGEMENT INVESTMENT COMPANIES. |
| | | |
| | | Not applicable. |
| | | |
| ITEM 8. | | PORTFOLIO MANAGERS OF CLOSED-END MANAGEMENT INVESTMENT COMPANIES. |
| | | |
| | | Not applicable. |
| | | |
| ITEM 9. | | PURCHASES OF EQUITY SECURITIES BY CLOSED-END MANAGEMENT INVESTMENT COMPANY AND AFFILIATED PURCHASERS. |
| | | |
| | | Not applicable. |
| | | |
| ITEM 10. | | SUBMISSION OF MATTERS TO A VOTE OF SECURITY HOLDERS.
There have been no material changes to the procedures by which shareholders may recommend nominees to the registrant’s board of trustees. |
| | | |
| | | |
| ITEM 11. | | CONTROLS AND PROCEDURES. |
| | | |
| | (a) | | The registrant’s principal executive and principal financial officers, or persons performing similar functions have concluded that the registrant’s disclosure controls and procedures (as defined in Rule 30a-3(c) under the Investment Company Act of 1940, as amended (the “1940 Act”)) are effective as of a date within 90 days of the filing of this report that includes the disclosure required by this paragraph, based on the evaluation of these controls and procedures required by Rule 30a-3(b) under the 1940 Act and 15d-15(b) under the Securities Exchange Act of 1934, as amended. |
| | | |
| | (b) | | There were no changes in the registrant’s internal control over financial reporting (as defined in Rule 30a-3(d) under the 1940 Act) that occurred during the registrant’s second fiscal quarter of the period covered by this report that have materially affected, or are reasonably likely to materially affect, the registrant’s internal control over financial reporting. |
| | | |
| | (a)(1) | | | Goldman Sachs Trust's Code of Ethics for Principal Executive and Senior Financial Officers is incorporated by reference to Exhibit 11(a)(1) of the registrant's Form N-CSR filed on March 8, 2004 for its Real Estate Securities Fund (Accession Number 0000950123-04-0002984). |
| | | |
| | (a)(2) | | Exhibit 99.CERT | Certifications pursuant to Section 302 of the Sarbanes-Oxley Act of 2002 filed herewith. |
| | | |
| | (b) | | Exhibit 99.906CERT | Certifications pursuant to Section 906 of the Sarbanes-Oxley Act of 2002 filed herewith. |
SIGNATURES
| | | | Pursuant to the requirements of the Securities Exchange Act of 1934, as amended, and the Investment Company Act of 1940, as amended, the Registrant has duly caused this report to be signed on its behalf by the undersigned, thereunto duly authorized. |
| | | | | | | |
| | | | | Goldman Sachs Trust | | |
| | | | | | | |
| By: | | | | /s/ James A. McNamara | | |
| | | | |
| | |
| | | | | James A. McNamara | | |
| | | | | President/Principal Executive Officer | | |
| | | | | Goldman Sachs Trust | | |
| | | | | | | |
| Date: | | | | September 2, 2009 | | |
| | | | Pursuant to the requirements of the Securities Exchange Act of 1934, as amended, and the Investment Company Act of 1940, as amended, this report has been signed below by the following persons on behalf of the Registrant and in the capacities and on the dates indicated. |
| | | | | | | |
| By: | | | | /s/ James A. McNamara | | |
| | | | |
| | |
| | | | | James A. McNamara | | |
| | | | | President/Principal Executive Officer | | |
| | | | | Goldman Sachs Trust | | |
| | | | | | | |
| Date: | | | | September 2, 2009 | | |
| | | | | | | |
| By: | | | | /s/ John M. Perlowski | | |
| | | | |
| | |
| | | | | John M. Perlowski | | |
| | | | | Treasurer/Principal Financial Officer | | |
| | | | | Goldman Sachs Trust | | |
| | | | | | | |
| Date: | | | | September 2, 2009 | | |


![[GRAPHIC]](https://capedge.com/proxy/N-CSRS/0000950123-09-040953/y78321y7832101.gif)
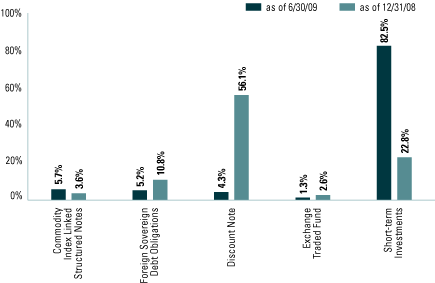

![[GRAPHIC]](https://capedge.com/proxy/N-CSRS/0000950123-09-040953/y78321y7832105.gif)
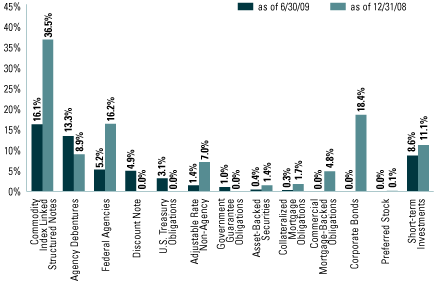
![[GRAPHIC]](https://capedge.com/proxy/N-CSRS/0000950123-09-040953/y78321y7832110.gif)
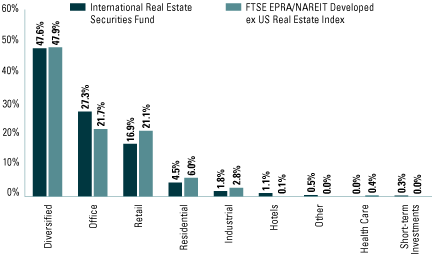
![[GRAPHIC]](https://capedge.com/proxy/N-CSRS/0000950123-09-040953/y78321y7832112.gif)
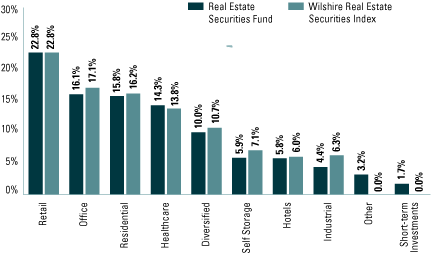
![[GRAPHIC]](https://capedge.com/proxy/N-CSRS/0000950123-09-040953/y78321y7832114.gif)