UNITED STATES
SECURITIES AND EXCHANGE COMMISSION
Washington, D.C. 20549
FORM N-CSR
CERTIFIED SHAREHOLDER REPORT OF REGISTERED
MANAGEMENT INVESTMENT COMPANIES
Investment Company Act file number 811-05349
Goldman Sachs Trust
(Exact name of registrant as specified in charter)71 South Wacker Drive, Chicago, Illinois 60606
(Address of principal executive offices) (Zip code)| | | |
| Peter V. Bonanno, Esq. | | Copies to: |
| Goldman, Sachs & Co. | | Jack W. Murphy, Esq. |
| One New York Plaza | | Dechert LLP |
| New York, New York 10004 | | 1775 I Street, NW |
| | | Washington, D.C. 20006 |
|
(Name and address of agents for service)
|
Registrant’s telephone number, including area code: (312) 655-4400
Date of fiscal year end: December 31
Date of reporting period: September 30, 2009
| | | |
| ITEM 1. | | REPORTS TO STOCKHOLDERS. |
| | | |
| | | The Semi-Annual Report to Stockholders is filed herewith. |
Goldman Sachs Funds
| | | | |
| | | | |
Semi-Annual Report | | | September 30, 2009 |
| | | | |
| | | | |
| | | | |
| | | | Single Sector Fixed Income Funds |
| | | | Emerging Markets Debt |
| | | | High Yield |
| | | | Investment Grade Credit |
| | | | Local Emerging Markets Debt |
| | | | U.S. Mortgages |
| | | | |
Goldman Sachs Single Sector Fixed
Income Funds
| | |
| n | GOLDMAN SACHS EMERGING MARKETS DEBT | |
| |
| n | GOLDMAN SACHS HIGH YIELD | |
| |
| n | GOLDMAN SACHS INVESTMENT GRADE CREDIT | |
| |
| n | GOLDMAN SACHS LOCAL EMERGING MARKETS DEBT | |
| |
| n | GOLDMAN SACHS U.S. MORTGAGES | |
TABLE OF CONTENTS
| | | |
| Principal Investment Strategies and Risks | | 1 |
| Investment Process | | 3 |
| Portfolio Management Discussion and Performance Summaries | | 9 |
| Schedules of Investments | | 26 |
| Financial Statements | | 66 |
| Notes to Financial Statements | | 73 |
| Financial Highlights | | 96 |
| Other Information | | 106 |
| | | | | | | |
NOT FDIC-INSURED | | | May Lose Value | | | No Bank Guarantee |
| | | | | | | |
GOLDMAN SACHS SINGLE SECTOR FIXED INCOME FUNDS
Principal Investment Strategies and Risks
The Emerging Markets Debt Fund invests primarily in fixed income securities of issuers located in emerging countries. The Fund’s investments in fixed income securities are subject to the risks associated with debt securities generally, including credit, liquidity and interest rate risk. The majority of the countries in which the Fund invests have sovereign ratings that are below investment grade or are unrated. High yield, lower rated securities involve greater price volatility and present greater risks than higher rated fixed income securities. Fixed income securities of emerging countries are less liquid and are subject to greater price volatility and will be subject to the risks of currency fluctuations and sudden economic or political developments. At times, the Fund may be unable to sell certain of its portfolio securities without a substantial drop in price, if at all. The securities markets of emerging countries have less government regulation and are subject to less extensive accounting and financial reporting requirements than the markets of more developed countries. The Fund is also subject to the risk that the issuers of sovereign debt or the government authorities that control the payment of debt may be unable or unwilling to repay principal or interest when due. The Fund may also engage in foreign currency transactions for hedging purposes (including cross hedging) or for speculative purposes. Forward foreign currency exchange contracts are subject to the risk that the counterparty to the contract will default on its obligations. The Fund may make substantial investments in derivative instruments, including options, financial futures, Eurodollar futures contracts, swaps, option on swaps, structured securities and other derivative investments. Derivative instruments may involve a high degree of financial risk. These risks include the risk that a small movement in the price of the underlying security or benchmark may result in a disproportionately large movement, unfavorable or favorable, in the price of the derivative instrument; the risk of default by a counterparty; and the risk that transactions may not be liquid. The Fund may concentrate its investments in particular countries or regions and may be subject to greater losses than if it were less concentrated in a particular country or region. The Fund is non-diversified and may invest more of its assets in fewer issuers than diversified funds and may be more susceptible to adverse developments affecting any single issuer held in its portfolio and may be susceptible to greater losses because of these developments.
The High Yield Fund invests primarily in high yield, fixed income securities that, at the time of purchase, are non-investment grade securities. The Fund’s investments in fixed income securities are subject to the risks associated with debt securities including credit, liquidity and interest rate risk. High yield, lower rated securities involve greater price volatility and present greater risks than higher rated fixed income securities. The Fund may also invest in foreign issuers who are denominated in currencies other than the U.S. dollar and in securities of issuers located in emerging countries denominated in any currency. The Fund’s foreign and emerging market investments may be more volatile and less liquid than its investments in U.S. securities and will be subject to the risks of currency fluctuations and sudden economic or political developments. At times, the Fund may be unable to sell certain of its portfolio securities without a substantial drop in price, if at all. The Fund may also engage in foreign currency transactions for hedging purposes (including cross hedging) or for speculative purposes. The Fund may make substantial investments in derivative instruments, including options, financial futures, Eurodollar futures contracts, swaps, options on swaps, structured securities and other derivative investments. Derivative instruments may involve a high degree of financial risk. These risks include the risk that a small movement in the price of the underlying security or benchmark may result in a disproportionately large movement, unfavorable or favorable, in the price of the derivative instrument; the risk of default by a counterparty; and the risk that transactions may not be liquid.
The Investment Grade Credit Fund invests primarily in investment grade fixed income securities. The Fund’s investments in fixed income securities are subject to the risks associated with debt securities generally, including credit, liquidity and interest rate risk. The guarantee on U.S. government securities applies only to the underlying securities of the Fund if held to maturity and not to the value of the Fund’s shares. The Fund’s investments in mortgage-backed securities are subject to prepayment risks. These risks may result in greater share price volatility. The Fund may invest in foreign and emerging markets securities, which may be more volatile and less liquid than its investments in U.S. securities and will be subject to the risks of currency fluctuations and political developments. At times, the Fund may be unable to sell certain of its portfolio securities without a substantial drop in price, if at all. The Fund may also engage in foreign currency transactions for hedging purposes (including cross hedging) or for speculative purposes.
GOLDMAN SACHS SINGLE SECTOR FIXED INCOME FUNDS
Forward foreign currency exchange contracts are subject to the risk that the counterparty to the contract will default on its obligations. The Fund may make substantial investments in derivative instruments, including options, financial futures, Eurodollar futures contracts, swaps, option on swaps, structured securities and other derivative investments. Derivative instruments may involve a high degree of financial risk. These risks include the risk that a small movement in the price of the underlying security or benchmark may result in a disproportionately large movement, unfavorable or favorable, in the price of the derivative instrument; the risk of default by a counterparty; and the risk that transactions may not be liquid.
The Local Emerging Markets Debt Fund invests primarily in sovereign and corporate debt of issuers located in emerging countries where such debt securities are denominated in the local currency of such emerging countries. The Fund’s investments in fixed income securities are subject to the risks associated with debt securities generally, including credit, liquidity and interest rate risk. The majority of the countries in which the Fund invests have sovereign ratings that are below investment grade or are unrated. High yield, lower rated securities involve greater price volatility and present greater risks than higher rated fixed income securities. Fixed income securities of emerging countries are less liquid and are subject to greater price volatility and will be subject to the risks of currency fluctuations and sudden economic or political developments. Since the Fund may invest in non-investment grade fixed income securities and emerging country issuers, it especially will be subject to the risk that the liquidity of particular portfolio securities will shrink or disappear suddenly and without warning as a result of adverse economic, market or political events, or adverse investor perceptions, whether or not accurate. At times, the Fund may be unable to sell certain of its portfolio securities without a substantial drop in price, if at all. The securities markets of emerging countries have less government regulation and are subject to less extensive accounting and financial reporting requirements than the markets of more developed countries. The Fund is also subject to the risk that the issuers of sovereign debt or the government authorities that control the payment of debt may be unable or unwilling to repay principal or interest when due. The Fund may also engage in foreign currency transactions for hedging purposes (including cross hedging) or for speculative purposes. Forward foreign currency exchange contracts are subject to the risk that the counterparty to the contract will default on its obligations. The Fund may make substantial investments in derivative instruments, including options, financial futures, Eurodollar futures contracts, swaps, option on swaps, structured securities and other derivative investments. Derivative instruments may involve a high degree of financial risk. These risks include the risk that a small movement in the price of the underlying security or benchmark may result in a disproportionately large movement, unfavorable or favorable, in the price of the derivative instrument; the risk of default by a counterparty; and the risk that transactions may not be liquid. The Fund is non-diversified and may invest more of its assets in fewer issuers than diversified funds and may be more susceptible to adverse developments affecting any single issuer held in its portfolio and may be susceptible to greater losses because of these developments.
The U.S. Mortgages Fund invests primarily in securities representing direct or indirect interests in or that are collateralized by mortgage-backed securities. The Fund’s investments in fixed income securities are subject to the risks associated with debt securities generally, including credit, liquidity and interest rate risk. The Fund’s investment in mortgage-backed securities (MBS) is subject to prepayment risk, the risk that in a declining interest rate environment the Fund’s underlying mortgages may be prepaid, causing the Fund to have to reinvest at lower interest rates. This risk may result in greater share price volatility than a fixed income fund not invested in MBS. The guarantee on U.S. government securities applies only to the underlying securities of the Fund if held to maturity and not to the value of the Fund’s shares. The Fund may make substantial investments in derivative instruments, including options, financial futures, Eurodollar futures contracts, swaps, option on swaps, structured securities and other derivative investments. Derivative instruments may involve a high degree of financial risk. These risks include the risk that a small movement in the price of the underlying security or benchmark may result in a disproportionately large movement, unfavorable or favorable, in the price of the derivative instrument; the risk of default by a counterparty; and the risk that transactions may not be liquid.
GOLDMAN SACHS SINGLE SECTOR FIXED INCOME FUNDS
What Differentiates the Goldman Sachs Asset
Management Fixed Income Investment Process?
At Goldman Sachs Asset Management, L.P. (“GSAM”), the goal of our fixed income investment process is to provide consistent, strong performance by actively managing our portfolios within a research-intensive, risk-managed framework.
| | | |
| | | |
| | | |
| | | A key element of our fixed income investment philosophy is to evaluate the broadest global opportunity set to capture relative value across sectors and instruments. Our globally integrated investment process involves managing dynamically along the risk/return spectrum, as we continue to develop value-added strategies through:
n Assess relative value among securities and sectors
n Leverage the vast resources of GSAM in selecting securities for each portfolio
n Team approach to decision making
n Manage risk by avoiding significant sector and interest rate bets
Fixed Income portfolios that:
n Include domestic and global investment options, income opportunities, and access to areas of specialization such as high yield
n Capitalize on GSAM’s industry-renowned credit research capabilities
n Use a risk-managed framework to seek total return, recognizing the importance of investors’ capital accumulation goals as well as their need for income |
MARKET OVERVIEW
Goldman Sachs Single Sector Fixed Income Funds
Market Review
The combination of improving financial conditions and stability in economic data led to a dramatic increase in demand for riskier fixed income assets during the six months ended September 30, 2009 (the “Reporting Period”). Fears of financial systemic risk were significantly reduced as a result of unprecedented policy mechanisms put in place earlier in the calendar year.
U.S. Fixed Income Market
The U.S. economy showed signs of improvement during the Reporting Period. After edging higher throughout the spring, the Purchasing Managers’ Index, which is an indicator of the economic health of the manufacturing sector, as reported by the Institute of Supply Management, rose above 50 for the first time in 18 months in August 2009. Because a reading above 50 indicates growth in the manufacturing sector, this was one of the strongest and most hopeful pieces of evidence that the economy had begun to pull out of recession. Business inventories declined. Retail sales were also better than expected. Although some of the uptick was attributed to higher gasoline prices, the government’s Cash for Clunkers program also provided a boost to retail sales. Indeed, even excluding auto sales, retail sales rose 1.1% in August 2009, significantly more than the forecasted 0.4% increase, indicating that the renewed strength in private demand was broader than expected.
While the marked upturn in discretionary spending indicated the possibility of sustained economic recovery, consumers continued to be burdened by high debt levels and a weak labor market. The pace of decline in nonfarm payrolls slowed, but at the end of September, the unemployment rate stood at 9.8%, the highest rate since June 1983. Although commodity and energy prices rose during the Reporting Period, inflation remained subdued. In a statement following its June meeting, the Federal Open Market Committee (the “Fed”) stated that “substantial resource slack is likely to dampen cost pressures, and the Committee expects that inflation will remain subdued for some time.” This sentiment was repeated by the Fed following its September meeting.
During the first months of the Reporting Period, what is known as the TED spread, which is the difference in yield between 3-month LIBOR* and 3-month U.S. Treasuries and a common measure of financial stress, stood at about 0.50%. This was the lowest reading of the TED spread since the middle of 2007, before the credit crisis hit in earnest. Interest rates rose during most of the second calendar quarter, but reversed course in the final weeks of June as heavy supply was well absorbed. Nevertheless, the 10-year Treasury ended the second calendar quarter 87 basis points (0.87%) higher at a yield of 3.53%. Notably, the U.S. Treasury yield curve, or spectrum of maturities, reached its steepest level ever, meaning the yields on securities with longer-term maturities were significantly higher than the yields on securities with shorter-term maturities. The differential between 2- and 10-year Treasury notes reached 275 basis points (2.75%) in May before ending June at
| | |
| * | | LIBOR, or London interbank offered rates, are floating interest rates that are widely used as reference rates in bank, corporate and government lending agreements. |
MARKET OVERVIEW
242 basis points (2.42%). Investors showed a strong appetite for risky assets and all spread, or non-Treasury, sectors handily outperformed U.S. Treasuries.
In the third calendar quarter, interest rates were relatively stable and even declined slightly, aided by continued signs of easy monetary policy. In its statement following its September meeting, the Fed stated that it “continues to anticipate that economic conditions are likely to warrant exceptionally low levels of the federal funds rate for an extended period.” The 10-year Treasury ended the Reporting Period 23 basis points (0.23%) lower at a yield of 3.31%. The 10-year Treasury remained surprisingly strong mainly due to support from international and domestic fund flows. The Treasury yield curve flattened slightly, meaning the difference in yields between shorter-term and longer-term Treasury securities narrowed. Still, the Treasury yield curve remained steep as the differential between the 2- and 10-year Treasury notes was 236 basis points (2.36%) at the end of September. Investors continued to show a strong appetite for risky assets and all non-Treasury sectors added to their year-to-date outperformance versus Treasuries.
| |
| n | Investment grade corporate bonds staged a remarkable rally during the Reporting Period. Credit spreads, or the difference in yields between corporate bonds and duration-equivalent Treasury securities, tightened in the face of positive economic data, favorable supply and demand technicals, and investors’ growing risk appetite. In fact, spreads ended the Reporting Period at their narrowest levels of the calendar year, reaching levels not seen since June 2008 before the aggressive selloff of the financial crisis. Financials led this sustained rally, driven by the increased issuance of debt securities by banks as they deleveraged their balance sheets and plugged funding gaps. Although investment grade corporate bond issuance was robust throughout the Reporting Period, supply was unable to keep up with demand. The correlation (or, the tendency to move in tandem) between the highest and lowest quality credits decreased as lower quality credits made the largest gains. |
| |
| n | U.S. mortgage-backed securities turned in solid performance during the Reporting Period, as agency securities continued to benefit from robust government demand. In line with other risky assets, credit-sensitive mortgages performed well. Meanwhile, non-agency mortgage securities, especially prime mortgages, rallied from lows reached during the first quarter of 2009 in anticipation of the U.S. government’s Public-Private Investment Program (PPIP) and indications that the residential housing market might be stabilizing. |
| |
| n | Commercial mortgage-backed securities (CMBS) outperformed Treasuries, as investors purchased CMBS eligible for the U.S. government’s Term Asset-backed Loan Facility (TALF). There was also strong demand for Re-REMICs, which are pools of commercial mortgage-backed securities that tend to have higher credit enhancement on senior tranches. However, the commercial real estate market remained extremely weak with the Moody’s/REAL National All Property Type Aggregate Index about 30% below its late 2007 peak. |
| |
| n | High yield corporate bonds rallied strongly during the Reporting Period as investors sought higher yields in the near-zero interest rate environment. Strength in the high yield corporate bond market was further attributable to perceived economic and financial stability and increased liquidity. The largest gains were made by bonds rated CCC or lower. |
MARKET OVERVIEW
Companies at risk of covenant breaches and seeking to reduce their exposure to near-term maturities issued bonds to replace bank debt in their capital structure. As liquidity improved and default expectations were revised downward, many companies were able to use internal cash flows to refinance near-term debt obligations. High yield companies also worked to repair their balance sheets by issuing equity to reduce leverage. Calendar year-to-date through September 30, 2009, approximately $24 billion in equity capital had been issued by high yield companies.
Emerging Markets Debt
As the Reporting Period began, global central banks had acted aggressively to improve liquidity in financial markets, thereby mitigating systemic risk, encouraging an increase in investor risk appetite, and stemming the flight to safety. Global economic data from around the world soon began to show signs of improvement. Manufacturing data, U.S. housing prices, corporate earnings, retail sales, and consumer confidence were all up and better than expected.
Emerging markets debt rallied as economic data in developed markets improved. The market also benefited from the strong support for the emerging markets at the April 2009 G20 summit, including a pledge to triple the International Monetary Fund’s (IMF) resources. Further, demand for crude oil and base metals rebounded, indicating that global trade was on the road to recovery. Given the high demand for higher-yielding assets, the general market consensus seemed to be that the worst of the global recession was over. The positive news about the developed markets, along with robust and coordinated global economic support from the IMF and other multinational financial institutions, reduced perceived risk for emerging market economies and enhanced the performance of emerging market assets.
In the J.P. Morgan EMBI Global Diversified Index, Argentina (+131.96% in U.S. dollar terms**), Ukraine (+94.28%) and Pakistan (+83.77%) were the top performers during the Reporting Period. Egypt (+4.95%), China (+5.95%) and Chile (+9.04%) were the weakest.
In the J.P. Morgan Government Bond Index — Emerging Markets Global Diversified Index, the top performers during the Reporting Period were Argentina (+170.48% in U.S. dollar terms**), Hungary (+57.07%) and Indonesia (+43.32%), while China (-0.40%), Chile (+4.77%) and Thailand (+4.79%) turned in the weakest performance.
Looking Ahead
U.S. Fixed Income Market
In our view, the U.S. economy will likely continue to rebound in the months ahead, but the sustainability of the recovery remains an open question. Most of the economic growth during the second half of 2009 is being driven by what may be temporary factors, including government spending, corporate cost-cutting and inventory rebuilding. We expect
| | |
| ** | | All regional and market returns are in U.S. dollar terms (unless otherwise specified), are based on country-specific stock market indices and reflect the reinvestment of any dividends if applicable. |
MARKET OVERVIEW
that these sources of growth will begin to fade in 2010, and consumer spending and/or business investment will need to sustain the recovery.
We believe prospects for consumption are still the key, because we see little potential for business investment to be a strong source of growth unless end-demand improves. While retail sales saw an uptick, with help from a temporary boost to auto sales with the Cash for Clunkers program and from higher gas prices, we think sustainable growth in consumer spending will depend largely on whether improvements in the job market and housing prices can continue. The pace of job cuts has slowed significantly, but U.S. employment remains very weak and the unemployment rate may well continue to rise. We believe the job market will continue to stabilize in the coming months, with unemployment peaking at slightly more than 10%. Still, the ongoing decline in hourly earnings suggests the job market will remain a challenge for consumers for some time to come.
As with employment, housing prices have stabilized in recent months but probably have further downside risk. In our view, home price gains during the Reporting Period were exaggerated by a summer seasonal boost combined with a foreclosure moratorium earlier in the year that temporarily reduced the supply of foreclosed homes being sold at distressed prices. We expect home prices to turn down again over the winter of 2009-2010 given the typical drop in demand during winter months. Plus, the pent-up foreclosure supply is likely to hit the market during these same months. That said, housing affordability has improved dramatically, particularly in markets like California that led the downturn. We believe that seasonal effects may well turn positive again after the winter, and we expect the California market to establish a true bottom in the spring of 2010, with other markets to follow. Considering the overall stabilization anticipated in housing prices and employment, as well as the continuing challenges in both sectors, we think consumption is likely to improve but remain rather subdued going forward over the near term.
With respect to a somewhat longer-term perspective, we believe the U.S. economy may expand at a year-over-year rate of about 2.4% over the next 12 months, slightly below the consensus forecast of 2.6%. We anticipate inflation of about 1.4% over the same period, which is also below the consensus forecast of about 1.8%.
In the near-term, we believe the risks to our view are probably tilted to the upside. The recovery appears to have gained momentum, and rebounds after a severe recession tend to exceed expectations. Over the longer term, we continue to see the possibility of higher inflation given the unprecedented amount of monetary and fiscal stimulus, but we see little potential for hyperinflation.
Given this view, in the months ahead, we still think there is value in the non-Treasury sectors of the market, although perhaps not as much so as at the beginning of the Reporting Period. We believe that high yield corporate bond returns, in particular, are likely to remain volatile until there is clarity on the strength of the recovery in the U.S. and the global economy. That said, we believe the stronger equity markets will continue to provide support for higher recovery values and aid in debt repayment through initial public offerings and share issuances. Default expectations vary substantially. Standard & Poor’s projects 13.9% for the 12 months beginning in August 2009, while Credit Suisse First Boston and Moody’s each predict a decline in speculative grade defaults. They forecast a
MARKET OVERVIEW
default rate in 2010 of 3% to 5% and 4.4%, respectively. For the U.S. Treasury market, we expect slow growth and low inflation to be supportive of still-lower yields.
Emerging Markets Debt
The environment for emerging market debt continues to be favorable, in our view, as a result of supportive sovereign macroeconomic stabilization programs and improved debt management efforts. In our opinion, they will continue to buffer the headwinds of a significant deterioration in global growth and the decline in capital flows. Despite positive long-term supply and demand dynamics, the 2008 global liquidity crunch — which sparked deleveraging, risk reduction and redemptions — was responsible for a dramatic decline in the assets of many emerging economies. However, investor demand and risk appetite picked up as the global economy stabilized. We expect supply and demand conditions to remain favorable as emerging countries continue to pay down more debt than they issue.
During previous large-scale crises in emerging economies, specifically the Latin American debt crisis and the Asian crisis in the late 1990s, private capital flows disappeared for a substantial period of time, recovering slowly. In our opinion, today’s lower deficits and larger foreign exchange reserves are providing better protection. Although these buffers cannot completely prevent the transmission of financial stress from developed to developing countries, they can blunt the economic impact and reduce the risk of default. In our opinion, this explains the relatively benign response of emerging markets debt to the recent financial crisis.
Meanwhile, local emerging markets have dramatically transformed in the last few years, deepening and becoming more liquid. The investor base has also grown and become more diversified. Inflows are rather consistent and stem from strategic investors, trends we consider durable. Future returns are likely to be driven by foreign currency appreciation and interest rate convergence. Emerging market currencies are underpinned by current account surpluses and strong growth rates relative to developed economies. In our view, they are not easily undermined and can anchor valuations over the medium term. As for the interest rates of emerging countries, we expect them to decline along with inflation and sovereign risk. Emerging external market spreads, or the difference in yields between emerging market debt and comparable duration U.S. Treasuries, tightened dramatically during the last decade, and we expect local emerging market yields to follow the same trend.
The economic and market forecasts presented herein have been generated by GSAM for informational purposes as of the date of this report. They are based on proprietary models and there can be no assurance that the forecasts will be achieved. Please see additional disclosures at the end of this report.
PORTFOLIO RESULTS
Goldman Sachs Emerging Markets Debt Fund
Portfolio Management Discussion and Analysis
Below, the Goldman Sachs Global Fixed Income Investment Management Team discusses the Fund’s performance and positioning for the six months ended September 30, 2009.
| |
| Q | How did the Goldman Sachs Emerging Markets Debt Fund (the “Fund”) perform during the Reporting Period? |
| |
| A | During the Reporting Period, the Fund’s Class A, C and Institutional Shares generated cumulative total returns, without sales charges, of 31.05%, 30.66% and 31.24%, respectively. These returns compare to the 23.02% cumulative total return of the Fund’s benchmark, the J.P. Morgan EMBI Global Diversified Index (with dividends reinvested) (the “J.P. Morgan Index”), during the same time period. |
| |
| Q | What key factors were responsible for the Fund’s performance during the Reporting Period? |
| |
| A | The Fund’s currency exposure to the Brazilian real contributed the most to its relative performance. As mentioned in our Market Review, emerging market currencies have been underpinned by current account surpluses and strong growth rates relative to developed economies. In our view, they are not easily undermined and can anchor valuations over the medium term. Sector and issue selection also enhanced Fund returns. |
| |
| Q | Which segments of emerging markets debt most significantly affected Fund performance? |
| |
| A | The Fund’s exposure to emerging market corporate bonds and quasi-sovereigns added to the Fund’s results versus the J.P. Morgan Index. Issue selection in corporate bonds and quasi-sovereign issuers also boosted relative performance. |
More specifically, the Fund benefited from country and issuer selection in Argentine and Ukrainian external debt. In Argentina, bond prices outperformed on the back of unfavorable electoral results for the current Kirchner government, which lost the majority in both the lower house and the senate. Higher commodity prices also supported the country’s fiscal and current accounts. Investors seemed heartened about a potential agreement with multilateral institutions and other debt holders that would result in the repayment of defaulted debt from 2005. This would be a qualitative change in the government’s attitude towards economic policies. In addition, the government is working to enhance the credibility of Argentina’s national statistics
Investment Objective
The Fund seeks a high level of total return consisting of income and capital appreciation.
agency, widely believed to have underestimated inflation readings and overestimated real growth numbers. Ukraine’s debt outperformed as Ukraine restarted its International Monetary Fund program. In April, the head of the IMF mission announced the team would recommend the disbursal of the second tranche of a $2.8 billion loan, a much larger amount than the originally scheduled $1.8 billion.
Detracting from the Fund’s performance versus the J.P. Morgan Index was country positioning and security selection in Indonesian external debt. Moody’s recently raised Indonesia’s foreign currency sovereign debt rating and confirmed the outlook as stable, citing the country’s strong macroeconomic management, growing policy credibility, and smooth political transition in recent elections. As expected, the Bank of Indonesia kept rates unchanged at 6.5% in September in response to a stronger domestic economy and a possible uptick in 2010 inflation because of higher commodity prices. Still, inflation has remained tame to date and is expected to be within the central bank’s target range of 4% to 6%.
| |
| Q | Did the Fund’s duration and yield curve positioning strategy help or hurt its results during the Reporting Period? |
| |
| A | The Fund does not use duration and yield curve positioning as active management strategies within its investment process. |
| |
| Q | Were there any notable changes in the Fund’s sector weightings during the Reporting Period? |
| |
| A | There were no substantial changes made in the Fund’s sector weightings during the Reporting Period. |
| |
| Q | How was the Fund positioned relative to its benchmark index at the end of September 2009? |
| |
| A | At the end of September 2009, the Fund had overweighted positions relative to the J.P. Morgan Index in Qatar and South Korea and underweighted positions in Panama and Lebanon. |
FUND BASICS
Emerging Markets Debt Fund
as of September 30, 2009
PERFORMANCE REVIEW
| | | | | | | | | | | | | | | |
April 1, 2009–
| | Fund Total Return
| | | J.P. Morgan EMBI Global
| | | 30–Day
| | | |
| September 30, 2009 | | (based on NAV1) | | | Diversified Index2 | | | Standardized Yield3 | | | |
|
| |
| Class A | | | 31.05 | % | | | 23.02 | % | | | 5.82 | % | | |
| Class C | | | 30.66 | | | | 23.02 | | | | 5.35 | | | |
| Institutional | | | 31.24 | | | | 23.02 | | | | 6.43 | | | |
|
| |
| 1 | The net asset value (NAV) represents the net assets of the class of the Fund (ex-dividend) divided by the total number of shares of the class outstanding. The Fund’s performance assumes the reinvestment of dividends and other distributions. The Fund’s performance does not reflect the deduction of any applicable sales charges. |
| 2 | The J.P. Morgan EMBI Global Diversified Index is an unmanaged index of debt instruments of 31 emerging countries. The Index figures do not reflect any deduction for fees, expenses or taxes. It is not possible to invest directly in an index. |
| 3 | The 30-Day Standardized Yield of the Fund is calculated by dividing the net investment income per share (as defined by securities industry regulations) earned by the Fund over a 30-day period (ending on the stated month-end date) by the maximum public offering price per share of the Fund on the last day of the period. This number is then annualized. This yield does not necessarily reflect income actually earned and distributed by the Fund and, therefore, may not be correlated with the dividends or other distributions paid to shareholders. |
STANDARDIZED AVERAGE ANNUAL TOTAL RETURNS4
| | | | | | | | | | | | | | | | | |
| For the period ended 9/30/09 | | One Year | | | Five Years | | | Since Inception | | | Inception Date | | |
|
| |
| Class A | | | 13.88 | % | | | 8.57 | % | | | 9.86 | % | | 8/29/03 | | |
| Class C | | | 17.32 | | | | N/A | | | | 5.91 | | | 9/29/06 | | |
| Institutional | | | 19.72 | | | | 9.96 | | | | 11.11 | | | 8/29/03 | | |
|
| |
| 4 | The Standardized Average Annual Total Returns are average annual total returns as of the most recent calendar quarter-end. They assume reinvestment of all distributions at NAV. These returns reflect a maximum initial sales charge of 4.5% for Class A Shares and the assumed contingent deferred sales charge for Class C Shares (1% if redeemed within 12 months of purchase). Because Institutional Shares do not involve a sales charge, such a charge is not applied to their Standardized Average Annual Total Returns. The Fund will charge a 2% redemption fee on the redemption of shares (including by exchange) held for 30 calendar days or less. The performance figures do not reflect the deduction of the redemption fee. If reflected, the redemption fee would reduce the performance quoted. |
The returns represent past performance. Past performance does not guarantee future results. The Fund’s investment return and principal value will fluctuate so that an investor’s shares, when redeemed, may be worth more or less than their original cost. Current performance may be lower or higher than the performance quoted above. Please visit our Web site at: www.goldmansachsfunds.com to obtain the most recent month-end returns. Performance reflects expense limitations in effect. In their absence, performance would be reduced. Returns do not reflect the deduction of taxes that a shareholder would pay on Fund distributions or the redemption of Fund shares.
EXPENSE RATIOS5
| | | | | | | | | | | |
| | | Net Expense Ratio (Current) | | | Gross Expense Ratio (Before Waivers) | | | |
|
| |
| Class A | | | 1.22 | % | | | 1.44 | % | | |
| Class C | | | 1.97 | | | | 2.19 | | | |
| Institutional | | | 0.88 | | | | 1.10 | | | |
|
| |
| 5 | The expense ratios of the Fund, both current (net of applicable fee waivers and/or expense limitations) and before waivers (gross of applicable fee waivers and/or expense limitations), are as set forth above according to the most recent publicly available Prospectuses for the Fund and may differ from the expense ratios disclosed in the Financial Highlights in this report. Applicable waivers and expense limitations are voluntary and may be modified or terminated at any time at the option of the investment adviser. If this occurs, the expense ratios may change without shareholder approval. |
FUND BASICS
TOP 10 COUNTRY ALLOCATION6
| | | | | | | | | | | |
| | | Percentage of Net Assets |
| | | as of 9/30/09 | | | as of 3/31/09 | | | |
|
| |
| Indonesia | | | 10.3 | % | | | 9.4 | % | | |
| Brazil | | | 9.2 | | | | 9.3 | | | |
| Mexico | | | 6.9 | | | | 5.2 | | | |
| Turkey | | | 6.3 | | | | 4.5 | | | |
| Russia | | | 6.3 | | | | 9.1 | | | |
| Venezuela | | | 5.5 | | | | 5.1 | | | |
| Philippines | | | 4.9 | | | | 6.8 | | | |
| Argentina | | | 4.2 | | | | 2.2 | | | |
| Uruguay | | | 3.7 | | | | 3.4 | | | |
| Peru | | | 3.3 | | | | 3.5 | | | |
|
| |
| 6 | The percentage shown for each investment category reflects the value of investments in that category as a percentage of net assets. The above table does not include repurchase agreements of 3.4% as of 9/30/09 and 14.0% as of 3/31/09. |
PORTFOLIO RESULTS
Goldman Sachs High Yield Fund
Portfolio Management Discussion and Analysis
Below, the Goldman Sachs High Yield Fixed Income Investment Management Team discusses the Fund’s performance and positioning for the six months ended September 30, 2009.
| |
| Q | How did the Goldman Sachs High Yield Fund (the “Fund”) perform during the Reporting Period? |
| |
| A | During the Reporting Period, the Fund’s Class A, B, C, Institutional, Service, IR and R Shares generated cumulative total returns, without sales charges, of 35.37%, 35.27%, 35.08%, 35.73%, 35.53%, 35.74% and 35.47%, respectively. These returns compare to the 40.25% cumulative total return of the Fund’s benchmark, the Barclays Capital U.S. High Yield Index, 2% Issuer Cap (the “Barclays Index”), during the same time period. |
| |
| Q | What key factors were responsible for the Fund’s performance during the Reporting Period? |
| |
| A | The Fund’s underweighted position in financials detracted most from its results relative to the Barclays Index. This was somewhat offset by an allocation to European high yield bonds and exposure to lower-rated issues. |
| |
| Q | Which segments within high yield most significantly affected Fund performance? |
| |
| A | The Fund’s underweighted position compared to the Barclays Index in financials detracted most from relative performance. The financial sector’s weight grew from 8.25% to 10.71% in the Barclays Index, largely because of the number of “fallen angels,” that is, bonds that were previously investment grade. The strong performance also appeared to be the result of exchange offers, in which bondholders swap the bonds they own for another class of debt. |
The Fund’s underweighted allocations to deep cyclical sectors, such as retail and home construction, were also a drag on its overall performance. Specific names also detracted from relative performance, including holdings in Rite Aid, Toys R Us, and Beazer Homes USA.
Adding modestly to the Fund’s results was its exposure to historically defensive sectors, such as packaging, consumer services, health care, and gaming, all of which outperformed the Barclays Index in the difficult economic environment. The portfolio particularly benefited from exposure to bonds issued by Beverage Packaging Holdings, Catalent Pharma Solutions and MGM Mirage. European names, including Carlsson Wagonlit Travel and Europcar, contributed to relative performance positively as well. Investments in lower-rated issues added value, as bonds rated CCC and lower outperformed higher quality high yield issues during the Reporting Period.
| |
| Q | Did the Fund’s duration and yield curve positioning strategy help or hurt its results during the Reporting Period? |
| |
| A | The Fund does not use duration and yield curve positioning as active management strategies within its investment process. |
| |
| Q | Were there any notable changes in the Fund’s sector weightings during the Reporting Period? |
| |
| A | There were no substantial changes made in the Fund’s sector weightings during the Reporting Period. |
| |
| Q | How was the Fund positioned relative to its benchmark index at the end of September 2009? |
| |
| A | At the end of September 2009, the Fund was overweighted B-rated bonds relative to the Barclays Index. It also had exposure to European high yield bonds, which are not represented in the benchmark index. |
Investment Objective
The Fund seeks a high level of current income and may also consider the potential for capital appreciation.
FUND BASICS
High Yield Fund
as of September 30, 2009
PERFORMANCE REVIEW
| | | | | | | | | | | | | | | |
| | | | | | Barclays Capital
| | | | | | |
| | | Fund Total Return
| | | U.S. High Yield Index
| | | 30-Day
| | | |
| April 1, 2009–September 30, 2009 | | (based on NAV)1 | | | 2% Issuer Cap2 | | | Standardized Yield3 | | | |
|
| |
| Class A | | | 35.37 | % | | | 40.25 | % | | | 8.01 | % | | |
| Class B | | | 35.27 | | | | 40.25 | | | | 7.65 | | | |
| Class C | | | 35.08 | | | | 40.25 | | | | 7.65 | | | |
| Institutional | | | 35.73 | | | | 40.25 | | | | 8.73 | | | |
| Service | | | 35.53 | | | | 40.25 | | | | 8.23 | | | |
| Class IR | | | 35.74 | | | | 40.25 | | | | 8.60 | | | |
| Class R | | | 35.47 | | | | 40.25 | | | | 8.14 | | | |
|
| |
| 1 | The net asset value (NAV) represents the net assets of the class of the Fund (ex-dividend) divided by the total number of shares of the class outstanding. The Fund’s performance assumes the reinvestment of dividends and other distributions. The Fund’s performance does not reflect the deduction of any applicable sales charges. |
| 2 | The Barclays Capital U.S. High Yield Index, 2% Issuer Cap, an unmanaged index, covers the universe of U.S. dollar denominated, non-convertible, fixed rate, non-investment grade debt. Index holdings must have at least one year to final maturity, at least $150 million par amount outstanding, and be publicly issued with a rating of Ba1 or lower. The Index figures do not reflect any deduction for fees, expenses or taxes. It is not possible to invest directly in an index. |
| 3 | The 30-Day Standardized Yield of the Fund is calculated by dividing the net investment income per share (as defined by securities industry regulations) earned by the Fund over a 30-day period (ending on the stated month-end date) by the maximum public offering price per share of the Fund on the last day of the period. This number is then annualized. This yield does not necessarily reflect income actually earned and distributed by the Fund and, therefore, may not be correlated with the dividends or other distributions paid to shareholders. |
STANDARDIZED AVERAGE ANNUAL TOTAL RETURNS4
| | | | | | | | | | | | | | | | | | | | | |
| For the period ended 9/30/09 | | One Year | | | Five Years | | | Ten Years | | | Since Inception | | | Inception Date | | |
|
| |
| Class A | | | 10.51 | % | | | 3.95 | % | | | 5.59 | % | | | 5.30 | % | | 8/1/97 | | |
| Class B | | | 9.70 | | | | 3.74 | | | | 5.31 | | | | 4.93 | | | 8/1/97 | | |
| Class C | | | 13.91 | | | | 4.17 | | | | 5.32 | | | | 4.95 | | | 8/15/97 | | |
| Institutional | | | 16.40 | | | | 5.32 | | | | 6.48 | | | | 6.10 | | | 8/1/97 | | |
| Service | | | 15.70 | | | | 4.76 | | | | 5.94 | | | | 5.56 | | | 8/1/97 | | |
| Class IR | | | 16.33 | | | | N/A | | | | N/A | | | | 2.14 | | | 11/30/07 | | |
| Class R | | | 15.41 | | | | N/A | | | | N/A | | | | 1.56 | | | 11/30/07 | | |
|
| |
| 4 | The Standardized Average Annual Total Returns are average annual total returns as of the most recent calendar quarter-end. They assume reinvestment of all distributions at NAV. These returns reflect a maximum initial sales charge of 4.5% for Class A Shares, the assumed contingent deferred sales charge for Class B Shares (5% maximum declining to 0% after six years) and the assumed contingent deferred sales charge for Class C Shares (1% if redeemed within 12 months of purchase). Because Institutional, Service, Class R and IR Shares do not involve a sales charge, such a charge is not applied to their Standardized Average Annual Total Returns. The Fund will charge a 2% redemption fee on the redemption of shares (including by exchange) held for 60 calendar days or less. The performance figures do not reflect the deduction of the redemption fee. If reflected, the redemption fee would reduce the performance quoted. |
| | The returns represent past performance. Past performance does not guarantee future results. The Fund’s investment return and principal value will fluctuate so that an investor’s shares, when redeemed, may be worth more or less than their original cost. Current performance may be lower or higher than the performance quoted above. Please visit our Web site at: www.goldmansachsfunds.com to obtain the most recent month-end returns. Performance reflects expense limitations in effect. In their absence, performance would be reduced. Returns do not reflect the deduction of taxes that a shareholder would pay on Fund distributions or the redemption of Fund shares. |
FUND BASICS
EXPENSE RATIOS5
| | | | | | | | | | | |
| | | Net Expense Ratio (Current) | | | Gross Expense Ratio (Before Waivers) | | | |
|
| |
| Class A | | | 1.07 | % | | | 1.08 | % | | |
| Class B | | | 1.82 | | | | 1.83 | | | |
| Class C | | | 1.82 | | | | 1.83 | | | |
| Institutional | | | 0.73 | | | | 0.74 | | | |
| Service | | | 1.23 | | | | 1.24 | | | |
| Class IR | | | 0.82 | | | | 0.83 | | | |
| Class R | | | 1.32 | | | | 1.33 | | | |
|
| |
| 5 | The expense ratios of the Fund, both current (net of applicable fee waivers and/or expense limitations) and before waivers (gross of applicable fee waivers and/or expense limitations), are as set forth above according to the most recent publicly available Prospectuses for the Fund and may differ from the expense ratios disclosed in the Financial Highlights in this report. Applicable waivers and expense limitations are voluntary and may be modified or terminated at any time at the option of the investment adviser. If this occurs, the expense ratios may change without shareholder approval. |
TOP 10 ISSUERS AS OF 9/30/096
| | | | | | | | | |
| Company | | % of Net Assets | | | Line of Business | | |
|
| |
| Sprint Nextel | | | 2.3 | % | | Telecommunications — Cellular | | |
| Ford | | | 2.2 | | | Automotive | | |
| HCA | | | 2.1 | | | Health Care — Services | | |
| Intelsat | | | 1.8 | | | Telecommunications — Satellites | | |
| GMAC | | | 1.8 | | | Finance | | |
| Cablevision | | | 1.5 | | | Media — Cable | | |
| MGM Mirage | | | 1.3 | | | Gaming | | |
| Chesapeake Energy | | | 1.2 | | | Energy — Exploration & Production | | |
| Sungard Data | | | 1.1 | | | Technology — Software/Services | | |
| UPC Holding | | | 1.1 | | | Media — Cable | | |
|
| |
| 6 | The top 10 issuers may not be representative of the Fund’s future investments. |
TOP 10 INDUSTRY ALLOCATION7
| | | | | | | | | | | |
| | | Percentage of Net Assets | | | |
| | | as of 9/30/09 | | | as of 3/31/09 | | | |
|
| |
| Health Care — Services | | | 5.3 | % | | | 5.5 | % | | |
| Telecommunications — Cellular | | | 5.2 | | | | 4.6 | | | |
| Gaming | | | 5.2 | | | | 3.0 | | | |
| Energy — Exploration & Production | | | 4.5 | | | | 4.0 | | | |
| Packaging | | | 4.1 | | | | 3.5 | | | |
| Media — Cable | | | 3.8 | | | | 4.2 | | | |
| Utilities — Electric | | | 3.7 | | | | 5.5 | | | |
| Finance | | | 3.7 | | | | 1.3 | | | |
| Telecommunications | | | 3.5 | | | | 3.4 | | | |
| Chemicals | | | 3.5 | | | | 2.9 | | | |
|
| |
| 7 | The percentage shown for each investment category reflects the value of investments in that category as a percentage of net assets. |
PORTFOLIO RESULTS
Goldman Sachs Investment Grade Credit Fund
Portfolio Management Discussion and Analysis
Below, the Goldman Sachs U.S. Fixed Income Investment Management Team discusses the Fund’s performance and positioning for the six months ended September 30, 2009.
| |
| Q | How did the Goldman Sachs Investment Grade Credit Fund (the “Fund”) perform during the Reporting Period? |
| |
| A | During the Reporting Period, the Fund’s Class A, Institutional and Separate Account Institutional Shares generated cumulative total returns, without sales charges, of 19.04%, 19.25% and 19.28%, respectively. These returns compare to the 16.94% cumulative total return of the Fund’s benchmark, the Barclays Capital U.S. Credit Index (the “Barclays Index”), during the same time period. |
| |
| Q | What key factors were responsible for the Fund’s performance during the Reporting Period? |
| |
| A | The Fund’s cross-sector positioning relative to its benchmark contributed most to its results during the Reporting Period. Our cross-sector strategy is one in which we invest Fund assets across a variety of fixed income sectors, including some that may not be included in the Fund’s benchmark. The Fund’s overweighted positions in corporate bonds and mortgage-backed securities particularly buoyed relative performance. Individual issue selection within investment grade corporate bonds also added to results, although selection within subordinated financials detracted from relative performance modestly. |
| |
| Q | Which segments of investment grade credit most significantly affected Fund performance? |
| |
| A | The Fund benefited from our cross-sector strategy, particularly a negative basis position in which the portfolio was long corporate cash bonds and short synthetics. During the Reporting Period, the relationship between corporate cash bonds and synthetics remained more volatile than in the past, which increased the basis risk. Basis risk is the risk that offsetting investments in a hedging strategy will not experience price changes in entirely opposite directions from each other. This imperfect correlation between the two investments creates the potential for excess gains or losses in a hedging strategy, thus adding risk to the position. |
Investment Objective
The Fund seeks a high level of total return consisting of capital appreciation and income that exceeds the total return of the Barclays Capital U.S. Credit Index.
The Fund also benefited during the Reporting Period from a modestly overweighted allocation compared to the Barclays Index to investment grade corporate bonds, which delivered their best quarterly excess return over Treasuries on record during the second calendar quarter. Investment grade corporate bonds continued to rally during the third calendar quarter, as strong demand allowed record issuance to be well absorbed.
In addition, the Fund’s exposure to credit-sensitive mortgage-backed securities was beneficial. Non-agency residential mortgage-backed securities (RMBS), including adjustable-rate mortgages (ARMs), performed especially well. RMBS benefited from improved supply and demand technicals and were further boosted by the release of details that indicated support of the sector within the highly anticipated Public-Private Investment Program (PPIP) and in part due to a variety of housing market indicators suggesting overall activity seemed to be stabilizing. For example, new home sales increased in August 2009 for the fourth consecutive month. Also, 18 of the 20 cities comprising the S&P/Case-Shiller Home Price Index posted modest price gains, and sales of existing homes rose for the fourth straight month.
Issue selection within the investment grade corporate bond sector also proved effective, primarily within the financials industry. However, selection within the Fund’s overweighted exposure to subordinated debt detracted from relative performance. Subordinated debt is debt that ranks below other securities with regard to claims on assets or earnings, but which typically offers a higher rate of return than senior debt due to the increased inherent risk.
PORTFOLIO RESULTS
| |
| Q | Did the Fund’s duration and yield curve positioning strategy help or hurt its results during the Reporting Period? |
| |
| A | The Fund does not use duration and yield curve positioning as active management strategies within its investment process. |
| |
| Q | Were there any notable changes in the Fund’s sector weightings during the Reporting Period? |
| |
| A | In response to rapid spread tightening during the Reporting Period, we trimmed the Fund’s overweighted position in corporate bonds and concentrated on individual issue selection. Spreads, or the difference in yields between non-Treasury sectors and duration-equivalent Treasury securities, contracted, as excess liquidity from government policy and programs made its way into the market. |
| |
| Q | How was the Fund positioned relative to its benchmark index at the end of September 2009? |
| |
| A | At the end of September 2009, the Fund had overweighted positions relative to the Barclays Index in quasi-government bonds, financial and utilities corporate bonds, and RMBS. The Fund had underweighted allocations to industrial corporate bonds and to emerging markets debt relative to the benchmark index. |
FUND BASICS
Investment Grade Credit Fund
as of September 30, 2009
PERFORMANCE REVIEW
| | | | | | | | | | | | | | | |
April 1, 2009–
| | Fund Total Return
| | | Barclays Capital
| | | 30-Day
| �� | | |
| September 30, 2009 | | (based on NAV)1 | | | U.S. Credit Index2 | | | Standardized Yield3 | | | |
|
| |
| Class A | | | 19.04 | % | | | 16.94 | % | | | 3.90 | % | | |
| Institutional | | | 19.25 | | | | 16.94 | | | | 4.41 | | | |
| Separate Account Institutional | | | 19.28 | | | | 16.94 | | | | 4.46 | | | |
|
| |
| 1 | The net asset value (NAV) represents the net assets of the class of the Fund (ex-dividend) divided by the total number of shares of the class outstanding. The Fund’s performance assumes the reinvestment of dividends and other distributions. The Fund’s performance does not reflect the deduction of any applicable sales charges. |
| 2 | The Barclays Capital U.S. Credit Index is an unmanaged index which is unbundled into pure corporates (industrial, utility, and finance, including both U.S. and Non-U.S. corporations) and non-corporates (sovereign, supranational, foreign agencies, and foreign local governments). The Index figures do not reflect any deduction for fees, expenses or taxes. It is not possible to invest directly in an index. |
| 3 | The 30-Day Standardized Yield of the Fund is calculated by dividing the net investment income per share (as defined by securities industry regulations) earned by the Fund over a 30-day period (ending on the stated month-end date) by the maximum public offering price per share of the Fund on the last day of the period. This number is then annualized. This yield does not necessarily reflect income actually earned and distributed by the Fund and, therefore, may not be correlated with the dividends or other distributions paid to shareholders. |
STANDARDIZED AVERAGE ANNUAL TOTAL RETURNS4
| | | | | | | | | | | | | | | | | |
| For the period ended 9/30/09 | | One Year | | | Five Years | | | Since Inception | | | Inception Date | | |
|
| |
| Class A | | | 7.70 | % | | | 1.71 | % | | | 2.45 | % | | 11/3/03 | | |
| Institutional | | | 12.17 | | | | 2.87 | | | | 3.52 | | | 11/3/03 | | |
| Separate Account Institutional | | | 12.20 | | | | 2.94 | | | | 3.57 | | | 11/3/03 | | |
|
| |
| 4 | The Standardized Average Annual Total Returns are average annual total returns as of the most recent calendar quarter-end. They assume reinvestment of all distributions at NAV. These returns reflect a maximum initial sales charge of 3.75% for Class A Shares. Effective July 29, 2009, the maximum sales charge for Class A was changed retroactively from 4.50% to the current charge of 3.75% for Class A shares. As a result, the Standardized Average Total Returns reflect the updated sales charge for Class A since inception. Because Institutional and Separate Account Institutional Shares do not involve a sales charge, such a charge is not applied to their Standardized Average Annual Total Returns. |
The returns represent past performance. Past performance does not guarantee future results. The Fund’s investment return and principal value will fluctuate so that an investor’s shares, when redeemed, may be worth more or less than their original cost. Current performance may be lower or higher than the performance quoted above. Please visit our Web site at: www.goldmansachsfunds.com to obtain the most recent month-end returns. Performance reflects fee waivers and/or expense limitations in effect. In their absence, performance would be reduced. Returns do not reflect the deduction of taxes that a shareholder would pay on Fund distributions or the redemption of Fund shares.
EXPENSE RATIOS5
| | | | | | | | | | | |
| | | Net Expense Ratio (Current) | | | Gross Expense Ratio (Before Waivers) | | | |
|
| |
| Class A | | | 0.76 | % | | | 0.97 | % | | |
| Institutional | | | 0.40 | | | | 0.63 | | | |
| Separate Account Institutional | | | 0.35 | | | | 0.58 | | | |
|
| |
| 5 | The expense ratios of the Fund, both current (net of applicable fee waivers and/or expense limitations) and before waivers (gross of applicable fee waivers and/or expense limitations), are as set forth above according to the most recent publicly available Prospectuses for the Fund and may differ from the expense ratios disclosed in the Financial Highlights in this report. Applicable waivers and expense limitations are voluntary and may be modified or terminated at any time at the option of the investment adviser. If this occurs, the expense ratios may change without shareholder approval. |
FUND BASICS
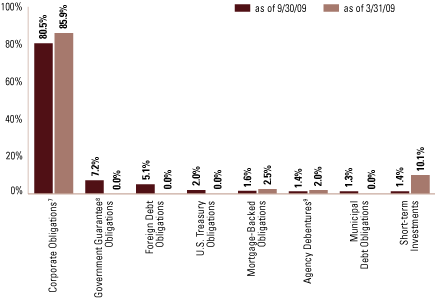
SECTOR ALLOCATIONS6
| |
| 6 | The percentage shown for each investment category reflects the value of investments in that category as a percentage of net assets. Short-term investments represent repurchase agreements. Figures in the above graph may not sum to 100% due to the exclusion of other assets and liabilities. |
| |
| 7 | Please refer to the table below for Top Ten Industry Allocations in the Corporate Obligations Sector. |
| |
| 8 | “Government Guarantee Obligations” are guaranteed under the Federal Deposit Insurance Corporation’s (“FDIC”) Temporary Liquidity Guarantee Program and are backed by the full faith and credit of the United States. The expiration date of the FDIC’s guarantee is the earlier of the maturity date of the debt or June 30, 2012. |
| |
| 9 | “Agency Debentures” include agency securities offered by companies such as Fannie Mae and Freddie Mac which operate under a government charter. While they have to report to a government regulator, their assets are not explicitly guaranteed by the government and they otherwise operate similar to any other publicly traded company. |
TOP TEN INDUSTRY ALLOCATIONS10
| | | | | | | | | | | |
| | | Percentage of Net Assets |
| | | as of 9/30/09 | | | as of 3/31/09 | | | |
|
| |
| Banks | | | 17.2 | % | | | 12.2 | % | | |
| Pipelines | | | 9.1 | | | | 6.7 | | | |
| Electric | | | 6.5 | | | | 8.2 | | | |
| Media | | | 6.4 | | | | 7.9 | | | |
| Energy | | | 5.2 | | | | 4.8 | | | |
| Wirelines and Wireless Communications | | | 5.0 | | | | 5.9 | | | |
| Insurance | | | 4.6 | | | | 6.2 | | | |
| Brokerage | | | 3.3 | | | | 7.3 | | | |
| Food & Beverage | | | 3.2 | | | | 3.6 | | | |
| Real Estate Investment Trusts | | | 3.0 | | | | 5.4 | | | |
|
| |
| 10 | The percentage shown for each investment category reflects the value of investments in that category as a percentage of net assets. |
PORTFOLIO RESULTS
Goldman Sachs Local Emerging
Markets Debt Fund
Portfolio Management Discussion and Analysis
Below, the Goldman Sachs Global Fixed Income Investment Management Team discusses the Fund’s performance and positioning for the six months ended September 30, 2009.
| |
| Q | How did the Goldman Sachs Local Emerging Markets Debt Fund (the “Fund”) perform during the Reporting Period? |
| |
| A | During the Reporting Period, the Fund’s Class A, C and Institutional Shares generated cumulative total returns, without sales charges, of 26.09%, 25.43% and 26.16%, respectively. These returns compare to the 26.01% cumulative total return of the Fund’s benchmark, the J.P. Morgan Government Bond Index — Emerging Markets Global Diversified Index (with dividends reinvested) (the “J.P. Morgan Index”), during the same time period. |
| |
| Q | What key factors were responsible for the Fund’s performance during the Reporting Period? |
| |
| A | The Fund’s currency exposure to the Brazilian real and the Peruvian new sol contributed the most to its returns. As mentioned in our Market Review, emerging market currencies have been underpinned by current account surpluses and strong growth rates relative to developed economies. In our view, they are not easily undermined and can anchor valuations over the medium term. Country and issue selection were also advantageous to the Fund’s results. |
| |
| Q | Which segments of local emerging markets debt most significantly affected Fund performance? |
| |
| A | The Fund benefited from country and issue selection in Hungary and Turkey. Hungary posted a second-quarter current account surplus, above consensus expectations and the country’s first surplus in more than a decade, thereby reducing the need for external financing. The surplus was accompanied by a sharp drop in domestic demand growth and aided by international funding from the IMF, World Bank, and European Union. Hungary’s economy seems to be on the path to a gradual recovery with a manageable external deficit. Detracting from Fund results was country and issue selection in Mexico and Peru. |
| Q | Did the Fund’s duration and yield curve positioning strategy help or hurt its results during the Reporting Period? |
| |
| A | The Fund does not use duration and yield curve positioning as active management strategies within its investment process. |
| |
| Q | Were there any notable changes in the Fund’s sector weightings during the Reporting Period? |
| |
| A | There were no substantial changes made in the Fund’s sector weightings during the Reporting Period. |
| |
| Q | How was the Fund positioned at the end of September 2009? |
| |
| A | At the end of September 2009, the Fund’s largest positions were in Brazil and Indonesia, and its smallest positions were in Uruguay and Hungary. |
Investment Objective
The Fund seeks a high level of total return consisting of income and capital appreciation.
FUND BASICS
Local Emerging Markets Debt Fund
as of September 30, 2009
PERFORMANCE REVIEW
| | | | | | | | | | | | | | | |
April 1, 2009–
| | Fund Total Return
| | | J.P. Morgan GBI EM
| | | 30-Day
| | | |
| September 30, 2009 | | (based on NAV1) | | | Global Diversified Index2 | | | Standardized Yield3 | | | |
|
| |
| Class A | | | 26.09 | % | | | 26.01 | % | | | 4.87 | % | | |
| Class C | | | 25.43 | | | | 26.01 | | | | 4.39 | | | |
| Institutional | | | 26.16 | | | | 26.01 | | | | 5.47 | | | |
|
| |
| 1 | The net asset value (NAV) represents the net assets of the class of the Fund (ex-dividend) divided by the total number of shares of the class outstanding. The Fund’s performance assumes the reinvestment of dividends and other distributions. The Fund’s performance does not reflect the deduction of any applicable sales charges. |
| 2 | The J.P. Morgan GBI EM Global Diversified Index is an unmanaged index of debt instruments of 14 Emerging Countries. The Index figures do not reflect any deduction for fees, expenses or taxes. It is not possible to invest directly in an index. |
| 3 | The 30-Day Standardized Yield of the Fund is calculated by dividing the net investment income per share (as defined by securities industry regulations) earned by the Fund over a 30-day period (ending on the stated month-end date) by the maximum public offering price per share of the Fund on the last day of the period. This number is then annualized. This yield does not necessarily reflect income actually earned and distributed by the Fund and, therefore, may not be correlated with the dividends or other distributions paid to shareholders. |
STANDARDIZED AVERAGE ANNUAL TOTAL RETURNS4
| | | | | | | | | | | | | |
| For the period ending 9/30/09 | | One Year | | | Since Inception | | | Inception Date | | |
|
| |
| Class A | | | 0.95 | % | | | -4.57 | % | | 2/15/08 | | |
| Class C | | | 4.96 | | | | -2.56 | | | 2/15/08 | | |
| Institutional | | | 5.99 | | | | -1.57 | | | 2/15/08 | | |
|
| |
| 4 | The Standardized Average Annual Total Returns are average annual total returns as of the most recent calendar quarter-end. They assume reinvestment of all distributions at NAV. These returns reflect a maximum initial sales charge of 4.5% for Class A Shares and the assumed contingent deferred sales charge for Class C Shares (1% if redeemed within 12 months of purchase). Because Institutional Shares do not involve a sales charge, such a charge is not applied to their Standardized Average Annual Total Returns. The Fund will charge a 2% redemption fee on the redemption of shares (including by exchange) held for 30 calendar days or less. The performance figures do not reflect the deduction of the redemption fee. If reflected, the redemption fee would reduce the performance quoted. |
The returns represent past performance. Past performance does not guarantee future results. The Fund’s investment return and principal value will fluctuate so that an investor’s shares, when redeemed, may be worth more or less than their original cost. Current performance may be lower or higher than the performance quoted above. Please visit our Web site at: www.goldmansachsfunds.com to obtain the most recent month-end returns. Performance reflects expense limitations in effect. In their absence, performance would be reduced. Returns do not reflect the deduction of taxes that a shareholder would pay on Fund distributions or the redemption of Fund shares.
EXPENSE RATIOS5
| | | | | | | | | | | |
| | | Net Expense Ratio (Current) | | | Gross Expense Ratio (Before Waivers) | | | |
|
| |
| Class A | | | 1.35 | % | | | 1.65 | % | | |
| Class C | | | 2.10 | | | | 2.40 | | | |
| Institutional | | | 1.01 | | | | 1.31 | | | |
|
| |
| 5 | The expense ratios of the Fund, both current (net of applicable fee waivers and/or expense limitations) and before waivers (gross of applicable fee waivers and/or expense limitations), are as set forth above according to the most recent publicly available Prospectuses for the Fund and may differ from the expense ratios disclosed in the Financial Highlights in this report. Applicable waivers and expense limitations are voluntary and may be modified or terminated at any time at the option of the investment adviser. If this occurs, the expense ratios may change without shareholder approval. |
FUND BASICS
TOP 10 COUNTRY ALLOCATION6
| | | | | | | | | | | |
| | | Percentage of Net Assets | | | |
| | | as of 9/30/09 | | | as of 3/31/09 | | | |
|
| |
| Brazil | | | 10.4 | % | | | 2.5 | % | | |
| Mexico | | | 8.7 | | | | 10.9 | | | |
| Turkey | | | 8.5 | | | | 7.2 | | | |
| South Africa | | | 6.6 | | | | — | | | |
| Poland | | | 5.7 | | | | 4.4 | | | |
| Hungary | | | 5.3 | | | | 4.4 | | | |
| Peru | | | 4.6 | | | | 4.9 | | | |
| Uruguay | | | 2.9 | | | | 2.8 | | | |
| Indonesia | | | 2.9 | | | | 4.8 | | | |
| Russia | | | 2.8 | | | | 3.8 | | | |
|
| |
| 6 | The percentage shown for each investment category reflects the value of investments in that category as a percentage of net assets. The above table does not include repurchase agreements of 31.1% as of 9/30/09 and 44.0% as of 3/31/09. |
PORTFOLIO RESULTS
Goldman Sachs U.S. Mortgages Fund
Portfolio Management Discussion and Analysis
Below, the Goldman Sachs U.S. Fixed Income Investment Management Team discusses the Fund’s performance and positioning for the six months ended September 30, 2009.
| |
| Q | How did the Goldman Sachs U.S. Mortgages Fund (the “Fund”) perform during the Reporting Period? |
| |
| A | During the Reporting Period, the Fund’s Class A, Institutional and Separate Account Institutional Shares generated cumulative total returns, without sales charges, of 7.73%, 7.81% and 7.84%, respectively. These returns compare to the 4.90% cumulative total return of the Fund’s benchmark, the Barclays Capital Securitized Index (with dividends reinvested) (the “Barclays Index”), during the same time period. |
| |
| Q | What key factors were responsible for the Fund’s performance during the Reporting Period? |
| |
| A | The Fund benefited most from an overweighted position relative to the Barclays Index in non-agency residential mortgage-backed securities (RMBS). Its short duration position compared to the Barclays Index also enhanced relative performance. Duration is a measure of the Fund’s sensitivity to changes in interest rates. An overweighted allocation to commercial mortgage-backed securities (CMBS) further contributed to relative performance. Individual issue selection in RMBS, CMBS, and asset-backed securities (ABS) detracted from relative performance. |
| |
| Q | Which segments of the U.S. mortgage-backed securities sector most significantly affected Fund performance? |
| |
| A | The Fund’s exposure to credit-sensitive mortgage-backed securities was beneficial. Non-agency RMBS, including adjustable-rate mortgages (ARMs), performed especially well. RMBS benefited from improved supply and demand technicals and were further boosted by the release of details that indicated support of the sector within the highly anticipated Public-Private Investment Program (PPIP) and in part due to a variety of housing market indicators suggesting overall activity seemed to be stabilizing. For example, new home sales increased in August 2009 for the fourth consecutive month. Also, 18 of the 20 cities comprising the S&P/Case-Shiller Home Price Index posted modest price gains, and sales of existing homes rose for the fourth straight month. |
Investment Objective
The Fund seeks a high level of total return consisting of income and capital appreciation.
An overweighted position in CMBS added to the Fund’s relative performance on strong demand for CMBS bonds eligible for the U.S. government’s Term Asset-backed Loan Facility (TALF). There was also strong demand for Re-REMICs, which are pools of commercial mortgage-backed securities that tend to have higher credit enhancement on senior tranches.
The major detractor from the Fund’s relative performance during the Reporting Period was individual issue selection among collateralized mortgage-backed securities, CMBS and mortgage-related ABS.
| |
| Q | Did the Fund’s duration and yield curve positioning strategy help or hurt its results during the Reporting Period? |
| |
| A | Overall, the Fund’s short duration position in the longer-maturity end of the U.S. fixed income yield curve relative to the Barclays Index contributed positively to its performance. This was especially true during the second quarter of 2009, as interest rates rose during these months on improving financial conditions and a stabilization of macroeconomic data. However, the same positioning detracted from performance as interest rates declined during the third calendar quarter, with U.S. government securities rallying as supply was generally well absorbed. |
| |
| Q | Were there any notable changes in the Fund’s weightings during the Reporting Period? |
| |
| A | During the Reporting Period, we reduced the Fund’s cash position and increased its allocations to CMBS and collateralized mortgage obligations (CMOs). |
PORTFOLIO RESULTS
| |
| Q | How was the Fund positioned relative to its benchmark index at the end of September 2009? |
| |
| A | At the end of September 2009, the Fund had overweighted allocations relative to the Barclays Index in agency securities, non-agency ARMs and CMBS. The Fund was underweight relative to the benchmark index in ABS, agency ARMs and premium agency pass-through mortgages. Pass-through mortgages consist of a pool of residential mortgage loans, where homeowners’ monthly payments of principal, interest and prepayments pass from the original bank through a government agency or investment bank to investors. |
FUND BASICS
U.S. Mortgages Fund
as of September 30, 2009
PERFORMANCE REVIEW
| | | | | | | | | | | | | | | |
April 1, 2009–
| | Fund Total Return
| | | Barclays Capital
| | | 30-Day
| | | |
| September 30, 2009 | | (based on NAV)1 | | | Securitized Index2 | | | Standardized Yield3 | | | |
|
| |
| Class A | | | 7.73 | % | | | 4.90 | % | | | 3.66 | % | | |
| Institutional | | | 7.81 | | | | 4.90 | | | | 4.17 | | | |
| Separate Account Institutional | | | 7.84 | | | | 4.90 | | | | 4.22 | | | |
|
| |
| 1 | The net asset value (NAV) represents the net assets of the class of the Fund (ex-dividend) divided by the total number of shares of the class outstanding. The Fund’s performance assumes the reinvestment of dividends and other distributions. The Fund’s performance does not reflect the deduction of any applicable sales charges. |
| 2 | The Barclays Capital Securitized Index is an unmanaged composite of asset-backed securities, collateralized mortgage-backed securities and fixed rate mortgage-backed securities. The Index figures do not reflect any deduction for fees, expenses or taxes. It is not possible to invest directly in an index. |
| 3 | The 30-Day Standardized Yield of the Fund is calculated by dividing the net investment income per share (as defined by securities industry regulations) earned by the Fund over a 30-day period (ending on the stated month-end date) by the maximum public offering price per share of the Fund on the last day of the period. This number is then annualized. This yield does not necessarily reflect income actually earned and distributed by the Fund and, therefore, may not be correlated with the dividends or other distributions paid to shareholders. |
STANDARDIZED AVERAGE ANNUAL TOTAL RETURNS4
| | | | | | | | | | | | | | | | | |
| For the period ended 9/30/09 | | One Year | | | Five Years | | | Since Inception | | | Inception Date | | |
|
| |
| Class A | | | 6.17 | % | | | 3.09 | % | | | 3.45 | % | | 11/3/03 | | |
| Institutional | | | 10.68 | | | | 4.28 | | | | 4.53 | | | 11/3/03 | | |
| Separate Account Institutional | | | 10.62 | | | | 4.34 | | | | 4.57 | | | 11/3/03 | | |
|
| |
| 4 | The Standardized Average Annual Total Returns are average annual total returns as of the most recent calendar quarter-end. They assume reinvestment of all distributions at NAV. These returns reflect a maximum initial sales charge of 3.75% for Class A Shares. Effective July 29, 2009, the maximum sales charge for Class A was changed retroactively from 4.50% to the current charge of 3.75% for Class A shares. As a result, the Standardized Average Total Returns reflect the updated sales charge for Class A since inception. Because Institutional and Separate Account Institutional Shares do not involve a sales charge, such a charge is not applied to their Standardized Average Annual Total Returns. |
The returns represent past performance. Past performance does not guarantee future results. The Fund’s investment return and principal value will fluctuate so that an investor’s shares, when redeemed, may be worth more or less than their original cost. Current performance may be lower or higher than the performance quoted above. Please visit our Web site at: www.goldmansachsfunds.com to obtain the most recent month-end returns. Performance reflects fee waivers and/or expense limitations in effect. In their absence, performance would be reduced. Returns do not reflect the deduction of taxes that a shareholder would pay on Fund distributions or the redemption of Fund shares.
EXPENSE RATIOS5
| | | | | | | | | | | |
| | | Net Expense Ratio (Current) | | | Gross Expense Ratio (Before Waivers) | | | |
|
| |
| Class A | | | 0.76 | % | | | 0.91 | % | | |
| Institutional | | | 0.40 | | | | 0.57 | | | |
| Separate Account Institutional | | | 0.35 | | | | 0.52 | | | |
|
| |
| 5 | The expense ratios of the Fund, both current (net of applicable fee waivers and/or expense limitations) and before waivers (gross of applicable fee waivers and/or expense limitations), are as set forth above according to the most recent publicly available Prospectuses for the Fund and may differ from the expense ratios disclosed in the Financial Highlights in this report. Applicable waivers and expense limitations are voluntary and may be modified or terminated at any time at the option of the investment adviser. If this occurs, the expense ratios may change without shareholder approval. |
FUND BASICS
SECTOR ALLOCATIONS6
| |
| 6 | The percentage shown for each investment category reflects the value of investments in that category as a percentage of net assets. Short-term investments represent repurchase agreements. Figures in the above graph may not sum up to 100% due to the exclusion of other assets and liabilities. |
| 7 | Federal Agencies are mortgage-backed securities guaranteed by Ginnie Mae, Fannie Mae and Freddie Mac. Ginnie Mae instruments are backed by the full faith and credit of the United States. |
| 8 | “Agency Debentures” include agency securities offered by companies such as Fannie Mae and Freddie Mac, which operate under a government charter. While they have to report to a government regulator, their assets are not explicitly guaranteed by the government and they otherwise operate like any other publicly traded company. |
GOLDMAN SACHS EMERGING MARKETS DEBT FUND
Schedule of Investments
September 30, 2009 (Unaudited)
| | | | | | | | | | | | | | | | | |
| | | Principal
| | Interest
| | Maturity
| | |
| | | Amount | | Rate | | Date | | Value |
| |
Sovereign Debt Obligations – 70.8% |
| | | | | | | | | | | | | | | | | |
| | | | | | | | | | | | | | | | | |
| | | Argentina – 4.2% |
| | | Republic of Argentina (B-/NR) |
| | | $ | 4,320,000 | | | | 7.000 | % | | | 03/28/11 | | | $ | 3,931,800 | |
| | | | 5,840,000 | | | | 7.000 | | | | 10/03/15 | | | | 4,202,529 | |
| | | | 3,090,000 | | | | 2.500 | (a) | | | 12/31/38 | | | | 1,035,150 | |
| | | | | | | | | | | | | | | | | |
| | | | | | | | | | | | | | | | 9,169,479 | |
| | | |
| | | |
| | | Brazil – 7.4% |
| | | Federal Republic of Brazil (BBB-/Baa3) |
| | | | 900,000 | | | | 6.000 | | | | 01/17/17 | | | | 969,300 | |
| | | | 5,185,000 | | | | 8.000 | | | | 01/15/18 | | | | 5,999,045 | |
| | | | 1,780,000 | | | | 5.875 | | | | 01/15/19 | | | | 1,909,940 | |
| | | | 5,330,000 | | | | 8.250 | | | | 01/20/34 | | | | 7,027,605 | |
| | | | 350,000 | | | | 5.625 | | | | 01/07/41 | | | | 341,243 | |
| | | | | | | | | | | | | | | | | |
| | | | | | | | | | | | | | | | 16,247,133 | |
| | | |
| | | |
| | | Colombia – 1.2% |
| | | Republic of Colombia (BBB-/Ba1) |
| | | | 2,240,000 | | | | 7.375 | | | | 03/18/19 | | | | 2,576,000 | |
| | | |
| | | |
| | | Dominican Republic – 1.2% |
| | | Dominican Republic (B/B2) |
| | | | 1,085,326 | | | | 9.040 | | | | 01/23/18 | | | | 1,150,445 | |
| | | | 1,160,000 | | | | 8.625 | | | | 04/20/27 | | | | 1,125,200 | |
| | | | 300,000 | | | | 8.625 | (b) | | | 04/20/27 | | | | 291,000 | |
| | | | | | | | | | | | | | | | | |
| | | | | | | | | | | | | | | | 2,566,645 | |
| | | |
| | | |
| | | El Salvador – 0.6% |
| | | Republic of El Salvador (BB/Baa3) |
| | | | 1,330,000 | | | | 8.250 | | | | 04/10/32 | | | | 1,416,450 | |
| | | |
| | | |
| | | Gabon(b) – 0.6% |
| | | Republic of Gabon (BB-/NR) |
| | | | 1,380,000 | | | | 8.200 | | | | 12/12/17 | | | | 1,421,400 | |
| | | |
| | | |
| | | Georgia – 0.2% |
| | | Republic of Georgia (B/NR) |
| | | | 570,000 | | | | 7.500 | | | | 04/15/13 | | | | 547,200 | |
| | | |
| | | |
| | | Ghana – 0.3% |
| | | Republic of Ghana (B+/NR) |
| | | | 580,000 | | | | 8.500 | | | | 10/04/17 | | | | 578,550 | |
| | | |
| | | |
| | | Indonesia – 10.3% |
| | | Republic of Indonesia (BB-/Ba2) |
| | | | 4,650,000 | | | | 6.750 | | | | 03/10/14 | | | | 4,987,125 | |
| | | | 3,770,000 | | | | 10.375 | | | | 05/04/14 | | | | 4,589,975 | |
| | | | 5,340,000 | | | | 11.625 | (b) | | | 03/04/19 | | | | 7,502,700 | |
| | | | 480,000 | | | | 11.625 | | | | 03/04/19 | | | | 674,400 | |
| | | | 740,000 | | | | 6.625 | | | | 02/17/37 | | | | 731,675 | |
| | | | 300,000 | | | | 7.750 | | | | 01/17/38 | | | | 333,000 | |
| | | | 3,400,000 | | | | 7.750 | (b) | | | 01/17/38 | | | | 3,774,000 | |
| | | | | | | | | | | | | | | | | |
| | | | | | | | | | | | | | | | 22,592,875 | |
| | | |
| | | |
| | | Iraq – 0.7% |
| | | Republic of Iraq (NR/NR) |
| | | | 2,090,000 | | | | 5.800 | | | | 01/15/28 | | | | 1,575,338 | |
| | | |
| | | |
| | | Lebanon – 1.2% |
| | | Republic of Lebanon MTN (B-/NR) |
| | | | 2,983,500 | | | | 4.000 | | | | 12/31/17 | | | | 2,610,563 | |
| | | |
| | | |
| | | Malaysia – 1.8% |
| | | Malaysia (A-/A3) |
| | | | 3,500,000 | | | | 7.500 | | | | 07/15/11 | | | | 3,851,013 | |
| | | |
| | | |
| | | Mexico – 3.9% |
| | | United Mexican States (BBB+/Baa1) |
| | | | 420,000 | | | | 5.625 | | | | 01/15/17 | | | | 440,475 | |
| | | | 2,560,000 | | | | 5.950 | | | | 03/19/19 | | | | 2,694,400 | |
| | | | 1,990,000 | | | | 7.500 | | | | 04/08/33 | | | | 2,378,050 | |
| | | | 950,000 | | | | 6.750 | | | | 09/27/34 | | | | 1,047,375 | |
| | | | 1,990,000 | | | | 6.050 | | | | 01/11/40 | | | | 2,007,512 | |
| | | | | | | | | | | | | | | | | |
| | | | | | | | | | | | | | | | 8,567,812 | |
| | | |
| | | |
| | | Pakistan(b) – 0.4% |
| | | Islamic Republic of Pakistan (B-/B3) |
| | | | 1,070,000 | | | | 6.875 | | | | 06/01/17 | | | | 914,850 | |
| | | |
| | | |
| | | Panama – 1.3% |
| | | Republic of Panama (BB+/Ba1) |
| | | | 2,542,000 | | | | 6.700 | | | | 01/26/36 | | | | 2,796,200 | |
| | | |
| | | |
| | | Peru – 3.3% |
| | | Republic of Peru (BBB-/Ba1) |
| | | | 2,910,000 | | | | 7.125 | | | | 03/30/19 | | | | 3,368,325 | |
| | | | 1,790,000 | | | | 8.750 | | | | 11/21/33 | | | | 2,389,650 | |
| | | | 1,380,000 | | | | 6.550 | | | | 03/14/37 | | | | 1,500,750 | |
| | | | | | | | | | | | | | | | | |
| | | | | | | | | | | | | | | | 7,258,725 | |
| | | |
| | | |
| | | Philippines – 4.9% |
| | | Republic of Philippines (NR/Ba3) |
| | | | 2,325,000 | | | | 7.500 | | | | 09/25/24 | | | | 2,624,460 | |
| | | Republic of Philippines (BB-/Ba3) |
| | | | 690,000 | | | | 8.375 | | | | 06/17/19 | | | | 840,903 | |
| | | | 1,000,000 | | | | 9.500 | (c) | | | 10/21/24 | | | | 1,272,500 | |
| | | | 4,200,000 | | | | 10.625 | | | | 03/16/25 | | | | 5,911,500 | |
| | | | | | | | | | | | | | | | | |
| | | | | | | | | | | | | | | | 10,649,363 | |
| | | |
| | | |
| | | Poland – 2.3% |
| | | Republic of Poland (A-/A2) |
| | | | 4,420,000 | | | | 6.375 | | | | 07/15/19 | | | | 4,944,212 | |
| | | |
| | | |
| | | Qatar – 1.0% |
| | | State of Qatar (AA-/Aa2) |
| | | | 950,000 | | | | 6.550 | | | | 04/09/19 | | | | 1,059,250 | |
| | | | 1,100,000 | | | | 6.550 | (b) | | | 04/09/19 | | | | 1,226,500 | |
| | | | | | | | | | | | | | | | | |
| | | | | | | | | | | | | | | | 2,285,750 | |
| | | |
| | | |
| | | Russia(a) – 6.3% |
| | | Russian Federation (BBB/Baa1) |
| | | | 12,675,900 | | | | 7.500 | | | | 03/31/30 | | | | 13,832,576 | |
| | | |
| | | |
| | | Serbia(a) – 0.5% |
| | | Republic of Serbia (BB-/NR) |
| | | | 1,140,000 | | | | 3.750 | | | | 11/01/24 | | | | 1,122,900 | |
| | | |
| | | |
| | | South Africa – 1.1% |
| | | Republic of South Africa (BBB+/A3) |
| | | | 1,490,000 | | | | 6.875 | | | | 05/27/19 | | | | 1,666,938 | |
| | | | 700,000 | | | | 5.875 | | | | 05/30/22 | | | | 719,250 | |
| | | | | | | | | | | | | | | | | |
| | | | | | | | | | | | | | | | 2,386,188 | |
| | | |
| | | |
| | | | | | | | | | | | | | | | | |
The accompanying notes are an integral part of these financial statements.
GOLDMAN SACHS EMERGING MARKETS DEBT FUND
| | | | | | | | | | | | | | | | | |
| | | Principal
| | Interest
| | Maturity
| | |
| | | Amount | | Rate | | Date | | Value |
| |
Sovereign Debt Obligations – (continued) |
| | | | | | | | | | | | | | | | | |
| | | Sri Lanka – 0.3% |
| | | Republic of Sri Lanka (B/NR) |
| | | $ | 540,000 | | | | 8.250 | % | | | 10/24/12 | | | $ | 549,450 | |
| | | |
| | | |
| | | Turkey – 6.3% |
| | | Republic of Turkey (BB-/Ba3) |
| | | | 1,910,000 | | | | 6.750 | | | | 04/03/18 | | | | 2,010,275 | |
| | | | 2,760,000 | | | | 7.000 | | | | 03/11/19 | | | | 2,939,400 | |
| | | | 2,020,000 | | | | 7.500 | | | | 11/07/19 | | | | 2,224,525 | |
| | | | 3,980,000 | | | | 7.250 | | | | 03/05/38 | | | | 4,114,325 | |
| | | Turkey Government Bond (BB/NR) |
| | | TRY | 3,411,763 | | | | 10.000 | | | | 02/15/12 | | | | 2,586,411 | |
| | | | | | | | | | | | | | | | | |
| | | | | | | | | | | | | | | | 13,874,936 | |
| | | |
| | | |
| | | Ukraine – 2.1% |
| | | Ukraine Government (CCC+/B2) |
| | | $ | 1,420,000 | | | | 6.875 | | | | 03/04/11 | | | | 1,317,050 | |
| | | EUR | 900,000 | | | | 4.950 | | | | 10/13/15 | | | | 968,005 | |
| | | $ | 1,130,000 | | | | 6.580 | | | | 11/21/16 | | | | 887,050 | |
| | | | 1,960,000 | | | | 6.750 | | | | 11/14/17 | | | | 1,538,600 | |
| | | | | | | | | | | | | | | | | |
| | | | | | | | | | | | | | | | 4,710,705 | |
| | | |
| | | |
| | | Uruguay – 3.7% |
| | | Republic of Uruguay (BB/Ba3) |
| | | | 3,449,587 | | | | 8.000 | | | | 11/18/22 | | | | 3,863,537 | |
| | | | 2,350,000 | | | | 6.875 | | | | 09/28/25 | | | | 2,420,500 | |
| | | | 1,820,000 | | | | 7.625 | | | | 03/21/36 | | | | 1,929,200 | |
| | | | | | | | | | | | | | | | | |
| | | | | | | | | | | | | | | | 8,213,237 | |
| | | |
| | | |
| | | Venezuela – 3.7% |
| | | Republic of Venezuela (NR/B2) |
| | | | 1,210,000 | | | | 7.650 | | | | 04/21/25 | | | | 807,675 | |
| | | Republic of Venezuela (BB-/B2) |
| | | | 1,060,000 | | | | 13.625 | | | | 08/15/18 | | | | 1,091,800 | |
| | | | 9,960,000 | | | | 6.000 | | | | 12/09/20 | | | | 6,150,300 | |
| | | | | | | | | | | | | | | | | |
| | | | | | | | | | | | | | | | 8,049,775 | |
| | | |
| | | |
| | | TOTAL SOVEREIGN DEBT OBLIGATIONS |
| | | (Cost $139,718,279) | | $ | 155,309,325 | |
| | | |
| | | |
| | | | | | | | | | | | | | | | | |
| | | | | | | | | | | | | | | | | |
Corporate Obligations – 22.6% |
| | | | | | | | | | | | | | | | | |
| | | | | | | | | | | | | | | | | |
| | | Bermuda – 1.9% |
| | | Digicel Group Ltd. (NR/Caa1) |
| | | $ | 1,570,000 | | | | 8.875 | % | | | 01/15/15 | | | $ | 1,460,100 | |
| | | Qtel International Finance Ltd. (A-/A1)(b) |
| | | | 2,400,000 | | | | 7.875 | | | | 06/10/19 | | | | 2,742,000 | |
| | | | | | | | | | | | | | | | | |
| | | | | | | | | | | | | | | | 4,202,100 | |
| | | |
| | | |
| | | Brazil – 1.7% |
| | | Companhia Energetica de Sao Paulo (NR/Ba2) |
| | | BRL | 3,695,168 | | | | 9.750 | | | | 01/15/15 | | | | 2,079,339 | |
| | | Independencia International Ltd. (NR/WR)(b)(d) |
| | | $ | 1,970,000 | | | | 9.875 | | | | 05/15/15 | | | | 344,750 | |
| | | RBS – Zero Hora Editora Jornalistica SA (BB/NR)(b) |
| | | |
| | | BRL | 800,000 | | | | 11.250 | | | | 06/15/17 | | | | 365,771 | |
| | | |
| | | |
| | | Telemar Norte Leste S.A. (NR/Baa2)(b) |
| | | | 860,000 | | | | 9.500 | | | | 04/23/19 | | | | 1,027,700 | |
| | | | | | | | | | | | | | | | | |
| | | | | | | | | | | | | | | | 3,817,560 | |
| | | |
| | | |
| | | Cayman Islands – 1.5% |
| | | CSN Islands XI Corp. (BB+/Ba1)(b) |
| | | | 800,000 | | | | 6.875 | | | | 09/21/19 | | | | 802,000 | |
| | | Petrobras International Finance Co. (BBB-/Baa1) |
| | | | 2,210,000 | | | | 7.875 | | | | 03/15/19 | | | | 2,535,975 | |
| | | | | | | | | | | | | | | | | |
| | | | | | | | | | | | | | | | 3,337,975 | |
| | | |
| | | |
| | | Chile – 0.8% |
| | | Corporacion Nacional del Cobre (A/A1) |
| | | | 400,000 | | | | 7.500 | | | | 01/15/19 | | | | 480,382 | |
| | | Empresa Nacional del Petroleo (BBB/A3)(b) |
| | | | 1,100,000 | | | | 6.250 | | | | 07/08/19 | | | | 1,168,452 | |
| | | | | | | | | | | | | | | | | |
| | | | | | | | | | | | | | | | 1,648,834 | |
| | | |
| | | |
| | | Colombia – 2.5% |
| | | Ecopetrol SA (BB+/Baa2)(b) |
| | | | 2,530,000 | | | | 7.625 | | | | 07/23/19 | | | | 2,758,555 | |
| | | EEB International Ltd. (BB/NR)(b) |
| | | | 690,000 | | | | 8.750 | | | | 10/31/14 | | | | 741,750 | |
| | | TGI International Ltd. (BB/NR) |
| | | | 1,040,000 | | | | 9.500 | | | | 10/03/17 | | | | 1,123,200 | |
| | | | 760,000 | | | | 9.500 | (b) | | | 10/03/17 | | | | 817,000 | |
| | | | | | | | | | | | | | | | | |
| | | | | | | | | | | | | | | | 5,440,505 | |
| | | |
| | | |
| | | Ireland – 1.1% |
| | | VIP Finance Ireland Ltd. for OJSC Vimpel Communications (BB+/Ba2) |
| | | | 1,140,000 | | | | 8.375 | | | | 04/30/13 | | | | 1,188,450 | |
| | | | 640,000 | | | | 9.125 | (b) | | | 04/30/18 | | | | 670,400 | |
| | | | 430,000 | | | | 9.125 | | | | 04/30/18 | | | | 450,425 | |
| | | | | | | | | | | | | | | | | |
| | | | | | | | | | | | | | | | 2,309,275 | |
| | | |
| | | |
| | | Kazakhstan – 2.6% |
| | | KazMunaiGaz Finance Sub BV (BB+/Baa2) |
| | | | 2,010,000 | | | | 8.375 | (b) | | | 07/02/13 | | | | 2,115,525 | |
| | | | 850,000 | | | | 11.750 | | | | 01/23/15 | | | | 1,005,125 | |
| | | | 2,100,000 | | | | 11.750 | (b) | | | 01/23/15 | | | | 2,483,250 | |
| | | | | | | | | | | | | | | | | |
| | | | | | | | | | | | | | | | 5,603,900 | |
| | | |
| | | |
| | | Malaysia(b) – 0.9% |
| | | Petronas Capital Ltd. (A-/A1) |
| | | | 2,000,000 | | | | 5.250 | | | | 08/12/19 | | | | 2,024,108 | |
| | | |
| | | |
| | | Mexico – 3.0% |
| | | Pemex Project Funding Master Trust (BBB+/Baa1) |
| | | | 2,220,000 | | | | 1.599 | (e) | | | 06/15/10 | | | | 2,217,336 | |
| | | | 1,370,000 | | | | 5.750 | | | | 03/01/18 | | | | 1,365,205 | |
| | | Petroleos Mexicanos (BBB+/Baa1) |
| | | | 2,770,000 | | | | 8.000 | | | | 05/03/19 | | | | 3,163,340 | |
| | | | | | | | | | | | | | | | | |
| | | | | | | | | | | | | | | | 6,745,881 | |
| | | |
| | | |
| | | Netherlands(b) – 0.5% |
| | | Arcos Dorados BV (BBB-/Ba2) |
| | | | 1,050,000 | | | | 7.500 | | | | 10/01/19 | | | | 1,042,081 | |
| | | |
| | | |
| | | | | | | | | | | | | | | | | |
The accompanying notes are an integral part of these financial statements.
GOLDMAN SACHS EMERGING MARKETS DEBT FUND
Schedule of Investments (continued)
September 30, 2009 (Unaudited)
| | | | | | | | | | | | | | | | | |
| | | Principal
| | Interest
| | Maturity
| | |
| | | Amount | | Rate | | Date | | Value |
| |
Corporate Obligations – (continued) |
| | | | | | | | | | | | | | | | | |
| | | Qatar(b) – 1.5% |
| | | Ras Laffan Liquefied Natural Gas Co. Ltd. III (A/Aa2) |
| | | $ | 3,200,000 | | | | 5.500 | % | | | 09/30/14 | | | $ | 3,384,000 | |
| | | |
| | | |
| | | South Africa – 1.1% |
| | | Peermont Proprietary Global Ltd. (B/B3) |
| | | EUR | 1,910,000 | | | | 7.750 | | | | 04/30/14 | | | | 2,375,747 | |
| | | |
| | | |
| | | Trinidad and Tobago(b) – 0.9% |
| | | Petroleum Co. of Trinidad & Tobago Ltd. (BBB/Baa3) |
| | | $ | 1,730,000 | | | | 9.750 | | | | 08/14/19 | | | | 1,956,574 | |
| | | |
| | | |
| | | United Arab Emirates(b) – 0.8% |
| | | Dolphin Energy Ltd. (NR/Aa3) |
| | | | 1,700,000 | | | | 5.888 | | | | 06/15/19 | | | | 1,718,071 | |
| | | |
| | | |
| | | Venezuela – 1.8% |
| | | Petroleos de Venezuela SA (NR/NR)(f) |
| | | | 920,000 | | | | 0.000 | | | | 07/10/11 | | | | 701,960 | |
| | | Petroleos de Venezuela SA (B+/NR) |
| | | | 2,390,000 | | | | 5.250 | | | | 04/12/17 | | | | 1,475,825 | |
| | | | 3,720,000 | | | | 5.375 | | | | 04/12/27 | | | | 1,789,320 | |
| | | | | | | | | | | | | | | | | |
| | | | | | | | | | | | | | | | 3,967,105 | |
| | | |
| | | |
| | | TOTAL CORPORATE OBLIGATIONS |
| | | (Cost $47,223,156) | | $ | 49,573,716 | |
| | | |
| | | |
| | | TOTAL INVESTMENTS BEFORE REPURCHASE AGREEMENT |
| | | (Cost $186,941,435) | | $ | 204,883,041 | |
| | | |
| | | |
| | | | | | | | | | | | | | | | | |
| | | | | | | | | | | | | | | | | |
Repurchase Agreement(g) – 3.4% |
| | | | | | | | | | | | | | | | | |
| | | | | | | | | | | | | | | | | |
| | | Joint Repurchase Agreement Account II |
| | | $ | 7,400,000 | | | | 0.061 | % | | | 10/01/09 | | | $ | 7,400,000 | |
| | | Maturity Value: $7,400,013 |
| | | (Cost $7,400,000) | | | | |
| | | |
| | | |
| | | TOTAL INVESTMENTS – 96.8% |
| | | (Cost $194,341,435) | | $ | 212,283,041 | |
| | | |
| | | |
| | | OTHER ASSETS IN EXCESS OF LIABILITIES – 3.2% | | | 6,909,756 | |
| | | |
| | | |
| | | NET ASSETS – 100.0% | | $ | 219,192,797 | |
| | | |
| | | |
The percentage shown for each investment category reflects the value of investments in that category as a percentage of net assets.
| | |
| (a) | | Coupon increases periodically based upon a predetermined schedule. Stated interest rate in effect at September 30, 2009. |
| |
| (b) | | Securities are exempt from registration under Rule 144A of the Securities Act of 1933. Under procedures approved by the Board of Trustees, such securities have been determined to be liquid by the investment adviser and may be resold, normally to qualified institutional buyers in transactions exempt from registration. Total market value of Rule 144A securities amounts to $41,292,437, which represents approximately 18.8% of net assets as of September 30, 2009. |
| |
| (c) | | Securities with “Put” features with resetting interest rates. Maturity dates disclosed are the final maturity dates. |
| |
| (d) | | Security is currently in default/non-income producing. |
| |
| (e) | | Variable rate security. Interest rate disclosed is that which is in effect at September 30, 2009. |
| |
| (f) | | Security issued with a zero coupon. Income is recognized through the accretion of discount. |
| |
| (g) | | Joint repurchase agreement was entered into on September 30, 2009. Additional information appears on page 65. |
Security ratings disclosed, if any, are issued by Standard & Poor’s/Moody’s Investors Service. A brief description of the ratings is available in the Fund’s Statement of Additional Information.
| | | | | | | |
| | | |
| | | |
| | | Investment Abbreviations: |
| | | KWCDC | | — | | South Korean Won Certificate of Deposit |
| | | LIBOR | | — | | London Interbank Offered Rate |
| | | MTN | | — | | Medium-Term Note |
| | | NR | | — | | Not Rated |
| | | TIIE | | — | | La Tasa de Interbank Equilibrium Interest Rate |
| | | WR | | — | | Withdrawn Rating |
| | | |
| | | |
The accompanying notes are an integral part of these financial statements.
GOLDMAN SACHS EMERGING MARKETS DEBT FUND
ADDITIONAL INVESTMENT INFORMATION
FORWARD FOREIGN CURRENCY EXCHANGE CONTRACTS — At September 30, 2009, the Fund had outstanding forward foreign currency exchange contracts, both to purchase and sell foreign currencies:
| | | | | | | | | | | | | | | | | |
Open Forward Foreign Currency
| | Contract
| | Expiration
| | Value on
| | | Current
| | | Unrealized
| |
| Exchange Contracts with Unrealized Gain | | Type | | Date | | Settlement Date | | | Value | | | Gain | |
| | |
| Brazilian Real | | Purchase | | 01/19/10 | | $ | 2,105,000 | | | $ | 2,119,682 | | | $ | 14,682 | |
| Euro | | Sale | | 10/13/09 | | | 446,380 | | | | 445,505 | | | | 875 | |
| South Korean Won | | Purchase | | 01/19/10 | | | 2,756,994 | | | | 2,817,312 | | | | 60,318 | |
| Turkish Lira | | Purchase | | 12/16/09 | | | 516,652 | | | | 525,416 | | | | 8,764 | |
| |
| |
TOTAL | | | | | | | | | | | | | | $ | 84,639 | |
| |
| |
| | | | | | | | | | | | | | | | | |
| | | | | | | | | | | | | | | | | |
Open Forward Foreign Currency
| | Contract
| | Expiration
| | Value on
| | | Current
| | | Unrealized
| |
| Exchange Contracts with Unrealized Loss | | Type | | Date | | Settlement Date | | | Value | | | Loss | |
| | |
| Brazilian Real | | Sale | | 01/19/10 | | $ | 292,425 | | | $ | 299,160 | | | $ | (6,735 | ) |
| Euro | | Sale | | 10/13/09 | | | 2,132,246 | | | | 2,187,814 | | | | (55,568 | ) |
| Mexican Peso | | Purchase | | 12/16/09 | | | 1,922,441 | | | | 1,893,138 | | | | (29,303 | ) |
| |
| |
TOTAL | | | | | | | | | | | | | | $ | (91,606 | ) |
| |
| |
SWAP CONTRACTS — At September 30, 2009, the Fund had outstanding swap contracts with the following terms:
INTEREST RATE SWAP CONTRACTS
| | | | | | | | | | | | | | | | | |
| | | | | | | | Rates Exchanged | | | |
| | | Notional
| | | | | Payments
| | | Payments
| | | |
| | | Amount
| | | Termination
| | received by
| | | made by
| | Market
| |
| Swap Counterparty | | (000s) | | | Date | | the Fund | | | the Fund | | Value* | |
| | |
| Citibank NA | | MXN | 140,000 | | | 09/13/11 | | | 6.250 | % | | Mexico Interbank
TIIE 28 Days | | $ | (21,866 | ) |
| Deutsche Bank Securities, Inc. | | KRW | 12,550,000 | | | 01/20/11 | | | 2.980 | | | 3 month KWCDC | | | (84,996 | ) |
| | | | 15,000,000 | | | 06/12/11 | | | 3.870 | | | 3 month KWCDC | | | (1,370 | ) |
| | | | 2,601,578 | | | 07/06/11 | | | 3.620 | | | 3 month KWCDC | | | (6,223 | ) |
| | | | 4,346,604 | | | 07/07/11 | | | 3.626 | | | 3 month KWCDC | | | (10,157 | ) |
| JPMorgan Securities, Inc. | | | 2,067,310 | | | 07/08/11 | | | 3.660 | | | 3 month KWCDC | | | (3,796 | ) |
| |
| |
TOTAL | | | | | | | | | | | | | | $ | (128,408 | ) |
| |
| |
| |
| * | There are no upfront payments on the swaps listed above, therefore, the unrealized loss of the swap contracts is equal to their market value. |
The accompanying notes are an integral part of these financial statements.
GOLDMAN SACHS EMERGING MARKETS DEBT FUND
Schedule of Investments (continued)
September 30, 2009 (Unaudited)
| |
| ADDITIONAL INVESTMENT INFORMATION (continued) | |
TOTAL RETURN SWAP CONTRACT
| | | | | | | | | | | | | |
| | | Notional
| | | | | | | | | |
| | | Amount
| | | Reference
| | Termination
| | Financing
| | Market
|
| Swap Counterparty | | (000s) | | | Security | | Date | | Fee# | | Value* |
| |
| Deutsche Bank Securities, Inc. | | TRY | 2,800 | | | Turkish
Government Bond
12.000%, 08/14/13 | | 08/14/13 | | TRY Central
Deposit Bank
+0.400% | | $563,229 |
| |
| |
| |
| * | There is no upfront payment on the swap listed above, therefore, the unrealized gain of the swap contract is equal to its market value. |
| |
| # | The Fund receives semi-annual coupon payments in accordance with the swap contract. On the termination date of the swap contract, the Fund will either receive from or pay to the counterparty an amount equal to the net of the accrued financing fees and the value of the reference security subtracted from the original notional cost (notional multiplied by the price change of the reference security, converted to U.S. Dollars). |
The accompanying notes are an integral part of these financial statements.
GOLDMAN SACHS HIGH YIELD FUND
Schedule of Investments
September 30, 2009 (Unaudited)
| | | | | | | | | | | | | | | | | |
| | | Principal
| | Interest
| | Maturity
| | |
| | | Amount | | Rate | | Date | | Value |
| |
Corporate Obligations – 93.2% |
| | | | | | | | | | | | | | | | | |
| | | | | | | | | | | | | | | | | |
| | | Aerospace – 0.7% |
| | | BE Aerospace, Inc. (BB/Ba3) |
| | | $ | 3,625,000 | | | | 8.500 | % | | | 07/01/18 | | | $ | 3,706,562 | |
| | | Esterline Technologies Corp. (B+/B1) |
| | | | 4,270,000 | | | | 7.750 | | | | 06/15/13 | | | | 4,227,300 | |
| | | Mecachrome International, Inc. (NR/WR)(a) |
| | | EUR | 3,500,000 | | | | 9.000 | | | | 05/15/14 | | | | 358,521 | |
| | | Moog, Inc. (B+/Ba3) |
| | | $ | 210,000 | | | | 6.250 | | | | 01/15/15 | | | | 197,400 | |
| | | Sequa Corp. (CCC/Caa2)(b) |
| | | | 5,312,390 | | | | 13.500 | (c) | | | 12/01/15 | | | | 4,037,416 | |
| | | | 9,250,000 | | | | 11.750 | | | | 12/01/15 | | | | 7,215,000 | |
| | | TransDigm, Inc. (B-/B3) |
| | | | 13,500,000 | | | | 7.750 | | | | 07/15/14 | | | | 13,365,000 | |
| | | Vought Aircraft Industries, Inc. (CCC+/B3) |
| | | | 2,750,000 | | | | 8.000 | | | | 07/15/11 | | | | 2,736,250 | |
| | | | | | | | | | | | | | | | | |
| | | | | | | | | | | | | | | | 35,843,449 | |
| | | |
| | | |
| | | Agriculture – 0.9% |
| | | JBS USA LLC/JBS USA Finance, Inc. (B+/B1)(b) |
| | | | 9,250,000 | | | | 11.625 | | | | 05/01/14 | | | | 9,943,750 | |
| | | Land O’ Lakes, Inc. (BB+/Ba2) |
| | | | 320,000 | | | | 8.750 | | | | 11/15/11 | | | | 320,000 | |
| | | Land O’ Lakes, Inc. (BBB/Baa3) |
| | | | 3,000,000 | | | | 9.000 | | | | 12/15/10 | | | | 3,022,500 | |
| | | National Beef Packing Co. LLC/NB Finance Corp. (B-/Caa1) |
| | | | 3,000,000 | | | | 10.500 | | | | 08/01/11 | | | | 3,000,000 | |
| | | Pilgrim’s Pride Corp. (NR/WR)(a) |
| | | | 5,750,000 | | | | 7.625 | | | | 05/01/15 | | | | 6,267,500 | |
| | | Smithfield Foods, Inc. (B+/Ba3)(b) |
| | | | 3,000,000 | | | | 10.000 | | | | 07/15/14 | | | | 3,150,000 | |
| | | Smithfield Foods, Inc. (B-/Caa1) |
| | | | 2,000,000 | | | | 7.000 | | | | 08/01/11 | | | | 1,920,000 | |
| | | | 9,125,000 | | | | 7.750 | | | | 05/15/13 | | | | 8,189,688 | |
| | | | 12,125,000 | | | | 7.750 | | | | 07/01/17 | | | | 9,821,250 | |
| | | Tereos Europe (BB/B1) |
| | | EUR | 4,000,000 | | | | 6.375 | | | | 04/15/14 | | | | 5,531,459 | |
| | | | | | | | | | | | | | | | | |
| | | | | | | | | | | | | | | | 51,166,147 | |
| | | |
| | | |
| | | Automotive – 2.3% |
| | | FCE Bank PLC (B-/Caa1) |
| | | | 10,000,000 | | | | 7.125 | | | | 01/16/12 | | | | 13,933,229 | |
| | | | 4,000,000 | | | | 7.125 | | | | 01/15/13 | | | | 5,420,730 | |
| | | Ford Motor Credit Co. LLC (CCC+/Caa1) |
| | | $ | 7,000,000 | | | | 7.375 | | | | 10/28/09 | | | | 7,000,000 | |
| | | | 3,500,000 | | | | 5.700 | | | | 01/15/10 | | | | 3,517,500 | |
| | | EUR | 7,000,000 | | | | 4.875 | | | | 01/15/10 | | | | 10,141,059 | |
| | | $ | 8,185,000 | | | | 7.875 | | | | 06/15/10 | | | | 8,205,462 | |
| | | | 5,000,000 | | | | 9.750 | | | | 09/15/10 | | | | 5,137,500 | |
| | | | 3,125,000 | | | | 8.625 | | | | 11/01/10 | | | | 3,179,688 | |
| | | | 6,250,000 | | | | 7.375 | | | | 02/01/11 | | | | 6,218,750 | |
| | | | 12,000,000 | | | | 9.875 | | | | 08/10/11 | | | | 12,270,000 | |
| | | | 32,125,000 | | | | 7.250 | | | | 10/25/11 | | | | 31,241,562 | |
| | | | 7,000,000 | | | | 7.000 | | | | 10/01/13 | | | | 6,580,000 | |
| | | | 8,000,000 | | | | 12.000 | | | | 05/15/15 | | | | 8,840,000 | |
| | | General Motors Corp. (NR/WR)(a) |
| | | | 7,125,000 | | | | 7.125 | | | | 07/15/13 | | | | 1,068,750 | |
| | | | 2,000,000 | | | | 7.700 | | | | 04/15/16 | | | | 300,000 | |
| | | |
| | | |
| | | | 1,000,000 | | | | 8.800 | %(d) | | | 03/01/21 | | | | 150,000 | |
| | | EUR | 2,000,000 | | | | 8.375 | | | | 07/05/33 | | | | 429,347 | |
| | | $ | 14,500,000 | | | | 8.375 | | | | 07/15/33 | | | | 2,320,000 | |
| | | | | | | | | | | | | | | | | |
| | | | | | | | | | | | | | | | 125,953,577 | |
| | | |
| | | |
| | | Automotive Parts – 1.1% |
| | | Accuride Corp. (D/C)(a) |
| | | | 3,000,000 | | | | 8.500 | | | | 02/01/15 | | | | 1,500,000 | |
| | | Allison Transmission, Inc. (CCC+/Caa2)(b) |
| | | | 3,250,000 | | | | 11.250 | (c) | | | 11/01/15 | | | | 2,998,125 | |
| | | | 4,500,000 | | | | 11.000 | | | | 11/01/15 | | | | 4,365,000 | |
| | | Lear Corp. Series B (D/WR)(a) |
| | | | 6,750,000 | | | | 8.500 | | | | 12/01/13 | | | | 4,455,000 | |
| | | Tenneco, Inc. (B-/B3) |
| | | | 2,000,000 | | | | 8.125 | | | | 11/15/15 | | | | 1,920,000 | |
| | | Tenneco, Inc. (CCC/Caa2) |
| | | | 2,750,000 | | | | 8.625 | | | | 11/15/14 | | | | 2,571,250 | |
| | | The Goodyear Tire & Rubber Co. (B+/B1) |
| | | | 3,000,000 | | | | 8.625 | | | | 12/01/11 | | | | 3,112,500 | |
| | | | 1,950,000 | | | | 9.000 | | | | 07/01/15 | | | | 2,023,125 | |
| | | | 8,625,000 | | | | 10.500 | | | | 05/15/16 | | | | 9,401,250 | |
| | | The Goodyear Tire & Rubber Co. (B+/B2) |
| | | | 5,000,000 | | | | 7.857 | | | | 08/15/11 | | | | 5,112,500 | |
| | | TRW Automotive, Inc. (CCC+/Caa2) |
| | | | 7,000,000 | | | | 7.000 | (b) | | | 03/15/14 | | | | 6,440,000 | |
| | | EUR | 7,000,000 | | | | 6.375 | | | | 03/15/14 | | | | 8,809,361 | |
| | | United Components, Inc. (B-/Caa2) |
| | | $ | 5,500,000 | | | | 9.375 | | | | 06/15/13 | | | | 4,413,750 | |
| | | Visteon Corp. (NR/WR)(a)(b)(d) |
| | | | 2,069,000 | | | | 12.250 | | | | 12/31/16 | | | | 527,595 | |
| | | | | | | | | | | | | | | | | |
| | | | | | | | | | | | | | | | 57,649,456 | |
| | | |
| | | |
| | | Banks – 1.4% |
| | | Bank of America Corp. (A-/A3) |
| | | | 6,500,000 | | | | 5.420 | | | | 03/15/17 | | | | 6,179,150 | |
| | | Bank of America Corp. (B/B3)(e) |
| | | | 3,500,000 | | | | 8.000 | | | | 12/29/49 | | | | 3,111,850 | |
| | | Citigroup, Inc. (A-/Baa1) |
| | | | 10,500,000 | | | | 5.000 | | | | 09/15/14 | | | | 10,017,112 | |
| | | | 2,375,000 | | | | 4.875 | | | | 05/07/15 | | | | 2,230,229 | |
| | | Lloyds Banking Group PLC (CCC+/B3)(b)(e) |
| | | | 21,000,000 | | | | 5.920 | | | | 10/01/49 | | | | 11,760,000 | |
| | | | 13,000,000 | | | | 6.413 | | | | 10/01/49 | | | | 7,540,000 | |
| | | | 15,900,000 | | | | 6.267 | | | | 11/14/49 | | | | 9,460,500 | |
| | | Wells Fargo Capital XIII (A-/Ba3)(e) |
| | | | 28,125,000 | | | | 7.700 | | | | 03/26/49 | | | | 24,750,000 | |
| | | Wells Fargo Capital XV (A-/Ba3)(e) |
| | | | 2,000,000 | | | | 9.750 | | | | 09/26/49 | | | | 2,080,000 | |
| | | | | | | | | | | | | | | | | |
| | | | | | | | | | | | | | | | 77,128,841 | |
| | | |
| | | |
| | | Building Materials – 2.2% |
| | | Associated Materials, Inc. (CCC-/Caa2)(f) |
| | | | 13,500,000 | | | | 11.250 | | | | 03/01/14 | | | | 10,192,500 | |
| | | Associated Materials, Inc. (CCC/B3) |
| | | | 1,250,000 | | | | 9.750 | | | | 04/15/12 | | | | 1,212,500 | |
| | | |
| | | |
The accompanying notes are an integral part of these financial statements.
GOLDMAN SACHS HIGH YIELD FUND
Schedule of Investments (continued)
September 30, 2009 (Unaudited)
| | | | | | | | | | | | | | | | | |
| | | Principal
| | Interest
| | Maturity
| | |
| | | Amount | | Rate | | Date | | Value |
| |
Corporate Obligations – (continued) |
| | | Building Materials – (continued) |
| | | | | | | | | | | | | | | | | |
| | | Atrium Cos., Inc. (CC/C)(b)(c) |
| | | $ | 7,257,165 | | | | 15.000 | % | | | 12/15/12 | | | $ | 90,714 | |
| | | Calcipar SA (B+/B1)(e) |
| | | EUR | 7,521,000 | | | | 2.308 | | | | 07/01/14 | | | | 6,988,713 | |
| | | CPG International, Inc. (B-/Caa1) |
| | | $ | 3,500,000 | | | | 10.500 | | | | 07/01/13 | | | | 2,957,500 | |
| | | Grohe Holding GMBH (B-/B3)(e) |
| | | EUR | 11,250,000 | | | | 3.871 | | | | 01/15/14 | | | | 13,910,961 | |
| | | Grohe Holding GMBH (CCC/Caa1) |
| | | | 24,500,000 | | | | 8.625 | | | | 10/01/14 | | | | 26,530,517 | |
| | | Heating Finance PLC (C/Caa3) |
| | | GBP | 2,000,000 | | | | 7.875 | | | | 03/31/14 | | | | 2,620,968 | |
| | | Legrand France SA (BBB/Baa3) |
| | | $ | 5,050,000 | | | | 8.500 | | | | 02/15/25 | | | | 4,696,500 | |
| | | Nortek, Inc. (CC/Caa2) |
| | | | 4,000,000 | | | | 10.000 | | | | 12/01/13 | | | | 4,070,000 | |
| | | Nortek, Inc. (D/Ca) |
| | | | 24,500,000 | | | | 8.500 | | | | 09/01/14 | | | | 16,905,000 | |
| | | NTK Holdings, Inc. (C/C)(f) |
| | | | 10,000,000 | | | | 10.750 | | | | 03/01/14 | | | | 275,000 | |
| | | Owens Corning, Inc. (BBB-/Ba1) |
| | | | 8,630,000 | | | | 6.500 | | | | 12/01/16 | | | | 8,420,222 | |
| | | | 3,750,000 | | | | 7.000 | | | | 12/01/36 | | | | 3,123,098 | |
| | | Panolam Industries International, Inc. (D/C)(a) |
| | | | 6,500,000 | | | | 10.750 | | | | 10/01/13 | | | | 292,500 | |
| | | PLY Gem Industries, Inc. (CC/Ca) |
| | | | 6,250,000 | | | | 9.000 | | | | 02/15/12 | | | | 3,437,500 | |
| | | PLY Gem Industries, Inc. (CCC/Caa1) |
| | | | 5,250,000 | | | | 11.750 | | | | 06/15/13 | | | | 4,646,250 | |
| | | Texas Industries, Inc. (B+/B2) |
| | | | 7,250,000 | | | | 7.250 | | | | 07/15/13 | | | | 6,996,250 | |
| | | USG Corp. (B+/Caa1) |
| | | | 3,000,000 | | | | 6.300 | | | | 11/15/16 | | | | 2,550,000 | |
| | | | | | | | | | | | | | | | | |
| | | | | | | | | | | | | | | | 119,916,693 | |
| | | |
| | | |
| | | Capital Goods – 1.9% |
| | | Altra Industrial Motion, Inc. (B+/B1) |
| | | | 2,000,000 | | | | 9.000 | | | | 12/01/11 | | | | 2,040,000 | |
| | | Baldor Electric Co. (B/B3) |
| | | | 14,250,000 | | | | 8.625 | | | | 02/15/17 | | | | 14,463,750 | |
| | | Briggs & Stratton Corp. (BB-/Ba3) |
| | | | 2,500,000 | | | | 8.875 | | | | 03/15/11 | | | | 2,593,750 | |
| | | Mueller Water Products, Inc. (B-/Caa1) |
| | | | 8,750,000 | | | | 7.375 | | | | 06/01/17 | | | | 7,612,500 | |
| | | Nexans SA (BB+/NR) |
| | | EUR | 7,000,000 | | | | 5.750 | | | | 05/02/17 | | | | 9,680,053 | |
| | | RBS Global & Rexnord Corp. (B-/Caa2) |
| | | $ | 20,440,000 | | | | 9.500 | | | | 08/01/14 | | | | 19,826,800 | |
| | | | 8,000,000 | | | | 8.875 | | | | 09/01/16 | | | | 6,680,000 | |
| | | RBS Global & Rexnord Corp. (CCC+/Caa3) |
| | | | 17,500,000 | | | | 11.750 | | | | 08/01/16 | | | | 15,837,500 | |
| | | SPX Corp. (BB/Ba2) |
| | | | 1,000,000 | | | | 7.625 | | | | 12/15/14 | | | | 1,007,500 | |
| | | Terex Corp. (B/Caa1) |
| | | | 9,000,000 | | | | 8.000 | | | | 11/15/17 | | | | 8,280,000 | |
| | | |
| | | |
| | | Terex Corp. (BB-/B2) |
| | | | 12,375,000 | | | | 10.875 | | | | 06/01/16 | | | | 13,488,750 | |
| | | VAC Finanzierung GMBH (CC/Ca) |
| | | EUR | 4,000,000 | | | | 9.250 | | | | 04/15/16 | | | | 1,463,349 | |
| | | | | | | | | | | | | | | | | |
| | | | | | | | | | | | | | | | 102,973,952 | |
| | | |
| | | |
| | | Chemicals – 3.5% |
| | | Airgas, Inc. (BBB-/Ba1)(b) |
| | | $ | 5,750,000 | | | | 7.125 | | | | 10/01/18 | | | | 5,908,125 | |
| | | Basell AF SCA (NR/WR)(a) |
| | | | 11,625,000 | | | | 8.375 | (b) | | | 08/15/15 | | | | 1,918,125 | |
| | | EUR | 2,250,000 | | | | 8.375 | | | | 08/15/15 | | | | 526,806 | |
| | | Cognis GMBH (B-/B2)(e) |
| | | | 20,325,000 | | | | 2.773 | | | | 09/15/13 | | | | 26,099,103 | |
| | | Cognis GMBH (CCC/Caa2) |
| | | | 19,000,000 | | | | 9.500 | | | | 05/15/14 | | | | 26,969,521 | |
| | | Equistar Chemicals LP (NR/WR)(a) |
| | | $ | 2,000,000 | | | | 7.550 | | | | 02/15/26 | | | | 1,320,000 | |
| | | Hexion U.S. Finance Corp./Hexion Nova Scotia Finance ULC (CCC/Caa1) |
| | | | 6,750,000 | | | | 9.750 | | | | 11/15/14 | | | | 5,821,875 | |
| | | Huntsman International LLC (CCC+/B3) |
| | | EUR | 2,500,000 | | | | 6.875 | | | | 11/15/13 | | | | 3,255,951 | |
| | | $ | 6,000,000 | | | | 7.875 | | | | 11/15/14 | | | | 5,580,000 | |
| | | Ineos Group Holdings PLC (CCC-/Caa3) |
| | | | 6,000,000 | | | | 8.500 | (b) | | | 02/15/16 | | | | 2,850,000 | |
| | | EUR | 7,875,000 | | | | 7.875 | | | | 02/15/16 | | | | 5,531,459 | |
| | | Invista (B/Ba3)(b) |
| | | $ | 1,600,000 | | | | 9.250 | | | | 05/01/12 | | | | 1,608,000 | |
| | | KRATON Polymers LLC/Capital Corp. (CCC/Caa1) |
| | | | 7,975,000 | | | | 8.125 | | | | 01/15/14 | | | | 5,532,656 | |
| | | MacDermid, Inc. (CCC/Caa2)(b) |
| | | | 9,250,000 | | | | 9.500 | | | | 04/15/17 | | | | 8,510,000 | |
| | | Momentive Performance Materials, Inc. (C/B3)(b) |
| | | | 5,541,975 | | | | 12.500 | | | | 06/15/14 | | | | 5,777,509 | |
| | | Momentive Performance Materials, Inc. (C/Caa2) |
| | | EUR | 3,750,000 | | | | 9.000 | | | | 12/01/14 | | | | 4,005,918 | |
| | | $ | 5,528,000 | | | | 9.750 | | | | 12/01/14 | | | | 4,243,341 | |
| | | Momentive Performance Materials, Inc. (C/Caa3) |
| | | | 2,310,000 | | | | 11.500 | | | | 12/01/16 | | | | 1,501,500 | |
| | | Nalco Co. (B/B2) |
| | | | 7,500,000 | | | | 8.875 | | | | 11/15/13 | | | | 7,743,750 | |
| | | EUR | 10,000,000 | | | | 9.000 | | | | 11/15/13 | | | | 14,999,327 | |
| | | Nalco Co. (BB-/Ba2) |
| | | | 540,000 | | | | 7.750 | | | | 11/15/11 | | | | 788,233 | |
| | | Rhodia S.A. (BB-/B1)(e) |
| | | | 6,750,000 | | | | 3.746 | | | | 10/15/13 | | | | 8,791,069 | |
| | | Rockwood Specialties Group, Inc. (B-/B3) |
| | | | 20,500,000 | | | | 7.625 | | | | 11/15/14 | | | | 29,998,654 | |
| | | SPCM SA (B+/B3) |
| | | | 3,250,000 | | | | 8.250 | | | | 06/15/13 | | | | 4,851,002 | |
| | | The Mosaic Co. (BBB-/Baa2)(b) |
| | | $ | 1,125,000 | | | | 7.375 | | | | 12/01/14 | | | | 1,203,750 | |
| | | | 3,385,000 | | | | 7.625 | | | | 12/01/16 | | | | 3,638,875 | |
| | | | | | | | | | | | | | | | | |
| | | | | | | | | | | | | | | | 188,974,549 | |
| | | |
| | | |
| | | | | | | | | | | | | | | | | |
The accompanying notes are an integral part of these financial statements.
GOLDMAN SACHS HIGH YIELD FUND
| | | | | | | | | | | | | | | | | |
| | | Principal
| | Interest
| | Maturity
| | |
| | | Amount | | Rate | | Date | | Value |
| |
Corporate Obligations – (continued) |
| | | | | | | | | | | | | | | | | |
| | | Conglomerates – 1.1% |
| | | Blount, Inc. (B/B2) |
| | | $ | 6,750,000 | | | | 8.875 | % | | | 08/01/12 | | | $ | 6,851,250 | |
| | | Bombardier, Inc. (BB+/Ba2) |
| | | | 9,500,000 | | | | 6.750 | (b) | | | 05/01/12 | | | | 9,642,500 | |
| | | | 4,500,000 | | | | 6.300 | (b) | | | 05/01/14 | | | | 4,410,000 | |
| | | | 1,320,000 | | | | 8.000 | (b) | | | 11/15/14 | | | | 1,356,300 | |
| | | EUR | 2,000,000 | | | | 7.250 | (b) | | | 11/15/16 | | | | 2,955,965 | |
| | | | 3,500,000 | | | | 7.250 | | | | 11/15/16 | | | | 5,160,647 | |
| | | Park-Ohio Industries, Inc. (CCC+/Caa2) |
| | | $ | 5,000,000 | | | | 8.375 | | | | 11/15/14 | | | | 3,850,000 | |
| | | Polypore, Inc. (B-/B3) |
| | | | 4,750,000 | | | | 8.750 | | | | 05/15/12 | | | | 4,631,250 | |
| | | EUR | 10,500,000 | | | | 8.750 | | | | 05/15/12 | | | | 14,366,428 | |
| | | Spectrum Brands, Inc. (CCC/Caa2)(c) |
| | | $ | 3,582,511 | | | | 12.000 | | | | 08/28/19 | | | | 3,403,385 | |
| | | Trimas Corp. (B-/Caa2) |
| | | | 5,401,000 | | | | 9.875 | | | | 06/15/12 | | | | 4,914,910 | |
| | | | | | | | | | | | | | | | | |
| | | | | | | | | | | | | | | | 61,542,635 | |
| | | |
| | | |
| | | Construction Machinery – 0.3% |
| | | Case New Holland, Inc. (BB+/Ba3) |
| | | | 1,500,000 | | | | 7.750 | (b) | | | 09/01/13 | | | | 1,496,250 | |
| | | | 3,750,000 | | | | 7.125 | | | | 03/01/14 | | | | 3,675,000 | |
| | | | 953,000 | | | | 7.250 | | | | 01/15/16 | | | | 914,880 | |
| | | Douglas Dynamics LLC (B-/B3)(b) |
| | | | 1,750,000 | | | | 7.750 | | | | 01/15/12 | | | | 1,583,750 | |
| | | Dresser-Rand Group, Inc. (BB-/B1) |
| | | | 10,106,000 | | | | 7.375 | | | | 11/01/14 | | | | 9,929,145 | |
| | | | | | | | | | | | | | | | | |
| | | | | | | | | | | | | | | | 17,599,025 | |
| | | |
| | | |
| | | Consumer Products-Household & Leisure – 1.8% |
| | | Affinion Group, Inc. (B-/B2) |
| | | | 6,250,000 | | | | 10.125 | | | | 10/15/13 | | | | 6,437,500 | |
| | | Affinion Group, Inc. (B-/Caa1) |
| | | | 4,625,000 | | | | 11.500 | | | | 10/15/15 | | | | 4,717,500 | |
| | | Ames True Temper (B-/Caa1)(e) |
| | | | 2,000,000 | | | | 4.509 | | | | 01/15/12 | | | | 1,740,000 | |
| | | Easton-Bell Sports, Inc. (CCC/Caa1) |
| | | | 7,000,000 | | | | 8.375 | | | | 10/01/12 | | | | 6,475,000 | |
| | | Elizabeth Arden, Inc. (B/B1) |
| | | | 3,250,000 | | | | 7.750 | | | | 01/15/14 | | | | 3,136,250 | |
| | | Freedom Group, Inc. (B+/B1)(b) |
| | | | 3,125,000 | | | | 10.250 | | | | 08/01/15 | | | | 3,312,500 | |
| | | Harry & David Holdings, Inc. (C/Ca) |
| | | | 2,000,000 | | | | 9.000 | | | | 03/01/13 | | | | 1,382,500 | |
| | | Jarden Corp. (B-/B3) |
| | | | 15,250,000 | | | | 7.500 | | | | 05/01/17 | | | | 14,792,500 | |
| | | Sealy Mattress Co. (BB-/Ba3)(b) |
| | | | 1,500,000 | | | | 10.875 | | | | 04/15/16 | | | | 1,653,750 | |
| | | Sealy Mattress Co. (CCC+/Caa1) |
| | | | 10,000,000 | | | | 8.250 | | | | 06/15/14 | | | | 9,300,000 | |
| | | Simmons Bedding Co. (C/Ca)(f) |
| | | | 4,500,000 | | | | 10.000 | | | | 12/15/14 | | | | 1,507,500 | |
| | | Simmons Bedding Co. (D/Caa3) |
| | | | 3,125,000 | | | | 7.875 | | | | 01/15/14 | | | | 2,921,875 | |
| | | Solo Cup Co. (CCC+/Caa2) |
| | | | 7,500,000 | | | | 8.500 | | | | 02/15/14 | | | | 7,125,000 | |
| | | |
| | | |
| | | Visant Corp. (BB-/B1) |
| | | | 8,125,000 | | | | 7.625 | | | | 10/01/12 | | | | 8,125,000 | |
| | | Visant Holding Corp. (B/B3) |
| | | | 16,750,000 | | | | 8.750 | | | | 12/01/13 | | | | 16,959,375 | |
| | | | 10,000,000 | | | | 10.250 | (f) | | | 12/01/13 | | | | 10,300,000 | |
| | | | | | | | | | | | | | | | | |
| | | | | | | | | | | | | | | | 99,886,250 | |
| | | |
| | | |
| | | Consumer Products-Industrial – 0.6% |
| | | Johnsondiversey Holdings, Inc. (CCC+/Caa1)(f) |
| | | | 7,539,000 | | | | 10.670 | | | | 05/15/13 | | | | 7,237,440 | |
| | | Johnsondiversey, Inc. (B-/B2) |
| | | | 5,483,000 | | | | 9.625 | | | | 05/15/12 | | | | 5,537,830 | |
| | | EUR | 14,467,000 | | | | 9.625 | | | | 05/15/12 | | | | 20,641,013 | |
| | | | | | | | | | | | | | | | | |
| | | | | | | | | | | | | | | | 33,416,283 | |
| | | |
| | | |
| | | Consumer Products-Non Durable – 1.3% |
| | | Belvedere SA (NR/WR)(a) |
| | | | 4,500,000 | | | | 0.000 | | | | 05/15/13 | | | | 658,507 | |
| | | Chattem, Inc. (B/B2) |
| | | $ | 2,655,000 | | | | 7.000 | | | | 03/01/14 | | | | 2,688,188 | |
| | | Church & Dwight Co., Inc. (BB+/Ba2) |
| | | | 1,250,000 | | | | 6.000 | | | | 12/15/12 | | | | 1,278,125 | |
| | | Constellation Brands, Inc. (B+/B2) |
| | | | 1,522,000 | | | | 8.125 | | | | 01/15/12 | | | | 1,522,000 | |
| | | Constellation Brands, Inc. (BB/Ba3) |
| | | | 3,875,000 | | | | 8.375 | | | | 12/15/14 | | | | 4,049,375 | |
| | | | 6,000,000 | | | | 7.250 | | | | 09/01/16 | | | | 6,015,000 | |
| | | | 12,000,000 | | | | 7.250 | | | | 05/15/17 | | | | 11,970,000 | |
| | | Prestige Brands, Inc. (B-/B3) |
| | | | 2,000,000 | | | | 9.250 | | | | 04/15/12 | | | | 2,030,000 | |
| | | Sally Holdings LLC (B-/Caa1) |
| | | | 16,000,000 | | | | 10.500 | | | | 11/15/16 | | | | 16,760,000 | |
| | | Sally Holdings LLC (B/B3) |
| | | | 14,250,000 | | | | 9.250 | | | | 11/15/14 | | | | 14,784,375 | |
| | | Yankee Acquisition Corp. (B-/B3) |
| | | | 7,500,000 | | | | 8.500 | | | | 02/15/15 | | | | 7,143,750 | |
| | | Yankee Acquisition Corp. (CCC+/Caa1) |
| | | | 875,000 | | | | 9.750 | | | | 02/15/17 | | | | 813,750 | |
| | | | | | | | | | | | | | | | | |
| | | | | | | | | | | | | | | | 69,713,070 | |
| | | |
| | | |
| | | Defense – 0.8% |
| | | Alliant Techsystems, Inc. (BB-/B1) |
| | | | 6,250,000 | | | | 6.750 | | | | 04/01/16 | | | | 6,031,250 | |
| | | Communications & Power Industries, Inc. (B-/B3) |
| | | | 2,000,000 | | | | 8.000 | | | | 02/01/12 | | | | 1,972,500 | |
| | | L-3 Communications Corp. (BB+/Ba2) |
| | | | 4,000,000 | | | | 7.625 | | | | 06/15/12 | | | | 4,060,000 | |
| | | | 2,500,000 | | | | 6.125 | | | | 07/15/13 | | | | 2,537,500 | |
| | | | 6,000,000 | | | | 6.125 | | | | 01/15/14 | | | | 6,082,500 | |
| | | | 9,000,000 | | | | 5.875 | | | | 01/15/15 | | | | 8,955,000 | |
| | | | 15,500,000 | | | | 6.375 | | | | 10/15/15 | | | | 15,655,000 | |
| | | | | | | | | | | | | | | | | |
| | | | | | | | | | | | | | | | 45,293,750 | |
| | | |
| | | |
| | | Energy-Coal – 0.7% |
| | | Arch Western Finance LLC (BB-/B1) |
| | | | 5,420,000 | | | | 6.750 | | | | 07/01/13 | | | | 5,331,925 | |
| | | |
| | | |
The accompanying notes are an integral part of these financial statements.
GOLDMAN SACHS HIGH YIELD FUND
Schedule of Investments (continued)
September 30, 2009 (Unaudited)
| | | | | | | | | | | | | | | | | |
| | | Principal
| | Interest
| | Maturity
| | |
| | | Amount | | Rate | | Date | | Value |
| |
Corporate Obligations – (continued) |
| | | Energy-Coal – (continued) |
| | | | | | | | | | | | | | | | | |
| | | Foundation PA Coal Co. (BB/Ba3) |
| | | $ | 1,650,000 | | | | 7.250 | % | | | 08/01/14 | | | $ | 1,641,750 | |
| | | Massey Energy Co. (BB-/NR) |
| | | | 3,000,000 | | | | 3.250 | | | | 08/01/15 | | | | 2,382,171 | |
| | | Massey Energy Co. (BB-/B2) |
| | | | 6,000,000 | | | | 6.875 | | | | 12/15/13 | | | | 5,805,000 | |
| | | Peabody Energy Corp. (BB+/Ba1) |
| | | | 4,250,000 | | | | 6.875 | | | | 03/15/13 | | | | 4,271,250 | |
| | | | 1,000,000 | | | | 5.875 | | | | 04/15/16 | | | | 952,500 | |
| | | | 16,385,000 | | | | 7.375 | | | | 11/01/16 | | | | 16,569,331 | |
| | | | | | | | | | | | | | | | | |
| | | | | | | | | | | | | | | | 36,953,927 | |
| | | |
| | | |
| | | Energy-Exploration & Production – 4.5% |
| | | Chesapeake Energy Corp. (BB/Ba3) |
| | | | 10,500,000 | | | | 9.500 | | | | 02/15/15 | | | | 11,051,250 | |
| | | | 10,750,000 | | | | 6.375 | | | | 06/15/15 | | | | 10,024,375 | |
| | | | 10,000,000 | | | | 6.625 | | | | 01/15/16 | | | | 9,450,000 | |
| | | | 13,125,000 | | | | 6.875 | | | | 01/15/16 | | | | 12,370,312 | |
| | | EUR | 4,500,000 | | | | 6.250 | | | | 01/15/17 | | | | 6,058,265 | |
| | | $ | 13,125,000 | | | | 6.500 | | | | 08/15/17 | | | | 12,107,812 | |
| | | | 6,250,000 | | | | 7.250 | | | | 12/15/18 | | | | 5,921,875 | |
| | | Cimarex Energy Co. (BB/Ba3) |
| | | | 6,000,000 | | | | 7.125 | | | | 05/01/17 | | | | 5,565,000 | |
| | | Encore Acquisition Co. (B/B1) |
| | | | 500,000 | | | | 6.250 | | | | 04/15/14 | | | | 465,000 | |
| | | | 11,500,000 | | | | 6.000 | | | | 07/15/15 | | | | 10,407,500 | |
| | | | 5,250,000 | | | | 9.500 | | | | 05/01/16 | | | | 5,538,750 | |
| | | | 4,000,000 | | | | 7.250 | | | | 12/01/17 | | | | 3,740,000 | |
| | | EXCO Resources, Inc. (B/Caa1) |
| | | | 3,000,000 | | | | 7.250 | | | | 01/15/11 | | | | 2,977,500 | |
| | | Forest Oil Corp. (BB-/B1)(b) |
| | | | 10,125,000 | | | | 8.500 | | | | 02/15/14 | | | | 10,226,250 | |
| | | KCS Energy, Inc. (B/B3) |
| | | | 2,375,000 | | | | 7.125 | | | | 04/01/12 | | | | 2,363,125 | |
| | | Newfield Exploration Co. (BB-/Ba3) |
| | | | 5,125,000 | | | | 6.625 | | | | 09/01/14 | | | | 5,060,938 | |
| | | | 12,750,000 | | | | 6.625 | | | | 04/15/16 | | | | 12,526,875 | |
| | | | 7,625,000 | | | | 7.125 | | | | 05/15/18 | | | | 7,615,469 | |
| | | OPTI Canada, Inc. (B/Caa1) |
| | | | 8,000,000 | | | | 7.875 | | | | 12/15/14 | | | | 6,140,000 | |
| | | Pioneer Natural Resources Co. (BB+/NR)(d) |
| | | | 20,533,000 | | | | 2.875 | | | | 01/15/38 | | | | 19,929,843 | |
| | | Pioneer Natural Resources Co. (BB+/Ba1) |
| | | | 2,750,000 | | | | 5.875 | | | | 07/15/16 | | | | 2,528,010 | |
| | | | 4,000,000 | | | | 6.650 | | | | 03/15/17 | | | | 3,795,626 | |
| | | Plains Exploration & Production Co. (BB/B1) |
| | | | 8,250,000 | | | | 7.750 | | | | 06/15/15 | | | | 8,208,750 | |
| | | | 2,250,000 | | | | 10.000 | | | | 03/01/16 | | | | 2,430,000 | |
| | | | 9,000,000 | | | | 7.000 | | | | 03/15/17 | | | | 8,572,500 | |
| | | | 5,000,000 | | | | 7.625 | | | | 06/01/18 | | | | 4,925,000 | |
| | | | 2,000,000 | | | | 8.625 | | | | 10/15/19 | | | | 2,030,000 | |
| | | Quicksilver Resources, Inc. (B-/B3) |
| | | | 7,375,000 | | | | 7.125 | | | | 04/01/16 | | | | 6,416,250 | |
| | | Quicksilver Resources, Inc. (B/B2) |
| | | | 2,250,000 | | | | 8.250 | | | | 08/01/15 | | | | 2,188,125 | |
| | | | 7,250,000 | | | | 11.750 | | | | 01/01/16 | | | | 7,965,938 | |
| | | |
| | | |
| | | Range Resources Corp. (BB/Ba3) |
| | | | 4,500,000 | | | | 6.375 | | | | 03/15/15 | | | | 4,387,500 | |
| | | | 8,625,000 | | | | 8.000 | | | | 05/15/19 | | | | 8,862,187 | |
| | | SandRidge Energy, Inc. (B-/B3)(b) |
| | | | 5,750,000 | | | | 9.875 | | | | 05/15/16 | | | | 5,980,000 | |
| | | | 2,500,000 | | | | 8.000 | | | | 06/01/18 | | | | 2,418,750 | |
| | | Southwestern Energy Co. (BB+/Ba2) |
| | | | 5,000,000 | | | | 7.500 | | | | 02/01/18 | | | | 5,050,000 | |
| | | Whiting Petroleum Corp. (BB/B1) |
| | | | 4,000,000 | | | | 7.250 | | | | 05/01/13 | | | | 3,990,000 | |
| | | | 4,000,000 | | | | 7.000 | | | | 02/01/14 | | | | 3,950,000 | |
| | | | | | | | | | | | | | | | | |
| | | | | | | | | | | | | | | | 243,238,775 | |
| | | |
| | | |
| | | Energy-Refining – 0.1% |
| | | Petroplus Finance Ltd. (BB-/B1)(b) |
| | | | 4,500,000 | | | | 7.000 | | | | 05/01/17 | | | | 4,095,000 | |
| | | Tesoro Corp. (BB+/Ba1) |
| | | | 2,250,000 | | | | 9.750 | | | | 06/01/19 | | | | 2,356,875 | |
| | | | | | | | | | | | | | | | | |
| | | | | | | | | | | | | | | | 6,451,875 | |
| | | |
| | | |
| | | Energy-Services – 0.4% |
| | | Compagnie Generale de Geophysique-Veritas (BB/Ba3) |
| | | | 6,250,000 | | | | 7.500 | | | | 05/15/15 | | | | 6,203,125 | |
| | | | 2,500,000 | | | | 9.500 | (b) | | | 05/15/16 | | | | 2,619,782 | |
| | | Helix Energy Solutions Group, Inc. (B+/B3)(b) |
| | | | 3,750,000 | | | | 9.500 | | | | 01/15/16 | | | | 3,750,000 | |
| | | Key Energy Services, Inc. (BB-/B1) |
| | | | 6,875,000 | | | | 8.375 | | | | 12/01/14 | | | | 6,514,063 | |
| | | | | | | | | | | | | | | | | |
| | | | | | | | | | | | | | | | 19,086,970 | |
| | | |
| | | |
| | | Entertainment & Leisure – 0.6% |
| | | HRP Myrtle Beach Operations LLC (NR/WR)(a)(b) |
| | | | 1,750,000 | | | | 0.000 | | | | 04/01/12 | | | | 175 | |
| | | Regal Cinemas Corp. (B-/B1)(b) |
| | | | 1,500,000 | | | | 8.625 | | | | 07/15/19 | | | | 1,552,500 | |
| | | Universal City Development Partners (B+/B2) |
| | | | 8,750,000 | | | | 11.750 | | | | 04/01/10 | | | | 8,750,000 | |
| | | Universal City Florida Holding Co. (B-/Caa2) |
| | | | 250,000 | | | | 5.233 | (e) | | | 05/01/10 | | | | 244,375 | |
| | | | 2,125,000 | | | | 8.375 | | | | 05/01/10 | | | | 2,103,750 | |
| | | WMG Acquisition Corp. (B/B1) |
| | | | 7,750,000 | | | | 7.375 | | | | 04/15/14 | | | | 7,401,250 | |
| | | WMG Acquisition Corp. (BB/Ba2)(b) |
| | | | 8,750,000 | | | | 9.500 | | | | 06/15/16 | | | | 9,275,000 | |
| | | WMG Holdings Corp. (B/B1)(f) |
| | | | 4,614,000 | | | | 9.500 | | | | 12/15/14 | | | | 4,429,440 | |
| | | | | | | | | | | | | | | | | |
| | | | | | | | | | | | | | | | 33,756,490 | |
| | | |
| | | |
| | | Environmental – 0.8% |
| | | Allied Waste North America, Inc. (BBB/Baa3) |
| | | | 3,875,000 | | | | 6.375 | | | | 04/15/11 | | | | 4,044,531 | |
| | | | 5,285,000 | | | | 7.875 | | | | 04/15/13 | | | | 5,443,550 | |
| | | | 6,000,000 | | | | 6.125 | | | | 02/15/14 | | | | 6,142,500 | |
| | | | 11,250,000 | | | | 7.250 | | | | 03/15/15 | | | | 11,700,000 | |
| | | Allied Waste North America, Inc. Series B (BBB/Baa3) |
| | | | 5,250,000 | | | | 6.875 | | | | 06/01/17 | | | | 5,541,375 | |
| | | |
| | | |
The accompanying notes are an integral part of these financial statements.
GOLDMAN SACHS HIGH YIELD FUND
| | | | | | | | | | | | | | | | | |
| | | Principal
| | Interest
| | Maturity
| | |
| | | Amount | | Rate | | Date | | Value |
| |
Corporate Obligations – (continued) |
| | | Environmental – (continued) |
| | | | | | | | | | | | | | | | | |
| | | Waste Services (B-/Caa1) |
| | | $ | 8,000,000 | | | | 9.500 | % | | | 04/15/14 | | | $ | 7,920,000 | |
| | | WCA Waste Corp. (B-/B3) |
| | | | 2,500,000 | | | | 9.250 | | | | 06/15/14 | | | | 2,450,000 | |
| | | | | | | | | | | | | | | | | |
| | | | | | | | | | | | | | | | 43,241,956 | |
| | | |
| | | |
| | | Finance – 3.7% |
| | | CIT Group, Inc. (CC/Ca) |
| | | | 5,000,000 | | | | 5.800 | | | | 07/28/11 | | | | 3,400,000 | |
| | | EUR | 1,000,000 | | | | 4.250 | | | | 09/22/11 | | | | 910,991 | |
| | | $ | 2,075,000 | | | | 7.750 | | | | 04/02/12 | | | | 1,307,250 | |
| | | EUR | 2,750,000 | | | | 3.800 | | | | 11/14/12 | | | | 2,338,871 | |
| | | $ | 23,750,000 | | | | 7.625 | | | | 11/30/12 | | | | 15,437,500 | |
| | | | 4,000,000 | | | | 5.000 | | | | 02/13/14 | | | | 2,520,000 | |
| | | EUR | 3,310,000 | | | | 5.000 | | | | 05/13/14 | | | | 2,687,761 | |
| | | $ | 16,250,000 | | | | 5.000 | | | | 02/01/15 | | | | 10,075,000 | |
| | | EUR | 4,125,000 | | | | 4.250 | | | | 03/17/15 | | | | 3,410,518 | |
| | | $ | 4,000,000 | | | | 5.400 | | | | 01/30/16 | | | | 2,480,000 | |
| | | | 1,180,000 | | | | 5.850 | | | | 09/15/16 | | | | 719,800 | |
| | | EUR | 5,250,000 | | | | 4.650 | | | | 09/19/16 | | | | 4,225,420 | |
| | | $ | 2,750,000 | | | | 5.650 | | | | 02/13/17 | | | | 1,677,500 | |
| | | ETrade Financial Corp. (CCC/B3) |
| | | | 5,750,000 | | | | 7.375 | | | | 09/15/13 | | | | 5,218,125 | |
| | | General Electric Capital Corp. (A+/Aa3)(e) |
| | | EUR | 12,125,000 | | | | 4.625 | | | | 09/15/66 | | | | 13,573,476 | |
| | | | 16,750,000 | | | | 5.500 | | | | 09/15/67 | | | | 18,996,099 | |
| | | GMAC Canada Ltd. (NR/Ca) |
| | | CAD | 7,250,000 | | | | 6.000 | | | | 05/25/10 | | | | 6,604,385 | |
| | | GMAC Canada Ltd. (CCC/Ca) |
| | | GBP | 500,000 | | | | 6.625 | | | | 12/17/10 | | | | 767,113 | |
| | | EUR | 4,000,000 | | | | 6.000 | | | | 05/23/12 | | | | 5,326,590 | |
| | | GMAC LLC (CCC/Ca)(b) |
| | | $ | 2,431,000 | | | | 5.750 | | | | 05/21/10 | | | | 2,351,992 | |
| | | | 3,536,000 | | | | 5.750 | | | | 09/27/10 | | | | 3,407,820 | |
| | | | 17,033,000 | | | | 7.250 | | | | 03/02/11 | | | | 16,649,757 | |
| | | | 2,652,000 | | | | 5.375 | | | | 06/06/11 | | | | 2,479,620 | |
| | | | 31,080,000 | | | | 6.875 | | | | 09/15/11 | | | | 29,526,000 | |
| | | | 7,500,000 | | | | 6.625 | | | | 05/15/12 | | | | 6,900,000 | |
| | | | 8,000,000 | | | | 6.875 | | | | 08/28/12 | | | | 7,400,000 | |
| | | | 4,407,000 | | | | 6.750 | | | | 12/01/14 | | | | 3,745,950 | |
| | | | 8,289,000 | | | | 8.000 | | | | 11/01/31 | | | | 6,796,980 | |
| | | NCO Group, Inc. (CCC+/Caa1) |
| | | | 7,250,000 | | | | 11.875 | | | | 11/15/14 | | | | 4,495,000 | |
| | | SLM Corp. (BBB-/Ba1) |
| | | CAD | 1,730,000 | | | | 4.300 | | | | 12/15/09 | | | | 1,597,823 | |
| | | $ | 4,000,000 | | | | 4.000 | | | | 01/15/10 | | | | 3,980,689 | |
| | | | 7,500,000 | | | | 0.664 | (e) | | | 07/26/10 | | | | 7,122,663 | |
| | | | 1,375,000 | | | | 4.500 | | | | 07/26/10 | | | | 1,335,885 | |
| | | EUR | 875,000 | | | | 0.973 | (e) | | | 12/15/10 | | | | 1,113,974 | |
| | | $ | 1,875,000 | | | | 5.450 | | | | 04/25/11 | | | | 1,772,410 | |
| | | | 1,500,000 | | | | 8.450 | | | | 06/15/18 | | | | 1,194,392 | |
| | | | | | | | | | | | | | | | | |
| | | | | | | | | | | | | | | | 203,547,354 | |
| | | |
| | | |
| | | Finance Insurance(b) – 0.1% |
| | | HUB International Holdings, Inc. (CCC+/B3) |
| | | | 6,500,000 | | | | 9.000 | | | | 12/15/14 | | | | 6,223,750 | |
| | | |
| | | |
| | | Food – 1.4% |
| | | Dean Foods Co. (B/B3) |
| | | | 14,250,000 | | | | 7.000 | | | | 06/01/16 | | | | 13,573,125 | |
| | | Dole Food Co. (CCC+/Caa1) |
| | | | 7,000,000 | | | | 7.250 | | | | 06/15/10 | | | | 7,000,000 | |
| | | | 2,750,000 | | | | 8.875 | | | | 03/15/11 | | | | 2,750,000 | |
| | | Foodcorp Ltd. (B/B2) |
| | | EUR | 7,000,000 | | | | 8.875 | | | | 06/15/12 | | | | 9,614,495 | |
| | | Michael Foods, Inc. (B-/B3) |
| | | $ | 7,500,000 | | | | 8.000 | | | | 11/15/13 | | | | 7,612,500 | |
| | | Pinnacle Foods Finance LLC (CCC/Caa2) |
| | | | 20,500,000 | | | | 9.250 | | | | 04/01/15 | | | | 20,807,500 | |
| | | | 13,000,000 | | | | 10.625 | | | | 04/01/17 | | | | 13,195,000 | |
| | | | | | | | | | | | | | | | | |
| | | | | | | | | | | | | | | | 74,552,620 | |
| | | |
| | | |
| | | Food and Beverage – 0.5% |
| | | Del Monte Corp. (BB-/B1) |
| | | | 1,500,000 | | | | 8.625 | | | | 12/15/12 | | | | 1,530,000 | |
| | | | 1,500,000 | | | | 6.750 | | | | 02/15/15 | | | | 1,485,000 | |
| | | | 4,000,000 | | | | 7.500 | (b) | | | 10/15/19 | | | | 4,020,000 | |
| | | M-Foods Holdings, Inc. (B-/B3)(b) |
| | | | 3,250,000 | | | | 9.750 | | | | 10/01/13 | | | | 3,339,375 | |
| | | Tyson Foods, Inc. (BB/Ba3) |
| | | | 11,250,000 | | | | 10.500 | | | | 03/01/14 | | | | 12,738,635 | |
| | | Wm. Wrigley Jr. Co. (NR/WR) |
| | | | 6,000,000 | | | | 4.300 | | | | 07/15/10 | | | | 6,087,379 | |
| | | | | | | | | | | | | | | | | |
| | | | | | | | | | | | | | | | 29,200,389 | |
| | | |
| | | |
| | | Gaming – 5.2% |
| | | Ameristar Casinos, Inc. (BB-/B2)(b) |
| | | | 9,125,000 | | | | 9.250 | | | | 06/01/14 | | | | 9,421,562 | |
| | | Boyd Gaming Corp. (B+/B3) |
| | | | 3,250,000 | | | | 6.750 | | | | 04/15/14 | | | | 2,941,250 | |
| | | | 1,000,000 | | | | 7.125 | | | | 02/01/16 | | | | 880,000 | |
| | | Buffalo Thunder Development Authority (NR/WR)(a)(b) |
| | | | 2,500,000 | | | | 9.375 | | | | 12/15/14 | | | | 425,000 | |
| | | Caesars Entertainment, Inc. (CCC-/Ca) |
| | | | 5,000,000 | | | | 7.875 | | | | 03/15/10 | | | | 5,006,250 | |
| | | CCM Merger, Inc. (CCC+/Caa3)(b) |
| | | | 4,500,000 | | | | 8.000 | | | | 08/01/13 | | | | 3,690,000 | |
| | | Chukchansi Economic Development Authority (B+/B3)(b) |
| | | | 5,470,000 | | | | 8.000 | | | | 11/15/13 | | | | 4,293,950 | |
| | | Circus & Eldorado (B-/Caa2) |
| | | | 3,000,000 | | | | 10.125 | | | | 03/01/12 | | | | 2,640,000 | |
| | | Cirsa Capital Luxembourg SA (B+/B3) |
| | | EUR | 1,750,000 | | | | 7.875 | | | | 07/15/12 | | | | 2,471,231 | |
| | | Cirsa Finance Luxembourg SA (B+/B2) |
| | | | 7,000,000 | | | | 8.750 | | | | 05/15/14 | | | | 9,884,922 | |
| | | Codere Finance Luxembourg SA (B/B2) |
| | | | 16,000,000 | | | | 8.250 | | | | 06/15/15 | | | | 21,072,225 | |
| | | Galaxy Entertainment Finance Co. Ltd. (B/B3)(b) |
| | | $ | 1,500,000 | | | | 9.875 | | | | 12/15/12 | | | | 1,447,500 | |
| | | Harrah’s Operating Co., Inc. (B/Caa)(b) |
| | | | 5,125,000 | | | | 11.250 | | | | 06/01/17 | | | | 5,150,625 | |
| | | Harrah’s Operating Co., Inc. (CCC-/NR)(b) |
| | | | 39,769,000 | | | | 10.000 | | | | 12/15/18 | | | | 30,920,397 | |
| | | |
| | | |
The accompanying notes are an integral part of these financial statements.
GOLDMAN SACHS HIGH YIELD FUND
Schedule of Investments (continued)
September 30, 2009 (Unaudited)
| | | | | | | | | | | | | | | | | |
| | | Principal
| | Interest
| | Maturity
| | |
| | | Amount | | Rate | | Date | | Value |
| |
Corporate Obligations – (continued) |
| | | Gaming – (continued) |
| | | | | | | | | | | | | | | | | |
| | | Harrahs Operating Escrow LLC/Harrahs Escrow Corp. (B/Caa1)(b) |
| | | $ | 8,000,000 | | | | 11.250 | % | | | 06/01/17 | | | $ | 8,040,000 | |
| | | Isle of Capri Casinos, Inc. (CCC+/Caa1) |
| | | | 1,815,000 | | | | 7.000 | | | | 03/01/14 | | | | 1,606,275 | |
| | | Mandalay Resort Group (CCC-/Ca) |
| | | | 2,000,000 | | | | 9.375 | | | | 02/15/10 | | | | 1,980,000 | |
| | | Mashantucket Pequot Tribe (CCC/Ca)(b) |
| | | | 4,000,000 | | | | 8.500 | | | | 11/15/15 | | | | 1,440,000 | |
| | | MGM Mirage, Inc. (B/B1)(b) |
| | | | 11,750,000 | | | | 13.000 | | | | 11/15/13 | | | | 13,541,875 | |
| | | | 1,875,000 | | | | 10.375 | | | | 05/15/14 | | | | 2,010,938 | |
| | | | 4,750,000 | | | | 11.125 | | | | 11/15/17 | | | | 5,236,875 | |
| | | MGM Mirage, Inc. (CCC+/Caa2) |
| | | | 2,000,000 | | | | 8.500 | | | | 09/15/10 | | | | 1,980,000 | |
| | | | 2,500,000 | | | | 6.750 | | | | 09/01/12 | | | | 2,137,500 | |
| | | | 9,500,000 | | | | 6.750 | | | | 04/01/13 | | | | 7,790,000 | |
| | | | 3,500,000 | | | | 5.875 | | | | 02/27/14 | | | | 2,712,500 | |
| | | | 21,750,000 | | | | 6.625 | | | | 07/15/15 | | | | 16,801,875 | |
| | | | 15,750,000 | | | | 7.500 | | | | 06/01/16 | | | | 12,363,750 | |
| | | MGM Mirage, Inc. (CCC-/Ca) |
| | | | 5,125,000 | | | | 8.375 | | | | 02/01/11 | | | | 4,715,000 | |
| | | Mohegan Tribal Gaming Authority (B-/B1) |
| | | | 250,000 | | | | 6.125 | | | | 02/15/13 | | | | 200,000 | |
| | | Mohegan Tribal Gaming Authority (CCC+/Caa2) |
| | | | 3,000,000 | | | | 8.000 | | | | 04/01/12 | | | | 2,542,500 | |
| | | | 1,555,000 | | | | 7.125 | | | | 08/15/14 | | | | 1,104,050 | |
| | | MTR Gaming Group, Inc. (B/B2)(b) |
| | | | 6,000,000 | | | | 12.625 | | | | 07/15/14 | | | | 5,955,000 | |
| | | Peermont Proprietary Global Ltd. (B/B3) |
| | | EUR | 15,500,000 | | | | 7.750 | | | | 04/30/14 | | | | 19,279,623 | |
| | | Penn National Gaming, Inc. (BB-/B1) |
| | | $ | 4,300,000 | | | | 6.750 | | | | 03/01/15 | | | | 4,128,000 | |
| | | Pinnacle Entertainment, Inc. (B/Caa1) |
| | | | 4,750,000 | | | | 8.250 | | | | 03/15/12 | | | | 4,750,000 | |
| | | | 1,500,000 | | | | 8.750 | | | | 10/01/13 | | | | 1,543,755 | |
| | | | 10,000,000 | | | | 7.500 | | | | 06/15/15 | | | | 9,000,000 | |
| | | Pinnacle Entertainment, Inc. (BB/B2)(b) |
| | | | 2,000,000 | | | | 8.625 | | | | 08/01/17 | | | | 2,010,000 | |
| | | Pokagon Gaming Authority (B+/B2)(b) |
| | | | 2,620,000 | | | | 10.375 | | | | 06/15/14 | | | | 2,698,600 | |
| | | River Rock Entertainment (B+/B2) |
| | | | 2,500,000 | | | | 9.750 | | | | 11/01/11 | | | | 2,300,000 | |
| | | San Pasqual Casino (BB-/B2)(b) |
| | | | 2,375,000 | | | | 8.000 | | | | 09/15/13 | | | | 2,256,250 | |
| | | Seneca Gaming Corp. (BB/Ba2) |
| | | | 6,550,000 | | | | 7.250 | | | | 05/01/12 | | | | 6,107,875 | |
| | | Shingle Springs Tribal Gaming Authority (B-/Caa1)(b) |
| | | | 9,000,000 | | | | 9.375 | | | | 06/15/15 | | | | 6,390,000 | |
| | | Snoqualmie Entertainment Authority (CCC/Caa1)(b) |
| | | | 7,250,000 | | | | 9.125 | | | | 02/01/15 | | | | 3,878,750 | |
| | | Station Casinos, Inc. (D/WR)(a) |
| | | | 2,500,000 | | | | 6.000 | | | | 04/01/12 | | | | 737,500 | |
| | | | 11,625,000 | | | | 6.500 | | | | 02/01/14 | | | | 465,000 | |
| | | | 13,000,000 | | | | 6.875 | | | | 03/01/16 | | | | 520,000 | |
| | | | 2,000,000 | | | | 7.750 | | | | 08/15/16 | | | | 570,000 | |
| | | |
| | | |
| | | Tropicana Entertainment LLC (NR/WR)(a) |
| | | | 2,000,000 | | | | 9.625 | | | | 12/15/14 | | | | 1,260 | |
| | | Turning Stone Casino Resort Enterprise (B+/B1)(b) |
| | | | 2,950,000 | | | | 9.125 | | | | 09/15/14 | | | | 2,743,500 | |
| | | Wynn Las Vegas LLC (BB+/Ba2) |
| | | | 16,000,000 | | | | 6.625 | | | | 12/01/14 | | | | 15,181,250 | |
| | | Yonkers Racing Corp. (B+/B1)(b) |
| | | | 4,750,000 | | | | 11.375 | | | | 07/15/16 | | | | 4,845,000 | |
| | | | | | | | | | | | | | | | | |
| | | | | | | | | | | | | | | | 281,809,413 | |
| | | |
| | | |
| | | Health Care-Medical Products – 3.4% |
| | | Accellent, Inc. (CCC+/Caa2) |
| | | | 7,625,000 | | | | 10.500 | | | | 12/01/13 | | | | 7,281,875 | |
| | | Bausch & Lomb, Inc. (B/Caa1) |
| | | | 21,000,000 | | | | 9.875 | | | | 11/01/15 | | | | 22,050,000 | |
| | | Bio-Rad Laboratories, Inc. (BB+/Ba3)(b) |
| | | | 3,250,000 | | | | 8.000 | | | | 09/15/16 | | | | 3,371,875 | |
| | | Boston Scientific Corp. (BB+/Ba1) |
| | | | 3,975,000 | | | | 5.450 | | | | 06/15/14 | | | | 3,994,875 | |
| | | | 9,125,000 | | | | 6.400 | | | | 06/15/16 | | | | 9,239,063 | |
| | | Catalent Pharma Solutions, Inc. (B-/Caa1) |
| | | EUR | 10,000,000 | | | | 9.750 | | | | 04/15/17 | | | | 9,804,438 | |
| | | Catalent Pharma Solutions, Inc. (B/Caa1)(c) |
| | | $ | 23,875,000 | | | | 9.500 | | | | 04/15/15 | | | | 20,890,625 | |
| | | CONMED Corp. (B/B1)(d) |
| | | | 9,500,000 | | | | 2.500 | | | | 11/15/24 | | | | 8,505,198 | |
| | | DJO Finance LLC/DJO Finance Corp. (B-/Caa1) |
| | | | 12,000,000 | | | | 10.875 | | | | 11/15/14 | | | | 12,240,000 | |
| | | Fresenius (BB+/Ba2) |
| | | | 6,625,000 | | | | 6.875 | | | | 07/15/17 | | | | 6,455,711 | |
| | | Fresenius US Finance II, Inc. (BB/Ba1) |
| | | EUR | 2,000,000 | | | | 8.750 | | | | 07/15/15 | | | | 3,252,751 | |
| | | $ | 9,750,000 | | | | 9.000 | (b) | | | 07/15/15 | | | | 10,725,000 | |
| | | Hologic, Inc. (BB-/NR)(d)(g) |
| | | | 32,763,000 | | | | 2.000 | | | | 12/15/37 | | | | 27,015,452 | |
| | | Inverness Medical Innovations, Inc. (B-/B3) |
| | | | 9,000,000 | | | | 9.000 | | | | 05/15/16 | | | | 8,943,750 | |
| | | The Cooper Companies, Inc. (BB-/Ba3) |
| | | | 8,670,000 | | | | 7.125 | | | | 02/15/15 | | | | 8,409,900 | |
| | | VWR Funding, Inc. (B-/Caa1)(c) |
| | | | 20,750,000 | | | | 10.250 | | | | 07/15/15 | | | | 18,986,250 | |
| | | Wright Medical Group, Inc. (NR/NR) |
| | | | 6,750,000 | | | | 2.625 | | | | 12/01/14 | | | | 5,703,075 | |
| | | | | | | | | | | | | | | | | |
| | | | | | | | | | | | | | | | 186,869,838 | |
| | | |
| | | |
| | | Health Care-Pharmaceutical – 0.4% |
| | | Angiotech Pharmaceuticals, Inc. (CC/C) |
| | | | 1,750,000 | | | | 7.750 | | | | 04/01/14 | | | | 1,251,250 | |
| | | Elan Corp. PLC (B/B2)(b) |
| | | | 750,000 | | | | 8.750 | | | | 10/15/16 | | | | 741,780 | |
| | | Elan Finance PLC/Elan Finance Corp. (B/B2) |
| | | | 5,000,000 | | | | 7.750 | | | | 11/15/11 | | | | 5,100,000 | |
| | | | 1,500,000 | | | | 8.875 | | | | 12/01/13 | | | | 1,515,000 | |
| | | Mylan, Inc. (BB-/NR) |
| | | | 7,030,000 | | | | 1.250 | | | | 03/15/12 | | | | 6,890,532 | |
| | | |
| | | |
The accompanying notes are an integral part of these financial statements.
GOLDMAN SACHS HIGH YIELD FUND
| | | | | | | | | | | | | | | | | |
| | | Principal
| | Interest
| | Maturity
| | |
| | | Amount | | Rate | | Date | | Value |
| |
Corporate Obligations – (continued) |
| | | Health Care-Pharmaceutical – (continued) |
| | | | | | | | | | | | | | | | | |
| | | Warner Chilcott Corp. (B+/B3) |
| | | $ | 5,606,000 | | | | 8.750 | % | | | 02/01/15 | | | $ | 5,746,150 | |
| | | | | | | | | | | | | | | | | |
| | | | | | | | | | | | | | | | 21,244,712 | |
| | | |
| | | |
| | | Health Care-Services – 5.3% |
| | | Alliance HealthCare Services, Inc. (B/B3) |
| | | | 3,250,000 | | | | 7.250 | | | | 12/15/12 | | | | 3,136,250 | |
| | | Community Health Systems, Inc. (B/B3) |
| | | | 21,000,000 | | | | 8.875 | | | | 07/15/15 | | | | 21,525,000 | |
| | | CRC Health Corp. (CCC+/Caa1) |
| | | | 3,250,000 | | | | 10.750 | | | | 02/01/16 | | | | 2,291,250 | |
| | | DaVita, Inc. (B+/B1) |
| | | | 5,875,000 | | | | 6.625 | | | | 03/15/13 | | | | 5,816,250 | |
| | | DaVita, Inc. (B/B2) |
| | | | 7,750,000 | | | | 7.250 | | | | 03/15/15 | | | | 7,672,500 | |
| | | HCA, Inc. (B-/Caa1) |
| | | GBP | 752,000 | | | | 8.750 | | | | 11/01/10 | | | | 1,207,819 | |
| | | $ | 6,250,000 | | | | 6.300 | | | | 10/01/12 | | | | 5,937,500 | |
| | | | 7,500,000 | | | | 6.250 | | | | 02/15/13 | | | | 7,162,500 | |
| | | | 11,670,000 | | | | 6.750 | | | | 07/15/13 | | | | 11,159,437 | |
| | | | 2,500,000 | | | | 5.750 | | | | 03/15/14 | | | | 2,218,750 | |
| | | | 9,000,000 | | | | 6.375 | | | | 01/15/15 | | | | 7,942,500 | |
| | | | 4,750,000 | | | | 6.500 | | | | 02/15/16 | | | | 4,227,500 | |
| | | HCA, Inc. (BB-/B2) |
| | | | 14,000,000 | | | | 9.125 | | | | 11/15/14 | | | | 14,385,000 | |
| | | | 24,545,000 | | | | 9.625 | (c) | | | 11/15/16 | | | | 25,342,712 | |
| | | | 13,000,000 | | | | 9.250 | | | | 11/15/16 | | | | 13,357,500 | |
| | | | 2,500,000 | | | | 9.875 | (b) | | | 02/15/17 | | | | 2,662,500 | |
| | | HCA, Inc. (BB/Ba3)(b) |
| | | | 12,625,000 | | | | 8.500 | | | | 04/15/19 | | | | 13,130,000 | |
| | | | 7,500,000 | | | | 7.875 | | | | 02/15/20 | | | | 7,556,250 | |
| | | LifePoint Hospitals, Inc. (B/NR) |
| | | | 24,750,000 | | | | 3.500 | | | | 05/15/14 | | | | 21,409,171 | |
| | | LifePoint Hospitals, Inc. (B/B1)(d) |
| | | | 10,375,000 | | | | 3.250 | | | | 08/15/25 | | | | 9,050,911 | |
| | | Psychiatric Solutions, Inc. (B-/B3) |
| | | | 2,220,000 | | | | 7.750 | | | | 07/15/15 | | | | 2,142,300 | |
| | | Select Medical Corp. (CCC/B3) |
| | | | 7,000,000 | | | | 7.625 | | | | 02/01/15 | | | | 6,553,750 | |
| | | Senior Housing Properties Trust (BBB-/Ba1) |
| | | | 1,600,000 | | | | 7.875 | | | | 04/15/15 | | | | 1,504,000 | |
| | | Tenet Healthcare Corp. (BB-/B2)(b) |
| | | | 7,000,000 | | | | 9.000 | | | | 05/01/15 | | | | 7,306,250 | |
| | | | 4,375,000 | | | | 10.000 | | | | 05/01/18 | | | | 4,812,500 | |
| | | | 8,625,000 | | | | 8.875 | | | | 07/01/19 | | | | 9,142,500 | |
| | | Tenet Healthcare Corp. (CCC+/Caa2) |
| | | | 13,000,000 | | | | 7.375 | | | | 02/01/13 | | | | 12,870,000 | |
| | | | 1,250,000 | | | | 9.250 | | | | 02/01/15 | | | | 1,304,688 | |
| | | U.S. Oncology, Inc. (CCC+/B3) |
| | | | 1,875,000 | | | | 10.750 | | | | 08/15/14 | | | | 1,964,063 | |
| | | United Surgical Partners International, Inc. (CCC+/Caa1) |
| | | | 5,250,000 | | | | 8.875 | | | | 05/01/17 | | | | 5,276,250 | |
| | | US Oncology, Inc. (B/Ba3)(b) |
| | | | 32,250,000 | | | | 9.125 | | | | 08/15/17 | | | | 33,862,500 | |
| | | Vanguard Health Holding Co. I (CCC+/Caa1)(f) |
| | | | 3,500,000 | | | | 11.250 | | | | 10/01/15 | | | | 3,578,750 | |
| | | |
| | | |
| | | Vanguard Health Holding Co. II (CCC+/Caa1) |
| | | | 11,375,000 | | | | 9.000 | | | | 10/01/14 | | | | 11,630,937 | |
| | | Ventas Realty LP (BBB-/Ba1) |
| | | | 1,750,000 | | | | 6.500 | | | | 06/01/16 | | | | 1,697,500 | |
| | | | | | | | | | | | | | | | | |
| | | | | | | | | | | | | | | | 290,837,288 | |
| | | |
| | | |
| | | Home Construction – 0.8% |
| | | D. R. Horton, Inc. (BB-/Ba3) |
| | | | 7,750,000 | | | | 5.375 | | | | 06/15/12 | | | | 7,711,250 | |
| | | | 2,915,000 | | | | 5.625 | | | | 09/15/14 | | | | 2,812,975 | |
| | | | 6,000,000 | | | | 5.250 | | | | 02/15/15 | | | | 5,610,000 | |
| | | | 5,500,000 | | | | 5.625 | | | | 01/15/16 | | | | 5,142,500 | |
| | | K. Hovnanian Enterprises, Inc. (CCC-/Caa1) |
| | | | 5,000,000 | | | | 11.500 | | | | 05/01/13 | | | | 5,275,000 | |
| | | KB HOME (BB-/B1) |
| | | | 2,000,000 | | | | 6.250 | | | | 06/15/15 | | | | 1,910,000 | |
| | | Meritage Homes Corp. (B+/B1) |
| | | | 5,750,000 | | | | 6.250 | | | | 03/15/15 | | | | 5,290,000 | |
| | | Pulte Homes, Inc. (BB/B1) |
| | | | 2,000,000 | | | | 5.250 | | | | 01/15/14 | | | | 1,940,000 | |
| | | | 7,250,000 | | | | 5.200 | | | | 02/15/15 | | | | 6,887,500 | |
| | | USG Corp. (BB/B1)(b) |
| | | | 3,250,000 | | | | 9.750 | | | | 08/01/14 | | | | 3,396,250 | |
| | | | | | | | | | | | | | | | | |
| | | | | | | | | | | | | | | | 45,975,475 | |
| | | |
| | | |
| | | Lodging – 0.7% |
| | | Gaylord Entertainment Co. (B-/Caa2) |
| | | | 4,825,000 | | | | 8.000 | | | | 11/15/13 | | | | 4,921,500 | |
| | | Host Hotels & Resorts LP (BB+/NR) |
| | | | 5,000,000 | | | | 6.875 | | | | 11/01/14 | | | | 4,900,000 | |
| | | Host Hotels & Resorts LP (BB+/Ba1) |
| | | | 1,000,000 | | | | 7.000 | | | | 08/15/12 | | | | 1,002,500 | |
| | | | 6,000,000 | | | | 6.750 | | | | 06/01/16 | | | | 5,775,000 | |
| | | Host Marriott LP (BB+/Ba1) |
| | | | 9,250,000 | | | | 7.125 | | | | 11/01/13 | | | | 9,122,812 | |
| | | | 8,250,000 | | | | 6.375 | | | | 03/15/15 | | | | 7,816,875 | |
| | | Starwood Hotels & Resorts Worldwide, Inc. (BB/Ba1) |
| | | | 4,250,000 | | | | 7.875 | | | | 10/15/14 | | | | 4,412,976 | |
| | | | | | | | | | | | | | | | | |
| | | | | | | | | | | | | | | | 37,951,663 | |
| | | |
| | | |
| | | Media – 1.7% |
| | | DIRECTV Holdings LLC (BBB-/Ba2) |
| | | | 7,500,000 | | | | 8.375 | | | | 03/15/13 | | | | 7,709,400 | |
| | | | 4,250,000 | | | | 6.375 | | | | 06/15/15 | | | | 4,308,438 | |
| | | | 31,500,000 | | | | 7.625 | | | | 05/15/16 | | | | 33,744,375 | |
| | | DISH DBS Corp. (BB-/Ba3) |
| | | | 8,000,000 | | | | 7.000 | | | | 10/01/13 | | | | 8,060,000 | |
| | | EchoStar DBS Corp. (BB-/Ba3) |
| | | | 3,500,000 | | | | 6.375 | | | | 10/01/11 | | | | 3,574,375 | |
| | | | 4,500,000 | | | | 6.625 | | | | 10/01/14 | | | | 4,398,750 | |
| | | | 7,000,000 | | | | 7.750 | | | | 05/31/15 | | | | 7,157,500 | |
| | | | 6,525,000 | | | | 7.125 | | | | 02/01/16 | | | | 6,476,062 | |
| | | Lamar Media Corp. (B/B2) |
| | | | 5,750,000 | | | | 7.250 | | | | 01/01/13 | | | | 5,656,562 | |
| | | | 9,684,000 | | | | 6.625 | | | | 08/15/15 | | | | 8,860,860 | |
| | | |
| | | |
The accompanying notes are an integral part of these financial statements.
GOLDMAN SACHS HIGH YIELD FUND
Schedule of Investments (continued)
September 30, 2009 (Unaudited)
| | | | | | | | | | | | | | | | | |
| | | Principal
| | Interest
| | Maturity
| | |
| | | Amount | | Rate | | Date | | Value |
| |
Corporate Obligations – (continued) |
| | | Media – (continued) |
| | | | | | | | | | | | | | | | | |
| | | Lamar Media Corp. (BB/Ba3) |
| | | $ | 1,250,000 | | | | 9.750 | % | | | 04/01/14 | | | $ | 1,353,125 | |
| | | | | | | | | | | | | | | | | |
| | | | | | | | | | | | | | | | 91,299,447 | |
| | | |
| | | |
| | | Media-Broadcasting & Radio – 1.2% |
| | | Bonten Media Acquisition Co. (CCC/Caa2)(b)(c) |
| | | | 3,670,625 | | | | 9.000 | | | | 06/01/15 | | | | 1,202,130 | |
| | | Clear Channel Communications, Inc. (CC/Ca) |
| | | | 6,000,000 | | | | 5.750 | | | | 01/15/13 | | | | 3,120,000 | |
| | | | 10,000,000 | | | | 5.500 | | | | 09/15/14 | | | | 4,450,000 | |
| | | | 5,750,000 | | | | 5.500 | | | | 12/15/16 | | | | 2,300,000 | |
| | | CMP Susquehanna Corp. (D/Ca) |
| | | | 480,000 | | | | 9.875 | | | | 05/15/14 | | | | — | |
| | | Fox Acquisition Sub LLC (CCC/Caa3)(b) |
| | | | 1,250,000 | | | | 13.375 | | | | 07/15/16 | | | | 793,750 | |
| | | Liberty Media LLC (BB+/Ba2) |
| | | | 4,000,000 | | | | 5.700 | | | | 05/15/13 | | | | 3,800,000 | |
| | | | 2,120,000 | | | | 8.250 | | | | 02/01/30 | | | | 1,738,400 | |
| | | LIN Television Corp. (B-/B3) |
| | | | 8,750,000 | | | | 6.500 | | | | 05/15/13 | | | | 7,746,250 | |
| | | Local TV Finance LLC (CCC/Caa3)(b)(c) |
| | | | 5,250,000 | | | | 9.250 | | | | 06/15/15 | | | | 1,798,125 | |
| | | Radio One, Inc. (CCC-/Caa3) |
| | | | 2,250,000 | | | | 6.375 | | | | 02/15/13 | | | | 787,500 | |
| | | UnitedGlobalcom, Inc. (B-/NR)(d) |
| | | EUR | 6,250,000 | | | | 1.750 | | | | 04/15/24 | | | | 8,631,472 | |
| | | Univision Communications, Inc. (B-/B2)(b) |
| | | $ | 1,875,000 | | | | 12.000 | | | | 07/01/14 | | | | 2,029,688 | |
| | | Univision Communications, Inc. (CCC/Caa2)(b)(c) |
| | | | 26,312,500 | | | | 9.750 | | | | 03/15/15 | | | | 20,392,187 | |
| | | XM Satellite Radio, Inc. (B+/Caa2)(b) |
| | | | 5,500,000 | | | | 11.250 | | | | 06/15/13 | | | | 5,692,500 | |
| | | | | | | | | | | | | | | | | |
| | | | | | | | | | | | | | | | 64,482,002 | |
| | | |
| | | |
| | | Media-Cable – 3.8% |
| | | Adelphia Communications Corp. (NR/NR)(a) |
| | | | 2,000,000 | | | | 10.250 | | | | 06/15/49 | | | | 45,000 | |
| | | Atlantic Broadband Finance LLC (B-/Caa1) |
| | | | 4,500,000 | | | | 9.375 | | | | 01/15/14 | | | | 4,376,250 | |
| | | Cablevision Systems Corp. (B+/B1) |
| | | | 12,000,000 | | | | 8.000 | | | | 04/15/12 | | | | 12,540,000 | |
| | | | 9,750,000 | | | | 8.625 | (b) | | | 09/15/17 | | | | 10,042,500 | |
| | | CCH I Holdings LLC (D/WR)(a) |
| | | | 8,000,000 | | | | 11.000 | | | | 10/01/15 | | | | 1,480,000 | |
| | | CCO Holdings LLC/CCO Holdings Capital Corp. (D/B2)(a) |
| | | | 14,250,000 | | | | 8.750 | | | | 11/15/13 | | | | 14,463,750 | |
| | | Charter Communications Holdings II (D/WR) |
| | | | 6,125,000 | | | | 10.250 | | | | 09/15/10 | | | | 6,890,625 | |
| | | Charter Communications Operating LLC (D/B1)(b) |
| | | | 13,500,000 | | | | 10.000 | | | | 04/30/12 | | | | 13,635,000 | |
| | | | 7,000,000 | | | | 10.375 | | | | 04/30/14 | | | | 7,070,000 | |
| | | | 10,000,000 | | | | 12.875 | | | | 09/15/14 | | | | 10,850,000 | |
| | | CSC Holdings, Inc. (BB/Ba3) |
| | | | 9,300,000 | | | | 6.750 | | | | 04/15/12 | | | | 9,613,875 | |
| | | | 10,500,000 | | | | 8.500 | (b) | | | 04/15/14 | | | | 11,051,250 | |
| | | | 16,600,000 | | | | 8.500 | (b) | | | 06/15/15 | | | | 17,430,000 | |
| | | | 11,000,000 | | | | 8.625 | (b) | | | 02/15/19 | | | | 11,660,000 | |
| | | |
| | | |
| | | CSC Holdings, Inc. Series B (BB/Ba3) |
| | | | 7,000,000 | | | | 7.625 | | | | 04/01/11 | | | | 7,297,500 | |
| | | Frontier Vision(a) |
| | | | 2,000,000 | | | | 11.000 | | | | 10/15/49 | | | | — | |
| | | Ono Finance II (CCC-/Caa2) |
| | | EUR | 10,500,000 | | | | 8.000 | | | | 05/16/14 | | | | 9,833,705 | |
| | | Ono Finance PLC (CCC-/Caa2) |
| | | | 4,250,000 | | | | 10.500 | | | | 05/15/14 | | | | 4,166,886 | |
| | | Rainbow National Services LLC (BB/B1)(b) |
| | | $ | 1,909,000 | | | | 10.375 | | | | 09/01/14 | | | | 1,966,270 | |
| | | UPC Holding BV (B-/B2) |
| | | EUR | 10,625,000 | | | | 8.625 | | | | 01/15/14 | | | | 15,703,564 | |
| | | | 13,750,000 | | | | 7.750 | | | | 01/15/14 | | | | 19,919,838 | |
| | | | 11,875,000 | | | | 8.000 | | | | 11/01/16 | | | | 16,508,405 | |
| | | | | | | | | | | | | | | | | |
| | | | | | | | | | | | | | | | 206,544,418 | |
| | | |
| | | |
| | | Media-Diversified – 0.6% |
| | | CanWest MediaWorks, Inc. (D/Ca) |
| | | $ | 9,000,000 | | | | 8.000 | | | | 09/15/12 | | | | 7,042,500 | |
| | | Quebecor Media, Inc. (B/B2) |
| | | | 8,660,000 | | | | 7.750 | | | | 03/15/16 | | | | 8,595,050 | |
| | | Videotron Ltee (BB-/NR)(b) |
| | | | 6,250,000 | | | | 9.125 | | | | 04/15/18 | | | | 6,765,625 | |
| | | Videotron Ltee (BB-/Ba2) |
| | | | 6,625,000 | | | | 6.875 | | | | 01/15/14 | | | | 6,542,188 | |
| | | | 1,000,000 | | | | 6.375 | | | | 12/15/15 | | | | 955,000 | |
| | | | 2,750,000 | | | | 9.125 | | | | 04/15/18 | | | | 2,976,875 | |
| | | | | | | | | | | | | | | | | |
| | | | | | | | | | | | | | | | 32,877,238 | |
| | | |
| | | |
| | | Metals – 1.1% |
| | | AK Steel Corp. (BB-/Ba3) |
| | | | 3,625,000 | | | | 7.750 | | | | 06/15/12 | | | | 3,625,000 | |
| | | Aleris International, Inc. (D/WR)(a) |
| | | | 8,500,000 | | | | 9.000 | | | | 12/15/14 | | | | 8,500 | |
| | | | 16,000,000 | | | | 10.000 | | | | 12/15/16 | | | | 40,000 | |
| | | FMG Finance Pty Ltd. (B/B2)(b) |
| | | | 5,000,000 | | | | 10.625 | | | | 09/01/16 | | | | 5,537,500 | |
| | | Freeport-McMoRan Copper & Gold, Inc. (BBB-/Ba2) |
| | | | 2,500,000 | | | | 4.995 | (e) | | | 04/01/15 | | | | 2,507,314 | |
| | | | 7,000,000 | | | | 8.250 | | | | 04/01/15 | | | | 7,437,500 | |
| | | | 7,000,000 | | | | 8.375 | | | | 04/01/17 | | | | 7,437,500 | |
| | | Noranda Aluminium Acquisition Corp. (D/Caa2)(c)(e) |
| | | | 6,810,611 | | | | 5.413 | | | | 05/15/15 | | | | 4,597,162 | |
| | | Noranda Aluminium Holding Corp. (D/Caa3)(c)(e) |
| | | | 2,312,583 | | | | 7.163 | | | | 11/15/14 | | | | 1,075,351 | |
| | | Novelis, Inc. (B-/Caa1) |
| | | | 11,375,000 | | | | 7.250 | | | | 02/15/15 | | | | 9,782,500 | |
| | | SGL Carbon SE (BBB-/Ba1)(e) |
| | | EUR | 1,000,000 | | | | 2.123 | | | | 05/16/15 | | | | 1,271,358 | |
| | | Steel Dynamics, Inc. (BB+/Ba2) |
| | | $ | 7,750,000 | | | | 7.375 | | | | 11/01/12 | | | | 7,788,750 | |
| | | | 7,000,000 | | | | 8.250 | (b) | | | 04/15/16 | | | | 7,052,500 | |
| | | Tube City IMS Corp. (B-/Caa1) |
| | | | 3,500,000 | | | | 9.750 | | | | 02/01/15 | | | | 2,835,000 | |
| | | | | | | | | | | | | | | | | |
| | | | | | | | | | | | | | | | 60,995,935 | |
| | | |
| | | |
| | | | | | | | | | | | | | | | | |
The accompanying notes are an integral part of these financial statements.
GOLDMAN SACHS HIGH YIELD FUND
| | | | | | | | | | | | | | | | | |
| | | Principal
| | Interest
| | Maturity
| | |
| | | Amount | | Rate | | Date | | Value |
| |
Corporate Obligations – (continued) |
| | | | | | | | | | | | | | | | | |
| | | Packaging – 4.1% |
| | | Ball Corp. (BB+/Ba1) |
| | | $ | 3,000,000 | | | | 6.625 | % | | | 03/15/18 | | | $ | 2,910,000 | |
| | | Berry Plastics Corp. (B+/B1)(e) |
| | | | 6,500,000 | | | | 5.259 | | | | 02/15/15 | | | | 5,980,000 | |
| | | Berry Plastics Holding Corp. (CCC+/Caa1) |
| | | | 2,500,000 | | | | 4.174 | (e) | | | 09/15/14 | | | | 1,962,500 | |
| | | | 9,000,000 | | | | 8.875 | | | | 09/15/14 | | | | 8,550,000 | |
| | | Berry Plastics Holding Corp. (CCC/Caa2) |
| | | | 8,000,000 | | | | 10.250 | | | | 03/01/16 | | | | 6,800,000 | |
| | | Beverage Packaging Holdings II SA/Luxembourg (B+/B2) |
| | | EUR | 7,250,000 | | | | 8.000 | | | | 12/15/16 | | | | 10,662,326 | |
| | | Beverage Packaging Holdings II SA/Luxembourg (B-/B3) |
| | | | 18,500,000 | | | | 9.500 | | | | 06/15/17 | | | | 26,801,236 | |
| | | Clondalkin Acquisition (B+/B1)(e) |
| | | | 1,000,000 | | | | 2.773 | | | | 12/15/13 | | | | 1,317,014 | |
| | | Clondalkin Industries BV (B-/Caa1) |
| | | | 2,500,000 | | | | 8.000 | | | | 03/15/14 | | | | 3,182,784 | |
| | | Consol Specialty Glass Ltd. (BB-/B1) |
| | | | 7,750,000 | | | | 7.625 | | | | 04/15/14 | | | | 10,206,859 | |
| | | Crown Americas LLC (BB-/B1) |
| | | $ | 10,625,000 | | | | 7.750 | | | | 11/15/15 | | | | 10,837,500 | |
| | | | 7,500,000 | | | | 7.625 | (b) | | | 05/15/17 | | | | 7,612,500 | |
| | | Gerresheimer Holdings GMBH (BB+/B1) |
| | | EUR | 4,800,000 | | | | 7.875 | | | | 03/01/15 | | | | 7,094,316 | |
| | | Graham Packaging Co., Inc. (CCC+/Caa1) |
| | | $ | 10,000,000 | | | | 8.500 | | | | 10/15/12 | | | | 10,125,000 | |
| | | | 22,250,000 | | | | 9.875 | | | | 10/15/14 | | | | 22,917,500 | |
| | | Graphic Packaging International, Inc. (B-/NR)(b) |
| | | | 3,000,000 | | | | 9.500 | | | | 06/15/17 | | | | 3,180,000 | |
| | | Graphic Packaging International, Inc. (B-/B3) |
| | | | 15,000,000 | | | | 9.500 | | | | 08/15/13 | | | | 15,412,500 | |
| | | Greif, Inc. (BB+/Ba2)(b) |
| | | | 2,000,000 | | | | 7.750 | | | | 08/01/19 | | | | 2,060,000 | |
| | | Impress Holdings BV (B-/B3) |
| | | EUR | 15,000,000 | | | | 9.250 | | | | 09/15/14 | | | | 22,608,741 | |
| | | Impress Holdings BV (BB-/Ba3)(e) |
| | | $ | 1,000,000 | | | | 3.634 | (b) | | | 09/15/13 | | | | 946,250 | |
| | | EUR | 6,000,000 | | | | 4.121 | | | | 09/15/13 | | | | 8,215,534 | |
| | | OI European Group BV (BB/Ba3) |
| | | | 750,000 | | | | 6.875 | | | | 03/31/17 | | | | 1,075,561 | |
| | | Owens Brockway Glass Container, Inc. (BB/Ba3) |
| | | $ | 2,500,000 | | | | 8.250 | | | | 05/15/13 | | | | 2,562,500 | |
| | | EUR | 4,750,000 | | | | 6.750 | | | | 12/01/14 | | | | 6,916,153 | |
| | | $ | 1,000,000 | | | | 6.750 | | | | 12/01/14 | | | | 996,250 | |
| | | | 5,000,000 | | | | 7.375 | | | | 05/15/16 | | | | 5,100,000 | |
| | | Plastipak Holdings, Inc. (B/B3)(b) |
| | | | 4,000,000 | | | | 8.500 | | | | 12/15/15 | | | | 4,000,000 | |
| | | Pregis Corp. (CCC+/Caa2) |
| | | | 7,000,000 | | | | 12.375 | | | | 10/15/13 | | | | 6,615,000 | |
| | | Sealed Air Corp. (BB+/Baa3)(b) |
| | | | 5,500,000 | | | | 7.875 | | | | 06/15/17 | | | | 5,835,757 | |
| | | Stichting Participatie Impress Cooperatieve UA (NR/NR)(c) |
| | | EUR | 1,139,030 | | | | 17.000 | | | | 09/29/49 | | | | 1,500,119 | |
| | | |
| | | |
| | | Tekni-Plex, Inc. (NR/WR) |
| | | | 2,500,000 | | | | 10.875 | | | | 08/15/12 | | | | 2,218,750 | |
| | | | | | | | | | | | | | | | | |
| | | | | | | | | | | | | | | | 226,202,650 | |
| | | |
| | | |
| | | Paper – 2.0% |
| | | Boise Cascade LLC (B+/Caa1) |
| | | | 3,732,000 | | | | 7.125 | | | | 10/15/14 | | | | 2,938,950 | |
| | | Catalyst Paper Corp. (CCC/Caa1) |
| | | | 1,250,000 | | | | 8.625 | | | | 06/15/11 | | | | 859,375 | |
| | | Domtar Corp. (BB-/Ba3) |
| | | | 8,500,000 | | | | 10.750 | | | | 06/01/17 | | | | 9,530,625 | |
| | | Georgia-Pacific Corp. (B+/B2) |
| | | | 7,250,000 | | | | 8.125 | | | | 05/15/11 | | | | 7,503,750 | |
| | | | 1,000,000 | | | | 9.500 | | | | 12/01/11 | | | | 1,065,000 | |
| | | | 1,500,000 | | | | 7.700 | | | | 06/15/15 | | | | 1,526,250 | |
| | | | 1,250,000 | | | | 8.000 | | | | 01/15/24 | | | | 1,237,500 | |
| | | | 2,750,000 | | | | 7.750 | | | | 11/15/29 | | | | 2,557,500 | |
| | | Georgia-Pacific Corp. (BB-/Ba3)(b) |
| | | | 16,250,000 | | | | 7.000 | | | | 01/15/15 | | | | 15,965,625 | |
| | | | 12,000,000 | | | | 7.125 | | | | 01/15/17 | | | | 11,640,000 | |
| | | Georgia-Pacific LLC (BB-/Ba3)(b) |
| | | | 6,000,000 | | | | 8.250 | | | | 05/01/16 | | | | 6,210,000 | |
| | | Jefferson Smurfit Corp. (D/WR)(a) |
| | | | 6,000,000 | | | | 8.250 | | | | 10/01/12 | | | | 4,260,000 | |
| | | | 1,750,000 | | | | 7.500 | | | | 06/01/13 | | | | 1,242,500 | |
| | | Lecta SA (B+/B2)(e) |
| | | EUR | 4,875,000 | | | | 3.498 | | | | 02/15/14 | | | | 5,672,818 | |
| | | NewPage Corp. (CCC-/Caa2) |
| | | $ | 5,375,000 | | | | 10.000 | | | | 05/01/12 | | | | 3,601,250 | |
| | | PE Paper Escrow GmbH (BB/Ba2)(b) |
| | | | 6,000,000 | | | | 12.000 | | | | 08/01/14 | | | | 6,410,588 | |
| | | Smurfit Kappa Funding PLC (B/B2) |
| | | EUR | 6,000,000 | | | | 7.750 | | | | 04/01/15 | | | | 8,516,691 | |
| | | $ | 3,500,000 | | | | 7.750 | | | | 04/01/15 | | | | 2,996,875 | |
| | | Smurfit-Stone Container Enterprises, Inc. (D/WR)(a) |
| | | | 8,500,000 | | | | 8.000 | | | | 03/15/17 | | | | 6,077,500 | |
| | | Stone Container Finance (D/WR)(a) |
| | | | 2,250,000 | | | | 7.375 | | | | 07/15/14 | | | | 1,845,000 | |
| | | Verso Paper Holdings LLC, Inc. (B+/Ba2)(b) |
| | | | 2,375,000 | | | | 11.500 | | | | 07/01/14 | | | | 2,458,125 | |
| | | Verso Paper Holdings LLC, Inc. (CCC/Caa1) |
| | | | 4,000,000 | | | | 11.375 | | | | 08/01/16 | | | | 2,360,000 | |
| | | | | | | | | | | | | | | | | |
| | | | | | | | | | | | | | | | 106,475,922 | |
| | | |
| | | |
| | | Printing – 0.2% |
| | | SGS International, Inc. (B-/B3) |
| | | | 5,750,000 | | | | 12.000 | | | | 12/15/13 | | | | 5,103,125 | |
| | | Valassis Communications, Inc. (CCC+/B3) |
| | | | 5,000,000 | | | | 8.250 | | | | 03/01/15 | | | | 4,487,500 | |
| | | | | | | | | | | | | | | | | |
| | | | | | | | | | | | | | | | 9,590,625 | |
| | | |
| | | |
| | | Publishing – 1.7% |
| | | Cengage Learning Acquisitions, Inc. (CCC+/Caa2)(b) |
| | | | 20,750,000 | | | | 10.500 | | | | 01/15/15 | | | | 19,816,250 | |
| | | Dex Media West Finance Co. (D/WR)(a) |
| | | | 1,800,000 | | | | 8.500 | | | | 08/15/10 | | | | 1,557,000 | |
| | | |
| | | |
The accompanying notes are an integral part of these financial statements.
GOLDMAN SACHS HIGH YIELD FUND
Schedule of Investments (continued)
September 30, 2009 (Unaudited)
| | | | | | | | | | | | | | | | | |
| | | Principal
| | Interest
| | Maturity
| | |
| | | Amount | | Rate | | Date | | Value |
| |
Corporate Obligations – (continued) |
| | | Publishing – (continued) |
| | | | | | | | | | | | | | | | | |
| | | Dex Media West LLC (D/WR)(a) |
| | | $ | 6,744,000 | | | | 9.875 | % | | | 08/15/13 | | | $ | 1,213,920 | |
| | | Dex Media, Inc. (D/WR)(a) |
| | | | 1,250,000 | | | | 8.000 | | | | 11/15/13 | | | | 218,750 | |
| | | | 12,750,000 | | | | 9.000 | (f) | | | 11/15/13 | | | | 2,231,250 | |
| | | Lighthouse International Co. SA (BB-/B3) |
| | | EUR | 6,500,000 | | | | 8.000 | | | | 04/30/14 | | | | 6,182,649 | |
| | | Morris Publishing Group LLC (NR/WR) |
| | | $ | 4,500,000 | | | | 7.000 | | | | 08/01/13 | | | | 900,000 | |
| | | Nielsen Finance LLC Co. (B-/Caa1) |
| | | | 3,500,000 | | | | 11.625 | | | | 02/01/14 | | | | 3,753,750 | |
| | | | 23,000,000 | | | | 10.000 | | | | 08/01/14 | | | | 23,115,000 | |
| | | EUR | 1,500,000 | | | | 9.000 | | | | 08/01/14 | | | | 2,030,397 | |
| | | $ | 5,000,000 | | | | 11.500 | | | | 05/01/16 | | | | 5,318,750 | |
| | | Nielsen Finance LLC Co. (CCC+/Caa1)(f) |
| | | | 19,000,000 | | | | 12.500 | | | | 08/01/16 | | | | 15,105,000 | |
| | | R.H. Donnelley Corp. (D/WR)(a) |
| | | | 5,555,000 | | | | 6.875 | | | | 01/15/13 | | | | 347,187 | |
| | | | 2,820,000 | | | | 11.750 | (b) | | | 05/15/15 | | | | 1,692,000 | |
| | | | 4,000,000 | | | | 8.875 | | | | 01/15/16 | | | | 250,000 | |
| | | | 3,000,000 | | | | 8.875 | | | | 10/15/17 | | | | 187,500 | |
| | | The Nielsen Co. (CCC+/Caa1)(f) |
| | | EUR | 5,000,000 | | | | 11.125 | | | | 08/01/16 | | | | 5,487,559 | |
| | | Truvo Subsidiary Corp. (CCC-/Caa3) |
| | | | 16,750,000 | | | | 8.500 | | | | 12/01/14 | | | | 5,882,663 | |
| | | | | | | | | | | | | | | | | |
| | | | | | | | | | | | | | | | 95,289,625 | |
| | | |
| | | |
| | | Real Estate – 0.3% |
| | | CB Richard Ellis Group, Inc. (B+/Ba3)(b) |
| | | $ | 5,875,000 | | | | 11.625 | | | | 06/15/17 | | | | 6,212,812 | |
| | | Felcor Lodging LP (B-/B2)(b) |
| | | | 1,250,000 | | | | 10.000 | | | | 10/01/14 | | | | 1,209,375 | |
| | | ProLogis (BBB-/NR)(d) |
| | | | 5,125,000 | | | | 2.250 | | | | 04/01/37 | | | | 4,629,546 | |
| | | | 3,500,000 | | | | 1.875 | | | | 11/15/37 | | | | 2,976,295 | |
| | | Realogy Corp. (C/Ca) |
| | | | 2,500,000 | | | | 10.500 | | | | 04/15/14 | | | | 1,837,500 | |
| | | | 2,023,866 | | | | 11.000 | (c) | | | 04/15/14 | | | | 1,335,752 | |
| | | | | | | | | | | | | | | | | |
| | | | | | | | | | | | | | | | 18,201,280 | |
| | | |
| | | |
| | | Restaurants – 0.5% |
| | | NPC International, Inc. (CCC+/Caa1) |
| | | | 6,850,000 | | | | 9.500 | | | | 05/01/14 | | | | 6,850,000 | |
| | | OSI Restaurant Partners, Inc. (CCC/Caa3) |
| | | | 7,750,000 | | | | 10.000 | | | | 06/15/15 | | | | 6,839,375 | |
| | | Seminole Hard Rock Entertainment, Inc. (BB/B1)(b)(e) |
| | | | 7,000,000 | | | | 2.799 | | | | 03/15/14 | | | | 5,530,000 | |
| | | Wendy’s/Arby’s Restaurants LLC (B+/B2)(b) |
| | | | 8,375,000 | | | | 10.000 | | | | 07/15/16 | | | | 8,877,500 | |
| | | | | | | | | | | | | | | | | |
| | | | | | | | | | | | | | | | 28,096,875 | |
| | | |
| | | |
| | | Retailers – 1.7% |
| | | AutoNation, Inc. (BB+/Ba2) |
| | | | 745,000 | | | | 7.000 | | | | 04/15/14 | | | | 744,069 | |
| | | Edcon Holdings Proprietary Ltd. (CCC+/Caa1)(e) |
| | | EUR | 3,500,000 | | | | 6.273 | | | | 06/15/15 | | | | 3,124,250 | |
| | | |
| | | |
| | | Edcon Proprietary Ltd. (B+/B2)(e) |
| | | EUR | 12,375,000 | | | | 4.023 | | | | 06/15/14 | | | | 12,947,895 | |
| | | General Nutrition Centers, Inc. (CCC+/Caa1)(c)(e) |
| | | | 12,625,000 | | | | 5.178 | | | | 03/15/14 | | | | 11,173,125 | |
| | | Jarden Corp. (B+/B2) |
| | | | 4,125,000 | | | | 8.000 | | | | 05/01/16 | | | | 4,228,125 | |
| | | Macy’s Retail Holdings, Inc. (BB/Ba2) |
| | | | 7,750,000 | | | | 5.350 | | | | 03/15/12 | | | | 7,595,000 | |
| | | | 3,500,000 | | | | 5.875 | | | | 01/15/13 | | | | 3,430,000 | |
| | | | 15,125,000 | | | | 5.900 | | | | 12/01/16 | | | | 13,915,000 | |
| | | Michaels Stores, Inc. (CCC/Caa2) |
| | | | 8,375,000 | | | | 10.000 | | | | 11/01/14 | | | | 8,207,500 | |
| | | Michaels Stores, Inc. (CCC/Caa3) |
| | | | 11,500,000 | | | | 11.375 | | | | 11/01/16 | | | | 10,695,000 | |
| | | Neiman-Marcus Group, Inc. (B-/Caa2)(c) |
| | | | 5,845,404 | | | | 9.000 | | | | 10/15/15 | | | | 4,968,593 | |
| | | Neiman-Marcus Group, Inc. (CCC+/Caa3) |
| | | | 14,500,000 | | | | 10.375 | | | | 10/15/15 | | | | 12,433,750 | |
| | | | | | | | | | | | | | | | | |
| | | | | | | | | | | | | | | | 93,462,307 | |
| | | |
| | | |
| | | Retailers-Food & Drug – 1.0% |
| | | Ahold Lease USA, Inc. (BBB/Baa3)(f) |
| | | | 821,619 | | | | 7.820 | | | | 01/02/20 | | | | 813,403 | |
| | | | 1,931,517 | | | | 8.620 | | | | 01/02/25 | | | | 1,912,202 | |
| | | Dole Food Co., Inc. (B-/B2)(b) |
| | | | 15,500,000 | | | | 13.875 | | | | 03/15/14 | | | | 18,290,000 | |
| | | Ingles Markets, Inc. (BB-/B1) |
| | | | 6,000,000 | | | | 8.875 | | | | 05/15/17 | | | | 6,150,000 | |
| | | Rite Aid Corp. (B+/B3)(b) |
| | | | 2,750,000 | | | | 9.750 | | | | 06/12/16 | | | | 2,963,125 | |
| | | Rite Aid Corp. (B-/Caa2) |
| | | | 6,500,000 | | | | 7.500 | | | | 03/01/17 | | | | 5,801,250 | |
| | | Rite Aid Corp. (CCC/Caa3) |
| | | | 750,000 | | | | 8.625 | | | | 03/01/15 | | | | 610,312 | |
| | | | 5,250,000 | | | | 9.375 | | | | 12/15/15 | | | | 4,252,500 | |
| | | | 5,000,000 | | | | 9.500 | | | | 06/15/17 | | | | 4,000,000 | |
| | | Supervalu, Inc. (B+/Ba3) |
| | | | 5,000,000 | | | | 7.500 | | | | 11/15/14 | | | | 5,000,000 | |
| | | | 5,500,000 | | | | 8.000 | | | | 05/01/16 | | | | 5,692,500 | |
| | | | | | | | | | | | | | | | | |
| | | | | | | | | | | | | | | | 55,485,292 | |
| | | |
| | | |
| | | Services Cyclical-Business Services – 1.6% |
| | | ACCO Brands Corp. (B-/Caa2) |
| | | | 7,250,000 | | | | 7.625 | | | | 08/15/15 | | | | 6,017,500 | |
| | | Carlson Wagonlit BV (CCC-/Caa2)(e) |
| | | EUR | 9,000,000 | | | | 6.649 | | | | 05/01/15 | | | | 9,581,277 | |
| | | Cornell Co., Inc. (B/B2) |
| | | $ | 1,500,000 | | | | 10.750 | | | | 07/01/12 | | | | 1,537,500 | |
| | | Corrections Corp. of America (BB/Ba2) |
| | | | 1,125,000 | | | | 6.250 | | | | 03/15/13 | | | | 1,110,938 | |
| | | | 3,500,000 | | | | 7.750 | | | | 06/01/17 | | | | 3,605,000 | |
| | | Great Lakes Dredge & Dock Co. (B-/Caa1) |
| | | | 5,440,000 | | | | 7.750 | | | | 12/15/13 | | | | 5,338,000 | |
| | | Iron Mountain, Inc. (B+/B2) |
| | | | 1,500,000 | | | | 6.625 | | | | 01/01/16 | | | | 1,455,000 | |
| | | | 4,625,000 | | | | 8.000 | | | | 06/15/20 | | | | 4,671,250 | |
| | | |
| | | |
The accompanying notes are an integral part of these financial statements.
GOLDMAN SACHS HIGH YIELD FUND
| | | | | | | | | | | | | | | | | |
| | | Principal
| | Interest
| | Maturity
| | |
| | | Amount | | Rate | | Date | | Value |
| |
Corporate Obligations – (continued) |
| | | Services Cyclical-Business Services – (continued) |
| | | | | | | | | | | | | | | | | |
| | | ISS Financing PLC (B/NR) |
| | | EUR | 4,500,000 | | | | 11.000 | % | | | 06/15/14 | | | $ | 6,991,172 | |
| | | ISS Global A/S (B/NR) |
| | | | 1,235,000 | | | | 4.750 | | | | 09/18/10 | | | | 1,798,171 | |
| | | ISS Holdings A/S (B/Caa1) |
| | | | 12,015,000 | | | | 8.875 | | | | 05/15/16 | | | | 15,648,103 | |
| | | Savcio Holdings Ltd. (B+/B2) |
| | | | 2,000,000 | | | | 8.000 | | | | 02/15/13 | | | | 2,604,761 | |
| | | West Corp. (B-/Caa1) |
| | | $ | 11,500,000 | | | | 9.500 | | | | 10/15/14 | | | | 11,270,000 | |
| | | | 14,250,000 | | | | 11.000 | | | | 10/15/16 | | | | 14,214,375 | |
| | | | | | | | | | | | | | | | | |
| | | | | | | | | | | | | | | | 85,843,047 | |
| | | |
| | | |
| | | Services Cyclical-Consumer Services – 0.1% |
| | | Service Corp. International (BB-/B1) |
| | | | 1,750,000 | | | | 6.750 | | | | 04/01/16 | | | | 1,719,375 | |
| | | | 2,125,000 | | | | 7.000 | | | | 06/15/17 | | | | 2,071,875 | |
| | | | 4,000,000 | | | | 7.625 | | | | 10/01/18 | | | | 4,040,000 | |
| | | | | | | | | | | | | | | | | |
| | | | | | | | | | | | | | | | 7,831,250 | |
| | | |
| | | |
| | | Services Cyclical-Rental Equipment – 1.6% |
| | | Ahern Rentals, Inc. (B/Caa3) |
| | | | 3,000,000 | | | | 9.250 | | | | 08/15/13 | | | | 1,500,000 | |
| | | Ashtead Capital, Inc. (B/B2)(b) |
| | | | 3,000,000 | | | | 9.000 | | | | 08/15/16 | | | | 2,865,000 | |
| | | Ashtead Holdings PLC (B/B2)(b) |
| | | | 2,000,000 | | | | 8.625 | | | | 08/01/15 | | | | 1,920,000 | |
| | | Europcar Groupe SA (B+/B3)(e) |
| | | EUR | 4,000,000 | | | | 4.373 | | | | 05/15/13 | | | | 5,121,721 | |
| | | Europcar Groupe SA (B/Caa1) |
| | | | 3,250,000 | | | | 8.125 | | | | 05/15/14 | | | | 4,085,780 | |
| | | Hertz Corp. (CCC+/B2) |
| | | | 1,750,000 | | | | 7.875 | | | | 01/01/14 | | | | 2,432,818 | |
| | | $ | 10,725,000 | | | | 8.875 | | | | 01/01/14 | | | | 10,778,625 | |
| | | Hertz Corp. (CCC+/B3) |
| | | | 10,250,000 | | | | 10.500 | | | | 01/01/16 | | | | 10,634,375 | |
| | | RSC Equipment Rental, Inc. (B-/Caa2) |
| | | | 20,000,000 | | | | 9.500 | | | | 12/01/14 | | | | 19,200,000 | |
| | | RSC Equipment Rental, Inc. (BB-/B1)(b) |
| | | | 5,250,000 | | | | 10.000 | | | | 07/15/17 | | | | 5,656,875 | |
| | | United Rentals North America, Inc. (B/B2) |
| | | | 3,000,000 | | | | 6.500 | | | | 02/15/12 | | | | 3,018,750 | |
| | | | 6,500,000 | | | | 10.875 | (b) | | | 06/15/16 | | | | 6,938,750 | |
| | | United Rentals North America, Inc. (CCC+/Caa1) |
| | | | 7,000,000 | | | | 7.750 | | | | 11/15/13 | | | | 6,387,500 | |
| | | | 5,750,000 | | | | 7.000 | | | | 02/15/14 | | | | 5,074,375 | |
| | | | | | | | | | | | | | | | | |
| | | | | | | | | | | | | | | | 85,614,569 | |
| | | |
| | | |
| | | Technology-Hardware – 1.0% |
| | | Avago Technologies (B+/B2) |
| | | | 7,120,000 | | | | 11.875 | | | | 12/01/15 | | | | 7,769,700 | |
| | | Avago Technologies Finance Corp. (BB/Ba3) |
| | | | 12,500,000 | | | | 10.125 | | | | 12/01/13 | | | | 13,234,375 | |
| | | Flextronics International Ltd. (BB-/Ba2) |
| | | | 3,528,000 | | | | 6.500 | | | | 05/15/13 | | | | 3,492,720 | |
| | | |
| | | |
| | | Freescale Semiconductor, Inc. (CCC/Caa2) |
| | | | 2,500,000 | | | | 8.875 | | | | 12/15/14 | | | | 1,900,000 | |
| | | | 15,556,984 | | | | 9.125 | (c) | | | 12/15/14 | | | | 10,812,104 | |
| | | Lucent Technologies, Inc. (B+/B1) |
| | | | 10,500,000 | | | | 6.450 | | | | 03/15/29 | | | | 8,006,250 | |
| | | NXP BV/NXP Funding LLC (CC/C) |
| | | | 1,500,000 | | | | 3.259 | (e) | | | 10/15/13 | | | | 1,087,500 | |
| | | EUR | 1,500,000 | | | | 3.746 | (e) | | | 10/15/13 | | | | 1,569,442 | |
| | | $ | 4,625,000 | | | | 7.875 | | | | 10/15/14 | | | | 3,642,187 | |
| | | Seagate Technology International (BB+/Ba1)(b) |
| | | | 4,250,000 | | | | 10.000 | | | | 05/01/14 | | | | 4,717,500 | |
| | | | | | | | | | | | | | | | | |
| | | | | | | | | | | | | | | | 56,231,778 | |
| | | |
| | | |
| | | Technology-Software/Services – 2.8% |
| | | Expedia, Inc. (BB/Ba2)(b) |
| | | | 4,750,000 | | | | 8.500 | | | | 07/01/16 | | | | 4,987,500 | |
| | | First Data Corp. (B-/Caa1) |
| | | | 39,125,000 | | | | 9.875 | | | | 09/24/15 | | | | 35,995,000 | |
| | | | 1,500,000 | | | | 10.550 | (c) | | | 09/24/15 | | | | 1,290,000 | |
| | | First Data Corp. (CCC+/Caa2) |
| | | | 5,535,000 | | | | 11.250 | | | | 03/31/16 | | | | 4,760,100 | |
| | | Sabre Holdings Corp. (CCC+/Caa1) |
| | | | 9,000,000 | | | | 8.350 | | | | 03/15/16 | | | | 7,650,000 | |
| | | Serena Software, Inc. (CCC+/Caa1) |
| | | | 5,976,000 | | | | 10.375 | | | | 03/15/16 | | | | 5,662,260 | |
| | | Sungard Data Systems, Inc. (B-/Caa1) |
| | | | 33,750,000 | | | | 10.250 | | | | 08/15/15 | | | | 34,762,500 | |
| | | Sungard Data Systems, Inc. (B/Caa1) |
| | | | 15,001,000 | | | | 9.125 | | | | 08/15/13 | | | | 15,226,015 | |
| | | | 11,000,000 | | | | 10.625 | (b) | | | 05/15/15 | | | | 11,742,500 | |
| | | Travelport, Inc. (CC/Caa1) |
| | | | 11,000,000 | | | | 11.875 | | | | 09/01/16 | | | | 10,065,000 | |
| | | Travelport, Inc. (CCC-/B3) |
| | | | 18,000,000 | | | | 9.875 | | | | 09/01/14 | | | | 17,415,000 | |
| | | Travelport, Inc. (D/B3)(d)(e) |
| | | EUR | 2,000,000 | | | | 5.450 | | | | 09/01/14 | | | | 2,429,159 | |
| | | | | | | | | | | | | | | | | |
| | | | | | | | | | | | | | | | 151,985,034 | |
| | | |
| | | |
| | | Telecommunications – 3.5% |
| | | BCM Ireland Finance Ltd. (CCC+/B3)(e) |
| | | | 3,000,000 | | | | 5.873 | | | | 08/15/16 | | | | 3,468,137 | |
| | | Citizens Communications Co. (BB/Ba2) |
| | | $ | 15,250,000 | | | | 9.250 | | | | 05/15/11 | | | | 16,622,500 | |
| | | | 8,500,000 | | | | 6.250 | | | | 01/15/13 | | | | 8,415,000 | |
| | | Frontier Communications Corp. (BB/Ba2) |
| | | | 16,250,000 | | | | 6.625 | | | | 03/15/15 | | | | 15,600,000 | |
| | | | 3,250,000 | | | | 8.125 | | | | 10/01/18 | | | | 3,290,625 | |
| | | Level 3 Financing, Inc. (CCC/Caa1) |
| | �� | | 10,250,000 | | | | 9.250 | | | | 11/01/14 | | | | 9,045,625 | |
| | | Nordic Telephone Co. Holdings (BB-/B1) |
| | | EUR | 2,250,000 | | | | 6.399 | (d)(e) | | | 05/01/16 | | | | 3,260,598 | |
| | | | 28,500,000 | | | | 8.250 | | | | 05/01/16 | | | | 43,790,718 | |
| | | $ | 8,000,000 | | | | 8.875 | (b) | | | 05/01/16 | | | | 8,290,000 | |
| | | Qwest Capital Funding, Inc. (B+/B1) |
| | | | 8,375,000 | | | | 7.900 | | | | 08/15/10 | | | | 8,521,562 | |
| | | |
| | | |
The accompanying notes are an integral part of these financial statements.
GOLDMAN SACHS HIGH YIELD FUND
Schedule of Investments (continued)
September 30, 2009 (Unaudited)
| | | | | | | | | | | | | | | | | |
| | | Principal
| | Interest
| | Maturity
| | |
| | | Amount | | Rate | | Date | | Value |
| |
Corporate Obligations – (continued) |
| | | Telecommunications – (continued) |
| | | | | | | | | | | | | | | | | |
| | | Qwest Communications International, Inc. (B+/Ba3) |
| | | $ | 3,000,000 | | | | 7.500 | % | | | 02/15/14 | | | $ | 2,955,000 | |
| | | | 6,750,000 | | | | 8.000 | (b) | | | 10/01/15 | | | | 6,716,250 | |
| | | Qwest Communications International, Inc. Series B (B+/Ba3) |
| | | | 1,750,000 | | | | 7.500 | | | | 02/15/14 | | | | 1,723,750 | |
| | | Qwest Corp. (BBB-/Ba1) |
| | | | 9,000,000 | | | | 8.875 | | | | 03/15/12 | | | | 9,427,500 | |
| | | | 1,450,000 | | | | 7.500 | | | | 10/01/14 | | | | 1,468,125 | |
| | | | 2,000,000 | | | | 8.375 | (b) | | | 05/01/16 | | | | 2,055,000 | |
| | | TDC A/S (BB-/Ba3) |
| | | EUR | 460,000 | | | | 6.500 | | | | 04/19/12 | | | | 700,066 | |
| | | Virgin Media Finance PLC (B/B2) |
| | | | 3,825,000 | | | | 8.750 | | | | 04/15/14 | | | | 5,807,424 | |
| | | $ | 16,750,000 | | | | 9.500 | | | | 08/15/16 | | | | 17,671,250 | |
| | | Windstream Corp. (BB/Ba3) |
| | | | 13,000,000 | | | | 8.125 | | | | 08/01/13 | | | | 13,422,500 | |
| | | | 8,000,000 | | | | 8.625 | | | | 08/01/16 | | | | 8,170,000 | |
| | | | 2,000,000 | | | | 7.875 | (b) | | | 11/01/17 | | | | 1,992,500 | |
| | | | 950,000 | | | | 7.000 | | | | 03/15/19 | | | | 893,000 | |
| | | | | | | | | | | | | | | | | |
| | | | | | | | | | | | | | | | 193,307,130 | |
| | | |
| | | |
| | | Telecommunications-Cellular – 5.2% |
| | | American Tower Corp. (BB+/Baa3) |
| | | | 5,000,000 | | | | 7.125 | | | | 10/15/12 | | | | 5,075,000 | |
| | | | 4,500,000 | | | | 7.000 | | | | 10/15/17 | | | | 4,635,000 | |
| | | CC Holdings GS V LLC/Crown Castle GS III Corp. (BB/Baa3)(b) |
| | | | 9,750,000 | | | | 7.750 | | | | 05/01/17 | | | | 10,140,000 | |
| | | Centennial Cellular Communications (B/B2) |
| | | | 1,500,000 | | | | 10.125 | | | | 06/15/13 | | | | 1,545,000 | |
| | | Crown Castle International Corp. (B+/B1) |
| | | | 10,250,000 | | | | 9.000 | | | | 01/15/15 | | | | 10,813,750 | |
| | | Digicel Group Ltd. (NR/B1)(b) |
| | | | 8,000,000 | | | | 9.250 | | | | 09/01/12 | | | | 8,000,000 | |
| | | Digicel Group Ltd. (NR/Caa1)(b) |
| | | | 23,250,000 | | | | 8.875 | | | | 01/15/15 | | | | 21,622,500 | |
| | | | 7,071,000 | | | | 9.125 | (c) | | | 01/15/15 | | | | 6,611,385 | |
| | | Digicel SA (NR/B1)(b) |
| | | | 5,500,000 | | | | 12.000 | | | | 04/01/14 | | | | 6,132,500 | |
| | | Hellas Telecommunications III (C/Ca) |
| | | EUR | 7,250,000 | | | | 8.500 | | | | 10/15/13 | | | | 8,169,146 | |
| | | Hellas Telecommunications Luxembourg V (CC/Caa2)(e) |
| | | | 1,250,000 | | | | 4.496 | | | | 10/15/12 | | | | 1,591,392 | |
| | | Nextel Communications, Inc. (BB/Ba2) |
| | | $ | 11,125,000 | | | | 6.875 | | | | 10/31/13 | | | | 10,290,625 | |
| | | | 3,000,000 | | | | 5.950 | | | | 03/15/14 | | | | 2,677,500 | |
| | | | 16,500,000 | | | | 7.375 | | | | 08/01/15 | | | | 14,788,125 | |
| | | Orascom Telecom Finance SCA (CCC+/B3)(b) |
| | | | 14,875,000 | | | | 7.875 | | | | 02/08/14 | | | | 14,168,437 | |
| | | SBA Telecommunications, Inc. (BB-/Ba2)(b) |
| | | | 2,500,000 | | | | 8.000 | | | | 08/15/16 | | | | 2,562,500 | |
| | | Sprint Capital Corp. (BB/Ba2) |
| | | | 8,000,000 | | | | 7.625 | | | | 01/30/11 | | | | 8,180,000 | |
| | | | 19,500,000 | | | | 8.375 | | | | 03/15/12 | | | | 20,182,500 | |
| | | | 46,125,000 | | | | 6.900 | | | | 05/01/19 | | | | 41,743,125 | |
| | | | 18,250,000 | | | | 8.750 | | | | 03/15/32 | | | | 17,246,250 | |
| | | |
| | | |
| | | Sprint Nextel Corp. (BB/Ba2) |
| | | | 14,250,000 | | | | 6.000 | | | | 12/01/16 | | | | 12,540,000 | |
| | | Wind Acquisition Finance SA (BB-/B2) |
| | | EUR | 26,000,000 | | | | 9.750 | | | | 12/01/15 | | | | 41,281,074 | |
| | | $ | 12,500,000 | | | | 10.750 | (b) | | | 12/01/15 | | | | 13,765,625 | |
| | | | 500,000 | | | | 11.750 | (b) | | | 07/15/17 | | | | 567,500 | |
| | | | | | | | | | | | | | | | | |
| | | | | | | | | | | | | | | | 284,328,934 | |
| | | |
| | | |
| | | Telecommunications-Satellites – 1.9% |
| | | Inmarsat Finance II PLC (BB/B1)(f) |
| | | | 6,000,000 | | | | 10.375 | | | | 11/15/12 | | | | 6,210,000 | |
| | | Inmarsat Finance PLC (BB+/Ba3) |
| | | | 1,601,000 | | | | 7.625 | | | | 06/30/12 | | | | 1,611,006 | |
| | | Intelsat Bermuda Ltd. (CCC+/Caa2) |
| | | | 13,000,000 | | | | 11.250 | | | | 06/15/16 | | | | 13,910,000 | |
| | | | 2,000,000 | | | | 11.250 | (b)(g) | | | 02/04/17 | | | | 1,990,000 | |
| | | | 7,437,500 | | | | 11.500 | (b)(c) | | | 02/04/17 | | | | 6,954,063 | |
| | | Intelsat Intermediate Holding Co. Ltd. (CCC+/NR)(f) |
| | | | 13,250,000 | | | | 9.500 | | | | 02/01/15 | | | | 13,150,625 | |
| | | Intelsat Jackson Holdings Ltd. (BB-/B3) |
| | | | 9,375,000 | | | | 9.500 | | | | 06/15/16 | | | | 9,890,625 | |
| | | Intelsat Ltd. (CCC+/Caa3) |
| | | | 10,500,000 | | | | 7.625 | | | | 04/15/12 | | | | 10,185,000 | |
| | | Intelsat Subsidiary Holding Co. Ltd. (BB-/B3) |
| | | | 15,000,000 | | | | 8.500 | | | | 01/15/13 | | | | 15,262,500 | |
| | | | 24,750,000 | | | | 8.875 | | | | 01/15/15 | | | | 25,183,125 | |
| | | | | | | | | | | | | | | | | |
| | | | | | | | | | | | | | | | 104,346,944 | |
| | | |
| | | |
| | | Textiles & Apparel – 0.2% |
| | | Propex Fabrics, Inc. (NR/WR)(a) |
| | | | 2,500,000 | | | | 10.000 | | | | 12/01/12 | | | | 250 | |
| | | Quiksilver, Inc. (CCC/Caa2) |
| | | | 8,000,000 | | | | 6.875 | | | | 04/15/15 | | | | 6,000,000 | |
| | | Warnaco, Inc. (BB+/Ba3) |
| | | | 2,000,000 | | | | 8.875 | | | | 06/15/13 | | | | 2,060,000 | |
| | | | | | | | | | | | | | | | | |
| | | | | | | | | | | | | | | | 8,060,250 | |
| | | |
| | | |
| | | Tobacco(b) – 0.1% |
| | | Alliance One International, Inc. (B+/B2) |
| | | | 6,125,000 | | | | 10.000 | | | | 07/15/16 | | | | 6,293,438 | |
| | | |
| | | |
| | | Transportation – 0.5% |
| | | Commercial Barge Line Co. (B+/B2)(b) |
| | | | 12,000,000 | | | | 12.500 | | | | 07/15/17 | | | | 12,480,000 | |
| | | RailAmerica, Inc. (BB-/B1)(b) |
| | | | 12,125,000 | | | | 9.250 | | | | 07/01/17 | | | | 12,700,937 | |
| | | Stena AB (BB+/Ba2) |
| | | EUR | 500,000 | | | | 6.125 | | | | 02/01/17 | | | | 636,557 | |
| | | | | | | | | | | | | | | | | |
| | | | | | | | | | | | | | | | 25,817,494 | |
| | | |
| | | |
| | | Utilities-Distribution – 0.4% |
| | | AmeriGas Partners LP (NR/Ba3) |
| | | $ | 3,750,000 | | | | 7.250 | | | | 05/20/15 | | | | 3,656,250 | |
| | | AmeriGas Partners LP/AmeriGas Eagle Finance Corp. (NR/Ba3) |
| | | | 7,500,000 | | | | 7.125 | | | | 05/20/16 | | | | 7,200,000 | |
| | | Ferrellgas Finance LP (B+/Ba3) |
| | | | 438,000 | | | | 6.750 | | | | 05/01/14 | | | | 418,290 | |
| | | |
| | | |
The accompanying notes are an integral part of these financial statements.
GOLDMAN SACHS HIGH YIELD FUND
| | | | | | | | | | | | | | | | | |
| | | Principal
| | Interest
| | Maturity
| | |
| | | Amount | | Rate | | Date | | Value |
| |
Corporate Obligations – (continued) |
| | | Utilities-Distribution – (continued) |
| | | | | | | | | | | | | | | | | |
| | | Inergy LP/Inergy Finance Corp. (B+/B1) |
| | | $ | 1,550,000 | | | | 6.875 | % | | | 12/15/14 | | | $ | 1,484,125 | |
| | | | 5,000,000 | | | | 8.250 | | | | 03/01/16 | | | | 5,025,000 | |
| | | Suburban Propane Partners LP (BB-/Ba3) |
| | | | 3,442,000 | | | | 6.875 | | | | 12/15/13 | | | | 3,407,580 | |
| | | | | | | | | | | | | | | | | |
| | | | | | | | | | | | | | | | 21,191,245 | |
| | | |
| | | |
| | | Utilities-Electric – 3.7% |
| | | Calpine Construction Finance Co. LP and CCFC Finance Corp. (BB-/B1)(b) |
| | | | 4,500,000 | | | | 8.000 | | | | 06/01/16 | | | | 4,601,250 | |
| | | Dynegy Holdings, Inc. (B/B3) |
| | | | 3,000,000 | | | | 8.750 | | | | 02/15/12 | | | | 3,030,000 | |
| | | | 4,500,000 | | | | 7.500 | | | | 06/01/15 | | | | 4,140,000 | |
| | | | 2,250,000 | | | | 8.375 | | | | 05/01/16 | | | | 2,109,375 | |
| | | | 1,500,000 | | | | 7.125 | | | | 05/15/18 | | | | 1,140,000 | |
| | | | 5,750,000 | | | | 7.750 | | | | 06/01/19 | | | | 4,916,250 | |
| | | Edison Mission Energy (B/B2) |
| | | | 9,625,000 | | | | 7.750 | | | | 06/15/16 | | | | 8,349,688 | |
| | | | 11,125,000 | | | | 7.000 | | | | 05/15/17 | | | | 9,331,094 | |
| | | | 7,000,000 | | | | 7.200 | | | | 05/15/19 | | | | 5,687,500 | |
| | | Elwood Energy LLC (BB/Ba1) |
| | | | 2,014,140 | | | | 8.159 | | | | 07/05/26 | | | | 1,772,443 | |
| | | Intergen NV (BB-/Ba3)(b) |
| | | | 4,500,000 | | | | 9.000 | | | | 06/30/17 | | | | 4,635,000 | |
| | | Ipalco Enterprises, Inc. (BB+/Ba1) |
| | | | 1,500,000 | | | | 8.625 | | | | 11/14/11 | | | | 1,537,500 | |
| | | Midwest Generation LLC (BB-/Ba1) |
| | | | 4,174,001 | | | | 8.560 | | | | 01/02/16 | | | | 4,247,046 | |
| | | Mirant Americas Generation LLC (B-/B3) |
| | | | 7,750,000 | | | | 8.300 | | | | 05/01/11 | | | | 7,866,250 | |
| | | Mirant Mid-Atlantic LLC (BB/Ba1) |
| | | | 2,236,320 | | | | 9.125 | | | | 06/30/17 | | | | 2,247,501 | |
| | | Mirant North America LLC (B-/B1) |
| | | | 10,500,000 | | | | 7.375 | | | | 12/31/13 | | | | 10,421,250 | |
| | | NiSource Finance Corp. (BBB-/Baa3) |
| | | | 5,000,000 | | | | 6.150 | | | | 03/01/13 | | | | 5,243,029 | |
| | | | 2,000,000 | | | | 5.400 | | | | 07/15/14 | | | | 2,038,543 | |
| | | | 1,500,000 | | | | 10.750 | | | | 03/15/16 | | | | 1,763,553 | |
| | | | 7,275,000 | | | | 6.400 | | | | 03/15/18 | | | | 7,412,747 | |
| | | | 3,250,000 | | | | 6.800 | | | | 01/15/19 | | | | 3,314,677 | |
| | | | 5,000,000 | | | | 5.450 | | | | 09/15/20 | | | | 4,679,001 | |
| | | NRG Energy, Inc. (BB-/B1) |
| | | | 21,725,000 | | | | 7.250 | | | | 02/01/14 | | | | 21,344,813 | |
| | | | 21,125,000 | | | | 7.375 | | | | 02/01/16 | | | | 20,491,250 | |
| | | | 2,500,000 | | | | 7.375 | | | | 01/15/17 | | | | 2,425,000 | |
| | | Orion Power Holdings, Inc. (BB/Ba3) |
| | | | 3,500,000 | | | | 12.000 | | | | 05/01/10 | | | | 3,622,500 | |
| | | RRI Energy, Inc. (B+/B2) |
| | | | 5,750,000 | | | | 7.625 | | | | 06/15/14 | | | | 5,649,375 | |
| | | | 6,375,000 | | | | 7.875 | | | | 06/15/17 | | | | 6,215,625 | |
| | | |
| | | |
| | | The AES Corp. (BB-/B1) |
| | | | 5,250,000 | | | | 9.375 | | | | 09/15/10 | | | | 5,407,500 | |
| | | | 8,000,000 | | | | 7.750 | | | | 10/15/15 | | | | 8,040,000 | |
| | | | 13,250,000 | | | | 9.750 | (b) | | | 04/15/16 | | | | 14,442,500 | |
| | | | 10,000,000 | | | | 8.000 | | | | 10/15/17 | | | | 10,125,000 | |
| | | | 6,000,000 | | | | 8.000 | | | | 06/01/20 | | | | 5,970,000 | |
| | | | | | | | | | | | | | | | | |
| | | | | | | | | | | | | | | | 204,217,260 | |
| | | |
| | | |
| | | Utilities-Pipelines – 2.2% |
| | | El Paso Corp. (BB-/Ba3) |
| | | | 4,000,000 | | | | 12.000 | | | | 12/12/13 | | | | 4,570,000 | |
| | | | 5,000,000 | | | | 8.250 | | | | 02/15/16 | | | | 5,125,000 | |
| | | | 10,500,000 | | | | 7.000 | | | | 06/15/17 | | | | 10,316,250 | |
| | | | 3,500,000 | | | | 7.250 | | | | 06/01/18 | | | | 3,443,125 | |
| | | | 2,000,000 | | | | 7.800 | | | | 08/01/31 | | | | 1,835,000 | |
| | | El Paso Natural Gas Co. (BB/Baa3) |
| | | | 2,625,000 | | | | 8.625 | | | | 01/15/22 | | | | 3,189,270 | |
| | | | 2,375,000 | | | | 7.500 | | | | 11/15/26 | | | | 2,644,421 | |
| | | | 4,250,000 | | | | 8.375 | | | | 06/15/32 | | | | 5,013,088 | |
| | | Enterprise Products Operating LP (BB/Ba1)(e) |
| | | | 3,750,000 | | | | 8.375 | | | | 08/01/66 | | | | 3,494,929 | |
| | | | 3,285,000 | | | | 7.034 | | | | 01/15/68 | | | | 2,876,737 | |
| | | Mark West Energy Partners LP/Mark West Energy Finance Corp. Series B (B+/B2) |
| | | | 7,250,000 | | | | 8.500 | | | | 07/15/16 | | | | 7,141,250 | |
| | | Regency Energy Partners (B/B1) |
| | | | 6,598,000 | | | | 8.375 | | | | 12/15/13 | | | | 6,696,970 | |
| | | | 8,000,000 | | | | 9.375 | (b) | | | 06/01/16 | | | | 8,320,000 | |
| | | Southern Star Central Corp. (BB+/Ba2) |
| | | | 1,000,000 | | | | 6.750 | | | | 03/01/16 | | | | 955,000 | |
| | | Targa Resources Partners LP (B/B2) |
| | | | 3,034,000 | | | | 8.250 | | | | 07/01/16 | | | | 2,867,130 | |
| | | | 6,625,000 | | | | 11.250 | (b) | | | 07/15/17 | | | | 6,989,375 | |
| | | Targa Resources, Inc. (B/B3) |
| | | | 9,055,000 | | | | 8.500 | | | | 11/01/13 | | | | 8,511,700 | |
| | | Tennessee Gas Pipeline Co. (BB/Baa3) |
| | | | 3,000,000 | | | | 7.000 | | | | 10/15/28 | | | | 3,196,683 | |
| | | | 3,000,000 | | | | 8.375 | | | | 06/15/32 | | | | 3,622,065 | |
| | | | 1,500,000 | | | | 7.625 | | | | 04/01/37 | | | | 1,694,135 | |
| | | The Williams Cos., Inc. (BB+/Baa3) |
| | | | 5,000,000 | | | | 8.125 | | | | 03/15/12 | | | | 5,447,297 | |
| | | | 6,750,000 | | | | 7.625 | | | | 07/15/19 | | | | 7,277,541 | |
| | | | 5,000,000 | | | | 8.750 | | | | 01/15/20 | | | | 5,728,189 | |
| | | | 9,000,000 | | | | 7.875 | | | | 09/01/21 | | | | 9,773,247 | |
| | | | 1,000,000 | | | | 7.500 | | | | 01/15/31 | | | | 1,027,993 | |
| | | | | | | | | | | | | | | | | |
| | | | | | | | | | | | | | | | 121,756,395 | |
| | | |
| | | |
| | | TOTAL CORPORATE OBLIGATIONS |
| | | (Cost $5,054,191,038) | | $ | 5,093,828,556 | |
| | | |
| | | |
| | | | | | | | | | | | | | | | | |
| | | | | | | | | | | | | | | | | |
| | | | | | | | | | | | | | | | | |
The accompanying notes are an integral part of these financial statements.
GOLDMAN SACHS HIGH YIELD FUND
Schedule of Investments (continued)
September 30, 2009 (Unaudited)
| | | | | | | | | | | | | | | | | |
| | | | | Dividend
| | Maturity
| | |
| | | Shares | | Rate | | Date | | Value |
| |
Preferred Stocks – 0.1% |
| | | | | | | | | | | | | | | | | |
| | | | | | | | | | | | | | | | | |
| | | CMP Susquehanna Radio Holdings Corp.(b)(e) |
| | | | 111,942 | | | | 0.000 | % | | | 09/09/49 | | | $ | — | |
| | | Lucent Technologies Capital Trust I |
| | | | 1,000 | | | | 7.750 | | | | 03/15/17 | | | | 765,000 | |
| | | Pliant Corp.(c) |
| | | | 2,796 | | | | 13.000 | | | | 07/18/11 | | | | 420 | |
| | | Preferred Blocker, Inc.(b) |
| | | | 7,813 | | | | 7.000 | | | | 12/31/11 | | | | 4,543,504 | |
| | | Spanish Broadcasting Systems, Inc.(c)(d) |
| | | | 3,074 | | | | 10.750 | | | | 10/15/13 | | | | 15 | |
| | | |
| | | |
| | | TOTAL PREFERRED STOCKS |
| | | (Cost $8,894,040) | | $ | 5,308,939 | |
| | | |
| | | |
| | | | | | | | | | | | | | | | | |
| | | | | | | | | | | | | | | | | |
| | | | | | | | | | | |
| | | Shares | | Description | | Value |
| |
Common Stocks – 0.3% |
| | | | | | | | | | | |
| | | | | | | | | | | |
| | | | 1,996,917 | | | Adelphia Recovery Trust Series ACC-1(a) | | $ | 39,938 | |
| | | | 24,334 | | | Axiohm Transaction Solutions, Inc.(a) | | | 243 | |
| | | | 8,366 | | | iPCS, Inc.(a) | | | 145,568 | |
| | | | 6,252 | | | Masonite Worldwide Holdings(a) | | | 237,604 | |
| | | | 1,656 | | | Nycomed(a) | | | 24 | |
| | | | 567,500 | | | Parmalat SpA(b) | | | 1,566,981 | |
| | | | 351 | | | Pliant Corp.(a) | | | 4 | |
| | | | 33,975 | | | Polymer Group, Inc.(a) | | | 339,750 | |
| | | | 2,500 | | | Port Townsend Holdings Co., Inc. | | | 912,500 | |
| | | | 20,372 | | | Smurfit Kappa Funding PLC | | | 160,385 | |
| | | | 444,042 | | | Spectrum Brands, Inc.(a) | | | 10,212,966 | |
| | | | 103,389 | | | Viasystems Group, Inc.(a) | | | 310,167 | |
| | | | 1,051 | | | Zemex Minerals Group, Inc.(a) | | | — | |
| | | |
| | | |
| | | TOTAL COMMON STOCKS |
| | | (Cost $32,867,063) | | $ | 13,926,130 | |
| | | |
| | | |
| | | | | | | | | | | |
| | | | | | | | | | | |
| | | | | | | | | | | |
| | | | | Expiration
| | |
| | | Units | | Date | | Value |
| |
Warrants(a) – 0.0% |
| | | | | | | | | | | |
| | | | | | | | | | | |
| | | APP China Group Ltd. |
| | | | 2,731 | | | 03/15/10 | | $ | — | |
| | | Atrium Corp. |
| | | | 3,385 | | | 12/31/12 | | | — | |
| | | Avecia Group PLC (Ordinary)(b) |
| | | | 40,000 | | | 07/01/10 | | | 400 | |
| | | Avecia Group PLC (Preferred)(b) |
| | | | 40,000 | | | 01/01/10 | | | 400 | |
| | | CNB Capital Trust I(b) |
| | | | 127,920 | | | 03/23/19 | | | — | |
| | | Masonite Worldwide Holdings |
| | | | 30,311 | | | 06/09/14 | | | 109,119 | |
| | | | 22,734 | | | 06/09/16 | | | 76,159 | |
| | | |
| | | |
| | | Parmalat SpA(b) |
| | | | 650 | | | 12/31/15 | | | 1,797 | |
| | | |
| | | |
| | | TOTAL WARRANTS |
| | | (Cost $1,028,071) | | $ | 187,875 | |
| | | |
| | | |
| | | | | | | | | | | |
| | | Shares | | Description | | Value |
| |
Special Purpose Entity(a) – 0.0% |
| | | | | | | | | | | |
| | | | | | | | | | | |
| | | | 526,991 | | | Adelphia Recovery Trust | | | | |
| | | (Cost $63,727) | | $ | 25,032 | |
| | | |
| | | |
| | | TOTAL INVESTMENTS BEFORE REPURCHASE AGREEMENT |
| | | (Cost $5,097,043,939) | | $ | 5,113,276,532 | |
| | | |
| | | |
| | | | | | | | | | | |
| | | | | | | | | | | |
| | | | | | | | | | | | | | | | | |
| | | Principal
| | Interest
| | Maturity
| | |
| | | Amount | | Rate | | Date | | Value |
| |
Repurchase Agreement(h) – 4.6% |
| | | | | | | | | | | | | | | | | |
| | | | | | | | | | | | | | | | | |
| �� | | Joint Repurchase Agreement Account II |
| | | $ | 252,500,000 | | | | 0.061 | % | | | 10/01/09 | | | $ | 252,500,000 | |
| | | Maturity Value: $252,500,428 |
| | | (Cost $252,500,000) | | | | | | | | |
| | | |
| | | |
| | | TOTAL INVESTMENTS – 98.2% |
| | | (Cost $5,349,543,939) | | $ | 5,365,776,532 | |
| | | |
| | | |
| | | OTHER ASSETS IN EXCESS
OF LIABILITIES – 1.8% | | | 98,889,992 | |
| | | |
| | | |
| | | NET ASSETS – 100.0% | | $ | 5,464,666,524 | |
| | | |
| | | |
The percentage shown for each investment category reflects the value of investments in that category as a percentage of net assets.
| | |
| (a) | | Security is currently in default and/or non-income producing. |
| |
| (b) | | Securities are exempt from registration under Rule 144A of the Securities Act of 1933. Under procedures approved by the Board of Trustees, such securities have been determined to be liquid by the investment adviser and may be resold, normally to qualified institutional buyers in transactions exempt from registration. Total market value of Rule 144A securities amounts to $964,066,326, which represents approximately 17.6% of net assets as of September 30, 2009. |
| |
| (c) | | Pay-in-kind securities. |
| |
| (d) | | Securities with “Put” features with resetting interest rates. Maturity dates disclosed are the final maturity dates. |
| |
| (e) | | Variable rate security. Interest rate disclosed is that which is in effect at September 30, 2009. |
| |
| (f) | | These securities are issued with a zero coupon or interest rate which increases to the stated rate at a set date in the future. |
| |
| (g) | | Coupon changes periodically based upon a predetermined schedule. Interest rate disclosed is that which is in effect at September 30, 2009. |
| |
| (h) | | Joint repurchase agreement was entered into on September 30, 2009. Additional information appears on page 65. |
The accompanying notes are an integral part of these financial statements.
GOLDMAN SACHS HIGH YIELD FUND
Security ratings disclosed, if any, are issued by Standard & Poor’s/Moody’s Investors Service. A brief description of the ratings is available in the Fund’s Statement of Additional Information.
| | | | | | | |
| | | |
| | | |
| | | Investment Abbreviations: |
| | | NR | | — | | Not Rated |
| | | WR | | — | | Withdrawn Rating |
| | | |
| | | |
| | | | | | | |
| | | | | As a % of
| |
| | | | | Net Assets | |
| |
Investments Industry Classifications† |
| | | | | | | |
| | | | | | | |
| | | Aerospace | | | 0.7 | % |
| | | Agriculture | | | 0.9 | |
| | | Automotive | | | 3.4 | |
| | | Banks | | | 1.4 | |
| | | Building Materials | | | 2.2 | |
| | | Capital Goods | | | 1.9 | |
| | | Chemicals | | | 3.5 | |
| | | Conglomerates | | | 1.1 | |
| | | Construction Machinery | | | 0.3 | |
| | | Consumer Products | | | 3.9 | |
| | | Defense | | | 0.8 | |
| | | Energy | | | 5.6 | |
| | | Entertainment & Leisure | | | 0.6 | |
| | | Environmental | | | 0.8 | |
| | | Finance | | | 3.9 | |
| | | Food | | | 1.9 | |
| | | Gaming | | | 5.2 | |
| | | Health Care | | | 9.1 | |
| | | Home Construction | | | 0.8 | |
| | | Lodging | | | 0.7 | |
| | | Media | | | 7.2 | |
| | | Metals | | | 1.1 | |
| | | Packaging | | | 4.1 | |
| | | Paper | | | 2.0 | |
| | | Printing | | | 0.2 | |
| | | Publishing | | | 1.8 | |
| | | Real Estate | | | 0.3 | |
| | | Restaurants | | | 0.5 | |
| | | Retailers | | | 2.7 | |
| | | Services Cyclical | | | 3.3 | |
| | | Short-term Investments# | | | 6.4 | |
| | | Technology | | | 3.8 | |
| | | Telecommunications | | | 10.7 | |
| | | Textiles & Apparel | | | 0.2 | |
| | | Tobacco | | | 0.1 | |
| | | Transportation | | | 0.5 | |
| | | Utilities | | | 6.4 | |
| | | |
| | | |
| | | TOTAL INVESTMENTS | | | 100.0 | % |
| | | |
| | | |
| | |
| † | | Industry concentrations greater than one-tenth of one percent are disclosed. |
| |
| # | | Short-term Investments include repurchase agreements and other assets/liabilities. |
The accompanying notes are an integral part of these financial statements.
GOLDMAN SACHS HIGH YIELD FUND
Schedule of Investments (continued)
September 30, 2009 (Unaudited)
ADDITIONAL INVESTMENT INFORMATION
FORWARD FOREIGN CURRENCY EXCHANGE CONTRACTS — At September 30, 2009, the Fund had outstanding forward foreign currency exchange contracts, both to purchase and sell foreign currencies:
| | | | | | | | | | | | | | | | | |
| | | Contract
| | Expiration
| | Value on
| | | Current
| | | Unrealized
| |
| Open Forward Foreign Currency Exchange Contracts with Unrealized Gain | | Type | | Date | | Settlement Date | | | Value | | | Gain | |
| | |
| Euro | | Purchase | | 11/19/09 | | $ | 25,637,574 | | | $ | 26,398,828 | | | $ | 761,254 | |
| |
| |
| | | | | | | | | | | | | | | | | |
| | | | | | | | | | | | | | | | | |
| | | Contract
| | Expiration
| | Value on
| | | Current
| | | Unrealized
| |
| Open Forward Foreign Currency Exchange Contracts with Unrealized Loss | | Type | | Date | | Settlement Date | | | Value | | | Loss | |
| | |
| Euro | | Purchase | | 11/19/09 | | $ | 10,594,172 | | | $ | 10,571,108 | | | $ | (23,064 | ) |
| Euro | | Sale | | 11/19/09 | | | 821,858,227 | | | | 847,972,781 | | | | (26,114,554 | ) |
| |
| |
TOTAL | | | | | | | | | | | | | | $ | (26,137,618 | ) |
| |
| |
The accompanying notes are an integral part of these financial statements.
GOLDMAN SACHS INVESTMENT GRADE CREDIT FUND
Schedule of Investments
September 30, 2009 (Unaudited)
| | | | | | | | | | | | | | | | | |
| | | Principal
| | Interest
| | Maturity
| | |
| | | Amount | | Rate | | Date | | Value |
| |
Corporate Obligations – 80.5% |
| | | | | | | | | | | | | | | | | |
| | | | | | | | | | | | | | | | | |
| | | Banks – 17.2% |
| | | ANZ Capital Trust I(a)(b) |
| | | $ | 850,000 | | | | 4.484 | % | | | 12/15/49 | | | $ | 835,876 | |
| | | ANZ Capital Trust II(a)(b) |
| | | | 2,575,000 | | | | 5.360 | | | | 12/29/49 | | | | 2,327,686 | |
| | | Astoria Financial Corp.(a) |
| | | | 225,000 | | | | 5.750 | | | | 10/15/12 | | | | 208,461 | |
| | | BB&T Corp. |
| | | | 2,400,000 | | | | 3.850 | | | | 07/27/12 | | | | 2,475,682 | |
| | | Bear Stearns & Co., Inc. |
| | | | 3,050,000 | | | | 6.950 | | | | 08/10/12 | | | | 3,395,214 | |
| | | | 5,600,000 | | | | 6.400 | | | | 10/02/17 | | | | 6,070,396 | |
| | | | 925,000 | | | | 7.250 | | | | 02/01/18 | | | | 1,057,808 | |
| | | Citigroup, Inc. |
| | | | 1,200,000 | | | | 5.500 | | | | 04/11/13 | | | | 1,227,991 | |
| | | | 1,425,000 | | | | 6.125 | | | | 05/15/18 | | | | 1,403,116 | |
| | | | 400,000 | | | | 5.875 | | | | 05/29/37 | | | | 348,761 | |
| | | | 725,000 | | | | 6.875 | | | | 03/05/38 | | | | 714,059 | |
| | | HBOS PLC(a)(b)(c) |
| | | | 1,750,000 | | | | 5.375 | | | | 11/01/49 | | | | 1,120,000 | |
| | | HSBC Bank USA NA |
| | | | 4,400,000 | | | | 6.000 | | | | 08/09/17 | | | | 4,644,301 | |
| | | | 1,790,000 | | | | 5.625 | | | | 08/15/35 | | | | 1,786,536 | |
| | | HSBC Capital Funding LP(a)(b)(c) |
| | | | 1,050,000 | | | | 4.610 | | | | 06/27/49 | | | | 842,143 | |
| | | JPMorgan Chase & Co. |
| | | | 2,650,000 | | | | 6.300 | | | | 04/23/19 | | | | 2,893,076 | |
| | | | 1,225,000 | | | | 7.900 | (a)(c) | | | 04/30/49 | | | | 1,176,208 | |
| | | JPMorgan Chase Capital Co. Series T(a) |
| | | | 1,650,000 | | | | 6.550 | | | | 09/29/36 | | | | 1,532,067 | |
| | | KeyBank NA |
| | | | 2,375,000 | | | | 5.500 | | | | 09/17/12 | | | | 2,450,335 | |
| | | Manufacturers & Traders Trust Co.(a)(c) |
| | | | 1,495,000 | | | | 5.585 | | | | 12/28/20 | | | | 1,189,514 | |
| | | Merrill Lynch & Co., Inc. |
| | | | 3,500,000 | | | | 6.050 | | | | 08/15/12 | | | | 3,730,739 | |
| | | | 7,111,000 | | | | 5.450 | | | | 02/05/13 | | | | 7,410,804 | |
| | | | 1,200,000 | | | | 6.400 | | | | 08/28/17 | | | | 1,215,317 | |
| | | | 5,125,000 | | | | 6.875 | | | | 04/25/18 | | | | 5,400,789 | |
| | | MUFG Capital Finance 1 Ltd.(a)(c) |
| | | | 3,025,000 | | | | 6.346 | | | | 07/25/49 | | | | 2,722,500 | |
| | | Nordea Bank Sweden AB(a)(b)(c) |
| | | | 2,380,000 | | | | 8.950 | | | | 11/12/49 | | | | 2,261,000 | |
| | | Northern Trust Co. |
| | | | 1,625,000 | | | | 6.500 | | | | 08/15/18 | | | | 1,865,854 | |
| | | PNC Bank NA |
| | | | 1,000,000 | | | | 4.875 | | | | 09/21/17 | | | | 955,717 | |
| | | | 850,000 | | | | 6.000 | | | | 12/07/17 | | | | 869,179 | |
| | | Resona Bank Ltd.(a)(b)(c) |
| | | | 1,475,000 | | | | 5.850 | | | | 04/15/49 | | | | 1,275,875 | |
| | | Royal Bank of Scotland Group PLC(b) |
| | | | 3,375,000 | | | | 4.875 | | | | 08/25/14 | | | | 3,426,874 | |
| | | Santander Issuances SA Unipersonal(a)(b)(c) |
| | | | 700,000 | | | | 5.805 | | | | 06/20/16 | | | | 623,000 | |
| | | Sovereign Bank(a)(c) |
| | | | 455,000 | | | | 2.193 | | | | 08/01/13 | | | | 433,901 | |
| | | |
| | | |
| | | Sumitomo Mitsui Banking Corp.(a)(b)(c) |
| | | | 450,000 | | | | 5.625 | | | | 10/15/49 | | | | 429,335 | |
| | | US Bank NA(a)(c) |
| | | EUR | 2,400,000 | | | | 4.375 | | | | 02/28/17 | | | | 3,263,877 | |
| | | Wachovia Bank NA |
| | | $ | 1,450,000 | | | | 7.800 | | | | 08/18/10 | | | | 1,531,120 | |
| | | | 1,300,000 | | | | 6.600 | | | | 01/15/38 | | | | 1,426,992 | |
| | | Wachovia Corp. |
| | | | 9,844,000 | | | | 5.500 | | | | 05/01/13 | | | | 10,556,778 | |
| | | | | | | | | | | | | | | | | |
| | | | | | | | | | | | | | | | 87,098,881 | |
| | | |
| | | |
| | | Brokerage – 3.3% |
| | | Morgan Stanley & Co. |
| | | | 1,500,000 | | | | 5.750 | | | | 08/31/12 | | | | 1,602,582 | |
| | | | 8,375,000 | | | | 6.250 | (a) | | | 08/28/17 | | | | 8,756,648 | |
| | | | 2,925,000 | | | | 6.625 | (a) | | | 04/01/18 | | | | 3,089,176 | |
| | | | 2,400,000 | | | | 7.300 | (a) | | | 05/13/19 | | | | 2,640,658 | |
| | | | 825,000 | | | | 5.625 | (a) | | | 09/23/19 | | | | 814,897 | |
| | | | | | | | | | | | | | | | | |
| | | | | | | | | | | | | | | | 16,903,961 | |
| | | |
| | | |
| | | Chemicals(a) – 1.8% |
| | | Airgas, Inc. |
| | | | 2,925,000 | | | | 4.500 | | | | 09/15/14 | | | | 2,976,793 | |
| | | The Dow Chemical Co. |
| | | | 4,675,000 | | | | 7.600 | | | | 05/15/14 | | | | 5,171,714 | |
| | | | 875,000 | | | | 5.900 | | | | 02/15/15 | | | | 898,085 | |
| | | | | | | | | | | | | | | | | |
| | | | | | | | | | | | | | | | 9,046,592 | |
| | | |
| | | |
| | | Consumer Products(a) – 0.7% |
| | | Whirlpool Corp. |
| | | | 2,650,000 | | | | 8.000 | | | | 05/01/12 | | | | 2,860,416 | |
| | | | 850,000 | | | | 8.600 | | | | 05/01/14 | | | | 950,831 | |
| | | | | | | | | | | | | | | | | |
| | | | | | | | | | | | | | | | 3,811,247 | |
| | | |
| | | |
| | | Consumer Products-Industrial(a)(d) – 0.2% |
| | | Allied Waste Industries, Inc. |
| | | | 840,000 | | | | 4.250 | | | | 04/15/34 | | | | 831,819 | |
| | | |
| | | |
| | | Distributors(a)(b) – 0.7% |
| | | Ras Laffan Liquefied Natural Gas Co. Ltd. III |
| | | | 2,300,000 | | | | 6.750 | | | | 09/30/19 | | | | 2,578,951 | |
| | | Southern Star Central Gas Pipeline, Inc. |
| | | | 1,100,000 | | | | 6.000 | | | | 06/01/16 | | | | 1,044,442 | |
| | | | | | | | | | | | | | | | | |
| | | | | | | | | | | | | | | | 3,623,393 | |
| | | |
| | | |
| | | Electric – 6.5% |
| | | Arizona Public Service Co.(a) |
| | | | 500,000 | | | | 6.250 | | | | 08/01/16 | | | | 517,915 | |
| | | Commonwealth Edison Co.(a) |
| | | | 2,000,000 | | | | 6.150 | | | | 09/15/17 | | | | 2,210,026 | |
| | | | 1,025,000 | | | | 5.900 | | | | 03/15/36 | | | | 1,089,325 | |
| | | EDF SA(b) |
| | | | 3,275,000 | | | | 6.950 | | | | 01/26/39 | | | | 4,057,581 | |
| | | Enel Finance International SA(a)(b) |
| | | | 5,100,000 | | | | 5.125 | | | | 10/07/19 | | | | 5,077,560 | |
| | | FirstEnergy Corp.(a) |
| | | | 3,225,000 | | | | 7.375 | | | | 11/15/31 | | | | 3,614,990 | |
| | | |
| | | |
The accompanying notes are an integral part of these financial statements.
GOLDMAN SACHS INVESTMENT GRADE CREDIT FUND
Schedule of Investments (continued)
September 30, 2009 (Unaudited)
| | | | | | | | | | | | | | | | | |
| | | Principal
| | Interest
| | Maturity
| | |
| | | Amount | | Rate | | Date | | Value |
| |
Corporate Obligations – (continued) |
| | | Electric – (continued) |
| | | | | | | | | | | | | | | | | |
| | | MidAmerican Energy Holdings Co.(a) |
| | | $ | 2,475,000 | | | | 5.750 | % | | | 04/01/18 | | | $ | 2,671,527 | |
| | | Nevada Power Co.(a) |
| | | | 2,400,000 | | | | 7.125 | | | | 03/15/19 | | | | 2,729,904 | |
| | | Niagara Mohawk Power Corp.(a)(b) |
| | | | 3,025,000 | | | | 4.881 | | | | 08/15/19 | | | | 3,089,430 | |
| | | NiSource Finance Corp.(a)(c) |
| | | | 500,000 | | | | 0.977 | | | | 11/23/09 | | | | 499,622 | |
| | | Pacific Gas and Electric Co.(a) |
| | | | 2,275,000 | | | | 6.050 | | | | 03/01/34 | | | | 2,530,717 | |
| | | Progress Energy, Inc.(a) |
| | | | 1,550,000 | | | | 7.050 | | | | 03/15/19 | | | | 1,804,725 | |
| | | | 1,000,000 | | | | 7.000 | | | | 10/30/31 | | | | 1,162,174 | |
| | | Public Service Co. of Oklahoma(a) |
| | | | 1,650,000 | | | | 6.625 | | | | 11/15/37 | | | | 1,789,352 | |
| | | | | | | | | | | | | | | | | |
| | | | | | | | | | | | | | | | 32,844,848 | |
| | | |
| | | |
| | | Energy(a) – 5.2% |
| | | Cenovus Energy, Inc.(b) |
| | | | 6,300,000 | | | | 6.750 | | | | 11/15/39 | | | | 6,788,458 | |
| | | ConocoPhillips Canada Funding Co. I |
| | | | 5,250,000 | | | | 5.300 | | | | 04/15/12 | | | | 5,674,788 | |
| | | Dolphin Energy Ltd.(b) |
| | | | 550,000 | | | | 5.888 | | | | 06/15/19 | | | | 555,847 | |
| | | Petro-Canada |
| | | | 4,675,000 | | | | 6.050 | | | | 05/15/18 | | | | 4,895,183 | |
| | | Suncor Energy, Inc. |
| | | | 1,387,000 | | | | 6.100 | | | | 06/01/18 | | | | 1,449,507 | |
| | | Transocean, Inc. |
| | | | 2,425,000 | | | | 6.000 | | | | 03/15/18 | | | | 2,590,467 | |
| | | XTO Energy, Inc. |
| | | | 300,000 | | | | 5.900 | | | | 08/01/12 | | | | 323,995 | |
| | | | 1,437,000 | | | | 6.500 | | | | 12/15/18 | | | | 1,586,393 | |
| | | | 2,350,000 | | | | 6.750 | | | | 08/01/37 | | | | 2,614,215 | |
| | | | | | | | | | | | | | | | | |
| | | | | | | | | | | | | | | | 26,478,853 | |
| | | |
| | | |
| | | Entertainment – 0.3% |
| | | Time Warner Entertainment Co. |
| | | | 1,290,000 | | | | 8.375 | | | | 03/15/23 | | | | 1,517,804 | |
| | | |
| | | |
| | | Environmental(a) – 1.4% |
| | | Allied Waste North America, Inc. |
| | | | 2,450,000 | | | | 6.375 | | | | 04/15/11 | | | | 2,557,187 | |
| | | | 1,975,000 | | | | 7.875 | | | | 04/15/13 | | | | 2,034,250 | |
| | | Waste Management, Inc. |
| | | | 725,000 | | | | 7.375 | | | | 03/11/19 | | | | 843,714 | |
| | | | 1,403,000 | | | | 7.375 | | | | 05/15/29 | | | | 1,588,463 | |
| | | | | | | | | | | | | | | | | |
| | | | | | | | | | | | | | | | 7,023,614 | |
| | | |
| | | |
| | | Food & Beverage(a)(b) – 3.2% |
| | | Anheuser-Busch InBev Worldwide, Inc. |
| | | | 3,300,000 | | | | 7.750 | | | | 01/15/19 | | | | 3,904,758 | |
| | | | 7,925,000 | | | | 8.200 | | | | 01/15/39 | | | | 10,450,214 | |
| | | |
| | | |
| | | Bacardi Ltd. |
| | | | 1,200,000 | | | | 7.450 | | | | 04/01/14 | | | | 1,354,380 | |
| | | | 450,000 | | | | 8.200 | | | | 04/01/19 | | | | 540,405 | |
| | | | | | | | | | | | | | | | | |
| | | | | | | | | | | | | | | | 16,249,757 | |
| | | |
| | | |
| | | Healthcare Products – 1.5% |
| | | Agilent Technologies, Inc.(a) |
| | | | 4,630,000 | | | | 5.500 | | | | 09/14/15 | | | | 4,762,584 | |
| | | CareFusion Corp.(b) |
| | | | 2,650,000 | | | | 6.375 | | | | 08/01/19 | | | | 2,874,079 | |
| | | | | | | | | | | | | | | | | |
| | | | | | | | | | | | | | | | 7,636,663 | |
| | | |
| | | |
| | | Life Insurance – 1.1% |
| | | Nationwide Life Global Funding I(b) |
| | | | 2,450,000 | | | | 5.450 | | | | 10/02/12 | | | | 2,432,260 | |
| | | Phoenix Life Insurance Co.(a)(b) |
| | | | 2,600,000 | | | | 7.150 | | | | 12/15/34 | | | | 617,500 | |
| | | Reinsurance Group of America, Inc. |
| | | | 625,000 | | | | 6.750 | | | | 12/15/11 | | | | 641,245 | |
| | | Symetra Financial Corp.(a)(b) |
| | | | 1,600,000 | | | | 6.125 | | | | 04/01/16 | | | | 1,356,520 | |
| | | | 725,000 | | | | 8.300 | (c) | | | 10/15/37 | | | | 449,500 | |
| | | | | | | | | | | | | | | | | |
| | | | | | | | | | | | | | | | 5,497,025 | |
| | | |
| | | |
| | | Media-Cable – 3.5% |
| | | British Sky Broadcasting Group PLC(a)(b) |
| | | | 1,975,000 | | | | 6.100 | | | | 02/15/18 | | | | 2,127,567 | |
| | | Comcast Cable Communications Holdings, Inc. |
| | | | 2,200,000 | | | | 8.375 | | | | 03/15/13 | | | | 2,557,344 | |
| | | | 1,350,000 | | | | 9.455 | | | | 11/15/22 | | | | 1,734,747 | |
| | | Comcast Corp.(a) |
| | | | 1,000,000 | | | | 5.500 | | | | 03/15/11 | | | | 1,049,031 | |
| | | Cox Communications, Inc.(a)(b) |
| | | | 2,000,000 | | | | 6.250 | | | | 06/01/18 | | | | 2,121,814 | |
| | | | 2,025,000 | | | | 8.375 | | | | 03/01/39 | | | | 2,497,990 | |
| | | Rogers Communications, Inc.(a) |
| | | | 2,500,000 | | | | 6.800 | | | | 08/15/18 | | | | 2,805,640 | |
| | | Time Warner Cable, Inc.(a) |
| | | | 1,300,000 | | | | 5.400 | | | | 07/02/12 | | | | 1,389,077 | |
| | | | 1,075,000 | | | | 8.750 | | | | 02/14/19 | | | | 1,324,325 | |
| | | | | | | | | | | | | | | | | |
| | | | | | | | | | | | | | | | 17,607,535 | |
| | | |
| | | |
| | | Media-Non Cable(a) – 2.9% |
| | | DirecTV Holdings LLC(b) |
| | | | 3,000,000 | | | | 5.875 | | | | 10/01/19 | | | | 2,992,464 | |
| | | News America, Inc. |
| | | | 725,000 | | | | 6.650 | | | | 11/15/37 | | | | 758,424 | |
| | | Reed Elsevier Capital, Inc. |
| | | | 5,005,000 | | | | 8.625 | | | | 01/15/19 | | | | 6,166,020 | |
| | | Thomson Reuters Corp. |
| | | | 1,025,000 | | | | 6.500 | | | | 07/15/18 | | | | 1,158,802 | |
| | | WPP Finance UK |
| | | | 3,450,000 | | | | 8.000 | | | | 09/15/14 | | | | 3,784,457 | |
| | | | | | | | | | | | | | | | | |
| | | | | | | | | | | | | | | | 14,860,167 | |
| | | |
| | | |
| | | | | | | | | | | | | | | | | |
The accompanying notes are an integral part of these financial statements.
GOLDMAN SACHS INVESTMENT GRADE CREDIT FUND
| | | | | | | | | | | | | | | | | |
| | | Principal
| | Interest
| | Maturity
| | |
| | | Amount | | Rate | | Date | | Value |
| |
Corporate Obligations – (continued) |
| | | | | | | | | | | | | | | | | |
| | | Metals & Mining – 1.2% |
| | | Anglo American Capital PLC(a)(b) |
| | | $ | 1,750,000 | | | | 9.375 | % | | | 04/08/19 | | | $ | 2,126,250 | |
| | | ArcelorMittal |
| | | | 2,875,000 | | | | 9.850 | | | | 06/01/19 | | | | 3,385,312 | |
| | | Xstrata Canada Corp.(a) |
| | | | 500,000 | | | | 7.250 | | | | 07/15/12 | | | | 535,000 | |
| | | | | | | | | | | | | | | | | |
| | | | | | | | | | | | | | | | 6,046,562 | |
| | | |
| | | |
| | | Noncaptive-Financial – 2.2% |
| | | American General Finance Corp. |
| | | | 2,775,000 | | | | 3.875 | | | | 10/01/09 | | | | 2,761,125 | |
| | | | 1,225,000 | | | | 8.450 | (d) | | | 10/15/09 | | | | 1,218,875 | |
| | | General Electric Capital Corp. |
| | | | 3,650,000 | | | | 6.875 | | | | 01/10/39 | | | | 3,822,754 | |
| | | SLM Corp. |
| | | | 3,750,000 | | | | 5.400 | | | | 10/25/11 | | | | 3,460,200 | |
| | | | | | | | | | | | | | | | | |
| | | | | | | | | | | | | | | | 11,262,954 | |
| | | |
| | | |
| | | Paper(a) – 0.3% |
| | | International Paper Co. |
| | | | 1,350,000 | | | | 7.500 | | | | 08/15/21 | | | | 1,430,413 | |
| | | |
| | | |
| | | Pharmaceuticals(a) – 1.6% |
| | | Roche Holdings, Inc.(b) |
| | | | 3,500,000 | | | | 6.000 | | | | 03/01/19 | | | | 3,895,987 | |
| | | | 625,000 | | | | 7.000 | | | | 03/01/39 | | | | 775,817 | |
| | | Watson Pharmaceuticals, Inc. |
| | | | 3,150,000 | | | | 5.000 | | | | 08/15/14 | | | | 3,229,027 | |
| | | | | | | | | | | | | | | | | |
| | | | | | | | | | | | | | | | 7,900,831 | |
| | | |
| | | |
| | | Pipelines – 9.1% |
| | | Buckeye Partners LP(a) |
| | | | 2,000,000 | | | | 5.500 | | | | 08/15/19 | | | | 2,044,162 | |
| | | CenterPoint Energy Resources Corp. Series B(a) |
| | | | 2,500,000 | | | | 7.875 | | | | 04/01/13 | | | | 2,815,140 | |
| | | DCP Midstream LLC(a)(b) |
| | | | 7,110,000 | | | | 9.750 | | | | 03/15/19 | | | | 8,493,762 | |
| | | Energy Transfer Partners LP(a) |
| | | | 275,000 | | | | 5.650 | | | | 08/01/12 | | | | 289,996 | |
| | | | 5,852,000 | | | | 5.950 | | | | 02/01/15 | | | | 6,190,371 | |
| | | Enterprise Products Operating LP(a) |
| | | | 2,350,000 | | | | 5.600 | | | | 10/15/14 | | | | 2,484,949 | |
| | | | 275,000 | | | | 5.000 | | | | 03/01/15 | | | | 280,618 | |
| | | Magellan Midstream Partners LP(a) |
| | | | 3,200,000 | | | | 6.550 | | | | 07/15/19 | | | | 3,555,904 | |
| | | Northwest Pipeline GP(a) |
| | | | 2,025,000 | | | | 6.050 | | | | 06/15/18 | | | | 2,179,331 | |
| | | ONEOK Partners LP(a) |
| | | | 1,000,000 | | | | 6.150 | | | | 10/01/16 | | | | 1,042,643 | |
| | | Southeast Supply Header LLC(a)(b) |
| | | | 2,325,000 | | | | 4.850 | | | | 08/15/14 | | | | 2,367,164 | |
| | | Southern Natural Gas Co.(a)(b) |
| | | | 700,000 | | | | 5.900 | | | | 04/01/17 | | | | 720,932 | |
| | | Tennessee Gas Pipeline Co.(a) |
| | | | 1,460,000 | | | | 7.000 | | | | 10/15/28 | | | | 1,555,719 | |
| | | | 2,125,000 | | | | 8.375 | | | | 06/15/32 | | | | 2,565,630 | |
| | | |
| | | |
| | | TEPPCO Partners LP(a) |
| | | | 1,500,000 | | | | 6.650 | | | | 04/15/18 | | | | 1,625,694 | |
| | | | 3,973,000 | | | | 7.550 | | | | 04/15/38 | | | | 4,686,408 | |
| | | The Williams Cos., Inc. |
| | | | 825,000 | | | | 6.375 | (b) | | | 10/01/10 | | | | 846,961 | |
| | | | 589,000 | | | | 7.875 | (a) | | | 09/01/21 | | | | 639,605 | |
| | | | 408,000 | | | | 8.750 | (a) | | | 03/15/32 | | | | 467,879 | |
| | | TransCanada PipeLines Ltd.(a)(c) |
| | | | 1,500,000 | | | | 6.350 | | | | 05/15/67 | | | | 1,309,658 | |
| | | | | | | | | | | | | | | | | |
| | | | | | | | | | | | | | | | 46,162,526 | |
| | | |
| | | |
| | | Property/Casualty Insurance – 3.5% |
| | | Ace Capital Trust II(a) |
| | | | 250,000 | | | | 9.700 | | | | 04/01/30 | | | | 248,916 | |
| | | ACE INA Holdings, Inc.(a) |
| | | | 1,500,000 | | | | 6.700 | | | | 05/15/36 | | | | 1,731,353 | |
| | | Arch Capital Group Ltd.(a) |
| | | | 1,245,000 | | | | 7.350 | | | | 05/01/34 | | | | 1,158,750 | |
| | | Aspen Insurance Holdings Ltd.(a) |
| | | | 1,025,000 | | | | 6.000 | | | | 08/15/14 | | | | 1,002,154 | |
| | | Catlin Insurance Co. Ltd.(a)(b)(c) |
| | | | 1,050,000 | | | | 7.249 | | | | 01/19/49 | | | | 683,813 | |
| | | CNA Financial Corp.(a) |
| | | | 1,000,000 | | | | 5.850 | | | | 12/15/14 | | | | 907,031 | |
| | | Endurance Specialty Holdings Ltd.(a) |
| | | | 1,350,000 | | | | 7.000 | | | | 07/15/34 | | | | 1,206,789 | |
| | | Marsh & McLennan Cos., Inc.(a) |
| | | | 1,000,000 | | | | 5.150 | | | | 09/15/10 | | | | 1,013,355 | |
| | | QBE Insurance Group Ltd.(b) |
| | | | 647,000 | | | | 9.750 | | | | 03/14/14 | | | | 734,412 | |
| | | | 855,000 | | | | 5.647 | (a)(c) | | | 07/01/23 | | | | 708,095 | |
| | | The Chubb Corp.(a) |
| | | | 1,300,000 | | | | 6.500 | | | | 05/15/38 | | | | 1,532,658 | |
| | | The Travelers Cos., Inc.(a)(c) |
| | | | 1,300,000 | | | | 6.250 | | | | 03/15/37 | | | | 1,142,994 | |
| | | White Mountains Reinsurance Group Ltd.(a)(b) |
| | | | 1,725,000 | | | | 6.375 | | | | 03/20/17 | | | | 1,568,162 | |
| | | Willis North America, Inc.(a) |
| | | | 1,475,000 | | | | 7.000 | | | | 09/29/19 | | | | 1,516,623 | |
| | | ZFS Finance USA Trust I(a)(b)(c) |
| | | | 1,375,000 | | | | 6.150 | | | | 12/15/65 | | | | 1,237,500 | |
| | | ZFS Finance USA Trust II(a)(b)(c) |
| | | | 1,275,000 | | | | 6.450 | | | | 12/15/65 | | | | 1,134,750 | |
| | | | | | | | | | | | | | | | | |
| | | | | | | | | | | | | | | | 17,527,355 | |
| | | |
| | | |
| | | Real Estate Investment Trusts(a) – 3.0% |
| | | Arden Realty LP(e) |
| | | | 1,160,000 | | | | 5.200 | | | | 09/01/11 | | | | 1,210,568 | |
| | | Health Care Property Investors, Inc. |
| | | | 1,825,000 | | | | 5.950 | | | | 09/15/11 | | | | 1,888,560 | |
| | | Pan Pacific Retail Properties, Inc. |
| | | | 1,350,000 | | | | 5.950 | | | | 06/01/14 | | | | 1,366,716 | |
| | | Post Apartment Homes LP |
| | | | 3,000,000 | | | | 6.300 | | | | 06/01/13 | | | | 2,953,404 | |
| | | ProLogis(d) |
| | | | 2,500,000 | | | | 2.250 | | | | 04/01/37 | | | | 2,258,315 | |
| | | |
| | | |
The accompanying notes are an integral part of these financial statements.
GOLDMAN SACHS INVESTMENT GRADE CREDIT FUND
Schedule of Investments (continued)
September 30, 2009 (Unaudited)
| | | | | | | | | | | | | | | | | |
| | | Principal
| | Interest
| | Maturity
| | |
| | | Amount | | Rate | | Date | | Value |
| |
Corporate Obligations – (continued) |
| | | Real Estate Investment Trusts(a) – (continued) |
| | | | | | | | | | | | | | | | | |
| | | Simon Property Group LP |
| | | $ | 1,000,000 | | | | 5.600 | % | | | 09/01/11 | | | $ | 1,040,944 | |
| | | | 1,350,000 | | | | 6.125 | | | | 05/30/18 | | | | 1,360,226 | |
| | | WEA Finance LLC(b) |
| | | | 1,625,000 | | | | 7.125 | | | | 04/15/18 | | | | 1,693,989 | |
| | | Westfield Capital Corp. Ltd.(b) |
| | | | 1,500,000 | | | | 4.375 | | | | 11/15/10 | | | | 1,522,004 | |
| | | | | | | | | | | | | | | | | |
| | | | | | | | | | | | | | | | 15,294,726 | |
| | | |
| | | |
| | | Retailers – 1.7% |
| | | CVS Caremark Corp.(a) |
| | | | 1,550,000 | | | | 5.750 | | | | 06/01/17 | | | | 1,659,283 | |
| | | | 800,000 | | | | 6.250 | | | | 06/01/27 | | | | 850,342 | |
| | | Nordstrom, Inc.(a) |
| | | | 3,350,000 | | | | 6.750 | | | | 06/01/14 | | | | 3,674,926 | |
| | | Wal-Mart Stores, Inc. |
| | | | 1,850,000 | | | | 7.550 | | | | 02/15/30 | | | | 2,378,386 | |
| | | | | | | | | | | | | | | | | |
| | | | | | | | | | | | | | | | 8,562,937 | |
| | | |
| | | |
| | | Technology-Hardware(a) – 1.3% |
| | | Cisco Systems, Inc. |
| | | | 1,925,000 | | | | 5.900 | | | | 02/15/39 | | | | 2,083,761 | |
| | | Fiserv, Inc. |
| | | | 2,275,000 | | | | 6.125 | | | | 11/20/12 | | | | 2,462,340 | |
| | | Xerox Corp. |
| | | | 1,750,000 | | | | 8.250 | | | | 05/15/14 | | | | 1,989,209 | |
| | | | | | | | | | | | | | | | | |
| | | | | | | | | | | | | | | | 6,535,310 | |
| | | |
| | | |
| | | Tobacco – 1.4% |
| | | Altria Group, Inc. |
| | | | 1,875,000 | | | | 9.700 | | | | 11/10/18 | | | | 2,328,857 | |
| | | BAT International Finance PLC(a)(b) |
| | | | 1,325,000 | | | | 9.500 | | | | 11/15/18 | | | | 1,718,561 | |
| | | Philip Morris International, Inc. |
| | | | 2,775,000 | | | | 5.650 | | | | 05/16/18 | | | | 2,953,754 | |
| | | | | | | | | | | | | | | | | |
| | | | | | | | | | | | | | | | 7,001,172 | |
| | | |
| | | |
| | | Transportation(a) – 0.7% |
| | | CSX Corp. |
| | | | 3,150,000 | | | | 6.250 | | | | 03/15/18 | | | | 3,416,159 | |
| | | |
| | | |
| | | Wireless Telecommunications(a) – 1.5% |
| | | AT&T, Inc. |
| | | | 1,650,000 | | | | 5.800 | | | | 02/15/19 | | | | 1,765,559 | |
| | | | 2,300,000 | | | | 6.400 | | | | 05/15/38 | | | | 2,441,593 | |
| | | New Cingular Wireless Services, Inc. |
| | | | 900,000 | | | | 8.750 | | | | 03/01/31 | | | | 1,189,846 | |
| | | Vodafone Group PLC |
| | | | 1,950,000 | | | | 5.000 | | | | 12/16/13 | | | | 2,079,636 | |
| | | | | | | | | | | | | | | | | |
| | | | | | | | | | | | | | | | 7,476,634 | |
| | | |
| | | |
| | | Wirelines Telecommunications(a) – 3.5% |
| | | British Telecommunications PLC |
| | | | 3,750,000 | | | | 9.125 | | | | 12/15/10 | | | | 4,037,539 | |
| | | France Telecom SA |
| | | | 4,375,000 | | | | 7.750 | | | | 03/01/11 | | | | 4,737,141 | |
| | | Telecom Italia Capital SA |
| | | | 1,500,000 | | | | 6.200 | | | | 07/18/11 | | | | 1,596,536 | |
| | | |
| | | |
| | | | 1,700,000 | | | | 4.950 | | | | 09/30/14 | | | | 1,759,323 | |
| | | Verizon Wireless Capital LLC(b) |
| | | | 4,600,000 | | | | 8.500 | | | | 11/15/18 | | | | 5,743,707 | |
| | | | | | | | | | | | | | | | | |
| | | | | | | | | | | | | | | | 17,874,246 | |
| | | |
| | | |
| | | TOTAL CORPORATE OBLIGATIONS |
| | | (Cost $387,791,832) | | $ | 407,523,984 | |
| | | |
| | | |
| | | | | | | | | | | | | | | | | |
| | | | | | | | | | | | | | | | | |
Agency Debentures – 1.4% |
| | | | | | | | | | | | | | | | | |
| | | | | | | | | | | | | | | | | |
| | | FHLB |
| | | $ | 5,700,000 | | | | 4.500 | % | | | 09/13/19 | | | $ | 5,881,562 | |
| | | Tennessee Valley Authority |
| | | | 1,400,000 | | | | 5.500 | | | | 07/18/17 | | | | 1,550,637 | |
| | | |
| | | |
| | | TOTAL AGENCY DEBENTURES |
| | | (Cost $7,346,464) | | $ | 7,432,199 | |
| | | |
| | | |
| | | | | | | | | | | | | | | | | |
| | | | | | | | | | | | | | | | | |
Mortgage-Backed Obligations – 1.6% |
| | | | | | | | | | | | | | | | | |
| | | | | | | | | | | | | | | | | |
| | | Collateralized Mortgage Obligations – 1.6% |
| | | Countrywide Alternative Loan Trust Series 2007-06, Class A4 |
| | | $ | 1,200,000 | | | | 5.750 | % | | | 04/25/47 | | | $ | 572,530 | |
| | | Countrywide Alternative Loan Trust Series 2007-15CB, Class A5 |
| | | | 2,321,285 | | | | 5.750 | | | | 07/25/37 | | | | 1,584,362 | |
| | | Countrywide Alternative Loan Trust Series 2007-16CB, Class 4A7 |
| | | | 1,821,949 | | | | 6.000 | | | | 08/25/37 | | | | 1,297,540 | |
| | | Residential Asset Securitization Trust Series 2007-06, Class 1A3 |
| | | | 1,482,055 | | | | 6.000 | | | | 04/25/37 | | | | 867,451 | |
| | | Structured Adjustable Rate Mortgage Loan Trust Series 2005-21, Class 7A1(c) |
| | | | 2,176,353 | | | | 6.010 | | | | 11/25/35 | | | | 1,709,665 | |
| | | Washington Mutual Mortgage Pass-Through Certificates Series 2005-AR15, Class A1A1(c) |
| | | | 1,594,986 | | | | 0.506 | | | | 11/25/45 | | | | 1,028,624 | |
| | | Wells Fargo Alternative Loan Trust Series 2007-PA2, Class 1A1 |
| | | | 1,615,520 | | | | 6.000 | | | | 06/25/37 | | | | 1,113,505 | |
| | | |
| | | |
| | | TOTAL MORTGAGE-BACKED OBLIGATIONS |
| | | (Cost $9,171,115) | | $ | 8,173,677 | |
| | | |
| | | |
| | | | | | | | | | | | | | | | | |
| | | | | | | | | | | | | | | | | |
Foreign Debt Obligations – 5.1% |
| | | | | | | | | | | | | | | | | |
| | | | | | | | | | | | | | | | | |
| | | Sovereign – 3.6% |
| | | Federal Republic of Brazil |
| | | $ | 820,000 | | | | 8.250 | % | | | 01/20/34 | | | $ | 1,081,170 | |
| | | | 4,000,000 | | | | 7.125 | | | | 01/20/37 | | | | 4,770,000 | |
| | | Landwirtschaftliche Rentenbank |
| | | | 4,800,000 | | | | 1.875 | | | | 09/24/12 | | | | 4,797,936 | |
| | | Ontario Province of Canada |
| | | | 1,400,000 | | | | 4.100 | | | | 06/16/14 | | | | 1,480,171 | |
| | | |
| | | |
The accompanying notes are an integral part of these financial statements.
GOLDMAN SACHS INVESTMENT GRADE CREDIT FUND
| | | | | | | | | | | | | | | | | |
| | | Principal
| | Interest
| | Maturity
| | |
| | | Amount | | Rate | | Date | | Value |
| |
Foreign Debt Obligations – (continued) |
| | | Sovereign – (continued) |
| | | | | | | | | | | | | | | | | |
| | | Societe Financement de l’Economie Francaise(b) |
| | | $ | 2,200,000 | | | | 3.375 | % | | | 05/05/14 | | | $ | 2,270,580 | |
| | | State of Qatar |
| | | | 600,000 | | | | 5.150 | | | | 04/09/14 | | | | 628,500 | |
| | | | 300,000 | | | | 6.550 | | | | 04/09/19 | | | | 334,500 | |
| | | Swedish Export Credit |
| | | | 2,900,000 | | | | 3.250 | | | | 09/16/14 | | | | 2,917,659 | |
| | | | | | | | | | | | | | | | | |
| | | | | | | | | | | | | | | | 18,280,516 | |
| | | |
| | | |
| | | Supranational – 1.5% |
| | | European Investment Bank |
| | | | 2,500,000 | | | | 3.000 | | | | 04/08/14 | | | | 2,558,347 | |
| | | | 3,300,000 | | | | 3.125 | | | | 06/04/14 | | | | 3,377,019 | |
| | | Inter-American Development Bank |
| | | | 1,600,000 | | | | 3.000 | | | | 04/22/14 | | | | 1,630,202 | |
| | | | | | | | | | | | | | | | | |
| | | | | | | | | | | | | | | | 7,565,568 | |
| | | |
| | | |
| | | TOTAL FOREIGN DEBT OBLIGATIONS |
| | | (Cost $24,965,018) | | $ | 25,846,084 | |
| | | |
| | | |
| | | | | | | | | | | | | | | | | |
| | | | | | | | | | | | | | | | | |
Municipal Debt Obligations – 1.3% |
| | | | | | | | | | | | | | | | | |
| | | | | | | | | | | | | | | | | |
| | | California – 0.8% |
| | | California State GO Bonds Build America Taxable Series 2009 |
| | | $ | 1,050,000 | | | | 7.500 | % | | | 04/01/34 | | | $ | 1,154,444 | |
| | | | 2,625,000 | | | | 7.550 | | | | 04/01/39 | | | | 2,921,257 | |
| | | | | | | | | | | | | | | | | |
| | | | | | | | | | | | | | | | 4,075,701 | |
| | | |
| | | |
| | | Illinois – 0.4% |
| | | Chicago Illinois Metropolitan Water Reclamation District GO Bonds Build America Bonds Taxable Direct Payment Series 2009 |
| | | | 1,775,000 | | | | 5.720 | | | | 12/01/38 | | | | 1,926,709 | |
| | | |
| | | |
| | | New Jersey – 0.1% |
| | | New Jersey State Turnpike Authority RB Build America Taxable Series 2009 F |
| | | | 350,000 | | | | 7.414 | | | | 01/01/40 | | | | 432,058 | |
| | | |
| | | |
| | | TOTAL MUNICIPAL DEBT OBLIGATIONS |
| | | (Cost $5,959,807) | | $ | 6,434,468 | |
| | | |
| | | |
| | | | | | | | | | | | | | | | | |
| | | | | | | | | | | | | | | | | |
Government Guarantee Obligations – 7.2% |
| | | | | | | | | | | | | | | | | |
| | | | | | | | | | | | | | | | | |
| | | ANZ National (International) Ltd.(b)(f) |
| | | $ | 3,700,000 | | | | 3.250 | % | | | 04/02/12 | | | $ | 3,825,818 | |
| | | Citigroup Funding, Inc.(g) |
| | | | 3,400,000 | | | | 1.875 | | | | 10/22/12 | | | | 3,408,925 | |
| | | | 5,400,000 | | | | 1.875 | | | | 11/15/12 | | | | 5,390,712 | |
| | | | 1,500,000 | | | | 2.250 | | | | 12/10/12 | | | | 1,520,196 | |
| | | General Electric Capital Corp.(g) |
| | | | 2,100,000 | | | | 2.000 | | | | 09/28/12 | | | | 2,111,703 | |
| | | | 4,400,000 | | | | 2.625 | | | | 12/28/12 | | | | 4,508,024 | |
| | | Israel Government AID Bond(g) |
| | | | 3,500,000 | | | | 5.500 | | | | 09/18/33 | | | | 3,836,182 | |
| | | |
| | | |
| | | LeasePlan Corp. NV(b)(f) |
| | | | 1,600,000 | | | | 3.000 | | | | 05/07/12 | | | | 1,630,106 | |
| | | Macquarie Bank Ltd.(b)(f) |
| | | | 4,200,000 | | | | 3.300 | | | | 07/17/14 | | | | 4,185,222 | |
| | | Societe Financement de l’Economie Francaise(b)(f) |
| | | | 5,900,000 | | | | 2.875 | | | | 09/22/14 | | | | 5,912,095 | |
| | | |
| | | |
| | | TOTAL GOVERNMENT GUARANTEE OBLIGATIONS |
| | | (Cost $36,065,847) | | $ | 36,328,983 | |
| | | |
| | | |
| | | | | | | | | | | | | | | | | |
| | | | | | | | | | | | | | | | | |
U.S. Treasury Obligations – 2.0% |
| | | | | | | | | | | | | | | | | |
| | | | | | | | | | | | | | | | | |
| | | United States Treasury Bonds |
| | | $ | 2,700,000 | | | | 4.250 | % | | | 05/15/39 | | | $ | 2,793,234 | |
| | | United States Treasury Note |
| | | | 3,200,000 | | | | 2.375 | | | | 09/30/14 | | | | 3,208,256 | |
| | | United States Treasury Principal-Only STRIPS(h) |
| | | | 800,000 | | | | 0.000 | | | | 05/15/20 | | | | 534,435 | |
| | | | 7,100,000 | | | | 0.000 | | | | 11/15/26 | | | | 3,439,517 | |
| | | |
| | | |
| | | TOTAL U.S. TREASURY OBLIGATIONS |
| | | (Cost $9,695,350) | | $ | 9,975,442 | |
| | | |
| | | |
| | | TOTAL INVESTMENTS BEFORE REPURCHASE AGREEMENT |
| | | (Cost $480,995,433) | | $ | 501,714,837 | |
| | | |
| | | |
| | | | | | | | | | | | | | | | | |
| | | | | | | | | | | | | | | | | |
Repurchase Agreement(i) – 1.4% |
| | | | | | | | | | | | | | | | | |
| | | | | | | | | | | | | | | | | |
| | | Joint Repurchase Agreement Account II |
| | | $ | 7,100,000 | | | | 0.061 | % | | | 10/01/09 | | | $ | 7,100,000 | |
| | | Maturity Value: $7,100,012 |
| | | (Cost $7,100,000) | | | | |
| | | |
| | | |
| | | TOTAL INVESTMENTS – 100.5% |
| | | (Cost $488,095,433) | | $ | 508,814,837 | |
| | | |
| | | |
| | | | | | | | | | | | | | | | | |
| | | LIABILITIES IN EXCESS OF
OTHER ASSETS – (0.5)% | | | (2,618,193 | ) |
| | | |
| | | |
| | | NET ASSETS – 100.0% | | $ | 506,196,644 | |
| | | |
| | | |
The accompanying notes are an integral part of these financial statements.
GOLDMAN SACHS INVESTMENT GRADE CREDIT FUND
Schedule of Investments (continued)
September 30, 2009 (Unaudited)
The percentage shown for each investment category reflects the value of investments in that category as a percentage of net assets.
| | |
| (a) | | Securities with “Call” features with resetting interest rates. Maturity dates disclosed are the final maturity dates. |
| |
| (b) | | Securities are exempt from registration under Rule 144A of the Securities Act of 1933. Under procedures approved by the Board of Trustees, such securities have been determined to be liquid by the investment adviser and may be resold, normally to qualified institutional buyers in transactions exempt from registration. Total market value of Rule 144A securities amounts to $123,849,196, which represents approximately 24.5% of net assets as of September 30, 2009. |
| |
| (c) | | Variable rate security. Interest rate disclosed is that which is in effect at September 30, 2009. |
| |
| (d) | | Securities with “Put” features with resetting interest rates. Maturity dates disclosed are the final maturity dates. |
| |
| (e) | | A portion of this security is segregated as collateral for initial margin requirement on futures transactions. |
| |
| (f) | | Represents securities which are guaranteed by a foreign government. Total market value of the securities amounts to $15,553,241, which represents approximately 3.1% of net assets as of September 30, 2009. |
| | |
| (g) | | This debt is guaranteed under the Federal Deposit Insurance Corporation’s (“FDIC”) Temporary Liquidity Guarantee Program and is backed by the full faith and credit of the United States. The expiration date of the FDIC’s guarantee is the earlier of the maturity date of the debt or June 30, 2012. Total market value of these securities amounts to $20,775,742, which represents approximately 4.1% of net assets as of September 30, 2009. |
| |
| (h) | | Security issued with a zero coupon. Income is recognized through the accretion of discount. |
| |
| (i) | | Joint repurchase agreement was entered into on September 30, 2009. Additional information appears on page 65. |
| | | | | | | |
| | | |
| | | |
| | | Investment Abbreviations: |
| | | FHLB | | — | | Federal Home Loan Bank |
| | | GO | | — | | General Obligation |
| | | LIBOR | | — | | London Interbank Offered Rate |
| | | RB | | — | | Revenue Bond |
| | | STRIPS | | — | | Separate Trading of Registered Interest and Principal of Securities |
| | | |
| | | |
ADDITIONAL INVESTMENT INFORMATION
FORWARD FOREIGN CURRENCY EXCHANGE CONTRACT — At September 30, 2009, the Fund had an outstanding forward foreign currency exchange contract to sell foreign currencies:
| | | | | | | | | | | | | | | | | |
Open Forward Foreign Currency
| | Contract
| | Expiration
| | Value on
| | | Current
| | | Unrealized
| |
| Exchange Contract with Unrealized Loss | | Type | | Date | | Settlement Date | | | Value | | | Loss | |
| | |
| Euro | | Sale | | 10/13/09 | | $ | 3,190,137 | | | $ | 3,283,088 | | | $ | (92,951 | ) |
| |
| |
FUTURES CONTRACTS — At September 30, 2009, the following futures contracts were open:
| | | | | | | | | | | | | | | |
| | | Number of
| | | | | | | | | |
| | | Contracts
| | | Settlement
| | Notional
| | | Unrealized
| |
| Type | | Long (Short) | | | Month | | Value | | | Gain (Loss) | |
| | |
| Eurodollars | | | 26 | | | December 2009 | | $ | 6,475,950 | | | $ | 26,585 | |
| Eurodollars | | | (15 | ) | | September 2010 | | | (3,698,813 | ) | | | (2,235 | ) |
| Eurodollars | | | (2 | ) | | December 2010 | | | (491,225 | ) | | | (401 | ) |
| 2 Year U.S. Treasury Notes | | | 145 | | | December 2009 | | | 31,460,469 | | | | 160,826 | |
| 5 Year U.S. Treasury Notes | | | (88 | ) | | December 2009 | | | (10,216,250 | ) | | | (44,276 | ) |
| 10 Year U.S. Treasury Notes | | | 30 | | | December 2009 | | | 3,549,844 | | | | 44,477 | |
| 30 Year U.S. Treasury Bonds | | | (187 | ) | | December 2009 | | | (22,697,125 | ) | | | (383,068 | ) |
| |
| |
TOTAL | | | | | | | | | | | | $ | (198,092 | ) |
| |
| |
The accompanying notes are an integral part of these financial statements.
GOLDMAN SACHS INVESTMENT GRADE CREDIT FUND
| |
| ADDITIONAL INVESTMENT INFORMATION (continued) | |
SWAP CONTRACTS — At September 30, 2009, the Fund had outstanding swap contracts with the following terms:
INTEREST RATE SWAP CONTRACTS
| | | | | | | | | | | | | | | | | | | | | | | | | |
| | | | | | | | | Rates Exchanged | | | | | Upfront
| | | | |
| | | Notional
| | | | | | Payments
| | Payments
| | | | | Payments made
| | | | |
| | | Amount
| | | Termination
| | | received by
| | made by
| | Market
| | | (received) by
| | | Unrealized
| |
| Swap Counterparty | | (000s) | | | Date | | | the Fund | | the Fund | | Value | | | the Fund | | | Gain (Loss) | |
| | |
| Banc of America Securities LLC | | $ | 7,000 | | | | 10/19/15 | | | 4.965% | | 3 month LIBOR | | $ | 957,677 | | | $ | — | | | $ | 957,677 | |
| | | | 15,900 | (a) | | | 08/14/17 | | | 4.955 | | 3 month LIBOR | | | 538,562 | | | | — | | | | 538,562 | |
| | | | 9,000 | (a) | | | 08/15/22 | | | 3 month LIBOR | | 5.078% | | | (509,153 | ) | | | — | | | | (509,153 | ) |
| | | | 400 | (a) | | | 12/17/29 | | | 3 month LIBOR | | 4.000 | | | (4,422 | ) | | | 26,970 | | | | (31,392 | ) |
| Credit Suisse First Boston Corp. | | | 900 | (a) | | | 12/17/29 | | | 3 month LIBOR | | 4.000 | | | (9,950 | ) | | | 25,389 | | | | (35,339 | ) |
| Deutsche Bank Securities, Inc. | | | 20,900 | (a) | | | 12/16/14 | | | 3.000 | | 3 month LIBOR | | | 185,529 | | | | (57,622 | ) | | | 243,151 | |
| | | | 3,800 | (a) | | | 12/16/16 | | | 3 month LIBOR | | 3.250 | | | (5,986 | ) | | | 65,087 | | | | (71,073 | ) |
| | | | 8,200 | (a) | | | 09/05/17 | | | 4.568 | | 3 month LIBOR | | | 137,870 | | | | — | | | | 137,870 | |
| | | | 4,800 | (a) | | | 09/06/22 | | | 3 month LIBOR | | 4.710 | | | (133,020 | ) | | | — | | | | (133,020 | ) |
| |
| |
TOTAL | | | | | | | | | | | | | | $ | 1,157,107 | | | $ | 59,824 | | | $ | 1,097,283 | |
| |
| |
| |
| (a) | Represents forward starting interest rate swaps whose effective dates of commencement of accruals and cash flows occur subsequent to September 30, 2009. |
CREDIT DEFAULT SWAP CONTRACTS
| | | | | | | | | | | | | | | | | | | | | | | | | | | |
| | | | | | | | | | | | | | | | | Upfront
| | | | |
| | | | | Notional
| | | | | | | | | | | | Payments made
| | | | |
| | | Referenced
| | Amount
| | | Rates received
| | | Termination
| | | Market
| | | (received) by
| | | Unrealized
| |
| Swap Counterparty | | Obligation | | (000s) | | | (paid) by Fund | | | Date | | | Value | | | the Fund | | | Gain (Loss) | |
| | |
Protection Purchased: | | | | | | | | | | | | | | | | | | | | | | | | | | |
| Deutsche Bank Securities, Inc. | | CDX North America Investment Grade Index | | $ | 4,300 | | | | (1.000 | )% | | | 12/22/14 | | | $ | (1,194 | ) | | $ | — | | | $ | (1,194 | ) |
| | | | | | 6,000 | | | | (1.000 | ) | | | 12/22/14 | | | | 1,376 | | | | (11,538 | ) | | | 12,914 | |
| JPMorgan Securities, Inc. | | CDX North America Investment Grade Index | | | 10,900 | | | | (1.500 | ) | | | 12/20/13 | | | | (94,612 | ) | | | 238,577 | | | | (333,189 | ) |
| |
| |
TOTAL | | | | | | | | | | | | | | | | $ | (94,430 | ) | | $ | 227,039 | | | $ | (321,469 | ) |
| |
| |
The accompanying notes are an integral part of these financial statements.
GOLDMAN SACHS LOCAL EMERGING MARKETS DEBT FUND
Schedule of Investments
September 30, 2009 (Unaudited)
| | | | | | | | | | | | | | | | | |
| | | Principal
| | Interest
| | Maturity
| | |
| | | Amount | | Rate | | Date | | Value |
| |
Sovereign Debt Obligations – 54.8% |
| | | | | | | | | | | | | | | | | |
| | | | | | | | | | | | | | | | | |
| | | Brazil – 9.9% |
| | | Brazil Notas do Tesouro Nacional (NR/Baa3) |
| | | | BRL 34,000,000 | | | | 10.000 | % | | | 01/01/17 | | | $ | 16,815,983 | |
| | | |
| | | |
| | | Colombia – 1.7% |
| | | Republic of Colombia (BB+/Ba1) |
| | | | COP 5,300,000,000 | | | | 9.850 | | | | 06/28/27 | | | | 2,926,924 | |
| | | |
| | | |
| | | Hungary – 5.3% |
| | | Hungary Government Bond (BBB-/Baa1) |
| | | | HUF 1,655,000,000 | | | | 7.250 | | | | 06/12/12 | | | | 8,944,109 | |
| | | |
| | | |
| | | Israel – 1.7% |
| | | Israel Government Bond – Shahar (NR/NR) |
| | | | ILS 10,400,000 | | | | 7.000 | | | | 04/29/11 | | | | 2,965,394 | |
| | | |
| | | |
| | | Mexico – 8.7% |
| | | Mexican Bonos (A+/Baa1) |
| | | | MXN 127,000,000 | | | | 9.000 | | | | 12/20/12 | | | | 10,044,108 | |
| | | | 56,000,000 | | | | 10.000 | | | | 12/05/24 | | | | 4,786,367 | |
| | | | | | | | | | | | | | | | | |
| | | | | | | | | | | | | | | | 14,830,475 | |
| | | |
| | | |
| | | Peru – 4.6% |
| | | Peru Government Bond (BBB+/Baa3) |
| | | | PEN 14,800,000 | | | | 12.250 | | | | 08/10/11 | | | | 6,106,615 | |
| | | | 4,000,000 | | | | 9.910 | | | | 05/05/15 | | | | 1,779,922 | |
| | | | | | | | | | | | | | | | | |
| | | | | | | | | | | | | | | | 7,886,537 | |
| | | |
| | | |
| | | Poland – 5.7% |
| | | Poland Government Bond (A/A2) |
| | | | PLN 10,175,000 | | | | 5.250 | | | | 04/25/13 | | | | 3,525,486 | |
| | | | 18,418,560 | | | | 3.000 | | | | 08/24/16 | | | | 6,086,898 | |
| | | | | | | | | | | | | | | | | |
| | | | | | | | | | | | | | | | 9,612,384 | |
| | | |
| | | |
| | | South Africa – 6.6% |
| | | Republic of South Africa (A+/A3) |
| | | | ZAR 67,560,000 | | | | 13.500 | | | | 09/15/15 | | | | 11,155,584 | |
| | | |
| | | |
| | | Turkey – 8.5% |
| | | Turkey Government Bond (BB/NR) |
| | | | TRY 19,130,246 | | | | 10.000 | | | | 02/15/12 | | | | 14,502,377 | |
| | | |
| | | |
| | | Uruguay – 2.1% |
| | | Republic of Uruguay (BB-/Ba3) |
| | | | UYU 66,728,330 | | | | 5.000 | | | | 09/14/18 | | | | 3,179,734 | |
| | | | 8,274,843 | | | | 3.700 | | | | 06/26/37 | | | | 333,895 | |
| | | | | | | | | | | | | | | | | |
| | | | | | | | | | | | | | | | 3,513,629 | |
| | | |
| | | |
| | | TOTAL SOVEREIGN DEBT OBLIGATIONS |
| | | (Cost $93,724,024) | | $ | 93,153,396 | |
| | | |
| | | |
| | | | | | | | | | | | | | | | | |
| | | | | | | | | | | | | | | | | |
Corporate Obligations – 4.3% |
| | | | | | | | | | | | | | | | | |
| | | | | | | | | | | | | | | | | |
| | | Brazil – 0.5% |
| | | RBS-Zero Hora Editora Jornalistica SA (BB/NR) |
| | | | BRL 2,000,000 | | | | 11.250 | % | | | 06/15/17 | | | $ | 914,428 | |
| | | |
| | | |
| | | Germany – 1.0% |
| | | Kreditanstalt fuer Wiederaufbau (AAA/Aaa) |
| | | | NGN 255,000,000 | | | | 8.500 | | | | 01/18/11 | | | | 1,632,272 | |
| | | |
| | | |
| | | Russia – 2.8% |
| | | Gazprombank (BB/Baa3) |
| | | | RUB 60,000,000 | | | | 7.250 | | | | 02/22/10 | | | | 1,923,314 | |
| | | Red Arrow International Leasing Plc (BBB/Baa2) |
| | | | 89,590,018 | | | | 8.375 | | | | 06/30/12 | | | | 2,834,532 | |
| | | | | | | | | | | | | | | | | |
| | | | | | | | | | | | | | | | 4,757,846 | |
| | | |
| | | |
| | | TOTAL CORPORATE OBLIGATIONS |
| | | (Cost $9,446,356) | | $ | 7,304,546 | |
| | | |
| | | |
| | | | | | | | | | | | | | | | | |
| | | | | | | | | | | | | | | | | |
Structured Notes – 8.8% |
| | | | | | | | | | | | | | | | | |
| | | | | | | | | | | | | | | | | |
| | | Egypt Treasury Bills (NR/NR)(a)(b) |
| | | | EGP 21,500,000 | | | | 0.000 | % | | | 10/27/09 | | | $ | 3,888,913 | |
| | | | 1,600,000 | | | | 0.000 | | | | 12/08/09 | | | | 286,238 | |
| | | Republic of Indonesia (BB+/Ba2) |
| | | | IDR 21,000,000,000 | | | | 10.000 | (c) | | | 07/15/17 | | | | 2,217,548 | |
| | | | $ 6,000,000 | | | | 10.000 | (d) | | | 07/15/17 | | | | 5,755,200 | |
| | | | IDR 26,000,000,000 | | | | 10.000 | (e) | | | 07/17/17 | | | | 2,745,535 | |
| | | |
| | | |
| | | TOTAL STRUCTURED NOTES |
| | | (Cost $14,238,386) | | $ | 14,893,434 | |
| | | |
| | | |
| | | | | | | | | | | | | | | | | |
| | | | | | | | | | | | | | | | | |
Foreign Debt Obligation – 0.8% |
| | | | | | | | | | | | | | | | | |
| | | | | | | | | | | | | | | | | |
| | | Supranational – 0.8% |
| | | International Bank Reconstruction & Development (AAA/Aaa) |
| | | | UYU 31,001,140 | | | | 3.400 | % | | | 04/15/17 | | | $ | 1,366,825 | |
| | | (Cost $1,576,802) | | | | |
| | | |
| | | |
| | | TOTAL INVESTMENTS BEFORE REPURCHASE AGREEMENT |
| | | (Cost $118,985,568) | | $ | 116,718,201 | |
| | | |
| | | |
| | | | | | | | | | | | | | | | | |
| | | | | | | | | | | | | | | | | |
Repurchase Agreement(f) – 31.1% |
| | | | | | | | | | | | | | | | | |
| | | | | | | | | | | | | | | | | |
| | | Joint Repurchase Agreement Account II |
| | | | $52,900,000 | | | | 0.061 | % | | | 10/01/09 | | | $ | 52,900,000 | |
| | | Maturity Value: $52,900,090 |
| | | (Cost $52,900,000) | | | | |
| | | |
| | | |
| | | TOTAL INVESTMENTS – 99.8% |
| | | (Cost $171,885,568) | | $ | 169,618,201 | |
| | | |
| | | |
| | | OTHER ASSETS IN EXCESS OF LIABILITIES – 0.2% | | | 394,088 | |
| | | |
| | | |
| | | NET ASSETS – 100.0% | | $ | 170,012,289 | |
| | | |
| | | |
The accompanying notes are an integral part of these financial statements.
GOLDMAN SACHS LOCAL EMERGING MARKETS DEBT FUND
The percentage shown for each investment category reflects the value of investments in that category as a percentage of net assets.
| | |
| (a) | | The underlying security is issued by Deutsche Bank AG. |
| |
| (b) | | Security issued with a zero coupon. Income is recognized through the accretion of discount. |
| |
| (c) | | The underlying security is issued by HSBC Corp. |
| |
| (d) | | The underlying security is issued by JPMorgan Chase. |
| |
| (e) | | The underlying security is issued by Barclays Bank PLC. |
| |
| (f) | | Joint repurchase agreement was entered into on September 30, 2009. Additional information appears on page 65. |
Security ratings disclosed, if any, are issued by Standard & Poor’s/Moody’s Investors Service. A brief description of the ratings is available in the Fund’s Statement of Additional Information.
| | | | | | | |
| | | |
| | | |
| | | Investment Abbreviations: |
| | | KWCDC | | — | | South Korean Won Certificate of Deposit |
| | | NR | | — | | Not Rated |
| | | WR | | — | | Withdrawn Rating |
| | | |
| | | |
ADDITIONAL INVESTMENT INFORMATION
FORWARD FOREIGN CURRENCY EXCHANGE CONTRACTS — At September 30, 2009, the Fund had outstanding forward foreign currency exchange contracts, both to purchase and sell foreign currencies:
| | | | | | | | | | | | | | | | | | |
Open Forward Foreign Currency
| | Contract
| | Expiration
| | Value on
| | | Current
| | | Unrealized
| |
| Exchange Contracts with Unrealized Gain | | Type | | Date | | Settlement Date | | | Value | | | Gain | |
| | |
| Israel Shekel | | Purchase | | 12/16/09 | | | $ | 1,132,652 | | | $ | 1,140,839 | | | $ | 8,187 | |
| Malaysian Ringgit | | Purchase | | 01/19/10 | | | | 3,181,714 | | | | 3,193,584 | | | | 11,870 | |
| New Taiwan Dollar | | Purchase | | 01/19/10 | | | | 8,116,007 | | | | 8,213,424 | | | | 97,417 | |
| Philippine Peso | | Purchase | | 01/19/10 | | | | 3,208,342 | | | | 3,211,881 | | | | 3,539 | |
| Singapore Dollar | | Purchase | | 12/16/09 | | | | 3,198,833 | | | | 3,260,603 | | | | 61,770 | |
| Singapore Dollar | | Purchase | | 12/18/09 | | | | 239,000 | | | | 240,194 | | | | 1,194 | |
| South African Rand | | Sale | | 10/21/09 | | | | 3,234,114 | | | | 3,197,211 | | | | 36,903 | |
| South Korean Won | | Purchase | | 01/19/10 | | | | 15,158,240 | | | | 15,489,873 | | | | 331,633 | |
| |
| |
TOTAL | | | | | | | | | | | | | | | $ | 552,513 | |
| |
| |
| | | | | | | | | | | | | | | | | | |
Open Forward Foreign Currency
| | Contract
| | Expiration
| | Value on
| | | Current
| | | Unrealized
| |
| Exchange Contracts with Unrealized Loss | | Type | | Date | | Settlement Date | | | Value | | | Loss | |
| | |
| Chilean Peso | | Purchase | | 01/19/10 | | | $ | 3,224,257 | | | $ | 3,198,330 | | | $ | (25,927 | ) |
| Indian Rupee | | Purchase | | 01/19/10 | | | | 8,074,445 | | | | 8,061,194 | | | | (13,251 | ) |
| New Taiwan Dollar | | Sale | | 01/19/10 | | | | 2,445,000 | | | | 2,481,603 | | | | (36,603 | ) |
| South African Rand | | Purchase | | 10/01/09 | | | | 1,619,500 | | | | 1,609,359 | | | | (10,141 | ) |
| South African Rand | | Purchase | | 10/21/09 | | | | 3,232,500 | | | | 3,197,211 | | | | (35,289 | ) |
| Yuan Renminbi | | Purchase | | 03/29/10 | | | | 3,239,886 | | | | 3,213,768 | | | | (26,118 | ) |
| |
| |
TOTAL | | | | | | | | | | | | | | | $ | (147,329 | ) |
| |
| |
INTEREST RATE SWAP CONTRACTS — At September 30, 2009, the Fund had outstanding swap contracts with the following terms:
| | | | | | | | | | | | | | | | | | | | | |
| | | | | | | | | Rates Exchanged | | | | |
| | | Notional
| | | | | | Payments
| | | Payments
| | | | |
| | | Amount
| | | Termination
| | | received by
| | | made by
| | | Market
| |
| Swap Counterparty | | (000s) | | | Date | | | the Fund | | | the Fund | | | Value* | |
| | |
| Citibank NA | | KRW | 8,500,000 | | | | 12/04/13 | | | | 4.080 | % | | | 3 month KWCDC | | | $ | (73,752 | ) |
| Deutsche Bank Securities, Inc. | | | 2,000,000 | | | | 06/09/11 | | | | 3.395 | | | | 3 month KWCDC | | | | (13,336 | ) |
| | | | 4,900,000 | | | | 07/22/11 | | | | 3.605 | | | | 3 month KWCDC | | | | (17,778 | ) |
| |
| |
TOTAL | | | | | | | | | | | | | | | | | | $ | (104,866 | ) |
| |
| |
| |
| * | There are no upfront payments on the swaps listed above, therefore, the unrealized loss of the swap contracts is equal to their market value. |
The accompanying notes are an integral part of these financial statements.
GOLDMAN SACHS U.S. MORTGAGES FUND
Schedule of Investments
September 30, 2009 (Unaudited)
| | | | | | | | | | | | | | | | | |
| | | Principal
| | Interest
| | Maturity
| | |
| | | Amount | | Rate | | Date | | Value |
| |
Mortgage-Backed Obligations – 103.0% |
| | | | | | | | | | | | | | | | | |
| | | | | | | | | | | | | | | | | |
| | | Collateralized Mortgage Obligations – 10.9% |
| | | Adjustable Rate Non-Agency(a) – 6.0% |
| | | Adjustable Rate Mortgage Trust Series 2004-5, Class 2A1 |
| | | $ | 376,966 | | | | 5.007 | % | | | 04/25/35 | | | $ | 317,235 | |
| | | American Home Mortgage Assets Series 2006-3, Class 1A1 |
| | | | 5,727,574 | | | | 1.871 | | | | 10/25/46 | | | | 2,832,389 | |
| | | American Home Mortgage Investment Trust Series 2004-3, Class 1A |
| | | | 18,240 | | | | 0.616 | | | | 10/25/34 | | | | 15,143 | |
| | | Bear Stearns Adjustable Rate Mortgage Trust Series 2004-1, Class 21A1 |
| | | | 400,530 | | | | 4.217 | | | | 04/25/34 | | | | 337,286 | |
| | | Bear Stearns Adjustable Rate Mortgage Trust Series 2005-03, Class 2A1 |
| | | | 1,386,950 | | | | 5.086 | | | | 06/25/35 | | | | 1,046,821 | |
| | | Bear Stearns Alt-A Trust Series 2004-3, Class A1 |
| | | | 117,306 | | | | 0.886 | | | | 04/25/34 | | | | 72,616 | |
| | | Bear Stearns Alt-A Trust Series 2005-5, Class 21A1 |
| | | | 1,432,767 | | | | 4.092 | | | | 07/25/35 | | | | 936,888 | |
| | | Countrywide Alternative Loan Trust Series 2005-16, Class A1 |
| | | | 1,126,121 | | | | 2.546 | | | | 06/25/35 | | | | 503,524 | |
| | | Countrywide Alternative Loan Trust Series 2005-38, Class A1 |
| | | | 316,690 | | | | 2.401 | | | | 09/25/35 | | | | 178,724 | |
| | | Countrywide Home Loan Trust Series 2003-52, Class A1 |
| | | | 418,878 | | | | 4.959 | | | | 02/19/34 | | | | 351,428 | |
| | | Countrywide Home Loan Trust Series 2004-HYB6, Class A2 |
| | | | 466,367 | | | | 4.377 | | | | 11/20/34 | | | | 354,731 | |
| | | Countrywide Home Loan Trust Series 2005-HYB4, Class 2A1 |
| | | | 2,064,303 | | | | 4.864 | | | | 08/20/35 | | | | 1,533,032 | |
| | | Harborview Mortgage Loan Trust Series 2005-14, Class 5A1A |
| | | | 1,322,094 | | | | 5.724 | | | | 12/19/35 | | | | 851,767 | |
| | | Harborview Mortgage Loan Trust Series 2005-15, Class 2A11 |
| | | | 831,019 | | | | 0.516 | | | | 10/20/45 | | | | 476,953 | |
| | | Harborview Mortgage Loan Trust Series 2005-16, Class 2A1A |
| | | | 465,216 | | | | 0.486 | | | | 01/19/36 | | | | 261,038 | |
| | | Impac CMB Trust Series 2004-08, Class 1A |
| | | | 128,584 | | | | 0.966 | | | | 10/25/34 | | | | 57,801 | |
| | | Impac CMB Trust Series 2005-06, Class 1A1 |
| | | | 1,508,309 | | | | 0.496 | | | | 10/25/35 | | | | 705,458 | |
| | | Impac Secured Assets Corp. Series 2005-2, Class A1W |
| | | | 1,822,083 | | | | 0.496 | | | | 03/25/36 | | | | 753,267 | |
| | | Indymac Index Mortgage Loan Trust Series 2005-AR13, Class 4A1 |
| | | | 854,831 | | | | 5.186 | | | | 08/25/35 | | | | 580,845 | |
| | | Indymac Index Mortgage Loan Trust Series 2005-AR15, Class A1 |
| | | | 584,083 | | | | 5.278 | | | | 09/25/35 | | | | 415,332 | |
| | | JPMorgan Mortgage Trust Series 2005-A4, Class 2A1 |
| | | | 1,543,899 | | | | 5.055 | | | | 07/25/35 | | | | 1,221,519 | |
| | | Lehman XS Trust Series 2005-5N, Class 3A1A |
| | | | 1,379,466 | | | | 0.546 | | | | 11/25/35 | | | | 780,100 | |
| | | Luminent Mortgage Trust Series 2006-5, Class A1A |
| | | | 597,144 | | | | 0.436 | | | | 07/25/36 | | | | 311,346 | |
| | | Master Adjustable Rate Mortgages Trust Series 2007-1, Class I2A3 |
| | | | 1,578,087 | | | | 1.791 | | | | 01/25/47 | | | | 481,451 | |
| | | |
| | | |
| | | Merrill Lynch Alternative Note Asset Series 2007-AF1, Class AV1 |
| | | | 2,420,777 | | | | 5.540 | | | | 06/25/37 | | | | 1,307,155 | |
| | | Morgan Stanley Mortgage Loan Trust Series 2004-8AR, Class 4A1 |
| | | | 1,447,320 | | | | 3.539 | | | | 10/25/34 | | | | 1,180,987 | |
| | | Mortgage IT Trust Series 2005-5, Class A1 |
| | | | 1,126,773 | | | | 0.506 | | | | 12/25/35 | | | | 664,908 | |
| | | Residential Accredit Loans, Inc. Series 2005-Q05, Class A1 |
| | | | 1,496,250 | | | | 1.901 | | | | 01/25/46 | | | | 807,830 | |
| | | Residential Funding Mortgage Securities I Series 2005-SA4, Class 2A1 |
| | | | 1,111,189 | | | | 5.210 | | | | 09/25/35 | | | | 859,571 | |
| | | Residential Funding Mortgage Securities I Series 2005-SA4, Class 2A2 |
| | | | 1,260,092 | | | | 5.190 | | | | 09/25/35 | | | | 1,047,593 | |
| | | Sequoia Mortgage Trust Series 2004-09, Class A2 |
| | | | 464,936 | | | | 1.039 | | | | 10/20/34 | | | | 327,406 | |
| | | Structured Adjustable Rate Mortgage Loan Series 2004-19, Class 2A2 |
| | | | 158,950 | | | | 3.341 | | | | 01/25/35 | | | | 87,280 | |
| | | Structured Adjustable Rate Mortgage Loan Trust Series 2004-05, Class 3A1 |
| | | | 617,114 | | | | 3.734 | | | | 05/25/34 | | | | 522,640 | |
| | | Structured Adjustable Rate Mortgage Loan Trust Series 2004-12, Class 3A2 |
| | | | 269,938 | | | | 3.396 | | | | 09/25/34 | | | | 226,910 | |
| | | Structured Asset Mortgage Investments, Inc. Series 2007-AR6, Class A1 |
| | | | 3,563,601 | | | | 2.401 | | | | 08/25/47 | | | | 1,856,714 | |
| | | Structured Asset Securities Corp. Series 2003-26A, Class 3A5 |
| | | | 901,038 | | | | 3.271 | | | | 09/25/33 | | | | 736,409 | |
| | | Washington Mutual Mortgage Pass-Through Certificates Series 2006-AR2, Class 1A1 |
| | | | 2,917,489 | | | | 5.279 | | | | 03/25/37 | | | | 2,164,344 | |
| | | | | | | | | | | | | | | | | |
| | | | | | | | | | | | | | | | 27,166,441 | |
| | | |
| | | |
| | | Interest Only(b) – 0.0% |
| | | ABN AMRO Mortgage Corp. Series 2003-5, Class A2 |
| | | | 15,804 | | | | 5.500 | % | | | 04/25/33 | | | | 2,009 | |
| | | ABN AMRO Mortgage Corp. Series 2003-8, Class A2 |
| | | | 119,292 | | | | 5.500 | | | | 06/25/33 | | | | 14,872 | |
| | | CS First Boston Mortgage Securities Corp. Series 2002-AR31, Class 5X(a)(c) |
| | | | 62,999 | | | | 0.000 | | | | 11/25/32 | | | | — | |
| | | CS First Boston Mortgage Securities Corp. Series 2003-19, Class 1A2 |
| | | | 236,914 | | | | 5.250 | | | | 07/25/33 | | | | 27,919 | |
| | | FHLMC REMIC Series 2575, Class IB |
| | | | 79,613 | | | | 5.500 | | | | 08/15/30 | | | | 1,875 | |
| | | FNMA REMIC Series 2004-47, Class EI(a)(c) |
| | | | 1,009,763 | | | | 0.000 | | | | 06/25/34 | | | | 11,165 | |
| | | FNMA REMIC Series 2004-62, Class DI(a)(c) |
| | | | 443,611 | | | | 0.000 | | | | 07/25/33 | | | | 6,738 | |
| | | |
| | | |
The accompanying notes are an integral part of these financial statements.
GOLDMAN SACHS U.S. MORTGAGES FUND
| | | | | | | | | | | | | | | | | |
| | | Principal
| | Interest
| | Maturity
| | |
| | | Amount | | Rate | | Date | | Value |
| |
Mortgage-Backed Obligations – (continued) |
| | | Interest Only(b) – (continued) |
| | | | | | | | | | | | | | | | | |
| | | Master Adjustable Rate Mortgages Trust Series 2003-2, Class 3AX(a) |
| | | $ | 29,804 | | | | 0.120 | % | | | 08/25/33 | | | $ | 43 | |
| | | Master Adjustable Rate Mortgages Trust Series 2003-2, Class 4AX(a) |
| | | | 10,418 | | | | 0.320 | | | | 07/25/33 | | | | 38 | |
| | | Washington Mutual Mortgage Pass-Through Certificates Series 2003-S3, Class 1A41 |
| | | | 51,941 | | | | 5.500 | | | | 06/25/33 | | | | 6,603 | |
| | | | | | | | | | | | | | | | | |
| | | | | | | | | | | | | | | | 71,262 | |
| | | |
| | | |
| | | Inverse Floaters(a) – 0.0% |
| | | GNMA Series 2001-48, Class SA |
| | | | 19,795 | | | | 25.703 | | | | 10/16/31 | | | | 29,089 | |
| | | GNMA Series 2001-51, Class SB |
| | | | 19,284 | | | | 25.703 | | | | 10/16/31 | | | | 28,571 | |
| | | GNMA Series 2001-59, Class SA |
| | | | 29,626 | | | | 25.541 | | | | 11/16/24 | | | | 43,752 | |
| | | | | | | | | | | | | | | | | |
| | | | | | | | | | | | | | | | 101,412 | |
| | | |
| | | |
| | | Planned Amortization Class – 1.1% |
| | | FNMA REMIC Series 2003-88, Class TH |
| | | | 5,000,000 | | | | 4.500 | | | | 09/25/18 | | | | 5,207,306 | |
| | | |
| | | |
| | | Regular Floater(a) – 3.0% |
| | | FHLMC REMIC Series 3013, Class XH(c) |
| | | | 56,588 | | | | 0.000 | | | | 08/15/35 | | | | 54,650 | |
| | | FHLMC REMIC Series 3038, Class XA(c) |
| | | | 49,318 | | | | 0.000 | | | | 09/15/35 | | | | 44,949 | |
| | | FHLMC REMIC Series 3313, Class AU(c) |
| | | | 41,810 | | | | 0.000 | | | | 04/15/37 | | | | 41,407 | |
| | | FHLMC REMIC Series 3325, Class SX(c) |
| | | | 684,911 | | | | 0.000 | | | | 06/15/37 | | | | 638,620 | |
| | | FHLMC REMIC Series 3342, Class FT |
| | | | 5,497,027 | | | | 0.693 | | | | 07/15/37 | | | | 5,370,126 | |
| | | FNMA REMIC Series 2006-81, Class LF(c) |
| | | | 44,921 | | | | 0.000 | | | | 09/25/36 | | | | 44,572 | |
| | | FNMA REMIC Series 2007-4, Class DF |
| | | | 3,303,215 | | | | 0.691 | | | | 02/25/37 | | | | 3,212,242 | |
| | | FNMA REMIC Series 2008-22, Class FD |
| | | | 4,441,850 | | | | 1.086 | | | | 04/25/48 | | | | 4,394,025 | |
| | | | | | | | | | | | | | | | | |
| | | | | | | | | | | | | | | | 13,800,591 | |
| | | |
| | | |
| | | Sequential Fixed Rate – 0.8% |
| | | Countrywide Alternative Loan Trust Series 2005-J11, Class 2A1 |
| | | | 622,150 | | | | 6.000 | | | | 10/25/35 | | | | 433,610 | |
| | | Countrywide Alternative Loan Trust Series 2006-5T2, Class A3 |
| | | | 647,961 | | | | 6.000 | | | | 04/25/36 | | | | 474,946 | |
| | | FHLMC REMIC Series 2042, Class N |
| | | | 531,107 | | | | 6.500 | | | | 03/15/28 | | | | 569,798 | |
| | | FHLMC REMIC Series 2590, Class NV |
| | | | 1,000,000 | | | | 5.000 | | | | 03/15/18 | | | | 1,061,129 | |
| | | |
| | | |
| | | FNMA REMIC Series 2000-16, Class ZG |
| | | | 824,900 | | | | 8.500 | | | | 06/25/30 | | | | 900,893 | |
| | | | | | | | | | | | | | | | | |
| | | | | | | | | | | | | | | | 3,440,376 | |
| | | |
| | | |
| | | TOTAL COLLATERALIZED MORTGAGE OBLIGATIONS | | $ | 49,787,388 | |
| | | |
| | | |
| | | Commercial Mortgage-Backed Securities – 11.3% |
| | | Interest Only(a)(b)(d) – 0.0% |
| | | Bear Stearns Commercial Mortgage Securities, Inc. Series 2003-T10, Class X2 |
| | | | 4,052,830 | | | | 1.325 | | | | 03/13/40 | | | | 68,784 | |
| | | JPMorgan Chase Commercial Mortgage Securities Corp. Series 2004-C1, Class X2 |
| | | | 4,262,183 | | | | 1.152 | | | | 01/15/38 | | | | 45,204 | |
| | | Prudential Commercial Mortgage Trust Series 2003-PWR1, Class X2 |
| | | | 4,099,625 | | | | 1.591 | | | | 02/11/36 | | | | 80,486 | |
| | | | | | | | | | | | | | | | | |
| | | | | | | | | | | | | | | | 194,474 | |
| | | |
| | | |
| | | Sequential Fixed Rate – 11.3% |
| | | Banc of America Commercial Mortgage, Inc. Series 2005-5, Class A4 |
| | | | 4,000,000 | | | | 5.115 | | | | 10/10/45 | | | | 3,957,978 | |
| | | Banc of America Commercial Mortgage, Inc. Series 2005-6, Class A4 |
| | | | 5,000,000 | | | | 5.351 | | | | 09/10/47 | | | | 4,853,891 | |
| | | Bear Stearns Commercial Mortgage Securities Series 2006-PW13, Class A4 |
| | | | 10,295,000 | | | | 5.540 | | | | 09/11/41 | | | | 9,650,970 | |
| | | Bear Stearns Commercial Mortgage Securities, Inc. Series 2005-PW10, Class A4 |
| | | | 5,000,000 | | | | 5.405 | | | | 12/11/40 | | | | 4,894,167 | |
| | | GE Capital Commercial Mortgage Corp. Series 2005-C4, Class A4 |
| | | | 5,000,000 | | | | 5.513 | | | | 11/10/45 | | | | 4,832,487 | |
| | | LB-UBS Commercial Mortgage Trust Series 2005-C5, Class A4 |
| | | | 2,000,000 | | | | 4.954 | | | | 09/15/30 | | | | 1,904,096 | |
| | | LB-UBS Commercial Mortgage Trust Series 2005-C7, Class A4 |
| | | | 2,000,000 | | | | 5.197 | | | | 11/15/30 | | | | 1,945,883 | |
| | | LB-UBS Commercial Mortgage Trust Series 2006-C1, Class A4 |
| | | | 13,500,000 | | | | 5.156 | | | | 02/15/31 | | | | 12,554,757 | |
| | | Wachovia Bank Commercial Mortgage Trust Series 2005-C21, Class A4 |
| | | | 4,000,000 | | | | 5.384 | | | | 10/15/44 | | | | 3,949,564 | |
| | | Wachovia Bank Commercial Mortgage Trust Series 2006-C25, Class A5 |
| | | | 3,000,000 | | | | 5.926 | | | | 05/15/43 | | | | 2,842,805 | |
| | | | | | | | | | | | | | | | | |
| | | | | | | | | | | | | | | | 51,386,598 | |
| | | |
| | | |
| | | TOTAL COMMERCIAL MORTGAGE-BACKED SECURITIES | | $ | 51,581,072 | |
| | | |
| | | |
| | | | | | | | | | | | | | | | | |
The accompanying notes are an integral part of these financial statements.
GOLDMAN SACHS U.S. MORTGAGES FUND
Schedule of Investments (continued)
September 30, 2009 (Unaudited)
| | | | | | | | | | | | | | | | | |
| | | Principal
| | Interest
| | Maturity
| | |
| | | Amount | | Rate | | Date | | Value |
| |
Mortgage-Backed Obligations – (continued) |
| | | | | | | | | | | | | | | | | |
| | | Federal Agencies – 80.8% |
| | | Adjustable Rate FHLMC(a) – 1.0% |
| | | $ | 311,379 | | | | 2.969 | % | | | 04/01/33 | | | $ | 318,895 | |
| | | | 4,107,803 | | | | 4.206 | | | | 08/01/35 | | | | 4,219,683 | |
| | | | | | | | | | | | | | | | | |
| | | | | | | | | | | | | | | | 4,538,578 | |
| | | |
| | | |
| | | Adjustable Rate FNMA(a) – 1.5% |
| | | | 20,194 | | | | 2.630 | | | | 07/01/22 | | | | 20,636 | |
| | | | 26,491 | | | | 2.849 | | | | 07/01/27 | | | | 27,142 | |
| | | | 63,584 | | | | 2.849 | | | | 11/01/27 | | | | 65,155 | |
| | | | 8,745 | | | | 2.849 | | | | 01/01/31 | | | | 8,972 | |
| | | | 9,993 | | | | 2.849 | | | | 06/01/32 | | | | 10,251 | |
| | | | 37,477 | | | | 2.630 | | | | 08/01/32 | | | | 38,433 | |
| | | | 83,962 | | | | 2.630 | | | | 05/01/33 | | | | 86,131 | |
| | | | 1,563,403 | | | | 3.180 | | | | 05/01/33 | | | | 1,593,689 | |
| | | | 488,250 | | | | 2.950 | | | | 06/01/33 | | | | 501,138 | |
| | | | 304,682 | | | | 5.315 | | | | 12/01/33 | | | | 311,381 | |
| | | | 557,265 | | | | 3.171 | | | | 08/01/34 | | | | 575,726 | |
| | | | 3,124,443 | | | | 4.585 | | | | 02/01/35 | | | | 3,207,491 | |
| | | | 31,465 | | | | 2.849 | | | | 11/01/35 | | | | 32,249 | |
| | | | 139,296 | | | | 2.849 | | | | 12/01/37 | | | | 142,752 | |
| | | | 62,137 | | | | 2.849 | | | | 01/01/38 | | | | 63,685 | |
| | | | 50,679 | | | | 2.849 | | | | 11/01/40 | | | | 51,994 | |
| | | | | | | | | | | | | | | | | |
| | | | | | | | | | | | | | | | 6,736,825 | |
| | | |
| | | |
| | | Adjustable Rate GNMA(a) – 0.8% |
| | | | 70,340 | | | | 4.375 | | | | 06/20/23 | | | | 73,198 | |
| | | | 32,421 | | | | 4.625 | | | | 07/20/23 | | | | 33,451 | |
| | | | 33,852 | | | | 4.625 | | | | 08/20/23 | | | | 34,930 | |
| | | | 88,035 | | | | 4.625 | | | | 09/20/23 | | | | 90,784 | |
| | | | 24,714 | | | | 4.375 | | | | 03/20/24 | | | | 25,669 | |
| | | | 217,805 | | | | 4.375 | | | | 04/20/24 | | | | 226,654 | |
| | | | 26,881 | | | | 4.375 | | | | 05/20/24 | | | | 27,973 | |
| | | | 225,208 | | | | 4.375 | | | | 06/20/24 | | | | 234,357 | |
| | | | 125,166 | | | | 4.625 | | | | 07/20/24 | | | | 129,369 | |
| | | | 175,490 | | | | 4.625 | | | | 08/20/24 | | | | 181,269 | |
| | | | 55,959 | | | | 4.625 | | | | 09/20/24 | | | | 57,733 | |
| | | | 65,532 | | | | 4.125 | | | | 11/20/24 | | | | 67,725 | |
| | | | 54,773 | | | | 4.125 | | | | 12/20/24 | | | | 56,809 | |
| | | | 45,959 | | | | 4.375 | | | | 01/20/25 | | | | 47,826 | |
| | | | 22,397 | | | | 4.375 | | | | 02/20/25 | | | | 23,307 | |
| | | | 78,040 | | | | 4.375 | | | | 05/20/25 | | | | 81,210 | |
| | | | 58,066 | | | | 4.625 | | | | 07/20/25 | | | | 60,080 | |
| | | | 28,207 | | | | 4.375 | | | | 02/20/26 | | | | 29,331 | |
| | | | 1,572 | | | | 4.625 | | | | 07/20/26 | | | | 1,625 | |
| | | | 85,674 | | | | 4.375 | | | | 01/20/27 | | | | 89,142 | |
| | | | 27,611 | | | | 4.375 | | | | 02/20/27 | | | | 28,725 | |
| | | | 223,120 | | | | 4.375 | | | | 04/20/27 | | | | 232,185 | |
| | | | 27,291 | | | | 4.375 | | | | 05/20/27 | | | | 28,399 | |
| | | | 24,077 | | | | 4.375 | | | | 06/20/27 | | | | 25,055 | |
| | | | 8,460 | | | | 4.125 | | | | 11/20/27 | | | | 8,725 | |
| | | | 34,703 | | | | 4.125 | | | | 12/20/27 | | | | 35,823 | |
| | | | 72,029 | | | | 4.375 | | | | 01/20/28 | | | | 74,955 | |
| | | | 24,187 | | | | 4.250 | | | | 02/20/28 | | | | 25,118 | |
| | | | 27,750 | | | | 4.375 | | | | 03/20/28 | | | | 28,877 | |
| | | | 138,015 | | | | 4.625 | | | | 07/20/29 | | | | 142,638 | |
| | | | 56,158 | | | | 4.625 | | | | 08/20/29 | | | | 57,995 | |
| | | | 19,002 | | | | 4.625 | | | | 09/20/29 | | | | 19,640 | |
| | | |
| | | |
| | | | 69,231 | | | | 4.125 | | | | 10/20/29 | | | | 71,451 | |
| | | | 87,915 | | | | 4.125 | | | | 11/20/29 | | | | 90,735 | |
| | | | 21,715 | | | | 4.125 | | | | 12/20/29 | | | | 22,406 | |
| | | | 29,147 | | | | 4.250 | | | | 01/20/30 | | | | 30,274 | |
| | | | 15,209 | | | | 4.250 | | | | 02/20/30 | | | | 15,799 | |
| | | | 61,324 | | | | 4.250 | | | | 03/20/30 | | | | 63,702 | |
| | | | 90,059 | | | | 4.375 | | | | 04/20/30 | | | | 93,717 | |
| | | | 225,534 | | | | 4.375 | | | | 05/20/30 | | | | 234,697 | |
| | | | 19,739 | | | | 4.375 | | | | 06/20/30 | | | | 20,540 | |
| | | | 195,012 | | | | 4.625 | | | | 07/20/30 | | | | 202,094 | |
| | | | 30,303 | | | | 4.625 | | | | 09/20/30 | | | | 31,404 | |
| | | | 58,578 | | | | 3.875 | | | | 10/20/30 | | | | 60,148 | |
| | | | 308,587 | | | | 3.750 | | | | 12/20/34 | | | | 316,713 | |
| | | | | | | | | | | | | | | | | |
| | | | | | | | | | | | | | | | 3,534,257 | |
| | | |
| | | |
| | | FHLMC – 23.0% |
| | | | 95,003 | | | | 5.000 | | | | 12/01/12 | | | | 100,948 | |
| | | | 21,139 | | | | 4.000 | | | | 02/01/14 | | | | 21,686 | |
| | | | 345,086 | | | | 4.000 | | | | 03/01/14 | | | | 354,028 | |
| | | | 68,377 | | | | 4.000 | | | | 04/01/14 | | | | 70,149 | |
| | | | 79,080 | | | | 4.000 | | | | 05/01/14 | | | | 81,317 | |
| | | | 2,682 | | | | 7.000 | | | | 04/01/15 | | | | 2,822 | |
| | | | 16,705 | | | | 7.000 | | | | 02/01/16 | | | | 17,965 | |
| | | | 41,344 | | | | 6.000 | | | | 03/01/16 | | | | 43,584 | |
| | | | 2,573 | | | | 5.000 | | | | 09/01/16 | | | | 2,709 | |
| | | | 26,531 | | | | 5.000 | | | | 11/01/16 | | | | 28,212 | |
| | | | 2,503 | | | | 5.000 | | | | 12/01/16 | | | | 2,665 | |
| | | | 102,985 | | | | 5.000 | | | | 01/01/17 | | | | 109,670 | |
| | | | 166,326 | | | | 5.000 | | | | 02/01/17 | | | | 177,038 | |
| | | | 136,437 | | | | 5.000 | | | | 03/01/17 | | | | 145,135 | |
| | | | 237,309 | | | | 5.000 | | | | 04/01/17 | | | | 252,718 | |
| | | | 6,404 | | | | 5.000 | | | | 05/01/17 | | | | 6,769 | |
| | | | 12,295 | | | | 5.000 | | | | 08/01/17 | | | | 13,094 | |
| | | | 635,705 | | | | 5.000 | | | | 09/01/17 | | | | 676,930 | |
| | | | 702,341 | | | | 5.000 | | | | 10/01/17 | | | | 747,940 | |
| | | | 406,683 | | | | 5.000 | | | | 11/01/17 | | | | 433,087 | |
| | | | 451,105 | | | | 5.000 | | | | 12/01/17 | | | | 480,391 | |
| | | | 527,947 | | | | 5.000 | | | | 01/01/18 | | | | 562,161 | |
| | | | 1,218,454 | | | | 5.000 | | | | 02/01/18 | | | | 1,297,139 | |
| | | | 1,179,136 | | | | 5.000 | | | | 03/01/18 | | | | 1,255,449 | |
| | | | 1,011,916 | | | | 5.000 | | | | 04/01/18 | | | | 1,077,432 | |
| | | | 281,468 | | | | 4.500 | | | | 05/01/18 | | | | 297,275 | |
| | | | 703,055 | | | | 5.000 | | | | 05/01/18 | | | | 748,254 | |
| | | | 164,282 | | | | 5.000 | | | | 06/01/18 | | | | 174,898 | |
| | | | 156,494 | | | | 5.000 | | | | 07/01/18 | | | | 166,605 | |
| | | | 92,931 | | | | 5.000 | | | | 08/01/18 | | | | 98,941 | |
| | | | 64,628 | | | | 5.000 | | | | 09/01/18 | | | | 68,803 | |
| | | | 222,644 | | | | 5.000 | | | | 10/01/18 | | | | 237,027 | |
| | | | 231,048 | | | | 5.000 | | | | 11/01/18 | | | | 245,975 | |
| | | | 148,516 | | | | 5.000 | | | | 12/01/18 | | | | 158,115 | |
| | | | 129,929 | | | | 5.000 | | | | 01/01/19 | | | | 138,327 | |
| | | | 23,019 | | | | 5.000 | | | | 02/01/19 | | | | 24,468 | |
| | | | 29,991 | | | | 5.000 | | | | 03/01/19 | | | | 31,835 | |
| | | | 506,605 | | | | 4.000 | | | | 04/01/19 | | | | 526,924 | |
| | | | 642,167 | | | | 5.500 | | | | 04/01/20 | | | | 684,850 | |
| | | | 3,541,216 | | | | 5.500 | | | | 05/01/21 | | | | 3,786,888 | |
| | | |
| | | |
The accompanying notes are an integral part of these financial statements.
GOLDMAN SACHS U.S. MORTGAGES FUND
| | | | | | | | | | | | | | | | | |
| | | Principal
| | Interest
| | Maturity
| | |
| | | Amount | | Rate | | Date | | Value |
| |
Mortgage-Backed Obligations – (continued) |
| | | FHLMC – (continued) |
| | | | | | | | | | | | | | | | | |
| | | $ | 2,469,685 | | | | 4.500 | % | | | 08/01/23 | | | $ | 2,531,227 | |
| | | | 31,261 | | | | 7.500 | | | | 03/01/27 | | | | 34,873 | |
| | | | 199,920 | | | | 7.000 | | | | 04/01/31 | | | | 219,170 | |
| | | | 2,091,838 | | | | 7.000 | | | | 09/01/31 | | | | 2,287,337 | |
| | | | 809,881 | | | | 7.000 | | | | 04/01/32 | | | | 886,725 | |
| | | | 2,152,673 | | | | 7.000 | | | | 05/01/32 | | | | 2,356,925 | |
| | | | 808,926 | | | | 6.000 | | | | 05/01/33 | | | | 865,899 | |
| | | | 52,426 | | | | 5.500 | | | | 12/01/33 | | | | 55,420 | |
| | | | 952,232 | | | | 5.000 | | | | 12/01/35 | | | | 988,834 | |
| | | | 1,009,544 | | | | 5.500 | | | | 01/01/36 | | | | 1,063,302 | |
| | | | 2,418 | | | | 5.500 | | | | 02/01/36 | | | | 2,546 | |
| | | | 30,082 | | | | 6.000 | | | | 10/01/36 | | | | 31,975 | |
| | | | 50,898 | | | | 6.000 | | | | 11/01/36 | | | | 54,045 | |
| | | | 2,895 | | | | 5.500 | | | | 12/01/36 | | | | 3,045 | |
| | | | 12,537 | | | | 5.500 | | | | 01/01/37 | | | | 13,187 | |
| | | | 96,433 | | | | 5.500 | | | | 03/01/37 | | | | 101,767 | |
| | | | 1,608,401 | | | | 5.500 | | | | 04/01/37 | | | | 1,692,284 | |
| | | | 18,419 | | | | 6.000 | | | | 04/01/37 | | | | 19,647 | |
| | | | 108,124 | | | | 5.500 | | | | 05/01/37 | | | | 113,691 | |
| | | | 25,094 | | | | 6.000 | | | | 05/01/37 | | | | 26,642 | |
| | | | 942,278 | | | | 5.500 | | | | 06/01/37 | | | | 990,977 | |
| | | | 28,332 | | | | 6.000 | | | | 06/01/37 | | | | 30,079 | |
| | | | 490,326 | | | | 5.500 | | | | 07/01/37 | | | | 515,570 | |
| | | | 5,223 | | | | 6.000 | | | | 07/01/37 | | | | 5,572 | |
| | | | 282,835 | | | | 5.500 | | | | 08/01/37 | | | | 297,396 | |
| | | | 81,835 | | | | 5.500 | | | | 09/01/37 | | | | 86,636 | |
| | | | 236,327 | | | | 6.000 | | | | 09/01/37 | | | | 252,157 | |
| | | | 88,076 | | | | 5.500 | | | | 10/01/37 | | | | 93,125 | |
| | | | 233,705 | | | | 6.000 | | | | 11/01/37 | | | | 248,048 | |
| | | | 815,471 | | | | 5.500 | | | | 12/01/37 | | | | 858,305 | |
| | | | 493,407 | | | | 5.500 | | | | 02/01/38 | | | | 520,429 | |
| | | | 25,213 | | | | 5.500 | | | | 03/01/38 | | | | 26,696 | |
| | | | 921,362 | | | | 5.500 | | | | 04/01/38 | | | | 971,160 | |
| | | | 52,880 | | | | 6.000 | | | | 04/01/38 | | | | 56,125 | |
| | | | 5,646,362 | | | | 5.500 | | | | 05/01/38 | | | | 5,940,406 | |
| | | | 3,408,904 | | | | 6.000 | | | | 05/01/38 | | | | 3,617,034 | |
| | | | 3,002,274 | | | | 5.500 | | | | 06/01/38 | | | | 3,170,031 | |
| | | | 340,661 | | | | 5.500 | | | | 07/01/38 | | | | 358,413 | |
| | | | 84,548 | | | | 6.000 | | | | 07/01/38 | | | | 90,173 | |
| | | | 2,029,751 | | | | 5.500 | | | | 08/01/38 | | | | 2,135,519 | |
| | | | 669,279 | | | | 5.500 | | | | 09/01/38 | | | | 709,069 | |
| | | | 45,181 | | | | 6.000 | | | | 09/01/38 | | | | 47,926 | |
| | | | 247,325 | | | | 5.500 | | | | 10/01/38 | | | | 261,281 | |
| | | | 835,315 | | | | 5.500 | | | | 11/01/38 | | | | 885,226 | |
| | | | 3,106,855 | | | | 5.500 | | | | 12/01/38 | | | | 3,273,912 | |
| | | | 2,005,563 | | | | 6.000 | | | | 12/01/38 | | | | 2,130,054 | |
| | | | 1,208,215 | | | | 5.500 | | | | 01/01/39 | | | | 1,271,740 | |
| | | | 118,778 | | | | 6.000 | | | | 01/01/39 | | | | 126,697 | |
| | | | 447,801 | | | | 5.500 | | | | 02/01/39 | | | | 473,221 | |
| | | | 55,030 | | | | 6.000 | | | | 02/01/39 | | | | 58,373 | |
| | | | 2,927,530 | | | | 5.000 | | | | 03/01/39 | | | | 3,037,312 | |
| | | | 54,649 | | | | 5.500 | | | | 03/01/39 | | | | 57,916 | |
| | | | 43,787 | | | | 5.500 | | | | 04/01/39 | | | | 46,404 | |
| | | | 3,946,053 | | | | 4.500 | | | | 05/01/39 | | | | 3,996,929 | |
| | | | 163,190 | | | | 5.000 | | | | 05/01/39 | | | | 169,565 | |
| | | | 10,915,775 | | | | 5.000 | | | | 06/01/39 | | | | 11,288,343 | |
| | | |
| | | |
| | | | 1,253,850 | | | | 5.000 | | | | 07/01/39 | | | | 1,301,058 | |
| | | | 552,178 | | | | 5.000 | | | | 08/01/39 | | | | 573,174 | |
| | | | 10,599,327 | | | | 4.500 | | | | 09/01/39 | | | | 10,738,422 | |
| | | | 6,994,399 | | | | 5.000 | | | | 09/01/39 | | | | 7,237,571 | |
| | | | 8,400,000 | | | | 4.500 | | | | TBA-30yr | (e) | | | 8,483,373 | |
| | | | | | | | | | | | | | | | | |
| | | | | | | | | | | | | | | | 105,130,181 | |
| | | |
| | | |
| | | FNMA – 44.2% |
| | | | 44,533 | | | | 4.000 | | | | 06/01/13 | | | | 45,674 | |
| | | | 60,213 | | | | 4.000 | | | | 07/01/13 | | | | 61,992 | |
| | | | 85,521 | | | | 4.000 | | | | 08/01/13 | | | | 87,751 | |
| | | | 166,223 | | | | 4.000 | | | | 09/01/13 | | | | 170,590 | |
| | | | 3,839 | | | | 5.500 | | | | 09/01/13 | | | | 4,094 | |
| | | | 347,487 | | | | 4.000 | | | | 10/01/13 | | | | 356,684 | |
| | | | 8,975 | | | | 5.500 | | | | 02/01/14 | | | | 9,572 | |
| | | | 271,802 | | | | 4.000 | | | | 04/01/14 | | | | 279,223 | |
| | | | 1,883 | | | | 5.500 | | | | 04/01/14 | | | | 2,008 | |
| | | | 3,753 | | | | 5.500 | | | | 04/01/16 | | | | 4,007 | |
| | | | 4,992 | | | | 5.500 | | | | 08/01/16 | | | | 5,330 | |
| | | | 61,940 | | | | 5.500 | | | | 11/01/16 | | | | 66,132 | |
| | | | 105,716 | | | | 5.000 | | | | 12/01/16 | | | | 110,576 | |
| | | | 49,390 | | | | 5.500 | | | | 12/01/16 | | | | 52,836 | |
| | | | 70,113 | | | | 5.500 | | | | 01/01/17 | | | | 74,858 | |
| | | | 19,306 | | | | 5.000 | | | | 02/01/17 | | | | 20,195 | |
| | | | 150,626 | | | | 5.000 | | | | 04/01/17 | | | | 157,587 | |
| | | | 43,601 | | | | 5.000 | | | | 05/01/17 | | | | 45,618 | |
| | | | 5,307 | | | | 5.500 | | | | 05/01/17 | | | | 5,686 | |
| | | | 206,776 | | | | 5.000 | | | | 06/01/17 | | | | 216,352 | |
| | | | 25,372 | | | | 5.500 | | | | 07/01/17 | | | | 27,185 | |
| | | | 3,458 | | | | 5.500 | | | | 09/01/17 | | | | 3,705 | |
| | | | 2,198,785 | | | | 5.000 | | | | 11/01/17 | | | | 2,334,950 | |
| | | | 1,634,376 | | | | 5.000 | | | | 12/01/17 | | | | 1,731,474 | |
| | | | 3,149,430 | | | | 5.000 | | | | 01/01/18 | | | | 3,333,824 | |
| | | | 45,066 | | | | 5.500 | | | | 01/01/18 | | | | 48,312 | |
| | | | 990,487 | | | | 5.000 | | | | 02/01/18 | | | | 1,052,251 | |
| | | | 36,170 | | | | 5.500 | | | | 02/01/18 | | | | 38,761 | |
| | | | 4,371 | | | | 6.000 | | | | 02/01/18 | | | | 4,704 | |
| | | | 5,926,019 | | | | 5.000 | | | | 03/01/18 | | | | 6,294,416 | |
| | | | 3,325,656 | | | | 5.000 | | | | 04/01/18 | | | | 3,532,466 | |
| | | | 59,895 | | | | 5.500 | | | | 04/01/18 | | | | 64,129 | |
| | | | 2,138,667 | | | | 5.000 | | | | 05/01/18 | | | | 2,273,529 | |
| | | | 12,536 | | | | 5.500 | | | | 05/01/18 | | | | 13,419 | |
| | | | 46,253 | | | | 6.000 | | | | 05/01/18 | | | | 49,770 | |
| | | | 2,692,551 | | | | 5.000 | | | | 06/01/18 | | | | 2,861,500 | |
| | | | 137,648 | | | | 5.000 | | | | 07/01/18 | | | | 146,234 | |
| | | | 2,940,515 | | | | 4.000 | | | | 08/01/18 | | | | 3,062,366 | |
| | | | 64,259 | | | | 5.000 | | | | 09/01/18 | | | | 68,271 | |
| | | | 58,212 | | | | 5.000 | | | | 10/01/18 | | | | 61,845 | |
| | | | 408,922 | | | | 5.000 | | | | 11/01/18 | | | | 434,339 | |
| | | | 264,370 | | | | 6.000 | | | | 11/01/18 | | | | 284,468 | |
| | | | 349,207 | | | | 7.000 | | | | 11/01/18 | | | | 380,000 | |
| | | | 444,047 | | | | 4.000 | | | | 12/01/18 | | | | 462,448 | |
| | | | 474,124 | | | | 6.000 | | | | 12/01/18 | | | | 510,166 | |
| | | | 386,077 | | | | 6.000 | | | | 01/01/19 | | | | 415,427 | |
| | | | 9,965 | | | | 5.500 | | | | 02/01/19 | | | | 10,665 | |
| | | | 46,862 | | | | 5.500 | | | | 04/01/19 | | | | 49,962 | |
| | | |
| | | |
The accompanying notes are an integral part of these financial statements.
GOLDMAN SACHS U.S. MORTGAGES FUND
Schedule of Investments (continued)
September 30, 2009 (Unaudited)
| | | | | | | | | | | | | | | | | |
| | | Principal
| | Interest
| | Maturity
| | |
| | | Amount | | Rate | | Date | | Value |
| |
Mortgage-Backed Obligations – (continued) |
| | | FNMA – (continued) |
| | | | | | | | | | | | | | | | | |
| | | $ | 136,104 | | | | 6.000 | % | | | 04/01/19 | | | $ | 143,528 | |
| | | | 220,375 | | | | 4.000 | | | | 05/01/19 | | | | 229,214 | |
| | | | 11,312 | | | | 5.500 | | | | 05/01/19 | | | | 12,109 | |
| | | | 28,873 | | | | 6.000 | | | | 05/01/19 | | | | 31,046 | |
| | | | 64,173 | | | | 5.500 | | | | 07/01/19 | | | | 68,417 | |
| | | | 152,260 | | | | 5.500 | | | | 08/01/19 | | | | 162,330 | |
| | | | 76,208 | | | | 5.500 | | | | 09/01/19 | | | | 81,247 | |
| | | | 953,712 | | | | 6.000 | | | | 09/01/19 | | | | 1,024,570 | |
| | | | 1,058,612 | | | | 4.000 | | | | 10/01/19 | | | | 1,101,070 | |
| | | | 167,082 | | | | 5.500 | | | | 10/01/19 | | | | 178,132 | |
| | | | 53,823 | | | | 5.500 | | | | 11/01/19 | | | | 57,383 | |
| | | | 39,662 | | | | 5.500 | | | | 12/01/19 | | | | 42,285 | |
| | | | 279,763 | | | | 5.500 | | | | 02/01/20 | | | | 299,477 | |
| | | | 1,190,340 | | | | 6.000 | | | | 12/01/20 | | | | 1,278,778 | |
| | | | 67,162 | | | | 5.500 | | | | 01/01/21 | | | | 71,604 | |
| | | | 617,160 | | | | 6.000 | | | | 04/01/21 | | | | 658,475 | |
| | | | 500,475 | | | | 6.000 | | | | 07/01/21 | | | | 534,687 | |
| | | | 421,961 | | | | 6.000 | | | | 08/01/21 | | | | 450,210 | |
| | | | 381,369 | | | | 6.000 | | | | 09/01/21 | | | | 407,439 | |
| | | | 107,255 | | | | 7.000 | | | | 09/01/21 | | | | 118,951 | |
| | | | 164,386 | | | | 6.000 | | | | 10/01/21 | | | | 175,391 | |
| | | | 203,559 | | | | 6.000 | | | | 11/01/21 | | | | 217,474 | |
| | | | 248,435 | | | | 6.000 | | | | 01/01/22 | | | | 265,330 | |
| | | | 316,596 | | | | 7.000 | | | | 06/01/22 | | | | 350,443 | |
| | | | 150,361 | | | | 7.000 | | | | 07/01/22 | | | | 166,436 | |
| | | | 77,869 | | | | 6.000 | | | | 03/01/23 | | | | 83,013 | |
| | | | 103,410 | | | | 4.500 | | | | 04/01/23 | | | | 107,283 | |
| | | | 24,113 | | | | 5.000 | | | | 07/01/23 | | | | 25,301 | |
| | | | 356,284 | | | | 6.000 | | | | 08/01/23 | | | | 380,006 | |
| | | | 21,353 | | | | 6.000 | | | | 11/01/23 | | | | 22,775 | |
| | | | 2,125 | | | | 7.000 | | | | 01/01/29 | | | | 2,341 | |
| | | | 1,065 | | | | 5.500 | | | | 04/01/29 | | | | 1,122 | |
| | | | 3,505 | | | | 7.000 | | | | 09/01/29 | | | | 3,862 | |
| | | | 6,813 | | | | 7.000 | | | | 02/01/30 | | | | 7,502 | |
| | | | 67,339 | | | | 7.000 | | | | 08/01/31 | | | | 73,637 | |
| | | | 31,801 | | | | 5.000 | | | | 12/01/31 | | | | 32,982 | |
| | | | 3,728 | | | | 7.000 | | | | 03/01/32 | | | | 4,093 | |
| | | | 2,714 | | | | 7.000 | | | | 04/01/32 | | | | 2,980 | |
| | | | 10,593 | | | | 7.000 | | | | 05/01/32 | | | | 11,631 | |
| | | | 24,291 | | | | 7.000 | | | | 06/01/32 | | | | 26,670 | |
| | | | 3,595 | | | | 7.000 | | | | 07/01/32 | | | | 3,947 | |
| | | | 173,693 | | | | 6.000 | | | | 01/01/33 | | | | 185,837 | |
| | | | 5,192 | | | | 6.000 | | | | 02/01/33 | | | | 5,555 | |
| | | | 702,515 | | | | 5.500 | | | | 03/01/33 | | | | 739,104 | |
| | | | 2,051,145 | | | | 5.500 | | | | 04/01/33 | | | | 2,160,102 | |
| | | | 583,781 | | | | 5.500 | | | | 05/01/33 | | | | 614,186 | |
| | | | 44,643 | | | | 5.000 | | | | 06/01/33 | | | | 46,302 | |
| | | | 642,988 | | | | 5.500 | | | | 06/01/33 | | | | 676,477 | |
| | | | 114,372 | | | | 6.000 | | | | 06/01/33 | | | | 122,387 | |
| | | | 4,025,929 | | | | 5.500 | | | | 07/01/33 | | | | 4,233,265 | |
| | | | 37,557 | | | | 6.000 | | | | 07/01/33 | | | | 40,177 | |
| | | | 262,386 | | | | 5.000 | | | | 08/01/33 | | | | 272,135 | |
| | | | 30,429 | | | | 5.000 | | | | 09/01/33 | | | | 31,560 | |
| | | | 560,706 | | | | 5.500 | | | | 09/01/33 | | | | 589,950 | |
| | | | 96,799 | | | | 6.000 | | | | 09/01/33 | | | | 103,552 | |
| | | | 65,834 | | | | 5.000 | | | | 10/01/33 | | | | 68,280 | |
| | | |
| | | |
| | | | 518,273 | | | | 5.500 | | | | 10/01/33 | | | | 545,267 | |
| | | | 19,632 | | | | 6.000 | | | | 10/01/33 | | | | 21,002 | |
| | | | 71,265 | | | | 5.000 | | | | 11/01/33 | | | | 73,912 | |
| | | | 1,075,681 | | | | 5.500 | | | | 12/01/33 | | | | 1,130,559 | |
| | | | 12,769 | | | | 5.000 | | | | 01/01/34 | | | | 13,244 | |
| | | | 1,776,422 | | | | 5.500 | | | | 01/01/34 | | | | 1,868,139 | |
| | | | 154,722 | | | | 5.500 | | | | 02/01/34 | | | | 163,057 | |
| | | | 35,132 | | | | 5.500 | | | | 03/01/34 | | | | 37,024 | |
| | | | 39,730 | | | | 5.500 | | | | 04/01/34 | | | | 41,869 | |
| | | | 591,587 | | | | 5.500 | | | | 06/01/34 | | | | 622,401 | |
| | | | 26,136 | | | | 5.000 | | | | 07/01/34 | | | | 27,107 | |
| | | | 181,617 | | | | 5.500 | | | | 07/01/34 | | | | 191,373 | |
| | | | 34,017 | | | | 5.500 | | | | 08/01/34 | | | | 35,887 | |
| | | | 99,305 | | | | 5.500 | | | | 10/01/34 | | | | 104,610 | |
| | | | 4,075,712 | | | | 6.000 | | | | 10/01/34 | | | | 4,328,537 | |
| | | | 1,952,695 | | | | 5.500 | | | | 11/01/34 | | | | 2,051,721 | |
| | | | 64,763 | | | | 6.000 | | | | 11/01/34 | | | | 69,271 | |
| | | | 1,038,363 | | | | 5.500 | | | | 12/01/34 | | | | 1,093,809 | |
| | | | 1,617,790 | | | | 6.000 | | | | 12/01/34 | | | | 1,730,387 | |
| | | | 17,904 | | | | 5.000 | | | | 03/01/35 | | | | 18,560 | |
| | | | 95,351 | | | | 5.000 | | | | 04/01/35 | | | | 98,748 | |
| | | | 1,181,919 | | | | 6.000 | | | | 04/01/35 | | | | 1,258,650 | |
| | | | 31,038 | | | | 5.500 | | | | 06/01/35 | | | | 32,833 | |
| | | | 335,151 | | | | 5.000 | | | | 07/01/35 | | | | 347,205 | |
| | | | 59,528 | | | | 5.500 | | | | 07/01/35 | | | | 62,681 | |
| | | | 157,603 | | | | 5.000 | | | | 08/01/35 | | | | 163,372 | |
| | | | 46,161 | | | | 5.500 | | | | 08/01/35 | | | | 48,607 | |
| | | | 205,106 | | | | 5.000 | | | | 09/01/35 | | | | 212,571 | |
| | | | 35,220 | | | | 5.500 | | | | 09/01/35 | | | | 37,084 | |
| | | | 188,262 | | | | 5.000 | | | | 10/01/35 | | | | 195,023 | |
| | | | 558,400 | | | | 6.000 | | | | 10/01/35 | | | | 594,391 | |
| | | | 67,451 | | | | 5.000 | | | | 11/01/35 | | | | 69,921 | |
| | | | 16,740 | | | | 5.500 | | | | 12/01/35 | | | | 17,652 | |
| | | | 16,127 | | | | 6.000 | | | | 12/01/35 | | | | 18,059 | |
| | | | 40,468 | | | | 5.500 | | | | 04/01/36 | | | | 42,597 | |
| | | | 22,470 | | | | 6.000 | | | | 04/01/36 | | | | 23,890 | |
| | | | 66,297 | | | | 5.500 | | | | 06/01/36 | | | | 69,775 | |
| | | | 58,027 | | | | 6.000 | | | | 06/01/36 | | | | 61,658 | |
| | | | 31,028 | | | | 5.000 | | | | 07/01/36 | | | | 32,183 | |
| | | | 31,118 | | | | 6.000 | | | | 07/01/36 | | | | 33,065 | |
| | | | 115,352 | | | | 6.000 | | | | 08/01/36 | | | | 122,571 | |
| | | | 2,185,498 | | | | 6.000 | | | | 09/01/36 | | | | 2,327,915 | |
| | | | 35,485 | | | | 6.000 | | | | 10/01/36 | | | | 37,705 | |
| | | | 455,543 | | | | 6.000 | | | | 11/01/36 | | | | 483,551 | |
| | | | 31,189 | | | | 5.000 | | | | 12/01/36 | | | | 32,300 | |
| | | | 13,102 | | | | 5.500 | | | | 12/01/36 | | | | 13,773 | |
| | | | 856,409 | | | | 6.000 | | | | 12/01/36 | | | | 911,339 | |
| | | | 18,143 | | | | 5.500 | | | | 01/01/37 | | | | 19,072 | |
| | | | 544,978 | | | | 6.000 | | | | 01/01/37 | | | | 579,536 | |
| | | | 30,842 | | | | 5.500 | | | | 02/01/37 | | | | 32,422 | |
| | | | 58,812 | | | | 5.500 | | | | 03/01/37 | | | | 61,970 | |
| | | | 1,188,898 | | | | 5.500 | | | | 04/01/37 | | | | 1,249,447 | |
| | | | 1,066,076 | | | | 5.500 | | | | 05/01/37 | | | | 1,120,390 | |
| | | | 1,317,571 | | | | 6.000 | | | | 05/01/37 | | | | 1,399,956 | |
| | | | 488,945 | | | | 5.000 | | | | 06/01/37 | | | | 505,982 | |
| | | | 440,525 | | | | 5.500 | | | | 06/01/37 | | | | 462,962 | |
| | | |
| | | |
The accompanying notes are an integral part of these financial statements.
GOLDMAN SACHS U.S. MORTGAGES FUND
| | | | | | | | | | | | | | | | | |
| | | Principal
| | Interest
| | Maturity
| | |
| | | Amount | | Rate | | Date | | Value |
| |
Mortgage-Backed Obligations – (continued) |
| | | FNMA – (continued) |
| | | | | | | | | | | | | | | | | |
| | | $ | 83,138 | | | | 5.500 | % | | | 07/01/37 | | | $ | 87,370 | |
| | | | 19,742 | | | | 5.500 | | | | 08/01/37 | | | | 20,759 | |
| | | | 372,369 | | | | 6.000 | | | | 08/01/37 | | | | 395,173 | |
| | | | 765,849 | | | | 6.000 | | | | 09/01/37 | | | | 812,577 | |
| | | | 161,715 | | | | 5.500 | | | | 10/01/37 | | | | 169,946 | |
| | | | 37,411 | | | | 6.000 | | | | 10/01/37 | | | | 39,694 | |
| | | | 639,791 | | | | 6.500 | | | | 10/01/37 | | | | 688,425 | |
| | | | 359,618 | | | | 6.000 | | | | 11/01/37 | | | | 381,559 | |
| | | | 1,675 | | | | 5.500 | | | | 12/01/37 | | | | 1,760 | |
| | | | 247,405 | | | | 6.000 | | | | 12/01/37 | | | | 262,500 | |
| | | | 261,638 | | | | 5.500 | | | | 01/01/38 | | | | 274,996 | |
| | | | 39,844 | | | | 6.000 | | | | 01/01/38 | | | | 42,275 | |
| | | | 266,257 | | | | 5.500 | | | | 02/01/38 | | | | 279,852 | |
| | | | 412,122 | | | | 6.000 | | | | 02/01/38 | | | | 437,396 | |
| | | | 4,100,411 | | | | 5.000 | | | | 03/01/38 | | | | 4,253,299 | |
| | | | 8,829,787 | | | | 5.500 | | | | 03/01/38 | | | | 9,303,678 | |
| | | | 1,624,564 | | | | 6.000 | | | | 03/01/38 | | | | 1,723,687 | |
| | | | 3,570,485 | | | | 5.500 | | | | 04/01/38 | | | | 3,751,238 | |
| | | | 8,704,806 | | | | 5.500 | | | | 05/01/38 | | | | 9,169,734 | |
| | | | 39,784 | | | | 6.000 | | | | 05/01/38 | | | | 42,199 | |
| | | | 8,055,854 | | | | 5.500 | | | | 06/01/38 | | | | 8,493,826 | |
| | | | 2,080,558 | | | | 5.500 | | | | 07/01/38 | | | | 2,187,755 | |
| | | | 132,063 | | | | 5.500 | | | | 08/01/38 | | | | 138,875 | |
| | | | 2,336,412 | | | | 5.500 | | | | 09/01/38 | | | | 2,455,402 | |
| | | | 3,314,161 | | | | 6.000 | | | | 09/01/38 | | | | 3,514,305 | |
| | | | 1,205,655 | | | | 5.500 | | | | 10/01/38 | | | | 1,268,283 | |
| | | | 1,472,752 | | | | 6.000 | | | | 10/01/38 | | | | 1,561,692 | |
| | | | 1,584,966 | | | | 5.500 | | | | 11/01/38 | | | | 1,669,398 | |
| | | | 23,569 | | | | 6.000 | | | | 11/01/38 | | | | 24,992 | |
| | | | 1,184,524 | | | | 5.500 | | | | 12/01/38 | | | | 1,249,749 | |
| | | | 7,846,488 | | | | 5.000 | | | | 01/01/39 | | | | 8,149,862 | |
| | | | 1,231,212 | | | | 5.500 | | | | 01/01/39 | | | | 1,293,005 | |
| | | | 72,916 | | | | 6.000 | | | | 01/01/39 | | | | 77,319 | |
| | | | 2,194,639 | | | | 6.500 | | | | 01/01/39 | | | | 2,358,590 | |
| | | | 208,262 | | | | 5.000 | | | | 02/01/39 | | | | 216,172 | |
| | | | 1,310,739 | | | | 5.500 | | | | 02/01/39 | | | | 1,376,400 | |
| | | | 5,949,130 | | | | 4.500 | | | | 03/01/39 | | | | 5,950,370 | |
| | | | 61,136 | | | | 5.000 | | | | 03/01/39 | | | | 63,419 | |
| | | | 285,755 | | | | 5.500 | | | | 03/01/39 | | | | 301,844 | |
| | | | 143,295 | | | | 5.000 | | | | 04/01/39 | | | | 148,647 | |
| | | | 321,166 | | | | 4.500 | | | | 05/01/39 | | | | 325,750 | |
| | | | 671,341 | | | | 5.000 | | | | 05/01/39 | | | | 696,755 | |
| | | | 899,750 | | | | 4.500 | | | | 06/01/39 | | | | 913,101 | |
| | | | 2,149,111 | | | | 5.000 | | | | 06/01/39 | | | | 2,222,907 | |
| | | | 488,058 | | | | 4.500 | | | | 07/01/39 | | | | 495,746 | |
| | | | 1,599,225 | | | | 5.000 | | | | 07/01/39 | | | | 1,656,147 | |
| | | | 739,647 | | | | 4.500 | | | | 08/01/39 | | | | 751,287 | |
| | | | 464,372 | | | | 5.000 | | | | 08/01/39 | | | | 481,876 | |
| | | | 100,000 | | | | 4.500 | | | | 09/01/39 | | | | 101,625 | |
| | | | 165,626 | | | | 5.000 | | | | 09/01/39 | | | | 171,810 | |
| | | | 2,747,847 | | | | 4.500 | | | | 10/01/39 | | | | 2,789,898 | |
| | | | 300,000 | | | | 5.000 | | | | 10/01/39 | | | | 311,515 | |
| | | | 14,000,000 | | | | 4.500 | | | | TBA-30yr | (e) | | | 14,173,893 | |
| | | | 24,000,000 | | | | 6.000 | | | | TBA-30yr | (e) | | | 25,065,000 | |
| | | | | | | | | | | | | | | | | |
| | | | | | | | | | | | | | | | 201,875,315 | |
| | | |
| | | |
| | | GNMA – 10.3% |
| | | | 977 | | | | 6.000 | | | | 12/15/23 | | | | 1,042 | |
| | | | 17,613 | | | | 6.000 | | | | 03/15/26 | | | | 18,766 | |
| | | | 24,832 | | | | 6.000 | | | | 04/15/26 | | | | 26,458 | |
| | | | 1,667,833 | | | | 5.500 | | | | 05/15/38 | | | | 1,763,017 | |
| | | | 907,181 | | | | 6.000 | | | | 12/15/38 | | | | 960,407 | |
| | | | 7,416,447 | | | | 5.500 | | | | 01/15/39 | | | | 7,814,988 | |
| | | | 2,548,774 | | | | 6.000 | | | | 01/15/39 | | | | 2,717,926 | |
| | | | 655,696 | | | | 5.500 | | | | 02/15/39 | | | | 691,887 | |
| | | | 7,249,468 | | | | 5.500 | | | | 03/15/39 | | | | 7,644,511 | |
| | | | 3,434,048 | | | | 5.000 | | | | 04/15/39 | | | | 3,575,557 | |
| | | | 4,950,914 | | | | 4.500 | | | | 05/15/39 | | | | 5,036,201 | |
| | | | 4,169,347 | | | | 5.000 | | | | 05/15/39 | | | | 4,340,106 | |
| | | | 6,172,920 | | | | 4.500 | | | | 06/15/39 | | | | 6,279,259 | |
| | | | 4,028,015 | | | | 5.000 | | | | 06/15/39 | | | | 4,192,679 | |
| | | | 996,521 | | | | 4.500 | | | | 07/15/39 | | | | 1,013,687 | |
| | | | 996,030 | | | | 5.000 | | | | 07/15/39 | | | | 1,036,493 | |
| | | | | | | | | | | | | | | | | |
| | | | | | | | | | | | | | | | 47,112,984 | |
| | | |
| | | |
| | | TOTAL FEDERAL AGENCIES | | $ | 368,928,140 | |
| | | |
| | | |
| | | TOTAL MORTGAGE-BACKED OBLIGATIONS |
| | | (Cost $479,221,163) | | $ | 470,296,600 | |
| | | |
| | | |
| | | | | | | | | | | | | | | | | |
| | | | | | | | | | | | | | | | | |
Agency Debentures – 1.1% |
| | | | | | | | | | | | | | | | | |
| | | | | | | | | | | | | | | | | |
| | | FHLMC |
| | | $ | 2,200,000 | | | | 4.500 | % | | | 09/13/19 | | | $ | 2,270,077 | |
| | | Tennessee Valley Authority(f) |
| | | | 2,800,000 | | | | 5.375 | | | | 04/01/56 | | | | 2,980,667 | |
| | | |
| | | |
| | | TOTAL AGENCY DEBENTURES |
| | | (Cost $5,031,818) | | $ | 5,250,744 | |
| | | |
| | | |
| | | | | | | | | | | | | | | | | |
| | | | | | | | | | | | | | | | | |
Asset-Backed Securities – 0.9% |
| | | | | | | | | | | | | | | | | |
| | | | | | | | | | | | | | | | | |
| | | Home Equity – 0.9% |
| | | CIT Mortgage Loan Trust Series 2007-1, Class 2A2(a)(d) |
| | | $ | 570,000 | | | | 1.496 | % | | | 10/25/37 | | | $ | 233,642 | |
| | | CIT Mortgage Loan Trust Series 2007-1, Class 2A3(a)(d) |
| | | | 1,100,000 | | | | 1.696 | | | | 10/25/37 | | | | 410,516 | |
| | | Countrywide Home Equity Loan Trust Series 2002-E, Class A(a) |
| | | | 35,029 | | | | 0.503 | | | | 10/15/28 | | | | 24,350 | |
| | | Countrywide Home Equity Loan Trust Series 2003-D, Class A(a) |
| | | | 160,459 | | | | 0.503 | | | | 06/15/29 | | | | 95,778 | |
| | | Countrywide Home Equity Loan Trust Series 2004-G, Class 2A(a) |
| | | | 69,161 | | | | 0.463 | | | | 12/15/29 | | | | 28,757 | |
| | | Countrywide Home Equity Loan Trust Series 2004-I, Class A(a) |
| | | | 660,339 | | | | 0.533 | | | | 02/15/34 | | | | 195,091 | |
| | | Countrywide Home Equity Loan Trust Series 2004-J, Class 2A(a) |
| | | | 66,362 | | | | 0.533 | | | | 12/15/33 | | | | 24,849 | |
| | | |
| | | |
The accompanying notes are an integral part of these financial statements.
GOLDMAN SACHS U.S. MORTGAGES FUND
Schedule of Investments (continued)
September 30, 2009 (Unaudited)
| | | | | | | | | | | | | | | | | |
| | | Principal
| | Interest
| | Maturity
| | |
| | | Amount | | Rate | | Date | | Value |
| |
Asset-Backed Securities – (continued) |
| | | Home Equity – (continued) |
| | | | | | | | | | | | | | | | | |
| | | Countrywide Home Equity Loan Trust Series 2004-O, Class 1A(a) |
| | | $ | 248,078 | | | | 0.523 | % | | | 02/15/34 | | | $ | 100,472 | |
| | | Countrywide Home Equity Loan Trust Series 2005-A, Class 2A(a) |
| | | | 425,172 | | | | 0.483 | | | | 04/15/35 | | | | 190,755 | |
| | | GMAC Mortgage Corp. Loan Trust Series 2007-HE3, Class 1A1 |
| | | | 522,288 | | | | 7.000 | | | | 09/25/37 | | | | 309,412 | |
| | | GMAC Mortgage Corp. Loan Trust Series 2007-HE3, Class 2A1 |
| | | | 584,662 | | | | 7.000 | | | | 09/25/37 | | | | 242,596 | |
| | | Household Home Equity Loan Trust Series 2007-3, Class APT(a) |
| | | | 2,562,363 | | | | 1.446 | | | | 11/20/36 | | | | 2,081,918 | |
| | | Morgan Stanley Capital, Inc. Series 2004-HE1, Class A4(a) |
| | | | 548,071 | | | | 0.986 | | | | 01/25/34 | | | | 266,434 | |
| | | Residential Asset Mortgage Products, Inc. Series 2004-RZ1, Class AII(a) |
| | | | 229,018 | | | | 0.726 | | | | 03/25/34 | | | | 133,970 | |
| | | | | | | | | | | | | | | | | |
| | | | | | | | | | | | | | | | 4,338,540 | |
| | | |
| | | |
| | | TOTAL ASSET-BACKED SECURITIES |
| | | (Cost $7,783,789) | | $ | 4,338,540 | |
| | | |
| | | |
| | | TOTAL INVESTMENTS BEFORE REPURCHASE AGREEMENT |
| | | (Cost $492,036,770) | | $ | 479,885,884 | |
| | | |
| | | |
| | | | | | | | | | | | | | | | | |
| | | | | | | | | | | | | | | | | |
Repurchase Agreement(g) – 9.2% |
| | | | | | | | | | | | | | | | | |
| | | | | | | | | | | | | | | | | |
| | | Joint Repurchase Agreement Account II |
| | | $ | 41,800,000 | | | | 0.061 | % | | | 10/01/09 | | | $ | 41,800,000 | |
| | | Maturity Value: $41,800,071 |
| | | (Cost $41,800,000) | | | | |
| | | |
| | | |
| | | TOTAL INVESTMENTS – 114.2% |
| | | (Cost $533,836,770) | | $ | 521,685,884 | |
| | | |
| | | |
| | | LIABILITIES IN EXCESS OF
OTHER ASSETS – (14.2)% | | | (65,054,502 | ) |
| | | |
| | | |
| | | NET ASSETS – 100.0% | | $ | 456,631,382 | |
| | | |
| | | |
The percentage shown for each investment category reflects the value of investments in that category as a percentage of net assets.
| | |
| (a) | | Variable rate security. Interest rate disclosed is that which is in effect at September 30, 2009. |
| |
| (b) | | Represents security with notional or nominal principal amount. The actual effective yield of this security is different than the stated interest rate. |
| |
| (c) | | Security is issued with zero coupon and interest rate is contingent upon LIBOR reaching a predetermined level. |
| |
| (d) | | Securities are exempt from registration under rule 144A of the Securities Act of 1933. Under procedures approved by the Board of Trustees, such securities have been determined to be liquid by the investment adviser and may be resold, normally to qualified institutional buyers in transactions exempt from registration. Total market value of Rule 144A securities amounted to $838,632, which represents approximately 0.2% of net assets as of September 30, 2009. |
| |
| (e) | | TBA (To Be Announced) Securities are purchased on a forward commitment basis with an approximate principal amount and no defined maturity date. The actual principal and maturity date will be determined upon settlement when the specific mortgage pools are assigned. Total market value of TBA securities (excluding forward sales contracts, if any) amounts to $47,722,266 which represents approximately 10.5% of net assets as of September 30, 2009. |
| |
| (f) | | A portion of this security is segregated as collateral for initial margin requirement on futures transactions. |
| |
| (g) | | Joint repurchase agreement was entered into on September 30, 2009. Additional information appears on page 65. |
| | | | | | | |
| | | |
| | | |
| | | Investment Abbreviations: |
| | | FHLMC | | — | | Federal Home Loan Mortgage Corp. |
| | | FNMA | | — | | Federal National Mortgage Association |
| | | GNMA | | — | | Government National Mortgage Association |
| | | LIBOR | | — | | London Interbank Offered Rate |
| | | REMIC | | — | | Real Estate Mortgage Investment Conduit |
| | | |
| | | |
The accompanying notes are an integral part of these financial statements.
GOLDMAN SACHS U.S. MORTGAGES FUND
ADDITIONAL INVESTMENT INFORMATION
FORWARD SALES CONTRACT — At September 30, 2009, the Fund had the following forward sales contract:
| | | | | | | | | | | | | | | | | | | |
| | | Interest
| | | Maturity
| | Settlement
| | | Principal
| | | | |
| Description | | Rate | | | Date(e) | | Date | | | Amount | | | Value | |
| | |
| FHLMC (Proceeds Receivable $9,211,016) | | | 5.000% | | | TBA-30yr | | | 10/14/09 | | | $ | 9,000,000 | | | $ | 9,298,125 | |
| |
| |
FUTURES CONTRACTS — At September 30, 2009, the following futures contracts were open:
| | | | | | | | | | | | | | | |
| | | Number of
| | | | | | | | | |
| | | Contracts
| | | Settlement
| | Notional
| | | Unrealized
| |
| Type | | Long (Short) | | | Month | | Value | | | Gain (Loss) | |
| | |
| Eurodollars | | | (102 | ) | | December 2009 | | $ | (25,405,650 | ) | | $ | (109,958 | ) |
| Eurodollars | | | (20 | ) | | March 2010 | | | (4,968,750 | ) | | | (41,647 | ) |
| Eurodollars | | | 3 | | | September 2010 | | | 739,762 | | | | 4,438 | |
| Eurodollars | | | (1 | ) | | December 2010 | | | (245,613 | ) | | | (201 | ) |
| 2 Year U.S. Treasury Notes | | | 262 | | | December 2009 | | | 56,845,813 | | | | 235,366 | |
| 5 Year U.S. Treasury Notes | | | (475 | ) | | December 2009 | | | (55,144,531 | ) | | | (368,895 | ) |
| 10 Year U.S. Treasury Notes | | | 272 | | | December 2009 | | | 32,185,250 | | | | 403,001 | |
| 30 Year U.S. Treasury Bonds | | | 14 | | | December 2009 | | | 1,699,250 | | | | 23,795 | |
| |
| |
TOTAL | | | | | | | | | | | | $ | 145,899 | |
| |
| |
INTEREST RATE SWAP CONTRACTS — At September 30, 2009, the Fund had outstanding swap contracts with the following terms(a):
| | | | | | | | | | | | | | | | | | | | | | | |
| | | | | | | | Rates Exchanged | | | | | Upfront
| | | | |
| | | Notional
| | | | | Payments
| | Payments
| | | | | Payments
| | | | |
| | | Amount
| | | Termination
| | received by
| | made by
| | Market
| | | made (received) by
| | | Unrealized
| |
| Swap Counterparty | | (000s) | | | Date | | the Fund | | the Fund | | Value | | | the Fund | | | Gain (Loss) | |
| | |
| Banc of America Securities LLC | | $ | 900 | | | 12/16/16 | | 3 month LIBOR | | 3.250% | | $ | (1,418 | ) | | $ | 8,270 | | | $ | (9,688 | ) |
| | | | 1,800 | | | 12/16/16 | | 3 month LIBOR | | 3.250 | | | (2,835 | ) | | | 16,928 | | | | (19,763 | ) |
| | | | 2,600 | | | 12/16/16 | | 3 month LIBOR | | 3.250 | | | (4,096 | ) | | | 45,500 | | | | (49,596 | ) |
| | | | 2,600 | | | 12/16/16 | | 3 month LIBOR | | 3.250 | | | (4,096 | ) | | | 41,290 | | | | (45,386 | ) |
| | | | 3,200 | | | 12/16/16 | | 3 month LIBOR | | 3.250 | | | (5,041 | ) | | | 54,209 | | | | (59,250 | ) |
| | | | 5,200 | | | 12/16/16 | | 3 month LIBOR | | 3.250 | | | (8,192 | ) | | | 131,837 | | | | (140,029 | ) |
| | | | 19,000 | | | 08/14/17 | | 4.955% | | 3 month LIBOR | | | 643,564 | | | | — | | | | 643,564 | |
| | | | 10,700 | | | 08/15/22 | | 3 month LIBOR | | 5.078 | | | (605,326 | ) | | | — | | | | (605,326 | ) |
| | | | 3,300 | | | 12/16/24 | | 3 month LIBOR | | 3.750 | | | 32,078 | | | | 213,555 | | | | (181,477 | ) |
| | | | 2,000 | | | 12/17/29 | | 3 month LIBOR | | 4.000 | | | (22,112 | ) | | | 134,847 | | | | (156,959 | ) |
| Credit Suisse First Boston Corp. | | | 3,600 | | | 12/17/29 | | 3 month LIBOR | | 4.000 | | | (39,801 | ) | | | 101,555 | | | | (141,356 | ) |
The accompanying notes are an integral part of these financial statements.
GOLDMAN SACHS SINGLE SECTOR FIXED INCOME FUNDS
Schedule of Investments (continued)
September 30, 2009 (Unaudited)
| |
| ADDITIONAL INVESTMENT INFORMATION (continued) | |
INTEREST RATE SWAP CONTRACTS — (continued)
| | | | | | | | | | | | | | | | | | | | | | | |
| | | | | | | | Rates Exchanged | | | | | Upfront
| | | | |
| | | Notional
| | | | | Payments
| | Payments
| | | | | Payments
| | | | |
| | | Amount
| | | Termination
| | received by
| | made by
| | Market
| | | made (received) by
| | | Unrealized
| |
| Swap Counterparty | | (000s) | | | Date | | the Fund | | the Fund | | Value | | | the Fund | | | Gain (Loss) | |
| | |
| Deutsche Bank Securities, Inc. | | $ | 6,300 | | | 12/17/12 | | 2.250% | | 3 month LIBOR | | $ | 25,205 | | | $ | (79,424 | ) | | $ | 104,629 | |
| | | | 3,600 | | | 12/16/14 | | 3.000 | | 3 month LIBOR | | | 31,958 | | | | (9,925 | ) | | | 41,883 | |
| | | | 9,400 | | | 09/05/17 | | 4.568 | | 3 month LIBOR | | | 158,046 | | | | — | | | | 158,046 | |
| | | | 5,500 | | | 09/06/22 | | 3 month LIBOR | | 4.710% | | | (152,419 | ) | | | — | | | | (152,419 | ) |
| | | | 1,200 | | | 12/16/24 | | 3 month LIBOR | | 3.750 | | | 11,665 | | | | 79,558 | | | | (67,893 | ) |
| | | | 400 | | | 12/17/29 | | 3 month LIBOR | | 4.000 | | | (4,423 | ) | | | 9,258 | | | | (13,681 | ) |
| JPMorgan Securities, Inc. | | | 4,000 | | | 12/16/19 | | 3 month LIBOR | | 3.500 | | | 17,943 | | | | 139,166 | | | | (121,223 | ) |
| | | | 1,800 | | | 12/16/24 | | 3 month LIBOR | | 3.750 | | | 17,497 | | | | 123,499 | | | | (106,002 | ) |
| | | | 3,000 | | | 12/16/24 | | 3 month LIBOR | | 3.750 | | | 29,162 | | | | 192,345 | | | | (163,183 | ) |
| |
| |
TOTAL | | | | | | | | | | | | $ | 117,359 | | | $ | 1,202,468 | | | $ | (1,085,109 | ) |
| |
| |
| |
| (a) | Represents forward starting interest rate swaps whose effective dates of commencement of accruals and cash flows occur subsequent to September 30, 2009. |
The accompanying notes are an integral part of these financial statements.
GOLDMAN SACHS SINGLE SECTOR FIXED INCOME FUNDS
| |
| ADDITIONAL INVESTMENT INFORMATION (continued) | |
JOINT REPURCHASE AGREEMENT ACCOUNT II — At September 30, 2009, the Funds had undivided interests in the Joint Repurchase Agreement Account II, as follows:
| | | | | |
| Fund | | Principal Amount | |
| | |
| Emerging Market Debt | | $ | 7,400,000 | |
|
| High Yield | | | 252,500,000 | |
|
| Investment Grade Credit | | | 7,100,000 | |
|
| Local Emerging Markets Debt | | | 52,900,000 | |
|
| U.S. Mortgages | | | 41,800,000 | |
|
REPURCHASE AGREEMENTS
| | | | | | | | | | | | | | | | | |
| | | Principal
| | | Interest
| | | Maturity
| | | Maturity
| |
| Counterparty | | Amount | | | Rate | | | Date | | | Value | |
| | |
| Banc of America Securities LLC | | $ | 1,033,500,000 | | | | 0.08 | % | | | 10/01/09 | | | $ | 1,033,502,297 | |
|
| Barclays Capital, Inc. | | | 800,000,000 | | | | 0.03 | | | | 10/01/09 | | | | 800,000,667 | |
|
| Barclays Capital, Inc. | | | 2,250,000,000 | | | | 0.04 | | | | 10/01/09 | | | | 2,250,002,500 | |
|
| Citigroup Global Markets, Inc. | | | 1,500,000,000 | | | | 0.06 | | | | 10/01/09 | | | | 1,500,002,500 | |
|
| Credit Suisse Securities (USA) LLC | | | 1,000,000,000 | | | | 0.03 | | | | 10/01/09 | | | | 1,000,000,833 | |
|
| Credit Suisse Securities (USA) LLC | | | 1,950,000,000 | | | | 0.07 | | | | 10/01/09 | | | | 1,950,003,792 | |
|
| Deutsche Bank Securities, Inc. | | | 300,000,000 | | | | 0.04 | | | | 10/01/09 | | | | 300,000,333 | |
|
| Deutsche Bank Securities, Inc. | | | 1,150,000,000 | | | | 0.08 | | | | 10/01/09 | | | | 1,150,002,556 | |
|
| JPMorgan Securities | | | 500,000,000 | | | | 0.04 | | | | 10/01/09 | | | | 500,000,556 | |
|
| JPMorgan Securities | | | 4,121,500,000 | | | | 0.07 | | | | 10/01/09 | | | | 4,121,508,014 | |
|
| Merrill Lynch & Co., Inc. | | | 950,000,000 | | | | 0.07 | | | | 10/01/09 | | | | 950,001,847 | |
|
| Morgan Stanley & Co. | | | 2,160,300,000 | | | | 0.05 | | | | 10/01/09 | | | | 2,160,303,000 | |
|
| RBS Securities, Inc. | | | 500,000,000 | | | | 0.07 | | | | 10/01/09 | | | | 500,000,972 | |
|
| UBS Securities LLC | | | 1,295,000,000 | | | | 0.08 | | | | 10/01/09 | | | | 1,295,002,878 | |
|
| Wachovia Capital Markets | | | 550,000,000 | | | | 0.07 | | | | 10/01/09 | | | | 550,001,069 | |
|
TOTAL | | | | | | | | | | | | | | $ | 20,060,333,814 | |
|
At September 30, 2009, the Joint Repurchase Agreement Account II was fully collateralized by:
| | | | | | | |
| Issuer | | Interest Rates | | Maturity Dates |
| |
| Federal Farm Credit Bank | | 3.800% to 6.900% | | | 11/04/09 to 08/03/37 | |
|
| Federal Home Loan Bank | | 0.820 to 6.640 | | | 10/02/09 to 03/14/36 | |
|
| Federal Home Loan Mortgage Corp. | | 0.000 to 15.000 | | | 10/13/09 to 10/01/39 | |
|
| Federal Home Loan Mortgage Corp. Interest-Only Stripped Securities | | 0.000 | | | 1/15/18 | |
|
| Federal National Mortgage Association | | 0.000 to 16.000 | | | 10/01/09 to 07/01/49 | |
|
| Federal National Mortgage Association Interest-Only Stripped Securities | | 0.000 | | | 05/15/20 | |
|
| Government National Mortgage Association | | 4.500 to 6.000 | | | 07/15/35 to 09/15/39 | |
|
| Tennessee Valley Authority Interest-Only Stripped Security | | 0.000 | | | 11/01/10 | |
|
| U.S. Treasury Inflation Protected Securities | | 0.625 to 4.250 | | | 01/15/10 to 01/15/15 | |
|
| U.S. Treasury Interest-Only Stripped Securities | | 0.000 | | | 11/30/09 to 08/15/19 | |
|
| U.S. Treasury Notes | | 1.750 to 7.250 | | | 08/31/11 to 02/15/18 | |
|
| U.S. Treasury Principal-Only Stripped Securities | | 0.000 | | | 11/15/09 to 08/15/17 | |
|
The aggregate market value of the collateral, including accrued interest, was $20,558,837,843.
The accompanying notes are an integral part of these financial statements.
GOLDMAN SACHS SINGLE SECTOR FIXED INCOME FUNDS
Statements of Assets and Liabilities
September 30, 2009 (Unaudited)
| | | | | | | | | |
| | | | | Emerging Markets
| | | |
| | | | | Debt Fund | | | |
|
| | | Assets: |
| | | | | | | | | |
| | | Investments in securities, at value (identified cost $186,941,435, $5,097,043,939, $480,995,433, $118,985,568 and $492,036,770, respectively) | | $ | 204,883,041 | | | |
| | | Repurchase agreement, at value which equals cost | | | 7,400,000 | | | |
| | | Cash | | | 1,124,782 | | | |
| | | Foreign currencies, at value (identified cost $8,383, $11,072,827, $0, $704 and $0, respectively) | | | 8,228 | | | |
| | | Receivables: | | | | | | |
| | | Fund shares sold | | | 5,957,178 | | | |
| | | Interest | | | 3,026,875 | | | |
| | | Due from broker — swap collateral | | | 750,000 | | | |
| | | Swap contracts, at value (includes upfront payments made (received) of $0, $0, ($69,160), $0 and $658,774, respectively) | | | 563,229 | | | |
| | | Investment securities sold, at value | | | 269,700 | | | |
| | | Forward foreign currency exchange contracts, at value | | | 84,639 | | | |
| | | Reimbursement from investment adviser | | | 11,719 | | | |
| | | Due from broker — variation margin, at value | | | — | | | |
| | | Foreign tax reclaims, at value | | | — | | | |
| | | Other assets, at value | | | 378 | | | |
| | | |
| | | |
| | | Total assets | | | 224,079,769 | | | |
| | | |
| | | |
| | | | | | | | | |
| | | | | | | | | |
|
| | | Liabilities: |
| | | | | | | | | |
| | | Due to Custodian | | | — | | | |
| | | Payables: | | | | | | |
| | | Investment securities purchased, at value | | | 2,424,550 | | | |
| | | Fund shares redeemed | | | 1,759,122 | | | |
| | | Distributions payable | | | 199,644 | | | |
| | | Amounts owed to affiliates | | | 161,652 | | | |
| | | Swap contracts, at value (includes upfront payments made (received) of $0, $0, $356,023, $0 and $543,694, respectively) | | | 128,408 | | | |
| | | Forward foreign currency exchange contracts, at value | | | 91,606 | | | |
| | | Due to broker — variation margin, at value | | | — | | | |
| | | Due to broker — swap collateral | | | — | | | |
| | | Due to broker — forward foreign currency exchange contracts collateral | | | — | | | |
| | | Due to broker — upfront payment | | | — | | | |
| | | Forward sale contracts, at value (proceeds receivable $0, $0, $0, $0 and $9,211,016, respectively) | | | — | | | |
| | | Accrued expenses and other liabilities | | | 121,990 | | | |
| | | |
| | | |
| | | Total liabilities | | | 4,886,972 | | | |
| | | |
| | | |
| | | | | | | | | |
| | | | | | | | | |
|
| | | Net Assets: |
| | | | | | | | | |
| | | Paid-in capital | | | 229,931,868 | | | |
| | | Accumulated undistributed (distribution in excess of) net investment income | | | 2,745,330 | | | |
| | | Accumulated net realized loss from investment, futures, swap and foreign currency related transactions | | | (31,861,958 | ) | | |
| | | Net unrealized gain (loss) on investments, futures, swaps and translation of assets and liabilities denominated in foreign currencies | | | 18,377,557 | | | |
| | | |
| | | |
| | | NET ASSETS | | $ | 219,192,797 | | | |
| |
| |
| | | | | | | | | |
| | | Net Assets: | | | | | | |
| | | Class A | | $ | 65,546,115 | | | |
| | | Class B | | | — | | | |
| | | Class C | | | 4,511,844 | | | |
| | | Institutional | | | 149,134,838 | | | |
| | | Service | | | — | | | |
| | | Separate Account Institutional Shares | | | — | | | |
| | | Class IR | | | — | | | |
| | | Class R | | | — | | | |
| |
| |
| | | | | | | | | |
| | | | | | | | | |
| | | Total Net Assets | | $ | 219,192,797 | | | |
| |
| |
| | | Shares Outstanding $0.001 par value (unlimited shares authorized): | | | | | | |
| | | Class A | | | 5,626,846 | | | |
| | | Class B | | | — | | | |
| | | Class C | | | 388,473 | | | |
| | | Institutional | | | 12,794,333 | | | |
| | | Service | | | — | | | |
| | | Separate Account Institutional Shares | | | — | | | |
| | | Class IR | | | — | | | |
| | | Class R | | | — | | | |
| |
| |
| | | Net asset value, offering and redemption price per share:(a) | | | | | | |
| | | Class A | | | $11.65 | | | |
| | | Class B | | | — | | | |
| | | Class C | | | 11.61 | | | |
| | | Institutional | | | 11.66 | | | |
| | | Service | | | — | | | |
| | | Separate Account Institutional Shares | | | — | | | |
| | | Class IR | | | — | | | |
| | | Class R | | | — | | | |
| |
| |
| |
| (a) | Maximum public offering price per share for Class A shares of Emerging Markets Debt, High Yield and Local Emerging Markets Debt Funds (NAV per share multiplied by 1.0471), Investment Grade Credit and U.S. Mortgages Funds (NAV per share multiplied by 1.0390) is $12.20, $7.05, $9.31, $9.34 and $10.16, respectively. At redemption, Class B and Class C shares may be subject to a contingent deferred sales charge, assessed on the amount equal to the lesser of the current net asset value or the original purchase price of the shares. |
The accompanying notes are an integral part of these financial statements.
GOLDMAN SACHS SINGLE SECTOR FIXED INCOME FUNDS
| | | | | | | | | | | | | | | | | | | |
| | | High Yield
| | | Investment Grade
| | | Local Emerging
| | | U.S. Mortgages
| | | |
| | | Fund | | | Credit Fund | | | Markets Debt Fund | | | Fund | | | |
|
| | | |
| | | | | | | | | | | | | | | | | | | |
| | | $ | 5,113,276,532 | | | $ | 501,714,837 | | | $ | 116,718,201 | | | $ | 479,885,884 | | | |
| | | | 252,500,000 | | | | 7,100,000 | | | | 52,900,000 | | | | 41,800,000 | | | |
| | | | 9,345,175 | | | | 18,752 | | | | — | | | | 711,543 | | | |
| | | | 11,072,813 | | | | — | | | | 642 | | | | — | | | |
| | | | | | | | | | | | | | | | | | | |
| | | | 28,881,093 | | | | 3,109,826 | | | | 6,591,497 | | | | 88,815 | | | |
| | | | 121,482,483 | | | | 6,952,863 | | | | 2,189,273 | | | | 1,807,612 | | | |
| | | | — | | | | — | | | | — | | | | — | | | |
| | | | — | | | | 1,821,014 | | | | — | | | | 967,118 | | | |
| | | | 6,362,258 | | | | 5,223,423 | | | | 2,781,491 | | | | 221,292,280 | | | |
| | | | 761,254 | | | | — | | | | 552,513 | | | | — | | | |
| | | | 70,446 | | | | 30,490 | | | | 52,303 | | | | 63,245 | | | |
| | | | — | | | | 65,800 | | | | — | | | | — | | | |
| | | | 18,122 | | | | — | | | | — | | | | — | | | |
| | | | 214,271 | | | | 535 | | | | 4,126 | | | | 306 | | | |
| | | |
| | | |
| | | | 5,543,984,447 | | | | 526,037,540 | | | | 181,790,046 | | | | 746,616,803 | | | |
| | | |
| | | |
| | | | | | | | | | | | | | | | | | | |
| | | | | | | | | | | | | | | | | | | |
|
| | | |
| | | | | | | | | | | | | | | | | | | |
| | | | — | | | | — | | | | 3,899,442 | | | | — | | | |
| | | | | | | | | | | | | | | | | | | |
| | | | 13,713,507 | | | | 13,138,784 | | | | 7,173,199 | | | | 272,820,108 | | | |
| | | | 24,561,193 | | | | 3,594,122 | | | | 153,702 | | | | 6,111,277 | | | |
| | | | 10,607,301 | | | | 641,055 | | | | 16,407 | | | | 464,853 | | | |
| | | | 3,504,382 | | | | 187,072 | | | | 124,557 | | | | 132,959 | | | |
| | | | — | | | | 758,337 | | | | 104,866 | | | | 849,759 | | | |
| | | | 26,137,618 | | | | 92,951 | | | | 147,329 | | | | — | | | |
| | | | — | | | | — | | | | — | | | | 13,860 | | | |
| | | | — | | | | 1,150,000 | | | | — | | | | 100,000 | | | |
| | | | 320,000 | | | | — | | | | — | | | | — | | | |
| | | | — | | | | 127,445 | | | | — | | | | — | | | |
| | | | — | | | | — | | | | — | | | | 9,298,125 | | | |
| | | | 473,922 | | | | 151,130 | | | | 158,255 | | | | 194,480 | | | |
| | | |
| | | |
| | | | 79,317,923 | | | | 19,840,896 | | | | 11,777,757 | | | | 289,985,421 | | | |
| | | |
| | | |
| | | | | | | | | | | | | | | | | | | |
| | | | | | | | | | | | | | | | | | | |
|
| | | |
| | | | | | | | | | | | | | | | | | | |
| | | | 5,690,115,599 | | | | 516,643,141 | | | | 185,836,874 | | | | 490,015,493 | | | |
| | | | 6,875,292 | | | | 97,571 | | | | (10,927,451 | ) | | | (559,205 | ) | | |
| | | | (223,938,070 | ) | | | (31,750,624 | ) | | | (2,983,596 | ) | | | (19,647,701 | ) | | |
| | | | (8,386,297 | ) | | | 21,206,556 | | | | (1,913,538 | ) | | | (13,177,205 | ) | | |
| | | |
| | | |
| | | $ | 5,464,666,524 | | | $ | 506,196,644 | | | $ | 170,012,289 | | | $ | 456,631,382 | | | |
| |
| |
| | | | | | | | | | | | | | | | | | | |
| | | | | | | | | | | | | | | | | | | |
| | | $ | 1,191,746,983 | | | $ | 157,313,562 | | | $ | 30,000,516 | | | $ | 6,794,925 | | | |
| | | | 66,884,066 | | | | — | | | | — | | | | — | | | |
| | | | 107,851,376 | | | | — | | | | 341,575 | | | | — | | | |
| | | | 4,077,156,076 | | | | 138,751,866 | | | | 139,670,198 | | | | 99,393,978 | | | |
| | | | 20,408,765 | | | | — | | | | — | | | | — | | | |
| | | | — | | | | 210,131,216 | | | | — | | | | 350,442,479 | | | |
| | | | 10,393 | | | | — | | | | — | | | | — | | | |
| | | | 608,865 | | | | — | | | | — | | | | — | | | |
| |
| |
| | | | | | | | | | | | | | | | | | | |
| | | | | | | | | | | | | | | | | | | |
| | | $ | 5,464,666,524 | | | $ | 506,196,644 | | | $ | 170,012,289 | | | $ | 456,631,382 | | | |
| |
| |
| | | | | | | | | | | | | | | | | | | |
| | | | 177,044,619 | | | | 17,504,824 | | | | 3,374,840 | | | | 694,920 | | | |
| | | | 9,914,797 | | | | — | | | | — | | | | — | | | |
| | | | 16,001,483 | | | | — | | | | 38,404 | | | | — | | | |
| | | | 604,058,356 | | | | 15,439,676 | | | | 15,714,748 | | | | 10,153,102 | | | |
| | | | 3,033,232 | | | | — | | | | — | | | | — | | | |
| | | | — | | | | 23,375,153 | | | | — | | | | 35,826,032 | | | |
| | | | 1,543 | | | | — | | | | — | | | | — | | | |
| | | | 90,460 | | | | — | | | | — | | | | — | | | |
| |
| |
| | | | | | | | | | | | | | | | | | | |
| | | | $6.73 | | | | $8.99 | | | | $8.89 | | | | $9.78 | | | |
| | | | 6.75 | | | | — | | | | — | | | | — | | | |
| | | | 6.74 | | | | — | | | | 8.89 | | | | — | | | |
| | | | 6.75 | | | | 8.99 | | | | 8.89 | | | | 9.79 | | | |
| | | | 6.73 | | | | — | | | | — | | | | — | | | |
| | | | — | | | | 8.99 | | | | — | | | | 9.78 | | | |
| | | | 6.74 | | | | — | | | | — | | | | — | | | |
| | | | 6.73 | | | | — | | | | — | | | | — | | | |
| |
| |
The accompanying notes are an integral part of these financial statements.
GOLDMAN SACHS SINGLE SECTOR FIXED INCOME FUNDS
Statements of Operations
For the Six Months Ended September 30, 2009 (Unaudited)
| | | | | | | |
| | | | | Emerging Markets
| |
| | | | | Debt Fund | |
| |
|
| | | Investment income: |
| | | | | | | |
| | | Interest — net of allowances | | $ | 6,885,563 | |
| | | Dividends | | | — | |
| | | |
| | | |
| | | Total investment income | | | 6,885,563 | |
| | | |
| | | |
| | | | | | | |
| | | | | | | |
|
| | | Expenses: |
| | | | | | | |
| | | Management fees | | | 720,002 | |
| | | Distribution and Service fees(b) | | | 79,063 | |
| | | Transfer Agent fees(b) | | | 60,963 | |
| | | Professional fees | | | 43,160 | |
| | | Custody and accounting fees | | | 25,955 | |
| | | Printing fees | | | 9,479 | |
| | | Trustee fees | | | 8,400 | |
| | | Registration fees | | | 7,524 | |
| | | Account Service Fee(b) | | | — | |
| | | Service share fees — Shareholder Administration Plan | | | — | |
| | | Service share fees — Service Plan | | | — | |
| | | Other | | | 6,848 | |
| | | |
| | | |
| | | Total expenses | | | 961,394 | |
| | | |
| | | |
| | | Less — expense reductions | | | (61,174 | ) |
| | | |
| | | |
| | | Net expenses | | | 900,220 | |
| | | |
| | | |
| | | NET INVESTMENT INCOME | | | 5,985,343 | |
| | | |
| | | |
| | | | | | | |
| | | | | | | |
|
| | | Realized and unrealized gain (loss) from investment, futures, swap and foreign currency related transactions: |
| | | | | | | |
| | | Net realized gain (loss) from: | | | | |
| | | Investment transactions | | | (2,479,541 | ) |
| | | Futures transactions | | | 296,924 | |
| | | Swap contracts | | | 1,865,842 | |
| | | Foreign currency related transactions | | | (188,307 | ) |
| | | Net change in unrealized gain (loss) on: | | | | |
| | | Investments | | | 43,113,568 | |
| | | Futures | | | — | |
| | | Swap contracts | | | (664,919 | ) |
| | | Translation of assets and liabilities denominated in foreign currencies | | | 128,291 | |
| | | |
| | | |
| | | Net realized and unrealized gain from investment, futures, swap and foreign currency related transactions | | | 42,071,858 | |
| | | |
| | | |
| | | NET INCREASE IN NET ASSETS RESULTING FROM OPERATIONS | | $ | 48,057,201 | |
| | | |
| | | |
| | |
| (a) | | Net of $14,467 in foreign withholding tax for the High Yield Fund. |
| | |
| (b) | | Class specific Distribution and Service, Transfer Agent and Account Service fees were as follows: |
| | | | | | | | | | | | | | | | | | | | | | | | | | | | | | | | | | | | | | | | | | | | | | | | | | | | | | | | | |
| | | Distribution and Service Fees | | | Transfer Agent Fees | | | Account Service Fee | |
| | | | | | | | | | | | | | | | | | | | | | | | | | | | | | Separate
| | | | | | | | | | | | | |
| | | | | | | | | | | | | | | | | | | | | | | | | | | | | | Account
| | | | | | | | | | | | | |
Fund | | Class A | | | Class B | | | Class C | | | Class R | | | Class A | | | Class B | | | Class C | | | Institutional | | | Service | | | Institutional | | | Class IR | | | Class R | | | Class A | | | Institutional | |
| Emerging Markets Debt | | $ | 66,103 | | | $ | — | | | $ | 12,960 | | | $ | — | | | $ | 34,373 | | | $ | — | | | $ | 1,685 | | | $ | 24,905 | | | $ | — | | | $ | — | | | $ | — | | | $ | — | | | $ | — | | | $ | — | |
| High Yield | | | 1,981,153 | | | | 311,401 | | | | 467,087 | | | | 785 | | | | 1,030,200 | | | | 40,482 | | | | 60,721 | | | | 656,996 | | | | 3,380 | | | | — | | | | 6 | | | | 204 | | | | — | | | | — | |
| Investment Grade Credit | | | 137,450 | | | | — | | | | — | | | | — | | | | 71,474 | | | | — | | | | — | | | | 14,670 | | | | — | | | | 38,502 | | | | — | | | | — | | | | 27,490 | | | | 18,337 | |
| Local Emerging Markets Debt | | | 28,515 | | | | — | | | | 677 | | | | — | | | | 14,828 | | | | — | | | | 88 | | | | 22,449 | | | | — | | | | — | | | | — | | | | — | | | | — | | | | — | |
| U.S. Mortgages | | | 8,577 | | | | — | | | | — | | | | — | | | | 4,461 | | | | — | | | | — | | | | 19,336 | | | | — | | | | 75,314 | | | | — | | | | — | | | | 1,715 | | | | 24,171 | |
The accompanying notes are an integral part of these financial statements.
GOLDMAN SACHS SINGLE SECTOR FIXED INCOME FUNDS
| | | | | | | | | | | | | | | | | |
| | | High Yield
| | | Investment Grade
| | | Local Emerging
| | | U.S. Mortgages
| |
| | | Fund | | | Credit Fund | | | Markets Debt Fund | | | Fund | |
| |
| | | | | | | | | | | | | | | | | |
| |
|
| | | |
| | | | | | | | | | | | | | | | | |
| | | $ | 248,838,879 | (a) | | $ | 11,275,060 | | | $ | 4,224,903 | | | $ | 11,325,305 | |
| | | | 413,794 | | | | — | | | | — | | | | — | |
| | | |
| | | |
| | | | 249,252,673 | | | | 11,275,060 | | | | 4,224,903 | | | | 11,325,305 | |
| | | |
| | | |
| | | | | | | | | | | | | | | | | |
| | | | | | | | | | | | | | | | | |
|
| | | |
| | | | | | | | | | | | | | | | | |
| | | | 16,557,343 | | | | 751,638 | | | | 608,355 | | | | 960,234 | |
| | | | 2,760,426 | | | | 137,450 | | | | 29,192 | | | | 8,577 | |
| | | | 1,791,989 | | | | 124,646 | | | | 37,365 | | | | 99,111 | |
| | | | 71,905 | | | | 44,111 | | | | 75,481 | | | | 54,657 | |
| | | | 234,401 | | | | 33,469 | | | | 70,048 | | | | 105,599 | |
| | | | 75,545 | | | | 13,291 | | | | 18,641 | | | | 16,033 | |
| | | | 8,400 | | | | 8,400 | | | | 8,400 | | | | 8,400 | |
| | | | 65,120 | | | | 10,000 | | | | 33,922 | | | | 7,724 | |
| | | | — | | | | 45,827 | | | | — | | | | 25,886 | |
| | | | 21,123 | | | | — | | | | — | | | | — | |
| | | | 21,123 | | | | — | | | | — | | | | — | |
| | | | 248,887 | | | | 10,795 | | | | 38,946 | | | | 19,148 | |
| | | |
| | | |
| | | | 21,856,262 | | | | 1,179,627 | | | | 920,350 | | | | 1,305,369 | |
| | | |
| | | |
| | | | (97,224 | ) | | | (267,861 | ) | | | (195,430 | ) | | | (414,210 | ) |
| | | |
| | | |
| | | | 21,759,038 | | | | 911,766 | | | | 724,920 | | | | 891,159 | |
| | | |
| | | |
| | | | 227,493,635 | | | | 10,363,294 | | | | 3,499,983 | | | | 10,434,146 | |
| | | |
| | | |
| | | | | | | | | | | | | | | | | |
| | | | | | | | | | | | | | | | | |
|
| | | |
| | | | | | | | | | | | | | | | | |
| | | | | | | | | | | | | | | | | |
| | | | (102,153,065 | ) | | | 760,300 | | | | (1,019,954 | ) | | | (4,154,581 | ) |
| | | | — | | | | 1,455,503 | | | | — | | | | 491,843 | |
| | | | — | | | | 514,267 | | | | 877,113 | | | | 2,974,650 | |
| | | | (44,091,142 | ) | | | (30,662 | ) | | | 4,035,575 | | | | — | |
| | | | | | | | | | | | | | | | | |
| | | | | | | | | | | | | | | | | |
| | | | | | | | | | | | | | | | | |
| | | | 1,428,323,812 | | | | 54,317,894 | | | | 24,524,711 | | | | 28,694,472 | |
| | | | — | | | | (394,864 | ) | | | — | | | | 56,368 | |
| | | | — | | | | (2,268,959 | ) | | | (880,199 | ) | | | (2,206,160 | ) |
| | | | (15,195,779 | ) | | | (67,029 | ) | | | (290,370 | ) | | | — | |
| | | |
| | | |
| | | | | | | | | | | | | | | | | |
| | | | | | | | | | | | | | | | | |
| | | | 1,266,883,826 | | | | 54,286,450 | | | | 27,246,876 | | | | 25,856,592 | |
| | | |
| | | |
| | | $ | 1,494,377,461 | | | $ | 64,649,744 | | | $ | 30,746,859 | | | $ | 36,290,738 | |
| | | |
| | | |
The accompanying notes are an integral part of these financial statements.
GOLDMAN SACHS SINGLE SECTOR FIXED INCOME FUNDS
Statements of Changes in Net Assets
| | | | | | | | | | | |
| | | | | Emerging Markets Debt Fund | |
| | | | | For the
| | | | |
| | | | | Six Months Ended
| | | For the Fiscal
| |
| | | | | September 30, 2009
| | | Year Ended
| |
| | | | | (Unaudited) | | | March 31, 2009 | |
| |
|
| | | From operations: |
| | | | | | | | | | | |
| | | Net investment income | | $ | 5,985,343 | | | $ | 13,452,110 | |
| | | Net realized gain (loss) from investment, futures, swap and foreign currency related transactions | | | (505,082 | ) | | | (29,496,727 | ) |
| | | Net change in unrealized gain (loss) on investments, futures, swaps and translation of assets and liabilities denominated in foreign currencies | | | 42,576,940 | | | | (22,226,490 | ) |
| | | |
| | | |
| | | Net increase (decrease) in net assets resulting from operations | | | 48,057,201 | | | | (38,271,107 | ) |
| | | |
| | | |
| | | | | | | | | | | |
| | | | | | | | | | | |
|
| | | Distributions to shareholders: |
| | | | | | | | | | | |
| | | From net investment income | | | | | | | | |
| | | Class A Shares | | | (1,772,076 | ) | | | (3,634,292 | ) |
| | | Class B Shares | | | — | | | | — | |
| | | Class C Shares | | | (75,845 | ) | | | (89,183 | ) |
| | | Institutional Shares | | | (4,416,973 | ) | | | (7,749,936 | ) |
| | | Service Shares | | | — | | | | — | |
| | | Separate Account Institutional Shares | | | — | | | | — | |
| | | Class IR Shares | | | — | | | | — | |
| | | Class R Shares | | | — | | | | — | |
| | | From net realized gains | | | | | | | | |
| | | Class A Shares | | | — | | | | (246,033 | ) |
| | | Class C Shares | | | — | | | | (8,518 | ) |
| | | Institutional Shares | | | — | | | | (539,055 | ) |
| | | From capital | | | | | | | | |
| | | Class A Shares | | | — | | | | — | |
| | | Class C Shares | | | — | | | | — | |
| | | Institutional Shares | | | — | | | | — | |
| | | |
| | | |
| | | Total distributions to shareholders | | | (6,264,894 | ) | | | (12,267,017 | ) |
| | | |
| | | |
| | | | | | | | | | | |
| | | | | | | | | | | |
|
| | | From share transactions: |
| | | | | | | | | | | |
| | | Net proceeds from sales of shares | | | 76,259,167 | | | | 95,945,617 | |
| | | Reinvestment of distributions | | | 5,506,135 | | | | 11,676,381 | |
| | | Cost of shares redeemed | | | (56,214,949 | )(a) | | | (140,008,996 | )(a) |
| | | |
| | | |
| | | Net increase (decrease) in net assets resulting from share transactions | | | 25,550,353 | | | | (32,386,998 | ) |
| | | |
| | | |
| | | TOTAL INCREASE (DECREASE) | | | 67,342,660 | | | | (82,925,122 | ) |
| | | |
| | | |
| | | | | | | | | | | |
| | | | | | | | | | | |
|
| | | Net assets: |
| | | | | | | | | | | |
| | | Beginning of period | | | 151,850,137 | | | | 234,775,259 | |
| | | |
| | | |
| | | End of period | | $ | 219,192,797 | | | $ | 151,850,137 | |
| | | |
| | | |
| | | Accumulated undistributed (distribution in excess of) net investment income | | $ | 2,745,330 | | | $ | 3,024,881 | |
| | | |
| | | |
| | |
| (a) | | Net of $1,044 and $36,350, $812,788 and $708,360, and $506 and $804 redemption fees for Emerging Markets Debt Fund, High Yield Fund and Local Emerging Markets Debt Fund, respectively, for the six months ended September 30, 2009 and fiscal year ended March 31, 2009, respectively. |
The accompanying notes are an integral part of these financial statements.
GOLDMAN SACHS SINGLE SECTOR FIXED INCOME FUNDS
| | | | | | | | | | | | | | | | | | | | | | | | | |
| | | High Yield Fund | | | Investment Grade Credit Fund | | | Local Emerging Markets Debt Fund | |
| | | For the
| | | | | | For the
| | | | | | For the
| | | | |
| | | Six Months Ended
| | | For the Fiscal
| | | Six Months Ended
| | | For the Fiscal
| | | Six Months Ended
| | | For the Fiscal
| |
| | | September 30, 2009
| | | Year Ended
| | | September 30, 2009
| | | Year Ended
| | | September 30, 2009
| | | Year Ended
| |
| | | (Unaudited) | | | March 31, 2009 | | | (Unaudited) | | | March 31, 2009 | | | (Unaudited) | | | March 31, 2009 | |
| |
|
| | | |
| | | | | | | | | | | | | | | | | | | | | | | | | |
| | | $ | 227,493,635 | | | $ | 321,117,208 | | | $ | 10,363,294 | | | $ | 15,472,979 | | | $ | 3,499,983 | | | $ | 7,784,909 | |
| | | | (146,244,207 | ) | | | (50,898,993 | ) | | | 2,699,408 | | | | (30,864,104 | ) | | | 3,892,734 | | | | (22,315,778 | ) |
| | | | | | | | | | | | | | | | | | | | | | | | | |
| | | | 1,413,128,033 | | | | (1,057,319,856 | ) | | | 51,587,042 | | | | (20,425,778 | ) | | | 23,354,142 | | | | (24,672,952 | ) |
| | | |
| | | |
| | | | 1,494,377,461 | | | | (787,101,641 | ) | | | 64,649,744 | | | | (35,816,903 | ) | | | 30,746,859 | | | | (39,203,821 | ) |
| | | |
| | | |
| | | | | | | | | | | | | | | | | | | | | | | | | |
| | | | | | | | | | | | | | | | | | | | | | | | | |
|
| | | |
| | | | | | | | | | | | | | | | | | | | | | | | | |
| | | | | | | | | | | | | | | | | | | | | | | | | |
| | | | (67,658,151 | ) | | | (149,941,677 | ) | | | (2,818,815 | ) | | | (1,123,084 | ) | | | (577,818 | ) | | | (516,298 | ) |
| | | | (2,373,824 | ) | | | (6,081,253 | ) | | | — | | | | — | | | | — | | | | — | |
| | | | (3,549,724 | ) | | | (7,132,100 | ) | | | — | | | | — | | | | (3,143 | ) | | | (1,557 | ) |
| | | | (141,338,747 | ) | | | (163,011,041 | ) | | | (1,980,870 | ) | | | (840,876 | ) | | | (3,057,066 | ) | | | (2,656,210 | ) |
| | | | (692,698 | ) | | | (1,125,704 | ) | | | — | | | | — | | | | — | | | | — | |
| | | | — | | | | — | | | | (5,443,573 | ) | | | (14,734,719 | ) | | | — | | | | — | |
| | | | (393 | ) | | | (813 | ) | | | — | | | | — | | | | — | | | | — | |
| | | | (12,582 | ) | | | (7,146 | ) | | | — | | | | — | | | | — | | | | — | |
| | | | | | | | | | | | | | | | | | | | | | | | | |
| | | | — | | | | — | | | | — | | | | — | | | | — | | | | — | |
| | | | — | | | | — | | | | — | | | | — | | | | — | | | | — | |
| | | | — | | | | — | | | | — | | | | — | | | | — | | | | — | |
| | | | | | | | | | | | | | | | | | | | | | | | | |
| | | | — | | | | — | | | | — | | | | — | | | | — | | | | (695,397 | ) |
| | | | — | | | | — | | | | — | | | | — | | | | — | | | | (2,097 | ) |
| | | | — | | | | — | | | | — | | | | — | | | | — | | | | (3,577,628 | ) |
| | | |
| | | |
| | | | (215,626,119 | ) | | | (327,299,734 | ) | | | (10,243,258 | ) | | | (16,698,679 | ) | | | (3,638,027 | ) | | | (7,449,187 | ) |
| | | |
| | | |
| | | | | | | | | | | | | | | | | | | | | | | | | |
| | | | | | | | | | | | | | | | | | | | | | | | | |
|
| | | |
| | | | | | | | | | | | | | | | | | | | | | | | | |
| | | | 2,852,964,560 | | | | 2,771,772,782 | | | | 272,592,337 | | | | 142,531,774 | | | | 60,125,556 | | | | 174,213,205 | |
| | | | 142,963,590 | | | | 248,846,070 | | | | 7,232,053 | | | | 13,232,110 | | | | 3,560,416 | | | | 7,257,644 | |
| | | | (2,573,138,833 | )(a) | | | (1,626,469,527 | )(a) | | | (75,031,361 | ) | | | (102,417,544 | ) | | | (39,074,437 | )(a) | | | (78,566,664 | )(a) |
| | | |
| | | |
| | | | 422,789,317 | | | | 1,394,149,325 | | | | 204,793,029 | | | | 53,346,340 | | | | 24,611,535 | | | | 102,904,185 | |
| | | |
| | | |
| | | | 1,701,540,659 | | | | 279,747,950 | | | | 259,199,515 | | | | 830,758 | | | | 51,720,367 | | | | 56,251,177 | |
| | | |
| | | |
| | | | | | | | | | | | | | | | | | | | | | | | | |
| | | | | | | | | | | | | | | | | | | | | | | | | |
|
| | | |
| | | | | | | | | | | | | | | | | | | | | | | | | |
| | | | 3,763,125,865 | | | | 3,483,377,915 | | | | 246,997,129 | | | | 246,166,371 | | | | 118,291,922 | | | | 62,040,745 | |
| | | |
| | | |
| | | $ | 5,464,666,524 | | | $ | 3,763,125,865 | | | $ | 506,196,644 | | | $ | 246,997,129 | | | $ | 170,012,289 | | | $ | 118,291,922 | |
| | | |
| | | |
| | | $ | 6,875,292 | | | $ | (4,992,224 | ) | | $ | 97,571 | | | $ | (22,465 | ) | | $ | (10,927,451 | ) | | $ | (10,789,407 | ) |
| | | |
| | | |
The accompanying notes are an integral part of these financial statements.
GOLDMAN SACHS SINGLE SECTOR FIXED INCOME FUNDS
Statements of Changes in Net Assets
| | | | | | | | | | | |
| | | | | U.S. Mortgages Fund | |
| | | | | For the
| | | | |
| | | | | Six Months Ended
| | | For the Fiscal
| |
| | | | | September 30, 2009
| | | Year Ended
| |
| | | | | (Unaudited) | | | March 31, 2009 | |
| |
|
| | | From operations: |
| | | | | | | | | | | |
| | | Net investment income | | $ | 10,434,146 | | | $ | 32,006,684 | |
| | | Net realized loss from investment, futures and swap transactions | | | (688,088 | ) | | | (15,960,434 | ) |
| | | Net change in unrealized gain (loss) on investments, futures and swaps | | | 26,544,680 | | | | (13,083,008 | ) |
| | | |
| | | |
| | | Net increase in net assets resulting from operations | | | 36,290,738 | | | | 2,963,242 | |
| | | |
| | | |
| | | | | | | | | | | |
| | | | | | | | | | | |
|
| | | Distributions to shareholders: |
| | | | | | | | | | | |
| | | From net investment income | | | | | | | | |
| | | Class A Shares | | | (141,418 | ) | | | (306,002 | ) |
| | | Institutional Shares | | | (2,209,817 | ) | | | (11,338,182 | ) |
| | | Separate Account Institutional Shares | | | (8,723,806 | ) | | | (22,308,954 | ) |
| | | From net realized gains | | | | | | | | |
| | | Class A Shares | | | — | | | | (55,345 | ) |
| | | Institutional Shares | | | — | | | | (2,170,124 | ) |
| | | Separate Account Institutional Shares | | | — | | | | (3,511,695 | ) |
| | | |
| | | |
| | | Total distributions to shareholders | | | (11,075,041 | ) | | | (39,690,302 | ) |
| | | |
| | | |
| | | | | | | | | | | |
| | | | | | | | | | | |
|
| | | From share transactions: |
| | | | | | | | | | | |
| | | Net proceeds from sales of shares | | | 67,148,309 | | | | 308,690,073 | |
| | | Reinvestment of distributions | | | 8,017,543 | | | | 29,100,597 | |
| | | Cost of shares redeemed | | | (168,504,507 | ) | | | (454,760,094 | ) |
| | | |
| | | |
| | | Net decrease in net assets resulting from share transactions | | | (93,338,655 | ) | | | (116,969,424 | ) |
| | | |
| | | |
| | | TOTAL DECREASE | | | (68,122,958 | ) | | | (153,696,484 | ) |
| | | |
| | | |
| | | | | | | | | | | |
| | | | | | | | | | | |
|
| | | Net assets: |
| | | | | | | | | | | |
| | | Beginning of period | | | 524,754,340 | | | | 678,450,824 | |
| | | |
| | | |
| | | End of period | | $ | 456,631,382 | | | $ | 524,754,340 | |
| | | |
| | | |
| | | Accumulated undistributed (distribution in excess of) net investment income | | $ | (559,205 | ) | | $ | 81,690 | |
| | | |
| | | |
The accompanying notes are an integral part of these financial statements.
GOLDMAN SACHS SINGLE SECTOR FIXED INCOME FUNDS
Notes to Financial Statements
September 30, 2009 (Unaudited)
1. ORGANIZATION
Goldman Sachs Trust (the “Trust”) is a Delaware statutory trust registered under the Investment Company Act of 1940, as amended (the “Act”), as an open-end management investment company. The following table lists those series of the Trust that are included in this report (collectively, the “Funds” or individually a “Fund”), along with their corresponding share classes and respective diversification status under the Act:
| | | | | |
| | | | | Diversified/
|
| Fund | | Share Classes Offered | | Non-diversified |
| |
| Emerging Markets Debt, Local Emerging Markets Debt | | A, C and Institutional | | Non-diversified |
| |
| |
| High Yield | | A, B, C, Institutional, Service, IR and R | | Diversified |
| |
| |
| Investment Grade Credit, U.S. Mortgages | | A, Institutional and Separate Account Institutional | | Diversified |
| |
| |
Class A Shares of the Emerging Markets Debt, High Yield, Investment Grade Credit, Local Emerging Markets Debt and U.S. Mortgages Funds are sold with a front-end sales charge of up to 4.50%, 4.50%, 3.75%, 4.50% and 3.75%, respectively. Prior to July 29, 2009, the maximum Class A front-end sales charges for the Investment Grade Credit and U.S. Mortgages Funds were 4.50%. The contingent deferred sales charge for Class B Shares is 5.00% maximum declining to zero after six years for High Yield, depending upon the period of time the shares are held. Effective November 2, 2009, the High Yield Fund’s Class B Shares will no longer be available for purchase by new or existing shareholders (although current Class B shareholders may continue to reinvest income and capital gain distributions into Class B Shares and Class B shareholders may continue to exchange their shares for Class B Shares of certain other Goldman Sachs Funds). Class C Shares of the Funds are sold with a contingent deferred sales charge of 1.00% during the first 12 months. Institutional, Service, Separate Account Institutional, Class IR and Class R Shares of the Funds are not subject to a sales charge. Goldman, Sachs & Co. (“Goldman Sachs” or the “Distributor”) serves as Distributor of the shares of the Funds pursuant to a Distribution Agreement. Goldman Sachs may retain a portion of such sales charges it receives as Distributor.
Goldman Sachs Asset Management, L.P., (“GSAM”), an affiliate of Goldman Sachs, serves as investment adviser to each Fund pursuant to a management agreement (the “Agreement”) with the Trust on behalf of the Funds.
2. SIGNIFICANT ACCOUNTING POLICIES
The following is a summary of the significant accounting policies consistently followed by the Funds. The preparation of financial statements in conformity with accounting principles generally accepted in the United States of America (“GAAP”) requires management to make estimates and assumptions that may affect the amounts and disclosures in the financial statements. Actual results could differ from those estimates and assumptions.
A. FASB Financial Accounting Standards Codification — In July 2009, the Financial Accounting Standards Board (“FASB”) launched its “Financial Accounting Standards Codification” (the “Codification”) as the single source of GAAP. While the Codification does not change GAAP, it introduces a new structure to the accounting literature and changes references to accounting standards and other authoritative accounting guidance that have been reflected in the accompanying Notes to Financial Statements.
GOLDMAN SACHS SINGLE SECTOR FIXED INCOME FUNDS
Notes to Financial Statements (continued)
September 30, 2009 (Unaudited)
| |
| 2. SIGNIFICANT ACCOUNTING POLICIES (continued) | |
B. Investment Valuation — The investment valuation policy of the Funds is to value investments at market value. Debt securities for which market quotations are readily available are valued on the basis of quotations furnished by an independent pricing service approved by the trustees or provided by securities dealers. The pricing services may use valuation models or matrix pricing, which consider (i) yield or price with respect to bonds that are considered comparable in characteristics such as rating, interest rate and maturity date or (ii) quotations from bond dealers, to determine current value. If accurate quotations are not readily available, or if GSAM believes that such quotations do not accurately reflect fair value, the fair value of the Funds’ investments may be determined based on yield equivalents, a pricing matrix or other sources, under valuation procedures established by the trustees. Short-term debt obligations that mature in sixty days or less and that do not exhibit signs of credit deterioration are valued at amortized cost, which approximates market value.
Investments in equity securities and investment companies traded on a United States (“U.S.”) securities exchange or the NASDAQ system are valued daily at their last sale price or official closing price on the principal exchange or system on which they are traded. If no sale occurs, such securities and investment companies are valued at the last bid price for long positions and at the last ask price for short positions. Unlisted equity securities for which market quotations are available are valued at the last sale price on the valuation date, or if no sale occurs, at the last bid price. In the absence of market quotations, broker quotes will be utilized or the security will be fair valued. Investments in investment companies (other than those that are exchange traded) are valued at the net asset value per share (“NAV”) on the valuation date.
GSAM, consistent with its procedures and applicable regulatory guidance, may make an adjustment to the previous closing prices of either domestic or foreign securities in light of significant events to reflect what it believes to be the fair value of the securities at the time of determining the Funds’ NAV. Significant events that could affect a large number of securities in a particular market may include, but are not limited to: situations relating to one or more single issuers in a market sector; significant fluctuations in U.S. or foreign markets; market dislocations; market disruptions or market closings; equipment failures; natural or man-made disasters or acts of God; armed conflicts; government actions or other developments; as well as the same or similar events which may affect specific issuers or the securities markets even though not tied directly to the securities markets. Other significant events that could relate to a single issuer may include, but are not limited to: corporate actions such as reorganizations, mergers and buy-outs; corporate announcements, including those relating to earnings, products and regulatory news; significant litigation; low trading volume; and trading limits or suspensions.
C. Security and Fund Share Transactions, and Investment Income — Security and Fund share transactions are reflected for financial reporting purposes as of the trade date which may cause the NAV as stated in the accompanying financial statements to be different than the NAV applied to share transactions. Realized gains and losses on sales of portfolio securities are calculated using the identified cost basis. Dividend income is recognized on the ex-dividend date, net of foreign withholding taxes, if any, which are reduced by any amounts reclaimable by the Funds, where applicable. Interest income is recorded on the basis of interest accrued, premium amortized and discount accreted. Certain mortgage security paydown gains and losses are included in interest income in the accompanying Statements of Operations. Market discounts, original issue discount (“OID”) and market premiums on debt securities are accreted/amortized to interest income over the life of the security with a corresponding adjustment in the cost basis of that security. In addition, it is the Funds’ policy to accrue for foreign capital gains taxes, if applicable, on certain foreign securities held by the Funds, which are subject to such taxes. An estimated foreign capital gains tax is recorded daily on net unrealized gains on these securities and is payable upon the sale of such securities when a gain is realized.
Net investment income (other than class specific expenses) and unrealized and realized gains or losses are allocated daily to each class of shares of the respective Fund based upon the relative proportion of net assets of each class.
GOLDMAN SACHS SINGLE SECTOR FIXED INCOME FUNDS
| |
| 2. SIGNIFICANT ACCOUNTING POLICIES (continued) | |
D. Expenses — Expenses incurred by the Trust that do not specifically relate to an individual Fund of the Trust are allocated to the Funds on a straight-line and/or “pro-rata” basis depending upon the nature of the expense and are accrued daily.
E. Redemption Fees — A 2% redemption fee will be imposed on the redemption of shares (including by exchange) held for 60 calendar days or less with respect to the High Yield Fund and 30 days or less with respect to the Emerging Markets Debt and Local Emerging Markets Debt Funds. For this purpose, the Funds use a first-in first-out method so that shares held longest will be treated as being redeemed first and shares held shortest will be treated as being redeemed last. Redemption fees are reimbursed to a Fund and are reflected as a reduction in share redemptions. Redemption fees are credited to Paid-in Capital and are allocated to each share class of a Fund on a pro-rata basis at the time of payment.
F. Federal Taxes and Distributions to Shareholders — It is each Fund’s policy to comply with the requirements of the Code, applicable to regulated investment companies (mutual funds) and to distribute each year substantially all of its investment company taxable income and capital gains to its shareholders. Accordingly, no federal tax provisions are required. Distributions to shareholders are recorded on the ex-dividend date. Income and capital gains distributions, if any, are declared and paid according to the following schedule:
| | | | | | | | | |
| | | Income Distributions
| | | Capital Gains Distributions
| |
| Fund | | Declared/Paid | | | Declared/Paid | |
| | |
| All Funds | | | Daily/Monthly | | | | Annually | |
| |
| |
Net capital losses are carried forward to future fiscal years and may be used to the extent allowed by the Code to offset any future capital gains. Utilization of capital loss carryforwards will reduce the requirement of future capital gains distributions.
The characterization of distributions to shareholders for financial reporting purposes is determined in accordance with federal income tax rules, which may differ from GAAP. The source of each Fund’s distributions may be shown in the accompanying financial statements as either from net investment income, net realized gain or capital. Financial statements are adjusted for permanent book/tax differences to reflect the appropriate tax character, and are not adjusted for temporary differences.
GSAM has reviewed the Funds’ tax positions for all open tax years (the current and prior three years, as applicable) and has concluded that no provision for income tax is required in the Funds’ financial statements. Such open tax years remain subject to examination and adjustment by tax authorities.
G. Foreign Currency Translations — The books and records of the Funds are accounted for in U.S. dollars. Amounts denominated in foreign currencies are translated into U.S. dollars on the following basis: (i) investment valuations, foreign currency and other assets and liabilities initially expressed in foreign currencies are converted into U.S. dollars based upon 4:00 p.m. Eastern Time exchange rates; and (ii) purchases and sales of foreign investments, income and expenses are converted into U.S. dollars based upon currency exchange rates prevailing on the respective dates of such transactions as of 4:00 p.m. Eastern Time.
GOLDMAN SACHS SINGLE SECTOR FIXED INCOME FUNDS
Notes to Financial Statements (continued)
September 30, 2009 (Unaudited)
| |
| 2. SIGNIFICANT ACCOUNTING POLICIES (continued) | |
Net realized and unrealized gain (loss) on foreign currency transactions represents: (i) foreign exchange gains and losses from the sale and holdings of foreign currencies; (ii) currency gains and losses between trade date and settlement date on investment security transactions and forward exchange contracts; and (iii) gains and losses from the difference between amounts of dividends, interest and foreign withholding taxes recorded and the amounts actually received. The effect of changes in foreign currency exchange rates on equity securities and derivative instruments are not segregated in the Statements of Operations from the effects of changes in market prices of those investments, but are included with the net realized and unrealized gain (loss) on investments. The effect of changes in foreign currency exchange rates on fixed income securities sold during the period are segregated in the Statements of Operations from the effects of changes in market prices of those investments, and are included with the net realized gain (loss) on foreign currency related transactions. The effect of changes in foreign currency exchange rates on fixed income securities held at period end are not segregated in the Statements of Operations from the effects of changes in market prices of those investments, but are included with the net change in unrealized gain (loss) on investments. Net unrealized foreign exchange gains and losses arising from changes in the value of other assets and liabilities as a result of changes in foreign exchange rates are included as increases and decreases in unrealized gain (loss) on foreign currency related transactions.
Non U.S. currency symbols utilized throughout the report are defined as follows:
| | | | | | | | | | | |
| BRL | | = | | Brazilian Real | | KRW | | = | | South Korean Won |
| CAD | | = | | Canadian Dollar | | MXN | | = | | Mexican Peso |
| COP | | = | | Colombian Peso | | NGN | | = | | Nigerian Naira |
| EGP | | = | | Egyptian Pound | | PEN | | = | | Peruvian Nuevo Sol |
| EUR | | = | | Euro | | PLN | | = | | Polish Zloty |
| GBP | | = | | British Pound | | RUB | | = | | Russian Ruble |
| HUF | | = | | Hungarian Forint | | TRY | | = | | Turkish Lira |
| IDR | | = | | Indonesian Rupiah | | UYU | | = | | Uruguayan Peso |
| ILS | | = | | Israeli Shekel | | ZAR | | = | | South African Rand |
H. Mortgage-Backed and Asset-Backed Securities — The Funds may invest in mortgage-backed and/or asset-backed securities. Mortgage-backed securities represent direct or indirect participations in, or are collateralized by and payable from, mortgage loans secured by residential and/or commercial real property. These securities may include mortgage pass-through securities, collateralized mortgage obligations, real estate mortgage investment conduit pass-through or participation certificates and stripped mortgage-backed securities. Asset-backed securities include securities whose principal and interest payments are collateralized by pools of assets such as auto loans, credit card receivables, leases, installment contracts and personal property. Asset-backed securities also include home equity line of credit loans and other second-lien mortgages.
The value of certain mortgage-backed and asset-backed securities (including adjustable rate mortgage loans) may be particularly sensitive to changes in prevailing interest rates. The value of these securities may also fluctuate in response to the market’s perception of the creditworthiness of the issuers. Early repayment of principal on mortgage-backed or asset-backed securities may expose a Fund to the risk of earning a lower rate of return upon reinvestment of principal. Asset-backed securities may present credit risks that are not presented by mortgage-backed securities because they generally do not have the benefit of a security interest in collateral that is comparable to mortgage assets. Some asset-backed securities may only have a subordinated claim on collateral. In addition, while mortgage-backed and asset-backed securities may be supported by some form of government or private guarantee and/or insurance, there is no assurance that private guarantors or insurers, if any, will meet their obligations.
GOLDMAN SACHS SINGLE SECTOR FIXED INCOME FUNDS
| |
| 2. SIGNIFICANT ACCOUNTING POLICIES (continued) | |
Stripped mortgage-backed securities are usually structured with two different classes: one that receives substantially all of the interest payments (the interest-only, or “IO” and/or the high coupon rate with relatively low principal amount, or “IOette”), and the other that receives substantially all of the principal payments (the principal-only, or “PO”) from a pool of mortgage loans. Little to no principal will be received at the maturity of an IO; as a result, adjustments are made to the cost of the security on a daily basis until maturity. These adjustments are included in interest income. Payments received for PO’s, typically monthly, are treated as a proportionate reduction to the cost basis of the securities and excess amounts are recorded as gains. All gains and losses resulting from principal payments are classified as interest income in the accompanying Statements of Operations.
I. Mortgage Dollar Rolls — The U.S. Mortgages and Investment Grade Credit Funds may enter into mortgage dollar rolls (“dollar rolls”) in which the Funds sell securities in the current month for delivery and simultaneously contracts with the same counterparty to repurchase similar (same type, coupon and maturity) but not identical securities on a specified future date. The Funds treat dollar rolls as two separate transactions: one involving the purchase of a security and a separate transaction involving a sale.
During the settlement period between sale and repurchase, the Funds will not be entitled to accrued interest and principal payments on the securities sold. Dollar roll transactions involve the risk that the market value of the securities sold by the Funds may decline below the repurchase price of those securities. In the event the buyer of the securities in a dollar roll transaction files for bankruptcy or becomes insolvent, the Funds’ use of proceeds from the transaction may be restricted pending a determination by, or with respect to, the other party.
J. Repurchase Agreements — The Funds may enter into repurchase agreements. Repurchase agreements involve the purchase of securities subject to the seller’s agreement to repurchase the securities at a mutually agreed upon date and price. During the term of a repurchase agreement, the value of the underlying securities held as collateral on behalf of the Funds, including accrued interest is required to exceed the value of the repurchase agreement, including accrued interest. If the seller defaults or becomes insolvent, realization of the collateral by the Funds may be delayed or limited and there may be a decline in the value of the collateral during the period while the Funds seek to assert their rights. The underlying securities for all repurchase agreements are held at the Funds’ custodian or designated subcustodians under tri-party repurchase agreements.
Pursuant to exemptive relief granted by the Securities and Exchange Commission and terms and conditions contained therein, the Funds, together with other registered investment companies having management agreements with GSAM, or its affiliates, may transfer uninvested cash into joint accounts, the daily aggregate balance of which is invested in one or more repurchase agreements. Under these joint accounts, the Funds’ credit exposure is allocated to the underlying repurchase agreements counterparties on a pro-rata basis. With the exception of certain transaction fees, the Funds are not subject to any expenses in relation to these investments.
K. Structured Notes — The Funds may invest in structured notes, the values of which are based on the price movements of a reference security or index. Fluctuations in value are recorded as unrealized gain and loss. Interest income is recorded on the basis of interest accrued, premium amortized and discount accreted. On the termination date, the Funds will receive a payment from a counterparty based on the value of the referenced security (notional multiplied by price of the referenced security) and record a realized gain or loss. Structured notes are subject to various risks including credit, counterparty and interest rate risks.
GOLDMAN SACHS SINGLE SECTOR FIXED INCOME FUNDS
Notes to Financial Statements (continued)
September 30, 2009 (Unaudited)
| |
| 2. SIGNIFICANT ACCOUNTING POLICIES (continued) | |
L. When-Issued Securities and Forward Commitments — The Funds may purchase when-issued securities, including TBA (“To Be Announced”) securities and enter into contracts to purchase or sell securities for a fixed price at a future date beyond the customary settlement period. When-issued securities are securities that have been authorized, but not yet issued in the market. A forward commitment involves entering into a contract to purchase or sell securities for a fixed price at a future date beyond the customary settlement period. The purchase of securities on a when-issued or forward commitment basis involves a risk of loss if the value of the security to be purchased declines before the settlement date. Conversely, the sale of securities on a forward commitment basis involves the risk that the value of the securities sold may increase before the settlement date. Although the Funds will generally purchase securities on a when-issued or forward commitment basis with the intention of acquiring the securities for their portfolios, the Funds may dispose of when-issued securities or forward commitments prior to settlement if GSAM deems it appropriate. When purchasing a security on a when-issued basis or entering into a forward commitment, the Funds must set aside liquid assets, or engage in other appropriate measures to cover their obligations under these contracts. The Funds may dispose of or renegotiate these contracts after they have been entered into and may sell these securities before they are delivered, which may result in a capital gain or loss.
M. Derivatives — The Funds may make investments in derivative instruments, including, but not limited to, options, futures, swaps and other derivatives relating to foreign currency transactions. A derivative is an instrument whose value is derived from underlying assets, indices, reference rates or a combination of these factors. Derivative instruments may be privately negotiated contracts (often referred to as over the counter (“OTC”) derivatives) or they may be listed and traded on an exchange. Derivative contracts may involve future commitments to purchase or sell financial instruments or commodities at specified terms on a specified date, or to exchange interest payment streams or currencies based on a notional or contractual amount. Derivative instruments may involve a high degree of financial risk. The use of derivatives also involves the risk of loss if the investment adviser is incorrect in its expectation of the timing or level of fluctuations in securities prices, interest rates or currency prices. Investments in derivative instruments also include the risk of default by the counterparty, the risk that the investment may not be liquid and the risk that a small movement in the price of the underlying security or benchmark may result in a disproportionately large movement, unfavorable or favorable, in the price of the derivative instrument.
Forward Foreign Currency Exchange Contracts — The Funds may enter into forward foreign currency exchange contracts for the purchase or sale of a specific foreign currency at a fixed price on a future date as a hedge or cross-hedge against either specific transactions, portfolio positions or to seek to increase total return. All contracts are “marked-to-market” daily at the applicable forward rate and any resulting unrealized gains or losses are recorded by the Funds. The Funds record realized gains or losses on the settlement date of a contract.
Risks may arise upon entering into these contracts from the potential inability of counterparties to meet the terms of their contracts and from unanticipated movements in the value of a foreign currency relative to the U.S. dollar.
The contractual amounts of forward foreign currency contracts do not necessarily represent the amounts potentially subject to risk. The measurement of the risks associated with these instruments is meaningful only when all related and offsetting transactions are considered. The Funds must set aside liquid assets, or engage in other appropriate measures to cover their obligations under these contracts.
GOLDMAN SACHS SINGLE SECTOR FIXED INCOME FUNDS
| |
| 2. SIGNIFICANT ACCOUNTING POLICIES (continued) | |
Futures Contracts — The Funds may purchase or sell futures contracts to hedge against changes in interest rates, securities prices, currency exchange rates, or to seek to increase total return. Futures contracts are valued at the last settlement price, or in the absence of a sale, the last bid price, at the end of each day on the board of trade or exchange upon which they are traded. Upon entering into a futures contract, the Funds deposit cash or securities in an account on behalf of the broker in an amount sufficient to meet the initial margin requirement. Subsequent payments are made or received by the Funds equal to the daily change in the contract value and are recorded as variation margin receivable or payable with a corresponding offset in unrealized gains or losses. The Funds recognize a realized gain or loss when a contract is closed or expires.
The use of futures contracts involves, to varying degrees, elements of market and counterparty risk which may exceed the amounts recognized in the Statements of Assets and Liabilities. Futures contracts may be illiquid, and exchanges may limit fluctuations in futures contract prices during a single day. Changes in the value of a futures contract may not directly correlate with changes in the value of the underlying securities. These risks may decrease the effectiveness of the Funds’ strategies and potentially result in a loss. The Funds must set aside liquid assets, or engage in other appropriate measures to cover their obligations under these contracts.
Swap Contracts — The Funds may enter into swap transactions for hedging purposes or to seek to increase total return. The Funds may be required to post collateral under the terms of a swap contract. Risks may arise as a result of the failure of the counterparty to the swap contract to comply with the terms of the swap contract. The loss incurred by the failure of a counterparty is generally limited to the net payment to be received by the Funds and/or the termination value at the end of the contract. Therefore, the Funds consider the creditworthiness of each counterparty to a contract in evaluating potential credit risk. Additionally, risks may arise from unanticipated movements in interest rates or in the value of the underlying reference asset or index. Entering into these agreements involves, to varying degrees, market risk, liquidity risk and elements of credit, legal and documentation risk in excess of amounts recognized in the Statements of Assets and Liabilities. The Funds may pay or receive cash to collateralize these contracts. This cash collateral is recorded as assets/liabilities on the Funds’ books.
Swaps are marked to market daily using either pricing vendor quotations, counterparty prices or model prices and the change in value, if any, is recorded as an unrealized gain or loss on the Statements of Operations. Upfront payments made and/or received by the Funds, are recorded as an asset and/or liability on the Statements of Assets and Liabilities and are recorded as a realized gain or loss ratably over the contract’s term/event, with the exception of forward starting interest rate swaps, which are recorded as a realized gain or loss ratably beginning on the effective start date. Periodic payments received or made on swap contracts are recorded as realized gains or losses on the Statements of Operations. Gains or losses are also realized upon early termination of the swap agreements and recorded as realized gains or losses on the Statements of Operations. The Funds invest in the following types of swaps:
An interest rate swap is an agreement that obligates two parties to exchange a series of cash flows at specified intervals, based upon or calculated by reference to changes in specified prices, rates or indices for a specified amount of an underlying asset or notional principal amount. The payment flows are usually netted against each other, with the difference being paid by one party to the other.
GOLDMAN SACHS SINGLE SECTOR FIXED INCOME FUNDS
Notes to Financial Statements (continued)
September 30, 2009 (Unaudited)
| |
| 2. SIGNIFICANT ACCOUNTING POLICIES (continued) | |
A credit default swap is an agreement that involves one party making a stream of payments to another party in exchange for the right to receive protection on a reference security or obligation. A Fund may use credit default swaps to provide a measure of protection against defaults of the reference security or obligation or to take a short position with respect to the likelihood of default. A Fund’s investment in credit default swaps may involve greater risks than if the Fund had invested in the referenced obligation directly. Credit events are contract specific but may include bankruptcy, failure to pay, restructuring and obligation acceleration. If a Fund buys protection through a credit default swap and no credit event occurs, its payments are limited to the periodic payments previously made to the counterparty. Upon the occurrence of a specified credit event, a Fund, as a buyer of credit protection, is entitled to receive an amount equal to the notional amount of the swap and deliver to the seller the defaulted reference obligation in a physically settled trade. A Fund may also receive a net settlement amount in the form of cash or securities equal to the notional amount of the swap reduced by the recovery value of the reference obligation in a cash settled trade.
A total return swap is an agreement that gives the Fund the right to receive the appreciation in the value of a specified security, index or other instrument in return for a fee paid to the counterparty, which will typically be an agreed upon interest rate. If the underlying asset declines in value over the term of the swap, the Fund may also be required to pay the dollar value of that decline to the counterparty.
In April 2009, the Funds adopted FASB Accounting Standards Codification (“ASC”) 815 “Disclosures about Derivative Instruments and Hedging Activities”, which requires enhanced disclosures about the Funds’ derivatives and hedging activities. The following tables set forth the gross value of the Funds’ derivative contracts for trading activities by certain risk types as of September 30, 2009. The values in the tables below exclude the effects of cash received or posted pursuant to derivative contracts, and therefore are not representative of the Funds’ net exposure.
Emerging Markets Debt
| | | | | | | | | | | | | | | | | | | | | | | |
| | | | Statements of Assets
| | | | | | | | | Statements of Assets
| | | | | | |
| | | | and Liabilities
| | Derivative
| | | Number of
| | | | and Liabilities
| | Derivative
| | | Number of
| |
| Risk | | | Location | | Assets | | | Contracts | | | | Location | | Liabilities | | | Contracts | |
| Interest rate | | | Swap contracts, at value;
Unrealized gain on futures(a) | | $ | 563,229 | | | | 1 | | | | Swap contracts, at value;
Unrealized loss on futures(a) | | $ | (128,408 | )(b) | | | 6 | |
| Currency | | | Forward foreign currency
exchange contracts, at value | | | 84,639 | | | | 4 | | | | Forward foreign currency
exchange contracts, at value | | | (91,606 | ) | | | 4 | |
| |
| |
Derivative contracts, at value | | $ | 647,868 | | | | 5 | | | | | | $ | (220,014 | ) | | | 10 | |
| |
| | | | | | | | | | | | | | | | | | | | | | | |
High Yield | | | | | | | | | | | | | | | | | | | | | | |
| | | | | | | | | | | | | | | | | | | | | | | |
| | | | | | | | | | | | | | | | | | | | | | | |
| | | | Statements of Assets
| | | | | | | | | Statements of Assets
| | | | | | |
| | | | and Liabilities
| | Derivative
| | | Number of
| | | | and Liabilities
| | Derivative
| | | Number of
| |
| Risk | | | Location | | Assets | | | Contracts | | | | Location | | Liabilities | | | Contracts | |
| Currency | | | Forward foreign currency
exchange contracts, at value | | $ | 761,254 | | | | 4 | | | | Forward foreign currency
exchange contracts, at value | | $ | (26,137,618 | ) | | | 3 | |
| |
| | | | | | | | | | | | | | | | | | | | |
Investment Grade Credit | | | | | | | | | | | | | | | | | | | |
| | | | | | | | | | | | | | | | | | | | | | | |
| | | | | | | | | | | | | | | | | | | | | | | |
| | | | Statements of Assets
| | | | | | | | | Statements of Assets
| | | | | | |
| | | | and Liabilities
| | Derivative
| | | Number of
| | | | and Liabilities
| | Derivative
| | | Number of
| |
| Risk | | | Location | | Assets | | | Contracts | | | | Location | | Liabilities | | | Contracts | |
| Interest rate | | | Swap contracts, at value;
Unrealized gain on futures(a) | | $ | 2,051,526 | | | | 205 | | | | Swap contracts, at value;
Unrealized loss on futures(a) | | $ | (1,092,511 | )(b) | | | 297 | |
| Credit | | | Swap contracts, at value | | | 1,376 | | | | 1 | | | | Swap contracts, at value | | | (95,806 | )(b) | | | 2 | |
| Currency | | | Forward foreign currency
exchange contracts, at value | | | — | | | | — | | | | Forward foreign currency
exchange contracts, at value | | | (92,951 | ) | | | 1 | |
| |
| |
Derivative contracts, at value | | $ | 2,052,902 | | | | 206 | | | | | | $ | (1,281,268 | ) | | | 300 | |
| |
GOLDMAN SACHS SINGLE SECTOR FIXED INCOME FUNDS
| |
| 2. SIGNIFICANT ACCOUNTING POLICIES (continued) | |
Local Emerging Markets Debt
| | | | | | | | | | | | | | | | | | | | | | | |
| | | | Statements of Assets
| | | | | | | | | Statements of Assets
| | | | | | |
| | | | and Liabilities
| | Derivative
| | | Number of
| | | | and Liabilities
| | Derivative
| | | Number of
| |
| Risk | | | Location | | Assets | | | Contracts | | | | Location | | Liabilities | | | Contracts | |
| Interest rate | | | Swap contracts, at value;
Unrealized gain on futures(a) | | $ | — | | | | — | | | | Swap contracts, at value;
Unrealized loss on futures(a) | | $ | (104,866 | )(b) | | | 3 | |
| Currency | | | Forward foreign currency
exchange contracts, at value | | | 552,513 | | | | 10 | | | | Forward foreign currency
exchange contracts, at value | | | (147,329 | ) | | | 9 | |
| |
| |
Derivative contracts, at value | | $ | 552,513 | | | | 10 | | | | | | $ | (252,195 | ) | | | 12 | |
| |
| | | | | | | | | | | | | | | | | | | | |
U.S. Mortgages | | | | | | | | | | | | | | | | | | | |
| | | | | | | | | | | | | | | | | | | | | | | |
| | | | | | | | | | | | | | | | | | | | | | | |
| | | | Statements of Assets
| | | | | | | | | Statements of Assets
| | | | | | |
| | | | and Liabilities
| | Derivative
| | | Number of
| | | | and Liabilities
| | Derivative
| | | Number of
| |
| Risk | | | Location | | Assets | | | Contracts | | | | Location | | Liabilities | | | Contracts | |
| Interest rate | | | Swap contracts, at value;
Unrealized gain on futures(a) | | $ | 1,633,718 | | | | 560 | | | | Swap contracts, at value;
Unrealized loss on futures(a) | | $ | (1,370,460 | )(b) | | | 609 | |
| |
| | |
| (a) | | Includes cumulative appreciation (depreciation) of futures contracts described in the Additional Investment Information section of the Schedule of Investments. Only current day’s variation margin is reported within the Statements of Assets and Liabilities. |
| | |
| (b) | | Amounts include $128,408, $758,337, $104,866 and $849,759 for Emerging Markets Debt, Investment Grade Credit, Local Emerging Markets Debt and U.S. Mortgages Funds, respectively, which represent the payments to be made pursuant to bilateral agreements should counterparties exercise their “right to terminate” provisions based on, among others, the Funds’ performance, its failure to pay on its obligations or failure to pledge collateral. Such amounts do not include incremental charges directly associated with the close-out of the agreements. They also do not reflect the fair value of any assets pledged as collateral which, through the daily margining process, substantially offsets the aforementioned amounts and for which the Funds are entitled to a full return. |
The following tables set forth by certain risk types the Funds’ gains (losses) related to derivative activities for the six months ended September 30, 2009 in accordance with ASC 815. These gains (losses) should be considered in the context that derivative contracts may have been executed to economically hedge securities and accordingly, gains or losses on derivative contracts may offset losses or gains attributable to securities. These gains (losses) are included in “Net realized gain (loss)” or “Net change in unrealized gain (loss)” in the Statements of Operations:
Emerging Markets Debt
| | | | | | | | | | | |
| | | | | | | | Net Change in
| |
| | | Location of Gain or (Loss) on Derivatives
| | Net Realized
| | | Unrealized
| |
| Risk | | Recognized on Statement of Operations | | Gain (Loss) | | | Gain (Loss) | |
| | |
| Interest rate | | Net realized gain (loss) from futures transactions and swap contracts/Net change in unrealized gain (loss) on swap contracts | | $ | 2,030,377 | | | $ | (560,401 | ) |
| Credit | | Net realized gain (loss) from swap contracts/Net change in unrealized gain (loss) on swap contracts | | | 132,389 | | | | (104,518 | ) |
| Currency | | Net realized gain (loss) from foreign currency related transactions/Net change in unrealized gain (loss) on translation of assets and liabilities denominated in foreign currencies | | | (25,991 | ) | | | 122,076 | |
| |
| |
| Total | | | | $ | 2,136,775 | | | $ | (542,843 | ) |
| |
| |
| | | | | | | | | |
High Yield | | | | | | | | |
| | | | | | | | | | | |
| | | | | | | | Net Change in
| |
| | | Location of Gain or (Loss) on Derivatives
| | Net Realized
| | | Unrealized
| |
| Risk | | Recognized on Statement of Operations | | Gain (Loss) | | | Gain (Loss) | |
| | |
| Currency | | Net realized gain (loss) from foreign currency related transactions/Net change in unrealized gain (loss) on translation of assets and liabilities denominated in foreign currencies | | $ | (64,244,481 | ) | | $ | (15,769,099 | ) |
| |
| |
GOLDMAN SACHS SINGLE SECTOR FIXED INCOME FUNDS
Notes to Financial Statements (continued)
September 30, 2009 (Unaudited)
| |
| 2. SIGNIFICANT ACCOUNTING POLICIES (continued) | |
Investment Grade Credit
| | | | | | | | | | | |
| | | | | | | | Net Change in
| |
| | | Location of Gain or (Loss) on Derivatives
| | Net Realized
| | | Unrealized
| |
| Risk | | Recognized on Statement of Operations | | Gain (Loss) | | | Gain (Loss) | |
| | |
| Interest rate | | Net realized gain (loss) from futures transactions and swap contracts/Net change in unrealized gain (loss) on futures and swap contracts | | $ | 2,874,403 | | | $ | (1,765,815 | ) |
| Credit | | Net realized gain (loss) from swap contracts/Net change in unrealized gain (loss) on swap contracts | | | (904,633 | ) | | | (898,008 | ) |
| Currency | | Net realized gain (loss) from foreign currency related transactions/Net change in unrealized gain (loss) on translation of assets and liabilities denominated in foreign currencies | | | (71,002 | ) | | | (69,410 | ) |
| |
| |
| Total | | | | $ | 1,898,768 | | | $ | (2,733,233 | ) |
| |
| |
Local Emerging Markets Debt
| | | | | | | | | | | |
| | | | | | | | Net Change in
| |
| | | Location of Gain or (Loss) on Derivatives
| | Net Realized
| | | Unrealized
| |
| Risk | | Recognized on Statement of Operations | | Gain (Loss) | | | Gain (Loss) | |
| | |
| Interest rate | | Net realized gain (loss) from swap contracts/Net change in unrealized gain (loss) on swap contracts | | $ | 877,113 | | | $ | (880,199 | ) |
| Currency | | Net realized gain (loss) from foreign currency related transactions/Net change in unrealized gain (loss) on translation of assets and liabilities denominated in foreign currencies | | | 8,187,239 | | | | (481,602 | ) |
| |
| |
| Total | | | | $ | 9,064,352 | | | $ | (1,361,801 | ) |
| |
| |
U.S. Mortgages
| | | | | | | | | | | |
| | | | | | | | Net Change in
| |
| | | Location of Gain or (Loss) on Derivatives
| | Net Realized
| | | Unrealized
| |
| Risk | | Recognized on Statement of Operations | | Gain (Loss) | | | Gain (Loss) | |
| | |
| Interest rate | | Net realized gain (loss) from futures transactions and swap contracts/Net change in unrealized gain (loss) on futures and swap contracts | | $ | 3,466,493 | | | $ | (2,149,792 | ) |
| |
| |
3. AGREEMENTS
A. Management Agreement — Under the Agreement applicable to each Fund, GSAM manages the Funds, subject to the general supervision of the trustees.
As compensation for the services rendered pursuant to the Agreement, the assumption of the expenses related thereto and administration of the Funds’ business affairs, including providing facilities, GSAM is entitled to a management fee computed daily and payable monthly, equal to an annual percentage rate of each Fund’s average daily net assets.
GOLDMAN SACHS SINGLE SECTOR FIXED INCOME FUNDS
| |
| 3. AGREEMENTS (continued) | |
For the six months ended September 30, 2009, contractual and effective net management fees with GSAM were at the following rates:
| | | | | | | | | | | | | | | | | | | | | | | | | | | | | |
| | | Contractual Management Rate | | | Effective Net
| |
| | | Up to
| | | Next
| | | Next
| | | Next
| | | Over
| | | Effective
| | | Management
| |
| Fund | | $1 billion | | | $1 billion | | | $3 billion | | | $3 billion | | | $8 billion | | | Rate | | | Rate | |
| | |
| Emerging Markets Debt | | | 0.80 | % | | | 0.80 | % | | | 0.72 | % | | | 0.68 | % | | | 0.67 | % | | | 0.80 | % | | | 0.80 | % |
| |
| |
| High Yield | | | 0.70 | | | | 0.70 | | | | 0.63 | | | | 0.60 | | | | 0.59 | | | | 0.66 | | | | 0.66 | |
| |
| |
| Investment Grade Credit | | | 0.40 | | | | 0.36 | | | | 0.34 | | | | 0.33 | | | | 0.32 | | | | 0.40 | | | | 0.33 | * |
| |
| |
| Local Emerging Markets Debt | | | 0.90 | | | | 0.90 | | | | 0.81 | | | | 0.77 | | | | 0.75 | | | | 0.90 | | | | 0.90 | |
| |
| |
| U.S. Mortgages | | | 0.40 | | | | 0.36 | | | | 0.34 | | | | 0.33 | | | | 0.32 | | | | 0.40 | | | | 0.33 | * |
| |
| |
| | |
| * | | GSAM has voluntarily agreed to waive a portion of its management fee in order to achieve the effective net management rates. |
B. Distribution Agreement and Service Plan — The Trust, on behalf of each Fund, has adopted Distribution and Service Plans (the “Plans”). Under the Plans, Goldman Sachs and/or authorized dealers are entitled to a fee accrued daily and paid monthly for distribution services and account maintenance services at the following annual rates calculated on a Fund’s average daily net assets of each respective share class:
| | | | | | | | | | | | | | | | | |
| | | Distribution and Service Plan Rates | |
| | | Class A* | | | Class B | | | Class C | | | Class R* | |
| | |
| Distribution Plan | | | 0.25 | % | | | 0.75 | % | | | 0.75 | % | | | 0.50 | % |
| |
| |
| Service Plan | | | — | | | | 0.25 | | | | 0.25 | | | | — | |
| |
| |
| | |
| * | | With respect to Class A and Class R Shares, the distributor at its discretion may use compensation for distribution services paid under the Plans to compensate service organizations for personal and account maintenance services and expenses so long as such total compensation under the Plans does not exceed the maximum cap on “service fees” imposed by the Financial Industry Regulatory Authority. |
Goldman Sachs may retain a portion of the Class A front end sales charge and Class B and Class C contingent deferred sales charges. During the six months ended September 30, 2009, Goldman Sachs advised the Funds that it retained the following approximate amounts:
| | | | | | | | | | | | | |
| | | Front End
| | | Contingent Deferred
| |
| | | Sales Charge | | | Sales Charge | |
| Fund | | Class A | | | Class B | | | Class C | |
| | |
| Emerging Markets Debt | | $ | 5,500 | | | | NA | | | $ | — | |
| |
| |
| High Yield | | | 102,100 | | | $ | — | | | | — | |
| |
| |
| Investment Grade Credit | | | 3,900 | | | | NA | | | | NA | |
| |
| |
| Local Emerging Markets Debt | | | 300 | | | | NA | | | | — | |
| |
| |
| U.S. Mortgages | | | 1,100 | | | | NA | | | | NA | |
| |
| |
GOLDMAN SACHS SINGLE SECTOR FIXED INCOME FUNDS
Notes to Financial Statements (continued)
September 30, 2009 (Unaudited)
| |
| 3. AGREEMENTS (continued) | |
C. Transfer Agency Agreement — Goldman Sachs also serves as the transfer agent of the Funds for a fee pursuant to a Transfer Agency Agreement. The fees charged for such transfer agency services are calculated daily and payable monthly at an annual rate as follows: 0.13% of the average daily net assets for Class A, Class B, Class C, Class IR and Class R Shares and 0.04% of the average daily net assets for Institutional, Separate Account Institutional, and Service Shares. Goldman Sachs has voluntarily agreed to waive a portion of the Transfer Agent Fees equal to 0.02% of the average daily net assets attributable to Institutional and Separate Account Institutional Shares of Investment Grade Credit and U.S. Mortgages. Goldman Sachs may discontinue or modify the waiver in the future at its discretion.
D. Service Plan and Shareholder Administration Plan — The Trust, on behalf of the High Yield Fund, has adopted a Service Plan and Shareholder Administration Plan for Service Shares. These plans allow for Service Shares to compensate service organizations for providing varying levels of personal and account administration and shareholder administration services to their customers who are beneficial owners of such shares. The Service Plan and Shareholder Administration Plan each provide for compensation to the service organizations in an amount equal to, on an annual basis, 0.25% (0.50% in aggregate) of the average daily net assets of the Service Shares.
E. Account Service Plans — The Trust, on behalf of Class A and Institutional Shares of Investment Grade Credit and U.S. Mortgages Funds, has adopted Account Service Plans. Under these Plans, Goldman Sachs and authorized dealers are entitled to receive a fee for account service and account maintenance equal to, on an annual basis, 0.05% of the average daily net assets of Investment Grade Credit and U.S. Mortgages Funds attributable to Class A and Institutional Shares.
F. Other Agreements — GSAM has voluntarily agreed to limit certain “Other Expenses” of the Funds (excluding management fees, distribution and service fees, transfer agent fees and expenses, Service Share fees, Account Service fees, taxes, interest, brokerage fees and litigation, indemnification, shareholder meetings and other extraordinary expenses, exclusive of any custody and transfer agent fee credit reductions) to the extent such expenses exceed, on an annual basis, a percentage rate of the average daily net assets of each Fund. Such expense reimbursements, if any, are computed daily and paid monthly. In addition, the Funds are not obligated to reimburse GSAM for prior fiscal year expense reimbursements, if any. These expense limitations may be modified or terminated at any time at the option of GSAM. The Other Expenses limitations for the Emerging Markets Debt, High Yield, Investment Grade Credit, Local Emerging Markets Debt and U.S. Mortgages Funds as an annual percentage rate of average daily net assets are 0.044%, 0.024%, 0.004%, 0.074% and 0.004%, respectively.
For the six months ended September 30, 2009, these expense reductions, including any waivers and expense reimbursements were as follows (in thousands):
| | | | | | | | | | | | | | | | | |
| | | Fee Waivers | | | Other
| | | Total
| |
| | | Management
| | | Transfer
| | | Expense
| | | Expense
| |
| Fund | | Fees | | | Agent Fees | | | Reimbursement | | | Reductions | |
| | |
| Emerging Markets Debt | | $ | — | | | $ | — | | | $ | 61 | | | $ | 61 | |
| |
| |
| High Yield | | | — | | | | — | | | | 97 | | | | 97 | |
| |
| |
| Investment Grade Credit | | | 131 | | | | 27 | | | | 110 | | | | 268 | |
| |
| |
| Local Emerging Markets Debt | | | — | | | | — | | | | 195 | | | | 195 | |
| |
| |
| U.S. Mortgages | | | 168 | | | | 47 | | | | 199 | | | | 414 | |
| |
| |
GOLDMAN SACHS SINGLE SECTOR FIXED INCOME FUNDS
| |
| 3. AGREEMENTS (continued) | |
As of September 30, 2009, the amounts owed to affiliates of the Funds were as follows (in thousands):
| | | | | | | | | | | | | | | | | |
| | | | | | Distribution
| | | | | | | |
| | | Management
| | | and Service
| | | Transfer
| | | | |
| Fund | | Fees | | | Fees | | | Agent Fees | | | Total | |
| | |
| Emerging Markets Debt | | $ | 134 | | | $ | 16 | | | $ | 12 | | | $ | 162 | |
| |
| |
| High Yield | | | 2,856 | | | | 376 | | | | 272 | | | | 3,504 | |
| |
| |
| Investment Grade Credit | | | 134 | | | | 31 | | | | 22 | | | | 187 | |
| |
| |
| Local Emerging Markets Debt | | | 112 | | | | 6 | | | | 7 | | | | 125 | |
| |
| |
| U.S. Mortgages | | | 124 | | | | 1 | | | | 8 | | | | 133 | |
| |
| |
G. Line of Credit Facility — The Funds participate in a $660,000,000 committed, unsecured revolving line of credit facility (the “facility”) together with other funds of the Trust and registered investment companies having management agreements with GSAM or its affiliates. Pursuant to the terms of the facility, the Funds and other borrowers may increase the credit amount by an additional $340,000,000, for a total of up to $1 billion. The facility is to be used solely for temporary or emergency purposes. The interest rate on borrowings is based on the federal funds rate. This facility also requires a fee to be paid by the Funds based on the amount of the commitment that has not been utilized. For the six months ended September 30, 2009, the Funds did not have any borrowings under the facility. Prior to May 12, 2009, the amount available through the facility was $700,000,000.
4. FAIR VALUE OF INVESTMENTS
The fair value of a financial instrument is the amount that would be received to sell an asset or paid to transfer a liability in an orderly transaction between market participants at the measurement date (i.e., the exit price). GAAP establishes a fair value hierarchy that prioritizes the inputs to valuation techniques used to measure fair value. The hierarchy gives the highest priority to unadjusted quoted prices in active markets for identical assets or liabilities (Level 1 measurements) and the lowest priority to unobservable inputs (Level 3 measurements). The three levels of the fair value hierarchy are described below:
Level 1— Unadjusted quoted prices in active markets that are accessible at the measurement date for identical, unrestricted assets or liabilities;
Level 2— Quoted prices in markets that are not active or financial instruments for which all significant inputs are observable, either directly or indirectly;
Level 3— Prices or valuations that require inputs that are both significant to the fair value measurement and unobservable.
GOLDMAN SACHS SINGLE SECTOR FIXED INCOME FUNDS
Notes to Financial Statements (continued)
September 30, 2009 (Unaudited)
| |
| 4. FAIR VALUE OF INVESTMENTS (continued) | |
The following is a summary of the Funds’ investments categorized in the fair value hierarchy:
Emerging Markets Debt
| | | | | | | | | | | | | |
| | | Level 1 | | | Level 2 | | | Level 3 | |
| | |
Assets | | | | | | | | | | | | |
| Fixed Income | | | | | | | | | | | | |
| Sovereign Debt Obligations | | $ | — | | | $ | 155,309,325 | | | $ | — | |
| Corporate Obligations | | | — | | | | 49,573,716 | | | | — | |
| Repurchase Agreements | | | — | | | | 7,400,000 | | | | — | |
| Derivatives | | | — | | | | 647,868 | | | | — | |
| |
| |
| Total | | $ | — | | | $ | 212,930,909 | | | $ | — | |
| |
| |
Liabilities | | | | | | | | | | | | |
| Derivatives | | $ | — | | | $ | (220,014 | ) | | $ | — | |
| |
| |
| | | | | | | | | | | | | |
High Yield | | | | | | | | | | | | |
| | | | | | | | | | | | | |
| | | | | | | | | | | | | |
| | | Level 1 | | | Level 2 | | | Level 3 | |
| | |
Assets | | | | | | | | | | | | |
| Common Stock and/or Other Equity Investments | | $ | 12,703,192 | | | $ | 5,310,720 | | | $ | 1,434,064 | |
| Fixed Income | | | | | | | | | | | | |
| Corporate Obligations | | | — | | | | 5,085,196,909 | | | | 8,631,647 | |
| Repurchase Agreements | | | — | | | | 252,500,000 | | | | — | |
| Derivatives | | | — | | | | 761,254 | | | | — | |
| |
| |
| Total | | $ | 12,703,192 | | | $ | 5,343,768,883 | | | $ | 10,065,711 | |
| |
| |
Liabilities | | | | | | | | | | | | |
| Derivatives | | $ | — | | | $ | (26,137,618 | ) | | $ | — | |
| |
| |
The following is a reconciliation of Level 3 investments for the six months ended September 30, 2009:
| | | | | | | | | |
| | | Common Stock
| | | | |
| | | and/or Other Equity
| | | Fixed Income —
| |
| | | Investments | | | Corporate Obligations | |
| | |
| Beginning Balance as of April 1, 2009 | | $ | 1,960,664 | | | $ | 4,787,585 | |
| Realized Gain (Loss) | | | — | | | | — | |
| Unrealized Gain (Loss) relating to instruments still held at reporting date | | | (526,600 | ) | | | 1,449,696 | |
| Net Purchases (Sales) | | | — | | | | 7,164,451 | |
| Net Transfers in and/or out of Level 3 | | | — | | | | (4,770,085 | ) |
| |
| |
| Ending Balance as of September 30, 2009 | | $ | 1,434,064 | | | $ | 8,631,647 | |
| |
| |
GOLDMAN SACHS SINGLE SECTOR FIXED INCOME FUNDS
| |
| 4. FAIR VALUE OF INVESTMENTS (continued) | |
Investment Grade Credit
| | | | | | | | | | | | | |
| | | Level 1 | | | Level 2 | | | Level 3 | |
| | |
Assets | | | | | | | | | | | | |
| Fixed Income | | | | | | | | | | | | |
U.S. Treasuries and/or Other U.S. Government Obligations and Agencies | | $ | 9,975,442 | | | $ | 7,432,199 | | | $ | — | |
| Corporate Obligations | | | — | | | | 407,523,984 | | | | — | |
| Foreign Debt Obligations | | | — | | | | 25,846,084 | | | | — | |
| Municipal Debt Obligations | | | — | | | | 6,434,468 | | | | — | |
| Government Guarantee Obligations | | | — | | | | 36,328,983 | | | | — | |
| Mortgage Backed Obligations | | | — | | | | 8,173,677 | | | | — | |
| Repurchase Agreements | | | — | | | | 7,100,000 | | | | — | |
| Derivatives | | | 231,888 | | | | 1,821,014 | | | | — | |
| |
| |
| Total | | $ | 10,207,330 | | | $ | 500,660,409 | | | $ | — | |
| |
| |
Liabilities | | | | | | | | | | | | |
| Derivatives | | $ | (429,980 | ) | | $ | (851,288 | ) | | | — | |
| |
| |
| | | | | | | | | | | | | |
Local Emerging Markets Debt | | | | | | | | | | | | |
| | | | | | | | | | | | | |
| | | | | | | | | | | | | |
| | | Level 1 | | | Level 2 | | | Level 3 | |
| | |
Assets | | | | | | | | | | | | |
| Fixed Income | | | | | | | | | | | | |
| Corporate Obligations | | $ | — | | | $ | 5,672,274 | | | $ | 1,632,272 | |
| Sovereign Debt Obligations | | | | | | | 93,153,396 | | | | — | |
| Foreign Debt Obligations | | | — | | | | — | | | | 1,366,825 | |
| Structured Notes | | | — | | | | 14,893,434 | | | | — | |
| Repurchase Agreements | | | — | | | | 52,900,000 | | | | — | |
| Derivatives | | | — | | | | 552,513 | | | | — | |
| |
| |
| Total | | $ | — | | | $ | 167,171,617 | | | $ | 2,999,097 | |
| |
| |
Liabilities | | | | | | | | | | | | |
| Derivatives | | $ | — | | | $ | (252,195 | ) | | $ | — | |
| |
| |
The following is a reconciliation of Level 3 investments for the six months ended September 30, 2009:
| | | | | | | | | |
| | | Fixed Income —
| | | Fixed Income —
| |
| | | Corporate Obligations | | | Foreign Debt Obligations | |
| | |
| Beginning Balance as of April 1, 2009 | | $ | 1,145,176 | | | $ | 816,799 | |
| Realized Gain (Loss) | | | — | | | | (572 | ) |
| Unrealized Gain (Loss) relating to instruments still held at reporting date | | | 487,096 | | | | 493,909 | |
| Net Purchases (Sales) | | | — | | | | 56,689 | |
| Net transfers in and/or out of Level 3 | | | — | | | | — | |
| |
| |
| Ending Balance as of September 30, 2009 | | $ | 1,632,272 | | | $ | 1,366,825 | |
| |
| |
GOLDMAN SACHS SINGLE SECTOR FIXED INCOME FUNDS
Notes to Financial Statements (continued)
September 30, 2009 (Unaudited)
| |
| 4. FAIR VALUE OF INVESTMENTS (continued) | |
U.S. Mortgages Fund
| | | | | | | | | | | | | |
| | | Level 1 | | | Level 2 | | | Level 3 | |
| | |
Assets | | | | | | | | | | | | |
| Fixed Income | | | | | | | | | | | | |
U.S. Treasuries and/or U.S. Government Obligations and Agencies | | $ | — | | | $ | 5,250,744 | | | $ | — | |
| Mortgage Backed Obligations | | | — | | | | 470,296,600 | | | | — | |
| Asset-Backed Securities | | | — | | | | 4,338,540 | | | | — | |
| Repurchase Agreements | | | — | | | | 41,800,000 | | | | — | |
| Derivatives | | | 666,600 | | | | 967,118 | | | | — | |
| |
| |
| Total | | $ | 666,600 | | | $ | 522,653,002 | | | $ | — | |
| |
| |
Liabilities | | | | | | | | | | | | |
| Fixed Income — Forward Sales Contracts | | | | | | | | | | | | |
| Mortgage-Backed Obligations | | $ | — | | | $ | (9,298,125 | ) | | $ | — | |
| Derivatives | | | (520,701 | ) | | | (849,759 | ) | | | — | |
| |
| |
| Total | | $ | (520,701 | ) | | $ | (10,147,884 | ) | | $ | — | |
| |
| |
5. PORTFOLIO SECURITIES TRANSACTIONS
The cost of purchases and proceeds from sales and maturities of long-term securities for the six months ended September 30, 2009, were as follows:
| | | | | | | | | | | | | | | | | |
| | | | | | | | | Sales and
| | | Sales and
| |
| | | Purchases of
| | | Purchases (Excluding
| | | Maturities of
| | | Maturities (Excluding
| |
| | | U.S. Government and
| | | U.S. Government and
| | | U.S. Government and
| | | U.S. Government and
| |
| Fund | | Agency Obligations | | | Agency Obligations) | | | Agency Obligations | | | Agency Obligations) | |
| | |
| Emerging Markets Debt | | $ | — | | | $ | 124,612,246 | | | $ | — | | | $ | 90,260,829 | |
| |
| |
| High Yield | | | — | | | | 1,315,372,646 | | | | — | | | | 755,705,237 | |
| |
| |
| Investment Grade Credit | | | 28,850,547 | | | | 312,251,832 | | | | 16,547,678 | | | | 100,657,159 | |
| |
| |
| Local Emerging Markets Debt | | | — | | | | 75,225,071 | | | | — | | | | 50,745,342 | |
| |
| |
| U.S. Mortgages | | | 2,325,181,853 | | | | 2,866,656 | | | | 2,336,234,606 | | | | 13,825,692 | |
| |
| |
GOLDMAN SACHS SINGLE SECTOR FIXED INCOME FUNDS
| |
| 5. PORTFOLIO SECURITIES TRANSACTIONS (continued) | |
For the six months ended September 30, 2009, Goldman Sachs earned approximately $300, $13,900 and $21,700 in brokerage commissions from portfolio transactions, including futures transactions executed with Goldman Sachs as the Futures Commission Merchant, executed on behalf of Emerging Markets Debt, Investment Grade Credit and U.S. Mortgages Funds, respectively.
6. TAX INFORMATION
As of the most recent fiscal year end March 31, 2009, the Funds’ capital loss carryforwards and certain timing differences on a tax basis were as follows.
| | | | | | | | | | | | | | | | | | | | | |
| | | | | | | | | | | | Local
| | | | |
| | | Emerging
| | | | | | Investment
| | | Emerging
| | | | |
| | | Markets Debt | | | High Yield | | | Grade Credit | | | Markets Debt | | | U.S. Mortgages | |
| | |
Capital loss carryforward1 | | | | | | | | | | | | | | | | | | | | |
| Expiring 2010 | | $ | — | | | $ | (3,471,539 | ) | | $ | — | | | $ | — | | | $ | — | |
| Expiring 2014 | | | — | | | | — | | | | (2,649,569 | ) | | | — | | | | — | |
| Expiring 2016 | | | — | | | | (846,548 | ) | | | (487,181 | ) | | | — | | | | — | |
| Expiring 2017 | | | (16,692,339 | ) | | | — | | | | (7,321,148 | ) | | | (1,868,584 | ) | | | — | |
| |
| |
| Total capital loss carryforward | | $ | (16,692,339 | ) | | $ | (4,318,087 | ) | | $ | (10,457,898 | ) | | $ | (1,868,584 | ) | | $ | — | |
| |
| |
| Timing differences (post October losses, income distribution payable, straddles and defaulted bond income) | | $ | (13,445,260 | ) | | $ | (95,398,102 | ) | | $ | (24,179,378 | ) | | $ | (15,095,405 | ) | | $ | (19,206,675 | ) |
| |
| |
| | |
| 1 | | Expiration occurs on March 31 of the year indicated. |
As of September 30, 2009, the Funds’ aggregate security unrealized gains and losses based on cost for U.S. federal income tax purposes was as follows:
| | | | | | | | | | | | | | | | | | | | | |
| | | | | | | | | | | | Local
| | | | |
| | | Emerging
| | | | | | Investment
| | | Emerging
| | | | |
| | | Markets Debt | | | High Yield | | | Grade Credit | | | Markets Debt | | | U.S. Mortgages | |
| | |
| Tax Cost | | $ | 196,504,934 | | | $ | 5,350,162,379 | | | $ | 488,115,938 | | | $ | 171,885,568 | | | $ | 533,836,768 | |
| |
| |
| Gross unrealized gain | | | 21,047,033 | | | | 389,882,115 | | | | 28,981,781 | | | | 4,002,502 | | | | 10,226,650 | |
| Gross unrealized loss | | | (5,268,926 | ) | | | (374,267,962 | ) | | | (8,282,882 | ) | | | (6,269,869 | ) | | | (22,377,534 | ) |
| |
| |
| Net unrealized security gain (loss) | | $ | 15,778,107 | | | $ | 15,614,153 | | | $ | 20,698,899 | | | $ | (2,267,367 | ) | | $ | (12,150,884 | ) |
| |
| |
The difference between book and tax basis unrealized gains (losses) is attributable primarily to wash sales, net mark-to market gains (losses) on regulated futures contracts, foreign currency contracts and differences related to the tax treatment of foreign currency and swap transactions as of the most recent fiscal year end.
GOLDMAN SACHS SINGLE SECTOR FIXED INCOME FUNDS
Notes to Financial Statements (continued)
September 30, 2009 (Unaudited)
7. OTHER RISKS
Funds’ Shareholder Concentration Risk — Certain Goldman Sachs Fund of Funds Portfolios may invest a significant percentage of their assets in the Funds. In the event the Fund of Funds Portfolios experience significant redemptions and/or reallocations, the Funds may be exposed to liquidity risk. In particular, the Funds may encounter difficulty meeting redemptions if unusual market conditions create an unfavorable environment in which the Funds are forced to liquidate their securities. As of September 30, 2009, the following Fund of Funds Portfolios were the beneficial owners of 5% or more of total outstanding shares of the following Funds:
| | | | | | | | | | | | | | | | | |
| | | | | | | | | Goldman Sachs
| | | | |
| | | Goldman Sachs
| | | Goldman Sachs
| | | Growth and
| | | Goldman Sachs
| |
| | | Balanced Strategy
| | | Growth Strategy
| | | Income Strategy
| | | Satellite Strategies
| |
| Fund | | Portfolio | | | Portfolio | | | Portfolio | | | Portfolio | |
| | |
| Emerging Markets Debt | | | 7 | % | | | 11 | % | | | 14 | % | | | 15 | % |
| |
| |
| Local Emerging Markets Debt | | | 9 | | | | 14 | | | | 18 | | | | 24 | |
| | | | | | | | | | | | | | | | | |
| |
| |
As of September 30, 2009, Goldman Sachs Group, Inc. (“GSG”) was the beneficial owner of approximately 99% of outstanding Class IR of the High Yield Fund.
Foreign Custody Risk — A Fund that invests in foreign securities, may hold such securities and foreign currency with foreign banks, agents, and securities depositories (each a “Foreign Custodian”) appointed by the Fund’s custodian. Investments in emerging markets may be subject to greater custody risks than investments in more developed markets. Custody services in emerging market countries are often undeveloped and may be less regulated than in more developed countries, and thus may not afford the same level of investor protection as would apply in developed countries. In some countries, Foreign Custodians may be subject to little or no regulatory oversight or independent evaluation of their operations. Furthermore, the laws of certain countries may place limitations on a Fund’s ability to recover its assets if a Foreign Custodian enters into bankruptcy.
Market and Credit Risks — In the normal course of business the Funds trade financial instruments and enter into financial transactions where risk of potential loss exists due to changes in the market (market risk). Additionally, the Funds may also be exposed to credit risk in the event that an issuer fails to perform or that an institution or entity with which the Funds have unsettled or open transaction defaults.
Investing in foreign markets may involve special risks and considerations not typically associated with investing in the U.S. These risks include revaluation of currencies, high rates of inflation, repatriation restrictions on income and capital, and adverse political and economic developments. Moreover, securities issued in these markets may be less liquid, be subject to government ownership controls, have delayed settlements and their prices may be more volatile than those of comparable securities in the U.S.
Portfolio Concentrations — As a result of certain of the Funds’ ability to invest a large percentage of their assets in obligations of issuers within the same country, state, industry or economic sector, an adverse economic, business or political development may affect the value of the Funds’ investments more than if their investments were not so concentrated.
GOLDMAN SACHS SINGLE SECTOR FIXED INCOME FUNDS
8. INDEMNIFICATIONS
Under the Trust’s organizational documents, its trustees, officers, employees and agents are indemnified, to the extent permitted by the Act, against certain liabilities that may arise out of performance of their duties to the Funds. Additionally, in the course of business, the Funds enter into contracts that contain a variety of indemnification clauses. The Funds’ maximum exposure under these arrangements is unknown, as this would involve future claims that may be made against the Funds that have not yet occurred. However, GSAM believes the risk of loss under these arrangements to be remote.
9. OTHER MATTERS
New Accounting Pronouncement — In May 2009, the FASB issued FASB ASC 855 “Subsequent Events”. This standard requires disclosure in the financial statements to reflect the effects of subsequent events that provide additional information on conditions about the financial statements as of the balance sheet date (recognized subsequent events) and disclosure of subsequent events that provide additional information about conditions after the balance sheet date if the financial statements would otherwise be misleading (unrecognized subsequent events). ASC 855 is effective for interim and annual financial statements issued for fiscal years ending after June 15, 2009. For purposes of inclusion in the financial statements, GSAM has concluded that subsequent events after the balance sheet date have been evaluated through November 24, 2009, the date that the financial statements were issued.
10. SUBSEQUENT EVENT
Effective December 1, 2009, the Funds’ transfer agent, Goldman Sachs, will discontinue its voluntary waiver of a portion of the transfer agency fees equal to 0.02% of the average daily net assets attributable to the Investment Grade Credit and U.S. Mortgage Funds’ Institutional and Separate Account Institutional Shares.
GOLDMAN SACHS SINGLE SECTOR FIXED INCOME FUNDS
Notes to Financial Statements (continued)
September 30, 2009 (Unaudited)
11. SUMMARY OF SHARE TRANSACTIONS
Share activity is as follows:
| | | | | | | | | | | | | | | | | |
| | | Emerging Markets Debt Fund | |
| | | For the Six Months Ended
| | | | |
| | | September 30, 2009
| | | For the Fiscal Year Ended
| |
| | | (Unaudited) | | | March 31, 2009 | |
| | |
| | | Shares | | | Dollars | | | Shares | | | Dollars | |
| | |
Class A Shares | | | | | | | | | | | | | | | | |
| Shares sold | | | 2,514,943 | | | $ | 26,739,772 | | | | 3,026,183 | | | $ | 32,623,917 | |
| Reinvestment of distributions | | | 139,498 | | | | 1,488,680 | | | | 346,749 | | | | 3,500,323 | |
Shares converted from Class B(a) | | | — | | | | — | | | | — | | | | — | |
| Shares redeemed | | | (1,468,832 | ) | | | (15,666,273 | ) | | | (6,484,563 | ) | | | (66,176,925 | ) |
| |
| |
| | | | 1,185,609 | | | | 12,562,179 | | | | (3,111,631 | ) | | | (30,052,685 | ) |
| |
| |
Class B Shares | | | | | | | | | | | | | | | | |
| Shares sold | | | — | | | | — | | | | — | | | | — | |
| Reinvestment of distributions | | | — | | | | — | | | | — | | | | — | |
Shares converted to Class A(a) | | | — | | | | — | | | | — | | | | — | |
| Shares redeemed | | | — | | | | — | | | | — | | | | — | |
| |
| |
| | | | — | | | | — | | | | — | | | | — | |
| |
| |
Class C Shares | | | | | | | | | | | | | | | | |
| Shares sold | | | 226,871 | | | | 2,465,126 | | | | 122,174 | | | | 1,280,679 | |
| Reinvestment of distributions | | | 5,417 | | | | 57,863 | | | | 8,262 | | | | 80,983 | |
| Shares redeemed | | | (25,065 | ) | | | (266,431 | ) | | | (112,107 | ) | | | (1,120,220 | ) |
| |
| |
| | | | 207,223 | | | | 2,256,558 | | | | 18,329 | | | | 241,442 | |
| |
| |
Institutional Shares | | | | | | | | | | | | | | | | |
| Shares sold | | | 4,339,642 | | | | 47,054,269 | | | | 5,827,279 | | | | 62,041,021 | |
| Reinvestment of distributions | | | 371,775 | | | | 3,959,592 | | | | 812,175 | | | | 8,095,075 | |
| Shares redeemed | | | (3,809,660 | ) | | | (40,282,245 | ) | | | (7,215,626 | ) | | | (72,711,851 | ) |
| |
| |
| | | | 901,757 | | | | 10,731,616 | | | | (576,172 | ) | | | (2,575,755 | ) |
| |
| |
Service Shares | | | | | | | | | | | | | | | | |
| Shares sold | | | — | | | | — | | | | — | | | | — | |
| Reinvestment of distributions | | | — | | | | — | | | | — | | | | — | |
| Shares redeemed | | | — | | | | — | | | | — | | | | — | |
| |
| |
| | | | — | | | | — | | | | — | | | | — | |
| |
| |
Separate Account Institutional Shares | | | | | | | | | | | | | | | | |
| Shares sold | | | — | | | | — | | | | — | | | | — | |
| Reinvestment of distributions | | | — | | | | — | | | | — | | | | — | |
| Shares redeemed | | | — | | | | — | | | | — | | | | — | |
| |
| |
| | | | — | | | | — | | | | — | | | | — | |
| |
| |
Class IR Shares | | | | | | | | | | | | | | | | |
| Shares sold | | | — | | | | — | | | | — | | | | — | |
| Reinvestment of distributions | | | — | | | | — | | | | — | | | | — | |
| Shares redeemed | | | — | | | | — | | | | — | | | | — | |
| |
| |
| | | | — | | | | — | | | | — | | | | — | |
| |
| |
Class R Shares | | | | | | | | | | | | | | | | |
| Shares sold | | | — | | | | — | | | | — | | | | — | |
| Reinvestment of distributions | | | — | | | | — | | | | — | | | | — | |
| Shares redeemed | | | — | | | | — | | | | — | | | | — | |
| |
| |
| | | | — | | | | — | | | | — | | | | — | |
| |
| |
NET INCREASE (DECREASE) | | | 2,294,589 | | | $ | 25,550,353 | | | | (3,669,474 | ) | | $ | (32,386,998 | ) |
| |
| |
| | |
| (a) | | Class B Shares automatically convert into Class A Shares on or about the fifteenth day of the last month of the calendar quarter that is eight years after the initial purchase date of either the Fund or another Goldman Sachs Fund. |
GOLDMAN SACHS SINGLE SECTOR FIXED INCOME FUNDS
| |
| 11. SUMMARY OF SHARE TRANSACTIONS (continued) | |
| | | | | | | | | | | | | | | | | | | | | | | | | | | | | | | | | |
| | | High Yield Fund | | | Investment Grade Credit Fund | |
| | | | |
| | | For the Six Months Ended
| | | | | | For the Six Months Ended
| | | | |
| | | September 30, 2009
| | | For the Fiscal Year Ended
| | | September 30, 2009
| | | For the Fiscal Year Ended
| |
| | | (Unaudited) | | | March 31, 2009 | | | (Unaudited) | | | March 31, 2009 | |
| | | | |
| | | Shares | | | Dollars | | | Shares | | | Dollars | | | Shares | | | Dollars | | | Shares | | | Dollars | |
| | | | |
| | | | | | | | | | | | | | | | | | | | | | | | | | | | | | | | | |
| | | | 102,924,762 | | | $ | 590,511,432 | | | | 205,710,219 | | | $ | 1,218,047,178 | | | | 13,810,305 | | | $ | 115,524,965 | | | | 7,006,450 | | | $ | 56,250,429 | |
| | | | 8,300,168 | | | | 50,333,692 | | | | 21,562,817 | | | | 126,829,477 | | | | 225,141 | | | | 1,930,111 | | | | 114,310 | | | | 939,487 | |
| | | | 256,045 | | | | 1,618,001 | | | | 520,347 | | | | 3,171,800 | | | | — | | | | — | | | | — | | | | — | |
| | | | (250,572,836 | ) | | | (1,500,266,102 | ) | | | (143,256,549 | ) | | | (831,476,779 | ) | | | (3,394,676 | ) | | | (29,212,916 | ) | | | (1,237,974 | ) | | | (10,028,963 | ) |
| |
| |
| | | | (139,091,861 | ) | | | (857,802,977 | ) | | | 84,536,834 | | | | 516,571,676 | | | | 10,640,770 | | | | 88,242,160 | | | | 5,882,786 | | | | 47,160,953 | |
| |
| |
| | | | | | | | | | | | | | | | | | | | | | | | | | | | | | | | | |
| | | | 876,307 | | | | 5,262,050 | | | | 1,200,946 | | | | 7,056,802 | | | | — | | | | — | | | | — | | | | — | |
| | | | 300,785 | | | | 1,852,056 | | | | 769,622 | | | | 4,616,387 | | | | — | | | | — | | | | — | | | | — | |
| | | | (255,640 | ) | | | (1,618,001 | ) | | | (519,690 | ) | | | (3,171,800 | ) | | | — | | | | — | | | | — | | | | — | |
| | | | (1,344,660 | ) | | | (8,271,294 | ) | | | (4,146,097 | ) | | | (25,019,789 | ) | | | — | | | | — | | | | — | | | | — | |
| |
| |
| | | | (423,208 | ) | | | (2,775,189 | ) | | | (2,695,219 | ) | | | (16,518,400 | ) | | | — | | | | — | | | | — | | | | — | |
| |
| |
| | | | | | | | | | | | | | | | | | | | | | | | | | | | | | | | | |
| | | | 3,094,169 | | | | 18,505,563 | | | | 4,258,054 | | | | 25,016,565 | | | | — | | | | — | | | | — | | | | — | |
| | | | 367,769 | | | | 2,267,329 | | | | 758,890 | | | | 4,524,637 | | | | — | | | | — | | | | — | | | | — | |
| | | | (1,810,885 | ) | | | (11,040,039 | ) | | | (4,861,892 | ) | | | (29,724,088 | ) | | | — | | | | — | | | | — | | | | — | |
| |
| |
| | | | 1,651,053 | | | | 9,732,853 | | | | 155,052 | | | | (182,886 | ) | | | — | | | | — | | | | — | | | | — | |
| |
| |
| | | | | | | | | | | | | | | | | | | | | | | | | | | | | | | | | |
| | | | 374,728,088 | | | | 2,232,850,628 | | | | 261,821,963 | | | | 1,513,344,260 | | | | 13,349,596 | | | | 113,034,207 | | | | 2,343,538 | | | | 19,074,167 | |
| | | | 14,122,997 | | | | 87,926,952 | | | | 19,154,876 | | | | 111,998,521 | | | | 118,983 | | | | 1,031,540 | | | | 70,044 | | | | 586,497 | |
| | | | (167,727,064 | ) | | | (1,051,028,444 | ) | | | (126,356,273 | ) | | | (737,249,656 | ) | | | (971,394 | ) | | | (8,421,566 | ) | | | (558,813 | ) | | | (4,758,912 | ) |
| |
| |
| | | | 221,124,021 | | | | 1,269,749,136 | | | | 154,620,566 | | | | 888,093,125 | | | | 12,497,185 | | | | 105,644,181 | | | | 1,854,769 | | | | 14,901,752 | |
| |
| |
| | | | | | | | | | | | | | | | | | | | | | | | | | | | | | | | | |
| | | | 921,067 | | | | 5,493,235 | | | | 1,316,436 | | | | 8,137,037 | | | | — | | | | — | | | | — | | | | — | |
| | | | 92,568 | | | | 570,587 | | | | 148,983 | | | | 869,087 | | | | — | | | | — | | | | — | | | | — | |
| | | | (413,830 | ) | | | (2,523,808 | ) | | | (517,885 | ) | | | (2,996,761 | ) | | | — | | | | — | | | | — | | | | — | |
| |
| |
| | | | 599,805 | | | | 3,540,014 | | | | 947,534 | | | | 6,009,363 | | | | — | | | | — | | | | — | | | | — | |
| |
| |
| | | | | | | | | | | | | | | | | | | | | | | | | | | | | | | | | |
| | | | — | | | | — | | | | — | | | | — | | | | 5,374,188 | | | | 44,033,165 | | | | 7,556,742 | | | | 67,207,178 | |
| | | | — | | | | — | | | | — | | | | — | | | | 502,416 | | | | 4,270,402 | | | | 1,375,908 | | | | 11,706,126 | |
| | | | — | | | | — | | | | — | | | | — | | | | (4,566,260 | ) | | | (37,396,879 | ) | | | (10,316,482 | ) | | | (87,629,669 | ) |
| |
| |
| | | | — | | | | — | | | | — | | | | — | | | | 1,310,344 | | | | 10,906,688 | | | | (1,383,832 | ) | | | (8,716,365 | ) |
| |
| |
| | | | | | | | | | | | | | | | | | | | | | | | | | | | | | | | | |
| | | | 4 | | | | 26 | | | | — | | | | — | | | | — | | | | — | | | | — | | | | — | |
| | | | 64 | | | | 393 | | | | 138 | | | | 815 | | | | — | | | | — | | | | — | | | | — | |
| | | | (4 | ) | | | (24 | ) | | | — | | | | — | | | | — | | | | — | | | | — | | | | — | |
| |
| |
| | | | 64 | | | | 395 | | | | 138 | | | | 815 | | | | — | | | | — | | | | — | | | | — | |
| |
| |
| | | | | | | | | | | | | | | | | | | | | | | | | | | | | | | | | |
| | | | 54,392 | | | | 341,626 | | | | 33,217 | | | | 170,940 | | | | — | | | | — | | | | — | | | | — | |
| | | | 2,011 | | | | 12,581 | | | | 1,372 | | | | 7,146 | | | | — | | | | — | | | | — | | | | — | |
| | | | (1,384 | ) | | | (9,122 | ) | | | (487 | ) | | | (2,454 | ) | | | — | | | | — | | | | — | | | | — | |
| |
| |
| | | | 55,019 | | | | 345,085 | | | | 34,102 | | | | 175,632 | | | | — | | | | — | | | | — | | | | — | |
| |
| |
| | | | 83,914,893 | | | $ | 422,789,317 | | | | 237,599,007 | | | $ | 1,394,149,325 | | | | 24,448,299 | | | $ | 204,793,029 | | | | 6,353,723 | | | $ | 53,346,340 | |
| |
| |
GOLDMAN SACHS SINGLE SECTOR FIXED INCOME FUNDS
Notes to Financial Statements (continued)
September 30, 2009 (Unaudited)
| |
| 11. SUMMARY OF SHARE TRANSACTIONS (continued) | |
Share activity is as follows:
| | | | | | | | | | | | | | | | | |
| | | Local Emerging Markets Debt Fund | |
| | | | |
| | | For the Six Months Ended
| | | | |
| | | September 30, 2009
| | | For the Fiscal Year Ended
| |
| | | (Unaudited) | | | March 31, 2009 | |
| | |
| | | Shares | | | Dollars | | | Shares | | | Dollars | |
| | |
Class A Shares | | | | | | | | | | | | | | | | |
| Shares sold | | | 1,403,630 | | | $ | 12,025,882 | | | | 6,629,481 | | | $ | 62,277,799 | |
| Reinvestment of distributions | | | 68,298 | | | | 574,460 | | | | 134,566 | | | | 1,117,122 | |
| Shares redeemed | | | (915,357 | ) | | | (7,548,333 | ) | | | (4,096,183 | ) | | | (35,894,268 | ) |
| |
| |
| | | | 556,571 | | | | 5,052,009 | | | | 2,667,864 | | | | 27,500,653 | |
| |
| |
Class C Shares | | | | | | | | | | | | | | | | |
| Shares sold | | | 33,957 | | | | 291,078 | | | | 2,966 | | | | 27,000 | |
| Reinvestment of distributions | | | 358 | | | | 3,096 | | | | 373 | | | | 3,447 | |
| Shares redeemed | | | (1 | ) | | | (10 | ) | | | (12,115 | ) | | | (113,742 | ) |
| |
| |
| | | | 34,314 | | | | 294,164 | | | | (8,776 | ) | | | (83,295 | ) |
| |
| |
Institutional Shares | | | | | | | | | | | | | | | | |
| Shares sold | | | 5,630,677 | | | | 47,808,596 | | | | 11,985,195 | | | | 111,908,406 | |
| Reinvestment of distributions | | | 354,393 | | | | 2,982,860 | | | | 734,333 | | | | 6,137,075 | |
| Shares redeemed | | | (3,801,540 | ) | | | (31,526,094 | ) | | | (5,322,908 | ) | | | (42,558,654 | ) |
| |
| |
| | | | 2,183,530 | | | | 19,265,362 | | | | 7,396,620 | | | | 75,486,827 | |
| |
| |
Separate Account Institutional Shares | | | | | | | | | | | | | | | | |
| Shares sold | | | — | | | | — | | | | — | | | | — | |
| Reinvestment of distributions | | | — | | | | — | | | | — | | | | — | |
| Shares redeemed | | | — | | | | — | | | | — | | | | — | |
| |
| |
| | | | — | | | | — | | | | — | | | | — | |
| |
| |
NET INCREASE (DECREASE) | | | 2,774,415 | | | $ | 24,611,535 | | | | 10,055,708 | | | $ | 102,904,185 | |
| |
| |
GOLDMAN SACHS SINGLE SECTOR FIXED INCOME FUNDS
| |
| 11. SUMMARY OF SHARE TRANSACTIONS (continued) | |
| | | | | | | | | | | | | | | | | |
| | | U.S. Mortgages Fund | |
| | |
| | | For the Six Months Ended
| | | | |
| | | September 30, 2009
| | | For the Fiscal Year Ended
| |
| | | (Unaudited) | | | March 31, 2009 | |
| | |
| | | Shares | | | Dollars | | | Shares | | | Dollars | |
| | |
| | | | | | | | | | | | | | | | | |
| | | | 645,411 | | | $ | 6,093,729 | | | | 268,131 | | | $ | 2,566,234 | |
| | | | 13,695 | | | | 130,975 | | | | 38,492 | | | | 356,067 | |
| | | | (356,422 | ) | | | (3,420,531 | ) | | | (644,117 | ) | | | (5,945,851 | ) |
| |
| |
| | | | 302,684 | | | | 2,804,173 | | | | (337,494 | ) | | | (3,023,550 | ) |
| |
| |
| | | | | | | | | | | | | | | | | |
| | | | — | | | | — | | | | — | | | | — | |
| | | | — | | | | — | | | | — | | | | — | |
| | | | — | | | | — | | | | — | | | | — | |
| |
| |
| | | | — | | | | — | | | | — | | | | — | |
| |
| |
| | | | | | | | | | | | | | | | | |
| | | | 1,764,818 | | | | 16,819,582 | | | | 16,618,730 | | | | 159,930,929 | |
| | | | 112,142 | | | | 1,072,936 | | | | 892,756 | | | | 8,297,418 | |
| | | | (1,373,285 | ) | | | (13,199,628 | ) | | | (24,901,290 | ) | | | (228,169,765 | ) |
| |
| |
| | | | 503,675 | | | | 4,692,890 | | | | (7,389,804 | ) | | | (59,941,418 | ) |
| |
| |
| | | | | | | | | | | | | | | | | |
| | | | 4,673,543 | | | | 44,234,998 | | | | 15,586,274 | | | | 146,192,910 | |
| | | | 714,072 | | | | 6,813,632 | | | | 2,209,606 | | | | 20,447,112 | |
| | | | (16,058,454 | ) | | | (151,884,348 | ) | | | (23,935,012 | ) | | | (220,644,478 | ) |
| |
| |
| | | | (10,670,839 | ) | | | (100,835,718 | ) | | | (6,139,132 | ) | | | (54,004,456 | ) |
| |
| |
| | | | (9,864,480 | ) | | $ | (93,338,655 | ) | | | (13,866,430 | ) | | $ | (116,969,424 | ) |
| |
| |
GOLDMAN SACHS EMERGING MARKETS DEBT FUND
Financial Highlights
Selected Data for a Share Outstanding Throughout Each Period
| | | | | | | | | | | | | | | | | | | | | | | | | | | | | | | | | |
| | | | | | | | Income (loss) from
| | | Distributions
| | | |
| | | | | Net asset
| | | investment operations | | | to shareholders | | | |
| | | | | value,
| | | Net
| | | Net realized
| | | Total from
| | | From net
| | | From net
| | | | | | |
| | | | | beginning
| | | investment
| | | and unrealized
| | | investment
| | | investment
| | | realized
| | | Total
| | | |
| | | Year - Share Class | | of period | | | income(a) | | | gain (loss) | | | operations | | | income | | | gains | | | distributions | | | |
| |
| FOR THE SIX MONTHS ENDED SEPTEMBER 30, (UNAUDITED) |
| | | | | | | | | | | | | | | | | | | | | | | | | | | | | | | | | |
| | | | | | | | | | | | | | | | | | | | | | | | | | | | | | | | | |
| | | 2009 - A | | $ | 9.19 | | | $ | 0.34 | | | $ | 2.48 | | | $ | 2.82 | | | $ | (0.36 | ) | | $ | — | | | $ | (0.36 | ) | | |
| | | 2009 - C | | | 9.16 | | | | 0.29 | | | | 2.47 | | | | 2.76 | | | | (0.31 | ) | | | — | | | | (0.31 | ) | | |
| | | 2009 - Institutional | | | 9.20 | | | | 0.36 | | | | 2.47 | | | | 2.83 | | | | (0.37 | ) | | | — | | | | (0.37 | ) | | |
| | | | | | | | | | | | | | | | | | | | | | | | | | | | | | | | | |
| | | | | | | | | | | | | | | | | | | | | | | | �� | | | | | | | | | |
| FOR THE FISCAL YEAR ENDED MARCH 31, |
| | | | | | | | | | | | | | | | | | | | | | | | | | | | | | | | | |
| | | | | | | | | | | | | | | | | | | | | | | | | | | | | | | | | |
| | | 2009 - A | | | 11.63 | | | | 0.68 | | | | (2.50 | ) | | | (1.82 | ) | | | (0.57 | ) | | | (0.05 | ) | | | (0.62 | ) | | |
| | | 2009 - C | | | 11.60 | | | | 0.60 | | | | (2.50 | ) | | | (1.90 | ) | | | (0.49 | ) | | | (0.05 | ) | | | (0.54 | ) | | |
| | | 2009 - Institutional | | | 11.63 | | | | 0.72 | | | | (2.50 | ) | | | (1.78 | ) | | | (0.60 | ) | | | (0.05 | ) | | | (0.65 | ) | | |
| | | | | | | | | | | | | | | | | | | | | | | | | | | | | | | | | |
| | | | | | | | | | | | | | | | | | | | | | | | | | | | | | | | | |
| FOR THE PERIOD NOVEMBER 1, 2007 TO MARCH 31, 2008* |
| | | | | | | | | | | | | | | | | | | | | | | | | | | | | | | | | |
| | | | | | | | | | | | | | | | | | | | | | | | | | | | | | | | | |
| | | 2008 - A | | | 12.16 | | | | 0.30 | | | | (0.37 | ) | | | (0.07 | ) | | | (0.31 | ) | | | (0.15 | ) | | | (0.46 | ) | | |
| | | 2008 - C | | | 12.14 | | | | 0.25 | | | | (0.36 | ) | | | (0.11 | ) | | | (0.28 | ) | | | (0.15 | ) | | | (0.43 | ) | | |
| | | 2008 - Institutional | | | 12.17 | | | | 0.32 | | | | (0.38 | ) | | | (0.06 | ) | | | (0.33 | ) | | | (0.15 | ) | | | (0.48 | ) | | |
| | | | | | | | | | | | | | | | | | | | | | | | | | | | | | | | | |
| | | | | | | | | | | | | | | | | | | | | | | | | | | | | | | | | |
| FOR THE FISCAL YEARS ENDED OCTOBER 31, |
| | | | | | | | | | | | | | | | | | | | | | | | | | | | | | | | | |
| | | | | | | | | | | | | | | | | | | | | | | | | | | | | | | | | |
| | | 2007 - A | | | 11.98 | | | | 0.63 | | | | 0.38 | | | | 1.01 | | | | (0.62 | ) | | | (0.21 | ) | | | (0.83 | ) | | |
| | | 2007 - C | | | 11.97 | | | | 0.53 | | | | 0.38 | | | | 0.91 | | | | (0.53 | ) | | | (0.21 | ) | | | (0.74 | ) | | |
| | | 2007 - Institutional | | | 11.99 | | | | 0.67 | | | | 0.39 | | | | 1.06 | | | | (0.67 | ) | | | (0.21 | ) | | | (0.88 | ) | | |
| | | | | | | | | | | | | | | | | | | | | | | | | | | | | | | | | |
| | | | | | | | | | | | | | | | | | | | | | | | | | | | | | | | | |
| | | |
| | | |
| | | 2006 - A | | | 11.75 | | | | 0.60 | | | | 0.69 | | | | 1.29 | | | | (0.65 | ) | | | (0.41 | ) | | | (1.06 | ) | | |
| | | 2006 - C (Commenced September 26, 2006) | | | 11.78 | | | | 0.01 | | | | 0.22 | | | | 0.23 | | | | (0.04 | ) | | | — | | | | (0.04 | ) | | |
| | | 2006 - Institutional | | | 11.76 | | | | 0.64 | | | | 0.69 | | | | 1.33 | | | | (0.69 | ) | | | (0.41 | ) | | | (1.10 | ) | | |
| | | | | | | | | | | | | | | | | | | | | | | | | | | | | | | | | |
| | | | | | | | | | | | | | | | | | | | | | | | | | | | | | | | | |
| | | |
| | | |
| | | 2005 - A | | | 11.18 | | | | 0.74 | | | | 1.00 | | | | 1.74 | | | | (0.64 | ) | | | (0.53 | ) | | | (1.17 | ) | | |
| | | 2005 - Institutional | | | 11.19 | | | | 0.77 | | | | 1.02 | | | | 1.79 | | | | (0.69 | ) | | | (0.53 | ) | | | (1.22 | ) | | |
| | | | | | | | | | | | | | | | | | | | | | | | | | | | | | | | | |
| | | | | | | | | | | | | | | | | | | | | | | | | | | | | | | | | |
| | | |
| | | |
| | | 2004 - A | | | 10.22 | | | | 0.59 | | | | 0.97 | | | | 1.56 | | | | (0.57 | ) | | | (0.03 | ) | | | (0.60 | ) | | |
| | | 2004 - Institutional | | | 10.23 | | | | 0.62 | | | | 0.98 | | | | 1.60 | | | | (0.61 | ) | | | (0.03 | ) | | | (0.64 | ) | | |
| | | | | | | | | | | | | | | | | | | | | | | | | | | | | | | | | |
| | | | | | | | | | | | | | | | | | | | | | | | | | | | | | | | | |
| | | |
| | | |
| | | | | | | | | | | | | | | | | | | | | | | | | | | | | | | | | |
| |
| * | The Fund changed its fiscal year end from October 31 to March 31. |
| |
| (a) | Calculated based on the average shares outstanding methodology. |
| |
| (b) | Assumes investment at the net asset value at the beginning of the period, reinvestment of all dividends and distributions, a complete redemption of the investment at the net asset value at the end of the period and no sales or redemption charges. Total returns would be reduced if a sales or redemption charge was taken into account. Returns do not reflect the deduction of taxes that a shareholder would pay on Fund distributions or the redemption of Fund shares. Total returns for periods less than one full year are not annualized. |
The accompanying notes are an integral part of these financial statements.
GOLDMAN SACHS EMERGING MARKETS DEBT FUND
| | | | | | | | | | | | | | | | | | | | | | | | | | | | | | | | | | | |
| | | | | | | | | | | | | | | | | | Ratios assuming no
| | | | | | |
| | | | | | | | | | | | | | | | | | expense reductions | | | | | | |
| | | | | | | | | | | | | | | Ratio of
| | | | | | Ratio of
| | | | | | |
| | | | | | | | | Net assets,
| | | Ratio of
| | | net investment
| | | Ratio of
| | | net investment
| | | | | | |
| | | Net asset
| | | | | | end of
| | | net expenses
| | | income
| | | total expenses
| | | income
| | | Portfolio
| | | |
| | | value, end
| | | Total
| | | period
| | | to average
| | | to average
| | | to average
| | | to average
| | | turnover
| | | |
| | | of period | | | return(b) | | | (in 000s) | | | net assets | | | net assets | | | net assets | | | net assets | | | rate | | | |
| |
| |
| | | | | | | | | | | | | | | | | | | | | | | | | | | | | | | | | | | |
| | | | | | | | | | | | | | | | | | | | | | | | | | | | | | | | | | | |
| | | $ | 11.65 | | | | 31.05 | % | | $ | 65,546 | | | | 1.22 | %(c) | | | 6.39 | %(c) | | | 1.29 | %(c) | | | 6.32 | %(c) | | | 58 | % | | |
| | | | 11.61 | | | | 30.66 | | | | 4,512 | | | | 1.97 | (c) | | | 5.55 | (c) | | | 2.04 | (c) | | | 5.48 | (c) | | | 58 | | | |
| | | | 11.66 | | | | 31.24 | | | | 149,135 | | | | 0.88 | (c) | | | 6.78 | (c) | | | 0.95 | (c) | | | 6.71 | (c) | | | 58 | | | |
| | | | | | | | | | | | | | | | | | | | | | | | | | | | | | | | | | | |
| | | | | | | | | | | | | | | | | | | | | | | | | | | | | | | | | | | |
| |
| | | | | | | | | | | | | | | | | | | | | | | | | | | | | | | | | | | |
| | | | | | | | | | | | | | | | | | | | | | | | | | | | | | | | | | | |
| | | | 9.19 | | | | (15.89 | ) | | | 40,814 | | | | 1.22 | | | | 6.58 | | | | 1.44 | | | | 6.36 | | | | 132 | | | |
| | | | 9.16 | | | | (16.57 | ) | | | 1,661 | | | | 1.97 | | | | 5.97 | | | | 2.19 | | | | 5.75 | | | | 132 | | | |
| | | | 9.20 | | | | (15.59 | ) | | | 109,375 | | | | 0.88 | | | | 7.03 | | | | 1.10 | | | | 6.81 | | | | 132 | | | |
| | | | | | | | | | | | | | | | | | | | | | | | | | | | | | | | | | | |
| | | | | | | | | | | | | | | | | | | | | | | | | | | | | | | | | | | |
| |
| | | | | | | | | | | | | | | | | | | | | | | | | | | | | | | | | | | |
| | | | | | | | | | | | | | | | | | | | | | | | | | | | | | | | | | | |
| | | | 11.63 | | | | (0.51 | ) | | | 87,818 | | | | 1.21 | (c) | | | 6.03 | (c) | | | 1.36 | (c) | | | 5.88 | (c) | | | 41 | | | |
| | | | 11.60 | | | | (0.82 | ) | | | 1,890 | | | | 1.96 | (c) | | | 5.20 | (c) | | | 2.11 | (c) | | | 5.05 | (c) | | | 41 | | | |
| | | | 11.63 | | | | (0.37 | ) | | | 145,067 | | | | 0.87 | (c) | | | 6.51 | (c) | | | 1.02 | (c) | | | 6.36 | (c) | | | 41 | | | |
| | | | | | | | | | | | | | | | | | | | | | | | | | | | | | | | | | | |
| | | | | | | | | | | | | | | | | | | | | | | | | | | | | | | | | | | |
| |
| | | | | | | | | | | | | | | | | | | | | | | | | | | | | | | | | | | |
| | | | | | | | | | | | | | | | | | | | | | | | | | | | | | | | | | | |
| | | | 12.16 | | | | 8.86 | | | | 84,661 | | | | 1.23 | | | | 5.23 | | | | 1.38 | | | | 5.08 | | | | 81 | | | |
| | | | 12.14 | | | | 7.80 | | | | 995 | | | | 1.98 | | | | 4.64 | | | | 2.13 | | | | 4.49 | | | | 81 | | | |
| | | | 12.17 | | | | 9.25 | | | | 188,311 | | | | 0.87 | | | | 5.68 | | | | 1.02 | | | | 5.53 | | | | 81 | | | |
| | | | | | | | | | | | | | | | | | | | | | | | | | | | | | | | | | | |
| | | | | | | | | | | | | | | | | | | | | | | | | | | | | | | | | | | |
| |
| |
| | | | 11.98 | | | | 11.63 | | | | 69,302 | | | | 1.23 | | | | 5.17 | | | | 1.53 | | | | 4.87 | | | | 167 | | | |
| | | | 11.97 | | | | 1.98 | | | | 1 | | | | 1.71 | (c) | | | 1.36 | (c) | | | 1.75 | (c) | | | 1.32 | (c) | | | 167 | | | |
| | | | 11.99 | | | | 11.93 | | | | 85,073 | | | | 0.86 | | | | 5.51 | | | | 1.16 | | | | 5.21 | | | | 167 | | | |
| | | | | | | | | | | | | | | | | | | | | | | | | | | | | | | | | | | |
| | | | | | | | | | | | | | | | | | | | | | | | | | | | | | | | | | | |
| |
| |
| | | | 11.75 | | | | 16.48 | | | | 34,327 | | | | 1.26 | | | | 6.13 | | | | 1.82 | | | | 5.57 | | | | 207 | | | |
| | | | 11.76 | | | | 17.01 | | | | 40,962 | | | | 0.88 | | | | 6.58 | | | | 1.52 | | | | 5.94 | | | | 207 | | | |
| | | | | | | | | | | | | | | | | | | | | | | | | | | | | | | | | | | |
| | | | | | | | | | | | | | | | | | | | | | | | | | | | | | | | | | | |
| |
| |
| | | | 11.18 | | | | 15.78 | | | | 5,411 | | | | 1.28 | | | | 5.43 | | | | 3.09 | | | | 3.62 | | | | 273 | | | |
| | | | 11.19 | | | | 16.22 | | | | 20,387 | | | | 0.88 | | | | 5.90 | | | | 2.57 | | | | 4.21 | | | | 273 | | | |
| | | | | | | | | | | | | | | | | | | | | | | | | | | | | | | | | | | |
| | | | | | | | | | | | | | | | | | | | | | | | | | | | | | | | | | | |
| |
| |
The accompanying notes are an integral part of these financial statements.
GOLDMAN SACHS HIGH YIELD FUND
Financial Highlights
Selected Data for a Share Outstanding Throughout Each Period
| | | | | | | | | | | | | | | | | | | | | | | | | |
| | | | | | | | Income (loss) from
| | | | | | |
| | | | | | | | investment operations | | | | | | |
| | | | | | | | | | | | | | | | | Distributions
| | | |
| | | | | Net asset
| | | | | | | | | | | | to shareholders
| | | |
| | | | | value,
| | | Net
| | | Net realized
| | | Total from
| | | from net
| | | |
| | | | | beginning
| | | investment
| | | and unrealized
| | | investment
| | | investment
| | | |
| | | Year - Share Class | | of period | | | income(a) | | | gain (loss) | | | operations | | | income | | | |
| |
| FOR THE SIX MONTHS ENDED SEPTEMBER 30, (UNAUDITED) |
| | | | | | | | | | | | | | | | | | | | | | | | | |
| | | | | | | | | | | | | | | | | | | | | | | | | |
| | | 2009 - A | | $ | 5.18 | | | $ | 0.26 | | | $ | 1.54 | | | $ | 1.80 | | | $ | (0.25 | ) | | |
| | | 2009 - B | | | 5.18 | | | | 0.25 | | | | 1.55 | | | | 1.80 | | | | (0.23 | ) | | |
| | | 2009 - C | | | 5.18 | | | | 0.25 | | | | 1.54 | | | | 1.79 | | | | (0.23 | ) | | |
| | | 2009 - Institutional | | | 5.19 | | | | 0.28 | | | | 1.54 | | | | 1.82 | | | | (0.26 | ) | | |
| | | 2009 - Service | | | 5.17 | | | | 0.26 | | | | 1.55 | | | | 1.81 | | | | (0.25 | ) | | |
| | | 2009 - IR | | | 5.18 | | | | 0.28 | | | | 1.54 | | | | 1.82 | | | | (0.26 | ) | | |
| | | 2009 - R | | | 5.17 | | | | 0.26 | | | | 1.55 | | | | 1.81 | | | | (0.25 | ) | | |
| | | | | | | | | | | | | | | | | | | | | | | | | |
| | | | | | | | | | | | | | | | | | | | | | | | | |
| FOR THE FISCAL YEAR ENDED MARCH 31, |
| | | | | | | | | | | | | | | | | | | | | | | | | |
| | | | | | | | | | | | | | | | | | | | | | | | | |
| | | 2009 - A | | | 7.12 | | | | 0.55 | | | | (1.92 | ) | | | (1.37 | ) | | | (0.57 | ) | | |
| | | 2009 - B | | | 7.13 | | | | 0.51 | | | | (1.94 | ) | | | (1.43 | ) | | | (0.52 | ) | | |
| | | 2009 - C | | | 7.12 | | | | 0.51 | | | | (1.93 | ) | | | (1.42 | ) | | | (0.52 | ) | | |
| | | 2009 - Institutional | | | 7.13 | | | | 0.57 | | | | (1.92 | ) | | | (1.35 | ) | | | (0.59 | ) | | |
| | | 2009 - Service | | | 7.12 | | | | 0.54 | | | | (1.93 | ) | | | (1.39 | ) | | | (0.56 | ) | | |
| | | 2009 - IR | | | 7.12 | | | | 0.57 | | | | (1.93 | ) | | | (1.36 | ) | | | (0.58 | ) | | |
| | | 2009 - R | | | 7.12 | | | | 0.53 | | | | (1.93 | ) | | | (1.40 | ) | | | (0.55 | ) | | |
| | | | | | | | | | | | | | | | | | | | | | | | | |
| | | | | | | | | | | | | | | | | | | | | | | | | |
| FOR THE PERIOD NOVEMBER 1, 2007 TO MARCH 31, 2008* |
| | | | | | | | | | | | | | | | | | | | | | | | | |
| | | | | | | | | | | | | | | | | | | | | | | | | |
| | | 2008 - A | | | 7.93 | | | | 0.24 | | | | (0.78 | ) | | | (0.54 | ) | | | (0.27 | ) | | |
| | | 2008 - B | | | 7.94 | | | | 0.22 | | | | (0.79 | ) | | | (0.57 | ) | | | (0.24 | ) | | |
| | | 2008 - C | | | 7.93 | | | | 0.22 | | | | (0.79 | ) | | | (0.57 | ) | | | (0.24 | ) | | |
| | | 2008 - Institutional | | | 7.94 | | | | 0.25 | | | | (0.78 | ) | | | (0.53 | ) | | | (0.28 | ) | | |
| | | 2008 - Service | | | 7.92 | | | | 0.24 | | | | (0.78 | ) | | | (0.54 | ) | | | (0.26 | ) | | |
| | | 2008 - IR (Commenced November 30, 2007) | | | 7.68 | | | | 0.20 | | | | (0.54 | ) | | | (0.34 | ) | | | (0.22 | ) | | |
| | | 2008 - R (Commenced November 30, 2007) | | | 7.68 | | | | 0.19 | | | | (0.54 | ) | | | (0.35 | ) | | | (0.21 | ) | | |
| | | | | | | | | | | | | | | | | | | | | | | | | |
| | | | | | | | | | | | | | | | | | | | | | | | | |
| FOR THE FISCAL YEARS ENDED OCTOBER 31, |
| | | | | | | | | | | | | | | | | | | | | | | | | |
| | | | | | | | | | | | | | | | | | | | | | | | | |
| | | 2007 - A | | | 8.04 | | | | 0.60 | | | | (0.10 | ) | | | 0.50 | | | | (0.61 | ) | | |
| | | 2007 - B | | | 8.05 | | | | 0.54 | | | | (0.10 | ) | | | 0.44 | | | | (0.55 | ) | | |
| | | 2007 - C | | | 8.04 | | | | 0.54 | | | | (0.10 | ) | | | 0.44 | | | | (0.55 | ) | | |
| | | 2007 - Institutional | | | 8.05 | | | | 0.63 | | | | (0.10 | ) | | | 0.53 | | | | (0.64 | ) | | |
| | | 2007 - Service | | | 8.03 | | | | 0.59 | | | | (0.10 | ) | | | 0.49 | | | | (0.60 | ) | | |
| | | | | | | | | | | | | | | | | | | | | | | | | |
| | | | | | | | | | | | | | | | | | | | | | | | | |
| | | |
| | | |
| | | 2006 - A | | | 7.81 | | | | 0.58 | | | | 0.23 | | | | 0.81 | | | | (0.58 | ) | | |
| | | 2006 - B | | | 7.82 | | | | 0.53 | | | | 0.22 | | | | 0.75 | | | | (0.52 | ) | | |
| | | 2006 - C | | | 7.81 | | | | 0.53 | | | | 0.22 | | | | 0.75 | | | | (0.52 | ) | | |
| | | 2006 - Institutional | | | 7.82 | | | | 0.61 | | | | 0.23 | | | | 0.84 | | | | (0.61 | ) | | |
| | | 2006 - Service | | | 7.80 | | | | 0.57 | | | | 0.23 | | | | 0.80 | | | | (0.57 | ) | | |
| | | | | | | | | | | | | | | | | | | | | | | | | |
| | | | | | | | | | | | | | | | | | | | | | | | | |
| | | |
| | | |
| | | 2005 - A | | | 8.08 | | | | 0.62 | | | | (0.22 | ) | | | 0.40 | | | | (0.67 | ) | | |
| | | 2005 - B | | | 8.09 | | | | 0.56 | | | | (0.22 | ) | | | 0.34 | | | | (0.61 | ) | | |
| | | 2005 - C | | | 8.08 | | | | 0.56 | | | | (0.22 | ) | | | 0.34 | | | | (0.61 | ) | | |
| | | 2005 - Institutional | | | 8.09 | | | | 0.65 | | | | (0.21 | ) | | | 0.44 | | | | (0.71 | ) | | |
| | | 2005 - Service | | | 8.09 | | | | 0.62 | | | | (0.24 | ) | | | 0.38 | | | | (0.67 | ) | | |
| | | | | | | | | | | | | | | | | | | | | | | | | |
| | | | | | | | | | | | | | | | | | | | | | | | | |
| | | |
| | | |
| | | 2004 - A | | | 7.79 | | | | 0.65 | | | | 0.32 | | | | 0.97 | | | | (0.68 | ) | | |
| | | 2004 - B | | | 7.80 | | | | 0.60 | | | | 0.31 | | | | 0.91 | | | | (0.62 | ) | | |
| | | 2004 - C | | | 7.79 | | | | 0.60 | | | | 0.31 | | | | 0.91 | | | | (0.62 | ) | | |
| | | 2004 - Institutional | | | 7.81 | | | | 0.69 | | | | 0.30 | | | | 0.99 | | | | (0.71 | ) | | |
| | | 2004 - Service | | | 7.80 | | | | 0.65 | | | | 0.31 | | | | 0.96 | | | | (0.67 | ) | | |
| | | | | | | | | | | | | | | | | | | | | | | | | |
| | | | | | | | | | | | | | | | | | | | | | | | | |
| | | |
| | | |
| | | | | | | | | | | | | | | | | | | | | | | | | |
| | | | | | | | | | | | | | | | | | | | | | | | | |
| |
| * | The Fund changed its fiscal year end from October 31 to March 31. |
| |
| (a) | Calculated based on the average shares outstanding methodology. |
| |
| (b) | Assumes investment at the net asset value at the beginning of the period, reinvestment of all dividends and distributions, a complete redemption of the investment at the net asset value at the end of the period and no sales or redemption charges. Total returns would be reduced if a sales or redemption charge was taken into account. Returns do not reflect the deduction of taxes that a shareholder would pay on Fund distributions or the redemption of Fund shares. Total returns for periods less than one full year are not annualized. |
The accompanying notes are an integral part of these financial statements.
GOLDMAN SACHS HIGH YIELD FUND
| | | | | | | | | | | | | | | | | | | | | | | | | | | | | | | | | | | |
| | | | | | | | | | | | | | | | | | Ratios assuming no
| | | | | | |
| | | | | | | | | | | | | | | | | | expense reductions | | | | | | |
| | | | | | | | | | | | | | | Ratio of
| | | | | | Ratio of
| | | | | | |
| | | | | | | | | Net assets,
| | | Ratio of
| | | net investment
| | | Ratio of
| | | net investment
| | | | | | |
| | | Net asset
| | | | | | end of
| | | net expenses
| | | income
| | | total expenses
| | | income
| | | Portfolio
| | | |
| | | value, end
| | | Total
| | | period
| | | to average
| | | to average
| | | to average
| | | to average
| | | turnover
| | | |
| | | of period | | | return(b) | | | (in 000s) | | | net assets | | | net assets | | | net assets | | | net assets | | | rate | | | |
| |
| |
| | | | | | | | | | | | | | | | | | | | | | | | | | | | | | | | | | | |
| | | | | | | | | | | | | | | | | | | | | | | | | | | | | | | | | | | |
| | | $ | 6.73 | | | | 35.37 | % | | $ | 1,191,747 | | | | 1.06 | %(c) | | | 8.80 | %(c) | | | 1.06 | %(c) | | | 8.80 | %(c) | | | 17 | % | | |
| | | | 6.75 | | | | 35.27 | | | | 66,884 | | | | 1.81 | (c) | | | 8.10 | (c) | | | 1.81 | (c) | | | 8.10 | (c) | | | 17 | | | |
| | | | 6.74 | | | | 35.08 | | | | 107,851 | | | | 1.81 | (c) | | | 8.09 | (c) | | | 1.81 | (c) | | | 8.09 | (c) | | | 17 | | | |
| | | | 6.75 | | | | 35.73 | | | | 4,077,156 | | | | 0.72 | (c) | | | 9.18 | (c) | | | 0.72 | (c) | | | 9.18 | (c) | | | 17 | | | |
| | | | 6.73 | | | | 35.53 | | | | 20,409 | | | | 1.22 | (c) | | | 8.68 | (c) | | | 1.22 | (c) | | | 8.68 | (c) | | | 17 | | | |
| | | | 6.74 | | | | 35.74 | | | | 10 | | | | 0.81 | (c) | | | 9.08 | (c) | | | 0.81 | (c) | | | 9.08 | (c) | | | 17 | | | |
| | | | 6.73 | | | | 35.47 | | | | 609 | | | | 1.31 | (c) | | | 8.62 | (c) | | | 1.31 | (c) | | | 8.62 | (c) | | | 17 | | | |
| | | | | | | | | | | | | | | | | | | | | | | | | | | | | | | | | | | |
| | | | | | | | | | | | | | | | | | | | | | | | | | | | | | | | | | | |
| |
| | | | | | | | | | | | | | | | | | | | | | | | | | | | | | | | | | | |
| | | | | | | | | | | | | | | | | | | | | | | | | | | | | | | | | | | |
| | | | 5.18 | | | | (20.12 | ) | | | 1,636,406 | | | | 1.07 | | | | 9.10 | | | | 1.08 | | | | 9.09 | | | | 14 | | | |
| | | | 5.18 | | | | (20.73 | ) | | | 53,589 | | | | 1.82 | | | | 8.20 | | | | 1.83 | | | | 8.19 | | | | 14 | | | |
| | | | 5.18 | | | | (20.72 | ) | | | 74,325 | | | | 1.82 | | | | 8.25 | | | | 1.83 | | | | 8.24 | | | | 14 | | | |
| | | | 5.19 | | | | (19.81 | ) | | | 1,986,033 | | | | 0.73 | | | | 9.49 | | | | 0.74 | | | | 9.48 | | | | 14 | | | |
| | | | 5.17 | | | | (20.28 | ) | | | 12,582 | | | | 1.23 | | | | 8.98 | | | | 1.24 | | | | 8.97 | | | | 14 | | | |
| | | | 5.18 | | | | (19.91 | ) | | | 8 | | | | 0.82 | | | | 9.31 | | | | 0.83 | | | | 9.30 | | | | 14 | | | |
| | | | 5.17 | | | | (20.47 | ) | | | 183 | | | | 1.32 | | | | 9.95 | | | | 1.33 | | | | 9.94 | | | | 14 | | | |
| | | | | | | | | | | | | | | | | | | | | | | | | | | | | | | | | | | |
| | | | | | | | | | | | | | | | | | | | | | | | | | | | | | | | | | | |
| |
| | | | | | | | | | | | | | | | | | | | | | | | | | | | | | | | | | | |
| | | | | | | | | | | | | | | | | | | | | | | | | | | | | | | | | | | |
| | | | 7.12 | | | | (6.82 | ) | | | 1,650,027 | | | | 1.07 | (c) | | | 7.87 | (c) | | | 1.09 | (c) | | | 7.85 | (c) | | | 11 | | | |
| | | | 7.13 | | | | (7.23 | ) | | | 92,953 | | | | 1.82 | (c) | | | 7.12 | (c) | | | 1.84 | (c) | | | 7.10 | (c) | | | 11 | | | |
| | | | 7.12 | | | | (7.11 | ) | | | 101,138 | | | | 1.82 | (c) | | | 7.12 | (c) | | | 1.84 | (c) | | | 7.10 | (c) | | | 11 | | | |
| | | | 7.13 | | | | (6.68 | ) | | | 1,628,668 | | | | 0.73 | (c) | | | 8.22 | (c) | | | 0.75 | (c) | | | 8.20 | (c) | | | 11 | | | |
| | | | 7.12 | | | | (6.89 | ) | | | 10,573 | | | | 1.23 | (c) | | | 7.72 | (c) | | | 1.25 | (c) | | | 7.70 | (c) | | | 11 | | | |
| | | | 7.12 | | | | (4.35 | ) | | | 10 | | | | 0.82 | (c) | | | 8.20 | (c) | | | 0.84 | (c) | | | 8.18 | (c) | | | 11 | | | |
| | | | 7.12 | | | | (4.51 | ) | | | 9 | | | | 1.32 | (c) | | | 7.73 | (c) | | | 1.34 | (c) | | | 7.71 | (c) | | | 11 | | | |
| | | | | | | | | | | | | | | | | | | | | | | | | | | | | | | | | | | |
| | | | | | | | | | | | | | | | | | | | | | | | | | | | | | | | | | | |
| |
| | | | | | | | | | | | | | | | | | | | | | | | | | | | | | | | | | | |
| | | | | | | | | | | | | | | | | | | | | | | | | | | | | | | | | | | |
| | | | 7.93 | | | | 6.41 | | | | 1,777,150 | | | | 1.09 | | | | 7.46 | | | | 1.11 | | | | 7.44 | | | | 50 | | | |
| | | | 7.94 | | | | 5.61 | | | | 115,817 | | | | 1.84 | | | | 6.72 | | | | 1.86 | | | | 6.70 | | | | 50 | | | |
| | | | 7.93 | | | | 5.61 | | | | 119,073 | | | | 1.84 | | | | 6.71 | | | | 1.86 | | | | 6.69 | | | | 50 | | | |
| | | | 7.94 | | | | 6.79 | | | | 1,646,138 | | | | 0.73 | | | | 7.82 | | | | 0.75 | | | | 7.80 | | | | 50 | | | |
| | | | 7.92 | | | | 6.28 | | | | 8,399 | | | | 1.24 | | | | 7.34 | | | | 1.26 | | | | 7.32 | | | | 50 | | | |
| | | | | | | | | | | | | | | | | | | | | | | | | | | | | | | | | | | |
| | | | | | | | | | | | | | | | | | | | | | | | | | | | | | | | | | | |
| |
| |
| | | | 8.04 | | | | 10.76 | | | | 1,395,265 | | | | 1.12 | | | | 7.38 | | | | 1.14 | | | | 7.36 | | | | 41 | | | |
| | | | 8.05 | | | | 9.93 | | | | 96,743 | | | | 1.87 | | | | 6.64 | | | | 1.89 | | | | 6.62 | | | | 41 | | | |
| | | | 8.04 | | | | 9.94 | | | | 90,528 | | | | 1.87 | | | | 6.64 | | | | 1.89 | | | | 6.62 | | | | 41 | | | |
| | | | 8.05 | | | | 11.16 | | | | 1,296,429 | | | | 0.75 | | | | 7.76 | | | | 0.77 | | | | 7.74 | | | | 41 | | | |
| | | | 8.03 | | | | 10.63 | | | | 2,980 | | | | 1.25 | | | | 7.26 | | | | 1.27 | | | | 7.24 | | | | 41 | | | |
| | | | | | | | | | | | | | | | | | | | | | | | | | | | | | | | | | | |
| | | | | | | | | | | | | | | | | | | | | | | | | | | | | | | | | | | |
| |
| |
| | | | 7.81 | | | | 5.10 | | | | 1,006,734 | | | | 1.15 | | | | 7.74 | | | | 1.17 | | | | 7.72 | | | | 52 | | | |
| | | | 7.82 | | | | 4.31 | | | | 104,637 | | | | 1.90 | | | | 6.98 | | | | 1.92 | | | | 6.96 | | | | 52 | | | |
| | | | 7.81 | | | | 4.32 | | | | 72,590 | | | | 1.90 | | | | 6.95 | | | | 1.92 | | | | 6.93 | | | | 52 | | | |
| | | | 7.82 | | | | 5.50 | | | | 825,508 | | | | 0.76 | | | | 8.11 | | | | 0.79 | | | | 8.08 | | | | 52 | | | |
| | | | 7.80 | | | | 4.72 | | | | 1,597 | | | | 1.26 | | | | 7.62 | | | | 1.29 | | | | 7.59 | | | | 52 | | | |
| | | | | | | | | | | | | | | | | | | | | | | | | | | | | | | | | | | |
| | | | | | | | | | | | | | | | | | | | | | | | | | | | | | | | | | | |
| |
| |
| | | | 8.08 | | | | 12.94 | | | | 1,109,364 | | | | 1.16 | | | | 8.31 | | | | 1.18 | | | | 8.29 | | | | 47 | | | |
| | | | 8.09 | | | | 12.09 | | | | 105,106 | | | | 1.91 | | | | 7.54 | | | | 1.93 | | | | 7.52 | | | | 47 | | | |
| | | | 8.08 | | | | 12.10 | | | | 56,174 | | | | 1.91 | | | | 7.53 | | | | 1.93 | | | | 7.51 | | | | 47 | | | |
| | | | 8.09 | | | | 13.23 | | | | 832,175 | | | | 0.76 | | | | 8.73 | | | | 0.78 | | | | 8.71 | | | | 47 | | | |
| | | | 8.09 | | | | 12.81 | | | | 1,160 | | | | 1.26 | | | | 8.18 | | | | 1.28 | | | | 8.16 | | | | 47 | | | |
| | | | | | | | | | | | | | | | | | | | | | | | | | | | | | | | | | | |
| | | | | | | | | | | | | | | | | | | | | | | | | | | | | | | | | | | |
| |
| |
The accompanying notes are an integral part of these financial statements.
GOLDMAN SACHS INVESTMENT GRADE CREDIT FUND
Financial Highlights
Selected Data for a Share Outstanding Throughout Each Period
| | | | | | | | | | | | | | | | | | | | | | | | | | | | | | | | | |
| | | | | | | | Income (loss) from
| | | Distributions
| | | |
| | | | | Net asset
| | | investment operations | | | to shareholders | | | |
| | | | | value,
| | | Net
| | | Net realized
| | | Total from
| | | From net
| | | From net
| | | | | | |
| | | | | beginning
| | | investment
| | | and unrealized
| | | investment
| | | investment
| | | realized
| | | Total
| | | |
| | | Year - Share Class | | of period | | | income(a) | | | gain (loss) | | | operations | | | income | | | gains | | | distributions | | | |
| |
| FOR THE SIX MONTHS ENDED SEPTEMBER 30, (UNAUDITED) |
| | | | | | | | | | | | | | | | | | | | | | | | | | | | | | | | | |
| | | | | | | | | | | | | | | | | | | | | | | | | | | | | | | | | |
| | | 2009 - A | | $ | 7.75 | | | $ | 0.22 | | | $ | 1.24 | | | $ | 1.46 | | | $ | (0.22 | ) | | $ | — | | | $ | (0.22 | ) | | |
| | | 2009 - Institutional | | | 7.75 | | | | 0.23 | | | | 1.25 | | | | 1.48 | | | | (0.24 | ) | | | — | | | | (0.24 | ) | | |
| | | 2009 - Separate Account Institutional | | | 7.75 | | | | 0.24 | | | | 1.24 | | | | 1.48 | | | | (0.24 | ) | | | — | | | | (0.24 | ) | | |
| | | | | | | | | | | | | | | | | | | | | | | | | | | | | | | | | |
| | | | | | | | | | | | | | | | | | | | | | | | | | | | | | | | | |
| FOR THE FISCAL YEAR ENDED MARCH 31, |
| | | | | | | | | | | | | | | | | | | | | | | | | | | | | | | | | |
| | | | | | | | | | | | | | | | | | | | | | | | | | | | | | | | | |
| | | 2009 - A | | | 9.64 | | | | 0.51 | | | | (1.83 | ) | | | (1.32 | ) | | | (0.57 | ) | | | — | | | | (0.57 | ) | | |
| | | 2009 - Institutional | | | 9.66 | | | | 0.55 | | | | (1.85 | ) | | | (1.30 | ) | | | (0.61 | ) | | | — | | | | (0.61 | ) | | |
| | | 2009 - Separate Account Institutional | | | 9.65 | | | | 0.57 | | | | (1.86 | ) | | | (1.29 | ) | | | (0.61 | ) | | | — | | | | (0.61 | ) | | |
| | | | | | | | | | | | | | | | | | | | | | | | | | | | | | | | | |
| | | | | | | | | | | | | | | | | | | | | | | | | | | | | | | | | |
| FOR THE PERIOD NOVEMBER 1, 2007 TO MARCH 31, 2008* |
| | | | | | | | | | | | | | | | | | | | | | | | | | | | | | | | | |
| | | | | | | | | | | | | | | | | | | | | | | | | | | | | | | | | |
| | | 2008 - A | | | 9.90 | | | | 0.22 | | | | (0.27 | ) | | | (0.05 | ) | | | (0.21 | ) | | | — | | | | (0.21 | ) | | |
| | | 2008 - Institutional | | | 9.92 | | | | 0.23 | | | | (0.27 | ) | | | (0.04 | ) | | | (0.22 | ) | | | — | | | | (0.22 | ) | | |
| | | 2008 - Separate Account Institutional | | | 9.91 | | | | 0.23 | | | | (0.26 | ) | | | (0.03 | ) | | | (0.23 | ) | | | — | | | | (0.23 | ) | | |
| | | | | | | | | | | | | | | | | | | | | | | | | | | | | | | | | |
| | | | | | | | | | | | | | | | | | | | | | | | | | | | | | | | | |
| FOR THE FISCAL YEARS ENDED OCTOBER 31, |
| | | | | | | | | | | | | | | | | | | | | | | | | | | | | | | | | |
| | | | | | | | | | | | | | | | | | | | | | | | | | | | | | | | | |
| | | 2007 - A | | | 9.95 | | | | 0.51 | | | | (0.08 | ) | | | 0.43 | | | | (0.48 | ) | | | — | | | | (0.48 | ) | | |
| | | 2007 - Institutional | | | 9.97 | | | | 0.55 | | | | (0.08 | ) | | | 0.47 | | | | (0.52 | ) | | | — | | | | (0.52 | ) | | |
| | | 2007 - Separate Account Institutional | | | 9.96 | | | | 0.56 | | | | (0.08 | ) | | | 0.48 | | | | (0.53 | ) | | | — | | | | (0.53 | ) | | |
| | | | | | | | | | | | | | | | | | | | | | | | | | | | | | | | | |
| | | | | | | | | | | | | | | | | | | | | | | | | | | | | | | | | |
| | | |
| | | |
| | | 2006 - A | | | 9.93 | | | | 0.47 | | | | — | | | | 0.47 | | | | (0.45 | ) | | | — | | | | (0.45 | ) | | |
| | | 2006 - Institutional | | | 9.95 | | | | 0.51 | | | | — | | | | 0.51 | | | | (0.49 | ) | | | — | | | | (0.49 | ) | | |
| | | 2006 - Separate Account Institutional | | | 9.94 | | | | 0.52 | | | | (0.01 | ) | | | 0.51 | | | | (0.49 | ) | | | — | | | | (0.49 | ) | | |
| | | | | | | | | | | | | | | | | | | | | | | | | | | | | | | | | |
| | | | | | | | | | | | | | | | | | | | | | | | | | | | | | | | | |
| | | |
| | | |
| | | 2005 - A | | | 10.31 | | | | 0.40 | | | | (0.35 | ) | | | 0.05 | | | | (0.39 | ) | | | (0.04 | ) | | | (0.43 | ) | | |
| | | 2005 - Institutional | | | 10.32 | | | | 0.52 | | | | (0.42 | ) | | | 0.10 | | | | (0.43 | ) | | | (0.04 | ) | | | (0.47 | ) | | |
| | | 2005 - Separate Account Institutional | | | 10.31 | | | | 0.46 | | | | (0.35 | ) | | | 0.11 | | | | (0.44 | ) | | | (0.04 | ) | | | (0.48 | ) | | |
| | | | | | | | | | | | | | | | | | | | | | | | | | | | | | | | | |
| | | | | | | | | | | | | | | | | | | | | | | | | | | | | | | | | |
| FOR THE PERIOD ENDED OCTOBER 31, |
| | | | | | | | | | | | | | | | | | | | | | | | | | | | | | | | | |
| | | | | | | | | | | | | | | | | | | | | | | | | | | | | | | | | |
| | | 2004 - A (Commenced November 3, 2003) | | | 10.00 | | | | 0.38 | | | | 0.31 | | | | 0.69 | | | | (0.38 | ) | | | — | | | | (0.38 | ) | | |
| | | 2004 - Institutional (Commenced November 3, 2003) | | | 10.00 | | | | 0.44 | | | | 0.30 | | | | 0.74 | | | | (0.42 | ) | | | — | | | | (0.42 | ) | | |
| | | 2004 - Separate Account Institutional (Commenced November 3, 2003) | | | 10.00 | | | | 0.43 | | | | 0.31 | | | | 0.74 | | | | (0.43 | ) | | | — | | | | (0.43 | ) | | |
| | | | | | | | | | | | | | | | | | | | | | | | | | | | | | | | | |
| | | | | | | | | | | | | | | | | | | | | | | | | | | | | | | | | |
| | | |
| | | |
| | | | | | | | | | | | | | | | | | | | | | | | | | | | | | | | | |
| |
| * | The Fund changed its fiscal year end from October 31 to March 31. |
| |
| (a) | Calculated based on the average shares outstanding methodology. |
| |
| (b) | Assumes investment at the net asset value at the beginning of the period, reinvestment of all dividends and distributions, a complete redemption of the investment at the net asset value at the end of the period and no sales or redemption charges. Total returns would be reduced if a sales or redemption charge was taken into account. Returns do not reflect the deduction of taxes that a shareholder would pay on Fund distributions or the redemption of Fund shares. Total returns for periods less than one full year are not annualized. |
The accompanying notes are an integral part of these financial statements.
GOLDMAN SACHS INVESTMENT GRADE CREDIT FUND
| | | | | | | | | | | | | | | | | | | | | | | | | | | | | | | | | | | |
| | | | | | | | | | | | | | | | | | Ratios assuming no
| | | | | | |
| | | | | | | | | | | | | | | | | | expense reductions | | | | | | |
| | | | | | | | | | | | | | | Ratio of
| | | | | | Ratio of
| | | | | | |
| | | | | | | | | Net assets,
| | | Ratio of
| | | net investment
| | | Ratio of
| | | net investment
| | | | | | |
| | | Net asset
| | | | | | end of
| | | net expenses
| | | income
| | | total expenses
| | | income
| | | Portfolio
| | | |
| | | value, end
| | | Total
| | | period
| | | to average
| | | to average
| | | to average
| | | to average
| | | turnover
| | | |
| | | of period | | | return(b) | | | (in 000s) | | | net assets | | | net assets | | | net assets | | | net assets | | | rate | | | |
| |
| |
| | | | | | | | | | | | | | | | | | | | | | | | | | | | | | | | | | | |
| | | | | | | | | | | | | | | | | | | | | | | | | | | | | | | | | | | |
| | | $ | 8.99 | | | | 19.04 | % | | $ | 157,314 | | | | 0.76 | %(c) | | | 5.19 | %(c) | | | 0.89 | %(c) | | | 5.06 | %(c) | | | 33 | % | | |
| | | | 8.99 | | | | 19.25 | | | | 138,752 | | | | 0.40 | (c) | | | 5.45 | (c) | | | 0.55 | (c) | | | 5.30 | (c) | | | 33 | | | |
| | | | 8.99 | | | | 19.28 | | | | 210,131 | | | | 0.35 | (c) | | | 5.73 | (c) | | | 0.50 | (c) | | | 5.58 | (c) | | | 33 | | | |
| | | | | | | | | | | | | | | | | | | | | | | | | | | | | | | | | | | |
| | | | | | | | | | | | | | | | | | | | | | | | | | | | | | | | | | | |
| |
| | | | | | | | | | | | | | | | | | | | | | | | | | | | | | | | | | | |
| | | | | | | | | | | | | | | | | | | | | | | | | | | | | | | | | | | |
| | | | 7.75 | | | | (14.00 | ) | | | 53,185 | | | | 0.76 | | | | 6.22 | | | | 0.97 | | | | 6.01 | | | | 135 | | | |
| | | | 7.75 | | | | (13.83 | ) | | | 22,809 | | | | 0.40 | | | | 6.52 | | | | 0.63 | | | | 6.29 | | | | 135 | | | |
| | | | 7.75 | | | | (13.72 | ) | | | 171,003 | | | | 0.35 | | | | 6.52 | | | | 0.58 | | | | 6.29 | | | | 135 | | | |
| | | | | | | | | | | | | | | | | | | | | | | | | | | | | | | | | | | |
| | | | | | | | | | | | | | | | | | | | | | | | | | | | | | | | | | | |
| |
| | | | | | | | | | | | | | | | | | | | | | | | | | | | | | | | | | | |
| | | | | | | | | | | | | | | | | | | | | | | | | | | | | | | | | | | |
| | | | 9.64 | | | | (0.54 | ) | | | 9,455 | | | | 0.76 | (c) | | | 5.31 | (c) | | | 0.95 | (c) | | | 5.12 | (c) | | | 15 | | | |
| | | | 9.66 | | | | (0.39 | ) | | | 10,504 | | | | 0.40 | (c) | | | 5.67 | (c) | | | 0.61 | (c) | | | 5.46 | (c) | | | 15 | | | |
| | | | 9.65 | | | | (0.37 | ) | | | 226,207 | | | | 0.35 | (c) | | | 5.72 | (c) | | | 0.56 | (c) | | | 5.51 | (c) | | | 15 | | | |
| | | | | | | | | | | | | | | | | | | | | | | | | | | | | | | | | | | |
| | | | | | | | | | | | | | | | | | | | | | | | | | | | | | | | | | | |
| |
| | | | | | | | | | | | | | | | | | | | | | | | | | | | | | | | | | | |
| | | | | | | | | | | | | | | | | | | | | | | | | | | | | | | | | | | |
| | | | 9.90 | | | | 4.44 | | | | 8,615 | | | | 0.79 | | | | 5.17 | | | | 0.97 | | | | 4.99 | | | | 74 | | | |
| | | | 9.92 | | | | 4.83 | | | | 10,893 | | | | 0.40 | | | | 5.59 | | | | 0.60 | | | | 5.39 | | | | 74 | | | |
| | | | 9.91 | | | | 4.89 | | | | 239,358 | | | | 0.35 | | | | 5.61 | | | | 0.55 | | | | 5.41 | | | | 74 | | | |
| | | | | | | | | | | | | | | | | | | | | | | | | | | | | | | | | | | |
| | | | | | | | | | | | | | | | | | | | | | | | | | | | | | | | | | | |
| |
| |
| | | | 9.95 | | | | 4.84 | | | | 3,420 | | | | 0.79 | | | | 4.82 | | | | 1.04 | | | | 4.57 | | | | 74 | | | |
| | | | 9.97 | | | | 5.35 | | | | 3,317 | | | | 0.40 | | | | 5.21 | | | | 0.65 | | | | 4.96 | | | | 74 | | | |
| | | | 9.96 | | | | 5.30 | | | | 206,122 | | | | 0.35 | | | | 5.26 | | | | 0.60 | | | | 5.01 | | | | 74 | | | |
| | | | | | | | | | | | | | | | | | | | | | | | | | | | | | | | | | | |
| | | | | | | | | | | | | | | | | | | | | | | | | | | | | | | | | | | |
| |
| |
| | | | 9.93 | | | | 0.50 | | | | 3,622 | | | | 0.81 | | | | 3.88 | | | | 1.07 | | | | 3.62 | | | | 88 | | | |
| | | | 9.95 | | | | 0.89 | | | | 3,638 | | | | 0.40 | | | | 4.40 | | | | 0.66 | | | | 4.14 | | | | 88 | | | |
| | | | 9.94 | | | | 1.04 | | | | 192,196 | | | | 0.35 | | | | 4.34 | | | | 0.62 | | | | 4.07 | | | | 88 | | | |
| | | | | | | | | | | | | | | | | | | | | | | | | | | | | | | | | | | |
| | | | | | | | | | | | | | | | | | | | | | | | | | | | | | | | | | | |
| |
| | | | | | | | | | | | | | | | | | | | | | | | | | | | | | | | | | | |
| | | | | | | | | | | | | | | | | | | | | | | | | | | | | | | | | | | |
| | | | 10.31 | | | | 7.00 | | | | 2,179 | | | | 0.82 | (c) | | | 3.66 | (c) | | | 1.85 | (c) | | | 2.63 | (c) | | | 78 | | | |
| | | | 10.32 | | | | 7.57 | | | | 76 | | | | 0.40 | (c) | | | 4.28 | (c) | | | 1.45 | (c) | | | 3.23 | (c) | | | 78 | | | |
| | | | | | | | | | | | | | | | | | | | | | | | | | | | | | | | | | | |
| | | | 10.31 | | | | 7.52 | | | | 70,269 | | | | 0.35 | (c) | | | 4.26 | (c) | | | 1.40 | (c) | | | 3.21 | (c) | | | 78 | | | |
| | | | | | | | | | | | | | | | | | | | | | | | | | | | | | | | | | | |
| | | | | | | | | | | | | | | | | | | | | | | | | | | | | | | | | | | |
| |
| |
The accompanying notes are an integral part of these financial statements.
GOLDMAN SACHS LOCAL EMERGING MARKETS DEBT FUND
Financial Highlights
Selected Data for a Share Outstanding Throughout Each Period
| | | | | | | | | | | | | | | | | | | | | | | | | | | | | | | | | |
| | | | | | | | Income (loss) from
| | | Distributions
| | | |
| | | | | Net asset
| | | investment operations | | | to shareholders | | | |
| | | | | value,
| | | Net
| | | Net realized
| | | Total from
| | | From net
| | | | | | | | | |
| | | | | beginning
| | | investment
| | | and unrealized
| | | investment
| | | investment
| | | From
| | | Total
| | | |
| | | Year - Share Class | | of period | | | income(a) | | | gain (loss) | | | operations | | | income | | | capital | | | distributions | | | |
| |
| FOR THE SIX MONTHS ENDED SEPTEMBER 30, (UNAUDITED) |
| | | | | | | | | | | | | | | | | | | | | | | | | | | | | | | | | |
| | | | | | | | | | | | | | | | | | | | | | | | | | | | | | | | | |
| | | 2009 - A | | $ | 7.23 | | | $ | 0.20 | | | $ | 1.67 | | | $ | 1.87 | | | $ | (0.21 | ) | | $ | — | | | $ | (0.21 | ) | | |
| | | 2009 - C | | | 7.24 | | | | 0.18 | | | | 1.65 | | | | 1.83 | | | | (0.18 | ) | | | — | | | | (0.18 | ) | | |
| | | 2009 - Institutional | | | 7.23 | | | | 0.22 | | | | 1.67 | | | | 1.89 | | | | (0.23 | ) | | | — | | | | (0.23 | ) | | |
| | | | | | | | | | | | | | | | | | | | | | | | | | | | | | | | | |
| | | | | | | | | | | | | | | | | | | | | | | | | | | | | | | | | |
| FOR THE FISCAL YEAR ENDED MARCH 31, |
| | | | | | | | | | | | | | | | | | | | | | | | | | | | | | | | | |
| | | | | | | | | | | | | | | | | | | | | | | | | | | | | | | | | |
| | | 2009 - A | | | 9.85 | | | | 0.50 | | | | (2.64 | ) | | | (2.14 | ) | | | (0.20 | ) | | | (0.28 | ) | | | (0.48 | ) | | |
| | | 2009 - C | | | 9.85 | | | | 0.48 | | | | (2.67 | ) | | | (2.19 | ) | | | (0.18 | ) | | | (0.24 | ) | | | (0.42 | ) | | |
| | | 2009 - Institutional | | | 9.85 | | | | 0.53 | | | | (2.64 | ) | | | (2.11 | ) | | | (0.22 | ) | | | (0.29 | ) | | | (0.51 | ) | | |
| | | | | | | | | | | | | | | | | | | | | | | | | | | | | | | | | |
| | | | | | | | | | | | | | | | | | | | | | | | | | | | | | | | | |
| FOR THE PERIOD ENDED MARCH 31, |
| | | | | | | | | | | | | | | | | | | | | | | | | | | | | | | | | |
| | | | | | | | | | | | | | | | | | | | | | | | | | | | | | | | | |
| | | 2008 - A (Commenced February 15, 2008) | | | 10.00 | | | | 0.04 | | | | (0.14 | ) | | | (0.10 | ) | | | (0.05 | ) | | | — | | | | (0.05 | ) | | |
| | | 2008 - C (Commenced February 15, 2008) | | | 10.00 | | | | 0.04 | | | | (0.14 | ) | | | (0.10 | ) | | | (0.05 | ) | | | — | | | | (0.05 | ) | | |
| | | 2008 - Institutional (Commenced February 15, 2008) | | | 10.00 | | | | 0.06 | | | | (0.15 | ) | | | (0.09 | ) | | | (0.06 | ) | | | — | | | | (0.06 | ) | | |
| | | | | | | | | | | | | | | | | | | | | | | | | | | | | | | | | |
| | | | | | | | | | | | | | | | | | | | | | | | | | | | | | | | | |
| | | |
| | | |
| | | | | | | | | | | | | | | | | | | | | | | | | | | | | | | | | |
| |
| (a) | Calculated based on the average shares outstanding methodology. |
| |
| (b) | Assumes investment at the net asset value at the beginning of the period, reinvestment of all dividends and distributions, a complete redemption of the investment at the net asset value at the end of the period and no sales or redemption charges. Total returns would be reduced if a sales or redemption charge was taken into account. Returns do not reflect the deduction of taxes that a shareholder would pay on Fund distributions or the redemption of Fund shares. Total returns for periods less than one full year are not annualized. |
The accompanying notes are an integral part of these financial statements.
GOLDMAN SACHS LOCAL EMERGING MARKETS DEBT FUND
| | | | | | | | | | | | | | | | | | | | | | | | | | | | | | | | | | | |
| | | | | | | | | | | | | | | | | | Ratios assuming no
| | | | | | |
| | | | | | | | | | | | | | | | | | expense reductions | | | | | | |
| | | | | | | | | | | | | | | Ratio of
| | | | | | Ratio of
| | | | | | |
| | | | | | | | | Net assets,
| | | Ratio of
| | | net investment
| | | Ratio of
| | | net investment
| | | | | | |
| | | Net asset
| | | | | | end of
| | | net expenses
| | | income
| | | total expenses
| | | income
| | | Portfolio
| | | |
| | | value, end
| | | Total
| | | period
| | | to average
| | | to average
| | | to average
| | | to average
| | | turnover
| | | |
| | | of period | | | return(b) | | | (in 000s) | | | net assets | | | net assets | | | net assets | | | net assets | | | rate | | | |
| |
| |
| | | | | | | | | | | | | | | | | | | | | | | | | | | | | | | | | | | |
| | | | | | | | | | | | | | | | | | | | | | | | | | | | | | | | | | | |
| | | $ | 8.89 | | | | 26.09 | % | | $ | 30,001 | | | | 1.35 | %(c) | | | 4.87 | %(c) | | | 1.64 | %(c) | | | 4.58 | %(c) | | | 60 | % | | |
| | | | 8.89 | | | | 25.43 | | | | 342 | | | | 2.10 | (c) | | | 4.34 | (c) | | | 2.39 | (c) | | | 4.05 | (c) | | | 60 | | | |
| | | | 8.89 | | | | 26.16 | | | | 139,670 | | | | 1.01 | (c) | | | 5.24 | (c) | | | 1.30 | (c) | | | 4.95 | (c) | | | 60 | | | |
| | | | | | | | | | | | | | | | | | | | | | | | | | | | | | | | | | | |
| | | | | | | | | | | | | | | | | | | | | | | | | | | | | | | | | | | |
| |
| | | | | | | | | | | | | | | | | | | | | | | | | | | | | | | | | | | |
| | | | | | | | | | | | | | | | | | | | | | | | | | | | | | | | | | | |
| | | | 7.23 | | | | (22.32 | ) | | | 20,385 | | | | 1.33 | | | | 5.99 | | | | 1.65 | | | | 5.67 | | | | 92 | | | |
| | | | 7.24 | | | | (22.79 | ) | | | 30 | | | | 2.08 | | | | 5.17 | | | | 2.40 | | | | 4.85 | | | | 92 | | | |
| | | | 7.23 | | | | (22.05 | ) | | | 97,877 | | | | 0.99 | | | | 6.30 | | | | 1.31 | | | | 5.98 | | | | 92 | | | |
| | | | | | | | | | | | | | | | | | | | | | | | | | | | | | | | | | | |
| | | | | | | | | | | | | | | | | | | | | | | | | | | | | | | | | | | |
| |
| | | | | | | | | | | | | | | | | | | | | | | | | | | | | | | | | | | |
| | | | | | | | | | | | | | | | | | | | | | | | | | | | | | | | | | | |
| | | | 9.85 | | | | (0.93 | ) | | | 1,482 | | | | 1.35 | (c) | | | 4.29 | (c) | | | 2.98 | (c) | | | 2.66 | (c) | | | 3 | | | |
| | | | 9.85 | | | | (1.01 | ) | | | 127 | | | | 2.10 | (c) | | | 4.30 | (c) | | | 3.73 | (c) | | | 2.67 | (c) | | | 3 | | | |
| | | | 9.85 | | | | (0.89 | ) | | | 60,432 | | | | 1.01 | (c) | | | 5.52 | (c) | | | 2.64 | (c) | | | 3.89 | (c) | | | 3 | | | |
| | | | | | | | | | | | | | | | | | | | | | | | | | | | | | | | | | | |
| | | | | | | | | | | | | | | | | | | | | | | | | | | | | | | | | | | |
| |
| |
The accompanying notes are an integral part of these financial statements.
GOLDMAN SACHS U.S. MORTGAGES FUND
Financial Highlights
Selected Data for a Share Outstanding Throughout Each Period
| | | | | | | | | | | | | | | | | | | | | | | | | | | | | | | | | |
| | | | | | | | Income (loss) from
| | | Distributions
| | | |
| | | | | Net asset
| | | investment operations | | | to shareholders | | | |
| | | | | value,
| | | Net
| | | Net realized
| | | Total from
| | | From net
| | | From net
| | | | | | |
| | | | | beginning
| | | investment
| | | and unrealized
| | | investment
| | | investment
| | | realized
| | | Total
| | | |
| | | Year - Share Class | | of period | | | income(a) | | | gain (loss) | | | operations | | | income | | | gains | | | distributions | | | |
| |
| FOR THE SIX MONTHS ENDED SEPTEMBER 30, (UNAUDITED) |
| | | | | | | | | | | | | | | | | | | | | | | | | | | | | | | | | |
| | | | | | | | | | | | | | | | | | | | | | | | | | | | | | | | | |
| | | 2009 - A | | $ | 9.27 | | | $ | 0.18 | | | $ | 0.53 | | | $ | 0.71 | | | $ | (0.20 | ) | | $ | — | | | $ | (0.20 | ) | | |
| | | 2009 - Institutional | | | 9.29 | | | | 0.20 | | | | 0.52 | | | | 0.72 | | | | (0.22 | ) | | | — | | | | (0.22 | ) | | |
| | | 2009 - Separate Account Institutional | | | 9.28 | | | | 0.21 | | | | 0.51 | | | | 0.72 | | | | (0.22 | ) | | | — | | | | (0.22 | ) | | |
| | | | | | | | | | | | | | | | | | | | | | | | | | | | | | | | | |
| | | | | | | | | | | | | | | | | | | | | | | | | | | | | | | | | |
| FOR THE FISCAL YEAR ENDED MARCH 31, |
| | | | | | | | | | | | | | | | | | | | | | | | | | | | | | | | | |
| | | | | | | | | | | | | | | | | | | | | | | | | | | | | | | | | |
| | | 2009 - A | | | 9.62 | | | | 0.37 | | | | (0.27 | ) | | | 0.10 | | | | (0.38 | ) | | | (0.07 | ) | | | (0.45 | ) | | |
| | | 2009 - Institutional | | | 9.64 | | | | 0.39 | | | | (0.26 | ) | | | 0.13 | | | | (0.41 | ) | | | (0.07 | ) | | | (0.48 | ) | | |
| | | 2009 - Separate Account Institutional | | | 9.64 | | | | 0.41 | | | | (0.29 | ) | | | 0.12 | | | | (0.41 | ) | | | (0.07 | ) | | | (0.48 | ) | | |
| | | | | | | | | | | | | | | | | | | | | | | | | | | | | | | | | |
| | | | | | | | | | | | | | | | | | | | | | | | | | | | | | | | | |
| FOR THE PERIOD NOVEMBER 1, 2007 TO MARCH 31, 2008* |
| | | | | | | | | | | | | | | | | | | | | | | | | | | | | | | | | |
| | | | | | | | | | | | | | | | | | | | | | | | | | | | | | | | | |
| | | 2008 - A | | | 9.91 | | | | 0.19 | | | | (0.29 | ) | | | (0.10 | ) | | | (0.19 | ) | | | — | | | | (0.19 | ) | | |
| | | 2008 - Institutional | | | 9.93 | | | | 0.20 | | | | (0.28 | ) | | | (0.08 | ) | | | (0.21 | ) | | | — | | | | (0.21 | ) | | |
| | | 2008 - Separate Account Institutional | | | 9.93 | | | | 0.21 | | | | (0.29 | ) | | | (0.08 | ) | | | (0.21 | ) | | | — | | | | (0.21 | ) | | |
| | | | | | | | | | | | | | | | | | | | | | | | | | | | | | | | | |
| | | | | | | | | | | | | | | | | | | | | | | | | | | | | | | | | |
| FOR THE FISCAL YEARS ENDED OCTOBER 31, |
| | | | | | | | | | | | | | | | | | | | | | | | | | | | | | | | | |
| | | | | | | | | | | | | | | | | | | | | | | | | | | | | | | | | |
| | | 2007 - A | | | 9.90 | | | | 0.44 | | | | 0.04 | | | | 0.48 | | | | (0.47 | ) | | | — | | | | (0.47 | ) | | |
| | | 2007 - Institutional | | | 9.91 | | | | 0.47 | | | | 0.05 | | | | 0.52 | | | | (0.50 | ) | | | — | | | | (0.50 | ) | | |
| | | 2007 - Separate Account Institutional | | | 9.91 | | | | 0.48 | | | | 0.05 | | | | 0.53 | | | | (0.51 | ) | | | — | | | | (0.51 | ) | | |
| | | | | | | | | | | | | | | | | | | | | | | | | | | | | | | | | |
| | | | | | | | | | | | | | | | | | | | | | | | | | | | | | | | | |
| | | |
| | | |
| | | 2006 - A | | | 9.82 | | | | 0.41 | | | | 0.08 | | | | 0.49 | | | | (0.41 | ) | | | — | | | | (0.41 | ) | | |
| | | 2006 - Institutional | | | 9.82 | | | | 0.45 | | | | 0.08 | | | | 0.53 | | | | (0.44 | ) | | | — | | | | (0.44 | ) | | |
| | | 2006 - Separate Account Institutional | | | 9.82 | | | | 0.45 | | | | 0.09 | | | | 0.54 | | | | (0.45 | ) | | | — | | | | (0.45 | ) | | |
| | | | | | | | | | | | | | | | | | | | | | | | | | | | | | | | | |
| | | | | | | | | | | | | | | | | | | | | | | | | | | | | | | | | |
| | | |
| | | |
| | | 2005 - A | | | 10.22 | | | | 0.28 | | | | (0.17 | ) | | | 0.11 | | | | (0.33 | ) | | | (0.18 | ) | | | (0.51 | ) | | |
| | | 2005 - Institutional | | | 10.22 | | | | 0.33 | | | | (0.18 | ) | | | 0.15 | | | | (0.37 | ) | | | (0.18 | ) | | | (0.55 | ) | | |
| | | 2005 - Separate Account Institutional | | | 10.21 | | | | 0.36 | | | | (0.20 | ) | | | 0.16 | | | | (0.37 | ) | | | (0.18 | ) | | | (0.55 | ) | | |
| | | | | | | | | | | | | | | | | | | | | | | | | | | | | | | | | |
| | | | | | | | | | | | | | | | | | | | | | | | | | | | | | | | | |
| FOR THE PERIOD ENDED OCTOBER 31, |
| | | | | | | | | | | | | | | | | | | | | | | | | | | | | | | | | |
| | | | | | | | | | | | | | | | | | | | | | | | | | | | | | | | | |
| | | 2004 - A | | | 10.00 | | | | 0.22 | | | | 0.33 | | | | 0.55 | | | | (0.33 | ) | | | — | | | | (0.33 | ) | | |
| | | 2004 - Institutional | | | 10.00 | | | | 0.29 | | | | 0.31 | | | | 0.60 | | | | (0.38 | ) | | | — | | | | (0.38 | ) | | |
| | | 2004 - Separate Account Institutional | | | 10.00 | | | | 0.31 | | | | 0.28 | | | | 0.59 | | | | (0.38 | ) | | | — | | | | (0.38 | ) | | |
| | | | | | | | | | | | | | | | | | | | | | | | | | | | | | | | | |
| | | | | | | | | | | | | | | | | | | | | | | | | | | | | | | | | |
| | | |
| | | |
| | | | | | | | | | | | | | | | | | | | | | | | | | | | | | | | | |
| |
| * | The Fund changed its fiscal year end from October 31 to March 31. |
| |
| (a) | Calculated based on the average shares outstanding methodology. |
| |
| (b) | Assumes investment at the net asset value at the beginning of the period, reinvestment of all dividends and distributions, a complete redemption of the investment at the net asset value at the end of the period and no sales or redemption charges. Total returns would be reduced if a sales or redemption charge was taken into account. Returns do not reflect the deduction of taxes that a shareholder would pay on Fund distributions or the redemption of Fund shares. Total returns for periods less than one full year are not annualized. |
| |
| (c) | The portfolio turnover rates excluding the effect of mortgage dollar rolls were as follows: |
| | | | | | | | | | | |
| | | For the Six Months
| | For the
|
| | | Ended September 30, | | Periods Ended |
| | | 2009 | | 2009 | | 2008 | | 2007 | | 2006 |
| | | 373% | | 511% | | 295% | | 380% | | 1,442% |
| |
| | Prior years include the effect of mortgage dollar roll transactions, if any. |
The accompanying notes are an integral part of these financial statements.
GOLDMAN SACHS U.S. MORTGAGES FUND
| | | | | | | | | | | | | | | | | | | | | | | | | | | | | | | | | | | |
| | | | | | | | | | | | | | | | | | Ratios assuming no
| | | | | | |
| | | | | | | | | | | | | | | | | | expense reductions | | | | | | |
| | | | | | | | | | | | | | | Ratio of
| | | | | | Ratio of
| | | | | | |
| | | | | | | | | Net assets,
| | | Ratio of
| | | net investment
| | | Ratio of
| | | net investment
| | | | | | |
| | | Net asset
| | | | | | end of
| | | net expenses
| | | income
| | | total expenses
| | | income
| | | Portfolio
| | | |
| | | value, end
| | | Total
| | | period
| | | to average
| | | to average
| | | to average
| | | to average
| | | turnover
| | | |
| | | of period | | | return(b) | | | (in 000s) | | | net assets | | | net assets | | | net assets | | | net assets | | | rate(c) | | | |
| |
| |
| | | | | | | | | | | | | | | | | | | | | | | | | | | | | | | | | | | |
| | | | | | | | | | | | | | | | | | | | | | | | | | | | | | | | | | | |
| | | $ | 9.78 | | | | 7.73 | % | | $ | 6,795 | | | | 0.76 | %(d) | | | 3.85 | %(d) | | | 0.91 | %(d) | | | 3.70 | %(d) | | | 460 | % | | |
| | | | 9.79 | | | | 7.81 | | | | 99,394 | | | | 0.40 | (d) | | | 4.30 | (d) | | | 0.57 | (d) | | | 4.13 | (d) | | | 460 | | | |
| | | | 9.78 | | | | 7.84 | | | | 350,442 | | | | 0.35 | (d) | | | 4.37 | (d) | | | 0.52 | (d) | | | 4.20 | (d) | | | 460 | | | |
| | | | | | | | | | | | | | | | | | | | | | | | | | | | | | | | | | | |
| | | | | | | | | | | | | | | | | | | | | | | | | | | | | | | | | | | |
| |
| | | | | | | | | | | | | | | | | | | | | | | | | | | | | | | | | | | |
| | | | | | | | | | | | | | | | | | | | | | | | | | | | | | | | | | | |
| | | | 9.27 | | | | 0.90 | | | | 3,637 | | | | 0.76 | | | | 3.93 | | | | 0.91 | | | | 3.78 | | | | 560 | | | |
| | | | 9.29 | | | | 1.38 | | | | 89,617 | | | | 0.40 | | | | 4.22 | | | | 0.57 | | | | 4.05 | | | | 560 | | | |
| | | | 9.28 | | | | 1.32 | | | | 431,500 | | | | 0.35 | | | | 4.39 | | | | 0.52 | | | | 4.22 | | | | 560 | | | |
| | | | | | | | | | | | | | | | | | | | | | | | | | | | | | | | | | | |
| | | | | | | | | | | | | | | | | | | | | | | | | | | | | | | | | | | |
| |
| | | | | | | | | | | | | | | | | | | | | | | | | | | | | | | | | | | |
| | | | | | | | | | | | | | | | | | | | | | | | | | | | | | | | | | | |
| | | | 9.62 | | | | (0.80 | ) | | | 7,021 | | | | 0.76 | (d) | | | 4.58 | (d) | | | 0.91 | (d) | | | 4.43 | (d) | | | 483 | | | |
| | | | 9.64 | | | | (0.75 | ) | | | 164,236 | | | | 0.40 | (d) | | | 4.94 | (d) | | | 0.57 | (d) | | | 4.77 | (d) | | | 483 | | | |
| | | | 9.64 | | | | (0.73 | ) | | | 507,194 | | | | 0.35 | (d) | | | 4.98 | (d) | | | 0.52 | (d) | | | 4.81 | (d) | | | 483 | | | |
| | | | | | | | | | | | | | | | | | | | | | | | | | | | | | | | | | | |
| | | | | | | | | | | | | | | | | | | | | | | | | | | | | | | | | | | |
| |
| | | | | | | | | | | | | | | | | | | | | | | | | | | | | | | | | | | |
| | | | | | | | | | | | | | | | | | | | | | | | | | | | | | | | | | | |
| | | | 9.91 | | | | 4.96 | | | | 7,044 | | | | 0.78 | | | | 4.43 | | | | 0.94 | | | | 4.27 | | | | 610 | | | |
| | | | 9.93 | | | | 5.43 | | | | 153,795 | | | | 0.40 | | | | 4.81 | | | | 0.58 | | | | 4.63 | | | | 610 | | | |
| | | | 9.93 | | | | 5.48 | | | | 532,819 | | | | 0.35 | | | | 4.84 | | | | 0.53 | | | | 4.66 | | | | 610 | | | |
| | | | | | | | | | | | | | | | | | | | | | | | | | | | | | | | | | | |
| | | | | | | | | | | | | | | | | | | | | | | | | | | | | | | | | | | |
| |
| |
| | | | 9.90 | | | | 5.21 | | | | 6,973 | | | | 0.79 | | | | 4.24 | | | | 0.98 | | | | 4.05 | | | | 1,665 | | | |
| | | | 9.91 | | | | 5.56 | | | | 117,497 | | | | 0.40 | | | | 4.64 | | | | 0.61 | | | | 4.43 | | | | 1,665 | | | |
| | | | 9.91 | | | | 5.73 | | | | 307,935 | | | | 0.35 | | | | 4.62 | | | | 0.56 | | | | 4.41 | | | | 1,665 | | | |
| | | | | | | | | | | | | | | | | | | | | | | | | | | | | | | | | | | |
| | | | | | | | | | | | | | | | | | | | | | | | | | | | | | | | | | | |
| |
| |
| | | | 9.82 | | | | 1.00 | | | | 7,916 | | | | 0.81 | | | | 2.88 | | | | 0.98 | | | | 2.71 | | | | 2,006 | | | |
| | | | 9.82 | | | | 1.49 | | | | 74,616 | | | | 0.40 | | | | 3.43 | | | | 0.58 | | | | 3.24 | | | | 2,006 | | | |
| | | | 9.82 | | | | 1.54 | | | | 387,306 | | | | 0.35 | | | | 3.42 | | | | 0.53 | | | | 3.24 | | | | 2,006 | | | |
| | | | | | | | | | | | | | | | | | | | | | | | | | | | | | | | | | | |
| | | | | | | | | | | | | | | | | | | | | | | | | | | | | | | | | | | |
| |
| | | | | | | | | | | | | | | | | | | | | | | | | | | | | | | | | | | |
| | | | | | | | | | | | | | | | | | | | | | | | | | | | | | | | | | | |
| | | | 10.22 | | | | 5.60 | | | | 628 | | | | 0.82 | (d) | | | 1.95 | (d) | | | 1.08 | (d) | | | 1.69 | (d) | | | 1,953 | | | |
| | | | 10.22 | | | | 6.07 | | | | 120,628 | | | | 0.40 | (d) | | | 2.86 | (d) | | | 0.68 | (d) | | | 2.58 | (d) | | | 1,953 | | | |
| | | | 10.21 | | | | 6.03 | | | | 101,429 | | | | 0.35 | (d) | | | 2.98 | (d) | | | 0.63 | (d) | | | 2.70 | (d) | | | 1,953 | | | |
| | | | | | | | | | | | | | | | | | | | | | | | | | | | | | | | | | | |
| | | | | | | | | | | | | | | | | | | | | | | | | | | | | | | | | | | |
| |
| |
The accompanying notes are an integral part of these financial statements.
GOLDMAN SACHS SINGLE SECTOR FIXED INCOME FUNDS
Fund Expenses (Unaudited) — Six Month Period Ended September 30, 2009
As a shareholder of Class A, Class B, Class C, Institutional, Service, Separate Account Institutional, Class IR or Class R Shares of a Fund, you incur two types of costs: (1) transaction costs, including sales charges on purchase payments (with respect to Class A Shares), contingent deferred sales charges on redemptions (with respect to Class B and Class C Shares), and redemption fees (if any); and (2) ongoing costs, including management fees; distribution and service (12b-1) fees (with respect to Class A, Class B, Class C and Class R Shares); and other Fund expenses. This Example is intended to help you understand your ongoing costs (in dollars) of investing in Class A, Class B, Class C, Institutional, Service, Separate Account Institutional, Class IR and Class R Shares of the Funds and to compare these costs with the ongoing costs of investing in other mutual funds.
The Example is based on an investment of $1,000 invested at the beginning of the period and held for the entire period from April 1, 2009 through September 30, 2009.
Actual Expenses — The first line under each share class in the table below provides information about actual account values and actual expenses. You may use the information in this line, together with the amount you invested, to estimate the expenses that you paid over the period. Simply divide your account value by $1,000 (for example, an $8,600 account value divided by $1,000 = 8.6), then multiply the result by the number in the first line under the heading entitled “Expenses Paid” to estimate the expenses you paid on your account during this period.
Hypothetical Example for Comparison Purposes — The second line under each share class in the table below provides information about hypothetical account values and hypothetical expenses based on the Funds’ actual net expense ratios and an assumed rate of return of 5% per year before expenses, which is not the Funds’ actual return. The hypothetical account values and expenses may not be used to estimate the actual ending account balance or expenses you paid for the period. You may use this information to compare the ongoing costs of investing in the Funds and other funds. To do so, compare this 5% hypothetical example with the 5% hypothetical examples that appear in the shareholder reports of the other funds.
Please note that the expenses shown in the table are meant to highlight your ongoing costs only and do not reflect any transactional costs, such as sales charges, redemption fees, or exchange fees. Therefore, the second line of the table is useful in comparing ongoing costs only, and will not help you determine the relative total costs of owning different funds. In addition, if these transactional costs were included, your costs would have been higher.
| | | | | | | | | | | | | | | | | | | | | | | | | | | | | | | | | | | | | | | | | | | | | | | | | | | | | | | | | | | | | | | | | | | | | | | | | | | | |
| | | | Emerging Markets Debt Fund | | | High Yield Fund | | | Investment Grade Credit Fund | | | Local Emerging Markets Debt Fund | | | U.S. Mortgages Fund |
| | | | | | | | | | Expenses
| | | | | | | | | Expenses
| | | | | | | | | Expenses
| | | | | | | | | Expenses
| | | | | | | | | Expenses
|
| | | | Beginning
| | | Ending
| | | Paid for the
| | | Beginning
| | | Ending
| | | Paid for the
| | | Beginning
| | | Ending
| | | Paid for the
| | | Beginning
| | | Ending
| | | Paid for the
| | | Beginning
| | | Ending
| | | Paid for the
|
| | | | Account Value
| | | Account Value
| | | 6 months ended
| | | Account Value
| | | Account Value
| | | 6 months ended
| | | Account Value
| | | Account Value
| | | 6 months ended
| | | Account Value
| | | Account Value
| | | 6 months ended
| | | Account Value
| | | Account Value
| | | 6 months ended
|
| Share Class | | | 4/1/09 | | | 9/30/09 | | | 9/30/09* | | | 4/1/08 | | | 9/30/09 | | | 9/30/09* | | | 4/1/09 | | | 9/30/09 | | | 9/30/09* | | | 4/1/09 | | | 9/30/09 | | | 9/30/09* | | | 4/1/09 | | | 9/30/09 | | | 9/30/09* |
Class A | | | | | | | | | | | | | | | | | | | | | | | | | | | | | | | | | | | | | | | | | | | | | | | | | | | | | | | | | | | | | | | | | | | | | | | | | | | |
| Actual | | | $ | 1,000.00 | | | | $ | 1,310.50 | | | | $ | 7.07 | | | | $ | 1,000.00 | | | | $ | 1,353.70 | | | | $ | 6.25 | | | | $ | 1,000.00 | | | | $ | 1,190.40 | | | | $ | 4.17 | | | | $ | 1,000.00 | | | | $ | 1,260.90 | | | | $ | 7.65 | | | | $ | 1,000.00 | | | | $ | 1,077.30 | | | | $ | 3.96 | |
| Hypothetical 5% return | | | | 1,000.00 | | | | | 1,018.95 | + | | | | 6.17 | | | | | 1,000.00 | | | | | 1,019.75 | + | | | | 5.37 | | | | | 1,000.00 | | | | | 1,021.26 | + | | | | 3.85 | | | | | 1,000.00 | | | | | 1,018.30 | + | | | | 6.83 | | | | | 1,000.00 | | | | | 1,021.26 | + | | | | 3.85 | |
| |
Class B | | | | | | | | | | | | | | | | | | | | | | | | | | | | | | | | | | | | | | | | | | | | | | | | | | | | | | | | | | | | | | | | | | | | | | | | | | | |
| Actual | | | | N/A | | | | | N/A | | | | | N/A | | | | | 1,000.00 | | | | | 1,352.70 | | | | | 10.68 | | | | | N/A | | | | | N/A | | | | | N/A | | | | | N/A | | | | | N/A | | | | | N/A | | | | | N/A | | | | | N/A | | | | | N/A | |
| Hypothetical 5% return | | | | N/A | | | | | N/A | | | | | N/A | | | | | 1,000.00 | | | | | 1,015.99 | + | | | | 9.15 | | | | | N/A | | | | | N/A | | | | | N/A | | | | | N/A | | | | | N/A | | | | | N/A | | | | | N/A | | | | | N/A | | | | | N/A | |
| |
Class C | | | | | | | | | | | | | | | | | | | | | | | | | | | | | | | | | | | | | | | | | | | | | | | | | | | | | | | | | | | | | | | | | | | | | | | | | | | |
| Actual | | | | 1,000.00 | | | | | 1,306.60 | | | | | 11.39 | | | | | 1,000.00 | | | | | 1,350.80 | | | | | 10.67 | | | | | N/A | | | | | N/A | | | | | N/A | | | | | 1,000.00 | | | | | 1,254.30 | | | | | 11.87 | | | | | N/A | | | | | N/A | | | | | N/A | |
| Hypothetical 5% return | | | | 1,000.00 | | | | | 1,015.19 | + | | | | 9.95 | | | | | 1,000.00 | | | | | 1,015.99 | + | | | | 9.15 | | | | | N/A | | | | | N/A | | | | | N/A | | | | | 1,000.00 | | | | | 1,014.54 | + | | | | 10.61 | | | | | N/A | | | | | N/A | | | | | N/A | |
| |
Institutional | | | | | | | | | | | | | | | | | | | | | | | | | | | | | | | | | | | | | | | | | | | | | | | | | | | | | | | | | | | | | | | | | | | | | | | | | | | |
| Actual | | | | 1,000.00 | | | | | 1,312.40 | | | | | 5.10 | | | | | 1,000.00 | | | | | 1,357.30 | | | | | 4.25 | | | | | 1,000.00 | | | | | 1,192.50 | | | | | 2.20 | | | | | 1,000.00 | | | | | 1,261.60 | | | | | 5.73 | | | | | 1,000.00 | | | | | 1,078.10 | | | | | 2.08 | |
| Hypothetical 5% return | | | | 1,000.00 | | | | | 1,020.66 | + | | | | 4.46 | | | | | 1,000.00 | | | | | 1,021.46 | + | | | | 3.65 | | | | | 1,000.00 | | | | | 1,023.06 | + | | | | 2.03 | | | | | 1,000.00 | | | | | 1,020.00 | + | | | | 5.11 | | | | | 1,000.00 | | | | | 1,023.06 | + | | | | 2.03 | |
| |
Service | | | | | | | | | | | | | | | | | | | | | | | | | | | | | | | | | | | | | | | | | | | | | | | | | | | | | | | | | | | | | | | | | | | | | | | | | | | |
| Actual | | | | N/A | | | | | N/A | | | | | N/A | | | | | 1,000.00 | | | | | 1,355.30 | | | | | 7.20 | | | | | N/A | | | | | N/A | | | | | N/A | | | | | N/A | | | | | N/A | | | | | N/A | | | | | N/A | | | | | N/A | | | | | N/A | |
| Hypothetical 5% return | | | | N/A | | | | | N/A | | | | | N/A | | | | | 1,000.00 | | | | | 1,018.95 | + | | | | 6.17 | | | | | N/A | | | | | N/A | | | | | N/A | | | | | N/A | | | | | N/A | | | | | N/A | | | | | N/A | | | | | N/A | | | | | N/A | |
| |
Separate Account Institutional | | | | | | | | | | | | | | | | | | | | | | | | | | | | | | | | | | | | | | | | | | | | | | | | | | | | | | | | | | | | | | | | | | | | | | | | | | | |
| Actual | | | | N/A | | | | | N/A | | | | | N/A | | | | | N/A | | | | | N/A | | | | | N/A | | | | | 1,000.00 | | | | | 1,192.80 | | | | | 1.92 | | | | | N/A | | | | | N/A | | | | | N/A | | | | | 1,000.00 | | | | | 1,078.40 | | | | | 1.82 | |
| Hypothetical 5% return | | | | N/A | | | | | N/A | | | | | N/A | | | | | N/A | | | | | N/A | | | | | N/A | | | | | 1,000.00 | | | | | 1,023.31 | + | | | | 1.78 | | | | | N/A | | | | | N/A | | | | | N/A | | | | | 1,000.00 | | | | | 1,023.31 | + | | | | 1.78 | |
| |
Class IR | | | | | | | | | | | | | | | | | | | | | | | | | | | | | | | | | | | | | | | | | | | | | | | | | | | | | | | | | | | | | | | | | | | | | | | | | | | |
| Actual | | | | N/A | | | | | N/A | | | | | N/A | | | | | 1,000.00 | | | | | 1,357.40 | | | | | 4.79 | | | | | N/A | | | | | N/A | | | | | N/A | | | | | N/A | | | | | N/A | | | | | N/A | | | | | N/A | | | | | N/A | | | | | N/A | |
| Hypothetical 5% return | | | | N/A | | | | | N/A | | | | | N/A | | | | | 1,000.00 | | | | | 1,021.01 | + | | | | 4.10 | | | | | N/A | | | | | N/A | | | | | N/A | | | | | N/A | | | | | N/A | | | | | N/A | | | | | N/A | | | | | N/A | | | | | N/A | |
| |
Class R | | | | | | | | | | | | | | | | | | | | | | | | | | | | | | | | | | | | | | | | | | | | | | | | | | | | | | | | | | | | | | | | | | | | | | | | | | | |
| Actual | | | | N/A | | | | | N/A | | | | | N/A | | | | | 1,000.00 | | | | | 1,354.70 | | | | | 7.73 | | | | | N/A | | | | | N/A | | | | | N/A | | | | | N/A | | | | | N/A | | | | | N/A | | | | | N/A | | | | | N/A | | | | | N/A | |
| Hypothetical 5% return | | | | N/A | | | | | N/A | | | | | N/A | | | | | 1,000.00 | | | | | 1,018.50 | + | | | | 6.63 | | | | | N/A | | | | | N/A | | | | | N/A | | | | | N/A | | | | | N/A | | | | | N/A | | | | | N/A | | | | | N/A | | | | | N/A | |
| |
| |
| * | Expenses for each share class are calculated using each Fund’s annualized net expense ratio for each class, which represents the ongoing expenses as a percentage of net assets for the six months ended September 30, 2009. Expenses are calculated by multiplying the annualized net expense ratio by the average account value for the period; then multiplying the result by the number of days in the most recent fiscal half year; and then dividing that result by the number of days in the fiscal year. The annualized net expense ratios for the period were as follows: |
| | | | | | | | | | | | | | | | | | | | | | | | | | | | | | | | | |
| | | | | | | | | | | | | | | | | | Separate Account
| | | | | | | |
| Fund | | Class A | | | Class B | | | Class C | | | Institutional | | | Service | | | Institutional | | | Class IR | | | Class R | |
| | |
| Emerging Markets Debt | | | 1.22 | % | | | N/A | | | | 1.97 | % | | | 0.88 | % | | | N/A | | | | N/A | | | | N/A | | | | N/A | |
| High Yield | | | 1.06 | | | | 1.81 | % | | | 1.81 | | | | 0.72 | | | | 1.22 | % | | | N/A | | | | 0.81 | % | | | 1.31 | % |
| Investment Grade Credit | | | 0.76 | | | | N/A | | | | N/A | | | | 0.40 | | | | N/A | | | | 0.35 | % | | | N/A | | | | N/A | |
| Local Emerging Markets Debt | | | 1.35 | | | | N/A | | | | 2.10 | | | | 1.01 | | | | N/A | | | | N/A | | | | N/A | | | | N/A | |
| U.S. Mortgages | | | 0.76 | | | | N/A | | | | N/A | | | | 0.40 | | | | N/A | | | | 0.35 | | | | N/A | | | | N/A | |
| |
| |
| |
| + | Hypothetical expenses are based on each Fund’s actual annualized net expense ratios and an assumed rate of return of 5% per year before expenses. |
106
GOLDMAN SACHS SINGLE SECTOR FIXED INCOME FUNDS
Statement Regarding Basis for Approval of Management Agreement (Unaudited)
Background
The Goldman Sachs U.S. Mortgages, Goldman Sachs Investment Grade Credit, Goldman Sachs High Yield, Goldman Sachs Emerging Markets Debt and Goldman Sachs Local Emerging Markets Debt Funds (the “Funds”) are investment portfolios of Goldman Sachs Trust (the “Trust”). The Board of Trustees oversees the management of the Trust and reviews the investment performance and expenses of the Funds at regularly scheduled meetings held during the year. In addition, the Board of Trustees determines annually whether to approve and continue the Trust’s investment management agreement (the “Management Agreement”) with Goldman Sachs Asset Management, L.P. (the “Investment Adviser”) on behalf of the Funds.
The Management Agreement was most recently approved for continuation until June 30, 2010 by the Board of Trustees, including those Trustees who are not parties to the Management Agreement or “interested persons” (as defined in the Investment Company Act of 1940, as amended) of any party thereto (the “Independent Trustees”), at a meeting held on June 17, 2009 (the “Annual Contract Meeting”).
To assist the Trustees in their deliberations at the Annual Contract Meeting, and in addition to reports on the Funds’ investment performance, expenses and other matters discussed at regularly scheduled Board meetings during the year, the Trustees have established a Contract Review Committee (the “Committee”), comprised of the Independent Trustees. The Committee held meetings on December 17, 2008, February 11, 2009 and May 20, 2009. At those Committee meetings, the Independent Trustees considered matters relating to the Management Agreement including:
| | |
| | (a) | the nature and quality of the advisory, administrative and other services provided to the Funds by the Investment Adviser and its affiliates; |
| | (b) | the Funds’ investment performance; |
| | (c) | the Funds’ management fee arrangements; |
| | (d) | the voluntary undertakings of the Investment Adviser and the Funds’ transfer agent, Goldman Sachs & Co. (“Goldman Sachs”), to reimburse certain fees and expenses of the Funds that exceed specified levels and the estimated annualized savings realized by the Funds from those undertakings; |
| | (e) | potential economies of scale and the levels of breakpoints in the fees payable by the Funds under the Management Agreement; |
| | (f) | the relative expense levels of the Funds as compared to those of comparable funds managed by the Investment Adviser, as well as those managed by other advisers; |
| | (g) | information relating to the profitability of the Management Agreement and the transfer agency and distribution and service arrangements of each of the Funds and the Trust as a whole to the Investment Adviser and its affiliates; |
| | (h) | the statutory and regulatory requirements applicable to the approval and continuation of mutual fund investment management agreements; |
| | (i) | a summary of fee concessions made by the Investment Adviser and its affiliates over the past several years with respect to the Funds; |
| | (j) | capacity issues relating to the securities in which the Funds invest; |
| | (k) | to the extent the Investment Adviser manages institutional accounts or collective investment vehicles having investment objectives and policies similar to those of the Funds, comparative information on the advisory fees charged and services provided to those accounts by the Investment Adviser; |
| | (l) | information on the processes followed by a third party mutual fund data provider engaged as part of the Trustees’ contract review (the “Outside Data Provider”) in producing investment performance (with the exception of Local Emerging Markets Debt Fund, which commenced operations in 2008) and expense comparisons for the Funds; |
| | (m) | the current pricing of services provided by, and the profitability of, the Funds’ transfer agent, Goldman Sachs; and |
| | (n) | the nature and quality of the services provided to the Funds by their unaffiliated service providers and reports on due diligence conducted by the Investment Adviser with respect to those service providers. |
GOLDMAN SACHS SINGLE SECTOR FIXED INCOME FUNDS
Statement Regarding Basis for Approval of Management Agreement (Unaudited) (continued)
At the Annual Contract Meeting, the Trustees reviewed the matters that were considered at the Committee meetings and also considered additional matters, including: (a) the quality of the Investment Adviser’s services; (b) the structure, staff and capabilities of the Investment Adviser and its portfolio management teams; (c) the groups or teams within the Investment Adviser that support the portfolio management teams, including legal, compliance, internal audit, the credit department, fund controllers, tax, product services, valuation oversight, market risk analysis, finance and strategy, operations, shareholder services, risk management and advisory, training and technology; (d) whether certain reductions in headcount due to economic conditions were likely to affect the quality of the services provided to the Funds; (e) the Investment Adviser’s business continuity and disaster recovery planning; (f) the Investment Adviser’s financial resources and its ability to hire and retain talented personnel; (g) the fees received by the Investment Adviser’s affiliates from the Funds for transfer agency, distribution and other services; (h) the terms of the Management Agreement and agreements with other service providers entered into by the Trust on behalf of the Funds; (i) the administrative services provided under the Management Agreement, including the nature and extent of the Investment Adviser’s oversight of the Funds’ other service providers, including the custodian and fund accounting agent; (j) portfolio trading related issues; (k) the Investment Adviser’s processes and policies addressing various types of potential conflicts of interest; (l) the Investment Adviser’s approach to risk management; (m) an overview of the Funds’ distribution plan; and (n) an annual review of the effectiveness of the Funds’ compliance program. At the Annual Contract Meeting, the Trustees also considered further the Investment Adviser’s profitability with respect to each Fund, and each Fund’s investment performance, fees and expenses, including each Fund’s expense trends over time (with the exception of Local Emerging Markets Debt Fund, which commenced operations in 2008) and any breakpoints in the fee rates payable by each Fund under the Management Agreement.
In connection with the Committee meetings and the Annual Contract Meeting, the Trustees attended sessions at which they reviewed information regarding the Funds’ assets, share purchase and redemption activity, and the payment of Rule 12b-1 distribution and service fees by the Funds and the payment of non-Rule 12b-1 shareholder service and/or administration fees by the High Yield Fund’s Service Shares and the Investment Grade Credit and U.S. Mortgages Funds’ Class A and Institutional Shares. Also, in conjunction with these meetings, the Trustees received written materials and oral presentations on the topics covered, and were advised by their independent legal counsel regarding their responsibilities under applicable law.
Information was also provided to the Trustees relating to revenue sharing payments made by and services provided by the Investment Adviser and its affiliates to intermediaries that promote the sale, distribution and/or servicing of Fund shares; portfolio manager ownership of Fund shares; the manner in which portfolio manager compensation is determined, the alignment of the interests of the Funds and of the portfolio managers and related potential conflicts of interest; the number and types of accounts managed by the portfolio managers; and other matters. During the course of their deliberations, the Independent Trustees met in executive sessions with their independent legal counsel, without representatives of the Investment Adviser or its affiliates present.
The presentations made at the Committee meetings and at the Annual Contract Meeting encompassed the Funds and other mutual fund portfolios for which the Board of Trustees has responsibility. While the management agreements for all of the Funds and the other mutual fund portfolios for which the Trustees have responsibility were considered at the same Annual Contract Meeting, the Trustees separately considered the Management Agreement as it applied to each Fund.
In evaluating the Management Agreement at the Annual Contract Meeting, the Trustees relied upon their knowledge, resulting from their meetings and other interactions throughout the year, of the Investment Adviser, its affiliates, their services and the Funds. At those meetings the Trustees regularly received materials relating to the Investment Adviser’s investment management and other services provided under the Management Agreement, including: (a) information on the investment performance of the Funds in comparison to the performance of similar mutual funds (with the exception of Local Emerging Markets Debt Fund, which commenced operations in 2008) and benchmark performance indices; (b) general investment outlooks in the markets in which the Funds invest; (c) compliance reports; and (d) expenses borne by the Funds. In addition, the Trustees were provided with copies of disclosure materials regarding the Funds and their expenses, as well as information on the Funds’ competitive universe. The Trustees also discussed the broad range of other investment choices that are available to Fund investors, including the availability of comparable funds managed by other advisers.
GOLDMAN SACHS SINGLE SECTOR FIXED INCOME FUNDS
Statement Regarding Basis for Approval of Management Agreement (Unaudited) (continued)
Nature, Extent and Quality of the Services Provided Under the Management Agreement
As part of their review, the Trustees considered the nature, extent and quality of the services provided by the Investment Adviser. In this regard, the Trustees considered both the investment advisory services, and the other, non-advisory services, that are provided to the Funds by the Investment Adviser and its affiliates. The Trustees concluded that, during the recent financial crisis, the Investment Adviser had demonstrated a willingness and an ability to commit substantial financial and other resources to the operations of the Funds and had represented that it will continue to commit those resources in multiple areas including portfolio management, trading, technology, human resources, tax, treasury, legal, compliance, valuation oversight, vendor oversight and risk management. The Independent Trustees also observed that the Investment Adviser had made significant commitments to address regulatory compliance requirements applicable to the Funds and the Investment Adviser, including the implementation and enhancement of compliance systems and education and training initiatives.
Investment Performance
The Independent Trustees also considered the investment performance of the Funds and the Investment Adviser. In this regard, they compared the investment performance of each Fund (with the exception of Local Emerging Markets Debt Fund, which commenced operations in 2008) to the performance of other similar SEC-registered funds and to rankings and ratings compiled by the Outside Data Provider. The Independent Trustees also reviewed each Fund’s investment performance over time on a year-by-year basis (other than Local Emerging Markets Debt Fund, which had only year-to-date performance through December 31, 2008) relative to its performance benchmark. This information on each Fund’s investment performance was provided for the one-, three-, five- and ten-year periods ended December 31, 2008, to the extent that each Fund had been in existence for those periods. The Independent Trustees also compared the performance of the U.S. Mortgages and High Yield Funds to that of the Investment Adviser’s institutional composites of the performance of other accounts having similar investment objectives and policies (the investment objectives and policies of the other Funds were not sufficiently similar to those of any of the Investment Adviser’s institutional composites). In addition, they considered the investment performance trends of the Funds over time, and reviewed the investment performance of each Fund in light of its investment objective and policies, market conditions, credit and duration parameters, and illiquidity in certain market sectors, as well as in light of periodic analyses of its quality and risk profile. The Independent Trustees considered whether each Fund had operated within its investment policies, and had complied with its investment limitations.
The Trustees noted that Local Emerging Markets Debt Fund commenced operations in 2008 and had provided a reasonable level of performance to investors in light of its investment policies and given prevailing conditions in the markets in which the Fund invests. In connection with the performance of the Investment Grade Credit and the U.S. Mortgages Funds, the Trustees noted that the Funds’ recent performance challenges were attributable in large part to investments in certain asset classes, such as non-agency mortgage-backed securities or corporate debt issued by financial services companies, that performed poorly in 2008 due to investor aversion to risk and resulting market illiquidity, which depressed the prices of these securities. The Trustees recognized that the market events of 2008 were in many respects unprecedented, and that there was potential for the Funds to recover some of the unrealized losses on certain portfolio holdings in the future. With respect to Emerging Markets Debt and High Yield Funds, the Trustees believed that the Funds had provided investment performance within a competitive range for long-term investors. With respect to each Fund, the Trustees concluded that the Investment Adviser’s continued management likely would benefit each Fund and its shareholders.
GOLDMAN SACHS SINGLE SECTOR FIXED INCOME FUNDS
Statement Regarding Basis for Approval of Management Agreement (Unaudited) (continued)
Costs of Services Provided and Competitive Information
The Independent Trustees considered the contractual fee rates payable by each Fund under the Management Agreement. In this regard, the Trustees considered information on the services rendered by the Investment Adviser to the Funds, which included both advisory and administrative services that were directed to the needs and operations of the Funds as registered mutual funds.
In particular, the Trustees reviewed analyses prepared by the Outside Data Provider regarding the expense rankings of the Funds. The analyses provided a comparison of the Funds’ management fees and breakpoints to those of relevant peer groups and category universes; an expense analysis which compared each Fund’s expenses to a peer group and a category universe; and a five-year history (or, in the case of Local Emerging Markets Debt Fund, since 2008), comparing each Fund’s expenses to the peer and category averages. The analyses also compared each Fund’s transfer agency fees, custody and accounting fees, distribution fees, other expenses and fee waivers/reimbursements to those of other funds in the peer group and peer group median. The Independent Trustees believed that the comparisons provided by the Outside Data Provider were useful in evaluating the reasonableness of the management fees and total expenses paid by the Funds.
In addition, the Independent Trustees considered the Investment Adviser’s voluntary undertakings to limit the Funds’ “other expenses” ratios (excluding certain expenses) to certain specified levels and to waive a portion of the contractual management fees payable by the U.S. Mortgages and Investment Grade Credit Funds, as well as Goldman Sachs’ voluntary undertaking to waive a portion of the transfer agency fees attributable to Institutional and Separate Account Institutional Shares of U.S. Mortgages and Investment Grade Credit Funds. They also considered, to the extent that the Investment Adviser manages institutional accounts or collective investment vehicles having investment objectives and policies similar to those of the Funds, comparative fee information for services provided by the Investment Adviser to those accounts, and information that indicated that services provided to the Funds differed in various significant respects from the services provided to institutional accounts, which operated under less stringent legal and regulatory structures, were in some instances subject to different investment guidelines, required fewer services from the Investment Adviser to a smaller number of client contact points, were less time-intensive and paid lower fees.
The Independent Trustees noted the competitive nature of the mutual fund marketplace, and that many of the Funds’ shareholders invested in the Funds in part because of the Funds’ relationship with the Investment Adviser and have a general expectation that the relationship will continue. They also noted that shareholders are able to redeem their Fund shares if they believe that the Fund fees and expenses are too high or if they are dissatisfied with the performance of the Fund.
Profitability
The Independent Trustees reviewed the Investment Adviser’s revenues and pre-tax profit margins with respect to the Trust and each of the Funds. In this regard the Independent Trustees reviewed, among other things, profitability analyses and summaries, revenue and expense schedules by Fund and by function (i.e., investment management, transfer agency and distribution and service) and the Investment Adviser’s expense allocation methodology. The Trustees also reviewed the report of the internal audit group within the Goldman Sachs organization, which included an assessment of the reasonableness and consistency of the Investment Adviser’s expense allocation methodology and an evaluation of the accuracy of the Investment Adviser’s profitability analysis calculations. Profitability data for the Trust and each Fund were provided for 2008 and 2007 (2008 only for Local Emerging Markets Debt Fund), and the Independent Trustees considered this information in relation to the Investment Adviser’s overall profitability. The Independent Trustees considered the Investment Adviser’s revenues and pre-tax profit margins both in absolute terms and in comparison to information on the reported pre-tax profit margins earned by certain other asset management firms.
GOLDMAN SACHS SINGLE SECTOR FIXED INCOME FUNDS
Statement Regarding Basis for Approval of Management Agreement (Unaudited) (continued)
Economies of Scale
The Independent Trustees also considered the breakpoints in the fee rate payable under the Management Agreement for each of the Funds at the following annual percentage rates of the average daily net assets of the Funds:
| | | | | | | | | | | | | | | | | | | | | |
| | | Emerging
| | | High
| | | Investment
| | | Local Emerging
| | | U.S.
| |
Average Daily
| | Markets
| | | Yield
| | | Grade
| | | Markets Debt
| | | Mortgages
| |
| Net Assets | | Debt Fund | | | Fund | | | Credit Fund | | | Fund | | | Fund | |
| | |
| First $1 billion | | | 0.80 | % | | | 0.70 | % | | | 0.40 | % | | | 0.90 | % | | | 0.40 | % |
| Next $1 billion | | | 0.80 | | | | 0.70 | | | | 0.36 | | | | 0.90 | | | | 0.36 | |
| Next $3 billion | | | 0.72 | | | | 0.63 | | | | 0.34 | | | | 0.81 | | | | 0.34 | |
| Next $3 billion | | | 0.68 | | | | 0.60 | | | | 0.33 | | | | 0.77 | | | | 0.33 | |
| Over $8 billion | | | 0.67 | | | | 0.59 | | | | 0.32 | | | | 0.75 | | | | 0.32 | |
| |
| |
The Trustees noted that the breakpoints at the $5 and $8 billion asset levels had been proposed by the Investment Adviser and approved by the Trustees in 2008 to further share potential economies of scale, if any, with the Funds and their shareholders as assets under management reach those asset levels. In approving these fee breakpoints, the Independent Trustees considered the Investment Adviser’s potential economies of scale in managing each Fund, and whether the Funds and their shareholders would participate in the benefits of those economies. In this regard, the Independent Trustees considered the amounts of assets in the Funds; the Funds’ recent share purchase and redemption activity; the information provided by the Investment Adviser relating to the costs of the services provided by the Investment Adviser and its affiliates and their realized profits; information comparing fee rates charged by the Investment Adviser with fee rates charged to other funds in the peer group; and the voluntary undertakings of the Investment Adviser and Goldman Sachs to limit certain fees and other expenses to certain amounts. Upon reviewing these matters at the Annual Contract Meeting, the Independent Trustees concluded that the fee breakpoints represented a means of ensuring that benefits of scalability would be passed along to shareholders at the specified asset levels.
Other Benefits to the Investment Adviser and Its Affiliates
The Independent Trustees also considered the other benefits derived by the Investment Adviser and its affiliates from their relationship with the Funds as stated above, including: (a) transfer agency fees received by Goldman Sachs; (b) futures commissions earned by Goldman Sachs for executing futures transactions on behalf of the Funds; (c) trading efficiencies resulting from aggregation of orders of the Funds with those for other funds or accounts managed by the Investment Adviser; (d) the Investment Adviser’s ability to leverage the infrastructure designed to service the Funds on behalf of its other clients; (e) the Investment Adviser’s ability to cross-market other products and services to Fund shareholders; (f) Goldman Sachs’ retention of certain fees as Fund Distributor; (g) the Investment Adviser’s ability to negotiate better pricing with custodians on behalf of its other clients, as a result of the relationship with the Funds; and (h) the Investment Adviser’s ability to leverage relationships with the Funds’ third party service providers to attract more firmwide business.
Other Benefits to the Funds and Their Shareholders
The Independent Trustees also noted that the Funds receive certain potential benefits as a result of their relationship with the Investment Adviser, including: (a) trading efficiencies resulting from aggregation of orders of the Funds with those of other funds or accounts managed by the Investment Adviser; (b) improved servicing and pricing from vendors because of the volume of business generated by the Investment Adviser and its affiliates; (c) improved servicing from broker-dealers because of the volume of business generated by the Investment Adviser and its affiliates; (d) the Investment Adviser’s ability to negotiate favorably with derivatives counterparties as a result of the size and reputation of the Goldman Sachs organization; (e) the advantages received from the Investment Adviser’s knowledge and experience gained from managing other accounts and products; (f) the Investment Adviser’s ability to hire and retain qualified personnel to provide services to the Funds because of the reputation of the Goldman Sachs organization; (g) the Funds’ access, through the Investment Adviser, to certain firmwide resources (e.g., proprietary databases); and (h) the Funds’ access to certain affiliated distribution channels.
GOLDMAN SACHS SINGLE SECTOR FIXED INCOME FUNDS
Statement Regarding Basis for Approval of Management Agreement (Unaudited) (continued)
Conclusion
In connection with their consideration of the Management Agreement, the Independent Trustees gave weight to each of the factors described above, but did not identify any particular factor as controlling their decision. After deliberation and consideration of all of the information provided, including the factors described above, the Independent Trustees concluded, in the exercise of their business judgment, that the management fees paid by each of the Funds were reasonable in light of the services provided to it by the Investment Adviser, the Investment Adviser’s costs and each Fund’s current and reasonably foreseeable asset levels, and that the Management Agreement should be approved and continued with respect to each Fund until June 30, 2010.
FUNDS PROFILE
Goldman Sachs Funds
Goldman Sachs is a premier financial services firm, known since 1869 for creating thoughtful and customized investment solutions in complex global markets.
Today, the Investment Management Division of Goldman Sachs serves a diverse set of clients worldwide, including private institutions, public entities and individuals. With portfolio management teams located around the world — and $761 billion in assets under management as of June 30, 2009 — our investment professionals bring firsthand knowledge of local markets to every investment decision, Goldman Sachs Asset Management ranks in the top 10 asset management firms worldwide, based on assets under management.
GOLDMAN SACHS FUNDS
In building a globally diversified portfolio, you can select from more than 80 Goldman Sachs Funds and gain access to investment opportunities across borders, investment styles, asset classes and security capitalizations.
![[FLOW CHART]](https://capedge.com/proxy/N-CSRS/0000950123-09-068016/y79887y7988712.gif)
| | | | | |
Money Market1
Fixed Income
n Enhanced Income Fund
n Ultra-Short Duration
Government Fund
n Short Duration Government
Fund
n Short Duration Tax-Free Fund
n Municipal Income Fund
n Government Income Fund
n Inflation Protected Securities
Fund
n U.S. Mortgages Fund
n Core Fixed Income Fund
n Core Plus Fixed Income Fund
n Investment Grade Credit Fund
n Global Income Fund
n High Yield Municipal Fund
n High Yield Fund
n Emerging Markets Debt Fund
n Local Emerging Markets
Debt Fund
n Credit Strategies Fund | | Fundamental Equity
n Growth and Income Fund
n Large Cap Value Fund
n Capital Growth Fund
n Strategic Growth Fund
n All Cap Growth Fund
n Concentrated Growth Fund
n Tollkeeper FundSM
n Mid Cap Value Fund
n Growth Opportunities Fund
n Small Cap Value Fund
n Small/Mid Cap Growth Fund
Structured Equity
n Balanced Fund
n Structured U.S. Equity Fund
n Structured Large Cap Growth Fund
n Structured Large Cap Value Fund
n Structured Small Cap Equity Fund
n Structured Small Cap Value Fund
n Structured Small Cap Growth Fund
n Structured Tax-Managed Equity
Fund
n Structured International Tax-
Managed Equity Fund
n U.S. Equity Dividend and Premium
Fund
n International Equity Dividend and
Premium Fund | | Fund of Funds2
n Asset Allocation Portfolios
n Income Strategies Portfolio
n Satellite Strategies Portfolio
n Enhanced Dividend Global Equity
Portfolio
n Tax-Advantaged Global Equity
Portfolio
Retirement Strategies2
Fundamental Equity International
n Structured International Equity Fund
n Structured International Equity
Flex Fund
n Strategic International Equity Fund
n Concentrated International Equity Fund
n Structured International Small Cap Fund
n International Small Cap Fund
n Asia Equity Fund
n Structured Emerging Markets
Equity Fund
n Emerging Markets Equity Fund
n BRIC Fund (Brazil, Russia, India, China)
Select Satellite2
n Real Estate Securities Fund
n International Real Estate Securities Fund
n Commodity Strategy Fund
n Absolute Return Tracker Fund |
| |
1 | An Investment in a money market fund is neither insured nor guaranteed by the Federal Deposit Insurance Corporation or any other government agency. Although the Funds seek to preserve the value of your investment at $1.00 per share, it is possible to lose money by investing in the Funds. |
| |
| 2 | Individual Funds within the Fund of Funds, Retirement Strategies and Select Satellite categories will have various placement on the risk/return spectrum and may have greater or lesser risk than that indicated by the placement of the general Fund of Funds, Retirement Strategies or Select Satellite category. |
The Goldman Sachs Tollkeeper FundSM is a registered service mark of Goldman, Sachs & Co.
| | | |
TRUSTEES
Ashok N. Bakhru, Chairman
John P. Coblentz, Jr.
Diana M. Daniels
Patrick T. Harker
James A. McNamara
Jessica Palmer
Alan A. Shuch
Richard P. Strubel | | OFFICERS
James A. McNamara, President
Peter V. Bonanno, Secretary
George F. Travers, Principal Financial Officer*
Scott M. McHugh, Treasurer*
* Effective October 16, 2009 |
| | | |
| | | |
GOLDMAN, SACHS & CO
Distributor and Transfer Agent | | GOLDMAN SACHS ASSET MANAGEMENT, L.P.
Investment Adviser |
Visit our Web site at www.goldmansachsfunds.com to obtain the most recent month-end returns.
Goldman Sachs Asset Management, L.P. 32 Old Slip, 32nd Floor, New York, New York 10005
The reports concerning the Fund included in this shareholder report may contain certain forward-looking statements about the factors that may affect the performance of the Fund in the future. These statements are based on Fund management’s predictions and expectations concerning certain future events and their expected impact on the Fund, such as performance of the economy as a whole and of specific industry sectors, changes in the levels of interest rates, the impact of developing world events, and other factors that may influence the future performance of the Fund. Management believes these forward-looking statements to be reasonable, although they are inherently uncertain and difficult to predict. Actual events may cause adjustments in portfolio management strategies from those currently expected to be employed.
A description of the policies and procedures that the Fund uses to determine how to vote proxies relating to portfolio securities and information regarding how the Fund voted proxies relating to portfolio securities for the 12-month period ending June 30, 2009 are available (I) without charge, upon request by calling 1-800-526-7384 (for Retail Shareholders) or 1-800-621-2550 (for Institutional Shareholders); and (II) on the Securities and Exchange Commission (”SEC”) Web site at http://www.sec.gov.
The Fund files its complete schedule of portfolio holdings with the SEC for the first and third quarters of each fiscal year on Form N-Q. The Fund’s Form N-Q will be available on the SEC’s website at http://www.sec.gov within 60 days after the Fund’s first and third fiscal quarters. The Fund’s Form N-Q, when available, may be reviewed and copied at the SEC’s Public Reference Room in Washington, D.C., and information on the operation of the Public Reference Room may also be obtained by calling 1-800-SEC-0330. Forms N-Q may be obtained upon request and without charge by calling 1-800-526-7384 (for Retail Shareholders) or 1-800-621-2550 (for Institutional Shareholders).
Holdings and allocations shown may not be representative of current or future investments. Holdings and allocations may not include the Fund’s entire investment portfolio, which may change at any time. Fund holdings should not be relied on in making investment decisions and should not be construed as research or investment advice regarding particular securities.
A prospectus for the Fund containing more complete information may be obtained from your authorized dealer or from Goldman, Sachs & Co. by calling (retail — 1-800-526-7384) (institutional — 1-800-621-2550). Please consider a fund’s objectives, risks, and charges and expenses, and read the prospectus carefully before investing. The prospectus contains this and other information about the Fund.
Copyright 2009 Goldman, Sachs & Co. All rights reserved. 29080.MF.TMPL SSFISAR09/109K/11-09
| | (a) | | The information required by this Item is only required in an annual report on this Form N-CSR. |
| | | |
| | (b) | | During the period covered by this report, no amendments were made to the provisions of the Code of Ethics. |
| | | |
| | (c) | | During the period covered by this report, the registrant did not grant any waivers, including an implicit waiver, from any provision of the Code of Ethics. |
| | | |
| | (d) | | A copy of the Code of Ethics is available as provided in Item 12(a)(1) of this report. |
| | | |
| | | |
| ITEM 3. | | AUDIT COMMITTEE FINANCIAL EXPERT. |
The information required by this Item is only required in an annual report on this Form N-CSR.
| | | |
| ITEM 4. | | PRINCIPAL ACCOUNTANT FEES AND SERVICES. |
The information required by this Item is only required in an annual report on this Form N-CSR.
| | | |
| ITEM 5. | | AUDIT COMMITTEE OF LISTED REGISTRANTS. |
| | | |
| | | The information required by this Item is only required in an annual report on this Form N-CSR. |
| | | |
| ITEM 6. | | SCHEDULE OF INVESTMENTS. |
| | | |
| | | The Schedule of Investments is included as part of the Semi-Annual Report to Stockholders filed under Item 1 of this Form N-CSR. |
| | | |
| ITEM 7. | | DISCLOSURE OF PROXY VOTING POLICIES AND PROCEDURES FOR CLOSED-END MANAGEMENT INVESTMENT COMPANIES. |
| | | |
| | | Not applicable. |
| | | |
| ITEM 8. | | PORTFOLIO MANAGERS OF CLOSED-END MANAGEMENT INVESTMENT COMPANIES. |
| | | |
| | | Not applicable. |
| | | |
| ITEM 9. | | PURCHASES OF EQUITY SECURITIES BY CLOSED-END MANAGEMENT INVESTMENT COMPANY AND AFFILIATED PURCHASERS. |
| | | |
| | | Not applicable. |
| | | |
| ITEM 10. | | SUBMISSION OF MATTERS TO A VOTE OF SECURITY HOLDERS.
There have been no material changes to the procedures by which shareholders may recommend nominees to the registrant’s board of trustees. |
| | | |
| | | |
| ITEM 11. | | CONTROLS AND PROCEDURES. |
| | | |
| | (a) | | The registrant’s principal executive and principal financial officers, or persons performing similar functions have concluded that the registrant’s disclosure controls and procedures (as defined in Rule 30a-3(c) under the Investment Company Act of 1940, as amended (the “1940 Act”)) are effective as of a date within 90 days of the filing of this report that includes the disclosure required by this paragraph, based on the evaluation of these controls and procedures required by Rule 30a-3(b) under the 1940 Act and 15d-15(b) under the Securities Exchange Act of 1934, as amended. |
| | | |
| | (b) | | There were no changes in the registrant’s internal control over financial reporting (as defined in Rule 30a-3(d) under the 1940 Act) that occurred during the registrant’s second fiscal quarter of the period covered by this report that have materially affected, or are reasonably likely to materially affect, the registrant’s internal control over financial reporting. |
| | | |
| | (a)(1) | | | Goldman Sachs Trust's Code of Ethics for Principal Executive and Senior Financial Officers is incorporated by reference to Exhibit 11(a)(1) of the registrant's Form N-CSR filed on March 8, 2004 for its Real Estate Securities Fund (Accession Number 0000950123-04-0002984). |
| | | |
| | (a)(2) | | Exhibit 99.CERT | Certifications pursuant to Section 302 of the Sarbanes-Oxley Act of 2002 filed herewith. |
| | | |
| | (b) | | Exhibit 99.906CERT | Certifications pursuant to Section 906 of the Sarbanes-Oxley Act of 2002 filed herewith. |
SIGNATURES
| | | | Pursuant to the requirements of the Securities Exchange Act of 1934 and the Investment Company Act of 1940, the registrant has duly caused this report to be signed on its behalf by the undersigned, thereunto duly authorized. |
| | | | | | | |
| | | | | Goldman Sachs Trust | | |
| | | | | | | |
| | | | /s/ James A. McNamara | | |
| | | | |
| | |
| | | | | By: James A. McNamara | | |
| | | | | Chief Executive Officer of | | |
| | | | | Goldman Sachs Trust | | |
| | | | | | | |
| | | | Date: December 2, 2009 | | |
| | | | Pursuant to the requirements of the Securities Exchange Act of 1934 and the Investment Company Act of 1940, this report has been signed below by the following persons on behalf of the registrant and in the capacities and on the dates indicated. |
| | | | | | | |
| | | | | /s/ James A. McNamara | | |
| | | | |
| | |
| | | | | By: James A. McNamara | | |
| | | | | Chief Executive Officer of | | |
| | | | | Goldman Sachs Trust | | |
| | | | | | | |
| | | | | Date: December 2, 2009 | | |
| | | | | | | |
| | | | | /s/ George F. Travers | | |
| | | | |
| | |
| | | | | By: George F. Travers | | |
| | | | | Chief Financial Officer of | | |
| | | | | Goldman Sachs Trust | | |
| | | | | | | |
| | | | | Date: December 2, 2009 | | |


![[GRAPHIC]](https://capedge.com/proxy/N-CSRS/0000950123-09-068016/y79887y7988704.gif)
![[GRAPHIC]](https://capedge.com/proxy/N-CSRS/0000950123-09-068016/y79887y7988705.gif)
![[GRAPHIC]](https://capedge.com/proxy/N-CSRS/0000950123-09-068016/y79887y7988706.gif)
![[GRAPHIC]](https://capedge.com/proxy/N-CSRS/0000950123-09-068016/y79887y7988708.gif)
![[GRAPHIC]](https://capedge.com/proxy/N-CSRS/0000950123-09-068016/y79887y7988709.gif)
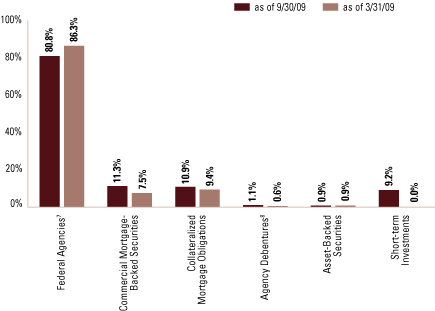
![[GRAPHIC]](https://capedge.com/proxy/N-CSRS/0000950123-09-068016/y79887y7988711.gif)