UNITED STATES
SECURITIES AND EXCHANGE COMMISSION
Washington, D.C. 20549
FORM N-CSR
CERTIFIED SHAREHOLDER REPORT OF REGISTERED
MANAGEMENT INVESTMENT COMPANIES
Investment Company Act file number 811-05349
Goldman Sachs Trust
(Exact name of registrant as specified in charter)71 South Wacker Drive, Chicago, Illinois 60606
(Address of principal executive offices) (Zip code)| | | |
| Peter V. Bonanno, Esq. | | Copies to: |
| Goldman, Sachs & Co. | | Geoffrey R. T. Kenyon, Esq. |
| 200 West Street | | Dechert LLP |
| New York, NY 10282 | | 200 Clarendon Street |
| | | 27th Floor |
| | | Boston, MA 02116-5021 |
|
(Name and address of agents for service)
|
Registrant’s telephone number, including area code: (312) 655-4400
Date of fiscal year end: October 31
Date of reporting period: April 30, 2010
| | | |
| ITEM 1. | | REPORTS TO STOCKHOLDERS. |
| | | |
| | | The Semi-Annual Report to Stockholders is filed herewith. |
Goldman Sachs Funds
| | | | |
| | | | |
Semi-Annual Report | | | April 30, 2010 |
| | | | |
| | | | |
| | | | |
| | | | Structured Domestic Equity Funds |
| | | | Balanced |
| | | | Structured Large Cap Growth |
| | | | Structured Large Cap Value |
| | | | Structured Small Cap Equity |
| | | | Structured Small Cap Growth |
| | | | Structured Small Cap Value |
| | | | Structured U.S. Equity |
| | | | |
Goldman Sachs Structured Domestic Equity Funds
| | |
| n | BALANCED | |
| |
| n | STRUCTURED LARGE CAP GROWTH | |
| |
| n | STRUCTURED LARGE CAP VALUE | |
| |
| n | STRUCTURED SMALL CAP EQUITY | |
| |
| n | STRUCTURED SMALL CAP GROWTH | |
| |
| n | STRUCTURED SMALL CAP VALUE | |
| |
| n | STRUCTURED U.S. EQUITY | |
TABLE OF CONTENTS
| | | |
| Principal Investment Strategies and Risks | | 1 |
| Market Review | | 3 |
| Investment Process — Balanced Fund | | 5 |
| Portfolio Management Discussion and Performance Summaries — Balanced Fund | | 6 |
| Investment Process — Structured Domestic Equity Funds | | 13 |
| Portfolio Management Discussion and Performance Summaries — Structured Domestic Equity Funds | | 15 |
| Schedules of Investments | | 45 |
| Financial Statements | | 88 |
| Notes to Financial Statements | | 96 |
| Financial Highlights | | 120 |
| Other Information | | 134 |
| | | | | | | |
NOT FDIC-INSURED | | | May Lose Value | | | No Bank Guarantee |
| | | | | | | |
GOLDMAN SACHS STRUCTURED DOMESTIC EQUITY FUNDS
Principal Investment Strategies and Risks
This is not a complete list of risks that may affect the Funds. For additional information concerning the risks applicable to the Funds, please see the Funds’ Prospectus.
The Goldman Sachs Balanced Fund invests in equity investments considered to have capital appreciation and/or dividend-paying ability and invests in fixed income securities. The Fund’s equity investments will be subject to market risk so that the value of the securities in which it invests may go up or down in response to the prospects of individual companies, particular industry sectors and/or general economic conditions. Foreign securities may be more volatile than investments in U.S. securities and will be subject to fluctuation and sudden economic and political developments. Investments in fixed income securities are subject to the risks associated with debt securities generally, including credit, liquidity and interest rate risk. The Fund’s balanced objective seeks to reduce the volatility associated with investing in a single market. There is no guarantee however, that market cycles will move in opposition to one another or that a balanced investment program will successfully reduce volatility.
The Goldman Sachs Structured Large Cap Growth Fund invests primarily in a broadly diversified portfolio of equity investments in large-capitalization U.S. issuers, including foreign issuers traded in the United States. The Fund’s equity investments will be subject to market risk, which means that the value of the securities in which it invests may go up or down in response to the prospects of individual companies, particular industry sectors and/or general economic conditions. The Fund may also invest in fixed income securities, which are subject to the risks associated with debt securities generally, including credit, liquidity and interest rate risk. Foreign and emerging market securities may be more volatile than investments in U.S. securities and will be subject to the risks of currency fluctuations and sudden economic or political developments.
The Goldman Sachs Structured Large Cap Value Fund invests primarily in a broadly diversified portfolio of equity investments in large-capitalization U.S. issuers, including foreign issuers traded in the United States. The Fund’s equity investments will be subject to market risk, which means that the value of the securities in which it invests may go up or down in response to the prospects of individual companies, particular industry sectors and/or general economic conditions. The Fund may also invest in fixed income securities, which are subject to the risks associated with debt securities generally, including credit, liquidity and interest rate risk. Foreign and emerging market securities may be more volatile than investments in U.S. securities and will be subject to the risks of currency fluctuations and sudden economic or political developments.
The Goldman Sachs Structured Small Cap Equity Fund invests primarily in a broadly diversified portfolio of equity investments in small-capitalization U.S. issuers, including foreign issuers traded in the United States. The Fund’s equity investments will be subject to market risk, which means that the value of the securities in which it invests may go up or down in response to the prospects of individual companies, particular industry sectors and/or general economic conditions. Stocks of smaller companies are often more volatile and less liquid and present greater risks than stocks of larger companies. At times, the Fund may be unable to sell certain of its portfolio securities without a substantial drop in price, if at all. The Fund may also invest in fixed income securities, which are subject to the risks associated with debt securities generally, including credit, liquidity and interest rate risk. Foreign and emerging market securities may be more volatile than investments in U.S. securities and will be subject to the risks of currency fluctuations and sudden economic or political developments.
GOLDMAN SACHS STRUCTURED DOMESTIC EQUITY FUNDS
The Goldman Sachs Structured Small Cap Growth Fund invests primarily in a broadly diversified portfolio of small-capitalization U.S. equity investments. The Fund’s equity investments are subject to market risk, which means that the value of the securities in which it invests may go up or down in response to the prospects of individual companies, particular industry sectors and/or general economic conditions. Stocks of smaller companies are often more volatile and less liquid and present greater risks than stocks of larger companies. At times, the Fund may be unable to sell certain of its portfolio securities without a substantial drop in price, if at all.
The Goldman Sachs Structured Small Cap Value Fund invests primarily in a broadly diversified portfolio of small-capitalization U.S. equity investments. The Fund’s equity investments are subject to market risk, which means that the value of the securities in which it invests may go up or down in response to the prospects of individual companies, particular industry sectors and/or general economic conditions. Stocks of smaller companies are often more volatile and less liquid and present greater risks than stocks of larger companies. At times, the Fund may be unable to sell certain of its portfolio securities without a substantial drop in price, if at all.
The Goldman Sachs Structured U.S. Equity Fund invests primarily in a broadly diversified portfolio of equity investments in U.S. issuers, including foreign issuers traded in the United States. The Fund’s equity investments will be subject to market risk, which means that the value of the securities in which it invests may go up or down in response to the prospects of individual companies, particular industry sectors and / or general economic conditions. The Fund may also invest in fixed income securities, which are subject to the risks associated with debt securities generally, including credit, liquidity and interest rate risk. Foreign and emerging market securities may be more volatile than investments in U.S. securities and will be subject to the risks of currency fluctuations and sudden economic or political developments.
MARKET REVIEW
Goldman Sachs Structured Domestic Equity Funds
Market Review
Overall, the U.S. stock and bond markets rose during the six months ended April 30, 2010 (the “Reporting Period”). For much of the period, economic data was mixed. During the fourth calendar quarter of 2009, U.S. industrial production was weak, suggesting that the economic recovery was experiencing a rather tepid recovery. The manufacturing index of the Federal Reserve Bank of Philadelphia, however, beat consensus estimates. Inventories drove much of the growth during the fourth quarter, followed by net exports and consumer spending. Although existing home sales were higher than expected, some observers seemed to believe the increase was a rush to buy before the housing tax credit expired. (The housing tax credit was subsequently expanded and extended until the end of April 2010.)
The U.S. labor market remained weak. At year end 2009, U.S. non-farm payrolls came in higher than expected and the unemployment rate fell from 10.2% to 10%. However initial jobless claims saw an unexpected increase, rising by 7,000 to 480,000. The U.S. trade deficit narrowed more than anticipated. Meanwhile, the Federal Reserve (the “Fed”) pledged to keep interest rates exceptionally low for an extended period.
In early 2010, market sentiment was generally negative as investors questioned the robustness of the economic recovery. There was also concern about the withdrawal of government support and the eventual tightening of monetary policy. The labor market remained soft amid signs that earlier improvements were the result of fewer layoffs, not increased hiring. President Obama’s proposal of the Financial Crisis Responsibility Fee, as well as other initiatives designed to limit the size and trading activities of financial institutions, sparked a widespread sell-off during the first calendar quarter of 2010.
In the final months of the Reporting Period, U.S. economic data grew more encouraging. Orders for durable goods increased, pointing to a healthy recovery in the manufacturing sector and in world trade. Retail sales, as well as income and spending figures, also seemed to suggest that households were playing a larger part in the economy’s recovery than previously believed. Although the labor market remained weak, job losses seemed to be stabilizing.
Equity Markets
The stock market rose during the Reporting Period. Small cap stocks outperformed large cap stocks, primarily because of gains in the energy sector. The Russell 2000 Index, which measures the small cap universe, gained 28.17%, while the S&P 500 Index, a measure of large cap stocks, returned 15.66%. Across the capitalization spectrum, value-oriented stocks outperformed growth-oriented stocks, largely on the strength of the consumer discretionary sector. The Russell 1000 Value Index, representing large cap value stocks rose 17.77% for the Reporting Period, outperforming the Russell 1000 Growth Index, which returned 15.79%.
Fixed Income Markets
During the Reporting Period as a whole, investors continued to show a strong appetite for risky assets, and most sectors of the bond market outperformed U.S. Treasuries. Short-term Treasury yields remained anchored by the Fed’s commitment to an extended period of low interest rates, while long-term Treasury yields increased as the market anticipated the prospect of greater issuance in the future. During the Reporting Period, the yield on the 10-year Treasury note rose from 3.12% to 3.82%. The spread, or difference in yields, between two- and 10-year Treasury notes widened, ending the Reporting Period at 2.81%.
MARKET REVIEW
Looking Ahead
Equity Markets
In the coming months, we strongly believe investors will use fundamentally-based criteria to build their portfolios. That is, we expect investors to overweight those stocks with less expensive valuations, higher-quality earnings, and higher profitability. Stocks with good momentum are likely, in our opinion, to outperform those with poor momentum. We intend to continue to focus on seeking profitable companies with strong fundamentals, sustainable earnings and a track record of using capital to enhance shareholder value. We anticipate remaining fully invested, with long-term performance likely to be the result of stock selection rather than sector or capitalization allocations.
We stand behind our investment philosophy that sound economic investment principles, coupled with a disciplined quantitative approach, can provide strong, uncorrelated returns over the long term. Our research agenda is robust, and we continue to enhance our existing models, add new proprietary forecasting signals, and improve our trading execution as we seek to provide the most value to our shareholders.
Fixed Income Markets
In our opinion, the U.S. economy will continue to recover, consistent with the historical pattern of sharp downturns being followed by equally sharp recoveries. Supportive financial conditions and an ongoing decline in inventories relative to sales suggest to us that economic growth should continue during the next six months.
The key question is whether consumers can drive a sustainable recovery as the impact of fiscal stimulus and the inventory cycle fades during the second half of 2010. Consumption appears to have held up relatively well during the first part of 2010, largely because of rising stock and bond prices, modest improvement in the housing market and signs of stabilization in employment. As long as these trends continue, we believe consumption growth is likely to remain positive, albeit subdued.
We believe near-term economic growth will be driven by the corporate sector. In our view, corporate cash — deployed by stock buybacks, mergers and acquisitions or business investment — could have a very positive impact on asset prices and employment. So far, business investment has remained subdued, but the rise in corporate profits, cash flow, orders and confidence suggest investment is likely to increase.
The most significant headwind, in our view, to higher business investment is excess capacity. However, when low growth created large capacity overhangs during the mid-1970s and early 1980s, business investment still increased sharply after the initial pullback. Thus, as long as business confidence does not suffer a significant decline, we do not believe excess capacity rules out a rise in business investment.
The U.S. economy continues to face other headwinds as well, ranging from a weaker commercial real estate sector to rising concerns about the country’s fiscal health. As a result, we believe 2010 growth is likely to peak in the second quarter and that consumption growth will remain modest. We expect the U.S. economy to expand modestly during 2010 with inflation rising slightly.
GOLDMAN SACHS BALANCED FUND
What Differentiates Goldman Sachs’
Balanced Fund Investment Process?
The Balanced Fund invests in a diversified investment portfolio through an asset allocation process of strategically selecting different asset classes — such as stocks and bonds. The Fund then adjusts its holdings over time. Goldman Sachs’ approach to asset allocation combines our global presence, market knowledge and risk management expertise.
| | | |
| | 
The Goldman Sachs Balanced Fund provides exposure to the wealth-building opportunities of stocks and the regular income potential of bonds

Fully invested, well-diversified portfolio that:
n Maintains style, sector, risk and capitalization characteristics similar to the benchmark.
n Offers broad access to a clearly defined equity universe.
n Aims to generate equity income that is consistent and repeatable.

In quantitative investing, we have a systematic and disciplined approach to investing. We have developed our own process-specific daily risk model that evaluates risk for more than 3,500 U.S. stocks daily. Our portfolio construction process uses this model in its attempt to manage and allocate portfolio risk.
In fixed income investing, we believe that a total return investment philosophy provides the most complete picture of performance. We emphasize fundamental credit expertise. Our group scrutinizes factors that could impact a bond’s performance over time — similar to the evaluation of company stocks. Additionally, we identify, monitor and measure a fund’s risk profile.

The Fund’s portfolio comprises the ideas of two experienced Goldman Sachs investment groups:
Global Quantitative Investment Strategies Group: A group of investment professionals with over 20 years of investment experience and a strong commitment to quantitative research.
Global Fixed Income Group: Broad, deep capabilities across global fixed income markets, with a total return investment philosophy.
|
PORTFOLIO RESULTS
Balanced Fund
Portfolio Management Discussion and Analysis
Below, the Goldman Sachs Quantitative Investment Strategies Team and the Goldman Sachs Fixed Income Investment Management Team discuss the Goldman Sachs Balanced Fund’s performance and positioning for the Reporting Period.
| |
| Q | How did the Goldman Sachs Balanced Fund (the “Fund”) perform during the Reporting Period? |
| |
| A | For the Reporting Period, the Fund’s Class A, B, C, and Institutional Shares generated cumulative total returns, without sales charges, of 11.77%, 11.39%, 11.38%, and 12.00%, respectively. These returns compare to the 15.66%, 2.54% and 10.38% cumulative total returns of the Fund’s benchmarks, the S&P 500 Index (with dividends reinvested), the Barclays Capital U.S. Aggregate Bond Index, and the blended index comprised of 60% S&P 500 Index (with dividends reinvested) and 40% Barclays Capital U.S. Aggregate Bond Index, during the same period. |
| |
| Q | How did the Fund’s asset allocation affect performance? |
| |
| A | In keeping with our investment approach, we split the Fund’s assets between equity and fixed income securities, targeting 60% equities and 40% fixed income. Because of the equity market’s strong performance during the Reporting Period, the Fund benefited from its larger allocation to stocks. At the beginning of the Reporting Period, the Fund was invested 59.7% in equities and 40.3% in fixed income. It was invested 58.6% in equities and 41.4% in fixed income at the end of the Reporting Period. |
| |
| Q | Did equity sector allocation overall help or hurt the Fund’s performance? |
| |
| A | In investing the equity portion of the Fund’s portfolio, we invest in higher dividend-paying names within industries and sectors, rather than on making industry or sector bets. Consequently, its industry and sector weights are similar to those of its equity benchmark, the S&P 500 Index, and they do not usually have a meaningful impact on relative performance. |
| |
| Q | What key factors had the greatest impact on the Fund’s equity portfolio results during the Reporting Period? |
| |
| A | In our stock selection process, we use a unique, proprietary risk model that tracks and manages risk in the portfolio. We also integrate tax considerations into our investment decisions. |
Importantly, we generally favor stocks offering a high dividend yield. We believe the Fund’s bias towards higher dividend-paying stocks was generally helpful during the Reporting Period as many of these stocks performed well. At the end of the Reporting Period, the dividend yield of the equity portion of the Fund was 3.2%, which was higher than the 1.9% dividend yield of the S&P 500 Index.
| |
| Q | Among individual holdings, which stocks contributed most to the Fund’s returns? |
| |
| A | The Fund benefited from an underweighted position relative to the S&P 500 Index in oil and gas giant Exxon Mobil. An overweight in home improvement retailer Home Depot was also advantageous. |
| |
| Q | What individual stocks detracted from the Fund’s results during the Reporting Period? |
| |
| A | The Fund was hampered during the Reporting Period by its overweights to investment management company Federated Investors, technology and software maker Apple and fertilizer producer Terra Industries. |
| |
| Q | Which fixed income market sectors most significantly affected the Fund’s performance? |
| |
| A | The Fund’s overweight position relative to the Barclays Capital U.S. Aggregate Bond Index in non-agency adjustable-rate mortgages (ARMs) was the largest contributor to relative returns. Non-agency ARMS benefited from improving fundamentals in the U.S. housing market and favorable technicals, such as the implementation of the Public-Private Investment Program (PPIP). |
PORTFOLIO RESULTS
An overweight in investment grade corporate bonds also enhanced relative results. During the Reporting Period, the Barclays Capital U.S. Aggregate Bond Index outperformed duration-matched Treasuries by a differential of 3.94%. Issuer selection within the investment grade corporate bond sector also contributed to relative performance.
Effective issuer selection within mortgage-backed and asset-backed securities added relative returns. In particular, the Fund benefited from investments in senior and super-senior tranches of distressed non-agency mortgage-backed securities that were backed by Option ARMs, which give borrowers payment options, and Alt-A mortgages, which are mortgages that fall between prime and subprime in terms of the credit quality of the underlying borrowers. This positive performance was partly offset by weaker issuer selection among commercial mortgage-backed securities (CMBS).
Our issuer selection within agencies and emerging markets debt also enhanced relative results.
| |
| Q | How did the Fund’s duration and yield curve positioning strategies affect performance during the Reporting Period? |
| |
| A | Within the fixed income portfolio, the Fund’s duration and yield curve positioning strategies added to relative returns. In particular, the portfolio’s overweighted positions on the longer end of the U.K. and German yield curves contributed. These positions were advantageous because of the regions’ sluggish economic recoveries and the heightened risk posed by certain sovereign credits, such as Greece, Portugal and Spain. Duration is a measure of the Fund’s sensitivity to changes in interest rates. Yield curve indicates the spectrum of maturities within a particular sector. |
| |
| Q | What changes did you make to the Fund’s fixed income weightings during the Reporting Period and how did it affect performance? |
| |
| A | During the Reporting Period, we shifted the Fund from a short duration stance to a long duration position relative to the Barclays Capital U.S. Aggregate Bond Index. We decreased the fixed income portfolio’s overweighted exposure in investment grade corporate bonds and non-agency ARMS. We also decreased the size of its underweight in agency mortgage-backed securities. Further, we moved from a neutral to an overweighted position in emerging markets debt. |
| |
| Q | What is the Team’s equity strategy for the months ahead? |
| |
| A | The Goldman Sachs Quantitative Investment Strategies Equity Team manages the equity portion of the Fund’s portfolio. The Team seeks to provide investors with a broad diversified exposure to the U.S. large-cap equity market. The team aims to be style neutral to the Benchmark and favors stocks with higher dividends within each industry. Its portfolio construction process integrates tax considerations into its investment decisions. The group uses a unique, proprietary risk model in its stock selection process. It believes this risk model can be beneficial as it identifies, tracks and manages risk in the portfolio. |
The equity portion of the Fund continues to be broadly diversified. At the end of the Reporting Period, its industry and sector weights were similar to that of the S&P 500 Index. We intend to maintain our focus on stocks with high dividend yields. With interest rates so low, we expect investors will continue to find these stocks desirable.
| |
| Q | What is the Fund’s tactical view and strategy for the fixed income markets looking ahead? |
| |
| A | Within the fixed income portfolio as of April 30, 2010, we were targeting a neutral duration position along the U.S. fixed income yield curve relative to the Barclays Capital U.S. Aggregate Bond Index. However, we remain cautious about longer-maturity Treasury yields, as we expect bond supply to continue rising and U.S. economic growth to show further signs of improvement. |
We plan to maintain a moderately underweighted position in agency mortgages because we believe they are expensive relative to Treasuries. In addition, we do not think investors are being adequately compensated for potential risks, such as prepayment risk.
We also favor a small overweight in investment-grade corporate bonds. Their spreads, or differences in yield, relative to Treasuries have tightened but at the end of the Reporting Period, we still considered them attractive. The tighter spreads have substantially reduced corporate interest payment costs, which has, in turn, lowered leverage,
PORTFOLIO RESULTS
thus creating a virtuous cycle. In 2010, we expect spreads to tighten further, driven by strong inflows and improving corporate fundamentals. Meanwhile, newly-issued bonds continue to be met by robust demand. Historically, an environment with slow to moderate global growth has been, in our view, the most beneficial for corporate bonds.
At the end of the Reporting Period, we maintained a small position in high yield bonds, which are not represented in the Barclays Capital U.S. Aggregate Bond Index. We believe high yield corporate bond returns will remain volatile in the near term until there is clarity on the strength of the global recovery. However, spreads remain wide because of persistent concerns about the amount of debt on corporate balance sheets. Nevertheless, market momentum is driving spreads tighter with the weakest credits rallying the most. We believe the strengthening equity markets will continue to support higher recovery values on defaults and assist debt repayment through initial public offerings and share issuances.
In emerging markets debt, we maintain a slight overweight position relative to the fixed income portfolio’s benchmark index. This position is underpinned by our outlook for strong economic growth and the relative fiscal stability of many emerging market countries. In contrast to Eurozone “peripherals,” such as Greece, Spain and Ireland, emerging market countries are generally perceived to have stronger fiscal positions, lower debt and faster growth, as evidenced by continued strong capital flows into the asset class.
Balanced Fund
as of April 30, 2010
PERFORMANCE REVIEW
| | | | | | | | | | | | | | | | | | | |
| | | | | | | | | Barclay’s Capital
| | | S&P (60%) Barclay’s
| | | |
November 1, 2009-
| | Fund Total Return
| | | S&P 500
| | | U.S. Aggregate
| | | Capital Aggregate
| | | |
| April 30, 2010 | | (based on NAV)1 | | | Index2 | | | Bond Index3 | | | (40%) Blended Index4 | | | |
|
| |
| Class A | | | 11.77 | % | | | 15.66 | % | | | 2.54 | % | | | 10.38 | % | | |
| Class B | | | 11.39 | | | | 15.66 | | | | 2.54 | | | | 10.38 | | | |
| Class C | | | 11.38 | | | | 15.66 | | | | 2.54 | | | | 10.38 | | | |
| Institutional | | | 12.00 | | | | 15.66 | | | | 2.54 | | | | 10.38 | | | |
|
| |
| 1 | The net asset value (NAV) represents the net assets of the class of the Fund (ex-dividend) divided by the total number of shares of the class outstanding. The Fund’s performance reflects the reinvestment of dividends and other distributions. The Fund’s performance does not reflect the deduction of any applicable sales charges. |
| 2 | The S&P 500 Index is the Standard & Poor’s 500 Composite Index of 500 stocks, an unmanaged index of common stock prices. The Index is unmanaged and the figures for the Index do not include any deduction for fees, expenses or taxes. It is not possible to invest directly in an index. |
| 3 | The Barclay’s Capital U.S. Aggregate Bond Index represents an unmanaged diversified portfolio of fixed income securities, including U.S. Treasuries, investment-grade corporate bonds, and mortgage-backed and asset-backed securities. The Index figures do not reflect any deductions for fees, expenses or taxes. It is not possible to invest directly in an index. |
| 4 | The S&P 500 (60%) / Barclays Capital Aggregate (40%) is a blended index comprised of 60% S&P 500 Index (with dividends reinvested) and 40% Barclays Capital U.S. Aggregate Bond Index. The index is unmanaged and the figures for the index do not include any deduction for fees, expenses or taxes. It is not possible to invest directly in an index. |
STANDARDIZED AVERAGE ANNUAL TOTAL RETURNS5
| | | | | | | | | | | | | | | | | | | | | |
| For the period ended 3/31/10 | | One Year | | | Five Years | | | Ten Years | | | Since Inception | | | Inception Date | | |
|
| |
| Class A | | | 31.29 | % | | | 2.73 | % | | | 1.96 | % | | | 6.07 | % | | 10/12/94 | | |
| Class B | | | 32.86 | | | | 2.72 | | | | 1.91 | | | | 4.68 | | | 5/1/96 | | |
| Class C | | | 36.87 | | | | 3.13 | | | | 1.78 | | | | 2.52 | | | 8/15/97 | | |
| Institutional | | | 39.58 | | | | 4.52 | | | | 3.05 | | | | 3.77 | | | 8/15/97 | | |
|
| |
| 5 | The Standardized Average Annual Total Returns are average annual total returns as of the most recent calendar quarter-end. They assume reinvestment of all distributions at NAV. These returns reflect a maximum initial sales charge of 5.5% for Class A Shares, the assumed contingent deferred sales charge for Class B Shares (5% maximum declining to 0% after six years) and the assumed contingent deferred sales charge for Class C Shares (1% if redeemed within 12 months of purchase). Class B Shares convert automatically to Class A Shares on or about the fifteenth day of the last month of the calendar quarter that is eight years after purchase. Returns for Class B Shares for the period after conversion reflect the performance of Class A Shares. Because Institutional Shares do not involve a sales charge, such a charge is not applied to their Standardized Average Annual Total Returns. Effective November 2, 2009, the Fund’s Class B Shares are no longer available for purchase by new or existing shareholders (although current Class B shareholders may continue to reinvest income and capital gains distributions into Class B Shares, and Class B shareholders may continue to exchange their shares for Class B Shares of certain other Goldman Sachs Funds). |
These returns represent past performance. Past performance does not guarantee future results. The investment return and principal value of an investment will fluctuate and, therefore, an investor’s shares, when redeemed, may be worth more or less than their original cost. Current performance may be lower or higher than the total return figures in the above charts. Please visit www.goldmansachsfunds.com to obtain the most recent month-end returns. Performance reflects expense limitations in effect. In their absence, performance would be reduced. Returns do not reflect the deduction of taxes that a shareholder would pay on Fund distributions or the redemption of Fund shares.
FUND BASICS
EXPENSE RATIOS6
| | | | | | | | | |
| | | Net Expense Ratio (Current) | | | Gross Expense Ratio (Before Waivers) | |
| |
| |
| Class A | | | 1.05 | % | | | 1.38 | % |
| Class B | | | 1.80 | | | | 2.13 | |
| Class C | | | 1.80 | | | | 2.13 | |
| Institutional | | | 0.65 | | | | 0.98 | |
|
| |
| 6 | The expense ratios of the Fund, both current (net of applicable fee waivers and/or expense limitations) and before waivers (gross of applicable fee waivers and/or expense limitations), are as set forth above according to the most recent publicly available Prospectus for the Fund and may differ from the expense ratios disclosed in the Financial Highlights in this report. Applicable waivers and expense limitations may be modified or terminated in the future, consistent with the terms of any arrangements in place. If this occurs, the expense ratios may change without shareholder approval. |
TOP TEN EQUITY HOLDINGS AS OF 4/30/107
| | | | | | | |
| Holding | | % of Net Assets | | | Line of Business |
|
| |
| Microsoft Corp. | | | 2.2 | % | | Software |
| International Business Machines Corp. | | | 2.0 | | | IT Services |
| Chevron Corp. | | | 2.0 | | | Oil, Gas & Consumable Fuels |
| Exxon Mobil Corp. | | | 1.8 | | | Oil, Gas & Consumable Fuels |
| JPMorgan Chase & Co. | | | 1.7 | | | Diversified Financial Services |
| Eli Lilly & Co. | | | 1.6 | | | Pharmaceuticals |
| The Procter & Gamble Co. | | | 1.5 | | | Household Products |
| General Electric Co. | | | 1.2 | | | Industrial Conglomerates |
| Bristol-Myers Squibb Co. | | | 1.2 | | | Pharmaceuticals |
| Intel Corp. | | | 1.2 | | | Semiconductors & Semiconductor |
| | | | | | | Equipment |
|
| |
| 7 | The top 10 holdings may not be representative of the Fund’s future investments. |
FUND BASICS
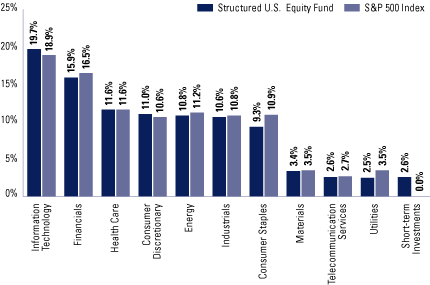
FUND’S EQUITY SECTOR ALLOCATIONS VS. BENCHMARK8
As of April 30, 2010
| |
| 8 | The Fund is actively managed and, as such, its composition may differ over time. The above graph categorizes investments using Global Industry Classification Standard (“GICS”), however, the sector classifications used by the portfolio management team may differ from GICS. Underlying industry sector allocations of exchange traded funds (“ETFs”) held by the Fund are not reflected in the graph above. Consequently, the Fund’s overall industry sector allocation may differ from the percentages contained in the graph above. The percentage shown for each investment category of the Fund reflects the value of investments in that category as a percentage of the total value of the Fund’s Equity investments (excluding investments in the securities lending reinvestment vehicle, if any). Investment in securities lending reinvestment vehicle represented 3.0% of the Funds’s net assets at April 30, 2010. |
FUND BASICS
FUND’S FIXED INCOME SECTOR ALLOCATIONS9
As of April 30, 2010
| |
| 9 | The percentage shown for each investment category reflects the value of investments in that category as a percentage of the Fund’s Fixed Income investments. Short-term investments represent repurchase agreements. Figures in the above graph may not sum to 100% due to the exclusion of other assets and liabilities. |
| |
| 10 | “Government Guarantee Obligations” are guaranteed under the Federal Deposit Insurance Corporation’s (“FDIC”) Temporary Liquidity Guarantee Program or the Foreign Government Guarantee Program and are backed by the full faith and credit of the United States or the federal government of a foreign country. The expiration date of the FDIC’s guarantee is the earlier of the maturity date of the debt or June 30, 2012. |
| 11 | “Agency Debentures” include agency securities offered by companies such as FNMA and FHLMC which operate under a government charter. While they are required to report to a government regulator, their assets are not explicitly guaranteed by the government and they otherwise operate similar to any other publicly traded company. |
GOLDMAN SACHS STRUCTURED DOMESTIC EQUITY FUNDS
What Differentiates Goldman Sachs’
Structured Domestic Equity Funds Investment Process?
At Goldman Sachs Asset Management, L.P. (GSAM), Structured Equity combines traditional fundamental analysis with sophisticated quantitative modeling. Our approach is not unlike that of a more traditional active manager: we look at fundamental investment themes that have been effective historically in forecasting excess returns of stocks. However, where we differ from Traditional managers is that we seek to rigorously test every potential research theme or signal to verify whether they have shown consistent predictive ability across a wide variety of stocks in different time periods and under different market conditions.
| | | |
| | 
n Comprehensive – We calculate expected excess returns for more than 10,000 stocks on a daily basis.
n Rigorous – We evaluate stocks based on fundamental investment criteria that have outperformed historically.
n Objective – Our stock selection process is free from the emotion that may lead to biased investment decisions.

n Our computer optimization process allocates risk to our best investment ideas and constructs funds that strive to neutralize systematic risks and deliver better returns.
n We use a unique, proprietary risk model that is designed to be more precise, more focused and faster to respond because it seeks to identify, track and manage risk specific to our process, using daily data.

Fully invested, well-diversified portfolio that seeks to:
n Maintain style, sector, risk and capitalization characteristics similar to the benchmark.
n Offer broad access to a clearly defined equity universe.
n Generate excess returns that are positive, consistent and repeatable.
|
GOLDMAN SACHS STRUCTURED DOMESTIC EQUITY FUNDS
Enhancements Made to Proprietary Quantitative Model
During the Reporting Period
We continuously look for ways to improve our investment process. Accordingly, we introduced a number of enhancements to our proprietary quantitative model during the Reporting Period. We continued to refine our process to adjust for crowding,4 which has the potential to shorten the length of time that signals within our investment themes are effective. In addition, we expanded our model’s cross-company linkage signals to examine relationships between global companies that are economically related. We also introduced two new signals within our Management investment theme. The first seeks to capture select actions by managers of hard-to-value companies, while the other identifies companies where managers have incentives tied to shareholder value. Lastly, we continued our sector-specific research and implemented a signal that measures the efficiency and profitability of airline companies. We believe that these enhancements have predictive ability and will add value to our process over time.
Changes Made to the Team’s Management
Robert B. Litterman, the Chairman of Quantitative Investment Strategies (QIS), retired at the end of 2009 following 23 years of distinguished service.
Kent Daniel, Managing Director and former co-CIO, has left the firm to pursue other personal and professional objectives. Bill Fallon, Managing Director and co-CIO of the QIS macro business, has assumed Kent’s research and co-CIO responsibilities for the QIS equity team. Katinka Domotorffy remains Chief Investment Officer and Head of QIS.
Don Mulvihill, Managing Director, has been named the co-CIO with Katinka Domotorffy of a new Customized Beta Strategies (CBS) team within QIS. The CBS team centralizes the QIS beta-driven solutions, including the Financial Solutions Group (focused on beta replication, currency hedging, drawdown risk management and transition management) as well as tax-advantaged solutions and other customized beta strategies.
Peter Zangari, formerly the Head of Implementation for the QIS equity strategies, has assumed the new role of Head of Risk Management for QIS.
Adrien Vesval, Managing Director and Portfolio Manager on the QIS team, has left the firm to pursue other opportunities. His responsibilities have been assumed primarily by Bernard Yoo, Vice President and Portfolio Manager, and the existing members of the QIS volatility team. Silverio Foresi, formerly Head of QIS trading, has left the QIS team to serve as Head of Analytics and Attribution in Goldman Sachs Asset Management’s Office of the CIO. Rich Vanecek, the Chief Operating Officer of Trading for the QIS team, and Jeff Bacidore, the head of QIS’s algorithmic trading, will co-manage the QIS trading desk.
| |
| 4 | Crowding is a phenomenon in which quantitative managers look for similar stock traits using similar investment themes. |
PORTFOLIO RESULTS
Structured Large Cap Growth Fund
Portfolio Management Discussion and Analysis
Below, the Goldman Sachs Quantitative Investment Strategies Team discusses the Goldman Sachs Structured Large Cap Growth Fund’s performance and positioning for the Reporting Period.
| |
| Q | How did the Goldman Sachs Structured Large Cap Growth Fund (the “Fund”) perform during the Reporting Period? |
| |
| A | During the Reporting Period, the Fund’s Class A, B, C, Institutional, Service, IR and R Shares generated cumulative total returns, without sales charges, of 15.66%, 15.26%, 15.30%, 15.99%, 15.67%, 15.89% and 15.50%, respectively. These returns compare to the 15.79% cumulative total return of the Fund’s benchmark, the Russell 1000 Growth Index (with dividends reinvested) (the “Index”), during the same period. |
| |
| Q | What key factors were most responsible for the Fund’s performance during the Reporting Period? |
| |
| A | As expected, and in keeping with our investment approach, our quantitative model and its six investment themes had the greatest impact on relative performance. We use these themes to take a long-term view of market patterns and look for inefficiencies, selecting stocks for the Fund and overweighting or underweighting the ones chosen by the model. Over time and by design, the performance of any one of the model’s investment themes tends to have a low correlation with the model’s other themes, demonstrating the diversification benefit of the Fund’s theme-driven quantitative model. The variance in performance supports our research indicating that the diversification provided by our different investment themes is a significant investment advantage over the long term, even though the Fund may experience underperformance in the short term. |
Overall, the Fund provided mixed returns relative to the Index during the Reporting Period. Among investment themes, our Quality theme contributed the most to relative results. Quality evaluates whether the company’s earnings are coming from more persistent, cash-based sources, as opposed to accruals. The Valuation, Sentiment and Management themes also enhanced relative performance. Valuation attempts to capture potential mispricings of securities, typically by comparing a measure of the company’s intrinsic value to its market value. Sentiment reflects selected investment views and decisions of individuals and financial intermediaries. Management assesses the characteristics, policies and strategic decisions of company management.
The Profitability and Momentum themes detracted from relative performance. Our Profitability theme assesses whether a company is earning more than its cost of capital, while our Momentum theme predicts drift in stock prices caused by under-reaction to company-specific information.
| |
| Q | How did the Fund’s sector allocations affect relative performance? |
| |
| A | In constructing the Fund’s portfolio, we focus on picking stocks rather than on making industry or sector bets. Consequently, the Fund is similar to the Index in terms of its sector allocation and style. |
| |
| Q | Did stock selection help or hurt Fund performance during the Reporting Period? |
| |
| A | We seek to outpace the Index by overweighting stocks we expect to outperform and underweighting those we think may lag. We also build positions based on our thematic views. For example, the Fund aims to hold a basket of stocks with better Momentum characteristics than the Index. During the Reporting Period, our stock picks added positively to the Fund’s relative performance. |
| |
| Q | Which stock positions contributed the most to the Fund’s relative returns during the Reporting Period? |
| |
| A | Investments in the information technology, industrials and financials sectors contributed to the Fund’s results versus the Index. An overweighted position in Toro, a turf maintenance equipment maker, was advantageous. We assumed the overweight because of our positive views on Profitability. The Fund also benefited from overweights in hard disk drive manufacturer Seagate Technology and shipping company United Parcel Service. Our positive views on Quality and Sentiment led to these overweights. |
PORTFOLIO RESULTS
| |
| Q | Which individual positions detracted from the Fund’s results during the Reporting Period? |
| |
| A | Stock picks in the health care, consumer discretionary and consumer staples sectors dampened the Fund’s relative results. The Fund was hindered by an underweight in technology and software maker Apple, a position we adopted because of our negative views on Quality. Also detracting were overweighted positions in biopharmaceutical firm Gilead Sciences and tobacco company Lorillard. Our positive views on Profitability led to our assuming both overweights. |
| |
| Q | What was the Fund’s sector positioning relative to the Index at the end of the Reporting Period? |
| |
| A | During the Reporting Period, the Fund was overweight the information technology, consumer discretionary, health care and industrials sectors relative to the Index. The Fund was underweight the consumer staples, utilities, energy, materials, financials and telecommunication services sectors relative to the Index at the end of the Reporting Period. |
FUND BASICS
Structured Large Cap Growth Fund
as of April 30, 2010
PERFORMANCE REVIEW
| | | | | | | | | | | |
| November 1, 2009–April 30, 2010 | | Fund Total Return (based on NAV)1 | | | Russell 1000 Growth Index2 | | | |
|
| |
| Class A | | | 15.66 | % | | | 15.79 | % | | |
| Class B | | | 15.26 | | | | 15.79 | | | |
| Class C | | | 15.30 | | | | 15.79 | | | |
| Institutional | | | 15.99 | | | | 15.79 | | | |
| Service | | | 15.67 | | | | 15.79 | | | |
| Class IR | | | 15.89 | | | | 15.79 | | | |
| Class R | | | 15.50 | | | | 15.79 | | | |
|
| |
| 1 | The net asset value (NAV) represents the net assets of the class of the Fund (ex-dividend) divided by the total number of shares of the class outstanding. The Fund’s performance reflects the reinvestment of dividends and other distributions. The Fund’s performance does not reflect the deduction of any applicable sales charges. |
| 2 | The Russell 1000 Growth Index is an unmanaged market capitalization weighted index of the 1000 largest U.S. companies with higher price-to-book ratios and higher forecasted growth values. The Index is unmanaged and the figures for the Index do not include any deduction for fees, expenses or taxes. It is not possible to invest directly in an unmanaged index. |
STANDARDIZED AVERAGE ANNUAL TOTAL RETURNS3
| | | | | | | | | | | | | | | | | | | | | |
| For the period ended 3/31/10 | | One Year | | | Five Years | | | Ten Years | | | Since Inception | | | Inception Date | | |
|
| |
| Class A | | | 37.18 | % | | | -1.23 | % | | | -6.03 | % | | | 1.58 | % | | 5/1/97 | | |
| Class B | | | 39.13 | | | | -1.29 | | | | -6.09 | | | | 1.55 | | | 5/1/97 | | |
| Class C | | | 42.85 | | | | -0.92 | | | | -6.22 | | | | -0.04 | | | 8/15/97 | | |
| Institutional | | | 45.67 | | | | 0.29 | | | | -5.10 | | | | 2.43 | | | 5/1/97 | | |
| Service | | | 44.97 | | | | -0.17 | | | | -5.57 | | | | 1.93 | | | 5/1/97 | | |
| Class IR | | | 45.35 | | | | N/A | | | | N/A | | | | -8.79 | | | 11/30/07 | | |
| Class R | | | 44.79 | | | | N/A | | | | N/A | | | | -9.19 | | | 11/30/07 | | |
|
| |
| 3 | The Standardized Average Annual Total Returns are average annual total returns as of the most recent calendar quarter-end. They assume reinvestment of all distributions at NAV. These returns reflect a maximum initial sales charge of 5.5% for Class A Shares, the assumed contingent deferred sales charge for Class B Shares (5% maximum declining to 0% after six years) and the assumed contingent deferred sales charge for Class C Shares (1% if redeemed within 12 months of purchase). Class B Shares convert automatically to Class A Shares on or about the fifteenth day of the last month of the calendar quarter that is eight years after purchase. Returns for Class B Shares for the period after conversion reflect the performance of Class A Shares. Because Institutional, Service, Class IR and Class R Shares do not involve a sales charge, such a charge is not applied to their Standardized Average Annual Total Returns. Effective November 2, 2009, the Fund’s Class B Shares are no longer available for purchase by new or existing shareholders (although current Class B shareholders may continue to reinvest income and capital gains distributions into Class B Shares, and Class B shareholders may continue to exchange their shares for Class B Shares of certain other Goldman Sachs Funds). |
These returns represent past performance. Past performance does not guarantee future results. The investment return and principal value of an investment will fluctuate and, therefore, an investor’s shares, when redeemed, may be worth more or less than their original cost. Current performance may be lower or higher than the total return figures in the above charts. Please visit www.goldmansachsfunds.com to obtain the most recent month-end returns. Performance reflects fee waivers and/or expense limitations in effect. In their absence, performance would be reduced. Returns do not reflect the deduction of taxes that a shareholder would pay on Fund distributions or the redemption of Fund shares.
FUND BASICS
EXPENSE RATIOS4
| | | | | | | | | | | |
| | | Net Expense Ratio (Current) | | | Gross Expense Ratio (Before Waivers) | | | |
|
| |
| Class A | | | 0.95 | % | | | 1.16 | % | | |
| Class B | | | 1.70 | | | | 1.91 | | | |
| Class C | | | 1.70 | | | | 1.91 | | | |
| Institutional | | | 0.55 | | | | 0.76 | | | |
| Service | | | 1.05 | | | | 1.26 | | | |
| Class IR | | | 0.70 | | | | 0.91 | | | |
| Class R | | | 1.20 | | | | 1.41 | | | |
|
| |
| 4 | The expense ratios of the Fund, both current (net of applicable fee waivers and/or expense limitations) and before waivers (gross of applicable fee waivers and/or expense limitations), are as set forth above according to the most recent publicly available Prospectus for the Fund and may differ from the expense ratios disclosed in the Financial Highlights in this report. Applicable waivers and expense limitations may be modified or terminated in the future, consistent with the terms of any arrangements in place. If this occurs, the expense ratios may change without shareholder approval. |
TOP TEN HOLDINGS AS OF 4/30/105
| | | | | | | | | |
| Holding | | % of Net Assets | | Line of Business | | |
|
| |
| Microsoft Corp. | | | 5.8 | % | | Software | | |
| Intel Corp. | | | 3.9 | | | Semiconductors & Semiconductor | | |
| | | | | | | Equipment | | |
| Cisco Systems, Inc. | | | 3.2 | | | Communications Equipment | | |
| The Procter & Gamble Co. | | | 3.0 | | | Household Products | | |
| Eli Lilly & Co. | | | 3.0 | | | Pharmaceuticals | | |
| Lorillard, Inc. | | | 2.3 | | | Tobacco | | |
| Oracle Corp. | | | 2.1 | | | Software | | |
| Accenture PLC | | | 2.1 | | | IT Services | | |
| United Parcel Service, Inc. Class B | | | 2.0 | | | Air Freight & Logistics | | |
| Amgen, Inc. | | | 2.0 | | | Biotechnology | | |
|
| |
| 5 | The top 10 holdings may not be representative of the Fund’s future investments. |
FUND BASICS
FUND VS. BENCHMARK SECTOR ALLOCATIONS6
As of April 30, 2010
| |
| 6 | The Fund is actively managed and, as such, its composition may differ over time. The above graph categorizes investments using Global Industry Classification Standard (“GICS”), however, the sector classifications used by the portfolio management team may differ from GICS. Underlying industry sector allocations of exchange traded funds (“ETFs”) held by the Fund are not reflected in the graph above. Consequently, the Fund’s overall industry sector allocations may differ from the percentages contained in the graph above. The percentage shown for each investment category reflects the value of investments in that category as a percentage of market value (excluding investments in the securities lending reinvestment vehicle, if any). |
PORTFOLIO RESULTS
Structured Large Cap Value Fund
Portfolio Management Discussion and Analysis
Below, the Goldman Sachs Quantitative Investment Strategies Team discusses the Goldman Sachs Structured
Large Cap Value Fund’s performance and positioning for the Reporting Period.
| |
| Q | How did the Goldman Sachs Structured Large Cap Value Fund (the “Fund”) perform during the Reporting Period? |
| |
| A | During the Reporting Period, the Fund’s Class A, B, C, Institutional, Service, IR and R Shares generated cumulative total returns, without sales charges, of 17.98%, 17.50%, 17.55%, 18.35%, 17.97%, 18.15% and 17.76%, respectively. These returns compare to the 17.77% cumulative total return of the Fund’s benchmark, the Russell 1000 Value Index (with dividends reinvested) (the “Index”), during the same period. |
| |
| Q | What key factors were most responsible for the Fund’s performance during the Reporting Period? |
| |
| A | As expected, and in keeping with our investment approach, our quantitative model and its six investment themes had the greatest impact on relative performance. We use the model’s six investment themes to take a long-term view of market patterns and look for inefficiencies, selecting stocks for the Fund and overweighting or underweighting the ones chosen by the model. Over time and by design, the performance of any one of the model’s investment themes tends to have a low correlation with the model’s other themes, demonstrating the diversification benefit of the Fund’s theme-driven quantitative model. The variance in performance supports our research indicating that the diversification provided by our different investment themes is a significant investment advantage over the long term, even though the Fund may experience underperformance in the short term. |
Overall, the Fund’s investment themes contributed positively to relative returns. Valuation was our best-performing theme. Valuation attempts to capture potential mispricings of securities, typically by comparing a measure of the company’s intrinsic value to its market value. Momentum and Management also added relative value. Momentum predicts drift in stock prices caused by under-reaction to company-specific information, while Management assesses the characteristics, policies and strategic decisions of company management.
Sentiment and Profitability slowed relative performance. Our Sentiment theme reflects selected investment views and decisions of individuals and financial intermediaries. Profitability assesses whether a company is earning more than its cost of capital. Quality also detracted from relative results, though to a lesser extent. Quality evaluates whether the company’s earnings are coming from more persistent, cash-based sources, as opposed to accruals.
| |
| Q | How did the Fund’s sector allocations affect relative performance? |
| |
| A | In constructing the Fund’s portfolio, we focus on picking stocks rather than on making industry or sector bets. Consequently, the Fund is similar to the Index in terms of its sector allocation and style. |
| |
| Q | Did stock selection help or hurt Fund performance during the Reporting Period? |
| |
| A | We seek to outpace the Index by overweighting stocks we expect to outperform and underweighting those we think may lag. We also build positions based on our thematic views. For example, the Fund aims to hold a basket of stocks with better Momentum characteristics than the Index. During the Reporting Period, our stock picks detracted from the Fund’s performance versus the Index. |
| |
| Q | Which stock positions contributed the most to the Fund’s relative returns during the Reporting Period? |
| |
| A | Security selection in the financials, energy and information sectors contributed to relative performance. The Fund benefited from overweighted positions in Cimarex Energy, an oil and gas exploration company, and Seagate Technology, a maker of hard disk drives. We chose to adopt these overweights because of our positive views on Quality and Sentiment. |
PORTFOLIO RESULTS
| |
| Q | Which individual positions detracted from the Fund’s results during the Reporting Period? |
| |
| A | Stock picks in the consumer discretionary, health care and utilities sectors hampered the Fund’s relative performance. Detracting were overweights in utilities holding company Exelon, oil and natural gas company Devon Energy and agribusiness giant Archer Daniels Midland. The Fund was overweight Exelon because of our positive views on Profitability and Quality, while our positive views on Quality and Sentiment led us to overweight Devon Energy. The overweight to Archer Daniels Midland was assumed because of our positive views on Profitability and Sentiment. |
| |
| Q | What was the Fund’s sector positioning relative to the Index at the end of the Reporting Period? |
| |
| A | During the Reporting Period, the Fund was overweight the information technology, health care, consumer discretionary, energy and materials sectors relative to the Index. The Fund was underweight the utilities and consumer staples sectors. It was neutral to the financials, industrials and telecommunication services sectors relative to the Index at the end of the Reporting Period. |
FUND BASICS
Structured Large Cap Value Fund
as of April 30, 2010
PERFORMANCE REVIEW
| | | | | | | | | | | |
| November 1, 2009–April 30, 2010 | | Fund Total Return (based on NAV)1 | | | Russell 1000 Value Index2 | | | |
|
| |
| Class A | | | 17.98 | % | | | 17.77 | % | | |
| Class B | | | 17.50 | | | | 17.77 | | | |
| Class C | | | 17.55 | | | | 17.77 | | | |
| Institutional | | | 18.35 | | | | 17.77 | | | |
| Service | | | 17.97 | | | | 17.77 | | | |
| Class IR | | | 18.15 | | | | 17.77 | | | |
| Class R | | | 17.76 | | | | 17.77 | | | |
|
| |
| 1 | The net asset value (NAV) represents the net assets of the class of the Fund (ex-dividend) divided by the total number of shares of the class outstanding. The Fund’s performance reflects the reinvestment of dividends and other distributions. The Fund’s performance does not reflect the deduction of any applicable sales charges. |
| 2 | The Russell 1000 Value Index is an unmanaged market capitalization weighted index of the 1000 largest U.S. companies with lower price-to-book ratios and lower forecasted growth values. The Index is unmanaged and the figures for the Index do not include any deduction for fees, expenses or taxes. It is not possible to invest directly in an unmanaged index. |
STANDARDIZED AVERAGE ANNUAL TOTAL RETURNS3
| | | | | | | | | | | | | | | | | | | | | |
| For the period ended 3/31/10 | | One Year | | | Five Years | | | Ten Years | | | Since Inception | | | Inception Date | | |
|
| |
| Class A | | | 39.45 | % | | | -2.35 | % | | | 0.92 | % | | | 1.43 | % | | 12/31/98 | | |
| Class B | | | 41.43 | | | | -2.38 | | | | 0.85 | | | | 1.39 | | | 12/31/98 | | |
| Class C | | | 45.62 | | | | -1.97 | | | | 0.73 | | | | 1.18 | | | 12/31/98 | | |
| Institutional | | | 48.13 | | | | -0.85 | | | | 1.89 | | | | 2.33 | | | 12/31/98 | | |
| Service | | | 47.49 | | | | -1.34 | | | | 1.40 | | | | 1.84 | | | 12/31/98 | | |
| Class IR | | | 48.00 | | | | N/A | | | | N/A | | | | -11.48 | | | 11/30/07 | | |
| Class R | | | 47.30 | | | | N/A | | | | N/A | | | | -11.88 | | | 11/30/07 | | |
|
| |
| 3 | The Standardized Average Annual Total Returns are average annual total returns as of the most recent calendar quarter-end. They assume reinvestment of all distributions at NAV. These returns reflect a maximum initial sales charge of 5.5% for Class A Shares, the assumed contingent deferred sales charge for Class B Shares (5% maximum declining to 0% after six years) and the assumed contingent deferred sales charge for Class C Shares (1% if redeemed within 12 months of purchase). Class B Shares convert automatically to Class A Shares on or about the fifteenth day of the last month of the calendar quarter that is eight years after purchase. Returns for Class B Shares for the period after conversion reflect the performance of Class A Shares. Because Institutional, Service, Class IR and Class R Shares do not involve a sales charge, such a charge is not applied to their Standardized Average Annual Total Returns. Effective November 2, 2009, the Fund’s Class B Shares are no longer available for purchase by new or existing shareholders (although current Class B shareholders may continue to reinvest income and capital gains distributions into Class B Shares, and Class B shareholders may continue to exchange their shares for Class B Shares of certain other Goldman Sachs Funds). |
These returns represent past performance. Past performance does not guarantee future results. The investment return and principal value of an investment will fluctuate and, therefore, an investor’s shares, when redeemed, may be worth more or less than their original cost. Current performance may be lower or higher than the total return figures in the above charts. Please visit www.goldmansachsfunds.com to obtain the most recent month-end returns. Performance reflects fee waivers and/or expense limitations in effect. In their absence, performance would be reduced. Returns do not reflect the deduction of taxes that a shareholder would pay on Fund distributions or the redemption of Fund shares.
FUND BASICS
EXPENSE RATIOS4
| | | | | | | | | | | |
| | | Net Expense Ratio (Current) | | | Gross Expense Ratio (Before Waivers) | | | |
|
| |
| Class A | | | 0.95 | % | | | 1.10 | % | | |
| Class B | | | 1.70 | | | | 1.85 | | | |
| Class C | | | 1.70 | | | | 1.85 | | | |
| Institutional | | | 0.55 | | | | 0.70 | | | |
| Service | | | 1.05 | | | | 1.20 | | | |
| Class IR | | | 0.70 | | | | 0.85 | | | |
| Class R | | | 1.20 | | | | 1.35 | | | |
|
| |
| 4 | The expense ratios of the Fund, both current (net of applicable fee waivers and/or expense limitations) and before waivers (gross of applicable fee waivers and/or expense limitations), are as set forth above according to the most recent publicly available Prospectus for the Fund and may differ from the expense ratios disclosed in the Financial Highlights in this report. Applicable waivers and expense limitations may be modified or terminated in the future, consistent with the terms of any arrangements in place. If this occurs, the expense ratios may change without shareholder approval. |
TOP TEN HOLDINGS AS OF 4/30/105
| | | | | | | | | |
| Holding | | % of Net Assets | | | Line of Business | | |
|
| |
| Exxon Mobil Corp. | | | 4.8 | % | | Oil, Gas & Consumable Fuels | | |
| Chevron Corp. | | | 3.7 | | | Oil, Gas & Consumable Fuels | | |
| Bank of America Corp. | | | 3.5 | | | Diversified Financial Services | | |
| AT&T, Inc. | | | 3.2 | | | Diversified Telecommunication Services | | |
| Wells Fargo & Co. | | | 3.2 | | | Commercial Banks | | |
| General Electric Co. | | | 3.1 | | | Industrial Conglomerates | | |
| Pfizer, Inc. | | | 3.0 | | | Pharmaceuticals | | |
| Simon Property Group, Inc. | | | 2.8 | | | Real Estate Investment Trusts | | |
| Time Warner, Inc. | | | 2.8 | | | Media | | |
| ConocoPhillips | | | 2.7 | | | Oil, Gas & Consumable Fuels | | |
|
| |
| 5 | The top 10 holdings may not be representative of the Fund’s future investments. |
FUND BASICS
FUND VS. BENCHMARK SECTOR ALLOCATIONS6
| |
| 6 | The Fund is actively managed and, as such, its composition may differ over time. The above graph categorizes investments using Global Industry Classification Standard (“GICS”), however, the sector classifications used by the portfolio management team may differ from GICS. Underlying industry sector allocations of exchange traded funds (“ETFs”) held by the Fund are not reflected in the graph above. Consequently, the Fund’s overall industry sector allocations may differ from the percentages contained in the graph above. The percentage shown for each investment category reflects the value of investments in that category as a percentage of market value (excluding investments in the securities lending reinvestment vehicle, if any). Investment in the securities lending reinvestment vehicle represented 0.1% of the Fund’s net assets at April 30, 2010. |
PORTFOLIO RESULTS
Structured Small Cap Equity Fund
Portfolio Management Discussion and Analysis
Below, the Goldman Sachs Quantitative Investment Strategies Team discusses the Goldman Sachs Structured Small Cap
Equity Fund’s performance and positioning for the Reporting Period.
| |
| Q | How did the Goldman Sachs Structured Small Cap Equity Fund (the “Fund”) perform during the Reporting Period? |
| |
| A | During the Reporting Period, the Fund’s Class A, B, C, Institutional, Service, IR and R Shares generated cumulative total returns, without sales charges, of 31.55%, 30.99%, 31.00%, 31.79%, 31.48%, 31.63% and 31.34%, respectively. These returns compare to the 28.17% cumulative total return of the Fund’s benchmark, the Russell 2000 Index (with dividends reinvested) (the “Index”), during the same period. |
| |
| Q | What key factors were most responsible for the Fund’s performance during the Reporting Period? |
| |
| A | As expected, and in keeping with our investment approach, our quantitative model and its six investment themes had the greatest impact on relative performance. We use these themes to take a long-term view of market patterns and look for inefficiencies, selecting stocks for the Fund and overweighting or underweighting the ones chosen by the model. Over time and by design, the performance of any one of the model’s investment themes tends to have a low correlation with the model’s other themes, demonstrating the diversification benefit of the Fund’s theme-driven quantitative model. The variance in performance supports our research indicating that the diversification provided by our different investment themes is a significant investment advantage over the long term, even though the Fund may experience underperformance in the short term. |
Overall, the Fund outperformed the Index during the Reporting Period with our Momentum theme contributing the most to relative results. Momentum predicts drift in stock prices caused by under-reaction to company-specific information. Also enhancing relative performance were Valuation and Management. Valuation captures potential mispricings of securities, typically by comparing a measure of the company’s intrinsic value to its market value. Management assesses the characteristics, policies and strategic decisions of company management. Sentiment, which reflects selected investment views and decisions of individuals and financial intermediaries, also added relative value, though to a lesser extent.
Profitability and Quality detracted from relative performance. Our Profitability theme assesses whether a company is earning more than its cost of capital, while Quality evaluates whether the company’s earnings are coming from more persistent, cash-based sources, as opposed to accruals.
| |
| Q | How did the Fund’s sector allocations affect relative performance? |
| |
| A | In constructing the Fund’s portfolio, we focus on picking stocks rather than on making industry or sector bets. Consequently, the Fund is similar to the Index in terms of its sector allocation and style. |
| |
| Q | Did stock selection help or hurt Fund performance during the Reporting Period? |
| |
| A | We seek to outpace the Index by overweighting stocks we expect to outperform and underweighting those we think may lag. We also build positions based on our thematic views. For example, the Fund aims to hold a basket of stocks with better Momentum characteristics than the benchmark. During the Reporting Period, stock selection overall contributed positively to the Fund’s relative performance. |
| |
| Q | Which positions contributed the most to the Fund’s relative returns during the Reporting Period? |
| |
| A | Investments in the information technology, consumer discretionary and financials sectors added the most to relative performance. In particular, the Fund was helped by its overweighted positions in computer component maker Lattice Semiconductor, language and testing services company Lionbridge Technologies and financial holding company International Bancshares. The Fund was overweight Lattice Semiconductor because of our positive views on Quality, Sentiment and Valuation. Its overweighted position in Lionbridge Technologies was assumed because of our positive views on Quality, Momentum and Sentiment. Our positive views on Valuation, Sentiment and Profitability led us to overweight International Bancshares. |
PORTFOLIO RESULTS
| |
| Q | Which individual positions detracted from the Fund’s results during the Reporting Period? |
| |
| A | Our stock picks in the consumer staples, industrials and health care sectors dampened relative results. The Fund was hampered by its overweighted positions in pharmaceutical and biotechnology company PDL BioPharma and business intelligence software maker MicroStrategy. An underweighted position in airline holding company UAL also detracted. We chose to overweight in PDL BioPharma because of our positive views on Profitability and Management. Our positive views on Profitability, Momentum and Management led us to overweight MicroStrategy, while our negative views on Management, Sentiment and Valuation were responsible for the Fund’s underweight in UAL. |
| |
| Q | What was the Fund’s sector positioning relative to the Index at the end of the Reporting Period? |
| |
| A | During the Reporting Period, the Fund was overweight the consumer discretionary, information technology, materials and industrials sectors relative to the Index. It was underweight the financials, utilities, energy, health care and consumer staples sectors versus the Index. The Fund was relatively neutral to the Index in the telecommunication services sector at the end of the Reporting Period. |
Structured Small Cap Equity Fund
as of April 30, 2010
PERFORMANCE REVIEW
| | | | | | | | | | | |
| November 1, 2009–April 30, 2010 | | Fund Total Return (based on NAV)1 | | | Russell 2000 Index2 | | | |
|
| |
| Class A | | | 31.55 | % | | | 28.17 | % | | |
| Class B | | | 30.99 | | | | 28.17 | | | |
| Class C | | | 31.00 | | | | 28.17 | | | |
| Institutional | | | 31.79 | | | | 28.17 | | | |
| Service | | | 31.48 | | | | 28.17 | | | |
| Class IR | | | 31.63 | | | | 28.17 | | | |
| Class R | | | 31.34 | | | | 28.17 | | | |
|
| |
| 1 | The net asset value (NAV) represents the net assets of the class of the Fund (ex-dividend) divided by the total number of shares of the class outstanding. The Fund’s performance reflects the reinvestment of dividends and other distributions. The Fund’s performance does not reflect the deduction of any applicable sales charges. |
| 2 | The Russell 2000 Index is an unmanaged index of common stock prices that measures the performance of the 2000 smallest companies in the Russell 3000 Index. The Index is unmanaged and the figures for the Index do not include any deduction for fees, expenses or taxes. It is not possible to invest directly in an index. |
STANDARDIZED AVERAGE ANNUAL TOTAL RETURNS3
| | | | | | | | | | | | | | | | | | | | | |
| For the period ended 3/31/10 | | One Year | | | Five Years | | | Ten Years | | | Since Inception | | | Inception Date | | |
|
| |
| Class A | | | 58.69 | % | | | -1.90 | % | | | 2.26 | % | | | 3.58 | % | | 8/15/97 | | |
| Class B | | | 61.74 | | | | -1.91 | | | | 2.21 | | | | 3.54 | | | 8/15/97 | | |
| Class C | | | 65.67 | | | | -1.54 | | | | 2.07 | | | | 3.28 | | | 8/15/97 | | |
| Institutional | | | 68.54 | | | | -0.41 | | | | 3.24 | | | | 4.45 | | | 8/15/97 | | |
| Service | | | 67.65 | | | | -0.90 | | | | 2.73 | | | | 3.94 | | | 8/15/97 | | |
| Class IR | | | 68.59 | | | | N/A | | | | N/A | | | | -3.60 | | | 11/30/07 | | |
| Class R | | | 67.50 | | | | N/A | | | | N/A | | | | -4.02 | | | 11/30/07 | | |
|
| |
| 3 | The Standardized Average Annual Total Returns are average annual total returns as of the most recent calendar quarter-end. They assume reinvestment of all distributions at NAV. These returns reflect a maximum initial sales charge of 5.5% for Class A Shares, the assumed contingent deferred sales charge for Class B Shares (5% maximum declining to 0% after six years) and the assumed contingent deferred sales charge for Class C Shares (1% if redeemed within 12 months of purchase). Class B Shares convert automatically to Class A Shares on or about the fifteenth day of the last month of the calendar quarter that is eight years after purchase. Returns for Class B Shares for the period after conversion reflect the performance of Class A Shares. Because Institutional, Service, Class IR and Class R Shares do not involve a sales charge, such a charge is not applied to their Standardized Average Annual Total Returns. Effective November 2, 2009, the Fund’s Class B Shares are no longer available for purchase by new or existing shareholders (although current Class B shareholders may continue to reinvest income and capital gains distributions into Class B Shares, and Class B shareholders may continue to exchange their shares for Class B Shares of certain other Goldman Sachs Funds). |
These returns represent past performance. Past performance does not guarantee future results. The investment return and principal value of an investment will fluctuate and, therefore, an investor’s shares, when redeemed, may be worth more or less than their original cost. Current performance may be lower or higher than the total return figures in the above charts. Please visit www.goldmansachsfunds.com to obtain the most recent month-end returns. Performance reflects fee waivers and/or expense limitations in effect. In their absence, performance would be reduced. Returns do not reflect the deduction of taxes that a shareholder would pay on Fund distributions or the redemption of Fund shares.
FUND BASICS
EXPENSE RATIOS4
| | | | | | | | | |
| | | Net Expense Ratio (Current) | | | Gross Expense Ratio (Before Waivers) | |
| |
| |
| Class A | | | 1.25 | % | | | 1.40 | % |
| Class B | | | 2.00 | | | | 2.15 | |
| Class C | | | 2.00 | | | | 2.15 | |
| Institutional | | | 0.85 | | | | 1.00 | |
| Service | | | 1.35 | | | | 1.50 | |
| Class IR | | | 1.00 | | | | 1.15 | |
| Class R | | | 1.50 | | | | 1.65 | |
|
| |
| 4 | The expense ratios of the Fund, both current (net of applicable fee waivers and/or expense limitations) and before waivers (gross of applicable fee waivers and/or expense limitations), are as set forth above according to the most recent publicly available Prospectus for the Fund and may differ from the expense ratios disclosed in the Financial Highlights in this report. Applicable waivers and expense limitations may be modified or terminated in the future, consistent with the terms of any arrangements in place. If this occurs, the expense ratios may change without shareholder approval. |
TOP TEN HOLDINGS AS OF 4/30/105
| | | | | | | |
| Holding | | % of Net Assets | | | Line of Business |
|
| |
| Allegiant Travel Co. | | | 1.3 | % | | Airlines |
| Lattice Semiconductor Corp. | | | 1.2 | | | Semiconductors & Semiconductor |
| | | | | | | Equipment |
| Nationwide Health Properties, Inc. | | | 1.2 | | | Real Estate Investment Trusts |
| Rayonier, Inc. | | | 1.2 | | | Real Estate Investment Trusts |
| International Bancshares Corp. | | | 1.0 | | | Commercial Banks |
| Cimarex Energy Co. | | | 1.0 | | | Oil, Gas & Consumable Fuels |
| USA Mobility, Inc. | | | 0.9 | | | Wireless Telecommunication Services |
| PharMerica Corp. | | | 0.8 | | | Health Care Providers & Services |
| Molina Healthcare, Inc. | | | 0.8 | | | Health Care Providers & Services |
| Skechers U.S.A., Inc. | | | 0.8 | | | Textiles, Apparel & Luxury Goods |
|
| |
| 5 | The top 10 holdings may not be representative of the Fund’s future investments. |
FUND BASICS
FUND VS. BENCHMARK SECTOR ALLOCATIONS6
As of April 30, 2010
| |
| 6 | The Fund is actively managed and, as such, its composition may differ over time. The above graph categorizes investments using Global Industry Classification Standard (“GICS”), however, the sector classifications used by the portfolio management team may differ from GICS. Underlying industry sector allocations of exchange traded funds (“ETFs”) held by the Fund are not reflected in the graph above. Consequently, the Fund’s overall industry sector allocations may differ from the percentages contained in the graph above. The percentage shown for each investment category reflects the value of investments in that category as a percentage of market value (excluding investments in the securities lending reinvestment vehicle, if any). Investment in the securities lending reinvestment vehicle represented 6.2% of the Fund’s net assets at April 30, 2010. |
PORTFOLIO RESULTS
Structured Small Cap Growth Fund
Portfolio Management Discussion and Analysis
Below, the Goldman Sachs Quantitative Investment Strategies Team discusses the Goldman Sachs Structured Small Cap Growth Fund’s performance and positioning for the Reporting Period.
| |
| Q | How did the Goldman Sachs Structured Small Cap Growth Fund (the “Fund”) perform during the Reporting Period? |
| |
| A | During the Reporting Period, the Fund’s Class A, B, C, Institutional, IR and R Shares generated cumulative total returns, without sales charges, of 27.27%, 26.80%, 26.83%, 27.47%, 27.35% and 27.09%, respectively. These returns compare to the 25.49% cumulative total return of the Fund’s benchmark, the Russell 2000 Growth Index (with dividends reinvested) (the “Index”), during the same period. |
| |
| Q | What key factors were most responsible for the Fund’s performance during the Reporting Period? |
| |
| A | As expected, and in keeping with our investment approach, our quantitative model and its six investment themes had the greatest impact on relative performance. We use these themes to take a long-term view of market patterns and look for inefficiencies, selecting stocks for the Fund and overweighting or underweighting the ones chosen by the model. Over time and by design, the performance of any one of the model’s investment themes tends to have a low correlation with the model’s other themes, demonstrating the diversification benefit of the Fund’s theme-driven quantitative model. The variance in performance supports our research indicating that the diversification provided by our different investment themes is a significant investment advantage over the long term, even though the Fund may experience underperformance in the short term. |
Overall, the Fund outperformed the Index during the Reporting Period, with our Quality and Sentiment themes enhancing relative results the most. Quality evaluates whether the company’s earnings are coming from more persistent, cash-based sources, as opposed to accruals. Sentiment reflects selected investment views and decisions of individuals and financial intermediaries. The Valuation theme also added relative value, though to a lesser extent. Valuation attempts to capture potential mispricings of securities, typically by comparing a measure of the company’s intrinsic value to its market value.
Our Momentum theme was the largest detractor from relative performance of the Reporting Period. Momentum predicts drift in stock prices caused by under-reaction to company-specific information. Management and Profitability also dampened relative performance. Management assesses the characteristics, policies and strategic decisions of company management, while Profitability assesses whether a company is earning more than its cost of capital.
| |
| Q | How did the Fund’s sector allocations affect relative performance? |
| |
| A | In constructing the Fund’s portfolio, we focus on picking stocks rather than on making industry or sector bets. Consequently, the Fund is similar to the Index in terms of its sector allocation and style. |
| |
| Q | Did stock selection help or hurt Fund performance during the Reporting Period? |
| |
| A | We seek to outpace the Index by overweighting stocks we expect to outperform and underweighting those we think may lag. We also build positions based on our thematic views. For example, the Fund aims to hold a basket of stocks with better Momentum characteristics than the Index. During the Reporting Period, our stock selection had a mixed impact on the Fund’s relative performance. |
| |
| Q | Which investments contributed the most to the Fund’s relative returns during the Reporting Period? |
| |
| A | Stock picks in the information technology, materials and industrials sectors added to relative performance. The Fund benefited from overweights in Lattice Semiconductor, a computer component maker, and Stillwater Mining, a metals mining company. We chose to overweight Lattice Semiconductor because of our positive views on Quality and Sentiment. The Fund’s overweighted position in Stillwater Mining was adopted because of our positive views on Momentum and Sentiment. Also contributing to results was the Fund’s underweight in Palm, a provider of mobile products. The position was assumed because of our negative views on Profitability and Sentiment. |
PORTFOLIO RESULTS
| |
| Q | Which individual positions detracted from the Fund’s results during the Reporting Period? |
| |
| A | Security selection in the health care, energy and consumer staples sectors slowed relative progress. The Fund was hindered by an underweighted position in airline holding company UAL as well as overweighted positions in pharmaceutical and biotechnology company PDL BioPharma and business intelligence software maker MicroStrategy. Our negative views on Management and Sentiment led us to underweight UAL. We chose to overweight PDL BioPharma because of our positive views on Profitability and Management. The Fund was overweight MicroStrategy as a result of our positive views on Momentum and Profitability. |
| |
| Q | What was the Fund’s sector positioning relative to the Index at the end of the Reporting Period? |
| |
| A | During the Reporting Period, the Fund was overweight the information technology, consumer discretionary and materials sectors relative to the Index. The Fund was underweight the health care, financials, telecommunication services, energy and consumer staples sectors. It was relatively neutral in the industrials and utilities sectors compared to the Index at the end of the Reporting Period. |
Structured Small Cap Growth Fund
as of April 30, 2010
PERFORMANCE REVIEW
| | | | | | | | | | | |
| | | Fund Total Return
| | | Russell 2000
| | | |
| November 1, 2009–April 30, 2010 | | (based on NAV)1 | | | Growth Index2 | | | |
|
| |
| Class A | | | 27.27 | % | | | 25.49 | % | | |
| Class B | | | 26.80 | | | | 25.49 | | | |
| Class C | | | 26.83 | | | | 25.49 | | | |
| Institutional | | | 27.47 | | | | 25.49 | | | |
| Class IR | | | 27.35 | | | | 25.49 | | | |
| Class R | | | 27.09 | | | | 25.49 | | | |
|
| |
| 1 | The net asset value (NAV) represents the net assets of the class of the Fund (ex-dividend) divided by the total number of shares of the class outstanding. The Fund’s performance reflects the reinvestment of dividends and other distributions. The Fund’s performance does not reflect the deduction of any applicable sales charges. |
| 2 | The Russell 2000 Growth Index measures the performance of the small-cap growth stocks of the U.S. equity universe. The Index figures do not reflect any deduction for fees, expenses or taxes. It is not possible to invest directly in an unmanaged index. |
STANDARDIZED AVERAGE ANNUAL TOTAL RETURNS3
| | | | | | | | | | | | | |
| For the period ended 3/31/10 | | One Year | | | Since Inception | | | Inception Date | | |
|
| |
| Class A | | | 54.49 | % | | | -8.88 | % | | 6/25/07 | | |
| Class B | | | 57.41 | | | | -8.69 | | | 6/25/07 | | |
| Class C | | | 61.47 | | | | -7.68 | | | 6/25/07 | | |
| Institutional | | | 64.31 | | | | -6.61 | | | 6/25/07 | | |
| Class IR | | | 64.00 | | | | -4.20 | | | 11/30/07 | | |
| Class R | | | 63.13 | | | | -4.69 | | | 11/30/07 | | |
|
| |
| 3 | The Standardized Average Annual Total Returns are average annual total returns as of the most recent calendar quarter-end. They assume reinvestment of all distributions at NAV. These returns reflect a maximum initial sales charge of 5.5% for Class A Shares, the assumed contingent deferred sales charge for Class B Shares (5% maximum declining to 0% after six years) and the assumed contingent deferred sales charge for Class C Shares (1% if redeemed within 12 months of purchase). Class B Shares convert automatically to Class A Shares on or about the fifteenth day of the last month of the calendar quarter that is eight years after purchase. Returns for Class B Shares for the period after conversion reflect the performance of Class A Shares. Because Institutional, Service, Class IR and R shares do not involve a sales charge, such a charge is not applied to their Standardized Average Annual Total Returns. Effective November 2, 2009, the Fund’s Class B Shares are no longer available for purchase by new or existing shareholders (although current Class B shareholders may continue to reinvest income and capital gains distributions into Class B Shares, and Class B shareholders may continue to exchange their shares for Class B Shares of certain other Goldman Sachs Funds). |
These returns represent past performance. Past performance does not guarantee future results. The Fund’s investment return and principal value will fluctuate so that an investor’s shares, when redeemed, may be worth more or less than their original cost. Current performance may be lower or higher than the performance quoted above. Please visit our Web site at: www.goldmansachsfunds.com to obtain the most recent month-end returns. Performance reflects fee waivers and/or expense limitations in effect. In their absence, performance would be reduced. Returns do not reflect the deduction of taxes that a shareholder would pay on Fund distributions or the redemption of Fund shares.
FUND BASICS
EXPENSE RATIOS4
| | | | | | | | | | | |
| | | Net Expense Ratio (Current) | | | Gross Expense Ratio (Before Waivers) | | | |
|
| |
| Class A | | | 1.25 | % | | | 2.44 | % | | |
| Class B | | | 2.00 | | | | 3.19 | | | |
| Class C | | | 2.00 | | | | 3.19 | | | |
| Institutional | | | 0.85 | | | | 2.04 | | | |
| Class IR | | | 1.00 | | | | 2.19 | | | |
| Class R | | | 1.50 | | | | 2.69 | | | |
|
| |
| 4 | The expense ratios of the Fund, both current (net of applicable fee waivers and/or expense limitations) and before waivers (gross of applicable fee waivers and/or expense limitations), are as set forth above according to the most recent publicly available Prospectus for the Fund and may differ from the expense ratios disclosed in the Financial Highlights in this report. Applicable waivers and expense limitations may be modified or terminated in the future, consistent with the terms of any agreements in place. If this occurs, the expense ratios may change without shareholder approval. |
TOP 10 HOLDINGS AS OF 4/30/105
| | | | | | | | | |
| Holding | | % of Net Assets | | | Line of Business | | |
|
| |
| Allegiant Travel Co. | | | 1.9 | % | | Airlines | | |
| HNI Corp. | | | 1.3 | | | Commercial Services & Supplies | | |
| Lancaster Colony Corp. | | | 1.2 | | | Food Products | | |
| RF Micro Devices, Inc. | | | 1.1 | | | Semiconductors & Semiconductor
Equipment | | |
| Cubist Pharmaceuticals, Inc. | | | 1.1 | | | Biotechnology | | |
| Lattice Semiconductor Corp. | | | 1.1 | | | Semiconductors & Semiconductor
Equipment | | |
| PharMerica Corp. | | | 1.0 | | | Health Care Providers & Services | | |
| World Fuel Services Corp. | | | 1.0 | | | Oil, Gas & Consumable Fuels | | |
| Tempur-Pedic International, Inc. | | | 1.0 | | | Household Durables | | |
| PDL BioPharma, Inc. | | | 0.9 | | | Biotechnology | | |
|
| |
| 5 | The top 10 holdings may not be representative of the Fund’s future investments. |
FUND BASICS
FUND VS. BENCHMARK SECTOR ALLOCATIONS6
As of April 30, 2010
| |
| 6 | The Fund is actively managed and, as such, its composition may differ over time. The above graph categorizes investments using Global Industry Classification Standard (“GICS”), however, the sector classifications used by the portfolio management team may differ from GICS. Underlying industry sector allocations of exchange traded funds (“ETFs”) held by the Fund are not reflected in the graph above. Consequently, the Fund’s overall industry sector allocations may differ from the percentages contained in the graph above. The percentage shown for each investment category reflects the value of investments in that category as a percentage of market value (excluding investments in the securities lending reinvestment vehicle, if any). Investment in the securities lending reinvestment vehicle represented 8.1% of the Fund’s net assets at April 30, 2010. |
PORTFOLIO RESULTS
Structured Small Cap Value Fund
Portfolio Management Discussion and Analysis
Below, the Goldman Sachs Quantitative Investment Strategies Team discusses the Goldman Sachs Structured Small Cap Value Fund’s performance and positioning for the Reporting Period.
| |
| Q | How did the Goldman Sachs Structured Small Cap Value Fund (the “Fund”) perform during the Reporting Period? |
| |
| A | During the Reporting Period, the Fund’s Class A, B, C, Institutional, IR and R Shares generated cumulative total returns, without sales charges, of 33.98%, 33.42%, 33.53%, 34.21%, 34.13% and 33.75%, respectively. These returns compare to the 30.66% cumulative total return of the Fund’s benchmark, the Russell 2000 Value Index (with dividends reinvested) (the “Index”), during the same period. |
| |
| Q | What key factors were most responsible for the Fund’s performance during the Reporting Period? |
| |
| A | As expected, and in keeping with our investment approach, our quantitative model and its six investment themes had the greatest impact on relative performance. We use these themes to take a long-term view of market patterns and look for inefficiencies, selecting stocks for the Fund and overweighting or underweighting the ones chosen by the model. Over time and by design, the performance of any one of the model’s investment themes tends to have a low correlation with the model’s other themes, demonstrating the diversification benefit of the Fund’s theme-driven quantitative model. The variance in performance supports our research indicating that the diversification provided by our different investment themes is a significant investment advantage over the long term, even though the Fund may experience underperformance in the short term. |
Overall, the Fund outperformed the Index during the Reporting Period, with Valuation contributing the most to relative results. Valuation attempts to capture potential mispricings of securities, typically by comparing a measure of the company’s intrinsic value to its market value. Our Quality theme also added relative value. Quality evaluates whether the company’s earnings are coming from more persistent, cash-based sources, as opposed to accruals.
Sentiment was the largest detractor from relative performance. Sentiment reflects selected investment views and decisions of individuals and financial intermediaries. Also hampering results were Profitability, Momentum and Management. The Profitability theme assesses whether a company is earning more than its cost of capital. Momentum predicts drift in stock prices caused by under-reaction to company-specific information. Management assesses the characteristics, policies and strategic decisions of company management.
| |
| Q | How did the Fund’s sector allocations affect relative performance? |
| |
| A | In constructing the Fund’s portfolio, we focus on picking stocks rather than on making industry or sector bets. Consequently, the Fund is similar to the Index in terms of its sector allocation and style. |
| |
| Q | Did stock selection help or hurt Fund performance during the Reporting Period? |
| |
| A | We seek to outpace the Index by overweighting stocks we expect to outperform and underweighting those we think may lag. We also build positions based on our thematic views. For example, the Fund aims to hold a basket of stocks with better Momentum characteristics than the Index. During the Reporting Period, our stock selection had a mixed impact on the Fund’s relative performance. |
| |
| Q | Which stock positions contributed the most to the Fund’s relative returns during the Reporting Period? |
| |
| A | Stock picks in the financials, information technology and materials sectors boosted the Fund’s relative performance during the Reporting Period. In particular, the Fund was overweight financial holding company International Bancshares, computer component maker Lattice Semiconductor and live music concert producer Live Nation Entertainment. Our positive views on Valuation and Sentiment led us to overweight International Bancshares, while the Fund was overweight Lattice Semiconductor because of our positive views on Quality and Sentiment. We chose to overweight Live Nation Entertainment as a result of our positive views on Quality and Profitability. |
PORTFOLIO RESULTS
| |
| Q | Which individual positions detracted from the Fund’s results during the Reporting Period? |
| |
| A | Security selection in the industrials, health care and consumer staples sectors detracted from the Fund’s relative performance during the Reporting Period. The Fund’s overweighted positions in oil and gas exploration company W&T Offshore, silver producer Coeur d’Alene Mines and airline company Republic Airways Holdings detracted. We chose to overweight W&T Offshore because of our positive views on Quality and Sentiment. Our positive views on Sentiment and Valuation led us to overweight Coeur d’Alene Mines. The Fund’s overweight Republic Airways Holdings was the result of our positive views on Valuation and Momentum. |
| |
| Q | What was the Fund’s sector positioning relative to the Index at the end of the Reporting Period? |
| |
| A | During the Reporting Period, the Fund was overweight the consumer discretionary, information technology, materials and industrials sectors relative to the Index. The Fund was underweight the utilities, energy, consumer staples, financials and telecommunication services sectors relative to the Index. It was relatively neutral compared to the Index in the health care sector at the end of the Reporting Period. |
Structured Small Cap Value Fund
as of April 30, 2010
PERFORMANCE REVIEW
| | | | | | | | | | | |
November 1, 2009–
| | Fund Total Return
| | | Russell 2000
| | | |
| April 30, 2010 | | (based on NAV)1 | | | Value Index2 | | | |
|
| |
| Class A | | | 33.98 | % | | | 30.66 | % | | |
| Class B | | | 33.42 | | | | 30.66 | | | |
| Class C | | | 33.53 | | | | 30.66 | | | |
| Institutional | | | 34.21 | | | | 30.66 | | | |
| Class IR | | | 34.13 | | | | 30.66 | | | |
| Class R | | | 33.75 | | | | 30.66 | | | |
|
| |
| 1 | The net asset value (NAV) represents the net assets of the class of the Fund (ex-dividend) divided by the total number of shares of the class outstanding. The Fund’s performance reflects the reinvestment of dividends and other distributions. The Fund’s performance does not reflect the deduction of any applicable sales charges. |
| 2 | The Russell 2000 Value Index is an unmanaged index of common stock prices that measures the performance of those Russell 2000 companies with lower price-to-book ratios and lower forecasted growth values. The Index figures do not reflect any deduction for fees, expenses or taxes. It is not possible to invest directly in an index. |
STANDARDIZED AVERAGE ANNUAL TOTAL RETURNS3
| | | | | | | | | | | | | |
| For the period ended 3/31/10 | | One Year | | | Since Inception | | | Inception Date | | |
|
| |
| Class A | | | 62.42 | % | | | -10.01 | % | | 6/25/07 | | |
| Class B | | | 65.67 | | | | -9.51 | | | 6/25/07 | | |
| Class C | | | 69.47 | | | | -8.87 | | | 6/25/07 | | |
| Institutional | | | 72.47 | | | | -7.74 | | | 6/25/07 | | |
| Class IR | | | 72.15 | | | | -2.87 | | | 11/30/07 | | |
| Class R | | | 71.26 | | | | -3.22 | | | 11/30/07 | | |
|
| |
| 3 | The Standardized Average Annual Total Returns are average annual total returns as of the most recent calendar quarter-end. They assume reinvestment of all distributions at NAV. These returns reflect a maximum initial sales charge of 5.5% for Class A Shares, the assumed contingent deferred sales charge for Class B Shares (5% maximum declining to 0% after six years) and the assumed contingent deferred sales charge for Class C Shares (1% if redeemed within 12 months of purchase). Class B Shares convert automatically to Class A Shares on or about the fifteenth day of the last month of the calendar quarter that is eight years after purchase. Returns for Class B Shares for the period after conversion reflect the performance of Class A Shares. Because Institutional, Class R and IR shares do not involve a sales charge, such a charge is not applied to their Standardized Average Annual Total Returns. Effective November 2, 2009, the Fund’s Class B Shares are no longer available for purchase by new or existing shareholders (although current Class B shareholders may continue to reinvest income and capital gains distributions into Class B Shares, and Class B shareholders may continue to exchange their shares for Class B Shares of certain other Goldman Sachs Funds). |
The returns represent past performance. Past performance does not guarantee future results. The Fund’s investment return and principal value will fluctuate so that an investor’s shares, when redeemed, may be worth more or less than their original cost. Current performance may be lower or higher than the performance quoted above. Please visit our Web site at: www.goldmansachsfunds.com to obtain the most recent month-end returns. Performance reflects fee waivers and/or expense limitations in effect. In their absence, performance would be reduced. Returns do not reflect the deduction of taxes that a shareholder would pay on Fund distributions or the redemption of Fund shares.
FUND BASICS
EXPENSE RATIOS4
| | | | | | | | | | | |
| | | Net Expense Ratio (Current) | | | Gross Expense Ratio (Before Waivers) | | | |
|
| |
| Class A | | | 1.25 | % | | | 1.69 | % | | |
| Class B | | | 2.00 | | | | 2.24 | | | |
| Class C | | | 2.00 | | | | 2.24 | | | |
| Institutional | | | 0.85 | | | | 1.29 | | | |
| Class IR | | | 1.00 | | | | 1.44 | | | |
| Class R | | | 1.50 | | | | 1.94 | | | |
|
| |
| 4 | The expense ratios of the Fund, both current (net of applicable fee waivers and/or expense limitations) and before waivers (gross of applicable fee waivers and/or expense limitations), are as set forth above according to the most recent publicly available Prospectus for the Fund and may differ from the expense ratios disclosed in the Financial Highlights in this report. Applicable waivers and expense limitations may be modified or terminated in the future, consistent with the terms of any agreements in place. If this occurs, the expense ratios may change without shareholder approval. |
TOP 10 HOLDINGS AS OF 4/30/105
| | | | | | | | | |
| Holding | | % of Net Assets | | Line of Business | | |
|
| |
| International Bancshares Corp. | | | 1.6 | % | | Commercial Banks | | |
| Southwest Gas Corp. | | | 1.4 | | | Gas Utilities | | |
| Allegiant Travel Co. | | | 1.1 | | | Airlines | | |
| Healthcare Realty Trust, Inc. | | | 1.0 | | | Real Estate Investment Trusts | | |
| OMEGA Healthcare Investors, Inc. | | | 1.0 | | | Real Estate Investment Trusts | | |
| Domtar Corp. | | | 1.0 | | | Paper and Forest Products | | |
| Lattice Semiconductor Corp. | | | 0.9 | | | Semiconductors & Semiconductor
Equipment | | |
| Potlatch Corp. | | | 0.9 | | | Real Estate Investment Trusts | | |
| Belden, Inc. | | | 0.9 | | | Electrical Equipment | | |
| Black Hills Corp. | | | 0.9 | | | Multi-Utilities | | |
|
| |
| 5 | The top 10 holdings may not be representative of the Fund’s future investments. |
FUND BASICS
FUND VS. BENCHMARK SECTOR ALLOCATIONS6
As of April 30, 2010
| |
| 6 | The Fund is actively managed and, as such, its composition may differ over time. The above graph categorizes investments using Global Industry Classification Standard (“GICS”), however, the sector classifications used by the portfolio management team may differ from GICS. Underlying industry sector allocations of exchange traded funds (“ETFs”) held by the Fund are not reflected in the graph above. Consequently, the Fund’s overall industry sector allocations may differ from the percentages contained in the graph above. The percentage shown for each investment category reflects the value of investments in that category as a percentage of market value (excluding investments in the securities lending reinvestment vehicle, if any).securities lending reinvestment vehicle represented 6.6% of the Fund’s net assets at April 30, 2010. |
PORTFOLIO RESULTS
Structured U.S. Equity Fund
Portfolio Management Discussion and Analysis
Below, the Goldman Sachs Quantitative Investment Strategies Team discusses the Goldman Sachs Structured U.S. Equity Fund’s performance and positioning for the Reporting Period.
| |
| Q | How did the Goldman Sachs Structured U.S. Equity Fund (the “Fund”) perform during the Reporting Period? |
| |
| A | During the Reporting Period, the Fund’s Class A, B, C, Institutional, Service, IR and R Shares generated cumulative total returns, without sales charges, of 15.80%, 15.34%, 15.34%, 16.00%, 15.69%, 15.93% and 15.59%, respectively. These returns compare to the 15.66% cumulative total return of the Fund’s benchmark, the S&P 500 Index (with dividends reinvested) (the “Index”), during the same period. |
| |
| Q | What key factors were most responsible for the Fund’s performance during the Reporting Period? |
| |
| A | As expected, and in keeping with our investment approach, our quantitative model and its six investment themes had the greatest impact on relative performance. We use these themes to take a long-term view of market patterns and look for inefficiencies, selecting stocks for the Fund and overweighting or underweighting the ones chosen by the model. Over time and by design, the performance of any one of the model’s investment themes tends to have a low correlation with the model’s other themes, demonstrating the diversification benefit of the Fund’s theme-driven quantitative model. The variance in performance supports our research indicating that the diversification provided by our different investment themes is a significant investment advantage over the long term, even though the Fund may experience underperformance in the short term. |
Overall, the Fund provided mixed returns relative to the Index during the Reporting Period. Among investment themes, our Quality theme contributed the most to relative results. Quality evaluates whether the company’s earnings are coming from more persistent, cash-based sources, as opposed to accruals. Other contributors were Valuation, Management and Momentum. The Valuation theme attempts to capture potential mispricings of securities, typically by comparing a measure of the company’s intrinsic value to its market value. Our Management theme assesses the characteristics, policies and strategic decisions of company management, while our Momentum theme predicts drift in stock prices caused by under-reaction to company-specific information.
Profitability and Sentiment were relatively the weakest performing themes during the Reporting Period. Profitability assesses whether a company is earning more than its cost of capital. Sentiment reflects selected investment views and decisions of individuals and financial intermediaries.
| |
| Q | How did the Fund’s sector allocations affect relative performance? |
| |
| A | In constructing the Fund’s portfolio, we focus on picking stocks rather than on making industry or sector bets. Consequently, the Fund is similar to the Index in terms of its sector allocation and style. Changes in the Fund’s sector weights generally do not have a meaningful impact on relative performance. |
| |
| Q | Did stock selection help or hurt Fund performance during the Reporting Period? |
| |
| A | We seek to outpace the Index by overweighting stocks we expect to outperform and underweighting those we think may lag. We also build positions based on our thematic views. For example, the Fund aims to hold a basket of stocks with better Momentum characteristics than the Index. During the Reporting Period, our stock selection contributed positively to the Fund’s relative performance. |
| |
| Q | Which stock positions contributed the most to the Fund’s relative returns during the Reporting Period? |
| |
| A | Stock selection in the financials, information technology and industrials sectors enhanced the Fund’s relative returns. The Fund benefited from overweighted positions in technology component maker Seagate Technology and shipping company United Parcel Service. We chose to overweight these two stocks because of our positive views on Quality and Sentiment. |
PORTFOLIO RESULTS
| |
| Q | Which individual positions detracted from the Fund’s results during the Reporting Period? |
| |
| A | Investments in the health care, consumer discretionary and utilities sectors dampened the Fund’s performance versus the Index. Specifically, the Fund was hurt by its underweighted position in technology and software company Apple and its overweighted positions in oil and gas company Devon Energy and tobacco company Lorillard. We chose to underweight Apple because of our negative views on Quality and Valuation. The overweight in Devon Energy was assumed as a result of our positive views on Sentiment and Quality. Our positive views on Profitability and Momentum led to the Fund’s overweight in Lorillard. |
| |
| Q | What was the Fund’s sector positioning relative to the Index at the end of the Reporting Period? |
| |
| A | During the Reporting Period, the Fund was overweight the information technology, consumer discretionary and health care sectors relative to the Index. The Fund was underweight the consumer staples and utilities sectors versus the Index. It was relatively neutral to the Index in the industrials, materials, telecommunication services and energy sectors at the end of the Reporting Period. |
Structured U.S. Equity Fund
as of April 30, 2010
PERFORMANCE REVIEW
| | | | | | | | | | | |
November 1, 2009–
| | Fund Total Return
| | | | | | |
| April 30, 2010 | | (based on NAV)1 | | | S&P 500 Index2 | | | |
|
| |
| Class A | | | 15.80 | % | | | 15.66 | % | | |
| Class B | | | 15.34 | | | | 15.66 | | | |
| Class C | | | 15.34 | | | | 15.66 | | | |
| Institutional | | | 16.00 | | | | 15.66 | | | |
| Service | | | 15.69 | | | | 15.66 | | | |
| Class IR | | | 15.93 | | | | 15.66 | | | |
| Class R | | | 15.59 | | | | 15.66 | | | |
|
| |
| 1 | The net asset value (NAV) represents the net assets of the class of the Fund (ex-dividend) divided by the total number of shares of the class outstanding. The Fund’s performance reflects the reinvestment of dividends and other distributions. The Fund’s performance does not reflect the deduction of any applicable sales charges. |
| 2 | The S&P 500 Index is the Standard & Poor’s 500 Composite Index of 500 stocks, an unmanaged index of common stock prices. The Index is unmanaged and the figures for the Index do not include any deduction for fees, expenses or taxes. It is not possible to invest directly in an unmanaged index. |
STANDARDIZED AVERAGE ANNUAL TOTAL RETURNS3
| | | | | | | | | | | | | | | | | | | | | |
| For the period ended 3/31/10 | | One Year | | | Five Years | | | Ten Years | | | Since Inception | | | Inception Date | | |
|
| |
| Class A | | | 36.17 | % | | | -1.32 | % | | | -2.04 | % | | | 6.65 | % | | 5/24/91 | | |
| Class B | | | 38.03 | | | | -1.35 | | | | -2.08 | | | | 4.48 | | | 5/1/96 | | |
| Class C | | | 42.04 | | | | -0.94 | | | | -2.21 | | | | 1.82 | | | 8/15/97 | | |
| Institutional | | | 44.73 | | | | 0.19 | | | | -1.09 | | | | 6.65 | | | 6/15/95 | | |
| Service | | | 43.99 | | | | -0.30 | | | | -1.58 | | | | 4.67 | | | 6/7/96 | | |
| Class IR | | | 44.39 | | | | N/A | | | | N/A | | | | -9.61 | | | 11/30/07 | | |
| Class R | | | 43.79 | | | | N/A | | | | N/A | | | | -10.02 | | | 11/30/07 | | |
|
| |
| 3 | The Standardized Average Annual Total Returns are average annual total returns as of the most recent calendar quarter-end. They assume reinvestment of all distributions at NAV. These returns reflect a maximum initial sales charge of 5.5% for Class A Shares, the assumed contingent deferred sales charge for Class B Shares (5% maximum declining to 0% after six years) and the assumed contingent deferred sales charge for Class C Shares (1% if redeemed within 12 months of purchase). Class B Shares convert automatically to Class A Shares on or about the fifteenth day of the last month of the calendar quarter that is eight years after purchase. Returns for Class B Shares for the period after conversion reflect the performance of Class A Shares. Because Institutional, Service, Class IR and Class R shares do not involve a sales charge, such a charge is not applied to their Standardized Average Annual Total Returns. Effective November 2, 2009, the Fund’s Class B Shares are no longer available for purchase by new or existing shareholders (although current Class B shareholders may continue to reinvest income and capital gains distributions into Class B Shares, and Class B shareholders may continue to exchange their shares for Class B Shares of certain other Goldman Sachs Funds). |
These returns represent past performance. Past performance does not guarantee future results. The investment return and principal value of an investment will fluctuate and, therefore, an investor’s shares, when redeemed, may be worth more or less than their original cost. Current performance may be lower or higher than the total return figures in the above charts. Please visit www.goldmansachsfunds.com to obtain the most recent month-end returns. Performance reflects fee waivers and/or expense limitations in effect. In their absence, performance would be reduced. Returns do not reflect the deduction of taxes that a shareholder would pay on Fund distributions or the redemption of Fund shares.
FUND BASICS
EXPENSE RATIOS4
| | | | | | | | | | | |
| | | Net Expense Ratio (Current) | | | Gross Expense Ratio (Before Waivers) | | | |
|
| |
| Class A | | | 0.95 | % | | | 1.19 | % | | |
| Class B | | | 1.70 | | | | 1.94 | | | |
| Class C | | | 1.70 | | | | 1.94 | | | |
| Institutional | | | 0.55 | | | | 0.79 | | | |
| Service | | | 1.05 | | | | 1.29 | | | |
| Class IR | | | 0.70 | | | | 0.94 | | | |
| Class R | | | 1.20 | | | | 1.44 | | | |
|
| |
| 4 | The expense ratios of the Fund, both current (net of applicable fee waivers and/or expense limitations) and before waivers (gross of applicable fee waivers and/or expense limitations), are as set forth above according to the most recent publicly available Prospectus for the Fund and may differ from the expense ratios disclosed in the Financial Highlights in this report. Applicable waivers and expense limitations may be modified or terminated in the future, consistent with the terms of any agreements in place. If this occurs, the expense ratios may change without shareholder approval. |
TOP TEN HOLDINGS AS OF 4/30/105
| | | | | | | | | |
| Holding | | % of Net Assets | | | Line of Business | | |
|
| |
| Microsoft Corp. | | | 4.0 | % | | Software | | |
| Exxon Mobil Corp. | | | 3.4 | | | Oil, Gas & Consumable Fuels | | |
| Eli Lilly & Co. | | | 2.7 | | | Pharmaceuticals | | |
| Intel Corp. | | | 2.2 | | | Semiconductors & Semiconductor
Equipment | | |
| Pfizer, Inc. | | | 2.2 | | | Pharmaceuticals | | |
| JPMorgan Chase & Co. | | | 2.1 | | | Diversified Financial Services | | |
| Time Warner, Inc. | | | 2.0 | | | Media | | |
| The Procter & Gamble Co. | | | 1.9 | | | Household Products | | |
| United Parcel Service, Inc. Class B | | | 1.9 | | | Air Freight & Logistics | | |
| ConocoPhillips | | | 1.8 | | | Oil, Gas & Consumable Fuels | | |
|
| |
| 5 | The top 10 holdings may not be representative of the Fund’s future investments. |
FUND BASICS
FUND VS. BENCHMARK SECTOR ALLOCATIONS6
As of April 30, 2010
| |
| 6 | The Fund is actively managed and, as such, its composition may differ over time. The above graph categorizes investments using Global Industry Classification Standard (“GICS”), however, the sector classifications used by the portfolio management team may differ from GICS. Underlying industry sector allocations of exchange traded funds (“ETFs”) held by the Fund are not reflected in the graph above. Consequently, the Fund’s overall industry sector allocations may differ from the percentages contained in the graph above. The percentage shown for each investment category reflects the value of investments in that category as a percentage of market value (excluding investments in the securities lending reinvestment vehicle, if any). |
GOLDMAN SACHS BALANCED FUND
Schedule of Investments
April 30, 2010 (Unaudited)
| | | | | | | | | | | |
| | | Shares | | Description | | Value |
| |
Common Stocks – 58.6% |
| | | | | | | | | | | |
| | | | | | | | | | | |
| | | Aerospace & Defense – 1.8% |
| | | | 900 | | | General Dynamics Corp. | | $ | 68,724 | |
| | | | 13,500 | | | Honeywell International, Inc. | | | 640,845 | |
| | | | 11,100 | | | The Boeing Co. | | | 803,973 | |
| | | | 12,662 | | | United Technologies Corp. | | | 949,017 | |
| | | | | | | | | | | |
| | | | | | | | | | 2,462,559 | |
| | | |
| | | |
| | | Air Freight & Logistics – 0.2% |
| | | | 4,400 | | | United Parcel Service, Inc. Class B | | | 304,216 | |
| | | |
| | | |
| | | Auto Components – 0.2% |
| | | | 7,100 | | | Johnson Controls, Inc. | | | 238,489 | |
| | | |
| | | |
| | | Automobiles – 0.1% |
| | | | 3,100 | | | Harley-Davidson, Inc. | | | 104,873 | |
| | | |
| | | |
| | | Beverages – 0.6% |
| | | | 2,900 | | | Coca-Cola Enterprises, Inc. | | | 80,417 | |
| | | | 2,200 | | | Dr. Pepper Snapple Group, Inc. | | | 72,006 | |
| | | | 10,800 | | | PepsiCo, Inc. | | | 704,376 | |
| | | | | | | | | | | |
| | | | | | | | | | 856,799 | |
| | | |
| | | |
| | | Biotechnology* – 0.2% |
| | | | 700 | | | Amgen, Inc. | | | 40,152 | |
| | | | 700 | | | Dendreon Corp. | | | 37,954 | |
| | | | 4,800 | | | Gilead Sciences, Inc. | | | 190,416 | |
| | | | | | | | | | | |
| | | | | | | | | | 268,522 | |
| | | |
| | | |
| | | Capital Markets – 1.1% |
| | | | 3,600 | | | Ameriprise Financial, Inc. | | | 166,896 | |
| | | | 4,200 | | | Bank of New York Mellon Corp. | | | 130,746 | |
| | | | 400 | | | BlackRock, Inc. | | | 73,600 | |
| | | | 19,900 | | | Morgan Stanley & Co. | | | 601,378 | |
| | | | 6,500 | | | T. Rowe Price Group, Inc. | | | 373,815 | |
| | | | 8,500 | | | The Charles Schwab Corp. | | | 163,965 | |
| | | | | | | | | | | |
| | | | | | | | | | 1,510,400 | |
| | | |
| | | |
| | | Chemicals – 1.1% |
| | | | 32,100 | | | E.I. du Pont de Nemours and Co. | | | 1,278,864 | |
| | | | 3,800 | | | Monsanto Co. | | | 239,628 | |
| | | | | | | | | | | |
| | | | | | | | | | 1,518,492 | |
| | | |
| | | |
| | | Commercial Banks – 2.1% |
| | | | 3,200 | | | BancorpSouth, Inc. | | | 70,848 | |
| | | | 1,100 | | | Bank of Hawaii Corp. | | | 58,168 | |
| | | | 9,000 | | | Fifth Third Bancorp | | | 134,190 | |
| | | | 2,300 | | | M&T Bank Corp. | | | 200,905 | |
| | | | 3,000 | | | PNC Financial Services Group, Inc. | | | 201,630 | |
| | | | 11,600 | | | Regions Financial Corp. | | | 102,544 | |
| | | | 7,600 | | | SunTrust Banks, Inc. | | | 224,960 | |
| | | | 18,200 | | | Valley National Bancorp | | | 295,568 | |
| | | | 47,200 | | | Wells Fargo & Co. | | | 1,562,792 | |
| | | | | | | | | | | |
| | | | | | | | | | 2,851,605 | |
| | | |
| | | |
| | | Commercial Services & Supplies – 0.9% |
| | | | 12,400 | | | Pitney Bowes, Inc. | | | 314,960 | |
| | | | 41,720 | | | R.R. Donnelley & Sons Co. | | | 896,563 | |
| | | | | | | | | | | |
| | | | | | | | | | 1,211,523 | |
| | | |
| | | |
| | | Communications Equipment – 0.7% |
| | | | 7,300 | | | Cisco Systems, Inc.* | | | 196,516 | |
| | | | 19,500 | | | QUALCOMM, Inc. | | | 755,430 | |
| | | | | | | | | | | |
| | | | | | | | | | 951,946 | |
| | | |
| | | |
| | | Computers & Peripherals – 1.9% |
| | | | 4,700 | | | Apple, Inc.* | | | 1,227,264 | |
| | | | 25,900 | | | Hewlett-Packard Co. | | | 1,346,023 | |
| | | | | | | | | | | |
| | | | | | | | | | 2,573,287 | |
| | | |
| | | |
| | | Consumer Finance – 0.6% |
| | | | 12,500 | | | American Express Co. | | | 576,500 | |
| | | | 5,000 | | | Capital One Financial Corp. | | | 217,050 | |
| | | | | | | | | | | |
| | | | | | | | | | 793,550 | |
| | | |
| | | |
| | | Distributors – 0.1% |
| | | | 3,100 | | | Genuine Parts Co. | | | 132,680 | |
| | | |
| | | |
| | | Diversified Consumer Services – 0.0% |
| | | | 3,000 | | | H&R Block, Inc. | | | 54,930 | |
| | | |
| | | |
| | | Diversified Financial Services – 2.8% |
| | | | 23,500 | | | Bank of America Corp. | | | 419,005 | |
| | | | 184,013 | | | Citigroup, Inc.* | | | 804,137 | |
| | | | 54,000 | | | JPMorgan Chase & Co. | | | 2,299,320 | |
| | | | 6,900 | | | NYSE Euronext | | | 225,147 | |
| | | | | | | | | | | |
| | | | | | | | | | 3,747,609 | |
| | | |
| | | |
| | | Diversified Telecommunication Services – 2.3% |
| | | | 43,350 | | | AT&T, Inc.(a) | | | 1,129,701 | |
| | | | 178,000 | | | Frontier Communications Corp.(b) | | | 1,416,880 | |
| | | | 17,400 | | | Verizon Communications, Inc. | | | 502,686 | |
| | | | | | | | | | | |
| | | | | | | | | | 3,049,267 | |
| | | |
| | | |
| | | Electric Utilities – 1.4% |
| | | | 61,300 | | | Duke Energy Corp. | | | 1,028,614 | |
| | | | 6,900 | | | FirstEnergy Corp. | | | 261,303 | |
| | | | 1,200 | | | Progress Energy, Inc. | | | 47,904 | |
| | | | 17,800 | | | Southern Co. | | | 615,168 | |
| | | | | | | | | | | |
| | | | | | | | | | 1,952,989 | |
| | | |
| | | |
| | | Electrical Equipment – 0.5% |
| | | | 1,900 | | | Cooper Industries PLC | | | 93,290 | |
| | | | 10,200 | | | Emerson Electric Co. | | | 532,746 | |
| | | | 400 | | | First Solar, Inc.* | | | 57,420 | |
| | | | | | | | | | | |
| | | | | | | | | | 683,456 | |
| | | |
| | | |
| | | Electronic Equipment, Instruments & Components – 0.1% |
| | | | 5,000 | | | Corning, Inc. | | | 96,250 | |
| | | | 2,200 | | | Molex, Inc. Class A | | | 49,302 | |
| | | | | | | | | | | |
| | | | | | | | | | 145,552 | |
| | | |
| | | |
| | | Energy Equipment & Services – 0.8% |
| | | | 1,500 | | | Baker Hughes, Inc. | | | 74,640 | |
| | | | 7,400 | | | Diamond Offshore Drilling, Inc.(b) | | | 585,340 | |
| | | | 8,300 | | | Halliburton Co. | | | 254,395 | |
| | | | 4,900 | | | Patterson-UTI Energy, Inc. | | | 74,921 | |
| | | | 2,100 | | | Smith International, Inc. | | | 100,296 | |
| | | | | | | | | | | |
| | | | | | | | | | 1,089,592 | |
| | | |
| | | |
The accompanying notes are an integral part of these financial statements.
GOLDMAN SACHS BALANCED FUND
Schedule of Investments (continued)
April 30, 2010 (Unaudited)
| | | | | | | | | | | |
| | | Shares | | Description | | Value |
| |
Common Stocks – (continued) |
| | | | | | | | | | | |
| | | Food & Staples Retailing – 1.3% |
| | | | 6,900 | | | CVS Caremark Corp. | | $ | 254,817 | |
| | | | 3,400 | | | SUPERVALU, Inc. | | | 50,660 | |
| | | | 4,600 | | | Sysco Corp. | | | 145,084 | |
| | | | 25,581 | | | Wal-Mart Stores, Inc. | | | 1,372,421 | |
| | | | | | | | | | | |
| | | | | | | | | | 1,822,982 | |
| | | |
| | | |
| | | Food Products – 1.1% |
| | | | 48,800 | | | Kraft Foods, Inc. | | | 1,444,480 | |
| | | |
| | | |
| | | Health Care Equipment & Supplies – 1.2% |
| | | | 3,700 | | | Becton, Dickinson & Co. | | | 282,569 | |
| | | | 200 | | | Intuitive Surgical, Inc.* | | | 72,112 | |
| | | | 29,000 | | | Medtronic, Inc. | | | 1,267,010 | |
| | | | | | | | | | | |
| | | | | | | | | | 1,621,691 | |
| | | |
| | | |
| | | Health Care Providers & Services – 0.6% |
| | | | 7,500 | | | Cardinal Health, Inc. | | | 260,175 | |
| | | | 2,600 | | | CIGNA Corp. | | | 83,356 | |
| | | | 700 | | | Express Scripts, Inc.* | | | 70,091 | |
| | | | 12,400 | | | UnitedHealth Group, Inc. | | | 375,844 | |
| | | | 1,000 | | | WellPoint, Inc.* | | | 53,800 | |
| | | | | | | | | | | |
| | | | | | | | | | 843,266 | |
| | | |
| | | |
| | | Hotels, Restaurants & Leisure – 0.4% |
| | | | 5,300 | | | Brinker International, Inc. | | | 98,156 | |
| | | | 2,600 | | | Las Vegas Sands Corp.* | | | 64,636 | |
| | | | 1,500 | | | McDonald’s Corp. | | | 105,885 | |
| | | | 4,500 | | | Starwood Hotels & Resorts Worldwide, Inc. | | | 245,295 | |
| | | | 1,200 | | | Wyndham Worldwide Corp. | | | 32,172 | |
| | | | 300 | | | Wynn Resorts Ltd. | | | 26,472 | |
| | | | | | | | | | | |
| | | | | | | | | | 572,616 | |
| | | |
| | | |
| | | Household Durables – 0.6% |
| | | | 11,200 | | | Garmin Ltd.(b) | | | 418,656 | |
| | | | 13,500 | | | Leggett & Platt, Inc. | | | 331,155 | |
| | | | | | | | | | | |
| | | | | | | | | | 749,811 | |
| | | |
| | | |
| | | Household Products – 1.9% |
| | | | 6,400 | | | Colgate-Palmolive Co. | | | 538,240 | |
| | | | 33,400 | | | The Procter & Gamble Co. | | | 2,076,144 | |
| | | | | | | | | | | |
| | | | | | | | | | 2,614,384 | |
| | | |
| | | |
| | | Industrial Conglomerates – 1.2% |
| | | | 89,300 | | | General Electric Co. | | | 1,684,198 | |
| | | |
| | | |
| | | Insurance – 2.4% |
| | | | 4,500 | | | Aflac, Inc. | | | 229,320 | |
| | | | 2,200 | | | American International Group, Inc.*(b) | | | 85,580 | |
| | | | 6,100 | | | Arthur J. Gallagher & Co. | | | 160,247 | |
| | | | 27,100 | | | Cincinnati Financial Corp. | | | 769,640 | |
| | | | 15,200 | | | Fidelity National Financial, Inc. | | | 230,736 | |
| | | | 5,200 | | | Genworth Financial, Inc.* | | | 85,904 | |
| | | | 9,000 | | | Mercury General Corp. | | | 404,910 | |
| | | | 4,100 | | | MetLife, Inc. | | | 186,878 | |
| | | | 20,600 | | | Old Republic International Corp. | | | 309,206 | |
| | | | 4,000 | | | Protective Life Corp. | | | 96,280 | |
| | | | 6,300 | | | Prudential Financial, Inc. | | | 400,428 | |
| | | |
| | | |
| | | | 6,800 | | | The Hartford Financial Services Group, Inc. | | | 194,276 | |
| | | | 1,300 | | | Unitrin, Inc. | | | 38,025 | |
| | | | | | | | | | | |
| | | | | | | | | | 3,191,430 | |
| | | |
| | | |
| | | Internet & Catalog Retail* – 0.3% |
| | | | 3,400 | | | Amazon.com, Inc. | | | 466,004 | |
| | | |
| | | |
| | | Internet Software & Services* – 0.4% |
| | | | 3,100 | | | Akamai Technologies, Inc. | | | 120,396 | |
| | | | 700 | | | Google, Inc. | | | 367,808 | |
| | | | | | | | | | | |
| | | | | | | | | | 488,204 | |
| | | |
| | | |
| | | IT Services – 3.4% |
| | | | 13,100 | | | Automatic Data Processing, Inc. | | | 568,016 | |
| | | | 21,100 | | | International Business Machines Corp. | | | 2,721,900 | |
| | | | 23,700 | | | Paychex, Inc. | | | 725,220 | |
| | | | 6,000 | | | Visa, Inc. | | | 541,380 | |
| | | | | | | | | | | |
| | | | | | | | | | 4,556,516 | |
| | | |
| | | |
| | | Leisure Equipment & Products – 0.5% |
| | | | 27,600 | | | Mattel, Inc. | | | 636,180 | |
| | | |
| | | |
| | | Machinery – 1.2% |
| | | | 22,200 | | | Caterpillar, Inc. | | | 1,511,598 | |
| | | | 1,800 | | | Joy Global, Inc. | | | 102,258 | |
| | | | | | | | | | | |
| | | | | | | | | | 1,613,856 | |
| | | |
| | | |
| | | Media – 1.5% |
| | | | 2,700 | | | CBS Corp. Class B | | | 43,767 | |
| | | | 47,600 | | | Comcast Corp. | | | 939,624 | |
| | | | 26,400 | | | Comcast Corp. Special Class A | | | 497,640 | |
| | | | 5,600 | | | Gannett Co., Inc. | | | 95,312 | |
| | | | 2,500 | | | Meredith Corp. | | | 89,825 | |
| | | | 11,900 | | | Regal Entertainment Group | | | 203,252 | |
| | | | 2,000 | | | The Walt Disney Co. | | | 73,680 | |
| | | | 1,100 | | | Time Warner Cable, Inc. | | | 61,908 | |
| | | | | | | | | | | |
| | | | | | | | | | 2,005,008 | |
| | | |
| | | |
| | | Metals & Mining – 1.3% |
| | | | 1,100 | | | Cliffs Natural Resources, Inc. | | | 68,783 | |
| | | | 8,100 | | | Freeport-McMoRan Copper & Gold, Inc. | | | 611,793 | |
| | | | 3,700 | | | Newmont Mining Corp. | | | 207,496 | |
| | | | 5,200 | | | Nucor Corp. | | | 235,664 | |
| | | | 21,400 | | | Southern Copper Corp. | | | 654,412 | |
| | | | | | | | | | | |
| | | | | | | | | | 1,778,148 | |
| | | |
| | | |
| | | Multi-Utilities – 1.0% |
| | | | 17,900 | | | CenterPoint Energy, Inc. | | | 257,044 | |
| | | | 8,400 | | | Integrys Energy Group, Inc. | | | 416,724 | |
| | | | 45,000 | | | NiSource, Inc. | | | 733,500 | |
| | | | | | | | | | | |
| | | | | | | | | | 1,407,268 | |
| | | |
| | | |
The accompanying notes are an integral part of these financial statements.
GOLDMAN SACHS BALANCED FUND
| | | | | | | | | | | |
| | | Shares | | Description | | Value |
| |
Common Stocks – (continued) |
| | | | | | | | | | | |
| | | Multiline Retail – 0.2% |
| | | | 4,700 | | | J.C. Penney Co., Inc. | | $ | 137,099 | |
| | | | 2,300 | | | Nordstrom, Inc.(b) | | | 95,059 | |
| | | | | | | | | | | |
| | | | | | | | | | 232,158 | |
| | | |
| | | |
| | | Office Electronics – 0.3% |
| | | | 31,600 | | | Xerox Corp. | | | 344,440 | |
| | | |
| | | |
| | | Oil, Gas & Consumable Fuels – 5.3% |
| | | | 1,100 | | | Alpha Natural Resources, Inc.* | | | 51,788 | |
| | | | 4,600 | | | Arch Coal, Inc. | | | 124,200 | |
| | | | 15,300 | | | Chesapeake Energy Corp. | | | 364,140 | |
| | | | 33,314 | | | Chevron Corp. | | | 2,713,092 | |
| | | | 4,800 | | | ConocoPhillips | | | 284,112 | |
| | | | 4,100 | | | CONSOL Energy, Inc. | | | 183,188 | |
| | | | 36,203 | | | Exxon Mobil Corp. | | | 2,456,374 | |
| | | | 12,600 | | | Marathon Oil Corp. | | | 405,090 | |
| | | | 1,000 | | | Massey Energy Co. | | | 36,630 | |
| | | | 800 | | | Occidental Petroleum Corp. | | | 70,928 | |
| | | | 3,100 | | | Peabody Energy Corp. | | | 144,832 | |
| | | | 1,500 | | | Petrohawk Energy Corp.* | | | 32,385 | |
| | | | 3,600 | | | The Williams Cos., Inc. | | | 84,996 | |
| | | | 10,700 | | | Valero Energy Corp. | | | 222,453 | |
| | | | 600 | | | XTO Energy, Inc. | | | 28,512 | |
| | | | | | | | | | | |
| | | | | | | | | | 7,202,720 | |
| | | |
| | | |
| | | Paper & Forest Products – 0.2% |
| | | | 7,700 | | | MeadWestvaco Corp. | | | 209,209 | |
| | | |
| | | |
| | | Pharmaceuticals – 4.3% |
| | | | 4,200 | | | Abbott Laboratories | | | 214,872 | |
| | | | 63,200 | | | Bristol-Myers Squibb Co. | | | 1,598,328 | |
| | | | 61,300 | | | Eli Lilly & Co. | | | 2,143,661 | |
| | | | 40,697 | | | Merck & Co., Inc. | | | 1,426,023 | |
| | | | 24,902 | | | Pfizer, Inc. | | | 416,361 | |
| | | | | | | | | | | |
| | | | | | | | | | 5,799,245 | |
| | | |
| | | |
| | | Real Estate Investment Trusts – 0.7% |
| | | | 9,900 | | | Duke Realty Corp. | | | 133,947 | |
| | | | 8,400 | | | HCP, Inc. | | | 269,808 | |
| | | | 2,300 | | | Host Hotels & Resorts, Inc. | | | 37,398 | |
| | | | 47,400 | | | HRPT Properties Trust | | | 371,616 | |
| | | | 7,200 | | | ProLogis | | | 94,824 | |
| | | | 1,100 | | | Simon Property Group, Inc. | | | 98,005 | |
| | | | | | | | | | | |
| | | | | | | | | | 1,005,598 | |
| | | |
| | | |
| | | Road & Rail – 0.2% |
| | | | 3,800 | | | Norfolk Southern Corp. | | | 225,454 | |
| | | |
| | | |
| | | Semiconductors & Semiconductor Equipment – 2.3% |
| | | | 70,000 | | | Intel Corp. | | | 1,598,100 | |
| | | | 15,500 | | | Maxim Integrated Products, Inc. | | | 301,010 | |
| | | | 33,000 | | | Microchip Technology, Inc.(b) | | | 963,930 | |
| | | | 8,400 | | | Texas Instruments, Inc. | | | 218,484 | |
| | | | | | | | | | | |
| | | | | | | | | | 3,081,524 | |
| | | |
| | | |
| | | Software – 2.3% |
| | | | 96,040 | | | Microsoft Corp. | | | 2,933,062 | |
| | | | 1,800 | | | VMware, Inc.* | | | 110,952 | |
| | | | | | | | | | | |
| | | | | | | | | | 3,044,014 | |
| | | |
| | | |
| | | Specialty Retail – 1.9% |
| | | | 43,400 | | | Limited Brands, Inc. | | | 1,163,120 | |
| | | | 38,600 | | | The Home Depot, Inc. | | | 1,360,650 | |
| | | | | | | | | | | |
| | | | | | | | | | 2,523,770 | |
| | | |
| | | |
| | | Thrifts & Mortgage Finance – 0.1% |
| | | | 9,000 | | | New York Community Bancorp, Inc. | | | 148,230 | |
| | | |
| | | |
| | | Tobacco – 1.0% |
| | | | 39,400 | | | Altria Group, Inc. | | | 834,886 | |
| | | | 1,200 | | | Philip Morris International, Inc. | | | 58,896 | |
| | | | 7,400 | | | Reynolds American, Inc. | | | 395,308 | |
| | | | | | | | | | | |
| | | | | | | | | | 1,289,090 | |
| | | |
| | | |
| | | TOTAL COMMON STOCKS |
| | | (Cost $67,575,980) | | $ | 79,103,830 | |
| | | |
| | | |
| | | | | | | | | | | | | | | | | |
| | | Principal
| | Interest
| | Maturity
| | |
| | | Amount | | Rate | | Date | | Value |
| |
Corporate Obligations – 8.3% |
| | | | | | | | | | | | | | | | | |
| | | | | | | | | | | | | | | | | |
| | | Banks – 1.5% |
| | | Astoria Financial Corp.(c) |
| | | $ | 150,000 | | | | 5.750 | % | | | 10/15/12 | | | $ | 152,673 | |
| | | BBVA Bancomer SA(d) |
| | | | 125,000 | | | | 7.250 | | | | 04/22/20 | | | | 126,843 | |
| | | Cie de Financement Foncier(d) |
| | | | 250,000 | | | | 2.125 | | | | 04/22/13 | | | | 251,692 | |
| | | Citigroup, Inc. |
| | | | 100,000 | | | | 5.300 | | | | 10/17/12 | | | | 105,357 | |
| | | | 150,000 | | | | 5.000 | | | | 09/15/14 | | | | 152,118 | |
| | | First Niagara Financial Group, Inc.(c) |
| | | | 50,000 | | | | 6.750 | | | | 03/19/20 | | | | 51,479 | |
| | | HSBC Bank USA NA |
| | | | 100,000 | | | | 6.000 | | | | 08/09/17 | | | | 108,796 | |
| | | JPMorgan Chase & Co. |
| | | | 50,000 | | | | 6.000 | | | | 01/15/18 | | | | 54,279 | |
| | | | 75,000 | | | | 6.300 | | | | 04/23/19 | | | | 82,875 | |
| | | JPMorgan Chase Capital XXV |
| | | | 75,000 | | | | 6.800 | | | | 10/01/37 | | | | 74,735 | |
| | | Lloyds TSB Bank PLC(d) |
| | | | 100,000 | | | | 4.375 | | | | 01/12/15 | | | | 99,301 | |
| | | Resona Bank Ltd.(c)(d)(e) |
| | | | 75,000 | | | | 5.850 | | | | 04/15/49 | | | | 74,550 | |
| | | EUR | 175,000 | | | | 4.125 | | | | 09/27/49 | | | | 223,683 | |
| | | Royal Bank of Scotland Group PLC(d) |
| | | $ | 100,000 | | | | 4.875 | | | | 08/25/14 | | | | 102,307 | |
| | | US Bank NA(c)(e) |
| | | EUR | 50,000 | | | | 4.375 | | | | 02/28/17 | | | | 66,957 | |
| | | Wachovia Bank NA |
| | | $ | 150,000 | | | | 6.600 | | | | 01/15/38 | | | | 160,411 | |
| | | Wachovia Corp. |
| | | | 50,000 | | | | 5.500 | | | | 05/01/13 | | | | 54,172 | |
| | | |
| | | |
The accompanying notes are an integral part of these financial statements.
GOLDMAN SACHS BALANCED FUND
Schedule of Investments (continued)
April 30, 2010 (Unaudited)
| | | | | | | | | | | | | | | | | |
| | | Principal
| | Interest
| | Maturity
| | |
| | | Amount | | Rate | | Date | | Value |
| |
Corporate Obligations – (continued) |
| | | Banks – (continued) |
| | | | | | | | | | | | | | | | | |
| | | Wells Fargo Capital XIII(c)(e) |
| | | $ | 125,000 | | | | 7.700 | % | | | 03/26/49 | | | $ | 129,375 | |
| | | | | | | | | | | | | | | | | |
| | | | | | | | | | | | | | | | 2,071,603 | |
| | | |
| | | |
| | | Brokerage – 0.8% |
| | | Ameriprise Financial, Inc.(c) |
| | | | 75,000 | | | | 5.300 | | | | 03/15/20 | | | | 78,134 | |
| | | JPMorgan Chase & Co. |
| | | | 275,000 | | | | 7.250 | | | | 02/01/18 | | | | 319,816 | |
| | | Merrill Lynch & Co., Inc. |
| | | | 100,000 | | | | 6.400 | | | | 08/28/17 | | | | 104,358 | |
| | | | 175,000 | | | | 6.875 | | | | 04/25/18 | | | | 187,302 | |
| | | Morgan Stanley & Co.(c) |
| | | | 300,000 | | | | 6.625 | | | | 04/01/18 | | | | 317,197 | |
| | | | 100,000 | | | | 7.300 | | | | 05/13/19 | | | | 109,592 | |
| | | | | | | | | | | | | | | | | |
| | | | | | | | | | | | | | | | 1,116,399 | |
| | | |
| | | |
| | | Chemicals(c) – 0.2% |
| | | The Dow Chemical Co. |
| | | | 125,000 | | | | 7.600 | | | | 05/15/14 | | | | 144,667 | |
| | | | 50,000 | | | | 5.900 | | | | 02/15/15 | | | | 54,870 | |
| | | | | | | | | | | | | | | | | |
| | | | | | | | | | | | | | | | 199,537 | |
| | | |
| | | |
| | | Consumer Products(c) – 0.0% |
| | | Whirlpool Corp. |
| | | | 25,000 | | | | 8.000 | | | | 05/01/12 | | | | 27,562 | |
| | | | 25,000 | | | | 8.600 | | | | 05/01/14 | | | | 29,364 | |
| | | | | | | | | | | | | | | | | |
| | | | | | | | | | | | | | | | 56,926 | |
| | | |
| | | |
| | | Diversified Manufacturing – 0.0% |
| | | General Electric Co. |
| | | | 50,000 | | | | 5.250 | | | | 12/06/17 | | | | 53,170 | |
| | | |
| | | |
| | | Electric(c) – 0.5% |
| | | Arizona Public Service Co. |
| | | | 100,000 | | | | 5.800 | | | | 06/30/14 | | | | 108,660 | |
| | | | 75,000 | | | | 6.250 | | | | 08/01/16 | | | | 81,405 | |
| | | CenterPoint Energy, Inc. Series B |
| | | | 25,000 | | | | 7.250 | | | | 09/01/10 | | | | 25,446 | |
| | | Commonwealth Edison Co. |
| | | | 175,000 | | | | 5.400 | | | | 12/15/11 | | | | 186,407 | |
| | | Enel Finance International SA(d) |
| | | | 125,000 | | | | 5.125 | | | | 10/07/19 | | | | 122,834 | |
| | | NiSource Finance Corp. |
| | | | 50,000 | | | | 10.750 | | | | 03/15/16 | | | | 64,422 | |
| | | Progress Energy, Inc. |
| | | | 75,000 | | | | 7.000 | | | | 10/30/31 | | | | 84,699 | |
| | | Puget Sound Energy, Inc.(e) |
| | | | 50,000 | | | | 6.974 | | | | 06/01/67 | | | | 47,469 | |
| | | | | | | | | | | | | | | | | |
| | | | | | | | | | | | | | | | 721,342 | |
| | | |
| | | |
| | | Energy(c) – 0.5% |
| | | Dolphin Energy Ltd.(d) |
| | | | 99,000 | | | | 5.888 | | | | 06/15/19 | | | | 101,970 | |
| | | Petroleos Mexicanos |
| | | | 200,000 | | | | 8.000 | | | | 05/03/19 | | | | 234,500 | |
| | | Suncor Energy, Inc. |
| | | | 75,000 | | | | 6.100 | | | | 06/01/18 | | | | 82,606 | |
| | | |
| | | |
| | | Transocean, Inc.(f) |
| | | | 275,000 | | | | 1.500 | | | | 12/15/37 | | | | 265,375 | |
| | | | | | | | | | | | | | | | | |
| | | | | | | | | | | | | | | | 684,451 | |
| | | |
| | | |
| | | Food & Beverage – 0.4% |
| | | Anheuser-Busch InBev Worldwide, Inc.(c)(d) |
| | | | 200,000 | | | | 7.750 | | | | 01/15/19 | | | | 240,727 | |
| | | Kraft Foods, Inc. |
| | | | 75,000 | | | | 6.125 | | | | 08/23/18 | | | | 82,757 | |
| | | | 75,000 | | | | 5.375 | | | | 02/10/20 | | | | 77,668 | |
| | | | 75,000 | | | | 6.500 | | | | 02/09/40 | | | | 80,721 | |
| | | | | | | | | | | | | | | | | |
| | | | | | | | | | | | | | | | 481,873 | |
| | | |
| | | |
| | | Health Care – Medical Products(c) – 0.1% |
| | | Boston Scientific Corp. |
| | | | 75,000 | | | | 4.500 | | | | 01/15/15 | | | | 73,539 | |
| | | | 50,000 | | | | 6.000 | | | | 01/15/20 | | | | 49,411 | |
| | | | | | | | | | | | | | | | | |
| | | | | | | | | | | | | | | | 122,950 | |
| | | |
| | | |
| | | Life Insurance – 0.4% |
| | | Prudential Financial, Inc. |
| | | | 175,000 | | | | 3.875 | | | | 01/14/15 | | | | 177,148 | |
| | | Reinsurance Group of America, Inc.(c)(e) |
| | | | 75,000 | | | | 6.750 | | | | 12/15/65 | | | | 70,783 | |
| | | The Hartford Financial Services Group, Inc.(c) |
| | | | 50,000 | | | | 6.625 | | | | 03/30/40 | | | | 49,019 | |
| | | The Northwestern Mutual Life Insurance Co.(c)(d) |
| | | | 175,000 | | | | 6.063 | | | | 03/30/40 | | | | 180,753 | |
| | | | | | | | | | | | | | | | | |
| | | | | | | | | | | | | | | | 477,703 | |
| | | |
| | | |
| | | Media – Cable – 0.6% |
| | | Comcast Cable Communications Holdings, Inc. |
| | | | 125,000 | | | | 10.625 | | | | 07/15/12 | | | | 146,761 | |
| | | | 125,000 | | | | 9.455 | | | | 11/15/22 | | | | 169,857 | |
| | | Cox Communications, Inc.(c)(d) |
| | | | 275,000 | | | | 6.250 | | | | 06/01/18 | | | | 300,244 | |
| | | Time Warner Cable, Inc. |
| | | | 125,000 | | | | 4.875 | | | | 03/15/20 | | | | 123,942 | |
| | | | | | | | | | | | | | | | | |
| | | | | | | | | | | | | | | | 740,804 | |
| | | |
| | | |
| | | Media – Non Cable(c) – 0.2% |
| | | DIRECTV Holdings LLC(d) |
| | | | 100,000 | | | | 6.350 | | | | 03/15/40 | | | | 103,295 | |
| | | DISH DBS Corp. |
| | | | 125,000 | | | | 7.125 | | | | 02/01/16 | | | | 126,719 | |
| | | | | | | | | | | | | | | | | |
| | | | | | | | | | | | | | | | 230,014 | |
| | | |
| | | |
| | | Metals & Mining(c) – 0.4% |
| | | Anglo American Capital PLC(d) |
| | | | 100,000 | | | | 9.375 | | | | 04/08/19 | | | | 130,247 | |
| | | ArcelorMittal |
| | | | 100,000 | | | | 6.125 | | | | 06/01/18 | | | | 107,513 | |
| | | Freeport-McMoRan Copper & Gold, Inc. |
| | | | 125,000 | | | | 8.375 | | | | 04/01/17 | | | | 140,000 | |
| | | Teck Resources Ltd. |
| | | | 100,000 | | | | 10.750 | | | | 05/15/19 | | | | 124,500 | |
| | | | | | | | | | | | | | | | | |
| | | | | | | | | | | | | | | | 502,260 | |
| | | |
| | | |
The accompanying notes are an integral part of these financial statements.
GOLDMAN SACHS BALANCED FUND
| | | | | | | | | | | | | | | | | |
| | | Principal
| | Interest
| | Maturity
| | |
| | | Amount | | Rate | | Date | | Value |
| |
Corporate Obligations – (continued) |
| | | Metals & Mining(c) – (continued) |
| | | | | | | | | | | | | | | | | |
| | | Noncaptive-Financial – 0.2% |
| | | Discover Financial Services(c) |
| | | $ | 50,000 | | | | 10.250 | % | | | 07/15/19 | | | $ | 61,483 | |
| | | OJSC Vimpel Communications |
| | | | 100,000 | | | | 8.250 | | | | 05/23/16 | | | | 109,250 | |
| | | SLM Corp. |
| | | | 150,000 | | | | 5.450 | | | | 04/25/11 | | | | 152,631 | |
| | | | | | | | | | | | | | | | | |
| | | | | | | | | | | | | | | | 323,364 | |
| | | |
| | | |
| | | Packaging(c)(e) – 0.1% |
| | | Impress Holdings BV |
| | | EUR | 125,000 | | | | 3.769 | | | | 09/15/13 | | | | 160,606 | |
| | | |
| | | |
| | | Paper(c) – 0.1% |
| | | International Paper Co. |
| | | $ | 50,000 | | | | 7.950 | | | | 06/15/18 | | | | 59,325 | |
| | | |
| | | |
| | | Pipelines – 0.6% |
| | | DCP Midstream LLC(c)(d) |
| | | | 25,000 | | | | 9.750 | | | | 03/15/19 | | | | 32,553 | |
| | | El Paso Natural Gas Co. |
| | | | 75,000 | | | | 7.500 | | | | 11/15/26 | | | | 83,918 | |
| | | El Paso Pipeline Partners Operating Co. LLC(c) |
| | | | 25,000 | | | | 6.500 | | | | 04/01/20 | | | | 25,625 | |
| | | Energy Transfer Partners LP(c) |
| | | | 100,000 | | | | 5.950 | | | | 02/01/15 | | | | 109,519 | |
| | | | 50,000 | | | | 9.000 | | | | 04/15/19 | | | | 62,187 | |
| | | Enterprise Products Operating LLC(c)(e) |
| | | | 100,000 | | | | 8.375 | | | | 08/01/66 | | | | 104,071 | |
| | | | 100,000 | | | | 7.034 | | | | 01/15/68 | | | | 96,671 | |
| | | Tennessee Gas Pipeline Co. |
| | | | 50,000 | | | | 7.500 | | | | 04/01/17 | | | | 57,188 | |
| | | The Williams Cos., Inc.(c) |
| | | | 75,000 | | | | 8.750 | | | | 03/15/32 | | | | 95,274 | |
| | | TransCanada PipeLines Ltd.(c)(e) |
| | | | 100,000 | | | | 6.350 | | | | 05/15/67 | | | | 95,000 | |
| | | Williams Partners LP(c)(d) |
| | | | 100,000 | | | | 5.250 | | | | 03/15/20 | | | | 102,855 | |
| | | | | | | | | | | | | | | | | |
| | | | | | | | | | | | | | | | 864,861 | |
| | | |
| | | |
| | | Property/Casualty Insurance(c) – 0.5% |
| | | Arch Capital Group Ltd. |
| | | | 100,000 | | | | 7.350 | | | | 05/01/34 | | | | 104,303 | |
| | | Aspen Insurance Holdings Ltd. |
| | | | 100,000 | | | | 6.000 | | | | 08/15/14 | | | | 105,739 | |
| | | Endurance Specialty Holdings Ltd. |
| | | | 50,000 | | | | 6.150 | | | | 10/15/15 | | | | 53,009 | |
| | | QBE Insurance Group Ltd.(d)(e) |
| | | | 225,000 | | | | 5.647 | | | | 07/01/23 | | | | 205,191 | |
| | | The Chubb Corp.(e) |
| | | | 100,000 | | | | 6.375 | | | | 03/29/67 | | | | 99,000 | |
| | | Transatlantic Holdings, Inc. |
| | | | 75,000 | | | | 8.000 | | | | 11/30/39 | | | | 77,798 | |
| | | | | | | | | | | | | | | | | |
| | | | | | | | | | | | | | | | 645,040 | |
| | | |
| | | |
| | | Real Estate Investment Trusts(c) – 0.5% |
| | | Developers Diversified Realty Corp. |
| | | | 75,000 | | | | 7.500 | | | | 04/01/17 | | | | 77,898 | |
| | | |
| | | |
| | | ProLogis(f) |
| | | | 75,000 | | | | 1.875 | | | | 11/15/37 | | | | 69,559 | |
| | | Reckson Operating Partnership LP |
| | | | 92,000 | | | | 5.150 | | | | 01/15/11 | | | | 90,045 | |
| | | Simon Property Group LP |
| | | | 125,000 | | | | 10.350 | | | | 04/01/19 | | | | 161,475 | |
| | | WEA Finance LLC(d) |
| | | | 150,000 | | | | 5.400 | | | | 10/01/12 | | | | 160,355 | |
| | | Westfield Capital Corp.(d) |
| | | | 125,000 | | | | 5.125 | | | | 11/15/14 | | | | 131,081 | |
| | | | | | | | | | | | | | | | | |
| | | | | | | | | | | | | | | | 690,413 | |
| | | |
| | | |
| | | Schools(c) – 0.1% |
| | | Rensselaer Polytechnic Institute |
| | | | 150,000 | | | | 5.600 | | | | 09/01/20 | | | | 154,271 | |
| | | |
| | | |
| | | Tobacco(c)(d) – 0.1% |
| | | BAT International Finance PLC |
| | | | 125,000 | | | | 9.500 | | | | 11/15/18 | | | | 164,881 | |
| | | |
| | | |
| | | Wireless Telecommunications(c) – 0.1% |
| | | AT&T, Inc. |
| | | | 100,000 | | | | 6.400 | | | | 05/15/38 | | | | 105,280 | |
| | | Verizon Wireless Capital LLC |
| | | | 50,000 | | | | 8.500 | | | | 11/15/18 | | | | 63,180 | |
| | | | | | | | | | | | | | | | | |
| | | | | | | | | | | | | | | | 168,460 | |
| | | |
| | | |
| | | Wirelines Telecommunications(c) – 0.4% |
| | | Qwest Corp. |
| | | | 75,000 | | | | 8.375 | | | | 05/01/16 | | | | 85,500 | |
| | | Telecom Italia Capital |
| | | | 225,000 | | | | 4.950 | | | | 09/30/14 | | | | 230,923 | |
| | | | 150,000 | | | | 7.200 | | | | 07/18/36 | | | | 152,144 | |
| | | Verizon Communications, Inc. |
| | | | 100,000 | | | | 6.400 | | | | 02/15/38 | | | | 106,807 | |
| | | | | | | | | | | | | | | | | |
| | | | | | | | | | | | | | | | 575,374 | |
| | | |
| | | |
| | | TOTAL CORPORATE OBLIGATIONS |
| | | (Cost $10,514,620) | | $ | 11,265,627 | |
| | | |
| | | |
| | | | | | | | | | | | | | | | | |
| | | | | | | | | | | | | | | | | |
Mortgage-Backed Obligations – 20.4% |
| | | | | | | | | | | | | | | | | |
| | | | | | | | | | | | | | | | | |
| | | Collateralized Mortgage Obligations – 4.8% |
| | | Adjustable Rate Non-Agency(e) – 3.9% |
| | | Bear Stearns Adjustable Rate Mortgage Trust Series 2004-1, Class 21A1 |
| | | $ | 17,281 | | | | 2.925 | % | | | 04/25/34 | | | $ | 15,678 | |
| | | Bear Stearns Alternative-A Trust II Series 2007-1, Class 1A1 |
| | | | 745,892 | | | | 5.882 | | | | 09/25/47 | | | | 487,460 | |
| | | Chase Mortgage Finance Corp. Series 2007-A1, Class 2A1 |
| | | | 482,855 | | | | 4.124 | | | | 02/25/37 | | | | 461,378 | |
| | | Countrywide Alternative Loan Trust Series 2005-31, Class 2A1 |
| | | | 268,554 | | | | 0.563 | | | | 08/25/35 | | | | 163,228 | |
| | | Countrywide Alternative Loan Trust Series 2005-38, Class A3 |
| | | | 298,732 | | | | 0.613 | | | | 09/25/35 | | | | 182,881 | |
| | | |
| | | |
The accompanying notes are an integral part of these financial statements.
GOLDMAN SACHS BALANCED FUND
Schedule of Investments (continued)
April 30, 2010 (Unaudited)
| | | | | | | | | | | | | | | | | |
| | | Principal
| | Interest
| | Maturity
| | |
| | | Amount | | Rate | | Date | | Value |
| |
Mortgage-Backed Obligations – (continued) |
| | | Adjustable Rate Non-Agency(e) – (continued) |
| | | | | | | | | | | | | | | | | |
| | | Countrywide Home Loan Trust Series 2004-HYB6, Class A2 |
| | | $ | 23,241 | | | | 3.520 | % | | | 11/20/34 | | | $ | 19,893 | |
| | | Granite Master Issuer PLC Series 2006-1A, Class A5(d) |
| | | | 388,118 | | | | 0.326 | | | | 12/20/54 | | | | 361,746 | |
| | | JPMorgan Alternative Loan Trust Series 2005-A2, Class 1A1 |
| | | | 350,612 | | | | 0.523 | | | | 01/25/36 | | | | 257,497 | |
| | | JPMorgan Mortgage Trust Series 2007-A1, Class 2A2 |
| | | | 479,626 | | | | 3.561 | | | | 07/25/35 | | | | 412,864 | |
| | | Lehman XS Trust Series 2005-7N, Class 1A1A |
| | | | 191,118 | | | | 0.533 | | | | 12/25/35 | | | | 127,023 | |
| | | Lehman XS Trust Series 2007-16N, Class 2A2 |
| | | | 847,044 | | | | 1.113 | | | | 09/25/47 | | | | 522,101 | |
| | | Merrill Lynch Alternative Note Asset Trust Series 2007-0AR3, Class A1 |
| | | | 590,822 | | | | 0.453 | | | | 07/25/47 | | | | 328,633 | |
| | | Structured Adjustable Rate Mortgage Loan Trust Series 2004-05, Class 3A1 |
| | | | 28,022 | | | | 2.735 | | | | 05/25/34 | | | | 26,421 | |
| | | Structured Adjustable Rate Mortgage Loan Trust Series 2004-06, Class 3A2 |
| | | | 291,182 | | | | 2.830 | | | | 06/25/34 | | | | 262,987 | |
| | | Structured Adjustable Rate Mortgage Loan Trust Series 2004-16, Class 3A1 |
| | | | 32,619 | | | | 2.796 | | | | 11/25/34 | | | | 28,762 | |
| | | Washington Mutual Mortgage Pass-Through Certificates Series 2004-AR03, Class A2 |
| | | | 34,898 | | | | 2.929 | | | | 06/25/34 | | | | 33,321 | |
| | | Washington Mutual Mortgage Pass-Through Certificates Series 2005-AR08, Class 2A1A |
| | | | 321,459 | | | | 0.553 | | | | 07/25/45 | | | | 259,283 | |
| | | Washington Mutual Mortgage Pass-Through Certificates Series 2005-AR11, Class A1A |
| | | | 509,556 | | | | 0.583 | | | | 08/25/45 | | | | 411,034 | |
| | | Washington Mutual Mortgage Pass-Through Certificates Series 2005-AR19, Class A1A1 |
| | | | 281,938 | | | | 0.533 | | | | 12/25/45 | | | | 227,093 | |
| | | Wells Fargo Alternative Loan Trust Series 2007-PA6, Class A1 |
| | | | 694,622 | | | | 6.395 | | | | 12/28/37 | | | | 507,315 | |
| | | Wells Fargo Mortgage Backed Securities Trust Series 2005-AR16, Class 1A1 |
| | | | 218,983 | | | | 3.208 | | | | 10/25/35 | | | | 212,374 | |
| | | | | | | | | | | | | | | | | |
| | | | | | | | | | | | | | | | 5,308,972 | |
| | | |
| | | |
| | | Interest Only(g) – 0.0% |
| | | ABN AMRO Mortgage Corp. Series 2003-8, Class A2 |
| | | | 45,159 | | | | 5.500 | | | | 06/25/33 | | | | 2,255 | |
| | | Bear Stearns Commercial Mortgage Securities, Inc. Series 2003-T10, Class X2(d)(e) |
| | | | 1,768,905 | | | | 1.372 | | | | 03/13/40 | | | | 20,084 | |
| | | CS First Boston Mortgage Securities Corp. Series 2003-19, Class 1A2 |
| | | | 117,457 | | | | 5.250 | | | | 07/25/33 | | | | 7,475 | |
| | | CS First Boston Mortgage Securities Corp. Series 2003-AR18, Class 2X(e)(h) |
| | | | 58,675 | | | | 0.000 | | | | 07/25/33 | | | | — | |
| | | |
| | | |
| | | CS First Boston Mortgage Securities Corp. Series 2003-AR20, Class 2X(e)(h) |
| | | | 80,330 | | | | 0.000 | | | | 08/25/33 | | | | — | |
| | | CS First Boston Mortgage Securities Corp. Series 2003-C3, Class ASP(d)(e) |
| | | | 1,028,324 | | | | 1.888 | | | | 05/15/38 | | | | 1,397 | |
| | | FHLMC REMIC Series 2575, Class IB |
| | | | 26,522 | | | | 5.500 | | | | 08/15/30 | | | | 308 | |
| | | FNMA REMIC Series 2004-47, Class EI(e)(h) |
| | | | 171,622 | | | | 0.000 | | | | 06/25/34 | | | | 2,492 | |
| | | FNMA REMIC Series 2004-62, Class DI(e)(h) |
| | | | 96,586 | | | | 0.000 | | | | 07/25/33 | | | | 786 | |
| | | Master Adjustable Rate Mortgages Trust Series 2003-2, Class 3AX(e) |
| | | | 71,417 | | | | 0.120 | | | | 08/25/33 | | | | 101 | |
| | | Master Adjustable Rate Mortgages Trust Series 2003-2, Class 4AX(e) |
| | | | 29,894 | | | | 0.320 | | | | 07/25/33 | | | | 109 | |
| | | Prudential Commercial Mortgage Trust Series 2003-PWR1, Class X2(d)(e) |
| | | | 2,043,001 | | | | 1.666 | | | | 02/11/36 | | | | 25,571 | |
| | | | | | | | | | | | | | | | | |
| | | | | | | | | | | | | | | | 60,578 | |
| | | |
| | | |
| | | Inverse Floaters(e) – 0.2% |
| | | FNMA REMIC Series 1993-248, Class SA |
| | | | 79,528 | | | | 5.724 | | | | 08/25/23 | | | | 76,391 | |
| | | GNMA Series 2001-48, Class SA |
| | | | 17,776 | | | | 25.656 | | | | 10/16/31 | | | | 25,052 | |
| | | GNMA Series 2001-51, Class SA |
| | | | 27,646 | | | | 31.391 | | | | 10/16/31 | | | | 41,248 | |
| | | GNMA Series 2001-51, Class SB |
| | | | 34,693 | | | | 25.656 | | | | 10/16/31 | | | | 48,438 | |
| | | GNMA Series 2001-59, Class SA |
| | | | 26,785 | | | | 25.493 | | | | 11/16/24 | | | | 37,250 | |
| | | GNMA Series 2002-13, Class SB |
| | | | 11,588 | | | | 36.372 | | | | 02/16/32 | | | | 18,164 | |
| | | | | | | | | | | | | | | | | |
| | | | | | | | | | | | | | | | 246,543 | |
| | | |
| | | |
| | | Regular Floater(e)(h) – 0.1% |
| | | FHLMC REMIC Series 3038, Class XA |
| | | | 33,874 | | | | 0.000 | | | | 09/15/35 | | | | 31,839 | |
| | | FHLMC REMIC Series 3325, Class XA |
| | | | 33,027 | | | | 0.000 | | | | 06/15/37 | | | | 31,527 | |
| | | | | | | | | | | | | | | | | |
| | | | | | | | | | | | | | | | 63,366 | |
| | | |
| | | |
| | | Sequential Fixed Rate – 0.6% |
| | | Countrywide Alternative Loan Trust Series 2005-1CB, Class 2A1 |
| | | | 503,644 | | | | 6.000 | | | | 03/25/35 | | | | 430,770 | |
| | | Countrywide Alternative Loan Trust Series 2007-16CB, Class 4A7 |
| | | | 427,721 | | | | 6.000 | | | | 08/25/37 | | | | 319,871 | |
| | | | | | | | | | | | | | | | | |
| | | | | | | | | | | | | | | | 750,641 | |
| | | |
| | | |
| | | TOTAL COLLATERALIZED MORTGAGE OBLIGATIONS | | $ | 6,430,100 | |
| | | |
| | | |
The accompanying notes are an integral part of these financial statements.
GOLDMAN SACHS BALANCED FUND
| | | | | | | | | | | | | | | | | |
| | | Principal
| | Interest
| | Maturity
| | |
| | | Amount | | Rate | | Date | | Value |
| |
Mortgage-Backed Obligations – (continued) |
| | | Sequential Fixed Rate – (continued) |
| | | | | | | | | | | | | | | | | |
| | | Commercial Mortgage-Backed Securities – 2.2% |
| | | Sequential Fixed Rate – 2.2% |
| | | GMAC Commercial Mortgage Securities, Inc. Series 2002-C1, Class A2 |
| | | $ | 1,000,000 | | | | 6.278 | % | | | 11/15/39 | | | $ | 1,047,445 | |
| | | LB-UBS Commercial Mortgage Trust Series 2005-C7, Class A4 |
| | | | 1,000,000 | | | | 5.197 | | | | 11/15/30 | | | | 1,042,790 | |
| | | LB-UBS Commercial Mortgage Trust Series 2006-C1, Class A4 |
| | | | 500,000 | | | | 5.156 | | | | 02/15/31 | | | | 514,070 | |
| | | Wachovia Bank Commercial Mortgage Trust Series 2006-C25, Class A5 |
| | | | 400,000 | | | | 5.926 | | | | 05/15/43 | | | | 418,772 | |
| | | |
| | | |
| | | TOTAL COMMERCIAL MORTGAGE-BACKED SECURITIES | | $ | 3,023,077 | |
| | | |
| | | |
| | | Federal Agencies – 13.4% |
| | | Adjustable Rate FHLMC(e) – 0.3% |
| | | $ | 397,102 | | | | 3.650 | % | | | 08/01/35 | | | $ | 415,231 | |
| | | |
| | | |
| | | Adjustable Rate FNMA(e) – 0.8% |
| | | | 19,979 | | | | 3.290 | | | | 09/01/32 | | | | 20,983 | |
| | | | 125,436 | | | | 3.376 | | | | 12/01/33 | | | | 131,185 | |
| | | | 194,728 | | | | 3.045 | | | | 01/01/34 | | | | 204,126 | |
| | | | 365,120 | | | | 2.763 | | | | 02/01/34 | | | | 382,741 | |
| | | | 283,188 | | | | 2.892 | | | | 01/01/35 | | | | 295,503 | |
| | | | | | | | | | | | | | | | | |
| | | | | | | | | | | | | | | | 1,034,538 | |
| | | |
| | | |
| | | Adjustable Rate GNMA(e) – 0.6% |
| | | | 16,599 | | | | 4.375 | | | | 06/20/23 | | | | 17,208 | |
| | | | 7,443 | | | | 3.625 | | | | 07/20/23 | | | | 7,673 | |
| | | | 7,837 | | | | 3.625 | | | | 08/20/23 | | | | 8,080 | |
| | | | 20,513 | | | | 3.625 | | | | 09/20/23 | | | | 21,150 | |
| | | | 6,157 | | | | 4.375 | | | | 03/20/24 | | | | 6,377 | |
| | | | 53,400 | | | | 4.375 | | | | 04/20/24 | | | | 55,459 | |
| | | | 6,526 | | | | 4.375 | | | | 05/20/24 | | | | 6,770 | |
| | | | 54,926 | | | | 4.375 | | | | 06/20/24 | | | | 57,003 | |
| | | | 29,316 | | | | 3.625 | | | | 07/20/24 | | | | 30,295 | |
| | | | 40,550 | | | | 3.625 | | | | 08/20/24 | | | | 41,883 | |
| | | | 12,726 | | | | 3.625 | | | | 09/20/24 | | | | 13,131 | |
| | | | 15,986 | | | | 3.125 | | | | 11/20/24 | | | | 16,508 | |
| | | | 13,775 | | | | 3.125 | | | | 12/20/24 | | | | 14,335 | |
| | | | 10,855 | | | | 4.375 | | | | 01/20/25 | | | | 11,273 | |
| | | | 5,388 | | | | 4.375 | | | | 02/20/25 | | | | 5,596 | |
| | | | 18,711 | | | | 4.375 | | | | 05/20/25 | | | | 19,480 | |
| | | | 13,602 | | | | 3.625 | | | | 07/20/25 | | | | 14,091 | |
| | | | 6,687 | | | | 4.375 | | | | 02/20/26 | | | | 6,931 | |
| | | | 19,829 | | | | 4.375 | | | | 01/20/27 | | | | 20,981 | |
| | | | 6,867 | | | | 4.375 | | | | 02/20/27 | | | | 7,121 | |
| | | | 53,669 | | | | 4.375 | | | | 04/20/27 | | | | 55,797 | |
| | | | 6,171 | | | | 4.375 | | | | 05/20/27 | | | | 6,416 | |
| | | | 5,949 | | | | 4.375 | | | | 06/20/27 | | | | 6,185 | |
| | | | 2,014 | | | | 3.125 | | | | 11/20/27 | | | | 2,080 | |
| | | | 8,650 | | | | 3.125 | | | | 12/20/27 | | | | 8,930 | |
| | | | 17,164 | | | | 4.375 | | | | 01/20/28 | | | | 17,809 | |
| | | | 5,737 | | | | 4.250 | | | | 02/20/28 | | | | 5,950 | |
| | | | 6,358 | | | | 4.375 | | | | 03/20/28 | | | | 6,597 | |
| | | |
| | | |
| | | | 31,680 | | | | 3.625 | | | | 07/20/29 | | | | 32,783 | |
| | | | 13,122 | | | | 3.625 | | | | 08/20/29 | | | | 13,579 | |
| | | | 4,080 | | | | 3.625 | | | | 09/20/29 | | | | 4,223 | |
| | | | 16,684 | | | | 3.125 | | | | 10/20/29 | | | | 17,226 | |
| | | | 21,039 | | | | 3.125 | | | | 11/20/29 | | | | 21,722 | |
| | | | 4,971 | | | | 3.125 | | | | 12/20/29 | | | | 5,133 | |
| | | | 6,612 | | | | 4.250 | | | | 01/20/30 | | | | 6,857 | |
| | | | 3,552 | | | | 4.250 | | | | 02/20/30 | | | | 3,683 | |
| | | | 13,717 | | | | 4.250 | | | | 03/20/30 | | | | 14,226 | |
| | | | 20,913 | | | | 4.375 | | | | 04/20/30 | | | | 21,775 | |
| | | | 51,926 | | | | 4.375 | | | | 05/20/30 | | | | 54,139 | |
| | | | 4,358 | | | | 4.375 | | | | 06/20/30 | | | | 4,538 | |
| | | | 41,242 | | | | 3.625 | | | | 07/20/30 | | | | 42,866 | |
| | | | 7,070 | | | | 3.625 | | | | 09/20/30 | | | | 7,346 | |
| | | | 14,183 | | | | 2.875 | | | | 10/20/30 | | | | 14,597 | |
| | | | | | | | | | | | | | | | | |
| | | | | | | | | | | | | | | | 755,802 | |
| | | |
| | | |
| | | FHLMC – 2.4% |
| | | | 40,876 | | | | 8.000 | | | | 07/01/15 | | | | 44,626 | |
| | | | 9,037 | | | | 7.000 | | | | 12/01/15 | | | | 9,649 | |
| | | | 42,774 | | | | 6.500 | | | | 07/01/16 | | | | 46,591 | |
| | | | 83,968 | | | | 7.000 | | | | 04/01/31 | | | | 93,532 | |
| | | | 139,474 | | | | 7.000 | | | | 07/01/32 | | | | 155,127 | |
| | | | 240,269 | | | | 6.500 | | | | 04/01/34 | | | | 262,963 | |
| | | | 364,412 | | | | 5.000 | | | | 04/01/39 | | | | 380,013 | |
| | | | 92,961 | | | | 5.000 | | | | 05/01/39 | | | | 96,941 | |
| | | | 187,283 | | | | 5.000 | | | | 06/01/39 | | | | 195,301 | |
| | | | 97,506 | | | | 5.000 | | | | 10/01/39 | | | | 101,681 | |
| | | | 491,872 | | | | 5.000 | | | | 11/01/39 | | | | 511,854 | |
| | | | 295,469 | | | | 5.000 | | | | 12/01/39 | | | | 308,119 | |
| | | | 1,000,000 | | | | 4.500 | | | | TBA-30yr | (i) | | | 1,008,281 | |
| | | | | | | | | | | | | | | | | |
| | | | | | | | | | | | | | | | 3,214,678 | |
| | | |
| | | |
| | | FNMA – 8.4% |
| | | | 518,083 | | | | 4.000 | | | | 09/01/18 | | | | 539,605 | |
| | | | 271,203 | | | | 6.000 | | | | 09/01/19 | | | | 292,606 | |
| | | | 336,702 | | | | 6.000 | | | | 12/01/20 | | | | 363,274 | |
| | | | 205,212 | | | | 5.500 | | | | 09/01/23 | | | | 220,283 | |
| | | | 78,635 | | | | 5.500 | | | | 10/01/23 | | | | 84,557 | |
| | | | 25,672 | | | | 7.000 | | | | 11/01/30 | | | | 28,241 | |
| | | | 105,555 | | | | 7.500 | | | | 03/01/31 | | | | 116,321 | |
| | | | 510,245 | | | | 6.000 | | | | 04/01/35 | | | | 552,031 | |
| | | | 225,760 | | | | 6.000 | | | | 11/01/35 | | | | 245,589 | |
| | | | 25,810 | | | | 6.000 | | | | 10/01/37 | | | | 27,554 | |
| | | | 372,554 | | | | 6.000 | | | | 06/01/38 | | | | 397,639 | |
| | | | 20,057 | | | | 6.000 | | | | 07/01/38 | | | | 21,407 | |
| | | | 20,748 | | | | 6.000 | | | | 09/01/38 | | | | 22,035 | |
| | | | 1,656,474 | | | | 5.000 | | | | 01/01/39 | | | | 1,724,732 | |
| | | | 49,768 | | | | 4.500 | | | | 04/01/39 | | | | 50,425 | |
| | | | 27,228 | | | | 5.000 | | | | 05/01/39 | | | | 28,302 | |
| | | | 525,482 | | | | 5.000 | | | | 06/01/39 | | | | 546,214 | |
| | | | 95,863 | | | | 4.500 | | | | 07/01/39 | | | | 97,188 | |
| | | | 29,565 | | | | 5.000 | | | | 07/01/39 | | | | 30,732 | |
| | | | 137,717 | | | | 4.500 | | | | 08/01/39 | | | | 139,621 | |
| | | | 223,990 | | | | 5.000 | | | | 09/01/39 | | | | 233,214 | |
| | | | 204,152 | | | | 4.500 | | | | 10/01/39 | | | | 206,975 | |
| | | | 1,049,495 | | | | 5.000 | | | | 10/01/39 | | | | 1,090,508 | |
| | | |
| | | |
The accompanying notes are an integral part of these financial statements.
GOLDMAN SACHS BALANCED FUND
Schedule of Investments (continued)
April 30, 2010 (Unaudited)
| | | | | | | | | | | | | | | | | |
| | | Principal
| | Interest
| | Maturity
| | |
| | | Amount | | Rate | | Date | | Value |
| |
Mortgage-Backed Obligations – (continued) |
| | | FNMA – (continued) |
| | | | | | | | | | | | | | | | | |
| | | $ | 178,857 | | | | 4.500 | % | | | 11/01/39 | | | $ | 181,301 | |
| | | | 88,216 | | | | 4.500 | | | | 12/01/39 | | | | 89,381 | |
| | | | 229,537 | | | | 4.500 | | | | 01/01/40 | | | | 232,566 | |
| | | | 693,175 | | | | 5.000 | | | | 01/01/40 | | | | 721,173 | |
| | | | 2,000,000 | | | | 4.500 | | | | TBA-30yr | (i) | | | 2,016,250 | |
| | | | 1,000,000 | | | | 6.000 | | | | TBA-30yr | (i) | | | 1,067,656 | |
| | | | | | | | | | | | | | | | | |
| | | | | | | | | | | | | | | | 11,367,380 | |
| | | |
| | | |
| | | GNMA – 0.9% |
| | | | 33,013 | | | | 5.000 | | | | 05/15/39 | | | | 34,559 | |
| | | | 157,907 | | | | 5.000 | | | | 06/15/39 | | | | 165,453 | |
| | | | 1,000,000 | | | | 6.000 | | | | TBA-30yr | (i) | | | 1,072,344 | |
| | | | | | | | | | | | | | | | | |
| | | | | | | | | | | | | | | | 1,272,356 | |
| | | |
| | | |
| | | TOTAL FEDERAL AGENCIES | | $ | 18,059,985 | |
| | | |
| | | |
| | | TOTAL MORTGAGE-BACKED OBLIGATIONS |
| | | (Cost $27,857,395) | | $ | 27,513,162 | |
| | | |
| | | |
| | | | | | | | | | | | | | | | | |
| | | | | | | | | | | | | | | | | |
Agency Debentures – 1.3% |
| | | | | | | | | | | | | | | | | |
| | | | | | | | | | | | | | | | | |
| | | FHLMC |
| | | $ | 300,000 | | | | 4.500 | % | | | 04/02/14 | | | $ | 325,219 | |
| | | | 700,000 | | | | 5.000 | | | | 11/13/14 | | | | 771,816 | |
| | | FNMA(j) |
| | | | 50,000 | | | | 0.000 | | | | 10/09/19 | | | | 29,898 | |
| | | Tennessee Valley Authority(a) |
| | | | 600,000 | | | | 5.375 | | | | 04/01/56 | | | | 623,296 | |
| | | |
| | | |
| | | TOTAL AGENCY DEBENTURES |
| | | (Cost $1,715,949) | | $ | 1,750,229 | |
| | | |
| | | |
| | | | | | | | | | | | | | | | | |
| | | | | | | | | | | | | | | | | |
Asset-Backed Securities – 1.3% |
| | | | | | | | | | | | | | | | | |
| | | | | | | | | | | | | | | | | |
| | | Home Equity – 0.4% |
| | | CIT Mortgage Loan Trust Series 2007-1, Class 2A1(d)(e) |
| | | $ | 168,348 | | | | 1.263 | % | | | 10/25/37 | | | $ | 160,060 | |
| | | CIT Mortgage Loan Trust Series 2007-1, Class 2A2(d)(e) |
| | | | 120,000 | | | | 1.496 | | | | 10/25/37 | | | | 57,357 | |
| | | CIT Mortgage Loan Trust Series 2007-1, Class 2A3(d)(e) |
| | | | 210,000 | | | | 1.696 | | | | 10/25/37 | | | | 94,088 | |
| | | Countrywide Home Equity Loan Trust Series 2002-E, Class A(e) |
| | | | 55,851 | | | | 0.514 | | | | 10/15/28 | | | | 44,878 | |
| | | Countrywide Home Equity Loan Trust Series 2003-D, Class A(e) |
| | | | 100,741 | | | | 0.514 | | | | 06/15/29 | | | | 71,072 | |
| | | Countrywide Home Equity Loan Trust Series 2004-N, Class 2A(e) |
| | | | 158,575 | | | | 0.534 | | | | 02/15/34 | | | | 83,767 | |
| | | GMAC Mortgage Corp. Loan Trust Series 2007-HE3, Class 1A1 |
| | | | 55,205 | | | | 7.000 | | | | 09/25/37 | | | | 32,247 | |
| | | |
| | | |
| | | GMAC Mortgage Corp. Loan Trust Series 2007-HE3, Class 2A1 |
| | | | 64,505 | | | | 7.000 | | | | 09/25/37 | | | | 30,409 | |
| | | | | | | | | | | | | | | | | |
| | | | | | | | | | | | | | | | 573,878 | |
| | | |
| | | |
| | | Manufactured Housing – 0.1% |
| | | Mid-State Trust Series 4, Class A |
| | | | 123,812 | | | | 8.330 | | | | 04/01/30 | | | | 123,593 | |
| | | |
| | | |
| | | Student Loan(e) – 0.8% |
| | | SLM Student Loan Trust Series 2010-1, Class A |
| | | | 1,000,000 | | | | 0.654 | | | | 03/25/25 | | | | 999,998 | |
| | | |
| | | |
| | | TOTAL ASSET-BACKED SECURITIES |
| | | (Cost $2,083,413) | | $ | 1,697,469 | |
| | | |
| | | |
| | | | | | | | | | | | | | | | | |
| | | | | | | | | | | | | | | | | |
Foreign Debt Obligations – 1.3% |
| | | | | | | | | | | | | | | | | |
| | | | | | | | | | | | | | | | | |
| | | Sovereign – 1.1% |
| | | Landwirtschaftliche Rentenbank |
| | | $ | 300,000 | | | | 5.250 | % | | | 07/02/12 | | | $ | 325,088 | |
| | | Mexican Bonos |
| | | MXN | 5,110,000 | | | | 9.000 | | | | 12/20/12 | | | | 447,865 | |
| | | | 995,000 | | | | 10.000 | | | | 12/05/24 | | | | 97,087 | |
| | | Republic of Argentina |
| | | $ | 60,000 | | | | 7.000 | | | | 10/03/15 | | | | 48,317 | |
| | | Republic of Indonesia(d) |
| | | | 100,000 | | | | 5.875 | | | | 03/13/20 | | | | 103,875 | |
| | | Republic of Peru |
| | | | 100,000 | | | | 7.125 | | | | 03/30/19 | | | | 116,400 | |
| | | State of Qatar(d) |
| | | | 270,000 | | | | 5.250 | | | | 01/20/20 | | | | 279,787 | |
| | | Swedish Export Credit |
| | | | 100,000 | | | | 3.250 | | | | 09/16/14 | | | | 102,373 | |
| | | | | | | | | | | | | | | | | |
| | | | | | | | | | | | | | | | 1,520,792 | |
| | | |
| | | |
| | | Supranational – 0.2% |
| | | North American Development Bank |
| | | | 200,000 | | | | 4.375 | | | | 02/11/20 | | | | 200,167 | |
| | | |
| | | |
| | | TOTAL FOREIGN DEBT OBLIGATIONS |
| | | (Cost $1,678,825) | | $ | 1,720,959 | |
| | | |
| | | |
| | | | | | | | | | | | | | | | | |
| | | | | | | | | | | | | | | | | |
Government Guarantee Obligations – 4.4% |
| | | | | | | | | | | | | | | | | |
| | | | | | | | | | | | | | | | | |
| | | Achmea Hypotheekbank NV(d)(k) |
| | | $ | 400,000 | | | | 3.200 | % | | | 11/03/14 | | | $ | 405,413 | |
| | | ANZ National (Int’l) Ltd.(d)(k) |
| | | | 400,000 | | | | 3.250 | | | | 04/02/12 | | | | 415,997 | |
| | | BRFkredit A/S(d)(k) |
| | | | 500,000 | | | | 2.050 | | | | 04/15/13 | | | | 502,859 | |
| | | Citigroup Funding, Inc.(l) |
| | | | 300,000 | | | | 1.875 | | | | 11/15/12 | | | | 303,434 | |
| | | Dexia Credit Local(d)(k) |
| | | | 200,000 | | | | 2.750 | | | | 01/10/14 | | | | 203,710 | |
| | | General Electric Capital Corp.(l) |
| | | | 500,000 | | | | 2.000 | | | | 09/28/12 | | | | 507,326 | |
| | | |
| | | |
The accompanying notes are an integral part of these financial statements.
GOLDMAN SACHS BALANCED FUND
| | | | | | | | | | | | | | | | | |
| | | Principal
| | Interest
| | Maturity
| | |
| | | Amount | | Rate | | Date | | Value |
| |
Government Guarantee Obligations – (continued) |
| | | | | | | | | | | | | | | | | |
| | | General Electric Capital Corp.(l) – (continued) |
| | | $ | 200,000 | | | | 2.625 | % | | | 12/28/12 | | | $ | 205,782 | |
| | | GMAC, Inc.(l) |
| | | | 700,000 | | | | 1.750 | | | | 10/30/12 | | | | 705,937 | |
| | | Kreditanstalt fuer Wiederaufbau(k) |
| | | | 400,000 | | | | 1.875 | | | | 01/14/13 | | | | 401,316 | |
| | | LeasePlan Corp. NV(d)(k) |
| | | | 300,000 | | | | 3.000 | | | | 05/07/12 | | | | 311,425 | |
| | | Royal Bank of Scotland Group PLC(d)(k) |
| | | | 500,000 | | | | 1.500 | | | | 03/30/12 | | | | 501,823 | |
| | | Societe Financement de l’Economie Francaise(d)(k) |
| | | | 400,000 | | | | 2.875 | | | | 09/22/14 | | | | 406,383 | |
| | | Swedish Housing Finance Corp.(d)(k) |
| | | | 100,000 | | | | 3.125 | | | | 03/23/12 | | | | 103,241 | |
| | | Western Corporate Federal Credit Union(l) |
| | | | 200,000 | | | | 1.750 | | | | 11/02/12 | | | | 201,358 | |
| | | Westpac Banking Corp.(d)(k) |
| | | | 400,000 | | | | 3.250 | | | | 12/16/11 | | | | 413,520 | |
| | | | 300,000 | | | | 1.900 | | | | 12/14/12 | | | | 301,928 | |
| | | |
| | | |
| | | TOTAL GOVERNMENT GUARANTEE OBLIGATIONS |
| | | (Cost $5,823,870) | | $ | 5,891,452 | |
| | | |
| | | |
| | | | | | | | | | | | | | | | | |
| | | | | | | | | | | | | | | | | |
Municipal Debt Obligations – 0.4% |
| | | | | | | | | | | | | | | | | |
| | | | | | | | | | | | | | | | | |
| | | California – 0.4% |
| | | California State GO Bonds Build America Taxable Series 2009 |
| | | $ | 75,000 | | | | 7.500 | % | | | 04/01/34 | | | $ | 82,382 | |
| | | | 125,000 | | | | 7.550 | | | | 04/01/39 | | | | 138,142 | |
| | | California State GO Bonds Build America Taxable Series 2010 |
| | | | 80,000 | | | | 7.950 | | | | 03/01/36 | | | | 85,007 | |
| | | | 175,000 | | | | 7.625 | | | | 03/01/40 | | | | 194,469 | |
| | | |
| | | |
| | | TOTAL MUNICIPAL DEBT OBLIGATIONS |
| | | (Cost $466,365) | | $ | 500,000 | |
| | | |
| | | |
| | | | | | | | | | | | | | | | | |
| | | | | | | | | | | | | | | | | |
U.S. Treasury Obligations – 1.3% |
| | | | | | | | | | | | | | | | | |
| | | | | | | | | | | | | | | | | |
| | | United States Treasury Bonds |
| | | $ | 900,000 | | | | 4.625 | % | | | 02/15/40 | | | $ | 914,130 | |
| | | United States Treasury Inflation Protected Securities |
| | | | 215,667 | | | | 1.625 | | | | 01/15/15 | | | | 227,680 | |
| | | | 214,644 | | | | 2.500 | | | | 07/15/16 | | | | 238,624 | |
| | | | 114,983 | | | | 2.375 | | | | 01/15/25 | | | | 125,179 | |
| | | United States Treasury Note |
| | | | 100,000 | | | | 1.750 | | | | 04/15/13 | | | | 100,750 | |
| | | United States Treasury Principal-Only STRIPS(j) |
| | | | 200,000 | | | | 0.000 | | | | 11/15/21 | | | | 123,356 | |
| | | |
| | | |
| | | TOTAL U.S. TREASURY OBLIGATIONS |
| | | (Cost $1,664,976) | | $ | 1,729,719 | |
| | | |
| | | |
| | | | | | | | | | | | | | | | | |
| | | | | | | | | | | | | | | | | |
Short-term Investment(m) – 6.2% |
| | | | | | | | | | | | | | | | | |
| | | | | | | | | | | | | | | | | |
| | | Repurchase Agreement – 6.2% |
| | | Joint Repurchase Agreement Account II |
| | | $ | 8,400,000 | | | | 0.200 | % | | | 05/03/10 | | | $ | 8,400,000 | |
| | | Maturity Value: $8,400,140 |
| | | (Cost $8,400,000) | | | | |
| | | |
| | | |
| | | TOTAL INVESTMENTS BEFORE SECURITIES LENDING REINVESTMENT VEHICLE |
| | | (Cost $127,781,393) | | $ | 139,572,447 | |
| | | |
| | | |
| | | | | | | | | | | | | |
| | | Shares | | Rate | | Value |
| |
Securities Lending Reinvestment Vehicle(e)(n) – 3.0% |
| | | | | | | | | | | | | |
| | | | | | | | | | | | | |
| | | Boston Global Investment Trust – Enhanced Portfolio II |
| | | | 4,097,279 | | | | 0.196 | % | | $ | 4,101,376 | |
| | | (Cost $4,095,848) | | | | |
| | | |
| | | |
| | | TOTAL INVESTMENTS – 106.5% |
| | | (Cost $131,877,241) | | $ | 143,673,823 | |
| | | |
| | | |
| | | LIABILITIES IN EXCESS OF OTHER ASSETS – (6.5)% | | | (8,711,222 | ) |
| | | |
| | | |
| | | NET ASSETS – 100.0% | | $ | 134,962,601 | |
| | | |
| | | |
The percentage shown for each investment category reflects the value of investments in that category as a percentage of net assets.
| | |
| * | | Non-income producing security |
| |
| (a) | | A portion of this security is segregated as collateral for initial margin requirements on futures transactions. |
| |
| (b) | | All or a portion of security is on loan. |
| |
| (c) | | Securities with “Call” features with resetting interest rates. Maturity dates disclosed are the final maturity dates. |
| |
| (d) | | Exempt from registration under Rule 144A of the Securities Act of 1933. Under procedures approved by the Board of Trustees, such securities have been determined to be liquid by the investment adviser and may be resold, normally to qualified institutional buyers in transactions exempt from registration. Total market value of Rule 144A securities amounts to $7,525,626, which represents approximately 5.6% of net assets as of April 30, 2010. |
| |
| (e) | | Variable rate security. Interest rate disclosed is that which is in effect at April 30, 2010. |
| |
| (f) | | Securities with “Put” features with resetting interest rates. Maturity dates disclosed are the next interest reset dates. |
| |
| (g) | | Security with a notional or nominal principal amount. The actual effective yield of this security is different than the stated interest rate. |
| |
| (h) | | Issued with zero coupon and interest rate is contingent upon LIBOR reaching a predetermined level. |
| |
| (i) | | TBA (To Be Announced) Securities are purchased on a forward commitment basis with an approximate principal amount and no defined maturity date. The actual principal and maturity date will be determined upon settlement when the specific mortgage pools are assigned. Total market value of TBA securities (excluding forward sales contracts, if any) amounts to $5,164,531 which represents approximately 3.8% of net assets as of April 30, 2010. |
The accompanying notes are an integral part of these financial statements.
GOLDMAN SACHS BALANCED FUND
Schedule of Investments (continued)
April 30, 2010 (Unaudited)
| | |
| (j) | | Issued with a zero coupon. Income is recognized through the accretion of discount. |
| |
| (k) | | Guaranteed by a foreign government until maturity. Total market value of these securities amounts to $3,967,615, which represents approximately 3.0% of net assets as of April 30, 2010. |
| |
| (l) | | Guaranteed under the Federal Deposit Insurance Corporation’s (“FDIC”) Temporary Liquidity Guarantee Program and is backed by the full faith and credit of the United States. The expiration date of the FDIC’s guarantee is the earlier of the maturity date of the debt or June 30, 2012. Total market value of these securities amounts to $1,923,837, which represents approximately 1.4% of net assets as of April 30, 2010. |
| |
| (m) | | Joint repurchase agreement was entered into on April 30, 2010. Additional information appears on pages 86-87. |
| |
| (n) | | Represents an affiliated issuer. |
| | | | | | | |
| | | |
| | | |
| | | Investment Abbreviations: |
| | | FHLMC | | — | | Federal Home Loan Mortgage Corp. |
| | | FNMA | | — | | Federal National Mortgage Association |
| | | GNMA | | — | | Government National Mortgage Association |
| | | GO | | — | | General Obligation |
| | | KWCDC | | — | | South Korean Won Certificate of Deposit |
| | | LIBOR | | — | | London Interbank Offered Rate |
| | | REMIC | | — | | Real Estate Mortgage Investment Conduit |
| | | STRIPS | | — | | Separate Trading of Registered Interest and Principal of Securities |
| | | |
| | | |
| | | | | | | |
| | | |
| | | |
| | | Currency Abbreviations: |
| | | EUR | | = | | Euro |
| | | KRW | | = | | South Korean Won |
| | | MXN | | = | | Mexican Peso |
| | | |
| | | |
ADDITIONAL INVESTMENT INFORMATION
FORWARD FOREIGN CURRENCY EXCHANGE CONTRACTS — At April 30, 2010, the Fund had outstanding forward foreign currency exchange contracts to sell foreign currencies:
| | | | | | | | | | | | | | | | | | | | | | | |
| | | | | | | | | | | Value on
| | | | | | | |
| | | | | | Contract
| | Expiration
| | | Settlement
| | | Current
| | | Unrealized
| |
| Counterparty | | Currency | | | Type | | Date | | | Date | | | Value | | | Loss | |
| | |
| JPMorgan Securities, Inc. | | | EUR | | | Sale | | | 06/09/10 | | | $ | 420,645 | | | $ | 422,847 | | | $ | (2,202 | ) |
| |
| |
FUTURES CONTRACTS — At April 30, 2010, the following futures contracts were open:
| | | | | | | | | | | | | | | |
| | | Number of
| | | | | | | | | |
| | | Contracts
| | | Expiration
| | Current
| | | Unrealized
| |
| Type | | Long (Short) | | | Date | | Value | | | Gain (Loss) | |
| | |
| S&P Mini 500 Index | | | 34 | | | June 2010 | | $ | 2,011,780 | | | $ | (34,613 | ) |
| U.K. Life Long Gilt | | | 6 | | | June 2010 | | | 1,064,365 | | | | 13,877 | |
| 2 Year U.S. Treasury Notes | | | 23 | | | June 2010 | | | 5,004,297 | | | | 16,771 | |
| 10 Year U.S. Treasury Notes | | | 62 | | | June 2010 | | | 7,310,188 | | | | 51,157 | |
| |
| |
TOTAL | | | | | | | | | | | | $ | 47,192 | |
| |
| |
The accompanying notes are an integral part of these financial statements.
GOLDMAN SACHS BALANCED FUND
| |
| ADDITIONAL INVESTMENT INFORMATION (continued) | |
SWAP CONTRACTS — At April 30, 2010, the Fund had outstanding swap contracts with the following terms:
INTEREST RATE SWAP CONTRACTS
| | | | | | | | | | | | | | | | | | | | | | | | | | | |
| | | | | | | | Rates
| | | | | | | | | | |
| | | | | | | | Exchanged | | | | | | Upfront
| | | | |
| | | Notional
| | | | | Payments
| | | Payments
| | | | | | Payments
| | | | |
| | | Amount
| | | Termination
| | received by
| | | made by
| | | Market
| | | made (received)
| | | Unrealized
| |
| Counterparty | | (000s) | | | Date | | the Fund | | | the Fund | | | Value | | | by the Fund | | | Gain (Loss) | |
| | |
| Citibank NA | | $ | 700 | (a) | | 06/16/17 | | | 3 month LIBOR | | | | 3.250% | | | $ | 210 | | | $ | 8,481 | | | $ | (8,271 | ) |
| Deutsche Bank Securities, Inc. | | KRW | 253,000 | | | 01/28/11 | | | 2.820 | % | | | 3 month KWCDC | | | | 106 | | | | (5 | ) | | | 111 | |
| | | | 550,000 | | | 06/26/11 | | | 3.693 | | | | 3 month KWCDC | | | | 3,864 | | | | — | | | | 3,864 | |
| | | | 219,234 | | | 07/06/11 | | | 3.620 | | | | 3 month KWCDC | | | | 1,364 | | | | — | | | | 1,364 | |
| | | | 366,287 | | | 07/07/11 | | | 3.626 | | | | 3 month KWCDC | | | | 2,353 | | | | — | | | | 2,353 | |
| JPMorgan Securities, Inc. | | | 246,000 | | | 01/28/11 | | | 2.830 | | | | 3 month KWCDC | | | | 119 | | | | — | | | | 119 | |
| | | | 200,000 | | | 06/15/11 | | | 3.900 | | | | 3 month KWCDC | | | | 1,935 | | | | — | | | | 1,935 | |
| | | | 540,000 | | | 06/22/11 | | | 3.720 | | | | 3 month KWCDC | | | | 4,121 | | | | — | | | | 4,121 | |
| | | | 174,212 | | | 07/08/11 | | | 3.660 | | | | 3 month KWCDC | | | | 1,216 | | | | — | | | | 1,216 | |
| |
| |
TOTAL | | | | | | | | | | | | | | | | $ | 15,288 | | | $ | 8,476 | | | $ | 6,812 | |
| |
| |
| |
| (a) | Represents forward starting interest rate swaps whose effective dates of commencement of accruals and cash flows occur subsequent to April 30, 2010. |
The accompanying notes are an integral part of these financial statements.
GOLDMAN SACHS BALANCED FUND
Schedule of Investments (continued)
April 30, 2010 (Unaudited)
| |
| ADDITIONAL INVESTMENT INFORMATION (continued) | |
SWAP CONTRACTS — (continued)
CREDIT DEFAULT SWAP CONTRACTS
| | | | | | | | | | | | | | | | | | | | | | | | | | | | | | | |
| | | | | | | | Rates
| | | | | | Credit
| | | | | | Upfront
| | | | |
| | | | | Notional
| | | received
| | | | | | Spread at
| | | | | | Payments
| | | | |
| | | Referenced
| | Amount
| | | (paid)
| | | Termination
| | | April 30, 2010
| | | Market
| | | made (received)
| | | Unrealized
| |
| Counterparty | | Obligation | | (000s) | | | by Fund | | | Date | | | (basis points)(b) | | | Value | | | by the Fund | | | Gain (Loss) | |
| | |
Protection Purchased: | | | | | | | | | | | | | | | | | | | | | | | | | | | | | | |
| Deutsche Bank Securities, Inc. | | CDX North America
Investment Grade Index | | $ | 1,300 | | | | (1.000 | )% | | | 06/20/15 | | | | 92 | | | $ | (6,549 | ) | | $ | (8,208 | ) | | $ | 1,659 | |
| JPMorgan Securities, Inc. | | CDX North America
Investment Grade Index | | | 1,100 | | | | (1.000 | ) | | | 06/20/15 | | | | 92 | | | | (5,542 | ) | | | (6,668 | ) | | | 1,126 | |
Protection Sold: | | | | | | | | | | | | | | | | | | | | | | | | | | | | | | |
| Credit Suisse First Boston Corp. | | ABX-HE-AAA 07-1
Index | | | 600 | | | | 0.090 | | | | 08/25/37 | | | | 925 | | | | (324,348 | ) | | | (129,787 | ) | | | (194,561 | ) |
| | | ABX-HE-AAA 07-2
Index | | | 500 | | | | 0.760 | | | | 01/25/38 | | | | 890 | | | | (272,022 | ) | | | (118,101 | ) | | | (153,921 | ) |
| | | Republic of Venezuela
9.25%, 09/15/27 | | | 100 | | | | 0.000 | | | | 06/20/10 | | | | 842 | | | | (1,182 | ) | | | (1,372 | ) | | | 190 | |
| |
| |
TOTAL | | | | | | | | | | | | | | | | | | | | $ | (609,643 | ) | | $ | (264,136 | ) | | $ | (345,507 | ) |
| |
| |
| |
| (b) | Credit spread on the Referenced Obligation, together with the term of the swap contract, are indicators of payment/performance risk. The likelihood of a credit event occurring which would require a fund to make a payment or otherwise be required to perform under the swap contract is generally greater as the credit spread and the term of the swap contract increase. |
The accompanying notes are an integral part of these financial statements.
GOLDMAN SACHS STRUCTURED LARGE CAP GROWTH FUND
Schedule of Investments
April 30, 2010 (Unaudited)
| | | | | | | | | | | |
| | | Shares | | Description | | Value |
| |
Common Stocks – 97.9% |
| | | | | | | | | | | |
| | | | | | | | | | | |
| | | Aerospace & Defense – 3.0% |
| | | | 78,926 | | | Honeywell International, Inc. | | $ | 3,746,617 | |
| | | | 5,987 | | | Lockheed Martin Corp. | | | 508,236 | |
| | | | 149,142 | | | Northrop Grumman Corp. | | | 10,116,302 | |
| | | | 99,128 | | | United Technologies Corp. | | | 7,429,644 | |
| | | | | | | | | | | |
| | | | | | | | | | 21,800,799 | |
| | | |
| | | |
| | | Air Freight & Logistics – 2.2% |
| | | | 13,997 | | | FedEx Corp. | | | 1,259,870 | |
| | | | 216,377 | | | United Parcel Service, Inc. Class B | | | 14,960,306 | |
| | | | | | | | | | | |
| | | | | | | | | | 16,220,176 | |
| | | |
| | | |
| | | Airlines – 0.1% |
| | | | 8,571 | | | Copa Holdings SA | | | 485,804 | |
| | | |
| | | |
| | | Auto Components – 0.5% |
| | | | 18,031 | | | Autoliv, Inc.* | | | 987,197 | |
| | | | 85,003 | | | Johnson Controls, Inc. | | | 2,855,251 | |
| | | | | | | | | | | |
| | | | | | | | | | 3,842,448 | |
| | | |
| | | |
| | | Beverages – 2.8% |
| | | | 92,651 | | | Hansen Natural Corp.* | | | 4,084,056 | |
| | | | 185,475 | | | PepsiCo., Inc. | | | 12,096,680 | |
| | | | 74,978 | | | The Coca-Cola Co. | | | 4,007,574 | |
| | | | | | | | | | | |
| | | | | | | | | | 20,188,310 | |
| | | |
| | | |
| | | Biotechnology* – 4.3% |
| | | | 250,467 | | | Amgen, Inc. | | | 14,366,787 | |
| | | | 44,766 | | | Biogen Idec, Inc. | | | 2,383,790 | |
| | | | 36,221 | | | Celgene Corp. | | | 2,243,891 | |
| | | | 28,770 | | | Genzyme Corp. | | | 1,531,715 | |
| | | | 284,444 | | | Gilead Sciences, Inc. | | | 11,283,893 | |
| | | | | | | | | | | |
| | | | | | | | | | 31,810,076 | |
| | | |
| | | |
| | | Building Products* – 0.2% |
| | | | 37,963 | | | Armstrong World Industries, Inc. | | | 1,653,289 | |
| | | |
| | | |
| | | Capital Markets – 0.5% |
| | | | 44,929 | | | Bank of New York Mellon Corp. | | | 1,398,640 | |
| | | | 22,234 | | | Federated Investors, Inc. Class B(a) | | | 536,284 | |
| | | | 67,684 | | | SEI Investments Co. | | | 1,520,182 | |
| | | | | | | | | | | |
| | | | | | | | | | 3,455,106 | |
| | | |
| | | |
| | | Chemicals – 1.5% |
| | | | 41,476 | | | E.I. du Pont de Nemours and Co. | | | 1,652,404 | |
| | | | 32,477 | | | Eastman Chemical Co. | | | 2,173,361 | |
| | | | 150,141 | | | Huntsman Corp. | | | 1,713,109 | |
| | | | 35,296 | | | Monsanto Co. | | | 2,225,766 | |
| | | | 56,545 | | | The Dow Chemical Co. | | | 1,743,282 | |
| | | | 34,558 | | | The Scotts Miracle-Gro Co. | | | 1,674,335 | |
| | | | | | | | | | | |
| | | | | | | | | | 11,182,257 | |
| | | |
| | | |
| | | Commercial Banks – 0.2% |
| | | | 43,144 | | | U.S. Bancorp | | | 1,154,965 | |
| | | |
| | | |
| | | Commercial Services & Supplies – 0.1% |
| | | | 18,012 | | | R.R. Donnelley & Sons Co. | | | 387,078 | |
| | | |
| | | |
| | | Communications Equipment – 3.7% |
| | | | 860,091 | | | Cisco Systems, Inc.* | | | 23,153,650 | |
| | | | 14,142 | | | EchoStar Corp.* | | | 271,668 | |
| | | | 370,655 | | | Tellabs, Inc. | | | 3,365,547 | |
| | | | | | | | | | | |
| | | | | | | | | | 26,790,865 | |
| | | |
| | | |
| | | Computers & Peripherals – 7.0% |
| | | | 37,308 | | | Apple, Inc.* | | | 9,741,865 | |
| | | | 605,351 | | | Dell, Inc.* | | | 9,794,579 | |
| | | | 35,944 | | | EMC Corp.* | | | 683,295 | |
| | | | 142,438 | | | Hewlett-Packard Co. | | | 7,402,503 | |
| | | | 46,159 | | | Lexmark International, Inc.* | | | 1,710,191 | |
| | | | 55,527 | | | SanDisk Corp.* | | | 2,214,972 | |
| | | | 552,772 | | | Seagate Technology* | | | 10,154,422 | |
| | | | 224,658 | | | Western Digital Corp.* | | | 9,231,197 | |
| | | | | | | | | | | |
| | | | | | | | | | 50,933,024 | |
| | | |
| | | |
| | | Consumer Finance – 0.1% |
| | | | 20,323 | | | Capital One Financial Corp. | | | 882,221 | |
| | | |
| | | |
| | | Diversified Consumer Services* – 0.5% |
| | | | 62,385 | | | Apollo Group, Inc. | | | 3,581,523 | |
| | | |
| | | |
| | | Electric Utilities – 0.2% |
| | | | 31,836 | | | Exelon Corp. | | | 1,387,731 | |
| | | |
| | | |
| | | Electrical Equipment – 1.2% |
| | | | 6,395 | | | Cooper Industries PLC | | | 313,995 | |
| | | | 124,940 | | | Emerson Electric Co. | | | 6,525,616 | |
| | | | 34,886 | | | Rockwell Automation, Inc. | | | 2,118,278 | |
| | | | | | | | | | | |
| | | | | | | | | | 8,957,889 | |
| | | |
| | | |
| | | Electronic Equipment, Instruments & Components – 2.3% |
| | | | 85,519 | | | Arrow Electronics, Inc.* | | | 2,608,329 | |
| | | | 71,299 | | | Avnet, Inc.* | | | 2,279,429 | |
| | | | 83,910 | | | Flextronics International Ltd.* | | | 650,302 | |
| | | | 364,211 | | | Ingram Micro, Inc.* | | | 6,614,072 | |
| | | | 135,338 | | | Tyco Electronics Ltd. | | | 4,347,057 | |
| | | | | | | | | | | |
| | | | | | | | | | 16,499,189 | |
| | | |
| | | |
| | | Energy Equipment & Services – 0.7% |
| | | | 38,957 | | | Baker Hughes, Inc. | | | 1,938,500 | |
| | | | 22,210 | | | Exterran Holdings, Inc.*(a) | | | 647,422 | |
| | | | 74,499 | | | Halliburton Co. | | | 2,283,394 | |
| | | | 6,245 | | | Schlumberger Ltd. | | | 446,018 | |
| | | | | | | | | | | |
| | | | | | | | | | 5,315,334 | |
| | | |
| | | |
| | | Food & Staples Retailing – 2.3% |
| | | | 4,309 | | | Costco Wholesale Corp. | | | 254,576 | |
| | | | 257,963 | | | Wal-Mart Stores, Inc. | | | 13,839,715 | |
| | | | 82,513 | | | Walgreen Co. | | | 2,900,332 | |
| | | | | | | | | | | |
| | | | | | | | | | 16,994,623 | |
| | | |
| | | |
| | | Food Products – 1.6% |
| | | | 261,025 | | | Archer-Daniels-Midland Co. | | | 7,293,038 | |
| | | | 24,051 | | | Hormel Foods Corp. | | | 980,319 | |
| | | | 176,091 | | | Tyson Foods, Inc. | | | 3,449,623 | |
| | | | | | | | | | | |
| | | | | | | | | | 11,722,980 | |
| | | |
| | | |
The accompanying notes are an integral part of these financial statements.
GOLDMAN SACHS STRUCTURED LARGE CAP GROWTH FUND
Schedule of Investments (continued)
April 30, 2010 (Unaudited)
| | | | | | | | | | | |
| | | Shares | | Description | | Value |
| |
Common Stocks – (continued) |
| | | | | | | | | | | |
| | | Health Care Equipment & Supplies – 2.8% |
| | | | 467,767 | | | Boston Scientific Corp.* | | $ | 3,218,237 | |
| | | | 220,685 | | | CareFusion Corp.* | | | 6,086,492 | |
| | | | 24,362 | | | Hill-Rom Holdings, Inc. | | | 772,519 | |
| | | | 92,034 | | | Medtronic, Inc. | | | 4,020,965 | |
| | | | 105,504 | | | Stryker Corp. | | | 6,060,150 | |
| | | | | | | | | | | |
| | | | | | | | | | 20,158,363 | |
| | | |
| | | |
| | | Health Care Providers & Services – 2.3% |
| | | | 210,927 | | | Cardinal Health, Inc. | | | 7,317,057 | |
| | | | 112,032 | | | Coventry Health Care, Inc.* | | | 2,659,640 | |
| | | | 22,342 | | | Humana, Inc.* | | | 1,021,476 | |
| | | | 21,027 | | | McKesson Corp. | | | 1,362,760 | |
| | | | 24,686 | | | Medco Health Solutions, Inc.* | | | 1,454,499 | |
| | | | 54,801 | | | WellPoint, Inc.* | | | 2,948,294 | |
| | | | | | | | | | | |
| | | | | | | | | | 16,763,726 | |
| | | |
| | | |
| | | Hotels, Restaurants & Leisure – 2.0% |
| | | | 146,454 | | | Carnival Corp. | | | 6,107,132 | |
| | | | 53,444 | | | Marriott International, Inc. | | | 1,964,601 | |
| | | | 6,500 | | | Panera Bread Co.* | | | 506,610 | |
| | | | 226,325 | | | Starbucks Corp. | | | 5,879,924 | |
| | | | | | | | | | | |
| | | | | | | | | | 14,458,267 | |
| | | |
| | | |
| | | Household Durables – 0.4% |
| | | | 27,930 | | | Harman International Industries, Inc.* | | | 1,102,676 | |
| | | | 4,898 | | | Mohawk Industries, Inc.* | | | 312,199 | |
| | | | 11,170 | | | Whirlpool Corp. | | | 1,216,078 | |
| | | | | | | | | | | |
| | | | | | | | | | 2,630,953 | |
| | | |
| | | |
| | | Household Products – 3.3% |
| | | | 39,312 | | | Kimberly-Clark Corp. | | | 2,408,253 | |
| | | | 352,268 | | | The Procter & Gamble Co. | | | 21,896,979 | |
| | | | | | | | | | | |
| | | | | | | | | | 24,305,232 | |
| | | |
| | | |
| | | Industrial Conglomerates – 0.8% |
| | | | 18,990 | | | 3M Co. | | | 1,683,843 | |
| | | | 113,828 | | | Tyco International Ltd. | | | 4,415,388 | |
| | | | | | | | | | | |
| | | | | | | | | | 6,099,231 | |
| | | |
| | | |
| | | Insurance – 1.4% |
| | | | 7,595 | | | Assurant, Inc. | | | 276,686 | |
| | | | 11,245 | | | Lincoln National Corp. | | | 343,985 | |
| | | | 33,641 | | | Loews Corp. | | | 1,252,791 | |
| | | | 12,226 | | | Protective Life Corp. | | | 294,280 | |
| | | | 15,571 | | | The Travelers Cos., Inc. | | | 790,072 | |
| | | | 295,156 | | | Unum Group | | | 7,222,467 | |
| | | | | | | | | | | |
| | | | | | | | | | 10,180,281 | |
| | | |
| | | |
| | | Internet & Catalog Retail – 1.5% |
| | | | 50,013 | | | Amazon.com, Inc.*(b) | | | 6,854,782 | |
| | | | 146,027 | | | Expedia, Inc. | | | 3,447,698 | |
| | | | 24,804 | | | Liberty Media Corp. – Interactive* | | | 380,989 | |
| | | | | | | | | | | |
| | | | | | | | | | 10,683,469 | |
| | | |
| | | |
| | | Internet Software & Services* – 2.3% |
| | | | 39,507 | | | AOL, Inc. | | | 922,883 | |
| | | | 25,895 | | | Google, Inc. | | | 13,606,269 | |
| | | | 79,899 | | | VeriSign, Inc. | | | 2,178,846 | |
| | | | | | | | | | | |
| | | | | | | | | | 16,707,998 | |
| | | |
| | | |
| | | IT Services – 3.2% |
| | | | 344,184 | | | Accenture PLC | | | 15,020,189 | |
| | | | 47,032 | | | International Business Machines Corp. | | | 6,067,128 | |
| | | | 87,791 | | | NeuStar, Inc.* | | | 2,148,246 | |
| | | | | | | | | | | |
| | | | | | | | | | 23,235,563 | |
| | | |
| | | |
| | | Machinery – 2.7% |
| | | | 14,788 | | | Eaton Corp. | | | 1,141,042 | |
| | | | 8,181 | | | Illinois Tool Works, Inc. | | | 418,049 | |
| | | | 18,170 | | | Ingersoll-Rand PLC | | | 671,927 | |
| | | | 53,911 | | | Oshkosh Corp.* | | | 2,082,043 | |
| | | | 83,615 | | | PACCAR, Inc. | | | 3,889,770 | |
| | | | 202,527 | | | The Toro Co. | | | 11,531,887 | |
| | | | | | | | | | | |
| | | | | | | | | | 19,734,718 | |
| | | |
| | | |
| | | Media – 2.3% |
| | | | 46,660 | | | Comcast Corp. Special Class A | | | 879,541 | |
| | | | 66,150 | | | DIRECTV* | | | 2,396,614 | |
| | | | 160,357 | | | DISH Network Corp. | | | 3,551,908 | |
| | | | 32,765 | | | Scripps Networks Interactive | | | 1,485,565 | |
| | | | 248,775 | | | Time Warner, Inc. | | | 8,229,477 | |
| | | | | | | | | | | |
| | | | | | | | | | 16,543,105 | |
| | | |
| | | |
| | | Metals & Mining – 1.6% |
| | | | 33,176 | | | Alcoa, Inc. | | | 445,885 | |
| | | | 35,943 | | | Freeport-McMoRan Copper & Gold, Inc. | | | 2,714,775 | |
| | | | 85,599 | | | Newmont Mining Corp. | | | 4,800,392 | |
| | | | 34,845 | | | Nucor Corp. | | | 1,579,175 | |
| | | | 25,869 | | | Reliance Steel & Aluminum Co. | | | 1,262,666 | |
| | | | 23,415 | | | Schnitzer Steel Industries, Inc. | | | 1,264,410 | |
| | | | | | | | | | | |
| | | | | | | | | | 12,067,303 | |
| | | |
| | | |
| | | Multiline Retail – 1.3% |
| | | | 25,852 | | | Big Lots, Inc.* | | | 987,546 | |
| | | | 70,658 | | | Dollar Tree, Inc.* | | | 4,290,354 | |
| | | | 13,263 | | | J.C. Penney Co., Inc. | | | 386,882 | |
| | | | 14,965 | | | Kohl’s Corp.* | | | 822,925 | |
| | | | 64,726 | | | Nordstrom, Inc. | | | 2,675,126 | |
| | | | | | | | | | | |
| | | | | | | | | | 9,162,833 | |
| | | |
| | | |
| | | Oil, Gas & Consumable Fuels – 2.9% |
| | | | 22,735 | | | Chevron Corp. | | | 1,851,538 | |
| | | | 68,660 | | | Devon Energy Corp. | | | 4,622,878 | |
| | | | 172,463 | | | Exxon Mobil Corp. | | | 11,701,615 | |
| | | | 141,822 | | | Valero Energy Corp. | | | 2,948,479 | |
| | | | | | | | | | | |
| | | | | | | | | | 21,124,510 | |
| | | |
| | | |
| | | Paper & Forest Products – 0.1% |
| | | | 38,321 | | | International Paper Co. | | | 1,024,704 | |
| | | |
| | | |
The accompanying notes are an integral part of these financial statements.
GOLDMAN SACHS STRUCTURED LARGE CAP GROWTH FUND
| | | | | | | | | | | |
| | | Shares | | Description | | Value |
| |
Common Stocks – (continued) |
| | | | | | | | | | | |
| | | Personal Products – 0.3% |
| | | | 36,354 | | | Herbalife Ltd. | | $ | 1,754,080 | |
| | | | 17,479 | | | NBTY, Inc.* | | | 711,046 | |
| | | | | | | | | | | |
| | | | | | | | | | 2,465,126 | |
| | | |
| | | |
| | | Pharmaceuticals – 5.9% |
| | | | 62,796 | | | Bristol-Myers Squibb Co. | | | 1,588,111 | |
| | | | 624,585 | | | Eli Lilly & Co. | | | 21,841,738 | |
| | | | 143,669 | | | Forest Laboratories, Inc.* | | | 3,916,417 | |
| | | | 139,120 | | | Johnson & Johnson | | | 8,945,416 | |
| | | | 51,194 | | | King Pharmaceuticals, Inc.* | | | 501,701 | |
| | | | 397,756 | | | Pfizer, Inc. | | | 6,650,480 | |
| | | | | | | | | | | |
| | | | | | | | | | 43,443,863 | |
| | | |
| | | |
| | | Professional Services – 0.6% |
| | | | 82,370 | | | Manpower, Inc. | | | 4,620,957 | |
| | | |
| | | |
| | | Real Estate Investment Trusts – 2.7% |
| | | | 18,663 | | | AvalonBay Communities, Inc. | | | 1,941,699 | |
| | | | 11,820 | | | Public Storage | | | 1,145,476 | |
| | | | 85,496 | | | Rayonier, Inc. | | | 4,187,594 | |
| | | | 141,267 | | | Simon Property Group, Inc. | | | 12,575,588 | |
| | | | | | | | | | | |
| | | | | | | | | | 19,850,357 | |
| | | |
| | | |
| | | Semiconductors & Semiconductor Equipment – 5.5% |
| | | | 55,638 | | | Fairchild Semiconductor International, Inc.* | | | 624,258 | |
| | | | 105,051 | | | Integrated Device Technology, Inc.* | | | 694,387 | |
| | | | 1,252,086 | | | Intel Corp. | | | 28,585,124 | |
| | | | 75,116 | | | Micron Technology, Inc.* | | | 702,335 | |
| | | | 363,113 | | | Texas Instruments, Inc. | | | 9,444,569 | |
| | | | | | | | | | | |
| | | | | | | | | | 40,050,673 | |
| | | |
| | | |
| | | Software – 9.5% |
| | | | 387,117 | | | Activision Blizzard, Inc. | | | 4,289,256 | |
| | | | 60,202 | | | Adobe Systems, Inc.* | | | 2,022,185 | |
| | | | 16,794 | | | CA, Inc. | | | 383,071 | |
| | | | 1,382,692 | | | Microsoft Corp. | | | 42,227,414 | |
| | | | 601,483 | | | Oracle Corp. | | | 15,542,321 | |
| | | | 291,849 | | | Symantec Corp.* | | | 4,894,308 | |
| | | | 17,066 | | | Synopsys, Inc.* | | | 387,569 | |
| | | | | | | | | | | |
| | | | | | | | | | 69,746,124 | |
| | | |
| | | |
| | | Specialty Retail – 3.4% |
| | | | 10,440 | | | Abercrombie & Fitch Co. | | | 456,541 | |
| | | | 61,440 | | | AutoNation, Inc.*(a) | | | 1,241,088 | |
| | | | 21,529 | | | Guess?, Inc. | | | 987,535 | |
| | | | 47,627 | | | Limited Brands, Inc. | | | 1,276,404 | |
| | | | 12,599 | | | PetSmart, Inc. | | | 416,649 | |
| | | | 190,723 | | | Ross Stores, Inc. | | | 10,680,488 | |
| | | | 132,819 | | | The Gap, Inc. | | | 3,284,614 | |
| | | | 102,624 | | | The TJX Cos., Inc. | | | 4,755,596 | |
| | | | 54,103 | | | Williams-Sonoma, Inc. | | | 1,558,166 | |
| | | | | | | | | | | |
| | | | | | | | | | 24,657,081 | |
| | | |
| | | |
| | | Textiles, Apparel & Luxury Goods – 0.3% |
| | | | 26,042 | | | NIKE, Inc. Class B | | | 1,976,848 | |
| | | |
| | | |
| | | Tobacco – 3.5% |
| | | | 215,558 | | | Lorillard, Inc. | | | 16,893,281 | |
| | | | 183,993 | | | Philip Morris International, Inc. | | | 9,030,376 | |
| | | | | | | | | | | |
| | | | | | | | | | 25,923,657 | |
| | | |
| | | |
| | | Wireless Telecommunication Services – 0.3% |
| | | | 501,621 | | | Sprint Nextel Corp.* | | | 2,131,889 | |
| | | | 13,136 | | | Telephone & Data Systems, Inc. | | | 455,294 | |
| | | | | | | | | | | |
| | | | | | | | | | 2,587,183 | |
| | | |
| | | |
| | | TOTAL COMMON STOCKS |
| | | (Cost $592,869,230) | | $ | 715,447,812 | |
| | | |
| | | |
| | | | | | | | | | | | | | | | | |
| | | Principal
| | Interest
| | Maturity
| | |
| | | Amount | | Rate | | Date | | Value |
| |
Short-term Investment(c) – 1.6% |
| | | | | | | | | | | | | | | | | |
| | | | | | | | | | | | | | | | | |
| | | Repurchase Agreement – 1.6% |
| | | Joint Repurchase Agreement Account II |
| | | $ | 11,300,000 | | | | 0.200 | % | | | 05/03/10 | | | $ | 11,300,000 | |
| | | Maturity Value: $11,300,188 |
| | | (Cost $11,300,000) | | | | |
| | | |
| | | |
| | | TOTAL INVESTMENTS BEFORE SECURITIES LENDING REINVESTMENT VEHICLE |
| | | (Cost $604,169,230) | | $ | 726,747,812 | |
| | | |
| | | |
| | | | | | | | | | | | | |
| | | Shares | | Rate | | Value |
| |
Securities Lending Reinvestment Vehicle(d)(e) – 0.0% |
| | | | | | | | | | | | | |
| | | | | | | | | | | | | |
| | | Boston Global Investment Trust – Enhanced Portfolio II |
| | | | 76,873 | | | | 0.196 | % | | $ | 76,950 | |
| | | (Cost $76,950) | | | | |
| | | |
| | | |
| | | TOTAL INVESTMENTS – 99.5% |
| | | (Cost $604,246,180) | | $ | 726,824,762 | |
| | | |
| | | |
| | | OTHER ASSETS IN EXCESS OF LIABILITIES – 0.5% | | | 3,765,550 | |
| | | |
| | | |
| | | NET ASSETS – 100.0% | | $ | 730,590,312 | |
| | | |
| | | |
The percentage shown for each investment category reflects the value of investments in that category as a percentage of net assets.
| | |
| * | | Non-income producing security. |
| |
| (a) | | All or a portion of security is on loan. |
| |
| (b) | | A portion of this security is segregated as collateral for initial margin requirement on futures transactions. |
| |
| (c) | | Joint repurchase agreement was entered into on April 30, 2010. Additional information appears on pages 86-87. |
| |
| (d) | | Variable rate security. Interest rate disclosed is that which is in effect at April 30, 2010. |
| |
| (e) | | Represents an affiliated issuer. |
The accompanying notes are an integral part of these financial statements.
GOLDMAN SACHS STRUCTURED LARGE CAP GROWTH FUND
Schedule of Investments (continued)
April 30, 2010 (Unaudited)
ADDITIONAL INVESTMENT INFORMATION
FUTURES CONTRACTS — At April 30, 2010, the following futures contracts were open:
| | | | | | | | | | | | | | | |
| | | Number of
| | | | | | | | | |
| | | Contracts
| | | Expiration
| | Current
| | | Unrealized
| |
| Type | | Long (Short) | | | Date | | Value | | | Gain (Loss) | |
| | |
| S&P Mini 500 Index | | | 175 | | | June 2010 | | $ | 10,354,750 | | | $ | (162,281 | ) |
| |
| |
The accompanying notes are an integral part of these financial statements.
GOLDMAN SACHS STRUCTURED LARGE CAP VALUE FUND
Schedule of Investments
April 30, 2010 (Unaudited)
| | | | | | | | | | | |
| | | Shares | | Description | | Value |
| |
Common Stocks – 100.3% |
| | | | | | | | | | | |
| | | | | | | | | | | |
| | | Aerospace & Defense – 1.9% |
| | | | 172,835 | | | Northrop Grumman Corp. | | $ | 11,723,398 | |
| | | | 48,310 | | | The Boeing Co. | | | 3,499,093 | |
| | | | | | | | | | | |
| | | | | | | | | | 15,222,491 | |
| | | |
| | | |
| | | Air Freight & Logistics – 1.7% |
| | | | 94,837 | | | FedEx Corp. | | | 8,536,279 | |
| | | | 76,173 | | | United Parcel Service, Inc. Class B | | | 5,266,601 | |
| | | | | | | | | | | |
| | | | | | | | | | 13,802,880 | |
| | | |
| | | |
| | | Auto Components – 1.0% |
| | | | 8,349 | | | Autoliv, Inc.* | | | 457,108 | |
| | | | 14,112 | | | Federal-Mogul Corp.* | | | 268,410 | |
| | | | 183,326 | | | Johnson Controls, Inc. | | | 6,157,920 | |
| | | | 21,685 | | | TRW Automotive Holdings Corp.* | | | 698,474 | |
| | | | | | | | | | | |
| | | | | | | | | | 7,581,912 | |
| | | |
| | | |
| | | Automobiles – 0.1% |
| | | | 27,153 | | | Thor Industries, Inc. | | | 969,634 | |
| | | |
| | | |
| | | Beverages – 0.3% |
| | | | 37,047 | | | Hansen Natural Corp.* | | | 1,633,032 | |
| | | | 9,502 | | | The Coca-Cola Co. | | | 507,882 | |
| | | | | | | | | | | |
| | | | | | | | | | 2,140,914 | |
| | | |
| | | |
| | | Biotechnology* – 0.8% |
| | | | 73,353 | | | Amgen, Inc. | | | 4,207,528 | |
| | | | 57,068 | | | Gilead Sciences, Inc. | | | 2,263,888 | |
| | | | | | | | | | | |
| | | | | | | | | | 6,471,416 | |
| | | |
| | | |
| | | Building Products*(a) – 0.2% |
| | | | 30,829 | | | Armstrong World Industries, Inc. | | | 1,342,603 | |
| | | |
| | | |
| | | Capital Markets – 2.6% |
| | | | 294,303 | | | Bank of New York Mellon Corp. | | | 9,161,652 | |
| | | | 121,410 | | | Eaton Vance Corp. | | | 4,278,488 | |
| | | | 47,380 | | | Federated Investors, Inc. Class B(a) | | | 1,142,806 | |
| | | | 255,865 | | | SEI Investments Co. | | | 5,746,728 | |
| | | | | | | | | | | |
| | | | | | | | | | 20,329,674 | |
| | | |
| | | |
| | | Chemicals – 1.5% |
| | | | 23,305 | | | Cytec Industries, Inc. | | | 1,120,038 | |
| | | | 74,813 | | | Eastman Chemical Co. | | | 5,006,486 | |
| | | | 175,985 | | | Huntsman Corp. | | | 2,007,989 | |
| | | | 112,834 | | | The Dow Chemical Co. | | | 3,478,672 | |
| | | | | | | | | | | |
| | | | | | | | | | 11,613,185 | |
| | | |
| | | |
| | | Commercial Banks – 5.8% |
| | | | 307,579 | | | BB&T Corp. | | | 10,223,926 | |
| | | | 7,657 | | | PNC Financial Services Group, Inc. | | | 514,627 | |
| | | | 69,471 | | | Regions Financial Corp. | | | 614,124 | |
| | | | 353,907 | | | U.S. Bancorp | | | 9,474,090 | |
| | | | 768,247 | | | Wells Fargo & Co. | | | 25,436,658 | |
| | | | | | | | | | | |
| | | | | | | | | | 46,263,425 | |
| | | |
| | | |
| | | Communications Equipment* – 0.3% |
| | | | 299,677 | | | Motorola, Inc. | | | 2,118,716 | |
| | | |
| | | |
| | | Computers & Peripherals* – 1.1% |
| | | | 383,404 | | | Seagate Technology | | | 7,043,132 | |
| | | | 37,613 | | | Western Digital Corp. | | | 1,545,518 | |
| | | | | | | | | | | |
| | | | | | | | | | 8,588,650 | |
| | | |
| | | |
| | | Consumer Finance – 1.6% |
| | | | 78,563 | | | AmeriCredit Corp.*(a) | | | 1,880,798 | |
| | | | 179,725 | | | Capital One Financial Corp. | | | 7,801,862 | |
| | | | 180,432 | | | Discover Financial Services | | | 2,789,479 | |
| | | | 9,653 | | | The Student Loan Corp. | | | 272,601 | |
| | | | | | | | | | | |
| | | | | | | | | | 12,744,740 | |
| | | |
| | | |
| | | Containers & Packaging – 0.1% |
| | | | 21,192 | | | Sonoco Products Co. | | | 702,091 | |
| | | |
| | | |
| | | Diversified Financial Services – 6.8% |
| | | | 1,542,518 | | | Bank of America Corp. | | | 27,503,096 | |
| | | | 2,157,056 | | | Citigroup, Inc.* | | | 9,426,335 | |
| | | | 390,507 | | | JPMorgan Chase & Co. | | | 16,627,788 | |
| | | | | | | | | | | |
| | | | | | | | | | 53,557,219 | |
| | | |
| | | |
| | | Diversified Telecommunication Services – 3.9% |
| | | | 978,493 | | | AT&T, Inc.(b) | | | 25,499,528 | |
| | | | 196,054 | | | Verizon Communications, Inc. | | | 5,664,000 | |
| | | | | | | | | | | |
| | | | | | | | | | 31,163,528 | |
| | | |
| | | |
| | | Electric Utilities – 2.8% |
| | | | 661,293 | | | Duke Energy Corp. | | | 11,096,497 | |
| | | | 249,772 | | | Exelon Corp. | | | 10,887,561 | |
| | | | | | | | | | | |
| | | | | | | | | | 21,984,058 | |
| | | |
| | | |
| | | Electrical Equipment – 0.3% |
| | | | 5,511 | | | Emerson Electric Co. | | | 287,839 | |
| | | | 28,094 | | | Rockwell Automation, Inc. | | | 1,705,868 | |
| | | | | | | | | | | |
| | | | | | | | | | 1,993,707 | |
| | | |
| | | |
| | | Electronic Equipment, Instruments & Components – 1.4% |
| | | | 33,677 | | | Arrow Electronics, Inc.* | | | 1,027,149 | |
| | | | 163,209 | | | Flextronics International Ltd.* | | | 1,264,870 | |
| | | | 280,464 | | | Ingram Micro, Inc.* | | | 5,093,226 | |
| | | | 113,454 | | | Tyco Electronics Ltd. | | | 3,644,142 | |
| | | | | | | | | | | |
| | | | | | | | | | 11,029,387 | |
| | | |
| | | |
| | | Energy Equipment & Services – 2.3% |
| | | | 63,139 | | | Baker Hughes, Inc. | | | 3,141,797 | |
| | | | 166,573 | | | Exterran Holdings, Inc.*(a) | | | 4,855,603 | |
| | | | 252,301 | | | Halliburton Co. | | | 7,733,026 | |
| | | | 27,919 | | | National-Oilwell Varco, Inc. | | | 1,229,273 | |
| | | | 19,260 | | | Oil States International, Inc.* | | | 930,450 | |
| | | | | | | | | | | |
| | | | | | | | | | 17,890,149 | |
| | | |
| | | |
| | | Food & Staples Retailing – 0.1% |
| | | | 70,945 | | | SUPERVALU, Inc. | | | 1,057,081 | |
| | | |
| | | |
| | | Food Products – 2.2% |
| | | | 310,901 | | | Archer-Daniels-Midland Co. | | | 8,686,574 | |
| | | | 61,385 | | | Smithfield Foods, Inc.* | | | 1,150,355 | |
| | | | 374,427 | | | Tyson Foods, Inc. | | | 7,335,025 | |
| | | | | | | | | | | |
| | | | | | | | | | 17,171,954 | |
| | | |
| | | |
The accompanying notes are an integral part of these financial statements.
GOLDMAN SACHS STRUCTURED LARGE CAP VALUE FUND
Schedule of Investments (continued)
April 30, 2010 (Unaudited)
| | | | | | | | | | | |
| | | Shares | | Description | | Value |
| |
Common Stocks – (continued) |
| | | | | | | | | | | |
| | | Gas Utilities – 0.1% |
| | | | 7,903 | | | Questar Corp. | | $ | 378,949 | |
| | | |
| | | |
| | | Health Care Equipment & Supplies* – 0.6% |
| | | | 340,058 | | | Boston Scientific Corp. | | | 2,339,599 | |
| | | | 82,593 | | | CareFusion Corp. | | | 2,277,915 | |
| | | | | | | | | | | |
| | | | | | | | | | 4,617,514 | |
| | | |
| | | |
| | | Health Care Providers & Services – 1.7% |
| | | | 63,626 | | | Cardinal Health, Inc. | | | 2,207,186 | |
| | | | 170,009 | | | Coventry Health Care, Inc.* | | | 4,036,014 | |
| | | | 5,656 | | | Humana, Inc.* | | | 258,592 | |
| | | | 126,451 | | | UnitedHealth Group, Inc. | | | 3,832,730 | |
| | | | 57,555 | | | WellPoint, Inc.* | | | 3,096,459 | |
| | | | | | | | | | | |
| | | | | | | | | | 13,430,981 | |
| | | |
| | | |
| | | Hotels, Restaurants & Leisure – 0.6% |
| | | | 119,011 | | | Carnival Corp. | | | 4,962,759 | |
| | | |
| | | |
| | | Household Durables – 1.2% |
| | | | 35,474 | | | D.R. Horton, Inc. | | | 521,113 | |
| | | | 89,741 | | | Harman International Industries, Inc.* | | | 3,542,975 | |
| | | | 13,051 | | | Mohawk Industries, Inc.* | | | 831,871 | |
| | | | 44,022 | | | Whirlpool Corp. | | | 4,792,675 | |
| | | | | | | | | | | |
| | | | | | | | | | 9,688,634 | |
| | | |
| | | |
| | | Household Products – 0.7% |
| | | | 83,739 | | | The Procter & Gamble Co. | | | 5,205,216 | |
| | | |
| | | |
| | | Independent Power Producers & Energy Traders – 0.3% |
| | | | 27,669 | | | Constellation Energy Group, Inc. | | | 978,099 | |
| | | | 150,318 | | | Mirant Corp.* | | | 1,752,708 | |
| | | | | | | | | | | |
| | | | | | | | | | 2,730,807 | |
| | | |
| | | |
| | | Industrial Conglomerates – 3.1% |
| | | | 1,280,759 | | | General Electric Co. | | | 24,155,115 | |
| | | |
| | | |
| | | Insurance – 3.9% |
| | | | 7,949 | | | Berkshire Hathaway, Inc. Class B* | | | 612,073 | |
| | | | 17,077 | | | Lincoln National Corp. | | | 522,385 | |
| | | | 118,374 | | | MetLife, Inc. | | | 5,395,487 | |
| | | | 59,944 | | | Prudential Financial, Inc. | | | 3,810,041 | |
| | | | 136,417 | | | The Travelers Cos., Inc. | | | 6,921,798 | |
| | | | 569,740 | | | Unum Group | | | 13,941,538 | |
| | | | | | | | | | | |
| | | | | | | | | | 31,203,322 | |
| | | |
| | | |
| | | Internet & Catalog Retail – 0.8% |
| | | | 102,393 | | | Expedia, Inc. | | | 2,417,499 | |
| | | | 261,527 | | | Liberty Media Corp. – Interactive* | | | 4,019,670 | |
| | | | | | | | | | | |
| | | | | | | | | | 6,437,169 | |
| | | |
| | | |
| | | Machinery – 3.0% |
| | | | 48,900 | | | AGCO Corp.* | | | 1,712,478 | |
| | | | 54,461 | | | Cummins, Inc. | | | 3,933,718 | |
| | | | 47,885 | | | Eaton Corp. | | | 3,694,807 | |
| | | | 68,861 | | | Ingersoll-Rand PLC | | | 2,546,480 | |
| | | | 81,826 | | | Oshkosh Corp.* | | | 3,160,120 | |
| | | | 26,710 | | | PACCAR, Inc. | | | 1,242,549 | |
| | | |
| | | |
| | | | 80,825 | | | The Toro Co. | | | 4,602,175 | |
| | | | 104,472 | | | Trinity Industries, Inc. | | | 2,600,308 | |
| | | | | | | | | | | |
| | | | | | | | | | 23,492,635 | |
| | | |
| | | |
| | | Media – 5.2% |
| | | | 134,428 | | | CBS Corp. Class B | | | 2,179,078 | |
| | | | 429,304 | | | Comcast Corp. | | | 8,474,461 | |
| | | | 109,895 | | | Comcast Corp. Special Class A | | | 2,071,521 | |
| | | | 210,251 | | | DISH Network Corp. | | | 4,657,060 | |
| | | | 15,895 | | | Gannett Co., Inc. | | | 270,533 | |
| | | | 11,075 | | | Liberty Media – Starz* | | | 613,444 | |
| | | | 22,243 | | | Scripps Networks Interactive | | | 1,008,497 | |
| | | | 662,524 | | | Time Warner, Inc. | | | 21,916,294 | |
| | | | | | | | | | | |
| | | | | | | | | | 41,190,888 | |
| | | |
| | | |
| | | Metals & Mining – 1.7% |
| | | | 252,787 | | | Alcoa, Inc. | | | 3,397,457 | |
| | | | 34,575 | | | Nucor Corp. | | | 1,566,939 | |
| | | | 119,465 | | | Reliance Steel & Aluminum Co. | | | 5,831,087 | |
| | | | 56,020 | | | Schnitzer Steel Industries, Inc. | | | 3,025,080 | |
| | | | | | | | | | | |
| | | | | | | | | | 13,820,563 | |
| | | |
| | | |
| | | Multi-Utilities – 1.9% |
| | | | 55,181 | | | Ameren Corp. | | | 1,432,499 | |
| | | | 105,664 | | | Dominion Resources, Inc. | | | 4,416,755 | |
| | | | 21,232 | | | DTE Energy Co. | | | 1,022,745 | |
| | | | 95,633 | | | Integrys Energy Group, Inc. | | | 4,744,353 | |
| | | | 65,839 | | | MDU Resources Group, Inc. | | | 1,395,787 | |
| | | | 134,953 | | | NiSource, Inc. | | | 2,199,734 | |
| | | | | | | | | | | |
| | | | | | | | | | 15,211,873 | |
| | | |
| | | |
| | | Multiline Retail – 0.5% |
| | | | 10,008 | | | Big Lots, Inc.* | | | 382,306 | |
| | | | 57,444 | | | J.C. Penney Co., Inc. | | | 1,675,641 | |
| | | | 43,303 | | | Nordstrom, Inc. | | | 1,789,713 | |
| | | | | | | | | | | |
| | | | | | | | | | 3,847,660 | |
| | | |
| | | |
| | | Oil, Gas & Consumable Fuels – 16.1% |
| | | | 25,569 | | | Chesapeake Energy Corp. | | | 608,542 | |
| | | | 362,191 | | | Chevron Corp. | | | 29,496,835 | |
| | | | 134,942 | | | Cimarex Energy Co. | | | 9,186,851 | |
| | | | 364,974 | | | ConocoPhillips | | | 21,602,811 | |
| | | | 132,888 | | | Devon Energy Corp. | | | 8,947,349 | |
| | | | 554,430 | | | Exxon Mobil Corp. | | | 37,618,076 | |
| | | | 46,093 | | | Hess Corp. | | | 2,929,210 | |
| | | | 10,152 | | | Mariner Energy, Inc.* | | | 242,430 | |
| | | | 29,870 | | | Occidental Petroleum Corp. | | | 2,648,274 | |
| | | | 7,765 | | | Peabody Energy Corp. | | | 362,781 | |
| | | | 88,498 | | | Quicksilver Resources, Inc.* | | | 1,227,467 | |
| | | | 236,193 | | | Tesoro Corp.(a) | | | 3,105,938 | |
| | | | 442,248 | | | Valero Energy Corp. | | | 9,194,336 | |
| | | | | | | | | | | |
| | | | | | | | | | 127,170,900 | |
| | | |
| | | |
| | | Paper & Forest Products – 1.1% |
| | | | 296,031 | | | International Paper Co. | | | 7,915,869 | |
| | | | 15,020 | | | MeadWestvaco Corp.(a) | | | 408,093 | |
| | | | | | | | | | | |
| | | | | | | | | | 8,323,962 | |
| | | |
| | | |
The accompanying notes are an integral part of these financial statements.
GOLDMAN SACHS STRUCTURED LARGE CAP VALUE FUND
| | | | | | | | | | | |
| | | Shares | | Description | | Value |
| |
Common Stocks – (continued) |
| | | | | | | | | | | |
| | | Pharmaceuticals – 5.4% |
| | | | 508,692 | | | Eli Lilly & Co. | | $ | 17,788,959 | |
| | | | 66,749 | | | Forest Laboratories, Inc.* | | | 1,819,578 | |
| | | | 1,401,987 | | | Pfizer, Inc. | | | 23,441,223 | |
| | | | | | | | | | | |
| | | | | | | | | | 43,049,760 | |
| | | |
| | | |
| | | Professional Services – 0.8% |
| | | | 118,815 | | | Manpower, Inc. | | | 6,665,521 | |
| | | |
| | | |
| | | Real Estate Investment Trusts – 5.2% |
| | | | 68,118 | | | AvalonBay Communities, Inc. | | | 7,086,997 | |
| | | | 18,010 | | | BRE Properties, Inc. | | | 752,097 | |
| | | | 9,985 | | | Nationwide Health Properties, Inc. | | | 349,675 | |
| | | | 48,859 | | | Plum Creek Timber Co., Inc.(a) | | | 1,944,588 | |
| | | | 14,209 | | | Public Storage | | | 1,376,994 | |
| | | | 152,143 | | | Rayonier, Inc. | | | 7,451,964 | |
| | | | 250,346 | | | Simon Property Group, Inc. | | | 22,285,801 | |
| | | | | | | | | | | |
| | | | | | | | | | 41,248,116 | |
| | | |
| | | |
| | | Semiconductors & Semiconductor Equipment – 2.5% |
| | | | 126,922 | | | Fairchild Semiconductor International, Inc.* | | | 1,424,065 | |
| | | | 121,151 | | | Integrated Device Technology, Inc.* | | | 800,808 | |
| | | | 525,951 | | | Intel Corp. | | | 12,007,461 | |
| | | | 259,823 | | | Micron Technology, Inc.* | | | 2,429,345 | |
| | | | 124,872 | | | Texas Instruments, Inc. | | | 3,247,921 | |
| | | | | | | | | | | |
| | | | | | | | | | 19,909,600 | |
| | | |
| | | |
| | | Software – 1.0% |
| | | | 244,902 | | | Activision Blizzard, Inc. | | | 2,713,514 | |
| | | | 119,504 | | | Microsoft Corp. | | | 3,649,652 | |
| | | | 114,175 | | | Symantec Corp.* | | | 1,914,715 | |
| | | | | | | | | | | |
| | | | | | | | | | 8,277,881 | |
| | | |
| | | |
| | | Specialty Retail – 1.9% |
| | | | 24,956 | | | Abercrombie & Fitch Co. | | | 1,091,326 | |
| | | | 85,466 | | | AutoNation, Inc.*(a) | | | 1,726,413 | |
| | | | 16,512 | | | Barnes & Noble, Inc.(a) | | | 363,924 | |
| | | | 24,015 | | | Guess?, Inc. | | | 1,101,568 | |
| | | | 65,031 | | | Limited Brands, Inc. | | | 1,742,831 | |
| | | | 230,007 | | | Office Depot, Inc.* | | | 1,577,848 | |
| | | | 71,394 | | | Ross Stores, Inc. | | | 3,998,064 | |
| | | | 77,208 | | | The Gap, Inc. | | | 1,909,354 | |
| | | | 64,906 | | | Williams-Sonoma, Inc. | | | 1,869,293 | |
| | | | | | | | | | | |
| | | | | | | | | | 15,380,621 | |
| | | |
| | | |
| | | Thrifts & Mortgage Finance – 0.2% |
| | | | 112,127 | | | Hudson City Bancorp, Inc. | | | 1,491,289 | |
| | | |
| | | |
| | | Tobacco – 1.0% |
| | | | 105,690 | | | Lorillard, Inc. | | | 8,282,925 | |
| | | |
| | | |
| | | Wireless Telecommunication Services* – 1.0% |
| | | | 1,780,358 | | | Sprint Nextel Corp. | | | 7,566,521 | |
| | | |
| | | |
| | | TOTAL COMMON STOCKS |
| | | (Cost $659,335,178) | | $ | 793,480,595 | |
| | | |
| | | |
| | | | | | | | | | | | | | | | | |
| | | Principal
| | Interest
| | Maturity
| | |
| | | Amount | | Rate | | Date | | Value |
| |
Short-term Investment(c) – 1.7% |
| | | | | | | | | | | | | | | | | |
| | | | | | | | | | | | | | | | | |
| | | Repurchase Agreement – 1.7% |
| | | Joint Repurchase Agreement Account II |
| | | $ | 13,300,000 | | | | 0.200 | % | | | 05/03/10 | | | $ | 13,300,000 | |
| | | Maturity Value: $13,300,222 |
| | | (Cost $13,300,000) | | | | |
| | | |
| | | |
| | | TOTAL INVESTMENTS BEFORE SECURITIES LENDING REINVESTMENT VEHICLE |
| | | (Cost $672,635,178) | | $ | 806,780,595 | |
| | | |
| | | |
| | | | | | | | | | | | | |
| | | Shares | | Rate | | Value |
| |
Securities Lending Reinvestment Vehicle(d)(e) – 0.1% |
| | | | | | | | | | | | | |
| | | | | | | | | | | | | |
| | | Boston Global Investment Trust – Enhanced Portfolio II |
| | | | 746,771 | | | | 0.196 | % | | $ | 747,518 | |
| | | (Cost $746,771) | | | | |
| | | |
| | | |
| | | TOTAL INVESTMENTS – 102.1% |
| | | (Cost $673,381,949) | | $ | 807,528,113 | |
| | | |
| | | |
| | | LIABILITIES IN EXCESS OF OTHER ASSETS – (2.1)% | | | (16,298,330 | ) |
| | | |
| | | |
| | | NET ASSETS – 100.0% | | $ | 791,229,783 | |
| | | |
| | | |
The percentage shown for each investment category reflects the value of investments in that category as a percentage of net assets.
| | |
| * | | Non-income producing security. |
| |
| (a) | | All or a portion of security is on loan. |
| |
| (b) | | All or a portion of this security is segregated as collateral for initial margin requirement on futures transactions. |
| |
| (c) | | Joint repurchase agreement was entered into on April 30, 2010. Additional information appears on pages 86-87. |
| |
| (d) | | Variable rate security. Interest rate disclosed is that which is in effect at April 30, 2010. |
| |
| (e) | | Represents an affiliated issuer. |
The accompanying notes are an integral part of these financial statements.
GOLDMAN SACHS STRUCTURED LARGE CAP VALUE FUND
Schedule of Investments (continued)
April 30, 2010 (Unaudited)
ADDITIONAL INVESTMENT INFORMATION
FUTURES CONTRACTS — At April 30, 2010, the following futures contracts were open:
| | | | | | | | | | | | | | | |
| | | Number of
| | | | | | | | | |
| | | Contracts
| | | Expiration
| | Current
| | | Unrealized
| |
| Type | | Long (Short) | | | Date | | Value | | | Gain (Loss) | |
| | |
| S&P Mini 500 Index | | | 227 | | | June 2010 | | $ | 13,431,590 | | | $ | (210,502 | ) |
| |
| |
The accompanying notes are an integral part of these financial statements.
GOLDMAN SACHS STRUCTURED SMALL CAP EQUITY FUND
Schedule of Investments
April 30, 2010 (Unaudited)
| | | | | | | | | | | |
| | | Shares | | Description | | Value |
| |
Common Stocks – 97.9% |
| | | | | | | | | | | |
| | | | | | | | | | | |
| | | Aerospace & Defense – 0.3% |
| | | | 9,216 | | | AAR Corp.* | | $ | 224,686 | |
| | | | 27,973 | | | Ceradyne, Inc.* | | | 621,001 | |
| | | | 3,990 | | | Cubic Corp. | | | 148,867 | |
| | | | 3,034 | | | Triumph Group, Inc. | | | 235,317 | |
| | | | | | | | | | | |
| | | | | | | | | | 1,229,871 | |
| | | |
| | | |
| | | Air Freight & Logistics* – 0.2% |
| | | | 11,980 | | | Dynamex, Inc. | | | 211,926 | |
| | | | 73,867 | | | Pacer International, Inc. | | | 490,477 | |
| | | | | | | | | | | |
| | | | | | | | | | 702,403 | |
| | | |
| | | |
| | | Airlines – 2.6% |
| | | | 30,971 | | | Alaska Air Group, Inc.* | | | 1,282,509 | |
| | | | 118,594 | | | Allegiant Travel Co.*(a) | | | 6,099,290 | |
| | | | 255,286 | | | Republic Airways Holdings, Inc.*(a) | | | 1,598,090 | |
| | | | 238,163 | | | SkyWest, Inc. | | | 3,567,682 | |
| | | | | | | | | | | |
| | | | | | | | | | 12,547,571 | |
| | | |
| | | |
| | | Auto Components – 0.9% |
| | | | 42,560 | | | Dana Holding Corp.* | | | 568,601 | |
| | | | 12,357 | | | Drew Industries, Inc.* | | | 316,957 | |
| | | | 60,532 | | | Federal-Mogul Corp.* | | | 1,151,319 | |
| | | | 27,889 | | | Modine Manufacturing Co.* | | | 390,725 | |
| | | | 43,526 | | | Standard Motor Products, Inc. | | | 463,987 | |
| | | | 72,124 | | | Stoneridge, Inc.* | | | 778,218 | |
| | | | 35,942 | | | Superior Industries International, Inc. | | | 605,982 | |
| | | | | | | | | | | |
| | | | | | | | | | 4,275,789 | |
| | | |
| | | |
| | | Beverages – 0.6% |
| | | | 15,563 | | | Hansen Natural Corp.* | | | 686,017 | |
| | | | 141,545 | | | National Beverage Corp. | | | 1,641,922 | |
| | | | 4,711 | | | The Boston Beer Co., Inc.* | | | 268,574 | |
| | | | | | | | | | | |
| | | | | | | | | | 2,596,513 | |
| | | |
| | | |
| | | Biotechnology – 3.5% |
| | | | 131,780 | | | Alkermes, Inc.* | | | 1,726,318 | |
| | | | 10,670 | | | Cepheid, Inc.*(a) | | | 213,293 | |
| | | | 29,657 | | | Cubist Pharmaceuticals, Inc.* | | | 664,910 | |
| | | | 68,941 | | | Emergent Biosolutions, Inc.* | | | 1,122,360 | |
| | | | 57,542 | | | Enzon Pharmaceuticals, Inc.*(a) | | | 608,794 | |
| | | | 32,302 | | | Exelixis, Inc.* | | | 186,706 | |
| | | | 26,083 | | | Human Genome Sciences, Inc.* | | | 722,238 | |
| | | | 455,639 | | | Insmed, Inc.* | | | 482,977 | |
| | | | 66,758 | | | Martek Biosciences Corp.*(a) | | | 1,470,679 | |
| | | | 68,315 | | | Maxygen, Inc.* | | | 437,899 | |
| | | | 68,797 | | | Myriad Genetics, Inc.* | | | 1,651,816 | |
| | | | 378,256 | | | Nabi Biopharmaceuticals* | | | 2,125,799 | |
| | | | 565,244 | | | PDL BioPharma, Inc.(a) | | | 3,289,720 | |
| | | | 214,816 | | | Progenics Pharmaceuticals, Inc.* | | | 1,383,415 | |
| | | | 11,967 | | | Seattle Genetics, Inc.* | | | 150,784 | |
| | | | 80,479 | | | Synta Pharmaceuticals Corp.* | | | 326,745 | |
| | | | | | | | | | | |
| | | | | | | | | | 16,564,453 | |
| | | |
| | | |
| | | Building Products – 1.4% |
| | | | 28,486 | | | American Woodmark Corp. | | | 658,312 | |
| | | |
| | | |
| | | | 91,264 | | | Apogee Enterprises, Inc. | | | 1,253,967 | |
| | | | 21,866 | | | Armstrong World Industries, Inc.* | | | 952,264 | |
| | | | 54,653 | | | Insteel Industries, Inc.(a) | | | 670,046 | |
| | | | 69,598 | | | Universal Forest Products, Inc. | | | 2,926,596 | |
| | | | | | | | | | | |
| | | | | | | | | | 6,461,185 | |
| | | |
| | | |
| | | Capital Markets – 2.3% |
| | | | 61,077 | | | American Capital Ltd.* | | | 375,013 | |
| | | | 104,361 | | | Apollo Investment Corp. | | | 1,269,030 | |
| | | | 101,335 | | | Ares Capital Corp. | | | 1,607,173 | |
| | | | 8,229 | | | Artio Global Investors, Inc. | | | 188,280 | |
| | | | 2,970 | | | Capital Southwest Corp. | | | 279,328 | |
| | | | 6,049 | | | Federated Investors, Inc. Class B(a) | | | 145,902 | |
| | | | 46,916 | | | GAMCO Investors, Inc. | | | 2,158,605 | |
| | | | 75,579 | | | Gladstone Capital Corp. | | | 1,014,270 | |
| | | | 144,519 | | | Hercules Technology Growth Capital, Inc. | | | 1,566,586 | |
| | | | 83,208 | | | MCG Capital Corp.* | | | 551,669 | |
| | | | 151,888 | | | NGP Capital Resources Co. | | | 1,161,943 | |
| | | | 80,409 | | | Pzena Investment Management, Inc.* | | | 619,149 | |
| | | | 8,315 | | | SEI Investments Co. | | | 186,755 | |
| | | | | | | | | | | |
| | | | | | | | | | 11,123,703 | |
| | | |
| | | |
| | | Chemicals – 2.0% |
| | | | 53,010 | | | A. Schulman, Inc. | | | 1,378,790 | |
| | | | 63,422 | | | Huntsman Corp. | | | 723,645 | |
| | | | 23,927 | | | Innospec, Inc.* | | | 318,468 | |
| | | | 88,957 | | | Omnova Solutions, Inc.* | | | 680,521 | |
| | | | 223,583 | | | PolyOne Corp.* | | | 2,528,724 | |
| | | | 65,654 | | | Spartech Corp.* | | | 934,913 | |
| | | | 21,742 | | | Stepan Co. | | | 1,646,956 | |
| | | | 36,221 | | | Westlake Chemical Corp. | | | 1,017,086 | |
| | | | 17,731 | | | Zep, Inc. | | | 326,960 | |
| | | | | | | | | | | |
| | | | | | | | | | 9,556,063 | |
| | | |
| | | |
| | | Commercial Banks – 4.5% |
| | | | 21,572 | | | 1st Source Corp. | | | 412,672 | |
| | | | 242,197 | | | CVB Financial Corp.(a) | | | 2,666,589 | |
| | | | 94,369 | | | First Bancorp(a) | | | 1,539,158 | |
| | | | 14,083 | | | First Bancorp, Inc. | | | 223,779 | |
| | | | 66,119 | | | Fulton Financial Corp. | | | 694,250 | |
| | | | 37,100 | | | Glacier Bancorp, Inc.(a) | | | 685,979 | |
| | | | 73,138 | | | Great Southern Bancorp, Inc.(a) | | | 1,783,836 | |
| | | | 197,038 | | | International Bancshares Corp. | | | 4,762,408 | |
| | | | 27,292 | | | Investors Bancorp, Inc.* | | | 379,632 | |
| | | | 10,458 | | | Lakeland Financial Corp. | | | 218,154 | |
| | | | 189,343 | | | Popular, Inc.*(a) | | | 746,011 | |
| | | | 71,709 | | | Renasant Corp. | | | 1,185,350 | |
| | | | 16,281 | | | Susquehanna Bancshares, Inc. | | | 177,463 | |
| | | | 18,558 | | | SVB Financial Group* | | | 913,610 | |
| | | | 15,816 | | | TCF Financial Corp. | | | 294,652 | |
| | | | 67,478 | | | Texas Capital Bancshares, Inc.* | | | 1,342,812 | |
| | | | 21,835 | | | Trustmark Corp. | | | 534,521 | |
| | | | 258,293 | | | Wilshire Bancorp, Inc. | | | 2,805,062 | |
| | | | | | | | | | | |
| | | | | | | | | | 21,365,938 | |
| | | |
| | | |
The accompanying notes are an integral part of these financial statements.
GOLDMAN SACHS STRUCTURED SMALL CAP EQUITY FUND
Schedule of Investments (continued)
April 30, 2010 (Unaudited)
| | | | | | | | | | | |
| | | Shares | | Description | | Value |
| |
Common Stocks – (continued) |
| | | | | | | | | | | |
| | | Commercial Services & Supplies – 1.1% |
| | | | 20,415 | | | Acco Brands Corp.* | | $ | 186,389 | |
| | | | 102,220 | | | HNI Corp.(a) | | | 3,172,909 | |
| | | | 117,464 | | | Kimball International, Inc. Class B | | | 944,410 | |
| | | | 32,606 | | | Steelcase, Inc. | | | 267,695 | |
| | | | 96,358 | | | The Standard Register Co. | | | 496,244 | |
| | | | 3,044 | | | United Stationers, Inc.* | | | 186,354 | |
| | | | | | | | | | | |
| | | | | | | | | | 5,254,001 | |
| | | |
| | | |
| | | Communications Equipment – 2.3% |
| | | | 34,487 | | | ADTRAN, Inc. | | | 923,217 | |
| | | | 29,175 | | | Bel Fuse, Inc. Class B | | | 683,278 | |
| | | | 22,863 | | | EchoStar Corp.* | | | 439,198 | |
| | | | 48,397 | | | Emulex Corp.* | | | 568,665 | |
| | | | 197,162 | | | Extreme Networks, Inc.* | | | 656,549 | |
| | | | 37,014 | | | PC-Tel, Inc.* | | | 240,961 | |
| | | | 62,231 | | | Plantronics, Inc. | | | 2,066,069 | |
| | | | 576,952 | | | Powerwave Technologies, Inc.*(a) | | | 1,021,205 | |
| | | | 213,236 | | | ShoreTel, Inc.* | | | 1,396,696 | |
| | | | 227,282 | | | Symmetricom, Inc.* | | | 1,506,880 | |
| | | | 82,386 | | | Tellabs, Inc. | | | 748,065 | |
| | | | 98,580 | | | Tollgrade Communications, Inc.* | | | 626,969 | |
| | | | | | | | | | | |
| | | | | | | | | | 10,877,752 | |
| | | |
| | | |
| | | Computers & Peripherals* – 1.2% |
| | | | 106,192 | | | Electronics for Imaging, Inc. | | | 1,364,567 | |
| | | | 213,284 | | | Imation Corp. | | | 2,311,999 | |
| | | | 674,365 | | | Quantum Corp. | | | 1,955,658 | |
| | | | | | | | | | | |
| | | | | | | | | | 5,632,224 | |
| | | |
| | | |
| | | Construction & Engineering* – 0.2% |
| | | | 74,421 | | | Dycom Industries, Inc. | | | 790,351 | |
| | | | 38,566 | | | Integrated Electrical Services, Inc. | | | 240,266 | |
| | | | | | | | | | | |
| | | | | | | | | | 1,030,617 | |
| | | |
| | | |
| | | Consumer Finance – 0.7% |
| | | | 328,697 | | | Advance America Cash Advance Centers, Inc. | | | 1,880,147 | |
| | | | 62,716 | | | Rewards Network, Inc. | | | 816,562 | |
| | | | 17,827 | | | World Acceptance Corp.*(a) | | | 628,937 | |
| | | | | | | | | | | |
| | | | | | | | | | 3,325,646 | |
| | | |
| | | |
| | | Distributors* – 0.1% |
| | | | 14,905 | | | Core-Mark Holding Co., Inc. | | | 454,901 | |
| | | |
| | | |
| | | Diversified Consumer Services – 0.4% |
| | | | 3,749 | | | Capella Education Co.* | | | 339,734 | |
| | | | 18,959 | | | Pre-Paid Legal Services, Inc.*(a) | | | 843,107 | |
| | | | 9,213 | | | Regis Corp. | | | 176,152 | |
| | | | 7,387 | | | Steiner Leisure Ltd.* | | | 346,229 | |
| | | | | | | | | | | |
| | | | | | | | | | 1,705,222 | |
| | | |
| | | |
| | | Diversified Financial Services – 1.5% |
| | | | 182,594 | | | Compass Diversified Holdings | | | 2,651,265 | |
| | | | 108,177 | | | PHH Corp.* | | | 2,454,536 | |
| | | | 5,042 | | | Portfolio Recovery Associates, Inc.*(a) | | | 335,142 | |
| | | | 364,716 | | | Primus Guaranty Ltd.*(a) | | | 1,644,869 | |
| | | | | | | | | | | |
| | | | | | | | | | 7,085,812 | |
| | | |
| | | |
| | | Electric Utilities – 0.3% |
| | | | 43,159 | | | Pinnacle West Capital Corp. | | | 1,611,557 | |
| | | |
| | | |
| | | Electrical Equipment – 1.5% |
| | | | 91,865 | | | Belden, Inc. | | | 2,522,613 | |
| | | | 34,764 | | | Encore Wire Corp.(a) | | | 772,108 | |
| | | | 31,793 | | | General Cable Corp.* | | | 908,326 | |
| | | | 226,865 | | | LSI Industries, Inc. | | | 1,594,861 | |
| | | | 115,899 | | | Microvision, Inc.*(a) | | | 362,764 | |
| | | | 3,940 | | | Thomas & Betts Corp.* | | | 165,244 | |
| | | | 63,751 | | | Vicor Corp.* | | | 963,915 | |
| | | | | | | | | | | |
| | | | | | | | | | 7,289,831 | |
| | | |
| | | |
| | | Electronic Equipment, Instruments & Components – 2.2% |
| | | | 94,263 | | | Agilysys, Inc. | | | 1,022,754 | |
| | | | 110,594 | | | Benchmark Electronics, Inc.* | | | 2,393,254 | |
| | | | 148,587 | | | Brightpoint, Inc.* | | | 1,202,069 | |
| | | | 37,587 | | | CTS Corp. | | | 394,663 | |
| | | | 46,789 | | | Ingram Micro, Inc.* | | | 849,688 | |
| | | | 20,487 | | | Insight Enterprises, Inc.* | | | 307,920 | |
| | | | 105,408 | | | Methode Electronics, Inc. | | | 1,170,029 | |
| | | | 192,049 | | | Power-One, Inc.*(a) | | | 1,509,505 | |
| | | | 81,400 | | | RadiSys Corp.* | | | 796,906 | |
| | | | 94,080 | | | Smart Modular Technologies, Inc.* | | | 660,442 | |
| | | | 24,045 | | | Vishay Intertechnology, Inc.* | | | 250,308 | |
| | | | | | | | | | | |
| | | | | | | | | | 10,557,538 | |
| | | |
| | | |
| | | Energy Equipment & Services – 1.3% |
| | | | 71,656 | | | Basic Energy Services, Inc.* | | | 731,608 | |
| | | | 131,078 | | | Complete Production Services, Inc.* | | | 1,977,967 | |
| | | | 6,818 | | | Dawson Geophysical Co.* | | | 199,699 | |
| | | | 6,651 | | | Dril-Quip, Inc.* | | | 385,292 | |
| | | | 35,421 | | | Exterran Holdings, Inc.*(a) | | | 1,032,522 | |
| | | | 45,652 | | | Global Industries Ltd.* | | | 305,868 | |
| | | | 16,790 | | | Oil States International, Inc.* | | | 811,125 | |
| | | | 24,588 | | | RPC, Inc.(a) | | | 335,626 | |
| | | | 10,146 | | | T-3 Energy Services, Inc.* | | | 301,844 | |
| | | | 21,487 | | | Willbros Group, Inc.* | | | 269,662 | |
| | | | | | | | | | | |
| | | | | | | | | | 6,351,213 | |
| | | |
| | | |
| | | Food & Staples Retailing* – 0.2% |
| | | | 74,341 | | | Winn-Dixie Stores, Inc. | | | 937,440 | |
| | | |
| | | |
| | | Food Products – 1.1% |
| | | | 25,413 | | | Dole Food Co., Inc.*(a) | | | 287,675 | |
| | | | 42,788 | | | J&J Snack Foods Corp. | | | 1,993,493 | |
| | | | 39,516 | | | Lancaster Colony Corp. | | | 2,172,195 | |
| | | | 38,446 | | | Smithfield Foods, Inc.* | | | 720,478 | |
| | | | | | | | | | | |
| | | | | | | | | | 5,173,841 | |
| | | |
| | | |
| | | Gas Utilities – 0.6% |
| | | | 31,700 | | | Atmos Energy Corp. | | | 937,686 | |
| | | | 10,861 | | | Nicor, Inc. | | | 472,562 | |
| | | | 45,824 | | | Southwest Gas Corp. | | | 1,425,126 | |
| | | | 6,440 | | | WGL Holdings, Inc. | | | 230,166 | |
| | | | | | | | | | | |
| | | | | | | | | | 3,065,540 | |
| | | |
| | | |
| | | Health Care Equipment & Supplies – 2.5% |
| | | | 9,338 | | | Analogic Corp. | | | 446,543 | |
| | | |
| | | |
The accompanying notes are an integral part of these financial statements.
GOLDMAN SACHS STRUCTURED SMALL CAP EQUITY FUND
| | | | | | | | | | | |
| | | Shares | | Description | | Value |
| |
Common Stocks – (continued) |
| | | Health Care Equipment & Supplies – (continued) |
| | | | | | | | | | | |
| | | | 34,248 | | | AngioDynamics, Inc.* | | $ | 547,968 | |
| | | | 1,897 | | | Atrion Corp. | | | 268,957 | |
| | | | 101,539 | | | Hill-Rom Holdings, Inc. | | | 3,219,802 | |
| | | | 20,578 | | | IDEXX Laboratories, Inc.*(a) | | | 1,361,029 | |
| | | | 74,229 | | | Invacare Corp. | | | 1,961,872 | |
| | | | 30,069 | | | IRIS International, Inc.* | | | 343,689 | |
| | | | 108,226 | | | Medical Action Industries, Inc.* | | | 1,284,642 | |
| | | | 12,693 | | | Meridian Bioscience, Inc. | | | 253,733 | |
| | | | 14,065 | | | Somanetics Corp.* | | | 284,535 | |
| | | | 52,717 | | | STERIS Corp. | | | 1,754,422 | |
| | | | 7,476 | | | The Cooper Companies, Inc. | | | 290,742 | |
| | | | | | | | | | | |
| | | | | | | | | | 12,017,934 | |
| | | |
| | | |
| | | Health Care Providers & Services* – 4.4% |
| | | | 144,627 | | | AMN Healthcare Services, Inc. | | | 1,321,891 | |
| | | | 85,487 | | | Assisted Living Concepts, Inc. | | | 3,000,594 | |
| | | | 138,847 | | | Healthspring, Inc. | | | 2,443,707 | |
| | | | 130,576 | | | Kindred Healthcare, Inc. | | | 2,329,476 | |
| | | | 52,224 | | | MedCath Corp. | | | 519,107 | |
| | | | 131,322 | | | Molina Healthcare, Inc. | | | 3,830,663 | |
| | | | 235,122 | | | Nighthawk Radiology Holdings, Inc. | | | 869,951 | |
| | | | 208,681 | | | PharMerica Corp.(a) | | | 4,027,543 | |
| | | | 82,884 | | | Sunrise Senior Living, Inc. | | | 460,835 | |
| | | | 128,752 | | | Universal American Financial Corp. | | | 1,976,343 | |
| | | | | | | | | | | |
| | | | | | | | | | 20,780,110 | |
| | | |
| | | |
| | | Hotels, Restaurants & Leisure – 2.4% |
| | | | 7,025 | | | Biglari Holdings, Inc.*(a) | | | 2,748,531 | |
| | | | 31,703 | | | Boyd Gaming Corp.* | | | 402,628 | |
| | | | 37,745 | | | Choice Hotels International, Inc. | | | 1,370,521 | |
| | | | 24,682 | | | International Speedway Corp. | | | 754,282 | |
| | | | 156,740 | | | O’Charley’s, Inc.* | | | 1,496,867 | |
| | | | 13,970 | | | Panera Bread Co.* | | | 1,088,822 | |
| | | | 129,148 | | | Papa John’s International, Inc.* | | | 3,538,655 | |
| | | | | | | | | | | |
| | | | | | | | | | 11,400,306 | |
| | | |
| | | |
| | | Household Durables – 2.4% |
| | | | 49,905 | | | Blyth, Inc. | | | 2,876,524 | |
| | | | 64,487 | | | D.R. Horton, Inc. | | | 947,314 | |
| | | | 26,806 | | | Ethan Allen Interiors, Inc.(a) | | | 541,481 | |
| | | | 107,143 | | | Furniture Brands International, Inc.*(a) | | | 887,144 | |
| | | | 24,636 | | | Harman International Industries, Inc.* | | | 972,629 | |
| | | | 22,700 | | | Hooker Furniture Corp. | | | 357,752 | |
| | | | 72,208 | | | iRobot Corp.*(a) | | | 1,457,158 | |
| | | | 70,211 | | | Kid Brands, Inc.* | | | 700,004 | |
| | | | 8,132 | | | Mohawk Industries, Inc.* | | | 518,334 | |
| | | | 61,442 | | | Tempur-Pedic International, Inc.* | | | 2,070,595 | |
| | | | | | | | | | | |
| | | | | | | | | | 11,328,935 | |
| | | |
| | | |
| | | Household Products* – 0.5% |
| | | | 248,484 | | | Central Garden & Pet Co. | | | 2,566,840 | |
| | | |
| | | |
| | | Industrial Conglomerates – 0.2% |
| | | | 59,362 | | | Tredegar Corp. | | | 1,012,716 | |
| | | |
| | | |
| | | Insurance – 2.0% |
| | | | 102,940 | | | American Equity Investment Life Holding Co. | | | 1,082,929 | |
| | | | 48,460 | | | Aspen Insurance Holdings Ltd. | | | 1,307,451 | |
| | | | 62,947 | | | Assured Guaranty Ltd. | | | 1,356,508 | |
| | | | 131,724 | | | CNA Surety Corp.* | | | 2,209,011 | |
| | | | 268,585 | | | Conseco, Inc.* | | | 1,584,652 | |
| | | | 14,251 | | | Endurance Specialty Holdings Ltd. | | | 525,149 | |
| | | | 10,837 | | | FBL Financial Group, Inc. | | | 280,028 | |
| | | | 23,955 | | | Flagstone Reinsurance Holdings Ltd. | | | 267,098 | |
| | | | 5,170 | | | Infinity Property & Casualty Corp. | | | 238,492 | |
| | | | 15,131 | | | Protective Life Corp. | | | 364,203 | |
| | | | 25,083 | | | United America Indemnity Ltd.* | | | 238,289 | |
| | | | | | | | | | | |
| | | | | | | | | | 9,453,810 | |
| | | |
| | | |
| | | Internet & Catalog Retail* – 0.2% |
| | | | 11,858 | | | HSN, Inc. | | | 357,282 | |
| | | | 2,330 | | | Netflix, Inc. | | | 230,134 | |
| | | | 29,914 | | | Overstock.com, Inc.(a) | | | 553,409 | |
| | | | | | | | | | | |
| | | | | | | | | | 1,140,825 | |
| | | |
| | | |
| | | Internet Software & Services – 1.4% |
| | | | 91,541 | | | EarthLink, Inc. | | | 825,700 | |
| | | | 186,298 | | | Internap Network Services Corp.* | | | 1,076,802 | |
| | | | 349,644 | | | Marchex, Inc. Class B | | | 1,839,127 | |
| | | | 62,675 | | | ModusLink Global Solutions, Inc.* | | | 559,688 | |
| | | | 512,186 | | | RealNetworks, Inc.* | | | 2,125,572 | |
| | | | | | | | | | | |
| | | | | | | | | | 6,426,889 | |
| | | |
| | | |
| | | IT Services* – 2.0% |
| | | | 82,591 | | | Acxiom Corp. | | | 1,575,836 | |
| | | | 476,660 | | | Ciber, Inc. | | | 1,892,340 | |
| | | | 33,625 | | | CSG Systems International, Inc. | | | 763,960 | |
| | | | 648,008 | | | Lionbridge Technologies, Inc. | | | 3,505,723 | |
| | | | 24,256 | | | NeuStar, Inc. | | | 593,545 | |
| | | | 43,800 | | | StarTek, Inc. | | | 296,964 | |
| | | | 36,689 | | | VeriFone Holdings, Inc. | | | 698,192 | |
| | | | | | | | | | | |
| | | | | | | | | | 9,326,560 | |
| | | |
| | | |
| | | Leisure Equipment & Products – 0.3% |
| | | | 184,657 | | | Nautilus, Inc.* | | | 631,527 | |
| | | | 13,552 | | | Polaris Industries, Inc.(a) | | | 801,872 | |
| | | | | | | | | | | |
| | | | | | | | | | 1,433,399 | |
| | | |
| | | |
| | | Life Sciences Tools & Services* – 1.2% |
| | | | 337,931 | | | Accelrys, Inc. | | | 2,362,138 | |
| | | | 161,376 | | | Affymetrix, Inc. | | | 1,119,949 | |
| | | | 20,347 | | | Albany Molecular Research, Inc. | | | 162,776 | |
| | | | 13,407 | | | Dionex Corp. | | | 1,093,609 | |
| | | | 110,357 | | | eResearchTechnology, Inc. | | | 813,331 | |
| | | | | | | | | | | |
| | | | | | | | | | 5,551,803 | |
| | | |
| | | |
| | | Machinery – 4.0% |
| | | | 79,003 | | | Albany International Corp. | | | 2,012,206 | |
| | | | 119,742 | | | Briggs & Stratton Corp. | | | 2,842,675 | |
| | | | 12,638 | | | EnPro Industries, Inc.* | | | 399,108 | |
| | | | 65,332 | | | Kadant, Inc.* | | | 1,307,293 | |
| | | | 29,623 | | | Miller Industries, Inc. | | | 423,609 | |
| | | |
| | | |
The accompanying notes are an integral part of these financial statements.
GOLDMAN SACHS STRUCTURED SMALL CAP EQUITY FUND
Schedule of Investments (continued)
April 30, 2010 (Unaudited)
| | | | | | | | | | | |
| | | Shares | | Description | | Value |
| |
Common Stocks – (continued) |
| | | Machinery – (continued) |
| | | | | | | | | | | |
| | | | 61,610 | | | Mueller Industries, Inc. | | $ | 1,826,736 | |
| | | | 36,474 | | | NACCO Industries, Inc. | | | 3,171,050 | |
| | | | 13,341 | | | Navistar International Corp.* | | | 644,904 | |
| | | | 73,109 | | | Oshkosh Corp.* | | | 2,823,470 | |
| | | | 12,507 | | | Tecumseh Products Co.* | | | 159,839 | |
| | | | 28,128 | | | Tennant Co. | | | 970,135 | |
| | | | 44,421 | | | The Toro Co. | | | 2,529,332 | |
| | | | | | | | | | | |
| | | | | | | | | | 19,110,357 | |
| | | |
| | | |
| | | Marine*(a) – 0.1% |
| | | | 17,107 | | | American Commercial Lines, Inc. | | | 348,983 | |
| | | |
| | | |
| | | Media – 1.2% |
| | | | 23,952 | | | Ascent Media Corp.* | | | 707,063 | |
| | | | 17,752 | | | Gannett Co., Inc. | | | 302,139 | |
| | | | 51,217 | | | Harte-Hanks, Inc. | | | 737,525 | |
| | | | 227,948 | | | Journal Communications, Inc.* | | | 1,292,465 | |
| | | | 46,979 | | | Regal Entertainment Group | | | 802,401 | |
| | | | 9,746 | | | Scholastic Corp. | | | 263,240 | |
| | | | 144,315 | | | The E.W. Scripps Co.* | | | 1,578,806 | |
| | | | | | | | | | | |
| | | | | | | | | | 5,683,639 | |
| | | |
| | | |
| | | Metals & Mining – 1.0% |
| | | | 38,148 | | | Brush Engineered Materials, Inc.* | | | 1,134,140 | |
| | | | 60,104 | | | Kaiser Aluminum Corp. | | | 2,415,580 | |
| | | | 7,009 | | | Reliance Steel & Aluminum Co. | | | 342,109 | |
| | | | 89,846 | | | Sutor Technology Group Ltd.* | | | 247,077 | |
| | | | 26,995 | | | Worthington Industries, Inc. | | | 431,110 | |
| | | | | | | | | | | |
| | | | | | | | | | 4,570,016 | |
| | | |
| | | |
| | | Multi-Utilities – 1.0% |
| | | | 35,703 | | | Black Hills Corp. | | | 1,174,272 | |
| | | | 75,205 | | | Integrys Energy Group, Inc. | | | 3,730,920 | |
| | | | | | | | | | | |
| | | | | | | | | | 4,905,192 | |
| | | |
| | | |
| | | Multiline Retail – 1.4% |
| | | | 113,799 | | | 99 Cents Only Stores* | | | 1,766,160 | |
| | | | 39,309 | | | Dillard’s, Inc. | | | 1,103,797 | |
| | | | 195,267 | | | Fred’s, Inc. | | | 2,712,259 | |
| | | | 27,090 | | | Saks, Inc.* | | | 264,128 | |
| | | | 156,291 | | | Tuesday Morning Corp.* | | | 883,044 | |
| | | | | | | | | | | |
| | | | | | | | | | 6,729,388 | |
| | | |
| | | |
| | | Oil, Gas & Consumable Fuels – 2.9% |
| | | | 6,714 | | | Berry Petroleum Co. | | | 217,332 | |
| | | | 66,884 | | | Cimarex Energy Co. | | | 4,553,463 | |
| | | | 186,044 | | | International Coal Group, Inc.* | | | 980,452 | |
| | | | 77,625 | | | PetroQuest Energy, Inc.* | | | 458,764 | |
| | | | 13,684 | | | Ship Finance International Ltd. | | | 270,943 | |
| | | | 8,688 | | | St. Mary Land & Exploration Co. | | | 349,605 | |
| | | | 30,945 | | | Stone Energy Corp.* | | | 504,403 | |
| | | | 13,977 | | | Teekay Corp. | | | 350,124 | |
| | | | 112,673 | | | Tesoro Corp. | | | 1,481,650 | |
| | | | 387,992 | | | USEC, Inc.* | | | 2,327,952 | |
| | | | 19,551 | | | Venoco, Inc.* | | | 291,310 | |
| | | | 148,343 | | | W&T Offshore, Inc. | | | 1,404,808 | |
| | | |
| | | |
| | | | 18,433 | | | World Fuel Services Corp.(a) | | | 524,050 | |
| | | | | | | | | | | |
| | | | | | | | | | 13,714,856 | |
| | | |
| | | |
| | | Paper & Forest Products* – 2.2% |
| | | | 50,981 | | | Buckeye Technologies, Inc. | | | 719,852 | |
| | | | 39,112 | | | Clearwater Paper Corp. | | | 2,490,652 | |
| | | | 46,050 | | | Domtar Corp. | | | 3,262,182 | |
| | | | 161,458 | | | KapStone Paper and Packaging Corp. | | | 2,082,808 | |
| | | | 159,359 | | | Louisiana-Pacific Corp. | | | 1,874,062 | |
| | | | | | | | | | | |
| | | | | | | | | | 10,429,556 | |
| | | |
| | | |
| | | Personal Products – 0.3% |
| | | | 168,242 | | | Mannatech, Inc.(a) | | | 649,414 | |
| | | | 6,627 | | | NBTY, Inc.* | | | 269,586 | |
| | | | 66,077 | | | Prestige Brands Holdings, Inc.* | | | 643,590 | |
| | | | | | | | | | | |
| | | | | | | | | | 1,562,590 | |
| | | |
| | | |
| | | Pharmaceuticals* – 1.4% |
| | | | 245,999 | | | DepoMed, Inc.(a) | | | 991,376 | |
| | | | 16,667 | | | Endo Pharmaceuticals Holdings, Inc. | | | 365,007 | |
| | | | 323,688 | | | King Pharmaceuticals, Inc. | | | 3,172,142 | |
| | | | 25,103 | | | Par Pharmaceutical Cos., Inc. | | | 681,296 | |
| | | | 121,484 | | | Questcor Pharmaceuticals, Inc. | | | 1,183,254 | |
| | | | 18,685 | | | ViroPharma, Inc. | | | 237,673 | |
| | | | | | | | | | | |
| | | | | | | | | | 6,630,748 | |
| | | |
| | | |
| | | Professional Services – 2.4% |
| | | | 16,303 | | | Administaff, Inc. | | | 360,948 | |
| | | | 70,132 | | | CDI Corp. | | | 1,222,401 | |
| | | | 199,007 | | | Kelly Services, Inc.* | | | 3,200,033 | |
| | | | 168,815 | | | Kforce, Inc.* | | | 2,344,840 | |
| | | | 268,229 | | | SFN Group, Inc.* | | | 2,293,358 | |
| | | | 27,212 | | | TrueBlue, Inc.* | | | 429,677 | |
| | | | 113,425 | | | Volt Information Sciences, Inc.* | | | 1,422,350 | |
| | | | | | | | | | | |
| | | | | | | | | | 11,273,607 | |
| | | |
| | | |
| | | Real Estate Investment Trusts – 7.9% |
| | | | 10,007 | | | Agree Realty Corp. | | | 256,479 | |
| | | | 2,956 | | | Alexandria Real Estate Equities, Inc. | | | 209,314 | |
| | | | 14,279 | | | American Campus Communities, Inc. | | | 402,239 | |
| | | | 42,393 | | | BRE Properties, Inc. | | | 1,770,332 | |
| | | | 55,514 | | | Equity Lifestyle Properties, Inc. | | | 3,081,582 | |
| | | | 23,999 | | | Federal Realty Investment Trust | | | 1,857,283 | |
| | | | 40,766 | | | FelCor Lodging Trust, Inc.* | | | 330,612 | |
| | | | 226,025 | | | Franklin Street Properties Corp.(a) | | | 3,331,609 | |
| | | | 63,530 | | | Health Care REIT, Inc.(b) | | | 2,854,403 | |
| | | | 72,282 | | | Healthcare Realty Trust, Inc. | | | 1,744,888 | |
| | | | 45,140 | | | LTC Properties, Inc. | | | 1,259,406 | |
| | | | 20,418 | | | Mack-Cali Realty Corp. | | | 701,562 | |
| | | | 46,943 | | | National Health Investors, Inc. | | | 1,906,825 | |
| | | | 12,423 | | | National Retail Properties, Inc. | | | 292,313 | |
| | | | 160,884 | | | Nationwide Health Properties, Inc. | | | 5,634,158 | |
| | | | 70,221 | | | OMEGA Healthcare Investors, Inc. | | | 1,405,824 | |
| | | |
| | | |
The accompanying notes are an integral part of these financial statements.
GOLDMAN SACHS STRUCTURED SMALL CAP EQUITY FUND
| | | | | | | | | | | |
| | | Shares | | Description | | Value |
| |
Common Stocks – (continued) |
| | | Real Estate Investment Trusts – (continued) |
| | | | | | | | | | | |
| | | | 66,178 | | | Potlatch Corp. | | $ | 2,479,028 | |
| | | | 112,869 | | | Rayonier, Inc. | | | 5,528,324 | |
| | | | 46,223 | | | Regency Centers Corp. | | | 1,897,454 | |
| | | | 29,948 | | | Sunstone Hotel Investors, Inc.* | | | 381,238 | |
| | | | | | | | | | | |
| | | | | | | | | | 37,324,873 | |
| | | |
| | | |
| | | Road & Rail – 1.2% |
| | | | 30,794 | | | Dollar Thrifty Automotive Group, Inc.* | | | 1,354,628 | |
| | | | 92,214 | | | Marten Transport Ltd.* | | | 2,014,876 | |
| | | | 30,946 | | | Universal Truckload Services, Inc.* | | | 565,074 | |
| | | | 80,288 | | | Werner Enterprises, Inc. | | | 1,800,057 | |
| | | | | | | | | | | |
| | | | | | | | | | 5,734,635 | |
| | | |
| | | |
| | | Semiconductors & Semiconductor Equipment – 4.8% |
| | | | 142,650 | | | Applied Micro Circuits Corp.* | | | 1,609,092 | |
| | | | 45,557 | | | Cohu, Inc. | | | 735,746 | |
| | | | 126,663 | | | DSP Group, Inc.* | | | 1,034,837 | |
| | | | 165,540 | | | Exar Corp.* | | | 1,223,341 | |
| | | | 59,601 | | | Fairchild Semiconductor International, Inc.* | | | 668,723 | |
| | | | 1,111,231 | | | Lattice Semiconductor Corp.* | | | 5,856,187 | |
| | | | 95,840 | | | LSI Corp.* | | | 576,957 | |
| | | | 88,294 | | | Micrel, Inc. | | | 1,030,391 | |
| | | | 134,056 | | | MIPS Technologies, Inc.* | | | 668,939 | |
| | | | 32,850 | | | OmniVision Technologies, Inc.* | | | 576,846 | |
| | | | 138,681 | | | Photronics, Inc.* | | | 755,811 | |
| | | | 359,785 | | | RF Micro Devices, Inc.* | | | 2,021,992 | |
| | | | 35,150 | | | Sigma Designs, Inc.* | | | 416,879 | |
| | | | 755,778 | | | Silicon Image, Inc.* | | | 2,811,494 | |
| | | | 17,615 | | | Standard Microsystems Corp.* | | | 452,353 | |
| | | | 84,657 | | | TriQuint Semiconductor, Inc.* | | | 638,314 | |
| | | | 164,705 | | | Zoran Corp.* | | | 1,602,580 | |
| | | | | | | | | | | |
| | | | | | | | | | 22,680,482 | |
| | | |
| | | |
| | | Software – 4.5% |
| | | | 18,160 | | | Advent Software, Inc.*(a)(b) | | | 820,469 | |
| | | | 95,103 | | | Blackbaud, Inc. | | | 2,192,124 | |
| | | | 22,155 | | | Bottomline Technologies, Inc.* | | | 385,497 | |
| | | | 126,778 | | | Commvault Systems, Inc.* | | | 2,655,999 | |
| | | | 41,606 | | | Double-Take Software, Inc.* | | | 447,264 | |
| | | | 36,713 | | | Epicor Software Corp.* | | | 337,025 | |
| | | | 51,464 | | | Kenexa Corp.* | | | 772,475 | |
| | | | 127,395 | | | Manhattan Associates, Inc.* | | | 3,651,141 | |
| | | | 76,655 | | | Mentor Graphics Corp.* | | | 689,128 | |
| | | | 31,073 | | | MicroStrategy, Inc.* | | | 2,380,192 | |
| | | | 38,695 | | | PROS Holdings, Inc.* | | | 352,125 | |
| | | | 18,121 | | | Quest Software, Inc.* | | | 317,661 | |
| | | | 49,504 | | | Renaissance Learning, Inc. | | | 703,452 | |
| | | | 362,163 | | | Symyx Technologies, Inc.* | | | 1,973,788 | |
| | | | 21,322 | | | Synopsys, Inc.* | | | 484,223 | |
| | | | 14,154 | | | Taleo Corp.* | | | 367,721 | |
| | | | 47,005 | | | The Ultimate Software Group, Inc.* | | | 1,572,317 | |
| | | | 85,448 | | | THQ, Inc.* | | | 649,405 | |
| | | |
| | | |
| | | | 77,154 | | | Unica Corp.* | | | 715,989 | |
| | | | | | | | | | | |
| | | | | | | | | | 21,467,995 | |
| | | |
| | | |
| | | Specialty Retail – 4.6% |
| | | | 145,780 | | | AnnTaylor Stores Corp.* | | | 3,163,426 | |
| | | | 72,537 | | | Asbury Automotive Group, Inc.* | | | 1,127,950 | |
| | | | 11,731 | | | AutoNation, Inc.*(a) | | | 236,966 | |
| | | | 28,944 | | | Barnes & Noble, Inc. | | | 637,926 | |
| | | | 117,058 | | | Brown Shoe Co., Inc. | | | 2,200,690 | |
| | | | 56,846 | | | Build-A-Bear Workshop, Inc.* | | | 543,448 | |
| | | | 60,066 | | | DSW, Inc.* | | | 1,813,993 | |
| | | | 13,481 | | | Genesco, Inc.* | | | 448,783 | |
| | | | 51,878 | | | Group 1 Automotive, Inc.* | | | 1,610,812 | |
| | | | 31,607 | | | Guess?, Inc. | | | 1,449,813 | |
| | | | 24,730 | | | Lithia Motors, Inc.* | | | 197,345 | |
| | | | 63,397 | | | Pier 1 Imports, Inc.* | | | 524,927 | |
| | | | 5,204 | | | Rue21, Inc.* | | | 164,446 | |
| | | | 35,484 | | | Shoe Carnival, Inc.* | | | 981,487 | |
| | | | 170,186 | | | Stage Stores, Inc. | | | 2,595,337 | |
| | | | 44,209 | | | The Cato Corp. | | | 1,049,964 | |
| | | | 18,936 | | | The Dress Barn, Inc.* | | | 524,149 | |
| | | | 37,938 | | | The Finish Line, Inc. | | | 611,181 | |
| | | | 43,956 | | | Williams-Sonoma, Inc. | | | 1,265,933 | |
| | | | 27,434 | | | Zumiez, Inc.* | | | 509,175 | |
| | | | | | | | | | | |
| | | | | | | | | | 21,657,751 | |
| | | |
| | | |
| | | Textiles, Apparel & Luxury Goods – 2.6% |
| | | | 27,863 | | | Columbia Sportswear Co. | | | 1,547,511 | |
| | | | 83,838 | | | Crocs, Inc.* | | | 809,875 | |
| | | | 66,997 | | | Jones Apparel Group, Inc. | | | 1,457,855 | |
| | | | 57,650 | | | Kenneth Cole Productions, Inc.* | | | 718,319 | |
| | | | 43,697 | | | Lululemon Athletica, Inc.*(a) | | | 1,643,881 | |
| | | | 42,133 | | | Oxford Industries, Inc. | | | 909,651 | |
| | | | 61,137 | | | Perry Ellis International, Inc.* | | | 1,475,236 | |
| | | | 98,277 | | | Skechers U.S.A., Inc.* | | | 3,768,923 | |
| | | | | | | | | | | |
| | | | | | | | | | 12,331,251 | |
| | | |
| | | |
| | | Thrifts & Mortgage Finance – 0.8% |
| | | | 52,348 | | | Brookline Bancorp, Inc. | | | 575,305 | |
| | | | 165,689 | | | First Financial Northwest, Inc. | | | 1,068,694 | |
| | | | 88,441 | | | NewAlliance Bancshares, Inc. | | | 1,152,386 | |
| | | | 12,429 | | | Northwest Bancshares, Inc. | | | 155,238 | |
| | | | 43,480 | | | Washington Federal, Inc. | | | 894,384 | |
| | | | | | | | | | | |
| | | | | | | | | | 3,846,007 | |
| | | |
| | | |
| | | Tobacco*(a) – 0.1% |
| | | | 123,905 | | | Alliance One International, Inc. | | | 630,676 | |
| | | |
| | | |
| | | Trading Companies & Distributors*(a) – 0.1% |
| | | | 61,629 | | | BlueLinx Holdings, Inc. | | | 308,761 | |
| | | |
| | | |
| | | Wireless Telecommunication Services* – 0.9% |
| | | | 293,295 | | | USA Mobility, Inc. | | | 4,088,532 | |
| | | |
| | | |
| | | TOTAL COMMON STOCKS |
| | | (Cost $354,651,021) | | $ | 464,246,646 | |
| | | |
| | | |
The accompanying notes are an integral part of these financial statements.
GOLDMAN SACHS STRUCTURED SMALL CAP EQUITY FUND
Schedule of Investments (continued)
April 30, 2010 (Unaudited)
| | | | | | | | | | | | | | | | | |
| | | Principal
| | Interest
| | Maturity
| | |
| | | Amount | | Rate | | Date | | Value |
| |
Short-term Investment(c) – 2.2% |
| | | | | | | | | | | | | | | | | |
| | | | | | | | | | | | | | | | | |
| | | Repurchase Agreement – 2.2% |
| | | Joint Repurchase Agreement Account II |
| | | $ | 10,600,000 | | | | 0.200 | % | | | 05/03/10 | | | $ | 10,600,000 | |
| | | Maturity Value: $10,600,177 |
| | | (Cost $10,600,000) | | | | |
| | | |
| | | |
| | | TOTAL INVESTMENTS BEFORE SECURITIES LENDING REINVESTMENT VEHICLE |
| | | (Cost $365,251,021) | | $ | 474,846,646 | |
| | | |
| | | |
| | | | | | | | | | | | | |
| | | Shares | | Rate | | Value |
| |
Securities Lending Reinvestment Vehicle(d)(e) – 6.2% |
| | | | | | | | | | | | | |
| | | | | | | | | | | | | |
| | | Boston Global Investment Trust – Enhanced Portfolio II |
| | | | 29,104,864 | | | | 0.196 | % | | $ | 29,133,969 | |
| | | (Cost $29,078,598) | | | | |
| | | |
| | | |
| | | TOTAL INVESTMENTS – 106.3% |
| | | (Cost $394,329,619) | | $ | 503,980,615 | |
| | | |
| | | |
| | | LIABILITIES IN EXCESS OF OTHER ASSETS – (6.3)% | | | (29,842,631 | ) |
| | | |
| | | |
| | | NET ASSETS – 100.0% | | $ | 474,137,984 | |
| | | |
| | | |
The percentage shown for each investment category reflects the value of investments in that category as a percentage of net assets.
| | |
| * | | Non-income producing security. |
| |
| (a) | | All or a portion of security is on loan. |
| |
| (b) | | All or a portion of security is segregated as collateral for initial margin requirement on futures transactions. |
| |
| (c) | | Joint repurchase agreement was entered into on April 30, 2010. Additional information appears on pages 86-87. |
| |
| (d) | | Variable rate security. Interest rate disclosed is that which is in effect at April 30, 2010. |
| |
| (e) | | Represents an affiliated issuer. |
| | | | | | | |
| | | |
| | | |
| | | Investment Abbreviation: |
| | | REIT | | — | | Real Estate Investment Trust |
| | | |
| | | |
ADDITIONAL INVESTMENT INFORMATION
FUTURES CONTRACTS — At April 30, 2010, the following futures contracts were open:
| | | | | | | | | | | | | | | |
| | | Number of
| | | | | | | | | |
| | | Contracts
| | | Expiration
| | Current
| | | Unrealized
| |
| Type | | Long (Short) | | | Date | | Value | | | Gain (Loss) | |
| | |
| Russell Mini 2000 Index | | | 138 | | | June 2010 | | $ | 9,873,900 | | | $ | 558,902 | |
| |
| |
The accompanying notes are an integral part of these financial statements.
GOLDMAN SACHS STRUCTURED SMALL CAP GROWTH FUND
Schedule of Investments
April 30, 2010 (Unaudited)
| | | | | | | | | | | |
| | | Shares | | Description | | Value |
| |
Common Stocks – 98.3% |
| | | | | | | | | | | |
| | | | | | | | | | | |
| | | Aerospace & Defense – 0.8% |
| | | | 3,173 | | | AAR Corp.* | | $ | 77,358 | |
| | | | 3,287 | | | Cubic Corp. | | | 122,638 | |
| | | | 2,604 | | | Esterline Technologies Corp.* | | | 145,251 | |
| | | | | | | | | | | |
| | | | | | | | | | 345,247 | |
| | | |
| | | |
| | | Air Freight & Logistics* – 0.2% |
| | | | 15,954 | | | Air Transport Services Group, Inc. | | | 87,747 | |
| | | | 2,476 | | | Pacer International, Inc. | | | 16,441 | |
| | | | | | | | | | | |
| | | | | | | | | | 104,188 | |
| | | |
| | | |
| | | Airlines – 2.8% |
| | | | 2,561 | | | Alaska Air Group, Inc.* | | | 106,051 | |
| | | | 15,469 | | | Allegiant Travel Co.*(a) | | | 795,571 | |
| | | | 28,592 | | | Republic Airways Holdings, Inc.* | | | 178,986 | |
| | | | 8,781 | | | SkyWest, Inc. | | | 131,539 | |
| | | | | | | | | | | |
| | | | | | | | | | 1,212,147 | |
| | | |
| | | |
| | | Auto Components – 0.7% |
| | | | 3,087 | | | Dorman Products, Inc.* | | | 78,255 | |
| | | | 4,603 | | | Drew Industries, Inc.* | | | 118,067 | |
| | | | 1,325 | | | Modine Manufacturing Co.* | | | 18,563 | |
| | | | 7,133 | | | Standard Motor Products, Inc. | | | 76,038 | |
| | | | | | | | | | | |
| | | | | | | | | | 290,923 | |
| | | |
| | | |
| | | Beverages – 0.2% |
| | | | 5,943 | | | National Beverage Corp. | | | 68,939 | |
| | | |
| | | |
| | | Biotechnology – 8.9% |
| | | | 27,489 | | | Alkermes, Inc.* | | | 360,106 | |
| | | | 7,376 | | | Cepheid, Inc.*(a) | | | 147,446 | |
| | | | 21,090 | | | Cubist Pharmaceuticals, Inc.*(b) | | | 472,838 | |
| | | | 13,492 | | | Emergent Biosolutions, Inc.* | | | 219,650 | |
| | | | 22,658 | | | Exelixis, Inc.* | | | 130,963 | |
| | | | 6,931 | | | Genomic Health, Inc.*(a) | | | 111,035 | |
| | | | 8,320 | | | Human Genome Sciences, Inc.* | | | 230,381 | |
| | | | 46,429 | | | Insmed, Inc.* | | | 49,215 | |
| | | | 786 | | | InterMune, Inc.* | | | 33,452 | |
| | | | 9,121 | | | Isis Pharmaceuticals, Inc.* | | | 98,051 | |
| | | | 13,921 | | | Martek Biosciences Corp.*(a) | | | 306,680 | |
| | | | 19,730 | | | Maxygen, Inc.* | | | 126,469 | |
| | | | 5,041 | | | Myriad Genetics, Inc.* | | | 121,034 | |
| | | | 35,992 | | | Nabi Biopharmaceuticals* | | | 202,275 | |
| | | | 4,245 | | | Onyx Pharmaceuticals, Inc.* | | | 122,553 | |
| | | | 8,961 | | | Opko Health, Inc.* | | | 19,356 | |
| | | | 69,417 | | | PDL BioPharma, Inc.(a) | | | 404,007 | |
| | | | 14,686 | | | Progenics Pharmaceuticals, Inc.*(a) | | | 94,578 | |
| | | | 1,919 | | | Regeneron Pharmaceuticals, Inc.* | | | 48,992 | |
| | | | 19,172 | | | SciClone Pharmaceuticals, Inc.* | | | 80,139 | |
| | | | 16,424 | | | Seattle Genetics, Inc.* | | | 206,942 | |
| | | | 6,901 | | | Synta Pharmaceuticals Corp.* | | | 28,018 | |
| | | | 33,029 | | | ZymoGenetics, Inc.* | | | 196,192 | |
| | | | | | | | | | | |
| | | | | | | | | | 3,810,372 | |
| | | |
| | | |
| | | Building Products – 1.0% |
| | | | 6,324 | | | Apogee Enterprises, Inc. | | | 86,892 | |
| | | | 561 | | | Armstrong World Industries, Inc.* | | | 24,431 | |
| | | | 4,811 | | | Simpson Manufacturing Co., Inc. | | | 163,526 | |
| | | | 4,202 | | | Trex Co., Inc.*(a) | | | 102,907 | |
| | | |
| | | |
| | | | 902 | | | Universal Forest Products, Inc. | | | 37,929 | |
| | | | | | | | | | | |
| | | | | | | | | | 415,685 | |
| | | |
| | | |
| | | Capital Markets – 0.6% |
| | | | 1,326 | | | Artio Global Investors, Inc. | | | 30,339 | |
| | | | 1,328 | | | Calamos Asset Management, Inc. | | | 16,534 | |
| | | | 3,700 | | | GAMCO Investors, Inc. | | | 170,237 | |
| | | | 7,098 | | | Pzena Investment Management, Inc.* | | | 54,654 | |
| | | | | | | | | | | |
| | | | | | | | | | 271,764 | |
| | | |
| | | |
| | | Chemicals – 1.1% |
| | | | 2,380 | | | Omnova Solutions, Inc.* | | | 18,207 | |
| | | | 6,299 | | | PolyOne Corp.* | | | 71,242 | |
| | | | 3,876 | | | Stepan Co. | | | 293,607 | |
| | | | 3,919 | | | Zep, Inc. | | | 72,266 | |
| | | | | | | | | | | |
| | | | | | | | | | 455,322 | |
| | | |
| | | |
| | | Commercial Banks – 0.3% |
| | | | 2,092 | | | Great Southern Bancorp, Inc.(a) | | | 51,024 | |
| | | | 1,297 | | | SVB Financial Group* | | | 63,851 | |
| | | | 2,691 | | | Wilshire Bancorp, Inc. | | | 29,224 | |
| | | | | | | | | | | |
| | | | | | | | | | 144,099 | |
| | | |
| | | |
| | | Commercial Services & Supplies – 1.7% |
| | | | 17,757 | | | HNI Corp.(a) | | | 551,177 | |
| | | | 4,660 | | | Steelcase, Inc. | | | 38,259 | |
| | | | 2,256 | | | United Stationers, Inc.* | | | 138,112 | |
| | | | | | | | | | | |
| | | | | | | | | | 727,548 | |
| | | |
| | | |
| | | Communications Equipment – 3.3% |
| | | | 14,908 | | | ADTRAN, Inc. | | | 399,087 | |
| | | | 6,529 | | | Arris Group, Inc.* | | | 80,242 | |
| | | | 974 | | | EMS Technologies, Inc.* | | | 15,477 | |
| | | | 15,904 | | | Emulex Corp.* | | | 186,872 | |
| | | | 3,688 | | | Loral Space & Communications, Inc.* | | | 158,805 | |
| | | | 2,337 | | | PC-Tel, Inc.* | | | 15,214 | |
| | | | 9,134 | | | Plantronics, Inc. | | | 303,249 | |
| | | | 4,053 | | | Polycom, Inc.* | | | 131,925 | |
| | | | 2,231 | | | Riverbed Technology, Inc.* | | | 69,139 | |
| | | | 10,317 | | | ShoreTel, Inc.* | | | 67,576 | |
| | | | | | | | | | | |
| | | | | | | | | | 1,427,586 | |
| | | |
| | | |
| | | Computers & Peripherals* – 1.3% |
| | | | 9,901 | | | Imation Corp. | | | 107,327 | |
| | | | 8,420 | | | Isilon Systems, Inc. | | | 109,291 | |
| | | | 76,923 | | | Quantum Corp. | | | 223,077 | |
| | | | 759 | | | Stratasys, Inc. | | | 18,094 | |
| | | | 7,643 | | | Super Micro Computer, Inc. | | | 108,378 | |
| | | | | | | | | | | |
| | | | | | | | | | 566,167 | |
| | | |
| | | |
| | | Consumer Finance – 0.6% |
| | | | 25,162 | | | Advance America Cash Advance Centers, Inc. | | | 143,926 | |
| | | | 7,796 | | | CompuCredit Holdings Corp.(a) | | | 46,698 | |
| | | | 3,031 | | | QC Holdings, Inc. | | | 15,731 | |
| | | |
| | | |
The accompanying notes are an integral part of these financial statements.
GOLDMAN SACHS STRUCTURED SMALL CAP GROWTH FUND
Schedule of Investments (continued)
April 30, 2010 (Unaudited)
| | | | | | | | | | | |
| | | Shares | | Description | | Value |
| |
Common Stocks – (continued) |
| | | Consumer Finance – (continued) |
| | | | | | | | | | | |
| | | | 2,585 | | | Rewards Network, Inc. | | $ | 33,657 | |
| | | | | | | | | | | |
| | | | | | | | | | 240,012 | |
| | | |
| | | |
| | | Distributors* – 0.3% |
| | | | 3,854 | | | Core-Mark Holding Co., Inc. | | | 117,624 | |
| | | |
| | | |
| | | Diversified Consumer Services* – 1.6% |
| | | | 2,182 | | | Capella Education Co. | | | 197,733 | |
| | | | 1,616 | | | Corinthian Colleges, Inc. | | | 25,242 | |
| | | | 3,963 | | | Pre-Paid Legal Services, Inc.(a) | | | 176,235 | |
| | | | 2,470 | | | Steiner Leisure Ltd. | | | 115,769 | |
| | | | 7,214 | | | Universal Technical Institute, Inc. | | | 172,847 | |
| | | | | | | | | | | |
| | | | | | | | | | 687,826 | |
| | | |
| | | |
| | | Diversified Financial Services – 0.4% |
| | | | 1,508 | | | Compass Diversified Holdings | | | 21,896 | |
| | | | 5,233 | | | NewStar Financial, Inc.* | | | 40,085 | |
| | | | 2,745 | | | PHH Corp.* | | | 62,284 | |
| | | | 13,681 | | | Primus Guaranty Ltd.* | | | 61,701 | |
| | | | | | | | | | | |
| | | | | | | | | | 185,966 | |
| | | |
| | | |
| | | Diversified Telecommunication Services – 0.1% |
| | | | 1,819 | | | CenturyTel, Inc. | | | 62,046 | |
| | | |
| | | |
| | | Electrical Equipment – 2.0% |
| | | | 5,358 | | | Acuity Brands, Inc. | | | 242,235 | |
| | | | 5,130 | | | GrafTech International Ltd.* | | | 86,492 | |
| | | | 3,896 | | | II-VI, Inc.* | | | 139,711 | |
| | | | 3,790 | | | LSI Industries, Inc. | | | 26,644 | |
| | | | 9,865 | | | Microvision, Inc.*(a) | | | 30,877 | |
| | | | 1,429 | | | Powell Industries, Inc.* | | | 47,986 | |
| | | | 4,223 | | | Vicor Corp.* | | | 63,852 | |
| | | | 7,450 | | | Woodward Governor Co. | | | 238,772 | |
| | | | | | | | | | | |
| | | | | | | | | | 876,569 | |
| | | |
| | | |
| | | Electronic Equipment, Instruments & Components – 2.4% |
| | | | 10,334 | | | Benchmark Electronics, Inc.* | | | 223,628 | |
| | | | 18,843 | | | Brightpoint, Inc.* | | | 152,440 | |
| | | | 3,865 | | | CTS Corp. | | | 40,583 | |
| | | | 7,365 | | | Insight Enterprises, Inc.* | | | 110,696 | |
| | | | 15,613 | | | Methode Electronics, Inc. | | | 173,304 | |
| | | | 3,447 | | | PC Mall, Inc.* | | | 17,890 | |
| | | | 22,899 | | | Power-One, Inc.*(a) | | | 179,986 | |
| | | | 6,979 | | | RadiSys Corp.* | | | 68,324 | |
| | | | 1,616 | | | SYNNEX Corp.* | | | 44,311 | |
| | | | | | | | | | | |
| | | | | | | | | | 1,011,162 | |
| | | |
| | | |
| | | Energy Equipment & Services – 1.4% |
| | | | 3,638 | | | Cal Dive International, Inc.* | | | 23,865 | |
| | | | 4,639 | | | Dril-Quip, Inc.* | | | 268,737 | |
| | | | 14,189 | | | RPC, Inc.(a) | | | 193,680 | |
| | | | 8,272 | | | Willbros Group, Inc.* | | | 103,814 | |
| | | | | | | | | | | |
| | | | | | | | | | 590,096 | |
| | | |
| | | |
| | | Food Products – 1.6% |
| | | | 8,829 | | | Dole Food Co., Inc.* | | | 99,944 | |
| | | | 644 | | | J & J Snack Foods Corp. | | | 30,004 | |
| | | |
| | | |
| | | | 9,742 | | | Lancaster Colony Corp. | | | 535,518 | |
| | | | | | | | | | | |
| | | | | | | | | | 665,466 | |
| | | |
| | | |
| | | Health Care Equipment & Supplies – 5.8% |
| | | | 1,028 | | | Abaxis, Inc.* | | | 26,636 | |
| | | | 10,279 | | | Align Technology, Inc.* | | | 174,537 | |
| | | | 3,349 | | | Analogic Corp. | | | 160,149 | |
| | | | 2,688 | | | AngioDynamics, Inc.* | | | 43,008 | |
| | | | 11,777 | | | Hansen Medical, Inc.* | | | 29,914 | |
| | | | 3,028 | | | ICU Medical, Inc.* | | | 107,827 | |
| | | | 4,745 | | | Immucor, Inc.* | | | 101,590 | |
| | | | 12,863 | | | Invacare Corp. | | | 339,969 | |
| | | | 3,409 | | | Kensey Nash Corp.* | | | 77,214 | |
| | | | 3,722 | | | Masimo Corp. | | | 87,132 | |
| | | | 13,724 | | | Medical Action Industries, Inc.* | | | 162,904 | |
| | | | 10,721 | | | Meridian Bioscience, Inc. | | | 214,313 | |
| | | | 5,476 | | | Micrus Endovascular Corp.* | | | 109,958 | |
| | | | 3,238 | | | Quidel Corp.* | | | 47,728 | |
| | | | 11,114 | | | RTI Biologics, Inc.* | | | 42,567 | |
| | | | 5,900 | | | Somanetics Corp.* | | | 119,357 | |
| | | | 10,963 | | | STERIS Corp. | | | 364,849 | |
| | | | 5,506 | | | Symmetry Medical, Inc.* | | | 63,649 | |
| | | | 3,609 | | | Thoratec Corp.* | | | 160,925 | |
| | | | 2,048 | | | Vascular Solutions, Inc.* | | | 20,275 | |
| | | | 823 | | | West Pharmaceutical Services, Inc. | | | 34,443 | |
| | | | | | | | | | | |
| | | | | | | | | | 2,488,944 | |
| | | |
| | | |
| | | Health Care Providers & Services – 4.3% |
| | | | 1,336 | | | Amedisys, Inc.*(a) | | | 76,927 | |
| | | | 2,265 | | | America Service Group, Inc. | | | 38,414 | |
| | | | 22,679 | | | AMN Healthcare Services, Inc.* | | | 207,286 | |
| | | | 2,720 | | | CorVel Corp.* | | | 90,576 | |
| | | | 7,893 | | | Cross Country Healthcare, Inc.* | | | 79,088 | |
| | | | 10,024 | | | Healthspring, Inc.* | | | 176,423 | |
| | | | 7,492 | | | Kindred Healthcare, Inc.* | | | 133,657 | |
| | | | 2,961 | | | Molina Healthcare, Inc.* | | | 86,372 | |
| | | | 1,370 | | | Omnicare, Inc. | | | 38,072 | |
| | | | 10,623 | | | Owens & Minor, Inc. | | | 334,093 | |
| | | | 22,758 | | | PharMerica Corp.* | | | 439,230 | |
| | | | 8,569 | | | Sunrise Senior Living, Inc.* | | | 47,644 | |
| | | | 4,774 | | | Universal American Financial Corp.* | | | 73,281 | |
| | | | | | | | | | | |
| | | | | | | | | | 1,821,063 | |
| | | |
| | | |
| | | Health Care Technology – 0.1% |
| | | | 1,958 | | | MedQuist, Inc. | | | 18,229 | |
| | | | 1,725 | | | Vital Images, Inc.* | | | 27,221 | |
| | | | | | | | | | | |
| | | | | | | | | | 45,450 | |
| | | |
| | | |
| | | Hotels, Restaurants & Leisure* – 2.9% |
| | | | 522 | | | Biglari Holdings, Inc. | | | 204,232 | |
| | | | 2,127 | | | Boyd Gaming Corp. | | | 27,013 | |
| | | | 16,913 | | | Caribou Coffee Co., Inc.(a) | | | 149,680 | |
| | | | 2,703 | | | Domino’s Pizza, Inc. | | | 41,653 | |
| | | | 2,845 | | | McCormick & Schmick’s Seafood Restaurants, Inc. | | | 28,194 | |
| | | | 8,881 | | | O’Charley’s, Inc. | | | 84,814 | |
| | | |
| | | |
The accompanying notes are an integral part of these financial statements.
GOLDMAN SACHS STRUCTURED SMALL CAP GROWTH FUND
| | | | | | | | | | | |
| | | Shares | | Description | | Value |
| |
Common Stocks – (continued) |
| | | Hotels, Restaurants & Leisure* – (continued) |
| | | | | | | | | | | |
| | | | 4,590 | | | P.F. Chang’s China Bistro, Inc. | | $ | 200,308 | |
| | | | 12,577 | | | Papa John’s International, Inc. | | | 344,610 | |
| | | | 421 | | | Peet’s Coffee & Tea, Inc. | | | 16,680 | |
| | | | 7,921 | | | Texas Roadhouse, Inc. | | | 117,072 | |
| | | | 4,716 | | | Universal Travel Group | | | 43,057 | |
| | | | | | | | | | | |
| | | | | | | | | | 1,257,313 | |
| | | |
| | | |
| | | Household Durables – 2.2% |
| | | | 3,656 | | | Blyth, Inc. | | | 210,732 | |
| | | | 5,902 | | | Hovnanian Enterprises, Inc.*(a) | | | 41,963 | |
| | | | 7,978 | | | iRobot Corp.* | | | 160,996 | |
| | | | 4,161 | | | M/I Homes, Inc.* | | | 64,912 | |
| | | | 6,125 | | | Sealy Corp.* | | | 22,907 | |
| | | | 12,591 | | | Tempur-Pedic International, Inc.* | | | 424,317 | |
| | | | | | | | | | | |
| | | | | | | | | | 925,827 | |
| | | |
| | | |
| | | Household Products* – 0.2% |
| | | | 9,277 | | | Central Garden & Pet Co. | | | 95,831 | |
| | | |
| | | |
| | | Insurance – 0.1% |
| | | | 1,755 | | | Assured Guaranty Ltd. | | | 37,820 | |
| | | | 2,709 | | | Conseco, Inc.* | | | 15,983 | |
| | | | | | | | | | | |
| | | | | | | | | | 53,803 | |
| | | |
| | | |
| | | Internet & Catalog Retail* – 0.7% |
| | | | 6,305 | | | 1-800-FLOWERS.COM, Inc. | | | 18,032 | |
| | | | 2,629 | | | Blue Nile, Inc.(a) | | | 141,940 | |
| | | | 4,545 | | | HSN, Inc. | | | 136,941 | |
| | | | 1,041 | | | Overstock.com, Inc. | | | 19,258 | |
| | | | | | | | | | | |
| | | | | | | | | | 316,171 | |
| | | |
| | | |
| | | Internet Software & Services – 1.8% |
| | | | 17,293 | | | Art Technology Group, Inc.* | | | 74,014 | |
| | | | 5,862 | | | DivX, Inc.* | | | 49,006 | |
| | | | 20,140 | | | EarthLink, Inc. | | | 181,663 | |
| | | | 3,176 | | | LivePerson, Inc.* | | | 26,234 | |
| | | | 12,807 | | | Marchex, Inc. Class B | | | 67,365 | |
| | | | 3,658 | | | ModusLink Global Solutions, Inc.* | | | 32,666 | |
| | | | 43,842 | | | RealNetworks, Inc.* | | | 181,944 | |
| | | | 14,053 | | | ValueClick, Inc.* | | | 144,465 | |
| | | | | | | | | | | |
| | | | | | | | | | 757,357 | |
| | | |
| | | |
| | | IT Services – 3.6% |
| | | | 16,306 | | | Acxiom Corp.* | | | 311,118 | |
| | | | 5,904 | | | CSG Systems International, Inc.* | | | 134,139 | |
| | | | 5,462 | | | Exlservice Holdings, Inc.* | | | 86,955 | |
| | | | 37,854 | | | Lionbridge Technologies, Inc.* | | | 204,790 | |
| | | | 3,638 | | | MAXIMUS, Inc. | | | 225,229 | |
| | | | 2,911 | | | RightNow Technologies, Inc.* | | | 47,740 | |
| | | | 1,979 | | | StarTek, Inc.* | | | 13,418 | |
| | | | 13,400 | | | TeleTech Holdings, Inc.* | | | 221,770 | |
| | | | 16,503 | | | VeriFone Holdings, Inc.*(a) | | | 314,052 | |
| | | | | | | | | | | |
| | | | | | | | | | 1,559,211 | |
| | | |
| | | |
| | | Life Sciences Tools & Services* – 1.3% |
| | | | 25,793 | | | Affymetrix, Inc. | | | 179,003 | |
| | | | 2,351 | | | Dionex Corp. | | | 191,771 | |
| | | | 17,698 | | | eResearchTechnology, Inc. | | | 130,434 | |
| | | |
| | | |
| | | | 2,099 | | | Kendle International, Inc. | | | 34,739 | |
| | | | | | | | | | | |
| | | | | | | | | | 535,947 | |
| | | |
| | | |
| | | Machinery – 2.5% |
| | | | 2,238 | | | Altra Holdings, Inc.* | | | 33,928 | |
| | | | 499 | | | Astec Industries, Inc.* | | | 16,527 | |
| | | | 6,402 | | | Briggs & Stratton Corp. | | | 151,984 | |
| | | | 3,811 | | | Met-Pro Corp. | | | 38,758 | |
| | | | 5,628 | | | Mueller Industries, Inc. | | | 166,870 | |
| | | | 1,885 | | | NACCO Industries, Inc. | | | 163,882 | |
| | | | 326 | | | Navistar International Corp.* | | | 15,759 | |
| | | | 2,913 | | | Oshkosh Corp.* | | | 112,500 | |
| | | | 5,835 | | | Sauer-Danfoss, Inc.* | | | 94,819 | |
| | | | 1,324 | | | Tecumseh Products Co.* | | | 16,921 | |
| | | | 4,264 | | | Tennant Co. | | | 147,065 | |
| | | | 2,296 | | | The Greenbrier Cos., Inc.* | | | 37,379 | |
| | | | 1,442 | | | The Toro Co. | | | 82,107 | |
| | | | | | | | | | | |
| | | | | | | | | | 1,078,499 | |
| | | |
| | | |
| | | Media – 0.7% |
| | | | 2,760 | | | Arbitron, Inc. | | | 85,036 | |
| | | | 1,468 | | | Clear Channel Outdoor Holdings, Inc.* | | | 16,999 | |
| | | | 13,571 | | | Journal Communications, Inc.* | | | 76,948 | |
| | | | 2,338 | | | Live Nation, Inc.* | | | 36,683 | |
| | | | 3,136 | | | Reading International, Inc.* | | | 13,077 | |
| | | | 6,892 | | | The E.W. Scripps Co.* | | | 75,398 | |
| | | | | | | | | | | |
| | | | | | | | | | 304,141 | |
| | | |
| | | |
| | | Metals & Mining – 1.0% |
| | | | 413 | | | Olympic Steel, Inc. | | | 13,125 | |
| | | | 7,891 | | | Stillwater Mining Co.* | | | 133,358 | |
| | | | 17,598 | | | Worthington Industries, Inc. | | | 281,040 | |
| | | | | | | | | | | |
| | | | | | | | | | 427,523 | |
| | | |
| | | |
| | | Multiline Retail – 1.0% |
| | | | 17,800 | | | 99 Cents Only Stores* | | | 276,256 | |
| | | | 10,569 | | | Fred’s, Inc. | | | 146,803 | |
| | | | | | | | | | | |
| | | | | | | | | | 423,059 | |
| | | |
| | | |
| | | Oil, Gas & Consumable Fuels – 2.2% |
| | | | 5,400 | | | McMoRan Exploration Co.* | | | 64,476 | |
| | | | 576 | | | Panhandle Oil and Gas, Inc. | | | 14,377 | |
| | | | 6,268 | | | Ship Finance International Ltd. | | | 124,106 | |
| | | | 7,019 | | | Tesoro Corp. | | | 92,300 | |
| | | | 4,522 | | | USEC, Inc.* | | | 27,132 | |
| | | | 20,649 | | | W&T Offshore, Inc. | | | 195,546 | |
| | | | 14,999 | | | World Fuel Services Corp.(a) | | | 426,422 | |
| | | | | | | | | | | |
| | | | | | | | | | 944,359 | |
| | | |
| | | |
| | | Paper & Forest Products* – 1.2% |
| | | | 4,851 | | | Clearwater Paper Corp. | | | 308,911 | |
| | | | 1,752 | | | Domtar Corp. | | | 124,112 | |
| | | | 3,705 | | | Louisiana-Pacific Corp.(a) | | | 43,571 | |
| | | | 4,459 | | | Wausau Paper Corp. | | | 39,462 | |
| | | | | | | | | | | |
| | | | | | | | | | 516,056 | |
| | | |
| | | |
The accompanying notes are an integral part of these financial statements.
GOLDMAN SACHS STRUCTURED SMALL CAP GROWTH FUND
Schedule of Investments (continued)
April 30, 2010 (Unaudited)
| | | | | | | | | | | |
| | | Shares | | Description | | Value |
| |
Common Stocks – (continued) |
| | | | | | | | | | | |
| | | Personal Products – 0.5% |
| | | | 15,745 | | | American Oriental Bioengineering, Inc.*(a) | | $ | 63,767 | |
| | | | 1,816 | | | Nu Skin Enterprises, Inc. | | | 54,589 | |
| | | | 2,665 | | | USANA Health Sciences, Inc.* | | | 96,607 | |
| | | | | | | | | | | |
| | | | | | | | | | 214,963 | |
| | | |
| | | |
| | | Pharmaceuticals – 2.5% |
| | | | 3,596 | | | Ardea Biosciences, Inc.* | | | 91,338 | |
| | | | 2,801 | | | Caraco Pharmaceutical Laboratories Ltd.* | | | 18,066 | |
| | | | 25,701 | | | DepoMed, Inc.* | | | 103,575 | |
| | | | 14,781 | | | Ista Pharmaceuticals, Inc.* | | | 57,794 | |
| | | | 16,840 | | | King Pharmaceuticals, Inc.* | | | 165,032 | |
| | | | 9,506 | | | Matrixx Initiatives, Inc.* | | | 48,671 | |
| | | | 6,039 | | | Medicis Pharmaceutical Corp. | | | 153,270 | |
| | | | 7,825 | | | Obagi Medical Products, Inc.* | | | 105,481 | |
| | | | 6,158 | | | The Medicines Co.* | | | 45,200 | |
| | | | 18,423 | | | ViroPharma, Inc.* | | | 234,341 | |
| | | | 1,505 | | | Watson Pharmaceuticals, Inc.* | | | 64,444 | |
| | | | | | | | | | | |
| | | | | | | | | | 1,087,212 | |
| | | |
| | | |
| | | Professional Services – 1.8% |
| | | | 4,050 | | | Administaff, Inc. | | | 89,667 | |
| | | | 8,356 | | | CDI Corp. | | | 145,645 | |
| | | | 21,322 | | | Kelly Services, Inc.* | | | 342,858 | |
| | | | 5,206 | | | Kforce, Inc.* | | | 72,311 | |
| | | | 12,400 | | | SFN Group, Inc.* | | | 106,020 | |
| | | | | | | | | | | |
| | | | | | | | | | 756,501 | |
| | | |
| | | |
| | | Real Estate Investment Trusts – 3.0% |
| | | | 4,360 | | | Equity Lifestyle Properties, Inc. | | | 242,024 | |
| | | | 3,316 | | | LTC Properties, Inc. | | | 92,516 | |
| | | | 5,376 | | | National Health Investors, Inc. | | | 218,373 | |
| | | | 3,656 | | | Nationwide Health Properties, Inc. | | | 128,033 | |
| | | | 17,225 | | | OMEGA Healthcare Investors, Inc. | | | 344,845 | |
| | | | 6,480 | | | Potlatch Corp. | | | 242,741 | |
| | | | | | | | | | | |
| | | | | | | | | | 1,268,532 | |
| | | |
| | | |
| | | Road & Rail – 1.1% |
| | | | 10,366 | | | Celadon Group, Inc.* | | | 154,764 | |
| | | | 3,770 | | | Heartland Express, Inc. | | | 62,356 | |
| | | | 6,674 | | | Marten Transport Ltd.* | | | 145,827 | |
| | | | 5,474 | | | Universal Truckload Services, Inc.* | | | 99,955 | |
| | | | 1,176 | | | Werner Enterprises, Inc. | | | 26,366 | |
| | | | | | | | | | | |
| | | | | | | | | | 489,268 | |
| | | |
| | | |
| | | Semiconductors & Semiconductor Equipment – 6.5% |
| | | | 16,297 | | | Advanced Analogic Technologies, Inc.* | | | 61,929 | |
| | | | 19,728 | | | Applied Micro Circuits Corp.* | | | 222,532 | |
| | | | 4,360 | | | Cabot Microelectronics Corp.* | | | 167,250 | |
| | | | 6,239 | | | Entropic Communications, Inc.* | | | 32,942 | |
| | | | 2,658 | | | Fairchild Semiconductor International, Inc.* | | | 29,823 | |
| | | | 5,814 | | | Integrated Device Technology, Inc.* | | | 38,430 | |
| | | | 4,768 | | | IXYS Corp.* | | | 43,055 | |
| | | | 86,509 | | | Lattice Semiconductor Corp.* | | | 455,902 | |
| | | |
| | | |
| | | | 7,038 | | | LSI Corp.* | | | 42,369 | |
| | | | 25,267 | | | Micrel, Inc. | | | 294,866 | |
| | | | 13,675 | | | PLX Technology, Inc.* | | | 71,794 | |
| | | | 84,782 | | | RF Micro Devices, Inc.* | | | 476,475 | |
| | | | 6,542 | | | Sigma Designs, Inc.*(a) | | | 77,588 | |
| | | | 4,792 | | | Skyworks Solutions, Inc.* | | | 80,697 | |
| | | | 7,920 | | | Standard Microsystems Corp.* | | | 203,385 | |
| | | | 2,772 | | | Tessera Technologies, Inc.* | | | 56,216 | |
| | | | 11,204 | | | TriQuint Semiconductor, Inc.* | | | 84,478 | |
| | | | 4,934 | | | Volterra Semiconductor Corp.* | | | 118,219 | |
| | | | 23,336 | | | Zoran Corp.* | | | 227,059 | |
| | | | | | | | | | | |
| | | | | | | | | | 2,785,009 | |
| | | |
| | | |
| | | Software – 7.9% |
| | | | 8,236 | | | Actuate Corp.* | | | 46,616 | |
| | | | 7,766 | | | Advent Software, Inc.*(b) | | | 350,868 | |
| | | | 12,615 | | | Blackbaud, Inc. | | | 290,776 | |
| | | | 7,233 | | | Bottomline Technologies, Inc.* | | | 125,854 | |
| | | | 13,999 | | | Commvault Systems, Inc.* | | | 293,279 | |
| | | | 2,563 | | | Deltek, Inc.* | | | 20,171 | |
| | | | 2,985 | | | Double-Take Software, Inc.* | | | 32,089 | |
| | | | 1,066 | | | ePlus, Inc.* | | | 19,838 | |
| | | | 7,054 | | | Kenexa Corp.* | | | 105,880 | |
| | | | 9,466 | | | Manhattan Associates, Inc.* | | | 271,296 | |
| | | | 12,318 | | | Mentor Graphics Corp.* | | | 110,739 | |
| | | | 4,090 | | | MicroStrategy, Inc.* | | | 313,294 | |
| | | | 3,926 | | | PROS Holdings, Inc.* | | | 35,727 | |
| | | | 7,787 | | | QAD, Inc.* | | | 42,984 | |
| | | | 11,479 | | | Quest Software, Inc.* | | | 201,227 | |
| | | | 10,134 | | | Renaissance Learning, Inc. | | | 144,004 | |
| | | | 1,778 | | | Rosetta Stone, Inc.* | | | 45,943 | |
| | | | 11,975 | | | Symyx Technologies, Inc.* | | | 65,264 | |
| | | | 9,979 | | | Taleo Corp.* | | | 259,254 | |
| | | | 8,272 | | | The Ultimate Software Group, Inc.* | | | 276,698 | |
| | | | 20,816 | | | THQ, Inc.*(a) | | | 158,202 | |
| | | | 6,267 | | | TiVo, Inc.* | | | 109,798 | |
| | | | 5,216 | | | Unica Corp.* | | | 48,404 | |
| | | | | | | | | | | |
| | | | | | | | | | 3,368,205 | |
| | | |
| | | |
| | | Specialty Retail – 5.0% |
| | | | 6,228 | | | AnnTaylor Stores Corp.* | | | 135,148 | |
| | | | 1,424 | | | Brown Shoe Co., Inc. | | | 26,771 | |
| | | | 818 | | | Citi Trends, Inc.* | | | 27,436 | |
| | | | 4,180 | | | Coldwater Creek, Inc.* | | | 29,594 | |
| | | | 10,053 | | | DSW, Inc.* | | | 303,601 | |
| | | | 453 | | | Genesco, Inc.* | | | 15,080 | |
| | | | 1,940 | | | Group 1 Automotive, Inc.* | | | 60,237 | |
| | | | 776 | | | Hibbett Sports, Inc.* | | | 21,340 | |
| | | | 5,707 | | | J. Crew Group, Inc.* | | | 265,204 | |
| | | | 4,754 | | | Jo-Ann Stores, Inc.* | | | 209,746 | |
| | | | 6,580 | | | Kirkland’s, Inc.* | | | 146,537 | |
| | | | 1,715 | | | Rue21, Inc.* | | | 54,194 | |
| | | | 8,449 | | | Stage Stores, Inc. | | | 128,847 | |
| | | | 2,766 | | | Stein Mart, Inc.* | | | 26,222 | |
| | | | 6,418 | | | The Cato Corp. | | | 152,427 | |
| | | | 2,524 | | | The Dress Barn, Inc.* | | | 69,864 | |
| | | | 8,296 | | | The Finish Line, Inc. | | | 133,649 | |
| | | |
| | | |
The accompanying notes are an integral part of these financial statements.
GOLDMAN SACHS STRUCTURED SMALL CAP GROWTH FUND
| | | | | | | | | | | |
| | | Shares | | Description | | Value |
| |
Common Stocks – (continued) |
| | | Specialty Retail – (continued) |
| | | | | | | | | | | |
| | | | 770 | | | The Gymboree Corp.* | | $ | 37,830 | |
| | | | 2,749 | | | Ulta Salon, Cosmetics & Fragrance, Inc.* | | | 63,557 | |
| | | | 13,592 | | | Zumiez, Inc.* | | | 252,268 | |
| | | | | | | | | | | |
| | | | | | | | | | 2,159,552 | |
| | | |
| | | |
| | | Textiles, Apparel & Luxury Goods – 3.4% |
| | | | 9,469 | | | Crocs, Inc.* | | | 91,471 | |
| | | | 3,525 | | | Fossil, Inc.* | | | 137,122 | |
| | | | 2,813 | | | G-III Apparel Group Ltd.* | | | 80,452 | |
| | | | 10,212 | | | Lululemon Athletica, Inc.*(a) | | | 384,175 | |
| | | | 7,132 | | | Oxford Industries, Inc. | | | 153,980 | |
| | | | 4,048 | | | Skechers U.S.A., Inc.* | | | 155,241 | |
| | | | 4,755 | | | The Timberland Co.* | | | 102,232 | |
| | | | 5,076 | | | Under Armour, Inc.*(a) | | | 171,315 | |
| | | | 5,411 | | | Wolverine World Wide, Inc. | | | 165,631 | |
| | | | | | | | | | | |
| | | | | | | | | | 1,441,619 | |
| | | |
| | | |
| | | Tobacco – 0.8% |
| | | | 30,247 | | | Alliance One International, Inc.*(a) | | | 153,957 | |
| | | | 3,552 | | | Universal Corp. | | | 183,923 | |
| | | | | | | | | | | |
| | | | | | | | | | 337,880 | |
| | | |
| | | |
| | | Trading Companies & Distributors – 0.2% |
| | | | 1,744 | | | Watsco, Inc. | | | 103,280 | |
| | | |
| | | |
| | | Wireless Telecommunication Services* – 0.7% |
| | | | 20,015 | | | USA Mobility, Inc. | | | 279,009 | |
| | | |
| | | |
| | | TOTAL COMMON STOCKS |
| | | (Cost $34,330,030) | | $ | 42,118,338 | |
| | | |
| | | |
| | | | | | | | | | | |
| | | | | | | | | | | |
Exchange Traded Fund – 0.1% |
| | | | | | | | | | | |
| | | | | | | | | | | |
| | | Other – 0.1% |
| | | | 400 | | | iShares Russell 2000 Growth
Index Fund | | $ | 30,548 | |
| | | (Cost $32,842) | | | | |
| | | |
| | | |
| | | | | | | | | | | | | | | | | |
| | | Principal
| | Interest
| | Maturity
| | |
| | | Amount | | Rate | | Date | | Value |
| |
Short-term Investment(c) – 2.5% |
| | | | | | | | | | | | | | | | | |
| | | | | | | | | | | | | | | | | |
| | | Repurchase Agreement – 2.5% |
| | | Joint Repurchase Agreement Account II |
| | | $ | 1,100,000 | | | | 0.200 | % | | | 05/03/10 | | | $ | 1,100,000 | |
| | | Maturity Value: $1,100,018 |
| | | (Cost $1,100,000) | | | | |
| | | |
| | | |
| | | TOTAL INVESTMENTS BEFORE SECURITIES LENDING REINVESTMENT VEHICLE |
| | | (Cost $35,462,872) | | $ | 43,248,886 | |
| | | |
| | | |
| | | | | | | | | | | |
| | | Shares | | Rate | | Value |
| |
Securities Lending Reinvestment Vehicle(d)(e) – 8.1% |
| | | | | | | | | | | |
| | | | | | | | | | | |
| | | Boston Global Investment Trust – Enhanced Portfolio II |
| | | | 3,465,093 | | | 0.196% | | $ | 3,468,558 | |
| | | (Cost $3,462,588) |
| | | |
| | | TOTAL INVESTMENTS – 109.0% |
| | | (Cost $38,925,460) | | $ | 46,717,444 | |
| | | |
| | | |
| | | LIABILITIES IN EXCESS OF
OTHER ASSETS – (9.0)% | | | (3,870,093 | ) |
| | | |
| | | |
| | | NET ASSETS – 100.0% | | $ | 42,847,351 | |
| | | |
| | | |
The percentage shown for each investment category reflects the value of investments in that category as a percentage of net assets.
| | |
| * | | Non-income producing security. |
| |
| (a) | | All or portion of security is on loan. |
| |
| (b) | | All or a portion of security is segregated as collateral for initial margin requirements on futures transaction. |
| |
| (c) | | Joint repurchase agreement was entered into on April 30, 2010. Additional information appears on pages 86-87. |
| |
| (d) | | Represents an affiliated issuer. |
| |
| (e) | | Variable rate security. Interest rate disclosed is that which is in effect at April 30, 2010. |
ADDITIONAL INVESTMENT INFORMATION
FUTURES CONTRACTS — At April 30, 2010, the following futures contracts were open:
| | | | | | | | | | | | | | | |
| | | Number of
| | | | | | | | | |
| | | Contracts
| | | Expiration
| | Current
| | | Unrealized
| |
| Type | | Long (Short) | | | Date | | Value | | | Gain (Loss) | |
| | |
| Russell Mini 2000 Index | | | 10 | | | June 2010 | | $ | 715,500 | | | $ | 43,632 | |
| |
| |
The accompanying notes are an integral part of these financial statements.
GOLDMAN SACHS STRUCTURED SMALL CAP VALUE FUND
Schedule of Investments
April 30, 2010 (Unaudited)
| | | | | | | | | | | |
| | | Shares | | Description | | Value |
| |
Common Stocks – 98.0% |
| | | | | | | | | | | |
| | | | | | | | | | | |
| | | Aerospace & Defense – 0.4% |
| | | | 2,172 | | | AAR Corp.* | | $ | 52,953 | |
| | | | 21,853 | | | Ceradyne, Inc.* | | | 485,137 | |
| | | | 2,669 | | | Ducommun, Inc. | | | 61,093 | |
| | | | | | | | | | | |
| | | | | | | | | | 599,183 | |
| | | |
| | | |
| | | Air Freight & Logistics* – 0.4% |
| | | | 14,350 | | | Dynamex, Inc. | | | 253,852 | |
| | | | 68,158 | | | Pacer International, Inc. | | | 452,569 | |
| | | | | | | | | | | |
| | | | | | | | | | 706,421 | |
| | | |
| | | |
| | | Airlines – 2.3% |
| | | | 32,594 | | | Allegiant Travel Co.*(a) | | | 1,676,310 | |
| | | | 103,013 | | | Republic Airways Holdings, Inc.* | | | 644,861 | |
| | | | 87,356 | | | SkyWest, Inc. | | | 1,308,593 | |
| | | | | | | | | | | |
| | | | | | | | | | 3,629,764 | |
| | | |
| | | |
| | | Auto Components – 1.3% |
| | | | 4,363 | | | ArvinMeritor, Inc.* | | | 66,841 | |
| | | | 44,392 | | | Dana Holding Corp.* | | | 593,077 | |
| | | | 6,652 | | | Drew Industries, Inc.* | | | 170,624 | |
| | | | 25,957 | | | Modine Manufacturing Co.* | | | 363,658 | |
| | | | 22,870 | | | Spartan Motors, Inc. | | | 141,108 | |
| | | | 11,922 | | | Standard Motor Products, Inc. | | | 127,088 | |
| | | | 32,539 | | | Stoneridge, Inc.* | | | 351,096 | |
| | | | 19,229 | | | Superior Industries International, Inc. | | | 324,201 | |
| | | | | | | | | | | |
| | | | | | | | | | 2,137,693 | |
| | | |
| | | |
| | | Beverages – 0.2% |
| | | | 25,648 | | | National Beverage Corp. | | | 297,517 | |
| | | |
| | | |
| | | Biotechnology – 0.8% |
| | | | 6,009 | | | Emergent Biosolutions, Inc.* | | | 97,827 | |
| | | | 18,698 | | | Martek Biosciences Corp.*(a) | | | 411,917 | |
| | | | 7,241 | | | Myriad Genetics, Inc.* | | | 173,856 | |
| | | | 33,046 | | | Nabi Biopharmaceuticals* | | | 185,718 | |
| | | | 40,102 | | | PDL BioPharma, Inc. | | | 233,394 | |
| | | | 37,435 | | | Progenics Pharmaceuticals, Inc.* | | | 241,081 | |
| | | | | | | | | | | |
| | | | | | | | | | 1,343,793 | |
| | | |
| | | |
| | | Building Products – 1.2% |
| | | | 7,390 | | | American Woodmark Corp. | | | 170,783 | |
| | | | 39,813 | | | Apogee Enterprises, Inc.(a) | | | 547,031 | |
| | | | 3,190 | | | Armstrong World Industries, Inc.* | | | 138,924 | |
| | | | 11,327 | | | Gibraltar Industries, Inc.* | | | 170,131 | |
| | | | 4,514 | | | Insteel Industries, Inc. | | | 55,342 | |
| | | | 2,195 | | | Trex Co., Inc.* | | | 53,756 | |
| | | | 18,442 | | | Universal Forest Products, Inc. | | | 775,486 | |
| | | | | | | | | | | |
| | | | | | | | | | 1,911,453 | |
| | | |
| | | |
| | | Capital Markets – 3.6% |
| | | | 54,073 | | | American Capital Ltd.* | | | 332,008 | |
| | | | 69,911 | | | Apollo Investment Corp. | | | 850,118 | |
| | | | 80,725 | | | Ares Capital Corp. | | | 1,280,298 | |
| | | | 5,316 | | | Artio Global Investors, Inc. | | | 121,630 | |
| | | | 29,223 | | | BlackRock Kelso Capital Corp. | | | 310,056 | |
| | | | 6,710 | | | Calamos Asset Management, Inc. | | | 83,539 | |
| | | | 1,932 | | | Capital Southwest Corp.(b) | | | 181,705 | |
| | | | 15,591 | | | GAMCO Investors, Inc. | | | 717,342 | |
| | | |
| | | |
| | | | 25,395 | | | Gladstone Capital Corp. | | | 340,801 | |
| | | | 47,252 | | | Hercules Technology Growth Capital, Inc. | | | 512,212 | |
| | | | 11,721 | | | Kohlberg Capital Corp. | | | 66,224 | |
| | | | 9,055 | | | MVC Capital, Inc. | | | 127,947 | |
| | | | 63,495 | | | NGP Capital Resources Co. | | | 485,737 | |
| | | | 51,238 | | | TICC Capital Corp. | | | 364,814 | |
| | | | | | | | | | | |
| | | | | | | | | | 5,774,431 | |
| | | |
| | | |
| | | Chemicals – 2.8% |
| | | | 38,068 | | | A. Schulman, Inc. | | | 990,149 | |
| | | | 14,562 | | | Huntsman Corp. | | | 166,152 | |
| | | | 6,180 | | | Innophos Holdings, Inc. | | | 176,068 | |
| | | | 4,893 | | | Minerals Technologies, Inc. | | | 282,326 | |
| | | | 26,285 | | | OM Group, Inc.* | | | 992,259 | |
| | | | 78,256 | | | PolyOne Corp.* | | | 885,075 | |
| | | | 29,178 | | | Spartech Corp.* | | | 415,495 | |
| | | | 6,612 | | | Stepan Co. | | | 500,859 | |
| | | | | | | | | | | |
| | | | | | | | | | 4,408,383 | |
| | | |
| | | |
| | | Commercial Banks – 9.5% |
| | | | 10,558 | | | 1st Source Corp. | | | 201,975 | |
| | | | 33,259 | | | Banco Latinoamericano de Comercio Exterior S.A. Class E | | | 470,947 | |
| | | | 6,286 | | | Chicopee Bancorp, Inc.* | | | 80,021 | |
| | | | 119,790 | | | CVB Financial Corp.(a) | | | 1,318,888 | |
| | | | 19,102 | | | F.N.B. Corp. | | | 178,031 | |
| | | | 28,175 | | | First Bancorp(a) | | | 459,534 | |
| | | | 27,558 | | | First Financial Bancorp | | | 526,633 | |
| | | | 7,978 | | | FirstMerit Corp. | | | 187,483 | |
| | | | 18,930 | | | Fulton Financial Corp. | | | 198,765 | |
| | | | 39,696 | | | Glacier Bancorp, Inc.(a) | | | 733,979 | |
| | | | 17,468 | | | Great Southern Bancorp, Inc.(a) | | | 426,045 | |
| | | | 2,085 | | | Home Bancshares, Inc. | | | 58,630 | |
| | | | 102,834 | | | International Bancshares Corp. | | | 2,485,498 | |
| | | | 97,006 | | | Investors Bancorp, Inc.* | | | 1,349,353 | |
| | | | 6,175 | | | Lakeland Financial Corp. | | | 128,811 | |
| | | | 9,564 | | | Nara Bancorp, Inc.* | | | 86,076 | |
| | | | 4,164 | | | Park National Corp.(a) | | | 285,234 | |
| | | | 103,105 | | | Popular, Inc.*(a) | | | 406,234 | |
| | | | 3,877 | | | Prosperity Bancshares, Inc. | | | 152,056 | |
| | | | 33,225 | | | Renasant Corp.(a) | | | 549,209 | |
| | | | 28,141 | | | Southwest Bancorp, Inc. | | | 412,547 | |
| | | | 50,912 | | | Susquehanna Bancshares, Inc.(a) | | | 554,941 | |
| | | | 20,306 | | | SVB Financial Group*(a) | | | 999,664 | |
| | | | 48,955 | | | Texas Capital Bancshares, Inc.* | | | 974,204 | |
| | | | 3,912 | | | TriCo Bancshares | | | 74,484 | |
| | | | 3,076 | | | Trustmark Corp. | | | 75,300 | |
| | | | 6,445 | | | Webster Financial Corp. | | | 133,540 | |
| | | | 84,003 | | | Wilshire Bancorp, Inc.(a) | | | 912,273 | |
| | | | 20,075 | | | Wintrust Financial Corp. | | | 748,798 | |
| | | | | | | | | | | |
| | | | | | | | | | 15,169,153 | |
| | | |
| | | |
| | | Commercial Services & Supplies – 1.5% |
| | | | 6,856 | | | Acco Brands Corp.* | | | 62,595 | |
| | | | 26,327 | | | HNI Corp.(a) | | | 817,190 | |
| | | | 38,524 | | | Kimball International, Inc. Class B | | | 309,733 | |
| | | |
| | | |
The accompanying notes are an integral part of these financial statements.
GOLDMAN SACHS STRUCTURED SMALL CAP VALUE FUND
| | | | | | | | | | | |
| | | Shares | | Description | | Value |
| |
Common Stocks – (continued) |
| | | Commercial Services & Supplies – (continued) |
| | | | | | | | | | | |
| | | | 25,633 | | | Steelcase, Inc. | | $ | 210,447 | |
| | | | 15,224 | | | United Stationers, Inc.* | | | 932,014 | |
| | | | | | | | | | | |
| | | | | | | | | | 2,331,979 | |
| | | |
| | | |
| | | Communications Equipment – 0.8% |
| | | | 4,566 | | | EchoStar Corp.* | | | 87,713 | |
| | | | 4,801 | | | EMS Technologies, Inc.* | | | 76,288 | |
| | | | 67,115 | | | Extreme Networks, Inc.* | | | 223,493 | |
| | | | 22 | | | PC-Tel, Inc.* | | | 143 | |
| | | | 11,668 | | | Plantronics, Inc. | | | 387,378 | |
| | | | 81,695 | | | Powerwave Technologies, Inc.* | | | 144,600 | |
| | | | 61,591 | | | Symmetricom, Inc.* | | | 408,348 | |
| | | | | | | | | | | |
| | | | | | | | | | 1,327,963 | |
| | | |
| | | |
| | | Computers & Peripherals* – 1.1% |
| | | | 46,971 | | | Electronics for Imaging, Inc. | | | 603,577 | |
| | | | 8,308 | | | Hutchinson Technology, Inc. | | | 50,596 | |
| | | | 67,110 | | | Imation Corp. | | | 727,472 | |
| | | | 113,510 | | | Quantum Corp. | | | 329,179 | |
| | | | | | | | | | | |
| | | | | | | | | | 1,710,824 | |
| | | |
| | | |
| | | Construction & Engineering* – 0.1% |
| | | | 18,097 | | | Dycom Industries, Inc. | | | 192,190 | |
| | | |
| | | |
| | | Consumer Finance – 1.2% |
| | | | 78,065 | | | Advance America Cash Advance Centers, Inc. | | | 446,532 | |
| | | | 15,209 | | | Cash America International, Inc. | | | 563,645 | |
| | | | 32,019 | | | CompuCredit Holdings Corp.(a) | | | 191,794 | |
| | | | 15,307 | | | Rewards Network, Inc. | | | 199,297 | |
| | | | 13,756 | | | World Acceptance Corp.*(a) | | | 485,312 | |
| | | | | | | | | | | |
| | | | | | | | | | 1,886,580 | |
| | | |
| | | |
| | | Containers & Packaging – 0.1% |
| | | | 18,765 | | | Myers Industries, Inc. | | | 203,788 | |
| | | |
| | | |
| | | Distributors* – 0.2% |
| | | | 8,196 | | | Core-Mark Holding Co., Inc. | | | 250,142 | |
| | | |
| | | |
| | | Diversified Financial Services – 1.6% |
| | | | 73,816 | | | Compass Diversified Holdings | | | 1,071,808 | |
| | | | 45,540 | | | PHH Corp.* | | | 1,033,303 | |
| | | | 85,559 | | | Primus Guaranty Ltd.* | | | 385,871 | |
| | | | | | | | | | | |
| | | | | | | | | | 2,490,982 | |
| | | |
| | | |
| | | Electric Utilities – 0.9% |
| | | | 10,605 | | | IDACORP, Inc. | | | 382,629 | |
| | | | 2,944 | | | Pinnacle West Capital Corp. | | | 109,929 | |
| | | | 68,680 | | | PNM Resources, Inc. | | | 933,361 | |
| | | | | | | | | | | |
| | | | | | | | | | 1,425,919 | |
| | | |
| | | |
| | | Electrical Equipment – 1.8% |
| | | | 7,661 | | | Acuity Brands, Inc. | | | 346,354 | |
| | | | 51,107 | | | Belden, Inc. | | | 1,403,398 | |
| | | | 9,209 | | | Encore Wire Corp. | | | 204,532 | |
| | | | 3,248 | | | General Cable Corp.* | | | 92,795 | |
| | | | 3,365 | | | II-VI, Inc.* | | | 120,669 | |
| | | | 69,049 | | | LSI Industries, Inc. | | | 485,415 | |
| | | | 6,762 | | | Vicor Corp.* | | | 102,241 | |
| | | |
| | | |
| | | | 2,316 | | | Woodward Governor Co. | | | 74,228 | |
| | | | | | | | | | | |
| | | | | | | | | | 2,829,632 | |
| | | |
| | | |
| | | Electronic Equipment, Instruments & Components – 2.5% |
| | | | 32,020 | | | Agilysys, Inc. | | | 347,417 | |
| | | | 34,269 | | | Benchmark Electronics, Inc.* | | | 741,581 | |
| | | | 26,901 | | | Brightpoint, Inc.* | | | 217,629 | |
| | | | 23,445 | | | CTS Corp. | | | 246,173 | |
| | | | 14,312 | | | DDi Corp.* | | | 122,511 | |
| | | | 36,047 | | | Insight Enterprises, Inc.* | | | 541,786 | |
| | | | 48,451 | | | Methode Electronics, Inc. | | | 537,806 | |
| | | | 8,012 | | | Newport Corp.* | | | 94,782 | |
| | | | 7,665 | | | PC Connection, Inc.* | | | 52,735 | |
| | | | 75,306 | | | Power-One, Inc.*(a) | | | 591,905 | |
| | | | 16,737 | | | RadiSys Corp.* | | | 163,855 | |
| | | | 28,874 | | | Smart Modular Technologies, Inc.* | | | 202,696 | |
| | | | 24,250 | | | Technitrol, Inc. | | | 130,950 | |
| | | | | | | | | | | |
| | | | | | | | | | 3,991,826 | |
| | | |
| | | |
| | | Energy Equipment & Services – 2.1% |
| | | | 28,438 | | | Basic Energy Services, Inc.* | | | 290,352 | |
| | | | 14,118 | | | Cal Dive International, Inc.* | | | 92,614 | |
| | | | 85,349 | | | Complete Production Services, Inc.* | | | 1,287,917 | |
| | | �� | 13,128 | | | Dawson Geophysical Co.* | | | 384,519 | |
| | | | 1,414 | | | Dril-Quip, Inc.* | | | 81,913 | |
| | | | 10,320 | | | Exterran Holdings, Inc.* | | | 300,828 | |
| | | | 48,433 | | | Global Industries Ltd.* | | | 324,501 | |
| | | | 4,785 | | | Oil States International, Inc.* | | | 231,163 | |
| | | | 7,091 | | | RPC, Inc.(a) | | | 96,792 | |
| | | | 2,436 | | | T-3 Energy Services, Inc.* | | | 72,471 | |
| | | | 14,910 | | | Union Drilling, Inc.* | | | 98,853 | |
| | | | | | | | | | | |
| | | | | | | | | | 3,261,923 | |
| | | |
| | | |
| | | Food & Staples Retailing – 0.4% |
| | | | 15,705 | | | Ingles Markets, Inc. | | | 251,751 | |
| | | | 29,985 | | | Winn-Dixie Stores, Inc.* | | | 378,111 | |
| | | | | | | | | | | |
| | | | | | | | | | 629,862 | |
| | | |
| | | |
| | | Food Products – 0.4% |
| | | | 6,080 | | | Chiquita Brands International, Inc.*(a) | | | 91,443 | |
| | | | 16,224 | | | Dole Food Co., Inc.* | | | 183,656 | |
| | | | 13,964 | | | Fresh Del Monte Produce, Inc.* | | | 291,429 | |
| | | | 6,782 | | | Imperial Sugar Co. | | | 108,715 | |
| | | | | | | | | | | |
| | | | | | | | | | 675,243 | |
| | | |
| | | |
| | | Gas Utilities – 1.8% |
| | | | 5,102 | | | Atmos Energy Corp. | | | 150,917 | |
| | | | 10,101 | | | Nicor, Inc. | | | 439,494 | |
| | | | 70,528 | | | Southwest Gas Corp. | | | 2,193,421 | |
| | | | | | | | | | | |
| | | | | | | | | | 2,783,832 | |
| | | |
| | | |
| | | Health Care Equipment & Supplies – 0.3% |
| | | | 3,982 | | | CONMED Corp.* | | | 88,560 | |
| | | | 7,686 | | | Invacare Corp. | | | 203,141 | |
| | | | 12,852 | | | Medical Action Industries, Inc.* | | | 152,553 | |
| | | |
| | | |
The accompanying notes are an integral part of these financial statements.
GOLDMAN SACHS STRUCTURED SMALL CAP VALUE FUND
Schedule of Investments (continued)
April 30, 2010 (Unaudited)
| | | | | | | | | | | |
| | | Shares | | Description | | Value |
| |
Common Stocks – (continued) |
| | | Health Care Equipment & Supplies – (continued) |
| | | | | | | | | | | |
| | | | 16,051 | | | RTI Biologics, Inc.* | | $ | 61,475 | |
| | | | | | | | | | | |
| | | | | | | | | | 505,729 | |
| | | |
| | | |
| | | Health Care Providers & Services* – 2.5% |
| | | | 31,488 | | | AMN Healthcare Services, Inc. | | | 287,800 | |
| | | | 8,856 | | | Assisted Living Concepts, Inc. | | | 310,846 | |
| | | | 27,985 | | | Healthspring, Inc. | | | 492,536 | |
| | | | 46,204 | | | Kindred Healthcare, Inc. | | | 824,279 | |
| | | | 5,399 | | | MedCath Corp. | | | 53,666 | |
| | | | 26,904 | | | Molina Healthcare, Inc. | | | 784,790 | |
| | | | 44,692 | | | Nighthawk Radiology Holdings, Inc. | | | 165,360 | |
| | | | 4,922 | | | PharMerica Corp. | | | 94,995 | |
| | | | 62,040 | | | Sunrise Senior Living, Inc. | | | 344,942 | |
| | | | 37,750 | | | Universal American Financial Corp. | | | 579,463 | |
| | | | | | | | | | | |
| | | | | | | | | | 3,938,677 | |
| | | |
| | | |
| | | Hotels, Restaurants & Leisure* – 1.6% |
| | | | 2,778 | | | Biglari Holdings, Inc. | | | 1,086,892 | |
| | | | 12,175 | | | Boyd Gaming Corp.(a) | | | 154,623 | |
| | | | 13,449 | | | Domino’s Pizza, Inc. | | | 207,249 | |
| | | | 60,496 | | | O’Charley’s, Inc.(a) | | | 577,737 | |
| | | | 16,395 | | | Papa John’s International, Inc. | | | 449,223 | |
| | | | | | | | | | | |
| | | | | | | | | | 2,475,724 | |
| | | |
| | | |
| | | Household Durables – 1.8% |
| | | | 14,711 | | | Blyth, Inc. | | | 847,942 | |
| | | | 6,605 | | | CSS Industries, Inc. | | | 132,232 | |
| | | | 19,789 | | | Ethan Allen Interiors, Inc.(a) | | | 399,738 | |
| | | | 44,139 | | | Furniture Brands International, Inc.* | | | 365,471 | |
| | | | 15,754 | | | Hooker Furniture Corp. | | | 248,283 | |
| | | | 15,449 | | | La-Z-Boy, Inc.* | | | 201,455 | |
| | | | 17,716 | | | M/I Homes, Inc.* | | | 276,370 | |
| | | | 36,730 | | | Sealy Corp.*(a) | | | 137,370 | |
| | | | 10,567 | | | Standard Pacific Corp.* | | | 67,734 | |
| | | | 4,887 | | | Tempur-Pedic International, Inc.* | | | 164,692 | |
| | | | | | | | | | | |
| | | | | | | | | | 2,841,287 | |
| | | |
| | | |
| | | Household Products* – 0.2% |
| | | | 37,385 | | | Central Garden & Pet Co. | | | 386,187 | |
| | | |
| | | |
| | | Industrial Conglomerates – 0.5% |
| | | | 125 | | | Seaboard Corp. | | | 182,501 | |
| | | | 5,464 | | | Standex International Corp. | | | 130,426 | |
| | | | 28,580 | | | Tredegar Corp. | | | 487,575 | |
| | | | | | | | | | | |
| | | | | | | | | | 800,502 | |
| | | |
| | | |
| | | Insurance – 3.3% |
| | | | 34,961 | | | American Equity Investment Life Holding Co. | | | 367,790 | |
| | | | 4,073 | | | American Safety Insurance Holdings Ltd.* | | | 65,901 | |
| | | | 13,378 | | | Aspen Insurance Holdings Ltd. | | | 360,938 | |
| | | | 24,104 | | | Assured Guaranty Ltd. | | | 519,441 | |
| | | | 38,800 | | | CNA Surety Corp.* | | | 650,676 | |
| | | | 116,264 | | | Conseco, Inc.* | | | 685,958 | |
| | | | 3,764 | | | Employers Holdings, Inc. | | | 62,031 | |
| | | | 6,861 | | | FBL Financial Group, Inc. | | | 177,288 | |
| | | |
| | | |
| | | | 16,931 | | | First Mercury Financial Corp. | | | 221,965 | |
| | | | 50,916 | | | Flagstone Reinsurance Holdings Ltd. | | | 567,713 | |
| | | | 4,834 | | | Genworth Financial, Inc.* | | | 79,858 | |
| | | | 1,839 | | | Infinity Property & Casualty Corp. | | | 84,833 | |
| | | | 5,252 | | | Kansas City Life Insurance Co. | | | 178,568 | |
| | | | 12,072 | | | Max Capital Group Ltd. | | | 269,206 | |
| | | | 6,994 | | | Platinum Underwriters Holdings Ltd. | | | 260,247 | |
| | | | 19,497 | | | PMA Capital Corp.* | | | 133,944 | |
| | | | 8,928 | | | Presidential Life Corp. | | | 105,172 | |
| | | | 6,310 | | | Protective Life Corp. | | | 151,882 | |
| | | | 11,337 | | | United America Indemnity Ltd.* | | | 107,702 | |
| | | | 11,604 | | | United Fire & Casualty Co. | | | 265,383 | |
| | | | | | | | | | | |
| | | | | | | | | | 5,316,496 | |
| | | |
| | | |
| | | Internet & Catalog Retail – 0.2% |
| | | | 42,411 | | | 1-800-FLOWERS.COM, Inc.* | | | 121,296 | |
| | | | 24,857 | | | Gaiam, Inc. | | | 225,204 | |
| | | | | | | | | | | |
| | | | | | | | | | 346,500 | |
| | | |
| | | |
| | | Internet Software & Services – 0.7% |
| | | | 34,944 | | | Internap Network Services Corp.* | | | 201,976 | |
| | | | 73,347 | | | iPass, Inc.* | | | 105,620 | |
| | | | 70,135 | | | Marchex, Inc. Class B | | | 368,910 | |
| | | | 120,015 | | | RealNetworks, Inc.* | | | 498,062 | |
| | | | | | | | | | | |
| | | | | | | | | | 1,174,568 | |
| | | |
| | | |
| | | IT Services* – 1.0% |
| | | | 16,460 | | | Acxiom Corp. | | | 314,057 | |
| | | | 114,279 | | | Ciber, Inc. | | | 453,688 | |
| | | | 7,874 | | | CSG Systems International, Inc. | | | 178,897 | |
| | | | 66,490 | | | Lionbridge Technologies, Inc. | | | 359,711 | |
| | | | 29,013 | | | Ness Technologies, Inc. | | | 187,714 | |
| | | | 2,672 | | | VeriFone Holdings, Inc. | | | 50,848 | |
| | | | | | | | | | | |
| | | | | | | | | | 1,544,915 | |
| | | |
| | | |
| | | Leisure Equipment & Products – 0.5% |
| | | | 36,492 | | | Callaway Golf Co.(a) | | | 342,660 | |
| | | | 50,333 | | | Nautilus, Inc.* | | | 172,139 | |
| | | | 11,683 | | | RC2 Corp.* | | | 214,616 | |
| | | | | | | | | | | |
| | | | | | | | | | 729,415 | |
| | | |
| | | |
| | | Life Sciences Tools & Services* – 0.3% |
| | | | 38,276 | | | Affymetrix, Inc. | | | 265,635 | |
| | | | 28,019 | | | Albany Molecular Research, Inc. | | | 224,152 | |
| | | | | | | | | | | |
| | | | | | | | | | 489,787 | |
| | | |
| | | |
| | | Machinery – 4.6% |
| | | | 26,974 | | | Albany International Corp. | | | 687,028 | |
| | | | 21,206 | | | American Railcar Industries, Inc. | | | 346,718 | |
| | | | 39,788 | | | Briggs & Stratton Corp. | | | 944,567 | |
| | | | 19,378 | | | EnPro Industries, Inc.* | | | 611,957 | |
| | | | 25,966 | | | Federal Signal Corp. | | | 209,286 | |
| | | | 20,596 | | | Kadant, Inc.* | | | 412,126 | |
| | | | 32,415 | | | Miller Industries, Inc. | | | 463,534 | |
| | | | 46,158 | | | Mueller Industries, Inc. | | | 1,368,585 | |
| | | | 10,851 | | | Mueller Water Products, Inc. | | | 60,766 | |
| | | | 12,963 | | | NACCO Industries, Inc. | | | 1,127,003 | |
| | | |
| | | |
The accompanying notes are an integral part of these financial statements.
GOLDMAN SACHS STRUCTURED SMALL CAP VALUE FUND
| | | | | | | | | | | |
| | | Shares | | Description | | Value |
| |
Common Stocks – (continued) |
| | | Machinery – (continued) |
| | | | | | | | | | | |
| | | | 15,532 | | | Oshkosh Corp.* | | $ | 599,846 | |
| | | | 22,287 | | | Tecumseh Products Co.* | | | 284,828 | |
| | | | 4,079 | | | The Toro Co. | | | 232,258 | |
| | | | | | | | | | | |
| | | | | | | | | | 7,348,502 | |
| | | |
| | | |
| | | Marine*(a) – 0.2% |
| | | | 18,284 | | | American Commercial Lines, Inc. | | | 372,994 | |
| | | |
| | | |
| | | Media – 1.1% |
| | | | 9,071 | | | Ascent Media Corp.* | | | 267,776 | |
| | | | 8,882 | | | Harte-Hanks, Inc. | | | 127,901 | |
| | | | 84,440 | | | Journal Communications, Inc.* | | | 478,775 | |
| | | | 9,968 | | | Scholastic Corp. | | | 269,236 | |
| | | | 54,456 | | | The E.W. Scripps Co.* | | | 595,748 | |
| | | | | | | | | | | |
| | | | | | | | | | 1,739,436 | |
| | | |
| | | |
| | | Metals & Mining – 1.6% |
| | | | 22,030 | | | Brush Engineered Materials, Inc.* | | | 654,952 | |
| | | | 9,010 | | | Haynes International, Inc. | | | 323,549 | |
| | | | 18,430 | | | Kaiser Aluminum Corp. | | | 740,702 | |
| | | | 1,674 | | | Olympic Steel, Inc. | | | 53,200 | |
| | | | 17,027 | | | Stillwater Mining Co.* | | | 287,756 | |
| | | | 38,429 | | | Sutor Technology Group Ltd.* | | | 105,680 | |
| | | | 26,429 | | | Worthington Industries, Inc. | | | 422,071 | |
| | | | | | | | | | | |
| | | | | | | | | | 2,587,910 | |
| | | |
| | | |
| | | Multi-Utilities – 1.3% |
| | | | 41,955 | | | Black Hills Corp. | | | 1,379,900 | |
| | | | 14,517 | | | Integrys Energy Group, Inc. | | | 720,188 | |
| | | | | | | | | | | |
| | | | | | | | | | 2,100,088 | |
| | | |
| | | |
| | | Multiline Retail – 1.1% |
| | | | 3,211 | | | 99 Cents Only Stores* | | | 49,835 | |
| | | | 24,470 | | | Dillard’s, Inc.(a) | | | 687,117 | |
| | | | 65,737 | | | Fred’s, Inc. | | | 913,087 | |
| | | | 28,308 | | | Tuesday Morning Corp.* | | | 159,940 | |
| | | | | | | | | | | |
| | | | | | | | | | 1,809,979 | |
| | | |
| | | |
| | | Oil, Gas & Consumable Fuels – 2.9% |
| | | | 8,725 | | | Berry Petroleum Co. | | | 282,428 | |
| | | | 3,880 | | | Bill Barrett Corp.* | | | 132,230 | |
| | | | 991 | | | Cimarex Energy Co. | | | 67,467 | |
| | | | 125,314 | | | International Coal Group, Inc.* | | | 660,405 | |
| | | | 1,385 | | | Overseas Shipholding Group, Inc. | | | 69,333 | |
| | | | 29,947 | | | PetroQuest Energy, Inc.* | | | 176,987 | |
| | | | 11,719 | | | Quicksilver Resources, Inc.* | | | 162,542 | |
| | | | 5,804 | | | Rosetta Resources, Inc.* | | | 144,520 | |
| | | | 13,330 | | | Ship Finance International Ltd. | | | 263,934 | |
| | | | 24,662 | | | Stone Energy Corp.* | | | 401,991 | |
| | | | 9,161 | | | Teekay Corp. | | | 229,483 | |
| | | | 26,991 | | | Tesoro Corp.(b) | | | 354,932 | |
| | | | 178,344 | | | USEC, Inc.* | | | 1,070,064 | |
| | | | 53,448 | | | W&T Offshore, Inc. | | | 506,153 | |
| | | | 2,259 | | | World Fuel Services Corp. | | | 64,223 | |
| | | | | | | | | | | |
| | | | | | | | | | 4,586,692 | |
| | | |
| | | |
| | | Paper & Forest Products – 2.8% |
| | | | 20,674 | | | Buckeye Technologies, Inc.* | | | 291,917 | |
| | | | 16,809 | | | Clearwater Paper Corp.* | | | 1,070,397 | |
| | | | 21,520 | | | Domtar Corp.* | | | 1,524,477 | |
| | | | 11,235 | | | Glatfelter | | | 165,042 | |
| | | | 35,575 | | | KapStone Paper and Packaging Corp.* | | | 458,918 | |
| | | | 76,658 | | | Louisiana-Pacific Corp.* | | | 901,498 | |
| | | | 11,964 | | | Wausau Paper Corp.* | | | 105,881 | |
| | | | | | | | | | | |
| | | | | | | | | | 4,518,130 | |
| | | |
| | | |
| | | Personal Products – 0.5% |
| | | | 77,477 | | | Mannatech, Inc.(a) | | | 299,061 | |
| | | | 55,416 | | | Prestige Brands Holdings, Inc.* | | | 539,752 | |
| | | | | | | | | | | |
| | | | | | | | | | 838,813 | |
| | | |
| | | |
| | | Pharmaceuticals* – 0.3% |
| | | | 20,599 | | | King Pharmaceuticals, Inc. | | | 201,870 | |
| | | | 4,538 | | | Par Pharmaceutical Cos., Inc. | | | 123,162 | |
| | | | 12,457 | | | ViroPharma, Inc. | | | 158,453 | |
| | | | | | | | | | | |
| | | | | | | | | | 483,485 | |
| | | |
| | | |
| | | Professional Services – 1.6% |
| | | | 32,016 | | | CDI Corp. | | | 558,039 | |
| | | | 63,172 | | | Kelly Services, Inc.* | | | 1,015,806 | |
| | | | 30,134 | | | Kforce, Inc.* | | | 418,561 | |
| | | | 62,302 | | | SFN Group, Inc.* | | | 532,682 | |
| | | | 3,877 | | | TrueBlue, Inc.* | | | 61,218 | |
| | | | | | | | | | | |
| | | | | | | | | | 2,586,306 | |
| | | |
| | | |
| | | Real Estate Investment Trusts – 12.6% |
| | | | 4,264 | | | Acadia Realty Trust | | | 81,357 | |
| | | | 19,980 | | | Agree Realty Corp. | | | 512,087 | |
| | | | 13,411 | | | American Campus Communities, Inc. | | | 377,788 | |
| | | | 13,329 | | | Associated Estates Realty Corp. | | | 187,006 | |
| | | | 15,538 | | | BRE Properties, Inc. | | | 648,867 | |
| | | | 4,984 | | | EastGroup Properties, Inc. | | | 203,746 | |
| | | | 24,488 | | | Equity Lifestyle Properties, Inc. | | | 1,359,329 | |
| | | | 61,714 | | | Extra Space Storage, Inc. | | | 926,944 | |
| | | | 2,409 | | | Federal Realty Investment Trust | | | 186,433 | |
| | | | 38,359 | | | FelCor Lodging Trust, Inc.* | | | 311,091 | |
| | | | 87,707 | | | Franklin Street Properties Corp. | | | 1,292,801 | |
| | | | 9,247 | | | Health Care REIT, Inc. | | | 415,468 | |
| | | | 66,355 | | | Healthcare Realty Trust, Inc. | | | 1,601,810 | |
| | | | 11,415 | | | Highwoods Properties, Inc. | | | 364,938 | |
| | | | 38,707 | | | LTC Properties, Inc. | | | 1,079,925 | |
| | | | 9,085 | | | Mack-Cali Realty Corp. | | | 312,161 | |
| | | | 23,310 | | | National Health Investors, Inc. | | | 946,852 | |
| | | | 37,017 | | | National Retail Properties, Inc. | | | 871,010 | |
| | | | 33,289 | | | Nationwide Health Properties, Inc. | | | 1,165,781 | |
| | | | 78,781 | | | OMEGA Healthcare Investors, Inc. | | | 1,577,196 | |
| | | | 37,858 | | | Potlatch Corp. | | | 1,418,161 | |
| | | | 20,852 | | | Rayonier, Inc. | | | 1,021,331 | |
| | | | 15,550 | | | Realty Income Corp.(a) | | | 509,884 | |
| | | | 21,922 | | | Regency Centers Corp.(b) | | | 899,898 | |
| | | | 55,163 | | | Sunstone Hotel Investors, Inc.* | | | 702,225 | |
| | | | 67,545 | | | U-Store-It Trust | | | 582,238 | |
| | | | 12,083 | | | Universal Health Realty Income Trust | | | 401,397 | |
| | | |
| | | |
The accompanying notes are an integral part of these financial statements.
GOLDMAN SACHS STRUCTURED SMALL CAP VALUE FUND
Schedule of Investments (continued)
April 30, 2010 (Unaudited)
| | | | | | | | | | | |
| | | Shares | | Description | | Value |
| |
Common Stocks – (continued) |
| | | Real Estate Investment Trusts – (continued) |
| | | | | | | | | | | |
| | | | 8,748 | | | Urstadt Biddle Properties | | $ | 147,491 | |
| | | | | | | | | | | |
| | | | | | | | | | 20,105,215 | |
| | | |
| | | |
| | | Road & Rail – 1.7% |
| | | | 6,082 | | | AMERCO* | | | 379,821 | |
| | | | 4,478 | | | Arkansas Best Corp. | | | 136,400 | |
| | | | 16,048 | | | Dollar Thrifty Automotive Group, Inc.* | | | 705,952 | |
| | | | 18,649 | | | Saia, Inc.* | | | 309,014 | |
| | | | 13,865 | | | Universal Truckload Services, Inc.* | | | 253,175 | |
| | | | 42,451 | | | Werner Enterprises, Inc. | | | 951,751 | |
| | | | | | | | | | | |
| | | | | | | | | | 2,736,113 | |
| | | |
| | | |
| | | Semiconductors & Semiconductor Equipment* – 2.9% |
| | | | 14,568 | | | Brooks Automation, Inc. | | | 141,601 | |
| | | | 41,507 | | | DSP Group, Inc. | | | 339,112 | |
| | | | 8,308 | | | Fairchild Semiconductor International, Inc. | | | 93,216 | |
| | | | 8,332 | | | Integrated Device Technology, Inc. | | | 55,075 | |
| | | | 276,318 | | | Lattice Semiconductor Corp. | | | 1,456,196 | |
| | | | 20,638 | | | OmniVision Technologies, Inc. | | | 362,403 | |
| | | | 38,766 | | | Photronics, Inc. | | | 211,275 | |
| | | | 76,334 | | | RF Micro Devices, Inc. | | | 428,997 | |
| | | | 5,745 | | | Sigma Designs, Inc.(a) | | | 68,136 | |
| | | | 140,199 | | | Silicon Image, Inc. | | | 521,540 | |
| | | | 18,944 | | | Standard Microsystems Corp. | | | 486,482 | |
| | | | 13,156 | | | TriQuint Semiconductor, Inc. | | | 99,196 | |
| | | | 39,751 | | | Zoran Corp. | | | 386,777 | |
| | | | | | | | | | | |
| | | | | | | | | | 4,650,006 | |
| | | |
| | | |
| | | Software – 1.5% |
| | | | 3,875 | | | Blackbaud, Inc. | | | 89,319 | |
| | | | 9,888 | | | Double-Take Software, Inc.* | | | 106,296 | |
| | | | 6,593 | | | Epicor Software Corp.* | | | 60,524 | |
| | | | 72,154 | | | Mentor Graphics Corp.* | | | 648,664 | |
| | | | 6,209 | | | MicroStrategy, Inc.* | | | 475,609 | |
| | | | 24,637 | | | QAD, Inc.* | | | 135,996 | |
| | | | 7,416 | | | Quest Software, Inc.* | | | 130,003 | |
| | | | 6,949 | | | Sonic Solutions* | | | 87,210 | |
| | | | 78,151 | | | Symyx Technologies, Inc.* | | | 425,923 | |
| | | | 31,061 | | | THQ, Inc.* | | | 236,064 | |
| | | | | | | | | | | |
| | | | | | | | | | 2,395,608 | |
| | | |
| | | |
| | | Specialty Retail – 4.7% |
| | | | 62,185 | | | AnnTaylor Stores Corp.* | | | 1,349,415 | |
| | | | 49,534 | | | Asbury Automotive Group, Inc.* | | | 770,254 | |
| | | | 21,738 | | | Borders Group, Inc.*(a) | | | 55,215 | |
| | | | 40,128 | | | Brown Shoe Co., Inc. | | | 754,406 | |
| | | | 42,263 | | | Build-A-Bear Workshop, Inc.* | | | 404,034 | |
| | | | 18,072 | | | DSW, Inc.* | | | 545,774 | |
| | | | 2,546 | | | Genesco, Inc.* | | | 84,756 | |
| | | | 20,296 | | | Group 1 Automotive, Inc.* | | | 630,191 | |
| | | | 28,938 | | | Lithia Motors, Inc.* | | | 230,925 | |
| | | | 62,528 | | | Pier 1 Imports, Inc.* | | | 517,732 | |
| | | | 12,614 | | | Shoe Carnival, Inc.* | | | 348,903 | |
| | | | 75,887 | | | Stage Stores, Inc. | | | 1,157,277 | |
| | | | 12,812 | | | The Finish Line, Inc. | | | 206,401 | |
| | | |
| | | |
| | | | 25,252 | | | Zumiez, Inc.* | | | 468,677 | |
| | | | | | | | | | | |
| | | | | | | | | | 7,523,960 | |
| | | |
| | | |
| | | Textiles, Apparel & Luxury Goods – 2.3% |
| | | | 7,059 | | | Columbia Sportswear Co.(a) | | | 392,057 | |
| | | | 12,151 | | | Jones Apparel Group, Inc. | | | 264,406 | |
| | | | 33,100 | | | Kenneth Cole Productions, Inc.* | | | 412,426 | |
| | | | 2,899 | | | Lululemon Athletica, Inc.* | | | 109,060 | |
| | | | 13,443 | | | Oxford Industries, Inc. | | | 290,234 | |
| | | | 26,199 | | | Perry Ellis International, Inc.* | | | 632,182 | |
| | | | 45,037 | | | Quiksilver, Inc.* | | | 240,047 | |
| | | | 34,154 | | | Skechers U.S.A., Inc.* | | | 1,309,806 | |
| | | | | | | | | | | |
| | | | | | | | | | 3,650,218 | |
| | | |
| | | |
| | | Thrifts & Mortgage Finance – 1.8% |
| | | | 51,474 | | | Astoria Financial Corp. | | | 830,790 | |
| | | | 57,379 | | | Brookline Bancorp, Inc.(a) | | | 630,595 | |
| | | | 20,762 | | | First Financial Northwest, Inc. | | | 133,915 | |
| | | | 82,431 | | | NewAlliance Bancshares, Inc. | | | 1,074,076 | |
| | | | 5,892 | | | Provident Financial Services, Inc. | | | 77,657 | |
| | | | 6,335 | | | Washington Federal, Inc. | | | 130,311 | |
| | | | | | | | | | | |
| | | | | | | | | | 2,877,344 | |
| | | |
| | | |
| | | Tobacco – 0.3% |
| | | | 66,113 | | | Alliance One International, Inc.*(a) | | | 336,515 | |
| | | | 1,537 | | | Universal Corp. | | | 79,586 | |
| | | | | | | | | | | |
| | | | | | | | | | 416,101 | |
| | | |
| | | |
| | | Trading Companies & Distributors*(a) – 0.1% |
| | | | 22,012 | | | BlueLinx Holdings, Inc. | | | 110,280 | |
| | | |
| | | |
| | | Wireless Telecommunication Services* – 0.2% |
| | | | 24,605 | | | USA Mobility, Inc. | | | 342,994 | |
| | | |
| | | |
| | | TOTAL COMMON STOCKS |
| | | (Cost $119,688,654) | | $ | 156,300,437 | |
| | | |
| | | |
| | | | | | | | | | | | | | | | | |
| | | | | | | Expiration
| | |
| | | Units | | Description | | Month | | Value |
| |
Warrant* – 0.0% |
| | | | | | | | | | | | | | | | | |
| | | | | | | | | | | | | | | | | |
| | | Granite Broadcasting Corp. |
| | | | 635 | | | | | | | | 06/12 | | | $ | 1 | |
| | | (Cost $12,055) | | | | |
| | | |
| | | |
The accompanying notes are an integral part of these financial statements.
GOLDMAN SACHS STRUCTURED SMALL CAP VALUE FUND
| | | | | | | | | | | | | | | | | |
| | | Principal
| | Interest
| | Maturity
| | |
| | | Amount | | Rate | | Date | | Value |
| |
Short-term Investment(c) – 2.8% |
| | | | | | | | | | | | | | | | | |
| | | | | | | | | | | | | | | | | |
| | | Repurchase Agreement – 2.8% |
| | | Joint Repurchase Agreement Account II |
| | | $ | 4,400,000 | | | | 0.200 | % | | | 05/03/10 | | | $ | 4,400,000 | |
| | | Maturity Value: $4,400,073 |
| | | (Cost $4,400,000) | | | | |
| | | |
| | | |
| | | TOTAL INVESTMENTS BEFORE SECURITIES LENDING REINVESTMENT VEHICLE |
| | | (Cost $124,100,709) | | $ | 160,700,438 | |
| | | |
| | | |
| | | | | | | | | | | |
| | | Shares | | Rate | | Value |
| |
Securities Lending Reinvestment Vehicle(d)(e) – 6.6% |
| | | | | | | | | | | |
| | | | | | | | | | | |
| | | Boston Global Investment Trust – Enhanced Portfolio II |
| | | | 10,580,924 | | | 0.196% | | $ | 10,591,505 | |
| | | (Cost $10,581,522) | | | | |
| | | |
| | | |
| | | TOTAL INVESTMENTS – 107.4% |
| | | (Cost $134,682,231) | | $ | 171,291,943 | |
| | | |
| | | |
| | | LIABILITIES IN EXCESS OF
OTHER ASSETS – (7.4)% | | | (11,742,008 | ) |
| | | |
| | | |
| | | NET ASSETS – 100.0% | | $ | 159,549,935 | |
| | | |
| | | |
The percentage shown for each investment category reflects the value of investments in that category as a percentage of net assets.
| | |
| * | | Non-income producing security. |
| |
| (a) | | All or a portion of security is on loan. |
| |
| (b) | | A portion of this security is segregated as collateral for initial margin requirement on futures transactions. |
| |
| (c) | | Joint repurchase agreement was entered into on April 30, 2010. Additional information appears on pages 86-87. |
| |
| (d) | | Represents an affiliated issuer. |
| |
| (e) | | Variable rate security. Interest rate disclosed is that which is in effect at April 30, 2010. |
| | | | | | | |
| | | |
| | | |
| | | Investment Abbreviation: |
| | | REIT | | — | | Real Estate Investment Trust |
| | | |
| | | |
ADDITIONAL INVESTMENT INFORMATION
FUTURES CONTRACTS — At April 30, 2010, the following futures contracts were open:
| | | | | | | | | | | | | | | |
| | | Number of
| | | | | | | | | |
| | | Contracts
| | | Expiration
| | Current
| | | Unrealized
| |
| Type | | Long (Short) | | | Date | | Value | | | Gain (Loss) | |
| | |
| Russell Mini 2000 Index | | | 49 | | | June 2010 | | $ | 3,505,950 | | | $ | 213,797 | |
| |
| |
The accompanying notes are an integral part of these financial statements.
GOLDMAN SACHS STRUCTURED U.S. EQUITY FUND
Schedule of Investments
April 30, 2010 (Unaudited)
| | | | | | | | | | | |
| | | Shares | | Description | | Value |
| |
Common Stocks – 97.8% |
| | | | | | | | | | | |
| | | | | | | | | | | |
| | | Aerospace & Defense – 2.7% |
| | | | 39,178 | | | Honeywell International, Inc. | | $ | 1,859,779 | |
| | | | 79,806 | | | Northrop Grumman Corp.(a) | | | 5,413,241 | |
| | | | 17,804 | | | The Boeing Co. | | | 1,289,544 | |
| | | | 88,940 | | | United Technologies Corp. | | | 6,666,053 | |
| | | | | | | | | | | |
| | | | | | | | | | 15,228,617 | |
| | | |
| | | |
| | | Air Freight & Logistics – 2.2% |
| | | | 19,419 | | | FedEx Corp. | | | 1,747,904 | |
| | | | 153,272 | | | United Parcel Service, Inc. Class B | | | 10,597,226 | |
| | | | | | | | | | | |
| | | | | | | | | | 12,345,130 | |
| | | |
| | | |
| | | Auto Components – 1.0% |
| | | | 7,857 | | | Autoliv, Inc.* | | | 430,171 | |
| | | | 150,869 | | | Johnson Controls, Inc. | | | 5,067,689 | |
| | | | | | | | | | | |
| | | | | | | | | | 5,497,860 | |
| | | |
| | | |
| | | Beverages – 1.7% |
| | | | 58,711 | | | Hansen Natural Corp.* | | | 2,587,981 | |
| | | | 82,429 | | | PepsiCo., Inc. | | | 5,376,019 | |
| | | | 32,272 | | | The Coca-Cola Co. | | | 1,724,939 | |
| | | | | | | | | | | |
| | | | | | | | | | 9,688,939 | |
| | | |
| | | |
| | | Biotechnology* – 2.4% |
| | | | 138,380 | | | Amgen, Inc. | | | 7,937,477 | |
| | | | 13,104 | | | Biogen Idec, Inc. | | | 697,788 | |
| | | | 10,435 | | | Celgene Corp. | | | 646,448 | |
| | | | 107,857 | | | Gilead Sciences, Inc. | | | 4,278,687 | |
| | | | | | | | | | | |
| | | | | | | | | | 13,560,400 | |
| | | |
| | | |
| | | Building Products* – 0.1% |
| | | | 16,965 | | | Armstrong World Industries, Inc. | | | 738,826 | |
| | | |
| | | |
| | | Capital Markets – 1.2% |
| | | | 146,696 | | | Bank of New York Mellon Corp. | | | 4,566,647 | |
| | | | 2,627 | | | Franklin Resources, Inc. | | | 303,786 | |
| | | | 90,828 | | | SEI Investments Co. | | | 2,039,997 | |
| | | | | | | | | | | |
| | | | | | | | | | 6,910,430 | |
| | | |
| | | |
| | | Chemicals – 1.5% |
| | | | 63,561 | | | E.I. du Pont de Nemours and Co. | | | 2,532,270 | |
| | | | 29,655 | | | Eastman Chemical Co. | | | 1,984,513 | |
| | | | 49,062 | | | Huntsman Corp. | | | 559,797 | |
| | | | 11,295 | | | Monsanto Co. | | | 712,263 | |
| | | | 88,607 | | | The Dow Chemical Co. | | | 2,731,754 | |
| | | | | | | | | | | |
| | | | | | | | | | 8,520,597 | |
| | | |
| | | |
| | | Commercial Banks – 3.2% |
| | | | 92,281 | | | BB&T Corp. | | | 3,067,421 | |
| | | | 7,486 | | | PNC Financial Services Group, Inc. | | | 503,134 | |
| | | | 173,168 | | | U.S. Bancorp | | | 4,635,707 | |
| | | | 297,262 | | | Wells Fargo & Co. | | | 9,842,345 | |
| | | | | | | | | | | |
| | | | | | | | | | 18,048,607 | |
| | | |
| | | |
| | | Commercial Services & Supplies – 0.0% |
| | | | 8,882 | | | R.R. Donnelley & Sons Co. | | | 190,874 | |
| | | |
| | | |
| | | Communications Equipment – 2.2% |
| | | | 359,036 | | | Cisco Systems, Inc.* | | | 9,665,249 | |
| | | | 214,570 | | | Motorola, Inc.* | | | 1,517,010 | |
| | | | 8,083 | | | QUALCOMM, Inc. | | | 313,135 | |
| | | | 99,664 | | | Tellabs, Inc. | | | 904,949 | |
| | | | | | | | | | | |
| | | | | | | | | | 12,400,343 | |
| | | |
| | | |
| | | Computers & Peripherals – 4.1% |
| | | | 352,836 | | | Dell, Inc.* | | | 5,708,886 | |
| | | | 122,677 | | | EMC Corp.* | | | 2,332,090 | |
| | | | 61,269 | | | Hewlett-Packard Co. | | | 3,184,150 | |
| | | | 14,269 | | | SanDisk Corp.* | | | 569,190 | |
| | | | 337,691 | | | Seagate Technology* | | | 6,203,384 | |
| | | | 123,589 | | | Western Digital Corp.* | | | 5,078,272 | |
| | | | | | | | | | | |
| | | | | | | | | | 23,075,972 | |
| | | |
| | | |
| | | Consumer Finance – 0.9% |
| | | | 16,203 | | | AmeriCredit Corp.*(b) | | | 387,900 | |
| | | | 106,414 | | | Capital One Financial Corp. | | | 4,619,431 | |
| | | | 18,019 | | | Discover Financial Services | | | 278,574 | |
| | | | | | | | | | | |
| | | | | | | | | | 5,285,905 | |
| | | |
| | | |
| | | Diversified Consumer Services* – 0.1% |
| | | | 12,216 | | | Apollo Group, Inc. | | | 701,321 | |
| | | |
| | | |
| | | Diversified Financial Services – 4.2% |
| | | | 516,568 | | | Bank of America Corp. | | | 9,210,408 | |
| | | | 628,962 | | | Citigroup, Inc.* | | | 2,748,564 | |
| | | | 272,235 | | | JPMorgan Chase & Co. | | | 11,591,766 | |
| | | | 7,943 | | | Moody’s Corp. | | | 196,351 | |
| | | | | | | | | | | |
| | | | | | | | | | 23,747,089 | |
| | | |
| | | |
| | | Diversified Telecommunication Services – 2.1% |
| | | | 387,733 | | | AT&T, Inc.(a) | | | 10,104,322 | |
| | | | 9,302 | | | CenturyTel, Inc. | | | 317,291 | |
| | | | 49,762 | | | Verizon Communications, Inc. | | | 1,437,624 | |
| | | | | | | | | | | |
| | | | | | | | | | 11,859,237 | |
| | | |
| | | |
| | | Electric Utilities – 1.8% |
| | | | 301,575 | | | Duke Energy Corp. | | | 5,060,428 | |
| | | | 2,363 | | | Entergy Corp. | | | 192,088 | |
| | | | 111,374 | | | Exelon Corp. | | | 4,854,793 | |
| | | | | | | | | | | |
| | | | | | | | | | 10,107,309 | |
| | | |
| | | |
| | | Electrical Equipment – 1.1% |
| | | | 108,883 | | | Emerson Electric Co. | | | 5,686,959 | |
| | | | 9,709 | | | Rockwell Automation, Inc. | | | 589,531 | |
| | | | | | | | | | | |
| | | | | | | | | | 6,276,490 | |
| | | |
| | | |
| | | Electronic Equipment, Instruments & Components – 1.5% |
| | | | 19,488 | | | Arrow Electronics, Inc.* | | | 594,384 | |
| | | | 103,987 | | | Flextronics International Ltd.* | | | 805,899 | |
| | | | 187,736 | | | Ingram Micro, Inc.* | | | 3,409,286 | |
| | | | 108,382 | | | Tyco Electronics Ltd. | | | 3,481,230 | |
| | | | | | | | | | | |
| | | | | | | | | | 8,290,799 | |
| | | |
| | | |
| | | Energy Equipment & Services – 1.4% |
| | | | 50,278 | | | Exterran Holdings, Inc.* | | | 1,465,604 | |
| | | | 107,750 | | | Halliburton Co. | | | 3,302,537 | |
| | | |
| | | |
The accompanying notes are an integral part of these financial statements.
GOLDMAN SACHS STRUCTURED U.S. EQUITY FUND
| | | | | | | | | | | |
| | | Shares | | Description | | Value |
| |
Common Stocks – (continued) |
| | | Energy Equipment & Services – (continued) |
| | | | | | | | | | | |
| | | | 43,074 | | | Schlumberger Ltd. | | $ | 3,076,345 | |
| | | | 2,350 | | | Transocean Ltd.* | | | 170,258 | |
| | | | | | | | | | | |
| | | | | | | | | | 8,014,744 | |
| | | |
| | | |
| | | Food & Staples Retailing – 1.8% |
| | | | 5,216 | | | Costco Wholesale Corp. | | | 308,161 | |
| | | | 42,555 | | | CVS Caremark Corp. | | | 1,571,556 | |
| | | | 112,663 | | | Wal-Mart Stores, Inc. | | | 6,044,370 | |
| | | | 64,784 | | | Walgreen Co. | | | 2,277,158 | |
| | | | | | | | | | | |
| | | | | | | | | | 10,201,245 | |
| | | |
| | | |
| | | Food Products – 1.5% |
| | | | 183,182 | | | Archer-Daniels-Midland Co. | | | 5,118,105 | |
| | | | 170,904 | | | Tyson Foods, Inc. | | | 3,348,009 | |
| | | | | | | | | | | |
| | | | | | | | | | 8,466,114 | |
| | | |
| | | |
| | | Health Care Equipment & Supplies – 1.1% |
| | | | 8,724 | | | Becton, Dickinson & Co. | | | 666,252 | |
| | | | 250,705 | | | Boston Scientific Corp.* | | | 1,724,850 | |
| | | | 75,951 | | | CareFusion Corp.* | | | 2,094,729 | |
| | | | 9,300 | | | Covidien PLC | | | 446,307 | |
| | | | 25,963 | | | Stryker Corp. | | | 1,491,315 | |
| | | | | | | | | | | |
| | | | | | | | | | 6,423,453 | |
| | | |
| | | |
| | | Health Care Providers & Services – 1.9% |
| | | | 69,089 | | | Cardinal Health, Inc. | | | 2,396,697 | |
| | | | 52,265 | | | Coventry Health Care, Inc.* | | | 1,240,771 | |
| | | | 17,693 | | | Humana, Inc.* | | | 808,924 | |
| | | | 12,449 | | | McKesson Corp. | | | 806,820 | |
| | | | 67,613 | | | UnitedHealth Group, Inc. | | | 2,049,350 | |
| | | | 66,674 | | | WellPoint, Inc.* | | | 3,587,061 | |
| | | | | | | | | | | |
| | | | | | | | | | 10,889,623 | |
| | | |
| | | |
| | | Hotels, Restaurants & Leisure – 1.4% |
| | | | 70,645 | | | Carnival Corp. | | | 2,945,896 | |
| | | | 58,464 | | | Marriott International, Inc. | | | 2,149,137 | |
| | | | 115,268 | | | Starbucks Corp. | | | 2,994,663 | |
| | | | | | | | | | | |
| | | | | | | | | | 8,089,696 | |
| | | |
| | | |
| | | Household Durables – 0.4% |
| | | | 35,343 | | | Harman International Industries, Inc.* | | | 1,395,342 | |
| | | | 14,762 | | | Leggett & Platt, Inc. | | | 362,112 | |
| | | | 3,226 | | | Whirlpool Corp. | | | 351,214 | |
| | | | | | | | | | | |
| | | | | | | | | | 2,108,668 | |
| | | |
| | | |
| | | Household Products – 2.2% |
| | | | 9,756 | | | Colgate-Palmolive Co. | | | 820,480 | |
| | | | 6,398 | | | Kimberly-Clark Corp. | | | 391,941 | |
| | | | 175,851 | | | The Procter & Gamble Co. | | | 10,930,898 | |
| | | | | | | | | | | |
| | | | | | | | | | 12,143,319 | |
| | | |
| | | |
| | | Independent Power Producers & Energy Traders – 0.1% |
| | | | 21,026 | | | Constellation Energy Group, Inc. | | | 743,269 | |
| | | |
| | | |
| | | Industrial Conglomerates – 1.8% |
| | | | 2,887 | | | 3M Co. | | | 255,990 | |
| | | | 493,284 | | | General Electric Co. | | | 9,303,336 | |
| | | |
| | | |
| | | | 12,974 | | | Tyco International Ltd. | | | 503,262 | |
| | | | | | | | | | | |
| | | | | | | | | | 10,062,588 | |
| | | |
| | | |
| | | Insurance – 3.1% |
| | | | 5,269 | | | ACE Ltd. | | | 280,258 | |
| | | | 18,874 | | | Berkshire Hathaway, Inc. Class B* | | | 1,453,298 | |
| | | | 12,601 | | | Loews Corp. | | | 469,261 | |
| | | | 92,939 | | | MetLife, Inc. | | | 4,236,160 | |
| | | | 42,709 | | | Prudential Financial, Inc. | | | 2,714,584 | |
| | | | 31,400 | | | The Travelers Cos., Inc. | | | 1,593,236 | |
| | | | 267,776 | | | Unum Group | | | 6,552,479 | |
| | | | | | | | | | | |
| | | | | | | | | | 17,299,276 | |
| | | |
| | | |
| | | Internet & Catalog Retail – 0.6% |
| | | | 14,945 | | | Amazon.com, Inc.* | | | 2,048,362 | |
| | | | 61,200 | | | Expedia, Inc. | | | 1,444,932 | |
| | | | | | | | | | | |
| | | | | | | | | | 3,493,294 | |
| | | |
| | | |
| | | Internet Software & Services – 1.3% |
| | | | 6,513 | | | AOL, Inc.* | | | 152,144 | |
| | | | 8,266 | | | eBay, Inc. | | | 196,813 | |
| | | | 11,055 | | | Google, Inc.* | | | 5,808,739 | |
| | | | 39,132 | | | VeriSign, Inc.* | | | 1,067,130 | |
| | | | | | | | | | | |
| | | | | | | | | | 7,224,826 | |
| | | |
| | | |
| | | IT Services – 1.3% |
| | | | 134,045 | | | Accenture PLC | | | 5,849,724 | |
| | | | 3,792 | | | Computer Sciences Corp.* | | | 198,663 | |
| | | | 10,539 | | | International Business Machines Corp. | | | 1,359,531 | |
| | | | | | | | | | | |
| | | | | | | | | | 7,407,918 | |
| | | |
| | | |
| | | Machinery – 2.3% |
| | | | 30,244 | | | Caterpillar, Inc. | | | 2,059,314 | |
| | | | 13,742 | | | Cummins, Inc. | | | 992,585 | |
| | | | 29,742 | | | Eaton Corp. | | | 2,294,893 | |
| | | | 68,178 | | | Ingersoll-Rand PLC | | | 2,521,222 | |
| | | | 33,310 | | | Oshkosh Corp.* | | | 1,286,432 | |
| | | | 62,975 | | | The Toro Co. | | | 3,585,797 | |
| | | | 8,884 | | | Timken Co. | | | 312,539 | |
| | | | | | | | | | | |
| | | | | | | | | | 13,052,782 | |
| | | |
| | | |
| | | Media – 4.0% |
| | | | 213,337 | | | Comcast Corp. | | | 4,211,272 | |
| | | | 178,033 | | | Comcast Corp. Special Class A | | | 3,355,922 | |
| | | | 183,024 | | | DISH Network Corp. | | | 4,053,982 | |
| | | | 338,249 | | | Time Warner, Inc. | | | 11,189,277 | |
| | | | | | | | | | | |
| | | | | | | | | | 22,810,453 | |
| | | |
| | | |
| | | Metals & Mining – 1.4% |
| | | | 24,294 | | | Alcoa, Inc. | | | 326,512 | |
| | | | 53,095 | | | Freeport-McMoRan Copper & Gold, Inc. | | | 4,010,265 | |
| | | | 30,510 | | | Newmont Mining Corp. | | | 1,711,001 | |
| | | | 6,432 | | | Nucor Corp. | | | 291,498 | |
| | | | 12,274 | | | Reliance Steel & Aluminum Co. | | | 599,094 | |
| | | |
| | | |
The accompanying notes are an integral part of these financial statements.
GOLDMAN SACHS STRUCTURED U.S. EQUITY FUND
Schedule of Investments (continued)
April 30, 2010 (Unaudited)
| | | | | | | | | | | |
| | | Shares | | Description | | Value |
| |
Common Stocks – (continued) |
| | | Metals & Mining – (continued) |
| | | | | | | | | | | |
| | | | 18,688 | | | Schnitzer Steel Industries, Inc. | | $ | 1,009,152 | |
| | | | | | | | | | | |
| | | | | | | | | | 7,947,522 | |
| | | |
| | | |
| | | Multi-Utilities – 0.6% |
| | | | 6,827 | | | Consolidated Edison, Inc. | | | 308,580 | |
| | | | 45,461 | | | Dominion Resources, Inc. | | | 1,900,270 | |
| | | | 13,755 | | | Integrys Energy Group, Inc. | | | 682,385 | |
| | | | 17,572 | | | NiSource, Inc. | | | 286,424 | |
| | | | | | | | | | | |
| | | | | | | | | | 3,177,659 | |
| | | |
| | | |
| | | Multiline Retail – 1.1% |
| | | | 13,366 | | | Big Lots, Inc.* | | | 510,581 | |
| | | | 15,129 | | | Dollar Tree, Inc.* | | | 918,633 | |
| | | | 44,641 | | | J.C. Penney Co., Inc. | | | 1,302,178 | |
| | | | 22,831 | | | Kohl’s Corp.* | | | 1,255,477 | |
| | | | 45,576 | | | Macy’s, Inc. | | | 1,057,363 | |
| | | | 23,548 | | | Nordstrom, Inc. | | | 973,239 | |
| | | | | | | | | | | |
| | | | | | | | | | 6,017,471 | |
| | | |
| | | |
| | | Oil, Gas & Consumable Fuels – 9.4% |
| | | | 127,157 | | | Chevron Corp. | | | 10,355,666 | |
| | | | 6,028 | | | Cimarex Energy Co. | | | 410,386 | |
| | | | 174,993 | | | ConocoPhillips | | | 10,357,836 | |
| | | | 128,646 | | | Devon Energy Corp. | | | 8,661,735 | |
| | | | 278,748 | | | Exxon Mobil Corp. | | | 18,913,052 | |
| | | | 184,117 | | | Valero Energy Corp. | | | 3,827,793 | |
| | | | 11,591 | | | XTO Energy, Inc. | | | 550,804 | |
| | | | | | | | | | | |
| | | | | | | | | | 53,077,272 | |
| | | |
| | | |
| | | Paper & Forest Products – 0.5% |
| | | | 95,584 | | | International Paper Co. | | | 2,555,916 | |
| | | |
| | | |
| | | Pharmaceuticals – 6.2% |
| | | | 428,520 | | | Eli Lilly & Co. | | | 14,985,344 | |
| | | | 60,446 | | | Forest Laboratories, Inc.* | | | 1,647,758 | |
| | | | 78,372 | | | Johnson & Johnson | | | 5,039,320 | |
| | | | 21,526 | | | Merck & Co., Inc. | | | 754,271 | |
| | | | 739,075 | | | Pfizer, Inc. | | | 12,357,334 | |
| | | | | | | | | | | |
| | | | | | | | | | 34,784,027 | |
| | | |
| | | |
| | | Professional Services – 0.4% |
| | | | 36,780 | | | Manpower, Inc. | | | 2,063,358 | |
| | | |
| | | |
| | | Real Estate Investment Trusts��– 3.3% |
| | | | 54,823 | | | Annaly Capital Management, Inc. | | | 929,250 | |
| | | | 9,625 | | | Mack-Cali Realty Corp. | | | 330,715 | |
| | | | 21,095 | | | Plum Creek Timber Co., Inc.(b) | | | 839,581 | |
| | | | 29,050 | | | Public Storage | | | 2,815,235 | |
| | | | 98,823 | | | Rayonier, Inc. | | | 4,840,351 | |
| | | | 98,176 | | | Simon Property Group, Inc. | | | 8,739,635 | |
| | | | | | | | | | | |
| | | | | | | | | | 18,494,767 | |
| | | |
| | | |
| | | Semiconductors & Semiconductor Equipment – 3.6% |
| | | | 556,034 | | | Intel Corp. | | | 12,694,256 | |
| | | | 37,607 | | | LSI Corp.* | | | 226,394 | |
| | | | 278,869 | | | Texas Instruments, Inc. | | | 7,253,383 | |
| | | | | | | | | | | |
| | | | | | | | | | 20,174,033 | |
| | | |
| | | |
| | | Software – 5.9% |
| | | | 138,653 | | | Activision Blizzard, Inc. | | | 1,536,275 | |
| | | | 740,828 | | | Microsoft Corp. | | | 22,624,887 | |
| | | | 202,057 | | | Oracle Corp. | | | 5,221,153 | |
| | | | 220,730 | | | Symantec Corp.* | | | 3,701,642 | |
| | | | | | | | | | | |
| | | | | | | | | | 33,083,957 | |
| | | |
| | | |
| | | Specialty Retail – 2.4% |
| | | | 15,551 | | | Abercrombie & Fitch Co. | | | 680,045 | |
| | | | 29,824 | | | Guess?, Inc. | | | 1,368,027 | |
| | | | 43,872 | | | Limited Brands, Inc. | | | 1,175,770 | |
| | | | 98,945 | | | Ross Stores, Inc. | | | 5,540,920 | |
| | | | 41,024 | | | The Gap, Inc. | | | 1,014,523 | |
| | | | 62,314 | | | The TJX Cos., Inc. | | | 2,887,631 | |
| | | | 39,829 | | | Williams-Sonoma, Inc. | | | 1,147,075 | |
| | | | | | | | | | | |
| | | | | | | | | | 13,813,991 | |
| | | |
| | | |
| | | Thrifts & Mortgage Finance – 0.1% |
| | | | 26,783 | | | Hudson City Bancorp, Inc. | | | 356,214 | |
| | | |
| | | |
| | | Tobacco – 2.2% |
| | | | 38,285 | | | Altria Group, Inc. | | | 811,259 | |
| | | | 127,923 | | | Lorillard, Inc. | | | 10,025,326 | |
| | | | 26,355 | | | Philip Morris International, Inc. | | | 1,293,503 | |
| | | | | | | | | | | |
| | | | | | | | | | 12,130,088 | |
| | | |
| | | |
| | | Trading Companies & Distributors – 0.0% |
| | | | 3,771 | | | MSC Industrial Direct Co., Inc. | | | 205,482 | |
| | | |
| | | |
| | | Wireless Telecommunication Services* – 0.5% |
| | | | 728,095 | | | Sprint Nextel Corp. | | | 3,094,404 | |
| | | |
| | | |
| | | TOTAL COMMON STOCKS |
| | | (Cost $458,666,640) | | $ | 551,882,174 | |
| | | |
| | | |
| | | | | | | | | | | | | | | | | |
| | | Principal
| | Interest
| | Maturity
| | |
| | | Amount | | Rate | | Date | | Value |
| |
Short-term Investment(c) – 2.6% |
| | | | | | | | | | | | | | | | | |
| | | | | | | | | | | | | | | | | |
| | | Repurchase Agreement – 2.6% |
| | | Joint Repurchase Agreement Account II |
| | | $ | 14,600,000 | | | | 0.200 | % | | | 05/03/10 | | | $ | 14,600,000 | |
| | | Maturity Value: $14,600,243 |
| | | (Cost $14,600,000) | | | | |
| | | |
| | | |
| | | TOTAL INVESTMENTS BEFORE SECURITIES LENDING REINVESTMENT VEHICLE |
| | | (Cost $473,266,640) | | $ | 566,482,174 | |
| | | |
| | | |
The accompanying notes are an integral part of these financial statements.
GOLDMAN SACHS STRUCTURED U.S. EQUITY FUND
| | | | | | | | | | | |
| | | Shares | | Rate | | Value |
| |
Securities Lending Reinvestment Vehicle(d)(e) – 0.0% |
| | | | | | | | | | | |
| | | | | | | | | | | |
| | | Boston Global Investment Trust – Enhanced Portfolio II |
| | | | 44,356 | | | 0.196% | | $ | 44,400 | |
| | | (Cost $44,400) |
| | | |
| | | TOTAL INVESTMENTS – 100.4% |
| | | (Cost $473,311,040) | | $ | 566,526,574 | |
| | | |
| | | |
| | | LIABILITIES IN EXCESS OF
OTHER ASSETS – (0.4)% | | | (2,304,174 | ) |
| | | |
| | | |
| | | NET ASSETS – 100.0% | | $ | 564,222,400 | |
| | | |
| | | |
The percentage shown for each investment category reflects the value of investments in that category as a percentage of net assets.
| | |
| * | | Non-income producing security. |
| |
| (a) | | All or a portion of security is segregated as collateral for initial margin requirement on futures transactions. |
| |
| (b) | | All or a portion of security is on loan. |
| |
| (c) | | Joint repurchase agreement was entered into on April 30, 2010. Additional information appears on pages 86-87. |
| |
| (d) | | Variable rate security. Interest rate disclosed is that which is in effect at April 30, 2010. |
| |
| (e) | | Represents an affiliated issuer. |
ADDITIONAL INVESTMENT INFORMATION
FUTURES CONTRACTS — At April 30, 2010, the following futures contracts were open:
| | | | | | | | | | | | | | | |
| | | Number of
| | | | | | | | | |
| | | Contracts
| | | Expiration
| | Current
| | | Unrealized
| |
| Type | | Long (Short) | | | Date | | Value | | | Gain (Loss) | |
| | |
| S&P Mini 500 Index | | | 173 | | | June 2010 | | $ | 10,236,410 | | | $ | 326,192 | |
| |
| |
The accompanying notes are an integral part of these financial statements.
GOLDMAN SACHS STRUCTURED DOMESTIC EQUITY FUNDS
April 30, 2010 (Unaudited)
ADDITIONAL INVESTMENT INFORMATION
JOINT REPURCHASE AGREEMENT ACCOUNT II — At April 30, 2010, the Funds had undivided interests in the Joint Repurchase Agreement Account II, as follows:
| | | | | |
| Fund | | Principal Amount | |
| | |
| Balanced | | $ | 8,400,000 | |
| |
| |
| Structured Large Cap Growth | | | 11,300,000 | |
| |
| |
| Structured Large Cap Value | | | 13,300,000 | |
| |
| |
| Structured Small Cap Equity | | | 10,600,000 | |
| |
| |
| Structured Small Cap Growth | | | 1,100,000 | |
| |
| |
| Structured Small Cap Value | | | 4,400,000 | |
| |
| |
| Structured U.S. Equity | | | 14,600,000 | |
| |
| |
REPURCHASE AGREEMENTS
| | | | | | | | | | | | | | | | | |
| | | Principal
| | | Interest
| | | Maturity
| | | Maturity
| |
| Counterparty | | Amount | | | Rate | | | Date | | | Value | |
| | |
| Banc of America Securities LLC | | $ | 6,297,000,000 | | | | 0.20 | % | | | 05/03/10 | | | $ | 6,297,104,950 | |
| |
| |
| Barclays Capital, Inc. | | | 4,500,000,000 | | | | 0.20 | | | | 05/03/10 | | | | 4,500,075,000 | |
| |
| |
| BNP Paribas Securities Co. | | | 4,200,000,000 | | | | 0.20 | | | | 05/03/10 | | | | 4,200,070,000 | |
| |
| |
| Citigroup Global Markets, Inc. | | | 350,000,000 | | | | 0.19 | | | | 05/03/10 | | | | 350,005,542 | |
| |
| |
| Citigroup Global Markets, Inc. | | | 2,000,000,000 | | | | 0.20 | | | | 05/03/10 | | | | 2,000,033,333 | |
| |
| |
| Credit Suisse Securities (USA) LLC | | | 850,000,000 | | | | 0.20 | | | | 05/03/10 | | | | 850,014,167 | |
| |
| |
| Deutsche Bank Securities, Inc. | | | 3,775,000,000 | | | | 0.20 | | | | 05/03/10 | | | | 3,775,062,916 | |
| |
| |
| JPMorgan Securities | | | 315,000,000 | | | | 0.20 | | | | 05/03/10 | | | | 315,005,250 | |
| |
| |
| Merrill Lynch & Co., Inc. | | | 850,000,000 | | | | 0.20 | | | | 05/03/10 | | | | 850,014,167 | |
| |
| |
| RBS Securities, Inc. | | | 1,750,000,000 | | | | 0.20 | | | | 05/03/10 | | | | 1,750,029,167 | |
| |
| |
| Wells Fargo Securities LLC | | | 3,750,000,000 | | | | 0.20 | | | | 05/03/10 | | | | 3,750,062,500 | |
| |
| |
TOTAL | | | | | | | | | | | | | | $ | 28,637,476,992 | |
| |
| |
The accompanying notes are an integral part of these financial statements.
GOLDMAN SACHS STRUCTURED DOMESTIC EQUITY FUNDS
| |
| ADDITIONAL INVESTMENT INFORMATION (continued) | |
At April 30, 2010, the Joint Repurchase Agreement Account II was fully collateralized by:
| | | | | | | | | |
| Issuer | | Interest Rates | | | Maturity Dates | |
| | |
| Federal Home Loan Bank | | | 0.000% to 5.500% | | | | 06/11/10 to 07/15/36 | |
| |
| |
| Federal Home Loan Mortgage Corp. | | | 0.324 to 13.250 | | | | 07/12/10 to 04/01/40 | |
| |
| |
| Federal Home Loan Mortgage Corp. Interest-Only Stripped Security | | | 0.000 | | | | 01/15/19 | |
| |
| |
| Federal National Mortgage Association | | | 0.000 to 10.500 | | | | 05/15/10 to 02/01/50 | |
| |
| |
| Federal National Mortgage Association Interest-Only Stripped Security | | | 0.000 | | | | 03/23/17 | |
| |
| |
| Government National Mortgage Association | | | 3.500 to 9.000 | | | | 04/15/13 to 04/20/40 | |
| |
| |
| Tennessee Valley Authority Interest-Only Stripped Security | | | 0.000 | | | | 11/01/10 | |
| |
| |
| U.S. Treasury Notes | | | 0.875 to 4.750 | | | | 01/31/11 to 08/15/19 | |
| |
| |
The aggregate market value of the collateral, including accrued interest, was $29,221,400,225.
The accompanying notes are an integral part of these financial statements.
GOLDMAN SACHS STRUCTURED DOMESTIC EQUITY FUNDS
Statements of Assets and Liabilities
April 30, 2010 (Unaudited)
| | | | | | | | | |
| | | | | Balanced
| | | |
| | | | | Fund | | | |
|
| | | Assets: |
| | | | | | | | | |
| | | Investments in securities of unaffiliated issuers, at value (identified cost $127,781,393, $604,169,230, $672,635,178, $365,251,021, $35,462,872, $124,100,709 and $473,266,640, respectively)(a) | | $ | 139,572,447 | | | |
| | | Investments in securities lending reinvestment vehicle — affiliated issuer, at value (identified cost $4,095,848, $76,950, $746,771, $29,078,598, $3,462,588, $10,581,522 and $44,400, respectively) | | | 4,101,376 | | | |
| | | Cash | | | — | | | |
| | | Foreign currencies, at value (identified cost $54,266 for the Balanced Fund) | | | 53,174 | | | |
| | | Receivables: | | | | | | |
| | | Investment securities sold, at value | | | 24,344,241 | | | |
| | | Due from broker — collateral for swap contracts | | | 750,000 | | | |
| | | Dividends and interest, at value | | | 506,593 | | | |
| | | Fund shares sold | | | 104,498 | | | |
| | | Reimbursement from investment adviser | | | 25,764 | | | |
| | | Swap contracts, at value (includes upfront payments made (received) of $8,476 for the Balanced Fund) | | | 15,288 | | | |
| | | Securities lending income | | | 6,834 | | | |
| | | Foreign tax reclaims, at value | | | 1,568 | | | |
| | | Other assets, at value | | | 1,037 | | | |
| | | |
| | | |
| | | Total assets | | | 169,482,820 | | | |
| | | |
| | | |
| | | | | | | | | |
| | | | | | | | | |
|
| | | Liabilities: |
| | | | | | | | | |
| | | Due to Custodian | | | 1,735,307 | | | |
| | | Payables: | | | | | | |
| | | Investment securities purchased, at value | | | 26,948,011 | | | |
| | | Payable upon return of securities loaned | | | 4,140,150 | | | |
| | | Fund shares redeemed | | | 825,117 | | | |
| | | Swap contracts, at value (includes upfront payments received of $264,136 for the Balanced Fund) | | | 609,643 | | | |
| | | Amounts owed to affiliates | | | 120,918 | | | |
| | | Due to broker — variation margin, at value | | | 4,931 | | | |
| | | Forward foreign currency exchange contracts, at value | | | 2,202 | | | |
| | | Accrued expenses and other liabilities | | | 133,940 | | | |
| | | |
| | | |
| | | Total liabilities | | | 34,520,219 | | | |
| | | |
| | | |
| | | | | | | | | |
| | | | | | | | | |
|
| | | Net Assets: |
| | | | | | | | | |
| | | Paid-in capital | | | 141,978,524 | | | |
| | | Accumulated undistributed (distribution in excess of) net investment income | | | 173,052 | | | |
| | | Accumulated net realized loss from investment, futures, swap and foreign currency related transactions | | | (18,690,440 | ) | | |
| | | Net unrealized gain on investments, futures, swaps and translation of assets and liabilities denominated in foreign currencies | | | 11,501,465 | | | |
| | | |
| | | |
| | | NET ASSETS | | $ | 134,962,601 | | | |
| |
| |
| | | | | | | | | |
| | | Net Assets: | | | | | | |
| | | Class A | | $ | 115,443,136 | | | |
| | | Class B | | | 8,808,953 | | | |
| | | Class C | | | 7,992,408 | | | |
| | | Institutional | | | 2,718,104 | | | |
| | | Service | | | — | | | |
| | | Class IR | | | — | | | |
| | | Class R | | | — | | | |
| |
| |
| | | | | | | | | |
| | | | | | | | | |
| | | Total Net Assets | | $ | 134,962,601 | | | |
| |
| |
| | | Shares Outstanding $0.001 par value (unlimited shares authorized): | | | | | | |
| | | Class A | | | 6,449,894 | | | |
| | | Class B | | | 496,010 | | | |
| | | Class C | | | 451,487 | | | |
| | | Institutional | | | 149,544 | | | |
| | | Service | | | — | | | |
| | | Class IR | | | — | | | |
| | | Class R | | | — | | | |
| |
| |
| | | Net asset value, offering and redemption price per share:(b) | | | | | | |
| | | Class A | | | $17.90 | | | |
| | | Class B | | | 17.76 | | | |
| | | Class C | | | 17.70 | | | |
| | | Institutional | | | 18.18 | | | |
| | | Service | | | — | | | |
| | | Class IR | | | — | | | |
| | | Class R | | | — | | | |
| |
| |
| | |
| (a) | | Includes loaned securities having a market value of $3,940,192, $2,296,330, $3,606,683, $30,113,857, $3,365,505, $10,655,201 and $548,524, for the Balanced, Structured Large Cap Growth, Structured Large Cap Value, Structured Small Cap Equity, Structured Small Cap Growth, Structured Small Cap Value and Structured U.S. Equity Funds, respectively. |
| | |
| (b) | | Maximum public offering price per share for Class A Shares of the Balanced, Structured Large Cap Growth, Structured Large Cap Value, Structured Small Cap Equity, Structured Small Cap Growth, Structured Small Cap Value and Structured U.S. Equity Funds (NAV per share multiplied by 1.0582) is $18.94, $12.16, $10.44, $11.67, $19.10, $26.39 and $23.85, respectively. At redemption, Class B and Class C Shares may be subject to a contingent deferred sales charge assessed on the amount equal to the lesser of the current net asset value or the original purchase price of the shares. |
The accompanying notes are an integral part of these financial statements.
GOLDMAN SACHS STRUCTURED DOMESTIC EQUITY FUNDS
| | | | | | | | | | | | | | | | | | | | | | | | | | | |
| | | Structured Large Cap
| | | Structured Large Cap
| | | Structured Small Cap
| | | Structured Small Cap
| | | Structured Small Cap
| | | Structured U.S.
| | | |
| | | Growth Fund | | | Value Fund | | | Equity Fund | | | Growth Fund | | | Value Fund | | | Equity Fund | | | |
| | | | | | | | | | | | | | | | | | | | | | | | | | | |
| | | | | | | | | | | | | | | | | | | | | | | | | | | |
| |
|
| | | |
| | | | | | | | | | | | | | | | | | | | | | | | | | | |
| | | $ | 726,747,812 | | | $ | 806,780,595 | | | $ | 474,846,646 | | | $ | 43,248,886 | | | $ | 160,700,438 | | | $ | 566,482,174 | | | |
| | | |
76,950 | | | | 747,518 | | | | 29,133,969 | | | | 3,468,558 | | | | 10,591,505 | | | | 44,400 | | | |
| | | | 16,210 | | | | 6,979 | | | | — | | | | — | | | | — | | | | 56,743 | | | |
| | | | — | | | | — | | | | — | | | | — | | | | — | | | | — | | | |
| | | | | | | | | | | | | | | | | | | | | | | | | | | |
| | | | 16,905,786 | | | | 18,450,846 | | | | 9,711,799 | | | | 433,791 | | | | 2,133,826 | | | | — | | | |
| | | | — | | | | — | | | | — | | | | — | | | | — | | | | — | | | |
| | | | 488,825 | | | | 825,601 | | | | 202,069 | | | | 16,084 | | | | 125,883 | | | | 465,953 | | | |
| | | | 258,877 | | | | 146,326 | | | | 280,087 | | | | 62,388 | | | | 223,797 | | | | 128,474 | | | |
| | | | 52,142 | | | | 30,260 | | | | 18,451 | | | | 22,386 | | | | 21,320 | | | | 30,343 | | | |
| | | | — | | | | — | | | | — | | | | — | | | | — | | | | — | | | |
| | | | 260 | | | | 761 | | | | 15,008 | | | | 2,296 | | | | 5,044 | | | | 84 | | | |
| | | | 378 | | | | 5,814 | | | | 1,871 | | | | — | | | | 616 | | | | 20,280 | | | |
| | | | 5,565 | | | | 6,482 | | | | 3,550 | | | | 350 | | | | 1,081 | | | | 4,169 | | | |
| | | |
| | | |
| | | | 744,552,805 | | | | 827,001,182 | | | | 514,213,450 | | | | 47,254,739 | | | | 173,803,510 | | | | 567,232,620 | | | |
| | | |
| | | |
| | | | | | | | | | | | | | | | | | | | | | | | | | | |
| | | | | | | | | | | | | | | | | | | | | | | | | | | |
|
| | | |
| | | | | | | | | | | | | | | | | | | | | | | | | | | |
| | | | — | | | | — | | | | 560,856 | | | | 57,697 | | | | 42,701 | | | | — | | | |
| | | | | | | | | | | | | | | | | | | | | | | | | | | |
| | | | 9,758,823 | | | | 11,142,146 | | | | 6,812,472 | | | | 414,507 | | | | 2,191,078 | | | | — | | | |
| | | | 2,384,550 | | | | 3,791,025 | | | | 31,262,408 | | | | 3,534,668 | | | | 11,171,125 | | | | 583,550 | | | |
| | | | 1,033,696 | | | | 19,930,077 | | | | 589,482 | | | | 248,117 | | | | 433,546 | | | | 1,416,438 | | | |
| | | | — | | | | — | | | | — | | | | — | | | | — | | | | — | | | |
| | | | 428,944 | | | | 472,531 | | | | 391,407 | | | | 50,813 | | | | 194,681 | | | | 433,386 | | | |
| | | | 191,625 | | | | 248,572 | | | | 296,700 | | | | 21,500 | | | | 105,350 | | | | 189,437 | | | |
| | | | — | | | | — | | | | — | | | | — | | | | — | | | | — | | | |
| | | | 164,855 | | | | 187,048 | | | | 162,141 | | | | 80,086 | | | | 115,094 | | | | 387,409 | | | |
| | | |
| | | |
| | | | 13,962,493 | | | | 35,771,399 | | | | 40,075,466 | | | | 4,407,388 | | | | 14,253,575 | | | | 3,010,220 | | | |
| | | |
| | | |
| | | | | | | | | | | | | | | | | | | | | | | | | | | |
| | | | | | | | | | | | | | | | | | | | | | | | | | | |
|
| | | |
| | | | | | | | | | | | | | | | | | | | | | | | | | | |
| | | | 1,372,857,746 | | | | 1,306,685,738 | | | | 675,507,964 | | | | 55,589,207 | | | | 206,502,776 | | | | 736,847,463 | | | |
| | | | 3,691,989 | | | | 361,281 | | | | 1,885,820 | | | | (54,358 | ) | | | (200,302 | ) | | | 1,876,539 | | | |
| | | | (768,375,724 | ) | | | (649,752,898 | ) | | | (313,465,698 | ) | | | (20,523,114 | ) | | | (83,576,048 | ) | | | (268,043,328 | ) | | |
| | | | 122,416,301 | | | | 133,935,662 | | | | 110,209,898 | | | | 7,835,616 | | | | 36,823,509 | | | | 93,541,726 | | | |
| | | |
| | | |
| | | $ | 730,590,312 | | | $ | 791,229,783 | | | $ | 474,137,984 | | | $ | 42,847,351 | | | $ | 159,549,935 | | | $ | 564,222,400 | | | |
| |
| |
| | | | | | | | | | | | | | | | | | | | | | | | | | | |
| | | | | | | | | | | | | | | | | | | | | | | | | | | |
| | | $ | 184,697,126 | | | $ | 201,097,146 | | | $ | 142,391,890 | | | $ | 23,307,637 | | | $ | 104,313,856 | | | $ | 342,792,031 | | | |
| | | | 10,250,673 | | | | 2,968,132 | | | | 2,842,474 | | | | 7,982,623 | | | | 28,301,362 | | | | 23,247,368 | | | |
| | | | 15,108,200 | | | | 13,704,372 | | | | 14,290,745 | | | | 5,601,161 | | | | 25,102,847 | | | | 39,879,965 | | | |
| | | | 520,310,633 | | | | 565,780,687 | | | | 312,953,925 | | | | 5,889,926 | | | | 1,695,703 | | | | 156,688,728 | | | |
| | | | 123,855 | | | | 7,618,153 | | | | 1,448,976 | | | | — | | | | — | | | | 1,546,436 | | | |
| | | | 8,192 | | | | 14,821 | | | | 32,075 | | | | 9,460 | | | | 10,048 | | | | 8,061 | | | |
| | | | 91,633 | | | | 46,472 | | | | 177,899 | | | | 56,544 | | | | 126,119 | | | | 59,811 | | | |
| |
| |
| | | | | | | | | | | | | | | | | | | | | | | | | | | |
| | | | | | | | | | | | | | | | | | | | | | | | | | | |
| | | $ | 730,590,312 | | | $ | 791,229,783 | | | $ | 474,137,984 | | | $ | 42,847,351 | | | $ | 159,549,935 | | | $ | 564,222,400 | | | |
| |
| |
| | | | | | | | | | | | | | | | | | | | | | | | | | | |
| | | | 16,074,303 | | | | 20,376,204 | | | | 12,914,884 | | | | 1,291,611 | | | | 4,183,345 | | | | 15,210,222 | | | |
| | | | 964,272 | | | | 302,459 | | | | 286,337 | | | | 509,891 | | | | 1,615,993 | | | | 1,101,380 | | | |
| | | | 1,422,669 | | | | 1,398,351 | | | | 1,436,775 | | | | 354,835 | | | | 1,268,073 | | | | 1,915,951 | | | |
| | | | 44,060,101 | | | | 57,343,352 | | | | 27,379,079 | | | | 296,664 | | | | 55,124 | | | | 6,793,251 | | | |
| | | | 10,874 | | | | 768,694 | | | | 132,624 | | | | — | | | | — | | | | 68,797 | | | |
| | | | 718 | | | | 1,504 | | | | 2,927 | | | | 522 | | | | 403 | | | | 360 | | | |
| | | | 8,046 | | | | 4,716 | | | | 16,204 | | | | 3,157 | | | | 5,076 | | | | 2,676 | | | |
| |
| |
| | | | | | | | | | | | | | | | | | | | | | | | | | | |
| | | | $11.49 | | | | $9.87 | | | | $11.03 | | | | $18.05 | | | | $24.94 | | | | $22.54 | | | |
| | | | 10.63 | | | | 9.81 | | | | 9.93 | | | | 15.66 | | | | 17.51 | | | | 21.11 | | | |
| | | | 10.62 | | | | 9.80 | | | | 9.95 | | | | 15.79 | | | | 19.80 | | | | 20.81 | | | |
| | | | 11.81 | | | | 9.87 | | | | 11.43 | | | | 19.85 | | | | 30.76 | | | | 23.07 | | | |
| | | | 11.39 | | | | 9.91 | | | | 10.93 | | | | — | | | | — | | | | 22.48 | | | |
| | | | 11.42 | | | | 9.86 | | | | 10.96 | | | | 18.11 | | | | 24.95 | | | | 22.39 | | | |
| | | | 11.39 | | | | 9.85 | | | | 10.98 | | | | 17.91 | | | | 24.84 | | | | 22.35 | | | |
| |
| |
The accompanying notes are an integral part of these financial statements.
GOLDMAN SACHS STRUCTURED DOMESTIC EQUITY FUNDS
Statements of Operations
For the Six Months Ended April 30, 2010 (Unaudited)
| | | | | | | |
| | | | | Balanced Fund | |
| |
|
| | | Investment income: |
| | | | | | | |
| | | Dividends | | $ | 1,589,137 | |
| | | Interest | | | 1,119,281 | |
| | | Securities lending income — affiliated issuer | | | 10,458 | |
| | | |
| | | |
| | | Total investment income | | | 2,718,876 | |
| | | |
| | | |
| | | | | | | |
| | | | | | | |
|
| | | Expenses: |
| | | | | | | |
| | | Management fees | | | 432,581 | |
| | | Distribution and Service fees(a) | | | 224,751 | |
| | | Transfer Agent fees(a) | | | 124,450 | |
| | | Custody and accounting fees | | | 71,572 | |
| | | Professional fees | | | 53,842 | |
| | | Printing and mailing costs | | | 36,599 | |
| | | Registration fees | | | 29,115 | |
| | | Trustee fees | | | 6,169 | |
| | | Service Share fees — Shareholder Administration Plan | | | — | |
| | | Service Share fees — Service Plan | | | — | |
| | | Other | | | 6,699 | |
| | | |
| | | |
| | | Total expenses | | | 985,778 | |
| | | |
| | | |
| | | Less — expense reductions | | | (227,964 | ) |
| | | |
| | | |
| | | Net expenses | | | 757,814 | |
| | | |
| | | |
| | | NET INVESTMENT INCOME | | | 1,961,062 | |
| | | |
| | | |
| | | | | | | |
| | | | | | | |
|
| | | Realized and unrealized gain (loss) from investment, futures, swap and foreign currency related transactions: |
| | | | | | | |
| | | Net realized gain from: | | | | |
| | | Investment transactions — unaffiliated issuers | | | 21,142,292 | |
| | | Securities lending reinvestment vehicle transactions — affiliated issuer | | | 3,432 | |
| | | Futures transactions | | | 370,912 | |
| | | Swap contracts | | | 94,399 | |
| | | Foreign currency related transactions | | | 49,162 | |
| | | Net change in unrealized gain (loss) on: | | | | |
| | | Investments — unaffiliated issuers | | | (8,646,142 | ) |
| | | Securities lending reinvestment vehicle — affiliated issuer | | | 944 | |
| | | Futures | | | (186,599 | ) |
| | | Swap contracts | | | 62,802 | |
| | | Translation of assets and liabilities denominated in foreign currencies | | | (8,334 | ) |
| | | |
| | | |
| | | Net realized and unrealized gain from investment, futures, swap and foreign currency related transactions | | | 12,882,868 | |
| | | |
| | | |
| | | NET INCREASE IN NET ASSETS RESULTING FROM OPERATIONS | | $ | 14,843,930 | |
| | | |
| | | |
| |
| (a) | Class specific Distribution and Service, and Transfer Agent fees were as follows: |
| | | | | | | | | | | | | | | | | | | | | | | | | | | | | | | | | | | | | | | | | | | | | |
| | | Distribution and Service Fees | | | Transfer Agent Fees | |
Fund | | Class A | | | Class B | | | Class C | | | Class R | | | Class A | | | Class B | | | Class C | | | Institutional | | | Service | | | Class IR | | | Class R | |
| Balanced | | $ | 142,480 | | | $ | 44,057 | | | $ | 38,214 | | | $ | — | | | $ | 108,285 | | | $ | 8,371 | | | $ | 7,261 | | | $ | 533 | | | $ | — | | | $ | — | | | $ | — | |
| Structured Large Cap Growth | | | 237,583 | | | | 53,523 | | | | 76,116 | | | | 183 | | | | 180,563 | | | | 10,170 | | | | 14,462 | | | | 108,730 | | | | 24 | | | | 7 | | | | 70 | |
| Structured Large Cap Value | | | 301,149 | | | | 15,753 | | | | 67,329 | | | | 103 | | | | 228,873 | | | | 2,993 | | | | 12,793 | | | | 127,131 | | | | 1,501 | | | | 12 | | | | 39 | |
| Structured Small Cap Equity | | | 160,785 | | | | 13,567 | | | | 63,258 | | | | 273 | | | | 122,197 | | | | 2,578 | | | | 12,019 | | | | 61,728 | | | | 342 | | | | 25 | | | | 104 | |
| Structured Small Cap Growth | | | 26,372 | | | | 38,902 | | | | 26,050 | | | | 139 | | | | 20,042 | | | | 7,391 | | | | 4,950 | | | | 998 | | | | — | | | | 8 | | | | 53 | |
| Structured Small Cap Value | | | 111,999 | | | | 138,931 | | | | 111,003 | | | | 245 | | | | 85,119 | | | | 26,397 | | | | 21,091 | | | | 281 | | | | — | | | | 8 | | | | 93 | |
| Structured U.S. Equity | | | 420,098 | | | | 121,881 | | | | 196,578 | | | | 139 | | | | 319,274 | | | | 23,157 | | | | 37,350 | | | | 30,765 | | | | 311 | | | | 7 | | | | 53 | |
The accompanying notes are an integral part of these financial statements.
GOLDMAN SACHS STRUCTURED DOMESTIC EQUITY FUNDS
| | | | | | | | | | | | | | | | | | | | | | | | | |
| | | Structured Large Cap
| | | Structured Large Cap
| | | Structured Small Cap
| | | Structured Small Cap
| | | Structured Small Cap
| | | Structured U.S.
| |
| | | Growth Fund | | | Value Fund | | | Equity Fund | | | Growth Fund | | | Value Fund | | | Equity Fund | |
| |
|
| | | |
| | | | | | | | | | | | | | | | | | | | | | | | | |
| | | $ | 6,513,515 | | | $ | 10,714,763 | | | $ | 4,414,468 | | | $ | 317,993 | | | $ | 1,539,281 | | | $ | 5,518,167 | |
| | | | 22,232 | | | | 37,080 | | | | 21,233 | | | | 578 | | | | 2,281 | | | | 14,504 | |
| | | | 18,271 | | | | 26,598 | | | | 187,114 | | | | 14,060 | | | | 36,180 | | | | 4,132 | |
| | | |
| | | |
| | | | 6,554,018 | | | | 10,778,441 | | | | 4,622,815 | | | | 332,631 | | | | 1,577,742 | | | | 5,536,803 | |
| | | |
| | | |
| | | | | | | | | | | | | | | | | | | | | | | | | |
| | | | | | | | | | | | | | | | | | | | | | | | | |
|
| | | |
| | | | | | | | | | | | | | | | | | | | | | | | | |
| | | | 2,469,500 | | | | 2,702,252 | | | | 1,931,549 | | | | 166,351 | | | | 599,675 | | | | 1,804,429 | |
| | | | 367,405 | | | | 384,334 | | | | 237,883 | | | | 91,463 | | | | 362,178 | | | | 738,696 | |
| | | | 314,026 | | | | 373,342 | | | | 198,993 | | | | 33,442 | | | | 132,989 | | | | 410,917 | |
| | | | 55,628 | | | | 42,465 | | | | 66,432 | | | | 46,917 | | | | 50,672 | | | | 50,394 | |
| | | | 36,163 | | | | 43,315 | | | | 36,092 | | | | 31,185 | | | | 41,056 | | | | 37,188 | |
| | | | 80,250 | | | | 89,122 | | | | 57,748 | | | | 36,183 | | | | 55,776 | | | | 85,249 | |
| | | | 71,679 | | | | 53,731 | | | | 62,329 | | | | 45,911 | | | | 49,449 | | | | 42,766 | |
| | | | 4,440 | | | | 7,023 | | | | 4,170 | | | | 3,993 | | | | 6,573 | | | | 3,831 | |
| | | | 149 | | | | 9,379 | | | | 2,139 | | | | — | | | | — | | | | 1,941 | |
| | | | 149 | | | | 9,379 | | | | 2,139 | | | | — | | | | — | | | | 1,941 | |
| | | | 13,500 | | | | 16,113 | | | | 10,407 | | | | 5,717 | | | | 12,683 | | | | 16,223 | |
| | | |
| | | |
| | | | 3,412,889 | | | | 3,730,455 | | | | 2,609,881 | | | | 461,162 | | | | 1,311,051 | | | | 3,193,575 | |
| | | |
| | | |
| | | | (778,397 | ) | | | (670,849 | ) | | | (319,011 | ) | | | (176,974 | ) | | | (241,640 | ) | | | (613,222 | ) |
| | | |
| | | |
| | | | 2,634,492 | | | | 3,059,606 | | | | 2,290,870 | | | | 284,188 | | | | 1,069,411 | | | | 2,580,353 | |
| | | |
| | | |
| | | | 3,919,526 | | | | 7,718,835 | | | | 2,331,945 | | | | 48,443 | | | | 508,331 | | | | 2,956,450 | |
| | | |
| | | |
| | | | | | | | | | | | | | | | | | | | | | | | | |
| | | | | | | | | | | | | | | | | | | | | | | | | |
|
| | | |
| | | | | | | | | | | | | | | | | | | | | | | | | |
| | | | | | | | | | | | | | | | | | | | | | | | | |
| | | | 33,188,575 | | | | 39,960,984 | | | | 46,315,611 | | | | 2,755,784 | | | | 9,837,022 | | | | 24,388,041 | |
| | | | 34,470 | | | | 952,746 | | | | 1,117,234 | | | | 258 | | | | 130,554 | | | | 494,917 | |
| | | | 1,156,748 | | | | 2,924,285 | | | | 1,537,209 | | | | 138,358 | | | | 408,912 | | | | 680,115 | |
| | | | — | | | | — | | | | — | | | | — | | | | — | | | | — | |
| | | | — | | | | — | | | | — | | | | — | | | | — | | | | — | |
| | | | | | | | | | | | | | | | | | | | | | | | | |
| | | | 75,237,901 | | | | 104,755,996 | | | | 77,997,313 | | | | 6,384,938 | | | | 30,414,347 | | | | 53,076,454 | |
| | | | — | | | | (803,609 | ) | | | (1,002,545 | ) | | | 3,261 | | | | (108,068 | ) | | | (470,458 | ) |
| | | | 344,788 | | | | 262,514 | | | | 1,533,109 | | | | 69,165 | | | | 347,869 | | | | 536,463 | |
| | | | — | | | | — | | | | — | | | | — | | | | — | | | | — | |
| | | | — | | | | — | | | | — | | | | — | | | | — | | | | — | |
| | | |
| | | |
| | | | 109,962,482 | | | | 148,052,916 | | | | 127,497,931 | | | | 9,351,764 | | | | 41,030,636 | | | | 78,705,532 | |
| | | |
| | | |
| | | $ | 113,882,008 | | | $ | 155,771,751 | | | $ | 129,829,876 | | | $ | 9,400,207 | | | $ | 41,538,967 | | | $ | 81,661,982 | |
| | | |
| | | |
The accompanying notes are an integral part of these financial statements.
GOLDMAN SACHS STRUCTURED DOMESTIC EQUITY FUNDS
Statements of Changes in Net Assets
| | | | | | | | | | | |
| | | | | Balanced Fund | |
| | | | | For the
| | | | |
| | | | | Six Months Ended
| | | For the Fiscal
| |
| | | | | April 30, 2010
| | | Year Ended
| |
| | | | | (Unaudited) | | | October 31, 2009 | |
| |
|
| | | From operations: |
| | | | | | | | | | | |
| | | Net investment income | | $ | 1,961,062 | | | $ | 3,931,697 | |
| | | Net realized gain (loss) from investment, futures, swap and foreign currency related transactions | | | 21,660,197 | | | | (17,859,566 | ) |
| | | Net change in unrealized gain (loss) on investments, futures, swaps and translation of assets and liabilities denominated in foreign currencies | | | (8,777,329 | ) | | | 30,851,437 | |
| | | |
| | | |
| | | Net increase (decrease) in net assets resulting from operations | | | 14,843,930 | | | | 16,923,568 | |
| | | |
| | | |
| | | | | | | | | | | |
| | | | | | | | | | | |
|
| | | Distributions to shareholders: |
| | | | | | | | | | | |
| | | From net investment income | | | | | | | | |
| | | Class A Shares | | | (2,164,048 | ) | | | (3,647,327 | ) |
| | | Class B Shares | | | (138,328 | ) | | | (242,243 | ) |
| | | Class C Shares | | | (117,454 | ) | | | (175,999 | ) |
| | | Institutional Shares | | | (55,135 | ) | | | (83,779 | ) |
| | | Service Shares | | | — | | | | (11 | )(a) |
| | | Class IR Shares | | | — | | | | — | |
| | | Class R Shares | | | — | | | | — | |
| | | |
| | | |
| | | Total distributions to shareholders | | | (2,474,965 | ) | | | (4,149,359 | ) |
| | | |
| | | |
| | | | | | | | | | | |
| | | | | | | | | | | |
|
| | | From share transactions: |
| | | | | | | | | | | |
| | | Net proceeds from sales of shares | | | 9,041,130 | | | | 26,289,966 | |
| | | Reinvestment of distributions | | | 2,346,241 | | | | 3,951,783 | |
| | | Cost of shares redeemed | | | (18,684,302 | ) | | | (49,377,705 | ) |
| | | |
| | | |
| | | Net decrease in net assets resulting from share transactions | | | (7,296,931 | ) | | | (19,135,956 | ) |
| | | |
| | | |
| | | TOTAL INCREASE (DECREASE) | | | 5,072,034 | | | | (6,361,747 | ) |
| | | |
| | | |
| | | | | | | | | | | |
| | | | | | | | | | | |
|
| | | Net assets: |
| | | | | | | | | | | |
| | | Beginning of period | | | 129,890,567 | | | | 136,252,314 | |
| | | |
| | | |
| | | End of period | | $ | 134,962,601 | | | $ | 129,890,567 | |
| | | |
| | | |
| | | Accumulated undistributed net investment income | | $ | 173,052 | | | $ | 686,955 | |
| | | |
| | | |
| |
| (a) | Service Shares liquidated on March 13, 2009. |
The accompanying notes are an integral part of these financial statements.
GOLDMAN SACHS STRUCTURED DOMESTIC EQUITY FUNDS
| | | | | | | | | | | | | | | | | |
| | | Structured Large Cap Growth Fund | | | Structured Large Cap Value Fund | |
| | | For the
| | | | | | For the
| | | | |
| | | Six Months Ended
| | | For the Fiscal
| | | Six Months Ended
| | | For the Fiscal
| |
| | | April 30, 2010
| | | Year Ended
| | | April 30, 2010
| | | Year Ended
| |
| | | (Unaudited) | | | October 31, 2009 | | | (Unaudited) | | | October 31, 2009 | |
| |
|
| | | |
| | | | | | | | | | | | | | | | | |
| | | $ | 3,919,526 | | | $ | 11,901,387 | | | $ | 7,718,835 | | | $ | 23,285,534 | |
| | | | 34,379,793 | | | | (331,582,097 | ) | | | 43,838,015 | | | | (369,393,614 | ) |
| | | | 75,582,689 | | | | 393,880,299 | | | | 104,214,901 | | | | 319,814,181 | |
| | | |
| | | |
| | | | 113,882,008 | | | | 74,199,589 | | | | 155,771,751 | | | | (26,293,899 | ) |
| | | |
| | | |
| | | | | | | | | | | | | | | | | |
| | | | | | | | | | | | | | | | | |
|
| | | |
| | | | | | | | | | | | | | | | | |
| | | | | | | | | | | | | | | | | |
| | | | (2,000,827 | ) | | | (2,460,359 | ) | | | (1,595,281 | ) | | | (5,715,953 | ) |
| | | | (45,907 | ) | | | — | | | | (8,147 | ) | | | (61,903 | ) |
| | | | (81,474 | ) | | | — | | | | (38,286 | ) | | | (211,390 | ) |
| | | | (8,134,562 | ) | | | (11,541,258 | ) | | | (5,670,253 | ) | | | (18,692,574 | ) |
| | | | (1,266 | ) | | | (1,697 | ) | | | (45,267 | ) | | | (156,966 | ) |
| | | | (102 | ) | | | (82 | ) | | | (96 | ) | | | (188 | ) |
| | | | (624 | ) | | | (42 | ) | | | (224 | ) | | | (378 | ) |
| | | |
| | | |
| | | | (10,264,762 | ) | | | (14,003,438 | ) | | | (7,357,554 | ) | | | (24,839,352 | ) |
| | | |
| | | |
| | | | | | | | | | | | | | | | | |
| | | | | | | | | | | | | | | | | |
|
| | | |
| | | | | | | | | | | | | | | | | |
| | | | 109,816,321 | | | | 65,267,750 | | | | 52,006,270 | | | | 210,779,458 | |
| | | | 10,186,805 | | | | 13,944,492 | | | | 7,145,955 | | | | 23,990,950 | |
| | | | (246,231,077 | ) | | | (518,234,359 | ) | | | (399,583,285 | ) | | | (388,550,047 | ) |
| | | |
| | | |
| | | | (126,227,951 | ) | | | (439,022,117 | ) | | | (340,431,060 | ) | | | (153,779,639 | ) |
| | | |
| | | |
| | | | (22,610,705 | ) | | | (378,825,966 | ) | | | (192,016,863 | ) | | | (204,912,890 | ) |
| | | |
| | | |
| | | | | | | | | | | | | | | | | |
| | | | | | | | | | | | | | | | | |
|
| | | |
| | | | | | | | | | | | | | | | | |
| | | | 753,201,017 | | | | 1,132,026,983 | | | | 983,246,646 | | | | 1,188,159,536 | |
| | | |
| | | |
| | | $ | 730,590,312 | | | $ | 753,201,017 | | | $ | 791,229,783 | | | $ | 983,246,646 | |
| | | |
| | | |
| | | $ | 3,691,989 | | | $ | 10,037,225 | | | $ | 361,281 | | | $ | — | |
| | | |
| | | |
The accompanying notes are an integral part of these financial statements.
GOLDMAN SACHS STRUCTURED DOMESTIC EQUITY FUNDS
Statements of Changes in Net Assets
| | | | | | | | | | | |
| | | | | Structured Small Cap Equity Fund | |
| | | | | For the
| | | | |
| | | | | Six Months Ended
| | | For the Fiscal
| |
| | | | | April 30, 2010
| | | Year Ended
| |
| | | | | (Unaudited) | | | October 31, 2009 | |
| |
|
| | | From operations: |
| | | | | | | | | | | |
| | | Net investment income (loss) | | $ | 2,331,945 | | | $ | 4,350,719 | |
| | | Net realized gain (loss) from investment and futures transactions | | | 48,970,054 | | | | (157,755,392 | ) |
| | | Net change in unrealized gain on investments and futures transactions | | | 78,527,877 | | | | 183,375,804 | |
| | | |
| | | |
| | | Net increase (decrease) in net assets resulting from operations | | | 129,829,876 | | | | 29,971,131 | |
| | | |
| | | |
| | | | | | | | | | | |
| | | | | | | | | | | |
|
| | | Distributions to shareholders: |
| | | | | | | | | | | |
| | | From net investment income | | | | | | | | |
| | | Class A Shares | | | (1,046,897 | ) | | | (1,037,788 | ) |
| | | Class B Shares | | | (3,362 | ) | | | — | |
| | | Class C Shares | | | (38,399 | ) | | | — | |
| | | Institutional Shares | | | (4,059,512 | ) | | | (4,785,738 | ) |
| | | Service Shares | | | (11,499 | ) | | | — | |
| | | Class IR Shares | | | (290 | ) | | | (73 | ) |
| | | Class R Shares | | | (144 | ) | | | (31 | ) |
| | | From net realized gains | | | | | | | | |
| | | Class A Shares | | | — | | | | — | |
| | | Class B Shares | | | — | | | | — | |
| | | Class C Shares | | | — | | | �� | — | |
| | | Institutional Shares | | | — | | | | — | |
| | | Service Shares | | | — | | | | — | |
| | | Class IR Shares | | | — | | | | — | |
| | | Class R Shares | | | — | | | | — | |
| | | |
| | | |
| | | Total distributions to shareholders | | | (5,160,103 | ) | | | (5,823,630 | ) |
| | | |
| | | |
| | | | | | | | | | | |
| | | | | | | | | | | |
|
| | | From share transactions: |
| | | | | | | | | | | |
| | | Net proceeds from sales of shares | | | 44,474,944 | | | | 133,423,193 | |
| | | Reinvestment of distributions | | | 5,098,529 | | | | 5,741,754 | |
| | | Cost of shares redeemed | | | (196,130,326 | ) | | | (265,912,500 | ) |
| | | |
| | | |
| | | Net decrease in net assets resulting from share transactions | | | (146,556,853 | ) | | | (126,747,553 | ) |
| | | |
| | | |
| | | TOTAL INCREASE (DECREASE) | | | (21,887,080 | ) | | | (102,600,052 | ) |
| | | |
| | | |
| | | | | | | | | | | |
| | | | | | | | | | | |
|
| | | Net assets: |
| | | | | | | | | | | |
| | | Beginning of period | | | 496,025,064 | | | | 598,625,116 | |
| | | |
| | | |
| | | End of period | | $ | 474,137,984 | | | $ | 496,025,064 | |
| | | |
| | | |
| | | Accumulated undistributed (distribution in excess of) net investment income | | $ | 1,885,820 | | | $ | 4,713,978 | |
| | | |
| | | |
| |
| (a) | Service Shares liquidated on March 13, 2009. |
The accompanying notes are an integral part of these financial statements.
GOLDMAN SACHS STRUCTURED DOMESTIC EQUITY FUNDS
| | | | | | | | | | | | | | | | | | | | | | | | | |
| | | Structured Small Cap Growth Fund | | | Structured Small Cap Value Fund | | | Structured U.S. Equity Fund | |
| | | For the
| | | | | | For the
| | | | | | For the
| | | | |
| | | Six Months Ended
| | | For the Fiscal
| | | Six Months Ended
| | | For the Fiscal
| | | Six Months Ended
| | | For the Fiscal
| |
| | | April 30, 2010
| | | Year Ended
| | | April 30, 2010
| | | Year Ended
| | | April 30, 2010
| | | Year Ended
| |
| | | (Unaudited) | | | October 31, 2009 | | | (Unaudited) | | | October 31, 2009 | | | (Unaudited) | | | October 31, 2009 | |
| |
|
| | | |
| | | | | | | | | | | | | | | | | | | | | | | | | |
| | | $ | 48,443 | | | $ | (99,541 | ) | | $ | 508,331 | | | $ | 1,045,919 | | | $ | 2,956,450 | | | $ | 9,560,694 | |
| | | | 2,894,400 | | | | (8,925,964 | ) | | | 10,376,488 | | | | (39,933,221 | ) | | | 25,563,073 | | | | (192,656,776 | ) |
| | | | 6,457,364 | | | | 12,357,981 | | | | 30,654,148 | | | | 37,694,934 | | | | 53,142,459 | | | | 207,207,048 | |
| | | |
| | | |
| | | | 9,400,207 | | | | 3,332,476 | | | | 41,538,967 | | | | (1,192,368 | ) | | | 81,661,982 | | | | 24,110,966 | |
| | | |
| | | |
| | | | | | | | | | | | | | | | | | | | | | | | | |
| | | | | | | | | | | | | | | | | | | | | | | | | |
|
| | | |
| | | | | | | | | | | | | | | | | | | | | | | | | |
| | | | | | | | | | | | | | | | | | | | | | | | | |
| | | | (67,730 | ) | | | — | | | | (739,027 | ) | | | (1,210,152 | ) | | | (4,873,370 | ) | | | (7,580,059 | ) |
| | | | — | | | | — | | | | (251,655 | ) | | | (497,123 | ) | | | (180,184 | ) | | | (348,414 | ) |
| | | | — | | | | — | | | | (158,919 | ) | | | (220,939 | ) | | | (362,928 | ) | | | (488,277 | ) |
| | | | (27,078 | ) | | | — | | | | (10,895 | ) | | | (17,834 | ) | | | (2,758,662 | ) | | | (4,147,729 | ) |
| | | | — | | | | — | | | | — | | | | (63 | )(a) | | | (20,088 | ) | | | (44,745 | ) |
| | | | (44 | ) | | | — | | | | (76 | ) | | | (132 | ) | | | (126 | ) | | | (157 | ) |
| | | | (185 | ) | | | — | | | | (766 | ) | | | (90 | ) | | | (810 | ) | | | (117 | ) |
| | | | | | | | | | | | | | | | | | | | | | | | | |
| | | | — | | | | — | | | | — | | | | — | | | | — | | | | (1,293,917 | ) |
| | | | — | | | | — | | | | — | | | | — | | | | — | | | | (171,980 | ) |
| | | | — | | | | — | | | | — | | | | — | | | | — | | | | (157,400 | ) |
| | | | — | | | | — | | | | — | | | | — | | | | — | | | | (554,383 | ) |
| | | | — | | | | — | | | | — | | | | — | | | | — | | | | (10,277 | ) |
| | | | — | | | | — | | | | — | | | | — | | | | — | | | | (23 | ) |
| | | | — | | | | — | | | | — | | | | — | | | | — | | | | (23 | ) |
| | | |
| | | |
| | | | (95,037 | ) | | | — | | | | (1,161,338 | ) | | | (1,946,333 | ) | | | (8,196,168 | ) | | | (14,797,501 | ) |
| | | |
| | | |
| | | | | | | | | | | | | | | | | | | | | | | | | |
| | | | | | | | | | | | | | | | | | | | | | | | | |
|
| | | |
| | | | | | | | | | | | | | | | | | | | | | | | | |
| | | | 2,569,948 | | | | 4,590,242 | | | | 6,290,295 | | | | 14,178,701 | | | | 35,128,171 | | | | 76,607,153 | |
| | | | 93,590 | | | | — | | | | 1,096,489 | | | | 1,853,221 | | | | 7,740,474 | | | | 13,792,232 | |
| | | | (4,686,309 | ) | | | (10,535,767 | ) | | | (17,989,709 | ) | | | (40,270,592 | ) | | | (99,718,011 | ) | | | (208,208,231 | ) |
| | | |
| | | |
| | | | (2,022,771 | ) | | | (5,945,525 | ) | | | (10,602,925 | ) | | | (24,238,670 | ) | | | (56,849,366 | ) | | | (117,808,846 | ) |
| | | |
| | | |
| | | | 7,282,399 | | | | (2,613,049 | ) | | | 29,774,704 | | | | (27,377,371 | ) | | | 16,616,448 | | | | (108,495,381 | ) |
| | | |
| | | |
| | | | | | | | | | | | | | | | | | | | | | | | | |
| | | | | | | | | | | | | | | | | | | | | | | | | |
|
| | | |
| | | | | | | | | | | | | | | | | | | | | | | | | |
| | | | 35,564,952 | | | | 38,178,001 | | | | 129,775,231 | | | | 157,152,602 | | | | 547,605,952 | | | | 656,101,333 | |
| | | |
| | | |
| | | $ | 42,847,351 | | | $ | 35,564,952 | | | $ | 159,549,935 | | | $ | 129,775,231 | | | $ | 564,222,400 | | | $ | 547,605,952 | |
| | | |
| | | |
| | | $ | (54,358 | ) | | $ | (7,764 | ) | | $ | (200,302 | ) | | $ | 452,705 | | | $ | 1,876,539 | | | $ | 7,116,257 | |
| | | |
| | | |
The accompanying notes are an integral part of these financial statements.
GOLDMAN SACHS STRUCTURED DOMESTIC EQUITY FUNDS
Notes to Financial Statements
April 30, 2010 (Unaudited)
1. ORGANIZATION
Goldman Sachs Trust (the “Trust”) is a Delaware statutory trust registered under the Investment Company Act of 1940, as amended (the “Act”), as an open-end management investment company. The following table lists those series of the Trust that are included in this report (collectively, the “Funds” or individually a “Fund”), along with their corresponding share classes and respective diversification status under the Act:
| | | | | | | |
| Fund | | Share Classes Offered | | Diversified/Non-diversified | |
| | |
| Balanced | | A, B, C and Institutional | | | Diversified | |
| |
| |
Structured Large Cap Growth,
Structured Large Cap Value,
Structured Small Cap Equity, and
Structured U.S. Equity | | A, B, C, Institutional, Service, IR and R | | | Diversified | |
| |
| |
Structured Small Cap Growth and
Structured Small Cap Value | | A, B, C, Institutional, IR and R | | | Diversified | |
| |
| |
Class A Shares of the Funds are sold with a front-end sales charge of up to 5.50%. Class B Shares are sold with a contingent deferred sales charge that declines from 5.00% to zero, depending upon the period of time the shares are held. Effective November 2, 2009, Class B shares are no longer available for purchase by new or existing shareholders (although current Class B shareholders may continue to reinvest income and capital gains distributions into Class B Shares, and may continue to exchange their shares for Class B Shares of certain other Goldman Sachs Funds). Class C Shares are sold with a contingent deferred sales charge of 1.00% during the first 12 months. Institutional, Service, Class IR and Class R Shares are not subject to a sales charge.
Goldman Sachs Asset Management, L.P. (“GSAM”), an affiliate of Goldman, Sachs & Co. (“Goldman Sachs”), serves as investment adviser to each Fund pursuant to a management agreement (the “Agreement”) with the Trust.
2. SIGNIFICANT ACCOUNTING POLICIES
The following is a summary of the significant accounting policies consistently followed by the Funds. The preparation of financial statements in conformity with accounting principles generally accepted in the United States of America (“GAAP”) requires management to make estimates and assumptions that may affect the amounts and disclosures in the financial statements. Actual results could differ from those estimates and assumptions.
A. Investment Valuation — The investment valuation policy of the Funds is to value investments at market value. Investments in equity securities and investment companies traded on a United States (“U.S.”) securities exchange or the NASDAQ system are valued daily at their last sale price or official closing price on the principal exchange or system on which they are traded. If no sale occurs, such securities and investment companies are valued at the last bid price for long positions and at the last ask price for short positions. Debt securities for which market quotations are readily available are valued on the basis of quotations furnished by an independent pricing service approved by the trustees or provided by securities dealers. The pricing services may use valuation models or matrix pricing, which consider: (i) yield or price with respect to bonds that are considered comparable in characteristics such as rating, interest rate and maturity date or (ii) quotations from bond dealers to determine current value. If accurate quotations are not readily available, or if GSAM believes that such quotations do not accurately reflect fair value, the fair value of the Funds’ investments may be determined based on yield equivalents, a pricing matrix or other sources, under valuation procedures established by the trustees. Unlisted equity securities for which market quotations are available are valued at the last sale price on the valuation date, or if no sale occurs, at the last bid price. In the absence of market quotations, broker quotes will be utilized or the security will be fair valued. Investments in investment companies (other than those that are exchange traded) are valued at the net asset
GOLDMAN SACHS STRUCTURED DOMESTIC EQUITY FUNDS
| |
| 2. SIGNIFICANT ACCOUNTING POLICIES (continued) | |
value per share (“NAV”) on the valuation date. Short-term debt obligations that mature in sixty days or less and that do not exhibit signs of credit deterioration are valued at amortized cost, which approximates market value.
GSAM, consistent with its procedures and applicable regulatory guidance, may make an adjustment to the previous closing prices of either domestic or foreign securities in light of significant events to reflect what it believes to be the fair value of the securities at the time of determining the Funds’ NAV. Significant events that could affect a large number of securities in a particular market may include, but are not limited to: situations relating to one or more single issuers in a market sector; significant fluctuations in U.S. or foreign markets; market dislocations; market disruptions or market closings; equipment failures; natural or man-made disasters or acts of God; armed conflicts; government actions or other developments; as well as the same or similar events which may affect specific issuers or the securities markets even though not tied directly to the securities markets. Other significant events that could relate to a single issuer may include, but are not limited to: corporate actions such as reorganizations, mergers and buy-outs; corporate announcements, including those relating to earnings, products and regulatory news; significant litigation; low trading volume; and trading limits or suspensions.
B. Security and Fund Share Transactions, and Investment Income — Security and Fund share transactions are reflected for financial reporting purposes as of the trade date, which may cause the NAV as stated in the accompanying financial statements to be different than the NAV applied to Fund share transactions. Realized gains and losses on sales of portfolio securities are calculated using the identified cost basis. Dividend income is recognized on the ex-dividend date, net of foreign withholding taxes, if any, which are reduced by any amounts reclaimable by the Funds, where applicable. Interest income is recorded on the basis of interest accrued, premium amortized and discount accreted. Realized gains and losses resulting from principal paydowns on mortgage-backed and asset-backed securities are included in interest income. Market discounts, original issue discount and market premiums on debt securities are accreted/amortized to interest income over the life of the security with a corresponding adjustment in the cost basis of that security. In addition, it is the Funds’ policy to accrue for foreign capital gains taxes, if applicable, on certain foreign securities held by the Funds. An estimated foreign capital gains tax is recorded daily on net unrealized gains on these securities and is payable upon the sale of such securities when a gain is realized.
Net investment income (other than class specific expenses) and unrealized and realized gains or losses are allocated daily to each class of shares of the respective Fund based upon the relative proportion of net assets of each class.
In addition, distributions received from the Funds’ investments in U.S. real estate investment trusts (“REITs”) often include a “return of capital”, which is recorded by the Funds as a reduction of the cost basis of the securities held. The Internal Revenue Code of 1986, as amended (the “Code”) requires a REIT to distribute at least 95% of its taxable income to investors. In many cases, however, because of “non-cash” expenses such as property depreciation, a REIT’s cash flow will exceed its taxable income. The REIT may distribute this excess cash to offer a more competitive yield. This portion of the Funds’ distributions is deemed a return of capital and is generally not taxable to shareholders.
C. Expenses — Expenses incurred by the Trust that do not specifically relate to an individual Fund of the Trust are allocated to the Funds on a straight-line and/or pro-rata basis depending upon the nature of the expense and are accrued daily.
D. Federal Taxes and Distributions to Shareholders — It is each Fund’s policy to comply with the requirements of the Internal Revenue Code of 1986, as amended (the “Code”) applicable to regulated investment companies (mutual funds) and to distribute each year substantially all of its investment company taxable income and capital gains to its shareholders.
GOLDMAN SACHS STRUCTURED DOMESTIC EQUITY FUNDS
Notes to Financial Statements (continued)
April 30, 2010 (Unaudited)
| |
| 2. SIGNIFICANT ACCOUNTING POLICIES (continued) | |
Accordingly, no federal income tax provisions are required. Distributions to shareholders are recorded on the ex-dividend date. Income and capital gains distributions, if any, are declared and paid according to the following schedule:
| | | | | | | | | |
| | | Income Distributions
| | | Capital Gains Distributions
| |
| Fund | | Declared/Paid | | | Declared/Paid | |
| | |
| Balanced and Structured Large Cap Value | | | Quarterly | | | | Annually | |
| |
| |
| Structured Large Cap Growth, Structured Small Cap Equity, Structured Small Cap Growth, Structured Small Cap Value and Structured U.S. Equity | | | Annually | | | | Annually | |
| |
| |
Net capital losses are carried forward to future fiscal years and may be used to the extent allowed by the Code to offset any future capital gains. Utilization of capital loss carryforwards will reduce the requirement of future capital gains distributions.
The characterization of distributions to shareholders for financial reporting purposes is determined in accordance with federal income tax rules, which may differ from GAAP. The source of each Fund’s distributions may be shown in the accompanying financial statements as either from net investment income, net realized gain or capital. The Funds’ capital accounts on the Statements of Assets and Liabilities reflect permanent GAAP/tax differences based on the appropriate tax character, but do not reflect temporary differences.
GSAM has reviewed the Funds’ tax positions for all open tax years (the current and prior three years, as applicable) and has concluded that no provision for income tax is required in the Funds’ financial statements. Such open tax years remain subject to examination and adjustment by tax authorities.
E. Foreign Currency Translations — The books and records of the Funds are accounted for in U.S. dollars. Amounts denominated in foreign currencies are translated into U.S. dollars on the following basis: (i) investment valuations, foreign currency and other assets and liabilities initially expressed in foreign currencies are converted into U.S. dollars based upon 4:00 p.m. Eastern Time exchange rates; and (ii) purchases and sales of foreign investments, income and expenses are converted into U.S. dollars based upon currency exchange rates prevailing on the respective dates of such transactions as of 4:00 p.m. Eastern Time.
Net realized and unrealized gain (loss) on foreign currency transactions represents: (i) foreign exchange gains and losses from the sale and holdings of foreign currencies; (ii) currency gains and losses between trade date and settlement date on investment security transactions and forward foreign currency exchange contracts; and (iii) gains and losses from the difference between amounts of dividends, interest and foreign withholding taxes recorded and the amounts actually received. The effect of changes in foreign currency exchange rates on equity securities and derivative instruments is included with the net realized and change in unrealized gain (loss) on investments on the Statements of Operations. The effect of changes in foreign currency exchange rates on fixed income securities sold during the period is included with the net realized gain (loss) on foreign currency related transactions, while the effect of changes in foreign currency exchange rates on fixed income securities held at period end is included with the net change in unrealized gain (loss) on investments on the Statements of Operations. Net unrealized foreign exchange gains and losses arising from changes in the value of other assets and liabilities as a result of changes in foreign exchange rates are included as increases and decreases in unrealized gain (loss) on foreign currency related transactions.
F. Forward Foreign Currency Exchange Contracts — The Funds may enter into forward foreign currency exchange contracts for the purchase or sale of a specific foreign currency at a fixed price on a future date as a hedge or cross-hedge against either specific transactions, portfolio positions or to seek to increase total return. All contracts are marked to market daily at the applicable forward rate. Unrealized gains or losses on forward foreign currency exchange contracts are recorded by the Funds on a daily basis and realized gains or losses are recorded on the settlement date of a contract.
Risks may arise upon entering into these contracts from the potential inability of counterparties to meet the terms of their contracts and from unanticipated movements in the value of a foreign currency relative to the U.S. dollar.
GOLDMAN SACHS STRUCTURED DOMESTIC EQUITY FUNDS
| |
| 2. SIGNIFICANT ACCOUNTING POLICIES (continued) | |
The contractual amounts of forward foreign currency exchange contracts do not necessarily represent the amounts potentially subject to risk. The measurement of the risks associated with these instruments is meaningful only when all related and offsetting transactions are considered. The Funds must set aside liquid assets, or engage in other appropriate measures to cover their obligations under these contracts.
G. Futures Contracts — The Funds may purchase or sell futures contracts to hedge against changes in interest rates, securities prices, currency exchange rates, or to seek to increase total return. Futures contracts are valued at the last settlement price, or in the absence of a sale, the last bid price, at the end of each day on the board of trade or exchange upon which they are traded. Upon entering into a futures contract, the Funds deposit cash or securities in an account on behalf of the broker in an amount sufficient to meet the initial margin requirement. Subsequent payments are made or received by the Funds equal to the daily change in the contract value and are recorded as variation margin receivable or payable with a corresponding offset in unrealized gains or losses. The Funds recognize a realized gain or loss when a contract is closed or expires.
The use of futures contracts involves, to varying degrees, elements of market and counterparty risk which may exceed the amounts recognized in the Statements of Assets and Liabilities. Futures contracts may be illiquid, and exchanges may limit fluctuations in futures contract prices during a single day. Changes in the value of a futures contract may not directly correlate with changes in the value of the underlying securities. These risks may decrease the effectiveness of the Funds’ strategies and potentially result in a loss. The Funds must set aside liquid assets, or engage in other appropriate measures to cover their obligations under these contracts.
H. Mortgage-Backed and Asset-Backed Securities — The Balanced Fund may invest in mortgage-backed and/or asset-backed securities. Mortgage-backed securities represent direct or indirect participations in, or are collateralized by and payable from, mortgage loans secured by residential and/or commercial real property. These securities may include mortgage pass-through securities, collateralized mortgage obligations, real estate mortgage investment conduit pass-through or participation certificates and stripped mortgage-backed securities. Asset-backed securities include securities whose principal and interest payments are collateralized by pools of assets such as auto loans, credit card receivables, leases, installment contracts and personal property. Asset-backed securities also include home equity line of credit loans and other second-lien mortgages.
The value of certain mortgage-backed and asset-backed securities (including adjustable rate mortgage loans) may be particularly sensitive to changes in prevailing interest rates. The value of these securities may also fluctuate in response to the market’s perception of the creditworthiness of the issuers. Early repayment of principal on mortgage-backed or asset-backed securities may expose a Fund to the risk of earning a lower rate of return upon reinvestment of principal. Asset-backed securities may present credit risks that are not presented by mortgage-backed securities because they generally do not have the benefit of a security interest in collateral that is comparable to mortgage assets. Some asset-backed securities may only have a subordinated claim on collateral. In addition, while mortgage-backed and asset-backed securities may be supported by some form of government or private guarantee and/or insurance, there is no assurance that private guarantors or insurers, if any, will meet their obligations.
Stripped mortgage-backed securities are usually structured with two different classes: one that receives substantially all of the interest payments (the interest-only, or “IO” and/or the high coupon rate with relatively low principal amount, or “IOette”), and the other that receives substantially all of the principal payments (the principal-only, or “PO”) from a pool of mortgage loans. Little to no principal will be received at the maturity of an IO; as a result, adjustments are made to the cost of the security on a daily basis until maturity. These adjustments are included in interest income. Payments received for PO’s are treated as a proportionate reduction to the cost basis of the securities and excess amounts are recorded as gains.
I. Mortgage Dollar Rolls — The Balanced Fund may enter into mortgage dollar rolls (“dollar rolls”) in which the Fund sells securities in the current month for delivery and simultaneously contracts with the same counterparty to repurchase similar (same type, coupon and maturity) but not identical securities on a specified future date. The Fund treats dollar rolls as two separate transactions: one involving the purchase of a security and a separate transaction involving a sale.
GOLDMAN SACHS STRUCTURED DOMESTIC EQUITY FUNDS
Notes to Financial Statements (continued)
April 30, 2010 (Unaudited)
| |
| 2. SIGNIFICANT ACCOUNTING POLICIES (continued) | |
During the settlement period between sale and repurchase, the Fund will not be entitled to accrue interest and principal payments on the securities sold. Dollar roll transactions involve the risk that the market value of the securities sold by the Fund may decline below the repurchase price of those securities. In the event the buyer of the securities in a dollar roll transaction files for bankruptcy or becomes insolvent, the Fund’s use of proceeds from the transaction may be restricted pending a determination by, or with respect to, the other counterparty.
J. Repurchase Agreements — The Funds may enter into repurchase agreements which involve the purchase of securities subject to the seller’s agreement to repurchase the securities at a mutually agreed upon date and price. During the term of a repurchase agreement, the value of the underlying securities held as collateral on behalf of the Funds, including accrued interest is required to exceed the value of the repurchase agreement, including accrued interest. If the seller defaults or becomes insolvent, realization of the collateral by the Funds may be delayed or limited and there may be a decline in the value of the collateral during the period while the Funds seek to assert their rights. The underlying securities for all repurchase agreements are held at the Funds’ custodian or designated sub-custodians under tri-party repurchase agreements.
Pursuant to exemptive relief granted by the Securities and Exchange Commission (“SEC”) and terms and conditions contained therein, the Funds, together with other registered investment companies having management agreements with GSAM, or its affiliates, may transfer uninvested cash into joint accounts, the daily aggregate balance of which is invested in one or more repurchase agreements. Under these joint accounts, the Funds’ credit exposure is allocated to the underlying repurchase agreements counterparties on a pro-rata basis. With the exception of certain transaction fees, the Funds are not subject to any expenses in relation to these investments.
K. Swap Contracts — Certain Funds may enter into swap transactions for hedging purposes or to seek to increase total return. Risks may arise as a result of the failure of the counterparty to the swap contract to comply with the terms of the swap contract. The loss incurred by the failure of a counterparty is generally limited to the net payment to be received by the Funds and/or the termination value at the end of the contract. Therefore, the Funds consider the creditworthiness of each counterparty to a contract in evaluating potential credit risk. Additionally, risks may arise from unanticipated movements in interest rates or in the value of the underlying reference asset or index. Entering into these agreements involves, to varying degrees, market risk, liquidity risk, and elements of credit, legal and documentation risk in excess of amounts recognized in the Statements of Assets and Liabilities. The Funds may pay or receive cash as collateral on these contracts which is recorded as an asset and/or liability. The Funds must set aside liquid assets, or engage in other appropriate measures to cover their obligations under these contracts.
Swaps are marked to market daily using either pricing vendor quotations, counterparty prices or model prices and the change in value, if any, is recorded as an unrealized gain or loss. Upfront payments made and/or received by the Funds, are recorded as an asset and/or liability and realized gains or losses are recognized ratably over the contract’s term/event, with the exception of forward starting interest rate swaps, whose realized gains or losses are recognized ratably from the effective start date. Periodic payments received or made on swap contracts are recorded as realized gains or losses. Gains or losses are realized upon termination of a swap contract and are recorded on the Statements of Operations. The Balanced Fund invests in the following types of swaps:
An interest rate swap is an agreement that obligates two parties to exchange a series of cash flows at specified intervals, based upon or calculated by reference to changes in specified prices, rates or indices for a specified amount of an underlying asset or notional principal amount. The payment flows are usually netted against each other, with the difference being paid by one party to the other.
A credit default swap is an agreement that involves one party making a stream of payments to another party in exchange for the right to receive protection on a reference security or obligation. A Fund may use credit default swaps to provide a measure of protection against defaults of the reference security or obligation or to take a short position with respect to the likelihood of default. A Fund’s investment in credit default swaps may involve greater risks than if the Fund had invested in the referenced obligation directly. Credit events are contract specific but may include bankruptcy, failure to pay, restructuring and obligation acceleration. If a Fund buys protection through a credit default swap and no credit event occurs, its payments are limited to the periodic payments previously made to the counterparty. Upon the occurrence of a
GOLDMAN SACHS STRUCTURED DOMESTIC EQUITY FUNDS
| |
| 2. SIGNIFICANT ACCOUNTING POLICIES (continued) | |
specified credit event, a Fund, as a buyer of credit protection, is entitled to receive an amount equal to the notional amount of the swap and deliver to the seller the defaulted reference obligation in a physically settled trade. A Fund may also receive a net settlement amount in the form of cash or securities equal to the notional amount of the swap reduced by the recovery value of the reference obligation in a cash settled trade.
As a seller of protection, a Fund generally receives a payment stream throughout the term of the swap, provided that there is no credit event. In addition, if the Fund sells protection through a credit default swap, the Fund could suffer a loss because the value of the referenced obligation may be less than the premium payments received. Upon the occurrence of a specified credit event, the Fund, as seller of credit protection, may be required to take possession of the defaulted reference obligation and pay the buyer an amount equal to the notional amount of the swap in a physically settled trade. The Fund may also pay a net settlement amount in the form of cash or securities equal to the notional amount of the swap reduced by the recovery value of the reference obligation in a cash settled trade. Recovery values are at times established through the credit event auction process in which market participants are ensured that a transparent price has been set for the defaulted security or obligation. In addition, the Fund is entitled to a return of any assets, which have been pledged as collateral to the counterparty.
The Fund’s credit default swaps are disclosed in the Additional Investment Information section of the Schedule of Investments. The maximum potential amount of future payments (undiscounted) that the Fund as seller of protection could be required to make under a credit default swap would be an amount equal to the notional amount of the agreement. These potential amounts would be partially offset by any recovery values of the respective referenced obligations or net amounts received from a settlement of a credit default swap for the same reference security or obligation where the Fund bought credit protection.
L. Treasury Inflation Protected Securities — The Funds may invest in treasury inflation protected securities (“TIPS”), including structured bonds in which the principal amount is adjusted daily to keep pace with inflation, as measured by the U.S. Consumer Pricing Index for Urban Consumers. The adjustments to principal due to inflation/deflation are reflected as increases/decreases to interest income with a corresponding adjustment to cost. Such adjustments may have a significant impact on the Funds’ distributions and may result in a return of capital to shareholders. The repayment of the original bond principal upon maturity is guaranteed by the full faith and credit of the U.S. Government.
M. When-Issued Securities and Forward Commitments — The Funds may purchase when-issued securities, including TBA (“To Be Announced”) securities and enter into contracts to purchase or sell securities for a fixed price at a future date beyond the customary settlement period. When-issued securities are securities that have been authorized, but not yet issued in the market. A forward commitment involves entering into a contract to purchase or sell securities for a fixed price at a future date beyond the customary settlement period. The purchase of securities on a when-issued or forward commitment basis involves a risk of loss if the value of the security to be purchased declines before the settlement date. Conversely, the sale of securities on a forward commitment basis involves the risk that the value of the securities sold may increase before the settlement date. Although the Funds will generally purchase securities on a when-issued or forward commitment basis with the intention of acquiring the securities for their portfolios, the Funds may dispose of when-issued securities or forward commitments prior to settlement if GSAM deems it appropriate. When purchasing a security on a when-issued basis or entering into a forward commitment, the Funds must set aside liquid assets, or engage in other appropriate measures to cover their obligations under these contracts. The Funds may dispose of or renegotiate these contracts after they have been entered into and may sell these securities before they are delivered, which may result in a capital gain or loss.
GOLDMAN SACHS STRUCTURED DOMESTIC EQUITY FUNDS
Notes to Financial Statements (continued)
April 30, 2010 (Unaudited)
3. AGREEMENTS AND AFFILIATED TRANSACTIONS
A. Management Agreement — Under the Agreement, GSAM manages the Funds, subject to the general supervision of the trustees.
As compensation for the services rendered pursuant to the Agreement, the assumption of the expenses related thereto and administration of the Funds’ business affairs, including providing facilities, GSAM is entitled to a management fee computed daily and paid monthly, equal to an annual percentage rate of each Fund’s average daily net assets.
For the six months ended April 30, 2010, contractual and effective net management fees with GSAM were at the following rates:
| | | | | | | | | | | | | | | | | | | | | | | | | | | | | |
| | | Contractual Management Rate | | | Effective Net
| |
| | | Up to
| | | Next
| | | Next
| | | Next
| | | Over
| | | Effective
| | | Management
| |
| Fund | | $1 billion | | | $1 billion | | | $3 billion | | | $3 billion | | | $8 billion | | | Rate | | | Rate* | |
| | |
| Balanced | | | 0.65 | % | | | 0.59 | % | | | 0.56 | % | | | 0.55 | % | | | 0.54 | % | | | 0.65 | % | | | 0.55 | % |
| |
| |
| Structured Large Cap Growth | | | 0.65 | | | | 0.59 | | | | 0.56 | | | | 0.55 | | | | 0.54 | | | | 0.65 | | | | 0.51 | |
| |
| |
| Structured Large Cap Value | | | 0.60 | | | | 0.54 | | | | 0.51 | | | | 0.50 | | | | 0.49 | | | | 0.60 | | | | 0.51 | |
| |
| |
| Structured Small Cap Equity | | | 0.85 | | | | 0.85 | | | | 0.77 | | | | 0.73 | | | | 0.72 | | | | 0.85 | | | | 0.81 | |
| |
| |
| Structured Small Cap Growth | | | 0.85 | | | | 0.85 | | | | 0.77 | | | | 0.73 | | | | 0.72 | | | | 0.85 | | | | 0.81 | |
| |
| |
| Structured Small Cap Value | | | 0.85 | | | | 0.85 | | | | 0.77 | | | | 0.73 | | | | 0.72 | | | | 0.85 | | | | 0.81 | |
| |
| |
| Structured U.S. Equity | | | 0.65 | | | | 0.59 | | | | 0.56 | | | | 0.55 | | | | 0.54 | | | | 0.65 | | | | 0.51 | |
| |
| |
| | |
| * | | GSAM agreed to waive a portion of its management fee in order to achieve the effective net management rates above. |
B. Distribution and Service Plans — The Trust, on behalf of each Fund, has adopted Distribution and Service Plans (the “Plans”). Under the Plans, Goldman Sachs is entitled to a fee accrued daily and paid monthly for distribution services and personal account maintenance services, which may then be paid by Goldman Sachs to authorized dealers, at the following annual rates calculated on a Fund’s average daily net assets of each respective share class:
| | | | | | | | | | | | | | | | | |
| | | Distribution and Service Plan Rates | |
| | | Class A* | | | Class B | | | Class C | | | Class R* | |
| | |
| Distribution Plan | | | 0.25 | % | | | 0.75 | % | | | 0.75 | % | | | 0.50 | % |
| |
| |
| Service Plan | | | — | | | | 0.25 | | | | 0.25 | | | | — | |
| |
| |
| | |
| * | | With respect to Class A and Class R Shares, the Distributor at its discretion may use compensation for distribution services paid under the Distribution Plan to compensate service organizations for personal and account maintenance services and expenses so long as such total compensation does not exceed the maximum cap on “service fees” imposed by the Financial Industry Regulatory Authority. |
GOLDMAN SACHS STRUCTURED DOMESTIC EQUITY FUNDS
| |
| 3. AGREEMENTS AND AFFILIATED TRANSACTIONS (continued) | |
C. Distribution Agreement — Goldman Sachs also serves as distributor of the shares of the Funds pursuant to a Distribution Agreement and may retain a portion of the Class A front end sales charge and Class B and Class C contingent deferred sales charges. During the six months ended April 30, 2010, Goldman Sachs advised the Funds that it retained the following approximate amounts:
| | | | | | | | | | | | | |
| | | Front End
| | | Contingent Deferred
| |
| | | Sales Charge | | | Sales Charge | |
| Fund | | Class A | | | Class B | | | Class C | |
| | |
| Balanced | | $ | 10,900 | | | $ | — | | | $ | — | |
| |
| |
| Structured Large Cap Growth | | | 2,500 | | | | — | | | | — | |
| |
| |
| Structured Large Cap Value | | | 11,700 | | | | — | | | | 300 | |
| |
| |
| Structured Small Cap Equity | | | 900 | | | | — | | | | — | |
| |
| |
| Structured Small Cap Growth | | | 700 | | | | — | | | | — | |
| |
| |
| Structured Small Cap Value | | | 2,700 | | | | — | | | | — | |
| |
| |
| Structured U.S. Equity | | | 7,200 | | | | — | | | | — | |
| |
| |
D. Transfer Agency Agreement — Goldman Sachs also serves as the transfer agent of the Funds for a fee pursuant to a Transfer Agency Agreement. The fees charged for such transfer agency services are calculated daily and paid monthly at an annual rate as follows: 0.19% of the average daily net assets for Class A, Class B, Class C, Class IR and Class R Shares and 0.04% of the average daily net assets for Institutional and Service Shares.
E. Service Plan and Shareholder Administration Plan — The Trust, on behalf of each Fund that offers Service Shares, has adopted a Service Plan and a Shareholder Administration Plan. These plans allow for Service Shares to compensate service organizations for providing varying levels of personal and account administration and shareholder administration services to their customers who are beneficial owners of such shares. The Service Plan and Shareholder Administration Plan each provide for compensation to the service organizations in an amount equal to, on an annual basis, 0.25% (0.50% in aggregate) of the average daily net assets of the Service Shares.
F. Other Agreements — GSAM has voluntarily agreed to limit certain “Other Expenses” of the Funds (excluding management fees, distribution and service fees, transfer agent fees and expenses, service fees and shareholder administration fees (as applicable), taxes, interest, brokerage fees and litigation, indemnification, shareholder meetings and other extraordinary expenses, exclusive of any custody and transfer agent fee credit reductions) to the extent such expenses exceed, on an annual basis, a percentage rate of the average daily net assets of each Fund. Such Other Expenses reimbursement, if any, are computed daily and paid monthly. In addition, the Funds are not obligated to reimburse GSAM for prior fiscal year expense reimbursements, if any. The Other Expenses limitations as an annual percentage rate of average daily net assets are 0.064% for the Balanced Fund and 0.004% for the remainder of the Funds. Additionally, the Funds have entered into certain offset arrangements with the custodian and the transfer agent resulting in a reduction in the Funds’ expenses.
GOLDMAN SACHS STRUCTURED DOMESTIC EQUITY FUNDS
Notes to Financial Statements (continued)
April 30, 2010 (Unaudited)
| |
| 3. AGREEMENTS AND AFFILIATED TRANSACTIONS (continued) | |
For the six months ended April 30, 2010, these expense reductions, including any fee waivers and Other Expenses reimbursement, were as follows (in thousands):
| | | | | | | | | | | | | | | | | |
| | | Management
| | | Custody
| | | Other Expenses
| | | Total Expense
| |
| Fund | | Fee Waiver | | | Fee Credits | | | Reimbursement | | | Reductions | |
| | |
| Balanced | | $ | 67 | | | $ | — | | | $ | 161 | | | $ | 228 | |
| |
| |
| Structured Large Cap Growth | | | 532 | | | | — | | | | 246 | | | | 778 | |
| |
| |
| Structured Large Cap Value | | | 405 | | | | 32 | | | | 234 | | | | 671 | |
| |
| |
| Structured Small Cap Equity | | | 91 | | | | — | | | | 228 | | | | 319 | |
| |
| |
| Structured Small Cap Growth | | | 8 | | | | — | | | | 169 | | | | 177 | |
| |
| |
| Structured Small Cap Value | | | 28 | | | | — | | | | 214 | | | | 242 | |
| |
| |
| Structured U.S. Equity | | | 389 | | | | — | | | | 224 | | | | 613 | |
| |
| |
As of April 30, 2010, the amounts owed to affiliates of the Funds were as follows (in thousands):
| | | | | | | | | | | | | | | | | |
| | | Management
| | | Distribution and
| | | Transfer
| | | | |
| Fund | | Fees | | | Service Fees | | | Agent Fees | | | Total | |
| | |
| Balanced | | $ | 62 | | | $ | 38 | | | $ | 21 | | | $ | 121 | |
| |
| |
| Structured Large Cap Growth | | | 316 | | | | 61 | | | | 52 | | | | 429 | |
| |
| |
| Structured Large Cap Value | | | 353 | | | | 62 | | | | 58 | | | | 473 | |
| |
| |
| Structured Small Cap Equity | | | 314 | | | | 42 | | | | 35 | | | | 391 | |
| |
| |
| Structured Small Cap Growth | | | 29 | | | | 16 | | | | 6 | | | | 51 | |
| |
| |
| Structured Small Cap Value | | | 105 | | | | 65 | | | | 25 | | | | 195 | |
| |
| |
| Structured U.S. Equity | | | 239 | | | | 124 | | | | 70 | | | | 433 | |
| |
| |
G. Line of Credit Facility — As of April 30, 2010, the Funds participated in a $660,000,000 committed, unsecured revolving line of credit facility (the “facility”) together with other funds of the Trust and registered investment companies having management agreements with GSAM or its affiliates. Pursuant to the terms of the facility, the Funds and other borrowers could increase the credit amount by an additional $340,000,000, for a total of up to $1 billion. This facility is to be used solely for temporary or emergency purposes. The interest rate on borrowings is based on the federal funds rate. The facility also requires a fee to be paid by the Funds based on the amount of the commitment that has not been utilized. For the six months ended April 30, 2010, the Funds did not have any borrowings under the facility. Effective May 11, 2010, the facility decreased to $580,000,000.
H. Other Transactions with Affiliates — For the six months ended April 30, 2010, Goldman Sachs earned approximately $3,400, $18,800, $23,200, $10,100, $100, $500 and $5,000 in brokerage commissions from portfolio transactions, including futures transactions executed with Goldman Sachs as the Futures Commission Merchant, on behalf of the Balanced, Structured Large Cap Growth, Structured Large Cap Value, Structured Small Cap Equity, Structured Small Cap Growth, Structured Small Cap Value and Structured U.S. Equity Funds, respectively.
GOLDMAN SACHS STRUCTURED DOMESTIC EQUITY FUNDS
3. AGREEMENTS AND AFFILIATED TRANSACTIONS (continued)
As of April 30, 2010, the following Fund of Funds Portfolios and the Profit Sharing Trust were the beneficial owners of 5% or more of total outstanding shares of the following Funds:
| | | | | | | | | | | | | | | | | | | | | |
| | | Goldman Sachs
| | | Goldman Sachs
| | | Goldman Sachs
| | | Goldman Sachs
| | | Goldman Sachs
| |
| | | Balanced Strategy
| | | Equity Growth
| | | Growth and Income
| | | Growth Strategy
| | | Profit Sharing
| |
| Fund | | Portfolio | | | Strategy Portfolio | | | Strategy Portfolio | | | Portfolio | | | Master Trust | |
| | |
| Structured Large Cap Growth | | | 6 | % | | | 11 | % | | | 23 | % | | | 24 | % | | | — | % |
| |
| |
| Structured Large Cap Value | | | 7 | | | | 11 | | | | 24 | | | | 25 | | | | — | |
| |
| |
| Structured Small Cap Equity | | | 8 | | | | 9 | | | | 23 | | | | 21 | | | | — | |
| |
| |
| Structured U.S. Equity | | | — | | | | — | | | | — | | | | — | | | | 15 | |
| |
| |
As of April 30, 2010, Goldman Sachs Group, Inc. (“GSG”) was the beneficial owner of 5% or more of outstanding Class IR and Class R Shares of the following Funds:
| | | | | | | | | |
| Fund | | Class IR | | | Class R | |
| | |
| Structured Large Cap Growth | | | 100 | % | | | 9 | % |
| |
| |
| Structured Large Cap Value | | | 52 | | | | 17 | |
| |
| |
| Structured Small Cap Equity | | | 31 | | | | 5 | |
| |
| |
| Structured Small Cap Growth | | | 100 | | | | 17 | |
| |
| |
| Structured Small Cap Value | | | 100 | | | | 8 | |
| |
| |
| Structured U.S. Equity | | | 100 | | | | 13 | |
| |
| |
4. FAIR VALUE OF INVESTMENTS
The fair value of a financial instrument is the amount that would be received to sell an asset or paid to transfer a liability in an orderly transaction between market participants at the measurement date (i.e., the exit price). GAAP establishes a fair value hierarchy that prioritizes the inputs to valuation techniques used to measure fair value. The hierarchy gives the highest priority to unadjusted quoted prices in active markets for identical assets or liabilities (Level 1 measurements) and the lowest priority to unobservable inputs (Level 3 measurements). The three levels of the fair value hierarchy are described below:
Level 1 — Unadjusted quoted prices in active markets that are accessible at the measurement date for identical, unrestricted assets or liabilities;
Level 2 — Quoted prices in markets that are not active or financial instruments for which all significant inputs are observable, either directly or indirectly;
Level 3 — Prices or valuations that require inputs that are both significant to the fair value measurement and unobservable.
GOLDMAN SACHS STRUCTURED DOMESTIC EQUITY FUNDS
Notes to Financial Statements (continued)
April 30, 2010 (Unaudited)
| |
| 4. FAIR VALUE OF INVESTMENTS (continued) | |
The following is a summary of the Funds’ investments categorized in the fair value hierarchy, as of April 30, 2010:
| | | | | | | | | | | | | |
| Balanced | | Level 1 | | | Level 2 | | | Level 3 | |
| | |
Assets | | | | | | | | | | | | |
Common Stock and/or Other Equity Investments | | $ | 79,103,830 | | | $ | — | | | $ | — | |
| Fixed Income | | | | | | | | | | | | |
| Corporate Obligations | | | — | | | | 11,265,627 | | | | — | |
| Mortgage-Backed Obligations | | | — | | | | 27,513,162 | | | | — | |
U.S. Treasuries and/or Other U.S. Government Obligations and Agencies | | | 1,729,719 | | | | 1,750,229 | | | | — | |
| Asset-Backed Securities | | | — | | | | 1,697,469 | | | | — | |
| Foreign Debt Obligations | | | — | | | | 1,720,959 | | | | — | |
| Government Guarantee Obligations | | | — | | | | 5,891,452 | | | | — | |
| Municipal Debt Obligations | | | — | | | | 500,000 | | | | — | |
| Short-term Investments | | | — | | | | 8,400,000 | | | | — | |
| Securities Lending Reinvestment Vehicle | | | — | | | | 4,101,376 | | | | — | |
| Derivatives | | | 81,805 | | | | 15,288 | | | | — | |
| |
| |
| Total | | $ | 80,915,354 | | | $ | 62,855,562 | | | $ | — | |
| |
| |
Liabilities | | | | | | | | | | | | |
| Derivatives | | $ | (34,613 | ) | | $ | (611,845 | ) | | $ | — | |
| |
| |
| | | | | | | | | | | | | |
| Structured Large Cap Growth | | Level 1 | | | Level 2 | | | Level 3 | |
| | |
Assets | | | | | | | | | | | | |
Common Stock and/or Other Equity Investments | | $ | 715,447,812 | | | $ | — | | | $ | — | |
| Short-term Investments | | | — | | | | 11,300,000 | | | | — | |
| Securities Lending Reinvestment Vehicle | | | — | | | | 76,950 | | | | — | |
| |
| |
| Total | | $ | 715,447,812 | | | $ | 11,376,950 | | | $ | — | |
| |
| |
Liabilities | | | | | | | | | | | | |
| Derivatives | | $ | (162,281 | ) | | $ | — | | | $ | — | |
| |
| |
| | | | | | | | | | | | | |
| Structured Large Cap Value | | Level 1 | | | Level 2 | | | Level 3 | |
| | |
Assets | | | | | | | | | | | | |
Common Stock and/or Other Equity Investments | | $ | 793,480,595 | | | $ | — | | | $ | — | |
| Short-term Investments | | | — | | | | 13,300,000 | | | | — | |
| Securities Lending Reinvestment Vehicle | | | — | | | | 747,518 | | | | — | |
| |
| |
| Total | | $ | 793,480,595 | | | $ | 14,047,518 | | | $ | — | |
| |
| |
Liabilities | | | | | | | | | | | | |
| Derivatives | | $ | (210,502 | ) | | $ | — | | | $ | — | |
| |
| |
GOLDMAN SACHS STRUCTURED DOMESTIC EQUITY FUNDS
4. FAIR VALUE OF INVESTMENTS (continued)
| | | | | | | | | | | | | |
| Structured Small Cap Equity | | Level 1 | | | Level 2 | | | Level 3 | |
| | |
Assets | | | | | | | | | | | | |
Common Stock and/or Other Equity Investments | | $ | 464,246,646 | | | $ | — | | | $ | — | |
| Short-term Investments | | | — | | | | 10,600,000 | | | | — | |
| Securities Lending Reinvestment Vehicle | | | — | | | | 29,133,969 | | | | — | |
| Derivatives | | | 558,902 | | | | — | | | | — | |
| |
| |
| Total | | $ | 464,805,548 | | | $ | 39,733,969 | | | $ | — | |
| |
| |
| | | | | | | | | | | | | |
| Structured Small Cap Growth | | Level 1 | | | Level 2 | | | Level 3 | |
| | |
Assets | | | | | | | | | | | | |
Common Stock and/or Other Equity Investments | | $ | 42,148,886 | | | $ | — | | | $ | — | |
| Short-term Investments | | | — | | | | 1,100,000 | | | | — | |
| Securities Lending Reinvestment Vehicle | | | — | | | | 3,468,558 | | | | — | |
| Derivatives | | | 43,632 | | | | — | | | | — | |
| |
| |
| Total | | $ | 42,192,518 | | | $ | 4,568,558 | | | $ | — | |
| |
| |
| | | | | | | | | | | | | |
| Structured Small Cap Value | | Level 1 | | | Level 2 | | | Level 3 | |
| | |
Assets | | | | | | | | | | | | |
Common Stock and/or Other Equity Investments | | $ | 156,300,438 | | | $ | — | | | $ | — | |
| Short-term Investments | | | — | | | | 4,400,000 | | | | — | |
| Securities Lending Reinvestment Vehicle | | | — | | | | 10,591,505 | | | | — | |
| Derivatives | | | 213,797 | | | | — | | | | — | |
| |
| |
| Total | | $ | 156,514,235 | | | $ | 14,991,505 | | | $ | — | |
| |
| |
| | | | | | | | | | | | | |
| Structured U.S. Equity | | Level 1 | | | Level 2 | | | Level 3 | |
| | |
Assets | | | | | | | | | | | | |
Common Stock and/or Other Equity Investments | | $ | 551,882,174 | | | $ | — | | | $ | — | |
| Short-term Investments | | | — | | | | 14,600,000 | | | | — | |
| Securities Lending Reinvestment Vehicle | | | — | | | | 44,400 | | | | — | |
| Derivatives | | | 326,192 | | | | — | | | | — | |
| |
| |
| Total | | $ | 552,208,366 | | | $ | 14,644,400 | | | $ | — | |
| |
| |
5. INVESTMENTS IN DERIVATIVES
The Funds may make investments in derivative instruments, including, but not limited to, options, futures, swaps and other derivatives relating to foreign currency transactions. A derivative is an instrument whose value is derived from underlying assets, indices, reference rates or a combination of these factors. Derivative instruments may be privately negotiated contracts (often referred to as over the counter (“OTC”) derivatives) or they may be listed and traded on an exchange. Derivative contracts may involve future commitments to purchase or sell financial instruments or commodities at specified terms on a specified date, or to exchange interest payment streams or currencies based on a notional or contractual amount. Derivative instruments may involve a high degree of financial risk. The use of derivatives also involves the risk of loss if the investment
GOLDMAN SACHS STRUCTURED DOMESTIC EQUITY FUNDS
Notes to Financial Statements (continued)
April 30, 2010 (Unaudited)
| |
| 5. INVESTMENTS IN DERIVATIVES (continued) | |
adviser is incorrect in its expectation of the timing or level of fluctuations in securities prices, interest rates or currency prices. Investments in derivative instruments also include the risk of default by the counterparty, the risk that the investment may not be liquid and the risk that a small movement in the price of the underlying security or benchmark may result in a disproportionately large movement, unfavorable or favorable, in the price of the derivative instrument.
The following tables set forth the gross value of the Funds’ derivative contracts for trading activities by certain risk types as of April 30, 2010. The values in the tables below exclude the effects of cash collateral received or posted pursuant to derivative contracts, and therefore are not representative of the Funds’ net exposure.
Balanced
| | | | | | | | | | | | | | |
| | | Statement of Assets
| | Derivative
| | | | Statement of Assets
| | Derivative
| |
| Risk | | and Liabilities Location | | Assets | | | | and Liabilities Location | | Liabilities | |
| | |
| Interest rate | | Receivables for swap contracts, at value; Unrealized gain on futures | | $ | 97,093(a | ) | | | — | | $ | — | |
| |
| |
| Credit | | — | | | — | | | | Payables for swap contracts, at value | | | (609,643 | )(b) |
| |
| |
| Equity | | — | | | — | | | | Unrealized loss on futures | | | (34,613 | )(a) |
| |
| |
| Currency | | — | | | — | | | | Payables for forward foreign currency exchange contracts, at value | | | (2,202 | ) |
| |
| |
| Total | | | | $ | 97,093 | | | | | | $ | (646,458 | ) |
| |
| |
| | | | | | | | | | | | | | |
| | | | | Statement of Assets
| | Derivative
| | | | Derivative
| |
| Risk | | Fund | | and Liabilities Location | | Assets(a) | | | | Liabilities(a) | |
| | |
| Equity | | Structured Large Cap Growth | | Unrealized loss on futures | | $ | — | | | | $ | (162,281 | ) |
| |
| |
| Equity | | Structured Large Cap Value | | Unrealized loss on futures | | | — | | | | | (210,502 | ) |
| |
| |
| Equity | | Structured Small Cap Equity | | Unrealized gain on futures | | | 558,902 | | | | | — | |
| |
| |
| Equity | | Structured Small Cap Growth | | Unrealized gain on futures | | | 43,632 | | | | | — | |
| |
| |
| Equity | | Structured Small Cap Value | | Unrealized gain on futures | | | 213,797 | | | | | — | |
| |
| |
| Equity | | Structured U.S. Equity | | Unrealized gain on futures | | | 326,192 | | | | | — | |
| |
| |
| | |
| (a) | | Includes cumulative appreciation (depreciation) on futures contracts described in the Additional Investment Information sections of the Schedule of Investments. Only current day’s variation margin is reported within the Statements of Assets and Liabilities. |
| | |
| (b) | | Amount represents the payments to be made pursuant to bilateral agreements should counterparties exercise their “right to terminate” provisions based on, among others, the Fund’s performance, its failure to pay on its obligations or failure to pledge collateral. Such amounts do not include incremental charges directly associated with the close-out of the agreements. They also do not reflect the fair value of any assets pledged as collateral which, through the daily margining process, substantially offsets the aforementioned amounts and for which the Fund is entitled to a full return. |
GOLDMAN SACHS STRUCTURED DOMESTIC EQUITY FUNDS
| |
| 5. INVESTMENTS IN DERIVATIVES (continued) | |
The following table sets forth by certain risk types the Fund’s gains (losses) related to derivative activities and their indicative volumes for the six months ended April 30, 2010. These gains (losses) should be considered in the context that derivative contracts may have been executed to economically hedge securities and accordingly, gains (losses) on derivative contracts may offset (losses) gains attributable to securities. These gains (losses) are included in “Net realized gain (loss)” or “Net change in unrealized gain (loss)” on the Statements of Operations:
Balanced
| | | | | | | | | | | | | | | | |
| | | | | | | | Net Change in
| | | | Average
| |
| | | | | Net Realized
| | | Unrealized
| | | | Number of
| |
| Risk | | Statement of Operations Location | | Gain (Loss) | | | Gain (Loss) | | | | Contracts(a) | |
| | |
| Interest rate | | Net realized gain (loss) from futures transactions and swap contracts/Net change in unrealized gain (loss) on futures and swap contracts | | $ | 410,159 | | | $ | (241,980 | ) | | | | 129 | |
| |
| |
| Credit | | Net realized gain (loss) from swap contracts/Net change in unrealized gain (loss) on swap contracts | | | (15,253 | ) | | | 155,932 | | | | | 8 | |
| |
| |
| Equity | | Net realized gain (loss) from futures transactions/Net change in unrealized gain (loss) on futures | | | 70,405 | | | | (37,749 | ) | | | | 26 | |
| |
| |
| Currency | | Net realized gain (loss) from foreign currency related transactions/Net change in unrealized gain (loss) on translation of assets and liabilities denominated in foreign currencies | | | 145,697 | | | | (3,693 | ) | | | | 1 | |
| |
| |
| Total | | | | $ | 611,008 | | | $ | (127,490 | ) | | | | 164 | |
| |
| |
The following table represents gains (losses) which are included in “Net realized gain (loss) from future transactions” and “Net change in unrealized gain (loss) on futures” in the Statements of Operations.
| | | | | | | | | | | | | | | | |
| | | | | | | | Net Change in
| | | | Average
| |
| | | | | Net Realized
| | | Unrealized
| | | | Number of
| |
| Risk | | Fund | | Gain (Loss) | | | Gain (Loss) | | | | Contracts(a) | |
| | |
| Equity | | Structured Large Cap Growth | | $ | 1,156,748 | | | $ | 344,788 | | | | | 254 | |
| |
| |
| Equity | | Structured Large Cap Value | | | 2,924,285 | | | | 262,514 | | | | | 435 | |
| |
| |
| Equity | | Structured Small Cap Equity | | | 1,537,209 | | | | 1,533,109 | | | | | 187 | |
| |
| |
| Equity | | Structured Small Cap Growth | | | 138,358 | | | | 69,165 | | | | | 12 | |
| |
| |
| Equity | | Structured Small Cap Value | | | 408,912 | | | | 347,869 | | | | | 51 | |
| |
| |
| Equity | | Structured U.S. Equity | | | 680,115 | | | | 536,463 | | | | | 208 | |
| |
| |
| | |
| (a) | | Average number of contracts is based on the average of quarter end balances for the six months ended April 30, 2010. |
GOLDMAN SACHS STRUCTURED DOMESTIC EQUITY FUNDS
Notes to Financial Statements (continued)
April 30, 2010 (Unaudited)
6. PORTFOLIO SECURITIES TRANSACTIONS
The cost of purchases and proceeds from sales and maturities of long-term securities for the six months ended April 30, 2010, were as follows:
| | | | | | | | | |
| Fund | | Purchases | | | Sales and Maturities | |
| | |
| Balanced* | | $ | 108,131,020 | | | $ | 115,339,064 | |
| |
| |
| Structured Large Cap Growth | | | 240,217,676 | | | | 371,691,600 | |
| |
| |
| Structured Large Cap Value | | | 150,288,653 | | | | 451,206,786 | |
| |
| |
| Structured Small Cap Equity | | | 190,360,149 | | | | 335,257,489 | |
| |
| |
| Structured Small Cap Growth | | | 20,351,572 | | | | 21,999,347 | |
| |
| |
| Structured Small Cap Value | | | 62,533,482 | | | | 72,720,391 | |
| |
| |
| Structured U.S. Equity | | | 135,908,136 | | | | 195,068,230 | |
| |
| |
| | |
| * | | Included in these amounts are the cost of purchases and proceeds from sales and maturities of U.S. Government and agency obligations in the amounts of $45,547,039 and $43,951,191, respectively. |
7. SECURITIES LENDING
Pursuant to exemptive relief granted by the SEC and the terms and conditions contained therein, the Funds may lend their securities through a securities lending agent, Goldman Sachs Agency Lending (“GSAL”), a wholly-owned subsidiary of Goldman Sachs, to certain qualified borrowers including Goldman Sachs and affiliates. In accordance with the Funds’ securities lending procedures, the Funds receive cash collateral at least equal to the market value of the securities on loan. The market value of the loaned securities is determined at the close of business of the Funds, at their last sale price or official closing price on the principal exchange or system on which they are traded, and any additional required collateral is delivered to the Funds on the next business day. As with other extensions of credit, the Funds may experience delay in the recovery of their securities or incur a loss should the borrower of the securities breach its agreement with the Funds or become insolvent at a time when the collateral is insufficient to cover the cost of repurchasing securities on loan.
The Funds invest the cash collateral received in connection with securities lending transactions in the Enhanced Portfolio II of Boston Global Investment Trust (“Enhanced Portfolio II”), a Delaware statutory trust. The Enhanced Portfolio II, deemed an affiliate of the Trust, is exempt from registration under Section 3(c)(7) of the Act and is managed by GSAM, for which GSAM may receive an investment advisory fee of up to 0.10% on an annualized basis of the average daily net assets of the Enhanced Portfolio II. The Enhanced Portfolio II invests primarily in short-term investments, but is not a “money market fund” subject to the requirements of Rule 2a-7 of the Act. The Funds’ investment of cash collateral in the Enhanced Portfolio II is subject to a net asset value that may fall or rise due to market and credit conditions.
Both the Funds and GSAL receive compensation relating to the lending of the Funds’ securities. The amounts earned by the Funds for the six months ended April 30, 2010, are reported under Investment Income on the Statement of
GOLDMAN SACHS STRUCTURED DOMESTIC EQUITY FUNDS
| |
| 7. SECURITIES LENDING (continued) | |
Operations. The table below details securities lending activity with affiliates of Goldman Sachs as of, and for the six months ended April 30, 2010:
| | | | | | | | | | | | | |
| | | | | | Amounts Received
| | | | |
| | | Earnings of GSAL
| | | by the Funds
| | | Amounts Payable to
| |
| | | Relating to
| | | from Lending to
| | | Goldman Sachs
| |
| | | Securities Loaned
| | | Goldman Sachs
| | | Upon Return of
| |
| | | for the Six Months Ended
| | | for the Six Months Ended
| | | Securities Loaned as of
| |
| Fund | | April 30, 2010 | | | April 30, 2010 | | | April 30, 2010 | |
| | |
| Balanced | | $ | 1,162 | | | $ | 1,150 | | | $ | 1,524,600 | |
| |
| |
| Structured Large Cap Growth | | | 2,028 | | | | 3,197 | | | | 50,500 | |
| |
| |
| Structured Large Cap Value | | | 2,946 | | | | 6,996 | | | | 1,528,175 | |
| |
| |
| Structured Small Cap Equity | | | 20,785 | | | | 65,291 | | | | 8,574,433 | |
| |
| |
| Structured Small Cap Growth | | | 1,557 | | | | 5,457 | | | | 572,875 | |
| |
| |
| Structured Small Cap Value | | | 4,014 | | | | 5,477 | | | | 2,002,975 | |
| |
| |
| Structured U.S. Equity | | | 458 | | | | 1,687 | | | | 211,250 | |
| |
| |
The following table provides information about the Funds’ investment in the Enhanced Portfolio II for the six months ended April 30, 2010 (in thousands):
| | | | | | | | | | | | | | | | | | | | | |
| | | Number of
| | | | | | | | | Number of
| | | | |
| | | Shares Held
| | | Shares
| | | Shares
| | | Shares Held
| | | Value at End
| |
| Fund | | Beginning of Period | | | Bought | | | Sold | | | End of Period | | | of Period | |
| | |
| Balanced | | | 1,077 | | | | 15,869 | | | | (12,849 | ) | | | 4,097 | | | $ | 4,101 | |
| |
| |
| Structured Large Cap Growth | | | 42,008 | | | | 73,828 | | | | (115,759 | ) | | | 77 | | | | 77 | |
| |
| |
| Structured Large Cap Value | | | 128,946 | | | | 106,485 | | | | (234,684 | ) | | | 747 | | | | 748 | |
| |
| |
| Structured Small Cap Equity | | | 115,598 | | | | 63,933 | | | | (150,426 | ) | | | 29,105 | | | | 29,134 | |
| |
| |
| Structured Small Cap Growth | | | 2,796 | | | | 7,999 | | | | (7,330 | ) | | | 3,465 | | | | 3,469 | |
| |
| |
| Structured Small Cap Value | | | 18,286 | | | | 27,324 | | | | (35,029 | ) | | | 10,581 | | | | 10,592 | |
| |
| |
| Structured U.S. Equity | | | 33,486 | | | | 18,067 | | | | (51,509 | ) | | | 44 | | | | 44 | |
| |
| |
GOLDMAN SACHS STRUCTURED DOMESTIC EQUITY FUNDS
Notes to Financial Statements (continued)
April 30, 2010 (Unaudited)
8. TAX INFORMATION
As of the Funds’ most recent fiscal year end, October 31, 2009, the Funds’ capital loss carryforwards and certain timing differences, on a tax basis were as follows:
| | | | | | | | | | | | | | | | | | | | | | | | | | | | | |
| | | | | | Structured
| | | Structured
| | | Structured
| | | Structured
| | | Structured
| | | | |
| | | | | | Large Cap
| | | Large Cap
| | | Small Cap
| | | Small Cap
| | | Small Cap
| | | Structured
| |
| | | Balanced | | | Growth | | | Value | | | Equity | | | Growth | | | Value | | | U.S. Equity | |
| | |
Capital loss carryforward:1 | | | | | | | | | | | | | | | | | | | | | | | | | | | | |
| Expiring 2010 | | $ | — | | | $ | (158,481,000 | ) | | $ | — | | | $ | — | | | $ | — | | | $ | — | | | $ | — | |
| Expiring 2011 | | | — | | | | (5,803,222 | ) | | | — | | | | — | | | | — | | | | — | | | | — | |
| Expiring 2015 | | | — | | | | (15,811,506 | ) | | | — | | | | (12,278,226 | ) | | | — | | | | — | | | | — | |
| Expiring 2016 | | | (17,972,763 | ) | | | (273,461,938 | ) | | | (290,576,670 | ) | | | (183,104,424 | ) | | | (13,802,987 | ) | | | (51,995,129 | ) | | | (90,696,325 | ) |
| Expiring 2017 | | | (20,327,685 | ) | | | (340,506,279 | ) | | | (382,280,649 | ) | | | (164,020,983 | ) | | | (9,400,642 | ) | | | (40,659,192 | ) | | | (197,368,294 | ) |
| |
| |
| Total capital loss carryforward | | $ | (38,300,448 | ) | | $ | (794,063,945 | ) | | $ | (672,857,319 | ) | | $ | (359,403,633 | ) | | $ | (23,203,629 | ) | | $ | (92,654,321 | ) | | $ | (288,064,619 | ) |
| |
| |
Timing differences
(Straddles Losses Deferrals) | | $ | (28,478 | ) | | $ | — | | | $ | — | | | $ | — | | | $ | — | | | $ | — | | | $ | — | |
| |
| |
| | |
| 1 | | Expiration occurs on October 31 of the year indicated. Utilization of these losses may be limited under the Code. |
As of April 30, 2010, the Funds’ aggregate security unrealized gains and losses based on cost for U.S. federal income tax purposes was as follows:
| | | | | | | | | | | | | | | | | | | | | | | | | | | | | |
| | | | | | Structured
| | | Structured
| | | Structured
| | | Structured
| | | Structured
| | | Structured
| |
| | | | | | Large Cap
| | | Large Cap
| | | Small Cap
| | | Small Cap
| | | Small Cap
| | | U.S.
| |
| | | Balanced | | | Growth | | | Value | | | Equity | | | Growth | | | Value | | | Equity | |
| | |
| Tax Cost | | $ | 133,672,267 | | | $ | 613,444,822 | | | $ | 694,588,559 | | | $ | 398,292,839 | | | $ | 39,172,642 | | | $ | 136,063,202 | | | $ | 479,063,093 | |
| |
| |
| Gross unrealized gain | | | 14,109,749 | | | | 132,019,638 | | | | 158,331,237 | | | | 119,025,098 | | | | 8,534,851 | | | | 39,128,704 | | | | 102,740,021 | |
| Gross unrealized loss | | | (4,108,193 | ) | | | (18,639,698 | ) | | | (45,391,683 | ) | | | (13,337,322 | ) | | | (990,049 | ) | | | (3,899,963 | ) | | | (15,276,540 | ) |
| |
| |
| Net unrealized security gain (loss) | | $ | 10,001,556 | | | $ | 113,379,940 | | | $ | (112,939,554 | ) | | $ | 105,687,776 | | | $ | 7,544,802 | | | $ | 35,228,741 | | | $ | 87,463,481 | |
| |
| |
The difference between GAAP-basis and tax-basis unrealized gains (losses) is attributable primarily to wash sales, net mark-to-market gains (losses) on regulated futures contracts, and differences related to the tax treatment of partnership investments, swap transactions, securities on loan and premium amortization as of the most recent fiscal year.
9. OTHER RISKS
Funds’ Shareholder Concentration Risk — Certain funds, accounts, individuals or Goldman Sachs affiliates may from time to time own (beneficially or of record) or control a significant percentage of the Funds’ shares. Redemptions by these funds, accounts or individuals of their holdings in the Funds may impact the Funds’ liquidity and NAV. These redemptions may also force the Funds to sell securities.
Market and Credit Risks — In the normal course of business, the Funds trade financial instruments and enter into financial transactions where risk of potential loss exists due to changes in the market (market risk). Additionally, the Funds may also be exposed to credit risk in the event that an issuer fails to perform or that an institution or entity with which the Funds have unsettled or open transaction defaults.
Investing in foreign markets may involve special risks and considerations not typically associated with investing in the U.S. These risks include revaluation of currencies, high rates of inflation, repatriation restrictions on income and capital, and adverse political and economic developments. Moreover, securities issued in these markets may be less liquid, be subject to
GOLDMAN SACHS STRUCTURED DOMESTIC EQUITY FUNDS
| |
| 9. OTHER RISKS (continued) | |
government ownership controls, have delayed settlements and their prices may be more volatile than those of comparable securities in the U.S.
10. INDEMNIFICATIONS
Under the Trust’s organizational documents, its trustees, officers, employees and agents are indemnified, to the extent permitted by the Act, against certain liabilities that may arise out of performance of their duties to the Funds. Additionally, in the course of business, the Funds enter into contracts that contain a variety of indemnification clauses. The Funds’ maximum exposure under these arrangements is unknown, as this would involve future claims that may be made against the Funds that have not yet occurred. However, GSAM believes the risk of loss under these arrangements to be remote.
11. OTHER MATTERS
Legal Proceedings — On April 16, 2010, the SEC brought an action under the U.S. federal securities laws in the U.S. District Court for the Southern District of New York against Goldman Sachs and one of its employees alleging that they made materially misleading statements and omissions in connection with a 2007 private placement of securities relating to a synthetic collateralized debt obligation sold to two institutional investors. Goldman Sachs and/or other affiliates of The Goldman Sachs Group, Inc. have received or may in the future receive notices and requests for information from various regulators, and have become or may in the future become involved in legal proceedings, based on allegations similar to those made by the SEC or other matters.
Neither Goldman Sachs Asset Management, L.P. or Goldman Sachs Asset Management International (collectively “GSAM”) nor any GSAM-managed funds have been named in the complaint. Moreover, the SEC complaint does not seek any penalties against them or against any employee who is or has been part of GSAM.
In the view of Goldman Sachs and GSAM, neither the matters alleged in this or any such similar proceedings nor their eventual resolution are likely to have a material affect on the ability of Goldman Sachs, GSAM or their affiliates to provide services to GSAM-managed funds. Due to a provision in the law governing the operation of mutual funds, the resolution of the SEC action could, under certain circumstances, result in a situation in which Goldman Sachs, GSAM and their affiliates would be ineligible to serve as an investment adviser or principal underwriter for U.S.-registered mutual funds absent an exemption from the SEC. While there is no assurance that such an exemption would be granted, the SEC has granted this type of relief in the past.
12. SUBSEQUENT EVENT
Subsequent events after the balance sheet date have been evaluated through the date the financial statements were issued. GSAM has concluded that there is no impact requiring adjustment or disclosure in the financial statements.
GOLDMAN SACHS STRUCTURED DOMESTIC EQUITY FUNDS
Notes to Financial Statements (continued)
April 30, 2010 (Unaudited)
13. SUMMARY OF SHARE TRANSACTIONS
Share activity is as follows:
| | | | | | | | | | | | | | | | | |
| | | Balanced Fund | |
| | | | |
| | | For the Six Months Ended
| | | | |
| | | April 30, 2010
| | | For the Fiscal Year Ended
| |
| | | (Unaudited) | | | October 31, 2009 | |
| | | | |
| | | Shares | | | Dollars | | | Shares | | | Dollars | |
| | | | |
Class A Shares | | | | | | | | | | | | | | | | |
| Shares sold | | | 425,030 | | | $ | 7,315,111 | | | | 1,589,860 | | | $ | 22,563,133 | |
| Reinvestment of distributions | | | 122,022 | | | | 2,078,289 | | | | 246,164 | | | | 3,526,580 | |
Shares converted from Class B(a) | | | 6,119 | | | | 105,864 | | | | 21,919 | | | | 309,553 | |
| Shares redeemed | | | (925,611 | ) | | | (15,977,671 | ) | | | (3,021,028 | ) | | | (42,922,686 | ) |
| |
| |
| | | | (372,440 | ) | | | (6,478,407 | ) | | | (1,163,085 | ) | | | (16,523,420 | ) |
| |
| |
Class B Shares | | | | | | | | | | | | | | | | |
| Shares sold | | | 35,699 | | | | 606,355 | | | | 84,152 | | | | 1,191,443 | |
| Reinvestment of distributions | | | 7,434 | | | | 125,363 | | | | 15,214 | | | | 215,934 | |
Shares converted to Class A(a) | | | (6,167 | ) | | | (105,864 | ) | | | (22,101 | ) | | | (309,553 | ) |
| Shares redeemed | | | (94,928 | ) | | | (1,614,883 | ) | | | (232,604 | ) | | | (3,357,216 | ) |
| |
| |
| | | | (57,962 | ) | | | (989,029 | ) | | | (155,339 | ) | | | (2,259,392 | ) |
| |
| |
Class C Shares | | | | | | | | | | | | | | | | |
| Shares sold | | | 58,246 | | | | 991,610 | | | | 163,424 | | | | 2,281,266 | |
| Reinvestment of distributions | | | 5,219 | | | | 87,860 | | | | 8,906 | | | | 126,420 | |
| Shares redeemed | | | (46,936 | ) | | | (807,631 | ) | | | (192,564 | ) | | | (2,658,873 | ) |
| |
| |
| | | | 16,529 | | | | 271,839 | | | | (20,234 | ) | | | (251,187 | ) |
| |
| |
Institutional Shares | | | | | | | | | | | | | | | | |
| Shares sold | | | 7,201 | | | | 128,054 | | | | 16,668 | | | | 254,124 | |
| Reinvestment of distributions | | | 3,163 | | | | 54,729 | | | | 5,678 | | | | 82,838 | |
| Shares redeemed | | | (16,097 | ) | | | (284,117 | ) | | | (30,806 | ) | | | (437,912 | ) |
| |
| |
| | | | (5,733 | ) | | | (101,334 | ) | | | (8,460 | ) | | | (100,950 | ) |
| |
| |
Service Shares(b) | | | | | | | | | | | | | | | | |
| Shares sold | | | — | | | | — | | | | — | | | | — | |
| Reinvestment of distributions | | | — | | | | — | | | | 1 | | | | 11 | |
| Shares redeemed | | | — | | | | — | | | | (81 | ) | | | (1,018 | ) |
| |
| |
| | | | — | | | | — | | | | (80 | ) | | | (1,007 | ) |
| |
| |
Class IR Shares | | | | | | | | | | | | | | | | |
| Shares sold | | | — | | | | — | | | | — | | | | — | |
| Reinvestment of distributions | | | — | | | | — | | | | — | | | | — | |
| Shares redeemed | | | — | | | | — | | | | — | | | | — | |
| |
| |
| | | | — | | | | — | | | | — | | | | — | |
| |
| |
Class R Shares | | | | | | | | | | | | | | | | |
| Shares sold | | | — | | | | — | | | | — | | | | — | |
| Reinvestment of distributions | | | — | | | | — | | | | — | | | | — | |
| Shares redeemed | | | — | | | | — | | | | — | | | | — | |
| |
| |
| | | | — | | | | — | | | | — | | | | — | |
| |
| |
NET DECREASE | | | (419,606 | ) | | $ | (7,296,931 | ) | | | (1,347,198 | ) | | $ | (19,135,956 | ) |
| |
| |
| | |
| (a) | | Class B Shares automatically convert into Class A Shares on or about the fifteenth day of the last month of the calendar quarter that is eight years after the initial purchase date of either the Fund or another Goldman Sachs Fund. |
| (b) | | Service Shares liquidated on March 13, 2009 for the Balanced Fund. |
GOLDMAN SACHS STRUCTURED DOMESTIC EQUITY FUNDS
13. SUMMARY OF SHARE TRANSACTIONS (continued)
| | | | | | | | | | | | | | | | | | | | | | | | | | | | | | | | | |
| | | Structured Large Cap Growth Fund | | | Structured Large Cap Value Fund | |
| | |
| | | For the Six Months Ended
| | | | | | For the Six Months Ended
| | | | |
| | | April 30, 2010
| | | For the Fiscal Year Ended
| | | April 30, 2010
| | | For the Fiscal Year Ended
| |
| | | (Unaudited) | | | October 31, 2009 | | | (Unaudited) | | | October 31, 2009 | |
| | |
| | | Shares | | | Dollars | | | Shares | | | Dollars | | | Shares | | | Dollars | | | Shares | | | Dollars | |
| | |
| | | | | | | | | | | | | | | | | | | | | | | | | | | | | | | | | |
| | | | 2,203,328 | | | $ | 24,112,520 | | | | 4,800,706 | | | $ | 41,112,887 | | | | 3,118,972 | | | $ | 28,299,620 | | | | 10,931,124 | | | $ | 84,695,695 | |
| | | | 184,731 | | | | 1,948,917 | | | | 299,358 | | | | 2,418,814 | | | | 170,502 | | | | 1,568,551 | | | | 757,630 | | | | 5,620,194 | |
| | | | 74,600 | | | | 814,171 | | | | 281,904 | | | | 2,343,676 | | | | 16,244 | | | | 149,600 | | | | 48,028 | | | | 337,715 | |
| | | | (4,696,384 | ) | | | (51,807,882 | ) | | | (18,981,715 | ) | | | (160,704,307 | ) | | | (12,294,763 | ) | | | (116,066,650 | ) | | | (18,502,759 | ) | | | (137,332,448 | ) |
| |
| |
| | | | (2,233,725 | ) | | | (24,932,274 | ) | | | (13,599,747 | ) | | | (114,828,930 | ) | | | (8,989,045 | ) | | | (86,048,879 | ) | | | (6,765,977 | ) | | | (46,678,844 | ) |
| |
| |
| | | | | | | | | | | | | | | | | | | | | | | | | | | | | | | | | |
| | | | 5,656 | | | | 57,180 | | | | 107,849 | | | | 843,431 | | | | 4,959 | | | | 42,598 | | | | 74,028 | | | | 547,962 | |
| | | | 4,153 | | | | 40,660 | | | | — | | | | — | | | | 792 | | | | 7,244 | | | | 7,427 | | | | 54,242 | |
| | | | (80,459 | ) | | | (814,171 | ) | | | (304,198 | ) | | | (2,343,676 | ) | | | (16,343 | ) | | | (149,600 | ) | | | (48,335 | ) | | | (337,715 | ) |
| | | | (152,267 | ) | | | (1,532,455 | ) | | | (576,897 | ) | | | (4,587,523 | ) | | | (80,116 | ) | | | (730,226 | ) | | | (245,163 | ) | | | (1,822,085 | ) |
| |
| |
| | | | (222,917 | ) | | | (2,248,786 | ) | | | (773,246 | ) | | | (6,087,768 | ) | | | (90,708 | ) | | | (829,984 | ) | | | (212,043 | ) | | | (1,557,596 | ) |
| |
| |
| | | | | | | | | | | | | | | | | | | | | | | | | | | | | | | | | |
| | | | 38,804 | | | | 392,237 | | | | 119,814 | | | | 953,723 | | | | 188,753 | | | | 1,723,681 | | | | 536,080 | | | | 4,011,152 | |
| | | | 6,742 | | | | 65,939 | | | | — | | | | — | | | | 3,908 | | | | 35,857 | | | | 26,231 | | | | 191,567 | |
| | | | (224,304 | ) | | | (2,276,208 | ) | | | (501,576 | ) | | | (3,988,005 | ) | | | (362,548 | ) | | | (3,304,577 | ) | | | (636,861 | ) | | | (4,601,908 | ) |
| |
| |
| | | | (178,758 | ) | | | (1,818,032 | ) | | | (381,762 | ) | | | (3,034,282 | ) | | | (169,887 | ) | | | (1,545,039 | ) | | | (74,550 | ) | | | (399,189 | ) |
| |
| |
| | | | | | | | | | | | | | | | | | | | | | | | | | | | | | | | | |
| | | | 7,757,199 | | | | 85,197,093 | | | | 2,504,835 | | | | 22,313,555 | | | | 2,255,197 | | | | 20,610,829 | | | | 15,220,204 | | | | 118,535,208 | |
| | | | 751,352 | | | | 8,129,624 | | | | 1,391,879 | | | | 11,524,762 | | | | 598,892 | | | | 5,496,957 | | | | 2,416,217 | | | | 17,996,208 | |
| | | | (17,035,731 | ) | | | (190,588,570 | ) | | | (39,524,867 | ) | | | (348,864,858 | ) | | | (30,162,774 | ) | | | (277,182,902 | ) | | | (32,032,873 | ) | | | (242,022,502 | ) |
| |
| |
| | | | (8,527,180 | ) | | | (97,261,853 | ) | | | (35,628,153 | ) | | | (315,026,541 | ) | | | (27,308,685 | ) | | | (251,075,116 | ) | | | (14,396,452 | ) | | | (105,491,086 | ) |
| |
| |
| | | | | | | | | | | | | | | | | | | | | | | | | | | | | | | | | |
| | | | 464 | | | | 5,039 | | | | 1,527 | | | | 13,361 | | | | 143,951 | | | | 1,322,888 | | | | 398,059 | | | | 2,954,089 | |
| | | | 90 | | | | 939 | | | | 99 | | | | 792 | | | | 4,001 | | | | 37,026 | | | | 17,316 | | | | 128,173 | |
| | | | (2,192 | ) | | | (23,097 | ) | | | (10,418 | ) | | | (85,199 | ) | | | (250,504 | ) | | | (2,298,610 | ) | | | (377,471 | ) | | | (2,764,759 | ) |
| |
| |
| | | | (1,638 | ) | | | (17,119 | ) | | | (8,792 | ) | | | (71,046 | ) | | | (102,552 | ) | | | (938,696 | ) | | | 37,904 | | | | 317,503 | |
| |
| |
| | | | | | | | | | | | | | | | | | | | | | | | | | | | | | | | | |
| | | | 2 | | | | 19 | | | | 4 | | | | 37 | | | | 343 | | | | 3,110 | | | | 372 | | | | 2,769 | |
| | | | 10 | | | | 102 | | | | 11 | | | | 82 | | | | 11 | | | | 96 | | | | 25 | | | | 188 | |
| | | | (2 | ) | | | (19 | ) | | | (4 | ) | | | (37 | ) | | | (2 | ) | | | (19 | ) | | | (4 | ) | | | (30 | ) |
| |
| |
| | | | 10 | | | | 102 | | | | 11 | | | | 82 | | | | 352 | | | | 3,187 | | | | 393 | | | | 2,927 | |
| |
| |
| | | | | | | | | | | | | | | | | | | | | | | | | | | | | | | | | |
| | | | 4,873 | | | | 52,233 | | | | 3,113 | | | | 30,756 | | | | 388 | | | | 3,544 | | | | 4,402 | | | | 32,583 | |
| | | | 59 | | | | 624 | | | | 5 | | | | 42 | | | | 24 | | | | 224 | | | | 52 | | | | 378 | |
| | | | (258 | ) | | | (2,846 | ) | | | (443 | ) | | | (4,430 | ) | | | (32 | ) | | | (301 | ) | | | (874 | ) | | | (6,315 | ) |
| |
| |
| | | | 4,674 | | | | 50,011 | | | | 2,675 | | | | 26,368 | | | | 380 | | | | 3,467 | | | | 3,580 | | | | 26,646 | |
| |
| |
| | | | (11,159,534 | ) | | $ | (126,227,951 | ) | | | (50,389,014 | ) | | $ | (439,022,117 | ) | | | (36,660,145 | ) | | $ | (340,431,060 | ) | | | (21,407,145 | ) | | $ | (153,779,639 | ) |
| |
| |
GOLDMAN SACHS STRUCTURED DOMESTIC EQUITY FUNDS
Notes to Financial Statements (continued)
April 30, 2010 (Unaudited)
13. SUMMARY OF SHARE TRANSACTIONS (continued)
Share activity is as follows:
| | | | | | | | | | | | | | | | | |
| | | Structured Small Cap Equity Fund | |
| | | | |
| | | For the Six Months Ended
| | | | |
| | | April 30, 2010
| | | For the Fiscal Year Ended
| |
| | | (Unaudited) | | | October 31, 2009 | |
| | | | |
| | | Shares | | | Dollars | | | Shares | | | Dollars | |
| | | | |
Class A Shares | | | | | | | | | | | | | | | | |
| Shares sold | | | 2,791,178 | | | $ | 27,450,382 | | | | 5,006,003 | | | $ | 36,054,997 | |
| Reinvestment of distributions | | | 114,398 | | | | 1,020,428 | | | | 149,053 | | | | 1,021,014 | |
Shares converted from Class B(a) | | | 16,401 | | | | 157,980 | | | | 43,864 | | | | 309,667 | |
| Shares redeemed | | | (5,440,256 | ) | | | (52,308,993 | ) | | | (10,107,784 | ) | | | (72,151,735 | ) |
| |
| |
| | | | (2,518,279 | ) | | | (23,680,203 | ) | | | (4,908,864 | ) | | | (34,766,057 | ) |
| |
| |
Class B Shares | | | | | | | | | | | | | | | | |
| Shares sold | | | 1,887 | | | | 16,865 | | | | 13,059 | | | | 81,928 | |
| Reinvestment of distributions | | | 355 | | | | 2,861 | | | | — | | | | — | |
Shares converted to Class A(a) | | | (18,184 | ) | | | (157,980 | ) | | | (48,701 | ) | | | (309,667 | ) |
| Shares redeemed | | | (58,428 | ) | | | (495,233 | ) | | | (135,164 | ) | | | (862,415 | ) |
| |
| |
| | | | (74,370 | ) | | | (633,487 | ) | | | (170,806 | ) | | | (1,090,154 | ) |
| |
| |
Class C Shares | | | | | | | | | | | | | | | | |
| Shares sold | | | 211,044 | | | | 1,868,036 | | | | 402,715 | | | | 2,625,073 | |
| Reinvestment of distributions | | | 4,417 | | | | 35,647 | | | | — | | | | — | |
| Shares redeemed | | | (252,208 | ) | | | (2,238,849 | ) | | | (495,370 | ) | | | (3,161,566 | ) |
| |
| |
| | | | (36,747 | ) | | | (335,166 | ) | | | (92,655 | ) | | | (536,493 | ) |
| |
| |
Institutional Shares | | | | | | | | | | | | | | | | |
| Shares sold | | | 1,441,360 | | | | 14,775,959 | | | | 13,462,872 | | | | 94,110,296 | |
| Reinvestment of distributions | | | 436,130 | | | | 4,029,850 | | | | 666,756 | | | | 4,720,636 | |
| Shares redeemed | | | (14,380,819 | ) | | | (140,228,768 | ) | | | (24,736,892 | ) | | | (188,602,122 | ) |
| |
| |
| | | | (12,503,329 | ) | | | (121,422,959 | ) | | | (10,607,264 | ) | | | (89,771,190 | ) |
| |
| |
Service Shares(b) | | | | | | | | | | | | | | | | |
| Shares sold | | | 18,466 | | | | 181,268 | | | | 70,940 | | | | 508,315 | |
| Reinvestment of distributions | | | 1,052 | | | | 9,309 | | | | — | | | | — | |
| Shares redeemed | | | (76,510 | ) | | | (803,488 | ) | | | (151,443 | ) | | | (1,110,488 | ) |
| |
| |
| | | | (56,992 | ) | | | (612,911 | ) | | | (80,503 | ) | | | (602,173 | ) |
| |
| |
Class IR Shares | | | | | | | | | | | | | | | | |
| Shares sold | | | 2,478 | | | | 26,195 | | | | 2,060 | | | | 15,225 | |
| Reinvestment of distributions | | | 33 | | | | 290 | | | | 11 | | | | 73 | |
| Shares redeemed | | | (2,497 | ) | | | (26,497 | ) | | | (31 | ) | | | (241 | ) |
| |
| |
| | | | 14 | | | | (12 | ) | | | 2,040 | | | | 15,057 | |
| |
| |
Class R Shares | | | | | | | | | | | | | | | | |
| Shares sold | | | 16,376 | | | | 156,239 | | | | 4,523 | | | | 27,359 | |
| Reinvestment of distributions | | | 16 | | | | 144 | | | | 5 | | | | 31 | |
| Shares redeemed | | | (2,708 | ) | | | (28,498 | ) | | | (2,881 | ) | | | (23,933 | ) |
| |
| |
| | | | 13,684 | | | | 127,885 | | | | 1,647 | | | | 3,457 | |
| |
| |
NET DECREASE | | | (15,176,019 | ) | | $ | (146,556,853 | ) | | | (15,856,405 | ) | | $ | (126,747,553 | ) |
| |
| |
| | |
| (a) | | Class B Shares automatically convert into Class A Shares on or about the fifteenth day of the last month of the calendar quarter that is eight years after the initial purchase date of either the Fund or another Goldman Sachs Fund. |
| (b) | | Service Shares liquidated on March 13, 2009 for the Structured Small Cap Growth and Structured Small Cap Value Funds. |
GOLDMAN SACHS STRUCTURED DOMESTIC EQUITY FUNDS
13. SUMMARY OF SHARE TRANSACTIONS (continued)
Share activity is as follows:
| | | | | | | | | | | | | | | | | |
| | | Structured Small Cap Growth Fund | |
| | | | |
| | | For the Six Months Ended
| | | | |
| | | April 30, 2010
| | | For the Fiscal Year Ended
| |
| | | (Unaudited) | | | October 31, 2009 | |
| | | | |
| | | Shares | | | Dollars | | | Shares | | | Dollars | |
| | | | |
Class A Shares | | | | | | | | | | | | | | | | |
| Shares sold | | | 81,899 | | | $ | 1,349,061 | | | | 214,147 | | | $ | 2,738,564 | |
| Reinvestment of distributions | | | 4,387 | | | | 66,626 | | | | — | | | | — | |
Shares converted from Class B(a) | | | 32,145 | | | | 528,223 | | | | 86,776 | | | | 1,009,878 | |
| Shares redeemed | | | (168,228 | ) | | | (2,735,897 | ) | | | (492,373 | ) | | | (5,843,857 | ) |
| |
| |
| | | | (49,797 | ) | | | (791,987 | ) | | | (191,450 | ) | | | (2,095,415 | ) |
| |
| |
Class B Shares | | | | | | | | | | | | | | | | |
| Shares sold | | | 4,710 | | | | 72,626 | | | | 70,357 | | | | 743,076 | |
| Reinvestment of distributions | | | — | | | | — | | | | — | | | | — | |
Shares converted to Class A(a) | | | (36,993 | ) | | | (528,223 | ) | | | (99,575 | ) | | | (1,009,878 | ) |
| Shares redeemed | | | (73,813 | ) | | | (1,040,424 | ) | | | (274,354 | ) | | | (2,937,159 | ) |
| |
| |
| | | | (106,096 | ) | | | (1,496,021 | ) | | | (303,572 | ) | | | (3,203,961 | ) |
| |
| |
Class C Shares | | | | | | | | | | | | | | | | |
| Shares sold | | | 24,644 | | | | 354,448 | | | | 70,544 | | | | 749,623 | |
| Reinvestment of distributions | | | — | | | | — | | | | — | | | | — | |
| Shares redeemed | | | (54,698 | ) | | | (785,950 | ) | | | (126,418 | ) | | | (1,353,487 | ) |
| |
| |
| | | | (30,054 | ) | | | (431,502 | ) | | | (55,874 | ) | | | (603,864 | ) |
| |
| |
Institutional Shares | | | | | | | | | | | | | | | | |
| Shares sold | | | 43,781 | | | | 772,084 | | | | 23,201 | | | | 317,744 | |
| Reinvestment of distributions | | | 1,606 | | | | 26,735 | | | | — | | | | — | |
| Shares redeemed | | | (5,622 | ) | | | (103,699 | ) | | | (30,148 | ) | | | (389,694 | ) |
| |
| |
| | | | 39,765 | | | | 695,120 | | | | (6,947 | ) | | | (71,950 | ) |
| |
| |
Service Shares(b) | | | | | | | | | | | | | | | | |
| Shares sold | | | — | | | | — | | | | — | | | | — | |
| Reinvestment of distributions | | | — | | | | — | | | | — | | | | — | |
| Shares redeemed | | | — | | | | — | | | | (437 | ) | | | (4,686 | ) |
| |
| |
| | | | — | | | | — | | | | (437 | ) | | | (4,686 | ) |
| |
| |
Class IR Shares | | | | | | | | | | | | | | | | |
| Shares sold | | | 1 | | | | 24 | | | | 2 | | | | 33 | |
| Reinvestment of distributions | | | 3 | | | | 44 | | | | — | | | | — | |
| Shares redeemed | | | (1 | ) | | | (24 | ) | | | (2 | ) | | | (23 | ) |
| |
| |
| | | | 3 | | | | 44 | | | | — | | | | 10 | |
| |
| |
Class R Shares | | | | | | | | | | | | | | | | |
| Shares sold | | | 1,355 | | | | 21,705 | | | | 2,892 | | | | 41,202 | |
| Reinvestment of distributions | | | 12 | | | | 185 | | | | — | | | | — | |
| Shares redeemed | | | (1,172 | ) | | | (20,315 | ) | | | (449 | ) | | | (6,861 | ) |
| |
| |
| | | | 195 | | | | 1,575 | | | | 2,443 | | | | 34,341 | |
| |
| |
NET DECREASE | | | (145,984 | ) | | $ | (2,022,771 | ) | | | (555,837 | ) | | $ | (5,945,525 | ) |
| |
| |
| | |
| (a) | | Class B Shares automatically convert into Class A Shares on or about the fifteenth day of the last month of the calendar quarter that is eight years after the initial purchase date of either the Fund or another Goldman Sachs Fund. |
| (b) | | Service Shares liquidated on March 13, 2009 for the Structured Small Cap Growth and Structured Small Cap Value Funds. |
GOLDMAN SACHS STRUCTURED DOMESTIC EQUITY FUNDS
Notes to Financial Statements (continued)
April 30, 2010 (Unaudited)
13. SUMMARY OF SHARE TRANSACTIONS (continued)
Share activity is as follows:
| | | | | | | | | | | | | | | | | |
| | | Structured Small Cap Value Fund | |
| | | | |
| | | For the Six Months Ended
| | | | |
| | | April 30, 2010
| | | For the Fiscal Year Ended
| |
| | | (Unaudited) | | | October 31, 2009 | |
| | | | |
| | | Shares | | | Dollars | | | Shares | | | Dollars | |
| | | | |
Class A Shares | | | | | | | | | | | | | | | | |
| Shares sold | | | 222,591 | | | $ | 5,065,455 | | | | 595,859 | | | $ | 9,577,665 | |
| Reinvestment of distributions | | | 35,405 | | | | 704,908 | | | | 74,404 | | | | 1,177,077 | |
Shares converted from Class B(a) | | | 158,798 | | | | 3,446,695 | | | | 277,342 | | | | 4,497,630 | |
| Shares redeemed | | | (486,342 | ) | | | (10,509,869 | ) | | | (1,311,032 | ) | | | (20,978,922 | ) |
| |
| |
| | | | (69,548 | ) | | | (1,292,811 | ) | | | (363,427 | ) | | | (5,726,550 | ) |
| |
| |
Class B Shares | | | | | | | | | | | | | | | | |
| Shares sold | | | 6,147 | | | | 92,757 | | | | 156,221 | | | | 1,800,139 | |
| Reinvestment of distributions | | | 17,352 | | | | 243,274 | | | | 42,686 | | | | 476,900 | |
Shares converted to Class A(a) | | | (225,669 | ) | | | (3,446,695 | ) | | | (392,043 | ) | | | (4,497,630 | ) |
| Shares redeemed | | | (273,443 | ) | | | (4,145,229 | ) | | | (981,080 | ) | | | (11,054,036 | ) |
| |
| |
| | | | (475,613 | ) | | | (7,255,893 | ) | | | (1,174,216 | ) | | | (13,274,627 | ) |
| |
| |
Class C Shares | | | | | | | | | | | | | | | | |
| Shares sold | | | 52,085 | | | | 938,911 | | | | 103,936 | | | | 1,424,067 | |
| Reinvestment of distributions | | | 8,843 | | | | 140,159 | | | | 14,986 | | | | 189,871 | |
| Shares redeemed | | | (190,231 | ) | | | (3,194,404 | ) | | | (508,276 | ) | | | (6,500,971 | ) |
| |
| |
| | | | (129,303 | ) | | | (2,115,334 | ) | | | (389,354 | ) | | | (4,887,033 | ) |
| |
| |
Institutional Shares | | | | | | | | | | | | | | | | |
| Shares sold | | | 5,348 | | | | 154,242 | | | | 66,913 | | | | 1,302,186 | |
| Reinvestment of distributions | | | 297 | | | | 7,307 | | | | 469 | | | | 9,088 | |
| Shares redeemed | | | (4,358 | ) | | | (119,500 | ) | | | (83,460 | ) | | | (1,731,540 | ) |
| |
| |
| | | | 1,287 | | | | 42,049 | | | | (16,078 | ) | | | (420,266 | ) |
| |
| |
Service Shares(b) | | | | | | | | | | | | | | | | |
| Shares sold | | | — | | | | — | | | | 1 | | | | 9 | |
| Reinvestment of distributions | | | — | | | | — | | | | 3 | | | | 63 | |
| Shares redeemed | | | — | | | | — | | | | (279 | ) | | | (4,314 | ) |
| |
| |
| | | | — | | | | — | | | | (275 | ) | | | (4,242 | ) |
| |
| |
Class IR Shares | | | | | | | | | | | | | | | | |
| Shares sold | | | 1 | | | | 19 | | | | 2 | | | | 31 | |
| Reinvestment of distributions | | | 4 | | | | 76 | | | | 8 | | | | 132 | |
| Shares redeemed | | | (1 | ) | | | (19 | ) | | | (2 | ) | | | (33 | ) |
| |
| |
| | | | 4 | | | | 76 | | | | 8 | | | | 130 | |
| |
| |
Class R Shares | | | | | | | | | | | | | | | | |
| Shares sold | | | 1,714 | | | | 38,911 | | | | 3,852 | | | | 74,604 | |
| Reinvestment of distributions | | | 39 | | | | 765 | | | | 6 | | | | 90 | |
| Shares redeemed | | | (885 | ) | | | (20,688 | ) | | | (41 | ) | | | (776 | ) |
| |
| |
| | | | 868 | | | | 18,988 | | | | 3,817 | | | | 73,918 | |
| |
| |
NET DECREASE | | | (672,305 | ) | | $ | (10,602,925 | ) | | | (1,939,525 | ) | | $ | (24,238,670 | ) |
| |
| |
| | |
| (a) | | Class B Shares automatically convert into Class A Shares on or about the fifteenth day of the last month of the calendar quarter that is eight years after the initial purchase date of either the Fund or another Goldman Sachs Fund. |
| (b) | | Service Shares liquidated on March 13, 2009 for the Structured Small Cap Growth and Structured Small Cap Value Funds. |
GOLDMAN SACHS STRUCTURED DOMESTIC EQUITY FUNDS
13. SUMMARY OF SHARE TRANSACTIONS (continued)
Share activity is as follows:
| | | | | | | | | | | | | | | | | |
| | | Structured U.S. Equity Fund | |
| | | | |
| | | For the Six Months Ended
| | | | |
| | | April 30, 2010
| | | For the Fiscal Year Ended
| |
| | | (Unaudited) | | | October 31, 2009 | |
| | | | |
| | | Shares | | | Dollars | | | Shares | | | Dollars | |
| | | | |
Class A Shares | | | | | | | | | | | | | | | | |
| Shares sold | | | 1,176,076 | | | $ | 24,628,376 | | | | 2,639,380 | | | $ | 45,117,108 | |
| Reinvestment of distributions | | | 223,051 | | | | 4,579,227 | | | | 490,247 | | | | 8,388,124 | |
Shares converted from Class B(a) | | | 95,045 | | | | 2,017,292 | | | | 548,778 | | | | 9,159,112 | |
| Shares redeemed | | | (2,917,532 | ) | | | (61,567,114 | ) | | | (7,285,908 | ) | | | (125,859,671 | ) |
| |
| |
| | | | (1,423,360 | ) | | | (30,342,219 | ) | | | (3,607,503 | ) | | | (63,195,327 | ) |
| |
| |
Class B Shares | | | | | | | | | | | | | | | | |
| Shares sold | | | 9,063 | | | | 183,860 | | | | 108,861 | | | | 1,733,654 | |
| Reinvestment of distributions | | | 8,450 | | | | 162,910 | | | | 29,127 | | | | 468,071 | |
Shares converted to Class A(a) | | | (101,306 | ) | | | (2,017,292 | ) | | | (585,603 | ) | | | (9,159,112 | ) |
| Shares redeemed | | | (185,984 | ) | | | (3,709,142 | ) | | | (884,687 | ) | | | (14,079,397 | ) |
| |
| |
| | | | (269,777 | ) | | | (5,379,664 | ) | | | (1,332,302 | ) | | | (21,036,784 | ) |
| |
| |
Class C Shares | | | | | | | | | | | | | | | | |
| Shares sold | | | 94,226 | | | | 1,851,769 | | | | 290,083 | | | | 4,663,434 | |
| Reinvestment of distributions | | | 16,939 | | | | 322,173 | | | | 35,580 | | | | 565,009 | |
| Shares redeemed | | | (265,889 | ) | | | (5,270,641 | ) | | | (700,981 | ) | | | (11,250,575 | ) |
| |
| |
| | | | (154,724 | ) | | | (3,096,699 | ) | | | (375,318 | ) | | | (6,022,132 | ) |
| |
| |
Institutional Shares | | | | | | | | | | | | | | | | |
| Shares sold | | | 381,540 | | | | 8,312,637 | | | | 1,404,315 | | | | 24,614,272 | |
| Reinvestment of distributions | | | 127,193 | | | | 2,668,510 | | | | 248,313 | | | | 4,338,032 | |
| Shares redeemed | | | (1,315,297 | ) | | | (28,195,454 | ) | | | (3,156,063 | ) | | | (55,651,058 | ) |
| |
| |
| | | | (806,564 | ) | | | (17,214,307 | ) | | | (1,503,435 | ) | | | (26,698,754 | ) |
| |
| |
Service Shares | | | | | | | | | | | | | | | | |
| Shares sold | | | 7,181 | | | | 148,351 | | | | 24,950 | | | | 428,351 | |
| Reinvestment of distributions | | | 328 | | | | 6,719 | | | | 1,917 | | | | 32,677 | |
| Shares redeemed | | | (46,398 | ) | | | (973,880 | ) | | | (75,715 | ) | | | (1,356,124 | ) |
| |
| |
| | | | (38,889 | ) | | | (818,810 | ) | | | (48,848 | ) | | | (895,096 | ) |
| |
| |
Class IR Shares | | | | | | | | | | | | | | | | |
| Shares sold | | | 1 | | | | 24 | | | | 2 | | | | 39 | |
| Reinvestment of distributions | | | 6 | | | | 126 | | | | 11 | | | | 180 | |
| Shares redeemed | | | (1 | ) | | | (24 | ) | | | (2 | ) | | | (40 | ) |
| |
| |
| | | | 6 | | | | 126 | | | | 11 | | | | 179 | |
| |
| |
Class R Shares | | | | | | | | | | | | | | | | |
| Shares sold | | | 150 | | | | 3,154 | | | | 2,832 | | | | 50,295 | |
| Reinvestment of distributions | | | 40 | | | | 809 | | | | 8 | | | | 139 | |
| Shares redeemed | | | (87 | ) | | | (1,756 | ) | | | (610 | ) | | | (11,366 | ) |
| |
| |
| | | | 103 | | | | 2,207 | | | | 2,230 | | | | 39,068 | |
| |
| |
NET DECREASE | | | (2,693,205 | ) | | $ | (56,849,366 | ) | | | (6,865,165 | ) | | $ | (117,808,846 | ) |
| |
| |
| | |
| (a) | | Class B Shares automatically convert into Class A Shares on or about the fifteenth day of the last month of the calendar quarter that is eight years after the initial purchase date of either the Fund or another Goldman Sachs Fund. |
GOLDMAN SACHS BALANCED FUND
Financial Highlights
Selected Data for a Share Outstanding Throughout Each Period
| | | | | | | | | | | | | | | | | | | | | | | | | | | | | | | | | |
| | | | | | | | Income (loss) from
| | | Distributions
| | | |
| | | | | Net asset
| | | investment operations | | | to shareholders | | | |
| | | | | value,
| | | Net
| | | Net realized
| | | Total from
| | | From net
| | | From net
| | | | | | |
| | | | | beginning
| | | investment
| | | and unrealized
| | | investment
| | | investment
| | | realized
| | | Total
| | | |
| | | Year - Share Class | | of period | | | income(a) | | | gain (loss) | | | operations | | | income | | | gains | | | distributions | | | |
| |
| FOR THE SIX MONTHS ENDED APRIL 30, (UNAUDITED) |
| | | | | | | | | | | | | | | | | | | | | | | | | | | | | | | | | |
| | | | | | | | | | | | | | | | | | | | | | | | | | | | | | | | | |
| | | 2010 - A | | $ | 16.32 | | | $ | 0.26 | (d) | | $ | 1.64 | | | $ | 1.90 | | | $ | (0.32 | ) | | $ | — | | | $ | (0.32 | ) | | |
| | | 2010 - B | | | 16.19 | | | | 0.20 | (d) | | | 1.63 | | | | 1.83 | | | | (0.26 | ) | | | — | | | | (0.26 | ) | | |
| | | 2010 - C | | | 16.14 | | | | 0.19 | (d) | | | 1.63 | | | | 1.82 | | | | (0.26 | ) | | | — | | | | (0.26 | ) | | |
| | | 2010 - Institutional | | | 16.57 | | | | 0.30 | (d) | | | 1.67 | | | | 1.97 | | | | (0.36 | ) | | | — | | | | (0.36 | ) | | |
| | | | | | | | | | | | | | | | | | | | | | | | | | | | | | | | | |
| | | | | | | | | | | | | | | | | | | | | | | | | | | | | | | | | |
| FOR THE FISCAL YEAR ENDED OCTOBER 31, |
| | | | | | | | | | | | | | | | | | | | | | | | | | | | | | | | | |
| | | | | | | | | | | | | | | | | | | | | | | | | | | | | | | | | |
| | | 2009 - A | | | 14.64 | | | | 0.46 | | | | 1.71 | | | | 2.17 | | | | (0.49 | ) | | | — | | | | (0.49 | ) | | |
| | | 2009 - B | | | 14.53 | | | | 0.35 | | | | 1.69 | | | | 2.04 | | | | (0.38 | ) | | | — | | | | (0.38 | ) | | |
| | | 2009 - C | | | 14.49 | | | | 0.35 | | | | 1.68 | | | | 2.03 | | | | (0.38 | ) | | | — | | | | (0.38 | ) | | |
| | | 2009 - Institutional | | | 14.86 | | | | 0.53 | | | | 1.73 | | | | 2.26 | | | | (0.55 | ) | | | — | | | | (0.55 | ) | | |
| | | | | | | | | | | | | | | | | | | | | | | | | | | | | | | | | |
| | | | | | | | | | | | | | | | | | | | | | | | | | | | | | | | | |
| FOR THE PERIOD SEPTEMBER 1, 2008 TO OCTOBER 31, 2008* |
| | | | | | | | | | | | | | | | | | | | | | | | | | | | | | | | | |
| | | | | | | | | | | | | | | | | | | | | | | | | | | | | | | | | |
| | | 2008 - A | | | 17.71 | | | | 0.10 | | | | (2.99 | ) | | | (2.89 | ) | | | (0.18 | ) | | | — | | | | (0.18 | ) | | |
| | | 2008 - B | | | 17.56 | | | | 0.08 | | | | (2.96 | ) | | | (2.88 | ) | | | (0.15 | ) | | | — | | | | (0.15 | ) | | |
| | | 2008 - C | | | 17.52 | | | | 0.08 | | | | (2.96 | ) | | | (2.88 | ) | | | (0.15 | ) | | | — | | | | (0.15 | ) | | |
| | | 2008 - Institutional | | | 17.98 | | | | 0.11 | | | | (3.03 | ) | | | (2.92 | ) | | | (0.20 | ) | | | — | | | | (0.20 | ) | | |
| | | | | | | | | | | | | | | | | | | | | | | | | | | | | | | | | |
| | | | | | | | | | | | | | | | | | | | | | | | | | | | | | | | | |
| FOR THE FISCAL YEARS ENDED AUGUST 31, |
| | | | | | | | | | | | | | | | | | | | | | | | | | | | | | | | | |
| | | | | | | | | | | | | | | | | | | | | | | | | | | | | | | | | |
| | | 2008 - A | | | 20.66 | | | | 0.64 | | | | (1.86 | ) | | | (1.22 | ) | | | (0.53 | ) | | | (1.20 | ) | | | (1.73 | ) | | |
| | | 2008 - B | | | 20.50 | | | | 0.50 | | | | (1.86 | ) | | | (1.36 | ) | | | (0.38 | ) | | | (1.20 | ) | | | (1.58 | ) | | |
| | | 2008 - C | | | 20.46 | | | | 0.50 | | | | (1.86 | ) | | | (1.36 | ) | | | (0.38 | ) | | | (1.20 | ) | | | (1.58 | ) | | |
| | | 2008 - Institutional | | | 20.95 | | | | 0.73 | | | | (1.89 | ) | | | (1.16 | ) | | | (0.61 | ) | | | (1.20 | ) | | | (1.81 | ) | | |
| | | | | | | | | | | | | | | | | | | | | | | | | | | | | | | | | |
| | | | | | | | | | | | | | | | | | | | | | | | | | | | | | | | | |
| | | |
| | | |
| | | 2007 - A | | | 20.68 | | | | 0.56 | | | | 1.52 | | | | 2.08 | | | | (0.60 | ) | | | (1.50 | ) | | | (2.10 | ) | | |
| | | 2007 - B | | | 20.52 | | | | 0.41 | | | | 1.51 | | | | 1.92 | | | | (0.44 | ) | | | (1.50 | ) | | | (1.94 | ) | | |
| | | 2007 - C | | | 20.49 | | | | 0.41 | | | | 1.51 | | | | 1.92 | | | | (0.45 | ) | | | (1.50 | ) | | | (1.95 | ) | | |
| | | 2007 - Institutional | | | 20.94 | | | | 0.66 | | | | 1.53 | | | | 2.19 | | | | (0.68 | ) | | | (1.50 | ) | | | (2.18 | ) | | |
| | | | | | | | | | | | | | | | | | | | | | | | | | | | | | | | | |
| | | | | | | | | | | | | | | | | | | | | | | | | | | | | | | | | |
| | | |
| | | |
| | | 2006 - A | | | 19.88 | | | | 0.46 | | | | 0.74 | | | | 1.20 | | | | (0.40 | ) | | | — | | | | (0.40 | ) | | |
| | | 2006 - B | | | 19.73 | | | | 0.30 | | | | 0.74 | | | | 1.04 | | | | (0.25 | ) | | | — | | | | (0.25 | ) | | |
| | | 2006 - C | | | 19.71 | | | | 0.31 | | | | 0.72 | | | | 1.03 | | | | (0.25 | ) | | | — | | | | (0.25 | ) | | |
| | | 2006 - Institutional | | | 20.12 | | | | 0.55 | | | | 0.75 | | | | 1.30 | | | | (0.48 | ) | | | — | | | | (0.48 | ) | | |
| | | | | | | | | | | | | | | | | | | | | | | | | | | | | | | | | |
| | | | | | | | | | | | | | | | | | | | | | | | | | | | | | | | | |
| | | |
| | | |
| | | 2005 - A | | | 18.63 | | | | 0.36 | (d) | | | 1.26 | | | | 1.62 | | | | (0.37 | ) | | | — | | | | (0.37 | ) | | |
| | | 2005 - B | | | 18.49 | | | | 0.21 | (d) | | | 1.26 | | | | 1.47 | | | | (0.23 | ) | | | — | | | | (0.23 | ) | | |
| | | 2005 - C | | | 18.47 | | | | 0.21 | (d) | | | 1.26 | | | | 1.47 | | | | (0.23 | ) | | | — | | | | (0.23 | ) | | |
| | | 2005 - Institutional | | | 18.66 | | | | 0.47 | (d) | | | 1.44 | | | | 1.91 | | | | (0.45 | ) | | | — | | | | (0.45 | ) | | |
| | | | | | | | | | | | | | | | | | | | | | | | | | | | | | | | | |
| | | | | | | | | | | | | | | | | | | | | | | | | | | | | | | | | |
| | | |
| | | |
| | |
| * | | The Fund changed its fiscal year end from August 31 to October 31. |
| (a) | | Calculated based on the average shares outstanding methodology. |
| (b) | | Assumes investment at the net asset value at the beginning of the period, reinvestment of all dividends and distributions, a complete redemption of the investment at the net asset value at the end of the period and no sales or redemption charges. Total returns would be reduced if a sales or redemption charge was taken into account. Returns do not reflect the deduction of taxes that a shareholder would pay on Fund distributions or the redemption of Fund shares. Total returns for periods less than one full year are not annualized. |
| (c) | | The portfolio turnover rates excluding the effect of mortgage dollar rolls were as follows: |
| | | | | | | | | | | | | | | | | | | | | |
| | | | | | For the Period
| | | | | | | | | | |
For the Six Months Ended
| | For the Fiscal Year Ended
| | | September 1, 2008 to
| | | For the Fiscal Years Ended August 31, | |
| April 30, 2010 | | October 31, 2009 | | | October 31, 2008* | | | 2008 | | | 2007 | | | 2006 | |
| 74% | | | 209 | % | | | 57 | % | | | 178 | % | | | 54 | % | | | 220 | % |
| | |
| | Prior year includes the effect of mortgage dollar roll transactions, if any. |
| (d) | | Reflects income recognized from special dividends which amounted to $0.05 and $0.04 per share and 0.56% and 0.20% of average net assets, for the period ended April 30, 2010 and the fiscal year ended October 31, 2005, respectively. |
| (e) | | Annualized. |
| (f) | | The effects of rounding net asset value in connection with a significant transaction during the period resulted in an increase in total return and expense ratio of 0.88% and 0.06%, respectively. |
The accompanying notes are an integral part of these financial statements.
GOLDMAN SACHS BALANCED FUND
| | | | | | | | | | | | | | | | | | | | | | | | | | | | | | | |
| | | | | | | | | | | | | | | | | | Ratio of
| | | | | | |
| | | | | | | | | Net assets,
| | | Ratio of
| | | Ratio of
| | | net investment
| | | | | | |
| | | Net asset
| | | | | | end of
| | | net expenses
| | | total expenses
| | | income
| | | Portfolio
| | | |
| | | value, end
| | | Total
| | | period
| | | to average
| | | to average
| | | to average
| | | turnover
| | | |
| | | of period | | | return(b) | | | (in 000s) | | | net assets | | | net assets | | | net assets | | | rate(c) | | | |
| |
| |
| | | | | | | | | | | | | | | | | | | | | | | | | | | | | | | |
| | | | | | | | | | | | | | | | | | | | | | | | | | | | | | | |
| | | $ | 17.90 | | | | 11.77 | % | | $ | 115,443 | | | | 1.05 | %(e) | | | 1.39 | %(e) | | | 3.03 | %(d)(e) | | | 82 | % | | |
| | | | 17.76 | | | | 11.39 | | | | 8,809 | | | | 1.80 | (e) | | | 2.14 | (e) | | | 2.31 | (d)(e) | | | 82 | | | |
| | | | 17.70 | | | | 11.38 | | | | 7,992 | | | | 1.80 | (e) | | | 2.14 | (e) | | | 2.27 | (d)(e) | | | 82 | | | |
| | | | 18.18 | | | | 12.00 | | | | 2,718 | | | | 0.65 | (e) | | | 0.99 | (e) | | | 3.43 | (d)(e) | | | 82 | | | |
| | | | | | | | | | | | | | | | | | | | | | | | | | | | | | | |
| | | | | | | | | | | | | | | | | | | | | | | | | | | | | | | |
| |
| | | | | | | | | | | | | | | | | | | | | | | | | | | | | | | |
| | | | | | | | | | | | | | | | | | | | | | | | | | | | | | | |
| | | | 16.32 | | | | 15.32 | | | | 111,326 | | | | 1.05 | | | | 1.38 | | | | 3.20 | | | | 225 | | | |
| | | | 16.19 | | | | 14.41 | | | | 8,970 | | | | 1.80 | | | | 2.13 | | | | 2.47 | | | | 225 | | | |
| | | | 16.14 | | | | 14.43 | | | | 7,022 | | | | 1.80 | | | | 2.13 | | | | 2.44 | | | | 225 | | | |
| | | | 16.57 | | | | 15.76 | | | | 2,572 | | | | 0.65 | | | | 0.98 | | | | 3.58 | | | | 225 | | | |
| | | | | | | | | | | | | | | | | | | | | | | | | | | | | | | |
| | | | | | | | | | | | | | | | | | | | | | | | | | | | | | | |
| |
| | | | | | | | | | | | | | | | | | | | | | | | | | | | | | | |
| | | | | | | | | | | | | | | | | | | | | | | | | | | | | | | |
| | | | 14.64 | | | | (16.41 | ) | | | 116,915 | | | | 1.04 | (e) | | | 1.54 | (e) | | | 3.72 | (e) | | | 58 | | | |
| | | | 14.53 | | | | (16.49 | ) | | | 10,306 | | | | 1.79 | (e) | | | 2.29 | (e) | | | 2.97 | (e) | | | 58 | | | |
| | | | 14.49 | | | | (16.52 | ) | | | 6,597 | | | | 1.79 | (e) | | | 2.29 | (e) | | | 2.97 | (e) | | | 58 | | | |
| | | | 14.86 | | | | (16.35 | ) | | | 2,433 | | | | 0.64 | (e) | | | 1.14 | (e) | | | 4.10 | (e) | | | 58 | | | |
| | | | | | | | | | | | | | | | | | | | | | | | | | | | | | | |
| | | | | | | | | | | | | | | | | | | | | | | | | | | | | | | |
| |
| | | | | | | | | | | | | | | | | | | | | | | | | | | | | | | |
| | | | | | | | | | | | | | | | | | | | | | | | | | | | | | | |
| | | | 17.71 | | | | (6.48 | ) | | | 148,623 | | | | 1.03 | | | | 1.29 | | | | 3.37 | | | | 184 | | | |
| | | | 17.56 | | | | (7.21 | ) | | | 12,946 | | | | 1.78 | | | | 2.04 | | | | 2.62 | | | | 184 | | | |
| | | | 17.52 | | | | (7.19 | ) | | | 7,835 | | | | 1.78 | | | | 2.04 | | | | 2.63 | | | | 184 | | | |
| | | | 17.98 | | | | (6.10 | ) | | | 2,951 | | | | 0.63 | | | | 0.89 | | | | 3.78 | | | | 184 | | | |
| | | | | | | | | | | | | | | | | | | | | | | | | | | | | | | |
| | | | | | | | | | | | | | | | | | | | | | | | | | | | | | | |
| |
| |
| | | | 20.66 | | | | 10.53 | | | | 180,905 | | | | 1.06 | | | | 1.31 | | | | 2.72 | | | | 63 | | | |
| | | | 20.50 | | | | 9.71 | | | | 16,906 | | | | 1.81 | | | | 2.06 | | | | 1.97 | | | | 63 | | | |
| | | | 20.46 | | | | 9.72 | | | | 7,696 | | | | 1.81 | | | | 2.06 | | | | 1.97 | | | | 63 | | | |
| | | | 20.95 | | | | 10.99 | | | | 3,187 | | | | 0.66 | | | | 0.91 | | | | 3.14 | | | | 63 | | | |
| | | | | | | | | | | | | | | | | | | | | | | | | | | | | | | |
| | | | | | | | | | | | | | | | | | | | | | | | | | | | | | | |
| |
| |
| | | | 20.68 | | | | 6.08 | | | | 178,220 | | | | 1.11 | | | | 1.27 | | | | 2.29 | | | | 256 | | | |
| | | | 20.52 | | | | 5.32 | | | | 20,462 | | | | 1.86 | | | | 2.02 | | | | 1.51 | | | | 256 | | | |
| | | | 20.49 | | | | 5.30 | | | | 6,244 | | | | 1.86 | | | | 2.02 | | | | 1.55 | | | | 256 | | | |
| | | | 20.94 | | | | 6.51 | | | | 2,088 | | | | 0.71 | | | | 0.87 | | | | 2.71 | | | | 256 | | | |
| | | | | | | | | | | | | | | | | | | | | | | | | | | | | | | |
| | | | | | | | | | | | | | | | | | | | | | | | | | | | | | | |
| |
| |
| | | | 19.88 | | | | 8.80 | | | | 195,531 | | | | 1.14 | | | | 1.31 | | | | 1.84 | (d) | | | 228 | | | |
| | | | 19.73 | | | | 8.00 | | | | 29,093 | | | | 1.89 | | | | 2.06 | | | | 1.10 | (d) | | | 228 | | | |
| | | | 19.71 | | | | 8.00 | | | | 6,080 | | | | 1.89 | | | | 2.06 | | | | 1.09 | (d) | | | 228 | | | |
| | | | 20.12 | | | | 10.36 | (f) | | | 2,052 | | | | 0.80 | (f) | | | 0.93 | | | | 2.14 | (d) | | | 228 | | | |
| | | | | | | | | | | | | | | | | | | | | | | | | | | | | | | |
| | | | | | | | | | | | | | | | | | | | | | | | | | | | | | | |
| |
| |
The accompanying notes are an integral part of these financial statements.
GOLDMAN SACHS STRUCTURED LARGE CAP GROWTH FUND
Financial Highlights
Selected Data for a Share Outstanding Throughout Each Period
| | | | | | | | | | | | | | | | | | | | | | | | | | | | | | | | | �� |
| | | | | | | | Income (loss) from
| | | Distributions
| | | |
| | | | | Net asset
| | | investment operations | | | to shareholders | | | |
| | | | | value,
| | | Net
| | | Net realized
| | | Total from
| | | From net
| | | From net
| | | | | | |
| | | | | beginning
| | | investment
| | | and unrealized
| | | investment
| | | investment
| | | realized
| | | Total
| | | |
| | | Year Share Class | | of period | | | income (loss)(a) | | | gain (loss) | | | operations | | | income | | | gains | | | distributions | | | |
| |
| FOR THE SIX MONTHS ENDED APRIL 30, (UNAUDITED) |
| | | | | | | | | | | | | | | | | | | | | | | | | | | | | | | | | |
| | | | | | | | | | | | | | | | | | | | | | | | | | | | | | | | | |
| | | 2010 - A | | $ | 10.04 | | | $ | 0.04 | | | $ | 1.52 | | | $ | 1.56 | | | $ | (0.11 | ) | | $ | — | | | $ | (0.11 | ) | | |
| | | 2010 - B | | | 9.26 | | | | — | (c) | | | 1.41 | | | | 1.41 | | | | (0.04 | ) | | | — | | | | (0.04 | ) | | |
| | | 2010 - C | | | 9.26 | | | | — | (c) | | | 1.41 | | | | 1.41 | | | | (0.05 | ) | | | — | | | | (0.05 | ) | | |
| | | 2010 - Institutional | | | 10.33 | | | | 0.07 | | | | 1.57 | | | | 1.64 | | | | (0.16 | ) | | | — | | | | (0.16 | ) | | |
| | | 2010 - Service | | | 9.95 | | | | 0.04 | | | | 1.51 | | | | 1.55 | | | | (0.11 | ) | | | — | | | | (0.11 | ) | | |
| | | 2010 - IR | | | 9.99 | | | | 0.05 | | | | 1.52 | | | | 1.57 | | | | (0.14 | ) | | | — | | | | (0.14 | ) | | |
| | | 2010 - R | | | 9.99 | | | | 0.02 | | | | 1.52 | | | | 1.54 | | | | (0.14 | ) | | | — | | | | (0.14 | ) | | |
| | | | | | | | | | | | | | | | | | | | | | | | | | | | | | | | | |
| FOR THE FISCAL YEAR ENDED OCTOBER 31, |
| | | | | | | | | | | | | | | | | | | | | | | | | | | | | | | | | |
| | | | | | | | | | | | | | | | | | | | | | | | | | | | | | | | | |
| | | 2009 - A | | | 8.94 | | | | 0.10 | | | | 1.08 | | | | 1.18 | | | | (0.08 | ) | | | — | | | | (0.08 | ) | | |
| | | 2009 - B | | | 8.23 | | | | 0.03 | | | | 1.00 | | | | 1.03 | | | | — | | | | — | | | | — | | | |
| | | 2009 - C | | | 8.23 | | | | 0.03 | | | | 1.00 | | | | 1.03 | | | | — | | | | — | | | | — | | | |
| | | 2009 - Institutional | | | 9.23 | | | | 0.14 | | | | 1.10 | | | | 1.24 | | | | (0.14 | ) | | | — | | | | (0.14 | ) | | |
| | | 2009 - Service | | | 8.87 | | | | 0.09 | | | | 1.07 | | | | 1.16 | | | | (0.08 | ) | | | — | | | | (0.08 | ) | | |
| | | 2009 - IR | | | 8.92 | | | | 0.11 | | | | 1.08 | | | | 1.19 | | | | (0.12 | ) | | | — | | | | (0.12 | ) | | |
| | | 2009 - R | | | 8.89 | | | | 0.05 | | | | 1.11 | | | | 1.16 | | | | (0.06 | ) | | | — | | | | (0.06 | ) | | |
| | | | | | | | | | | | | | | | | | | | | | | | | | | | | | | | | |
| FOR THE PERIOD SEPTEMBER 1, 2008 TO OCTOBER 31, 2008* |
| | | | | | | | | | | | | | | | | | | | | | | | | | | | | | | | | |
| | | | | | | | | | | | | | | | | | | | | | | | | | | | | | | | | |
| | | 2008 - A | | | 12.38 | | | | 0.01 | | | | (3.45 | ) | | | (3.44 | ) | | | — | | | | — | | | | — | | | |
| | | 2008 - B | | | 11.40 | | | | (0.01 | ) | | | (3.16 | ) | | | (3.17 | ) | | | — | | | | — | | | | — | | | |
| | | 2008 - C | | | 11.41 | | | | (0.01 | ) | | | (3.17 | ) | | | (3.18 | ) | | | — | | | | — | | | | — | | | |
| | | 2008 - Institutional | | | 12.76 | | | | 0.01 | | | | (3.54 | ) | | | (3.53 | ) | | | — | | | | — | | | | — | | | |
| | | 2008 - Service | | | 12.28 | | | | — | (c) | | | (3.41 | ) | | | (3.41 | ) | | | — | | | | — | | | | — | | | |
| | | 2008 - IR | | | 12.35 | | | | 0.01 | | | | (3.44 | ) | | | (3.43 | ) | | | — | | | | — | | | | — | | | |
| | | 2008 - R | | | 12.31 | | | | — | (c) | | | (3.42 | ) | | | (3.42 | ) | | | — | | | | — | | | | — | | | |
| | | | | | | | | | | | | | | | | | | | | | | | | | | | | | | | | |
| FOR THE FISCAL YEARS ENDED AUGUST 31, |
| | | | | | | | | | | | | | | | | | | | | | | | | | | | | | | | | |
| | | | | | | | | | | | | | | | | | | | | | | | | | | | | | | | | |
| | | 2008 - A | | | 14.36 | | | | 0.06 | | | | (1.91 | ) | | | (1.85 | ) | | | (0.03 | ) | | | (0.10 | ) | | | (0.13 | ) | | |
| | | 2008 - B | | | 13.31 | | | | (0.04 | ) | | | (1.77 | ) | | | (1.81 | ) | | | — | (c) | | | (0.10 | ) | | | (0.10 | ) | | |
| | | 2008 - C | | | 13.31 | | | | (0.04 | ) | | | (1.76 | ) | | | (1.80 | ) | | | — | (c) | | | (0.10 | ) | | | (0.10 | ) | | |
| | | 2008 - Institutional | | | 14.81 | | | | 0.11 | | | | (1.97 | ) | | | (1.86 | ) | | | (0.09 | ) | | | (0.10 | ) | | | (0.19 | ) | | |
| | | 2008 - Service | | | 14.25 | | | | 0.04 | | | | (1.90 | ) | | | (1.86 | ) | | | (0.01 | ) | | | (0.10 | ) | | | (0.11 | ) | | |
| | | 2008 - IR (Commenced November 30, 2007) | | | 14.53 | | | | 0.06 | | | | (2.05 | ) | | | (1.99 | ) | | | (0.09 | ) | | | (0.10 | ) | | | (0.19 | ) | | |
| | | 2008 - R (Commenced November 30, 2007) | | | 14.53 | | | | 0.02 | | | | (2.05 | ) | | | (2.03 | ) | | | (0.09 | ) | | | (0.10 | ) | | | (0.19 | ) | | |
| | | | | | | | | | | | | | | | | | | | | | | | | | | | | | | | | |
| | | |
| | | |
| | | 2007 - A | | | 13.20 | | | | 0.04 | | | | 1.13 | | | | 1.17 | | | | (0.01 | ) | | | — | | | | (0.01 | ) | | |
| | | 2007 - B | | | 12.33 | | | | (0.06 | ) | | | 1.04 | | | | 0.98 | | | | — | | | | — | | | | — | | | |
| | | 2007 - C | | | 12.34 | | | | (0.06 | ) | | | 1.03 | | | | 0.97 | | | | — | | | | — | | | | — | | | |
| | | 2007 - Institutional | | | 13.58 | | | | 0.10 | | | | 1.17 | | | | 1.27 | | | | (0.04 | ) | | | — | | | | (0.04 | ) | | |
| | | 2007 - Service | | | 13.10 | | | | 0.02 | | | | 1.13 | | | | 1.15 | | | | — | | | | — | | | | — | | | |
| | | | | | | | | | | | | | | | | | | | | | | | | | | | | | | | | |
| | | |
| | | |
| | | 2006 - A | | | 12.55 | | | | 0.04 | | | | 0.61 | | | | 0.65 | | | | — | (c) | | | — | | | | — | | | |
| | | 2006 - B | | | 11.81 | | | | (0.06 | ) | | | 0.58 | | | | 0.52 | | | | — | | | | — | | | | — | | | |
| | | 2006 - C | | | 11.81 | | | | (0.06 | ) | | | 0.59 | | | | 0.53 | | | | — | | | | — | | | | — | | | |
| | | 2006 - Institutional | | | 12.89 | | | | 0.09 | | | | 0.64 | | | | 0.73 | | | | (0.04 | ) | | | — | | | | (0.04 | ) | | |
| | | 2006 - Service | | | 12.43 | | | | 0.02 | | | | 0.65 | | | | 0.67 | | | | — | | | | — | | | | — | | | |
| | | | | | | | | | | | | | | | | | | | | | | | | | | | | | | | | |
| | | |
| | | |
| | | 2005 - A | | | 11.13 | | | | 0.04 | (e) | | | 1.38 | (f) | | | 1.42 | | | | — | | | | — | | | | — | | | |
| | | 2005 - B | | | 10.55 | | | | (0.04 | )(e) | | | 1.30 | (f) | | | 1.26 | | | | — | | | | — | | | | — | | | |
| | | 2005 - C | | | 10.55 | | | | (0.04 | )(e) | | | 1.30 | (f) | | | 1.26 | | | | — | | | | — | | | | — | | | |
| | | 2005 - Institutional | | | 11.38 | | | | 0.08 | (e) | | | 1.43 | (f) | | | 1.51 | | | | — | | | | — | | | | — | | | |
| | | 2005 - Service | | | 11.04 | | | | 0.04 | (e) | | | 1.35 | (f) | | | 1.39 | | | | — | | | | — | | | | — | | | |
| | | | | | | | | | | | | | | | | | | | | | | | | | | | | | | | | |
| | | |
| | | |
| | |
| * | | The Fund changed its fiscal year end from August 31 to October 31. |
| | |
| (a) | | Calculated based on the average shares outstanding methodology. |
| | |
| (b) | | Assumes investment at the net asset value at the beginning of the period, reinvestment of all dividends and distributions, a complete redemption of the investment at the net asset value at the end of the period and no sales or redemption charges. Total returns would be reduced if a sales or redemption charge was taken into account. Returns do not reflect the deduction of taxes that a shareholder would pay on Fund distributions or the redemption of Fund shares. Total returns for periods less than one full year are not annualized. |
| | |
| (c) | | Amount is less than $0.005 per share. |
| | |
| (e) | | Reflects income recognized from special dividends which amounted to $0.03 per share and 0.30% of average net assets. |
| | |
| (f) | | Reflects an increase of $0.01 due to payments by affiliates during the period to reimburse certain security claims. |
| | |
| (g) | | Performance has not been restated to reflect the impact of security claims recorded during the period. If restated the performance would have been 12.67%, 11.85%, 11.85%, 13.18%, and 12.50% for Class A, Class B, Class C, Institutional and Service Shares, respectively. |
The accompanying notes are an integral part of these financial statements.
GOLDMAN SACHS STRUCTURED LARGE CAP GROWTH FUND
| | | | | | | | | | | | | | | | | | | | | | | | | | | | | | | |
| | | | | | | | | | | | | | | | | | Ratio of
| | | | | | |
| | | | | | | | | Net assets,
| | | Ratio of
| | | Ratio of
| | | net investment
| | | | | | |
| | | Net asset
| | | | | | end of
| | | net expenses
| | | total expenses
| | | income (loss)
| | | Portfolio
| | | |
| | | value, end
| | | Total
| | | period
| | | to average
| | | to average
| | | to average
| | | turnover
| | | |
| | | of period | | | return(b) | | | (in 000s) | | | net assets | | | net assets | | | net assets | | | rate | | | |
| |
| |
| | | | | | | | | | | | | | | | | | | | | | | | | | | | | | | |
| | | | | | | | | | | | | | | | | | | | | | | | | | | | | | | |
| | | $ | 11.49 | | | | 15.66 | % | | $ | 184,697 | | | | 0.95 | %(d) | | | 1.15 | %(d) | | | 0.76 | %(d) | | | 32 | % | | |
| | | | 10.63 | | | | 15.26 | | | | 10,251 | | | | 1.70 | (d) | | | 1.90 | (d) | | | 0.03 | (d) | | | 32 | | | |
| | | | 10.62 | | | | 15.30 | | | | 15,108 | | | | 1.70 | (d) | | | 1.90 | (d) | | | 0.01 | (d) | | | 32 | | | |
| | | | 11.81 | | | | 15.99 | | | | 520,311 | | | | 0.55 | (d) | | | 0.75 | (d) | | | 1.18 | (d) | | | 32 | | | |
| | | | 11.39 | | | | 15.67 | | | | 124 | | | | 1.05 | (d) | | | 1.25 | (d) | | | 0.65 | (d) | | | 32 | | | |
| | | | 11.42 | | | | 15.89 | | | | 8 | | | | 0.70 | (d) | | | 0.90 | (d) | | | 0.99 | (d) | | | 32 | | | |
| | | | 11.39 | | | | 15.50 | | | | 92 | | | | 1.20 | (d) | | | 1.40 | (d) | | | 0.40 | (d) | | | 32 | | | |
| | | | | | | | | | | | | | | | | | | | | | | | | | | | | | | |
| |
| | | | | | | | | | | | | | | | | | | | | | | | | | | | | | | |
| | | | | | | | | | | | | | | | | | | | | | | | | | | | | | | |
| | | | 10.04 | | | | 13.42 | | | | 183,762 | | | | 0.95 | | | | 1.16 | | | | 1.13 | | | | 109 | | | |
| | | | 9.26 | | | | 12.52 | | | | 10,993 | | | | 1.70 | | | | 1.91 | | | | 0.38 | | | | 109 | | | |
| | | | 9.26 | | | | 12.52 | | | | 14,832 | | | | 1.70 | | | | 1.91 | | | | 0.31 | | | | 109 | | | |
| | | | 10.33 | | | | 13.75 | | | | 543,449 | | | | 0.55 | | | | 0.76 | | | | 1.53 | | | | 109 | | | |
| | | | 9.95 | | | | 13.29 | | | | 125 | | | | 1.05 | | | | 1.26 | | | | 1.08 | | | | 109 | | | |
| | | | 9.99 | | | | 13.65 | | | | 7 | | | | 0.70 | | | | 0.95 | | | | 1.25 | | | | 109 | | | |
| | | | 9.99 | | | | 13.21 | | | | 34 | | | | 1.20 | | | | 1.41 | | | | 0.55 | | | | 109 | | | |
| | | | | | | | | | | | | | | | | | | | | | | | | | | | | | | |
| |
| | | | | | | | | | | | | | | | | | | | | | | | | | | | | | | |
| | | | | | | | | | | | | | | | | | | | | | | | | | | | | | | |
| | | | 8.94 | | | | (27.79 | ) | | | 285,337 | | | | 0.95 | (d) | | | 1.14 | (d) | | | 0.34 | (d) | | | 19 | | | |
| | | | 8.23 | | | | (27.81 | ) | | | 16,129 | | | | 1.70 | (d) | | | 1.89 | (d) | | | (0.38 | )(d) | | | 19 | | | |
| | | | 8.23 | | | | (27.87 | ) | | | 16,324 | | | | 1.70 | (d) | | | 1.89 | (d) | | | (0.41 | )(d) | | | 19 | | | |
| | | | 9.23 | | | | (27.66 | ) | | | 814,036 | | | | 0.55 | (d) | | | 0.74 | (d) | | | 0.74 | (d) | | | 19 | | | |
| | | | 8.87 | | | | (27.77 | ) | | | 189 | | | | 1.05 | (d) | | | 1.24 | (d) | | | 0.23 | (d) | | | 19 | | | |
| | | | 8.92 | | | | (27.77 | ) | | | 6 | | | | 0.70 | (d) | | | 0.89 | (d) | | | 0.63 | (d) | | | 19 | | | |
| | | | 8.89 | | | | (27.78 | ) | | | 6 | | | | 1.20 | (d) | | | 1.39 | (d) | | | 0.13 | (d) | | | 19 | | | |
| | | | | | | | | | | | | | | | | | | | | | | | | | | | | | | |
| |
| | | | | | | | | | | | | | | | | | | | | | | | | | | | | | | |
| | | | | | | | | | | | | | | | | | | | | | | | | | | | | | | |
| | | | 12.38 | | | | (12.96 | ) | | | 434,970 | | | | 0.95 | | | | 1.10 | | | | 0.40 | | | | 118 | | | |
| | | | 11.40 | | | | (13.71 | ) | | | 25,718 | | | | 1.70 | | | | 1.85 | | | | (0.34 | ) | | | 118 | | | |
| | | | 11.41 | | | | (13.63 | ) | | | 23,960 | | | | 1.70 | | | | 1.85 | | | | (0.34 | ) | | | 118 | | | |
| | | | 12.76 | | | | (12.71 | ) | | | 1,278,322 | | | | 0.55 | | | | 0.70 | | | | 0.82 | | | | 118 | | | |
| | | | 12.28 | | | | (13.11 | ) | | | 273 | | | | 1.05 | | | | 1.20 | | | | 0.32 | | | | 118 | | | |
| | | | 12.35 | | | | (13.86 | ) | | | 9 | | | | 0.70 | (d) | | | 0.85 | (d) | | | 0.63 | (d) | | | 118 | | | |
| | | | 12.31 | | | | (14.18 | ) | | | 9 | | | | 1.20 | (d) | | | 1.35 | (d) | | | 0.21 | (d) | | | 118 | | | |
| | | | | | | | | | | | | | | | | | | | | | | | | | | | | | | |
| |
| |
| | | | 14.36 | | | | 8.85 | | | | 678,286 | | | | 0.95 | | | | 1.09 | | | | 0.30 | | | | 140 | | | |
| | | | 13.31 | | | | 7.95 | �� | | | 49,211 | | | | 1.70 | | | | 1.84 | | | | (0.48 | ) | | | 140 | | | |
| | | | 13.31 | | | | 7.86 | | | | 35,896 | | | | 1.70 | | | | 1.84 | | | | (0.48 | ) | | | 140 | | | |
| | | | 14.81 | | | | 9.39 | | | | 1,635,283 | | | | 0.55 | | | | 0.69 | | | | 0.69 | | | | 140 | | | |
| | | | 14.25 | | | | 8.78 | | | | 258 | | | | 1.05 | | | | 1.19 | | | | 0.12 | | | | 140 | | | |
| | | | | | | | | | | | | | | | | | | | | | | | | | | | | | | |
| |
| |
| | | | 13.20 | | | | 5.21 | | | | 310,386 | | | | 1.00 | | | | 1.16 | | | | 0.28 | | | | 111 | | | |
| | | | 12.33 | | | | 4.40 | | | | 41,947 | | | | 1.76 | | | | 1.91 | | | | (0.52 | ) | | | 111 | | | |
| | | | 12.34 | | | | 4.49 | | | | 22,811 | | | | 1.76 | | | | 1.91 | | | | (0.52 | ) | | | 111 | | | |
| | | | 13.58 | | | | 5.66 | | | | 488,448 | | | | 0.60 | | | | 0.76 | | | | 0.69 | | | | 111 | | | |
| | | | 13.10 | | | | 5.39 | | | | 260 | | | | 1.10 | | | | 1.26 | | | | 0.15 | | | | 111 | | | |
| | | | | | | | | | | | | | | | | | | | | | | | | | | | | | | |
| |
| |
| | | | 12.55 | | | | 12.76 | (g) | | | 166,792 | | | | 1.11 | | | | 1.24 | | | | 0.37 | (e) | | | 146 | | | |
| | | | 11.81 | | | | 11.94 | (g) | | | 65,545 | | | | 1.86 | | | | 1.99 | | | | (0.32 | )(e) | | | 146 | | | |
| | | | 11.81 | | | | 11.94 | (g) | | | 29,672 | | | | 1.86 | | | | 1.99 | | | | (0.32 | )(e) | | | 146 | | | |
| | | | 12.89 | | | | 13.27 | (g) | | | 263,906 | | | | 0.71 | | | | 0.84 | | | | 0.65 | (e) | | | 146 | | | |
| | | | 12.43 | | | | 12.59 | (g) | | | 227 | | | | 1.21 | | | | 1.34 | | | | 0.38 | (e) | | | 146 | | | |
| | | | | | | | | | | | | | | | | | | | | | | | | | | | | | | |
| |
| |
The accompanying notes are an integral part of these financial statements.
GOLDMAN SACHS STRUCTURED LARGE CAP VALUE FUND
Financial Highlights
Selected Data for a Share Outstanding Throughout Each Period
| | | | | | | | | | | | | | | | | | | | | | | | | | | | | | | | | |
| | | | | | | | Income (loss) from
| | | Distributions
| | | |
| | | | | Net asset
| | | investment operations | | | to shareholders | | | |
| | | | | value,
| | | Net
| | | Net realized
| | | Total from
| | | From net
| | | From net
| | | | | | |
| | | | | beginning
| | | investment
| | | and unrealized
| | | investment
| | | investment
| | | realized
| | | Total
| | | |
| | | Year - Share Class | | of period | | | income(a) | | | gain (loss) | | | operations | | | income | | | gains | | | distributions | | | |
| |
| FOR THE SIX MONTHS ENDED APRIL 30, (UNAUDITED) |
| | | | | | | | | | | | | | | | | | | | | | | | | | | | | | | | | |
| | | | | | | | | | | | | | | | | | | | | | | | | | | | | | | | | |
| | | 2010 - A | | $ | 8.42 | | | $ | 0.07 | | | $ | 1.44 | | | $ | 1.51 | | | $ | (0.06 | ) | | $ | — | | | $ | (0.06 | ) | | |
| | | 2010 - B | | | 8.37 | | | | 0.03 | | | | 1.43 | | | | 1.46 | | | | (0.02 | ) | | | — | | | | (0.02 | ) | | |
| | | 2010 - C | | | 8.36 | | | | 0.03 | | | | 1.44 | | | | 1.47 | | | | (0.03 | ) | | | — | | | | (0.03 | ) | | |
| | | 2010 - Institutional | | | 8.41 | | | | 0.08 | | | | 1.46 | | | | 1.54 | | | | (0.08 | ) | | | — | | | | (0.08 | ) | | |
| | | 2010 - Service | | | 8.45 | | | | 0.06 | | | | 1.45 | | | | 1.51 | | | | (0.05 | ) | | | — | | | | (0.05 | ) | | |
| | | 2010 - IR | | | 8.41 | | | | 0.07 | | | | 1.45 | | | | 1.52 | | | | (0.07 | ) | | | — | | | | (0.07 | ) | | |
| | | 2010 - R | | | 8.41 | | | | 0.05 | | | | 1.44 | | | | 1.49 | | | | (0.05 | ) | | | — | | | | (0.05 | ) | | |
| | | | | | | | | | | | | | | | | | | | | | | | | | | | | | | | | |
| FOR THE FISCAL YEAR ENDED OCTOBER 31, |
| | | | | | | | | | | | | | | | | | | | | | | | | | | | | | | | | |
| | | | | | | | | | | | | | | | | | | | | | | | | | | | | | | | | |
| | | 2009 - A | | | 8.60 | | | | 0.17 | | | | (0.16 | ) | | | 0.01 | | | | (0.19 | ) | | | — | | | | (0.19 | ) | | |
| | | 2009 - B | | | 8.54 | | | | 0.12 | | | | (0.17 | ) | | | (0.05 | ) | | | (0.12 | ) | | | — | | | | (0.12 | ) | | |
| | | 2009 - C | | | 8.54 | | | | 0.11 | | | | (0.16 | ) | | | (0.05 | ) | | | (0.13 | ) | | | — | | | | (0.13 | ) | | |
| | | 2009 - Institutional | | | 8.59 | | | | 0.20 | | | | (0.16 | ) | | | 0.04 | | | | (0.22 | ) | | | — | | | | (0.22 | ) | | |
| | | 2009 - Service | | | 8.63 | | | | 0.16 | | | | (0.16 | ) | | | — | | | | (0.18 | ) | | | — | | | | (0.18 | ) | | |
| | | 2009 - IR | | | 8.59 | | | | 0.18 | | | | (0.15 | ) | | | 0.03 | | | | (0.21 | ) | | | — | | | | (0.21 | ) | | |
| | | 2009 - R | | | 8.59 | | | | 0.11 | | | | (0.11 | ) | | | — | | | | (0.18 | ) | | | — | | | | (0.18 | ) | | |
| | | | | | | | | | | | | | | | | | | | | | | | | | | | | | | | | |
| FOR THE PERIOD SEPTEMBER 1, 2008 TO OCTOBER 31, 2008* |
| | | | | | | | | | | | | | | | | | | | | | | | | | | | | | | | | |
| | | | | | | | | | | | | | | | | | | | | | | | | | | | | | | | | |
| | | 2008 - A | | | 11.24 | | | | 0.03 | | | | (2.62 | ) | | | (2.59 | ) | | | (0.05 | ) | | | — | | | | (0.05 | ) | | |
| | | 2008 - B | | | 11.16 | | | | 0.02 | | | | (2.62 | ) | | | (2.60 | ) | | | (0.02 | ) | | | — | | | | (0.02 | ) | | |
| | | 2008 - C | | | 11.16 | | | | 0.02 | | | | (2.62 | ) | | | (2.60 | ) | | | (0.02 | ) | | | — | | | | (0.02 | ) | | |
| | | 2008 - Institutional | | | 11.24 | | | | 0.04 | | | | (2.63 | ) | | | (2.59 | ) | | | (0.06 | ) | | | — | | | | (0.06 | ) | | |
| | | 2008 - Service | | | 11.28 | | | | 0.03 | | | | (2.64 | ) | | | (2.61 | ) | | | (0.04 | ) | | | — | | | | (0.04 | ) | | |
| | | 2008 - IR | | | 11.23 | | | | 0.03 | | | | (2.62 | ) | | | (2.59 | ) | | | (0.05 | ) | | | — | | | | (0.05 | ) | | |
| | | 2008 - R | | | 11.23 | | | | 0.02 | | | | (2.62 | ) | | | (2.60 | ) | | | (0.04 | ) | | | — | | | | (0.04 | ) | | |
| | | | | | | | | | | | | | | | | | | | | | | | | | | | | | | | | |
| FOR THE FISCAL YEARS ENDED AUGUST 31, |
| | | | | | | | | | | | | | | | | | | | | | | | | | | | | | | | | |
| | | | | | | | | | | | | | | | | | | | | | | | | | | | | | | | | |
| | | 2008 - A | | | 14.51 | | | | 0.18 | | | | (2.80 | ) | | | (2.62 | ) | | | (0.19 | ) | | | (0.46 | ) | | | (0.65 | ) | | |
| | | 2008 - B | | | 14.39 | | | | 0.09 | | | | (2.78 | ) | | | (2.69 | ) | | | (0.08 | ) | | | (0.46 | ) | | | (0.54 | ) | | |
| | | 2008 - C | | | 14.40 | | | | 0.09 | | | | (2.78 | ) | | | (2.69 | ) | | | (0.09 | ) | | | (0.46 | ) | | | (0.55 | ) | | |
| | | 2008 - Institutional | | | 14.51 | | | | 0.23 | | | | (2.80 | ) | | | (2.57 | ) | | | (0.24 | ) | | | (0.46 | ) | | | (0.70 | ) | | |
| | | 2008 - Service | | | 14.56 | | | | 0.17 | | | | (2.82 | ) | | | (2.65 | ) | | | (0.17 | ) | | | (0.46 | ) | | | (0.63 | ) | | |
| | | 2008 - IR (Commenced November 30, 2007) | | | 13.89 | | | | 0.15 | | | | (2.18 | ) | | | (2.03 | ) | | | (0.17 | ) | | | (0.46 | ) | | | (0.63 | ) | | |
| | | 2008 - R (Commenced November 30, 2007) | | | 13.89 | | | | 0.11 | | | | (2.17 | ) | | | (2.06 | ) | | | (0.14 | ) | | | (0.46 | ) | | | (0.60 | ) | | |
| | | | | | | | | | | | | | | | | | | | | | | | | | | | | | | | | |
| | | |
| | | |
| | | 2007 - A | | | 13.99 | | | | 0.18 | | | | 1.06 | | | | 1.24 | | | | (0.17 | ) | | | (0.55 | ) | | | (0.72 | ) | | |
| | | 2007 - B | | | 13.88 | | | | 0.07 | | | | 1.04 | | | | 1.11 | | | | (0.05 | ) | | | (0.55 | ) | | | (0.60 | ) | | |
| | | 2007 - C | | | 13.90 | | | | 0.07 | | | | 1.04 | | | | 1.11 | | | | (0.06 | ) | | | (0.55 | ) | | | (0.61 | ) | | |
| | | 2007 - Institutional | | | 14.00 | | | | 0.24 | | | | 1.04 | | | | 1.28 | | | | (0.22 | ) | | | (0.55 | ) | | | (0.77 | ) | | |
| | | 2007 - Service | | | 14.06 | | | | 0.17 | | | | 1.05 | | | | 1.22 | | | | (0.17 | ) | | | (0.55 | ) | | | (0.72 | ) | | |
| | | | | | | | | | | | | | | | | | | | | | | | | | | | | | | | | |
| | | |
| | | |
| | | 2006 - A | | | 12.69 | | | | 0.17 | | | | 1.51 | | | | 1.68 | | | | (0.14 | ) | | | (0.24 | ) | | | (0.38 | ) | | |
| | | 2006 - B | | | 12.59 | | | | 0.07 | | | | 1.49 | | | | 1.56 | | | | (0.03 | ) | | | (0.24 | ) | | | (0.27 | ) | | |
| | | 2006 - C | | | 12.60 | | | | 0.07 | | | | 1.50 | | | | 1.57 | | | | (0.03 | ) | | | (0.24 | ) | | | (0.27 | ) | | |
| | | 2006 - Institutional | | | 12.69 | | | | 0.23 | | | | 1.50 | | | | 1.73 | | | | (0.18 | ) | | | (0.24 | ) | | | (0.42 | ) | | |
| | | 2006 - Service | | | 12.73 | | | | 0.17 | | | | 1.50 | | | | 1.67 | | | | (0.10 | ) | | | (0.24 | ) | | | (0.34 | ) | | |
| | | | | | | | | | | | | | | | | | | | | | | | | | | | | | | | | |
| | | |
| | | |
| | | 2005 - A | | | 11.15 | | | | 0.12 | | | | 1.76 | | | | 1.88 | | | | (0.09 | ) | | | (0.25 | ) | | | (0.34 | ) | | |
| | | 2005 - B | | | 11.06 | | | | 0.03 | | | | 1.76 | | | | 1.79 | | | | (0.01 | ) | | | (0.25 | ) | | | (0.26 | ) | | |
| | | 2005 - C | | | 11.07 | | | | 0.03 | | | | 1.76 | | | | 1.79 | | | | (0.01 | ) | | | (0.25 | ) | | | (0.26 | ) | | |
| | | 2005 - Institutional | | | 11.14 | | | | 0.17 | | | | 1.77 | | | | 1.94 | | | | (0.14 | ) | | | (0.25 | ) | | | (0.39 | ) | | |
| | | 2005 - Service | | | 11.18 | | | | 0.11 | | | | 1.77 | | | | 1.88 | | | | (0.08 | ) | | | (0.25 | ) | | | (0.33 | ) | | |
| | | | | | | | | | | | | | | | | | | | | | | | | | | | | | | | | |
| | | |
| | | |
| | |
| * | | The Fund changed its fiscal year end from August 31 to October 31. |
| (a) | | Calculated based on the average shares outstanding methodology. |
| (b) | | Assumes investment at the net asset value at the beginning of the period, reinvestment of all dividends and distributions, a complete redemption of the investment at the net asset value at the end of the period and no sales or redemption charges. Total returns would be reduced if a sales or redemption charge was taken into account. Returns do not reflect the deduction of taxes that a shareholder would pay on Fund distributions or the redemption of Fund shares. Total returns for periods less than one full year are not annualized. |
| (c) | | Annualized. |
The accompanying notes are an integral part of these financial statements.
GOLDMAN SACHS STRUCTURED LARGE CAP VALUE FUND
| | | | | | | | | | | | | | | | | | | | | | | | | | | | | | | |
| | | | | | | | | | | | | | | | | | Ratio of
| | | | | | |
| | | | | | | | | Net assets,
| | | Ratio of
| | | Ratio of
| | | net investment
| | | | | | |
| | | Net asset
| | | | | | end of
| | | net expenses
| | | total expenses
| | | income
| | | Portfolio
| | | |
| | | value, end
| | | Total
| | | period
| | | to average
| | | to average
| | | to average
| | | turnover
| | | |
| | | of period | | | return(b) | | | (in 000s) | | | net assets | | | net assets | | | net assets | | | rate | | | |
| |
| |
| | | | | | | | | | | | | | | | | | | | | | | | | | | | | | | |
| | | | | | | | | | | | | | | | | | | | | | | | | | | | | | | |
| | | $ | 9.87 | | | | 17.98 | % | | $ | 201,097 | | | | 0.95 | %(c) | | | 1.10 | %(c) | | | 1.44 | %(c) | | | 16 | % | | |
| | | | 9.81 | | | | 17.50 | | | | 2,968 | | | | 1.70 | (c) | | | 1.85 | (c) | | | 0.69 | (c) | | | 16 | | | |
| | | | 9.80 | | | | 17.55 | | | | 13,704 | | | | 1.70 | (c) | | | 1.85 | (c) | | | 0.65 | (c) | | | 16 | | | |
| | | | 9.87 | | | | 18.35 | | | | 565,781 | | | | 0.55 | (c) | | | 0.70 | (c) | | | 1.85 | (c) | | | 16 | | | |
| | | | 9.91 | | | | 17.97 | | | | 7,618 | | | | 1.05 | (c) | | | 1.20 | (c) | | | 1.30 | (c) | | | 16 | | | |
| | | | 9.86 | | | | 18.15 | | | | 15 | | | | 0.70 | (c) | | | 0.85 | (c) | | | 1.57 | (c) | | | 16 | | | |
| | | | 9.85 | | | | 17.76 | | | | 46 | | | | 1.20 | (c) | | | 1.35 | (c) | | | 1.10 | (c) | | | 16 | | | |
| | | | | | | | | | | | | | | | | | | | | | | | | | | | | | | |
| |
| | | | | | | | | | | | | | | | | | | | | | | | | | | | | | | |
| | | | | | | | | | | | | | | | | | | | | | | | | | | | | | | |
| | | | 8.42 | | | | 0.37 | | | | 247,183 | | | | 0.95 | | | | 1.10 | | | | 2.28 | | | | 114 | | | |
| | | | 8.37 | | | | (0.42 | ) | | | 3,290 | | | | 1.70 | | | | 1.85 | | | | 1.58 | | | | 114 | | | |
| | | | 8.36 | | | | (0.36 | ) | | | 13,110 | | | | 1.70 | | | | 1.85 | | | | 1.47 | | | | 114 | | | |
| | | | 8.41 | | | | 0.67 | | | | 712,253 | | | | 0.55 | | | | 0.70 | | | | 2.65 | | | | 114 | | | |
| | | | 8.45 | | | | 0.28 | | | | 7,364 | | | | 1.05 | | | | 1.20 | | | | 2.10 | | | | 114 | | | |
| | | | 8.41 | | | | 0.65 | | | | 10 | | | | 0.70 | | | | 0.85 | | | | 2.30 | | | | 114 | | | |
| | | | 8.41 | | | | 0.26 | | | | 36 | | | | 1.20 | | | | 1.35 | | | | 1.45 | | | | 114 | | | |
| | | | | | | | | | | | | | | | | | | | | | | | | | | | | | | |
| |
| | | | | | | | | | | | | | | | | | | | | | | | | | | | | | | |
| | | | | | | | | | | | | | | | | | | | | | | | | | | | | | | |
| | | | 8.60 | | | | (23.14 | ) | | | 310,622 | | | | 0.95 | (c) | | | 1.10 | (c) | | | 1.59 | (c) | | | 24 | | | |
| | | | 8.54 | | | | (23.21 | ) | | | 5,170 | | | | 1.70 | (c) | | | 1.85 | (c) | | | 0.87 | (c) | | | 24 | | | |
| | | | 8.54 | | | | (23.29 | ) | | | 14,029 | | | | 1.70 | (c) | | | 1.85 | (c) | | | 0.86 | (c) | | | 24 | | | |
| | | | 8.59 | | | | (23.05 | ) | | | 851,132 | | | | 0.55 | (c) | | | 0.70 | (c) | | | 2.02 | (c) | | | 24 | | | |
| | | | 8.63 | | | | (23.16 | ) | | | 7,193 | | | | 1.05 | (c) | | | 1.20 | (c) | | | 1.50 | (c) | | | 24 | | | |
| | | | 8.59 | | | | (23.10 | ) | | | 7 | | | | 0.70 | (c) | | | 0.85 | (c) | | | 1.81 | (c) | | | 24 | | | |
| | | | 8.59 | | | | (23.21 | ) | | | 6 | | | | 1.20 | (c) | | | 1.35 | (c) | | | 1.33 | (c) | | | 24 | | | |
| | | | | | | | | | | | | | | | | | | | | | | | | | | | | | | |
| |
| | | | | | | | | | | | | | | | | | | | | | | | | | | | | | | |
| | | | | | | | | | | | | | | | | | | | | | | | | | | | | | | |
| | | | 11.24 | | | | (18.65 | ) | | | 398,881 | | | | 0.95 | | | | 1.05 | | | | 1.41 | | | | 130 | | | |
| | | | 11.16 | | | | (19.22 | ) | | | 7,306 | | | | 1.70 | | | | 1.80 | | | | 0.67 | | | | 130 | | | |
| | | | 11.16 | | | | (19.21 | ) | | | 18,614 | | | | 1.70 | | | | 1.80 | | | | 0.67 | | | | 130 | | | |
| | | | 11.24 | | | | (18.30 | ) | | | 1,027,705 | | | | 0.55 | | | | 0.65 | | | | 1.82 | | | | 130 | | | |
| | | | 11.28 | | | | (18.73 | ) | | | 8,994 | | | | 1.05 | | | | 1.15 | | | | 1.31 | | | | 130 | | | |
| | | | 11.23 | | | | (15.18 | ) | | | 8 | | | | 0.70 | (c) | | | 0.80 | (c) | | | 1.70 | (c) | | | 130 | | | |
| | | | 11.23 | | | | (15.44 | ) | | | 8 | | | | 1.20 | (c) | | | 1.30 | (c) | | | 1.26 | (c) | | | 130 | | | |
| | | | | | | | | | | | | | | | | | | | | | | | | | | | | | | |
| |
| |
| | | | 14.51 | | | | 8.90 | | | | 640,535 | | | | 0.95 | | | | 1.04 | | | | 1.23 | | | | 119 | | | |
| | | | 14.39 | | | | 8.03 | | | | 16,587 | | | | 1.70 | | | | 1.79 | | | | 0.46 | | | | 119 | | | |
| | | | 14.40 | | | | 7.99 | | | | 25,946 | | | | 1.70 | | | | 1.79 | | | | 0.47 | | | | 119 | | | |
| | | | 14.51 | | | | 9.24 | | | | 1,444,839 | | | | 0.55 | | | | 0.64 | | | | 1.64 | | | | 119 | | | |
| | | | 14.56 | | | | 8.70 | | | | 14,237 | | | | 1.05 | | | | 1.14 | | | | 1.14 | | | | 119 | | | |
| | | | | | | | | | | | | | | | | | | | | | | | | | | | | | | |
| |
| |
| | | | 13.99 | | | | 13.43 | | | | 438,245 | | | | 0.99 | | | | 1.10 | | | | 1.31 | | | | 127 | | | |
| | | | 13.88 | | | | 12.56 | | | | 19,200 | | | | 1.75 | | | | 1.84 | | | | 0.49 | | | | 127 | | | |
| | | | 13.90 | | | | 12.66 | | | | 22,768 | | | | 1.75 | | | | 1.84 | | | | 0.51 | | | | 127 | | | |
| | | | 14.00 | | | | 13.92 | | | | 715,191 | | | | 0.59 | | | | 0.69 | | | | 1.69 | | | | 127 | | | |
| | | | 14.06 | | | | 13.35 | | | | 1,697 | | | | 1.11 | | | | 1.20 | | | | 1.28 | | | | 127 | | | |
| | | | | | | | | | | | | | | | | | | | | | | | | | | | | | | |
| |
| |
| | | | 12.69 | | | | 17.13 | | | | 186,441 | | | | 1.10 | | | | 1.14 | | | | 0.99 | | | | 132 | | | |
| | | | 12.59 | | | | 16.32 | | | | 20,479 | | | | 1.85 | | | | 1.89 | | | | 0.22 | | | | 132 | | | |
| | | | 12.60 | | | | 16.32 | | | | 20,666 | | | | 1.85 | | | | 1.89 | | | | 0.22 | | | | 132 | | | |
| | | | 12.69 | | | | 17.69 | | | | 384,875 | | | | 0.70 | | | | 0.74 | | | | 1.39 | | | | 132 | | | |
| | | | 12.73 | | | | 17.06 | | | | 799 | | | | 1.20 | | | | 1.24 | | | | 0.87 | | | | 132 | | | |
| | | | | | | | | | | | | | | | | | | | | | | | | | | | | | | |
| |
| |
The accompanying notes are an integral part of these financial statements.
GOLDMAN SACHS STRUCTURED SMALL CAP EQUITY FUND
Financial Highlights
Selected Data for a Share Outstanding Throughout Each Period
| | | | | | | | | | | | | | | | | | | | | | | | | | | | | | | | | |
| | | | | | | | Income (loss) from
| | | Distributions
| | | |
| | | | | Net asset
| | | investment operations | | | to shareholders | | | |
| | | | | value,
| | | Net
| | | Net realized
| | | Total from
| | | From net
| | | From net
| | | | | | |
| | | | | beginning
| | | investment
| | | and unrealized
| | | investment
| | | investment
| | | realized
| | | Total
| | | |
| | | Year - Share Class | | of period | | | income (loss)(a) | | | gain (loss) | | | operations | | | income | | | gains | | | distributions | | | |
| |
| FOR THE SIX MONTHS ENDED APRIL 30, (UNAUDITED) |
| | | | | | | | | | | | | | | | | | | | | | | | | | | | | | | | | |
| | | | | | | | | | | | | | | | | | | | | | | | | | | | | | | | | |
| | | 2010 - A | | $ | 8.45 | | | $ | 0.03 | (c) | | $ | 2.62 | | | $ | 2.65 | | | $ | (0.07 | ) | | $ | — | | | $ | (0.07 | ) | | |
| | | 2010 - B | | | 7.59 | | | | — | (c)(e) | | | 2.35 | | | | 2.35 | | | | (0.01 | ) | | | — | | | | (0.01 | ) | | |
| | | 2010 - C | | | 7.62 | | | | — | (c)(e) | | | 2.36 | | | | 2.36 | | | | (0.03 | ) | | | — | | | | (0.03 | ) | | |
| | | 2010 - Institutional | | | 8.78 | | | | 0.06 | (c) | | | 2.69 | | | | 2.75 | | | | (0.10 | ) | | | — | | | | (0.10 | ) | | |
| | | 2010 - Service | | | 8.37 | | | | 0.03 | (c) | | | 2.59 | | | | 2.62 | | | | (0.06 | ) | | | — | | | | (0.06 | ) | | |
| | | 2010 - IR | | | 8.42 | | | | 0.04 | (c) | | | 2.60 | | | | 2.64 | | | | (0.10 | ) | | | — | | | | (0.10 | ) | | |
| | | 2010 - R | | | 8.41 | | | | — | (c)(e) | | | 2.62 | | | | 2.62 | | | | (0.05 | ) | | | — | | | | (0.05 | ) | | |
| | | | | | | | | | | | | | | | | | | | | | | | | | | | | | | | | |
| FOR THE FISCAL YEAR ENDED OCTOBER 31, |
| | | | | | | | | | | | | | | | | | | | | | | | | | | | | | | | | |
| | | | | | | | | | | | | | | | | | | | | | | | | | | | | | | | | |
| | | 2009 - A | | | 7.98 | | | | 0.04 | | | | 0.48 | | | | 0.52 | | | | (0.05 | ) | | | — | | | | (0.05 | ) | | |
| | | 2009 - B | | | 7.16 | | | | (0.01 | ) | | | 0.44 | | | | 0.43 | | | | — | | | | — | | | | — | | | |
| | | 2009 - C | | | 7.19 | | | | (0.01 | ) | | | 0.44 | | | | 0.43 | | | | — | | | | — | | | | — | | | |
| | | 2009 - Institutional | | | 8.30 | | | | 0.07 | | | | 0.51 | | | | 0.58 | | | | (0.10 | ) | | | — | | | | (0.10 | ) | | |
| | | 2009 - Service | | | 7.85 | | | | 0.04 | | | | 0.48 | | | | 0.52 | | | | — | | | | — | | | | — | | | |
| | | 2009 - IR | | | 7.96 | | | | 0.04 | | | | 0.50 | | | | 0.54 | | | | (0.08 | ) | | | — | | | | (0.08 | ) | | |
| | | 2009 - R | | | 7.93 | | | | (0.01 | ) | | | 0.53 | | | | 0.52 | | | | (0.04 | ) | | | — | | | | (0.04 | ) | | |
| | | | | | | | | | | | | | | | | | | | | | | | | | | | | | | | | |
| FOR THE PERIOD SEPTEMBER 1, 2008 TO OCTOBER 31, 2008* |
| | | | | | | | | | | | | | | | | | | | | | | | | | | | | | | | | |
| | | | | | | | | | | | | | | | | | | | | | | | | | | | | | | | | |
| | | 2008 - A | | | 11.00 | | | | 0.02 | | | | (3.04 | ) | | | (3.02 | ) | | | — | | | | — | | | | — | | | |
| | | 2008 - B | | | 9.89 | | | | — | (e) | | | (2.73 | ) | | | (2.73 | ) | | | — | | | | — | | | | — | | | |
| | | 2008 - C | | | 9.94 | | | | — | (e) | | | (2.75 | ) | | | (2.75 | ) | | | — | | | | — | | | | — | | | |
| | | 2008 - Institutional | | | 11.45 | | | | 0.02 | | | | (3.17 | ) | | | (3.15 | ) | | | — | | | | — | | | | — | | | |
| | | 2008 - Service | | | 10.84 | | | | 0.01 | | | | (3.00 | ) | | | (2.99 | ) | | | — | | | | — | | | | — | | | |
| | | 2008 - IR | | | 10.98 | | | | 0.02 | | | | (3.04 | ) | | | (3.02 | ) | | | — | | | | — | | | | — | | | |
| | | 2008 - R | | | 10.95 | | | | 0.01 | | | | (3.03 | ) | | | (3.02 | ) | | | — | | | | — | | | | — | | | |
| | | | | | | | | | | | | | | | | | | | | | | | | | | | | | | | | |
| FOR THE FISCAL YEARS ENDED AUGUST 31, |
| | | | | | | | | | | | | | | | | | | | | | | | | | | | | | | | | |
| | | | | | | | | | | | | | | | | | | | | | | | | | | | | | | | | |
| | | 2008 - A | | | 12.89 | | | | 0.01 | | | | (1.23 | ) | | | (1.22 | ) | | | (0.01 | ) | | | (0.66 | ) | | | (0.67 | ) | | |
| | | 2008 - B | | | 11.74 | | | | (0.06 | ) | | | (1.13 | ) | | | (1.19 | ) | | | — | | | | (0.66 | ) | | | (0.66 | ) | | |
| | | 2008 - C | | | 11.79 | | | | (0.06 | ) | | | (1.13 | ) | | | (1.19 | ) | | | — | | | | (0.66 | ) | | | (0.66 | ) | | |
| | | 2008 - Institutional | | | 13.37 | | | | 0.06 | | | | (1.27 | ) | | | (1.21 | ) | | | (0.05 | ) | | | (0.66 | ) | | | (0.71 | ) | | |
| | | 2008 - Service | | | 12.72 | | | | 0.01 | | | | (1.23 | ) | | | (1.22 | ) | | | — | | | | (0.66 | ) | | | (0.66 | ) | | |
| | | 2008 - IR (Commenced November 30, 2007) | | | 12.16 | | | | 0.03 | | | | (0.50 | ) | | | (0.47 | ) | | | (0.05 | ) | | | (0.66 | ) | | | (0.71 | ) | | |
| | | 2008 - R (Commenced November 30, 2007) | | | 12.16 | | | | (0.01 | ) | | | (0.49 | ) | | | (0.50 | ) | | | (0.05 | ) | | | (0.66 | ) | | | (0.71 | ) | | |
| | | | | | | | | | | | | | | | | | | | | | | | | | | | | | | | | |
| | | |
| | | |
| | | 2007 - A | | | 13.76 | | | | 0.04 | | | | (0.06 | ) | | | (0.02 | ) | | | (0.01 | ) | | | (0.84 | ) | | | (0.85 | ) | | |
| | | 2007 - B | | | 12.69 | | | | (0.06 | ) | | | (0.05 | ) | | | (0.11 | ) | | | — | | | | (0.84 | ) | | | (0.84 | ) | | |
| | | 2007 - C | | | 12.74 | | | | (0.06 | ) | | | (0.05 | ) | | | (0.11 | ) | | | — | | | | (0.84 | ) | | | (0.84 | ) | | |
| | | 2007 - Institutional | | | 14.23 | | | | 0.10 | | | | (0.06 | ) | | | 0.04 | | | | (0.06 | ) | | | (0.84 | ) | | | (0.90 | ) | | |
| | | 2007 - Service | | | 13.59 | | | | 0.02 | | | | (0.05 | ) | | | (0.03 | ) | | | — | | | | (0.84 | ) | | | (0.84 | ) | | |
| | | | | | | | | | | | | | | | | | | | | | | | | | | | | | | | | |
| | | |
| | | |
| | | 2006 - A | | | 14.55 | | | | — | (e) | | | 0.35 | | | | 0.35 | | | | — | | | | (1.14 | ) | | | (1.14 | ) | | |
| | | 2006 - B | | | 13.60 | | | | (0.10 | ) | | | 0.33 | | | | 0.23 | | | | — | | | | (1.14 | ) | | | (1.14 | ) | | |
| | | 2006 - C | | | 13.64 | | | | (0.10 | ) | | | 0.34 | | | | 0.24 | | | | — | | | | (1.14 | ) | | | (1.14 | ) | | |
| | | 2006 - Institutional | | | 14.95 | | | | 0.06 | | | | 0.36 | | | | 0.42 | | | | — | | | | (1.14 | ) | | | (1.14 | ) | | |
| | | 2006 - Service | | | 14.40 | | | | (0.01 | ) | | | 0.34 | | | | 0.33 | | | | — | | | | (1.14 | ) | | | (1.14 | ) | | |
| | | | | | | | | | | | | | | | | | | | | | | | | | | | | | | | | |
| | | |
| | | |
| | | 2005 - A | | | 12.24 | | | | (0.02 | ) | | | 3.02 | | | | 3.00 | | | | — | | | | (0.69 | ) | | | (0.69 | ) | | |
| | | 2005 - B | | | 11.56 | | | | (0.11 | ) | | | 2.84 | | | | 2.73 | | | | — | | | | (0.69 | ) | | | (0.69 | ) | | |
| | | 2005 - C | | | 11.60 | | | | (0.11 | ) | | | 2.84 | | | | 2.73 | | | | — | | | | (0.69 | ) | | | (0.69 | ) | | |
| | | 2005 - Institutional | | | 12.52 | | | | 0.04 | | | | 3.08 | | | | 3.12 | | | | — | | | | (0.69 | ) | | | (0.69 | ) | | |
| | | 2005 - Service | | | 12.13 | | | | (0.03 | ) | | | 2.99 | | | | 2.96 | | | | — | | | | (0.69 | ) | | | (0.69 | ) | | |
| | | | | | | | | | | | | | | | | | | | | | | | | | | | | | | | | |
| | | |
| | | |
| | |
| * | | The Fund changed its fiscal year end from August 31 to October 31. |
| (a) | | Calculated based on the average shares outstanding methodology. |
| (b) | | Assumes investment at the net asset value at the beginning of the period, reinvestment of all dividends and distributions, a complete redemption of the investment at the net asset value at the end of the period and no sales or redemption charges. Total returns would be reduced if a sales or redemption charge was taken into account. Returns do not reflect the deduction of taxes that a shareholder would pay on Fund distributions or the redemption of Fund shares. Total returns for periods less than one full year are not annualized. |
| (c) | | Reflects income recognized from special dividends which amounted to $0.04 per share and 0.85% of average net assets. |
| (d) | | Annualized. |
| (e) | | Amount is less than $0.005 per share. |
| (f) | | Amount is less than 0.005% per share. |
The accompanying notes are an integral part of these financial statements.
GOLDMAN SACHS STRUCTURED SMALL CAP EQUITY FUND
| | | | | | | | | | | | | | | | | | | | | | | | | | | | | | | |
| | | | | | | | | | | | | | | | | | Ratio of
| | | | | | |
| | | | | | | | | Net assets,
| | | Ratio of
| | | Ratio of
| | | net investment
| | | | | | |
| | | Net asset
| | | | | | end of
| | | net expenses
| | | total expenses
| | | income (loss)
| | | Portfolio
| | | |
| | | value, end
| | | Total
| | | period
| | | to average
| | | to average
| | | to average
| | | turnover
| | | |
| | | of period | | | return(b) | | | (in 000s) | | | net assets | | | net assets | | | net assets | | | rate | | | |
| |
| |
| | | | | | | | | | | | | | | | | | | | | | | | | | | | | | | |
| | | | | | | | | | | | | | | | | | | | | | | | | | | | | | | |
| | | $ | 11.03 | | | | 31.55 | % | | $ | 142,392 | | | | 1.25 | %(d) | | | 1.39 | %(d) | | | 0.73 | %(c)(d) | | | 37 | % | | |
| | | | 9.93 | | | | 30.99 | | | | 2,842 | | | | 2.00 | (d) | | | 2.14 | (d) | | | (0.02 | )(c)(d) | | | 37 | | | |
| | | | 9.95 | | | | 31.00 | | | | 14,291 | | | | 2.00 | (d) | | | 2.14 | (d) | | | (0.08 | )(c)(d) | | | 37 | | | |
| | | | 11.43 | | | | 31.79 | | | | 312,954 | | | | 0.85 | (d) | | | 0.99 | (d) | | | 1.21 | (c)(d) | | | 37 | | | |
| | | | 10.93 | | | | 31.48 | | | | 1,449 | | | | 1.35 | (d) | | | 1.49 | (d) | | | 0.62 | (c)(d) | | | 37 | | | |
| | | | 10.96 | | | | 31.63 | | | | 32 | | | | 1.00 | (d) | | | 1.14 | (d) | | | 0.94 | (c)(d) | | | 37 | | | |
| | | | 10.98 | | | | 31.34 | | | | 178 | | | | 1.50 | (d) | | | 1.64 | (d) | | | (0.06 | )(c)(d) | | | 37 | | | |
| | | | | | | | | | | | | | | | | | | | | | | | | | | | | | | |
| |
| | | | | | | | | | | | | | | | | | | | | | | | | | | | | | | |
| | | | | | | | | | | | | | | | | | | | | | | | | | | | | | | |
| | | | 8.45 | | | | 6.70 | | | | 130,439 | | | | 1.25 | | | | 1.40 | | | | 0.61 | | | | 141 | | | |
| | | | 7.59 | | | | 6.01 | | | | 2,737 | | | | 2.00 | | | | 2.15 | | | | (0.11 | ) | | | 141 | | | |
| | | | 7.62 | | | | 5.98 | | | | 11,226 | | | | 2.00 | | | | 2.15 | | | | (0.18 | ) | | | 141 | | | |
| | | | 8.78 | | | | 7.13 | | | | 349,989 | | | | 0.85 | | | | 1.00 | | | | 0.96 | | | | 141 | | | |
| | | | 8.37 | | | | 6.62 | | | | 1,588 | | | | 1.35 | | | | 1.50 | | | | 0.53 | | | | 141 | | | |
| | | | 8.42 | | | | 7.09 | | | | 25 | | | | 1.00 | | | | 1.15 | | | | 0.52 | | | | 141 | | | |
| | | | 8.41 | | | | 6.61 | | | | 21 | | | | 1.50 | | | | 1.65 | | | | (0.10 | ) | | | 141 | | | |
| | | | | | | | | | | | | | | | | | | | | | | | | | | | | | | |
| |
| | | | | | | | | | | | | | | | | | | | | | | | | | | | | | | |
| | | | | | | | | | | | | | | | | | | | | | | | | | | | | | | |
| | | | 7.98 | | | | (27.45 | ) | | | 162,243 | | | | 1.25 | (d) | | | 1.46 | (d) | | | 0.76 | (d) | | | 31 | | | |
| | | | 7.16 | | | | (27.60 | ) | | | 3,806 | | | | 2.00 | (d) | | | 2.21 | (d) | | | 0.01 | (d) | | | 31 | | | |
| | | | 7.19 | | | | (27.67 | ) | | | 11,262 | | | | 2.00 | (d) | | | 2.21 | (d) | | | 0.01 | (d) | | | 31 | | | |
| | | | 8.30 | | | | (27.51 | ) | | | 419,179 | | | | 0.85 | (d) | | | 1.06 | (d) | | | 1.16 | (d) | | | 31 | | | |
| | | | 7.85 | | | | (27.58 | ) | | | 2,121 | | | | 1.35 | (d) | | | 1.56 | (d) | | | 0.66 | (d) | | | 31 | | | |
| | | | 7.96 | | | | (27.50 | ) | | | 7 | | | | 1.00 | (d) | | | 1.21 | (d) | | | 0.99 | (d) | | | 31 | | | |
| | | | 7.93 | | | | (27.58 | ) | | | 7 | | | | 1.50 | (d) | | | 1.71 | (d) | | | 0.54 | (d) | | | 31 | | | |
| | | | | | | | | | | | | | | | | | | | | | | | | | | | | | | |
| |
| | | | | | | | | | | | | | | | | | | | | | | | | | | | | | | |
| | | | | | | | | | | | | | | | | | | | | | | | | | | | | | | |
| | | | 11.00 | | | | (9.73 | ) | | | 211,930 | | | | 1.25 | | | | 1.36 | | | | 0.12 | | | | 160 | | | |
| | | | 9.89 | | | | (10.39 | ) | | | 5,807 | | | | 2.00 | | | | 2.11 | | | | (0.57 | ) | | | 160 | | | |
| | | | 9.94 | | | | (10.35 | ) | | | 16,250 | | | | 2.00 | | | | 2.11 | | | | (0.60 | ) | | | 160 | | | |
| | | | 11.45 | | | | (9.29 | ) | | | 547,109 | | | | 0.85 | | | | 0.96 | | | | 0.54 | | | | 160 | | | |
| | | | 10.84 | | | | (9.80 | ) | | | 2,904 | | | | 1.35 | | | | 1.46 | | | | 0.12 | | | | 160 | | | |
| | | | 10.98 | | | | (4.14 | ) | | | 10 | | | | 1.00 | (d) | | | 1.11 | (d) | | | 0.36 | (d) | | | 160 | | | |
| | | | 10.95 | | | | (4.40 | ) | | | 10 | | | | 1.50 | (d) | | | 1.61 | (d) | | | (0.07 | )(d) | | | 160 | | | |
| | | | | | | | | | | | | | | | | | | | | | | | | | | | | | | |
| |
| |
| | | | 12.89 | | | | (0.76 | ) | | | 208,875 | | | | 1.26 | | | | 1.34 | | | | 0.24 | | | | 154 | | | |
| | | | 11.74 | | | | (1.52 | ) | | | 10,875 | | | | 2.01 | | | | 2.09 | | | | (0.51 | ) | | | 154 | | | |
| | | | 11.79 | | | | (1.44 | ) | | | 21,631 | | | | 2.01 | | | | 2.09 | | | | (0.51 | ) | | | 154 | | | |
| | | | 13.37 | | | | (0.32 | ) | | | 575,499 | | | | 0.86 | | | | 0.94 | | | | 0.64 | | | | 154 | | | |
| | | | 12.72 | | | | (0.80 | ) | | | 26,406 | | | | 1.36 | | | | 1.44 | | | | 0.14 | | | | 154 | | | |
| | | | | | | | | | | | | | | | | | | | | | | | | | | | | | | |
| |
| |
| | | | 13.76 | | | | 2.42 | | | | 185,508 | | | | 1.27 | | | | 1.37 | | | | —- | (f) | | | 151 | | | |
| | | | 12.69 | | | | 1.66 | | | | 16,197 | | | | 2.02 | | | | 2.11 | | | | (0.75 | ) | | | 151 | | | |
| | | | 12.74 | | | | 1.65 | | | | 25,899 | | | | 2.02 | | | | 2.11 | | | | (0.75 | ) | | | 151 | | | |
| | | | 14.23 | | | | 2.77 | | | | 504,101 | | | | 0.87 | | | | 0.97 | | | | 0.40 | | | | 151 | | | |
| | | | 13.59 | | | | 2.30 | | | | 29,501 | | | | 1.37 | | | | 1.46 | | | | (0.09 | ) | | | 151 | | | |
| | | | | | | | | | | | | | | | | | | | | | | | | | | | | | | |
| |
| |
| | | | 14.55 | | | | 24.97 | | | | 154,877 | | | | 1.33 | | | | 1.41 | | | | (0.15 | ) | | | 149 | | | |
| | | | 13.60 | | | | 24.07 | | | | 19,555 | | | | 2.08 | | | | 2.16 | | | | (0.89 | ) | | | 149 | | | |
| | | | 13.64 | | | | 24.09 | | | | 24,901 | | | | 2.08 | | | | 2.16 | | | | (0.90 | ) | | | 149 | | | |
| | | | 14.95 | | | | 25.57 | | | | 328,912 | | | | 0.93 | | | | 1.01 | | | | 0.25 | | | | 149 | | | |
| | | | 14.40 | | | | 24.86 | | | | 38,412 | | | | 1.43 | | | | 1.51 | | | | (0.26 | ) | | | 149 | | | |
| | | | | | | | | | | | | | | | | | | | | | | | | | | | | | | |
| |
| |
The accompanying notes are an integral part of these financial statements.
GOLDMAN SACHS STRUCTURED SMALL CAP GROWTH FUND
Financial Highlights
Selected Data for a Share Outstanding Throughout Each Period
| | | | | | | | | | | | | | | | | | | | | | | | | | | | | | | | | |
| | | | | | | | Income (loss) from
| | | Distributions
| | | |
| | | | | Net asset
| | | investment operations | | | to shareholders | | | |
| | | | | value,
| | | Net
| | | Net realized
| | | Total from
| | | From net
| | | From net
| | | | | | |
| | | | | beginning
| | | investment
| | | and unrealized
| | | investment
| | | investment
| | | realized
| | | Total
| | | |
| | | Year - Share Class | | of period | | | income (loss)(a) | | | gain (loss) | | | operations | | | income | | | gains | | | distributions | | | |
| |
| FOR THE SIX MONTHS ENDED APRIL 30, (UNAUDITED) |
| | | | | | | | | | | | | | | | | | | | | | | | | | | | | | | | | |
| | | | | | | | | | | | | | | | | | | | | | | | | | | | | | | | | |
| | | 2009 - A | | $ | 14.23 | | | $ | 0.04 | (c) | | $ | 3.83 | | | $ | 3.87 | | | $ | (0.05 | ) | | $ | — | | | $ | (0.05 | ) | | |
| | | 2009 - B | | | 12.35 | | | | (0.02 | )(c) | | | 3.33 | | | | 3.31 | | | | — | | | | — | | | | — | | | |
| | | 2009 - C | | | 12.45 | | | | (0.02 | )(c) | | | 3.36 | | | | 3.34 | | | | — | | | | — | | | | — | | | |
| | | 2009 - Institutional | | | 15.67 | | | | 0.07 | (c) | | | 4.21 | | | | 4.28 | | | | (0.10 | ) | | | — | | | | (0.10 | ) | | |
| | | 2009 - IR | | | 14.30 | | | | 0.05 | (c) | | | 3.85 | | | | 3.90 | | | | (0.09 | ) | | | — | | | | (0.09 | ) | | |
| | | 2009 - R | | | 14.15 | | | | 0.01 | (c) | | | 3.81 | | | | 3.82 | | | | (0.06 | ) | | | — | | | | (0.06 | ) | | |
| | | | | | | | | | | | | | | | | | | | | | | | | | | | | | | | | |
| | | | | | | | | | | | | | | | | | | | | | | | | | | | | | | | | |
| FOR THE FISCAL YEARS ENDED OCTOBER 31, |
| | | | | | | | | | | | | | | | | | | | | | | | | | | | | | | | | |
| | | | | | | | | | | | | | | | | | | | | | | | | | | | | | | | | |
| | | 2009 - A | | | 12.66 | | | | (0.01 | ) | | | 1.58 | | | | 1.57 | | | | — | | | | — | | | | — | | | |
| | | 2009 - B | | | 11.07 | | | | (0.08 | ) | | | 1.36 | | | | 1.28 | | | | — | | | | — | | | | — | | | |
| | | 2009 - C | | | 11.16 | | | | (0.09 | ) | | | 1.38 | | | | 1.29 | | | | — | | | | — | | | | — | | | |
| | | 2009 - Institutional | | | 13.88 | | | | 0.04 | | | | 1.75 | | | | 1.79 | | | | — | | | | — | | | | — | | | |
| | | 2009 - IR | | | 12.68 | | | | 0.03 | | | | 1.59 | | | | 1.62 | | | | — | | | | — | | | | — | | | |
| | | 2009 - R | | | 12.63 | | | | (0.06 | ) | | | 1.58 | | | | 1.52 | | | | — | | | | — | | | | — | | | |
| | | | | | | | | | | | | | | | | | | | | | | | | | | | | | | | | |
| | | | | | | | | | | | | | | | | | | | | | | | | | | | | | | | | |
| | | |
| | | |
| | | 2008 - A | | | 36.25 | | | | (0.05 | ) | | | (9.43 | ) | | | (9.48 | ) | | | — | | | | (14.11 | ) | | | (14.11 | ) | | |
| | | 2008 - B | | | 33.77 | | | | (0.17 | ) | | | (8.42 | ) | | | (8.59 | ) | | | — | | | | (14.11 | ) | | | (14.11 | ) | | |
| | | 2008 - C | | | 33.92 | | | | (0.17 | ) | | | (8.48 | ) | | | (8.65 | ) | | | — | | | | (14.11 | ) | | | (14.11 | ) | | |
| | | 2008 - Institutional | | | 38.18 | | | | 0.02 | | | | (10.21 | ) | | | (10.19 | ) | | | — | | | | (14.11 | ) | | | (14.11 | ) | | |
| | | 2008 - IR (Commenced November 30, 2007) | | | 33.22 | | | | (0.01 | ) | | | (6.42 | ) | | | (6.43 | ) | | | — | | | | (14.11 | ) | | | (14.11 | ) | | |
| | | 2008 - R (Commenced November 30, 2007) | | | 33.22 | | | | (0.08 | ) | | | (6.40 | ) | | | (6.48 | ) | | | — | | | | (14.11 | ) | | | (14.11 | ) | | |
| | | | | | | | | | | | | | | | | | | | | | | | | | | | | | | | | |
| | | | | | | | | | | | | | | | | | | | | | | | | | | | | | | | | |
| | | |
| | | |
| | | 2007 - A | | | 32.78 | | | | (0.27 | ) | | | 5.59 | | | | 5.32 | | | | — | | | | (1.85 | ) | | | (1.85 | ) | | |
| | | 2007 - B | | | 30.83 | | | | (0.46 | ) | | | 5.25 | | | | 4.79 | | | | — | | | | (1.85 | ) | | | (1.85 | ) | | |
| | | 2007 - C | | | 30.96 | | | | (0.46 | ) | | | 5.27 | | | | 4.81 | | | | — | | | | (1.85 | ) | | | (1.85 | ) | | |
| | | 2007 - Institutional | | | 34.28 | | | | (0.12 | ) | | | 5.87 | | | | 5.75 | | | | — | | | | (1.85 | ) | | | (1.85 | ) | | |
| | | | | | | | | | | | | | | | | | | | | | | | | | | | | | | | | |
| | | | | | | | | | | | | | | | | | | | | | | | | | | | | | | | | |
| | | |
| | | |
| | | 2006 - A | | | 28.23 | | | | (0.38 | ) | | | 6.64 | | | | 6.26 | | | | — | | | | (1.71 | ) | | | (1.71 | ) | | |
| | | 2006 - B | | | 26.79 | | | | (0.52 | ) | | | 6.27 | | | | 5.75 | | | | — | | | | (1.71 | ) | | | (1.71 | ) | | |
| | | 2006 - C | | | 26.89 | | | | (0.52 | ) | | | 6.30 | | | | 5.78 | | | | — | | | | (1.71 | ) | | | (1.71 | ) | | |
| | | 2006 - Institutional | | | 29.32 | | | | (0.26 | ) | | | 6.93 | | | | 6.67 | | | | — | | | | (1.71 | ) | | | (1.71 | ) | | |
| | | | | | | | | | | | | | | | | | | | | | | | | | | | | | | | | |
| | | | | | | | | | | | | | | | | | | | | | | | | | | | | | | | | |
| | | |
| | | |
| | | 2005 - A | | | 26.45 | | | | (0.26 | ) | | | 2.04 | | | | 1.78 | | | | — | | | | — | | | | — | | | |
| | | 2005 - B | | | 25.25 | | | | (0.40 | ) | | | 1.94 | | | | 1.54 | | | | — | | | | — | | | | — | | | |
| | | 2005 - C | | | 25.34 | | | | (0.40 | ) | | | 1.95 | | | | 1.55 | | | | — | | | | — | | | | — | | | |
| | | 2005 - Institutional | | | 27.35 | | | | (0.14 | ) | | | 2.11 | | | | 1.97 | | | | — | | | | — | | | | — | | | |
| | | | | | | | | | | | | | | | | | | | | | | | | | | | | | | | | |
| | | | | | | | | | | | | | | | | | | | | | | | | | | | | | | | | |
| | | |
| | | |
| |
| (a) | Calculated based on the average shares outstanding methodology. |
| (b) | Assumes investment at the net asset value at the beginning of the period, reinvestment of all dividends and distributions, a complete redemption of the investment at the net asset value at the end of the period and no sales or redemption charges. Total return would be reduced if a sales or redemption charge were taken into account. Returns do not reflect the deduction of taxes that a shareholder would pay on Fund distributions or the redemption of Fund shares. Total returns for periods less than one full year are not annualized. |
| (c) | Reflects income recognized from special dividends which amounted to $0.08 per share and 1.04% of average net assets. |
| (d) | Annualized. |
The accompanying notes are an integral part of these financial statements.
GOLDMAN SACHS STRUCTURED SMALL CAP GROWTH FUND
| | | | | | | | | | | | | | | | | | | | | | | | | | | | | | | | | | | | | | | |
| | | | | | | | | | | | | | | | | | | | | Ratio of
| | | Ratio of
| | | | | | |
| | | | | | | | | Net assets,
| | | Ratio of
| | | Ratio of
| | | Ratio of
| | | net investment
| | | net investment
| | | | | | |
| | | Net asset
| | | | | | end of
| | | net expenses
| | | net expenses
| | | total expenses
| | | income (loss)
| | | income (loss)
| | | Portfolio
| | | |
| | | value, end
| | | Total
| | | period
| | | to average
| | | (not including fees
| | | to average
| | | to average
| | | (not including fees
| | | turnover
| | | |
| | | of period | | | return(b) | | | (in 000s) | | | net assets | | | paid indirectly) | | | net assets | | | net assets | | | paid indirectly) | | | rate | | | |
| |
| |
| | | | | | | | | | | | | | | | | | | | | | | | | | | | | | | | | | | | | | | |
| | | | | | | | | | | | | | | | | | | | | | | | | | | | | | | | | | | | | | | |
| | | $ | 18.05 | | | | 27.27 | % | | $ | 23,308 | | | | 1.25 | %(d) | | | 1.25 | %(d) | | | 2.15 | %(d) | | | 0.44 | %(c)(d) | | | 0.44 | %(c)(d) | | | 48 | % | | |
| | | | 15.66 | | | | 26.80 | | | | 7,983 | | | | 2.00 | (d) | | | 2.00 | (d) | | | 2.90 | (d) | | | (0.25 | )(c)(d) | | | (0.25 | )(c)(d) | | | 48 | | | |
| | | | 15.79 | | | | 26.83 | | | | 5,601 | | | | 2.00 | (d) | | | 2.00 | (d) | | | 2.90 | (d) | | | (0.29 | )(c)(d) | | | (0.29 | )(c)(d) | | | 48 | | | |
| | | | 19.85 | | | | 27.47 | | | | 5,890 | | | | 0.85 | (d) | | | 0.85 | (d) | | | 1.75 | (d) | | | 0.78 | (c)(d) | | | 0.78 | (c)(d) | | | 48 | | | |
| | | | 18.11 | | | | 27.35 | | | | 9 | | | | 1.00 | (d) | | | 1.00 | (d) | | | 1.90 | (d) | | | 0.69 | (c)(d) | | | 0.69 | (c)(d) | | | 48 | | | |
| | | | 17.91 | | | | 27.09 | | | | 57 | | | | 1.50 | (d) | | | 1.50 | (d) | | | 2.40 | (d) | | | 0.15 | (c)(d) | | | 0.15 | (c)(d) | | | 48 | | | |
| | | | | | | | | | | | | | | | | | | | | | | | | | | | | | | | | | | | | | | |
| | | | | | | | | | | | | | | | | | | | | | | | | | | | | | | | | | | | | | | |
| |
| | | | | | | | | | | | | | | | | | | | | | | | | | | | | | | | | | | | | | | |
| | | | | | | | | | | | | | | | | | | | | | | | | | | | | | | | | | | | | | | |
| | | | 14.23 | | | | 12.40 | | | | 19,090 | | | | 1.25 | | | | 1.25 | | | | 2.44 | | | | (0.06 | ) | | | (0.06 | ) | | | 193 | | | |
| | | | 12.35 | | | | 11.56 | | | | 7,608 | | | | 2.00 | | | | 2.00 | | | | 3.19 | | | | (0.78 | ) | | | (0.78 | ) | | | 193 | | | |
| | | | 12.45 | | | | 11.56 | | | | 4,793 | | | | 2.00 | | | | 2.00 | | | | 3.19 | | | | (0.82 | ) | | | (0.82 | ) | | | 193 | | | |
| | | | 15.67 | | | | 12.90 | | | | 4,026 | | | | 0.85 | | | | 0.85 | | | | 2.04 | | | | 0.31 | | | | 0.31 | | | | 193 | | | |
| | | | 14.30 | | | | 12.78 | | | | 7 | | | | 1.00 | | | | 1.00 | | | | 2.19 | | | | 0.18 | | | | 0.18 | | | | 193 | | | |
| | | | 14.15 | | | | 12.03 | | | | 42 | | | | 1.50 | | | | 1.50 | | | | 2.69 | | | | (0.44 | ) | | | (0.44 | ) | | | 193 | | | |
| | | | | | | | | | | | | | | | | | | | | | | | | | | | | | | | | | | | | | | |
| | | | | | | | | | | | | | | | | | | | | | | | | | | | | | | | | | | | | | | |
| |
| |
| | | | 12.66 | | | | (39.66 | ) | | | 19,402 | | | | 1.25 | | | | 1.25 | | | | 2.00 | | | | (0.32 | ) | | | (0.32 | ) | | | 182 | | | |
| | | | 11.07 | | | | (40.12 | ) | | | 10,176 | | | | 2.00 | | | | 2.00 | | | | 2.75 | | | | (1.07 | ) | | | (1.07 | ) | | | 182 | | | |
| | | | 11.16 | | | | (40.12 | ) | | | 4,918 | | | | 2.00 | | | | 2.00 | | | | 2.75 | | | | (1.07 | ) | | | (1.07 | ) | | | 182 | | | |
| | | | 13.88 | | | | (39.44 | ) | | | 3,662 | | | | 0.85 | | | | 0.85 | | | | 1.60 | | | | (0.12 | ) | | | (0.12 | ) | | | 182 | | | |
| | | | 12.68 | | | | (34.14 | ) | | | 7 | | | | 1.00 | (d) | | | 1.00 | (d) | | | 1.75 | (d) | | | (0.06 | )(d) | | | (0.06 | )(d) | | | 182 | | | |
| | | | 12.63 | | | | (34.40 | ) | | | 7 | | | | 1.50 | (d) | | | 1.50 | (d) | | | 2.25 | (d) | | | (0.40 | )(d) | | | (0.40 | )(d) | | | 182 | | | |
| | | | | | | | | | | | | | | | | | | | | | | | | | | | | | | | | | | | | | | |
| | | | | | | | | | | | | | | | | | | | | | | | | | | | | | | | | | | | | | | |
| |
| |
| | | | 36.25 | | | | 17.04 | | | | 45,070 | | | | 1.25 | | | | 1.51 | | | | 2.17 | | | | (0.79 | ) | | | (1.05 | ) | | | 154 | | | |
| | | | 33.77 | | | | 16.32 | | | | 26,184 | | | | 1.87 | | | | 2.13 | | | | 2.78 | | | | (1.40 | ) | | | (1.67 | ) | | | 154 | | | |
| | | | 33.92 | | | | 16.32 | | | | 11,911 | | | | 1.87 | | | | 2.13 | | | | 2.78 | | | | (1.40 | ) | | | (1.67 | ) | | | 154 | | | |
| | | | 38.18 | | | | 17.53 | | | | 15,686 | | | | 0.79 | | | | 1.10 | | | | 1.74 | | | | (0.33 | ) | | | (0.63 | ) | | | 154 | | | |
| | | | | | | | | | | | | | | | | | | | | | | | | | | | | | | | | | | | | | | |
| | | | | | | | | | | | | | | | | | | | | | | | | | | | | | | | | | | | | | | |
| |
| |
| | | | 32.78 | | | | 23.15 | | | | 47,721 | | | | 1.60 | | | | 1.65 | | | | 2.18 | | | | (1.25 | ) | | | (1.30 | ) | | | 60 | | | |
| | | | 30.83 | | | | 22.40 | | | | 30,515 | | | | 2.15 | | | | 2.20 | | | | 2.73 | | | | (1.80 | ) | | | (1.85 | ) | | | 60 | | | |
| | | | 30.96 | | | | 22.48 | | | | 13,294 | | | | 2.15 | | | | 2.20 | | | | 2.73 | | | | (1.80 | ) | | | (1.85 | ) | | | 60 | | | |
| | | | 34.28 | | | | 23.71 | | | | 19,037 | | | | 1.15 | | | | 1.20 | | | | 1.73 | | | | (0.80 | ) | | | (0.85 | ) | | | 60 | | | |
| | | | | | | | | | | | | | | | | | | | | | | | | | | | | | | | | | | | | | | |
| | | | | | | | | | | | | | | | | | | | | | | | | | | | | | | | | | | | | | | |
| |
| |
| | | | 28.23 | | | | 6.69 | | | | 42,959 | | | | 1.20 | | | | 1.65 | | | | 2.23 | | | | (0.92 | ) | | | (1.37 | ) | | | 146 | | | |
| | | | 26.79 | | | | 6.14 | | | | 33,060 | | | | 1.75 | | | | 2.20 | | | | 2.78 | | | | (1.47 | ) | | | (1.92 | ) | | | 146 | | | |
| | | | 26.89 | | | | 6.12 | | | | 13,431 | | | | 1.75 | | | | 2.20 | | | | 2.78 | | | | (1.47 | ) | | | (1.92 | ) | | | 146 | | | |
| | | | 29.32 | | | | 7.20 | | | | 11,836 | | | | 0.75 | | | | 1.20 | | | | 1.78 | | | | (0.47 | ) | | | (0.92 | ) | | | 146 | | | |
| | | | | | | | | | | | | | | | | | | | | | | | | | | | | | | | | | | | | | | |
| | | | | | | | | | | | | | | | | | | | | | | | | | | | | | | | | | | | | | | |
| |
| |
The accompanying notes are an integral part of these financial statements.
GOLDMAN SACHS STRUCTURED SMALL CAP VALUE FUND
Financial Highlights
Selected Data for a Share Outstanding Throughout Each Period
| | | | | | | | | | | | | | | | | | | | | | | | | | | | | | | | | |
| | | | | | | | Income (loss) from
| | | Distributions to
| | | |
| | | | | | | | investment operations | | | shareholders | | | |
| | | | | Net asset
| | | Net
| | | | | | | | | | | | | | | | | | |
| | | | | value,
| | | investment
| | | Net realized
| | | Total from
| | | From net
| | | From net
| | | | | | |
| | | | | beginning
| | | income
| | | and unrealized
| | | investment
| | | investment
| | | realized
| | | Total
| | | |
| | | Year - Share Class | | of period | | | (loss)(a) | | | gain (loss) | | | operations | | | income | | | gains | | | distributions | | | |
| |
| FOR THE SIX MONTHS ENDED APRIL 30, (UNAUDITED) |
| | | | | | | | | | | | | | | | | | | | | | | | | | | | | | | | | |
| | | | | | | | | | | | | | | | | | | | | | | | | | | | | | | | | |
| | | 2010 - A | | $ | 18.78 | | | $ | 0.10(c | ) | | $ | 6.24 | | | $ | 6.34 | | | $ | (0.18 | ) | | $ | — | | | $ | (0.18 | ) | | |
| | | 2010 - B | | | 13.24 | | | | 0.02(c | ) | | | 4.37 | | | | 4.39 | | | | (0.12 | ) | | | — | | | | (0.12 | ) | | |
| | | 2010 - C | | | 14.94 | | | | 0.02(c | ) | | | 4.96 | | | | 4.98 | | | | (0.12 | ) | | | — | | | | (0.12 | ) | | |
| | | 2010 - Institutional | | | 23.11 | | | | 0.18(c | ) | | | 7.67 | | | | 7.85 | | | | (0.20 | ) | | | — | | | | (0.20 | ) | | |
| | | 2010 - IR | | | 18.78 | | | | 0.13(c | ) | | | 6.23 | | | | 6.36 | | | | (0.19 | ) | | | — | | | | (0.19 | ) | | |
| | | 2010 - R | | | 18.74 | | | | 0.07(c | ) | | | 6.21 | | | | 6.28 | | | | (0.18 | ) | | | — | | | | (0.18 | ) | | |
| | | | | | | | | | | | | | | | | | | | | | | | | | | | | | | | | |
| | | | | | | | | | | | | | | | | | | | | | | | | | | | | | | | | |
| FOR THE FISCAL YEARS ENDED OCTOBER 31,* |
| | | | | | | | | | | | | | | | | | | | | | | | | | | | | | | | | |
| | | | | | | | | | | | | | | | | | | | | | | | | | | | | | | | | |
| | | 2009 - A | | | 18.62 | | | | 0.18 | | | | 0.25 | | | | 0.43 | | | | (0.27 | ) | | | — | | | | (0.27 | ) | | |
| | | 2009 - B | | | 13.16 | | | | 0.05 | | | | 0.19 | | | | 0.24 | | | | (0.16 | ) | | | — | | | | (0.16 | ) | | |
| | | 2009 - C | | | 14.84 | | | | 0.05 | | | | 0.18 | | | | 0.23 | | | | (0.13 | ) | | | — | | | | (0.13 | ) | | |
| | | 2009 - Institutional | | | 22.89 | | | | 0.31 | | | | 0.28 | | | | 0.59 | | | | (0.37 | ) | | | — | | | | (0.37 | ) | | |
| | | 2009 - IR | | | 18.69 | | | | 0.22 | | | | 0.21 | | | | 0.43 | | | | (0.34 | ) | | | — | | | | (0.34 | ) | | |
| | | 2009 - R | | | 18.62 | | | | 0.12 | | | | 0.23 | | | | 0.35 | | | | (0.23 | ) | | | — | | | | (0.23 | ) | | |
| | | | | | | | | | | | | | | | | | | | | | | | | | | | | | | | | |
| | | | | | | | | | | | | | | | | | | | | | | | | | | | | | | | | |
| | | |
| | | |
| | | 2008 - A | | | 89.04 | | | | 0.14 | | | | (14.42 | ) | | | (14.28 | ) | | | — | | | | (56.14 | ) | | | (56.14 | ) | | |
| | | 2008 - B | | | 81.13 | | | | (0.07 | ) | | | (11.76 | ) | | | (11.83 | ) | | | — | | | | (56.14 | ) | | | (56.14 | ) | | |
| | | 2008 - C | | | 83.58 | | | | — | (e) | | | (12.60 | ) | | | (12.60 | ) | | | — | | | | (56.14 | ) | | | (56.14 | ) | | |
| | | 2008 - Institutional | | | 95.27 | | | | 0.42 | | | | (16.66 | ) | | | (16.24 | ) | | | — | | | | (56.14 | ) | | | (56.14 | ) | | |
| | | 2008 - IR (Commenced November 30, 2007) | | | 81.41 | | | | 0.21 | | | | (6.79 | ) | | | (6.58 | ) | | | — | | | | (56.14 | ) | | | (56.14 | ) | | |
| | | 2008 - R (Commenced November 30, 2007) | | | 81.41 | | | | 0.14 | | | | (6.79 | ) | | | (6.65 | ) | | | — | | | | (56.14 | ) | | | (56.14 | ) | | |
| | | | | | | | | | | | | | | | | | | | | | | | | | | | | | | | | |
| | | | | | | | | | | | | | | | | | | | | | | | | | | | | | | | | |
| | | |
| | | |
| | | 2007 - A | | | 92.33 | | | | (0.35 | ) | | | 7.42 | | | | 7.07 | | | | (0.21 | ) | | | (10.15 | ) | | | (10.36 | ) | | |
| | | 2007 - B | | | 85.26 | | | | (0.84 | ) | | | 6.86 | | | | 6.02 | | | | — | | | | (10.15 | ) | | | (10.15 | ) | | |
| | | 2007 - C | | | 87.57 | | | | (0.84 | ) | | | 7.00 | | | | 6.16 | | | | — | | | | (10.15 | ) | | | (10.15 | ) | | |
| | | 2007 - Institutional | | | 98.14 | | | | — | (e) | | | 7.98 | | | | 7.98 | | | | (0.70 | ) | | | (10.15 | ) | | | (10.85 | ) | | |
| | | | | | | | | | | | | | | | | | | | | | | | | | | | | | | | | |
| | | | | | | | | | | | | | | | | | | | | | | | | | | | | | | | | |
| | | |
| | | |
| | | 2006 - A | | | 80.43 | | | | 0.35 | | | | 14.70 | | | | 15.05 | | | | — | | | | (3.15 | ) | | | (3.15 | ) | | |
| | | 2006 - B | | | 74.90 | | | | (0.14 | ) | | | 13.65 | | | | 13.51 | | | | — | | | | (3.15 | ) | | | (3.15 | ) | | |
| | | 2006 - C | | | 76.86 | | | | (0.14 | ) | | | 14.00 | | | | 13.86 | | | | — | | | | (3.15 | ) | | | (3.15 | ) | | |
| | | 2006 - Institutional | | | 84.91 | | | | 0.77 | | | | 15.61 | | | | 16.38 | | | | — | | | | (3.15 | ) | | | (3.15 | ) | | |
| | | | | | | | | | | | | | | | | | | | | | | | | | | | | | | | | |
| | | | | | | | | | | | | | | | | | | | | | | | | | | | | | | | | |
| | | |
| | | |
| | | 2005 - A | | | 73.15 | | | | (0.35 | ) | | | 8.61 | | | | 8.26 | | | | — | | | | (0.98 | ) | | | (0.98 | ) | | |
| | | 2005 - B | | | 68.53 | | | | (0.70 | ) | | | 8.05 | | | | 7.35 | | | | — | | | | (0.98 | ) | | | (0.98 | ) | | |
| | | 2005 - C | | | 70.28 | | | | (0.77 | ) | | | 8.33 | | | | 7.56 | | | | — | | | | (0.98 | ) | | | (0.98 | ) | | |
| | | 2005 - Institutional | | | 76.79 | | | | — | (e) | | | 9.10 | | | | 9.10 | | | | — | | | | (0.98 | ) | | | (0.98 | ) | | |
| | | | | | | | | | | | | | | | | | | | | | | | | | | | | | | | | |
| | | | | | | | | | | | | | | | | | | | | | | | | | | | | | | | | |
| | | |
| | | |
| | |
| * | | All per share amounts representing data prior to February 9, 2009 have been restated to reflect a 7 for 1 reverse stock split which occurred on that date. |
| (a) | | Calculated based on the average shares outstanding methodology. |
| (b) | | Assumes investment at the net asset value at the beginning of the period, reinvestment of all dividends and distributions, a complete redemption of the investment at the net asset value at the end of the period and no sales or redemption charges. Total returns would be reduced if a sales or redemption charge were taken into account. Returns do not reflect the deduction of taxes that a shareholder would pay on Fund distribution or the redemption of Fund shares. Total returns for periods less than one full year are not annualized. |
| (c) | | Reflects income recognized from special dividends which amounted to $0.05 and 0.51% of average net assets. |
| (d) | | Annualized. |
| (e) | | Amount is less than $0.005 per share. |
The accompanying notes are an integral part of these financial statements.
GOLDMAN SACHS STRUCTURED SMALL CAP VALUE FUND
| | | | | | | | | | | | | | | | | | | | | | | | | | | | | | | | | | | | | | | |
| | | | | | | | | | | | | | | Ratio of
| | | | | | Ratio of
| | | Ratio of
| | | | | | |
| | | | | | | | | Net assets,
| | | Ratio of
| | | net expenses
| | | Ratio of
| | | net investment
| | | net income (loss)
| | | | | | |
| | | Net asset
| | | | | | end of
| | | net expenses
| | | (not including
| | | total expenses
| | | income (loss)
| | | (not including
| | | Portfolio
| | | |
| | | value, end
| | | Total
| | | period
| | | to average
| | | fees paid
| | | to average
| | | to average
| | | fees paid
| | | turnover
| | | |
| | | of period | | | return(b) | | | (in 000s) | | | net assets | | | indirectly) | | | net assets | | | net assets | | | indirectly) | | | rate | | | |
| |
| |
| | | | | | | | | | | | | | | | | | | | | | | | | | | | | | | | | | | | | | | |
| | | | | | | | | | | | | | | | | | | | | | | | | | | | | | | | | | | | | | | |
| | | $ | 24.94 | | | | 33.98 | % | | $ | 104,314 | | | | 1.25 | %(d) | | | 1.25 | %(d) | | | 1.59 | %(d) | | | 0.97 | %(c)(d) | | | 0.97 | %(c)(d) | | | 40 | % | | |
| | | | 17.51 | | | | 33.42 | | | | 28,301 | | | | 2.00 | (d) | | | 2.00 | (d) | | | 2.34 | (d) | | | 0.28 | (c)(d) | | | 0.28 | (c)(d) | | | 40 | | | |
| | | | 19.80 | | | | 33.53 | | | | 25,103 | | | | 2.00 | (d) | | | 2.00 | (d) | | | 2.34 | (d) | | | 0.23 | (c)(d) | | | 0.23 | (c)(d) | | | 40 | | | |
| | | | 30.76 | | | | 34.21 | | | | 1,696 | | | | 0.85 | (d) | | | 0.85 | (d) | | | 1.19 | (d) | | | 1.36 | (c)(d) | | | 1.36 | (c)(d) | | | 40 | | | |
| | | | 24.95 | | | | 34.13 | | | | 10 | | | | 1.00 | (d) | | | 1.00 | (d) | | | 1.34 | (d) | | | 1.21 | (c)(d) | | | 1.21 | (c)(d) | | | 40 | | | |
| | | | 24.84 | | | | 33.75 | | | | 126 | | | | 1.50 | (d) | | | 1.50 | (d) | | | 1.84 | (d) | | | 0.67 | (c)(d) | | | 0.67 | (c)(d) | | | 40 | | | |
| | | | | | | | | | | | | | | | | | | | | | | | | | | | | | | | | | | | | | | |
| | | | | | | | | | | | | | | | | | | | | | | | | | | | | | | | | | | | | | | |
| |
| | | | | | | | | | | | | | | | | | | | | | | | | | | | | | | | | | | | | | | |
| | | | | | | | | | | | | | | | | | | | | | | | | | | | | | | | | | | | | | | |
| | | | 18.78 | | | | 2.64 | | | | 79,873 | | | | 1.25 | | | | 1.25 | | | | 1.69 | | | | 1.11 | | | | 1.11 | | | | 164 | | | |
| | | | 13.24 | | | | 2.27 | | | | 27,689 | | | | 2.00 | | | | 2.00 | | | | 2.44 | | | | 0.42 | | | | 0.42 | | | | 164 | | | |
| | | | 14.94 | | | | 1.61 | | | | 20,883 | | | | 2.00 | | | | 2.00 | | | | 2.44 | | | | 0.38 | | | | 0.38 | | | | 164 | | | |
| | | | 23.11 | | | | 2.97 | | | | 1,244 | | | | 0.85 | | | | 0.85 | | | | 1.29 | | | | 1.55 | | | | 1.55 | | | | 164 | | | |
| | | | 18.78 | | | | 2.43 | | | | 7 | | | | 1.00 | | | | 1.00 | | | | 1.44 | | | | 1.34 | | | | 1.34 | | | | 164 | | | |
| | | | 18.74 | | | | 2.17 | | | | 79 | | | | 1.50 | | | | 1.50 | | | | 1.94 | | | | 0.68 | | | | 0.68 | | | | 164 | | | |
| | | | | | | | | | | | | | | | | | | | | | | | | | | | | | | | | | | | | | | |
| | | | | | | | | | | | | | | | | | | | | | | | | | | | | | | | | | | | | | | |
| |
| |
| | | | 18.62 | | | | (33.48 | ) | | | 85,992 | | | | 1.25 | | | | 1.25 | | | | 1.53 | | | | 0.71 | | | | 0.71 | | | | 147 | | | |
| | | | 13.16 | | | | (34.04 | ) | | | 43,039 | | | | 2.00 | | | | 2.00 | | | | 2.28 | | | | (0.05 | ) | | | (0.05 | ) | | | 147 | | | |
| | | | 14.84 | | | | (33.89 | ) | | | 26,503 | | | | 2.00 | | | | 2.00 | | | | 2.28 | | | | (0.05 | ) | | | (0.05 | ) | | | 147 | | | |
| | | | 22.89 | | | | (33.07 | ) | | | 1,599 | | | | 0.85 | | | | 0.85 | | | | 1.13 | | | | 1.05 | | | | 1.05 | | | | 147 | | | |
| | | | 18.69 | | | | (27.00 | ) | | | 7 | | | | 1.00 | (d) | | | 1.00 | (d) | | | 1.28 | (d) | | | 1.03 | (d) | | | 1.03 | (d) | | | 147 | | | |
| | | | 18.62 | | | | (27.27 | ) | | | 7 | | | | 1.50 | (d) | | | 1.50 | (d) | | | 1.78 | (d) | | | 0.60 | (d) | | | 0.60 | (d) | | | 147 | | | |
| | | | | | | | | | | | | | | | | | | | | | | | | | | | | | | | | | | | | | | |
| | | | | | | | | | | | | | | | | | | | | | | | | | | | | | | | | | | | | | | |
| |
| |
| | | | 89.04 | | | | 8.15 | | | | 213,172 | | | | 1.20 | | | | 1.49 | | | | 1.58 | | | | (0.40 | ) | | | (0.69 | ) | | | 97 | | | |
| | | | 81.13 | | | | 7.45 | | | | 117,553 | | | | 1.82 | | | | 2.10 | | | | 2.19 | | | | (1.03 | ) | | | (1.31 | ) | | | 97 | | | |
| | | | 83.58 | | | | 7.41 | | | | 70,151 | | | | 1.82 | | | | 2.10 | | | | 2.19 | | | | (1.01 | ) | | | (1.29 | ) | | | 97 | | | |
| | | | 95.27 | | | | 8.57 | | | | 16,005 | | | | 0.73 | | | | 1.07 | | | | 1.14 | | | | (0.04 | ) | | | (0.38 | ) | | | 97 | | | |
| | | | | | | | | | | | | | | | | | | | | | | | | | | | | | | | | | | | | | | |
| | | | | | | | | | | | | | | | | | | | | | | | | | | | | | | | | | | | | | | |
| |
| |
| | | | 92.33 | | | | 19.38 | | | | 264,595 | | | | 1.59 | | | | 1.60 | | | | 1.60 | | | | 0.38 | | | | 0.37 | | | | 4 | | | |
| | | | 85.26 | | | | 18.73 | | | | 175,297 | | | | 2.14 | | | | 2.15 | | | | 2.15 | | | | (0.15 | ) | | | (0.16 | ) | | | 4 | | | |
| | | | 87.57 | | | | 18.71 | | | | 92,123 | | | | 2.14 | | | | 2.15 | | | | 2.15 | | | | (0.16 | ) | | | (0.17 | ) | | | 4 | | | |
| | | | 98.14 | | | | 19.94 | | | | 25,954 | | | | 1.14 | | | | 1.15 | | | | 1.15 | | | | 0.82 | | | | 0.82 | | | | 4 | | | |
| | | | | | | | | | | | | | | | | | | | | | | | | | | | | | | | | | | | | | | |
| | | | | | | | | | | | | | | | | | | | | | | | | | | | | | | | | | | | | | | |
| |
| |
| | | | 80.43 | | | | 11.35 | | | | 252,526 | | | | 1.63 | | | | 1.64 | | | | 1.64 | | | | (0.40 | ) | | | (0.41 | ) | | | 4 | | | |
| | | | 74.90 | | | | 10.78 | | | | 198,305 | | | | 2.18 | | �� | | 2.19 | | | | 2.19 | | | | (0.95 | ) | | | (0.96 | ) | | | 4 | | | |
| | | | 76.86 | | | | 10.81 | | | | 107,803 | | | | 2.18 | | | | 2.19 | | | | 2.19 | | | | (0.95 | ) | | | (0.96 | ) | | | 4 | | | |
| | | | 84.91 | | | | 11.91 | | | | 21,728 | | | | 1.18 | | | | 1.19 | | | | 1.19 | | | | 0.05 | | | | 0.04 | | | | 4 | | | |
| | | | | | | | | | | | | | | | | | | | | | | | | | | | | | | | | | | | | | | |
| | | | | | | | | | | | | | | | | | | | | | | | | | | | | | | | | | | | | | | |
| |
| |
The accompanying notes are an integral part of these financial statements.
GOLDMAN SACHS STRUCTURED U.S. EQUITY FUND
Financial Highlights
Selected Data for a Share Outstanding Throughout Each Period
| | | | | | | | | | | | | | | | | | | | | | | | | | | | | | | | | |
| | | | | | | | Income (loss) from
| | | Distributions
| | | |
| | | | | Net asset
| | | investment operations | | | to shareholders | | | |
| | | | | value,
| | | Net
| | | Net realized
| | | Total from
| | | From net
| | | From net
| | | | | | |
| | | | | beginning
| | | investment
| | | and unrealized
| | | investment
| | | investment
| | | realized
| | | Total
| | | |
| | | Year - Share Class | | of period | | | income(a) | | | gain (loss) | | | operations | | | income | | | gains | | | distributions | | | |
| |
| FOR THE SIX MONTHS ENDED APRIL 30, (UNAUDITED) |
| | | | | | | | | | | | | | | | | | | | | | | | | | | | | | | | | |
| | | | | | | | | | | | | | | | | | | | | | | | | | | | | | | | | |
| | | 2010 - A | | $ | 19.75 | | | $ | 0.11 | | | $ | 2.98 | | | $ | 3.09 | | | $ | (0.30 | ) | | $ | — | | | $ | (0.30 | ) | | |
| | | 2010 - B | | | 18.43 | | | | 0.03 | | | | 2.78 | | | | 2.81 | | | | (0.13 | ) | | | — | | | | (0.13 | ) | | |
| | | 2010 - C | | | 18.21 | | | | 0.03 | | | | 2.75 | | | | 2.78 | | | | (0.18 | ) | | | — | | | | (0.18 | ) | | |
| | | 2010 - Institutional | | | 20.25 | | | | 0.16 | | | | 3.04 | | | | 3.20 | | | | (0.38 | ) | | | — | | | | (0.38 | ) | | |
| | | 2010 - Service | | | 19.66 | | | | 0.11 | | | | 2.95 | | | | 3.06 | | | | (0.24 | ) | | | — | | | | (0.24 | ) | | |
| | | 2010 - IR | | | 19.65 | | | | 0.14 | | | | 2.96 | | | | 3.10 | | | | (0.36 | ) | | | — | | | | (0.36 | ) | | |
| | | 2010 - R | | | 19.63 | | | | 0.08 | | | | 2.95 | | | | 3.03 | | | | (0.31 | ) | | | — | | | | (0.31 | ) | | |
| | | | | | | | | | | | | | | | | | | | | | | | | | | | | | | | | |
| FOR THE FISCAL YEARS ENDED OCTOBER 31, |
| | | | | | | | | | | | | | | | | | | | | | | | | | | | | | | | | |
| | | | | | | | | | | | | | | | | | | | | | | | | | | | | | | | | |
| | | 2009 - A | | | 19.02 | | | | 0.31 | | | | 0.87 | | | | 1.18 | | | | (0.38 | ) | | | (0.07 | ) | | | (0.45 | ) | | |
| | | 2009 - B | | | 17.63 | | | | 0.18 | | | | 0.82 | | | | 1.00 | | | | (0.13 | ) | | | (0.07 | ) | | | (0.20 | ) | | |
| | | 2009 - C | | | 17.50 | | | | 0.16 | | | | 0.82 | | | | 0.98 | | | | (0.20 | ) | | | (0.07 | ) | | | (0.27 | ) | | |
| | | 2009 - Institutional | | | 19.52 | | | | 0.38 | | | | 0.91 | | | | 1.29 | | | | (0.49 | ) | | | (0.07 | ) | | | (0.56 | ) | | |
| | | 2009 - Service | | | 18.84 | | | | 0.29 | | | | 0.88 | | | | 1.17 | | | | (0.28 | ) | | | (0.07 | ) | | | (0.35 | ) | | |
| | | 2009 - IR | | | 18.96 | | | | 0.34 | | | | 0.87 | | | | 1.21 | | | | (0.45 | ) | | | (0.07 | ) | | | (0.52 | ) | | |
| | | 2009 - R | | | 18.89 | | | | 0.16 | | | | 0.98 | | | | 1.14 | | | | (0.33 | ) | | | (0.07 | ) | | | (0.40 | ) | | |
| | | | | | | | | | | | | | | | | | | | | | | | | | | | | | | | | |
| FOR THE PERIOD SEPTEMBER 1, 2008 TO OCTOBER 31, 2008* |
| | | | | | | | | | | | | | | | | | | | | | | | | | | | | | | | | |
| | | | | | | | | | | | | | | | | | | | | | | | | | | | | | | | | |
| | | 2008 - A | | | 24.97 | | | | 0.04 | | | | (5.99 | ) | | | (5.95 | ) | | | — | | | | — | | | | — | | | |
| | | 2008 - B | | | 23.18 | | | | 0.02 | | | | (5.57 | ) | | | (5.55 | ) | | | — | | | | — | | | | — | | | |
| | | 2008 - C | | | 23.01 | | | | 0.02 | | | | (5.53 | ) | | | (5.51 | ) | | | — | | | | — | | | | — | | | |
| | | 2008 - Institutional | | | 25.61 | | | | 0.06 | | | | (6.15 | ) | | | (6.09 | ) | | | — | | | | — | | | | — | | | |
| | | 2008 - Service | | | 24.74 | | | | 0.04 | | | | (5.94 | ) | | | (5.90 | ) | | | — | | | | — | | | | — | | | |
| | | 2008 - IR | | | 24.88 | | | | 0.05 | | | | (5.97 | ) | | | (5.92 | ) | | | — | | | | — | | | | — | | | |
| | | 2008 - R | | | 24.81 | | | | 0.04 | | | | (5.96 | ) | | | (5.92 | ) | | | — | | | | — | | | | — | | | |
| | | | | | | | | | | | | | | | | | | | | | | | | | | | | | | | | |
| FOR THE FISCAL YEARS ENDED AUGUST 31, |
| | | | | | | | | | | | | | | | | | | | | | | | | | | | | | | | | |
| | | | | | | | | | | | | | | | | | | | | | | | | | | | | | | | | |
| | | 2008 - A | | | 33.30 | | | | 0.29 | | | | (4.86 | ) | | | (4.57 | ) | | | (0.34 | ) | | | (3.42 | ) | | | (3.76 | ) | | |
| | | 2008 - B | | | 31.17 | | | | 0.08 | | | | (4.54 | ) | | | (4.46 | ) | | | (0.11 | ) | | | (3.42 | ) | | | (3.53 | ) | | |
| | | 2008 - C | | | 31.01 | | | | 0.07 | | | | (4.49 | ) | | | (4.42 | ) | | | (0.16 | ) | | | (3.42 | ) | | | (3.58 | ) | | |
| | | 2008 - Institutional | | | 34.07 | | | | 0.42 | | | | (4.98 | ) | | | (4.56 | ) | | | (0.48 | ) | | | (3.42 | ) | | | (3.90 | ) | | |
| | | 2008 - Service | | | 32.98 | | | | 0.26 | | | | (4.80 | ) | | | (4.54 | ) | | | (0.28 | ) | | | (3.42 | ) | | | (3.70 | ) | | |
| | | 2008 - IR (Commenced November 30, 2007) | | | 33.02 | | | | 0.26 | | | | (4.49 | ) | | | (4.23 | ) | | | (0.49 | ) | | | (3.42 | ) | | | (3.91 | ) | | |
| | | 2008 - R (Commenced November 30, 2007) | | | 33.02 | | | | 0.17 | | | | (4.48 | ) | | | (4.31 | ) | | | (0.48 | ) | | | (3.42 | ) | | | (3.90 | ) | | |
| | | | | | | | | | | | | | | | | | | | | | | | | | | | | | | | | |
| | | |
| | | |
| | | 2007 - A | | | 31.79 | | | | 0.28 | | | | 2.61 | | | | 2.89 | | | | (0.27 | ) | | | (1.11 | ) | | | (1.38 | ) | | |
| | | 2007 - B | | | 29.92 | | | | 0.03 | | | | 2.45 | | | | 2.48 | | | | (0.12 | ) | | | (1.11 | ) | | | (1.23 | ) | | |
| | | 2007 - C | | | 29.78 | | | | 0.02 | | | | 2.45 | | | | 2.47 | | | | (0.13 | ) | | | (1.11 | ) | | | (1.24 | ) | | |
| | | 2007 - Institutional | | | 32.48 | | | | 0.42 | | | | 2.66 | | | | 3.08 | | | | (0.38 | ) | | | (1.11 | ) | | | (1.49 | ) | | |
| | | 2007 - Service | | | 31.50 | | | | 0.24 | | | | 2.59 | | | | 2.83 | | | | (0.24 | ) | | | (1.11 | ) | | | (1.35 | ) | | |
| | | | | | | | | | | | | | | | | | | | | | | | | | | | | | | | | |
| | | |
| | | |
| | | 2006 - A | | | 29.13 | | | | 0.24 | | | | 2.53 | | | | 2.77 | | | | (0.11 | ) | | | — | | | | (0.11 | ) | | |
| | | 2006 - B | | | 27.52 | | | | — | (d) | | | 2.40 | | | | 2.40 | | | | — | | | | — | | | | — | | | |
| | | 2006 - C | | | 27.39 | | | | 0.01 | | | | 2.38 | | | | 2.39 | | | | — | | | | — | | | | — | | | |
| | | 2006 - Institutional | | | 29.72 | | | | 0.38 | | | | 2.56 | | | | 2.94 | | | | (0.18 | ) | | | — | | | | (0.18 | ) | | |
| | | 2006 - Service | | | 28.88 | | | | 0.21 | | | | 2.50 | | | | 2.71 | | | | (0.09 | ) | | | — | | | | (0.09 | ) | | |
| | | | | | | | | | | | | | | | | | | | | | | | | | | | | | | | | |
| | | |
| | | |
| | | 2005 - A | | | 25.81 | | | | 0.26 | (e) | | | 3.28 | | | | 3.54 | | | | (0.22 | ) | | | — | | | | (0.22 | ) | | |
| | | 2005 - B | | | 24.39 | | | | 0.05 | (e) | | | 3.09 | | | | 3.14 | | | | (0.01 | ) | | | — | | | | (0.01 | ) | | |
| | | 2005 - C | | | 24.30 | | | | 0.05 | (e) | | | 3.07 | | | | 3.12 | | | | (0.03 | ) | | | — | | | | (0.03 | ) | | |
| | | 2005 - Institutional | | | 26.32 | | | | 0.36 | (e) | | | 3.37 | | | | 3.73 | | | | (0.33 | ) | | | — | | | | (0.33 | ) | | |
| | | 2005 - Service | | | 25.60 | | | | 0.23 | (e) | | | 3.25 | | | | 3.48 | | | | (0.20 | ) | | | — | | | | (0.20 | ) | | |
| | | | | | | | | | | | | | | | | | | | | | | | | | | | | | | | | |
| | | |
| | | |
| | |
| * | | The Fund changed its fiscal year end from August 31 to October 31. |
| (a) | | Calculated based on the average shares outstanding methodology. |
| (b) | | Assumes investment at the net asset value at the beginning of the period, reinvestment of all dividends and distributions, a complete redemption of the investment at the net asset value at the end of the period and no sales or redemption charges. Total returns would be reduced if a sales or redemption charge was taken into account. Returns do not reflect the deduction of taxes that a shareholder would pay on Fund distributions or the redemption of Fund shares. Total returns for periods less than one full year are not annualized. |
| (c) | | Annualized. |
| (d) | | Amount is less than $0.005 per share. |
| (e) | | Reflects income recognized from a special dividend which amounted to $0.10 per share and 0.03% of average net assets. |
The accompanying notes are an integral part of these financial statements.
GOLDMAN SACHS STRUCTURED U.S. EQUITY FUND
| | | | | | | | | | | | | | | | | | | | | | | | | | | | | | | |
| | | | | | | | | | | | | | | | | | Ratio of
| | | | | | |
| | | | | | | | | Net assets,
| | | Ratio of
| | | Ratio of
| | | net investment
| | | | | | |
| | | Net asset
| | | | | | end of
| | | net expenses
| | | total expenses
| | | income
| | | Portfolio
| | | |
| | | value, end
| | | Total
| | | period
| | | to average
| | | to average
| | | to average
| | | turnover
| | | |
| | | of period | | | return(b) | | | (in 000s) | | | net assets | | | net assets | | | net assets | | | rate | | | |
| |
| |
| | | | | | | | | | | | | | | | | | | | | | | | | | | | | | | |
| | | | | | | | | | | | | | | | | | | | | | | | | | | | | | | |
| | | $ | 22.54 | | | | 15.80 | % | | $ | 342,792 | | | | 0.95 | %(c) | | | 1.17 | %(c) | | | 1.04 | %(c) | | | 25 | % | | |
| | | | 21.11 | | | | 15.34 | | | | 23,247 | | | | 1.70 | (c) | | | 1.92 | (c) | | | 0.32 | (c) | | | 25 | | | |
| | | | 20.81 | | | | 15.34 | | | | 39,880 | | | | 1.70 | (c) | | | 1.92 | (c) | | | 0.29 | (c) | | | 25 | | | |
| | | | 23.07 | | | | 16.00 | | | | 156,689 | | | | 0.55 | (c) | | | 0.77 | (c) | | | 1.45 | (c) | | | 25 | | | |
| | | | 22.48 | | | | 15.69 | | | | 1,546 | | | | 1.05 | (c) | | | 1.27 | (c) | | | 1.06 | (c) | | | 25 | | | |
| | | | 22.39 | | | | 15.93 | | | | 8 | | | | 0.70 | (c) | | | 0.92 | (c) | | | 1.30 | (c) | | | 25 | | | |
| | | | 22.35 | | | | 15.59 | | | | 60 | | | | 1.20 | (c) | | | 1.42 | (c) | | | 0.76 | (c) | | | 25 | | | |
| | | | | | | | | | | | | | | | | | | | | | | | | | | | | | | |
| |
| | | | | | | | | | | | | | | | | | | | | | | | | | | | | | | |
| | | | | | | | | | | | | | | | | | | | | | | | | | | | | | | |
| | | | 19.75 | | | | 6.57 | | | | 328,575 | | | | 0.95 | | | | 1.19 | | | | 1.75 | | | | 122 | | | |
| | | | 18.43 | | | | 5.83 | | | | 25,269 | | | | 1.70 | | | | 1.94 | | | | 1.14 | | | | 122 | | | |
| | | | 18.21 | | | | 5.82 | | | | 37,716 | | | | 1.70 | | | | 1.94 | | | | 0.99 | | | | 122 | | | |
| | | | 20.25 | | | | 7.04 | | | | 153,872 | | | | 0.55 | | | | 0.79 | | | | 2.14 | | | | 122 | | | |
| | | | 19.66 | | | | 6.50 | | | | 2,117 | | | | 1.05 | | | | 1.29 | | | | 1.68 | | | | 122 | | | |
| | | | 19.65 | | | | 6.83 | | | | 7 | | | | 0.70 | | | | 0.94 | | | | 1.93 | | | | 122 | | | |
| | | | 19.63 | | | | 6.39 | | | | 50 | | | | 1.20 | | | | 1.44 | | | | 0.89 | | | | 122 | | | |
| | | | | | | | | | | | | | | | | | | | | | | | | | | | | | | |
| |
| | | | | | | | | | | | | | | | | | | | | | | | | | | | | | | |
| | | | | | | | | | | | | | | | | | | | | | | | | | | | | | | |
| | | | 19.02 | | | | (23.83 | ) | | | 384,949 | | | | 0.95 | (c) | | | 1.22 | (c) | | | 1.16 | (c) | | | 27 | | | |
| | | | 17.63 | | | | (23.94 | ) | | | 47,671 | | | | 1.70 | (c) | | | 1.97 | (c) | | | 0.46 | (c) | | | 27 | | | |
| | | | 17.50 | | | | (23.95 | ) | | | 42,816 | | | | 1.70 | (c) | | | 1.97 | (c) | | | 0.41 | (c) | | | 27 | | | |
| | | | 19.52 | | | | (23.78 | ) | | | 177,704 | | | | 0.55 | (c) | | | 0.82 | (c) | | | 1.57 | (c) | | | 27 | | | |
| | | | 18.84 | | | | (23.85 | ) | | | 2,949 | | | | 1.05 | (c) | | | 1.32 | (c) | | | 1.05 | (c) | | | 27 | | | |
| | | | 18.96 | | | | (23.79 | ) | | | 6 | | | | 0.70 | (c) | | | 0.97 | (c) | | | 1.48 | (c) | | | 27 | | | |
| | | | 18.89 | | | | (23.86 | ) | | | 6 | | | | 1.20 | (c) | | | 1.47 | (c) | | | 0.99 | (c) | | | 27 | | | |
| | | | | | | | | | | | | | | | | | | | | | | | | | | | | | | |
| |
| | | | | | | | | | | | | | | | | | | | | | | | | | | | | | | |
| | | | | | | | | | | | | | | | | | | | | | | | | | | | | | | |
| | | | 24.97 | | | | (15.39 | ) | | | 530,590 | | | | 0.95 | | | | 1.13 | | | | 1.03 | | | | 96 | | | |
| | | | 23.18 | | | | (16.04 | ) | | | 77,406 | | | | 1.70 | | | | 1.88 | | | | 0.28 | | | | 96 | | | |
| | | | 23.01 | | | | (16.01 | ) | | | 58,873 | | | | 1.70 | | | | 1.88 | | | | 0.28 | | | | 96 | | | |
| | | | 25.61 | | | | (15.09 | ) | | | 253,353 | | | | 0.55 | | | | 0.73 | | | | 1.40 | | | | 96 | | | |
| | | | 24.74 | | | | (15.43 | ) | | | 3,908 | | | | 1.05 | | | | 1.23 | | | | 0.91 | | | | 96 | | | |
| | | | 24.88 | | | | (14.61 | ) | | | 9 | | | | 0.70 | (c) | | | 0.88 | (c) | | | 1.30 | (c) | | | 96 | | | |
| | | | 24.81 | | | | (14.89 | ) | | | 9 | | | | 1.20 | (c) | | | 1.38 | (c) | | | 0.85 | (c) | | | 96 | | | |
| | | | | | | | | | | | | | | | | | | | | | | | | | | | | | | |
| |
| |
| | | | 33.30 | | | | 9.11 | | | | 863,259 | | | | 0.95 | | | | 1.10 | | | | 0.82 | | | | 119 | | | |
| | | | 31.17 | | | | 8.27 | | | | 154,414 | | | | 1.70 | | | | 1.85 | | | | 0.09 | | | | 119 | | | |
| | | | 31.01 | | | | 8.27 | | | | 100,803 | | | | 1.70 | | | | 1.85 | | | | 0.07 | | | | 119 | | | |
| | | | 34.07 | | | | 9.56 | | | | 594,020 | | | | 0.55 | | | | 0.70 | | | | 1.22 | | | | 119 | | | |
| | | | 32.98 | | | | 9.01 | | | | 15,884 | | | | 1.05 | | | | 1.20 | | | | 0.72 | | | | 119 | | | |
| | | | | | | | | | | | | | | | | | | | | | | | | | | | | | | |
| |
| |
| | | | 31.79 | | | | 9.51 | | | | 611,999 | | | | 0.99 | | | | 1.15 | | | | 0.79 | | | | 129 | | | |
| | | | 29.92 | | | | 8.72 | | | | 78,110 | | | | 1.75 | | | | 1.90 | | | | 0.01 | | | | 129 | | | |
| | | | 29.78 | | | | 8.73 | | | | 36,628 | | | | 1.75 | | | | 1.90 | | | | 0.03 | | | | 129 | | | |
| | | | 32.48 | | | | 9.97 | | | | 644,250 | | | | 0.59 | | | | 0.75 | | | | 1.22 | | | | 129 | | | |
| | | | 31.50 | | | | 9.39 | | | | 13,019 | | | | 1.09 | | | | 1.25 | | | | 0.70 | | | | 129 | | | |
| | | | | | | | | | | | | | | | | | | | | | | | | | | | | | | |
| |
| |
| | | | 29.13 | | | | 13.75 | | | | 477,204 | | | | 1.09 | | | | 1.19 | | | | 0.93 | (e) | | | 142 | | | |
| | | | 27.52 | | | | 12.87 | | | | 108,595 | | | | 1.84 | | | | 1.94 | | | | 0.19 | (e) | | | 142 | | | |
| | | | 27.39 | | | | 12.86 | | | | 38,380 | | | | 1.84 | | | | 1.94 | | | | 0.20 | (e) | | | 142 | | | |
| | | | 29.72 | | | | 14.16 | | | | 269,545 | | | | 0.69 | | | | 0.79 | | | | 1.23 | (e) | | | 142 | | | |
| | | | 28.88 | | | | 13.61 | | | | 10,328 | | | | 1.15 | | | | 1.25 | | | | 0.84 | (e) | | | 142 | | | |
| | | | | | | | | | | | | | | | | | | | | | | | | | | | | | | |
| |
| |
The accompanying notes are an integral part of these financial statements.
GOLDMAN SACHS STRUCTURED DOMESTIC EQUITY FUNDS
Fund Expenses — Six Month Period Ended April 30, 2010 (Unaudited)
As a shareholder of Class A, Class B, Class C, Institutional, Service, Class IR or Class R Shares of a Fund, you incur two types of costs: (1) transaction costs, including sales charges on purchase payments (with respect to Class A Shares), contingent deferred sales charges on redemptions (with respect to Class B and Class C Shares), and redemption fees (if any); and (2) ongoing costs, including management fees; distribution and service (12b-1) fees (with respect to Class A, Class B, Class C and Class R Shares); and other Fund expenses. This Example is intended to help you understand your ongoing costs (in dollars) of investing in Class A, Class B, Class C, Institutional, Service, Class IR or Class R Shares of the Funds and to compare these costs with the ongoing costs of investing in other mutual funds.
The Example is based on an investment of $1,000 invested at the beginning of the period and held for the entire period from November 1, 2009 through April 30, 2010.
Actual Expenses — The first line under each share class in the table below provides information about actual account values and actual expenses. You may use the information in this line, together with the amount you invested, to estimate the expenses that you paid over the period. Simply divide your account value by $1,000 (for example, an $8,600 account value divided by $1,000=8.6), then multiply the result by the number in the first line under the heading entitled “Expenses Paid” to estimate the expenses you paid on your account during this period.
Hypothetical Example for Comparison Purposes — The second line under each share class in the table below provides information about hypothetical account values and hypothetical expenses based on the Funds’ actual net expense ratios and an assumed rate of return of 5% per year before expenses, which is not the Funds’ actual return. The hypothetical account values and expenses may not be used to estimate the actual ending account balance or expenses you paid for the period. You may use this information to compare the ongoing costs of investing in the Funds and other funds. To do so, compare this 5% hypothetical example with the 5% hypothetical examples that appear in the shareholder reports of the other funds.
Please note that the expenses shown in the table are meant to highlight your ongoing costs only and do not reflect any transactional costs, such as sales charges, redemption fees, or exchange fees. Therefore, the second line of the table is useful in comparing ongoing costs only, and will not help you determine the relative total costs of owning different funds. In addition, if these transactional costs were included, your costs would have been higher.
| | | | | | | | | | | | | | | | | | | | | | | | | | | | | | | | | | | | | | | | | | | | | | | | | | | | | | | | | | | | | |
| | | | Balanced Fund | | | Structured Large Cap Growth Fund | | | Structured Large Cap Value Fund | | | Structured Small Cap Equity Fund |
| | | | | | | | | | Expenses
| | | | | | | | | Expenses
| | | | | | | | | Expenses
| | | | | | | | | Expenses
|
| | | | Beginning
| | | Ending
| | | Paid for the
| | | Beginning
| | | Ending
| | | Paid for the
| | | Beginning
| | | Ending
| | | Paid for the
| | | Beginning
| | | Ending
| | | Paid for the
|
| | | | Account Value
| | | Account Value
| | | 6 months ended
| | | Account Value
| | | Account Value
| | | 6 months ended
| | | Account Value
| | | Account Value
| | | 6 months ended
| | | Account Value
| | | Account Value
| | | 6 months ended
|
| Share Class | | | 11/1/09 | | | 4/30/10 | | | 4/30/10* | | | 11/1/09 | | | 4/30/10 | | | 4/30/10* | | | 11/1/09 | | | 4/30/10 | | | 4/30/10* | | | 11/1/09 | | | 4/30/10 | | | 4/30/10* |
Class A | | | | | | | | | | | | | | | | | | | | | | | | | | | | | | | | | | | | | | | | | | | | | | | | | | | | | | | | | | | | |
| Actual | | | $ | 1,000.00 | | | | $ | 1,117.70 | | | | $ | 5.51 | | | | $ | 1,000.00 | | | | $ | 1,156.60 | | | | $ | 5.08 | | | | $ | 1,000.00 | | | | $ | 1,179.80 | | | | $ | 5.13 | | | | $ | 1,000.00 | | | | $ | 1,315.50 | | | | $ | 7.18 | |
| Hypothetical 5% return | | | | 1,000.00 | | | | | 1,019.59 | + | | | | 5.26 | | | | | 1,000.00 | | | | | 1,020.08 | + | | | | 4.76 | | | | | 1,000.00 | | | | | 1,020.08 | + | | | | 4.76 | | | | | 1,000.00 | | | | | 1,018.60 | + | | | | 6.26 | |
| |
Class B | | | | | | | | | | | | | | | | | | | | | | | | | | | | | | | | | | | | | | | | | | | | | | �� | | | | | | | | | | | | | | |
| Actual | | | | 1,000.00 | | | | | 1,113.90 | | | | | 9.43 | | | | | 1,000.00 | | | | | 1,152.60 | | | | | 9.07 | | | | | 1,000.00 | | | | | 1,175.00 | | | | | 9.17 | | | | | 1,000.00 | | | | | 1,309.90 | | | | | 11.45 | |
| Hypothetical 5% return | | | | 1,000.00 | | | | | 1,015.87 | + | | | | 9.00 | | | | | 1,000.00 | | | | | 1,016.36 | + | | | | 8.50 | | | | | 1,000.00 | | | | | 1,016.36 | + | | | | 8.50 | | | | | 1,000.00 | | | | | 1,014.88 | + | | | | 9.99 | |
| |
Class C | | | | | | | | | | | | | | | | | | | | | | | | | | | | | | | | | | | | | | | | | | | | | | | | | | | | | | | | | | | | |
| Actual | | | | 1,000.00 | | | | | 1,113.80 | | | | | 9.43 | | | | | 1,000.00 | | | | | 1,153.00 | | | | | 9.08 | | | | | 1,000.00 | | | | | 1,175.50 | | | | | 9.17 | | | | | 1,000.00 | | | | | 1,310.00 | | | | | 11.46 | |
| Hypothetical 5% return | | | | 1,000.00 | | | | | 1,015.87 | + | | | | 9.00 | | | | | 1,000.00 | | | | | 1,016.36 | + | | | | 8.50 | | | | | 1,000.00 | | | | | 1,016.36 | + | | | | 8.50 | | | | | 1,000.00 | | | | | 1,014.88 | + | | | | 9.99 | |
| |
Institutional | | | | | | | | | | | | | | | | | | | | | | | | | | | | | | | | | | | | | | | | | | | | | | | | | | | | | | | | | | | | |
| Actual | | | | 1,000.00 | | | | | 1,120.00 | | | | | 3.42 | | | | | 1,000.00 | | | | | 1,159.90 | | | | | 2.95 | | | | | 1,000.00 | | | | | 1,183.50 | | | | | 2.98 | | | | | 1,000.00 | | | | | 1,317.90 | | | | | 4.89 | |
| Hypothetical 5% return | | | | 1,000.00 | | | | | 1,021.57 | + | | | | 3.26 | | | | | 1,000.00 | | | | | 1,022.07 | + | | | | 2.76 | | | | | 1,000.00 | | | | | 1,022.07 | + | | | | 2.76 | | | | | 1,000.00 | | | | | 1,020.58 | + | | | | 4.26 | |
| |
Service | | | | | | | | | | | | | | | | | | | | | | | | | | | | | | | | | | | | | | | | | | | | | | | | | | | | | | | | | | | | |
| Actual | | | | N/A | | | | | N/A | | | | | N/A | | | | | 1,000.00 | | | | | 1,156.70 | | | | | 5.61 | | | | | 1,000.00 | | | | | 1,179.70 | | | | | 5.67 | | | | | 1,000.00 | | | | | 1,314.80 | | | | | 7.75 | |
| Hypothetical 5% return | | | | N/A | | | | | N/A | | | | | N/A | | | | | 1,000.00 | | | | | 1,019.59 | + | | | | 5.26 | | | | | 1,000.00 | | | | | 1,019.59 | + | | | | 5.26 | | | | | 1,000.00 | | | | | 1,018.10 | + | | | | 6.76 | |
| |
Class IR | | | | | | | | | | | | | | | | | | | | | | | | | | | | | | | | | | | | | | | | | | | | | | | | | | | | | | | | | | | | |
| Actual | | | | N/A | | | | | N/A | | | | | N/A | | | | | 1,000.00 | | | | | 1,158.90 | | | | | 3.75 | | | | | 1,000.00 | | | | | 1,181.50 | | | | | 3.79 | | | | | 1,000.00 | | | | | 1,316.30 | | | | | 5.74 | |
| Hypothetical 5% return | | | | N/A | | | | | N/A | | | | | N/A | | | | | 1,000.00 | | | | | 1,021.32 | + | | | | 3.51 | | | | | 1,000.00 | | | | | 1,021.32 | + | | | | 3.51 | | | | | 1,000.00 | | | | | 1,019.84 | + | | | | 5.01 | |
| |
Class R | | | | | | | | | | | | | | | | | | | | | | | | | | | | | | | | | | | | | | | | | | | | | | | | | | | | | | | | | | | | |
| Actual | | | | N/A | | | | | N/A | | | | | N/A | | | | | 1,000.00 | | | | | 1,155.00 | | | | | 6.41 | | | | | 1,000.00 | | | | | 1,177.60 | | | | | 6.48 | | | | | 1,000.00 | | | | | 1,313.40 | | | | | 8.60 | |
| Hypothetical 5% return | | | | N/A | | | | | N/A | | | | | N/A | | | | | 1,000.00 | | | | | 1,018.84 | + | | | | 6.01 | | | | | 1,000.00 | | | | | 1,018.84 | + | | | | 6.01 | | | | | 1,000.00 | | | | | 1,017.36 | + | | | | 7.50 | |
| |
134
GOLDMAN SACHS STRUCTURED DOMESTIC EQUITY FUNDS
Fund Expenses — Six Month Period Ended April 30, 2010 (Unaudited) (continued)
| | | | | | | | | | | | | | | | | | | | | | | | | | | | | | | | | | | | | | | | | | | | | | |
| | | | Structured Small Cap Growth Fund | | | Structured Small Cap Value Fund | | | Structured U.S. Equity Fund |
| | | | | | | | | | Expenses
| | | | | | | | | Expenses
| | | | | | | | | Expenses
|
| | | | Beginning
| | | Ending
| | | Paid for the
| | | Beginning
| | | Ending
| | | Paid for the
| | | Beginning
| | | Ending
| | | Paid for the
|
| | | | Account Value
| | | Account Value
| | | 6 months ended
| | | Account Value
| | | Account Value
| | | 6 months ended
| | | Account Value
| | | Account Value
| | | 6 months ended
|
| Share Class | | | 11/1/09 | | | 4/30/10 | | | 4/30/10* | | | 11/1/09 | | | 4/30/10 | | | 4/30/10* | | | 11/1/09 | | | 4/30/10 | | | 4/30/10* |
Class A | | | | | | | | | | | | | | | | | | | | | | | | | | | | | | | | | | | | | | | | | | | | | |
| Actual | | | $ | 1,000.00 | | | | $ | 1,272.70 | | | | $ | 7.04 | | | | $ | 1,000.00 | | | | $ | 1,339.80 | | | | $ | 7.25 | | | | $ | 1,000.00 | | | | $ | 1,158.00 | | | | $ | 5.08 | |
| Hypothetical 5% return | | | | 1,000.00 | | | | | 1,018.60 | + | | | | 6.26 | | | | | 1,000.00 | | | | | 1,018.60 | + | | | | 6.26 | | | | | 1,000.00 | | | | | 1,020.08 | + | | | | 4.76 | |
| |
Class B | | | | | | | | | | | | | | | | | | | | | | | | | | | | | | | | | | | | | | | | | | | | | |
| Actual | | | | 1,000.00 | | | | | 1,268.00 | | | | | 11.25 | | | | | 1,000.00 | | | | | 1,334.20 | | | | | 11.58 | | | | | 1,000.00 | | | | | 1,153.40 | | | | | 9.08 | |
| Hypothetical 5% return | | | | 1,000.00 | | | | | 1,014.88 | + | | | | 9.99 | | | | | 1,000.00 | | | | | 1,014.88 | + | | | | 9.99 | | | | | 1,000.00 | | | | | 1,016.36 | + | | | | 8.50 | |
| |
Class C | | | | | | | | | | | | | | | | | | | | | | | | | | | | | | | | | | | | | | | | | | | | | |
| Actual | | | | 1,000.00 | | | | | 1,268.30 | | | | | 11.25 | | | | | 1,000.00 | | | | | 1,335.30 | | | | | 11.58 | | | | | 1,000.00 | | | | | 1,153.40 | | | | | 9.08 | |
| Hypothetical 5% return | | | | 1,000.00 | | | | | 1,014.88 | + | | | | 9.99 | | | | | 1,000.00 | | | | | 1,014.88 | + | | | | 9.99 | | | | | 1,000.00 | | | | | 1,016.36 | + | | | | 8.50 | |
| |
Institutional | | | | | | | | | | | | | | | | | | | | | | | | | | | | | | | | | | | | | | | | | | | | | |
| Actual | | | | 1,000.00 | | | | | 1,274.70 | | | | | 4.79 | | | | | 1,000.00 | | | | | 1,342.10 | | | | | 4.94 | | | | | 1,000.00 | | | | | 1,160.00 | | | | | 2.95 | |
| Hypothetical 5% return | | | | 1,000.00 | | | | | 1,020.58 | + | | | | 4.26 | | | | | 1,000.00 | | | | | 1,020.58 | + | | | | 4.26 | | | | | 1,000.00 | | | | | 1,022.07 | + | | | | 2.76 | |
| |
Service | | | | | | | | | | | | | | | | | | | | | | | | | | | | | | | | | | | | | | | | | | | | | |
| Actual | | | | N/A | | | | | N/A | | | | | N/A | | | | | N/A | | | | | N/A | | | | | N/A | | | | | 1,000.00 | | | | | 1,156.90 | | | | | 5.62 | |
| Hypothetical 5% return | | | | N/A | | | | | N/A | | | | | N/A | | | | | N/A | | | | | N/A | | | | | N/A | | | | | 1,000.00 | | | | | 1,019.59 | + | | | | 5.26 | |
| |
Class IR | | | | | | | | | | | | | | | | | | | | | | | | | | | | | | | | | | | | | | | | | | | | | |
| Actual | | | | 1,000.00 | | | | | 1,273.50 | | | | | 5.64 | | | | | 1,000.00 | | | | | 1,341.30 | | | | | 5.81 | | | | | 1,000.00 | | | | | 1,159.30 | | | | | 3.75 | |
| Hypothetical 5% return | | | | 1,000.00 | | | | | 1,019.84 | + | | | | 5.01 | | | | | 1,000.00 | | | | | 1,019.84 | + | | | | 5.01 | | | | | 1,000.00 | | | | | 1,021.32 | + | | | | 3.51 | |
| |
Class R | | | | | | | | | | | | | | | | | | | | | | | | | | | | | | | | | | | | | | | | | | | | | |
| Actual | | | | 1,000.00 | | | | | 1,270.90 | | | | | 8.45 | | | | | 1,000.00 | | | | | 1,337.50 | | | | | 8.69 | | | | | 1,000.00 | | | | | 1,155.90 | | | | | 6.41 | |
| Hypothetical 5% return | | | | 1,000.00 | | | | | 1,017.36 | + | | | | 7.50 | | | | | 1,000.00 | | | | | 1,017.36 | + | | | | 7.50 | | | | | 1,000.00 | | | | | 1,018.84 | + | | | | 6.01 | |
| |
| |
| * | Expenses for each share class are calculated using each Fund’s annualized net expense ratio for each class, which represents the ongoing expenses as a percentage of net assets for the six months ended April 30, 2010. Expenses are calculated by multiplying the annualized net expense ratio by the average account value for the period; then multiplying the result by the number of days in the most recent fiscal half year; and then dividing that result by the number of days in the fiscal year. The annualized net expense ratios for the period were as follows: |
| | | | | | | | | | | | | | | | | | | | | | | | | | | | | |
| Fund | | Class A | | | Class B | | | Class C | | | Institutional | | | Service | | | Class IR | | | Class R | |
| | |
| Balanced | | | 1.05 | % | | | 1.80 | % | | | 1.80 | % | | | 0.65 | % | | | N/A | | | | N/A | | | | N/A | |
| Structured Large Cap Growth | | | 0.95 | | | | 1.70 | | | | 1.70 | | | | 0.55 | | | | 1.05 | % | | | 0.70 | % | | | 1.20 | % |
| Structured Large Cap Value | | | 0.95 | | | | 1.70 | | | | 1.70 | | | | 0.55 | | | | 1.05 | | | | 0.70 | | | | 1.20 | |
| Structured Small Cap Equity | | | 1.25 | | | | 2.00 | | | | 2.00 | | | | 0.85 | | | | 1.35 | | | | 1.00 | | | | 1.50 | |
| Structured Small Cap Growth | | | 1.25 | | | | 2.00 | | | | 2.00 | | | | 0.85 | | | | N/A | | | | 1.00 | | | | 1.50 | |
| Structured Small Cap Value | | | 1.25 | | | | 2.00 | | | | 2.00 | | | | 0.85 | | | | N/A | | | | 1.00 | | | | 1.50 | |
| Structured U.S. Equity | | | 0.95 | | | | 1.70 | | | | 1.70 | | | | 0.55 | | | | 1.05 | | | | 0.70 | | | | 1.20 | |
| |
| |
| |
| + | Hypothetical expenses are based on each Fund’s actual annualized net expense ratios and an assumed rate of return of 5% per year before expenses. |
135
(This page intentionally left blank)
Goldman Sachs Funds
Goldman Sachs is a premier financial services firm, known since 1869 for creating thoughtful and customized investment solutions in complex global markets.
Today, the Investment Management Division of Goldman Sachs serves a diverse set of clients worldwide, including private institutions, public entities and individuals. With portfolio management teams located around the world — and $713.9 billion in assets under management as of March 31, 2010 — our investment professionals bring firsthand knowledge of local markets to every investment decision. Goldman Sachs Asset Management ranks in the top 10 asset management firms worldwide, based on assets under management.1
OVERVIEW OF GOLDMAN SACHS FUNDS

| | | | | |
Money Market2
n Institutional Liquid Assets Prime Obligations Portfolio
n Institutional Liquid Assets Tax-Exempt Diversified Portfolio
n Financial Square Federal Fund
n Financial Square Government Fund
n Financial Square Money Market Fund
n Financial Square Prime Obligations Fund
n Financial Square Tax-Free Money Market Fund
n Financial Square Treasury Instruments Fund
n Financial Square Treasury Obligations Fund
Fixed Income
Short Duration and Government
n Enhanced Income Fund
n Ultra-Short Duration Govt. Fund
n Short Duration Government Fund
n Government Income Fund
n Inflation Protected Securities Fund
Multi-Sector
n Core Fixed Income Fund
n Core Plus Fixed Income Fund
n Global Income Fund
Municipal and Tax-Free
n High Yield Municipal Fund
n Municipal Income Fund
n Short Duration Tax-Free Fund
Single Sector
n Investment Grade Credit Fund
n U.S. Mortgages Fund
| |
n High Yield Fund
n Emerging Markets Debt Fund
n Local Emerging Markets Debt Fund
Corporate Credit
n Credit Strategies Fund
Fundamental Equity
n Growth and Income Fund
n Small Cap Value Fund
n Mid Cap Value Fund
n Large Cap Value Fund
n Capital Growth Fund
n Strategic Growth Fund
n Small/Mid Cap Growth Fund
n All Cap Growth Fund
n Concentrated Growth Fund
n Tollkeeper Fundsm
n Growth Opportunities Fund
n U.S. Equity Fund
Structured Equity
n Balanced Fund
n Structured Small Cap Equity Fund
n Structured U.S. Equity Fund
n Structured Small Cap Growth Fund
n Structured Large Cap Growth Fund
n Structured Large Cap Value Fund
n Structured Small Cap Value Fund
n Structured Tax-Managed Equity Fund
n Structured International Tax-Managed Equity Fund
n U.S. Equity Dividend and Premium Fund
n International Equity Dividend and Premium Fund
n Structured International Small Cap Fund
| |
n Structured International Equity Fund
n Structured Emerging Markets
Equity Fund
n Structured International Equity
Flex Fund
Fundamental Equity International
n Strategic International Equity Fund
n Concentrated International
Equity Fund
n International Small Cap Fund
n Asia Equity Fund
n Emerging Markets Equity Fund
n BRIC Fund (Brazil, Russia, India, China)
Select Satellite3
n Real Estate Securities Fund
n International Real Estate Securities Fund
n Commodity Strategy Fund
n Dynamic Allocation Fund
n Absolute Return Tracker Fund
Total Portfolio Solutions3
n Balanced Strategy Portfolio
n Growth and Income Strategy Portfolio
n Growth Strategy Portfolio
n Equity Growth Strategy Portfolio
n Income Strategies Portfolio
n Satellite Strategies Portfolio
n Retirement Strategies Portfolios
n Enhanced Dividend Global Equity Portfolio
n Tax Advantaged Global Equity
Portfolio
|
| |
| 1 | Ranked 9th in Total Assets Worldwide. Pensions&Investments, May 2009. |
| |
| 2 | An investment in a money market fund is neither insured nor guaranteed by the Federal Deposit Insurance Corporation (“FDIC”) or any other government agency. Although the Funds seek to preserve the value of your investment at $1.00 per share, it is possible to lose money by investing in the Funds. |
| |
| 3 | Individual Funds within the Total Portfolio Solutions and Select Satellite categories will have various placement on the risk/return spectrum and may have greater or lesser risk than that indicated by the placement of the general Total Portfolio Solutions or Select Satellite category. |
Firmwide assets under management includes assets managed by GSAM and its Investment Advisory Affiliates. The Goldman Sachs Tollkeeper Fundsm is a registered service mark of Goldman, Sachs & Co.
| | | |
TRUSTEES
Ashok N. Bakhru, Chairman
John P. Coblentz, Jr.
Diana M. Daniels
Patrick T. Harker
James A. McNamara
Jessica Palmer
Alan A. Shuch
Richard P. Strubel | | OFFICERS
James A. McNamara, President
George F. Travers, Principal Financial Officer
Peter V. Bonanno, Secretary
Scott M. McHugh, Treasurer |
| | | |
| | | |
GOLDMAN, SACHS & CO.
Distributor and Transfer Agent | | GOLDMAN SACHS ASSET MANAGEMENT, L.P.
Investment Adviser |
Visit our Website at www.goldmansachsfunds.com to obtain the most recent month-end returns.
Goldman Sachs Asset Management, L.P. 200 West Street, New York, New York 10282
A summary prospectus and a Prospectus for the Funds containing more information may be obtained from your authorized dealer or from Goldman, Sachs & Co. by calling (retail – 1-800-526-7384) (institutional – 1-800-621-2550). Please consider a Fund’s objectives, risks, and charges and expenses, and read the summary prospectus and/or the Prospectus carefully before investing. The summary prospectus and the Prospectus contains this and other information about the Funds.
The reports concerning the Funds included in this shareholder report may contain certain forward-looking statements about the factors that may affect the performance of the Funds in the future. These statements are based on Fund management’s predictions and expectations concerning certain future events and their expected impact on the Funds, such as performance of the economy as a whole and of specific industry sectors, changes in the levels of interest rates, the impact of developing world events, and other factors that may influence the future performance of the Funds. Management believes these forward-looking statements to be reasonable, although they are inherently uncertain and difficult to predict. Actual events may cause adjustments in portfolio management strategies from those currently expected to be employed.
A description of the policies and procedures that the Funds use to determine how to vote proxies relating to portfolio securities and information regarding how a Fund voted proxies relating to portfolio securities during the most recent 12-month period ended June 30 is available (I) without charge, upon request by calling 1-800-526-7384 (for Retail Shareholders) or 1-800-621-2550 (for Institutional Shareholders); and (II) on the Securities and Exchange Commission Web site at http://www.sec.gov.
The Funds file their complete schedule of portfolio holdings with the Securities and Exchange Commission (”SEC”) for the first and third quarters of each fiscal year on Form N-Q. The Funds’ Forms N-Q will become available on the SEC’s website at http://www.sec.gov within 60 days after the Funds’ first and third fiscal quarters. When available, the Funds’ Forms N-Q may be reviewed and copied at the SEC’s Public Reference Room in Washington, D.C. and information on the operation of the Public Reference Room may also be obtained by calling 1-800-SEC-0330. When available, Form N-Q may be obtained upon request and without charge by calling 1-800-526-7384 (for Retail Shareholders) or 1-800-621-2550 (for Institutional Shareholders).
Holdings and allocations shown are unaudited, and may not be representative of current or future investments. Holdings and allocations may not include the Funds’ entire investment portfolio, which may change at any time. Fund holdings should not be relied on in making investment decisions and should not be construed as research or investment advice regarding particular securities.
The Global Industry Classification Standard (GICS) was developed by and is the exclusive property and a service mark of Morgan Stanley Capital International Inc. (MSCI) and Standard & Poor’s, a division of The McGraw-Hill Companies, Inc. (S&P) and is licensed for use by Goldman Sachs. Neither MSCI, S&P nor any other party involved in making or compiling the GICS or any GICS classifications makes any express or implied warranties or representations with respect to such standard or classification (or the results to be obtained by the use thereof), and all such parties hereby expressly disclaim all warranties of originality, accuracy, completeness, merchantability or fitness for a particular purpose with respect to any of such standard or classification. Without limiting any of the foregoing, in no event shall MSCI, S&P, any of their affiliates or any third party involved in making or compiling the GICS or any GICS classifications have any liability for any direct, indirect, special, punitive, consequential or any other damages (including lost profits) even if notified of the possibility of such damages.
Economic and market forecasts presented herein reflect our judgment as of the date of this presentation and are subject to change without notice. These forecasts do not take into account the specific investment objectives, restrictions, tax and financial situation or other needs of any specific client. Actual data will vary and may not be reflected here. These forecasts are subject to high levels of uncertainty that may affect actual performance. Accordingly, these forecasts should be viewed as merely representative of a broad range of possible outcomes. These forecasts are estimated, based on assumptions, and are subject to significant revision and may change materially as economic and market conditions change. Goldman Sachs has no obligation to provide updates or changes to these forecasts. Case studies and examples are for illustrative purposes only.
This material is not authorized for distribution to prospective investors unless preceded or accompanied by a current summary prospectus or Prospectus for the Funds. Please consider a Fund’s objectives, risks, and charges and expenses, and read the summary prospectus and/or Prospectus carefully before investing. The summary prospectus and Prospectus contain this and other information about the Funds.
Copyright 2010 Goldman, Sachs & Co. All rights reserved. 37245.MF.TMPL STDOMSAR10 / 85.2K / 06-10
| | | | |
| | The information required by this Item is only required in an annual report on this Form N-CSR. |
| | | |
| ITEM 3. | | AUDIT COMMITTEE FINANCIAL EXPERT. |
The information required by this Item is only required in an annual report on this Form N-CSR.
| | | |
| ITEM 4. | | PRINCIPAL ACCOUNTANT FEES AND SERVICES. |
The information required by this Item is only required in an annual report on this Form N-CSR.
| | | |
| ITEM 5. | | AUDIT COMMITTEE OF LISTED REGISTRANTS. |
| | | |
| | | The information required by this Item is only required in an annual report on this Form N-CSR. |
| | | |
| ITEM 6. | | SCHEDULE OF INVESTMENTS. |
| | | |
| | (a) | | The Schedule of Investments is included as part of the Semi-Annual Report to Stockholders filed under Item 1 of this Form N-CSR. |
| | | |
| | (b) | | Not applicable. |
| | | |
| ITEM 7. | | DISCLOSURE OF PROXY VOTING POLICIES AND PROCEDURES FOR CLOSED-END MANAGEMENT INVESTMENT COMPANIES. |
| | | |
| | | Not applicable. |
| | | |
| ITEM 8. | | PORTFOLIO MANAGERS OF CLOSED-END MANAGEMENT INVESTMENT COMPANIES. |
| | | |
| | | Not applicable. |
| | | |
| ITEM 9. | | PURCHASES OF EQUITY SECURITIES BY CLOSED-END MANAGEMENT INVESTMENT COMPANY AND AFFILIATED PURCHASERS. |
| | | |
| | | Not applicable. |
| | | |
| ITEM 10. | | SUBMISSION OF MATTERS TO A VOTE OF SECURITY HOLDERS.
There have been no material changes to the procedures by which shareholders may recommend nominees to the registrant’s board of trustees. |
| | | |
| | | |
| ITEM 11. | | CONTROLS AND PROCEDURES. |
| | | |
| | (a) | | The registrant’s principal executive and principal financial officers, or persons performing similar functions have concluded that the registrant’s disclosure controls and procedures (as defined in Rule 30a-3(c) under the Investment Company Act of 1940, as amended (the “1940 Act”)) are effective as of a date within 90 days of the filing of this report that includes the disclosure required by this paragraph, based on the evaluation of these controls and procedures required by Rule 30a-3(b) under the 1940 Act and 15d-15(b) under the Securities Exchange Act of 1934, as amended. |
| | | |
| | (b) | | There were no changes in the registrant’s internal control over financial reporting (as defined in Rule 30a-3(d) under the 1940 Act) that occurred during the registrant’s second fiscal quarter of the period covered by this report that have materially affected, or are reasonably likely to materially affect, the registrant’s internal control over financial reporting. |
| | | |
| | (a)(1) | | | Not applicable. |
| | | |
| | (a)(2) | | Exhibit 99.CERT | Certifications pursuant to Section 302 of the Sarbanes-Oxley Act of 2002 filed herewith. |
| | | |
| | (a)(3) | | | Not applicable. |
| | | |
| | (b) | | Exhibit 99.906CERT | Certifications pursuant to Section 906 of the Sarbanes-Oxley Act of 2002 filed herewith. |
SIGNATURES
| | | | Pursuant to the requirements of the Securities Exchange Act of 1934 and the Investment Company Act of 1940, the registrant has duly caused this report to be signed on its behalf by the undersigned, thereunto duly authorized. |
| | | | | | | |
| | | | | Goldman Sachs Trust | | |
| | | | | | | |
| | | | /s/ James A. McNamara | | |
| | | | |
| | |
| | | | | By: James A. McNamara | | |
| | | | | Chief Executive Officer of | | |
| | | | | Goldman Sachs Trust | | |
| | | | | | | |
| | | | Date: June 30, 2010 | | |
| | | | Pursuant to the requirements of the Securities Exchange Act of 1934 and the Investment Company Act of 1940, this report has been signed below by the following persons on behalf of the registrant and in the capacities and on the dates indicated. |
| | | | | | | |
| | | | | /s/ James A. McNamara | | |
| | | | |
| | |
| | | | | By: James A. McNamara | | |
| | | | | Chief Executive Officer of | | |
| | | | | Goldman Sachs Trust | | |
| | | | | | | |
| | | | | Date: June 30, 2010 | | |
| | | | | | | |
| | | | | /s/ George F. Travers | | |
| | | | |
| | |
| | | | | By: George F. Travers | | |
| | | | | Chief Financial Officer of | | |
| | | | | Goldman Sachs Trust | | |
| | | | | | | |
| | | | | Date: June 30, 2010 | | |


![[GRAPHIC]](https://capedge.com/proxy/N-CSRS/0000950123-10-063085/y84743y8474307.gif)
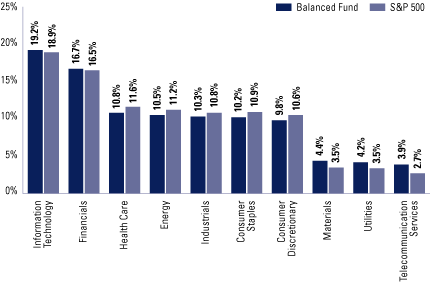
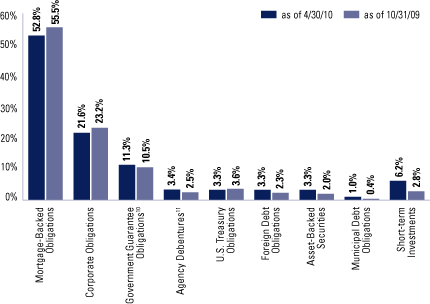

![[GRAPHIC]](https://capedge.com/proxy/N-CSRS/0000950123-10-063085/y84743y8474311.gif)
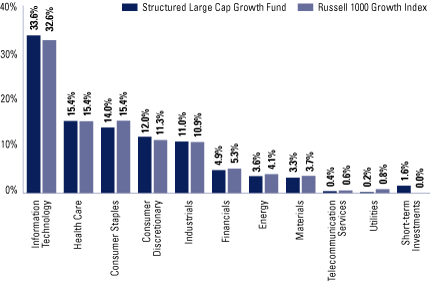
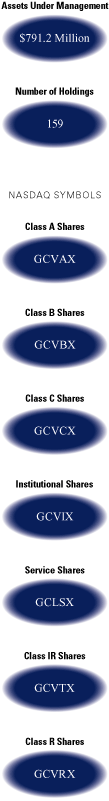
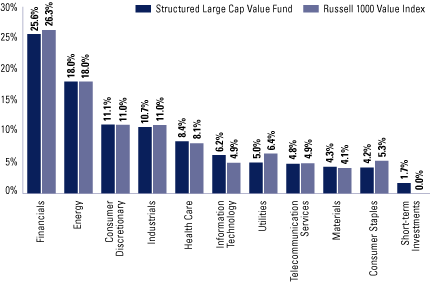
![[GRAPHIC]](https://capedge.com/proxy/N-CSRS/0000950123-10-063085/y84743y8474315.gif)
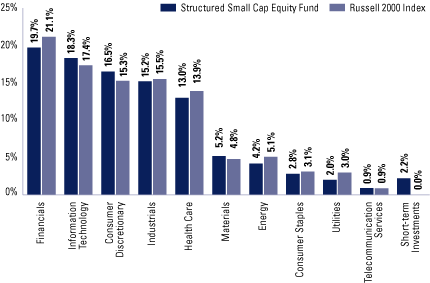
![[GRAPHIC]](https://capedge.com/proxy/N-CSRS/0000950123-10-063085/y84743y8474317.gif)
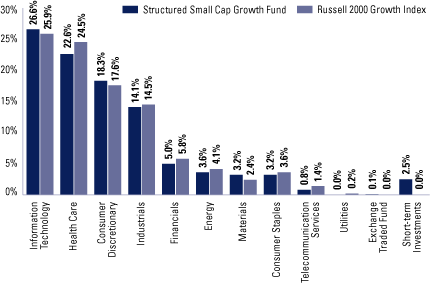

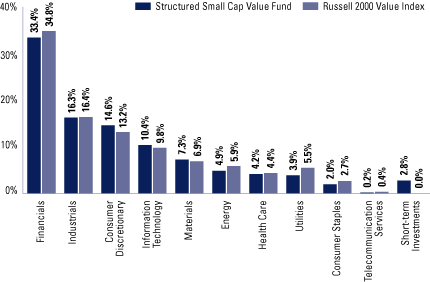
![[GRAPHIC]](https://capedge.com/proxy/N-CSRS/0000950123-10-063085/y84743y8474321.gif)