UNITED STATES
SECURITIES AND EXCHANGE COMMISSION
Washington, D.C. 20549
FORM N-CSR
CERTIFIED SHAREHOLDER REPORT OF REGISTERED
MANAGEMENT INVESTMENT COMPANIES
Investment Company Act file number 811-05349
Goldman Sachs Trust
(Exact name of registrant as specified in charter)71 South Wacker Drive, Chicago, Illinois 60606
(Address of principal executive offices) (Zip code)| | | |
| Peter V. Bonanno, Esq. | | Copies to: |
| Goldman, Sachs & Co. | | Geoffrey R. T. Kenyon, Esq. |
| 200 West Street | | Dechert LLP |
| New York, New York 10282 | | 200 Clarendon Street |
| | | 27th Floor |
| | | Boston, MA 02116-5021 |
|
(Name and address of agents for service)
|
Registrant’s telephone number, including area code: (312) 655-4400
Date of fiscal year end: March 31
Date of reporting period: September 30, 2010
| | | |
| ITEM 1. | | REPORTS TO STOCKHOLDERS. |
| | | |
| | | The Semi-Annual Report to Stockholders is filed herewith. |
Goldman Sachs Funds
| | | | |
| | | | |
Semi-Annual Report | | | September 30, 2010 |
| | | | |
| | | | |
| | | | |
| | | | Multi Sector Fixed Income Funds |
| | | | Core Fixed Income |
| | | | Core Plus Fixed Income |
| | | | Global Income |
| | | | Strategic Income |
| | | | |
Goldman Sachs Multi Sector Fixed Income Funds
| | |
| n | CORE FIXED INCOME | |
| |
| n | CORE PLUS FIXED INCOME | |
| |
| n | GLOBAL INCOME | |
| |
| n | STRATEGIC INCOME | |
TABLE OF CONTENTS
| | | |
| Principal Investment Strategies and Risks | | 1 |
| Investment Process | | 3 |
| Market Review | | 4 |
| Portfolio Management Discussions and Performance Summaries | | 6 |
| Schedules of Investments | | 24 |
| Financial Statements | | 76 |
| Notes to the Financial Statements | | 80 |
| Financial Highlights | | 102 |
| Other Information | | 110 |
| | | | | | | |
NOT FDIC-INSURED | | | May Lose Value | | | No Bank Guarantee |
| | | | | | | |
GOLDMAN SACHS MULTI SECTOR FIXED INCOME FUNDS
Principal Investment Strategies and Risks
The Core Fixed Income Fund invests primarily in fixed income securities, including U.S. government securities, corporate debt securities, privately issued mortgage-backed securities and asset-backed securities. The Fund’s investments in fixed income securities are subject to the risks associated with debt securities generally, including credit, liquidity and interest rate risk. The guarantee on U.S. government securities applies only to the underlying securities of the Fund if held to maturity and not to the value of the Fund’s shares. The Fund’s investments in mortgage-backed securities are subject to prepayment risks. These risks may result in greater share price volatility. The Fund may invest in foreign and emerging markets securities, which may be more volatile and less liquid than investments in U.S. securities and will be subject to the risks of currency fluctuations and political developments. At times, the Fund may be unable to sell certain of its portfolio securities without a substantial drop in price, if at all. The Fund may also engage in foreign currency transactions for hedging purposes (including cross hedging) or for speculative purposes. Forward foreign currency exchange contracts are subject to the risk that the counterparty to the contract will default on its obligations. The Fund may make substantial investments in derivative instruments, including options, financial futures, Eurodollar futures contracts, swaps, options on swaps, structured securities and other derivative investments. Derivative instruments may involve a high degree of financial risk. These risks include the risk that a small movement in the price of the underlying security or benchmark may result in a disproportionately large movement, unfavorable or favorable, in the price of the derivative instrument; risks of default by a counterparty; and the risks that transactions may not be liquid.
The Core Plus Fixed Income Fund invests primarily in fixed income securities, including U.S. government securities, corporate debt securities, privately issued mortgage-backed securities, asset-backed securities, high yield non-investment grade securities and fixed income securities of issuers located in emerging countries. The Fund’s investments in fixed income securities are subject to the risks associated with debt securities generally, including credit, liquidity and interest rate risk. The guarantee on U.S. government securities applies only to the underlying securities of the Fund if held to maturity and not to the value of the Fund’s shares. The Fund’s investments in mortgage-backed securities are subject to prepayment risks. These risks may result in greater share price volatility. The Fund may invest in high yield, fixed income securities that, at the time of purchase, are non-investment grade. High yield, lower rated securities involve greater price volatility and present greater risks than higher rated fixed income securities. The Fund may also invest in foreign issuers which are denominated in currencies other than the U.S. dollar and in securities of issuers located in emerging countries denominated in any currency. The Fund’s foreign and emerging market investments may be more volatile and less liquid than its investments in U.S. securities and will be subject to the risks of currency fluctuations and sudden economic or political developments. At times, the Fund may be unable to sell certain of its portfolio securities without a substantial drop in price, if at all. The Fund may also engage in foreign currency transactions for hedging purposes (including cross hedging) or for speculative purposes. Forward foreign currency exchange contracts are subject to the risk that the counterparty to the contract will default on its obligations. The Fund may make substantial investments in derivative instruments, including options, financial futures, Eurodollar futures contracts, swaps, options on swaps, structured securities and other derivative investments. Derivative instruments may involve a high degree of financial risk. These risks include the risk that a small movement in the price of the underlying security or benchmark may result in a disproportionately large movement, unfavorable or favorable, in the price of the derivative instrument; risks of default by a counterparty; and the risks that transactions may not be liquid.
GOLDMAN SACHS MULTI SECTOR FIXED INCOME FUNDS
The Global Income Fund invests primarily in a portfolio of fixed income securities of U.S. and foreign issuers. The Fund’s investments in fixed income securities are subject to the risks associated with debt securities generally, including credit, liquidity and interest rate risk. The Fund may invest in foreign and emerging market securities, which may be more volatile and less liquid than its investments in U.S. securities and will be subject to the risks of currency fluctuations and sudden economic or political developments. At times, the Fund may be unable to sell certain of its portfolio securities without a substantial drop in price, if at all. The Fund may also engage in foreign currency transactions for hedging purposes (including cross hedging) for speculative purposes. Forward foreign currency exchange contracts are subject to the risk that the counterparty to the contract will default on its obligations. The Fund may make substantial investments in derivative instruments, including options, financial futures, Eurodollar futures contracts, swaps, options on swaps, structured securities and other derivative investments. Derivative instruments may involve a high degree of financial risk. These risks include the risk that a small movement in the price of the underlying security or benchmark may result in a disproportionately large movement, unfavorable or favorable, in the price of the derivative instrument; risks of default by a counterparty; and the risks that transactions may not be liquid. The Fund may concentrate its investments in particular countries or regions and may be subject to greater losses than if it were less concentrated in a particular country or region. The Fund is non-diversified and may invest more of its assets in fewer issuers than diversified funds, may be more susceptible to adverse developments affecting any single issuer held in its portfolio, and may be susceptible to greater losses because of these developments.
The Strategic Income Fund invests in a broadly diversified portfolio of U.S. and foreign investment grade and non-investment grade fixed income investments including, but not limited to: U.S. Government securities (such as U.S. Treasury securities or Treasury inflation protected securities), non-U.S. sovereign debt, agency securities, corporate debt securities, agency and non-agency mortgage-backed securities, asset-backed securities, custodial receipts, municipal securities, loan participations and convertible securities. The Fund’s investments in fixed income securities are subject to the risks associated with debt securities generally, including credit, liquidity and interest rate risk. The guarantee on certain U.S. government securities applies only to the underlying securities of the Fund if held to maturity and not to the value of the Fund’s shares. The Fund’s investments in mortgage-backed securities are subject to, among other risks, prepayment risks. These risks may result in greater share price volatility. The Fund may invest in high yield, fixed income securities that, at the time of purchase, are non-investment grade. High yield, lower rated securities involve greater price volatility, are less liquid and present greater risks than higher rated fixed income securities. The Fund may also invest in foreign issuers which are denominated in currencies other than the U.S. dollar and in securities of issuers located in emerging countries denominated in any currency. The Fund’s foreign and emerging market investments may be more volatile and less liquid than its investments in U.S. securities and will be subject to the risks of currency fluctuations and sudden economic or political developments. At times, the Fund may be unable to sell certain of its portfolio securities without a substantial drop in price, if at all. The Fund may also engage in foreign currency transactions for hedging purposes (including cross hedging) or for speculative purposes. Accordingly, forward foreign currency exchange contracts are subject to the risk that attempts to hedge will be unsuccessful as well as the risks of derivatives noted below. The Fund may also make substantial investments in other derivative instruments, including interest rate futures contracts, options (including options on futures contracts, swaps, bonds, stocks and indexes), swaps (including credit default, index, basis, total return, volatility and currency swaps), other forward contracts and other derivative instruments. Derivative instruments may involve a high degree of financial risk. These risks include the risk that a small movement in the price of the underlying security or benchmark may result in a disproportionately large movement, unfavorable or favorable, in the price of the derivative instrument; risks of default by a counterparty; and the risks that transactions may not be liquid. The Fund is subject to the risks associated with implementing short positions. Taking short positions involves leverage of the Fund’s assets and presents various other risks. Losses on short positions are potentially unlimited as a loss occurs when the value of an asset with respect to which the Fund has a short position increases. Note that the implementation of short positions, as well as the use of derivatives generally, involves sophisticated investment techniques that have the potential to add additional risk to a portfolio.
GOLDMAN SACHS MULTI SECTOR FIXED INCOME FUNDS
What Differentiates the Goldman Sachs Asset
Management Fixed Income Investment Process?
At Goldman Sachs Asset Management, L.P. (“GSAM”), the goal of our fixed income investment process is to provide consistent, strong performance by actively managing our portfolios within a research-intensive, risk-managed framework.
| | | |
| | | |
| | | |
| | | A key element of our fixed income investment philosophy is to evaluate the broadest global opportunity set to capture relative value across sectors and instruments. Our globally integrated investment process involves managing dynamically along the risk/return spectrum, as we continue to develop value-added strategies through:

n Assess relative value among sectors (such as mortgage-backed and corporate debt securities) and sub-sectors
n Leverage the vast resources of GSAM in selecting securities for each portfolio

n Team approach to decision making
n Manage risk by avoiding significant sector and interest rate bets
n Careful management of yield curve strategies — while closely managing
portfolio duration
|
| | | 
|
| | | Fixed Income portfolios that: |
| | | |
| | | |
| | | n Include domestic and global investment options, income opportunities, and access to areas of specialization
n Capitalize on GSAM’s industry-renowned credit research capabilities
n Use a risk-managed framework to seek total return, recognizing the importance of investors’ capital accumulation goals as well as their need for income |
MARKET REVIEW
Goldman Sachs Multi Sector Fixed Income Funds
Market Review
The six months ended September 30, 2010 (the “Reporting Period”) brought the first signals of slowing momentum in global economic growth — a development that in our view was broadly consistent with the traditional cycle of recovery. After the recession ended in June 2009 (the date officially cited by the National Bureau of Economic Research), the world’s largest economies had begun to rebound. However, by the spring of 2010, global economic conditions showed signs of deterioration. The slowdown was most evident in the U.S. and China, raising concerns that the world’s two largest economies — both crucial sources of worldwide demand — might lead the global economy into a double-dip recession. Doubts about the sustainability of the global economic recovery drove sharp declines in government bond yields. In the U.S., for example, yields on 10-year Treasuries fell from 3.87% at the beginning of the Reporting Period to 2.51% on September 30, 2010.
During the second calendar quarter, the broader market impact of the economic slowdown was magnified by the sovereign debt crisis unfolding in Europe. Investors’ risk appetite suffered against this backdrop, and corporate bonds and emerging markets debt weakened in line with falling equity prices. By May, doubts about the solvency of peripheral European nations — Portugal, Italy, Ireland, Greece and Spain — had reached a fevered pitch. Those solvency concerns were based on high indebtedness and record budget deficits among the peripheral European nations. On April 27th, Greece’s debt rating was cut to junk by Standard & Poor’s, and risk premiums rose on Greek debt and on the sovereign debt of its similarly fiscally troubled neighbors, threatening a crisis. European lawmakers worked jointly with the International Monetary Fund (IMF) and the European Central Bank (ECB) to avert a liquidity crisis and to prevent contagion from spreading around the world through Europe’s still-fragile banking system. Although policymakers’ response succeeded in stabilizing peripheral European markets, volatility continued to flare intermittently through the end of the Reporting Period.
Riskier fixed income assets recovered during the third calendar quarter much of the ground they had lost in the months prior, and corporate bond markets experienced a record surge in new issuance. This rebound in risk appetite was helped by stronger economic signals. For example, reports of second quarter Gross Domestic Product (GDP) figures indicated that growth in the Eurozone had outstripped that of both the U.S. and Japan, primarily because of improved domestic demand among the largest European states and Germany’s exceptional exports strength. September’s economic data showed that while U.S. manufacturing and services activity had slowed, both sectors continued to expand. In China, expansion of its manufacturing sector seemed to be re-accelerating, judging by the most recently available purchasing managers survey. Still, economic growth remained below trend across the G-3 (the three largest developed economies — the U.S., Eurozone and Japan).
In the U.S., with consumer demand still weak and employment still declining, attention turned to the dwindling policy options for further stimulus. The increased focus on the widening fiscal deficit made substantial increases in government spending unlikely. Short-term interest rates had remained near zero for almost two years. During September, Federal Reserve (the “Fed”) policymakers began to demonstrate a clear willingness to revisit the exceptional bond-buying strategy it had halted earlier this year, thereby opening the door to a resumption of a second round of quantitative easing. As a result, by the end of the Reporting Period, U.S. markets were strongly positioned for more aggressive purchases by the Fed, and two-year Treasury yields had reached an all-time low near 0.5%.
MARKET REVIEW
Looking Ahead
During the Reporting Period, we grew increasingly convinced that the positives in the global economy outweigh the negatives and that economic growth should likely continue at a slow but steady pace. In the U.S., we believe the building blocks for growth are still in place and that downside risks are limited by two key factors. First, the Fed is likely, in our view, to resume quantitative easing, which should keep financial conditions highly accommodative. Second, leverage, or the use of borrowed money, in the U.S. private sector and financial system broadly has declined dramatically since 2008, and as such, we think the possibility of another severe pullback in either asset prices or employment is significantly reduced.
The biggest risk to continued economic recovery, in our view, is fiscal tightening in the U.S., where $270 billion of tax cuts and $75 billion of tax credits are scheduled to expire at the end of 2010. We estimate the expiration of these measures would be equivalent to approximately a 10% annualized decline in disposable income, or about 2% of GDP. If this scenario materializes, the risk of a double-dip recession in the U.S. may well rise. We further believe that a massive amount of quantitative easing from the Fed would be required to offset the impact of such a scenario on economic growth. However, that said, at the end of the Reporting Period, we considered this a low-probability risk and believed that a compromise would likely be reached to extend most of these tax measures for at least the next couple of years.
From an investment perspective, we think the slow but steady economic growth environment, combined with Fed asset purchases, favors overweight positions in high quality non-Treasury sectors and select emerging markets bonds. We anticipate that U.S. interest rates may stabilize as economic growth settles into a slower but steady range. Given our view that the Fed will resume quantitative easing, we favored an overweight position in the intermediate portion of the U.S. yield curve, or spectrum of maturities, at the end of the Reporting Period. In the intermediate, i.e. five- to 10-year, portion of the yield curve, we believe the likelihood of further quantitative easing reduces the downside risk of higher interest rates and increases the possibility of a stronger rally in rates than would be justified by economic fundamentals alone. We believe, however, that rates on 30-year maturities are likely to move higher on investor concerns about the potential long-term inflationary effect of more quantitative easing.
Against this backdrop, we saw value in high quality non-Treasury sectors, including corporate bonds and certain agency mortgage-backed securities. Yields on corporate bonds were low at the end of the Reporting Period, but the difference between yields on corporate bonds and U.S. Treasuries remained near long-term historical averages. As a result, we believe much of the yield on corporate bonds was compensation for credit risk, which, in our view, is low and declining given the prevalence of high corporate cash balances and cautious, credit-friendly business strategies. We also saw value at the end of the Reporting Period in select emerging market sovereign debt, where yields remained attractive relative to the yields of developed country government bonds and where debt fundamentals were improving rather than deteriorating.
PORTFOLIO RESULTS
Goldman Sachs Core Fixed Income Fund
Investment Objective
The Fund seeks a total return consisting of capital appreciation and income that exceeds the total return of the Barclays Capital U.S. Aggregate Bond Index.
Portfolio Management Discussion and Analysis
Below, the Goldman Sachs U.S. Fixed Income Investment Management Team discusses the Fund’s performance and positioning for the six-month period ended September 30, 2010 (the “Reporting Period”).
| |
| Q | How did the Goldman Sachs Core Fixed Income Fund (the “Fund”) perform during the Reporting Period? |
| |
| A | During the Reporting Period, the Fund’s Class A, B, C, Institutional, Service, IR and R Shares generated cumulative total returns, without sales charges, of 5.96%, 5.54%, 5.43%, 6.01%, 5.85%, 5.98% and 5.72%, respectively. These returns compare to the 6.05% cumulative total return of the Fund’s benchmark, the Barclays Capital U.S. Aggregate Bond Index (the “Barclays Index”), during the same period. |
| |
| Q | What key factors were responsible for the Fund’s performance during the Reporting Period? |
| |
| A | Both top-down and bottom-up strategies contributed to the Fund’s performance during the Reporting Period. Within our top-down strategies, our cross-sector strategy contributed the most to relative performance. Our cross-sector strategy is one in which we invest Fund assets across a variety of fixed income sectors, including some that may not be included in the Fund’s benchmark. Bottom-up individual issue selection within the collateralized and corporate bond sectors contributed positively to the Fund’s performance during the Reporting Period. |
The primary detractor from Fund performance was its short duration in U.S. securities compared to the Barclays Index, as interest rates declined during the Reporting Period. Duration is a measure of the Fund’s sensitivity to changes in interest rates.
| |
| Q | Which fixed income market sectors most significantly affected Fund performance? |
| |
| A | Exposure to non-agency residential mortgage-backed securities (RMBS) was particularly beneficial during the Reporting Period. Despite a short-lived sell-off in May, non-agency RMBS performed strongly, driven by supportive supply and demand dynamics. The Fund’s outperformance was further boosted by issue selection of non-agency RMBS within the collateralized sector. Within non-agency RMBS, the Fund’s focus on the senior tranches of mortgage securities backed by various collateral sectors added value. |
Individual issue selection of agency mortgage-backed securities (MBS) contributed modestly as well. During the latter part of the Reporting Period, mortgage rates reached historically low levels and concerns surrounding a refinancing wave and heightened prepayment risk mounted within the MBS sector. Against this backdrop, select agency MBS, such as low-loan balanced pools with inherent prepayment protection features, outperformed securities more susceptible to prepayment risk. The Fund was positioned to benefit from such market conditions, as it had an overweighted allocation to those securities with prepayment protection and an underweighted exposure to those securities more susceptible to prepayments.
Within the corporate bond sector, a bias to be overweight lower quality bonds added value, as lower quality credits outperformed higher quality securities during the Reporting Period. There were no real detractors from a sector allocation or security selection perspective during the Reporting Period.
PORTFOLIO RESULTS
| |
| Q | Did the Fund’s duration and yield curve positioning strategy help or hurt its results during the Reporting Period? |
| |
| A | The Fund’s shorter U.S. duration relative to the Barclays Index from May through July was the primary detractor from performance, as interest rates declined during the Reporting Period. During the second and third calendar quarters, 10-year U.S. Treasury rates declined approximately 135 basis points to 2.51%, driven by reports pointing to weaker than expected economic data. During the third calendar quarter, the Fed’s decision to reinvest mortgage paydowns into U.S. Treasuries, together with the market speculating about an additional round of quantitative easing, or buying of U.S. Treasuries by the Fed, led yields even lower. Duration is a measure of the Fund’s sensitivity to changes in interest rates. |
| |
| Q | How did the Fund use derivatives during the Reporting Period? |
| |
| A | As market conditions warranted during the Reporting Period, the Fund engaged in forward foreign currency exchange contracts, financial futures contracts and swap contracts to enhance the portfolio return and for hedging purposes. We also used such instruments to adopt a negative basis position in which the Fund’s portfolio was long corporate cash bonds and short derivative instruments, such as credit default swaps. We used derivatives for the efficient management of the Fund and to apply active investment views with greater versatility and to afford greater risk management precision. |
| |
| Q | Were there any notable changes in the Fund’s weightings during the Reporting Period? |
| |
| A | During the Reporting Period, we increased the Fund’s exposure to agency MBS from an underweighted position to an overweighted one. We slightly reduced the Fund’s significant exposure to non-agency MBS. We also reduced the Fund’s exposure to quasi-government securities, including agency securities and FDIC (Federal Deposit Insurance Corporation)-guaranteed corporate bonds. Toward the end of the Reporting Period, we shifted from a net short U.S. duration to a net long bias in U.S. duration. |
| |
| Q | How was the Fund positioned relative to its benchmark index at the end of the Reporting Period? |
| |
| A | At the end of September 2010, the Fund had overweighted allocations relative to the Barclays Index in quasi-government securities, including government-guaranteed corporate bonds, as well as in asset-backed securities and RMBS. The Fund also had exposure to covered bonds, which is a sector not represented in the Barclays Index. Covered bonds are securities created from either mortgage loans or public sector loans. The Fund had underweighted exposure relative to the benchmark index in U.S. government securities, agency non-government-guaranteed securities and investment grade corporate bonds. The Fund had rather neutral positions compared to the Barclays Index in commercial mortgage-backed securities (CMBS) and emerging market debt. The Fund also had a position in cash at the end of the Reporting Period. The Fund maintained a modestly longer duration relative to the Barclays Index at the end of the Reporting Period. |
FUND BASICS
Core Fixed Income Fund
as of September 30, 2010
PERFORMANCE REVIEW
| | | | | | | | | | | | | | | | | | | |
| | | | | | Barclays Capital
| | | 30-Day
| | | 30 Day
| | | |
April 1, 2010–
| | Fund Total Return
| | | U.S. Aggregate
| | | Standardized
| | | Standardized
| | | |
| September 30, 2010 | | (based on NAV1) | | | Bond Index2 | | | Subsidized Yield3 | | | Unsubsidized Yield3 | | | |
|
| |
| Class A | | | 5.96 | % | | | 6.05 | % | | | 1.56 | % | | | 1.56 | % | | |
| Class B | | | 5.54 | | | | 6.05 | | | | 0.88 | | | | 0.88 | | | |
| Class C | | | 5.43 | | | | 6.05 | | | | 0.88 | | | | 0.88 | | | |
| Institutional | | | 6.01 | | | | 6.05 | | | | 1.95 | | | | 1.95 | | | |
| Service | | | 5.85 | | | | 6.05 | | | | 1.46 | | | | 1.46 | | | |
| Class IR | | | 5.98 | | | | 6.05 | | | | 1.86 | | | | 1.86 | | | |
| Class R | | | 5.72 | | | | 6.05 | | | | 1.39 | | | | 1.39 | | | |
|
| |
| 1 | The net asset value (“NAV”) represents the net assets of the class of the Fund (ex-dividend) divided by the total number of shares of the class outstanding. The Fund’s performance assumes the reinvestment of dividends and other distributions. The Fund’s performance does not reflect the deduction of any applicable sales charges. |
| 2 | The Barclays Capital U.S. Aggregate Bond Index represents an unmanaged diversified portfolio of fixed income securities, including U.S. Treasuries, investment-grade corporate bonds, and mortgage-backed and asset-backed securities. The Index figures do not reflect any deduction for fees, expenses or taxes. It is not possible to invest directly in an index. |
| 3 | The 30-Day Standardized Subsidized Yield of the Fund is calculated by dividing the net investment income per share (as defined by securities industry regulations) earned by the Fund over a 30-day period (ending on the stated month-end date) by the maximum public offering price (“POP”) per share of the Fund on the last day of the period. This number is then annualized. This yield does not necessarily reflect income actually earned and distributed by the Fund and, therefore, may not be correlated with the dividends or other distributions paid to shareholders. The 30-Day Standardized Unsubsidized Yield does not reflect any applicable expense reductions. |
STANDARDIZED AVERAGE ANNUAL TOTAL RETURNS4
| | | | | | | | | | | | | | | | | | | | | |
| For the period ended 9/30/10 | | One Year | | | Five Years | | | Ten Years | | | Since Inception | | | Inception Date | | |
|
| |
| Class A | | | 6.12 | % | | | 3.62 | % | | | 5.09 | % | | | 5.34 | % | | 5/1/97 | | |
| Class B | | | 4.28 | | | | 3.22 | | | | 4.86 | | | | 5.17 | | | 5/1/97 | | |
| Class C | | | 8.35 | | | | 3.64 | | | | 4.70 | | | | 4.68 | | | 8/15/97 | | |
| Institutional | | | 10.57 | | | | 4.76 | | | | 5.88 | | | | 6.02 | | | 1/5/94 | | |
| Service | | | 10.01 | | | | 4.26 | | | | 5.36 | | | | 5.53 | | | 3/13/96 | | |
| Class IR | | | 10.37 | | | | N/A | | | | N/A | | | | 4.37 | | | 11/30/07 | | |
| Class R | | | 9.85 | | | | N/A | | | | N/A | | | | 3.89 | | | 11/30/07 | | |
|
| |
| 4 | The Standardized Average Annual Total Returns are average annual total returns as of the most recent calendar quarter-end. They assume reinvestment of all distributions at NAV. These returns reflect a maximum initial sales charge of 3.75% for Class A Shares, the assumed contingent deferred sales charge for Class B Shares (5% maximum declining to 0% after six years) and the assumed contingent deferred sales charge for Class C Shares (1% if redeemed within 12 months of purchase). Class B Shares convert automatically to Class A Shares on or about the fifteenth day of the last month of the calendar quarter that is eight years after purchase. Returns for Class B Shares for the period after conversion reflect the performance of Class A Shares. Prior to July 29, 2009, the maximum initial sales charge applicable to Class A Shares was 4.5%, which is not reflected in the average annual total return figures shown. Because Institutional, Service, Class IR and Class R Shares do not involve a sales charge, such a charge is not applied to their Standardized Average Annual Total Returns. Effective November 2, 2009, the Fund’s Class B Shares are no longer available for purchase by new or existing shareholders (although current Class B shareholders may continue to reinvest income and capital gains distributions into Class B Shares, and Class B shareholders may continue to exchange their shares for Class B Shares of certain other Goldman Sachs Funds). |
The returns represent past performance. Past performance does not guarantee future results. The Fund’s investment return and principal value will fluctuate so that an investor’s shares, when redeemed, may be worth more or less than their original cost. Current performance may be lower or higher than the performance quoted above. Please visit our Web site at: www.goldmansachsfunds.com to obtain the most recent month-end returns. Performance reflects expense limitations in effect. In their absence, performance would be reduced. Returns do not reflect the deduction of taxes that a shareholder would pay on Fund distributions or the redemption of Fund shares.
FUND BASICS
EXPENSE RATIOS5
| | | | | | | | | |
| | | Net Expense Ratio (Current) | | | Gross Expense Ratio (Before Waivers) | |
| |
| |
| Class A | | | 0.82 | % | | | 0.82 | % |
| Class B | | | 1.57 | | | | 1.57 | |
| Class C | | | 1.57 | | | | 1.57 | |
| Institutional | | | 0.48 | | | | 0.48 | |
| Service | | | 0.98 | | | | 0.98 | |
| Class IR | | | 0.57 | | | | 0.57 | |
| Class R | | | 1.07 | | | | 1.07 | |
|
| |
| 5 | The expense ratios of the Fund, both current (net of applicable fee waivers and/or expense limitations) and before waivers (gross of applicable fee waivers and/or expense limitations), are as set forth above according to the most recent publicly available Prospectus for the Fund and may differ from the expense ratios disclosed in the Financial Highlights in this report. Applicable waivers and expense limitations may be modified or terminated in the future, consistent with the terms of any agreements in place. If this occurs, the expense ratios may change without shareholder approval. |
FUND BASICS
FUND COMPOSITION6
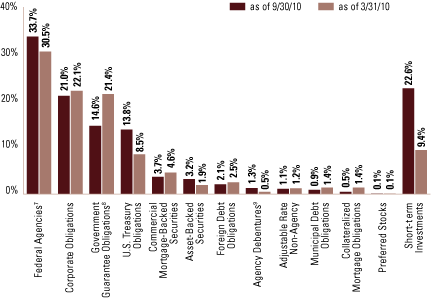
| |
| 6 | The percentage shown for each investment category reflects the value of investments in that category as a percentage of net assets. Short-term investments represent repurchase agreements. Figures in the above graph may not sum to 100% due to the exclusion of other assets and liabilities. |
| 7 | “Federal Agencies” are mortgage-backed securities guaranteed by the Government National Mortgage Association (“GNMA”), Federal National Mortgage Association (“FNMA”) and Federal Home Loan Mortgage Corp. (“FHLMC”). GNMA instruments are backed by the full faith and credit of the U.S. Government. |
| 8 | “Government Guarantee Obligations” are guaranteed under the Federal Deposit Insurance Corporation’s (“FDIC”) Temporary Liquidity Guarantee Program or a foreign government guarantee program and are backed by the full faith and credit of the United States or the government of a foreign country. The expiration date of the FDIC’s guarantee is the earlier of the maturity date of the debt or June 30, 2012 and the expiration date of a foreign country guarantee is the maturity date of the debt. |
| 9 | “Agency Debentures” include agency securities offered by companies such as Fannie Mae and Freddie Mac, which operate under a government charter. While they are required to report to a government regulator, their assets are not explicitly guaranteed by the government and they otherwise operate like any other publicly traded company. |
PORTFOLIO RESULTS
Goldman Sachs Core Plus Fixed Income Fund
Investment Objective
The Fund seeks a total return consisting of capital appreciation and income that exceeds the total return of the Barclays Capital U.S. Aggregate Bond Index.
Portfolio Management Discussion and Analysis
Below, the Goldman Sachs U.S. Fixed Income Investment Management Team discusses the Fund’s performance and positioning for the six-month period ended September 30, 2010 (the “Reporting Period”).
| |
| Q | How did the Goldman Sachs Core Plus Fixed Income Fund (the “Fund”) perform during the Reporting Period? |
| |
| A | During the Reporting Period, the Fund’s Class A, B, C, Institutional, Service, IR and R Shares generated cumulative total returns, without sales charges, of 5.86%, 5.47%, 5.47%, 5.94%, 5.69%, 5.89% and 5.72%, respectively. These returns compare to the 6.05% cumulative total return of the Fund’s benchmark, the Barclays Capital U.S. Aggregate Bond Index (the “Index”), during the same time period. |
| |
| Q | What key factors were responsible for the Fund’s performance during the Reporting Period? |
| |
| A | Both top-down and bottom-up strategies contributed to the Fund’s performance during the Reporting Period. Within our top-down strategies, our cross-sector strategy contributed the most to relative performance. Our cross-sector strategy is one in which we invest Fund assets across a variety of fixed income sectors, including some that may not be included in the Fund’s benchmark. Bottom-up individual issue selection within the collateralized and corporate bond sectors contributed positively to the Fund’s performance during the Reporting Period. |
The primary detractors from Fund performance were our duration and currency strategies. The Fund had a short duration in U.S. securities compared to the Index, which hurt as interest rates declined during the Reporting Period. Duration is a measure of the Fund’s sensitivity to changes in interest rates. Within the currency strategy, the Fund’s positioning in the Australian dollar, Mexican peso and Canadian dollar detracted most.
| |
| Q | Which fixed income market sectors most significantly affected Fund performance? |
| |
| A | Exposure to non-agency residential mortgage-backed securities (RMBS) was particularly beneficial during the Reporting Period. Despite a short-lived sell-off in May, non-agency RMBS performed strongly, driven by supportive supply and demand dynamics. The Fund’s outperformance was further boosted by issue selection of non-agency RMBS within the collateralized sector. Within non-agency RMBS, the Fund’s focus on the senior tranches of mortgage securities backed by various collateral sectors added value. |
Individual issue selection of agency mortgage-backed securities (MBS) contributed as well. During the latter part of the Reporting Period, mortgage rates reached historically low levels and concerns surrounding a refinancing wave and heightened prepayment risk mounted within the MBS sector. Against this backdrop, select agency MBS, such as low-loan balanced pools with inherent prepayment protection features, outperformed securities more susceptible to prepayment risk. The Fund was positioned to benefit from such market conditions, as it had an overweighted allocation to those securities with prepayment protection and an underweighted exposure to those securities more susceptible to prepayments.
Within the corporate bond sector, a bias to be overweight lower quality bonds added value, as lower quality credits outperformed higher quality securities during the Reporting Period. Positioning on the corporate bond yield curve, or spectrum of maturities, also boosted results, as the Fund was overweight the intermediate segment of the yield curve rather than the short-term end of the yield curve for much of the Reporting Period. The intermediate segment of the yield curve outpaced shorter-term maturities during the Reporting Period. There were no real detractors from a sector allocation or security selection perspective during the Reporting Period.
PORTFOLIO RESULTS
| |
| Q | Did the Fund’s duration and yield curve positioning strategy help or hurt its results during the Reporting Period? |
| |
| A | The Fund’s shorter U.S. duration relative to the Barclays Index from May through July was the primary detractor from performance, as interest rates declined during the Reporting Period. During the second and third calendar quarters, 10-year U.S. Treasury rates declined approximately 135 basis points to 2.51%, driven by reports pointing to weaker than expected economic data. During the third calendar quarter, the Fed’s decision to reinvest mortgage paydowns into U.S. Treasuries, together with the market speculating about an additional round of quantitative easing, or buying of U.S. Treasuries by the Fed, led yields even lower. The Fund’s shorter Japanese duration relative to the Barclays Index further detracted from performance, as interest rates there similarly fell during the Reporting Period. Duration is a measure of the Fund’s sensitivity to changes in interest rates. |
| |
| Q | How did the Fund use derivatives during the Reporting Period? |
| |
| A | As market conditions warranted during the Reporting Period, the Fund engaged in forward foreign currency exchange contracts, financial futures contracts and swap contracts to enhance the portfolio return and for hedging purposes. We also used such instruments to adopt a negative basis position in which the Fund’s portfolio was long corporate cash bonds and short derivative instruments, such as credit default swaps. We used derivatives for the efficient management of the Fund and to apply active investment views with greater versatility and to afford greater risk management precision. |
| |
| Q | Were there any notable changes in the Fund’s weightings during the Reporting Period? |
| |
| A | During the Reporting Period, we increased the Fund’s exposure to agency MBS from an underweighted position to an overweighted one. We reduced the Fund’s exposure to commercial mortgage-backed securities (CMBS). We also reduced the Fund’s exposure to quasi-government securities, including FDIC (Federal Deposit Insurance Corporation)-guaranteed corporate bonds. Toward the end of the Reporting Period, we shifted from a net short U.S. duration to a net long bias in U.S. duration. |
| |
| Q | How was the Fund positioned relative to its benchmark index at the end of the Reporting Period? |
| |
| A | At the end of September 2010, the Fund had overweighted allocations relative to the Barclays Index in quasi-government securities, including government-guaranteed corporate bonds and agency government-guaranteed securities, as well as in asset-backed securities, RMBS and emerging market debt. The Fund also had a modest exposure to high yield corporate bonds, which is a sector not represented in the Barclays Index. The Fund had underweighted exposure relative to the benchmark index in U.S. government securities, agency non-government-guaranteed securities, CMBS and investment grade corporate bonds. The Fund maintained a modestly longer duration relative to the Barclays Index at the end of the Reporting Period. |
FUND BASICS
Core Plus Fixed Income Fund
as of September 30, 2010
PERFORMANCE REVIEW
| | | | | | | | | | | | | | | | | | | |
| | | | | | Barclays Capital
| | | 30-Day
| | | 30-Day
| | | |
April 1, 2010–
| | Fund Total Return
| | | U.S. Aggregate
| | | Standardized
| | | Standardized
| | | |
| September 30, 2010 | | (based on NAV1) | | | Bond Index2 | | | Subsidized Yield3 | | | Unsubsidized Yield3 | | | |
|
| |
| Class A | | | 5.86 | % | | | 6.05 | % | | | 2.28 | % | | | 2.11 | % | | |
| Class B | | | 5.47 | | | | 6.05 | | | | 1.63 | | | | 1.45 | | | |
| Class C | | | 5.47 | | | | 6.05 | | | | 1.63 | | | | 1.45 | | | |
| Institutional | | | 5.94 | | | | 6.05 | | | | 2.71 | | | | 2.53 | | | |
| Service | | | 5.69 | | | | 6.05 | | | | 2.24 | | | | 2.06 | | | |
| Class IR | | | 5.89 | | | | 6.05 | | | | 2.62 | | | | 2.44 | | | |
| Class R | | | 5.72 | | | | 6.05 | | | | 2.12 | | | | 1.94 | | | |
|
| |
| 1 | The net asset value (“NAV”) represents the net assets of the class of the Fund (ex-dividend) divided by the total number of shares of the class outstanding. The Fund’s performance assumes the reinvestment of dividends and other distributions. The Fund’s performance does not reflect the deduction of any applicable sales charges. |
| 2 | The Barclays Capital U.S. Aggregate Bond Index represents an unmanaged diversified portfolio of fixed income securities, including U.S. Treasuries, investment-grade corporate bonds, and mortgage-backed and asset-backed securities. The Index figures do not reflect any deduction for fees, expenses or taxes. It is not possible to invest directly in an index. |
| 3 | The 30-Day Standardized Subsidized Yield of the Fund is calculated by dividing the net investment income per share (as defined by securities industry regulations) earned by the Fund over a 30-day period (ending on the stated month-end date) by the maximum public offering price (“POP”) per share of the Fund on the last day of the period. This number is then annualized. This yield does not necessarily reflect income actually earned and distributed by the Fund and, therefore, may not be correlated with the dividends or other distributions paid to shareholders. The 30-Day Standardized Unsubsidized Yield does not reflect any applicable expense reductions. |
STANDARDIZED AVERAGE ANNUAL TOTAL RETURNS4
| | | | | | | | | | | | | |
| For the period ended 9/30/10 | | One Year | | | Since Inception | | | Inception Date | | |
|
| |
| Class A | | | 5.41 | % | | | 4.85 | % | | 11/30/06 | | |
| Class B | | | 3.69 | | | | 5.22 | | | 6/20/07 | | |
| Class C | | | 7.68 | | | | 5.09 | | | 11/30/06 | | |
| Institutional | | | 9.89 | | | | 6.25 | | | 11/30/06 | | |
| Service | | | 9.36 | | | | 6.76 | | | 6/20/07 | | |
| Class IR | | | 9.78 | | | | 6.26 | | | 11/30/07 | | |
| Class R | | | 9.35 | | | | 5.74 | | | 11/30/07 | | |
|
| |
| 4 | The Standardized Average Annual Total Returns are average annual total returns as of the most recent calendar quarter-end. They assume reinvestment of all distributions at NAV. These returns reflect a maximum initial sales charge of 3.75% for Class A Shares, the assumed contingent deferred sales charge for Class B Shares (5% maximum declining to 0% after six years) and the assumed contingent deferred sales charge for Class C Shares (1% if redeemed within 12 months of purchase). Class B Shares convert automatically to Class A Shares on or about the fifteenth day of the last month of the calendar quarter that is eight years after purchase. Returns for Class B Shares for the period after conversion reflect the performance of Class A Shares. Prior to July 29, 2009, the maximum initial sales charge applicable to Class A Shares was 4.5%, which is not reflected in the average annual total return figures shown. Because Institutional, Service, Class IR and Class R Shares do not involve a sales charge, such a charge is not applied to their Standardized Average Annual Total Returns. Effective November 2, 2009, the Fund’s Class B Shares are no longer available for purchase by new or existing shareholders (although current Class B shareholders may continue to reinvest income and capital gains distributions into Class B Shares, and Class B shareholders may continue to exchange their shares for Class B Shares of certain other Goldman Sachs Funds). |
The returns represent past performance. Past performance does not guarantee future results. The Fund’s investment return and principal value will fluctuate so that an investor’s shares, when redeemed, may be worth more or less than their original cost. Current performance may be lower or higher than the performance quoted above. Please visit our Web site at: www.goldmansachsfunds.com to obtain the most recent month-end returns. Performance reflects expense limitations in effect. In their absence, performance would be reduced. Returns do not reflect the deduction of taxes that a shareholder would pay on Fund distributions or the redemption of Fund shares.
FUND BASICS
EXPENSE RATIOS5
| | | | | | | | | | | |
| | | Net Expense Ratio (Current) | | | Gross Expense Ratio (Before Waivers) | | | |
|
| |
| Class A | | | 0.83 | % | | | 1.14 | % | | |
| Class B | | | 1.58 | | | | 1.89 | | | |
| Class C | | | 1.58 | | | | 1.89 | | | |
| Institutional | | | 0.49 | | | | 0.80 | | | |
| Service | | | 0.99 | | | | 1.30 | | | |
| Class IR | | | 0.58 | | | | 0.89 | | | |
| Class R | | | 1.08 | | | | 1.39 | | | |
|
| |
| 5 | The expense ratios of the Fund, both current (net of applicable fee waivers and/or expense limitations) and before waivers (gross of applicable fee waivers and/or expense limitations), are as set forth above according to the most recent publicly available Prospectus for the Fund and may differ from the expense ratios disclosed in the Financial Highlights in this report. Applicable waivers and expense limitations may be modified or terminated in the future, consistent with the terms of any agreements in place. If this occurs, the expense ratios may change without shareholder approval. |
FUND COMPOSITION6
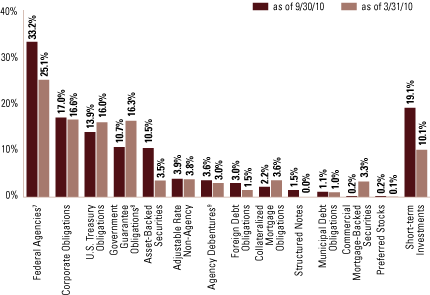
| |
| 6 | The percentage shown for each investment category reflects the value of investments in that category as a percentage of net assets. Short-term investments represent repurchase agreements. Figures in the above graph may not sum to 100% due to the exclusion of other assets and liabilities. |
| 7 | “Federal Agencies” are mortgage-backed securities guaranteed by the Government National Mortgage Association (“GNMA”), Federal National Mortgage Association (“FNMA”) and Federal Home Loan Mortgage Corp. (“FHLMC”). GNMA instruments are backed by the full faith and credit of the U.S. Government. |
| 8 | “Government Guarantee Obligations” are guaranteed under the Federal Deposit Insurance Corporation’s (“FDIC”) Temporary Liquidity Guarantee Program or a foreign government guarantee program and are backed by the full faith and credit of the United States or the government of a foreign country. The expiration date of the FDIC’s guarantee is the earlier of the maturity date of the debt or June 30, 2012 and the expiration date of a foreign country guarantee is the maturity date of the debt. |
| 9 | “Agency Debentures” include agency securities offered by companies such as Fannie Mae and Freddie Mac, which operate under a government charter. While they are required to report to a government regulator, their assets are not explicitly guaranteed by the government and they otherwise operate like any other publicly traded company. |
PORTFOLIO RESULTS
Goldman Sachs Global Income Fund
Investment Objective
The Fund seeks a high total return, emphasizing current income, and, to a lesser extent, providing opportunities for capital appreciation.
Portfolio Management Discussion and Analysis
Below, the Goldman Sachs Global Fixed Income Investment Management Team discusses the Fund’s performance and positioning for the six-month period ended September 30, 2010 (the “Reporting Period”).
| |
| Q | How did the Goldman Sachs Global Income Fund (the “Fund”) perform during the Reporting Period? |
| |
| A | During the Reporting Period, the Fund’s Class A, B, C, Institutional and Service Shares generated cumulative total returns, without sales charges, of 3.52%, 3.13%, 3.24%, 3.70%, and 3.52%, respectively. These returns compare to the 4.57% cumulative total return of the Fund’s benchmark, the Barclays Capital Global Aggregate Bond Index (USD hedged) (the “Barclays Index”), during the same time period. |
The Fund’s Class IR Shares were launched on July 30, 2010. During the period from inception through September 30, 2010, the Fund’s Class IR Shares generated a cumulative total return, without sales charges, of 1.30%. This compares to the 1.43% cumulative total return of the Barclays Index during the same time period.
| |
| Q | What key factors were responsible for the Fund’s performance during the Reporting Period? |
| |
| A | Both top-down and bottom-up strategies contributed to the Fund’s performance during the Reporting Period. Within our top-down strategies, our country strategy contributed positively. In particular, trades made within the European countries proved timely and effective. For example, as a classic flight to safety took hold with risk aversion heightening due to the sovereign debt crisis, trades we made within Germany, Greece and Portugal contributed to the Fund’s results. Indeed, these trades more than offset the impact of trades we made within France, Ireland, and in an effort to seek some reduced risk, Japan, which detracted. |
Bottom-up individual issue selection within the corporate bond, government agency and collateralized sectors was helpful as well.
These contributing factors were not enough, however, to completely offset the detracting effects of our duration and currency strategies and of our security selection within the emerging markets debt sector. During the Reporting Period, the Fund was especially hurt by its shorter positions relative to the Barclays Index on the Japanese and U.S. yield curves, or spectrums of maturities. Duration is a measure of the Fund’s sensitivity to changes in interest rates. Within the Fund’s currency strategy, positioning in the U.S. dollar detracted most.
| |
| Q | Which fixed income market sectors most significantly affected Fund performance? |
| |
| A | The Fund’s overweighted allocation to residential mortgage-backed securities (RMBS) contributed to the Fund’s performance. So, too, did individual issue selection in the corporate bond, government agency and collateralized sectors add value. Within the corporate bond sector, the Fund’s bias toward lower quality issues particularly boosted results, as lower quality securities outperformed higher quality during the Reporting Period. The Fund also benefited within the corporate bond sector, from a regional perspective, from an emphasis on the U.S. over Europe, again due to greater potential impact on the European corporate sector from sovereign debt concerns there. |
Conversely, the Fund’s overweighted allocation to corporate bonds, its underweighted exposure to commercial mortgage-backed securities (CMBS), and individual issue selection among emerging markets debt securities detracted from its results relative to the Barclays Index. An overweighted position in Mexico 5-year bonds especially disappointed.
Within currency, the Fund’s positioning in the U.S. dollar detracted from its performance during the Reporting Period. The Fund’s short position in the seven-year segment of the Japanese yield curve also detracted from Fund returns, as Japanese government bonds rallied with the flight to safety driven by the risk aversion arising from the European sovereign debt crisis. The short position we took
PORTFOLIO RESULTS
for the Fund in U.S. 10-year futures between May and July also detracted from results, as the safe haven demand for U.S. Treasuries drove yields to multi-year lows.
| |
| Q | Did the Fund’s duration and yield curve positioning strategy help or hurt its results during the Reporting Period? |
| |
| A | The combined effect of the Fund’s duration and yield curve positioning detracted from results during the Reporting Period. As mentioned, duration is a measure of the Fund’s sensitivity to changes in interest rates. Yield curve indicates the spectrum of maturities within a particular sector. |
The Fund’s duration strategy is actively managed and constantly monitored in an effort to generate greater performance and reduced risk through volatile markets. During the Reporting Period, we moved from a longer duration relative to the Barclays Index to a shorter position relative to the Barclays Index within the Fund when yields had fallen sharply. By the end of the Reporting Period, we had shifted back to a modestly longer duration position relative to the benchmark index, as we expected bond yields to remain supported with the anticipated quantitative easing by the Fed.
| |
| Q | How did the Fund use derivatives during the Reporting Period? |
| |
| A | We used derivatives for the efficient management of the Fund. These derivatives allowed us to manage interest rate, credit and currency risks more effectively by allowing us both to hedge and to apply active investment views with greater versatility and to afford greater risk management precision. Duration, yield curve and country strategies for permitted countries were implemented across the portfolio using exchange traded futures contracts. Currency transactions were carried out using primarily over-the-counter (“OTC”) spot and forward foreign currency exchange contracts. Currency transactions were generally dealt against the base currency of the portfolio for passive currency management, for example, rollover of positions are often done this way to result in a realized profit or loss flow in base currency. Active currency (long/short) views are traded on a forward basis which may or may not include the base currency (U.S. dollars) of the Fund. Interest rate and credit default swaps are also cost-efficient instruments, which grant us greater precision and versatility in the management of active strategies. |
| |
| Q | Did the Fund make any significant purchases or sales during the fiscal year? |
| |
| A | As mentioned earlier, we made several trades within the European countries, which proved effective, as the Fund remained underweight peripheral European bonds and overweight German bonds, given the sovereign debt concerns surrounding the periphery. |
| |
| Q | Were there any notable changes in the Fund’s weightings during the Reporting Period? |
| |
| A | There were no material changes in the Fund’s sector or country weightings during the Reporting Period. As indicated, we did make adjustments in the Fund’s duration, however. At the beginning of the Reporting Period, the Fund had a modestly longer duration relative to the Barclays Index, as we believed that confidence in risk assets was being tested by the strain in European bond markets and that the probability of financial reform had increased in the U.S. Then, approximately mid-way through the Reporting Period, we shifted to a shorter position relative to the Barclays Index in the Fund’s duration, as we believed at the time that the rally in global bond market had largely run its course. Realizing we were premature in our view, toward the end of August, we shifted the Fund’s duration to a modestly longer position relative to the Barclays Index. Our revised view was that global bond markets should continue to perform well in light of the anticipated monetary easing by the Fed. However, we maintained only a modestly long duration position, as we were mindful that any positive surprises in the economic data could cause a sharp upward correction in rates from the very low levels seen at the end of the Reporting Period. |
| |
| Q | How was the Fund positioned relative to its benchmark index at the end of the Reporting Period? |
| |
| A | At the end of September 2010, the Fund had overweighted allocations relative to the Barclays Index in corporate bonds, collateralized securities and government securities. The Fund had underweighted exposure relative to the benchmark index in quasi-government securities and emerging market debt. |
FUND BASICS
Global Income Fund
as of September 30, 2010
PERFORMANCE REVIEW
| | | | | | | | | | | | | | | | | | | |
| | | | | | Barclays Capital
| | | 30-Day
| | | 30-Day
| | | |
April 1, 2010–
| | Fund Total Return
| | | Global Aggregate Bond
| | | Standardized
| | | Standardized
| | | |
| September 30, 2010 | | (based on NAV1) | | | Index (USD hedged)2 | | | Subsidized Yield3 | | | Unsubsidized Yield3 | | | |
|
| |
| Class A | | | 3.52 | % | | | 4.57 | % | | | 1.23 | % | | | 1.10 | % | | |
| Class B | | | 3.13 | | | | 4.57 | | | | 0.53 | | | | 0.40 | | | |
| Class C | | | 3.24 | | | | 4.57 | | | | 0.54 | | | | 0.40 | | | |
| Institutional | | | 3.70 | | | | 4.57 | | | | 1.61 | | | | 1.48 | | | |
| Service | | | 3.52 | | | | 4.57 | | | | 1.12 | | | | 0.98 | | | |
|
July 30, 2010–
September 30, 2010 |
|
| Class IR | | | 1.30 | % | | | 1.43 | % | | | 1.53 | % | | | 0.15 | % | | |
|
| |
| 1 | The net asset value (“NAV”) represents the net assets of the class of the Fund (ex-dividend) divided by the total number of shares of the class outstanding. The Fund’s performance reflects the reinvestment of dividends and other distributions. The Fund’s performance does not reflect the deduction of any applicable sales charges. |
| 2 | The Barclays Capital Global Aggregate Bond Index (USD hedged), an unmanaged index, provides a broad based measure of the global investment-grade fixed-rate debt markets and covers the most liquid portion of the global investment grade fixed-rate bond market, including government, credit and collateralized securities. The Index figures do not include any deduction for fees, expenses or taxes. It is not possible to invest directly in an index. |
| 3 | The 30-Day Standardized Subsidized Yield of the Fund is calculated by dividing the net investment income per share (as defined by securities industry regulations) earned by the Fund over a 30-day period (ending on the stated month-end date) by the maximum public offering price (“POP”) per share of the Fund on the last day of the period. This number is then annualized. This yield does not necessarily reflect income actually earned and distributed by the Fund and, therefore, may not be correlated with the dividends or other distributions paid to shareholders. The 30-Day Standardized Unsubsidized Yield does not reflect any applicable expense reductions. |
FUND BASICS
STANDARDIZED AVERAGE ANNUAL TOTAL RETURNS4
| | | | | | | | | | | | | | | | | | | | | |
| For the period ended 9/30/10 | | One Year | | | Five Years | | | Ten Years | | | Since Inception | | | Inception Date | | |
|
| |
| Class A | | | 3.28 | % | | | 3.96 | % | | | 4.59 | % | | | 5.85 | % | | 8/2/91 | | |
| Class B | | | 1.47 | | | | 3.56 | | | | 4.45 | | | | 5.30 | | | 5/1/96 | | |
| Class C | | | 5.59 | | | | 3.98 | | | | 4.31 | | | | 4.52 | | | 8/15/97 | | |
| Institutional | | | 7.72 | | | | 5.13 | | | | 5.49 | | | | 6.44 | | | 8/1/95 | | |
| Service | | | 7.19 | | | | 4.61 | | | | 4.96 | | | | 5.25 | | | 3/12/97 | | |
| Class IR | | | N/A | | | | N/A | | | | N/A | | | | 1.30 | | | 7/30/10 | | |
|
| |
| 4 | The Standardized Average Annual Total Returns are average annual total returns or cumulative total returns (only if the performance is one year or less) as of the most recent calendar quarter-end. They assume reinvestment of all distributions at NAV. These returns reflect a maximum initial sales charge of 3.75% for Class A Shares, the assumed contingent deferred sales charge for Class B Shares (5% maximum declining to 0% after six years) and the assumed contingent deferred sales charge for Class C Shares (1% if redeemed within 12 months of purchase). Class B Shares convert automatically to Class A Shares on or about the fifteenth day of the last month of the calendar quarter that is eight years after purchase. Returns for Class B Shares for the period after conversion reflect the performance of Class A Shares. Prior to July 29, 2009, the maximum initial sales charge applicable to Class A Shares was changed 4.5%, which is not reflected in the average annual total return figures shown. Because Institutional, Service and Class IR Shares do not involve a sales charge, such a charge is not applied to their Standardized Average Annual Total Returns. Effective November 2, 2009, the Fund’s Class B Shares are no longer available for purchase by new or existing shareholders (although current Class B shareholders may continue to reinvest income and capital gains distributions into Class B Shares, and Class B shareholders may continue to exchange their shares for Class B Shares of certain other Goldman Sachs Funds). |
The returns represent past performance. Past performance does not guarantee future results. The Fund’s investment return and principal value will fluctuate so that an investor’s shares, when redeemed, may be worth more or less than their original cost. Current performance may be lower or higher than the performance quoted above. Please visit our Web site at: www.goldmansachsfunds.com to obtain the most recent month-end returns. Performance reflects expense limitations in effect. In their absence, performance would be reduced. Returns do not reflect the deduction of taxes that a shareholder would pay on Fund distributions or the redemption of Fund shares.
EXPENSE RATIOS5
| | | | | | | | | | | |
| | | Net Expense Ratio (Current) | | | Gross Expense Ratio (Before Waivers) | | | |
|
| |
| Class A | | | 1.03 | % | | | 1.11 | % | | |
| Class B | | | 1.78 | | | | 1.86 | | | |
| Class C | | | 1.78 | | | | 1.86 | | | |
| Institutional | | | 0.69 | | | | 0.77 | | | |
| Service | | | 1.19 | | | | 1.27 | | | |
| Class IR | | | 0.78 | | | | 0.86 | | | |
|
| |
| 5 | The expense ratios of the Fund, both current (net of applicable fee waivers and/or expense limitations) and before waivers (gross of applicable fee waivers and/or expense limitations), are as set forth above according to the most recent publicly available Prospectus for the Fund and may differ from the expense ratios disclosed in the Financial Highlights in this report. Applicable waivers and expense limitations may be modified or terminated in the future, consistent with the terms of any agreements in place. If this occurs, the expense ratios may change without shareholder approval. |
FUND BASICS
CURRENCY ALLOCATION BY CURRENCY OF ISSUE6
| | | | | | | | | | | |
| | | Percentage of Net Assets |
| | | as of 9/30/10 | | | as of 3/31/10 | | | |
|
| |
U.S. Dollar7 | | | 42.7 | | | | 42.4 | | | |
| Euro | | | 30.8 | | | | 32.6 | | | |
| Japanese Yen | | | 17.3 | | | | 13.6 | | | |
| British Pound | | | 5.7 | | | | 5.0 | | | |
| Canadian Dollar | | | 2.2 | | | | 1.1 | | | |
| Swedish Krona | | | 0.5 | | | | 0.5 | | | |
| Danish Krone | | | 0.3 | | | | 0.4 | | | |
| Australian Dollar | | | 0.3 | | | | 0.1 | | | |
| Polish Zloty | | | 0.3 | | | | 0.3 | | | |
|
| |
| 6 | The percentage shown for each currency reflects the value of investments in that category as a percentage of net assets. Figures in the above table are reflective of the Fund’s total investments before the effect of derivative instruments, including forward foreign exchange currency contracts. Figures in the above table may not sum to 100% due to the exclusion of other assets and liabilities. |
| 7 | These figures represent the value excluding short-term obligations. If short-term obligations had been included the percentage for 9/30/10 and 3/31/10 would have been 48.8% and 46.5%, respectively. |
PORTFOLIO RESULTS
Goldman Sachs Strategic Income Fund
Investment Objective
The Fund seeks total return comprised of income and capital appreciation.
Portfolio Management Discussion and Analysis
Below, the Goldman Sachs U.S. Fixed Income Investment Management Team discusses the Fund’s performance and positioning for the period since its inception on June 30, 2010 through September 30, 2010 (the “Reporting Period”).
| |
| Q | How did the Goldman Sachs Strategic Income Fund (the “Fund”) perform during the Reporting Period? |
| |
| A | During the Reporting Period, the Fund’s Class A, C, Institutional, IR and R Shares generated cumulative total returns, without sales charges, of 1.13%, 1.07%, 1.21%, 1.18% and 1.08%, respectively. These returns compare to the 2.48% cumulative total return of the Fund’s primary benchmark, the Barclays Capital U.S. Aggregate Bond Index, and the 0.10% cumulative total return of the Fund’s secondary benchmark, the 3-Month LIBOR Index (USD) (the “LIBOR Index”), during the same period. |
| |
| Q | What key factors were responsible for the Fund’s performance during the Reporting Period? |
| |
| A | Both top-down and bottom-up strategies contributed to the Fund’s performance during the Reporting Period. Within our top-down strategies, our cross-sector strategy contributed the most to relative performance. Our cross-sector strategy is one in which we invest Fund assets across a variety of fixed income sectors, including some that may not be included in the Fund’s benchmark. Bottom-up individual issue selection within the emerging markets debt and corporate bond sectors contributed positively to the Fund’s performance during the Reporting Period. |
The primary detractor from Fund performance was its currency strategy, specifically currency exposure in Europe, as a classic flight to quality ensued, sparked by increased uncertainty regarding the sovereign debt crisis in peripheral Europe and the potential impact of financial regulatory reform in the U.S. To a lesser extent, security selection within the collateralized sector also detracted.
| |
| Q | Which fixed income market sectors most significantly affected Fund performance? |
| |
| A | Exposure to non-agency residential mortgage-backed securities (RMBS) was particularly beneficial during the Reporting Period. Non-agency RMBS performed strongly, driven by supportive supply and demand dynamics. An exposure to the corporate bond sector also contributed positively to Fund results, as spreads tightened during the Reporting Period, meaning the differential in yields between corporate bonds and U.S. Treasuries narrowed. |
Individual issue selection within the high yield corporate bond sector added value. The Fund’s bias to be overweight lower quality bonds especially helped, as lower quality credits outperformed higher quality securities during the Reporting Period.
There were no real detractors from a sector allocation or security selection perspective during the Reporting Period.
| |
| Q | Did the Fund’s duration and yield curve positioning strategy help or hurt its results during the Reporting Period? |
| |
| A | Neither duration nor yield curve positioning materially impacted Fund performance during the Reporting Period. |
| |
| Q | How did the Fund use derivatives during the Reporting Period? |
| |
| A | In seeking to achieve its investment objective, we engaged in forward foreign currency exchange contracts as we sought to enhance portfolio return and for hedging purposes. |
| |
| Q | Were there any notable changes in the Fund’s weightings during the Reporting Period? |
| |
| A | With the Fund launching on June 30, 2010, it was not a matter of making changes during the Reporting Period but rather of building the Fund’s portfolio in a prudent manner to reach its fully invested status. |
PORTFOLIO RESULTS
From our perspective, the Reporting Period was a time when the combination of extraordinary policy measures and an uncertain economic growth outlook in the wake of the global financial crisis boosted risk and lowered returns in markets traditionally considered safe havens. At the same time, advances in developing economies and broad deleveraging in the private sector, wherein the amount of debt owed is reduced as payments are made, supported credit quality in markets traditionally regarded as higher risk.
Against this backdrop, we maintained a somewhat defensive stance in building the Fund’s portfolio with three key factors critical to our decision making. First was the macroeconomic outlook, both domestic and global, including growth, leading indicators, inflation and employment. A second, complementary factor was the technical environment, including supply/demand factors, market volatility and asset flows, which often help drive short-term performance. Third was valuation, i.e. whether the assets are priced attractively from both a macroeconomic and technical perspective.
| |
| Q | How was the Fund positioned relative to its benchmark index at the end of September 2010? |
| |
| A | The Fund held virtually all of its assets in sectors not represented in the benchmark index at the end of September 2010. |
At the end of September 2010, the Fund had its greatest allocations to the U.S. government bond and RMBS sectors with somewhat lesser weightings in asset-backed securities, quasi-government securities, high yield corporate bonds and emerging market debt. The Fund had modest exposures to investment grade corporate bonds and to covered bonds as well. Covered bonds are securities created from either mortgage loans or public sector loans. The Fund also had a sizable position in cash at the end of the Reporting Period.
FUND BASICS
Strategic Income Fund
as of September 30, 2010
PERFORMANCE REVIEW
| | | | | | | | | | | | | | | | | | | | | | | |
| | | | | | | | | 3-Month
| | | | | | | | | |
| | | Fund Total
| | | Barclays Capital
| | | LIBOR
| | | 30-Day
| | | 30-Day
| | | |
June 30, 2010–
| | Return (based
| | | U.S. Aggregate
| | | Index
| | | Standardized
| | | Standardized
| | | |
| September 30, 2010 | | on NAV1) | | | Bond Index2 | | | (USD)3 | | | Subsidized Yield4 | | | Unsubsidized Yield4 | | | |
|
| |
| Class A | | | 1.13 | % | | | 2.48 | % | | | 0.10 | % | | | 3.47 | % | | | 2.79 | % | | |
| Class C | | | 1.07 | | | | 2.48 | | | | 0.10 | | | | 2.60 | | | | 1.57 | | | |
| Institutional | | | 1.21 | | | | 2.48 | | | | 0.10 | | | | 4.04 | | | | 3.40 | | | |
| Class IR | | | 1.18 | | | | 2.48 | | | | 0.10 | | | | 3.95 | | | | 2.67 | | | |
| Class R | | | 1.08 | | | | 2.48 | | | | 0.10 | | | | 3.45 | | | | 2.90 | | | |
|
| |
| 1 | The net asset value (NAV) represents the net assets of the class of the Fund (ex-dividend) divided by the total number of shares of the class outstanding. The Fund’s performance reflects the reinvestment of dividends and other distributions. The Fund’s performance does not reflect the deduction of any applicable sales charges. |
| 2 | The Barclays Capital U.S. Aggregate Bond Index represents an unmanaged diversified portfolio of fixed income securities, including U.S. Treasuries, investment-grade corporate bonds, and mortgage-backed and asset-backed securities. The Index figures do not reflect any deduction for fees, expenses or taxes. It is not possible to invest directly in an index. |
| 3 | The LIBOR, the London Interbank Offered Rate, is based on the rates that contributor banks in London offer each other for inter-bank deposits. LIBOR is compiled by the British Bankers Association (BBA) and is published daily. It is not possible to invest directly in an unmanaged index. |
| 4 | The 30-Day Standardized Subsidized Yield of the Fund is calculated by dividing the net investment income per share (as defined by securities industry regulations) earned by the Fund over a 30-day period (ending on the stated month-end date) by the maximum public offering price (“POP”) per share of the Fund on the last day of the period. This number is then annualized. This yield does not necessarily reflect income actually earned and distributed by the Fund and, therefore, may not be correlated with the dividends or other distributions paid to shareholders. The 30-Day Standardized Unsubsidized Yield does not reflect any applicable expense reductions. |
STANDARDIZED TOTAL RETURNS5
| | | | | | | | | |
| For the period ended 9/30/10 | | Since Inception | | | Inception Date | | |
|
| |
| Class A | | | -2.66 | % | | 6/30/10 | | |
| Class C | | | 0.07 | | | 6/30/10 | | |
| Institutional | | | 1.21 | | | 6/30/10 | | |
| Class IR | | | 1.18 | | | 6/30/10 | | |
| Class R | | | 1.08 | | | 6/30/10 | | |
|
| |
| 5 | The Standardized Total Returns are cumulative total returns as of the most recent calendar quarter-end. They assume reinvestment of all distributions at NAV. These returns reflect a maximum initial sales charge of 3.75% for Class A Shares and the assumed contingent deferred sales charge for Class C Shares (1% if redeemed within 12 months of purchase). Because Institutional, Class IR and Class R Shares do not involve a sales charge, such a charge is not applied to their Standardized Total Returns. |
The returns represent past performance. Past performance does not guarantee future results. The Fund’s investment return and principal value will fluctuate so that an investor’s shares, when redeemed, may be worth more or less than their original cost. Current performance may be lower or higher than the performance quoted above. Please visit our Web site at: www.goldmansachsfunds.com to obtain the most recent month-end returns. Performance reflects expense limitations in effect. In their absence, performance would be reduced. Returns do not reflect the deduction of taxes that a shareholder would pay on Fund distributions or the redemption of Fund shares.
FUND BASICS
EXPENSE RATIOS6
| | | | | | | | | | | |
| | | Net Expense Ratio (Current) | | | Gross Expense Ratio (Before Waivers) | | | |
|
| |
| Class A | | | 1.03 | % | | | 1.19 | % | | |
| Class C | | | 1.78 | | | | 1.94 | | | |
| Institutional | | | 0.69 | | | | 0.85 | | | |
| Class IR | | | 0.78 | | | | 0.94 | | | |
| Class R | | | 1.28 | | | | 1.44 | | | |
|
| |
| 6 | The expense ratios of the Fund, both current (net of applicable fee waivers and/or expense limitations) and before waivers (gross of applicable fee waivers and/or expense limitations), are as set forth above according to the most recent publicly available Prospectus for the Fund and may differ from the expense ratios disclosed in the Financial Highlights in this report. Applicable waivers and expense limitations may be modified or terminated in the future, consistent with the terms of any agreements in place. If this occurs, the expense ratios may change without shareholder approval. |
FUND COMPOSITION7
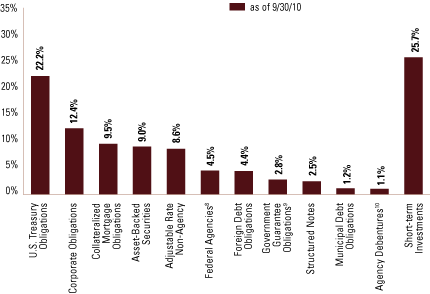
| |
| 7 | The percentage shown for each investment category reflects the value of investments in that category as a percentage of net assets. Short-term investments represent repurchase agreements. Figures in the above graph may not sum to 100% due to the exclusion of other assets and liabilities. |
| 8 | “Federal Agencies” are mortgage-backed securities guaranteed by the Government National Mortgage Association (“GNMA”), Federal National Mortgage Association (“FNMA”) and Federal Home Loan Mortgage Corp. (“FHLMC”). GNMA instruments are backed by the full faith and credit of the U.S. Government. |
| 9 | “Government Guarantee Obligations” are guaranteed under the Federal Deposit Insurance Corporation’s (“FDIC”) Temporary Liquidity Guarantee Program or a foreign government guarantee program and are backed by the full faith and credit of the United States or the government of a foreign country. The expiration date of the FDIC’s guarantee is the earlier of the maturity date of the debt or June 30, 2012 and the expiration date of a foreign country guarantee is the maturity date of the debt. |
| |
| 10 | “Agency Debentures” include agency securities offered by companies such as Fannie Mae and Freddie Mac, which operate under a government charter. While they are required to report to a government regulator, their assets are not explicitly guaranteed by the government and they otherwise operate like any other publicly traded company. |
GOLDMAN SACHS CORE FIXED INCOME FUND
Schedule of Investments
September 30, 2010 (Unaudited)
| | | | | | | | | | | | | | | | | |
| | | Principal
| | Interest
| | Maturity
| | |
| | | Amount | | Rate | | Date | | Value |
| |
Corporate Obligations – 21.0% |
| | | | | | | | | | | | | | | | | |
| | | | | | | | | | | | | | | | | |
| | | Banks – 7.8% |
| | | ANZ Capital Trust II(a)(b) |
| | | $ | 3,500,000 | | | | 5.360 | % | | | 12/29/49 | | | $ | 3,506,562 | |
| | | Astoria Financial Corp.(a) |
| | | | 4,050,000 | | | | 5.750 | | | | 10/15/12 | | | | 4,185,542 | |
| | | Bank of America Corp. |
| | | | 3,250,000 | | | | 5.750 | | | | 12/01/17 | | | | 3,461,911 | |
| | | Bank of Nova Scotia(b) |
| | | | 22,500,000 | | | | 1.450 | | | | 07/26/13 | | | | 22,743,315 | |
| | | BBVA Bancomer SA(b) |
| | | | 3,775,000 | | | | 7.250 | | | | 04/22/20 | | | | 4,077,683 | |
| | | Canadian Imperial Bank of Commerce(b) |
| | | | 8,000,000 | | | | 2.000 | | | | 02/04/13 | | | | 8,203,584 | |
| | | | 2,700,000 | | | | 2.600 | | | | 07/02/15 | | | | 2,809,337 | |
| | | Capital One Bank USA NA |
| | | | 1,825,000 | | | | 8.800 | | | | 07/15/19 | | | | 2,328,447 | |
| | | Cie de Financement Foncier(b) |
| | | | 8,100,000 | | | | 1.625 | | | | 07/23/12 | | | | 8,133,088 | |
| | | | 3,900,000 | | | | 2.125 | | | | 04/22/13 | | | | 3,970,695 | |
| | | Citigroup, Inc. |
| | | | 7,125,000 | | | | 5.000 | | | | 09/15/14 | | | | 7,388,636 | |
| | | | 5,150,000 | | | | 5.375 | | | | 08/09/20 | | | | 5,311,506 | |
| | | Credit Agricole SA(a)(b)(c) |
| | | | 1,500,000 | | | | 8.375 | | | | 10/13/49 | | | | 1,605,000 | |
| | | Credit Suisse of New York |
| | | | 1,575,000 | | | | 4.375 | | | | 08/05/20 | | | | 1,608,792 | |
| | | Discover Bank |
| | | | 2,075,000 | | | | 8.700 | | | | 11/18/19 | | | | 2,464,372 | |
| | | Fifth Third Bank(c) |
| | | | 4,025,000 | | | | 0.479 | | | | 05/17/13 | | | | 3,852,871 | |
| | | HSBC Bank USA NA |
| | | | 3,225,000 | | | | 4.875 | | | | 08/24/20 | | | | 3,363,675 | |
| | | Intesa Sanpaolo SPA(b) |
| | | | 5,075,000 | | | | 3.625 | | | | 08/12/15 | | | | 5,135,281 | |
| | | JPMorgan Chase & Co. |
| | | | 4,250,000 | | | | 7.250 | | | | 02/01/18 | | | | 5,159,884 | |
| | | JPMorgan Chase Capital XXV |
| | | | 1,600,000 | | | | 6.800 | | | | 10/01/37 | | | | 1,612,219 | |
| | | Lloyds TSB Bank PLC(b) |
| | | | 2,775,000 | | | | 6.500 | | | | 09/14/20 | | | | 2,801,737 | |
| | | MUFG Capital Finance 1 Ltd.(a)(c) |
| | | | 4,650,000 | | | | 6.346 | | | | 07/25/49 | | | | 4,603,500 | |
| | | Regions Financial Corp. |
| | | | 3,475,000 | | | | 5.750 | | | | 06/15/15 | | | | 3,541,780 | |
| | | Resona Bank Ltd.(a)(b)(c) |
| | | EUR | 2,675,000 | | | | 4.125 | | | | 09/27/49 | | | | 3,485,423 | |
| | | Royal Bank of Scotland PLC |
| | | $ | 1,950,000 | | | | 4.875 | (b) | | | 08/25/14 | | | | 2,068,697 | |
| | | | 2,800,000 | | | | 5.625 | | | | 08/24/20 | | | | 2,935,699 | |
| | | Santander Issuances SA Unipersonal(a)(b)(c) |
| | | | 1,600,000 | | | | 5.805 | | | | 06/20/16 | | | | 1,556,845 | |
| | | Sovereign Bank(a)(c) |
| | | | 250,000 | | | | 2.176 | | | | 08/01/13 | | | | 242,100 | |
| | | Stadshypotek AB(b) |
| | | | 14,400,000 | | | | 1.450 | | | | 09/30/13 | | | | 14,447,045 | |
| | | The Toronto-Dominion Bank(b) |
| | | | 7,000,000 | | | | 2.200 | | | | 07/29/15 | | | | 7,093,877 | |
| | | US Bank NA(a)(c) |
| | | EUR | 1,700,000 | | | | 4.375 | | | | 02/28/17 | | | | 2,298,290 | |
| | | | | | | | | | | | | | | | | |
| | | | | | | | | | | | | | | | 145,997,393 | |
| | | |
| | | |
| | | Brokerage – 1.0% |
| | | Merrill Lynch & Co., Inc. |
| | | $ | 2,950,000 | | | | 6.400 | | | | 08/28/17 | | | | 3,221,355 | |
| | | | 2,300,000 | | | | 6.875 | | | | 04/25/18 | | | | 2,573,758 | |
| | | Morgan Stanley & Co.(a) |
| | | | 3,000,000 | | | | 5.300 | | | | 03/01/13 | | | | 3,222,024 | |
| | | | 4,825,000 | | | | 6.625 | | | | 04/01/18 | | | | 5,342,849 | |
| | | | 750,000 | | | | 7.300 | | | | 05/13/19 | | | | 857,210 | |
| | | | 1,925,000 | | | | 5.625 | | | | 09/23/19 | | | | 2,001,569 | |
| | | | 1,925,000 | | | | 5.500 | | | | 07/24/20 | | | | 1,983,170 | |
| | | | | | | | | | | | | | | | | |
| | | | | | | | | | | | | | | | 19,201,935 | |
| | | |
| | | |
| | | Chemicals(a) – 0.2% |
| | | The Dow Chemical Co. |
| | | | 3,500,000 | | | | 7.600 | | | | 05/15/14 | | | | 4,090,400 | |
| | | |
| | | |
| | | Consumer Products(a) – 0.1% |
| | | Whirlpool Corp. |
| | | | 1,025,000 | | | | 8.000 | | | | 05/01/12 | | | | 1,119,291 | |
| | | | 1,375,000 | | | | 8.600 | | | | 05/01/14 | | | | 1,639,725 | |
| | | | | | | | | | | | | | | | | |
| | | | | | | | | | | | | | | | 2,759,016 | |
| | | |
| | | |
| | | Distributor(a)(b) – 0.1% |
| | | Ras Laffan Liquefied Natural Gas Co. Ltd. III |
| | | | 1,700,000 | | | | 5.500 | | | | 09/30/14 | | | | 1,861,500 | |
| | | |
| | | |
| | | Electric(a) – 0.7% |
| | | Arizona Public Service Co. |
| | | | 2,590,000 | | | | 5.800 | | | | 06/30/14 | | | | 2,863,051 | |
| | | Edison International |
| | | | 3,475,000 | | | | 3.750 | | | | 09/15/17 | | | | 3,563,036 | |
| | | Nevada Power Co. |
| | | | 2,725,000 | | | | 7.125 | | | | 03/15/19 | | | | 3,359,876 | |
| | | Progress Energy, Inc. |
| | | | 3,075,000 | | | | 7.050 | | | | 03/15/19 | | | | 3,750,103 | |
| | | | | | | | | | | | | | | | | |
| | | | | | | | | | | | | | | | 13,536,066 | |
| | | |
| | | |
| | | Energy – 1.5% |
| | | Anadarko Petroleum Corp.(a) |
| | | | 3,325,000 | | | | 6.375 | | | | 09/15/17 | | | | 3,664,000 | |
| | | BP Capital Markets PLC |
| | | | 1,800,000 | | | | 5.250 | | | | 11/07/13 | | | | 1,957,368 | |
| | | | 2,375,000 | | | | 3.875 | | | | 03/10/15 | | | | 2,462,865 | |
| | | | 3,000,000 | | | | 4.500 | (a) | | | 10/01/20 | | | | 3,070,946 | |
| | | Dolphin Energy Ltd.(a)(b) |
| | | | 1,678,775 | | | | 5.888 | | | | 06/15/19 | | | | 1,804,683 | |
| | | Nexen, Inc.(a) |
| | | | 465,000 | | | | 7.500 | | | | 07/30/39 | | | | 566,844 | |
| | | Petroleos Mexicanos(a)(b) |
| | | | 3,470,000 | | | | 6.625 | | | | 06/15/35 | | | | 3,799,650 | |
| | | Suncor Energy, Inc.(a) |
| | | | 1,950,000 | | | | 6.100 | | | | 06/01/18 | | | | 2,278,541 | |
| | | |
| | | |
The accompanying notes are an integral part of these financial statements.
GOLDMAN SACHS CORE FIXED INCOME FUND
| | | | | | | | | | | | | | | | | |
| | | Principal
| | Interest
| | Maturity
| | |
| | | Amount | | Rate | | Date | | Value |
| |
Corporate Obligations – (continued) |
| | | Energy – (continued) |
| | | | | | | | | | | | | | | | | |
| | | Talisman Energy, Inc.(a) |
| | | $ | 2,900,000 | | | | 7.750 | % | | | 06/01/19 | | | $ | 3,673,122 | |
| | | Transocean, Inc.(a) |
| | | | 4,625,000 | | | | 6.500 | | | | 11/15/20 | | | | 5,037,018 | |
| | | | | | | | | | | | | | | | | |
| | | | | | | | | | | | | | | | 28,315,037 | |
| | | |
| | | |
| | | Food & Beverage – 0.8% |
| | | Anheuser-Busch InBev Worldwide, Inc.(a) |
| | | | 4,400,000 | | | | 4.125 | | | | 01/15/15 | | | | 4,720,607 | |
| | | | 2,850,000 | | | | 7.750 | (b) | | | 01/15/19 | | | | 3,697,054 | |
| | | Kraft Foods, Inc. |
| | | | 2,225,000 | | | | 6.125 | | | | 08/23/18 | | | | 2,626,432 | |
| | | | 1,975,000 | | | | 6.500 | | | | 02/09/40 | | | | 2,309,808 | |
| | | Wm. Wrigley Jr. Co.(a)(b) |
| | | | 1,400,000 | | | | 3.700 | | | | 06/30/14 | | | | 1,449,733 | |
| | | | | | | | | | | | | | | | | |
| | | | | | | | | | | | | | | | 14,803,634 | |
| | | |
| | | |
| | | Health Care – Medical Products(a) – 0.6% |
| | | Agilent Technologies, Inc. |
| | | | 4,105,000 | | | | 5.500 | | | | 09/14/15 | | | | 4,611,802 | |
| | | Boston Scientific Corp. |
| | | | 1,800,000 | | | | 4.500 | | | | 01/15/15 | | | | 1,843,040 | |
| | | Covidien International Finance SA |
| | | | 2,100,000 | | | | 4.200 | | | | 06/15/20 | | | | 2,234,637 | |
| | | Hospira, Inc. |
| | | | 2,125,000 | | | | 5.600 | | | | 09/15/40 | | | | 2,200,550 | |
| | | | | | | | | | | | | | | | | |
| | | | | | | | | | | | | | | | 10,890,029 | |
| | | |
| | | |
| | | Life Insurance – 0.6% |
| | | MetLife Capital Trust X(a)(b)(c) |
| | | | 2,000,000 | | | | 9.250 | | | | 04/08/38 | | | | 2,360,000 | |
| | | Reinsurance Group of America, Inc. |
| | | | 550,000 | | | | 6.750 | | | | 12/15/11 | | | | 575,566 | |
| | | Symetra Financial Corp.(a)(b)(c) |
| | | | 3,100,000 | | | | 8.300 | | | | 10/15/37 | | | | 2,674,759 | |
| | | The Northwestern Mutual Life Insurance Co.(a)(b) |
| | | | 4,175,000 | | | | 6.063 | | | | 03/30/40 | | | | 4,849,910 | |
| | | | | | | | | | | | | | | | | |
| | | | | | | | | | | | | | | | 10,460,235 | |
| | | |
| | | |
| | | Media – Cable – 0.2% |
| | | Comcast Cable Communications Holdings, Inc. |
| | | | 1,220,000 | | | | 8.375 | | | | 03/15/13 | | | | 1,418,541 | |
| | | | 2,050,000 | | | | 9.455 | | | | 11/15/22 | | | | 2,856,966 | |
| | | | | | | | | | | | | | | | | |
| | | | | | | | | | | | | | | | 4,275,507 | |
| | | |
| | | |
| | | Media – Non Cable(a) – 0.4% |
| | | NBC Universal, Inc.(b) |
| | | | 4,625,000 | | | | 4.375 | | | | 04/01/21 | | | | 4,697,906 | |
| | | WPP Finance UK |
| | | | 1,834,000 | | | | 8.000 | | | | 09/15/14 | | | | 2,178,928 | |
| | | | | | | | | | | | | | | | | |
| | | | | | | | | | | | | | | | 6,876,834 | |
| | | |
| | | |
| | | Metals & Mining(a) – 0.5% |
| | | Anglo American Capital PLC(b) |
| | | | 1,375,000 | | | | 9.375 | | | | 04/08/19 | | | | 1,854,149 | |
| | | Freeport-McMoRan Copper & Gold, Inc. |
| | | | 3,544,000 | | | | 8.375 | | | | 04/01/17 | | | | 3,942,700 | |
| | | Teck Resources Ltd. |
| | | | 2,450,000 | | | | 10.750 | | | | 05/15/19 | | | | 3,062,500 | |
| | | | | | | | | | | | | | | | | |
| | | | | | | | | | | | | | | | 8,859,349 | |
| | | |
| | | |
| | | Noncaptive – Financial – 0.4% |
| | | General Electric Capital Corp. |
| | | | 1,300,000 | | | | 6.000 | | | | 06/15/12 | | | | 1,400,913 | |
| | | HSBC Finance Corp. |
| | | | 5,875,000 | | | | 5.700 | | | | 06/01/11 | | | | 6,057,213 | |
| | | | | | | | | | | | | | | | | |
| | | | | | | | | | | | | | | | 7,458,126 | |
| | | |
| | | |
| | | Pharmaceuticals(a) – 0.2% |
| | | Watson Pharmaceuticals, Inc. |
| | | | 2,700,000 | | | | 5.000 | | | | 08/15/14 | | | | 2,951,419 | |
| | | |
| | | |
| | | Pipelines(a) – 2.2% |
| | | Boardwalk Pipelines LP |
| | | | 4,400,000 | | | | 5.875 | | | | 11/15/16 | | | | 4,968,910 | |
| | | CenterPoint Energy Resources Corp. Series B |
| | | | 4,075,000 | | | | 5.950 | | | | 01/15/14 | | | | 4,547,733 | |
| | | DCP Midstream LLC(b) |
| | | | 2,205,000 | | | | 9.750 | | | | 03/15/19 | | | | 2,934,127 | |
| | | El Paso Pipeline Partners Operating Co. LLC |
| | | | 1,650,000 | | | | 6.500 | | | | 04/01/20 | | | | 1,765,500 | |
| | | Energy Transfer Partners LP |
| | | | 1,750,000 | | | | 5.950 | | | | 02/01/15 | | | | 1,942,247 | |
| | | | 1,825,000 | | | | 9.700 | (d) | | | 03/15/19 | | | | 2,414,782 | |
| | | Enterprise Products Operating LLC |
| | | | 6,225,000 | | | | 5.900 | | | | 04/15/13 | | | | 6,846,762 | |
| | | Tennessee Gas Pipeline Co. |
| | | | 1,450,000 | | | | 8.375 | | | | 06/15/32 | | | | 1,746,672 | |
| | | The Williams Cos., Inc. |
| | | | 2,600,000 | | | | 8.750 | | | | 03/15/32 | | | | 3,275,743 | |
| | | TransCanada PipeLines Ltd.(c) |
| | | | 3,200,000 | | | | 6.350 | | | | 05/15/67 | | | | 2,976,000 | |
| | | Valmont Industries, Inc. |
| | | | 3,100,000 | | | | 6.625 | | | | 04/20/20 | | | | 3,178,676 | |
| | | Williams Partners LP/Williams Partners Finance Corp. |
| | | | 2,975,000 | | | | 7.250 | | | | 02/01/17 | | | | 3,545,524 | |
| | | | | | | | | | | | | | | | | |
| | | | | | | | | | | | | | | | 40,142,676 | |
| | | |
| | | |
| | | Property/Casualty Insurance(a) – 1.4% |
| | | Alleghany Corp. |
| | | | 3,475,000 | | | | 5.625 | | | | 09/15/20 | | | | 3,545,877 | |
| | | Arch Capital Group Ltd. |
| | | | 1,575,000 | | | | 7.350 | | | | 05/01/34 | | | | 1,668,599 | |
| | | Axis Specialty Finance LLC |
| | | | 2,350,000 | | | | 5.875 | | | | 06/01/20 | | | | 2,394,395 | |
| | | CNA Financial Corp. |
| | | | 500,000 | | | | 5.850 | | | | 12/15/14 | | | | 537,227 | |
| | | Endurance Specialty Holdings Ltd. |
| | | | 1,325,000 | | | | 6.150 | | | | 10/15/15 | | | | 1,430,001 | |
| | | |
| | | |
The accompanying notes are an integral part of these financial statements.
GOLDMAN SACHS CORE FIXED INCOME FUND
Schedule of Investments (continued)
September 30, 2010 (Unaudited)
| | | | | | | | | | | | | | | | | |
| | | Principal
| | Interest
| | Maturity
| | |
| | | Amount | | Rate | | Date | | Value |
| |
Corporate Obligations – (continued) |
| | | Property/Casualty Insurance(a) – (continued) |
| | | | | | | | | | | | | | | | | |
| | | QBE Insurance Group Ltd.(b)(c) |
| | | $ | 3,150,000 | | | | 5.647 | % | | | 07/01/23 | | | $ | 2,945,924 | |
| | | The Chubb Corp.(c) |
| | | | 4,225,000 | | | | 6.375 | | | | 03/29/67 | | | | 4,140,500 | |
| | | Transatlantic Holdings, Inc. |
| | | | 2,025,000 | | | | 8.000 | | | | 11/30/39 | | | | 2,073,792 | |
| | | ZFS Finance USA Trust I(b)(c) |
| | | | 3,050,000 | | | | 5.875 | | | | 05/09/32 | | | | 2,861,632 | |
| | | | 4,000,000 | | | | 6.150 | | | | 12/15/65 | | | | 3,940,000 | |
| | | | | | | | | | | | | | | | | |
| | | | | | | | | | | | | | | | 25,537,947 | |
| | | |
| | | |
| | | Real Estate Investment Trusts(a) – 1.4% |
| | | Developers Diversified Realty Corp. |
| | | | 2,300,000 | | | | 7.500 | | | | 04/01/17 | | | | 2,415,000 | |
| | | Duke Realty LP |
| | | | 3,025,000 | | | | 5.950 | | | | 02/15/17 | | | | 3,238,008 | |
| | | HCP, Inc. |
| | | | 2,950,000 | | | | 6.000 | | | | 01/30/17 | | | | 3,148,933 | |
| | | Healthcare Realty Trust, Inc. |
| | | | 2,400,000 | | | | 6.500 | | | | 01/17/17 | | | | 2,585,549 | |
| | | Kilroy Realty LP(b) |
| | | | 2,350,000 | | | | 6.625 | | | | 06/01/20 | | | | 2,384,489 | |
| | | Liberty Property LP |
| | | | 1,100,000 | | | | 7.250 | | | | 03/15/11 | | | | 1,125,193 | |
| | | ProLogis(d) |
| | | | 950,000 | | | | 2.250 | | | | 04/01/37 | | | | 919,326 | |
| | | | 1,200,000 | | | | 1.875 | | | | 11/15/37 | | | | 1,135,078 | |
| | | Simon Property Group LP |
| | | | 3,350,000 | | | | 10.350 | | | | 04/01/19 | | | | 4,658,691 | |
| | | | 1,275,000 | | | | 4.375 | | | | 03/01/21 | | | | 1,292,496 | |
| | | WCI Finance LLC(b) |
| | | | 2,986,000 | | | | 5.400 | | | | 10/01/12 | | | | 3,185,157 | |
| | | | | | | | | | | | | | | | | |
| | | | | | | | | | | | | | | | 26,087,920 | |
| | | |
| | | |
| | | Schools(a) – 0.2% |
| | | Rensselaer Polytechnic Institute |
| | | | 4,200,000 | | | | 5.600 | | | | 09/01/20 | | | | 4,647,174 | |
| | | |
| | | |
| | | Tobacco – 0.2% |
| | | Altria Group, Inc. |
| | | | 2,475,000 | | | | 9.700 | | | | 11/10/18 | | | | 3,327,471 | |
| | | |
| | | |
| | | Wirelines Telecommunications(a) – 0.5% |
| | | Qwest Corp. |
| | | | 1,550,000 | | | | 8.375 | | | | 05/01/16 | | | | 1,821,250 | |
| | | Telecom Italia Capital SA |
| | | | 1,225,000 | | | | 4.950 | | | | 09/30/14 | | | | 1,301,093 | |
| | | | 3,625,000 | | | | 7.200 | | | | 07/18/36 | | | | 3,874,356 | |
| | | Verizon Wireless Capital LLC |
| | | | 1,175,000 | | | | 8.500 | | | | 11/15/18 | | | | 1,595,334 | |
| | | | | | | | | | | | | | | | | |
| | | | | | | | | | | | | | | | 8,592,033 | |
| | | |
| | | |
| | | TOTAL CORPORATE OBLIGATIONS |
| | | (Cost $369,661,625) | | $ | 390,671,701 | |
| | | |
| | | |
| | | | | | | | | | | | | | | | | |
| | | | | | | | | | | | | | | | | |
Mortgage-Backed Obligations – 39.0% |
| | | | | | | | | | | | | | | | | |
| | | | | | | | | | | | | | | | | |
| | | Adjustable Rate Non-Agency(c) – 1.1% |
| | | Bear Stearns Adjustable Rate Mortgage Trust Series 2003-05, Class 1A1 |
| | | $ | 54,026 | | | | 3.075 | % | | | 08/25/33 | | | $ | 47,374 | |
| | | Bear Stearns Adjustable Rate Mortgage Trust Series 2006-02, Class 3A2 |
| | | | 567,815 | | | | 5.750 | | | | 07/25/36 | | | | 410,084 | |
| | | Bear Stearns Alt-A Trust Series 2005-8, Class 11A1 |
| | | | 1,599,263 | | | | 0.526 | | | | 10/25/35 | | | | 969,657 | |
| | | Countrywide Home Loan Mortgage Pass-Through Trust Series 2003-37, Class 1A1 |
| | | | 32,358 | | | | 3.321 | | | | 08/25/33 | | | | 29,187 | |
| | | CS First Boston Mortgage Securities Corp. Series 2003-AR9, Class 2A2 |
| | | | 50,062 | | | | 2.632 | | | | 03/25/33 | | | | 42,761 | |
| | | Downey Savings & Loan Association Mortgage Loan Trust Series 2005-AR6, Class 2A1A |
| | | | 4,670,138 | | | | 0.547 | | | | 10/19/45 | | | | 3,041,194 | |
| | | Harborview Mortgage Loan Trust Series 2005-16, Class 2A1A |
| | | | 1,286,514 | | | | 0.497 | | | | 01/19/36 | | | | 770,107 | |
| | | Lehman XS Trust Series 2005-5N, Class 3A1A |
| | | | 5,918,371 | | | | 0.556 | | | | 11/25/35 | | | | 3,941,463 | |
| | | Lehman XS Trust Series 2005-9N, Class 1A1 |
| | | | 6,735,779 | | | | 0.526 | | | | 02/25/36 | | | | 4,090,175 | |
| | | Master Adjustable Rate Mortgages Trust Series 2006-OA2, Class 4A1A |
| | | | 2,645,793 | | | | 1.236 | | | | 12/25/46 | | | | 907,533 | |
| | | Residential Accredit Loans, Inc. Series 2007-QH9, Class A1 |
| | | | 7,770,327 | | | | 6.374 | | | | 11/25/37 | | | | 3,827,252 | |
| | | Sequoia Mortgage Trust Series 2003-4, Class 1A2 |
| | | | 1,726,445 | | | | 1.057 | | | | 07/20/33 | | | | 1,516,941 | |
| | | Washington Mutual Mortgage Pass-Through Certificates Series 2002-AR19, Class A7 |
| | | | 120,051 | | | | 2.741 | | | | 02/25/33 | | | | 108,432 | |
| | | | | | | | | | | | | | | | | |
| | | | | | | | | | | | | | | | 19,702,160 | |
| | | |
| | | |
| | | Collateralized Mortgage Obligations – 0.5% |
| | | Interest Only(c)(e) – 0.0% |
| | | CS First Boston Mortgage Securities Corp. Series 2002-AR31, Class 5X(f) |
| | | $ | 275,054 | | | | 0.000 | % | | | 11/25/32 | | | $ | — | |
| | | CS First Boston Mortgage Securities Corp. Series 2003-AR18, Class 2X(f) |
| | | | 976,512 | | | | 0.000 | | | | 07/25/33 | | | | 1 | |
| | | CS First Boston Mortgage Securities Corp. Series 2003-AR20, Class 2X(f) |
| | | | 1,331,046 | | | | 0.000 | | | | 08/25/33 | | | | 2 | |
| | | FNMA REMIC Series 2004-47, Class EI(f) |
| | | | 3,192,744 | | | | 0.000 | | | | 06/25/34 | | | | 27,971 | |
| | | Wells Fargo Mortgage Backed Securities Trust Series 2003-G, Class AI0 |
| | | | 4,965,325 | | | | 0.771 | | | | 06/25/33 | | | | 45,405 | |
| | | | | | | | | | | | | | | | | |
| | | | | | | | | | | | | | | | 73,379 | |
| | | |
| | | |
The accompanying notes are an integral part of these financial statements.
GOLDMAN SACHS CORE FIXED INCOME FUND
| | | | | | | | | | | | | | | | | |
| | | Principal
| | Interest
| | Maturity
| | |
| | | Amount | | Rate | | Date | | Value |
| |
Mortgage-Backed Obligations – (continued) |
| | | | | | | | | | | | | | | | | |
| | | Inverse Floaters(c) – 0.1% |
| | | GNMA Series 2001-48, Class SA |
| | | $ | 115,351 | | | | 25.651 | % | | | 10/16/31 | | | $ | 178,099 | |
| | | GNMA Series 2001-51, Class SA |
| | | | 218,415 | | | | 31.385 | | | | 10/16/31 | | | | 357,110 | |
| | | GNMA Series 2001-51, Class SB |
| | | | 225,721 | | | | 25.651 | | | | 10/16/31 | | | | 362,386 | |
| | | GNMA Series 2001-59, Class SA |
| | | | 41,267 | | | | 25.489 | | | | 11/16/24 | | | | 63,319 | |
| | | GNMA Series 2002-11, Class SA |
| | | | 116,581 | | | | 36.366 | | | | 02/16/32 | | | | 208,998 | |
| | | GNMA Series 2002-13, Class SB |
| | | | 272,368 | | | | 36.366 | | | | 02/16/32 | | | | 489,216 | |
| | | | | | | | | | | | | | | | | |
| | | | | | | | | | | | | | | | 1,659,128 | |
| | | |
| | | |
| | | Inverse Floating Rate – Interest Only(c)(e) – 0.0% |
| | | FNMA REMIC Series 2003-46, Class BS |
| | | | 3,019,961 | | | | 7.444 | | | | 04/25/17 | | | | 81,650 | |
| | | |
| | | |
| | | Planned Amortization Class – 0.1% |
| | | FHLMC REMIC Series 2639, Class UL |
| | | | 160,411 | | | | 4.750 | | | | 03/15/22 | | | | 168,210 | |
| | | FHLMC REMIC Series 2681, Class PC |
| | | | 115,361 | | | | 5.000 | | | | 01/15/19 | | | | 115,258 | |
| | | FHLMC REMIC Series 2775, Class MC |
| | | | 513,770 | | | | 5.000 | | | | 08/15/27 | | | | 520,023 | |
| | | FHLMC REMIC Series 2949, Class WV |
| | | | 1,569,207 | | | | 5.000 | | | | 12/15/20 | | | | 1,578,964 | |
| | | FNMA REMIC Series 2003-134, Class ME |
| | | | 198,031 | | | | 4.500 | | | | 06/25/33 | | | | 207,471 | |
| | | FNMA REMIC Series 2004-64, Class BA |
| | | | 131,797 | | | | 5.000 | | | | 03/25/34 | | | | 137,707 | |
| | | | | | | | | | | | | | | | | |
| | | | | | | | | | | | | | | | 2,727,633 | |
| | | |
| | | |
| | | Regular Floater(c) – 0.1% |
| | | FHLMC REMIC Series 3013, Class XH(f) |
| | | | 3,444 | | | | 0.000 | | | | 08/15/35 | | | | 3,449 | |
| | | FHLMC REMIC Series 3038, Class XA(f) |
| | | | 179,499 | | | | 0.000 | | | | 09/15/35 | | | | 178,067 | |
| | | FHLMC REMIC Series 3273, Class TC(f) |
| | | | 250,084 | | | | 0.000 | | | | 02/15/37 | | | | 247,429 | |
| | | FHLMC REMIC Series 3325, Class SX(f) |
| | | | 347,639 | | | | 0.000 | | | | 06/15/37 | | | | 344,384 | |
| | | FNMA REMIC Series 2004-62, Class DI(e)(f) |
| | | | 1,408,052 | | | | 0.000 | | | | 07/25/33 | | | | 8,607 | |
| | | FNMA REMIC Series 2004-71, Class DI(e)(f) |
| | | | 3,502,008 | | | | 0.000 | | | | 04/25/34 | | | | 13,204 | |
| | | FNMA REMIC Series 2006-48, Class VF |
| | | | 131,473 | | | | 0.606 | | | | 02/25/20 | | | | 131,548 | |
| | | FNMA REMIC Series 2007-27, Class XA(f) |
| | | | 12,572 | | | | 0.000 | | | | 05/25/35 | | | | 12,485 | |
| | | FNMA REMIC Series 2007-56, Class GY(f) |
| | | | 37,219 | | | | 0.000 | | | | 06/25/37 | | | | 36,606 | |
| | | | | | | | | | | | | | | | | |
| | | | | | | | | | | | | | | | 975,779 | |
| | | |
| | | |
| | | Sequential Fixed Rate – 0.0% |
| | | FHLMC REMIC Series 2664, Class MA |
| | | | 178,265 | | | | 5.000 | | | | 04/15/30 | | | | 181,815 | |
| | | FHLMC REMIC Series 2796, Class AB |
| | | | 55,384 | | | | 5.500 | | | | 10/15/31 | | | | 56,414 | |
| | | | | | | | | | | | | | | | | |
| | | | | | | | | | | | | | | | 238,229 | |
| | | |
| | | |
| | | Sequential Floating Rate(b)(c) – 0.2% |
| | | FDIC Structured Sale Guaranteed Notes Series 2010-S1, Class 1A |
| | | | 3,338,769 | | | | 0.806 | | | | 02/25/48 | | | | 3,347,570 | |
| | | |
| | | |
| | | | | | | | | | | | | | | | | |
| | | TOTAL COLLATERALIZED MORTGAGE OBLIGATIONS | | $ | 9,103,368 | |
| | | |
| | | |
| | | Commercial Mortgage-Backed Securities – 3.7% |
| | | Agency – 0.1% |
| | | FNMA |
| | | $ | 2,557,012 | | | | 6.460 | % | | | 12/01/28 | | | $ | 2,838,657 | |
| | | FNMA Series 2001-M2, Class C(c) |
| | | | 150,612 | | | | 6.300 | | | | 09/25/15 | | | | 151,484 | |
| | | | | | | | | | | | | | | | | |
| | | | | | | | | | | | | | | | 2,990,141 | |
| | | |
| | | |
| | | Sequential Fixed Rate – 3.0% |
| | | Banc of America Commercial Mortgage, Inc. Series 2006-4, Class A4 |
| | | | 7,505,000 | | | | 5.634 | | | | 07/10/46 | | | | 8,125,362 | |
| | | CWCapital Cobalt Ltd. Series 2006-C1, Class A4 |
| | | | 10,500,000 | | | | 5.223 | | | | 08/15/48 | | | | 10,619,816 | |
| | | GMAC Commercial Mortgage Securities, Inc. Series 2002-C1, Class A2 |
| | | | 15,000,000 | | | | 6.278 | | | | 11/15/39 | | | | 15,592,313 | |
| | | LB-UBS Commercial Mortgage Trust Series 2005-C5, Class A4 |
| | | | 9,000,000 | | | | 4.954 | | | | 09/15/30 | | | | 9,785,211 | |
| | | LB-UBS Commercial Mortgage Trust Series 2006-C1, Class A4 |
| | | | 6,000,000 | | | | 5.156 | | | | 02/15/31 | | | | 6,527,121 | |
| | | LB-UBS Commercial Mortgage Trust Series 2006-C6, Class A4 |
| | | | 4,757,000 | | | | 5.372 | | | | 09/15/39 | | | | 5,163,701 | |
| | | | | | | | | | | | | | | | | |
| | | | | | | | | | | | | | | | 55,813,524 | |
| | | |
| | | |
| | | Sequential Floating Rate(c) – 0.6% |
| | | LB-UBS Commercial Mortgage Trust Series 2005-C7, Class A4 |
| | | | 10,175,000 | | | | 5.197 | | | | 11/15/30 | | | | 11,217,911 | |
| | | |
| | | |
| | | | | | | | | | | | | | | | | |
| | | TOTAL COMMERCIAL MORTGAGE-BACKED SECURITIES | | $ | 70,021,576 | |
| | | |
| | | |
| | | Federal Agencies – 33.7% |
| | | Adjustable Rate FNMA(c) – 1.1% |
| | | $ | 22,419 | | | | 2.592 | % | | | 06/01/33 | | | $ | 23,538 | |
| | | | 2,903,443 | | | | 2.652 | | | | 07/01/34 | | | | 3,050,191 | |
| | | | 8,347,063 | | | | 2.766 | | | | 09/01/34 | | | | 8,727,280 | |
| | | | 6,221,702 | | | | 2.710 | | | | 05/01/35 | | | | 6,539,295 | |
| | | | 2,214,917 | | | | 2.192 | | | | 06/01/35 | | | | 2,291,425 | |
| | | | | | | | | | | | | | | | | |
| | | | | | | | | | | | | | | | 20,631,729 | |
| | | |
| | | |
The accompanying notes are an integral part of these financial statements.
GOLDMAN SACHS CORE FIXED INCOME FUND
Schedule of Investments (continued)
September 30, 2010 (Unaudited)
| | | | | | | | | | | | | | | | | |
| | | Principal
| | Interest
| | Maturity
| | |
| | | Amount | | Rate | | Date | | Value |
| |
Mortgage-Backed Obligations – (continued) |
| | | | | | | | | | | | | | | | | |
| | | FHLMC – 4.5% |
| | | $ | 557,074 | | | | 6.500 | % | | | 12/01/13 | | | $ | 602,915 | |
| | | | 5,947 | | | | 5.500 | | | | 06/01/14 | | | | 6,402 | |
| | | | 1,242 | | | | 7.000 | | | | 10/01/14 | | | | 1,331 | |
| | | | 209,824 | | | | 6.000 | | | | 12/01/14 | | | | 222,848 | |
| | | | 10,118 | | | | 7.000 | | | | 05/01/15 | | | | 10,857 | |
| | | | 35,634 | | | | 8.000 | | | | 07/01/15 | | | | 38,626 | |
| | | | 10,003 | | | | 7.000 | | | | 02/01/16 | | | | 10,914 | |
| | | | 17,238 | | | | 7.000 | | | | 03/01/16 | | | | 18,569 | |
| | | | 315,566 | | | | 7.500 | | | | 05/01/16 | | | | 343,168 | |
| | | | 1,700 | | | | 5.000 | | | | 11/01/16 | | | | 1,812 | |
| | | | 1,785 | | | | 5.000 | | | | 12/01/16 | | | | 1,902 | |
| | | | 6,308 | | | | 5.000 | | | | 01/01/17 | | | | 6,733 | |
| | | | 32,262 | | | | 5.000 | | | | 02/01/17 | | | | 34,432 | |
| | | | 17,322 | | | | 5.000 | | | | 03/01/17 | | | | 18,487 | |
| | | | 4,353 | | | | 5.000 | | | | 04/01/17 | | | | 4,645 | |
| | | | 161,662 | | | | 5.000 | | | | 09/01/17 | | | | 172,535 | |
| | | | 420,458 | | | | 5.000 | | | | 10/01/17 | | | | 448,740 | |
| | | | 1,065 | | | | 7.000 | | | | 10/01/17 | | | | 1,183 | |
| | | | 244,561 | | | | 5.000 | | | | 11/01/17 | | | | 261,013 | |
| | | | 91,316 | | | | 5.000 | | | | 12/01/17 | | | | 97,457 | |
| | | | 140,309 | | | | 5.000 | | | | 01/01/18 | | | | 149,701 | |
| | | | 389,813 | | | | 5.000 | | | | 02/01/18 | | | | 416,103 | |
| | | | 278,273 | | | | 5.000 | | | | 03/01/18 | | | | 297,143 | |
| | | | 165,010 | | | | 5.000 | | | | 04/01/18 | | | | 176,257 | |
| | | | 106,542 | | | | 5.000 | | | | 05/01/18 | | | | 113,828 | |
| | | | 76,664 | | | | 5.000 | | | | 06/01/18 | | | | 81,906 | |
| | | | 155,593 | | | | 5.000 | | | | 07/01/18 | | | | 166,199 | |
| | | | 54,609 | | | | 5.000 | | | | 08/01/18 | | | | 58,326 | |
| | | | 227,210 | | | | 4.500 | | | | 09/01/18 | | | | 241,189 | |
| | | | 23,164 | | | | 5.000 | | | | 10/01/18 | | | | 24,739 | |
| | | | 41,093 | | | | 5.000 | | | | 11/01/18 | | | | 43,888 | |
| | | | 351,596 | | | | 5.000 | | | | 06/01/19 | | | | 375,453 | |
| | | | 1,978,385 | | | | 4.500 | | | | 10/01/23 | | | | 2,107,349 | |
| | | | 229,685 | | | | 5.500 | | | | 10/01/25 | | | | 245,576 | |
| | | | 288,683 | | | | 5.500 | | | | 11/01/25 | | | | 308,655 | |
| | | | 37,685 | | | | 7.000 | | | | 06/01/26 | | | | 42,332 | |
| | | | 56,802 | | | | 7.500 | | | | 03/01/27 | | | | 64,405 | |
| | | | 55,669 | | | | 7.500 | | | | 12/01/30 | | | | 62,081 | |
| | | | 35,017 | | | | 7.500 | | | | 01/01/31 | | | | 39,050 | |
| | | | 249,422 | | | | 6.500 | | | | 10/01/33 | | | | 276,117 | |
| | | | 903,994 | | | | 5.000 | | | | 12/01/35 | | | | 962,012 | |
| | | | 2,487 | | | | 5.500 | | | | 02/01/36 | | | | 2,666 | |
| | | | 29,729 | | | | 6.000 | | | | 04/01/37 | | | | 32,513 | |
| | | | 8,647 | | | | 6.000 | | | | 07/01/37 | | | | 9,469 | |
| | | | 396,448 | | | | 6.000 | | | | 09/01/37 | | | | 434,187 | |
| | | | 1,400,694 | | | | 5.500 | | | | 02/01/38 | | | | 1,484,718 | |
| | | | 73,643 | | | | 5.000 | | | | 04/01/38 | | | | 78,416 | |
| | | | 324,351 | | | | 6.000 | | | | 07/01/38 | | | | 355,184 | |
| | | | 144,947 | | | | 6.500 | | | | 09/01/38 | | | | 157,717 | |
| | | | 22,079 | | | | 6.000 | | | | 10/01/38 | | | | 24,195 | |
| | | | 7,335,976 | | | | 6.000 | | | | 11/01/38 | | | | 8,036,619 | |
| | | | 4,197,645 | | | | 5.500 | | | | 12/01/38 | | | | 4,448,150 | |
| | | | 401,348 | | | | 6.000 | | | | 12/01/38 | | | | 439,930 | |
| | | | 197,569 | | | | 6.000 | | | | 01/01/39 | | | | 216,500 | |
| | | | 915,667 | | | | 5.500 | | | | 02/01/39 | | | | 970,312 | |
| | | | 808,488 | | | | 5.000 | | | | 03/01/39 | | | | 864,808 | |
| | | | 1,088,450 | | | | 5.000 | | | | 04/01/39 | | | | 1,161,708 | |
| | | | 567,474 | | | | 5.000 | | | | 05/01/39 | | | | 608,506 | |
| | | | 2,503,741 | | | | 5.000 | | | | 06/01/39 | | | | 2,658,582 | |
| | | | 341,063 | | | | 5.000 | | | | 07/01/39 | | | | 365,723 | |
| | | | 478,228 | | | | 5.000 | | | | 08/01/39 | | | | 512,807 | |
| | | | 9,394,117 | | | | 4.500 | | | | 09/01/39 | | | | 9,898,841 | |
| | | | 4,012,351 | | | | 5.000 | | | | 09/01/39 | | | | 4,295,969 | |
| | | | 1,338,715 | | | | 4.500 | | | | 10/01/39 | | | | 1,409,412 | |
| | | | 5,650,106 | | | | 5.000 | | | | 10/01/39 | | | | 6,041,228 | |
| | | | 3,008,798 | | | | 5.000 | | | | 11/01/39 | | | | 3,211,304 | |
| | | | 303,670 | | | | 5.000 | | | | 01/01/40 | | | | 324,109 | |
| | | | 230,104 | | | | 4.500 | | | | 02/01/40 | | | | 242,615 | |
| | | | 7,266,623 | | | | 5.000 | | | | 03/01/40 | | | | 7,792,035 | |
| | | | 2,286,396 | | | | 4.500 | | | | 04/01/40 | | | | 2,410,718 | |
| | | | 7,035,923 | | | | 5.000 | | | | 04/01/40 | | | | 7,544,652 | |
| | | | 3,918,809 | | | | 4.500 | | | | 05/01/40 | | | | 4,131,893 | |
| | | | 1,913,460 | | | | 4.500 | | | | 06/01/40 | | | | 2,017,504 | |
| | | | 99,698 | | | | 4.500 | | | | 07/01/40 | | | | 105,119 | |
| | | | 1,697,811 | | | | 4.500 | | | | 09/01/40 | | | | 1,790,130 | |
| | | | 1,000,000 | | | | 3.000 | | | | TBA-15yr | (g) | | | 1,007,187 | |
| | | | | | | | | | | | | | | | | |
| | | | | | | | | | | | | | | | 83,642,304 | |
| | | |
| | | |
| | | FNMA – 23.2% |
| | | | 1,162,262 | | | | 7.040 | | | | 08/01/15 | | | | 1,336,717 | |
| | | | 190,913 | | | | 8.500 | | | | 10/01/15 | | | | 199,095 | |
| | | | 6,430 | | | | 7.000 | | | | 01/01/16 | | | | 6,943 | |
| | | | 313,910 | | | | 6.000 | | | | 12/01/16 | | | | 339,341 | |
| | | | 33,011 | | | | 5.000 | | | | 12/01/17 | | | | 35,213 | |
| | | | 1,655,885 | | | | 4.500 | | | | 05/01/18 | | | | 1,758,796 | |
| | | | 3,816,574 | | | | 4.500 | | | | 06/01/18 | | | | 4,054,225 | |
| | | | 204,273 | | | | 5.000 | | | | 06/01/18 | | | | 218,261 | |
| | | | 3,080,724 | | | | 4.000 | | | | 07/01/18 | | | | 3,263,528 | |
| | | | 2,051,665 | | | | 4.500 | | | | 07/01/18 | | | | 2,179,172 | |
| | | | 1,503,064 | | | | 4.000 | | | | 08/01/18 | | | | 1,592,253 | |
| | | | 1,755,609 | | | | 4.500 | | | | 08/01/18 | | | | 1,864,718 | |
| | | | 39,536 | | | | 6.000 | | | | 08/01/18 | | | | 42,863 | |
| | | | 11,238,126 | | | | 4.000 | | | | 09/01/18 | | | | 11,904,973 | |
| | | | 3,103 | | | | 6.500 | | | | 10/01/18 | | | | 3,383 | |
| | | | 97,769 | | | | 5.000 | | | | 05/01/19 | | | | 104,568 | |
| | | | 4,723,098 | | | | 6.000 | | | | 09/01/19 | | | | 5,112,263 | |
| | | | 5,838,880 | | | | 6.000 | | | | 12/01/20 | | | | 6,319,981 | |
| | | | 213,146 | | | | 6.000 | | | | 03/01/21 | | | | 231,068 | |
| | | | 175,540 | | | | 6.000 | | | | 06/01/21 | | | | 190,299 | |
| | | | 286,188 | | | | 6.000 | | | | 08/01/21 | | | | 310,251 | |
| | | | 401,515 | | | | 6.000 | | | | 10/01/22 | | | | 435,048 | |
| | | | 1,024,152 | | | | 5.500 | | | | 09/01/23 | | | | 1,106,443 | |
| | | | 213,820 | | | | 5.500 | | | | 10/01/23 | | | | 231,594 | |
| | | | 412,228 | | | | 7.000 | | | | 08/01/27 | | | | 459,699 | |
| | | | 13,033 | | | | 6.500 | | | | 09/01/27 | | | | 14,220 | |
| | | | 1,043,457 | | | | 7.000 | | | | 03/01/28 | | | | 1,162,117 | |
| | | | 12,543 | | | | 6.500 | | | | 05/01/28 | | | | 13,695 | |
| | | | 3,043 | | | | 5.500 | | | | 01/01/29 | | | | 3,262 | |
| | | | 440 | | | | 5.500 | | | | 04/01/29 | | | | 473 | |
| | | | 5,151 | | | | 7.500 | | | | 12/01/30 | | | | 5,685 | |
| | | | 6,923 | | | | 8.000 | | | | 01/01/31 | | | | 6,993 | |
| | | | 21,026 | | | | 8.000 | | | | 02/01/31 | | | | 23,260 | |
| | | |
| | | |
The accompanying notes are an integral part of these financial statements.
GOLDMAN SACHS CORE FIXED INCOME FUND
| | | | | | | | | | | | | | | | | |
| | | Principal
| | Interest
| | Maturity
| | |
| | | Amount | | Rate | | Date | | Value |
| |
Mortgage-Backed Obligations – (continued) |
| | | FNMA – (continued) |
| | | | | | | | | | | | | | | | | |
| | | $ | 252,391 | | | | 7.000 | % | | | 03/01/31 | | | $ | 282,741 | |
| | | | 23,345 | | | | 5.500 | | | | 02/01/33 | | | | 25,060 | |
| | | | 493,431 | | | | 5.500 | | | | 03/01/33 | | | | 529,651 | |
| | | | 53,334 | | | | 5.500 | | | | 05/01/33 | | | | 57,243 | |
| | | | 69,579 | | | | 5.000 | | | | 07/01/33 | | | | 73,807 | |
| | | | 13,593 | | | | 5.500 | | | | 07/01/33 | | | | 14,589 | |
| | | | 416,745 | | | | 5.000 | | | | 08/01/33 | | | | 442,034 | |
| | | | 130,184 | | | | 5.500 | | | | 08/01/33 | | | | 139,724 | |
| | | | 54,816 | | | | 5.000 | | | | 09/01/33 | | | | 58,146 | |
| | | | 255,341 | | | | 5.500 | | | | 09/01/33 | | | | 274,013 | |
| | | | 8,706 | | | | 6.500 | | | | 09/01/33 | | | | 9,665 | |
| | | | 4,616 | | | | 5.500 | | | | 10/01/33 | | | | 4,954 | |
| | | | 41,323 | | | | 5.000 | | | | 11/01/33 | | | | 43,838 | |
| | | | 64,345 | | | | 5.500 | | | | 11/01/33 | | | | 69,050 | |
| | | | 25,723 | | | | 5.000 | | | | 12/01/33 | | | | 27,288 | |
| | | | 15,588 | | | | 5.500 | | | | 12/01/33 | | | | 16,727 | |
| | | | 24,939 | | | | 5.000 | | | | 01/01/34 | | | | 26,457 | |
| | | | 26,367 | | | | 5.500 | | | | 01/01/34 | | | | 28,293 | |
| | | | 53,702 | | | | 5.500 | | | | 02/01/34 | | | | 57,621 | |
| | | | 16,510 | | | | 5.000 | | | | 03/01/34 | | | | 17,515 | |
| | | | 6,510 | | | | 5.500 | | | | 03/01/34 | | | | 6,985 | |
| | | | 8,793 | | | | 5.500 | | | | 04/01/34 | | | | 9,435 | |
| | | | 1,095,619 | | | | 5.500 | | | | 05/01/34 | | | | 1,175,899 | |
| | | | 37,702 | | | | 5.500 | | | | 07/01/34 | | | | 40,459 | |
| | | | 14,179 | | | | 5.500 | | | | 08/01/34 | | | | 15,214 | |
| | | | 891 | | | | 5.500 | | | | 10/01/34 | | | | 955 | |
| | | | 543,446 | | | | 5.500 | | | | 12/01/34 | | | | 582,081 | |
| | | | 2,106 | | | | 6.000 | | | | 12/01/34 | | | | 2,292 | |
| | | | 680,155 | | | | 5.000 | | | | 04/01/35 | | | | 719,503 | |
| | | | 45,224 | | | | 5.500 | | | | 04/01/35 | | | | 48,439 | |
| | | | 39,500 | | | | 5.500 | | | | 07/01/35 | | | | 42,271 | |
| | | | 1,485 | | | | 5.500 | | | | 08/01/35 | | | | 1,589 | |
| | | | 71,745 | | | | 5.500 | | | | 09/01/35 | | | | 77,092 | |
| | | | 56,058 | | | | 5.500 | | | | 11/01/35 | | | | 60,848 | |
| | | | 6,883 | | | | 5.500 | | | | 12/01/35 | | | | 7,372 | |
| | | | 10,109 | | | | 5.500 | | | | 01/01/36 | | | | 10,973 | |
| | | | 62,441 | | | | 5.500 | | | | 02/01/36 | | | | 67,722 | |
| | | | 3,277,473 | | | | 5.500 | | | | 03/01/36 | | | | 3,539,618 | |
| | | | 156,264 | | | | 6.000 | | | | 03/01/36 | | | | 170,059 | |
| | | | 34,128 | | | | 5.500 | | | | 04/01/36 | | | | 37,024 | |
| | | | 31,833 | | | | 6.000 | | | | 04/01/36 | | | | 34,644 | |
| | | | 922,654 | | | | 6.000 | | | | 11/01/36 | | | | 996,536 | |
| | | | 780,041 | | | | 6.000 | | | | 01/01/37 | | | | 842,668 | |
| | | | 8,440 | | | | 5.500 | | | | 02/01/37 | | | | 9,038 | |
| | | | 15,870 | | | | 5.500 | | | | 04/01/37 | | | | 16,996 | |
| | | | 15,862 | | | | 5.500 | | | | 05/01/37 | | | | 16,987 | |
| | | | 7,085 | | | | 5.500 | | | | 06/01/37 | | | | 7,585 | |
| | | | 337,847 | | | | 6.000 | | | | 06/01/37 | | | | 363,133 | |
| | | | 53,225 | | | | 6.000 | | | | 07/01/37 | | | | 57,275 | |
| | | | 884 | | | | 5.500 | | | | 08/01/37 | | | | 946 | |
| | | | 1,154,170 | | | | 6.000 | | | | 08/01/37 | | | | 1,239,194 | |
| | | | 807,822 | | | | 6.000 | | | | 09/01/37 | | | | 867,331 | |
| | | | 2,355,624 | | | | 6.000 | | | | 10/01/37 | | | | 2,534,467 | |
| | | | 4,714,638 | | | | 6.000 | | | | 11/01/37 | | | | 5,067,115 | |
| | | | 2,921,826 | | | | 5.500 | | | | 12/01/37 | | | | 3,108,580 | |
| | | | 6,759,860 | | | | 6.000 | | | | 12/01/37 | | | | 7,269,755 | |
| | | | 6,119,790 | | | | 5.500 | | | | 01/01/38 | | | | 6,508,169 | |
| | | | 2,629,437 | | | | 6.000 | | | | 01/01/38 | | | | 2,828,377 | |
| | | | 231,007 | | | | 5.000 | | | | 02/01/38 | | | | 242,174 | |
| | | | 6,334 | | | | 5.500 | | | | 02/01/38 | | | | 6,782 | |
| | | | 71,242 | | | | 6.000 | | | | 02/01/38 | | | | 77,754 | |
| | | | 3,316,460 | | | | 5.500 | | | | 03/01/38 | | | | 3,522,574 | |
| | | | 2,479,543 | | | | 6.000 | | | | 03/01/38 | | | | 2,665,490 | |
| | | | 3,753,964 | | | | 5.500 | | | | 05/01/38 | | | | 3,993,941 | |
| | | | 21,957 | | | | 6.000 | | | | 05/01/38 | | | | 24,088 | |
| | | | 4,813,216 | | | | 5.500 | | | | 06/01/38 | | | | 5,117,385 | |
| | | | 19,984 | | | | 6.000 | | | | 06/01/38 | | | | 21,923 | |
| | | | 1,834,421 | | | | 5.500 | | | | 07/01/38 | | | | 1,950,211 | |
| | | | 4,692,150 | | | | 6.000 | | | | 07/01/38 | | | | 5,037,852 | |
| | | | 112,271 | | | | 6.000 | | | | 08/01/38 | | | | 121,051 | |
| | | | 423,970 | | | | 6.000 | | | | 10/01/38 | | | | 455,668 | |
| | | | 283 | | | | 5.500 | | | | 12/01/38 | | | | 308 | |
| | | | 319,056 | | | | 5.000 | | | | 01/01/39 | | | | 341,004 | |
| | | | 1,169,600 | | | | 5.000 | | | | 02/01/39 | | | | 1,250,540 | |
| | | | 776,576 | | | | 4.500 | | | | 03/01/39 | | | | 819,720 | |
| | | | 1,157,306 | | | | 5.000 | | | | 03/01/39 | | | | 1,236,916 | |
| | | | 193,632 | | | | 4.500 | | | | 04/01/39 | | | | 204,017 | |
| | | | 188,217 | | | | 5.000 | | | | 04/01/39 | | | | 201,249 | |
| | | | 710,646 | | | | 4.500 | | | | 05/01/39 | | | | 748,760 | |
| | | | 1,216,322 | | | | 5.000 | | | | 05/01/39 | | | | 1,302,723 | |
| | | | 357,721 | | | | 4.500 | | | | 06/01/39 | | | | 377,611 | |
| | | | 337,652 | | | | 5.000 | | | | 06/01/39 | | | | 361,378 | |
| | | | 546,436 | | | | 4.500 | | | | 07/01/39 | | | | 576,753 | |
| | | | 8,121,230 | | | | 5.000 | | | | 07/01/39 | | | | 8,684,005 | |
| | | | 1,055,871 | | | | 4.500 | | | | 08/01/39 | | | | 1,113,848 | |
| | | | 8,029,375 | | | | 5.000 | | | | 08/01/39 | | | | 8,598,339 | |
| | | | 1,167,010 | | | | 5.500 | | | | 08/01/39 | | | | 1,241,476 | |
| | | | 1,691,477 | | | | 4.500 | | | | 09/01/39 | | | | 1,785,896 | |
| | | | 17,225,998 | | | | 5.000 | | | | 09/01/39 | | | | 18,451,288 | |
| | | | 7,213,061 | | | | 4.500 | | | | 10/01/39 | | | | 7,602,602 | |
| | | | 11,504,298 | | | | 5.000 | | | | 10/01/39 | | | | 12,315,775 | |
| | | | 4,000,000 | | | | 5.500 | | | | 10/01/39 | | | | 4,254,500 | |
| | | | 479,676 | | | | 4.500 | | | | 11/01/39 | | | | 506,039 | |
| | | | 10,407,032 | | | | 5.000 | | | | 11/01/39 | | | | 11,124,183 | |
| | | | 3,624,201 | | | | 4.500 | | | | 12/01/39 | | | | 3,822,611 | |
| | | | 1,807,276 | | | | 5.000 | | | | 12/01/39 | | | | 1,934,910 | |
| | | | 591,000 | | | | 4.500 | | | | 01/01/40 | | | | 623,387 | |
| | | | 1,013,550 | | | | 5.000 | | | | 01/01/40 | | | | 1,084,400 | |
| | | | 581,966 | | | | 4.500 | | | | 02/01/40 | | | | 614,334 | |
| | | | 2,530,595 | | | | 5.000 | | | | 02/01/40 | | | | 2,709,882 | |
| | | | 252,909 | | | | 4.500 | | | | 03/01/40 | | | | 267,026 | |
| | | | 3,079,636 | | | | 5.000 | | | | 03/01/40 | | | | 3,306,880 | |
| | | | 711,375 | | | | 4.500 | | | | 04/01/40 | | | | 751,084 | |
| | | | 764,340 | | | | 4.500 | | | | 05/01/40 | | | | 807,006 | |
| | | | 52,223 | | | | 4.500 | | | | 06/01/40 | | | | 55,139 | |
| | | | 198,176 | | | | 4.500 | | | | 07/01/40 | | | | 209,238 | |
| | | | 3,976,805 | | | | 4.500 | | | | 08/01/40 | | | | 4,198,791 | |
| | | | 5,978,504 | | | | 4.500 | | | | 09/01/40 | | | | 6,232,734 | |
| | | | 10,000,000 | | | | 3.000 | | | | TBA-15yr | (g) | | | 10,071,874 | |
| | | | 50,000,000 | | | | 3.500 | | | | TBA-15yr | (g) | | | 51,353,517 | |
| | | | 5,000,000 | | | | 3.500 | | | | TBA-30yr | (g) | | | 5,037,109 | |
| | | | 53,000,000 | | | | 5.500 | | | | TBA-30yr | (g) | | | 56,333,202 | |
| | | |
| | | |
The accompanying notes are an integral part of these financial statements.
GOLDMAN SACHS CORE FIXED INCOME FUND
Schedule of Investments (continued)
September 30, 2010 (Unaudited)
| | | | | | | | | | | | | | | | | |
| | | Principal
| | Interest
| | Maturity
| | |
| | | Amount | | Rate | | Date | | Value |
| |
Mortgage-Backed Obligations – (continued) |
| | | FNMA – (continued) |
| | | | | | | | | | | | | | | | | |
| | | $ | 71,000,000 | | | | 6.000 | % | | | TBA-30yr | (g) | | $ | 76,169,652 | |
| | | | 15,000,000 | | | | 6.500 | | | | TBA-30yr | (g) | | | 16,362,891 | |
| | | | | | | | | | | | | | | | | |
| | | | | | | | | | | | | | | | 433,394,932 | |
| | | |
| | | |
| | | GNMA – 4.9% |
| | | | 29,349 | | | | 6.000 | | | | 10/15/38 | | | | 32,069 | |
| | | | 114,472 | | | | 6.000 | | | | 11/15/38 | | | | 124,984 | |
| | | | 171,863 | | | | 6.000 | | | | 12/15/38 | | | | 187,788 | |
| | | | 424,089 | | | | 6.000 | | | | 01/15/39 | | | | 463,384 | |
| | | | 2,061,667 | | | | 4.500 | | | | 06/15/39 | | | | 2,189,313 | |
| | | | 938,162 | | | | 4.500 | | | | 07/15/39 | | | | 996,247 | |
| | | | 92,245 | | | | 5.000 | | | | 07/15/39 | | | | 98,814 | |
| | | | 3,525,306 | | | | 5.000 | | | | 08/15/39 | | | | 3,776,346 | |
| | | | 188,915 | | | | 4.500 | | | | 10/15/39 | | | | 200,611 | |
| | | | 80,000,000 | | | | 4.000 | | | | TBA-30yr | (g) | | | 82,625,703 | |
| | | | | | | | | | | | | | | | | |
| | | | | | | | | | | | | | | | 90,695,259 | |
| | | |
| | | |
| | | | | | | | | | | | | | | | | |
| | | TOTAL FEDERAL AGENCIES | | $ | 628,364,224 | |
| | | |
| | | |
| | | TOTAL MORTGAGE-BACKED OBLIGATIONS |
| | | (Cost $721,073,157) | | $ | 727,191,328 | |
| | | |
| | | |
| | | | | | | | | | | | | | | | | |
| | | | | | | | | | | | | | | | | |
Agency Debentures – 1.3% |
| | | | | | | | | | | | | | | | | |
| | | | | | | | | | | | | | | | | |
| | | FHLB |
| | | $ | 2,400,000 | | | | 5.000 | % | | | 09/28/29 | | | $ | 2,713,831 | |
| | | FHLMC |
| | | | 13,400,000 | | | | 1.750 | | | | 09/10/15 | | | | 13,532,620 | |
| | | FNMA |
| | | | 5,300,000 | | | | 3.000 | | | | 07/28/14 | | | | 5,402,672 | |
| | | Small Business Administration |
| | | | 252,322 | | | | 6.300 | | | | 06/01/18 | | | | 275,987 | |
| | | Tennessee Valley Authority |
| | | | 2,800,000 | | | | 4.625 | | | | 09/15/60 | | | | 2,916,911 | |
| | | |
| | | |
| | | TOTAL AGENCY DEBENTURES |
| | | (Cost $24,228,782) | | $ | 24,842,021 | |
| | | |
| | | |
| | | | | | | | | | | | | | | | | |
| | | | | | | | | | | | | | | | | |
Asset-Backed Securities – 3.2% |
| | | | | | | | | | | | | | | | | |
| | | | | | | | | | | | | | | | | |
| | | Home Equity – 0.9% |
| | | CIT Mortgage Loan Trust Series 2007-1, Class 2A2(b)(c) |
| | | $ | 3,400,000 | | | | 1.506 | % | | | 10/25/37 | | | $ | 2,107,767 | |
| | | CIT Mortgage Loan Trust Series 2007-1, Class 2A3(b)(c) |
| | | | 6,500,000 | | | | 1.706 | | | | 10/25/37 | | | | 3,268,363 | |
| | | Countrywide Home Equity Loan Trust Series 2002-E, Class A(c) |
| | | | 589,056 | | | | 0.517 | | | | 10/15/28 | | | | 516,358 | |
| | | Countrywide Home Equity Loan Trust Series 2004-G, Class 2A(c) |
| | | | 478,175 | | | | 0.477 | | | | 12/15/29 | | | | 245,757 | |
| | | Countrywide Home Equity Loan Trust Series 2006-HW, Class 2A1B(c) |
| | | | 11,366,822 | | | | 0.407 | | | | 11/15/36 | | | | 8,240,505 | |
| | | GMAC Mortgage Corp. Loan Trust Series 2007-HE3, Class 1A1 |
| | | | 1,506,827 | | | | 7.000 | | | | 09/25/37 | | | | 967,288 | |
| | | GMAC Mortgage Corp. Loan Trust Series 2007-HE3, Class 2A1 |
| | | | 2,145,353 | | | | 7.000 | | | | 09/25/37 | | | | 1,227,032 | |
| | | Impac CMB Trust Series 2004-08, Class 1A(c) |
| | | | 638,133 | | | | 0.976 | | | | 10/25/34 | | | | 409,317 | |
| | | Impac CMB Trust Series 2004-10, Class 2A(c) |
| | | | 822,422 | | | | 0.896 | | | | 03/25/35 | | | | 498,317 | |
| | | | | | | | | | | | | | | | | |
| | | | | | | | | | | | | | | | 17,480,704 | |
| | | |
| | | |
| | | Manufactured Housing – 0.1% |
| | | Mid-State Trust Series 4, Class A |
| | | | 1,013,999 | | | | 8.330 | | | | 04/01/30 | | | | 1,012,335 | |
| | | |
| | | |
| | | Student Loan(c) – 2.2% |
| | | Brazos Higher Education Authority Inc. Series 2005 I-A-2 |
| | | | 9,036,500 | | | | 0.369 | | | | 12/26/18 | | | | 8,946,225 | |
| | | Brazos Higher Education Authority, Inc Series 2004 I-A-2 |
| | | | 14,743,710 | | | | 0.449 | | | | 06/27/22 | | | | 14,498,198 | |
| | | Brazos Higher Education Authority, Inc. Series 2005-3, Class A14 |
| | | | 1,498,408 | | | | 0.399 | | | | 09/25/23 | | | | 1,490,205 | |
| | | Education Funding Capital Trust I Series 2004-1, Class A2 |
| | | | 2,949,646 | | | | 0.452 | | | | 12/15/22 | | | | 2,895,541 | |
| | | Knowledgeworks Foundation Student Loan Series 2010-1, Class A |
| | | | 2,400,000 | | | | 1.242 | | | | 02/25/42 | | | | 2,370,298 | |
| | | Nelnet Student Loan Trust Series 2010-3A, Class A(b) |
| | | | 3,150,000 | | | | 1.212 | | | | 07/27/48 | | | | 3,157,317 | |
| | | Northstar Education Finance, Inc. Series 2005-1, Class A1 |
| | | | 775,143 | | | | 0.588 | | | | 10/28/26 | | | | 770,449 | |
| | | South Carolina Student Loan Corp. Series 2005, Class A2 |
| | | | 5,000,000 | | | | 0.417 | | | | 12/01/20 | | | | 4,838,698 | |
| | | US Education Loan Trust LLC Series 2006-1, Class A2(b) |
| | | | 1,392,067 | | | | 0.427 | | | | 03/01/25 | | | | 1,381,140 | |
| | | | | | | | | | | | | | | | | |
| | | | | | | | | | | | | | | | 40,348,071 | |
| | | |
| | | |
| | | TOTAL ASSET-BACKED SECURITIES |
| | | (Cost $68,592,121) | | $ | 58,841,110 | |
| | | |
| | | |
| | | | | | | | | | | | | | | | | |
| | | | | | | | | | | | | | | | | |
Foreign Debt Obligations – 2.1% |
| | | | | | | | | | | | | | | | | |
| | | | | | | | | | | | | | | | | |
| | | Sovereign – 1.8% |
| | | Federal Republic of Brazil |
| | | $ | 1,710,000 | | | | 8.250 | % | | | 01/20/34 | | | $ | 2,470,950 | |
| | | | 1,460,000 | | | | 7.125 | | | | 01/20/37 | | | | 1,912,600 | |
| | | Ontario Province of Canada |
| | | | 2,800,000 | | | | 4.100 | | | | 06/16/14 | | | | 3,074,778 | |
| | | Republic of Chile |
| | | | 9,450,000 | | | | 3.875 | | | | 08/05/20 | | | | 9,808,029 | |
| | | Russian Federation |
| | | | 100,000 | | | | 5.000 | | | | 04/29/20 | | | | 104,000 | |
| | | | 1,682,600 | | | | 7.500 | | | | 03/31/30 | | | | 2,006,500 | |
| | | |
| | | |
The accompanying notes are an integral part of these financial statements.
GOLDMAN SACHS CORE FIXED INCOME FUND
| | | | | | | | | | | | | | | | | |
| | | Principal
| | Interest
| | Maturity
| | |
| | | Amount | | Rate | | Date | | Value |
| |
Foreign Debt Obligations – (continued) |
| | | Sovereign – (continued) |
| | | | | | | | | | | | | | | | | |
| | | State of Qatar |
| | | $ | 2,000,000 | | | | 5.150 | % | | | 04/09/14 | | | $ | 2,188,000 | |
| | | | 5,410,000 | | | | 5.250 | (b) | | | 01/20/20 | | | | 5,937,475 | |
| | | United Kingdom Gilt |
| | | GBP | 4,100,000 | | | | 4.250 | | | | 09/07/39 | | | | 6,822,620 | |
| | | | | | | | | | | | | | | | | |
| | | | | | | | | | | | | | | | 34,324,952 | |
| | | |
| | | |
| | | Supranational – 0.3% |
| | | North American Development Bank |
| | | $ | 5,100,000 | | | | 4.375 | | | | 02/11/20 | | | | 5,573,570 | |
| | | |
| | | |
| | | TOTAL FOREIGN DEBT OBLIGATIONS |
| | | (Cost $37,166,039) | | $ | 39,898,522 | |
| | | |
| | | |
| | | | | | | | | | | | | | | | | |
| | | | | | | | | | | | | | | | | |
Municipal Debt Obligations – 0.9% |
| | | | | | | | | | | | | | | | | |
| | | | | | | | | | | | | | | | | |
| | | California – 0.8% |
| | | California State GO Bonds Build America Taxable Series 2009 |
| | | $ | 2,225,000 | | | | 7.500 | % | | | 04/01/34 | | | $ | 2,420,755 | |
| | | | 3,925,000 | | | | 7.550 | | | | 04/01/39 | | | | 4,268,477 | |
| | | California State GO Bonds Build America Taxable Series 2010 |
| | | | 1,645,000 | | | | 7.950 | | | | 03/01/36 | | | | 1,763,605 | |
| | | | 5,600,000 | | | | 7.625 | | | | 03/01/40 | | | | 6,159,328 | |
| | | | | | | | | | | | | | | | | |
| | | | | | | | | | | | | | | | 14,612,165 | |
| | | |
| | | |
| | | Illinois – 0.1% |
| | | Illinois State GO Bonds Build America Series 2010 |
| | | | 2,850,000 | | | | 7.350 | | | | 07/01/35 | | | | 2,990,790 | |
| | | |
| | | |
| | | TOTAL MUNICIPAL DEBT OBLIGATIONS |
| | | (Cost $16,615,257) | | $ | 17,602,955 | |
| | | |
| | | |
| | | | | | | | | | | | | | | | | |
| | | | | | | | | | | | | | | | | |
Government Guarantee Obligations – 14.6% |
| | | | | | | | | | | | | | | | | |
| | | | | | | | | | | | | | | | | |
| | | Achmea Hypotheekbank NV(b)(h) |
| | | $ | 7,100,000 | | | | 3.200 | % | | | 11/03/14 | | | $ | 7,547,527 | |
| | | Ally Financial, Inc.(i) |
| | | | 22,300,000 | | | | 1.750 | | | | 10/30/12 | | | | 22,823,629 | |
| | | ANZ National (International) Ltd.(b)(h) |
| | | | 12,500,000 | | | | 3.250 | | | | 04/02/12 | | | | 12,989,113 | |
| | | BRFkredit A/S(b)(h) |
| | | | 15,000,000 | | | | 2.050 | | | | 04/15/13 | | | | 15,353,298 | |
| | | Citibank NA(c)(i) |
| | | | 3,300,000 | | | | 0.448 | | | | 05/07/12 | | | | 3,304,171 | |
| | | | 2,100,000 | | | | 0.263 | | | | 06/04/12 | | | | 2,099,061 | |
| | | Citigroup Funding, Inc.(i) |
| | | | 36,700,000 | | | | 1.875 | | | | 10/22/12 | | | | 37,653,349 | |
| | | | 12,200,000 | | | | 1.875 | | | | 11/15/12 | | | | 12,519,954 | |
| | | Commonwealth Bank of Australia(b)(h) |
| | | | 5,700,000 | | | | 2.500 | | | | 12/10/12 | | | | 5,924,466 | |
| | | Danske Bank AS(b)(h) |
| | | | 3,500,000 | | | | 2.500 | | | | 05/10/12 | | | | 3,584,418 | |
| | | FIH Erhvervsbank A/S(a)(b)(h) |
| | | | 9,200,000 | | | | 2.000 | | | | 06/12/13 | | | | 9,409,153 | |
| | | General Electric Capital Corp.(i) |
| | | | 10,700,000 | | | | 2.000 | | | | 09/28/12 | | | | 10,998,215 | |
| | | | 13,700,000 | | | | 2.625 | | | | 12/28/12 | | | | 14,302,803 | |
| | | Israel Government AID Bond(i) |
| | | | 4,000,000 | | | | 5.500 | | | | 09/18/33 | | | | 4,871,337 | |
| | | Kreditanstalt fuer Wiederaufbau MTN(h) |
| | | | 8,700,000 | | | | 2.500 | | | | 05/28/13 | | | | 9,083,009 | |
| | | LeasePlan Corp. NV(b)(h) |
| | | | 9,000,000 | | | | 3.000 | | | | 05/07/12 | | | | 9,299,772 | |
| | | Macquarie Bank Ltd.(b)(h) |
| | | | 13,800,000 | | | | 3.300 | | | | 07/17/14 | | | | 14,706,412 | |
| | | National Australia Bank Ltd.(b)(h) |
| | | | 6,200,000 | | | | 2.550 | | | | 01/13/12 | | | | 6,348,657 | |
| | | Royal Bank of Scotland PLC(b)(h) |
| | | | 15,700,000 | | | | 1.500 | | | | 03/30/12 | | | | 15,809,894 | |
| | | Societe Financement de l’Economie Francaise(b)(h) |
| | | | 14,000,000 | | | | 2.375 | | | | 03/26/12 | | | | 14,297,891 | |
| | | Swedbank AB(b)(h) |
| | | | 1,100,000 | | | | 3.000 | | | | 12/22/11 | | | | 1,131,009 | |
| | | | 7,600,000 | | | | 2.800 | | | | 02/10/12 | | | | 7,824,603 | |
| | | Swedish Housing Finance Corp.(b)(h) |
| | | | 2,500,000 | | | | 3.125 | | | | 03/23/12 | | | | 2,585,911 | |
| | | Westpac Banking Corp.(b)(h) |
| | | | 15,900,000 | | | | 3.250 | | | | 12/16/11 | | | | 16,368,891 | |
| | | | 9,800,000 | | | | 1.900 | | | | 12/14/12 | | | | 10,019,902 | |
| | | Westpac Securities NZ Ltd.(b)(h) |
| | | | 1,500,000 | | | | 2.500 | | | | 05/25/12 | | | | 1,535,235 | |
| | | |
| | | |
| | | TOTAL GOVERNMENT GUARANTEE OBLIGATIONS |
| | | (Cost $265,735,593) | | $ | 272,391,680 | |
| | | |
| | | |
| | | | | | | | | | | | | | | | | |
| | | | | | | | | | | | | | | | | |
U.S. Treasury Obligations – 13.8% |
| | | | | | | | | | | | | | | | | |
| | | | | | | | | | | | | | | | | |
| | | United States Treasury Bonds |
| | | $ | 1,100,000 | | | | 5.375 | % | | | 02/15/31 | | | $ | 1,416,371 | |
| | | | 200,000 | | | | 4.250 | (j) | | | 05/15/39 | | | | 219,978 | |
| | | | 4,300,000 | | | | 4.375 | (j) | | | 11/15/39 | | | | 4,824,729 | |
| | | | 30,300,000 | | | | 4.375 | | | | 05/15/40 | | | | 34,029,927 | |
| | | | 7,100,000 | | | | 3.875 | | | | 08/15/40 | | | | 7,340,761 | |
| | | United States Treasury Inflation Protected Securities |
| | | | 10,214,748 | | | | 2.375 | | | | 04/15/11 | | | | 10,347,233 | |
| | | | 11,518,845 | | | | 3.000 | | | | 07/15/12 | | | | 12,235,202 | |
| | | | 925,256 | | | | 2.375 | | | | 01/15/25 | | | | 1,063,972 | |
| | | | 1,208,251 | | | | 2.000 | | | | 01/15/26 | | | | 1,328,604 | |
| | | United States Treasury Notes |
| | | | 8,800,000 | | | | 0.750 | | | | 05/31/12 | | | | 8,853,592 | |
| | | | 20,800,000 | | | | 0.625 | | | | 06/30/12 | | | | 20,884,654 | |
| | | | 42,500,000 | | | | 3.000 | | | | 09/30/16 | | | | 45,850,276 | |
| | | | 36,000,000 | | | | 3.125 | | | | 10/31/16 | | | | 39,079,798 | |
| | | | 7,700,000 | | | | 3.250 | | | | 12/31/16 | | | | 8,404,396 | |
| | | | 39,350,000 | | | | 3.625 | | | | 08/15/19 | | | | 43,272,016 | |
| | | | 11,600,000 | | | | 3.375 | | | | 11/15/19 | | | | 12,496,447 | |
| | | | 1,300,000 | | | | 3.500 | | | | 05/15/20 | | | | 1,411,098 | |
| | | |
| | | |
The accompanying notes are an integral part of these financial statements.
GOLDMAN SACHS CORE FIXED INCOME FUND
Schedule of Investments (continued)
September 30, 2010 (Unaudited)
| | | | | | | | | | | | | | | | | |
| | | Principal
| | Interest
| | Maturity
| | |
| | | Amount | | Rate | | Date | | Value |
| |
U.S. Treasury Obligations – (continued) |
| | | | | | | | | | | | | | | | | |
| | | United States Treasury Principal-Only STRIPS(k) |
| | | $ | 4,600,000 | | | | 0.000 | % | | | 11/15/21 | | | $ | 3,299,304 | |
| | | |
| | | |
| | | TOTAL U.S. TREASURY OBLIGATIONS |
| | | (Cost $248,679,081) | | $ | 256,358,358 | |
| | | |
| | | |
| | | | | | | | | | | | | |
| | | Shares | | Rate | | Value |
| |
Preferred Stock(c) – 0.1% |
| | | | | | | | | | | | | |
| | | | | | | | | | | | | |
| | | JPMorgan Chase & Co. |
| | | | 1,200,000 | | | | 7.900 | % | | $ | 1,285,956 | |
| | | (Cost $1,200,000) |
| | | |
| | | TOTAL INVESTMENTS BEFORE SHORT-TERM INVESTMENT |
| | | (Cost $1,752,951,655) | | $ | 1,789,083,631 | |
| | | |
| | | |
| | | | | | | | | | | | | | | | | |
| | | Principal
| | Interest
| | Maturity
| | |
| | | Amount | | Rate | | Date | | Value |
| |
Short-term Investment(l) – 22.6% |
| | | | | | | | | | | | | | | | | |
| | | | | | | | | | | | | | | | | |
| | | Repurchase Agreement – 22.6% |
| | | Joint Repurchase Agreement Account II |
| | | $ | 421,700,000 | | | | 0.270 | % | | | 10/01/10 | | | $ | 421,700,000 | |
| | | Maturity Value: $421,703,163 | | | | |
| | | (Cost $421,700,000) | | | | |
| | | |
| | | |
| | | TOTAL INVESTMENTS – 118.6% |
| | | (Cost $2,174,651,655) | | $ | 2,210,783,631 | |
| | | |
| | | |
| | | LIABILITIES IN EXCESS OF
OTHER ASSETS – (18.6)% | | | (346,842,581 | ) |
| | | |
| | | |
| | | NET ASSETS – 100.0% | | $ | 1,863,941,050 | |
| | | |
| | | |
The percentage shown for each investment category reflects the value of investments in that category as a percentage of net assets.
| | |
| (a) | | Security with “Call” features with resetting interest rates. Maturity dates disclosed are the final maturity dates. |
| |
| (b) | | Exempt from registration under Rule 144A of the Securities Act of 1933. Under procedures approved by the Board of Trustees, such securities have been determined to be liquid by the investment adviser and may be resold, normally to qualified institutional buyers in transactions exempt from registration. Total market value of Rule 144A securities amounts to $312,874,626, which represents approximately 16.8% of net assets as of September 30, 2010. |
| |
| (c) | | Variable rate security. Interest rate disclosed is that which is in effect at September 30, 2010. |
| |
| (d) | | Security with “Put” features with resetting interest rates. Maturity dates disclosed are the final maturity dates. |
| |
| (e) | | Security with a notional or nominal principal amount. The actual effective yield of this security is different than the stated interest rate. |
| |
| (f) | | Issued with zero coupon and interest rate is contingent upon LIBOR reaching a predetermined level. |
| |
| (g) | | TBA (To Be Announced) Securities are purchased on a forward commitment basis with an approximate principal amount and no defined maturity date. The actual principal and maturity date will be determined upon settlement when the specific mortgage pools are assigned. Total market value of TBA securities (excluding forward sales contracts, if any) amounts to $298,961,135 which represents approximately 16.0% of net assets as of September 30, 2010. |
| |
| (h) | | Guaranteed by a foreign government until maturity. Total market value of these securities amounts to $163,819,161, which represents approximately 8.8% of net assets as of September 30, 2010. |
| |
| (i) | | Guaranteed under the Federal Deposit Insurance Corporation’s (“FDIC”) Temporary Liquidity Guarantee Program and is backed by the full faith and credit of the United States. The expiration date of the FDIC’s guarantee is the earlier of the maturity date of the debt or June 30, 2012. Total market value of these securities amounts to $108,572,519, which represents approximately 5.8% of net assets as of September 30, 2010. |
| |
| (j) | | All or a portion of security is segregated as collateral for initial margin requirement on futures transactions. |
| |
| (k) | | Issued with a zero coupon. Income is recognized through the accretion of discount. |
| |
| (l) | | Joint repurchase agreement was entered into on September 30, 2010. Additional information appears on pages 74-75. |
| | | | | | | |
| | | |
| | | |
| | | Currency Abbreviations: |
| | | AUD | | — | | Australian Dollar |
| | | CAD | | — | | Canadian Dollar |
| | | CHF | | — | | Swiss Franc |
| | | EUR | | — | | Euro |
| | | GBP | | — | | British Pound |
| | | JPY | | — | | Japanese Yen |
| | | NOK | | — | | Norwegian Krone |
| | | NZD | | — | | New Zealand Dollar |
| | | SEK | | — | | Swedish Krona |
| | | |
| | | Investment Abbreviations: |
| | | BP | | — | | British Pound Offered Rate |
| | | FDIC | | — | | Federal Deposit Insurance Corp. |
| | | FHLB | | — | | Federal Home Loan Bank |
| | | FHLMC | | — | | Federal Home Loan Mortgage Corp. |
| | | FNMA | | — | | Federal National Mortgage Association |
| | | GNMA | | — | | Government National Mortgage Association |
| | | GO | | — | | General Obligation |
| | | LIBOR | | — | | London Interbank Offered Rate |
| | | MTN | | — | | Medium Term Note |
| | | REMIC | | — | | Real Estate Mortgage Investment Conduit |
| | | STRIPS | | — | | Separate Trading of Registered Interest and Principal of Securities |
| | | |
| | | |
The accompanying notes are an integral part of these financial statements.
GOLDMAN SACHS CORE FIXED INCOME FUND
ADDITIONAL INVESTMENT INFORMATION
FORWARD FOREIGN CURRENCY EXCHANGE CONTRACTS — At September 30, 2010, the Fund had outstanding forward foreign currency exchange contracts, both to purchase and sell foreign currencies:
FORWARD FOREIGN CURRENCY EXCHANGE CONTRACTS WITH UNREALIZED GAIN
| | | | | | | | | | | | | | | |
| | | | | Contract
| | Expiration
| | Current
| | Unrealized
|
| Counterparty | | Currency | | Type | | Date | | Value | | Gain |
| |
| Barclays Bank PLC | | NOK | | Purchase | | 12/15/10 | | $ | 782,541 | | | $ | 19,439 | |
| Citibank NA | | CAD | | Purchase | | 12/15/10 | | | 1,414,569 | | | | 9,569 | |
| Credit Suisse International (London) | | EUR | | Purchase | | 12/15/10 | | | 7,312,217 | | | | 213,192 | |
| Deutsche Bank AG (London) | | AUD | | Purchase | | 12/15/10 | | | 4,772,793 | | | | 29,398 | |
| | | CAD | | Purchase | | 12/15/10 | | | 3,254,092 | | | | 46,092 | |
| HSBC Bank PLC | | EUR | | Purchase | | 12/15/10 | | | 1,654,003 | | | | 99,318 | |
| JPMorgan Securities, Inc. | | | | Purchase | | 12/15/10 | | | 4,618,521 | | | | 142,811 | |
| UBS AG (London) | | | | Purchase | | 12/15/10 | | | 4,866,637 | | | | 93,824 | |
| Westpac Banking Corp. | | AUD | | Purchase | | 12/15/10 | | | 1,606,569 | | | | 24,131 | |
| | | GBP | | Purchase | | 12/15/10 | | | 5,552,927 | | | | 138,092 | |
| |
| |
TOTAL | | | | | | | | | | | | $ | 815,866 | |
| |
| |
FORWARD FOREIGN CURRENCY EXCHANGE CONTRACTS WITH UNREALIZED LOSS
| | | | | | | | | | | | | | | |
| | | | | Contract
| | Expiration
| | Current
| | Unrealized
|
| Counterparty | | Currency | | Type | | Date | | Value | | Loss |
| |
| Citibank NA | | EUR | | Sale | | 12/15/10 | | $ | 1,649,915 | | | $ | (60,962 | ) |
| Credit Suisse International (London) | | CHF | | Sale | | 12/15/10 | | | 1,660,344 | | | | (52,236 | ) |
| | | JPY | | Sale | | 12/15/10 | | | 2,631,494 | | | | (23,383 | ) |
| | | NZD | | Purchase | | 12/15/10 | | | 1,581,567 | | | | (7,767 | ) |
| Deutsche Bank AG (London) | | | | Sale | | 12/15/10 | | | 6,798,893 | | | | (160,085 | ) |
| HSBC Bank PLC | | EUR | | Sale | | 12/15/10 | | | 6,462,054 | | | | (111,874 | ) |
| JPMorgan Securities, Inc. | | CAD | | Sale | | 12/15/10 | | | 483,454 | | | | (2,886 | ) |
| | | EUR | | Sale | | 10/22/10 | | | 7,271,823 | | | | (462,204 | ) |
| | | GBP | | Sale | | 10/29/10 | | | 6,942,466 | | | | (67,902 | ) |
| Royal Bank of Canada | | CAD | | Sale | | 12/15/10 | | | 1,602,590 | | | | (7,590 | ) |
| | | EUR | | Purchase | | 12/15/10 | | | 3,130,888 | | | | (8,031 | ) |
| Westpac Banking Corp. | | AUD | | Sale | | 12/15/10 | | | 2,332,616 | | | | (122,866 | ) |
| |
| |
TOTAL | | | | | | | | | | | | $ | (1,087,786 | ) |
| |
| |
The accompanying notes are an integral part of these financial statements.
GOLDMAN SACHS CORE FIXED INCOME FUND
Schedule of Investments (continued)
September 30, 2010 (Unaudited)
| |
| ADDITIONAL INVESTMENT INFORMATION (continued) | |
FORWARD FOREIGN CROSS CURRENCY EXCHANGE CONTRACTS WITH UNREALIZED GAIN (PURCHASE/SALE)
| | | | | | | | | | | | | | | | | |
| | | | | | | Purchase
| | Sale
| | |
| | | | | Expiration
| | Current
| | Current
| | Unrealized
|
| Counterparty | | Currency | | Date | | Value | | Value | | Gain |
| |
| Citibank NA | | EUR/CHF | | 12/15/10 | | $ | 3,314,817 | | | $ | 3,288,279 | | | $ | 26,538 | |
| Credit Suisse International (London) | | SEK/EUR | | 12/15/10 | | | 4,023,118 | | | | 3,981,240 | | | | 41,878 | |
| Deutsche Bank AG (London) | | EUR/GBP | | 12/15/10 | | | 1,694,876 | | | | 1,669,892 | | | | 24,984 | |
| HSBC Bank PLC | | EUR/GBP | | 12/15/10 | | | 3,310,730 | | | | 3,221,027 | | | | 89,703 | |
| | | SEK/EUR | | 12/15/10 | | | 3,306,864 | | | | 3,306,643 | | | | 221 | |
| | | EUR/NOK | | 12/15/10 | | | 3,287,569 | | | | 3,263,933 | | | | 23,636 | |
| Royal Bank of Canada | | EUR/CAD | | 12/15/10 | | | 2,476,916 | | | | 2,388,928 | | | | 87,988 | |
| UBS AG (London) | | EUR/CAD | | 12/15/10 | | | 2,416,969 | | | | 2,387,277 | | | | 29,692 | |
| |
| |
TOTAL | | | | | | | | | | | | | | $ | 324,640 | |
| |
| |
FORWARD FOREIGN CROSS CURRENCY EXCHANGE CONTRACTS WITH UNREALIZED LOSS (PURCHASE/SALE)
| | | | | | | | | | | | | | | | | |
| | | | | | | Purchase
| | Sale
| | |
| | | | | Expiration
| | Current
| | Current
| | Unrealized
|
| Counterparty | | Currency | | Date | | Value | | Value | | Loss |
| |
| Barclays Bank PLC | | NOK/EUR | | 12/15/10 | | $ | 4,878,658 | | | $ | 4,959,377 | | | $ | (80,719 | ) |
| Citibank NA | | EUR/SEK | | 12/15/10 | | | 3,354,328 | | | | 3,362,942 | | | | (8,614 | ) |
| | | NZD/EUR | | 12/15/10 | | | 2,404,805 | | | | 2,555,938 | | | | (151,133 | ) |
| Credit Suisse International (London) | | NZD/EUR | | 12/15/10 | | | 1,532,440 | | | | 1,585,881 | | | | (53,441 | ) |
| HSBC Bank PLC | | CHF/EUR | | 12/15/10 | | | 1,660,343 | | | | 1,715,312 | | | | (54,969 | ) |
| | | EUR/SEK | | 12/15/10 | | | 3,373,402 | | | | 3,385,307 | | | | (11,905 | ) |
| | | NZD/EUR | | 12/15/10 | | | 3,180,684 | | | | 3,373,402 | | | | (192,718 | ) |
| Royal Bank of Canada | | CAD/EUR | | 12/15/10 | | | 3,173,281 | | | | 3,372,040 | | | | (198,759 | ) |
| | | CHF/EUR | | 12/15/10 | | | 1,631,485 | | | | 1,658,090 | | | | (26,605 | ) |
| UBS AG (London) | | CHF/EUR | | 12/15/10 | | | 1,648,278 | | | | 1,688,064 | | | | (39,786 | ) |
| | | JPY/EUR | | 12/15/10 | | | 1,598,248 | | | | 1,704,413 | | | | (106,165 | ) |
| Westpac Banking Corp. | | AUD/EUR | | 12/15/10 | | | 1,621,687 | | | | 1,656,727 | | | | (35,040 | ) |
| |
| |
TOTAL | | | | | | | | | | | | | | $ | (959,854 | ) |
| |
| |
FUTURES CONTRACTS — At September 30, 2010, the following futures contracts were open:
| | | | | | | | | | | | | | | |
| | | Number of
| | | | | | |
| | | Contracts
| | Expiration
| | Current
| | Unrealized
|
| Type | | Long (Short) | | Date | | Value | | Gain (Loss) |
| |
| Australia 10 Year Treasury Bond | | | 85 | | | December 2010 | | $ | 8,862,759 | | | $ | 53,213 | |
| Eurodollars | | | (3 | ) | | December 2010 | | | (747,300 | ) | | | (5,635 | ) |
| 10 Year German Euro-Bobl | | | 71 | | | December 2010 | | | 12,721,211 | | | | 83,323 | |
| 2 Year U.S. Treasury Notes | | | 19 | | | December 2010 | | | 4,170,203 | | | | 859 | |
| 5 Year U.S. Treasury Notes | | | 999 | | | December 2010 | | | 120,746,321 | | | | 664,219 | |
| 10 Year U.S. Treasury Notes | | | 1,246 | | | December 2010 | | | 157,054,406 | | | | 896,954 | |
| 30 Year U.S. Treasury Bonds | | | 474 | | | December 2010 | | | 63,382,688 | | | | 297,715 | |
| |
| |
TOTAL | | | | | | | | | | | | $ | 1,990,648 | |
| |
| |
The accompanying notes are an integral part of these financial statements.
GOLDMAN SACHS CORE FIXED INCOME FUND
| |
| ADDITIONAL INVESTMENT INFORMATION (continued) | |
SWAP CONTRACTS — At September 30, 2010, the Fund had outstanding swap contracts with the following terms:
INTEREST RATE SWAP CONTRACTS
| | | | | | | | | | | | | | | | | |
| | | | | | | Rates Exchanged | | |
| | | Notional
| | | | Payments
| | Payments
| | |
| | | Amount
| | Termination
| | received by
| | made by
| | Unrealized
|
| Counterparty | | (000s)(a) | | Date | | the Fund | | the Fund | | Gain (Loss)* |
| |
| Credit Suisse International (London) | | $ | 25,500 | | | 08/15/17 | | 3 month LIBOR | | | 2.252 | % | | $ | (247,782 | ) |
| Deutsche Bank Securities, Inc. | | | 20,300 | | | 08/15/17 | | 3 month LIBOR | | | 2.242 | | | | (183,237 | ) |
| | | | 23,000 | | | 08/15/17 | | 3 month LIBOR | | | 2.114 | | | | (23,389 | ) |
| JPMorgan Securities, Inc. | | | 23,200 | | | 08/15/17 | | 3 month LIBOR | | | 2.161 | | | | (92,620 | ) |
| |
| |
TOTAL | | | | | | | | | | | | | | $ | (547,028 | ) |
| |
| |
| | |
| * | | There are no upfront payments on the swap contract(s), therefore the unrealized gain (loss) of the swap contract(s) is equal to their market value. |
| (a) | | Represents forward starting interest rate swaps whose effective dates of commencement of accruals and cash flows occur subsequent to September 30, 2010. |
CREDIT DEFAULT SWAP CONTRACTS
| | | | | | | | | | | | | | | | | | | | | | | | | | | | | | | |
| | | | | | | | | | | Credit
| | | | | | |
| | | | | | | Rates
| | | | Spread at
| | | | Upfront
| | |
| | | | | Notional
| | received
| | | | September 30,
| | | | Payments
| | |
| | | Referenced
| | Amount
| | (paid) by
| | Termination
| | 2010
| | Market
| | made (received)
| | Unrealized
|
| Counterparty | | Obligation | | (000s) | | Fund | | Date | | (basis points)(b) | | Value | | by the Fund | | Gain (Loss) |
| |
Protection Sold: | | | | | | | | | | | | | | | | | | | | | | | | | | | | | | |
Credit Suisse First
Boston Corp. | | | Prudential Financial, Inc. 4.500%, 7/15/13 | | |
$ | 1,150 | | | |
1.000 | % | |
06/20/15 | | |
191 | | |
$ | (45,497 | ) | |
$ | (55,153 | ) | |
$ | 9,656 | |
Deutsche Bank
Securities, Inc. | | | MetLife, Inc. 5.000%, 6/15/15 | | | |
3,100 | | | |
1.000 | | |
03/20/15 | | |
204 | | | |
(133,925 | ) | | |
(165,561 | ) | | |
31,636 | |
| | | | | | | | 1,100 | | | | 1.000 | | | 03/20/15 | | | 204 | | | | (47,521 | ) | | | (39,594 | ) | | | (7,927 | ) |
JPMorgan Securities,
Inc. | | | Prudential Financial, Inc. 4.500%, 7/15/13 | | | |
975 | | | |
1.000 | | |
06/20/15 | | |
191 | | | |
(38,574 | ) | | |
(56,456 | ) | | |
17,882 | |
| | | | CDX North America Investment Grade Index | | | |
25,000 | | | |
1.000 | | |
12/20/15 | | |
104 | | | |
(69,116 | ) | | |
(76,755 | ) | | |
7,639 | |
| |
| |
TOTAL | | | | | | | | | | | | | | | | | | | | $ | (334,633 | ) | | $ | (393,519 | ) | | $ | 58,886 | |
| |
| |
| |
| (b) | Credit spread on the Referenced Obligation, together with the term of the swap contract, are indicators of payment/performance risk. The likelihood of a credit event occurring which would require a fund to make a payment or otherwise be required to perform under the swap contract is generally greater as the credit spread and the term of the swap contract increase. |
The accompanying notes are an integral part of these financial statements.
GOLDMAN SACHS CORE PLUS FIXED INCOME FUND
Schedule of Investments
September 30, 2010 (Unaudited)
| | | | | | | | | | | | | | | | | |
| | | Principal
| | Interest
| | Maturity
| | |
| | | Amount | | Rate | | Date | | Value |
| |
Corporate Obligations – 17.0% |
| | | | | | | | | | | | | | | | | |
| | | | | | | | | | | | | | | | | |
| | | Automotive – 0.2% |
| | | Ally Financial, Inc. |
| | | $ | 625,000 | | | | 6.875 | % | | | 09/15/11 | | | $ | 645,312 | |
| | | |
| | | |
| | | Banks – 4.0% |
| | | ANZ Capital Trust II(a)(b) |
| | | | 175,000 | | | | 5.360 | | | | 07/29/49 | | | | 175,328 | |
| | | Bank of America Corp. |
| | | | 450,000 | | | | 5.625 | | | | 07/01/20 | | | | 475,082 | |
| | | Bank of America NA |
| | | | 1,575,000 | | | | 6.100 | | | | 06/15/17 | | | | 1,684,761 | |
| | | Barclays Bank PLC |
| | | | 900,000 | | | | 6.750 | | | | 05/22/19 | | | | 1,071,454 | |
| | | BBVA Bancomer SA(b) |
| | | | 750,000 | | | | 7.250 | | | | 04/22/20 | | | | 810,136 | |
| | | Citigroup, Inc. |
| | | | 400,000 | | | | 6.375 | | | | 08/12/14 | | | | 443,810 | |
| | | | 925,000 | | | | 5.000 | | | | 09/15/14 | | | | 959,226 | |
| | | | 850,000 | | | | 5.375 | | | | 08/09/20 | | | | 876,656 | |
| | | Credit Agricole SA(a)(b)(c) |
| | | | 150,000 | | | | 8.375 | | | | 10/13/49 | | | | 160,500 | |
| | | Credit Suisse of New York |
| | | | 300,000 | | | | 4.375 | | | | 08/05/20 | | | | 306,437 | |
| | | Discover Bank |
| | | | 400,000 | | | | 8.700 | | | | 11/18/19 | | | | 475,060 | |
| | | Fifth Third Bank(c) |
| | | | 450,000 | | | | 0.479 | | | | 05/17/13 | | | | 430,756 | |
| | | First Niagara Financial Group, Inc.(a) |
| | | | 325,000 | | | | 6.750 | | | | 03/19/20 | | | | 359,760 | |
| | | HSBC Bank USA NA |
| | | | 1,100,000 | | | | 4.875 | | | | 08/24/20 | | | | 1,147,300 | |
| | | HSBC Holdings PLC |
| | | | 500,000 | | | | 6.800 | | | | 06/01/38 | | | | 584,773 | |
| | | JPMorgan Chase Capital XXII Series V(a) |
| | | | 250,000 | | | | 6.450 | | | | 02/02/37 | | | | 247,218 | |
| | | JPMorgan Securities, Inc. |
| | | | 750,000 | | | | 7.250 | | | | 02/01/18 | | | | 910,568 | |
| | | Lloyds TSB Bank PLC(b) |
| | | | 500,000 | | | | 6.500 | | | | 09/14/20 | | | | 504,817 | |
| | | MUFG Capital Finance 1 Ltd.(a)(c) |
| | | | 250,000 | | | | 6.346 | | | | 07/29/49 | | | | 247,500 | |
| | | PNC Bank NA |
| | | | 250,000 | | | | 6.875 | | | | 04/01/18 | | | | 293,210 | |
| | | Resona Preferred Global Securities Cayman Ltd.(a)(b)(c) |
| | | | 550,000 | | | | 7.191 | | | | 12/29/49 | | | | 539,120 | |
| | | Royal Bank of Scotland PLC |
| | | | 600,000 | | | | 4.875 | (b) | | | 08/25/14 | | | | 636,522 | |
| | | | 225,000 | | | | 5.625 | | | | 08/24/20 | | | | 235,904 | |
| | | US Bank NA(a)(c) |
| | | EUR | 200,000 | | | | 4.375 | | | | 02/28/17 | | | | 270,387 | |
| | | | | | | | | | | | | | | | | |
| | | | | | | | | | | | | | | | 13,846,285 | |
| | | |
| | | |
| | | Brokerage – 0.7% |
| | | Morgan Stanley & Co. |
| | | $ | 550,000 | | | | 0.780 | (c) | | | 01/09/12 | | | | 546,710 | |
| | | | 325,000 | | | | 6.625 | (a) | | | 04/01/18 | | | | 359,881 | |
| | | | 525,000 | | | | 7.300 | (a) | | | 05/13/19 | | | | 600,047 | |
| | | | 250,000 | | | | 5.625 | (a) | | | 09/23/19 | | | | 259,944 | |
| | | | 650,000 | | | | 5.500 | (a) | | | 07/24/20 | | | | 669,642 | |
| | | | | | | | | | | | | | | | | |
| | | | | | | | | | | | | | | | 2,436,224 | |
| | | |
| | | |
| | | Chemicals(a) – 0.2% |
| | | The Dow Chemical Co. |
| | | | 500,000 | | | | 7.600 | | | | 05/15/14 | | | | 584,343 | |
| | | | 175,000 | | | | 5.900 | | | | 02/15/15 | | | | 195,393 | |
| | | | | | | | | | | | | | | | | |
| | | | | | | | | | | | | | | | 779,736 | |
| | | |
| | | |
| | | Consumer Products(a) – 0.1% |
| | | Whirlpool Corp. |
| | | | 75,000 | | | | 8.000 | | | | 05/01/12 | | | | 81,899 | |
| | | | 100,000 | | | | 8.600 | | | | 05/01/14 | | | | 119,253 | |
| | | | | | | | | | | | | | | | | |
| | | | | | | | | | | | | | | | 201,152 | |
| | | |
| | | |
| | | Distributor(a)(b) – 0.1% |
| | | Ras Laffan Liquefied Natural Gas Co. Ltd. III |
| | | | 250,000 | | | | 6.750 | | | | 09/30/19 | | | | 296,923 | |
| | | |
| | | |
| | | Electric(a) – 0.6% |
| | | Arizona Public Service Co. |
| | | | 150,000 | | | | 6.250 | | | | 08/01/16 | | | | 171,900 | |
| | | | 375,000 | | | | 8.750 | | | | 03/01/19 | | | | 489,578 | |
| | | Enel Finance International SA(b) |
| | | | 425,000 | | | | 5.125 | | | | 10/07/19 | | | | 450,724 | |
| | | Nevada Power Co. |
| | | | 225,000 | | | | 7.125 | | | | 03/15/19 | | | | 277,421 | |
| | | NiSource Finance Corp. |
| | | | 125,000 | | | | 10.750 | | | | 03/15/16 | | | | 165,070 | |
| | | Progress Energy, Inc. |
| | | | 100,000 | | | | 5.625 | | | | 01/15/16 | | | | 113,963 | |
| | | | 150,000 | | | | 7.050 | | | | 03/15/19 | | | | 182,932 | |
| | | Puget Sound Energy, Inc.(c) |
| | | | 250,000 | | | | 6.974 | | | | 06/01/67 | | | | 235,732 | |
| | | | | | | | | | | | | | | | | |
| | | | | | | | | | | | | | | | 2,087,320 | |
| | | |
| | | |
| | | Energy – 1.3% |
| | | Anadarko Petroleum Corp.(a) |
| | | | 600,000 | | | | 6.375 | | | | 09/15/17 | | | | 661,173 | |
| | | BP Capital Markets PLC |
| | | | 300,000 | | | | 5.250 | | | | 11/07/13 | | | | 326,228 | |
| | | | 525,000 | | | | 3.875 | | | | 03/10/15 | | | | 544,423 | |
| | | | 475,000 | | | | 4.500 | (a) | | | 10/01/20 | | | | 486,233 | |
| | | Dolphin Energy Ltd.(a)(b) |
| | | | 230,232 | | | | 5.888 | | | | 06/15/19 | | | | 247,500 | |
| | | Halliburton Co.(b) |
| | | | 25,000 | | | | 7.600 | | | | 08/15/96 | | | | 30,760 | |
| | | Nexen, Inc.(a) |
| | | | 75,000 | | | | 7.500 | | | | 07/30/39 | | | | 91,426 | |
| | | Petro-Canada(a) |
| | | | 550,000 | | | | 6.050 | | | | 05/15/18 | | | | 640,382 | |
| | | Petroleos Mexicanos(a) |
| | | | 370,000 | | | | 8.000 | | | | 05/03/19 | | | | 461,575 | |
| | | Transocean, Inc.(a) |
| | | | 850,000 | | | | 6.500 | | | | 11/15/20 | | | | 925,722 | |
| | | | | | | | | | | | | | | | | |
| | | | | | | | | | | | | | | | 4,415,422 | |
| | | |
| | | |
The accompanying notes are an integral part of these financial statements.
GOLDMAN SACHS CORE PLUS FIXED INCOME FUND
| | | | | | | | | | | | | | | | | |
| | | Principal
| | Interest
| | Maturity
| | |
| | | Amount | | Rate | | Date | | Value |
| |
Corporate Obligations – (continued) |
| | | | | | | | | | | | | | | | | |
| | | Food & Beverage – 0.7% |
| | | Anheuser-Busch InBev Worldwide, Inc.(a) |
| | | $ | 175,000 | | | | 7.200 | %(b) | | | 01/15/14 | | | $ | 203,922 | |
| | | | 625,000 | | | | 4.125 | | | | 01/15/15 | | | | 670,541 | |
| | | | 475,000 | | | | 7.750 | (b) | | | 01/15/19 | | | | 616,176 | |
| | | Kraft Foods, Inc. |
| | | | 375,000 | | | | 6.125 | | | | 08/23/18 | | | | 442,657 | |
| | | | 350,000 | | | | 6.500 | | | | 02/09/40 | | | | 409,333 | |
| | | | | | | | | | | | | | | | | |
| | | | | | | | | | | | | | | | 2,342,629 | |
| | | |
| | | |
| | | Health Care – Medical Products(a) – 0.7% |
| | | Agilent Technologies, Inc. |
| | | | 525,000 | | | | 5.500 | | | | 09/14/15 | | | | 589,817 | |
| | | Boston Scientific Corp. |
| | | | 300,000 | | | | 4.500 | | | | 01/15/15 | | | | 307,173 | |
| | | | 150,000 | | | | 6.000 | | | | 01/15/20 | | | | 159,673 | |
| | | | 125,000 | | | | 7.000 | | | | 11/15/35 | | | | 124,868 | |
| | | Covidien International Finance SA |
| | | | 400,000 | | | | 4.200 | | | | 06/15/20 | | | | 425,645 | |
| | | Hospira, Inc. |
| | | | 400,000 | | | | 5.600 | | | | 09/15/40 | | | | 414,221 | |
| | | Life Technologies Corp. |
| | | | 450,000 | | | | 6.000 | | | | 03/01/20 | | | | 509,766 | |
| | | | | | | | | | | | | | | | | |
| | | | | | | | | | | | | | | | 2,531,163 | |
| | | |
| | | |
| | | Health Care – Services(a) – 0.1% |
| | | HCA, Inc. |
| | | | 250,000 | | | | 7.875 | | | | 02/15/20 | | | | 273,750 | |
| | | |
| | | |
| | | Life Insurance – 1.1% |
| | | MetLife Capital Trust X(a)(b)(c) |
| | | | 400,000 | | | | 9.250 | | | | 04/08/38 | | | | 472,000 | |
| | | MetLife, Inc.(a) |
| | | | 525,000 | | | | 4.750 | | | | 02/08/21 | | | | 556,975 | |
| | | Prudential Financial, Inc. |
| | | | 850,000 | | | | 3.875 | | | | 01/14/15 | | | | 890,872 | |
| | | | 775,000 | | | | 6.000 | | | | 12/01/17 | | | | 869,789 | |
| | | Symetra Financial Corp.(a)(b) |
| | | | 100,000 | | | | 6.125 | | | | 04/01/16 | | | | 103,471 | |
| | | The Northwestern Mutual Life Insurance Co.(a)(b) |
| | | | 725,000 | | | | 6.063 | | | | 03/30/40 | | | | 842,200 | |
| | | | | | | | | | | | | | | | | |
| | | | | | | | | | | | | | | | 3,735,307 | |
| | | |
| | | |
| | | Media – Cable – 0.6% |
| | | Comcast Cable Communications Holdings, Inc. |
| | | | 175,000 | | | | 9.455 | | | | 11/15/22 | | | | 243,887 | |
| | | Comcast Holdings Corp. |
| | | | 200,000 | | | | 10.625 | | | | 07/15/12 | | | | 231,140 | |
| | | Cox Communications, Inc.(a)(b) |
| | | | 150,000 | | | | 5.875 | | | | 12/01/16 | | | | 172,192 | |
| | | | 300,000 | | | | 6.250 | | | | 06/01/18 | | | | 345,891 | |
| | | CSC Holdings, Inc. Series B |
| | | | 250,000 | | | | 7.625 | | | | 04/01/11 | | | | 255,625 | |
| | | DIRECTV Holdings LLC(a) |
| | | | 250,000 | | | | 6.350 | | | | 03/15/40 | | | | 269,736 | |
| | | DIRECTV Holdings LLC / DirecTV Financing Co, Inc.(a) |
| | | | 250,000 | | | | 5.875 | | | | 10/01/19 | | | | 282,741 | |
| | | DISH DBS Corp.(a) |
| | | | 125,000 | | | | 7.125 | | | | 02/01/16 | | | | 131,250 | |
| | | | | | | | | | | | | | | | | |
| | | | | | | | | | | | | | | | 1,932,462 | |
| | | |
| | | |
| | | Media – Non Cable(a) – 0.7% |
| | | NBC Universal, Inc.(b) |
| | | | 1,125,000 | | | | 4.375 | | | | 04/01/21 | | | | 1,142,734 | |
| | | Reed Elsevier Capital, Inc. |
| | | | 645,000 | | | | 8.625 | | | | 01/15/19 | | | | 847,338 | |
| | | WPP Finance UK |
| | | | 276,000 | | | | 8.000 | | | | 09/15/14 | | | | 327,908 | |
| | | | | | | | | | | | | | | | | |
| | | | | | | | | | | | | | | | 2,317,980 | |
| | | |
| | | |
| | | Metals & Mining(a) – 0.7% |
| | | Anglo American Capital PLC(b) |
| | | | 500,000 | | | | 9.375 | | | | 04/08/19 | | | | 674,236 | |
| | | ArcelorMittal |
| | | | 325,000 | | | | 6.125 | | | | 06/01/18 | | | | 348,709 | |
| | | Freeport-McMoRan Copper & Gold, Inc. |
| | | | 675,000 | | | | 8.375 | | | | 04/01/17 | | | | 750,937 | |
| | | Teck Resources Ltd. |
| | | | 500,000 | | | | 10.750 | | | | 05/15/19 | | | | 625,000 | |
| | | | | | | | | | | | | | | | | |
| | | | | | | | | | | | | | | | 2,398,882 | |
| | | |
| | | |
| | | Noncaptive – Financial – 0.2% |
| | | Capital One Capital III |
| | | | 300,000 | | | | 7.686 | | | | 08/15/36 | | | | 304,500 | |
| | | General Electric Co. |
| | | | 275,000 | | | | 5.250 | | | | 12/06/17 | | | | 308,689 | |
| | | Pemex Project Funding Master Trust |
| | | | 10,000 | | | | 9.125 | | | | 10/13/10 | | | | 10,011 | |
| | | | | | | | | | | | | | | | | |
| | | | | | | | | | | | | | | | 623,200 | |
| | | |
| | | |
| | | Packaging(a)(c) – 0.0% |
| | | Impress Holdings BV |
| | | EUR | 125,000 | | | | 3.960 | | | | 09/15/13 | | | | 169,554 | |
| | | |
| | | |
| | | Paper(a) – 0.1% |
| | | International Paper Co. |
| | | $ | 175,000 | | | | 7.950 | | | | 06/15/18 | | | | 211,799 | |
| | | |
| | | |
| | | Pipelines – 1.9% |
| | | Boardwalk Pipelines LP(a) |
| | | | 575,000 | | | | 5.875 | | | | 11/15/16 | | | | 649,346 | |
| | | Buckeye Partners LP(a) |
| | | | 475,000 | | | | 5.500 | | | | 08/15/19 | | | | 519,662 | |
| | | DCP Midstream LLC(a)(b) |
| | | | 500,000 | | | | 9.750 | | | | 03/15/19 | | | | 665,335 | |
| | | El Paso Corp.(a) |
| | | | 500 | | | | 7.750 | | | | 01/15/32 | | | | 519 | |
| | | Energy Transfer Partners LP(a) |
| | | | 675,000 | | | | 5.950 | | | | 02/01/15 | | | | 749,153 | |
| | | Enterprise Products Operating LLC(a) |
| | | | 275,000 | | | | 6.650 | | | | 04/15/18 | | | | 321,633 | |
| | | | 100,000 | | | | 7.034 | (c) | | | 01/15/68 | | | | 100,080 | |
The accompanying notes are an integral part of these financial statements.
GOLDMAN SACHS CORE PLUS FIXED INCOME FUND
Schedule of Investments (continued)
September 30, 2010 (Unaudited)
| | | | | | | | | | | | | | | | | |
| | | Principal
| | Interest
| | Maturity
| | |
| | | Amount | | Rate | | Date | | Value |
| |
Corporate Obligations – (continued) |
| | | Pipelines – (continued) |
| | | | | | | | | | | | | | | | | |
| | | Gulf South Pipeline Co. LP(a)(b) |
| | | $ | 175,000 | | | | 6.300 | % | | | 08/15/17 | | | $ | 200,018 | |
| | | Southern Natural Gas Co.(a)(b) |
| | | | 50,000 | | | | 5.900 | | | | 04/01/17 | | | | 54,704 | |
| | | Southern Star Central Gas Pipeline, Inc.(a)(b) |
| | | | 300,000 | | | | 6.000 | | | | 06/01/16 | | | | 316,581 | |
| | | Tennessee Gas Pipeline Co. |
| | | | 825,000 | | | | 8.000 | (a) | | | 02/01/16 | | | | 983,616 | |
| | | | 325,000 | | | | 7.625 | | | | 04/01/37 | | | | 376,027 | |
| | | The Williams Cos., Inc.(a) |
| | | | 533,000 | | | | 7.875 | | | | 09/01/21 | | | | 645,686 | |
| | | TransCanada PipeLines Ltd.(a)(c) |
| | | | 875,000 | | | | 6.350 | | | | 05/15/67 | | | | 813,750 | |
| | | Williams Partners LP(a) |
| | | | 275,000 | | | | 5.250 | | | | 03/15/20 | | | | 298,946 | |
| | | | | | | | | | | | | | | | | |
| | | | | | | | | | | | | | | | 6,695,056 | |
| | | |
| | | |
| | | Property/Casualty Insurance – 0.3% |
| | | Endurance Specialty Holdings Ltd.(a) |
| | | | 75,000 | | | | 6.150 | | | | 10/15/15 | | | | 80,943 | |
| | | | 25,000 | | | | 7.000 | | | | 07/15/34 | | | | 24,188 | |
| | | QBE Insurance Group Ltd.(b) |
| | | | 122,000 | | | | 9.750 | | | | 03/14/14 | | | | 147,589 | |
| | | The Chubb Corp.(a)(c) |
| | | | 125,000 | | | | 6.375 | | | | 03/29/67 | | | | 122,500 | |
| | | Transatlantic Holdings, Inc.(a) |
| | | | 275,000 | | | | 8.000 | | | | 11/30/39 | | | | 281,626 | |
| | | ZFS Finance USA Trust I(a)(b)(c) |
| | | | 500,000 | | | | 6.150 | | | | 12/15/65 | | | | 492,500 | |
| | | | | | | | | | | | | | | | | |
| | | | | | | | | | | | | | | | 1,149,346 | |
| | | |
| | | |
| | | Real Estate Investment Trust(a) – 0.8% |
| | | Developers Diversified Realty Corp. |
| | | | 450,000 | | | | 7.500 | | | | 04/01/17 | | | | 472,500 | |
| | | Liberty Property LP |
| | | | 775,000 | | | | 4.750 | | | | 10/01/20 | | | | 780,486 | |
| | | ProLogis(d) |
| | | | 325,000 | | | | 1.875 | | | | 11/15/37 | | | | 307,417 | |
| | | Simon Property Group LP |
| | | | 625,000 | | | | 10.350 | | | | 04/01/19 | | | | 869,159 | |
| | | | 250,000 | | | | 4.375 | | | | 03/01/21 | | | | 253,430 | |
| | | WEA Finance LLC/WT Finance Australia Property Ltd.(b) |
| | | | 150,000 | | | | 7.500 | | | | 06/02/14 | | | | 174,589 | |
| | | | | | | | | | | | | | | | | |
| | | | | | | | | | | | | | | | 2,857,581 | |
| | | |
| | | |
| | | Retailers(a) – 0.2% |
| | | CVS Caremark Corp. |
| | | | 525,000 | | | | 5.750 | | | | 06/01/17 | | | | 604,168 | |
| | | |
| | | |
| | | Schools(a) – 0.3% |
| | | Rensselaer Polytechnic Institute |
| | | | 850,000 | | | | 5.600 | | | | 09/01/20 | | | | 940,499 | |
| | | |
| | | |
| | | Technology(a) – 0.1% |
| | | Fiserv, Inc. |
| | | | 225,000 | | | | 6.125 | | | | 11/20/12 | | | | 246,311 | |
| | | |
| | | |
| | | Tobacco – 0.5% |
| | | Altria Group, Inc. |
| | | | 500,000 | | | | 9.700 | | | | 11/10/18 | | | | 672,216 | |
| | | BAT International Finance PLC(a)(b) |
| | | | 672,000 | | | | 9.500 | | | | 11/15/18 | | | | 913,689 | |
| | | | | | | | | | | | | | | | | |
| | | | | | | | | | | | | | | | 1,585,905 | |
| | | |
| | | |
| | | Wireless Telecommunications(a) – 0.3% |
| | | AT&T, Inc. |
| | | | 450,000 | | | | 6.400 | | | | 05/15/38 | | | | 511,471 | |
| | | Hellas Telecommunications Luxembourg V(c)(e) |
| | | EUR | 126,604 | | | | 4.835 | | | | 10/15/12 | | | | 55,230 | |
| | | Sprint Capital Corp. |
| | | $ | 125,000 | | | | 8.375 | | | | 03/15/12 | | | | 133,437 | |
| | | Telemar Norte Leste SA(b) |
| | | | 325,000 | | | | 5.500 | | | | 10/23/20 | | | | 329,290 | |
| | | | | | | | | | | | | | | | | |
| | | | | | | | | | | | | | | | 1,029,428 | |
| | | |
| | | |
| | | Wirelines Telecommunications(a) – 0.5% |
| | | Angel Lux Common SA |
| | | EUR | 125,000 | | | | 8.250 | | | | 05/01/16 | | | | 180,562 | |
| | | Qwest Corp. |
| | | $ | 375,000 | | | | 8.375 | | | | 05/01/16 | | | | 440,625 | |
| | | Telecom Italia Capital SA |
| | | | 175,000 | | | | 6.200 | | | | 07/18/11 | | | | 181,309 | |
| | | | 325,000 | | | | 7.200 | | | | 07/18/36 | | | | 347,356 | |
| | | Verizon Communications, Inc. |
| | | | 200,000 | | | | 6.400 | | | | 02/15/38 | | | | 230,358 | |
| | | | 150,000 | | | | 8.950 | | | | 03/01/39 | | | | 221,380 | |
| | | Verizon Wireless Capital LLC |
| | | | 150,000 | | | | 8.500 | | | | 11/15/18 | | | | 203,660 | |
| | | | | | | | | | | | | | | | | |
| | | | | | | | | | | | | | | | 1,805,250 | |
| | | |
| | | |
| | | TOTAL CORPORATE OBLIGATIONS |
| | | (Cost $53,853,693) | | $ | 58,158,644 | |
| | | |
| | | |
| | | | | | | | | | | | | | | | | |
| | | | | | | | | | | | | | | | | |
Mortgage-Backed Obligations – 39.5% |
| | | | | | | | | | | | | | | | | |
| | | | | | | | | | | | | | | | | |
| | | Adjustable Rate Non-Agency(c) – 3.9% |
| | | Adjustable Rate Mortgage Trust Series 2004-5, Class 2A1 |
| | | $ | 108,734 | | | | 3.080 | % | | | 04/25/35 | | | $ | 98,629 | |
| | | Banc of America Funding Corp. Series 2007-E, Class 4A1 |
| | | | 1,237,666 | | | | 5.723 | | | | 07/20/47 | | | | 929,735 | |
| | | Bear Stearns Adjustable Rate Mortgage Trust Series 2004-1, Class 21A1 |
| | | | 100,037 | | | | 2.616 | | | | 04/25/34 | | | | 90,318 | |
| | | Countrywide Alternative Loan Trust Series 2005-38, Class A3 |
| | | | 288,091 | | | | 0.606 | | | | 09/25/35 | | | | 163,148 | |
| | | Countrywide Home Loan Mortgage Pass-Through Trust Series 2004-HYB5, Class 2A1 |
| | | | 214,474 | | | | 3.069 | | | | 04/20/35 | | | | 201,154 | |
| | | Countrywide Home Loan Mortgage Pass-Through Trust Series 2004-HYB6, Class A2 |
| | | | 131,126 | | | | 3.251 | | | | 11/20/34 | | | | 111,317 | |
| | | Downey Savings & Loan Association Mortgage Loan Trust Series 2006-AR1, Class 2A1A |
| | | | 2,324,212 | | | | 1.310 | | | | 04/19/47 | | | | 1,443,568 | |
| | | |
| | | |
The accompanying notes are an integral part of these financial statements.
GOLDMAN SACHS CORE PLUS FIXED INCOME FUND
| | | | | | | | | | | | | | | | | |
| | | Principal
| | Interest
| | Maturity
| | |
| | | Amount | | Rate | | Date | | Value |
| |
Mortgage-Backed Obligations – (continued) |
| | | Adjustable Rate Non-Agency(c) – (continued) |
| | | | | | | | | | | | | | | | | |
| | | First Horizon Asset Securities Series, Inc. 2004-AR6, Class 2A1 |
| | | $ | 51,356 | | | | 2.987 | % | | | 12/25/34 | | | $ | 48,807 | |
| | | GMAC Mortgage Corp. Loan Trust Series 2004-AR1, Class 12A |
| | | | 181,038 | | | | 3.425 | | | | 06/25/34 | | | | 178,433 | |
| | | Harborview Mortgage Loan Trust Series 2006-09, Class 2A1A |
| | | | 1,164,918 | | | | 0.467 | | | | 11/19/36 | | | | 707,921 | |
| | | Harborview Mortgage Loan Trust Series 2006-10, Class 2A1A |
| | | | 573,694 | | | | 0.437 | | | | 11/19/36 | | | | 350,699 | |
| | | Indymac Index Mortgage Loan Trust Series 2005-AR13, Class 4A1 |
| | | | 364,678 | | | | 2.612 | | | | 08/25/35 | | | | 287,163 | |
| | | JPMorgan Mortgage Trust Series 2005-A4, Class 2A1 |
| | | | 419,522 | | | | 2.903 | | | | 07/25/35 | | | | 381,805 | |
| | | Lehman XS Trust Series 2006-2N, Class 1A1 |
| | | | 1,235,058 | | | | 0.516 | | | | 02/25/46 | | | | 655,976 | |
| | | Lehman XS Trust Series 2007-16N, Class 2A2 |
| | | | 1,223,016 | | | | 1.106 | | | | 09/25/47 | | | | 733,932 | |
| | | Lehman XS Trust Series 2007-4N, Class 1A1 |
| | | | 1,162,222 | | | | 0.386 | | | | 03/25/47 | | | | 793,790 | |
| | | Master Adjustable Rate Mortgages Trust Series 2006-A2, Class 4A1B |
| | | | 661,448 | | | | 1.586 | | | | 12/25/46 | | | | 199,294 | |
| | | Morgan Stanley Mortgage Loan Trust Series 2004-8AR, Class 4A1 |
| | | | 515,918 | | | | 2.793 | | | | 10/25/34 | | | | 435,216 | |
| | | Residential Accredit Loans, Inc. Series 2007-QH9, Class A1 |
| | | | 863,370 | | | | 6.374 | | | | 11/25/37 | | | | 425,250 | |
| | | Residential Funding Mortgage Securities I Series 2005-SA4, Class 2A2 |
| | | | 500,456 | | | | 5.203 | | | | 09/25/35 | | | | 439,612 | |
| | | Residential Funding Mortgage Securities I Series 2007-SA2, Class 2A1 |
| | | | 1,146,386 | | | | 5.626 | | | | 04/25/37 | | | | 776,666 | |
| | | Structured Adjustable Rate Mortgage Loan Trust Series 2004-05, Class 3A1 |
| | | | 187,302 | | | | 2.463 | | | | 05/25/34 | | | | 178,130 | |
| | | Structured Adjustable Rate Mortgage Loan Trust Series 2004-12, Class 3A2 |
| | | | 73,284 | | | | 2.716 | | | | 09/25/34 | | | | 66,409 | |
| | | Structured Adjustable Rate Mortgage Loan Trust Series 2004-16, Class 3A1 |
| | | | 347,351 | | | | 2.644 | | | | 11/25/34 | | | | 292,040 | |
| | | Structured Adjustable Rate Mortgage Loan Trust Series 2005-22, Class 1A4 |
| | | | 3,000,000 | | | | 5.178 | | | | 12/25/35 | | | | 1,012,576 | |
| | | Structured Adjustable Rate Mortgage Loan Trust Series 2006-1, Class 5A2 |
| | | | 1,000,000 | | | | 4.797 | | | | 02/25/36 | | | | 573,056 | |
| | | Washington Mutual Asset-Backed Certificates Series 2007-HE1, Class 2A3 |
| | | | 3,000,000 | | | | 0.406 | | | | 01/25/37 | | | | 1,135,521 | |
| | | Washington Mutual Mortgage Pass-Through Certificates Series 2004-AR03, Class A2 |
| | | | 198,276 | | | | 2.707 | | | | 06/25/34 | | | | 192,420 | |
| | | Washington Mutual Mortgage Pass-Through Certificates Series 2006-AR02, Class 1A1 |
| | | | 493,180 | | | | 5.200 | | | | 03/25/37 | | | | 411,250 | |
| | | | | | | | | | | | | | | | | |
| | | | | | | | | | | | | | | | 13,313,835 | |
| | | |
| | | |
| | | Collateralized Mortgage Obligations – 2.2% |
| | | Planned Amortization Class – 0.1% |
| | | FNMA REMIC Series 2005-70, Class PA |
| | | | 376,690 | | | | 5.500 | % | | | 08/25/35 | | | $ | 414,968 | |
| | | |
| | | |
| | | Regular Floater(c) – 0.5% |
| | | FHLMC REMIC Series 3038, Class XA(f) |
| | | | 25,643 | | | | 0.000 | | | | 09/15/35 | | | | 25,438 | |
| | | FHLMC REMIC Series 3266, Class F |
| | | | 1,288,977 | | | | 0.557 | | | | 01/15/37 | | | | 1,281,845 | |
| | | FNMA REMIC Series 2007-2, Class FM |
| | | | 452,077 | | | | 0.506 | | | | 02/25/37 | | | | 449,040 | |
| | | | | | | | | | | | | | | | | |
| | | | | | | | | | | | | | | | 1,756,323 | |
| | | |
| | | |
| | | Sequential Fixed Rate – 0.4% |
| | | Countrywide Alternative Loan Trust Series 2005-1CB, Class 2A1 |
| | | | 570,269 | | | | 6.000 | | | | 03/25/35 | | | | 518,752 | |
| | | FHLMC REMIC Series 3200, Class AD |
| | | | 218,371 | | | | 5.500 | | | | 05/15/29 | | | | 221,807 | |
| | | First Horizon Alternative Mortgage Securities Series 2006-FA8, Class 1A7 |
| | | | 741,762 | | | | 6.000 | | | | 02/25/37 | | | | 549,543 | |
| | | | | | | | | | | | | | | | | |
| | | | | | | | | | | | | | | | 1,290,102 | |
| | | |
| | | |
| | | Sequential Floating Rate(c) – 1.2% |
| | | Bear Stearns Alt-A Trust Series 2006-6, Class 1A1 |
| | | | 1,815,168 | | | | 0.416 | | | | 11/25/36 | | | | 749,712 | |
| | | Countrywide Alternative Loan Trust Series 2006-0C8, Class 2A3 |
| | | | 6,876,210 | | | | 0.506 | | | | 11/25/36 | | | | 952,827 | |
| | | Deutsche Alt-A Securities, Inc. Alternative Loan Trust Series 2006-AR3, Class A6 |
| | | | 6,786,557 | | | | 0.536 | | | | 08/25/36 | | | | 1,257,554 | |
| | | Deutsche Alt-A Securities, Inc. Alternative Loan Trust Series 2007-BAR1, Class A3 |
| | | | 4,000,000 | | | | 0.416 | | | | 03/25/37 | | | | 1,295,996 | |
| | | | | | | | | | | | | | | | | |
| | | | | | | | | | | | | | | | 4,256,089 | |
| | | |
| | | |
| | | | | | | | | | | | | | | | | |
| | | TOTAL COLLATERALIZED MORTGAGE OBLIGATIONS | | $ | 7,717,482 | |
| | | |
| | | |
| | | Commercial Mortgage-Backed Securities – 0.2% |
| | | Sequential Fixed Rate – 0.2% |
| | | Banc of America Commercial Mortgage, Inc. Series 2002-2, Class A3 |
| | | $ | 530,000 | | | | 5.118 | % | | | 07/11/43 | | | $ | 552,881 | |
| | | GMAC Commercial Mortgage Securities, Inc. Series 2000-C3, Class A2 |
| | | | 11,891 | | | | 6.957 | | | | 09/15/35 | | | | 11,887 | |
| | | |
| | | |
| | | | | | | | | | | | | | | | | |
| | | TOTAL COMMERCIAL MORTGAGE-BACKED SECURITIES | | $ | 564,768 | |
| | | |
| | | |
The accompanying notes are an integral part of these financial statements.
GOLDMAN SACHS CORE PLUS FIXED INCOME FUND
Schedule of Investments (continued)
September 30, 2010 (Unaudited)
| | | | | | | | | | | | | | | | | |
| | | Principal
| | Interest
| | Maturity
| | |
| | | Amount | | Rate | | Date | | Value |
| |
Mortgage-Backed Obligations – (continued) |
| | | | | | | | | | | | | | | | | |
| | | Federal Agencies – 33.2% |
| | | Adjustable Rate FHLMC(c) – 0.2% |
| | | $ | 344,994 | | | | 4.837 | % | | | 09/01/35 | | | $ | 361,294 | |
| | | | 143,974 | | | | 5.732 | | | | 04/01/37 | | | | 150,677 | |
| | | | | | | | | | | | | | | | | |
| | | | | | | | | | | | | | | | 511,971 | |
| | | |
| | | |
| | | FHLMC – 4.1% |
| | | | 175,610 | | | | 5.000 | | | | 05/01/18 | | | | 187,574 | |
| | | | 249,899 | | | | 6.500 | | | | 08/01/37 | | | | 276,139 | |
| | | | 15,556 | | | | 6.000 | | | | 09/01/37 | | | | 17,037 | |
| | | | 555,847 | | | | 6.500 | | | | 10/01/37 | | | | 616,643 | |
| | | | 386,398 | | | | 5.500 | | | | 02/01/38 | | | | 409,577 | |
| | | | 18,113 | | | | 6.000 | | | | 02/01/38 | | | | 19,843 | |
| | | | 166,726 | | | | 6.000 | | | | 07/01/38 | | | | 182,406 | |
| | | | 496,518 | | | | 6.500 | | | | 09/01/38 | | | | 540,263 | |
| | | | 19,457 | | | | 6.000 | | | | 10/01/38 | | | | 21,321 | |
| | | | 1,104,643 | | | | 5.500 | | | | 12/01/38 | | | | 1,170,566 | |
| | | | 228,917 | | | | 5.500 | | | | 02/01/39 | | | | 242,578 | |
| | | | 587,017 | | | | 5.000 | | | | 04/01/39 | | | | 629,461 | |
| | | | 121,090 | | | | 5.000 | | | | 05/01/39 | | | | 129,846 | |
| | | | 358,709 | | | | 5.000 | | | | 06/01/39 | | | | 384,645 | |
| | | | 366,875 | | | | 5.000 | | | | 07/01/39 | | | | 392,031 | |
| | | | 141,596 | | | | 5.000 | | | | 08/01/39 | | | | 151,436 | |
| | | | 942,477 | | | | 4.500 | | | | 09/01/39 | | | | 993,724 | |
| | | | 1,978,870 | | | | 5.000 | | | | 10/01/39 | | | | 2,118,582 | |
| | | | 380,453 | | | | 5.000 | | | | 11/01/39 | | | | 407,961 | |
| | | | 1,519,949 | | | | 5.000 | | | | 12/01/39 | | | | 1,629,848 | |
| | | | 3,223,161 | | | | 5.000 | | | | 04/01/40 | | | | 3,456,211 | |
| | | | | | | | | | | | | | | | | |
| | | | | | | | | | | | | | | | 13,977,692 | |
| | | |
| | | |
| | | FNMA – 20.5% |
| | | | 15,079 | | | | 6.000 | | | | 12/01/18 | | | | 16,348 | |
| | | | 145,462 | | | | 6.000 | | | | 02/01/19 | | | | 158,090 | |
| | | | 200,522 | | | | 5.000 | | | | 05/01/19 | | | | 214,195 | |
| | | | 282,584 | | | | 4.000 | | | | 06/01/19 | | | | 299,319 | |
| | | | 259,342 | | | | 5.000 | | | | 08/01/19 | | | | 277,378 | |
| | | | 220,708 | | | | 6.000 | | | | 08/01/19 | | | | 239,869 | |
| | | | 236,155 | | | | 6.000 | | | | 09/01/19 | | | | 255,613 | |
| | | | 291,944 | | | | 6.000 | | | | 12/01/20 | | | | 315,999 | |
| | | | 363,196 | | | | 6.000 | | | | 04/01/21 | | | | 393,121 | |
| | | | 118,667 | | | | 6.000 | | | | 06/01/21 | | | | 128,645 | |
| | | | 64,751 | | | | 6.000 | | | | 07/01/21 | | | | 70,196 | |
| | | | 361,481 | | | | 5.000 | | | | 08/01/23 | | | | 385,895 | |
| | | | 179,263 | | | | 5.500 | | | | 09/01/23 | | | | 193,641 | |
| | | | 71,273 | | | | 5.500 | | | | 10/01/23 | | | | 77,198 | |
| | | | 76 | | | | 6.000 | | | | 03/01/32 | | | | 84 | |
| | | | 407,309 | | | | 6.000 | | | | 12/01/32 | | | | 447,397 | |
| | | | 5,074 | | | | 6.000 | | | | 05/01/33 | | | | 5,562 | |
| | | | 27,953 | | | | 5.000 | | | | 08/01/33 | | | | 29,649 | |
| | | | 3,596 | | | | 5.500 | | | | 09/01/33 | | | | 3,859 | |
| | | | 2,141 | | | | 6.000 | | | | 12/01/33 | | | | 2,344 | |
| | | | 4,484 | | | | 5.500 | | | | 02/01/34 | | | | 4,811 | |
| | | | 65,622 | | | | 6.000 | | | | 02/01/34 | | | | 71,952 | |
| | | | 734 | | | | 5.500 | | | | 04/01/34 | | | | 788 | |
| | | | 45,378 | | | | 5.500 | | | | 12/01/34 | | | | 48,604 | |
| | | | 126,855 | | | | 5.000 | | | | 04/01/35 | | | | 134,194 | |
| | | | 2,582 | | | | 6.000 | | | | 04/01/35 | | | | 2,806 | |
| | | | 5,991 | | | | 5.500 | | | | 09/01/35 | | | | 6,438 | |
| | | | 210,474 | | | | 5.000 | | | | 11/01/35 | | | | 222,333 | |
| | | | 5,753 | | | | 6.000 | | | | 02/01/36 | | | | 6,241 | |
| | | | 153,671 | | | | 4.500 | | | | 03/01/36 | | | | 161,224 | |
| | | | 233,682 | | | | 5.000 | | | | 03/01/36 | | | | 246,850 | |
| | | | 35,881 | | | | 6.000 | | | | 03/01/36 | | | | 39,023 | |
| | | | 38,255 | | | | 6.000 | | | | 04/01/36 | | | | 41,632 | |
| | | | 1,799 | | | | 6.000 | | | | 05/01/36 | | | | 1,947 | |
| | | | 3,857 | | | | 6.000 | | | | 06/01/36 | | | | 4,175 | |
| | | | 109,415 | | | | 6.000 | | | | 11/01/36 | | | | 118,176 | |
| | | | 90,115 | | | | 6.000 | | | | 01/01/37 | | | | 97,331 | |
| | | | 747 | | | | 5.500 | | | | 02/01/37 | | | | 801 | |
| | | | 1,191 | | | | 5.500 | | | | 04/01/37 | | | | 1,275 | |
| | | | 1,325 | | | | 5.500 | | | | 05/01/37 | | | | 1,419 | |
| | | | 59,842 | | | | 6.000 | | | | 06/01/37 | | | | 64,649 | |
| | | | 136,869 | | | | 6.000 | | | | 08/01/37 | | | | 146,952 | |
| | | | 95,797 | | | | 6.000 | | | | 09/01/37 | | | | 102,854 | |
| | | | 279,346 | | | | 6.000 | | | | 10/01/37 | | | | 300,554 | |
| | | | 132,073 | | | | 6.000 | | | | 11/01/37 | | | | 142,113 | |
| | | | 733,831 | | | | 5.500 | | | | 12/01/37 | | | | 780,729 | |
| | | | 569,734 | | | | 6.000 | | | | 12/01/37 | | | | 613,372 | |
| | | | 1,538,689 | | | | 5.500 | | | | 01/01/38 | | | | 1,636,339 | |
| | | | 192,676 | | | | 6.000 | | | | 01/01/38 | | | | 207,212 | |
| | | | 71,242 | | | | 6.000 | | | | 02/01/38 | | | | 77,754 | |
| | | | 1,620 | | | | 5.500 | | | | 03/01/38 | | | | 1,735 | |
| | | | 200,121 | | | | 6.000 | | | | 03/01/38 | | | | 215,827 | |
| | | | 58,277 | | | | 5.000 | | | | 05/01/38 | | | | 61,303 | |
| | | | 941,582 | | | | 5.500 | | | | 05/01/38 | | | | 1,001,758 | |
| | | | 21,957 | | | | 6.000 | | | | 05/01/38 | | | | 24,088 | |
| | | | 956,162 | | | | 5.500 | | | | 06/01/38 | | | | 1,016,374 | |
| | | | 19,984 | | | | 6.000 | | | | 06/01/38 | | | | 21,923 | |
| | | | 495,048 | | | | 5.500 | | | | 07/01/38 | | | | 526,223 | |
| | | | 355,615 | | | | 6.000 | | | | 07/01/38 | | | | 382,815 | |
| | | | 2,082 | | | | 5.500 | | | | 08/01/38 | | | | 2,230 | |
| | | | 18,783 | | | | 6.000 | | | | 08/01/38 | | | | 20,606 | |
| | | | 1,009 | | | | 5.500 | | | | 09/01/38 | | | | 1,081 | |
| | | | 41,099 | | | | 6.000 | | | | 10/01/38 | | | | 44,172 | |
| | | | 705 | | | | 5.500 | | | | 12/01/38 | | | | 755 | |
| | | | 263,021 | | | | 5.000 | | | | 02/01/39 | | | | 281,247 | |
| | | | 1,431,812 | | | | 4.500 | | | | 03/01/39 | | | | 1,511,660 | |
| | | | 334,699 | | | | 5.000 | | | | 03/01/39 | | | | 357,723 | |
| | | | 73,015 | | | | 4.500 | | | | 04/01/39 | | | | 76,931 | |
| | | | 879,631 | | | | 4.500 | | | | 05/01/39 | | | | 926,808 | |
| | | | 28,778 | | | | 5.000 | | | | 05/01/39 | | | | 30,901 | |
| | | | 70,198 | | | | 4.500 | | | | 06/01/39 | | | | 74,117 | |
| | | | 27,368 | | | | 5.000 | | | | 06/01/39 | | | | 29,387 | |
| | | | 123,544 | | | | 4.500 | | | | 07/01/39 | | | | 130,440 | |
| | | | 1,416,855 | | | | 5.000 | | | | 07/01/39 | | | | 1,514,818 | |
| | | | 589,485 | | | | 4.500 | | | | 08/01/39 | | | | 622,182 | |
| | | | 931,745 | | | | 5.000 | | | | 08/01/39 | | | | 1,000,497 | |
| | | | 291,753 | | | | 5.500 | | | | 08/01/39 | | | | 310,369 | |
| | | | 594,430 | | | | 4.500 | | | | 09/01/39 | | | | 627,611 | |
| | | | 170,321 | | | | 5.000 | | | | 09/01/39 | | | | 182,888 | |
| | | | 695,041 | | | | 4.500 | | | | 10/01/39 | | | | 732,583 | |
| | | | 488,502 | | | | 5.000 | | | | 10/01/39 | | | | 524,549 | |
| | | | 1,000,000 | | | | 5.500 | | | | 10/01/39 | | | | 1,063,625 | |
| | | | 666,630 | | | | 4.500 | | | | 11/01/39 | | | | 703,686 | |
| | | |
| | | |
The accompanying notes are an integral part of these financial statements.
GOLDMAN SACHS CORE PLUS FIXED INCOME FUND
| | | | | | | | | | | | | | | | | |
| | | Principal
| | Interest
| | Maturity
| | |
| | | Amount | | Rate | | Date | | Value |
| |
Mortgage-Backed Obligations – (continued) |
| | | FNMA – (continued) |
| | | | | | | | | | | | | | | | | |
| | | $ | 1,010,336 | | | | 4.500 | % | | | 12/01/39 | | | $ | 1,065,320 | |
| | | | 642,732 | | | | 4.500 | | | | 01/01/40 | | | | 678,422 | |
| | | | 2,292,489 | | | | 5.000 | | | | 01/01/40 | | | | 2,461,293 | |
| | | | 169,871 | | | | 4.500 | | | | 02/01/40 | | | | 179,351 | |
| | | | 228,493 | | | | 5.000 | | | | 02/01/40 | | | | 244,210 | |
| | | | 291,246 | | | | 4.500 | | | | 03/01/40 | | | | 307,504 | |
| | | | 468,430 | | | | 4.500 | | | | 04/01/40 | | | | 494,578 | |
| | | | 995,799 | | | | 5.000 | | | | 07/01/40 | | | | 1,048,916 | |
| | | | 1,992,835 | | | | 4.500 | | | | 09/01/40 | | | | 2,077,578 | |
| | | | 4,000,000 | | | | 3.500 | | | | TBA-15yr | (g) | | | 4,114,688 | |
| | | | 1,000,000 | | | | 3.000 | | | | TBA-15yr | (g) | | | 1,005,312 | |
| | | | 5,000,000 | | | | 3.500 | | | | TBA-15yr | (g) | | | 5,127,344 | |
| | | | 1,000,000 | | | | 3.500 | | | | TBA-30yr | (g) | | | 1,007,422 | |
| | | | 14,000,000 | | | | 5.500 | | | | TBA-30yr | (g) | | | 14,880,468 | |
| | | | 12,000,000 | | | | 6.000 | | | | TBA-30yr | (g) | | | 12,873,744 | |
| | | | | | | | | | | | | | | | | |
| | | | | | | | | | | | | | | | 70,388,012 | |
| | | |
| | | |
| | | GNMA – 8.4% |
| | | | 11,601 | | | | 5.500 | | | | 05/15/36 | | | | 12,491 | |
| | | | 843,760 | | | | 6.000 | | | | 08/15/38 | | | | 920,357 | |
| | | | 27,000,000 | | | | 4.000 | | | | TBA-30yr | (g) | | | 27,887,656 | |
| | | | | | | | | | | | | | | | | |
| | | | | | | | | | | | | | | | 28,820,504 | |
| | | |
| | | |
| | | | | | | | | | | | | | | | | |
| | | TOTAL FEDERAL AGENCIES | | $ | 113,698,179 | |
| | | |
| | | |
| | | TOTAL MORTGAGE-BACKED OBLIGATIONS |
| | | (Cost $135,127,012) | | $ | 135,294,264 | |
| | | |
| | | |
| | | | | | | | | | | | | | | | | |
| | | | | | | | | | | | | | | | | |
Agency Debentures – 3.6% |
| | | | | | | | | | | | | | | | | |
| | | | | | | | | | | | | | | | | |
| | | FHLB |
| | | $ | 2,400,000 | | | | 4.625 | %(h) | | | 09/11/20 | | | $ | 2,729,520 | |
| | | | 300,000 | | | | 5.000 | | | | 09/28/29 | | | | 339,229 | |
| | | FHLMC |
| | | | 4,300,000 | | | | 4.500 | | | | 04/02/14 | | | | 4,780,473 | |
| | | | 2,400,000 | | | | 1.750 | | | | 09/10/15 | | | | 2,423,753 | |
| | | FNMA |
| | | | 900,000 | | | | 3.000 | | | | 07/28/14 | | | | 917,435 | |
| | | Tennessee Valley Authority |
| | | | 600,000 | | | | 4.625 | | | | 09/15/60 | | | | 625,052 | |
| | | Tennessee Valley Authority Series B |
| | | | 400,000 | | | | 4.375 | | | | 06/15/15 | | | | 451,225 | |
| | | |
| | | |
| | | TOTAL AGENCY DEBENTURES |
| | | (Cost $11,543,434) | | $ | 12,266,687 | |
| | | |
| | | |
| | | | | | | | | | | | | | | | | |
| | | | | | | | | | | | | | | | | |
Asset-Backed Securities – 10.5% |
| | | | | | | | | | | | | | | | | |
| | | | | | | | | | | | | | | | | |
| | | Collateralized Loan Obligations(b)(c) – 4.6% |
| | | Gulf Stream Compass CLO, Ltd. Series 04-1A, Class A |
| | | $ | 3,977,472 | | | | 0.886 | % | | | 07/15/16 | | | $ | 3,781,689 | |
| | | KKR Financial CLO Ltd. Series 2007-AA, Class A |
| | | | 665,139 | | | | 1.276 | | | | 10/15/17 | | | | 624,896 | |
| | | Mountain View Funding CLO Series 2007-3A, Class A1 |
| | | | 1,982,321 | | | | 0.741 | | | | 04/16/21 | | | | 1,784,041 | |
| | | Mt. Wilson CLO Ltd. Series 06-1A, Class A |
| | | | 3,650,459 | | | | 0.776 | | | | 07/15/18 | | | | 3,357,415 | |
| | | Navigare Funding CLO Ltd. Series 06-1A, Class A |
| | | | 3,500,000 | | | | 0.605 | | | | 05/20/19 | | | | 3,285,618 | |
| | | Navigator CDO Ltd. Series 05-1A, Class A1B |
| | | | 444,307 | | | | 0.768 | | | | 10/21/17 | | | | 414,158 | |
| | | WG Horizons CLO Series 06-1A, Class A1 |
| | | | 3,000,000 | | | | 0.564 | | | | 05/24/19 | | | | 2,702,136 | |
| | | | | | | | | | | | | | | | | |
| | | | | | | | | | | | | | | | 15,949,953 | |
| | | |
| | | |
| | | Home Equity – 1.3% |
| | | ACE Securities Corp. Series 2007-HE4, Class A2A(c) |
| | | | 8,333,716 | | | | 0.386 | | | | 05/25/37 | | | | 2,513,251 | |
| | | Bear Stearns Asset Backed Securities Trust Series 2001-3, Class A2(c) |
| | | | 12,533 | | | | 0.656 | | | | 10/27/32 | | | | 11,705 | |
| | | Bear Stearns Asset Backed Securities Trust Series 2002-2, Class A1(c) |
| | | | 8,690 | | | | 0.916 | | | | 10/25/32 | | | | 7,193 | |
| | | CIT Mortgage Loan Trust Series 2007-1, Class 2A1(b)(c) |
| | | | 126,789 | | | | 1.256 | | | | 10/25/37 | | | | 119,072 | |
| | | CIT Mortgage Loan Trust Series 2007-1, Class 2A2(b)(c) |
| | | | 150,000 | | | | 1.506 | | | | 10/25/37 | | | | 92,990 | |
| | | CIT Mortgage Loan Trust Series 2007-1, Class 2A3(b)(c) |
| | | | 450,000 | | | | 1.706 | | | | 10/25/37 | | | | 226,271 | |
| | | CS First Boston Mortgage Securities Corp. Series 2001-HE17, Class A1(c) |
| | | | 1,879 | | | | 0.876 | | | | 01/25/32 | | | | 1,260 | |
| | | First Alliance Mortgage Loan Trust Series 1999-4, Class A2(c) |
| | | | 2,388 | | | | 1.017 | | | | 03/20/31 | | | | 1,562 | |
| | | GMAC Mortgage Corp. Loan Trust Series 2007-HE3, Class 1A1 |
| | | | 50,228 | | | | 7.000 | | | | 09/25/37 | | | | 32,243 | |
| | | GMAC Mortgage Corp. Loan Trust Series 2007-HE3, Class 2A1 |
| | | | 91,944 | | | | 7.000 | | | | 09/25/37 | | | | 52,587 | |
| | | Home Equity Asset Trust Series 2002-1, Class A4(c) |
| | | | 257 | | | | 0.856 | | | | 11/25/32 | | | | 178 | |
| | | People’s Financial Realty Mortgage Securities Trust Series 2006-1, Class 1A3(c) |
| | | | 5,433,448 | | | | 0.416 | | | | 09/25/36 | | | | 1,523,901 | |
| | | Renaissance Home Equity Loan Trust Series 2003-2, Class A(c) |
| | | | 3,026 | | | | 0.696 | | | | 08/25/33 | | | | 2,482 | |
| | | Renaissance Home Equity Loan Trust Series 2003-3, Class A(c) |
| | | | 8,147 | | | | 0.756 | | | | 12/25/33 | | | | 6,717 | |
| | | | | | | | | | | | | | | | | |
| | | | | | | | | | | | | | | | 4,591,412 | |
| | | |
| | | |
| | | Student Loan – 4.6% |
| | | Bank of America Student Loan Trust Series 2010-1A, Class A(b)(c) |
| | | | 500,000 | | | | 1.362 | | | | 02/25/43 | | | | 499,955 | |
| | | Brazos Higher Education Authority, Inc. Series 2005 I-A-2(c) |
| | | | 1,643,000 | | | | 0.369 | | | | 12/26/18 | | | | 1,626,586 | |
The accompanying notes are an integral part of these financial statements.
GOLDMAN SACHS CORE PLUS FIXED INCOME FUND
Schedule of Investments (continued)
September 30, 2010 (Unaudited)
| | | | | | | | | | | | | | | | | |
| | | Principal
| | Interest
| | Maturity
| | |
| | | Amount | | Rate | | Date | | Value |
| |
Asset-Backed Securities – (continued) |
| | | Student Loan – (continued) |
| | | | | | | | | | | | | | | | | |
| | | Brazos Higher Education Authority, Inc. Student Loan Revenue Series 2004 I-A-2(c) |
| | | $ | 1,661,263 | | | | 0.449 | % | | | 06/27/22 | | | $ | 1,633,600 | |
| | | Brazos Higher Education Authority, Inc. Series 2005-3, Class A14(c) |
| | | | 1,454,338 | | | | 0.399 | | | | 09/25/23 | | | | 1,446,376 | |
| | | Brazos Student Finance, Corp. Series 2010-1, Class A1(c) |
| | | | 913,663 | | | | 1.189 | | | | 06/25/35 | | | | 912,904 | |
| | | College Loan, Corp. Trust Series 06-1, Class A3(c) |
| | | | 1,000,000 | | | | 0.588 | | | | 10/25/25 | | | | 987,227 | |
| | | Education Funding Capital Trust I Series 2004-1, Class A2(c) |
| | | | 536,299 | | | | 0.452 | | | | 12/15/22 | | | | 526,462 | |
| | | Goal Capital Funding Trust Series 2010-1, Class A(b)(c) |
| | | | 1,078,802 | | | | 0.964 | | | | 08/25/48 | | | | 1,066,684 | |
| | | Missouri Higher Education Loan Authority Student Loan Series 2010, Class A-1(c) |
| | | | 939,971 | | | | 1.268 | | | | 11/26/32 | | | | 942,271 | |
| | | Northstar Education Finance, Inc. Series 2005-1, Class A1 |
| | | | 193,786 | | | | 0.588 | | | | 10/28/26 | | | | 192,612 | |
| | | SLC Student Loan Trust Series 2006-2, Class A4(c) |
| | | | 900,000 | | | | 0.372 | | | | 06/15/22 | | | | 877,016 | |
| | | SLM Student Loan Trust Series 2008-6, Class A2(c) |
| | | | 2,100,000 | | | | 1.048 | | | | 10/25/17 | | | | 2,115,078 | |
| | | South Carolina Student Loan Corp. Series 2005, Class A1(c) |
| | | | 1,000,000 | | | | 0.397 | | | | 12/03/18 | | | | 990,744 | |
| | | South Carolina Student Loan Corp. Series 2006-1, Class A1(c) |
| | | | 1,500,000 | | | | 0.387 | | | | 12/01/19 | | | | 1,467,585 | |
| | | US Education Loan Trust LLC Series 2006-1, Class A2(b)(c) |
| | | | 371,217 | | | | 0.427 | | | | 03/01/25 | | | | 368,303 | |
| | | | | | | | | | | | | | | | | |
| | | | | | | | | | | | | | | | 15,653,403 | |
| | | |
| | | |
| | | TOTAL ASSET-BACKED SECURITIES |
| | | (Cost $36,861,116) | | $ | 36,194,768 | |
| | | |
| | | |
| | | | | | | | | | | | | | | | | |
| | | | | | | | | | | | | | | | | |
Foreign Debt Obligations – 3.0% |
| | | | | | | | | | | | | | | | | |
| | | | | | | | | | | | | | | | | |
| | | Sovereign – 2.7% |
| | | Federal Republic of Brazil |
| | | $ | 780,000 | | | | 4.875 | % | | | 01/22/21 | | | $ | 856,050 | |
| | | Mexican Bonos |
| | | MXN | 24,070,000 | | | | 9.000 | | | | 12/20/12 | | | | 2,066,937 | |
| | | | 13,500,000 | | | | 10.000 | | | | 12/05/24 | | | | 1,427,003 | |
| | | Ontario Province of Canada |
| | | $ | 500,000 | | | | 4.100 | | | | 06/16/14 | | | | 549,068 | |
| | | Republic of South Africa |
| | | ZAR | 14,180,000 | | | | 10.500 | | | | 12/21/26 | | | | 2,496,482 | |
| | | Republic of Venezuela |
| | | $ | 580,000 | | | | 5.750 | | | | 02/26/16 | | | | 400,200 | |
| | | | 60,000 | | | | 9.000 | | | | 05/07/23 | | | | 40,260 | |
| | | | 110,000 | | | | 8.250 | | | | 10/13/24 | | | | 70,400 | |
| | | State of Qatar |
| | | | 500,000 | | | | 5.150 | | | | 04/09/14 | | | | 547,000 | |
| | | | 630,000 | | | | 5.250 | (b) | | | 01/20/20 | | | | 691,425 | |
| | | |
| | | |
| | | United Mexican States |
| | | | 300,000 | | | | 6.050 | | | | 01/11/40 | | | | 343,500 | |
| | | | | | | | | | | | | | | | | |
| | | | | | | | | | | | | | | | 9,488,325 | |
| | | |
| | | |
| | | Supranational – 0.3% |
| | | North American Development Bank |
| | | | 900,000 | | | | 4.375 | | | | 02/11/20 | | | | 983,571 | |
| | | |
| | | |
| | | TOTAL FOREIGN DEBT OBLIGATIONS |
| | | (Cost $9,876,675) | | $ | 10,471,896 | |
| | | |
| | | |
| | | | | | | | | | | | | | | | | |
| | | | | | | | | | | | | | | | | |
Structured Notes(f) – 1.5% |
| | | | | | | | | | | | | | | | | |
| | | | | | | | | | | | | | | | | |
| | | Egypt Treasury Bills(i) |
| | | EGP | 20,050,000 | | | | 0.000 | % | | | 04/07/11 | | | $ | 3,357,750 | |
| | | Federal Republic of Brazil(c)(j) |
| | | BRL | 3,168,655 | | | | 6.000 | | | | 08/15/40 | | | | 1,886,111 | |
| | | |
| | | |
| | | TOTAL STRUCTURED NOTES |
| | | (Cost $5,252,412) | | $ | 5,243,861 | |
| | | |
| | | |
| | | | | | | | | | | | | | | | | |
| | | | | | | | | | | | | | | | | |
Municipal Debt Obligations – 1.1% |
| | | | | | | | | | | | | | | | | |
| | | | | | | | | | | | | | | | | |
| | | California – 0.9% |
| | | California State GO Bonds Build America Taxable Series 2009 |
| | | $ | 375,000 | | | | 7.500 | % | | | 04/01/34 | | | $ | 407,993 | |
| | | | 500,000 | | | | 7.550 | | | | 04/01/39 | | | | 543,755 | |
| | | California State GO Bonds Build America Taxable Series 2010 |
| | | | 625,000 | | | | 7.950 | | | | 03/01/36 | | | | 670,062 | |
| | | | 1,375,000 | | | | 7.625 | | | | 03/01/40 | | | | 1,512,335 | |
| | | | | | | | | | | | | | | | | |
| | | | | | | | | | | | | | | | 3,134,145 | |
| | | |
| | | |
| | | Ohio – 0.2% |
| | | Buckeye Tobacco Settlement Financial Authority RB
Asset-Backed Senior Turbo Series 2007 A-2 |
| | | | 25,000 | | | | 5.875 | | | | 06/01/47 | | | | 18,259 | |
| | | Illinois State GO Bonds Build America Series 2010 |
| | | | 500,000 | | | | 7.350 | | | | 07/01/35 | | | | 524,700 | |
| | | | | | | | | | | | | | | | | |
| | | | | | | | | | | | | | | | 542,959 | |
| | | |
| | | |
| | | TOTAL MUNICIPAL DEBT OBLIGATIONS |
| | | (Cost $3,445,116) | | $ | 3,677,104 | |
| | | |
| | | |
| | | | | | | | | | | | | | | | | |
| | | | | | | | | | | | | | | | | |
Government Guarantee Obligations – 10.7% |
| | | | | | | | | | | | | | | | | |
| | | | | | | | | | | | | | | | | |
| | | Achmea Hypotheekbank NV(b)(k) |
| | | $ | 1,800,000 | | | | 3.200 | % | | | 11/03/14 | | | $ | 1,913,458 | |
| | | ANZ National (International) Ltd.(b)(k) |
| | | | 1,700,000 | | | | 3.250 | | | | 04/02/12 | | | | 1,766,519 | |
| | | BRFkredit A/S(b)(k) |
| | | | 3,000,000 | | | | 2.050 | | | | 04/15/13 | | | | 3,070,660 | |
| | | Citibank NA(c)(l) |
| | | | 600,000 | | | | 0.448 | | | | 05/07/12 | | | | 600,758 | |
| | | | 400,000 | | | | 0.263 | | | | 06/04/12 | | | | 399,821 | |
| | | |
| | | |
The accompanying notes are an integral part of these financial statements.
GOLDMAN SACHS CORE PLUS FIXED INCOME FUND
| | | | | | | | | | | | | | | | | |
| | | Principal
| | Interest
| | Maturity
| | |
| | | Amount | | Rate | | Date | | Value |
| |
Government Guarantee Obligations – (continued) |
| | | | | | | | | | | | | | | | | |
| | | Citigroup Funding, Inc.(l) |
| | | $ | 1,600,000 | | | | 1.875 | % | | | 11/15/12 | | | $ | 1,641,961 | |
| | | Commonwealth Bank of Australia(b)(k) |
| | | | 1,500,000 | | | | 2.500 | | | | 12/10/12 | | | | 1,559,070 | |
| | | Danske Bank AS(b)(k) |
| | | | 700,000 | | | | 2.500 | | | | 05/10/12 | | | | 716,884 | |
| | | FIH Erhvervsbank A/S(b)(k) |
| | | | 1,400,000 | | | | 2.000 | | | | 06/12/13 | | | | 1,431,828 | |
| | | ING Bank NV(b)(k) |
| | | | 1,400,000 | | | | 2.625 | | | | 02/09/12 | | | | 1,431,006 | |
| | | Israel Government AID Bond(l) |
| | | | 50,000 | | | | 5.500 | | | | 04/26/24 | | | | 61,700 | |
| | | | 40,000 | | | | 5.500 | | | | 09/18/33 | | | | 48,713 | |
| | | Kreditanstalt fuer Wiederaufbau MTN(k) |
| | | | 1,000,000 | | | | 2.500 | | | | 05/28/13 | | | | 1,044,024 | |
| | | Landwirtschaftliche Rentenbank(k) |
| | | | 2,400,000 | | | | 1.875 | | | | 09/24/12 | | | | 2,455,426 | |
| | | | 2,600,000 | | | | 4.875 | | | | 01/10/14 | | | | 2,914,638 | |
| | | LeasePlan Corp. NV(b)(k) |
| | | | 600,000 | | | | 3.000 | | | | 05/07/12 | | | | 619,985 | |
| | | Macquarie Bank Ltd.(b)(k) |
| | | | 1,900,000 | | | | 3.300 | | | | 07/17/14 | | | | 2,024,796 | |
| | | Royal Bank of Scotland PLC(b)(k) |
| | | | 2,200,000 | | | | 1.500 | | | | 03/30/12 | | | | 2,215,399 | |
| | | | 900,000 | | | | 2.625 | | | | 05/11/12 | | | | 922,946 | |
| | | Swedbank AB(b)(k) |
| | | | 800,000 | | | | 3.000 | | | | 12/22/11 | | | | 822,552 | |
| | | | 200,000 | | | | 2.800 | | | | 02/10/12 | | | | 205,911 | |
| | | | 300,000 | | | | 2.900 | | | | 01/14/13 | | | | 311,609 | |
| | | Swedish Housing Finance Corp.(b)(k) |
| | | | 3,000,000 | | | | 3.125 | | | | 03/23/12 | | | | 3,103,094 | |
| | | Westpac Banking Corp.(b)(k) |
| | | | 3,300,000 | | | | 3.250 | | | | 12/16/11 | | | | 3,397,317 | |
| | | | 1,600,000 | | | | 1.900 | | | | 12/14/12 | | | | 1,635,902 | |
| | | Westpac Securities NZ Ltd.(b)(k) |
| | | | 300,000 | | | | 2.500 | | | | 05/25/12 | | | | 307,047 | |
| | | |
| | | |
| | | TOTAL GOVERNMENT GUARANTEE OBLIGATIONS |
| | | (Cost $35,753,695) | | $ | 36,623,024 | |
| | | |
| | | |
| | | | | | | | | | | | | | | | | |
| | | | | | | | | | | | | | | | | |
U.S. Treasury Obligations – 13.9% |
| | | | | | | | | | | | | | | | | |
| | | | | | | | | | | | | | | | | |
| | | United States Treasury Bonds |
| | | $ | 1,800,000 | | | | 4.375 | % | | | 05/15/40 | | | $ | 2,021,580 | |
| | | | 4,400,000 | | | | 3.875 | | | | 08/15/40 | | | | 4,549,204 | |
| | | United States Treasury Inflation Protected Securities |
| | | | 1,867,212 | | | | 2.375 | | | | 04/15/11 | | | | 1,891,430 | |
| | | | 1,818,765 | | | | 3.000 | | | | 07/15/12 | | | | 1,931,874 | |
| | | | 231,314 | | | | 2.375 | | | | 01/15/25 | | | | 265,993 | |
| | | | 109,841 | | | | 2.000 | | | | 01/15/26 | | | | 120,782 | |
| | | United States Treasury Notes |
| | | | 3,300,000 | | | | 1.000 | | | | 04/30/12 | | | | 3,333,198 | |
| | | | 8,000,000 | | | | 0.750 | | | | 05/31/12 | | | | 8,048,720 | |
| | | | 7,400,000 | | | | 2.500 | | | | 06/30/17 | | | | 7,707,471 | |
| | | | 4,400,000 | | | | 3.125 | | | | 05/15/19 | | | | 4,676,276 | |
| | | | 3,200,000 | | | | 3.625 | | | | 08/15/19 | | | | 3,518,944 | |
| | | United States Treasury Principal-Only STRIPS(m) |
| | | | 2,100,000 | | | | 0.000 | | | | 08/15/20 | | | | 1,596,336 | |
| | | | 5,500,000 | | | | 0.000 | | | | 05/15/21 | | | | 4,043,765 | |
| | | | 5,400,000 | | | | 0.000 | | | | 11/15/26 | | | | 3,117,744 | |
| | | | 2,200,000 | | | | 0.000 | | | | 02/15/40 | | | | 683,936 | |
| | | |
| | | |
| | | TOTAL U.S. TREASURY OBLIGATIONS |
| | | (Cost $45,245,393) | | $ | 47,507,253 | |
| | | |
| | | |
| | | | | | | | | | | | | |
| | | Shares | | Rate | | Value |
| |
Preferred Stocks(c) – 0.2% |
| | | | | | | | | | | | | |
| | | | | | | | | | | | | |
| | | Citigroup Capital XIII |
| | | | 16,000 | | | | 7.875 | % | | $ | 414,400 | |
| | | JPMorgan Chase & Co. |
| | | | 350,000 | | | | 7.900 | | | | 375,070 | |
| | | |
| | | |
| | | TOTAL PREFERRED STOCKS – 0.2% |
| | | (Cost $750,000) | | $ | 789,470 | |
| | | |
| | | |
| | | TOTAL INVESTMENTS BEFORE SHORT-TERM INVESTMENT |
| | | (Cost $337,708,546) | | $ | 346,226,971 | |
| | | |
| | | |
| | | | | | | | | | | | | | | | | |
| | | Principal
| | Interest
| | Maturity
| | |
| | | Amount | | Rate | | Date | | Value |
| |
Short-term Investment(n) – 19.1% |
| | | | | | | | | | | | | | | | | |
| | | | | | | | | | | | | | | | | |
| | | Repurchase Agreement – 19.1% |
| | | Joint Repurchase Agreement Account II |
| | | $ | 65,500,000 | | | | 0.270 | % | | | 10/01/10 | | | $ | 65,500,000 | |
| | | Maturity Value: $65,500,491 | | | | |
| | | (Cost $65,500,000) | | | | |
| | | |
| | | |
| | | TOTAL INVESTMENTS – 120.1% |
| | | (Cost $403,208,546) | | $ | 411,726,971 | |
| | | |
| | | |
| | | LIABILITIES IN EXCESS OF OTHER ASSETS – (20.1)% | | | (68,954,145 | ) |
| | | |
| | | |
| | | NET ASSETS – 100.0% | | $ | 342,772,826 | |
| | | |
| | | |
The percentage shown for each investment category reflects the value of investments in that category as a percentage of net assets.
| | |
| (a) | | Security with “Call” features with resetting interest rates. Maturity dates disclosed are the final maturity dates. |
| |
| (b) | | Exempt from registration under Rule 144A of the Securities Act of 1933. Under procedures approved by the Board of Trustees, such securities have been determined to be liquid by the investment adviser and may be resold, normally to qualified institutional buyers in transactions exempt from registration. Total market value of Rule 144A securities amounts to $58,190,083 which represents approximately 17.0% of net assets as of September 30, 2010. |
| |
| (c) | | Variable rate security. Interest rate disclosed is that which is in effect at September 30, 2010. |
The accompanying notes are an integral part of these financial statements.
GOLDMAN SACHS CORE PLUS FIXED INCOME FUND
Schedule of Investments (continued)
September 30, 2010 (Unaudited)
| | |
| (d) | | Security with “Put” features with resetting interest rates. Maturity dates disclosed are the final maturity dates. |
| |
| (e) | | Security is currently in default and/or non-income producing. |
| |
| (f) | | Issued with zero coupon and interest rate is contingent upon LIBOR reaching a predetermined level. |
| |
| (g) | | TBA (To Be Announced) Securities are purchased on a forward commitment basis with an approximate principal amount and no defined maturity date. The actual principal and maturity date will be determined upon settlement when the specific mortgage pools are assigned. Total market value of TBA securities (excluding forward sales contracts, if any) amounts to $66,896,634 which represents approximately 19.5% of net assets as of September 30, 2010. |
| |
| (h) | | A portion of this security is segregated as collateral for initial margin requirements on futures transactions. |
| |
| (i) | | The underlying security is issued by Deutsche Bank. |
| |
| (j) | | The underlying security is issued by HSBC Bank. |
| |
| (k) | | Guaranteed by a foreign government until maturity. Total market value of these securities amounts to $33,870,071, which represents approximately 9.9% of net assets as of September 30, 2010. |
| |
| (l) | | Guaranteed under the Federal Deposit Insurance Corporation’s (“FDIC”) Temporary Liquidity Guarantee Program and is backed by the full faith and credit of the United States. The expiration date of the FDIC’s guarantee is the earlier of the maturity date of the debt or June 30, 2012. Total market value of these securities amounts to $2,752,953, which represents approximately 0.8% of net assets as of September 30, 2010. |
| |
| (m) | | Issued with a zero coupon. Income is recognized through the accretion of discount. |
| |
| (n) | | Joint repurchase agreement was entered into on September 30, 2010. Additional information appears on pages 74-75. |
| | | | | | | |
| | | |
| | | |
| | | | | | | |
| | | Currency Abbreviations: |
| | | AUD | | — | | Australian Dollar |
| | | BRL | | — | | Brazilian Real |
| | | CAD | | — | | Canadian Dollar |
| | | CHF | | — | | Swiss Franc |
| | | EGP | | — | | Egyptian Pound |
| | | EUR | | — | | Euro |
| | | GBP | | — | | British Pound |
| | | IDR | | — | | Indonesian Rupiah |
| | | JPY | | — | | Japanese Yen |
| | | KRW | | — | | South Korean Won |
| | | MXN | | — | | Mexican Peso |
| | | NOK | | — | | Norwegian Krone |
| | | NZD | | — | | New Zealand Dollar |
| | | SEK | | — | | Swedish Krona |
| | | ZAR | | — | | South African Rand |
| | | |
| | | Investment Abbreviations: |
| | | BP | | — | | British Pound Offered Rate |
| | | EURO | | — | | Euro Offered Rate |
| | | FHLB | | — | | Federal Home Loan Bank |
| | | FHLMC | | — | | Federal Home Loan Mortgage Corp. |
| | | FNMA | | — | | Federal National Mortgage Association |
| | | GNMA | | — | | Government National Mortgage Association |
| | | GO | | — | | General Obligation |
| | | KWCDC | | — | | South Korean Won Certificate of Deposit |
| | | LIBOR | | — | | London Interbank Offered Rate |
| | | MTN | | — | | Medium Term Note |
| | | RB | | — | | Revenue Bond |
| | | REMIC | | — | | Real Estate Mortgage Investment Conduit |
| | | STRIPS | | — | | Separate Trading of Registered Interest and Principal of Securities |
| | | |
| | | |
ADDITIONAL INVESTMENT INFORMATION
FORWARD FOREIGN CURRENCY EXCHANGE CONTRACTS — At September 30, 2010, the Fund had outstanding forward foreign currency exchange contracts, both to purchase and sell foreign currencies:
FORWARD FOREIGN CURRENCY EXCHANGE CONTRACTS WITH UNREALIZED GAIN
| | | | | | | | | | | | | | | | | |
| | | | | Contract
| | Expiration
| | Current
| | Unrealized
|
| Counterparty | | Currency | | Type | | Date | | Value | | Gain |
| |
| Citibank NA | | CAD | | Purchase | | | 12/15/10 | | | $ | 411,785 | | | $ | 2,785 | |
| Deutsche Bank AG (London) | | AUD | | Purchase | | | 12/15/10 | | | | 1,368,169 | | | | 8,428 | |
| | | CAD | | Purchase | | | 12/15/10 | | | | 943,362 | | | | 13,362 | |
| | | MXN | | Sale | | | 11/24/10 | | | | 3,529,511 | | | | 11,311 | |
| HSBC Bank PLC | | EUR | | Purchase | | | 12/15/10 | | | | 482,304 | | | | 28,961 | |
| JPMorgan Securities, Inc. | | AUD | | Purchase | | | 12/15/10 | | | | 218,331 | | | | 5,145 | |
| | | EUR | | Purchase | | | 12/15/10 | | | | 3,418,645 | | | | 103,023 | |
| | | IDR | | Purchase | | | 10/14/10 | | | | 2,010,436 | | | | 26,272 | |
| UBS AG (London) | | BRL | | Purchase | | | 10/04/10 | | | | 1,743,177 | | | | 13,827 | |
| | | EUR | | Purchase | | | 12/15/10 | | | | 1,395,139 | | | | 26,864 | |
| Westpac Banking Corp. | | AUD | | Purchase | | | 12/15/10 | | | | 460,524 | | | | 6,918 | |
| | | GBP | | Purchase | | | 10/29/10 | | | | 92,418 | | | | 945 | |
| | | | | Purchase | | | 12/15/10 | | | | 1,608,691 | | | | 40,005 | |
| |
| |
TOTAL | | | | | | | | | | | | | | $ | 287,846 | |
| |
| |
The accompanying notes are an integral part of these financial statements.
GOLDMAN SACHS CORE PLUS FIXED INCOME FUND
| |
| ADDITIONAL INVESTMENT INFORMATION (continued) | |
FORWARD FOREIGN CURRENCY EXCHANGE CONTRACTS WITH UNREALIZED LOSS
| | | | | | | | | | | | | | | | | |
| | | | | Contract
| | Expiration
| | Current
| | Unrealized
|
| Counterparty | | Currency | | Type | | Date | | Value | | Loss |
| |
| Bank of America Securities LLC | | NZD | | Sale | | | 12/15/10 | | | $ | 1,969,708 | | | $ | (43,677 | ) |
| Citibank NA | | EUR | | Sale | | | 12/15/10 | | | | 472,767 | | | | (17,468 | ) |
| HSBC Bank PLC | | BRL | | Sale | | | 10/04/10 | | | | 1,743,177 | | | | (20,488 | ) |
| | | EUR | | Sale | | | 12/15/10 | | | | 1,857,006 | | | | (32,149 | ) |
| | | IDR | | Sale | | | 10/14/10 | | | | 2,658,300 | | | | (65,648 | ) |
| JPMorgan Securities, Inc. | | CAD | | Sale | | | 12/15/10 | | | | 160,125 | | | | (956 | ) |
| | | CHF | | Sale | | | 12/15/10 | | | | 480,036 | | | | (15,366 | ) |
| | | EUR | | Sale | | | 10/22/10 | | | | 952,022 | | | | (60,511 | ) |
| | | IDR | | Purchase | | | 10/14/10 | | | | 647,864 | | | | (3,382 | ) |
| | | JPY | | Sale | | | 12/15/10 | | | | 760,393 | | | | (6,632 | ) |
| | | NZD | | Purchase | | | 12/15/10 | | | | 448,439 | | | | (2,159 | ) |
| Morgan Stanley Capital Services, Inc. | | ZAR | | Sale | | | 11/10/10 | | | | 2,461,282 | | | | (66,640 | ) |
| Royal Bank of Canada | | CAD | | Sale | | | 12/15/10 | | | | 459,175 | | | | (2,175 | ) |
| | | EUR | | Purchase | | | 12/15/10 | | | | 912,835 | | | | (2,342 | ) |
| UBS AG (London) | | BRL | | Sale | | | 01/18/11 | | | | 1,703,886 | | | | (11,711 | ) |
| Westpac Banking Corp. | | AUD | | Sale | | | 12/15/10 | | | | 665,821 | | | | (35,071 | ) |
| |
| |
TOTAL | | | | | | | | | | | | | | $ | (386,375 | ) |
| |
| |
FORWARD FOREIGN CROSS CURRENCY EXCHANGE CONTRACTS WITH UNREALIZED GAIN (PURCHASE/SALE)
| | | | | | | | | | | | | | | | | |
| | | | | | | Purchase
| | Sale
| | |
| | | | | Expiration
| | Current
| | Current
| | Unrealized
|
| Counterparty | | Currency | | Date | | Value | | Value | | Gain |
| |
| Citibank NA | | EUR/CHF | | 12/15/10 | | $ | 967,333 | | | $ | 959,588 | | | $ | 7,745 | |
| Deutsche Bank AG (London) | | EUR/GBP | | 12/15/10 | | | 480,941 | | | | 473,851 | | | | 7,090 | |
| HSBC Bank PLC | | EUR/GBP | | 12/15/10 | | | 946,896 | | | | 921,240 | | | | 25,656 | |
| | | EUR/NOK | | 12/15/10 | | | 935,996 | | | | 929,279 | | | | 6,717 | |
| | | SEK/EUR | | 12/15/10 | | | 945,597 | | | | 945,534 | | | | 63 | |
| Royal Bank of Canada | | EUR/CAD | | 12/15/10 | | | 708,469 | | | | 683,302 | | | | 25,167 | |
| UBS AG (London) | | EUR/CAD | | 12/15/10 | | | 693,482 | | | | 684,963 | | | | 8,519 | |
| | | SEK/EUR | | 12/15/10 | | | 1,166,539 | | | | 1,154,772 | | | | 11,767 | |
| |
| |
TOTAL | | | | | | | | | | | | | | $ | 92,724 | |
| |
| |
The accompanying notes are an integral part of these financial statements.
GOLDMAN SACHS CORE PLUS FIXED INCOME FUND
Schedule of Investments (continued)
September 30, 2010 (Unaudited)
| |
| ADDITIONAL INVESTMENT INFORMATION (continued) | |
FORWARD FOREIGN CROSS CURRENCY EXCHANGE CONTRACTS WITH UNREALIZED LOSS (PURCHASE/SALE)
| | | | | | | | | | | | | | | | | |
| | | | | | | Purchase
| | Sale
| | |
| | | | | Expiration
| | Current
| | Current
| | Unrealized
|
| Counterparty | | Currency | | Date | | Value | | Value | | Loss |
| |
| Barclays Bank PLC | | NOK/EUR | | 12/15/10 | | $ | 1,417,112 | | | $ | 1,440,559 | | | $ | (23,447 | ) |
| Citibank NA | | NZD/EUR | | 12/15/10 | | | 699,906 | | | | 743,893 | | | | (43,987 | ) |
| | | EUR/SEK | | 12/15/10 | | | 978,232 | | | | 980,744 | | | | (2,512 | ) |
| HSBC Bank PLC | | NZD/EUR | | 12/15/10 | | | 927,486 | | | | 983,682 | | | | (56,196 | ) |
| | | CHF/EUR | | 12/15/10 | | | 480,036 | | | | 495,928 | | | | (15,892 | ) |
| | | EUR/SEK | | 12/15/10 | | | 985,045 | | | | 988,521 | | | | (3,476 | ) |
| JPMorgan Securities, Inc. | | NZD/EUR | | 12/15/10 | | | 448,027 | | | | 463,230 | | | | (15,203 | ) |
| Royal Bank of Canada | | CAD/EUR | | 12/15/10 | | | 926,983 | | | | 985,045 | | | | (58,062 | ) |
| | | CHF/EUR | | 12/15/10 | | | 466,522 | | | | 474,130 | | | | (7,608 | ) |
| UBS AG (London) | | JPY/EUR | | 12/15/10 | | | 465,038 | | | | 495,929 | | | | (30,891 | ) |
| | | CHF/EUR | | 12/15/10 | | | 478,919 | | | | 490,479 | | | | (11,560 | ) |
| Westpac Banking Corp. | | AUD/EUR | | 12/15/10 | | | 464,101 | | | | 474,129 | | | | (10,028 | ) |
| |
| |
TOTAL | | | | | | | | | | | | | | $ | (278,862 | ) |
| |
| |
FUTURES CONTRACTS — At September 30, 2010, the following futures contracts were open:
| | | | | | | | | | | | | | | |
| | | Number of
| | | | | | |
| | | Contracts
| | Expiration
| | Current
| | Unrealized
|
| Type | | Long (Short) | | Date | | Value | | Gain (Loss) |
| |
| Australia 10 Year Treasury Bond | | | 43 | | | December 2010 | | $ | 4,483,513 | | | $ | 25,075 | |
| Japan 10 Year Government Bond | | | (9 | ) | | December 2010 | | | (15,462,146 | ) | | | (237,226 | ) |
| U.K. Life Long Gilt | | | 5 | | | December 2010 | | | 976,471 | | | | (6,061 | ) |
| 5 Year German Euro-Bobl | | | (2 | ) | | December 2010 | | | (328,843 | ) | | | (431 | ) |
| 10 Year German Euro-Bund | | | 32 | | | December 2010 | | | 5,733,504 | | | | 36,242 | |
| 2 Year U.S. Treasury Notes | | | 111 | | | December 2010 | | | 24,362,766 | | | | 44,276 | |
| 5 Year U.S. Treasury Notes | | | 363 | | | December 2010 | | | 43,874,789 | | | | 256,042 | |
| 10 Year U.S. Treasury Notes | | | 718 | | | December 2010 | | | 90,501,656 | | | | 94,394 | |
| 30 Year U.S. Treasury Bonds | | | 23 | | | December 2010 | | | 3,075,531 | | | | 53,675 | |
| |
| |
TOTAL | | | | | | | | | | | | $ | 265,986 | |
| |
| |
The accompanying notes are an integral part of these financial statements.
GOLDMAN SACHS CORE PLUS FIXED INCOME FUND
| |
| ADDITIONAL INVESTMENT INFORMATION (continued) | |
SWAP CONTRACTS — At September 30, 2010, the Fund had outstanding swap contracts with the following terms:
INTEREST RATE SWAP CONTRACTS
| | | | | | | | | | | | | | | | | | | | | | | | | | | |
| | | | | | | | | Rates Exchanged | | | | Upfront
| | |
| | | | | Notional
| | | | Payments
| | Payments
| | | | Payments
| | |
| | | | | Amount
| | Termination
| | received by
| | made by
| | Market
| | made (received)
| | Unrealized
|
| Counterparty | | | | (000s) | | Date | | the Fund | | the Fund | | Value | | by the Fund | | Gain (Loss) |
| |
| Bank of America Securities LLC | | $ | | | 22,500 | (a) | | | 08/15/17 | | | 3 month LIBOR | | 2.075% | | $ | 31,636 | | | $ | — | | | $ | 31,636 | |
| Barclays Bank PLC | | GBP | | | 6,120 | (a) | | | 11/08/15 | | | 6 month BP | | 2.537 | | | (190,119 | ) | | | 48 | | | | (190,167 | ) |
| | | EUR | | | 7,090 | (a) | | | 04/23/20 | | | 4.259% | | 6 month EURO | | | 428,512 | | | | — | | | | 428,512 | |
| | | | | | 1,750 | (a) | | | 05/12/20 | | | 4.265 | | 6 month EURO | | | 105,345 | | | | — | | | | 105,345 | |
| | | | | | 6,280 | (a) | | | 05/14/20 | | | 4.360 | | 6 month EURO | | | 411,651 | | | | — | | | | 411,651 | |
| | | GBP | | | 10,520 | (a) | | | 11/08/20 | | | 3.411 | | 6 month BP | | | 524,962 | | | | (600 | ) | | | 525,562 | |
| | | | | | 5,280 | (a) | | | 11/08/25 | | | 6 month BP | | 3.778 | | | (332,834 | ) | | | 357 | | | | (333,191 | ) |
| | | EUR | | | 2,120 | (a) | | | 04/23/40 | | | 6 month EURO | | 4.085 | | | (438,661 | ) | | | — | | | | (438,661 | ) |
| | | | | | 490 | (a) | | | 05/12/40 | | | 6 month EURO | | 3.940 | | | (86,371 | ) | | | — | | | | (86,371 | ) |
| | | | | | 1,850 | (a) | | | 05/14/40 | | | 6 month EURO | | 4.055 | | | (370,772 | ) | | | — | | | | (370,772 | ) |
| Citibank NA | | | | | 7,100 | (a) | | | 04/23/20 | | | 4.286 | | 6 month EURO | | | 440,224 | | | | — | | | | 440,224 | |
| | | | | | 2,130 | (a) | | | 04/23/40 | | | 6 month EURO | | 4.119 | | | (456,016 | ) | | | — | | | | (456,016 | ) |
| | | GBP | | | 760 | (a) | | | 12/15/40 | | | 4.250 | | 6 month BP | | | 132,449 | | | | 120,960 | | | | 11,489 | |
| Credit Suisse First Boston Corp. | | $ | | | 7,500 | (a) | | | 08/15/17 | | | 3 month LIBOR | | 2.252 | | | (72,877 | ) | | | — | | | | (72,877 | ) |
| | | EUR | | | 1,900 | (a) | | | 08/06/20 | | | 3.764 | | 6 month EURO | | | 55,506 | | | | — | | | | 55,506 | |
| | | | | | 500 | (a) | | | 08/06/40 | | | 6 month EURO | | 3.630 | | | (55,440 | ) | | | — | | | | (55,440 | ) |
| Deutsche Bank Securities, Inc. | | KRW | | | 471,000 | | | | 01/28/11 | | | 2.820 | | 3 month KWCDC | | | 321 | | | | — | | | | 321 | |
| | | | | | 260,000 | | | | 06/12/11 | | | 3.870 | | 3 month KWCDC | | | 1,695 | | | | — | | | | 1,695 | |
| | | | | | 1,200,000 | | | | 06/26/11 | | | 3.693 | | 3 month KWCDC | | | 6,217 | | | | — | | | | 6,217 | |
| | | | | | 496,931 | | | | 07/06/11 | | | 3.620 | | 3 month KWCDC | | | 3,554 | | | | — | | | | 3,554 | |
| | | | | | 830,250 | | | | 07/07/11 | | | 3.626 | | 3 month KWCDC | | | 5,970 | | | | — | | | | 5,970 | |
| | | $ | | | 6,100 | (a) | | | 08/15/17 | | | 3 month LIBOR | | 2.241 | | | (55,061 | ) | | | — | | | | (55,061 | ) |
| | | | | | 6,800 | (a) | | | 08/15/17 | | | 3 month LIBOR | | 2.113 | | | (6,915 | ) | | | — | | | | (6,915 | ) |
| | | | | | 28,500 | (a) | | | 08/15/17 | | | 3 month LIBOR | | 2.033 | | | 115,351 | | | | — | | | | 115,351 | |
| JPMorgan Securities, Inc. | | KRW | | | 458,000 | | | | 01/28/11 | | | 2.830 | | 3 month KWCDC | | | 333 | | | | — | | | | 333 | |
| | | | | | 360,000 | | | | 06/15/11 | | | 3.900 | | 3 month KWCDC | | | 2,408 | | | | — | | | | 2,408 | |
| | | | | | 1,250,000 | | | | 06/22/11 | | | 3.720 | | 3 month KWCDC | | | 6,718 | | | | — | | | | 6,718 | |
| | | | | | 394,879 | | | | 07/08/11 | | | 3.660 | | 3 month KWCDC | | | 2,947 | | | | — | | | | 2,947 | |
| | | $ | | | 6,900 | (a) | | | 08/15/17 | | | 3 month LIBOR | | 2.161 | | | (27,547 | ) | | | — | | | | (27,547 | ) |
| | | EUR | | | 1,750 | (a) | | | 08/07/20 | | | 3.653 | | 6 month EURO | | | 40,088 | | | | — | | | | 40,088 | |
| | | | | | 3,530 | (a) | | | 08/10/20 | | | 3.530 | | 6 month EURO | | | 56,028 | | | | — | | | | 56,028 | |
| | | | | | 480 | (a) | | | 08/07/40 | | | 6 month EURO | | 3.542 | | | (44,416 | ) | | | — | | | | (44,416 | ) |
| | | | | | 960 | (a) | | | 08/10/40 | | | 6 month EURO | | 3.417 | | | (63,680 | ) | | | — | | | | (63,680 | ) |
| |
| |
TOTAL | | | | | | | | | | | | | | | | $ | 171,206 | | | $ | 120,765 | | | $ | 50,441 | |
| |
| |
| |
| (a) | Represents forward starting interest rate swaps whose effective dates of commencement of accruals and cash flows occur subsequent to September 30, 2010. |
The accompanying notes are an integral part of these financial statements.
GOLDMAN SACHS CORE PLUS FIXED INCOME FUND
Schedule of Investments (continued)
September 30, 2010 (Unaudited)
| |
| ADDITIONAL INVESTMENT INFORMATION (continued) | |
CREDIT DEFAULT SWAP CONTRACTS
| | | | | | | | | | | | | | | | | | | | | | | | | | | |
| | | | | | | | | | | Credit
| | | | | | |
| | | | | | | Rates
| | | | Spread at
| | | | Upfront
| | |
| | | | | Notional
| | received
| | | | September 30,
| | | | Payments
| | |
| | | Referenced
| | Amount
| | (paid) by
| | Termination
| | 2010
| | Market
| | made (received)
| | Unrealized
|
| Counterparty | | Obligation | | (000s) | | Fund | | Date | | (basis points)(b) | | Value | | by the Fund | | Gain (Loss) |
| |
Protection Sold: | | | | | | | | | | | | | | | | | | | | | | | | | | |
| Credit Suisse First Boston Corp. | | ABX-HE-AAA 07-1 Index | |
$ | 883 | | |
0.090% | |
08/25/37 | | |
2009 | | |
$ | (456,921 | ) | |
$ | (188,094 | ) | |
$ | (268,827 | ) |
| | | ABX.HE.AAA07-2 Index | | |
243 | | |
0.760 | |
01/25/38 | | |
2189 | | | |
(135,788 | ) | | |
(68,720 | ) | | |
(67,068 | ) |
| Deutsche Bank Securities, Inc. | | CDX North America Investment Grade Index | | |
15,000 | | |
1.000 | |
12/20/15 | | |
107 | | | |
(43,357 | ) | | |
(51,609 | ) | | |
8,252 | |
| | | CDX North America High Yield Index | | |
4,700 | | |
5.000 | |
06/20/15 | | |
523 | | | |
(34,609 | ) | | |
(59,914 | ) | | |
25,305 | |
| | | | | | 19,000 | | | 1.000 | | 12/20/15 | | | 107 | | | | (55,447 | ) | | | (79,301 | ) | | | 23,854 | |
| JPMorgan Securities, Inc. | | CDX North America Investment Grade Index | | |
4,700 | | |
1.000 | |
12/20/15 | | |
104 | | | |
(13,823 | ) | | |
(15,351 | ) | | |
1,528 | |
| |
| |
TOTAL | | | | | | | | | | | | | | | | $ | (739,945 | ) | | $ | (462,989 | ) | | $ | (276,956 | ) |
| |
| |
| |
| (b) | Credit spread on the Referenced Obligation, together with the term of the swap contract, are indicators of payment/performance risk. The likelihood of a credit event occurring which would require a fund to make a payment or otherwise be required to perform under the swap contract is generally greater as the credit spread and the term of the swap contract increase. |
The accompanying notes are an integral part of these financial statements.
GOLDMAN SACHS GLOBAL INCOME FUND
Schedule of Investments
September 30, 2010 (Unaudited)
| | | | | | | | | | | | | | | | | |
| | | Principal
| | Interest
| | Maturity
| | |
| | | Amount | | Rate | | Date | | Value |
| |
Foreign Sovereign Debt Obligations – 46.3% |
| | | | | | | | | | | | | | | | | |
| | | | | | | | | | | | | | | | | |
| | | British Pound – 5.6% |
| | | United Kingdom Gilt |
| | | GBP | 2,540,000 | | | | 4.250 | % | | | 09/07/39 | | | $ | 4,226,696 | |
| | | United Kingdom Gilt Inflation Linked |
| | | | 790,000 | | | | 2.500 | | | | 07/26/16 | | | | 3,897,344 | |
| | | United Kingdom Treasury |
| | | | 7,000,000 | | | | 4.500 | | | | 03/07/13 | | | | 11,952,424 | |
| | | | 630,000 | | | | 2.250 | | | | 03/07/14 | | | | 1,023,899 | |
| | | | 870,000 | | | | 4.500 | | | | 03/07/19 | | | | 1,542,643 | |
| | | | 3,500,000 | | | | 3.750 | | | | 09/07/19 | | | | 5,868,173 | |
| | | | 7,110,000 | | | | 4.000 | | | | 03/07/22 | | | | 11,975,392 | |
| | | | 1,150,000 | | | | 4.750 | | | | 12/07/30 | | | | 2,055,926 | |
| | | | 3,390,000 | | | | 4.500 | | | | 09/07/34 | | | | 5,854,263 | |
| | | | 3,300,000 | | | | 4.500 | | | | 12/07/42 | | | | 5,732,950 | |
| | | | | | | | | | | | | | | | | |
| | | | | | | | | | | | | | | | 54,129,710 | |
| | | |
| | | |
| | | Canadian Dollar – 2.2% |
| | | Government of Canada |
| | | CAD | 2,340,000 | | | | 3.500 | | | | 06/01/13 | | | | 2,392,217 | |
| | | | 10,920,000 | | | | 2.500 | | | | 06/01/15 | | | | 10,890,495 | |
| | | | 1,760,000 | | | | 4.500 | | | | 06/01/15 | | | | 1,907,417 | |
| | | | 4,950,000 | | | | 5.750 | | | | 06/01/29 | | | | 6,431,055 | |
| | | | | | | | | | | | | | | | | |
| | | | | | | | | | | | | | | | 21,621,184 | |
| | | |
| | | |
| | | Danish Krone – 0.3% |
| | | Kingdom of Denmark |
| | | DKK | 16,000,000 | | | | 4.000 | | | | 11/15/15 | | | | 3,250,001 | |
| | | |
| | | |
| | | Euro – 16.9% |
| | | Federal Republic of Germany |
| | | EUR | 2,710,000 | | | | 3.250 | | | | 07/04/15 | | | | 3,998,569 | |
| | | | 4,630,000 | | | | 4.000 | | | | 07/04/16 | | | | 7,103,102 | |
| | | | 240,000 | | | | 4.000 | | | | 01/04/18 | | | | 371,474 | |
| | | | 6,100,000 | | | | 4.250 | | | | 07/04/18 | | | | 9,610,601 | |
| | | | 9,130,000 | | | | 3.250 | | | | 01/04/20 | | | | 13,501,937 | |
| | | | 6,550,000 | | | | 3.000 | | | | 07/04/20 | | | | 9,495,674 | |
| | | | 4,800,000 | | | | 5.625 | | | | 01/04/28 | | | | 9,017,279 | |
| | | | 3,370,000 | | | | 5.500 | | | | 01/04/31 | | | | 6,402,964 | |
| | | | 50,000 | | | | 4.000 | | | | 01/04/37 | | | | 81,670 | |
| | | | 850,000 | | | | 4.250 | | | | 07/04/39 | | | | 1,465,916 | |
| | | | 5,610,000 | | | | 4.750 | | | | 07/04/40 | | | | 10,467,820 | |
| | | Government of Finland |
| | | | 7,990,000 | | | | 3.125 | | | | 09/15/14 | | | | 11,623,248 | |
| | | | 390,000 | | | | 4.375 | | | | 07/04/19 | | | | 612,704 | |
| | | Government of France |
| | | | 7,000,000 | | | | 5.000 | | | | 10/25/11 | | | | 9,961,679 | |
| | | Government of Ireland |
| | | | 1,060,000 | | | | 4.600 | | | | 04/18/16 | | | | 1,355,915 | |
| | | | 420,000 | | | | 4.500 | | | | 04/18/20 | | | | 486,594 | |
| | | | 750,000 | | | | 5.000 | | | | 10/18/20 | | | | 898,263 | |
| | | Kingdom of Belgium |
| | | | 2,610,000 | | | | 4.000 | | | | 03/28/14 | | | | 3,830,063 | |
| | | | 1,470,000 | | | | 3.500 | | | | 03/28/15 | | | | 2,124,758 | |
| | | | 1,260,000 | | | | 2.750 | | | | 03/28/16 | | | | 1,750,864 | |
| | | | 2,270,000 | | | | 3.750 | | | | 09/28/20 | | | | 3,256,734 | |
| | | Kingdom of The Netherlands |
| | | | 9,800,000 | | | | 4.250 | | | | 07/15/13 | | | | 14,520,023 | |
| | | |
| | | |
| | | Republic of Austria(a) |
| | | EUR | 3,150,000 | | | | 4.350 | | | | 03/15/19 | | | | 4,839,306 | |
| | | Republic of Italy |
| | | | 3,970,000 | | | | 4.250 | | | | 02/01/15 | | | | 5,757,234 | |
| | | | 8,800,000 | | | | 3.000 | | | | 04/15/15 | | | | 12,124,247 | |
| | | | 870,000 | | | | 5.250 | | | | 08/01/17 | | | | 1,330,071 | |
| | | | 5,080,000 | | | | 4.500 | | | | 02/01/18 | | | | 7,434,391 | |
| | | | 1,960,000 | | | | 4.500 | | | | 03/01/19 | | | | 2,837,686 | |
| | | | 980,000 | | | | 4.250 | | | | 09/01/19 | | | | 1,392,952 | |
| | | | 660,000 | | | | 4.250 | | | | 03/01/20 | | | | 932,748 | |
| | | | 3,870,000 | | | | 6.000 | | | | 05/01/31 | | | | 6,159,788 | |
| | | | | | | | | | | | | | | | | |
| | | | | | | | | | | | | | | | 164,746,274 | �� |
| | | |
| | | |
| | | Japanese Yen – 17.3% |
| | | Government of Japan |
| | | JPY | 3,000,000,000 | | | | 1.500 | | | | 06/20/12 | | | | 36,771,382 | |
| | | | 1,800,000,000 | | | | 0.800 | | | | 03/20/13 | | | | 21,907,734 | |
| | | | 800,000,000 | | | | 1.100 | | | | 09/20/13 | | | | 9,850,771 | |
| | | | 1,400,000,000 | | | | 0.400 | | | | 06/20/15 | | | | 16,891,231 | |
| | | | 1,216,000,000 | | | | 1.500 | | | | 09/20/18 | | | | 15,580,663 | |
| | | | 300,000,000 | | | | 1.300 | | | | 12/20/19 | | | | 3,748,013 | |
| | | | 400,000,000 | | | | 1.900 | | | | 06/20/25 | | | | 5,112,003 | |
| | | | 875,000,000 | | | | 2.000 | | | | 12/20/25 | | | | 11,248,488 | |
| | | | 430,000,000 | | | | 2.100 | | | | 12/20/26 | | | | 5,578,122 | |
| | | | 350,000,000 | | | | 2.100 | | | | 12/20/27 | | | | 4,529,615 | |
| | | | 350,000,000 | | | | 2.000 | | | | 06/20/30 | | | | 4,404,818 | |
| | | | 285,000,000 | | | | 2.500 | | | | 09/20/34 | | | | 3,877,659 | |
| | | | 250,000,000 | | | | 2.500 | | | | 03/20/38 | | | | 3,428,827 | |
| | | | 100,000,000 | | | | 2.200 | | | | 09/20/39 | | | | 1,296,088 | |
| | | Government of Japan CPI Linked Bond |
| | | | 84,320,000 | | | | 0.800 | | | | 12/10/15 | | | | 999,962 | |
| | | | 437,360,000 | | | | 1.000 | | | | 06/10/16 | | | | 5,178,849 | |
| | | | 1,496,880,000 | | | | 1.200 | | | | 03/10/17 | | | | 17,904,105 | |
| | | | | | | | | | | | | | | | | |
| | | | | | | | | | | | | | | | 168,308,330 | |
| | | |
| | | |
| | | Polish Zloty – 0.3% |
| | | Government of Poland |
| | | PLN | 8,000,000 | | | | 4.750 | | | | 04/25/12 | | | | 2,760,366 | |
| | | |
| | | |
| | | Swedish Krona – 0.5% |
| | | Kingdom of Sweden |
| | | SEK | 11,000,000 | | | | 6.750 | | | | 05/05/14 | | | | 1,907,438 | |
| | | | 20,000,000 | | | | 4.500 | | | | 08/12/15 | | | | 3,298,642 | |
| | | | | | | | | | | | | | | | | |
| | | | | | | | | | | | | | | | 5,206,080 | |
| | | |
| | | |
| | | United States Dollar – 3.2% |
| | | Federal Republic of Brazil |
| | | $ | 1,250,000 | | | | 5.625 | | | | 01/07/41 | | | | 1,368,750 | |
| | | Kingdom of Denmark |
| | | | 17,700,000 | | | | 1.875 | | | | 03/16/12 | | | | 17,969,111 | |
| | | Quebec Province of Canada |
| | | | 3,350,000 | | | | 5.125 | | | | 11/14/16 | | | | 3,903,191 | |
| | | Russian Federation |
| | | | 100,000 | | | | 5.000 | | | | 04/29/20 | | | | 104,000 | |
| | | | 3,472,600 | | | | 7.500 | | | | 03/31/30 | | | | 4,141,075 | |
| | | State of Qatar |
| | | | 1,569,000 | | | | 5.150 | | | | 04/09/14 | | | | 1,716,486 | |
| | | |
| | | |
The accompanying notes are an integral part of these financial statements.
GOLDMAN SACHS GLOBAL INCOME FUND
Schedule of Investments (continued)
September 30, 2010 (Unaudited)
| | | | | | | | | | | | | | | | | |
| | | Principal
| | Interest
| | Maturity
| | |
| | | Amount | | Rate | | Date | | Value |
| |
Foreign Sovereign Debt Obligations – (continued) |
| | | | | | | | | | | | | | | | | |
| | | United Mexican States |
| | | $ | 1,270,000 | | | | 6.050 | % | | | 01/11/40 | | | $ | 1,454,150 | |
| | | | | | | | | | | | | | | | | |
| | | | | | | | | | | | | | | | 30,656,763 | |
| | | |
| | | |
| | | TOTAL FOREIGN SOVEREIGN DEBT OBLIGATIONS |
| | | (Cost $393,830,345) | | $ | 450,678,708 | |
| | | |
| | | |
| | | | | | | | | | | | | | | | | |
| | | | | | | | | | | | | | | | | |
Corporate Obligations – 22.5% |
| | | | | | | | | | | | | | | | | |
| | | | | | | | | | | | | | | | | |
| | | Banks – 9.8% |
| | | Abbey National Treasury Services PLC |
| | | EUR | 750,000 | | | | 2.500 | % | | | 03/18/13 | | | $ | 1,018,893 | |
| | | Bank of America Corp. |
| | | $ | 400,000 | | | | 7.375 | | | | 05/15/14 | | | | 459,932 | |
| | | | 2,800,000 | | | | 5.750 | | | | 12/01/17 | | | | 2,982,569 | |
| | | Bank of Nova Scotia |
| | | | 4,400,000 | | | | 1.450 | | | | 07/26/13 | | | | 4,447,582 | |
| | | | 13,100,000 | | | | 1.450 | (a) | | | 07/26/13 | | | | 13,241,663 | |
| | | Bank of Scotland PLC(a) |
| | | | 2,070,000 | | | | 5.250 | | | | 02/21/17 | | | | 2,248,784 | |
| | | BNP Paribas(a)(b) |
| | | | 450,000 | | | | 5.186 | | | | 06/29/49 | | | | 423,000 | |
| | | Canadian Imperial Bank of Commerce(a) |
| | | | 3,190,000 | | | | 2.000 | | | | 02/04/13 | | | | 3,271,179 | |
| | | | 1,490,000 | | | | 2.600 | | | | 07/02/15 | | | | 1,550,337 | |
| | | Cie de Financement Foncier(a) |
| | | | 4,000,000 | | | | 1.625 | | | | 07/23/12 | | | | 4,016,340 | |
| | | | 2,600,000 | | | | 2.125 | | | | 04/22/13 | | | | 2,647,130 | |
| | | Citigroup, Inc. |
| | | | 2,300,000 | | | | 5.125 | | | | 05/05/14 | | | | 2,442,771 | |
| | | | 1,700,000 | | | | 6.010 | | | | 01/15/15 | | | | 1,866,441 | |
| | | | 550,000 | | | | 5.375 | | | | 08/09/20 | | | | 567,248 | |
| | | Credit Suisse of New York |
| | | | 2,350,000 | | | | 4.375 | | | | 08/05/20 | | | | 2,400,420 | |
| | | DnB NOR Boligkreditt |
| | | EUR | 2,200,000 | | | | 3.375 | | | | 01/20/17 | | | | 3,147,768 | |
| | | HSBC Bank USA NA |
| | | $ | 400,000 | | | | 4.875 | | | | 08/24/20 | | | | 417,200 | |
| | | HSBC Covered Bonds France |
| | | EUR | 1,800,000 | | | | 3.375 | | | | 01/20/17 | | | | 2,551,847 | |
| | | HSBC Holdings PLC |
| | | $ | 3,500,000 | | | | 6.800 | | | | 06/01/38 | | | | 4,093,408 | |
| | | Intesa Sanpaolo SPA |
| | | EUR | 2,350,000 | | | | 6.625 | | | | 05/08/18 | | | | 3,385,267 | |
| | | Lloyds TSB Bank PLC(a) |
| | | $ | 3,050,000 | | | | 4.375 | | | | 01/12/15 | | | | 3,123,563 | |
| | | Morgan Stanley, Inc. |
| | | | 2,800,000 | | | | 4.000 | | | | 07/24/15 | | | | 2,853,595 | |
| | | MUFG Capital Finance 4 Ltd.(b) |
| | | EUR | 1,350,000 | | | | 5.271 | | | | 01/25/49 | | | | 1,693,329 | |
| | | Nordea Hypotek AB |
| | | | 2,100,000 | | | | 3.500 | | | | 01/18/17 | | | | 3,011,710 | |
| | | Resona Bank Ltd.(b) |
| | | | 650,000 | | | | 4.125 | | | | 09/27/49 | | | | 873,420 | |
| | | Royal Bank of Scotland Group PLC |
| | | $ | 900,000 | | | | 0.499 | (b) | | | 08/29/17 | | | | 726,072 | |
| | | EUR | 2,750,000 | | | | 6.934 | | | | 04/09/18 | | | | 4,045,247 | |
| | | Swedish Covered Bond Corp. |
| | | | 2,000,000 | | | | 3.000 | | | | 02/03/15 | | | | 2,812,933 | |
| | | Toronto-Dominion Bank |
| | | $ | 2,990,000 | | | | 2.200 | | | | 07/29/15 | | | | 3,030,096 | |
| | | UBS AG |
| | | | 2,250,000 | | | | 4.875 | | | | 08/04/20 | | | | 2,372,445 | |
| | | UBS AG London |
| | | EUR | 1,600,000 | | | | 3.875 | | | | 12/02/19 | | | | 2,328,218 | |
| | | UBS AG Stamford |
| | | $ | 1,500,000 | | | | 5.875 | | | | 12/20/17 | | | | 1,693,011 | |
| | | US Bank NA(b) |
| | | EUR | 2,450,000 | | | | 4.375 | | | | 02/28/17 | | | | 3,312,242 | |
| | | Wachovia Bank NA |
| | | | 1,750,000 | | | | 6.000 | | | | 05/23/13 | | | | 2,611,943 | |
| | | WM Covered Bond Program |
| | | | 700,000 | | | | 4.375 | | | | 05/19/14 | | | | 1,002,255 | |
| | | | 2,050,000 | | | | 4.000 | | | | 09/27/16 | | | | 2,888,698 | |
| | | | | | | | | | | | | | | | | |
| | | | | | | | | | | | | | | | 95,558,556 | |
| | | |
| | | |
| | | Brokerage – 0.3% |
| | | JPMorgan Chase & Co. |
| | | $ | 150,000 | | | | 7.250 | | | | 02/01/18 | | | | 182,113 | |
| | | Morgan Stanley |
| | | EUR | 1,650,000 | | | | 5.500 | | | | 10/02/17 | | | | 2,368,927 | |
| | | | | | | | | | | | | | | | | |
| | | | | | | | | | | | | | | | 2,551,040 | |
| | | |
| | | |
| | | Communications – 3.0% |
| | | AT&T, Inc. |
| | | $ | 3,300,000 | | | | 5.600 | | | | 05/15/18 | | | | 3,839,610 | |
| | | | 2,050,000 | | | | 6.300 | | | | 01/15/38 | | | | 2,299,521 | |
| | | Comcast Cable Communications Holdings, Inc. |
| | | | 170,000 | | | | 9.455 | | | | 11/15/22 | | | | 236,919 | |
| | | Comcast Corp. |
| | | | 2,200,000 | | | | 5.700 | | | | 05/15/18 | | | | 2,502,675 | |
| | | Omnicom Group, Inc. |
| | | | 1,150,000 | | | | 4.450 | | | | 08/15/20 | | | | 1,182,307 | |
| | | Qwest Corp. |
| | | | 450,000 | | | | 8.375 | | | | 05/01/16 | | | | 528,750 | |
| | | Reed Elsevier Capital, Inc. |
| | | | 2,250,000 | | | | 7.750 | | | | 01/15/14 | | | | 2,626,101 | |
| | | Telecom Italia Capital SA |
| | | | 2,204,000 | | | | 4.950 | | | | 09/30/14 | | | | 2,340,905 | |
| | | Telecom Italia Finance SA |
| | | EUR | 649,000 | | | | 7.750 | | | | 01/24/33 | | | | 1,041,836 | |
| | | Telefonica Emisiones SAU |
| | | $ | 900,000 | | | | 7.045 | | | | 06/20/36 | | | | 1,077,662 | |
| | | Telemar Norte Leste SA |
| | | | 850,000 | | | | 5.500 | | | | 10/23/20 | | | | 861,219 | |
| | | Time Warner Cable, Inc. |
| | | | 2,200,000 | | | | 6.550 | | | | 05/01/37 | | | | 2,458,124 | |
| | | Verizon New Jersey, Inc. |
| | | | 65,000 | | | | 8.000 | | | | 06/01/22 | | | | 81,292 | |
| | | |
| | | |
The accompanying notes are an integral part of these financial statements.
GOLDMAN SACHS GLOBAL INCOME FUND
| | | | | | | | | | | | | | | | | |
| | | Principal
| | Interest
| | Maturity
| | |
| | | Amount | | Rate | | Date | | Value |
| |
Corporate Obligations – (continued) |
| | | Communications – (continued) |
| | | | | | | | | | | | | | | | | |
| | | Verizon Wireless Capital LLC |
| | | EUR | 2,850,000 | | | | 8.750 | % | | | 12/18/15 | | | $ | 5,032,388 | |
| | | WPP PLC |
| | | | 2,100,000 | | | | 4.375 | | | | 12/05/13 | | | | 3,001,240 | |
| | | | | | | | | | | | | | | | | |
| | | | | | | | | | | | | | | | 29,110,549 | |
| | | |
| | | |
| | | Consumer Noncyclical – 1.5% |
| | | Altria Group, Inc. |
| | | $ | 2,900,000 | | | | 9.700 | | | | 11/10/18 | | | | 3,898,855 | |
| | | BAT International Finance PLC(a) |
| | | | 2,258,000 | | | | 9.500 | | | | 11/15/18 | | | | 3,070,103 | |
| | | Boston Scientific Corp. |
| | | | 1,573,000 | | | | 4.500 | | | | 01/15/15 | | | | 1,610,612 | |
| | | Imperial Tobacco Finance PLC |
| | | EUR | 1,650,000 | | | | 7.250 | | | | 09/15/14 | | | | 2,626,361 | |
| | | | 150,000 | | | | 8.375 | | | | 02/17/16 | | | | 256,559 | |
| | | Kraft Foods, Inc. |
| | | $ | 2,050,000 | | | | 6.500 | | | | 02/09/40 | | | | 2,397,522 | |
| | | Pfizer, Inc. |
| | | | 850,000 | | | | 7.200 | | | | 03/15/39 | | | | 1,161,744 | |
| | | | | | | | | | | | | | | | | |
| | | | | | | | | | | | | | | | 15,021,756 | |
| | | |
| | | |
| | | Electric(a) – 0.4% |
| | | Enel Finance International SA |
| | | | 1,200,000 | | | | 6.250 | | | | 09/15/17 | | | | 1,360,949 | |
| | | | 2,600,000 | | | | 5.125 | | | | 10/07/19 | | | | 2,757,367 | |
| | | | | | | | | | | | | | | | | |
| | | | | | | | | | | | | | | | 4,118,316 | |
| | | |
| | | |
| | | Energy – 0.5% |
| | | Canadian Natural Resources Ltd. |
| | | | 1,100,000 | | | | 6.750 | | | | 02/01/39 | | | | 1,340,256 | |
| | | Dolphin Energy Ltd.(a) |
| | | | 1,352,613 | | | | 5.888 | | | | 06/15/19 | | | | 1,454,059 | |
| | | Transocean, Inc. |
| | | | 1,100,000 | | | | 6.500 | | | | 11/15/20 | | | | 1,197,994 | |
| | | | 1,159,000 | | | | 6.800 | | | | 03/15/38 | | | | 1,170,590 | |
| | | | | | | | | | | | | | | | | |
| | | | | | | | | | | | | | | | 5,162,899 | |
| | | |
| | | |
| | | Financial Companies – 2.8% |
| | | American Express Centurion Bank |
| | | | 3,250,000 | | | | 5.200 | | | | 11/26/10 | | | | 3,270,374 | |
| | | American Express Credit Corp. |
| | | GBP | 850,000 | | | | 5.375 | | | | 10/01/14 | | | | 1,423,351 | |
| | | Capital One Financial Corp. |
| | | $ | 4,540,000 | | | | 5.700 | | | | 09/15/11 | | | | 4,735,815 | |
| | | GE Capital European Funding |
| | | EUR | 1,100,000 | | | | 5.250 | | | | 05/18/15 | | | | 1,646,785 | |
| | | General Electric Capital Corp. |
| | | $ | 1,750,000 | | | | 4.375 | | | | 09/16/20 | | | | 1,756,480 | |
| | | Nationwide Building Society |
| | | EUR | 2,550,000 | | | | 4.625 | | | | 09/13/12 | | | | 3,621,369 | |
| | | | 4,700,000 | | | | 3.875 | | | | 12/05/13 | | | | 6,637,118 | |
| | | Pemex Project Funding Master Trust |
| | | $ | 1,450,000 | | | | 5.750 | | | | 03/01/18 | | | | 1,591,375 | |
| | | Yorkshire Building Society |
| | | EUR | 1,600,000 | | | | 3.250 | | | | 09/22/15 | | | | 2,179,556 | |
| | | | | | | | | | | | | | | | | |
| | | | | | | | | | | | | | | | 26,862,223 | |
| | | |
| | | |
| | | Food & Beverage(a) – 0.2% |
| | | Anheuser-Busch InBev Worldwide, Inc. |
| | | $ | 700,000 | | | | 7.750 | | | | 01/15/19 | | | | 908,048 | |
| | | | 500,000 | | | | 6.875 | | | | 11/15/19 | | | | 622,249 | |
| | | | 450,000 | | | | 8.200 | | | | 01/15/39 | | | | 644,394 | |
| | | | | | | | | | | | | | | | | |
| | | | | | | | | | | | | | | | 2,174,691 | |
| | | |
| | | |
| | | Insurance – 1.3% |
| | | AON Financial Services Luxembourg SA |
| | | EUR | 1,650,000 | | | | 6.250 | | | | 07/01/14 | | | | 2,418,495 | |
| | | Aviva PLC(b) |
| | | | 1,050,000 | | | | 6.875 | | | | 05/22/38 | | | | 1,476,722 | |
| | | AXA SA(b) |
| | | | 1,900,000 | | | | 6.211 | | | | 10/05/49 | | | | 2,310,778 | |
| | | Cloverie PLC for Zurich Insurance Co.(b) |
| | | | 850,000 | | | | 7.500 | | | | 07/24/39 | | | | 1,364,559 | |
| | | Endurance Specialty Holdings Ltd. |
| | | $ | 20,000 | | | | 7.000 | | | | 07/15/34 | | | | 19,350 | |
| | | MetLife, Inc. |
| | | | 450,000 | | | | 5.875 | | | | 02/06/41 | | | | 489,470 | |
| | | Old Mutual PLC(b) |
| | | EUR | 250,000 | | | | 4.500 | | | | 01/18/17 | | | | 322,635 | |
| | | Standard Life PLC(b) |
| | | | 1,450,000 | | | | 6.375 | | | | 07/12/22 | | | | 1,966,343 | |
| | | | 650,000 | | | | 5.314 | | | | 01/06/49 | | | | 765,991 | |
| | | ZFS Finance USA Trust I(a)(b) |
| | | $ | 1,050,000 | | | | 5.875 | | | | 05/09/32 | | | | 985,152 | |
| | | | 950,000 | | | | 6.150 | | | | 12/15/65 | | | | 935,750 | |
| | | | | | | | | | | | | | | | | |
| | | | | | | | | | | | | | | | 13,055,245 | |
| | | |
| | | |
| | | Metals & Mining – 0.9% |
| | | Anglo American Capital PLC(a) |
| | | | 3,400,000 | | | | 9.375 | | | | 04/08/14 | | | | 4,186,005 | |
| | | ArcelorMittal |
| | | | 1,500,000 | | | | 9.850 | | | | 06/01/19 | | | | 1,912,832 | |
| | | Glencore Finance Europe SA |
| | | EUR | 1,000,000 | | | | 7.125 | | | | 04/23/15 | | | | 1,483,728 | |
| | | | 700,000 | | | | 5.250 | | | | 03/22/17 | | | | 957,121 | |
| | | | | | | | | | | | | | | | | |
| | | | | | | | | | | | | | | | 8,539,686 | |
| | | |
| | | |
| | | Natural Gas – 1.3% |
| | | Centrica PLC |
| | | | 1,700,000 | | | | 7.125 | | | | 12/09/13 | | | | 2,664,787 | |
| | | DCP Midstream LLC(a) |
| | | $ | 1,820,000 | | | | 5.350 | | | | 03/15/20 | | | | 1,968,913 | |
| | | Energy Transfer Partners LP |
| | | | 550,000 | | | | 8.500 | | | | 04/15/14 | | | | 649,776 | |
| | | | 100,000 | | | | 9.700 | | | | 03/15/19 | | | | 132,317 | |
| | | | 1,050,000 | | | | 9.000 | | | | 04/15/19 | | | | 1,343,993 | |
| | | Enterprise Products Operating LLC |
| | | | 2,050,000 | | | | 5.200 | | | | 09/01/20 | | | | 2,216,893 | |
| | | The Williams Cos., Inc. |
| | | | 2,950,000 | | | | 8.750 | | | | 03/15/32 | | | | 3,716,709 | |
| | | | | | | | | | | | | | | | | |
| | | | | | | | | | | | | | | | 12,693,388 | |
| | | |
| | | |
The accompanying notes are an integral part of these financial statements.
GOLDMAN SACHS GLOBAL INCOME FUND
Schedule of Investments (continued)
September 30, 2010 (Unaudited)
| | | | | | | | | | | | | | | | | |
| | | Principal
| | Interest
| | Maturity
| | |
| | | Amount | | Rate | | Date | | Value |
| |
Corporate Obligations – (continued) |
| | | | | | | | | | | | | | | | | |
| | | Real Estate Investment Trust – 0.4% |
| | | Simon Property Group LP |
| | | $ | 2,200,000 | | | | 5.650 | % | | | 02/01/20 | | | $ | 2,448,062 | |
| | | | 1,350,000 | | | | 4.375 | | | | 03/01/21 | | | | 1,368,525 | |
| | | | | | | | | | | | | | | | | |
| | | | | | | | | | | | | | | | 3,816,587 | |
| | | |
| | | |
| | | Transportation – 0.1% |
| | | Atlantia SpA |
| | | EUR | 500,000 | | | | 5.625 | | | | 05/06/16 | | | | 760,144 | |
| | | |
| | | |
| | | TOTAL CORPORATE OBLIGATIONS |
| | | (Cost $206,159,779) | | $ | 219,425,080 | |
| | | |
| | | |
| | | | | | | | | | | | | | | | | |
| | | | | | | | | | | | | | | | | |
Foreign Debt Obligations – 1.9% |
| | | | | | | | | | | | | | | | | |
| | | | | | | | | | | | | | | | | |
| | | Bank Nederlandse Gemeenten |
| | | $ | 3,300,000 | | | | 1.750 | %(a) | | | 10/06/15 | | | $ | 3,290,067 | |
| | | EUR | 3,525,000 | | | | 4.125 | | | | 06/28/16 | | | | 5,276,332 | |
| | | Eksportfinans ASA |
| | | $ | 6,700,000 | | | | 2.000 | | | | 09/15/15 | | | | 6,716,630 | |
| | | German Postal Pensions Securitisation 2 PLC |
| | | EUR | 1,050,000 | | | | 4.250 | | | | 01/18/17 | | | | 1,565,021 | |
| | | Landeskreditbank Baden-Wuerttemberg Foerderbank |
| | | $ | 1,500,000 | | | | 2.000 | | | | 10/01/12 | | | | 1,531,752 | |
| | | |
| | | |
| | | TOTAL FOREIGN DEBT OBLIGATIONS |
| | | (Cost $18,013,602) | | $ | 18,379,802 | |
| | | |
| | | |
| | | | | | | | | | | | | | | | | |
| | | | | | | | | | | | | | | | | |
Asset-Backed Securities – 3.6% |
| | | | | | | | | | | | | | | | | |
| | | | | | | | | | | | | | | | | |
| | | Home Equity – 0.4% |
| | | CIT Mortgage Loan Trust Series 2007-1, Class 2A1(a)(b) |
| | | $ | 1,470,749 | | | | 1.256 | % | | | 10/25/37 | | | $ | 1,381,234 | |
| | | CIT Mortgage Loan Trust Series 2007-1, Class 2A2(a)(b) |
| | | | 1,600,000 | | | | 1.506 | | | | 10/25/37 | | | | 991,890 | |
| | | CIT Mortgage Loan Trust Series 2007-1, Class 2A3(a)(b) |
| | | | 2,900,000 | | | | 1.706 | | | | 10/25/37 | | | | 1,458,193 | |
| | | GMAC Mortgage Corp. Loan Trust Series 2007-HE3, Class 1A1 |
| | | | 163,240 | | | | 7.000 | | | | 09/25/37 | | | | 104,790 | |
| | | GMAC Mortgage Corp. Loan Trust Series 2007-HE3, Class 2A1 |
| | | | 199,211 | | | | 7.000 | | | | 09/25/37 | | | | 113,939 | |
| | | | | | | | | | | | | | | | | |
| | | | | | | | | | | | | | | | 4,050,046 | |
| | | |
| | | |
| | | Student Loans(b) – 3.2% |
| | | Access Group, Inc. Series 2004-2, Class A2 |
| | | | 4,000,000 | | | | 0.648 | | | | 01/25/16 | | | | 3,915,147 | |
| | | Bank of America Student Loan Trust Series 2010-1A, Class A(a) |
| | | | 1,500,000 | | | | 1.362 | | | | 02/25/43 | | | | 1,499,866 | |
| | | Brazos Higher Education Authority, Inc. Series 2005-3, Class A14 |
| | | | 661,063 | | | | 0.399 | | | | 09/25/23 | | | | 657,443 | |
| | | College Loan Corp. Trust Series 2005-1, Class A2 |
| | | | 4,000,000 | | | | 0.598 | | | | 07/25/24 | | | | 3,971,211 | |
| | | Knowledgeworks Foundation Student Loan Series 2010-1, Class A |
| | | | 1,400,000 | | | | 1.242 | | | | 02/25/42 | | | | 1,382,674 | |
| | | Nelnet Student Loan Trust Series 2010-3A, Class A(a) |
| | | | 1,650,000 | | | | 1.212 | | | | 07/27/48 | | | | 1,653,833 | |
| | | SLC Student Loan Trust Series 2006-1, Class A4 |
| | | | 3,000,000 | | | | 0.372 | | | | 12/15/21 | | | | 2,944,359 | |
| | | SLC Student Loan Trust Series 2006-2, Class A4 |
| | | | 2,500,000 | | | | 0.372 | | | | 06/15/22 | | | | 2,436,156 | |
| | | SLM Student Loan Trust Series 2008-6, Class A2 |
| | | | 8,000,000 | | | | 1.048 | | | | 10/25/17 | | | | 8,057,439 | |
| | | US Education Loan Trust LLC Series 2006-1, Class A2 |
| | | | 1,020,849 | | | | 0.427 | | | | 03/01/25 | | | | 1,012,836 | |
| | | Wachovia Student Loan Trust Series 2006-1, Class A4(a) |
| | | | 4,000,000 | | | | 0.578 | | | | 04/25/23 | | | | 3,954,791 | |
| | | | | | | | | | | | | | | | | |
| | | | | | | | | | | | | | | | 31,485,755 | |
| | | |
| | | |
| | | TOTAL ASSET-BACKED SECURITIES |
| | | (Cost $37,601,765) | | $ | 35,535,801 | |
| | | |
| | | |
| | | | | | | | | | | | | | | | | |
| | | | | | | | | | | | | | | | | |
Mortgage-Backed Obligations – 15.3% |
| | | | | | | | | | | | | | | | | |
| | | | | | | | | | | | | | | | | |
| | | Adjustable Rate Non-Agency(b) – 0.3% |
| | | American Home Mortgage Investment Trust Series 2004-3, Class 1A |
| | | $ | 15,902 | | | | 0.626 | % | | | 10/25/34 | | | $ | 14,829 | |
| | | Countrywide Alternative Loan Trust Series 2005-38, Class A1 |
| | | | 288,091 | | | | 1.870 | | | | 09/25/35 | | | | 177,435 | |
| | | Countrywide Alternative Loan Trust Series 2005-82, Class A1 |
| | | | 3,729,782 | | | | 0.526 | | | | 02/25/36 | | | | 1,910,940 | |
| | | Countrywide Alternative Loan Trust Series 2006-OA1, Class 2A1 |
| | | | 1,291,511 | | | | 0.467 | | | | 03/20/46 | | | | 739,658 | |
| | | | | | | | | | | | | | | | | |
| | | | | | 2,842,862 | |
| | | |
| | | |
| | | Collateralized Mortgage Obligations(b) – 1.4% |
| | | Countrywide Home Loan Mortgage Pass-Through Trust Series 2004-HYB5, Class 2A1 |
| | | | 428,947 | | | | 3.069 | | | | 04/20/35 | | | | 402,309 | |
| | | FDIC Structured Sale Guaranteed Notes Series 2010-S1, Class 1A(a) |
| | | | 834,691 | | | | 0.806 | | | | 02/25/48 | | | | 836,892 | |
| | | GMAC Mortgage Corp. Loan Trust Series 2004-AR1, Class 12A |
| | | | 724,152 | | | | 3.425 | | | | 06/25/34 | | | | 713,730 | |
| | | Harborview Mortgage Loan Trust Series 2006-6, Class 3A1A |
| | | | 1,750,767 | | | | 5.702 | | | | 08/19/36 | | | | 1,162,645 | |
| | | Indymac Index Mortgage Loan Trust Series 2005-AR13, Class 4A1 |
| | | | 364,678 | | | | 2.612 | | | | 08/25/35 | | | | 287,163 | |
| | | Lanark Master Issuer PLC Series 2007-1X, Class 3A2 |
| | | EUR | 4,140,411 | | | | 1.031 | | | | 12/22/54 | | | | 5,497,442 | |
| | | Luminent Mortgage Trust Series 2006-5, Class A1A |
| | | $ | 1,618,736 | | | | 0.446 | | | | 07/25/36 | | | | 862,948 | |
| | | Residential Accredit Loans, Inc. Series 2005-Q05, Class A1 |
| | | | 1,769,454 | | | | 1.370 | | | | 01/25/46 | | | | 949,843 | |
| | | |
| | | |
The accompanying notes are an integral part of these financial statements.
GOLDMAN SACHS GLOBAL INCOME FUND
| | | | | | | | | | | | | | | | | |
| | | Principal
| | Interest
| | Maturity
| | |
| | | Amount | | Rate | | Date | | Value |
| |
Mortgage-Backed Obligations – (continued) |
| | | Collateralized Mortgage Obligations(b) – (continued) |
| | | | | | | | | | | | | | | | | |
| | | Sequoia Mortgage Trust Series 2004-10, Class A3A |
| | | $ | 358,488 | | | | 0.794 | % | | | 11/20/34 | | | $ | 300,044 | |
| | | Structured Adjustable Rate Mortgage Loan Trust Series 2004-05, Class 3A1 |
| | | | 856,240 | | | | 2.463 | | | | 05/25/34 | | | | 814,311 | |
| | | Structured Adjustable Rate Mortgage Loan Trust Series 2004-12, Class 3A2 |
| | | | 170,996 | | | | 2.716 | | | | 09/25/34 | | | | 154,953 | |
| | | Structured Adjustable Rate Mortgage Loan Trust Series 2004-16, Class 3A1 |
| | | | 884,166 | | | | 2.644 | | | | 11/25/34 | | | | 743,374 | |
| | | Washington Mutual Mortgage Pass-Through Certificates Series 2007-0A1, Class A1A |
| | | | 1,916,478 | | | | 1.070 | | | | 02/25/47 | | | | 1,137,813 | |
| | | |
| | | |
| | | TOTAL COLLATERALIZED
MORTGAGE OBLIGATIONS | | $ | 13,863,467 | |
| | | |
| | | |
| | | Federal Agencies – 13.6% |
| | | Adjustable Rate FNMA(b) – 1.1% |
| | | $ | 4,489,411 | | | | 5.734 | % | | | 09/01/37 | | | $ | 4,717,516 | |
| | | | 2,513,587 | | | | 6.107 | | | | 09/01/37 | | | | 2,631,536 | |
| | | | 3,432,736 | | | | 5.830 | | | | 10/01/37 | | | | 3,626,629 | |
| | | | | | | | | | | | | | | | | |
| | | | | | | | | | | | | | | | 10,975,681 | |
| | | |
| | | |
| | | FHLMC – 2.0% |
| | | | 2,466 | | | | 5.000 | | | | 09/01/16 | | | | 2,628 | |
| | | | 33,141 | | | | 5.000 | | | | 11/01/16 | | | | 35,317 | |
| | | | 7,827 | | | | 5.000 | | | | 12/01/16 | | | | 8,341 | |
| | | | 108,461 | | | | 5.000 | | | | 01/01/17 | | | | 115,682 | |
| | | | 190,280 | | | | 5.000 | | | | 02/01/17 | | | | 203,080 | |
| | | | 146,451 | | | | 5.000 | | | | 03/01/17 | | | | 156,299 | |
| | | | 257,921 | | | | 5.000 | | | | 04/01/17 | | | | 275,274 | |
| | | | 10,309 | | | | 5.000 | | | | 05/01/17 | | | | 11,003 | |
| | | | 4,264 | | | | 5.000 | | | | 06/01/17 | | | | 4,551 | |
| | | | 9,406 | | | | 5.000 | | | | 08/01/17 | | | | 10,038 | |
| | | | 667,058 | | | | 5.000 | | | | 09/01/17 | | | | 711,930 | |
| | | | 743,935 | | | | 5.000 | | | | 10/01/17 | | | | 793,977 | |
| | | | 439,480 | | | | 5.000 | | | | 11/01/17 | | | | 469,042 | |
| | | | 487,481 | | | | 5.000 | | | | 12/01/17 | | | | 520,272 | |
| | | | 601,605 | | | | 5.000 | | | | 01/01/18 | | | | 642,300 | |
| | | | 1,315,555 | | | | 5.000 | | | | 02/01/18 | | | | 1,404,883 | |
| | | | 1,300,244 | | | | 5.000 | | | | 03/01/18 | | | | 1,388,696 | |
| | | | 1,093,174 | | | | 5.000 | | | | 04/01/18 | | | | 1,167,641 | |
| | | | 744,874 | | | | 5.000 | | | | 05/01/18 | | | | 795,657 | |
| | | | 176,051 | | | | 5.000 | | | | 06/01/18 | | | | 188,055 | |
| | | | 167,076 | | | | 5.000 | | | | 07/01/18 | | | | 178,465 | |
| | | | 98,689 | | | | 5.000 | | | | 08/01/18 | | | | 105,397 | |
| | | | 65,562 | | | | 5.000 | | | | 09/01/18 | | | | 70,029 | |
| | | | 245,728 | | | | 5.000 | | | | 10/01/18 | | | | 262,465 | |
| | | | 266,109 | | | | 5.000 | | | | 11/01/18 | | | | 284,234 | |
| | | | 180,314 | | | | 5.000 | | | | 12/01/18 | | | | 192,601 | |
| | | | 132,888 | | | | 5.000 | | | | 01/01/19 | | | | 141,959 | |
| | | | 21,457 | | | | 5.000 | | | | 02/01/19 | | | | 22,944 | |
| | | | 32,006 | | | | 5.000 | | | | 03/01/19 | | | | 34,224 | |
| | | | 108,951 | | | | 5.000 | | | | 02/01/37 | | | | 115,773 | |
| | | | 47,633 | | | | 5.000 | | | | 03/01/39 | | | | 51,077 | |
| | | | 922,455 | | | | 5.000 | | | | 04/01/39 | | | | 989,153 | |
| | | | 33,215 | | | | 5.000 | | | | 05/01/39 | | | | 35,617 | |
| | | | 90,344 | | | | 5.000 | | | | 08/01/39 | | | | 96,876 | |
| | | | 1,037,359 | | | | 4.500 | | | | 09/01/39 | | | | 1,093,558 | |
| | | | 161,312 | | | | 5.000 | | | | 09/01/39 | | | | 172,976 | |
| | | | 946,462 | | | | 4.500 | | | | 10/01/39 | | | | 996,681 | |
| | | | 977,755 | | | | 5.000 | | | | 10/01/39 | | | | 1,048,451 | |
| | | | 572,162 | | | | 5.000 | | | | 11/01/39 | | | | 613,531 | |
| | | | 163,396 | | | | 5.000 | | | | 01/01/40 | | | | 173,117 | |
| | | | 1,979,273 | | | | 5.000 | | | | 06/01/40 | | | | 2,122,383 | |
| | | | 1,800,000 | | | | 4.500 | | | | 09/01/40 | | | | 1,873,988 | |
| | | | | | | | | | | | | | | | | |
| | | | | | | | | | | | | | | | 19,580,165 | |
| | | |
| | | |
| | | FNMA – 6.6% |
| | | | 5,097 | | | | 5.000 | | | | 01/01/17 | | | | 5,430 | |
| | | | 11,208 | | | | 5.000 | | | | 08/01/17 | | | | 11,956 | |
| | | | 263,537 | | | | 5.000 | | | | 09/01/17 | | | | 281,112 | |
| | | | 32,808 | | | | 5.000 | | | | 03/01/18 | | | | 35,045 | |
| | | | 60,439 | | | | 5.000 | | | | 04/01/18 | | | | 64,563 | |
| | | | 151,130 | | | | 5.000 | | | | 05/01/18 | | | | 161,453 | |
| | | | 75,168 | | | | 5.000 | | | | 06/01/18 | | | | 80,296 | |
| | | | 95,026 | | | | 5.000 | | | | 07/01/18 | | | | 101,506 | |
| | | | 156,373 | | | | 5.000 | | | | 10/01/18 | | | | 167,035 | |
| | | | 64,007 | | | | 5.000 | | | | 11/01/18 | | | | 68,375 | |
| | | | 262,370 | | | | 5.000 | | | | 12/01/18 | | | | 280,260 | |
| | | | 53,543 | | | | 5.000 | | | | 02/01/19 | | | | 57,267 | |
| | | | 10,507 | | | | 5.000 | | | | 03/01/19 | | | | 11,223 | |
| | | | 106,495 | | | | 5.000 | | | | 04/01/19 | | | | 113,887 | |
| | | | 238,046 | | | | 5.000 | | | | 07/01/19 | | | | 254,600 | |
| | | | 141,110 | | | | 5.000 | | | | 08/01/19 | | | | 150,924 | |
| | | | 98,105 | | | | 5.000 | | | | 09/01/19 | | | | 104,928 | |
| | | | 814,549 | | | | 5.000 | | | | 10/01/19 | | | | 870,089 | |
| | | | 16,979 | | | | 5.000 | | | | 11/01/19 | | | | 18,160 | |
| | | | 90,657 | | | | 5.000 | | | | 12/01/19 | | | | 96,947 | |
| | | | 153,206 | | | | 5.000 | | | | 01/01/20 | | | | 163,682 | |
| | | | 1,968,304 | | | | 5.000 | | | | 05/01/21 | | | | 2,105,187 | |
| | | | 27,953 | | | | 5.000 | | | | 08/01/33 | | | | 29,649 | |
| | | | 14,476 | | | | 5.500 | | | | 02/01/34 | | | | 15,533 | |
| | | | 13,727 | | | | 5.500 | | | | 05/01/34 | | | | 14,729 | |
| | | | 10,739 | | | | 5.500 | | | | 10/01/34 | | | | 11,512 | |
| | | | 79,572 | | | | 5.500 | | | | 12/01/34 | | | | 85,229 | |
| | | | 23,351 | | | | 5.500 | | | | 04/01/35 | | | | 25,011 | |
| | | | 20,105 | | | | 5.500 | | | | 07/01/35 | | | | 21,516 | |
| | | | 20,793,037 | | | | 6.000 | | | | 10/01/37 | | | | 22,324,795 | |
| | | | 38,661 | | | | 6.000 | | | | 07/01/38 | | | | 41,500 | |
| | | | 420,634 | | | | 5.000 | | | | 02/01/39 | | | | 449,702 | |
| | | | 1,489,589 | | | | 4.500 | | | | 03/01/39 | | | | 1,572,738 | |
| | | | 502,049 | | | | 5.000 | | | | 03/01/39 | | | | 536,584 | |
| | | | 1,136,760 | | | | 4.500 | | | | 05/01/39 | | | | 1,197,728 | |
| | | | 28,778 | | | | 5.000 | | | | 05/01/39 | | | | 30,901 | |
| | | | 136,563 | | | | 4.500 | | | | 06/01/39 | | | | 144,041 | |
| | | | 27,368 | | | | 5.000 | | | | 06/01/39 | | | | 29,387 | |
| | | | 125,881 | | | | 4.500 | | | | 07/01/39 | | | | 132,908 | |
| | | | 99,852 | | | | 5.000 | | | | 07/01/39 | | | | 107,220 | |
| | | | 620,342 | | | | 4.500 | | | | 08/01/39 | | | | 654,762 | |
| | | |
| | | |
The accompanying notes are an integral part of these financial statements.
GOLDMAN SACHS GLOBAL INCOME FUND
Schedule of Investments (continued)
September 30, 2010 (Unaudited)
| | | | | | | | | | | | | | | | | |
| | | Principal
| | Interest
| | Maturity
| | |
| | | Amount | | Rate | | Date | | Value |
| |
Mortgage-Backed Obligations – (continued) |
| | | FNMA – (continued) |
| | | | | | | | | | | | | | | | | |
| | | $ | 46,160 | | | | 5.000 | % | | | 08/01/39 | | | $ | 49,567 | |
| | | | 430,193 | | | | 4.500 | | | | 09/01/39 | | | | 454,206 | |
| | | | 482,123 | | | | 5.000 | | | | 09/01/39 | | | | 517,699 | |
| | | | 406,680 | | | | 4.500 | | | | 10/01/39 | | | | 428,760 | |
| | | | 285,491 | | | | 5.000 | | | | 10/01/39 | | | | 306,558 | |
| | | | 826,927 | | | | 4.500 | | | | 11/01/39 | | | | 873,087 | |
| | | | 504,890 | | | | 5.000 | | | | 11/01/39 | | | | 542,145 | |
| | | | 285,496 | | | | 4.500 | | | | 12/01/39 | | | | 301,433 | |
| | | | 83,368 | | | | 5.000 | | | | 12/01/39 | | | | 89,519 | |
| | | | 318,312 | | | | 5.000 | | | | 01/01/40 | | | | 341,800 | |
| | | | 12,178,710 | | | | 5.000 | | | | 05/01/40 | | | | 13,052,684 | |
| | | | 596,331 | | | | 4.500 | | | | 06/01/40 | | | | 629,618 | |
| | | | 497,500 | | | | 5.000 | | | | 07/01/40 | | | | 534,210 | |
| | | | 996,417 | | | | 4.500 | | | | 09/01/40 | | | | 1,038,789 | |
| | | | 9,000,000 | | | | 3.500 | | | | TBA-15yr | (c) | | | 9,248,437 | |
| | | | 1,000,000 | | | | 3.000 | | | | TBA-15yr | (c) | | | 1,005,313 | |
| | | | 2,000,000 | | | | 3.500 | | | | TBA-30yr | (c) | | | 2,014,844 | |
| | | | | | | | | | | | | | | | | |
| | | | | | | | | | | | | | | | 64,058,039 | |
| | | |
| | | |
| | | GNMA – 3.9% |
| | | | 95,432 | | | | 4.500 | | | | 10/15/39 | | | | 101,341 | |
| | | | 33,000,000 | | | | 4.000 | | | | TBA-30yr | (c) | | | 34,085,625 | |
| | | | 3,000,000 | | | | 4.500 | | | | TBA-30yr | (c) | | | 3,157,500 | |
| | | | | | | | | | | | | | | | | |
| | | | | | | | | | | | | | | | 37,344,466 | |
| | | |
| | | |
| | | TOTAL FEDERAL AGENCIES | | $ | 131,958,351 | |
| | | |
| | | |
| | | TOTAL MORTGAGE-BACKED OBLIGATIONS |
| | | (Cost $150,647,575) | | $ | 148,664,680 | |
| | | |
| | | |
| | | | | | | | | | | | | | | | | |
| | | | | | | | | | | | | | | | | |
Agency Debentures – 0.7% |
| | | | | | | | | | | | | | | | | |
| | | | | | | | | | | | | | | | | |
| | | FFCB |
| | | $ | 2,200,000 | | | | 4.250 | % | | | 04/16/18 | | | $ | 2,473,872 | |
| | | FHLB |
| | | | 1,900,000 | | | | 4.500 | | | | 09/13/19 | | | | 2,142,760 | |
| | | | 1,300,000 | | | | 5.625 | | | | 03/14/36 | | | | 1,613,773 | |
| | | Tennessee Valley Authority |
| | | | 300,000 | | | | 4.625 | | | | 09/15/60 | | | | 312,526 | |
| | | |
| | | |
| | | TOTAL AGENCY DEBENTURES |
| | | (Cost $5,775,364) | | $ | 6,542,931 | |
| | | |
| | | |
| | | | | | | | | | | | | | | | | |
| | | | | | | | | | | | | | | | | |
Government Guarantee Obligations – 6.8% |
| | | | | | | | | | | | | | | | | |
| | | | | | | | | | | | | | | | | |
| | | Achmea Hypotheekbank NV(a)(d) |
| | | $ | 4,800,000 | | | | 3.200 | % | | | 11/03/14 | | | $ | 5,102,554 | |
| | | Citigroup Funding, Inc.(e) |
| | | | 1,900,000 | | | | 1.875 | | | | 10/22/12 | | | | 1,949,356 | |
| | | Fortis Bank Nederland NV(e) |
| | | EUR | 4,400,000 | | | | 3.000 | | | | 04/17/12 | | | | 6,138,866 | |
| | | General Electric Capital Corp.(d) |
| | | | 2,500,000 | | | | 4.000 | | | | 06/15/12 | | | | 3,556,499 | |
| | | ING Bank NV(e) |
| | | | 2,600,000 | | | | 3.375 | | | | 03/03/14 | | | | 3,731,743 | |
| | | Kreditanstalt fuer Wiederaufbau |
| | | $ | 1,600,000 | | | | 3.250 | (d) | | | 02/15/11 | | | | 1,618,507 | |
| | | EUR | 12,900,000 | | | | 1.250 | (e) | | | 06/17/13 | | | | 17,585,120 | |
| | | | 3,000,000 | | | | 3.125 | (e) | | | 02/25/14 | | | | 4,298,602 | |
| | | AUD | 3,000,000 | | | | 6.000 | (d) | | | 08/20/20 | | | | 2,872,018 | |
| | | LeasePlan Corp. NV(e) |
| | | EUR | 2,750,000 | | | | 3.250 | | | | 05/22/14 | | | | 3,933,517 | |
| | | NIBC Bank NV(a)(d) |
| | | $ | 2,700,000 | | | | 2.800 | | | | 12/02/14 | | | | 2,816,505 | |
| | | Swedbank AB(e) |
| | | EUR | 2,550,000 | | | | 3.375 | | | | 05/27/14 | | | | 3,664,793 | |
| | | Western Corporate Federal Credit Union(e) |
| | | $ | 2,150,000 | | | | 1.750 | | | | 11/02/12 | | | | 2,198,914 | |
| | | Westpac Securities NZ Ltd.(a)(d) |
| | | | 6,975,000 | | | | 2.500 | | | | 05/25/12 | | | | 7,138,843 | |
| | | |
| | | |
| | | TOTAL GOVERNMENT GUARANTEE OBLIGATIONS |
| | | (Cost $61,914,798) | | $ | 66,605,837 | |
| | | |
| | | |
| | | | | | | | | | | | | | | | | |
| | | | | | | | | | | | | | | | | |
U.S. Treasury Obligations – 3.0% |
| | | | | | | | | | | | | | | | | |
| | | | | | | | | | | | | | | | | |
| | | United States Treasury Bonds |
| | | $ | 1,400,000 | | | | 4.500 | % | | | 08/15/39 | | | $ | 1,603,112 | |
| | | | 3,000,000 | | | | 4.375 | | | | 05/15/40 | | | | 3,369,300 | |
| | | United States Treasury Inflation Protected Securities |
| | | | 2,214,976 | | | | 1.625 | | | | 01/15/15 | | | | 2,367,083 | |
| | | | 1,038,910 | | | | 2.125 | | | | 02/15/40 | | | | 1,160,900 | |
| | | United States Treasury Notes |
| | | | 5,900,000 | | | | 0.375 | | | | 08/31/12 | | | | 5,895,622 | |
| | | | 5,900,000 | | | | 0.750 | | | | 08/15/13 | | | | 5,922,243 | |
| | | | 1,680,000 | | | | 1.250 | | | | 08/31/15 | | | | 1,679,647 | |
| | | | 100,000 | | | | 3.250 | | | | 05/31/16 | | | | 109,510 | |
| | | | 6,130,000 | | | | 3.250 | | | | 12/31/16 | | | | 6,690,773 | |
| | | |
| | | |
| | | TOTAL U.S. TREASURY OBLIGATIONS |
| | | (Cost $27,511,780) | | $ | 28,798,190 | |
| | | |
| | | |
| | | | | | | | | | | | | | | |
| | | | | Exercise
| | Expiration
| | |
| | | Contracts | | Rate | | Date | | Value |
| |
Options Purchased – 0.0% |
| | | | | | | | | | | | | | | |
| | | | | | | | | | | | | | | |
| | | Cross Currency Options – 0.0% |
| | | Call TRY 7,751,240
Put EUR 4,123,000 | | | 1.880 | % | | | 10/01/10 | | | $ | — | |
| | | Put CHF 3,657,055
Call EUR 2,719,000 | | | 1.345 | | | | 10/01/10 | | | | 4,159 | |
| | | Put CHF 7,663,125
Call EUR 5,025,000 | | | 1.525 | | | | 01/07/11 | | | | 2,692 | |
| | | Put GBP 2,362,315
Call EUR 2,731,000 | | | 0.865 | | | | 10/21/10 | | | | 45,242 | |
| | | Put NZD 5,090,572
Call EUR 2,692,000 | | | 1.891 | | | | 10/28/10 | | | | 23,363 | |
| | | | | | | | | | | | | | | |
| | | | | | | | | | | | | | 75,456 | |
| | | |
| | | |
| | | | | | | | | | | | | | | |
The accompanying notes are an integral part of these financial statements.
GOLDMAN SACHS GLOBAL INCOME FUND
| | | | | | | | | | | | | | | |
| | | | | Exercise
| | Expiration
| | |
| | | Contracts | | Rate | | Date | | Value |
| |
Options Purchased – (continued) |
| | | | | | | | | | | | | | | |
| | | Currency Options – 0.0% |
| | | Call HKD 42,273,000
Put USD 5,490,000 | | | 7.700 | % | | | 12/23/10 | | | $ | 3,151 | |
| | | Call USD 3,596,715
Put EUR 2,799,000 | | | 1.285 | | | | 10/04/10 | | | | — | |
| | | Put CHF 5,433,120
Call USD 5,488,000 | | | 0.990 | | | | 10/07/10 | | | | 7,546 | |
| | | Put USD 3,719,871
Call EUR 2,799,000 | | | 1.329 | | | | 10/04/10 | | | | 98,194 | |
| | | Put USD 3,756,800
Call GBP 2,348,000 | | | 1.600 | | | | 10/07/10 | | | | 3,191 | |
| | | Put USD 4,640,000
Call GBP 2,900,000 | | | 1.600 | | | | 10/01/10 | | | | 23 | |
| | | Put USD 5,717,250
Call EUR 4,235,000 | | | 1.350 | | | | 10/18/10 | | | | 97,027 | |
| | | | | | | | | | | | | | | |
| | | | | | | | | | | | | | 209,132 | |
| | | |
| | | |
| | | TOTAL OPTIONS PURCHASED |
| | | (Cost $178,785) | | $ | 284,588 | |
| | | |
| | | |
| | | | | | | | | | | | | | | | | |
| | | Principal
| | Interest
| | Maturity
| | |
| | | Amount | | Rate | | Date | | Value |
| |
Short-Term Obligations – 6.1% |
| | | | | | | | | | | | | | | | | |
| | | | | | | | | | | | | | | | | |
| | | Commercial Paper – 6.1% |
| | | JPMorgan Corp. |
| | | $ | 26,903,461 | | | | 0.150 | % | | | 10/01/10 | | | $ | 26,903,461 | |
| | | Rabobank |
| | | | 32,978,896 | | | | 0.170 | | | | 10/01/10 | | | | 32,978,896 | |
| | | |
| | | |
| | | TOTAL SHORT-TERM OBLIGATIONS |
| | | (Cost $59,882,357) | | $ | 59,882,357 | |
| | | |
| | | |
| | | TOTAL INVESTMENTS – 106.2% |
| | | (Cost $961,516,150) | | $ | 1,034,797,974 | |
| | | |
| | | |
| | | LIABILITIES IN EXCESS OF
OTHER ASSETS – (6.2)% | | | (60,446,370 | ) |
| | | |
| | | |
| | | NET ASSETS – 100.0% | | $ | 974,351,604 | |
| | | |
| | | |
The percentage shown for each investment category reflects the value of investments in that category as a percentage of net assets.
| | |
| (a) | | Exempt from registration under Rule 144A of the Securities Act of 1933. Under procedures approved by the Board of Trustees, such securities have been determined to be liquid by the investment adviser and may be resold, normally to qualified institutional buyers in transactions exempt from registration. Total market value of Rule 144A securities amounts to $84,378,959, which represents approximately 8.7% of net assets as of September 30, 2010. |
| |
| (b) | | Variable rate security. Interest rate disclosed is that which is in effect at September 30, 2010. |
| |
| (c) | | TBA (To Be Announced) Securities are purchased/sold on a forward commitment basis with an approximate principal amount and no defined maturity date. The actual principal and maturity date will be determined upon settlement when the specific mortgage pools are assigned. Total market value of TBA securities (excluding forward sales contracts, if any) amounts to $49,511,719 which represents approximately 5.1% of net assets as of September 30, 2010. |
| |
| (d) | | Guaranteed by a foreign government until maturity. Total market value of these securities amounts to $23,104,926, which represents approximately 2.4% of net assets as of September 30, 2010. |
| |
| (e) | | Guaranteed under the Federal Deposit Insurance Corporation’s (“FDIC”) Temporary Liquidity Guarantee Program and is backed by the full faith and credit of the United States. The expiration date of the FDIC’s guarantee is the earlier of the maturity date of the debt or June 30, 2012. Total market value of these securities amounts to $43,500,911, which represents approximately 4.4% of net assets as of September 30, 2010. |
| | | | | | | |
| | | |
| | | |
| | | Currency Abbreviations: |
| | | AUD | | — | | Australian Dollar |
| | | BRL | | — | | Brazilian Real |
| | | CAD | | — | | Canadian Dollar |
| | | CHF | | — | | Swiss Franc |
| | | CLP | | — | | Chilean Peso |
| | | CNY | | — | | Chinese Yuan |
| | | COP | | — | | Colombian Peso |
| | | CZK | | — | | Czech Koruna |
| | | DKK | | — | | Danish Krone |
| | | EGP | | — | | Egyptian Pound |
| | | EUR | | — | | Euro |
| | | GBP | | — | | British Pound |
| | | HKD | | — | | Hong Kong Dollar |
| | | HUF | | — | | Hungarian Forint |
| | | IDR | | — | | Indonesian Rupiah |
| | | ILS | | — | | Israeli Shekel |
| | | INR | | — | | Indian Rupee |
| | | JPY | | — | | Japanese Yen |
| | | KRW | | — | | South Korean Won |
| | | MXN | | — | | Mexican Peso |
| | | MYR | | — | | Malaysian Ringgit |
| | | NOK | | — | | Norwegian Krone |
| | | NZD | | — | | New Zealand Dollar |
| | | PHP | | — | | Philippine Peso |
| | | PLN | | — | | Polish Zloty |
| | | RUB | | — | | Russian Ruble |
| | | SEK | | — | | Swedish Krona |
| | | SGD | | — | | Singapore Dollar |
| | | TRY | | — | | Turkish Lira |
| | | TWD | | — | | Taiwan Dollar |
| | | ZAR | | — | | South African Rand |
| | | |
| | | Investment Abbreviations: |
| | | BP | | — | | British Pound Offered Rate |
| | | CDOR | | — | | Canadian Dollar Offered Rate |
| | | CHFOR | | — | | Swiss Franc Offered Rate |
| | | CPI | | — | | Consumer Price Index |
| | | EURO | | — | | Euro Offered Rate |
| | | FDIC | | — | | Federal Deposit Insurance Corp. |
| | | FFCB | | — | | Federal Farm Credit Bank |
| | | FHLB | | — | | Federal Home Loan Bank |
| | | FHLMC | | — | | Federal Home Loan Mortgage Corp. |
| | | FNMA | | — | | Federal National Mortgage Association |
| | | GNMA | | — | | Government National Mortgage Association |
| | | JYOR | | — | | Japanese Yen Offered Rate |
| | | KWCDC | | — | | South Korean Won Certificate of Deposit |
| | | LIBOR | | — | | London Interbank Offered Rate |
| | | |
| | | |
The accompanying notes are an integral part of these financial statements.
GOLDMAN SACHS GLOBAL INCOME FUND
Schedule of Investments (continued)
September 30, 2010 (Unaudited)
ADDITIONAL INVESTMENT INFORMATION
FORWARD FOREIGN CURRENCY EXCHANGE CONTRACTS — At September 30, 2010, the Fund had outstanding forward foreign currency exchange contracts, both to purchase and sell foreign currencies:
FORWARD FOREIGN CURRENCY EXCHANGE CONTRACTS WITH UNREALIZED GAIN
| | | | | | | | | | | | | | | |
| | | | | Contract
| | Expiration
| | Current
| | Unrealized
|
| Counterparty | | Currency | | Type | | Date | | Value | | Gain |
| |
| Bank of America Securities LLC | | CAD | | Purchase | | 12/15/10 | | $ | 2,730,102 | | | $ | 47,102 | |
| | | | | Sale | | 12/15/10 | | | 803,599 | | | | 4,401 | |
| | | CLP | | Purchase | | 10/25/10 | | | 1,011,000 | | | | 22,800 | |
| | | CNY | | Purchase | | 03/10/11 | | | 7,838,836 | | | | 59,587 | |
| | | CZK | | Purchase | | 12/15/10 | | | 1,932,652 | | | | 93,188 | |
| | | EUR | | Purchase | | 12/15/10 | | | 6,798,964 | | | | 243,553 | |
| | | HUF | | Purchase | | 12/15/10 | | | 1,833,316 | | | | 316 | |
| | | INR | | Purchase | | 10/15/10 | | | 1,418,586 | | | | 57,586 | |
| | | | | Purchase | | 10/21/10 | | | 987,950 | | | | 20,950 | |
| | | KRW | | Purchase | | 10/29/10 | | | 478,876 | | | | 2,876 | |
| | | MXN | | Sale | | 12/15/10 | | | 455,279 | | | | 2,721 | |
| | | PHP | | Purchase | | 10/18/10 | | | 673,524 | | | | 6,524 | |
| | | TRY | | Purchase | | 12/15/10 | | | 1,860,690 | | | | 30,690 | |
| | | ZAR | | Purchase | | 12/15/10 | | | 958,440 | | | | 24,440 | |
| Barclays Bank PLC | | AUD | | Purchase | | 12/15/10 | | | 2,041,243 | | | | 77,847 | |
| | | CNY | | Purchase | | 12/10/10 | | | 3,403,429 | | | | 45,868 | |
| | | EUR | | Purchase | | 12/15/10 | | | 2,803,902 | | | | 56,042 | |
| | | GBP | | Purchase | | 12/15/10 | | | 1,354,948 | | | | 21,596 | |
| | | IDR | | Purchase | | 10/04/10 | | | 924,352 | | | | 4,620 | |
| | | INR | | Purchase | | 10/15/10 | | | 1,130,129 | | | | 35,187 | |
| | | MYR | | Purchase | | 10/25/10 | | | 1,833,721 | | | | 721 | |
| | | PHP | | Purchase | | 11/19/10 | | | 2,764,772 | | | | 86,165 | |
| | | PLN | | Purchase | | 12/15/10 | | | 2,701,115 | | | | 122,857 | |
| | | TWD | | Purchase | | 11/19/10 | | | 1,162,303 | | | | 7,375 | |
| BNP Paribas SA | | AUD | | Purchase | | 12/15/10 | | | 2,178,156 | | | | 94,428 | |
| | | EGP | | Purchase | | 10/12/10 | | | 1,342,475 | | | | 475 | |
| | | | | Purchase | | 11/08/10 | | | 3,857,596 | | | | 19,596 | |
| | | | | Purchase | | 11/09/10 | | | 739,080 | | | | 1,032 | |
| | | EUR | | Purchase | | 12/15/10 | | | 2,829,789 | | | | 81,588 | |
| | | GBP | | Purchase | | 12/15/10 | | | 923,186 | | | | 6,929 | |
| | | | | Sale | | 12/15/10 | | | 905,916 | | | | 9,674 | |
| | | JPY | | Purchase | | 12/15/10 | | | 1,886,981 | | | | 46,980 | |
| | | | | Sale | | 12/15/10 | | | 1,828,040 | | | | 3,960 | |
| Citibank NA | | CAD | | Purchase | | 12/15/10 | | | 839,369 | | | | 4,165 | |
| | | CNY | | Purchase | | 12/10/10 | | | 3,381,614 | | | | 46,559 | |
| | | IDR | | Purchase | | 11/09/10 | | | 1,348,097 | | | | 2,097 | |
| | | ILS | | Purchase | | 12/15/10 | | | 945,720 | | | | 25,720 | |
| | | KRW | | Purchase | | 10/18/10 | | | 938,068 | | | | 18,068 | |
| | | RUB | | Purchase | | 10/20/10 | | | 935,010 | | | | 15,010 | |
| | | | | Purchase | | 10/25/10 | | | 926,660 | | | | 11,660 | |
| | | | | Purchase | | 12/07/10 | | | 1,571,039 | | | | 8,058 | |
| | | SGD | | Purchase | | 12/15/10 | | | 850,202 | | | | 14,082 | |
| | | TWD | | Purchase | | 11/19/10 | | | 5,312,972 | | | | 77,938 | |
The accompanying notes are an integral part of these financial statements.
GOLDMAN SACHS GLOBAL INCOME FUND
| |
| ADDITIONAL INVESTMENT INFORMATION (continued) | |
FORWARD FOREIGN CURRENCY EXCHANGE CONTRACTS WITH UNREALIZED GAIN (continued)
| | | | | | | | | | | | | | | |
| | | | | Contract
| | Expiration
| | Current
| | Unrealized
|
| Counterparty | | Currency | | Type | | Date | | Value | | Gain |
| |
| Credit Suisse International (London) | | AUD | | Purchase | | 10/21/10 | | $ | 2,059,233 | | | $ | 16,704 | |
| | | BRL | | Purchase | | 10/28/10 | | | 980,630 | | | | 14,630 | |
| | | CAD | | Purchase | | 12/15/10 | | | 1,355,174 | | | | 11,174 | |
| | | EUR | | Purchase | | 10/22/10 | | | 8,025,697 | | | | 483,671 | |
| | | | | Purchase | | 12/15/10 | | | 926,459 | | | | 12,363 | |
| | | HUF | | Purchase | | 12/15/10 | | | 871,710 | | | | 70,710 | |
| | | JPY | | Purchase | | 12/15/10 | | | 1,877,661 | | | | 18,661 | |
| | | | | Sale | | 12/15/10 | | | 1,161,197 | | | | 3,803 | |
| | | PHP | | Purchase | | 10/20/10 | | | 473,106 | | | | 3,106 | |
| | | TRY | | Purchase | | 12/15/10 | | | 1,380,240 | | | | 45,240 | |
| Deutsche Bank AG (London) | | AUD | | Purchase | | 12/15/10 | | | 1,743,481 | | | | 42,734 | |
| | | CLP | | Purchase | | 10/25/10 | | | 449,308 | | | | 10,108 | |
| | | CNY | | Purchase | | 12/21/10 | | | 920,336 | | | | 2,336 | |
| | | | | Purchase | | 12/27/10 | | | 916,123 | | | | 1,123 | |
| | | | | Purchase | | 03/10/11 | | | 3,586,053 | | | | 25,669 | |
| | | COP | | Purchase | | 11/26/10 | | | 1,833,995 | | | | 3,995 | |
| | | EUR | | Purchase | | 12/15/10 | | | 7,936,215 | | | | 462,711 | |
| | | GBP | | Purchase | | 12/15/10 | | | 12,464,213 | | | | 51,443 | |
| | | | | Sale | | 12/15/10 | | | 3,852,889 | | | | 18,912 | |
| | | ILS | | Purchase | | 12/15/10 | | | 4,444,612 | | | | 141,516 | |
| | | INR | | Purchase | | 10/15/10 | | | 3,066,132 | | | | 92,909 | |
| | | | | Purchase | | 10/25/10 | | | 926,217 | | | | 10,217 | |
| | | JPY | | Purchase | | 12/15/10 | | | 2,165,445 | | | | 13,445 | |
| | | KRW | | Purchase | | 11/01/10 | | | 544,475 | | | | 475 | |
| | | RUB | | Purchase | | 12/07/10 | | | 2,158,261 | | | | 11,917 | |
| | | ZAR | | Purchase | | 12/15/10 | | | 390,959 | | | | 4,959 | |
| HSBC Bank PLC | | CNY | | Purchase | | 12/10/10 | | | 2,768,295 | | | | 32,867 | |
| | | IDR | | Sale | | 11/09/10 | | | 1,348,097 | | | | 6,331 | |
| JPMorgan Securities, Inc. | | CNY | | Purchase | | 12/21/10 | | | 2,782,414 | | | | 7,414 | |
| | | EUR | | Purchase | | 10/22/10 | | | 6,519,723 | | | | 79,369 | |
| | | | | Purchase | | 12/15/10 | | | 3,043,691 | | | | 113,320 | |
| | | ILS | | Purchase | | 12/15/10 | | | 69,985 | | | | 985 | |
| | | INR | | Purchase | | 10/15/10 | | | 852,292 | | | | 25,292 | |
| | | JPY | | Purchase | | 12/15/10 | | | 2,293,586 | | | | 29,586 | |
| | | KRW | | Purchase | | 10/29/10 | | | 478,667 | | | | 2,667 | |
| | | RUB | | Purchase | | 10/27/10 | | | 692,372 | | | | 2,372 | |
| | | SGD | | Purchase | | 12/15/10 | | | 5,325,615 | | | | 80,894 | |
| | | TRY | | Purchase | | 12/15/10 | | | 708,589 | | | | 18,589 | |
| Morgan Stanley Capital Services, Inc. | | BRL | | Purchase | | 10/18/10 | | | 709,007 | | | | 12,075 | |
| | | CAD | | Sale | | 12/15/10 | | | 1,097,754 | | | | 2,246 | |
| | | EGP | | Purchase | | 11/09/10 | | | 591,456 | | | | 1,019 | |
| | | EUR | | Purchase | | 12/15/10 | | | 6,986,594 | | | | 262,425 | |
| | | GBP | | Purchase | | 12/15/10 | | | 8,432,490 | | | | 129,814 | |
| | | INR | | Purchase | | 10/20/10 | | | 992,209 | | | | 25,209 | |
| | | JPY | | Purchase | | 12/15/10 | | | 1,864,265 | | | | 31,265 | |
| | | RUB | | Purchase | | 10/25/10 | | | 1,848,741 | | | | 13,741 | |
| | | TRY | | Purchase | | 12/15/10 | | | 9,470,691 | | | | 229,691 | |
| | | ZAR | | Purchase | | 12/15/10 | | | 1,703,626 | | | | 31,386 | |
| Royal Bank of Canada | | BRL | | Purchase | | 10/18/10 | | | 2,697,315 | | | | 28,315 | |
| | | CAD | | Purchase | | 12/15/10 | | | 3,466,299 | | | | 23,299 | |
| | | CLP | | Purchase | | 10/25/10 | | | 461,050 | | | | 2,050 | |
| | | MXN | | Sale | | 12/15/10 | | | 1,273,979 | | | | 8,021 | |
| | | PLN | | Purchase | | 12/15/10 | | | 2,698,386 | | | | 125,336 | |
The accompanying notes are an integral part of these financial statements.
GOLDMAN SACHS GLOBAL INCOME FUND
Schedule of Investments (continued)
September 30, 2010 (Unaudited)
| |
| ADDITIONAL INVESTMENT INFORMATION (continued) | |
FORWARD FOREIGN CURRENCY EXCHANGE CONTRACTS WITH UNREALIZED GAIN (continued)
| | | | | | | | | | | | | | | |
| | | | | Contract
| | Expiration
| | Current
| | Unrealized
|
| Counterparty | | Currency | | Type | | Date | | Value | | Gain |
| |
| Royal Bank of Scotland | | CAD | | Sale | | 12/15/10 | | $ | 917,715 | | | $ | 2,285 | |
| | | CNY | | Purchase | | 12/10/10 | | | 3,559,985 | | | | 26,856 | |
| | | EUR | | Purchase | | 12/15/10 | | | 2,352,934 | | | | 91,324 | |
| | | HUF | | Purchase | | 12/15/10 | | | 2,870,119 | | | | 194,536 | |
| State Street Bank | | AUD | | Purchase | | 12/15/10 | | | 6,029,899 | | | | 230,612 | |
| | | EUR | | Purchase | | 12/15/10 | | | 6,235,889 | | | | 299,818 | |
| | | INR | | Purchase | | 10/15/10 | | | 2,391,208 | | | | 122,738 | |
| | | KRW | | Purchase | | 10/18/10 | | | 1,266,426 | | | | 19,785 | |
| | | MXN | | Purchase | | 12/15/10 | | | 854,410 | | | | 18,291 | |
| | | | | Sale | | 12/15/10 | | | 1,820,306 | | | | 11,694 | |
| Westpac Banking Corp. | | AUD | | Purchase | | 12/15/10 | | | 915,304 | | | | 6,511 | |
| | | JPY | | Purchase | | 12/15/10 | | | 1,538,896 | | | | 33,880 | |
| | | NZD | | Purchase | | 12/15/10 | | | 828,303 | | | | 3,509 | |
| |
| |
TOTAL | | | | | | | | | | | | $ | 5,524,979 | |
| |
| |
FORWARD FOREIGN CURRENCY EXCHANGE CONTRACTS WITH UNREALIZED LOSS
| | | | | | | | | | | | | | | |
| | | | | Contract
| | Expiration
| | Current
| | Unrealized
|
| Counterparty | | Currency | | Type | | Date | | Value | | Loss |
| |
| Bank of America Securities LLC | | BRL | | Sale | | 10/18/10 | | $ | 1,790,665 | | | $ | (25,389 | ) |
| | | CAD | | Purchase | | 12/15/10 | | | 1,057,799 | | | | (3,201 | ) |
| | | EUR | | Sale | | 12/15/10 | | | 2,768,478 | | | | (135,198 | ) |
| | | GBP | | Purchase | | 12/15/10 | | | 521,255 | | | | (3,802 | ) |
| | | HUF | | Sale | | 12/15/10 | | | 3,673,000 | | | | (309,572 | ) |
| | | ILS | | Sale | | 12/15/10 | | | 306,065 | | | | (5,065 | ) |
| | | JPY | | Purchase | | 12/15/10 | | | 1,325,936 | | | | (9,064 | ) |
| | | | | Sale | | 12/15/10 | | | 940,983 | | | | (20,983 | ) |
| | | MYR | | Purchase | | 11/01/10 | | | 908,610 | | | | (2,390 | ) |
| | | SGD | | Sale | | 12/15/10 | | | 994,335 | | | | (22,335 | ) |
| | | TWD | | Sale | | 11/19/10 | | | 925,205 | | | | (8,205 | ) |
| Barclays Bank PLC | | AUD | | Purchase | | 12/15/10 | | | 757,328 | | | | (4,192 | ) |
| | | | | Sale | | 12/15/10 | | | 644,351 | | | | (12,875 | ) |
| | | CAD | | Sale | | 12/15/10 | | | 514,179 | | | | (11,256 | ) |
| | | EUR | | Sale | | 12/15/10 | | | 1,389,008 | | | | (25,636 | ) |
| | | GBP | | Sale | | 12/15/10 | | | 1,361,228 | | | | (22,776 | ) |
| | | ILS | | Sale | | 12/15/10 | | | 208,399 | | | | (3,399 | ) |
| | | INR | | Sale | | 10/15/10 | | | 963,302 | | | | (17,899 | ) |
| | | JPY | | Sale | | 12/15/10 | | | 693,165 | | | | (19,165 | ) |
| | | MYR | | Purchase | | 11/01/10 | | | 908,655 | | | | (2,345 | ) |
| | | PHP | | Sale | | 11/19/10 | | | 2,732,828 | | | | (44,828 | ) |
| | | PLN | | Sale | | 11/09/10 | | | 2,655,592 | | | | (160,168 | ) |
| | | SEK | | Sale | | 11/16/10 | | | 5,581,098 | | | | (244,381 | ) |
| | | TRY | | Sale | | 12/15/10 | | | 918,738 | | | | (2,738 | ) |
| | | TWD | | Purchase | | 11/01/10 | | | 814,980 | | | | (1,020 | ) |
The accompanying notes are an integral part of these financial statements.
GOLDMAN SACHS GLOBAL INCOME FUND
| |
| ADDITIONAL INVESTMENT INFORMATION (continued) | |
FORWARD FOREIGN CURRENCY EXCHANGE CONTRACTS WITH UNREALIZED LOSS (continued)
| | | | | | | | | | | | | | | |
| | | | | Contract
| | Expiration
| | Current
| | Unrealized
|
| Counterparty | | Currency | | Type | | Date | | Value | | Loss |
| |
| BNP Paribas SA | | AUD | | Purchase | | 12/15/10 | | $ | 452,865 | | | $ | (856 | ) |
| | | | | Sale | | 12/15/10 | | | 774,562 | | | | (23,640 | ) |
| | | CAD | | Sale | | 12/15/10 | | | 919,984 | | | | (4,984 | ) |
| | | CNY | | Purchase | | 12/29/10 | | | 1,176,886 | | | | (5,114 | ) |
| | | EGP | | Sale | | 11/08/10 | | | 2,020,428 | | | | (13,741 | ) |
| | | EUR | | Sale | | 12/15/10 | | | 2,362,471 | | | | (99,421 | ) |
| | | GBP | | Sale | | 12/15/10 | | | 916,906 | | | | (1,276 | ) |
| | | HUF | | Sale | | 12/15/10 | | | 3,671,012 | | | | (308,049 | ) |
| | | INR | | Purchase | | 11/04/10 | | | 548,404 | | | | (1,596 | ) |
| | | JPY | | Sale | | 12/15/10 | | | 6,422,352 | | | | (41,352 | ) |
| | | MXN | | Purchase | | 12/15/10 | | | 826,865 | | | | (1,135 | ) |
| Citibank NA | | AUD | | Sale | | 12/15/10 | | | 8,362,269 | | | | (527,808 | ) |
| | | CZK | | Sale | | 12/15/10 | | | 3,061,359 | | | | (186,690 | ) |
| | | IDR | | Sale | | 10/04/10 | | | 2,763,861 | | | | (59,861 | ) |
| | | MYR | | Purchase | | 10/29/10 | | | 2,741,423 | | | | (2,577 | ) |
| | | PLN | | Sale | | 12/15/10 | | | 2,535,562 | | | | (110,815 | ) |
| | | RUB | | Purchase | | 10/29/10 | | | 1,822,907 | | | | (7,093 | ) |
| | | SGD | | Sale | | 12/15/10 | | | 2,753,318 | | | | (66,318 | ) |
| | | TWD | | Purchase | | 11/01/10 | | | 1,829,828 | | | | (3,172 | ) |
| | | | | Sale | | 11/19/10 | | | 1,783,936 | | | | (28,084 | ) |
| | | ZAR | | Sale | | 12/15/10 | | | 2,324,403 | | | | (77,258 | ) |
| Credit Suisse International (London) | | AUD | | Purchase | | 12/15/10 | | | 903,815 | | | | (3,709 | ) |
| | | CHF | | Sale | | 12/15/10 | | | 1,108,553 | | | | (21,597 | ) |
| | | EUR | | Sale | | 10/06/10 | | | 940,575 | | | | (7,527 | ) |
| | | | | Sale | | 12/15/10 | | | 1,434,650 | | | | (90,937 | ) |
| | | GBP | | Purchase | | 12/15/10 | | | 907,486 | | | | (7,066 | ) |
| | | JPY | | Sale | | 12/15/10 | | | 2,565,953 | | | | (24,247 | ) |
| | | MYR | | Purchase | | 11/01/10 | | | 913,839 | | | | (3,161 | ) |
| | | NOK | | Sale | | 12/15/10 | | | 2,593,006 | | | | (84,647 | ) |
| | | ZAR | | Purchase | | 12/15/10 | | | 729,553 | | | | (3,447 | ) |
| Deutsche Bank AG (London) | | AUD | | Purchase | | 12/15/10 | | | 450,950 | | | | (3,485 | ) |
| | | | | Sale | | 12/15/10 | | | 1,408,381 | | | | (80,185 | ) |
| | | CAD | | Purchase | | 12/15/10 | | | 662,408 | | | | (592 | ) |
| | | | | Sale | | 12/15/10 | | | 1,081,383 | | | | (3,383 | ) |
| | | CNY | | Purchase | | 01/12/11 | | | 2,388,411 | | | | (20,589 | ) |
| | | COP | | Sale | | 11/26/10 | | | 1,371,803 | | | | (9,803 | ) |
| | | EUR | | Sale | | 10/06/10 | | | 1,881,149 | | | | (41,548 | ) |
| | | | | Sale | | 12/15/10 | | | 6,087,077 | | | | (367,570 | ) |
| | | GBP | | Purchase | | 12/15/10 | | | 4,302,864 | | | | (15,353 | ) |
| | | | | Sale | | 12/15/10 | | | 11,207,635 | | | | (52,352 | ) |
| | | IDR | | Sale | | 10/04/10 | | | 1,373,673 | | | | (18,673 | ) |
| | | ILS | | Sale | | 12/15/10 | | | 208,281 | | | | (3,281 | ) |
| | | INR | | Sale | | 10/15/10 | | | 2,604,545 | | | | (68,806 | ) |
| | | | | Sale | | 10/20/10 | | | 919,176 | | | | (4,176 | ) |
| | | | | Sale | | 10/29/10 | | | 917,424 | | | | (2,424 | ) |
| | | JPY | | Purchase | | 12/15/10 | | | 1,158,906 | | | | (6,094 | ) |
| | | | | Sale | | 12/15/10 | | | 1,309,508 | | | | (8,508 | ) |
| | | MXN | | Sale | | 12/15/10 | | | 1,394,265 | | | | (50,265 | ) |
| | | NZD | | Purchase | | 12/15/10 | | | 906,357 | | | | (4,526 | ) |
| | | | | Sale | | 12/15/10 | | | 2,610,424 | | | | (38,373 | ) |
| | | SGD | | Sale | | 12/15/10 | | | 596,611 | | | | (13,611 | ) |
| | | ZAR | | Sale | | 12/15/10 | | | 2,345,258 | | | | (77,656 | ) |
The accompanying notes are an integral part of these financial statements.
GOLDMAN SACHS GLOBAL INCOME FUND
Schedule of Investments (continued)
September 30, 2010 (Unaudited)
| |
| ADDITIONAL INVESTMENT INFORMATION (continued) | |
FORWARD FOREIGN CURRENCY EXCHANGE CONTRACTS WITH UNREALIZED LOSS (continued)
| | | | | | | | | | | | | | | |
| | | | | Contract
| | Expiration
| | Current
| | Unrealized
|
| Counterparty | | Currency | | Type | | Date | | Value | | Loss |
| |
| HSBC Bank PLC | | CNY | | Sale | | 12/10/10 | | $ | 8,583,039 | | | $ | (54,617 | ) |
| | | EUR | | Sale | | 10/22/10 | | | 333,968,786 | | | | (21,322,426 | ) |
| | | GBP | | Sale | | 10/29/10 | | | 56,498,220 | | | | (595,756 | ) |
| | | IDR | | Purchase | | 10/04/10 | | | 1,356,379 | | | | (172 | ) |
| | | TRY | | Sale | | 12/15/10 | | | 3,043,496 | | | | (115,161 | ) |
| JPMorgan Securities, Inc. | | CAD | | Purchase | | 12/15/10 | | | 2,668,379 | | | | (621 | ) |
| | | EUR | | Purchase | | 12/15/10 | | | 1,827,032 | | | | (4,700 | ) |
| | | | | Sale | | 12/15/10 | | | 3,716,737 | | | | (59,703 | ) |
| | | INR | | Sale | | 10/15/10 | | | 1,138,333 | | | | (15,281 | ) |
| | | | | Sale | | 10/25/10 | | | 925,813 | | | | (10,813 | ) |
| | | | | Purchase | | 11/04/10 | | | 914,339 | | | | (2,662 | ) |
| | | MXN | | Sale | | 12/15/10 | | | 830,949 | | | | (2,949 | ) |
| | | SGD | | Sale | | 12/15/10 | | | 344,818 | | | | (8,281 | ) |
| | | TRY | | Sale | | 12/15/10 | | | 3,510,280 | | | | (140,280 | ) |
| Morgan Stanley Capital Services, Inc. | | AUD | | Sale | | 10/21/10 | | | 4,935,020 | | | | (263,434 | ) |
| | | BRL | | Sale | | 10/18/10 | | | 1,734,150 | | | | (28,251 | ) |
| | | CAD | | Purchase | | 12/15/10 | | | 671,616 | | | | (1,384 | ) |
| | | | | Sale | | 12/15/10 | | | 332,578 | | | | (578 | ) |
| | | CZK | | Sale | | 12/15/10 | | | 3,070,944 | | | | (188,773 | ) |
| | | EUR | | Sale | | 10/06/10 | | | 940,575 | | | | (2,545 | ) |
| | | | | Sale | | 12/15/10 | | | 2,381,545 | | | | (129,453 | ) |
| | | ILS | | Sale | | 12/15/10 | | | 1,847,556 | | | | (53,928 | ) |
| | | INR | | Purchase | | 11/04/10 | | | 339,464 | | | | (536 | ) |
| | | JPY | | Sale | | 11/05/10 | | | 165,338,567 | | | | (2,298,730 | ) |
| | | NZD | | Sale | | 12/15/10 | | | 549,793 | | | | (2,585 | ) |
| | | RUB | | Sale | | 12/07/10 | | | 1,862,389 | | | | (23,389 | ) |
| | | SEK | | Sale | | 12/15/10 | | | 2,836,841 | | | | (167,841 | ) |
| | | SGD | | Sale | | 12/15/10 | | | 796,155 | | | | (18,155 | ) |
| | | TRY | | Sale | | 12/15/10 | | | 3,985,558 | | | | (136,085 | ) |
| Royal Bank of Canada | | BRL | | Sale | | 10/28/10 | | | 984,375 | | | | (18,375 | ) |
| | | CAD | | Sale | | 11/08/10 | | | 20,975,808 | | | | (49,232 | ) |
| | | | | Sale | | 12/15/10 | | | 2,678,906 | | | | (3,323 | ) |
| | | COP | | Sale | | 11/26/10 | | | 947,989 | | | | (13,989 | ) |
| | | EUR | | Sale | | 10/22/10 | | | 2,372,203 | | | | (99,956 | ) |
| Royal Bank of Scotland | | AUD | | Sale | | 12/15/10 | | | 1,408,381 | | | | (80,141 | ) |
| | | CNY | | Purchase | | 12/28/10 | | | 1,033,679 | | | | (4,601 | ) |
| | | GBP | | Sale | | 12/15/10 | | | 2,456,343 | | | | (30,609 | ) |
| | | KRW | | Sale | | 10/18/10 | | | 2,024,380 | | | | (40,850 | ) |
| | | NZD | | Sale | | 12/15/10 | | | 2,619,222 | | | | (39,491 | ) |
| | | PHP | | Purchase | | 10/29/10 | | | 914,463 | | | | (2,537 | ) |
| State Street Bank | | CAD | | Sale | | 12/15/10 | | | 917,792 | | | | (792 | ) |
| | | EUR | | Sale | | 12/15/10 | | | 2,546,401 | | | | (145,147 | ) |
| | | KRW | | Sale | | 10/18/10 | | | 2,033,020 | | | | (38,609 | ) |
| | | MXN | | Purchase | | 12/15/10 | | | 915,417 | | | | (1,583 | ) |
| | | SGD | | Sale | | 12/15/10 | | | 756,099 | | | | (17,099 | ) |
| | | ZAR | | Sale | | 12/15/10 | | | 1,020,799 | | | | (26,799 | ) |
The accompanying notes are an integral part of these financial statements.
GOLDMAN SACHS GLOBAL INCOME FUND
| |
| ADDITIONAL INVESTMENT INFORMATION (continued) | |
FORWARD FOREIGN CURRENCY EXCHANGE CONTRACTS WITH UNREALIZED LOSS (continued)
| | | | | | | | | | | | | | | |
| | | | | Contract
| | Expiration
| | Current
| | Unrealized
|
| Counterparty | | Currency | | Type | | Date | | Value | | Loss |
| |
| UBS AG (London) | | EUR | | Sale | | 10/04/10 | | $ | 5,773,190 | | | $ | (115,357 | ) |
| | | | | Sale | | 12/15/10 | | | 1,858,369 | | | | (29,408 | ) |
| | | MXN | | Sale | | 12/15/10 | | | 1,365,466 | | | | (30,466 | ) |
| | | NZD | | Sale | | 12/15/10 | | | 930,419 | | | | (3,967 | ) |
| Westpac Banking Corp. | | DKK | | Sale | | 11/18/10 | | | 2,989,601 | | | | (108,617 | ) |
| |
| |
TOTAL | | | | | | | | | | | | $ | (30,376,350 | ) |
| |
| |
FORWARD FOREIGN CROSS CURRENCY EXCHANGE CONTRACTS WITH UNREALIZED GAIN (PURCHASE/SALE)
| | | | | | | | | | | | | | | | | |
| | | | | | | Purchase
| | Sale
| | |
| | | | | Expiration
| | Current
| | Current
| | Unrealized
|
| Counterparty | | Currency | | Date | | Value | | Value | | Gain |
| |
| Bank of America Securities LLC | | EUR/CHF | | 12/15/10 | | $ | 4,448,367 | | | $ | 4,354,107 | | | $ | 94,260 | |
| | | EUR/GBP | | 12/15/10 | | | 904,320 | | | | 899,592 | | | | 4,728 | |
| | | HUF/EUR | | 12/15/10 | | | 484,908 | | | | 476,854 | | | | 8,054 | |
| | | PLN/HUF | | 12/15/10 | | | 734,959 | | | | 732,779 | | | | 2,180 | |
| Barclays Bank PLC | | EUR/CAD | | 12/15/10 | | | 1,427,837 | | | | 1,374,167 | | | | 53,670 | |
| | | EUR/CHF | | 12/15/10 | | | 1,456,448 | | | | 1,416,414 | | | | 40,034 | |
| | | EUR/JPY | | 12/15/10 | | | 918,285 | | | | 908,390 | | | | 9,895 | |
| | | EUR/NOK | | 12/15/10 | | | 2,352,935 | | | | 2,319,636 | | | | 33,299 | |
| | | NOK/GBP | | 12/15/10 | | | 916,854 | | | | 910,625 | | | | 6,229 | |
| | | TRY/EUR | | 10/04/10 | | | 948,317 | | | | 946,078 | | | | 2,239 | |
| | | TRY/EUR | | 12/15/10 | | | 920,517 | | | | 918,285 | | | | 2,232 | |
| BNP Paribas SA | | EUR/CHF | | 12/15/10 | | | 1,641,741 | | | | 1,625,597 | | | | 16,144 | |
| | | EUR/JPY | | 12/15/10 | | | 952,346 | | | | 945,469 | | | | 6,877 | |
| | | HUF/EUR | | 12/15/10 | | | 739,845 | | | | 718,006 | | | | 21,839 | |
| | | PLN/EUR | | 12/15/10 | | | 943,521 | | | | 940,084 | | | | 3,437 | |
| Credit Suisse International (London) | | AUD/NZD | | 12/15/10 | | | 1,370,084 | | | | 1,326,359 | | | | 43,725 | |
| | | EUR/CHF | | 12/15/10 | | | 1,430,562 | | | | 1,368,839 | | | | 61,723 | |
| | | EUR/GBP | | 12/15/10 | | | 2,837,963 | | | | 2,772,850 | | | | 65,113 | |
| | | EUR/JPY | | 12/15/10 | | | 953,708 | | | | 939,478 | | | | 14,230 | |
| Deutsche Bank AG (London) | | EUR/CHF | | 12/15/10 | | | 3,508,557 | | | | 3,474,873 | | | | 33,684 | |
| | | EUR/GBP | | 12/15/10 | | | 4,752,033 | | | | 4,616,915 | | | | 135,118 | |
| | | EUR/JPY | | 12/15/10 | | | 4,403,620 | | | | 4,348,119 | | | | 55,501 | |
| | | JPY/EUR | | 12/15/10 | | | 903,921 | | | | 903,298 | | | | 623 | |
| | | PLN/NZD | | 12/15/10 | | | 946,433 | | | | 926,044 | | | | 20,389 | |
| HSBC Bank PLC | | TRY/EUR | | 12/15/10 | | | 499,143 | | | | 497,970 | | | | 1,173 | |
| JPMorgan Securities, Inc. | | EUR/CAD | | 12/15/10 | | | 1,389,689 | | | | 1,371,697 | | | | 17,992 | |
| | | EUR/GBP | | 12/15/10 | | | 916,921 | | | | 901,198 | | | | 15,723 | |
| | | SEK/EUR | | 12/15/10 | | | 1,463,193 | | | | 1,448,274 | | | | 14,919 | |
| Morgan Stanley Capital Services, Inc. | | EUR/CHF | | 12/15/10 | | | 4,029,757 | | | | 3,944,674 | | | | 85,083 | |
| Royal Bank of Scotland | | HUF/EUR | | 12/15/10 | | | 759,506 | | | | 750,705 | | | | 8,801 | |
| | | NOK/GBP | | 12/15/10 | | | 923,211 | | | | 915,336 | | | | 7,875 | |
| State Street Bank | | EUR/CHF | | 12/15/10 | | | 918,285 | | | | 902,167 | | | | 16,118 | |
| | | EUR/NOK | | 12/15/10 | | | 2,802,540 | | | | 2,782,732 | | | | 19,808 | |
| | | SEK/EUR | | 12/15/10 | | | 1,906,138 | | | | 1,903,329 | | | | 2,809 | |
The accompanying notes are an integral part of these financial statements.
GOLDMAN SACHS GLOBAL INCOME FUND
Schedule of Investments (continued)
September 30, 2010 (Unaudited)
| |
| ADDITIONAL INVESTMENT INFORMATION (continued) | |
FORWARD FOREIGN CROSS CURRENCY EXCHANGE CONTRACTS WITH UNREALIZED GAIN
(PURCHASE/SALE) (continued)
| | | | | | | | | | | | | | | | | |
| | | | | | | Purchase
| | Sale
| | |
| | | | | Expiration
| | Current
| | Current
| | Unrealized
|
| Counterparty | | Currency | | Date | | Value | | Value | | Gain |
| |
| UBS AG (London) | | EUR/GBP | | 12/15/10 | | $ | 957,795 | | | $ | 925,542 | | | $ | 32,253 | |
| | | NOK/GBP | | 12/15/10 | | | 920,920 | | | | 915,336 | | | | 5,584 | |
| | | SEK/EUR | | 12/15/10 | | | 3,607,986 | | | | 3,564,230 | | | | 43,756 | |
| |
| |
TOTAL | | | | | | | | | | | | | | $ | 1,007,117 | |
| |
| |
FORWARD FOREIGN CROSS CURRENCY EXCHANGE CONTRACTS WITH UNREALIZED LOSS (PURCHASE/SALE)
| | | | | | | | | | | | | | | | | |
| | | | | | | Purchase
| | Sale
| | |
| | | | | Expiration
| | Current
| | Current
| | Unrealized
|
| Counterparty | | Currency | | Date | | Value | | Value | | Loss |
| |
| Bank of America Securities LLC | | CHF/EUR | | 12/15/10 | | $ | 894,634 | | | $ | 918,285 | | | $ | (23,651 | ) |
| | | EUR/PLN | | 12/15/10 | | | 929,184 | | | | 930,716 | | | | (1,532 | ) |
| | | EUR/SEK | | 12/15/10 | | | 1,444,187 | | | | 1,449,460 | | | | (5,273 | ) |
| | | JPY/EUR | | 12/15/10 | | | 902,644 | | | | 918,285 | | | | (15,641 | ) |
| | | NZD/EUR | | 12/15/10 | | | 885,438 | | | | 915,560 | | | | (30,122 | ) |
| Barclays Bank PLC | | CHF/EUR | | 12/15/10 | | | 144,278 | | | | 147,144 | | | | (2,866 | ) |
| | | GBP/NZD | | 12/15/10 | | | 555,796 | | | | 559,286 | | | | (3,490 | ) |
| BNP Paribas SA | | CHF/EUR | | 12/15/10 | | | 1,386,437 | | | | 1,419,663 | | | | (33,226 | ) |
| | | EUR/HUF | | 12/15/10 | | | 737,080 | | | | 737,127 | | | | (47 | ) |
| | | JPY/EUR | | 12/15/10 | | | 922,377 | | | | 929,184 | | | | (6,807 | ) |
| | | NZD/EUR | | 12/15/10 | | | 1,375,954 | | | | 1,455,086 | | | | (79,132 | ) |
| | | PLN/HUF | | 12/15/10 | | | 1,429,221 | | | | 1,502,249 | | | | (73,028 | ) |
| Citibank NA | | EUR/PLN | | 12/15/10 | | | 937,359 | | | | 940,621 | | | | (3,262 | ) |
| | | PLN/EUR | | 12/15/10 | | | 1,388,623 | | | | 1,400,589 | | | | (11,966 | ) |
| Credit Suisse International (London) | | AUD/EUR | | 12/15/10 | | | 2,803,473 | | | | 2,869,299 | | | | (65,826 | ) |
| | | CHF/EUR | | 12/15/10 | | | 2,077,031 | | | | 2,155,381 | | | | (78,350 | ) |
| | | JPY/EUR | | 12/15/10 | | | 927,064 | | | | 935,996 | | | | (8,932 | ) |
| | | NZD/EUR | | 12/15/10 | | | 2,027,103 | | | | 2,151,293 | | | | (124,190 | ) |
| Deutsche Bank AG (London) | | AUD/EUR | | 12/15/10 | | | 934,000 | | | | 953,708 | | | | (19,708 | ) |
| | | CHF/EUR | | 12/15/10 | | | 2,939,097 | | | | 3,000,775 | | | | (61,678 | ) |
| | | GBP/EUR | | 12/15/10 | | | 1,688,162 | | | | 1,743,034 | | | | (54,872 | ) |
| | | JPY/EUR | | 12/15/10 | | | 2,169,842 | | | | 2,201,704 | | | | (31,862 | ) |
| | | NZD/EUR | | 12/15/10 | | | 1,300,899 | | | | 1,376,065 | | | | (75,166 | ) |
| | | PLN/EUR | | 12/15/10 | | | 746,718 | | | | 752,067 | | | | (5,349 | ) |
| JPMorgan Securities, Inc. | | CHF/EUR | | 12/15/10 | | | 2,149,908 | | | | 2,183,992 | | | | (34,084 | ) |
| | | EUR/TRY | | 10/04/10 | | | 441,680 | | | | 443,016 | | | | (1,336 | ) |
| | | GBP/NZD | | 12/15/10 | | | 370,530 | | | | 372,274 | | | | (1,744 | ) |
| | | ILS/EUR | | 12/15/10 | | | 1,385,438 | | | | 1,434,650 | | | | (49,212 | ) |
| Morgan Stanley Capital Services, Inc. | | CHF/EUR | | 12/15/10 | | | 938,131 | | | | 953,708 | | | | (15,577 | ) |
| | | EUR/HUF | | 12/15/10 | | | 1,149,900 | | | | 1,186,196 | | | | (36,296 | ) |
| | | JPY/EUR | | 12/15/10 | | | 915,869 | | | | 916,922 | | | | (1,053 | ) |
| Royal Bank of Scotland | | NOK/EUR | | 12/15/10 | | | 4,863,846 | | | | 4,938,392 | | | | (74,546 | ) |
| State Street Bank | | AUD/CAD | | 12/15/10 | | | 906,687 | | | | 912,786 | | | | (6,099 | ) |
| | | CHF/EUR | | 12/15/10 | | | 694,407 | | | | 720,731 | | | | (26,324 | ) |
| | | EUR/SEK | | 12/15/10 | | | 2,825,701 | | | | 2,829,716 | | | | (4,015 | ) |
The accompanying notes are an integral part of these financial statements.
GOLDMAN SACHS GLOBAL INCOME FUND
| |
| ADDITIONAL INVESTMENT INFORMATION (continued) | |
FORWARD FOREIGN CROSS CURRENCY EXCHANGE CONTRACTS WITH UNREALIZED LOSS
(PURCHASE/SALE) (continued)
| | | | | | | | | | | | | | | | | |
| | | | | | | Purchase
| | Sale
| | |
| | | | | Expiration
| | Current
| | Current
| | Unrealized
|
| Counterparty | | Currency | | Date | | Value | | Value | | Loss |
| |
| State Street Bank (continued) | | NOK/EUR | | 12/15/10 | | $ | 4,905,754 | | | $ | 4,988,421 | | | $ | (82,667 | ) |
| UBS AG (London) | | CHF/EUR | | 12/15/10 | | | 2,087,961 | | | | 2,149,931 | | | | (61,970 | ) |
| | | NZD/AUD | | 12/15/10 | | | 916,065 | | | | 917,214 | | | | (1,149 | ) |
| |
| |
TOTAL | | | | | | | | | | | | | | $ | (1,212,048 | ) |
| |
| |
FORWARD SALES CONTRACTS — At September 30, 2010, the Fund had the following forward sales contracts:(c)
| | | | | | | | | | | | | | | | | | | |
| | | Interest
| | Maturity
| | Settlement
| | Principal
| | |
| Description | | Rate | | Date | | Date | | Amount | | Value |
| |
| FHLMC (Proceeds Receivable $1,042,852) | | | 4.500% | | | TBA-30yr | | | 10/13/10 | | | $ | (1,000,000 | ) | | $ | (1,039,766 | ) |
| |
| |
FUTURES CONTRACTS — At September 30, 2010, the following futures contracts were open:
| | | | | | | | | | | | | | | |
| | | Number of
| | | | | | |
| | | Contracts
| | Expiration
| | Current
| | Unrealized
|
| Type | | Long (Short) | | Date | | Value | | Gain (Loss) |
| |
| Australia 10 Year Treasury Bond | | | 129 | | | December 2010 | | $ | 13,450,540 | | | $ | 93,586 | |
| Eurodollars | | | 3 | | | December 2010 | | | 747,300 | | | | 4,867 | |
| Eurodollars | | | 3 | | | March 2011 | | | 746,925 | | | | 17,734 | |
| Eurodollars | | | 3 | | | June 2011 | | | 746,363 | | | | 19,609 | |
| Eurodollars | | | 3 | | | September 2011 | | | 745,650 | | | | 21,027 | |
| Eurodollars | | | 3 | | | December 2011 | | | 744,750 | | | | 22,173 | |
| Eurodollars | | | 405 | | | March 2012 | | | 100,404,562 | | | | 151,064 | |
| Japan 10 Year Government Bond | | | (13 | ) | | December 2010 | | | (22,334,212 | ) | | | (352,123 | ) |
| Ultra Long U.S. Treasury Bonds | | | (6 | ) | | December 2010 | | | (847,688 | ) | | | (11,986 | ) |
| U.K. Life Long Gilt | | | (25 | ) | | December 2010 | | | (4,882,355 | ) | | | (458 | ) |
| 2 Year German Euro-Schatz | | | 41 | | | December 2010 | | | 6,097,117 | | | | (78 | ) |
| 5 Year German Euro-Bobl | | | (69 | ) | | December 2010 | | | (11,345,092 | ) | | | (8,107 | ) |
| 10 Year German Euro-Bund | | | 109 | | | December 2010 | | | 19,529,747 | | | | 112,137 | |
| 2 Year U.S. Treasury Notes | | | 281 | | | December 2010 | | | 61,675,110 | | | | 116,889 | |
| 5 Year U.S. Treasury Notes | | | 194 | | | December 2010 | | | 23,448,234 | | | | 65,313 | |
| 10 Year U.S. Treasury Notes | | | 738 | | | December 2010 | | | 93,022,594 | | | | 607,896 | |
| 30 Year U.S. Treasury Bonds | | | 39 | | | December 2010 | | | 5,215,031 | | | | 20,529 | |
| |
| |
TOTAL | | | | | | | | | | | | $ | 880,072 | |
| |
| |
The accompanying notes are an integral part of these financial statements.
GOLDMAN SACHS GLOBAL INCOME FUND
Schedule of Investments (continued)
September 30, 2010 (Unaudited)
| |
| ADDITIONAL INVESTMENT INFORMATION (continued) | |
SWAP CONTRACTS — At September 30, 2010, the Fund had outstanding swap contracts with the following terms:
INTEREST RATE SWAP CONTRACTS
| | | | | | | | | | | | | | | | | | | | | | | | | |
| | | | | | | Rates Exchanged | | | | | | |
| | | | | | | | | | | | | Upfront
| | |
| | | Notional
| | | | Payments
| | Payments
| | | | Payments made
| | |
| | | Amount
| | Termination
| | received by
| | made by
| | Market
| | (received) by
| | Unrealized
|
| Counterparty | | (000s) | | Date | | the Fund | | the Fund | | Value | | the Fund | | Gain (Loss) |
| |
| Bank of America Securities LLC | | | CAD 9,800 | (a) | | | 04/08/16 | | | 3 month CDOR | | 3.845% | | $ | (712,614 | ) | | $ | — | | | $ | (712,614 | ) |
| | | | 13,700 | (a) | | | 04/08/21 | | | 4.350% | | 3 month CDOR | | | 1,503,343 | | | | — | | | | 1,503,343 | |
| | | | 4,000 | (a) | | | 04/08/41 | | | 3 month CDOR | | 4.496 | | | (708,570 | ) | | | — | | | | (708,570 | ) |
| Barclays Bank PLC | | | GBP 15,630 | | | | 11/02/15 | | | 6 month BP | | 2.587 | | | (554,123 | ) | | | 827 | | | | (554,950 | ) |
| | | | 14,050 | (a) | | | 11/03/15 | | | 6 month BP | | 2.589 | | | (498,784 | ) | | | (3,908 | ) | | | (494,876 | ) |
| | | | 5,590 | (a) | | | 11/10/15 | | | 6 month BP | | 2.482 | | | (149,706 | ) | | | 4,204 | | | | (153,910 | ) |
| | | | EUR 20,310 | (a) | | | 04/23/20 | | | 4.259 | | 6 month EURO | | | 1,227,514 | | | | — | | | | 1,227,514 | |
| | | | 4,870 | (a) | | | 05/12/20 | | | 4.265 | | 6 month EURO | | | 293,161 | | | | — | | | | 293,161 | |
| | | | 8,470 | (a) | | | 05/14/20 | | | 4.265 | | 6 month EURO | | | 509,344 | | | | — | | | | 509,344 | |
| | | | GBP 26,380 | (a) | | | 11/02/20 | | | 3.493 | | 6 month BP | | | 1,638,193 | | | | (18,047 | ) | | | 1,656,240 | |
| | | | 24,210 | (a) | | | 11/03/20 | | | 3.485 | | 6 month BP | | | 1,473,301 | | | | (4,451 | ) | | | 1,477,752 | |
| | | | 9,610 | (a) | | | 11/10/20 | | | 3.395 | | 6 month BP | | | 455,990 | | | | (17,391 | ) | | | 473,381 | |
| | | | 13,180 | (a) | | | 11/02/25 | | | 6 month BP | | 3.872 | | | (1,078,386 | ) | | | 11,637 | | | | (1,090,023 | ) |
| | | | 12,180 | (a) | | | 11/03/25 | | | 6 month BP | | 3.865 | | | (978,946 | ) | | | (1,107 | ) | | | (977,839 | ) |
| | | | 4,815 | | | | 11/10/25 | | | 6 month BP | | 3.777 | | | (302,378 | ) | | | 11,226 | | | | (313,604 | ) |
| | | | EUR 6,090 | (a) | | | 04/23/40 | | | 6 month EURO | | 4.085 | | | (1,260,116 | ) | | | — | | | | (1,260,116 | ) |
| | | | 1,350 | (a) | | | 05/12/40 | | | 6 month EURO | | 3.940 | | | (237,962 | ) | | | — | | | | (237,962 | ) |
| | | | 2,530 | (a) | | | 05/14/40 | | | 6 month EURO | | 3.935 | | | (443,088 | ) | | | — | | | | (443,088 | ) |
| Citibank NA | | | KRW 8,068,285 | | | | 07/15/14 | | | 3.905 | | 3 month KWCDC | | | 118,872 | | | | — | | | | 118,872 | |
| | | | EUR 20,380 | (a) | | | 04/23/20 | | | 4.286 | | 6 month EURO | | | 1,263,630 | | | | — | | | | 1,263,630 | |
| | | | 12,950 | (a) | | | 05/14/20 | | | 4.348 | | 6 month EURO | | | 839,640 | | | | — | | | | 839,640 | |
| | | | 6,110 | (a) | | | 04/23/40 | | | 6 month EURO | | 4.119 | | | (1,308,102 | ) | | | — | | | | (1,308,102 | ) |
| | | | 3,820 | (a) | | | 05/14/40 | | | 6 month EURO | | 4.044 | | | (756,581 | ) | | | — | | | | (756,581 | ) |
| Credit Suisse First Boston Corp. | | $ | 53,650 | (a) | | | 12/15/12 | | | 3 month LIBOR | | 1.750 | | | (1,132,417 | ) | | | (187,554 | ) | | | (944,863 | ) |
| | | | EUR 26,320 | (a) | | | 12/15/15 | | | 6 month EURO | | 2.750 | | | (1,191,044 | ) | | | (543,499 | ) | | | (647,545 | ) |
| | | $ | 16,830 | (a) | | | 08/15/17 | | | 3 month LIBOR | | 2.107 | | | (10,248 | ) | | | — | | | | (10,248 | ) |
| | | | 33,650 | (a) | | | 08/15/17 | | | 3 month LIBOR | | 2.244 | | | (308,598 | ) | | | — | | | | (308,598 | ) |
| | | | EUR 5,650 | | | | 08/06/20 | | | 3.764 | | 6 month EURO | | | 165,058 | | | | — | | | | 165,058 | |
| | | | 1,550 | (b) | | | 08/06/40 | | | 6 month EURO | | 3.630 | | | (171,863 | ) | | | — | | | | (171,863 | ) |
JPMorgan
Securities, Inc. | | | 5,310 | (a) | | | 08/07/20 | | | 3.653 | | 6 month EURO | | | 121,640 | | | | — | | | | 121,640 | |
| | | | 10,600 | (a) | | | 08/10/20 | | | 3.530 | | 6 month EURO | | | 168,243 | | | | — | | | | 168,243 | |
| | | | 1,450 | (a) | | | 08/07/40 | | | 6 month EURO | | 3.542 | | | (134,172 | ) | | | — | | | | (134,172 | ) |
| | | | 2,900 | (a) | | | 08/10/40 | | | 6 month EURO | | 3.417 | | | (192,364 | ) | | | — | | | | (192,364 | ) |
| Morgan Stanley Capital Services, Inc. | | $ | 16,830 | (a) | | | 08/15/17 | | | 3 month LIBOR | | 2.186 | | | (93,283 | ) | | | — | | | | (93,283 | ) |
| UBS AG (London) | | | JPY 1,076,000 | (a) | | | 12/15/15 | | | 1.000 | | 6 month JYOR | | | 322,855 | | | | 152,770 | | | | 170,085 | |
| | | | CHF 5,400 | | | | 01/06/17 | | | 2.105 | | 6 month CHFOR | | | 324,902 | | | | — | | | | 324,902 | |
| |
| |
TOTAL | | | | | | | | | | | | | | $ | (1,797,659 | ) | | $ | (595,293 | ) | | $ | (1,202,366 | ) |
| |
| |
| |
| (a) | Represents forward starting interest rate swaps whose effective dates of commencement of accruals and cash flows occur subsequent to September 30, 2010. |
The accompanying notes are an integral part of these financial statements.
GOLDMAN SACHS GLOBAL INCOME FUND
| |
| ADDITIONAL INVESTMENT INFORMATION (continued) | |
WRITTEN OPTIONS — For the six months ended September 30, 2010, the Fund had the following written options activity:
| | | | | | | | | |
| | | Number of
| | | Premiums
| |
| | | Contracts | | | Received | |
| | |
| Contracts Outstanding March 31, 2010 | | | — | | | $ | — | |
| |
| |
| Contracts written | | | 4,738,000 | | | | 5,923 | |
| Contracts expired | | | (4,738,000 | ) | | | (5,923 | ) |
| |
| |
| Contracts Outstanding September 30, 2010 | | | — | | | $ | — | |
| |
| |
The accompanying notes are an integral part of these financial statements.
GOLDMAN SACHS STRATEGIC INCOME FUND
Schedule of Investments
September 30, 2010 (Unaudited)
| | | | | | | | | | | | | | | | | |
| | | Principal
| | Interest
| | Maturity
| | |
| | | Amount | | Rate | | Date | | Value |
| |
Corporate Obligations – 12.4% |
| | | | | | | | | | | | | | | | | |
| | | | | | | | | | | | | | | | | |
| | | Aerospace & Defense(a) – 0.1% |
| | | L-3 Communications Corp. |
| | | $ | 100,000 | | | | 6.375 | % | | | 10/15/15 | | | $ | 103,000 | |
| | | Spirit AeroSystems, Inc. |
| | | | 125,000 | | | | 7.500 | | | | 10/01/17 | | | | 128,125 | |
| | | | | | | | | | | | | | | | | |
| | | | | | | | | | | | | | | | 231,125 | |
| | | |
| | | |
| | | Automotive – 0.3% |
| | | FCE Bank PLC |
| | | EUR | 50,000 | | | | 7.250 | | | | 07/15/13 | | | | 71,467 | |
| | | Ford Motor Credit Co. LLC |
| | | $ | 500,000 | | | | 7.800 | | | | 06/01/12 | | | | 533,125 | |
| | | | | | | | | | | | | | | | | |
| | | | | | | | | | | | | | | | 604,592 | |
| | | |
| | | |
| | | Banks(b) – 1.2% |
| | | Cie de Financement Foncier |
| | | | 1,500,000 | | | | 2.125 | | | | 04/22/13 | | | | 1,527,190 | |
| | | Stadshypotek AB |
| | | | 1,100,000 | | | | 1.450 | | | | 09/30/13 | | | | 1,103,594 | |
| | | | | | | | | | | | | | | | | |
| | | | | | | | | | | | | | | | 2,630,784 | |
| | | |
| | | |
| | | Building Materials(a) – 0.6% |
| | | Cemex Finance LLC |
| | | | 1,220,000 | | | | 9.500 | | | | 12/14/16 | | | | 1,227,681 | |
| | | PLY Gem Industries, Inc. |
| | | | 148,000 | | | | 11.750 | | | | 06/15/13 | | | | 157,990 | |
| | | | | | | | | | | | | | | | | |
| | | | | | | | | | | | | | | | 1,385,671 | |
| | | |
| | | |
| | | Energy – 2.2% |
| | | Brigham Exploration Co.(a)(b) |
| | | | 271,000 | | | | 8.750 | | | | 10/01/18 | | | | 278,453 | |
| | | Comstock Resources, Inc.(a) |
| | | | 640,000 | | | | 8.375 | | | | 10/15/17 | | | | 656,000 | |
| | | Continental Resources, Inc.(a)(b) |
| | | | 100,000 | | | | 7.125 | | | | 04/01/21 | | | | 103,250 | |
| | | EXCO Resources, Inc.(a) |
| | | | 75,000 | | | | 7.250 | | | | 01/15/11 | | | | 74,906 | |
| | | | 310,000 | | | | 7.500 | | | | 09/15/18 | | | | 307,287 | |
| | | Forest Oil Corp.(a) |
| | | | 250,000 | | | | 8.500 | | | | 02/15/14 | | | | 272,500 | |
| | | Gaz Capital SA for Gazprom(c) |
| | | | 300,000 | | | | 9.250 | | | | 04/23/19 | | | | 372,750 | |
| | | Penn Virginia Corp. |
| | | | 125,000 | | | | 4.500 | | | | 11/15/12 | | | | 120,994 | |
| | | Petrohawk Energy Corp.(a) |
| | | | 125,000 | | | | 10.500 | | | | 08/01/14 | | | | 140,625 | |
| | | | 70,000 | | | | 7.875 | | | | 06/01/15 | | | | 73,500 | |
| | | | 41,000 | | | | 7.250 | (b) | | | 08/15/18 | | | | 41,820 | |
| | | Plains Exploration & Production Co.(a) |
| | | | 125,000 | | | | 7.750 | | | | 06/15/15 | | | | 130,938 | |
| | | Quicksilver Resources, Inc.(a) |
| | | | 513,000 | | | | 8.250 | | | | 08/01/15 | | | | 542,497 | |
| | | SESI LLC(a)(c)(d) |
| | | | 340,000 | | | | 1.500 | | | | 12/15/26 | | | | 331,024 | |
| | | Whiting Petroleum Corp.(a) |
| | | | 950,000 | | | | 7.000 | | | | 02/01/14 | | | | 1,002,250 | |
| | | | 485,000 | | | | 6.500 | | | | 10/01/18 | | | | 494,700 | |
| | | | | | | | | | | | | | | | | |
| | | | | | | | | | | | | | | | 4,943,494 | |
| | | |
| | | |
| | | Entertainment(a) – 0.3% |
| | | MU Finance PLC(b) |
| | | $ | 275,000 | | | | 8.375 | | | | 02/01/17 | | | $ | 269,500 | |
| | | Universal City Development Partners Ltd. |
| | | | 489,000 | | | | 8.875 | | | | 11/15/15 | | | | 504,281 | |
| | | | | | | | | | | | | | | | | |
| | | | | | | | | | | | | | | | 773,781 | |
| | | |
| | | |
| | | Gaming(a) – 0.2% |
| | | Harrah’s Operating Co., Inc. |
| | | | 250,000 | | | | 11.250 | | | | 06/01/17 | | | | 273,750 | |
| | | MGM Resorts International |
| | | | 250,000 | | | | 10.375 | | | | 05/15/14 | | | | 276,875 | |
| | | | | | | | | | | | | | | | | |
| | | | | | | | | | | | | | | | 550,625 | |
| | | |
| | | |
| | | Health Care – Medical Products(a) – 0.4% |
| | | Bausch & Lomb, Inc. |
| | | | 239,000 | | | | 9.875 | | | | 11/01/15 | | | | 253,937 | |
| | | DJO Finance LLC/DJO Finance Corp. |
| | | | 655,000 | | | | 10.875 | | | | 11/15/14 | | | | 713,950 | |
| | | | | | | | | | | | | | | | | |
| | | | | | | | | | | | | | | | 967,887 | |
| | | |
| | | |
| | | Health Care – Services(a) – 0.4% |
| | | Alliance HealthCare Services, Inc. |
| | | | 250,000 | | | | 8.000 | | | | 12/01/16 | | | | 231,875 | |
| | | DaVita, Inc. |
| | | | 397,000 | | | | 6.625 | | | | 03/15/13 | | | | 403,451 | |
| | | HCA, Inc. |
| | | | 107,000 | | | | 9.125 | | | | 11/15/14 | | | | 112,751 | |
| | | Psychiatric Solutions, Inc. |
| | | | 139,000 | | | | 7.750 | | | | 07/15/15 | | | | 143,865 | |
| | | Tenet Healthcare Corp. |
| | | | 125,000 | | | | 8.875 | | | | 07/01/19 | | | | 138,125 | |
| | | | | | | | | | | | | | | | | |
| | | | | | | | | | | | | | | | 1,030,067 | |
| | | |
| | | |
| | | Lodging(a) – 0.1% |
| | | Felcor Lodging LP |
| | | | 125,000 | | | | 10.000 | | | | 10/01/14 | | | | 135,938 | |
| | | |
| | | |
| | | Media – Cable(a) – 0.5% |
| | | Charter Communications Operating LLC(b) |
| | | | 600,000 | | | | 8.000 | | | | 04/30/12 | | | | 636,000 | |
| | | DISH DBS Corp. |
| | | | 300,000 | | | | 6.625 | | | | 10/01/14 | | | | 313,500 | |
| | | GCI, Inc. |
| | | | 125,000 | | | | 7.250 | | | | 02/15/14 | | | | 127,812 | |
| | | | | | | | | | | | | | | | | |
| | | | | | | | | | | | | | | | 1,077,312 | |
| | | |
| | | |
| | | Media – Non Cable(a) – 0.6% |
| | | Lamar Media Corp. |
| | | | 125,000 | | | | 9.750 | | | | 04/01/14 | | | | 143,438 | |
| | | LIN Television Corp. |
| | | | 125,000 | | | | 6.500 | | | | 05/15/13 | | | | 124,375 | |
| | | Nielsen Finance LLC(b) |
| | | | 187,000 | | | | 7.750 | | | | 10/15/18 | | | | 185,629 | |
| | | Univision Communications, Inc.(b) |
| | | | 750,000 | | | | 12.000 | | | | 07/01/14 | | | | 817,500 | |
| | | | | | | | | | | | | | | | | |
| | | | | | | | | | | | | | | | 1,270,942 | |
| | | |
| | | |
The accompanying notes are an integral part of these financial statements.
GOLDMAN SACHS STRATEGIC INCOME FUND
| | | | | | | | | | | | | | | | | |
| | | Principal
| | Interest
| | Maturity
| | |
| | | Amount | | Rate | | Date | | Value |
| |
Corporate Obligations – (continued) |
| | | | | | | | | | | | | | | | | |
| | | Metals & Mining(a) – 0.1% |
| | | Teck Resources Ltd. |
| | | $ | 117,000 | | | | 10.750 | % | | | 05/15/19 | | | $ | 146,250 | |
| | | |
| | | |
| | | Noncaptive – Financial – 2.0% |
| | | Ally Credit Canada Ltd. |
| | | GBP | 250,000 | | | | 6.625 | | | | 12/17/10 | | | | 392,329 | |
| | | Ally Financial, Inc. |
| | | $ | 125,000 | | | | 6.875 | | | | 08/28/12 | | | | 130,000 | |
| | | | 125,000 | | | | 6.750 | | | | 12/01/14 | | | | 130,000 | |
| | | CIT Group Funding Co. of Delaware LLC(a) |
| | | | 148,931 | | | | 10.250 | | | | 05/01/13 | | | | 154,702 | |
| | | | 55,483 | | | | 10.250 | | | | 05/01/14 | | | | 57,633 | |
| | | | 154,586 | | | | 10.250 | | | | 05/01/15 | | | | 159,610 | |
| | | | 119,000 | | | | 10.250 | | | | 05/01/16 | | | | 122,868 | |
| | | | 750,000 | | | | 10.250 | | | | 05/01/17 | | | | 776,250 | |
| | | CIT Group, Inc.(a) |
| | | | 1,013,000 | | | | 7.000 | | | | 05/01/13 | | | | 1,019,331 | |
| | | | 97,000 | | | | 7.000 | | | | 05/01/14 | | | | 96,758 | |
| | | International Lease Finance Corp. |
| | | | 96,000 | | | | 4.750 | | | | 01/13/12 | | | | 95,520 | |
| | | | 20,000 | | | | 5.400 | | | | 02/15/12 | | | | 20,100 | |
| | | SLM Corp. |
| | | CAD | 150,000 | | | | 4.625 | | | | 06/15/11 | | | | 144,766 | |
| | | EUR | 1,000,000 | | | | 3.125 | | | | 09/17/12 | | | | 1,280,896 | |
| | | | | | | | | | | | | | | | | |
| | | | | | | | | | | | | | | | 4,580,763 | |
| | | |
| | | |
| | | Packaging(a)(b) – 0.0% |
| | | OI European Group BV |
| | | | 70,000 | | | | 6.750 | | | | 09/15/20 | | | | 97,575 | |
| | | |
| | | |
| | | Paper(a) – 0.2% |
| | | Domtar Corp. |
| | | $ | 225,000 | | | | 10.750 | | | | 06/01/17 | | | | 277,875 | |
| | | Georgia-Pacific LLC(b) |
| | | | 97,000 | | | | 8.250 | | | | 05/01/16 | | | | 107,913 | |
| | | | | | | | | | | | | | | | | |
| | | | | | | | | | | | | | | | 385,788 | |
| | | |
| | | |
| | | Pipelines – 0.2% |
| | | Carrizo Oil & Gas, Inc.(a)(c) |
| | | | 200,000 | | | | 4.375 | | | | 06/01/28 | | | | 186,185 | |
| | | Goodrich Petroleum Corp.(a)(c) |
| | | | 250,000 | | | | 3.250 | | | | 12/01/26 | | | | 244,885 | |
| | | Regency Energy Partners LP |
| | | | 125,000 | | | | 9.375 | | | | 06/01/16 | | | | 137,500 | |
| | | | | | | | | | | | | | | | | |
| | | | | | | | | | | | | | | | 568,570 | |
| | | |
| | | |
| | | Services Cyclical – Business Services(a)(b) – 0.0% |
| | | West Corp. |
| | | | 100,000 | | | | 8.625 | | | | 10/01/18 | | | | 100,000 | |
| | | |
| | | |
| | | Services Cyclical – Rental Equipment(a) – 1.5% |
| | | Mobile Mini, Inc. |
| | | | 125,000 | | | | 9.750 | | | | 08/01/14 | | | | 130,938 | |
| | | RSC Equipment Rental, Inc. |
| | | | 1,017,000 | | | | 9.500 | | | | 12/01/14 | | | | 1,055,137 | |
| | | United Rentals North America, Inc. |
| | | | 2,231,000 | | | | 7.750 | | | | 11/15/13 | | | | 2,253,310 | |
| | | | | | | | | | | | | | | | | |
| | | | | | | | | | | | | | | | 3,439,385 | |
| | | |
| | | |
| | | Technology – 0.1% |
| | | VeriFone Systems, Inc. |
| | | $ | 125,000 | | | | 1.375 | | | | 06/15/12 | | | $ | 124,131 | |
| | | |
| | | |
| | | Transportation(a) – 0.2% |
| | | United Air Lines, Inc.(b) |
| | | | 250,000 | | | | 9.875 | | | | 08/01/13 | | | | 268,750 | |
| | | United Continental Holdings Corp.(c) |
| | | | 125,000 | | | | 5.000 | | | | 02/01/21 | | | | 125,765 | |
| | | | | | | | | | | | | | | | | |
| | | | | | | | | | | | | | | | 394,515 | |
| | | |
| | | |
| | | Wireless Telecommunications – 0.7% |
| | | Crown Castle International Corp.(a) |
| | | | 125,000 | | | | 9.000 | | | | 01/15/15 | | | | 137,500 | |
| | | Intelsat Subsidiary Holding Co. SA(a) |
| | | | 250,000 | | | | 8.500 | | | | 01/15/13 | | | | 252,500 | |
| | | Nextel Communications, Inc.(a) |
| | | | 356,000 | | | | 6.875 | | | | 10/31/13 | | | | 359,560 | |
| | | NII Holdings, Inc. |
| | | | 250,000 | | | | 3.125 | | | | 06/15/12 | | | | 242,736 | |
| | | Sprint Capital Corp.(a) |
| | | | 110,000 | | | | 8.375 | | | | 03/15/12 | | | | 117,425 | |
| | | Wind Acquisition Finance SA(a) |
| | | EUR | 250,000 | | | | 11.750 | | | | 07/15/17 | | | | 378,302 | |
| | | | | | | | | | | | | | | | | |
| | | | | | | | | | | | | | | | 1,488,023 | |
| | | |
| | | |
| | | Wirelines Telecommunications(a) – 0.5% |
| | | Frontier Communications Corp. |
| | | $ | 95,000 | | | | 8.250 | | | | 05/01/14 | | | | 104,381 | |
| | | | 697,000 | | | | 7.875 | | | | 04/15/15 | | | | 754,503 | |
| | | Windstream Corp. |
| | | | 349,000 | | | | 8.625 | | | | 08/01/16 | | | | 368,195 | |
| | | | | | | | | | | | | | | | | |
| | | | | | | | | | | | | | | | 1,227,079 | |
| | | |
| | | |
| | | TOTAL CORPORATE OBLIGATIONS |
| | | (Cost $27,884,923) | | $ | 28,154,297 | |
| | | |
| | | |
| | | | | | | | | | | | | | | | | |
| | | | | | | | | | | | | | | | | |
Mortgage-Backed Obligations – 22.6% |
| | | | | | | | | | | | | | | | | |
| | | | | | | | | | | | | | | | | |
| | | Adjustable Rate Non-Agency – 8.6% |
| | | American Home Mortgage Assets Series 2007-2, Class A1(e) |
| | | $ | 2,899,337 | | | | 0.381 | % | | | 03/25/47 | | | $ | 1,577,297 | |
| | | BCAP LLC Trust Series 2007-AA2, Class 2A7 |
| | | | 4,350,000 | | | | 6.000 | | | | 04/25/37 | | | | 3,305,174 | |
| | | Countrywide Alternative Loan Trust Series 2005-76, Class 1A1(e) |
| | | | 3,738,254 | | | | 1.850 | | | | 01/25/36 | | | | 2,590,677 | |
| | | Deutsche Alt-A Securities, Inc. Alternate Loan Trust Series 2006-OA1, Class A1(e) |
| | | | 781,806 | | | | 0.456 | | | | 02/25/47 | | | | 492,143 | |
| | | Downey Savings & Loan Association Mortgage Loan Trust Series 2006-AR2, Class 2A1A(e) |
| | | | 2,352,279 | | | | 0.457 | | | | 11/19/37 | | | | 1,583,554 | |
| | | Harborview Mortgage Loan Trust Series 2006-14, Class 2A1A(e) |
| | | | 122,352 | | | | 0.407 | | | | 01/25/47 | | | | 69,765 | |
| | | Lehman XS Trust Series 2007-16N, Class 2A2(e) |
| | | | 815,344 | | | | 1.106 | | | | 09/25/47 | | | | 489,288 | |
| | | |
| | | |
The accompanying notes are an integral part of these financial statements.
GOLDMAN SACHS STRATEGIC INCOME FUND
Schedule of Investments (continued)
September 30, 2010 (Unaudited)
| | | | | | | | | | | | | | | | | |
| | | Principal
| | Interest
| | Maturity
| | |
| | | Amount | | Rate | | Date | | Value |
| |
Mortgage-Backed Obligations – (continued) |
| | | Adjustable Rate Non-Agency – (continued) |
| | | | | | | | | | | | | | | | | |
| | | Luminent Mortgage Trust Series 2007-2, Class 2A1(e) |
| | | $ | 3,892,706 | | | | 0.486 | % | | | 05/25/37 | | | $ | 2,191,983 | |
| | | Residential Accredit Loans, Inc. Series 2005-Q05, Class A1(e) |
| | | | 2,875,364 | | | | 1.370 | | | | 01/25/46 | | | | 1,543,495 | |
| | | Residential Accredit Loans, Inc. Series 2007-QH2, Class A1(e) |
| | | | 844,674 | | | | 0.396 | | | | 03/25/37 | | | | 502,581 | |
| | | Residential Accredit Loans, Inc. Series 2007-QH9, Class A1(e) |
| | | | 3,108,131 | | | | 6.374 | | | | 11/25/37 | | | | 1,530,901 | |
| | | Structured Asset Mortgage Investments, Inc. Series 2006-AR6, Class 1A3(e) |
| | | | 894,177 | | | | 0.446 | | | | 07/25/46 | | | | 470,069 | |
| | | Structured Asset Mortgage Investments, Inc. Series 2006-AR7, Class A1A(e) |
| | | | 950,534 | | | | 0.466 | | | | 08/25/36 | | | $ | 560,340 | |
| | | Structured Asset Mortgage Investments, Inc. Series 2007-AR7, Class 1A1(e) |
| | | | 2,552,655 | | | | 1.106 | | | | 05/25/47 | | | | 1,374,349 | |
| | | Washington Mutual Mortgage Pass-Through Certificates Series 2005-AR6, Class 2A1A(e) |
| | | | 774,189 | | | | 0.486 | | | | 04/25/45 | | | | 620,932 | |
| | | Washington Mutual Mortgage Pass-Through Certificates Series 2005-AR8, Class 1A1A(e) |
| | | | 645,872 | | | | 0.526 | | | | 07/25/45 | | | | 517,919 | |
| | | | | | | | | | | | | | | | | |
| | | | | | | | | | | | | | | | 19,420,467 | |
| | | |
| | | |
| | | Collateralized Mortgage Obligations – 9.5% |
| | | Regular Floater(e) – 0.7% |
| | | Countrywide Alternative Loan Trust Series 2005-64CB, Class 1A12 |
| | | $ | 2,560,860 | | | | 1.056 | % | | | 12/25/35 | | | $ | 1,671,246 | |
| | | |
| | | |
| | | Sequential Fixed Rate – 7.5% |
| | | Banc of America Funding Corp. Series 2007-8, Class 2A1 |
| | | | 4,839,126 | | | | 7.000 | | | | 10/25/37 | | | | 3,624,155 | |
| | | Citicorp Mortgage Securities, Inc. Series 2007-4, Class 2A1 |
| | | | 1,890,960 | | | | 5.500 | | | | 05/25/22 | | | | 1,884,015 | |
| | | Citimortgage Alternative Loan Trust Series 2007-A1, Class 1A7 |
| | | | 3,088,256 | | | | 6.000 | | | | 01/25/37 | | | | 2,171,117 | |
| | | Countrywide Alternative Loan Trust Series 2007-18CB, Class 2A25 |
| | | | 1,279,323 | | | | 6.000 | | | | 08/25/37 | | | | 988,662 | |
| | | Residential Accredit Loans, Inc. Series 06-QS2, Class 1A9 |
| | | | 1,758,833 | | | | 5.500 | | | | 02/25/36 | | | | 1,222,340 | |
| | | Wells Fargo Alternative Loan Trust Series 2007-PA3, Class 1A1 |
| | | | 2,117,399 | | | | 5.750 | | | | 07/25/37 | | | | 1,611,822 | |
| | | Wells Fargo Alternative Loan Trust Series 2007-PA3, Class 3A1 |
| | | | 7,060,168 | | | | 6.250 | | | | 07/25/37 | | | | 5,478,691 | |
| | | | | | | | | | | | | | | | | |
| | | | | | | | | | | | | | | | 16,980,802 | |
| | | |
| | | |
| | | Sequential Floating Rate(e) – 0.8% |
| | | Banc of America Funding Corp. Series 2007-2, Class 2A1 |
| | | | 839,421 | | | | 5.662 | | | | 03/25/37 | | | | 787,451 | |
| | | Washington Mutual Alternative Mortgage Pass-Through Certificates Series 2006-AR10, Class A1 |
| | | | 1,965,746 | | | | 0.356 | | | | 12/25/36 | | | | 1,098,572 | |
| | | | | | | | | | | | | | | | | |
| | | | | | | | | | | | | | | | 1,886,023 | |
| | | |
| | | |
| | | Support – 0.5% |
| | | Countrywide Alternative Loan Trust Series 2006-4CB, Class 2A4 |
| | | | 1,463,832 | | | | 5.500 | | | | 04/25/36 | | | | 1,085,958 | |
| | | |
| | | |
| | | TOTAL COLLATERALIZED MORTGAGE OBLIGATIONS | | $ | 21,624,029 | |
| | | |
| | | |
| | | Federal Agencies(f) – 4.5% |
| | | FNMA – 4.5% |
| | | $ | 10,000,000 | | | | 3.500 | % | | | TBA-15yr | | | $ | 10,254,688 | |
| | | |
| | | |
| | | TOTAL MORTGAGE-BACKED OBLIGATIONS |
| | | (Cost $51,054,978) | | $ | 51,299,184 | |
| | | |
| | | |
| | | | | | | | | | | | | | | | | |
| | | | | | | | | | | | | | | | | |
Agency Debentures – 1.1% |
| | | | | | | | | | | | | | | | | |
| | | | | | | | | | | | | | | | | |
| | | FHLMC |
| | | $ | 800,000 | | | | 3.800 | % | | | 03/09/16 | | | $ | 811,887 | |
| | | FNMA |
| | | | 100,000 | | | | 3.000 | | | | 07/28/14 | | | | 101,937 | |
| | | | 1,500,000 | | | | 3.000 | | | | 01/28/15 | | | | 1,512,037 | |
| | | |
| | | |
| | | TOTAL AGENCY DEBENTURES |
| | | (Cost $2,434,672) | | $ | 2,425,861 | |
| | | |
| | | |
| | | | | | | | | | | | | | | | | |
| | | | | | | | | | | | | | | | | |
Asset-Backed Securities(e) – 9.0% |
| | | | | | | | | | | | | | | | | |
| | | | | | | | | | | | | | | | | |
| | | Collateralized Loan Obligations(b) – 3.4% |
| | | Black Diamond CLO Ltd. Series 2005-1A, Class A1 |
| | | $ | 3,000,000 | | | | 0.561 | % | | | 06/20/17 | | | $ | 2,728,506 | |
| | | DFR Middle Market CLO Ltd. Series 2007-1A, Class A1A |
| | | | 1,556,603 | | | | 0.781 | | | | 07/20/19 | | | | 1,449,971 | |
| | | KKR Financial CLO Ltd. Series 2007-1A, Class A |
| | | | 841,287 | | | | 0.726 | | | | 05/15/21 | | | | 748,920 | |
| | | KKR Financial CLO Ltd. Series 2007-AA, Class A |
| | | | 1,900,397 | | | | 1.276 | | | | 10/15/17 | | | | 1,785,417 | |
| | | Mountain View Funding CLO Series 2007-3A, Class A1 |
| | | | 991,160 | | | | 0.741 | | | | 04/16/21 | | | | 892,021 | |
| | | | | | | | | | | | | | | | | |
| | | | | | | | | | | | | | | | 7,604,835 | |
| | | |
| | | |
| | | Home Equity – 5.0% |
| | | CIT Mortgage Loan Trust Series 2007-1, Class 2A1(b) |
| | | | 608,586 | | | | 1.256 | | | | 10/25/37 | | | | 571,545 | |
| | | CIT Mortgage Loan Trust Series 2007-1, Class 2A2(b) |
| | | | 600,000 | | | | 1.506 | | | | 10/25/37 | | | | 371,959 | |
| | | CIT Mortgage Loan Trust Series 2007-1, Class 2A3(b) |
| | | | 1,120,000 | | | | 1.706 | | | | 10/25/37 | | | | 563,164 | |
| | | Countrywide Asset-Backed Certificates Series 2007-2, Class 2A4 |
| | | | 20,000,000 | | | | 0.476 | | | | 08/25/37 | | | | 4,800,000 | |
| | | |
| | | |
The accompanying notes are an integral part of these financial statements.
GOLDMAN SACHS STRATEGIC INCOME FUND
| | | | | | | | | | | | | | | | | |
| | | Principal
| | Interest
| | Maturity
| | |
| | | Amount | | Rate | | Date | | Value |
| |
Asset-Backed Securities(e) – (continued) |
| | | Home Equity – (continued) |
| | | | | | | | | | | | | | | | | |
| | | Soundview Home Equity Loan Trust Series 2006-EQ1, Class A4 |
| | | $ | 11,762,000 | | | | 0.506 | % | | | 10/25/36 | | | $ | 5,116,470 | |
| | | | | | | | | | | | | | | | | |
| | | | | | | | | | | | | | | | 11,423,138 | |
| | | |
| | | |
| | | Student Loan(b) – 0.6% |
| | | US Education Loan Trust LLC Series 2006-1, Class A2 |
| | | | 1,299,259 | | | | 0.427 | | | | 03/01/25 | | | | 1,289,061 | |
| | | |
| | | |
| | | TOTAL ASSET-BACKED SECURITIES |
| | | (Cost $20,295,577) | | $ | 20,317,034 | |
| | | |
| | | |
| | | | | | | | | | | | | | | | | |
| | | | | | | | | | | | | | | | | |
Foreign Debt Obligations – 4.4% |
| | | | | | | | | | | | | | | | | |
| | | | | | | | | | | | | | | | | |
| | | Sovereign – 4.4% |
| | | Dubai DOF Sukuk Ltd. |
| | | $ | 290,000 | | | | 6.396 | % | | | 11/03/14 | | | $ | 289,130 | |
| | | Mexican Bonos |
| | | MXN | 6,400,000 | | | | 9.000 | | | | 12/20/12 | | | | 549,580 | |
| | | | 16,700,000 | | | | 10.000 | | | | 12/05/24 | | | | 1,765,256 | |
| | | Republic of Argentina |
| | | $ | 470,000 | | | | 7.000 | | | | 09/12/13 | | | | 440,873 | |
| | | | 750,000 | | | | 7.000 | | | | 10/03/15 | | | | 660,458 | |
| | | | 1,420,000 | | | | 0.000 | (e) | | | 12/15/35 | | | | 166,850 | |
| | | EUR | 7,360,000 | | | | 2.840 | (e) | | | 12/15/35 | | | | 1,083,621 | |
| | | Republic of Belarus |
| | | $ | 770,000 | | | | 8.750 | | | | 08/03/15 | | | | 793,100 | |
| | | Republic of South Africa |
| | | ZAR | 11,500,000 | | | | 10.500 | | | | 12/21/26 | | | | 2,024,650 | |
| | | Republic of Venezuela |
| | | $ | 690,000 | | | | 5.750 | | | | 02/26/16 | | | | 476,100 | |
| | | | 130,000 | | | | 7.750 | | | | 10/13/19 | | | | 86,125 | |
| | | | 1,100,000 | | | | 9.000 | | | | 05/07/23 | | | | 738,100 | |
| | | | 290,000 | | | | 8.250 | | | | 10/13/24 | | | | 185,600 | |
| | | | 40,000 | | | | 7.650 | | | | 04/21/25 | | | | 24,400 | |
| | | Russian Federation(d) |
| | | | 617,550 | | | | 7.500 | | | | 03/31/30 | | | | 736,428 | |
| | | |
| | | |
| | | TOTAL FOREIGN DEBT OBLIGATIONS |
| | | (Cost $9,812,974) | | $ | 10,020,271 | |
| | | |
| | | |
| | | | | | | | | | | | | | | | | |
| | | | | | | | | | | | | | | | | |
Structured Notes(g) – 2.5% |
| | | | | | | | | | | | | | | | | |
| | | | | | | | | | | | | | | | | |
| | | Egypt Treasury Bills(b)(h) |
| | | EGP | 10,300,000 | | | | 0.000 | % | | | 04/05/11 | | | $ | 1,724,929 | |
| | | Federal Republic of Brazil(e)(i) |
| | | BRL | 6,549,842 | | | | 6.000 | | | | 08/15/40 | | | | 3,898,731 | |
| | | |
| | | |
| | | TOTAL STRUCTURED NOTES |
| | | (Cost $5,625,027) | | $ | 5,623,660 | |
| | | |
| | | |
| | | | | | | | | | | | | | | | | |
| | | | | | | | | | | | | | | | | |
Municipal Debt Obligations – 1.2% |
| | | | | | | | | | | | | | | | | |
| | | | | | | | | | | | | | | | | |
| | | California – 0.9% |
| | | California State GO Bonds Build America Series 2009 |
| | | $ | 300,000 | | | | 7.350 | % | | | 11/01/39 | | | $ | 320,187 | |
| | | California State GO Bonds Build America Taxable Series 2009 |
| | | | 500,000 | | | | 7.500 | | | | 04/01/34 | | | | 543,990 | |
| | | California State GO Bonds Build America Taxable Series 2010 |
| | | | 1,000,000 | | | | 7.625 | | | | 03/01/40 | | | | 1,099,880 | |
| | | | | | | | | | | | | | | | | |
| | | | | | | | | | | | | | | | 1,964,057 | |
| | | |
| | | |
| | | Illinois – 0.3% |
| | | Illinois State GO Bonds Build America Series 2010 |
| | | | 650,000 | | | | 7.350 | | | | 07/01/35 | | | | 682,110 | |
| | | |
| | | |
| | | TOTAL MUNICIPAL DEBT OBLIGATIONS |
| | | (Cost $2,656,472) | | $ | 2,646,167 | |
| | | |
| | | |
| | | | | | | | | | | | | | | | | |
| | | | | | | | | | | | | | | | | |
Government Guarantee Obligations(j) – 2.8% |
| | | | | | | | | | | | | | | | | |
| | | | | | | | | | | | | | | | | |
| | | FIH Erhvervsbank A/S(b) |
| | | $ | 585,000 | | | | 1.750 | % | | | 12/06/12 | | | $ | 595,352 | |
| | | | 1,300,000 | | | | 2.000 | | | | 06/12/13 | | | | 1,329,555 | |
| | | ING Bank NV(b) |
| | | | 600,000 | | | | 2.625 | | | | 02/09/12 | | | | 613,288 | |
| | | Landwirtschaftliche Rentenbank |
| | | | 1,500,000 | | | | 5.000 | | | | 02/15/13 | | | | 1,644,936 | |
| | | Swedbank AB(b) |
| | | | 2,200,000 | | | | 3.000 | | | | 12/22/11 | | | | 2,262,018 | |
| | | |
| | | |
| | | TOTAL GOVERNMENT GUARANTEE OBLIGATIONS |
| | | (Cost $6,425,332) | | $ | 6,445,149 | |
| | | |
| | | |
| | | | | | | | | | | | | | | | | |
| | | | | | | | | | | | | | | | | |
U.S. Treasury Obligations – 22.2% |
| | | | | | | | | | | | | | | | | |
| | | | | | | | | | | | | | | | | |
| | | United State Treasury Bills(g)(k) |
| | | $ | 2,000,000 | | | | 0.000 | % | | | 06/30/11 | | | $ | 1,996,827 | |
| | | United States Treasury Inflation Protected Securities |
| | | | 1,757,376 | | | | 2.375 | | | | 04/15/11 | | | | 1,780,169 | |
| | | | 2,910,024 | | | | 3.000 | | | | 07/15/12 | | | | 3,090,998 | |
| | | United States Treasury Notes |
| | | | 16,100,000 | | | | 0.625 | | | | 06/30/12 | | | | 16,165,525 | |
| | | | 800,000 | | | | 0.625 | | | | 07/31/12 | | | | 803,328 | |
| | | | 14,100,000 | | | | 0.750 | | | �� | 08/15/13 | | | | 14,153,157 | |
| | | | 8,500,000 | | | | 0.750 | | | | 09/15/13 | | | | 8,527,201 | |
| | | | 3,700,000 | | | | 1.250 | | | | 09/30/15 | | | | 3,694,783 | |
| | | |
| | | |
| | | TOTAL U.S. TREASURY OBLIGATIONS |
| | | (Cost $50,020,779) | | $ | 50,211,988 | |
| | | |
| | | |
The accompanying notes are an integral part of these financial statements.
GOLDMAN SACHS STRATEGIC INCOME FUND
Schedule of Investments (continued)
September 30, 2010 (Unaudited)
| | | | | | | | | | | |
| | | Shares | | Rate | | Value |
| |
Preferred Stock*(e) – 0.0% |
| | | | | | | | | | | |
| | | | | | | | | | | |
| | | Citigroup Capital XIII |
| | | | 360 | | | 7.875% | | $ | 9,324 | |
| | | (Cost $9,000) | | | | |
| | | |
| | | |
| | | TOTAL INVESTMENTS BEFORE SHORT-TERM INVESTMENT |
| | | (Cost $176,219,734) | | $ | 177,152,935 | |
| | | |
| | | |
| | | | | | | | | | | | | | | | | |
| | | Principal
| | Interest
| | Maturity
| | |
| | | Amount | | Rate | | Date | | Value |
| |
Short-term Investment(l) – 25.7% |
| | | | | | | | | | | | | | | | | |
| | | | | | | | | | | | | | | | | |
| | | Repurchase Agreement – 25.7% |
| | | Joint Repurchase Agreement Account II |
| | | $ | 58,100,000 | | | | 0.270 | % | | | 10/01/10 | | | $ | 58,100,000 | |
| | | Maturity Value: $58,100,436 | | | | |
| | | (Cost $58,100,000) | | | | |
| | | |
| | | |
| | | TOTAL INVESTMENTS – 103.9% |
| | | (Cost $234,319,734) | | $ | 235,252,935 | |
| | | |
| | | |
| | | LIABILITIES IN EXCESS OF
OTHER ASSETS – (3.9)% | | | (8,931,922 | ) |
| | | |
| | | |
| | | NET ASSETS – 100.0% | | $ | 226,321,013 | |
| | | |
| | | |
The percentage shown for each investment category reflects the value of investments in that category as a percentage of net assets.
| | |
| * | | Non-income producing security. |
| |
| (a) | | Security with “Call” features with resetting interest rates. Maturity dates disclosed are the final maturity dates. |
| |
| (b) | | Exempt from registration under Rule 144A of the Securities Act of 1933. Under procedures approved by the Board of Trustees, such securities have been determined to be liquid by the investment adviser and may be resold, normally to qualified institutional buyers in transactions exempt from registration. Total market value of Rule 144A securities amounts to $22,462,880, which represents approximately 9.9% of net assets as of September 30, 2010. |
| |
| (c) | | Security with “Put” features with resetting interest rates. Maturity dates disclosed are the final maturity dates. |
| |
| (d) | | Coupon changes periodically based upon a predetermined schedule. Interest rate disclosed is that which is in effect at September 30, 2010. |
| |
| (e) | | Variable rate security. Interest rate disclosed is that which is in effect at September 30, 2010. |
| |
| (f) | | TBA (To Be Announced) Securities are purchased on a forward commitment basis with an approximate principal amount and no defined maturity date. The actual principal and maturity date will be determined upon settlement when the specific mortgage pools are assigned. Total market value of TBA securities (excluding forward sales contracts, if any) amounts to $10,254,688 which represents approximately 4.5% of net assets as of September 30, 2010. |
| |
| (g) | | Issued with a zero coupon. Income is recognized through the accretion of discount. |
| |
| (h) | | The underlying security is issued by Deutsche Bank AG. |
| |
| (i) | | The underlying security is issued by HSBC Corp. |
| |
| (j) | | Guaranteed by a foreign government until maturity. |
| |
| (k) | | A portion of this security is segregated as collateral for initial margin requirements on futures transactions. |
| |
| (l) | | Joint repurchase agreement was entered into on September 30, 2010. Additional information appears on pages 74-75. |
| | | | | | | |
| | | |
| | | |
| | | Currency Abbreviations: |
| | | AUD | | — | | Australian Dollar |
| | | BRL | | — | | Brazilian Real |
| | | CAD | | — | | Canadian Dollar |
| | | CHF | | — | | Swiss Franc |
| | | EGP | | — | | Egyptian Pound |
| | | EUR | | — | | Euro |
| | | GBP | | — | | British Pound |
| | | JPY | | — | | Japanese Yen |
| | | MXN | | — | | Mexican Peso |
| | | NOK | | — | | Norwegian Krone |
| | | NZD | | — | | New Zealand Dollar |
| | | SEK | | — | | Swedish Krona |
| | | ZAR | | — | | South African Rand |
| | | |
| | | Investment Abbreviations: |
| | | BP | | — | | British Pound Offered Rate |
| | | EURO | | — | | Euro Offered Rate |
| | | FHLMC | | — | | Federal Home Loan Mortgage Corp. |
| | | FNMA | | — | | Federal National Mortgage Association |
| | | GO | | — | | General Obligation |
| | | LIBOR | | — | | London Interbank Offered Rate |
| | | |
| | | |
The accompanying notes are an integral part of these financial statements.
GOLDMAN SACHS STRATEGIC INCOME FUND
ADDITIONAL INVESTMENT INFORMATION
FORWARD FOREIGN CURRENCY EXCHANGE CONTRACTS — At September 30, 2010, the Fund had outstanding forward foreign currency exchange contracts, both to purchase and sell foreign currencies:
FORWARD FOREIGN CURRENCY EXCHANGE CONTRACTS WITH UNREALIZED GAIN
| | | | | | | | | | | | | | | | | |
| | | | | Contract
| | Expiration
| | Current
| | Unrealized
|
| Counterparty | | Currency | | Type | | Date | | Value | | Gain |
| |
| Bank of America Securities LLC | | CAD | | Purchase | | | 12/15/10 | | | $ | 946,899 | | | $ | 1,815 | |
| Barclays Bank PLC | | NOK | | Purchase | | | 12/15/10 | | | | 397,781 | | | | 9,881 | |
| Citibank NA | | CAD | | Purchase | | | 12/15/10 | | | | 414,806 | | | | 2,806 | |
| Credit Suisse International (London) | | EUR | | Purchase | | | 12/15/10 | | | | 3,117,263 | | | | 87,524 | |
| | | GBP | | Purchase | | | 12/15/10 | | | | 278,773 | | | | 2,308 | |
| | | SEK | | Purchase | | | 12/15/10 | | | | 495,492 | | | | 21,392 | |
| Deutsche Bank AG (London) | | AUD | | Purchase | | | 12/15/10 | | | | 2,308,366 | | | | 14,197 | |
| | | CAD | | Purchase | | | 12/15/10 | | | | 907,859 | | | | 12,859 | |
| | | MXN | | Sale | | | 11/24/10 | | | | 875,631 | | | | 2,806 | |
| HSBC Bank PLC | | EUR | | Purchase | | | 12/15/10 | | | | 557,238 | | | | 33,460 | |
| JPMorgan Securities, Inc. | | AUD | | Purchase | | | 12/15/10 | | | | 741,052 | | | | 11,882 | |
| | | BRL | | Purchase | | | 10/04/10 | | | | 2,667,911 | | | | 23,486 | |
| | | EUR | | Purchase | | | 12/15/10 | | | | 1,527,184 | | | | 28,604 | |
| | | GBP | | Purchase | | | 12/15/10 | | | | 1,289,364 | | | | 32,064 | |
| | | NZD | | Sale | | | 12/15/10 | | | | 145,016 | | | | 780 | |
| Morgan Stanley & Co. | | EUR | | Sale | | | 12/15/10 | | | | 818,128 | | | | 1,537 | |
| Royal Bank of Canada | | | | Purchase | | | 10/14/10 | | | | 2,788,914 | | | | 189,205 | |
| UBS AG (London) | | | | Purchase | | | 12/15/10 | | | | 2,205,791 | | | | 39,306 | |
| |
| |
TOTAL | | | | | | | | | | | | | | $ | 515,912 | |
| |
| |
FORWARD FOREIGN CURRENCY EXCHANGE CONTRACTS WITH UNREALIZED LOSS
| | | | | | | | | | | | | | | | | |
| | | | | Contract
| | Expiration
| | Current
| | Unrealized
|
| Counterparty | | Currency | | Type | | Date | | Value | | Loss |
| |
| BNP Paribas SA | | NZD | | Sale | | | 12/15/10 | | | $ | 1,594,612 | | | $ | (34,004 | ) |
| Citibank NA | | EUR | | Sale | | | 12/15/10 | | | | 667,596 | | | | (24,667 | ) |
| Credit Suisse International (London) | | CAD | | Purchase | | | 12/15/10 | | | | 200,284 | | | | (849 | ) |
| | | CHF | | Sale | | | 12/15/10 | | | | 427,285 | | | | (13,443 | ) |
| | | JPY | | Sale | | | 12/15/10 | | | | 927,993 | | | | (8,325 | ) |
| | | NZD | | Purchase | | | 12/15/10 | | | | 695,627 | | | | (3,416 | ) |
| HSBC Bank PLC | | EUR | | Sale | | | 12/15/10 | | | | 3,145,875 | | | | (54,463 | ) |
| JPMorgan Securities, Inc. | | AUD | | Sale | | | 12/15/10 | | | | 483,245 | | | | (25,454 | ) |
| | | BRL | | Sale | | | 10/04/10 | | | | 2,667,911 | | | | (31,356 | ) |
| | | | | Sale | | | 01/18/11 | | | | 2,607,777 | | | | (20,889 | ) |
| | | CAD | | Sale | | | 12/15/10 | | | | 25,738 | | | | (154 | ) |
| | | EUR | | Sale | | | 10/22/10 | | | | 885,282 | | | | (44,420 | ) |
| | | | | Sale | | | 10/14/10 | | | | 2,788,914 | | | | (80,340 | ) |
| | | | | Sale | | | 12/15/10 | | | | 676,960 | | | | (30,404 | ) |
| | | GBP | | Sale | | | 10/29/10 | | | | 413,980 | | | | (4,049 | ) |
| Morgan Stanley & Co. | | MXN | | Sale | | | 11/24/10 | | | | 1,029,168 | | | | (5,855 | ) |
| | | NOK | | Purchase | | | 12/15/10 | | | | 546,976 | | | | (2,491 | ) |
| | | ZAR | | Sale | | | 11/10/10 | | | | 1,489,174 | | | | (40,319 | ) |
| Royal Bank of Canada | | CAD | | Sale | | | 12/15/10 | | | | 781,702 | | | | (3,702 | ) |
| | | EUR | | Purchase | | | 12/15/10 | | | | 1,681,251 | | | | (4,312 | ) |
| | | | | Sale | | | 10/22/10 | | | | 900,855 | | | | (37,959 | ) |
| | | GBP | | Purchase | | | 12/15/10 | | | | 524,495 | | | | (6,666 | ) |
| |
| |
TOTAL | | | | | | | | | | | | | | $ | (477,537 | ) |
| |
| |
The accompanying notes are an integral part of these financial statements.
GOLDMAN SACHS STRATEGIC INCOME FUND
Schedule of Investments (continued)
September 30, 2010 (Unaudited)
| |
| ADDITIONAL INVESTMENT INFORMATION (continued) | |
FORWARD FOREIGN CROSS CURRENCY EXCHANGE CONTRACTS WITH UNREALIZED GAIN (PURCHASE/SALE)
| | | | | | | | | | | | | | | | | |
| | | | | Expiration
| | Purchase
| | Sale
| | Unrealized
|
| Counterparty | | Currency | | Date | | Current Value | | Current Value | | Gain |
| |
| Bank of America Securities LLC | | SEK/EUR | | 12/15/10 | | $ | 928,346 | | | $ | 919,078 | | | $ | 9,268 | |
| Citibank NA | | EUR/CHF | | 12/15/10 | | | 1,216,659 | | | | 1,206,919 | | | | 9,740 | |
| Deutsche Bank AG (London) | | EUR/GBP | | 12/15/10 | | | 745,255 | | | | 734,269 | | | | 10,986 | |
| HSBC Bank PLC | | EUR/GBP | | 12/15/10 | | | 1,337,916 | | | | 1,301,666 | | | | 36,250 | |
| | | SEK/EUR | | 12/15/10 | | | 1,279,417 | | | | 1,279,331 | | | | 86 | |
| | | EUR/NOK | | 12/15/10 | | | 1,347,454 | | | | 1,337,477 | | | | 9,977 | |
| Royal Bank of Canada | | EUR/CAD | | 12/15/10 | | | 1,001,394 | | | | 965,821 | | | | 35,573 | |
| UBS AG (London) | | EUR/CAD | | 12/15/10 | | | 1,148,537 | | | | 1,134,427 | | | | 14,110 | |
| |
| |
TOTAL | | | | | | | | | | | | | | $ | 125,990 | |
| |
| |
FORWARD FOREIGN CROSS CURRENCY EXCHANGE CONTRACTS WITH UNREALIZED LOSS (PURCHASE/SALE)
| | | | | | | | | | | | | | | | | |
| | | | | Expiration
| | Purchase
| | Sale
| | Unrealized
|
| Counterparty | | Currency | | Date | | Current Value | | Current Value | | Loss |
| |
| Bank of America Securities LLC | | GBP/NZD | | 12/15/10 | | $ | 397,221 | | | $ | 399,491 | | | $ | (2,270 | ) |
| Barclays Bank PLC | | NOK/EUR | | 12/15/10 | | | 1,450,564 | | | | 1,474,564 | | | | (24,000 | ) |
| Citibank NA | | AUD/EUR | | 12/15/10 | | | 626,367 | | | | 640,347 | | | | (13,980 | ) |
| | | NZD/EUR | | 12/15/10 | | | 781,946 | | | | 831,088 | | | | (49,142 | ) |
| | | EUR/SEK | | 12/15/10 | | | 1,129,463 | | | | 1,132,364 | | | | (2,901 | ) |
| Credit Suisse International (London) | | NZD/EUR | | 12/15/10 | | | 550,309 | | | | 569,500 | | | | (19,191 | ) |
| HSBC Bank PLC | | NZD/EUR | | 12/15/10 | | | 1,071,361 | | | | 1,136,275 | | | | (64,914 | ) |
| | | CHF/EUR | | 12/15/10 | | | 427,285 | | | | 441,431 | | | | (14,146 | ) |
| | | EUR/SEK | | 12/15/10 | | | 1,168,974 | | | | 1,173,099 | | | | (4,125 | ) |
| JPMorgan Securities, Inc. | | CHF/EUR | | 12/15/10 | | | 482,869 | | | | 494,566 | | | | (11,697 | ) |
| Royal Bank of Canada | | CAD/EUR | | 12/15/10 | | | 1,098,788 | | | | 1,167,611 | | | | (68,823 | ) |
| | | CHF/EUR | | 12/15/10 | | | 620,689 | | | | 630,810 | | | | (10,121 | ) |
| UBS AG (London) | | JPY/EUR | | 12/15/10 | | | 468,871 | | | | 500,016 | | | | (31,145 | ) |
| |
| |
TOTAL | | | | | | | | | | | | | | $ | (316,455 | ) |
| |
| |
FUTURES CONTRACTS — At September 30, 2010, the following futures contracts were open:
| | | | | | | | | | | | | | | |
| | | Number of
| | | | | | |
| | | Contracts
| | Expiration
| | Current
| | Unrealized
|
| Type | | Long (Short) | | Date | | Value | | Gain (Loss) |
| |
| Australia 10 Year Treasury Bond | | | 46 | | | December 2010 | | $ | 4,796,317 | | | $ | 42,181 | |
| Eurodollars | | | 110 | | | March 2012 | | | 27,270,375 | | | | 44,736 | |
| Japan 10 Year Government Bond | | | (13 | ) | | December 2010 | | | (22,334,212 | ) | | | (267,911 | ) |
| Ultra Long U.S. Treasury Bond | | | (5 | ) | | December 2010 | | | (706,406 | ) | | | (26,571 | ) |
| 10 Year German Euro-Bund | | | 26 | | | December 2010 | | | 4,658,472 | | | | 29,506 | |
| 2 Year U.S. Treasury Notes | | | 384 | | | December 2010 | | | 84,282,000 | | | | 107,081 | |
| 5 Year U.S. Treasury Notes | | | 143 | | | December 2010 | | | 17,284,008 | | | | 69,042 | |
| 10 Year U.S. Treasury Notes | | | 89 | | | December 2010 | | | 11,218,172 | | | | 88,717 | |
| 30 Year U.S. Treasury Bonds | | | (14 | ) | | December 2010 | | | (1,872,063 | ) | | | (1,977 | ) |
| |
| |
TOTAL | | | | | | | | | | | | $ | 84,804 | |
| |
| |
The accompanying notes are an integral part of these financial statements.
GOLDMAN SACHS STRATEGIC INCOME FUND
| |
| ADDITIONAL INVESTMENT INFORMATION (continued) | |
SWAP CONTRACTS — At September 30, 2010, the Fund had outstanding swap contracts with the following terms:
INTEREST RATE SWAP CONTRACTS
| | | | | | | | | | | | | | | | | | | | | | | |
| | | | | | | Rates Exchanged | | | | Upfront
| | |
| | | Notional
| | | | Payments
| | Payments
| | | | Payments
| | |
| | | Amount
| | Termination
| | received by
| | made by
| | Market
| | made (received)
| | Unrealized
|
| Counterparty | | (000s)(a) | | Date | | the Fund | | the Fund | | Value | | by the Fund | | Gain (Loss) |
| |
Bank of America
Securities LLC | |
GBP | 100 | | |
12/15/40 | |
4.250% | |
6 month BP | |
$ | 17,427 | | |
$ | 14,315 | | |
$ | 3,112 | |
| Citibank NA | | EUR | 17,390 | | | 08/10/20 | | 2.950 | | 6 month EURO | | | (294,350 | ) | | | — | | | | (294,350 | ) |
| | | | 4,810 | | | 08/10/40 | | 6 month EURO | | 2.863% | | | 238,800 | | | | — | | | | 238,800 | |
| | | GBP | 540 | | | 12/15/40 | | 4.250 | | 6 month BP | | | 94,108 | | | | 85,945 | | | | 8,163 | |
| Credit Suisse First | | EUR | 1,500 | | | 12/15/17 | | 3.000 | | 6 month EURO | | | 86,927 | | | | 94,973 | | | | (8,046 | ) |
| Boston Corp. | | | 700 | | | 08/06/20 | | 3.764 | | 6 month EURO | | | 20,449 | | | | — | | | | 20,449 | |
| | | | 10,300 | | | 08/10/20 | | 3.504 | | 6 month EURO | | | 148,338 | | | | — | | | | 148,338 | |
| | | | 200 | | | 08/06/40 | | 6 month EURO | | 3.630 | | | (22,176 | ) | | | — | | | | (22,176 | ) |
| | | | 2,700 | | | 08/10/40 | | 6 month EURO | | 3.323 | | | (126,014 | ) | | | — | | | | (126,014 | ) |
| JPMorgan Securities, Inc. | | | 730 | | | 08/07/20 | | 3.653 | | 6 month EURO | | | 16,723 | | | | — | | | | 16,723 | |
| | | | 1,620 | | | 08/10/20 | | 3.530 | | 6 month EURO | | | 25,713 | | | | — | | | | 25,713 | |
| | | | 200 | | | 08/07/40 | | 6 month EURO | | 3.542 | | | (18,507 | ) | | | — | | | | (18,507 | ) |
| | | | 440 | | | 08/10/40 | | 6 month EURO | | 3.417 | | | (29,186 | ) | | | — | | | | (29,186 | ) |
| |
| |
TOTAL | | | | | | | | | | | | $ | 158,252 | | | $ | 195,233 | | | $ | (36,981 | ) |
| |
| |
| |
| (a) | Represents forward starting interest rate swaps whose effective dates of commencement of accruals and cash flows occur subsequent to September 30, 2010. |
CREDIT DEFAULT SWAP CONTRACTS
| | | | | | | | | | | | | | | | | | | | | | | | | | | | | |
| | | | | | | | | | | Credit
| | | | | | |
| | | | | | | Rates
| | | | Spread at
| | | | Upfront
| | |
| | | | | Notional
| | received
| | | | September 30,
| | | | Payments
| | |
| | | Referenced
| | Amount
| | (paid) by
| | Termination
| | 2010
| | Market
| | made (received)
| | Unrealized
|
| Counterparty | | Obligation | | (000s) | | Fund | | Date | | (basis points)(b) | | Value | | by the Fund | | Gain (Loss) |
| |
Protection Sold: | | | | | | | | | | | | | | | | | | | | | | | | | | | | |
| Citibank NA | | CDX North America
High Yield Index | | $3,000 | | | 5.000 | % | | | 06/20/15 | | | | 523 | | | $ | (22,091 | ) | | $ | (44,365 | ) | | $ | 22,274 | |
Deutsche Bank
Securities, Inc. | | CDX North America
High Yield Index | | 5,000 | | | 5.000 | | | | 06/20/15 | | | | 523 | | | | (36,818 | ) | | | (105,466 | ) | | | 68,648 | |
| |
| |
TOTAL | | | | | | | | | | | | | | | | | | $ | (58,909 | ) | | $ | (149,831 | ) | | $ | 90,922 | |
| |
| |
| |
| (b) | Credit spread on the Referenced Obligation, together with the term of the swap contract, are indicators of payment/performance risk. The likelihood of a credit event occurring which would require a fund to make a payment or otherwise be required to perform under the swap contract is generally greater as the credit spread and the term of the swap contract increase. |
The accompanying notes are an integral part of these financial statements.
GOLDMAN SACHS MULTI SECTOR FIXED INCOME FUNDS
Schedule of Investments
September 30, 2010 (Unaudited)
ADDITIONAL INVESTMENT INFORMATION
JOINT REPURCHASE AGREEMENT ACCOUNT II — At September 30, 2010, certain Funds had undivided interests in the Joint Repurchase Agreement Account II, as follows:
| | | | | |
| Fund | | Principal Amount |
| |
| Core Fixed Income | | $ | 421,700,000 | |
| |
| |
| Core Plus Fixed Income | | | 65,500,000 | |
| |
| |
| Strategic Income | | | 58,100,000 | |
| |
| |
REPURCHASE AGREEMENTS
| | | | | | | | | | | | | | | | | |
| | | Principal
| | Interest
| | Maturity
| | Maturity
|
| Counterparty | | Amount | | Rate | | Date | | Value |
| |
| Banc of America Securities LLC | | $ | 300,000,000 | | | | 0.250 | % | | | 10/01/10 | | | $ | 300,002,083 | |
| |
| |
| Banc of America Securities LLC | | | 1,107,500,000 | | | | 0.300 | | | | 10/01/10 | | | | 1,107,509,229 | |
| |
| |
| Barclays Capital, Inc. | | | 1,400,000,000 | | | | 0.250 | | | | 10/01/10 | | | | 1,400,009,722 | |
| |
| |
| BNP Paribas Securities Co. | | | 3,200,000,000 | | | | 0.240 | | | | 10/01/10 | | | | 3,200,021,333 | |
| |
| |
| BNP Paribas Securities Co. | | | 1,500,000,000 | | | | 0.280 | | | | 10/01/10 | | | | 1,500,011,667 | |
| |
| |
| BNP Paribas Securities Co. | | | 800,000,000 | | | | 0.290 | | | | 10/01/10 | | | | 800,006,444 | |
| |
| |
| Citibank N.A. | | | 250,000,000 | | | | 0.300 | | | | 10/01/10 | | | | 250,002,083 | |
| |
| |
| Citigroup Global Markets, Inc. | | | 1,250,000,000 | | | | 0.300 | | | | 10/01/10 | | | | 1,250,010,417 | |
| |
| |
| Credit Suisse Securities (USA) LLC | | | 500,000,000 | | | | 0.220 | | | | 10/01/10 | | | | 500,003,056 | |
| |
| |
| Credit Suisse Securities (USA) LLC | | | 550,000,000 | | | | 0.250 | | | | 10/01/10 | | | | 550,003,819 | |
| |
| |
| Deutsche Bank Securities, Inc. | | | 400,000,000 | | | | 0.280 | | | | 10/01/10 | | | | 400,003,111 | |
| |
| |
| JPMorgan Securities | | | 1,500,000,000 | | | | 0.250 | | | | 10/01/10 | | | | 1,500,010,417 | |
| |
| |
| JPMorgan Securities | | | 160,000,000 | | | | 0.300 | | | | 10/01/10 | | | | 160,001,333 | |
| |
| |
| Merrill Lynch & Co., Inc. | | | 850,000,000 | | | | 0.300 | | | | 10/01/10 | | | | 850,007,083 | |
| |
| |
| RBS Securities, Inc. | | | 1,000,000,000 | | | | 0.280 | | | | 10/01/10 | | | | 1,000,007,778 | |
| |
| |
| RBS Securities, Inc. | | | 1,000,000,000 | | | | 0.300 | | | | 10/01/10 | | | | 1,000,008,333 | |
| |
| |
| UBS Securities LLC | | | 750,000,000 | | | | 0.250 | | | | 10/01/10 | | | | 750,005,208 | |
| |
| |
| UBS Securities LLC | | | 750,000,000 | | | | 0.280 | | | | 10/01/10 | | | | 750,005,833 | |
| |
| |
| UBS Securities LLC | | | 170,000,000 | | | | 0.300 | | | | 10/01/10 | | | | 170,001,417 | |
| |
| |
| Wells Fargo Securities LLC | | | 500,000,000 | | | | 0.250 | | | | 10/01/10 | | | | 500,003,472 | |
| |
| |
| Wells Fargo Securities LLC | | | 3,250,000,000 | | | | 0.280 | | | | 10/01/10 | | | | 3,250,025,278 | |
| |
| |
TOTAL | | | | | | | | | | | | | | $ | 21,187,659,116 | |
| |
| |
The accompanying notes are an integral part of these financial statements.
GOLDMAN SACHS MULTI SECTOR FIXED INCOME FUNDS
| |
| ADDITIONAL INVESTMENT INFORMATION (continued) | |
At September 30, 2010, the Joint Repurchase Agreement Account II was fully collateralized by:
| | | | | |
| Issuer | | Interest Rates | | Maturity Dates |
| |
| Federal Farm Credit Bank | | 4.550 to 7.350% | | 03/07/11 to 10/29/37 |
| |
| |
| Federal Farm Credit Bank Principal-Only Stripped Securities | | 0.000 | | 12/16/15 |
| |
| |
| Federal Home Loan Bank | | 0.000 to 8.290 | | 10/01/10 to 07/15/36 |
| |
| |
| Federal Home Loan Mortgage Corp. | | 0.000 to 7.690 | | 10/04/10 to 09/01/40 |
| |
| |
| Federal Home Loan Mortgage Corp. Interest-Only Stripped Securities | | 0.000 | | 01/15/12 to 01/15/28 |
| |
| |
| Federal Home Loan Mortgage Corp. Principal-Only Stripped Securities | | 0.000 | | 11/15/13 to 03/15/31 |
| |
| |
| Federal National Mortgage Association | | 0.000 to 10.350 | | 10/12/10 to 06/01/50 |
| |
| |
| Federal National Mortgage Association Interest-Only Stripped Securities | | 0.000 | | 11/15/12 to 07/15/29 |
| |
| |
| Federal National Mortgage Association Principal-Only Stripped Security | | 0.000 | | 03/23/28 |
| |
| |
| Government National Mortgage Association | | 4.000 to 6.000 | | 03/15/24 to 09/15/40 |
| |
| |
| Tennessee Valley Authority | | 4.375 to 6.000 | | 03/15/13 to 07/18/17 |
| |
| |
| Tennessee Valley Authority Interest-Only Stripped Securities | | 0.000 | | 11/01/10 to 07/15/20 |
| |
| |
| Tennessee Valley Authority Principal-Only Stripped Security | | 0.000 | | 12/15/17 |
| |
| |
| U.S. Treasury Bond | | 5.000 | | 05/15/37 |
| |
| |
| U.S. Treasury Interest-Only Stripped Securities | | 0.000 | | 02/15/11 to 08/15/20 |
| |
| |
| U.S. Treasury Notes | | 0.750 to 4.625 | | 01/31/11 to 11/15/18 |
| |
| |
The aggregate market value of the collateral, including accrued interest, was $21,615,378,308.
The accompanying notes are an integral part of these financial statements.
GOLDMAN SACHS MULTI SECTOR FIXED INCOME FUNDS
Statements of Assets and Liabilities
September 30, 2010 (Unaudited)
| | | | | | | | | | | | | | | | | | | | | |
| | | | | Core Fixed
| | | Core Plus Fixed
| | | Global
| | | Strategic
| | | |
| | | | | Income Fund | | | Income Fund | | | Income Fund | | | Income Fund | | | |
|
| | | Assets: |
| | | | | | | | | | | | | | | | | | | | | |
| | | Investments in securities, at value (identified cost $1,752,951,655, $337,708,546, $961,516,150 and $176,219,734, respectively) | | $ | 1,789,083,631 | | | $ | 346,226,971 | | | $ | 1,034,797,974 | | | $ | 177,152,935 | | | |
| | | Repurchase agreement, at value which equals cost | | | 421,700,000 | | | | 65,500,000 | | | | — | | | | 58,100,000 | | | |
| | | Cash(a) | | | — | | | | 912,575 | | | | 1,063,125 | | | | 5,532,596 | | | |
| | | Foreign currencies, at value (identified cost $148,767, $72,745, $292,188 and $29,623, respectively) | | | 150,539 | | | | 73,016 | | | | 292,897 | | | | 29,734 | | | |
| | | Receivables: | | | | | | | | | | | | | | | | | | |
| | | Investment securities sold, at value | | | 630,440,128 | | | | 100,518,685 | | | | 131,230,930 | | | | 425,380 | | | |
| | | Interest, at value | | | 10,779,159 | | | | 2,015,078 | | | | 9,580,313 | | | | 1,224,072 | | | |
| | | Fund shares sold | | | 3,287,366 | | | | 137,427 | | | | 173,563 | | | | 17,036,605 | | | |
| | | Forward foreign currency exchange contracts, at value | | | 1,140,506 | | | | 380,570 | | | | 6,532,096 | | | | 641,902 | | | |
| | | Due from broker — collateral for swap contracts | | | 800,000 | | | | 901,313 | | | | 2,666,307 | | | | 150,000 | | | |
| | | Due from broker — upfront payment | | | 69,116 | | | | 135,816 | | | | — | | | | 97,255 | | | |
| | | Due from broker — variation margin(b) | | | 59,540 | | | | — | | | | 2,517,962 | | | | 36,536 | | | |
| | | Swap contracts, at value (includes upfront payments made (received) of $0, $120,360, $112,881 and $195,233, respectively) | | | — | | | | 2,371,915 | | | | 10,425,686 | | | | 648,485 | | | |
| | | Reimbursement from investment adviser | | | — | | | | 51,564 | | | | 113,143 | | | | 80,948 | | | |
| | | Deferred offering costs | | | — | | | | — | | | | — | | | | 130,891 | | | |
| | | Other assets | | | 3,946 | | | | 721 | | | | 39,700 | | | | — | | | |
| | | |
| | | |
| | | Total assets | | | 2,857,513,931 | | | | 519,225,651 | | | | 1,199,433,696 | | | | 261,287,339 | | | |
| | | |
| | | |
| | | | | | | | | | | | | | | | | | | | | |
| | | | | | | | | | | | | | | | | | | | | |
|
| | | Liabilities: |
| | | | | | | | | | | | | | | | | | | | | |
| | | Due to custodian | | | 35,896 | | | | — | | | | — | | | | — | | | |
| | | Payables: | | | | | | | | | | | | | | | | | | |
| | | Investment securities purchased | | | 968,291,789 | | | | 172,002,777 | | | | 148,475,473 | | | | 33,100,789 | | | |
| | | Fund shares redeemed | | | 20,378,484 | | | | 232,102 | | | | 29,719,132 | | | | 108,849 | | | |
| | | Forward foreign currency exchange contracts, at value | | | 2,047,640 | | | | 665,237 | | | | 31,588,398 | | | | 793,992 | | | |
| | | Amounts owed to affiliates | | | 934,597 | | | | 195,014 | | | | 649,602 | | | | 98,277 | | | |
| | | Swap contracts, at value (includes upfront payments received (made) of $393,519, $462,584, $708,174 and $149,831, respectively) | | | 881,661 | | | | 2,940,654 | | | | 12,223,345 | | | | 549,142 | | | |
| | | Income distribution | | | 762,573 | | | | 184,741 | | | | — | | | | 60,600 | | | |
| | | Due to broker — variation margin | | | — | | | | 32,190 | | | | 82,217 | | | | — | | | |
| | | Forward sale contracts, at value (proceeds receivable $0, $0, $1,042,852 and $0, respectively) | | | — | | | | — | | | | 1,039,766 | | | | — | | | |
| | | Due to broker — collateral for swap contracts | | | — | | | | — | | | | 871,942 | | | | — | | | |
| | | Accrued expenses and other liabilities | | | 240,241 | | | | 200,110 | | | | 432,217 | | | | 254,677 | | | |
| | | |
| | | |
| | | Total liabilities | | | 993,572,881 | | | | 176,452,825 | | | | 225,082,092 | | | | 34,966,326 | | | |
| | | |
| | | |
| | | | | | | | | | | | | | | | | | | | | |
| | | | | | | | | | | | | | | | | | | | | |
|
| | | Net Assets: |
| | | | | | | | | | | | | | | | | | | | | |
| | | Paid-in capital | | | 1,951,442,125 | | | | 327,319,678 | | | | 948,375,289 | | | | 225,472,461 | | | |
| | | Accumulated undistributed (distribution in excess of) net investment income | | | 8,673,887 | | | | 450,262 | | | | (7,212,030 | ) | | | (35,468 | ) | | |
| | | Accumulated net realized gain (loss) from investment, futures, option, swap and foreign currency related transactions | | | (132,907,044 | ) | | | 6,722,006 | | | | (15,251,785 | ) | | | (35,492 | ) | | |
| | | Net unrealized gain on investments, futures, swaps and translation of assets and liabilities denominated in foreign currencies | | | 36,732,082 | | | | 8,280,880 | | | | 48,440,130 | | | | 919,512 | | | |
| | | |
| | | |
| | | NET ASSETS | | $ | 1,863,941,050 | | | $ | 342,772,826 | | | $ | 974,351,604 | | | $ | 226,321,013 | | | |
| |
| |
| | | | | | | | | | | | | | | | | | | | | |
| | | Net Assets: | | | | | | | | | | | | | | | | | | |
| | | Class A | | $ | 816,047,653 | | | $ | 110,466,093 | | | $ | 237,742,995 | | | $ | 106,979,019 | | | |
| | | Class B | | | 14,905,408 | | | | 8,290,782 | | | | 4,100,156 | | | | — | | | |
| | | Class C | | | 34,853,023 | | | | 13,273,387 | | | | 8,408,654 | | | | 3,831,587 | | | |
| | | Institutional | | | 991,419,108 | | | | 210,322,139 | | | | 723,989,145 | | | | 115,299,139 | | | |
| | | Service | | | 4,836,459 | | | | 12,414 | | | | 87,465 | | | | — | | | |
| | | Class IR | | | 1,863,015 | | | | 368,018 | | | | 23,189 | | | | 201,160 | | | |
| | | Class R | | | 16,384 | | | | 39,993 | | | | — | | | | 10,108 | | | |
| |
| |
| | | Total Net Assets | | $ | 1,863,941,050 | | | $ | 342,772,826 | | | $ | 974,351,604 | | | $ | 226,321,013 | | | |
| |
| |
| | | Shares Outstanding $0.001 par value (unlimited shares authorized): | | | | | | | | | | | | | | | | | | |
| | | Class A | | | 81,796,733 | | | | 10,390,814 | | | | 18,205,508 | | | | 10,619,977 | | | |
| | | Class B | | | 1,487,715 | | | | 780,627 | | | | 315,170 | | | | — | | | |
| | | Class C | | | 3,476,557 | | | | 1,249,674 | | | | 648,066 | | | | 380,303 | | | |
| | | Institutional | | | 99,004,295 | | | | 19,794,833 | | | | 55,523,230 | | | | 11,449,253 | | | |
| | | Service | | | 482,681 | | | | 1,168 | | | | 6,715 | | | | — | | | |
| | | Class IR | | | 186,664 | | | | 34,608 | | | | 1,779 | | | | 19,976 | | | |
| | | Class R | | | 1,641 | | | | 3,763 | | | | — | | | | 1,004 | | | |
| |
| |
| | | Net asset value, offering and redemption price per share:(c) | | | | | | | | | | | | | | | | | | |
| | | Class A | | | $ 9.98 | | | | $10.63 | | | | $13.06 | | | | $10.07 | | | |
| | | Class B | | | 10.02 | | | | 10.62 | | | | 13.01 | | | | — | | | |
| | | Class C | | | 10.03 | | | | 10.62 | | | | 12.97 | | | | 10.08 | | | |
| | | Institutional | | | 10.01 | | | | 10.63 | | | | 13.04 | | | | 10.07 | | | |
| | | Service | | | 10.02 | | | | 10.63 | | | | 13.02 | | | | — | | | |
| | | Class IR | | | 9.98 | | | | 10.63 | | | | 13.04 | | | | 10.07 | | | |
| | | Class R | | | 9.98 | | | | 10.63 | | | | — | | | | 10.07 | | | |
| |
| |
(a) Includes restricted cash of $411,985 on deposit with counterparty for the Core Plus Fixed Income Fund relating to initial margin requirements and collateral on futures transactions.
(b) Includes cash on deposit with counterparty of $2,517,962 for Global Income Fund, relating to initial margin requirements on futures transactions.
(c) Maximum public offering price per share for Class A Shares of the Core Fixed Income, Core Plus Fixed Income, Global Income and Strategic Income Funds (NAV per share multiplied by 1.0390) is $10.37, $11.04, $13.57 and $10.46, respectively. At redemption, Class B and Class C Shares may be subject to a contingent deferred sales charge, assessed on the amount equal to the lesser of the current net asset value or the original purchase price of the shares.
The accompanying notes are an integral part of these financial statements.
GOLDMAN SACHS MULTI SECTOR FIXED INCOME FUNDS
Statements of Operations
For the Six Months Ended September 30, 2010 (Unaudited)
| | | | | | | | | | | | | | | | | | | | | | | |
| | | | | Core Fixed
| | | Core Plus Fixed
| | | Global
| | | Strategic
| | | | |
| | | | | Income Fund | | | Income Fund | | | Income Fund | | | Income Fund(a) | | | | |
| |
|
| | | Investment income: |
| | | | | | | | | | | | | | | | | | | | | | | |
| | | Interest | | $ | 26,319,810 | | | $ | 6,252,866 | | | $ | 14,632,741 | | | $ | 731,884 | | | | | |
| | | |
| | | |
| | | | | | | | | | | | | | | | | | | | | | | |
| | | | | | | | | | | | | | | | | | | | | | | |
|
| | | Expenses: |
| | | | | | | | | | | | | | | | | | | | | | | |
| | | Management fees | | | 3,342,231 | | | | 736,514 | | | | 3,113,623 | | | | 130,240 | | | | | |
| | | Distribution and Service fees(b) | | | 1,247,833 | | | | 235,353 | | | | 348,239 | | | | 20,090 | | | | | |
| | | Transfer Agent fees(b) | | | 731,917 | | | | 120,972 | | | | 299,765 | | | | 15,615 | | | | | |
| | | Custody and accounting fees | | | 206,093 | | | | 102,912 | | | | 268,250 | | | | 22,987 | | | | | |
| | | Professional fees | | | 56,600 | | | | 75,399 | | | | 67,857 | | | | 52,898 | | | | | |
| | | Registration fees | | | 54,244 | | | | 91,983 | | | | 47,967 | | | | 12,735 | | | | | |
| | | Printing and mailing costs | | | 95,042 | | | | 36,114 | | | | 63,079 | | | | 16,133 | | | | | |
| | | Trustee fees | | | 9,874 | | | | 8,105 | | | | 8,871 | | | | 4,084 | | | | | |
| | | Service Share fees — Shareholder Administration Plan | | | 6,524 | | | | 15 | | | | 116 | | | | — | | | | | |
| | | Service Share fees — Service Plan | | | 6,524 | | | | 15 | | | | 116 | | | | — | | | | | |
| | | Amortization of offering costs | | | — | | | | — | | | | — | | | | 44,109 | | | | | |
| | | Other | | | 12,078 | | | | 1,799 | | | | 6,304 | | | | 5,747 | | | | | |
| | | |
| | | |
| | | Total expenses | | | 5,768,960 | | | | 1,409,181 | | | | 4,224,187 | | | | 324,638 | | | | | |
| | | |
| | | |
| | | Less — expense reductions | | | (1,492 | ) | | | (311,417 | ) | | | (444,315 | ) | | | (147,151 | ) | | | | |
| | | |
| | | |
| | | Net expenses | | | 5,767,468 | | | | 1,097,764 | | | | 3,779,872 | | | | 177,487 | | | | | |
| | | |
| | | |
| | | NET INVESTMENT INCOME | | | 20,552,342 | | | | 5,155,102 | | | | 10,852,869 | | | | 554,397 | | | | | |
| | | |
| | | |
| | | | | | | | | | | | | | | | | | | | | | | |
| | | | | | | | | | | | | | | | | | | | | | | |
|
| | | Realized and unrealized gain (loss) from investment, futures, option, swap and foreign currency related transactions: |
| | | | | | | | | | | | | | | | | | | | | | | |
| | | Net realized gain (loss) from: | | | | | | | | | | | | | | | | | | | | |
| | | Investment transactions | | | 33,882,839 | | | | 6,310,917 | | | | 14,120,412 | | | | 227,358 | | | | | |
| | | Futures transactions | | | 13,102,331 | | | | 846,779 | | | | (2,599,710 | ) | | | (1,008 | ) | | | | |
| | | Written options | | | — | | | | — | | | | 5,923 | | | | — | | | | | |
| | | Swap contracts | | | 1,959,724 | | | | 54,758 | | | | 2,409,635 | | | | (3,302 | ) | | | | |
| | | Foreign currency related transactions | | | (245,888 | ) | | | (547,244 | ) | | | (7,809,897 | ) | | | (258,540 | ) | | | | |
| | | Net change in unrealized gain (loss) on: | | | | | | | | | | | | | | | | | | | | |
| | | Investments | | | 29,609,797 | | | | 6,582,577 | | | | 50,375,739 | | | | 933,201 | | | | | |
| | | Futures | | | 2,803,084 | | | | 471,259 | | | | 1,552,574 | | | | 84,804 | | | | | |
| | | Swap contracts | | | (475,739 | ) | | | 223,087 | | | | (2,254,280 | ) | | | 53,941 | | | | | |
| | | Translation of assets and liabilities denominated in foreign currencies | | | (1,149,904 | ) | | | (309,312 | ) | | | (31,448,510 | ) | | | (152,434 | ) | | | | |
| | | |
| | | |
| | | Net realized and unrealized gain from investment, futures, option, swap and foreign currency related transactions | | | 79,486,244 | | | | 13,632,821 | | | | 24,351,886 | | | | 884,020 | | | | | |
| | | |
| | | |
| | | NET INCREASE IN NET ASSETS RESULTING FROM OPERATIONS | | $ | 100,038,586 | | | $ | 18,787,923 | | | $ | 35,204,755 | | | $ | 1,438,417 | | | | | |
| | | |
| | | |
| |
| (a) | Commenced operations on June 30, 2010. |
| (b) | Class specific Distribution and Service, and Transfer Agent fees were as follows: |
| | | | | | | | | | | | | | | | | | | | | | | | | | | | | | | | | | | | | | | | | | | | | |
| | | Distribution and Service Fees | | | Transfer Agent Fees | |
Fund | | Class A | | | Class B | | | Class C | | | Class R | | | Class A | | | Class B | | | Class C | | | Institutional | | | Service | | | Class IR(c) | | | Class R | |
| Core Fixed Income | | $ | 999,935 | | | $ | 79,759 | | | $ | 168,101 | | | $ | 38 | | | $ | 519,966 | | | $ | 10,369 | | | $ | 21,853 | | | $ | 177,881 | | | $ | 1,044 | | | $ | 794 | | | $ | 10 | |
| Core Plus Fixed Income | | | 126,550 | | | | 44,439 | | | | 64,267 | | | | 97 | | | | 65,806 | | | | 5,777 | | | | 8,355 | | | | 40,797 | | | | 2 | | | | 210 | | | | 25 | |
| Global Income | | | 283,932 | | | | 23,651 | | | | 40,656 | | | | — | | | | 147,645 | | | | 3,075 | | | | 5,285 | | | | 143,738 | | | | 18 | | | | 4 | | | | — | |
| Strategic Income | | | 18,947 | | | | — | | | | 1,130 | | | | 13 | | | | 9,853 | | | | — | | | | 148 | | | | 5,602 | | | | — | | | | 8 | | | | 4 | |
| |
| (c) | Commenced operations on July 30, 2010 for Global Income Fund. |
The accompanying notes are an integral part of these financial statements.
GOLDMAN SACHS MULTI SECTOR FIXED INCOME FUNDS
Statements of Changes in Net Assets
| | | | | | | | | | | |
| | | | | Core Fixed Income Fund | |
| | | | | For the
| | | | |
| | | | | Six Months Ended
| | | For the Fiscal
| |
| | | | | September 30, 2010
| | | Year Ended
| |
| | | | | (Unaudited) | | | March 31, 2010 | |
| |
|
| | | From operations: |
| | | | | | | | | | | |
| | | Net investment income | | $ | 20,552,342 | | | $ | 53,447,202 | |
| | | Net realized gain (loss) from investment, futures, options, swap and foreign currency related transactions | | | 48,699,006 | | | | (89,181,724 | ) |
| | | Net change in unrealized gain on investments, futures, swaps and translation of assets and liabilities denominated in foreign currencies | | | 30,787,238 | | | | 296,773,763 | |
| | | |
| | | |
| | | Net increase in net assets resulting from operations | | | 100,038,586 | | | | 261,039,241 | |
| | | |
| | | |
| | | | | | | | | | | |
| | | | | | | | | | | |
|
| | | Distributions to shareholders: |
| | | | | | | | | | | |
| | | From net investment income | | | | | | | | |
| | | Class A Shares | | | (9,395,993 | ) | | | (24,910,163 | ) |
| | | Class B Shares | | | (128,624 | ) | | | (502,776 | ) |
| | | Class C Shares | | | (268,261 | ) | | | (822,116 | ) |
| | | Institutional Shares | | | (11,768,960 | ) | | | (28,338,593 | ) |
| | | Service Shares | | | (57,510 | ) | | | (220,644 | ) |
| | | Class IR Shares(b) | | | (14,865 | ) | | | (2,081 | ) |
| | | Class R Shares | | | (159 | ) | | | (362 | ) |
| | | |
| | | |
| | | Total distributions to shareholders | | | (21,634,372 | ) | | | (54,796,735 | ) |
| | | |
| | | |
| | | | | | | | | | | |
| | | | | | | | | | | |
|
| | | From share transactions: |
| | | | | | | | | | | |
| | | Proceeds from sales of shares | | | 573,208,101 | | | | 702,108,372 | |
| | | Reinvestment of distributions | | | 16,330,534 | | | | 40,342,479 | |
| | | Cost of shares redeemed(c) | | | (370,143,513 | ) | | | (884,585,894 | ) |
| | | |
| | | |
| | | Net increase (decrease) in net assets resulting from share transactions | | | 219,395,122 | | | | (142,135,043 | ) |
| | | |
| | | |
| | | TOTAL INCREASE | | | 297,799,336 | | | | 64,107,463 | |
| | | |
| | | |
| | | | | | | | | | | |
| | | | | | | | | | | |
|
| | | Net assets: |
| | | | | | | | | | | |
| | | Beginning of period | | | 1,566,141,714 | | | | 1,502,034,251 | |
| | | |
| | | |
| | | End of period | | $ | 1,863,941,050 | | | $ | 1,566,141,714 | |
| | | |
| | | |
| | | Accumulated undistributed (distribution in excess of) net investment income | | $ | 8,673,887 | | | $ | 9,755,917 | |
| | | |
| | | |
| |
| (a) | Commenced operations on June 30, 2010. |
| (b) | Commenced operations on July 30, 2010 for Global Income Fund. |
| (c) | Net of $4,029 and $10,331 and $8,393 and $11,922 of redemption fees remitted to the Core Plus Fixed Income Fund and Global Income Fund, respectively, for the six months ended September 30, 2010 and fiscal year ended March 31, 2010, respectively. |
The accompanying notes are an integral part of these financial statements.
GOLDMAN SACHS MULTI SECTOR FIXED INCOME FUNDS
| | | | | | | | | | | | | | | | | | | | | |
| | | Core Plus Fixed Income Fund | | | Global Income Fund | | | Strategic Income Fund | |
| | | For the
| | | | | | For the
| | | | | | For the
| |
| | | Six Months Ended
| | | For the Fiscal
| | | Six Months Ended
| | | For the Fiscal
| | | Period Ended
| |
| | | September 30, 2010
| | | Year Ended
| | | September 30, 2010
| | | Year Ended
| | | September 30, 2010(a)
| |
| | | (Unaudited) | | | March 31, 2010 | | | (Unaudited) | | | March 31, 2010 | | | (Unaudited) | |
| |
|
| | | |
| | | | | | | | | | | | | | | | | | | | | |
| | | $ | 5,155,102 | | | $ | 7,071,902 | | | $ | 10,852,869 | | | $ | 29,349,305 | | | $ | 554,397 | |
| | | |
6,665,210 | | | | 2,912,385 | | | | 6,126,363 | | | | (32,184,697 | ) | | | (35,492 | ) |
| | | |
6,967,611 | | | | 14,628,078 | | | | 18,225,523 | | | | 126,842,735 | | | | 919,512 | |
| | | |
| | | |
| | | | 18,787,923 | | | | 24,612,365 | | | | 35,204,755 | | | | 124,007,343 | | | | 1,438,417 | |
| | | |
| | | |
| | | | | | | | | | | | | | | | | | | | | |
| | | | | | | | | | | | | | | | | | | | | |
|
| | | |
| | | | | | | | | | | | | | | | | | | | | |
| | | | | | | | | | | | | | | | | | | | | |
| | | | (1,581,802 | ) | | | (2,238,162 | ) | | | (2,384,144 | ) | | | (20,025,980 | ) | | | (217,691 | ) |
| | | | (106,165 | ) | | | (311,280 | ) | | | (31,388 | ) | | | (570,596 | ) | | | — | |
| | | | (153,546 | ) | | | (363,457 | ) | | | (55,900 | ) | | | (523,110 | ) | | | (3,704 | ) |
| | | | (3,538,022 | ) | | | (4,561,188 | ) | | | (8,788,570 | ) | | | (69,062,749 | ) | | | (368,268 | ) |
| | | | (181 | ) | | | (400 | ) | | | (898 | ) | | | (21,607 | ) | | | — | |
| | | | (5,446 | ) | | | (3,924 | ) | | | (84 | ) | | | — | | | | (164 | ) |
| | | | (557 | ) | | | (883 | ) | | | — | | | | — | | | | (38 | ) |
| | | |
| | | |
| | | | (5,385,719 | ) | | | (7,479,294 | ) | | | (11,260,984 | ) | | | (90,204,042 | ) | | | (589,865 | ) |
| | | |
| | | |
| | | | | | | | | | | | | | | | | | | | | |
| | | | | | | | | | | | | | | | | | | | | |
|
| | | |
| | | | | | | | | | | | | | | | | | | | | |
| | | | 59,835,565 | | | | 213,501,207 | | | | 211,819,941 | | | | 287,590,821 | | | | 235,336,148 | |
| | | | 4,546,646 | | | | 6,779,774 | | | | 11,027,676 | | | | 88,636,855 | | | | 499,797 | |
| | | | (42,610,149 | ) | | | (40,878,405 | ) | | | (189,642,157 | ) | | | (372,256,969 | ) | | | (10,363,484 | ) |
| | | |
| | | |
| | | | 21,772,062 | | | | 179,402,576 | | | | 33,205,460 | | | | 3,970,707 | | | | 225,472,461 | |
| | | |
| | | |
| | | | 35,174,266 | | | | 196,535,647 | | | | 57,149,231 | | | | 37,774,008 | | | | 226,321,013 | |
| | | |
| | | |
| | | | | | | | | | | | | | | | | | | | | |
| | | | | | | | | | | | | | | | | | | | | |
|
| | | |
| | | | | | | | | | | | | | | | | | | | | |
| | | | 307,598,560 | | | | 111,062,913 | | | | 917,202,373 | | | | 879,428,365 | | | | — | |
| | | |
| | | |
| | | $ | 342,772,826 | | | $ | 307,598,560 | | | $ | 974,351,604 | | | $ | 917,202,373 | | | $ | 226,321,013 | |
| | | |
| | | |
| | | $ | 450,262 | | | $ | 680,879 | | | $ | (7,212,030 | ) | | $ | (6,803,915 | ) | | $ | (35,468 | ) |
| | | |
| | | |
The accompanying notes are an integral part of these financial statements.
GOLDMAN SACHS MULTI SECTOR FIXED INCOME FUNDS
Notes to Financial Statements
September 30, 2010 (Unaudited)
1. ORGANIZATION
Goldman Sachs Trust (the “Trust”) is a Delaware statutory trust registered under the Investment Company Act of 1940, as amended (the “Act”), as an open-end management investment company. The following table lists those series of the Trust that are included in this report (collectively, the “Funds” or individually a “Fund”), along with their corresponding share classes and respective diversification status under the Act:
| | | | | |
| | | | | Diversified/
|
| Fund | | Share Classes Offered* | | Non-diversified |
| |
| Core Fixed Income and Core Plus Fixed Income | | A, B, C, Institutional, Service, IR and R | | Diversified |
| |
| |
| Global Income | | A, B, C, Institutional, Service and IR | | Non-diversified |
| |
| |
| Strategic Income (Commenced operations on June 30, 2010) | | A, C, Institutional, IR and R | | Diversified |
| |
| |
| |
| * | Effective November 2, 2009, Class B Shares are no longer available for purchase by new or existing shareholders except under certain circumstances. |
Class A Shares are sold with a front-end sales charge of up to 3.75%. Class B Shares were sold with a contingent deferred sales charge that declines from 5.00% to zero, depending upon the period of time the shares are held. Class C Shares are sold with a contingent deferred sales charge of 1.00% during the first 12 months. Institutional, Service, Class IR and Class R Shares are not subject to a sales charge. Class IR Shares of the Global Income Fund commenced operations on July 30, 2010.
Goldman Sachs Asset Management, L.P. (“GSAM”), an affiliate of Goldman, Sachs & Co. (“Goldman Sachs”), serves as investment adviser to each of the Core Fixed Income, Core Plus Fixed Income and Strategic Income Funds pursuant to a management agreement with the Trust. Goldman Sachs Asset Management International (“GSAMI”), an affiliate of GSAM and Goldman Sachs, serves as investment adviser pursuant to a management agreement with the Trust on behalf of the Global Income Fund (the management agreements with GSAM and GSAMI are collectively referred to herein as the “Agreements”).
2. SIGNIFICANT ACCOUNTING POLICIES
The following is a summary of the significant accounting policies consistently followed by the Funds. The preparation of financial statements in conformity with accounting principles generally accepted in the United States of America (“GAAP”) requires management to make estimates and assumptions that may affect the amounts and disclosures in the financial statements. Actual results could differ from those estimates and assumptions.
A. Investment Valuation — The investment valuation policy of the Funds is to value investments at market value. Debt securities for which market quotations are readily available are valued on the basis of quotations furnished by an independent pricing service approved by the trustees or provided by securities dealers. The pricing services may use valuation models or matrix pricing, which consider: (i) yield or price with respect to bonds that are considered comparable in characteristics such as rating, interest rate and maturity date or (ii) quotations from bond dealers to determine current value. If accurate quotations are not readily available, or if GSAM or GSAMI believes that such quotations do not accurately reflect fair value, the fair value of the Funds’ investments may be determined based on yield equivalents, a pricing matrix or other sources, under valuation procedures established by the trustees. Short-term debt obligations that mature in sixty days or less and that do not exhibit signs of credit deterioration are valued at amortized cost, which approximates market value.
Investments in equity securities and investment companies traded on a United States (“U.S.”) securities exchange or the NASDAQ system are valued daily at their last sale price or official closing price on the principal exchange or system on which they are traded. If no sale occurs, such securities and investment companies are valued at the last bid price for long positions and at the last ask price for short positions. Unlisted equity securities for which market quotations are available are valued at the last sale price on the valuation date, or if no sale occurs, at the last bid price. In the absence of market
GOLDMAN SACHS MULTI SECTOR FIXED INCOME FUNDS
| |
| 2. SIGNIFICANT ACCOUNTING POLICIES (continued) | |
quotations, broker quotes will be utilized or the security will be fair valued. Investments in investment companies (other than those that are exchange traded) are valued at the net asset value per share (“NAV”) on the valuation date.
GSAM or GSAMI, consistent with its procedures and applicable regulatory guidance, may make an adjustment to the previous closing prices of either domestic or foreign securities in light of significant events to reflect what it believes to be the fair value of the securities at the time of determining the Funds’ NAV. Significant events that could affect a large number of securities in a particular market may include, but are not limited to: situations relating to one or more single issuers in a market sector; significant fluctuations in U.S. or foreign markets; market dislocations; market disruptions or market closings; equipment failures; natural or man-made disasters or acts of God; armed conflicts; government actions or other developments; as well as the same or similar events which may affect specific issuers or the securities markets even though not tied directly to the securities markets. Other significant events that could relate to a single issuer may include, but are not limited to: corporate actions such as reorganizations, mergers and buy-outs; corporate announcements, including those relating to earnings, products and regulatory news; significant litigation; low trading volume; and trading limits or suspensions.
B. Security and Fund Share Transactions, and Investment Income — Security and Fund share transactions are reflected for financial reporting purposes as of the trade date, which may cause the NAV as stated in the accompanying financial statements to be different than the NAV applied to Fund share transactions. Realized gains and losses on sales of portfolio securities are calculated using the identified cost basis. Dividend income is recognized on the ex-dividend date, net of foreign withholding taxes, if any, which are reduced by any amounts reclaimable by the Funds, where applicable. Interest income is recorded on the basis of interest accrued, premium amortized and discount accreted. Realized gains and losses resulting from principal paydowns on mortgage-backed and asset-backed securities are included in interest income. Market discounts, original issue discount and market premiums on debt securities are accreted/amortized to interest income over the life of the security with a corresponding adjustment in the cost basis of that security. In addition, it is the Funds’ policy to accrue for foreign capital gains taxes, if applicable, on certain foreign securities held by the Funds. An estimated foreign capital gains tax is recorded daily on net unrealized gains on these securities and is payable upon the sale of such securities when a gain is realized.
Investment income and unrealized and realized gains or losses are allocated daily to each class of shares of the respective Fund based upon the relative proportion of net assets of each class.
C. Expenses — Expenses incurred by the Trust that do not specifically relate to an individual Fund of the Trust are allocated to the Funds on a straight-line and/or pro-rata basis depending upon the nature of the expense and are accrued daily.
D. Redemption Fees — All classes of the Core Plus Fixed Income and Global Income Funds charge a 2% redemption fee on the redemption of shares (including by exchange) held for 30 calendar days or less. For this purpose, the Funds use a first-in first-out method so that shares held longest will be treated as being redeemed first and shares held shortest will be treated as being redeemed last. Redemption fees are reimbursed to a Fund and are reflected as a reduction in share redemptions. Redemption fees are credited to Paid-in Capital and are allocated to each share class of a Fund on a pro-rata basis at the time of payment. Effective October 1, 2010, the redemption fee for each of the Goldman Sachs Core Plus Fixed Income Fund and the Goldman Sachs Global Income Fund was eliminated.
E. Federal Taxes and Distributions to Shareholders — It is each Fund’s policy to comply with the requirements of the Internal Revenue Code of 1986, as amended (the “Code”), applicable to regulated investment companies (mutual funds) and to distribute each year substantially all of its investment company taxable income and capital gains to its shareholders. Accordingly, the Funds are not required to make any provisions for the payment of federal income tax. Distributions to
GOLDMAN SACHS MULTI SECTOR FIXED INCOME FUNDS
Notes to Financial Statements (continued)
September 30, 2010 (Unaudited)
| |
| 2. SIGNIFICANT ACCOUNTING POLICIES (continued) | |
shareholders are recorded on the ex-dividend date. Income and capital gains distributions, if any, are declared and paid according to the following schedule:
| | | | | |
| | | Income Distributions
| | Capital Gains Distributions
|
| Fund | | Declared/Paid | | Declared/Paid |
| |
| Core Fixed Income, Core Plus Fixed Income and Strategic Income | | Daily/Monthly | | Annually |
| |
| |
| Global Income | | Monthly | | Annually |
| |
| |
Net capital losses are carried forward to future fiscal years and may be used to the extent allowed by the Code to offset any future capital gains. Utilization of capital loss carryforwards will reduce the requirement of future capital gains distributions.
The characterization of distributions to shareholders for financial reporting purposes is determined in accordance with federal income tax rules, which may differ from GAAP. The source of each Fund’s distributions may be shown in the accompanying financial statements as either from net investment income, net realized gain or capital. The Funds’ capital accounts on the Statements of Assets and Liabilities reflect permanent GAAP/tax differences based on the appropriate tax character.
F. Foreign Currency Translations — The books and records of the Funds are accounted for in U.S. dollars. Amounts denominated in foreign currencies are translated into U.S. dollars on the following basis: (i) investment valuations, foreign currency and other assets and liabilities initially expressed in foreign currencies are converted into U.S. dollars based upon 4:00 p.m. Eastern Time exchange rates; and (ii) purchases and sales of foreign investments, income and expenses are converted into U.S. dollars based upon currency exchange rates prevailing on the respective dates of such transactions as of 4:00 p.m. Eastern Time.
Net realized and unrealized gain (loss) on foreign currency transactions represents: (i) foreign exchange gains and losses from the sale and holdings of foreign currencies; (ii) currency gains and losses between trade date and settlement date on investment security transactions and forward foreign currency exchange contracts; and (iii) gains and losses from the difference between amounts of dividends, interest and foreign withholding taxes recorded and the amounts actually received. The effect of changes in foreign currency exchange rates on equity securities and derivative instruments is included with the net realized and change in unrealized gain (loss) on investments on the Statements of Operations. The effect of changes in foreign currency exchange rates on fixed income securities sold during the period is included with the net realized gain (loss) on foreign currency related transactions, while the effect of changes in foreign currency exchange rates on fixed income securities held at period end is included with the net change in unrealized gain (loss) on investments on the Statements of Operations. Net unrealized foreign exchange gains and losses arising from changes in the value of other assets and liabilities as a result of changes in foreign exchange rates are included as increases and decreases in unrealized gain (loss) on foreign currency related transactions.
G. Forward Foreign Currency Exchange Contracts — The Funds may enter into forward foreign currency exchange contracts for the purchase or sale of a specific foreign currency at a fixed price on a future date as a hedge or cross-hedge against either specific transactions, portfolio positions or to seek to increase total return. All contracts are marked to market daily at the applicable forward rate. Unrealized gains or losses on forward foreign currency exchange contracts are recorded by the Funds on a daily basis and realized gains or losses are recorded on the settlement date of a contract.
Risks may arise upon entering into these contracts from the potential inability of counterparties to meet the terms of their contracts and from unanticipated movements in the value of a foreign currency relative to the U.S. dollar.
The contractual amounts of forward foreign currency exchange contracts do not necessarily represent the amounts potentially subject to risk. The measurement of the risks associated with these instruments is meaningful only when all related and offsetting transactions are considered. The Funds must set aside liquid assets, or engage in other appropriate measures to cover their obligations under these contracts.
GOLDMAN SACHS MULTI SECTOR FIXED INCOME FUNDS
| |
| 2. SIGNIFICANT ACCOUNTING POLICIES (continued) | |
H. Futures Contracts — The Funds may purchase or sell futures contracts to hedge against changes in interest rates, securities prices, currency exchange rates, or to seek to increase total return. Futures contracts are valued at the last settlement price, or in the absence of a sale, the last bid price, at the end of each day on the board of trade or exchange upon which they are traded. Upon entering into a futures contract, the Funds deposit cash or securities in an account on behalf of the broker in an amount sufficient to meet the initial margin requirement. Subsequent payments are made or received by the Funds equal to the daily change in the contract value and are recorded as variation margin receivable or payable with a corresponding offset in unrealized gains or losses. The Funds recognize a realized gain or loss when a contract is closed or expires.
The use of futures contracts involves, to varying degrees, elements of market and counterparty risk which may exceed the amounts recognized in the Statements of Assets and Liabilities. Futures contracts may be illiquid, and exchanges may limit fluctuations in futures contract prices during a single day. Changes in the value of a futures contract may not directly correlate with changes in the value of the underlying securities. These risks may decrease the effectiveness of the Funds’ strategies and potentially result in a loss. The Funds must set aside liquid assets, or engage in other appropriate measures to cover their obligations under these contracts.
I. Mortgage-Backed and Asset-Backed Securities — The Funds may invest in mortgage-backed and/or asset-backed securities. Mortgage-backed securities represent direct or indirect participations in, or are collateralized by and payable from, mortgage loans secured by residential and/or commercial real property. These securities may include mortgage pass-through securities, collateralized mortgage obligations, real estate mortgage investment conduit pass-through or participation certificates and stripped mortgage-backed securities. Asset-backed securities include securities whose principal and interest payments are collateralized by pools of assets such as auto loans, credit card receivables, leases, installment contracts and personal property. Asset-backed securities also include home equity line of credit loans and other second-lien mortgages.
The value of certain mortgage-backed and asset-backed securities (including adjustable rate mortgage loans) may be particularly sensitive to changes in prevailing interest rates. The value of these securities may also fluctuate in response to the market’s perception of the creditworthiness of the issuers. Early repayment of principal on mortgage-backed or asset-backed securities may expose a Fund to the risk of earning a lower rate of return upon reinvestment of principal. Asset-backed securities may present credit risks that are not presented by mortgage-backed securities because they generally do not have the benefit of a security interest in collateral that is comparable to mortgage assets. Some asset-backed securities may only have a subordinated claim on collateral. In addition, while mortgage-backed and asset-backed securities may be supported by some form of government or private guarantee and/or insurance, there is no assurance that private guarantors or insurers, if any, will meet their obligations.
Stripped mortgage-backed securities are usually structured with two different classes: one that receives substantially all of the interest payments (the interest-only, or “IO” and/or the high coupon rate with relatively low principal amount, or “IOette”), and the other that receives substantially all of the principal payments (the principal-only, or “PO”) from a pool of mortgage loans. Little to no principal will be received at the maturity of an IO; as a result, adjustments are made to the cost of the security on a daily basis until maturity. These adjustments are included in interest income. Payments received for PO’s are treated as a proportionate reduction to the cost basis of the securities and excess amounts are recorded as gains.
J. Mortgage Dollar Rolls — The Funds may enter into mortgage dollar rolls (“dollar rolls”) in which the Funds sell securities in the current month for delivery and simultaneously contracts with the same counterparty to repurchase similar (same type, coupon and maturity) but not identical securities on a specified future date. The Funds treat dollar rolls as two separate transactions: one involving the purchase of a security and a separate transaction involving a sale.
During the settlement period between sale and repurchase, the Funds will not be entitled to accrue interest and principal payments on the securities sold. Dollar roll transactions involve the risk that the market value of the securities sold by the Funds may decline below the repurchase price of those securities. In the event the buyer of the securities in a dollar roll transaction files for bankruptcy or becomes insolvent, the Funds’ use of proceeds from the transaction may be restricted pending a determination by, or with respect to, the other counterparty.
GOLDMAN SACHS MULTI SECTOR FIXED INCOME FUNDS
Notes to Financial Statements (continued)
September 30, 2010 (Unaudited)
| |
| 2. SIGNIFICANT ACCOUNTING POLICIES (continued) | |
K. Offering Costs — Offering costs paid in connection with the offering of shares of the Strategic Income Fund are being amortized on a straight-line basis over 12 months from the date of commencement of operations.
L. Options — The Funds may write and/or purchase call and put options on futures, swaps (“swaptions”), currencies, securities or any securities index consisting of securities in which the Funds may invest. When the Funds write call or put options, an amount equal to the premium received is recorded as a liability and is subsequently marked to market to reflect the current market value of the option written. Options on a futures contract may be written with premiums to be determined on a future date. The premiums for these options are based upon implied volatility parameters at specified terms. When a written option expires on its stipulated expiration date or the Funds enter into a closing purchase transaction, the Funds realize a gain or loss without regard to any unrealized gain or loss on the underlying future, swap, security or currency transaction, and the liability related to such option is extinguished. When a written call option is exercised, the Funds realize a gain or loss from the sale of the underlying future, swap, security or currency transaction, and the proceeds of the sale are increased by the premium originally received. When a written put option is exercised, the amount of the premium originally received will reduce the cost of the future, swap, security or currency transaction that the Funds purchase upon exercise. There is a risk of loss from a change in value of such options which may exceed the related premiums received. The Funds must set aside liquid assets, or engage in other appropriate measures to cover their obligations under written option contracts.
Upon the purchase of a call option or a put option by the Funds, the premium paid is recorded as an investment and subsequently marked to market to reflect the current market value of the option. Certain options may be purchased with premiums to be determined on a future date. The premiums for these options are based upon implied voluntary parameters at specified terms. If an option which the Funds have purchased expires on the stipulated expiration date, the Funds will realize a loss in the amount of the cost of the option. If the Funds enter into a closing sale transaction, the Funds will realize a gain or loss, depending on whether the sale proceeds for the closing sale transaction are greater or less than the cost of the option. If the Funds exercise a purchased put option, the Funds will realize a gain or loss from the sale of the underlying future, swap, security or currency transaction, and the proceeds from such sale will be decreased by the premium originally paid. If the Funds exercise a purchased call option, the cost of the future, swap, security or currency transaction which the Funds purchase upon exercise will be increased by the premium originally paid. Purchased over-the counter options are subject to the risk that the counterparty may default on its obligations, which could result in a loss to the Funds.
M. Repurchase Agreements — The Funds may enter into repurchase agreements which involve the purchase of securities subject to the seller’s agreement to repurchase the securities at a mutually agreed upon date and price. During the term of a repurchase agreement, the value of the underlying securities held as collateral on behalf of the Funds, including accrued interest, is required to exceed the value of the repurchase agreement, including accrued interest. If the seller defaults or becomes insolvent, realization of the collateral by the Funds may be delayed or limited and there may be a decline in the value of the collateral during the period while the Funds seek to assert their rights. The underlying securities for all repurchase agreements are held at the Funds’ custodian or designated sub-custodians under tri-party repurchase agreements.
Pursuant to exemptive relief granted by the Securities and Exchange Commission (“SEC”) and terms and conditions contained therein, the Funds, together with other registered investment companies having management agreements with GSAM, or its affiliates, may transfer uninvested cash into joint accounts, the daily aggregate balance of which is invested in one or more repurchase agreements. Under these joint accounts, the Funds’ credit exposure is allocated to the underlying repurchase agreements counterparties on a pro-rata basis. With the exception of certain transaction fees, the Funds are not subject to any expenses in relation to these investments.
N. Structured Notes — The Funds may invest in structured notes, the values of which are based on the price movements of a reference security or index. Fluctuations in value are recorded as unrealized gain and loss. Interest income is recorded on the basis of interest accrued, premium amortized and discount accreted. On the termination date, the Funds will receive a payment from a counterparty based on the value of the referenced security (notional multiplied by price of the referenced security) and record a realized gain or loss. Structured notes are subject to various risks including credit, counterparty and interest rate risks.
GOLDMAN SACHS MULTI SECTOR FIXED INCOME FUNDS
| |
| 2. SIGNIFICANT ACCOUNTING POLICIES (continued) | |
O. Swap Contracts — The Funds may enter into swap transactions for hedging purposes or to seek to increase total return. Risks may arise as a result of the failure of the counterparty to the swap contract to comply with the terms of the swap contract. The loss incurred by the failure of a counterparty is generally limited to the net payment to be received by the Funds and/or the termination value at the end of the contract. Therefore, the Funds consider the creditworthiness of each counterparty to a contract in evaluating potential credit risk. Additionally, risks may arise from unanticipated movements in interest rates or in the value of the underlying reference asset or index. Entering into these agreements involves, to varying degrees, market risk, liquidity risk and elements of credit, legal and documentation risk in excess of amounts recognized in the Statements of Assets and Liabilities. The Funds may pay or receive cash as collateral on these contracts which is recorded as an asset and/or liability. The Funds must set aside liquid assets, or engage in other appropriate measures to cover their obligations under these contracts.
Swaps are marked to market daily using either pricing vendor quotations, counterparty prices or model prices and the change in value, if any, is recorded as an unrealized gain or loss. Upfront payments made and/or received by the Funds, are recorded as an asset and/or liability and realized gains or losses are recognized ratably over the contract’s term/event, with the exception of forward starting interest rate swaps, whose realized gains or losses are recognized ratably from the effective start date. Periodic payments received or made on swap contracts are recorded as realized gains or losses. Gains or losses are realized upon termination of a swap contract and are recorded on the Statements of Operations. The Funds invest in the following types of swaps:
An interest rate swap is an agreement that obligates two parties to exchange a series of cash flows at specified intervals, based upon or calculated by reference to changes in specified prices, rates or indices for a specified amount of an underlying asset or notional principal amount. The payment flows are usually netted against each other, with the difference being paid by one party to the other.
A credit default swap is an agreement that involves one party making a stream of payments to another party in exchange for the right to receive protection on a reference security or obligation. A Fund may use credit default swaps to provide a measure of protection against defaults of the reference security or obligation or to take a short position with respect to the likelihood of default. A Fund’s investment in credit default swaps may involve greater risks than if the Fund had invested in the referenced obligation directly. Credit events are contract specific but may include bankruptcy, failure to pay, restructuring and obligation acceleration. If a Fund buys protection through a credit default swap and no credit event occurs, its payments are limited to the periodic payments previously made to the counterparty. Upon the occurrence of a specified credit event, a Fund, as a buyer of credit protection, is entitled to receive an amount equal to the notional amount of the swap and deliver to the seller the defaulted reference obligation in a physically settled trade. A Fund may also receive a net settlement amount in the form of cash or securities equal to the notional amount of the swap reduced by the recovery value of the reference obligation in a cash settled trade.
As a seller of protection, a Fund generally receives a payment stream throughout the term of the swap, provided that there is no credit event. In addition, if the Funds sell protection through a credit default swap, the Funds could suffer a loss because the value of the referenced obligation may be less than the premium payments received. Upon the occurrence of a specified credit event, the Funds, as sellers of credit protection, may be required to take possession of the defaulted reference obligation and pay the buyer an amount equal to the notional amount of the swap in a physically settled trade. The Funds may also pay a net settlement amount in the form of cash or securities equal to the notional amount of the swap reduced by the recovery value of the reference obligation in a cash settled trade. Recovery values are at times established through the credit event auction process in which market participants are ensured that a transparent price has been set for the defaulted security or obligation. In addition, the Funds are entitled to a return of any assets, which have been pledged as collateral to the counterparty.
The Funds’ credit default swaps are disclosed in the Additional Investment Information section of the Schedules of Investments. The maximum potential amount of future payments (undiscounted) that the Funds as sellers of protection could be required to make under a credit default swap would be an amount equal to the notional amount of the agreement. These potential amounts would be partially offset by any recovery values of the respective referenced obligations or net amounts
GOLDMAN SACHS MULTI SECTOR FIXED INCOME FUNDS
Notes to Financial Statements (continued)
September 30, 2010 (Unaudited)
| |
| 2. SIGNIFICANT ACCOUNTING POLICIES (continued) | |
received from a settlement of a credit default swap for the same reference security or obligation where the Funds bought credit protection.
P. Treasury Inflation Protected Securities — The Funds may invest in treasury inflation protected securities (“TIPS”), including structured bonds in which the principal amount is adjusted daily to keep pace with inflation, as measured by the U.S. Consumer Pricing Index for Urban Consumers. The adjustments to principal due to inflation/deflation are reflected as increases/decreases to interest income with a corresponding adjustment to cost. Such adjustments may have a significant impact on the Funds’ distributions and may result in a return of capital to shareholders. The repayment of the original bond principal upon maturity is guaranteed by the full faith and credit of the U.S. Government.
Q. When-Issued Securities and Forward Commitments — The Funds may purchase when-issued securities, including TBA (“To Be Announced”) securities and enter into contracts to purchase or sell securities for a fixed price at a future date beyond the customary settlement period. When-issued securities are securities that have been authorized, but not yet issued in the market. A forward commitment involves entering into a contract to purchase or sell securities for a fixed price at a future date beyond the customary settlement period. The purchase of securities on a when-issued or forward commitment basis involves a risk of loss if the value of the security to be purchased declines before the settlement date. Conversely, the sale of securities on a forward commitment basis involves the risk that the value of the securities sold may increase before the settlement date. Although the Funds will generally purchase securities on a when-issued or forward commitment basis with the intention of acquiring the securities for their portfolios, the Funds may dispose of when-issued securities or forward commitments prior to settlement if GSAM deems it appropriate. When purchasing a security on a when-issued basis or entering into a forward commitment, the Funds must set aside liquid assets, or engage in other appropriate measures to cover their obligations under these contracts. The Funds may dispose of or renegotiate these contracts after they have been entered into and may sell these securities before they are delivered, which may result in a capital gain or loss.
3. FAIR VALUE OF INVESTMENTS
The fair value of a financial instrument is the amount that would be received to sell an asset or paid to transfer a liability in an orderly transaction between market participants at the measurement date (i.e., the exit price). GAAP establishes a fair value hierarchy that prioritizes the inputs to valuation techniques used to measure fair value. The hierarchy gives the highest priority to unadjusted quoted prices in active markets for identical assets or liabilities (Level 1 measurements) and the lowest priority to unobservable inputs (Level 3 measurements). The three levels of the fair value hierarchy are described below:
Level 1 — Unadjusted quoted prices in active markets that are accessible at the measurement date for identical, unrestricted assets or liabilities;
Level 2 — Quoted prices in markets that are not active or financial instruments for which significant inputs are observable (including, but not limited to, quoted prices for similar securities, interest rates, foreign exchange rates and credit spreads), either directly or indirectly;
Level 3 — Prices or valuations that require significant unobservable inputs (including GSAM and GSAMI’s assumptions in determining fair value measurement).
GOLDMAN SACHS MULTI SECTOR FIXED INCOME FUNDS
| |
| 3. FAIR VALUE OF INVESTMENTS (continued) | |
The following is a summary of the Funds’ investments categorized in the fair value hierarchy, as of September 30, 2010:
| | | | | | | | | | | | | |
| Core Fixed Income | | Level 1 | | | Level 2 | | | Level 3 | |
| | |
Assets | | | | | | | | | | | | |
| Fixed Income | | | | | | | | | | | | |
| Corporate Obligations | | $ | — | | | $ | 390,671,701 | | | $ | — | |
| Mortgage-Backed Obligations | | | — | | | | 727,191,328 | | | | — | |
U.S. Treasuries and/or Other U.S. Government Obligations and Agencies | | | 256,358,358 | | | | 24,842,021 | | | | — | |
| Asset-Backed Securities | | | — | | | | 58,841,110 | | | | — | |
| Foreign Debt Obligations | | | 6,822,620 | | | | 33,075,902 | | | | — | |
| Municipal Debt Obligations | | | — | | | | 17,602,955 | | | | — | |
| Government Guarantee Obligations | | | — | | | | 272,391,680 | | | | — | |
Common Stock and/or Other Equity Investments | | | — | | | | 1,285,956 | | | | — | |
| Short-term Investments | | | — | | | | 421,700,000 | | | | — | |
| Derivatives | | | 1,996,283 | | | | 1,140,506 | | | | — | |
| |
| |
Total | | $ | 265,177,261 | | | $ | 1,948,743,159 | | | $ | — | |
| |
| |
Liabilities | | | | | | | | | | | | |
| Derivatives | | $ | (5,635 | ) | | $ | (2,929,301 | ) | | $ | — | |
| |
| |
| | | | | | | | | | | | | |
| Core Plus Fixed Income | | Level 1 | | | Level 2 | | | Level 3 | |
| | |
Assets | | | | | | | | | | | | |
| Fixed Income | | | | | | | | | | | | |
| Corporate Obligations | | $ | — | | | $ | 58,158,644 | | | $ | — | |
| Mortgage-Backed Obligations | | | — | | | | 135,294,264 | | | | — | |
U.S. Treasuries and/or Other U.S. Government Obligations and Agencies | | | 47,507,253 | | | | 12,266,687 | | | | — | |
| Asset-Backed Securities | | | — | | | | 36,194,768 | | | | — | |
| Foreign Debt Obligations | | | — | | | | 10,471,896 | | | | — | |
| Structured Notes | | | — | | | | 5,243,861 | | | | — | |
| Municipal Debt Obligations | | | — | | | | 3,677,104 | | | | — | |
| Government Guarantee Obligations | | | — | | | | 36,623,024 | | | | — | |
Common Stock and/or Other Equity Investments | | | — | | | | 789,470 | | | | — | |
| Short-term Investments | | | — | | | | 65,500,000 | | | | — | |
| Derivatives | | | 509,704 | | | | 2,752,485 | | | | — | |
| |
| |
Total | | $ | 48,016,957 | | | $ | 366,972,203 | | | $ | — | |
| |
| |
Liabilities | | | | | | | | | | | | |
| Derivatives | | $ | (243,718 | ) | | $ | (3,605,891 | ) | | $ | — | |
| |
| |
GOLDMAN SACHS MULTI SECTOR FIXED INCOME FUNDS
Notes to Financial Statements (continued)
September 30, 2010 (Unaudited)
| |
| 3. FAIR VALUE OF INVESTMENTS (continued) | |
| | | | | | | | | | | | | |
| Global Income | | Level 1 | | | Level 2 | | | Level 3 | |
| | |
Assets | | | | | | | | | | | | |
| Fixed Income | | | | | | | | | | | | |
| Foreign Debt Obligations | | $ | 363,507,026 | | | $ | 105,551,484 | | | $ | — | |
| Corporate Obligations | | | — | | | | 219,425,080 | | | | — | |
| Asset-Backed Securities | | | — | | | | 35,535,801 | | | | — | |
| Mortgage-Backed Obligations | | | — | | | | 148,664,680 | | | | — | |
U.S. Treasuries and/or Other U.S. Government Obligations and Agencies | | | 28,798,190 | | | | 6,542,931 | | | | — | |
| Government Guarantee Obligations | | | — | | | | 66,605,837 | | | | — | |
| Short-term Investments | | | — | | | | 59,882,357 | | | | — | |
| Derivatives | | | 1,252,824 | | | | 17,242,370 | | | | — | |
| |
| |
Total | | $ | 393,558,040 | | | $ | 659,450,540 | | | $ | — | |
| |
| |
Liabilities | | | | | | | | | | | | |
| Fixed Income — Mortgage-Backed Obligations | | | | | | | | | | | | |
| Forward Sales Contracts | | $ | — | | | $ | (1,039,766 | ) | | $ | — | |
| Derivatives | | | (372,752 | ) | | | (43,811,743 | ) | | | — | |
| |
| |
Total | | $ | (372,752 | ) | | $ | (44,851,509 | ) | | $ | — | |
| |
| |
| | | | | | | | | | | | | |
| Strategic Income | | Level 1 | | | Level 2 | | | Level 3 | |
| | |
Assets | | | | | | | | | | | | |
| Fixed Income | | | | | | | | | | | | |
| Corporate Obligations | | $ | — | | | $ | 28,154,297 | | | $ | — | |
| Mortgage-Backed Obligations | | | — | | | | 51,299,184 | | | | — | |
U.S. Treasuries and/or Other U.S. Government Obligations and Agencies | | | 50,211,988 | | | | 2,425,861 | | | | — | |
| Asset-Backed Securities | | | — | | | | 20,317,034 | | | | — | |
| Foreign Debt Obligations | | | — | | | | 10,020,271 | | | | — | |
| Structured Notes | | | — | | | | 5,623,660 | | | | — | |
| Municipal Debt Obligations | | | — | | | | 2,646,167 | | | | — | |
| Government Guarantee Obligations | | | — | | | | 6,445,149 | | | | — | |
Common Stock and/or Other Equity Investments | | | — | | | | 9,324 | | | | — | |
| Short-term Investments | | | — | | | | 58,100,000 | | | | — | |
| Derivatives | | | 381,263 | | | | 1,290,387 | | | | — | |
| |
| |
Total | | $ | 50,593,251 | | | $ | 186,331,334 | | | $ | — | |
| |
| |
Liabilities | | | | | | | | | | | | |
| Derivatives | | $ | (296,459 | ) | | $ | (1,343,134 | ) | | $ | — | |
| |
| |
4. AGREEMENTS AND AFFILIATED TRANSACTIONS
A. Management Agreement — Under the Agreements, GSAM and GSAMI manage the Funds, subject to the general supervision of the trustees.
As compensation for the services rendered pursuant to the Agreements, the assumption of the expenses related thereto and administration of the Funds’ business affairs, including providing facilities, GSAM and GSAMI are entitled to a
GOLDMAN SACHS MULTI SECTOR FIXED INCOME FUNDS
| |
| 4. AGREEMENTS AND AFFILIATED TRANSACTIONS (continued) | |
management fee computed daily and paid monthly, equal to an annual percentage rate of each Fund’s average daily net assets.
For the six months ended September 30, 2010, contractual management fees with GSAM and GSAMI were at the following rates:
| | | | | | | | | | | | | | | | | | | | | | | | | |
| | | Contractual Management Rate | |
| | | First
| | | Next
| | | Next
| | | Next
| | | Over
| | | Effective
| |
| Fund | | $1 billion | | | $1 billion | | | $3 billion | | | $3 billion | | | $8 billion | | | Rate | |
| | |
| Core Fixed Income | | | 0.40 | % | | | 0.36 | % | | | 0.34 | % | | | 0.33 | % | | | 0.32 | % | | | 0.38 | % |
| |
| |
| Core Plus Fixed Income | | | 0.45 | | | | 0.41 | | | | 0.39 | | | | 0.38 | | | | 0.37 | | | | 0.45 | |
| |
| |
| Global Income | | | 0.65 | | | | 0.59 | | | | 0.56 | | | | 0.55 | | | | 0.54 | | | | 0.65 | |
| |
| |
| Strategic Income | | | 0.60 | | | | 0.54 | | | | 0.51 | | | | 0.50 | | | | 0.49 | | | | 0.60 | |
| |
| |
B. Distribution and Service Plans — The Trust, on behalf of each Fund, has adopted Distribution and Service Plans (the “Plans”). Under the Plans, Goldman Sachs, which serves as distributor (the “Distributor”), is entitled to a fee, computed daily and paid monthly for distribution services and personal and account maintenance services, which may then be paid by Goldman Sachs to authorized dealers, at the following annual rates calculated on a Fund’s average daily net assets of each respective share class:
| | | | | | | | | | | | | | | | | |
| | | Distribution and Service Plan Rates | |
| | | Class A* | | | Class B | | | Class C | | | Class R* | |
| | |
| Distribution Plan | | | 0.25 | % | | | 0.75 | % | | | 0.75 | % | | | 0.50 | % |
| |
| |
| Service Plan | | | — | | | | 0.25 | | | | 0.25 | | | | — | |
| |
| |
| |
| * | With respect to Class A and Class R Shares, the Distributor at its discretion may use compensation for distribution services paid under the Distribution Plan to compensate service organizations for personal and account maintenance services and expenses as long as such total compensation does not exceed the maximum cap on “service fees” imposed by the Financial Industry Regulatory Authority. |
C. Distribution Agreement — Goldman Sachs, as Distributor of the shares of the Funds pursuant to a Distribution Agreement may retain a portion of the Class A front end sales charge and Class B and Class C contingent deferred sales charges. During the six months ended September 30, 2010, Goldman Sachs advised that it retained the following approximate amounts:
| | | | | | | | | | | | | |
| | | Front End
| | | Contingent Deferred
| |
| | | Sales Charge | | | Sales Charge | |
| Fund | | Class A | | | Class B | | | Class C | |
| | |
| Core Fixed Income | | $ | 18,800 | | | $ | — | | | $ | 600 | |
| |
| |
| Core Plus Fixed Income | | | 12,700 | | | | — | | | | — | |
| |
| |
| Global Income | | | 21,800 | | | | — | | | | — | |
| |
| |
| Strategic Income | | | 10,500 | | | | N/A | | | | — | |
| |
| |
D. Service Plan and Shareholder Administration Plan — The Trust, on behalf of each Fund that offers Service Shares, has adopted a Service Plan and Shareholder Administration Plan. These plans allow for Service Shares to compensate service organizations for providing varying levels of personal and account maintenance and shareholder administration services to their customers who are beneficial owners of such shares. The Service Plan and Shareholder Administration Plan
GOLDMAN SACHS MULTI SECTOR FIXED INCOME FUNDS
Notes to Financial Statements (continued)
September 30, 2010 (Unaudited)
| |
| 4. AGREEMENTS AND AFFILIATED TRANSACTIONS (continued) | |
each provide for compensation to the service organizations in an amount equal to, on an annual basis, 0.25% (0.50% in aggregate) of the average daily net assets of the Service Shares.
E. Transfer Agency Agreement — Goldman Sachs also serves as the transfer agent of the Funds for a fee pursuant to a Transfer Agency Agreement. The fees charged for such transfer agency services are computed daily and paid monthly at an annual rate as follows: 0.13% of the average daily net assets for Class A, Class B, Class C, Class IR and Class R Shares and 0.04% of the average daily net assets for Institutional and Service Shares.
F. Other Expense Agreements and Affiliated Transactions — GSAM and GSAMI have agreed to limit certain “Other Expense” of the Funds (excluding management fees, distribution and service fees, transfer agent fees and expenses, service fees and shareholder administration fees (as applicable), taxes, interest, brokerage fees and litigation, indemnification, shareholder meetings and other extraordinary expenses, exclusive of any custody and transfer agent fee credit reductions) to the extent such expenses exceed, on an annual basis, a percentage rate of the average daily net assets of each Fund. Such Other Expense reimbursements, if any, are computed daily and paid monthly. In addition, the Funds are not obligated to reimburse GSAM and GSAMI for prior fiscal year expense reimbursements, if any. The Other Expense limitations for the Core Fixed Income, Core Plus Fixed Income, Global Income and Strategic Income Funds as an annual percentage rate of average daily net assets are 0.104%, 0.004%, 0.004% and 0.054%, respectively. These Other Expense reimbursements will remain in place through at least July 29, 2011 for the Core Fixed Income, Core Plus Fixed Income and Global Income Funds and June 30, 2011 for the Strategic Income Fund, and prior to such date GSAM and GSAMI may not terminate the arrangements without the approval of the Trustees. In addition, the Funds have entered into certain offset arrangements with the custodian and the transfer agent, which may result in a reduction of the Funds’ expenses.
For the six months ended September 30, 2010, these expense reductions, including Other Expense reimbursements, were as follows (in thousands):
| | | | | | | | | | | | | |
| | | Custody Fee
| | | Other Expense
| | | Total Expense
| |
| Fund | | Credits | | | Reimbursements | | | Reductions | |
| | |
| Core Fixed Income | | $ | 1 | | | $ | — | | | $ | 1 | |
| |
| |
| Core Plus Fixed Income | | | 1 | | | | 310 | | | | 311 | |
| |
| |
| Global Income | | | 1 | | | | 443 | | | | 444 | |
| |
| |
| Strategic Income | | | — | | | | 147 | | | | 147 | |
| |
| |
As of September 30, 2010, the amounts owed to affiliates of the Funds were as follows (in thousands):
| | | | | | | | | | | | | | | | | |
| | | Management
| | | Distribution and
| | | Transfer
| | | | |
| Fund | | Fees | | | Service Fees | | | Agent Fees | | | Total | |
| | |
| Core Fixed Income | | $ | 599 | | | $ | 209 | | | $ | 127 | | | $ | 935 | |
| |
| |
| Core Plus Fixed Income | | | 134 | | | | 40 | | | | 21 | | | | 195 | |
| |
| |
| Global Income | | | 539 | | | | 59 | | | | 52 | | | | 650 | |
| |
| |
| Strategic Income | | | 74 | | | | 14 | | | | 10 | | | | 98 | |
| |
| |
G. Line of Credit Facility — As of September 30, 2010, the Funds participated in a $580,000,000 committed, unsecured revolving line of credit facility (the “facility”) together with other funds of the Trust and registered investment companies having management agreements with GSAM, GSAMI or its affiliates. Pursuant to the terms of the facility, the Funds and other borrowers could increase the credit amount by an additional $340,000,000, for a total of up to $920,000,000. This facility is to be used solely for temporary or emergency purposes. The interest rate on borrowings is based on the federal funds rate. The facility also requires a fee to be paid by the Funds based on the amount of the commitment that has not
GOLDMAN SACHS MULTI SECTOR FIXED INCOME FUNDS
| |
| 4. AGREEMENTS AND AFFILIATED TRANSACTIONS (continued) | |
been utilized. For the six months ended September 30, 2010, the Funds did not have any borrowings under the facility. Prior to May 11, 2010, the amount available through the facility was $660,000,000.
H. Other Transactions with Affiliates — For the six months ended September 30, 2010, Goldman Sachs earned approximately $57,200, $18,600, $0 and $3,100 in brokerage commissions from portfolio transactions, including futures transactions executed with Goldman Sachs as the Futures Commission Merchant, on behalf of Core Fixed Income, Core Plus Fixed Income, Global Income and Strategic Income Funds, respectively.
As of September 30, 2010, the following Fund of Funds Portfolios were the beneficial owners of 5% or more of total outstanding shares of the following Fund:
| | | | | | | | | | | | | |
| | | | | | | | | Goldman Sachs
| |
| | | Goldman Sachs
| | | Goldman Sachs
| | | Growth and
| |
| | | Balanced Strategy
| | | Growth Strategy
| | | Income Strategy
| |
| Fund | | Portfolio | | | Portfolio | | | Portfolio | |
| | |
| Core Fixed Income | | | — | % | | | — | % | | | 5 | % |
| |
| |
| Global Income | | | 17 | % | | | 14 | % | | | 39 | % |
| |
| |
As of September 30, 2010, the Goldman Sachs Group, Inc. (“GSG”) was the beneficial owner of approximately 68% of the Class R Shares of the Core Fixed Income Fund, 100% and 29% of the Service and Class R Shares, respectively, of the Core Plus Fixed Income Fund and 13%, 5% and 100% of the Institutional, Class IR and Class R Shares, respectively, of the Strategic Income Fund.
5. INVESTMENTS IN DERIVATIVES
The Funds may make investments in derivative instruments, including, but not limited to, options, futures, swaps and other derivatives relating to foreign currency transactions. A derivative is an instrument whose value is derived from underlying assets, indices, reference rates or a combination of these factors. Derivative instruments may be privately negotiated contracts (often referred to as over the counter (“OTC”) derivatives) or they may be listed and traded on an exchange. Derivative contracts may involve future commitments to purchase or sell financial instruments or commodities at specified terms on a specified date, or to exchange interest payment streams or currencies based on a notional or contractual amount. Derivative instruments may involve a high degree of financial risk. The use of derivatives also involves the risk of loss if the investment adviser is incorrect in its expectation of the timing or level of fluctuations in securities prices, interest rates or currency prices. Investments in derivative instruments also include the risk of default by the counterparty, the risk that the investment may not be liquid and the risk that a small movement in the price of the underlying security or benchmark may result in a disproportionately large movement, unfavorable or favorable, in the price of the derivative instrument.
GOLDMAN SACHS MULTI SECTOR FIXED INCOME FUNDS
Notes to Financial Statements (continued)
September 30, 2010 (Unaudited)
| |
| 5. INVESTMENTS IN DERIVATIVES (continued) | |
The following tables set forth, by certain risk types, the gross value of the Funds’ derivative contracts for trading activities as of September 30, 2010. The values in the tables below exclude the effects of cash collateral received or posted pursuant to these derivative contracts, and therefore are not representative of the Funds’ net exposure.
Core Fixed Income
| | | | | | | | | | | | | | |
| | | Statements of Assets
| | | | | | Statements of Assets
| | | |
| | | and Liabilities
| | | | | | and Liabilities
| | | |
| Risk | | Location | | Assets | | | | Location | | Liabilities | |
| | |
| Interest rate | | Due from broker — variation margin | | $ | 1,996,283(a | ) | | | Payables for swap contracts, at value;
Due to broker — variation margin | | $ | (552,663 | )(a)(b) |
| |
| |
| Credit | | — | | | — | | | | Payables for swap contracts, at value | | | (334,633 | )(b) |
| |
| |
| Currency | | Receivables for forward foreign currency exchange contracts, at value | | | 1,140,506 | | | | Payables for forward foreign currency exchange contracts, at value | | | (2,047,640 | ) |
| |
| |
Total | | | | $ | 3,136,789 | | | | | | $ | (2,934,936 | ) |
| |
| |
Core Plus Fixed Income
| | | | | | | | | | | | | | |
| | | Statements of Assets
| | | | | | Statements of Assets
| | | |
| | | and Liabilities
| | | | | | and Liabilities
| | | |
| Risk | | Location | | Assets | | | | Location | | Liabilities | |
| | |
| Interest rate | | Receivables for swap contracts, at value; Due from broker — variation margin | | $ | 2,881,619(a | ) | | | Payables for swap contracts, at value; Due to broker — variation margin | | $ | (2,444,427 | )(a)(b) |
| |
| |
| Credit | | — | | | — | | | | Payables for swap contracts, at value | | | (739,945 | )(b) |
| |
| |
| Currency | | Receivables for forward foreign currency exchange contracts, at value | | | 380,570 | | | | Payables for forward foreign currency exchange contracts, at value | | | (665,237 | ) |
| |
| |
Total | | | | $ | 3,262,189 | | | | | | $ | (3,849,609 | ) |
| |
| |
Global Income
| | | | | | | | | | | | | | |
| | | Statements of Assets
| | | | | | Statements of Assets
| | | |
| | | and Liabilities
| | | | | | and Liabilities
| | | |
| Risk | | Location | | Assets | | | | Location | | Liabilities | |
| | |
| Interest rate | | Receivables for swap contracts, at value; Due from broker — variation margin | | $ | 11,678,510(a | ) | | | Payables for swap contracts, at value; Due to broker — variation margin | | $ | (12,596,097 | )(a)(b) |
| |
| |
| Currency | | Investments in Securities, at value; Receivables for forward foreign currency exchange contracts, at value | | | 6,816,684 | | | | Payables for forward foreign currency exchange contracts, at value | | | (31,588,398 | ) |
| |
| |
Total | | | | $ | 18,495,194 | | | | | | $ | (44,184,495 | ) |
| |
| |
GOLDMAN SACHS MULTI SECTOR FIXED INCOME FUNDS
| |
| 5. INVESTMENTS IN DERIVATIVES (continued) | |
Strategic Income
| | | | | | | | | | | | | | |
| | | Statements of Assets
| | | | | | Statements of Assets
| | | |
| | | and Liabilities
| | | | | | and Liabilities
| | | |
| Risk | | Location | | Assets | | | | Location | | Liabilities | |
| | |
| Interest rate | | Receivables for swap contracts, at value; Due from broker — variation margin | | $ | 1,029,748(a | ) | | | Payables for swap contracts, at value; Due to broker — variation margin | | $ | (786,692 | )(a)(b) |
| |
| |
| Credit | | — | | | — | | | | Payables for swap contracts, at value | | | (58,909 | )(b) |
| |
| |
| Currency | | Receivables for forward foreign currency exchange contracts, at value | | | 641,902 | | | | Payables for forward foreign currency exchange contracts, at value | | | (793,992 | ) |
| |
| |
Total | | | | $ | 1,671,650 | | | | | | $ | (1,639,593 | ) |
| |
| |
| |
| (a) | Includes unrealized gain (loss) on futures contracts described in the Additional Investment Information sections of the Schedules of Investments. Only current day’s variation margin is reported within the Statements of Assets and Liabilities. |
| |
| (b) | Aggregate of amounts include $881,661, $2,940,654, $12,223,345 and $549,142 for Core Fixed Income, Core Plus Fixed Income, Global Income and Strategic Income Funds, respectively, which represent the payments to be made pursuant to bilateral agreements should counterparties exercise their “right to terminate” provisions based on, among others, the Funds’ performance, its failure to pay on its obligations or failure to pledge collateral. Such amounts do not include incremental charges directly associated with the close-out of the agreements. They also do not reflect the fair value of any assets pledged as collateral which, through the daily margining process, substantially offsets the aforementioned amounts and for which the Funds are entitled to a full return. |
The following tables set forth, by certain risk types, the Funds’ gains (losses) related to derivative activities and their indicative volumes for the six months ended September 30, 2010. These gains (losses) should be considered in the context that these contracts may have been executed to economically hedge securities and accordingly, gains (losses) on such contracts may offset (losses) gains attributable to securities. These gains (losses) are included in “Net realized gain (loss)” or “Net change in unrealized gain (loss)” on the Statements of Operations:
Core Fixed Income
| | | | | | | | | | | | | | | | |
| | | | | | | | Net Change in
| | | | Average
| |
| | | | | Net Realized
| | | Unrealized
| | | | Number of
| |
| Risk | | Statements of Operations Location | | Gain (Loss) | | | Gain (Loss) | | | | Contracts(a) | |
| | |
| Interest rate | | Net realized gain (loss) from futures transactions and swap contracts/Net change in unrealized gain (loss) on futures and swap contracts | | $ | 12,931,894 | | | $ | 2,354,598 | | | | | 1,672 | |
| |
| |
| Credit | | Net realized gain (loss) from swap contracts/Net change in unrealized gain (loss) on swap contracts | | | 2,130,161 | | | | (27,253 | ) | | | | 5 | |
| |
| |
| Currency | | Net realized gain (loss) from foreign currency related transactions/Net change in unrealized gain (loss) on translation of assets and liabilities denominated in foreign currencies | | | (177,414 | ) | | | (1,157,922 | ) | | | | 110 | |
| |
| |
Total | | | | $ | 14,884,641 | | | $ | 1,169,423 | | | | | 1,787 | |
| |
| |
GOLDMAN SACHS MULTI SECTOR FIXED INCOME FUNDS
Notes to Financial Statements (continued)
September 30, 2010 (Unaudited)
| |
| 5. INVESTMENTS IN DERIVATIVES (continued) | |
Core Plus Fixed Income
| | | | | | | | | | | | | | | | |
| | | | | | | | Net Change in
| | | | Average
| |
| | | | | Net Realized
| | | Unrealized
| | | | Number of
| |
| Risk | | Statements of Operations Location | | Gain (Loss) | | | Gain (Loss) | | | | Contracts(a) | |
| | |
| Interest rate | | Net realized gain (loss) from futures transactions and swap contracts/Net change in unrealized gain (loss) on futures and swap contracts | | $ | 994,962 | | | $ | 364,490 | | | | | 736 | |
| |
| |
| Credit | | Net realized gain (loss) from swap contracts/Net change in unrealized gain (loss) on swap contracts | | | (93,425 | ) | | | 329,856 | | | | | 5 | |
| |
| |
| Currency | | Net realized gain (loss) from foreign currency related transactions/Net change in unrealized gain (loss) on translation of assets and liabilities denominated in foreign currencies | | | (407,415 | ) | | | (317,035 | ) | | | | 103 | |
| |
| |
Total | | | | $ | 494,122 | | | $ | 377,311 | | | | | 844 | |
| |
| |
Global Income
| | | | | | | | | | | | | | | | |
| | | | | | | | Net Change in
| | | | Average
| |
| | | | | Net Realized
| | | Unrealized
| | | | Number of
| |
| Risk | | Statements of Operations Location | | Gain (Loss) | | | Gain (Loss) | | | | Contracts(a) | |
| | |
| Interest rate | | Net realized gain (loss) from futures transactions and swap contracts/Net change in unrealized gain (loss) on futures and swap contracts | | $ | (2,349,824 | ) | | $ | (744,831 | ) | | | | 1,582 | |
| |
| |
| Credit | | Net realized gain (loss) from swap contracts/Net change in unrealized gain (loss) on swap contracts | | | 2,159,749 | | | | 43,125 | | | | | 6 | |
| |
| |
| Currency | | Net realized gain (loss) from investment transactions, written options and foreign currency related transactions/Net change in unrealized gain (loss) on investments and translation of assets and liabilities denominated in foreign currencies | | | 972,757 | | | | (32,184,028 | ) | | | | 688 | |
| |
| |
Total | | | | $ | 782,682 | | | $ | (32,885,734 | ) | | | | 2,276 | |
| |
| |
Strategic Income
| | | | | | | | | | | | | | | | |
| | | | | | | | | | | | Average
| |
| | | | | Net Realized
| | | Unrealized
| | | | Number of
| |
| Risk | | Statements of Operations Location | | Gain (Loss) | | | Gain (Loss) | | | | Contracts(a) | |
| | |
| Interest rate | | Net realized gain (loss) from futures transactions and swap contracts/Unrealized gain (loss) on futures and swap contracts | | $ | (27,407 | ) | | $ | 47,823 | | | | | 373 | |
| |
| |
| Credit | | Net realized gain (loss) from swap contracts/Unrealized gain (loss) on swap contracts | | | 23,097 | | | | 90,922 | | | | | 2 | |
| |
| |
| Currency | | Net realized gain (loss) from foreign currency related transactions/Unrealized gain (loss) on translation of assets and liabilities denominated in foreign currencies | | | (258,127 | ) | | | (152,090 | ) | | | | 61 | |
| |
| |
Total | | | | $ | (262,437 | ) | | $ | (13,345 | ) | | | | 436 | |
| |
| |
| |
| (a) | Average number of contracts is based on the average of month end balances for the period ended September 30, 2010. |
GOLDMAN SACHS MULTI SECTOR FIXED INCOME FUNDS
6. PORTFOLIO SECURITIES TRANSACTIONS
The cost of purchases and proceeds from sales and maturities of long-term securities for the six months ended September 30, 2010, were as follows:
| | | | | | | | | | | | | | | | | |
| | | | | | | | | Sales and
| | | Sales and
| |
| | | Purchases of
| | | Purchases (Excluding
| | | Maturities of
| | | Maturities (Excluding
| |
| | | U.S. Government and
| | | U.S. Government and
| | | U.S. Government and
| | | U.S. Government and
| |
| Fund | | Agency Obligations | | | Agency Obligations) | | | Agency Obligations | | | Agency Obligations) | |
| | |
| Core Fixed Income | | $ | 3,662,497,676 | | | $ | 304,153,417 | | | $ | 3,413,972,252 | | | $ | 338,011,799 | |
| |
| |
| Core Plus Fixed Income | | | 679,879,776 | | | | 97,429,906 | | | | 646,495,531 | | | | 87,487,438 | |
| |
| |
| Global Income | | | 969,205,352 | | | | 537,338,941 | | | | 1,032,570,354 | | | | 430,576,222 | |
| |
| |
| Strategic Income | | | 92,224,960 | | | | 122,359,406 | | | | 29,637,336 | | | | 6,575,897 | |
| |
| |
7. TAX INFORMATION
As of the Funds’ most recent fiscal year end, March 31, 2010, the Funds’ capital loss carryforwards and certain timing differences, on a tax basis were as follows:
| | | | | | | | | | | | | | | | | |
| | | Core
| | | Core Plus
| | | Global
| | | Strategic
| |
| | | Fixed Income | | | Fixed Income | | | Income | | | Income | |
| | |
Capital loss carryforward:(1) | | | | | | | | | | | | | | | | |
| Expiring 2014 | | $ | — | | | $ | — | | | $ | (1,892,830 | ) | | $ | — | |
| Expiring 2017 | | | (8,343,574 | ) | | | — | | | | — | | | | — | |
| Expiring 2018 | | | (131,291,875 | ) | | | — | | | | (12,251,045 | ) | | | — | |
| |
| |
| Total capital loss carryforward | | $ | (139,635,449 | ) | | $ | — | | | $ | (14,143,875 | ) | | $ | — | |
| |
| |
Timing differences (Income Distributions Payable,
Post-October Losses and Straddles) | | $ | (43,279,515 | ) | | $ | (442,891 | ) | | $ | (25,132,404 | ) | | $ | — | |
| |
| |
| |
| (1) | Expiration occurs on March 31 of the year indicated. |
GOLDMAN SACHS MULTI SECTOR FIXED INCOME FUNDS
Notes to Financial Statements (continued)
September 30, 2010 (Unaudited)
| |
| 7. TAX INFORMATION (continued) | |
As of September 30, 2010, the Funds’ aggregate security unrealized gains and losses based on cost for U.S. federal income tax purposes were as follows:
| | | | | | | | | | | | | | | | | |
| | | Core
| | | Core Plus
| | | Global
| | | Strategic
| |
| | | Fixed Income | | | Fixed Income | | | Income | | | Income | |
| | |
| Tax Cost | | $ | 2,175,402,184 | | | $ | 403,262,955 | | | $ | 961,864,415 | | | $ | 234,319,734 | |
| |
| |
| Gross unrealized gain | | | 61,074,076 | | | | 12,705,066 | | | | 84,674,069 | | | | 1,278,506 | |
| Gross unrealized loss | | | (25,692,629 | ) | | | (4,241,050 | ) | | | (11,740,510 | ) | | | (345,305 | ) |
| |
| |
| Net unrealized security gain | | $ | 35,381,447 | | | $ | 8,464,016 | | | $ | 72,933,559 | | | $ | 933,201 | |
| |
| |
The difference between GAAP-basis and tax-basis unrealized gains (losses), as of the most recent fiscal year end, is attributable primarily to wash sales, net mark-to-market gains (losses) on regulated futures contracts and forward foreign currency exchange contracts, and differences related to the tax treatment of swap transactions, market discount accretion and premium amortization.
GSAM and GSAMI have reviewed the Funds’ tax positions for all open tax years (the current and prior three years, as applicable) and has concluded that no provision for income tax is required in the Funds’ financial statements. Such open tax years remain subject to examination and adjustment by tax authorities.
8. OTHER RISKS
Foreign Custody Risk — A Fund that invests in foreign securities may hold such securities and foreign currency with foreign banks, agents, and securities depositories (each a “Foreign Custodian”) appointed by the Fund’s custodian. Investments in emerging markets may be subject to greater custody risks than investments in more developed markets. Custody services in emerging market countries are often undeveloped and may be less regulated than in more developed countries, and thus may not afford the same level of investor protection as would apply in developed countries. In some countries, Foreign Custodians may be subject to little or no regulatory oversight or independent evaluation of their operations. Further, the laws of certain countries may place limitations on a Fund’s ability to recover its assets if a Foreign Custodian enters into bankruptcy.
Funds’ Shareholder Concentration Risk — Certain funds, accounts, individuals or Goldman Sachs affiliates may from time to time own (beneficially or of record) or control a significant percentage of the Funds’ shares. Redemptions by these funds, accounts or individuals of their holdings in the Funds may impact the Funds’ liquidity and NAV. These redemptions may also force the Funds to sell securities.
Market and Credit Risks — In the normal course of business, the Funds trade financial instruments and enter into financial transactions where risk of potential loss exists due to changes in the market (market risk). Additionally, the Funds may also be exposed to credit risk in the event that an issuer fails to perform or that an institution or entity with which the Funds have unsettled or open transaction defaults.
GOLDMAN SACHS MULTI SECTOR FIXED INCOME FUNDS
| |
| 8. OTHER RISKS (continued) | |
Investing in foreign markets may involve special risks and considerations not typically associated with investing in the U.S. These risks include revaluation of currencies, high rates of inflation, repatriation restrictions on income and capital, and adverse political and economic developments. Moreover, securities issued in these markets may be less liquid, be subject to government ownership controls, have delayed settlements and their prices may be more volatile than those of comparable securities in the U.S.
Portfolio Concentration Risk — As a result of certain of the Funds’ ability to invest a large percentage of their assets in obligations of issuers within the same country, state, industry or economic sector, an adverse economic, business or political development may affect the value of the Funds’ investments more than if their investments were not so concentrated.
9. INDEMNIFICATIONS
Under the Trust’s organizational documents, its trustees, officers, employees and agents are indemnified, to the extent permitted by the Act, against certain liabilities that may arise out of performance of their duties to the Funds. Additionally, in the course of business, the Funds enter into contracts that contain a variety of indemnification clauses. The Funds’ maximum exposure under these arrangements is unknown, as this would involve future claims that may be made against the Funds that have not yet occurred. However, GSAM and GSAMI believe the risk of loss under these arrangements to be remote.
10. SUBSEQUENT EVENTS
Subsequent events after the balance sheet date have been evaluated through the date the financial statements were issued. GSAM and GSAMI have concluded that, excluding the removal of the Redemption fee disclosed in the Significant Accounting Policies, there is no impact requiring adjustment or disclosure in the financial statements.
GOLDMAN SACHS MULTI SECTOR FIXED INCOME FUNDS
Notes to Financial Statements (continued)
September 30, 2010 (Unaudited)
11. SUMMARY OF SHARE TRANSACTIONS
Share activity is as follows:
| | | | | | | | | | | | | | | | | |
| | | Core Fixed Income Fund | |
| | | | |
| | | For the Six Months Ended
| | | | |
| | | September 30, 2010
| | | For the Fiscal Year Ended
| |
| | | (Unaudited) | | | March 31, 2010 | |
| | | | |
| | | Shares | | | Dollars | | | Shares | | | Dollars | |
| | | | |
Class A Shares | | | | | | | | | | | | | | | | |
| Shares sold | | | 11,502,265 | | | $ | 112,364,607 | | | | 42,252,017 | | | $ | 382,798,857 | |
| Reinvestment of distributions | | | 767,249 | | | | 7,511,368 | | | | 2,186,150 | | | | 19,927,326 | |
Shares converted from Class B(a) | | | 48,931 | | | | 476,686 | | | | 62,053 | | | | 565,096 | |
| Shares redeemed | | | (14,942,914 | ) | | | (145,311,757 | ) | | | (32,719,043 | ) | | | (296,128,599 | ) |
| |
| |
| | | | (2,624,469 | ) | | | (24,959,096 | ) | | | 11,781,177 | | | | 107,162,680 | |
| |
| |
Class B Shares | | | | | | | | | | | | | | | | |
| Shares sold | | | 133,231 | | | | 1,311,133 | | | | 432,183 | | | | 3,888,198 | |
| Reinvestment of distributions | | | 11,962 | | | | 117,431 | | | | 47,822 | | | | 436,493 | |
Shares converted to Class A(a) | | | (48,731 | ) | | | (476,686 | ) | | | (61,781 | ) | | | (565,096 | ) |
| Shares redeemed | | | (351,001 | ) | | | (3,439,796 | ) | | | (805,452 | ) | | | (7,350,663 | ) |
| |
| |
| | | | (254,539 | ) | | | (2,487,918 | ) | | | (387,228 | ) | | | (3,591,068 | ) |
| |
| |
Class C Shares | | | | | | | | | | | | | | | | |
| Shares sold | | | 592,569 | | | | 5,823,726 | | | | 1,457,496 | | | | 13,216,194 | |
| Reinvestment of distributions | | | 23,968 | | | | 235,590 | | | | 77,873 | | | | 713,337 | |
| Shares redeemed | | | (611,839 | ) | | | (5,982,283 | ) | | | (1,028,874 | ) | | | (9,406,423 | ) |
| |
| |
| | | | 4,698 | | | | 77,033 | | | | 506,495 | | | | 4,523,108 | |
| |
| |
Institutional Shares | | | | | | | | | | | | | | | | |
| Shares sold | | | 46,211,789 | | | | 451,732,833 | | | | 32,720,699 | | | | 300,870,023 | |
| Reinvestment of distributions | | | 853,255 | | | | 8,408,073 | | | | 2,104,749 | | | | 19,097,397 | |
| Shares redeemed | | | (21,806,866 | ) | | | (214,141,256 | ) | | | (63,595,747 | ) | | | (567,529,761 | ) |
| |
| |
| | | | 25,258,178 | | | | 245,999,650 | | | | (28,770,299 | ) | | | (247,562,341 | ) |
| |
| |
Service Shares | | | | | | | | | | | | | | | | |
| Shares sold | | | 23,577 | | | | 230,580 | | | | 127,903 | | | | 1,182,152 | |
| Reinvestment of distributions | | | 4,383 | | | | 43,048 | | | | 18,199 | | | | 165,483 | |
| Shares redeemed | | | (128,069 | ) | | | (1,254,365 | ) | | | (445,703 | ) | | | (4,073,782 | ) |
| |
| |
| | | | (100,109 | ) | | | (980,737 | ) | | | (299,601 | ) | | | (2,726,147 | ) |
| |
| |
Class IR Shares | | | | | | | | | | | | | | | | |
| Shares sold | | | 179,404 | | | | 1,743,518 | | | | 16,099 | | | | 149,660 | |
| Reinvestment of distributions | | | 1,507 | | | | 14,865 | | | | 222 | | | | 2,081 | |
| Shares redeemed | | | (1,428 | ) | | | (13,994 | ) | | | (10,216 | ) | | | (96,620 | ) |
| |
| |
| | | | 179,483 | | | | 1,744,389 | | | | 6,105 | | | | 55,121 | |
| |
| |
Class R Shares | | | | | | | | | | | | | | | | |
| Shares sold | | | 175 | | | | 1,704 | | | | 351 | | | | 3,288 | |
| Reinvestment of distributions | | | 16 | | | | 159 | | | | 40 | | | | 362 | |
| Shares redeemed | | | (6 | ) | | | (62 | ) | | | (5 | ) | | | (46 | ) |
| |
| |
| | | | 185 | | | | 1,801 | | | | 386 | | | | 3,604 | |
| |
| |
NET INCREASE (DECREASE) | | | 22,463,427 | | | $ | 219,395,122 | | | | (17,162,965 | ) | | $ | (142,135,043 | ) |
| |
| |
| |
| (a) | Class B Shares automatically convert into Class A Shares on or about the fifteenth day of the last month of the calendar quarter that is eight years after the initial purchase date of either the Fund or another Goldman Sachs Fund. |
GOLDMAN SACHS MULTI SECTOR FIXED INCOME FUNDS
| |
| 11. SUMMARY OF SHARE TRANSACTIONS (continued) | |
Share activity is as follows:
| | | | | | | | | | | | | | | | | |
| | | Core Plus Fixed Income Fund | |
| | | | |
| | | For the Six Months Ended
| | | | |
| | | September 30, 2010
| | | For the Fiscal Year Ended
| |
| | | (Unaudited) | | | March 31, 2010 | |
| | | | |
| | | Shares | | | Dollars | | | Shares | | | Dollars | |
| | | | |
Class A Shares | | | | | | | | | | | | | | | | |
| Shares sold | | | 2,896,366 | | | $ | 30,050,231 | | | | 5,908,208 | | | $ | 59,326,886 | |
| Reinvestment of distributions | | | 103,646 | | | | 1,083,975 | | | | 195,814 | | | | 1,940,615 | |
Shares converted from Class B(a) | | | 120,958 | | | | 1,253,414 | | | | 68,607 | | | | 684,522 | |
| Shares redeemed | | | (1,975,784 | ) | | | (20,450,312 | ) | | | (1,914,195 | ) | | | (18,925,404 | ) |
| |
| |
| | | | 1,145,186 | | | | 11,937,308 | | | | 4,258,434 | | | | 43,026,619 | |
| |
| |
Class B Shares | | | | | | | | | | | | | | | | |
| Shares sold | | | 61,487 | | | | 638,865 | | | | 143,524 | | | | 1,404,652 | |
| Reinvestment of distributions | | | 9,276 | | | | 96,807 | | | | 28,725 | | | | 282,662 | |
Shares converted to Class A(a) | | | (121,075 | ) | | | (1,253,414 | ) | | | (68,676 | ) | | | (684,522 | ) |
| Shares redeemed | | | (70,787 | ) | | | (741,647 | ) | | | (363,052 | ) | | | (3,566,249 | ) |
| |
| |
| | | | (121,099 | ) | | | (1,259,389 | ) | | | (259,479 | ) | | | (2,563,457 | ) |
| |
| |
Class C Shares | | | | | | | | | | | | | | | | |
| Shares sold | | | 167,175 | | | | 1,742,257 | | | | 340,643 | | | | 3,366,470 | |
| Reinvestment of distributions | | | 10,980 | | | | 114,667 | | | | 27,689 | | | | 273,169 | |
| Shares redeemed | | | (170,189 | ) | | | (1,769,195 | ) | | | (332,824 | ) | | | (3,296,801 | ) |
| |
| |
| | | | 7,966 | | | | 87,729 | | | | 35,508 | | | | 342,838 | |
| |
| |
Institutional Shares | | | | | | | | | | | | | | | | |
| Shares sold | | | 2,633,987 | | | | 27,318,333 | | | | 15,101,571 | | | | 149,082,731 | |
| Reinvestment of distributions | | | 310,589 | | | | 3,245,013 | | | | 426,942 | | | | 4,278,120 | |
| Shares redeemed | | | (1,881,197 | ) | | | (19,619,387 | ) | | | (1,567,253 | ) | | | (15,070,727 | ) |
| |
| |
| | | | 1,063,379 | | | | 10,943,959 | | | | 13,961,260 | | | | 138,290,124 | |
| |
| |
Service Shares | | | | | | | | | | | | | | | | |
| Reinvestment of distributions | | | 17 | | | | 181 | | | | 41 | | | | 401 | |
| |
| |
| | | | 17 | | | | 181 | | | | 41 | | | | 401 | |
| |
| |
Class IR Shares | | | | | | | | | | | | | | | | |
| Shares sold | | | 8,146 | | | | 85,014 | | | | 27,673 | | | | 280,049 | |
| Reinvestment of distributions | | | 521 | | | | 5,446 | | | | 387 | | | | 3,924 | |
| Shares redeemed | | | (2,826 | ) | | | (29,251 | ) | | | (349 | ) | | | (3,544 | ) |
| |
| |
| | | | 5,841 | | | | 61,209 | | | | 27,711 | | | | 280,429 | |
| |
| |
Class R Shares | | | | | | | | | | | | | | | | |
| Shares sold | | | 83 | | | | 865 | | | | 4,098 | | | | 40,419 | |
| Reinvestment of distributions | | | 54 | | | | 557 | | | | 88 | | | | 883 | |
| Shares redeemed | | | (35 | ) | | | (357 | ) | | | (1,574 | ) | | | (15,680 | ) |
| |
| |
| | | | 102 | | | | 1,065 | | | | 2,612 | | | | 25,622 | |
| |
| |
NET INCREASE | | | 2,101,392 | | | $ | 21,772,062 | | | | 18,026,087 | | | $ | 179,402,576 | |
| |
| |
| |
| (a) | Class B Shares automatically convert into Class A Shares on or about the fifteenth day of the last month of the calendar quarter that is eight years after the initial purchase date of either the Fund or another Goldman Sachs Fund. |
GOLDMAN SACHS MULTI SECTOR FIXED INCOME FUNDS
Notes to Financial Statements (continued)
September 30, 2010 (Unaudited)
| |
| 11. SUMMARY OF SHARE TRANSACTIONS (continued) | |
Share activity is as follows:
| | | | | | | | | | | | | | | | | |
| | | Global Income Fund | |
| | | | |
| | | For the Six Months Ended
| | | | |
| | | September 30, 2010
| | | For the Fiscal Year Ended
| |
| | | (Unaudited) | | | March 31, 2010 | |
| | | | |
| | | Shares | | | Dollars | | | Shares | | | Dollars | |
| | | | |
Class A Shares | | | | | | | | | | | | | | | | |
| Shares sold | | | 4,438,859 | | | $ | 57,185,026 | | | | 8,076,900 | | | $ | 102,060,057 | |
| Reinvestment of distributions | | | 176,678 | | | | 2,283,162 | | | | 1,556,742 | | | | 19,062,917 | |
Shares converted from Class B(a) | | | 18,401 | | | | 236,124 | | | | 54,707 | | | | 692,847 | |
| Shares redeemed | | | (3,588,657 | ) | | | (46,307,783 | ) | | | (9,030,928 | ) | | | (113,884,152 | ) |
| |
| |
| | | | 1,045,281 | | | | 13,396,529 | | | | 657,421 | | | | 7,931,669 | |
| |
| |
Class B Shares | | | | | | | | | | | | | | | | |
| Shares sold | | | 30,266 | | | | 388,773 | | | | 120,761 | | | | 1,506,656 | |
| Reinvestment of distributions | | | 2,109 | | | | 27,120 | | | | 38,532 | | | | 469,296 | |
Shares converted to Class A(a) | | | (18,473 | ) | | | (236,124 | ) | | | (54,938 | ) | | | (692,847 | ) |
| Shares redeemed | | | (104,100 | ) | | | (1,336,464 | ) | | | (235,354 | ) | | | (2,940,638 | ) |
| |
| |
| | | | (90,198 | ) | | | (1,156,695 | ) | | | (130,999 | ) | | | (1,657,533 | ) |
| |
| |
Class C Shares | | | | | | | | | | | | | | | | |
| Shares sold | | | 165,848 | | | | 2,129,203 | | | | 305,887 | | | | 3,821,080 | |
| Reinvestment of distributions | | | 3,452 | | | | 44,298 | | | | 30,641 | | | | 372,722 | |
| Shares redeemed | | | (122,205 | ) | | | (1,571,481 | ) | | | (133,285 | ) | | | (1,668,388 | ) |
| |
| |
| | | | 47,095 | | | | 602,020 | | | | 203,243 | | | | 2,525,414 | |
| |
| |
Institutional Shares | | | | | | | | | | | | | | | | |
| Shares sold | | | 11,801,765 | | | | 152,089,021 | | | | 14,276,189 | | | | 180,188,568 | |
| Reinvestment of distributions | | | 671,997 | | | | 8,672,200 | | | | 5,614,696 | | | | 68,721,688 | |
| Shares redeemed | | | (10,872,459 | ) | | | (140,411,320 | ) | | | (20,114,067 | ) | | | (253,611,838 | ) |
| |
| |
| | | | 1,601,303 | | | | 20,349,901 | | | | (223,182 | ) | | | (4,701,582 | ) |
| |
| |
Service Shares | | | | | | | | | | | | | | | | |
| Shares sold | | | 380 | | | | 4,893 | | | | 1,145 | | | | 14,460 | |
| Reinvestment of distributions | | | 63 | | | | 812 | | | | 839 | | | | 10,232 | |
| Shares redeemed | | | (1,171 | ) | | | (15,099 | ) | | | (12,026 | ) | | | (151,953 | ) |
| |
| |
| | | | (728 | ) | | | (9,394 | ) | | | (10,042 | ) | | | (127,261 | ) |
| |
| |
Class IR Shares(b) | | | | | | | | | | | | | | | | |
| Shares sold | | | 1,773 | | | | 23,025 | | | | — | | | | — | |
| Reinvestment of distributions | | | 7 | | | | 84 | | | | — | | | | — | |
| Shares redeemed | | | (1 | ) | | | (10 | ) | | | — | | | | — | |
| |
| |
| | | | 1,779 | | | | 23,099 | | | | — | | | | — | |
| |
| |
NET INCREASE | | | 2,604,532 | | | $ | 33,205,460 | | | | 496,441 | | | $ | 3,970,707 | |
| |
| |
| |
| (a) | Class B Shares automatically convert into Class A Shares on or about the fifteenth day of the last month of the calendar quarter that is eight years after the initial purchase date of either the Fund or another Goldman Sachs Fund. |
| |
| (b) | Commenced operations on July 30, 2010. |
GOLDMAN SACHS MULTI SECTOR FIXED INCOME FUNDS
| |
| 11. SUMMARY OF SHARE TRANSACTIONS (continued) | |
Share activity is as follows:
| | | | | | | | | |
| | | Strategic Income Fund | |
| | | | |
| | | For the Period Ended
| |
| | | September 30, 2010(a)
| |
| | | (Unaudited) | |
| | | | |
| | | Shares | | | Dollars | |
| | | | |
Class A Shares | | | | | | | | |
| Shares sold | | | 11,349,958 | | | $ | 113,992,141 | |
| Reinvestment of distributions | | | 16,089 | | | | 161,936 | |
| Shares redeemed | | | (746,070 | ) | | | (7,509,556 | ) |
| |
| |
| | | | 10,619,977 | | | | 106,644,521 | |
| |
| |
Class C Shares | | | | | | | | |
| Shares sold | | | 380,075 | | | | 3,820,442 | |
| Reinvestment of distributions | | | 343 | | | | 3,456 | |
| Shares redeemed | | | (115 | ) | | | (1,157 | ) |
| |
| |
| | | | 380,303 | | | | 3,822,741 | |
| |
| |
Institutional Shares | | | | | | | | |
| Shares sold | | | 11,699,610 | | | | 117,312,825 | |
| Reinvestment of distributions | | | 33,224 | | | | 334,203 | |
| Shares redeemed | | | (283,581 | ) | | | (2,852,706 | ) |
| |
| |
| | | | 11,449,253 | | | | 114,794,322 | |
| |
| |
Class IR Shares | | | | | | | | |
| Shares sold | | | 19,965 | | | | 200,720 | |
| Reinvestment of distributions | | | 16 | | | | 164 | |
| Shares redeemed | | | (5 | ) | | | (45 | ) |
| |
| |
| | | | 19,976 | | | | 200,839 | |
| |
| |
Class R Shares | | | | | | | | |
| Shares sold | | | 1,002 | | | | 10,020 | |
| Reinvestment of distributions | | | 4 | | | | 38 | |
| Shares redeemed | | | (2 | ) | | | (20 | ) |
| |
| |
| | | | 1,004 | | | | 10,038 | |
| |
| |
NET INCREASE | | | 22,470,513 | | | $ | 225,472,461 | |
| |
| |
| |
| (a) | Commenced operations on June 30, 2010. |
GOLDMAN SACHS CORE FIXED INCOME FUND
Financial Highlights
Selected Data for a Share Outstanding Throughout Each Period
| | | | | | | | | | | | | | | | | | | | | | | | | | | | | | | | | | | | | |
| | | | | | | | Income (loss) from
| | | Distributions
| | | | | | |
| | | | | Net asset
| | | investment operations | | | to shareholders | | | | | | |
| | | | | value,
| | | Net
| | | Net realized
| | | Total from
| | | From net
| | | From net
| | | | | | | | | |
| | | | | beginning
| | | investment
| | | and unrealized
| | | investment
| | | investment
| | | realized
| | | From
| | | Total
| | | |
| | | Year - Share Class | | of period | | | income(a) | | | gain (loss) | | | operations | | | income | | | gains | | | capital | | | distributions | | | |
| |
| FOR THE SIX MONTHS ENDED SEPTEMBER 30, (UNAUDITED) |
| | | | | | | | | | | | | | | | | | | | | | | | | | | | | | | | | | | | | |
| | | | | | | | | | | | | | | | | | | | | | | | | | | | | | | | | | | | | |
| | | 2010 - A | | $ | 9.53 | | | $ | 0.11 | | | $ | 0.45 | | | $ | 0.56 | | | $ | (0.11 | ) | | $ | — | | | $ | — | | | $ | (0.11 | ) | | |
| | | 2010 - B | | | 9.57 | | | | 0.07 | | | | 0.46 | | | | 0.53 | | | | (0.08 | ) | | | — | | | | — | | | | (0.08 | ) | | |
| | | 2010 - C | | | 9.58 | | | | 0.07 | | | | 0.46 | | | | 0.53 | | | | (0.08 | ) | | | — | | | | — | | | | (0.08 | ) | | |
| | | 2010 - Institutional | | | 9.57 | | | | 0.12 | | | | 0.45 | | | | 0.57 | | | | (0.13 | ) | | | — | | | | — | | | | (0.13 | ) | | |
| | | 2010 - Service | | | 9.58 | | | | 0.10 | | | | 0.45 | | | | 0.55 | | | | (0.11 | ) | | | — | | | | — | | | | (0.11 | ) | | |
| | | 2010 - IR | | | 9.54 | | | | 0.11 | | | | 0.46 | | | | 0.57 | | | | (0.13 | ) | | | — | | | | — | | | | (0.13 | ) | | |
| | | 2010 - R | | | 9.54 | | | | 0.10 | | | | 0.44 | | | | 0.54 | | | | (0.10 | ) | | | — | | | | — | | | | (0.10 | ) | | |
| | | | | | | | | | | | | | | | | | | | | | | | | | | | | | | | | | | | | |
| FOR THE FISCAL YEARS ENDED MARCH 31, |
| | | | | | | | | | | | | | | | | | | | | | | | | | | | | | | | | | | | | |
| | | | | | | | | | | | | | | | | | | | | | | | | | | | | | | | | | | | | |
| | | 2010 - A | | | 8.27 | | | | 0.31 | | | | 1.27 | | | | 1.58 | | | | (0.32 | ) | | | — | | | | — | | | | (0.32 | ) | | |
| | | 2010 - B | | | 8.31 | | | | 0.24 | | | | 1.27 | | | | 1.51 | | | | (0.25 | ) | | | — | | | | — | | | | (0.25 | ) | | |
| | | 2010 - C | | | 8.31 | | | | 0.24 | | | | 1.28 | | | | 1.52 | | | | (0.25 | ) | | | — | | | | — | | | | (0.25 | ) | | |
| | | 2010 - Institutional | | | 8.30 | | | | 0.34 | | | | 1.28 | | | | 1.62 | | | | (0.35 | ) | | | — | | | | — | | | | (0.35 | ) | | |
| | | 2010 - Service | | | 8.31 | | | | 0.30 | | | | 1.27 | | | | 1.57 | | | | (0.30 | ) | | | — | | | | — | | | | (0.30 | ) | | |
| | | 2010 - IR | | | 8.28 | | | | 0.31 | | | | 1.29 | | | | 1.60 | | | | (0.34 | ) | | | — | | | | — | | | | (0.34 | ) | | |
| | | 2010 - R | | | 8.28 | | | | 0.28 | | | | 1.28 | | | | 1.56 | | | | (0.30 | ) | | | — | | | | — | | | | (0.30 | ) | | |
| | | |
| | | |
| | | 2009 - A | | | 9.57 | | | | 0.42 | | | | (1.23 | ) | | | (0.81 | ) | | | (0.44 | ) | | | (0.05 | ) | | | — | | | | (0.49 | ) | | |
| | | 2009 - B | | | 9.61 | | | | 0.35 | | | | (1.23 | ) | | | (0.88 | ) | | | (0.37 | ) | | | (0.05 | ) | | | — | | | | (0.42 | ) | | |
| | | 2009 - C | | | 9.61 | | | | 0.35 | | | | (1.23 | ) | | | (0.88 | ) | | | (0.37 | ) | | | (0.05 | ) | | | — | | | | (0.42 | ) | | |
| | | 2009 - Institutional | | | 9.60 | | | | 0.45 | | | | (1.23 | ) | | | (0.78 | ) | | | (0.47 | ) | | | (0.05 | ) | | | — | | | | (0.52 | ) | | |
| | | 2009 - Service | | | 9.61 | | | | 0.41 | | | | (1.24 | ) | | | (0.83 | ) | | | (0.42 | ) | | | (0.05 | ) | | | — | | | | (0.47 | ) | | |
| | | 2009 - IR | | | 9.58 | | | | 0.44 | | | | (1.23 | ) | | | (0.79 | ) | | | (0.46 | ) | | | (0.05 | ) | | | — | | | | (0.51 | ) | | |
| | | 2009 - R | | | 9.57 | | | | 0.40 | | | | (1.22 | ) | | | (0.82 | ) | | | (0.42 | ) | | | (0.05 | ) | | | — | | | | (0.47 | ) | | |
| | | | | | | | | | | | | | | | | | | | | | | | | | | | | | | | | | | | | |
| FOR THE PERIOD NOVEMBER 1, 2007 TO MARCH 31, 2008* |
| | | | | | | | | | | | | | | | | | | | | | | | | | | | | | | | | | | | | |
| | | | | | | | | | | | | | | | | | | | | | | | | | | | | | | | | | | | | |
| | | 2008 - A | | | 9.86 | | | | 0.19 | | | | (0.28 | ) | | | (0.09 | ) | | | (0.20 | ) | | | — | | | | — | | | | (0.20 | ) | | |
| | | 2008 - B | | | 9.90 | | | | 0.16 | | | | (0.28 | ) | | | (0.12 | ) | | | (0.17 | ) | | | — | | | | — | | | | (0.17 | ) | | |
| | | 2008 - C | | | 9.91 | | | | 0.16 | | | | (0.29 | ) | | | (0.13 | ) | | | (0.17 | ) | | | — | | | | — | | | | (0.17 | ) | | |
| | | 2008 - Institutional | | | 9.90 | | | | 0.21 | | | | (0.30 | ) | | | (0.09 | ) | | | (0.21 | ) | | | — | | | | — | | | | (0.21 | ) | | |
| | | 2008 - Service | | | 9.91 | | | | 0.19 | | | | (0.30 | ) | | | (0.11 | ) | | | (0.19 | ) | | | — | | | | — | | | | (0.19 | ) | | |
| | | 2008 - IR (Commenced November 30, 2007) | | | 10.01 | | | | 0.16 | | | | (0.43 | ) | | | (0.27 | ) | | | (0.16 | ) | | | — | | | | — | | | | (0.16 | ) | | |
| | | 2008 - R (Commenced November 30, 2007) | | | 10.01 | | | | 0.14 | | | | (0.44 | ) | | | (0.30 | ) | | | (0.14 | ) | | | — | | | | — | | | | (0.14 | ) | | |
| | | | | | | | | | | | | | | | | | | | | | | | | | | | | | | | | | | | | |
| FOR THE FISCAL YEARS ENDED OCTOBER 31, |
| | | | | | | | | | | | | | | | | | | | | | | | | | | | | | | | | | | | | |
| | | | | | | | | | | | | | | | | | | | | | | | | | | | | | | | | | | | | |
| | | 2007 - A | | | 9.82 | | | | 0.44 | | | | 0.02 | | | | 0.46 | | | | (0.42 | ) | | | — | | | | — | | | | (0.42 | ) | | |
| | | 2007 - B | | | 9.86 | | | | 0.37 | | | | 0.02 | | | | 0.39 | | | | (0.35 | ) | | | — | | | | — | | | | (0.35 | ) | | |
| | | 2007 - C | | | 9.87 | | | | 0.37 | | | | 0.02 | | | | 0.39 | | | | (0.35 | ) | | | — | | | | — | | | | (0.35 | ) | | |
| | | 2007 - Institutional | | | 9.86 | | | | 0.48 | | | | 0.02 | | | | 0.50 | | | | (0.46 | ) | | | — | | | | — | | | | (0.46 | ) | | |
| | | 2007 - Service | | | 9.86 | | | | 0.43 | | | | 0.03 | | | | 0.46 | | | | (0.41 | ) | | | — | | | | — | | | | (0.41 | ) | | |
| | | |
| | | |
| | | 2006 - A | | | 9.87 | | | | 0.41 | | | | (0.01 | ) | | | 0.40 | | | | (0.38 | ) | | | (0.06 | ) | | | (0.01 | ) | | | (0.45 | ) | | |
| | | 2006 - B | | | 9.91 | | | | 0.34 | | | | (0.01 | ) | | | 0.33 | | | | (0.31 | ) | | | (0.06 | ) | | | (0.01 | ) | | | (0.38 | ) | | |
| | | 2006 - C | | | 9.91 | | | | 0.34 | | | | — | | | | 0.34 | | | | (0.31 | ) | | | (0.06 | ) | | | (0.01 | ) | | | (0.38 | ) | | |
| | | 2006 - Institutional | | | 9.90 | | | | 0.45 | | | | — | | | | 0.45 | | | | (0.42 | ) | | | (0.06 | ) | | | (0.01 | ) | | | (0.49 | ) | | |
| | | 2006 - Service | | | 9.91 | | | | 0.40 | | | | (0.01 | ) | | | 0.39 | | | | (0.37 | ) | | | (0.06 | ) | | | (0.01 | ) | | | (0.44 | ) | | |
| | | |
| | | |
| | | 2005 - A | | | 10.25 | | | | 0.32 | | | | (0.20 | ) | | | 0.12 | | | | (0.37 | ) | | | (0.13 | ) | | | — | | | | (0.50 | ) | | |
| | | 2005 - B | | | 10.29 | | | | 0.24 | | | | (0.20 | ) | | | 0.04 | | | | (0.29 | ) | | | (0.13 | ) | | | — | | | | (0.42 | ) | | |
| | | 2005 - C | | | 10.29 | | | | 0.24 | | | | (0.20 | ) | | | 0.04 | | | | (0.29 | ) | | | (0.13 | ) | | | — | | | | (0.42 | ) | | |
| | | 2005 - Institutional | | | 10.28 | | | | 0.36 | | | | (0.21 | ) | | | 0.15 | | | | (0.40 | ) | | | (0.13 | ) | | | — | | | | (0.53 | ) | | |
| | | 2005 - Service | | | 10.29 | | | | 0.31 | | | | (0.21 | ) | | | 0.10 | | | | (0.35 | ) | | | (0.13 | ) | | | — | | | | (0.48 | ) | | |
| | | |
| | | |
| | | | | | | | | | | | | | | | | | | | | | | | | | | | | | | | | | | | | |
| |
| * | The Fund changed its fiscal year end from October 31 to March 31. |
| (a) | Calculated based on the average shares outstanding methodology. |
| (b) | Assumes investment at the net asset value at the beginning of the period, reinvestment of all dividends and distributions, a complete redemption of the investment at the net asset value at the end of the period and no sales or redemption charges. Total returns would be reduced if a sales or redemption charge was taken into account. Returns do not reflect the deduction of taxes that a shareholder would pay on Fund distributions or the redemption of Fund shares. Total returns for periods less than one full year are not annualized. |
| (c) | The portfolio turnover rates excluding the effect of mortgage dollar rolls were as follows: |
| | | | | | | | | | | | | | | | | | | | | | | | | | | |
For the Six Months
| | | | |
| Ended September 30, | | For the Periods Ended | | |
2010 | | 2010 | | 2009 | | 2008 | | 2007 | | 2006 | | |
| | 158% | | | | 330%(e | ) | | | 371 | % | | | 193 | % | | | 141 | % | | | 516 | % | | | | |
Prior years include the effect of mortgage dollar roll transactions, if any.
| |
| (d) | Annualized. |
| (e) | The amount previously reported has been adjusted to exclude certain “To Be Announced” activity where a mortgage security was delivered. |
The accompanying notes are an integral part of these financial statements.
GOLDMAN SACHS CORE FIXED INCOME FUND
| | | | | | | | | | | | | | | | | | | | | | | | | | | | | | | |
| | | | | | | | | | | | | | | | | | Ratio of
| | | | | | |
| | | | | | | | | Net assets,
| | | Ratio of
| | | Ratio of
| | | net investment
| | | | | | |
| | | Net asset
| | | | | | end of
| | | net expenses
| | | total expenses
| | | income
| | | Portfolio
| | | |
| | | value, end
| | | Total
| | | period
| | | to average
| | | to average
| | | to average
| | | turnover
| | | |
| | | of period | | | return(b) | | | (in 000s) | | | net assets | | | net assets | | | net assets | | | rate(c) | | | |
| |
| |
| | | | | | | | | | | | | | | | | | | | | | | | | | | | | | | |
| | | | | | | | | | | | | | | | | | | | | | | | | | | | | | | |
| | | $ | 9.98 | | | | 5.96 | % | | $ | 816,048 | | | | 0.81 | %(d) | | | 0.81 | %(d) | | | 2.22 | %(d) | | | 226 | % | | |
| | | | 10.02 | | | | 5.54 | | | | 14,905 | | | | 1.56 | (d) | | | 1.56 | (d) | | | 1.48 | (d) | | | 226 | | | |
| | | | 10.03 | | | | 5.43 | | | | 34,853 | | | | 1.56 | (d) | | | 1.56 | (d) | | | 1.47 | (d) | | | 226 | | | |
| | | | 10.01 | | | | 6.01 | | | | 991,419 | | | | 0.47 | (d) | | | 0.47 | (d) | | | 2.53 | (d) | | | 226 | | | |
| | | | 10.02 | | | | 5.85 | | | | 4,836 | | | | 0.97 | (d) | | | 0.97 | (d) | | | 2.07 | (d) | | | 226 | | | |
| | | | 9.98 | | | | 5.98 | | | | 1,863 | | | | 0.56 | (d) | | | 0.56 | (d) | | | 2.35 | (d) | | | 226 | | | |
| | | | 9.98 | | | | 5.72 | | | | 16 | | | | 1.06 | (d) | | | 1.06 | (d) | | | 1.98 | (d) | | | 226 | | | |
| | | | | | | | | | | | | | | | | | | | | | | | | | | | | | | |
| |
| | | | | | | | | | | | | | | | | | | | | | | | | | | | | | | |
| | | | | | | | | | | | | | | | | | | | | | | | | | | | | | | |
| | | | 9.53 | | | | 19.32 | | | | 804,834 | | | | 0.82 | | | | 0.82 | | | | 3.37 | | | | 418 | (e) | | |
| | | | 9.57 | | | | 18.36 | | | | 16,680 | | | | 1.57 | | | | 1.57 | | | | 2.68 | | | | 418 | (e) | | |
| | | | 9.58 | | | | 18.48 | | | | 33,260 | | | | 1.57 | | | | 1.57 | | | | 2.62 | | | | 418 | (e) | | |
| | | | 9.57 | | | | 19.79 | | | | 705,704 | | | | 0.48 | | | | 0.48 | | | | 3.78 | | | | 418 | (e) | | |
| | | | 9.58 | | | | 19.05 | | | | 5,580 | | | | 0.98 | | | | 0.98 | | | | 3.30 | | | | 418 | (e) | | |
| | | | 9.54 | | | | 19.58 | | | | 69 | | | | 0.57 | | | | 0.57 | | | | 3.30 | | | | 418 | (e) | | |
| | | | 9.54 | | | | 19.03 | | | | 14 | | | | 1.07 | | | | 1.07 | | | | 3.10 | | | | 418 | (e) | | |
| |
| |
| | | | 8.27 | | | | (8.63 | ) | | | 600,963 | | | | 0.80 | | | | 0.81 | | | | 4.70 | | | | 413 | | | |
| | | | 8.31 | | | | (9.26 | ) | | | 17,694 | | | | 1.55 | | | | 1.56 | | | | 3.95 | | | | 413 | | | |
| | | | 8.31 | | | | (9.26 | ) | | | 24,655 | | | | 1.55 | | | | 1.56 | | | | 3.95 | | | | 413 | | | |
| | | | 8.30 | | | | (8.27 | ) | | | 851,372 | | | | 0.46 | | | | 0.47 | | | | 5.04 | | | | 413 | | | |
| | | | 8.31 | | | | (8.72 | ) | | | 7,333 | | | | 0.96 | | | | 0.97 | | | | 4.55 | | | | 413 | | | |
| | | | 8.28 | | | | (8.39 | ) | | | 9 | | | | 0.55 | | | | 0.56 | | | | 4.97 | | | | 413 | | | |
| | | | 8.28 | | | | (8.81 | ) | | | 9 | | | | 1.05 | | | | 1.06 | | | | 4.51 | | | | 413 | | | |
| | | | | | | | | | | | | | | | | | | | | | | | | | | | | | | |
| |
| | | | | | | | | | | | | | | | | | | | | | | | | | | | | | | |
| | | | | | | | | | | | | | | | | | | | | | | | | | | | | | | |
| | | | 9.57 | | | | (0.99 | ) | | | 809,957 | | | | 0.78 | (d) | | | 0.78 | (d) | | | 4.63 | (d) | | | 239 | | | |
| | | | 9.61 | | | | (1.28 | ) | | | 21,415 | | | | 1.53 | (d) | | | 1.53 | (d) | | | 3.89 | (d) | | | 239 | | | |
| | | | 9.61 | | | | (1.38 | ) | | | 28,402 | | | | 1.53 | (d) | | | 1.53 | (d) | | | 3.89 | (d) | | | 239 | | | |
| | | | 9.60 | | | | (0.94 | ) | | | 1,571,578 | | | | 0.44 | (d) | | | 0.44 | (d) | | | 4.97 | (d) | | | 239 | | | |
| | | | 9.61 | | | | (1.04 | ) | | | 24,199 | | | | 0.94 | (d) | | | 0.94 | (d) | | | 4.47 | (d) | | | 239 | | | |
| | | | 9.58 | | | | (2.75 | ) | | | 10 | | | | 0.53 | (d) | | | 0.53 | (d) | | | 4.66 | (d) | | | 239 | | | |
| | | | 9.57 | | | | (2.90 | ) | | | 10 | | | | 1.03 | (d) | | | 1.03 | (d) | | | 4.22 | (d) | | | 239 | | | |
| | | | | | | | | | | | | | | | | | | | | | | | | | | | | | | |
| |
| | | | | | | | | | | | | | | | | | | | | | | | | | | | | | | |
| | | | | | | | | | | | | | | | | | | | | | | | | | | | | | | |
| | | | 9.86 | | | | 4.84 | | | | 798,223 | | | | 0.80 | | | | 0.81 | | | | 4.51 | | | | 166 | | | |
| | | | 9.90 | | | | 4.05 | | | | 20,736 | | | | 1.55 | | | | 1.56 | | | | 3.74 | | | | 166 | | | |
| | | | 9.91 | | | | 4.05 | | | | 23,008 | | | | 1.55 | | | | 1.56 | | | | 3.76 | | | | 166 | | | |
| | | | 9.90 | | | | 5.21 | | | | 1,684,860 | | | | 0.44 | | | | 0.45 | | | | 4.87 | | | | 166 | | | |
| | | | 9.91 | | | | 4.68 | | | | 29,899 | | | | 0.94 | | | | 0.95 | | | | 4.32 | | | | 166 | | | |
| |
| |
| | | | 9.82 | | | | 4.21 | | | | 714,877 | | | | 0.83 | | | | 0.84 | | | | 4.25 | | | | 562 | | | |
| | | | 9.86 | | | | 3.42 | | | | 22,971 | | | | 1.58 | | | | 1.59 | | | | 3.49 | | | | 562 | | | |
| | | | 9.87 | | | | 3.52 | | | | 20,937 | | | | 1.58 | | | | 1.59 | | | | 3.49 | | | | 562 | | | |
| | | | 9.86 | | | | 4.69 | | | | 1,558,971 | | | | 0.46 | | | | 0.47 | | | | 4.65 | | | | 562 | | | |
| | | | 9.86 | | | | 4.06 | | | | 46,600 | | | | 0.96 | | | | 0.97 | | | | 4.13 | | | | 562 | | | |
| |
| |
| | | | 9.87 | | | | 1.14 | | | | 658,114 | | | | 0.86 | | | | 0.87 | | | | 3.14 | | | | 283 | | | |
| | | | 9.91 | | | | 0.38 | | | | 29,096 | | | | 1.61 | | | | 1.62 | | | | 2.40 | | | | 283 | | | |
| | | | 9.91 | | | | 0.38 | | | | 23,432 | | | | 1.61 | | | | 1.62 | | | | 2.40 | | | | 283 | | | |
| | | | 9.90 | | | | 1.53 | | | | 1,098,280 | | | | 0.47 | | | | 0.48 | | | | 3.54 | | | | 283 | | | |
| | | | 9.91 | | | | 1.02 | | | | 31,682 | | | | 0.97 | | | | 0.98 | | | | 3.03 | | | | 283 | | | |
| |
| |
The accompanying notes are an integral part of these financial statements.
GOLDMAN SACHS CORE PLUS FIXED INCOME FUND
Financial Highlights
Selected Data for a Share Outstanding Throughout Each Period
| | | | | | | | | | | | | | | | | | | | | | | | | |
| | | | | | | | Income (loss) from
| | | | | | |
| | | | | | | | investment operations | | | | | | |
| | | | | | | | | | | | | | | | | Distributions
| | | |
| | | | | Net asset
| | | | | | | | | | | | to shareholders
| | | |
| | | | | value,
| | | Net
| | | Net realized
| | | Total from
| | | from net
| | | |
| | | | | beginning
| | | investment
| | | and unrealized
| | | investment
| | | investment
| | | |
| | | Year - Share Class | | of period | | | income(a) | | | gain (loss) | | | operations | | | income | | | |
| |
| FOR THE SIX MONTHS ENDED SEPTEMBER 30, (UNAUDITED) |
| | | | | | | | | | | | | | | | | | | | | | | | | |
| | | | | | | | | | | | | | | | | | | | | | | | | |
| | | 2010 - A | | $ | 10.20 | | | $ | 0.16 | | | $ | 0.43 | | | $ | 0.59 | | | $ | (0.16 | ) | | |
| | | 2010 - B | | | 10.20 | | | | 0.12 | | | | 0.42 | | | | 0.54 | | | | (0.12 | ) | | |
| | | 2010 - C | | | 10.20 | | | | 0.12 | | | | 0.42 | | | | 0.54 | | | | (0.12 | ) | | |
| | | 2010 - Institutional | | | 10.20 | | | | 0.17 | | | | 0.44 | | | | 0.61 | | | | (0.18 | ) | | |
| | | 2010 - Service | | | 10.20 | | | | 0.15 | | | | 0.44 | | | | 0.59 | | | | (0.16 | ) | | |
| | | 2010 - IR | | | 10.21 | | | | 0.17 | | | | 0.43 | | | | 0.60 | | | | (0.18 | ) | | |
| | | 2010 - R | | | 10.20 | | | | 0.14 | | | | 0.44 | | | | 0.58 | | | | (0.15 | ) | | |
| | | | | | | | | | | | | | | | | | | | | | | | | |
| | | | | | | | | | | | | | | | | | | | | | | | | |
| FOR THE FISCAL YEARS ENDED MARCH 31, |
| | | | | | | | | | | | | | | | | | | | | | | | | |
| | | | | | | | | | | | | | | | | | | | | | | | | |
| | | 2010 - A | | | 9.16 | | | | 0.34 | | | | 1.07 | | | | 1.41 | | | | (0.37 | ) | | |
| | | 2010 - B | | | 9.15 | | | | 0.28 | | | | 1.07 | | | | 1.35 | | | | (0.30 | ) | | |
| | | 2010 - C | | | 9.15 | | | | 0.28 | | | | 1.07 | | | | 1.35 | | | | (0.30 | ) | | |
| | | 2010 - Institutional | | | 9.16 | | | | 0.37 | | | | 1.07 | | | | 1.44 | | | | (0.40 | ) | | |
| | | 2010 - Service | | | 9.16 | | | | 0.34 | | | | 1.05 | | | | 1.39 | | | | (0.35 | ) | | |
| | | 2010 - IR | | | 9.16 | | | | 0.32 | | | | 1.12 | | | | 1.44 | | | | (0.39 | ) | | |
| | | 2010 - R | | | 9.16 | | | | 0.31 | | | | 1.07 | | | | 1.38 | | | | (0.34 | ) | | |
| | | | | | | | | | | | | | | | | | | | | | | | | |
| | | | | | | | | | | | | | | | | | | | | | | | | |
| | | |
| | | |
| | | 2009 - A | | | 9.90 | | | | 0.43 | | | | (0.75 | ) | | | (0.32 | ) | | | (0.42 | ) | | |
| | | 2009 - B | | | 9.90 | | | | 0.36 | | | | (0.76 | ) | | | (0.40 | ) | | | (0.35 | ) | | |
| | | 2009 - C | | | 9.90 | | | | 0.36 | | | | (0.76 | ) | | | (0.40 | ) | | | (0.35 | ) | | |
| | | 2009 - Institutional | | | 9.90 | | | | 0.46 | | | | (0.74 | ) | | | (0.28 | ) | | | (0.46 | ) | | |
| | | 2009 - Service | | | 9.90 | | | | 0.41 | | | | (0.74 | ) | | | (0.33 | ) | | | (0.41 | ) | | |
| | | 2009 - IR | | | 9.91 | | | | 0.45 | | | | (0.75 | ) | | | (0.30 | ) | | | (0.45 | ) | | |
| | | 2009 - R | | | 9.91 | | | | 0.40 | | | | (0.75 | ) | | | (0.35 | ) | | | (0.40 | ) | | |
| | | | | | | | | | | | | | | | | | | | | | | | | |
| | | | | | | | | | | | | | | | | | | | | | | | | |
| FOR THE PERIOD NOVEMBER 1, 2007 TO MARCH 31, 2008* |
| | | | | | | | | | | | | | | | | | | | | | | | | |
| | | | | | | | | | | | | | | | | | | | | | | | | |
| | | 2008 - A | | | 9.99 | | | | 0.18 | | | | (0.05 | ) | | | 0.13 | | | | (0.22 | ) | | |
| | | 2008 - B | | | 9.99 | | | | 0.15 | | | | (0.05 | ) | | | 0.10 | | | | (0.19 | ) | | |
| | | 2008 - C | | | 9.99 | | | | 0.15 | | | | (0.05 | ) | | | 0.10 | | | | (0.19 | ) | | |
| | | 2008 - Institutional | | | 9.99 | | | | 0.20 | | | | (0.05 | ) | | | 0.15 | | | | (0.24 | ) | | |
| | | 2008 - Service | | | 9.99 | | | | 0.18 | | | | (0.05 | ) | | | 0.13 | | | | (0.22 | ) | | |
| | | 2008 - IR (Commenced November 30, 2007) | | | 10.12 | | | | 0.15 | | | | (0.17 | ) | | | (0.02 | ) | | | (0.19 | ) | | |
| | | 2008 - R (Commenced November 30, 2007) | | | 10.12 | | | | 0.14 | | | | (0.18 | ) | | | (0.04 | ) | | | (0.17 | ) | | |
| | | | | | | | | | | | | | | | | | | | | | | | | |
| | | | | | | | | | | | | | | | | | | | | | | | | |
| FOR THE PERIOD ENDED OCTOBER 31, |
| | | | | | | | | | | | | | | | | | | | | | | | | |
| | | | | | | | | | | | | | | | | | | | | | | | | |
| | | 2007 - A (Commenced November 30, 2006) | | | 10.00 | | | | 0.39 | | | | (0.02 | ) | | | 0.37 | | | | (0.38 | ) | | |
| | | 2007 - B (Commenced June 20, 2007) | | | 9.77 | | | | 0.14 | | | | 0.21 | | | | 0.35 | | | | (0.13 | ) | | |
| | | 2007 - C (Commenced November 30, 2006) | | | 10.00 | | | | 0.33 | | | | (0.02 | ) | | | 0.31 | | | | (0.32 | ) | | |
| | | 2007 - Institutional (Commenced November 30, 2006) | | | 10.00 | | | | 0.42 | | | | (0.01 | ) | | | 0.41 | | | | (0.42 | ) | | |
| | | 2007 - Service (Commenced June 20, 2007) | | | 9.77 | | | | 0.16 | | | | 0.21 | | | | 0.37 | | | | (0.15 | ) | | |
| | | | | | | | | | | | | | | | | | | | | | | | | |
| | | | | | | | | | | | | | | | | | | | | | | | | |
| | | |
| | | |
| | | | | | | | | | | | | | | | | | | | | | | | | |
| | | | | | | | | | | | | | | | | | | | | | | | | |
| |
| * | The Fund changed its fiscal year end from October 31 to March 31. |
| |
| (a) | Calculated based on the average shares outstanding methodology. |
| |
| (b) | Assumes investment at the net asset value at the beginning of the period, reinvestment of all dividends and distributions, a complete redemption of the investment at the net asset value at the end of the period and no sales or redemption charges. Total returns would be reduced if a sales or redemption charge was taken into account. Returns do not reflect the deduction of taxes that a shareholder would pay on Fund distributions or the redemption of Fund shares. Total returns for periods less than one full year are not annualized. |
| |
| (c) | The portfolio turnover rates excluding the effect of mortgage dollar rolls were as follows: |
| | | | | | | | | | | | | | | | | | | |
For the Six Months
| | |
| Ended September 30, | | For the Periods Ended |
2010 | | 2010(e) | | 2009 | | 2008 | | 2007 |
| | 187 | % | | | 313 | % | | | 330 | % | | | 63 | % | | | 312 | % |
| |
| (e) | The amount previously reported has been adjusted to exclude certain “To Be Announced” activity where a mortgage security was delivered. |
| |
| (f) | Includes a non-recurring reduction of expenses of a merged fund which amounted to 0.06% of average net assets. |
The accompanying notes are an integral part of these financial statements.
GOLDMAN SACHS CORE PLUS FIXED INCOME FUND
| | | | | | | | | | | | | | | | | | | | | | | | | | | | | | | |
| | | | | | | | | | | | | | | | | | Ratio of
| | | | | | |
| | | | | | | | | Net assets,
| | | Ratio of
| | | Ratio of
| | | net investment
| | | | | | |
| | | Net asset
| | | | | | end of
| | | net expenses
| | | total expenses
| | | income
| | | Portfolio
| | | |
| | | value, end
| | | Total
| | | period
| | | to average
| | | to average
| | | to average
| | | turnover
| | | |
| | | of period | | | return(b) | | | (in 000s) | | | net assets | | | net assets | | | net assets | | | rate(c) | | | |
| |
| |
| | | | | | | | | | | | | | | | | | | | | | | | | | | | | | | |
| | | | | | | | | | | | | | | | | | | | | | | | | | | | | | | |
| | | $ | 10.63 | | | | 5.86 | % | | $ | 110,466 | | | | 0.83 | %(d) | | | 1.02 | %(d) | | | 2.98 | %(d) | | | 233 | % | | |
| | | | 10.62 | | | | 5.47 | | | | 8,291 | | | | 1.58 | (d) | | | 1.77 | (d) | | | 2.26 | (d) | | | 233 | | | |
| | | | 10.62 | | | | 5.47 | | | | 13,273 | | | | 1.58 | (d) | | | 1.77 | (d) | | | 2.25 | (d) | | | 233 | | | |
| | | | 10.63 | | | | 5.94 | | | | 210,322 | | | | 0.49 | (d) | | | 0.68 | (d) | | | 3.33 | (d) | | | 233 | | | |
| | | | 10.63 | | | | 5.69 | | | | 12 | | | | 0.99 | (d) | | | 1.18 | (d) | | | 2.86 | (d) | | | 233 | | | |
| | | | 10.63 | | | | 5.89 | | | | 368 | | | | 0.58 | (d) | | | 0.77 | (d) | | | 3.22 | (d) | | | 233 | | | |
| | | | 10.63 | | | | 5.72 | | | | 40 | | | | 1.08 | (d) | | | 1.27 | (d) | | | 2.74 | (d) | | | 233 | | | |
| | | | | | | | | | | | | | | | | | | | | | | | | | | | | | | |
| | | | | | | | | | | | | | | | | | | | | | | | | | | | | | | |
| |
| | | | | | | | | | | | | | | | | | | | | | | | | | | | | | | |
| | | | | | | | | | | | | | | | | | | | | | | | | | | | | | | |
| | | | 10.20 | | | | 15.60 | | | | 94,351 | | | | 0.83 | | | | 1.14 | | | | 3.48 | | | | 419 | (e) | | |
| | | | 10.20 | | | | 14.75 | | | | 9,193 | | | | 1.58 | | | | 1.89 | | | | 2.87 | | | | 419 | (e) | | |
| | | | 10.20 | | | | 14.75 | | | | 12,661 | | | | 1.58 | | | | 1.89 | | | | 2.83 | | | | 419 | (e) | | |
| | | | 10.20 | | | | 15.99 | | | | 191,051 | | | | 0.49 | | | | 0.80 | | | | 3.72 | | | | 419 | (e) | | |
| | | | 10.20 | | | | 15.42 | | | | 12 | | | | 0.99 | | | | 1.30 | | | | 3.44 | | | | 419 | (e) | | |
| | | | 10.21 | | | | 16.00 | | | | 294 | | | | 0.58 | | | | 0.89 | | | | 3.23 | | | | 419 | (e) | | |
| | | | 10.20 | | | | 15.30 | | | | 37 | | | | 1.08 | | | | 1.39 | | | | 3.15 | | | | 419 | (e) | | |
| | | | | | | | | | | | | | | | | | | | | | | | | | | | | | | |
| | | | | | | | | | | | | | | | | | | | | | | | | | | | | | | |
| |
| |
| | | | 9.16 | | | | (3.17 | ) | | | 45,686 | | | | 0.75 | (f) | | | 1.33 | (f) | | | 4.57 | (f) | | | 365 | | | |
| | | | 9.15 | | | | (4.00 | ) | | | 10,626 | | | | 1.50 | (f) | | | 2.08 | (f) | | | 3.82 | (f) | | | 365 | | | |
| | | | 9.15 | | | | (4.00 | ) | | | 11,040 | | | | 1.50 | (f) | | | 2.08 | (f) | | | 3.82 | (f) | | | 365 | | | |
| | | | 9.16 | | | | (2.84 | ) | | | 43,681 | | | | 0.41 | (f) | | | 0.99 | (f) | | | 4.91 | (f) | | | 365 | | | |
| | | | 9.16 | | | | (3.34 | ) | | | 10 | | | | 0.91 | (f) | | | 1.49 | (f) | | | 4.38 | (f) | | | 365 | | | |
| | | | 9.16 | | | | (3.02 | ) | | | 10 | | | | 0.50 | (f) | | | 1.08 | (f) | | | 4.82 | (f) | | | 365 | | | |
| | | | 9.16 | | | | (3.49 | ) | | | 10 | | | | 1.00 | (f) | | | 1.58 | (f) | | | 4.32 | (f) | | | 365 | | | |
| | | | | | | | | | | | | | | | | | | | | | | | | | | | | | | |
| | | | | | | | | | | | | | | | | | | | | | | | | | | | | | | |
| |
| | | | | | | | | | | | | | | | | | | | | | | | | | | | | | | |
| | | | | | | | | | | | | | | | | | | | | | | | | | | | | | | |
| | | | 9.90 | | | | 1.21 | | | | 54,330 | | | | 0.79 | (d) | | | 1.21 | (d) | | | 4.37 | (d) | | | 96 | | | |
| | | | 9.90 | | | | 0.99 | | | | 13,843 | | | | 1.54 | (d) | | | 1.96 | (d) | | | 3.63 | (d) | | | 96 | | | |
| | | | 9.90 | | | | 0.99 | | | | 11,727 | | | | 1.54 | (d) | | | 1.96 | (d) | | | 3.63 | (d) | | | 96 | | | |
| | | | 9.90 | | | | 1.45 | | | | 51,281 | | | | 0.45 | (d) | | | 0.87 | (d) | | | 4.73 | (d) | | | 96 | | | |
| | | | 9.90 | | | | 1.26 | | | | 11 | | | | 0.95 | (d) | | | 1.37 | (d) | | | 4.26 | (d) | | | 96 | | | |
| | | | 9.91 | | | | (0.26 | ) | | | 10 | | | | 0.54 | (d) | | | 0.96 | (d) | | | 4.49 | (d) | | | 96 | | | |
| | | | 9.91 | | | | (0.41 | ) | | | 10 | | | | 1.04 | (d) | | | 1.46 | (d) | | | 4.00 | (d) | | | 96 | | | |
| | | | | | | | | | | | | | | | | | | | | | | | | | | | | | | |
| | | | | | | | | | | | | | | | | | | | | | | | | | | | | | | |
| |
| | | | | | | | | | | | | | | | | | | | | | | | | | | | | | | |
| | | | | | | | | | | | | | | | | | | | | | | | | | | | | | | |
| | | | 9.99 | | | | 3.93 | | | | 53,541 | | | | 0.83 | (d) | | | 1.51 | (d) | | | 4.45 | (d) | | | 350 | | | |
| | | | 9.99 | | | | 3.60 | | | | 15,077 | | | | 1.58 | (d) | | | 2.26 | (d) | | | 3.86 | (d) | | | 350 | | | |
| | | | 9.99 | | | | 3.13 | | | | 11,798 | | | | 1.58 | (d) | | | 2.26 | (d) | | | 3.78 | (d) | | | 350 | | | |
| | | | 9.99 | | | | 4.21 | | | | 31,155 | | | | 0.47 | (d) | | | 1.15 | (d) | | | 4.62 | (d) | | | 350 | | | |
| | | | 9.99 | | | | 3.83 | | | | 10 | | | | 0.97 | (d) | | | 1.65 | (d) | | | 4.42 | (d) | | | 350 | | | |
| | | | | | | | | | | | | | | | | | | | | | | | | | | | | | | |
| | | | | | | | | | | | | | | | | | | | | | | | | | | | | | | |
| |
| |
The accompanying notes are an integral part of these financial statements.
GOLDMAN SACHS GLOBAL INCOME FUND
Financial Highlights
Selected Data for a Share Outstanding Throughout Each Period
| | | | | | | | | | | | | | | | | | | | | | | | | | | | | | | | | |
| | | | | | | | Income (loss) from
| | | Distributions
| | | |
| | | | | Net asset
| | | investment operations | | | to shareholders | | | |
| | | | | value,
| | | Net
| | | Net realized
| | | Total from
| | | From net
| | | From net
| | | | | | |
| | | | | beginning
| | | investment
| | | and unrealized
| | | investment
| | | investment
| | | realized
| | | Total
| | | |
| | | Year - Share Class | | of period | | | income(a) | | | gain (loss) | | | operations | | | income | | | gains | | | distributions | | | |
| |
| FOR THE SIX MONTHS ENDED SEPTEMBER 30, (UNAUDITED) |
| | | | | | | | | | | | | | | | | | | | | | | | | | | | | | | | | |
| | | | | | | | | | | | | | | | | | | | | | | | | | | | | | | | | |
| | | 2010 - A | | $ | 12.74 | | | $ | 0.13 | | | $ | 0.33 | | | $ | 0.46 | | | $ | (0.14 | ) | | $ | — | | | $ | (0.14 | ) | | |
| | | 2010 - B | | | 12.69 | | | | 0.08 | | | | 0.33 | | | | 0.41 | | | | (0.09 | ) | | | — | | | | (0.09 | ) | | |
| | | 2010 - C | | | 12.66 | | | | 0.08 | | | | 0.32 | | | | 0.40 | | | | (0.09 | ) | | | — | | | | (0.09 | ) | | |
| | | 2010 - Institutional | | | 12.72 | | | | 0.15 | | | | 0.33 | | | | 0.48 | | | | (0.16 | ) | | | — | | | | (0.16 | ) | | |
| | | 2010 - Service | | | 12.70 | | | | 0.12 | | | | 0.33 | | | | 0.45 | | | | (0.13 | ) | | | — | | | | (0.13 | ) | | |
| | | 2010 - IR (Commenced July 30, 2010) | | | 12.91 | | | | 0.05 | | | | 0.13 | | | | 0.18 | | | | (0.05 | ) | | | — | | | | (0.05 | ) | | |
| | | | | | | | | | | | | | | | | | | | | | | | | | | | | | | | | |
| | | | | | | | | | | | | | | | | | | | | | | | | | | | | | | | | |
| FOR THE FISCAL YEARS ENDED MARCH 31, |
| | | | | | | | | | | | | | | | | | | | | | | | | | | | | | | | | |
| | | | | | | | | | | | | | | | | | | | | | | | | | | | | | | | | |
| | | 2010 - A | | | 12.30 | | | | 0.38 | | | | 1.35 | | | | 1.73 | | | | (1.29 | ) | | | — | | | | (1.29 | ) | | |
| | | 2010 - B | | | 12.25 | | | | 0.29 | | | | 1.34 | | | | 1.63 | | | | (1.19 | ) | | | — | | | | (1.19 | ) | | |
| | | 2010 - C | | | 12.23 | | | | 0.28 | | | | 1.34 | | | | 1.62 | | | | (1.19 | ) | | | — | | | | (1.19 | ) | | |
| | | 2010 - Institutional | | | 12.28 | | | | 0.42 | | | | 1.35 | | | | 1.77 | | | | (1.33 | ) | | | — | | | | (1.33 | ) | | |
| | | 2010 - Service | | | 12.27 | | | | 0.36 | | | | 1.34 | | | | 1.70 | | | | (1.27 | ) | | | — | | | | (1.27 | ) | | |
| | | | | | | | | | | | | | | | | | | | | | | | | | | | | | | | | |
| | | |
| | | |
| | | 2009 - A | | | 12.91 | | | | 0.45 | | | | (0.60 | ) | | | (0.15 | ) | | | (0.46 | ) | | | — | | | | (0.46 | ) | | |
| | | 2009 - B | | | 12.87 | | | | 0.35 | | | | (0.60 | ) | | | (0.25 | ) | | | (0.37 | ) | | | — | | | | (0.37 | ) | | |
| | | 2009 - C | | | 12.84 | | | | 0.35 | | | | (0.59 | ) | | | (0.24 | ) | | | (0.37 | ) | | | — | | | | (0.37 | ) | | |
| | | 2009 - Institutional | | | 12.89 | | | | 0.49 | | | | (0.59 | ) | | | (0.10 | ) | | | (0.51 | ) | | | — | | | | (0.51 | ) | | |
| | | 2009 - Service | | | 12.88 | | | | 0.43 | | | | (0.60 | ) | | | (0.17 | ) | | | (0.44 | ) | | | — | | | | (0.44 | ) | | |
| | | | | | | | | | | | | | | | | | | | | | | | | | | | | | | | | |
| | | | | | | | | | | | | | | | | | | | | | | | | | | | | | | | | |
| FOR THE PERIOD NOVEMBER 1, 2007 TO MARCH 31, 2008* |
| | | | | | | | | | | | | | | | | | | | | | | | | | | | | | | | | |
| | | | | | | | | | | | | | | | | | | | | | | | | | | | | | | | | |
| | | 2008 - A | | | 12.93 | | | | 0.17 | | | | — | | | | 0.17 | | | | (0.19 | ) | | | — | | | | (0.19 | ) | | |
| | | 2008 - B | | | 12.88 | | | | 0.13 | | | | 0.01 | | | | 0.14 | | | | (0.15 | ) | | | — | | | | (0.15 | ) | | |
| | | 2008 - C | | | 12.86 | | | | 0.13 | | | | — | | | | 0.13 | | | | (0.15 | ) | | | — | | | | (0.15 | ) | | |
| | | 2008 - Institutional | | | 12.91 | | | | 0.19 | | | | — | | | | 0.19 | | | | (0.21 | ) | | | — | | | | (0.21 | ) | | |
| | | 2008 - Service | | | 12.90 | | | | 0.16 | | | | — | | | | 0.16 | | | | (0.18 | ) | | | — | | | | (0.18 | ) | | |
| | | | | | | | | | | | | | | | | | | | | | | | | | | | | | | | | |
| | | | | | | | | | | | | | | | | | | | | | | | | | | | | | | | | |
| FOR THE FISCAL YEARS ENDED OCTOBER 31, |
| | | | | | | | | | | | | | | | | | | | | | | | | | | | | | | | | |
| | | | | | | | | | | | | | | | | | | | | | | | | | | | | | | | | |
| | | 2007 - A | | | 12.74 | | | | 0.37 | | | | 0.20 | | | | 0.57 | | | | (0.34 | ) | | | (0.04 | ) | | | (0.38 | ) | | |
| | | 2007 - B | | | 12.70 | | | | 0.27 | | | | 0.19 | | | | 0.46 | | | | (0.25 | ) | | | (0.03 | ) | | | (0.28 | ) | | |
| | | 2007 - C | | | 12.67 | | | | 0.27 | | | | 0.20 | | | | 0.47 | | | | (0.25 | ) | | | (0.03 | ) | | | (0.28 | ) | | |
| | | 2007 - Institutional | | | 12.73 | | | | 0.42 | | | | 0.18 | | | | 0.60 | | | | (0.38 | ) | | | (0.04 | ) | | | (0.42 | ) | | |
| | | 2007 - Service | | | 12.71 | | | | 0.35 | | | | 0.20 | | | | 0.55 | | | | (0.32 | ) | | | (0.04 | ) | | | (0.36 | ) | | |
| | | | | | | | | | | | | | | | | | | | | | | | | | | | | | | | | |
| | | |
| | | |
| | | 2006 - A | | | 13.25 | | | | 0.34 | | | | (0.09 | ) | | | 0.25 | | | | (0.71 | ) | | | (0.05 | ) | | | (0.76 | ) | | |
| | | 2006 - B | | | 13.20 | | | | 0.24 | | | | (0.08 | ) | | | 0.16 | | | | (0.62 | ) | | | (0.04 | ) | | | (0.66 | ) | | |
| | | 2006 - C | | | 13.18 | | | | 0.24 | | | | (0.09 | ) | | | 0.15 | | | | (0.62 | ) | | | (0.04 | ) | | | (0.66 | ) | | |
| | | 2006 - Institutional | | | 13.23 | | | | 0.38 | | | | (0.07 | ) | | | 0.31 | | | | (0.76 | ) | | | (0.05 | ) | | | (0.81 | ) | | |
| | | 2006 - Service | | | 13.22 | | | | 0.32 | | | | (0.08 | ) | | | 0.24 | | | | (0.70 | ) | | | (0.05 | ) | | | (0.75 | ) | | |
| | | | | | | | | | | | | | | | | | | | | | | | | | | | | | | | | |
| | | |
| | | |
| | | 2005 - A | | | 13.65 | | | | 0.32 | | | | 0.28 | | | | 0.60 | | | | (1.00 | ) | | | — | | | | (1.00 | ) | | |
| | | 2005 - B | | | 13.61 | | | | 0.22 | | | | 0.27 | | | | 0.49 | | | | (0.90 | ) | | | — | | | | (0.90 | ) | | |
| | | 2005 - C | | | 13.58 | | | | 0.22 | | | | 0.28 | | | | 0.50 | | | | (0.90 | ) | | | — | | | | (0.90 | ) | | |
| | | 2005 - Institutional | | | 13.64 | | | | 0.37 | | | | 0.28 | | | | 0.65 | | | | (1.06 | ) | | | — | | | | (1.06 | ) | | |
| | | 2005 - Service | | | 13.63 | | | | 0.30 | | | | 0.28 | | | | 0.58 | | | | (0.99 | ) | | | — | | | | (0.99 | ) | | |
| | | | | | | | | | | | | | | | | | | | | | | | | | | | | | | | | |
| | | |
| | | |
| | | | | | | | | | | | | | | | | | | | | | | | | | | | | | | | | |
| |
| * | The Fund changed its fiscal year end from October 31 to March 31. |
| |
| (a) | Calculated based on the average shares outstanding methodology. |
| |
| (b) | Assumes investment at the net asset value at the beginning of the period, reinvestment of all dividends and distributions, a complete redemption of the investment at the net asset value at the end of the period and no sales or redemption charges. Total returns would be reduced if a sales or redemption charge was taken into account. Returns do not reflect the deduction of taxes that a shareholder would pay on Fund distributions or the redemption of Fund shares. Total returns for periods less than one full year are not annualized. |
The accompanying notes are an integral part of these financial statements.
GOLDMAN SACHS GLOBAL INCOME FUND
| | | | | | | | | | | | | | | | | | | | | | | | | | | | | | | |
| | | | | | | | | | | | | | | | | | Ratio of
| | | | | | |
| | | | | | | | | Net assets,
| | | Ratio of
| | | Ratio of
| | | net investment
| | | | | | |
| | | Net asset
| | | | | | end of
| | | net expenses
| | | total expenses
| | | income
| | | Portfolio
| | | |
| | | value, end
| | | Total
| | | period
| | | to average
| | | to average
| | | to average
| | | turnover
| | | |
| | | of period | | | return(b) | | | (in 000s) | | | net assets | | | net assets | | | net assets | | | rate | | | |
| |
| |
| | | | | | | | | | | | | | | | | | | | | | | | | | | | | | | |
| | | | | | | | | | | | | | | | | | | | | | | | | | | | | | | |
| | | $ | 13.06 | | | | 3.52 | % | | $ | 237,743 | | | | 1.03 | %(c) | | | 1.12 | %(c) | | | 2.02 | %(c) | | | 156 | % | | |
| | | | 13.01 | | | | 3.13 | | | | 4,100 | | | | 1.78 | (c) | | | 1.87 | (c) | | | 1.30 | (c) | | | 156 | | | |
| | | | 12.97 | | | | 3.24 | | | | 8,409 | | | | 1.78 | (c) | | | 1.87 | (c) | | | 1.28 | (c) | | | 156 | | | |
| | | | 13.04 | | | | 3.70 | | | | 723,989 | | | | 0.69 | (c) | | | 0.78 | (c) | | | 2.36 | (c) | | | 156 | | | |
| | | | 13.02 | | | | 3.52 | | | | 87 | | | | 1.19 | (c) | | | 1.28 | (c) | | | 1.88 | (c) | | | 156 | | | |
| | | | 13.04 | | | | 1.30 | | | | 23 | | | | 0.78 | (c) | | | 0.87 | (c) | | | 2.12 | (c) | | | 156 | | | |
| | | | | | | | | | | | | | | | | | | | | | | | | | | | | | | |
| | | | | | | | | | | | | | | | | | | | | | | | | | | | | | | |
| |
| | | | | | | | | | | | | | | | | | | | | | | | | | | | | | | |
| | | | | | | | | | | | | | | | | | | | | | | | | | | | | | | |
| | | | 12.74 | | | | 14.73 | | | | 218,572 | | | | 1.03 | | | | 1.11 | | | | 3.02 | | | | 267 | | | |
| | | | 12.69 | | | | 13.92 | | | | 5,143 | | | | 1.78 | | | | 1.86 | | | | 2.30 | | | | 267 | | | |
| | | | 12.66 | | | | 13.80 | | | | 7,606 | | | | 1.78 | | | | 1.86 | | | | 2.22 | | | | 267 | | | |
| | | | 12.72 | | | | 15.14 | | | | 685,787 | | | | 0.69 | | | | 0.77 | | | | 3.36 | | | | 267 | | | |
| | | | 12.70 | | | | 14.50 | | | | 95 | | | | 1.19 | | | | 1.27 | | | | 2.87 | | | | 267 | | | |
| | | | | | | | | | | | | | | | | | | | | | | | | | | | | | | |
| |
| |
| | | | 12.30 | | | | (1.10 | ) | | | 202,926 | | | | 1.02 | | | | 1.11 | | | | 3.61 | | | | 168 | | | |
| | | | 12.25 | | | | (1.93 | ) | | | 6,572 | | | | 1.77 | | | | 1.86 | | | | 2.85 | | | | 168 | | | |
| | | | 12.23 | | | | (1.85 | ) | | | 4,863 | | | | 1.77 | | | | 1.86 | | | | 2.85 | | | | 168 | | | |
| | | | 12.28 | | | | (0.76 | ) | | | 664,853 | | | | 0.68 | | | | 0.77 | | | | 3.94 | | | | 168 | | | |
| | | | 12.27 | | | | (1.26 | ) | | | 214 | | | | 1.18 | | | | 1.27 | | | | 3.44 | | | | 168 | | | |
| | | | | | | | | | | | | | | | | | | | | | | | | | | | | | | |
| | | | | | | | | | | | | | | | | | | | | | | | | | | | | | | |
| |
| | | | | | | | | | | | | | | | | | | | | | | | | | | | | | | |
| | | | | | | | | | | | | | | | | | | | | | | | | | | | | | | |
| | | | 12.91 | | | | 1.33 | | | | 311,900 | | | | 1.01 | (c) | | | 1.07 | (c) | | | 3.17 | (c) | | | 141 | | | |
| | | | 12.87 | | | | 1.10 | | | | 10,479 | | | | 1.76 | (c) | | | 1.82 | (c) | | | 2.42 | (c) | | | 141 | | | |
| | | | 12.84 | | | | 1.02 | | | | 6,110 | | | | 1.76 | (c) | | | 1.82 | (c) | | | 2.44 | (c) | | | 141 | | | |
| | | | 12.89 | | | | 1.48 | | | | 1,077,177 | | | | 0.67 | (c) | | | 0.73 | (c) | | | 3.54 | (c) | | | 141 | | | |
| | | | 12.88 | | | | 1.27 | | | | 380 | | | | 1.17 | (c) | | | 1.23 | (c) | | | 3.03 | (c) | | | 141 | | | |
| | | | | | | | | | | | | | | | | | | | | | | | | | | | | | | |
| | | | | | | | | | | | | | | | | | | | | | | | | | | | | | | |
| |
| | | | | | | | | | | | | | | | | | | | | | | | | | | | | | | |
| | | | | | | | | | | | | | | | | | | | | | | | | | | | | | | |
| | | | 12.93 | | | | 4.46 | | | | 324,537 | | | | 1.04 | | | | 1.10 | | | | 2.92 | | | | 116 | | | |
| | | | 12.88 | | | | 3.59 | | | | 11,127 | | | | 1.79 | | | | 1.85 | | | | 2.13 | | | | 116 | | | |
| | | | 12.86 | | | | 3.69 | | | | 5,282 | | | | 1.79 | | | | 1.85 | | | | 2.13 | | | | 116 | | | |
| | | | 12.91 | | | | 4.76 | | | | 1,089,450 | | | | 0.68 | | | | 0.74 | | | | 3.30 | | | | 116 | | | |
| | | | 12.90 | | | | 4.31 | | | | 376 | | | | 1.18 | | | | 1.24 | | | | 2.75 | | | | 116 | | | |
| | | | | | | | | | | | | | | | | | | | | | | | | | | | | | | |
| |
| |
| | | | 12.74 | | | | 2.07 | | | | 252,962 | | | | 1.05 | | | | 1.17 | | | | 2.63 | | | | 97 | | | |
| | | | 12.70 | | | | 1.36 | | | | 17,716 | | | | 1.80 | | | | 1.93 | | | | 1.89 | | | | 97 | | | |
| | | | 12.67 | | | | 1.28 | | | | 6,908 | | | | 1.80 | | | | 1.93 | | | | 1.89 | | | | 97 | | | |
| | | | 12.73 | | | | 2.53 | | | | 590,541 | | | | 0.68 | | | | 0.80 | | | | 3.00 | | | | 97 | | | |
| | | | 12.71 | | | | 1.93 | | | | 435 | | | | 1.18 | | | | 1.31 | | | | 2.51 | | | | 97 | | | |
| | | | | | | | | | | | | | | | | | | | | | | | | | | | | | | |
| |
| |
| | | | 13.25 | | | | 4.56 | | | | 173,712 | | | | 1.08 | | | | 1.32 | | | | 2.36 | | | | 137 | | | |
| | | | 13.20 | | | | 3.72 | | | | 24,819 | | | | 1.83 | | | | 2.07 | | | | 1.61 | | | | 137 | | | |
| | | | 13.18 | | | | 3.80 | | | | 8,370 | | | | 1.83 | | | | 2.07 | | | | 1.61 | | | | 137 | | | |
| | | | 13.23 | | | | 4.90 | | | | 214,410 | | | | 0.69 | | | | 0.91 | | | | 2.70 | | | | 137 | | | |
| | | | 13.22 | | | | 4.38 | | | | 463 | | | | 1.19 | | | | 1.43 | | | | 2.26 | | | | 137 | | | |
| | | | | | | | | | | | | | | | | | | | | | | | | | | | | | | |
| |
| |
The accompanying notes are an integral part of these financial statements.
GOLDMAN SACHS STRATEGIC INCOME FUND
Financial Highlights
Selected Data for a Share Outstanding Throughout the Period
| | | | | | | | | | | | | | | | | | | | | | | | | |
| | | | | | | | Income from
| | | Distributions
| | | |
| | | | | Net asset
| | | investment operations | | | to shareholders
| | | |
| | | | | value,
| | | Net
| | | Net realized
| | | Total from
| | | from net
| | | |
| | | | | beginning
| | | investment
| | | and unrealized
| | | investment
| | | investment
| | | |
| | | Year - Share Class | | of period | | | income(a) | | | gain | | | operations | | | income | | | |
| |
| FOR THE PERIOD ENDED SEPTEMBER 30, (UNAUDITED) |
| | | | | | | | | | | | | | | | | | | | | | | | | |
| | | | | | | | | | | | | | | | | | | | | | | | | |
| | | 2010 - A (Commenced June 30, 2010) | | $ | 10.00 | | | $ | 0.06 | | | $ | 0.05 | | | $ | 0.11 | | | $ | (0.04 | ) | | |
| | | 2010 - C (Commenced June 30, 2010) | | | 10.00 | | | | 0.05 | | | | 0.06 | | | | 0.11 | | | | (0.03 | ) | | |
| | | 2010 - Institutional (Commenced June 30, 2010) | | | 10.00 | | | | 0.06 | | | | 0.06 | | | | 0.12 | | | | (0.05 | ) | | |
| | | 2010 - IR (Commenced June 30, 2010) | | | 10.00 | | | | 0.05 | | | | 0.07 | | | | 0.12 | | | | (0.05 | ) | | |
| | | 2010 - R (Commenced June 30, 2010) | | | 10.00 | | | | 0.04 | | | | 0.07 | | | | 0.11 | | | | (0.04 | ) | | |
| | | | | | | | | | | | | | | | | | | | | | | | | |
| | | | | | | | | | | | | | | | | | | | | | | | | |
| | | |
| | | |
| | | | | | | | | | | | | | | | | | | | | | | | | |
| | | | | | | | | | | | | | | | | | | | | | | | | |
| |
| (a) | Calculated based on the average shares outstanding methodology. |
| |
| (b) | Assumes investment at the net asset value at the beginning of the period, reinvestment of all dividends and distributions, a complete redemption of the investment at the net asset value at the end of the period and no sales or redemption charges. Total returns would be reduced if a sales or redemption charge was taken into account. Returns do not reflect the deduction of taxes that a shareholder would pay on Fund distributions or the redemption of Fund shares. Total returns for periods less than one full year are not annualized. |
The accompanying notes are an integral part of these financial statements.
GOLDMAN SACHS STRATEGIC INCOME FUND
| | | | | | | | | | | | | | | | | | | | | | | | | | | | | | | |
| | | | | | | | | | | | | | | | | | Ratio of
| | | | | | |
| | | | | | | | | Net assets,
| | | Ratio of
| | | Ratio of
| | | net investment
| | | | | | |
| | | Net asset
| | | | | | end of
| | | net expenses
| | | total expenses
| | | income
| | | Portfolio
| | | |
| | | value, end
| | | Total
| | | period
| | | to average
| | | to average
| | | to average
| | | turnover
| | | |
| | | of period | | | return(b) | | | (in 000s) | | | net assets(c) | | | net assets(c) | | | net assets(c) | | | rate | | | |
| |
| |
| | | | | | | | | | | | | | | | | | | | | | | | | | | | | | | |
| | | | | | | | | | | | | | | | | | | | | | | | | | | | | | | |
| | | $ | 10.07 | | | | 1.13 | % | | $ | 106,979 | | | | 1.03 | % | | | 1.71 | % | | | 2.58 | % | | | 33 | % | | |
| | | | 10.08 | | | | 1.07 | | | | 3,832 | | | | 1.78 | | | | 2.46 | | | | 2.26 | | | | 33 | | | |
| | | | 10.07 | | | | 1.21 | | | | 115,299 | | | | 0.69 | | | | 1.37 | | | | 2.58 | | | | 33 | | | |
| | | | 10.07 | | | | 1.18 | | | | 201 | | | | 0.78 | | | | 1.46 | | | | 2.18 | | | | 33 | | | |
| | | | 10.07 | | | | 1.08 | | | | 10 | | | | 1.28 | | | | 1.96 | | | | 1.40 | | | | 33 | | | |
| | | | | | | | | | | | | | | | | | | | | | | | | | | | | | | |
| | | | | | | | | | | | | | | | | | | | | | | | | | | | | | | |
| |
| |
The accompanying notes are an integral part of these financial statements.
GOLDMAN SACHS MULTI SECTOR FIXED INCOME FUNDS
Fund Expenses — Six Month Period Ended September 30, 2010 (Unaudited)
As a shareholder of Class A, Class B, Class C, Institutional, Service, Class IR or Class R Shares of a Fund, you incur two types of costs: (1) transaction costs, including sales charges on purchase payments (with respect to Class A Shares), contingent deferred sales charges on redemptions (with respect to Class B and Class C Shares), and redemption fees (if any); and (2) ongoing costs, including management fees; distribution and service (12b-1) fees (with respect to Class A, Class B, Class C and Class R Shares); and other Fund expenses. This Example is intended to help you understand your ongoing costs (in dollars) of investing in Class A, Class B, Class C, Institutional, Service, Class IR or Class R Shares of the Funds and to compare these costs with the ongoing costs of investing in other mutual funds.
The Example is based on an investment of $1,000 invested at the beginning of the period and held for the entire period from April 1, 2010 through September 30, 2010.
Actual Expenses — The first line under each share class in the table below provides information about actual account values and actual expenses. You may use the information in this line, together with the amount you invested, to estimate the expenses that you paid over the period. Simply divide your account value by $1,000 (for example, an $8,600 account value divided by $1,000 = 8.6), then multiply the result by the number in the first line under the heading entitled “Expenses Paid” to estimate the expenses you paid on your account during this period.
Hypothetical Example for Comparison Purposes — The second line under each share class in the table below provides information about hypothetical account values and hypothetical expenses based on the Funds’ actual net expense ratios and an assumed rate of return of 5% per year before expenses, which is not the Funds’ actual return. The hypothetical account values and expenses may not be used to estimate the actual ending account balance or expenses you paid for the period. You may use this information to compare the ongoing costs of investing in the Funds and other funds. To do so, compare this 5% hypothetical example with the 5% hypothetical examples that appear in the shareholder reports of the other funds.
Please note that the expenses shown in the table are meant to highlight your ongoing costs only and do not reflect any transactional costs, such as sales charges, redemption fees, or exchange fees. Therefore, the second line of the table is useful in comparing ongoing costs only, and will not help you determine the relative total costs of owning different funds. In addition, if these transactional costs were included, your costs would have been higher.
| | | | | | | | | | | | | | | | | | | | | | | | | | | | | | | | | | | | | | | | | | | | | | | | | | | | | �� | | | | | | | | |
| | | | Core Fixed Income Fund | | | Core Plus Fixed Income Fund | | | Global Income Fund | | | Strategic Income Fund(a) |
| | | | | | | | | | Expenses
| | | | | | | | | Expenses
| | | | | | | | | Expenses
| | | | | | | | | Expenses
|
| | | | Beginning
| | | Ending
| | | Paid for the
| | | Beginning
| | | Ending
| | | Paid for the
| | | Beginning
| | | Ending
| | | Paid for the
| | | Beginning
| | | Ending
| | | Paid for the
|
| | | | Account Value
| | | Account Value
| | | 6 months ended
| | | Account Value
| | | Account Value
| | | 6 months ended
| | | Account Value
| | | Account Value
| | | 6 months ended
| | | Account Value
| | | Account Value
| | | 6 months ended
|
| Share Class | | | 4/1/10 | | | 9/30/10 | | | 9/30/10* | | | 4/1/10 | | | 9/30/10 | | | 9/30/10* | | | 4/1/10 | | | 9/30/10 | | | 9/30/10* | | | 7/1/10 | | | 9/30/10 | | | 9/30/10* |
Class A | | | | | | | | | | | | | | | | | | | | | | | | | | | | | | | | | | | | | | | | | | | | | | | | | | | | | | | | | | | | |
| Actual | | | $ | 1,000.00 | | | | $ | 1,059.60 | | | | $ | 4.18 | | | | $ | 1,000.00 | | | | $ | 1,058.60 | | | | $ | 4.28 | | | | $ | 1,000.00 | | | | $ | 1,035.20 | | | | $ | 5.25 | | | | $ | 1,000.00 | | | | $ | 1,011.30 | | | | $ | 2.61 | |
| Hypothetical 5% return | | | | 1,000.00 | | | | | 1,021.01 | + | | | | 4.10 | | | | | 1,000.00 | | | | | 1,020.91 | + | | | | 4.20 | | | | | 1,000.00 | | | | | 1,019.90 | + | | | | 5.22 | | | | | 1,000.00 | | | | | 1,010.01 | + | | | | 2.61 | |
| |
Class B | | | | | | | | | | | | | | | | | | | | | | | | | | | | | | | | | | | | | | | | | | | | | | | | | | | | | | | | | | | | |
| Actual | | | | 1,000.00 | | | | | 1,055.40 | | | | | 8.04 | | | | | 1,000.00 | | | | | 1,054.70 | | | | | 8.14 | | | | | 1,000.00 | | | | | 1,031.30 | | | | | 9.06 | | | | | N/A | | | | | N/A | | | | | N/A | |
| Hypothetical 5% return | | | | 1,000.00 | | | | | 1,017.25 | + | | | | 7.89 | | | | | 1,000.00 | | | | | 1,017.15 | + | | | | 7.99 | | | | | 1,000.00 | | | | | 1,016.14 | + | | | | 9.00 | | | | | N/A | | | | | N/A | | | | | N/A | |
| |
Class C | | | | | | | | | | | | | | | | | | | | | | | | | | | | | | | | | | | | | | | | | | | | | | | | | | | | | | | | | | | | |
| Actual | | | | 1,000.00 | | | | | 1,054.30 | | | | | 8.03 | | | | | 1,000.00 | | | | | 1,054.70 | | | | | 8.14 | | | | | 1,000.00 | | | | | 1,032.40 | | | | | 9.07 | | | | | 1,000.00 | | | | | 1,010.70 | | | | | 4.51 | |
| Hypothetical 5% return | | | | 1,000.00 | | | | | 1,017.25 | + | | | | 7.89 | | | | | 1,000.00 | | | | | 1,017.15 | + | | | | 7.99 | | | | | 1,000.00 | | | | | 1,016.14 | + | | | | 9.00 | | | | | 1,000.00 | | | | | 1,008.12 | + | | | | 4.50 | |
| |
Institutional | | | | | | | | | | | | | | | | | | | | | | | | | | | | | | | | | | | | | | | | | | | | | | | | | | | | | | | | | | | | |
| Actual | | | | 1,000.00 | | | | | 1,060.10 | | | | | 2.43 | | | | | 1,000.00 | | | | | 1,059.40 | | | | | 2.53 | | | | | 1,000.00 | | | | | 1,037.00 | | | | | 3.52 | | | | | 1,000.00 | | | | | 1,012.10 | | | | | 1.75 | |
| Hypothetical 5% return | | | | 1,000.00 | | | | | 1,022.71 | + | | | | 2.38 | | | | | 1,000.00 | | | | | 1,022.61 | + | | | | 2.48 | | | | | 1,000.00 | | | | | 1,021.61 | + | | | | 3.50 | | | | | 1,000.00 | | | | | 1,010.86 | + | | | | 1.75 | |
| |
Service | | | | | | | | | | | | | | | | | | | | | | | | | | | | | | | | | | | | | | | | | | | | | | | | | | | | | | | | | | | | |
| Actual | | | | 1,000.00 | | | | | 1,058.50 | | | | | 5.01 | | | | | 1,000.00 | | | | | 1,056.90 | | | | | 5.10 | | | | | 1,000.00 | | | | | 1,035.20 | | | | | 6.07 | | | | | N/A | | | | | N/A | | | | | N/A | |
| Hypothetical 5% return | | | | 1,000.00 | | | | | 1,020.21 | + | | | | 4.91 | | | | | 1,000.00 | | | | | 1,020.10 | + | | | | 5.01 | | | | | 1,000.00 | | | | | 1,019.10 | + | | | | 6.02 | | | | | N/A | | | | | N/A | | | | | N/A | |
| |
Class IR(b) | | | | | | | | | | | | | | | | | | | | | | | | | | | | | | | | | | | | | | | | | | | | | | | | | | | | | | | | | | | | |
| Actual | | | | 1,000.00 | | | | | 1,059.80 | | | | | 2.89 | | | | | 1,000.00 | | | | | 1,058.90 | | | | | 2.99 | | | | | 1,000.00 | | | | | 1,013.00 | | | | | 1.31 | | | | | 1,000.00 | | | | | 1,011.80 | | | | | 1.98 | |
| Hypothetical 5% return | | | | 1,000.00 | | | | | 1,022.26 | + | | | | 2.84 | | | | | 1,000.00 | | | | | 1,022.16 | + | | | | 2.94 | | | | | 1,000.00 | | | | | 1,007.05 | + | | | | 1.31 | | | | | 1,000.00 | | | | | 1,010.64 | + | | | | 1.98 | |
| |
Class R | | | | | | | | | | | | | | | | | | | | | | | | | | | | | | | | | | | | | | | | | | | | | | | | | | | | | | | | | | | | |
| Actual | | | | 1,000.00 | | | | | 1,057.20 | | | | | 5.47 | | | | | 1,000.00 | | | | | 1,057.20 | | | | | 5.57 | | | | | N/A | | | | | N/A | | | | | N/A | | | | | 1,000.00 | | | | | 1,010.80 | | | | | 3.24 | |
| Hypothetical 5% return | | | | 1,000.00 | | | | | 1,019.75 | + | | | | 5.37 | | | | | 1,000.00 | | | | | 1,019.65 | + | | | | 5.47 | | | | | N/A | | | | | N/A | | | | | N/A | | | | | 1,000.00 | | | | | 1,009.38 | + | | | | 3.24 | |
| |
| |
| (a) | Commenced operations on June 30, 2010. |
| (b) | Commenced operations on July 30, 2010 for Global Income Fund. |
| * | Expenses for each share class are calculated using each Fund’s annualized net expense ratio for each class, which represents the ongoing expenses as a percentage of net assets for the six months ended September 30, 2010. Expenses are calculated by multiplying the annualized net expense ratio by the average account value for the period; then multiplying the result by the number of days in the most recent fiscal half year; and then dividing that result by the number of days in the fiscal year. The annualized net expense ratios for the period were as follows: |
| | | | | | | | | | | | | | | | | | | | | | | | | | | | | |
| Fund | | Class A | | Class B | | Class C | | Institutional | | Service | | Class IR | | Class R |
| |
| Core Fixed Income | | | 0.81 | % | | | 1.56 | % | | | 1.56 | % | | | 0.47 | % | | | 0.97 | % | | | 0.56 | % | | | 1.06 | % |
| Core Plus Fixed Income | | | 0.83 | | | | 1.58 | | | | 1.58 | | | | 0.49 | | | | 0.99 | | | | 0.58 | | | | 1.08 | |
| Global Income | | | 1.03 | | | | 1.78 | | | | 1.78 | | | | 0.69 | | | | 1.19 | | | | 0.78 | | | | N/A | |
Strategic Income(a) | | | 1.03 | | | | N/A | | | | 1.78 | | | | 0.69 | | | | N/A | | | | 0.78 | | | | 1.28 | |
| |
| |
| |
| + | Hypothetical expenses are based on each Fund’s actual annualized net expense ratios and an assumed rate of return of 5% per year before expenses. |
110
GOLDMAN SACHS MULTI SECTOR FIXED INCOME FUNDS
Statement Regarding Basis for Approval of Management Agreements (Unaudited)
Background
The Goldman Sachs Core Fixed Income, Goldman Sachs Core Plus Fixed Income and Goldman Sachs Global Income Funds (the “Funds”) are investment portfolios of Goldman Sachs Trust (the “Trust”). The Board of Trustees oversees the management of the Trust and reviews the investment performance and expenses of the Funds at regularly scheduled meetings held during the year. In addition, the Board of Trustees determines annually whether to approve the continuance of the Trust’s investment management agreements (the “Management Agreements”) on behalf of Core Fixed Income and Core Plus Fixed Income Funds with Goldman Sachs Asset Management, L.P. and on behalf of Global Income Fund with Goldman Sachs Asset Management International (together with Goldman Sachs Asset Management, L.P., the “Investment Advisers”).
The Management Agreements were most recently approved for continuation until June 30, 2011 by the Board of Trustees, including those Trustees who are not parties to the Management Agreements or “interested persons” (as defined in the Investment Company Act of 1940, as amended) of any party thereto (the “Independent Trustees”), at a meeting held on June 16-17, 2010 (the “Annual Meeting”).
The review process undertaken by the Trustees spans the course of the year and culminates with the Annual Meeting. To assist the Trustees in their deliberations, the Trustees have established a Contract Review Committee (the “Committee”), comprised of the Independent Trustees. The Committee held three meetings over the course of the year, since last approving the Management Agreements. At those Committee meetings, regularly scheduled Board meetings and/or the Annual Meeting, the Board, or the Independent Trustees, as applicable, considered matters relating to the Management Agreements, including:
| | |
| | (a) | the nature and quality of the advisory, administrative and other services provided to the Funds by the Investment Advisers and their affiliates, including information about: |
| | |
| | (i) | the structure, staff and capabilities of the Investment Advisers and their portfolio management teams; |
| |
| | (ii) | the groups within the Investment Advisers and their affiliates that support the portfolio management teams or provide other types of necessary services, including fund services groups (e.g., accounting and financial reporting, tax, shareholder services and operations), controls and risk management groups (e.g., legal, compliance, valuation oversight, credit risk management, internal audit, market risk analysis and finance and strategy), sales and distribution support groups and others (e.g., information technology and training); |
| |
| | (iii) | trends in headcount; |
| |
| | (iv) | the Investment Advisers’ financial resources and ability to hire and retain talented personnel and strengthen their operations; and |
| |
| | (v) | the parent company’s support of the Investment Advisers and their mutual fund business, as expressed by the firm’s senior management; |
| | |
| | (b) | information on the investment performance of the Funds, including comparisons to the performance of similar mutual funds, as provided by a third party mutual fund data provider engaged as part of the contract review process (the “Outside Data Provider”), and benchmark performance indices, and general investment outlooks in the markets in which the Funds invest; |
| | (c) | the terms of the Management Agreements and agreements with affiliated service providers entered into by the Trust on behalf of the Funds; |
| | (d) | expense information for the Funds, including: |
| | |
| | (i) | the relative management fee and expense levels of the Funds as compared to those of comparable funds managed by other advisers, as provided by the Outside Data Provider; |
| |
| | (ii) | each Fund’s expense trends over time; and |
| |
| | (iii) | to the extent the Investment Advisers manage institutional accounts or collective investment vehicles having investment objectives and policies similar to those of the Funds, comparative information on the advisory fees charged and services provided to those accounts by the Investment Advisers; |
GOLDMAN SACHS MULTI SECTOR FIXED INCOME FUNDS
Statement Regarding Basis for Approval of Management Agreements (Unaudited) (continued)
| | |
| | (e) | with respect to the extensive investment performance and expense comparison data provided by the Outside Data Provider, its processes in producing that data for the Funds; |
| | (f) | the undertakings of the Investment Advisers to reimburse certain expenses of the Funds that exceed specified levels, and a summary of contractual fee reductions made by the Investment Advisers and their affiliates over the past several years with respect to the Funds; |
| | (g) | information relating to the profitability of the Management Agreements and the transfer agency and distribution and service arrangements of each of the Funds and the Trust as a whole to the Investment Advisers and their affiliates; |
| | (h) | potential economies of scale, if any, and the levels of breakpoints in the fees payable by the Funds under the Management Agreements; |
| | (i) | a summary of the “fall-out” benefits derived by the Investment Advisers and their affiliates from their relationships with the Funds, including the fees received by the Investment Advisers’ affiliates from the Funds for transfer agency, distribution and other services; |
| | (j) | a summary of potential benefits derived by the Funds as a result of their relationship with the Investment Advisers; |
| | (k) | portfolio trading related issues; |
| | (l) | portfolio manager ownership of Fund shares; the manner in which portfolio manager compensation is determined, the alignment of the interests of the Funds and of the portfolio managers and related potential conflicts of interest; and the number and types of accounts managed by the portfolio managers; |
| | (m) | the nature and quality of the services provided to the Funds by their unaffiliated service providers, and the Investment Advisers’ general oversight and evaluation (including reports on due diligence) of those service providers as part of the administration services provided under the Management Agreements; and |
| | (n) | the processes and policies followed by the Investment Advisers in addressing various types of potential conflicts of interest; their approach to risk management; the annual review of the effectiveness of the Funds’ compliance program; and compliance reports. |
The Trustees also received an overview of the Funds’ distribution arrangements. They received information regarding the Funds’ assets, share purchase and redemption activity and the payment of Rule 12b-1 distribution and service fees by the Funds and the payment of non-Rule 12b-1 shareholder service and/or administration fees by the Funds’ Service Shares. Information was also provided to the Trustees relating to revenue sharing payments made by and services provided by the Investment Advisers and their affiliates to intermediaries that promote the sale, distribution and/or servicing of Fund shares.
The presentations made at the Board and Committee meetings and at the Annual Meeting encompassed the Funds and other mutual fund portfolios for which the Board of Trustees has responsibility. In evaluating the Management Agreements at the Annual Meeting, the Trustees relied upon their knowledge, resulting from their meetings and other interactions throughout the year, of the Investment Advisers, their affiliates, their services and the Funds. In conjunction with these meetings, the Trustees received written materials and oral presentations on the topics covered, and were advised by their independent legal counsel regarding their responsibilities and other regulatory requirements related to the approval and continuation of mutual fund investment management agreements under applicable law. During the course of their deliberations, the Independent Trustees met in executive sessions with their independent legal counsel, without representatives of the Investment Advisers or their affiliates present. The Independent Trustees also discussed the broad range of other investment choices that are available to Fund investors, including the availability of comparable funds managed by other advisers.
GOLDMAN SACHS MULTI SECTOR FIXED INCOME FUNDS
Statement Regarding Basis for Approval of Management Agreements (Unaudited) (continued)
Nature, Extent and Quality of the Services Provided Under the Management Agreements
As part of their review, the Trustees considered the nature, extent and quality of the services provided by the Investment Advisers. In this regard, the Trustees considered both the investment advisory services, and the other, non-advisory services, that are provided to the Funds by the Investment Advisers and their affiliates. The Independent Trustees concluded that the Investment Advisers had committed substantial financial and operational resources to the Funds and expressed confidence that the Investment Advisers would continue to do so in the future. The Trustees also observed that the Investment Advisers had made significant commitments to address regulatory compliance requirements applicable to the Funds and the Investment Advisers.
Investment Performance
The Trustees also considered the investment performance of the Funds and the Investment Advisers. In this regard, they compared the investment performance of each Fund to the performance of other similar SEC-registered funds and to rankings and ratings compiled by the Outside Data Provider. This information on each Fund’s investment performance relative to that of its peers was provided for the one-, three-, five- and ten-year periods ended December 31, 2009, to the extent that each Fund had been in existence for those periods. The Trustees also reviewed each Fund’s investment performance over time on a year-by-year basis relative to its performance benchmark. In addition, they considered the investment performance trends of the Funds over time, and reviewed the investment performance of each Fund in light of its investment objective and policies, market conditions, and credit and duration parameters. The Trustees considered whether each Fund had operated within its investment policies and had complied with its investment limitations.
In addition, the Trustees considered materials prepared and presentations made by the Investment Advisers’ Chief Investment Officer and portfolio management personnel, in which Fund performance was assessed. The Trustees also considered the Investment Advisers’ periodic reports with respect to the Funds’ risk profiles, and how the Investment Advisers’ approach to risk monitoring and management influences portfolio management.
The Trustees noted that each of the Funds outperformed its respective benchmark for the one-year period ended December 31, 2009. They also noted that each of the Funds ranked in the top half of its respective peer group for the one-year period ended December 31, 2009. The Trustees recognized that despite a challenging track record over the three- and five-year time period ended December 31, 2009 for the Core Fixed Income Fund, the recent performance of the Funds had generally improved. The Trustees concluded that the Investment Advisers’ continued management likely would benefit each Fund and its shareholders.
Costs of Services Provided and Competitive Information
The Trustees considered the contractual fee rates payable by each Fund under the Management Agreements. In this regard, the Trustees considered information on the services rendered by the Investment Advisers to the Funds, which included both advisory and administrative services that were directed to the needs and operations of the Funds as registered mutual funds.
In particular, the Trustees reviewed analyses prepared by the Outside Data Provider regarding the expense rankings of the Funds. The analyses provided a comparison of the Funds’ management fees and breakpoints to those of relevant peer groups and category universes; an expense analysis which compared each Fund’s expenses to a peer group and a category universe; and a five-year (three-year, in the case of Core Plus Fixed Income Fund) history comparing each Fund’s expenses to the peer and category averages. The analyses also compared each Fund’s transfer agency fees, custody and accounting fees, distribution fees, other expenses and fee waivers/reimbursements to those of other funds in the peer group and the peer group median. The Trustees concluded that the comparisons provided by the Outside Data Provider were useful in evaluating the reasonableness of the management fees and total expenses paid by the Funds.
In addition, the Trustees considered the Investment Advisers’ undertakings to limit the Funds’ “other expenses” ratios (excluding certain expenses) to certain specified levels. They also considered, to the extent that the Investment Advisers manage institutional accounts or collective investment vehicles having investment objectives and policies similar to those of the Funds, comparative fee information for services provided by the Investment Advisers to those accounts, and information that indicated that services provided to the Funds differed in various significant respects from the services provided to institutional accounts, which generally operated under less stringent legal and regulatory structures, required fewer services from the Investment Advisers to a smaller number of client contact points, were less time-intensive and paid lower fees. By contrast, the Trustees noted that the Investment Advisers provide substantial administrative services to the Funds under the terms of the Management Agreements.
GOLDMAN SACHS MULTI SECTOR FIXED INCOME FUNDS
Statement Regarding Basis for Approval of Management Agreements (Unaudited) (continued)
In addition, the Trustees noted that shareholders are able to redeem their Fund shares at any time if they believe that the Fund fees and expenses are too high or if they are dissatisfied with the performance of the Fund.
Profitability
The Trustees reviewed the Investment Advisers’ revenues and pre-tax profit margins with respect to the Trust and each of the Funds. In this regard the Trustees noted that they had received, among other things, profitability analyses and summaries, revenue and expense schedules by Fund and by function (i.e., investment management, transfer agency and distribution and service) and the Investment Advisers’ expense allocation methodology. They observed that the profitability and expense figures are substantially similar to those used by the Investment Advisers for many internal purposes, including compensation decisions among various business groups, and are thus subject to a vigorous internal debate about how certain revenue and expenses should be allocated. The Trustees also reviewed the report of the internal audit group within the Goldman Sachs organization, which included an assessment of the reasonableness and consistency of the Investment Advisers’ expense allocation methodology and an evaluation of the accuracy of the Investment Advisers’ profitability analysis calculations. Profitability data for the Trust and each Fund were provided for 2009 and 2008, and the Trustees considered this information in relation to the Investment Advisers’ overall profitability. The Trustees considered the Investment Advisers’ revenues and pre-tax profit margins both in absolute terms and in comparison to information on the reported pre-tax profit margins earned by certain other asset management firms.
Economies of Scale
The Trustees considered the information that had been provided regarding the Investment Advisers’ profitability and the rationale for the Funds’ breakpoint structure. The Trustees also considered the breakpoints in the fee rate payable under the Management Agreements for each of the Funds at the following annual percentage rates of the average daily net assets of the Funds:
| | | | | | | | | | | | | |
| | | Core Fixed
| | | Core Plus Fixed
| | | | |
Average Daily
| | Income
| | | Income
| | | Global Income
| |
| Net Assets | | Fund | | | Fund | | | Fund | |
| | |
| First $1 billion | | | 0.40 | % | | | 0.45 | % | | | 0.65 | % |
| Next $1 billion | | | 0.36 | | | | 0.41 | | | | 0.59 | |
| Next $3 billion | | | 0.34 | | | | 0.39 | | | | 0.56 | |
| Next $3 billion | | | 0.33 | | | | 0.38 | | | | 0.55 | |
| Over $8 billion | | | 0.32 | | | | 0.37 | | | | 0.54 | |
The Trustees noted that the breakpoints at the $5 and $8 billion asset levels had been proposed by the Investment Advisers and approved by the Trustees in 2008 to further share potential economies of scale, if any, with the Funds and their shareholders as assets under management reach those asset levels. The Trustees considered the amounts of assets in the Funds; the Funds’ recent share purchase and redemption activity; the information provided by the Investment Advisers relating to the costs of the services provided by the Investment Advisers and their affiliates and their realized profits; information comparing fee rates charged by the Investment Advisers with fee rates charged to other funds in the peer group; and the Investment Advisers’ undertakings to limit other expenses to certain amounts. Upon reviewing these matters at the Annual Meeting, the Trustees concluded that the fee breakpoints represented a means of assuring that benefits of scalability would be passed along to shareholders at the specified asset levels. They also noted that Goldman Sachs Asset Management, L.P. was passing along savings to shareholders of the Core Fixed Income Fund, which had asset levels above the first breakpoint.
GOLDMAN SACHS MULTI SECTOR FIXED INCOME FUNDS
Statement Regarding Basis for Approval of Management Agreements (Unaudited) (continued)
Other Benefits to the Investment Advisers and Their Affiliates
The Trustees also considered the other benefits derived by the Investment Advisers and their affiliates from their relationship with the Funds as stated above, including: (a) transfer agency fees received by Goldman, Sachs & Co. (“Goldman Sachs”); (b) futures commissions earned by Goldman Sachs for executing futures transactions on behalf of the Funds; (c) trading efficiencies resulting from aggregation of orders of the Funds with those for other funds or accounts managed by the Investment Advisers; (d) the Investment Advisers’ ability to leverage the infrastructure designed to service the Funds on behalf of their other clients; (e) the Investment Advisers’ ability to cross-market other products and services to Fund shareholders; (f) Goldman Sachs’ retention of certain fees as Fund Distributor; (g) the Investment Advisers’ ability to negotiate better pricing with custodians on behalf of their other clients, as a result of the relationship with the Funds; and (h) the Investment Advisers’ ability to leverage relationships with the Funds’ third party service providers to attract more firmwide business. In the course of considering the foregoing, the Independent Trustees requested and received further information quantifying certain of the fall-out benefits.
Other Benefits to the Funds and Their Shareholders
The Trustees also noted that the Funds receive certain potential benefits as a result of their relationship with the Investment Advisers, including: (a) trading efficiencies resulting from aggregation of orders of the Funds with those of other funds or accounts managed by the Investment Advisers; (b) improved servicing and pricing from vendors because of the volume of business generated by the Investment Advisers and their affiliates; (c) improved servicing from broker-dealers because of the volume of business generated by the Investment Adviser and its affiliates; (d) the Investment Advisers’ ability to negotiate favorable terms with derivatives counterparties as a result of the size and reputation of the Goldman Sachs organization; (e) the advantages gained from the Investment Advisers’ knowledge and experience gained from managing other accounts and products; (f) the Investment Advisers’ ability to hire and retain qualified personnel to provide services to the Funds because of the reputation of the Goldman Sachs organization; (g) the Funds’ access, through the Investment Advisers, to certain firmwide resources (e.g., proprietary databases); and (h) the Funds’ access to certain affiliated distribution channels. The Trustees noted the competitive nature of the mutual fund marketplace, and noted further that many of the Funds’ shareholders invested in the Funds in part because of the Funds’ relationship with the Investment Advisers and that those shareholders have a general expectation that the relationship will continue.
Goldman Sachs Strategic Income Fund
The Goldman Sachs Strategic Income Fund (the “Strategic Income Fund”) commenced investment operations on June 30, 2010, and the Trustees considered, at a meeting held on June 16-17, 2010, (i) the initial appointment of Goldman Sachs Asset Management, L.P. (the “Investment Adviser”) to serve as the Strategic Income Fund’s investment adviser and (ii) the initial approval of the Management Agreement on behalf of the Strategic Income Fund. At that meeting, the Trustees considered the nature, extent and quality of the services that would be provided by the Investment Adviser and its affiliates to the Strategic Income Fund. In this regard, the Trustees noted that, although the Strategic Income Fund was new (and therefore had no performance information to evaluate), many of the portfolio personnel who would be providing services to the Strategic Income Fund were currently providing services to other investment portfolios of the Trust. The Trustees concluded that the Investment Adviser would be able to provide quality services to the Strategic Income Fund.
The Trustees considered the management fee to be paid by the Strategic Income Fund, and the Strategic Income Fund’s anticipated total expenses, along with the Strategic Income Fund’s anticipated assets under management. They also considered a report prepared by the Outside Data Provider, which compared the Strategic Income Fund’s anticipated management fee and total expenses to those of a peer group and category median. The Trustees also noted the Investment Adviser’s undertaking to limit the Strategic Income Fund’s “other expenses” ratio (excluding certain expenses) to a specified level. They recognized that the Strategic Income Fund did not yet have profitability data to evaluate, but would after the Strategic Income Fund commenced operations. They reviewed the proposed breakpoints in the management fee schedule and concluded that the breakpoints represented a means of assuring that benefits of scalability would be passed along to shareholders at the specified asset levels. The Trustees also considered the fees to be paid to Goldman Sachs in its capacity as the Strategic Income Fund’s transfer agent and distributor, along with other fall-out benefits (as outlined above for the other Funds) that would potentially be received by the Investment Adviser and its affiliates.
GOLDMAN SACHS MULTI SECTOR FIXED INCOME FUNDS
Statement Regarding Basis for Approval of Management Agreements (Unaudited) (continued)
The Trustees concluded, in the exercise of their business judgment, that the proposed management fee to be paid by the Strategic Income Fund would be reasonable in light of the services provided to it by the Investment Adviser and the Strategic Income Fund’s reasonably foreseeable asset levels, and that the Management Agreement should be approved on behalf of the Strategic Income Fund.
Conclusion
In connection with their consideration of the Management Agreements, the Trustees gave weight to each of the factors described above, but did not identify any particular factor as controlling their decision. After deliberation and consideration of all of the information provided, including the factors described above, the Trustees concluded, in the exercise of their business judgment, that the management fees paid by each of the Funds were reasonable in light of the services provided to it by the Investment Advisers, the Investment Advisers’ costs and each Fund’s current and reasonably foreseeable asset levels. The Trustees concluded that the Management Agreements should be approved and continued with respect to each applicable Fund until June 30, 2011.
FUNDS PROFILE
Goldman Sachs Funds
Goldman Sachs is a premier financial services firm, known since 1869 for creating thoughtful and customized investment solutions in complex global markets.
Today, the Investment Management Division of Goldman Sachs serves a diverse set of clients worldwide, including private institutions, public entities and individuals. With portfolio management teams located around the world — and $700.8 billion in assets under management as of September 30, 2010 — our investment professionals bring firsthand knowledge of local markets to every investment decision. Goldman Sachs Asset Management ranks in the top 10 asset management firms worldwide, based on assets under management.1
OVERVIEW OF GOLDMAN SACHS FUNDS

| | | | | |
Money Market2
Financial Square FundsSM
n Financial Square Tax-Exempt Funds
n Financial Square Federal Fund
n Financial Square Government Fund
n Financial Square Money
Market Fund
n Financial Square Prime
Obligations Fund
n Financial Square Treasury
Instruments Fund
n Financial Square Treasury
Obligations Fund
Fixed Income
Short Duration and Government
n Enhanced Income Fund
n Ultra-Short Duration Govt. Fund
n Short Duration Government Fund
n Government Income Fund
n Inflation Protected Securities Fund
Multi-Sector
n Core Fixed Income Fund
n Core Plus Fixed Income Fund
n Global Income Fund
n Strategic Income Fund
Municipal and Tax-Free
n High Yield Municipal Fund
n Municipal Income Fund
n Short Duration Tax-Free Fund
Single Sector
n Investment Grade Credit Fund
n U.S. Mortgages Fund
n High Yield Fund | | n Emerging Markets Debt Fund
n Local Emerging Markets Debt Fund
Corporate Credit
n Credit Strategies Fund
Fundamental Equity
n Growth and Income Fund
n Small Cap Value Fund
n Mid Cap Value Fund
n Large Cap Value Fund
n Capital Growth Fund
n Strategic Growth Fund
n Small/Mid Cap Growth Fund
n All Cap Growth Fund
n Concentrated Growth Fund
n Technology Tollkeeper FundSM 4
n Growth Opportunities Fund
n U.S. Equity Fund
Structured Equity
n Balanced Fund
n Structured Small Cap Equity Fund
n Structured U.S. Equity Fund
n Structured Small Cap
Growth Fund
n Structured Large Cap
Growth Fund
n Structured Large Cap
Value Fund
n Structured Small Cap Value Fund
n Structured Tax-Managed Equity Fund
n Structured International
Tax-Managed Equity Fund
n U.S. Equity Dividend and Premium Fund | | n International Equity Dividend and Premium Fund
n Structured International Small Cap Fund
n Structured International Equity Fund
n Structured Emerging Markets Equity Fund
Fundamental Equity International
n Strategic International Equity Fund
n Concentrated International Equity Fund
n International Small Cap Fund
n Asia Equity Fund
n Emerging Markets Equity Fund
n BRIC Fund (Brazil, Russia, India, China)
Select Satellite3
n Real Estate Securities Fund
n International Real Estate Securities Fund
n Commodity Strategy Fund
n Dynamic Allocation Fund
n Absolute Return Tracker Fund
Total Portfolio Solutions3
n Balanced Strategy Portfolio
n Growth and Income Strategy Portfolio
n Growth Strategy Portfolio
n Equity Growth Strategy Portfolio
n Income Strategies Portfolio
n Satellite Strategies Portfolio
n Retirement Strategies Portfolios
n Enhanced Dividend Global Equity Portfolio
n Tax Advantaged Global Equity Portfolio |
| |
| | Firmwide assets under management includes assets managed by GSAM and its Investment Advisory Affiliates. |
| |
| 1 | Ranking for Goldman Sachs Group, Inc., includes Goldman Sachs Asset Management, Private Wealth Management and Merchant Banking 2009 year-end assets. Ranked 9th in total assets worldwide. Pensions&Investments, June 2010. |
| 2 | An investment in a money market fund is neither insured nor guaranteed by the Federal Deposit Insurance Corporation (“FDIC”) or any other government agency. Although the Funds seek to preserve the value of your investment at $1.00 per share, it is possible to lose money by investing in the Funds. |
| 3 | Individual Funds within the Total Portfolio Solutions and Select Satellite categories will have various placement on the risk/return spectrum and may have greater or lesser risk than that indicated by the placement of the general Total Portfolio Solutions or Select Satellite category. |
| 4 | Effective July 31, 2010, the Goldman Sachs Tollkeeper Fund was renamed the Goldman Sachs Technology Tollkeeper Fund. |
| |
| | The Goldman Sachs Technology Tollkeeper FundSM and Financial Square FundsSM are registered service marks of Goldman, Sachs & Co. |
| | | |
TRUSTEES
Ashok N. Bakhru, Chairman
Donald C. Burke**
John P. Coblentz, Jr.
Diana M. Daniels
Patrick T. Harker*
Joseph P. LoRusso**
James A. McNamara
Jessica Palmer
Alan A. Shuch
Richard P. Strubel
*Resigned effective September 30, 2010
**Effective August 19, 2010 | | OFFICERS
James A. McNamara, President
George F. Travers, Principal Financial Officer
Peter V. Bonanno, Secretary
Scott M. McHugh, Treasurer
GOLDMAN SACHS ASSET MANAGEMENT, L.P.
Investment Adviser
GOLDMAN SACHS ASSET MANAGEMENT INTERNATIONAL
Investment Adviser
Christchurch Court, 10-15 Newgate Street
London, England EC1 A7H0 |
GOLDMAN, SACHS & CO.
Distributor and Transfer Agent | | |
Visit our Website at www.goldmansachsfunds.com to obtain the most recent month-end returns.
Goldman Sachs Asset Management, L.P. 200 West Street, New York, New York 10282
The reports concerning the Funds included in this shareholder report may contain certain forward-looking statements about the factors that may affect the performance of the Funds in the future. These statements are based on Fund management’s predictions and expectations concerning certain future events and their expected impact on the Funds, such as performance of the economy as a whole and of specific industry sectors, changes in the levels of interest rates, the impact of developing world events, and other factors that may influence the future performance of the Funds. Management believes these forward-looking statements to be reasonable, although they are inherently uncertain and difficult to predict. Actual events may cause adjustments in portfolio management strategies from those currently expected to be employed.
A description of the policies and procedures that the Funds use to determine how to vote proxies relating to portfolio securities and information regarding how a Fund voted proxies relating to portfolio securities during the most recent 12-month period ended June 30 is available (I) without charge, upon request by calling 1-800-526-7384 (for Retail Shareholders) or 1-800-621-2550 (for Institutional Shareholders); and (II) on the Securities and Exchange Commission (“SEC”) Web site at http://www.sec.gov.
The Funds file their complete schedule of portfolio holdings with the SEC for the first and third quarters of each fiscal year on Form N-Q. The Funds’ Forms N-Q will become available on the SEC’s website at http://www.sec.gov within 60 days after the Funds’ first and third fiscal quarters. When available, the Funds’ Forms N-Q may be reviewed and copied at the SEC’s Public Reference Room in Washington, D.C. and information on the operation of the Public Reference Room may also be obtained by calling 1-800-SEC-0330. When available, Form N-Q may be obtained upon request and without charge by calling 1-800-526-7384 (for Retail Shareholders) or 1-800-621-2550 (for Institutional Shareholders).
Holdings and allocations shown may not be representative of current or future investments. Holdings and allocations may not include the Funds’ entire investment portfolio, which may change at any time. Fund holdings should not be relied on in making investment decisions and should not be construed as research or investment advice regarding particular securities.
Economic and market forecasts presented herein reflect our judgment as of the date of this presentation and are subject to change without notice. These forecasts do not take into account the specific investment objectives, restrictions, tax and financial situation or other needs of any specific client. Actual data will vary and may not be reflected here. These forecasts are subject to high levels of uncertainty that may affect actual performance. Accordingly, these forecasts should be viewed as merely representative of a broad range of possible outcomes. These forecasts are estimated, based on assumptions, and are subject to significant revision and may change materially as economic and market conditions change. Goldman Sachs has no obligation to provide updates or changes to these forecasts. Case studies and examples are for illustrative purposes only.
This material is not authorized for distribution to prospective investors unless preceded or accompanied by a current Prospectus or summary prospectus, if applicable. Investors should consider a Fund’s objective, risks, and charges and expenses, and read the summary prospectus, if available, and/or the Prospectus carefully before investing or sending money. The summary prospectus, if available, and the Prospectus contain this and other information about a Fund and may be obtained from your authorized dealer or from Goldman, Sachs & Co. by calling (retail — 1-800-526-7384) (institutional — 1-800-621-2550).
Copyright© 2010 Goldman, Sachs & Co. All rights reserved. 44115.MF.TMPL MSFISAR10 / 35.2K / 11-10
The information required by this Item is only required in an annual report on this Form N-CSR.
| | | |
| ITEM 3. | | AUDIT COMMITTEE FINANCIAL EXPERT. |
The information required by this Item is only required in an annual report on this Form N-CSR.
| | | |
| ITEM 4. | | PRINCIPAL ACCOUNTANT FEES AND SERVICES. |
The information required by this Item is only required in an annual report on this Form N-CSR.
| | | |
| ITEM 5. | | AUDIT COMMITTEE OF LISTED REGISTRANTS. |
| | | |
| | | Not applicable. |
| | | |
| ITEM 6. | | INVESTMENTS. |
| | | |
| | (a) | Schedules of Investments are included as part of the Semi-Annual Report to Stockholders filed under Item 1 of this Form N-CSR. |
| | | |
| | (b) | Not applicable. |
| | | |
| ITEM 7. | | DISCLOSURE OF PROXY VOTING POLICIES AND PROCEDURES FOR CLOSED-END MANAGEMENT INVESTMENT COMPANIES. |
| | | |
| | | Not applicable. |
| | | |
| ITEM 8. | | PORTFOLIO MANAGERS OF CLOSED-END MANAGEMENT INVESTMENT COMPANIES. |
| | | |
| | | Not applicable. |
| | | |
| ITEM 9. | | PURCHASES OF EQUITY SECURITIES BY CLOSED-END MANAGEMENT INVESTMENT COMPANY AND AFFILIATED PURCHASERS. |
| | | |
| | | Not applicable. |
| | | |
| ITEM 10. | | SUBMISSION OF MATTERS TO A VOTE OF SECURITY HOLDERS.
There have been no material changes to the procedures by which shareholders may recommend nominees to the registrant’s board of trustees. |
| | | |
| | | |
| ITEM 11. | | CONTROLS AND PROCEDURES. |
| | | |
| | (a) | | The registrant’s principal executive and principal financial officers, or persons performing similar functions have concluded that the registrant’s disclosure controls and procedures (as defined in Rule 30a-3(c) under the Investment Company Act of 1940, as amended (the “1940 Act”)) are effective as of a date within 90 days of the filing of this report that includes the disclosure required by this paragraph, based on the evaluation of these controls and procedures required by Rule 30a-3(b) under the 1940 Act and 15d-15(b) under the Securities Exchange Act of 1934, as amended. |
| | | |
| | (b) | | There were no changes in the registrant’s internal control over financial reporting (as defined in Rule 30a-3(d) under the 1940 Act) that occurred during the registrant’s second fiscal quarter of the period covered by this report that have materially affected, or are reasonably likely to materially affect, the registrant’s internal control over financial reporting. |
| | | |
| | (a)(1) | | | The information required by this Item is only required in an annual report on this Form N-CSR. |
| | | |
| | (a)(2) | | Exhibit 99.CERT | Certifications pursuant to Section 302 of the Sarbanes-Oxley Act of 2002 are filed herewith. |
| | | |
| | (a)(3) | | | Not applicable. |
| | | |
| | (b) | | Exhibit 99.906CERT | Certifications pursuant to Section 906 of the Sarbanes-Oxley Act of 2002 are filed herewith. |
SIGNATURES
| | | | Pursuant to the requirements of the Securities Exchange Act of 1934, as amended, and the Investment Company Act of 1940, as amended, the Registrant has duly caused this report to be signed on its behalf by the undersigned, thereunto duly authorized. |
| | | | | | | |
| | | | | Goldman Sachs Trust | | |
| | | | | | | |
| By: | | | | /s/ James A. McNamara | | |
| | | | |
| | |
| | | | | James A. McNamara | | |
| | | | | Principal Executive Officer | | |
| | | | | Goldman Sachs Trust | | |
| | | | | | | |
| Date: | | | | December 1, 2010 | | |
| | | | Pursuant to the requirements of the Securities Exchange Act of 1934, as amended, and the Investment Company Act of 1940, as amended, this report has been signed below by the following persons on behalf of the Registrant and in the capacities and on the dates indicated. |
| | | | | | | |
| By: | | | | /s/ James A. McNamara | | |
| | | | |
| | |
| | | | | James A. McNamara | | |
| | | | | Principal Executive Officer | | |
| | | | | Goldman Sachs Trust | | |
| | | | | | | |
| Date: | | | | December 1, 2010 | | |
| | | | | | | |
| By: | | | | /s/ George F. Travers | | |
| | | | |
| | |
| | | | | George F. Travers | | |
| | | | | Principal Financial Officer | | |
| | | | | Goldman Sachs Trust | | |
| | | | | | | |
| Date: | | | | December 1, 2010 | | |