UNITED STATES
SECURITIES AND EXCHANGE COMMISSION
Washington, D.C. 20549
FORM N-CSR
CERTIFIED SHAREHOLDER REPORT OF REGISTERED
MANAGEMENT INVESTMENT COMPANIES
Investment Company Act file number 811-05349
Goldman Sachs Trust
(Exact name of registrant as specified in charter)71 South Wacker Drive, Chicago, Illinois 60606
(Address of principal executive offices) (Zip code)| | | |
| Peter V. Bonanno, Esq. | | Copies to: |
| Goldman, Sachs & Co. | | Geoffrey R. T. Kenyon, Esq. |
| 200 West Street | | Dechert LLP |
| New York, New York 10282 | | 200 Clarendon Street |
| | | 27th Floor |
| | | Boston, MA 02116-5021 |
|
(Name and address of agents for service)
|
Registrant’s telephone number, including area code: (312) 655-4400
Date of fiscal year end: March 31
Date of reporting period: September 30, 2010
| | | |
| ITEM 1. | | REPORTS TO STOCKHOLDERS. |
| | | |
| | | The Semi-Annual Report to Stockholders is filed herewith. |
Goldman Sachs Funds
| | | | |
| | | | |
Semi-Annual Report | | | September 30, 2010 |
| | | | |
| | | | |
| | | | |
| | | | Single Sector Fixed Income Funds |
| | | | Emerging Markets Debt |
| | | | High Yield |
| | | | Investment Grade Credit |
| | | | Local Emerging Markets Debt |
| | | | U.S. Mortgages |
| | | | |
Goldman Sachs Single Sector Fixed Income Funds
| | |
| n | GOLDMAN SACHS EMERGING MARKETS DEBT FUND | |
| |
| n | GOLDMAN SACHS HIGH YIELD FUND | |
| |
| n | GOLDMAN SACHS INVESTMENT GRADE CREDIT FUND | |
| |
| n | GOLDMAN SACHS LOCAL EMERGING MARKETS DEBT FUND | |
| |
| n | GOLDMAN SACHS U.S. MORTGAGES FUND | |
TABLE OF CONTENTS
| | | |
| Principal Investment Strategies and Risks | | 1 |
| Investment Process | | 3 |
| Market Review | | 4 |
Portfolio Management Discussion
and Performance Summaries | | 8 |
| Schedules of Investments | | 28 |
| Financial Statements | | 74 |
| Notes to the Financial Statements | | 81 |
| Financial Highlights | | 104 |
| Other Information | | 114 |
| | | | | | | |
NOT FDIC-INSURED | | | May Lose Value | | | No Bank Guarantee |
| | | | | | | |
GOLDMAN SACHS SINGLE SECTOR FIXED INCOME FUNDS
Principal Investment Strategies and Risks
The Emerging Markets Debt Fund invests primarily in fixed income securities of issuers located in emerging countries. The Fund’s investments in fixed income securities are subject to the risks associated with debt securities generally, including credit, liquidity and interest rate risk. The majority of the countries in which the Fund invests have sovereign ratings that are below investment grade or are unrated. High yield, lower rated securities involve greater price volatility and present greater risks than higher rated fixed income securities. Fixed income securities of emerging countries are less liquid and are subject to greater price volatility and will be subject to the risks of currency fluctuations and sudden economic or political developments. At times, the Fund may be unable to sell certain of its portfolio securities without a substantial drop in price, if at all. The securities markets of emerging countries have less government regulation and are subject to less extensive accounting and financial reporting requirements than the markets of more developed countries. The Fund is also subject to the risk that the issuers of sovereign debt or the government authorities that control the payment of debt may be unable or unwilling to repay principal or interest when due. The Fund may also engage in foreign currency transactions for hedging purposes (including cross hedging) or for speculative purposes. Forward foreign currency exchange contracts are subject to the risk that the counterparty to the contract will default on its obligations. The Fund may make substantial investments in derivative instruments, including options, financial futures, Eurodollar futures contracts, swaps, option on swaps, structured securities and other derivative investments. Derivative instruments may involve a high degree of financial risk. These risks include the risk that a small movement in the price of the underlying security or benchmark may result in a disproportionately large movement, unfavorable or favorable, in the price of the derivative instrument; risks of default by a counterparty; and the risks that transactions may not be liquid. The Fund may concentrate its investments in particular countries or regions and may be subject to greater losses than if it were less concentrated in a particular country or region. The Fund is non-diversified and may invest more of its assets in fewer issuers than diversified funds and may be more susceptible to adverse developments affecting any single issuer held in its portfolio and may be susceptible to greater losses because of these developments.
The High Yield Fund invests primarily in high yield, fixed income securities that, at the time of purchase, are non-investment grade securities. The Fund’s investments in fixed income securities are subject to the risks associated with debt securities including credit, liquidity and interest rate risk. High yield, lower rated securities involve greater price volatility and present greater risks than higher rated fixed income securities. The Fund may also invest in foreign issuers who are denominated in currencies other than the U.S. dollar and in securities of issuers located in emerging countries denominated in any currency. The Fund’s foreign and emerging market investments may be more volatile and less liquid than its investment in U.S. securities and will be subject to the risks of currency fluctuations and sudden economic or political developments. At times, the Fund may be unable to sell certain of its portfolio securities without a substantial drop in price, if at all. The Fund may also engage in foreign currency transactions for hedging purposes (including cross hedging) or for speculative purposes. The Fund may make substantial investments in derivative instruments, including options, financial futures, Eurodollar futures contracts, swaps, options on swaps, structured securities and other derivative investments. Derivative instruments may involve a high degree of financial risk. These risks include the risk that a small movement in the price of the underlying security or benchmark may result in a disproportionately large movement, unfavorable or favorable, in the price of the derivative instrument; risks of default by a counterparty; and the risks that transactions may not be liquid.
The Investment Grade Credit Fund invests primarily in investment grade fixed income securities. The Fund’s investments in fixed income securities are subject to the risks associated with debt securities generally, including credit, liquidity and interest rate risk. The guarantee on U.S. government securities applies only to the underlying securities of the Fund if held to maturity and not to the value of the Fund’s shares. The Fund’s investments in mortgage-backed securities are subject to prepayment risks. These risks may result in greater share price volatility. The Fund may invest in foreign and emerging markets securities, which may be more volatile and less liquid than its investment in U.S. securities and will be subject to the risks of currency fluctuations and political developments. At times, the Fund may be unable to sell certain of its portfolio securities without a substantial drop in price, if at all. The Fund may also engage in foreign currency transactions for hedging purposes (including cross hedging) or for speculative purposes. Forward foreign currency exchange contracts are subject to the risk that the counterparty to the contract will default on its obligations. The Fund may make substantial investments in derivative instruments, including options, financial futures, Eurodollar futures contracts, swaps, option on swaps, structured securities and other derivative investments. Derivative instruments may involve a high degree of financial risk. These risks include the risk that a small movement in the price of the underlying security or benchmark may result in a disproportionately large movement, unfavorable or favorable, in the price of the derivative instrument; risks of default by a counterparty; and the risks that transactions may not be liquid.
GOLDMAN SACHS SINGLE SECTOR FIXED INCOME FUNDS
The Local Emerging Markets Debt Fund invests primarily in sovereign and corporate debt of issuers located in emerging countries where such debt securities are denominated in the local currency of such emerging countries. The Fund’s investments in fixed income securities are subject to the risks associated with debt securities generally, including credit, liquidity and interest rate risk. The majority of the countries in which the Fund invests have sovereign ratings that are below investment grade or are unrated. High yield, lower rated securities involve greater price volatility and present greater risks than higher rated fixed income securities. Fixed income securities of emerging countries are less liquid and are subject to greater price volatility and will be subject to the risks of currency fluctuations and sudden economic or political developments. Since the Fund may invest in non-investment grade fixed income securities and emerging country issuers, it especially will be subject to the risk that the liquidity of particular portfolio securities will shrink or disappear suddenly and without warning as a result of adverse economic, market or political events, or adverse investor perceptions, whether or not accurate. At times, the Fund may be unable to sell certain of its portfolio securities without a substantial drop in price, if at all. The securities markets of emerging countries have less government regulation and are subject to less extensive accounting and financial reporting requirements than the markets of more developed countries. The Fund is also subject to the risk that the issuers of sovereign debt or the government authorities that control the payment of debt may be unable or unwilling to repay principal or interest when due. The Fund may also engage in foreign currency transactions for hedging purposes (including cross hedging) or for speculative purposes. Forward foreign currency exchange contracts are subject to the risk that the counterparty to the contract will default on its obligations. The Fund may make substantial investments in derivative instruments, including options, financial futures, Eurodollar futures contracts, swaps, option on swaps, structured securities and other derivative investments. Derivative instruments may involve a high degree of financial risk. These risks include the risk that a small movement in the price of the underlying security or benchmark may result in a disproportionately large movement, unfavorable or favorable, in the price of the derivative instrument; risks of default by a counterparty; and the risks that transactions may not be liquid. The Fund is non-diversified and may invest more of its assets in fewer issuers than diversified funds and may be more susceptible to adverse developments affecting any single issuer held in its portfolio and may be susceptible to greater losses because of these developments.
The U.S. Mortgages Fund invests primarily in securities representing direct or indirect interests in or that are collateralized by mortgage-backed securities. The Fund’s investments in fixed income securities are subject to the risks associated with debt securities generally, including credit, liquidity and interest rate risk. The Fund’s investment in mortgage-backed securities (MBS) is subject to prepayment risk, the risk that in a declining interest rate environment the Fund’s underlying mortgages may be prepaid, causing the Fund to have to reinvest at lower interest rates. This risk may result in greater share price volatility than a fixed income fund not invested in MBS. The guarantee on U.S. government securities applies only to the underlying securities of the Fund if held to maturity and not to the value of the Fund’s shares. The Fund may make substantial investments in derivative instruments, including options, financial futures, Eurodollar futures contracts, swaps, option on swaps, structured securities and other derivative investments. Derivative instruments may involve a high degree of financial risk. These risks include the risk that a small movement in the price of the underlying security or benchmark may result in a disproportionately large movement, unfavorable or favorable, in the price of the derivative instrument; risks of default by a counterparty; and the risks that transactions may not be liquid.
GOLDMAN SACHS SINGLE SECTOR FIXED INCOME FUNDS
What Differentiates the Goldman Sachs Asset
Management Fixed Income Investment Process?
At Goldman Sachs Asset Management, L.P. (“GSAM”), the goal of our fixed income investment process is to provide consistent, strong performance by actively managing our portfolios within a research-intensive, risk-managed framework.
| | | |
| | | |
| | | |
| | | A key element of our fixed income investment philosophy is to evaluate the broadest global opportunity set to capture relative value across sectors and instruments. Our globally integrated investment process involves managing dynamically along the risk/return spectrum, as we continue to develop value-added strategies through:
n Assess relative value among securities and sectors
n Leverage the vast resources of GSAM in selecting securities for each portfolio
n Team approach to decision making
n Manage risk by avoiding significant sector and interest rate bets
|
| | |  |
| | | Fixed Income portfolios that: |
| | | |
| | | |
| | | n Include domestic and global investment options, income opportunities,
and access to areas of specialization such as high yield
n Capitalize on GSAM’s industry-renowned credit research capabilities
n Use a risk-managed framework to seek total return, recognizing the
importance of investors’ capital accumulation goals as well as their need
for income |
| | | |
| | | |
| | | |
| | | Since the conclusion of the fiscal year ended March 31, 2010, we have continued to experience periods of extreme volatility in the financial markets. In particular, continued deleveraging, a lack of liquidity and uncertainty regarding the economy have led to increased investor risk aversion. Despite these challenges, we continue to follow our investment approach that includes actively managing the Funds’ portfolios within a research-intensive, risk-managed framework.
|
MARKET REVIEW
Goldman Sachs Single Sector Fixed Income Funds
Market Review
The six months ended September 30, 2010 (the “Reporting Period”) brought the first signals of slowing momentum in global economic growth — a development that in our view was broadly consistent with the traditional cycle of recovery. After the recession ended in June 2009 (the date officially cited by the National Bureau of Economic Research), the world’s largest economies had begun to rebound. However, by the spring of 2010, global economic conditions showed signs of deterioration. The slowdown was most evident in the U.S. and China, raising concerns that the world’s two largest economies — both crucial sources of worldwide demand — might lead the global economy into a double-dip of the recession. Doubts about the sustainability of the global economic recovery drove sharp declines in government bond yields. In the U.S., for example, yields on 10-year Treasuries fell from 3.87% at the beginning of the Reporting Period to 2.51% on September 30, 2010.
During the second calendar quarter, the broader market impact of the economic slowdown was magnified by the sovereign debt crisis unfolding in Europe. Investors’ risk appetite suffered against this backdrop, and corporate bonds and emerging markets debt weakened in line with falling equity prices. By May, doubts about the solvency of peripheral European nations — Portugal, Italy, Ireland, Greece and Spain — had reached a fevered pitch. Those solvency concerns were based on high indebtedness and record budget deficits among the peripheral European nations. On April 27th, Greece’s debt rating was cut to junk by Standard & Poor’s, and risk premiums rose on Greek debt and on the sovereign debt of its similarly fiscally troubled neighbors, threatening a crisis. European lawmakers worked jointly with the International Monetary Fund (IMF) and the European Central Bank (ECB) to avert a liquidity crisis and to prevent contagion from spreading around the world through Europe’s still-fragile banking system. Although policymakers’ response succeeded in stabilizing peripheral European markets, volatility continued to flare intermittently through the end of the Reporting Period.
Riskier fixed income assets recovered during the third calendar quarter much of the ground they had lost in the months prior, and corporate bond markets experienced a record surge in new issuance. This rebound in risk appetite was helped by stronger economic signals. For example, reports of second quarter Gross Domestic Product (GDP) figures indicated that growth in the Eurozone had outstripped that of both the U.S. and Japan, primarily because of improved domestic demand among the largest European states and Germany’s exceptional exports strength. September’s economic data showed that while U.S. manufacturing and services activity had slowed, both sectors continued to expand. In China, expansion of its manufacturing sector seemed to be re-accelerating, judging by the most recently available purchasing managers survey. Still, economic growth remained below trend across the G-3 (the three largest developed economies — the U.S., Eurozone and Japan).
In the U.S., with consumer demand still weak and employment still declining, attention turned to the dwindling policy options for further stimulus. The increased focus on the widening fiscal deficit made substantial increases in government spending unlikely. Short-term interest rates had remained near zero for almost two years. During September, Federal Reserve (the “Fed”) policymakers began to demonstrate a clear willingness to revisit the exceptional bond-buying strategy it had halted earlier this year, thereby opening the door to a resumption of a second round of quantitative easing. As a result, by the end of the Reporting Period, U.S. markets were strongly positioned for more aggressive Treasury purchases by the Fed, and two-year Treasury yields had reached an all-time low near 0.5%.
MARKET REVIEW
| |
| n | Investment grade corporate bonds posted strong results during the Reporting Period amid a sustained bond market rally that drove yields steadily and markedly lower. During May, as volatility increased in response to the European sovereign debt crisis, credit spreads, or the difference in yields between corporate bonds and duration-equivalent Treasury securities, widened. However, spreads then narrowed during the third calendar quarter in response to positive fundamental and technical factors. For example, on the fundamental side, corporate earnings were generally positive as companies, especially in the U.S., continued to reduce leverage, or the use of borrowed money, and repair their balance sheets. Further, merger and acquisition activity started to pick up with a number of large transactions that included mining giant BHP Billiton’s hostile takeover bid for Canadian fertilizer firm Potash Corp. The technical picture was also supportive. The third calendar quarter saw heavy new issuance, with more than $100 billion in September alone, as companies seized the opportunity to issue debt at low interest rates. Demand was also high, however, as investors continued to move into spread, or non-Treasury, product in pursuit of yield. The announcement of the Basel III regulations, which require banks to hold substantially higher capital reserves, was well received. The new rules support credit repair in the financials sector, and we believe the timeframes are reasonable, making gradual implementation achievable. |
| |
| n | U.S. mortgage-backed securities generated mixed results during the Reporting Period. U.S. agency mortgage-backed securities (MBS) slightly underperformed Treasury securities, largely because of deteriorating investor sentiment following the Fed’s announcement during the third calendar quarter that it would reinvest the proceeds of maturing MBS held by the Fed into Treasuries. Late in the third calendar quarter, amid historically low mortgage interest rates and growing fears of a homeowner refinancing wave, the risk of a prepayment spike increased. Driven by supportive supply and demand dynamics, non-agency MBS posted solid gains. |
| |
| n | High yield corporate bonds continued to benefit during the Reporting Period from the search for yield. Still, the sector experienced some volatility. For instance, although they withstood the pressure on riskier fixed income assets during April, high yield corporate bonds declined in early May as credit market liquidity suffered from mounting concerns about European sovereign debt and pending financial regulatory reform in Europe and the U.S. Generally speaking, however, high yield technicals enhanced the performance of the asset class. In the third calendar quarter, the high yield market logged one of its strongest quarters ever with $85.7 billion in new issuance. By the end of the Reporting Period, 2010 new issuance was a record $203 billion, surpassing 2009’s full year total of $180.7 billion. On the demand side, according to Lipper/AMG Data, high yield mutual funds experienced inflows of approximately $5.8 billion during the Reporting Period. Such demand was supported by a second calendar quarter earnings reporting season that delivered both revenue and earnings surprises. Many high yield companies continued to reap the benefits of significantly improved operating leverage on better margins and positive revenue growth. More than two-thirds of high yield issuance has been used for refinancing activities, which has allowed companies to lower their interest expenses and further improve coverage ratios. Extremely low default activity continued during the Reporting Period with the default rate falling to 2.5% for the rolling 12-month period ended September 30, 2010. The annualized default rate for speculative grade bonds (those rated no higher than BB) for the first nine months of 2010 was a mere 0.3%. |
| |
| n | Emerging markets debt provided positive returns during the Reporting Period, despite a decline in May that reflected the general turmoil in the financial markets. At that time, lower quality and less liquid credits underperformed, while more liquid and higher quality credits held up well. |
MARKET REVIEW
In emerging external debt markets, represented by the J.P. Morgan EMBI Global Diversified Index, the top performers during the Reporting Period were (in U.S. dollar terms*) Belize (+28.89%), Argentina (+15.34%) and the Philippines (+14.89%), while Ecuador (−9.03%), Venezuela (−1.77%), and Serbia (+1.66%) turned in the weakest performance.
In emerging local debt markets, represented by the J.P. Morgan Government Bond Index-Emerging Markets Global Diversified Index, the top performers during the Reporting Period were (in U.S. dollar terms*) Colombia (+19.35%) and Indonesia (+17.43%), while Russia (−0.32%) and Hungary (−0.30%) turned in the weakest performance.
Looking Ahead
During the Reporting Period, we grew increasingly convinced that the positives in the global economy outweigh the negatives and that economic growth will likely continue at a slow but steady pace. In the U.S., we believe the building blocks for growth are still in place and that downside risks are limited by two key factors. First, the Fed is likely, in our view, to resume quantitative easing, which should keep financial conditions highly accommodative. Second, leverage, or the use of borrowed money, in the U.S. private sector and financial system broadly has declined dramatically since 2008, and as such, we think the possibility of another severe pullback in either asset prices or employment is significantly reduced.
The biggest risk to continued economic recovery, in our view, is fiscal tightening in the U.S., where $270 billion of tax cuts and $75 billion of tax credits are scheduled to expire at the end of 2010. We estimate the expiration of these measures would be equivalent to approximately a 10% annualized decline in disposable income, or about 2% of GDP. If this scenario materializes, the risk of a double-dip recession in the U.S. may well rise. We further believe that a massive amount of quantitative easing from the Fed would be required to offset the impact of such a scenario on economic growth. However, that said, at the end of the Reporting Period, we considered this a low-probability risk and believed that a compromise would likely be reached to extend most of these tax measures for at least the next couple of years.
From an investment perspective, we think the slow but steady economic growth environment, combined with Fed asset purchases, favors overweight positions in high quality non-Treasury sectors and select emerging markets bonds. We anticipate that U.S. interest rates may stabilize as economic growth settles into a slower but steady range. Given our view that the Fed will resume quantitative easing, we favored an overweight position in the intermediate portion of the U.S. yield curve, or spectrum of maturities, at the end of the Reporting Period. In the intermediate, i.e. five- to 10-year, portion of the yield curve, we believe the likelihood of further quantitative easing reduces the downside risk of higher interest rates and increases the possibility of a stronger rally in rates than would be justified by economic fundamentals alone. We believe, however, that rates on 30-year maturities are likely to move higher on investor concerns about the potential long-term inflationary effect of more quantitative easing.
| |
| * | All regional and market returns are in U.S. dollar terms (unless otherwise specified), are based on country-specific stock market indices and reflect the reinvestment of any dividends if applicable. |
MARKET REVIEW
Against this backdrop, we saw value in high quality non-Treasury sectors, including corporate bonds and certain agency mortgage-backed securities. Yields on corporate bonds were low at the end of the Reporting Period, but the difference between yields on corporate bonds and U.S. Treasuries remained near long-term historical averages. As a result, we believe much of the yield on corporate bonds was compensation for credit risk, which, in our view, is low and declining given the prevalence of high corporate cash balances and cautious, credit-friendly business strategies. We also saw value at the end of the Reporting Period in select emerging market sovereign debt, where yields remained attractive relative to the yields of developed country government bonds and where debt fundamentals were improving rather than deteriorating.
PORTFOLIO RESULTS
Goldman Sachs Emerging Markets Debt Fund
Portfolio Management Discussion and Analysis
Below, the Goldman Sachs Global Fixed Income Investment Management Team discusses the Goldman Sachs Emerging Markets Debt Fund’s performance and positioning for the six-month period ended September 30, 2010 (the “Reporting Period”).
| |
| Q | How did the Goldman Sachs Emerging Markets Debt Fund (the “Fund”) perform during the Reporting Period? |
| |
| A | During the Reporting Period, the Fund’s Class A, C and Institutional Shares generated cumulative total returns, without sales charges, of 10.15%, 9.66% and 10.33%, respectively. These returns compare to the 9.57% cumulative total return of the Fund’s benchmark, the J.P. Morgan EMBI Global Diversified Index (with dividends reinvested) (the “Index”), during the same time period. During the period from inception on July 30, 2010 to September 30, 2010, the Fund’s Class IR Shares generated a cumulative total return, without sales charges, of 4.44%. This compares to the 4.00% cumulative total return of the Index during the same time period. |
| |
| Q | What key factors were responsible for the Fund’s performance during the Reporting Period? |
| |
| A | Country and issue selection added most to the Fund’s relative performance. Detracting from results was quasi-sovereign debt in Latin America. The Fund’s U.S. duration and yield curve positioning also modestly dampened relative returns. Duration is a measure of the Fund’s sensitivity to changes in interest rates. Yield curve indicates the spectrum of maturities within a particular sector. |
| |
| Q | Which segments of emerging markets debt most significantly affected Fund performance? |
| |
| A | Country and issue selection in Argentina contributed positively to the Fund’s results versus the Index. Argentina external debt outperformed the Index for several reasons; Standard & Poor’s upgraded Argentina’s rating from B- to B, largely because of the country’s lower debt levels and improved economic performance. Argentina has been able to reduce debt by accessing funding from public agencies and has lowered the country’s near-term financing risk, but long term financing risk has not yet been addressed. Stronger than expected growth has been supported by agricultural production and expansionary fiscal policy has pushed growth much higher than what the market had been anticipating. We believe Argentina’s economy should |
Investment Objective
The Fund seeks a high level of total return consisting of income and capital appreciation.
continue to grow at a robust rate because of a supportive global economic environment and possible future funding from international agencies.
The Fund also benefited from its exposure to Mexico’s interest rates, accomplished through a position in Mexican local bonds. Mexico’s interest rates were supported by better-than expected inflation data and the expectation that inflation would remain subdued over the medium term, which should allow the Mexican central bank to maintain an easy monetary policy through the rest of 2010.
Issue selection in Venezuelan quasi-sovereign debt hampered the Fund’s relative performance. The Fund’s selection of a Venezuelan quasi-sovereign was a detractor during the second calendar quarter as lower quality and less liquid names suffered on fears of contagion from Europe’s severe debt problems. It also weakened on supply concerns and uncertainty surrounding new foreign exchange rules. Also detracting from the Fund’s relative results was a position in the South Korean won, accomplished through the use of currency forwards. The Korean won depreciated in May when risk aversion increased and concerns increased about the future strength of the global economic recovery.
| |
| Q | Did the Fund’s duration and yield curve positioning strategy help or hurt its results during the Reporting Period? |
| |
| A | The Fund’s U.S. duration and yield curve positioning detracted slightly from its relative returns during the Reporting Period. Because we thought the market was overstating the risk of a double-dip recession and based on our belief that yields would rise, the Fund had a short duration bias. This position dampened performance, however, when yields fell and the yield curve steepened in response to disappointing economic data. A steepened yield curve means yields on shorter-term maturities were lower than those on longer-term maturities. |
PORTFOLIO RESULTS
| |
| Q | How did the Fund use derivatives during the Reporting Period? |
| |
| A | In seeking to achieve its investment objective, including the management and influence of duration and yield curve positioning, as market conditions warranted during the Reporting Period, the Fund used financial futures contracts, forward foreign currency exchange contracts and swap contracts, among others. For example, as market conditions shifted, such instruments helped us shorten and lengthen the duration of the Fund and introduce a steepening or flattening yield curve bias within the Fund. In addition, such instruments, as well as credit linked notes, helped the Fund gain exposure to certain countries or currencies. |
| |
| Q | Were there any notable changes in the Fund’s weightings during the Reporting Period? |
| |
| A | During the Reporting Period, we reduced the Fund’s overweighted position in Indonesia to a smaller overweight relative to the Index. |
| |
| Q | How was the Fund positioned relative to its benchmark index at the end of September 2010? |
| |
| A | At the end of September 2010, the Fund had overweighted positions relative to the Index in Chilean and Brazilian local bonds and underweighted positions in Panamanian and Mexican external debt. |
FUND BASICS
Emerging Markets Debt Fund
as of September 30, 2010
PERFORMANCE REVIEW
| | | | | | | | | | | | | | | | | | | |
| | | | | | | | | 30-Day
| | | 30-Day
| | | |
| | | | | | J.P. Morgan
| | | Standardized
| | | Standardized
| | | |
April 1, 2010–
| | Fund Total Return
| | | EMBI Global
| | | Subsidized
| | | Unsubsidized
| | | |
| September 30, 2010 | | (based on NAV1) | | | Diversified Index2 | | | Yield3 | | | Yield3 | | | |
|
| |
| Class A | | | 10.15 | % | | | 9.57 | % | | | 4.39 | % | | | 4.15 | % | | |
| Class C | | | 9.66 | | | | 9.57 | | | | 3.86 | | | | 3.61 | | | |
| Institutional | | | 10.33 | | | | 9.57 | | | | 4.94 | | | | 4.70 | | | |
|
July 30, 2010–
September 30, 2010 |
|
| Class IR | | | 4.44 | % | | | 4.00 | % | | | 4.83 | % | | | 4.50 | % | | |
|
| |
| 1 | The net asset value (“NAV”) represents the net assets of the class of the Fund (ex-dividend) divided by the total number of shares of the class outstanding. The Fund’s performance assumes the reinvestment of dividends and other distributions. The Fund’s performance does not reflect the deduction of any applicable sales charges. |
| 2 | The J.P. Morgan EMBI Global Diversified Index is an unmanaged index of debt instruments of 41 emerging countries. The Index figures do not reflect any deduction for fees, expenses or taxes. It is not possible to invest directly in an index. |
| 3 | The 30-Day Standardized Subsidized Yield of the Fund is calculated by dividing the net investment income per share (as defined by securities industry regulations) earned by the Fund over a 30-day period (ending on the stated month-end date) by the maximum public offering price (“POP”) per share of the Fund on the last day of the period. This number is then annualized. This yield does not necessarily reflect income actually earned and distributed by the Fund and, therefore, may not be correlated with the dividends or other distributions paid to shareholders. The 30-Day Standardized Unsubsidized Yield does not reflect any applicable expense reductions. |
STANDARDIZED AVERAGE ANNUAL TOTAL RETURNS4
| | | | | | | | | | | | | | | | | |
| For the period ended 9/30/10 | | One Year | | | Five Years | | | Since Inception | | | Inception Date | | |
|
| |
| Class A | | | 13.16 | % | | | 8.08 | % | | | 11.04 | % | | 8/29/03 | | |
| Class C | | | 16.67 | | | | N/A | | | | 8.74 | | | 9/29/06 | | |
| Institutional | | | 18.89 | | | | 9.46 | | | | 12.17 | | | 8/29/03 | | |
| Class IR | | | N/A | | | | N/A | | | | 4.44 | | | 7/30/10 | | |
|
| |
| 4 | The Standardized Average Annual Total Returns are average annual total returns or cumulative total returns (only if performance is one year or less) as of the most recent calendar quarter-end. They assume reinvestment of all distributions at NAV. These returns reflect a maximum initial sales charge of 4.5% for Class A Shares and the assumed contingent deferred sales charge for Class C Shares (1% if redeemed within 12 months of purchase). Because Institutional and Class IR Shares do not involve a sales charge, such a charge is not applied to their Standardized Average Annual Total Returns. The Fund will charge a 2% redemption fee on the redemption of shares (including by exchange) held for 30 calendar days or less. The performance figures do not reflect the deduction of the redemption fee. If reflected, the redemption fee would reduce the performance quoted. |
The returns represent past performance. Past performance does not guarantee future results. The Fund’s investment return and principal value will fluctuate so that an investor’s shares, when redeemed, may be worth more or less than their original cost. Current performance may be lower or higher than the performance quoted above. Please visit our Web site at: www.goldmansachsfunds.com to obtain the most recent month-end returns. Performance reflects expense limitations in effect. In their absence, performance would be reduced. Returns do not reflect the deduction of taxes that a shareholder would pay on Fund distributions or the redemption of Fund shares.
FUND BASICS
EXPENSE RATIOS5
| | | | | | | | | |
| | | Net Expense Ratio (Current) | | | Gross Expense Ratio (Before Waivers) | |
| |
| |
| Class A | | | 1.22 | % | | | 1.31 | % |
| Class C | | | 1.97 | | | | 2.06 | |
| Institutional | | | 0.88 | | | | 0.97 | |
| Class IR | | | 0.97 | | | | 1.06 | |
|
| |
| 5 | The expense ratios of the Fund, both current (net of applicable fee waivers and/or expense limitations) and before waivers (gross of applicable fee waivers and/or expense limitations), are as set forth above according to the most recent publicly available Prospectus for the Fund and may differ from the expense ratios disclosed in the Financial Highlights in this report. Applicable waivers and expense limitations may be modified or terminated in the future, consistent with the terms of any agreements in place. If this occurs, the expense ratios may change without shareholder approval. |
TOP 10 COUNTRY ALLOCATION6
| | | | | | | | | | | |
| | |
Percentage of Net Assets | | | |
| | |
|
| | | as of 9/30/10 | | | as of 3/31/10 | | | |
|
| |
| Brazil | | | 7.7 | % | | | 6.2 | % | | |
| Indonesia | | | 7.6 | | | | 10.1 | | | |
| Mexico | | | 6.9 | | | | 7.7 | | | |
| Russia | | | 6.0 | | | | 7.0 | | | |
| Philippines | | | 5.8 | | | | 5.9 | | | |
| Turkey | | | 5.5 | | | | 4.2 | | | |
| Venezuela | | | 5.4 | | | | 5.2 | | | |
| Colombia | | | 5.2 | | | | 2.6 | | | |
| South Africa | | | 4.6 | | | | 2.4 | | | |
| Argentina | | | 4.5 | | | | 3.7 | | | |
|
| |
| 6 | The percentage shown for each investment category reflects the value of investments in that category as a percentage of net assets. The above table does not include repurchase agreements of 9.7% as of 9/30/10 and 7.4% as of 3/31/10. |
PORTFOLIO RESULTS
Goldman Sachs High Yield Fund
Portfolio Management Discussion and Analysis
Below, the Goldman Sachs High Yield Fixed Income Investment Management Team discusses the Goldman Sachs High Yield Fund’s performance and positioning for the six-month period ended September 30, 2010 (the “Reporting Period”).
| |
| Q | How did the Goldman Sachs High Yield Fund (the “Fund”) perform during the Reporting Period? |
| |
| A | During the Reporting Period, the Fund’s Class A, B, C, Institutional, Service, IR and R Shares generated cumulative total returns, without sales charges, of 5.35%, 4.95%, 4.96%, 5.52%, 5.42%, 5.63% and 5.22%, respectively. These returns compare to the 6.55% cumulative total return of the Fund’s benchmark, the Barclays Capital U.S. Corporate High Yield Bond Index, 2% Issuer Capped (the “Index”), during the same time period. |
| |
| Q | What key factors were responsible for the Fund’s performance during the Reporting Period? |
| |
| A | The Fund’s underweighted position in financials detracted most from its results relative to the Index. This was somewhat offset by our decision to hold certain bonds while their issuers restructured. |
| |
| Q | Which segments within high yield most significantly affected Fund performance? |
| |
| A | The Fund’s underweighted position relative to the Index in financials detracted most from performance. We maintained the underweight because of our concern about the viability of short-term funded entities with below-investment grade ratings as well as our overall concern about balance sheet health and the regulatory environment. However, the financials sector returned 8.38% during the Reporting Period, outperforming the rest of the high yield bond market, as represented by the Index, by almost 2%. Banks were the strongest segment, returning 9.54%. The Fund’s performance was also dampened by its overweighted exposure to stable companies, such as Reynolds Packaging Group and Peermont Hotels, Casinos and Resorts, that modestly lagged the Index. |
On the positive side, the Fund benefited from its exposure to the recovery stories — all within cyclical sectors — of Grohe, a building materials supplier of premium showers and faucets; EdCon, a clothing and footwear retailer; and Carlson Wagonlit Travel, a consumer services company specializing in hospitality and business travel.
Investment Objective
The Fund seeks a high level of current income and may also consider the potential for capital appreciation.
Our decision to hold certain bonds through the issuing company’s restructuring also proved to be advantageous. Ultimately, some of these bonds were exchanged by the issuer for an equity stake in the company, boosting the Fund’s performance. Examples included CIT Group, which provides lending, leasing and advisory services to middle market businesses; Spectrum Brands, a consumer products company; and Nortek, a building products manufacturer. The Fund’s underweighted position in electric utilities, a segment that underperformed the Index, also contributed to results as falling natural gas prices made it harder for utilities to meet debt payments.
| |
| Q | Did the Fund’s duration and yield curve positioning strategy help or hurt its results during the Reporting Period? |
| |
| A | The Fund does not use duration and yield curve positioning as active management strategies within its investment process. |
| |
| Q | How did the Fund use derivatives during the Reporting Period? |
| |
| A | As we sought to increase the Fund’s total return and to hedge its portfolio against shifts in market conditions, we used instruments that included forward contracts related to foreign currency transactions and swap contracts. |
| |
| Q | Were there any notable changes in the Fund’s weightings during the Reporting Period? |
| |
| A | There were no substantial changes made in the Fund’s sector weightings during the Reporting Period, but we modestly reduced the Fund’s weighting in the media industry. |
PORTFOLIO RESULTS
| |
| Q | How was the Fund positioned relative to its benchmark index at the end of September 2010? |
| |
| A | At the end of September 2010, the Fund was overweight packaging, health care, gaming and consumer products relative to the Index. It was underweight retail, finance, energy and electric utilities versus the Index. |
FUND BASICS
High Yield Fund
as of September 30, 2010
PERFORMANCE REVIEW
| | | | | | | | | | | | | | | | | | | |
| | | | | | Barclays Capital
| | | 30-Day
| | | 30-Day
| | | |
| | | | | | U.S. Corporate
| | | Standardized
| | | Standardized
| | | |
April 1, 2010–
| | Fund Total Return
| | | High Yield Bond Index
| | | Subsidized
| | | Unsubsidized
| | | |
| September 30, 2010 | | (based on NAV)1 | | | 2% Issuer Capped2 | | | Yield3 | | | Yield3 | | | |
|
| |
| Class A | | | 5.35 | % | | | 6.55 | % | | | 6.32 | % | | | 6.32 | % | | |
| Class B | | | 4.95 | | | | 6.55 | | | | 5.87 | | | | 5.87 | | | |
| Class C | | | 4.96 | | | | 6.55 | | | | 5.87 | | | | 5.86 | | | |
| Institutional | | | 5.52 | | | | 6.55 | | | | 6.96 | | | | 6.96 | | | |
| Service | | | 5.42 | | | | 6.55 | | | | 6.46 | | | | 6.45 | | | |
| Class IR | | | 5.63 | | | | 6.55 | | | | 6.85 | | | | 6.85 | | | |
| Class R | | | 5.22 | | | | 6.55 | | | | 6.37 | | | | 6.36 | | | |
|
| |
| 1 | The net asset value (“NAV”) represents the net assets of the class of the Fund (ex-dividend) divided by the total number of shares of the class outstanding. The Fund’s performance assumes the reinvestment of dividends and other distributions. The Fund’s performance does not reflect the deduction of any applicable sales charges. |
| 2 | The Barclays Capital U.S. Corporate High Yield Bond Index, 2% Issuer Capped, an unmanaged index, covers the universe of U.S. dollar denominated, non-convertible, fixed rate, non-investment grade debt. Index holdings must have at least one year to final maturity, at least $150 million par amount outstanding, and be publicly issued with a rating of Ba1 or lower. The Index figures do not reflect any deduction for fees, expenses or taxes. It is not possible to invest directly in an index. |
| 3 | The 30-Day Standardized Subsidized Yield of the Fund is calculated by dividing the net investment income per share (as defined by securities industry regulations) earned by the Fund over a 30-day period (ending on the stated month-end date) by the maximum public offering price (“POP”) per share of the Fund on the last day of the period. This number is then annualized. This yield does not necessarily reflect income actually earned and distributed by the Fund and, therefore, may not be correlated with the dividends or other distributions paid to shareholders. The 30-Day Standardized Unsubsidized Yield does not reflect any applicable expense reductions. |
STANDARDIZED AVERAGE ANNUAL TOTAL RETURNS4
| | | | | | | | | | | | | | | | | | | | | |
| For the period ended 9/30/10 | | One Year | | | Five Years | | | Ten Years | | | Since Inception | | | Inception Date | | |
|
| |
| Class A | | | 10.16 | % | | | 5.33 | % | | | 6.71 | % | | | 6.03 | % | | 8/1/97 | | |
| Class B | | | 8.97 | | | | 5.07 | | | | 6.55 | | | | 5.92 | | | 8/1/97 | | |
| Class C | | | 13.44 | | | | 5.50 | | | | 6.41 | | | | 5.65 | | | 8/15/97 | | |
| Institutional | | | 15.75 | | | | 6.66 | | | | 7.60 | | | | 6.81 | | | 8/1/97 | | |
| Service | | | 15.21 | | | | 6.15 | | | | 7.05 | | | | 6.27 | | | 8/1/97 | | |
| Class IR | | | 15.66 | | | | N/A | | | | N/A | | | | 6.72 | | | 11/30/07 | | |
| Class R | | | 15.11 | | | | N/A | | | | N/A | | | | 6.14 | | | 11/30/07 | | |
|
| |
| 4 | The Standardized Average Annual Total Returns are average annual total returns as of the most recent calendar quarter-end. They assume reinvestment of all distributions at NAV. These returns reflect a maximum initial sales charge of 4.5% for Class A Shares, the assumed contingent deferred sales charge for Class B Shares (5% maximum declining to 0% after six years) and the assumed contingent deferred sales charge for Class C Shares (1% if redeemed within 12 months of purchase). Class B Shares convert automatically to Class A Shares on or about the fifteenth day of the last month of the calendar quarter that is eight years after purchase. Returns for Class B Shares for the period after conversion reflect the performance of Class A Shares. Because Institutional, Service, Class R and IR Shares do not involve a sales charge, such a charge is not applied to their Standardized Average Annual Total Returns. The Fund will charge a 2% redemption fee on the redemption of shares (including by exchange) held for 60 calendar days or less. The performance figures do not reflect the deduction of the redemption fee. If reflected, the redemption fee would reduce the performance quoted. Effective November 2, 2009, the Fund’s Class B Shares are no longer available for purchase by new or existing shareholders (although current Class B shareholders may continue to reinvest income and capital gains distributions into Class B Shares, and Class B shareholders may continue to exchange their shares for Class B Shares of certain other Goldman Sachs Funds). |
The returns represent past performance. Past performance does not guarantee future results. The Fund’s investment return and principal value will fluctuate so that an investor’s shares, when redeemed, may be worth more or less than their original cost. Current performance may be lower or higher than the performance quoted above. Please visit our Web site at: www.goldmansachsfunds.com to obtain the most recent month-end returns. Performance reflects expense limitations in effect. In their absence, performance would be reduced. Returns do not reflect the deduction of taxes that a shareholder would pay on Fund distributions or the redemption of Fund shares.
FUND BASICS
EXPENSE RATIOS5
| | | | | | | | | |
| | | Net Expense Ratio (Current) | | | Gross Expense Ratio (Before Waivers) | |
| |
| |
| Class A | | | 1.05 | % | | | 1.06 | % |
| Class B | | | 1.80 | | | | 1.81 | |
| Class C | | | 1.80 | | | | 1.81 | |
| Institutional | | | 0.71 | | | | 0.72 | |
| Service | | | 1.21 | | | | 1.22 | |
| Class IR | | | 0.80 | | | | 0.81 | |
| Class R | | | 1.30 | | | | 1.31 | |
|
| |
| 5 | The expense ratios of the Fund, both current (net of applicable fee waivers and/or expense limitations) and before waivers (gross of applicable fee waivers and/or expense limitations), are as set forth above according to the most recent publicly available Prospectus for the Fund and may differ from the expense ratios disclosed in the Financial Highlights in this report. Applicable waivers and expense limitations may be modified or terminated in the future, consistent with the terms of any agreements in place. If this occurs, the expense ratios may change without shareholder approval. |
TOP 10 ISSUERS AS OF 9/30/106
| | | | | | | | | |
| Company | | % of Net Assets | | | Line of Business | | |
|
| |
| Intelsat | | | 2.7 | % | | Telecommunications – Satellites | | |
| Sprint Nextel | | | 2.5 | | | Telecommunications – Cellular | | |
| HCA | | | 2.4 | | | Health Care – Services | | |
| Ally Financial | | | 2.2 | | | Finance | | |
| CIT Group | | | 2.2 | | | Finance | | |
| AIG | | | 2.0 | | | Finance | | |
| Ford | | | 1.8 | | | Automotive | | |
| MGM Mirage | | | 1.2 | | | Gaming | | |
| First Data | | | 1.2 | | | Technology – Software/Services | | |
| Sungard Data | | | 1.1 | | | Technology – Software/Services | | |
|
| |
| 6 | The top 10 issuers may not be representative of the Fund’s future investments. |
TOP 10 INDUSTRY ALLOCATION7
| | | | | | | | | | | |
| | | Percentage of Net Assets | | | |
| | | |
| | |
as of 9/30/10 | | | as of 3/31/10 | | | |
|
| |
| Health Care | | | 9.2 | % | | | 9.0 | % | | |
| Finance | | | 8.5 | | | | 8.0 | | | |
| Energy | | | 6.5 | | | | 6.5 | | | |
| Telecommunications – Non Cellular | | | 6.2 | | | | 5.6 | | | |
| Gaming | | | 5.5 | | | | 5.0 | | | |
| Media | | | 5.2 | | | | 6.8 | | | |
| Utilities | | | 4.9 | | | | 5.3 | | | |
| Automotive | | | 4.2 | | | | 3.6 | | | |
| Packaging | | | 4.2 | | | | 3.9 | | | |
| Services Cyclical | | | 4.2 | | | | 3.4 | | | |
|
| |
| 7 | The percentage shown for each investment category reflects the value of investments in that category as a percentage of net assets. |
PORTFOLIO RESULTS
Goldman Sachs Investment Grade Credit Fund
Portfolio Management Discussion and Analysis
Below, the Goldman Sachs U.S. Fixed Income Investment Management Team discusses the Goldman Sachs Investment Grade Credit Fund’s performance and positioning for the six-month period ended September 30, 2010 (the “Reporting Period”).
| |
| Q | How did the Goldman Sachs Investment Grade Credit Fund (the “Fund”) perform during the Reporting Period? |
| |
| A | During the Reporting Period, the Fund’s Class A, Institutional and Separate Account Institutional Shares generated cumulative total returns, without sales charges, of 8.39%, 8.57% and 8.60%, respectively. These returns compare to the 8.07% cumulative total return of the Fund’s benchmark, the Barclays Capital U.S. Credit Index (the “Index”), during the same time period. |
| |
| Q | What key factors were responsible for the Fund’s performance during the Reporting Period? |
| |
| A | Issue selection among investment grade corporate bonds contributed the most to the Fund’s relative performance. The Fund’s cross-sector positioning relative to its benchmark also added value. Our cross-sector strategy is one in which we invest Fund assets across a variety of fixed income sectors, including some that may not be included in the Fund’s benchmark. However, an overweighted position in investment grade corporate bonds overall hampered progress. The combined effect of the Fund’s duration and yield curve positioning further detracted from performance. Duration is a measure of the Fund’s sensitivity to changes in interest rates. Yield curve indicates the spectrum of maturities within a particular sector. |
| |
| Q | Which segments of investment grade credit most significantly affected Fund performance? |
| |
| A | The biggest contributor to the Fund’s relative outperformance was our individual issue selection of investment grade corporate bonds. Particularly advantageous was the Fund’s bias toward issues at the lower end of the investment grade ratings spectrum; many of these names performed strongly during the Reporting Period. Issue selection in the industrials and energy sectors, as well as in the bank and insurance industries, enhanced relative results. Among the largest relative contributors were exploration company Transocean, oil company British Petroleum and beverage maker Anheuser-Busch InBev. A small allocation to non-agency residential mortgage-backed securities (RMBS) also added to results. |
Investment Objective
The Fund seeks a high level of total return consisting of capital appreciation and income that exceeds the total return of the Index.
In addition, the Fund benefited from a negative basis position in which the portfolio owned corporate cash bonds and we bought protection against credit default risk through derivatives, such as credit default swaps. Basis can be either positive (credit spreads trade wider than cash spreads) or negative (cash spreads trade wider than credit spreads). In a basis trade, the Fund is positioned to take advantage of changes in the basis. We believed that the negative basis of corporate cash bonds relative to derivatives would continue to narrow from the extreme levels they reached in late 2008 during the financial crisis. The Fund benefited from our stance when cash spreads widened less than credit spreads (that is, the negative basis narrowed) during May and June as investors sought to reduce risk and take advantage of the greater liquidity in derivatives.
Detracting was issue selection within the utilities sector. The Fund was also hampered by its overall overweight to corporate bonds, which underperformed — especially pipeline and financial issues — during the severe spread widening in May.
| |
| Q | Did the Fund’s duration and yield curve positioning strategy help or hurt its results during the Reporting Period? |
| |
| A | The combined effect of the Fund’s duration and yield curve positioning detracted from performance. Most of the impact came during the second calendar quarter when the Fund was underweight five- and 10-year maturities in the U.S. Treasury yield curve. As yields in this segment of the U.S. Treasury yield curve enjoyed a sustained and strong rally, such positioning dampened results. However, this was somewhat offset by the positive contribution from the Fund’s overweight position in the intermediate segment of the corporate bond yield curve versus the short-term end of the curve for much of the Reporting Period. |
PORTFOLIO RESULTS
| |
| Q | How did the Fund use derivatives during the Reporting Period? |
| |
| A | In seeking to achieve its investment objective, including the management and influence of duration and yield curve positioning, as market conditions warranted during the Reporting Period, the Fund used instruments that included financial futures contracts, swap contracts and forward foreign currency exchange contracts related to foreign currency transactions. For example, as market conditions shifted, such instruments helped us shorten and lengthen the duration of the Fund or to introduce a steepening or flattening yield curve bias within the Fund. We also used such instruments to adopt, as mentioned previously, a negative basis position in which the Fund’s portfolio was long corporate cash bonds and short derivative instruments, such as credit default swaps. |
| |
| Q | Were there any notable changes in the Fund’s weightings during the Reporting Period? |
| |
| A | In response to increased market volatility and investor risk aversion in May, we aggressively reduced the Fund’s overweighted allocation to corporate bonds. We sold the most liquid issues first, which had the effect of reducing the Fund’s overweight in financials. As risk appetite returned, we took advantage of the supportive macro environment and favorable corporate earnings data to rebuild positions, especially in financials, and shifted the Fund back to an overweight in corporate bonds. |
After the oil spill in the Gulf of Mexico, we underweighted the Fund in energy names such as British Petroleum and Anadarko Petroleum. As news about the capping of the oil well improved during the third calendar quarter, we shifted the Fund to an overweighted position.
| |
| Q | How was the Fund positioned relative to its benchmark index at the end of September 2010? |
| |
| A | At the end of September 2010, the Fund had overweighted positions relative to the Index in investment grade corporate credit. Within corporate bonds, the Fund was overweight banking, insurance, real estate investment trusts (REITs), energy and pipelines. Relative to the Index, the Fund was underweight retail, information technology and utilities corporate bonds. |
FUND BASICS
Investment Grade Credit Fund
as of September 30, 2010
PERFORMANCE REVIEW
| | | | | | | | | | | | | | | | | | | |
| | | | | | | | | 30-Day
| | | 30-Day
| | | |
| | | | | | | | | Standardized
| | | Standardized
| | | |
April 1, 2010–
| | Fund Total Return
| | | Barclays Capital
| | | Subsidized
| | | Unsubsidized
| | | |
| September 30, 2010 | | (based on NAV)1 | | | U.S. Credit Index2 | | | Yield3 | | | Yield3 | | | |
|
| |
| Class A | | | 8.39 | % | | | 8.07 | % | | | 3.01 | % | | | 2.96 | % | | |
| Institutional | | | 8.57 | | | | 8.07 | | | | 3.46 | | | | 3.41 | | | |
Separate Account
Institutional | | | 8.60 | | | | 8.07 | | | | 3.51 | | | | 3.46 | | | |
|
| |
| 1 | The net asset value (“NAV”) represents the net assets of the class of the Fund (ex-dividend) divided by the total number of shares of the class outstanding. The Fund’s performance assumes the reinvestment of dividends and other distributions. The Fund’s performance does not reflect the deduction of any applicable sales charges. |
| 2 | The Barclays Capital U.S. Credit Index is an unmanaged index which is unbundled into pure corporates (industrial, utility, and finance, including both U.S. and Non-U.S. corporations) and non-corporates (sovereign, supranational, foreign agencies, and foreign local governments). The Index figures do not reflect any deduction for fees, expenses or taxes. It is not possible to invest directly in an index. |
| 3 | The 30-Day Standardized Subsidized Yield of the Fund is calculated by dividing the net investment income per share (as defined by securities industry regulations) earned by the Fund over a 30-day period (ending on the stated month-end date) by the maximum public offering price (“POP”) per share of the Fund on the last day of the period. This number is then annualized. This yield does not necessarily reflect income actually earned and distributed by the Fund and, therefore, may not be correlated with the dividends or other distributions paid to shareholders. The 30-Day Standardized Unsubsidized Yield does not reflect any applicable expense reductions. |
STANDARDIZED AVERAGE ANNUAL TOTAL RETURNS4
| | | | | | | | | | | | | | | | | |
| For the period ended 9/30/10 | | One Year | | | Five Years | | | Since Inception | | | Inception Date | | |
|
| |
| Class A | | | 8.63 | % | | | 3.71 | % | | | 3.89 | % | | 11/3/03 | | |
| Institutional | | | 13.25 | | | | 4.85 | | | | 4.87 | | | 11/3/03 | | |
| Separate Account Institutional | | | 13.31 | | | | 4.92 | | | | 4.92 | | | 11/3/03 | | |
|
| |
| 4 | The Standardized Average Annual Total Returns are average annual total returns as of the most recent calendar quarter-end. They assume reinvestment of all distributions at NAV. These returns reflect a maximum initial sales charge of 3.75% for Class A Shares. Prior to July 29, 2009, the maximum initial sales charge applicable to Class A Shares was 4.5%, which is not reflected in the average annual total return figures shown. Because Institutional and Separate Account Institutional Shares do not involve a sales charge, such a charge is not applied to their Standardized Average Annual Total Returns. |
The returns represent past performance. Past performance does not guarantee future results. The Fund’s investment return and principal value will fluctuate so that an investor’s shares, when redeemed, may be worth more or less than their original cost. Current performance may be lower or higher than the performance quoted above. Please visit our Web site at: www.goldmansachsfunds.com to obtain the most recent month-end returns. Performance reflects fee waivers and/or expense limitations in effect. In their absence, performance would be reduced. Returns do not reflect the deduction of taxes that a shareholder would pay on Fund distributions or the redemption of Fund shares.
FUND BASICS
EXPENSE RATIOS5
| | | | | | | | | |
| | | Net Expense Ratio (Current) | | | Gross Expense Ratio (Before Waivers) | |
| |
| |
| Class A | | | 0.76 | % | | | 0.89 | % |
| Institutional | | | 0.42 | | | | 0.55 | |
| Separate Account Institutional | | | 0.37 | | | | 0.50 | |
|
| |
| 5 | The expense ratios of the Fund, both current (net of applicable fee waivers and/or expense limitations) and before waivers (gross of applicable fee waivers and/or expense limitations), are as set forth above according to the most recent publicly available Prospectus for the Fund and may differ from the expense ratios disclosed in the Financial Highlights in this report. Applicable waivers and expense limitations may be modified or terminated in the future, consistent with the terms of any agreements in place. If this occurs, the expense ratios may change without shareholder approval. |
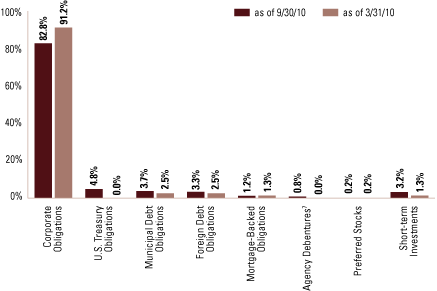
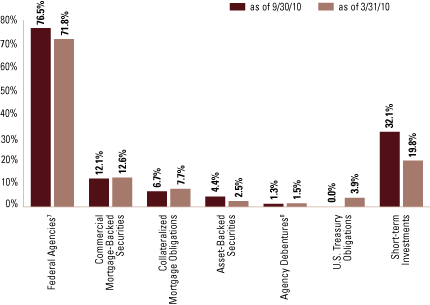
FUND COMPOSITION6
| |
| 6 | The percentage shown for each investment category reflects the value of investments in that category as a percentage of net assets. Short-Term investments represent repurchase agreements. Figures in the above graph may not sum to 100% due to the exclusion of other assets and liabilities. |
| 7 | “Agency Debentures” include agency securities offered by companies such as Fannie Mae and Freddie Mac which operate under a government charter. While they are required to report to a government regulator, their assets are not explicitly guaranteed by the government and they otherwise operate similar to any other publicly traded company. |
FUND BASICS
TOP TEN INDUSTRY ALLOCATIONS8
| | | | | | | | | | | |
| | |
Percentage of Net Assets | | | |
| | |
|
| | | as of 9/30/10 | | | as of 3/31/10 | | | |
|
| |
| Banks | | | 22.5 | % | | | 18.7 | % | | |
| Energy | | | 7.4 | | | | 5.7 | | | |
| Insurance | | | 6.5 | | | | 7.0 | | | |
| Pipelines | | | 6.3 | | | | 8.9 | | | |
| Wirelines and Wireless Telecommunications | | | 5.0 | | | | 5.2 | | | |
| Real Estate Investment Trusts | | | 5.2 | | | | 5.4 | | | |
| Health Care | | | 4.2 | | | | 4.3 | | | |
| Media | | | 4.1 | | | | 8.3 | | | |
| Electric | | | 3.5 | | | | 4.9 | | | |
| Food & Beverage | | | 3.3 | | | | 4.5 | | | |
|
| |
| 8 | The percentage shown for each investment category reflects the value of investments in that category as a percentage of net assets. |
PORTFOLIO RESULTS
Goldman Sachs Local Emerging
Markets Debt Fund
Portfolio Management Discussion and Analysis
Below, the Goldman Sachs Global Fixed Income Investment Management Team discusses the Goldman Sachs Local Emerging Markets Debt Fund’s performance and positioning for the six-month period ended September 30, 2010 (the “Reporting Period”).
| |
| Q | How did the Goldman Sachs Local Emerging Markets Debt Fund (the “Fund”) perform during the Reporting Period? |
| |
| A | During the Reporting Period, the Fund’s Class A, C and Institutional Shares generated cumulative total returns, without sales charges, of 8.95%, 8.52% and 9.13%, respectively. These returns compare to the 10.14% cumulative total return of the Fund’s benchmark, the J.P. Morgan Government Bond Index — Emerging Markets Global Diversified Index (with dividends reinvested) (the “Index”), during the same time period. During the period from inception on July 30, 2010 to September 30, 2010, the Fund’s Class IR Shares generated a cumulative total return, without sales charges, of 5.71%. This compares to the 6.48% cumulative total return of the Index during the same time period. |
| |
| Q | What key factors were responsible for the Fund’s performance during the Reporting Period? |
| |
| A | The Fund’s currency positions detracted from relative performance. Contributing to results was country and issue selection. |
| |
| Q | Which segments of local emerging markets debt most significantly affected Fund performance? |
| |
| A | The Fund was hampered by its currency positions in the Turkish lira and the South Korean won (accomplished through the use of currency forwards). It was overweight the Turkish lira through the middle of May; the currency depreciated from mid-April through early June. An overweight in the South Korean won worked against the Fund when the currency depreciated sharply during May in response to the European sovereign debt crisis and concern about the future strength of the global economic recovery. |
The Fund benefited from country and issue selection in Colombian and Mexican local debt. Colombia interest rates outperformed on lower-than-expected inflation data, which should enable the country’s central bank to keep rates on hold for the rest of 2010. Furthermore, the Colombian peso appreciated 3.6% in June after former defense
Investment Objective
The Fund seeks a high level of total return consisting of income and capital appreciation.
minister Juan Manuel Santos was elected president, largely on expectations that he would continue former President Uribe’s investor-friendly economic policies. Mexico interest rates were supported by better-than-expected inflation data and the likelihood that inflation would remain subdued over the medium term, which should allow the Mexican central bank to maintain an easy monetary policy through the rest of 2010.
| |
| Q | Did the Fund’s duration and yield curve positioning strategy help or hurt its results during the Reporting Period? |
| |
| A | The Fund does not use duration and yield curve positioning as active management strategies within its investment process. |
| |
| Q | How did the Fund use derivatives during the Reporting Period? |
| |
| A | To gain exposure to certain countries or currencies, the Fund used forward foreign currency exchange contracts and swap contracts. In addition, such instruments, as well as credit linked notes, helped the Fund gain exposure to certain countries or currencies. |
| |
| Q | Were there any notable changes in the Fund’s weightings during the Reporting Period? |
| |
| A | There were no substantial changes made in the Fund’s sector weightings during the Reporting Period. |
| |
| Q | How was the Fund positioned relative to its benchmark index at the end of September 2010? |
| |
| A | At the end of September 2010, the Fund had overweighted positions relative to the Index in Brazilian local bonds and the Chinese renminbi. It held underweighted positions in Thai local debt and the Thai baht. |
FUND BASICS
Local Emerging Markets Debt Fund
as of September 30, 2010
PERFORMANCE REVIEW
| | | | | | | | | | | | | | | | | | | |
| | | | | | | | | 30-Day
| | | 30-Day
| | | |
| | | | | | J.P. Morgan
| | | Standardized
| | | Standardized
| | | |
April 1, 2010–
| | Fund Total Return
| | | GBI EM Global
| | | Subsidized
| | | Unsubsidized
| | | |
| September 30, 2010 | | (based on NAV1) | | | Diversified Index2 | | | Yield3 | | | Yield3 | | | |
|
| |
| Class A | | | 8.95 | % | | | 10.14 | % | | | 4.34 | % | | | 3.75 | % | | |
| Class C | | | 8.52 | | | | 10.14 | | | | 3.79 | | | | 3.15 | | | |
| Institutional | | | 9.13 | | | | 10.14 | | | | 4.88 | | | | 4.25 | | | |
|
| |
July 30, 2010–
September 30, 2010 |
|
| Class IR | | | 5.71 | % | | | 6.48 | % | | | 4.69 | % | | | 4.00 | % | | |
|
| |
| 1 | The net asset value (“NAV”) represents the net assets of the class of the Fund (ex-dividend) divided by the total number of shares of the class outstanding. The Fund’s performance assumes the reinvestment of dividends and other distributions. The Fund’s performance does not reflect the deduction of any applicable sales charges. |
| 2 | The J.P. Morgan GBI EM Global Diversified Index is an unmanaged index of debt instruments of 14 Emerging Countries. The Index figures do not reflect any deduction for fees, expenses or taxes. It is not possible to invest directly in an index. |
| 3 | The 30-Day Standardized Subsidized Yield of the Fund is calculated by dividing the net investment income per share (as defined by securities industry regulations) earned by the Fund over a 30-day period (ending on the stated month-end date) by the maximum public offering price (“POP”) per share of the Fund on the last day of the period. This number is then annualized. This yield does not necessarily reflect income actually earned and distributed by the Fund and, therefore, may not be correlated with the dividends or other distributions paid to shareholders. The 30-Day Standardized Unsubsidized Yield does not reflect any applicable expense reductions. |
STANDARDIZED AVERAGE ANNUAL TOTAL RETURNS4
| | | | | | | | | | | | | | | |
| For the period ending 9/30/10 | | One Year | | | Since Inception | | | Inception Date | | | |
|
| |
| Class A | | | 11.71 | % | | | 3.12 | % | | | 2/15/08 | | | |
| Class C | | | 16.34 | | | | 4.24 | | | | 2/15/08 | | | |
| Institutional | | | 17.51 | | | | 5.30 | | | | 2/15/08 | | | |
| Class IR | | | N/A | | | | 5.71 | | | | 7/30/10 | | | |
|
| |
| 4 | The Standardized Average Annual Total Returns are average annual total returns or cumulative total returns (only if the performance is one year or less) as of the most recent calendar quarter-end. They assume reinvestment of all distributions at NAV. These returns reflect a maximum initial sales charge of 4.5% for Class A Shares and the assumed contingent deferred sales charge for Class C Shares (1% if redeemed within 12 months of purchase). Because Institutional and Class IR Shares do not involve a sales charge, such a charge is not applied to their Standardized Average Annual Total Returns. The Fund will charge a 2% redemption fee on the redemption of shares (including by exchange) held for 30 calendar days or less. The performance figures do not reflect the deduction of the redemption fee. If reflected, the redemption fee would reduce the performance quoted. |
The returns represent past performance. Past performance does not guarantee future results. The Fund’s investment return and principal value will fluctuate so that an investor’s shares, when redeemed, may be worth more or less than their original cost. Current performance may be lower or higher than the performance quoted above. Please visit our Web site at: www.goldmansachsfunds.com to obtain the most recent month-end returns. Performance reflects expense limitations in effect. In their absence, performance would be reduced. Returns do not reflect the deduction of taxes that a shareholder would pay on Fund distributions or the redemption of Fund shares.
FUND BASICS
EXPENSE RATIOS5
| | | | | | | | | |
| | | Net Expense Ratio (Current) | | | Gross Expense Ratio (Before Waivers) | |
| |
| |
| Class A | | | 1.35 | % | | | 1.49 | % |
| Class C | | | 2.10 | | | | 2.24 | |
| Institutional | | | 1.01 | | | | 1.15 | |
| Class IR | | | 1.10 | | | | 1.24 | |
|
| |
| 5 | The expense ratios of the Fund, both current (net of applicable fee waivers and/or expense limitations) and before waivers (gross of applicable fee waivers and/or expense limitations), are as set forth above according to the most recent publicly available Prospectus for the Fund and may differ from the expense ratios disclosed in the Financial Highlights in this report. Applicable waivers and expense limitations may be modified or terminated in the future, consistent with the terms of any agreements in place. If this occurs, the expense ratios may change without shareholder approval. |
TOP 10 COUNTRY ALLOCATION6
| | | | | | | | | | | |
| | | Percentage of Net Assets |
| | | |
| | | as of 9/30/10 | | | as of 3/31/10 | | | |
|
| |
| Mexico | | | 9.3 | % | | | 5.5 | % | | |
| Thailand | | | 7.8 | | | | 6.5 | | | |
| South Africa | | | 7.8 | | | | 4.6 | | | |
| Brazil | | | 7.7 | | | | 7.7 | | | |
| Hungary | | | 7.5 | | | | 7.4 | | | |
| Indonesia | | | 7.1 | | | | 6.9 | | | |
| Turkey | | | 4.9 | | | | 9.3 | | | |
| Poland | | | 4.6 | | | | 8.3 | | | |
| Egypt | | | 4.3 | | | | 3.7 | | | |
| Malaysia | | | 4.1 | | | | 2.6 | | | |
|
| |
| 6 | The percentage shown for each investment category reflects the value of investments in that category as a percentage of net assets. The above table does not include repurchase agreements of 16.4% as of 9/30/10 and 20.7% as of 3/31/10. |
PORTFOLIO RESULTS
Goldman Sachs U.S. Mortgages Fund
Portfolio Management Discussion and Analysis
Below, the Goldman Sachs U.S. Fixed Income Investment Management Team discusses the Goldman Sachs U.S. Mortgages Fund’s performance and positioning for the six-month period ended September 30, 2010 (the “Reporting Period”).
| |
| Q | How did the Goldman Sachs U.S. Mortgages Fund (the “Fund”) perform during the Reporting Period? |
| |
| A | During the Reporting Period, the Fund’s Class A, Institutional and Separate Account Institutional Shares generated cumulative total returns, without sales charges, of 3.71%, 3.89% and 3.92%, respectively. These returns compare to the 4.00% cumulative total return of the Fund’s benchmark, the Barclays Capital U.S. Securitized Bond Index (with dividends reinvested) (the “Index”), during the same time period. |
| |
| Q | What key factors were responsible for the Fund’s performance during the Reporting Period? |
| |
| A | The Fund’s duration strategy detracted most from its relative results during the Reporting Period. Duration is a measure of the Fund’s sensitivity to changes in interest rates. Contributing to performance was our cross-sector strategy in which we invest Fund assets across a variety of fixed income sectors, including some that may not be included in the Fund’s benchmark. Bottom-up individual issue selection among agency and non-agency mortgage-backed securities (MBS) also added value. |
| |
| Q | Which segments of the U.S. mortgage-backed securities sector most significantly affected Fund performance? |
| |
| A | The Fund’s cross-sector positioning contributed positively to results during the Reporting Period. Specifically, the Fund’s exposure to non-agency MBS was advantageous. Despite the temporary sell-off during May, non-agency MBS performed strongly during the Reporting Period, driven by supportive supply and demand dynamics. In addition, the Fund’s underweight to agency MBS enhanced relative performance, as agency MBS underperformed U.S. Treasury securities during the Reporting Period. |
Issue selection also added to the Fund’s relative results during the Reporting Period. In particular, the Fund benefited from our focus on agency MBS with lower prepayment risk. These gains were offset somewhat by issue selection among commercial mortgage-backed securities (CMBS), which detracted.
Investment Objective
The Fund seeks a high level of total return consisting of income and capital appreciation.
| |
| Q | Did the Fund’s duration and yield curve positioning strategy help or hurt its results during the Reporting Period? |
| |
| A | The Fund’s underweighted duration bias in the medium- to long-maturity portions of the Treasury yield curve, or spectrum of maturities, during the Reporting Period detracted from its relative performance during the Reporting Period. During the second and third calendar quarters of 2010, interest rates on 10-year Treasuries fell approximately 135 basis points to 2.51%, driven by reports pointing to weaker than expected economic data. During the third calendar quarter, the Fed’s decision to reinvest mortgage paydowns into U.S. Treasuries, together with the market speculating about an additional round of quantitative easing, or buying of U.S. Treasuries by the Fed, led yields even lower. |
| |
| Q | How did the Fund use derivatives during the Reporting Period? |
| |
| A | In seeking to achieve its investment objective, including the management and influence of duration and yield curve positioning, as market conditions warranted during the Reporting Period, the Fund used instruments that included financial futures contracts and swap contracts. For example, as market conditions shifted, such instruments helped us shorten and lengthen the duration of the Fund and were used to introduce a steepening or flattening yield curve bias within the Fund. |
| |
| Q | Were there any notable changes in the Fund’s weightings during the Reporting Period? |
| |
| A | During the Reporting Period, we shifted the Fund from a short duration bias to a long duration bias. We reduced the Fund’s underweighted exposure to agency MBS but continued to maintain an underweight. |
PORTFOLIO RESULTS
| |
| Q | How was the Fund positioned relative to its benchmark index at the end of September 2010? |
| |
| A | At the end of September 2010, the Fund had overweighted allocations relative to the Index in agency securities, agency collateralized mortgage obligations (CMO), asset-backed securities (ABS) and CMBS. It was underweight relative to the Index in residential mortgage-backed securities (RMBS), particularly agency pass-through mortgage securities. |
FUND BASICS
U.S. Mortgages Fund
as of September 30, 2010
PERFORMANCE REVIEW
| | | | | | | | | | | | | | | | | | | |
| | | | | | | | | 30-Day
| | | 30-Day
| | | |
| | | | | | Barclays Capital
| | | Standardized
| | | Standardized
| | | |
April 1, 2010–
| | Fund Total Return
| | | U.S. Securitized
| | | Subsidized
| | | Unsubsidized
| | | |
| September 30, 2010 | | (based on NAV)1 | | | Bond Index2 | | | Yield3 | | | Yield3 | | | |
|
| |
| Class A | | | 3.71 | % | | | 4.00 | % | | | 1.85 | % | | | 1.75 | % | | |
| Institutional | | | 3.89 | | | | 4.00 | | | | 2.26 | | | | 2.15 | | | |
| Separate Account Institutional | | | 3.92 | | | | 4.00 | | | | 2.31 | | | | 2.20 | | | |
|
| |
| 1 | The net asset value (“NAV”) represents the net assets of the class of the Fund (ex-dividend) divided by the total number of shares of the class outstanding. The Fund’s performance assumes the reinvestment of dividends and other distributions. The Fund’s performance does not reflect the deduction of any applicable sales charges. |
| 2 | The Barclays Capital U.S. Securitized Bond Index is an unmanaged composite of asset-backed securities, collateralized mortgage-backed securities and fixed rate mortgage-backed securities. The Index figures do not reflect any deduction for fees, expenses or taxes. It is not possible to invest directly in an index. |
| 3 | The 30-Day Standardized Subsidized Yield of the Fund is calculated by dividing the net investment income per share (as defined by securities industry regulations) earned by the Fund over a 30-day period (ending on the stated month-end date) by the maximum public offering price (“POP”) per share of the Fund on the last day of the period. This number is then annualized. This yield does not necessarily reflect income actually earned and distributed by the Fund and, therefore, may not be correlated with the dividends or other distributions paid to shareholders. The 30-Day Standardized Unsubsidized Yield does not reflect any applicable expense reductions. |
STANDARDIZED AVERAGE ANNUAL TOTAL RETURNS4
| | | | | | | | | | | | | | | | | | | |
| For the period ended 9/30/10 | | One Year | | | Five Years | | | Since Inception | | | Inception Date | | | |
|
| |
| Class A | | | 3.64 | % | | | 4.15 | % | | | 4.05 | % | | | 11/3/03 | | | |
| Institutional | | | 8.03 | | | | 5.33 | | | | 5.03 | | | | 11/3/03 | | | |
| Separate Account Institutional | | | 8.09 | | | | 5.38 | | | | 5.07 | | | | 11/3/03 | | | |
|
| |
| 4 | The Standardized Average Annual Total Returns are average annual total returns as of the most recent calendar quarter-end. They assume reinvestment of all distributions at NAV. These returns reflect a maximum initial sales charge of 3.75% for Class A Shares. Prior to July 29, 2009, the maximum initial sales charge applicable to Class A Shares was 4.5%, which is not reflected in the average annual total return figures shown. Because Institutional and Separate Account Institutional Shares do not involve a sales charge, such a charge is not applied to their Standardized Average Annual Total Returns. |
The returns represent past performance. Past performance does not guarantee future results. The Fund’s investment return and principal value will fluctuate so that an investor’s shares, when redeemed, may be worth more or less than their original cost. Current performance may be lower or higher than the performance quoted above. Please visit our Web site at: www.goldmansachsfunds.com to obtain the most recent month-end returns. Performance reflects fee waivers and/or expense limitations in effect. In their absence, performance would be reduced. Returns do not reflect the deduction of taxes that a shareholder would pay on Fund distributions or the redemption of Fund shares.
EXPENSE RATIOS5
| | | | | | | | | |
| | | Net Expense Ratio (Current) | | | Gross Expense Ratio (Before Waivers) | |
| |
| |
| Class A | | | 0.76 | % | | | 0.94 | % |
| Institutional | | | 0.42 | | | | 0.60 | |
| Separate Account Institutional | | | 0.37 | | | | 0.55 | |
|
| |
| 5 | The expense ratios of the Fund, both current (net of applicable fee waivers and/or expense limitations) and before waivers (gross of applicable fee waivers and/or expense limitations), are as set forth above according to the most recent publicly available Prospectus for the Fund and may differ from the expense ratios disclosed in the Financial Highlights in this report. Applicable waivers and expense limitations may be modified or terminated in the future, consistent with the terms of any agreements in place. If this occurs, the expense ratios may change without shareholder approval. |
FUND BASICS
FUND COMPOSITION6
| |
| 6 | The percentage shown for each investment category reflects the value of investments in that category as a percentage of net assets. Short-Term investments represent repurchase agreements. Figures in the above graph may not sum up to 100% due to the exclusion of other assets and liabilities. |
| 7 | “Federal Agencies” are mortgage-backed securities guaranteed by Government National Mortgage Association (“GNMA”), Federal National Mortgage Association (“FNMA”) and Federal Home Loan Mortgage Corp. (“FHLMC”). GNMA instruments are backed by the full faith and credit of the U.S. Government. |
| 8 | “Agency Debentures” include agency securities offered by companies such as Fannie Mae and Freddie Mac, which operate under a government charter. While they are required to report to a government regulator, their assets are not explicitly guaranteed by the government and they otherwise operate like any other publicly traded company. |
GOLDMAN SACHS EMERGING MARKETS DEBT FUND
Schedule of Investments
September 30, 2010 (Unaudited)
| | | | | | | | | | | | | | | | | |
| | | Principal
| | Interest
| | Maturity
| | |
| | | Amount | | Rate | | Date | | Value |
| |
Sovereign Debt Obligations – 70.0% |
| | | | | | | | | | | | | | | | | |
| | | | | | | | | | | | | | | | | |
| | | Argentina – 4.5% |
| | | Republic of Argentina (B/NR) |
| | | $ | 3,160,000 | | | | 7.000 | % | | | 09/12/13 | | | $ | 2,964,168 | |
| | | | 4,490,000 | | | | 7.000 | | | | 10/03/15 | | | | 3,953,944 | |
| | | ARS | 6,159,180 | | | | 5.830 | (a) | | | 12/31/33 | | | | 1,104,796 | |
| | | EUR | 3,313,676 | | | | 7.820 | | | | 12/31/33 | | | | 3,196,039 | |
| | | | 1,320,000 | | | | 2.260 | (b) | | | 12/31/38 | | | | 607,328 | |
| | | Republic of Argentina (NR/NR) |
| | | $ | 6,210,000 | | | | 7.000 | | | | 04/17/17 | | | | 5,078,745 | |
| | | ARS | 14,967,675 | | | | 2.000 | (a) | | | 02/04/18 | | | | 2,922,192 | |
| | | EUR | 849,011 | | | | 7.820 | (a) | | | 12/31/33 | | | | 815,977 | |
| | | | 47,580,000 | | | | 2.840 | (a) | | | 12/15/35 | | | | 7,005,252 | |
| | | | | | | | | | | | | | | | | |
| | | | | | | | | | | | | | | | 27,648,441 | |
| | | |
| | | |
| | | Belarus – 1.4% |
| | | Republic of Belarus (B+/B1) |
| | | $ | 8,350,000 | | | | 8.750 | | | | 08/03/15 | | | | 8,600,500 | |
| | | |
| | | |
| | | Brazil – 4.8% |
| | | Federal Republic of Brazil (BBB-/Baa3) |
| | | | 150,000 | | | | 6.000 | | | | 01/17/17 | | | | 174,750 | |
| | | | 6,450,000 | | | | 5.875 | | | | 01/15/19 | | | | 7,562,625 | |
| | | | 1,000,000 | | | | 8.875 | | | | 10/14/19 | | | | 1,407,500 | |
| | | | 2,630,000 | | | | 8.250 | | | | 01/20/34 | | | | 3,800,350 | |
| | | | 2,360,000 | | | | 5.625 | | | | 01/07/41 | | | | 2,584,200 | |
| | | Federal Republic of Brazil (NR/Baa3) |
| | | | 12,967,000 | | | | 4.875 | | | | 01/22/21 | | | | 14,231,282 | |
| | | | | | | | | | | | | | | | | |
| | | | | | | | | | | | | | | | 29,760,707 | |
| | | |
| | | |
| | | Chile – 0.3% |
| | | Republic of Chile (A+/Aa3) |
| | | | 1,750,000 | | | | 3.875 | | | | 08/05/20 | | | | 1,816,302 | |
| | | |
| | | |
| | | Colombia – 4.5% |
| | | Republic of Colombia (BBB-/Ba1) |
| | | | 2,278,000 | | | | 7.375 | | | | 01/27/17 | | | | 2,807,635 | |
| | | | 6,920,000 | | | | 7.375 | | | | 03/18/19 | | | | 8,753,800 | |
| | | | 6,880,000 | | | | 7.375 | | | | 09/18/37 | | | | 9,064,400 | |
| | | | 6,210,000 | | | | 6.125 | | | | 01/18/41 | | | | 7,094,925 | |
| | | | | | | | | | | | | | | | | |
| | | | | | | | | | | | | | | | 27,720,760 | |
| | | |
| | | |
| | | Costa Rica – 1.0% |
| | | Republic of Costa Rica (BB+/Baa3) |
| | | | 410,000 | | | | 6.548 | | | | 03/20/14 | | | | 462,275 | |
| | | | 3,987,000 | | | | 9.995 | | | | 08/01/20 | | | | 5,661,540 | |
| | | | | | | | | | | | | | | | | |
| | | | | | | | | | | | | | | | 6,123,815 | |
| | | |
| | | |
| | | Dominican Republic – 2.2% |
| | | Dominican Republic (B/B1) |
| | | | 5,246,289 | | | | 9.040 | | | | 01/23/18 | | | | 6,216,853 | |
| | | | 5,240,000 | | | | 7.500 | (c) | | | 05/06/21 | | | | 5,921,200 | |
| | | | 100,000 | | | | 7.500 | | | | 05/06/21 | | | | 113,000 | |
| | | | 1,060,000 | | | | 8.625 | | | | 04/20/27 | | | | 1,245,500 | |
| | | | | | | | | | | | | | | | | |
| | | | | | | | | | | | | | | | 13,496,553 | |
| | | |
| | | |
| | | Egypt(c) – 0.2% |
| | | Republic of Egypt (BB+/Ba1) |
| | | | 100,000 | | | | 5.750 | | | | 04/29/20 | | | | 107,000 | |
| | | | 1,160,000 | | | | 6.875 | | | | 04/30/40 | | | | 1,305,000 | |
| | | | | | | | | | | | | | | | | |
| | | | | | | | | | | | | | | | 1,412,000 | |
| | | |
| | | |
| | | El Salvador – 0.9% |
| | | Republic of El Salvador (BB/Ba1) |
| | | | 4,132,000 | | | | 8.250 | | | | 04/10/32 | | | | 4,689,820 | |
| | | | 600,000 | | | | 7.650 | | | | 06/15/35 | | | | 652,500 | |
| | | | | | | | | | | | | | | | | |
| | | | | | | | | | | | | | | | 5,342,320 | |
| | | |
| | | |
| | | Gabon – 0.4% |
| | | Republic of Gabon (BB-/NR) |
| | | | 1,270,000 | | | | 8.200 | | | | 12/12/17 | | | | 1,470,025 | |
| | | | 760,000 | | | | 8.200 | (c) | | | 12/12/17 | | | | 879,700 | |
| | | | | | | | | | | | | | | | | |
| | | | | | | | | | | | | | | | 2,349,725 | |
| | | |
| | | |
| | | Georgia – 0.2% |
| | | Republic of Georgia (B+/Ba3) |
| | | | 1,240,000 | | | | 7.500 | | | | 04/15/13 | | | | 1,264,800 | |
| | | |
| | | |
| | | Ghana – 0.3% |
| | | Republic of Ghana (B/NR) |
| | | | 1,880,000 | | | | 8.500 | | | | 10/04/17 | | | | 2,147,900 | |
| | | |
| | | |
| | | Hungary – 1.3% |
| | | Hungary Government Bond (BBB-/Baa1) |
| | | EUR | 510,000 | | | | 6.750 | | | | 07/28/14 | | | | 729,742 | |
| | | | 10,000 | | | | 3.500 | | | | 07/18/16 | | | | 12,444 | |
| | | | 700,000 | | | | 5.750 | | | | 06/11/18 | | | | 957,902 | |
| | | $ | 5,763,000 | | | | 6.250 | | | | 01/29/20 | | | | 6,137,595 | |
| | | | | | | | | | | | | | | | | |
| | | | | | | | | | | | | | | | 7,837,683 | |
| | | |
| | | |
| | | Indonesia – 7.1% |
| | | Republic of Indonesia (BB/Ba2) |
| | | | 4,650,000 | | | | 6.750 | | | | 03/10/14 | | | | 5,272,170 | |
| | | | 820,000 | | | | 7.500 | | | | 01/15/16 | | | | 997,366 | |
| | | | 1,404,000 | | | | 6.875 | | | | 01/17/18 | | | | 1,695,330 | |
| | | | 1,880,000 | | | | 11.625 | | | | 03/04/19 | | | | 2,909,300 | |
| | | | 13,129,000 | | | | 5.875 | (c) | | | 03/13/20 | | | | 15,114,105 | |
| | | | 2,520,000 | | | | 5.875 | | | | 03/13/20 | | | | 2,901,024 | |
| | | | 2,780,000 | | | | 8.500 | | | | 10/12/35 | | | | 4,037,950 | |
| | | | 300,000 | | | | 6.625 | | | | 02/17/37 | | | | 364,500 | |
| | | | 3,198,000 | | | | 7.750 | (c) | | | 01/17/38 | | | | 4,333,290 | |
| | | | 4,804,000 | | | | 7.750 | | | | 01/17/38 | | | | 6,509,420 | |
| | | | | | | | | | | | | | | | | |
| | | | | | | | | | | | | | | | 44,134,455 | |
| | | |
| | | |
| | | Iraq – 0.8% |
| | | Republic of Iraq (NR/NR) |
| | | | 5,690,000 | | | | 5.800 | | | | 01/15/28 | | | | 4,893,400 | |
| | | |
| | | |
| | | Ivory Coast(b) – 0.5% |
| | | Republic of Ivory Coast (NR/NR) |
| | | | 4,314,000 | | | | 2.500 | | | | 12/31/32 | | | | 2,508,591 | |
| | | | 1,000,000 | | | | 2.500 | (c) | | | 12/31/32 | | | | 581,500 | |
| | | | | | | | | | | | | | | | | |
| | | | | | | | | | | | | | | | 3,090,091 | |
| | | |
| | | |
The accompanying notes are an integral part of these financial statements.
GOLDMAN SACHS EMERGING MARKETS DEBT FUND
| | | | | | | | | | | | | | | | | |
| | | Principal
| | Interest
| | Maturity
| | |
| | | Amount | | Rate | | Date | | Value |
| |
Sovereign Debt Obligations – (continued) |
| | | | | | | | | | | | | | | | | |
| | | Lebanon – 1.3% |
| | | Republic of Lebanon (B/NR) |
| | | $ | 600,000 | | | | 6.375 | % | | | 03/09/20 | | | $ | 622,500 | |
| | | | 4,230,000 | | | | 8.250 | | | | 04/12/21 | | | | 4,938,525 | |
| | | Republic of Lebanon MTN (B/NR) |
| | | | 2,707,500 | | | | 4.000 | | | | 12/31/17 | | | | 2,653,350 | |
| | | | | | | | | | | | | | | | | |
| | | | | | | | | | | | | | | | 8,214,375 | |
| | | |
| | | |
| | | Malaysia – 0.6% |
| | | Malaysia (A-/A3) |
| | | | 3,500,000 | | | | 7.500 | | | | 07/15/11 | | | | 3,615,479 | |
| | | |
| | | |
| | | Mexico – 3.2% |
| | | Mexican Bonos (A/Baa1) |
| | | MXN | 146,465,500 | | | | 10.000 | | | | 12/05/24 | | | | 15,481,980 | |
| | | United Mexican States (BBB/Baa1) |
| | | $ | 16,000 | | | | 6.750 | | | | 09/27/34 | | | | 19,880 | |
| | | | 3,770,000 | | | | 6.050 | (d) | | | 01/11/40 | | | | 4,316,650 | |
| | | | | | | | | | | | | | | | | |
| | | | | | | | | | | | | | | | 19,818,510 | |
| | | |
| | | |
| | | Pakistan – 0.3% |
| | | Islamic Republic of Pakistan (B-/B3) |
| | | | 1,070,000 | | | | 6.875 | (c) | | | 06/01/17 | | | | 965,675 | |
| | | | 1,320,000 | | | | 6.875 | | | | 06/01/17 | | | | 1,191,300 | |
| | | | | | | | | | | | | | | | | |
| | | | | | | | | | | | | | | | 2,156,975 | |
| | | |
| | | |
| | | Panama – 0.0% |
| | | Republic of Panama (BBB-/Baa3) |
| | | | 184,000 | | | | 7.250 | | | | 03/15/15 | | | | 219,052 | |
| | | |
| | | |
| | | Peru – 2.3% |
| | | Republic of Peru (BBB-/Baa3) |
| | | | 4,462,000 | | | | 7.350 | | | | 07/21/25 | | | | 5,778,290 | |
| | | | 5,698,000 | | | | 8.750 | | | | 11/21/33 | | | | 8,461,530 | |
| | | | 111,000 | | | | 6.550 | | | | 03/14/37 | | | | 134,865 | |
| | | | | | | | | | | | | | | | | |
| | | | | | | | | | | | | | | | 14,374,685 | |
| | | |
| | | |
| | | Philippines – 5.8% |
| | | Republic of Philippines (BB-/Ba3) |
| | | | 189,000 | | | | 9.875 | | | | 01/15/19 | | | | 270,270 | |
| | | | 3,759,000 | | | | 8.375 | | | | 06/17/19 | | | | 4,999,470 | |
| | | | 5,826,000 | | | | 6.500 | | | | 01/20/20 | | | | 6,962,070 | |
| | | | 3,565,000 | | | | 7.500 | | | | 09/25/24 | | | | 4,634,500 | |
| | | | 1,000,000 | | | | 9.500 | (e) | | | 10/21/24 | | | | 1,495,000 | |
| | | | 3,917,000 | | | | 10.625 | | | | 03/16/25 | | | | 6,296,577 | |
| | | | 2,412,000 | | | | 9.500 | | | | 02/02/30 | | | | 3,693,496 | |
| | | | 2,832,000 | | | | 7.750 | | | | 01/14/31 | | | | 3,763,020 | |
| | | | 3,208,000 | | | | 6.375 | | | | 10/23/34 | | | | 3,733,310 | |
| | | | | | | | | | | | | | | | | |
| | | | | | | | | | | | | | | | 35,847,713 | |
| | | |
| | | |
| | | Poland – 1.7% |
| | | Republic of Poland (A-/A2) |
| | | | 5,650,000 | | | | 3.875 | | | | 07/16/15 | | | | 5,868,937 | |
| | | | 4,100,000 | | | | 6.375 | | | | 07/15/19 | | | | 4,850,813 | |
| | | | | | | | | | | | | | | | | |
| | | | | | | | | | | | | | | | 10,719,750 | |
| | | |
| | | |
| | | Qatar – 0.3% |
| | | State of Qatar (AA/Aa2) |
| | | | 350,000 | | | | 5.250 | (c) | | | 01/20/20 | | | | 384,125 | |
| | | | 1,490,000 | | | | 6.400 | | | | 01/20/40 | | | | 1,767,140 | |
| | | | | | | | | | | | | | | | | |
| | | | | | | | | | | | | | | | 2,151,265 | |
| | | |
| | | |
| | | Romania – 0.2% |
| | | Republic of Romania (BB+/Baa3) |
| | | EUR | 930,000 | | | | 6.500 | | | | 06/18/18 | | | | 1,313,084 | |
| | | |
| | | |
| | | Russia – 6.0% |
| | | Russian Federation (BBB/Baa1) |
| | | $ | 800,000 | | | | 3.625 | (c) | | | 04/29/15 | | | | 804,960 | |
| | | | 2,000,000 | | | | 5.000 | (c) | | | 04/29/20 | | | | 2,080,000 | |
| | | | 200,000 | | | | 5.000 | | | | 04/29/20 | | | | 208,000 | |
| | | | 28,640,000 | | | | 7.500 | (b) | | | 03/31/30 | | | | 34,153,200 | |
| | | | | | | | | | | | | | | | | |
| | | | | | | | | | | | | | | | 37,246,160 | |
| | | |
| | | |
| | | Serbia(b) – 0.5% |
| | | Republic of Serbia (BB-/NR) |
| | | | 2,977,333 | | | | 6.750 | | | | 11/01/24 | | | | 2,917,787 | |
| | | |
| | | |
| | | South Africa – 3.9% |
| | | Republic of South Africa (A+/A3) |
| | | ZAR | 70,440,000 | | | | 10.500 | | | | 12/21/26 | | | | 12,401,422 | |
| | | Republic of South Africa (BBB+/A3) |
| | | $ | 960,000 | | | | 6.500 | | | | 06/02/14 | | | | 1,094,400 | |
| | | | 2,317,000 | | | | 6.875 | | | | 05/27/19 | | | | 2,832,532 | |
| | | | 5,322,000 | | | | 5.500 | | | | 03/09/20 | | | | 5,947,335 | |
| | | | 1,730,000 | | | | 5.875 | | | | 05/30/22 | | | | 2,002,475 | |
| | | | | | | | | | | | | | | | | |
| | | | | | | | | | | | | | | | 24,278,164 | |
| | | |
| | | |
| | | Sri Lanka – 0.6% |
| | | Republic of Sri Lanka (B+/B1)(c) |
| | | | 1,650,000 | | | | 6.250 | | | | 10/04/20 | | | | 1,657,590 | |
| | | Republic of Sri Lanka (B+/NR) |
| | | | 190,000 | | | | 8.250 | | | | 10/24/12 | | | | 206,862 | |
| | | | 374,000 | | | | 7.400 | | | | 01/22/15 | | | | 409,530 | |
| | | | 1,330,000 | | | | 7.400 | (c) | | | 01/22/15 | | | | 1,456,350 | |
| | | | | | | | | | | | | | | | | |
| | | | | | | | | | | | | | | | 3,730,332 | |
| | | |
| | | |
| | | Turkey – 5.3% |
| | | Republic of Turkey (BB/Ba2) |
| | | | 6,065,000 | | | | 5.625 | | | | 03/30/21 | | | | 6,610,850 | |
| | | | 4,661,000 | | | | 11.875 | | | | 01/15/30 | | | | 8,261,622 | |
| | | | 1,800,000 | | | | 8.000 | | | | 02/14/34 | | | | 2,346,750 | |
| | | | 830,000 | | | | 6.875 | | | | 03/17/36 | | | | 964,875 | |
| | | | 7,850,000 | | | | 7.250 | | | | 03/05/38 | | | | 9,478,875 | |
| | | | 4,317,000 | | | | 6.750 | | | | 05/30/40 | | | | 4,921,380 | |
| | | | | | | | | | | | | | | | | |
| | | | | | | | | | | | | | | | 32,584,352 | |
| | | |
| | | |
| | | Ukraine – 0.7% |
| | | Ukraine Government (B+/B2) |
| | | EUR | 2,810,000 | | | | 4.950 | | | | 10/13/15 | | | | 3,485,967 | |
| | | $ | 700,000 | | | | 7.750 | (c) | | | 09/23/20 | | | | 702,625 | |
| | | | | | | | | | | | | | | | | |
| | | | | | | | | | | | | | | | 4,188,592 | |
| | | |
| | | |
The accompanying notes are an integral part of these financial statements.
GOLDMAN SACHS EMERGING MARKETS DEBT FUND
Schedule of Investments (continued)
September 30, 2010 (Unaudited)
| | | | | | | | | | | | | | | | | |
| | | Principal
| | Interest
| | Maturity
| | |
| | | Amount | | Rate | | Date | | Value |
| |
Sovereign Debt Obligations – (continued) |
| | | | | | | | | | | | | | | | | |
| | | United Arab Emirates – 0.5% |
| | | Dubai DOF Sukuk Ltd. (NR/NR) |
| | | $ | 2,950,000 | | | | 6.396 | % | | | 11/03/14 | | | $ | 2,941,150 | |
| | | |
| | | |
| | | Uruguay – 2.0% |
| | | Republic of Uruguay (BB+/Ba3) |
| | | | 1,826,907 | | | | 8.000 | | | | 11/18/22 | | | | 2,352,143 | |
| | | | 466,000 | | | | 6.875 | | | | 09/28/25 | | | | 559,200 | |
| | | | 2,200,000 | | | | 7.875 | (f) | | | 01/15/33 | | | | 2,882,000 | |
| | | | 5,036,000 | | | | 7.625 | | | | 03/21/36 | | | | 6,496,440 | |
| | | | | | | | | | | | | | | | | |
| | | | | | | | | | | | | | | | 12,289,783 | |
| | | |
| | | |
| | | Venezuela – 4.4% |
| | | Republic of Venezuela (BB-/B2) |
| | | | 360,000 | | | | 5.750 | | | | 02/26/16 | | | | 248,400 | |
| | | | 1,170,000 | | | | 13.625 | | | | 08/15/18 | | | | 1,088,100 | |
| | | | 890,000 | | | | 7.000 | | | | 12/01/18 | | | | 589,625 | |
| | | | 14,540,000 | | | | 7.750 | | | | 10/13/19 | | | | 9,632,750 | |
| | | | 8,601,000 | | | | 6.000 | | | | 12/09/20 | | | | 4,988,580 | |
| | | | 8,090,000 | | | | 8.250 | | | | 10/13/24 | | | | 5,177,600 | |
| | | | 7,610,000 | | | | 7.650 | | | | 04/21/25 | | | | 4,642,100 | |
| | | | 470,000 | | | | 9.250 | | | | 05/07/28 | | | | 311,375 | |
| | | | 1,300,000 | | | | 7.000 | | | | 03/31/38 | | | | 715,000 | |
| | | | | | | | | | | | | | | | | |
| | | | | | | | | | | | | | | | 27,393,530 | |
| | | |
| | | |
| | | TOTAL SOVEREIGN DEBT OBLIGATIONS |
| | | (Cost $398,990,419) | | $ | 433,640,190 | |
| | | |
| | | |
| | | | | | | | | | | | | | | | | |
| | | | | | | | | | | | | | | | | |
Corporate Obligations – 16.0% |
| | | | | | | | | | | | | | | | | |
| | | | | | | | | | | | | | | | | |
| | | Brazil – 1.2% |
| | | Banco Cruzeiro do Sul SA (NR/Ba3)(c) |
| | | $ | 730,000 | | | | 8.875 | % | | | 09/22/20 | | | $ | 770,079 | |
| | | CCL Finance Ltd. (BB-/NR) |
| | | | 1,058,000 | | | | 9.500 | | | | 08/15/14 | | | | 1,237,860 | |
| | | Companhia Energetica de Sao Paulo (NR/Ba2) |
| | | BRL | 3,127,249 | | | | 9.750 | | | | 01/15/15 | | | | 1,914,231 | |
| | | Independencia International Ltd. (NR/NR)(c) |
| | | $ | 1,277,436 | | | | 12.000 | | | | 12/30/16 | | | | 38,323 | |
| | | Telemar Norte Leste SA (BBB-/Baa2)(c) |
| | | | 3,374,000 | | | | 5.500 | | | | 10/23/20 | | | | 3,418,533 | |
| | | | | | | | | | | | | | | | | |
| | | | | | | | | | | | | | | | 7,379,026 | |
| | | |
| | | |
| | | Chile – 0.6% |
| | | Corporacion Nacional del Cobre(A/A1) |
| | | | 2,995,000 | | | | 6.150 | | | | 10/24/36 | | | | 3,548,416 | |
| | | |
| | | |
| | | Colombia – 0.7% |
| | | EEB International Ltd. (BB/NR) |
| | | | 1,020,000 | | | | 8.750 | | | | 10/31/14 | | | | 1,114,310 | |
| | | | 690,000 | | | | 8.750 | (c) | | | 10/31/14 | | | | 753,798 | |
| | | TGI International Ltd. (BB/NR) |
| | | | 1,440,000 | | | | 9.500 | | | | 10/03/17 | | | | 1,634,400 | |
| | | | 760,000 | | | | 9.500 | (c) | | | 10/03/17 | | | | 864,091 | |
| | | | | | | | | | | | | | | | | |
| | | | | | | | | | | | | | | | 4,366,599 | |
| | | |
| | | |
| | | Indonesia – 0.5% |
| | | Adaro Indonesia PT (NR/Ba1) |
| | | | 2,350,000 | | | | 7.625 | (c) | | | 10/22/19 | | | | 2,561,500 | |
| | | | 700,000 | | | | 7.625 | | | | 10/22/19 | | | | 763,000 | |
| | | | | | | | | | | | | | | | | |
| | | | | | | | | | | | | | | | 3,324,500 | |
| | | |
| | | |
| | | Ireland – 0.6% |
| | | MTS International Funding Ltd. (BB/Ba2) |
| | | | 1,220,000 | | | | 8.625 | | | | 06/22/20 | | | | 1,403,000 | |
| | | VIP Finance Ireland Ltd. for OJSC Vimpel Communications (BB+/Ba2) |
| | | | 500,000 | | | | 9.125 | (c) | | | 04/30/18 | | | | 571,900 | |
| | | | 1,599,000 | | | | 9.125 | | | | 04/30/18 | | | | 1,828,936 | |
| | | | | | | | | | | | | | | | | |
| | | | | | | | | | | | | | | | 3,803,836 | |
| | | |
| | | |
| | | Kazakhstan – 3.1% |
| | | Kazakhstan Temir Zholy Finance BV (BB+/Baa3)(c) |
| | | | 700,000 | | | | 6.375 | | | | 10/06/20 | | | | 699,132 | |
| | | Kazatomprom (NR/Baa3)(c) |
| | | | 700,000 | | | | 6.250 | | | | 05/20/15 | | | | 757,750 | |
| | | KazMunaiGaz Finance Sub BV (BB+/Baa2) |
| | | | 10,000 | | | | 8.375 | (c) | | | 07/02/13 | | | | 11,075 | |
| | | | 2,100,000 | | | | 11.750 | (c) | | | 01/23/15 | | | | 2,661,750 | |
| | | | 6,750,000 | | | | 11.750 | | | | 01/23/15 | | | | 8,555,625 | |
| | | KazMunaiGaz Finance Sub BV (NR/Baa2)(c) |
| | | | 5,680,000 | | | | 7.000 | | | | 05/05/20 | | | | 6,283,500 | |
| | | | | | | | | | | | | | | | | |
| | | | | | | | | | | | | | | | 18,968,832 | |
| | | |
| | | |
| | | Luxembourg – 1.1% |
| | | Gaz Capital SA for Gazprom (BBB/Baa1)(e) |
| | | | 3,400,000 | | | | 9.250 | | | | 04/23/19 | | | | 4,224,500 | |
| | | Gazprom International SA for Gazprom (BBB+/NR) |
| | | | 2,440,551 | | | | 7.201 | | | | 02/01/20 | | | | 2,641,896 | |
| | | | | | | | | | | | | | | | | |
| | | | | | | | | | | | | | | | 6,866,396 | |
| | | |
| | | |
| | | Malaysia – 0.7% |
| | | Petronas Capital Ltd. (A-/A1) |
| | | | 1,630,000 | | | | 5.250 | | | | 08/12/19 | | | | 1,821,257 | |
| | | | 2,200,000 | | | | 5.250 | (c) | | | 08/12/19 | | | | 2,458,139 | |
| | | | | | | | | | | | | | | | | |
| | | | | | | | | | | | | | | | 4,279,396 | |
| | | |
| | | |
| | | Mexico – 3.7% |
| | | Cemex Finance LLC (B/NR) |
| | | | 1,990,000 | | | | 9.500 | | | | 12/14/16 | | | | 2,002,529 | |
| | | | 3,460,000 | | | | 9.500 | (c) | | | 12/14/16 | | | | 3,481,784 | |
| | | Pemex Project Funding Master Trust (BBB/Baa1) |
| | | | 6,296,000 | | | | 5.750 | | | | 03/01/18 | | | | 6,909,860 | |
| | | Petroleos Mexicanos (BBB/Baa1) |
| | | | 2,572,000 | | | | 8.000 | | | | 05/03/19 | | | | 3,208,570 | |
| | | | 4,930,000 | | | | 5.500 | (c) | | | 01/21/21 | | | | 5,250,450 | |
| | | | 1,580,000 | | | | 6.625 | (c) | | | 06/15/35 | | | | 1,730,100 | |
| | | | | | | | | | | | | | | | | |
| | | | | | | | | | | | | | | | 22,583,293 | |
| | | |
| | | |
The accompanying notes are an integral part of these financial statements.
GOLDMAN SACHS EMERGING MARKETS DEBT FUND
| | | | | | | | | | | | | | | | | |
| | | Principal
| | Interest
| | Maturity
| | |
| | | Amount | | Rate | | Date | | Value |
| |
Corporate Obligations – (continued) |
| | | | | | | | | | | | | | | | | |
| | | Qatar – 1.3% |
| | | Ras Laffan Liquefied Natural Gas Co. Ltd. II (A/Aa2) |
| | | $ | 6,806,004 | | | | 5.298 | % | | | 09/30/20 | | | $ | 7,364,097 | |
| | | Ras Laffan Liquefied Natural Gas Co. Ltd. III (A/Aa2)(c) |
| | | | 180,000 | | | | 5.500 | | | | 09/30/14 | | | | 197,100 | |
| | | | 499,632 | | | | 5.832 | | | | 09/30/16 | | | | 548,381 | |
| | | | | | | | | | | | | | | | | |
| | | | | | | | | | | | | | | | 8,109,578 | |
| | | |
| | | |
| | | South Africa – 0.7% |
| | | Peermont Proprietary Global Ltd. (B/B3) |
| | | EUR | 3,480,000 | | | | 7.750 | | | | 04/30/14 | | | | 4,217,515 | |
| | | |
| | | |
| | | Turkey(c) – 0.2% |
| | | Akbank TAS (NR/Ba1) |
| | | $ | 1,270,000 | | | | 5.125 | | | | 07/22/15 | | | | 1,270,000 | |
| | | |
| | | |
| | | Ukraine – 0.1% |
| | | Biz Finance PLC for Ukreximbank (NR/B1) |
| | | | 700,000 | | | | 8.375 | | | | 04/27/15 | | | | 721,000 | |
| | | |
| | | |
| | | United Arab Emirates – 0.5% |
| | | Dolphin Energy Ltd. (NR/A1) |
| | | | 1,227,904 | | | | 5.888 | | | | 06/15/19 | | | | 1,319,997 | |
| | | | 1,630,810 | | | | 5.888 | (c) | | | 06/15/19 | | | | 1,753,120 | |
| | | | | | | | | | | | | | | | | |
| | | | | | | | | | | | | | | | 3,073,117 | |
| | | |
| | | |
| | | Venezuela – 1.0% |
| | | Petroleos de Venezuela SA (B+/NR) |
| | | | 529,900 | | | | 5.250 | | | | 04/12/17 | | | | 308,667 | |
| | | Petroleos de Venezuela SA (NR/NR) |
| | | | 8,300,000 | | | | 4.900 | | | | 10/28/14 | | | | 5,291,250 | |
| | | | 1,439,000 | | | | 5.000 | | | | 10/28/15 | | | | 827,425 | |
| | | | | | | | | | | | | | | | | |
| | | | | | | | | | | | | | | | 6,427,342 | |
| | | |
| | | |
| | | TOTAL CORPORATE OBLIGATIONS |
| | | (Cost $95,549,284) | | $ | 98,938,846 | |
| | | |
| | | |
| | | | | | | | | | | | | | | | | |
| | | | | | | | | | | | | | | | | |
Structured Notes – 3.1% |
| | | | | | | | | | | | | | | | | |
| | | | | | | | | | | | | | | | | |
| | | Egyptian Treasury Bills (NR/NR)(g)(h) |
| | | EGP | 25,800,000 | | | | 0.000 | % | | | 10/26/10 | | | $ | 4,506,050 | |
| | | | 26,700,000 | | | | 0.000 | (c) | | | 11/02/10 | | | | 4,655,264 | |
| | | Notas do Tesouro Nacional Series B (NR/NR)(a)(i) |
| | | BRL | 17,408,282 | | | | 6.000 | | | | 08/15/40 | | | | 10,362,113 | |
| | | |
| | | |
| | | TOTAL STRUCTURED NOTES |
| | | (Cost $19,622,232) | | $ | 19,523,427 | |
| | | |
| | | |
| | | TOTAL INVESTMENTS BEFORE SHORT-TERM INVESTMENT |
| | | (Cost $514,161,935) | | $ | 552,102,463 | |
| | | |
| | | |
| | | | | | | | | | | | | | | | | |
| | | | | | | | | | | | | | | | | |
Short-term Investment(j) – 9.7% |
| | | | | | | | | | | | | | | | | |
| | | | | | | | | | | | | | | | | |
| | | Repurchase Agreement – 9.7% |
| | | Joint Repurchase Agreement Account II |
| | | $ | 60,300,000 | | | | 0.270 | % | | | 10/01/10 | | | $ | 60,300,000 | |
| | | Maturity Value: $60,300,452 | | | | |
| | | (Cost $60,300,000) | | | | |
| | | |
| | | |
| | | TOTAL INVESTMENTS – 98.8% |
| | | (Cost $574,461,935) | | $ | 612,402,463 | |
| | | |
| | | |
| | | OTHER ASSETS IN EXCESS OF LIABILITIES – 1.2% | | | 7,326,400 | |
| | | |
| | | |
| | | NET ASSETS – 100.0% | | $ | 619,728,863 | |
| | | |
| | | |
The percentage shown for each investment category reflects the value of investments in that category as a percentage of net assets.
| | |
| (a) | | Variable rate security. Interest rate disclosed is that which is in effect at September 30, 2010. |
| |
| (b) | | Coupon increases periodically based upon a predetermined schedule. Stated interest rate in effect at September 30, 2010. |
| |
| (c) | | Exempt from registration under Rule 144A of the Securities Act of 1933. Under procedures approved by the Board of Trustees, such securities have been determined to be liquid by the investment adviser and may be resold, normally to qualified institutional buyers in transactions exempt from registration. Total market value of Rule 144A securities amounts to $77,028,889, which represents approximately 12.4% of net assets as of September 30, 2010. |
| |
| (d) | | All or a portion of security is segregated as collateral for initial margin requirement on futures transactions. |
| |
| (e) | | Security with “Put” features with resetting interest rates. Maturity dates disclosed are the final maturity dates. |
| |
| (f) | | Pay-in-kind securities. |
| |
| (g) | | Issued with a zero coupon. Income is recognized through the accretion of discount. |
| |
| (h) | | The underlying security is issued by HSBC Corp. |
| |
| (i) | | The underlying security is issued by Deutsche Bank AG. |
| |
| (j) | | Joint repurchase agreement was entered into on September 30, 2010. Additional information appears on pages 72-73. |
Security ratings disclosed, if any, are obtained from by Standard & Poor’s (“S&P”)/Moody’s Investor Service (“Moody’s”) and are unaudited. A brief description of the ratings is available in the Fund’s Statement of Additional Information.
The accompanying notes are an integral part of these financial statements.
GOLDMAN SACHS EMERGING MARKETS DEBT FUND
Schedule of Investments (continued)
September 30, 2010 (Unaudited)
| | | | | | | |
| | | |
| | | |
| | | Currency Abbreviations: |
| | | ARS | | — | | Argentine Peso |
| | | BRL | | — | | Brazilian Real |
| | | CLP | | — | | Chilean Peso |
| | | CNY | | — | | Chinese Yuan |
| | | COP | | — | | Colombian Peso |
| | | EGP | | — | | Egyptian Pound |
| | | EUR | | — | | Euro |
| | | IDR | | — | | Indonesian Rupiah |
| | | ILS | | — | | Israeli Shekel |
| | | INR | | — | | Indian Rupee |
| | | KRW | | — | | South Korean Won |
| | | MXN | | — | | Mexican Peso |
| | | MYR | | — | | Malaysian Ringgit |
| | | PHP | | — | | Philippine Peso |
| | | PLN | | — | | Polish Zloty |
| | | TRY | | — | | Turkish Lira |
| | | ZAR | | — | | South African Rand |
| | | |
| | | |
| | | | | | | |
| | | |
| | | |
| | | Investment Abbreviations: |
| | | KWCDC | | — | | South Korean Won Certificate of Deposit |
| | | MTN | | — | | Medium Term Note |
| | | NR | | — | | Not Rated |
| | | WIBOR | | — | | Warsaw Interbank Offered Rate |
| | | |
| | | |
ADDITIONAL INVESTMENT INFORMATION
FORWARD FOREIGN CURRENCY CONTRACTS — At September 30, 2010, the Fund had outstanding forward foreign currency exchange contracts, both to purchase and sell foreign currencies:
FORWARD FOREIGN CURRENCY EXCHANGE CONTRACTS WITH UNREALIZED GAIN
| | | | | | | | | | | | | | | | | |
| | | | | Contract
| | Expiration
| | Current
| | Unrealized
|
| Counterparty | | Currency | | Type | | Date | | Value | | Gain |
| |
| Barclays Bank PLC | | CNY | | Purchase | | | 03/17/11 | | | $ | 9,846,981 | | | $ | 90,472 | |
| | | IDR | | Purchase | | | 10/14/10 | | | | 106,804 | | | | — | |
| | | MXN | | Sale | | | 12/15/10 | | | | 3,061,749 | | | | 21,356 | |
| | | TRY | | Purchase | | | 12/15/10 | | | | 3,068,644 | | | | 37,644 | |
| Citibank NA | | IDR | | Purchase | | | 10/14/10 | | | | 1,891,893 | | | | 38,031 | |
| Credit Suisse International (London) | | PLN | | Purchase | | | 12/15/10 | | | | 57,327 | | | | — | |
| Deutsche Bank AG (London) | | IDR | | Purchase | | | 10/14/10 | | | | 1,560,393 | | | | 16,145 | |
| | | INR | | Purchase | | | 10/14/10 | | | | 6,619,702 | | | | 301,953 | |
| | | PHP | | Purchase | | | 10/14/10 | | | | 2,558,532 | | | | 81,531 | |
| HSBC Bank PLC | | ILS | | Purchase | | | 12/15/10 | | | | 2,544,668 | | | | 81,461 | |
| JPMorgan Securities, Inc. | | IDR | | Purchase | | | 10/14/10 | | | | 2,514,891 | | | | 10,953 | |
| | | KRW | | Purchase | | | 10/14/10 | | | | 121,000 | | | | — | |
| | | PLN | | Purchase | | | 12/15/10 | | | | 2,505,848 | | | | 150,195 | |
| Royal Bank of Scotland PLC | | EUR | | Purchase | | | 10/22/10 | | | | 51,475 | | | | — | |
| State Street Bank | | KRW | | Purchase | | | 10/14/10 | | | | 5,276,780 | | | | 166,780 | |
| | | MXN | | Sale | | | 12/15/10 | | | | 1,247,433 | | | | 5,817 | |
| UBS AG (London) | | BRL | | Purchase | | | 10/04/10 | | | | 9,530,362 | | | | 74,006 | |
| | | CNY | | Purchase | | | 03/17/11 | | | | 227,145 | | | | — | |
| |
| |
TOTAL | | | | | | | | | | | | | | $ | 1,076,344 | |
| |
| |
The accompanying notes are an integral part of these financial statements.
GOLDMAN SACHS EMERGING MARKETS DEBT FUND
| |
| ADDITIONAL INVESTMENT INFORMATION (continued) | |
FORWARD FOREIGN CURRENCY EXCHANGE CONTRACTS WITH UNREALIZED LOSS
| | | | | | | | | | | | | | | | | |
| | | | | Contract
| | Expiration
| | Current
| | Unrealized
|
| Counterparty | | Currency | | Type | | Date | | Value | | Loss |
| |
| Bank of America NA | | INR | | Sale | | | 10/14/10 | | | $ | 103,000 | | | $ | — | |
| Citibank NA | | EUR | | Sale | | | 12/15/10 | | | | 8,319,060 | | | | (569,508 | ) |
| | | INR | | Purchase | | | 01/18/11 | | | | 2,954,826 | | | | (14,174 | ) |
| | | KRW | | Sale | | | 10/14/10 | | | | 5,276,780 | | | | (259,867 | ) |
| Deutsche Bank AG (London) | | INR | | Sale | | | 10/14/10 | | | | 1,345,103 | | | | (45,103 | ) |
| | | MXN | | Sale | | | 12/15/10 | | | | 11,471,968 | | | | (426,262 | ) |
| HSBC Bank PLC | | BRL | | Sale | | | 10/04/10 | | | | 9,529,591 | | | | (109,656 | ) |
| | | EUR | | Sale | | | 12/15/10 | | | | 404,648 | | | | — | |
| | | IDR | | Sale | | | 10/14/10 | | | | 264,571 | | | | — | |
| | | KRW | | Sale | | | 10/14/10 | | | | 118,783 | | | | — | |
| JPMorgan Securities, Inc. | | EUR | | Sale | | | 10/22/10 | | | | 13,439,924 | | | | (845,829 | ) |
| | | IDR | | Purchase | | | 10/14/10 | | | | 1,036,973 | | | | (5,414 | ) |
| | | | | Sale | | | 10/14/10 | | | | 6,842,340 | | | | (181,321 | ) |
| Morgan Stanley & Co. | | CNY | | Purchase | | | 03/17/11 | | | | 5,881,215 | | | | (5,785 | ) |
| | | INR | | Sale | | | 10/14/10 | | | | 5,172,379 | | | | (236,032 | ) |
| | | ZAR | | Sale | | | 11/10/10 | | | | 12,464,828 | | | | (332,819 | ) |
| Royal Bank of Canada | | BRL | | Sale | | | 10/14/10 | | | | 2,680,525 | | | | (175,489 | ) |
| UBS AG (London) | | | | Sale | | | 01/18/11 | | | | 9,315,761 | | | | (62,680 | ) |
| | | MYR | | Purchase | | | 01/18/11 | | | | 2,953,770 | | | | (15,230 | ) |
| |
| |
TOTAL | | | | | | | | | | | | | | $ | (3,285,169 | ) |
| |
| |
FUTURES CONTRACTS — At September 30, 2010, the following futures contracts were open:
| | | | | | | | | | | | | | | |
| | | Number of
| | | | | | |
| | | Contracts
| | Expiration
| | Current
| | Unrealized
|
| Type | | Long (Short) | | Date | | Value | | Gain (Loss) |
| |
| Ultra Long U.S. Treasury Bonds | | | (79 | ) | | December 2010 | | $ | (11,161,219 | ) | | $ | (66,258 | ) |
| 2 Year U.S. Treasury Notes | | | 207 | | | December 2010 | | | 45,433,266 | | | | 70,846 | |
| 5 Year U.S. Treasury Notes | | | 435 | | | December 2010 | | | 52,577,227 | | | | 366,145 | |
| 10 Year U.S. Treasury Notes | | | 202 | | | December 2010 | | | 25,461,469 | | | | 364,729 | |
| 30 Year U.S. Treasury Bonds | | | 178 | | | December 2010 | | | 23,801,937 | | | | 325,816 | |
| |
| |
TOTAL | | | | | | | | | | | | $ | 1,061,278 | |
| |
| |
The accompanying notes are an integral part of these financial statements.
GOLDMAN SACHS EMERGING MARKETS DEBT FUND
Schedule of Investments (continued)
September 30, 2010 (Unaudited)
| |
| ADDITIONAL INVESTMENT INFORMATION (continued) | |
SWAP CONTRACTS — At September 30, 2010, the Fund had outstanding swap contracts with the following terms:
INTEREST RATE SWAP CONTRACTS
| | | | | | | | | | | | | | | | | |
| | | | | | | Rates Exchanged | | |
| | | Notional
| | | | Payments
| | Payments
| | |
| | | Amount
| | Termination
| | received by
| | made by
| | Unrealized
|
| Counterparty | | (000s) | | Date | | the Fund | | the Fund | | Gain (Loss)* |
| |
| Credit Suisse International (London) | | CLP | 9,500,000 | | | 09/11/12 | | | 4.210 | % | | 6 month Chilean Interbank
Camara Rate Average | | $ | (59,521 | ) |
| | | | 3,650,000 | | | 11/17/14 | | | 5.000 | | | 6 month Chilean Interbank
Camara Rate Average | | | 114,616 | |
| Deutsche Bank Securities, Inc. | | KRW | 2,601,578 | | | 07/06/11 | | | 3.620 | | | 3 month KWCDC | | | 18,607 | |
| | | | 4,346,604 | | | 07/07/11 | | | 3.626 | | | 3 month KWCDC | | | 31,253 | |
| | | CLP | 10,831,000 | | | 09/04/12 | | | 4.120 | | | 6 month Chilean Interbank
Camara Rate Average | | | (165,164 | ) |
| | | | 2,000,000 | | | 02/02/15 | | | 5.160 | | | 6 month Chilean Interbank
Camara Rate Average | | | 50,451 | |
| | | PLN | 64,300 | | | 07/14/15 | | | 5.080 | | | 6 month WIBOR | | | 222,488 | |
| | | | 40,130 | | | 09/14/15 | | | 4.930 | | | 6 month WIBOR | | | 27,140 | |
| JPMorgan Securities, Inc. | | CLP | 3,230,000 | | | 07/27/12 | | | 4.090 | | | 6 month Chilean Interbank
Camara Rate Average | | | (10,691 | ) |
| | | | 3,382,000 | | | 07/30/12 | | | 4.000 | | | 6 month Chilean Interbank
Camara Rate Average | | | (24,338 | ) |
| | | | 8,009,000 | | | 09/27/12 | | | 4.460 | | | 6 month Chilean Interbank
Camara Rate Average | | | 35,137 | |
| | | | 1,000,000 | | | 12/15/14 | | | 5.260 | | | 6 month Chilean Interbank
Camara Rate Average | | | 45,129 | |
| | | | 2,080,000 | | | 07/19/15 | | | 4.970 | | | 6 month Chilean Interbank
Camara Rate Average | | | (7,854 | ) |
| |
| |
TOTAL | | | | | | | | | | | | | | $ | 277,253 | |
| |
| |
| |
| * | There are no upfront payments on the swap contract(s), therefore, the unrealized gain (loss) of the swap contract(s) is equal to their market value. |
CREDIT DEFAULT SWAP CONTRACTS
| | | | | | | | | | | | | | | | | | | | | | | | | | | | | | | |
| | | | | | | | | | | Credit
| | | | | | |
| | | | | | | Rates
| | | | Spread at
| | | | Upfront
| | |
| | | | | Notional
| | received
| | | | September 30,
| | | | Payments
| | |
| | | Referenced
| | Amount
| | (paid) by
| | Termination
| | 2010
| | Market
| | made (received)
| | Unrealized
|
| Counterparty | | Obligation | | (000s) | | Fund | | Date | | (basis points)(a) | | Value | | by the Fund | | Gain (Loss) |
| |
Protection Sold: | | | | | | | | | | | | | | | | | | | | | | | | | | | | | | |
| JPMorgan Securities, Inc. | | | Republic of
Kazakhstan | | | $8,700 | | | 1.000% | | | | 06/20/15 | | | | 173 | | | $ | (282,261 | ) | | $ | (245,962 | ) | | $ | (36,299 | ) |
| |
| |
| |
| (a) | Credit spread on the Referenced Obligation, together with the term of the swap contract, are indicators of payment/performance risk. The likelihood of a credit event occurring which would require a fund to make a payment or otherwise be required to perform under the swap contract is generally greater as the credit spread and the term of the swap contract increase. |
The accompanying notes are an integral part of these financial statements.
GOLDMAN SACHS EMERGING MARKETS DEBT FUND
| |
| ADDITIONAL INVESTMENT INFORMATION (continued) | |
TOTAL RETURN SWAP CONTRACTS
| | | | | | | | | | | | | | | | | |
| | | Notional
| | | | | | | | |
| | | Amount
| | Reference
| | Termination
| | Financing
| | Unrealized
|
| Counterparty | | (000s) | | Security | | Date | | Fee# | | Gain (Loss)* |
| |
| Deutsche Bank Securities, Inc. | | COP | 2,560,000 | | | Titulos de Tesoreria
11.000%, 07/24/20 | | | 10/27/10 | | | Colombia Minimum
Repo Rate +0.750% | | $ | (4,414 | ) |
| | | | 1,902,000 | | | | | | 10/28/10 | | | Colombia Minimum
Repo Rate +0.750% | | | (3,394 | ) |
| |
| |
TOTAL | | | | | | | | | | | | | | $ | (7,808 | ) |
| |
| |
| |
| * | There is no upfront payment on the swaps contract(s), therefore, the unrealized gain/loss of the swap contract(s) is equal to their market value. |
| # | The Fund receives semi-annual coupon payments in accordance with the swap contract(s). On the termination date of the swap contract(s), the Fund will either receive from or pay to the counterparty an amount equal to the net of the accrued financing fees and the value of the reference security subtracted from the original notional cost (notional multiplied by the price change of the reference security, converted to U.S. Dollars). |
The accompanying notes are an integral part of these financial statements.
GOLDMAN SACHS HIGH YIELD FUND
Schedule of Investments
September 30, 2010 (Unaudited)
| | | | | | | | | | | | | | | | | |
| | | Principal
| | Interest
| | Maturity
| | |
| | | Amount | | Rate | | Date | | Value |
| |
Corporate Obligations – 92.7% |
| | | | | | | | | | | | | | | | | |
| | | | | | | | | | | | | | | | | |
| | | Aerospace – 0.5% |
| | | BE Aerospace, Inc. (BB/Ba3) |
| | | $ | 3,625,000 | | | | 8.500 | % | | | 07/01/18 | | | $ | 3,946,719 | |
| | | Esterline Technologies Corp. (BB/Ba3)(a) |
| | | | 3,500,000 | | | | 7.000 | | | | 08/01/20 | | | | 3,622,500 | |
| | | Sequa Corp. (CCC/Caa2)(a)(b) |
| | | | 5,212,055 | | | | 13.500 | | | | 12/01/15 | | | | 5,576,899 | |
| | | Spirit AeroSystems, Inc. (BB-/B1) |
| | | | 3,000,000 | | | | 7.500 | | | | 10/01/17 | | | | 3,075,000 | |
| | | TransDigm, Inc. (B-/B3) |
| | | | 11,240,000 | | | | 7.750 | | | | 07/15/14 | | | | 11,380,500 | |
| | | | | | | | | | | | | | | | | |
| | | | | | | | | | | | | | | | 27,601,618 | |
| | | |
| | | |
| | | Agriculture – 0.9% |
| | | JBS USA LLC/JBS USA Finance, Inc. (BB/B1) |
| | | | 9,250,000 | | | | 11.625 | | | | 05/01/14 | | | | 10,730,000 | |
| | | Smithfield Foods, Inc. (B+/B1)(a) |
| | | | 3,000,000 | | | | 10.000 | | | | 07/15/14 | | | | 3,442,500 | |
| | | Smithfield Foods, Inc. (B-/Caa1) |
| | | | 2,000,000 | | | | 7.000 | | | | 08/01/11 | | | | 2,070,000 | |
| | | | 12,500,000 | | | | 7.750 | | | | 05/15/13 | | | | 12,968,750 | |
| | | | 13,500,000 | | | | 7.750 | | | | 07/01/17 | | | | 13,736,250 | |
| | | Tereos Europe (BB/B1) |
| | | EUR | 4,000,000 | | | | 6.375 | | | | 04/15/14 | | | | 5,578,148 | |
| | | | | | | | | | | | | | | | | |
| | | | | | | | | | | | | | | | 48,525,648 | |
| | | |
| | | |
| | | Airlines(a) – 0.3% |
| | | Air Canada (B+/B2) |
| | | $ | 12,000,000 | | | | 9.250 | | | | 08/01/15 | | | | 12,226,380 | |
| | | Air Canada (B-/Caa1) |
| | | | 5,375,000 | | | | 12.000 | | | | 02/01/16 | | | | 5,169,578 | |
| | | | | | | | | | | | | | | | | |
| | | | | | | | | | | | | | | | 17,395,958 | |
| | | |
| | | |
| | | Automotive – 1.9% |
| | | FCE Bank PLC (BB-/Ba2) |
| | | EUR | 10,000,000 | | | | 7.125 | | | | 01/16/12 | | | | 14,106,260 | |
| | | | 4,000,000 | | | | 7.125 | | | | 01/15/13 | | | | 5,655,031 | |
| | | Ford Motor Credit Co. LLC (B+/Ba2) |
| | | $ | 3,125,000 | | | | 8.625 | | | | 11/01/10 | | | | 3,128,906 | |
| | | | 6,250,000 | | | | 7.375 | | | | 02/01/11 | | | | 6,359,375 | |
| | | | 32,125,000 | | | | 7.250 | | | | 10/25/11 | | | | 33,570,625 | |
| | | | 6,750,000 | | | | 7.000 | | | | 10/01/13 | | | | 7,222,500 | |
| | | | 19,750,000 | | | | 7.000 | | | | 04/15/15 | | | | 21,132,500 | |
| | | | 8,000,000 | | | | 12.000 | | | | 05/15/15 | | | | 10,040,000 | |
| | | Motors Liquidation Co. (NR/WR)(c) |
| | | | 7,125,000 | | | | 7.125 | | | | 07/15/13 | | | | 2,297,812 | |
| | | | 2,000,000 | | | | 7.700 | | | | 04/15/16 | | | | 615,000 | |
| | | | 1,000,000 | | | | 8.800 | (d) | | | 03/01/21 | | | | 312,500 | |
| | | EUR | 2,000,000 | | | | 8.375 | | | | 07/05/33 | | | | 913,378 | |
| | | $ | 14,500,000 | | | | 8.375 | | | | 07/15/33 | | | | 4,893,750 | |
| | | | | | | | | | | | | | | | | |
| | | | | | | | | | | | | | | | 110,247,637 | |
| | | |
| | | |
| | | Automotive Parts – 2.3% |
| | | Accuride Corp. (B/B2)(a) |
| | | | 2,000,000 | | | | 9.500 | | | | 08/01/18 | | | | 2,100,000 | |
| | | Accuride Corp. (NR/NR)(b) |
| | | | 1,584,542 | | | | 7.500 | | | | 02/26/20 | | | | 3,953,432 | |
| | | |
| | | |
| | | Allison Transmission, Inc. (CCC+/Caa2)(a) |
| | | | 4,500,000 | | | | 11.000 | | | | 11/01/15 | | | | 4,871,250 | |
| | | | 16,500,000 | | | | 11.250 | (b) | | | 11/01/15 | | | | 17,902,500 | |
| | | American Axle & Manufacturing Holdings, Inc. (BB-/Ba2)(a) |
| | | | 12,000,000 | | | | 9.250 | | | | 01/15/17 | | | | 13,170,000 | |
| | | American Axle & Manufacturing, Inc. (B-/B3) |
| | | | 3,375,000 | | | | 5.250 | | | | 02/11/14 | | | | 3,176,719 | |
| | | ArvinMeritor, Inc. (CCC/Caa1) |
| | | | 10,750,000 | | | | 10.625 | | | | 03/15/18 | | | | 11,878,750 | |
| | | Lear Corp. (BB+/Ba3) |
| | | | 1,000,000 | | | | 7.875 | | | | 03/15/18 | | | | 1,060,000 | |
| | | | 1,375,000 | | | | 8.125 | | | | 03/15/20 | | | | 1,464,375 | |
| | | Navistar International Corp. (BB-/B1) |
| | | | 9,000,000 | | | | 8.250 | | | | 11/01/21 | | | | 9,618,750 | |
| | | Pinafore LLC/Pinafore, Inc. (B+/B1)(a) |
| | | | 7,000,000 | | | | 9.000 | | | | 10/01/18 | | | | 7,332,500 | |
| | | Tenneco, Inc. (B/B2) |
| | | | 2,000,000 | | | | 8.125 | | | | 11/15/15 | | | | 2,100,000 | |
| | | Tenneco, Inc. (CCC+/Caa1) |
| | | | 3,000,000 | | | | 8.625 | | | | 11/15/14 | | | | 3,090,000 | |
| | | The Goodyear Tire & Rubber Co. (B+/B1) |
| | | | 8,625,000 | | | | 10.500 | | | | 05/15/16 | | | | 9,703,125 | |
| | | | 4,250,000 | | | | 8.250 | | | | 08/15/20 | | | | 4,451,875 | |
| | | | 6,000,000 | | | | 8.750 | | | | 08/15/20 | | | | 6,420,000 | |
| | | TRW Automotive, Inc. (BB/B2) |
| | | EUR | 5,000,000 | | | | 6.375 | | | | 03/15/14 | | | | 6,918,495 | |
| | | $ | 6,500,000 | | | | 7.000 | | | | 03/15/14 | | | | 6,906,250 | |
| | | | 3,750,000 | | | | 8.875 | | | | 12/01/17 | | | | 4,115,625 | |
| | | UCI Holdco, Inc. (CCC+/Caa1)(b)(e) |
| | | | 7,399,905 | | | | 9.250 | | | | 12/15/13 | | | | 7,177,908 | |
| | | United Components, Inc. (NR/WR) |
| | | | 5,601,000 | | | | 9.375 | | | | 06/15/13 | | | | 5,699,018 | |
| | | | | | | | | | | | | | | | | |
| | | | | | | | | | | | | | | | 133,110,572 | |
| | | |
| | | |
| | | Building Materials – 2.0% |
| | | AMH Holdings, Inc. (CCC+/Caa2)(f) |
| | | | 13,500,000 | | | | 11.250 | | | | 03/01/14 | | | | 14,040,000 | |
| | | Atrium Cos., Inc. (NR/WR)(a)(c) |
| | | | 7,801,452 | | | | 15.000 | | | | 12/15/12 | | | | 117,022 | |
| | | Calcipar SA (B+/B1)(e) |
| | | EUR | 7,521,000 | | | | 1.961 | | | | 07/01/14 | | | | 8,424,895 | |
| | | CPG International, Inc. (B-/Caa1) |
| | | $ | 5,500,000 | | | | 10.500 | | | | 07/01/13 | | | | 5,555,000 | |
| | | Grohe Holding GMBH (B-/B3)(e) |
| | | EUR | 13,000,000 | | | | 3.710 | | | | 01/15/14 | | | | 16,348,779 | |
| | | Grohe Holding GMBH (CCC/Caa1) |
| | | | 24,500,000 | | | | 8.625 | | | | 10/01/14 | | | | 33,650,130 | |
| | | Heating Finance PLC (B/B2) |
| | | GBP | 2,000,000 | | | | 7.875 | | | | 03/31/14 | | | | 3,110,381 | |
| | | HeidelbergCement AG (BB-/B1) |
| | | EUR | 3,500,000 | | | | 8.000 | | | | 01/31/17 | | | | 5,047,002 | |
| | | | 3,250,000 | | | | 7.500 | | | | 04/03/20 | | | | 4,462,947 | |
| | | Nortek, Inc. (NR/NR) |
| | | $ | 4,017,777 | | | | 11.000 | | | | 12/01/13 | | | | 4,278,933 | |
| | | PLY Gem Industries, Inc. (B-/Caa1) |
| | | | 10,500,000 | | | | 11.750 | | | | 06/15/13 | | | | 11,208,750 | |
| | | |
| | | |
The accompanying notes are an integral part of these financial statements.
GOLDMAN SACHS HIGH YIELD FUND
| | | | | | | | | | | | | | | | | |
| | | Principal
| | Interest
| | Maturity
| | |
| | | Amount | | Rate | | Date | | Value |
| |
Corporate Obligations – (continued) |
| | | Building Materials – (continued) |
| | | | | | | | | | | | | | | | | |
| | | USG Corp. (B+/Caa2) |
| | | $ | 3,000,000 | | | | 6.300 | % | | | 11/15/16 | | | $ | 2,610,000 | |
| | | USG Corp. (BB/B2)(a) |
| | | | 3,250,000 | | | | 9.750 | | | | 08/01/14 | | | | 3,375,937 | |
| | | | | | | | | | | | | | | | | |
| | | | | | | | | | | | | | | | 112,229,776 | |
| | | |
| | | |
| | | Capital Goods – 2.1% |
| | | Altra Holdings, Inc. (B+/B1) |
| | | | 5,000,000 | | | | 8.125 | | | | 12/01/16 | | | | 5,200,000 | |
| | | Amsted Industries, Inc. (BB-/B1)(a) |
| | | | 6,000,000 | | | | 8.125 | | | | 03/15/18 | | | | 6,270,000 | |
| | | Baldor Electric Co. (B/B3) |
| | | | 14,500,000 | | | | 8.625 | | | | 02/15/17 | | | | 15,515,000 | |
| | | Mueller Water Products, Inc. (B+/B1)(a) |
| | | | 2,625,000 | | | | 8.750 | | | | 09/01/20 | | | | 2,782,500 | |
| | | Mueller Water Products, Inc. (CCC+/B3) |
| | | | 11,520,000 | | | | 7.375 | | | | 06/01/17 | | | | 10,137,600 | |
| | | RBS Global, Inc. (CCC+/Caa2) |
| | | | 17,500,000 | | | | 11.750 | | | | 08/01/16 | | | | 18,900,000 | |
| | | RBS Global, Inc./Rexnord LLC (B-/Caa1) |
| | | | 26,000,000 | | | | 8.500 | | | | 05/01/18 | | | | 26,422,500 | |
| | | SPX Corp. (BB+/Ba1) |
| | | | 1,000,000 | | | | 7.625 | | | | 12/15/14 | | | | 1,097,500 | |
| | | Standard Steel LLC/Standard Steel Finance Corp. (B/Caa1)(a) |
| | | | 5,000,000 | | | | 12.000 | | | | 05/01/15 | | | | 5,200,000 | |
| | | Terex Corp. (B/Caa1) |
| | | | 7,875,000 | | | | 8.000 | | | | 11/15/17 | | | | 7,875,000 | |
| | | Terex Corp. (BB-/B2) |
| | | | 12,375,000 | | | | 10.875 | | | | 06/01/16 | | | | 14,138,437 | |
| | | VAC Finanzierung GMBH (B-/Caa2) |
| | | EUR | 4,000,000 | | | | 9.250 | | | | 04/15/16 | | | | 4,035,221 | |
| | | | | | | | | | | | | | | | | |
| | | | | | | | | | | | | | | | 117,573,758 | |
| | | |
| | | |
| | | Chemicals – 2.7% |
| | | CF Industries, Inc. (BB+/B1) |
| | | $ | 3,250,000 | | | | 6.875 | | | | 05/01/18 | | | | 3,493,750 | |
| | | | 875,000 | | | | 7.125 | | | | 05/01/20 | | | | 954,844 | |
| | | Cognis GMBH (B/B2)(e) |
| | | EUR | 12,250,000 | | | | 2.879 | | | | 09/15/13 | | | | 16,574,568 | |
| | | Cognis GMBH (CCC+/Caa2) |
| | | | 1,625,000 | | | | 9.500 | | | | 05/15/14 | | | | 2,286,605 | |
| | | Hexion U.S. Finance Corp./Hexion Nova Scotia Finance ULC (CCC+/B3) |
| | | $ | 10,750,000 | | | | 8.875 | | | | 02/01/18 | | | | 10,481,250 | |
| | | Hexion U.S. Finance Corp./Hexion Nova Scotia Finance ULC (CCC+/Caa1) |
| | | | 6,750,000 | | | | 9.750 | | | | 11/15/14 | | | | 6,969,375 | |
| | | Huntsman International LLC (B-/B3) |
| | | EUR | 2,500,000 | | | | 6.875 | | | | 11/15/13 | | | | 3,493,329 | |
| | | $ | 6,000,000 | | | | 7.875 | | | | 11/15/14 | | | | 6,225,000 | |
| | | | 4,000,000 | | | | 8.625 | | | | 03/15/20 | | | | 4,160,000 | |
| | | Invista (BB-/Ba3)(a) |
| | | | 770,000 | | | | 9.250 | | | | 05/01/12 | | | | 780,588 | |
| | | KRATON Polymers LLC (B-/B3) |
| | | | 8,225,000 | | | | 8.125 | | | | 01/15/14 | | | | 8,307,250 | |
| | | LBI Escrow Corp. (BB/Ba3)(a) |
| | | | 1,000,000 | | | | 8.000 | | | | 11/01/17 | | | | 1,091,250 | |
| | | |
| | | |
| | | Lyondell Chemical Co. (B/B3) |
| | | | 7,994,086 | | | | 11.000 | | | | 05/01/18 | | | | 8,833,465 | |
| | | MacDermid, Inc. (CCC/Caa2)(a) |
| | | | 7,750,000 | | | | 9.500 | | | | 04/15/17 | | | | 8,098,750 | |
| | | Momentive Performance Materials, Inc. (CCC-/B2) |
| | | | 5,541,000 | | | | 12.500 | | | | 06/15/14 | | | | 6,261,330 | |
| | | Momentive Performance Materials, Inc. (CCC-/Caa1) |
| | | EUR | 3,750,000 | | | | 9.000 | | | | 12/01/14 | | | | 5,061,067 | |
| | | $ | 5,000,000 | | | | 9.750 | | | | 12/01/14 | | | | 5,125,000 | |
| | | | 678,628 | | | | 10.125 | (b) | | | 12/01/14 | | | | 688,807 | |
| | | Momentive Performance Materials, Inc. (CCC-/Caa2) |
| | | | 2,310,000 | | | | 11.500 | | | | 12/01/16 | | | | 2,315,775 | |
| | | Nalco Co. (B/B2) |
| | | EUR | 11,500,000 | | | | 9.000 | | | | 11/15/13 | | | | 15,951,733 | |
| | | OXEA Finance/Cy SCA (B+/B2)(a) |
| | | $ | 4,875,000 | | | | 9.500 | | | | 07/15/17 | | | | 5,261,741 | |
| | | Rockwood Specialties Group, Inc. (B/B3) |
| | | EUR | 21,810,000 | | | | 7.625 | | | | 11/15/14 | | | | 30,327,139 | |
| | | SPCM SA (BB-/B3)(a) |
| | | | 2,375,000 | | | | 8.250 | | | | 06/15/17 | | | | 3,318,662 | |
| | | | | | | | | | | | | | | | | |
| | | | | | | | | | | | | | | | 156,061,278 | |
| | | |
| | | |
| | | Conglomerates – 0.6% |
| | | Park-Ohio Industries, Inc. (CCC+/Caa1) |
| | | $ | 5,000,000 | | | | 8.375 | | | | 11/15/14 | | | | 4,875,000 | |
| | | Polypore, Inc. (B-/B3) |
| | | | 4,000,000 | | | | 8.750 | | | | 05/15/12 | | | | 4,010,000 | |
| | | EUR | 12,500,000 | | | | 8.750 | | | | 05/15/12 | | | | 17,040,629 | |
| | | TriMas Corp. (B-/B3)(a) |
| | | $ | 9,000,000 | | | | 9.750 | | | | 12/15/17 | | | | 9,517,500 | |
| | | | | | | | | | | | | | | | | |
| | | | | | | | | | | | | | | | 35,443,129 | |
| | | |
| | | |
| | | Construction Machinery – 0.5% |
| | | Case New Holland, Inc. (BB+/Ba3) |
| | | | 1,500,000 | | | | 7.750 | | | | 09/01/13 | | | | 1,631,250 | |
| | | | 8,875,000 | | | | 7.875 | (a) | | | 12/01/17 | | | | 9,718,125 | |
| | | CNH America LLC (BB+/Ba3) |
| | | | 953,000 | | | | 7.250 | | | | 01/15/16 | | | | 1,019,710 | |
| | | Dresser-Rand Group, Inc. (BB-/B1) |
| | | | 10,106,000 | | | | 7.375 | | | | 11/01/14 | | | | 10,207,060 | |
| | | The Manitowoc Co., Inc. (B+/Caa1) |
| | | | 5,000,000 | | | | 9.500 | | | | 02/15/18 | | | | 5,175,000 | |
| | | | | | | | | | | | | | | | | |
| | | | | | | | | | | | | | | | 27,751,145 | |
| | | |
| | | |
| | | Consumer Products – Household & Leisure – 1.6% |
| | | Affinion Group, Inc. (B-/B3) |
| | | | 6,250,000 | | | | 10.125 | | | | 10/15/13 | | | | 6,421,875 | |
| | | Affinion Group, Inc. (B-/Caa1) |
| | | | 5,250,000 | | | | 11.500 | | | | 10/15/15 | | | | 5,538,750 | |
| | | | 5,375,000 | | | | 11.625 | (a) | | | 11/15/15 | | | | 5,297,062 | |
| | | Ames True Temper (NR/WR)(e) |
| | | | 2,000,000 | | | | 4.526 | | | | 01/15/12 | | | | 1,990,000 | |
| | | Central Garden & Pet Co. (B/B2) |
| | | | 5,500,000 | | | | 8.250 | | | | 03/01/18 | | | | 5,610,000 | |
| | | Easton-Bell Sports, Inc. (CCC+/B3) |
| | | | 3,125,000 | | | | 9.750 | | | | 12/01/16 | | | | 3,394,531 | |
| | | |
| | | |
The accompanying notes are an integral part of these financial statements.
GOLDMAN SACHS HIGH YIELD FUND
Schedule of Investments (continued)
September 30, 2010 (Unaudited)
| | | | | | | | | | | | | | | | | |
| | | Principal
| | Interest
| | Maturity
| | |
| | | Amount | | Rate | | Date | | Value |
| |
Corporate Obligations – (continued) |
| | | Consumer Products – Household & Leisure – (continued) |
| | | | | | | | | | | | | | | | | |
| | | Elizabeth Arden, Inc. (B/B1) |
| | | $ | 3,645,000 | | | | 7.750 | % | | | 01/15/14 | | | $ | 3,672,337 | |
| | | FGI Holding Co., Inc. (B-/B3)(a)(b) |
| | | | 875,000 | | | | 11.250 | | | | 10/01/15 | | | | 837,813 | |
| | | Freedom Group, Inc. (B/Ba3)(a) |
| | | | 7,250,000 | | | | 10.250 | | | | 08/01/15 | | | | 7,675,937 | |
| | | Harry & David Holdings, Inc. (CCC-/Ca) |
| | | | 2,000,000 | | | | 9.000 | | | | 03/01/13 | | | | 1,340,000 | |
| | | Jarden Corp. (B/B1) |
| | | | 7,750,000 | | | | 7.500 | | | | 05/01/17 | | | | 8,021,250 | |
| | | | 1,875,000 | | | | 7.500 | | | | 01/15/20 | | | | 1,945,313 | |
| | | Jarden Corp. (BB-/Ba3) |
| | | | 2,375,000 | | | | 8.000 | | | | 05/01/16 | | | | 2,535,313 | |
| | | Sealy Mattress Co. (BB-/Ba3)(a) |
| | | | 1,350,000 | | | | 10.875 | | | | 04/15/16 | | | | 1,518,750 | |
| | | Sealy Mattress Co. (CCC+/Caa1) |
| | | | 13,500,000 | | | | 8.250 | | | | 06/15/14 | | | | 13,466,250 | |
| | | Solo Cup Co. (CCC+/Caa2) |
| | | | 6,000,000 | | | | 8.500 | | | | 02/15/14 | | | | 5,130,000 | |
| | | Spectrum Brands Holdings, Inc. (B/B2)(a) |
| | | | 10,250,000 | | | | 9.500 | | | | 06/15/18 | | | | 11,044,375 | |
| | | Spectrum Brands Holdings, Inc. (CCC+/Caa1)(b) |
| | | | 5,085,308 | | | | 12.000 | | | | 08/28/19 | | | | 5,657,405 | |
| | | | | | | | | | | | | | | | | |
| | | | | | | | | | | | | | | | 91,096,961 | |
| | | |
| | | |
| | | Consumer Products – Industrial – 0.0% |
| | | JohnsonDiversey, Inc. (B-/B3) |
| | | | 2,500,000 | | | | 8.250 | | | | 11/15/19 | | | | 2,662,500 | |
| | | |
| | | |
| | | Consumer Products – Non Durable – 1.1% |
| | | Belvedere SA (NR/WR)(c) |
| | | EUR | 4,500,000 | | | | 0.000 | | | | 05/15/13 | | | | 1,042,887 | |
| | | Constellation Brands, Inc. (BB/Ba3) |
| | | $ | 3,875,000 | | | | 8.375 | | | | 12/15/14 | | | | 4,243,125 | |
| | | | 6,000,000 | | | | 7.250 | | | | 09/01/16 | | | | 6,360,000 | |
| | | | 10,000,000 | | | | 7.250 | | | | 05/15/17 | | | | 10,600,000 | |
| | | Prestige Brands, Inc. (B+/B3) |
| | | | 1,750,000 | | | | 8.250 | | | | 04/01/18 | | | | 1,811,250 | |
| | | Sally Holdings LLC (B/Caa1) |
| | | | 16,000,000 | | | | 10.500 | | | | 11/15/16 | | | | 17,360,000 | |
| | | Sally Holdings LLC (BB-/B3) |
| | | | 14,250,000 | | | | 9.250 | | | | 11/15/14 | | | | 14,891,250 | |
| | | Yankee Acquisition Corp. (B-/B3) |
| | | | 7,500,000 | | | | 8.500 | | | | 02/15/15 | | | | 7,706,250 | |
| | | Yankee Acquisition Corp. (CCC+/Caa1) |
| | | | 875,000 | | | | 9.750 | | | | 02/15/17 | | | | 905,625 | |
| | | | | | | | | | | | | | | | | |
| | | | | | | | | | | | | | | | 64,920,387 | |
| | | |
| | | |
| | | Defense – 0.6% |
| | | Alliant Techsystems, Inc. (BB-/Ba3) |
| | | | 6,250,000 | | | | 6.750 | | | | 04/01/16 | | | | 6,406,250 | |
| | | Communications & Power Industries, Inc. (B-/B3) |
| | | | 2,000,000 | | | | 8.000 | | | | 02/01/12 | | | | 1,997,500 | |
| | | DynCorp International, Inc. (B/B1)(a) |
| | | | 1,250,000 | | | | 10.375 | | | | 07/01/17 | | | | 1,243,750 | |
| | | |
| | | |
| | | L-3 Communications Corp. (BB+/Ba1) |
| | | | 9,000,000 | | | | 5.875 | | | | 01/15/15 | | | | 9,180,000 | |
| | | | 14,625,000 | | | | 6.375 | | | | 10/15/15 | | | | 15,063,750 | |
| | | | | | | | | | | | | | | | | |
| | | | | | | | | | | | | | | | 33,891,250 | |
| | | |
| | | |
| | | Emerging Markets(a) – 1.2% |
| | | Cemex Finance LLC (B/NR) |
| | | | 15,000,000 | | | | 9.500 | | | | 12/14/16 | | | | 15,094,439 | |
| | | Digicel Group Ltd. (NR/Caa1) |
| | | | 23,250,000 | | | | 8.875 | | | | 01/15/15 | | | | 23,656,875 | |
| | | | 7,071,000 | | | | 9.125 | (b) | | | 01/15/15 | | | | 7,221,259 | |
| | | | 6,000,000 | | | | 10.500 | | | | 04/15/18 | | | | 6,570,000 | |
| | | Digicel Ltd. (NR/B1) |
| | | | 3,875,000 | | | | 12.000 | | | | 04/01/14 | | | | 4,485,313 | |
| | | Orascom Telecom Finance SCA (CCC/Caa1) |
| | | | 14,000,000 | | | | 7.875 | | | | 02/08/14 | | | | 13,475,000 | |
| | | | | | | | | | | | | | | | | |
| | | | | | | | | | | | | | | | 70,502,886 | |
| | | |
| | | |
| | | Energy – Coal – 0.7% |
| | | Cloud Peak Energy Resources LLC/Cloud Peak Energy Finance Corp. (NR/B1) |
| | | | 2,125,000 | | | | 8.250 | | | | 12/15/17 | | | | 2,244,531 | |
| | | Foresight Energy LLC/Foresight Energy Corp. (B/Caa1)(a) |
| | | | 12,875,000 | | | | 9.625 | | | | 08/15/17 | | | | 13,325,625 | |
| | | Foundation PA Coal Co. LLC (BB/Ba3) |
| | | | 1,500,000 | | | | 7.250 | | | | 08/01/14 | | | | 1,533,750 | |
| | | Peabody Energy Corp. (BB+/Ba1) |
| | | | 1,000,000 | | | | 5.875 | | | | 04/15/16 | | | | 1,012,500 | |
| | | | 16,500,000 | | | | 7.375 | | | | 11/01/16 | | | | 18,273,750 | |
| | | Penn Virginia Resource Partners LP/Penn Virginia Resource Finance Corp. (B/B2) |
| | | | 2,375,000 | | | | 8.250 | | | | 04/15/18 | | | | 2,446,250 | |
| | | | | | | | | | | | | | | | | |
| | | | | | | | | | | | | | | | 38,836,406 | |
| | | |
| | | |
| | | Energy – Exploration & Production – 5.0% |
| | | Antero Resources Finance Corp. (B/Caa1) |
| | | | 1,875,000 | | | | 9.375 | | | | 12/01/17 | | | | 1,992,188 | |
| | | Chesapeake Energy Corp. (BB/Ba3) |
| | | | 10,500,000 | | | | 9.500 | | | | 02/15/15 | | | | 12,140,625 | |
| | | EUR | 4,500,000 | | | | 6.250 | | | | 01/15/17 | | | | 6,195,973 | |
| | | $ | 12,875,000 | | | | 6.500 | | | | 08/15/17 | | | | 13,309,531 | |
| | | | 2,000,000 | | | | 6.875 | | | | 08/15/18 | | | | 2,100,000 | |
| | | | 6,250,000 | | | | 7.250 | | | | 12/15/18 | | | | 6,718,750 | |
| | | | 2,000,000 | | | | 6.625 | | | | 08/15/20 | | | | 2,090,000 | |
| | | Cimarex Energy Co. (BB/Ba3) |
| | | | 6,000,000 | | | | 7.125 | | | | 05/01/17 | | | | 6,300,000 | |
| | | Comstock Resources, Inc. (B/B2) |
| | | | 11,250,000 | | | | 8.375 | | | | 10/15/17 | | | | 11,531,250 | |
| | | CONSOL Energy, Inc. (BB/B1)(a) |
| | | | 7,750,000 | | | | 8.000 | | | | 04/01/17 | | | | 8,389,375 | |
| | | | 6,875,000 | | | | 8.250 | | | | 04/01/20 | | | | 7,493,750 | |
| | | Continental Resources, Inc. (BB/B1)(a) |
| | | | 2,125,000 | | | | 7.375 | | | | 10/01/20 | | | | 2,231,250 | |
| | | Denbury Resources, Inc. (BB/B1) |
| | | | 1,375,000 | | | | 9.750 | | | | 03/01/16 | | | | 1,543,438 | |
| | | Encore Acquisition Co. (NR/B1) |
| | | | 5,250,000 | | | | 9.500 | | | | 05/01/16 | | | | 5,880,000 | |
| | | |
| | | |
The accompanying notes are an integral part of these financial statements.
GOLDMAN SACHS HIGH YIELD FUND
| | | | | | | | | | | | | | | | | |
| | | Principal
| | Interest
| | Maturity
| | |
| | | Amount | | Rate | | Date | | Value |
| |
Corporate Obligations – (continued) |
| | | Energy – Exploration & Production – (continued) |
| | | | | | | | | | | | | | | | | |
| | | EXCO Resources, Inc. (B/B3) |
| | | $ | 3,000,000 | | | | 7.250 | % | | | 01/15/11 | | | $ | 2,996,250 | |
| | | | 1,500,000 | | | | 7.500 | | | | 09/15/18 | | | | 1,486,875 | |
| | | Forest Oil Corp. (B+/B1) |
| | | | 10,125,000 | | | | 8.500 | | | | 02/15/14 | | | | 11,036,250 | |
| | | Harvest Operations Corp. (BB-/Ba1)(a) |
| | | | 1,375,000 | | | | 6.875 | | | | 10/01/17 | | | | 1,402,500 | |
| | | Newfield Exploration Co. (BB+/Ba3) |
| | | | 5,125,000 | | | | 6.625 | | | | 09/01/14 | | | | 5,240,312 | |
| | | | 12,750,000 | | | | 6.625 | | | | 04/15/16 | | | | 13,260,000 | |
| | | | 7,625,000 | | | | 7.125 | | | | 05/15/18 | | | | 8,139,687 | |
| | | | 6,500,000 | | | | 6.875 | | | | 02/01/20 | | | | 6,857,500 | |
| | | NFR Energy LLC/NFR Energy Finance Corp. (B/Caa1)(a) |
| | | | 14,750,000 | | | | 9.750 | | | | 02/15/17 | | | | 14,676,250 | |
| | | OPTI Canada, Inc. (B-/Caa3) |
| | | | 7,500,000 | | | | 7.875 | | | | 12/15/14 | | | | 5,625,000 | |
| | | Pioneer Drilling Co. (B/B3)(a) |
| | | | 5,250,000 | | | | 9.875 | | | | 03/15/18 | | | | 5,368,125 | |
| | | Pioneer Natural Resources Co. (BB+/Ba1) |
| | | | 2,750,000 | | | | 5.875 | | | | 07/15/16 | | | | 2,826,662 | |
| | | | 4,000,000 | | | | 6.650 | | | | 03/15/17 | | | | 4,256,298 | |
| | | Pioneer Natural Resources Co. (BB+/NR)(d) |
| | | | 20,533,000 | | | | 2.875 | | | | 01/15/38 | | | | 25,752,489 | |
| | | Plains Exploration & Production Co. (BB-/B1) |
| | | | 8,250,000 | | | | 7.750 | | | | 06/15/15 | | | | 8,641,875 | |
| | | | 2,250,000 | | | | 10.000 | | | | 03/01/16 | | | | 2,553,750 | |
| | | | 9,000,000 | | | | 7.000 | | | | 03/15/17 | | | | 9,202,500 | |
| | | | 5,000,000 | | | | 7.625 | | | | 06/01/18 | | | | 5,262,500 | |
| | | | 2,000,000 | | | | 8.625 | | | | 10/15/19 | | | | 2,190,000 | |
| | | | 7,250,000 | | | | 7.625 | | | | 04/01/20 | | | | 7,576,250 | |
| | | Quicksilver Resources, Inc. (B+/B2) |
| | | | 2,750,000 | | | | 8.250 | | | | 08/01/15 | | | | 2,908,125 | |
| | | | 9,500,000 | | | | 11.750 | | | | 01/01/16 | | | | 11,115,000 | |
| | | Quicksilver Resources, Inc. (B-/B3) |
| | | | 7,375,000 | | | | 7.125 | | | | 04/01/16 | | | | 7,282,812 | |
| | | Range Resources Corp. (BB/Ba3) |
| | | | 4,250,000 | | | | 6.375 | | | | 03/15/15 | | | | 4,324,375 | |
| | | | 8,625,000 | | | | 8.000 | | | | 05/15/19 | | | | 9,444,375 | |
| | | SandRidge Energy, Inc. (B+/B3)(a) |
| | | | 6,625,000 | | | | 9.875 | | | | 05/15/16 | | | | 6,873,437 | |
| | | | 2,500,000 | | | | 8.000 | | | | 06/01/18 | | | | 2,450,000 | |
| | | | 875,000 | | | | 8.750 | | | | 01/15/20 | | | | 868,438 | |
| | | Stone Energy Corp. (BB-/Caa1) |
| | | | 4,250,000 | | | | 8.625 | | | | 02/01/17 | | | | 4,165,000 | |
| | | Whiting Petroleum Corp. (BB/Ba3) |
| | | | 4,000,000 | | | | 7.000 | | | | 02/01/14 | | | | 4,220,000 | |
| | | | 875,000 | | | | 6.500 | | | | 10/01/18 | | | | 892,500 | |
| | | | | | | | | | | | | | | | | |
| | | | | | | | | | | | | | | | 286,811,265 | |
| | | |
| | | |
| | | Energy – Refining – 0.0% |
| | | Tesoro Corp. (BB+/Ba1) |
| | | | 2,250,000 | | | | 9.750 | | | | 06/01/19 | | | | 2,463,750 | |
| | | |
| | | |
| | | Energy – Services – 0.8% |
| | | Aquilex Holdings LLC/Aquilex Finance Corp. (B-/B3) |
| | | | 3,000,000 | | | | 11.125 | | | | 12/15/16 | | | | 2,970,000 | |
| | | CHC Helicopter SA (B+/B1)(a) |
| | | | 12,000,000 | | | | 9.250 | | | | 10/15/20 | | | | 12,040,255 | |
| | | Compagnie Generale de Geophysique-Veritas (BB-/Ba3) |
| | | | 3,250,000 | | | | 7.500 | | | | 05/15/15 | | | | 3,302,813 | |
| | | | 2,500,000 | | | | 9.500 | | | | 05/15/16 | | | | 2,699,350 | |
| | | Expro Finance Luxembourg SCA (B+/B2)(a) |
| | | | 15,625,000 | | | | 8.500 | | | | 12/15/16 | | | | 14,784,666 | |
| | | Key Energy Services, Inc. (BB-/B1) |
| | | | 6,875,000 | | | | 8.375 | | | | 12/01/14 | | | | 7,253,125 | |
| | | | | | | | | | | | | | | | | |
| | | | | | | | | | | | | | | | 43,050,209 | |
| | | |
| | | |
| | | Entertainment & Leisure – 1.6% |
| | | Cedar Fair LP/Canada’s Wonderland Co./Magnum Management Corp. (B-/B2)(a) |
| | | | 6,625,000 | | | | 9.125 | | | | 08/01/18 | | | | 6,989,375 | |
| | | GWR Operating Partnership LLP (BB-/B3)(a) |
| | | | 8,000,000 | | | | 10.875 | | | | 04/01/17 | | | | 8,240,000 | |
| | | HRP Myrtle Beach Operations LLC (NR/WR)(a)(c) |
| | | | 1,750,000 | | | | 0.000 | | | | 04/01/12 | | | | 175 | |
| | | MU Finance PLC (NR/NR)(a) |
| | | | 8,500,000 | | | | 8.375 | | | | 02/01/17 | | | | 8,330,000 | |
| | | GBP | 19,625,000 | | | | 8.750 | | | | 02/01/17 | | | | 29,749,889 | |
| | | Regal Cinemas Corp. (B-/B2) |
| | | $ | 1,500,000 | | | | 8.625 | | | | 07/15/19 | | | | 1,571,250 | |
| | | Universal City Development Partners Ltd. (CCC+/B3) |
| | | | 11,000,000 | | | | 8.875 | | | | 11/15/15 | | | | 11,343,750 | |
| | | | 4,750,000 | | | | 10.875 | | | | 11/15/16 | | | | 5,141,875 | |
| | | WMG Acquisition Corp. (B/B1) |
| | | | 7,750,000 | | | | 7.375 | | | | 04/15/14 | | | | 7,285,000 | |
| | | WMG Acquisition Corp. (BB/Ba2) |
| | | | 8,250,000 | | | | 9.500 | | | | 06/15/16 | | | | 8,827,500 | |
| | | WMG Holdings Corp. (B/B1)(f) |
| | | | 5,000,000 | | | | 9.500 | | | | 12/15/14 | | | | 4,800,000 | |
| | | | | | | | | | | | | | | | | |
| | | | | | | | | | | | | | | | 92,278,814 | |
| | | |
| | | |
| | | Environmental – 0.0% |
| | | WCA Waste Corp. (B-/B3) |
| | | | 2,500,000 | | | | 9.250 | | | | 06/15/14 | | | | 2,550,000 | |
| | | |
| | | |
| | | Finance – 8.0% |
| | | Ally Credit Canada Ltd. (B/B3) |
| | | GBP | 500,000 | | | | 6.625 | | | | 12/17/10 | | | | 784,658 | |
| | | Ally Financial, Inc. (B/B3) |
| | | $ | 20,000,000 | | | | 7.250 | | | | 03/02/11 | | | | 20,325,000 | |
| | | | 2,652,000 | | | | 5.375 | | | | 06/06/11 | | | | 2,671,890 | |
| | | | 41,750,000 | | | | 6.875 | | | | 09/15/11 | | | | 43,106,875 | |
| | | | 7,500,000 | | | | 6.625 | | | | 05/15/12 | | | | 7,771,875 | |
| | | | 8,000,000 | | | | 6.875 | | | | 08/28/12 | | | | 8,320,000 | |
| | | | 7,000,000 | | | | 6.750 | | | | 12/01/14 | | | | 7,280,000 | |
| | | | 10,000,000 | | | | 8.300 | (a) | | | 02/12/15 | | | | 10,925,000 | |
| | | | 9,000,000 | | | | 8.000 | | | | 11/01/31 | | | | 9,630,000 | |
| | | American General Finance Corp. (B/B3) |
| | | | 2,000,000 | | | | 5.200 | | | | 12/15/11 | | | | 1,945,000 | |
| | | | 13,625,000 | | | | 4.875 | | | | 07/15/12 | | | | 12,841,563 | |
| | | | 10,000,000 | | | | 5.375 | | | | 10/01/12 | | | | 9,450,000 | |
| | | |
| | | |
The accompanying notes are an integral part of these financial statements.
GOLDMAN SACHS HIGH YIELD FUND
Schedule of Investments (continued)
September 30, 2010 (Unaudited)
| | | | | | | | | | | | | | | | | |
| | | Principal
| | Interest
| | Maturity
| | |
| | | Amount | | Rate | | Date | | Value |
| |
Corporate Obligations – (continued) |
| | | Finance – (continued) |
| | | | | | | | | | | | | | | | | |
| | | American International Group, Inc. (BBB/Ba2)(e) |
| | | $ | 9,375,000 | | | | 8.175 | % | | | 05/15/58 | | | $ | 9,328,125 | |
| | | CIT Group, Inc. (B+/B3) |
| | | | 5,970,706 | | | | 7.000 | | | | 05/01/13 | | | | 6,008,023 | |
| | | | 14,662,603 | | | | 7.000 | | | | 05/01/14 | | | | 14,625,946 | |
| | | | 36,300,103 | | | | 7.000 | | | | 05/01/15 | | | | 36,027,852 | |
| | | | 25,405,214 | | | | 7.000 | | | | 05/01/16 | | | | 25,024,136 | |
| | | | 27,391,189 | | | | 7.000 | | | | 05/01/17 | | | | 26,843,365 | |
| | | ETrade Financial Corp. (CCC+/B3) |
| | | | 5,750,000 | | | | 7.375 | | | | 09/15/13 | | | | 5,606,250 | |
| | | GE Capital Trust II (A+/Aa3)(e) |
| | | EUR | 16,750,000 | | | | 5.500 | | | | 09/15/67 | | | | 19,791,398 | |
| | | GE Capital Trust IV (A+/Aa3)(e) |
| | | | 10,125,000 | | | | 4.625 | | | | 09/15/66 | | | | 11,353,386 | |
| | | Ally Credit Canada Ltd. (B/B3) |
| | | | 4,000,000 | | | | 6.000 | | | | 05/23/12 | | | | 5,562,061 | |
| | | International Lease Finance Corp. (BB+/B1) |
| | | $ | 3,125,000 | | | | 5.250 | | | | 01/10/13 | | | | 3,078,125 | |
| | | | 24,686,000 | | | | 6.375 | | | | 03/25/13 | | | | 24,747,715 | |
| | | | 4,445,000 | | | | 5.875 | | | | 05/01/13 | | | | 4,433,888 | |
| | | | 17,410,000 | | | | 5.625 | | | | 09/20/13 | | | | 17,061,800 | |
| | | | 13,635,000 | | | | 6.625 | | | | 11/15/13 | | | | 13,669,087 | |
| | | | 4,000,000 | | | | 8.625 | (a) | | | 09/15/15 | | | | 4,310,000 | |
| | | | 10,500,000 | | | | 8.750 | (a) | | | 03/15/17 | | | | 11,366,250 | |
| | | | 2,250,000 | | | | 8.875 | | | | 09/01/17 | | | | 2,435,625 | |
| | | International Lease Finance Corp. (BBB-/Ba3)(a) |
| | | | 1,000,000 | | | | 6.750 | | | | 09/01/16 | | | | 1,072,500 | |
| | | | 1,000,000 | | | | 7.125 | | | | 09/01/18 | | | | 1,075,000 | |
| | | Lloyds Banking Group PLC (C/B3)(a)(c)(e) |
| | | | 21,000,000 | | | | 5.920 | | | | 10/01/49 | | | | 14,966,537 | |
| | | | 13,000,000 | | | | 6.413 | | | | 10/01/49 | | | | 9,265,067 | |
| | | | 10,900,000 | | | | 6.267 | | | | 11/14/49 | | | | 7,716,592 | |
| | | National Money Mart Co. (B+/B2) |
| | | | 13,500,000 | | | | 10.375 | | | | 12/15/16 | | | | 14,377,500 | |
| | | NCO Group, Inc. (CCC/Caa2) |
| | | | 7,250,000 | | | | 11.875 | | | | 11/15/14 | | | | 6,506,875 | |
| | | SLM Corp. (BBB-/Ba1) |
| | | EUR | 1,625,000 | | | | 1.079 | (e) | | | 12/15/10 | | | | 2,182,053 | |
| | | GBP | 3,000,000 | | | | 5.375 | | | | 12/15/10 | | | | 4,665,571 | |
| | | Wells Fargo Capital XIII (A-/Ba1)(e) |
| | | $ | 16,125,000 | | | | 7.700 | | | | 03/26/49 | | | | 16,669,219 | |
| | | | | | | | | | | | | | | | | |
| | | | | | | | | | | | | | | | 454,821,807 | |
| | | |
| | | |
| | | Finance Insurance(a) – 0.2% |
| | | HUB International Holdings, Inc. (CCC+/B3) |
| | | | 9,250,000 | | | | 9.000 | | | | 12/15/14 | | | | 9,134,375 | |
| | | |
| | | |
| | | Food – 1.6% |
| | | Dean Foods Co. (B/B2) |
| | | | 14,375,000 | | | | 7.000 | | | | 06/01/16 | | | | 14,087,500 | |
| | | Del Monte Corp. (BB/Ba3) |
| | | | 1,500,000 | | | | 6.750 | | | | 02/15/15 | | | | 1,541,250 | |
| | | | 6,750,000 | | | | 7.500 | | | | 10/15/19 | | | | 7,256,250 | |
| | | Dole Food Co., Inc. (B+/B2) |
| | | | 9,000,000 | | | | 13.875 | | | | 03/15/14 | | | | 10,890,000 | |
| | | Foodcorp Ltd. (B-/B2) |
| | | EUR | 6,500,000 | | | | 8.875 | | | | 06/15/12 | | | | 8,994,044 | |
| | | |
| | | |
| | | Pinnacle Foods Finance LLC (CCC+/B3) |
| | | | 20,500,000 | | | | 9.250 | | | | 04/01/15 | | | | 21,320,000 | |
| | | Pinnacle Foods Finance LLC (CCC+/Caa1) |
| | | | 13,000,000 | | | | 10.625 | | | | 04/01/17 | | | | 13,845,000 | |
| | | TreeHouse Foods, Inc. (BB-/Ba2) |
| | | | 3,625,000 | | | | 7.750 | | | | 03/01/18 | | | | 3,878,750 | |
| | | Tyson Foods, Inc. (BB+/Ba2) |
| | | | 8,065,000 | | | | 10.500 | | | | 03/01/14 | | | | 9,698,162 | |
| | | | | | | | | | | | | | | | | |
| | | | | | | | | | | | | | | | 91,510,956 | |
| | | |
| | | |
| | | Gaming – 5.4% |
| | | Ameristar Casinos, Inc. (BB-/B2) |
| | | | 9,500,000 | | | | 9.250 | | | | 06/01/14 | | | | 10,153,125 | |
| | | Boyd Gaming Corp. (B-/Caa1) |
| | | | 3,000,000 | | | | 6.750 | | | | 04/15/14 | | | | 2,688,750 | |
| | | | 1,000,000 | | | | 7.125 | | | | 02/01/16 | | | | 843,750 | |
| | | Buffalo Thunder Development Authority (NR/WR)(a)(c) |
| | | | 2,000,000 | | | | 9.375 | | | | 12/15/14 | | | | 500,000 | |
| | | CCM Merger, Inc. (CCC+/Caa3)(a) |
| | | | 4,500,000 | | | | 8.000 | | | | 08/01/13 | | | | 4,100,625 | |
| | | Chukchansi Economic Development Authority (B+/B3)(a) |
| | | | 6,220,000 | | | | 8.000 | | | | 11/15/13 | | | | 3,498,750 | |
| | | Circus & Eldorado (B-/Caa2) |
| | | | 3,000,000 | | | | 10.125 | | | | 03/01/12 | | | | 2,775,000 | |
| | | Codere Finance Luxembourg SA (B/B2) |
| | | EUR | 15,625,000 | | | | 8.250 | | | | 06/15/15 | | | | 21,300,786 | |
| | | Harrah’s Operating Co., Inc. (B/Caa1) |
| | | $ | 16,000,000 | | | | 11.250 | | | | 06/01/17 | | | | 17,520,000 | |
| | | Harrah’s Operating Co., Inc. (CCC/Ca)(a) |
| | | | 9,250,000 | | | | 12.750 | | | | 04/15/18 | | | | 8,579,375 | |
| | | Harrah’s Operating Co., Inc. (CCC/NR) |
| | | | 39,769,000 | | | | 10.000 | | | | 12/15/18 | | | | 31,616,355 | |
| | | Isle of Capri Casinos, Inc. (CCC+/Caa1) |
| | | | 3,568,000 | | | | 7.000 | | | | 03/01/14 | | | | 3,202,280 | |
| | | Las Vegas Sands Corp. (B/B2) |
| | | | 1,500,000 | | | | 6.375 | | | | 02/15/15 | | | | 1,516,875 | |
| | | Marina District Finance Co., Inc. (BB/B2)(a) |
| | | | 5,125,000 | | | | 9.500 | | | | 10/15/15 | | | | 4,984,062 | |
| | | | 2,750,000 | | | | 9.875 | | | | 08/15/18 | | | | 2,660,625 | |
| | | Mashantucket Pequot Tribe (NR/WR)(a)(c) |
| | | | 4,000,000 | | | | 8.500 | | | | 11/15/15 | | | | 620,000 | |
| | | MCE Finance Ltd. (B+/B1)(a) |
| | | | 10,875,000 | | | | 10.250 | | | | 05/15/18 | | | | 12,112,031 | |
| | | MGM Resorts International (B/B1) |
| | | | 11,500,000 | | | | 13.000 | | | | 11/15/13 | | | | 13,541,250 | |
| | | | 1,875,000 | | | | 10.375 | | | | 05/15/14 | | | | 2,076,563 | |
| | | | 4,750,000 | | | | 11.125 | | | | 11/15/17 | | | | 5,403,125 | |
| | | | 2,250,000 | | | | 9.000 | (a) | | | 03/15/20 | | | | 2,396,250 | |
| | | MGM Resorts International (CCC+/Caa1) |
| | | | 2,500,000 | | | | 6.750 | | | | 09/01/12 | | | | 2,350,000 | |
| | | | 9,500,000 | | | | 6.750 | | | | 04/01/13 | | | | 8,692,500 | |
| | | | 5,500,000 | | | | 5.875 | | | | 02/27/14 | | | | 4,675,000 | |
| | | | 21,500,000 | | | | 6.625 | | | | 07/15/15 | | | | 18,060,000 | |
| | | | 14,000,000 | | | | 7.500 | | | | 06/01/16 | | | | 11,830,000 | |
| | | | 1,500,000 | | | | 11.375 | | | | 03/01/18 | | | | 1,421,250 | |
| | | |
| | | |
The accompanying notes are an integral part of these financial statements.
GOLDMAN SACHS HIGH YIELD FUND
| | | | | | | | | | | | | | | | | |
| | | Principal
| | Interest
| | Maturity
| | |
| | | Amount | | Rate | | Date | | Value |
| |
Corporate Obligations – (continued) |
| | | Gaming – (continued) |
| | | | | | | | | | | | | | | | | |
| | | Mohegan Tribal Gaming Authority (CCC+/B2) |
| | | $ | 5,535,000 | | | | 6.125 | % | | | 02/15/13 | | | $ | 4,289,625 | |
| | | Mohegan Tribal Gaming Authority (CCC+/Caa2) |
| | | | 1,000,000 | | | | 8.000 | | | | 04/01/12 | | | | 760,000 | |
| | | | 1,555,000 | | | | 7.125 | | | | 08/15/14 | | | | 870,800 | |
| | | MTR Gaming Group, Inc. (B/B2) |
| | | | 1,250,000 | | | | 12.625 | | | | 07/15/14 | | | | 1,334,375 | |
| | | Peermont Proprietary Global Ltd. (B/B3) |
| | | EUR | 13,000,000 | | | | 7.750 | | | | 04/30/14 | | | | 15,755,084 | |
| | | Peninsula Gaming LLC (B/B3) |
| | | $ | 5,715,000 | | | | 10.750 | | | | 08/15/17 | | | | 6,043,612 | |
| | | Penn National Gaming, Inc. (BB-/B1) |
| | | | 4,125,000 | | | | 6.750 | | | | 03/01/15 | | | | 4,145,625 | |
| | | Pinnacle Entertainment, Inc. (B/Caa1) |
| | | | 12,875,000 | | | | 7.500 | | | | 06/15/15 | | | | 12,408,281 | |
| | | | 1,625,000 | | | | 8.750 | | | | 05/15/20 | | | | 1,600,625 | |
| | | Pinnacle Entertainment, Inc. (BB/B1) |
| | | | 6,000,000 | | | | 8.625 | | | | 08/01/17 | | | | 6,360,000 | |
| | | Pokagon Gaming Authority (B+/B2)(a) |
| | | | 2,625,000 | | | | 10.375 | | | | 06/15/14 | | | | 2,716,875 | |
| | | River Rock Entertainment Authority (B+/B2) |
| | | | 1,500,000 | | | | 9.750 | | | | 11/01/11 | | | | 1,342,500 | |
| | | San Pasqual Casino (BB-/B2)(a) |
| | | | 3,375,000 | | | | 8.000 | | | | 09/15/13 | | | | 3,311,719 | |
| | | Scientific Games International, Inc. (BB-/B1) |
| | | | 8,750,000 | | | | 9.250 | | | | 06/15/19 | | | | 9,384,375 | |
| | | Seneca Gaming Corp. (BB/Ba2) |
| | | | 6,550,000 | | | | 7.250 | | | | 05/01/12 | | | | 6,451,750 | |
| | | Shingle Springs Tribal Gaming Authority (CCC/Caa2)(a) |
| | | | 10,000,000 | | | | 9.375 | | | | 06/15/15 | | | | 7,400,000 | |
| | | Snoqualmie Entertainment Authority (CCC/Caa3)(a) |
| | | | 7,250,000 | | | | 9.125 | | | | 02/01/15 | | | | 6,380,000 | |
| | | Station Casinos, Inc. (NR/WR)(c) |
| | | | 2,500,000 | | | | 6.000 | | | | 04/01/12 | | | | 3,125 | |
| | | | 11,625,000 | | | | 6.500 | | | | 02/01/14 | | | | 1,163 | |
| | | | 13,000,000 | | | | 6.875 | | | | 03/01/16 | | | | 1,300 | |
| | | | 2,000,000 | | | | 7.750 | | | | 08/15/16 | | | | 1,000 | |
| | | Tropicana Entertainment LLC (NR/WR)(c) |
| | | | 2,000,000 | | | | 9.625 | | | | 12/15/14 | | | | 4,200 | |
| | | Turning Stone Resort Casino Enterprise (B+/B1)(a) |
| | | | 2,950,000 | | | | 9.125 | | | | 09/15/14 | | | | 3,009,000 | |
| | | Wynn Las Vegas LLC/Wynn Las Vegas Capital Corp. (BB+/Ba2) |
| | | | 3,000,000 | | | | 7.875 | | | | 11/01/17 | | | | 3,217,500 | |
| | | Wynn Las Vegas LLC/Wynn Las Vegas Capital Corp. (BB+/Ba3)(a) |
| | | | 9,250,000 | | | | 7.750 | | | | 08/15/20 | | | | 9,805,000 | |
| | | Yonkers Racing Corp. (BB-/B1)(a) |
| | | | 4,500,000 | | | | 11.375 | | | | 07/15/16 | | | | 4,848,750 | |
| | | | | | | | | | | | | | | | | |
| | | | | | | | | | | | | | | | 310,564,611 | |
| | | |
| | | |
| | | Health Care – Medical Products – 3.8% |
| | | Accellent, Inc. (B+/B1) |
| | | | 6,750,000 | | | | 8.375 | | | | 02/01/17 | | | | 6,885,000 | |
| | | Accellent, Inc. (CCC+/Caa2) |
| | | | 7,625,000 | | | | 10.500 | | | | 12/01/13 | | | | 7,739,375 | |
| | | |
| | | |
| | | Alere, Inc. (B-/B2) |
| | | | 4,000,000 | | | | 7.875 | | | | 02/01/16 | | | | 4,080,000 | |
| | | Alere, Inc. (B-/B3) |
| | | | 9,000,000 | | | | 9.000 | | | | 05/15/16 | | | | 9,270,000 | |
| | | | 1,500,000 | | | | 8.625 | (a) | | | 10/01/18 | | | | 1,526,250 | |
| | | Bausch & Lomb, Inc. (B/Caa1) |
| | | | 22,000,000 | | | | 9.875 | | | | 11/01/15 | | | | 23,375,000 | |
| | | Bio-Rad Laboratories, Inc. (BBB-/Ba2) |
| | | | 3,250,000 | | | | 8.000 | | | | 09/15/16 | | | | 3,526,250 | |
| | | Boston Scientific Corp. (BBB-/Ba1) |
| | | | 9,125,000 | | | | 6.400 | | | | 06/15/16 | | | | 10,559,997 | |
| | | Catalent Pharma Solutions, Inc. (B/Caa1)(b) |
| | | | 25,000,118 | | | | 9.500 | | | | 04/15/15 | | | | 25,375,120 | |
| | | Catalent Pharma Solutions, Inc. (B-/Caa1) |
| | | EUR | 8,500,000 | | | | 9.750 | | | | 04/15/17 | | | | 10,718,556 | |
| | | CONMED Corp. (B/B1)(d) |
| | | $ | 9,500,000 | | | | 2.500 | | | | 11/15/24 | | | | 9,364,302 | |
| | | DJO Finance LLC/DJO Finance Corp. (B-/B3) |
| | | | 14,750,000 | | | | 10.875 | | | | 11/15/14 | | | | 16,077,500 | |
| | | DJO Finance LLC/DJO Finance Corp. (CCC+/Caa1) |
| | | | 1,024,000 | | | | 11.750 | | | | 11/15/14 | | | | 1,075,200 | |
| | | FMC Finance III SA (BB+/Ba2) |
| | | | 6,625,000 | | | | 6.875 | | | | 07/15/17 | | | | 7,080,993 | |
| | | Fresenius US Finance II, Inc. (BB/Ba1)(a) |
| | | | 9,750,000 | | | | 9.000 | | | | 07/15/15 | | | | 11,115,000 | |
| | | Hologic, Inc. (BB+/NR)(d)(g) |
| | | | 32,763,000 | | | | 2.000 | | | | 12/15/37 | | | | 30,481,385 | |
| | | Talecris Biotherapeutics Holdings Corp. (BB/B1) |
| | | | 3,625,000 | | | | 7.750 | | | | 11/15/16 | | | | 3,987,500 | |
| | | The Cooper Cos., Inc. (BB/Ba3) |
| | | | 8,670,000 | | | | 7.125 | | | | 02/15/15 | | | | 8,756,700 | |
| | | VWR Funding, Inc. (B-/Caa1)(b) |
| | | | 21,917,187 | | | | 10.250 | | | | 07/15/15 | | | | 23,067,839 | |
| | | Wright Medical Group, Inc. (NR/NR) |
| | | | 5,239,000 | | | | 2.625 | | | | 12/01/14 | | | | 4,628,657 | |
| | | | | | | | | | | | | | | | | |
| | | | | | | | | | | | | | | | 218,690,624 | |
| | | |
| | | |
| | | Health Care – Pharmaceutical – 0.3% |
| | | Elan Finance PLC/Elan Finance Corp. (B/B2) |
| | | | 1,500,000 | | | | 8.875 | | | | 12/01/13 | | | | 1,530,000 | |
| | | Mylan, Inc. (BB-/NR) |
| | | | 7,030,000 | | | | 1.250 | | | | 03/15/12 | | | | 7,275,839 | |
| | | Warner Chilcott Co. LLC/Warner Chilcott Finance LLC (B+/B3)(a) |
| | | | 10,625,000 | | | | 7.750 | | | | 09/15/18 | | | | 10,850,781 | |
| | | | | | | | | | | | | | | | | |
| | | | | | | | | | | | | | | | 19,656,620 | |
| | | |
| | | |
| | | Health Care – Services – 5.1% |
| | | Alliance HealthCare Services, Inc. (B/NR) |
| | | | 2,250,000 | | | | 8.000 | | | | 12/01/16 | | | | 2,086,875 | |
| | | Community Health Systems, Inc. (B/B3) |
| | | | 21,000,000 | | | | 8.875 | | | | 07/15/15 | | | | 22,260,000 | |
| | | CRC Health Corp. (CCC/Caa1) |
| | | | 2,875,000 | | | | 10.750 | | | | 02/01/16 | | | | 2,702,500 | |
| | | DaVita, Inc. (B/B2) |
| | | | 7,750,000 | | | | 7.250 | | | | 03/15/15 | | | | 8,021,250 | |
| | | |
| | | |
The accompanying notes are an integral part of these financial statements.
GOLDMAN SACHS HIGH YIELD FUND
Schedule of Investments (continued)
September 30, 2010 (Unaudited)
| | | | | | | | | | | | | | | | | |
| | | Principal
| | Interest
| | Maturity
| | |
| | | Amount | | Rate | | Date | | Value |
| |
Corporate Obligations – (continued) |
| | | Health Care – Services – (continued) |
| | | | | | | | | | | | | | | | | |
| | | DaVita, Inc. (B+/B1) |
| | | $ | 4,569,000 | | | | 6.625 | % | | | 03/15/13 | | | $ | 4,643,246 | |
| | | Gentiva Health Services, Inc. (B-/B2)(a) |
| | | | 4,875,000 | | | | 11.500 | | | | 09/01/18 | | | | 5,204,062 | |
| | | HCA, Inc. (B-/Caa1) |
| | | GBP | 752,000 | | | | 8.750 | | | | 11/01/10 | | | | 1,181,316 | |
| | | $ | 7,500,000 | | | | 6.250 | | | | 02/15/13 | | | | 7,631,250 | |
| | | | 11,670,000 | | | | 6.750 | | | | 07/15/13 | | | | 11,990,925 | |
| | | | 2,500,000 | | | | 5.750 | | | | 03/15/14 | | | | 2,484,375 | |
| | | | 9,000,000 | | | | 6.375 | | | | 01/15/15 | | | | 9,045,000 | |
| | | | 4,750,000 | | | | 6.500 | | | | 02/15/16 | | | | 4,750,000 | |
| | | HCA, Inc. (BB/Ba3) |
| | | | 12,625,000 | | | | 8.500 | | | | 04/15/19 | | | | 14,013,750 | |
| | | | 7,500,000 | | | | 7.875 | | | | 02/15/20 | | | | 8,212,500 | |
| | | | 16,750,000 | | | | 7.250 | | | | 09/15/20 | | | | 17,943,437 | |
| | | HCA, Inc. (BB-/B2) |
| | | | 14,000,000 | | | | 9.125 | | | | 11/15/14 | | | | 14,752,500 | |
| | | | 13,000,000 | | | | 9.250 | | | | 11/15/16 | | | | 14,040,000 | |
| | | | 24,545,000 | | | | 9.625 | (b) | | | 11/15/16 | | | | 26,784,731 | |
| | | | 2,500,000 | | | | 9.875 | | | | 02/15/17 | | | | 2,750,000 | |
| | | HEALTHSOUTH Corp. (B+/B2) |
| | | | 6,500,000 | | | | 7.750 | | | | 09/15/22 | | | | 6,565,000 | |
| | | LifePoint Hospitals, Inc. (BB-/Ba1)(a) |
| | | | 3,000,000 | | | | 6.625 | | | | 10/01/20 | | | | 3,060,000 | |
| | | OnCure Holdings, Inc. (B/B2)(a) |
| | | | 6,250,000 | | | | 11.750 | | | | 05/15/17 | | | | 5,750,000 | |
| | | Patheon, Inc. (B+/B1)(a) |
| | | | 3,875,000 | | | | 8.625 | | | | 04/15/17 | | | | 3,981,563 | |
| | | Psychiatric Solutions, Inc. (B-/B3) |
| | | | 3,667,000 | | | | 7.750 | | | | 07/15/15 | | | | 3,795,345 | |
| | | Radiation Therapy Services, Inc. (CCC+/Caa1)(a) |
| | | | 4,375,000 | | | | 9.875 | | | | 04/15/17 | | | | 4,320,313 | |
| | | Select Medical Corp. (B-/B3) |
| | | | 2,125,000 | | | | 7.625 | | | | 02/01/15 | | | | 2,066,563 | |
| | | Tenet Healthcare Corp. (BB-/B1) |
| | | | 7,000,000 | | | | 9.000 | | | | 05/01/15 | | | | 7,630,000 | |
| | | | 4,375,000 | | | | 10.000 | | | | 05/01/18 | | | | 4,998,438 | |
| | | | 8,625,000 | | | | 8.875 | | | | 07/01/19 | | | | 9,530,625 | |
| | | Tenet Healthcare Corp. (CCC+/Caa1) |
| | | | 1,250,000 | | | | 9.250 | | | | 02/01/15 | | | | 1,337,500 | |
| | | U.S. Oncology, Inc. (B/Ba3) |
| | | | 32,250,000 | | | | 9.125 | | | | 08/15/17 | | | | 34,023,750 | |
| | | U.S. Oncology, Inc. (CCC+/B3) |
| | | | 1,921,000 | | | | 10.750 | | | | 08/15/14 | | | | 1,997,840 | |
| | | United Surgical Partners International, Inc. (CCC+/Caa1) |
| | | | 5,250,000 | | | | 8.875 | | | | 05/01/17 | | | | 5,368,125 | |
| | | Vanguard Health Holding Co. II LLC/Vanguard Holding Co. II, Inc. (B-/B3) |
| | | | 18,250,000 | | | | 8.000 | | | | 02/01/18 | | | | 18,432,500 | |
| | | | | | | | | | | | | | | | | |
| | | | | | | | | | | | | | | | 293,355,279 | |
| | | |
| | | |
| | | Home Construction – 0.2% |
| | | KB HOME (B+/B1) |
| | | | 2,000,000 | | | | 6.250 | | | | 06/15/15 | | | | 1,905,000 | |
| | | Meritage Homes Corp. (B+/B1) |
| | | | 5,750,000 | | | | 6.250 | | | | 03/15/15 | | | | 5,577,500 | |
| | | | 1,750,000 | | | | 7.150 | | | | 04/15/20 | | | | 1,627,500 | |
| | | | | | | | | | | | | | | | | |
| | | | | | | | | | | | | | | | 9,110,000 | |
| | | |
| | | |
| | | Lodging – 0.8% |
| | | Felcor Lodging LP (NR/B2) |
| | | | 7,500,000 | | | | 10.000 | | | | 10/01/14 | | | | 8,156,250 | |
| | | Gaylord Entertainment Co. (B-/Caa2) |
| | | | 9,500,000 | | | | 6.750 | | | | 11/15/14 | | | | 9,405,000 | |
| | | Host Hotels & Resorts LP (BB+/Ba1) |
| | | | 5,879,000 | | | | 7.125 | | | | 11/01/13 | | | | 5,952,488 | |
| | | | 8,250,000 | | | | 6.375 | | | | 03/15/15 | | | | 8,435,625 | |
| | | | 6,000,000 | | | | 6.750 | | | | 06/01/16 | | | | 6,210,000 | |
| | | Host Hotels & Resorts LP (BB+/NR) |
| | | | 5,000,000 | | | | 6.875 | | | | 11/01/14 | | | | 5,156,250 | |
| | | | | | | | | | | | | | | | | |
| | | | | | | | | | | | | | | | 43,315,613 | |
| | | |
| | | |
| | | Media – 0.6% |
| | | Allbritton Communications Co. (B/B2) |
| | | | 3,000,000 | | | | 8.000 | | | | 05/15/18 | | | | 3,015,000 | |
| | | DISH DBS Corp. (BB-/Ba3) |
| | | | 6,525,000 | | | | 7.125 | | | | 02/01/16 | | | | 6,851,250 | |
| | | Gray Television, Inc. (CCC/Caa2) |
| | | | 5,250,000 | | | | 10.500 | | | | 06/29/15 | | | | 5,223,750 | |
| | | Lamar Media Corp. (B+/B1) |
| | | | 10,500,000 | | | | 6.625 | | | | 08/15/15 | | | | 10,552,500 | |
| | | | 5,250,000 | | | | 7.875 | | | | 04/15/18 | | | | 5,525,625 | |
| | | Lamar Media Corp. (BB/Ba3) |
| | | | 1,250,000 | | | | 9.750 | | | | 04/01/14 | | | | 1,434,375 | |
| | | | | | | | | | | | | | | | | |
| | | | | | | | | | | | | | | | 32,602,500 | |
| | | |
| | | |
| | | Media – Broadcasting & Radio – 1.6% |
| | | Bonten Media Acquisition Co. (CCC/Caa3)(a)(b) |
| | | | 4,037,233 | | | | 9.000 | | | | 06/01/15 | | | | 2,200,292 | |
| | | Clear Channel Communications, Inc. (CCC-/Ca) |
| | | | 6,000,000 | | | | 5.750 | | | | 01/15/13 | | | | 5,040,000 | |
| | | | 10,000,000 | | | | 5.500 | | | | 09/15/14 | | | | 6,450,000 | |
| | | | 5,750,000 | | | | 5.500 | | | | 12/15/16 | | | | 2,932,500 | |
| | | CMP Susquehanna Corp. (NR/NR) |
| | | | 480,000 | | | | 9.875 | | | | 05/15/14 | | | | — | |
| | | Entravision Communications Corp. (B/B1)(a) |
| | | | 2,000,000 | | | | 8.750 | | | | 08/01/17 | | | | 2,055,000 | |
| | | Fox Acquisition Sub LLC (CCC/Caa3)(a) |
| | | | 1,250,000 | | | | 13.375 | | | | 07/15/16 | | | | 1,300,000 | |
| | | LIN Television Corp. (B-/B3) |
| | | | 9,760,000 | | | | 6.500 | | | | 05/15/13 | | | | 9,696,800 | |
| | | LIN Television Corp. (BB-/Ba3)(a) |
| | | | 2,875,000 | | | | 8.375 | | | | 04/15/18 | | | | 3,025,938 | |
| | | Local TV Finance LLC (CCC/Caa2)(a)(b) |
| | | | 5,788,125 | | | | 9.250 | | | | 06/15/15 | | | | 5,108,020 | |
| | | Nexstar Broadcasting, Inc./Mission Broadcasting, Inc. (B/B3)(a) |
| | | | 3,250,000 | | | | 8.875 | | | | 04/15/17 | | | | 3,388,125 | |
| | | |
| | | |
The accompanying notes are an integral part of these financial statements.
GOLDMAN SACHS HIGH YIELD FUND
| | | | | | | | | | | | | | | | | |
| | | Principal
| | Interest
| | Maturity
| | |
| | | Amount | | Rate | | Date | | Value |
| |
Corporate Obligations – (continued) |
| | | Media – Broadcasting & Radio – (continued) |
| | | | | | | | | | | | | | | | | |
| | | Radio One, Inc. (D/Caa3) |
| | | $ | 2,250,000 | | | | 6.375 | % | | | 02/15/13 | | | $ | 1,890,000 | |
| | | Sinclair Television Group, Inc. (B+/Ba3)(a) |
| | | | 8,750,000 | | | | 9.250 | | | | 11/01/17 | | | | 9,384,375 | |
| | | Umbrella Acquisition, Inc. (CCC/Caa2)(a)(b) |
| | | | 29,147,836 | | | | 9.750 | | | | 03/15/15 | | | | 27,836,183 | |
| | | Univision Communications, Inc. (B-/B2)(a) |
| | | | 1,875,000 | | | | 12.000 | | | | 07/01/14 | | | | 2,043,750 | |
| | | XM Satellite Radio, Inc. (BB-/B2)(a) |
| | | | 5,500,000 | | | | 11.250 | | | | 06/15/13 | | | | 6,050,000 | |
| | | | | | | | | | | | | | | | | |
| | | | | | | | | | | | | | | | 88,400,983 | |
| | | |
| | | |
| | | Media – Cable – 2.5% |
| | | Adelphia Communications Corp. (NR/NR) |
| | | | 2,000,000 | | | | 10.250 | | | | 06/15/49 | | | | 27,620 | |
| | | Atlantic Broadband Finance LLC (B-/B3) |
| | | | 4,500,000 | | | | 9.375 | | | | 01/15/14 | | | | 4,556,250 | |
| | | CCH II LLC/CCH II Capital Corp. (B/B2) |
| | | | 4,491,939 | | | | 13.500 | | | | 11/30/16 | | | | 5,334,178 | |
| | | CCO Holdings LLC/CCO Holdings Capital Corp. (B/B2)(a) |
| | | | 1,000,000 | | | | 7.250 | | | | 10/30/17 | | | | 1,015,000 | |
| | | | 3,125,000 | | | | 7.875 | | | | 04/30/18 | | | | 3,242,187 | |
| | | | 1,750,000 | | | | 8.125 | | | | 04/30/20 | | | | 1,846,250 | |
| | | Charter Communications Operating LLC (BB+/B1)(a) |
| | | | 10,750,000 | | | | 8.000 | | | | 04/30/12 | | | | 11,395,000 | |
| | | | 10,000,000 | | | | 10.875 | | | | 09/15/14 | | | | 11,300,000 | |
| | | CSC Holdings LLC (BB/Ba3) |
| | | | 10,500,000 | | | | 8.500 | | | | 04/15/14 | | | | 11,550,000 | |
| | | | 16,600,000 | | | | 8.500 | | | | 06/15/15 | | | | 18,114,750 | |
| | | | 11,000,000 | | | | 8.625 | | | | 02/15/19 | | | | 12,430,000 | |
| | | Frontier Vision (NR/NR) |
| | | | 2,000,000 | | | | 11.000 | | | | 10/15/49 | | | | — | |
| | | GCI, Inc. (BB-/B2) |
| | | | 3,000,000 | | | | 8.625 | | | | 11/15/19 | | | | 3,202,500 | |
| | | UPC Holding BV (B-/B2) |
| | | EUR | 11,875,000 | | | | 8.000 | | | | 11/01/16 | | | | 16,580,361 | |
| | | | 21,125,000 | | | | 8.375 | (a) | | | 08/15/20 | | | | 28,841,861 | |
| | | Virgin Media Finance PLC (B+/Ba3) |
| | | $ | 11,000,000 | | | | 8.375 | | | | 10/15/19 | | | | 12,100,000 | |
| | | Ziggo Bond Co. BV (B/B2) |
| | | EUR | 1,375,000 | | | | 8.000 | | | | 05/15/18 | | | | 1,966,506 | |
| | | | | | | | | | | | | | | | | |
| | | | | | | | | | | | | | | | 143,502,463 | |
| | | |
| | | |
| | | Media – Diversified – 0.5% |
| | | Quebecor Media, Inc. (B/B2) |
| | | $ | 9,510,000 | | | | 7.750 | | | | 03/15/16 | | | | 9,837,200 | |
| | | Sun Media Corp. (B+/Ba2) |
| | | | 2,500,000 | | | | 7.625 | | | | 02/15/13 | | | | 2,509,375 | |
| | | Videotron Ltee (BB-/Ba2) |
| | | | 4,000,000 | | | | 6.875 | | | | 01/15/14 | | | | 4,040,000 | |
| | | | 1,000,000 | | | | 6.375 | | | | 12/15/15 | | | | 1,010,000 | |
| | | | 8,500,000 | | | | 9.125 | | | | 04/15/18 | | | | 9,562,500 | |
| | | CAD | 3,000,000 | | | | 7.125 | (a) | | | 01/15/20 | | | | 3,079,384 | |
| | | | | | | | | | | | | | | | | |
| | | | | | | | | | | | | | | | 30,038,459 | |
| | | |
| | | |
| | | Metals – 0.7% |
| | | AK Steel Corp. (BB/Ba3) |
| | | | 1,500,000 | | | | 7.625 | | | | 05/15/20 | | | | 1,530,000 | |
| | | Aleris International, Inc. (NR/WR)(c) |
| | | | 8,500,000 | | | | 9.000 | | | | 12/15/14 | | | | 21,250 | |
| | | | 16,000,000 | | | | 10.000 | | | | 12/15/16 | | | | 7,200 | |
| | | Algoma Acquisition Corp. (CCC+/Caa2)(a) |
| | | | 500,000 | | | | 9.875 | | | | 06/15/15 | | | | 446,250 | |
| | | Essar Steel Algoma, Inc. (B+/B3)(a) |
| | | | 10,000,000 | | | | 9.375 | | | | 03/15/15 | | | | 10,050,000 | |
| | | FMG Resources Pty Ltd. (B/B1)(a) |
| | | | 4,000,000 | | | | 10.625 | | | | 09/01/16 | | | | 4,925,000 | |
| | | Noranda Aluminium Acquisition Corp. (CCC+/B3)(b)(e) |
| | | | 7,205,604 | | | | 5.373 | | | | 05/15/15 | | | | 6,061,715 | |
| | | SGL Carbon SE (BBB-/Ba1)(e) |
| | | EUR | 1,500,000 | | | | 2.149 | | | | 05/16/15 | | | | 1,876,173 | |
| | | Steel Dynamics, Inc. (BB+/Ba2) |
| | | $ | 7,750,000 | | | | 7.375 | | | | 11/01/12 | | | | 8,311,875 | |
| | | | 5,500,000 | | | | 7.750 | | | | 04/15/16 | | | | 5,706,250 | |
| | | Tube City IMS Corp. (B-/Caa1) |
| | | | 3,500,000 | | | | 9.750 | | | | 02/01/15 | | | | 3,543,750 | |
| | | | | | | | | | | | | | | | | |
| | | | | | | | | | | | | | | | 42,479,463 | |
| | | |
| | | |
| | | Packaging – 4.2% |
| | | Ardagh Glass Finance PLC (B-/B3) |
| | | EUR | 3,500,000 | | | | 8.750 | | | | 02/01/20 | | | | 4,723,662 | |
| | | Ardagh Packaging Finance PLC (B-/B3)(a) |
| | | $ | 875,000 | | | | 9.125 | | | | 10/15/20 | | | | 875,000 | |
| | | EUR | 4,375,000 | | | | 9.250 | | | | 10/15/20 | | | | 5,964,220 | |
| | | Ardagh Packaging Finance PLC (BB-/Ba3)(a) |
| | | | 6,500,000 | | | | 7.375 | | | | 10/15/17 | | | | 8,861,127 | |
| | | $ | 1,250,000 | | | | 7.375 | | | | 10/15/17 | | | | 1,250,000 | |
| | | Berry Plastics Corp. (B/B1)(e) |
| | | | 6,500,000 | | | | 5.276 | | | | 02/15/15 | | | | 6,142,500 | |
| | | Berry Plastics Corp. (CCC/Caa1) |
| | | | 8,875,000 | | | | 4.167 | (e) | | | 09/15/14 | | | | 7,654,688 | |
| | | | 11,000,000 | | | | 8.875 | | | | 09/15/14 | | | | 10,615,000 | |
| | | | 8,250,000 | | | | 9.500 | | | | 05/15/18 | | | | 7,755,000 | |
| | | Berry Plastics Corp. (CCC/Caa2) |
| | | | 8,000,000 | | | | 10.250 | | | | 03/01/16 | | | | 7,480,000 | |
| | | Clondalkin Acquisition BV (B+/B1)(e) |
| | | EUR | 1,000,000 | | | | 2.879 | | | | 12/15/13 | | | | 1,220,109 | |
| | | Clondalkin Industries BV (B-/Caa1) |
| | | | 3,000,000 | | | | 8.000 | | | | 03/15/14 | | | | 3,752,346 | |
| | | Consol Glass Ltd. (BB-/B1) |
| | | | 7,750,000 | | | | 7.625 | | | | 04/15/14 | | | | 10,531,381 | |
| | | Crown Americas LLC (BB-/Ba3) |
| | | $ | 10,625,000 | | | | 7.750 | | | | 11/15/15 | | | | 11,076,563 | |
| | | | 7,500,000 | | | | 7.625 | | | | 05/15/17 | | | | 8,100,000 | |
| | | Crown European Holdings SA (BB-/Ba1)(a) |
| | | EUR | 1,625,000 | | | | 7.125 | | | | 08/15/18 | | | | 2,326,046 | |
| | | Gerresheimer Holdings GMBH (BB+/B1) |
| | | | 3,600,000 | | | | 7.875 | | | | 03/01/15 | | | | 5,082,661 | |
| | | Graham Packaging Co. LP (B-/Caa1) |
| | | $ | 22,250,000 | | | | 9.875 | | | | 10/15/14 | | | | 22,945,312 | |
| | | |
| | | |
The accompanying notes are an integral part of these financial statements.
GOLDMAN SACHS HIGH YIELD FUND
Schedule of Investments (continued)
September 30, 2010 (Unaudited)
| | | | | | | | | | | | | | | | | |
| | | Principal
| | Interest
| | Maturity
| | |
| | | Amount | | Rate | | Date | | Value |
| |
Corporate Obligations – (continued) |
| | | Packaging – (continued) |
| | | | | | | | | | | | | | | | | |
| | | Graham Packaging Co. LP/GPC Capital Corp. I (B-/Caa1)(a) |
| | | $ | 1,000,000 | | | | 8.250 | % | | | 01/01/17 | | | $ | 1,005,000 | |
| | | | 2,000,000 | | | | 8.250 | | | | 10/01/18 | | | | 2,030,000 | |
| | | Graphic Packaging International, Inc. (B/B3) |
| | | | 4,000,000 | | | | 9.500 | | | | 06/15/17 | | | | 4,260,000 | |
| | | Greif, Inc. (BB+/Ba2) |
| | | | 2,000,000 | | | | 7.750 | | | | 08/01/19 | | | | 2,162,500 | |
| | | Impress Holdings BV (B+/Ba3)(e) |
| | | EUR | 6,000,000 | | | | 3.960 | | | | 09/15/13 | | | | 8,138,604 | |
| | | Impress Holdings BV (B-/B3) |
| | | | 15,000,000 | | | | 9.250 | | | | 09/15/14 | | | | 21,368,949 | |
| | | Owens-Brockway Glass Container, Inc. (BB/Ba3) |
| | | | 2,750,000 | | | | 6.750 | | | | 12/01/14 | | | | 3,823,917 | |
| | | $ | 1,000,000 | | | | 6.750 | | | | 12/01/14 | | | | 1,027,500 | |
| | | | 5,000,000 | | | | 7.375 | | | | 05/15/16 | | | | 5,412,500 | |
| | | Plastipak Holdings, Inc. (B/B3)(a) |
| | | | 4,000,000 | | | | 8.500 | | | | 12/15/15 | | | | 4,140,000 | |
| | | Pregis Corp. (CCC+/Caa2) |
| | | | 7,000,000 | | | | 12.375 | | | | 10/15/13 | | | | 7,052,500 | |
| | | Reynolds Group Issuer, Inc. (B-/Caa1) |
| | | EUR | 9,500,000 | | | | 8.000 | | | | 12/15/16 | | | | 12,238,580 | |
| | | | 22,375,000 | | | | 9.500 | | | | 06/15/17 | | | | 29,358,874 | |
| | | $ | 6,250,000 | | | | 8.500 | (a) | | | 05/15/18 | | | | 6,078,125 | |
| | | Reynolds Group Issuer, Inc. (BB-/B1)(a) |
| | | | 2,375,000 | | | | 7.750 | | | | 10/15/16 | | | | 2,434,375 | |
| | | Stichting Participatie Impress Cooperatieve UA (NR/NR)(b) |
| | | EUR | 685,896 | | | | 17.000 | | | | 09/29/49 | | | | 1,047,253 | |
| | | Tekni-Plex, Inc. (NR/WR) |
| | | $ | 2,500,000 | | | | 10.875 | | | | 08/15/12 | | | | 2,343,750 | |
| | | | | | | | | | | | | | | | | |
| | | | | | | | | | | | | | | | 240,278,042 | |
| | | |
| | | |
| | | Paper – 1.6% |
| | | Boise Cascade LLC (B+/Caa1) |
| | | | 3,882,000 | | | | 7.125 | | | | 10/15/14 | | | | 3,668,490 | |
| | | Domtar Corp. (BBB-/Ba2) |
| | | | 8,750,000 | | | | 10.750 | | | | 06/01/17 | | | | 10,806,250 | |
| | | Georgia-Pacific Corp. (BB/Ba3) |
| | | | 1,500,000 | | | | 7.700 | | | | 06/15/15 | | | | 1,657,500 | |
| | | | 1,250,000 | | | | 8.000 | | | | 01/15/24 | | | | 1,406,250 | |
| | | | 2,750,000 | | | | 7.750 | | | | 11/15/29 | | | | 2,887,500 | |
| | | Georgia-Pacific Corp. (BB+/Ba2)(a) |
| | | | 14,125,000 | | | | 7.000 | | | | 01/15/15 | | | | 14,690,000 | |
| | | | 11,625,000 | | | | 7.125 | | | | 01/15/17 | | | | 12,264,375 | |
| | | Georgia-Pacific LLC (BB+/Ba2)(a) |
| | | | 6,000,000 | | | | 8.250 | | | | 05/01/16 | | | | 6,675,000 | |
| | | Lecta SA (B+/B2)(e) |
| | | EUR | 4,875,000 | | | | 3.524 | | | | 02/15/14 | | | | 5,964,646 | |
| | | NewPage Corp. (CCC+/B2) |
| | | $ | 875,000 | | | | 11.375 | | | | 12/31/14 | | | | 789,687 | |
| | | PE Paper Escrow GmbH (BB/Ba2)(a) |
| | | | 6,875,000 | | | | 12.000 | | | | 08/01/14 | | | | 7,880,469 | |
| | | Smurfit Kappa Acquisitions (BB/Ba2) |
| | | EUR | 2,250,000 | | | | 7.750 | | | | 11/15/19 | | | | 3,220,679 | |
| | | Smurfit Kappa Funding PLC (B/B2) |
| | | $ | 5,000,000 | | | | 7.750 | | | | 04/01/15 | | | | 5,062,500 | |
| | | EUR | 6,000,000 | | | | 7.750 | | | | 04/01/15 | | | | 8,404,438 | |
| | | |
| | | |
| | | Stone Container Finance Co. of Canada II (NR/WR)(c) |
| | | | 2,250,000 | | | | 7.375 | | | | 07/15/14 | | | | 73,125 | |
| | | Verso Paper Holdings LLC (BB-/Ba2) |
| | | | 2,375,000 | | | | 11.500 | | | | 07/01/14 | | | | 2,588,750 | |
| | | Verso Paper Holdings LLC (CCC+/Caa1) |
| | | | 4,000,000 | | | | 11.375 | | | | 08/01/16 | | | | 3,560,000 | |
| | | | | | | | | | | | | | | | | |
| | | | | | | | | | | | | | | | 91,599,659 | |
| | | |
| | | |
| | | Printing – 0.2% |
| | | SGS International, Inc. (B-/B3) |
| | | | 5,750,000 | | | | 12.000 | | | | 12/15/13 | | | | 5,951,250 | |
| | | Valassis Communications, Inc. (BB-/Ba3) |
| | | | 2,908,000 | | | | 8.250 | | | | 03/01/15 | | | | 3,046,130 | |
| | | | | | | | | | | | | | | | | |
| | | | | | | | | | | | | | | | 8,997,380 | |
| | | |
| | | |
| | | Publishing – 1.5% |
| | | Cengage Learning Acquisitions, Inc. (CCC+/Caa2)(a) |
| | | | 21,000,000 | | | | 10.500 | | | | 01/15/15 | | | | 20,895,000 | |
| | | Dex One Corp. (CCC+/B3)(b) |
| | | | 1,371,318 | | | | 12.000 | | | | 01/29/17 | | | | 1,078,199 | |
| | | Morris Publishing Group LLC (NR/NR) |
| | | | 1,456,202 | | | | 10.000 | | | | 09/01/14 | | | | 1,390,673 | |
| | | Nielsen Co. BV (B-/Caa1)(f) |
| | | EUR | 5,000,000 | | | | 11.125 | | | | 08/01/16 | | | | 6,748,089 | |
| | | Nielsen Finance LLC (B/Caa1) |
| | | $ | 3,500,000 | | | | 11.625 | | | | 02/01/14 | | | | 3,981,250 | |
| | | | 23,000,000 | | | | 10.000 | | | | 08/01/14 | | | | 24,207,500 | |
| | | | 5,000,000 | | | | 11.500 | | | | 05/01/16 | | | | 5,687,500 | |
| | | | 4,500,000 | | | | 7.750 | (a) | | | 10/15/18 | | | | 4,467,015 | |
| | | Nielsen Finance LLC (B-/Caa1)(f) |
| | | | 19,000,000 | | | | 12.500 | | | | 08/01/16 | | | | 19,047,500 | |
| | | Truvo Subsidiary Corp. (NR/WR)(c) |
| | | EUR | 16,750,000 | | | | 8.500 | | | | 12/01/14 | | | | 742,119 | |
| | | | | | | | | | | | | | | | | |
| | | | | | | | | | | | | | | | 88,244,845 | |
| | | |
| | | |
| | | Real Estate – 0.4% |
| | | CB Richard Ellis Services, Inc. (B+/Ba3) |
| | | $ | 6,375,000 | | | | 11.625 | | | | 06/15/17 | | | | 7,387,031 | |
| | | ProLogis (BBB-/Baa2) |
| | | | 1,250,000 | | | | 7.375 | | | | 10/30/19 | | | | 1,254,647 | |
| | | ProLogis (BBB-/NR)(d) |
| | | | 5,125,000 | | | | 2.250 | | | | 04/01/37 | | | | 4,959,524 | |
| | | | 3,500,000 | | | | 1.875 | | | | 11/15/37 | | | | 3,310,643 | |
| | | Realogy Corp. (C/Caa3) |
| | | | 2,500,000 | | | | 10.500 | | | | 04/15/14 | | | | 2,131,250 | |
| | | | 2,268,655 | | | | 11.000 | (b) | | | 04/15/14 | | | | 1,951,044 | |
| | | | | | | | | | | | | | | | | |
| | | | | | | | | | | | | | | | 20,994,139 | |
| | | |
| | | |
| | | Restaurants – 0.9% |
| | | CKE Restaurants, Inc. (B/B2)(a) |
| | | | 14,250,000 | | | | 11.375 | | | | 07/15/18 | | | | 14,570,625 | |
| | | NPC International, Inc. (CCC+/Caa1) |
| | | | 12,002,000 | | | | 9.500 | | | | 05/01/14 | | | | 12,182,030 | |
| | | OSI Restaurant Partners, Inc. (CCC/Caa3) |
| | | | 8,750,000 | | | | 10.000 | | | | 06/15/15 | | | | 8,837,500 | |
| | | |
| | | |
The accompanying notes are an integral part of these financial statements.
GOLDMAN SACHS HIGH YIELD FUND
| | | | | | | | | | | | | | | | | |
| | | Principal
| | Interest
| | Maturity
| | |
| | | Amount | | Rate | | Date | | Value |
| |
Corporate Obligations – (continued) |
| | | Restaurants – (continued) |
| | | | | | | | | | | | | | | | | |
| | | Seminole Hard Rock Entertainment, Inc. (BB/B2)(a)(e) |
| | | $ | 7,500,000 | | | | 2.792 | % | | | 03/15/14 | | | $ | 6,543,750 | |
| | | Wendy’s/Arby’s Restaurants LLC (B+/B3) |
| | | | 8,375,000 | | | | 10.000 | | | | 07/15/16 | | | | 8,887,969 | |
| | | | | | | | | | | | | | | | | |
| | | | | | | | | | | | | | | | 51,021,874 | |
| | | |
| | | |
| | | Retailers – 1.4% |
| | | Claire’s Stores, Inc. (CCC+/Ca)(b) |
| | | | 3,550,084 | | | | 9.625 | | | | 06/01/15 | | | | 3,337,079 | |
| | | Edcon Holdings Proprietary Ltd. (CCC/Caa1)(e) |
| | | EUR | 3,500,000 | | | | 6.379 | | | | 06/15/15 | | | | 3,876,743 | |
| | | Edcon Proprietary Ltd. (B/B2)(e) |
| | | | 12,375,000 | | | | 4.129 | | | | 06/15/14 | | | | 14,170,987 | |
| | | General Nutrition Centers, Inc. (B-/Caa1)(b)(e) |
| | | $ | 12,625,000 | | | | 5.750 | | | | 03/15/14 | | | | 12,514,531 | |
| | | Levi Strauss & Co. (B+/B2) |
| | | EUR | 2,000,000 | | | | 7.750 | | | | 05/15/18 | | | | 2,753,766 | |
| | | Michaels Stores, Inc. (CCC/Caa1) |
| | | $ | 6,375,000 | | | | 10.000 | | | | 11/01/14 | | | | 6,725,625 | |
| | | Michaels Stores, Inc. (CCC/Caa2) |
| | | | 11,500,000 | | | | 11.375 | | | | 11/01/16 | | | | 12,535,000 | |
| | | Neiman-Marcus Group, Inc. (B-/Caa1)(b) |
| | | | 8,162,442 | | | | 9.000 | | | | 10/15/15 | | | | 8,478,737 | |
| | | Neiman-Marcus Group, Inc. (CCC+/Caa2) |
| | | | 14,500,000 | | | | 10.375 | | | | 10/15/15 | | | | 15,225,000 | |
| | | | | | | | | | | | | | | | | |
| | | | | | | | | | | | | | | | 79,617,468 | |
| | | |
| | | |
| | | Retailers – Food & Drug – 0.6% |
| | | Ingles Markets, Inc. (BB-/B1) |
| | | | 6,000,000 | | | | 8.875 | | | | 05/15/17 | | | | 6,457,500 | |
| | | Rite Aid Corp. (B+/B3) |
| | | | 2,750,000 | | | | 9.750 | | | | 06/12/16 | | | | 2,928,750 | |
| | | Rite Aid Corp. (B-/Caa2) |
| | | | 6,500,000 | | | | 7.500 | | | | 03/01/17 | | | | 6,012,500 | |
| | | Rite Aid Corp. (CCC/Caa3) |
| | | | 750,000 | | | | 8.625 | | | | 03/01/15 | | | | 648,750 | |
| | | | 5,250,000 | | | | 9.375 | | | | 12/15/15 | | | | 4,528,125 | |
| | | | 5,000,000 | | | | 9.500 | | | | 06/15/17 | | | | 4,181,250 | |
| | | Supervalu, Inc. (B+/Ba3) |
| | | | 5,375,000 | | | | 7.500 | | | | 11/15/14 | | | | 5,388,438 | |
| | | | 5,500,000 | | | | 8.000 | | | | 05/01/16 | | | | 5,534,375 | |
| | | | | | | | | | | | | | | | | |
| | | | | | | | | | | | | | | | 35,679,688 | |
| | | |
| | | |
| | | Services Cyclical – Business Services – 2.2% |
| | | ACCO Brands Corp. (B-/Caa1) |
| | | | 10,375,000 | | | | 7.625 | | | | 08/15/15 | | | | 9,960,000 | |
| | | ACCO Brands Corp. (BB-/B1) |
| | | | 3,500,000 | | | | 10.625 | | | | 03/15/15 | | | | 3,902,500 | |
| | | Carlson Wagonlit BV (CCC/Caa2)(e) |
| | | EUR | 11,655,000 | | | | 6.649 | | | | 05/01/15 | | | | 14,855,918 | |
| | | Corrections Corp. of America (BB/Ba2) |
| | | $ | 1,125,000 | | | | 6.250 | | | | 03/15/13 | | | | 1,139,063 | |
| | | | 3,500,000 | | | | 7.750 | | | | 06/01/17 | | | | 3,762,500 | |
| | | Garda World Security Corp. (B/B3)(a) |
| | | | 3,000,000 | | | | 9.750 | | | | 03/15/17 | | | | 3,217,500 | |
| | | Great Lakes Dredge & Dock Co. (B-/B3) |
| | | | 6,000,000 | | | | 7.750 | | | | 12/15/13 | | | | 6,045,000 | |
| | | |
| | | |
| | | Iron Mountain, Inc. (B+/B2) |
| | | | 1,500,000 | | | | 6.625 | | | | 01/01/16 | | | | 1,507,500 | |
| | | | 4,625,000 | | | | 8.000 | | | | 06/15/20 | | | | 4,867,812 | |
| | | ISS Financing PLC (B/NR) |
| | | EUR | 4,500,000 | | | | 11.000 | | | | 06/15/14 | | | | 6,748,089 | |
| | | ISS Holdings A/S (B/Caa1) |
| | | | 9,015,000 | | | | 8.875 | | | | 05/15/16 | | | | 12,904,187 | |
| | | Savcio Holdings Property Ltd. (B+/B2) |
| | | | 2,000,000 | | | | 8.000 | | | | 02/15/13 | | | | 2,699,236 | |
| | | Sitel LLC/Sitel Finance Corp. (B-/Caa2)(a) |
| | | $ | 14,575,000 | | | | 11.500 | | | | 04/01/18 | | | | 11,368,500 | |
| | | Trans Union LLC/TransUnion Financing Corp. (B-/B3)(a) |
| | | | 12,000,000 | | | | 11.375 | | | | 06/15/18 | | | | 13,680,000 | |
| | | West Corp. (B/B3) |
| | | | 11,500,000 | | | | 9.500 | | | | 10/15/14 | | | | 12,031,875 | |
| | | | 1,625,000 | | | | 8.625 | | | | 10/01/18 | | | | 1,637,280 | |
| | | West Corp. (B-/Caa1) |
| | | | 14,250,000 | | | | 11.000 | | | | 10/15/16 | | | | 15,087,187 | |
| | | | | | | | | | | | | | | | | |
| | | | | | | | | | | | | | | | 125,414,147 | |
| | | |
| | | |
| | | Services Cyclical – Consumer Services – 0.1% |
| | | Service Corp. International (BB-/B1) |
| | | | 1,750,000 | | | | 6.750 | | | | 04/01/16 | | | | 1,820,000 | |
| | | | 2,125,000 | | | | 7.000 | | | | 06/15/17 | | | | 2,252,500 | |
| | | | 4,000,000 | | | | 7.625 | | | | 10/01/18 | | | | 4,300,000 | |
| | | | | | | | | | | | | | | | | |
| | | | | | | | | | | | | | | | 8,372,500 | |
| | | |
| | | |
| | | Services Cyclical – Rental Equipment – 1.8% |
| | | Ashtead Capital, Inc. (B+/B2)(a) |
| | | | 3,000,000 | | | | 9.000 | | | | 08/15/16 | | | | 3,135,000 | |
| | | Ashtead Holdings PLC (B+/B2)(a) |
| | | | 1,750,000 | | | | 8.625 | | | | 08/01/15 | | | | 1,787,188 | |
| | | EC Finance PLC (B+/B2) |
| | | EUR | 6,125,000 | | | | 9.750 | | | | 08/01/17 | | | | 9,059,650 | |
| | | Europcar Groupe SA (B+/B3)(e) |
| | | | 3,500,000 | | | | 4.399 | | | | 05/15/13 | | | | 4,461,237 | |
| | | Hertz Corp. (CCC+/B2) |
| | | | 2,250,000 | | | | 7.875 | | | | 01/01/14 | | | | 3,113,323 | |
| | | $ | 10,725,000 | | | | 8.875 | | | | 01/01/14 | | | | 11,006,531 | |
| | | Hertz Corp. (CCC+/B3) |
| | | | 10,250,000 | | | | 10.500 | | | | 01/01/16 | | | | 10,903,437 | |
| | | Maxim Crane Works LP (B/Caa1)(a) |
| | | | 11,000,000 | | | | 12.250 | | | | 04/15/15 | | | | 10,010,000 | |
| | | RSC Equipment Rental, Inc. (B-/Caa2) |
| | | | 20,750,000 | | | | 9.500 | | | | 12/01/14 | | | | 21,528,125 | |
| | | RSC Equipment Rental, Inc. (BB-/B1)(a) |
| | | | 5,250,000 | | | | 10.000 | | | | 07/15/17 | | | | 5,788,125 | |
| | | United Rentals North America, Inc. (B/B3) |
| | | | 6,500,000 | | | | 10.875 | | | | 06/15/16 | | | | 7,361,250 | |
| | | United Rentals North America, Inc. (CCC+/Caa1) |
| | | | 7,000,000 | | | | 7.750 | | | | 11/15/13 | | | | 7,070,000 | |
| | | | 5,750,000 | | | | 7.000 | | | | 02/15/14 | | | | 5,750,000 | |
| | | | | | | | | | | | | | | | | |
| | | | | | | | | | | | | | | | 100,973,866 | |
| | | | | | | | | | | | | | | | | |
| | | |
| | | |
The accompanying notes are an integral part of these financial statements.
GOLDMAN SACHS HIGH YIELD FUND
Schedule of Investments (continued)
September 30, 2010 (Unaudited)
| | | | | | | | | | | | | | | | | |
| | | Principal
| | Interest
| | Maturity
| | |
| | | Amount | | Rate | | Date | | Value |
| |
Corporate Obligations – (continued) |
| | | | | | | | | | | | | | | | | |
| | | Technology – Hardware – 0.7% |
| | | Alcatel-Lucent USA, Inc. (B/B1) |
| | | $ | 10,500,000 | | | | 6.450 | % | | | 03/15/29 | | | $ | 7,665,000 | |
| | | Freescale Semiconductor, Inc. (CCC/Caa2)(a) |
| | | | 19,630,000 | | | | 10.750 | | | | 08/01/20 | | | | 19,679,075 | |
| | | NXP BV/NXP Funding LLC (CCC+/Caa1) |
| | | | 1,500,000 | | | | 3.276 | (e) | | | 10/15/13 | | | | 1,413,750 | |
| | | EUR | 3,000,000 | | | | 3.585 | (e) | | | 10/15/13 | | | | 3,823,917 | |
| | | $ | 4,875,000 | | | | 7.875 | | | | 10/15/14 | | | | 5,033,438 | |
| | | | 875,000 | | | | 9.750 | (a) | | | 08/01/18 | | | | 931,875 | |
| | | | | | | | | | | | | | | | | |
| | | | | | | | | | | | | | | | 38,547,055 | |
| | | |
| | | |
| | | Technology – Software/Services – 3.5% |
| | | Aspect Software, Inc. (B-/Caa1)(a) |
| | | | 4,500,000 | | | | 10.625 | | | | 05/15/17 | | | | 4,668,750 | |
| | | Expedia, Inc. (BBB-/Ba1) |
| | | | 4,000,000 | | | | 8.500 | | | | 07/01/16 | | | | 4,390,000 | |
| | | Fidelity National Information Services, Inc. (BB-/Ba2)(a) |
| | | | 4,750,000 | | | | 7.625 | | | | 07/15/17 | | | | 5,058,750 | |
| | | First Data Corp. (B-/Caa1) |
| | | | 42,500,000 | | | | 9.875 | | | | 09/24/15 | | | | 34,637,500 | |
| | | | 37,630,028 | | | | 10.550 | (b) | | | 09/24/15 | | | | 30,386,247 | |
| | | First Data Corp. (CCC+/Caa2) |
| | | | 5,535,000 | | | | 11.250 | | | | 03/31/16 | | | | 3,929,850 | |
| | | Sabre Holdings Corp. (CCC+/Caa1) |
| | | | 9,000,000 | | | | 8.350 | | | | 03/15/16 | | | | 9,202,500 | |
| | | Serena Software, Inc. (CCC+/Caa1) |
| | | | 6,076,000 | | | | 10.375 | | | | 03/15/16 | | | | 6,235,495 | |
| | | Sungard Data Systems, Inc. (B/Caa1) |
| | | | 15,001,000 | | | | 9.125 | | | | 08/15/13 | | | | 15,343,173 | |
| | | | 11,000,000 | | | | 10.625 | | | | 05/15/15 | | | | 12,237,500 | |
| | | Sungard Data Systems, Inc. (B-/Caa1) |
| | | | 35,500,000 | | | | 10.250 | | | | 08/15/15 | | | | 37,363,750 | |
| | | Travelport LLC (CCC+/B3) |
| | | EUR | 2,000,000 | | | | 5.513 | (e) | | | 09/01/14 | | | | 2,558,603 | |
| | | $ | 2,000,000 | | | | 9.000 | (a) | | | 03/01/16 | | | | 1,992,500 | |
| | | Travelport, Inc. (CCC/Caa1) |
| | | | 11,000,000 | | | | 11.875 | | | | 09/01/16 | | | | 11,783,750 | |
| | | Travelport, Inc. (CCC+/B3) |
| | | | 18,000,000 | | | | 9.875 | | | | 09/01/14 | | | | 18,517,500 | |
| | | | | | | | | | | | | | | | | |
| | | | | | | | | | | | | | | | 198,305,868 | |
| | | |
| | | |
| | | Telecommunications – 3.5% |
| | | Angel Lux Common SA (BB/B1) |
| | | EUR | 1,336,053 | | | | 6.399 | (e) | | | 05/01/16 | | | | 1,822,886 | |
| | | | 28,500,000 | | | | 8.250 | | | | 05/01/16 | | | | 41,168,251 | |
| | | $ | 8,000,000 | | | | 8.875 | (a) | | | 05/01/16 | | | | 8,530,000 | |
| | | Cincinnati Bell, Inc. (B-/B3) |
| | | | 2,750,000 | | | | 8.750 | | | | 03/15/18 | | | | 2,681,250 | |
| | | ERC Ireland Finance Ltd. (CCC/Caa2)(e) |
| | | EUR | 3,000,000 | | | | 5.899 | | | | 08/15/16 | | | | 2,228,914 | |
| | | Frontier Communications Corp. (BB/Ba2) |
| | | $ | 8,500,000 | | | | 6.250 | | | | 01/15/13 | | | | 8,882,500 | |
| | | | 16,250,000 | | | | 6.625 | | | | 03/15/15 | | | | 16,778,125 | |
| | | | 5,500,000 | | | | 7.875 | | | | 04/15/15 | | | | 5,953,750 | |
| | | | 12,875,000 | | | | 8.250 | | | | 04/15/17 | | | | 14,065,937 | |
| | | | 3,250,000 | | | | 8.125 | | | | 10/01/18 | | | | 3,514,063 | |
| | | |
| | | |
| | | | 10,500,000 | | | | 8.500 | | | | 04/15/20 | | | | 11,523,750 | |
| | | | 3,000,000 | | | | 8.750 | | | | 04/15/22 | | | | 3,266,250 | |
| | | Level 3 Financing, Inc. (CCC/Caa1) |
| | | | 10,250,000 | | | | 9.250 | | | | 11/01/14 | | | | 9,635,000 | |
| | | | 6,000,000 | | | | 10.000 | | | | 02/01/18 | | | | 5,400,000 | |
| | | Qwest Communications International, Inc. (B+/Ba2) |
| | | | 6,250,000 | | | | 8.000 | | | | 10/01/15 | | | | 6,750,000 | |
| | | | 9,750,000 | | | | 7.125 | (a) | | | 04/01/18 | | | | 10,188,750 | |
| | | Qwest Communications International, Inc. Series B (B+/Ba2) |
| | | | 1,500,000 | | | | 7.500 | | | | 02/15/14 | | | | 1,526,250 | |
| | | Qwest Corp. (BBB-/Baa3) |
| | | | 1,450,000 | | | | 7.500 | | | | 10/01/14 | | | | 1,631,250 | |
| | | | 2,000,000 | | | | 8.375 | | | | 05/01/16 | | | | 2,350,000 | |
| | | TW Telecom Holdings, inc. (B-/NR) |
| | | | 2,750,000 | | | | 8.000 | | | | 03/01/18 | | | | 2,880,625 | |
| | | Windstream Corp. (B+/Ba3) |
| | | | 13,000,000 | | | | 8.125 | | | | 08/01/13 | | | | 14,072,500 | |
| | | | 8,750,000 | | | | 8.625 | | | | 08/01/16 | | | | 9,231,250 | |
| | | | 5,000,000 | | | | 7.875 | | | | 11/01/17 | | | | 5,175,000 | |
| | | | 3,500,000 | | | | 8.125 | (a) | | | 09/01/18 | | | | 3,596,250 | |
| | | | 950,000 | | | | 7.000 | | | | 03/15/19 | | | | 926,250 | |
| | | | 3,500,000 | | | | 7.750 | (a) | | | 10/15/20 | | | | 3,491,250 | |
| | | | | | | | | | | | | | | | | |
| | | | | | | | | | | | | | | | 197,270,051 | |
| | | |
| | | |
| | | Telecommunications – Cellular – 3.9% |
| | | CC Holdings GS V LLC/Crown Castle GS III Corp. (BB/Baa3)(a) |
| | | | 9,375,000 | | | | 7.750 | | | | 05/01/17 | | | | 10,359,375 | |
| | | Crown Castle International Corp. (B-/B1) |
| | | | 10,750,000 | | | | 9.000 | | | | 01/15/15 | | | | 11,825,000 | |
| | | Hellas Telecommunications Luxembourg III (NR/WR)(c) |
| | | EUR | 6,148,649 | | | | 8.500 | | | | 10/15/13 | | | | 167,643 | |
| | | Hellas Telecommunications Luxembourg V (NR/WR)(c)(e) |
| | | | 1,266,038 | | | | 0.000 | | | | 10/15/12 | | | | 552,296 | |
| | | Nextel Communications, Inc. (BB-/Ba2) |
| | | $ | 11,125,000 | | | | 6.875 | | | | 10/31/13 | | | | 11,236,250 | |
| | | | 3,000,000 | | | | 5.950 | | | | 03/15/14 | | | | 2,977,500 | |
| | | | 16,500,000 | | | | 7.375 | | | | 08/01/15 | | | | 16,582,500 | |
| | | SBA Telecommunications, Inc. (BB-/Ba3) |
| | | | 2,500,000 | | | | 8.000 | | | | 08/15/16 | | | | 2,675,000 | |
| | | Sprint Capital Corp. (BB-/Ba3) |
| | | | 8,000,000 | | | | 7.625 | | | | 01/30/11 | | | | 8,130,000 | |
| | | | 19,750,000 | | | | 8.375 | | | | 03/15/12 | | | | 21,083,125 | |
| | | | 46,625,000 | | | | 6.900 | | | | 05/01/19 | | | | 46,858,125 | |
| | | | 18,250,000 | | | | 8.750 | | | | 03/15/32 | | | | 19,116,875 | |
| | | Sprint Nextel Corp. (BB-/Ba3) |
| | | | 14,250,000 | | | | 6.000 | | | | 12/01/16 | | | | 14,071,875 | |
| | | Wind Acquisition Finance SA (B+/B2) |
| | | EUR | 26,000,000 | | | | 11.000 | | | | 12/01/15 | | | | 37,216,734 | |
| | | $ | 12,750,000 | | | | 12.000 | (a) | | | 12/01/15 | | | | 13,515,000 | |
| | | | 1,500,000 | | | | 11.750 | (a) | | | 07/15/17 | | | | 1,680,000 | |
| | | Wind Acquisition Holdings Finance SA (B-/B3)(b) |
| | | EUR | 5,035,833 | | | | 12.250 | | | | 07/15/17 | | | | 7,362,821 | |
| | | | | | | | | | | | | | | | | |
| | | | | | | | | | | | | | | | 225,410,119 | |
| | | | | | | | | | | | | | | | | |
| | | |
| | | |
The accompanying notes are an integral part of these financial statements.
GOLDMAN SACHS HIGH YIELD FUND
| | | | | | | | | | | | | | | | | |
| | | Principal
| | Interest
| | Maturity
| | |
| | | Amount | | Rate | | Date | | Value |
| |
Corporate Obligations – (continued) |
| | | | | | | | | | | | | | | | | |
| | | Telecommunications – Satellites – 2.7% |
| | | Intelsat Corp. (BB-/B3) |
| | | $ | 9,625,000 | | | | 9.250 | % | | | 06/15/16 | | | $ | 10,274,688 | |
| | | Intelsat Intermediate Holding Co. Ltd. (CCC+/NR)(f) |
| | | | 13,250,000 | | | | 9.500 | | | | 02/01/15 | | | | 13,713,750 | |
| | | Intelsat Jackson Holdings Ltd. (B+/B3) |
| | | | 10,125,000 | | | | 9.500 | | | | 06/15/16 | | | | 10,783,125 | |
| | | Intelsat Jackson Holdings SA (B+/B3)(a) |
| | | | 1,500,000 | | | | 7.250 | | | | 10/15/20 | | | | 1,507,500 | |
| | | Intelsat Jackson Holdings SA (CCC+/Caa2) |
| | | | 19,000,000 | | | | 11.250 | | | | 06/15/16 | | | | 20,615,000 | |
| | | | 2,000,000 | | | | 11.500 | | | | 06/15/16 | | | | 2,170,000 | |
| | | Intelsat Luxembourgh SA (CCC+/Caa3) |
| | | | 12,000,000 | | | | 11.250 | (g) | | | 02/04/17 | | | | 12,900,000 | |
| | | | 36,125,000 | | | | 11.500 | (b) | | | 02/04/17 | | | | 39,195,625 | |
| | | Intelsat SA (CCC+/Caa3) |
| | | | 10,500,000 | | | | 7.625 | | | | 04/15/12 | | | | 10,893,750 | |
| | | Intelsat Subsidiary Holding Co. SA (B+/B3) |
| | | | 10,000,000 | | | | 8.500 | | | | 01/15/13 | | | | 10,100,000 | |
| | | | 19,750,000 | | | | 8.875 | | | | 01/15/15 | | | | 20,441,250 | |
| | | | | | | | | | | | | | | | | |
| | | | | | | | | | | | | | | | 152,594,688 | |
| | | |
| | | |
| | | Textiles & Apparel – 0.2% |
| | | Propex Fabrics, Inc. (NR/WR)(c) |
| | | | 2,500,000 | | | | 10.000 | | | | 12/01/12 | | | | 950 | |
| | | Quiksilver, Inc. (CCC/Caa1) |
| | | | 11,500,000 | | | | 6.875 | | | | 04/15/15 | | | | 10,867,500 | |
| | | | | | | | | | | | | | | | | |
| | | | | | | | | | | | | | | | 10,868,450 | |
| | | |
| | | |
| | | Tobacco – 0.1% |
| | | Alliance One International, Inc. (B+/B2) |
| | | | 6,250,000 | | | | 10.000 | | | | 07/15/16 | | | | 6,718,750 | |
| | | |
| | | |
| | | Transportation – 0.6% |
| | | Commercial Barge Line Co. (B+/B2) |
| | | | 9,875,000 | | | | 12.500 | | | | 07/15/17 | | | | 10,850,156 | |
| | | Marquette Transportation Co./Marquette Transportation Finance Corp. (B-/B3)(a) |
| | | | 1,625,000 | | | | 10.875 | | | | 01/15/17 | | | | 1,661,563 | |
| | | RailAmerica, Inc. (BB/B1) |
| | | | 9,701,000 | | | | 9.250 | | | | 07/01/17 | | | | 10,646,847 | |
| | | Stena AB (BB+/Ba2) |
| | | EUR | 500,000 | | | | 6.125 | | | | 02/01/17 | | | | 631,935 | |
| | | Teekay Corp. (BB/B1) |
| | | $ | 1,750,000 | | | | 8.500 | | | | 01/15/20 | | | | 1,905,312 | |
| | | United Air Lines, Inc. (BB-/Ba3)(a) |
| | | | 1,375,000 | | | | 9.875 | | | | 08/01/13 | | | | 1,478,125 | |
| | | Western Express, Inc. (B-/Caa1)(a) |
| | | | 7,250,000 | | | | 12.500 | | | | 04/15/15 | | | | 6,960,000 | |
| | | | | | | | | | | | | | | | | |
| | | | | | | | | | | | | | | | 34,133,938 | |
| | | |
| | | |
| | | Utilities – Distribution – 0.5% |
| | | AmeriGas Partners LP (NR/Ba3) |
| | | | 3,750,000 | | | | 7.250 | | | | 05/20/15 | | | | 3,853,125 | |
| | | AmeriGas Partners LP/AmeriGas Eagle Finance Corp. (NR/Ba3) |
| | | | 7,500,000 | | | | 7.125 | | | | 05/20/16 | | | | 7,800,000 | |
| | | |
| | | |
| | | Ferrellgas LP (B+/Ba3) |
| | | | 438,000 | | | | 6.750 | | | | 05/01/14 | | | | 442,380 | |
| | | Ferrellgas Partners LP/Ferrellgas Partners Finance Corp.
(B-/B2) |
| | | | 4,625,000 | | | | 8.625 | | | | 06/15/20 | | | | 4,937,188 | |
| | | Inergy LP/Inergy Finance Corp. (B+/Ba3) |
| | | | 4,300,000 | | | | 6.875 | | | | 12/15/14 | | | | 4,364,500 | |
| | | | 5,000,000 | | | | 8.250 | | | | 03/01/16 | | | | 5,225,000 | |
| | | | 1,250,000 | | | | 7.000 | (a) | | | 10/01/18 | | | | 1,281,250 | |
| | | | | | | | | | | | | | | | | |
| | | | | | | | | | | | | | | | 27,903,443 | |
| | | |
| | | |
| | | Utilities – Electric – 2.7% |
| | | Calpine Construction Finance Co. LP and CCFC Finance Corp. (BB-/Ba3)(a) |
| | | | 4,500,000 | | | | 8.000 | | | | 06/01/16 | | | | 4,815,000 | |
| | | Calpine Corp. (B+/B1)(a) |
| | | | 2,875,000 | | | | 7.250 | | | | 10/15/17 | | | | 2,910,938 | |
| | | Dynegy Holdings, Inc. (B-/Caa2) |
| | | | 3,000,000 | | | | 8.750 | | | | 02/15/12 | | | | 3,000,000 | |
| | | | 4,500,000 | | | | 7.500 | | | | 06/01/15 | | | | 3,555,000 | |
| | | | 2,500,000 | | | | 8.375 | | | | 05/01/16 | | | | 1,943,750 | |
| | | | 1,500,000 | | | | 7.125 | | | | 05/15/18 | | | | 1,005,000 | |
| | | | 6,000,000 | | | | 7.750 | | | | 06/01/19 | | | | 4,095,000 | |
| | | Edison Mission Energy (B-/B3) |
| | | | 9,625,000 | | | | 7.750 | | | | 06/15/16 | | | | 7,555,625 | |
| | | | 11,125,000 | | | | 7.000 | | | | 05/15/17 | | | | 7,982,187 | |
| | | | 7,000,000 | | | | 7.200 | | | | 05/15/19 | | | | 4,917,500 | |
| | | Elwood Energy LLC (BB/Ba1) |
| | | | 1,844,760 | | | | 8.159 | | | | 07/05/26 | | | | 1,729,463 | |
| | | Intergen NV (BB-/Ba3)(a) |
| | | | 4,500,000 | | | | 9.000 | | | | 06/30/17 | | | | 4,758,750 | |
| | | Midwest Generation LLC (B+/Ba2) |
| | | | 3,470,928 | | | | 8.560 | | | | 01/02/16 | | | | 3,427,541 | |
| | | Mirant Mid-Atlantic Pass-Through Trust Series B (BB/Ba1) |
| | | | 2,236,319 | | | | 9.125 | | | | 06/30/17 | | | | 2,381,680 | |
| | | Mirant North America LLC (B-/B1) |
| | | | 5,000,000 | | | | 7.375 | | | | 12/31/13 | | | | 5,150,000 | |
| | | NRG Energy, Inc. (BB-/B1) |
| | | | 21,725,000 | | | | 7.250 | | | | 02/01/14 | | | | 22,213,812 | |
| | | | 21,125,000 | | | | 7.375 | | | | 02/01/16 | | | | 21,653,125 | |
| | | | 2,500,000 | | | | 7.375 | | | | 01/15/17 | | | | 2,556,250 | |
| | | RRI Energy, Inc. (B/B3) |
| | | | 4,625,000 | | | | 7.625 | | | | 06/15/14 | | | | 4,544,063 | |
| | | | 5,250,000 | | | | 7.875 | | | | 06/15/17 | | | | 4,803,750 | |
| | | The AES Corp. (BB-/B1) |
| | | | 8,000,000 | | | | 7.750 | | | | 10/15/15 | | | | 8,560,000 | |
| | | | 13,250,000 | | | | 9.750 | | | | 04/15/16 | | | | 15,171,250 | |
| | | | 10,000,000 | | | | 8.000 | | | | 10/15/17 | | | | 10,775,000 | |
| | | | 6,000,000 | | | | 8.000 | | | | 06/01/20 | | | | 6,510,000 | |
| | | | | | | | | | | | | | | | | |
| | | | | | | | | | | | | | | | 156,014,684 | |
| | | |
| | | |
| | | Utilities – Pipelines – 1.7% |
| | | Crosstex Energy LP/Crosstex Energy Finance Corp. (B+/B3) |
| | | | 6,045,000 | | | | 8.875 | | | | 02/15/18 | | | | 6,317,025 | |
| | | |
| | | |
The accompanying notes are an integral part of these financial statements.
GOLDMAN SACHS HIGH YIELD FUND
Schedule of Investments (continued)
September 30, 2010 (Unaudited)
| | | | | | | | | | | | | | | | | |
| | | Principal
| | Interest
| | Maturity
| | |
| | | Amount | | Rate | | Date | | Value |
| |
Corporate Obligations – (continued) |
| | | Utilities – Pipelines – (continued) |
| | | | | | | | | | | | | | | | | |
| | | El Paso Corp. (BB-/Ba3) |
| | | $ | 5,000,000 | | | | 8.250 | % | | | 02/15/16 | | | $ | 5,550,000 | |
| | | | 10,500,000 | | | | 7.000 | | | | 06/15/17 | | | | 11,261,250 | |
| | | | 3,500,000 | | | | 7.250 | | | | 06/01/18 | | | | 3,771,250 | |
| | | | 4,000,000 | | | | 6.500 | (a) | | | 09/15/20 | | | | 4,070,000 | |
| | | | 2,000,000 | | | | 7.800 | | | | 08/01/31 | | | | 2,060,000 | |
| | | El Paso Natural Gas Co. (BB/Baa3) |
| | | | 2,750,000 | | | | 8.375 | | | | 06/15/32 | | | | 3,327,191 | |
| | | Energy Transfer Equity LP (BB-/Ba2) |
| | | | 5,475,000 | | | | 7.500 | | | | 10/15/20 | | | | 5,762,438 | |
| | | Enterprise Products Operating LLC (BB/Ba1)(e) |
| | | | 3,750,000 | | | | 8.375 | | | | 08/01/66 | | | | 3,918,604 | |
| | | | 3,285,000 | | | | 7.034 | | | | 01/15/68 | | | | 3,287,624 | |
| | | Mark West Energy Partners LP/Mark West Energy Finance Corp. Series B (BB-/B1) |
| | | | 8,750,000 | | | | 8.500 | | | | 07/15/16 | | | | 9,231,250 | |
| | | Regency Energy Partners LP (B+/B1) |
| | | | 6,598,000 | | | | 8.375 | | | | 12/15/13 | | | | 6,894,910 | |
| | | | 9,000,000 | | | | 9.375 | (a) | | | 06/01/16 | | | | 9,900,000 | |
| | | Southern Star Central Corp. (BB+/Ba2) |
| | | | 1,000,000 | | | | 6.750 | | | | 03/01/16 | | | | 1,010,000 | |
| | | Targa Resources Partners LP (B+/B1) |
| | | | 3,034,000 | | | | 8.250 | | | | 07/01/16 | | | | 3,223,625 | |
| | | | 7,625,000 | | | | 11.250 | | | | 07/15/17 | | | | 8,806,875 | |
| | | Targa Resources Partners LP/Targa Resources Partners Finance Corp. (B+/B1)(a) |
| | | | 2,250,000 | | | | 7.875 | | | | 10/15/18 | | | | 2,340,000 | |
| | | Tennessee Gas Pipeline Co. (BB/Baa3) |
| | | | 3,000,000 | | | | 7.000 | | | | 10/15/28 | | | | 3,279,531 | |
| | | | 1,500,000 | | | | 7.625 | | | | 04/01/37 | | | | 1,735,510 | |
| | | | | | | | | | | | | | | | | |
| | | | | | | | | | | | | | | | 95,747,083 | |
| | | |
| | | |
| | | TOTAL CORPORATE OBLIGATIONS |
| | | (Cost $5,010,052,310) | | $ | 5,296,896,437 | |
| | | |
| | | |
| | | | | | | | | | | | | | | | | |
| | | | | | | | | | | | | | | | | |
Senior Term Loans(h) – 0.2% |
| | | | | | | | | | | | | | | | | |
| | | | | | | | | | | | | | | | | |
| | | Gaming – 0.1% |
| | | Harrahs Operating Co., Inc. (NR/NR) |
| | | $ | 3,750,000 | | | | 3.498 | % | | | 01/28/15 | | | $ | 3,228,000 | |
| | | |
| | | |
| | | Real Estate – 0.0% |
| | | Realogy Corp. (CCC-/Caa1) |
| | | | 1,738,481 | | | | 3.258 | | | | 10/10/13 | | | | 1,543,528 | |
| | | |
| | | |
| | | Services Cyclical – Rental Equipment – 0.1% |
| | | Ahern Rentals, Inc. (CCC+/Ca) |
| | | | 3,375,000 | | | | 16.000 | | | | 12/15/12 | | | | 3,307,500 | |
| | | |
| | | |
| | | TOTAL SENIOR TERM LOANS |
| | | (Cost $8,095,156) | | $ | 8,079,028 | |
| | | |
| | | |
| | | | | | | | | | | | | |
| | | Shares | | Rate | | Value |
| |
Preferred Stocks – 0.1% |
| | | | | | | | | | | | | |
| | | | | | | | | | | | | |
| | | Ally Financial, Inc.(a) |
| | | | 7,813 | | | | 7.000 | % | | $ | 7,032,921 | |
| | | Citigroup Capital XIII(e) |
| | | | 6,875 | | | | 7.875 | | | | 178,063 | |
| | | CMP Susquehanna Radio Holdings Corp.(a)(e) |
| | | | 111,942 | | | | 0.000 | | | | — | |
| | | Lucent Technologies Capital Trust I |
| | | | 1,000 | | | | 7.750 | | | | 810,000 | |
| | | Pliant Corp.(b) |
| | | | 2,796 | | | | 13.000 | | | | 420 | |
| | | Spanish Broadcasting Systems, Inc.(b)(d) |
| | | | 3,074 | | | | 10.750 | | | | 15 | |
| | | |
| | | |
| | | TOTAL PREFERRED STOCKS |
| | | (Cost $9,065,305) | | $ | 8,021,419 | |
| | | |
| | | |
| | | | | | | | | | | |
| | | Shares | | Description | | Value |
| |
Common Stocks – 1.2% |
| | | | | | | | | | | |
| | | | | | | | | | | |
| | | | 1,996,917 | | | Adelphia Recovery Trust Series ACC-1(c) | | $ | 28,955 | |
| | | | 2,731 | | | APP China Group Ltd.(c) | | | — | |
| | | | 24,334 | | | Axiohm Transaction Solutions, Inc.(c) | | | 243 | |
| | | | 42,605 | | | Charter Communications, Inc.(c) | | | 1,380,402 | |
| | | | 365,648 | | | CIT Group, Inc.(c) | | | 14,925,751 | |
| | | | 133,498 | | | LyondellBasell Industries NV(c) | | | 3,190,602 | |
| | | | 59,971 | | | LyondellBasell Industries NV Class B(c) | | | 1,430,308 | |
| | | | 6,252 | | | Masonite Worldwide Holdings(c) | | | 231,324 | |
| | | | 541,841 | | | Nortek, Inc.(c) | | | 21,158,891 | |
| | | | 1,656 | | | Nycomed(c) | | | 23 | |
| | | | 3,874 | | | Panolam Holdings Co.(c) | | | 39 | |
| | | | 567,500 | | | Parmalat SpA(a) | | | 1,458,078 | |
| | | | 351 | | | Pliant Corp.(c) | | | 3 | |
| | | | 33,975 | | | Polymer Group, Inc.(c) | | | 764,437 | |
| | | | 2,500 | | | Port Townsend Holdings Co., Inc.(c) | | | — | |
| | | | 250 | | | Simmons Bedding Co. | | | — | |
| | | | 20,372 | | | Smurfit Kappa Funding PLC(c) | | | 205,514 | |
| | | | 584,686 | | | Smurfit-Stone Container Corp.(c) | | | 10,740,682 | |
| | | | 444,042 | | | Spectrum Brands Holdings, Inc.(c) | | | 12,069,062 | |
| | | | 8,648 | | | Viasystems Group, Inc. | | | 131,450 | |
| | | | 1,051 | | | Zemex Minerals Group, Inc.(c) | | | — | |
| | | |
| | | |
| | | TOTAL COMMON STOCKS |
| | | (Cost $94,301,964) | | $ | 67,715,764 | |
| | | |
| | | |
| | | | | | | | | | | | | |
| | | Units | | Expiration Date | | Value |
| |
Warrants(c) – 0.0% |
| | | | | | | | | | | | | |
| | | | | | | | | | | | | |
| | | Atrium Corp. |
| | | | 3,385 | | | | 12/31/12 | | | $ | — | |
| | | CNB Capital Trust I(a) |
| | | | 127,920 | | | | 03/23/19 | | | | — | |
| | | |
| | | |
The accompanying notes are an integral part of these financial statements.
GOLDMAN SACHS HIGH YIELD FUND
| | | | | | | | | | | | | |
| | | Units | | Expiration Date | | Value |
| |
Warrants(c) – (continued) |
| | | | | | | | | | | | | |
| | | Masonite Worldwide Holdings |
| | | | 30,311 | | | | 05/20/14 | | | $ | 53,844 | |
| | | | 22,734 | | | | 05/20/16 | | | | 79,569 | |
| | | Nortek, Inc. |
| | | | 11,520 | | | | 12/07/14 | | | | 115,200 | |
| | | Parmalat SpA |
| | | | 650 | | | | 12/31/15 | | | | 1,668 | |
| | | |
| | | |
| | | TOTAL WARRANTS |
| | | (Cost $147,716) | | $ | 250,281 | |
| | | |
| | | |
| | | | | | | | | | | |
| | | Shares | | Description | | Value |
| |
Special Purpose Entity(c) – 0.0% |
| | | | | | | | | | | |
| | | | | | | | | | | |
| | | | 526,991 | | | Adelphia Recovery Trust | | | | |
| | | (Cost $63,727) | | $ | 45,917 | |
| | | |
| | | |
| | | TOTAL INVESTMENTS BEFORE SHORT-TERM INVESTMENT |
| | | (Cost $5,121,726,178) | | $ | 5,381,008,846 | |
| | | |
| | | |
| | | | | | | | | | | | | | | | | |
| | | Principal
| | Interest
| | Maturity
| | |
| | | Amount | | Rate | | Date | | Value |
| |
Short-term Investment(i) – 5.4% |
| | | | | | | | | | | | | | | | | |
| | | | | | | | | | | | | | | | | |
| | | Repurchase Agreement – 5.4% |
| | | Joint Repurchase Agreement Account II |
| | | $ | 309,400,000 | | | | 0.270 | % | | | 10/01/10 | | | $ | 309,400,000 | |
| | | Maturity Value: $309,402,321 | | | | |
| | | (Cost $309,400,000) | | | | |
| | | |
| | | |
| | | TOTAL INVESTMENTS – 99.6% |
| | | (Cost $5,431,126,178) | | $ | 5,690,408,846 | |
| | | |
| | | |
| | | OTHER ASSETS IN EXCESS OF LIABILITIES – 0.4% | | | 22,913,659 | |
| | | |
| | | |
| | | NET ASSETS – 100.0% | | $ | 5,713,322,505 | |
| | | |
| | | |
The percentage shown for each investment category reflects the value of investments in that category as a percentage of net assets.
| | |
| (a) | | Exempt from registration under Rule 144A of the Securities Act of 1933. Under procedures approved by the Board of Trustees, such securities have been determined to be liquid by the investment adviser and may be resold, normally to qualified institutional buyers in transactions exempt from registration. Total market value of Rule 144A securities amounts to $1,021,836,927, which represents approximately 17.9% of net assets as of September 30, 2010. |
| |
| (b) | | Pay-in-kind securities. |
| |
| (c) | | Security is currently in default and/or non-income producing. |
| |
| (d) | | Securities with “Put” features with resetting interest rates. Maturity dates disclosed are the final maturity dates. |
| |
| (e) | | Variable rate security. Interest rate disclosed is that which is in effect at September 30, 2010. |
| |
| (f) | | Issued with a zero coupon or interest rate which increases to the stated rate at a set date in the future. |
| |
| (g) | | Coupon changes periodically based upon a predetermined schedule. Interest rate disclosed is that which is in effect at September 30, 2010. |
| |
| (h) | | Senior Term Loans often require prepayments from excess cash flows or permit the borrower to repay at its election. The degree to which borrowers repay, whether as a contractual requirement or at their election, cannot be predicted with accuracy. As a result, the actual remaining maturity may be substantially less than the stated maturities shown. The stated interest rate represents the weighted average interest rate of all contracts within the senior loan facility at September 30, 2010. Senior Term Loans typically have rates of interest which are redetermined either daily, monthly, quarterly or semi-annually by reference to a base lending rate, plus a premium. These base lending rates are primarily the London-interbank Offered Rate (“LIBOR”), and secondarily the prime rate offered by one or more major United States banks (the “Prime Rate”) and the certificate of deposit (“CD”) rate or other base lending rates used by commercial lenders. |
| |
| (i) | | Joint repurchase agreement was entered into on September 30, 2010. Additional information appears on pages 72-73. |
Security ratings disclosed, if any, are obtained from Standard & Poor’s (“S&P”)/Moody’s Investors Service (“Moody’s”) and are unaudited. A brief description of the ratings is available in the Fund’s Statement of Additional Information.
| | | | | | | |
| | | |
| | | |
| | | Currency Abbreviations: |
| | | CAD | | — | | Canadian Dollar |
| | | EUR | | — | | Euro |
| | | GBP | | — | | British Pound |
| | | |
| | | Investment Abbreviations: |
| | | NR | | — | | Not Rated |
| | | WR | | — | | Withdrawn Rating |
| | | |
| | | |
The accompanying notes are an integral part of these financial statements.
GOLDMAN SACHS HIGH YIELD FUND
Schedule of Investments (continued)
September 30, 2010 (Unaudited)
| | | | | | | |
| | | | | As a % of
|
| | | | | Net Assets |
| |
Investments Industry Classifications† |
| | | | | | | |
| | | | | | | |
| | | Aerospace | | | 0.5 | % |
| | | Agriculture | | | 0.9 | |
| | | Airlines | | | 0.3 | |
| | | Automotive | | | 4.2 | |
| | | Building Materials | | | 2.3 | |
| | | Capital Goods | | | 2.1 | |
| | | Chemicals | | | 2.8 | |
| | | Conglomerates | | | 0.6 | |
| | | Construction Machinery | | | 0.5 | |
| | | Consumer Products | | | 3.0 | |
| | | Defense | | | 0.6 | |
| | | Emerging Markets | | | 1.2 | |
| | | Energy | | | 6.5 | |
| | | Entertainment & Leisure | | | 1.6 | |
| | | Finance | | | 8.5 | |
| | | Food | | | 1.6 | |
| | | Gaming | | | 5.5 | |
| | | Health Care | | | 9.3 | |
| | | Home Construction | | | 0.2 | |
| | | Lodging | | | 0.8 | |
| | | Media | | | 5.2 | |
| | | Metals | | | 0.7 | |
| | | Packaging | | | 4.2 | |
| | | Paper | | | 1.8 | |
| | | Printing | | | 0.2 | |
| | | Publishing | | | 1.5 | |
| | | Real Estate | | | 0.4 | |
| | | Restaurants | | | 0.9 | |
| | | Retailers | | | 2.0 | |
| | | Services Cyclical | | | 4.2 | |
| | | Short-term Investments# | | | 5.8 | |
| | | Technology | | | 4.2 | |
| | | Telecommunications | | | 10.1 | |
| | | Textiles & Apparel | | | 0.2 | |
| | | Tobacco | | | 0.1 | |
| | | Transportation | | | 0.6 | |
| | | Utilities | | | 4.9 | |
| | | |
| | | |
| | | TOTAL INVESTMENTS | | | 100.0 | % |
| | | |
| | | |
| | |
| † | | Industry concentrations greater than one-tenth of one percent are disclosed. |
| |
| # | | Short-term Investments include repurchase agreements and other assets/liabilities. |
The accompanying notes are an integral part of these financial statements.
GOLDMAN SACHS HIGH YIELD FUND
ADDITIONAL INVESTMENT INFORMATION
FORWARD FOREIGN CURRENCY EXCHANGE CONTRACTS — At September 30, 2010, the Fund had outstanding forward foreign currency exchange contracts, both to purchase and sell foreign currencies:
FORWARD FOREIGN CURRENCY EXCHANGE CONTRACTS WITH UNREALIZED GAIN
| | | | | | | | | | | | | | | | | | | |
| | | | | Contract
| | Expiration
| | Current
| | Unrealized
|
| Counterparty | | Currency | | Type | | Date | | Value | | Gain |
| |
| Citibank NA | | | EUR | | | Purchase | | | 10/05/10 | | | $ | 7,325,013 | | | $ | 487,092 | |
| |
| |
FORWARD FOREIGN CURRENCY EXCHANGE CONTRACTS WITH UNREALIZED LOSS
| | | | | | | | | | | | | | | | | | | |
| | | | | Contract
| | Expiration
| | Current
| | Unrealized
|
| Counterparty | | Currency | | Type | | Date | | Value | | Loss |
| |
| Barclays Bank PLC | | | GBP | | | Sale | | | 10/05/10 | | | $ | 29,477,803 | | | $ | (482,109 | ) |
| Citibank NA | | | EUR | | | Sale | | | 10/05/10 | | | | 672,423,532 | | | | (40,891,323 | ) |
| |
| |
TOTAL | | | | | | | | | | | | | | | | $ | (41,373,432 | ) |
| |
| |
The accompanying notes are an integral part of these financial statements.
GOLDMAN SACHS INVESTMENT GRADE CREDIT FUND
Schedule of Investments
September 30, 2010 (Unaudited)
| | | | | | | | | | | | | | | | | |
| | | Principal
| | Interest
| | Maturity
| | |
| | | Amount | | Rate | | Date | | Value |
| |
Corporate Obligations – 82.8% |
| | | | | | | | | | | | | | | | | |
| | | | | | | | | | | | | | | | | |
| | | Banks – 22.3% |
| | | ANZ Capital Trust II(a)(b) |
| | | $ | 2,575,000 | | | | 5.360 | % | | | 01/29/49 | | | $ | 2,579,828 | |
| | | Astoria Financial Corp.(b) |
| | | | 2,900,000 | | | | 5.750 | | | | 10/15/12 | | | | 2,997,054 | |
| | | Bank of America Corp. |
| | | | 9,925,000 | | | | 5.625 | | | | 07/01/20 | | | | 10,478,200 | |
| | | Bank of Nova Scotia(a) |
| | | | 7,900,000 | | | | 1.450 | | | | 07/26/13 | | | | 7,985,431 | |
| | | Canadian Imperial Bank of Commerce(a) |
| | | | 2,900,000 | | | | 2.000 | | | | 02/04/13 | | | | 2,973,799 | |
| | | | 1,000,000 | | | | 2.600 | | | | 07/02/15 | | | | 1,040,495 | |
| | | Capital One Bank USA NA |
| | | | 2,650,000 | | | | 8.800 | | | | 07/15/19 | | | | 3,381,032 | |
| | | Cie de Financement Foncier(a) |
| | | | 2,900,000 | | | | 1.625 | | | | 07/23/12 | | | | 2,911,847 | |
| | | | 1,400,000 | | | | 2.125 | | | | 04/22/13 | | | | 1,425,378 | |
| | | Citigroup, Inc. |
| | | | 6,200,000 | | | | 5.500 | | | | 04/11/13 | | | | 6,662,215 | |
| | | | 5,625,000 | | | | 6.375 | | | | 08/12/14 | | | | 6,241,086 | |
| | | | 1,750,000 | | | | 5.500 | | | | 10/15/14 | | | | 1,895,872 | |
| | | | 5,725,000 | | | | 5.375 | | | | 08/09/20 | | | | 5,904,539 | |
| | | Credit Agricole SA(a)(b)(c) |
| | | | 1,350,000 | | | | 8.375 | | | | 10/13/49 | | | | 1,444,500 | |
| | | Credit Suisse of New York |
| | | | 4,125,000 | | | | 4.375 | | | | 08/05/20 | | | | 4,213,503 | |
| | | Discover Bank |
| | | | 3,700,000 | | | | 8.700 | | | | 11/18/19 | | | | 4,394,303 | |
| | | Fifth Third Bank(c) |
| | | | 5,325,000 | | | | 0.479 | | | | 05/17/13 | | | | 5,097,276 | |
| | | HSBC Bank USA NA |
| | | | 4,550,000 | | | | 6.000 | | | | 08/09/17 | | | | 5,158,345 | |
| | | | 2,325,000 | | | | 4.875 | | | | 08/24/20 | | | | 2,424,975 | |
| | | | 1,790,000 | | | | 5.625 | | | | 08/15/35 | | | | 1,822,879 | |
| | | HSBC Capital Funding LP(a)(b)(c) |
| | | | 1,050,000 | | | | 4.610 | | | | 06/27/49 | | | | 1,013,482 | |
| | | Intesa Sanpaolo SPA(a) |
| | | | 2,825,000 | | | | 3.625 | | | | 08/12/15 | | | | 2,858,555 | |
| | | JPMorgan Chase Capital XX Series T(b) |
| | | | 1,650,000 | | | | 6.550 | | | | 09/29/36 | | | | 1,652,406 | |
| | | JPMorgan Chase Capital XXV |
| | | | 1,300,000 | | | | 6.800 | | | | 10/01/37 | | | | 1,309,928 | |
| | | JPMorgan Securities, Inc. |
| | | | 8,375,000 | | | | 6.400 | | | | 10/02/17 | | | | 9,748,784 | |
| | | KeyBank NA |
| | | | 2,375,000 | | | | 5.500 | | | | 09/17/12 | | | | 2,537,482 | |
| | | Lloyds TSB Bank PLC(a) |
| | | | 4,075,000 | | | | 6.500 | | | | 09/14/20 | | | | 4,114,263 | |
| | | Manufacturers & Traders Trust Co.(b)(c) |
| | | | 3,525,000 | | | | 2.033 | | | | 04/01/13 | | | | 3,486,803 | |
| | | | 1,495,000 | | | | 5.585 | | | | 12/28/20 | | | | 1,435,200 | |
| | | Merrill Lynch & Co., Inc. |
| | | | 1,250,000 | | | | 6.400 | | | | 08/28/17 | | | | 1,364,981 | |
| | | | 4,450,000 | | | | 6.875 | | | | 04/25/18 | | | | 4,979,662 | |
| | | MUFG Capital Finance 1 Ltd.(c) |
| | | | 3,025,000 | | | | 6.346 | | | | 07/25/49 | | | | 2,994,750 | |
| | | |
| | | |
| | | PNC Funding Corp. |
| | | | 4,825,000 | | | | 5.500 | | | | 09/28/12 | | | | 5,184,740 | |
| | | Regions Financial Corp. |
| | | | 3,600,000 | | | | 5.750 | | | | 06/15/15 | | | | 3,669,182 | |
| | | Resona Bank Ltd.(a)(b)(c) |
| | | EUR | 1,475,000 | | | | 5.850 | | | | 04/15/49 | | | | 1,471,587 | |
| | | Royal Bank of Scotland PLC |
| | | $ | 3,650,000 | | | | 3.400 | | | | 08/23/13 | | | | 3,741,998 | |
| | | | 3,375,000 | | | | 4.875 | (a) | | | 08/25/14 | | | | 3,580,436 | |
| | | Santander Issuances SA Unipersonal(a)(b)(c) |
| | | | 700,000 | | | | 5.805 | | | | 06/20/16 | | | | 681,120 | |
| | | Sovereign Bank |
| | | | 4,600,000 | | | | 5.125 | | | | 03/15/13 | | | | 4,780,887 | |
| | | | 455,000 | | | | 2.176 | (b)(c) | | | 08/01/13 | | | | 440,622 | |
| | | Stadshypotek AB(a) |
| | | | 4,900,000 | | | | 1.450 | | | | 09/30/13 | | | | 4,916,008 | |
| | | Sumitomo Mitsui Banking Corp.(a) |
| | | | 3,700,000 | | | | 3.150 | | | | 07/22/15 | | | | 3,875,215 | |
| | | The Toronto-Dominion Bank(a) |
| | | | 2,500,000 | | | | 2.200 | | | | 07/29/15 | | | | 2,533,528 | |
| | | UBS AG |
| | | | 2,250,000 | | | | 4.875 | | | | 08/04/20 | | | | 2,372,445 | |
| | | US Bank NA(b)(c) |
| | | EUR | 2,400,000 | | | | 4.375 | | | | 02/28/17 | | | | 3,244,645 | |
| | | | | | | | | | | | | | | | | |
| | | | | | | | | | | | | | | | 159,021,266 | |
| | | |
| | | |
| | | Brokerage – 2.4% |
| | | Morgan Stanley & Co. |
| | | $ | 4,250,000 | | | | 4.750 | | | | 04/01/14 | | | | 4,405,245 | |
| | | | 8,375,000 | | | | 6.250 | (b) | | | 08/28/17 | | | | 9,072,302 | |
| | | | 3,250,000 | | | | 7.300 | (b) | | | 05/13/19 | | | | 3,714,577 | |
| | | | | | | | | | | | | | | | | |
| | | | | | | | | | | | | | | | 17,192,124 | |
| | | |
| | | |
| | | Captive Financial – 1.3% |
| | | Caterpillar Financial Services Corp. |
| | | | 3,525,000 | | | | 6.200 | | | | 09/30/13 | | | | 4,024,352 | |
| | | John Deere Capital Corp. |
| | | | 5,023,000 | | | | 5.250 | | | | 10/01/12 | | | | 5,446,985 | |
| | | | | | | | | | | | | | | | | |
| | | | | | | | | | | | | | | | 9,471,337 | |
| | | |
| | | |
| | | Chemicals(b) – 1.7% |
| | | Airgas, Inc. |
| | | | 2,925,000 | | | | 4.500 | | | | 09/15/14 | | | | 3,112,276 | |
| | | The Dow Chemical Co. |
| | | | 7,850,000 | | | | 7.600 | | | | 05/15/14 | | | | 9,174,184 | |
| | | | | | | | | | | | | | | | | |
| | | | | | | | | | | | | | | | 12,286,460 | |
| | | |
| | | |
| | | Consumer Products(b) – 0.7% |
| | | Whirlpool Corp. |
| | | | 2,050,000 | | | | 8.000 | | | | 05/01/12 | | | | 2,444,681 | |
| | | | 2,675,000 | | | | 8.600 | | | | 05/01/14 | | | | 2,921,076 | |
| | | | | | | | | | | | | | | | | |
| | | | | | | | | | | | | | | | 5,365,757 | |
| | | |
| | | |
| | | Distributors(a)(b) – 0.5% |
| | | Ras Laffan Liquefied Natural Gas Co. Ltd. III |
| | | | 2,300,000 | | | | 6.750 | | | | 09/30/19 | | | | 2,731,688 | |
| | | |
| | | |
The accompanying notes are an integral part of these financial statements.
GOLDMAN SACHS INVESTMENT GRADE CREDIT FUND
| | | | | | | | | | | | | | | | | |
| | | Principal
| | Interest
| | Maturity
| | |
| | | Amount | | Rate | | Date | | Value |
| |
Corporate Obligations – (continued) |
| | | Distributors(a)(b) – (continued) |
| | | | | | | | | | | | | | | | | |
| | | Southern Star Central Gas Pipeline, Inc. |
| | | $ | 1,100,000 | | | | 6.000 | % | | | 06/01/16 | | | $ | 1,160,796 | |
| | | | | | | | | | | | | | | | | |
| | | | | | | | | | | | | | | | 3,892,484 | |
| | | |
| | | |
| | | Electric(b) – 3.5% |
| | | Arizona Public Service Co. |
| | | | 525,000 | | | | 6.250 | | | | 08/01/16 | | | | 601,650 | |
| | | | 6,115,000 | | | | 8.750 | | | | 03/01/19 | | | | 7,983,393 | |
| | | Enel Finance International SA(a) |
| | | | 3,400,000 | | | | 5.700 | | | | 01/15/13 | | | | 3,667,726 | |
| | | | 4,325,000 | | | | 3.875 | | | | 10/07/14 | | | | 4,532,302 | |
| | | Nevada Power Co. |
| | | | 2,425,000 | | | | 7.125 | | | | 03/15/19 | | | | 2,989,981 | |
| | | Progress Energy, Inc. |
| | | | 1,575,000 | | | | 7.050 | | | | 03/15/19 | | | | 1,920,785 | |
| | | | 1,000,000 | | | | 7.000 | | | | 10/30/31 | | | | 1,230,531 | |
| | | Public Service Co. of Oklahoma |
| | | | 1,650,000 | | | | 6.625 | | | | 11/15/37 | | | | 1,939,051 | |
| | | | | | | | | | | | | | | | | |
| | | | | | | | | | | | | | | | 24,865,419 | |
| | | |
| | | |
| | | Energy – 7.4% |
| | | Anadarko Petroleum Corp.(b) |
| | | | 6,025,000 | | | | 6.375 | | | | 09/15/17 | | | | 6,639,279 | |
| | | BP Capital Markets PLC |
| | | | 3,975,000 | | | | 5.250 | | | | 11/07/13 | | | | 4,322,521 | |
| | | | 4,475,000 | | | | 3.875 | | | | 03/10/15 | | | | 4,640,556 | |
| | | | 4,875,000 | | | | 4.500 | (b) | | | 10/01/20 | | | | 4,990,288 | |
| | | Cenovus Energy, Inc.(b) |
| | | | 6,300,000 | | | | 6.750 | | | | 11/15/39 | | | | 7,606,418 | |
| | | Dolphin Energy Ltd.(a)(b) |
| | | | 527,615 | | | | 5.888 | | | | 06/15/19 | | | | 567,186 | |
| | | Nexen, Inc.(b) |
| | | | 885,000 | | | | 7.500 | | | | 07/30/39 | | | | 1,078,831 | |
| | | Petro-Canada(b) |
| | | | 4,675,000 | | | | 6.050 | | | | 05/15/18 | | | | 5,443,245 | |
| | | Petroleos Mexicanos(a)(b) |
| | | | 900,000 | | | | 6.625 | | | | 06/15/35 | | | | 985,500 | |
| | | Shell International Finance BV(b) |
| | | | 4,775,000 | | | | 1.875 | | | | 03/25/13 | | | | 4,874,796 | |
| | | Transocean, Inc.(b) |
| | | | 7,425,000 | | | | 6.500 | | | | 11/15/20 | | | | 8,086,456 | |
| | | | 1,400,000 | | | | 6.800 | | | | 03/15/38 | | | | 1,414,000 | |
| | | Valero Logistics(b) |
| | | | 2,000,000 | | | | 6.050 | | | | 03/15/13 | | | | 2,160,495 | |
| | | | | | | | | | | | | | | | | |
| | | | | | | | | | | | | | | | 52,809,571 | |
| | | |
| | | |
| | | Environmental(b) – 0.4% |
| | | Allied Waste North America, Inc. |
| | | | 2,450,000 | | | | 6.375 | | | | 04/15/11 | | | | 2,520,805 | |
| | | |
| | | |
| | | Food & Beverage – 3.3% |
| | | Anheuser-Busch InBev Worldwide, Inc.(a)(b) |
| | | | 7,575,000 | | | | 7.750 | | | | 01/15/19 | | | | 9,826,381 | |
| | | | 2,500,000 | | | | 8.200 | | | | 01/15/39 | | | | 3,579,965 | |
| | | Bacardi Ltd.(a)(b) |
| | | | 1,200,000 | | | | 7.450 | | | | 04/01/14 | | | | 1,419,020 | |
| | | | 450,000 | | | | 8.200 | | | | 04/01/19 | | | | 584,264 | |
| | | |
| | | |
| | | Kraft Foods, Inc. |
| | | | 625,000 | | | | 6.125 | | | | 08/23/18 | | | | 737,762 | |
| | | | 6,575,000 | | | | 6.500 | | | | 02/09/40 | | | | 7,689,614 | |
| | | | | | | | | | | | | | | | | |
| | | | | | | | | | | | | | | | 23,837,006 | |
| | | |
| | | |
| | | Health Care – Medical Products(b) – 3.5% |
| | | Agilent Technologies, Inc. |
| | | | 6,226,000 | | | | 5.500 | | | | 09/14/15 | | | | 6,994,660 | |
| | | Boston Scientific Corp. |
| | | | 3,825,000 | | | | 4.500 | | | | 01/15/15 | | | | 3,916,460 | |
| | | | 2,475,000 | | | | 6.000 | | | | 01/15/20 | | | | 2,634,603 | |
| | | Hospira, Inc. |
| | | | 2,100,000 | | | | 5.600 | | | | 09/15/40 | | | | 2,174,661 | |
| | | Life Technologies Corp. |
| | | | 6,000,000 | | | | 4.400 | | | | 03/01/15 | | | | 6,414,034 | |
| | | St. Jude Medical, Inc. |
| | | | 2,675,000 | | | | 3.750 | | | | 07/15/14 | | | | 2,872,370 | |
| | | | | | | | | | | | | | | | | |
| | | | | | | | | | | | | | | | 25,006,788 | |
| | | |
| | | |
| | | Health Care – Services(b) – 0.7% |
| | | CIGNA Corp. |
| | | | 4,250,000 | | | | 6.350 | | | | 03/15/18 | | | | 4,957,457 | |
| | | |
| | | |
| | | Life Insurance – 3.6% |
| | | Lincoln National Corp.(b) |
| | | | 1,200,000 | | | | 4.300 | | | | 06/15/15 | | | | 1,266,366 | |
| | | MetLife Capital Trust X(a)(b)(c) |
| | | | 1,500,000 | | | | 9.250 | | | | 04/08/38 | | | | 1,770,000 | |
| | | Nationwide Life Global Funding I(a) |
| | | | 2,450,000 | | | | 5.450 | | | | 10/02/12 | | | | 2,548,179 | |
| | | Prudential Financial, Inc. |
| | | | 2,550,000 | | | | 6.100 | | | | 06/15/17 | | | | 2,859,218 | |
| | | | 3,650,000 | | | | 6.000 | | | | 12/01/17 | | | | 4,096,427 | |
| | | Reinsurance Group of America, Inc.(b)(c) |
| | | | 1,950,000 | | | | 6.750 | | | | 12/15/65 | | | | 1,672,125 | |
| | | Symetra Financial Corp.(a)(b) |
| | | | 1,600,000 | | | | 6.125 | | | | 04/01/16 | | | | 1,655,536 | |
| | | | 725,000 | | | | 8.300 | (c) | | | 10/15/37 | | | | 625,549 | |
| | | The Northwestern Mutual Life Insurance Co.(a)(b) |
| | | | 7,600,000 | | | | 6.063 | | | | 03/30/40 | | | | 8,828,578 | |
| | | | | | | | | | | | | | | | | |
| | | | | | | | | | | | | | | | 25,321,978 | |
| | | |
| | | |
| | | Media – Cable – 2.7% |
| | | Comcast Cable Communications Holdings, Inc. |
| | | | 2,200,000 | | | | 8.375 | | | | 03/15/13 | | | | 2,558,024 | |
| | | | 1,025,000 | | | | 9.455 | | | | 11/15/22 | | | | 1,428,483 | |
| | | Comcast Corp.(b) |
| | | | 7,150,000 | | | | 5.300 | | | | 01/15/14 | | | | 7,974,806 | |
| | | Cox Communications, Inc.(a)(b) |
| | | | 2,025,000 | | | | 8.375 | | | | 03/01/39 | | | | 2,743,777 | |
| | | DIRECTV Holdings LLC(b) |
| | | | 3,925,000 | | | | 7.625 | | | | 05/15/16 | | | | 4,356,750 | |
| | | | | | | | | | | | | | | | | |
| | | | | | | | | | | | | | | | 19,061,840 | |
| | | |
| | | |
| | | Media – Non Cable – 1.4% |
| | | NBC Universal, Inc.(a)(b) |
| | | | 3,625,000 | | | | 4.375 | | | | 04/01/21 | | | | 3,682,143 | |
| | | |
| | | |
The accompanying notes are an integral part of these financial statements.
GOLDMAN SACHS INVESTMENT GRADE CREDIT FUND
Schedule of Investments (continued)
September 30, 2010 (Unaudited)
| | | | | | | | | | | | | | | | | |
| | | Principal
| | Interest
| | Maturity
| | |
| | | Amount | | Rate | | Date | | Value |
| |
Corporate Obligations – (continued) |
| | | Media – Non Cable – (continued) |
| | | | | | | | | | | | | | | | | |
| | | News America, Inc. |
| | | $ | 1,800,000 | | | | 5.300 | % | | | 12/15/14 | | | $ | 2,032,244 | |
| | | WPP Finance UK(b) |
| | | | 3,450,000 | | | | 8.000 | | | | 09/15/14 | | | | 4,098,856 | |
| | �� | | | | | | | | | | | | | | | |
| | | | | | | | | | | | | | | | 9,813,243 | |
| | | |
| | | |
| | | Metals & Mining(b) – 1.6% |
| | | Anglo American Capital PLC(a) |
| | | | 3,428,000 | | | | 9.375 | | | | 04/08/14 | | | | 4,220,478 | |
| | | ArcelorMittal |
| | | | 1,500,000 | | | | 5.375 | | | | 06/01/13 | | | | 1,608,900 | |
| | | Freeport-McMoRan Copper & Gold, Inc. |
| | | | 4,725,000 | | | | 8.375 | | | | 04/01/17 | | | | 5,256,563 | |
| | | | | | | | | | | | | | | | | |
| | | | | | | | | | | | | | | | 11,085,941 | |
| | | |
| | | |
| | | Noncaptive – Financial – 0.6% |
| | | General Electric Capital Corp. |
| | | | 3,650,000 | | | | 6.875 | | | | 01/10/39 | | | | 4,159,265 | |
| | | |
| | | |
| | | Pharmaceuticals – 2.7% |
| | | Roche Holdings, Inc.(a)(b) |
| | | | 5,900,000 | | | | 5.000 | | | | 03/01/14 | | | | 6,596,560 | |
| | | Teva Pharmaceutical Finance III LLC |
| | | | 3,275,000 | | | | 1.500 | | | | 06/15/12 | | | | 3,311,634 | |
| | | Watson Pharmaceuticals, Inc.(b) |
| | | | 8,425,000 | | | | 5.000 | | | | 08/15/14 | | | | 9,209,521 | |
| | | | | | | | | | | | | | | | | |
| | | | | | | | | | | | | | | | 19,117,715 | |
| | | |
| | | |
| | | Pipelines – 6.3% |
| | | CenterPoint Energy Resources Corp. Series B(b) |
| | | | 2,500,000 | | | | 7.875 | | | | 04/01/13 | | | | 2,866,962 | |
| | | DCP Midstream LLC(a)(b) |
| | | | 5,060,000 | | | | 9.750 | | | | 03/15/19 | | | | 6,733,190 | |
| | | Energy Transfer Partners LP(b) |
| | | | 275,000 | | | | 5.650 | | | | 08/01/12 | | | | 291,469 | |
| | | | 5,952,000 | | | | 5.950 | | | | 02/01/15 | | | | 6,605,861 | |
| | | Enterprise Products Operating LLC(b) |
| | | | 2,350,000 | | | | 5.600 | | | | 10/15/14 | | | | 2,650,876 | |
| | | | 1,575,000 | | | | 6.650 | | | | 04/15/18 | | | | 1,842,079 | |
| | | | 3,973,000 | | | | 7.550 | | | | 04/15/38 | | | | 4,930,851 | |
| | | Northwest Pipeline GP(b) |
| | | | 2,025,000 | | | | 6.050 | | | | 06/15/18 | | | | 2,368,036 | |
| | | Southern Natural Gas Co.(a)(b) |
| | | | 700,000 | | | | 5.900 | | | | 04/01/17 | | | | 765,854 | |
| | | Tennessee Gas Pipeline Co.(b) |
| | | | 1,460,000 | | | | 7.000 | | | | 10/15/28 | | | | 1,596,038 | |
| | | | 2,125,000 | | | | 8.375 | | | | 06/15/32 | | | | 2,559,777 | |
| | | The Williams Cos., Inc. |
| | | | 825,000 | | | | 6.750 | (a) | | | 10/01/10 | | | | 825,118 | |
| | | | 691,000 | | | | 7.875 | (b) | | | 09/01/21 | | | | 837,091 | |
| | | | 408,000 | | | | 8.750 | (b) | | | 03/15/32 | | | | 514,040 | |
| | | TransCanada PipeLines Ltd.(b)(c) |
| | | | 3,425,000 | | | | 6.350 | | | | 05/15/67 | | | | 3,185,250 | |
| | | Valmont Industries, Inc.(b) |
| | | | 4,500,000 | | | | 6.625 | | | | 04/20/20 | | | | 4,614,207 | |
| | | |
| | | |
| | | Williams Partners LP(b) |
| | | | 1,800,000 | | | | 3.800 | | | | 02/15/15 | | | | 1,894,018 | |
| | | | | | | | | | | | | | | | | |
| | | | | | | | | | | | | | | | 45,080,717 | |
| | | �� |
| | | |
| | | Property/Casualty Insurance(b) – 2.9% |
| | | ACE INA Holdings, Inc. |
| | | | 1,500,000 | | | | 6.700 | | | | 05/15/36 | | | | 1,831,545 | |
| | | Alleghany Corp. |
| | | | 2,900,000 | | | | 5.625 | | | | 09/15/20 | | | | 2,959,149 | |
| | | Arch Capital Group Ltd. |
| | | | 1,245,000 | | | | 7.350 | | | | 05/01/34 | | | | 1,318,988 | |
| | | Aspen Insurance Holdings Ltd. |
| | | | 1,025,000 | | | | 6.000 | | | | 08/15/14 | | | | 1,111,292 | |
| | | Axis Specialty Finance LLC |
| | | | 2,600,000 | | | | 5.875 | | | | 06/01/20 | | | | 2,649,117 | |
| | | CNA Financial Corp. |
| | | | 1,025,000 | | | | 5.850 | | | | 12/15/14 | | | | 1,101,316 | |
| | | Endurance Specialty Holdings Ltd. |
| | | | 550,000 | | | | 7.000 | | | | 07/15/34 | | | | 532,128 | |
| | | QBE Insurance Group Ltd.(a) |
| | | | 647,000 | | | | 9.750 | | | | 03/14/14 | | | | 782,706 | |
| | | | 855,000 | | | | 5.647 | (c) | | | 07/01/23 | | | | 799,608 | |
| | | The Travelers Cos., Inc.(c) |
| | | | 1,300,000 | | | | 6.250 | | | | 03/15/37 | | | | 1,248,000 | |
| | | Transatlantic Holdings, Inc. |
| | | | 3,725,000 | | | | 8.000 | | | | 11/30/39 | | | | 3,814,753 | |
| | | ZFS Finance USA Trust I(a)(c) |
| | | | 1,375,000 | | | | 6.150 | | | | 12/15/65 | | | | 1,354,375 | |
| | | ZFS Finance USA Trust II(a)(c) |
| | | | 1,275,000 | | | | 6.450 | | | | 12/15/65 | | | | 1,211,250 | |
| | | | | | | | | | | | | | | | | |
| | | | | | | | | | | | | | | | 20,714,227 | |
| | | |
| | | |
| | | Real Estate Investment Trusts(b) – 5.2% |
| | | Arden Realty LP(d) |
| | | | 1,160,000 | | | | 5.200 | | | | 09/01/11 | | | | 1,203,559 | |
| | | Developers Diversified Realty Corp. |
| | | | 2,750,000 | | | | 7.500 | | | | 04/01/17 | | | | 2,887,500 | |
| | | Duke Realty LP |
| | | | 2,825,000 | | | | 6.750 | | | | 03/15/20 | | | | 3,153,547 | |
| | | HCP, Inc. |
| | | | 4,750,000 | | | | 6.300 | | | | 09/15/16 | | | | 5,158,856 | |
| | | Pan Pacific Retail Properties, Inc. |
| | | | 1,350,000 | | | | 5.950 | | | | 06/01/14 | | | | 1,492,873 | |
| | | Post Apartment Homes LP |
| | | | 3,000,000 | | | | 6.300 | | | | 06/01/13 | | | | 3,229,049 | |
| | | ProLogis(e) |
| | | | 8,000,000 | | | | 2.250 | | | | 04/01/37 | | | | 7,741,696 | |
| | | Simon Property Group LP |
| | | | 2,475,000 | | | | 5.750 | | | | 12/01/15 | | | | 2,818,369 | |
| | | | 2,375,000 | | | | 10.350 | | | | 04/01/19 | | | | 3,302,804 | |
| | | | 3,500,000 | | | | 5.650 | | | | 02/01/20 | | | | 3,894,644 | |
| | | | 450,000 | | | | 4.375 | | | | 03/01/21 | | | | 456,175 | |
| | | WEA Finance LLC(a) |
| | | | 1,300,000 | | | | 7.125 | | | | 04/15/18 | | | | 1,528,816 | |
| | | | | | | | | | | | | | | | | |
| | | | | | | | | | | | | | | | 36,867,888 | |
| | | | | | | | | | | | | | | | | |
| | | |
| | | |
The accompanying notes are an integral part of these financial statements.
GOLDMAN SACHS INVESTMENT GRADE CREDIT FUND
| | | | | | | | | | | | | | | | | |
| | | Principal
| | Interest
| | Maturity
| | |
| | | Amount | | Rate | | Date | | Value |
| |
Corporate Obligations – (continued) |
| | | | | | | | | | | | | | | | | |
| | | Restaurants(b) – 0.5% |
| | | Yum! Brands, Inc. |
| | | $ | 3,475,000 | | | | 3.875 | % | | | 11/01/20 | | | $ | 3,456,838 | |
| | | |
| | | |
| | | Retailers(b) – 0.3% |
| | | Nordstrom, Inc. |
| | | | 1,675,000 | | | | 6.750 | | | | 06/01/14 | | | | 1,952,991 | |
| | | |
| | | |
| | | Technology – Hardware(b) – 0.2% |
| | | Fiserv, Inc. |
| | | | 1,175,000 | | | | 6.125 | | | | 11/20/12 | | | | 1,286,291 | |
| | | |
| | | |
| | | Tobacco – 1.6% |
| | | Altria Group, Inc. |
| | | | 4,575,000 | | | | 9.700 | | | | 11/10/18 | | | | 6,150,780 | |
| | | BAT International Finance PLC(a)(b) |
| | | | 4,032,000 | | | | 9.500 | | | | 11/15/18 | | | | 5,482,133 | |
| | | | | | | | | | | | | | | | | |
| | | | | | | | | | | | | | | | 11,632,913 | |
| | | |
| | | |
| | | Transportation(b) – 0.5% |
| | | Burlington Northern Santa Fe LLC |
| | | | 2,975,000 | | | | 7.000 | | | | 02/01/14 | | | | 3,480,687 | |
| | | |
| | | |
| | | Wireless Telecommunications – 3.3% |
| | | AT&T, Inc.(b) |
| | | | 2,300,000 | | | | 6.400 | | | | 05/15/38 | | | | 2,614,184 | |
| | | Qtel International Finance Ltd. |
| | | | 2,200,000 | | | | 7.875 | | | | 06/10/19 | | | | 2,700,500 | |
| | | Telecom Italia Capital SA(b) |
| | | | 6,990,000 | | | | 5.250 | | | | 10/01/15 | | | | 7,536,941 | |
| | | Verizon Wireless Capital LLC(b) |
| | | | 4,600,000 | | | | 8.500 | | | | 11/15/18 | | | | 6,245,562 | |
| | | Vodafone Group PLC(b) |
| | | | 4,075,000 | | | | 5.350 | | | | 02/27/12 | | | | 4,302,435 | |
| | | | | | | | | | | | | | | | | |
| | | | | | | | | | | | | | | | 23,399,622 | |
| | | |
| | | |
| | | Wirelines Telecommunications(b) – 1.7% |
| | | Qwest Corp. |
| | | | 3,975,000 | | | | 8.375 | | | | 05/01/16 | | | | 4,670,625 | |
| | | Telecom Italia Capital SA |
| | | | 1,500,000 | | | | 6.200 | | | | 07/18/11 | | | | 1,554,076 | |
| | | | 5,700,000 | | | | 4.950 | | | | 09/30/14 | | | | 6,054,066 | |
| | | | | | | | | | | | | | | | | |
| | | | | | | | | | | | | | | | 12,278,767 | |
| | | |
| | | |
| | | TOTAL CORPORATE OBLIGATIONS |
| | | (Cost $552,379,699) | | $ | 589,937,397 | |
| | | |
| | | |
| | | | | | | | | | | | | | | | | |
| | | | | | | | | | | | | | | | | |
Mortgage-Backed Obligations – 1.2% |
| | | | | | | | | | | | | | | | | |
| | | | | | | | | | | | | | | | | |
| | | Collateralized Mortgage Obligations – 1.2% |
| | | Countrywide Alternative Loan Trust Series 2007-06, Class A4 |
| | | $ | 1,200,000 | | | | 5.750 | % | | | 04/25/47 | | | $ | 747,313 | |
| | | Countrywide Alternative Loan Trust Series 2007-15CB, Class A5 |
| | | | 2,106,591 | | | | 5.750 | | | | 07/25/37 | | | | 1,608,509 | |
| | | Countrywide Alternative Loan Trust Series 2007-16CB, Class 4A7 |
| | | | 1,627,840 | | | | 6.000 | | | | 08/25/37 | | | | 1,246,173 | |
| | | |
| | | |
| | | Residential Asset Securitization Trust Series 2007-06, Class 1A3 |
| | | | 1,061,885 | | | | 6.000 | | | | 04/25/37 | | | | 791,250 | |
| | | Structured Adjustable Rate Mortgage Loan Trust Series 2005-21, Class 7A1(c) |
| | | | 1,902,275 | | | | 5.894 | | | | 11/25/35 | | | | 1,684,770 | |
| | | Washington Mutual Mortgage Pass-Through Certificates Series 2005-AR15, Class A1A1(c) |
| | | | 1,415,461 | | | | 1.413 | | | | 11/25/45 | | | | 1,135,592 | |
| | | Wells Fargo Alternative Loan Trust Series 2007-PA2, Class 1A1 |
| | | | 1,420,663 | | | | 6.000 | | | | 06/25/37 | | | | 1,157,122 | |
| | | |
| | | |
| | | TOTAL MORTGAGE-BACKED OBLIGATIONS |
| | | (Cost $8,048,137) | | $ | 8,370,729 | |
| | | |
| | | |
| | | | | | | | | | | | | | | | | |
| | | | | | | | | | | | | | | | | |
Foreign Debt Obligations – 3.3% |
| | | | | | | | | | | | | | | | | |
| | | | | | | | | | | | | | | | | |
| | | Sovereign – 3.0% |
| | | Federal Republic of Brazil |
| | | $ | 820,000 | | | | 8.250 | % | | | 01/20/34 | | | $ | 1,184,900 | |
| | | | 4,000,000 | | | | 7.125 | | | | 01/20/37 | | | | 5,240,000 | |
| | | Ontario Province of Canada |
| | | | 1,400,000 | | | | 4.100 | | | | 06/16/14 | | | | 1,537,389 | |
| | | Republic of Peru |
| | | | 1,250,000 | | | | 8.750 | | | | 11/21/33 | | | | 1,856,250 | |
| | | | 1,000,000 | | | | 6.550 | | | | 03/14/37 | | | | 1,215,000 | |
| | | Russian Federation |
| | | | 4,475,000 | | | | 7.500 | | | | 03/31/30 | | | | 5,336,437 | |
| | | State of Qatar |
| | | | 600,000 | | | | 5.150 | | | | 04/09/14 | | | | 656,400 | |
| | | United Mexican States |
| | | | 3,800,000 | | | | 6.050 | | | | 01/11/40 | | | | 4,351,000 | |
| | | | | | | | | | | | | | | | | |
| | | | | | | | | | | | | | | | 21,377,376 | |
| | | |
| | | |
| | | Supranational – 0.3% |
| | | North American Development Bank |
| | | | 2,000,000 | | | | 4.375 | | | | 02/11/20 | | | | 2,185,714 | |
| | | |
| | | |
| | | TOTAL FOREIGN DEBT OBLIGATIONS |
| | | (Cost $21,296,328) | | $ | 23,563,090 | |
| | | |
| | | |
| | | | | | | | | | | | | | | | | |
| | | | | | | | | | | | | | | | | |
Agency Debentures – 0.8% |
| | | | | | | | | | | | | | | | | |
| | | | | | | | | | | | | | | | | |
| | | FHLMC |
| | | $ | 4,900,000 | | | | 1.750 | % | | | 09/10/15 | | | $ | 4,948,495 | |
| | | Tennessee Valley Authority |
| | | | 1,100,000 | | | | 4.625 | | | | 09/15/60 | | | | 1,145,930 | |
| | | |
| | | |
| | | TOTAL AGENCY DEBENTURES |
| | | (Cost $5,971,767) | | $ | 6,094,425 | |
| | | |
| | | |
| | | | | | | | | | | | | | | | | |
| | | | | | | | | | | | | | | | | |
| | | | | | | | | | | | | | | | | |
The accompanying notes are an integral part of these financial statements.
GOLDMAN SACHS INVESTMENT GRADE CREDIT FUND
Schedule of Investments (continued)
September 30, 2010 (Unaudited)
| | | | | | | | | | | | | | | | | |
| | | Principal
| | Interest
| | Maturity
| | |
| | | Amount | | Rate | | Date | | Value |
| |
U.S. Treasury Obligations – 4.8% |
| | | | | | | | | | | | | | | | | |
| | | | | | | | | | | | | | | | | |
| | | United States Treasury Bonds |
| | | $ | 6,300,000 | | | | 4.375 | % | | | 05/15/40 | | | $ | 7,075,530 | |
| | | | 1,100,000 | | | | 3.875 | | | | 08/15/40 | | | | 1,137,301 | |
| | | United States Treasury Notes |
| | | | 16,100,000 | | | | 0.750 | (d) | | | 05/31/12 | | | | 16,198,049 | |
| | | | 7,700,000 | | | | 0.625 | | | | 06/30/12 | | | | 7,731,338 | |
| | | | 1,600,000 | | | | 3.125 | | | | 10/31/16 | | | | 1,736,880 | |
| | | |
| | | |
| | | TOTAL U.S. TREASURY OBLIGATIONS |
| | | (Cost $33,488,635) | | $ | 33,879,098 | |
| | | |
| | | |
| | | | | | | | | | | | | | | | | |
| | | | | | | | | | | | | | | | | |
Municipal Debt Obligations – 3.7% |
| | | | | | | | | | | | | | | | | |
| | | | | | | | | | | | | | | | | |
| | | California – 2.5% |
| | | California State GO Bonds Build America Taxable Series 2009 |
| | | $ | 1,375,000 | | | | 7.500 | % | | | 04/01/34 | | | $ | 1,495,972 | |
| | | | 10,120,000 | | | | 7.550 | | | | 04/01/39 | | | | 11,005,601 | |
| | | | 455,000 | | | | 7.300 | | | | 10/01/39 | | | | 481,595 | |
| | | California State GO Bonds Build America Taxable Series 2010 |
| | | | 1,845,000 | | | | 7.625 | | | | 03/01/40 | | | | 2,029,279 | |
| | | California State University RB Build America Bonds Series 2010 |
| | | | 2,825,000 | | | | 6.484 | | | | 11/01/41 | | | | 3,076,425 | |
| | | | | | | | | | | | | | | | | |
| | | | | | | | | | | | | | | | 18,088,872 | |
| | | |
| | | |
| | | Illinois – 1.1% |
| | | Chicago Illinois Metropolitan Water Reclamation District GO Bonds Build America Bonds Taxable Direct Payment Series 2009 |
| | | | 1,775,000 | | | | 5.720 | | | | 12/01/38 | | | | 2,020,181 | |
| | | Illinois State GO Bonds Build America Series 2010 |
| | | | 5,675,000 | | | | 6.630 | | | | 02/01/35 | | | | 5,580,057 | |
| | | | | | | | | | | | | | | | | |
| | | | | | | | | | | | | | | | 7,600,238 | |
| | | |
| | | |
| | | New Jersey – 0.1% |
| | | New Jersey State Turnpike Authority RB Build America Taxable Series 2009 F |
| | | | 350,000 | | | | 7.414 | | | | 01/01/40 | | | | 434,542 | |
| | | |
| | | |
| | | TOTAL MUNICIPAL DEBT OBLIGATIONS |
| | | (Cost $25,005,073) | | $ | 26,123,652 | |
| | | |
| | | |
| | | | | | | | | | | |
| | | Shares | | Rate | | Value |
| |
Preferred Stock(b)(c) – 0.2% |
| | | | | | | | | | | |
| | | | | | | | | | | |
| | | JPMorgan Chase & Co. |
| | | | 1,225,000 | | | 7.900% | | $ | 1,312,747 | |
| | | (Cost $1,225,000) | | | | |
| | | |
| | | |
| | | TOTAL INVESTMENTS BEFORE SHORT-TERM INVESTMENT |
| | | (Cost $647,414,639) | | $ | 689,281,138 | |
| | | |
| | | |
| | | | | | | | | | | | | | | | | |
| | | Principal
| | Interest
| | Maturity
| | |
| | | Amount | | Rate | | Date | | Value |
| |
Short-term Investment(f) – 3.2% |
| | | | | | | | | | | | | | | | | |
| | | | | | | | | | | | | | | | | |
| | | Repurchase Agreement – 3.2% |
| | | Joint Repurchase Agreement Account II |
| | | $ | 22,800,000 | | | | 0.270 | % | | | 10/01/10 | | | $ | 22,800,000 | |
| | | Maturity Value: $22,800,171 | | | | |
| | | (Cost $22,800,000) | | | | |
| | | |
| | | |
| | | TOTAL INVESTMENTS – 100.0% |
| | | (Cost $670,214,639) | | $ | 712,081,138 | |
| | | |
| | | |
| | | OTHER ASSETS IN EXCESS OF LIABILITIES – 0.0% | | | 295,869 | |
| | | |
| | | |
| | | NET ASSETS – 100.0% | | $ | 712,377,007 | |
| | | |
| | | |
The percentage shown for each investment category reflects the value of investments in that category as a percentage of net assets.
| | |
| (a) | | Exempt from registration under Rule 144A of the Securities Act of 1933. Under procedures approved by the Board of Trustees, such securities have been determined to be liquid by the investment adviser and may be resold, normally to qualified institutional buyers in transactions exempt from registration. Total market value of Rule 144A securities amounts to $126,614,150, which represents approximately 17.8% of net assets as of September 30, 2010. |
| |
| (b) | | Security with “Call” features with resetting interest rates. Maturity dates disclosed are the final maturity dates. |
| |
| (c) | | Variable rate security. Interest rate disclosed is that which is in effect at September 30, 2010. |
| |
| (d) | | A portion of this security is segregated as collateral for initial margin requirements on futures transactions. |
| |
| (e) | | Security with “Put” features with resetting interest rates. Maturity dates disclosed are the final maturity dates. |
| |
| (f) | | Joint repurchase agreement was entered into on September 30, 2010. Additional information appears on pages 72-73. |
| | | | | | | |
| | | |
| | | |
| | | Currency Abbreviation: |
| | | EUR | | — | | Euro |
| | | |
| | | Investment Abbreviations: |
| | | FHLMC | | — | | Federal Home Loan Mortgage Corp. |
| | | GO | | — | | General Obligation |
| | | LIBOR | | — | | London Interbank Offered Rate |
| | | RB | | — | | Revenue Bond |
| | | |
| | | |
The accompanying notes are an integral part of these financial statements.
GOLDMAN SACHS INVESTMENT GRADE CREDIT FUND
ADDITIONAL INVESTMENT INFORMATION
FORWARD FOREIGN CURRENCY EXCHANGE CONTRACTS WITH UNREALIZED LOSS — At September 30, 2010, the Fund had an outstanding forward foreign currency exchange contract, to sell foreign currencies:
| | | | | | | | | | | | | | | | | | | |
| | | | | Contract
| | Expiration
| | Current
| | Unrealized
|
| Counterparty | | Currency | | Type | | Date | | Value | | Loss |
| |
| JPMorgan Securities, Inc. | | | EUR | | | Sale | | | 10/22/10 | | | $ | 3,058,020 | | | $ | (194,371 | ) |
| |
| |
FUTURES CONTRACTS — At September 30, 2010, the following futures contracts were open:
| | | | | | | | | | | | | | | |
| | | Number of
| | | | | | |
| | | Contracts
| | Expiration
| | Current
| | Unrealized
|
| Type | | Long (Short) | | Date | | Value | | Gain (Loss) |
| |
| Eurodollars | | | (15 | ) | | December 2010 | | $ | (3,736,500 | ) | | $ | (4,710 | ) |
| Eurodollars | | | (14 | ) | | March 2011 | | | (3,485,650 | ) | | | (4,056 | ) |
| Eurodollars | | | (14 | ) | | June 2011 | | | (3,483,025 | ) | | | (5,806 | ) |
| Eurodollars | | | (14 | ) | | September 2011 | | | (3,479,700 | ) | | | (7,557 | ) |
| Eurodollars | | | (14 | ) | | December 2011 | | | (3,475,500 | ) | | | (10,298 | ) |
| Eurodollars | | | (14 | ) | | March 2012 | | | (3,470,775 | ) | | | (12,165 | ) |
| 5 Year U.S. Treasury Notes | | | 114 | | | December 2010 | | | 13,778,859 | | | | 74,299 | |
| 10 Year U.S. Treasury Notes | | | 1,147 | | | December 2010 | | | 144,575,766 | | | | 263,863 | |
| 30 Year U.S. Treasury Bonds | | | 329 | | | December 2010 | | | 43,993,469 | | | | (47,113 | ) |
| |
| |
TOTAL | | | | | | | | | | | | $ | 246,457 | |
| |
| |
SWAP CONTRACTS — At September 30, 2010, the Fund had outstanding swap contracts with the following terms:
INTEREST RATE SWAP CONTRACTS
| | | | | | | | | | | | | | | | | |
| | | | | | | Rates Exchanged | | |
| | | Notional
| | | | Payments
| | Payments
| | |
| | | Amount
| | Termination
| | received by
| | made by
| | Unrealized
|
| Counterparty | | (000s)(a) | | Date | | the Fund | | the Fund | | Gain (Loss)* |
| |
| Bank of America Securities LLC | | $ | 16,500 | | | | 08/15/17 | | | 3 month LIBOR | | 2.104% | | $ | — | |
| | | | 46,500 | | | | 08/15/17 | | | 3 month LIBOR | | 2.075 | | | 65,381 | |
| Deutsche Bank Securities Inc. | | | 43,500 | | | | 08/15/17 | | | 3 month LIBOR | | 2.033 | | | 176,062 | |
| |
| |
TOTAL | | | | | | | | | | | | | | $ | 241,443 | |
| |
| |
| |
| * | There are no upfront payments on the swap contract(s), therefore, the unrealized gain (loss) of the swap contract(s) is equal to their market value. |
| |
| (a) | Represents forward starting interest rate swaps whose effective dates of commencement of accruals and cash flows occur subsequent to September 30, 2010. |
The accompanying notes are an integral part of these financial statements.
GOLDMAN SACHS INVESTMENT GRADE CREDIT FUND
Schedule of Investments (continued)
September 30, 2010 (Unaudited)
| |
| ADDITIONAL INVESTMENT INFORMATION (continued) | |
CREDIT DEFAULT SWAP CONTRACTS
| | | | | | | | | | | | | | | | | | | | | | | | | | | |
| | | | | | | | | | | Credit
| | | | Upfront
| | |
| | | | | | | Rates
| | | | Spread at
| | | | Payments
| | |
| | | | | Notional
| | received
| | | | September 30,
| | | | made
| | |
| | | Referenced
| | Amount
| | (paid) by
| | Termination
| | 2010
| | Market
| | (received)
| | Unrealized
|
| Counterparty | | Obligation | | (000s) | | Fund | | Date | | (basis points)(b) | | Value | | by the Fund | | Gain (Loss) |
| |
Protection Sold: | | | | | | | | | | | | | | | | | | | | | | | | | | |
Credit Suisse
International (London) | | Prudential Financial, Inc.
4.50%, 07/15/13 | | $ | 2,350 | | | 1.000% | | 06/20/15 | | | 191 | | | $ | (92,972 | ) | | $ | (112,705 | ) | | $ | 19,733 | |
| Deutsche Bank Securities, Inc. | | MetLife Inc.
5.00%, 06/15/15 | | | 1,825 | | | 1.000 | | 03/20/15 | | | 204 | | | | (78,843 | ) | | | (87,074 | ) | | | 8,231 | |
| | | | | | 5,200 | | | 1.000 | | 09/20/15 | | | 215 | | | | (272,598 | ) | | | (305,827 | ) | | | 33,229 | |
| | | CDX North America
Investment Grade Index | | | 60,000 | | | 1.000 | | 12/20/15 | | | 107 | | | | (174,234 | ) | | | (227,697 | ) | | | 53,463 | |
| JPMorgan Securities, Inc. | | CDX North America
Investment Grade Index | | | 11,000 | | | 1.000 | | 12/20/15 | | | 104 | | | | (30,411 | ) | | | (33,772 | ) | | | 3,361 | |
| |
| |
TOTAL | | | | | | | | | | | | | | | | $ | (649,058 | ) | | $ | (767,075 | ) | | $ | 118,017 | |
| |
| |
| |
| (b) | Credit Spread of the Referenced Obligation, together with the term of the swap contract, are indicators of payment/performance risk. The likelihood of a credit event occurring which would require a fund to make a payment or otherwise be required to perform under the swap contract is generally greater as the credit spread and the term of the swap contract increase. |
The accompanying notes are an integral part of these financial statements.
GOLDMAN SACHS LOCAL EMERGING MARKETS DEBT FUND
Schedule of Investments
September 30, 2010 (Unaudited)
| | | | | | | | | | | | | | | | | |
| | | Principal
| | Interest
| | Maturity
| | |
| | | Amount | | Rate | | Date | | Value |
| |
Sovereign Debt Obligations – 66.6% |
| | | | | | | | | | | | | | | | | |
| | | | | | | | | | | | | | | | | |
| | | Argentina(a) – 1.7% |
| | | Republic of Argentina (B/NR) |
| | | | ARS 40,675,818 | | | | 5.830 | % | | | 12/31/33 | | | $ | 7,296,180 | |
| | | Republic of Argentina (NR/NR) |
| | | | 28,723,769 | | | | 2.000 | | | | 02/04/18 | | | | 5,607,843 | |
| | | | EUR 19,190,000 | | | | 2.840 | | | | 12/15/35 | | | | 2,825,364 | |
| | | | ARS 442,470,000 | | | | 3.720 | | | | 12/15/35 | | | | 11,817,780 | |
| | | | | | | | | | | | | | | | | |
| | | | | | | | | | | | | | | | 27,547,167 | |
| | | |
| | | |
| | | Brazil – 7.7% |
| | | Brazil Letras do Tesouro Nacional (NR/NR) |
| | | | BRL 34,260,000 | | | | 0.000 | (b) | | | 01/01/11 | | | | 19,732,173 | |
| | | | 66,387,189 | | | | 6.000 | | | | 08/15/40 | | | | 39,516,336 | |
| | | Brazil Notas do Tesouro Nacional (NR/Baa3) |
| | | | 22,634,631 | | | | 6.000 | | | | 05/15/15 | | | | 13,283,330 | |
| | | | 35,791,000 | | | | 10.000 | | | | 01/01/17 | | | | 19,553,204 | |
| | | | 68,076,000 | | | | 10.000 | | | | 01/01/21 | | | | 36,016,037 | |
| | | | | | | | | | | | | | | | | |
| | | | | | | | | | | | | | | | 128,101,080 | |
| | | |
| | | |
| | | Chile – 0.2% |
| | | Republic of Chile (A+/Aa3) |
| | | | CLP 1,537,000,000 | | | | 5.500 | | | | 08/05/20 | | | | 3,371,512 | |
| | | |
| | | |
| | | Colombia – 3.4% |
| | | Republic of Colombia (BB+/Ba1) |
| | | | COP 46,004,000,000 | | | | 7.750 | | | | 04/14/21 | | | | 30,134,018 | |
| | | | 32,258,000,000 | | | | 9.850 | | | | 06/28/27 | | | | 25,701,652 | |
| | | | | | | | | | | | | | | | | |
| | | | | | | | | | | | | | | | 55,835,670 | |
| | | |
| | | |
| | | Hungary – 7.5% |
| | | Hungary Government Bond (BBB-/Baa1) |
| | | | HUF 4,964,000,000 | | | | 7.250 | | | | 06/12/12 | | | | 24,825,894 | |
| | | | 2,230,000,000 | | | | 5.500 | | | | 02/12/14 | | | | 10,695,267 | |
| | | | 11,666,000,000 | | | | 8.000 | | | | 02/12/15 | | | | 59,956,503 | |
| | | | 1,700,000,000 | | | | 6.500 | | | | 06/24/19 | | | | 8,121,891 | |
| | | Hungary Government Bond (BBB-/NR) |
| | | | 4,702,000,000 | | | | 5.500 | | | | 02/12/16 | | | | 22,152,547 | |
| | | | | | | | | | | | | | | | | |
| | | | | | | | | | | | | | | | 125,752,102 | |
| | | |
| | | |
| | | Indonesia – 3.8% |
| | | Republic of Indonesia (NR/Ba2) |
| | | | IDR 469,300,000,000 | | | | 10.500 | | | | 08/15/30 | | | | 63,427,801 | |
| | | |
| | | |
| | | Malaysia – 4.1% |
| | | Malaysia Government Bond (NR/A3) |
| | | | MYR 112,700,000 | | | | 3.741 | | | | 02/27/15 | | | | 37,103,016 | |
| | | | 90,000,000 | | | | 4.378 | | | | 11/29/19 | | | | 30,889,213 | |
| | | | | | | | | | | | | | | | | |
| | | | | | | | | | | | | | | | 67,992,229 | |
| | | |
| | | |
| | | Mexico – 9.3% |
| | | Mexican Bonos (A/Baa1) |
| | | | MXN 157,320,000 | | | | 8.000 | | | | 06/11/20 | | | | 14,161,703 | |
| | | | 1,174,524,000 | | | | 10.000 | | | | 12/05/24 | | | | 124,151,809 | |
| | | | 158,255,000 | | | | 10.000 | | | | 11/20/36 | | | | 17,039,986 | |
| | | | | | | | | | | | | | | | | |
| | | | | | | | | | | | | | | | 155,353,498 | |
| | | |
| | | |
| | | Peru – 1.3% |
| | | Peru Government Bond (NR/Baa3) |
| | | | PEN 13,690,000 | | | | 6.950 | | | | 08/12/31 | | | $ | 5,186,072 | |
| | | Peru Government Bond (BBB+/Baa3) |
| | | | 15,743,000 | | | | 9.910 | | | | 05/05/15 | | | | 6,807,397 | |
| | | | 23,661,000 | | | | 8.200 | | | | 08/12/26 | | | | 10,118,759 | |
| | | | | | | | | | | | | | | | | |
| | | | | | | | | | | | | | | | 22,112,228 | |
| | | |
| | | |
| | | Philippines – 0.3% |
| | | Republic of Philippines (BB-/Ba3) |
| | | | PHP 236,000,000 | | | | 4.950 | | | | 01/15/21 | | | | 5,477,544 | |
| | | |
| | | |
| | | Poland – 4.6% |
| | | Poland Government Bond (A/A2) |
| | | | PLN 33,475,000 | | | | 5.250 | | | | 04/25/13 | | | | 11,645,212 | |
| | | | 22,500,000 | | | | 6.250 | | | | 10/24/15 | | | | 8,119,614 | |
| | | | 18,754,080 | | | | 3.000 | | | | 08/24/16 | | | | 6,422,652 | |
| | | | 19,800,000 | | | | 5.250 | | | | 10/25/20 | | | | 6,688,890 | |
| | | Poland Government Bond (A/NR) |
| | | | 128,970,000 | | | | 5.500 | | | | 10/25/19 | | | | 44,589,452 | |
| | | | | | | | | | | | | | | | | |
| | | | | | | | | | | | | | | | 77,465,820 | |
| | | |
| | | |
| | | Russia – 0.7% |
| | | Russian Federation (BBB/Baa1) |
| | | $ | 500,000 | | | | 5.000 | | | | 04/29/20 | | | | 520,000 | |
| | | | 9,057,400 | | | | 7.500 | | | | 03/31/30 | | | | 10,800,949 | |
| | | | | | | | | | | | | | | | | |
| | | | | | | | | | | | | | | | 11,320,949 | |
| | | |
| | | |
| | | South Africa – 7.8% |
| | | Republic of South Africa (A+/A3) |
| | | | ZAR 735,555,000 | | | | 10.500 | | | | 12/21/26 | | | | 129,499,258 | |
| | | |
| | | |
| | | Thailand – 7.8% |
| | | Thailand Government Bond (NR/Baa1) |
| | | | THB 3,290,600,000 | | | | 3.625 | | | | 05/22/15 | | | | 113,733,653 | |
| | | | 180,000,000 | | | | 4.125 | | | | 11/18/16 | | | | 6,410,662 | |
| | | Thailand Government Bond (NR/NR)(b) |
| | | | 314,000,000 | | | | 0.000 | | | | 08/04/11 | | | | 10,179,785 | |
| | | | | | | | | | | | | | | | | |
| | | | | | | | | | | | | | | | 130,324,100 | |
| | | |
| | | |
| | | Turkey – 4.9% |
| | | Turkey Government Bond (BB+/Ba2) |
| | | | TRY 19,535,000 | | | | 16.000 | | | | 03/07/12 | | | | 14,969,788 | |
| | | Turkey Government Bond (NR/NR) |
| | | | 14,175,000 | | | | 11.000 | | | | 08/06/14 | | | | 10,607,610 | |
| | | | 13,672,426 | | | | 7.000 | | | | 10/01/14 | | | | 10,987,657 | |
| | | | 62,373,922 | | | | 4.000 | | | | 04/01/20 | | | | 44,843,855 | |
| | | | | | | | | | | | | | | | | |
| | | | | | | | | | | | | | | | 81,408,910 | |
| | | |
| | | |
| | | Venezuela – 1.5% |
| | | Republic of Venezuela (BB-/B2) |
| | | $ | 2,460,000 | | | | 5.750 | | | | 02/26/16 | | | | 1,697,400 | |
| | | | 7,330,000 | | | | 7.750 | | | | 10/13/19 | | | | 4,856,125 | |
| | | | 21,510,000 | | | | 8.250 | | | | 10/13/24 | | | | 13,766,400 | |
| | | |
| | | |
The accompanying notes are an integral part of these financial statements.
GOLDMAN SACHS LOCAL EMERGING MARKETS DEBT FUND
Schedule of Investments (continued)
September 30, 2010 (Unaudited)
| | | | | | | | | | | | | | | | | |
| | | Principal
| | Interest
| | Maturity
| | |
| | | Amount | | Rate | | Date | | Value |
| |
Sovereign Debt Obligations – (continued) |
| | | Venezuela – (continued) |
| | | | | | | | | | | | | | | | | |
| | | Republic of Venezuela (BB-/B2) – (continued) |
| | | $ | 1,230,000 | | | | 7.650 | % | | | 04/21/25 | | | $ | 750,300 | |
| | | | 5,360,000 | | | | 9.250 | | | | 05/07/28 | | | | 3,551,000 | |
| | | | | | | | | | | | | | | | | |
| | | | | | | | | | | | | | | | 24,621,225 | |
| | | |
| | | |
| | | TOTAL SOVEREIGN DEBT OBLIGATIONS |
| | | (Cost $1,038,346,647) | | $ | 1,109,611,093 | |
| | | |
| | | |
| | | | | | | | | | | | | | | | | |
| | | | | | | | | | | | | | | | | |
Structured Notes – 7.6% |
| | | | | | | | | | | | | | | | | |
| | | | | | | | | | | | | | | | | |
| | | Egyptian Treasury Bills (NR/NR)(b)(c) |
| | | | EGP 148,000,000 | | | | 0.000 | % | | | 10/26/10 | | | $ | 25,848,656 | |
| | | | 81,000,000 | | | | 0.000 | | | | 11/11/10 | | | | 14,102,082 | |
| | | | 191,000,000 | | | | 0.000 | | | | 02/01/11 | | | | 32,513,279 | |
| | | Republic of Indonesia (BB+/Ba2) |
| | | | IDR 35,000,000,000 | | | | 10.750 | (d) | | | 05/15/16 | | | | 4,533,333 | |
| | | | 46,000,000,000 | | | | 10.000 | (d) | | | 07/15/17 | | | | 5,860,374 | |
| | | | 140,000,000,000 | | | | 10.000 | (e) | | | 07/17/17 | | | | 17,835,922 | |
| | | | 123,000,000,000 | | | | 10.000 | (f) | | | 07/17/17 | | | | 15,672,336 | |
| | | | 80,000,000,000 | | | | 11.000 | (f) | | | 11/17/20 | | | | 11,091,541 | |
| | | |
| | | |
| | | TOTAL STRUCTURED NOTES |
| | | (Cost $121,572,011) | | $ | 127,457,523 | |
| | | |
| | | |
| | | | | | | | | | | | | | | | | |
| | | | | | | | | | | | | | | | | |
Corporate Obligations – 2.1% |
| | | | | | | | | | | | | | | | | |
| | | | | | | | | | | | | | | | | |
| | | Chile(g) – 0.4% |
| | | Banco Santander Chile (A+/Aa3) |
| | | | CLP 3,676,000,000 | | | | 6.500 | % | | | 09/22/20 | | | $ | 7,524,532 | |
| | | |
| | | |
| | | Germany – 0.1% |
| | | Kreditanstalt fuer Wiederaufbau (AAA/Aaa) |
| | | | NGN 255,000,000 | | | | 8.500 | | | | 01/18/11 | | | | 1,651,213 | |
| | | |
| | | |
| | | Philippines – 0.1% |
| | | JPMorgan Chase & Co. (A+/Aa3) |
| | | | PHP 52,000,000 | | | | 6.000 | | | | 10/10/12 | | | | 1,208,850 | |
| | | |
| | | |
| | | Russia – 1.5% |
| | | Red Arrow International Leasing PLC (BBB/Baa2) |
| | | | RUB 51,671,135 | | | | 8.375 | | | | 06/30/12 | | | | 1,739,877 | |
| | | RSHB Capital SA for OJSC Russian Agricultural Bank (NR/Baa1) |
| | | | 710,600,000 | | | | 7.500 | | | | 03/25/13 | | | | 23,504,698 | |
| | | | | | | | | | | | | | | | | |
| | | | | | | | | | | | | | | | 25,244,575 | |
| | | |
| | | |
| | | TOTAL CORPORATE OBLIGATIONS |
| | | (Cost $36,655,289) | | $ | 35,629,170 | |
| | | |
| | | |
| | | TOTAL INVESTMENTS BEFORE SHORT-TERM INVESTMENT |
| | | (Cost $1,196,573,947) | | $ | 1,272,697,786 | |
| | | |
| | | |
| | | | | | | | | | | | | | | | | |
| | | | | | | | | | | | | | | | | |
Short-term Investment(h) – 16.4% |
| | | | | | | | | | | | | | | | | |
| | | | | | | | | | | | | | | | | |
| | | Repurchase Agreement – 16.4% |
| | | Joint Repurchase Agreement Account II |
| | | $ | 272,900,000 | | | | 0.270 | % | | | 10/01/10 | | | $ | 272,900,000 | |
| | | Maturity Value: $272,902,047 | | | | |
| | | (Cost $272,900,000) | | | | |
| | | |
| | | |
| | | TOTAL INVESTMENTS – 92.7% |
| | | (Cost $1,469,473,947) | | $ | 1,545,597,786 | |
| | | |
| | | |
| | | OTHER ASSETS IN EXCESS OF LIABILITIES – 7.3% | | | 120,839,108 | |
| | | |
| | | |
| | | NET ASSETS – 100.0% | | $ | 1,666,436,894 | |
| | | |
| | | |
The percentage shown for each investment category reflects the value of investments in that category as a percentage of net assets.
| | |
| (a) | | Variable rate security. Interest rate disclosed is that which is in effect at September 30, 2010. |
| |
| (b) | | Issued with a zero coupon. Income is recognized through the accretion of discount. |
| |
| (c) | | The underlying security is issued by Deutsche Bank AG. |
| |
| (d) | | The underlying security is issued by HSBC Corp. |
| |
| (e) | | The underlying security is issued by Barclays Bank PLC. |
| |
| (f) | | The underlying security is issued by JPMorgan Chase. |
| |
| (g) | | Exempt from registration under Rule 144A of the Securities Act of 1933. Under procedures approved by the Board of Trustees, such securities have been determined to be liquid by the investment adviser and may be resold, normally to qualified institutional buyers in transactions exempt from registration. Total market value of Rule 144A securities amounts to $7,524,532, which represents approximately 0.4% of net assets as of September 30, 2010. |
| |
| (h) | | Joint repurchase agreement was entered into on September 30, 2010. Additional information appears on pages 72-73. |
Security ratings disclosed, if any, are issued by Standard & Poor’s (“S&P”)/Moody’s Investor Service (“Moodys”). A brief description of the ratings is available in the Fund’s Statement of Additional Information.
The accompanying notes are an integral part of these financial statements.
GOLDMAN SACHS LOCAL EMERGING MARKETS DEBT FUND
| | | | | | | |
| | | |
| | | |
| | | Currency Abbreviations: |
| | | ARS | | — | | Argentine Peso |
| | | BRL | | — | | Brazilian Real |
| | | CLP | | — | | Chilean Peso |
| | | CNY | | — | | Yuan Renminbi |
| | | COP | | — | | Colombian Peso |
| | | EGP | | — | | Egyptian Pound |
| | | EUR | | — | | Euro |
| | | HUF | | — | | Hungarian Forint |
| | | IDR | | — | | Indonesian Rupiah |
| | | ILS | | — | | Israeli Shekel |
| | | INR | | — | | Indian Rupee |
| | | JPY | | — | | Japanese Yen |
| | | KRW | | — | | South Korean Won |
| | | MXN | | — | | Mexican Peso |
| | | MYR | | — | | Malaysian Ringgit |
| | | NGN | | — | | Nigerian Naira |
| | | PEN | | — | | Peruvian Nuevo Sol |
| | | PHP | | — | | Philippine Peso |
| | | PLN | | — | | Polish Zloty |
| | | RUB | | — | | Russian Ruble |
| | | SGD | | — | | Singapore Dollar |
| | | THB | | — | | Thai Baht |
| | | TRY | | — | | Turkish Lira |
| | | TWD | | — | | Taiwan Dollar |
| | | ZAR | | — | | South African Rand |
| | | |
| | | |
| | | | | | | |
| | | |
| | | |
| | | Investment Abbreviations: |
| | | BUBOR | | — | | Budapest Interbank Offered Rate |
| | | JIBAR | | — | | Johannesburg Interbank Agreed Rate |
| | | LIBOR | | — | | London Interbank Offered Rate |
| | | NR | | — | | Not Rated |
| | | WIBOR | | — | | Warsaw Interbank Offered Rate |
| | | |
| | | |
ADDITIONAL INVESTMENT INFORMATION
FORWARD FOREIGN CURRENCY EXCHANGE CONTRACTS — At September 30, 2010, the Fund had outstanding forward foreign currency exchange contracts, both to purchase and sell foreign currencies:
FORWARD FOREIGN CURRENCY EXCHANGE CONTRACTS WITH UNREALIZED GAIN
| | | | | | | | | | | | | | | | | |
| | | | | Contract
| | Expiration
| | Current
| | Unrealized
|
| Counterparty | | Currency | | Type | | Date | | Value | | Gain |
| |
| Barclays Bank PLC | | BRL | | Purchase | | | 10/14/10 | | | $ | 8,168,775 | | | $ | 75,775 | |
| | | CNY | | Purchase | | | 03/17/11 | | | | 57,272,840 | | | | 526,213 | |
| | | EUR | | Purchase | | | 12/15/10 | | | | 16,166,717 | | | | 798,229 | |
| | | KRW | | Purchase | | | 10/14/10 | | | | 14,955,130 | | | | 614,869 | |
| | | MXN | | Sale | | | 12/15/10 | | | | 6,241,284 | | | | 43,533 | |
| | | MYR | | Purchase | | | 10/14/10 | | | | 51,525,895 | | | | 2,245,367 | |
| | | RUB | | Purchase | | | 10/14/10 | | | | 4,998,226 | | | | 55,226 | |
| | | SGD | | Purchase | | | 12/15/10 | | | | 16,250,140 | | | | 63,140 | |
| Citibank NA | | COP | | Purchase | | | 10/14/10 | | | | 14,584,106 | | | | 12,106 | |
| | | MYR | | Purchase | | | 10/14/10 | | | | 51,132,521 | | | | 2,076,385 | |
| Credit Suisse International (London) | | PLN | | Purchase | | | 12/15/10 | | | | 4,996,231 | | | | 16,231 | |
| Deutsche Bank AG (London) | | BRL | | Purchase | | | 10/14/10 | | | | 15,417,721 | | | | 169,721 | |
| | | COP | | Purchase | | | 10/14/10 | | | | 9,184,372 | | | | 388,159 | |
| | | EUR | | Purchase | | | 12/15/10 | | | | 16,454,192 | | | | 154,167 | |
| | | INR | | Purchase | | | 10/14/10 | | | | 11,445,805 | | | | 543,635 | |
| | | MXN | | Purchase | | | 12/15/10 | | | | 30,355,437 | | | | 1,153,143 | |
| | | PHP | | Purchase | | | 10/14/10 | | | | 16,727,834 | | | | 918,834 | |
| HSBC Bank PLC | | BRL | | Purchase | | | 10/14/10 | | | | 5,424,297 | | | | 261,297 | |
| | | CNY | | Purchase | | | 03/17/11 | | | | 21,146,836 | | | | 16,836 | |
| | | COP | | Purchase | | | 10/14/10 | | | | 16,199,666 | | | | 12,666 | |
| | | EUR | | Purchase | | | 12/15/10 | | | | 16,210,315 | | | | 377,825 | |
| | | HUF | | Purchase | | | 12/15/10 | | | | 16,489,385 | | | | 6,385 | |
| | | IDR | | Purchase | | | 10/14/10 | | | | 39,643,775 | | | | 710,775 | |
The accompanying notes are an integral part of these financial statements.
GOLDMAN SACHS LOCAL EMERGING MARKETS DEBT FUND
Schedule of Investments (continued)
September 30, 2010 (Unaudited)
| |
| ADDITIONAL INVESTMENT INFORMATION (continued) | |
FORWARD FOREIGN CURRENCY EXCHANGE CONTRACTS WITH UNREALIZED GAIN (continued)
| | | | | | | | | | | | | | | | | |
| | | | | Contract
| | Expiration
| | Current
| | Unrealized
|
| Counterparty | | Currency | | Type | | Date | | Value | | Gain |
| |
| HSBC Bank PLC (continued) | | ILS | | Purchase | | | 12/15/10 | | | $ | 21,240,764 | | | $ | 696,019 | |
| | | INR | | Purchase | | | 10/14/10 | | | | 23,835,668 | | | | 871,668 | |
| | | JPY | | Sale | | | 12/15/10 | | | | 16,568,937 | | | | 32,063 | |
| | | MXN | | Purchase | | | 12/15/10 | | | | 6,497,395 | | | | 77,105 | |
| | | | | Sale | | | 12/15/10 | | | | 12,365,736 | | | | 85,264 | |
| | | MYR | | Purchase | | | 10/25/10 | | | | 15,834,660 | | | | 3,660 | |
| | | PHP | | Purchase | | | 10/14/10 | | | | 19,236,290 | | | | 971,943 | |
| | | RUB | | Purchase | | | 10/14/10 | | | | 68,668,638 | | | | 813,110 | |
| | | TRY | | Purchase | | | 12/15/10 | | | | 58,293,955 | | | | 983,301 | |
| JPMorgan Securities, Inc. | | BRL | | Purchase | | | 10/14/10 | | | | 3,079,927 | | | | 154,927 | |
| | | PLN | | Purchase | | | 12/15/10 | | | | 132,196,484 | | | | 6,259,351 | |
| Morgan Stanley & Co. | | HUF | | Purchase | | | 12/15/10 | | | | 3,460,047 | | | | 61,047 | |
| | | TRY | | Purchase | | | 12/15/10 | | | | 8,177,143 | | | | 156,428 | |
| Royal Bank of Canada | | BRL | | Purchase | | | 10/04/10 | | | | 37,220,745 | | | | 648,745 | |
| | | | | Purchase | | | 10/14/10 | | | | 11,783,547 | | | | 698,554 | |
| | | COP | | Purchase | | | 10/14/10 | | | | 14,537,470 | | | | 120,018 | |
| | | INR | | Purchase | | | 10/14/10 | | | | 29,803,035 | | | | 1,233,774 | |
| | | KRW | | Purchase | | | 10/14/10 | | | | 43,832,053 | | | | 1,277,052 | |
| | | PHP | | Purchase | | | 10/14/10 | | | | 7,284,045 | | | | 236,045 | |
| Royal Bank of Scotland PLC | | TRY | | Purchase | | | 12/15/10 | | | | 25,283,340 | | | | 1,207,239 | |
| State Street Bank | | MXN | | Sale | | | 12/15/10 | | | | 8,576,105 | | | | 39,992 | |
| UBS AG (London) | | BRL | | Purchase | | | 01/18/11 | | | | 5,905,791 | | | | 40,591 | |
| | | INR | | Purchase | | | 10/14/10 | | | | 8,011,024 | | | | 96,024 | |
| Westpac Banking Corp. | | IDR | | Purchase | | | 10/14/10 | | | | 11,565,175 | | | | 75,175 | |
| | | JPY | | Purchase | | | 12/15/10 | | | | 16,102,922 | | | | 271,922 | |
| | | MYR | | Purchase | | | 10/14/10 | | | | 7,367,176 | | | | 273,176 | |
| |
| |
TOTAL | | | | | | | | | | | | | | $ | 28,624,710 | |
| |
| |
FORWARD FOREIGN CURRENCY EXCHANGE CONTRACTS WITH UNREALIZED LOSS
| | | | | | | | | | | | | | | | | |
| | | | | Contract
| | Expiration
| | Current
| | Unrealized
|
| Counterparty | | Currency | | Type | | Date | | Value | | Loss |
| |
| Bank of America NA | | MXN | | Sale | | | 12/15/10 | | | $ | 6,391,382 | | | $ | (141,979 | ) |
| Barclays Bank PLC | | HUF | | Sale | | | 12/15/10 | | | | 10,786,195 | | | | (915,853 | ) |
| | | IDR | | Purchase | | | 01/18/11 | | | | 16,296,572 | | | | (186,428 | ) |
| | | KRW | | Sale | | | 10/14/10 | | | | 38,034,521 | | | | (1,694,521 | ) |
| | | MYR | | Sale | | | 10/14/10 | | | | 29,126,119 | | | | (135,944 | ) |
| | | PHP | | Sale | | | 10/14/10 | | | | 22,693,967 | | | | (818,967 | ) |
| | | PLN | | Sale | | | 12/15/10 | | | | 4,782,182 | | | | (182,423 | ) |
| | | RUB | | Purchase | | | 10/14/10 | | | | 24,161,633 | | | | (90,367 | ) |
| Citibank NA | | MYR | | Purchase | | | 10/14/10 | | | | 16,185,708 | | | | (5,292 | ) |
| Credit Suisse International (London) | | IDR | | Sale | | | 10/14/10 | | | | 32,484,354 | | | | (884,899 | ) |
The accompanying notes are an integral part of these financial statements.
GOLDMAN SACHS LOCAL EMERGING MARKETS DEBT FUND
| |
| ADDITIONAL INVESTMENT INFORMATION (continued) | |
FORWARD FOREIGN CURRENCY EXCHANGE CONTRACTS WITH UNREALIZED LOSS (continued)
| | | | | | | | | | | | | | | | | |
| | | | | Contract
| | Expiration
| | Current
| | Unrealized
|
| Counterparty | | Currency | | Type | | Date | | Value | | Loss |
| |
| Deutsche Bank AG (London) | | COP | | Sale | | | 10/14/10 | | | $ | 14,705,438 | | | $ | (133,438 | ) |
| | | HUF | | Sale | | | 12/15/10 | | | | 43,559,009 | | | | (4,659,424 | ) |
| | | INR | | Sale | | | 10/14/10 | | | | 15,282,633 | | | | (716,633 | ) |
| | | KRW | | Sale | | | 10/14/10 | | | | 7,639,405 | | | | (324,405 | ) |
| | | MXN | | Sale | | | 12/15/10 | | | | 15,774,799 | | | | (90,350 | ) |
| | | MYR | | Purchase | | | 10/14/10 | | | | 16,279,851 | | | | (31,726 | ) |
| | | PEN | | Purchase | | | 11/02/10 | | | | 9,389,888 | | | | (5,112 | ) |
| | | PHP | | Sale | | | 10/14/10 | | | | 15,105,745 | | | | (526,745 | ) |
| | | PLN | | Sale | | | 12/15/10 | | | | 19,805,266 | | | | (975,806 | ) |
| | | RUB | | Sale | | | 10/14/10 | | | | 14,509,506 | | | | (43,506 | ) |
| HSBC Bank PLC | | BRL | | Sale | | | 10/04/10 | | | | 31,178,770 | | | | (366,445 | ) |
| | | | | Sale | | | 10/14/10 | | | | 15,303,951 | | | | (724,951 | ) |
| | | IDR | | Sale | | | 10/14/10 | | | | 15,026,057 | | | | (302,057 | ) |
| | | KRW | | Sale | | | 10/14/10 | | | | 21,046,165 | | | | (737,165 | ) |
| | | MYR | | Purchase | | | 10/14/10 | | | | 14,810,947 | | | | (24,053 | ) |
| | | RUB | | Purchase | | | 10/14/10 | | | | 28,899,726 | | | | (278,274 | ) |
| | | | | Sale | | | 10/14/10 | | | | 31,637,853 | | | | (378,853 | ) |
| | | TRY | | Sale | | | 12/15/10 | | | | 7,871,599 | | | | (381,599 | ) |
| | | TWD | | Purchase | | | 01/18/11 | | | | 16,372,423 | | | | (110,577 | ) |
| | | ZAR | | Sale | | | 12/15/10 | | | | 63,086,543 | | | | (2,519,693 | ) |
| Morgan Stanley & Co. | | CNY | | Purchase | | | 01/18/11 | | | | 2,436,108 | | | | (9,892 | ) |
| | | PLN | | Sale | | | 12/15/10 | | | | 3,607,493 | | | | (201,551 | ) |
| | | ZAR | | Purchase | | | 12/15/10 | | | | 66,713,580 | | | | (77,388 | ) |
| Royal Bank of Canada | | CLP | | Sale | | | 10/14/10 | | | | 3,972,374 | | | | (315,374 | ) |
| | | INR | | Sale | | | 10/14/10 | | | | 42,122,482 | | | | (1,841,314 | ) |
| | | KRW | | Sale | | | 10/14/10 | | | | 15,233,087 | | | | (654,087 | ) |
| UBS AG (London) | | BRL | | Sale | | | 10/04/10 | | | | 6,041,974 | | | | (47,925 | ) |
| |
| |
TOTAL | | | | | | | | | | | | | | $ | (21,535,016 | ) |
| |
| |
SWAP CONTRACTS — At September 30, 2010, the Fund had outstanding swap contracts with the following terms:
INTEREST RATE SWAP CONTRACTS
| | | | | | | | | | | | | | | | | | | |
| | | | | | | | | Rates Exchanged | | |
| | | | | Notional
| | | | Payments
| | Payments
| | |
| | | | | Amount
| | Termination
| | received by
| | made by
| | Unrealized
|
| Counterparty | | | | (000s) | | Date | | the Fund | | the Fund | | Gain (Loss)* |
| |
| Bank of America NA | | ZAR | | | 300,000 | | | 04/09/12 | | | 7.020 | % | | 3 month JIBAR | | $ | 602,822 | |
| Citibank NA | | PLN | | | 125,000 | | | 06/28/12 | | | 4.600 | | | 6 month WIBOR | | | 93,834 | |
| Deutsche Bank Securities, Inc. | | ZAR | | | 375,000 | | | 02/01/12 | | | 7.363 | | | 3 month JIBAR | | | 946,762 | |
| | | HUF | | | 6,920,000 | | | 02/15/12 | | | 6.390 | | | 6 month BUBOR | | | 1,351,900 | |
| | | PLN | | | 92,758 | | | 03/11/12 | | | 4.890 | | | 6 month WIBOR | | | 1,001,954 | |
| | | | | | | | | | | | | | | 6 month Chilean Interbank | | | | |
| | | CLP | | | 20,000,000 | | | 03/19/12 | | | 2.650 | | | Camara Rate Average | | | (957,728 | ) |
| | | PLN | | | 150,000 | | | 03/22/12 | | | 4.750 | | | 6 month WIBOR | | | 1,452,812 | |
| | | | | | 78,400 | | | 06/14/12 | | | 4.430 | | | 6 month WIBOR | | | (21,654 | ) |
| | | | | | 267,000 | | | 06/14/12 | | | 4.410 | | | 6 month WIBOR | | | (109,075 | ) |
| | | | | | 213,850 | | | 06/29/12 | | | 4.580 | | | 6 month WIBOR | | | 130,552 | |
| | | | | | | | | | | | | | | 6 month Chilean Interbank | | | | |
| | | CLP | | | 8,400,000 | | | 08/20/12 | | | 4.190 | | | Camara Rate Average | | | (28,217 | ) |
The accompanying notes are an integral part of these financial statements.
GOLDMAN SACHS LOCAL EMERGING MARKETS DEBT FUND
Schedule of Investments (continued)
September 30, 2010 (Unaudited)
| |
| ADDITIONAL INVESTMENT INFORMATION (continued) | |
INTEREST RATE SWAP CONTRACTS (continued)
| | | | | | | | | | | | | | | | | | | |
| | | | | | | | | Rates Exchanged | | |
| | | | | Notional
| | | | Payments
| | Payments
| | |
| | | | | Amount
| | Termination
| | received by
| | made by
| | Unrealized
|
| Counterparty | | | | (000s) | | Date | | the Fund | | the Fund | | Gain (Loss)* |
| |
| | | | | | | | | | | | | | | 6 month Chilean Interbank | | | | |
| Deutsche Bank Securities, Inc. (continued) | | CLP | | | 8,550,000 | | | 08/20/12 | | | 4.150 | % | | Camara Rate Average | | $ | (43,780 | ) |
| | | | | | | | | | | | | | | 6 month Chilean Interbank | | | | |
| | | | | | 8,146,000 | | | 09/04/12 | | | 4.120 | | | Camara Rate Average | | | (70,248 | ) |
| | | PLN | | | 307,130 | | | 09/28/12 | | | 4.660 | | | 6 month WIBOR | | | 137,279 | |
| | | | | | | | | | | | | | | 6 month Chilean Interbank | | | | |
| | | CLP | | | 1,800,000 | | | 11/18/14 | | | 5.040 | | | Camara Rate Average | | | 60,960 | |
| | | | | | | | | | | | | | | 6 month Chilean Interbank | | | | |
| | | | | | 3,900,000 | | | 02/02/15 | | | 5.160 | | | Camara Rate Average | | | 98,380 | |
| JPMorgan Securities, Inc. | | HUF | | | 3,910,000 | | | 02/06/12 | | | 6.350 | | | 6 month BUBOR | | | 771,358 | |
| | | ZAR | | | 300,000 | | | 02/18/12 | | | 7.390 | | | 3 month JIBAR | | | 768,823 | |
| | | | | | | | | | | | | | | 6 month Chilean Interbank | | | | |
| | | CLP | | | 9,600,000 | | | 07/29/12 | | | 4.010 | | | Camara Rate Average | | | (66,457 | ) |
| | | | | | | | | | | | | | | 6 month Chilean Interbank | | | | |
| | | | | | 9,861,000 | | | 07/30/12 | | | 4.000 | | | Camara Rate Average | | | (70,962 | ) |
| | | | | | | | | | | | | | | 6 month Chilean Interbank | | | | |
| | | | | | 8,462,000 | | | 09/27/12 | | | 4.460 | | | Camara Rate Average | | | 37,124 | |
| | | | | | | | | | | | | | | 6 month Chilean Interbank | | | | |
| | | | | | 2,145,000 | | | 12/15/14 | | | 5.260 | | | Camara Rate Average | | | 95,655 | |
| | | | | | | | | | | | | | | 6 month Chilean Interbank | | | | |
| | | | | | 15,750,000 | | | 04/20/15 | | | 4.950 | | | Camara Rate Average | | | 457,574 | |
| |
| |
TOTAL | | | | | | | | | | | | | | | | $ | 6,639,668 | |
| |
| |
| |
| * | There are no upfront payments on the swap contract(s), therefore, the unrealized gain/loss of the swap contract(s) is equal to their market value. |
TOTAL RETURN SWAP CONTRACTS
| | | | | | | | | | | | | | | | | |
| | | | | Notional
| | | | | | | | |
| | | | | Amount
| | Reference
| | Termination
| | Financing
| | Unrealized
|
| Counterparty | | | | (000s) | | Security | | Date | | Fee# | | Gain (Loss)* |
| |
| Deutsche Bank Securities, Inc. | | COP | | | 30,000,000 | | | Titulos de Tesoreria,
11.000% 07/24/20 | | 10/27/10 | | Colombia Minimum Repo Rate +0.750% | | $ | (51,732 | ) |
| | | | | | 3,858,500 | | | | | 10/28/10 | | Colombia Minimum Repo Rate +0.750% | | | (6,886 | ) |
| | | IDR | | | 89,000,000 | | | Republic of Indonesia,
10.750% 05/23/16 | | 05/23/16 | | 6 month LIBOR +0.200% | | | 1,269,710 | |
| |
| |
TOTAL | | | | | | | | | | | | | | $ | 1,211,092 | |
| |
| |
| |
| * | There are no upfront payments on the swap contract(s), therefore, the unrealized gain/loss of the swap contract(s) is equal to their market value. |
| # | The Fund receives semi-annual coupon payments in accordance with the swap contract(s). On the termination date of the swap contract(s), the Fund will either receive from or pay to the counterparty an amount equal to the net of the accrued financing fees and the value of the reference security subtracted from the original notional cost (notional multiplied by the price change of the reference security, converted to U.S. Dollars). |
The accompanying notes are an integral part of these financial statements.
GOLDMAN SACHS U.S. MORTGAGES FUND
Schedule of Investments
September 30, 2010 (Unaudited)
| | | | | | | | | | | | | | | | | |
| | | Principal
| | Interest
| | Maturity
| | |
| | | Amount | | Rate | | Date | | Value |
| |
Mortgage-Backed Obligations – 95.3% |
| | | | | | | | | | | | | | | | | |
| | | | | | | | | | | | | | | | | |
| | | Collateralized Mortgage Obligations – 6.7% |
| | | Adjustable Rate Non-Agency(a) – 1.9% |
| | | Adjustable Rate Mortgage Trust Series 2004-5, Class 2A1 |
| | | $ | 299,019 | | | | 3.080 | % | | | 04/25/35 | | | $ | 271,231 | |
| | | American Home Mortgage Investment Trust Series 2004-3, Class 1A |
| | | | 10,793 | | | | 0.626 | | | | 10/25/34 | | | | 10,065 | |
| | | Bear Stearns Adjustable Rate Mortgage Trust Series 2004-1, Class 21A1 |
| | | | 333,457 | | | | 2.616 | | | | 04/25/34 | | | | 301,062 | |
| | | Bear Stearns Alt-A Trust Series 2004-3, Class A1 |
| | | | 101,328 | | | | 0.896 | | | | 04/25/34 | | | | 79,473 | |
| | | Bear Stearns Alt-A Trust Series 2005-5, Class 21A1 |
| | | | 1,317,518 | | | | 2.657 | | | | 07/25/35 | | | | 941,532 | |
| | | Countrywide Alternative Loan Trust Series 2005-16, Class A1 |
| | | | 1,035,520 | | | | 2.015 | | | | 06/25/35 | | | | 587,140 | |
| | | Countrywide Alternative Loan Trust Series 2005-38, Class A1 |
| | | | 288,091 | | | | 1.870 | | | | 09/25/35 | | | | 177,435 | |
| | | Countrywide Home Loan Mortgage Pass-Through Trust Series 2003-52, Class A1 |
| | | | 350,721 | | | | 3.325 | | | | 02/19/34 | | | | 306,555 | |
| | | Countrywide Home Loan Mortgage Pass-Through Trust Series 2004-HYB6, Class A2 |
| | | | 393,378 | | | | 3.251 | | | | 11/20/34 | | | | 333,952 | |
| | | Harborview Mortgage Loan Trust Series 2005-15, Class 2A11 |
| | | | 717,843 | | | | 0.527 | | | | 10/20/45 | | | | 423,958 | |
| | | Harborview Mortgage Loan Trust Series 2005-16, Class 2A1A |
| | | | 428,838 | | | | 0.497 | | | | 01/19/36 | | | | 256,703 | |
| | | Impac CMB Trust Series 2004-08, Class 1A |
| | | | 112,612 | | | | 0.976 | | | | 10/25/34 | | | | 72,232 | |
| | | JPMorgan Mortgage Trust Series 2005-A4, Class 2A1 |
| | | | 1,258,565 | | | | 2.903 | | | | 07/25/35 | | | | 1,145,414 | |
| | | Master Adjustable Rate Mortgages Trust Series 2007-1, Class I2A3 |
| | | | 1,387,919 | | | | 1.126 | | | | 01/25/47 | | | | 570,712 | |
| | | Morgan Stanley Mortgage Loan Trust Series 2004-8AR, Class 4A1 |
| | | | 1,289,795 | | | | 2.793 | | | | 10/25/34 | | | | 1,088,039 | |
| | | Mortgage IT Trust Series 2005-5, Class A1 |
| | | | 959,715 | | | | 0.516 | | | | 12/25/35 | | | | 671,485 | |
| | | Sequoia Mortgage Trust Series 2004-09, Class A2 |
| | | | 429,502 | | | | 0.768 | | | | 10/20/34 | | | | 349,588 | |
| | | Structured Adjustable Rate Mortgage Loan Trust Series 2004-05, Class 3A1 |
| | | | 561,908 | | | | 2.463 | | | | 05/25/34 | | | | 534,392 | |
| | | Structured Adjustable Rate Mortgage Loan Trust Series 2004-12, Class 3A2 |
| | | | 244,281 | | | | 2.716 | | | | 09/25/34 | | | | 221,362 | |
| | | Structured Adjustable Rate Mortgage Loan Trust Series 2004-19, Class 2A2 |
| | | | 142,527 | | | | 2.734 | | | | 01/25/35 | | | | 78,482 | |
| | | | | | | | | | | | | | | | | |
| | | | | | | | | | | | | | | | 8,420,812 | |
| | | |
| | | |
| | | Interest Only(b) – 0.2% |
| | | ABN AMRO Mortgage Corp. Series 2003-8, Class A2 |
| | | | 48,523 | | | | 5.500 | | | | 06/25/33 | | | | 2,370 | |
| | | |
| | | |
| | | CS First Boston Mortgage Securities Corp. Series 2002-AR31, Class 5X(a)(c) |
| | | | 61,049 | | | | 0.000 | | | | 11/25/32 | | | | — | |
| | | CS First Boston Mortgage Securities Corp. Series 2003-19, Class 1A2 |
| | | | 118,207 | | | | 5.250 | | | | 07/25/33 | | | | 5,119 | |
| | | FHLMC REMIC Series 2575, Class IB |
| | | | 7,542 | | | | 5.500 | | | | 08/15/30 | | | | 30 | |
| | | FHLMC STRIPS Series 256, Class 56 |
| | | | 8,216,962 | | | | 4.500 | | | | 05/15/23 | | | | 712,366 | |
| | | FNMA REMIC Series 2004-47, Class EI(a)(c) |
| | | | 779,331 | | | | 0.000 | | | | 06/25/34 | | | | 6,827 | |
| | | FNMA REMIC Series 2004-62, Class DI(a)(c) |
| | | | 337,933 | | | | 0.000 | | | | 07/25/33 | | | | 2,066 | |
| | | Master Adjustable Rate Mortgages Trust Series 2003-2, Class 3AX(a) |
| | | | 26,991 | | | | 0.120 | | | | 08/25/33 | | | | 82 | |
| | | Master Adjustable Rate Mortgages Trust Series 2003-2, Class 4AX(a) |
| | | | 9,072 | | | | 0.320 | | | | 07/25/33 | | | | 55 | |
| | | | | | | | | | | | | | | | | |
| | | | | | | | | | | | | | | | 728,915 | |
| | | |
| | | |
| | | Inverse Floaters(a) – 0.0% |
| | | GNMA Series 2001-48, Class SA |
| | | | 16,479 | | | | 25.651 | | | | 10/16/31 | | | | 25,443 | |
| | | GNMA Series 2001-51, Class SB |
| | | | 16,123 | | | | 25.651 | | | | 10/16/31 | | | | 25,885 | |
| | | GNMA Series 2001-59, Class SA |
| | | | 24,688 | | | | 25.489 | | | | 11/16/24 | | | | 37,880 | |
| | | | | | | | | | | | | | | | | |
| | | | | | | | | | | | | | | | 89,208 | |
| | | |
| | | |
| | | Planned Amortization Class – 1.2% |
| | | FNMA REMIC Series 2003-88, Class TH |
| | | | 5,000,000 | | | | 4.500 | | | | 09/25/18 | | | | 5,395,230 | |
| | | |
| | | |
| | | Regular Floater(a) – 0.8% |
| | | FHLMC REMIC Series 3038, Class XA(c) |
| | | | 25,643 | | | | 0.000 | | | | 09/15/35 | | | | 26,016 | |
| | | FHLMC REMIC Series 3313, Class AU(c) |
| | | | 12,237 | | | | 0.000 | | | | 04/15/37 | | | | 12,113 | |
| | | FHLMC REMIC Series 3325, Class SX(c) |
| | | | 219,561 | | | | 0.000 | | | | 06/15/37 | | | | 217,506 | |
| | | FHLMC REMIC Series 3342, Class FT |
| | | | 3,371,444 | | | | 0.707 | | | | 07/15/37 | | | | 3,363,631 | |
| | | | | | | | | | | | | | | | | |
| | | | | | | | | | | | | | | | 3,619,266 | |
| | | |
| | | |
| | | Sequential Fixed Rate – 2.4% |
| | | FHLMC REMIC Series 2042, Class N |
| | | | 430,812 | | | | 6.500 | | | | 03/15/28 | | | | 476,186 | |
| | | FHLMC REMIC Series 2590, Class NV |
| | | | 1,000,000 | | | | 5.000 | | | | 03/15/18 | | | | 1,101,079 | |
| | | FHLMC REMIC Series 2770, Class TW |
| | | | 7,300,000 | | | | 4.500 | | | | 03/15/19 | | | | 8,010,618 | |
| | | FNMA REMIC Series 2000-16, Class ZG |
| | | | 623,016 | | | | 8.500 | | | | 06/25/30 | | | | 714,107 | |
| | | | | | | | | | | | | | | | | |
| | | | | | | | | | | | | | | | 10,301,990 | |
| | | |
| | | |
| | | | | | | | | | | | | | | | | |
The accompanying notes are an integral part of these financial statements.
GOLDMAN SACHS U.S. MORTGAGES FUND
Schedule of Investments (continued)
September 30, 2010 (Unaudited)
| | | | | | | | | | | | | | | | | |
| | | Principal
| | Interest
| | Maturity
| | |
| | | Amount | | Rate | | Date | | Value |
| |
Mortgage-Backed Obligations – (continued) |
| | | | | | | | | | | | | | | | | |
| | | Sequential Floating Rate(a)(d) – 0.2% |
| | | FDIC Structured Sale Guaranteed Notes Series 2010-S1, Class 1A |
| | | $ | 834,693 | | | | 0.806 | % | | | 02/25/48 | | | $ | 836,893 | |
| | | |
| | | |
| | | TOTAL COLLATERALIZED MORTGAGE OBLIGATIONS | | $ | 29,392,314 | |
| | | |
| | | |
| | | Commercial Mortgage-Backed Securities – 12.1% |
| | | Interest Only(a)(b)(d) – 0.0% |
| | | Bear Stearns Commercial Mortgage Securities, Inc. Series 2003-T10, Class X2 |
| | | | 3,708,995 | | | | 1.375 | | | | 03/13/40 | | | | 22,455 | |
| | | JPMorgan Chase Commercial Mortgage Securities Corp. Series 2004-C1, Class X2 |
| | | | 3,161,115 | | | | 1.104 | | | | 01/15/38 | | | | 10,707 | |
| | | Prudential Commercial Mortgage Trust Series 2003-PWR1, Class X2 |
| | | | 3,763,424 | | | | 1.666 | | | | 02/11/36 | | | | 22,736 | |
| | | | | | | | | | | | | | | | | |
| | | | | | | | | | | | | | | | 55,898 | |
| | | |
| | | |
| | | Sequential Fixed Rate – 3.2% |
| | | Bear Stearns Commercial Mortgage Securities, Inc. Series 2002-TOP6, Class A2 |
| | | | 5,915,965 | | | | 6.460 | | | | 10/15/36 | | | | 6,222,992 | |
| | | Credit Suisse Mortgage Capital Certificates Trust Series 2006-C4, Class A3 |
| | | | 825,000 | | | | 5.467 | | | | 09/15/39 | | | | 870,901 | |
| | | LB-UBS Commercial Mortgage Trust Series 2006-C1, Class A4 |
| | | | 3,640,000 | | | | 5.156 | | | | 02/15/31 | | | | 3,959,787 | |
| | | LB-UBS Commercial Mortgage Trust Series 2006-C6, Class A4 |
| | | | 2,500,000 | | | | 5.372 | | | | 09/15/39 | | | | 2,713,738 | |
| | | | | | | | | | | | | | | | | |
| | | | | | | | | | | | | | | | 13,767,418 | |
| | | |
| | | |
| | | Sequential Floating Rate(a) – 8.9% |
| | | Banc of America Commercial Mortgage, Inc. Series 2005-6, Class A4 |
| | | | 5,000,000 | | | | 5.346 | | | | 09/10/47 | | | | 5,531,747 | |
| | | Banc of America Commercial Mortgage, Inc. Series 2006-2, Class A4 |
| | | | 2,000,000 | | | | 5.928 | | | | 05/10/45 | | | | 2,194,055 | |
| | | Commercial Mortgage Pass-Through Certificates Series 2006-C7, Class A4 |
| | | | 2,000,000 | | | | 5.961 | | | | 06/10/46 | | | | 2,226,925 | |
| | | GE Capital Commercial Mortgage Corp. Series 2005-C4, Class A4 |
| | | | 5,000,000 | | | | 5.515 | | | | 11/10/45 | | | | 5,492,523 | |
| | | JPMorgan Chase Commercial Mortgage Securities Corp. Series 2005-CB11, Class A4 |
| | | | 3,500,000 | | | | 5.335 | | | | 08/12/37 | | | | 3,837,443 | |
| | | JPMorgan Chase Commercial Mortgage Securities Corp. Series 2005-LDP1, Class A4 |
| | | | 2,000,000 | | | | 5.038 | | | | 03/15/46 | | | | 2,176,355 | |
| | | LB-UBS Commercial Mortgage Trust Series 2005-C7, Class A4 |
| | | | 2,000,000 | | | | 5.197 | | | | 11/15/30 | | | | 2,204,995 | |
| | | |
| | | |
| | | Merrill Lynch/Countrywide Commercial Mortgage Trust Series 2006-1, Class A4 |
| | | | 3,000,000 | | | | 5.594 | | | | 02/12/39 | | | | 3,322,593 | |
| | | Morgan Stanley Capital I Series 2006-HQ9, Class A4 |
| | | | 2,769,000 | | | | 5.731 | | | | 07/12/44 | | | | 3,075,831 | |
| | | Morgan Stanley Capital I Series 2006-IQ11, Class A4 |
| | | | 5,000,000 | | | | 5.938 | | | | 10/15/42 | | | | 5,557,568 | |
| | | Wachovia Bank Commercial Mortgage Trust Series 2006-C25, Class A5 |
| | | | 3,000,000 | | | | 5.923 | | | | 05/15/43 | | | | 3,296,308 | |
| | | | | | | | | | | | | | | | | |
| | | | | | | | | | | | | | | | 38,916,343 | |
| | | |
| | | |
| | | TOTAL COMMERCIAL
MORTGAGE-BACKED SECURITIES | | $ | 52,739,659 | |
| | | |
| | | |
| | | Federal Agencies – 76.5% |
| | | Adjustable Rate FHLMC(a) – 0.1% |
| | | | 274,609 | | | | 2.625 | | | | 04/01/33 | | | | 288,611 | |
| | | |
| | | |
| | | Adjustable Rate FNMA(a) – 1.3% |
| | | | 9,967 | | | | 3.075 | | | | 07/01/22 | | | | 10,258 | |
| | | | 24,877 | | | | 3.047 | | | | 07/01/27 | | | | 25,740 | |
| | | | 50,338 | | | | 3.047 | | | | 11/01/27 | | | | 52,081 | |
| | | | 8,298 | | | | 3.047 | | | | 01/01/31 | | | | 8,613 | |
| | | | 9,649 | | | | 3.047 | | | | 06/01/32 | | | | 10,016 | |
| | | | 33,235 | | | | 3.075 | | | | 08/01/32 | | | | 34,442 | |
| | | | 1,341,858 | | | | 2.095 | | | | 05/01/33 | | | | 1,386,550 | |
| | | | 78,639 | | | | 3.075 | | | | 05/01/33 | | | | 81,592 | |
| | | | 422,537 | | | | 2.749 | | | | 06/01/33 | | | | 445,100 | |
| | | | 225,896 | | | | 3.378 | | | | 12/01/33 | | | | 235,994 | |
| | | | 489,658 | | | | 2.949 | | | | 08/01/34 | | | | 518,502 | |
| | | | 2,506,448 | | | | 2.695 | | | | 02/01/35 | | | | 2,632,638 | |
| | | | 21,208 | | | | 3.047 | | | | 11/01/35 | | | | 21,946 | |
| | | | 123,386 | | | | 3.047 | | | | 12/01/37 | | | | 127,709 | |
| | | | 52,734 | | | | 3.047 | | | | 01/01/38 | | | | 54,588 | |
| | | | 48,575 | | | | 3.047 | | | | 11/01/40 | | | | 50,410 | |
| | | | | | | | | | | | | | | | | |
| | | | | | | | | | | | | | | | 5,696,179 | |
| | | |
| | | |
| | | Adjustable Rate GNMA(a) – 0.7% |
| | | | 60,351 | | | | 3.375 | | | | 06/20/23 | | | | 62,395 | |
| | | | 28,488 | | | | 3.625 | | | | 07/20/23 | | | | 29,270 | |
| | | | 29,752 | | | | 3.625 | | | | 08/20/23 | | | | 30,547 | |
| | | | 77,688 | | | | 3.625 | | | | 09/20/23 | | | | 79,770 | |
| | | | 22,482 | | | | 3.375 | | | | 03/20/24 | | | | 23,202 | |
| | | | 191,990 | | | | 3.375 | | | | 04/20/24 | | | | 198,772 | |
| | | | 23,484 | | | | 3.375 | | | | 05/20/24 | | | | 24,299 | |
| | | | 201,238 | | | | 3.375 | | | | 06/20/24 | | | | 208,468 | |
| | | | 112,228 | | | | 3.625 | | | | 07/20/24 | | | | 115,806 | |
| | | | 151,230 | | | | 3.625 | | | | 08/20/24 | | | | 155,782 | |
| | | | 48,613 | | | | 3.625 | | | | 09/20/24 | | | | 49,958 | |
| | | | 56,425 | | | | 3.125 | | | | 11/20/24 | | | | 58,285 | |
| | | | 50,936 | | | | 3.125 | | | | 12/20/24 | | | | 53,135 | |
| | | | 39,359 | | | | 3.375 | | | | 01/20/25 | | | | 40,870 | |
| | | | 19,797 | | | | 3.375 | | | | 02/20/25 | | | | 20,585 | |
| | | | 66,683 | | | | 3.375 | | | | 05/20/25 | | | | 69,467 | |
| | | | 51,310 | | | | 3.625 | | | | 07/20/25 | | | | 53,158 | |
| | | | 24,870 | | | | 3.375 | | | | 02/20/26 | | | | 25,709 | |
| | | |
| | | |
The accompanying notes are an integral part of these financial statements.
GOLDMAN SACHS U.S. MORTGAGES FUND
| | | | | | | | | | | | | | | | | |
| | | Principal
| | Interest
| | Maturity
| | |
| | | Amount | | Rate | | Date | | Value |
| |
Mortgage-Backed Obligations – (continued) |
| | | Adjustable Rate GNMA(a) – (continued) |
| | | | | | | | | | | | | | | | | |
| | | $ | 1,434 | | | | 3.625 | % | | | 07/20/26 | | | $ | 1,476 | |
| | | | 72,234 | | | | 3.375 | | | | 01/20/27 | | | | 74,920 | |
| | | | 25,162 | | | | 3.375 | | | | 02/20/27 | | | | 26,004 | |
| | | | 196,138 | | | | 3.375 | | | | 04/20/27 | | | | 203,386 | |
| | | | 21,740 | | | | 3.375 | | | | 05/20/27 | | | | 22,545 | |
| | | | 21,532 | | | | 3.375 | | | | 06/20/27 | | | | 22,330 | |
| | | | 7,527 | | | | 3.125 | | | | 11/20/27 | | | | 7,755 | |
| | | | 31,493 | | | | 3.125 | | | | 12/20/27 | | | | 32,415 | |
| | | | 59,934 | | | | 3.375 | | | | 01/20/28 | | | | 61,972 | |
| | | | 21,439 | | | | 3.250 | | | | 02/20/28 | | | | 22,168 | |
| | | | 23,733 | | | | 3.375 | | | | 03/20/28 | | | | 24,568 | |
| | | | 118,059 | | | | 3.625 | | | | 07/20/29 | | | | 121,702 | |
| | | | 50,504 | | | | 3.625 | | | | 08/20/29 | | | | 52,065 | |
| | | | 14,921 | | | | 3.625 | | | | 09/20/29 | | | | 15,383 | |
| | | | 59,890 | | | | 3.125 | | | | 10/20/29 | | | | 61,637 | |
| | | | 76,674 | | | | 3.125 | | | | 11/20/29 | | | | 78,951 | |
| | | | 17,823 | | | | 3.125 | | | | 12/20/29 | | | | 18,345 | |
| | | | 24,355 | | | | 3.250 | | | | 01/20/30 | | | | 25,182 | |
| | | | 13,133 | | | | 3.250 | | | | 02/20/30 | | | | 13,580 | |
| | | | 52,200 | | | | 3.250 | | | | 03/20/30 | | | | 53,973 | |
| | | | 72,601 | | | | 3.375 | | | | 04/20/30 | | | | 75,387 | |
| | | | 188,668 | | | | 3.375 | | | | 05/20/30 | | | | 196,559 | |
| | | | 15,505 | | | | 3.375 | | | | 06/20/30 | | | | 16,105 | |
| | | | 155,331 | | | | 3.625 | | | | 07/20/30 | | | | 161,594 | |
| | | | 27,300 | | | | 3.625 | | | | 09/20/30 | | | | 28,403 | |
| | | | 50,935 | | | | 2.875 | | | | 10/20/30 | | | | 52,321 | |
| | | | 240,352 | | | | 2.750 | | | | 12/20/34 | | | | 247,520 | |
| | | | | | | | | | | | | | | | | |
| | | | | | | | | | | | | | | | 3,017,724 | |
| | | |
| | | |
| | | FHLMC – 17.7% |
| | | | 1,864 | | | | 7.000 | | | | 04/01/15 | | | | 1,958 | |
| | | | 23,772 | | | | 6.000 | | | | 03/01/16 | | | | 25,615 | |
| | | | 1,716 | | | | 5.000 | | | | 09/01/16 | | | | 1,829 | |
| | | | 19,928 | | | | 5.000 | | | | 11/01/16 | | | | 21,237 | |
| | | | 1,343 | | | | 5.000 | | | | 12/01/16 | | | | 1,431 | |
| | | | 70,818 | | | | 5.000 | | | | 01/01/17 | | | | 75,528 | |
| | | | 121,672 | | | | 5.000 | | | | 02/01/17 | | | | 129,857 | |
| | | | 96,544 | | | | 5.000 | | | | 03/01/17 | | | | 103,037 | |
| | | | 179,411 | | | | 5.000 | | | | 04/01/17 | | | | 191,479 | |
| | | | 4,376 | | | | 5.000 | | | | 05/01/17 | | | | 4,671 | |
| | | | 6,756 | | | | 5.000 | | | | 08/01/17 | | | | 7,211 | |
| | | | 480,027 | | | | 5.000 | | | | 09/01/17 | | | | 512,318 | |
| | | | 538,491 | | | | 5.000 | | | | 10/01/17 | | | | 574,709 | |
| | | | 312,868 | | | | 5.000 | | | | 11/01/17 | | | | 333,914 | |
| | | | 327,431 | | | | 5.000 | | | | 12/01/17 | | | | 349,457 | |
| | | | 388,844 | | | | 5.000 | | | | 01/01/18 | | | | 415,150 | |
| | | | 915,151 | | | | 5.000 | | | | 02/01/18 | | | | 977,289 | |
| | | | 897,521 | | | | 5.000 | | | | 03/01/18 | | | | 958,586 | |
| | | | 748,411 | | | | 5.000 | | | | 04/01/18 | | | | 799,394 | |
| | | | 82,399 | | | | 4.500 | | | | 05/01/18 | | | | 87,453 | |
| | | | 525,573 | | | | 5.000 | | | | 05/01/18 | | | | 561,404 | |
| | | | 128,343 | | | | 5.000 | | | | 06/01/18 | | | | 137,094 | |
| | | | 121,815 | | | | 5.000 | | | | 07/01/18 | | | | 130,118 | |
| | | | 70,282 | | | | 5.000 | | | | 08/01/18 | | | | 75,060 | |
| | | | 47,801 | | | | 5.000 | | | | 09/01/18 | | | | 51,057 | |
| | | | 173,723 | | | | 5.000 | | | | 10/01/18 | | | | 185,558 | |
| | | |
| | | |
| | | | 184,590 | | | | 5.000 | | | | 11/01/18 | | | | 197,162 | |
| | | | 115,966 | | | | 5.000 | | | | 12/01/18 | | | | 123,867 | |
| | | | 96,889 | | | | 5.000 | | | | 01/01/19 | | | | 103,502 | |
| | | | 15,625 | | | | 5.000 | | | | 02/01/19 | | | | 16,709 | |
| | | | 23,335 | | | | 5.000 | | | | 03/01/19 | | | | 24,952 | |
| | | | 398,116 | | | | 4.000 | | | | 04/01/19 | | | | 421,513 | |
| | | | 490,961 | | | | 5.500 | | | | 04/01/20 | | | | 529,754 | |
| | | | 1,988,988 | | | | 4.500 | | | | 08/01/23 | | | | 2,118,643 | |
| | | | 145,832 | | | | 7.000 | | | | 04/01/31 | | | | 161,907 | |
| | | | 1,924,999 | | | | 7.000 | | | | 09/01/31 | | | | 2,145,117 | |
| | | | 622,545 | | | | 7.000 | | | | 04/01/32 | | | | 693,726 | |
| | | | 1,757,872 | | | | 7.000 | | | | 05/01/32 | | | | 1,955,940 | |
| | | | 765,815 | | | | 6.000 | | | | 05/01/33 | | | | 838,717 | |
| | | | 45,731 | | | | 5.500 | | | | 12/01/33 | | | | 49,000 | |
| | | | 768,394 | | | | 5.000 | | | | 12/01/35 | | | | 817,710 | |
| | | | 735,164 | | | | 5.500 | | | | 01/01/36 | | | | 788,062 | |
| | | | 1,865 | | | | 5.500 | | | | 02/01/36 | | | | 1,999 | |
| | | | 29,053 | | | | 5.000 | | | | 02/01/37 | | | | 30,872 | |
| | | | 14,865 | | | | 6.000 | | | | 04/01/37 | | | | 16,257 | |
| | | | 4,322 | | | | 6.000 | | | | 07/01/37 | | | | 4,734 | |
| | | | 189,398 | | | | 6.000 | | | | 09/01/37 | | | | 207,427 | |
| | | | 386,398 | | | | 5.500 | | | | 02/01/38 | | | | 409,577 | |
| | | | 72,263 | | | | 6.000 | | | | 07/01/38 | | | | 79,210 | |
| | | | 1,159,876 | | | | 5.500 | | | | 12/01/38 | | | | 1,229,094 | |
| | | | 200,674 | | | | 6.000 | | | | 12/01/38 | | | | 219,966 | |
| | | | 98,784 | | | | 6.000 | | | | 01/01/39 | | | | 108,250 | |
| | | | 274,700 | | | | 5.500 | | | | 02/01/39 | | | | 291,094 | |
| | | | 2,092,558 | | | | 5.000 | | | | 03/01/39 | | | | 2,233,397 | |
| | | | 3,676,671 | | | | 4.500 | | | | 05/01/39 | | | | 3,876,590 | |
| | | | 154,269 | | | | 5.000 | | | | 05/01/39 | | | | 165,425 | |
| | | | 26,751 | | | | 5.000 | | | | 06/01/39 | | | | 28,685 | |
| | | | 1,103,109 | | | | 5.000 | | | | 07/01/39 | | | | 1,177,909 | |
| | | | 522,112 | | | | 5.000 | | | | 08/01/39 | | | | 558,148 | |
| | | | 10,048,866 | | | | 4.500 | | | | 09/01/39 | | | | 10,587,739 | |
| | | | 3,475,245 | | | | 5.000 | | | | 09/01/39 | | | | 3,723,234 | |
| | | | 5,829,638 | | | | 4.500 | | | | 10/01/39 | | | | 6,138,621 | |
| | | | 12,387,079 | | | | 5.000 | | | | 10/01/39 | | | | 13,274,541 | |
| | | | 1,426,641 | | | | 5.000 | | | | 11/01/39 | | | | 1,529,793 | |
| | | | 569,981 | | | | 5.000 | | | | 12/01/39 | | | | 611,193 | |
| | | | 106,201 | | | | 4.500 | | | | 02/01/40 | | | | 111,976 | |
| | | | 261,717 | | | | 5.000 | | | | 02/01/40 | | | | 279,332 | |
| | | | 487,335 | | | | 5.000 | | | | 03/01/40 | | | | 520,135 | |
| | | | 1,055,260 | | | | 4.500 | | | | 04/01/40 | | | | 1,112,640 | |
| | | | 1,782,580 | | | | 4.500 | | | | 05/01/40 | | | | 1,879,508 | |
| | | | 689,318 | | | | 4.500 | | | | 06/01/40 | | | | 726,799 | |
| | | | 99,698 | | | | 4.500 | | | | 07/01/40 | | | | 105,119 | |
| | | | 5,767,019 | | | | 4.500 | | | | 08/01/40 | | | | 6,080,600 | |
| | | | 1,000,000 | | | | 3.000 | | | | TBA-15yr | (e) | | | 1,007,187 | |
| | | | 1,000,000 | | | | 6.000 | | | | TBA-30yr | (e) | | | 1,072,422 | |
| | | | | | | | | | | | | | | | | |
| | | | | | | | | | | | | | | | 77,098,168 | |
| | | |
| | | |
| | | FNMA – 43.4% |
| | | | 2,707 | | | | 5.500 | | | | 04/01/16 | | | | 2,918 | |
| | | | 3,564 | | | | 5.500 | | | | 08/01/16 | | | | 3,841 | |
| | | | 45,067 | | | | 5.500 | | | | 11/01/16 | | | | 48,576 | |
| | | | 71,194 | | | | 5.000 | | | | 12/01/16 | | | | 74,943 | |
| | | |
| | | |
The accompanying notes are an integral part of these financial statements.
GOLDMAN SACHS U.S. MORTGAGES FUND
Schedule of Investments (continued)
September 30, 2010 (Unaudited)
| | | | | | | | | | | | | | | | | |
| | | Principal
| | Interest
| | Maturity
| | |
| | | Amount | | Rate | | Date | | Value |
| |
Mortgage-Backed Obligations – (continued) |
| | | FNMA – (continued) |
| | | | | | | | | | | | | | | | | |
| | | $ | 36,448 | | | | 5.500 | % | | | 12/01/16 | | | $ | 39,232 | |
| | | | 51,139 | | | | 5.500 | | | | 01/01/17 | | | | 55,121 | |
| | | | 12,272 | | | | 5.000 | | | | 02/01/17 | | | | 12,929 | |
| | | | 101,048 | | | | 5.000 | | | | 04/01/17 | | | | 106,493 | |
| | | | 33,800 | | | | 5.000 | | | | 05/01/17 | | | | 36,644 | |
| | | | 3,795 | | | | 5.500 | | | | 05/01/17 | | | | 4,096 | |
| | | | 141,032 | | | | 5.000 | | | | 06/01/17 | | | | 148,770 | |
| | | | 18,751 | | | | 5.500 | | | | 07/01/17 | | | | 20,239 | |
| | | | 2,515 | | | | 5.500 | | | | 09/01/17 | | | | 2,715 | |
| | | | 269,214 | | | | 5.000 | | | | 11/01/17 | | | | 287,167 | |
| | | | 1,231,662 | | | | 5.000 | | | | 12/01/17 | | | | 1,313,798 | |
| | | | 1,368,219 | | | | 5.000 | | | | 01/01/18 | | | | 1,459,648 | |
| | | | 36,559 | | | | 5.500 | | | | 01/01/18 | | | | 39,460 | |
| | | | 752,906 | | | | 5.000 | | | | 02/01/18 | | | | 804,244 | |
| | | | 28,439 | | | | 5.500 | | | | 02/01/18 | | | | 30,695 | |
| | | | 3,237 | | | | 6.000 | | | | 02/01/18 | | | | 3,509 | |
| | | | 1,770,914 | | | | 5.000 | | | | 03/01/18 | | | | 1,890,652 | |
| | | | 2,468,043 | | | | 5.000 | | | | 04/01/18 | | | | 2,636,325 | |
| | | | 48,299 | | | | 5.500 | | | | 04/01/18 | | | | 52,382 | |
| | | | 304,021 | | | | 5.000 | | | | 05/01/18 | | | | 324,750 | |
| | | | 10,111 | | | | 5.500 | | | | 05/01/18 | | | | 10,965 | |
| | | | 36,097 | | | | 6.000 | | | | 05/01/18 | | | | 39,134 | |
| | | | 2,067,739 | | | | 5.000 | | | | 06/01/18 | | | | 2,207,849 | |
| | | | 111,531 | | | | 5.000 | | | | 07/01/18 | | | | 119,135 | |
| | | | 2,346,456 | | | | 4.000 | | | | 08/01/18 | | | | 2,485,690 | |
| | | | 50,342 | | | | 5.000 | | | | 09/01/18 | | | | 53,790 | |
| | | | 45,241 | | | | 5.000 | | | | 10/01/18 | | | | 48,326 | |
| | | | 306,227 | | | | 5.000 | | | | 11/01/18 | | | | 327,107 | |
| | | | 206,943 | | | | 6.000 | | | | 11/01/18 | | | | 224,353 | |
| | | | 241,987 | | | | 7.000 | | | | 11/01/18 | | | | 263,759 | |
| | | | 352,213 | | | | 4.000 | | | | 12/01/18 | | | | 373,113 | |
| | | | 2,126,879 | | | | 4.500 | | | | 12/01/18 | | | | 2,258,404 | |
| | | | 384,048 | | | | 6.000 | | | | 12/01/18 | | | | 416,360 | |
| | | | 320,250 | | | | 6.000 | | | | 01/01/19 | | | | 347,194 | |
| | | | 7,800 | | | | 5.500 | | | | 02/01/19 | | | | 8,431 | |
| | | | 31,680 | | | | 5.500 | | | | 04/01/19 | | | | 34,243 | |
| | | | 100,636 | | | | 6.000 | | | | 04/01/19 | | | | 109,113 | |
| | | | 176,407 | | | | 4.000 | | | | 05/01/19 | | | | 186,854 | |
| | | | 8,647 | | | | 5.500 | | | | 05/01/19 | | | | 9,342 | |
| | | | 22,621 | | | | 6.000 | | | | 05/01/19 | | | | 24,524 | |
| | | | 50,970 | | | | 5.500 | | | | 07/01/19 | | | | 55,094 | |
| | | | 121,203 | | | | 5.500 | | | | 08/01/19 | | | | 131,011 | |
| | | | 59,974 | | | | 5.500 | | | | 09/01/19 | | | | 64,827 | |
| | | | 708,465 | | | | 6.000 | | | | 09/01/19 | | | | 766,839 | |
| | | | 839,019 | | | | 4.000 | | | | 10/01/19 | | | | 888,709 | |
| | | | 129,085 | | | | 5.500 | | | | 10/01/19 | | | | 139,531 | |
| | | | 44,945 | | | | 5.500 | | | | 11/01/19 | | | | 48,582 | |
| | | | 33,053 | | | | 5.500 | | | | 12/01/19 | | | | 35,727 | |
| | | | 217,905 | | | | 5.500 | | | | 02/01/20 | | | | 235,429 | |
| | | | 1,056,893 | | | | 4.500 | | | | 03/01/20 | | | | 1,122,251 | |
| | | | 875,832 | | | | 6.000 | | | | 12/01/20 | | | | 947,997 | |
| | | | 56,918 | | | | 5.500 | | | | 01/01/21 | | | | 61,524 | |
| | | | 405,624 | | | | 6.000 | | | | 04/01/21 | | | | 439,729 | |
| | | | 331,642 | | | | 6.000 | | | | 07/01/21 | | | | 359,527 | |
| | | | 279,129 | | | | 6.000 | | | | 08/01/21 | | | | 302,599 | |
| | | | 267,824 | | | | 6.000 | | | | 09/01/21 | | | | 290,344 | |
| | | |
| | | |
| | | | 81,796 | | | | 7.000 | | | | 09/01/21 | | | | 92,451 | |
| | | | 96,547 | | | | 6.000 | | | | 10/01/21 | | | | 104,664 | |
| | | | 148,569 | | | | 6.000 | | | | 11/01/21 | | | | 161,061 | |
| | | | 166,780 | | | | 6.000 | | | | 01/01/22 | | | | 180,803 | |
| | | | 254,150 | | | | 7.000 | | | | 06/01/22 | | | | 287,963 | |
| | | | 108,398 | | | | 7.000 | | | | 07/01/22 | | | | 122,813 | |
| | | | 50,473 | | | | 6.000 | | | | 03/01/23 | | | | 54,688 | |
| | | | 61,055 | | | | 4.500 | | | | 04/01/23 | | | | 64,216 | |
| | | | 14,861 | | | | 5.000 | | | | 07/01/23 | | | | 15,761 | |
| | | | 280,960 | | | | 6.000 | | | | 08/01/23 | | | | 304,416 | |
| | | | 19,219 | | | | 6.000 | | | | 11/01/23 | | | | 20,824 | |
| | | | 2,059 | | | | 7.000 | | | | 01/01/29 | | | | 2,322 | |
| | | | 879 | | | | 5.500 | | | | 04/01/29 | | | | 945 | |
| | | | 3,396 | | | | 7.000 | | | | 09/01/29 | | | | 3,820 | |
| | | | 4,347 | | | | 7.000 | | | | 02/01/30 | | | | 4,881 | |
| | | | 55,239 | | | | 7.000 | | | | 08/01/31 | | | | 61,255 | |
| | | | 2,859 | | | | 7.000 | | | | 03/01/32 | | | | 3,200 | |
| | | | 2,624 | | | | 7.000 | | | | 04/01/32 | | | | 2,937 | |
| | | | 6,716 | | | | 7.000 | | | | 05/01/32 | | | | 7,518 | |
| | | | 17,684 | | | | 7.000 | | | | 06/01/32 | | | | 19,793 | |
| | | | 2,915 | | | | 7.000 | | | | 07/01/32 | | | | 3,263 | |
| | | | 141,033 | | | | 6.000 | | | | 01/01/33 | | | | 154,762 | |
| | | | 5,067 | | | | 6.000 | | | | 02/01/33 | | | | 5,560 | |
| | | | 686,821 | | | | 5.500 | | | | 04/01/33 | | | | 737,152 | |
| | | | 107,949 | | | | 6.000 | | | | 06/01/33 | | | | 118,322 | |
| | | | 36,717 | | | | 6.000 | | | | 07/01/33 | | | | 40,245 | |
| | | | 171,583 | | | | 5.000 | | | | 08/01/33 | | | | 181,994 | |
| | | | 9,261 | | | | 5.000 | | | | 09/01/33 | | | | 9,824 | |
| | | | 17,947 | | | | 5.500 | | | | 09/01/33 | | | | 19,259 | |
| | | | 81,299 | | | | 6.000 | | | | 09/01/33 | | | | 89,009 | |
| | | | 17,045 | | | | 6.000 | | | | 10/01/33 | | | | 18,661 | |
| | | | 10,244 | | | | 5.000 | | | | 11/01/33 | | | | 10,867 | |
| | | | 10,583 | | | | 5.000 | | | | 01/01/34 | | | | 11,227 | |
| | | | 132,242 | | | | 5.500 | | | | 02/01/34 | | | | 141,891 | |
| | | | 28,198 | | | | 5.500 | | | | 03/01/34 | | | | 30,256 | |
| | | | 34,569 | | | | 5.500 | | | | 04/01/34 | | | | 37,091 | |
| | | | 635 | | | | 5.500 | | | | 06/01/34 | | | | 681 | |
| | | | 141,409 | | | | 5.500 | | | | 07/01/34 | | | | 151,681 | |
| | | | 28,346 | | | | 5.500 | | | | 08/01/34 | | | | 30,414 | |
| | | | 85,319 | | | | 5.500 | | | | 10/01/34 | | | | 91,465 | |
| | | | 63,166 | | | | 6.000 | | | | 11/01/34 | | | | 68,763 | |
| | | | 830,364 | | | | 5.500 | | | | 12/01/34 | | | | 889,398 | |
| | | | 1,424,491 | | | | 6.000 | | | | 12/01/34 | | | | 1,550,692 | |
| | | | 13,786 | | | | 5.000 | | | | 03/01/35 | | | | 14,562 | |
| | | | 20,578 | | | | 5.000 | | | | 04/01/35 | | | | 21,738 | |
| | | | 926,299 | | | | 6.000 | | | | 04/01/35 | | | | 1,017,466 | |
| | | | 23,505 | | | | 5.500 | | | | 06/01/35 | | | | 25,154 | |
| | | | 178,951 | | | | 5.000 | | | | 07/01/35 | | | | 189,152 | |
| | | | 52,276 | | | | 5.500 | | | | 07/01/35 | | | | 55,944 | |
| | | | 76,776 | | | | 5.000 | | | | 08/01/35 | | | | 81,102 | |
| | | | 39,524 | | | | 5.500 | | | | 08/01/35 | | | | 42,297 | |
| | | | 134,520 | | | | 5.000 | | | | 09/01/35 | | | | 142,099 | |
| | | | 29,902 | | | | 5.500 | | | | 09/01/35 | | | | 32,131 | |
| | | | 45,486 | | | | 5.000 | | | | 10/01/35 | | | | 48,049 | |
| | | | 468,986 | | | | 6.000 | | | | 10/01/35 | | | | 509,920 | |
| | | | 44,334 | | | | 5.000 | | | | 11/01/35 | | | | 46,832 | |
| | | |
| | | |
The accompanying notes are an integral part of these financial statements.
GOLDMAN SACHS U.S. MORTGAGES FUND
| | | | | | | | | | | | | | | | | |
| | | Principal
| | Interest
| | Maturity
| | |
| | | Amount | | Rate | | Date | | Value |
| |
Mortgage-Backed Obligations – (continued) |
| | | FNMA – (continued) |
| | | | | | | | | | | | | | | | | |
| | | $ | 13,759 | | | | 5.500 | % | | | 12/01/35 | | | $ | 14,738 | |
| | | | 12,761 | | | | 6.000 | | | | 12/01/35 | | | | 13,915 | |
| | | | 679 | | | | 5.500 | | | | 02/01/36 | | | | 729 | |
| | | | 30,515 | | | | 5.500 | | | | 04/01/36 | | | | 32,732 | |
| | | | 17,155 | | | | 6.000 | | | | 04/01/36 | | | | 18,669 | |
| | | | 25,124 | | | | 5.000 | | | | 07/01/36 | | | | 26,540 | |
| | | | 1,667,615 | | | | 6.000 | | | | 09/01/36 | | | | 1,822,651 | |
| | | | 407,911 | | | | 6.000 | | | | 11/01/36 | | | | 440,574 | |
| | | | 717,314 | | | | 6.000 | | | | 12/01/36 | | | | 783,553 | |
| | | | 680,413 | | | | 6.000 | | | | 01/01/37 | | | | 738,908 | |
| | | | 27,145 | | | | 5.500 | | | | 02/01/37 | | | | 29,070 | |
| | | | 86,799 | | | | 5.500 | | | | 04/01/37 | | | | 93,132 | |
| | | | 6,611 | | | | 5.500 | | | | 05/01/37 | | | | 7,080 | |
| | | | 342,926 | | | | 5.000 | | | | 06/01/37 | | | | 363,515 | |
| | | | 2,612 | | | | 5.500 | | | | 06/01/37 | | | | 2,796 | |
| | | | 139,444 | | | | 6.000 | | | | 06/01/37 | | | | 149,716 | |
| | | | 37,754 | | | | 5.500 | | | | 07/01/37 | | | | 40,415 | |
| | | | 23,531 | | | | 6.000 | | | | 07/01/37 | | | | 25,322 | |
| | | | 10,534 | | | | 5.500 | | | | 08/01/37 | | | | 11,276 | |
| | | | 510,265 | | | | 6.000 | | | | 08/01/37 | | | | 547,854 | |
| | | | 357,142 | | | | 6.000 | | | | 09/01/37 | | | | 383,452 | |
| | | | 1,041,434 | | | | 6.000 | | | | 10/01/37 | | | | 1,120,501 | |
| | | | 386,871 | | | | 6.500 | | | | 10/01/37 | | | | 428,127 | |
| | | | 1,165,641 | | | | 6.000 | | | | 11/01/37 | | | | 1,251,511 | |
| | | | 1,135,442 | | | | 5.500 | | | | 12/01/37 | | | | 1,208,017 | |
| | | | 913,424 | | | | 6.000 | | | | 12/01/37 | | | | 980,714 | |
| | | | 2,377,976 | | | | 5.500 | | | | 01/01/38 | | | | 2,528,888 | |
| | | | 175,541 | | | | 6.000 | | | | 01/01/38 | | | | 188,473 | |
| | | | 2,668 | | | | 5.500 | | | | 02/01/38 | | | | 2,857 | |
| | | | 1,871,286 | | | | 5.000 | | | | 03/01/38 | | | | 2,007,028 | |
| | | | 984,911 | | | | 5.500 | | | | 03/01/38 | | | | 1,046,378 | |
| | | | 66,581 | | | | 6.000 | | | | 03/01/38 | | | | 71,471 | |
| | | | 146,084 | | | | 5.500 | | | | 04/01/38 | | | | 156,733 | |
| | | | 1,490,815 | | | | 5.500 | | | | 05/01/38 | | | | 1,586,348 | |
| | | | 1,484,330 | | | | 5.500 | | | | 06/01/38 | | | | 1,577,857 | |
| | | | 629,068 | | | | 5.500 | | | | 07/01/38 | | | | 668,866 | |
| | | | 10,789 | | | | 5.500 | | | | 08/01/38 | | | | 11,556 | |
| | | | 41,331 | | | | 6.000 | | | | 08/01/38 | | | | 44,407 | |
| | | | 6,517 | | | | 5.500 | | | | 09/01/38 | | | | 6,981 | |
| | | | 187,439 | | | | 6.000 | | | | 10/01/38 | | | | 201,452 | |
| | | | 3,654 | | | | 5.500 | | | | 12/01/38 | | | | 3,914 | |
| | | | 4,004,942 | | | | 5.000 | | | | 01/01/39 | | | | 4,267,585 | |
| | | | 1,664,204 | | | | 6.500 | | | | 01/01/39 | | | | 1,844,024 | |
| | | | 183,913 | | | | 5.000 | | | | 02/01/39 | | | | 196,936 | |
| | | | 45,958 | | | | 5.500 | | | | 02/01/39 | | | | 49,455 | |
| | | | 53,807 | | | | 5.000 | | | | 03/01/39 | | | | 57,509 | |
| | | | 127,918 | | | | 5.000 | | | | 04/01/39 | | | | 136,717 | |
| | | | 623,091 | | | | 5.000 | | | | 05/01/39 | | | | 666,985 | |
| | | | 241,087 | | | | 4.500 | | | | 06/01/39 | | | | 254,544 | |
| | | | 176,192 | | | | 5.000 | | | | 06/01/39 | | | | 188,696 | |
| | | | 318,065 | | | | 4.500 | | | | 07/01/39 | | | | 335,820 | |
| | | | 561,940 | | | | 5.000 | | | | 07/01/39 | | | | 601,994 | |
| | | | 372,275 | | | | 4.500 | | | | 08/01/39 | | | | 392,879 | |
| | | | 2,680,684 | | | | 5.000 | | | | 08/01/39 | | | | 2,870,247 | |
| | | | 364,691 | | | | 5.500 | | | | 08/01/39 | | | | 387,961 | |
| | | | 95,562 | | | | 4.500 | | | | 09/01/39 | | | | 100,897 | |
| | | |
| | | |
| | | | 1,409,418 | | | | 5.000 | | | | 09/01/39 | | | | 1,506,371 | |
| | | | 2,898,793 | | | | 4.500 | | | | 10/01/39 | | | | 3,055,918 | |
| | | | 754,953 | | | | 5.000 | | | | 10/01/39 | | | | 808,302 | |
| | | | 2,000,000 | | | | 5.500 | | | | 10/01/39 | | | | 2,127,250 | |
| | | | 479,813 | | | | 4.500 | | | | 11/01/39 | | | | 506,596 | |
| | | | 4,564,725 | | | | 5.000 | | | | 11/01/39 | | | | 4,888,284 | |
| | | | 132,479 | | | | 4.500 | | | | 12/01/39 | | | | 139,874 | |
| | | | 2,800,103 | | | | 5.000 | | | | 12/01/39 | | | | 2,992,720 | |
| | | | 795,723 | | | | 4.500 | | | | 01/01/40 | | | | 840,139 | |
| | | | 6,939,152 | | | | 5.000 | | | | 01/01/40 | | | | 7,425,710 | |
| | | | 223,668 | | | | 4.500 | | | | 02/01/40 | | | | 236,153 | |
| | | | 1,744,926 | | | | 5.000 | | | | 02/01/40 | | | | 1,864,959 | |
| | | | 383,484 | | | | 4.500 | | | | 03/01/40 | | | | 404,889 | |
| | | | 507,127 | | | | 5.000 | | | | 03/01/40 | | | | 542,012 | |
| | | | 616,781 | | | | 4.500 | | | | 04/01/40 | | | | 651,210 | |
| | | | 5,444,761 | | | | 5.000 | | | | 05/01/40 | | | | 5,832,678 | |
| | | | 1,989,687 | | | | 5.000 | | | | 06/01/40 | | | | 2,126,556 | |
| | | | 990,881 | | | | 4.500 | | | | 07/01/40 | | | | 1,046,192 | |
| | | | 3,474,034 | | | | 5.000 | | | | 07/01/40 | | | | 3,689,655 | |
| | | | 5,970,451 | | | | 4.500 | | | | 08/01/40 | | | | 6,303,724 | |
| | | | 3,000,000 | | | | 3.000 | | | | TBA-15yr | (e) | | | 3,023,438 | |
| | | | 6,000,000 | | | | 3.500 | | | | TBA-15yr | (e) | | | 6,172,031 | |
| | | | 10,000,000 | | | | 3.500 | | | | TBA-15yr | (e) | | | 10,254,688 | |
| | | | 20,000,000 | | | | 5.500 | | | | TBA-30yr | (e) | | | 21,257,812 | |
| | | | 33,000,000 | | | | 6.000 | | | | TBA-30yr | (e) | | | 35,402,796 | |
| | | | | | | | | | | | | | | | | |
| | | | | | | | | | | | | | | | 189,062,729 | |
| | | |
| | | |
| | | GNMA – 13.3% |
| | | | 15,883 | | | | 6.000 | | | | 03/15/26 | | | | 17,381 | |
| | | | 22,400 | | | | 6.000 | | | | 04/15/26 | | | | 24,512 | |
| | | | 1,011,783 | | | | 5.500 | | | | 01/15/39 | | | | 1,087,503 | |
| | | | 2,036,172 | | | | 6.000 | | | | 01/15/39 | | | | 2,225,840 | |
| | | | 934,852 | | | | 4.500 | | | | 05/15/39 | | | | 992,732 | |
| | | | 1,982,386 | | | | 4.500 | | | | 06/15/39 | | | | 2,105,124 | |
| | | | 938,162 | | | | 4.500 | | | | 07/15/39 | | | | 996,247 | |
| | | | 95,265 | | | | 4.500 | | | | 10/15/39 | | | | 101,163 | |
| | | | 49,000,000 | | | | 4.000 | | | | TBA-30yr | (e) | | | 50,608,204 | |
| | | | | | | | | | | | | | | | | |
| | | | | | | | | | | | | | | | 58,158,706 | |
| | | |
| | | |
| | | TOTAL FEDERAL AGENCIES | | $ | 333,322,117 | |
| | | |
| | | |
| | | TOTAL MORTGAGE-BACKED OBLIGATIONS |
| | | (Cost $406,550,135) | | $ | 415,454,090 | |
| | | |
| | | |
| | | | | | | | | | | | | | | | | |
| | | | | | | | | | | | | | | | | |
Agency Debentures – 1.3% |
| | | | | | | | | | | | | | | | | |
| | | | | | | | | | | | | | | | | |
| | | FHLB |
| | | $ | 1,700,000 | | | | 5.625 | % | | | 03/14/36 | | | $ | 2,110,319 | |
| | | Tennessee Valley Authority(f) |
| | | | 2,800,000 | | | | 5.375 | | | | 04/01/56 | | | | 3,381,122 | |
| | | |
| | | |
| | | TOTAL AGENCY DEBENTURES |
| | | (Cost $4,628,706) | | $ | 5,491,441 | |
| | | |
| | | |
| | | | | | | | | | | | | | | | | |
| | | | | | | | | | | | | | | | | |
| | | | | | | | | | | | | | | | | |
The accompanying notes are an integral part of these financial statements.
GOLDMAN SACHS U.S. MORTGAGES FUND
Schedule of Investments (continued)
September 30, 2010 (Unaudited)
| | | | | | | | | | | | | | | | | |
| | | Principal
| | Interest
| | Maturity
| | |
| | | Amount | | Rate | | Date | | Value |
| |
Asset-Backed Securities – 4.4% |
| | | | | | | | | | | | | | | | | |
| | | | | | | | | | | | | | | | | |
| | | Home Equity – 0.5% |
| | | CIT Mortgage Loan Trust Series 2007-1, Class 2A2(a)(d) |
| | | $ | 570,000 | | | | 1.506 | % | | | 10/25/37 | | | $ | 353,361 | |
| | | CIT Mortgage Loan Trust Series 2007-1, Class 2A3(a)(d) |
| | | | 1,100,000 | | | | 1.706 | | | | 10/25/37 | | | | 553,108 | |
| | | Countrywide Home Equity Loan Trust Series 2002-E, Class A(a) |
| | | | 23,562 | | | | 0.517 | | | | 10/15/28 | | | | 20,654 | |
| | | Countrywide Home Equity Loan Trust Series 2003-D, Class A(a) |
| | | | 117,552 | | | | 0.517 | | | | 06/15/29 | | | | 84,844 | |
| | | Countrywide Home Equity Loan Trust Series 2004-G, Class 2A(a) |
| | | | 63,757 | | | | 0.477 | | | | 12/15/29 | | | | 32,768 | |
| | | Countrywide Home Equity Loan Trust Series 2004-I, Class A(a) |
| | | | 567,709 | | | | 0.547 | | | | 02/15/34 | | | | 265,475 | |
| | | Countrywide Home Equity Loan Trust Series 2004-J, Class 2A(a) |
| | | | 57,438 | | | | 0.547 | | | | 12/15/33 | | | | 29,423 | |
| | | Countrywide Home Equity Loan Trust Series 2004-O, Class 1A(a) |
| | | | 217,848 | | | | 0.537 | | | | 02/15/34 | | | | 94,952 | |
| | | Countrywide Home Equity Loan Trust Series 2005-A, Class 2A(a) |
| | | | 352,378 | | | | 0.497 | | | | 04/15/35 | | | | 144,131 | |
| | | GMAC Mortgage Corp. Loan Trust Series 2007-HE3, Class 1A1 |
| | | | 426,934 | | | | 7.000 | | | | 09/25/37 | | | | 274,065 | |
| | | GMAC Mortgage Corp. Loan Trust Series 2007-HE3, Class 2A1 |
| | | | 521,014 | | | | 7.000 | | | | 09/25/37 | | | | 297,994 | |
| | | Residential Asset Mortgage Products, Inc. Series 2004-RZ1, Class AII(a) |
| | | | 208,464 | | | | 0.736 | | | | 03/25/34 | | | | 138,958 | |
| | | | | | | | | | | | | | | | | |
| | | | | | | | | | | | | | | | 2,289,733 | |
| | | |
| | | |
| | | Student Loan(a) – 3.9% |
| | | Bank of America Student Loan Trust Series 2010-1A, Class A(d) |
| | | | 500,000 | | | | 1.362 | | | | 02/25/43 | | | | 499,955 | |
| | | Brazos Higher Education Authority Inc. Student Loan Revenue Series 2004 I-A-2 |
| | | | 3,945,500 | | | | 0.449 | | | | 06/27/22 | | | | 3,879,799 | |
| | | Brazos Higher Education Authority Inc. Student Loan Revenue Series 2005 I-A-2 |
| | | | 2,053,750 | | | | 0.369 | | | | 12/26/18 | | | | 2,033,233 | |
| | | Brazos Higher Education Authority, Inc. Series 2005-3, Class A14 |
| | | | 1,983,187 | | | | 0.399 | | | | 09/25/23 | | | | 1,972,330 | |
| | | College Loan Corp. Trust Series 2004-1, Class A3 |
| | | | 1,750,000 | | | | 0.658 | | | | 04/25/21 | | | | 1,749,109 | |
| | | Education Funding Capital Trust I Series 2004-1, Class A2 |
| | | | 804,449 | | | | 0.452 | | | | 12/15/22 | | | | 789,693 | |
| | | Goal Capital Funding Trust Series 10-1, Class A(d) |
| | | | 1,569,167 | | | | 0.964 | | | | 08/25/48 | | | | 1,551,540 | |
| | | |
| | | |
| | | Knowledgeworks Foundation Student Loan Series 2010-1, Class A |
| | | | 600,000 | | | | 1.242 | | | | 02/25/42 | | | | 592,574 | |
| | | Nelnet Student Loan Trust Series 2010-3A, Class A(d) |
| | | | 800,000 | | | | 1.212 | | | | 07/27/48 | | | | 801,858 | |
| | | Northstar Education Finance, Inc. Series 2005-1, Class A1 |
| | | | 290,678 | | | | 0.588 | | | | 10/28/26 | | | | 288,919 | |
| | | SLC Student Loan Trust Series 2006-2, Class A4 |
| | | | 1,100,000 | | | | 0.372 | | | | 06/15/22 | | | | 1,071,909 | |
| | | South Carolina Student Loan Corp. Series 2005, Class A2 |
| | | | 1,500,000 | | | | 0.417 | | | | 12/01/20 | | | | 1,451,610 | |
| | | US Education Loan Trust LLC Series 2006-1, Class A2(d) |
| | | | 417,619 | | | | 0.427 | | | | 03/01/25 | | | | 414,341 | |
| | | | | | | | | | | | | | | | | |
| | | | | | | | | | | | | | | | 17,096,870 | |
| | | |
| | | |
| | | TOTAL ASSET-BACKED SECURITIES |
| | | (Cost $21,266,785) | | $ | 19,386,603 | |
| | | |
| | | |
| | | TOTAL INVESTMENTS BEFORE SHORT-TERM INVESTMENT |
| | | (Cost $432,445,626) | | $ | 440,332,134 | |
| | | |
| | | |
| | | | | | | | | | | | | | | | | |
| | | | | | | | | | | | | | | | | |
Short-term Investment(g) – 32.1% |
| | | | | | | | | | | | | | | | | |
| | | | | | | | | | | | | | | | | |
| | | Repurchase Agreement – 32.1% |
| | | Joint Repurchase Agreement Account II |
| | | $ | 140,000,000 | | | | 0.270 | % | | | 10/01/10 | | | $ | 140,000,000 | |
| | | Maturity Value: $140,001,050 | | | | |
| | | (Cost $140,000,000) | | | | |
| | | |
| | | |
| | | TOTAL INVESTMENTS – 133.1% |
| | | (Cost $572,445,626) | | $ | 580,332,134 | |
| | | |
| | | |
| | | LIABILITIES IN EXCESS OF OTHER ASSETS – (33.1)% | | | (144,442,537 | ) |
| | | |
| | | |
| | | NET ASSETS – 100.0% | | $ | 435,889,597 | |
| | | |
| | | |
The percentage shown for each investment category reflects the value of investments in that category as a percentage of net assets.
| | |
| (a) | | Variable rate security. Interest rate disclosed is that which is in effect at September 30, 2010. |
| |
| (b) | | Security with a notional or nominal principal amount. The actual effective yield of this security is different than the stated interest rate. |
| |
| (c) | | Issued with zero coupon and interest rate is contingent upon LIBOR reaching a predetermined level. |
| |
| (d) | | Exempt from registration under Rule 144A of the Securities Act of 1933. Under procedures approved by the Board of Trustees, such securities have been determined to be liquid by the investment adviser and may be resold, normally to qualified institutional buyers in transactions exempt from registration. Total market value of Rule 144A securities amounts to $5,066,954, which represents approximately 1.2% of net assets as of September 30, 2010. |
The accompanying notes are an integral part of these financial statements.
GOLDMAN SACHS U.S. MORTGAGES FUND
| | |
| (e) | | TBA (To Be Announced) Securities are purchased on a forward commitment basis with an approximate principal amount and no defined maturity date. The actual principal and maturity date will be determined upon settlement when the specific mortgage pools are assigned. Total market value of TBA securities (excluding forward sales contracts, if any) amounts to $128,798,578 which represents approximately 29.5% of net assets as of September 30, 2010. |
| |
| (f) | | All or a portion of security is segregated as collateral for initial margin requirement on futures transactions. |
| |
| (g) | | Joint repurchase agreement was entered into on September 30, 2010. Additional information appears on pages 72-73. |
| | | | | | | |
| | | |
| | | |
| | | Investment Abbreviations: |
| | | FDIC | | — | | Federal Deposit Insurance Corp. |
| | | FHLB | | — | | Federal Home Loan Bank |
| | | FHLMC | | — | | Federal Home Loan Mortgage Corp. |
| | | FNMA | | — | | Federal National Mortgage Association |
| | | GNMA | | — | | Government National Mortgage Association |
| | | LIBOR | | — | | London Interbank Offered Rate |
| | | REMIC | | — | | Real Estate Mortgage Investment Conduit |
| | | STRIPS | | — | | Separate Trading of Registered Interest and Principal of Securities |
| | | |
| | | |
ADDITIONAL INVESTMENT INFORMATION
FUTURES CONTRACTS — At September 30, 2010, the following futures contracts were open:
| | | | | | | | | | | | | | | |
| | | Number of
| | | | | | |
| | | Contracts
| | Expiration
| | Current
| | Unrealized
|
| Type | | Long (Short) | | Date | | Value | | Gain (Loss) |
| |
| Eurodollars | | | (1 | ) | | December 2010 | | $ | (249,100 | ) | | $ | (1,878 | ) |
| 2 Year U.S. Treasury Notes | | | 3 | | | December 2010 | | | 658,453 | | | | 979 | |
| 5 Year U.S. Treasury Notes | | | (353 | ) | | December 2010 | | | (42,666,117 | ) | | | (289,832 | ) |
| 10 Year U.S. Treasury Notes | | | 451 | | | December 2010 | | | 56,847,141 | | | | 270,212 | |
| 30 Year U.S. Treasury Bonds | | | (165 | ) | | December 2010 | | | (22,063,594 | ) | | | (105,530 | ) |
| Ultra Long U.S. Treasury Bonds | | | (22 | ) | | December 2010 | | | (3,108,188 | ) | | | 29,011 | |
| |
| |
TOTAL | | | | | | | | | | | | $ | (97,038 | ) |
| |
| |
SWAP CONTRACTS — At September 30, 2010, the Fund had outstanding swap contracts with the following terms:
INTEREST RATE SWAP CONTRACTS
| | | | | | | | | | | | | | | | | |
| | | | | | | Rates Exchanged | | |
| | | Notional
| | | | Payments
| | Payments
| | |
| | | Amount
| | Termination
| | received by
| | made by
| | Unrealized
|
| Counterparty | | (000s)(a) | | Date | | the Fund | | the Fund | | Gain (Loss)* |
| |
| Credit Suisse First Boston Corp. | | $ | 9,700 | | | | 08/15/17 | | | 3 month LIBOR | | 2.252% | | $ | (94,254 | ) |
| Deutsche Bank Securities, Inc. | | | 7,800 | | | | 08/15/17 | | | 3 month LIBOR | | 2.242 | | | (70,406 | ) |
| | | | 8,800 | | | | 08/15/17 | | | 3 month LIBOR | | 2.114 | | | (8,949 | ) |
| JPMorgan Securities, Inc. | | | 8,800 | | | | 08/15/17 | | | 3 month LIBOR | | 2.161 | | | (35,132 | ) |
| |
| |
TOTAL | | | | | | | | | | | | | | $ | (208,741 | ) |
| |
| |
| |
| * | There are no upfront payments on the swap contract(s), therefore the unrealized gain (loss) of the swap contract(s) is equal to their market value. |
| |
| (a) | Represents forward starting interest rate swaps whose effective dates of commencement of accruals and cash flows occur subsequent to September 30, 2010. |
The accompanying notes are an integral part of these financial statements.
GOLDMAN SACHS SINGLE SECTOR FIXED INCOME FUNDS
Schedule of Investments
September 30, 2010 (Unaudited)
ADDITIONAL INVESTMENT INFORMATION
JOINT REPURCHASE AGREEMENT ACCOUNT II — At September 30, 2010, the Funds had undivided interests in the Joint Repurchase Agreement Account II, as follows:
| | | | | |
| Fund | | Principal Amount |
| |
| Emerging Markets Debt | | $ | 60,300,000 | |
| |
| |
| High Yield | | | 309,400,000 | |
| |
| |
| Investment Grade Credit | | | 22,800,000 | |
| |
| |
| Local Emerging Markets Debt | | | 272,900,000 | |
| |
| |
| U.S. Mortgages | | | 140,000,000 | |
| |
| |
REPURCHASE AGREEMENTS
| | | | | | | | | | | | | | | | | |
| | | Principal
| | Interest
| | Maturity
| | Maturity
|
| Counterparty | | Amount | | Rate | | Date | | Value |
| |
| Banc of America Securities LLC | | $ | 300,000,000 | | | | 0.250 | % | | | 10/01/10 | | | $ | 300,002,083 | |
| |
| |
| Banc of America Securities LLC | | | 1,107,500,000 | | | | 0.300 | | | | 10/01/10 | | | | 1,107,509,229 | |
| |
| |
| Barclays Capital, Inc. | | | 1,400,000,000 | | | | 0.250 | | | | 10/01/10 | | | | 1,400,009,722 | |
| |
| |
| BNP Paribas Securities Co. | | | 3,200,000,000 | | | | 0.240 | | | | 10/01/10 | | | | 3,200,021,333 | |
| |
| |
| BNP Paribas Securities Co. | | | 1,500,000,000 | | | | 0.280 | | | | 10/01/10 | | | | 1,500,011,667 | |
| |
| |
| BNP Paribas Securities Co. | | | 800,000,000 | | | | 0.290 | | | | 10/01/10 | | | | 800,006,444 | |
| |
| |
| Citibank N.A | | | 250,000,000 | | | | 0.300 | | | | 10/01/10 | | | | 250,002,083 | |
| |
| |
| Citigroup Global Markets, Inc. | | | 1,250,000,000 | | | | 0.300 | | | | 10/01/10 | | | | 1,250,010,417 | |
| |
| |
| Credit Suisse Securities (USA) LLC | | | 500,000,000 | | | | 0.220 | | | | 10/01/10 | | | | 500,003,056 | |
| |
| |
| Credit Suisse Securities (USA) LLC | | | 550,000,000 | | | | 0.250 | | | | 10/01/10 | | | | 550,003,819 | |
| |
| |
| Deutsche Bank Securities, Inc. | | | 400,000,000 | | | | 0.280 | | | | 10/01/10 | | | | 400,003,111 | |
| |
| |
| JPMorgan Securities | | | 1,500,000,000 | | | | 0.250 | | | | 10/01/10 | | | | 1,500,010,417 | |
| |
| |
| JPMorgan Securities | | | 160,000,000 | | | | 0.300 | | | | 10/01/10 | | | | 160,001,333 | |
| |
| |
| Merrill Lynch & Co., Inc. | | | 850,000,000 | | | | 0.300 | | | | 10/01/10 | | | | 850,007,083 | |
| |
| |
| RBS Securities, Inc. | | | 1,000,000,000 | | | | 0.280 | | | | 10/01/10 | | | | 1,000,007,778 | |
| |
| |
| RBS Securities, Inc. | | | 1,000,000,000 | | | | 0.300 | | | | 10/01/10 | | | | 1,000,008,333 | |
| |
| |
| UBS Securities LLC | | | 750,000,000 | | | | 0.250 | | | | 10/01/10 | | | | 750,005,208 | |
| |
| |
| UBS Securities LLC | | | 750,000,000 | | | | 0.280 | | | | 10/01/10 | | | | 750,005,833 | |
| |
| |
| UBS Securities LLC | | | 170,000,000 | | | | 0.300 | | | | 10/01/10 | | | | 170,001,417 | |
| |
| |
| Wells Fargo Securities LLC | | | 500,000,000 | | | | 0.250 | | | | 10/01/10 | | | | 500,003,472 | |
| |
| |
| Wells Fargo Securities LLC | | | 3,250,000,000 | | | | 0.280 | | | | 10/01/10 | | | | 3,250,025,278 | |
| |
| |
TOTAL | | | | | | | | | | | | | | $ | 21,187,659,116 | |
| |
| |
The accompanying notes are an integral part of these financial statements.
GOLDMAN SACHS SINGLE SECTOR FIXED INCOME FUNDS
| |
| ADDITIONAL INVESTMENT INFORMATION (continued) | |
At September 30, 2010, the Joint Repurchase Agreement Account II was fully collateralized by:
| | | | | | | |
| Issuer | | Interest Rates | | Maturity Dates |
| |
| Federal Farm Credit Bank | | | 4.550 to 7.350 | % | | 03/07/11 to 10/29/37 |
| |
| |
| Federal Farm Credit Bank Principal-Only Stripped Securities | | | 0.000 | | | 12/16/15 |
| |
| |
| Federal Home Loan Bank | | | 0.000 to 8.290 | | | 10/01/10 to 07/15/36 |
| |
| |
| Federal Home Loan Mortgage Corp. | | | 0.000 to 7.690 | | | 10/04/10 to 09/01/40 |
| |
| |
| Federal Home Loan Mortgage Corp. Interest-Only Stripped Securities | | | 0.000 | | | 01/15/12 to 01/15/28 |
| |
| |
| Federal Home Loan Mortgage Corp. Principal-Only Stripped Securities | | | 0.000 | | | 11/15/13 to 03/15/31 |
| |
| |
| Federal National Mortgage Association | | | 0.000 to 10.350 | | | 10/12/10 to 06/01/50 |
| |
| |
| Federal National Mortgage Association Interest-Only Stripped Securities | | | 0.000 | | | 11/15/12 to 07/15/29 |
| |
| |
| Federal National Mortgage Association Principal-Only Stripped Security | | | 0.000 | | | 03/23/28 |
| |
| |
| Government National Mortgage Association | | | 4.000 to 6.000 | | | 03/15/24 to 09/15/40 |
| |
| |
| Tennessee Valley Authority | | | 4.375 to 6.000 | | | 03/15/13 to 07/18/17 |
| |
| |
| Tennessee Valley Authority Interest-Only Stripped Securities | | | 0.000 | | | 11/01/10 to 07/15/20 |
| |
| |
| Tennessee Valley Authority Principal-Only Stripped Security | | | 0.000 | | | 12/15/17 |
| |
| |
| U.S. Treasury Bond | | | 5.000 | | | 05/15/37 |
| |
| |
| U.S. Treasury Interest-Only Stripped Securities | | | 0.000 | | | 02/15/11 to 08/15/20 |
| |
| |
| U.S. Treasury Notes | | | 0.750 to 4.625 | | | 01/31/11 to 11/15/18 |
| |
| |
The aggregate market value of the collateral, including accrued interest, was $21,615,378,308.
The accompanying notes are an integral part of these financial statements.
GOLDMAN SACHS SINGLE SECTOR FIXED INCOME FUNDS
Statements of Assets and Liabilities
September 30, 2010 (Unaudited)
| | | | | | | | | |
| | | | | Emerging Markets
| | | |
| | | | | Debt Fund | | | |
|
| | | Assets: |
| | | | | | | | | |
| | | Investments in securities, at value (identified cost $514,161,935, $5,121,726,178, $647,414,639, $1,196,573,947 and $432,445,626, respectively) | | | $552,102,463 | | | |
| | | Repurchase agreement, at value which equals cost | | | 60,300,000 | | | |
| | | Cash | | | 898,181 | | | |
| | | Foreign currencies, at value (identified cost $161,442, $26, $0, $7,787,461 and $0, respectively) | | | 161,442 | | | |
| | | Receivables: | | | | | | |
| | | Fund shares sold | | | 21,138,234 | | | |
| | | Investment securities sold, at value | | | 10,451,220 | | | |
| | | Interest at value, net of allowances | | | 8,810,622 | | | |
| | | Due from broker — collateral for swap contracts | | | 1,033,002 | | | |
| | | Forward foreign currency exchange contracts, at value | | | 1,076,344 | | | |
| | | Swap contracts, at value | | | 544,821 | | | |
| | | Due from broker — upfront payment | | | 115,726 | | | |
| | | Reimbursement from investment adviser | | | 114,543 | | | |
| | | Due from broker — variation margin, at value | | | 10,020 | | | |
| | | Foreign tax reclaims, at value | | | — | | | |
| | | Other assets, at value | | | 712 | | | |
| | | |
| | | |
| | | Total assets | | | 656,757,330 | | | |
| | | |
| | | |
| | | | | | | | | |
| | | | | | | | | |
|
| | | Liabilities: |
| | | | | | | | | |
| | | Payables: | | | | | | |
| | | Investment securities purchased, at value | | | 27,739,447 | | | |
| | | Fund shares redeemed | | | 4,476,772 | | | |
| | | Forward foreign currency exchange contracts, at value | | | 3,285,169 | | | |
| | | Swap contracts, at value (includes upfront payments received of $245,962, $0, $767,075, $0 and $0, respectively) | | | 557,637 | | | |
| | | Amounts owed to affiliates | | | 459,650 | | | |
| | | Income distributions | | | 343,564 | | | |
| | | Due to broker — variation margin, at value | | | — | | | |
| | | Due to broker — collateral for swap contracts | | | — | | | |
| | | Deferred foreign capital gains tax | | | — | | | |
| | | Accrued expenses | | | 166,228 | | | |
| | | |
| | | |
| | | Total liabilities | | | 37,028,467 | | | |
| | | |
| | | |
| | | | | | | | | |
| | | | | | | | | |
|
| | | Net Assets: |
| | | | | | | | | |
| | | Paid-in capital | | | 584,751,125 | | | |
| | | Accumulated undistributed (distributions in excess of) net investment income | | | 2,025,528 | | | |
| | | Accumulated net realized gain (loss) from investment, futures, swap and foreign currency related transactions | | | (4,126,017 | ) | | |
| | | Net unrealized gain on investments, futures, swaps and translation of assets and liabilities denominated in foreign currencies | | | 37,078,227 | | | |
| | | |
| | | |
| | | NET ASSETS | | | $619,728,863 | | | |
| |
| |
| | | | | | | | | |
| | | Net Assets: | | | | | | |
| | | Class A | | | $199,020,616 | | | |
| | | Class B | | | — | | | |
| | | Class C | | | 22,716,052 | | | |
| | | Institutional | | | 397,275,619 | | | |
| | | Service | | | — | | | |
| | | Separate Account Institutional Shares | | | — | | | |
| | | Class IR | | | 716,576 | | | |
| | | Class R | | | — | | | |
| |
| |
| | | | | | | | | |
| | | | | | | | | |
| | | Total Net Assets | | | $619,728,863 | | | |
| |
| |
| | | Shares Outstanding $0.001 par value (unlimited shares authorized): | | | | | | |
| | | Class A | | | 15,458,788 | | | |
| | | Class B | | | — | | | |
| | | Class C | | | 1,765,874 | | | |
| | | Institutional | | | 30,831,509 | | | |
| | | Service | | | — | | | |
| | | Separate Account Institutional Shares | | | — | | | |
| | | Class IR | | | 55,603 | | | |
| | | Class R | | | — | | | |
| |
| |
| | | Net asset value, offering and redemption price per share:(a) | | | | | | |
| | | Class A | | | $12.87 | | | |
| | | Class B | | | — | | | |
| | | Class C | | | 12.86 | | | |
| | | Institutional | | | 12.89 | | | |
| | | Service | | | — | | | |
| | | Separate Account Institutional Shares | | | — | | | |
| | | Class IR | | | 12.89 | | | |
| | | Class R | | | — | | | |
| |
| |
| |
| (a) | Maximum public offering price per share for Class A shares of Emerging Markets Debt, High Yield and Local Emerging Markets Debt Funds (NAV per share multiplied by 1.0471), Investment Grade Credit and U.S. Mortgages Funds (NAV per share multiplied by 1.0390) is $13.48, $7.51, $10.35, $10.09 and $10.63, respectively. At redemption, Class B and Class C Shares may be subject to a contingent deferred sales charge, assessed on the amount equal to the lesser of the current net asset value or the original purchase price of the shares. |
The accompanying notes are an integral part of these financial statements.
GOLDMAN SACHS SINGLE SECTOR FIXED INCOME FUNDS
| | | | | | | | | | | | | | | | | |
| | | High Yield
| | | Investment Grade
| | | Local Emerging
| | | U.S. Mortgages
| |
| | | Fund | | | Credit Fund | | | Markets Debt Fund | | | Fund | |
|
| | | |
| | | | | | | | | | | | | | | | | |
| | | $ | 5,381,008,846 | | | $ | 689,281,138 | | | $ | 1,272,697,786 | | | $ | 440,332,134 | |
| | | | 309,400,000 | | | | 22,800,000 | | | | 272,900,000 | | | | 140,000,000 | |
| | | | 12,991,041 | | | | 95,540 | | | | 155,611 | | | | 14,292 | |
| | | | 26 | | | | — | | | | 7,915,311 | | | | — | |
| | | | | | | | | | | | | | | | | |
| | | | 55,066,045 | | | | 1,039,641 | | | | 26,450,671 | | | | 10,123 | |
| | | | 14,348,770 | | | | 4,843,053 | | | | 133,714,150 | | | | 219,838,480 | |
| | | | 104,715,504 | | | | 9,049,813 | | | | 26,062,716 | | | | 1,183,447 | |
| | | | — | | | | — | | | | — | | | | — | |
| | | | 487,092 | | | | — | | | | 28,624,710 | | | | — | |
| | | | — | | | | 241,443 | | | | 9,277,499 | | | | — | |
| | | | — | | | | 242,247 | | | | — | | | | — | |
| | | | 25,622 | | | | 30,111 | | | | 806,051 | | | | 37,209 | |
| | | | — | | | | — | | | | — | | | | — | |
| | | | 23,278 | | | | — | | | | 74,723 | | | | — | |
| | | | 20,735 | | | | 1,648 | | | | 253 | | | | 1,153 | |
| | | |
| | | |
| | | | 5,878,086,959 | | | | 727,624,634 | | | | 1,778,679,481 | | | | 801,416,838 | |
| | | |
| | | |
| | | | | | | | | | | | | | | | | |
| | | | | | | | | | | | | | | | | |
|
| | | |
| | | | | | | | | | | | | | | | | |
| | | | | | | | | | | | | | | | | |
| | | | | | | | | | | | | | | | | |
| | | | | | | | | | | | | | | | | |
| | | | 85,856,590 | | | | 10,336,849 | | | | 77,583,093 | | | | 364,066,009 | |
| | | | 19,074,059 | | | | 2,948,066 | | | | 2,897,333 | | | | 699,741 | |
| | | | 41,373,432 | | | | 194,371 | | | | 21,535,016 | | | | — | |
| | | | — | | | | 649,058 | | | | 1,426,739 | | | | 208,741 | |
| | | | 3,674,958 | | | | 271,766 | | | | 1,432,977 | | | | 135,658 | |
| | | | 14,084,458 | | | | 626,271 | | | | 1,245,088 | | | | 168,715 | |
| | | | — | | | | 66,742 | | | | — | | | | 53,784 | |
| | | | — | | | | — | | | | 4,000,000 | | | | — | |
| | | | — | | | | — | | | | 1,501,103 | | | | — | |
| | | | 700,957 | | | | 154,504 | | | | 621,238 | | | | 194,593 | |
| | | |
| | | |
| | | | 164,764,454 | | | | 15,247,627 | | | | 112,242,587 | | | | 365,527,241 | |
| | | |
| | | |
| | | | | | | | | | | | | | | | | |
| | | | | | | | | | | | | | | | | |
|
| | | |
| | | | | | | | | | | | | | | | | |
| | | | 5,590,414,350 | | | | 672,524,925 | | | | 1,563,886,661 | | | | 449,166,009 | |
| | | | 3,188,361 | | | | 659,891 | | | | (7,977,835 | ) | | | (462,676 | ) |
| | | | (99,651,979 | ) | | | (3,090,124 | ) | | | 19,599,744 | | | | (20,394,465 | ) |
| | | | 219,371,773 | | | | 42,282,315 | | | | 90,928,324 | | | | 7,580,729 | |
| | | |
| | | |
| | | $ | 5,713,322,505 | | | $ | 712,377,007 | | | $ | 1,666,436,894 | | | $ | 435,889,597 | |
| |
| |
| | | | | | | | | | | | | | | | | |
| | | | | | | | | | | | | | | | | |
| | | $ | 865,813,714 | | | $ | 203,039,877 | | | $ | 887,667,501 | | | $ | 7,314,093 | |
| | | | 52,496,604 | | | | — | | | | — | | | | — | |
| | | | 111,212,326 | | | | — | | | | 5,731,572 | | | | — | |
| | | | 4,651,160,918 | | | | 214,351,286 | | | | 771,524,593 | | | | 58,189,897 | |
| | | | 21,262,175 | | | | — | | | | — | | | | — | |
| | | | — | | | | 294,985,844 | | | | — | | | | 370,385,607 | |
| | | | 1,535,585 | | | | — | | | | 1,513,228 | | | | — | |
| | | | 9,841,183 | | | | — | | | | — | | | | — | |
| |
| |
| | | | | | | | | | | | | | | | | |
| | | | | | | | | | | | | | | | | |
| | | $ | 5,713,322,505 | | | $ | 712,377,007 | | | $ | 1,666,436,894 | | | $ | 435,889,597 | |
| |
| |
| | | | | | | | | | | | | | | | | |
| | | | 120,769,203 | | | | 20,920,520 | | | | 89,807,437 | | | | 714,989 | |
| | | | 7,306,725 | | | | — | | | | — | | | | — | |
| | | | 15,492,609 | | | | — | | | | 579,097 | | | | — | |
| | | | 646,927,998 | | | | 22,083,413 | | | | 78,055,460 | | | | 5,683,665 | |
| | | | 2,967,410 | | | | — | | | | — | | | | — | |
| | | | — | | | | 30,381,213 | | | | — | | | | 36,199,836 | |
| | | | 214,002 | | | | — | | | | 153,141 | | | | — | |
| | | | 1,372,660 | | | | — | | | | — | | | | — | |
| |
| |
| | | | | | | | | | | | | | | | | |
| | | | $7.17 | | | | $9.71 | | | | $9.88 | | | | $10.23 | |
| | | | 7.18 | | | | — | | | | — | | | | — | |
| | | | 7.18 | | | | — | | | | 9.90 | | | | — | |
| | | | 7.19 | | | | 9.71 | | | | 9.88 | | | | 10.24 | |
| | | | 7.17 | | | | — | | | | — | | | | — | |
| | | | — | | | | 9.71 | | | | — | | | | 10.23 | |
| | | | 7.18 | | | | — | | | | 9.88 | | | | — | |
| | | | 7.17 | | | | — | | | | — | | | | — | |
| |
| |
The accompanying notes are an integral part of these financial statements.
GOLDMAN SACHS SINGLE SECTOR FIXED INCOME FUNDS
Statements of Operations
For the Six Months Ended September 30, 2010 (Unaudited)
| | | | | | | |
| | | | | Emerging Markets
| |
| | | | | Debt Fund | |
| |
|
| | | Investment income: |
| | | | | | | |
| | | Interest (net of foreign withholding taxes of $586,621 for Local Emerging Markets Debt) | | $ | 13,944,384 | |
| | | Dividends (net of foreign withholding taxes of $11,063 for High Yield) | | | — | |
| | | |
| | | |
| | | Total investment income | | | 13,944,384 | |
| | | |
| | | |
| | | | | | | |
| | | | | | | |
|
| | | Expenses: |
| | | | | | | |
| | | Management fees | | | 1,832,097 | |
| | | Distribution and Service fees(a) | | | 240,311 | |
| | | Transfer Agent fees(a) | | | 158,210 | |
| | | Custody and accounting fees | | | 109,622 | |
| | | Professional fees | | | 71,396 | |
| | | Printing and mailing costs | | | 61,761 | |
| | | Registration fees | | | 41,149 | |
| | | Trustee fees | | | 8,472 | |
| | | Account Service Fee(a) | | | — | |
| | | Service Share fees — Shareholder Administration Plan | | | — | |
| | | Service Share fees — Service Plan | | | — | |
| | | Other | | | 2,783 | |
| | | |
| | | |
| | | Total expenses | | | 2,525,801 | |
| | | |
| | | |
| | | Less — expense reductions | | | (196,531 | ) |
| | | |
| | | |
| | | Net expenses | | | 2,329,270 | |
| | | |
| | | |
| | | NET INVESTMENT INCOME | | | 11,615,114 | |
| | | |
| | | |
| | | | | | | |
| | | | | | | |
|
| | | Realized and unrealized gain (loss) from investment, futures, swap and foreign currency related transactions: |
| | | | | | | |
| | | Net realized gain (loss) from: | | | | |
| | | Investment transactions (net of foreign taxes of $341,791 for Local Emerging Markets Debt) | | | 12,630,210 | |
| | | Futures transactions | | | 2,977,457 | |
| | | Swap contracts | | | 1,566,992 | |
| | | Foreign currency related transactions | | | (79,177 | ) |
| | | Net change in unrealized gain (loss) on: | | | | |
| | | Investments (net of deferred foreign taxes of $1,501,103 for Local Emerging Markets Debt) | | | 20,003,864 | |
| | | Futures | | | 1,061,278 | |
| | | Swap contracts | | | (154,746 | ) |
| | | Translation of assets and liabilities denominated in foreign currencies | | | (2,578,584 | ) |
| | | |
| | | |
| | | Net realized and unrealized gain from investment, futures, swap and foreign currency related transactions | | | 35,427,294 | |
| | | |
| | | |
| | | NET INCREASE IN NET ASSETS RESULTING FROM OPERATIONS | | $ | 47,042,408 | |
| | | |
| | | |
| |
| (a) | Class specific Distribution and Service, Transfer Agent and Account Service fees were as follows: |
| (b) | Commenced operations on July 30, 2010 for Emerging Markets Debt and Local Emerging Markets Debt Funds. |
| | | | | | | | | | | | | | | | | | | | | | | | | | | | | | | | | | | | | | | | | | | | | | | | | | | | | | | | | |
| | | Distribution and Service Fees | | | Transfer Agent Fees | | | Account Service Fee | |
| | | | | | | | | | | | | | | | | | | | | | | | | | | | | | Separate
| | | | | | | | | | | | | |
| | | | | | | | | | | | | | | | | | | | | | | | | | | | | | Account
| | | | | | | | | | | | | |
| | | | | | | | | | | | | | | | | | | | | | | | | | | | | | Institutional
| | | | | | | | | | | | | |
Fund | | Class A | | | Class B | | | Class C | | | Class R | | | Class A | | | Class B | | | Class C | | | Institutional | | | Service | | | Shares | | | Class IR(b) | | | Class R | | | Class A | | | Institutional | |
| Emerging Markets Debt | | $ | 166,436 | | | $ | — | | | $ | 73,875 | | | $ | — | | | $ | 86,547 | | | $ | — | | | $ | 9,604 | | | $ | 62,002 | | | $ | — | | | $ | — | | | $ | 57 | | | $ | — | | | $ | — | | | $ | — | |
| High Yield | | | 1,553,627 | | | | 280,713 | | | | 541,193 | | | | 19,409 | | | | 807,886 | | | | 36,493 | | | | 70,355 | | | | 880,106 | | | | 4,311 | | | | — | | | | 641 | | | | 5,046 | | | | — | | | | — | |
| Investment Grade Credit | | | 233,917 | | | | — | | | | — | | | | — | | | | 121,637 | | | | — | | | | — | | | | 38,903 | | | | — | | | | 56,885 | | | | — | | | | — | | | | 46,783 | | | | 48,629 | |
| Local Emerging Markets Debt | | | 883,526 | | | | — | | | | 11,050 | | | | — | | | | 459,434 | | | | — | | | | 1,437 | | | | 114,519 | | | | — | | | | — | | | | 82 | | | | — | | | | — | | | | — | |
| U.S. Mortgages | | | 12,793 | | | | — | | | | — | | | | — | | | | 6,652 | | | | — | | | | — | | | | 12,065 | | | | — | | | | 74,705 | | | | — | | | | — | | | | 2,559 | | | | 15,081 | |
The accompanying notes are an integral part of these financial statements.
GOLDMAN SACHS SINGLE SECTOR FIXED INCOME FUNDS
| | | | | | | | | | | | | | | | | |
| | | High Yield
| | | Investment Grade
| | | Local Emerging
| | | U.S. Mortgages
| |
| | | Fund | | | Credit Fund | | | Markets Debt Fund | | | Fund | |
| |
|
| | | |
| | | | | | | | | | | | | | | | | |
| | | $ | 254,989,899 | | | $ | 16,096,790 | | | $ | 38,665,140 | | | $ | 6,799,962 | |
| | | | 432,550 | | | | — | | | | — | | | | — | |
| | | |
| | | |
| | | | 255,422,449 | | | | 16,096,790 | | | | 38,665,140 | | | | 6,799,962 | |
| | | |
| | | |
| | | | | | | | | | | | | | | | | |
| | | | | | | | | | | | | | | | | |
|
| | | |
| | | | | | | | | | | | | | | | | |
| | | | 18,968,328 | | | | 1,332,148 | | | | 5,767,896 | | | | 888,168 | |
| | | | 2,394,942 | | | | 233,917 | | | | 894,576 | | | | 12,793 | |
| | | | 1,804,838 | | | | 217,425 | | | | 575,472 | | | | 93,422 | |
| | | | 258,686 | | | | 57,955 | | | | 1,142,524 | | | | 122,809 | |
| | | | 56,877 | | | | 40,894 | | | | 49,307 | | | | 44,817 | |
| | | | 290,277 | | | | 33,919 | | | | 76,932 | | | | 50,166 | |
| | | | 40,959 | | | | 21,747 | | | | 28,178 | | | | 15,008 | |
| | | | 15,825 | | | | 8,703 | | | | 10,388 | | | | 8,053 | |
| | | | — | | | | 95,412 | | | | — | | | | 17,640 | |
| | | | 26,946 | | | | — | | | | — | | | | — | |
| | | | 26,946 | | | | — | | | | — | | | | — | |
| | | | 84,162 | | | | 10,252 | | | | 12,458 | | | | 11,486 | |
| | | |
| | | |
| | | | 23,968,786 | | | | 2,052,372 | | | | 8,557,731 | | | | 1,264,362 | |
| | | |
| | | |
| | | | (48,004 | ) | | | (393,385 | ) | | | (846,891 | ) | | | (399,080 | ) |
| | | |
| | | |
| | | | 23,920,782 | | | | 1,658,987 | | | | 7,710,840 | | | | 865,282 | |
| | | |
| | | |
| | | | 231,501,667 | | | | 14,437,803 | | | | 30,954,300 | | | | 5,934,680 | |
| | | |
| | | |
| | | | | | | | | | | | | | | | | |
| | | | | | | | | | | | | | | | | |
|
| | | |
| | | | | | | | | | | | | | | | | |
| | | | | | | | | | | | | | | | | |
| | | | | | | | | | | | | | | | | |
| | | | | | | | | | | | | | | | | �� |
| | | | 82,395,678 | | | | 14,423,586 | | | | 23,826,494 | | | | 9,080,076 | |
| | | | — | | | | 7,079,383 | | | | — | | | | (4,311,602 | ) |
| | | | 659,514 | | | | 893,757 | | | | 546,009 | | | | (17,684 | ) |
| | | | 40,925,623 | | | | 172,424 | | | | 972,136 | | | | — | |
| | | | | | | | | | | | | | | | | |
| | | | (3,392,047 | ) | | | 17,538,565 | | | | 62,034,380 | | | | 6,510,662 | |
| | | | — | | | | 232,990 | | | | — | | | | 16,984 | |
| | | | — | | | | 313,418 | | | | 5,021,739 | | | | (311,622 | ) |
| | | | (50,214,143 | ) | | | (195,198 | ) | | | 1,661,266 | | | | — | |
| | | |
| | | |
| | | | 70,374,625 | | | | 40,458,925 | | | | 94,062,024 | | | | 10,966,814 | |
| | | |
| | | |
| | | $ | 301,876,292 | | | $ | 54,896,728 | | | $ | 125,016,324 | | | $ | 16,901,494 | |
| | | |
| | | |
The accompanying notes are an integral part of these financial statements.
GOLDMAN SACHS SINGLE SECTOR FIXED INCOME FUNDS
Statements of Changes in Net Assets
| | | | | | | | | | | |
| | | | | Emerging Markets Debt Fund | |
| | | | | For the
| | | | |
| | | | | Six Months Ended
| | | For the Fiscal
| |
| | | | | September 30, 2010
| | | Year Ended
| |
| | | | | (Unaudited) | | | March 31, 2010 | |
| |
|
| | | From operations: |
| | | | | | | | | | | |
| | | Net investment income | | $ | 11,615,114 | | | $ | 15,342,226 | |
| | | Net realized gain (loss) from investment, futures, swap and foreign currency related transactions | | | 17,095,482 | | | | 13,397,415 | |
| | | Payments by affiliate relating to certain fixed income securities | | | — | | | | 13,881 | |
| | | Net change in unrealized gain (loss) on investments, futures, swaps and translation of assets and liabilities denominated in foreign currencies | | | 18,331,812 | | | | 42,945,798 | |
| | | |
| | | |
| | | Net increase in net assets resulting from operations | | | 47,042,408 | | | | 71,699,320 | |
| | | |
| | | |
| | | | | | | | | | | |
| | | | | | | | | | | |
|
| | | Distributions to shareholders: |
| | | | | | | | | | | |
| | | From net investment income | | | | | | | | |
| | | Class A Shares | | | (3,410,574 | ) | | | (5,165,806 | ) |
| | | Class B Shares | | | — | | | | — | |
| | | Class C Shares | | | (321,298 | ) | | | (338,717 | ) |
| | | Institutional Shares | | | (8,533,121 | ) | | | (13,461,063 | ) |
| | | Service Shares | | | — | | | | — | |
| | | Separate Account Institutional Shares | | | — | | | | — | |
| | | Class IR Shares(a) | | | (2,033 | ) | | | — | |
| | | Class R Shares | | | — | | | | — | |
| | | |
| | | |
| | | Total distributions to shareholders | | | (12,267,026 | ) | | | (18,965,586 | ) |
| | | |
| | | |
| | | | | | | | | | | |
| | | | | | | | | | | |
|
| | | From share transactions: |
| | | | | | | | | | | |
| | | Proceeds from sales of shares | | | 265,078,462 | | | | 285,588,213 | |
| | | Proceeds of shares sold in connection with in-kind subscriptions | | | 12,379,470 | | | | — | |
| | | Reinvestment of distributions | | | 10,662,033 | | | | 16,055,510 | |
| | | Cost of shares redeemed | | | (97,177,294 | )(b) | | | (112,216,784 | )(b) |
| | | |
| | | |
| | | Net increase (decrease) in net assets resulting from share transactions | | | 190,942,671 | | | | 189,426,939 | |
| | | |
| | | |
| | | TOTAL INCREASE (DECREASE) | | | 225,718,053 | | | | 242,160,673 | |
| | | |
| | | |
| | | | | | | | | | | |
| | | | | | | | | | | |
|
| | | Net assets: |
| | | | | | | | | | | |
| | | Beginning of period | | | 394,010,810 | | | | 151,850,137 | |
| | | |
| | | |
| | | End of period | | $ | 619,728,863 | | | $ | 394,010,810 | |
| | | |
| | | |
| | | Accumulated undistributed (distribution in excess of) net investment income | | $ | 2,025,528 | | | $ | 2,677,440 | |
| | | |
| | | |
| |
| (a) | Commenced operations on July 30, 2010 for Emerging Markets Debt and Local Emerging Markets Debt Funds. |
| (b) | Net of $8,162 and $10,270, $186,970 and $1,018,273, and $20,554 and $6,213 redemption fees for Emerging Markets Debt Fund, High Yield Fund and Local Emerging Markets Debt Fund, respectively, for the six months ended September 30, 2010 and the fiscal year ended March 31, 2010, respectively. |
The accompanying notes are an integral part of these financial statements.
GOLDMAN SACHS SINGLE SECTOR FIXED INCOME FUNDS
| | | | | | | | | | | | | | | | | | | | | | | | | |
| | | High Yield Fund | | | Investment Grade Credit Fund | | | Local Emerging Markets Debt Fund | |
| | | For the
| | | | | | For the
| | | | | | For the
| | | | |
| | | Six Months Ended
| | | For the Fiscal
| | | Six Months Ended
| | | For the Fiscal
| | | Six Months Ended
| | | For the Fiscal
| |
| | | September 30, 2010
| | | Year Ended
| | | September 30, 2010
| | | Year Ended
| | | September 30, 2010
| | | Year Ended
| |
| | | (Unaudited) | | | March 31, 2010 | | | (Unaudited) | | | March 31, 2010 | | | (Unaudited) | | | March 31, 2010 | |
| |
|
| | | |
| | | | | | | | | | | | | | | | | | | | | | | | | |
| | | $ | 231,501,667 | | | $ | 458,723,728 | | | $ | 14,437,803 | | | $ | 24,974,739 | | | $ | 30,954,300 | | | $ | 12,291,873 | |
| | | | 123,980,815 | | | | (140,381,437 | ) | | | 22,569,150 | | | | 9,532,201 | | | | 25,344,639 | | | | 7,873,216 | |
| | | | — | | | | — | | | | — | | | | — | | | | — | | | | — | |
| | | | (53,606,190 | ) | | | 1,694,492,293 | | | | 17,889,775 | | | | 54,773,026 | | | | 68,717,385 | | | | 47,478,619 | |
| | | |
| | | |
| | | | 301,876,292 | | | | 2,012,834,584 | | | | 54,896,728 | | | | 89,279,966 | | | | 125,016,324 | | | | 67,643,708 | |
| | | |
| | | |
| | | | | | | | | | | | | | | | | | | | | | | | | |
| | | | | | | | | | | | | | | | | | | | | | | | | |
|
| | | |
| | | | | | | | | | | | | | | | | | | | | | | | | |
| | | | | | | | | | | | | | | | | | | | | | | | | |
| | | | (47,341,146 | ) | | | (121,306,199 | ) | | | (3,749,085 | ) | | | (6,897,887 | ) | | | (18,461,207 | ) | | | (4,386,105 | ) |
| | | | (1,928,465 | ) | | | (4,845,041 | ) | | | — | | | | — | | | | — | | | | — | |
| | | | (3,724,266 | ) | | | (7,739,011 | ) | | | — | | | | — | | | | (48,085 | ) | | | (9,406 | ) |
| | | | (175,403,425 | ) | | | (326,193,304 | ) | | | (4,252,176 | ) | | | (6,497,318 | ) | | | (16,007,782 | ) | | | (8,660,730 | ) |
| | | | (804,178 | ) | | | (1,575,273 | ) | | | — | | | | — | | | | — | | | | — | |
| | | | — | | | | — | | | | (6,276,450 | ) | | | (11,798,713 | ) | | | — | | | | — | |
| | | | (39,111 | ) | | | (19,368 | ) | | | — | | | | — | | | | (3,152 | ) | | | — | |
| | | | (287,652 | ) | | | (94,435 | ) | | | — | | | | — | | | | — | | | | — | |
| | | |
| | | |
| | | | (229,528,243 | ) | | | (461,772,631 | ) | | | (14,277,711 | ) | | | (25,193,918 | ) | | | (34,520,226 | ) | | | (13,056,241 | ) |
| | | |
| | | |
| | | | | | | | | | | | | | | | | | | | | | | | | |
| | | | | | | | | | | | | | | | | | | | | | | | | |
|
| | | |
| | | | | | | | | | | | | | | | | | | | | | | | | |
| | | | 1,056,071,773 | | | | 4,269,359,427 | | | | 106,837,554 | | | | 481,186,903 | | | | 901,709,027 | | | | 677,733,264 | |
| | | | — | | | | — | | | | — | | | | — | | | | — | | | | — | |
| | | | 150,504,414 | | | | 310,611,056 | | | | 10,611,867 | | | | 18,133,125 | | | | 27,951,003 | | | | 12,305,729 | |
| | | | (1,762,710,948 | )(b) | | | (3,697,049,084 | )(b) | | | (76,755,180 | ) | | | (179,339,456 | ) | | | (151,801,832 | )(b) | | | (64,835,784 | )(b) |
| | | |
| | | |
| | | | (556,134,761 | ) | | | 882,921,399 | | | | 40,694,241 | | | | 319,980,572 | | | | 777,858,198 | | | | 625,203,209 | |
| | | |
| | | |
| | | | (483,786,712 | ) | | | 2,433,983,352 | | | | 81,313,258 | | | | 384,066,620 | | | | 868,354,296 | | | | 679,790,676 | |
| | | |
| | | |
| | | | | | | | | | | | | | | | | | | | | | | | | |
| | | | | | | | | | | | | | | | | | | | | | | | | |
|
| | | |
| | | | | | | | | | | | | | | | | | | | | | | | | |
| | | | 6,197,109,217 | | | | 3,763,125,865 | | | | 631,063,749 | | | | 246,997,129 | | | | 798,082,598 | | | | 118,291,922 | |
| | | |
| | | |
| | | $ | 5,713,322,505 | | | $ | 6,197,109,217 | | | $ | 712,377,007 | | | $ | 631,063,749 | | | $ | 1,666,436,894 | | | $ | 798,082,598 | |
| | | |
| | | |
| | | $ | 3,188,361 | | | $ | 1,214,937 | | | $ | 659,891 | | | $ | 499,799 | | | $ | (7,977,835 | ) | | $ | (4,411,909 | ) |
| | | |
| | | |
The accompanying notes are an integral part of these financial statements.
GOLDMAN SACHS SINGLE SECTOR FIXED INCOME FUNDS
Statements of Changes in Net Assets
| | | | | | | | | | | |
| | | | | U.S. Mortgages Fund | |
| | | | | For the
| | | | |
| | | | | Six Months Ended
| | | For the Fiscal
| |
| | | | | September 30, 2010
| | | Year Ended
| |
| | | | | (Unaudited) | | | March 31, 2010 | |
| |
|
| | | From operations: |
| | | | | | | | | | | |
| | | Net investment income | | $ | 5,934,680 | | | $ | 18,003,916 | |
| | | Net realized gain (loss) from investment, futures and swap transactions | | | 4,750,790 | | | | (5,062,595 | ) |
| | | Net change in unrealized gain on investments, futures and swaps | | | 6,216,024 | | | | 41,086,590 | |
| | | |
| | | |
| | | Net increase in net assets resulting from operations | | | 16,901,494 | | | | 54,027,911 | |
| | | |
| | | |
| | | | | | | | | | | |
| | | | | | | | | | | |
|
| | | Distributions to shareholders: |
| | | | | | | | | | | |
| | | From net investment income | | | | | | | | |
| | | Class A Shares | | | (132,696 | ) | | | (335,583 | ) |
| | | Institutional Shares | | | (871,204 | ) | | | (3,723,536 | ) |
| | | Separate Account Institutional Shares | | | (5,474,979 | ) | | | (15,068,011 | ) |
| | | |
| | | |
| | | Total distributions to shareholders | | | (6,478,879 | ) | | | (19,127,130 | ) |
| | | |
| | | |
| | | | | | | | | | | |
| | | | | | | | | | | |
|
| | | From share transactions: |
| | | | | | | | | | | |
| | | Proceeds from sales of shares | | | 25,799,975 | | | | 146,131,384 | |
| | | Reinvestment of distributions | | | 5,319,788 | | | | 14,056,810 | |
| | | Cost of shares redeemed | | | (50,645,212 | ) | | | (274,850,884 | ) |
| | | |
| | | |
| | | Net decrease in net assets resulting from share transactions | | | (19,525,449 | ) | | | (114,662,690 | ) |
| | | |
| | | |
| | | TOTAL DECREASE | | | (9,102,834 | ) | | | (79,761,909 | ) |
| | | |
| | | |
| | | | | | | | | | | |
| | | | | | | | | | | |
|
| | | Net assets: |
| | | | | | | | | | | |
| | | Beginning of period | | | 444,992,431 | | | | 524,754,340 | |
| | | |
| | | |
| | | End of period | | $ | 435,889,597 | | | $ | 444,992,431 | |
| | | |
| | | |
| | | Accumulated undistributed (distribution in excess of) net investment income | | $ | (462,676 | ) | | $ | 81,523 | |
| | | |
| | | |
The accompanying notes are an integral part of these financial statements.
GOLDMAN SACHS SINGLE SECTOR FIXED INCOME FUNDS
Notes to Financial Statements
September 30, 2010 (Unaudited)
1. ORGANIZATION
Goldman Sachs Trust (the “Trust”) is a Delaware statutory trust registered under the Investment Company Act of 1940, as amended (the “Act”), as an open-end management investment company. The following table lists those series of the Trust that are included in this report (collectively, the “Funds” or individually a “Fund”), along with their corresponding share classes and respective diversification status under the Act:
| | | | | |
| | | | | Diversified/
|
| Fund | | Share Classes Offered* | | Non-diversified |
| |
| Emerging Markets Debt, Local Emerging Markets Debt | | A, C, Institutional and IR | | Non-diversified |
| |
| |
| High Yield | | A, B, C, Institutional, Service, IR and R | | Diversified |
| |
| |
| Investment Grade Credit, U.S. Mortgages | | A, Institutional and Separate Account Institutional | | Diversified |
| |
| |
| |
| * | Effective November 2, 2009, the High Yield Fund’s Class B Shares are no longer available for purchase by new or existing shareholders except under certain circumstances. |
Class A Shares of the Emerging Markets Debt, High Yield, Investment Grade Credit, Local Emerging Markets Debt and U.S. Mortgages Funds are sold with a front-end sales charge of up to 4.50%, 4.50%, 3.75%, 4.50% and 3.75%, respectively. Class B Shares were sold with a contingent deferred sales charge that declines from 5.00% to zero, depending upon the period of time the shares are held. Class C Shares are sold with a contingent deferred sales charge of 1.00% during the first 12 months. Institutional, Service, Separate Account Institutional, Class IR and Class R Shares are not subject to a sales charge. Class IR Shares of the Emerging Markets Debt and Local Emerging Markets Debt Funds commenced operations on July 30, 2010.
Goldman Sachs Asset Management, L.P., (“GSAM”), an affiliate of Goldman, Sachs & Co. (“Goldman Sachs”), serves as investment adviser to each Fund pursuant to a management agreement (the “Agreement”) with the Trust.
2. SIGNIFICANT ACCOUNTING POLICIES
The following is a summary of the significant accounting policies consistently followed by the Funds. The preparation of financial statements in conformity with accounting principles generally accepted in the United States of America (“GAAP”) requires management to make estimates and assumptions that may affect the amounts and disclosures in the financial statements. Actual results could differ from those estimates and assumptions.
A. Investment Valuation — The investment valuation policy of the Funds is to value investments at market value. Debt securities for which market quotations are readily available are valued on the basis of quotations furnished by an independent pricing service approved by the trustees or provided by securities dealers. The pricing services may use valuation models or matrix pricing, which consider: (i) yield or price with respect to bonds that are considered comparable in characteristics such as rating, interest rate and maturity date or (ii) quotations from bond dealers to determine current value. If accurate quotations are not readily available, or if GSAM believes that such quotations do not accurately reflect fair value, the fair value of the Funds’ investments may be determined based on yield equivalents, a pricing matrix or other sources, under valuation procedures established by the trustees. Short-term debt obligations that mature in sixty days or less and that do not exhibit signs of credit deterioration are valued at amortized cost, which approximates market value.
GOLDMAN SACHS SINGLE SECTOR FIXED INCOME FUNDS
Notes to Financial Statements (continued)
September 30, 2010 (Unaudited)
| |
| 2. SIGNIFICANT ACCOUNTING POLICIES (continued) | |
Investments in equity securities and investment companies traded on a United States (“U.S.”) securities exchange or the NASDAQ system are valued daily at their last sale price or official closing price on the principal exchange or system on which they are traded. If no sale occurs, such securities and investment companies are valued at the last bid price for long positions and at the last ask price for short positions. Unlisted equity securities for which market quotations are available are valued at the last sale price on the valuation date, or if no sale occurs, at the last bid price. In the absence of market quotations, broker quotes will be utilized or the security will be fair valued. Investments in investment companies (other than those that are exchange traded) are valued at the net asset value per share (“NAV”) on the valuation date.
GSAM, consistent with its procedures and applicable regulatory guidance, may make an adjustment to the previous closing prices of either domestic or foreign securities in light of significant events to reflect what it believes to be the fair value of the securities at the time of determining the Funds’ NAV. Significant events that could affect a large number of securities in a particular market may include, but are not limited to: situations relating to one or more single issuers in a market sector; significant fluctuations in U.S. or foreign markets; market dislocations; market disruptions or market closings; equipment failures; natural or man-made disasters or acts of God; armed conflicts; government actions or other developments; as well as the same or similar events which may affect specific issuers or the securities markets even though not tied directly to the securities markets. Other significant events that could relate to a single issuer may include, but are not limited to: corporate actions such as reorganizations, mergers and buy-outs; corporate announcements, including those relating to earnings, products and regulatory news; significant litigation; low trading volume; and trading limits or suspensions.
B. Security and Fund Share Transactions, and Investment Income — Security and Fund share transactions are reflected for financial reporting purposes as of the trade date, which may cause the NAV as stated in the accompanying financial statements to be different than the NAV applied to Fund share transactions. Realized gains and losses on sales of portfolio securities are calculated using the identified cost basis. Dividend income is recognized on the ex-dividend date, net of foreign withholding taxes, if any, which are reduced by any amounts reclaimable by the Funds, where applicable. Interest income is recorded on the basis of interest accrued, premium amortized and discount accreted. Realized gains and losses resulting from principal paydowns on mortgage-backed and asset-backed securities are included in interest income. Market discounts, original issue discount and market premiums on debt securities are accreted/amortized to interest income over the life of the security with a corresponding adjustment in the cost basis of that security. In addition, it is the Funds’ policy to accrue for foreign capital gains taxes, if applicable, on certain foreign securities held by the Funds. An estimated foreign capital gains tax is recorded daily on net unrealized gains on these securities and is payable upon the sale of such securities when a gain is realized.
Investment income and unrealized and realized gains or losses are allocated daily to each class of shares of the respective Fund based upon the relative proportion of net assets of each class.
C. Expenses — Expenses incurred by the Trust that do not specifically relate to an individual Fund of the Trust are allocated to the Funds on a straight-line and/or pro-rata basis depending upon the nature of the expense and are accrued daily.
D. In-Kind Transactions — The Funds may allow investors, under certain circumstances, to purchase shares with securities instead of cash. In addition, the Trust reserves the right to redeem an investor’s shares by distributing securities instead of cash. These are known as in-kind transactions. Securities included as part of in-kind purchases and redemptions of Fund shares are valued in the same manner as they are valued for purposes of computing the Fund’s NAV, in accordance with the Funds’ valuation procedures, and such valuations are as of the date the trade is submitted pursuant to the procedures specified in the Fund’s prospectus.
E. Redemption Fees — A 2% redemption fee will be imposed on the redemption of shares (including by exchange) held for 60 calendar days or less with respect to the High Yield Fund and 30 calendar days or less with respect to the Emerging Markets Debt and Local Emerging Markets Debt Funds. For this purpose, the Funds use a first-in first-out method so that shares held longest will be treated as being redeemed first and shares held shortest will be treated as being redeemed last.
GOLDMAN SACHS SINGLE SECTOR FIXED INCOME FUNDS
| |
| 2. SIGNIFICANT ACCOUNTING POLICIES (continued) | |
Redemption fees are reimbursed to a Fund and are reflected as a reduction in share redemptions. Redemption fees are credited to Paid-in Capital and are allocated to each share class of a Fund on a pro-rata basis at the time of payment.
F. Federal Taxes and Distributions to Shareholders — It is each Fund’s policy to comply with the requirements of the Internal Revenue Code of 1986, as amended (the “Code”), applicable to regulated investment companies (mutual funds) and to distribute each year substantially all of its investment company taxable income and capital gains to its shareholders. Accordingly, the Funds are not required to make any provisions for the payment of federal income tax. Distributions to shareholders are recorded on the ex-dividend date. Income and capital gains distributions, if any, are declared and paid according to the following schedule:
| | | | | | | | | |
| | | Income Distributions
| | | Capital Gains Distributions
| |
| Fund | | Declared/Paid | | | Declared/Paid | |
| | |
| All Funds | | | Daily/Monthly | | | | Annually | |
| |
| |
Net capital losses are carried forward to future fiscal years and may be used to the extent allowed by the Code to offset any future capital gains. Utilization of capital loss carryforwards will reduce the requirement of future capital gains distributions.
The characterization of distributions to shareholders for financial reporting purposes is determined in accordance with federal income tax rules, which may differ from GAAP. The source of each Fund’s distributions may be shown in the accompanying financial statements as either from net investment income, net realized gain or capital. The Funds’ capital accounts on the Statements of Assets and Liabilities reflect permanent GAAP/tax differences based on the appropriate tax character.
G. Foreign Currency Translations — The books and records of the Funds are accounted for in U.S. dollars. Amounts denominated in foreign currencies are translated into U.S. dollars on the following basis: (i) investment valuations, foreign currency and other assets and liabilities initially expressed in foreign currencies are converted into U.S. dollars based upon 4:00 p.m. Eastern Time exchange rates; and (ii) purchases and sales of foreign investments, income and expenses are converted into U.S. dollars based upon currency exchange rates prevailing on the respective dates of such transactions as of 4:00 p.m. Eastern Time.
Net realized and unrealized gain (loss) on foreign currency transactions represents: (i) foreign exchange gains and losses from the sale and holdings of foreign currencies; (ii) currency gains and losses between trade date and settlement date on investment security transactions and forward foreign currency exchange contracts; and (iii) gains and losses from the difference between amounts of dividends, interest and foreign withholding taxes recorded and the amounts actually received. The effect of changes in foreign currency exchange rates on equity securities and derivative instruments is included with the net realized and change in unrealized gain (loss) on investments on the Statements of Operations. The effect of changes in foreign currency exchange rates on fixed income securities sold during the period is included with the net realized gain (loss) on foreign currency related transactions, while the effect of changes in foreign currency exchange rates on fixed income securities held at period end is included with the net change in unrealized gain (loss) on investments on the Statements of Operations. Net unrealized foreign exchange gains and losses arising from changes in the value of other assets and liabilities as a result of changes in foreign exchange rates are included as increases and decreases in unrealized gain (loss) on foreign currency related transactions.
H. Forward Foreign Currency Exchange Contracts — The Funds may enter into forward foreign currency exchange contracts for the purchase or sale of a specific foreign currency at a fixed price on a future date as a hedge or cross-hedge against either specific transactions, portfolio positions or to seek to increase total return. All contracts are marked to market daily at the applicable forward rate. Unrealized gains or losses on forward foreign currency exchange contracts are recorded by the Funds on a daily basis and realized gains or losses are recorded on the settlement date of a contract.
Risks may arise upon entering into these contracts from the potential inability of counterparties to meet the terms of their contracts and from unanticipated movements in the value of a foreign currency relative to the U.S. dollar.
GOLDMAN SACHS SINGLE SECTOR FIXED INCOME FUNDS
Notes to Financial Statements (continued)
September 30, 2010 (Unaudited)
| |
| 2. SIGNIFICANT ACCOUNTING POLICIES (continued) | |
The contractual amounts of forward foreign currency exchange contracts do not necessarily represent the amounts potentially subject to risk. The measurement of the risks associated with these instruments is meaningful only when all related and offsetting transactions are considered. The Funds must set aside liquid assets, or engage in other appropriate measures to cover their obligations under these contracts.
I. Futures Contracts — The Funds may purchase or sell futures contracts to hedge against changes in interest rates, securities prices, currency exchange rates, or to seek to increase total return. Futures contracts are valued at the last settlement price, or in the absence of a sale, the last bid price, at the end of each day on the board of trade or exchange upon which they are traded. Upon entering into a futures contract, the Funds deposit cash or securities in an account on behalf of the broker in an amount sufficient to meet the initial margin requirement. Subsequent payments are made or received by the Funds equal to the daily change in the contract value and are recorded as variation margin receivable or payable with a corresponding offset in unrealized gains or losses. The Funds recognize a realized gain or loss when a contract is closed or expires.
The use of futures contracts involves, to varying degrees, elements of market and counterparty risk which may exceed the amounts recognized in the Statements of Assets and Liabilities. Futures contracts may be illiquid, and exchanges may limit fluctuations in futures contract prices during a single day. Changes in the value of a futures contract may not directly correlate with changes in the value of the underlying securities. These risks may decrease the effectiveness of the Funds’ strategies and potentially result in a loss. The Funds must set aside liquid assets, or engage in other appropriate measures to cover their obligations under these contracts.
J. Mortgage-Backed and Asset-Backed Securities — Certain Funds may invest in mortgage-backed and/or asset-backed securities. Mortgage-backed securities represent direct or indirect participations in, or are collateralized by and payable from, mortgage loans secured by residential and/or commercial real property. These securities may include mortgage pass-through securities, collateralized mortgage obligations, real estate mortgage investment conduit pass-through or participation certificates and stripped mortgage-backed securities. Asset-backed securities include securities whose principal and interest payments are collateralized by pools of assets such as auto loans, credit card receivables, leases, installment contracts and personal property. Asset-backed securities also include home equity line of credit loans and other second-lien mortgages.
The value of certain mortgage-backed and asset-backed securities (including adjustable rate mortgage loans) may be particularly sensitive to changes in prevailing interest rates. The value of these securities may also fluctuate in response to the market’s perception of the creditworthiness of the issuers. Early repayment of principal on mortgage-backed or asset-backed securities may expose a Fund to the risk of earning a lower rate of return upon reinvestment of principal. Asset-backed securities may present credit risks that are not presented by mortgage-backed securities because they generally do not have the benefit of a security interest in collateral that is comparable to mortgage assets. Some asset-backed securities may only have a subordinated claim on collateral. In addition, while mortgage-backed and asset-backed securities may be supported by some form of government or private guarantee and/or insurance, there is no assurance that private guarantors or insurers, if any, will meet their obligations.
Stripped mortgage-backed securities are usually structured with two different classes: one that receives substantially all of the interest payments (the interest-only, or “IO” and/or the high coupon rate with relatively low principal amount, or “IOette”), and the other that receives substantially all of the principal payments (the principal-only, or “PO”) from a pool of mortgage loans. Little to no principal will be received at the maturity of an IO; as a result, adjustments are made to the cost of the security on a daily basis until maturity. These adjustments are included in interest income. Payments received for PO’s are treated as a proportionate reduction to the cost basis of the securities and excess amounts are recorded as gains.
K. Mortgage Dollar Rolls — Certain Funds may enter into mortgage dollar rolls (“dollar rolls”) in which the Funds sell securities in the current month for delivery and simultaneously contracts with the same counterparty to repurchase similar (same type, coupon and maturity) but not identical securities on a specified future date. The Funds treat dollar rolls as two separate transactions: one involving the purchase of a security and a separate transaction involving a sale.
During the settlement period between sale and repurchase, the Funds will not be entitled to accrue interest and principal payments on the securities sold. Dollar roll transactions involve the risk that the market value of the securities sold by the
GOLDMAN SACHS SINGLE SECTOR FIXED INCOME FUNDS
| |
| 2. SIGNIFICANT ACCOUNTING POLICIES (continued) | |
Funds may decline below the repurchase price of those securities. In the event the buyer of the securities in a dollar roll transaction files for bankruptcy or becomes insolvent, the Funds’ use of proceeds from the transaction may be restricted pending a determination by, or with respect to, the other counterparty.
L. Repurchase Agreements — The Funds may enter into repurchase agreements which involve the purchase of securities subject to the seller’s agreement to repurchase the securities at a mutually agreed upon date and price. During the term of a repurchase agreement, the value of the underlying securities held as collateral on behalf of the Funds, including accrued interest, is required to exceed the value of the repurchase agreement, including accrued interest. If the seller defaults or becomes insolvent, realization of the collateral by the Funds may be delayed or limited and there may be a decline in the value of the collateral during the period while the Funds seek to assert their rights. The underlying securities for all repurchase agreements are held at the Funds’ custodian or designated sub-custodians under tri-party repurchase agreements.
Pursuant to exemptive relief granted by the Securities and Exchange Commission (“SEC”) and terms and conditions contained therein, the Funds, together with other registered investment companies having management agreements with GSAM, or its affiliates, may transfer uninvested cash into joint accounts, the daily aggregate balance of which is invested in one or more repurchase agreements. Under these joint accounts, the Funds’ credit exposure is allocated to the underlying repurchase agreements counterparties on a pro-rata basis. With the exception of certain transaction fees, the Funds are not subject to any expenses in relation to these investments.
M. Senior Term Loans — The High Yield Fund may invest in Senior Term Loans, which are exempt from registration under the Securities Act of 1933, as amended (the “1933 Act”), and contain certain restrictions on resale and cannot be sold publicly. Senior Term Loans are portions of loans originated by banks and sold in pieces to investors. These floating rate loans (“Loans”) in which the Fund invests are arranged through private negotiations between the borrower and one or more financial institutions (“Lenders”). The Fund invests in such Loans in the form of participations in Loans (“Participations”) or assignments of all or a portion of loans from third parties (“Assignments”). Participations typically result in the Fund having a contractual relationship only with the Lender, not with the borrower. The Fund has the right to receive payments of principal, interest and any fees to which it is entitled from the Lender selling the Participations and only upon receipt by the Lender of the payments from the borrower. In connection with purchasing Participations, the Fund generally has no right to enforce compliance by the borrower with the terms of the loan agreement relating to the Loan, nor any rights of set-off against the borrower, and the Fund will not benefit directly from any collateral supporting the Loan in which it has purchased the Participation. As a result, the Fund assumes the credit risk of both the borrower and the Lender that is selling the Participation. Assignments typically result in the Fund having a direct contractual relationship with the borrower, and the Fund may enforce compliance by the borrower with the terms of the loan agreement. All Senior Term Loans involve interest rate risk, liquidity risk and credit risk, including the potential default or insolvency of the borrower. Senior Term Loans are marked to market daily using pricing vendor quotations, and the change in value, if any, is recorded as an unrealized gain or loss.
N. Structured Notes — The Funds may invest in structured notes, the values of which are based on the price movements of a reference security or index. Fluctuations in value are recorded as unrealized gain and loss. Interest income is recorded on the basis of interest accrued, premium amortized and discount accreted. On the termination date, the Funds will receive a payment from a counterparty based on the value of the referenced security (notional multiplied by price of the referenced security) and record a realized gain or loss. Structured notes are subject to various risks including credit, counterparty and interest rate risks.
O. Swap Contracts — The Funds may enter into swap transactions for hedging purposes or to seek to increase total return. Risks may arise as a result of the failure of the counterparty to the swap contract to comply with the terms of the swap contract. The loss incurred by the failure of a counterparty is generally limited to the net payment to be received by the Funds and/or the termination value at the end of the contract. Therefore, the Funds consider the creditworthiness of each counterparty to a contract in evaluating potential credit risk. Additionally, risks may arise from unanticipated movements in interest rates or in the value of the underlying reference asset or index. Entering into these agreements involves, to varying
GOLDMAN SACHS SINGLE SECTOR FIXED INCOME FUNDS
Notes to Financial Statements (continued)
September 30, 2010 (Unaudited)
| |
| 2. SIGNIFICANT ACCOUNTING POLICIES (continued) | |
degrees, market risk, liquidity risk and elements of credit, legal and documentation risk in excess of amounts recognized in the Statements of Assets and Liabilities. The Funds may pay or receive cash as collateral on these contracts which is recorded as an asset and/or liability. The Funds must set aside liquid assets, or engage in other appropriate measures to cover their obligations under these contracts.
Swaps are marked to market daily using either pricing vendor quotations, counterparty prices or model prices and the change in value, if any, is recorded as an unrealized gain or loss. Upfront payments made and/or received by the Funds, are recorded as an asset and/or liability and realized gains or losses are recognized ratably over the contract’s term/event, with the exception of forward starting interest rate swaps, whose realized gains or losses are recognized ratably from the effective start date. Periodic payments received or made on swap contracts are recorded as realized gains or losses. Gains or losses are realized upon termination of a swap contract and are recorded on the Statements of Operations. The Funds invest in the following types of swaps:
An interest rate swap is an agreement that obligates two parties to exchange a series of cash flows at specified intervals, based upon or calculated by reference to changes in specified prices, rates or indices for a specified amount of an underlying asset or notional principal amount. The payment flows are usually netted against each other, with the difference being paid by one party to the other.
A credit default swap is an agreement that involves one party making a stream of payments to another party in exchange for the right to receive protection on a reference security or obligation. A Fund may use credit default swaps to provide a measure of protection against defaults of the reference security or obligation or to take a short position with respect to the likelihood of default. A Fund’s investment in credit default swaps may involve greater risks than if the Fund had invested in the referenced obligation directly. Credit events are contract specific but may include bankruptcy, failure to pay, restructuring and obligation acceleration. If a Fund buys protection through a credit default swap and no credit event occurs, its payments are limited to the periodic payments previously made to the counterparty. Upon the occurrence of a specified credit event, a Fund, as a buyer of credit protection, is entitled to receive an amount equal to the notional amount of the swap and deliver to the seller the defaulted reference obligation in a physically settled trade. A Fund may also receive a net settlement amount in the form of cash or securities equal to the notional amount of the swap reduced by the recovery value of the reference obligation in a cash settled trade.
As a seller of protection, a Fund generally receives a payment stream throughout the term of the swap, provided that there is no credit event. In addition, if the Funds sell protection through a credit default swap, the Funds could suffer a loss because the value of the referenced obligation may be less than the premium payments received. Upon the occurrence of a specified credit event, the Funds, as sellers of credit protection, may be required to take possession of the defaulted reference obligation and pay the buyer an amount equal to the notional amount of the swap in a physically settled trade. The Funds may also pay a net settlement amount in the form of cash or securities equal to the notional amount of the swap reduced by the recovery value of the reference obligation in a cash settled trade. Recovery values are at times established through the credit event auction process in which market participants are ensured that a transparent price has been set for the defaulted security or obligation. In addition, the Funds are entitled to a return of any assets, which have been pledged as collateral to the counterparty.
The Funds’ credit default swaps are disclosed in the Additional Investment Information section of the Schedules of Investments. The maximum potential amount of future payments (undiscounted) that the Funds as sellers of protection could be required to make under a credit default swap would be an amount equal to the notional amount of the agreement. These potential amounts would be partially offset by any recovery values of the respective referenced obligations or net amounts received from a settlement of a credit default swap for the same reference security or obligation where the Funds bought credit protection.
A total return swap is an agreement that gives the Funds the right to receive the appreciation in the value of a specified security, index or other instrument in return for a fee paid to the counterparty, which will typically be an agreed upon interest rate. If the underlying asset declines in value over the term of the swap, the Funds may also be required to pay the dollar value of that decline to the counterparty.
GOLDMAN SACHS SINGLE SECTOR FIXED INCOME FUNDS
| |
| 2. SIGNIFICANT ACCOUNTING POLICIES (continued) | |
P. When-Issued Securities and Forward Commitments — The Funds may purchase when-issued securities, including TBA (“To Be Announced”) securities and enter into contracts to purchase or sell securities for a fixed price at a future date beyond the customary settlement period. When-issued securities are securities that have been authorized, but not yet issued in the market. A forward commitment involves entering into a contract to purchase or sell securities for a fixed price at a future date beyond the customary settlement period. The purchase of securities on a when-issued or forward commitment basis involves a risk of loss if the value of the security to be purchased declines before the settlement date. Conversely, the sale of securities on a forward commitment basis involves the risk that the value of the securities sold may increase before the settlement date. Although the Funds will generally purchase securities on a when-issued or forward commitment basis with the intention of acquiring the securities for their portfolios, the Funds may dispose of when-issued securities or forward commitments prior to settlement if GSAM deems it appropriate. When purchasing a security on a when-issued basis or entering into a forward commitment, the Funds must set aside liquid assets, or engage in other appropriate measures to cover their obligations under these contracts. The Funds may dispose of or renegotiate these contracts after they have been entered into and may sell these securities before they are delivered, which may result in a capital gain or loss.
3. FAIR VALUE OF INVESTMENTS
The fair value of a financial instrument is the amount that would be received to sell an asset or paid to transfer a liability in an orderly transaction between market participants at the measurement date (i.e., the exit price). GAAP establishes a fair value hierarchy that prioritizes the inputs to valuation techniques used to measure fair value. The hierarchy gives the highest priority to unadjusted quoted prices in active markets for identical assets or liabilities (Level 1 measurements) and the lowest priority to unobservable inputs (Level 3 measurements). The three levels of the fair value hierarchy are described below:
Level 1 — Unadjusted quoted prices in active markets that are accessible at the measurement date for identical, unrestricted assets or liabilities;
Level 2 — Quoted prices in markets that are not active or financial instruments for which significant inputs are observable (including, but not limited to, quoted prices for similar securities, interest rates, foreign exchange rates and credit spreads), either directly or indirectly;
Level 3 — Prices or valuations that require significant unobservable inputs (including GSAM’s assumptions in determining fair value measurement).
The following is a summary of the Funds’ investments categorized in the fair value hierarchy, as of September 30, 2010:
| | | | | | | | | | | | | |
| Emerging Markets Debt | | Level 1 | | | Level 2 | | | Level 3 | |
| | |
Assets | | | | | | | | | | | | |
| Fixed Income | | | | | | | | | | | | |
| Sovereign Debt Obligations | | $ | — | | | $ | 433,640,190 | | | $ | — | |
| Corporate Obligations | | | — | | | | 98,938,846 | | | | — | |
| Structured Notes | | | — | | | | 19,523,427 | | | | — | |
| Short-term Investments | | | — | | | | 60,300,000 | | | | — | |
| Derivatives | | | 1,127,536 | | | | 1,621,165 | | | | — | |
| |
| |
Total | | $ | 1,127,536 | | | $ | 614,023,628 | | | $ | — | |
| |
| |
Liabilities | | | | | | | | | | | | |
| Derivatives | | $ | (66,258 | ) | | $ | (3,842,806 | ) | | $ | — | |
| |
| |
GOLDMAN SACHS SINGLE SECTOR FIXED INCOME FUNDS
Notes to Financial Statements (continued)
September 30, 2010 (Unaudited)
| |
| 3. FAIR VALUE OF INVESTMENTS (continued) | |
| | | | | | | | | | | | | |
| High Yield | | Level 1 | | | Level 2 | | | Level 3 | |
| | |
Assets | | | | | | | | | | | | |
| Fixed Income | | | | | | | | | | | | |
| Corporate Obligations | | $ | — | | | $ | 5,296,896,437 | | | $ | — | |
| Senior Term Loans | | | — | | | | 8,079,028 | | | | — | |
Common Stock and/or Other Equity Investments | | | 67,555,859 | | | | 8,477,522 | | | | — | |
| Short-term Investments | | | — | | | | 309,400,000 | | | | — | |
| Derivatives | | | — | | | | 487,092 | | | | — | |
| |
| |
Total | | $ | 67,555,859 | | | $ | 5,623,340,079 | | | $ | — | |
| |
| |
Liabilities | | | | | | | | | | | | |
| Derivatives | | $ | — | | | $ | (41,373,432 | ) | | $ | — | |
| |
| |
| | | | | | | | | | | | | |
| Investment Grade Credit | | Level 1 | | | Level 2 | | | Level 3 | |
| | |
Assets | | | | | | | | | | | | |
| Fixed Income | | | | | | | | | | | | |
| Corporate Obligations | | $ | — | | | $ | 589,937,397 | | | $ | — | |
| Mortgage-Backed Obligations | | | — | | | | 8,370,729 | | | | — | |
| Foreign Debt Obligations | | | — | | | | 23,563,090 | | | | — | |
U.S. Treasuries and/or Other U.S. Government Obligations and Agencies | | | 33,879,098 | | | | 6,094,425 | | | | — | |
| Municipal Debt Obligations | | | — | | | | 26,123,652 | | | | — | |
Common Stock and/or Other Equity Investments | | | — | | | | 1,312,747 | | | | — | |
| Short-term Investments | | | — | | | | 22,800,000 | | | | — | |
| Derivatives | | | 338,162 | | | | 241,443 | | | | — | |
| |
| |
Total | | $ | 34,217,260 | | | $ | 678,443,483 | | | $ | — | |
| |
| |
Liabilities | | | | | | | | | | | | |
| Derivatives | | $ | (91,705 | ) | | $ | (843,429 | ) | | $ | — | |
| |
| |
GOLDMAN SACHS SINGLE SECTOR FIXED INCOME FUNDS
| |
| 3. FAIR VALUE OF INVESTMENTS (continued) | |
| | | | | | | | | | | | | |
| Local Emerging Markets Debt | | Level 1 | | | Level 2 | | | Level 3 | |
| | |
Assets | | | | | | | | | | | | |
| Fixed Income | | | | | | | | | | | | |
| Sovereign Debt Obligations | | $ | — | | | $ | 1,109,611,093 | | | $ | — | |
| Structured Notes | | | — | | | | 127,457,523 | | | | — | |
| Corporate Obligations | | | — | | | | 32,769,107 | | | | 2,860,063 | |
| Short-term Investments | | | — | | | | 272,900,000 | | | | — | |
| Derivatives | | | — | | | | 37,902,209 | | | | — | |
| |
| |
Total | | $ | — | | | $ | 1,580,639,932 | | | $ | 2,860,063 | |
| |
| |
Liabilities | | | | | | | | | | | | |
| Derivatives | | $ | — | | | $ | (22,961,755 | ) | | $ | — | |
| |
| |
The following is a reconciliation of Level 3 investments for the six months ended September 30, 2010:
| | | | | |
| | | Fixed Income —
| |
| | | Corporate
| |
| | | Obligations | |
| | |
| Beginning Balance as of April 1, 2010 | | $ | 1,598,582 | |
| Realized gain (loss) | | | (54,235 | ) |
| Unrealized gain (loss) relating to instruments still held at reporting date | | | (105,132 | ) |
| Net purchases (sales) | | | (1,559,557 | ) |
| Transfers into Level 3 | | | 2,980,405 | |
| Transfers out of Level 3 | | | — | |
| |
| |
| Ending Balance as of September 30, 2010 | | $ | 2,860,063 | |
| |
| |
| | | | | | | | | | | | | |
| U.S. Mortgages | | Level 1 | | | Level 2 | | | Level 3 | |
| | |
Assets | | | | | | | | | | | | |
| Fixed Income | | | | | | | | | | | | |
| Mortgage-Backed Obligations | | $ | — | | | $ | 415,454,090 | | | $ | — | |
U.S. Treasuries and/or Other U.S. Government Obligations and Agencies | | | — | | | | 5,491,441 | | | | — | |
| Asset-Backed Securities | | | — | | | | 19,386,603 | | | | — | |
| Short-term Investments | | | — | | | | 140,000,000 | | | | — | |
| Derivatives | | | 300,202 | | | | — | | | | — | |
| |
| |
Total | | $ | 300,202 | | | $ | 580,332,134 | | | $ | — | |
| |
| |
Liabilities | | | | | | | | | | | | |
| Derivatives | | $ | (397,240 | ) | | $ | (208,741 | ) | | $ | — | |
| |
| |
GOLDMAN SACHS SINGLE SECTOR FIXED INCOME FUNDS
Notes to Financial Statements (continued)
September 30, 2010 (Unaudited)
4. AGREEMENTS AND AFFILIATED TRANSACTIONS
A. Management Agreement — Under the Agreement, GSAM manages the Funds, subject to the general supervision of the trustees.
As compensation for the services rendered pursuant to the Agreement, the assumption of the expenses related thereto and administration of the Funds’ business affairs, including providing facilities, GSAM is entitled to a management fee computed daily and paid monthly, equal to an annual percentage rate of each Fund’s average daily net assets.
For the six months ended September 30, 2010, contractual and effective net management fees with GSAM were at the following rates:
| | | | | | | | | | | | | | | | | | | | | | | | | | | | | |
| | | Contractual Management Rate | | | Effective Net
| |
| | | First
| | | Next
| | | Next
| | | Next
| | | Over
| | | Effective
| | | Management
| |
| Fund | | $1 billion | | | $1 billion | | | $3 billion | | | $3 billion | | | $8 billion | | | Rate | | | Rate | |
| | |
| Emerging Markets Debt | | | 0.80 | % | | | 0.80 | % | | | 0.72 | % | | | 0.68 | % | | | 0.67 | % | | | 0.80 | % | | | 0.80 | % |
| |
| |
| High Yield | | | 0.70 | | | | 0.70 | | | | 0.63 | | | | 0.60 | | | | 0.59 | | | | 0.65 | | | | 0.65 | |
| |
| |
| Investment Grade Credit | | | 0.40 | | | | 0.36 | | | | 0.34 | | | | 0.33 | | | | 0.32 | | | | 0.40 | | | | 0.33 | * |
| |
| |
| Local Emerging Markets Debt | | | 0.90 | | | | 0.90 | | | | 0.81 | | | | 0.77 | | | | 0.75 | | | | 0.90 | | | | 0.90 | |
| |
| |
| U.S. Mortgages | | | 0.40 | | | | 0.36 | | | | 0.34 | | | | 0.33 | | | | 0.32 | | | | 0.40 | | | | 0.33 | * |
| |
| |
| |
| * | GSAM agreed to waive a portion of its management fee in order to achieve the effective net management rates above, through at least July 29, 2011, and prior to such date GSAM may not terminate the arrangement without the approval of the Trustees. |
B. Distribution and Service Plans — The Trust, on behalf of each Fund, has adopted Distribution and Service Plans (the “Plans”). Under the Plans, Goldman Sachs, which serves as distributor (the “Distributor”), is entitled to a fee, computed daily and paid monthly, for distribution services and personal and account maintenance services, which may then be paid by Goldman Sachs to authorized dealers, at the following annual rates calculated on a Fund’s average daily net assets of each respective share class:
| | | | | | | | | | | | | | | | | |
| | | Distribution and Service Plan Rates | |
| | | Class A* | | | Class B | | | Class C | | | Class R* | |
| | |
| Distribution Plan | | | 0.25 | % | | | 0.75 | % | | | 0.75 | % | | | 0.50 | % |
| |
| |
| Service Plan | | | — | | | | 0.25 | | | | 0.25 | | | | — | |
| |
| |
| |
| * | With respect to Class A and Class R Shares, the Distributor at its discretion may use compensation for distribution services paid under the Distribution Plan to compensate service organizations for personal and account maintenance services and expenses as long as such total compensation does not exceed the maximum cap on “service fees” imposed by the Financial Industry Regulatory Authority. |
GOLDMAN SACHS SINGLE SECTOR FIXED INCOME FUNDS
| |
| 4. AGREEMENTS AND AFFILIATED TRANSACTIONS (continued) | |
C. Distribution Agreement — Goldman Sachs, as Distributor of the shares of the Funds pursuant to a Distribution Agreement, may retain a portion of the Class A front end sales charge and Class B and Class C contingent deferred sales charges. During the six months ended September 30, 2010, Goldman Sachs advised that it retained the following approximate amounts:
| | | | | | | | | | | | | |
| | | Front End
| | | Contingent Deferred
| |
| | | Sales Charge | | | Sales Charge | |
| | | | | | | |
| Fund | | Class A | | | Class B | | | Class C | |
| | |
| Emerging Markets Debt | | $ | 23,400 | | | | N/A | | | $ | — | |
| |
| |
| High Yield | | | 52,100 | | | $ | — | | | | — | |
| |
| |
| Investment Grade Credit | | | 1,900 | | | | N/A | | | | N/A | |
| |
| |
| Local Emerging Markets Debt | | | 15,000 | | | | N/A | | | | — | |
| |
| |
| U.S. Mortgages | | | 100 | | | | N/A | | | | N/A | |
| |
| |
D. Service Plan and Shareholder Administration Plan — The Trust, on behalf of each Fund that offers Service Shares, has adopted a Service Plan and Shareholder Administration Plan. These plans allow for Service Shares to compensate service organizations for providing varying levels of personal and account maintenance and shareholder administration services to their customers who are beneficial owners of such shares. The Service Plan and Shareholder Administration Plan each provide for compensation to the service organizations in an amount equal to, on an annual basis, 0.25% (0.50% in aggregate) of the average daily net assets of the Service Shares.
E. Transfer Agency Agreement — Goldman Sachs also serves as the transfer agent of the Funds for a fee pursuant to a Transfer Agency Agreement. The fees charged for such transfer agency services are computed daily and paid monthly at an annual rate as follows: 0.13% of the average daily net assets for Class A, Class B, Class C, Class IR and Class R Shares and 0.04% of the average daily net assets for Institutional, Separate Account Institutional, and Service Shares.
F. Account Service Plans — The Trust, on behalf of Class A and Institutional Shares of Investment Grade Credit and U.S. Mortgages Funds, has adopted Account Service Plans. Under these Plans, Goldman Sachs and authorized dealers are entitled to receive a fee for account service and account maintenance equal to, on an annual basis, 0.05% of the average daily net assets of Investment Grade Credit and U.S. Mortgages Funds attributable to Class A and Institutional Shares.
G. Other Expense Agreements and Affiliated Transactions — GSAM has agreed to limit certain “Other Expense” of the Funds (excluding management fees, distribution and service fees, transfer agent fees and expenses, service fees and shareholder administration fees (as applicable), Account Service fees, taxes, interest, brokerage fees and litigation, indemnification, shareholder meetings and other extraordinary expenses, exclusive of any custody and transfer agent fee credit reductions) to the extent such expenses exceed, on an annual basis, a percentage rate of the average daily net assets of each Fund. Such Other Expense reimbursements, if any, are computed daily and paid monthly. In addition, the Funds are not obligated to reimburse GSAM for prior fiscal year expense reimbursements, if any. The Other Expense limitations for the Emerging Markets Debt, High Yield, Investment Grade Credit, Local Emerging Markets Debt and U.S. Mortgages Funds as an annual percentage rate of average daily net assets are 0.044%, 0.024%, 0.004%, 0.074% and 0.004%, respectively. These Other Expense reimbursements will remain in place through at least July 29, 2011, and prior to such date GSAM may not terminate the arrangements without the approval of the Trustees. In addition, the Funds have entered into certain offset arrangements with the custodian and the transfer agent, which may result in a reduction of the Fund’s expenses.
GOLDMAN SACHS SINGLE SECTOR FIXED INCOME FUNDS
Notes to Financial Statements (continued)
September 30, 2010 (Unaudited)
| |
| 4. AGREEMENTS AND AFFILIATED TRANSACTIONS (continued) | |
For the six months ended September 30, 2010, these expense reductions, including any waivers and Other Expense reimbursements, were as follows (in thousands):
| | | | | | | | | | | | | | | | | |
| | | Management
| | | Custody
| | | Other
| | | Total
| |
| | | Fee
| | | Fee
| | | Expense
| | | Expense
| |
| Fund | | Waivers | | | Credits | | | Reimbursements | | | Reductions | |
| | |
| Emerging Markets Debt | | $ | — | | | $ | 2 | | | $ | 195 | | | $ | 197 | |
| |
| |
| High Yield | | | — | | | | 2 | | | | 46 | | | | 48 | |
| |
| |
| Investment Grade Credit | | | 233 | | | | — | | | | 160 | | | | 393 | |
| |
| |
| Local Emerging Markets Debt | | | — | | | | 2 | | | | 845 | | | | 847 | |
| |
| |
| U.S. Mortgages | | | 155 | | | | — | | | | 244 | | | | 399 | |
| |
| |
As of September 30, 2010, the amounts owed to affiliates of the Funds were as follows (in thousands):
| | | | | | | | | | | | | | | | | |
| | | Management
| | | Distribution and
| | | Transfer
| | | | |
| Fund | | Fees | | | Service Fees | | | Agent Fees | | | Total | |
| | |
| Emerging Markets Debt | | $ | 372 | | | $ | 54 | | | $ | 34 | | | $ | 460 | |
| |
| |
| High Yield | | | 3,042 | | | | 355 | | | | 278 | | | | 3,675 | |
| |
| |
| Investment Grade Credit | | | 192 | | | | 42 | | | | 38 | | | | 272 | |
| |
| |
| Local Emerging Markets Debt | | | 1,140 | | | | 179 | | | | 114 | | | | 1,433 | |
| |
| |
| U.S. Mortgages | | | 119 | | | | 2 | | | | 15 | | | | 136 | |
| |
| |
H. Line of Credit Facility — As of September 30, 2010, the Funds participated in a $580,000,000 committed, unsecured revolving line of credit facility (the “facility”) together with other funds of the Trust and registered investment companies having management agreements with GSAM or its affiliates. Pursuant to the terms of the facility, the Funds and other borrowers could increase the credit amount by an additional $340,000,000, for a total of up to $920,000,000. This facility is to be used solely for temporary or emergency purposes. The interest rate on borrowings is based on the federal funds rate. The facility also requires a fee to be paid by the Funds based on the amount of the commitment that has not been utilized. For the six months ended September 30, 2010, the Funds did not have any borrowings under the facility. Prior to May 11, 2010, the amount available through the facility was $660,000,000.
I. Other Transactions with Affiliates — For the six months ended September 30, 2010, Goldman Sachs earned approximately $5,800, $0, $20,400, $0 and $11,700 in brokerage commissions from portfolio transactions, including futures transactions executed with Goldman Sachs as the Futures Commission Merchant, on behalf of the Emerging Markets Debt, High Yield, Investment Grade Credit, Local Emerging Markets Debt and U.S. Mortgages Funds, respectively.
As of September 30, 2010, the Goldman Sachs Satellite Strategies Portfolio was the beneficial owner of 16% and 7% of total outstanding shares of the Emerging Markets Debt and Local Emerging Markets Debt Funds, respectively.
GOLDMAN SACHS SINGLE SECTOR FIXED INCOME FUNDS
5. INVESTMENTS IN DERIVATIVES
The Funds may make investments in derivative instruments, including, but not limited to, options, futures, swaps and other derivatives relating to foreign currency transactions. A derivative is an instrument whose value is derived from underlying assets, indices, reference rates or a combination of these factors. Derivative instruments may be privately negotiated contracts (often referred to as over the counter (“OTC”) derivatives) or they may be listed and traded on an exchange. Derivative contracts may involve future commitments to purchase or sell financial instruments or commodities at specified terms on a specified date, or to exchange interest payment streams or currencies based on a notional or contractual amount. Derivative instruments may involve a high degree of financial risk. The use of derivatives also involves the risk of loss if the investment adviser is incorrect in its expectation of the timing or level of fluctuations in securities prices, interest rates or currency prices. Investments in derivative instruments also include the risk of default by the counterparty, the risk that the investment may not be liquid and the risk that a small movement in the price of the underlying security or benchmark may result in a disproportionately large movement, unfavorable or favorable, in the price of the derivative instrument.
The following tables set forth, by certain risk types, the gross value of the Funds’ investments in derivative contracts for trading activities as of September 30, 2010. The values in the tables below exclude the effects of cash collateral received or posted pursuant to these derivative contracts, and therefore are not representative of the Funds’ net exposure.
Emerging Markets Debt
| | | | | | | | | | | | | | |
| | | Statements of Assets
| | | | | | Statements of Assets
| | | |
| | | and Liabilities
| | | | | | and Liabilities
| | | |
| Risk | | Location | | Assets | | | | Location | | Liabilities | |
| | |
| Interest rate | | Receivables for swap contracts, at value; Due from broker — variation margin, at value | | $ | 1,672,357 | (a) | | | Payables for swap contracts, at value; Due to broker — variation margin, at value | | $ | (341,634 | )(a)(b) |
| |
| |
| Credit | | — | | | — | | | | Payables for swap contracts, at value | | | (282,261 | )(b) |
| |
| |
| Currency | | Receivables for forward foreign currency exchange contracts, at value | | | 1,076,344 | | | | Payables for forward foreign currency exchange contracts, at value | | | (3,285,169 | ) |
| |
| |
Total | | | | $ | 2,748,701 | | | | | | $ | (3,909,064 | ) |
| |
| |
High Yield
| | | | | | | | | | | | | | |
| | | Statements of Assets
| | | | | | Statements of Assets
| | | |
| | | and Liabilities
| | | | | | and Liabilities
| | | |
| Risk | | Location | | Assets | | | | Location | | Liabilities | |
| | |
| Currency | | Receivables for forward foreign currency exchange contracts, at value | | $ | 487,092 | | | | Payables for forward foreign currency exchange contracts, at value | | $ | (41,373,432 | ) |
| |
| |
GOLDMAN SACHS SINGLE SECTOR FIXED INCOME FUNDS
Notes to Financial Statements (continued)
September 30, 2010 (Unaudited)
| |
| 5. INVESTMENTS IN DERIVATIVES (continued) | |
Investment Grade Credit
| | | | | | | | | | | | | | |
| | | Statements of Assets
| | | | | | Statements of Assets
| | | |
| | | and Liabilities
| | | | | | and Liabilities
| | | |
| Risk | | Location | | Assets | | | | Location | | Liabilities | |
| | |
| Interest rate | | Receivables for swap contracts, at value; Due from broker — variation margin, at value | | $ | 579,605 | (a) | | | Due to broker — variation margin, at value | | $ | (91,705 | )(a) |
| |
| |
| Credit | | — | | | — | | | | Payables for swap contracts, at value | | | (649,058 | )(b) |
| |
| |
| Currency | | — | | | — | | | | Payables for forward foreign currency exchange contracts, at value | | | (194,371 | ) |
| |
| |
Total | | | | $ | 579,605 | | | | | | $ | (935,134 | ) |
| |
| |
Local Emerging Markets Debt
| | | | | | | | | | | | | | |
| | | Statements of Assets
| | | | | | Statements of Assets
| | | |
| | | and Liabilities
| | | | | | and Liabilities
| | | |
| Risk | | Location | | Assets | | | | Location | | Liabilities | |
| | |
| Interest rate | | Receivables for swap contracts, at value; | | $ | 9,277,499 | | | | Payables for swap contracts, at value | | $ | (1,426,739 | )(b) |
| |
| |
| Currency | | Receivables for forward foreign currency exchange contracts, at value | | | 28,624,710 | | | | Payables for forward foreign currency exchange contracts, at value | | | (21,535,016 | ) |
| |
| |
Total | | | | $ | 37,902,209 | | | | | | $ | (22,961,755 | ) |
| |
| |
U.S. Mortgages
| | | | | | | | | | | | | | |
| | | Statements of Assets
| | | | | | Statements of Assets
| | | |
| | | and Liabilities
| | | | | | and Liabilities
| | | |
| Risk | | Location | | Assets | | | | Location | | Liabilities | |
| | |
| Interest rate | | Due from broker — variation margin | | $ | 300,202(a | ) | | | Payables for swap contracts, at value; Due to broker — variation margin | | $ | (605,981 | )(a)(b) |
| |
| |
| |
| (a) | Includes unrealized gain (loss) on futures contracts described in the Additional Investment Information sections of the Schedules of Investments. Only current day’s variation margin is reported within the Statements of Assets and Liabilities. |
| |
| (b) | Aggregate of amounts include $557,637, $649,058, $1,426,739 and $208,741 for Emerging Markets Debt, Investment Grade Credit, Local Emerging Markets Debt, and U.S. Mortgages Funds, respectively, which represent the payments to be made pursuant to bilateral agreements should counterparties exercise their “right to terminate” provisions based on, among others, the Funds’ performance, its failure to pay on its obligations or failure to pledge collateral. Such amounts do not include incremental charges directly associated with the close-out of the agreements. They also do not reflect the fair value of any assets pledged as collateral which, through the daily margining process, substantially offsets the aforementioned amounts and for which the Funds are entitled to a full return. |
The following tables set forth, by certain risk types, the Funds’ gains (losses) related to investments in derivative activities and their indicative volumes for the six months ended September 30, 2010. These gains (losses) should be considered in the context that these contracts may have been executed to economically hedge securities and accordingly,
GOLDMAN SACHS SINGLE SECTOR FIXED INCOME FUNDS
| |
| 5. INVESTMENTS IN DERIVATIVES (continued) | |
gains (losses) on such contracts may offset (losses) gains attributable to securities. These gains (losses) are included in “Net realized gain (loss)” or “Net change in unrealized gain (loss)” on the Statements of Operations:
Emerging Markets Debt
| | | | | | | | | | | | | | | | |
| | | | | | | | Net Change in
| | | | Average
| |
| | | | | Net Realized
| | | Unrealized
| | | | Number of
| |
| Risk | | Statements of Operations Location | | Gain (Loss) | | | Gain (Loss) | | | | Contracts(a) | |
| | |
| Interest rate | | Net realized gain (loss) from futures transactions and swap contracts/Net change in unrealized gain (loss) on futures and swap contracts | | $ | 4,487,874 | | | $ | 942,831 | | | | | 532 | |
| |
| |
| Credit | | Net realized gain (loss) from swap contracts/Net change in unrealized gain (loss) on swap contracts | | | 56,575 | | | | (36,299 | ) | | | | 1 | |
| |
| |
| Currency | | Net realized gain (loss) from foreign currency related transactions/Net change in unrealized gain (loss) on translation of assets and liabilities denominated in foreign currencies | | | 808,608 | | | | (2,694,204 | ) | | | | 27 | |
| |
| |
Total | | | | $ | 5,353,057 | | | $ | (1,787,672 | ) | | | | 560 | |
| |
| |
High Yield
| | | | | | | | | | | | | | | | |
| | | | | | | | Net Change in
| | | | Average
| |
| | | | | Net Realized
| | | Unrealized
| | | | Number of
| |
| Risk | | Statements of Operations Location | | Gain (Loss) | | | Gain (Loss) | | | | Contracts(a) | |
| | |
| Credit | | Net realized gain (loss) from swap contracts/Net change in unrealized gain (loss) on swap contracts | | $ | 659,514 | | | $ | — | | | | | 1 | |
| |
| |
| Currency | | Net realized gain (loss) from foreign currency related transactions/Net change in unrealized gain (loss) on translation of assets and liabilities denominated in foreign currencies | | | 49,189,015 | | | | (52,013,751 | ) | | | | 4 | |
| |
| |
Total | | | | $ | 49,848,529 | | | $ | (52,013,751 | ) | | | | 5 | |
| |
| |
Investment Grade Credit
| | | | | | | | | | | | | | | | |
| | | | | | | | Net Change in
| | | | Average
| |
| | | | | Net Realized
| | | Unrealized
| | | | Number of
| |
| Risk | | Statements of Operations Location | | Gain (Loss) | | | Gain (Loss) | | | | Contracts(a) | |
| | |
| Interest rate | | Net realized gain (loss) from futures transactions/Net change in unrealized gain (loss) on futures and swap contracts | | $ | 7,079,383 | | | $ | 474,433 | | | | | 1,072 | |
| |
| |
| Credit | | Net realized gain (loss) from swap contracts/Net change in unrealized gain (loss) on swap contracts | | | 893,757 | | | | 71,975 | | | | | 7 | |
| |
| |
| Currency | | Net realized gain (loss) from foreign currency related transactions/Net change in unrealized gain (loss) on translation of assets and liabilities denominated in foreign currencies | | | 133,132 | | | | (198,931 | ) | | | | 2 | |
| |
| |
Total | | | | $ | 8,106,272 | | | $ | 347,477 | | | | | 1,081 | |
| |
| |
GOLDMAN SACHS SINGLE SECTOR FIXED INCOME FUNDS
Notes to Financial Statements (continued)
September 30, 2010 (Unaudited)
| |
| 5. INVESTMENTS IN DERIVATIVES (continued) | |
Local Emerging Markets Debt
| | | | | | | | | | | | | | | | |
| | | | | | | | Net Change in
| | | | Average
| |
| | | | | Net Realized
| | | Unrealized
| | | | Number of
| |
| Risk | | Statements of Operations Location | | Gain (Loss) | | | Gain (Loss) | | | | Contracts(a) | |
| | |
| Interest rate | | Net realized gain (loss) from futures transactions and swap contracts/Net change in unrealized gain (loss) on swap contracts | | $ | 546,009 | | | $ | 5,021,739 | | | | | 22 | |
| |
| |
| Currency | | Net realized gain (loss) from foreign currency related transactions/Net change in unrealized gain (loss) on translation of assets and liabilities denominated in foreign currencies | | | 1,262,931 | | | | 391,586 | | | | | 122 | |
| |
| |
Total | | | | $ | 1,808,940 | | | $ | 5,413,325 | | | | | 144 | |
| |
| |
U.S. Mortgages
| | | | | | | | | | | | | | | | |
| | | | | | | | Net Change in
| | | | Average
| |
| | | | | Net Realized
| | | Unrealized
| | | | Number of
| |
| Risk | | Statements of Operations Location | | Gain (Loss) | | | Gain (Loss) | | | | Contracts(a) | |
| | |
| Interest rate | | Net realized gain (loss) from futures transactions and swap contracts/Net change in unrealized gain (loss) on futures and swap contracts | | $ | (4,329,286 | ) | | $ | (294,638 | ) | | | | 737 | |
| |
| |
| |
| (a) | Average number of contracts is based on the average of month end balances for the six months ended September 30, 2010. |
6. PORTFOLIO SECURITIES TRANSACTIONS
The cost of purchases and proceeds from sales and maturities of long-term securities (excluding in-kind transactions) for the six months ended September 30, 2010, were as follows:
| | | | | | | | | | | | | | | | | |
| | | | | | | | | Sales and
| | | Sales and
| |
| | | Purchases of
| | | Purchases (Excluding
| | | Maturities of
| | | Maturities (Excluding
| |
| | | U.S. Government and
| | | U.S. Government and
| | | U.S. Government and
| | | U.S. Government and
| |
| Fund | | Agency Obligations | | | Agency Obligations) | | | Agency Obligations | | | Agency Obligations) | |
| | |
| Emerging Markets Debt | | $ | — | | | $ | 363,445,333 | | | $ | — | | | $ | 204,929,586 | |
| |
| |
| High Yield | | | — | | | | 1,112,849,203 | | | | — | | | | 1,682,116,795 | |
| |
| |
| Investment Grade Credit | | | 161,265,116 | | | | 261,681,399 | | | | 122,578,619 | | | | 258,864,056 | |
| |
| |
| Local Emerging Markets Debt | | | — | | | | 1,308,165,641 | | | | — | | | | 769,228,308 | |
| |
| |
| U.S. Mortgages | | | 1,473,078,810 | | | | 30,400,328 | | | | 1,493,722,467 | | | | 29,350,525 | |
| |
| |
In-kind transactions for the six months ended September 30, 2010, were as follows:
| | | | | | | | | |
| | | In-kind
| | | In-kind
| |
| Fund | | Purchases | | | Redemptions | |
| | |
| Emerging Markets Debt | | $ | 10,765,018 | | | $ | — | |
| |
| |
GOLDMAN SACHS SINGLE SECTOR FIXED INCOME FUNDS
7. TAX INFORMATION
As of the Funds’ most recent fiscal year end, March 31, 2010, the Funds’ capital loss carryforwards and certain timing differences, on a tax basis were as follows:
| | | | | | | | | | | | | | | | | | | | | |
| | | | | | | | | | | | Local
| | | | |
| | | Emerging
| | | | | | Investment
| | | Emerging
| | | | |
| | | Markets Debt | | | High Yield | | | Grade Credit | | | Markets Debt | | | U.S. Mortgages | |
| | |
Capital loss carryforward(1) | | | | | | | | | | | | | | | | | | | | |
| Expiring 2014 | | $ | — | | | $ | — | | | $ | (2,649,569 | ) | | $ | — | | | $ | — | |
| Expiring 2016 | | | — | | | | (846,548 | ) | | | (487,181 | ) | | | — | | | | — | |
| Expiring 2017 | | | (15,632,681 | ) | | | — | | | | (7,321,148 | ) | | | (1,699,339 | ) | | | — | |
| Expiring 2018 | | | (4,130,595 | ) | | | (207,311,126 | ) | | | (15,180,070 | ) | | | (3,693,914 | ) | | | (22,646,854 | ) |
| |
| |
| Total capital loss carryforward | | $ | (19,763,276 | ) | | $ | (208,157,674 | ) | | $ | (25,637,968 | ) | | $ | (5,393,253 | ) | | $ | (22,646,854 | ) |
| |
| |
| Timing differences (Post-October losses, Income Distribution and Straddle Losses) | | $ | (1,137,889 | ) | | $ | (18,030,901 | ) | | $ | (622,362 | ) | | $ | (6,881,982 | ) | | $ | (2,833,169 | ) |
| |
| |
| |
| (1) | Expiration occurs on March 31 of the year indicated. |
As of September 30, 2010, the Funds’ aggregate security unrealized gains and losses based on cost for U.S. federal income tax purposes were as follows:
| | | | | | | | | | | | | | | | | | | | | |
| | | | | | | | | | | | Local
| | | | |
| | | Emerging
| | | | | | Investment
| | | Emerging
| | | | |
| | | Markets Debt | | | High Yield | | | Grade Credit | | | Markets Debt | | | U.S. Mortgages | |
| | |
| Tax Cost | | $ | 575,919,847 | | | $ | 5,435,089,801 | | | $ | 670,222,478 | | | $ | 1,470,797,489 | | | $ | 572,445,624 | |
| |
| |
| Gross unrealized gain | | | 41,281,452 | | | | 478,377,376 | | | | 43,049,741 | | | | 82,087,986 | | | | 13,259,541 | |
| Gross unrealized loss | | | (4,798,836 | ) | | | (223,058,331 | ) | | | (1,191,081 | ) | | | (7,287,689 | ) | | | (5,373,031 | ) |
| |
| |
| Net unrealized security gain | | $ | 36,482,616 | | | $ | 255,319,045 | | | $ | 41,858,660 | | | $ | 74,800,297 | | | $ | 7,886,510 | |
| |
| |
The difference between GAAP-basis and tax-basis unrealized gains (losses), as of the most recent fiscal year end, is attributable primarily to wash sales, net mark-to-market gains (losses) on regulated futures contracts and foreign currency exchange contracts, and differences related to the tax treatment of swap transactions.
GSAM has reviewed the Funds’ tax positions for all open tax years (the current and prior three years, as applicable) and has concluded that no provision for income tax is required in the Funds’ financial statements. Such open tax years remain subject to examination and adjustment by tax authorities.
GOLDMAN SACHS SINGLE SECTOR FIXED INCOME FUNDS
Notes to Financial Statements (continued)
September 30, 2010 (Unaudited)
8. OTHER RISKS
Foreign Custody Risk — A Fund that invests in foreign securities may hold such securities and foreign currency with foreign banks, agents, and securities depositories (each a “Foreign Custodian”) appointed by the Fund’s custodian. Investments in emerging markets may be subject to greater custody risks than investments in more developed markets. Custody services in emerging market countries are often undeveloped and may be less regulated than in more developed countries, and thus may not afford the same level of investor protection as would apply in developed countries. In some countries, Foreign Custodians may be subject to little or no regulatory oversight or independent evaluation of their operations. Further, the laws of certain countries may place limitations on a Fund’s ability to recover its assets if a Foreign Custodian enters into bankruptcy.
Funds’ Shareholder Concentration Risk — Certain funds, accounts, individuals or Goldman Sachs affiliates may from time to time own (beneficially or of record) or control a significant percentage of the Funds’ shares. Redemptions by these funds, accounts or individuals of their holdings in the Funds may impact the Funds’ liquidity and NAV. These redemptions may also force the Funds to sell securities.
Market and Credit Risks — In the normal course of business, the Funds trade financial instruments and enter into financial transactions where risk of potential loss exists due to changes in the market (market risk). Additionally, the Funds may also be exposed to credit risk in the event that an issuer fails to perform or that an institution or entity with which the Funds have unsettled or open transaction defaults.
Investing in foreign markets may involve special risks and considerations not typically associated with investing in the U.S. These risks include revaluation of currencies, high rates of inflation, repatriation restrictions on income and capital, and adverse political and economic developments. Moreover, securities issued in these markets may be less liquid, be subject to government ownership controls, have delayed settlements and their prices may be more volatile than those of comparable securities in the U.S.
Portfolio Concentration Risk — As a result of certain of the Funds’ ability to invest a large percentage of their assets in obligations of issuers within the same country, state, industry or economic sector, an adverse economic, business or political development may affect the value of the Funds’ investments more than if their investments were not so concentrated.
9. INDEMNIFICATIONS
Under the Trust’s organizational documents, its trustees, officers, employees and agents are indemnified, to the extent permitted by the Act, against certain liabilities that may arise out of performance of their duties to the Funds. Additionally, in the course of business, the Funds enter into contracts that contain a variety of indemnification clauses. The Funds’ maximum exposure under these arrangements is unknown, as this would involve future claims that may be made against the Funds that have not yet occurred. However, GSAM believes the risk of loss under these arrangements to be remote.
GOLDMAN SACHS SINGLE SECTOR FIXED INCOME FUNDS
10. SUBSEQUENT EVENTS
Subsequent events after the balance sheet date have been evaluated through the date the financial statements were issued. Other than the item discussed below, GSAM has concluded that there is no impact requiring adjustment or disclosure in the financial statements.
Effective November 1, 2010, Goldman Sachs has agreed to waive in its entirety the account service fee for Class A Shares and Institutional Shares of the U.S. Mortgages and Investment Grade Credit Funds. Effective December 1, 2010, the Account Service Plan with respect to the Funds has been terminated, and the Funds will no longer charge an account service fee.
GOLDMAN SACHS SINGLE SECTOR FIXED INCOME FUNDS
Notes to Financial Statements (continued)
September 30, 2010 (Unaudited)
11. SUMMARY OF SHARE TRANSACTIONS
Share activity is as follows:
| | | | | | | | | | | | | | | | | |
| | | Emerging Markets Debt Fund | |
| | | | |
| | | For the Six Months Ended
| | | | |
| | | September 30, 2010
| | | For the Fiscal Year Ended
| |
| | | (Unaudited) | | | March 31, 2010 | |
| | |
| | | Shares | | | Dollars | | | Shares | | | Dollars | |
| | |
Class A Shares | | | | | | | | | | | | | | | | |
| Shares sold | | | 9,695,418 | | | $ | 119,697,114 | | | | 8,618,605 | | | $ | 98,385,699 | |
| Reinvestment of distributions | | | 240,723 | | | | 2,962,615 | | | | 384,457 | | | | 4,342,633 | |
Shares converted from Class B(a) | | | — | | | | — | | | | — | | | | — | |
| Shares redeemed | | | (3,260,595 | ) | | | (39,446,525 | ) | | | (4,661,057 | ) | | | (53,238,308 | ) |
| |
| |
| | | | 6,675,546 | | | | 83,213,204 | | | | 4,342,005 | | | | 49,490,024 | |
| |
| |
Class B Shares | | | | | | | | | | | | | | | | |
| Shares sold | | | — | | | | — | | | | — | | | | — | |
| Reinvestment of distributions | | | — | | | | — | | | | — | | | | — | |
Shares converted to Class A(a) | | | — | | | | — | | | | — | | | | — | |
| Shares redeemed | | | — | | | | — | | | | — | | | | — | |
| |
| |
| | | | — | | | | — | | | | — | | | | — | |
| |
| |
Class C Shares | | | | | | | | | | | | | | | | |
| Shares sold | | | 972,301 | | | | 12,064,094 | | | | 749,959 | | | | 8,603,028 | |
| Reinvestment of distributions | | | 16,008 | | | | 196,822 | | | | 18,245 | | | | 207,265 | |
| Shares redeemed | | | (109,302 | ) | | | (1,325,064 | ) | | | (62,587 | ) | | | (704,481 | ) |
| |
| |
| | | | 879,007 | | | | 10,935,852 | | | | 705,617 | | | | 8,105,812 | |
| |
| |
Institutional Shares | | | | | | | | | | | | | | | | |
| Shares sold | | | 10,753,246 | | | | 132,610,991 | | | | 15,587,034 | | | | 178,599,486 | |
| Shares sold in connection with in-kind | | | 960,393 | | | | 12,379,470 | | | | — | | | | — | |
| Reinvestment of distributions | | | 610,151 | | | | 7,500,565 | | | | 1,018,508 | | | | 11,505,612 | |
| Shares redeemed | | | (4,652,073 | ) | | | (56,404,519 | ) | | | (5,338,326 | ) | | | (58,273,995 | ) |
| |
| |
| | | | 7,671,717 | | | | 96,086,507 | | | | 11,267,216 | | | | 131,831,103 | |
| |
| |
Service Shares | | | | | | | | | | | | | | | | |
| Shares sold | | | — | | | | — | | | | — | | | | — | |
| Reinvestment of distributions | | | — | | | | — | | | | — | | | | — | |
| Shares redeemed | | | — | | | | — | | | | — | | | | — | |
| |
| |
| | | | — | | | | — | | | | — | | | | — | |
| |
| |
Separate Account Institutional Shares | | | | | | | | | | | | | | | | |
| Shares sold | | | — | | | | — | | | | — | | | | — | |
| Reinvestment of distributions | | | — | | | | — | | | | — | | | | — | |
| Shares redeemed | | | — | | | | — | | | | — | | | | — | |
| |
| |
| | | | — | | | | — | | | | — | | | | — | |
| |
| |
Class IR Shares(b) | | | | | | | | | | | | | | | | |
| Shares sold | | | 55,537 | | | | 706,263 | | | | — | | | | — | |
| Reinvestment of distributions | | | 158 | | | | 2,031 | | | | — | | | | — | |
| Shares redeemed | | | (92 | ) | | | (1,186 | ) | | | — | | | | — | |
| |
| |
| | | | 55,603 | | | | 707,108 | | | | — | | | | — | |
| |
| |
Class R Shares | | | | | | | | | | | | | | | | |
| Shares sold | | | — | | | | — | | | | — | | | | — | |
| Reinvestment of distributions | | | — | | | | — | | | | — | | | | — | |
| Shares redeemed | | | — | | | | — | | | | — | | | | — | |
| |
| |
| | | | — | | | | — | | | | — | | | | — | |
| |
| |
NET INCREASE (DECREASE) | | | 15,281,873 | | | $ | 190,942,671 | | | | 16,314,838 | | | $ | 189,426,939 | |
| |
| |
| |
| (a) | Class B Shares automatically convert into Class A Shares on or about the fifteenth day of the last month of the calendar quarter that is eight years after the initial purchase date of either the Fund or another Goldman Sachs Fund. |
| |
| (b) | Commenced operations on July 30, 2010 for Emerging Markets Debt Fund. |
GOLDMAN SACHS SINGLE SECTOR FIXED INCOME FUNDS
| | | | | | | | | | | | | | | | | | | | | | | | | | | | | | | | | |
| | | High Yield Fund | | | Investment Grade Credit Fund | |
| | |
| | | For the Six Months Ended
| | | | | | For the Six Months Ended
| | | | |
| | | September 30, 2010
| | | For the Fiscal Year Ended
| | | September 30, 2010
| | | For the Fiscal Year Ended
| |
| | | (Unaudited) | | | March 31, 2010 | | | (Unaudited) | | | March 31, 2010 | |
| | |
| | | Shares | | | Dollars | | | Shares | | | Dollars | | | Shares | | | Dollars | | | Shares | | | Dollars | |
| | |
| | | | | | | | | | | | | | | | | | | | | | | | | | | | | | | | | |
| | | | 24,912,486 | | | $ | 175,001,028 | | | | 142,882,419 | | | $ | 865,512,247 | | | | 5,248,133 | | | $ | 49,070,758 | | | | 19,848,557 | | | $ | 170,241,994 | |
| | | | 6,125,321 | | | | 43,055,733 | | | | 15,126,588 | | | | 97,524,702 | | | | 282,434 | | | | 2,658,499 | | | | 539,148 | | | | 4,788,534 | |
| | | | 360,552 | | | | 2,489,541 | | | | 481,240 | | | | 3,190,205 | | | | — | | | | — | | | | — | | | | — | |
| | | | (100,244,496 | ) | | | (708,223,046 | ) | | | (285,011,387 | ) | | | (1,738,175,872 | ) | | | (2,964,187 | ) | | | (27,898,887 | ) | | | (8,897,619 | ) | | | (79,236,789 | ) |
| |
| |
| | | | (68,846,137 | ) | | | (487,676,744 | ) | | | (126,521,140 | ) | | | (771,948,718 | ) | | | 2,566,380 | | | | 23,830,370 | | | | 11,490,086 | | | | 95,793,739 | |
| |
| |
| | | | | | | | | | | | | | | | | | | | | | | | | | | | | | | | | |
| | | | 165,441 | | | | 1,172,112 | | | | 1,127,340 | | | | 6,988,801 | | | | — | | | | — | | | | — | | | | — | |
| | | | 224,514 | | | | 1,582,555 | | | | 587,849 | | | | 3,838,421 | | | | — | | | | — | | | | — | | | | — | |
| | | | (359,932 | ) | | | (2,489,541 | ) | | | (480,305 | ) | | | (3,190,205 | ) | | | — | | | | — | | | | — | | | | — | |
| | | | (1,286,611 | ) | | | (9,072,047 | ) | | | (3,009,576 | ) | | | (19,796,341 | ) | | | — | | | | — | | | | — | | | | — | |
| |
| |
| | | | (1,256,588 | ) | | | (8,806,921 | ) | | | (1,774,692 | ) | | | (12,159,324 | ) | | | — | | | | — | | | | — | | | | — | |
| |
| |
| | | | | | | | | | | | | | | | | | | | | | | | | | | | | | | | | |
| | | | 1,560,201 | | | | 11,021,739 | | | | 5,057,306 | | | | 32,040,900 | | | | — | | | | — | | | | — | | | | — | |
| | | | 380,911 | | | | 2,683,133 | | | | 792,644 | | | | 5,208,358 | | | | — | | | | — | | | | — | | | | — | |
| | | | (2,275,735 | ) | | | (16,005,003 | ) | | | (4,373,148 | ) | | | (28,712,649 | ) | | | — | | | | — | | | | — | | | | — | |
| |
| |
| | | | (334,623 | ) | | | (2,300,131 | ) | | | 1,476,802 | | | | 8,536,609 | | | | — | | | | — | | | | — | | | | — | |
| |
| |
| | | | | | | | | | | | | | | | | | | | | | | | | | | | | | | | | |
| | | | 121,718,500 | | | | 860,406,334 | | | | 534,463,809 | | | | 3,348,636,456 | | | | 3,914,857 | | | | 36,924,737 | | | | 21,476,553 | | | | 186,939,287 | |
| | | | — | | | | — | | | | — | | | | — | | | | — | | | | — | | | | — | | | | — | |
| | | | 14,483,212 | | | | 102,180,241 | | | | 30,678,475 | | | | 202,626,967 | | | | 282,455 | | | | 2,658,696 | | | | 427,664 | | | | 3,841,591 | |
| | | | (146,260,566 | ) | | | (1,023,287,758 | ) | | | (291,089,767 | ) | | | (1,903,289,316 | ) | | | (2,951,149 | ) | | | (27,459,360 | ) | | | (4,009,458 | ) | | | (36,184,467 | ) |
| |
| |
| | | | (10,058,854 | ) | | | (60,701,183 | ) | | | 274,052,517 | | | | 1,647,974,107 | | | | 1,246,163 | | | | 12,124,073 | | | | 17,894,759 | | | | 154,596,411 | |
| |
| |
| | | | | | | | | | | | | | | | | | | | | | | | | | | | | | | | | |
| | | | 391,605 | | | | 2,755,039 | | | | 1,599,229 | | | | 10,167,040 | | | | — | | | | — | | | | — | | | | — | |
| | | | 96,068 | | | | 675,453 | | | | 198,137 | | | | 1,299,910 | | | | — | | | | — | | | | — | | | | — | |
| | | | (725,256 | ) | | | (5,074,272 | ) | | | (1,025,800 | ) | | | (6,740,569 | ) | | | — | | | | — | | | | — | | | | — | |
| |
| |
| | | | (237,583 | ) | | | (1,643,780 | ) | | | 771,566 | | | | 4,726,381 | | | | — | | | | — | | | | — | | | | — | |
| |
| |
| | | | | | | | | | | | | | | | | | | | | | | | | | | | | | | | | |
| | | | — | | | | — | | | | — | | | | — | | | | 2,264,427 | | | | 20,842,059 | | | | 14,180,545 | | | | 124,005,622 | |
| | | | — | | | | — | | | | — | | | | — | | | | 562,594 | | | | 5,294,672 | | | | 1,077,010 | | | | 9,503,000 | |
| | | | — | | | | — | | | | — | | | | — | | | | (2,279,622 | ) | | | (21,396,933 | ) | | | (7,488,550 | ) | | | (63,918,200 | ) |
| |
| |
| | | | — | | | | — | | | | — | | | | — | | | | 547,399 | | | | 4,739,798 | | | | 7,769,005 | | | | 69,590,422 | |
| |
| |
| | | | | | | | | | | | | | | | | | | | | | | | | | | | | | | | | |
| | | | 111,411 | | | | 785,637 | | | | 108,497 | | | | 748,462 | | | | — | | | | — | | | | — | | | | — | |
| | | | 5,546 | | | | 39,110 | | | | 2,791 | | | | 19,370 | | | | — | | | | — | | | | — | | | | — | |
| | | | (14,034 | ) | | | (98,318 | ) | | | (1,688 | ) | | | (11,735 | ) | | | — | | | | — | | | | — | | | | — | |
| |
| |
| | | | 102,923 | | | | 726,429 | | | | 109,600 | | | | 756,097 | | | | — | | | | — | | | | — | | | | — | |
| |
| |
| | | | | | | | | | | | | | | | | | | | | | | | | | | | | | | | | |
| | | | 702,888 | | | | 4,929,884 | | | | 762,062 | | | | 5,265,521 | | | | — | | | | — | | | | — | | | | — | |
| | | | 40,935 | | | | 288,189 | | | | 13,621 | | | | 93,328 | | | | — | | | | — | | | | — | | | | — | |
| | | | (135,940 | ) | | | (950,504 | ) | | | (46,347 | ) | | | (322,602 | ) | | | — | | | | — | | | | — | | | | — | |
| |
| |
| | | | 607,883 | | | | 4,267,569 | | | | 729,336 | | | | 5,036,247 | | | | — | | | | — | | | | — | | | | — | |
| |
| |
| | | | (80,022,979 | ) | | $ | (556,134,761 | ) | | | 148,843,989 | | | $ | 882,921,399 | | | | 4,359,942 | | | $ | 40,694,241 | | | | 37,153,850 | | | $ | 319,980,572 | |
| |
| |
GOLDMAN SACHS SINGLE SECTOR FIXED INCOME FUNDS
Notes to Financial Statements (continued)
September 30, 2010 (Unaudited)
11. SUMMARY OF SHARE TRANSACTIONS (continued)
Share activity is as follows:
| | | | | | | | | | | | | | | | | |
| | | Local Emerging Markets Debt Fund | |
| | | | |
| | | For the Six Months Ended
| | | | |
| | | September 30, 2010
| | | For the Fiscal Year Ended
| |
| | | (Unaudited) | | | March 31, 2010 | |
| | |
| | | Shares | | | Dollars | | | Shares | | | Dollars | |
| | |
Class A Shares | | | | | | | | | | | | | | | | |
| Shares sold | | | 54,980,387 | | | $ | 515,726,994 | | | | 44,392,803 | | | $ | 399,811,004 | |
| Reinvestment of distributions | | | 1,604,988 | | | | 14,966,889 | | | | 455,072 | | | | 4,087,953 | |
| Shares redeemed | | | (11,816,933 | ) | | | (111,415,846 | ) | | | (2,627,149 | ) | | | (23,005,413 | ) |
| |
| |
| | | | 44,768,442 | | | | 419,278,037 | | | | 42,220,726 | | | | 380,893,544 | |
| |
| |
Class C Shares | | | | | | | | | | | | | | | | |
| Shares sold | | | 492,567 | | | | 4,669,333 | | | | 129,335 | | | | 1,156,792 | |
| Reinvestment of distributions | | | 4,802 | | | | 45,319 | | | | 997 | | | | 8,929 | |
| Shares redeemed | | | (18,625 | ) | | | (175,970 | ) | | | (34,069 | ) | | | (311,162 | ) |
| |
| |
| | | | 478,744 | | | | 4,538,682 | | | | 96,263 | | | | 854,559 | |
| |
| |
Institutional Shares | | | | | | | | | | | | | | | | |
| Shares sold | | | 40,487,472 | | | | 379,813,332 | | | | 31,002,693 | | | | 276,765,468 | |
| Reinvestment of distributions | | | 1,387,015 | | | | 12,935,643 | | | | 932,810 | | | | 8,208,847 | |
| Shares redeemed | | | (4,373,966 | ) | | | (40,178,881 | ) | | | (4,911,782 | ) | | | (41,519,209 | ) |
| |
| |
| | | | 37,500,521 | | | | 352,570,094 | | | | 27,023,721 | | | | 243,455,106 | |
| |
| |
Separate Account Institutional Shares | | | | | | | | | | | | | | | | |
| Shares sold | | | — | | | | — | | | | — | | | | — | |
| Reinvestment of distributions | | | — | | | | — | | | | — | | | | — | |
| Shares redeemed | | | — | | | | — | | | | — | | | | — | |
| |
| |
| | | | — | | | | — | | | | — | | | | — | |
| |
| |
Class IR Shares(a) | | | | | | | | | | | | | | | | |
| Shares sold | | | 156,008 | | | | 1,499,368 | | | | — | | | | — | |
| Reinvestment of distributions | | | 319 | | | | 3,152 | | | | — | | | | — | |
| Shares redeemed | | | (3,186 | ) | | | (31,135 | ) | | | — | | | | — | |
| |
| |
| | | | 153,141 | | | | 1,471,385 | | | | — | | | | — | |
| |
| |
NET INCREASE (DECREASE) | | | 82,900,848 | | | $ | 777,858,198 | | | | 69,340,710 | | | $ | 625,203,209 | |
| |
| |
| |
| (a) | Commenced operations on July 30, 2010 for Local Emerging Markets Debt Fund. |
GOLDMAN SACHS SINGLE SECTOR FIXED INCOME FUNDS
| | | | | | | | | | | | | | | | | |
| | | U.S. Mortgages Fund | |
| | |
| | | For the Six Months Ended
| | | | |
| | | September 30, 2010
| | | For the Fiscal Year Ended
| |
| | | (Unaudited) | | | March 31, 2010 | |
| | |
| | | Shares | | | Dollars | | | Shares | | | Dollars | |
| | |
| | | | | | | | | | | | | | | | | |
| | | | 41,077 | | | $ | 418,481 | | | | 1,709,998 | | | $ | 16,630,699 | |
| | | | 11,243 | | | | 113,936 | | | | 32,234 | | | | 315,157 | |
| | | | (617,799 | ) | | | (6,274,240 | ) | | | (854,000 | ) | | | (8,360,524 | ) |
| |
| |
| | | | (565,479 | ) | | | (5,741,823 | ) | | | 888,232 | | | | 8,585,332 | |
| |
| |
| | | | | | | | | | | | | | | | | |
| | | | — | | | | — | | | | — | | | | — | |
| | | | — | | | | — | | | | — | | | | — | |
| | | | — | | | | — | | | | — | | | | — | |
| |
| |
| | | | — | | | | — | | | | — | | | | — | |
| |
| |
| | | | | | | | | | | | | | | | | |
| | | | 545,884 | | | | 5,555,954 | | | | 2,906,853 | | | | 28,139,990 | |
| | | | 74,237 | | | | 754,815 | | | | 199,389 | | | | 1,941,281 | |
| | | | (1,231,400 | ) | | | (12,486,317 | ) | | | (6,460,725 | ) | | | (63,856,712 | ) |
| |
| |
| | | | (611,279 | ) | | | (6,175,548 | ) | | | (3,354,483 | ) | | | (33,775,441 | ) |
| |
| |
| | | | | | | | | | | | | | | | | |
| | | | 1,963,802 | | | | 19,825,540 | | | | 10,407,678 | | | | 101,360,695 | |
| | | | 438,184 | | | | 4,451,037 | | | | 1,215,749 | | | | 11,800,372 | |
| | | | (3,148,711 | ) | | | (31,884,655 | ) | | | (21,173,737 | ) | | | (202,633,648 | ) |
| |
| |
| | | | (746,725 | ) | | | (7,608,078 | ) | | | (9,550,310 | ) | | | (89,472,581 | ) |
| |
| |
| | | | | | | | | | | | | | | | | |
| | | | — | | | | — | | | | — | | | | — | |
| | | | — | | | | — | | | | — | | | | — | |
| | | | — | | | | — | | | | — | | | | — | |
| |
| |
| | | | — | | | | — | | | | — | | | | — | |
| |
| |
| | | | (1,923,483 | ) | | $ | (19,525,449 | ) | | | (12,016,561 | ) | | $ | (114,662,690 | ) |
| |
| |
GOLDMAN SACHS EMERGING MARKETS DEBT FUND
Financial Highlights
Selected Data for a Share Outstanding Throughout Each Period
| | | | | | | | | | | | | | | | | | | | | | | | | | | | | | | | | |
| | | | | | | | Income (loss) from
| | | Distributions
| | | |
| | | | | Net asset
| | | investment operations | | | to shareholders | | | |
| | | | | value,
| | | Net
| | | Net realized
| | | Total from
| | | From net
| | | From net
| | | | | | |
| | | | | beginning
| | | investment
| | | and unrealized
| | | investment
| | | investment
| | | realized
| | | Total
| | | |
| | | Year - Share Class | | of period | | | income(a) | | | gain (loss) | | | operations | | | income | | | gains | | | distributions | | | |
| |
| FOR THE SIX MONTHS ENDED SEPTEMBER 30, (UNAUDITED) |
| | | | | | | | | | | | | | | | | | | | | | | | | | | | | | | | | |
| | | | | | | | | | | | | | | | | | | | | | | | | | | | | | | | | |
| | | 2010 - A | | $ | 11.99 | | | $ | 0.30 | | | $ | 0.90 | | | $ | 1.20 | | | $ | (0.32 | ) | | $ | — | | | $ | (0.32 | ) | | |
| | | 2010 - C | | | 11.98 | | | | 0.25 | | | | 0.90 | | | | 1.15 | | | | (0.27 | ) | | | — | | | | (0.27 | ) | | |
| | | 2010 - Institutional | | | 12.00 | | | | 0.32 | | | | 0.91 | | | | 1.23 | | | | (0.34 | ) | | | — | | | | (0.34 | ) | | |
| | | 2010 - IR (Commenced July 30, 2010) | | | 12.44 | | | | 0.09 | | | | 0.46 | | | | 0.55 | | | | (0.10 | ) | | | — | | | | (0.10 | ) | | |
| | | | | | | | | | | | | | | | | | | | | | | | | | | | | | | | | |
| | | | | | | | | | | | | | | | | | | | | | | | | | | | | | | | | |
| FOR THE FISCAL YEARS ENDED MARCH 31, |
| | | | | | | | | | | | | | | | | | | | | | | | | | | | | | | | | |
| | | | | | | | | | | | | | | | | | | | | | | | | | | | | | | | | |
| | | 2010 - A | | | 9.19 | | | | 0.70 | | | | 2.96 | | | | 3.66 | | | | (0.86 | ) | | | — | | | | (0.86 | ) | | |
| | | 2010 - C | | | 9.16 | | | | 0.61 | | | | 2.99 | | | | 3.60 | | | | (0.78 | ) | | | — | | | | (0.78 | ) | | |
| | | 2010 - Institutional | | | 9.20 | | | | 0.74 | | | | 2.96 | | | | 3.70 | | | | (0.90 | ) | | | — | | | | (0.90 | ) | | |
| | | | | | | | | | | | | | | | | | | | | | | | | | | | | | | | | |
| | | | | | | | | | | | | | | | | | | | | | | | | | | | | | | | | |
| | | |
| | | |
| | | 2009 - A | | | 11.63 | | | | 0.68 | | | | (2.50 | ) | | | (1.82 | ) | | | (0.57 | ) | | | (0.05 | ) | | | (0.62 | ) | | |
| | | 2009 - C | | | 11.60 | | | | 0.60 | | | | (2.50 | ) | | | (1.90 | ) | | | (0.49 | ) | | | (0.05 | ) | | | (0.54 | ) | | |
| | | 2009 - Institutional | | | 11.63 | | | | 0.72 | | | | (2.50 | ) | | | (1.78 | ) | | | (0.60 | ) | | | (0.05 | ) | | | (0.65 | ) | | |
| | | | | | | | | | | | | | | | | | | | | | | | | | | | | | | | | |
| | | | | | | | | | | | | | | | | | | | | | | | | | | | | | | | | |
| FOR THE PERIOD NOVEMBER 1, 2007 TO MARCH 31, 2008* |
| | | | | | | | | | | | | | | | | | | | | | | | | | | | | | | | | |
| | | | | | | | | | | | | | | | | | | | | | | | | | | | | | | | | |
| | | 2008 - A | | | 12.16 | | | | 0.30 | | | | (0.37 | ) | | | (0.07 | ) | | | (0.31 | ) | | | (0.15 | ) | | | (0.46 | ) | | |
| | | 2008 - C | | | 12.14 | | | | 0.25 | | | | (0.36 | ) | | | (0.11 | ) | | | (0.28 | ) | | | (0.15 | ) | | | (0.43 | ) | | |
| | | 2008 - Institutional | | | 12.17 | | | | 0.32 | | | | (0.38 | ) | | | (0.06 | ) | | | (0.33 | ) | | | (0.15 | ) | | | (0.48 | ) | | |
| | | | | | | | | | | | | | | | | | | | | | | | | | | | | | | | | |
| | | | | | | | | | | | | | | | | | | | | | | | | | | | | | | | | |
| FOR THE FISCAL YEARS ENDED OCTOBER 31, |
| | | | | | | | | | | | | | | | | | | | | | | | | | | | | | | | | |
| | | | | | | | | | | | | | | | | | | | | | | | | | | | | | | | | |
| | | 2007 - A | | | 11.98 | | | | 0.63 | | | | 0.38 | | | | 1.01 | | | | (0.62 | ) | | | (0.21 | ) | | | (0.83 | ) | | |
| | | 2007 - C | | | 11.97 | | | | 0.53 | | | | 0.38 | | | | 0.91 | | | | (0.53 | ) | | | (0.21 | ) | | | (0.74 | ) | | |
| | | 2007 - Institutional | | | 11.99 | | | | 0.67 | | | | 0.39 | | | | 1.06 | | | | (0.67 | ) | | | (0.21 | ) | | | (0.88 | ) | | |
| | | | | | | | | | | | | | | | | | | | | | | | | | | | | | | | | |
| | | | | | | | | | | | | | | | | | | | | | | | | | | | | | | | | |
| | | |
| | | |
| | | 2006 - A | | | 11.75 | | | | 0.60 | | | | 0.69 | | | | 1.29 | | | | (0.65 | ) | | | (0.41 | ) | | | (1.06 | ) | | |
| | | 2006 - C (Commenced September 26, 2006) | | | 11.78 | | | | 0.01 | | | | 0.22 | | | | 0.23 | | | | (0.04 | ) | | | — | | | | (0.04 | ) | | |
| | | 2006 - Institutional | | | 11.76 | | | | 0.64 | | | | 0.69 | | | | 1.33 | | | | (0.69 | ) | | | (0.41 | ) | | | (1.10 | ) | | |
| | | | | | | | | | | | | | | | | | | | | | | | | | | | | | | | | |
| | | | | | | | | | | | | | | | | | | | | | | | | | | | | | | | | |
| | | |
| | | |
| | | 2005 - A | | | 11.18 | | | | 0.74 | | | | 1.00 | | | | 1.74 | | | | (0.64 | ) | | | (0.53 | ) | | | (1.17 | ) | | |
| | | 2005 - Institutional | | | 11.19 | | | | 0.77 | | | | 1.02 | | | | 1.79 | | | | (0.69 | ) | | | (0.53 | ) | | | (1.22 | ) | | |
| | | | | | | | | | | | | | | | | | | | | | | | | | | | | | | | | |
| | | | | | | | | | | | | | | | | | | | | | | | | | | | | | | | | |
| | | |
| | | |
| | | | | | | | | | | | | | | | | | | | | | | | | | | | | | | | | |
| | | | | | | | | | | | | | | | | | | | | | | | | | | | | | | | | |
| |
| * | The Fund changed its fiscal year end from October 31 to March 31. |
| |
| (a) | Calculated based on the average shares outstanding methodology. |
| |
| (b) | Assumes investment at the net asset value at the beginning of the period, reinvestment of all dividends and distributions, a complete redemption of the investment at the net asset value at the end of the period and no sales or redemption charges. Total returns would be reduced if a sales or redemption charge was taken into account. Returns do not reflect the deduction of taxes that a shareholder would pay on Fund distributions or the redemption of Fund shares. Total returns for periods less than one full year are not annualized. |
| |
| (d) | Portfolio turnover rates exclude portfolio securities received as a result of in-kind subscriptions. |
The accompanying notes are an integral part of these financial statements.
GOLDMAN SACHS EMERGING MARKETS DEBT FUND
| | | | | | | | | | | | | | | | | | | | | | | | | | | | | | | |
| | | | | | | | | | | | | | | | | | Ratio of
| | | | | | |
| | | | | | | | | Net assets,
| | | Ratio of
| | | Ratio of
| | | net investment
| | | | | | |
| | | Net asset
| | | | | | end of
| | | net expenses
| | | total expenses
| | | income
| | | Portfolio
| | | |
| | | value, end
| | | Total
| | | period
| | | to average
| | | to average
| | | to average
| | | turnover
| | | |
| | | of period | | | return(b) | | | (in 000s) | | | net assets | | | net assets | | | net assets | | | rate | | | |
| |
| |
| | | | | | | | | | | | | | | | | | | | | | | | | | | | | | | |
| | | | | | | | | | | | | | | | | | | | | | | | | | | | | | | |
| | | $ | 12.87 | | | | 10.15 | % | | $ | 199,021 | | | | 1.22 | %(c) | | | 1.31 | %(c) | | | 4.84 | %(c) | | | 49 | %(d) | | |
| | | | 12.86 | | | | 9.66 | | | | 22,716 | | | | 1.97 | (c) | | | 2.06 | (c) | | | 4.07 | (c) | | | 49 | (d) | | |
| | | | 12.89 | | | | 10.33 | | | | 397,276 | | | | 0.88 | (c) | | | 0.97 | (c) | | | 5.22 | (c) | | | 49 | (d) | | |
| | | | 12.89 | | | | 4.44 | | | | 717 | | | | 0.97 | (c) | | | 1.24 | (c) | | | 4.20 | (c) | | | 49 | (d) | | |
| | | | | | | | | | | | | | | | | | | | | | | | | | | | | | | |
| | | | | | | | | | | | | | | | | | | | | | | | | | | | | | | |
| |
| | | | | | | | | | | | | | | | | | | | | | | | | | | | | | | |
| | | | | | | | | | | | | | | | | | | | | | | | | | | | | | | |
| | | | 11.99 | | | | 40.98 | | | | 105,352 | | | | 1.22 | | | | 1.31 | | | | 6.27 | | | | 121 | | | |
| | | | 11.98 | | | | 40.28 | | | | 10,629 | | | | 1.97 | | | | 2.06 | | | | 5.41 | | | | 121 | | | |
| | | | 12.00 | | | | 41.42 | | | | 278,030 | | | | 0.88 | | | | 0.97 | | | | 6.63 | | | | 121 | | | |
| | | | | | | | | | | | | | | | | | | | | | | | | | | | | | | |
| | | | | | | | | | | | | | | | | | | | | | | | | | | | | | | |
| |
| |
| | | | 9.19 | | | | (15.89 | ) | | | 40,814 | | | | 1.22 | | | | 1.44 | | | | 6.58 | | | | 132 | | | |
| | | | 9.16 | | | | (16.57 | ) | | | 1,661 | | | | 1.97 | | | | 2.19 | | | | 5.97 | | | | 132 | | | |
| | | | 9.20 | | | | (15.59 | ) | | | 109,375 | | | | 0.88 | | | | 1.10 | | | | 7.03 | | | | 132 | | | |
| | | | | | | | | | | | | | | | | | | | | | | | | | | | | | | |
| | | | | | | | | | | | | | | | | | | | | | | | | | | | | | | |
| |
| | | | | | | | | | | | | | | | | | | | | | | | | | | | | | | |
| | | | | | | | | | | | | | | | | | | | | | | | | | | | | | | |
| | | | 11.63 | | | | (0.51 | ) | | | 87,818 | | | | 1.21 | (c) | | | 1.36 | (c) | | | 6.03 | (c) | | | 41 | | | |
| | | | 11.60 | | | | (0.82 | ) | | | 1,890 | | | | 1.96 | (c) | | | 2.11 | (c) | | | 5.20 | (c) | | | 41 | | | |
| | | | 11.63 | | | | (0.37 | ) | | | 145,067 | | | | 0.87 | (c) | | | 1.02 | (c) | | | 6.51 | (c) | | | 41 | | | |
| | | | | | | | | | | | | | | | | | | | | | | | | | | | | | | |
| | | | | | | | | | | | | | | | | | | | | | | | | | | | | | | |
| |
| | | | | | | | | | | | | | | | | | | | | | | | | | | | | | | |
| | | | | | | | | | | | | | | | | | | | | | | | | | | | | | | |
| | | | 12.16 | | | | 8.86 | | | | 84,661 | | | | 1.23 | | | | 1.38 | | | | 5.23 | | | | 81 | | | |
| | | | 12.14 | | | | 7.80 | | | | 995 | | | | 1.98 | | | | 2.13 | | | | 4.64 | | | | 81 | | | |
| | | | 12.17 | | | | 9.25 | | | | 188,311 | | | | 0.87 | | | | 1.02 | | | | 5.68 | | | | 81 | | | |
| | | | | | | | | | | | | | | | | | | | | | | | | | | | | | | |
| | | | | | | | | | | | | | | | | | | | | | | | | | | | | | | |
| |
| |
| | | | 11.98 | | | | 11.63 | | | | 69,302 | | | | 1.23 | | | | 1.53 | | | | 5.17 | | | | 167 | | | |
| | | | 11.97 | | | | 1.98 | | | | 1 | | | | 1.71 | (c) | | | 1.75 | (c) | | | 1.36 | (c) | | | 167 | | | |
| | | | 11.99 | | | | 11.93 | | | | 85,073 | | | | 0.86 | | | | 1.16 | | | | 5.51 | | | | 167 | | | |
| | | | | | | | | | | | | | | | | | | | | | | | | | | | | | | |
| | | | | | | | | | | | | | | | | | | | | | | | | | | | | | | |
| |
| |
| | | | 11.75 | | | | 16.48 | | | | 34,327 | | | | 1.26 | | | | 1.82 | | | | 6.13 | | | | 207 | | | |
| | | | 11.76 | | | | 17.01 | | | | 40,962 | | | | 0.88 | | | | 1.52 | | | | 6.58 | | | | 207 | | | |
| | | | | | | | | | | | | | | | | | | | | | | | | | | | | | | |
| | | | | | | | | | | | | | | | | | | | | | | | | | | | | | | |
| |
| |
The accompanying notes are an integral part of these financial statements.
GOLDMAN SACHS HIGH YIELD FUND
Financial Highlights
Selected Data for a Share Outstanding Throughout Each Period
| | | | | | | | | | | | | | | | | | | | | | | | | |
| | | | | | | | Income (loss) from
| | | Distributions
| | | |
| | | | | Net asset
| | | investment operations | | | to shareholders
| | | |
| | | | | value,
| | | Net
| | | Net realized
| | | Total from
| | | from net
| | | |
| | | | | beginning
| | | investment
| | | and unrealized
| | | investment
| | | investment
| | | |
| | | Year - Share Class | | of period | | | income(a) | | | gain (loss) | | | operations | | | income | | | |
| |
| FOR THE SIX MONTHS ENDED SEPTEMBER 30, (UNAUDITED) |
| | | | | | | | | | | | | | | | | | | | | | | | | |
| | | | | | | | | | | | | | | | | | | | | | | | | |
| | | 2010 - A | | $ | 7.07 | | | $ | 0.27 | | | $ | 0.10 | | | $ | 0.37 | | | $ | (0.27 | ) | | |
| | | 2010 - B | | | 7.08 | | | | 0.25 | | | | 0.09 | | | | 0.34 | | | | (0.24 | ) | | |
| | | 2010 - C | | | 7.08 | | | | 0.25 | | | | 0.09 | | | | 0.34 | | | | (0.24 | ) | | |
| | | 2010 - Institutional | | | 7.09 | | | | 0.28 | | | | 0.10 | | | | 0.38 | | | | (0.28 | ) | | |
| | | 2010 - Service | | | 7.06 | | | | 0.27 | | | | 0.10 | | | | 0.37 | | | | (0.26 | ) | | |
| | | 2010 - IR | | | 7.07 | | | | 0.28 | | | | 0.11 | | | | 0.39 | | | | (0.28 | ) | | |
| | | 2010 - R | | | 7.07 | | | | 0.26 | | | | 0.10 | | | | 0.36 | | | | (0.26 | ) | | |
| | | | | | | | | | | | | | | | | | | | | | | | | |
| | | | | | | | | | | | | | | | | | | | | | | | | |
| FOR THE FISCAL YEARS ENDED MARCH 31, |
| | | | | | | | | | | | | | | | | | | | | | | | | |
| | | | | | | | | | | | | | | | | | | | | | | | | |
| | | 2010 - A | | | 5.18 | | | | 0.53 | | | | 1.90 | | | | 2.43 | | | | (0.54 | ) | | |
| | | 2010 - B | | | 5.18 | | | | 0.49 | | | | 1.90 | | | | 2.39 | | | | (0.49 | ) | | |
| | | 2010 - C | | | 5.18 | | | | 0.49 | | | | 1.90 | | | | 2.39 | | | | (0.49 | ) | | |
| | | 2010 - Institutional | | | 5.19 | | | | 0.56 | | | | 1.91 | | | | 2.47 | | | | (0.57 | ) | | |
| | | 2010 - Service | | | 5.17 | | | | 0.53 | | | | 1.89 | | | | 2.42 | | | | (0.53 | ) | | |
| | | 2010 - IR | | | 5.18 | | | | 0.55 | | | | 1.90 | | | | 2.45 | | | | (0.56 | ) | | |
| | | 2010 - R | | | 5.17 | | | | 0.52 | | | | 1.91 | | | | 2.43 | | | | (0.53 | ) | | |
| | | | | | | | | | | | | | | | | | | | | | | | | |
| | | | | | | | | | | | | | | | | | | | | | | | | |
| | | |
| | | |
| | | 2009 - A | | | 7.12 | | | | 0.55 | | | | (1.92 | ) | | | (1.37 | ) | | | (0.57 | ) | | |
| | | 2009 - B | | | 7.13 | | | | 0.51 | | | | (1.94 | ) | | | (1.43 | ) | | | (0.52 | ) | | |
| | | 2009 - C | | | 7.12 | | | | 0.51 | | | | (1.93 | ) | | | (1.42 | ) | | | (0.52 | ) | | |
| | | 2009 - Institutional | | | 7.13 | | | | 0.57 | | | | (1.92 | ) | | | (1.35 | ) | | | (0.59 | ) | | |
| | | 2009 - Service | | | 7.12 | | | | 0.54 | | | | (1.93 | ) | | | (1.39 | ) | | | (0.56 | ) | | |
| | | 2009 - IR | | | 7.12 | | | | 0.57 | | | | (1.93 | ) | | | (1.36 | ) | | | (0.58 | ) | | |
| | | 2009 - R | | | 7.12 | | | | 0.53 | | | | (1.93 | ) | | | (1.40 | ) | | | (0.55 | ) | | |
| | | | | | | | | | | | | | | | | | | | | | | | | |
| | | | | | | | | | | | | | | | | | | | | | | | | |
| FOR THE PERIOD NOVEMBER 1, 2007 TO MARCH 31, 2008* |
| | | | | | | | | | | | | | | | | | | | | | | | | |
| | | | | | | | | | | | | | | | | | | | | | | | | |
| | | 2008 - A | | | 7.93 | | | | 0.24 | | | | (0.78 | ) | | | (0.54 | ) | | | (0.27 | ) | | |
| | | 2008 - B | | | 7.94 | | | | 0.22 | | | | (0.79 | ) | | | (0.57 | ) | | | (0.24 | ) | | |
| | | 2008 - C | | | 7.93 | | | | 0.22 | | | | (0.79 | ) | | | (0.57 | ) | | | (0.24 | ) | | |
| | | 2008 - Institutional | | | 7.94 | | | | 0.25 | | | | (0.78 | ) | | | (0.53 | ) | | | (0.28 | ) | | |
| | | 2008 - Service | | | 7.92 | | | | 0.24 | | | | (0.78 | ) | | | (0.54 | ) | | | (0.26 | ) | | |
| | | 2008 - IR (Commenced November 30, 2007) | | | 7.68 | | | | 0.20 | | | | (0.54 | ) | | | (0.34 | ) | | | (0.22 | ) | | |
| | | 2008 - R (Commenced November 30, 2007) | | | 7.68 | | | | 0.19 | | | | (0.54 | ) | | | (0.35 | ) | | | (0.21 | ) | | |
| | | | | | | | | | | | | | | | | | | | | | | | | |
| | | | | | | | | | | | | | | | | | | | | | | | | |
| FOR THE FISCAL YEARS ENDED OCTOBER 31, |
| | | | | | | | | | | | | | | | | | | | | | | | | |
| | | | | | | | | | | | | | | | | | | | | | | | | |
| | | 2007 - A | | | 8.04 | | | | 0.60 | | | | (0.10 | ) | | | 0.50 | | | | (0.61 | ) | | |
| | | 2007 - B | | | 8.05 | | | | 0.54 | | | | (0.10 | ) | | | 0.44 | | | | (0.55 | ) | | |
| | | 2007 - C | | | 8.04 | | | | 0.54 | | | | (0.10 | ) | | | 0.44 | | | | (0.55 | ) | | |
| | | 2007 - Institutional | | | 8.05 | | | | 0.63 | | | | (0.10 | ) | | | 0.53 | | | | (0.64 | ) | | |
| | | 2007 - Service | | | 8.03 | | | | 0.59 | | | | (0.10 | ) | | | 0.49 | | | | (0.60 | ) | | |
| | | | | | | | | | | | | | | | | | | | | | | | | |
| | | | | | | | | | | | | | | | | | | | | | | | | |
| | | |
| | | |
| | | 2006 - A | | | 7.81 | | | | 0.58 | | | | 0.23 | | | | 0.81 | | | | (0.58 | ) | | |
| | | 2006 - B | | | 7.82 | | | | 0.53 | | | | 0.22 | | | | 0.75 | | | | (0.52 | ) | | |
| | | 2006 - C | | | 7.81 | | | | 0.53 | | | | 0.22 | | | | 0.75 | | | | (0.52 | ) | | |
| | | 2006 - Institutional | | | 7.82 | | | | 0.61 | | | | 0.23 | | | | 0.84 | | | | (0.61 | ) | | |
| | | 2006 - Service | | | 7.80 | | | | 0.57 | | | | 0.23 | | | | 0.80 | | | | (0.57 | ) | | |
| | | | | | | | | | | | | | | | | | | | | | | | | |
| | | | | | | | | | | | | | | | | | | | | | | | | |
| | | |
| | | |
| | | 2005 - A | | | 8.08 | | | | 0.62 | | | | (0.22 | ) | | | 0.40 | | | | (0.67 | ) | | |
| | | 2005 - B | | | 8.09 | | | | 0.56 | | | | (0.22 | ) | | | 0.34 | | | | (0.61 | ) | | |
| | | 2005 - C | | | 8.08 | | | | 0.56 | | | | (0.22 | ) | | | 0.34 | | | | (0.61 | ) | | |
| | | 2005 - Institutional | | | 8.09 | | | | 0.65 | | | | (0.21 | ) | | | 0.44 | | | | (0.71 | ) | | |
| | | 2005 - Service | | | 8.09 | | | | 0.62 | | | | (0.24 | ) | | | 0.38 | | | | (0.67 | ) | | |
| | | | | | | | | | | | | | | | | | | | | | | | | |
| | | | | | | | | | | | | | | | | | | | | | | | | |
| | | |
| | | |
| | | | | | | | | | | | | | | | | | | | | | | | | |
| | | | | | | | | | | | | | | | | | | | | | | | | |
| |
| * | The Fund changed its fiscal year end from October 31 to March 31. |
| |
| (a) | Calculated based on the average shares outstanding methodology. |
| |
| (b) | Assumes investment at the net asset value at the beginning of the period, reinvestment of all dividends and distributions, a complete redemption of the investment at the net asset value at the end of the period and no sales or redemption charges. Total returns would be reduced if a sales or redemption charge was taken into account. Returns do not reflect the deduction of taxes that a shareholder would pay on Fund distributions or the redemption of Fund shares. Total returns for periods less than one full year are not annualized. |
The accompanying notes are an integral part of these financial statements.
GOLDMAN SACHS HIGH YIELD FUND
| | | | | | | | | | | | | | | | | | | | | | | | | | | | | | | |
| | | | | | | | | | | | | | | | | | Ratio of
| | | | | | |
| | | | | | | | | Net assets,
| | | Ratio of
| | | Ratio of
| | | net investment
| | | | | | |
| | | Net asset
| | | | | | end of
| | | net expenses
| | | total expenses
| | | income
| | | Portfolio
| | | |
| | | value, end
| | | Total
| | | period
| | | to average
| | | to average
| | | to average
| | | turnover
| | | |
| | | of period | | | return(b) | | | (in 000s) | | | net assets | | | net assets | | | net assets | | | rate | | | |
| |
| |
| | | | | | | | | | | | | | | | | | | | | | | | | | | | | | | |
| | | | | | | | | | | | | | | | | | | | | | | | | | | | | | | |
| | | $ | 7.17 | | | | 5.35 | % | | $ | 865,814 | | | | 1.05 | %(c) | | | 1.05 | %(c) | | | 7.70 | %(c) | | | 20 | % | | |
| | | | 7.18 | | | | 4.95 | | | | 52,497 | | | | 1.80 | (c) | | | 1.80 | (c) | | | 6.94 | (c) | | | 20 | | | |
| | | | 7.18 | | | | 4.96 | | | | 111,212 | | | | 1.80 | (c) | | | 1.80 | (c) | | | 6.94 | (c) | | | 20 | | | |
| | | | 7.19 | | | | 5.52 | | | | 4,651,161 | | | | 0.71 | (c) | | | 0.71 | (c) | | | 8.04 | (c) | | | 20 | | | |
| | | | 7.17 | | | | 5.42 | | | | 21,262 | | | | 1.21 | (c) | | | 1.21 | (c) | | | 7.52 | (c) | | | 20 | | | |
| | | | 7.18 | | | | 5.63 | | | | 1,536 | | | | 0.80 | (c) | | | 0.80 | (c) | | | 7.95 | (c) | | | 20 | | | |
| | | | 7.17 | | | | 5.22 | | | | 9,841 | | | | 1.30 | (c) | | | 1.30 | (c) | | | 7.47 | (c) | | | 20 | | | |
| | | | | | | | | | | | | | | | | | | | | | | | | | | | | | | |
| | | | | | | | | | | | | | | | | | | | | | | | | | | | | | | |
| |
| | | | | | | | | | | | | | | | | | | | | | | | | | | | | | | |
| | | | | | | | | | | | | | | | | | | | | | | | | | | | | | | |
| | | | 7.07 | | | | 48.28 | | | | 1,339,958 | | | | 1.05 | | | | 1.06 | | | | 8.38 | | | | 35 | | | |
| | | | 7.08 | | | | 47.38 | | | | 60,649 | | | | 1.80 | | | | 1.81 | | | | 7.61 | | | | 35 | | | |
| | | | 7.08 | | | | 47.38 | | | | 111,997 | | | | 1.80 | | | | 1.81 | | | | 7.56 | | | | 35 | | | |
| | | | 7.09 | | | | 48.88 | | | | 4,655,677 | | | | 0.71 | | | | 0.72 | | | | 8.64 | | | | 35 | | | |
| | | | 7.06 | | | | 48.13 | | | | 22,639 | | | | 1.21 | | | | 1.22 | | | | 8.14 | | | | 35 | | | |
| | | | 7.07 | | | | 48.63 | | | | 786 | | | | 0.80 | | | | 0.81 | | | | 8.01 | | | | 35 | | | |
| | | | 7.07 | | | | 48.20 | | | | 5,404 | | | | 1.30 | | | | 1.31 | | | | 7.78 | | | | 35 | | | |
| | | | | | | | | | | | | | | | | | | | | | | | | | | | | | | |
| | | | | | | | | | | | | | | | | | | | | | | | | | | | | | | |
| |
| |
| | | | 5.18 | | | | (20.12 | ) | | | 1,636,406 | | | | 1.07 | | | | 1.08 | | | | 9.10 | | | | 14 | | | |
| | | | 5.18 | | | | (20.73 | ) | | | 53,589 | | | | 1.82 | | | | 1.83 | | | | 8.20 | | | | 14 | | | |
| | | | 5.18 | | | | (20.72 | ) | | | 74,325 | | | | 1.82 | | | | 1.83 | | | | 8.25 | | | | 14 | | | |
| | | | 5.19 | | | | (19.81 | ) | | | 1,986,033 | | | | 0.73 | | | | 0.74 | | | | 9.49 | | | | 14 | | | |
| | | | 5.17 | | | | (20.28 | ) | | | 12,582 | | | | 1.23 | | | | 1.24 | | | | 8.98 | | | | 14 | | | |
| | | | 5.18 | | | | (19.91 | ) | | | 8 | | | | 0.82 | | | | 0.83 | | | | 9.31 | | | | 14 | | | |
| | | | 5.17 | | | | (20.47 | ) | | | 183 | | | | 1.32 | | | | 1.33 | | | | 9.95 | | | | 14 | | | |
| | | | | | | | | | | | | | | | | | | | | | | | | | | | | | | |
| | | | | | | | | | | | | | | | | | | | | | | | | | | | | | | |
| |
| | | | | | | | | | | | | | | | | | | | | | | | | | | | | | | |
| | | | | | | | | | | | | | | | | | | | | | | | | | | | | | | |
| | | | 7.12 | | | | (6.82 | ) | | | 1,650,027 | | | | 1.07 | (c) | | | 1.09 | (c) | | | 7.87 | (c) | | | 11 | | | |
| | | | 7.13 | | | | (7.23 | ) | | | 92,953 | | | | 1.82 | (c) | | | 1.84 | (c) | | | 7.12 | (c) | | | 11 | | | |
| | | | 7.12 | | | | (7.11 | ) | | | 101,138 | | | | 1.82 | (c) | | | 1.84 | (c) | | | 7.12 | (c) | | | 11 | | | |
| | | | 7.13 | | | | (6.68 | ) | | | 1,628,668 | | | | 0.73 | (c) | | | 0.75 | (c) | | | 8.22 | (c) | | | 11 | | | |
| | | | 7.12 | | | | (6.89 | ) | | | 10,573 | | | | 1.23 | (c) | | | 1.25 | (c) | | | 7.72 | (c) | | | 11 | | | |
| | | | 7.12 | | | | (4.35 | ) | | | 10 | | | | 0.82 | (c) | | | 0.84 | (c) | | | 8.20 | (c) | | | 11 | | | |
| | | | 7.12 | | | | (4.51 | ) | | | 9 | | | | 1.32 | (c) | | | 1.34 | (c) | | | 7.73 | (c) | | | 11 | | | |
| | | | | | | | | | | | | | | | | | | | | | | | | | | | | | | |
| | | | | | | | | | | | | | | | | | | | | | | | | | | | | | | |
| |
| | | | | | | | | | | | | | | | | | | | | | | | | | | | | | | |
| | | | | | | | | | | | | | | | | | | | | | | | | | | | | | | |
| | | | 7.93 | | | | 6.41 | | | | 1,777,150 | | | | 1.09 | | | | 1.11 | | | | 7.46 | | | | 50 | | | |
| | | | 7.94 | | | | 5.61 | | | | 115,817 | | | | 1.84 | | | | 1.86 | | | | 6.72 | | | | 50 | | | |
| | | | 7.93 | | | | 5.61 | | | | 119,073 | | | | 1.84 | | | | 1.86 | | | | 6.71 | | | | 50 | | | |
| | | | 7.94 | | | | 6.79 | | | | 1,646,138 | | | | 0.73 | | | | 0.75 | | | | 7.82 | | | | 50 | | | |
| | | | 7.92 | | | | 6.28 | | | | 8,399 | | | | 1.24 | | | | 1.26 | | | | 7.34 | | | | 50 | | | |
| | | | | | | | | | | | | | | | | | | | | | | | | | | | | | | |
| | | | | | | | | | | | | | | | | | | | | | | | | | | | | | | |
| |
| |
| | | | 8.04 | | | | 10.76 | | | | 1,395,265 | | | | 1.12 | | | | 1.14 | | | | 7.38 | | | | 41 | | | |
| | | | 8.05 | | | | 9.93 | | | | 96,743 | | | | 1.87 | | | | 1.89 | | | | 6.64 | | | | 41 | | | |
| | | | 8.04 | | | | 9.94 | | | | 90,528 | | | | 1.87 | | | | 1.89 | | | | 6.64 | | | | 41 | | | |
| | | | 8.05 | | | | 11.16 | | | | 1,296,429 | | | | 0.75 | | | | 0.77 | | | | 7.76 | | | | 41 | | | |
| | | | 8.03 | | | | 10.63 | | | | 2,980 | | | | 1.25 | | | | 1.27 | | | | 7.26 | | | | 41 | | | |
| | | | | | | | | | | | | | | | | | | | | | | | | | | | | | | |
| | | | | | | | | | | | | | | | | | | | | | | | | | | | | | | |
| |
| |
| | | | 7.81 | | | | 5.10 | | | | 1,006,734 | | | | 1.15 | | | | 1.17 | | | | 7.74 | | | | 52 | | | |
| | | | 7.82 | | | | 4.31 | | | | 104,637 | | | | 1.90 | | | | 1.92 | | | | 6.98 | | | | 52 | | | |
| | | | 7.81 | | | | 4.32 | | | | 72,590 | | | | 1.90 | | | | 1.92 | | | | 6.95 | | | | 52 | | | |
| | | | 7.82 | | | | 5.50 | | | | 825,508 | | | | 0.76 | | | | 0.79 | | | | 8.11 | | | | 52 | | | |
| | | | 7.80 | | | | 4.72 | | | | 1,597 | | | | 1.26 | | | | 1.29 | | | | 7.62 | | | | 52 | | | |
| | | | | | | | | | | | | | | | | | | | | | | | | | | | | | | |
| | | | | | | | | | | | | | | | | | | | | | | | | | | | | | | |
| |
| |
The accompanying notes are an integral part of these financial statements.
GOLDMAN SACHS INVESTMENT GRADE CREDIT FUND
Financial Highlights
Selected Data for a Share Outstanding Throughout Each Period
| | | | | | | | | | | | | | | | | | | | | | | | | | | | | | | | | |
| | | | | | | | Income (loss) from
| | | Distributions
| | | |
| | | | | | | | investment operations | | | to shareholders | | | |
| | | | | Net asset
| | | | | | | | | | | | | | | | | | | | | |
| | | | | value,
| | | Net
| | | Net realized
| | | Total from
| | | From net
| | | From net
| | | | | | |
| | | | | beginning
| | | investment
| | | and unrealized
| | | investment
| | | investment
| | | realized
| | | Total
| | | |
| | | Year - Share Class | | of period | | | income(a) | | | gain (loss) | | | operations | | | income | | | gains | | | distributions | | | |
| |
| FOR THE SIX MONTHS ENDED SEPTEMBER 30, (UNAUDITED) |
| | | | | | | | | | | | | | | | | | | | | | | | | | | | | | | | | |
| | | | | | | | | | | | | | | | | | | | | | | | | | | | | | | | | |
| | | 2010 - A | | $ | 9.14 | | | $ | 0.19 | | | $ | 0.57 | | | $ | 0.76 | | | $ | (0.19 | ) | | $ | — | | | $ | (0.19 | ) | | |
| | | 2010 - Institutional | | | 9.14 | | | | 0.21 | | | | 0.56 | | | | 0.77 | | | | (0.20 | ) | | | — | | | | (0.20 | ) | | |
| | | 2010 - Separate Account Institutional | | | 9.14 | | | | 0.21 | | | | 0.57 | | | | 0.78 | | | | (0.21 | ) | | | — | | | | (0.21 | ) | | |
| | | | | | | | | | | | | | | | | | | | | | | | | | | | | | | | | |
| | | | | | | | | | | | | | | | | | | | | | | | | | | | | | | | | |
| FOR THE FISCAL YEARS ENDED MARCH 31, |
| | | | | | | | | | | | | | | | | | | | | | | | | | | | | | | | | |
| | | | | | | | | | | | | | | | | | | | | | | | | | | | | | | | | |
| | | 2010 - A | | | 7.75 | | | | 0.43 | | | | 1.40 | | | | 1.83 | | | | (0.44 | ) | | | — | | | | (0.44 | ) | | |
| | | 2010 - Institutional | | | 7.75 | | | | 0.46 | | | | 1.40 | | | | 1.86 | | | | (0.47 | ) | | | — | | | | (0.47 | ) | | |
| | | 2010 - Separate Account Institutional | | | 7.75 | | | | 0.47 | | | | 1.39 | | | | 1.86 | | | | (0.47 | ) | | | — | | | | (0.47 | ) | | |
| | | | | | | | | | | | | | | | | | | | | | | | | | | | | | | | | |
| | | | | | | | | | | | | | | | | | | | | | | | | | | | | | | | | |
| | | |
| | | |
| | | 2009 - A | | | 9.64 | | | | 0.51 | | | | (1.83 | ) | | | (1.32 | ) | | | (0.57 | ) | | | — | | | | (0.57 | ) | | |
| | | 2009 - Institutional | | | 9.66 | | | | 0.55 | | | | (1.85 | ) | | | (1.30 | ) | | | (0.61 | ) | | | — | | | | (0.61 | ) | | |
| | | 2009 - Separate Account Institutional | | | 9.65 | | | | 0.57 | | | | (1.86 | ) | | | (1.29 | ) | | | (0.61 | ) | | | — | | | | (0.61 | ) | | |
| | | | | | | | | | | | | | | | | | | | | | | | | | | | | | | | | |
| | | | | | | | | | | | | | | | | | | | | | | | | | | | | | | | | |
| FOR THE PERIOD NOVEMBER 1, 2007 TO MARCH 31, 2008* |
| | | | | | | | | | | | | | | | | | | | | | | | | | | | | | | | | |
| | | | | | | | | | | | | | | | | | | | | | | | | | | | | | | | | |
| | | 2008 - A | | | 9.90 | | | | 0.22 | | | | (0.27 | ) | | | (0.05 | ) | | | (0.21 | ) | | | — | | | | (0.21 | ) | | |
| | | 2008 - Institutional | | | 9.92 | | | | 0.23 | | | | (0.27 | ) | | | (0.04 | ) | | | (0.22 | ) | | | — | | | | (0.22 | ) | | |
| | | 2008 - Separate Account Institutional | | | 9.91 | | | | 0.23 | | | | (0.26 | ) | | | (0.03 | ) | | | (0.23 | ) | | | — | | | | (0.23 | ) | | |
| | | | | | | | | | | | | | | | | | | | | | | | | | | | | | | | | |
| | | | | | | | | | | | | | | | | | | | | | | | | | | | | | | | | |
| FOR THE FISCAL YEARS ENDED OCTOBER 31, |
| | | | | | | | | | | | | | | | | | | | | | | | | | | | | | | | | |
| | | | | | | | | | | | | | | | | | | | | | | | | | | | | | | | | |
| | | 2007 - A | | | 9.95 | | | | 0.51 | | | | (0.08 | ) | | | 0.43 | | | | (0.48 | ) | | | — | | | | (0.48 | ) | | |
| | | 2007 - Institutional | | | 9.97 | | | | 0.55 | | | | (0.08 | ) | | | 0.47 | | | | (0.52 | ) | | | — | | | | (0.52 | ) | | |
| | | 2007 - Separate Account Institutional | | | 9.96 | | | | 0.56 | | | | (0.08 | ) | | | 0.48 | | | | (0.53 | ) | | | — | | | | (0.53 | ) | | |
| | | | | | | | | | | | | | | | | | | | | | | | | | | | | | | | | |
| | | | | | | | | | | | | | | | | | | | | | | | | | | | | | | | | |
| | | |
| | | |
| | | 2006 - A | | | 9.93 | | | | 0.47 | | | | — | | | | 0.47 | | | | (0.45 | ) | | | — | | | | (0.45 | ) | | |
| | | 2006 - Institutional | | | 9.95 | | | | 0.51 | | | | — | | | | 0.51 | | | | (0.49 | ) | | | — | | | | (0.49 | ) | | |
| | | 2006 - Separate Account Institutional | | | 9.94 | | | | 0.52 | | | | (0.01 | ) | | | 0.51 | | | | (0.49 | ) | | | — | | | | (0.49 | ) | | |
| | | | | | | | | | | | | | | | | | | | | | | | | | | | | | | | | |
| | | | | | | | | | | | | | | | | | | | | | | | | | | | | | | | | |
| | | |
| | | |
| | | 2005 - A | | | 10.31 | | | | 0.40 | | | | (0.35 | ) | | | 0.05 | | | | (0.39 | ) | | | (0.04 | ) | | | (0.43 | ) | | |
| | | 2005 - Institutional | | | 10.32 | | | | 0.52 | | | | (0.42 | ) | | | 0.10 | | | | (0.43 | ) | | | (0.04 | ) | | | (0.47 | ) | | |
| | | 2005 - Separate Account Institutional | | | 10.31 | | | | 0.46 | | | | (0.35 | ) | | | 0.11 | | | | (0.44 | ) | | | (0.04 | ) | | | (0.48 | ) | | |
| | | | | | | | | | | | | | | | | | | | | | | | | | | | | | | | | |
| | | | | | | | | | | | | | | | | | | | | | | | | | | | | | | | | |
| | | |
| | | |
| | | | | | | | | | | | | | | | | | | | | | | | | | | | | | | | | |
| | | | | | | | | | | | | | | | | | | | | | | | | | | | | | | | | |
| |
| * | The Fund changed its fiscal year end from October 31 to March 31. |
| |
| (a) | Calculated based on the average shares outstanding methodology. |
| |
| (b) | Assumes investment at the net asset value at the beginning of the period, reinvestment of all dividends and distributions, a complete redemption of the investment at the net asset value at the end of the period and no sales or redemption charges. Total returns would be reduced if a sales or redemption charge was taken into account. Returns do not reflect the deduction of taxes that a shareholder would pay on Fund distributions or the redemption of Fund shares. Total returns for periods less than one full year are not annualized. |
The accompanying notes are an integral part of these financial statements.
GOLDMAN SACHS INVESTMENT GRADE CREDIT FUND
| | | | | | | | | | | | | | | | | | | | | | | | | | | | | | | |
| | | | | | | | | | | | | | | | | | Ratio of
| | | | | | |
| | | | | | | | | Net assets,
| | | Ratio of
| | | Ratio of
| | | net investment
| | | | | | |
| | | Net asset
| | | | | | end of
| | | net expenses
| | | total expenses
| | | income
| | | Portfolio
| | | |
| | | value, end
| | | Total
| | | period
| | | to average
| | | to average
| | | to average
| | | turnover
| | | |
| | | of period | | | return(b) | | | (in 000s) | | | net assets | | | net assets | | | net assets | | | rate | | | |
| |
| |
| | | | | | | | | | | | | | | | | | | | | | | | | | | | | | | |
| | | | | | | | | | | | | | | | | | | | | | | | | | | | | | | |
| | | $ | 9.71 | | | | 8.39 | % | | $ | 203,040 | | | | 0.76 | %(c) | | | 0.88 | %(c) | | | 4.05 | %(c) | | | 60 | % | | |
| | | | 9.71 | | | | 8.57 | | | | 214,351 | | | | 0.42 | (c) | | | 0.54 | (c) | | | 4.42 | (c) | | | 60 | | | |
| | | | 9.71 | | | | 8.60 | | | | 294,986 | | | | 0.37 | (c) | | | 0.49 | (c) | | | 4.46 | (c) | | | 60 | | | |
| | | | | | | | | | | | | | | | | | | | | | | | | | | | | | | |
| | | | | | | | | | | | | | | | | | | | | | | | | | | | | | | |
| |
| | | | | | | | | | | | | | | | | | | | | | | | | | | | | | | |
| | | | | | | | | | | | | | | | | | | | | | | | | | | | | | | |
| | | | 9.14 | | | | 23.96 | | | | 167,774 | | | | 0.76 | | | | 0.89 | | | | 4.90 | | | | 90 | | | |
| | | | 9.14 | | | | 24.39 | | | | 190,478 | | | | 0.41 | | | | 0.55 | | | | 5.17 | | | | 90 | | | |
| | | | 9.14 | | | | 24.45 | | | | 272,812 | | | | 0.36 | | | | 0.50 | | | | 5.39 | | | | 90 | | | |
| | | | | | | | | | | | | | | | | | | | | | | | | | | | | | | |
| | | | | | | | | | | | | | | | | | | | | | | | | | | | | | | |
| |
| |
| | | | 7.75 | | | | (14.00 | ) | | | 53,185 | | | | 0.76 | | | | 0.97 | | | | 6.22 | | | | 135 | | | |
| | | | 7.75 | | | | (13.83 | ) | | | 22,809 | | | | 0.40 | | | | 0.63 | | | | 6.52 | | | | 135 | | | |
| | | | 7.75 | | | | (13.72 | ) | | | 171,003 | | | | 0.35 | | | | 0.58 | | | | 6.52 | | | | 135 | | | |
| | | | | | | | | | | | | | | | | | | | | | | | | | | | | | | |
| | | | | | | | | | | | | | | | | | | | | | | | | | | | | | | |
| |
| | | | | | | | | | | | | | | | | | | | | | | | | | | | | | | |
| | | | | | | | | | | | | | | | | | | | | | | | | | | | | | | |
| | | | 9.64 | | | | (0.54 | ) | | | 9,455 | | | | 0.76 | (c) | | | 0.95 | (c) | | | 5.31 | (c) | | | 15 | | | |
| | | | 9.66 | | | | (0.39 | ) | | | 10,504 | | | | 0.40 | (c) | | | 0.61 | (c) | | | 5.67 | (c) | | | 15 | | | |
| | | | 9.65 | | | | (0.37 | ) | | | 226,207 | | | | 0.35 | (c) | | | 0.56 | (c) | | | 5.72 | (c) | | | 15 | | | |
| | | | | | | | | | | | | | | | | | | | | | | | | | | | | | | |
| | | | | | | | | | | | | | | | | | | | | | | | | | | | | | | |
| |
| | | | | | | | | | | | | | | | | | | | | | | | | | | | | | | |
| | | | | | | | | | | | | | | | | | | | | | | | | | | | | | | |
| | | | 9.90 | | | | 4.44 | | | | 8,615 | | | | 0.79 | | | | 0.97 | | | | 5.17 | | | | 74 | | | |
| | | | 9.92 | | | | 4.83 | | | | 10,893 | | | | 0.40 | | | | 0.60 | | | | 5.59 | | | | 74 | | | |
| | | | 9.91 | | | | 4.89 | | | | 239,358 | | | | 0.35 | | | | 0.55 | | | | 5.61 | | | | 74 | | | |
| | | | | | | | | | | | | | | | | | | | | | | | | | | | | | | |
| | | | | | | | | | | | | | | | | | | | | | | | | | | | | | | |
| |
| |
| | | | 9.95 | | | | 4.84 | | | | 3,420 | | | | 0.79 | | | | 1.04 | | | | 4.82 | | | | 74 | | | |
| | | | 9.97 | | | | 5.35 | | | | 3,317 | | | | 0.40 | | | | 0.65 | | | | 5.21 | | | | 74 | | | |
| | | | 9.96 | | | | 5.30 | | | | 206,122 | | | | 0.35 | | | | 0.60 | | | | 5.26 | | | | 74 | | | |
| | | | | | | | | | | | | | | | | | | | | | | | | | | | | | | |
| | | | | | | | | | | | | | | | | | | | | | | | | | | | | | | |
| |
| |
| | | | 9.93 | | | | 0.50 | | | | 3,622 | | | | 0.81 | | | | 1.07 | | | | 3.88 | | | | 88 | | | |
| | | | 9.95 | | | | 0.89 | | | | 3,638 | | | | 0.40 | | | | 0.66 | | | | 4.40 | | | | 88 | | | |
| | | | 9.94 | | | | 1.04 | | | | 192,196 | | | | 0.35 | | | | 0.62 | | | | 4.34 | | | | 88 | | | |
| | | | | | | | | | | | | | | | | | | | | | | | | | | | | | | |
| | | | | | | | | | | | | | | | | | | | | | | | | | | | | | | |
| |
| |
The accompanying notes are an integral part of these financial statements.
GOLDMAN SACHS LOCAL EMERGING MARKETS DEBT FUND
Financial Highlights
Selected Data for a Share Outstanding Throughout Each Period
| | | | | | | | | | | | | | | | | | | | | | | | | | | | | | | | | | | | | |
| | | | | | | | Income (loss) from
| | | Distributions
| | | | | | |
| | | | | Net asset
| | | investment operations | | | to shareholders | | | | | | |
| | | | | value,
| | | Net
| | | Net realized
| | | Total from
| | | From net
| | | | | | | | | | | | |
| | | | | beginning
| | | investment
| | | and unrealized
| | | investment
| | | investment
| | | From
| | | Total
| | | | | | |
| | | Year - Share Class | | of period | | | income(a) | | | gain (loss) | | | operations | | | income | | | capital | | | distributions | | | | | | |
| |
| FOR THE SIX MONTHS ENDED SEPTEMBER 30, (UNAUDITED) |
| | | | | | | | | | | | | | | | | | | | | | | | | | | | | | | | | | | | | |
| | | | | | | | | | | | | | | | | | | | | | | | | | | | | | | | | | | | | |
| | | 2010 - A | | $ | 9.31 | | | $ | 0.22 | | | $ | 0.60 | | | $ | 0.82 | | | $ | (0.25 | ) | | $ | — | | | $ | (0.25 | ) | | | | | | |
| | | 2010 - C | | | 9.33 | | | | 0.18 | | | | 0.60 | | | | 0.78 | | | | (0.21 | ) | | | — | | | | (0.21 | ) | | | | | | |
| | | 2010 - Institutional | | | 9.31 | | | | 0.23 | | | | 0.60 | | | | 0.83 | | | | (0.26 | ) | | | — | | | | (0.26 | ) | | | | | | |
| | | 2010 - IR (Commenced July 30, 2010) | | | 9.43 | | | | 0.06 | | | | 0.48 | | | | 0.54 | | | | (0.09 | ) | | | — | | | | (0.09 | ) | | | | | | |
| | | | | | | | | | | | | | | | | | | | | | | | | | | | | | | | | | | | | |
| | | | | | | | | | | | | | | | | | | | | | | | | | | | | | | | | | | | | |
| FOR THE FISCAL YEARS ENDED MARCH 31, |
| | | | | | | | | | | | | | | | | | | | | | | | | | | | | | | | | | | | | |
| | | | | | | | | | | | | | | | | | | | | | | | | | | | | | | | | | | | | |
| | | 2010 - A | | | 7.23 | | | | 0.42 | | | | 2.10 | | | | 2.52 | | | | (0.44 | ) | | | — | | | | (0.44 | ) | | | | | | |
| | | 2010 - C | | | 7.24 | | | | 0.36 | | | | 2.10 | | | | 2.46 | | | | (0.37 | ) | | | — | | | | (0.37 | ) | | | | | | |
| | | 2010 - Institutional | | | 7.23 | | | | 0.45 | | | | 2.10 | | | | 2.55 | | | | (0.47 | ) | | | — | | | | (0.47 | ) | | | | | | |
| | | | | | | | | | | | | | | | | | | | | | | | | | | | | | | | | | | | | |
| | | | | | | | | | | | | | | | | | | | | | | | | | | | | | | | | | | | | |
| | | |
| | | |
| | | 2009 - A | | | 9.85 | | | | 0.50 | | | | (2.64 | ) | | | (2.14 | ) | | | (0.20 | ) | | | (0.28 | ) | | | (0.48 | ) | | | | | | |
| | | 2009 - C | | | 9.85 | | | | 0.48 | | | | (2.67 | ) | | | (2.19 | ) | | | (0.18 | ) | | | (0.24 | ) | | | (0.42 | ) | | | | | | |
| | | 2009 - Institutional | | | 9.85 | | | | 0.53 | | | | (2.64 | ) | | | (2.11 | ) | | | (0.22 | ) | | | (0.29 | ) | | | (0.51 | ) | | | | | | |
| | | | | | | | | | | | | | | | | | | | | | | | | | | | | | | | | | | | | |
| | | | | | | | | | | | | | | | | | | | | | | | | | | | | | | | | | | | | |
| FOR THE PERIOD ENDED MARCH 31, |
| | | | | | | | | | | | | | | | | | | | | | | | | | | | | | | | | | | | | |
| | | | | | | | | | | | | | | | | | | | | | | | | | | | | | | | | | | | | |
| | | 2008 - A (Commenced February 15, 2008) | | | 10.00 | | | | 0.04 | | | | (0.14 | ) | | | (0.10 | ) | | | (0.05 | ) | | | — | | | | (0.05 | ) | | | | | | |
| | | 2008 - C (Commenced February 15, 2008) | | | 10.00 | | | | 0.04 | | | | (0.14 | ) | | | (0.10 | ) | | | (0.05 | ) | | | — | | | | (0.05 | ) | | | | | | |
| | | 2008 - Institutional (Commenced February 15, 2008) | | | 10.00 | | | | 0.06 | | | | (0.15 | ) | | | (0.09 | ) | | | (0.06 | ) | | | — | | | | (0.06 | ) | | | | | | |
| | | | | | | | | | | | | | | | | | | | | | | | | | | | | | | | | | | | | |
| | | | | | | | | | | | | | | | | | | | | | | | | | | | | | | | | | | | | |
| | | |
| | | |
| | | | | | | | | | | | | | | | | | | | | | | | | | | | | | | | | | | | | |
| | | | | | | | | | | | | | | | | | | | | | | | | | | | | | | | | | | | | |
| |
| (a) | Calculated based on the average shares outstanding methodology. |
| |
| (b) | Assumes investment at the net asset value at the beginning of the period, reinvestment of all dividends and distributions, a complete redemption of the investment at the net asset value at the end of the period and no sales or redemption charges. Total returns would be reduced if a sales or redemption charge was taken into account. Returns do not reflect the deduction of taxes that a shareholder would pay on Fund distributions or the redemption of Fund shares. Total returns for periods less than one full year are not annualized. |
The accompanying notes are an integral part of these financial statements.
GOLDMAN SACHS LOCAL EMERGING MARKETS DEBT FUND
| | | | | | | | | | | | | | | | | | | | | | | | | | | | | | | |
| | | | | | | | | | | | | | | | | | Ratio of
| | | | | | |
| | | | | | | | | Net assets,
| | | Ratio of
| | | Ratio of
| | | net investment
| | | | | | |
| | | Net asset
| | | | | | end of
| | | net expenses
| | | total expenses
| | | income
| | | Portfolio
| | | |
| | | value, end
| | | Total
| | | period
| | | to average
| | | to average
| | | to average
| | | turnover
| | | |
| | | of period | | | return(b) | | | (in 000s) | | | net assets | | | net assets | | | net assets | | | rate | | | |
| |
| |
| | | | | | | | | | | | | | | | | | | | | | | | | | | | | | | |
| | | | | | | | | | | | | | | | | | | | | | | | | | | | | | | |
| | | $ | 9.88 | | | | 8.95 | % | | $ | 887,668 | | | | 1.35 | %(c) | | | 1.48 | %(c) | | | 4.67 | %(c) | | | 77 | % | | |
| | | | 9.90 | | | | 8.52 | | | | 5,732 | | | | 2.10 | (c) | | | 2.33 | (c) | | | 3.79 | (c) | | | 77 | | | |
| | | | 9.88 | | | | 9.13 | | | | 771,525 | | | | 1.01 | (c) | | | 1.14 | (c) | | | 5.03 | (c) | | | 77 | | | |
| | | | 9.88 | | | | 5.71 | | | | 1,513 | | | | 1.10 | (c) | | | 1.68 | (c) | | | 3.81 | (c) | | | 77 | | | |
| | | | | | | | | | | | | | | | | | | | | | | | | | | | | | | |
| | | | | | | | | | | | | | | | | | | | | | | | | | | | | | | |
| |
| | | | | | | | | | | | | | | | | | | | | | | | | | | | | | | |
| | | | | | | | | | | | | | | | | | | | | | | | | | | | | | | |
| | | | 9.31 | | | | 35.39 | | | | 419,456 | | | | 1.35 | | | | 1.49 | | | | 4.74 | | | | 134 | | | |
| | | | 9.33 | | | | 34.47 | | | | 936 | | | | 2.10 | | | | 2.24 | | | | 4.09 | | | | 134 | | | |
| | | | 9.31 | | | | 35.84 | | | | 377,691 | | | | 1.01 | | | | 1.15 | | | | 5.16 | | | | 134 | | | |
| | | | | | | | | | | | | | | | | | | | | | | | | | | | | | | |
| | | | | | | | | | | | | | | | | | | | | | | | | | | | | | | |
| |
| |
| | | | 7.23 | | | | (22.32 | ) | | | 20,385 | | | | 1.33 | | | | 1.65 | | | | 5.99 | | | | 92 | | | |
| | | | 7.24 | | | | (22.79 | ) | | | 30 | | | | 2.08 | | | | 2.40 | | | | 5.17 | | | | 92 | | | |
| | | | 7.23 | | | | (22.05 | ) | | | 97,877 | | | | 0.99 | | | | 1.31 | | | | 6.30 | | | | 92 | | | |
| | | | | | | | | | | | | | | | | | | | | | | | | | | | | | | |
| | | | | | | | | | | | | | | | | | | | | | | | | | | | | | | |
| |
| | | | | | | | | | | | | | | | | | | | | | | | | | | | | | | |
| | | | | | | | | | | | | | | | | | | | | | | | | | | | | | | |
| | | | 9.85 | | | | (0.93 | ) | | | 1,482 | | | | 1.35 | (c) | | | 2.98 | (c) | | | 4.29 | (c) | | | 3 | | | |
| | | | 9.85 | | | | (1.01 | ) | | | 127 | | | | 2.10 | (c) | | | 3.73 | (c) | | | 4.30 | (c) | | | 3 | | | |
| | | | 9.85 | | | | (0.89 | ) | | | 60,432 | | | | 1.01 | (c) | | | 2.64 | (c) | | | 5.52 | (c) | | | 3 | | | |
| | | | | | | | | | | | | | | | | | | | | | | | | | | | | | | |
| | | | | | | | | | | | | | | | | | | | | | | | | | | | | | | |
| |
| |
The accompanying notes are an integral part of these financial statements.
GOLDMAN SACHS U.S. MORTGAGES FUND
Financial Highlights
Selected Data for a Share Outstanding Throughout Each Period
| | | | | | | | | | | | | | | | | | | | | | | | | | | | | | | | | |
| | | | | | | | Income (loss) from
| | | Distributions
| | | |
| | | | | Net asset
| | | investment operations | | | to shareholders | | | |
| | | | | value,
| | | Net
| | | Net realized
| | | Total from
| | | From net
| | | From net
| | | | | | |
| | | | | beginning
| | | investment
| | | and unrealized
| | | investment
| | | investment
| | | realized
| | | Total
| | | |
| | | Year - Share Class | | of period | | | income(a) | | | gain (loss) | | | operations | | | income | | | gains | | | distributions | | | |
| |
| FOR THE SIX MONTHS ENDED SEPTEMBER 30, (UNAUDITED) |
| | | | | | | | | | | | | | | | | | | | | | | | | | | | | | | | | |
| | | | | | | | | | | | | | | | | | | | | | | | | | | | | | | | | |
| | | 2010 - A | | $ | 9.99 | | | $ | 0.12 | | | $ | 0.25 | | | $ | 0.37 | | | $ | (0.13 | ) | | $ | — | | | $ | (0.13 | ) | | |
| | | 2010 - Institutional | | | 10.00 | | | | 0.13 | | | | 0.26 | | | | 0.39 | | | | (0.15 | ) | | | — | | | | (0.15 | ) | | |
| | | 2010 - Separate Account Institutional | | | 9.99 | | | | 0.14 | | | | 0.25 | | | | 0.39 | | | | (0.15 | ) | | | — | | | | (0.15 | ) | | |
| | | | | | | | | | | | | | | | | | | | | | | | | | | | | | | | | |
| | | | | | | | | | | | | | | | | | | | | | | | | | | | | | | | | |
| FOR THE FISCAL YEARS ENDED MARCH 31, |
| | | | | | | | | | | | | | | | | | | | | | | | | | | | | | | | | |
| | | | | | | | | | | | | | | | | | | | | | | | | | | | | | | | | |
| | | 2010 - A | | | 9.27 | | | | 0.32 | | | | 0.76 | | | | 1.08 | | | | (0.36 | ) | | | — | | | | (0.36 | ) | | |
| | | 2010 - Institutional | | | 9.29 | | | | 0.38 | | | | 0.73 | | | | 1.11 | | | | (0.40 | ) | | | — | | | | (0.40 | ) | | |
| | | 2010 - Separate Account Institutional | | | 9.28 | | | | 0.38 | | | | 0.73 | | | | 1.11 | | | | (0.40 | ) | | | — | | | | (0.40 | ) | | |
| | | | | | | | | | | | | | | | | | | | | | | | | | | | | | | | | |
| | | | | | | | | | | | | | | | | | | | | | | | | | | | | | | | | |
| | | |
| | | |
| | | 2009 - A | | | 9.62 | | | | 0.37 | | | | (0.27 | ) | | | 0.10 | | | | (0.38 | ) | | | (0.07 | ) | | | (0.45 | ) | | |
| | | 2009 - Institutional | | | 9.64 | | | | 0.39 | | | | (0.26 | ) | | | 0.13 | | | | (0.41 | ) | | | (0.07 | ) | | | (0.48 | ) | | |
| | | 2009 - Separate Account Institutional | | | 9.64 | | | | 0.41 | | | | (0.29 | ) | | | 0.12 | | | | (0.41 | ) | | | (0.07 | ) | | | (0.48 | ) | | |
| | | | | | | | | | | | | | | | | | | | | | | | | | | | | | | | | |
| | | | | | | | | | | | | | | | | | | | | | | | | | | | | | | | | |
| FOR THE PERIOD NOVEMBER 1, 2007 TO MARCH 31, 2008* |
| | | | | | | | | | | | | | | | | | | | | | | | | | | | | | | | | |
| | | | | | | | | | | | | | | | | | | | | | | | | | | | | | | | | |
| | | 2008 - A | | | 9.91 | | | | 0.19 | | | | (0.29 | ) | | | (0.10 | ) | | | (0.19 | ) | | | — | | | | (0.19 | ) | | |
| | | 2008 - Institutional | | | 9.93 | | | | 0.20 | | | | (0.28 | ) | | | (0.08 | ) | | | (0.21 | ) | | | — | | | | (0.21 | ) | | |
| | | 2008 - Separate Account Institutional | | | 9.93 | | | | 0.21 | | | | (0.29 | ) | | | (0.08 | ) | | | (0.21 | ) | | | — | | | | (0.21 | ) | | |
| | | | | | | | | | | | | | | | | | | | | | | | | | | | | | | | | |
| | | | | | | | | | | | | | | | | | | | | | | | | | | | | | | | | |
| FOR THE FISCAL YEARS ENDED OCTOBER 31, |
| | | | | | | | | | | | | | | | | | | | | | | | | | | | | | | | | |
| | | | | | | | | | | | | | | | | | | | | | | | | | | | | | | | | |
| | | 2007 - A | | | 9.90 | | | | 0.44 | | | | 0.04 | | | | 0.48 | | | | (0.47 | ) | | | — | | | | (0.47 | ) | | |
| | | 2007 - Institutional | | | 9.91 | | | | 0.47 | | | | 0.05 | | | | 0.52 | | | | (0.50 | ) | | | — | | | | (0.50 | ) | | |
| | | 2007 - Separate Account Institutional | | | 9.91 | | | | 0.48 | | | | 0.05 | | | | 0.53 | | | | (0.51 | ) | | | — | | | | (0.51 | ) | | |
| | | | | | | | | | | | | | | | | | | | | | | | | | | | | | | | | |
| | | | | | | | | | | | | | | | | | | | | | | | | | | | | | | | | |
| | | |
| | | |
| | | 2006 - A | | | 9.82 | | | | 0.41 | | | | 0.08 | | | | 0.49 | | | | (0.41 | ) | | | — | | | | (0.41 | ) | | |
| | | 2006 - Institutional | | | 9.82 | | | | 0.45 | | | | 0.08 | | | | 0.53 | | | | (0.44 | ) | | | — | | | | (0.44 | ) | | |
| | | 2006 - Separate Account Institutional | | | 9.82 | | | | 0.45 | | | | 0.09 | | | | 0.54 | | | | (0.45 | ) | | | — | | | | (0.45 | ) | | |
| | | | | | | | | | | | | | | | | | | | | | | | | | | | | | | | | |
| | | | | | | | | | | | | | | | | | | | | | | | | | | | | | | | | |
| | | |
| | | |
| | | 2005 - A | | | 10.22 | | | | 0.28 | | | | (0.17 | ) | | | 0.11 | | | | (0.33 | ) | | | (0.18 | ) | | | (0.51 | ) | | |
| | | 2005 - Institutional | | | 10.22 | | | | 0.33 | | | | (0.18 | ) | | | 0.15 | | | | (0.37 | ) | | | (0.18 | ) | | | (0.55 | ) | | |
| | | 2005 - Separate Account Institutional | | | 10.21 | | | | 0.36 | | | | (0.20 | ) | | | 0.16 | | | | (0.37 | ) | | | (0.18 | ) | | | (0.55 | ) | | |
| | | | | | | | | | | | | | | | | | | | | | | | | | | | | | | | | |
| | | | | | | | | | | | | | | | | | | | | | | | | | | | | | | | | |
| | | |
| | | |
| | | | | | | | | | | | | | | | | | | | | | | | | | | | | | | | | |
| | | | | | | | | | | | | | | | | | | | | | | | | | | | | | | | | |
| |
| * | The Fund changed its fiscal year end from October 31 to March 31. |
| |
| (a) | Calculated based on the average shares outstanding methodology. |
| |
| (b) | Assumes investment at the net asset value at the beginning of the period, reinvestment of all dividends and distributions, a complete redemption of the investment at the net asset value at the end of the period and no sales or redemption charges. Total returns would be reduced if a sales or redemption charge was taken into account. Returns do not reflect the deduction of taxes that a shareholder would pay on Fund distributions or the redemption of Fund shares. Total returns for periods less than one full year are not annualized. |
| |
| (c) | The portfolio turnover rates excluding the effect of mortgage dollar rolls were as follows: |
| | | | | | �� | | | | | | | | | | | | | | | | | | | | | |
For the Six Months
| | For the
| | |
| Ended September 30, | | Periods Ended | | |
2010 | | 2010(e) | | 2009 | | 2008 | | 2007 | | 2006 | | |
| | 219% | | | | 464% | | | | 511 | % | | | 295 | % | | | 380 | % | | | 1,442 | % | | | | |
| |
| | Prior years include the effect of mortgage dollar roll transactions, if any. |
| |
| (e) | The amount previously reported has been adjusted to exclude certain “To Be Announced” activity where a mortgage security was delivered. |
The accompanying notes are an integral part of these financial statements.
GOLDMAN SACHS U.S. MORTGAGES FUND
| | | | | | | | | | | | | | | | | | | | | | | | | | | | | | | |
| | | | | | | | | | | | | | | | | | Ratio of
| | | | | | |
| | | | | | | | | Net assets,
| | | Ratio of
| | | Ratio of
| | | net investment
| | | | | | |
| | | Net asset
| | | | | | end of
| | | net expenses
| | | total expenses
| | | income
| | | Portfolio
| | | |
| | | value, end
| | | Total
| | | period
| | | to average
| | | to average
| | | to average
| | | turnover
| | | |
| | | of period | | | return(b) | | | (in 000s) | | | net assets | | | net assets | | | net assets | | | rate(c) | | | |
| |
| |
| | | | | | | | | | | | | | | | | | | | | | | | | | | | | | | |
| | | | | | | | | | | | | | | | | | | | | | | | | | | | | | | |
| | | $ | 10.23 | | | | 3.71 | % | | $ | 7,314 | | | | 0.76 | %(d) | | | 0.94 | %(d) | | | 2.33 | %(d) | | | 346 | % | | |
| | | | 10.24 | | | | 3.89 | | | | 58,190 | | | | 0.42 | (d) | | | 0.60 | (d) | | | 2.64 | (d) | | | 346 | | | |
| | | | 10.23 | | | | 3.92 | | | | 370,386 | | | | 0.37 | (d) | | | 0.55 | (d) | | | 2.69 | (d) | | | 346 | | | |
| | | | | | | | | | | | | | | | | | | | | | | | | | | | | | | |
| | | | | | | | | | | | | | | | | | | | | | | | | | | | | | | |
| |
| | | | | | | | | | | | | | | | | | | | | | | | | | | | | | | |
| | | | | | | | | | | | | | | | | | | | | | | | | | | | | | | |
| | | | 9.99 | | | | 11.84 | | | | 12,791 | | | | 0.76 | | | | 0.94 | | | | 3.29 | | | | 628 | (e) | | |
| | | | 10.00 | | | | 12.11 | | | | 62,950 | | | | 0.41 | | | | 0.60 | | | | 3.88 | | | | 628 | (e) | | |
| | | | 9.99 | | | | 12.17 | | | | 369,251 | | | | 0.36 | | | | 0.55 | | | | 3.91 | | | | 628 | (e) | | |
| | | | | | | | | | | | | | | | | | | | | | | | | | | | | | | |
| | | | | | | | | | | | | | | | | | | | | | | | | | | | | | | |
| |
| |
| | | | 9.27 | | | | 0.90 | | | | 3,637 | | | | 0.76 | | | | 0.91 | | | | 3.93 | | | | 560 | | | |
| | | | 9.29 | | | | 1.38 | | | | 89,617 | | | | 0.40 | | | | 0.57 | | | | 4.22 | | | | 560 | | | |
| | | | 9.28 | | | | 1.32 | | | | 431,500 | | | | 0.35 | | | | 0.52 | | | | 4.39 | | | | 560 | | | |
| | | | | | | | | | | | | | | | | | | | | | | | | | | | | | | |
| | | | | | | | | | | | | | | | | | | | | | | | | | | | | | | |
| |
| | | | | | | | | | | | | | | | | | | | | | | | | | | | | | | |
| | | | | | | | | | | | | | | | | | | | | | | | | | | | | | | |
| | | | 9.62 | | | | (0.80 | ) | | | 7,021 | | | | 0.76 | (d) | | | 0.91 | (d) | | | 4.58 | (d) | | | 483 | | | |
| | | | 9.64 | | | | (0.75 | ) | | | 164,236 | | | | 0.40 | (d) | | | 0.57 | (d) | | | 4.94 | (d) | | | 483 | | | |
| | | | 9.64 | | | | (0.73 | ) | | | 507,194 | | | | 0.35 | (d) | | | 0.52 | (d) | | | 4.98 | (d) | | | 483 | | | |
| | | | | | | | | | | | | | | | | | | | | | | | | | | | | | | |
| | | | | | | | | | | | | | | | | | | | | | | | | | | | | | | |
| |
| | | | | | | | | | | | | | | | | | | | | | | | | | | | | | | |
| | | | | | | | | | | | | | | | | | | | | | | | | | | | | | | |
| | | | 9.91 | | | | 4.96 | | | | 7,044 | | | | 0.78 | | | | 0.94 | | | | 4.43 | | | | 610 | | | |
| | | | 9.93 | | | | 5.43 | | | | 153,795 | | | | 0.40 | | | | 0.58 | | | | 4.81 | | | | 610 | | | |
| | | | 9.93 | | | | 5.48 | | | | 532,819 | | | | 0.35 | | | | 0.53 | | | | 4.84 | | | | 610 | | | |
| | | | | | | | | | | | | | | | | | | | | | | | | | | | | | | |
| | | | | | | | | | | | | | | | | | | | | | | | | | | | | | | |
| |
| |
| | | | 9.90 | | | | 5.21 | | | | 6,973 | | | | 0.79 | | | | 0.98 | | | | 4.24 | | | | 1,665 | | | |
| | | | 9.91 | | | | 5.56 | | | | 117,497 | | | | 0.40 | | | | 0.61 | | | | 4.64 | | | | 1,665 | | | |
| | | | 9.91 | | | | 5.73 | | | | 307,935 | | | | 0.35 | | | | 0.56 | | | | 4.62 | | | | 1,665 | | | |
| | | | | | | | | | | | | | | | | | | | | | | | | | | | | | | |
| | | | | | | | | | | | | | | | | | | | | | | | | | | | | | | |
| |
| |
| | | | 9.82 | | | | 1.00 | | | | 7,916 | | | | 0.81 | | | | 0.98 | | | | 2.88 | | | | 2,006 | | | |
| | | | 9.82 | | | | 1.49 | | | | 74,616 | | | | 0.40 | | | | 0.58 | | | | 3.43 | | | | 2,006 | | | |
| | | | 9.82 | | | | 1.54 | | | | 387,306 | | | | 0.35 | | | | 0.53 | | | | 3.42 | | | | 2,006 | | | |
| | | | | | | | | | | | | | | | | | | | | | | | | | | | | | | |
| | | | | | | | | | | | | | | | | | | | | | | | | | | | | | | |
| |
| |
The accompanying notes are an integral part of these financial statements.
GOLDMAN SACHS SINGLE SECTOR FIXED INCOME FUNDS
Fund Expenses — Six Month Period Ended September 30, 2010 (Unaudited)
As a shareholder of Class A, Class B, Class C, Institutional, Service, Separate Account Institutional, Class IR or Class R Shares of a Fund, you incur two types of costs: (1) transaction costs, including sales charges on purchase payments (with respect to Class A Shares), contingent deferred sales charges on redemptions (with respect to Class B and Class C Shares), and redemption fees (if any); and (2) ongoing costs, including management fees; distribution and service (12b-1) fees (with respect to Class A, Class B, Class C and Class R Shares); and other Fund expenses. This Example is intended to help you understand your ongoing costs (in dollars) of investing in Class A, Class B, Class C, Institutional, Service, Separate Account Institutional, Class IR or Class R Shares of the Funds and to compare these costs with the ongoing costs of investing in other mutual funds.
The Example is based on an investment of $1,000 invested at the beginning of the period and held for the entire period from April 1, 2010 through September 30, 2010.
Actual Expenses — The first line under each share class in the table below provides information about actual account values and actual expenses. You may use the information in this line, together with the amount you invested, to estimate the expenses that you paid over the period. Simply divide your account value by $1,000 (for example, an $8,600 account value divided by $1,000 = 8.6), then multiply the result by the number in the first line under the heading entitled “Expenses Paid” to estimate the expenses you paid on your account during this period.
Hypothetical Example for Comparison Purposes — The second line under each share class in the table below provides information about hypothetical account values and hypothetical expenses based on the Funds’ actual net expense ratios and an assumed rate of return of 5% per year before expenses, which is not the Funds’ actual return. The hypothetical account values and expenses may not be used to estimate the actual ending account balance or expenses you paid for the period. You may use this information to compare the ongoing costs of investing in the Funds and other funds. To do so, compare this 5% hypothetical example with the 5% hypothetical examples that appear in the shareholder reports of the other funds.
Please note that the expenses shown in the table are meant to highlight your ongoing costs only and do not reflect any transactional costs, such as sales charges, redemption fees, or exchange fees. Therefore, the second line of the table is useful in comparing ongoing costs only, and will not help you determine the relative total costs of owning different funds. In addition, if these transactional costs were included, your costs would have been higher.
| | | | | | | | | | | | | | | | | | | | | | | | | | | | | | | | | | | | | | | | | | | | | | | | | | | | | | | | | | | | | | | | | | | | | | | | | | | | |
| | | | Emerging Markets Debt Fund | | | High Yield Fund | | | Investment Grade Credit Fund | | | Local Emerging Markets Debt Fund | | | U.S. Mortgages Fund |
| | | | | | | | | | Expenses
| | | | | | | | | Expenses
| | | | | | | | | Expenses
| | | | | | | | | Expenses
| | | | | | | | | Expenses
|
| | | | Beginning
| | | Ending
| | | Paid for the
| | | Beginning
| | | Ending
| | | Paid for the
| | | Beginning
| | | Ending
| | | Paid for the
| | | Beginning
| | | Ending
| | | Paid for the
| | | Beginning
| | | Ending
| | | Paid for the
|
| | | | Account Value
| | | Account Value
| | | 6 months ended
| | | Account Value
| | | Account Value
| | | 6 months ended
| | | Account Value
| | | Account Value
| | | 6 months ended
| | | Account Value
| | | Account Value
| | | 6 months ended
| | | Account Value
| | | Account Value
| | | 6 months ended
|
| Share Class | | | 4/1/10 | | | 9/30/10 | | | 9/30/10* | | | 4/1/10 | | | 9/30/10 | | | 9/30/10* | | | 4/1/10 | | | 9/30/10 | | | 9/30/10* | | | 4/1/10 | | | 9/30/10 | | | 9/30/10* | | | 4/1/10 | | | 9/30/10 | | | 9/30/10* |
Class A | | | | | | | | | | | | | | | | | | | | | | | | | | | | | | | | | | | | | | | | | | | | | | | | | | | | | | | | | | | | | | | | | | | | | | | | | | | |
| Actual | | | $ | 1,000.00 | | | | $ | 1,101.50 | | | | $ | 6.43 | | | | $ | 1,000.00 | | | | $ | 1,053.50 | | | | $ | 5.41 | | | | $ | 1,000.00 | | | | $ | 1,083.90 | | | | $ | 3.97 | | | | $ | 1,000.00 | | | | $ | 1,089.50 | | | | $ | 7.07 | | | | $ | 1,000.00 | | | | $ | 1,037.10 | | | | $ | 3.88 | |
| Hypothetical 5% return | | | | 1,000.00 | | | | | 1,018.95 | + | | | | 6.17 | | | | | 1,000.00 | | | | | 1,019.80 | + | | | | 5.32 | | | | | 1,000.00 | | | | | 1,021.26 | + | | | | 3.85 | | | | | 1,000.00 | | | | | 1,018.30 | + | | | | 6.83 | | | | | 1,000.00 | | | | | 1,021.26 | + | | | | 3.85 | |
| |
Class B | | | | | | | | | | | | | | | | | | | | | | | | | | | | | | | | | | | | | | | | | | | | | | | | | | | | | | | | | | | | | | | | | | | | | | | | | | | |
| Actual | | | | N/A | | | | | N/A | | | | | N/A | | | | | 1,000.00 | | | | | 1,049.50 | | | | | 9.25 | | | | | N/A | | | | | N/A | | | | | N/A | | | | | N/A | | | | | N/A | | | | | N/A | | | | | N/A | | | | | N/A | | | | | N/A | |
| Hypothetical 5% return | | | | N/A | | | | | N/A | | | | | N/A | | | | | 1,000.00 | | | | | 1,016.04 | + | | | | 9.10 | | | | | N/A | | | | | N/A | | | | | N/A | | | | | N/A | | | | | N/A | | | | | N/A | | | | | N/A | | | | | N/A | | | | | N/A | |
| |
Class C | | | | | | | | | | | | | | | | | | | | | | | | | | | | | | | | | | | | | | | | | | | | | | | | | | | | | | | | | | | | | | | | | | | | | | | | | | | |
| Actual | | | | 1,000.00 | | | | | 1,096.60 | | | | | 10.35 | | | | | 1,000.00 | | | | | 1,049.60 | | | | | 9.25 | | | | | N/A | | | | | N/A | | | | | N/A | | | | | 1,000.00 | | | | | 1,085.20 | | | | | 10.98 | | | | | N/A | | | | | N/A | | | | | N/A | |
| Hypothetical 5% return | | | | 1,000.00 | | | | | 1,015.19 | + | | | | 9.95 | | | | | 1,000.00 | | | | | 1,016.04 | + | | | | 9.10 | | | | | N/A | | | | | N/A | | | | | N/A | | | | | 1,000.00 | | | | | 1,014.54 | + | | | | 10.61 | | | | | N/A | | | | | N/A | | | | | N/A | |
| |
Institutional | | | | | | | | | | | | | | | | | | | | | | | | | | | | | | | | | | | | | | | | | | | | | | | | | | | | | | | | | | | | | | | | | | | | | | | | | | | |
| Actual | | | | 1,000.00 | | | | | 1,103.30 | | | | | 4.64 | | | | | 1,000.00 | | | | | 1,055.20 | | | | | 3.66 | | | | | 1,000.00 | | | | | 1,085.70 | | | | | 2.20 | | | | | 1,000.00 | | | | | 1,091.30 | | | | | 5.29 | | | | | 1,000.00 | | | | | 1,038.90 | | | | | 2.15 | |
| Hypothetical 5% return | | | | 1,000.00 | | | | | 1,020.66 | + | | | | 4.46 | | | | | 1,000.00 | | | | | 1,021.51 | + | | | | 3.60 | | | | | 1,000.00 | | | | | 1,022.96 | + | | | | 2.13 | | | | | 1,000.00 | | | | | 1,020.00 | + | | | | 5.11 | | | | | 1,000.00 | | | | | 1,022.96 | + | | | | 2.13 | |
| |
Service | | | | | | | | | | | | | | | | | | | | | | | | | | | | | | | | | | | | | | | | | | | | | | | | | | | | | | | | | | | | | | | | | | | | | | | | | | | |
| Actual | | | | N/A | | | | | N/A | | | | | N/A | | | | | 1,000.00 | | | | | 1,054.20 | | | | | 6.23 | | | | | N/A | | | | | N/A | | | | | N/A | | | | | N/A | | | | | N/A | | | | | N/A | | | | | N/A | | | | | N/A | | | | | N/A | |
| Hypothetical 5% return | | | | N/A | | | | | N/A | | | | | N/A | | | | | 1,000.00 | | | | | 1,019.00 | + | | | | 6.12 | | | | | N/A | | | | | N/A | | | | | N/A | | | | | N/A | | | | | N/A | | | | | N/A | | | | | N/A | | | | | N/A | | | | | N/A | |
| |
Separate Account Institutional | | | | | | | | | | | | | | | | | | | | | | | | | | | | | | | | | | | | | | | | | | | | | | | | | | | | | | | | | | | | |
| Actual | | | | N/A | | | | | N/A | | | | | N/A | | | | | N/A | | | | | N/A | | | | | N/A | | | | | 1,000.00 | | | | | 1,086.00 | | | | | 1.93 | | | | | N/A | | | | | N/A | | | | | N/A | | | | | 1,000.00 | | | | | 1,039.20 | | | | | 1.89 | |
| Hypothetical 5% return | | | | N/A | | | | | N/A | | | | | N/A | | | | | N/A | | | | | N/A | | | | | N/A | | | | | 1,000.00 | | | | | 1,023.21 | + | | | | 1.88 | | | | | N/A | | | | | N/A | | | | | N/A | | | | | 1,000.00 | | | | | 1,023.21 | + | | | | 1.88 | |
| |
Class IR(a) | | | | | | | | | | | | | | | | | | | | | | | | | | | | | | | | | | | | | | | | | | | | | | | | | | | | | | | | | | | | | | | | | | | | | | | | | | | |
| Actual | | | | 1,000.00 | | | | | 1,044.40 | | | | | 1.66 | | | | | 1,000.00 | | | | | 1,056.30 | | | | | 4.12 | | | | | N/A | | | | | N/A | | | | | N/A | | | | | 1,000.00 | | | | | 1,057.10 | | | | | 1.89 | | | | | N/A | | | | | N/A | | | | | N/A | |
| Hypothetical 5% return | | | | 1,000.00 | | | | | 1,006.74 | + | | | | 1.63 | | | | | 1,000.00 | | | | | 1,021.06 | + | | | | 4.05 | | | | | N/A | | | | | N/A | | | | | N/A | | | | | 1,000.00 | | | | | 1,006.52 | + | | | | 1.84 | | | | | N/A | | | | | N/A | | | | | N/A | |
| |
Class R | | | | | | | | | | | | | | | | | | | | | | | | | | | | | | | | | | | | | | | | | | | | | | | | | | | | | | | | | | | | | | | | | | | | | | | | | | | |
| Actual | | | | N/A | | | | | N/A | | | | | N/A | | | | | 1,000.00 | | | | | 1,052.20 | | | | | 6.69 | | | | | N/A | | | | | N/A | | | | | N/A | | | | | N/A | | | | | N/A | | | | | N/A | | | | | N/A | | | | | N/A | | | | | N/A | |
| Hypothetical 5% return | | | | N/A | | | | | N/A | | | | | N/A | | | | | 1,000.00 | | | | | 1,018.55 | + | | | | 6.58 | | | | | N/A | | | | | N/A | | | | | N/A | | | | | N/A | | | | | N/A | | | | | N/A | | | | | N/A | | | | | N/A | | | | | N/A | |
| |
| |
| (a) | Commenced operations on July 30, 2010 for Emerging Markets Debt and Local Emerging Markets Debt Fund. |
| * | Expenses for each share class are calculated using each Fund’s annualized net expense ratio for each class, which represents the ongoing expenses as a percentage of net assets for the six months ended September 30, 2010. Expenses are calculated by multiplying the annualized net expense ratio by the average account value for the period; then multiplying the result by the number of days in the most recent fiscal half year; and then dividing that result by the number of days in the fiscal year. The annualized net expense ratios for the period were as follows: |
| | | | | | | | | | | | | | | | | | | | | | | | | | | | | | | | | |
| | | | | | | | | | | | | Separate Account
| | | | |
| Fund | | Class A | | Class B | | Class C | | Institutional | | Service | | Institutional | | Class IR(a) | | Class R |
| |
| Emerging Markets Debt | | | 1.22 | % | | | N/A | | | | 1.97 | % | | | 0.88 | % | | | N/A | | | | N/A | | | | 0.97 | % | | | N/A | |
| High Yield | | | 1.05 | | | | 1.80 | % | | | 1.80 | | | | 0.71 | | | | 1.21 | % | | | N/A | | | | 0.80 | | | | 1.30 | % |
| Investment Grade Credit | | | 0.76 | | | | N/A | | | | N/A | | | | 0.42 | | | | N/A | | | | 0.37 | % | | | N/A | | | | N/A | |
| Local Emerging Markets Debt | | | 1.35 | | | | N/A | | | | 2.10 | | | | 1.01 | | | | N/A | | | | N/A | | | | 1.10 | | | | N/A | |
| U.S. Mortgages | | | 0.76 | | | | N/A | | | | N/A | | | | 0.42 | | | | N/A | | | | 0.37 | | | | N/A | | | | N/A | |
| |
| |
| |
| + | Hypothetical expenses are based on each Fund’s actual annualized net expense ratios and an assumed rate of return of 5% per year before expenses. |
114
GOLDMAN SACHS SINGLE SECTOR FIXED INCOME FUNDS
Statement Regarding Basis for Approval of Management Agreement (Unaudited)
Background
The Goldman Sachs Emerging Markets Debt, Goldman Sachs High Yield, Goldman Sachs Investment Grade Credit, Goldman Sachs Local Emerging Markets Debt and Goldman Sachs U.S. Mortgages Funds (the “Funds”) are investment portfolios of Goldman Sachs Trust (the “Trust”). The Board of Trustees oversees the management of the Trust and reviews the investment performance and expenses of the Funds at regularly scheduled meetings held during the year. In addition, the Board of Trustees determines annually whether to approve the continuance of the Trust’s investment management agreement (the “Management Agreement”) with Goldman Sachs Asset Management, L.P. (the “Investment Adviser”) on behalf of the Funds.
The Management Agreement was most recently approved for continuation until June 30, 2011 by the Board of Trustees, including those Trustees who are not parties to the Management Agreement or “interested persons” (as defined in the Investment Company Act of 1940, as amended) of any party thereto (the “Independent Trustees”), at a meeting held on June 16-17, 2010 (the “Annual Meeting”).
The review process undertaken by the Trustees spans the course of the year and culminates with the Annual Meeting. To assist the Trustees in their deliberations, the Trustees have established a Contract Review Committee (the “Committee”), comprised of the Independent Trustees. The Committee held three meetings over the course of the year, since last approving the Management Agreement. At those Committee meetings, regularly scheduled Board meetings and/or the Annual Meeting, the Board, or the Independent Trustees, as applicable, considered matters relating to the Management Agreement, including:
| | |
| | (a) | the nature and quality of the advisory, administrative and other services provided to the Funds by the Investment Adviser and its affiliates, including information about: |
| | |
| | (i) | the structure, staff and capabilities of the Investment Adviser and its portfolio management teams; |
| |
| | (ii) | the groups within the Investment Adviser and its affiliates that support the portfolio management teams or provide other types of necessary services, including fund services groups (e.g., accounting and financial reporting, tax, shareholder services and operations), controls and risk management groups (e.g., legal, compliance, valuation oversight, credit risk management, internal audit, market risk analysis and finance and strategy), sales and distribution support groups and others (e.g., information technology and training); |
| |
| | (iii) | trends in headcount; |
| |
| | (iv) | the Investment Adviser’s financial resources and ability to hire and retain talented personnel and strengthen its operations; and |
| |
| | (v) | the parent company’s support of the Investment Adviser and its mutual fund business, as expressed by the firm’s senior management; |
| | |
| | (b) | information on the investment performance of the Funds, including comparisons to the performance of similar mutual funds, as provided by a third party mutual fund data provider engaged as part of the contract review process (the “Outside Data Provider”), and benchmark performance indices, and general investment outlooks in the markets in which the Funds invest; |
| |
| | (c) | the terms of the Management Agreement and agreements with affiliated service providers entered into by the Trust on behalf of the Funds; |
GOLDMAN SACHS SINGLE SECTOR FIXED INCOME FUNDS
Statement Regarding Basis for Approval of Management Agreement (Unaudited) (continued)
| | |
| | (d) | expense information for the Funds, including: |
| | |
| | (i) | the relative management fee and expense levels of the Funds as compared to those of comparable funds managed by other advisers, as provided by the Outside Data Provider; |
| |
| | (ii) | each Fund’s expense trends over time; and |
| |
| | (iii) | to the extent the Investment Adviser manages institutional accounts or collective investment vehicles having investment objectives and policies similar to those of the Funds, comparative information on the advisory fees charged and services provided to those accounts by the Investment Adviser; |
| | |
| | (e) | with respect to the extensive investment performance and expense comparison data provided by the Outside Data Provider, its processes in producing that data for the Funds; |
| |
| | (f) | the undertakings of the Investment Adviser to waive certain fees (with respect to the Investment Grade Credit and U.S. Mortgages Funds) and reimburse certain expenses of the Funds that exceed specified levels, and a summary of contractual fee reductions made by the Investment Adviser and its affiliates over the past several years with respect to the Funds; |
| |
| | (g) | information relating to the profitability of the Management Agreement and the transfer agency and distribution and service arrangements of each of the Funds and the Trust as a whole to the Investment Adviser and its affiliates; |
| |
| | (h) | potential economies of scale, if any, and the levels of breakpoints in the fees payable by the Funds under the Management Agreement; |
| |
| | (i) | a summary of the “fall-out” benefits derived by the Investment Adviser and its affiliates from their relationships with the Funds, including the fees received by the Investment Adviser’s affiliates from the Funds for transfer agency, distribution and other services; |
| |
| | (j) | a summary of potential benefits derived by the Funds as a result of their relationship with the Investment Adviser; |
| |
| | (k) | portfolio trading related issues; |
| |
| | (l) | portfolio manager ownership of Fund shares; the manner in which portfolio manager compensation is determined, the alignment of the interests of the Funds and of the portfolio managers and related potential conflicts of interest; and the number and types of accounts managed by the portfolio managers; |
| |
| | (m) | the nature and quality of the services provided to the Funds by their unaffiliated service providers, and the Investment Adviser’s general oversight and evaluation (including reports on due diligence) of those service providers as part of the administration services provided under the Management Agreement; and |
| |
| | (n) | the Investment Adviser’s processes and policies addressing various types of potential conflicts of interest; its approach to risk management; the annual review of the effectiveness of the Funds’ compliance program; and compliance reports. |
The Trustees also received an overview of the Funds’ distribution arrangements. They received information regarding the Funds’ assets, share purchase and redemption activity and the payment of Rule 12b-1 distribution and service fees by the Funds and the payment of non-Rule 12b-1 shareholder service and/or administration fees by the High Yield Fund’s Service Shares and the Investment Grade Credit and U.S. Mortgages Funds’ Class A and Institutional Shares. Information was also provided to the Trustees relating to revenue sharing payments made by and services provided by the Investment Adviser and its affiliates to intermediaries that promote the sale, distribution and/or servicing of Fund shares.
GOLDMAN SACHS SINGLE SECTOR FIXED INCOME FUNDS
Statement Regarding Basis for Approval of Management Agreement (Unaudited) (continued)
The presentations made at the Board and Committee meetings and at the Annual Meeting encompassed the Funds and other mutual fund portfolios for which the Board of Trustees has responsibility. In evaluating the Management Agreement at the Annual Meeting, the Trustees relied upon their knowledge, resulting from their meetings and other interactions throughout the year, of the Investment Adviser, its affiliates, their services and the Funds. In conjunction with these meetings, the Trustees received written materials and oral presentations on the topics covered, and were advised by their independent legal counsel regarding their responsibilities and other regulatory requirements related to the approval and continuation of mutual fund investment management agreements under applicable law. During the course of their deliberations, the Independent Trustees met in executive sessions with their independent legal counsel, without representatives of the Investment Adviser or its affiliates present. The Independent Trustees also discussed the broad range of other investment choices that are available to Fund investors, including the availability of comparable funds managed by other advisers.
Nature, Extent and Quality of the Services Provided Under the Management Agreement
As part of their review, the Trustees considered the nature, extent and quality of the services provided by the Investment Adviser. In this regard, the Trustees considered both the investment advisory services, and the other, non-advisory services, that are provided to the Funds by the Investment Adviser and its affiliates. The Independent Trustees concluded that the Investment Adviser had committed substantial financial and operational resources to the Funds and expressed confidence that the Investment Adviser would continue to do so in the future. The Trustees also observed that the Investment Adviser had made significant commitments to address regulatory compliance requirements applicable to the Funds and the Investment Adviser.
Investment Performance
The Trustees also considered the investment performance of the Funds and the Investment Adviser. In this regard, they compared the investment performance of each Fund to the performance of other similar SEC-registered funds and to rankings and ratings compiled by the Outside Data Provider. This information on each Fund’s investment performance relative to that of its peers was provided for the one-, three-, five- and ten-year periods ended December 31, 2009, to the extent that each Fund had been in existence for those periods. The Trustees also reviewed each Fund’s investment performance over time on a year-by-year basis relative to its performance benchmark. In addition, they considered the investment performance trends of the Funds over time, and reviewed the investment performance of each Fund in light of its investment objective and policies, market conditions and credit and duration parameters. The Trustees considered whether each Fund had operated within its investment policies and had complied with its investment limitations.
In addition, the Trustees considered materials prepared and presentations made by the Investment Adviser’s Chief Investment Officer and portfolio management personnel, in which Fund performance was assessed. The Trustees also considered the Investment Adviser’s periodic reports with respect to the Funds’ risk profiles, and how the Investment Adviser’s approach to risk monitoring and management influences portfolio management.
The Trustees noted that each of the Funds, with the exception of High Yield Fund, outperformed its respective benchmark for the one-year period ended December 31, 2009. They also noted that each of the Funds, with the exception of Local Emerging Markets Debt Fund, ranked in the top half of its respective peer group for the one-year period ended December 31, 2009. The Trustees recognized that despite a challenging track record over the three- and five-year time period ended December 31, 2009 for the Investment Grade Credit Fund, the recent performance of the Funds was generally strong. The Trustees concluded that the Investment Adviser’s continued management likely would benefit each Fund and its shareholders.
GOLDMAN SACHS SINGLE SECTOR FIXED INCOME FUNDS
Statement Regarding Basis for Approval of Management Agreement (Unaudited) (continued)
Costs of Services Provided and Competitive Information
The Trustees considered the contractual fee rates payable by each Fund under the Management Agreement. In this regard, the Trustees considered information on the services rendered by the Investment Adviser to the Funds, which included both advisory and administrative services that were directed to the needs and operations of the Funds as registered mutual funds.
In particular, the Trustees reviewed analyses prepared by the Outside Data Provider regarding the expense rankings of the Funds. The analyses provided a comparison of the Funds’ management fees and breakpoints to those of relevant peer groups and category universes; an expense analysis which compared each Fund’s expenses to a peer group and a category universe; and a five-year (two-year, in the case of Local Emerging Markets Debt Fund) history comparing each Fund’s expenses to the peer and category averages. The analyses also compared each Fund’s transfer agency fees, custody and accounting fees, distribution fees, other expenses and fee waivers/reimbursements to those of other funds in the peer group and the peer group median. The Trustees concluded that the comparisons provided by the Outside Data Provider were useful in evaluating the reasonableness of the management fees and total expenses paid by the Funds.
In addition, the Trustees considered the Investment Adviser’s undertakings to limit the Funds’ “other expenses” ratios (excluding certain expenses) to certain specified levels and to waive a portion of the contractual management fees paid by the Investment Grade Credit and U.S. Mortgages Funds. They also considered, to the extent that the Investment Adviser manages institutional accounts or collective investment vehicles having investment objectives and policies similar to those of the Funds, comparative fee information for services provided by the Investment Adviser to those accounts, and information that indicated that services provided to the Funds differed in various significant respects from the services provided to institutional accounts, which generally operated under less stringent legal and regulatory structures, required fewer services from the Investment Adviser to a smaller number of client contact points, were less time-intensive and paid lower fees. By contrast, the Trustees noted that the Investment Adviser provides substantial administrative services to the Funds under the terms of the Management Agreement.
In addition, the Trustees noted that shareholders are able to redeem their Fund shares at any time if they believe that the Fund fees and expenses are too high or if they are dissatisfied with the performance of the Fund.
Profitability
The Trustees reviewed the Investment Adviser’s revenues and pre-tax profit margins with respect to the Trust and each of the Funds. In this regard the Trustees noted that they had received, among other things, profitability analyses and summaries, revenue and expense schedules by Fund and by function (i.e., investment management, transfer agency and distribution and service) and the Investment Adviser’s expense allocation methodology. They observed that the profitability and expense figures are substantially similar to those used by the Investment Adviser for many internal purposes, including compensation decisions among various business groups, and are thus subject to a vigorous internal debate about how certain revenue and expenses should be allocated. The Trustees also reviewed the report of the internal audit group within the Goldman Sachs organization, which included an assessment of the reasonableness and consistency of the Investment Adviser’s expense allocation methodology and an evaluation of the accuracy of the Investment Adviser’s profitability analysis calculations. Profitability data for the Trust and each Fund were provided for 2009 and 2008, and the Trustees considered this information in relation to the Investment Adviser’s overall profitability. The Trustees considered the Investment Adviser’s revenues and pre-tax profit margins both in absolute terms and in comparison to information on the reported pre-tax profit margins earned by certain other asset management firms.
GOLDMAN SACHS SINGLE SECTOR FIXED INCOME FUNDS
Statement Regarding Basis for Approval of Management Agreement (Unaudited) (continued)
Economies of Scale
The Trustees considered the information that had been provided regarding the Investment Adviser’s profitability and the rationale for the Funds’ breakpoint structure. The Trustees also considered the breakpoints in the fee rate payable under the Management Agreement for each of the Funds at the following annual percentage rates of the average daily net assets of the Funds:
| | | | | | | | | | | | | | | | | | | | | |
| | | | | | | | | | | | Local
| | | | |
| | | Emerging
| | | | | | Investment
| | | Emerging
| | | | |
| | | Markets
| | | | | | Grade
| | | Markets
| | | U.S.
| |
Average Daily
| | Debt
| | | High Yield
| | | Credit
| | | Debt
| | | Mortgages
| |
| Net Assets | | Fund | | | Fund | | | Fund | | | Fund | | | Fund | |
| | |
| First $1 billion | | | 0.80 | % | | | 0.70 | % | | | 0.40 | % | | | 0.90 | % | | | 0.40 | % |
| Next $1 billion | | | 0.80 | | | | 0.70 | | | | 0.36 | | | | 0.90 | | | | 0.36 | |
| Next $3 billion | | | 0.72 | | | | 0.63 | | | | 0.34 | | | | 0.81 | | | | 0.34 | |
| Next $3 billion | | | 0.68 | | | | 0.60 | | | | 0.33 | | | | 0.77 | | | | 0.33 | |
| Over $8 billion | | | 0.67 | | | | 0.59 | | | | 0.32 | | | | 0.75 | | | | 0.32 | |
The Trustees noted that the breakpoints at the $5 and $8 billion asset levels had been proposed by the Investment Adviser and approved by the Trustees in 2008 to further share potential economies of scale, if any, with the Funds and their shareholders as assets under management reach those asset levels. The Trustees considered the amounts of assets in the Funds; the Funds’ recent share purchase and redemption activity; the information provided by the Investment Adviser relating to the costs of the services provided by the Investment Adviser and its affiliates and their realized profits; information comparing fee rates charged by the Investment Adviser with fee rates charged to other funds in the peer group; and the Investment Adviser’s undertakings to limit management fees (with respect to the Investment Grade Credit and U.S. Mortgages Funds) and other expenses (with respect to all of the Funds) to certain amounts. Upon reviewing these matters at the Annual Meeting, the Trustees concluded that the fee breakpoints represented a means of assuring that benefits of scalability would be passed along to shareholders at the specified asset levels. They also noted that the Investment Adviser was passing along savings to shareholders of the High Yield Fund, which had asset levels above the first breakpoint.
Other Benefits to the Investment Adviser and Its Affiliates
The Trustees also considered the other benefits derived by the Investment Adviser and its affiliates from their relationship with the Funds as stated above, including: (a) transfer agency fees received by Goldman, Sachs & Co. (“Goldman Sachs”); (b) futures commissions earned by Goldman Sachs for executing futures transactions on behalf of the Funds; (c) trading efficiencies resulting from aggregation of orders of the Funds with those for other funds or accounts managed by the Investment Adviser; (d) the Investment Adviser’s ability to leverage the infrastructure designed to service the Funds on behalf of its other clients; (e) the Investment Adviser’s ability to cross-market other products and services to Fund shareholders; (f) Goldman Sachs’ retention of certain fees as Fund Distributor; (g) the Investment Adviser’s ability to negotiate better pricing with custodians on behalf of its other clients, as a result of the relationship with the Funds; and (h) the Investment Adviser’s ability to leverage relationships with the Funds’ third party service providers to attract more firmwide business. In the course of considering the foregoing, the Independent Trustees requested and received further information quantifying certain of the fall-out benefits.
GOLDMAN SACHS SINGLE SECTOR FIXED INCOME FUNDS
Statement Regarding Basis for Approval of Management Agreement (Unaudited) (continued)
Other Benefits to the Funds and Their Shareholders
The Trustees also noted that the Funds receive certain potential benefits as a result of their relationship with the Investment Adviser, including: (a) trading efficiencies resulting from aggregation of orders of the Funds with those of other funds or accounts managed by the Investment Adviser; (b) improved servicing and pricing from vendors because of the volume of business generated by the Investment Adviser and its affiliates; (c) improved servicing from broker-dealers because of the volume of business generated by the Investment Adviser and its affiliates; (d) the Investment Adviser’s ability to negotiate favorable terms with derivatives counterparties as a result of the size and reputation of the Goldman Sachs organization; (e) the advantages gained from the Investment Adviser’s knowledge and experience gained from managing other accounts and products; (f) the Investment Adviser’s ability to hire and retain qualified personnel to provide services to the Funds because of the reputation of the Goldman Sachs organization; (g) the Funds’ access, through the Investment Adviser, to certain firmwide resources (e.g., proprietary databases); and (h) the Funds’ access to certain affiliated distribution channels. The Trustees noted the competitive nature of the mutual fund marketplace, and noted further that many of the Funds’ shareholders invested in the Funds in part because of the Funds’ relationship with the Investment Adviser and that those shareholders have a general expectation that the relationship will continue.
Conclusion
In connection with their consideration of the Management Agreement, the Trustees gave weight to each of the factors described above, but did not identify any particular factor as controlling their decision. After deliberation and consideration of all of the information provided, including the factors described above, the Trustees concluded, in the exercise of their business judgment, that the management fees paid by each of the Funds were reasonable in light of the services provided to it by the Investment Adviser, the Investment Adviser’s costs and each Fund’s current and reasonably foreseeable asset levels. The Trustees concluded that the Management Agreement should be approved and continued with respect to each Fund until June 30, 2011.
FUNDS PROFILE
Goldman Sachs Funds
Goldman Sachs is a premier financial services firm, known since 1869 for creating thoughtful and customized investment solutions in complex global markets.
Today, the Investment Management Division of Goldman Sachs serves a diverse set of clients worldwide, including private institutions, public entities and individuals. With portfolio management teams located around the world — and $700.8 billion in assets under management as of September 30, 2010 — our investment professionals bring firsthand knowledge of local markets to every investment decision. Goldman Sachs Asset Management ranks in the top 10 asset management firms worldwide, based on assets under management.1
OVERVIEW OF GOLDMAN SACHS FUNDS

| | | | | |
Money Market2
Financial Square FundsSM
n Financial Square Tax-Exempt Funds
n Financial Square Federal Fund
n Financial Square Government Fund
n Financial Square Money Market Fund
n Financial Square Prime
Obligations Fund
n Financial Square Treasury
Instruments Fund
n Financial Square Treasury
Obligations Fund
Fixed Income
Short Duration and
Government
n Enhanced Income Fund
n Ultra-Short Duration Govt. Fund
n Short Duration Government Fund
n Government Income Fund
n Inflation Protected Securities Fund
Multi-Sector
n Core Fixed Income Fund
n Core Plus Fixed Income Fund
n Global Income Fund
n Strategic Income Fund
Municipal and Tax-Free
n High Yield Municipal Fund
n Municipal Income Fund
n Short Duration Tax-Free Fund
Single Sector
n Investment Grade Credit Fund
n U.S. Mortgages Fund
n High Yield Fund | | n Emerging Markets Debt Fund
n Local Emerging Markets Debt Fund
Corporate Credit
n Credit Strategies Fund
Fundamental Equity
n Growth and Income Fund
n Small Cap Value Fund
n Mid Cap Value Fund
n Large Cap Value Fund
n Capital Growth Fund
n Strategic Growth Fund
n Small/Mid Cap Growth Fund
n All Cap Growth Fund
n Concentrated Growth Fund
n Technology Tollkeeper FundSM 4
n Growth Opportunities Fund
n U.S. Equity Fund
Structured Equity
n Balanced Fund
n Structured Small Cap Equity Fund
n Structured U.S. Equity Fund
n Structured Small Cap
Growth Fund
n Structured Large Cap Growth Fund
n Structured Large Cap Value Fund
n Structured Small Cap Value Fund
n Structured Tax-Managed
Equity Fund
n Structured International
Tax-Managed Equity Fund
n U.S. Equity Dividend and
Premium Fund | | n International Equity Dividend
and Premium Fund
n Structured International Small Cap Fund
n Structured International Equity Fund
n Structured Emerging Markets
Equity Fund
Fundamental Equity
International
n Strategic International Equity Fund
n Concentrated International Equity Fund
n International Small Cap Fund
n Asia Equity Fund
n Emerging Markets Equity Fund
n BRIC Fund (Brazil, Russia, India, China)
Select Satellite3
n Real Estate Securities Fund
n International Real Estate
Securities Fund
n Commodity Strategy Fund
n Dynamic Allocation Fund
n Absolute Return Tracker Fund
Total Portfolio Solutions3
n Balanced Strategy Portfolio
n Growth and Income Strategy Portfolio
n Growth Strategy Portfolio
n Equity Growth Strategy Portfolio
n Income Strategies Portfolio
n Satellite Strategies Portfolio
n Retirement Strategies Portfolios
n Enhanced Dividend Global
Equity Portfolio
n Tax Advantaged Global Equity Portfolio |
Firmwide assets under management includes assets managed by GSAM and its Investment Advisory Affiliates.
| |
| 1 | Ranking for Goldman Sachs Group, Inc., includes Goldman Sachs Asset Management, Private Wealth Management and Merchant Banking 2009 year-end assets. Ranked 9th in total assets worldwide. Pensions&Investments, June 2010. |
| 2 | An investment in a money market fund is neither insured nor guaranteed by the Federal Deposit Insurance Corporation (“FDIC”) or any other government agency. Although the Funds seek to preserve the value of your investment at $1.00 per share, it is possible to lose money by investing in the Funds. |
| 3 | Individual Funds within the Total Portfolio Solutions and Select Satellite categories will have various placement on the risk/return spectrum and may have greater or lesser risk than that indicated by the placement of the general Total Portfolio Solutions or Select Satellite category. |
| 4 | Effective July 31, 2010, the Goldman Sachs Tollkeeper Fund was renamed the Goldman Sachs Technology Tollkeeper Fund. |
The Goldman Sachs Technology Tollkeeper FundSM and Financial Square FundsSM are registered service marks of Goldman, Sachs & Co.
| | | |
TRUSTEES
Ashok N. Bakhru, Chairman
Donald C. Burke**
John P. Coblentz, Jr.
Diana M. Daniels
Patrick T. Harker* | | OFFICERS
James A. McNamara, President
George F. Travers, Principal Financial Officer
Peter V. Bonanno, Secretary
Scott M. McHugh, Treasurer |
Joseph P. LoRusso**
James A. McNamara
Jessica Palmer
Alan A. Shuch
Richard P. Strubel | | |
| *Resigned effective September 30, 2010 | | |
**Effective August 19, 2010 | | |
GOLDMAN, SACHS & CO.
Distributor and Transfer Agent | | GOLDMAN SACHS ASSET MANAGEMENT, L.P.
Investment Adviser |
Visit our Web site at www.goldmansachsfunds.com to obtain the most recent month-end returns.
Goldman Sachs Asset Management, L.P. 200 West Street, New York, New York 10282
The reports concerning the Funds included in this shareholder report may contain certain forward-looking statements about the factors that may affect the performance of the Funds in the future. These statements are based on Fund management’s predictions and expectations concerning certain future events and their expected impact on the Funds, such as performance of the economy as a whole and of specific industry sectors, changes in the levels of interest rates, the impact of developing world events, and other factors that may influence the future performance of the Funds. Management believes these forward-looking statements to be reasonable, although they are inherently uncertain and difficult to predict. Actual events may cause adjustments in portfolio management strategies from those currently expected to be employed.
A description of the policies and procedures that the Fund uses to determine how to vote proxies relating to portfolio securities and information regarding how the Fund voted proxies relating to portfolio securities for the 12-month period ending June 30, 2009 are available (I) without charge, upon request by calling 1-800-526-7384 (for Retail Shareholders) or 1-800-621-2550 (for Institutional Shareholders); and (II) on the Securities and Exchange Commission (”SEC”) Web site at http://www.sec.gov.
The Funds file their complete schedule of portfolio holdings with the SEC for the first and third quarters of each fiscal year on Form N-Q. The Funds’ Form N-Q will become available on the SEC’s website at http://www.sec.gov within 60 days after the Funds’ first and third fiscal quarters. When available, the Funds’ Forms N-Q may be reviewed and copied at the SEC’s Public Reference Room in Washington, D.C. and information on the operation of the Public Reference Room may also be obtained by calling 1-800-SEC-0330. When available, Form N-Q may be obtained upon request and without charge by calling 1-800-526-7384 (for Retail Shareholders) or 1-800-621-2550 (for Institutional Shareholders).
Holdings and allocations shown may not be representative of current or future investments. Holdings and allocations may not include the Funds’ entire investment portfolio, which may change at any time. Fund holdings should not be relied on in making investment decisions and should not be construed as research or investment advice regarding particular securities.
This material is not authorized for distribution to prospective investors unless preceded or accompanied by a current Prospectus or summary prospectus, if applicable. Investors should consider a Fund’s objective, risks, and charges and expenses, and read the summary prospectus, if available, and/or the Prospectus carefully before investing or sending money. The summary prospectus, if available, and the Prospectus contain this and other information about a Fund and may be obtained from your authorized dealer or from Goldman, Sachs & Co. by calling (retail — 1-800-526-7384) (institutional — 1-800-621-2550).
Copyright ©2010 Goldman, Sachs & Co. All rights reserved. 44089.MF.TMPL SSFISAR10 / 114.3K / 11-10
The information required by this Item is only required in an annual report on this Form N-CSR.
| | | |
| ITEM 3. | | AUDIT COMMITTEE FINANCIAL EXPERT. |
The information required by this Item is only required in an annual report on this Form N-CSR.
| | | |
| ITEM 4. | | PRINCIPAL ACCOUNTANT FEES AND SERVICES. |
The information required by this Item is only required in an annual report on this Form N-CSR.
| | | |
| ITEM 5. | | AUDIT COMMITTEE OF LISTED REGISTRANTS. |
| | | |
| | | Not applicable. |
| | | |
| ITEM 6. | | INVESTMENTS. |
| | | |
| | (a) | Schedules of Investments are included as part of the Semi-Annual Report to Stockholders filed under Item 1 of this Form N-CSR. |
| | | |
| | (b) | Not applicable. |
| | | |
| ITEM 7. | | DISCLOSURE OF PROXY VOTING POLICIES AND PROCEDURES FOR CLOSED-END MANAGEMENT INVESTMENT COMPANIES. |
| | | |
| | | Not applicable. |
| | | |
| ITEM 8. | | PORTFOLIO MANAGERS OF CLOSED-END MANAGEMENT INVESTMENT COMPANIES. |
| | | |
| | | Not applicable. |
| | | |
| ITEM 9. | | PURCHASES OF EQUITY SECURITIES BY CLOSED-END MANAGEMENT INVESTMENT COMPANY AND AFFILIATED PURCHASERS. |
| | | |
| | | Not applicable. |
| | | |
| ITEM 10. | | SUBMISSION OF MATTERS TO A VOTE OF SECURITY HOLDERS.
There have been no material changes to the procedures by which shareholders may recommend nominees to the registrant’s board of trustees. |
| | | |
| | | |
| ITEM 11. | | CONTROLS AND PROCEDURES. |
| | | |
| | (a) | | The registrant’s principal executive and principal financial officers, or persons performing similar functions have concluded that the registrant’s disclosure controls and procedures (as defined in Rule 30a-3(c) under the Investment Company Act of 1940, as amended (the “1940 Act”)) are effective as of a date within 90 days of the filing of this report that includes the disclosure required by this paragraph, based on the evaluation of these controls and procedures required by Rule 30a-3(b) under the 1940 Act and 15d-15(b) under the Securities Exchange Act of 1934, as amended. |
| | | |
| | (b) | | There were no changes in the registrant’s internal control over financial reporting (as defined in Rule 30a-3(d) under the 1940 Act) that occurred during the registrant’s second fiscal quarter of the period covered by this report that have materially affected, or are reasonably likely to materially affect, the registrant’s internal control over financial reporting. |
| | | |
| | (a)(1) | | | The information required by this Item is only required in an annual report on this Form N-CSR. |
| | | |
| | (a)(2) | | Exhibit 99.CERT | Certifications pursuant to Section 302 of the Sarbanes-Oxley Act of 2002 are filed herewith. |
| | | |
| | (a)(3) | | | Not applicable. |
| | | |
| | (b) | | Exhibit 99.906CERT | Certifications pursuant to Section 906 of the Sarbanes-Oxley Act of 2002 are filed herewith. |
SIGNATURES
| | | | Pursuant to the requirements of the Securities Exchange Act of 1934, as amended, and the Investment Company Act of 1940, as amended, the Registrant has duly caused this report to be signed on its behalf by the undersigned, thereunto duly authorized. |
| | | | | | | |
| | | | | Goldman Sachs Trust | | |
| | | | | | | |
| By: | | | | /s/ James A. McNamara | | |
| | | | |
| | |
| | | | | James A. McNamara | | |
| | | | | Principal Executive Officer | | |
| | | | | Goldman Sachs Trust | | |
| | | | | | | |
| Date: | | | | December 1, 2010 | | |
| | | | Pursuant to the requirements of the Securities Exchange Act of 1934, as amended, and the Investment Company Act of 1940, as amended, this report has been signed below by the following persons on behalf of the Registrant and in the capacities and on the dates indicated. |
| | | | | | | |
| By: | | | | /s/ James A. McNamara | | |
| | | | |
| | |
| | | | | James A. McNamara | | |
| | | | | Principal Executive Officer | | |
| | | | | Goldman Sachs Trust | | |
| | | | | | | |
| Date: | | | | December 1, 2010 | | |
| | | | | | | |
| By: | | | | /s/ George F. Travers | | |
| | | | |
| | |
| | | | | George F. Travers | | |
| | | | | Principal Financial Officer | | |
| | | | | Goldman Sachs Trust | | |
| | | | | | | |
| Date: | | | | December 1, 2010 | | |