UNITED STATES
SECURITIES AND EXCHANGE COMMISSION
Washington, D.C. 20549
FORM N-CSR
CERTIFIED SHAREHOLDER REPORT OF REGISTERED
MANAGEMENT INVESTMENT COMPANIES
Investment Company Act file number 811-05349
Goldman Sachs Trust
(Exact name of registrant as specified in charter)71 South Wacker Drive, Chicago, Illinois 60606
(Address of principal executive offices) (Zip code)| | | |
| Peter V. Bonanno, Esq. | | Copies to: |
| Goldman, Sachs & Co. | | Geoffrey R.T. Kenyon, Esq. |
| 200 West Street | | Dechert LLP |
| New York, New York 10282 | | 200 Clarendon Street |
| | | 27th Floor
Boston, MA 02116-5021 |
|
(Name and address of agents for service)
|
Registrant’s telephone number, including area code: (312) 655-4400
Date of fiscal year end: August 31
Date of reporting period: February 28, 2011
| | | |
| ITEM 1. | | REPORTS TO STOCKHOLDERS. |
| | | |
| | | The Semi-Annual Report to Stockholders is filed herewith. |
Goldman Sachs Funds
| | | | |
| | | | |
Semi-Annual Report | | | February 28, 2011 |
| | | | |
| | | | |
| | | | |
| | | | |
| | | | Retirement Strategies Portfolios |
| | | | Retirement Strategy 2010 Portfolio |
| | | | Retirement Strategy 2015 Portfolio |
| | | | Retirement Strategy 2020 Portfolio |
| | | | Retirement Strategy 2030 Portfolio |
| | | | Retirement Strategy 2040 Portfolio |
| | | | Retirement Strategy 2050 Portfolio |
| | | | |
Goldman Sachs Retirement Strategies Portfolios
| |
| n | GOLDMAN SACHS RETIREMENT STRATEGY 2010 PORTFOLIO |
| |
| n | GOLDMAN SACHS RETIREMENT STRATEGY 2015 PORTFOLIO |
| |
| n | GOLDMAN SACHS RETIREMENT STRATEGY 2020 PORTFOLIO |
| |
| n | GOLDMAN SACHS RETIREMENT STRATEGY 2030 PORTFOLIO |
| |
| n | GOLDMAN SACHS RETIREMENT STRATEGY 2040 PORTFOLIO |
| |
| n | GOLDMAN SACHS RETIREMENT STRATEGY 2050 PORTFOLIO |
| | | |
| TABLE OF CONTENTS | | |
| |
| | | |
| Principal Investment Strategies and Risks | | 1 |
| | | |
| Investment Process | | 2 |
| | | |
| Market Review | | 4 |
| | | |
Portfolio Management Discussion and
Performance Summaries | | 6 |
| | | |
| Schedules of Investments | | 20 |
| | | |
| Financial Statements | | 26 |
| | | |
| Notes to Financial Statements | | 33 |
| | | |
| Financial Highlights | | 44 |
| | | |
| Other Information | | 56 |
| | | | | | | |
NOT FDIC-INSURED | | | May Lose Value | | | No Bank Guarantee |
| | | | | | | |
GOLDMAN SACHS RETIREMENT STRATEGIES PORTFOLIOS
Principal Investment Strategies and Risks
The Retirement Strategies Portfolios are expected to invest all of their assets in a combination of affiliated underlying core equity, core fixed income, and other diversifier funds (“Underlying Funds”). Because the Portfolios are subject to the Underlying Fund expenses as well as their own expenses, the cost of this type of investment may be higher than a mutual fund that only invests in stocks and bonds. The risk factors to which the Portfolios are subject are proportionate to the amount of assets they allocate to each Underlying Fund. As the Portfolios are further away from their target date, the Portfolios will have a higher allocation to equity investments and will therefore have greater risk exposure to those risks associated with equity investments. As the Portfolios approach (and pass) their individual target date, their asset allocations will shift so that they invest a greater percentage of their assets in underlying fixed income funds. The Portfolios will then be more susceptible to the risks associated with fixed income investments.
Some of the risk factors associated with many of the underlying equity and certain of the other diversifier funds include the volatility of U.S. and non-U.S. equity investments, including Real Estate Investment Trusts (REITs)* ; the illiquidity associated with investments in small-capitalization companies; and the political, economic and currency risks of non-U.S. securities, which are particularly significant with respect to equities of issuers located in emerging markets. Some of the risk factors associated with many of the underlying fixed income and certain of the other diversifier funds include prepayment, credit and interest rate risk; the price fluctuations of U.S. government securities in response to changes in interest rates and inflation; the credit risk and volatility of high yield bonds; the volatility of investments in commodities; the political, economic and currency risks of non-U.S. securities, which are particularly significant with respect to issuers located in emerging markets; and financial risks associated with derivative investments.
Each Portfolio employs an asset allocation strategy designed for investors planning to retire at or around age 65 in approximately the calendar year designated in the Portfolio’s name (target date). Approximately five years after a Portfolio’s target date, the Portfolio expects that it will become part of another mutual fund managed by the Investment Adviser, the Goldman Sachs Income Strategies Portfolio, which has a current target allocation of approximately 60% of total assets in fixed income and 40% of total assets in equity. The principal value of a Portfolio is not guaranteed at any time and a Portfolio may experience losses, including near, at, or after the target date. There is no guarantee that a Portfolio will provide adequate income at and through retirement.
| | |
| * | A REIT is a corporation or trust that uses the pooled capital of many investors to purchase and manage income property. REITs are traded on major exchanges just like stocks. Source : InvestorWords.com | |
GOLDMAN SACHS RETIREMENT STRATEGIES PORTFOLIOS
What Differentiates Goldman Sachs’
Approach to Retirement Strategies?
We believe that strong, consistent investment results through asset allocation are best achieved through teams of experts working together on a global scale.
| |
| n | Goldman Sachs’ Quantitative Investment Strategies Team determines the strategic and quarterly tactical asset allocations. The team is comprised of over 110 professionals with significant academic and practitioner experience. |
| |
| n | Goldman Sachs’ Portfolio Management Teams offer expert management of the underlying Goldman Sachs mutual funds in which each Retirement Strategy Portfolio (each, a “Portfolio”) invests. These same teams manage portfolios for institutional and high net worth investors. |
Goldman Sachs Asset Allocation Investment Process
Quantitative Investment Strategies Team
Each Retirement Strategy Portfolio represents a diversified global portfolio on the efficient frontier. Aimed at helping investors reach their retirement goals, each Portfolio is designed to invest within a specified core equity, core fixed income and other diversifying asset class range, becoming more conservative as the Portfolio reaches its target date. The long-term strategic asset allocation is the primary source of risk and the corresponding primary determinant of total return. It therefore represents an anchor, or neutral starting point, from which tactical asset allocation decisions are made.
Quantitative Investment Strategies Team
For each Portfolio, the strategic asset allocation is combined with a measured amount of tactical risk. Changing market conditions create opportunities to capitalize on investing in different countries and asset classes relative to others over time. Within each Portfolio, we shift assets away from the strategic allocation (over and underweighting certain asset classes and countries) to seek to benefit from changing conditions in global capital markets.
Using proprietary portfolio construction models to maintain each Portfolio’s original risk/return profile over time, the team makes eight active decisions based on its current outlook on global equity, fixed income and currency markets.
| | | |
n Asset class selection | | Are stocks, bonds or cash more attractive? |
n Regional equity selection | | Are U.S. or non-U.S. equities more attractive? |
n Regional bond selection | | Are U.S. or non-U.S. bonds more attractive? |
n U.S. equity style selection | | Are U.S. value or U.S. growth equities more attractive? |
n U.S. equity size selection | | Are U.S. large-cap or U.S. small-cap equities more attractive? |
n Equity country selection | | Which international countries are more attractive? |
n High yield selection | | Are high yield or core fixed income securities more attractive? |
n Emerging/developed
equity selection | | Are emerging or developed equities more attractive? |
GOLDMAN SACHS RETIREMENT STRATEGIES PORTFOLIOS
Mutual Fund Portfolio Management Teams
Each Portfolio is comprised of underlying Goldman Sachs Mutual Funds managed by broad, deep portfolio management teams. In addition to global tactical asset allocation, we seek to generate excess returns through security selection within each underlying mutual fund. Whether in the core equity, core fixed income or other diversifying asset classes arenas, these portfolio management teams share a commitment to firsthand fundamental research and seek performance driven by successful security selection.
Enhancements Made to Proprietary Quantitative Model during the Six-Month Period Ended February 28, 2011
To construct the Retirement Strategies Portfolios (the “Portfolios”), the Quantitative Investment Strategies (“QIS”) team makes active decisions based on its current outlook on global equity, fixed income and currency markets. On a quarterly basis, in order to benefit from changing conditions in global capital markets, the QIS team shifts assets away from the existing allocation (i.e., tactically tilting the Portfolios’ positions in certain asset classes and countries from their strategic, long-term weights).
The QIS team’s Global Tactical Asset Allocation (GTAA) model, which drives the tactical views implemented in the Portfolios, uses financial and economic factors in seeking to capture intuitive fundamental relationships across markets that are grounded in financial theory and have behavioral or economic motivation. The QIS team’s approach is to combine traditional fundamental analysis with sophisticated quantitative modeling and, through proprietary daily risk models, to carefully construct and manage risk in the Portfolios.
During the six-month period ended February 28, 2011, the QIS team enhanced the GTAA model by refining various signals in its currency, bond and equity strategies. The QIS team believes these enhancements will further add value to its process over time.
MARKET REVIEW
Goldman Sachs Retirement Strategies Portfolios
Market Review
After a slowdown that raised fears of a double dip recession, the global economic recovery regained momentum during the six months ended February 28, 2011 (the “Reporting Period”).
When the Reporting Period began in September 2010, U.S. economic data was mixed. Earlier gains in U.S. industrial production and business investment had leveled out, and though activity slowed across manufacturing and services, these sectors still continued to expand. The exception to this pattern in the U.S. economy was consumer demand, which remained constrained by ongoing job losses and a persistently weak housing market.
Still, as the Reporting Period progressed, investor sentiment was buoyed by strong corporate earnings and confidence in accommodative monetary and fiscal policy, including the formal announcement of a second round of quantitative easing by the Federal Reserve (“the Fed”) in November and the extension of tax cuts by the U.S. government in December. U.S. economic growth increased with the Gross Domestic Product (“GDP”) expanding at an annualized rate of 2.6% in the third quarter and 2.8% in fourth quarter. Robust sales figures, strong increases in purchasing and manufacturing surveys, and increased business spending were reported. Although the labor market did not show a consistently positive trend, conditions began to improve. In December, the unemployment rate declined to 9.4%, with non-farm payrolls showing a modest increase of 103,000 jobs. Although job growth was meager in January, the rate of joblessness fell further to 9.0%. The unemployment rate then dropped to 8.9% in February as non-farm payrolls increased by 192,000 jobs.
The economic recovery continued overseas as well. The Eurozone beat expectations despite the divergence between the economic strength of Germany and the economic contractions in peripheral European Union member states. Growth in many emerging market countries tended to be far more robust than that of their developed market counterparts.
Equity Markets
U.S. and international equity indices posted substantial gains during the Reporting Period, reflecting increased confidence about the global economic recovery. The U.S. equity market, as represented by the Standard & Poor’s 500® Index (the “S&P 500 Index”), posted a return of 27.73% for the Reporting Period. Notably, the U.S. equity market outpaced the developed international equity markets, as investors gained confidence in the U.S. economic recovery. The MSCI EAFE Index (Net), representing non-U.S. equity markets, rose 23.77%. In the last two months of the Reporting Period, unrest in the Arab nations, particularly the fall of Egypt’s Mubarak government and violent clashes in Libya, prompted investor flows from emerging to developed equity markets, such as the U.S. Still, the emerging equity markets, represented by the MSCI Emerging Markets Index (Net), rose 14.95% for the Reporting Period overall.
From a capitalization perspective within the U.S. equity market, small-cap companies performed best, followed by mid-cap companies and then large-cap companies. Growth stocks outperformed value stocks across the capitalization spectrum. (All as measured by Russell Investments indices.)
MARKET REVIEW
Fixed Income Markets
The fixed income market experienced mixed results during the Reporting Period. In the U.S., government bonds and investment grade corporate bonds were among the weakest-performing sectors with longer-term maturities generally turning in the worst results. High yield corporate bonds posted the largest gains. The Barclays Capital U.S. High Yield Bond Index (2% Cap), up 10.05%, significantly outperformed the Barclays Capital U.S. Aggregate Bond Index, which returned -0.83%.
The global fixed income market, as represented by the Barclays Capital Global Aggregate Bond Index (U.S. dollar hedged), was up 1.77% for the Reporting Period. Emerging markets debt, as represented by the JP Morgan EMBI Global Diversified Index, was relatively flat at -0.52%. During the Reporting Period, there was concern that rising inflation in many of these high growth economies would prompt interest rate increases. Still, both dollar-denominated and local currency emerging market bonds benefited from strong investor demand for higher yields, with local currency bonds receiving additional support from currency appreciation versus the U.S. dollar.
Regional and Sector Preferences
Equities
n Regional — The Quantitative Investment Strategies (“QIS”) team grew increasingly bullish on equities versus fixed income as a result of equities’ inexpensive long-term valuations. The QIS team preferred international equities relative to U.S. equities until the beginning of 2011 when supportive macroeconomic conditions and strong momentum in U.S. stocks led to a shift in preference for U.S. equities over international equities. When the Reporting Period began, the QIS team favored emerging market equities versus developed market equities, becoming relatively neutral at the end of 2010 and then bearish in early 2011 because of expensive valuations, weak momentum and poor investment flows for emerging market equities.
The QIS Team implemented its country level views within the Goldman Sachs Structured International Equity Fund and the Goldman Sachs Structured Emerging Markets Equity Fund, which served as two of the Portfolios’ Underlying Funds.
n Style and Size — Among U.S. equities, the Portfolios were overweight U.S. value stocks at the beginning of the Reporting Period, largely because U.S. value stocks appeared relatively inexpensive compared to U.S. growth stocks. However, in response to weak momentum and lower risk premiums in the fourth quarter of 2010, the QIS team shifted the Portfolios to a neutral position. Throughout the Reporting Period, the Portfolios maintained an overweight to small-cap stocks relative to large-cap stocks. However, near the end of the Reporting Period, as small-cap stocks appeared increasingly expensive versus large-cap stocks, the QIS team moderated its bullish view and slightly reduced the Portfolios’ overweighted position.
Fixed Income
During the Reporting Period, the QIS team preferred international fixed income over U.S. fixed income because of that segment’s relatively less expensive valuations and strong short-term momentum. Within U.S. fixed income, the QIS team favored U.S. high yield bonds over investment-grade bonds because of a supportive interest rate environment and strong momentum.
PORTFOLIO RESULTS
Goldman Sachs Retirement Strategies Portfolios
Portfolio Management Discussion and Analysis
Below, the Goldman Sachs Quantitative Investment Strategies Team discusses the Portfolios’ performance and positioning for the six-month period ended February 28, 2011 (the “Reporting Period”).
| |
| Q | How did the Goldman Sachs Retirement Strategies Portfolios (the “Portfolios”) perform during the Reporting Period? |
| |
| A | Goldman Sachs Retirement Strategy 2010 Portfolio — During the Reporting Period, the Portfolio’s Class A, Institutional, IR and R Shares generated cumulative total returns, without sales charges, of 15.42%, 15.59%, 15.60% and 15.32%, respectively. This compares to the 12.76% cumulative total return of the Portfolio’s blended benchmark, which is comprised of the S&P 500® Index, the Barclays Capital U.S. Aggregate Bond Index and the MSCI EAFE Index (Net), during the same period. |
Goldman Sachs Retirement Strategy 2015 Portfolio — During the Reporting Period, the Portfolio’s Class A, Institutional, IR and R Shares generated cumulative total returns, without sales charges, of 17.58%, 17.97%, 17.84% and 17.50%, respectively. This compares to the 15.04% cumulative total return of the Portfolio’s blended benchmark, which is comprised of the S&P 500® Index, the Barclays Capital U.S. Aggregate Bond Index and the MSCI EAFE Index (Net), during the same period.
Goldman Sachs Retirement Strategy 2020 Portfolio — During the Reporting Period, the Portfolio’s Class A, Institutional, IR and R Shares generated cumulative total returns, without sales charges, of 19.67%, 19.80%, 19.78% and 19.52%, respectively. This compares to the 17.02% cumulative total return of the Portfolio’s blended benchmark, which is comprised of the S&P 500® Index, the Barclays Capital U.S. Aggregate Bond Index and the MSCI EAFE Index (Net), during the same period.
Goldman Sachs Retirement Strategy 2030 Portfolio — During the Reporting Period, the Portfolio’s Class A, Institutional, IR and R Shares generated cumulative total returns, without sales charges, of 22.38%, 22.54%, 22.45% and 22.04%, respectively. This compares to the 19.93% cumulative total return of the Portfolio’s blended benchmark, which is comprised of the S&P 500® Index, the Barclays Capital U.S. Aggregate Bond Index and the MSCI EAFE Index (Net), during the same period.
Goldman Sachs Retirement Strategy 2040 Portfolio — During the Reporting Period, the Portfolio’s Class A, Institutional, IR and R Shares generated cumulative total returns, without sales charges, of 23.36%, 23.81%, 23.68% and 23.33%, respectively. This compares to the 21.41% cumulative total return of the Portfolio’s blended benchmark, which is comprised of the S&P 500® Index, the Barclays Capital U.S. Aggregate Bond Index and the MSCI EAFE Index (Net), during the same period.
Goldman Sachs Retirement Strategy 2050 Portfolio — During the Reporting Period, the Portfolio’s Class A, Institutional, IR and R Shares generated cumulative total returns, without sales charges, of 24.90%, 24.96%, 24.83% and 24.77%, respectively. This compares to the 22.83% cumulative total return of the Portfolio’s blended benchmark, which is comprised of the S&P 500® Index, the Barclays Capital U.S. Aggregate Bond Index and the MSCI EAFE Index (Net), during the same period.
The components of the Portfolios’ blended benchmarks generated cumulative total returns of 27.73%, -0.83% and 23.77% for the S&P 500® Index, the Barclays Capital U.S. Aggregate Bond Index and the MSCI EAFE Index (Net), respectively, during the same period. The differing returns of the Portfolios’ blended benchmarks reflect the varying percentages of the components comprising each blended benchmark.
| |
| Q | What key factors affected the Portfolios’ performance during the Reporting Period? |
| |
| A | During the Reporting Period, all six Portfolios provided positive results. Our strategic, long-term asset allocation policy and our quarterly tactical decisions added to the Portfolios’ relative performance. The performance of the Underlying Funds overall also enhanced results. |
| |
| Q | How did Global Tactical Asset Allocation decisions help or hurt the Portfolios’ performance during the Reporting Period? |
| |
| A | During the Reporting Period, the implementation of our quarterly tactical views contributed to the performance of all six Portfolios. |
PORTFOLIO RESULTS
As equities outperformed fixed income during the Reporting Period, our preference for global equities over global fixed income contributed positively.
Within the Portfolios’ equity allocation, an overweighted position to small-cap stocks versus large-cap stocks from the beginning of the Reporting Period through the end of 2010 was advantageous. Small-cap stocks significantly outpaced large-cap stocks during the Reporting Period as a whole. The impact of the Portfolios’ overweight to U.S. value stocks over U.S. growth stocks was flat.
Our preference for developed market stocks over emerging market stocks in January and February 2011 boosted relative results, as developed market stocks outperformed their emerging market counterparts during these months. Our views on domestic equities versus international equities detracted from the Portfolios’ performance during the Reporting Period overall.
In fixed income, the Portfolios’ modestly overweighted position to high yield bonds versus investment-grade bonds enhanced their relative performance. Our preference for international fixed income versus U.S. fixed income detracted slightly from results during the Reporting Period.
| |
| Q | How did the Portfolios’ Underlying Funds perform relative to their respective benchmark indices during the Reporting Period? |
| |
| A | During the Reporting Period, the performance of the Underlying Funds overall enhanced the Portfolios’ results. Among Underlying Core Equity Funds, the Goldman Sachs Structured International Equity Fund and the Goldman Sachs Structured Small Cap Equity Fund performed best relative to their respective benchmark indices. The Goldman Sachs Strategic Growth Fund and the Goldman Sachs Structured Large Cap Growth Fund underperformed most relative to their respective benchmark indices. |
Among Underlying Core Fixed Income Funds, the Goldman Sachs Core Fixed Income Fund outperformed most relative to its respective benchmark index. The Goldman Sachs Inflation Protected Securities Fund underperformed most relative to its benchmark index. Among Underlying Other Diversifier Funds, the Goldman Sachs Structured International Small Cap Fund and the Goldman Sachs Structured Emerging Markets Equity Funds performed best relative to their respective benchmark indices. The Goldman Sachs Real Estate Securities Fund and the Goldman Sachs Absolute Return Tracker Fund underperformed most relative to their benchmark indices during the Reporting Period.
| |
| Q | How did the Portfolios use derivatives during the Reporting Period? |
| |
| A | The Portfolios do not directly invest in derivatives. However, some of the Underlying Funds used derivatives during the Reporting Period to apply their active investment views with greater versatility and to afford greater risk management precision. As market conditions warranted during the Reporting Period, some of these Underlying Funds engaged in forward foreign currency exchange contracts, financial futures contracts and swap contracts to enhance return and for hedging purposes. |
| |
| Q | What tactical changes did you make during the Reporting Period within both the equity and fixed income portions of the Portfolios? |
| |
| A | We grew increasingly bullish on equities versus fixed income during the Reporting Period. In the fourth quarter of 2010, we favored international equities over U.S. equities. We reversed our view in early 2011 and became bullish on U.S. equities over international equities. Although we favored value stocks over growth stocks at the beginning of the Reporting Period, we adopted a relatively neutral position during the fourth quarter and through the end of the Reporting Period. We moderated our preference for small-cap stocks over large-cap stocks. From an overweight in emerging market equities versus developed market equities, we shifted the Portfolios to a neutral position during the fourth calendar quarter and then to an underweight in early 2011. |
In fixed income, we moderated the Portfolios’ overweight to non-U.S. fixed income versus U.S. fixed income. Throughout the Reporting Period, the Portfolios remained consistently overweight to U.S. high yield bonds relative to investment-grade bonds.
| |
| Q | What was the Portfolios’ tactical view and strategy at the end of the Reporting Period? |
| |
| A | As of February 28, 2011, we remained bullish on stocks relative to bonds because of, in our view, equities’ inexpensive long-term valuations. Within the U.S. equity market, the Portfolios were neutral value stocks versus growth stocks and overweight small-cap stocks versus large-cap stocks. The Portfolios were overweight U.S. equities relative to international equities. We favored developed market stocks versus the stocks of emerging nations, and we continued to have a preference for international fixed income relative to U.S. fixed income. We were slightly bullish on high yield bonds relative to investment-grade fixed income. |
FUND BASICS
Retirement Strategy 2010 Portfolio
as of February 28, 2011
| | | | | | | |
| September 1, 2010–February 28, 2011 | | Portfolio Total Return (based on NAV)1 | | |
|
| |
| Class A | | | 15.42 | % | | |
| Institutional | | | 15.59 | | | |
| Class IR | | | 15.60 | | | |
| Class R | | | 15.32 | | | |
|
| | |
| 1 | | The net asset value (NAV) represents the net assets of the class of the Portfolio (ex-dividend) divided by the total number of shares of the class outstanding. The Portfolio’s performance assumes the reinvestment of dividends and other distributions. The Portfolio’s performance does not reflect the deduction of any applicable sales charges. |
| |
| STANDARDIZED AVERAGE ANNUAL TOTAL RETURNS2 | |
| | | | | | | | | | | | | |
| For the period ended 12/31/10 | | One Year | | Since Inception | | Inception Date | | |
|
| |
| Class A | | | 4.01 | % | | | -2.38 | % | | 9/5/07 | | |
| Institutional | | | 10.59 | | | | -0.30 | | | 9/5/07 | | |
| Class IR | | | 10.46 | | | | -1.39 | | | 11/30/07 | | |
| Class R | | | 9.89 | | | | -1.88 | | | 11/30/07 | | |
|
| | |
| 2 | | The Standardized Average Annual Total Returns are average annual total returns as of the most recent calendar quarter-end. They assume reinvestment of all distributions at NAV. These returns reflect a maximum initial sales charge of 5.5% for Class A Shares. Because Institutional, Class IR and Class R Shares do not involve a sales charge, such a charge is not applied to their Standardized Average Annual Total Returns. |
| |
| | The returns represent past performance. Past performance does not guarantee future results. The Portfolio’s investment return and principal value of an investment will fluctuate and, therefore, an investor’s shares, when redeemed, may be worth more or less than their original cost. Current performance may be lower or higher than the total return figures in the above charts. Please visit www.goldmansachsfunds.com to obtain the most recent month-end returns. Performance reflects expense limitations in effect. In their absence, performance would be reduced. Returns do not reflect the deduction of taxes that a shareholder would pay on Portfolio distributions or the redemption of Portfolio shares. |
| | | | | | | | | |
| | | Net Expense Ratio (Current) | | Gross Expense Ratio (Before Waivers) |
|
| |
| Class A | | | 1.25 | % | | | 2.76 | % |
| Institutional | | | 0.85 | | | | 2.36 | |
| Class IR | | | 1.00 | | | | 2.51 | |
| Class R | | | 1.50 | | | | 3.01 | |
|
| | |
| 3 | | The expense ratios of the Portfolio, both current (net of applicable fee waivers and/or expense limitations) and before waivers (gross of applicable fee waivers and/or expense limitations), are as set forth above according to the most recent publicly available Prospectus for the Portfolio and may differ from the expense ratios disclosed in the Financial Highlights in this report due to Underlying Fund fees and expenses. Applicable waivers and expense limitations may be modified or terminated in the future, consistent with the terms of any agreements in place. If this occurs, the expense ratios may change without shareholder approval. |
FUND BASICS
| |
| OVERALL UNDERLYING FUND WEIGHTINGS4 | |
Percentage of Net Assets
| | |
| 4 | | The Portfolio is actively managed and, as such, its composition may differ over time. The percentage shown for each underlying fund reflects the value of that underlying fund as a percentage of net assets of the Portfolio. Figures in the above graph may not sum to 100% due to rounding and/or the exclusion of other assets and liabilities. |
FUND BASICS
Retirement Strategy 2015 Portfolio
as of February 28, 2011
| | | | | | | |
| September 1, 2010–February 28, 2011 | | Portfolio Total Return (based on NAV)1 | | |
|
| |
| Class A | | | 17.58 | % | | |
| Institutional | | | 17.97 | | | |
| Class IR | | | 17.84 | | | |
| Class R | | | 17.50 | | | |
|
| | |
| 1 | | The net asset value (NAV) represents the net assets of the class of the Portfolio (ex-dividend) divided by the total number of shares of the class outstanding. The Portfolio’s performance assumes the reinvestment of dividends and other distributions. The Portfolio’s performance does not reflect the deduction of any applicable sales charges. |
| |
| STANDARDIZED AVERAGE ANNUAL TOTAL RETURNS2 | |
| | | | | | | | | | | | | |
| For the period ended 12/31/10 | | One Year | | Since Inception | | Inception Date | | |
|
| |
| Class A | | | 4.33 | % | | | -3.45 | % | | 9/5/07 | | |
| Institutional | | | 10.91 | | | | -1.40 | | | 9/5/07 | | |
| Class IR | | | 10.63 | | | | -2.50 | | | 11/30/07 | | |
| Class R | | | 10.09 | | | | -3.00 | | | 11/30/07 | | |
|
| | |
| 2 | | The Standardized Average Annual Total Returns are average annual total returns as of the most recent calendar quarter-end. They assume reinvestment of all distributions at NAV. These returns reflect a maximum initial sales charge of 5.5% for Class A Shares. Because Institutional, Class IR and Class R Shares do not involve a sales charge, such a charge is not applied to their Standardized Average Annual Total Returns. |
| |
| | The returns represent past performance. Past performance does not guarantee future results. The Portfolio’s investment return and principal value of an investment will fluctuate and, therefore, an investor’s shares, when redeemed, may be worth more or less than their original cost. Current performance may be lower or higher than the total return figures in the above charts. Please visit www.goldmansachsfunds.com to obtain the most recent month-end returns. Performance reflects expense limitations in effect. In their absence, performance would be reduced. Returns do not reflect the deduction of taxes that a shareholder would pay on Portfolio distributions or the redemption of Portfolio shares. |
| | | | | | | | | |
| | | Net Expense Ratio (Current) | | Gross Expense Ratio (Before Waivers) |
|
| |
| Class A | | | 1.28 | % | | | 2.87 | % |
| Institutional | | | 0.88 | | | | 2.47 | |
| Class IR | | | 1.03 | | | | 2.62 | |
| Class R | | | 1.53 | | | | 3.12 | |
|
| | |
| 3 | | The expense ratios of the Portfolio, both current (net of applicable fee waivers and/or expense limitations) and before waivers (gross of applicable fee waivers and/or expense limitations), are as set forth above according to the most recent publicly available Prospectus for the Portfolio and may differ from the expense ratios disclosed in the Financial Highlights in this report due to Underlying Fund fees and expenses. Applicable waivers and expense limitations may be modified or terminated in the future, consistent with the terms of any agreements in place. If this occurs, the expense ratios may change without shareholder approval. |
FUND BASICS
| |
| OVERALL UNDERLYING FUND WEIGHTINGS4 | |
Percentage of Net Assets
| | |
| 4 | | The Portfolio is actively managed and, as such, its composition may differ over time. The percentage shown for each underlying fund reflects the value of that underlying fund as a percentage of net assets of the Portfolio. Figures in the above graph may not sum to 100% due to rounding and/or the exclusion of other assets and liabilities. |
FUND BASICS
Retirement Strategy 2020 Portfolio
as of February 28, 2011
| | | | | | | |
| September 1, 2010–February 28, 2011 | | Portfolio Total Return (based on NAV)1 | | |
|
| |
| Class A | | | 19.67 | % | | |
| Institutional | | | 19.80 | | | |
| Class IR | | | 19.78 | | | |
| Class R | | | 19.52 | | | |
|
| | |
| 1 | | The net asset value (NAV) represents the net assets of the class of the Portfolio (ex-dividend) divided by the total number of shares of the class outstanding. The Portfolio’s performance assumes the reinvestment of dividends and other distributions. The Portfolio’s performance does not reflect the deduction of any applicable sales charges. |
| |
| STANDARDIZED AVERAGE ANNUAL TOTAL RETURNS2 | |
| | | | | | | | | | | | | |
| For the period ended 12/31/10 | | One Year | | Since Inception | | Inception Date | | |
|
| |
| Class A | | | 4.81 | % | | | -4.31 | % | | 9/5/07 | | |
| Institutional | | | 11.24 | | | | -2.29 | | | 9/5/07 | | |
| Class IR | | | 11.36 | | | | -3.36 | | | 11/30/07 | | |
| Class R | | | 10.61 | | | | -3.87 | | | 11/30/07 | | |
|
| | |
| 2 | | The Standardized Average Annual Total Returns are average annual total returns as of the most recent calendar quarter-end. They assume reinvestment of all distributions at NAV. These returns reflect a maximum initial sales charge of 5.5% for Class A Shares. Because Institutional, Class IR and Class R Shares do not involve a sales charge, such a charge is not applied to their Standardized Average Annual Total Returns. |
| |
| | The returns represent past performance. Past performance does not guarantee future results. The Portfolio’s investment return and principal value of an investment will fluctuate and, therefore, an investor’s shares, when redeemed, may be worth more or less than their original cost. Current performance may be lower or higher than the total return figures in the above charts. Please visit www.goldmansachsfunds.com to obtain the most recent month-end returns. Performance reflects expense limitations in effect. In their absence, performance would be reduced. Returns do not reflect the deduction of taxes that a shareholder would pay on Portfolio distributions or the redemption of Portfolio shares. |
| | | | | | | | | |
| | | Net Expense Ratio (Current) | | Gross Expense Ratio (Before Waivers) |
|
| |
| Class A | | | 1.30 | % | | | 2.66 | % |
| Institutional | | | 0.90 | | | | 2.26 | |
| Class IR | | | 1.05 | | | | 2.41 | |
| Class R | | | 1.55 | | | | 2.91 | |
|
| | |
| 3 | | The expense ratios of the Portfolio, both current (net of applicable fee waivers and/or expense limitations) and before waivers (gross of applicable fee waivers and/or expense limitations), are as set forth above according to the most recent publicly available Prospectus for the Portfolio and may differ from the expense ratios disclosed in the Financial Highlights in this report due to Underlying Fund fees and expenses. Applicable waivers and expense limitations may be modified or terminated in the future, consistent with the terms of any agreements in place. If this occurs, the expense ratios may change without shareholder approval. |
FUND BASICS
| |
| OVERALL UNDERLYING FUND WEIGHTINGS4 | |
Percentage of Net Assets
| | |
| 4 | | The Portfolio is actively managed and, as such, its composition may differ over time. The percentage shown for each underlying fund reflects the value of that underlying fund as a percentage of net assets of the Portfolio. Figures in the above graph may not sum to 100% due to rounding and/or the exclusion of other assets and liabilities. |
FUND BASICS
Retirement Strategy 2030 Portfolio
as of February 28, 2011
| | | | | | | |
| September 1, 2010–February 28, 2011 | | Portfolio Total Return (based on NAV)1 | | |
|
| |
| Class A | | | 22.38 | % | | |
| Institutional | | | 22.54 | | | |
| Class IR | | | 22.45 | | | |
| Class R | | | 22.04 | | | |
|
| | |
| 1 | | The net asset value (NAV) represents the net assets of the class of the Portfolio (ex-dividend) divided by the total number of shares of the class outstanding. The Portfolio’s performance assumes the reinvestment of dividends and other distributions. The Portfolio’s performance does not reflect the deduction of any applicable sales charges. |
| |
| STANDARDIZED AVERAGE ANNUAL TOTAL RETURNS2 | |
| | | | | | | | | | | | | |
| For the period ended 12/31/10 | | One Year | | Since Inception | | Inception Date | | |
|
| |
| Class A | | | 5.28 | % | | | -5.51 | % | | 9/5/07 | | |
| Institutional | | | 11.94 | | | | -3.51 | | | 9/5/07 | | |
| Class IR | | | 11.69 | | | | -4.63 | | | 11/30/07 | | |
| Class R | | | 11.25 | | | | -5.10 | | | 11/30/07 | | |
|
| | |
| 2 | | The Standardized Average Annual Total Returns are average annual total returns as of the most recent calendar quarter-end. They assume reinvestment of all distributions at NAV. These returns reflect a maximum initial sales charge of 5.5% for Class A Shares. Because Institutional, Class IR and Class R Shares do not involve a sales charge, such a charge is not applied to their Standardized Average Annual Total Returns. |
| |
| | The returns represent past performance. Past performance does not guarantee future results. The Portfolio’s investment return and principal value of an investment will fluctuate and, therefore, an investor’s shares, when redeemed, may be worth more or less than their original cost. Current performance may be lower or higher than the total return figures in the above charts. Please visit www.goldmansachsfunds.com to obtain the most recent month-end returns. Performance reflects expense limitations in effect. In their absence, performance would be reduced. Returns do not reflect the deduction of taxes that a shareholder would pay on Portfolio distributions or the redemption of Portfolio shares. |
| | | | | | | | | |
| | | Net Expense Ratio (Current) | | Gross Expense Ratio (Before Waivers) |
|
| |
| Class A | | | 1.32 | % | | | 2.34 | % |
| Institutional | | | 0.92 | | | | 1.94 | |
| Class IR | | | 1.07 | | | | 2.09 | |
| Class R | | | 1.57 | | | | 2.59 | |
|
| | |
| 3 | | The expense ratios of the Portfolio, both current (net of applicable fee waivers and/or expense limitations) and before waivers (gross of applicable fee waivers and/or expense limitations), are as set forth above according to the most recent publicly available Prospectus for the Portfolio and may differ from the expense ratios disclosed in the Financial Highlights in this report due to Underlying Fund fees and expenses. Applicable waivers and expense limitations may be modified or terminated in the future, consistent with the terms of any agreements in place. If this occurs, the expense ratios may change without shareholder approval. |
FUND BASICS
| |
| OVERALL UNDERLYING FUND WEIGHTINGS4 | |
Percentage of Net Assets
| | |
| 4 | | The Portfolio is actively managed and, as such, its composition may differ over time. The percentage shown for each underlying fund reflects the value of that underlying fund as a percentage of net assets of the Portfolio. Figures in the above graph may not sum to 100% due to rounding and/or the exclusion of other assets and liabilities. |
FUND BASICS
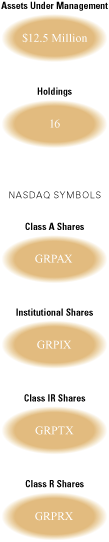
Retirement Strategy 2040 Portfolio
as of February 28, 2011
| | | | | | | |
| September 1, 2010–February 28, 2011 | | Portfolio Total Return (based on NAV)1 | | |
|
| |
| Class A | | | 23.36 | % | | |
| Institutional | | | 23.81 | | | |
| Class IR | | | 23.68 | | | |
| Class R | | | 23.33 | | | |
|
| | |
| 1 | | The net asset value (NAV) represents the net assets of the class of the Portfolio (ex-dividend) divided by the total number of shares of the class outstanding. The Portfolio’s performance assumes the reinvestment of dividends and other distributions. The Portfolio’s performance does not reflect the deduction of any applicable sales charges. |
| |
| STANDARDIZED AVERAGE ANNUAL TOTAL RETURNS2 | |
| | | | | | | | | | | | | |
| For the period ended 12/31/10 | | One Year | | Since Inception | | Inception Date | | |
|
| |
| Class A | | | 5.52 | % | | | -5.89 | % | | 9/5/07 | | |
| Institutional | | | 12.18 | | | | -3.90 | | | 9/5/07 | | |
| Class IR | | | 11.88 | | | | -5.02 | | | 11/30/07 | | |
| Class R | | | 11.48 | | | | -5.44 | | | 11/30/07 | | |
|
| | |
| 2 | | The Standardized Average Annual Total Returns are average annual total returns as of the most recent calendar quarter-end. They assume reinvestment of all distributions at NAV. These returns reflect a maximum initial sales charge of 5.5% for Class A Shares. Because Institutional, Class IR and Class R Shares do not involve a sales charge, such a charge is not applied to their Standardized Average Annual Total Returns. |
| |
| | The returns represent past performance. Past performance does not guarantee future results. The Portfolio’s investment return and principal value of an investment will fluctuate and, therefore, an investor’s shares, when redeemed, may be worth more or less than their original cost. Current performance may be lower or higher than the total return figures in the above charts. Please visit www.goldmansachsfunds.com to obtain the most recent month-end returns. Performance reflects expense limitations in effect. In their absence, performance would be reduced. Returns do not reflect the deduction of taxes that a shareholder would pay on Portfolio distributions or the redemption of Portfolio shares. |
| | | | | | | | | |
| | | Net Expense Ratio (Current) | | Gross Expense Ratio (Before Waivers) |
|
| |
| Class A | | | 1.34 | % | | | 2.86 | % |
| Institutional | | | 0.94 | | | | 2.46 | |
| Class IR | | | 1.09 | | | | 2.61 | |
| Class R | | | 1.59 | | | | 3.11 | |
|
| | |
| 3 | | The expense ratios of the Portfolio, both current (net of applicable fee waivers and/or expense limitations) and before waivers (gross of applicable fee waivers and/or expense limitations), are as set forth above according to the most recent publicly available Prospectus for the Portfolio and may differ from the expense ratios disclosed in the Financial Highlights in this report due to Underlying Fund fees and expenses. Applicable waivers and expense limitations may be modified or terminated in the future, consistent with the terms of any agreements in place. If this occurs, the expense ratios may change without shareholder approval. |
FUND BASICS
| |
| OVERALL UNDERLYING FUND WEIGHTINGS4 | |
Percentage of Net Assets
| | |
| 4 | | The Portfolio is actively managed and, as such, its composition may differ over time. The percentage shown for each underlying fund reflects the value of that underlying fund as a percentage of net assets of the Portfolio. Figures in the above graph may not sum to 100% due to rounding and/or the exclusion of other assets and liabilities. |
FUND BASICS
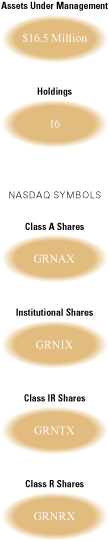
Retirement Strategy 2050 Portfolio
as of February 28, 2011
| | | | | | | |
| September 1, 2010–February 28, 2011 | | Portfolio Total Return (based on NAV)1 | | |
|
| |
| Class A | | | 24.90 | % | | |
| Institutional | | | 24.96 | | | |
| Class IR | | | 24.83 | | | |
| Class R | | | 24.77 | | | |
|
| | |
| 1 | | The net asset value (NAV) represents the net assets of the class of the Portfolio (ex-dividend) divided by the total number of shares of the class outstanding. The Portfolio’s performance assumes the reinvestment of dividends and other distributions. The Portfolio’s performance does not reflect the deduction of any applicable sales charges. |
| |
| STANDARDIZED AVERAGE ANNUAL TOTAL RETURNS2 | |
| | | | | | | | | | | | | |
| For the period ended 12/31/10 | | One Year | | Since Inception | | Inception Date | | |
|
| |
| Class A | | | 5.84 | % | | | -6.14 | % | | 9/5/07 | | |
| Institutional | | | 12.50 | | | | -4.17 | | | 9/5/07 | | |
| Class IR | | | 12.37 | | | | -5.31 | | | 11/30/07 | | |
| Class R | | | 11.60 | | | | -5.82 | | | 11/30/07 | | |
|
| | |
| 2 | | The Standardized Average Annual Total Returns are average annual total returns as of the most recent calendar quarter-end. They assume reinvestment of all distributions at NAV. These returns reflect a maximum initial sales charge of 5.5% for Class A Shares. Because Institutional, Class IR and Class R Shares do not involve a sales charge, such a charge is not applied to their Standardized Average Annual Total Returns. |
| |
| | The returns represent past performance. Past performance does not guarantee future results. The Portfolio’s investment return and principal value of an investment will fluctuate and, therefore, an investor’s shares, when redeemed, may be worth more or less than their original cost. Current performance may be lower or higher than the total return figures in the above charts. Please visit www.goldmansachsfunds.com to obtain the most recent month-end returns. Performance reflects expense limitations in effect. In their absence, performance would be reduced. Returns do not reflect the deduction of taxes that a shareholder would pay on Portfolio distributions or the redemption of Portfolio shares. |
| | | | | | | | | |
| | | Net Expense Ratio (Current) | | Gross Expense Ratio (Before Waivers) |
|
| |
| Class A | | | 1.34 | % | | | 3.35 | % |
| Institutional | | | 0.94 | | | | 2.95 | |
| Class IR | | | 1.09 | | | | 3.10 | |
| Class R | | | 1.59 | | | | 3.60 | |
|
| | |
| 3 | | The expense ratios of the Portfolio, both current (net of applicable fee waivers and/or expense limitations) and before waivers (gross of applicable fee waivers and/or expense limitations), are as set forth above according to the most recent publicly available Prospectus for the Portfolio and may differ from the expense ratios disclosed in the Financial Highlights in this report due to Underlying Fund fees and expenses. Applicable waivers and expense limitations may be modified or terminated in the future, consistent with the terms of any agreements in place. If this occurs, the expense ratios may change without shareholder approval. |
FUND BASICS
| |
| OVERALL UNDERLYING FUND WEIGHTINGS4 | |
Percentage of Net Assets
| | |
| 4 | | The Portfolio is actively managed and, as such, its composition may differ over time. The percentage shown for each underlying fund reflects the value of that underlying fund as a percentage of net assets of the Portfolio. Figures in the above graph may not sum to 100% due to rounding and/or the exclusion of other assets and liabilities. |
GOLDMAN SACHS RETIREMENT STRATEGY 2010 PORTFOLIO
Schedule of Investments
February 28, 2011 (Unaudited)
| | | | | | | | | |
| Shares | | Description | | Value |
| |
Underlying Funds (Institutional Shares)(a) – 100.5% |
Underlying Core Equity Funds – 50.9% |
| | 236,674 | | | Goldman Sachs Structured International Equity Fund – 21.1% | | $ | 2,631,812 | |
| | 87,187 | | | Goldman Sachs Structured Large Cap Growth Fund – 9.1% | | | 1,136,923 | |
| | 103,458 | | | Goldman Sachs Structured Large Cap Value Fund – 8.9% | | | 1,111,144 | |
| | 40,097 | | | Goldman Sachs Structured Small Cap Equity Fund – 4.2% | | | 525,675 | |
| | 43,887 | | | Goldman Sachs Strategic Growth Fund – 3.8% | | | 475,734 | |
| | 37,630 | | | Goldman Sachs Large Cap Value Fund – 3.8% | | | 473,387 | |
| | | | | | | | | |
| | | | | | | | 6,354,675 | |
| |
| |
Underlying Core Fixed Income Funds – 25.5% |
| | 146,532 | | | Goldman Sachs Inflation Protected Securities Fund – 12.8% | | | 1,598,659 | |
| | 79,464 | | | Goldman Sachs Global Income Fund – 8.1% | | | 1,008,404 | |
| | 58,672 | | | Goldman Sachs Core Fixed Income Fund – 4.6% | | | 578,503 | |
| | | | | | | | | |
| | | | | | | | 3,185,566 | |
| |
| |
Underlying Other Diversifier Funds – 24.1% |
| | 99,323 | | | Goldman Sachs Commodity Strategy Fund – 5.2% | | | 653,545 | |
| | 59,715 | | | Goldman Sachs Absolute Return Tracker Fund – 4.5% | | | 564,307 | |
| | 45,113 | | | Goldman Sachs Structured International Small Cap Fund – 3.3% | | | 406,469 | |
| | 44,404 | | | Goldman Sachs Structured Emerging Markets Equity Fund – 3.2% | | | 394,756 | |
| | 32,451 | | | Goldman Sachs High Yield Fund – 1.9% | | | 241,757 | |
| | 14,539 | | | Goldman Sachs Real Estate Securities Fund – 1.6% | | | 198,025 | |
| | 31,010 | | | Goldman Sachs International Real Estate Securities Fund – 1.6% | | | 196,290 | |
| | 19,007 | | | Goldman Sachs Local Emerging Markets Debt Fund – 1.4% | | | 177,716 | |
| | 13,879 | | | Goldman Sachs Emerging Markets Debt Fund – 1.4% | | | 168,902 | |
| | | | | | | | | |
| | | | | | | | 3,001,767 | |
| |
| |
TOTAL UNDERLYING FUNDS
(INSTITUTIONAL SHARES) – 100.5% |
(Cost $11,042,638) | | $ | 12,542,008 | |
| |
| |
LIABILITIES IN EXCESS OF
OTHER ASSETS – (0.5)% | | | (60,665 | ) |
| |
| |
NET ASSETS – 100.0% | | $ | 12,481,343 | |
| |
| |
The percentage shown for each investment and investment category reflects the value of the respective investment or category as a percentage of net assets.
| | |
| (a) | | Represents Affiliated Funds. |
20 The accompanying notes are an integral part of these financial statements.
GOLDMAN SACHS RETIREMENT STRATEGY 2015 PORTFOLIO
Schedule of Investments
February 28, 2011 (Unaudited)
| | | | | | | | | |
| Shares | | Description | | Value |
| |
Underlying Funds (Institutional Shares)(a) – 100.5% |
Underlying Core Equity Funds – 58.3% |
| | 281,347 | | | Goldman Sachs Structured International Equity Fund – 24.5% | | $ | 3,128,574 | |
| | 102,426 | | | Goldman Sachs Structured Large Cap Growth Fund – 10.5% | | | 1,335,629 | |
| | 121,415 | | | Goldman Sachs Structured Large Cap Value Fund – 10.2% | | | 1,303,999 | |
| | 51,673 | | | Goldman Sachs Strategic Growth Fund – 4.4% | | | 560,135 | |
| | 44,247 | | | Goldman Sachs Large Cap Value Fund – 4.4% | | | 556,631 | |
| | 41,792 | | | Goldman Sachs Structured Small Cap Equity Fund – 4.3% | | | 547,895 | |
| | | | | | | | | |
| | | | | | | | 7,432,863 | |
| |
| |
Underlying Core Fixed Income Funds – 17.6% |
| | 103,214 | | | Goldman Sachs Inflation Protected Securities Fund – 8.9% | | | 1,126,063 | |
| | 63,576 | | | Goldman Sachs Global Income Fund – 6.3% | | | 806,778 | |
| | 31,259 | | | Goldman Sachs Core Fixed Income Fund – 2.4% | | | 308,214 | |
| | | | | | | | | |
| | | | | | | | 2,241,055 | |
| |
| |
Underlying Other Diversifier Funds – 24.6% |
| | 109,621 | | | Goldman Sachs Commodity Strategy Fund – 5.7% | | | 721,308 | |
| | 59,854 | | | Goldman Sachs Absolute Return Tracker Fund – 4.4% | | | 565,616 | |
| | 50,274 | | | Goldman Sachs Structured Emerging Markets Equity Fund – 3.5% | | | 446,932 | |
| | 47,370 | | | Goldman Sachs Structured International Small Cap Fund – 3.4% | | | 426,801 | |
| | 31,083 | | | Goldman Sachs High Yield Fund – 1.8% | | | 231,572 | |
| | 14,548 | | | Goldman Sachs Real Estate Securities Fund – 1.6% | | | 198,141 | |
| | 31,102 | | | Goldman Sachs International Real Estate Securities Fund – 1.5% | | | 196,874 | |
| | 18,573 | | | Goldman Sachs Local Emerging Markets Debt Fund – 1.4% | | | 173,660 | |
| | 13,641 | | | Goldman Sachs Emerging Markets Debt Fund – 1.3% | | | 166,009 | |
| | | | | | | | | |
| | | | | | | | 3,126,913 | |
| |
| |
TOTAL UNDERLYING FUNDS
(INSTITUTIONAL SHARES) – 100.5% |
(Cost $10,797,983) | | $ | 12,800,831 | |
| |
| |
LIABILITIES IN EXCESS
OF OTHER ASSETS – (0.5)% | | | (57,693 | ) |
| |
| |
NET ASSETS – 100.0% | | $ | 12,743,138 | |
| |
| |
The percentage shown for each investment and investment category reflects the value of the respective investment or category as a percentage of net assets.
| | |
| (a) | | Represents Affiliated Funds. |
The accompanying notes are an integral part of these financial statements. 21
GOLDMAN SACHS RETIREMENT STRATEGY 2020 PORTFOLIO
Schedule of Investments
February 28, 2011 (Unaudited)
| | | | | | | | | |
| Shares | | Description | | Value |
| |
Underlying Funds (Institutional Shares)(a) – 100.3% |
Underlying Core Equity Funds – 64.7% |
| | 465,122 | | | Goldman Sachs Structured International Equity Fund – 27.6% | | $ | 5,172,161 | |
| | 167,604 | | | Goldman Sachs Structured Large Cap Growth Fund – 11.6% | | | 2,185,556 | |
| | 198,600 | | | Goldman Sachs Structured Large Cap Value Fund – 11.4% | | | 2,132,959 | |
| | 84,529 | | | Goldman Sachs Strategic Growth Fund – 4.9% | | | 916,290 | |
| | 72,352 | | | Goldman Sachs Large Cap Value Fund – 4.8% | | | 910,185 | |
| | 62,479 | | | Goldman Sachs Structured Small Cap Equity Fund – 4.4% | | | 819,096 | |
| | | | | | | | | |
| | | | | | | | 12,136,247 | |
| |
| |
Underlying Core Fixed Income Funds – 11.1% |
| | 95,673 | | | Goldman Sachs Inflation Protected Securities Fund – 5.6% | | | 1,043,795 | |
| | 68,552 | | | Goldman Sachs Global Income Fund – 4.6% | | | 869,928 | |
| | 16,398 | | | Goldman Sachs Core Fixed Income Fund – 0.9% | | | 161,682 | |
| | | | | | | | | |
| | | | | | | | 2,075,405 | |
| |
| |
Underlying Other Diversifier Funds – 24.5% |
| | 170,417 | | | Goldman Sachs Commodity Strategy Fund – 6.0% | | | 1,121,343 | |
| | 77,860 | | | Goldman Sachs Absolute Return Tracker Fund – 3.9% | | | 735,779 | |
| | 80,576 | | | Goldman Sachs Structured Emerging Markets Equity Fund – 3.8% | | | 716,316 | |
| | 71,241 | | | Goldman Sachs Structured International Small Cap Fund – 3.4% | | | 641,884 | |
| | 45,257 | | | Goldman Sachs High Yield Fund – 1.8% | | | 337,166 | |
| | 20,950 | | | Goldman Sachs Real Estate Securities Fund – 1.5% | | | 285,333 | |
| | 44,929 | | | Goldman Sachs International Real Estate Securities Fund – 1.5% | | | 284,397 | |
| | 26,243 | | | Goldman Sachs Local Emerging Markets Debt Fund – 1.3% | | | 245,368 | |
| | 19,253 | | | Goldman Sachs Emerging Markets Debt Fund – 1.3% | | | 234,306 | |
| | | | | | | | | |
| | | | | | | | 4,601,892 | |
| |
| |
TOTAL UNDERLYING FUNDS
(INSTITUTIONAL SHARES) – 100.3% |
(Cost $15,921,199) | | $ | 18,813,544 | |
| |
| |
LIABILITIES IN EXCESS OF
OTHER ASSETS – (0.3)% | | | (65,159 | ) |
| |
| |
NET ASSETS – 100.0% | | $ | 18,748,385 | |
| |
| |
The percentage shown for each investment and investment category reflects the value of the respective investment or category as a percentage of net assets.
| | |
| (a) | | Represents Affiliated Funds. |
22 The accompanying notes are an integral part of these financial statements.
GOLDMAN SACHS RETIREMENT STRATEGY 2030 PORTFOLIO
Schedule of Investments
February 28, 2011 (Unaudited)
| | | | | | | | | |
| Shares | | Description | | Value |
| |
Underlying Funds (Institutional Shares)(a) – 100.5% |
Underlying Core Equity Funds – 72.5% |
| | 798,996 | | | Goldman Sachs Structured International Equity Fund – 31.1% | | $ | 8,884,840 | |
| | 287,439 | | | Goldman Sachs Structured Large Cap Growth Fund – 13.1% | | | 3,748,209 | |
| | 339,997 | | | Goldman Sachs Structured Large Cap Value Fund – 12.8% | | | 3,651,573 | |
| | 144,881 | | | Goldman Sachs Strategic Growth Fund – 5.5% | | | 1,570,515 | |
| | 123,753 | | | Goldman Sachs Large Cap Value Fund – 5.5% | | | 1,556,807 | |
| | 96,981 | | | Goldman Sachs Structured Small Cap Equity Fund – 4.5% | | | 1,271,417 | |
| | | | | | | | | |
| | | | | | | | 20,683,361 | |
| |
| |
Underlying Core Fixed Income Funds – 5.0% |
| | 65,986 | | | Goldman Sachs Inflation Protected Securities Fund – 2.5% | | | 719,911 | |
| | 55,971 | | | Goldman Sachs Global Income Fund – 2.5% | | | 710,269 | |
| | | | | | | | | |
| | | | | | | | 1,430,180 | |
| |
| |
Underlying Other Diversifier Funds – 23.0% |
| | 265,146 | | | Goldman Sachs Commodity Strategy Fund – 6.1% | | | 1,744,659 | |
| | 133,933 | | | Goldman Sachs Structured Emerging Markets Equity Fund – 4.2% | | | 1,190,668 | |
| | 110,965 | | | Goldman Sachs Structured International Small Cap Fund – 3.5% | | | 999,791 | |
| | 101,609 | | | Goldman Sachs Absolute Return Tracker Fund – 3.4% | | | 960,202 | |
| | 31,395 | | | Goldman Sachs Real Estate Securities Fund – 1.5% | | | 427,600 | |
| | 67,331 | | | Goldman Sachs International Real Estate Securities Fund – 1.5% | | | 426,208 | |
| | 45,845 | | | Goldman Sachs High Yield Fund – 1.2% | | | 341,542 | |
| | 26,246 | | | Goldman Sachs Local Emerging Markets Debt Fund – 0.8% | | | 245,402 | |
| | 19,338 | | | Goldman Sachs Emerging Markets Debt Fund – 0.8% | | | 235,345 | |
| | | | | | | | | |
| | | | | | | | 6,571,417 | |
| |
| |
TOTAL UNDERLYING FUNDS
(INSTITUTIONAL SHARES) – 100.5% |
(Cost $24,175,313) | | $ | 28,684,958 | |
| |
| |
LIABILITIES IN EXCESS OF
OTHER ASSETS – (0.5)% | | | (141,493 | ) |
| |
| |
NET ASSETS – 100.0% | | $ | 28,543,465 | |
| |
| |
The percentage shown for each investment and investment category reflects the value of the respective investment or category as a percentage of net assets.
| | |
| (a) | | Represents Affiliated Funds. |
The accompanying notes are an integral part of these financial statements. 23
GOLDMAN SACHS RETIREMENT STRATEGY 2040 PORTFOLIO
Schedule of Investments
February 28, 2011 (Unaudited)
| | | | | | | | | |
| Shares | | Description | | Value |
| |
Underlying Funds (Institutional Shares)(a) – 100.4% |
Underlying Core Equity Funds – 75.7% |
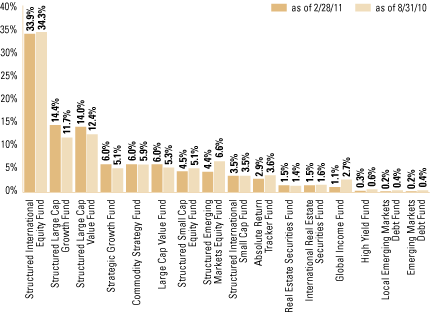
| | 483,587 | | | Goldman Sachs Structured International Equity Fund – 32.6% | | $ | 5,377,491 | |
| | 174,266 | | | Goldman Sachs Structured Large Cap Growth Fund – 13.7% | | | 2,272,422 | |
| | 205,979 | | | Goldman Sachs Structured Large Cap Value Fund – 13.4% | | | 2,212,211 | |
| | 87,886 | | | Goldman Sachs Strategic Growth Fund – 5.8% | | | 952,682 | |
| | 75,052 | | | Goldman Sachs Large Cap Value Fund – 5.7% | | | 944,159 | |
| | 56,382 | | | Goldman Sachs Structured Small Cap Equity Fund – 4.5% | | | 739,169 | |
| | | | | | | | | |
| | | | | | | | 12,498,134 | |
| |
| |
Underlying Core Fixed Income Funds – 3.0% |
| | 38,723 | | | Goldman Sachs Global Income Fund – 3.0% | | | 491,389 | |
| |
| |
Underlying Other Diversifier Funds – 21.7% |
| | 152,013 | | | Goldman Sachs Commodity Strategy Fund – 6.1% | | | 1,000,248 | |
| | 80,021 | | | Goldman Sachs Structured Emerging Markets Equity Fund – 4.3% | | | 711,387 | |
| | 64,617 | | | Goldman Sachs Structured International Small Cap Fund – 3.5% | | | 582,203 | |
| | 54,741 | | | Goldman Sachs Absolute Return Tracker Fund – 3.1% | | | 517,303 | |
| | 17,974 | | | Goldman Sachs Real Estate Securities Fund – 1.5% | | | 244,799 | |
| | 38,585 | | | Goldman Sachs International Real Estate Securities Fund – 1.5% | | | 244,245 | |
| | 15,958 | | | Goldman Sachs High Yield Fund – 0.7% | | | 118,886 | |
| | 9,079 | | | Goldman Sachs Local Emerging Markets Debt Fund – 0.5% | | | 84,884 | |
| | 6,663 | | | Goldman Sachs Emerging Markets Debt Fund – 0.5% | | | 81,090 | |
| | | | | | | | | |
| | | | | | | | 3,585,045 | |
| |
| |
TOTAL UNDERLYING FUNDS
(INSTITUTIONAL SHARES) – 100.4% |
(Cost $13,606,017) | | $ | 16,574,568 | |
| |
| |
LIABILITIES IN EXCESS OF
OTHER ASSETS – (0.4)% | | | (64,747 | ) |
| |
| |
NET ASSETS – 100.0% | | $ | 16,509,821 | |
| |
| |
The percentage shown for each investment and investment category reflects the value of the respective investment or category as a percentage of net assets.
| | |
| (a) | | Represents Affiliated Funds. |
24 The accompanying notes are an integral part of these financial statements.
GOLDMAN SACHS RETIREMENT STRATEGY 2050 PORTFOLIO
Schedule of Investments
February 28, 2011 (Unaudited)
| | | | | | | | | |
| Shares | | Description | | Value |
| |
Underlying Funds (Institutional Shares)(a) – 100.4% |
Underlying Core Equity Funds – 78.8% |
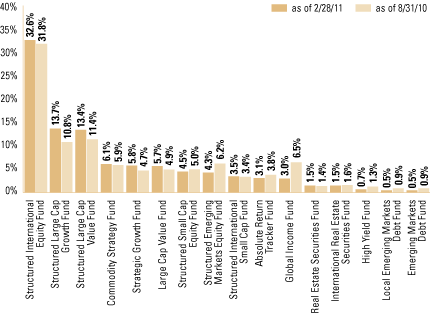
| | 381,747 | | | Goldman Sachs Structured International Equity Fund – 33.9% | | $ | 4,245,026 | |
| | 137,953 | | | Goldman Sachs Structured Large Cap Growth Fund – 14.4% | | | 1,798,903 | |
| | 163,031 | | | Goldman Sachs Structured Large Cap Value Fund – 14.0% | | | 1,750,958 | |
| | 69,574 | | | Goldman Sachs Strategic Growth Fund – 6.0% | | | 754,184 | |
| | 59,435 | | | Goldman Sachs Large Cap Value Fund – 6.0% | | | 747,688 | |
| | 42,965 | | | Goldman Sachs Structured Small Cap Equity Fund – 4.5% | | | 563,265 | |
| | | | | | | | | |
| | | | | | | | 9,860,024 | |
| |
| |
Underlying Core Fixed Income Funds – 1.1% |
| | 10,836 | | | Goldman Sachs Global Income Fund – 1.1% | | | 137,508 | |
| |
| |
Underlying Other Diversifier Funds – 20.5% |
| | 114,186 | | | Goldman Sachs Commodity Strategy Fund – 6.0% | | | 751,343 | |
| | 62,686 | | | Goldman Sachs Structured Emerging Markets Equity Fund – 4.4% | | | 557,279 | |
| | 49,315 | | | Goldman Sachs Structured International Small Cap Fund – 3.5% | | | 444,328 | |
| | 38,799 | | | Goldman Sachs Absolute Return Tracker Fund – 2.9% | | | 366,650 | |
| | 13,499 | | | Goldman Sachs Real Estate Securities Fund – 1.5% | | | 183,851 | |
| | 29,008 | | | Goldman Sachs International Real Estate Securities Fund – 1.5% | | | 183,620 | |
| | 4,476 | | | Goldman Sachs High Yield Fund – 0.3% | | | 33,349 | |
| | 2,548 | | | Goldman Sachs Local Emerging Markets Debt Fund – 0.2% | | | 23,827 | |
| | 1,847 | | | Goldman Sachs Emerging Markets Debt Fund – 0.2% | | | 22,478 | |
| | | | | | | | | |
| | | | | | | | 2,566,725 | |
| |
| |
TOTAL UNDERLYING FUNDS
(INSTITUTIONAL SHARES) – 100.4% |
(Cost $10,304,805) | | $ | 12,564,257 | |
| |
| |
LIABILITIES IN EXCESS OF
OTHER ASSETS – (0.4)% | | | (55,620 | ) |
| |
| |
NET ASSETS – 100.0% | | $ | 12,508,637 | |
| |
| |
The percentage shown for each investment and investment category reflects the value of the respective investment or category as a percentage of net assets.
| | |
| (a) | | Represents Affiliated Funds. |
The accompanying notes are an integral part of these financial statements. 25
GOLDMAN SACHS RETIREMENT STRATEGIES PORTFOLIOS
Statements of Assets and Liabilities
February 28, 2011 (Unaudited)
| | | | | | | |
| | | Retirement
| | |
| | | Strategy 2010
| | |
| | | Portfolio | | |
Assets: |
| | | | | | | |
| Investments in Affiliated Underlying Funds, at value (identified cost $11,042,638, $10,797,983, $15,921,199, $24,175,313, $13,606,017 and $10,304,805, respectively) | | $ | 12,542,008 | | | |
| Cash | | | 5,690 | | | |
| Receivables: | | | | | | |
| Dividends | | | 6,309 | | | |
| Reimbursement from investment adviser | | | 1,776 | | | |
| Portfolio shares sold | | | 1,912 | | | |
| |
| |
Total assets | | | 12,557,695 | | | |
| |
| |
| | | | | | | |
| | | | | | | |
Liabilities: |
| | | | | | | |
| Payables: | | | | | | |
| Investment securities purchased | | | 11,999 | | | |
| Amounts owed to affiliates | | | 3,948 | | | |
| Portfolio shares redeemed | | | 625 | | | |
| Accrued expenses | | | 59,780 | | | |
| |
| |
Total liabilities | | | 76,352 | | | |
| |
| |
| | | | | | | |
| | | | | | | |
Net Assets: |
| | | | | | | |
| Paid-in capital | | | 13,243,140 | | | |
| Accumulated undistributed (distributions in excess of) net investment income | | | (89,005 | ) | | |
| Accumulated net realized loss from investment transactions | | | (2,172,162 | ) | | |
| Net unrealized gain on investments | | | 1,499,370 | | | |
| |
| |
NET ASSETS | | $ | 12,481,343 | | | |
| | | | | | | |
| Net Assets: | | | | | | |
| Class A | | $ | 5,091,467 | | | |
| Institutional | | | 5,284,200 | | | |
| Class IR | | | 9,921 | | | |
| Class R | | | 2,095,755 | | | |
| | | | | | | |
| | | | | | | |
| Total Net Assets | | $ | 12,481,343 | | | |
| | | | | | | |
| Shares Outstanding $0.001 par value (unlimited shares authorized): | | | | | | |
| Class A | | | 574,359 | | | |
| Institutional | | | 593,556 | | | |
| Class IR | | | 1,116 | | | |
| Class R | | | 236,739 | | | |
| | | | | | | |
Net asset value, offering and redemption price per share:(a) | | | | | | |
| Class A | | | $8.86 | | | |
| Institutional | | | 8.90 | | | |
| Class IR | | | 8.89 | | | |
| Class R | | | 8.85 | | | |
| | | | | | | |
| | |
| (a) | | Maximum public offering price per share (NAV per share multiplied by 1.0582) for Class A Shares of the Retirement Strategy 2010, Retirement Strategy 2015, Retirement Strategy 2020, Retirement Strategy 2030, Retirement Strategy 2040 and Retirement Strategy 2050 Portfolios is $9.38, $9.01, $8.81, $8.50, $8.32 and $8.32, respectively. |
26 The accompanying notes are an integral part of these financial statements.
GOLDMAN SACHS RETIREMENT STRATEGIES PORTFOLIOS
| | | | | | | | | | | | | | | | | | | | | |
Retirement
| | Retirement
| | Retirement
| | Retirement
| | Retirement
| | |
Strategy 2015
| | Strategy 2020
| | Strategy 2030
| | Strategy 2040
| | Strategy 2050
| | |
| Portfolio | | Portfolio | | Portfolio | | Portfolio | | Portfolio | | |
| |
| | | | | | | | | | | | | | | | | | | | | |
| | | | | | | | | | | | | | | | | | | | | |
| $ | 12,800,831 | | | $ | 18,813,544 | | | $ | 28,684,958 | | | $ | 16,574,568 | | | $ | 12,564,257 | | | |
| | 2,433 | | | | 16,223 | | | | 57,594 | | | | 27,198 | | | | 15,034 | | | |
| | | | | | | | | | | | | | | | | | | | | |
| | 4,977 | | | | 5,730 | | | | 5,027 | | | | 1,425 | | | | 397 | | | |
| | — | | | | 1,573 | | | | — | | | | 2,141 | | | | 2,489 | | | |
| | 2,871 | | | | 5,185 | | | | 16,607 | | | | 7,179 | | | | 30,502 | | | |
| |
| |
| | 12,811,112 | | | | 18,842,255 | | | | 28,764,186 | | | | 16,612,511 | | | | 12,612,679 | | | |
| |
| |
| | | | | | | | | | | | | | | | | | | | | |
| | | | | | | | | | | | | | | | | | | | | |
| |
| | | | | | | | | | | | | | | | | | | | | |
| | | | | | | | | | | | | | | | | | | | | |
| | 4,977 | | | | 21,953 | | | | 56,551 | | | | 28,623 | | | | 40,432 | | | |
| | 3,562 | | | | 5,871 | | | | 9,923 | | | | 5,163 | | | | 2,707 | | | |
| | — | | | | 7,238 | | | | 95,440 | | | | 9,822 | | | | 1,624 | | | |
| | 59,435 | | | | 58,808 | | | | 58,807 | | | | 59,082 | | | | 59,279 | | | |
| |
| |
| | 67,974 | | | | 93,870 | | | | 220,721 | | | | 102,690 | | | | 104,042 | | | |
| |
| |
| | | | | | | | | | | | | | | | | | | | | |
| | | | | | | | | | | | | | | | | | | | | |
| |
| | | | | | | | | | | | | | | | | | | | | |
| | 13,835,858 | | | | 18,955,968 | | | | 27,178,649 | | | | 16,978,230 | | | | 13,852,248 | | | |
| | (64,216 | ) | | | (72,321 | ) | | | (63,562 | ) | | | 19,229 | | | | 97,035 | | | |
| | (3,031,352 | ) | | | (3,027,607 | ) | | | (3,081,267 | ) | | | (3,456,189 | ) | | | (3,700,098 | ) | | |
| | 2,002,848 | | | | 2,892,345 | | | | 4,509,645 | | | | 2,968,551 | | | | 2,259,452 | | | |
| |
| |
| $ | 12,743,138 | | | $ | 18,748,385 | | | $ | 28,543,465 | | | $ | 16,509,821 | | | $ | 12,508,637 | | | |
| | | | | | | | | | | | | | | | | | | | | |
| | | | | | | | | | | | | | | | | | | | | |
| $ | 4,966,423 | | | $ | 11,499,513 | | | $ | 19,379,009 | | | $ | 10,174,342 | | | $ | 4,269,082 | | | |
| | 6,742,083 | | | | 6,143,203 | | | | 7,507,158 | | | | 5,647,470 | | | | 8,026,893 | | | |
| | 9,626 | | | | 202,941 | | | | 9,026 | | | | 10,208 | | | | 8,881 | | | |
| | 1,025,006 | | | | 902,728 | | | | 1,648,272 | | | | 677,801 | | | | 203,781 | | | |
| | | | | | | | | | | | | | | | | | | | | |
| | | | | | | | | | | | | | | | | | | | | |
| $ | 12,743,138 | | | $ | 18,748,385 | | | $ | 28,543,465 | | | $ | 16,509,821 | | | $ | 12,508,637 | | | |
| | | | | | | | | | | | | | | | | | | | | |
| | | | | | | | | | | | | | | | | | | | | |
| | 583,474 | | | | 1,380,442 | | | | 2,414,436 | | | | 1,294,093 | | | | 543,441 | | | |
| | 788,855 | | | | 733,853 | | | | 931,758 | | | | 715,269 | | | | 1,016,837 | | | |
| | 1,128 | | | | 24,274 | | | | 1,125 | | | | 1,295 | | | | 1,126 | | | |
| | 121,105 | | | | 108,657 | | | | 205,729 | | | | 86,325 | | | | 25,894 | | | |
| | | | | | | | | | | | | | | | | | | | | |
| | | | | | | | | | | | | | | | | | | | | |
| | $8.51 | | | | $8.33 | | | | $8.03 | | | | $7.86 | | | | $7.86 | | | |
| | 8.55 | | | | 8.37 | | | | 8.06 | | | | 7.90 | | | | 7.89 | | | |
| | 8.54 | | | | 8.36 | | | | 8.02 | | | | 7.89 | | | | 7.88 | | | |
| | 8.46 | | | | 8.31 | | | | 8.01 | | | | 7.85 | | | | 7.87 | | | |
| | | | | | | | | | | | | | | | | | | | | |
The accompanying notes are an integral part of these financial statements. 27
GOLDMAN SACHS RETIREMENT STRATEGIES PORTFOLIOS
Statements of Operations
For the Six Months Ended February 28, 2011 (Unaudited)
| | | | | |
| | | Retirement
|
| | | Strategy 2010
|
| | | Portfolio |
| |
Investment income: |
| | | | | |
| Dividends from Affiliated Underlying Funds | | | $241,459 | |
| |
| |
| | | | | |
| | | | | |
Expenses: |
| | | | | |
| Professional fees | | | 31,696 | |
| Custody and accounting fees | | | 20,790 | |
| Registration fees | | | 19,925 | |
| Printing and mailing costs | | | 13,525 | |
Distribution and Service fees(a) | | | 11,548 | |
| Management fees | | | 9,419 | |
Transfer Agent fees(a) | | | 8,199 | |
| Trustee fees | | | 7,948 | |
| Other | | | 1,870 | |
| |
| |
Total expenses | | | 124,920 | |
| |
| |
| | | | | |
| Less — expense reductions | | | (98,016 | ) |
| |
| |
Net expenses | | | 26,904 | |
| |
| |
NET INVESTMENT INCOME | | | 214,555 | |
| |
| |
| | | | | |
| | | | | |
Realized and unrealized gain (loss) from investment transactions: |
| | | | | |
| Capital gain distributions from Affiliated Underlying Funds | | | 105,913 | |
| Net realized gain (loss) from Affiliated Underlying Funds | | | 583,890 | |
| Net change in unrealized gain on Affiliated Underlying Funds | | | 890,960 | |
| |
| |
Net realized and unrealized gain from investment transactions | | | 1,580,763 | |
| |
| |
NET INCREASE IN NET ASSETS RESULTING FROM OPERATIONS | | $ | 1,795,318 | |
| |
| |
| | |
| (a) | | Class specific Distribution and Service, and Transfer Agent fees were as follows: |
| | | | | | | | | | | | | | | | | | | | | | | | | |
| | | Distribution and Service Fees | | Transfer Agent Fees |
Portfolio | | Class A | | Class R | | Class A | | Institutional | | Class IR | | Class R |
| Retirement Strategy 2010 | | $ | 7,385 | | | $ | 4,163 | | | $ | 5,613 | | | $ | 995 | | | $ | 9 | | | $ | 1,582 | |
| Retirement Strategy 2015 | | | 6,278 | | | | 1,949 | | | | 4,772 | | | | 1,252 | | | | 9 | | | | 741 | |
| Retirement Strategy 2020 | | | 13,399 | | | | 1,743 | | | | 10,183 | | | | 1,089 | | | | 149 | | | | 663 | |
| Retirement Strategy 2030 | | | 22,007 | | | | 3,466 | | | | 16,725 | | | | 1,215 | | | | 58 | | | | 1,318 | |
| Retirement Strategy 2040 | | | 11,416 | | | | 1,441 | | | | 8,676 | | | | 1,012 | | | | 9 | | | | 548 | |
| Retirement Strategy 2050 | | | 4,702 | | | | 497 | | | | 3,574 | | | | 1,433 | | | | 7 | | | | 189 | |
28 The accompanying notes are an integral part of these financial statements.
GOLDMAN SACHS RETIREMENT STRATEGIES PORTFOLIOS
| | | | | | | | | | | | | | | | | | | |
Retirement
| | Retirement
| | Retirement
| | Retirement
| | Retirement
|
Strategy 2015
| | Strategy 2020
| | Strategy 2030
| | Strategy 2040
| | Strategy 2050
|
| Portfolio | | Portfolio | | Portfolio | | Portfolio | | Portfolio |
| |
| |
| | | | | | | | | | | | | | | | | | | |
| | | | | | | | | | | | | | | | | | | |
| | $243,434 | | | | $349,646 | | | | $532,725 | | | | $316,804 | | | | $237,374 | |
| |
| |
| | | | | | | | | | | | | | | | | | | |
| | | | | | | | | | | | | | | | | | | |
| |
| | | | | | | | | | | | | | | | | | | |
| | 31,696 | | | | 31,696 | | | | 31,696 | | | | 31,696 | | | | 31,696 | |
| | 20,138 | | | | 22,511 | | | | 21,986 | | | | 21,590 | | | | 21,241 | |
| | 18,985 | | | | 19,754 | | | | 21,412 | | | | 20,216 | | | | 19,042 | |
| | 13,215 | | | | 13,523 | | | | 13,565 | | | | 13,497 | | | | 13,482 | |
| | 8,227 | | | | 15,142 | | | | 25,473 | | | | 12,857 | | | | 5,199 | |
| | 9,056 | | | | 12,766 | | | | 18,846 | | | | 11,084 | | | | 8,350 | |
| | 6,774 | | | | 12,084 | | | | 19,316 | | | | 10,245 | | | | 5,203 | |
| | 7,947 | | | | 7,948 | | | | 7,950 | | | | 7,948 | | | | 7,946 | |
| | 1,866 | | | | 1,903 | | | | 1,683 | | | | 1,884 | | | | 1,540 | |
| |
| |
| | 117,904 | | | | 137,327 | | | | 161,927 | | | | 131,017 | | | | 113,699 | |
| |
| |
| | (96,021 | ) | | | (100,398 | ) | | | (102,815 | ) | | | (99,492 | ) | | | (96,951 | ) |
| |
| |
| | 21,883 | | | | 36,929 | | | | 59,112 | | | | 31,525 | | | | 16,748 | |
| |
| |
| | 221,551 | | | | 312,717 | | | | 473,613 | | | | 285,279 | | | | 220,626 | |
| |
| |
| | | | | | | | | | | | | | | | | | | |
| | | | | | | | | | | | | | | | | | | |
| |
| | | | | | | | | | | | | | | | | | | |
| | 79,611 | | | | 82,802 | | | | 63,750 | | | | 4,299 | | | | 2,570 | |
| | 345,793 | | | | 439,274 | | | | 460,910 | | | | 303,538 | | | | (154,441 | ) |
| | 1,274,848 | | | | 2,149,447 | | | | 3,832,205 | | | | 2,411,724 | | | | 2,330,164 | |
| |
| |
| | 1,700,252 | | | | 2,671,523 | | | | 4,356,865 | | | | 2,719,561 | | | | 2,178,293 | |
| |
| |
| $ | 1,921,803 | | | $ | 2,984,240 | | | $ | 4,830,478 | | | $ | 3,004,840 | | | $ | 2,398,919 | |
| |
| |
The accompanying notes are an integral part of these financial statements. 29
GOLDMAN SACHS RETIREMENT STRATEGIES PORTFOLIOS
Statements of Changes in Net Assets
| | | | | | | | | | | | | | | | | |
| | | Retirement Strategy 2010 Portfolio | | Retirement Strategy 2015 Portfolio |
| | | For the
| | | | For the
| | |
| | | Six Months Ended
| | For the Fiscal
| | Six Months Ended
| | For the Fiscal
|
| | | February 28, 2011
| | Year Ended
| | February 28, 2011
| | Year Ended
|
| | | (Unaudited) | | August 31, 2010 | | (Unaudited) | | August 31, 2010 |
| |
From operations: |
| | | | | | | | | | | | | | | | | |
| Net investment income | | $ | 214,555 | | | $ | 343,736 | | | $ | 221,551 | | | $ | 326,582 | |
| Net realized gain (loss) from investment transactions and capital gain distributions | | | 689,803 | | | | (154,123 | ) | | | 425,404 | | | | (1,694,640 | ) |
| Net change in unrealized gain on investment transactions | | | 890,960 | | | | 608,254 | | | | 1,274,848 | | | | 2,055,822 | |
| |
| |
Net increase in net assets resulting from operations | | | 1,795,318 | | | | 797,867 | | | | 1,921,803 | | | | 687,764 | |
| |
| |
| | | | | | | | | | | | | | | | | |
| | | | | | | | | | | | | | | | | |
Distributions to shareholders: |
| | | | | | | | | | | | | | | | | |
| From net investment income | | | | | | | | | | | | | | | | |
| Class A Shares | | | (169,854 | ) | | | (167,074 | ) | | | (141,662 | ) | | | (136,021 | ) |
| Institutional Shares | | | (172,543 | ) | | | (273,641 | ) | | | (201,695 | ) | | | (289,801 | ) |
| Class IR Shares | | | (312 | ) | | | (255 | ) | | | (275 | ) | | | (239 | ) |
| Class R Shares | | | (64,179 | ) | | | (217 | ) | | | (28,143 | ) | | | (842 | ) |
| From net realized gains | | | | | | | | | | | | | | | | |
| Class A Shares | | | — | | | | (511 | ) | | | — | | | | — | |
| Institutional Shares | | | — | | | | (754 | ) | | | — | | | | — | |
| Class IR Shares | | | — | | | | (1 | ) | | | — | | | | — | |
| Class R Shares | | | — | | | | (1 | ) | | | — | | | | — | |
| |
| |
Total distributions to shareholders | | | (406,888 | ) | | | (442,454 | ) | | | (371,775 | ) | | | (426,903 | ) |
| |
| |
| | | | | | | | | | | | | | | | | |
| | | | | | | | | | | | | | | | | |
From share transactions: |
| | | | | | | | | | | | | | | | | |
| Proceeds from sales of shares | | | 2,019,065 | | | | 4,492,766 | | | | 1,990,625 | | | | 2,766,367 | |
| Reinvestment of distributions | | | 406,210 | | | | 440,896 | | | | 370,303 | | | | 426,903 | |
| Cost of shares redeemed | | | (3,198,892 | ) | | | (6,833,914 | ) | | | (1,833,183 | ) | | | (6,041,445 | ) |
| |
| |
Net increase (decrease) in net assets resulting from share transactions | | | (773,617 | ) | | | (1,900,252 | ) | | | 527,745 | | | | (2,848,175 | ) |
| |
| |
TOTAL INCREASE (DECREASE) | | | 614,813 | | | | (1,544,839 | ) | | | 2,077,773 | | | | (2,587,314 | ) |
| |
| |
| | | | | | | | | | | | | | | | | |
| | | | | | | | | | | | | | | | | |
Net assets: |
| | | | | | | | | | | | | | | | | |
| Beginning of period | | | 11,866,530 | | | | 13,411,369 | | | | 10,665,365 | | | | 13,252,679 | |
| |
| |
| End of period | | $ | 12,481,343 | | | $ | 11,866,530 | | | $ | 12,743,138 | | | $ | 10,665,365 | |
| |
| |
Accumulated undistributed (distributions in excess of) net investment income | | $ | (89,005 | ) | | $ | 103,328 | | | $ | (64,216 | ) | | $ | 86,008 | |
| |
| |
30 The accompanying notes are an integral part of these financial statements.
GOLDMAN SACHS RETIREMENT STRATEGIES PORTFOLIOS
| | | | | | | | | | | | | | | | | | | | | | | |
| Retirement Strategy 2020 Portfolio | | Retirement Strategy 2030 Portfolio | | Retirement Strategy 2040 Portfolio |
For the
| | | | For the
| | | | For the
| | |
Six Months Ended
| | For the Fiscal
| | Six Months Ended
| | For the Fiscal
| | Six Months Ended
| | For the Fiscal
|
February 28, 2011
| | Year Ended
| | February 28, 2011
| | Year Ended
| | February 28, 2011
| | Year Ended
|
| (Unaudited) | | August 31, 2010 | | (Unaudited) | | August 31, 2010 | | (Unaudited) | | August 31, 2010 |
| |
| |
| | | | | | | | | | | | | | | | | | | | | | | |
| $ | 312,717 | | | $ | 367,262 | | | $ | 473,613 | | | $ | 484,914 | | | $ | 285,279 | | | $ | 302,306 | |
| | | | | | | | | | | | | | | | | | | | | | | |
| | 522,076 | | | | (947,692 | ) | | | 524,660 | | | | (576,560 | ) | | | 307,837 | | | | (1,668,218 | ) |
| | 2,149,447 | | | | 1,200,250 | | | | 3,832,205 | | | | 738,136 | | | | 2,411,724 | | | | 1,790,231 | |
| |
| |
| | 2,984,240 | | | | 619,820 | | | | 4,830,478 | | | | 646,490 | | | | 3,004,840 | | | | 424,319 | |
| |
| |
| | | | | | | | | | | | | | | | | | | | | | | |
| | | | | | | | | | | | | | | | | | | | | | | |
| |
| | | | | | | | | | | | | | | | | | | | | | | |
| | | | | | | | | | | | | | | | | | | | | | | |
| | (280,175 | ) | | | (248,560 | ) | | | (400,680 | ) | | | (327,021 | ) | | | (175,415 | ) | | | (179,030 | ) |
| | (157,850 | ) | | | (276,203 | ) | | | (168,089 | ) | | | (207,054 | ) | | | (112,649 | ) | | | (211,378 | ) |
| | (5,051 | ) | | | (247 | ) | | | (1,562 | ) | | | (175 | ) | | | (189 | ) | | | (193 | ) |
| | (21,884 | ) | | | (2,289 | ) | | | (34,327 | ) | | | (12,764 | ) | | | (11,758 | ) | | | (5,401 | ) |
| | | | | | | | | | | | | | | | | | | | | | | |
| | — | | | | — | | | | — | | | | — | | | | — | | | | — | |
| | — | | | | — | | | | — | | | | — | | | | — | | | | — | |
| | — | | | | — | | | | — | | | | — | | | | — | | | | — | |
| | — | | | | — | | | | — | | | | — | | | | — | | | | — | |
| |
| |
| | (464,960 | ) | | | (527,299 | ) | | | (604,658 | ) | | | (547,014 | ) | | | (300,011 | ) | | | (396,002 | ) |
| |
| |
| | | | | | | | | | | | | | | | | | | | | | | |
| | | | | | | | | | | | | | | | | | | | | | | |
| |
| | | | | | | | | | | | | | | | | | | | | | | |
| | 3,629,466 | | | | 6,286,890 | | | | 7,165,525 | | | | 9,572,195 | | | | 3,068,390 | | | | 5,216,591 | |
| | 464,562 | | | | 527,299 | | | | 602,424 | | | | 547,014 | | | | 299,944 | | | | 395,688 | |
| | (2,444,413 | ) | | | (7,791,763 | ) | | | (3,194,856 | ) | | | (11,462,798 | ) | | | (1,347,642 | ) | | | (7,810,963 | ) |
| |
| |
| | 1,649,615 | | | | (977,574 | ) | | | 4,573,093 | | | | (1,343,589 | ) | | | 2,020,692 | | | | (2,198,684 | ) |
| |
| |
| | 4,168,895 | | | | (885,053 | ) | | | 8,798,913 | | | | (1,244,113 | ) | | | 4,725,521 | | | | (2,170,367 | ) |
| |
| |
| | | | | | | | | | | | | | | | | | | | | | | |
| | | | | | | | | | | | | | | | | | | | | | | |
| |
| | | | | | | | | | | | | | | | | | | | | | | |
| | 14,579,490 | | | | 15,464,543 | | | | 19,744,552 | | | | 20,988,665 | | | | 11,784,300 | | | | 13,954,667 | |
| |
| |
| $ | 18,748,385 | | | $ | 14,579,490 | | | $ | 28,543,465 | | | $ | 19,744,552 | | | $ | 16,509,821 | | | $ | 11,784,300 | |
| |
| |
$ | (72,321 | ) | | $ | 79,922 | | | $ | (63,562 | ) | | $ | 67,483 | | | $ | 19,229 | | | $ | 33,961 | |
| |
| |
The accompanying notes are an integral part of these financial statements. 31
GOLDMAN SACHS RETIREMENT STRATEGIES PORTFOLIOS
Statements of Changes in Net Assets
| | | | | | | | | |
| | | Retirement Strategy 2050 Portfolio |
| | | For the
| | |
| | | Six Months Ended
| | For the Fiscal
|
| | | February 28, 2011
| | Year Ended
|
| | | (Unaudited) | | August 31, 2010 |
| |
From operations: |
| | | | | | | | | |
| Net investment income | | $ | 220,626 | | | $ | 205,101 | |
| Net realized loss from investment transactions and capital gain distributions | | | (151,871 | ) | | | (2,166,824 | ) |
| Net change in unrealized gain on investment transactions | | | 2,330,164 | | | | 2,107,719 | |
| |
| |
Net increase in net assets resulting from operations | | | 2,398,919 | | | | 145,996 | |
| |
| |
| | | | | | | | | |
| | | | | | | | | |
Distributions to shareholders: |
| | | | | | | | | |
| From net investment income | | | | | | | | |
| Class A Shares | | | (79,043 | ) | | | (54,568 | ) |
| Institutional Shares | | | (168,453 | ) | | | (172,324 | ) |
| Class IR Shares | | | (180 | ) | | | (158 | ) |
| Class R Shares | | | (2,978 | ) | | | (227 | ) |
| |
| |
Total distributions to shareholders | | | (250,654 | ) | | | (227,277 | ) |
| |
| |
| | | | | | | | | |
| | | | | | | | | |
From share transactions: |
| | | | | | | | | |
| Proceeds from sales of shares | | | 1,411,141 | | | | 2,575,477 | |
| Reinvestment of distributions | | | 250,522 | | | | 227,277 | |
| Cost of shares redeemed | | | (519,731 | ) | | | (2,952,052 | ) |
| |
| |
Net increase (decrease) in net assets resulting from share transactions | | | 1,141,932 | | | | (149,298 | ) |
| |
| |
TOTAL INCREASE (DECREASE) | | | 3,290,197 | | | | (230,579 | ) |
| |
| |
| | | | | | | | | |
| | | | | | | | | |
Net assets: |
| | | | | | | | | |
| Beginning of period | | | 9,218,440 | | | | 9,449,019 | |
| |
| |
| End of period | | $ | 12,508,637 | | | $ | 9,218,440 | |
| |
| |
Accumulated undistributed net investment income | | $ | 97,035 | | | $ | 127,063 | |
| |
| |
32 The accompanying notes are an integral part of these financial statements.
GOLDMAN SACHS RETIREMENT STRATEGIES PORTFOLIOS
Notes to Financial Statements
February 28, 2011 (Unaudited)
Goldman Sachs Trust (the “Trust”) is a Delaware statutory trust registered under the Investment Company Act of 1940, as amended (the “Act”), as an open-end management investment company. The following table lists those series of the Trust that are included in this report (collectively, the “Portfolios” or individually a “Portfolio”), along with their corresponding share classes and respective diversification status under the Act:
| | | | | |
| | | | | Diversified/
|
| Portfolio | | Share Classes Offered | | Non-diversified |
| |
| All Retirement Strategies Portfolios | | A, Institutional, IR and R | | Diversified |
| |
| |
Class A Shares are sold with a front-end sales charge of up to 5.50%. Institutional, Class IR and Class R Shares are not subject to a sales charge.
Goldman Sachs Asset Management, L.P. (“GSAM”), an affiliate of Goldman, Sachs & Co. (“Goldman Sachs”), serves as investment adviser to each Portfolio pursuant to a management agreement (the “Agreement”) with the Trust.
The Portfolios are expected to invest primarily all of their assets in a combination of domestic and international equity, fixed income and other diversifier underlying funds (“Underlying Funds”) which are registered under the Act, for which GSAM and Goldman Sachs Asset Management International (“GSAMI”), affiliates of Goldman Sachs, act as investment advisers.
| |
| 2. SIGNIFICANT ACCOUNTING POLICIES | |
The following is a summary of the significant accounting policies consistently followed by the Portfolios. The preparation of financial statements in conformity with accounting principles generally accepted in the United States of America (“GAAP”) requires management to make estimates and assumptions that may affect the amounts and disclosures in the financial statements. Actual results could differ from those estimates and assumptions.
A. Investment Valuation — The investment valuation policy of the Portfolios, as well as the Underlying Funds, is to value investments at market value. Investments in the Underlying Funds are valued at the net asset value per share (“NAV”) of the Institutional Share class of each Underlying Fund on the day of valuation. Because each Portfolio invests primarily in other mutual funds, that fluctuate in value, the Portfolios’ shares will correspondingly fluctuate in value. The Underlying Funds may invest in debt securities which, if market quotations are readily available, are valued on the basis of quotations furnished by an independent pricing service approved by the trustees or provided by securities dealers. The pricing services may use valuation models or matrix pricing, which consider: (i) yield or price with respect to bonds that are considered comparable in characteristics such as rating, interest rate and maturity date or (ii) quotations from bond dealers to determine current value. If accurate quotations are not readily available, or if GSAM or GSAMI believes that such quotations do not accurately reflect fair value, the fair value of the Underlying Funds’ investments may be determined based on yield equivalents, a pricing matrix or other sources, under valuation procedures established by the trustees. Short-term debt obligations that mature in sixty days or less and that do not exhibit signs of credit deterioration are valued at amortized cost, which approximates market value.
The Underlying Funds may invest in equity securities and investment companies. Investments in equity securities and investment companies traded on a United States (“U.S.”) securities exchange or the NASDAQ system are valued daily at their last sale price or official closing price on the principal exchange or system on which they are traded. Investments in equity securities and investment companies traded on a foreign securities exchange for which an independent fair value service cannot provide a quote are valued daily at their last sale price or official closing price on the principal exchange on which they are traded. If no sale occurs, such securities and investment companies are valued at the last bid price for long positions and at the last ask price for short positions. Unlisted equity securities in the Underlying Funds for which market quotations are available are valued at the last sale price on valuation date, or if no sale occurs, at the last bid price. In the absence of market quotations, broker quotes will be utilized or the security will be fair valued. Investments in investment companies (other than those that are exchange traded) are valued at the NAV of the investment company on the valuation date.
GOLDMAN SACHS RETIREMENT STRATEGIES PORTFOLIOS
Notes to Financial Statements (continued)
February 28, 2011 (Unaudited)
| |
| 2. SIGNIFICANT ACCOUNTING POLICIES (continued) | |
The Underlying Funds may also invest in equity securities traded on a foreign securities exchange that are valued daily at fair value determined by an independent fair value service (if available) under valuation procedures approved by the trustees consistent with applicable regulatory guidance. The independent fair value service takes into account multiple factors including, but not limited to, movements in the U.S. securities markets, certain depositary receipts, futures contracts and foreign currency exchange rates that have occurred subsequent to the close of the foreign securities exchanges. While the independent fair value service may not take into account market or security specific information, under the valuation procedures, these securities might also be fair valued by GSAM or GSAMI by taking into consideration market or security specific information as discussed below.
GSAM or GSAMI, consistent with its procedures and applicable regulatory guidance, may make an adjustment to the previous closing prices of either domestic or foreign securities in light of significant events to reflect what it believes to be the fair value of the securities at the time of determining an Underlying Fund’s NAV. Significant events that could affect a large number of securities in a particular market may include, but are not limited to: situations relating to one or more single issuers in a market sector; significant fluctuations in U.S. or foreign markets; market dislocations; market disruptions or market closings; equipment failures; natural or man-made disasters or acts of God; armed conflicts; government actions or other developments; as well as the same or similar events which may affect specific issuers or the securities markets even though not tied directly to the securities markets. Other significant events that could relate to a single issuer may include, but are not limited to: corporate actions such as reorganizations, mergers and buy-outs; corporate announcements, including those relating to earnings, products and regulatory news; significant litigation; low trading volume; and trading limits or suspensions.
B. Security and Portfolio Share Transactions, and Investment Income — Purchases and sales of the Underlying Funds and Portfolio share transactions are reflected for financial reporting purposes as of the trade date, which may cause the NAV as stated in the accompanying financial statements to be different than the NAV applied to Portfolio share transactions. Realized gains and losses on sales of Underlying Funds are calculated using the identified cost basis. Dividend income, capital gains and return of capital distributions from Underlying Funds are recognized on the ex-dividend date. Interest income is recorded on the basis of interest accrued, premium amortized and discount accreted.
Investment income and unrealized and realized gains or losses are allocated daily to each class of shares of the respective Portfolio based upon the relative proportion of net assets of each class.
C. Expenses — Expenses incurred by the Trust that do not specifically relate to an individual Portfolio of the Trust are allocated to the Portfolios on a straight-line and/or pro-rata basis depending upon the nature of the expense and are accrued daily. Non-class specific expenses are allocated daily to each share class of the respective Portfolio based upon the relative proportion of net assets of each class. Class specific expenses, where applicable, are borne by the respective share classes and include Distribution and Service, Transfer Agent, and Service fees.
Expenses included in the accompanying financial statements reflect the expenses of each Portfolio and do not include any expenses associated with the Underlying Funds. Because the Underlying Funds have varied expense and fee levels and the Portfolios may own different proportions of Underlying Funds at different times, the amount of fees and expenses incurred indirectly by each Portfolio will vary.
D. Federal Taxes and Distributions to Shareholders — It is each Portfolio’s policy to comply with the requirements of the Internal Revenue Code of 1986, as amended (the “Code”), applicable to regulated investment companies (mutual funds) and to distribute each year substantially all of its investment company taxable income and capital gains to its shareholders. Accordingly, the Portfolios are not required to make any provisions for the payment of federal income tax. Distributions to shareholders are recorded on the ex-dividend date. Income and capital gains distributions, if any, are declared and paid according to the following schedule:
| | | | | |
| | | Income Distributions
| | Capital Gains Distributions
|
| Portfolio | | Declared/Paid | | Declared/Paid |
| |
| All Retirement Strategies Portfolios | | Annually | | Annually |
| |
| |
GOLDMAN SACHS RETIREMENT STRATEGIES PORTFOLIOS
| |
| 2. SIGNIFICANT ACCOUNTING POLICIES (continued) | |
Net capital losses are carried forward to future fiscal years and may be used to the extent allowed by the Code to offset any future capital gains. Utilization of capital loss carryforwards will reduce the requirement of future capital gains distributions.
The characterization of distributions to shareholders for financial reporting purposes is determined in accordance with federal income tax rules, which may differ from GAAP. The source of each Portfolio’s distributions may be shown in the accompanying financial statements as either from net investment income, net realized gain or capital. Certain components of the Portfolios’ net assets on the Statements of Assets and Liabilities reflect permanent GAAP/tax differences based on the appropriate tax character.
| |
| 3. FAIR VALUE OF INVESTMENTS | |
The fair value of a financial instrument is the amount that would be received to sell an asset or paid to transfer a liability in an orderly transaction between market participants at the measurement date (i.e., the exit price). GAAP establishes a fair value hierarchy that prioritizes the inputs to valuation techniques used to measure fair value. The hierarchy gives the highest priority to unadjusted quoted prices in active markets for identical assets or liabilities (Level 1 measurements) and the lowest priority to unobservable inputs (Level 3 measurements). The three levels of the fair value hierarchy are described below:
Level 1 — Unadjusted quoted prices in active markets that are accessible at the measurement date for identical, unrestricted assets or liabilities;
Level 2 — Quoted prices in markets that are not active or financial instruments for which significant inputs are observable (including, but not limited to, quoted prices for similar securities, interest rates, foreign exchange rates, volatility and credit spreads), either directly or indirectly;
Level 3 — Prices or valuations that require significant unobservable inputs (including GSAM’s assumptions in determining fair value measurement).
All Underlying Funds are classified as Level 1 securities. Please refer to the Schedule of Investments for further detail.
| |
| 4. AGREEMENTS AND AFFILIATED TRANSACTIONS | |
A. Management Agreement — Under the Agreement, GSAM manages the Portfolios, subject to the general supervision of the trustees.
As compensation for the services rendered pursuant to the Agreement, the assumption of the expenses related thereto and administration of the Portfolios’ business affairs, including providing facilities, GSAM is entitled to a management fee, computed daily and paid monthly, equal to an annual percentage rate of 0.15% of each Portfolio’s average daily net assets. GSAM agreed to waive a portion of its management fee equal to 0.05% of each Portfolio’s average daily net assets through at least December 29, 2011. Prior to such date GSAM may not terminate the agreement without the approval of the trustees.
B. Distribution and Service Plans — The Trust, on behalf of each Portfolio, has adopted Distribution and Service Plans (the “Plans”). Under the Plans, Goldman Sachs, which serves as distributor (the “Distributor”), is entitled to a fee, computed daily and paid monthly for distribution services and personal and account maintenance services, which may then be paid by Goldman Sachs to authorized dealers, equal to, on an annual basis, 0.25% and 0.50% of each Portfolio’s average daily net assets attributable to Class A and Class R Shares, respectively. With respect to Class A and Class R Shares, the Distributor at its discretion may use compensation for distribution services paid under the Distribution Plan to compensate service organizations for personal and account maintenance services and expenses as long as such total compensation does not exceed the maximum cap on “service fees” imposed by the Financial Industry Regulatory Authority.
C. Distribution Agreement — Goldman Sachs, as Distributor of the shares of the Portfolios pursuant to a Distribution Agreement, may retain a portion of the Class A front end sales charge. During the six months ended February 28, 2011, Goldman Sachs advised that it did not retain any front end sales charges.
GOLDMAN SACHS RETIREMENT STRATEGIES PORTFOLIOS
Notes to Financial Statements (continued)
February 28, 2011 (Unaudited)
| |
| 4. AGREEMENTS AND AFFILIATED TRANSACTIONS (continued) | |
D. Transfer Agency Agreement — Goldman Sachs also serves as the transfer agent of the Portfolios for a fee pursuant to a Transfer Agency Agreement. The fees charged for such transfer agency services are computed daily and paid monthly at an annual rate as follows: 0.19% of the average daily net assets for Class A, Class IR and Class R Shares and 0.04% of the average daily net assets for Institutional Shares.
E. Other Expense Agreements and Affiliated Transactions — GSAM has agreed to limit certain “Other Expense” of the Portfolios (excluding management fees, distribution and service fees, transfer agent fees and expenses, taxes, interest, brokerage fees and litigation, indemnification, shareholder meetings and other extraordinary expenses, exclusive of any transfer agent fee credit reductions) to the extent such expenses exceed, on an annual basis, a percentage rate of the average daily net assets of each Portfolio. Such Other Expense reimbursements, if any, are computed daily and paid monthly. In addition, the Portfolios are not obligated to reimburse GSAM for prior fiscal year expense reimbursements, if any. The Other Expense limitations as an annual percentage rate of average daily net assets for the Portfolios are 0.014%. These Other Expense reimbursements will remain in place through at least December 29, 2011, and prior to such date GSAM may not terminate the arrangements without the approval of the trustees. In addition, the Portfolios have entered into certain offset arrangements with the custodian and the transfer agent, which may result in a reduction in the Portfolios’ expenses.
For the six months ended February 28, 2011, these expense reductions, including any fee waivers and Other Expense reimbursements, were as follows (in thousands):
| | | | | | | | | | | | | |
| | | | | Other
| | Total
|
| | | Management
| | Expense
| | Expense
|
| Portfolio | | Fee Waiver | | Reimbursements | | Reductions |
| |
| Retirement Strategy 2010 | | $ | 3 | | | $ | 95 | | | $ | 98 | |
| |
| |
| Retirement Strategy 2015 | | | 3 | | | | 93 | | | | 96 | |
| |
| |
| Retirement Strategy 2020 | | | 4 | | | | 96 | | | | 100 | |
| |
| |
| Retirement Strategy 2030 | | | 6 | | | | 97 | | | | 103 | |
| |
| |
| Retirement Strategy 2040 | | | 3 | | | | 96 | | | | 99 | |
| |
| |
| Retirement Strategy 2050 | | | 3 | | | | 94 | | | | 97 | |
| |
| |
As of February 28, 2011, the amounts owed to affiliates of the Portfolios were as follows (in thousands):
| | | | | | | | | | | | | | | | | |
| | | | | Distribution
| | | | |
| | | Management
| | and Service
| | Transfer
| | |
| Portfolio | | Fees | | Fees | | Agent Fees | | Total |
| |
| Retirement Strategy 2010 | | $ | 1 | | | $ | 2 | | | $ | 1 | | | $ | 4 | |
| |
| |
| Retirement Strategy 2015 | | | 1 | | | | 2 | | | | 1 | | | | 4 | |
| |
| |
| Retirement Strategy 2020 | | | 1 | | | | 3 | | | | 2 | | | | 6 | |
| |
| |
| Retirement Strategy 2030 | | | 2 | | | | 5 | | | | 3 | | | | 10 | |
| |
| |
| Retirement Strategy 2040 | | | 1 | | | | 2 | | | | 2 | | | | 5 | |
| |
| |
| Retirement Strategy 2050 | | | 1 | | | | 1 | | | | 1 | | | | 3 | |
| |
| |
F. Line of Credit Facility — As of February 28, 2011, the Portfolios participated in a $580,000,000 committed, unsecured revolving line of credit facility (the “facility”) together with other funds of the Trust and registered investment companies having management agreements with GSAM or its affiliates. Pursuant to the terms of the facility, the Portfolios and other borrowers could
GOLDMAN SACHS RETIREMENT STRATEGIES PORTFOLIOS
| |
| 4. AGREEMENTS AND AFFILIATED TRANSACTIONS (continued) | |
increase the credit amount by an additional $340,000,000, for a total of up to $920,000,000. This facility is to be used solely for temporary or emergency purposes. The interest rate on borrowings is based on the federal funds rate. The facility also requires a fee to be paid by the Portfolios based on the amount of the commitment that has not been utilized. For the six months ended February 28, 2011, the Portfolios did not have any borrowings under the facility.
G. Other Transactions with Affiliates — As of February 28, 2011, the Goldman Sachs Group, Inc. was the beneficial owner of the outstanding shares of the Portfolios as follows:
| | | | | | | | | | | | | | | | | | | | | | | |
Retirement
| | Retirement
| | Retirement
| | Retirement
| | Retirement
| | Retirement
|
| Strategy 2010 | | Strategy 2015 | | Strategy 2020 | | Strategy 2030 | | Strategy 2040 | | Strategy 2050 |
| |
| | 42 | % | | | 38 | % | | | 22 | % | | | 6 | % | | | 24 | % | | | 56 | % |
| |
| |
| |
| 5. PORTFOLIO SECURITIES TRANSACTIONS | |
The cost of purchases and proceeds from sales of the Underlying Funds for the six months ended February 28, 2011, were as follows:
| | | | | | | | | |
| Portfolio | | Purchases | | Sales |
| |
| Retirement Strategy 2010 | | $ | 4,080,328 | | | $ | 4,943,981 | |
| |
| |
| Retirement Strategy 2015 | | | 3,934,755 | | | | 3,476,877 | |
| |
| |
| Retirement Strategy 2020 | | | 6,159,814 | | | | 4,567,938 | |
| |
| |
| Retirement Strategy 2030 | | | 10,543,285 | | | | 5,942,991 | |
| |
| |
| Retirement Strategy 2040 | | | 5,070,357 | | | | 3,054,433 | |
| |
| |
| Retirement Strategy 2050 | | | 2,827,077 | | | | 1,709,862 | |
| |
| |
As of the most recent fiscal year end, August 31, 2010, the Portfolios’ capital loss carryforwards and certain timing differences on a tax basis were as follows:
| | | | | | | | | | | | | | | | | | | | | | | | | |
| | | Retirement
| | Retirement
| | Retirement
| | Retirement
| | Retirement
| | Retirement
|
| | | Strategy
| | Strategy
| | Strategy
| | Strategy
| | Strategy
| | Strategy
|
| | | 2010 | | 2015 | | 2020 | | 2030 | | 2040 | | 2050 |
| |
Capital loss carryforward:(1) | | | | | | | | | | | | | | | | | | | | | | | | |
| Expiring 2017 | | $ | — | | | $ | (37,262 | ) | | $ | (92,140 | ) | | $ | (6,509 | ) | | $ | (60,191 | ) | | $ | (127,377 | ) |
| Expiring 2018 | | | (540,451 | ) | | | (331,636 | ) | | | (290,270 | ) | | | (261,102 | ) | | | (337,900 | ) | | | (280,682 | ) |
| |
| |
| Total capital loss carryforward | | $ | (540,451 | ) | | $ | (368,898 | ) | | $ | (382,410 | ) | | $ | (267,611 | ) | | $ | (398,091 | ) | | $ | (408,059 | ) |
| |
| |
| Timing differences (post-October loss deferral) | | $ | (686,257 | ) | | $ | (1,427,553 | ) | | $ | (691,650 | ) | | $ | (428,603 | ) | | $ | (929,956 | ) | | $ | (1,018,904 | ) |
| |
| |
| | |
| (1) | | Expiration occurs on August 31 of the year indicated. |
GOLDMAN SACHS RETIREMENT STRATEGIES PORTFOLIOS
Notes to Financial Statements (continued)
February 28, 2011 (Unaudited)
| |
| 6. TAX INFORMATION (continued) | |
As of February 28, 2011, the Portfolios’ aggregate security unrealized gains and losses based on cost for U.S. federal income tax purposes were as follows:
| | | | | | | | | | | | | | | | | | | | | | | | | |
| | | Retirement
| | Retirement
| | Retirement
| | Retirement
| | Retirement
| | Retirement
|
| | | Strategy
| | Strategy
| | Strategy
| | Strategy
| | Strategy
| | Strategy
|
| | | 2010 | | 2015 | | 2020 | | 2030 | | 2040 | | 2050 |
| |
| Tax Cost | | $ | 12,674,955 | | | $ | 12,455,563 | | | $ | 18,394,855 | | | $ | 27,084,005 | | | $ | 16,041,420 | | | $ | 12,425,396 | |
| |
| |
| Gross unrealized gain | | | 1,499,370 | | | | 2,002,848 | | | | 2,913,143 | | | | 4,528,404 | | | | 2,974,157 | | | | 2,261,042 | |
| Gross unrealized loss | | | (1,632,317 | ) | | | (1,657,580 | ) | | | (2,494,454 | ) | | | (2,927,451 | ) | | | (2,441,009 | ) | | | (2,122,181 | ) |
| |
| |
| Net unrealized security gain (loss) | | $ | (132,947 | ) | | $ | 345,268 | | | $ | 418,689 | | | $ | 1,600,953 | | | $ | 533,148 | | | $ | 138,861 | |
| |
| |
The difference between GAAP-basis and tax-basis unrealized gains (losses), as of the most recent fiscal year end, is attributable primarily to wash sales and differences related to the tax treatment of Underlying Fund investments.
GSAM has reviewed the Portfolios’ tax positions for all open tax years (the current and prior three years, as applicable) and has concluded that no provision for income tax is required in the Portfolios’ financial statements. Such open tax years remain subject to examination and adjustment by tax authorities.
Under the recently enacted Regulated Investment Company Modernization Act of 2010, the Portfolios will be permitted to carry forward capital losses incurred in taxable years beginning after December 22, 2010 for an unlimited period. However, any losses incurred during those future taxable years will be required to be utilized prior to the losses incurred in pre-enactment taxable years. As a result of this ordering rule, pre-enactment capital loss carryforwards may be more likely to expire unused. Additionally, post-enactment capital losses that are carried forward will retain their character as either short-term or long-term capital losses rather than being considered all short-term as under previous law.
Concentration in the Underlying Funds — The investments of a Portfolio are concentrated in the Underlying Funds, and the Portfolio’s investment performance is directly related to the investment performance of the Underlying Funds it holds. A Portfolio that has a relative concentration of its portfolio in a single Underlying Fund may be more susceptible to adverse developments affecting that Underlying Fund, and may be more susceptible to losses because of these developments.
Market and Credit Risks — In the normal course of business, the Portfolios and the Underlying Funds trade financial instruments and enter into financial transactions where risk of potential loss exists due to changes in the market (market risk). Additionally, the Portfolios and the Underlying Funds may also be exposed to credit risk in the event that an issuer fails to perform or that an institution or entity with which the Portfolios and the Underlying Funds have unsettled or open transaction defaults.
Investing in foreign markets by the Underlying Funds may involve special risks and considerations not typically associated with investing in the U.S. These risks include revaluation of currencies, high rates of inflation, repatriation restrictions on income and capital, and adverse political and economic developments. Moreover, securities issued in these markets may be less liquid, be subject to government ownership controls, have delayed settlements and their prices may be more volatile than those of comparable securities in the U.S.
GOLDMAN SACHS RETIREMENT STRATEGIES PORTFOLIOS
Under the Trust’s organizational documents, its trustees, officers, employees and agents are indemnified, to the extent permitted by the Act, against certain liabilities that may arise out of performance of their duties to the Portfolios. Additionally, in the course of business, the Portfolios enter into contracts that contain a variety of indemnification clauses. The Portfolios’ maximum exposure under these arrangements is unknown, as this would involve future claims that may be made against the Portfolios that have not yet occurred. However, GSAM believes the risk of loss under these arrangements to be remote.
Subsequent events after the balance sheet date have been evaluated through the date the financial statements were issued. GSAM has concluded that there is no impact requiring adjustment or disclosure in the financial statements.
GOLDMAN SACHS RETIREMENT STRATEGIES PORTFOLIOS
Notes to Financial Statements (continued)
February 28, 2011 (Unaudited)
| |
| 10. SUMMARY OF SHARE TRANSACTIONS | |
Share activity is as follows:
| | | | | | | | | | | | | | | | | |
| | | Retirement Strategy 2010 Portfolio |
| | | |
| | | For the Six Months Ended
| | |
| | | February 28, 2011
| | For the Fiscal Year Ended
|
| | | (Unaudited) | | August 31, 2010 |
| | | |
| | | Shares | | Dollars | | Shares | | Dollars |
| | | |
Class A Shares | | | | | | | | | | | | | | | | |
| Shares sold | | | 48,814 | | | $ | 418,138 | | | | 501,992 | | | $ | 4,060,841 | |
| Reinvestment of distributions | | | 19,810 | | | | 169,176 | | | | 21,016 | | | | 166,029 | |
| Shares redeemed | | | (366,762 | ) | | | (3,134,109 | ) | | | (309,012 | ) | | | (2,497,613 | ) |
| |
| |
| | | | (298,138 | ) | | | (2,546,795 | ) | | | 213,996 | | | | 1,729,257 | |
| |
| |
Institutional Shares | | | | | | | | | | | | | | | | |
| Shares sold | | | 1,235 | | | | 10,052 | | | | 11 | | | | 85 | |
| Reinvestment of distributions | | | 20,134 | | | | 172,543 | | | | 34,602 | | | | 274,394 | |
| Shares redeemed | | | (3 | ) | | | (24 | ) | | | (538,901 | ) | | | (4,300,078 | ) |
| |
| |
| | | | 21,366 | | | | 182,571 | | | | (504,288 | ) | | | (4,025,599 | ) |
| |
| |
Class IR Shares | | | | | | | | | | | | | | | | |
| Shares sold | | | — | | | | — | | | | 1 | | | | 10 | |
| Reinvestment of distributions | | | 36 | | | | 312 | | | | 33 | | | | 256 | |
| Shares redeemed | | | — | | | | — | | | | (1 | ) | | | (10 | ) |
| |
| |
| | | | 36 | | | | 312 | | | | 33 | | | | 256 | |
| |
| |
Class R Shares | | | | | | | | | | | | | | | | |
| Shares sold | | | 186,346 | | | | 1,590,875 | | | | 53,790 | | | | 431,830 | |
| Reinvestment of distributions | | | 7,524 | | | | 64,179 | | | | 27 | | | | 217 | |
| Shares redeemed | | | (7,458 | ) | | | (64,759 | ) | | | (4,532 | ) | | | (36,213 | ) |
| |
| |
| | | | 186,412 | | | | 1,590,295 | | | | 49,285 | | | | 395,834 | |
| |
| |
NET INCREASE (DECREASE) | | | (90,324 | ) | | $ | (773,617 | ) | | | (240,974 | ) | | $ | (1,900,252 | ) |
| |
| |
GOLDMAN SACHS RETIREMENT STRATEGIES PORTFOLIOS
| | | | | | | | | | | | | | | | | | | | | | | | | | | | | | | |
| Retirement Strategy 2015 Portfolio | | Retirement Strategy 2020 Portfolio |
| |
For the Six Months Ended
| | | | For the Six Months Ended
| | |
February 28, 2011
| | For the Fiscal Year Ended
| | February 28, 2011
| | For the Fiscal Year Ended
|
| (Unaudited) | | August 31, 2010 | | (Unaudited) | | August 31, 2010 |
| |
| Shares | | Dollars | | Shares | | Dollars | | Shares | | Dollars | | Shares | | Dollars |
| |
| | | | | | | | | | | | | | | | | | | | | | | | | | | | | | | |
| | 84,808 | | | $ | 698,263 | | | | 315,659 | | | $ | 2,412,364 | | | | 215,662 | | | $ | 1,734,254 | | | | 703,049 | | | $ | 5,227,980 | |
| | 17,202 | | | | 140,540 | | | | 18,160 | | | | 136,021 | | | | 35,190 | | | | 280,114 | | | | 34,284 | | | | 248,560 | |
| | (211,409 | ) | | | (1,710,268 | ) | | | (228,949 | ) | | | (1,730,992 | ) | | | (269,942 | ) | | | (2,140,848 | ) | | | (422,547 | ) | | | (3,103,896 | ) |
| |
| |
| | (109,399 | ) | | | (871,465 | ) | | | 104,870 | | | | 817,393 | | | | (19,090 | ) | | | (126,480 | ) | | | 314,786 | | | | 2,372,644 | |
| |
| |
| | | | | | | | | | | | | | | | | | | | | | | | | | | | | | | |
| | 59,793 | | | | 476,649 | | | | 28,244 | | | | 211,175 | | | | 150,343 | | | | 1,158,684 | | | | 98,490 | | | | 718,892 | |
| | 24,584 | | | | 201,345 | | | | 38,537 | | | | 289,801 | | | | 19,689 | | | | 157,513 | | | | 37,992 | | | | 276,203 | |
| | (12,038 | ) | | | (100,469 | ) | | | (571,179 | ) | | | (4,300,078 | ) | | | (30,265 | ) | | | (242,066 | ) | | | (633,384 | ) | | | (4,600,078 | ) |
| |
| |
| | 72,339 | | | | 577,525 | | | | (504,398 | ) | | | (3,799,102 | ) | | | 139,767 | | | | 1,074,131 | | | | (496,902 | ) | | | (3,604,983 | ) |
| |
| |
| | | | | | | | | | | | | | | | | | | | | | | | | | | | | | | |
| | — | | | | — | | | | 3 | | | | 25 | | | | 11,567 | | | | 92,364 | | | | 13,842 | | | | 102,839 | |
| | 34 | | | | 275 | | | | 32 | | | | 239 | | | | 632 | | | | 5,051 | | | | 34 | | | | 247 | |
| | — | | | | — | | | | (3 | ) | | | (25 | ) | | | (1,886 | ) | | | (15,313 | ) | | | (973 | ) | | | (6,952 | ) |
| |
| |
| | 34 | | | | 275 | | | | 32 | | | | 239 | | | | 10,313 | | | | 82,102 | | | | 12,903 | | | | 96,134 | |
| |
| |
| | | | | | | | | | | | | | | | | | | | | | | | | | | | | | | |
| | 101,095 | | | | 815,713 | | | | 18,804 | | | | 142,803 | | | | 82,345 | | | | 644,164 | | | | 32,305 | | | | 237,179 | |
| | 3,466 | | | | 28,143 | | | | 112 | | | | 842 | | | | 2,753 | | | | 21,884 | | | | 316 | | | | 2,289 | |
| | (2,726 | ) | | | (22,446 | ) | | | (1,289 | ) | | | (10,350 | ) | | | (5,904 | ) | | | (46,186 | ) | | | (10,936 | ) | | | (80,837 | ) |
| |
| |
| | 101,835 | | | | 821,410 | | | | 17,627 | | | | 133,295 | | | | 79,194 | | | | 619,862 | | | | 21,685 | | | | 158,631 | |
| |
| |
| | 64,809 | | | $ | 527,745 | | | | (381,869 | ) | | $ | (2,848,175 | ) | | | 210,184 | | | $ | 1,649,615 | | | | (147,528 | ) | | $ | (977,574 | ) |
| |
| |
GOLDMAN SACHS RETIREMENT STRATEGIES PORTFOLIOS
Notes to Financial Statements (continued)
February 28, 2011 (Unaudited)
| |
| 10. SUMMARY OF SHARE TRANSACTIONS (continued) | |
| | | | | | | | | | | | | | | | | |
| | | Retirement Strategy 2030 Portfolio |
| | | |
| | | For the Six Months Ended
| | |
| | | February 28, 2011
| | For the Fiscal Year Ended
|
| | | (Unaudited) | | August 31, 2010 |
| | | |
| | | Shares | | Dollars | | Shares | | Dollars |
| | | |
Class A Shares | | | | | | | | | | | | | | | | |
| Shares sold | | | 365,292 | | | $ | 2,787,623 | | | | 1,116,258 | | | $ | 7,844,983 | |
| Reinvestment of distributions | | | 52,214 | | | | 399,439 | | | | 47,463 | | | | 327,021 | |
| Shares redeemed | | | (374,949 | ) | | | (2,805,056 | ) | | | (708,464 | ) | | | (4,952,098 | ) |
| |
| |
| | | | 42,557 | | | | 382,006 | | | | 455,257 | | | | 3,219,906 | |
| |
| |
Institutional Shares | | | | | | | | | | | | | | | | |
| Shares sold | | | 508,060 | | | | 3,726,103 | | | | 182,548 | | | | 1,297,065 | |
| Reinvestment of distributions | | | 21,786 | | | | 167,096 | | | | 29,964 | | | | 207,054 | |
| Shares redeemed | | | (33,975 | ) | | | (263,218 | ) | | | (929,081 | ) | | | (6,419,968 | ) |
| |
| |
| | | | 495,871 | | | | 3,629,981 | | | | (716,569 | ) | | | (4,915,849 | ) |
| |
| |
Class IR Shares | | | | | | | | | | | | | | | | |
| Shares sold | | | 776 | | | | 6,053 | | | | 6,727 | | | | 49,683 | |
| Reinvestment of distributions | | | 204 | | | | 1,562 | | | | 25 | | | | 175 | |
| Shares redeemed | | | (7,675 | ) | | | (61,787 | ) | | | (4 | ) | | | (25 | ) |
| |
| |
| | | | (6,695 | ) | | | (54,172 | ) | | | 6,748 | | | | 49,833 | |
| |
| |
Class R Shares | | | | | | | | | | | | | | | | |
| Shares sold | | | 86,211 | | | | 645,746 | | | | 54,419 | | | | 380,464 | |
| Reinvestment of distributions | | | 4,493 | | | | 34,327 | | | | 1,853 | | | | 12,764 | |
| Shares redeemed | | | (8,328 | ) | | | (64,795 | ) | | | (12,853 | ) | | | (90,707 | ) |
| |
| |
| | | | 82,376 | | | | 615,278 | | | | 43,419 | | | | 302,521 | |
| |
| |
NET INCREASE (DECREASE) | | | 614,109 | | | $ | 4,573,093 | | | | (211,145 | ) | | $ | (1,343,589 | ) |
| |
| |
GOLDMAN SACHS RETIREMENT STRATEGIES PORTFOLIOS
| | | | | | | | | | | | | | | | | | | | | | | | | | | | | | | |
| Retirement Strategy 2040 Portfolio | | Retirement Strategy 2050 Portfolio |
| |
For the Six Months Ended
| | | | For the Six Months Ended
| | |
February 28, 2011
| | For the Fiscal Year Ended
| | February 28, 2011
| | For the Fiscal Year Ended
|
| (Unaudited) | | August 31, 2010 | | (Unaudited) | | August 31, 2010 |
| |
| Shares | | Dollars | | Shares | | Dollars | | Shares | | Dollars | | Shares | | Dollars |
| |
| | | | | | | | | | | | | | | | | | | | | | | | | | | | | | | |
| | 226,626 | | | $ | 1,678,097 | | | | 688,543 | | | $ | 4,691,732 | | | | 101,852 | | | $ | 749,975 | | | | 291,151 | | | $ | 1,958,294 | |
| | 23,442 | | | | 175,348 | | | | 26,714 | | | | 178,716 | | | | 10,580 | | | | 79,035 | | | | 8,194 | | | | 54,568 | |
| | (153,540 | ) | | | (1,136,311 | ) | | | (511,127 | ) | | | (3,479,427 | ) | | | (48,655 | ) | | | (360,103 | ) | | | (178,730 | ) | | | (1,211,665 | ) |
| |
| |
| | 96,528 | | | | 717,134 | | | | 204,130 | | | | 1,391,021 | | | | 63,777 | | | | 468,907 | | | | 120,615 | | | | 801,197 | |
| |
| |
| | | | | | | | | | | | | | | | | | | | | | | | | | | | | | | |
| | 170,499 | | | | 1,184,091 | | | | 45,119 | | | | 310,880 | | | | 88,453 | | | | 637,053 | | | | 43,300 | | | | 290,258 | |
| | 15,000 | | | | 112,649 | | | | 31,502 | | | | 211,378 | | | | 22,444 | | | | 168,329 | | | | 25,797 | | | | 172,324 | |
| | (22,937 | ) | | | (172,777 | ) | | | (648,040 | ) | | | (4,327,298 | ) | | | (13,488 | ) | | | (100,235 | ) | | | (256,120 | ) | | | (1,611,845 | ) |
| |
| |
| | 162,562 | | | | 1,123,963 | | | | (571,419 | ) | | | (3,805,040 | ) | | | 97,409 | | | | 705,147 | | | | (187,023 | ) | | | (1,149,263 | ) |
| |
| |
| | | | | | | | | | | | | | | | | | | | | | | | | | | | | | | |
| | 185 | | | | 1,386 | | | | 173 | | | | 1,223 | | | | — | | | | — | | | | 7 | | | | 46 | |
| | 25 | | | | 189 | | | | 29 | | | | 193 | | | | 24 | | | | 180 | | | | 23 | | | | 158 | |
| | (197 | ) | | | (1,499 | ) | | | (4 | ) | | | (27 | ) | | | — | | | | — | | | | (7 | ) | | | (46 | ) |
| |
| |
| | 13 | | | | 76 | | | | 198 | | | | 1,389 | | | | 24 | | | | 180 | | | | 23 | | | | 158 | |
| |
| |
| | | | | | | | | | | | | | | | | | | | | | | | | | | | | | | |
| | 27,536 | | | | 204,816 | | | | 31,348 | | | | 212,756 | | | | 3,239 | | | | 24,113 | | | | 48,183 | | | | 326,879 | |
| | 1,572 | | | | 11,758 | | | | 807 | | | | 5,401 | | | | 398 | | | | 2,978 | | | | 34 | | | | 227 | |
| | (4,851 | ) | | | (37,055 | ) | | | (610 | ) | | | (4,211 | ) | | | (8,090 | ) | | | (59,393 | ) | | | (19,048 | ) | | | (128,496 | ) |
| |
| |
| | 24,257 | | | | 179,519 | | | | 31,545 | | | | 213,946 | | | | (4,453 | ) | | | (32,302 | ) | | | 29,169 | | | | 198,610 | |
| |
| |
| | 283,360 | | | $ | 2,020,692 | | | | (335,546 | ) | | $ | (2,198,684 | ) | | | 156,757 | | | $ | 1,141,932 | | | | (37,216 | ) | | $ | (149,298 | ) |
| |
| |
GOLDMAN SACHS RETIREMENT STRATEGY 2010 PORTFOLIO
Financial Highlights
Selected Data for a Share Outstanding Throughout Each Period
| | | | | | | | | | | | | | | | | | | | | | | | | | | | | | | |
| | | | | Income (loss) from
| | Distributions
| | |
| | | | | investment operations | | to shareholders | | |
| | | Net asset
| | | | | | | | | | | | | | |
| | | value,
| | Net
| | Net realized
| | Total from
| | From net
| | From net
| | | | |
| | | beginning
| | investment
| | and unrealized
| | investment
| | investment
| | realized
| | Total
| | |
| Year - Share Class | | of period | | income(a) | | gain (loss) | | operations | | income | | gains | | distributions | | |
| |
FOR THE SIX MONTHS ENDED FEBRUARY 28, (UNAUDITED) |
| 2011 - A | | $ | 7.91 | | | $ | 0.14 | (d) | | $ | 1.07 | | | $ | 1.21 | | | $ | (0.26 | ) | | $ | — | | | $ | (0.26 | ) | | |
| 2011 - Institutional | | | 7.97 | | | | 0.16 | (d) | | | 1.07 | | | | 1.23 | | | | (0.30 | ) | | | — | | | | (0.30 | ) | | |
| 2011 - IR | | | 7.95 | | | | 0.15 | (d) | | | 1.08 | | | | 1.23 | | | | (0.29 | ) | | | — | | | | (0.29 | ) | | |
| 2011 - R | | | 7.93 | | | | 0.15 | (d) | | | 1.05 | | | | 1.20 | | | | (0.28 | ) | | | — | | | | (0.28 | ) | | |
| | | | | | | | | | | | | | | | | | | | | | | | | | | | | | | |
| | | | | | | | | | | | | | | | | | | | | | | | | | | | | | | |
FOR THE FISCAL YEARS ENDED AUGUST 31, |
| 2010 - A | | | 7.69 | | | | 0.17 | (d) | | | 0.28 | | | | 0.45 | | | | (0.23 | ) | | | — | (e) | | | (0.23 | ) | | |
| 2010 - Institutional | | | 7.74 | | | | 0.24 | (d) | | | 0.24 | | | | 0.48 | | | | (0.25 | ) | | | — | (e) | | | (0.25 | ) | | |
| 2010 - IR | | | 7.72 | | | | 0.20 | (d) | | | 0.27 | | | | 0.47 | | | | (0.24 | ) | | | — | (e) | | | (0.24 | ) | | |
| 2010 - R | | | 7.71 | | | | 0.07 | (d) | | | 0.36 | | | | 0.43 | | | | (0.21 | ) | | | — | (e) | | | (0.21 | ) | | |
| |
|
| 2009 - A | | | 9.03 | | | | 0.26 | (d) | | | (1.29 | ) | | | (1.03 | ) | | | (0.24 | ) | | | (0.07 | ) | | | (0.31 | ) | | |
| 2009 - Institutional | | | 9.06 | | | | 0.28 | (d) | | | (1.28 | ) | | | (1.00 | ) | | | (0.25 | ) | | | (0.07 | ) | | | (0.32 | ) | | |
| 2009 - IR | | | 9.04 | | | | 0.27 | (d) | | | (1.28 | ) | | | (1.01 | ) | | | (0.24 | ) | | | (0.07 | ) | | | (0.31 | ) | | |
| 2009 - R | | | 9.01 | | | | 0.24 | (d) | | | (1.28 | ) | | | (1.04 | ) | | | (0.19 | ) | | | (0.07 | ) | | | (0.26 | ) | | |
| | | | | | | | | | | | | | | | | | | | | | | | | | | | | | | |
| | | | | | | | | | | | | | | | | | | | | | | | | | | | | | | |
FOR THE PERIOD ENDED AUGUST 31, |
| 2008 - A (Commenced September 5, 2007) | | | 10.00 | | | | 0.30 | | | | (1.01 | ) | | | (0.71 | ) | | | (0.20 | ) | | | (0.06 | ) | | | (0.26 | ) | | |
| 2008 - Institutional (Commenced September 5, 2007) | | | 10.00 | | | | 0.32 | | | | (0.98 | ) | | | (0.66 | ) | | | (0.22 | ) | | | (0.06 | ) | | | (0.28 | ) | | |
| 2008 - IR (Commenced November 30, 2007) | | | 10.28 | | | | 0.32 | | | | (1.28 | ) | | | (0.96 | ) | | | (0.22 | ) | | | (0.06 | ) | | | (0.28 | ) | | |
| 2008 - R (Commenced November 30, 2007) | | | 10.28 | | | | 0.31 | | | | (1.31 | ) | | | (1.00 | ) | | | (0.21 | ) | | | (0.06 | ) | | | (0.27 | ) | | |
| |
|
| | |
| (a) | | Recognition of net investment income by the Portfolio is affected by the timing of declaration of dividends by the Underlying Funds in which the Portfolio invests. |
| (b) | | Assumes investment at the net asset value at the beginning of the period, reinvestment of all dividends and distributions, a complete redemption of the investment at the net asset value at the end of the period and no sales or redemption charges. Total returns would be reduced if a sales or redemption charge was taken into account. Returns do not reflect the deduction of taxes that a shareholder would pay on Portfolio distributions or the redemption of Portfolio shares. Total returns for periods less than one full year are not annualized. |
| (c) | | Expense ratios exclude the expenses of the Underlying Funds in which the Portfolio invests. |
| (d) | | Calculated based on the average shares outstanding methodology. |
| (e) | | Amount is less than $0.005 per share. |
| (f) | | Annualized. |
44 The accompanying notes are an integral part of these financial statements.
GOLDMAN SACHS RETIREMENT STRATEGY 2010 PORTFOLIO
| | | | | | | | | | | | | | | | | | | | | | | | | | | | | |
| | | | | | | | | | |
| | | | |
| | | | | | | | | | |
| | | | |
| | | | | | | | | | | Ratio of
| | | | |
| | | | | Net assets,
| | Ratio of
| | Ratio of
| | net investment
| | | | |
Net asset
| | | | end of
| | net expenses
| | total expenses
| | income
| | Portfolio
| | |
value, end
| | Total
| | period
| | to average
| | to average
| | to average
| | turnover
| | |
| of period | | return(b) | | (in 000s) | | net assets(c) | | net assets(c) | | net assets(a) | | rate | | |
| |
| |
| $ | 8.86 | | | | 15.42 | % | | $ | 5,091 | | | | 0.55 | %(f) | | | 2.11 | %(f) | | | 3.17 | %(f) | | | 32 | % | | |
| | 8.90 | | | | 15.59 | | | | 5,284 | | | | 0.15 | (f) | | | 1.71 | (f) | | | 3.69 | (f) | | | 32 | | | |
| | 8.89 | | | | 15.60 | | | | 10 | | | | 0.30 | (f) | | | 1.86 | (f) | | | 3.54 | (f) | | | 32 | | | |
| | 8.85 | | | | 15.32 | | | | 2,096 | | | | 0.80 | (f) | | | 2.36 | (f) | | | 3.46 | (f) | | | 32 | | | |
| | | | | | | | | | | | | | | | | | | | | | | | | | | | | |
| | | | | | | | | | | | | | | | | | | | | | | | | | | | | |
| |
| | 7.91 | | | | 5.85 | | | | 6,901 | | | | 0.55 | | | | 2.06 | | | | 2.06 | | | | 60 | | | |
| | 7.97 | | | | 6.28 | | | | 4,558 | | | | 0.15 | | | | 1.66 | | | | 2.90 | | | | 60 | | | |
| | 7.95 | | | | 6.16 | | | | 9 | | | | 0.30 | | | | 1.81 | | | | 2.43 | | | | 60 | | | |
| | 7.93 | | | | 5.56 | | | | 399 | | | | 0.80 | | | | 2.31 | | | | 0.86 | | | | 60 | | | |
| |
|
| | 7.69 | | | | (10.77 | ) | | | 5,065 | | | | 0.55 | | | | 3.16 | | | | 3.91 | | | | 54 | | | |
| | 7.74 | | | | (10.38 | ) | | | 8,330 | | | | 0.15 | | | | 2.76 | | | | 4.13 | | | | 54 | | | |
| | 7.72 | | | | (10.59 | ) | | | 8 | | | | 0.30 | | | | 2.91 | | | | 3.97 | | | | 54 | | | |
| | 7.71 | | | | (10.98 | ) | | | 8 | | | | 0.80 | | | | 3.41 | | | | 3.50 | | | | 54 | | | |
| | | | | | | | | | | | | | | | | | | | | | | | | | | | | |
| | | | | | | | | | | | | | | | | | | | | | | | | | | | | |
| |
| | 9.03 | | | | (7.27 | ) | | | 1,604 | | | | 0.55 | (f) | | | 3.54 | (f) | | | 2.59 | (f) | | | 41 | | | |
| | 9.06 | | | | (6.85 | ) | | | 9,296 | | | | 0.15 | (f) | | | 3.14 | (f) | | | 2.74 | (f) | | | 41 | | | |
| | 9.04 | | | | (9.58 | ) | | | 9 | | | | 0.30 | (f) | | | 3.29 | (f) | | | 2.37 | (f) | | | 41 | | | |
| | 9.01 | | | | (9.92 | ) | | | 9 | | | | 0.80 | (f) | | | 3.79 | (f) | | | 2.30 | (f) | | | 41 | | | |
| |
|
The accompanying notes are an integral part of these financial statements. 45
GOLDMAN SACHS RETIREMENT STRATEGY 2015 PORTFOLIO
Financial Highlights
Selected Data for a Share Outstanding Throughout Each Period
| | | | | | | | | | | | | | | | | | | | | | | | | | | | | | | |
| | | | | Income (loss) from
| | Distributions
| | |
| | | | | investment operations | | to shareholders | | |
| | | Net asset
| | | | | | | | | | | | | | |
| | | value,
| | Net
| | Net realized
| | Total from
| | From net
| | From net
| | | | |
| | | beginning
| | investment
| | and unrealized
| | investment
| | investment
| | realized
| | Total
| | |
| Year - Share Class | | of period | | income(a) | | gain (loss) | | operations | | income | | gains | | distributions | | |
| |
FOR THE SIX MONTHS ENDED FEBRUARY 28, (UNAUDITED) |
| 2011 - A | | $ | 7.44 | | | $ | 0.14 | (d) | | $ | 1.16 | | | $ | 1.30 | | | $ | (0.23 | ) | | $ | — | | | $ | (0.23 | ) | | |
| 2011 - Institutional | | | 7.48 | | | | 0.16 | (d) | | | 1.17 | | | | 1.33 | | | | (0.26 | ) | | | — | | | | (0.26 | ) | | |
| 2011 - IR | | | 7.47 | | | | 0.15 | (d) | | | 1.17 | | | | 1.32 | | | | (0.25 | ) | | | — | | | | (0.25 | ) | | |
| 2011 - R | | | 7.42 | | | | 0.15 | (d) | | | 1.14 | | | | 1.29 | | | | (0.25 | ) | | | — | | | | (0.25 | ) | | |
| | | | | | | | | | | | | | | | | | | | | | | | | | | | | | | |
| | | | | | | | | | | | | | | | | | | | | | | | | | | | | | | |
FOR THE FISCAL YEARS ENDED AUGUST 31, |
| 2010 - A | | | 7.29 | | | | 0.15 | (d) | | | 0.21 | | | | 0.36 | | | | (0.21 | ) | | | — | | | | (0.21 | ) | | |
| 2010 - Institutional | | | 7.33 | | | | 0.21 | (d) | | | 0.17 | | | | 0.38 | | | | (0.23 | ) | | | — | | | | (0.23 | ) | | |
| 2010 - IR | | | 7.31 | | | | 0.18 | (d) | | | 0.20 | | | | 0.38 | | | | (0.22 | ) | | | — | | | | (0.22 | ) | | |
| 2010 - R | | | 7.30 | | | | 0.08 | (d) | | | 0.25 | | | | 0.33 | | | | (0.21 | ) | | | — | | | | (0.21 | ) | | |
| |
|
| 2009 - A | | | 8.86 | | | | 0.23 | (d) | | | (1.45 | ) | | | (1.22 | ) | | | (0.21 | ) | | | (0.14 | ) | | | (0.35 | ) | | |
| 2009 - Institutional | | | 8.89 | | | | 0.26 | (d) | | | (1.46 | ) | | | (1.20 | ) | | | (0.22 | ) | | | (0.14 | ) | | | (0.36 | ) | | |
| 2009 - IR | | | 8.87 | | | | 0.25 | (d) | | | (1.46 | ) | | | (1.21 | ) | | | (0.21 | ) | | | (0.14 | ) | | | (0.35 | ) | | |
| 2009 - R | | | 8.84 | | | | 0.21 | (d) | | | (1.44 | ) | | | (1.23 | ) | | | (0.17 | ) | | | (0.14 | ) | | | (0.31 | ) | | |
| | | | | | | | | | | | | | | | | | | | | | | | | | | | | | | |
| | | | | | | | | | | | | | | | | | | | | | | | | | | | | | | |
FOR THE PERIOD ENDED AUGUST 31, |
| 2008 - A (Commenced September 5, 2007) | | | 10.00 | | | | 0.30 | | | | (1.16 | ) | | | (0.86 | ) | | | (0.22 | ) | | | (0.06 | ) | | | (0.28 | ) | | |
| 2008 - Institutional (Commenced September 5, 2007) | | | 10.00 | | | | 0.32 | | | | (1.13 | ) | | | (0.81 | ) | | | (0.24 | ) | | | (0.06 | ) | | | (0.30 | ) | | |
| 2008 - IR (Commenced November 30, 2007) | | | 10.26 | | | | 0.31 | | | | (1.40 | ) | | | (1.09 | ) | | | (0.24 | ) | | | (0.06 | ) | | | (0.30 | ) | | |
| 2008 - R (Commenced November 30, 2007) | | | 10.26 | | | | 0.31 | | | | (1.44 | ) | | | (1.13 | ) | | | (0.23 | ) | | | (0.06 | ) | | | (0.29 | ) | | |
| |
|
| | |
| (a) | | Recognition of net investment income by the Portfolio is affected by the timing of declaration of dividends by the Underlying Funds in which the Portfolio invests. |
| (b) | | Assumes investment at the net asset value at the beginning of the period, reinvestment of all dividends and distributions, a complete redemption of the investment at the net asset value at the end of the period and no sales or redemption charges. Total returns would be reduced if a sales or redemption charge was taken into account. Returns do not reflect the deduction of taxes that a shareholder would pay on Portfolio distributions or the redemption of Portfolio shares. Total returns for periods less than one full year are not annualized. |
| (c) | | Expense ratios exclude the expenses of the Underlying Funds in which the Portfolio invests. |
| (d) | | Calculated based on the average shares outstanding methodology. |
| (e) | | Annualized. |
46 The accompanying notes are an integral part of these financial statements.
GOLDMAN SACHS RETIREMENT STRATEGY 2015 PORTFOLIO
| | | | | | | | | | | | | | | | | | | | | | | | | | | | | |
| | | | | | | | | | | Ratio of
| | | | |
| | | | | Net assets,
| | Ratio of
| | Ratio of
| | net investment
| | | | |
Net asset
| | | | end of
| | net expenses
| | total expenses
| | income
| | Portfolio
| | |
value, end
| | Total
| | period
| | to average
| | to average
| | to average
| | turnover
| | |
| of period | | return(b) | | (in 000s) | | net assets(c) | | net assets(c) | | net assets(a) | | rate
| | |
| |
| |
| $ | 8.51 | | | | 17.58 | % | | $ | 4,966 | | | | 0.55 | %(e) | | | 2.14 | %(e) | | | 3.43 | %(e) | | | 29 | % | | |
| | 8.55 | | | | 17.97 | | | | 6,742 | | | | 0.15 | (e) | | | 1.74 | (e) | | | 3.86 | (e) | | | 29 | | | |
| | 8.54 | | | | 17.84 | | | | 10 | | | | 0.30 | (e) | | | 1.89 | (e) | | | 3.67 | (e) | | | 29 | | | |
| | 8.46 | | | | 17.50 | | | | 1,025 | | | | 0.80 | (e) | | | 2.39 | (e) | | | 3.69 | (e) | | | 29 | | | |
| | | | | | | | | | | | | | | | | | | | | | | | | | | | | |
| | | | | | | | | | | | | | | | | | | | | | | | | | | | | |
| |
| | 7.44 | | | | 4.94 | | | | 5,153 | | | | 0.55 | | | | 2.14 | | | | 2.02 | | | | 49 | | | |
| | 7.48 | | | | 5.23 | | | | 5,361 | | | | 0.15 | | | | 1.74 | | | | 2.79 | | | | 49 | | | |
| | 7.47 | | | | 5.25 | | | | 8 | | | | 0.30 | | | | 1.89 | | | | 2.34 | | | | 49 | | | |
| | 7.42 | | | | 4.55 | | | | 143 | | | | 0.80 | | | | 2.39 | | | | 1.12 | | | | 49 | | | |
| |
|
| | 7.29 | | | | (12.96 | ) | | | 4,287 | | | | 0.55 | | | | 3.23 | | | | 3.58 | | | | 39 | | | |
| | 7.33 | | | | (12.64 | ) | | | 8,946 | | | | 0.15 | | | | 2.83 | | | | 3.95 | | | | 39 | | | |
| | 7.31 | | | | (12.85 | ) | | | 8 | | | | 0.30 | | | | 2.98 | | | | 3.81 | | | | 39 | | | |
| | 7.30 | | | | (13.25 | ) | | | 12 | | | | 0.80 | | | | 3.48 | | | | 3.30 | | | | 39 | | | |
| | | | | | | | | | | | | | | | | | | | | | | | | | | | | |
| | | | | | | | | | | | | | | | | | | | | | | | | | | | | |
| |
| | 8.86 | | | | (8.80 | ) | | | 1,741 | | | | 0.55 | (e) | | | 3.57 | (e) | | | 2.27 | (e) | | | 34 | | | |
| | 8.89 | | | | (8.38 | ) | | | 9,855 | | | | 0.15 | (e) | | | 3.17 | (e) | | | 2.60 | (e) | | | 34 | | | |
| | 8.87 | | | | (10.90 | ) | | | 9 | | | | 0.30 | (e) | | | 3.32 | (e) | | | 2.79 | (e) | | | 34 | | | |
| | 8.84 | | | | (11.24 | ) | | | 9 | | | | 0.80 | (e) | | | 3.82 | (e) | | | 2.25 | (e) | | | 34 | | | |
| |
|
The accompanying notes are an integral part of these financial statements. 47
GOLDMAN SACHS RETIREMENT STRATEGY 2020 PORTFOLIO
Financial Highlights
Selected Data for a Share Outstanding Throughout Each Period
| | | | | | | | | | | | | | | | | | | | | | | | | | | | | | | |
| | | | | Income (loss) from
| | Distributions
| | |
| | | | | investment operations | | to shareholders | | |
| | | Net asset
| | | | | | | | | | | | | | |
| | | value,
| | Net
| | Net realized
| | Total from
| | From net
| | From net
| | | | |
| | | beginning
| | investment
| | and unrealized
| | investment
| | investment
| | realized
| | Total
| | |
| Year - Share Class | | of period | | income(a) | | gain (loss) | | operations | | income | | gains | | distributions | | |
| |
FOR THE SIX MONTHS ENDED FEBRUARY 28, (UNAUDITED) |
| 2011 - A | | $ | 7.14 | | | $ | 0.14 | (d) | | $ | 1.26 | | | $ | 1.40 | | | $ | (0.21 | ) | | $ | — | | | $ | (0.21 | ) | | |
| 2011 - Institutional | | | 7.19 | | | | 0.16 | (d) | | | 1.25 | | | | 1.41 | | | | (0.23 | ) | | | — | | | | (0.23 | ) | | |
| 2011 - IR | | | 7.18 | | | | 0.16 | (d) | | | 1.25 | | | | 1.41 | | | | (0.23 | ) | | | — | | | | (0.23 | ) | | |
| 2011 - R | | | 7.14 | | | | 0.15 | (d) | | | 1.23 | | | | 1.38 | | | | (0.21 | ) | | | — | | | | (0.21 | ) | | |
| | | | | | | | | | | | | | | | | | | | | | | | | | | | | | | |
| | | | | | | | | | | | | | | | | | | | | | | | | | | | | | | |
FOR THE FISCAL YEARS ENDED AUGUST 31, |
| 2010 - A | | | 7.06 | | | | 0.14 | (d) | | | 0.16 | | | | 0.30 | | | | (0.22 | ) | | | — | | | | (0.22 | ) | | |
| 2010 - Institutional | | | 7.10 | | | | 0.21 | (d) | | | 0.12 | | | | 0.33 | | | | (0.24 | ) | | | — | | | | (0.24 | ) | | |
| 2010 - IR | | | 7.09 | | | | 0.09 | (d) | | | 0.23 | | | | 0.32 | | | | (0.23 | ) | | | — | | | | (0.23 | ) | | |
| 2010 - R | | | 7.08 | | | | 0.09 | (d) | | | 0.20 | | | | 0.29 | | | | (0.23 | ) | | | — | | | | (0.23 | ) | | |
| |
|
| 2009 - A | | | 8.74 | | | | 0.19 | (d) | | | (1.57 | ) | | | (1.38 | ) | | | (0.15 | ) | | | (0.15 | ) | | | (0.30 | ) | | |
| 2009 - Institutional | | | 8.77 | | | | 0.23 | (d) | | | (1.58 | ) | | | (1.35 | ) | | | (0.17 | ) | | | (0.15 | ) | | | (0.32 | ) | | |
| 2009 - IR | | | 8.75 | | | | 0.22 | (d) | | | (1.58 | ) | | | (1.36 | ) | | | (0.15 | ) | | | (0.15 | ) | | | (0.30 | ) | | |
| 2009 - R | | | 8.72 | | | | 0.13 | (d) | | | (1.51 | ) | | | (1.38 | ) | | | (0.11 | ) | | | (0.15 | ) | | | (0.26 | ) | | |
| | | | | | | | | | | | | | | | | | | | | | | | | | | | | | | |
| | | | | | | | | | | | | | | | | | | | | | | | | | | | | | | |
FOR THE PERIOD ENDED AUGUST 31, |
| 2008 - A (Commenced September 5, 2007) | | | 10.00 | | | | 0.30 | | | | (1.27 | ) | | | (0.97 | ) | | | (0.23 | ) | | | (0.06 | ) | | | (0.29 | ) | | |
| 2008 - Institutional (Commenced September 5, 2007) | | | 10.00 | | | | 0.31 | | | | (1.24 | ) | | | (0.93 | ) | | | (0.24 | ) | | | (0.06 | ) | | | (0.30 | ) | | |
| 2008 - IR (Commenced November 30, 2007) | | | 10.25 | | | | 0.31 | | | | (1.51 | ) | | | (1.20 | ) | | | (0.24 | ) | | | (0.06 | ) | | | (0.30 | ) | | |
| 2008 - R (Commenced November 30, 2007) | | | 10.25 | | | | 0.30 | | | | (1.53 | ) | | | (1.23 | ) | | | (0.24 | ) | | | (0.06 | ) | | | (0.30 | ) | | |
| |
|
| | |
| (a) | | Recognition of net investment income by the Portfolio is affected by the timing of declaration of dividends by the Underlying Funds in which the Portfolio invests. |
| (b) | | Assumes investment at the net asset value at the beginning of the period, reinvestment of all dividends and distributions, a complete redemption of the investment at the net asset value at the end of the period and no sales or redemption charges. Total returns would be reduced if a sales or redemption charge was taken into account. Returns do not reflect the deduction of taxes that a shareholder would pay on Portfolio distributions or the redemption of Portfolio shares. Total returns for periods less than one full year are not annualized. |
| (c) | | Expense ratios exclude the expenses of the Underlying Funds in which the Portfolio invests. |
| (d) | | Calculated based on the average shares outstanding methodology. |
| (e) | | Annualized. |
48 The accompanying notes are an integral part of these financial statements.
GOLDMAN SACHS RETIREMENT STRATEGY 2020 PORTFOLIO
| | | | | | | | | | | | | | | | | | | | | | | | | | | | | |
| | | | | | | | | | | Ratio of
| | | | |
| | | | | Net assets,
| | Ratio of
| | Ratio of
| | net investment
| | | | |
Net asset
| | | | end of
| | net expenses
| | total expenses
| | income
| | Portfolio
| | |
value, end
| | Total
| | period
| | to average
| | to average
| | to average
| | turnover
| | |
| of period | | return(b) | | (in 000s) | | net assets(c) | | net assets(c) | | net assets(a) | | rate | | |
| |
| |
| $ | 8.33 | | | | 19.67 | % | | $ | 11,500 | | | | 0.55 | %(e) | | | 1.73 | %(e) | | | 3.51 | %(e) | | | 27 | % | | |
| | 8.37 | | | | 19.80 | | | | 6,143 | | | | 0.15 | (e) | | | 1.33 | (e) | | | 3.98 | (e) | | | 27 | | | |
| | 8.36 | | | | 19.78 | | | | 203 | | | | 0.30 | (e) | | | 1.48 | (e) | | | 3.98 | (e) | | | 27 | | | |
| | 8.31 | | | | 19.52 | | | | 903 | | | | 0.80 | (e) | | | 1.98 | (e) | | | 3.76 | (e) | | | 27 | | | |
| | | | | | | | | | | | | | | | | | | | | | | | | | | | | |
| | | | | | | | | | | | | | | | | | | | | | | | | | | | | |
| |
| | 7.14 | | | | 4.21 | | | | 9,999 | | | | 0.55 | | | | 1.91 | | | | 1.95 | | | | 64 | | | |
| | 7.19 | | | | 4.66 | | | | 4,270 | | | | 0.15 | | | | 1.51 | | | | 2.82 | | | | 64 | | | |
| | 7.18 | | | | 4.53 | | | | 100 | | | | 0.30 | | | | 1.66 | | | | 1.22 | | | | 64 | | | |
| | 7.14 | | | | 3.98 | | | | 210 | | | | 0.80 | | | | 2.16 | | | | 1.16 | | | | 64 | | | |
| |
|
| | 7.06 | | | | (15.06 | ) | | | 7,658 | | | | 0.55 | | | | 3.00 | | | | 3.04 | | | | 45 | | | |
| | 7.10 | | | | (14.69 | ) | | | 7,744 | | | | 0.15 | | | | 2.60 | | | | 3.73 | | | | 45 | | | |
| | 7.09 | | | | (14.80 | ) | | | 8 | | | | 0.30 | | | | 2.75 | | | | 3.58 | | | | 45 | | | |
| | 7.08 | | | | (15.21 | ) | | | 55 | | | | 0.80 | | | | 3.25 | | | | 1.98 | | | | 45 | | | |
| | | | | | | | | | | | | | | | | | | | | | | | | | | | | |
| | | | | | | | | | | | | | | | | | | | | | | | | | | | | |
| |
| | 8.74 | | | | (9.94 | ) | | | 3,049 | | | | 0.55 | (e) | | | 3.47 | (e) | | | 2.06 | (e) | | | 33 | | | |
| | 8.77 | | | | (9.56 | ) | | | 9,040 | | | | 0.15 | (e) | | | 3.07 | (e) | | | 2.48 | (e) | | | 33 | | | |
| | 8.75 | | | | (11.97 | ) | | | 9 | | | | 0.30 | (e) | | | 3.22 | (e) | | | 2.68 | (e) | | | 33 | | | |
| | 8.72 | | | | (12.31 | ) | | | 9 | | | | 0.80 | (e) | | | 3.72 | (e) | | | 2.17 | (e) | | | 33 | | | |
| |
|
The accompanying notes are an integral part of these financial statements. 49
GOLDMAN SACHS RETIREMENT STRATEGY 2030 PORTFOLIO
Financial Highlights
Selected Data for a Share Outstanding Throughout Each Period
| | | | | | | | | | | | | | | | | | | | | | | | | | | | | | | |
| | | | | Income (loss) from
| | Distributions
| | |
| | | | | investment operations | | to shareholders | | |
| | | Net asset
| | | | | | | | | | | | | | |
| | | value,
| | Net
| | Net realized
| | Total from
| | From net
| | From net
| | | | |
| | | beginning
| | investment
| | and unrealized
| | investment
| | investment
| | realized
| | Total
| | |
| Year - Share Class | | of period | | income(a) | | gain (loss) | | operations | | income | | gains | | distributions | | |
| |
FOR THE SIX MONTHS ENDED FEBRUARY 28, (UNAUDITED) |
| 2011 - A | | $ | 6.71 | | | $ | 0.14 | (d) | | $ | 1.35 | | | $ | 1.49 | | | $ | (0.17 | ) | | $ | — | | | $ | (0.17 | ) | | |
| 2011 - Institutional | | | 6.75 | | | | 0.16 | (d) | | | 1.35 | | | | 1.51 | | | | (0.20 | ) | | | — | | | | (0.20 | ) | | |
| 2011 - IR | | | 6.74 | | | | 0.15 | (d) | | | 1.32 | | | | 1.47 | | | | (0.19 | ) | | | — | | | | (0.19 | ) | | |
| 2011 - R | | | 6.71 | | | | 0.14 | (d) | | | 1.33 | | | | 1.47 | | | | (0.17 | ) | | | — | | | | (0.17 | ) | | |
| | | | | | | | | | | | | | | | | | | | | | | | | | | | | | | |
| | | | | | | | | | | | | | | | | | | | | | | | | | | | | | | |
FOR THE FISCAL YEARS ENDED AUGUST 31, |
| 2010 - A | | | 6.65 | | | | 0.13 | (d) | | | 0.08 | | | | 0.21 | | | | (0.15 | ) | | | — | | | | (0.15 | ) | | |
| 2010 - Institutional | | | 6.68 | | | | 0.21 | (d) | | | 0.03 | | | | 0.24 | | | | (0.17 | ) | | | — | | | | (0.17 | ) | | |
| 2010 - IR | | | 6.67 | | | | 0.07 | (d) | | | 0.16 | | | | 0.23 | | | | (0.16 | ) | | | — | | | | (0.16 | ) | | |
| 2010 - R | | | 6.66 | | | | 0.10 | (d) | | | 0.11 | | | | 0.21 | | | | (0.16 | ) | | | — | | | | (0.16 | ) | | |
| |
|
| 2009 - A | | | 8.53 | | | | 0.14 | (d) | | | (1.69 | ) | | | (1.55 | ) | | | (0.18 | ) | | | (0.15 | ) | | | (0.33 | ) | | |
| 2009 - Institutional | | | 8.55 | | | | 0.20 | (d) | | | (1.73 | ) | | | (1.53 | ) | | | (0.19 | ) | | | (0.15 | ) | | | (0.34 | ) | | |
| 2009 - IR | | | 8.53 | | | | 0.20 | (d) | | | (1.73 | ) | | | (1.53 | ) | | | (0.18 | ) | | | (0.15 | ) | | | (0.33 | ) | | |
| 2009 - R | | | 8.50 | | | | 0.02 | (d) | | | (1.57 | ) | | | (1.55 | ) | | | (0.14 | ) | | | (0.15 | ) | | | (0.29 | ) | | |
| | | | | | | | | | | | | | | | | | | | | | | | | | | | | | | |
| | | | | | | | | | | | | | | | | | | | | | | | | | | | | | | |
FOR THE PERIOD ENDED AUGUST 31, |
| 2008 - A (Commenced September 5, 2007) | | | 10.00 | | | | 0.29 | | | | (1.45 | ) | | | (1.16 | ) | | | (0.24 | ) | | | (0.07 | ) | | | (0.31 | ) | | |
| 2008 - Institutional (Commenced September 5, 2007) | | | 10.00 | | | | 0.30 | | | | (1.43 | ) | | | (1.13 | ) | | | (0.25 | ) | | | (0.07 | ) | | | (0.32 | ) | | |
| 2008 - IR (Commenced November 30, 2007) | | | 10.22 | | | | 0.30 | | | | (1.67 | ) | | | (1.37 | ) | | | (0.25 | ) | | | (0.07 | ) | | | (0.32 | ) | | |
| 2008 - R (Commenced November 30, 2007) | | | 10.22 | | | | 0.29 | | | | (1.69 | ) | | | (1.40 | ) | | | (0.25 | ) | | | (0.07 | ) | | | (0.32 | ) | | |
| |
|
| | |
| (a) | | Recognition of net investment income by the Portfolio is affected by the timing of declaration of dividends by the Underlying Funds in which the Portfolio invests. |
| (b) | | Assumes investment at the net asset value at the beginning of the period, reinvestment of all dividends and distributions, a complete redemption of the investment at the net asset value at the end of the period and no sales or redemption charges. Total returns would be reduced if a sales or redemption charge was taken into account. Returns do not reflect the deduction of taxes that a shareholder would pay on Portfolio distributions or the redemption of Portfolio shares. Total returns for periods less than one full year are not annualized. |
| (c) | | Expense ratios exclude the expenses of the Underlying Funds in which the Portfolio invests. |
| (d) | | Calculated based on the average shares outstanding methodology. |
| (e) | | Annualized. |
50 The accompanying notes are an integral part of these financial statements.
GOLDMAN SACHS RETIREMENT STRATEGY 2030 PORTFOLIO
| | | | | | | | | | | | | | | | | | | | | | | | | | | | | |
| | | | | | | | | | | Ratio of
| | | | |
| | | | | Net assets,
| | Ratio of
| | Ratio of
| | net investment
| | | | |
Net asset
| | | | end of
| | net expenses
| | total expenses
| | income
| | Portfolio
| | |
value, end
| | Total
| | period
| | to average
| | to average
| | to average
| | turnover
| | |
| of period | | return(b) | | (in 000s) | | net assets(c) | | net assets(c) | | net assets(a) | | rate | | |
| |
| |
| $ | 8.03 | | | | 22.38 | % | | $ | 19,379 | | | | 0.55 | %(e) | | | 1.37 | %(e) | | | 3.62 | %(e) | | | 24 | % | | |
| | 8.06 | | | | 22.54 | | | | 7,507 | | | | 0.15 | (e) | | | 0.97 | (e) | | | 4.22 | (e) | | | 24 | | | |
| | 8.02 | | | | 22.45 | | | | 9 | | | | 0.30 | (e) | | | 1.12 | (e) | | | 3.91 | (e) | | | 24 | | | |
| | 8.01 | | | | 22.04 | | | | 1,648 | | | | 0.80 | (e) | | | 1.62 | (e) | | | 3.74 | (e) | | | 24 | | | |
| | | | | | | | | | | | | | | | | | | | | | | | | | | | | |
| | | | | | | | | | | | | | | | | | | | | | | | | | | | | |
| |
| | 6.71 | | | | 3.14 | | | | 15,923 | | | | 0.55 | | | | 1.57 | | | | 1.92 | | | | 67 | | | |
| | 6.75 | | | | 3.57 | | | | 2,941 | | | | 0.15 | | | | 1.17 | | | | 2.99 | | | | 67 | | | |
| | 6.74 | | | | 3.44 | | | | 53 | | | | 0.30 | | | | 1.32 | | | | 0.98 | | | | 67 | | | |
| | 6.71 | | | | 3.02 | | | | 827 | | | | 0.80 | | | | 1.82 | | | | 1.42 | | | | 67 | | | |
| |
|
| | 6.65 | | | | (17.33 | ) | | | 12,749 | | | | 0.55 | | | | 2.66 | | | | 2.48 | | | | 39 | | | |
| | 6.68 | | | | (16.99 | ) | | | 7,700 | | | | 0.15 | | | | 2.26 | | | | 3.48 | | | | 39 | | | |
| | 6.67 | | | | (17.10 | ) | | | 7 | | | | 0.30 | | | | 2.41 | | | | 3.37 | | | | 39 | | | |
| | 6.66 | | | | (17.52 | ) | | | 533 | | | | 0.80 | | | | 2.91 | | | | 0.25 | | | | 39 | | | |
| | | | | | | | | | | | | | | | | | | | | | | | | | | | | |
| | | | | | | | | | | | | | | | | | | | | | | | | | | | | |
| |
| | 8.53 | | | | (11.97 | ) | | | 3,747 | | | | 0.55 | (e) | | | 3.42 | (e) | | | 1.91 | (e) | | | 39 | | | |
| | 8.55 | | | | (11.67 | ) | | | 8,838 | | | | 0.15 | (e) | | | 3.02 | (e) | | | 2.33 | (e) | | | 39 | | | |
| | 8.53 | | | | (13.77 | ) | | | 9 | | | | 0.30 | (e) | | | 3.17 | (e) | | | 2.65 | (e) | | | 39 | | | |
| | 8.50 | | | | (14.11 | ) | | | 9 | | | | 0.80 | (e) | | | 3.67 | (e) | | | 2.14 | (e) | | | 39 | | | |
| |
|
The accompanying notes are an integral part of these financial statements. 51
GOLDMAN SACHS RETIREMENT STRATEGY 2040 PORTFOLIO
Financial Highlights
Selected Data for a Share Outstanding Throughout Each Period
| | | | | | | | | | | | | | | | | | | | | | | | | | | | | | | |
| | | | | Income (loss) from
| | Distributions
| | |
| | | | | investment operations | | to shareholders | | |
| | | Net asset
| | | | | | | | | | | | | | |
| | | value,
| | Net
| | Net realized
| | Total from
| | From net
| | From net
| | | | |
| | | beginning
| | investment
| | and unrealized
| | investment
| | investment
| | realized
| | Total
| | |
| Year - Share Class | | of period | | income(a) | | gain (loss) | | operations | | income | | gains | | distributions | | |
| |
FOR THE SIX MONTHS ENDED FEBRUARY 28, (UNAUDITED) |
| 2011 - A | | $ | 6.49 | | | $ | 0.14 | (d) | | $ | 1.37 | | | $ | 1.51 | | | $ | (0.14 | ) | | $ | — | | | $ | (0.14 | ) | | |
| 2011 - Institutional | | | 6.52 | | | | 0.15 | (d) | | | 1.39 | | | | 1.54 | | | | (0.16 | ) | | | — | | | | (0.16 | ) | | |
| 2011 - IR | | | 6.51 | | | | 0.15 | (d) | | | 1.38 | | | | 1.53 | | | | (0.15 | ) | | | — | | | | (0.15 | ) | | |
| 2011 - R | | | 6.48 | | | | 0.14 | (d) | | | 1.37 | | | | 1.51 | | | | (0.14 | ) | | | — | | | | (0.14 | ) | | |
| | | | | | | | | | | | | | | | | | | | | | | | | | | | | | | |
| | | | | | | | | | | | | | | | | | | | | | | | | | | | | | | |
FOR THE FISCAL YEARS ENDED AUGUST 31, |
| 2010 - A | | | 6.48 | | | | 0.12 | (d) | | | 0.06 | | | | 0.18 | | | | (0.17 | ) | | | — | | | | (0.17 | ) | | |
| 2010 - Institutional | | | 6.51 | | | | 0.18 | (d) | | | 0.02 | | | | 0.20 | | | | (0.19 | ) | | | — | | | | (0.19 | ) | | |
| 2010 - IR | | | 6.49 | | | | 0.14 | (d) | | | 0.06 | | | | 0.20 | | | | (0.18 | ) | | | — | | | | (0.18 | ) | | |
| 2010 - R | | | 6.49 | | | | 0.08 | (d) | | | 0.08 | | | | 0.16 | | | | (0.17 | ) | | | — | | | | (0.17 | ) | | |
| |
|
| 2009 - A | | | 8.45 | | | | 0.12 | (d) | | | (1.72 | ) | | | (1.60 | ) | | | (0.16 | ) | | | (0.21 | ) | | | (0.37 | ) | | |
| 2009 - Institutional | | | 8.47 | | | | 0.20 | (d) | | | (1.77 | ) | | | (1.57 | ) | | | (0.18 | ) | | | (0.21 | ) | | | (0.39 | ) | | |
| 2009 - IR | | | 8.45 | | | | 0.19 | (d) | | | (1.78 | ) | | | (1.59 | ) | | | (0.16 | ) | | | (0.21 | ) | | | (0.37 | ) | | |
| 2009 - R | | | 8.42 | | | | 0.04 | (d) | | | (1.64 | ) | | | (1.60 | ) | | | (0.12 | ) | | | (0.21 | ) | | | (0.33 | ) | | |
| | | | | | | | | | | | | | | | | | | | | | | | | | | | | | | |
| | | | | | | | | | | | | | | | | | | | | | | | | | | | | | | |
FOR THE PERIOD ENDED AUGUST 31, |
| 2008 - A (Commenced September 5, 2007) | | | 10.00 | | | | 0.29 | | | | (1.52 | ) | | | (1.23 | ) | | | (0.25 | ) | | | (0.07 | ) | | | (0.32 | ) | | |
| 2008 - Institutional (Commenced September 5, 2007) | | | 10.00 | | | | 0.30 | | | | (1.50 | ) | | | (1.20 | ) | | | (0.26 | ) | | | (0.07 | ) | | | (0.33 | ) | | |
| 2008 - IR (Commenced November 30, 2007) | | | 10.21 | | | | 0.30 | | | | (1.73 | ) | | | (1.43 | ) | | | (0.26 | ) | | | (0.07 | ) | | | (0.33 | ) | | |
| 2008 - R (Commenced November 30, 2007) | | | 10.21 | | | | 0.30 | | | | (1.77 | ) | | | (1.47 | ) | | | (0.25 | ) | | | (0.07 | ) | | | (0.32 | ) | | |
| |
|
| | |
| (a) | | Recognition of net investment income by the Portfolio is affected by the timing of declaration of dividends by the Underlying Funds in which the Portfolio invests. |
| (b) | | Assumes investment at the net asset value at the beginning of the period, reinvestment of all dividends and distributions, a complete redemption of the investment at the net asset value at the end of the period and no sales or redemption charges. Total returns would be reduced if a sales or redemption charge was taken into account. Returns do not reflect the deduction of taxes that a shareholder would pay on Portfolio distributions or the redemption of Portfolio shares. Total returns for periods less than one full year are not annualized. |
| (c) | | Expense ratios exclude the expenses of the Underlying Funds in which the Portfolio invests. |
| (d) | | Calculated based on the average shares outstanding methodology. |
| (e) | | Annualized. |
52 The accompanying notes are an integral part of these financial statements.
GOLDMAN SACHS RETIREMENT STRATEGY 2040 PORTFOLIO
| | | | | | | | | | | | | | | | | | | | | | | | | | | | | |
| | | | | | | | | | | Ratio of
| | | | |
| | | | | Net assets,
| | Ratio of
| | Ratio of
| | net investment
| | | | |
Net asset
| | | | end of
| | net expenses
| | total expenses
| | income
| | Portfolio
| | |
value, end
| | Total
| | period
| | to average
| | to average
| | to average
| | turnover
| | |
| of period | | return(b) | | (in 000s) | | net assets(c) | | net assets(c) | | net assets(a) | | rate | | |
| |
| |
| $ | 7.86 | | | | 23.36 | % | | $ | 10,174 | | | | 0.55 | %(e) | | | 1.90 | %(e) | | | 3.73 | %(e) | | | 21 | % | | |
| | 7.90 | | | | 23.81 | | | | 5,647 | | | | 0.15 | (e) | | | 1.50 | (e) | | | 4.11 | (e) | | | 21 | | | |
| | 7.89 | | | | 23.68 | | | | 10 | | | | 0.30 | (e) | | | 1.65 | (e) | | | 4.09 | (e) | | | 21 | | | |
| | 7.85 | | | | 23.33 | | | | 678 | | | | 0.80 | (e) | | | 2.15 | (e) | | | 3.83 | (e) | | | 21 | | | |
| | | | | | | | | | | | | | | | | | | | | | | | | | | | | |
| | | | | | | | | | | | | | | | | | | | | | | | | | | | | |
| |
| | 6.49 | | | | 2.66 | | | | 7,769 | | | | 0.55 | | | | 2.07 | | | | 1.78 | | | | 63 | | | |
| | 6.52 | | | | 2.94 | | | | 3,605 | | | | 0.15 | | | | 1.67 | | | | 2.68 | | | | 63 | | | |
| | 6.51 | | | | 2.97 | | | | 8 | | | | 0.30 | | | | 1.82 | | | | 1.99 | | | | 63 | | | |
| | 6.48 | | | | 2.38 | | | | 402 | | | | 0.80 | | | | 2.32 | | | | 1.19 | | | | 63 | | | |
| |
|
| | 6.48 | | | | (17.91 | ) | | | 6,435 | | | | 0.55 | | | | 3.41 | | | | 2.24 | | | | 36 | | | |
| | 6.51 | | | | (17.53 | ) | | | 7,314 | | | | 0.15 | | | | 3.01 | | | | 3.45 | | | | 36 | | | |
| | 6.49 | | | | (17.77 | ) | | | 7 | | | | 0.30 | | | | 3.16 | | | | 3.31 | | | | 36 | | | |
| | 6.49 | | | | (18.08 | ) | | | 198 | | | | 0.80 | | | | 3.66 | | | | 0.73 | | | | 36 | | | |
| | | | | | | | | | | | | | | | | | | | | | | | | | | | | |
| | | | | | | | | | | | | | | | | | | | | | | | | | | | | |
| |
| | 8.45 | | | | (12.73 | ) | | | 1,751 | | | | 0.55 | (e) | | | 3.64 | (e) | | | 1.83 | (e) | | | 32 | | | |
| | 8.47 | | | | (12.43 | ) | | | 8,760 | | | | 0.15 | (e) | | | 3.24 | (e) | | | 2.26 | (e) | | | 32 | | | |
| | 8.45 | | | | (14.43 | ) | | | 9 | | | | 0.30 | (e) | | | 3.39 | (e) | | | 2.59 | (e) | | | 32 | | | |
| | 8.42 | | | | (14.77 | ) | | | 9 | | | | 0.80 | (e) | | | 3.89 | (e) | | | 2.08 | (e) | | | 32 | | | |
| |
|
The accompanying notes are an integral part of these financial statements. 53
GOLDMAN SACHS RETIREMENT STRATEGY 2050 PORTFOLIO
Financial Highlights
Selected Data for a Share Outstanding Throughout Each Period
| | | | | | | | | | | | | | | | | | | | | | | | | | | | | | | |
| | | | | Income (loss) from
| | Distributions
| | |
| | | | | investment operations | | to shareholders | | |
| | | Net asset
| | | | | | | | | | | | | | |
| | | value,
| | Net
| | Net realized
| | Total from
| | From net
| | From net
| | | | |
| | | beginning
| | investment
| | and unrealized
| | investment
| | investment
| | realized
| | Total
| | |
| Year - Share Class | | of period | | income(a) | | gain (loss) | | operations | | income | | gains | | distributions | | |
| |
FOR THE SIX MONTHS ENDED FEBRUARY 28, (UNAUDITED) |
| 2011 - A | | $ | 6.42 | | | $ | 0.14 | | | $ | 1.45 | | | $ | 1.59 | | | $ | (0.15 | ) | | $ | — | | | $ | (0.15 | ) | | |
| 2011 - Institutional | | | 6.46 | | | | 0.15 | | | | 1.45 | | | | 1.60 | | | | (0.17 | ) | | | — | | | | (0.17 | ) | | |
| 2011 - IR | | | 6.45 | | | | 0.14 | | | | 1.45 | | | | 1.59 | | | | (0.16 | ) | | | — | | | | (0.16 | ) | | |
| 2011 - R | | | 6.41 | | | | 0.12 | | | | 1.46 | | | | 1.58 | | | | (0.12 | ) | | | — | | | | (0.12 | ) | | |
| | | | | | | | | | | | | | | | | | | | | | | | | | | | | | | |
| | | | | | | | | | | | | | | | | | | | | | | | | | | | | | | |
FOR THE FISCAL YEARS ENDED AUGUST 31, |
| 2010 - A | | | 6.42 | | | | 0.11 | (d) | | | 0.03 | | | | 0.14 | | | | (0.14 | ) | | | — | | | | (0.14 | ) | | |
| 2010 - Institutional | | | 6.44 | | | | 0.15 | (d) | | | 0.03 | | | | 0.18 | | | | (0.16 | ) | | | — | | | | (0.16 | ) | | |
| 2010 - IR | | | 6.43 | | | | 0.13 | (d) | | | 0.04 | | | | 0.17 | | | | (0.15 | ) | | | — | | | | (0.15 | ) | | |
| 2010 - R | | | 6.43 | | | | 0.01 | (d) | | | 0.10 | | | | 0.11 | | | | (0.13 | ) | | | — | | | | (0.13 | ) | | |
| |
|
| 2009 - A | | | 8.40 | | | | 0.10 | (d) | | | (1.74 | ) | | | (1.64 | ) | | | (0.09 | ) | | | (0.25 | ) | | | (0.34 | ) | | |
| 2009 - Institutional | | | 8.43 | | | | 0.18 | (d) | | | (1.82 | ) | | | (1.64 | ) | | | (0.10 | ) | | | (0.25 | ) | | | (0.35 | ) | | |
| 2009 - IR | | | 8.41 | | | | 0.17 | (d) | | | (1.81 | ) | | | (1.64 | ) | | | (0.09 | ) | | | (0.25 | ) | | | (0.34 | ) | | |
| 2009 - R | | | 8.38 | | | | 0.14 | (d) | | | (1.79 | ) | | | (1.65 | ) | | | (0.05 | ) | | | (0.25 | ) | | | (0.30 | ) | | |
| | | | | | | | | | | | | | | | | | | | | | | | | | | | | | | |
| | | | | | | | | | | | | | | | | | | | | | | | | | | | | | | |
FOR THE PERIOD ENDED AUGUST 31, |
| 2008 - A (Commenced September 5, 2007) | | | 10.00 | | | | 0.29 | | | | (1.57 | ) | | | (1.28 | ) | | | (0.25 | ) | | | (0.07 | ) | | | (0.32 | ) | | |
| 2008 - Institutional (Commenced September 5, 2007) | | | 10.00 | | | | 0.30 | | | | (1.54 | ) | | | (1.24 | ) | | | (0.26 | ) | | | (0.07 | ) | | | (0.33 | ) | | |
| 2008 - IR (Commenced November 30, 2007) | | | 10.21 | | | | 0.30 | | | | (1.77 | ) | | | (1.47 | ) | | | (0.26 | ) | | | (0.07 | ) | | | (0.33 | ) | | |
| 2008 - R (Commenced November 30, 2007) | | | 10.21 | | | | 0.29 | | | | (1.79 | ) | | | (1.50 | ) | | | (0.26 | ) | | | (0.07 | ) | | | (0.33 | ) | | |
| |
|
| | |
| (a) | | Recognition of net investment income by the Portfolio is affected by the timing of declaration of dividends by the Underlying Funds in which the Portfolio invests. |
| (b) | | Assumes investment at the net asset value at the beginning of the period, reinvestment of all dividends and distributions, a complete redemption of the investment at the net asset value at the end of the period and no sales or redemption charges. Total returns would be reduced if a sales or redemption charge was taken into account. Returns do not reflect the deduction of taxes that a shareholder would pay on Portfolio distributions or the redemption of Portfolio shares. Total returns for periods less than one full year are not annualized. |
| (c) | | Expense ratios exclude the expenses of the Underlying Funds in which the Portfolio invests. |
| (d) | | Calculated based on the average shares outstanding methodology. |
| (e) | | Annualized. |
54 The accompanying notes are an integral part of these financial statements.
GOLDMAN SACHS RETIREMENT STRATEGY 2050 PORTFOLIO
| | | | | | | | | | | | | | | | | | | | | | | | | | | | | |
| | | | | | | | | | | Ratio of
| | | | |
| | | | | Net assets,
| | Ratio of
| | Ratio of
| | net investment
| | | | |
Net asset
| | | | end of
| | net expenses
| | total expenses
| | income
| | Portfolio
| | |
value, end
| | Total
| | period
| | to average
| | to average
| | to average
| | turnover
| | |
| of period | | return(b) | | (in 000s) | | net assets(c) | | net assets(c) | | net assets(a) | | rate | | |
| |
| |
| $ | 7.86 | | | | 24.90 | % | | $ | 4,269 | | | | 0.55 | %(e) | | | 2.29 | %(e) | | | 3.74 | %(e) | | | 15 | % | | |
| | 7.89 | | | | 24.96 | | | | 8,027 | | | | 0.15 | (e) | | | 1.89 | (e) | | | 4.10 | (e) | | | 15 | | | |
| | 7.88 | | | | 24.83 | | | | 9 | | | | 0.30 | (e) | | | 2.04 | (e) | | | 3.94 | (e) | | | 15 | | | |
| | 7.87 | | | | 24.77 | | | | 204 | | | | 0.80 | (e) | | | 2.54 | (e) | | | 3.22 | (e) | | | 15 | | | |
| | | | | | | | | | | | | | | | | | | | | | | | | | | | | |
| | | | | | | | | | | | | | | | | | | | | | | | | | | | | |
| |
| | 6.42 | | | | 2.08 | | | | 3,080 | | | | 0.55 | | | | 2.56 | | | | 1.67 | | | | 53 | | | |
| | 6.46 | | | | 2.65 | | | | 5,937 | | | | 0.15 | | | | 2.16 | | | | 2.16 | | | | 53 | | | |
| | 6.45 | | | | 2.52 | | | | 7 | | | | 0.30 | | | | 2.31 | | | | 1.94 | | | | 53 | | | |
| | 6.41 | | | | 1.68 | | | | 195 | | | | 0.80 | | | | 2.81 | | | | 0.10 | | | | 53 | | | |
| |
|
| | 6.42 | | | | (18.64 | ) | | | 2,304 | | | | 0.55 | | | | 4.38 | | | | 1.76 | | | | 28 | | | |
| | 6.44 | | | | (18.51 | ) | | | 7,131 | | | | 0.15 | | | | 3.98 | | | | 3.21 | | | | 28 | | | |
| | 6.43 | | | | (18.62 | ) | | | 7 | | | | 0.30 | | | | 4.13 | | | | 3.09 | | | | 28 | | | |
| | 6.43 | | | | (18.93 | ) | | | 8 | | | | 0.80 | | | | 4.63 | | | | 2.54 | | | | 28 | | | |
| | | | | | | | | | | | | | | | | | | | | | | | | | | | | |
| | | | | | | | | | | | | | | | | | | | | | | | | | | | | |
| |
| | 8.40 | | | | (13.18 | ) | | | 501 | | | | 0.55 | (e) | | | 3.79 | (e) | | | 1.74 | (e) | | | 39 | | | |
| | 8.43 | | | | (12.77 | ) | | | 8,716 | | | | 0.15 | (e) | | | 3.39 | (e) | | | 2.13 | (e) | | | 39 | | | |
| | 8.41 | | | | (14.77 | ) | | | 9 | | | | 0.30 | (e) | | | 3.54 | (e) | | | 2.35 | (e) | | | 39 | | | |
| | 8.38 | | | | (15.11 | ) | | | 8 | | | | 0.80 | (e) | | | 4.04 | (e) | | | 1.87 | (e) | | | 39 | | | |
| |
|
The accompanying notes are an integral part of these financial statements. 55
GOLDMAN SACHS RETIREMENT STRATEGIES PORTFOLIOS
Portfolio Expenses — Six Month Period Ended February 28, 2011 (Unaudited)
As a shareholder of Class A, Institutional, Class IR or Class R Shares of a Portfolio, you incur two types of costs: (1) transaction costs, including sales charges on purchase payments (with respect to Class A Shares), and redemption fees (if any); and (2) ongoing costs, including management fees; distribution and service (12b-1) fees (with respect to Class A and Class R Shares); and other Portfolio expenses. This Example is intended to help you understand your ongoing costs (in dollars) of investing in Class A, Institutional, Class IR or Class R Shares of the Portfolios and to compare these costs with the ongoing costs of investing in other mutual funds.
The Example is based on an investment of $1,000 invested at the beginning of the period and held for the entire period from September 1, 2010 through February 28, 2011.
Actual Expenses — The first line under each share class in the table below provides information about actual account values and actual expenses. You may use the information in this line, together with the amount you invested, to estimate the expenses that you paid over the period. Simply divide your account value by $1,000 (for example, an $8,600 account value divided by $1,000=8.6), then multiply the result by the number in the first line under the heading entitled “Expenses Paid” to estimate the expenses you paid on your account during this period.
Hypothetical Example for Comparison Purposes — The second line under each share class in the table below provides information about hypothetical account values and hypothetical expenses based on the Portfolios’ actual net expense ratios and an assumed rate of return of 5% per year before expenses, which is not the Portfolios’ actual return. The hypothetical account values and expenses may not be used to estimate the actual ending account balance or expenses you paid for the period. You may use this information to compare the ongoing costs of investing in the Portfolios and other funds. To do so, compare this 5% hypothetical example with the 5% hypothetical examples that appear in the shareholder reports of the other funds.
Please note that the expenses shown in the table are meant to highlight your ongoing costs only and do not reflect any transactional costs, such as sales charges, redemption fees, or exchange fees and do not include expenses of Underlying Funds in which the Portfolios invest. Therefore, the second line of the table is useful in comparing ongoing costs only, and will not help you determine the relative total costs of owning different funds. In addition, if these transactional costs were included, your costs would have been higher.
| | | | | | | | | | | | | | | | | | | | | | | | | | | | | | | | | | | | | | | | | | | | | | | | | | | | | | | | | | | | | | | | | | | | | | | | | | | | | | | | | | | | | | | | | | | |
| | | | Retirement Strategy Portfolio 2010 | | | Retirement Strategy Portfolio 2015 | | | Retirement Strategy Portfolio 2020 | | | Retirement Strategy Portfolio 2030 | | | Retirement Strategy Portfolio 2040 | | | Retirement Strategy Portfolio 2050 |
| | | | | | | | | | Expenses
| | | | | | | | | Expenses
| | | | | | | | | Expenses
| | | | | | | | | Expenses
| | | | | | | | | Expenses
| | | | | | | | | Expenses
|
| | | | Beginning
| | | Ending
| | | Paid for the
| | | Beginning
| | | Ending
| | | Paid for the
| | | Beginning
| | | Ending
| | | Paid for the
| | | Beginning
| | | Ending
| | | Paid for the
| | | Beginning
| | | Ending
| | | Paid for the
| | | Beginning
| | | Ending
| | | Paid for the
|
| | | | Account Value
| | | Account Value
| | | 6 months ended
| | | Account Value
| | | Account Value
| | | 6 months ended
| | | Account Value
| | | Account Value
| | | 6 months ended
| | | Account Value
| | | Account Value
| | | 6 months ended
| | | Account Value
| | | Account Value
| | | 6 months ended
| | | Account Value
| | | Account Value
| | | 6 months ended
|
| Share Class | | | 9/1/10 | | | 2/28/11 | | | 2/28/11* | | | 9/1/10 | | | 2/28/11 | | | 2/28/11* | | | 9/1/10 | | | 2/28/11 | | | 2/28/11* | | | 9/1/10 | | | 2/28/11 | | | 2/28/11* | | | 9/1/10 | | | 2/28/11 | | | 2/28/11* | | | 9/1/10 | | | 2/28/11 | | | 2/28/11* |
Class A | | | | | | | | | | | | | | | | | | | | | | | | | | | | | | | | | | | | | | | | | | | | | | | | | | | | | | | | | | | | | | | | | | | | | | | | | | | | | | | | | | | | | | | | | | |
| Actual | | | $ | 1,000.00 | | | | $ | 1,154.20 | | | | $ | 2.94 | | | | $ | 1,000.00 | | | | $ | 1,175.80 | | | | $ | 2.97 | | | | $ | 1,000.00 | | | | $ | 1,196.70 | | | | $ | 3.00 | | | | $ | 1,000.00 | | | | $ | 1,223.80 | | | | $ | 3.03 | | | | $ | 1,000.00 | | | | $ | 1,233.60 | | | | $ | 3.05 | | | | $ | 1,000.00 | | | | $ | 1,249.00 | | | | $ | 3.07 | |
| Hypothetical 5% return | | | | 1,000.00 | | | | | 1,022.07 | + | | | | 2.76 | | | | | 1,000.00 | | | | | 1,022.07 | + | | | | 2.76 | | | | | 1,000.00 | | | | | 1,022.07 | + | | | | 2.76 | | | | | 1,000.00 | | | | | 1,022.07 | + | | | | 2.76 | | | | | 1,000.00 | | | | | 1,022.07 | + | | | | 2.76 | | | | | 1,000.00 | | | | | 1,022.07 | + | | | | 2.76 | |
| |
Institutional | | | | | | | | | | | | | | | | | | | | | | | | | | | | | | | | | | | | | | | | | | | | | | | | | | | | | | | | | | | | | | | | | | | | | | | | | | | | | | | | | | | | | | | | | | |
| Actual | | | | 1,000.00 | | | | | 1,155.90 | | | | | 0.80 | | | | | 1,000.00 | | | | | 1,179.70 | | | | | 0.81 | | | | | 1,000.00 | | | | | 1,198.00 | | | | | 0.82 | | | | | 1,000.00 | | | | | 1,225.40 | | | | | 0.83 | | | | | 1,000.00 | | | | | 1,238.10 | | | | | 0.83 | | | | | 1,000.00 | | | | | 1,249.60 | | | | | 0.84 | |
| Hypothetical 5% return | | | | 1,000.00 | | | | | 1,024.05 | + | | | | 0.75 | | | | | 1,000.00 | | | | | 1,024.05 | + | | | | 0.75 | | | | | 1,000.00 | | | | | 1,024.05 | + | | | | 0.75 | | | | | 1,000.00 | | | | | 1,024.05 | + | | | | 0.75 | | | | | 1,000.00 | | | | | 1,024.05 | + | | | | 0.75 | | | | | 1,000.00 | | | | | 1,024.05 | + | | | | 0.75 | |
| |
Class IR | | | | | | | | | | | | | | | | | | | | | | | | | | | | | | | | | | | | | | | | | | | | | | | | | | | | | | | | | | | | | | | | | | | | | | | | | | | | | | | | | | | | | | | | | | |
| Actual | | | | 1,000.00 | | | | | 1,156.00 | | | | | 1.60 | | | | | 1,000.00 | | | | | 1,178.40 | | | | | 1.62 | | | | | 1,000.00 | | | | | 1,197.80 | | | | | 1.63 | | | | | 1,000.00 | | | | | 1,224.50 | | | | | 1.65 | | | | | 1,000.00 | | | | | 1,236.80 | | | | | 1.66 | | | | | 1,000.00 | | | | | 1,248.30 | | | | | 1.67 | |
| Hypothetical 5% return | | | | 1,000.00 | | | | | 1,023.31 | + | | | | 1.51 | | | | | 1,000.00 | | | | | 1,023.31 | + | | | | 1.51 | | | | | 1,000.00 | | | | | 1,023.31 | + | | | | 1.51 | | | | | 1,000.00 | | | | | 1,023.31 | + | | | | 1.51 | | | | | 1,000.00 | | | | | 1,023.31 | + | | | | 1.51 | | | | | 1,000.00 | | | | | 1,023.31 | + | | | | 1.51 | |
| |
Class R | | | | | | | | | | | | | | | | | | | | | | | | | | | | | | | | | | | | | | | | | | | | | | | | | | | | | | | | | | | | | | | | | | | | | | | | | | | | | | | | | | | | | | | | | | |
| Actual | | | | 1,000.00 | | | | | 1,153.20 | | | | | 4.27 | | | | | 1,000.00 | | | | | 1,175.00 | | | | | 4.31 | | | | | 1,000.00 | | | | | 1,195.20 | | | | | 4.35 | | | | | 1,000.00 | | | | | 1,220.40 | | | | | 4.40 | | | | | 1,000.00 | | | | | 1,233.30 | | | | | 4.43 | | | | | 1,000.00 | | | | | 1,247.70 | | | | | 4.46 | |
| Hypothetical 5% return | | | | 1,000.00 | | | | | 1,020.83 | + | | | | 4.01 | | | | | 1,000.00 | | | | | 1,020.83 | + | | | | 4.01 | | | | | 1,000.00 | | | | | 1,020.83 | + | | | | 4.01 | | | | | 1,000.00 | | | | | 1,020.83 | + | | | | 4.01 | | | | | 1,000.00 | | | | | 1,020.83 | + | | | | 4.01 | | | | | 1,000.00 | | | | | 1,020.83 | + | | | | 4.01 | |
| |
| |
| * | Expenses for each share class are calculated using each Portfolio’s annualized net expense ratio for each class, which represents the ongoing expenses as a percentage of net assets for the six months ended February 28, 2011. Expenses are calculated by multiplying the annualized net expense ratio by the average account value for the period; then multiplying the result by the number of days in the most recent fiscal half year; and then dividing that result by the number of days in the fiscal year. The annualized net expense ratios for the period were as follows: |
| | | | | | | | | | | | | | | | | |
| Portfolio | | Class A | | Institutional | | Class IR | | Class R |
| |
| Retirement Strategy 2010 | | | 0.55 | % | | | 0.15 | % | | | 0.30 | % | | | 0.80 | % |
| Retirement Strategy 2015 | | | 0.55 | | | | 0.15 | | | | 0.30 | | | | 0.80 | |
| Retirement Strategy 2020 | | | 0.55 | | | | 0.15 | | | | 0.30 | | | | 0.80 | |
| Retirement Strategy 2030 | | | 0.55 | | | | 0.15 | | | | 0.30 | | | | 0.80 | |
| Retirement Strategy 2040 | | | 0.55 | | | | 0.15 | | | | 0.30 | | | | 0.80 | |
| Retirement Strategy 2050 | | | 0.55 | | | | 0.15 | | | | 0.30 | | | | 0.80 | |
| |
| |
| | |
| + | | Hypothetical expenses are based on each Portfolio’s actual annualized net expense ratios and an assumed rate of return of 5% per year before expenses. |
56
FUNDS PROFILE
Goldman Sachs Funds
Goldman Sachs is a premier financial services firm, known since 1869 for creating thoughtful and customized investment solutions in complex global markets.
Today, the Investment Management Division of Goldman Sachs serves a diverse set of clients worldwide, including private institutions, public entities and individuals. With portfolio management teams located around the world — and $717.1 billion in assets under management as of December 31, 2010 — our investment professionals bring firsthand knowledge of local markets to every investment decision. Goldman Sachs Asset Management ranks in the top 10 asset management firms worldwide, based on assets under management.1
| |
| OVERVIEW OF GOLDMAN SACHS FUNDS | |

| | | | | |
Money Market2
Financial Square Fundssm
n Financial Square Tax-Exempt Funds
n Financial Square Federal Fund
n Financial Square Government Fund
n Financial Square Money Market Fund
n Financial Square Prime Obligations Fund
n Financial Square Treasury Instruments Fund
n Financial Square Treasury Obligations Fund
Fixed Income
Short Duration and Government
n Enhanced Income Fund
n Ultra-Short Duration Govt. Fund
n Short Duration Government Fund
n Government Income Fund
n Inflation Protected Securities Fund
Multi-Sector
n Core Fixed Income Fund
n Core Plus Fixed Income Fund
n Global Income Fund
n Strategic Income Fund
Municipal and Tax-Free
n High Yield Municipal Fund
n Municipal Income Fund
n Short Duration Tax-Free Fund
Single Sector
n Investment Grade Credit Fund
n U.S. Mortgages Fund
n High Yield Fund
n High Yield Floating Rate Fund | | n Emerging Markets Debt Fund
n Local Emerging Markets Debt Fund
Corporate Credit
n Credit Strategies Fund
Fundamental Equity
n Growth and Income Fund
n Small Cap Value Fund
n Mid Cap Value Fund
n Large Cap Value Fund
n Capital Growth Fund
n Strategic Growth Fund
n Small/Mid Cap Growth Fund
n Flexible Cap Growth Fund3
n Concentrated Growth Fund
n Technology Tollkeeper FundSM 5
n Growth Opportunities Fund
n U.S. Equity Fund
Structured Equity
n Balanced Fund
n Structured Small Cap Equity Fund
n Structured U.S. Equity Fund
n Structured Small Cap Growth Fund
n Structured Large Cap Growth Fund
n Structured Large Cap Value Fund
n Structured Small Cap Value Fund
n Structured Tax-Managed Equity Fund
n Structured International Tax-Managed Equity Fund
n U.S. Equity Dividend and Premium Fund | | n International Equity Dividend and Premium Fund
n Structured International Small Cap Fund
n Structured International Equity Fund
n Structured Emerging Markets Equity Fund
Fundamental Equity International
n Strategic International Equity Fund
n Concentrated International Equity Fund
n International Small Cap Fund
n Asia Equity Fund
n Emerging Markets Equity Fund
n BRIC Fund (Brazil, Russia, India, China)
n N-11 Equity Fund
Select Satellite4
n Real Estate Securities Fund
n International Real Estate Securities Fund
n Commodity Strategy Fund
n Dynamic Allocation Fund
n Absolute Return Tracker Fund
Total Portfolio Solutions4
n Balanced Strategy Portfolio
n Growth and Income Strategy Portfolio
n Growth Strategy Portfolio
n Equity Growth Strategy Portfolio
n Income Strategies Portfolio
n Satellite Strategies Portfolio
n Retirement Strategies Portfolios
n Enhanced Dividend Global Equity Portfolio
n Tax Advantaged Global Equity Portfolio |
Firmwide assets under management includes assets managed by GSAM and its Investment Advisory Affiliates.
| |
| 1 | Ranking for Goldman Sachs Group, Inc., includes Goldman Sachs Asset Management, Private Wealth Management and Merchant Banking 2009 year-end assets. Ranked 9th in total assets worldwide. Pensions&Investments, June 2010. |
| 2 | An investment in a money market fund is neither insured nor guaranteed by the Federal Deposit Insurance Corporation (“FDIC”) or any other government agency. Although the Funds seek to preserve the value of your investment at $1.00 per share, it is possible to lose money by investing in the Funds. |
| 3 | Effective March 31, 2011, the Goldman Sachs All Cap Growth Fund changed its name to the Goldman Sachs Flexible Cap Growth Fund. |
| 4 | Individual Funds within the Total Portfolio Solutions and Select Satellite categories will have various placement on the risk/return spectrum and may have greater or lesser risk than that indicated by the placement of the general Total Portfolio Solutions or Select Satellite category. |
| 5 | Effective July 31, 2010, the Goldman Sachs Tollkeeper Fund was renamed the Goldman Sachs Technology Tollkeeper Fund. |
The Goldman Sachs Technology Tollkeeper Fundsm and Financial Square Fundssm are registered service marks of Goldman, Sachs & Co.
| | | |
TRUSTEES
Ashok N. Bakhru, Chairman
Donald C. Burke
John P. Coblentz, Jr.
Diana M. Daniels
Joseph P. LoRusso
James A. McNamara
Jessica Palmer
Alan A. Shuch
Richard P. Strubel
| | OFFICERS
James A. McNamara, President
George F. Travers, Principal Financial Officer
Peter V. Bonanno, Secretary
Scott M. McHugh, Treasurer
|
| | | |
GOLDMAN, SACHS & CO
Distributor and Transfer Agent | | GOLDMAN SACHS ASSET MANAGEMENT, L.P.
Investment Adviser |
Visit our Web site at www.goldmansachsfunds.com to obtain the most recent month-end returns.
Goldman Sachs Asset Management, L.P. 200 West Street, New York, New York 10282
The reports concerning the Portfolios included in this shareholder report may contain certain forward-looking statements about the factors that may affect the performance of the Portfolios in the future. These statements are based on Portfolio management’s predictions and expectations concerning certain future events and their expected impact on the Portfolios, such as performance of the economy as a whole and of specific industry sectors, changes in the levels of interest rates, the impact of developing world events, and other factors that may influence the future performance of the Portfolios. Management believes these forward-looking statements to be reasonable, although they are inherently uncertain and difficult to predict. Actual events may cause adjustments in portfolio management strategies from those currently expected to be employed.
Portfolios on the efficient frontier are optimal in both the sense that they offer maximal expected return for some given level of risk and minimal risk for some given level of expected return. The efficient frontier is the line created from a risk-reward graph, comprised of optimal portfolios. The optimal portfolios plotted along the curve have the highest expected return possible for the given amount of risk.
A description of the policies and procedures that the Portfolios use to determine how to vote proxies relating to portfolio securities and information regarding how a Portfolio voted proxies relating to portfolio securities during the most recent 12-month period ended June 30 is available (i) without charge, upon request by calling 1-800-526-7384 (for Retail Shareholders) or 1-800-621-2550 (for Institutional Shareholders); and (ii) on the Securities and Exchange Commission Web site at http://www.sec.gov.
The Portfolios file their complete schedule of portfolio holdings with the Securities and Exchange Commission (“SEC”) for the first and third quarters of each fiscal year on Form N-Q. The Portfolios’ Form N-Q will become available on the SEC’s website at http://www.sec.gov within 60 days after the Portfolios’ first and third fiscal quarters. When available, the Portfolios’ Forms N-Q may be reviewed and copied at the SEC’s Public Reference Room in Washington, D.C. and information on the operation of the Public Reference Room may also be obtained by calling 1-800-SEC-0330. When available, Form N-Q may be obtained upon request and without charge by calling 1-800-526-7384 (for Retail Shareholders) or 1-800-621-2550 (for Institutional Shareholders).
Holdings and allocations shown may not be representative of current or future investments.
Holdings and allocations may not include the Portfolios’ entire investment portfolio, which may change at any time. Portfolio holdings should not be relied on in making investment decisions and should not be construed as research or investment advice regarding particular securities.
This material is not authorized for distribution to prospective investors unless preceded or accompanied by a current Prospectus or summary prospectus, if applicable. Investors should consider a Fund’s objective, risks, and charges and expenses, and read the summary prospectus, if available, and/or the Prospectus carefully before investing or sending money. The summary prospectus, if available, and the Prospectus contain this and other information about a Fund and may be obtained from your authorized dealer or from Goldman, Sachs & Co. by calling (retail – 1-800-526-7384) (institutional – 1-800-621-2550).
© 2011 Goldman Sachs. All rights reserved. 51119.MF.MED.TMPL/4/2011 RTMTSAR11/1K
| | | |
| | | The information required by this Item is only required in an annual report on this Form N-CSR. |
| | | |
| ITEM 3. | | AUDIT COMMITTEE FINANCIAL EXPERT. |
| | | |
| | | The information required by this Item is only required in an annual report on this Form N-CSR. |
| | | |
| ITEM 4. | | PRINCIPAL ACCOUNTANT FEES AND SERVICES. |
| | | |
| | | The information required by this Item is only required in an annual report on this Form N-CSR. |
| | | |
| ITEM 5. | | AUDIT COMMITTEE OF LISTED REGISTRANTS. |
| | | |
| | | Not applicable. |
| | | |
| ITEM 6. | | SCHEDULE OF INVESTMENTS. |
| | | |
| | | Schedule of Investments is included as part of the Report to Stockholders filed under Item 1. |
| | | |
| ITEM 7. | | DISCLOSURE OF PROXY VOTING POLICIES AND PROCEDURES FOR CLOSED-END MANAGEMENT INVESTMENT COMPANIES. |
| | | |
| | | Not applicable. |
| | | |
| ITEM 8. | | PORTFOLIO MANAGERS OF CLOSED-END MANAGEMENT INVESTMENT COMPANIES. |
| | | |
| | | Not applicable. |
| | | |
| ITEM 9. | | PURCHASES OF EQUITY SECURITIES BY CLOSED-END MANAGEMENT INVESTMENT COMPANY AND AFFILIATED PURCHASERS. |
| | | |
| | | Not applicable. |
| | | |
| ITEM 10. | | SUBMISSION OF MATTERS TO A VOTE OF SECURITY HOLDERS.
There have been no material changes to the procedures by which shareholders may recommend nominees to the registrant’s board of trustees. |
| | | |
| | | |
| ITEM 11. | | CONTROLS AND PROCEDURES. |
| | | |
| | (a) | | The registrant’s principal executive and principal financial officers, or persons performing similar functions have concluded that the registrant’s disclosure controls and procedures (as defined in Rule 30a-3(c) under the Investment Company Act of 1940, as amended (the “1940 Act”)) are effective as of a date within 90 days of the filing of this report that includes the disclosure required by this paragraph, based on the evaluation of these controls and procedures required by Rule 30a-3(b) under the 1940 Act and 15d-15(b) under the Securities Exchange Act of 1934, as amended. |
| | | |
| | (b) | | There were no changes in the registrant’s internal control over financial reporting (as defined in Rule 30a-3(d) under the 1940 Act) that occurred during the registrant’s second fiscal quarter of the period covered by this report that have materially affected, or are reasonably likely to materially affect, the registrant’s internal control over financial reporting. |
| | | |
| | (a)(1) | | The information required by this Item is only required in connection with an annual report on this Form N-CSR. |
| |
| | (a)(2) | | Exhibit 99.CERT | Certifications pursuant to Section 302 of the Sarbanes-Oxley Act of 2002 filed herewith. |
| | | |
| | (b) | | Exhibit 99.906CERT | Certifications pursuant to Section 906 of the Sarbanes-Oxley Act of 2002 filed herewith. |
SIGNATURES
| | | | Pursuant to the requirements of the Securities Exchange Act of 1934 and the Investment Company Act of 1940, the registrant has duly caused this report to be signed on its behalf by the undersigned, thereunto duly authorized. |
| | | | | | | |
| | | | | Goldman Sachs Trust | | |
| | | | | | | |
| By: | | | | /s/ James A. McNamara | | |
| | | | |
| | |
| | | | | James A. McNamara | | |
| | | | | President/Principal Executive Officer | | |
| | | | | Goldman Sachs Trust | | |
| | | | | | | |
| Date: | | | | May 2, 2011 | | |
| | | | Pursuant to the requirements of the Securities Exchange Act of 1934 and the Investment Company Act of 1940, this report has been signed below by the following persons on behalf of the registrant and in the capacities and on the dates indicated. |
| | | | | | | |
| By: | | | | /s/ James A. McNamara | | |
| | | | |
| | |
| | | | | James A. McNamara | | |
| | | | | President/Principal Executive Officer | | |
| | | | | Goldman Sachs Trust | | |
| | | | | | | |
| Date: | | | | May 2, 2011 | | |
| | | | | | | |
| By: | | | | /s/ George F. Travers | | |
| | | | |
| | |
| | | | | George F. Travers | | |
| | | | | Principal Financial Officer | | |
| | | | | Goldman Sachs Trust | | |
| | | | | | | |
| Date: | | | | May 2, 2011 | | |