UNITED STATES
SECURITIES AND EXCHANGE COMMISSION
Washington, D.C. 20549
FORM N-CSR
CERTIFIED SHAREHOLDER REPORT OF REGISTERED
MANAGEMENT INVESTMENT COMPANIES
Investment Company Act file number
811-05549
Reynolds Funds, Inc.
(Exact name of registrant as specified in charter)
615 East Michigan Street
Milwaukee, WI 53202
(Address of principal executive offices) (Zip code)
Frederick L. Reynolds
Reynolds Capital Management
2580 Kekaa Drive #115
Lahaina, Hawaii 96761
(Name and address of agent for service)
414-226-4556
Registrant's telephone number, including area code:
Date of fiscal year end: September 30
Date of reporting period: March 31, 2009
Item 1. Reports to Stockholders.
SEMIANNUAL REPORT
March 31, 2009
REYNOLDS
BLUE CHIP
GROWTH FUND
Seeking Long-Term Capital Appreciation
A No-Load Mutual Fund
1-800-773-9665
www.reynoldsfunds.com
REYNOLDS BLUE CHIP GROWTH FUND
May 26, 2009
Dear Fellow Shareholders:
Investment Strategy
Ideally I would always invest in stocks for the long-term and have low turnover. However, it is very important to closely analyze intermediate-term potential economic cycles and resulting stock market problems or positives. Eighteen months ago in October 2007, I became increasingly concerned regarding several potential economic problems. I believed that one of these potential problems was high housing prices, and the increasingly speculative financial instruments that had evolved in this segment of the economy. As a result, I began implementing a strong defensive strategy for the Reynolds Blue Chip Growth Fund by selling equities held in the Fund and raising the cash position. The beginning of the implementation of this defensive strategy coincided within a few days of the intermediate top of the stock market in October 2007. I began purchasing equities for the Blue Chip Fund in March 2009, as I believed that the prices of many high quality equities had declined to attractive long-term buying ranges.
The U.S. Economy
There are many economic and investment negatives at the present time including: (1) in the fourth quarter of 2008 and the first quarter of 2009 real Gross Domestic Product (GDP) decreased at an annual rate of more than 6.0 percent; (2) more than 5.7 million jobs have been lost since the recession started in December 2007 and unemployment is at 8.9 percent, the highest level since 1983; (3) further sizable job losses and increased unemployment is likely in the coming months; (4) consumer confidence as measured by the Reuters/University of Michigan Survey of Consumers is near a 25 year low (consumer spending accounts for about 70% of every dollar of U.S. GDP) and consumer spending has been weak; (5) weakness in business investment continues and further near-term softness in business equipment spending may occur; (6) conditions in commercial real estate continue to be poor; (7) mortgage credit is still relatively tight; (8) risk aversion continues at high levels; (9) there continues to be considerable stress in financial markets and financial institutions; (10) the large drop in U.S. exports that began last fall has hurt domestic production; and (11) many foreign economies are having some of the same financial problems as the U.S.
There are currently many potential economic and investment positives. Early signs are beginning to appear that indicate that the decline of domestic economic activity may be slowing and beginning to stabilize including: (1) final demand, especially demand by households, may be stabilizing - for example, consumer spending has improved somewhat and the recent consumer confidence survey was better than expected; (2) the housing market has shown some signs of bottoming and stabilizing; (3) businesses have been able to reduce some inventories and this liquidation should slow over the next few quarters; (4) the various government programs to build confidence, increase liquidity in the financial system, and stimulate the economy are showing some positive effects; (5) inflation remains at moderate levels; (6) interest rates remain low; (7) investor sentiment and the functioning of financial markets have improved somewhat in both the U.S. and abroad; and (8) the U.S. economy may begin to come out of the current recession in the latter part of 2009 or early next year.
GDP increased 1.1% in calendar 2008, 2.0% in 2007, 2.8% in 2006, 3.1% in 2005, 3.9% in 2004, 2.7% in 2003, 1.9% in 2002, 0.8% in 2001 and 3.7% in 2000. GDP is forecast to decrease 2.9% in 2009.
U.S. inflation numbers have been helped in the last few years by such factors as: (1) slowing U.S. and world economies; (2) global competition; (3) advances in technology resulting in increasing productivity; and (4) technology innovations that are helping to lower production and distribution costs. Reduced cost pressures and weakness in demand have continued to keep inflation low so far this year. Inflation should remain low in this environment.
Inflation, as measured by the Consumer Price Index, increased 3.8% in 2008, 2.9% in 2007, 3.2% in 2006, 3.4% in 2005, 2.7% in 2004, 2.3% in 2003, 1.6% in 2002, 2.8% in 2001 and 3.4% in 2000. U.S. inflation is forecast to decrease 1.2% in 2009.
The World Economy
Foreign economic growth has also slowed considerably. Many countries are also in a recession. Many foreign countries are having some of the same economic problems as the U.S., such as dislocations in credit markets. As a result, many foreign governments have implemented some of the same financial policies and procedures as the U.S. Additionally, the International Monetary Fund (IMF) is providing loans to some developing foreign countries that are in relatively better financial shape than other developing foreign countries. The average GDP
1
growth of France, Italy, and Germany was 0.7% in 2008 and is forecast to decrease 3.9% in 2009. The United Kingdom grew at a 0.7% rate in 2008 and is forecast to decrease 3.8% in 2009. Japan’s GDP declined 0.7% in 2008 and is forecast to decline 7.2% in 2009. Many developing countries in the world have been growing faster than the U.S. in the last few years. Their growth is also starting to slow. However, many of their economies are still growing faster than the U.S. Brazil grew at a 5.1% rate in 2008 and is forecast to decline 1.9% in 2009, India grew at a 6.0% rate in 2008 and is forecast to grow 4.8% in 2009, and China grew at a 9.1% rate in 2008 and is forecast to grow 7.7% in 2009. A few indicators suggest that the decline in foreign economic activity may also be moderating. Many economists believe that China has a particularly good long-term outlook and it is thought that China will be one of the first countries to show a pickup in growth. Many worldwide larger multinational companies should be well positioned to benefit long-term from worldwide growth. To the extent that these companies’ U.S. earnings are growing slower, this could be somewhat offset by their possible stronger foreign earnings. The long-term strategy of the Reynolds Blue Chip Growth Fund is to be structured to benefit from this worldwide growth by investing in many of these worldwide leading multinational growth companies.
The Reynolds Blue Chip Growth Fund is positioned to participate in long-term worldwide growth trends through investments in multinational U.S. headquartered companies. In addition, the Fund has investments in leading foreign headquartered companies, whose stocks or American Depositary Receipts (ADRs) trade in the United States. These ADR’s are denominated in dollars and they must use GAAP (Generally Accepted Accounting Principles) accounting to qualify as an ADR. The Blue Chip Fund may hold up to 25% of its assets in ADR’s.
Opportunistic Investing in Companies of Various Sizes
The Reynolds Blue Chip Growth Fund usually invests in companies of various sizes as classified by their market capitalizations. The Fund emphasizes investments in larger companies. A company’s market capitalization is calculated by taking the number of shares the company has outstanding multiplied by its current market price. Other considerations in selecting companies for the Fund include revenue growth rates, product innovations, financial strength, management’s knowledge and experience plus the overall economic and geopolitical environments and interest rates.
Portfolio as of March 31, 2009
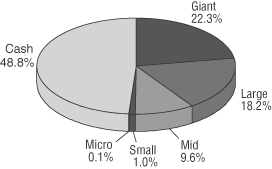
Source: Morningstar web site and Morningstar Market Cap Breakpoints
Morningstar separates stock portfolio holdings into five market-capitalization groups: Giant, Large, Mid, Small and Micro. Of the 5,000 largest domestic stocks in the equities database, the top 1% are categorized as Giant, the next 4% are Large, the next 15% are Mid, the next 30% are Small, and the remaining 50% are Micro. Stocks outside of the largest 5,000 are also classified as Micro.
Market caps are the minimum in each cap group; therefore, the minimum large market cap is the large-mid breakpoint and mid is the mid-small breakpoint, etc. As of March 31, 2009 the minimums in each cap group are as follows:
| (in millions) | ||||
| Giant | $ | 44,037.06 | ||
| Large | $ | 9,949.41 | ||
| Mid | $ | 1,925.95 | ||
| Small | $ | 533.20 | ||
| Micro | $ | <533.20 | ||
2
The long-term strategy of the Reynolds Blue Chip Growth Fund is to emphasize investment in “blue chip” growth companies. In the long-term these companies build value as their earnings grow. This growth in value should ultimately be recognized in higher stock prices for these companies.
Performance highlights (as of March 31, 2009)
The performance of the Reynolds Blue Chip Growth Fund for the six months ended March 31, 2009 was a negative 1.70%. The performance of the Standard & Poor’s 500 Index(1) during this period was a negative 30.54%.
Six Months Ended | ||||||
| March 31, 2009 | ||||||
| Reynolds Blue Chip Growth Fund | 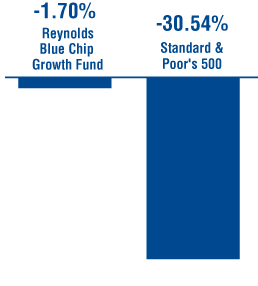 | |||||
| Cumulative Total Return | Average Annual Total Return | |||||
| One Year | -1.48% | -1.48% | ||||
| Three Years | -2.12% | -0.71% | ||||
| Five Years | -0.39% | -0.08% | ||||
| Ten Years | -41.97% | -5.30% | ||||
| Since inception (August 12, 1988) | 257.40% | 6.37% | ||||
| Six Month Returns | ||||||
The performance of the Blue Chip Fund was a positive 1.07% for the three months ended March 31, 2009. The performance of the Standard & Poor’s 500 Index during this period was a negative 11.01%.
| Standard & Poor’s 500 | |||||
| Cumulative Total Return | Average Annual Total Return | ||||
| One Year | -38.09% | -38.09% | |||
| Three Years | -34.28% | -13.05% | |||
| Five Years | -21.66% | -4.76% | |||
| Ten Years | -26.32% | -3.00% | |||
| Since inception (August 12, 1988) | 380.88% | 7.91% | |||
| (1) | The Standard & Poor’s 500 Index consists of 500 selected common stocks, most of which are listed on the New York Stock Exchange. The Standard & Poor’s Ratings Group designates the stocks to be included in the Index on a statistical basis. A particular stock’s weighting in the Index is based on its relative total market value (i.e. its market price per share times the number of shares outstanding.) Stocks may be added or deleted from the Index from time to time. |
Low Long-Term Interest Rates by Historical Standards are a Significant Positive for Stock Valuations
Long-term interest rates remain near historically low levels. Low long-term interest rates usually result in higher stock valuations for many reasons including:
| (1) | Long-term borrowing costs of corporations are lower resulting in higher business confidence and profits. |
| (2) | Long-term borrowing costs of individuals are lower which increases consumer confidence and spending. |
| (3) | A company’s stock is usually valued by placing a present value on that company’s future stream of earnings and dividends. The present value is higher when interest and inflation rates are low. |
Linked Money Market Fund
The First American Treasury Obligations Fund is a money market fund offered by an affiliate of our transfer agent, U.S. Bancorp Fund Services, LLC. This Fund is offered as a money market alternative to our shareholders. The First American Treasury Obligations Fund offers many free shareholder conveniences including automatic investment and withdrawal plans and check writing access to your funds and is linked to your holdings in the Reynolds Blue Chip Growth Fund. This Fund is also included on your quarterly statements.
3
Information about the Reynolds Blue Chip Growth Fund and the First American Treasury Obligations Fund
Reynoldsfunds.com website: You can access current information about your investment holdings via our website, reynoldsfunds.com. You must first request a personal identification number (PIN) by calling our shareholder service representatives at (800) 773-9665. You will be able to view your account list, account detail (including balances), transaction history, distributions, and the current Reynolds Blue Chip Growth Fund net asset value. Additional information available (PIN number not needed) includes quarterly updates of the returns of the Blue Chip Fund, top ten holdings and industry percentages. Also, detailed statistics and graphs of past performances from a link to Morningstar for the Blue Chip Fund.
For automatic current daily net asset values: Call 1-800-773-9665 (1-800-7REYNOLDS) twenty-four hours a day, seven days a week and press “any key” then “1”. The updated current net asset value for the Blue Chip Fund is usually available each business day after 5 P.M. (PST).
For First American Treasury Obligations Fund current one and seven day yields: Call 1-800-773-9665 and press “any key” then “1”.
For shareholders to automatically access their current account information: Call 1-800-773-9665 (twenty-four hours a day, seven days a week), press “any key” then “2” and enter your 16 digit account number which appears at the top right of your statement.
To speak to a Fund representative regarding the current daily net asset value, current account information and any other questions: Call 1-800-773-9665 and press “0” from 6 A.M. to 5 P.M. (PST).
Shareholder statement frequency: Consolidated statements summarizing the Blue Chip Fund and First American Treasury Obligations Fund accounts held by a shareholder are sent quarterly. In addition, individual Blue Chip Fund statements are sent whenever a transaction occurs. These transactions are: (1) statements are sent for the Blue Chip Fund or First American Treasury Obligations Fund when a shareholder purchases or redeems shares; (2) Blue Chip Fund statements are sent twice a year if, and when, any ordinary income or capital gains are distributed.
Tax reporting: Individual 1099 forms, which summarize any dividend income and any long- or short-term capital gains, are sent annually to shareholders each January. The percentage of income earned from various government securities, if any, for the Blue Chip Fund and the First American Treasury Obligations Fund are also reported in January.
Minimum investment: $1,000 for regular and retirement accounts ($100 for additional investments for all accounts – except for the Automatic Investment Plan, which is $50 for regular and retirement plan accounts).
Retirement plans: All types are offered including Traditional IRA, Roth IRA, Coverdell Education Savings Account, SIMPLE IRA Plan, and SEP IRA.
Automatic Investment Plan: There is no charge to automatically debit your checking account to invest in the Blue Chip Fund or the First American Treasury Obligations Fund ($50 minimum for either of these Funds) at periodic intervals to make automatic purchases in either of these Funds. This is useful for dollar cost averaging for the Blue Chip Fund.
Systematic Withdrawal Plan: For shareholders with a $10,000 minimum starting balance, there is no charge to automatically redeem shares ($100 minimum) in the Blue Chip Fund or the First American Treasury Obligations Fund as often as monthly and send a check to you or transfer funds to your bank account.
Free Check Writing: Free check writing ($100 minimum) is offered for accounts invested in the First American Treasury Obligations Fund.
Exchanges or regular redemptions between the Blue Chip Fund and the First American Treasury Obligations Fund: As often as desired – no charge.
NASDAQ symbols: Reynolds Blue Chip Growth Fund – RBCGX and First American Treasury Obligations Fund – FATXX.
Portfolio Manager: Frederick Reynolds is the portfolio manager of the Reynolds Blue Chip Growth Fund.
4
The Reynolds Blue Chip Growth Fund and the First American Treasury Obligations Fund are No-Load: No front-end sales commissions or deferred sales charges (“loads”) are charged. Over 40% of all mutual funds impose these marketing charges that are ultimately paid by the shareholder. These marketing charges are either: (1) a front-end fee or “load” in which up to 5% of a shareholder’s assets are deducted from the original investment (some funds even charge a fee when a shareholder reinvests capital gains or dividends); or (2) a back-end penalty fee or “load” which is typically deducted from a shareholder’s account if a shareholder redeems within five years of the original investment. These fees reduce a shareholder’s return. The Blue Chip Fund and First American Treasury Obligations Fund are No-Load as they do not have these extra charges.
We appreciate your continued confidence in the Reynolds Blue Chip Growth Fund and would like to welcome our new shareholders. We look forward to strong results in the future.
Sincerely,

Frederick L. Reynolds
President
This report is not authorized for use as an offer of sale or a solicitation of an offer to buy shares of the Reynolds Blue Chip Growth Fund unless accompanied or preceded by the Fund’s current prospectus. Performance data quoted represents past performance; past performance does not guarantee future results. The investment return and principal value of an investment will fluctuate so that an investor’s shares, when redeemed, may be worth more or less than their original cost. Current performance of the Fund may be lower or higher than the performance quoted. Performance data current to the most recent month end may be obtained by visiting www.reynoldsfunds.com.
5
Reynolds Blue Chip Growth Fund
COST DISCUSSION
As a shareholder of the Reynolds Blue Chip Growth Fund, you do not incur (except as described below) transaction costs, including sales charges (loads) on purchase payments, reinvested dividends, or other distributions; redemption fees; and exchange fees, but do incur ongoing costs, including management fees; distribution [and/or service] (12b-1) fees; and other Fund expenses. This example is intended to help you understand your ongoing costs (in dollars) of investing in the Fund and to compare these costs with the ongoing costs of investing in other mutual funds.
The example is based on an investment of $1,000 invested at the beginning of the period and held for the entire period from October 1, 2008 through March 31, 2009.
Actual Expenses
The first line of the table below provides information about actual account values and actual expenses. You may use the information in this line, together with the amount you invested, to estimate the expenses that you paid over the period. Simply divide your account value by $1,000 (for example, an $8,600 account value divided by $1,000 = 8.6), then multiply the result by the number in the first line under the heading entitled “Expenses Paid During Period” to estimate the expenses you paid on your account during this period.
In addition to the costs highlighted and described below, the only Fund transaction costs you might currently incur would be wire fees ($15 per wire), if you choose to have proceeds from a redemption wired to your bank account instead of receiving a check. Additionally, U.S. Bank charges an annual processing fee ($15) if you maintain an IRA account with the Fund. To determine your total costs of investing in the Fund, you would need to add any applicable wire or IRA processing fees you’ve incurred during the period to the costs provided in the example below.
Hypothetical Example for Comparison Purposes
The second line of the table below provides information about hypothetical account values and hypothetical expenses based on the Fund’s actual expense ratio and an assumed rate of return of 5% per year before expenses, which is not the Fund’s actual return. The hypothetical account values and expenses may not be used to estimate the actual ending account balance or expenses you paid for the period. You may use this information to compare the ongoing costs of investing in the Fund and other funds. To do so, compare this 5% hypothetical example with the 5% hypothetical examples that appear in the shareholder reports of the other funds.
Please note that the expenses shown in the table are meant to highlight your ongoing costs only and do not reflect any transactional costs, such as sales charges (loads), redemption or exchange fees. Therefore, the second line of the table is useful in comparing ongoing costs only, and will not help you determine the relative total costs of owning different funds. In addition, if these transactional costs were included, your costs would have been higher.
| Beginning Account | Ending Account | Expenses Paid During | |
| Value 10/1/08 | Value 3/31/09 | Period* 10/1/08-3/31/09 | |
| Reynolds Blue Chip Growth Fund Actual | $1,000.00 | $ 983.00 | $ 9.89 |
| Hypothetical (5% return before expenses) | $1,000.00 | $1,015.00 | $10.05 |
| * | Expenses are equal to the Fund’s annualized expense ratio of 2.00% multiplied by the average account value over the period, multiplied by 182/365 (to reflect the one-half year period between October 1, 2008 and March 31, 2009). |
6
Reynolds Blue Chip Growth Fund
STATEMENT OF ASSETS AND LIABILITIES
March 31, 2009 (Unaudited)
| ASSETS: | ||||
| Investments in securities, at value (cost $12,374,039) | $ | 12,756,466 | ||
| Cash | 10,514,085 | |||
| Receivable from investments sold | 2,671,315 | |||
| Receivable from shareholders for purchases | 369,340 | |||
| Dividends receivable | 4,365 | |||
| Total assets | $ | 26,315,571 | ||
| LIABILITIES: | ||||
| Payable to brokers for securities purchased | $ | 1,342,371 | ||
| Payable to adviser for management fees | 19,833 | |||
| Payable to shareholders for redemptions | 5,860 | |||
| Other liabilities | 14,484 | |||
| Total liabilities | 1,382,548 | |||
| NET ASSETS: | ||||
| Capital Stock, $0.01 par value; 40,000,000 shares authorized; 796,415 shares outstanding | 115,702,069 | |||
| Net unrealized appreciation on investments | 382,427 | |||
| Accumulated net realized loss on investments | (91,151,473 | ) | ||
| Net assets | 24,933,023 | |||
| Total liabilities and net assets | $ | 26,315,571 | ||
| CALCULATION OF NET ASSET VALUE PER SHARE: | ||||
| Net asset value, offering and redemption price per share ($24,933,023 ÷ 796,415 shares outstanding) | $ | 31.31 | ||
The accompanying notes to financial statements are an integral part of this statement.
7
Reynolds Blue Chip Growth Fund
SCHEDULE OF INVESTMENTS
March 31, 2009 (Unaudited)
| Shares | Value | ||||||
| LONG-TERM INVESTMENTS — 51.2% (a) | |||||||
| COMMON STOCKS — 51.2% (a) | |||||||
| Aerospace & Defense — 0.6% | |||||||
| 2,000 | The Boeing Co. | $ | 71,160 | ||||
| 2,000 | United Technologies Corp. | 85,960 | |||||
| 157,120 | |||||||
| Air Freight & Logistics — 0.4% | |||||||
| 2,000 | FedEx Corp. | 88,980 | |||||
| Airlines — 0.3% | |||||||
| 8,000 | AMR Corp.* | 25,520 | |||||
| 5,000 | Southwest Airlines Co. | 31,650 | |||||
| 6,000 | UAL Corp.* | 26,880 | |||||
| 84,050 | |||||||
| Automobiles — 0.2% | |||||||
| 1,000 | Toyota Motor Corp. SP-ADR | 63,300 | |||||
| Beverages — 2.1% | |||||||
| 5,000 | The Coca-Cola Co. | 219,750 | |||||
| 2,500 | Coca-Cola Femsa, | ||||||
| S.A.B. de C.V. SP-ADR | 85,150 | ||||||
| 2,500 | Hansen Natural Corp.* | 90,000 | |||||
| 2,500 | PepsiCo, Inc. | 128,700 | |||||
| 523,600 | |||||||
| Biotechnology — 0.9% | |||||||
| 2,000 | Amgen Inc.* | 99,040 | |||||
| 2,500 | Gilead Sciences, Inc.* | 115,800 | |||||
| 214,840 | |||||||
| Capital Markets — 1.2% | |||||||
| 800 | Goldman Sachs Group, Inc. | 84,816 | |||||
| 7,500 | Charles Schwab Corp. | 116,250 | |||||
| 3,000 | State Street Corp. | 92,340 | |||||
| 293,406 | |||||||
| Chemicals — 0.7% | |||||||
| 2,000 | Monsanto Co. | 166,200 | |||||
| Commercial Banks — 0.2% | |||||||
| 3,000 | Wells Fargo & Co.* | 42,720 | |||||
| Communications Equipment — 2.1% | |||||||
| 6,000 | Cisco Systems, Inc.* | 100,620 | |||||
| 4,000 | Corning Inc. | 53,080 | |||||
| 7,500 | Juniper Networks, Inc.* | 112,950 | |||||
| 7,000 | Motorola, Inc. | 29,610 | |||||
| 7,000 | Nokia Corp. SP-ADR | 81,690 | |||||
| 3,500 | Research In Motion Ltd.* | 150,745 | |||||
| 528,695 | |||||||
| Computers & Peripherals — 3.9% | |||||||
| 6,000 | Apple Inc.* | 630,720 | |||||
| 2,000 | Hewlett-Packard Co. | 64,120 | |||||
| 3,000 | International Business | ||||||
| Machines Corp. | 290,670 | ||||||
| 985,510 | |||||||
| Construction & Engineering — 0.3% | |||||||
| 2,000 | Fluor Corp. | 69,100 | |||||
| Electrical Equipment — 0.6% | |||||||
| 5,000 | Emerson Electric Co. | 142,900 | |||||
| Energy Equipment & Services — 1.6% | |||||||
| 2,500 | Baker Hughes Inc. | 71,375 | |||||
| 1,500 | Diamond Offshore Drilling, Inc. | 94,290 | |||||
| 3,500 | Schlumberger Ltd. | 142,170 | |||||
| 1,500 | Transocean Ltd.* | 88,260 | |||||
| 396,095 | |||||||
| Financial Services – Diversified — 0.7% | |||||||
| 11,000 | Bank of America Corp. | 75,020 | |||||
| 19,000 | Citigroup Inc. | 48,070 | |||||
| 3,000 | NYSE Euronext | 53,700 | |||||
| 176,790 | |||||||
| Food & Staples Retailing — 2.6% | |||||||
| 6,000 | Costco Wholesale Corp. | 277,920 | |||||
| 2,000 | CVS Caremark Corp. | 54,980 | |||||
| 4,000 | Wal-Mart Stores, Inc. | 208,400 | |||||
| 6,000 | Whole Foods Market, Inc.* | 100,800 | |||||
| 642,100 | |||||||
| Food Products — 0.3% | |||||||
| 1,500 | General Mills, Inc. | 74,820 | |||||
| Health Care Equipment & Supplies — 0.8% | |||||||
| 2,500 | Baxter International Inc. | 128,050 | |||||
| 1,000 | Becton, Dickinson & Co. | 67,240 | |||||
| 195,290 | |||||||
The accompanying notes to financial statements are an integral part of this schedule.
8
Reynolds Blue Chip Growth Fund
SCHEDULE OF INVESTMENTS (Continued)
March 31, 2009 (Unaudited)
| Shares | Value | ||||||
| LONG-TERM INVESTMENTS — 51.2% (a) (Continued) | |||||||
| COMMON STOCKS — 51.2% (a) (Continued) | |||||||
| Health Care Providers & Services — 1.0% | |||||||
| 2,500 | Aetna Inc. | $ | 60,825 | ||||
| 3,000 | CIGNA Corp. | 52,770 | |||||
| 2,000 | Medco Health Solutions, Inc.* | 82,680 | |||||
| 2,500 | UnitedHealth Group Inc. | 52,325 | |||||
| 248,600 | |||||||
| Hotels, Restaurants & Leisure — 2.7% | |||||||
| 8,000 | Brinker International, Inc. | 120,800 | |||||
| 4,000 | The Cheesecake Factory Inc.* | 45,800 | |||||
| 5,000 | McDonald’s Corp. | 272,850 | |||||
| 1,000 | P.F. Chang’s China Bistro, Inc.* | 22,880 | |||||
| 7,000 | Starbucks Corp.* | 77,770 | |||||
| 5,000 | Starwood Hotels & Resorts | ||||||
| Worldwide, Inc. | 63,500 | ||||||
| 3,000 | Yum! Brands, Inc. | 82,440 | |||||
| 686,040 | |||||||
| Household Durables — 0.4% | |||||||
| 5,000 | Newell Rubbermaid Inc.* | 31,900 | |||||
| 3,000 | Sony Corp. SP-ADR | 61,890 | |||||
| 93,790 | |||||||
| Household Products — 0.9% | |||||||
| 2,000 | The Clorox Co. | 102,960 | |||||
| 1,500 | Colgate-Palmolive Co. | 88,470 | |||||
| 1,000 | The Procter & Gamble Co. | 47,090 | |||||
| 238,520 | |||||||
| Industrial Conglomerates — 0.6% | |||||||
| 1,500 | 3M Co. | 74,580 | |||||
| 7,500 | General Electric Co.* | 75,825 | |||||
| 150,405 | |||||||
| Insurance — 1.0% | |||||||
| 3,500 | China Life Insurance | ||||||
| Co., Ltd. ADR | 172,340 | ||||||
| 3,000 | MetLife, Inc. | 68,310 | |||||
| 240,650 | |||||||
| Internet & Catalog Retail — 0.4% | |||||||
| 1,500 | Amazon.com, Inc.* | 110,160 | |||||
| Internet Software & Services — 2.7% | |||||||
| 3,000 | Akamai Technologies, Inc.* | 58,200 | |||||
| 600 | Baidu, Inc. SP-ADR* | 105,960 | |||||
| 4,000 | eBay Inc.* | 50,240 | |||||
| 1,000 | Google Inc.* | 348,060 | |||||
| 2,500 | Sohu.com Inc.* | 103,275 | |||||
| 665,735 | |||||||
| Life Sciences Tools & Services — 0.4% | |||||||
| 2,500 | Waters Corp.* | 92,375 | |||||
| Machinery — 2.1% | |||||||
| 5,500 | Caterpillar Inc. | 153,780 | |||||
| 7,500 | Deere & Co. | 246,525 | |||||
| 4,000 | Ingersoll-Rand Company Ltd. | 55,200 | |||||
| 3,000 | Joy Global Inc. | 63,900 | |||||
| 519,405 | |||||||
| Media — 0.6% | |||||||
| 6,000 | The Walt Disney Co. | 108,960 | |||||
| 4,000 | Grupo Televisa S.A. SP-ADR | 54,560 | |||||
| 163,520 | |||||||
| Metals & Mining — 2.0% | |||||||
| 6,000 | Barrick Gold Corp. | 194,520 | |||||
| 4,000 | Newmont Mining Corp. | 179,040 | |||||
| 2,000 | Nucor Corp. | 76,340 | |||||
| 3,000 | Pan American Silver Corp.* | 52,260 | |||||
| 502,160 | |||||||
| Multiline Retail — 1.4% | |||||||
| 5,000 | Dillard’s, Inc. | 28,500 | |||||
| 2,000 | Family Dollar Stores, Inc. | 66,740 | |||||
| 5,000 | Macy’s, Inc. | 44,500 | |||||
| 6,000 | Nordstrom, Inc. | 100,500 | |||||
| 3,000 | Target Corp. | 103,170 | |||||
| 343,410 | |||||||
| Oil, Gas & Consumable Fuels — 1.6% | |||||||
| 2,000 | Chevron Corp. | 134,480 | |||||
| 2,000 | EnCana Corp. | 81,220 | |||||
| 1,500 | Exxon Mobil Corp. | 102,150 | |||||
| 1,000 | Peabody Energy Corp. | 25,040 | |||||
| 1,500 | Petroleo Brasileiro S.A. – ADR | 45,705 | |||||
| 388,595 | |||||||
| Paper & Forest Products — 0.4% | |||||||
| 6,000 | International Paper Co. | 42,240 | |||||
The accompanying notes to financial statements are an integral part of this schedule.
9
Reynolds Blue Chip Growth Fund
SCHEDULE OF INVESTMENTS (Continued)
March 31, 2009 (Unaudited)
| Shares | Value | ||||||
| LONG-TERM INVESTMENTS — 51.2% (a) (Continued) | |||||||
| COMMON STOCKS — 51.2% (a) (Continued) | |||||||
| Paper & Forest Products — 0.4% (Continued) | |||||||
| 2,000 | Weyerhaeuser Co. | $ | 55,140 | ||||
| 97,380 | |||||||
| Pharmaceuticals — 2.7% | |||||||
| 3,500 | Abbott Laboratories | 166,950 | |||||
| 3,500 | Eli Lilly and Co. | 116,935 | |||||
| 3,000 | Johnson & Johnson | 157,800 | |||||
| 3,000 | Merck & Co., Inc. | 80,250 | |||||
| 11,000 | Pfizer Inc. | 149,820 | |||||
| 671,755 | |||||||
| Semiconductors & Semiconductor | |||||||
| Equipment — 1.8% | |||||||
| 3,000 | Broadcom Corp.* | 59,940 | |||||
| 3,000 | Intel Corp. | 45,150 | |||||
| 6,500 | KLA-Tencor Corp. | 130,000 | |||||
| 7,000 | Novellus Systems, Inc.* | 116,410 | |||||
| 6,000 | Texas Instruments Inc. | 99,060 | |||||
| 450,560 | |||||||
| Software — 1.9% | |||||||
| 5,000 | Adobe Systems Inc.* | 106,950 | |||||
| 3,000 | Autodesk, Inc.* | 50,430 | |||||
| 7,000 | Microsoft Corp. | 128,590 | |||||
| 7,000 | Oracle Corp. | 126,490 | |||||
| 1,500 | SAP AG SP-ADR | 52,935 | |||||
| 465,395 | |||||||
| Specialty Retail — 4.3% | |||||||
| 2,500 | Abercrombie & Fitch Co. | 59,500 | |||||
| 5,500 | American Eagle Outfitters, Inc. | 67,320 | |||||
| 5,500 | AnnTaylor Stores Corp.* | 28,600 | |||||
| 5,000 | Bed Bath & Beyond Inc.* | 123,750 | |||||
| 4,000 | Best Buy Co., Inc. | 151,840 | |||||
| 4,000 | The Gap, Inc. | 51,960 | |||||
| 3,000 | The Home Depot, Inc. | 70,680 | |||||
| 5,500 | Lowe’s Companies, Inc. | 100,375 | |||||
| 4,000 | Ross Stores, Inc. | 143,520 | |||||
| 7,500 | Staples, Inc. | 135,825 | |||||
| 5,500 | The TJX Companies, Inc. | 141,020 | |||||
| 1,074,390 | |||||||
| Telecommunication Services – Diversified — 1.1% | |||||||
| 4,000 | AT&T Inc. | 100,800 | |||||
| 2,000 | Verizon Communications Inc. | 60,400 | |||||
| 17,000 | Vimpel-Communications | ||||||
| SP-ADR | 111,180 | ||||||
| 272,380 | |||||||
| Telecommunication Services – Wireless — 1.1% | |||||||
| 5,000 | China Mobile Ltd. SP-ADR | 217,600 | |||||
| 3,500 | Vodafone Group PLC - SP-ADR | 60,970 | |||||
| 278,570 | |||||||
| Textiles, Apparel & Luxury Goods — 0.6% | |||||||
| 2,000 | NIKE, Inc. Cl B | 93,780 | |||||
| 1,500 | Polo Ralph Lauren Corp. | 63,375 | |||||
| 157,155 | |||||||
| Total common stocks | |||||||
| (cost $12,374,039) | 12,756,466 | ||||||
| WARRANTS — 0.0% (a) | |||||||
| 70 | Krispy Kreme Doughnuts, Inc., | ||||||
| Expiration Date - 3/02/12, | |||||||
| Exercise Price - $12.21 (b) | 0 | ||||||
Total investments — 51.2% | |||||||
| (cost $12,374,039) | 12,756,466 | ||||||
| Cash and receivables, | |||||||
less liabilities — 48.8% (a) | 12,176,557 | ||||||
| TOTAL NET | |||||||
| ASSETS — 100.0% | $ | 24,933,023 | |||||
| * | Non-income producing security. |
| (a) | Percentages for the various classifications relate to net assets. |
| (b) | This security was fair valued as determined by the adviser using procedures approved by the Board of Directors. The total fair value of such security at March 31, 2009 is $0 which represents 0.0% of total net assets. |
ADR – American Depositary Receipts
The accompanying notes to financial statements are an integral part of this schedule.
10
Reynolds Blue Chip Growth Fund
STATEMENT OF OPERATIONS
For the Six Months Ending March 31, 2009 (Unaudited)
| INVESTMENT INCOME: | ||||
| Dividends | $ | 13,217 | ||
| Interest | 26,849 | |||
| Total investment income | 40,066 | |||
| EXPENSES: | ||||
| Management fees | 108,933 | |||
| Transfer agent fees | 43,419 | |||
| Insurance expense | 43,013 | |||
| Professional fees | 32,798 | |||
| Administrative and accounting services | 23,837 | |||
| Registration fees | 20,283 | |||
| Printing and postage expense | 19,979 | |||
| Custodian fees | 12,340 | |||
| Board of Directors fees | 10,000 | |||
| Chief Compliance Officers fees | 10,000 | |||
| Distribution fees | 9,561 | |||
| Other expenses | 4,171 | |||
| Total expenses before reimbursement | 338,334 | |||
| Less expenses reimbursed by adviser | (120,420 | ) | ||
| Net expenses | 217,914 | |||
| NET INVESTMENT LOSS | (177,848 | ) | ||
| NET REALIZED LOSS ON INVESTMENTS | (485,110 | ) | ||
| NET CHANGE IN UNREALIZED APPRECIATION ON INVESTMENTS | 301,472 | |||
| NET LOSS ON INVESTMENTS | (183,638 | ) | ||
| NET DECREASE IN NET ASSETS RESULTING FROM OPERATIONS | $ | (361,486 | ) | |
STATEMENTS OF CHANGES IN NET ASSETS
For the Six Months Ending March 31, 2009 (Unaudited) and For the Year Ended September 30, 2008
| 2009 | 2008 | |||||||
| OPERATIONS: | ||||||||
| Net investment loss | $ | (177,848 | ) | $ | (7,103 | ) | ||
| Net realized (loss) gain on investments | (485,110 | ) | 1,901,890 | |||||
| Net increase (decrease) in unrealized appreciation on investments | 301,472 | (1,890,407 | ) | |||||
| Net (decrease) increase in net assets resulting from operations | (361,486 | ) | 4,380 | |||||
| DISTRIBUTIONS TO SHAREHOLDERS: | ||||||||
| Distributions from net investment income ($0.210445 per share) | — | (171,260 | ) | |||||
| FUND SHARE ACTIVITIES: | ||||||||
| Proceeds from shares issued (163,249 and 17,522 shares, respectively) | 5,088,369 | 610,010 | ||||||
| Net asset value of shares issued in distributions reinvested (4,918 shares) | — | 164,990 | ||||||
| Cost of shares redeemed (62,305 and 159,033 shares, respectively) | (1,944,685 | ) | (5,127,068 | ) | ||||
| Net increase (decrease) in net assets derived from Fund share activities | 3,143,684 | (4,352,068 | ) | |||||
| TOTAL INCREASE (DECREASE) | 2,782,198 | (4,518,948 | ) | |||||
| NET ASSETS AT THE BEGINNING OF THE PERIOD | 22,150,825 | 26,669,773 | ||||||
| NET ASSETS AT THE END OF THE PERIOD (Includes undistributed | ||||||||
| net investment income of $0 and $0, respectively) | $ | 24,933,023 | $ | 22,150,825 | ||||
The accompanying notes to financial statements are an integral part of these statements.
11
Reynolds Blue Chip Growth Fund
FINANCIAL HIGHLIGHTS
(Selected data for each share of the Fund outstanding throughout each period)
| (Unaudited) | ||||||||||||||||||||||||
| For the Six | ||||||||||||||||||||||||
| Months Ending | Years Ended September 30, | |||||||||||||||||||||||
| March 31, 2009 | 2008 | 2007 | 2006 | 2005 | 2004 | |||||||||||||||||||
| PER SHARE OPERATING PERFORMANCE: | ||||||||||||||||||||||||
| Net asset value, beginning of period | $ | 31.85 | $ | 32.05 | $ | 28.98 | $ | 29.48 | $ | 26.98 | $ | 27.93 | ||||||||||||
| Income from investment operations: | ||||||||||||||||||||||||
| Net investment (loss) income | (0.25 | ) | (0.01 | ) | 0.17 | (0.17 | ) | (0.34 | ) | (0.40 | ) | |||||||||||||
| Net realized and unrealized (losses) gains on investments | (0.29 | ) | 0.02 | 2.90 | (0.33 | ) | 2.84 | (0.55 | )* | |||||||||||||||
| Total from investment operations | (0.54 | ) | 0.01 | 3.07 | (0.50 | ) | 2.50 | (0.95 | ) | |||||||||||||||
| Less distributions: | ||||||||||||||||||||||||
| Distributions from net investment income | — | (0.21 | ) | — | — | — | — | |||||||||||||||||
| Distributions from net realized gains | — | — | — | — | — | — | ||||||||||||||||||
| Total from distributions | — | (0.21 | ) | — | — | — | — | |||||||||||||||||
| Net asset value, end of period | $ | 31.31 | $ | 31.85 | $ | 32.05 | $ | 28.98 | $ | 29.48 | $ | 26.98 | ||||||||||||
| TOTAL RETURN | (1.70 | %)(1) | (0.00 | %) | 10.59 | % | (1.70 | %) | 9.27 | % | (3.44 | %) | ||||||||||||
| RATIOS/SUPPLEMENTAL DATA: | ||||||||||||||||||||||||
| Net assets, end of period (in 000's $) | 24,933 | 22,151 | 26,670 | 38,288 | 54,441 | 84,210 | ||||||||||||||||||
| Ratio of expenses (after reimbursement) to average net assets** | 2.00 | %(2) | 2.00 | % | 2.02 | % | 2.01 | % | 1.80 | % | 1.63 | % | ||||||||||||
| Ratio of net investment (loss) income to average net assets*** | (1.63 | %)(2) | (0.03 | %) | 0.55 | % | (0.55 | %) | (1.18 | %) | (1.33 | %) | ||||||||||||
| Portfolio turnover rate | 258 | % | 364 | % | 313 | % | 281 | % | 168 | % | 94 | % | ||||||||||||
| (1) | Not Annualized. |
| (2) | Annualized. |
| * | The amount shown may not correlate with the aggregate gains and losses of portfolio securities due to the timing of subscriptions and redemptions of Fund shares. |
| ** | Computed after giving effect to adviser's expense limitation undertaking. If the Fund had paid all of its expenses for the six months ending March 31, 2009 and for the years ended September 30, 2008 and 2007, the ratios would have been 3.11%(2), 2.67% and 2.25%, respectively. |
| *** | If the Fund had paid all of its expenses for the six months ending March 31, 2009 and for the years ended September 30, 2008 and 2007, the ratios would have been (2.74%)(2), (0.70%) and 0.32%, respectively. |
The accompanying notes to financial statements are an integral part of this statement.
NOTES TO FINANCIAL STATEMENTS
March 31, 2009 (Unaudited)
| (1) | Summary of Significant Accounting Policies — |
The following is a summary of significant accounting policies of the Reynolds Funds, Inc. (the “Company”), which is registered as a diversified, open-end management investment company under the Investment Company Act of 1940 (the “Act”), as amended. This Company consists of one fund: the Reynolds Blue Chip Growth Fund (the “Fund”). The Company was incorporated under the laws of Maryland on April 28,1988.
The investment objective of the Fund is to produce long-term growth of capital by investing in a diversified portfolio of common stocks issued by well-established growth companies commonly referred to as “blue chip” companies.
(a) Each security, excluding short-term investments, is valued at the last sale price reported by the principal security exchange on which the issue is traded, or if no sale is reported, the latest bid price. Securities which are traded on the Nasdaq National Markets are valued at the Nasdaq Official Closing Price, or if no sale is reported, the latest bid price. Short-term investments with maturities of 60 days or less are valued at amortized cost which approximates value. Securities for which quotations are not readily available are valued at fair value as determined by the investment adviser under the supervision of the Board of Directors. The fair value of a security is the amount which the Fund might receive upon a current sale. The fair value of a security may differ from the last quoted price and the Fund may not be able to sell a security at the fair value. Market quotations may not be available, for example, if trading in particular securities was halted during the day and not resumed prior to the close of trading on the New York Stock Exchange. Variable rate demand notes are recorded at par value which approximates market value. For financial reporting purposes, investment transactions are recorded on the trade date.
12
Reynolds Blue Chip Growth Fund
NOTES TO FINANCIAL STATEMENTS (Continued)
March 31, 2009 (Unaudited)
| (1) | Summary of Significant Accounting Policies — (Continued) |
The Fund adopted the provisions of Statement of Financial Accounting Standards No. 157, “Fair Value Measurements” (“SFAS No. 157”), effective October 1, 2008. Under SFAS No. 157, fair value is defined as the price that would be received to sell an asset or paid to transfer a liability (i.e., the “exit price”) in an orderly transaction between market participants at the measurement date.
In determining fair value, the Fund uses various valuation approaches. SFAS No. 157 establishes a fair value hierarchy for inputs used in measuring fair value that maximizes the use of observable inputs and minimizes the use of unobservable inputs by requiring that the most observable inputs be used when available. Observable inputs are those that market participants would use in pricing the asset or liability based on market data obtained from sources independent of the Fund. Unobservable inputs reflect the Fund's assumptions about the inputs market participants would use in pricing the asset or liability developed based on the best information available in the circumstances.
The fair value hierarchy is categorized into three levels based on the inputs as follows:
Level 1—Valuations based on unadjusted quoted prices in active markets for identical assets.
Level 2—Valuations based on quoted prices in markets that are not active or for which all significant inputs are observable, either directly or indirectly.
Level 3—Valuations based on inputs that are unobservable and significant to the overall fair value measurement.
The inputs or methodology used for valuing securities are not an indication of the risk associated with investing in those securities.
The following table summarizes the Fund’s investments as of March 31, 2009, based on the inputs used to value them:
| Valuation Inputs | Investments in Securities | ||||
| Level 1—Quoted prices | $ | 12,756,466 | |||
| Level 2—Other significant observable inputs | — | ||||
| Level 3—Significant unobservable inputs | — | ||||
| Total | $ | 12,756,466 | |||
(b) Net realized gains and losses on sales of securities are computed on the identified cost basis.
(c) The Fund records dividend income on the ex-dividend date and interest income on an accrual basis.
(d) The Fund may own investments in short-term variable rate demand notes, which are unsecured instruments. The Fund may be susceptible to credit risk with respect to these notes to the extent the issuer defaults on its payment obligation. The Fund’s policy is to monitor the creditworthiness of the issuer and nonperformance by these issuers is not anticipated.
(e) Accounting principles generally accepted in the United States of America (“GAAP”) require that permanent differences between income for financial reporting and tax purposes be reclassified in the capital accounts. For the six months ending March 31, 2009, the Fund reclassified $177,848 of net investment loss to capital stock.
(f) The preparation of financial statements in conformity with GAAP requires management to make estimates and assumptions that affect the reported amounts of assets and liabilities and disclosure of contingent assets and liabilities at the date of the financial statements and the reported amounts of revenues and expenses during the reporting period. Actual results could differ from these estimates.
(g) No provision has been made for Federal income taxes since the Fund has elected to be taxed as a “regulated investment company” and intends to distribute substantially all net investment company taxable income and net capital gains to shareholders and otherwise comply with the provisions of the Internal Revenue Code applicable to regulated investment companies.
(h) Effective March 31, 2008, the Fund adopted Financial Accounting Standards Board Interpretation No. 48 (FIN 48), “Accounting for Uncertainty in Income Taxes”. FIN 48 requires the evaluation of tax positions taken on previously filed tax returns or expected to be taken on future returns. These positions must meet a “more-likely-than-not” standard that, based on the technical merits, have a more than fifty percent likelihood of being sustained upon examination. In evaluating whether a tax position has met the recognition threshold, the Fund must presume that the position will be examined by the appropriate taxing authority that has full knowledge of all relevant information. Tax positions not deemed to meet the “more-likely-than-not” threshold are recorded as a tax expense in the current year.
FIN 48 requires the Fund to analyze all open tax years, as defined by the Statute of Limitations, for all major jurisdictions. Open tax years are those that are open for exam by taxing authorities. Major jurisdictions for the Fund include Federal and the state of Maryland. As of March 31, 2009, open Federal and Maryland tax years include the tax years ended September 30, 2005 through 2008. The Fund has no examinations in progress.
The Fund has reviewed all open tax years and major jurisdictions and concluded that the adoption of FIN 48 resulted in no effect to the Fund’s financial position or results of operations. There is no tax liability resulting from unrecognized tax benefits relating to uncertain income tax positions taken or expected to be taken on the tax return for the fiscal year-end September 30, 2009. The Fund is also not aware of any tax positions for which it is reasonably possible that the total amounts of unrecognized tax benefits will significantly change in the next twelve months.
13
Reynolds Blue Chip Growth Fund
NOTES TO FINANCIAL STATEMENTS (Continued)
March 31, 2009 (Unaudited)
| (2) | Investment Adviser and Management Agreement and Transactions With Related Parties — |
The Fund has a management agreement with Reynolds Capital Management (“RCM”), with whom an officer and a director of the Fund is affiliated, to serve as investment adviser and manager. Under the terms of the agreement, the Fund will pay RCM a monthly management fee at the annual rate of 1% of the daily net assets.
For the six months ending March 31, 2009, RCM reimbursed the Fund for expenses over 2.00% of the Fund’s daily net assets totaling $120,420.
The Fund has adopted a Service and Distribution Plan (the “Plan”) pursuant to Rule 12b-1 under the Act. The Plan provides that the Fund may incur certain costs which may not exceed a maximum amount equal to 0.25% per annum of the Fund’s average daily net assets. Payments made pursuant to the Plan may only be used to pay distribution expenses incurred in the current year.
Under the Fund’s organizational documents, each director, officer, employee or other agent of the Fund (including the Fund’s investment manager) is indemnified, to the extent permitted by the Act, against certain liabilities that may arise out of performance of their duties to the Fund. Additionally, in the normal course of business, the Fund enters into contracts that contain a variety of indemnification clauses. The Fund’s maximum exposure under these arrangements is unknown as this would involve future claims that may be made against the Fund that have not yet occurred. However, the Fund has not had prior claims or losses pursuant to these contracts and believes the risk of loss to be remote.
| (3) | Distributions to Shareholders — |
Net investment income and net realized gains, if any, for the Fund are distributed to shareholders at least annually.
| (4) | Investment Transactions — |
For the six months ending March 31, 2009, purchases and proceeds of sales of investment securities (excluding short-term securities) were $30,131,545 and $17,251,911, respectively.
| (5) | Income Tax Information — |
The following information for the Fund is presented on an income tax basis as of March 31, 2009:
| Gross | Gross | Net Unrealized | |
| Cost of | Unrealized | Unrealized | Appreciation |
| Investments | Appreciation | Depreciation | on Investments |
| $12,424,755 | $557,506 | $(225,795) | $331,711 |
The following information for the Fund is presented on an income tax basis as of September 30, 2008:
| Gross | Gross | Net Unrealized | Distributable | Distributable | |
| Cost of | Unrealized | Unrealized | Appreciation | Ordinary | Long-Term |
| Investments | Appreciation | Depreciation | on Investments | Income | Capital Gains |
| $22,098,362 | $85,347 | $(4,392) | $80,955 | $ — | $ — |
The difference, if any, between the cost amount for financial statement and federal income tax purposes is due primarily to timing differences in recognizing certain gains and losses in security transactions.
The tax components of dividends paid during the year ended September 30, 2008, capital loss carryovers, which may be used to offset future capital gains, subject to Internal Revenue Code limitations (expiring in varying amounts through 2013), as of September 30, 2008, and tax basis post-October losses as of September 30, 2008, which are not recognized for tax purposes until the first day of the following fiscal year are:
| September 30, 2008 | September 30, 2007 | ||||||
| Ordinary | Long-Term | Net Capital | Ordinary | Long-Term | |||
| Income | Capital Gains | Loss | Post-October | Income | Capital Gains | ||
| Distributions | Distributions | Carryovers | Losses | Distributions | Distributions | ||
| $171,260 | — | $90,666,363 | — | — | — | ||
The Fund has utilized $1,865,914 of its capital loss carryovers during the year ended September 30, 2008.
For corporate shareholders in the Fund, the percentage of dividend income distributed for the year ended September 30, 2008, which is designated as qualifying for the dividends received deduction is 79% (unaudited).
For the shareholders in the Fund, the percentage of dividend income distributed for the year ended September 30, 2008, which is designated as qualified dividend income under the Jobs and Growth Tax Relief Act of 2003, is 79% (unaudited).
14
Reynolds Blue Chip Growth Fund
ADVISORY AGREEMENT
On November 21, 2008, the Board of Directors (“Directors”) of Reynolds Funds, Inc. approved the continuation of the Reynolds Blue Chip Growth Fund’s investment advisory agreement with Reynolds Capital Management. Prior to approving the continuation of the advisory agreement, the Directors considered:
| • | the nature, extent and quality of the services provided by Reynolds Capital Management |
| • | the investment performance of the Fund |
| • | the costs of the services to be provided and profits to be realized by Reynolds Capital Management from its relationship with the Fund |
| • | the extent to which economies of scale would be realized as the Fund grew and whether fee levels reflect any economies of scale |
| • | the expense ratio of the Fund |
In considering the nature, extent and quality of the services provided by Reynolds Capital Management, the Directors reviewed a report describing the portfolio management, shareholder communication and servicing services provided by Reynolds Capital Management to the Fund. The Directors concluded that Reynolds Capital Management was providing essential services to the Fund as well as services that were in addition to services typically provided non-mutual fund clients.
The Directors compared the performance of the Fund to benchmark indices over various periods of time and concluded that the overall performance of the Fund warranted the continuation of the advisory agreement, despite some periods of relatively poor performance.
In concluding that the advisory fees payable by the Fund were reasonable, the Directors reviewed reports of the costs of services provided, and the profits realized, by Reynolds Capital Management, from its relationship with the Fund and concluded that such profits were reasonable and not excessive. The Directors also reviewed reports comparing the expense ratio of, and the advisory fees paid by, the Fund, to those of, and paid by, other comparable mutual funds and concluded that the advisory fees paid by the Fund and the expense ratio of the Fund was comparable to those of comparable mutual funds.
For additional information about the Directors and Officers or for a description of the policies and procedures that the Fund uses to determine how to vote proxies relating to portfolio securities, please call (800) 773-9665 and request a Statement of Additional Information. One will be mailed to you free of charge. The Statement of Additional Information is also available on the website of the Securities and Exchange Commission (the “Commission”) at http://www.sec.gov. Information on how the Fund voted proxies relating to portfolio securities is available on the Fund’s website at http://www.reynoldsfunds.com or the website of the Commission no later than August 31 for the prior 12 months ending June 30. The Fund files its complete schedule of portfolio holdings with the Commission for the first and third quarters of each fiscal year on Form N-Q. The Fund’s Form N-Q is available on the Commission’s website. The Fund’s Form N-Q may be reviewed and copied at the Commission’s Public Reference Room in Washington, D.C., and that information on the operation of the Public Reference Room may be obtained by calling 1-800-SEC-0330.
15
REYNOLDS BLUE CHIP GROWTH FUND
c/o U.S. BANCORP FUND SERVICES, LLC
615 East Michigan Street
Milwaukee, Wisconsin 53202
www.reynoldsfunds.com
Board of Directors
DENNIS N. MOSER
FREDERICK L. REYNOLDS
ROBERT E. STAUDER
Investment Adviser
REYNOLDS CAPITAL MANAGEMENT
2580 Kekaa Drive, #115
Lahaina, Hawaii 96761
Administrator
FIDUCIARY MANAGEMENT, INC.
100 East Wisconsin Avenue, Suite 2200
Milwaukee, Wisconsin 53202
Transfer Agent and
Dividend Disbursing Agent
U.S. BANCORP FUND SERVICES, LLC
615 East Michigan Street
Milwaukee, Wisconsin 53202
1-800-773-9665
or 1-800-7REYNOLDS
1-414-765-4124
Custodian
U.S. Bank, N.A.
1555 North RiverCenter Drive, Suite 302
Milwaukee, Wisconsin 53212
Independent Registered Public Accounting Firm
COHEN FUND AUDIT SERVICES, LTD.
800 Westpoint Parkway, Suite 1100
Westlake, Ohio 44145
Legal Counsel
FOLEY & LARDNER LLP
777 East Wisconsin Avenue
Milwaukee, Wisconsin 53202
Item 2. Code of Ethics.
Not applicable.
Item 3. Audit Committee Financial Expert.
Not applicable.
Item 4. Principal Accountant Fees and Services.
Not applicable.
Item 5. Audit Committee of Listed Registrants.
Not applicable.
Item 6. Schedule of Investments.
The schedule of investments in securities of unaffiliated issuers is included as part of the report to shareholders filed under Item 1.
Item 7. Disclosure of Proxy Voting Policies and Procedures for Closed-End Management Investment Companies.
Not applicable.
Item 8. Portfolio Managers of Closed-End Management Investment Companies.
Not applicable.
Item 9. Purchases of Equity Securities By Closed-End Management Investment Company and Affiliated Purchasers.
Not applicable.
Item 10. Submission of Matters to a Vote of Security Holders.
None.
Item 11. Controls and Procedures.
| (a) | The disclosure controls and procedures of the Reynolds Funds, Inc. are periodically evaluated. As of March 27, 2009, the date of the last evaluation, we concluded that our disclosure controls and procedures are adequate. |
| (b) | The internal controls of the Reynolds Funds, Inc. are periodically evaluated. There were no changes to Reynolds Funds’ internal control over financial reporting that occurred during the first fiscal quarter of the period covered by this report that have materially affected, or are reasonably likely to materially affect, such controls. |
Item 12. Exhibits.
| (a) | Any code of ethics or amendment thereto. Not applicable. |
| (b) | Certifications pursuant to Section 302 of the Sarbanes-Oxley Act of 2002. Filed herewith. |
| (c) | Certification pursuant to Section 906 of the Sarbanes-Oxley Act of 2002. Filed herewith. |
SIGNATURES
Pursuant to the requirements of the Securities Exchange Act of 1934 and the Investment Company Act of 1940, the registrant has duly caused this report to be signed on its behalf by the undersigned, thereunto duly authorized.
Reynolds Funds, Inc.
Registrant
By /s/Frederick L. Reynolds
Frederick L. Reynolds, Principal Executive Officer
Date May 28, 2009
Pursuant to the requirements of the Securities Exchange Act of 1934 and the Investment Company Act of 1940, this report has been signed below by the following persons on behalf of the registrant and in the capacities and on the dates indicated.
Reynolds Funds, Inc.
Registrant
By /s/Frederick L. Reynolds
Frederick L. Reynolds, Principal Financial Officer
Date May 28, 2009