UNITED STATES
SECURITIES AND EXCHANGE COMMISSION
Washington, D.C. 20549
FORM N-CSR
CERTIFIED SHAREHOLDER REPORT OF REGISTERED
MANAGEMENT INVESTMENT COMPANIES
Investment Company Act file number 811-05549
Reynolds Funds, Inc.
(Exact name of registrant as specified in charter)
c/o U.S. Bancorp Fund Services, LLC
615 E. Michigan Street
Milwaukee, WI 53202
(Address of principal executive offices) (Zip code)
Frederick L. Reynolds
Reynolds Capital Management, LLC
3565 South Las Vegas Blvd. #403
Las Vegas, NV 89109
Registrant's telephone number, including area code:
(415) 265-7167
Date of fiscal year end: September 30
Date of reporting period: March 31, 2013
Item 1. Reports to Stockholders.
SEMIANNUAL REPORT
March 31, 2013
REYNOLDS BLUE CHIP GROWTH FUND Seeking Long-Term Capital Appreciation |
A No-Load Mutual Fund
1-800-773-9665
www.reynoldsfunds.com
REYNOLDS BLUE CHIP GROWTH FUND
May 22, 2013
Dear Fellow Shareholders:
Performance Highlights (March 31, 2013)
The annualized average total returns of the Reynolds Blue Chip Growth Fund (the “Fund” or the “Blue Chip Fund”) for the 1-year, 3-year, 5-year, 10-year periods and since inception (August 12, 1988) through March 31, 2013 were +7.81%, +10.79%, +15.10%, +11.46% and +8.42%, respectively. The annualized average total returns for the Fund’s benchmark, the Standard & Poor’s 500 Index, for the 1-year, 3-year, 5-year, 10-year periods and since inception (August 12, 1988) through March 31, 2013 were +13.96%, +12.67%, +5.81%, +8.53% and +9.94%, respectively. The performance of the Reynolds Blue Chip Growth Fund was +8.89% in the six months ended March 31, 2013. The performance of the Standard & Poor’s 500 Index during that same period was +10.19%. The performance of the Reynolds Blue Chip Growth Fund was +9.99% in the three months ended March 31, 2013. The performance of the Standard & Poor’s 500 Index during that same period was +10.61%.
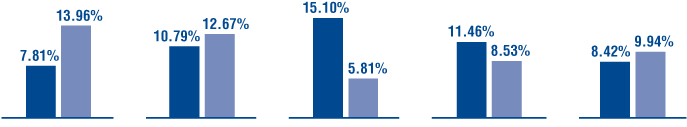 | ||||||||||
| One | Three Year | Five Year | Ten Year | Since | ||||||
| Year | Average | Average | Average | Inception | ||||||
| Returns | Annual Returns | Annual Returns | Annual Returns | August 12, 1988 | ||||||
■ Reynolds Blue Chip Growth Fund ■ Standard & Poor’s 500(1) | ||||||||||
| (1) | The Standard & Poor’s 500 Index consists of 500 selected common stocks, most of which are listed on the New York Stock Exchange. The Standard & Poor’s Ratings Group designates the stocks to be included in the Index on a statistical basis. A particular stock’s weighting in the Index is based on its relative total market value (i.e. its market price per share times the number of shares outstanding.) Stocks may be added or deleted from the Index from time to time. |
____________
As stated in the Prospectus dated January 31, 2013 the expense ratio of the Fund is 1.53%.
____________
Redesigned Web Site
We have a newly redesigned web site. To access it go to reynoldsfunds.com. At our website you can access current information about your investment holdings. You must first request a personal identification number (PIN) by calling our shareholder service representatives at 1-800-773-9665. You will be able to view your account list, account detail (including balances), transaction history, distributions, and the current Reynolds Blue Chip Growth Fund net asset value. Additional information available (PIN number not needed) includes quarterly updates of the returns of the Blue Chip Fund, top ten holdings, industry percentages, and news articles regarding the Fund. Also, detailed statistics and graphs of past performances from a link to Morningstar for the Blue Chip Fund.
Investment Strategy
We had an extremely high cash position in the Reynolds Blue Chip Growth Fund during the period from October 2007 to March 2009 when the stock market was in a correction phase. We started buying near the market bottom in March 2009. We believe that stocks are currently selling at attractive valuations based on historical valuation measures. One of these valuation measures is a company’s price earnings ratio relative to inflation, interest rates and the economic outlook. Another valuation measure is a company’s price earnings ratio relative to its forecasted earnings growth rate (the PEG ratio). Many stocks of high quality companies are currently selling at PE ratios and PEG ratios toward the lower end of their historical ranges and we believe that they are attractively valued.
The U.S. Economy
The U.S. economic recovery that started in mid-2009 has continued, although at a modest pace, so far in 2013. The U.S. economic recovery continues to be affected by a number of secular factors that are altering the pace and composition of growth. The economy in 2013 is being affected
- 1 -
by sustained subpar growth, low inflation, Federal Reserve (“Fed”) easing, strong consumer spending, higher than normal unemployment, greater prudence and less speculation in lending, reduced government spending including defense outlays, gains in residential construction and weakness overseas. The U.S. economy is growing, but at a lower than ideal rate. For example, growth of 3% or better is needed to meaningfully reduce unemployment which is currently around 7.5%. The Federal Reserve’s third round of economic stimulus referred to as “QE3”, which involves purchasing $40 billion per month of open-ended mortgage-backed securities, is continuing. This stimulus has tended to moderately lower longer term interest rates and added a moderate amount to economic growth. U.S. Gross Domestic Product (GDP) increased 2.2% in 2012, 1.8% in 2011 and 2.4% in 2010. GDP grew at a 0.4% annual rate in the fourth calendar quarter and at a 3.1% annual rate in the third calendar quarter of 2012. GDP expanded at a preliminary estimated inflation-adjusted annual rate of 2.5% in the quarter ended March 31, 2013 helped by a strong private sector including strong consumer spending, which accounted for most of the increase in GDP. For the next six months the outlook remains for modest, less than ideal growth, accompanied by higher than normal unemployment, modest inflation pressures, no change in the Federal Reserve policy on the federal funds rate, a strong private sector and a weak public sector. The economy will continue to be characterized by large fiscal deficits. The U.S. economy is more likely to slow than accelerate in the next coming months and is forecast to expand at a 1.2% rate in the quarter ended June 30, 2013 and 1.8% for the year ended December 31, 2013.
U.S. inflation numbers have been helped in the last few years by global competition and technology innovations that are helping to lower production and distribution costs. Inflation, as measured by the Consumer Price Index, increased 2.1% in 2012, 3.1% in 2011 and 1.6% in 2010. U.S. inflation is estimated to have increased at a 1.7% annual rate in the first quarter of 2013, after increasing at 1.9 % and 1.7% annual rates in the fourth and third quarters of 2012, respectively. U.S. inflation is forecast to increase 1.8% in 2013.
There are some current and potential economic and investment negatives at the present time including: (1) U.S. and worldwide economic growth continues at a slower than ideal rate; (2) a package of tax increases and cutbacks on government spending (“the fiscal cliff”) began on January 1, 2013 and will continue unless Congress acts to change it; (3) unemployment at 7.5% is still high as hiring continues cautiously; (4) business spending has been weaker as businesses are worried about slow growth; (5) there are concerns about U.S. tax and spending policies; (6) mortgage rates are low, but mortgage credit is still somewhat tight; (7) the U.S. deficit needs to be reduced; (8) there are major economic problems with some individual Euro-zone countries such as Cyprus, Greece, Italy, Portugal, and Spain which may continue for some time; (9) Europe is in a recession with Euro-zone growth forecast to be negative for 2013; and (10) growth in China should remain below trend for the next couple of years.
Some current and potential economic and investment positives are: (1) central banks worldwide have stepped up monetary stimulus to boost growth; (2) consumer spending, which accounts for about 71% of the economy, continues to expand; (3) many companies have recently reported better than expected first quarter earnings and analysts are turning more positive on the outlook for corporate earnings; (4) real estate activity including new construction continues to increase and the rise in property values has resulted in improving household balance sheets; (5) employment and payrolls are increasing with unemployment currently at 7.5%, the lowest in more than four years; (6) there has been an increase in the willingness of companies to commit capital as evidenced by the increase in merger and acquisition activity; (7) the economy has grown in the last fourteen quarters and growth should continue in the near term; (8) growth in the service sector is broadening; (9) automobile sales have been strong; (10) businesses have been able to use the credit markets to strengthen their balance sheets; (11) gasoline prices are cheaper; (12) the rise in stock market prices has added to net worth; (13) Federal Reserve policy makers have said that they will maintain stimulus until the labor market improves “significantly”; (14) European bailout funds have been expanded; (15) current valuations of stocks are toward the lower end of historical ranges; (16) the U.S. economy currently has better fundamentals than the economies of most other industrialized countries; (17) the European Central Bank (ECB) recently cut interest rates; and (18) China’s economic growth rate seems to be stabilizing.
The World Economy
The global economic recovery that started in mid-2009 has continued in 2013. Global economic activity slowed in the last nine quarters. The World Economy is forecast to increase 2.7% in 2013 after increasing 2.7% in 2012, 4.0% in 2011 and 4.8% in 2010.
The Euro-zone is currently in a recession and is currently the weakest economic area among industrialized countries. Europe has been implementing significant fiscal retrenchment which is slowing their economic growth. The biggest risk to Euro-zone economic growth is related to the potential sovereign government debt crises that have appeared. Euro-zone real GDP has decreased over the last six quarters. The Euro-zone’s GDP is forecast to decrease 0.4% in 2013 after decreasing 0.5% in 2012, increasing 1.5% in 2011 and increasing 1.7% in 2010. Several Euro-zone countries including Italy and Spain have slipped into a recession.
The United Kingdom’s GDP is forecast to increase 0.9% in 2013 after increasing 0.3% in 2012, 0.7% in 2011 and 1.3% in 2010. Japan’s GDP is forecast to increase 0.8% in 2013 after increasing 1.9% in 2012, decreasing 0.7% in 2011 and increasing 4.0% in 2010. Korea’s GDP is forecast to increase 2.7% in 2013 after increasing 2.0% in 2012, 3.6% in 2011 and 6.2% in 2010. Canada’s GDP is forecast to increase 1.5% in 2013 after increasing 1.8% in 2012, 2.5% in 2011 and 3.1% in 2010.
- 2 -
Some developing countries in the world have been growing faster than the U.S. in the last few years. Their economies continued to grow faster than the U.S. during the most recent worldwide economic slowdown and their economies are continuing to grow faster. Recovery is strongest in Asia with China having the strongest growth among “advanced economies”. Other Asian countries are having good growth rates as well. The biggest developing economies are many times referred to as the “BRIC” economy, which is short for Brazil, Russia, India, and China. China’s population is approximately 19% of the world’s total population of approximately seven billion. In the second quarter of 2010 China overtook Japan and became the world’s second largest economy after the U.S. It is the world’s fastest growing major economy. Many economists believe that China has a particularly good long-term outlook. Near term, however, there have been cross currents in China’s economic outlook. China’s GDP is forecast to increase 7.8% in 2013 after increasing 7.7% in 2012, 6.4% in 2011 and 10.4% in 2010.
India’s population is approximately 17% of the world’s population. It is the world’s second fastest growing major economy. India’s GDP is forecast to increase 5.7% in 2013 after increasing 5.0% in 2012, 6.6% in 2011 and 8.4% in 2010.
Brazil is Latin America’s biggest economy. GDP is forecast to increase 2.6% in 2013 after increasing 0.9% in 2012, 2.7% in 2011 and 7.5% in 2010. Russia’s GDP is forecast to increase 3.1% in 2013 after increasing at 3.4% in 2012, 4.3% in 2011 and 4.0% in 2010.
Many worldwide larger multinational companies should be well positioned to benefit long-term from worldwide growth. To the extent that some of these companies’ U.S. earnings are growing slower, this could be somewhat offset by their possible stronger foreign earnings. The long-term strategy of the Reynolds Blue Chip Growth Fund is to be structured to benefit from this worldwide growth by investing in many of these leading multinational growth companies.
The Blue Chip Fund is positioned to participate in long-term worldwide growth trends through investments in multinational U.S. headquartered companies. In addition, the Fund has investments in leading foreign headquartered companies, whose stocks or American Depositary Receipts (ADRs) trade in the United States. These ADRs are denominated in dollars and they must use GAAP (Generally Accepted Accounting Principles) accounting to qualify as an ADR. The Blue Chip Fund may hold up to 35% of its assets in ADRs.
Opportunistic Investing in Companies of Various Sizes and Diversified Among Various Industries
The Reynolds Blue Chip Growth Fund usually invests in companies of various sizes as classified by their market capitalizations. A company’s market capitalization is calculated by taking the number of shares the company has outstanding multiplied by its current market price. Other considerations in selecting companies for the Fund include revenue growth rates, product innovations, financial strength, management’s knowledge and experience plus the overall economic and geopolitical environments and interest rates. The Fund’s investments are diversified among various industries.
The long-term strategy of the Reynolds Blue Chip Growth Fund is to emphasize investment in worldwide “blue chip” growth companies. These companies are defined as companies with a minimum market capitalization of $1 billion. In the long-term these companies build value as their earnings grow. This growth in value should ultimately be recognized in higher stock prices for these companies.
Industry Sectors(2) as of March 31, 2013
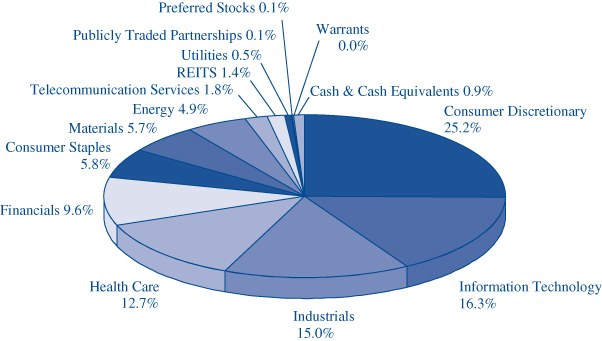
| (2) | The Global Industry Classification Standard (“GICS®”) was developed by and/or is the exclusive property of MSCI, Inc. and Standard & Poor’s Financial Services LLC (“S&P”). GICS® is a service mark of MSCI and S&P and has been licensed for use by U.S. Bancorp Fund Services, LLC. |
- 3 -
Low Long-Term Interest Rates by Historical Standards are a Significant Positive for Stock Valuations
Long-term interest rates remain near historically low levels. Low long-term interest rates usually result in higher stock valuations for many reasons including:
| (1) | Long-term borrowing costs of corporations are lower resulting in higher business confidence and profits. |
| (2) | Long-term borrowing costs of individuals are lower which increases consumer confidence and spending. |
| (3) | A company’s stock is usually valued by placing a present value on that company’s future stream of earnings and dividends. The present value is higher when interest and inflation rates are low. |
Linked Money Market Fund
The First American Treasury Obligations Fund is a money market fund offered by an affiliate of our transfer agent, U.S. Bancorp Fund Services, LLC. This Fund is offered as a money market alternative to our shareholders. The First American Treasury Obligations Fund offers many free shareholder conveniences including automatic investment and withdrawal plans and check writing access to your funds and is linked to your holdings in the Reynolds Blue Chip Growth Fund. This Fund is also included on your quarterly statements.
Information about the Reynolds Blue Chip Growth Fund and the First American Treasury Obligations Fund
Reynoldsfunds.com website: You can access current information about your investment holdings via our website, reynoldsfunds.com. You will be able to view your account list, account detail (including balances), transaction history, distributions, and the current Reynolds Blue Chip Growth Fund net asset value. Additional information available (PIN number not needed) includes quarterly updates of the returns of the Blue Chip Fund, top ten holdings, industry percentages, and news articles regarding the Fund. Also, detailed statistics and graphs of past performances from a link to Morningstar for the Blue Chip Fund.
For automatic current daily net asset values: Call 1-800-773-9665 (1-800-7REYNOLDS) twenty-four hours a day, seven days a week and press “any key” then “1”. The updated current net asset value for the Blue Chip Fund is usually available each business day after 5 P.M. (PST).
For the Reynolds Blue Chip Growth Fund shareholders to automatically access their current account information: Call1-800-773-9665 (twenty-four hours a day, seven days a week), press “any key” then “2” and enter your 16 digit account number which appears at the top right of your statement.
To speak to a Fund representative regarding the current daily net asset value, current account information and any other questions: Call 1-800-773-9665 and press “0” from 6 A.M. to 5 P.M. (PST).
Shareholder statement frequency: Consolidated statements summarizing the Blue Chip Fund and First American Treasury Obligations Fund accounts held by a shareholder are sent quarterly. In addition, individual Blue Chip Fund statements are sent whenever a transaction occurs. These transactions are: (1) statements are sent for the Blue Chip Fund or First American Treasury Obligations Fund when a shareholder purchases or redeems shares; (2) Blue Chip Fund statements are sent twice a year if, and when, any ordinary income or capital gains are distributed.
Tax reporting: Individual 1099 forms, which summarize any dividend income and any long- or short-term capital gains, are sent annually to shareholders each January. The percentage of income earned from various government securities, if any, for the Blue Chip Fund and the First American Treasury Obligations Fund are also reported in January.
Minimum investment: $1,000 for regular and retirement accounts ($100 for additional investments for all accounts – except for the Automatic Investment Plan, which is $50 for regular and retirement plan accounts).
Retirement plans: All types are offered including Traditional IRA, Roth IRA, Coverdell Education Savings Account, SIMPLE IRA Plan, and SEP IRA.
Automatic Investment Plan: There is no charge to automatically debit your checking account to invest in the Blue Chip Fund or the First American Treasury Obligations Fund ($50 minimum for either of these Funds) at periodic intervals to make automatic purchases in either of these Funds. This is useful for dollar cost averaging for the Blue Chip Fund.
Systematic Withdrawal Plan: For shareholders with a $10,000 minimum starting balance, there is no charge to automatically redeem shares ($100 minimum) in the Blue Chip Fund or the First American Treasury Obligations Fund as often as monthly and send a check to you or transfer funds to your bank account.
Free Check Writing: Free check writing ($100 minimum) is offered for accounts invested in the First American Treasury Obligations Fund.
Exchanges or regular redemptions between the Blue Chip Fund and the First American Treasury Obligations Fund: As often as desired – no charge.
- 4 -
NASDAQ symbols: Reynolds Blue Chip Growth Fund – RBCGX and First American Treasury Obligations Fund – FATXX.
Portfolio Manager: Frederick Reynolds is the portfolio manager of the Reynolds Blue Chip Growth Fund.
The Reynolds Blue Chip Growth Fund and the First American Treasury Obligations Fund are No-Load: No front-end sales commissions or deferred sales charges (“loads”) are charged. Over 40% of all mutual funds impose these marketing charges that are ultimately paid by the shareholder. These marketing charges are either: (1) a front-end fee or “load” in which up to 5% of a shareholder’s assets are deducted from the original investment (some funds even charge a fee when a shareholder reinvests capital gains or dividends); or (2) a back-end penalty fee or “load” which is typically deducted from a shareholder’s account if a shareholder redeems within five years of the original investment. These fees reduce a shareholder’s return. The Blue Chip Fund and First American Treasury Obligations Fund are No-Load as they do not have these extra charges.
We appreciate your continued confidence in the Reynolds Blue Chip Growth Fund and would like to welcome our new shareholders. We look forward to strong results in the future.
Sincerely,

Frederick L. Reynolds
President
____________
This report is not authorized for use as an offer of sale or a solicitation of an offer to buy shares of the Reynolds Blue Chip Growth Fund unless accompanied or preceded by the Fund’s current prospectus.
Performance data quoted represents past performance; past performance does not guarantee future results. The investment return and principal value of an investment will fluctuate so that an investor’s shares, when redeemed, may be worth more or less than their original cost. Current performance of the Fund may be lower or higher than the performance quoted. Returns do not reflect the deduction of taxes that a shareholder would pay on Fund distributions or the redemption of Fund shares. Performance data current to the most recent month-end may be obtained by visiting www.reynoldsfunds.com or by calling 1-800-773-9665.
Risks associated with investing in the Fund are as follows: Stock Market Risk, Growth Investing Risk, Technology Companies Risk, Consumer Discretionary Companies Risk, Smaller and Medium Capitalization Companies Risk, Foreign Securities Risk and Portfolio Turnover Risks. For details regarding these risks, please refer to the Fund’s Prospectus or Summary Prospectus dated January 31, 2013.
Distributed by Rafferty Capital Markets, LLC
For additional information about the Directors and Officers or for a description of the policies and procedures that the Fund uses to determine how to vote proxies relating to portfolio securities, please call (800) 773-9665 and request a Statement of Additional Information. One will be mailed to you free of charge. The Statement of Additional Information is also available on the website of the Securities and Exchange Commission (the “Commission”) at http://www.sec.gov. Information on how the Fund voted proxies relating to portfolio securities is available on the Fund’s website at http://www.reynoldsfunds.com or the website of the Commission no later than August 31 for the prior 12 months ending June 30. The Fund files its complete schedule of portfolio holdings with the Commission for the first and third quarters of each fiscal year on Form N-Q. The Fund’s Form N-Q is available on the Commission’s website. The Fund’s Form N-Q may be reviewed and copied at the Commission’s Public Reference Room in Washington, D.C., and that information on the operation of the Public Reference Room may be obtained by calling 1-800-SEC-0330.
- 5 -
Reynolds Blue Chip Growth Fund
COST DISCUSSION (Unaudited)
As a shareholder of the Reynolds Blue Chip Growth Fund, you do not incur (except as described below) transaction costs, including sales charges (loads) on purchase payments, reinvested dividends, or other distributions; redemption fees; and exchange fees, but do incur ongoing costs, including management fees; distribution [and/or service] (12b-1) fees; and other Fund expenses. This example is intended to help you understand your ongoing costs (in dollars) of investing in the Fund and to compare these costs with the ongoing costs of investing in other mutual funds.
The example is based on an investment of $1,000 invested at the beginning of the period and held for the entire period from October 1, 2012 through March 31, 2013.
Actual Expenses
The first line of the table below provides information about actual account values and actual expenses. You may use the information in this line, together with the amount you invested, to estimate the expenses that you paid over the period. Simply divide your account value by $1,000 (for example, an $8,600 account value divided by $1,000 = 8.6), then multiply the result by the number in the first line under the heading entitled “Expenses Paid During Period” to estimate the expenses you paid on your account during this period.
In addition to the costs highlighted and described below, the only Fund transaction costs you might currently incur would be wire fees ($15 per wire), if you choose to have proceeds from a redemption wired to your bank account instead of receiving a check. Additionally, U.S. Bank charges an annual processing fee ($15) if you maintain an IRA account with the Fund. To determine your total costs of investing in the Fund, you would need to add any applicable wire or IRA processing fees you’ve incurred during the period to the costs provided in the example below.
Hypothetical Example for Comparison Purposes
The second line of the table below provides information about hypothetical account values and hypothetical expenses based on the Fund’s actual expense ratio and an assumed rate of return of 5% per year before expenses, which is not the Fund’s actual return. The hypothetical account values and expenses may not be used to estimate the actual ending account balance or expenses you paid for the period. You may use this information to compare the ongoing costs of investing in the Fund and other funds. To do so, compare this 5% hypothetical example with the 5% hypothetical examples that appear in the shareholder reports of the other funds.
Please note that the expenses shown in the table are meant to highlight your ongoing costs only and do not reflect any transactional costs, such as sales charges (loads), redemption or exchange fees. Therefore, the second line of the table is useful in comparing ongoing costs only, and will not help you determine the relative total costs of owning different funds. In addition, if these transactional costs were included, your costs would have been higher.
| Beginning Account | Ending Account | Expenses Paid During | |
| Value 10/01/12 | Value 3/31/13 | Period* 10/01/12-3/31/13 | |
| Reynolds Blue Chip Growth Fund Actual | $1,000.00 | $1,088.90 | $8.33 |
| Hypothetical (5% return before expenses) | $1,000.00 | $1,016.95 | $8.05 |
| * | Expenses are equal to the Fund’s annualized expense ratio of 1.60% multiplied by the average account value over the period, multiplied by 182/365 (to reflect the one-half year period between October 1, 2012 and March 31, 2013). |
- 6 -
Reynolds Blue Chip Growth Fund
STATEMENT OF ASSETS AND LIABILITIES
March 31, 2013 (Unaudited)
| ASSETS: | ||||
| Investments in securities, at value (cost $149,087,000) | $ | 186,278,323 | ||
| Receivable from investments sold | 3,404,986 | |||
| Cash | 705,873 | |||
| Receivable from shareholders for purchases | 214,388 | |||
| Dividends receivable | 157,001 | |||
| Prepaid expenses | 23,697 | |||
| Other receivables | 45 | |||
| Total assets | $ | 190,784,313 | ||
| LIABILITIES: | ||||
| Payable for investments purchased | $ | 2,409,603 | ||
| Payable to shareholders for redemptions | 167,666 | |||
| Payable to adviser for management fees | 158,165 | |||
| Payable for distribution expenses | 22,705 | |||
| Other liabilities | 101,900 | |||
| Total liabilities | 2,860,039 | |||
| NET ASSETS: | ||||
| Capital Stock, $0.01 par value; 40,000,000 shares authorized; 2,959,072 shares outstanding | 153,239,224 | |||
| Net unrealized appreciation on investments and translation of assets and liabilities in foreign currencies | 37,191,323 | |||
| Accumulated net realized loss on investments and foreign currency transactions | (1,862,182 | ) | ||
| Accumulated net investment loss | (644,091 | ) | ||
| Net assets | 187,924,274 | |||
| Total liabilities and net assets | $ | 190,784,313 | ||
| CALCULATION OF NET ASSET VALUE PER SHARE: | ||||
| Net asset value, offering and redemption price per share ($187,924,274 ÷ 2,959,072 shares outstanding) | $ | 63.51 | ||
The accompanying notes to financial statements are an integral part of this statement.
SCHEDULE OF INVESTMENTS
March 31, 2013 (Unaudited)
| Shares | Value | ||||||
| LONG-TERM INVESTMENTS — 99.1% (a) | |||||||
| COMMON STOCKS — 97.5% (a) | |||||||
| Aerospace & Defense — 1.3% | |||||||
| 3,500 | BE Aerospace, Inc.* | $ | 211,015 | ||||
| 1,400 | The Boeing Co. | 120,190 | |||||
| 1,800 | Esterline Technologies Corporation.* | 136,260 | |||||
| 7,300 | GenCorp Inc.* | 97,090 | |||||
| 4,600 | Hexcel Corp.* | 133,446 | |||||
| 6,900 | Honeywell International Inc. | 519,915 | |||||
| 1,100 | L-3 Communications Holdings, Inc. | 89,012 | |||||
| 500 | Lockheed Martin Corp. | 48,260 | |||||
| 1,600 | Northrop Grumman Corporation | 112,240 | |||||
| 800 | Precision Castparts Corp. | 151,696 | |||||
| 1,400 | Raytheon Co. | 82,306 | |||||
| 2,800 | Rockwell Collins, Inc. | 176,736 | |||||
| 500 | Teledyne Technologies Inc.* | 39,220 | |||||
| 4,200 | Triumph Group, Inc. | 329,700 | |||||
| 2,200 | United Technologies Corp. | 205,546 | |||||
| 2,452,632 | |||||||
| Air Freight & Logistics — 0.2% | |||||||
| 3,200 | C. H. Robinson Worldwide, Inc. | 190,272 | |||||
| 1,300 | FedEx Corp. | 127,660 | |||||
| 1,600 | United Parcel Service, Inc. Cl B | 137,440 | |||||
| 455,372 | |||||||
The accompanying notes to financial statements are an integral part of this schedule.
- 7 -
Reynolds Blue Chip Growth Fund
SCHEDULE OF INVESTMENTS (Continued)
March 31, 2013 (Unaudited)
| Shares | Value | ||||||
| LONG-TERM INVESTMENTS — 99.1% (a) (Continued) | |||||||
| COMMON STOCKS — 97.5% (a) (Continued) | |||||||
| Airlines — 1.9% | |||||||
| 7,600 | Alaska Air Group, Inc.* | $ | 486,096 | ||||
| 6,200 | Allegiant Travel Co.* | 550,436 | |||||
| 3,000 | China Southern Airlines | ||||||
| Company Limited - SP-ADR | 85,920 | ||||||
| 2,900 | Copa Holdings S.A. | 346,869 | |||||
| 20,000 | Delta Air Lines, Inc.* | 330,200 | |||||
| 19,100 | Hawaiian Holdings, Inc.* | 110,016 | |||||
| 12,400 | JetBlue Airways Corp.* | 85,560 | |||||
| 18,900 | Republic Airways Holdings Inc.* | 218,106 | |||||
| 6,900 | Ryanair Holdings PLC - SP-ADR | 288,282 | |||||
| 5,900 | SkyWest, Inc. | 94,695 | |||||
| 32,900 | Southwest Airlines Co. | 443,492 | |||||
| 3,800 | Spirit Airlines Inc.* | 96,368 | |||||
| 4,400 | United Continental Holdings Inc.* | 140,844 | |||||
| 22,200 | US Airways Group, Inc.* | 376,734 | |||||
| 3,653,618 | |||||||
| Auto Components — 0.3% | |||||||
| 1,400 | BorgWarner, Inc.* | 108,276 | |||||
| 800 | Delphi Automotive PLC | 35,520 | |||||
| 800 | Drew Industries Incorporated | 29,048 | |||||
| 3,000 | Johnson Controls, Inc. | 105,210 | |||||
| 200 | Magna International Inc. | 11,740 | |||||
| 1,200 | Tenneco Inc.* | 47,172 | |||||
| 3,900 | TRW Automotive Holdings Corp.* | 214,500 | |||||
| 551,466 | |||||||
| Automobiles — 0.4% | |||||||
| 3,400 | Ford Motor Company | 44,710 | |||||
| 3,200 | Harley-Davidson, Inc. | 170,560 | |||||
| 2,400 | HONDA MOTOR CO., LTD. - SP-ADR | 91,824 | |||||
| 5,900 | Tata Motors Ltd. - SP-ADR | 144,019 | |||||
| 2,000 | Tesla Motors, Inc.* | 75,780 | |||||
| 1,700 | TOYOTA MOTOR | ||||||
| CORPORATION - SP-ADR | 174,488 | ||||||
| 2,200 | Winnebago Industries, Inc.* | 45,408 | |||||
| 746,789 | |||||||
| Beverages — 1.5% | |||||||
| 3,300 | Anheuser-Busch InBev N.V. - SP-ADR | 328,515 | |||||
| 1,900 | The Boston Beer Company, Inc.* | 303,316 | |||||
| 16,900 | Coca-Cola Enterprises Inc. | 623,948 | |||||
| 2,400 | Coca-Cola Femsa, S.A.B. | ||||||
| de C.V. - SP-ADR | 393,048 | ||||||
| 9,800 | Constellation Brands, Inc.* | 466,872 | |||||
| 14,200 | Cott Corp. | 143,704 | |||||
| 1,800 | Crimson Wine Group Ltd* | 16,740 | |||||
| 300 | Diageo plc - SP-ADR | 37,752 | |||||
| 6,200 | Dr Pepper Snapple Group, Inc. | 291,090 | |||||
| 1,200 | Fomento Economico Mexicano, | ||||||
| S.A.B. de C.V. - SP-ADR | 136,200 | ||||||
| 1,800 | PepsiCo, Inc. | 142,398 | |||||
| 2,883,583 | |||||||
| Biotechnology — 3.6% | |||||||
| 1,000 | Acadia Healthcare Co. Inc.* | 29,390 | |||||
| 1,800 | ACADIA Pharmaceuticals Inc.* | 14,292 | |||||
| 800 | Aegerion Pharmaceuticals, Inc.* | 32,272 | |||||
| 2,000 | Affymax Inc.* | 2,780 | |||||
| 4,300 | Alexion Pharmaceuticals, Inc.* | 396,202 | |||||
| 7,000 | Alkermes PLC*^ | 165,970 | |||||
| 4,900 | Amgen Inc. | 502,299 | |||||
| 17,700 | Arena Pharmaceuticals, Inc.* | 145,317 | |||||
| 17,600 | ARIAD Pharmaceuticals, Inc.* | 318,384 | |||||
| 2,100 | Biogen Idec Inc.* | 405,111 | |||||
| 2,000 | BioMarin Pharmaceutical Inc.* | 124,520 | |||||
| 8,500 | Celgene Corp.* | 985,235 | |||||
| 700 | Cubist Pharmaceuticals, Inc.* | 32,774 | |||||
| 6,400 | Dendreon Corp.* | 30,272 | |||||
| 9,000 | Elan Corporation plc - SP-ADR* | 106,200 | |||||
| 8,100 | Geron Corporation* | 8,667 | |||||
| 17,900 | Gilead Sciences, Inc.* | 875,847 | |||||
| 1,100 | Grifols S.A. - ADR* | 31,911 | |||||
| 10,500 | Incyte Corp.* | 245,805 | |||||
| 2,200 | Infinity Pharmaceuticals, Inc.* | 106,634 | |||||
| 7,300 | Isis Pharmaceuticals, Inc.* | 123,662 | |||||
| 1,500 | Keryx Biopharmaceuticals, Inc.* | 10,560 | |||||
| 2,000 | Medivation Inc.* | 93,540 | |||||
| 2,800 | Onyx Pharmaceuticals, Inc.* | 248,808 | |||||
| 12,900 | Orexigen Therapeutics Inc.* | 80,625 | |||||
| 8,100 | Peregrine Pharmaceuticals, Inc.* | 10,854 | |||||
| 10,900 | Pharmacyclics, Inc.* | 876,469 | |||||
| 190 | Prothena Corp. PLC* | 1,271 | |||||
| 600 | Regeneron Pharmaceuticals, Inc.* | 105,840 | |||||
| 3,300 | Sarepta Therapeutics, Inc.* | 121,935 | |||||
| 12,400 | Savient Pharmaceuticals Inc.* | 9,920 | |||||
| 9,300 | Seattle Genetics, Inc.* | 330,243 | |||||
| 1,900 | United Therapeutics Corporation* | 115,653 | |||||
| 1,300 | Vertex Pharmaceuticals Incorporated* | 71,474 | |||||
| 6,760,736 | |||||||
| Building Products — 0.9% | |||||||
| 1,900 | AAON, Inc. | 52,421 | |||||
The accompanying notes to financial statements are an integral part of this schedule.
- 8 -
Reynolds Blue Chip Growth Fund
SCHEDULE OF INVESTMENTS (Continued)
March 31, 2013 (Unaudited)
| Shares | Value | ||||||
| LONG-TERM INVESTMENTS — 99.1% (a) (Continued) | |||||||
| COMMON STOCKS — 97.5% (a) (Continued) | |||||||
| Building Products — 0.9% (Continued) | |||||||
| 1,900 | American Woodmark Corporation* | $ | 64,657 | ||||
| 800 | Apogee Enterprises, Inc. | 23,160 | |||||
| 600 | Armstrong World Industries, Inc.* | 33,534 | |||||
| 14,700 | Fortune Brands Home & Security Inc.* | 550,221 | |||||
| 3,900 | Lennox International Inc. | 247,611 | |||||
| 16,500 | Masco Corp. | 334,125 | |||||
| 3,100 | Owens Corning Inc.* | 122,233 | |||||
| 4,900 | PGT, Inc.* | 33,663 | |||||
| 1,900 | Quanex Building | ||||||
| Products Corporation | 30,590 | ||||||
| 8,000 | USG Corporation* | 211,520 | |||||
| 1,703,735 | |||||||
| Capital Markets — 3.1% | |||||||
| 1,600 | Affiliated Managers Group, Inc.* | 245,712 | |||||
| 4,100 | Ameriprise Financial, Inc. | 301,965 | |||||
| 1,100 | The Bank of New York Mellon Corporation | 30,789 | |||||
| 600 | BlackRock, Inc. | 154,128 | |||||
| 3,500 | The Carlyle Group | 105,875 | |||||
| 10,200 | E*Trade Financial Corp.* | 109,242 | |||||
| 3,200 | Eaton Vance Corp. | 133,856 | |||||
| 2,200 | Evercore Partners Inc. | 91,520 | |||||
| 775 | FBR & Company* | 14,671 | |||||
| 2,200 | Federated Investors, Inc. Cl B | 52,074 | |||||
| 8,300 | Financial Engines, Inc. | 300,626 | |||||
| 1,100 | Franklin Resources, Inc. | 165,891 | |||||
| 4,300 | The Goldman Sachs Group, Inc. | 632,745 | |||||
| 2,200 | Invesco Limited | 63,712 | |||||
| 10,900 | Janus Capital Group Inc. | 102,460 | |||||
| 2,400 | Legg Mason, Inc. | 77,160 | |||||
| 800 | Manning & Napier Inc. | 13,232 | |||||
| 12,300 | Morgan Stanley | 270,354 | |||||
| 1,000 | Northern Trust Corporation | 54,560 | |||||
| 1,200 | PennantPark Investment Corporation | 13,548 | |||||
| 12,600 | Piper Jaffray Companies, Inc.* | 432,180 | |||||
| 3,300 | T. Rowe Price Group Inc. | 247,071 | |||||
| 6,800 | Raymond James Financial, Inc. | 313,480 | |||||
| 10,800 | The Charles Schwab Corporation | 191,052 | |||||
| 8,400 | SEI Investments Co. | 242,340 | |||||
| 3,200 | State Street Corporation | 189,088 | |||||
| 6,900 | TD Ameritrade Holding Corp. | 142,278 | |||||
| 4,100 | Triangle Capital Corporation | 114,759 | |||||
| 2,900 | UBS AG | 44,631 | |||||
| 3,700 | Virtus Investment Partners Inc.* | 689,236 | |||||
| 5,800 | Waddell & Reed Financial, Inc. | 253,924 | |||||
| 5,794,159 | |||||||
| Chemicals — 3.2% | |||||||
| 500 | Air Products and Chemicals, Inc. | 43,560 | |||||
| 900 | Airgas, Inc. | 89,244 | |||||
| 1,500 | Balchem Corporation | 65,910 | |||||
| 4,400 | Chemtura Corporation* | 95,084 | |||||
| 1,200 | Cytec Industries Inc. | 88,896 | |||||
| 10,144 | Eastman Chemical Co. | 708,762 | |||||
| 4,600 | Ecolab Inc. | 368,828 | |||||
| 5,500 | FMC Corporation | 313,665 | |||||
| 700 | H.B. Fuller Company | 27,356 | |||||
| 3,000 | W.R. Grace & Co.* | 232,530 | |||||
| 7,200 | Huntsman Corporation | 133,848 | |||||
| 8,000 | International Flavors & Fragrances Inc. | 613,360 | |||||
| 3,500 | Koppers Holdings, Inc. | 153,930 | |||||
| 3,900 | Kraton Performance Polymers, Inc.* | 91,260 | |||||
| 2,900 | LyondellBasell Industries N.V. | 183,541 | |||||
| 1,400 | Methanex Corporation | 56,882 | |||||
| 7,300 | Monsanto Company | 771,099 | |||||
| 5,000 | The Mosaic Company | 298,050 | |||||
| 500 | NewMarket Corporation | 130,180 | |||||
| 7,700 | Olin Corp. | 194,194 | |||||
| 1,800 | PolyOne Corporation | 43,938 | |||||
| 2,100 | PPG Industries, Inc. | 281,274 | |||||
| 6,800 | RPM International, Inc. | 214,744 | |||||
| 4,100 | Sigma-Aldrich Corp. | 318,488 | |||||
| 1,200 | Sociedad Quimica y Minera de | ||||||
| Chile S.A. - SP-ADR | 66,540 | ||||||
| 6,800 | The Valspar Corp. | 423,300 | |||||
| 6,008,463 | |||||||
| Commercial Banks — 1.2% | |||||||
| 1,100 | Bank of Hawaii Corporation | 55,891 | |||||
| 3,500 | Bank of the Ozarks, Inc. | 155,225 | |||||
| 3,300 | Barclays PLC - SP-ADR | 58,608 | |||||
| 1,800 | CapitalSource Inc. | 17,316 | |||||
| 5,800 | Citizens Republic Bancorp, Inc.* | 130,790 | |||||
| 1,600 | East West Bancorp, Inc. | 41,072 | |||||
| 1,600 | Enterprise Financial Services Corp. | 22,944 | |||||
| 20,400 | Fifth Third Bancorp | 332,724 | |||||
| 1,000 | First Financial Bankshares, Inc. | 48,600 | |||||
| 2,400 | Fulton Financial Corporation | 28,080 | |||||
| 2,200 | HDFC Bank Ltd. - ADR | 82,324 | |||||
| 1,400 | HSBC Holdings plc - SP-ADR | 74,676 | |||||
| 2,100 | Hudson City Bancorp, Inc. | 18,144 | |||||
The accompanying notes to financial statements are an integral part of this schedule.
- 9 -
Reynolds Blue Chip Growth Fund
SCHEDULE OF INVESTMENTS (Continued)
March 31, 2013 (Unaudited)
| Shares | Value | ||||||
| LONG-TERM INVESTMENTS — 99.1% (a) (Continued) | |||||||
| COMMON STOCKS — 97.5% (a) (Continued) | |||||||
| Commercial Banks — 1.2% (Continued) | |||||||
| 18,500 | Huntington Bancshares Inc. | $ | 136,715 | ||||
| 500 | ICICI Bank Limited - SP-ADR | 21,450 | |||||
| 12,300 | KeyCorp | 122,508 | |||||
| 500 | Mercantile Bank Corporation | 8,355 | |||||
| 5,900 | Mizuho Financial Group, Inc. - ADR | 25,193 | |||||
| 800 | PNC Financial Services Group, Inc. | 53,200 | |||||
| 2,200 | Popular, Inc.* | 60,742 | |||||
| 40,200 | Regions Financial Corp. | 329,238 | |||||
| 1,000 | Royal Bank of Scotland | ||||||
| Group plc - SP-ADR* | 8,430 | ||||||
| 1,700 | Southwest Bancorp, Inc.* | 21,352 | |||||
| 1,200 | SunTrust Banks, Inc. | 34,572 | |||||
| 7,200 | Synovus Financial Corp. | 19,944 | |||||
| 5,100 | Texas Capital Bancshares, Inc.* | 206,295 | |||||
| 2,200 | Wells Fargo & Co. | 81,378 | |||||
| 5,600 | Zions Bancorporation | 139,944 | |||||
| 2,335,710 | |||||||
| Commercial Services & Supplies — 1.1% | |||||||
| 5,900 | The ADT Corporation | 288,746 | |||||
| 3,600 | Avery Dennison Corporation | 155,052 | |||||
| 5,800 | Cintas Corp. | 255,954 | |||||
| 1,400 | Consolidated Graphics, Inc.* | 54,740 | |||||
| 2,700 | Copart, Inc.* | 92,556 | |||||
| 2,600 | A.T. Cross Company* | 35,802 | |||||
| 6,200 | R.R. Donnelley & Sons Company | 74,710 | |||||
| 5,400 | KAR Auction Services Inc. | 108,162 | |||||
| 2,500 | Manpower Inc. | 141,800 | |||||
| 1,700 | Herman Miller, Inc. | 47,039 | |||||
| 2,200 | Mobile Mini, Inc.* | 64,746 | |||||
| 3,400 | PHH Corporation* | 74,664 | |||||
| 1,200 | Quad Graphics, Inc. | 28,728 | |||||
| 1,200 | Republic Services, Inc. | 39,600 | |||||
| 13,400 | RINO International Corp.*(b) | 134 | |||||
| 3,900 | Rollins, Inc. | 95,745 | |||||
| 7,300 | Steelcase Inc. | 107,529 | |||||
| 400 | Stericycle, Inc.* | 42,472 | |||||
| 3,100 | Tetra Tech, Inc.* | 94,519 | |||||
| 2,700 | Waste Connections, Inc. | 97,146 | |||||
| 2,200 | Waste Management, Inc. | 86,262 | |||||
| 1,986,106 | |||||||
| Communications Equipment — 1.2% | |||||||
| 1,200 | ADTRAN, Inc. | 23,580 | |||||
| 1,500 | Aruba Networks Inc.* | 37,110 | |||||
| 10,500 | Brocade Communications | ||||||
| Systems, Inc.* | 60,585 | ||||||
| 2,300 | CalAmp Corporation* | 25,231 | |||||
| 1,400 | F5 Networks, Inc.* | 124,712 | |||||
| 6,200 | Finisar Corp.* | 81,778 | |||||
| 3,100 | Harris Corp. | 143,654 | |||||
| 2,200 | Infinera Corporation* | 15,400 | |||||
| 2,000 | InterDigital, Inc. | 95,660 | |||||
| 2,900 | Ituran Location and Control Ltd. | 45,385 | |||||
| 8,900 | JDS Uniphase Corp.* | 118,993 | |||||
| 1,300 | Loral Space & Communications Inc. | 80,444 | |||||
| 1,600 | Motorola Solutions, Inc. | 102,448 | |||||
| 4,700 | NETGEAR, Inc.* | 157,497 | |||||
| 25,200 | Nokia Oyj - SP-ADR | 82,656 | |||||
| 500 | Palo Alto Networks, Inc.* | 28,300 | |||||
| 900 | Plantronics, Inc. | 39,771 | |||||
| 900 | Polycom, Inc.* | 9,972 | |||||
| 2,300 | Procera Networks, Inc.* | 27,347 | |||||
| 2,100 | QUALCOMM, Inc. | 140,595 | |||||
| 2,200 | RADWARE Ltd.* | 83,006 | |||||
| 9,900 | Riverbed Technology, Inc.* | 147,609 | |||||
| 4,900 | Ruckus Wireless Inc.* | 102,900 | |||||
| 17,300 | Telefonaktiebolaget | ||||||
| LM Ericsson - SP-ADR | 217,980 | ||||||
| 3,000 | Ubiquiti Networks Inc. | 41,160 | |||||
| 3,400 | ViaSat, Inc.* | 164,696 | |||||
| 2,198,469 | |||||||
| Computers & Peripherals — 0.8% | |||||||
| 2,300 | Cray, Inc.* | 53,383 | |||||
| 4,300 | Dell Inc. | 61,619 | |||||
| 2,400 | Electronics for Imaging, Inc.* | 60,864 | |||||
| 9,500 | Hewlett-Packard Company | 226,480 | |||||
| 2,300 | Lexmark International, Inc. | 60,720 | |||||
| 1,200 | NCR Corporation* | 33,072 | |||||
| 3,900 | NetApp, Inc.* | 133,224 | |||||
| 1,100 | QLogic Corp.* | 12,760 | |||||
| 5,600 | SanDisk Corp.* | 308,000 | |||||
| 5,600 | Seagate Technology PLC | 204,736 | |||||
| 5,100 | Silicon Graphics | ||||||
| International Corporation* | 70,125 | ||||||
| 500 | Stratasys Ltd* | 37,110 | |||||
| 3,000 | Western Digital Corp. | 150,840 | |||||
| 1,412,933 | |||||||
The accompanying notes to financial statements are an integral part of this schedule.
- 10 -
Reynolds Blue Chip Growth Fund
SCHEDULE OF INVESTMENTS (Continued)
March 31, 2013 (Unaudited)
| Shares | Value | ||||||
| LONG-TERM INVESTMENTS — 99.1% (a) (Continued) | |||||||
| COMMON STOCKS — 97.5% (a) (Continued) | |||||||
| Construction & Engineering — 0.8% | |||||||
| 8,147 | Chicago Bridge & Iron | ||||||
| Company N. V. NYS | $ | 505,929 | |||||
| 2,600 | EMCOR Group, Inc. | 110,214 | |||||
| 3,900 | Fluor Corp. | 258,687 | |||||
| 3,700 | Foster Wheeler AG* | 84,545 | |||||
| 1,000 | Granite Construction Incorporated | 31,840 | |||||
| 7,200 | Jacobs Engineering Group Inc.* | 404,928 | |||||
| 1,100 | MasTec Inc.* | 32,065 | |||||
| 1,100 | Quanta Services, Inc.* | 31,438 | |||||
| 1,459,646 | |||||||
| Construction Materials — 0.2% | |||||||
| 2,000 | CaesarStone Sdot Yam Ltd.* | 52,800 | |||||
| 1,200 | James Hardie Industries Plc -SP-ADR | 62,556 | |||||
| 400 | Martin Marietta Materials, Inc. | 40,808 | |||||
| 2,100 | Texas Industries, Inc.* | 132,531 | |||||
| 2,000 | Vulcan Materials Company | 103,400 | |||||
| 392,095 | |||||||
| Consumer Finance — 0.6% | |||||||
| 5,800 | American Express Co. | 391,268 | |||||
| 1,000 | Cash America International, Inc. | 52,470 | |||||
| 13,000 | Discover Financial Services | 582,920 | |||||
| 600 | Portfolio Recovery Associates, Inc.* | 76,152 | |||||
| 500 | World Acceptance Corporation* | 42,935 | |||||
| 1,145,745 | |||||||
| Consumer Services — Diversified — 0.2% | |||||||
| 1,400 | Bright Horizons Family Solutions Inc.* | 47,306 | |||||
| 2,200 | Coinstar, Inc.* | 128,524 | |||||
| 6,800 | H&R Block, Inc. | 200,056 | |||||
| 2,500 | Sotheby’s | 93,525 | |||||
| 469,411 | |||||||
| Containers & Packaging — 0.6% | |||||||
| 1,200 | AEP Industries Inc.* | 86,172 | |||||
| 2,300 | Ball Corp. | 109,434 | |||||
| 2,700 | Bemis Company, Inc. | 108,972 | |||||
| 23,000 | Boise, Inc. | 199,180 | |||||
| 5,800 | Crown Holdings, Inc.* | 241,338 | |||||
| 1,200 | Owens-Illinois, Inc.* | 31,980 | |||||
| 3,800 | Packaging Corp of America | 170,506 | |||||
| 700 | Rock-Tenn Company | 64,953 | |||||
| 1,400 | Sealed Air Corporation | 33,754 | |||||
| 1,200 | Sonoco Products Company | 41,988 | |||||
| 1,088,277 | |||||||
| Distributors — 0.1% | |||||||
| 1,300 | Genuine Parts Co. | 101,400 | |||||
| Electric Utilities — 0.1% | |||||||
| 400 | ITC Holdings Corporation | 35,704 | |||||
| 800 | Otter Tail Corporation | 24,912 | |||||
| 2,000 | Pepco Holdings, Inc. | 42,800 | |||||
| 103,416 | |||||||
| Electrical Equipment — 1.2% | |||||||
| 1,000 | AMETEK, Inc. | 43,360 | |||||
| 2,500 | The Babcock & Wilcox Co. | 71,025 | |||||
| 5,200 | Eaton Corp. PLC | 318,500 | |||||
| 5,900 | Emerson Electric Co. | 329,633 | |||||
| 800 | Generac Holdings, Inc. | 28,272 | |||||
| 5,400 | Hubbell Incorporated Cl B | 524,394 | |||||
| 1,200 | Rockwell Automation, Inc. | 103,620 | |||||
| 2,100 | Roper Industries, Inc. | 267,351 | |||||
| 2,710 | Sensata Technologies Holding N.V.* | 89,077 | |||||
| 4,900 | A.O. Smith Corp. | 360,493 | |||||
| 5,700 | Solarcity Corporation* | 107,616 | |||||
| 2,243,341 | |||||||
| Electronic Equipment, | |||||||
| Instruments & Components — 1.0% | |||||||
| 2,500 | Agilent Technologies, Inc. | 104,925 | |||||
| 1,600 | Amphenol Corporation | 119,440 | |||||
| 1,100 | Badger Meter, Inc. | 58,872 | |||||
| 1,100 | Coherent, Inc. | 62,414 | |||||
| 2,000 | Flextronics International Ltd.* | 13,520 | |||||
| 3,800 | InvenSense Inc.* | 40,584 | |||||
| 1,000 | Itron, Inc.* | 46,400 | |||||
| 4,800 | Jabil Circuit, Inc. | 88,704 | |||||
| 1,000 | Littelfuse, Inc. | 67,850 | |||||
| 900 | Measurement Specialties, Inc.* | 35,793 | |||||
| 1,700 | Molex Inc. | 49,776 | |||||
| 9,100 | Nam Tai Electronics, Inc. | 123,760 | |||||
| 4,000 | OSI Systems, Inc.* | 249,160 | |||||
| 1,400 | PC Connection, Inc. | 22,890 | |||||
| 8,900 | Sanmina - SCI Corp.* | 101,104 | |||||
| 5,200 | TE Connectivity Limited | 218,036 | |||||
| 2,900 | Tech Data Corp.* | 132,269 | |||||
| 11,200 | Trimble Navigation Ltd.* | 335,552 | |||||
| 1,871,049 | |||||||
| Energy Equipment & Services — 1.4% | |||||||
| 4,800 | Cameron International Corp.* | 312,960 | |||||
| 4,300 | Dresser-Rand Group, Inc.* | 265,138 | |||||
| 400 | Dril-Quip, Inc.* | 34,868 | |||||
The accompanying notes to financial statements are an integral part of this schedule.
- 11 -
Reynolds Blue Chip Growth Fund
SCHEDULE OF INVESTMENTS (Continued)
March 31, 2013 (Unaudited)
| Shares | Value | ||||||
| LONG-TERM INVESTMENTS — 99.1% (a) (Continued) | |||||||
| COMMON STOCKS — 97.5% (a) (Continued) | |||||||
| Energy Equipment & Services — 1.4% (Continued) | |||||||
| 900 | Ensco PLC | $ | 54,000 | ||||
| 4,000 | FMC Technologies, Inc.* | 217,560 | |||||
| 4,200 | Helmerich & Payne, Inc. | 254,940 | |||||
| 13,200 | Hercules Offshore, Inc.* | 97,944 | |||||
| 3,000 | Lufkin Industries, Inc. | 199,170 | |||||
| 5,300 | National-Oilwell Varco Inc. | 374,975 | |||||
| 5,600 | Newpark Resources, Inc.* | 51,968 | |||||
| 1,000 | Noble Corporation | 38,150 | |||||
| 2,100 | Oceaneering International, Inc. | 139,461 | |||||
| 1,000 | Oil States International, Inc.* | 81,570 | |||||
| 8,000 | Parker Drilling Co.* | 34,240 | |||||
| 6,100 | Patterson-UTI Energy, Inc. | 145,424 | |||||
| 11,200 | RPC, Inc. | 169,904 | |||||
| 600 | Schlumberger Ltd. | 44,934 | |||||
| 3,600 | Tenaris S.A. - ADR | 146,808 | |||||
| 600 | Transocean Ltd. | 31,176 | |||||
| 2,695,190 | |||||||
| Financial Services — Diversified — 1.2% | |||||||
| 40,400 | Bank of America Corp. | 492,072 | |||||
| 1,000 | CBOE Holdings Inc. | 36,940 | |||||
| 8,800 | Citigroup Inc. | 389,312 | |||||
| 2,900 | CME Group Inc. | 178,031 | |||||
| 1,100 | Compass Diversified Holdings | 17,457 | |||||
| 700 | IntercontinentalExchange Inc.* | 114,149 | |||||
| 4,500 | JPMorgan Chase & Co. | 213,570 | |||||
| 4,900 | KKR Financial Holdings LLC | 54,243 | |||||
| 10,445 | Leucadia National Corporation | 286,506 | |||||
| 1,900 | McGraw Hill Financial Inc. (f/k/a | ||||||
| The McGraw-Hill Companies, Inc.) | 98,952 | ||||||
| 2,600 | Moody’s Corporation | 138,632 | |||||
| 800 | The NASDAQ OMX Group, Inc. | 25,840 | |||||
| 11,700 | NewStar Financial, Inc.* | 154,791 | |||||
| 3,100 | NYSE Euronext | 119,784 | |||||
| 2,320,279 | |||||||
| Food & Staples Retailing — 0.9% | |||||||
| 3,200 | Costco Wholesale Corp. | 339,552 | |||||
| 3,900 | CVS Caremark Corporation | 214,461 | |||||
| 5,300 | The Kroger Co. | 175,642 | |||||
| 3,900 | PriceSmart, Inc. | 303,537 | |||||
| 5,500 | Safeway Inc. | 144,925 | |||||
| 6,600 | SUPERVALU Inc. | 33,264 | |||||
| 1,800 | Sysco Corporation | 63,306 | |||||
| 1,800 | United Natural Foods, Inc.* | 88,560 | |||||
| 1,600 | Walgreen Company | 76,288 | |||||
| 800 | Wal-Mart Stores, Inc. | 59,864 | |||||
| 2,500 | Whole Foods Market, Inc. | 216,875 | |||||
| 1,716,274 | |||||||
| Food Products — 2.6% | |||||||
| 600 | Annie’s, Inc.* | 22,956 | |||||
| 5,400 | B & G Foods Inc. | 164,646 | |||||
| 3,100 | Bunge Limited | 228,873 | |||||
| 6,100 | Campbell Soup Company | 276,696 | |||||
| 5,300 | ConAgra Foods, Inc. | 189,793 | |||||
| 1,400 | Dean Foods Company* | 25,382 | |||||
| 1,200 | Dole Food Company, Inc.* | 13,080 | |||||
| 5,300 | General Mills, Inc. | 261,343 | |||||
| 4,400 | Green Mountain Coffee Roasters, Inc.* | 249,744 | |||||
| 2,100 | The Hain Celestial Group, Inc.* | 128,268 | |||||
| 4,300 | The Hershey Company | 376,379 | |||||
| 4,400 | Hormel Foods Corporation | 181,808 | |||||
| 8,600 | Inventure Foods, Inc.* | 66,908 | |||||
| 2,900 | J & J Snack Foods Corp. | 222,981 | |||||
| 8,600 | Kellogg Company | 554,098 | |||||
| 1,600 | Kraft Foods Group, Inc. | 82,448 | |||||
| 6,500 | McCormick & Company, Inc. | 478,075 | |||||
| 1,100 | Mead Johnson Nutrition Company | 85,195 | |||||
| 1,200 | Mondelez International Inc. | 36,732 | |||||
| 2,400 | Post Holdings Inc.* | 103,032 | |||||
| 600 | Sanderson Farms, Inc. | 32,772 | |||||
| 1,200 | Smithfield Foods, Inc.* | 31,776 | |||||
| 4,600 | The J.M. Smucker Co. | 456,136 | |||||
| 6,400 | SunOpta Inc.* | 46,080 | |||||
| 10,600 | Tyson Foods, Inc. | 263,092 | |||||
| 5,900 | Unilever N.V. NYS | 241,900 | |||||
| 3,300 | Unilever PLC - SP-ADR | 139,392 | |||||
| 4,959,585 | |||||||
| Gas Utilities — 0.1% | |||||||
| 4,200 | Questar Corporation | 102,186 | |||||
| Health Care Equipment & Supplies — 2.4% | |||||||
| 5,900 | Abbott Laboratories | 208,388 | |||||
| 2,300 | Align Technology, Inc.* | 77,073 | |||||
| 1,000 | ArthroCare Corporation* | 34,760 | |||||
| 5,000 | Baxter International Inc. | 363,200 | |||||
| 3,300 | Becton, Dickinson and Company | 315,513 | |||||
| 14,400 | Boston Scientific Corporation* | 112,464 | |||||
| 3,200 | CareFusion Corporation* | 111,968 | |||||
| 3,500 | Covidien PLC | 237,440 | |||||
| 2,000 | DENTSPLY International Inc. | 84,840 | |||||
| 1,700 | Edwards Lifesciences Corp.* | 139,672 | |||||
The accompanying notes to financial statements are an integral part of this schedule.
- 12 -
Reynolds Blue Chip Growth Fund
SCHEDULE OF INVESTMENTS (Continued)
March 31, 2013 (Unaudited)
| Shares | Value | ||||||
| LONG-TERM INVESTMENTS — 99.1% (a) (Continued) | |||||||
| COMMON STOCKS — 97.5% (a) (Continued) | |||||||
| Health Care Equipment & Supplies — 2.4% (Continued) | |||||||
| 3,200 | Endologix, Inc.* | $ | 51,680 | ||||
| 3,400 | Hologic, Inc.* | 76,840 | |||||
| 1,100 | ICU Medical, Inc.* | 64,845 | |||||
| 600 | Intuitive Surgical, Inc.* | 294,714 | |||||
| 600 | Medidata Solutions, Inc.* | 34,788 | |||||
| 4,200 | Medtronic, Inc. | 197,232 | |||||
| 2,000 | Quidel Corporation* | 47,500 | |||||
| 2,400 | ResMed Inc. | 111,264 | |||||
| 2,900 | Sirona Dental Systems, Inc.* | 213,817 | |||||
| 27,000 | The Spectranetics Corporation* | 500,310 | |||||
| 4,500 | St. Jude Medical, Inc. | 181,980 | |||||
| 7,300 | Stryker Corp. | 476,252 | |||||
| 2,000 | Symmetry Medical Inc.* | 22,900 | |||||
| 6,400 | Varian Medical Systems, Inc.* | 460,800 | |||||
| 1,700 | Zimmer Holdings, Inc. | 127,874 | |||||
| 4,548,114 | |||||||
| Health Care Providers & Services — 2.5% | |||||||
| 5,500 | Air Methods Corporation* | 265,320 | |||||
| 4,200 | AmerisourceBergen Corporation | 216,090 | |||||
| 16,600 | AMN Healthcare Services, Inc.* | 262,778 | |||||
| 6,100 | BioScrip, Inc.* | 77,531 | |||||
| 2,000 | Capital Senior Living Corporation* | 52,860 | |||||
| 1,800 | Catamaran Corporation* | 95,454 | |||||
| 1,500 | CIGNA Corp. | 93,555 | |||||
| 9,000 | Community Health Systems Inc. | 426,510 | |||||
| 1,200 | DaVita, Inc.* | 142,308 | |||||
| 3,100 | HCA Holdings, Inc. | 125,953 | |||||
| 27,000 | Health Management Associates, Inc.* | 347,490 | |||||
| 1,700 | Health Net Inc.* | 48,654 | |||||
| 2,100 | HEALTHSOUTH Corp.* | 55,377 | |||||
| 1,000 | Humana Inc. | 69,110 | |||||
| 700 | Laboratory Corporation of America Holdings* | 63,140 | |||||
| 600 | Magellan Health Services, Inc.* | 28,542 | |||||
| 3,500 | McKesson Corp. | 377,860 | |||||
| 5,700 | Molina Healthcare Inc.* | 175,959 | |||||
| 500 | MWI Veterinary Supply, Inc.* | 66,130 | |||||
| 5,500 | Patterson Companies Inc. | 209,220 | |||||
| 1,000 | Quest Diagnostics Inc. | 56,450 | |||||
| 5,000 | Henry Schein, Inc.* | 462,750 | |||||
| 15,500 | Tenet Healthcare Corp.* | 737,490 | |||||
| 2,900 | Universal Health Services, Inc. Cl B | 185,223 | |||||
| 600 | WellPoint, Inc. | 39,738 | |||||
| 4,681,492 | |||||||
| Health Care Technology — 0.4% | |||||||
| 2,100 | athenahealth Inc.* | 203,784 | |||||
| 3,500 | Cerner Corp.* | 331,625 | |||||
| 500 | HealthStream, Inc.* | 11,470 | |||||
| 3,300 | MedAssets, Inc.* | 63,525 | |||||
| 6,100 | Omnicell, Inc.* | 115,168 | |||||
| 725,572 | |||||||
| Home Building — 1.6% | |||||||
| 11,600 | D.R. Horton, Inc. | 281,880 | |||||
| 28,900 | Hovnanian Enterprises, Inc. | 166,753 | |||||
| 17,400 | KB Home | 378,798 | |||||
| 16,800 | Lennar Corp. | 696,864 | |||||
| 900 | Meritage Homes Corporation* | 42,174 | |||||
| 29,000 | Pulte Group Inc.* | 586,960 | |||||
| 9,000 | The Ryland Group, Inc. | 374,580 | |||||
| 13,700 | Standard Pacific Corp.* | 118,368 | |||||
| 10,800 | Toll Brothers, Inc.* | 369,792 | |||||
| 3,016,169 | |||||||
| Hotels, Restaurants & Leisure — 5.1% | |||||||
| 3,300 | AFC Enterprises, Inc.* | 119,889 | |||||
| 2,200 | Boyd Gaming Corp.* | 18,194 | |||||
| 7,500 | Brinker International, Inc. | 282,375 | |||||
| 1,700 | Buffalo Wild Wings Inc.* | 148,801 | |||||
| 3,100 | Burger King Worldwide Inc. | 59,210 | |||||
| 1,400 | Carnival Corp. | 48,020 | |||||
| 3,400 | The Cheesecake Factory Inc. | 131,274 | |||||
| 1,000 | Chipotle Mexican Grill, Inc.* | 325,870 | |||||
| 3,800 | Cracker Barrel Old Country Store, Inc. | 307,230 | |||||
| 4,300 | Darden Restaurants, Inc. | 222,224 | |||||
| 7,400 | Denny’s Corp.* | 42,698 | |||||
| 4,200 | DineEquity, Inc. | 288,918 | |||||
| 9,700 | Domino’s Pizza, Inc. | 498,968 | |||||
| 5,400 | Dunkin’ Brands Group Inc. | 199,152 | |||||
| 3,300 | Home Inns & Hotels | ||||||
| Management, Inc. - ADR* | 98,307 | ||||||
| 800 | Hyatt Hotels Corp.* | 34,584 | |||||
| 7,800 | InterContinental Hotels Group PLC - ADR | 237,276 | |||||
| 1,200 | International Game Technology | 19,800 | |||||
| 2,900 | Jack in the Box Inc.* | 100,311 | |||||
| 73,900 | Jamba, Inc.* | 210,615 | |||||
| 23,000 | Krispy Kreme Doughnuts, Inc.* | 332,120 | |||||
| 6,300 | Las Vegas Sands Corp. | 355,005 | |||||
| 1,500 | LIFE TIME FITNESS, Inc.* | 64,170 | |||||
| 6,900 | Luby’s, Inc.* | 51,612 | |||||
| 5,500 | Marriott International Inc. | 232,265 | |||||
The accompanying notes to financial statements are an integral part of this schedule.
- 13 -
Reynolds Blue Chip Growth Fund
SCHEDULE OF INVESTMENTS (Continued)
March 31, 2013 (Unaudited)
| Shares | Value | ||||||
| LONG-TERM INVESTMENTS — 99.1% (a) (Continued) | |||||||
| COMMON STOCKS — 97.5% (a) (Continued) | |||||||
| Hotels, Restaurants & Leisure — 5.1% (Continued) | |||||||
| 6,700 | Marriott Vacations | ||||||
| Worldwide Corporation* | $ | 287,497 | |||||
| 1,300 | McDonald’s Corp. | 129,597 | |||||
| 28,800 | Melco Crown | ||||||
| Entertainment Ltd. - ADR* | 672,192 | ||||||
| 14,500 | MGM Resorts International* | 190,675 | |||||
| 2,100 | Panera Bread Co.* | 347,004 | |||||
| 8,200 | Papa John’s International, Inc.* | 506,924 | |||||
| 4,400 | Royal Caribbean Cruises Ltd. | 146,168 | |||||
| 12,800 | Ruth’s Hospitality Group Inc.* | 122,112 | |||||
| 4,600 | SHFL entertainment, Inc.* | 76,222 | |||||
| 1,500 | Sonic Corp.* | 19,320 | |||||
| 19,400 | Starbucks Corp. | 1,105,024 | |||||
| 5,000 | Starwood Hotels & Resorts | ||||||
| Worldwide, Inc. | 318,650 | ||||||
| 1,100 | Tim Hortons, Inc. | 59,752 | |||||
| 6,200 | The Wendy’s Company | 35,154 | |||||
| 7,300 | Wyndham Worldwide Corp. | 470,704 | |||||
| 3,700 | Wynn Resorts Ltd. | 463,092 | |||||
| 1,600 | Yum! Brands, Inc. | 115,104 | |||||
| 9,494,079 | |||||||
| Household Durables — 2.1% | |||||||
| 2,000 | Ethan Allen Interiors Inc. | 65,840 | |||||
| 1,400 | Harman International Industries, Inc. | 62,482 | |||||
| 3,000 | iRobot Corporation* | 76,980 | |||||
| 11,100 | Jarden Corporation* | 475,635 | |||||
| 12,400 | La-Z-Boy Inc. | 233,988 | |||||
| 8,200 | Leggett & Platt, Incorporated | 276,996 | |||||
| 3,800 | M.D.C. Holdings, Inc. | 139,270 | |||||
| 2,500 | Mohawk Industries, Inc.* | 282,800 | |||||
| 13,400 | Newell Rubbermaid Inc. | 349,740 | |||||
| 4,300 | SodaStream International Ltd.* | 213,452 | |||||
| 5,900 | SONY CORPORATION - SP-ADR | 102,660 | |||||
| 4,330 | Stanley Black & Decker Inc. | 350,600 | |||||
| 9,800 | Tempur-Pedic International Inc.* | 486,374 | |||||
| 8,300 | Tupperware Brands Corp. | 678,442 | |||||
| 1,200 | Whirlpool Corporation | 142,152 | |||||
| 3,937,411 | |||||||
| Household Products — 0.6% | |||||||
| 2,800 | Church & Dwight Co., Inc. | 180,964 | |||||
| 4,500 | The Clorox Company | 398,385 | |||||
| 1,000 | Colgate-Palmolive Co. | 118,030 | |||||
| 2,500 | Energizer Holdings, Inc. | 249,325 | |||||
| 1,000 | The Procter & Gamble Company | 77,060 | |||||
| 600 | Spectrum Brands Holdings, Inc. | 33,954 | |||||
| 1,200 | WD-40 Co. | 65,724 | |||||
| 1,123,442 | |||||||
| Independent Power Producers & | |||||||
| Energy Traders — 0.0% | |||||||
| 900 | Dynegy Inc.* | 21,591 | |||||
| 2,300 | NRG Energy, Inc. | 60,927 | |||||
| 82,518 | |||||||
| Industrial Conglomerates — 0.7% | |||||||
| 2,400 | 3M Co. | 255,144 | |||||
| 900 | Carlisle Companies Incorporated | 61,011 | |||||
| 6,200 | General Electric Company | 143,344 | |||||
| 7,300 | Koninklijke Philips | ||||||
| Electronics N.V. NYS | 215,715 | ||||||
| 3,600 | McDermott International, Inc.* | 39,564 | |||||
| 2,600 | Siemens AG - SP-ADR | 280,280 | |||||
| 10,100 | Textron Inc. | 301,081 | |||||
| 1,700 | Tyco International Ltd. | 54,400 | |||||
| 1,350,539 | |||||||
| Insurance — 3.3% | |||||||
| 3,100 | ACE Limited | 275,807 | |||||
| 1,000 | Aflac, Inc. | 52,020 | |||||
| 700 | Allied World Assurance Company | ||||||
| Holdings AG | 64,904 | ||||||
| 6,000 | The Allstate Corporation | 294,420 | |||||
| 25,000 | Ambac Financial Group, Inc.* | 1,065 | |||||
| 4,800 | American Financial Group, Inc. | 227,424 | |||||
| 10,600 | American International Group, Inc.* | 411,492 | |||||
| 800 | AmTrust Financial Services, Inc. | 27,720 | |||||
| 4,400 | Arch Capital Group Ltd.* | 231,308 | |||||
| 2,400 | Aspen Insurance Holdings Ltd. | 92,592 | |||||
| 5,400 | Berkshire Hathaway Inc. Cl B* | 562,680 | |||||
| 1,000 | Brown & Brown, Inc. | 32,040 | |||||
| 800 | The Chubb Corporation | 70,024 | |||||
| 2,600 | CNO Financial Group, Inc. | 29,770 | |||||
| 10,400 | eHealth, Inc.* | 185,952 | |||||
| 900 | Everest Re Group, Ltd. | 116,874 | |||||
| 2,900 | Fidelity National Financial, Inc. | 73,167 | |||||
| 10,600 | First American Financial Corporation | 271,042 | |||||
| 700 | Arthur J Gallagher & Co. | 28,917 | |||||
| 14,200 | Genworth Financial Inc.* | 142,000 | |||||
| 800 | Hanover Insurance Group Inc. | 39,744 | |||||
| 6,900 | The Hartford Financial | ||||||
| ��Services Group, Inc. | 178,020 | ||||||
The accompanying notes to financial statements are an integral part of this schedule.
- 14 -
Reynolds Blue Chip Growth Fund
SCHEDULE OF INVESTMENTS (Continued)
March 31, 2013 (Unaudited)
| Shares | Value | ||||||
| LONG-TERM INVESTMENTS — 99.1% (a) (Continued) | |||||||
| COMMON STOCKS — 97.5% (a) (Continued) | |||||||
| Insurance — 3.3% (Continued) | |||||||
| 2,900 | Homeowners Choice, Inc. | $ | 79,025 | ||||
| 2,900 | Lincoln National Corporation | 94,569 | |||||
| 800 | Loews Corporation | 35,256 | |||||
| 100 | Markel Corporation* | 50,350 | |||||
| 7,200 | Marsh & McLennan Companies, Inc. | 273,384 | |||||
| 15,100 | MBIA Inc.* | 155,077 | |||||
| 5,200 | MetLife, Inc. | 197,704 | |||||
| 2,400 | Platinum Underwriters Holdings, Ltd. | 133,944 | |||||
| 3,200 | The Progressive Corporation | 80,864 | |||||
| 1,800 | Protective Life Corporation | 64,440 | |||||
| 6,300 | Prudential Financial, Inc. | 371,637 | |||||
| 5,000 | Stewart Information | ||||||
| Services Corporation | 127,350 | ||||||
| 6,100 | Torchmark Corp. | 364,780 | |||||
| 7,800 | The Travelers Companies, Inc. | 656,682 | |||||
| 1,200 | Unum Group | 33,900 | |||||
| 4,100 | XL Group PLC | 124,230 | |||||
| 6,252,174 | |||||||
| Internet & Catalog Retail — 2.2% | |||||||
| 2,300 | 1-800-FLOWERS.COM, Inc.* | 11,431 | |||||
| 3,900 | Amazon.com, Inc.* | 1,039,311 | |||||
| 13,000 | Ctrip.com International, Ltd. - ADR* | 277,940 | |||||
| 11,600 | Expedia, Inc. | 696,116 | |||||
| 25,200 | Groupon, Inc.* | 154,224 | |||||
| 1,700 | HomeAway Inc.* | 55,250 | |||||
| 3,700 | HSN, Inc. | 202,982 | |||||
| 900 | Liberty Interactive Corporation* | 68,022 | |||||
| 4,900 | Liberty Interactive Corporation Cl A* | 104,762 | |||||
| 2,700 | Netflix Inc.* | 511,407 | |||||
| 1,500 | Orbitz Worldwide, Inc.* | 8,565 | |||||
| 7,700 | Overstock.com, Inc.* | 94,864 | |||||
| 600 | Priceline.com Inc.* | 412,758 | |||||
| 9,200 | TripAdvisor Inc.* | 483,184 | |||||
| 4,120,816 | |||||||
| Internet Software & Services — 3.2% | |||||||
| 5,300 | Akamai Technologies, Inc.* | 187,037 | |||||
| 200 | Baidu, Inc. - SP-ADR* | 17,540 | |||||
| 8,400 | BroadVision, Inc.* | 74,004 | |||||
| 400 | CoStar Group Inc.* | 43,784 | |||||
| 3,600 | eBay Inc.* | 195,192 | |||||
| 1,800 | Equinix, Inc.* | 389,358 | |||||
| 3,000 | FleetCor Technologies Inc.* | 230,010 | |||||
| 1,600 | Google Inc.* | 1,270,448 | |||||
| 1,100 | IAC/InterActiveCorp | 49,148 | |||||
| 11,600 | Internet Initiative | ||||||
| Japan Inc. - SP-ADR | 195,924 | ||||||
| 1,800 | j2 Global, Inc. | 70,578 | |||||
| 800 | LinkedIn Corporation* | 140,848 | |||||
| 4,500 | Liquidity Services Inc.* | 134,145 | |||||
| 600 | MercadoLibre Inc. | 57,936 | |||||
| 500 | Monster Worldwide, Inc.* | 2,535 | |||||
| 5,900 | Move, Inc.* | 70,505 | |||||
| 2,300 | NetEase.com Inc. - ADR | 125,971 | |||||
| 7,300 | NIC Inc. | 139,868 | |||||
| 9,400 | OpenTable, Inc.* | 592,012 | |||||
| 1,700 | Qihoo 360 Technology Co. Ltd. - ADR* | 50,371 | |||||
| 6,300 | Rackspace Hosting, Inc.* | 318,024 | |||||
| 1,800 | Rediff.com India Limited - ADR* | 5,004 | |||||
| 500 | SINA Corporation* | 24,295 | |||||
| 2,400 | Sohu.com Inc.* | 119,064 | |||||
| 12,100 | Support.com Inc.* | 50,578 | |||||
| 7,600 | Synacor Inc.* | 22,724 | |||||
| 3,000 | Travelzoo Inc.* | 64,110 | |||||
| 600 | Trulia, Inc.* | 18,828 | |||||
| 8,600 | ValueClick, Inc.* | 254,130 | |||||
| 4,300 | VeriSign, Inc.* | 203,304 | |||||
| 2,000 | VistaPrint N.V.* | 77,320 | |||||
| 14,700 | Yahoo! Inc.* | 345,891 | |||||
| 1,500 | Youku Tudou Inc.* | 25,155 | |||||
| 7,200 | Zillow, Inc.* | 393,624 | |||||
| 5,959,265 | |||||||
| IT Services — 3.4% | |||||||
| 4,500 | Accenture PLC | 341,865 | |||||
| 1,400 | Automatic Data Processing, Inc. | 91,028 | |||||
| 9,500 | Cognizant Technology Solutions Corp.* | 727,795 | |||||
| 5,800 | Computer Sciences Corporation | 285,534 | |||||
| 700 | CSG Systems International, Inc.* | 14,833 | |||||
| 4,800 | DST Systems, Inc. | 342,096 | |||||
| 2,700 | Exlservice Holdings Inc.* | 88,776 | |||||
| 8,500 | Fidelity National Information | ||||||
| Services, Inc. | 336,770 | ||||||
| 6,700 | Fiserv, Inc.* | 588,461 | |||||
| 4,300 | Gartner, Inc.* | 233,963 | |||||
| 4,800 | InterXion Holding N.V.* | 116,256 | |||||
| 2,200 | Iron Mountain Incorporated | 79,882 | |||||
| 1,100 | Mastercard, Inc. | 595,243 | |||||
| 4,100 | MAXIMUS, Inc. | 327,877 | |||||
| 2,500 | NeuStar, Inc.* | 116,325 | |||||
The accompanying notes to financial statements are an integral part of this schedule.
- 15 -
Reynolds Blue Chip Growth Fund
SCHEDULE OF INVESTMENTS (Continued)
March 31, 2013 (Unaudited)
| Shares | Value | ||||||
| LONG-TERM INVESTMENTS — 99.1% (a) (Continued) | |||||||
| COMMON STOCKS — 97.5% (a) (Continued) | |||||||
| IT Services — 3.4% (Continued) | |||||||
| 3,900 | Paychex, Inc. | $ | 136,773 | ||||
| 6,300 | Sapient Corp.* | 76,797 | |||||
| 700 | TeleTech Holdings, Inc.* | 14,847 | |||||
| 4,800 | Total System Services, Inc. | 118,944 | |||||
| 1,200 | Unisys Corporation* | 27,300 | |||||
| 9,400 | VeriFone Systems, Inc.* | 194,392 | |||||
| 9,300 | Visa Inc. | 1,579,512 | |||||
| 6,435,269 | |||||||
| Leisure Equipment & Products — 0.2% | |||||||
| 40,900 | Eastman Kodak Co.* | 12,270 | |||||
| 2,500 | Mattel, Inc. | 109,475 | |||||
| 2,000 | Nautilus, Inc.* | 14,600 | |||||
| 11,900 | Smith & Wesson Holding Corporation* | 107,100 | |||||
| 1,400 | Sturm, Ruger & Company, Inc. | 71,022 | |||||
| 314,467 | |||||||
| Life Sciences Tools & Services — 1.0% | |||||||
| 5,000 | Affymetrix, Inc.* | 23,600 | |||||
| 4,600 | Bruker Corp.* | 87,860 | |||||
| 4,700 | Cambrex Corp.* | 60,113 | |||||
| 500 | Furiex Pharmaceuticals Inc.* | 18,740 | |||||
| 1,500 | Illumina, Inc.* | 81,000 | |||||
| 2,300 | Life Technologies Corporation* | 148,649 | |||||
| 1,400 | Luminex Corporation* | 23,128 | |||||
| 1,200 | Mettler-Toledo International Inc.* | 255,864 | |||||
| 13,100 | Parexel International Corp.* | 517,581 | |||||
| 3,900 | PerkinElmer, Inc. | 131,196 | |||||
| 1,000 | QIAGEN N.V.* | 21,080 | |||||
| 3,500 | Thermo Fisher Scientific, Inc. | 267,715 | |||||
| 1,600 | Waters Corp.* | 150,256 | |||||
| 1,786,782 | |||||||
| Machinery — 3.0% | |||||||
| 6,150 | 3D Systems Corporation* | 198,276 | |||||
| 7,500 | Alamo Group Inc. | 286,875 | |||||
| 1,200 | Barnes Group Inc. | 34,716 | |||||
| 1,400 | Briggs & Stratton Corporation | 34,720 | |||||
| 1,300 | CNH Global N.V. | 53,716 | |||||
| 7,100 | Crane Co. | 396,606 | |||||
| 2,100 | Danaher Corporation | 130,515 | |||||
| 3,700 | Donaldson Company, Inc. | 133,903 | |||||
| 2,700 | Dover Corporation | 196,776 | |||||
| 500 | EnPro Industries, Inc.* | 25,585 | |||||
| 1,200 | FreightCar America Inc. | 26,184 | |||||
| 3,100 | Hardinge, Inc. | 42,253 | |||||
| 6,200 | IDEX Corporation | 331,204 | |||||
| 4,100 | Illinois Tool Works Inc. | 249,854 | |||||
| 3,900 | Ingersoll-Rand PLC | 214,539 | |||||
| 1,800 | ITT Corp. | 51,174 | |||||
| 2,900 | Joy Global Inc. | 172,608 | |||||
| 1,800 | KUBOTA CORPORATION - SP-ADR | 129,906 | |||||
| 500 | Lincoln Electric Holdings, Inc. | 27,090 | |||||
| 3,000 | Manitex International Inc.* | 37,230 | |||||
| 4,300 | The Manitowoc Company, Inc. | 88,408 | |||||
| 7,200 | Mueller Water Products, Inc. | 42,696 | |||||
| 900 | Nordson Corporation | 59,355 | |||||
| 4,000 | PACCAR Inc. | 202,240 | |||||
| 4,700 | Pall Corp. | 321,339 | |||||
| 6,500 | Parker Hannifin Corp. | 595,270 | |||||
| 7,200 | Snap-On, Inc. | 595,440 | |||||
| 1,600 | Tennant Company | 77,696 | |||||
| 12,100 | Terex Corp.* | 416,482 | |||||
| 3,900 | Titan International, Inc. | 82,212 | |||||
| 2,000 | The Toro Co. | 92,080 | |||||
| 1,000 | Trinity Industries, Inc. | 45,330 | |||||
| 1,100 | Valmont Industries, Inc. | 172,997 | |||||
| 1,500 | Wabtec Corporation | 153,165 | |||||
| 5,718,440 | |||||||
| Marine — 0.0% | |||||||
| 200 | Diana Shipping Inc.* | 2,132 | |||||
| Media — 4.0% | |||||||
| 11,400 | Belo Corp. | 112,062 | |||||
| 8,300 | CBS Corp. Cl B Non-Voting | 387,527 | |||||
| 8,800 | Comcast Corp. | 369,688 | |||||
| 5,400 | DIRECTV* | 305,694 | |||||
| 8,700 | Discovery Communications, Inc.* | 685,038 | |||||
| 2,000 | DISH Network Corp. | 75,800 | |||||
| 12,100 | The Walt Disney Co. | 687,280 | |||||
| 4,100 | Entravision Communications | ||||||
| Corporation | 13,079 | ||||||
| 3,600 | Gannett Co., Inc. | 78,732 | |||||
| 3,000 | Grupo Televisa S.A.B. - SP-ADR | 79,830 | |||||
| 2,200 | Hong Kong Television | ||||||
| Network Limited - ADR | 14,102 | ||||||
| 6,300 | IMAX Corp.* | 168,399 | |||||
| 10,700 | The Interpublic Group | ||||||
| of Companies, Inc. | 139,421 | ||||||
| 1,300 | Lamar Advertising Company* | 63,193 | |||||
| 800 | Liberty Global, Inc.* | 58,720 | |||||
| 800 | Liberty Media Corporation* | 89,304 | |||||
The accompanying notes to financial statements are an integral part of this schedule.
- 16 -
Reynolds Blue Chip Growth Fund
SCHEDULE OF INVESTMENTS (Continued)
March 31, 2013 (Unaudited)
| Shares | Value | ||||||
| LONG-TERM INVESTMENTS — 99.1% (a) (Continued) | |||||||
| COMMON STOCKS — 97.5% (a) (Continued) | |||||||
| Media — 4.0% (Continued) | |||||||
| 7,700 | LIN TV Corporation* | $ | 84,623 | ||||
| 6,800 | Lions Gate Entertainment Corp.* | 161,636 | |||||
| 5,700 | Live Nation Entertainment, Inc.* | 70,509 | |||||
| 3,100 | Morningstar, Inc. | 216,752 | |||||
| 3,200 | The New York Times Company* | 31,360 | |||||
| 17,900 | News Corp. Cl B | 550,604 | |||||
| 1,500 | Nexstar Broadcasting Group, Inc. | 27,000 | |||||
| 4,300 | Omnicom Group Inc. | 253,270 | |||||
| 700 | Pandora Media Inc.* | 9,912 | |||||
| 3,600 | Scripps Networks Interactive | 231,624 | |||||
| 1,500 | Sinclair Broadcast Group, Inc. | 30,360 | |||||
| 187,800 | Sirius XM Radio Inc. | 578,424 | |||||
| 13,500 | Starz - Liberty Capital* | 299,025 | |||||
| 4,100 | Time Warner Cable Inc. | 393,846 | |||||
| 14,400 | Time Warner Inc. | 829,728 | |||||
| 2,000 | Valassis Communications, Inc. | 59,740 | |||||
| 4,400 | Viacom Inc. Cl B | 270,908 | |||||
| 7,427,190 | |||||||
| Metals & Mining — 0.8% | |||||||
| 900 | Allegheny Technologies, Inc. | 28,539 | |||||
| 900 | Cliffs Natural Resources Inc. | 17,109 | |||||
| 1,400 | Freeport-McMoRan | ||||||
| Copper & Gold Inc. | 46,340 | ||||||
| 9,800 | Golden Star Resources Ltd.* | 15,680 | |||||
| 7,000 | Hecla Mining Co. | 27,650 | |||||
| 16,300 | Kinross Gold Corp. | 129,259 | |||||
| 5,400 | Molycorp, Inc.* | 28,080 | |||||
| 26,200 | New Gold Inc.* | 238,420 | |||||
| 29,400 | NovaGold Resources Inc.* | 106,722 | |||||
| 800 | Nucor Corporation | 36,920 | |||||
| 6,900 | Paramount Gold and | ||||||
| Silver Corporation* | 15,387 | ||||||
| 1,175 | Pilot Gold Inc.*^ | 1,943 | |||||
| 7,400 | Rare Element Resources Ltd.*^ | 16,946 | |||||
| 1,100 | Reliance Steel & Aluminum Co. | 78,287 | |||||
| 1,000 | Royal Gold, Inc. | 71,030 | |||||
| 5,200 | RTI International Metals, Inc.* | 164,788 | |||||
| 2,500 | Steel Dynamics, Inc. | 39,675 | |||||
| 11,900 | Stillwater Mining Company* | 153,867 | |||||
| 1,600 | SunCoke Energy, Inc.* | 26,128 | |||||
| 14,200 | Taseko Mines Ltd.* | 39,334 | |||||
| 2,400 | Teck Resources Ltd. Cl B | 67,584 | |||||
| 2,400 | US Silica Holdings Inc. | 56,592 | |||||
| 3,000 | Worthington Industries, Inc. | 92,940 | |||||
| 1,499,220 | |||||||
| Multiline Retail — 0.7% | |||||||
| 1,700 | Big Lots, Inc.* | 59,959 | |||||
| 3,400 | Dollar General Corp.* | 171,972 | |||||
| 3,300 | Dollar Tree, Inc.* | 159,819 | |||||
| 3,500 | Family Dollar Stores, Inc. | 206,675 | |||||
| 800 | Kohl’s Corp. | 36,904 | |||||
| 3,800 | Macy’s, Inc. | 158,992 | |||||
| 1,700 | Nordstrom, Inc. | 93,891 | |||||
| 7,100 | Saks, Inc.* | 81,437 | |||||
| 1,156 | Sears Canada Inc. | 11,118 | |||||
| 3,300 | Target Corp. | 225,885 | |||||
| 6,500 | Tuesday Morning Corporation* | 50,440 | |||||
| 1,257,092 | |||||||
| Multi-Utilities — 0.2% | |||||||
| 1,800 | Dominion Resources, Inc. | 104,724 | |||||
| 3,400 | NiSource Inc. | 99,756 | |||||
| 1,500 | Sempra Energy | 119,910 | |||||
| 2,000 | Vectren Corporation | 70,840 | |||||
| 395,230 | |||||||
| Office Electronics — 0.1% | |||||||
| 2,000 | Xerox Corporation | 17,200 | |||||
| 3,400 | Zebra Technologies Corporation* | 160,242 | |||||
| 177,442 | |||||||
| Oil, Gas & Consumable Fuels — 3.4% | |||||||
| 3,900 | Alpha Natural Resources, Inc.* | 32,019 | |||||
| 1,200 | Anadarko Petroleum Corp. | 104,940 | |||||
| 5,400 | Cabot Oil & Gas Corporation | 365,094 | |||||
| 2,800 | Calumet Specialty | ||||||
| Products Partners, L.P. | 104,300 | ||||||
| 2,200 | Canadian Natural Resources Ltd. | 70,686 | |||||
| 6,500 | Carrizo Oil & Gas, Inc.* | 167,505 | |||||
| 20,400 | Cheniere Energy, Inc.* | 571,200 | |||||
| 600 | Chevron Corporation | 71,292 | |||||
| 6,600 | Clean Energy Fuels Corporation* | 85,800 | |||||
| 200 | CNOOC Limited - ADR | 38,300 | |||||
| 500 | ConocoPhillips | 30,050 | |||||
| 1,200 | Continental Resources, Inc.* | 104,316 | |||||
| 900 | Crosstex Energy, Inc. | 17,334 | |||||
| 900 | Denbury Resources Inc.* | 16,785 | |||||
| 3,600 | Enbridge Inc. | 167,544 | |||||
| 1,200 | Enterprise Products Partners L.P. | 72,348 | |||||
| 2,100 | Genesis Energy, L.P. | 101,262 | |||||
The accompanying notes to financial statements are an integral part of this schedule.
- 17 -
Reynolds Blue Chip Growth Fund
SCHEDULE OF INVESTMENTS (Continued)
March 31, 2013 (Unaudited)
| Shares | Value | ||||||
| LONG-TERM INVESTMENTS — 99.1% (a) (Continued) | |||||||
| COMMON STOCKS — 97.5% (a) (Continued) | |||||||
| Oil, Gas & Consumable Fuels — 3.4% (Continued) | |||||||
| 900 | Gulfport Energy Corporation* | $ | 41,247 | ||||
| 2,900 | Hess Corp. | 207,669 | |||||
| 5,300 | HollyFrontier Corporation | 272,685 | |||||
| 28,500 | Ivanhoe Energy, Inc.* | 18,525 | |||||
| 13,800 | James River Coal Company* | 24,150 | |||||
| 24,700 | Kodiak Oil & Gas Corp.* | 224,523 | |||||
| 2,700 | Marathon Oil Corp. | 91,044 | |||||
| 8,950 | Marathon Petroleum Corporation | 801,920 | |||||
| 1,700 | Oasis Petroleum Inc.* | 64,719 | |||||
| 1,600 | Occidental Petroleum Corp. | 125,392 | |||||
| 600 | PetroChina Company Ltd. | 79,092 | |||||
| 1,500 | Petroleo Brasileiro S.A. - ADR | 24,855 | |||||
| 3,000 | Phillips 66 | 209,910 | |||||
| 2,000 | Pioneer Natural Resources Co. | 248,500 | |||||
| 1,700 | Range Resources Corp. | 137,768 | |||||
| 11,400 | Rentech, Inc. | 26,790 | |||||
| 800 | Southwestern Energy Company* | 29,808 | |||||
| 5,400 | StealthGas, Inc.* | 64,746 | |||||
| 2,200 | Summit Midstream Partners L.P. | 60,786 | |||||
| 5,300 | Suncor Energy, Inc. | 159,053 | |||||
| 3,900 | Tesoro Corp. | 228,345 | |||||
| 16,400 | TransGlobe Energy Corp.* | 140,548 | |||||
| 4,600 | Valero Energy Corp. | 209,254 | |||||
| 7,800 | Western Refining, Inc. | 276,198 | |||||
| 5,400 | Whiting Petroleum Corp.* | 274,536 | |||||
| 7,100 | The Williams Companies, Inc. | 265,966 | |||||
| 6,428,804 | |||||||
| Paper & Forest Products — 0.9% | |||||||
| 10,700 | P.H. Glatfelter Co. | 250,166 | |||||
| 10,900 | International Paper Co. | 507,722 | |||||
| 1,200 | Kapstone Paper and | ||||||
| Packaging Corporation | 33,360 | ||||||
| 29,200 | Louisiana-Pacific Corp.* | 630,720 | |||||
| 8,200 | MeadWestvaco Corporation | 297,660 | |||||
| 1,719,628 | |||||||
| Personal Products — 0.1% | |||||||
| 900 | Avon Products, Inc. | 18,657 | |||||
| 1,400 | The Estee Lauder Companies Inc. | 89,642 | |||||
| 3,200 | Medifast, Inc.* | 73,344 | |||||
| 3,400 | Nutrisystem, Inc. | 28,832 | |||||
| 1,900 | Revlon, Inc.* | 42,484 | |||||
| 252,959 | |||||||
| Pharmaceuticals — 2.9% | |||||||
| 6,900 | AbbVie Inc. | 281,382 | |||||
| 600 | Actavis Inc.* | 55,266 | |||||
| 3,700 | Allergan, Inc. | 413,031 | |||||
| 1,700 | AstraZeneca PLC - SP-ADR | 84,966 | |||||
| 1,100 | Bayer AG - SP-ADR | 113,905 | |||||
| 8,200 | Bristol-Myers Squibb Company | 337,758 | |||||
| 1,500 | Dr. Reddy’s Laboratories | ||||||
| Limited - ADR | 48,525 | ||||||
| 800 | Endo Health Solutions Inc.* (f/k/a Endo | ||||||
| Pharmaceuticals Holdings Inc.) | 24,608 | ||||||
| 5,200 | Forest Laboratories, Inc.* | 197,808 | |||||
| 700 | GlaxoSmithKline-PLC - SP-ADR | 32,837 | |||||
| 2,700 | Jazz Pharmaceuticals, Inc.* | 150,957 | |||||
| 11,400 | Johnson & Johnson | 929,442 | |||||
| 4,200 | Eli Lilly and Co. | 238,518 | |||||
| 2,200 | The Medicines Company* | 73,524 | |||||
| 4,200 | Merck & Co., Inc. | 185,766 | |||||
| 8,000 | Mylan, Inc.* | 231,520 | |||||
| 2,300 | Novartis AG - ADR | 163,852 | |||||
| 1,200 | Novo Nordisk A/S - SP-ADR | 193,800 | |||||
| 700 | Perrigo Co. | 83,111 | |||||
| 13,600 | Pfizer Inc. | 392,496 | |||||
| 1,800 | Questcor Pharmaceuticals, Inc. | 58,572 | |||||
| 3,000 | Sanofi - ADR | 153,240 | |||||
| 5,000 | SciClone Pharmaceuticals, Inc.* | 23,000 | |||||
| 800 | Shire PLC- ADR | 73,088 | |||||
| 800 | Teva Pharmaceutical Industries Ltd. | 31,744 | |||||
| 6,300 | Valeant Pharmaceuticals | ||||||
| International, Inc.* | 472,626 | ||||||
| 8,200 | ViroPharma Inc.* | 206,312 | |||||
| 14,200 | VIVUS Inc.* | 156,200 | |||||
| 5,407,854 | |||||||
| Professional Services — 0.6% | |||||||
| 4,300 | IHS Inc.* | 450,296 | |||||
| 2,800 | Kelly Services, Inc. | 52,304 | |||||
| 1,100 | Nielsen Holdings N.V. | 39,402 | |||||
| 11,800 | On Assignment, Inc.* | 298,658 | |||||
| 3,100 | Robert Half International, Inc. | 116,343 | |||||
| 2,600 | TrueBlue, Inc.* | 54,964 | |||||
| 1,500 | Verisk Analytics, Inc.* | 92,445 | |||||
| 1,104,412 | |||||||
| Real Estate Management | |||||||
| & Development — 0.1% | |||||||
| 4,400 | CBRE Group, Inc.* | 111,100 | |||||
| 500 | The St. Joe Company* | 10,625 | |||||
| 121,725 | |||||||
The accompanying notes to financial statements are an integral part of this schedule.
- 18 -
Reynolds Blue Chip Growth Fund
SCHEDULE OF INVESTMENTS (Continued)
March 31, 2013 (Unaudited)
| Shares | Value | ||||||
| LONG-TERM INVESTMENTS — 99.1% (a) (Continued) | |||||||
| COMMON STOCKS — 97.5% (a) (Continued) | |||||||
| Road & Rail — 2.2% | |||||||
| 11,000 | Avis Budget Group, Inc.* | $ | 306,130 | ||||
| 2,600 | Canadian National Railway Company | 260,780 | |||||
| 800 | Canadian Pacific Railway Limited | 104,376 | |||||
| 6,800 | CSX Corp. | 167,484 | |||||
| 1,300 | Genesee & Wyoming Inc.* | 121,043 | |||||
| 22,800 | Hertz Global Holdings, Inc.* | 507,528 | |||||
| 5,900 | J.B. Hunt Transportation Services, Inc. | 439,432 | |||||
| 5,700 | Kansas City Southern | 632,130 | |||||
| 2,400 | Norfolk Southern Corporation | 184,992 | |||||
| 8,100 | Old Dominion Freight Line, Inc.* | 309,420 | |||||
| 4,700 | Ryder Systems, Inc. | 280,825 | |||||
| 5,600 | Union Pacific Corp. | 797,496 | |||||
| 4,111,636 | |||||||
| Semiconductors & Semiconductor | |||||||
| Equipment — 2.5% | |||||||
| 9,700 | Advanced Energy Industries, Inc.* | 177,510 | |||||
| 15,800 | Advanced Micro Devices, Inc.* | 40,290 | |||||
| 700 | Analog Devices, Inc. | 32,543 | |||||
| 2,000 | Applied Materials, Inc. | 26,960 | |||||
| 5,600 | Applied Micro Circuits Corporation* | 41,552 | |||||
| 10,000 | ARM Holdings plc - SP-ADR | 423,700 | |||||
| 3,900 | Atmel Corporation* | 27,144 | |||||
| 4,800 | Cavium Inc.* | 186,288 | |||||
| 4,700 | Cree, Inc.* | 257,137 | |||||
| 800 | Cypress Semiconductor Corp. | 8,824 | |||||
| 14,100 | Entegris Inc.* | 139,026 | |||||
| 9,000 | Fairchild Semiconductor | ||||||
| International, Inc.* | 127,260 | ||||||
| 3,300 | Integrated Device Technology, Inc.* | 24,651 | |||||
| 4,300 | JA Solar Holdings | ||||||
| Company, Ltd. - ADR* | 15,566 | ||||||
| 3,000 | KLA-Tencor Corp. | 158,220 | |||||
| 12,800 | Kulicke and Soffa Industries, Inc.* | 147,968 | |||||
| 2,300 | Lam Research Corporation* | 95,358 | |||||
| 15,900 | Lattice Semiconductor Corp.* | 86,655 | |||||
| 3,100 | Linear Technology Corporation | 118,947 | |||||
| 27,300 | LSI Corp.* | 185,094 | |||||
| 2,600 | LTX-Credence Corporation* | 15,704 | |||||
| 10,500 | Marvell Technology Group Ltd. | 111,090 | |||||
| 5,200 | Maxim Integrated Products, Inc. | 169,780 | |||||
| 700 | Mellanox Technologies Ltd.* | 38,857 | |||||
| 3,300 | MEMC Electronic Materials, Inc.* | 14,520 | |||||
| 17,000 | Micron Technology, Inc.* | 169,660 | |||||
| 6,100 | NVIDIA Corp. | 78,202 | |||||
| 6,300 | NXP Semiconductors N.V.* | 190,638 | |||||
| 9,800 | OmniVision Technologies, Inc.* | 135,044 | |||||
| 19,400 | ON Semiconductor Corp.* | 160,632 | |||||
| 5,200 | PDF Solutions, Inc.* | 83,304 | |||||
| 700 | PMC-Sierra, Inc.* | 4,753 | |||||
| 3,900 | ReneSola Ltd. - ADR* | 5,382 | |||||
| 12,000 | RF Micro Devices, Inc.* | 63,840 | |||||
| 8,200 | Skyworks Solutions, Inc.* | 180,646 | |||||
| 1,400 | Spreadtrum | ||||||
| Communications Inc. - ADR | 28,714 | ||||||
| 1,100 | SunPower Corporation* | 12,694 | |||||
| 8,300 | Taiwan Semiconductor Manufacturing | ||||||
| Company Ltd. - SP-ADR | 142,677 | ||||||
| 13,600 | Teradyne, Inc.* | 220,592 | |||||
| 6,500 | Texas Instruments Incorporated | 230,620 | |||||
| 4,500 | TriQuint Semiconductor, Inc.* | 22,725 | |||||
| 2,600 | Ultratech, Inc.* | 102,778 | |||||
| 4,400 | Veeco Instruments Inc.* | 168,652 | |||||
| 800 | Xilinx, Inc. | 30,536 | |||||
| 4,702,733 | |||||||
| Software — 4.2% | |||||||
| 1,100 | Activision Blizzard, Inc. | 16,027 | |||||
| 6,300 | Adobe Systems Inc.* | 274,113 | |||||
| 1,200 | Advent Software, Inc.* | 33,564 | |||||
| 1,200 | ANSYS, Inc.* | 97,704 | |||||
| 5,200 | Autodesk, Inc.* | 214,448 | |||||
| 700 | BroadSoft Inc.* | 18,529 | |||||
| 600 | CA, Inc. | 15,102 | |||||
| 6,900 | Cadence Design Systems, Inc.* | 96,117 | |||||
| 1,100 | CommVault Systems, Inc.* | 90,178 | |||||
| 19,200 | Compuware Corp.* | 240,000 | |||||
| 1,500 | Ebix, Inc. | 24,330 | |||||
| 6,400 | Electronic Arts Inc.* | 113,280 | |||||
| 800 | ePlus inc. | 36,968 | |||||
| 400 | FactSet Research Systems Inc. | 37,040 | |||||
| 5,000 | Fair Isaac Corp. | 228,450 | |||||
| 11,300 | Fortinet Inc.* | 267,584 | |||||
| 9,200 | Glu Mobile Inc.* | 27,416 | |||||
| 9,500 | Jack Henry & Associates, Inc. | 438,995 | |||||
| 7,300 | Informatica Corp.* | 251,631 | |||||
| 500 | Intuit Inc. | 32,825 | |||||
| 20,800 | Mentor Graphics Corporation | 375,440 | |||||
| 1,400 | Netsol Technologies, Inc.* | 18,438 | |||||
| 8,520 | NetSuite Inc.* | 682,111 | |||||
The accompanying notes to financial statements are an integral part of this schedule.
- 19 -
Reynolds Blue Chip Growth Fund
SCHEDULE OF INVESTMENTS (Continued)
March 31, 2013 (Unaudited)
| Shares | Value | ||||||
| LONG-TERM INVESTMENTS — 99.1% (a) (Continued) | |||||||
| COMMON STOCKS — 97.5% (a) (Continued) | |||||||
| Software — 4.2% (Continued) | |||||||
| 4,500 | Nuance Communications, Inc.* | $ | 90,810 | ||||
| 3,100 | Oracle Corp. | 100,254 | |||||
| 4,900 | Progress Software Corporation* | 111,622 | |||||
| 3,100 | QLIK Technologies Inc.* | 80,073 | |||||
| 3,200 | Quality Systems, Inc. | 58,496 | |||||
| 1,600 | Red Hat, Inc.* | 80,896 | |||||
| 1,400 | Rosetta Stone, Inc.* | 21,532 | |||||
| 1,700 | Rovi Corporation* | 36,397 | |||||
| 4,000 | Salesforce.com, Inc.* | 715,320 | |||||
| 6,800 | SAP AG - SP-ADR | 547,672 | |||||
| 600 | Solarwinds, Inc.* | 35,460 | |||||
| 2,300 | Sourcefire Inc.* | 136,229 | |||||
| 12,000 | Symantec Corp.* | 296,160 | |||||
| 900 | Synchronoss Technologies, Inc.* | 27,927 | |||||
| 8,800 | Synopsys, Inc.* | 315,744 | |||||
| 1,900 | TIBCO Software Inc.* | 38,418 | |||||
| 5,300 | TiVo Inc.* | 65,667 | |||||
| 11,800 | Tyler Technologies, Inc.* | 722,868 | |||||
| 3,300 | The Ultimate Software Group, Inc.* | 343,728 | |||||
| 1,300 | Virnetx Holding Corporation* | 24,921 | |||||
| 3,500 | VMware Inc.* | 276,080 | |||||
| 8,700 | Wave Systems Corp.* | 5,942 | |||||
| 20,400 | Zynga Inc.* | 68,544 | |||||
| 7,831,050 | |||||||
| Solar — 0.1% | |||||||
| 8,300 | First Solar, Inc.* | 223,768 | |||||
| 10,000 | LDK Solar Company Ltd. - ADR* | 11,000 | |||||
| 234,768 | |||||||
| Specialty Retail — 6.4% | |||||||
| 4,200 | AutoNation, Inc.* | 183,750 | |||||
| 700 | AutoZone, Inc.* | 277,739 | |||||
| 3,300 | Bed Bath & Beyond Inc.* | 212,586 | |||||
| 14,400 | Best Buy Co., Inc. | 318,960 | |||||
| 36,000 | Borders Group, Inc.*(b) | — | |||||
| 10,400 | CarMax, Inc.* | 433,680 | |||||
| 5,650 | Coldwater Creek Inc.* | 17,854 | |||||
| 13,200 | Dick’s Sporting Goods, Inc. | 624,360 | |||||
| 1,200 | DSW, Inc. | 76,560 | |||||
| 3,000 | Express, Inc.* | 53,430 | |||||
| 2,000 | Five Below, Inc.* | 75,780 | |||||
| 5,400 | Foot Locker, Inc. | 184,896 | |||||
| 5,300 | Francesca’s Holdings Corporation* | 151,898 | |||||
| 4,000 | GameStop Corporation | 111,880 | |||||
| 3,800 | The Gap, Inc. | 134,520 | |||||
| 1,800 | GNC Acquisition Holdings Inc. | 70,704 | |||||
| 2,800 | Group 1 Automotive, Inc. | 168,196 | |||||
| 500 | Guess?, Inc. | 12,415 | |||||
| 2,900 | Hibbett Sports Inc.* | 163,183 | |||||
| 16,400 | The Home Depot, Inc. | 1,144,392 | |||||
| 17,300 | Lithia Motors, Inc. | 821,404 | |||||
| 30,100 | Lowe’s Companies, Inc. | 1,141,392 | |||||
| 10,300 | Lumber Liquidators Holdings, Inc.* | 723,266 | |||||
| 900 | Mattress Firm Holding Corp.* | 31,086 | |||||
| 53,800 | Office Depot, Inc.* | 211,434 | |||||
| 23,300 | OfficeMax Inc. | 270,513 | |||||
| 5,700 | O’Reilly Automotive, Inc.* | 584,535 | |||||
| 3,100 | PetSmart, Inc. | 192,510 | |||||
| 34,000 | Pier 1 Imports, Inc. | 782,000 | |||||
| 2,200 | RadioShack Corporation | 7,392 | |||||
| 2,400 | Rent-A-Center, Inc. | 88,656 | |||||
| 6,400 | Ross Stores, Inc. | 387,968 | |||||
| 700 | Sears Hometown and | ||||||
| Outlet Stores Inc.* | 28,245 | ||||||
| 1,600 | Select Comfort Corporation* | 31,632 | |||||
| 3,400 | The Sherwin-Williams Co. | 574,226 | |||||
| 1,100 | Signet Jewelers Ltd. | 73,700 | |||||
| 15,000 | Sonic Automotive, Inc. | 332,400 | |||||
| 2,600 | Staples, Inc. | 34,918 | |||||
| 1,500 | Tiffany & Co. | 104,310 | |||||
| 6,500 | The TJX Companies, Inc. | 303,875 | |||||
| 1,300 | Tractor Supply Company | 135,369 | |||||
| 2,800 | Ulta Salon, Cosmetics & | ||||||
| Fragrance, Inc. | 227,276 | ||||||
| 4,000 | Urban Outfitters, Inc.* | 154,960 | |||||
| 1,600 | Vitamin Shoppe, Inc.* | 78,160 | |||||
| 4,900 | Williams-Sonoma, Inc. | 252,448 | |||||
| 6,300 | Zale Corporation* | 24,759 | |||||
| 12,015,217 | |||||||
| Telecommunication Services – | |||||||
| Diversified — 0.6% | |||||||
| 33,300 | 8x8, Inc.* | 228,105 | |||||
| 7,000 | BT Group plc - SP-ADR | 294,210 | |||||
| 800 | CenturyLink Inc. | 28,104 | |||||
| 1,200 | Level 3 Communications, Inc.* | 24,348 | |||||
| 3,400 | magicJack VocalTec Ltd.* | 47,600 | |||||
| 11,900 | tw telecom inc.* | 299,761 | |||||
| 3,700 | Verizon Communications Inc. | 181,855 | |||||
| 2,500 | VimpelCom Ltd. - SP-ADR | 29,725 | |||||
The accompanying notes to financial statements are an integral part of this schedule.
- 20 -
Reynolds Blue Chip Growth Fund
SCHEDULE OF INVESTMENTS (Continued)
March 31, 2013 (Unaudited)
| Shares | Value | ||||||
| LONG-TERM INVESTMENTS — 99.1% (a) (Continued) | |||||||
| COMMON STOCKS — 97.5% (a) (Continued) | |||||||
| Telecommunication Services – | |||||||
| Diversified — 0.6% (Continued) | |||||||
| 7,000 | Windstream Corporation | $ | 55,650 | ||||
| 1,189,358 | |||||||
| Telecommunication Services – | |||||||
| Wireless — 1.2% | |||||||
| 6,100 | Crown Castle International Corp.* | 424,804 | |||||
| 16,900 | Leap Wireless International, Inc.* | 99,541 | |||||
| 17,160 | MetroPCS Communications, Inc.* | 187,044 | |||||
| 2,100 | Mobile TeleSystems - SP-ADR | 43,554 | |||||
| 6,040 | NII Holdings Inc.* | 26,153 | |||||
| 4,000 | Rogers Communications, Inc. Cl B | 204,240 | |||||
| 14,000 | SBA Communications Corporation* | 1,008,280 | |||||
| 19,000 | Sprint Nextel Corp.* | 117,990 | |||||
| 700 | Turkcell Iletisim Hizmetleri | ||||||
| AS - ADR* | 11,648 | ||||||
| 1,900 | Vodafone Group Plc - SP-ADR | 53,979 | |||||
| 2,177,233 | |||||||
| Textiles, Apparel & Luxury Goods — 2.0% | |||||||
| 900 | Coach, Inc. | 44,991 | |||||
| 2,300 | Crocs, Inc.* | 34,086 | |||||
| 1,800 | Deckers Outdoor Corporation* | 100,242 | |||||
| 17,100 | Fifth & Pacific Companies, Inc.* | 322,848 | |||||
| 6,000 | Gildan Activewear Inc. | 239,460 | |||||
| 2,900 | Hanesbrands, Inc. | 132,124 | |||||
| 4,800 | Iconix Brand Group, Inc.* | 124,176 | |||||
| 14,700 | Joe’s Jeans, Inc.* | 24,990 | |||||
| 16,900 | Luxottica Group SpA - ADR | 849,901 | |||||
| 900 | Steven Madden, Ltd.* | 38,826 | |||||
| 3,700 | Michael Kors Holdings Ltd.* | 210,123 | |||||
| 3,700 | Movado Group, Inc. | 124,024 | |||||
| 6,600 | NIKE, Inc. Cl B | 389,466 | |||||
| 6,600 | PVH Corp. | 704,946 | |||||
| 1,100 | Ralph Lauren Corporation | 186,241 | |||||
| 2,200 | Skechers U.S.A., Inc.* | 46,530 | |||||
| 1,800 | Under Armour, Inc.* | 92,160 | |||||
| 500 | VF Corp. | 83,875 | |||||
| 3,749,009 | |||||||
| Thrifts & Mortgage Finance — 0.1% | |||||||
| 3,600 | Bank Mutual Corporation | 19,908 | |||||
| 1,000 | Nationstar Mortgage Holdings, Inc.* | 36,900 | |||||
| 3,600 | Ocwen Financial Corporation* | 136,512 | |||||
| 7,100 | Radian Group Inc. | 76,041 | |||||
| 269,361 | |||||||
| Trading Companies & Distributors — 0.8% | |||||||
| 2,000 | Air Lease Corporation | 58,640 | |||||
| 4,600 | Fastenal Co. | 236,210 | |||||
| 1,900 | W.W. Grainger, Inc. | 427,462 | |||||
| 4,700 | TAL International Group, Inc. | 212,957 | |||||
| 1,600 | Titan Machinery, Inc.* | 44,400 | |||||
| 900 | TransDigm Group, Inc. | 137,628 | |||||
| 7,600 | United Rentals, Inc.* | 417,772 | |||||
| 1,535,069 | |||||||
| Transportation Infrastructure — 0.0% | |||||||
| 200 | Grupo Aeroportuario del Sureste | ||||||
| S.A.B. de C.V. - ADR | 27,334 | ||||||
| 200 | Macquarie Infrastructure | ||||||
| Company LLC | 10,808 | ||||||
| 38,142 | |||||||
| Water Utilities — 0.2% | |||||||
| 1,300 | American States Water Company | 74,841 | |||||
| 3,300 | American Water Works Co., Inc. | 136,752 | |||||
| 3,500 | California Water Service Group | 69,650 | |||||
| 2,600 | Consolidated Water Co., Ltd. | 25,740 | |||||
| 306,983 | |||||||
| Total common stocks | |||||||
| (cost $146,335,102) | 183,112,461 | ||||||
| PUBLICLY TRADED PARTNERSHIPS — 0.1% (a) | |||||||
| Capital Markets — 0.0% | |||||||
| 900 | Lazard Ltd. | 30,717 | |||||
| Chemicals — 0.0% | |||||||
| 1,700 | Rentech Nitrogen Partners LP | 60,996 | |||||
| Diversified Financial Services — 0.1% | |||||||
| 1,300 | Texas Pacific Land Trust | 91,624 | |||||
| Oil, Gas & Consumable Fuels — 0.0% | |||||||
| 1,400 | Linn Energy LLC | 53,060 | |||||
| Total publicly traded partnerships | |||||||
| (cost $225,803) | 236,397 | ||||||
| REITS — 1.4% (a) | |||||||
| Real Estate Investment Trusts — 1.4% | |||||||
| 1,000 | Campus Crest Communities, Inc. | 13,900 | |||||
| 4,500 | Chimera Investment Corporation | 14,355 | |||||
| 5,200 | Corrections Corporation of America | 203,164 | |||||
| 2,800 | Cousins Properties, Inc. | 29,932 | |||||
| 1,500 | CubeSmart | 23,700 | |||||
| 5,900 | Extra Space Storage Inc. | 231,693 | |||||
| 1,200 | The Geo Group Inc. | 45,144 | |||||
The accompanying notes to financial statements are an integral part of this schedule.
- 21 -
Reynolds Blue Chip Growth Fund
SCHEDULE OF INVESTMENTS (Continued)
March 31, 2013 (Unaudited)
| Shares | Value | ||||||
| LONG-TERM INVESTMENTS — 99.1% (a) (Continued) | |||||||
| REITS — 1.4% (a) (Continued) | |||||||
| Real Estate Investment | |||||||
| Trusts — 1.4% (Continued) | |||||||
| 3,000 | Gramercy Property Trust Inc.* (f/k/a | ||||||
| Gramercy Capital Corp.) | $ | 15,630 | |||||
| 300 | Healthcare Realty Trust, Inc. | 8,517 | |||||
| 3,000 | Medical Properties Trust Inc. | 48,120 | |||||
| 4,400 | MFA Financial, Inc. | 41,008 | |||||
| 8,700 | OMEGA Healthcare Investors, Inc. | 264,132 | |||||
| 2,300 | Parkway Properties, Inc. | 42,665 | |||||
| 2,200 | Potlatch Corporation | 100,892 | |||||
| 400 | PS Business Parks, Inc. | 31,568 | |||||
| 300 | Public Storage | 45,696 | |||||
| 2,300 | Rayonier Inc. | 137,241 | |||||
| 2,400 | Redwood Trust, Inc. | 55,632 | |||||
| 1,800 | Simon Property Group, Inc. | 285,408 | |||||
| 5,600 | Sovran Self Storage, Inc. | 361,144 | |||||
| 3,000 | STAG Industrial, Inc. | 63,810 | |||||
| 3,900 | Tanger Factory Outlet Centers, Inc. | 141,102 | |||||
| 400 | Taubman Centers, Inc. | 31,064 | |||||
| 2,400 | Ventas, Inc. | 175,680 | |||||
| 3,600 | Western Asset Mortgage Capital Corp. | 83,664 | |||||
| 4,500 | Weyerhaeuser Company | 141,210 | |||||
| Total REITS | |||||||
| (cost $2,327,587) | 2,636,071 | ||||||
| WARRANTS — 0.0% (a) | |||||||
| 3,150 | American International Group, Inc.*, | ||||||
| Expiration Date - 01/19/21, | |||||||
| Exercise Price - $45.00 | 47,880 | ||||||
| Total warrants | |||||||
| (cost $47,259) | 47,880 | ||||||
| PREFERRED STOCKS — 0.1% (a) | |||||||
| Beverages — 0.1% | |||||||
| 5,800 | Companhia de Bebidas das | ||||||
| Americas Preferred - SP-ADR | 245,514 | ||||||
| Total preferred stocks | |||||||
| (cost $151,249) | 245,514 | ||||||
Total investments — 99.1% | |||||||
| (cost $149,087,000) | 186,278,323 | ||||||
| Cash and receivables, | |||||||
less liabilities — 0.9% (a) | 1,645,951 | ||||||
| TOTAL NET ASSETS — 100.0% | $ | 187,924,274 | |||||
| * | Non-income producing security. |
| ^ | Passive Foreign Investment Company (PFIC) |
| (a) | Percentages for the various classifications relate to net assets. |
| (b) | These securities were fair valued as determined by the adviser using procedures approved by the Board of Directors and are classified as level 2 or 3. As of March 31, 2013, the aggregate value of these securities was $134 which represents 0.0% of total net assets. |
ADR – Unsponsored American Depositary Receipt
AG – German Corporation
A/S – Danish Company
LLC – Limited Liability Company
L.P. – Limited Partnership
N.V. – Dutch Public Limited Liability Co.
NYS – New York Registered Shares
PLC – Public Limited Company
S.A. – Sociedad Anónima
S.A.B. de C.V. – Sociedad Anónima Bursetil de Capital Variable
SP - ADR – Sponsored American Depositary Receipt
SpA – Italian Corporation
The Global Industry Classification Standard (“GICS®”) was developed by and/or is the exclusive property of MSCI, Inc. and Standard & Poor’s Financial Services LLC (“S&P”). GICS® is a service mark of MSCI & S&P and has been licensed for use by U.S. Bancorp Fund Services, LLC.
The accompanying notes to financial statements are an integral part of this schedule.
- 22 -
Reynolds Blue Chip Growth Fund
STATEMENT OF OPERATIONS
For the Six Months Ending March 31, 2013 (Unaudited)
| INVESTMENT INCOME: | ||||
| Dividends (net of foreign withholding taxes of $12,095) | $ | 1,409,288 | ||
| Total investment income | 1,409,288 | |||
| EXPENSES: | ||||
| Management fees | 891,582 | |||
| Transfer agent fees | 121,295 | |||
| Administrative and accounting services | 117,586 | |||
| Distribution fees | 84,932 | |||
| Custodian fees | 77,839 | |||
| Printing and postage expense | 25,609 | |||
| Registration fees | 23,309 | |||
| Insurance expense | 22,534 | |||
| Professional fees | 22,029 | |||
| Board of Directors fees | 13,961 | |||
| Chief Compliance Officer fees | 11,500 | |||
| Overdraft fees | 8,016 | |||
| Other expenses | 9,874 | |||
| Total expenses | 1,430,066 | |||
| NET INVESTMENT LOSS | (20,778 | ) | ||
| NET REALIZED GAIN ON INVESTMENTS AND FOREIGN CURRENCY TRANSACTIONS | 2,968,252 | |||
| NET INCREASE IN UNREALIZED APPRECIATION ON INVESTMENTS AND | ||||
| TRANSACTIONS OF ASSETS AND LIABILITIES IN FOREIGN CURRENCIES | 11,993,577 | |||
| NET GAIN ON INVESTMENTS AND FOREIGN CURRENCY | 14,961,829 | |||
| NET INCREASE IN NET ASSETS RESULTING FROM OPERATIONS | $ | 14,941,051 | ||
STATEMENTS OF CHANGES IN NET ASSETS
For the Six Months Ending March 31, 2013 (Unaudited) and For the Year Ended September 30, 2012
| 2013 | 2012 | |||||||
| OPERATIONS: | ||||||||
| Net investment loss | $ | (20,778 | ) | $ | (705,833 | ) | ||
| Net realized gain on investments and foreign currency transactions | 2,968,252 | 2,601,844 | ||||||
| Net increase in unrealized appreciation on investments and transactions of assets and liabilities | ||||||||
| in foreign currencies | 11,993,577 | 46,128,097 | ||||||
| Net increase in net assets resulting from operations | 14,941,051 | 48,024,108 | ||||||
| DISTRIBUTIONS TO SHAREHOLDERS: | ||||||||
| Distributions from net capital gains ($0.62743 per share) | (1,885,775 | ) | — | |||||
| FUND SHARE ACTIVITIES: | ||||||||
| Proceeds from shares issued (414,426 and 914,026 shares, respectively) | 24,670,666 | 50,025,921 | ||||||
| Net asset value of shares issued in distributions reinvested (31,377 shares) | 1,783,482 | — | ||||||
| Cost of shares redeemed (642,127 and 2,042,077 shares, respectively) | (37,657,888 | ) | (111,159,830 | ) | ||||
| Net decrease in net assets derived from Fund share activities | (11,203,740 | ) | (61,133,909 | ) | ||||
| TOTAL INCREASE (DECREASE) | 1,851,536 | (13,109,801 | ) | |||||
| NET ASSETS AT THE BEGINNING OF THE PERIOD | 186,072,738 | 199,182,539 | ||||||
| NET ASSETS AT THE END OF THE PERIOD (Includes undistributed net investment income of $0 and | ||||||||
| accumulated net investment loss of $(623,313), respectively) | $ | 187,924,274 | $ | 186,072,738 | ||||
The accompanying notes to financial statements are an integral part of these statements.
- 23 -
Reynolds Blue Chip Growth Fund
FINANCIAL HIGHLIGHTS
(Selected data for each share of the Fund outstanding throughout each period)
| (Unaudited) | ||||||||||||||||||||||||
| For the Six | ||||||||||||||||||||||||
| Months Ending | Years Ended September 30, | |||||||||||||||||||||||
| March 31, 2013 | 2012 | 2011 | 2010 | 2009 | 2008 | |||||||||||||||||||
| PER SHARE OPERATING PERFORMANCE: | ||||||||||||||||||||||||
| Net asset value, beginning of period | $ | 58.97 | $ | 46.50 | $ | 48.29 | $ | 41.87 | $ | 31.85 | $ | 32.05 | ||||||||||||
| Income from investment operations: | ||||||||||||||||||||||||
| Net investment loss (a) | (0.01 | ) | (0.19 | ) | (0.27 | ) | (0.25 | ) | (0.42 | ) | (0.01 | ) | ||||||||||||
| Net realized and unrealized | ||||||||||||||||||||||||
| gains (loss) on investments | 5.18 | 12.66 | (1.52 | ) | 6.67 | 10.44 | 0.02 | |||||||||||||||||
| Total from investment operations | 5.17 | 12.47 | (1.79 | ) | 6.42 | 10.02 | 0.01 | |||||||||||||||||
| Less distributions: | ||||||||||||||||||||||||
| Distributions from net investment income | — | — | — | — | — | (0.21 | ) | |||||||||||||||||
| Distributions from net realized gains | (0.63 | ) | — | — | — | — | — | |||||||||||||||||
| Total from distributions | (0.63 | ) | — | — | — | — | (0.21 | ) | ||||||||||||||||
| Net asset value, end of period | $ | 63.51 | $ | 58.97 | $ | 46.50 | $ | 48.29 | $ | 41.87 | $ | 31.85 | ||||||||||||
| TOTAL RETURN | 8.89 | %(1) | 26.82 | % | (3.71 | %) | 15.33 | % | 31.46 | % | (0.00 | %) | ||||||||||||
| RATIOS/SUPPLEMENTAL DATA: | ||||||||||||||||||||||||
| Net assets, end of period (in 000’s $) | 187,924 | 186,073 | 199,183 | 116,043 | 48,553 | 22,151 | ||||||||||||||||||
| Ratio of expenses (after reimbursement) | ||||||||||||||||||||||||
| to average net assets* | 1.60 | %(2) | 1.53 | % | 1.55 | % | 1.80 | % | 2.00 | % | 2.00 | % | ||||||||||||
Ratio of net investment loss to average net assets** | (0.02 | %)(2) | (0.34 | %) | (0.49 | %) | (0.55 | %) | (1.24 | %) | (0.03 | %) | ||||||||||||
| Portfolio turnover rate | 65 | % | 99 | % | 55 | % | 80 | % | 527 | % | 364 | % | ||||||||||||
| (a) | Amount calculated based on average shares outstanding throughout the period. |
| * | Computed after giving effect to adviser’s expense limitation undertaking. If the Fund had paid all of its expenses for the years ended September 30, 2009 and 2008, the ratios would have been 2.51% and 2.67%, respectively. |
| ** | If the Fund had paid all of its expenses for the years ended September 30, 2009 and 2008, the ratios would have been (1.75%) and (0.70%), respectively. |
| (1) | Not annualized. |
| (2) | Annualized. |
The accompanying notes to financial statements are an integral part of this statement.
NOTES TO FINANCIAL STATEMENTS
March 31, 2013 (Unaudited)
| (1) | Summary of Significant Accounting Policies — |
The following is a summary of significant accounting policies of the Reynolds Funds, Inc. (the “Company”), which is registered as a diversified, open-end management investment company under the Investment Company Act of 1940 (the “Act”), as amended. This Company consists of one fund: the Reynolds Blue Chip Growth Fund (the “Fund”). The Company was incorporated under the laws of Maryland on April 28,1988.
The investment objective of the Fund is to produce long-term growth of capital by investing in a diversified portfolio of common stocks issued by well-established growth companies commonly referred to as “blue chip” companies.
(a) Each security, excluding short-term investments, is valued at the last sale price reported by the principal security exchange on which the issue is traded, or if no sale is reported, the latest bid price. Securities which are traded on the Nasdaq National Markets are valued at the Nasdaq Official Closing Price, or if no sale is reported, the latest bid price. Short-term investments with maturities of 60 days or less are valued at amortized cost which approximates value. Securities for which quotations are not readily available are valued at fair value as determined by the investment adviser under the supervision of the Board of Directors. The fair value of a security is the amount which the Fund might receive upon a current sale. The fair value of a security may differ
- 24 -
Reynolds Blue Chip Growth Fund
NOTES TO FINANCIAL STATEMENTS (Continued)
March 31, 2013 (Unaudited)
| (1) | Summary of Significant Accounting Policies — (Continued) |
from the last quoted price and the Fund may not be able to sell a security at the fair value. Market quotations may not be available, for example, if trading in particular securities was halted during the day and not resumed prior to the close of trading on the New York Stock Exchange.
Under accounting principles generally accepted in the United States of America (“GAAP”), fair value is defined as the price that would be received to sell an asset or paid to transfer a liability (i.e., the “exit price”) in an orderly transaction between market participants at the measurement date.
In determining fair value, the Fund uses various valuation approaches. GAAP establishes a fair value hierarchy for inputs used in measuring fair value that maximizes the use of observable inputs and minimizes the use of unobservable inputs by generally requiring that the most observable inputs be used when available. Observable inputs are those that market participants would use in pricing the asset or liability based on market data obtained from sources independent of the Fund. Unobservable inputs reflect the Fund's assumptions about the inputs market participants would use in pricing the asset or liability developed based on the best information available in the circumstances. The inputs or methodologies used for valuing securities are not necessarily an indication of the risks associated with investing in those securities.
The fair value hierarchy is categorized into three levels based on the inputs as follows:
| Level 1— | Valuations based on unadjusted quoted prices in active markets for identical assets. |
| Level 2— | Valuations based on quoted prices for similar securities or in markets that are not active or for which all significant inputs are observable, either directly or indirectly. |
| Level 3— | Valuations based on inputs that are unobservable and significant to the overall fair value measurement. |
The following table summarizes the Fund’s investments as of March 31, 2013, based on the inputs used to value them:
| Valuation Inputs | Investments in Securities | |||
| Level 1—Common Stocks | $ | 183,112,327 | ||
| Publicly Traded Partnerships | 236,397 | |||
| REITS | 2,636,071 | |||
| Warrants | 47,880 | |||
| Preferred Stocks | 245,514 | |||
| Total Level 1 | 186,278,189 | |||
| Level 2—Common Stocks | 134 | |||
| Level 3—Common Stocks | 0 | |||
| Total | $ | 186,278,323 | * | |
It is the Fund’s policy to recognize transfers between levels at the end of the quarterly reporting period. For the six months ended March 31, 2013, the following transfers were made:
Transfers out of Level 1 and into Level 2: $134.
The security transferred out of Level 1 and into Level 2 as a result of this security not trading as of March 31, 2013.
* Please refer to the Schedule of Investments to view common stocks, publicly traded partnerships and preferred stocks segregated by industry type.
(b) Investment transactions are accounted for on a trade date basis for financial reporting purposes. Net realized gains and losses on sales of securities are computed on the highest amortized cost basis.
(c) The Fund records dividend income on the ex-dividend date and interest income on an accrual basis. Withholding taxes on foreign dividends have been provided for in accordance with the Fund’s understanding of the applicable country’s tax rules and regulations.
(d) GAAP requires that permanent differences between income for financial reporting and tax purposes be reclassified in the capital accounts. For the year ended September 30, 2012, the Fund reclassified $82,520 of net investment loss and $18,042 of accumulated realized losses to capital stock.
(e) The preparation of financial statements in conformity with GAAP requires management to make estimates and assumptions that affect the reported amounts of assets and liabilities and disclosure of contingent assets and liabilities at the date of the financial statements and the reported amounts of revenues and expenses during the reporting period. Actual results could differ from these estimates.
- 25 -
Reynolds Blue Chip Growth Fund
NOTES TO FINANCIAL STATEMENTS (Continued)
March 31, 2013 (Unaudited)
| (1) | Summary of Significant Accounting Policies — (Continued) |
(f) No provision has been made for Federal income taxes since the Fund has elected to be taxed as a “regulated investment company” and intends to distribute substantially all net investment company taxable income and net capital gains to shareholders and otherwise comply with the provisions of the Internal Revenue Code applicable to regulated investment companies.
(g) The Fund has reviewed all open tax years and major jurisdictions, which include Federal and the state of Maryland, and concluded that there are no significant uncertain tax positions that would require recognition in the financial statements as of and for the year ended September 30, 2012. Open tax years are those that are open for exam by taxing authorities and, as of March 31, 2013, open Federal tax years include the tax years ended September 30, 2009 through 2012. The Fund recognizes interest and penalties, if any, related to unrecognized tax benefits as income tax expense in the Fund’s Statement of Operations. During the six months ending March 31, 2013, the Fund did not incur any interest or penalties. The Fund has no examinations in progress and is also not aware of any tax positions for which it is reasonably possible that the total amounts of unrecognized tax benefits will significantly change in the next twelve months.
| (2) | Investment Adviser and Management Agreement and Transactions With Related Parties — |
The Fund has a management agreement with Reynolds Capital Management, LLC (“RCM”), to serve as investment adviser and manager. The sole owner of RCM is Mr. Frederick L. Reynolds. Mr. Reynolds is also an officer and interested director of the Fund. Under the terms of the agreement, the Fund will pay RCM a monthly management fee at the annual rate of 1% of the daily net assets.
The agreement further stipulates that RCM will reimburse the Fund for all expenses exceeding 2% of its daily average net assets (excluding interest, taxes, brokerage commissions and extraordinary items). The Fund is not obligated to reimburse RCM for any expenses reimbursed in previous fiscal years. No such reimbursements were required for the six months ending March 31, 2013.
The Fund has adopted a Service and Distribution Plan (the “Plan”) pursuant to Rule 12b-1 under the Act. The Plan provides that the Fund may incur certain costs which may not exceed a maximum amount equal to 0.25% per annum of the Fund’s average daily net assets. Payments made pursuant to the Plan may only be used to pay distribution expenses incurred in the current year, and may be less than the maximum amount allowed by the Plan.
Under the Fund’s organizational documents, each director, officer, employee or other agent of the Fund (including the Fund’s investment manager) is indemnified, to the extent permitted by the Act, against certain liabilities that may arise out of performance of their duties to the Fund. Additionally, in the normal course of business, the Fund enters into contracts that contain a variety of indemnification clauses. The Fund’s maximum exposure under these arrangements is unknown as this would involve future claims that may be made against the Fund that have not yet occurred. However, the Fund has not had prior claims or losses pursuant to these contracts and believes the risk of loss to be remote.
| (3) | Distributions to Shareholders — |
Net investment income and net realized gains, if any, for the Fund are distributed to shareholders at least annually and are recorded on the ex-dividend date.
| (4) | Investment Transactions — |
For the six months ending March 31, 2013, purchases and proceeds of sales of investment securities (excluding short-term securities) were $115,860,751 and $127,596,891, respectively.
| (5) | Income Tax Information — |
The following information for the Fund is presented on an income tax basis as of September 30, 2012:
| Gross | Gross | Net Unrealized | Distributable | Distributable | |||
| Cost of | Unrealized | Unrealized | Appreciation | Ordinary | Long-Term | ||
| Investments | Appreciation | Depreciation | on Investments | Income | Capital Gains | ||
| $162,967,353 | $31,043,221 | $(10,668,455) | $20,374,766 | $ — | $1,885,771 |
The difference, if any, between the cost amount for financial statement and federal income tax purposes is due primarily to timing differences in recognizing certain gains and losses in security transactions.
On December 22, 2010, the Regulated Investment Company Modernization Act of 2010 (the “RIC Act”) was enacted, which changed various technical rules governing the tax treatment of regulated investment companies. The changes are generally effective for taxable years beginning after the date of enactment. Capital losses incurred in taxable years beginning after the date of enactment may now be carried forward indefinitely, and retain the character of the original loss. Post-enactment losses must be utilized prior to pre-enactment losses. Under pre-enactment law, capital losses could be
- 26 -
Reynolds Blue Chip Growth Fund
NOTES TO FINANCIAL STATEMENTS (Continued)
March 31, 2013 (Unaudited)
| (5) | Income Tax Information — (Continued) |
carried forward for up to eight years, and carried forward as short-term capital loss, irrespective of the character of the original loss. The RIC Act now allows regulated investment companies to elect to “push” to the first day of the next taxable year all or part of any late year ordinary loss, which is defined as the sum of the specified post-October losses and other post-December ordinary losses, over the specified post-October gains and other post-December ordinary gains. This reduces the circumstances under which a regulated investment company might be required to file amended Forms 1099 to restate previously reported distributions.
The tax components of dividends paid during the year ended September 30, 2012, capital loss carryovers, which may be used to offset future capital gains, subject to Internal Revenue Code limitations, tax basis post-October losses as of September 30, 2012, which are not recognized for tax purposes until the first day of the following fiscal year, and late year ordinary losses are:
| September 30, 2012 | September 30, 2011 | |||||||||||||
| Pre-Enactment | Post-Enactment | |||||||||||||
| Ordinary | Long-Term | Net Capital | Short-Term | Late Year | Ordinary | Long-Term | ||||||||
| Income | Capital Gains | Loss | Capital Loss | Post-October | Ordinary | Income | Capital Gains | |||||||
| Distributions | Distributions | Carryovers | Carryovers | Losses | Losses | Distributions | Distributions | |||||||
| $ — | $ — | $ — | $ — | $ — | $630,763 | $ — | $ — | |||||||
The Fund has utilized $3,755,501 of its capital loss carryovers during the year ended September 30, 2012.
Since there were no ordinary distributions paid for the year ended September 30, 2012, there were no distributions designated as qualifying for the dividends received deduction for corporate shareholders nor as qualified dividend income under the Jobs and Growth Tax Relief Act of 2003.
ADVISORY AGREEMENT
On December 7, 2012, the Board of Directors (“Directors”) of Reynolds Funds, Inc. approved the continuation of the Reynolds Blue Chip Growth Fund’s (“Fund”) investment advisory agreement with Reynolds Capital Management, LLC (“RCM”). Prior to approving the continuation of the advisory agreement, the Directors considered:
| • | the nature, extent and quality of the services provided by RCM |
| • | the investment performance of the Fund |
| • | the costs of the services to be provided and profits to be realized by RCM from its relationship with the Fund |
| • | the extent to which economies of scale would be realized as the Fund grew and whether fee levels reflect any economies of scale |
| • | the expense ratio of the Fund |
In considering the nature, extent and quality of the services provided by RCM, the Directors reviewed a report describing the portfolio management, shareholder communication and servicing services provided by RCM to the Fund. The Directors concluded that RCM was providing essential services to the Fund as well as services that were in addition to services typically provided non-mutual fund clients.
The Directors reviewed the performance of the Fund and the profitability of RCM. The Directors also reviewed data comparing fees and expenses of the Fund to comparable mutual funds.
In concluding that the advisory fees payable by the Fund were reasonable, the Directors reviewed reports of the costs of services provided, and the profits realized, by RCM, from its relationship with the Fund and concluded that such profits were reasonable and not excessive. The Directors also reviewed reports comparing the expense ratio of, and the advisory fees paid by, the Fund to those of, and paid by, other comparable mutual funds and concluded that the advisory fees paid by the Fund and the expense ratio of the Fund was comparable to those of comparable mutual funds. The Directors concluded that given the size of the Fund, investment advisory fee breakpoints were not warranted at this time.
- 27 -
REYNOLDS BLUE CHIP GROWTH FUND
c/o U.S. BANCORP FUND SERVICES, LLC
615 East Michigan Street
Milwaukee, Wisconsin 53202
www.reynoldsfunds.com
Board of Directors
DENNIS N. MOSER
FREDERICK L. REYNOLDS
ROBERT E. STAUDER
Investment Adviser
REYNOLDS CAPITAL MANAGEMENT, LLC
3565 South Las Vegas Boulevard, #403
Las Vegas, Nevada 89109
Transfer Agent,
Dividend Disbursing Agent,
Administrator and Accountant
U.S. BANCORP FUND SERVICES, LLC
615 East Michigan Street
Milwaukee, Wisconsin 53202
1-800-773-9665
or 1-800-7REYNOLDS
1-414-765-4124
Custodian
U.S. BANK, N.A.
1555 North RiverCenter Drive, Suite 302
Milwaukee, Wisconsin 53212
Independent Registered Public Accounting Firm
COHEN FUND AUDIT SERVICES, LTD.
1350 Euclid Avenue, Suite 800
Cleveland, Ohio 44115
Legal Counsel
FOLEY & LARDNER LLP
777 East Wisconsin Avenue
Milwaukee, Wisconsin 53202
Distributor
RAFFERTY CAPITAL MARKETS, LLC
1010 Franklin Avenue
Garden City, New York 11530
Item 2. Code of Ethics.
Not applicable for semi-annual reports.
Item 3. Audit Committee Financial Expert.
Not applicable for semi-annual reports.
Item 4. Principal Accountant Fees and Services.
Not applicable for semi-annual reports.
Item 5. Audit Committee of Listed Registrants.
Not applicable to registrants who are not listed issuers (as defined in Rule 10A-3 under the Securities Exchange Act of 1934).
Item 6. Schedule of Investments.
(a) Schedule of Investments is included as part of the report to shareholders filed under Item 1 of this Form.
(b) Not applicable to open-end investment companies.
Item 7. Disclosure of Proxy Voting Policies and Procedures for Closed-End Management Investment Companies.
Not applicable to open-end investment companies.
Item 8. Portfolio Managers of Closed-End Management Investment Companies.
Not applicable to open-end investment companies.
Item 9. Purchases of Equity Securities By Closed-End Management Investment Company and Affiliated Purchasers.
Not applicable to open-end investment companies.
Item 10. Submission of Matters to a Vote of Security Holders.
Not applicable.
Item 11. Controls and Procedures.
| (a) | The Registrant’s President/Chief Executive Officer and Treasurer/Chief Financial Officer have reviewed the Registrant's disclosure controls and procedures (as defined in Rule 30a-3(c) under the Investment Company Act of 1940 (the “Act”)) as of a date within 90 days of the filing of this report, as required by Rule 30a-3(b) under the Act and Rules 13a-15(b) or 15d-15(b) under the Securities Exchange Act of 1934. Based on their review, such officers have concluded that the disclosure controls and procedures are effective in ensuring that information required to be disclosed in this report is appropriately recorded, processed, summarized and reported and made known to them by others within the Registrant and by the Registrant’s service provider. |
| (b) | There were no changes in the Registrant's internal control over financial reporting (as defined in Rule 30a-3(d) under the Act) that occurred during the second fiscal quarter of the period covered by this report that has materially affected, or is reasonably likely to materially affect, the Registrant's internal control over financial reporting. |
Item 12. Exhibits.
| (a) | (1) Any code of ethics or amendment thereto, that is the subject of the disclosure required by Item 2, to the extent that the registrant intends to satisfy Item 2 requirements through filing an exhibit. Not applicable. |
(2) A separate certification for each principal executive and principal financial officer pursuant to Section 302 of the Sarbanes-Oxley Act of 2002. Filed herewith.
(3) Any written solicitation to purchase securities under Rule 23c-1 under the Act sent or given during the period covered by the report by or on behalf of the Registrant to 10 or more persons. Not applicable to open-end investment companies.
| (b) | Certifications pursuant to Section 906 of the Sarbanes-Oxley Act of 2002. Furnished herewith. |
SIGNATURES
Pursuant to the requirements of the Securities Exchange Act of 1934 and the Investment Company Act of 1940, the registrant has duly caused this report to be signed on its behalf by the undersigned, thereunto duly authorized.
Reynolds Funds, Inc.
Registrant
By /s/ Frederick L. Reynolds
Frederick L. Reynolds, President, Principal Executive Officer
Date May 29, 2013
Pursuant to the requirements of the Securities Exchange Act of 1934 and the Investment Company Act of 1940, this report has been signed below by the following persons on behalf of the registrant and in the capacities and on the dates indicated.
Reynolds Funds, Inc.
Registrant
By /s/ Frederick L. Reynolds
Frederick L. Reynolds, President, Principal Executive Officer
Date May 29, 2013
Reynolds Funds, Inc.
Registrant
By /s/ Frederick L. Reynolds
Frederick L. Reynolds, Treasurer, Principal Financial Officer
Date May 29, 2013