UNITED STATES
SECURITIES AND EXCHANGE COMMISSION
Washington, D.C. 20549
FORM N-CSR
CERTIFIED SHAREHOLDER REPORT OF REGISTERED
MANAGEMENT INVESTMENT COMPANIES
Investment Company Act file number 811-05549
Reynolds Funds, Inc.
(Exact name of registrant as specified in charter)
c/o U.S. Bancorp Fund Services, LLC
615 E. Michigan Street
Milwaukee, WI 53202
(Address of principal executive offices) (Zip code)
Frederick L. Reynolds
Reynolds Capital Management, LLC
3565 South Las Vegas Blvd. #403
Las Vegas, NV 89109
Registrant's telephone number, including area code:
(415) 265-7167
Date of fiscal year end: September 30, 2015
Date of reporting period: March 31, 2015
Item 1. Reports to Stockholders.
SEMIANNUAL REPORT
March 31, 2015
| REYNOLDS |
BLUE CHIP GROWTH FUND |
| Seeking Long-Term Capital Appreciation |
A No-Load Mutual Fund
1-800-773-9665
www.reynoldsfunds.com
REYNOLDS BLUE CHIP GROWTH FUND
May 27, 2015
Dear Fellow Shareholders:
Reynolds Blue Chip Growth Fund’s 26th Anniversary
The Reynolds Blue Chip Growth Fund celebrated its 26th Anniversary last summer. It began operations on August 12, 1988.
Performance Highlights (March 31, 2015)
The performance of the Reynolds Blue Chip Growth Fund (the “Fund” or the “Blue Chip Fund”) was +3.39% in the three months ended March 31, 2015. The performance of the Standard & Poor’s 500 Index was +0.95% in the three months ended March 31, 2015. The annualized average total returns of the Reynolds Blue Chip Growth Fund and S&P 500 Index for the 1-year, 5-year, and 10-year periods through March 31, 2015 were:
| Average Annual Total Returns | |||
| 1 Year | 5 Year | 10 Year | |
| Reynolds Blue Chip Growth Fund | 7.31% | 12.32% | 11.75% |
The Standard & Poor's 500 Index(1) | 12.73% | 14.47% | 8.01% |
| (1) | The Standard & Poor’s 500 Index (“S&P”) is a capitalization-weighted index, representing the aggregate market value of the common equity of 500 stocks primarily traded on the New York Stock Exchange. Returns shown include the reinvestment of all dividends. Past performance is not predictive of future performance. The table does not reflect the deduction of taxes that a shareholder would pay on fund distributions or the redemption of fund shares. Investment return and principal value will fluctuate, so that your shares, when redeemed, may be worth more or less than the original cost. |
As stated in the Prospectus dated January 31, 2015 the expense ratio of the Fund is 1.59%.
Web Site
Our website is reynoldsfunds.com. At our website you can access current information about your investment holdings. You must first request a personal identification number (PIN) by calling our shareholder service representatives at 1-800-773-9665. You will be able to view your account list, account detail (including balances), transaction history, distributions, and the current Reynolds Blue Chip Growth Fund net asset value. Additional information available (PIN not needed) includes quarterly updates of the returns of the Blue Chip Fund, top ten holdings, industry percentages, and news articles regarding the Fund. Detailed statistics and graphs of past performances from Morningstar are also available via a link on the Fund’s website.
Investment Strategy
We believe that stocks are currently selling at attractive valuations based on historical valuation measures. One of these valuation measures is a company’s price earnings ratio (the “PE ratio”) relative to inflation, interest rates and the economic outlook. Another valuation measure is a company’s PE ratio relative to its forecasted earnings growth rate (the “PEG ratio”). Many stocks of high quality companies are currently selling at PE ratios and PEG ratios below their average historical ranges and we believe that they are attractively valued.
The U.S. Economy
The U.S. economic recovery that started in mid-2009 has continued so far in 2015. The U.S. economic recovery has been affected by a number of secular factors that are altering the pace and composition of growth. The U.S. economy in
- 1 -
2015 has been affected by low inflation, slowing consumer spending and a higher saving rate, higher than normal unemployment, greater prudence and less speculation in lending; and, although the U.S. economy is growing, it is growing at a lower than ideal rate. For example, growth of 3.0% or better is needed to meaningfully reduce unemployment. Currently, unemployment is around 5.4%. The Federal Reserve’s third round of economic stimulus, which involved purchasing open-ended mortgage-backed securities, has ended. This stimulus lowered longer term interest rates and added to economic growth. U.S. Gross Domestic Product (GDP) increased 2.4% in 2014, 2.2% in 2013 and 2.3% in 2012. GDP increased at an estimated inflation-adjusted annual rate of 0.1% in the quarter ended March 31, 2015. GDP is estimated to increase at an inflation-adjusted annual rate of 1.6% in the quarter ended June 30, 2015 and increase 2.3% for the year ended December 31, 2015. For 2015, the outlook remains for slower than ideal growth, accompanied by somewhat higher than normal unemployment, low inflation, a strong private sector and a weaker public sector.
U.S. inflation numbers have been helped in the last few years by global competition and technology innovations that are helping to lower production and distribution costs. Inflation, as measured by the Consumer Price Index, increased 1.6% in 2014, 1.5% in 2013 and 2.1% in 2012. U.S. inflation decreased at a -0.1% rate in the first quarter of 2015. U.S. inflation is forecast to decrease at a -0.1% rate in the quarter ending June 30, 2015 and to increase 0.2% for the year ended December 31, 2015.
There are some current and potential economic and investment negatives at the present time: (1) worldwide economic growth continues at a slower than ideal rate; (2) growth in Japan, Brazil and Russia has been weaker than many other areas; (3) although continuing to improve, unemployment at 5.4% is still high; (4) mortgage rates are low, but mortgage credit is still somewhat tight; (5) the manufacturing sector remains mixed; (6) the U.S. trade deficit has expanded; (7) a widening disparity between higher and lower income levels; and (8) problems with Russia and the Ukraine, the Middle East and other parts of the world.
Some current and potential economic and investment positives are: (1) monetary policy and financial conditions generally are very supportive of growth; (2) the U.S. economy has grown in the last twenty-two quarters and growth should continue in 2015; (3) many companies have recently reported better than expected first quarter earnings and revenues; (4) the rise in residential property values and in stock market prices has added to net worth and households have strengthened their balance sheets; (5) employment and payrolls are increasing with unemployment currently at 5.4%, the lowest in more than seven years; (6) although the Federal Reserve probably will be raising interest rates later this year, interest rates will still be very low by historical standards; (7) gasoline prices are lower; (8) there has been an increase in the willingness of companies to commit capital as evidenced by the increase in merger and acquisition activity; (9) businesses have been able to use the credit markets to strengthen their balance sheets; (10) current valuations of stocks are below the midpoint of the historical average taking into consideration inflation and interest rates; (11) the U.S. economy currently has better fundamentals than the economies of most other industrialized countries; (12) the Eurozone economy is showing better numbers, (13) China recently announced stimulus for their economy; (14) central banks worldwide continue with monetary stimulus to boost growth; and (15) worldwide economic growth does not appear to be strong enough to lead to a significant rise in global inflationary pressures.
The World Economy
The global economic recovery that started in mid-2009 is continuing in 2015, although at a low rate. The world economy is forecast to increase 3.0% in 2015 after increasing 2.7% in 2014, 3.0% in 2013 and 2.7% in 2012.
The Eurozone continues to show some better numbers. The Eurozone’s GDP is forecast to increase 1.5% in 2015, after increasing 0.9% in 2014, decreasing -0.4% in 2013 and decreasing -0.5% in 2012. The United Kingdom’s GDP is forecast to increase 2.2% in 2015 after increasing 2.8% in 2014, 1.7% in 2013 and 0.3% in 2012.
Among larger industrialized economies, Canada’s GDP is forecast to increase 1.9% in 2015 after increasing 2.5% in 2014, 2.0% in 2013 and 1.8% in 2012. Japan’s GDP is forecast to increase 1.1% in 2015 after decreasing -0.1% in 2014,
- 2 -
increasing 1.5% in 2013 and increasing 1.9% in 2012. Korea’s GDP is forecast to increase 2.6% in 2015 after increasing 3.3% in 2014, 3.0% in 2013 and 2.0% in 2012.
The biggest developing economies are many times referred to as the “BRIC” economy, which is short for Brazil, Russia, India, and China.
China currently has the second strongest growth among “developing economies.” It is also currently the world’s second fastest growing major economy. China’s population is approximately 18% of the world’s total population of approximately 7.3 billion. In the second quarter of 2010, China overtook Japan and became the world’s second largest economy after the U.S. Many economists believe that China has a particularly good long-term outlook. Near term, however, there have been cross currents in China’s economic outlook and growth has been slowing, although economic growth is at a high rate. China’s GDP is forecast to increase 6.5% in 2015 after increasing 7.4% in 2014, 7.1% in 2013 and 7.7% in 2012.
India’s population is approximately 17% of the world’s population. India currently has the fastest growth among “developing economies” and it currently is the world’s fastest growing major economy. India’s GDP is forecast to increase 7.4% in 2015 after increasing 6.9% in 2014, 4.6% in 2013 and 5.0% in 2012.
Brazil is Latin America’s biggest economy. GDP is forecast to decrease -1.2% in 2015 after increasing 0.1% in 2014, 2.3% in 2013 and 0.9% in 2012. Russia’s GDP is forecast to decrease -3.5% in 2015 after increasing 0.7% in 2014, 1.0% in 2013 and 3.4% in 2012.
Opportunistic Investing in Companies of Various Sizes and Diversified Among Various Industries
The Reynolds Blue Chip Growth Fund usually invests in companies of various sizes as classified by their market capitalizations. A company’s market capitalization is calculated by taking the number of shares the company has outstanding multiplied by its current market price. Other considerations in selecting companies for the Fund include revenue growth rates, product innovations, financial strength, management’s knowledge and experience, plus the overall economic and geopolitical environments and interest rates. The Fund’s investments are diversified among various industries.
The long-term strategy of the Reynolds Blue Chip Growth Fund is to emphasize investment in worldwide “blue chip” growth companies. These companies are defined as companies with a minimum market capitalization of U.S. $1 billion. In the long-term, these companies build value as their earnings grow. This growth in value should ultimately be recognized in higher stock prices for these companies.
Industry Sectors(1) as of March 31, 2015
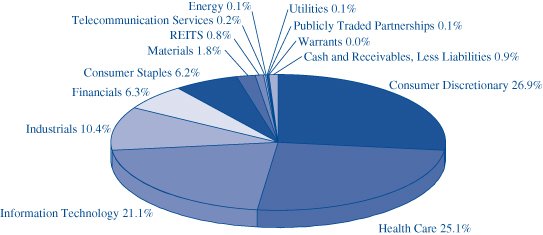
| (1) | The Global Industry Classification Standard (“GICS®”) was developed by and/or is the exclusive property of MSCI, Inc. and Standard & Poor’s Financial Services LLC (“S&P”). GICS® is a service mark of MSCI and S&P and has been licensed for use by U.S. Bancorp Fund Services, LLC. |
- 3 -
Low Long-Term Interest Rates by Historical Standards are a Significant Positive for Stock Valuations
Long-term interest rates remain near historically low levels. Low long-term interest rates usually result in higher stock valuations for many reasons including:
| (1) | Long-term borrowing costs of corporations are lower resulting in higher business confidence and profits. | |
| (2) | Long-term borrowing costs of individuals are lower which increases consumer confidence and spending. | |
| (3) | A company’s stock is usually valued by placing a present value on that company’s future stream of earnings and dividends. The present value is higher when interest and inflation rates are low. |
Linked Money Market Fund
The First American Treasury Obligations Fund is a money market fund offered by an affiliate of our transfer agent, U.S. Bancorp Fund Services, LLC. The First American Treasury Obligations Fund is offered as a money market alternative to our shareholders. The First American Treasury Obligations Fund offers many free shareholder conveniences including automatic investment and withdrawal plans and check writing access to your funds and is linked to your holdings in the Reynolds Blue Chip Growth Fund. The First American Treasury Obligations Fund is also included on your quarterly statements.
Information about the Reynolds Blue Chip Growth Fund and the First American Treasury Obligations Fund
Reynoldsfunds.com website: You can access current information about your investment holdings via our website, reynoldsfunds.com. You will be able to view your account list, account detail (including balances), transaction history, distributions, and the current Reynolds Blue Chip Growth Fund net asset value. Additional information available (PIN not needed) includes quarterly updates of the returns of the Blue Chip Fund, top ten holdings, industry percentages, and news articles regarding the Fund. Detailed statistics and graphs of past performances from Morningstar are also available via a link on the Fund’s website.
For automatic current daily net asset values: Call 1-800-773-9665 (1-800-7REYNOLDS) twenty-four hours a day, seven days a week and press “any key” then “1”. The updated current net asset value for the Blue Chip Fund is usually available each business day after 5 P.M. (PST).
For the Reynolds Blue Chip Growth Fund shareholders to automatically access their current account information: Call 1-800-773-9665 (twenty-four hours a day, seven days a week), press “any key” then “2” and enter your 16 digit account number which appears at the top right of your statement.
To speak to a Fund representative regarding the current daily net asset value, current account information and any other questions: Call 1-800-773-9665 and press “0” from 6 A.M. to 5 P.M. (PST).
Shareholder statement frequency: Consolidated statements summarizing the Blue Chip Fund and First American Treasury Obligations Fund accounts held by a shareholder are sent quarterly. In addition, individual Blue Chip Fund statements are sent whenever a transaction occurs. These transactions are: (1) statements are sent for the Blue Chip Fund or First American Treasury Obligations Fund when a shareholder purchases or redeems shares; (2) Blue Chip Fund statements are sent if, and when, any ordinary income or capital gains are distributed.
Tax reporting: Individual 1099 forms, which summarize any dividend income and any long- or short-term capital gains, are sent annually to shareholders each January. The percentage of income earned from various government securities, if any, for the Blue Chip Fund and the First American Treasury Obligations Fund are also reported in January.
Minimum investment: $1,000 for regular and retirement accounts ($100 for additional investments for all accounts – except for the Automatic Investment Plan, which is $50 for regular and retirement plan accounts).
Retirement plans: All types are offered including Traditional IRA, Roth IRA, Coverdell Education Savings Account, SIMPLE IRA Plan, and SEP IRA.
- 4 -
Automatic Investment Plan: There is no charge to automatically debit your checking account to invest in the Blue Chip Fund or the First American Treasury Obligations Fund ($50 minimum for either of these Funds) at periodic intervals to make automatic purchases in either of these Funds. This is useful for dollar cost averaging for the Blue Chip Fund.
Systematic Withdrawal Plan: For shareholders with a $10,000 minimum starting balance, there is no charge to automatically redeem shares ($100 minimum) in the Blue Chip Fund or the First American Treasury Obligations Fund as often as monthly and send a check to you or transfer funds to your bank account.
Free Check Writing: Free check writing ($100 minimum) is offered for accounts invested in the First American Treasury Obligations Fund.
Exchanges or regular redemptions between the Blue Chip Fund and the First American Treasury Obligations Fund: As often as desired – no charge.
NASDAQ symbols: Reynolds Blue Chip Growth Fund – RBCGX and First American Treasury Obligations Fund – FATXX.
Portfolio Manager: Frederick Reynolds is the portfolio manager of the Reynolds Blue Chip Growth Fund. He has been the portfolio manager of the Fund since its inception in 1988.
The Reynolds Blue Chip Growth Fund and the First American Treasury Obligations Fund are No-Load: No front-end sales commissions or deferred sales charges (“loads”) are charged. Some mutual funds impose these marketing charges that are ultimately paid by the shareholder. These marketing charges are either: (1) a front-end fee or “load” in which up to 5% of a shareholder’s assets are deducted from the original investment (some funds even charge a fee when a shareholder reinvests capital gains or dividends); or (2) a back-end penalty fee or “load” which is typically deducted from a shareholder’s account if a shareholder redeems within five years of the original investment. These fees reduce a shareholder’s return. The Reynolds Blue Chip Fund and the First American Treasury Obligations Fund are No-Load as they do not have these extra charges.
We appreciate your continued confidence in the Reynolds Blue Chip Growth Fund and would like to welcome our new shareholders. We look forward to strong results in the future.
Sincerely,

Frederick L. Reynolds
President
This report is not authorized for use as an offer of sale or a solicitation of an offer to buy shares of the Reynolds Blue Chip Growth Fund unless accompanied or preceded by the Fund’s current prospectus.
Performance data quoted represents past performance; past performance does not guarantee future results. The investment return and principal value of an investment will fluctuate so that an investor’s shares, when redeemed, may be worth more or less than their original cost. Current performance of the Fund may be lower or higher than the performance quoted. Returns do not reflect the deduction of taxes that a shareholder would pay on Fund distributions or the redemption of Fund shares. Performance data current to the most recent month-end may be obtained by visiting www.reynoldsfunds.com or by calling 1-800-773-9665.
- 5 -
Investors in the Fund may lose money. There are risks associated with investments in the types of securities in which the Fund invests. These risks include:
Market Risk – The prices of the stocks in which the Fund invests may decline for a number of reasons. These reasons include factors that are specific to one or more stocks in which the Fund invests as well as factors that affect the equity securities markets generally. The price declines may be steep, sudden and/or prolonged.
Growth Investing Risk – The investment adviser may be wrong in its assessment of a company’s potential for growth and the growth stocks the Fund holds may not grow as the investment adviser anticipates. Finally, there are periods when investing in growth stocks falls out of favor with investors and these stocks may underperform.
Smaller and Medium Capitalization Companies Risk – The Fund invests in smaller companies, which involve additional risks such as limited liquidity and greater volatility.
Foreign Securities Risk – The Fund invests in foreign securities which involve greater volatility and political, economic and currency risks and different accounting methods.
Additional risks associated with investing in the Fund are as follows: Technology Companies Risk, Consumer Discretionary Companies Risk, and Portfolio Turnover Risk. For details regarding these risks, please refer to the Fund’s Prospectus or Summary Prospectus dated January 31, 2015.
For additional information about the Directors and Officers or for a description of the policies and procedures that the Fund uses to determine how to vote proxies relating to portfolio securities, please call (800) 773-9665 and request a Statement of Additional Information. One will be mailed to you free of charge. The Statement of Additional Information is also available on the website of the Securities and Exchange Commission (the “Commission”) at http://www.sec.gov. Information on how the Fund voted proxies relating to portfolio securities is available on the Fund’s website at http://www.reynoldsfunds.com or the website of the Commission no later than August 31 for the prior 12 months ending June 30. The Fund files its complete schedule of portfolio holdings with the Commission for the first and third quarters of each fiscal year on Form N-Q. The Fund’s Form N-Q is available on the Commission’s website. The Fund’s Form N-Q may be reviewed and copied at the Commission’s Public Reference Room in Washington, D.C., and that information on the operation of the Public Reference Room may be obtained by calling 1-800-SEC-0330.
Distributed by Rafferty Capital Markets, LLC
- 6 -
Reynolds Blue Chip Growth Fund
EXPENSE EXAMPLE (Unaudited)
As a shareholder of the Reynolds Blue Chip Growth Fund, you do not incur (except as described below) transaction costs, including sales charges (loads) on purchase payments, reinvested dividends, or other distributions; redemption fees; and exchange fees, but do incur ongoing costs, including management fees; distribution and/or service (12b-1) fees; and other Fund expenses. This example is intended to help you understand your ongoing costs (in dollars) of investing in the Fund and to compare these costs with the ongoing costs of investing in other mutual funds.
The example is based on an investment of $1,000 invested at the beginning of the period and held for the entire period from October 1, 2014 through March 31, 2015.
Actual Expenses
The first line of the table below provides information about actual account values and actual expenses. You may use the information in this line, together with the amount you invested, to estimate the expenses that you paid over the period. Simply divide your account value by $1,000 (for example, an $8,600 account value divided by $1,000 = 8.6), then multiply the result by the number in the first line under the heading entitled “Expenses Paid During Period” to estimate the expenses you paid on your account during this period.
In addition to the costs highlighted and described below, the only Fund transaction costs you might currently incur would be wire fees ($15 per wire), if you choose to have proceeds from a redemption wired to your bank account instead of receiving a check. Additionally, U.S. Bank charges an annual processing fee ($15) if you maintain an IRA account with the Fund. To determine your total costs of investing in the Fund, you would need to add any applicable wire or IRA processing fees you’ve incurred during the period to the costs provided in the example below.
Hypothetical Example for Comparison Purposes
The second line of the table below provides information about hypothetical account values and hypothetical expenses based on the Fund’s actual expense ratio and an assumed rate of return of 5% per year before expenses, which is not the Fund’s actual return. The hypothetical account values and expenses may not be used to estimate the actual ending account balance or expenses you paid for the period. You may use this information to compare the ongoing costs of investing in the Fund and other funds. To do so, compare this 5% hypothetical example with the 5% hypothetical examples that appear in the shareholder reports of the other funds.
Please note that the expenses shown in the table are meant to highlight your ongoing costs only and do not reflect any transactional costs, such as sales charges (loads), redemption or exchange fees. Therefore, the second line of the table is useful in comparing ongoing costs only, and will not help you determine the relative total costs of owning different funds. In addition, if these transactional costs were included, your costs would have been higher.
| Beginning Account | Ending Account | Expenses Paid During | |
| Value 10/01/14 | Value 3/31/15 | Period* 10/01/14-3/31/15 | |
| Reynolds Blue Chip Growth Fund Actual | $1,000.00 | $1,052.80 | $8.60 |
| Hypothetical (5% return before expenses) | $1,000.00 | $1,016.56 | $8.45 |
| * | Expenses are equal to the Fund’s annualized expense ratio of 1.68% multiplied by the average account value over the period, multiplied by 182/365 (to reflect the one-half year period between October 1, 2014 and March 31, 2015). |
- 7 -
Reynolds Blue Chip Growth Fund
STATEMENT OF ASSETS AND LIABILITIES
March 31, 2015 (Unaudited)
| ASSETS: | ||||
| Investments in securities, at value (cost $101,291,409) | $ | 133,124,572 | ||
| Cash | 130,942 | |||
| Receivable from investments sold | 3,085,161 | |||
| Prepaid expenses | 91,337 | |||
| Dividends receivable | 70,046 | |||
| Receivable from shareholders for purchases | 40,002 | |||
| Other receivables | 1,139 | |||
| Total assets | 136,543,199 | |||
| LIABILITIES: | ||||
| Payable for investments purchased | 1,871,679 | |||
| Payable to adviser for management fees | 110,514 | |||
| Payable to shareholders for redemptions | 91,610 | |||
| Payable for distribution expenses | 16,380 | |||
| Other liabilities | 164,791 | |||
| Total liabilities | 2,254,974 | |||
| NET ASSETS | $ | 134,288,225 | ||
| NET ASSETS CONSIST OF: | ||||
| Capital Stock, $0.01 par value; 40,000,000 shares authorized; 2,222,188 shares outstanding | $ | 95,666,210 | ||
| Net unrealized appreciation on investments | 31,833,163 | |||
| Accumulated undistributed net realized gain on investments | 7,180,085 | |||
| Accumulated undistributed net investment loss | (391,233 | ) | ||
| Net assets | $ | 134,288,225 | ||
| CALCULATION OF NET ASSET VALUE PER SHARE: | ||||
| Net asset value, offering and redemption price per share ($134,288,225 ÷ 2,222,188 shares outstanding) | $ | 60.43 | ||
SCHEDULE OF INVESTMENTS
March 31, 2015 (Unaudited)
| Shares | Value | ||||||
| LONG-TERM INVESTMENTS — 99.1% (a) | |||||||
| COMMON STOCKS — 98.2% (a) | |||||||
| Aerospace & Defense — 2.1% | |||||||
| 2,200 | The Boeing Company | $ | 330,176 | ||||
| 400 | Esterline Technologies Corporation* | 45,768 | |||||
| 2,900 | GenCorp, Inc.* | 67,251 | |||||
| 600 | General Dynamics Corporation | 81,438 | |||||
| 4,800 | Hexcel Corporation | 246,816 | |||||
| 600 | Honeywell International, Inc. | 62,586 | |||||
| 700 | L-3 Communications Holdings, Inc. | 88,053 | |||||
| 1,400 | Lockheed Martin Corporation | 284,144 | |||||
| 2,000 | Northrop Grumman Corporation | 321,920 | |||||
| 1,000 | Raytheon Company | 109,250 | |||||
| 4,400 | Rockwell Collins, Inc. | 424,820 | |||||
| 5,600 | Spirit AeroSystems | ||||||
| Holdings, Inc., Class A* | 292,376 | ||||||
| 4,400 | Textron, Inc. | 195,052 | |||||
| 600 | TransDigm Group, Inc. | 131,232 | |||||
| 700 | United Technologies Corporation | 82,040 | |||||
| 2,762,922 | |||||||
| Air Freight & Logistics — 0.6% | |||||||
| 900 | C.H. Robinson Worldwide, Inc. | 65,898 | |||||
| 1,400 | Expeditors International of Washington, Inc. | 67,452 | |||||
The accompanying notes are an integral part of these financial statements.
- 8 -
Reynolds Blue Chip Growth Fund
SCHEDULE OF INVESTMENTS (Continued)
March 31, 2015 (Unaudited)
| Shares | Value | ||||||
| LONG-TERM INVESTMENTS — 99.1% (a) (Continued) | |||||||
| COMMON STOCKS — 98.2% (a) (Continued) | |||||||
| Air Freight & Logistics — 0.6% (Continued) | |||||||
| 3,100 | FedEx Corporation | $ | 512,895 | ||||
| 1,600 | United Parcel Service, Inc., Class B | 155,104 | |||||
| 801,349 | |||||||
| Airlines — 2.9% | |||||||
| 8,400 | Alaska Air Group, Inc. | 555,912 | |||||
| 5,300 | Allegiant Travel Company | 1,019,137 | |||||
| 3,400 | American Airlines Group, Inc. | 179,452 | |||||
| 1,400 | China Eastern Airlines | ||||||
| Corporation, Ltd. - ADR* | 44,730 | ||||||
| 1,400 | China Southern Airlines | ||||||
| Company, Ltd. - SP-ADR | 50,456 | ||||||
| 3,900 | Delta Air Lines, Inc. | 175,344 | |||||
| 13,700 | Hawaiian Holdings, Inc.* | 301,742 | |||||
| 11,200 | JetBlue Airways Corporation* | 215,600 | |||||
| 3,400 | SkyWest, Inc. | 49,674 | |||||
| 14,300 | Southwest Airlines Company | 633,490 | |||||
| 6,400 | Spirit Airlines, Inc.* | 495,104 | |||||
| 3,400 | United Continental Holdings, Inc.* | 228,650 | |||||
| 3,949,291 | |||||||
| Auto Components — 0.2% | |||||||
| 400 | Autoliv, Inc. | 47,108 | |||||
| 700 | BorgWarner, Inc. | 42,336 | |||||
| 1,400 | The Goodyear Tire & Rubber Company | 37,912 | |||||
| 800 | Lear Corporation | 88,656 | |||||
| 216,012 | |||||||
| Automobiles — 0.8% | |||||||
| 500 | Harley-Davidson, Inc. | 30,370 | |||||
| 1,000 | HONDA MOTOR COMPANY, | ||||||
| Ltd. - SP-ADR | 32,760 | ||||||
| 4,000 | Tesla Motors, Inc.* | 755,080 | |||||
| 1,500 | TOYOTA MOTOR | ||||||
| CORPORATION - SP-ADR | 209,835 | ||||||
| 1,028,045 | |||||||
| Banks — 1.1% | |||||||
| 12,200 | Bank of America Corporation | 187,758 | |||||
| 2,600 | Citigroup, Inc. | 133,952 | |||||
| 4,300 | East West Bancorp, Inc. | 173,978 | |||||
| 700 | First Republic Bank | 39,963 | |||||
| 4,200 | Huntington Bancshares, Inc. | 46,410 | |||||
| 2,900 | JPMorgan Chase & Company | 175,682 | |||||
| 1,800 | KeyCorp | 25,488 | |||||
| 1,100 | Signature Bank* | 142,538 | |||||
| 1,400 | SunTrust Banks, Inc. | 57,526 | |||||
| 5,500 | U.S. Bancorp | 240,185 | |||||
| 3,700 | Webster Financial Corporation | 137,085 | |||||
| 1,600 | Wells Fargo & Company | 87,040 | |||||
| 1,447,605 | |||||||
| Beverages — 1.5% | |||||||
| 1,800 | Anheuser-Busch InBev N.V. - SP-ADR | 219,438 | |||||
| 1,600 | Coca-Cola Bottling Company Consolidated | 180,896 | |||||
| 700 | The Coca-Cola Company | 28,385 | |||||
| 2,400 | Constellation Brands, Inc., Class A* | 278,904 | |||||
| 6,100 | Dr. Pepper Snapple Group, Inc. | 478,728 | |||||
| 400 | Fomento Economico Mexicano, | ||||||
| S.A.B. de C.V. - SP-ADR* | 37,400 | ||||||
| 3,100 | Monster Beverage Corporation* | 429,025 | |||||
| 3,700 | PepsiCo, Inc. | 353,794 | |||||
| 2,006,570 | |||||||
| Biotechnology — 8.9% | |||||||
| 2,300 | ACADIA Pharmaceuticals, Inc.* | 74,957 | |||||
| 5,100 | Alexion Pharmaceuticals, Inc.* | 883,830 | |||||
| 10,200 | Alkermes plc* | 621,894 | |||||
| 600 | AMAG Pharmaceuticals, Inc.* | 32,796 | |||||
| 4,300 | Amgen, Inc. | 687,355 | |||||
| 4,500 | Arena Pharmaceuticals, Inc.* | 19,665 | |||||
| 5,400 | ARIAD Pharmaceuticals, Inc.* | 44,496 | |||||
| 3,400 | Biogen Idec, Inc.* | 1,435,616 | |||||
| 3,800 | BioMarin Pharmaceutical, Inc.* | 473,556 | |||||
| 12,600 | Celgene Corporation* | 1,452,528 | |||||
| 3,400 | Celldex Therapeutics, Inc.* | 94,758 | |||||
| 900 | Cepheid, Inc.* | 51,210 | |||||
| 400 | China Biologic Products, Inc.* | 38,204 | |||||
| 900 | Clovis Oncology, Inc.* | 66,807 | |||||
| 400 | Esperion Therapeutics, Inc.* | 37,040 | |||||
| 5,000 | Exelixis, Inc.* | 12,850 | |||||
| 10,500 | Gilead Sciences, Inc.* | 1,030,365 | |||||
| 4,500 | Incyte Corporation* | 412,470 | |||||
| 1,800 | Infinity Pharmaceuticals, Inc.* | 25,164 | |||||
| 1,200 | Intercept Pharmaceuticals, Inc.* | 338,424 | |||||
| 800 | Intrexon Corporation* | 36,296 | |||||
| 7,100 | Isis Pharmaceuticals, Inc.* | 452,057 | |||||
| 300 | Juno Therapeutics, Inc.* | 18,198 | |||||
| 500 | Kite Pharma, Inc.* | 28,840 | |||||
| 2,800 | Medivation, Inc.* | 361,396 | |||||
| 1,000 | Myriad Genetics, Inc.* | 35,400 | |||||
| 700 | Neurocrine Biosciences, Inc.* | 27,797 | |||||
| 4,100 | NewLink Genetics Corporation* | 224,311 | |||||
The accompanying notes are an integral part of these financial statements.
- 9 -
Reynolds Blue Chip Growth Fund
SCHEDULE OF INVESTMENTS (Continued)
March 31, 2015 (Unaudited)
| Shares | Value | ||||||
| LONG-TERM INVESTMENTS — 99.1% (a) (Continued) | |||||||
| COMMON STOCKS — 98.2% (a) (Continued) | |||||||
| Biotechnology — 8.9% (Continued) | |||||||
| 6,800 | Orexigen Therapeutics, Inc.* | $ | 53,244 | ||||
| 2,400 | PDL BioPharma, Inc. | 16,884 | |||||
| 200 | Puma Biotechnology, Inc.* | 47,222 | |||||
| 1,500 | Receptos, Inc.* | 247,335 | |||||
| 2,000 | Regeneron Pharmaceuticals, Inc.* | 902,960 | |||||
| 4,000 | Repligen Corporation* | 121,440 | |||||
| 2,200 | Sarepta Therapeutics, Inc.* | 29,216 | |||||
| 2,500 | Seattle Genetics, Inc.* | 88,375 | |||||
| 800 | Synageva BioPharma Corporation* | 78,024 | |||||
| 1,400 | Tekmira Pharmaceuticals Corporation* | 24,444 | |||||
| 3,000 | United Therapeutics Corporation* | 517,305 | |||||
| 6,500 | Vertex Pharmaceuticals, Inc.* | 766,805 | |||||
| 11,911,534 | |||||||
| Building Products — 0.5% | |||||||
| 1,500 | A.O. Smith Corporation | 98,490 | |||||
| 900 | Advanced Drainage Systems, Inc. | 26,946 | |||||
| 3,200 | Lennox International, Inc. | 357,408 | |||||
| 6,400 | Masco Corporation | 170,880 | |||||
| 1,000 | Owens Corning | 43,400 | |||||
| 697,124 | |||||||
| Capital Markets — 2.3% | |||||||
| 400 | Affiliated Managers Group, Inc.* | 85,912 | |||||
| 300 | Ameriprise Financial, Inc. | 39,252 | |||||
| 4,700 | The Bank of New York | ||||||
| Mellon Corporation | 189,128 | ||||||
| 300 | BlackRock, Inc. | 109,752 | |||||
| 13,900 | The Charles Schwab Corporation | 423,116 | |||||
| 18,100 | E*TRADE Financial Corporation* | 516,845 | |||||
| 500 | Franklin Resources, Inc. | 25,660 | |||||
| 1,400 | The Goldman Sachs Group, Inc. | 263,158 | |||||
| 1,400 | Interactive Brokers Group, Inc., Class A | 47,628 | |||||
| 1,500 | Invesco, Ltd. | 59,535 | |||||
| 4,500 | Investment Technology Group, Inc.* | 136,395 | |||||
| 5,300 | Janus Capital Group, Inc. | 91,107 | |||||
| 2,600 | Legg Mason, Inc. | 143,520 | |||||
| 6,800 | Morgan Stanley | 242,692 | |||||
| 1,000 | Piper Jaffray Companies, Inc.* | 52,460 | |||||
| 2,400 | Raymond James Financial, Inc. | 136,272 | |||||
| 4,600 | SEI Investments Company | 202,814 | |||||
| 6,400 | TD Ameritrade Holding Corporation | 238,464 | |||||
| 500 | Waddell & Reed Financial, Inc., Class A | 24,770 | |||||
| 3,028,480 | |||||||
| Chemicals — 1.5% | |||||||
| 1,800 | Ecolab, Inc. | 205,884 | |||||
| 1,100 | International Flavors & Fragrances, Inc. | 129,140 | |||||
| 2,400 | Monsanto Company | 270,096 | |||||
| 4,600 | RPM International, Inc. | 220,754 | |||||
| 3,900 | The Scotts Miracle-Gro Company, Class A | 261,963 | |||||
| 2,000 | The Sherwin-Williams Company | 569,000 | |||||
| 1,000 | Sigma-Aldrich Corporation | 138,250 | |||||
| 2,800 | The Valspar Corporation | 235,284 | |||||
| 2,030,371 | |||||||
| Commercial Services & Supplies — 1.0% | |||||||
| 8,300 | Cintas Corporation | 677,529 | |||||
| 2,400 | KAR Auction Services, Inc. | 91,032 | |||||
| 2,700 | Rollins, Inc. | 66,771 | |||||
| 2,500 | Stericycle, Inc.* | 351,075 | |||||
| 1,900 | Waste Connections, Inc. | 91,466 | |||||
| 1,277,873 | |||||||
| Communications Equipment — 1.2% | |||||||
| 700 | Aruba Networks, Inc.* | 17,143 | |||||
| 15,900 | Brocade Communications Systems, Inc. | 188,654 | |||||
| 4,300 | Ciena Corporation* | 83,033 | |||||
| 10,000 | Cisco Systems, Inc. | 275,250 | |||||
| 3,500 | F5 Networks, Inc.* | 402,290 | |||||
| 2,200 | Finisar Corporation* | 46,948 | |||||
| 4,300 | Infinera Corporation* | 84,581 | |||||
| 1,700 | Palo Alto Networks, Inc.* | 248,336 | |||||
| 1,200 | Plantronics, Inc. | 63,540 | |||||
| 2,000 | QUALCOMM, Inc. | 138,680 | |||||
| 1,800 | Ruckus Wireless, Inc.* | 23,166 | |||||
| 700 | ViaSat, Inc.* | 41,727 | |||||
| 1,613,348 | |||||||
| Construction Materials — 0.1% | |||||||
| 1,000 | Vulcan Materials Company | 84,300 | |||||
| Consumer Finance — 0.1% | |||||||
| 800 | American Express Company | 62,496 | |||||
| 900 | Capital One Financial Corporation | 70,938 | |||||
| 600 | Discover Financial Services | 33,810 | |||||
| 167,244 | |||||||
| Containers & Packaging — 0.1% | |||||||
| 1,300 | Crown Holdings, Inc.* | 70,226 | |||||
| 2,500 | Sealed Air Corporation | 113,900 | |||||
| 184,126 | |||||||
| Distributors — 0.2% | |||||||
| 3,600 | Genuine Parts Company | 335,484 | |||||
The accompanying notes are an integral part of these financial statements.
- 10 -
Reynolds Blue Chip Growth Fund
SCHEDULE OF INVESTMENTS (Continued)
March 31, 2015 (Unaudited)
| Shares | Value | ||||||
| LONG-TERM INVESTMENTS — 99.1% (a) (Continued) | |||||||
| COMMON STOCKS — 98.2% (a) (Continued) | |||||||
| Electrical Equipment — 0.2% | |||||||
| 1,800 | Sensata Technologies Holding N.V.* | $ | 103,410 | ||||
| 2,700 | SolarCity Corporation* | 138,456 | |||||
| 241,866 | |||||||
| Electronic Equipment, | |||||||
| Instruments & Components — 0.8% | |||||||
| 6,100 | Amphenol Corporation, Class A | 359,473 | |||||
| 9,600 | Flextronics International, Ltd.* | 121,680 | |||||
| 4,100 | Jabil Circuit, Inc. | 95,858 | |||||
| 1,120 | Methode Electronics, Inc. | 52,685 | |||||
| 1,100 | TE Connectivity, Ltd. | 78,782 | |||||
| 2,200 | Universal Display Corporation* | 102,850 | |||||
| 2,900 | Zebra Technologies Corporation, Class A* | 263,073 | |||||
| 1,074,401 | |||||||
| Energy Equipment & Services — 0.0% | |||||||
| 500 | Schlumberger, Ltd. | 41,720 | |||||
| 1,400 | Transocean, Ltd. | 20,538 | |||||
| 62,258 | |||||||
| Financial Services – Diversified — 1.4% | |||||||
| 7,300 | Berkshire Hathaway, Inc., Class B* | 1,053,536 | |||||
| 2,000 | CME Group, Inc. | 189,420 | |||||
| 1,600 | IntercontinentalExchange Group, Inc. | 373,232 | |||||
| 800 | Moody’s Corporation | 83,040 | |||||
| 3,200 | The NASDAQ OMX Group, Inc. | 163,008 | |||||
| 1,862,236 | |||||||
| Food & Staples Retailing — 2.6% | |||||||
| 10,700 | Costco Wholesale Corporation | 1,620,997 | |||||
| 11,700 | CVS Health Corporation | 1,207,557 | |||||
| 1,100 | The Kroger Company | 84,326 | |||||
| 3,600 | SUPERVALU, Inc.* | 41,868 | |||||
| 1,400 | United Natural Foods, Inc.* | 107,856 | |||||
| 2,600 | Walgreens Boots Alliance, Inc. | 220,168 | |||||
| 4,600 | Whole Foods Market, Inc. | 239,568 | |||||
| 3,522,340 | |||||||
| Food Products — 0.9% | |||||||
| 800 | Archer-Daniels-Midland Company | 37,920 | |||||
| 600 | General Mills, Inc. | 33,960 | |||||
| 3,300 | The Hain Celestial Group, Inc.* | 211,365 | |||||
| 800 | The J.M. Smucker Company | 92,584 | |||||
| 2,500 | Keurig Green Mountain, Inc. | 279,325 | |||||
| 1,600 | McCormick & Company, Inc., | ||||||
| Non Voting Shares | 123,376 | ||||||
| 2,100 | Mead Johnson Nutrition Company | 211,113 | |||||
| 4,100 | WhiteWave Foods Company* | 181,794 | |||||
| 1,171,437 | |||||||
| Health Care Equipment & Supplies — 3.6% | |||||||
| 9,100 | Abbott Laboratories | 421,603 | |||||
| 2,300 | ABIOMED, Inc.* | 164,634 | |||||
| 2,300 | Align Technology, Inc.* | 123,705 | |||||
| 1,600 | Becton, Dickinson and Company | 229,744 | |||||
| 11,200 | Boston Scientific Corporation* | 198,800 | |||||
| 600 | C.R. Bard, Inc. | 100,410 | |||||
| 500 | Cyberonics, Inc.* | 32,460 | |||||
| 4,800 | Edwards Lifesciences Corporation* | 683,808 | |||||
| 1,600 | Hologic, Inc.* | 52,840 | |||||
| 2,500 | IDEXX Laboratories, Inc.* | 386,200 | |||||
| 1,900 | Integra LifeSciences Holdings* | 117,135 | |||||
| 400 | Intuitive Surgical, Inc.* | 202,012 | |||||
| 6,707 | Medtronic plc | 523,079 | |||||
| 3,900 | ResMed, Inc. | 279,942 | |||||
| 900 | Sirona Dental Systems, Inc.* | 80,991 | |||||
| 6,800 | The Spectranetics Corporation* | 236,368 | |||||
| 1,600 | STERIS Corporation | 112,432 | |||||
| 4,000 | Stryker Corporation | 369,000 | |||||
| 1,000 | Varian Medical Systems, Inc.* | 94,090 | |||||
| 3,200 | Zimmer Holdings, Inc. | 376,064 | |||||
| 4,785,317 | |||||||
| Health Care Providers & Services — 6.0% | |||||||
| 1,000 | Acadia Healthcare Company, Inc.* | 71,600 | |||||
| 6,200 | Aetna, Inc. | 660,486 | |||||
| 5,100 | AmerisourceBergen Corporation | 579,717 | |||||
| 6,300 | Anthem, Inc. | 972,783 | |||||
| 2,000 | Brookdale Senior Living, Inc.* | 75,520 | |||||
| 6,800 | Cardinal Health, Inc. | 613,836 | |||||
| 5,400 | Centene Corporation* | 381,726 | |||||
| 2,000 | Cigna Corporation | 258,880 | |||||
| 800 | Community Health Systems, Inc.* | 41,824 | |||||
| 1,000 | DaVita HealthCare Partners, Inc.* | 81,280 | |||||
| 3,200 | Express Scripts Holding Company* | 277,664 | |||||
| 4,000 | Fresenius Medical Care AG & | ||||||
| Company KGaA - ADR | 165,800 | ||||||
| 1,400 | HCA Holdings, Inc.* | 105,322 | |||||
| 2,000 | Henry Schein, Inc.* | 279,240 | |||||
| 4,700 | Humana, Inc. | 836,694 | |||||
| 2,000 | Laboratory Corporation | ||||||
| of America Holdings* | 252,180 | ||||||
The accompanying notes are an integral part of these financial statements.
- 11 -
Reynolds Blue Chip Growth Fund
SCHEDULE OF INVESTMENTS (Continued)
March 31, 2015 (Unaudited)
| Shares | Value | ||||||
| LONG-TERM INVESTMENTS — 99.1% (a) (Continued) | |||||||
| COMMON STOCKS — 98.2% (a) (Continued) | |||||||
| Health Care Providers & | |||||||
| Services — 6.0% (Continued) | |||||||
| 1,500 | Magellan Health, Inc.* | $ | 106,230 | ||||
| 2,100 | McKesson Corporation | 475,020 | |||||
| 500 | Molina Healthcare, Inc.* | 33,645 | |||||
| 1,100 | Omnicare, Inc. | 84,766 | |||||
| 2,800 | Patterson Companies, Inc. | 136,612 | |||||
| 3,100 | Quest Diagnostics, Inc. | 238,235 | |||||
| 700 | Tenet Healthcare Corporation* | 34,657 | |||||
| 4,500 | UnitedHealth Group, Inc. | 532,305 | |||||
| 2,100 | Universal Health Services, Inc., Class B | 247,191 | |||||
| 6,300 | VCA, Inc.* | 345,366 | |||||
| 2,000 | WellCare Health Plans, Inc.* | 182,920 | |||||
| 8,071,499 | |||||||
| Health Care Technology — 0.8% | |||||||
| 2,600 | athenahealth, Inc.* | 310,414 | |||||
| 9,800 | Cerner Corporation* | 717,948 | |||||
| 1,028,362 | |||||||
| Hotels, Restaurants & Leisure — 7.7% | |||||||
| 1,400 | BJ’s Restaurants, Inc.* | 70,630 | |||||
| 1,000 | Bloomin’ Brands, Inc. | 24,330 | |||||
| 1,900 | Bob Evans Farms, Inc. | 87,894 | |||||
| 2,600 | Boyd Gaming Corporation* | 36,920 | |||||
| 4,000 | Brinker International, Inc. | 246,240 | |||||
| 700 | Buffalo Wild Wings, Inc.* | 126,868 | |||||
| 5,300 | Carnival Corporation | 253,552 | |||||
| 2,000 | The Cheesecake Factory, Inc. | 98,660 | |||||
| 1,200 | Chipotle Mexican Grill, Inc.* | 780,648 | |||||
| 1,100 | Choice Hotels International, Inc. | 70,477 | |||||
| 200 | Cracker Barrel Old Country Store, Inc. | 30,428 | |||||
| 5,000 | Darden Restaurants, Inc. | 346,700 | |||||
| 4,300 | Denny’s Corporation* | 49,020 | |||||
| 700 | DineEquity, Inc. | 74,907 | |||||
| 13,300 | Domino’s Pizza, Inc. | 1,337,315 | |||||
| 3,800 | Dunkin’ Brands Group, Inc. | 180,728 | |||||
| 800 | El Pollo Loco Holdings, Inc.* | 20,488 | |||||
| 600 | Fiesta Restaurant Group, Inc.* | 36,600 | �� | ||||
| 900 | The Habit Restaurants, Inc., Class A* | 28,926 | |||||
| 4,000 | Hilton Worldwide Holdings, Inc.* | 118,480 | |||||
| 3,500 | Hyatt Hotels Corporation, Class A* | 207,270 | |||||
| 1,500 | InterContinental Hotels Group plc - ADR | 58,740 | |||||
| 5,700 | Jack in the Box, Inc. | 546,744 | |||||
| 700 | Las Vegas Sands Corporation | 38,528 | |||||
| 2,200 | LIFE TIME FITNESS, Inc.* | 156,112 | |||||
| 7,000 | Marriott International, Inc., Class A | 562,240 | |||||
| 5,600 | Marriott Vacations Worldwide Corporation | 453,880 | |||||
| 1,700 | McDonald’s Corporation | 165,648 | |||||
| 2,400 | MGM Resorts International* | 50,472 | |||||
| 800 | Noodles & Company* | 13,952 | |||||
| 4,000 | Norwegian Cruise Line Holdings, Ltd.* | 216,040 | |||||
| 1,800 | Panera Bread Company, Class A* | 287,991 | |||||
| 3,000 | Papa John’s International, Inc. | 185,430 | |||||
| 1,500 | Red Robin Gourmet Burgers, Inc.* | 130,500 | |||||
| 19 | Restaurant Brands International, Inc. | 695 | |||||
| 2,700 | Royal Caribbean Cruises, Ltd. | 220,995 | |||||
| 1,200 | Ruth’s Hospitality Group, Inc. | 19,056 | |||||
| 1,100 | Shake Shack, Class A* | 55,055 | |||||
| 19,200 | Starbucks Corporation | 1,818,240 | |||||
| 2,500 | Starwood Hotels & Resorts | ||||||
| Worldwide, Inc. | 208,750 | ||||||
| 2,700 | Texas Roadhouse, Inc. | 98,361 | |||||
| 4,200 | Wyndham Worldwide Corporation | 379,974 | |||||
| 400 | Wynn Resorts, Ltd. | 50,352 | |||||
| 4,400 | Yum! Brands, Inc. | 346,368 | |||||
| 10,291,204 | |||||||
| Household Durables — 1.6% | |||||||
| 15,660 | D.R. Horton, Inc. | 445,997 | |||||
| 700 | Garmin, Ltd. | 33,264 | |||||
| 5,400 | Jarden Corporation* | 285,660 | |||||
| 1,500 | KB Home | 23,430 | |||||
| 10,500 | Leggett & Platt, Inc. | 483,945 | |||||
| 1,800 | Lennar Corporation, Class A | 93,258 | |||||
| 800 | Libbey, Inc. | 31,928 | |||||
| 300 | Mohawk Industries, Inc.* | 55,725 | |||||
| 2,100 | Newell Rubbermaid, Inc. | 82,047 | |||||
| 1,800 | PulteGroup, Inc. | 40,014 | |||||
| 1,900 | The Ryland Group, Inc. | 92,606 | |||||
| 700 | Tempur Sealy International, Inc.* | 40,418 | |||||
| 1,300 | Toll Brothers, Inc.* | 51,142 | |||||
| 2,100 | Whirlpool Corporation | 424,326 | |||||
| 2,183,760 | |||||||
| Household Products — 1.2% | |||||||
| 5,500 | Church & Dwight Company, Inc. | 469,810 | |||||
| 4,000 | The Clorox Company | 441,560 | |||||
| 5,500 | Colgate-Palmolive Company | 381,370 | |||||
| 800 | Energizer Holdings, Inc. | 110,440 | |||||
The accompanying notes are an integral part of these financial statements.
- 12 -
Reynolds Blue Chip Growth Fund
SCHEDULE OF INVESTMENTS (Continued)
March 31, 2015 (Unaudited)
| Shares | Value | ||||||
| LONG-TERM INVESTMENTS — 99.1% (a) (Continued) | |||||||
| COMMON STOCKS — 98.2% (a) (Continued) | |||||||
| Household Products — 1.2% (Continued) | |||||||
| 1,900 | Kimberly-Clark Corporation | $ | 203,509 | ||||
| 800 | The Procter & Gamble Company | 65,552 | |||||
| 1,672,241 | |||||||
| Industrial Conglomerates — 0.3% | |||||||
| 1,500 | 3M Company | 247,425 | |||||
| 2,100 | Danaher Corporation | 178,290 | |||||
| 425,715 | |||||||
| Insurance — 1.2% | |||||||
| 500 | Aflac, Inc. | 32,005 | |||||
| 2,500 | Allied World Assurance | ||||||
| Company Holdings AG | 101,000 | ||||||
| 2,900 | The Allstate Corporation | 206,393 | |||||
| 3,700 | American International Group, Inc. | 202,723 | |||||
| 500 | China Life Insurance Company, Ltd. - ADR | 33,040 | |||||
| 2,700 | FBL Financial Group, Inc., Class A | 167,427 | |||||
| 2,600 | Genworth Financial, Inc., Class A* | 19,006 | |||||
| 500 | Hanover Insurance Group, Inc. | 36,290 | |||||
| 2,800 | Lincoln National Corporation | 160,888 | |||||
| 3,900 | Marsh & McLennan Companies, Inc. | 218,751 | |||||
| 600 | MetLife, Inc. | 30,330 | |||||
| 3,100 | The Travelers Companies, Inc. | 335,203 | |||||
| 1,400 | Universal Insurance Holdings, Inc. | 35,826 | |||||
| 1,900 | Unum Group | 64,087 | |||||
| 1,642,969 | |||||||
| Internet & Catalog Retail — 4.4% | |||||||
| 5,700 | Amazon.com, Inc.* | 2,120,970 | |||||
| 3,900 | Expedia, Inc. | 367,107 | |||||
| 8,300 | Groupon, Inc.* | 59,843 | |||||
| 2,100 | HSN, Inc. | 143,283 | |||||
| 3,500 | Liberty Interactive Corporation, Class A* | 102,165 | |||||
| 4,300 | Netflix, Inc.* | 1,791,767 | |||||
| 1,200 | Overstock.com, Inc.* | 29,064 | |||||
| 600 | The Priceline Group, Inc.* | 698,490 | |||||
| 4,700 | TripAdvisor, Inc.* | 390,899 | |||||
| 8,000 | Vipshop Holdings, Ltd. - ADS* | 235,520 | |||||
| 5,939,108 | |||||||
| Internet Software & Services — 6.0% | |||||||
| 5,100 | Akamai Technologies, Inc.* | 362,329 | |||||
| 9,700 | Alibaba Group Holding, Ltd. - SP-ADR* | 807,428 | |||||
| 5,900 | Baidu, Inc. - SP-ADR* | 1,229,560 | |||||
| 600 | Bitauto Holdings, Ltd. - ADR* | 30,528 | |||||
| 1,300 | Cimpress N.V.* | 109,694 | |||||
| 5,900 | eBay, Inc.* | 340,312 | |||||
| 8,800 | Facebook, Inc., Class A* | 723,492 | |||||
| 1,900 | Google, Inc., Class A* | 1,053,930 | |||||
| 2,100 | Google, Inc., Class C* | 1,150,800 | |||||
| 3,100 | GrubHub, Inc.* | 140,709 | |||||
| 1,100 | LinkedIn Corporation, Class A* | 274,846 | |||||
| 1,300 | LogMeIn, Inc.* | 72,787 | |||||
| 400 | MercadoLibre, Inc. | 49,008 | |||||
| 700 | NetEase, Inc. - ADR | 73,710 | |||||
| 1,400 | Pandora Media, Inc.* | 22,694 | |||||
| 2,100 | Rackspace Hosting, Inc.* | 108,339 | |||||
| 4,200 | Twitter, Inc.* | 210,336 | |||||
| 7,000 | VeriSign, Inc.* | 468,790 | |||||
| 4,000 | Yahoo!, Inc.* | 177,740 | |||||
| 7,100 | Zillow Group, Inc., Class A* | 712,130 | |||||
| 8,119,162 | |||||||
| IT Services — 4.3% | |||||||
| 3,800 | Amdocs, Ltd. | 206,720 | |||||
| 2,400 | Automatic Data Processing, Inc. | 205,536 | |||||
| 9,400 | Broadridge Financial Solutions, Inc. | 517,094 | |||||
| 3,800 | Cognizant Technology Solutions | ||||||
| Corporation, Class A* | 237,082 | ||||||
| 500 | Computer Sciences Corporation | 32,640 | |||||
| 3,600 | CSG Systems International, Inc. | 109,404 | |||||
| 4,400 | DST Systems, Inc. | 487,124 | |||||
| 1,200 | EPAM Systems, Inc.* | 73,548 | |||||
| 5,600 | Fidelity National Information | ||||||
| Services, Inc. | 381,136 | ||||||
| 9,900 | Fiserv, Inc.* | 786,060 | |||||
| 5,300 | Gartner, Inc.* | 444,405 | |||||
| 8,500 | Genpact, Ltd.* | 197,625 | |||||
| 2,900 | Infosys, Ltd. - SP-ADR | 101,732 | |||||
| 1,300 | Jack Henry & Associates, Inc. | 90,857 | |||||
| 6,700 | Mastercard, Inc., Class A | 578,813 | |||||
| 500 | MAXIMUS, Inc. | 33,380 | |||||
| 5,600 | Paychex, Inc. | 277,844 | |||||
| 4,100 | Sabre Corporation | 99,630 | |||||
| 2,400 | Total System Services, Inc. | 91,560 | |||||
| 1,200 | VeriFone Systems, Inc.* | 41,868 | |||||
| 10,400 | Visa, Inc., Class A | 680,264 | |||||
| 2,200 | The Western Union Company | 45,782 | |||||
| 5,720,104 | |||||||
The accompanying notes are an integral part of these financial statements.
- 13 -
Reynolds Blue Chip Growth Fund
SCHEDULE OF INVESTMENTS (Continued)
March 31, 2015 (Unaudited)
| Shares | Value | ||||||
| LONG-TERM INVESTMENTS — 99.1% (a) (Continued) | |||||||
| COMMON STOCKS — 98.2% (a) (Continued) | |||||||
| Leisure Products — 0.0% | |||||||
| 200 | Hasbro, Inc. | $ | 12,648 | ||||
| Life Sciences Tools & Services — 1.5% | |||||||
| 10,000 | Affymetrix, Inc.* | 125,600 | |||||
| 500 | Agilent Technologies, Inc. | 20,775 | |||||
| 4,600 | Charles River Laboratories | ||||||
| International, Inc.* | 364,734 | ||||||
| 500 | ICON plc* | 35,265 | |||||
| 2,000 | Illumina, Inc.* | 371,280 | |||||
| 600 | Mettler-Toledo International, Inc.* | 197,190 | |||||
| 3,000 | PAREXEL International Corporation* | 206,970 | |||||
| 2,500 | PerkinElmer, Inc. | 127,850 | |||||
| 1,500 | Thermo Fisher Scientific, Inc. | 201,510 | |||||
| 2,700 | Waters Corporation* | 335,664 | |||||
| 1,986,838 | |||||||
| Machinery — 1.2% | |||||||
| 1,200 | Alamo Group, Inc. | 75,756 | |||||
| 700 | Barnes Group, Inc. | 28,343 | |||||
| 5,900 | IDEX Corporation | 447,397 | |||||
| 3,600 | Pall Corporation | 361,404 | |||||
| 2,300 | Snap-On, Inc. | 338,238 | |||||
| 1,200 | Stanley Black & Decker, Inc. | 114,432 | |||||
| 800 | The Toro Company | 56,096 | |||||
| 400 | Valmont Industries, Inc. | 49,152 | |||||
| 1,200 | Wabtec Corporation | 114,012 | |||||
| 1,584,830 | |||||||
| Media — 2.4% | |||||||
| 600 | CBS Corporation, Class B Non-Voting | 36,378 | |||||
| 5,500 | Comcast Corporation, Class A | 310,585 | |||||
| 1,400 | DIRECTV* | 119,140 | |||||
| 600 | Discovery Communications, Inc., Class C* | 17,685 | |||||
| 700 | Gannett Company, Inc. | 25,956 | |||||
| 1,700 | IMAX Corporation* | 57,307 | |||||
| 2,100 | The Interpublic Group of Companies, Inc. | 46,452 | |||||
| 1,316 | Liberty Global plc, Class A* | 67,735 | |||||
| 1,100 | Liberty Media Corporation, Class A* | 42,405 | |||||
| 600 | Nexstar Broadcasting Group, Inc., Class A | 34,332 | |||||
| 2,600 | Omnicom Group, Inc. | 202,748 | |||||
| 700 | Scholastic Corporation | 28,658 | |||||
| 54,500 | Sirius XM Holdings, Inc.* | 208,190 | |||||
| 2,200 | Starz, Class A* | 75,702 | |||||
| 600 | Time Warner Cable, Inc. | 89,928 | |||||
| 1,700 | Time Warner, Inc. | 143,548 | |||||
| 1,700 | Twenty-First Century Fox, Inc., Class A | 57,528 | |||||
| 2,400 | Viacom, Inc., Class B | 163,920 | |||||
| 14,200 | The Walt Disney Company | 1,489,438 | |||||
| 3,217,635 | |||||||
| Multiline Retail — 1.5% | |||||||
| 1,300 | Big Lots, Inc. | 62,439 | |||||
| 1,000 | Dillard’s, Inc., Class A | 136,510 | |||||
| 4,600 | Dollar General Corporation* | 346,748 | |||||
| 5,600 | Dollar Tree, Inc.* | 454,412 | |||||
| 500 | Family Dollar Stores, Inc. | 39,620 | |||||
| 2,900 | Kohl’s Corporation | 226,925 | |||||
| 2,600 | Macy’s, Inc. | 168,766 | |||||
| 4,500 | Nordstrom, Inc. | 361,440 | |||||
| 2,900 | Target Corporation | 238,003 | |||||
| 2,034,863 | |||||||
| Oil, Gas & Consumable Fuels — 0.1% | |||||||
| 900 | Canadian Natural Resources, Ltd. | 27,639 | |||||
| 1,900 | Denbury Resources, Inc. | 13,851 | |||||
| 900 | Sasol - SP-ADR | 30,636 | |||||
| 700 | Western Refining, Inc. | 34,573 | |||||
| 106,699 | |||||||
| Paper & Forest Products — 0.1% | |||||||
| 900 | Boise Cascade Company* | 33,714 | |||||
| 1,100 | International Paper Company | 61,039 | |||||
| 1,400 | Mercer International, Inc.* | 21,504 | |||||
| 116,257 | |||||||
| Pharmaceuticals — 4.4% | |||||||
| 4,100 | AbbVie, Inc. | 240,014 | |||||
| 1,284 | Actavis plc* | 382,189 | |||||
| 3,100 | Akorn, Inc.* | 147,281 | |||||
| 7,200 | Bristol-Myers Squibb Company | 464,400 | |||||
| 2,900 | Dr. Reddy’s Laboratories, Ltd. - ADR | 165,590 | |||||
| 7,200 | Eli Lilly and Company | 523,080 | |||||
| 2,600 | Endo International plc* | 233,220 | |||||
| 900 | GW Pharmaceuticals plc - ADR* | 82,017 | |||||
| 3,500 | Horizon Pharma plc* | 90,895 | |||||
| 3,500 | Jazz Pharmaceuticals plc* | 604,765 | |||||
| 2,200 | Johnson & Johnson | 221,320 | |||||
| 600 | Lannet Company, Inc.* | 40,626 | |||||
| 6,600 | Mallinckrodt plc* | 835,890 | |||||
| 1,000 | The Medicines Company* | 28,020 | |||||
| 3,500 | Merck & Company, Inc. | 201,180 | |||||
| 1,700 | Mylan N.V.* | 100,895 | |||||
| 1,000 | Novo Nordisk A/S - SP-ADR | 53,390 | |||||
The accompanying notes are an integral part of these financial statements.
- 14 -
Reynolds Blue Chip Growth Fund
SCHEDULE OF INVESTMENTS (Continued)
March 31, 2015 (Unaudited)
| Shares | Value | ||||||
| LONG-TERM INVESTMENTS — 99.1% (a) (Continued) | |||||||
| COMMON STOCKS — 98.2% (a) (Continued) | |||||||
| Pharmaceuticals — 4.4% (Continued) | |||||||
| 300 | Perrigo Company plc | $ | 49,665 | ||||
| 11,900 | Pfizer, Inc. | 414,001 | |||||
| 2,700 | SciClone Pharmaceuticals, Inc.* | 23,922 | |||||
| 1,700 | Shire plc- ADR | 406,793 | |||||
| 4,400 | Teva Pharmaceutical | ||||||
| Industries, Ltd. - SP-ADR | 274,120 | ||||||
| 1,500 | Valeant Pharmaceuticals | ||||||
| International, Inc.* | 297,930 | ||||||
| 5,881,203 | |||||||
| Professional Services — 0.7% | |||||||
| 2,600 | 51job, Inc. - ADR* | 83,889 | |||||
| 400 | The Dun & Bradstreet Corporation | 51,344 | |||||
| 900 | Equifax, Inc. | 83,700 | |||||
| 1,100 | IHS, Inc., Class A* | 125,136 | |||||
| 2,100 | On Assignment, Inc.* | 80,577 | |||||
| 2,900 | Robert Half International, Inc. | 175,508 | |||||
| 2,500 | Towers Watson & Company, Class A | 330,463 | |||||
| 500 | Verisk Analytics, Inc., Class A* | 35,700 | |||||
| 966,317 | |||||||
| Real Estate Management & | |||||||
| Development — 0.2% | |||||||
| 3,700 | Brookfield Asset Management, Inc., | ||||||
| Class A | 198,357 | ||||||
| 300 | Jones Lang LaSalle, Inc. | 51,120 | |||||
| 249,477 | |||||||
| Road & Rail — 0.8% | |||||||
| 1,400 | Avis Budget Group, Inc.* | 82,621 | |||||
| 400 | J.B. Hunt Transportation Services, Inc. | 34,158 | |||||
| 1,200 | Kansas City Southern | 122,496 | |||||
| 1,500 | Norfolk Southern Corporation | 154,380 | |||||
| 3,500 | Old Dominion Freight Line, Inc.* | 270,550 | |||||
| 1,000 | Ryder System, Inc. | 94,890 | |||||
| 700 | Saia, Inc.* | 31,010 | |||||
| 800 | Swift Transportation Company* | 20,816 | |||||
| 2,800 | Union Pacific Corporation | 303,268 | |||||
| 1,114,189 | |||||||
| Semiconductors & | |||||||
| Semiconductor Equipment — 3.5% | |||||||
| 2,800 | Ambarella, Inc.* | 211,988 | |||||
| 2,300 | Analog Devices, Inc. | 144,900 | |||||
| 1,800 | ARM Holdings plc - SP-ADR | 88,740 | |||||
| 2,900 | Atmel Corporation | 23,867 | |||||
| 2,300 | Avago Technologies, Ltd. | 292,054 | |||||
| 5,500 | Broadcom Corporation, Class A | 238,122 | |||||
| 4,800 | Canadian Solar, Inc.* | 160,272 | |||||
| 500 | Cavium, Inc.* | 35,410 | |||||
| 5,500 | Cirrus Logic, Inc.* | 182,930 | |||||
| 1,000 | Cree, Inc.* | 35,490 | |||||
| 4,900 | Cypress Semiconductor Corporation | 69,139 | |||||
| 7,500 | First Solar, Inc.* | 448,425 | |||||
| 900 | Freescale Semiconductor, Ltd.* | 36,684 | |||||
| 8,000 | Integrated Device Technology, Inc.* | 160,160 | |||||
| 4,900 | JA Solar Holdings Company, Ltd. - ADR* | 46,844 | |||||
| 300 | KLA-Tencor Corporation | 17,487 | |||||
| 400 | Kulicke & Soffa Industries, Inc.* | 6,252 | |||||
| 1,100 | Lam Research Corporation | 77,258 | |||||
| 1,500 | Linear Technology Corporation | 70,200 | |||||
| 700 | Mellanox Technologies, Ltd.* | 31,738 | |||||
| 2,800 | Micrel, Inc. | 42,224 | |||||
| 1,300 | Monolithic Power Systems | 68,445 | |||||
| 2,800 | NVIDIA Corporation | 58,590 | |||||
| 2,300 | NXP Semiconductors N.V.* | 230,828 | |||||
| 11,600 | ON Semiconductor Corporation* | 140,476 | |||||
| 400 | Qorvo, Inc.* | 31,880 | |||||
| 2,000 | Rambus, Inc.* | 25,150 | |||||
| 12,900 | Skyworks Solutions, Inc. | 1,267,941 | |||||
| 4,100 | SunEdison, Inc.* | 98,400 | |||||
| 2,700 | SunPower Corporation* | 84,537 | |||||
| 1,700 | Synaptics, Inc.* | 138,219 | |||||
| 1,600 | Teradyne, Inc. | 30,160 | |||||
| 1,200 | Texas Instruments, Inc. | 68,622 | |||||
| 5,600 | Tower Semiconductor, Ltd.* | 95,088 | |||||
| 4,758,520 | |||||||
| Software — 3.5% | |||||||
| 3,300 | Adobe Systems, Inc.* | 244,002 | |||||
| 1,400 | Aspen Technology, Inc.* | 53,886 | |||||
| 5,600 | Autodesk, Inc.* | 328,384 | |||||
| 4,900 | Check Point Software Technologies, Ltd.* | 401,653 | |||||
| 2,300 | Citrix Systems, Inc.* | 146,901 | |||||
| 600 | CommVault Systems, Inc.* | 26,220 | |||||
| 900 | Ebix, Inc. | 27,342 | |||||
| 8,200 | Electronic Arts, Inc.* | 482,283 | |||||
| 4,600 | FactSet Research Systems, Inc. | 732,320 | |||||
| 2,500 | Fair Isaac Corporation | 221,800 | |||||
| 1,700 | FireEye, Inc.* | 66,725 | |||||
| 10,800 | Fortinet, Inc.* | 377,460 | |||||
The accompanying notes are an integral part of these financial statements.
- 15 -
Reynolds Blue Chip Growth Fund
SCHEDULE OF INVESTMENTS (Continued)
March 31, 2015 (Unaudited)
| Shares | Value | ||||||
| LONG-TERM INVESTMENTS — 99.1% (a) (Continued) | |||||||
| COMMON STOCKS — 98.2% (a) (Continued) | |||||||
| Software — 3.5% (Continued) | |||||||
| 800 | Imperva, Inc.* | $ | 34,160 | ||||
| 2,700 | Informatica Corporation* | 118,408 | |||||
| 1,600 | Intuit, Inc. | 155,136 | |||||
| 1,900 | Microsoft Corporation | 77,244 | |||||
| 2,000 | Oracle Corporation | 86,300 | |||||
| 500 | Red Hat, Inc.* | 37,875 | |||||
| 1,200 | Salesforce.com, Inc.* | 80,172 | |||||
| 600 | SAP SE - SP-ADR | 43,302 | |||||
| 700 | SolarWinds, Inc.* | 35,868 | |||||
| 7,100 | Symantec Corporation | 165,891 | |||||
| 600 | Synchronoss Technologies, Inc.* | 28,476 | |||||
| 5,000 | Synopsys, Inc.* | 231,600 | |||||
| 1,500 | Take-Two Interactive Software, Inc.* | 38,183 | |||||
| 1,500 | The Ultimate Software Group, Inc.* | 254,933 | |||||
| 3,600 | VASCO Data Security International, Inc.* | 77,544 | |||||
| 1,400 | Verint Systems, Inc.* | 86,702 | |||||
| 400 | VMware, Inc., Class A* | 32,804 | |||||
| 3,200 | Zynga, Inc., Class A* | 9,120 | |||||
| 4,702,694 | |||||||
| Specialty Retail — 5.9% | |||||||
| 1,400 | Abercrombie & Fitch Company, Class A | 30,856 | |||||
| 400 | Advance Auto Parts, Inc. | 59,876 | |||||
| 2,100 | American Eagle Outfitters, Inc. | 35,868 | |||||
| 800 | Asbury Automotive Group, Inc.* | 66,480 | |||||
| 500 | AutoNation, Inc.* | 32,165 | |||||
| 1,100 | AutoZone, Inc.* | 750,376 | |||||
| 2,200 | Bed Bath & Beyond, Inc.* | 168,905 | |||||
| 7,600 | Best Buy Company, Inc. | 287,204 | |||||
| 36,000 | Borders Group, Inc.*(b) | — | |||||
| 7,400 | CarMax, Inc.* | 510,674 | |||||
| 400 | Conn’s, Inc.* | 12,112 | |||||
| 1,800 | Dick’s Sporting Goods, Inc. | 102,582 | |||||
| 900 | DSW, Inc., Class A | 33,192 | |||||
| 2,300 | Foot Locker, Inc. | 144,900 | |||||
| 6,200 | The Home Depot, Inc. | 704,382 | |||||
| 2,100 | L Brands, Inc. | 198,009 | |||||
| 1,400 | Lithia Motors, Inc., Class A | 139,174 | |||||
| 15,700 | Lowe’s Companies, Inc. | 1,167,923 | |||||
| 600 | Lumber Liquidators Holdings, Inc.* | 18,468 | |||||
| 600 | The Michaels Companies, Inc.* | 16,236 | |||||
| 16,000 | Office Depot, Inc.* | 147,200 | |||||
| 1,600 | O’Reilly Automotive, Inc.* | 345,984 | |||||
| 1,500 | Outerwall, Inc. | 99,180 | |||||
| 3,900 | The Pep Boys-Manny, Moe & Jack* | 37,518 | |||||
| 400 | Restoration Hardware Holdings, Inc.* | 39,676 | |||||
| 9,500 | Ross Stores, Inc. | 1,000,920 | |||||
| 3,000 | Sally Beauty Holdings, Inc.* | 103,110 | |||||
| 2,500 | Select Comfort Corporation* | 86,175 | |||||
| 1,400 | Staples, Inc. | 22,799 | |||||
| 400 | Tiffany & Company | 35,204 | |||||
| 6,600 | The TJX Companies, Inc. | 462,330 | |||||
| 4,200 | Tractor Supply Company | 357,252 | |||||
| 2,200 | Ulta Salon, Cosmetics & Fragrance, Inc.* | 331,870 | |||||
| 2,300 | Urban Outfitters, Inc.* | 104,995 | |||||
| 3,500 | Williams-Sonoma, Inc. | 278,985 | |||||
| 7,932,580 | |||||||
| Technology Hardware, | |||||||
| Storage & Peripherals — 1.7% | |||||||
| 17,300 | Apple, Inc. | 2,152,639 | |||||
| 2,200 | NetApp, Inc. | 78,012 | |||||
| 800 | SanDisk Corporation | 50,896 | |||||
| 2,281,547 | |||||||
| Telecommunication Services – | |||||||
| Diversified — 0.1% | |||||||
| 12,500 | Frontier Communications Corporation | 88,125 | |||||
| 2,200 | IDT Corporation, Class B | 39,050 | |||||
| 600 | Level 3 Communications, Inc.* | 32,304 | |||||
| 159,479 | |||||||
| Textiles, Apparel & Luxury Goods — 2.2% | |||||||
| 400 | Carter’s, Inc. | 36,988 | |||||
| 800 | Coach, Inc. | 33,144 | |||||
| 22,600 | Hanesbrands, Inc. | 757,326 | |||||
| 1,900 | lululemon athletica, Inc.* | 121,638 | |||||
| 2,300 | Luxottica Group SpA - SP-ADR | 144,279 | |||||
| 4,500 | NIKE, Inc., Class B | 451,485 | |||||
| 400 | PVH Corporation | 42,624 | |||||
| 500 | Skechers U.S.A., Inc., Class A* | 35,955 | |||||
| 1,100 | Tumi Holdings, Inc.* | 26,906 | |||||
| 8,600 | Under Armour, Inc., Class A* | 694,450 | |||||
| 7,800 | VF Corporation | 587,418 | |||||
| 2,932,213 | |||||||
| Trading Companies & Distributors — 0.1% | |||||||
| 600 | W.W. Grainger, Inc. | 141,486 | |||||
| Water Utilities — 0.1% | |||||||
| 2,400 | American Water Works Company, Inc. | 130,104 | |||||
The accompanying notes are an integral part of these financial statements.
- 16 -
Reynolds Blue Chip Growth Fund
SCHEDULE OF INVESTMENTS (Continued)
March 31, 2015 (Unaudited)
| Shares | Value | ||||||
| LONG-TERM INVESTMENTS — 99.1% (a) (Continued) | |||||||
| COMMON STOCKS — 98.2% (a) (Continued) | |||||||
| Wireless Telecommunication | |||||||
| Services — 0.1% | |||||||
| 1,100 | SBA Communications | ||||||
| Corporation, Class A* | $ | 128,810 | |||||
| 800 | T-Mobile US, Inc.* | 25,352 | |||||
| 154,162 | |||||||
| TOTAL COMMON STOCKS | |||||||
| (cost $100,050,152) | 131,819,398 | ||||||
| PUBLICLY TRADED PARTNERSHIPS — 0.1% (a) | |||||||
| Capital Markets — 0.1% | |||||||
| 2,100 | The Blackstone Group L.P. | 81,669 | |||||
| Hotels, Restaurants & Leisure — 0.0% | |||||||
| 800 | Cedar Fair L.P. | 45,920 | |||||
| TOTAL PUBLICLY | |||||||
| TRADED PARTNERSHIPS | |||||||
| (cost $126,669) | 127,589 | ||||||
| REITS — 0.8% (a) | |||||||
| Real Estate Investment Trusts — 0.8% | |||||||
| 1,400 | Boston Properties, Inc. | 196,672 | |||||
| 800 | CBRE Group, Inc., Class A* | 30,968 | |||||
| 1,000 | Digital Realty Trust, Inc. | 65,960 | |||||
| 1,207 | Equinix, Inc. | 281,050 | |||||
| 4,200 | Extra Space Storage, Inc. | 283,794 | |||||
| 1,300 | Iron Mountain, Inc. | 47,424 | |||||
| 1,300 | Lamar Advertising Company, Class A | 77,051 | |||||
| 900 | OMEGA Healthcare Investors, Inc. | 36,513 | |||||
| 900 | Regency Centers Corporation | 61,236 | |||||
| 1,700 | Tanger Factory Outlet Centers, Inc. | 59,789 | |||||
| TOTAL REITS | |||||||
| (cost $1,091,554) | 1,140,457 | ||||||
| WARRANTS — 0.0% (a) | |||||||
| Insurance — 0.0% | |||||||
| 1,700 | American International Group, Inc., | ||||||
| Expiration Date - 01/19/21, | |||||||
| Exercise Price - $45.00* | 37,128 | ||||||
| TOTAL WARRANTS | |||||||
| (cost $23,034) | 37,128 | ||||||
TOTAL INVESTMENTS — 99.1% (a) | |||||||
| (cost $101,291,409) | 133,124,572 | ||||||
| Cash and receivables, | |||||||
| less liabilities — 0.9% (a) | 1,163,653 | ||||||
TOTAL NET ASSETS — 100.0% (a) | $ | 134,288,225 | |||||
| * | Non-income producing security. | |
| (a) | Percentages for the various classifications relate to net assets. | |
| (b) | This security was fair valued as determined by the adviser using procedures approved by the Board of Directors and is classified as level 3. As of March 31, 2015, the value of this security was $0 which represents 0.0% of total net assets. |
ADR – Unsponsored American Depositary Receipt
ADS – American Depositary Share
AG – German Corporation
A/S – Danish Company
KGaA – German Limited Partnership
L.P. – Limited Partnership
N.V. – Dutch Public Limited Liability Co.
plc – Public Limited Company
REITS – Real Estate Investment Trusts
S.A.B. de C.V. – Sociedad Anonima Bursetil de Capital Variable
SP-ADR – Sponsored American Depositary Receipt
SpA – Italian Corporation
The Global Industry Classification Standard (“GICS®”) was developed by and/or is the exclusive property of MSCI, Inc. and Standard & Poor’s Financial Services LLC (“S&P”). GICS® is a service mark of MSCI & S&P and has been licensed for use by U.S. Bancorp Fund Services, LLC.
The accompanying notes are an integral part of these financial statements.
- 17 -
Reynolds Blue Chip Growth Fund
STATEMENT OF OPERATIONS
For the Six Months Ended March 31, 2015 (Unaudited)
| INVESTMENT INCOME: | ||||
| Dividends (net of foreign withholding tax of $2,096) | $ | 845,334 | ||
| Total investment income | 845,334 | |||
| EXPENSES: | ||||
| Management fees | 736,420 | |||
| Distribution fees | 90,800 | |||
| Transfer agent fees | 69,641 | |||
| Administration fees | 67,616 | |||
| Shareholder servicing fees | 63,791 | |||
| Custodian fees | 56,867 | |||
| Fund accounting fees | 35,519 | |||
| Insurance expense | 35,465 | |||
| Professional fees | 27,675 | |||
| Chief Compliance Officer fees | 13,840 | |||
| Registration fees | 13,584 | |||
| Board of Directors fees | 12,465 | |||
| Printing and postage expense | 12,153 | |||
| Overdraft fees | 261 | |||
| Other expenses | 392 | |||
| Total expenses | 1,236,489 | |||
| NET INVESTMENT LOSS | (391,155 | ) | ||
| NET REALIZED GAIN ON INVESTMENTS AND FOREIGN CURRENCY TRANSACTIONS | 13,427,685 | |||
| NET CHANGE IN UNREALIZED DEPRECIATION ON INVESTMENTS AND FOREIGN CURRENCY TRANSACTIONS | (5,694,525 | ) | ||
| NET GAIN ON INVESTMENTS | 7,733,160 | |||
| NET INCREASE IN NET ASSETS RESULTING FROM OPERATIONS | $ | 7,342,005 | ||
STATEMENTS OF CHANGES IN NET ASSETS
For the Six Months Ended March 31, 2015 (Unaudited) and For the Year Ended September 30, 2014
| 2015 | 2014 | |||||||
| OPERATIONS: | ||||||||
| Net investment loss | $ | (391,155 | ) | $ | (1,274,785 | ) | ||
| Net realized gain on investments and foreign currency transactions | 13,427,685 | 36,109,347 | ||||||
| Net change in unrealized depreciation on investments and foreign currency transactions | (5,694,525 | ) | (13,952,558 | ) | ||||
| Net increase in net assets resulting from operations | 7,342,005 | 20,882,004 | ||||||
| DISTRIBUTIONS TO SHAREHOLDERS: | ||||||||
| Distributions from net capital gains ($18.93395 per share and $3.37552 per share, respectively) | (37,422,133 | ) | (9,569,666 | ) | ||||
| FUND SHARE ACTIVITIES: | ||||||||
| Proceeds from shares issued (103,029 and 368,942 shares, respectively) | 6,914,349 | 27,454,429 | ||||||
| Net asset value of shares issued in distributions reinvested (592,591 and 122,033 shares, respectively) | 34,891,785 | 9,048,741 | ||||||
| Cost of shares redeemed (621,118 and 1,224,594 shares, respectively) | (40,368,206 | ) | (90,763,759 | ) | ||||
| Net increase (decrease) in net assets derived from Fund share activities | 1,437,928 | (54,260,589 | ) | |||||
| TOTAL DECREASE IN NET ASSETS | (28,642,200 | ) | (42,948,251 | ) | ||||
| NET ASSETS AT THE BEGINNING OF THE PERIOD | 162,930,425 | 205,878,676 | ||||||
| NET ASSETS AT THE END OF THE PERIOD (Includes undistributed net | ||||||||
| investment loss of $(391,233) and $(78), respectively) | $ | 134,288,225 | $ | 162,930,425 | ||||
The accompanying notes are an integral part of these financial statements.
- 18 -
Reynolds Blue Chip Growth Fund
FINANCIAL HIGHLIGHTS
(Selected data for each share of the Fund outstanding throughout each period)
| (Unaudited) | ||||||||||||||||||||||||
| For the Six | ||||||||||||||||||||||||
| Months Ended | Years Ended September 30, | |||||||||||||||||||||||
| March 31, 2015 | 2014 | 2013 | 2012 | 2011 | 2010 | |||||||||||||||||||
| PER SHARE OPERATING PERFORMANCE: | ||||||||||||||||||||||||
| Net asset value, beginning of period | $ | 75.86 | $ | 71.45 | $ | 58.97 | $ | 46.50 | $ | 48.29 | $ | 41.87 | ||||||||||||
| Income from investment operations: | ||||||||||||||||||||||||
Net investment loss(1) | (0.18 | ) | (0.49 | ) | (0.14 | ) | (0.19 | ) | (0.27 | ) | (0.25 | ) | ||||||||||||
| Net realized and unrealized gains (losses) on investments | 3.68 | 8.28 | 13.25 | 12.66 | (1.52 | ) | 6.67 | |||||||||||||||||
| Total from investment operations | 3.50 | 7.79 | 13.11 | 12.47 | (1.79 | ) | 6.42 | |||||||||||||||||
| Less distributions: | ||||||||||||||||||||||||
| Distributions from net investment income | — | — | — | — | — | — | ||||||||||||||||||
| Distributions from net realized gains | (18.93 | ) | (3.38 | ) | (0.63 | ) | — | — | — | |||||||||||||||
| Total from distributions | (18.93 | ) | (3.38 | ) | (0.63 | ) | — | — | — | |||||||||||||||
| Net asset value, end of period | $ | 60.43 | $ | 75.86 | $ | 71.45 | $ | 58.97 | $ | 46.50 | $ | 48.29 | ||||||||||||
| TOTAL RETURN | 5.28 | %(2) | 11.01 | % | 22.50 | % | 26.82 | % | (3.71 | %) | 15.33 | % | ||||||||||||
| RATIOS/SUPPLEMENTAL DATA: | ||||||||||||||||||||||||
| Net assets, end of period (in 000’s) | $ | 134,288 | $ | 162,930 | $ | 205,879 | $ | 186,073 | $ | 199,183 | $ | 116,043 | ||||||||||||
| Ratio of expenses (after reimbursement) to average net assets | 1.68 | %(3) | 1.59 | % | 1.58 | % | 1.53 | % | 1.55 | % | 1.80 | % | ||||||||||||
| Ratio of net investment loss to average net assets | (0.53 | %)(3) | (0.65 | %) | (0.21 | %) | (0.34 | %) | (0.49 | %) | (0.55 | %) | ||||||||||||
| Portfolio turnover rate | 136 | %(2) | 102 | % | 133 | % | 99 | % | 55 | % | 80 | % | ||||||||||||
| (1) | Amount calculated based on average shares outstanding throughout the period. |
| (2) | Not annualized. |
| (3) | Annualized. |
The accompanying notes are an integral part of these financial statements.
NOTES TO FINANCIAL STATEMENTS
March 31, 2015 (Unaudited)
| (1) | Summary of Significant Accounting Policies — |
The following is a summary of significant accounting policies of the Reynolds Funds, Inc. (the “Company”), which is registered as a diversified, open-end management investment company under the Investment Company Act of 1940 (the “Act”), as amended. This Company consists of one fund: the Reynolds Blue Chip Growth Fund (the “Fund”). The Company was incorporated under the laws of Maryland on April 28, 1988. | |
The investment objective of the Fund is to produce long-term growth of capital by investing in a diversified portfolio of common stocks issued by well-established growth companies commonly referred to as “blue chip” companies. | |
The following is a summary of the Fund’s pricing procedures. It is intended to be a general discussion and may not necessarily reflect all pricing procedures followed by the Fund. | |
| (a) Each security, excluding short-term investments, is valued at the last sale price reported by the principal security exchange on which the issue is traded, or if no sale is reported, the latest bid price. Securities which are traded on the Nasdaq National Markets are valued at the Nasdaq Official Closing Price, or if no sale is reported, the latest bid price. Short-term investments with maturities of 60 days or less are valued at amortized cost which approximates fair value. Securities for which quotations are not readily available are valued at fair value as determined by the investment adviser under the supervision of the Board of Directors. The fair value of a security is the amount which the Fund might receive upon a current |
- 19 -
Reynolds Blue Chip Growth Fund
NOTES TO FINANCIAL STATEMENTS (Continued)
March 31, 2015 (Unaudited)
| (1) | Summary of Significant Accounting Policies — (Continued) |
sale. The fair value of a security may differ from the last quoted price and the Fund may not be able to sell a security at the fair value. Market quotations may not be available, for example, if trading in particular securities was halted during the day and not resumed prior to the close of trading on the New York Stock Exchange. | |
Under accounting principles generally accepted in the United States of America (“GAAP”), fair value is defined as the price that would be received to sell an asset or paid to transfer a liability (i.e., the “exit price”) in an orderly transaction between market participants at the measurement date. | |
In determining fair value, the Fund uses various valuation approaches. GAAP establishes a fair value hierarchy for inputs used in measuring fair value that maximizes the use of observable inputs and minimizes the use of unobservable inputs by generally requiring that the most observable inputs be used when available. Observable inputs are those that market participants would use in pricing the asset or liability based on market data obtained from sources independent of the Fund. Unobservable inputs reflect the Fund’s assumptions about the inputs market participants would use in pricing the asset or liability developed based on the best information available in the circumstances. The inputs or methodologies used for valuing securities are not necessarily an indication of the risks associated with investing in those securities. | |
| The fair value hierarchy is categorized into three levels based on the inputs as follows: |
| Level 1— | Valuations based on unadjusted quoted prices in active markets for identical assets. | |
| Level 2— | Valuations based on quoted prices for similar securities or in markets that are not active or for which all significant inputs are observable, either directly or indirectly. | |
| Level 3— | Valuations based on inputs that are unobservable and significant to the overall fair value measurement. |
| The following table summarizes the Fund’s investments as of March 31, 2015, based on the inputs used to value them: |
| Valuation Inputs | Investments in Securities | ||||||
| Level 1— | Common Stocks | $ | 131,819,398 | ||||
| Publicly Traded Partnerships | 127,589 | ||||||
| REITS | 1,140,457 | ||||||
| Warrants | 37,128 | ||||||
| Total Level 1 | 133,124,572 | ||||||
| Level 2— | None | — | |||||
| Level 3— | Common Stocks | — | * | ||||
| Total | $ | 133,124,572 | ** | ||||
| It is the Fund’s policy to recognize transfers between levels at the end of the reporting period. For the six months ended March 31, 2015, there were no transfers between levels. |
| * | The security classified as Level 3 is a result of the company filing for bankruptcy and no additional observable inputs being available as of March 31, 2015. The security was classified as Level 3 as of September 30, 2014, and there was no change in value from September 30, 2014 to March 31, 2015. | ||
| ** | Please refer to the Schedule of Investments to view common stocks, publicly traded partnerships, REITS and warrants segregated by industry type. |
| (b) Investment transactions are accounted for on a trade date basis for financial reporting purposes. Net realized gains and losses on sales of securities are computed on the highest amortized cost basis. |
- 20 -
Reynolds Blue Chip Growth Fund
NOTES TO FINANCIAL STATEMENTS (Continued)
March 31, 2015 (Unaudited)
| (1) | Summary of Significant Accounting Policies — (Continued) |
(c) The Fund records dividend income on the ex-dividend date and interest income on an accrual basis. Withholding taxes on foreign dividends have been provided for in accordance with the Fund’s understanding of the applicable country’s tax rules and regulations. | |
| (d) GAAP requires that certain components of net assets relating to permanent differences be reclassified between financial and tax reporting. These reclassifications have no effect on net assets or net asset value per share. For the year ended September 30, 2014, the following table shows the reclassifications made: |
| Accumulated Net | Accumulated Undistributed Net | |
| Investment Loss | Realized Gain on Investments | Capital Stock |
| $1,335,971 | $(1,458,889) | $122,918 |
(e) The preparation of financial statements in conformity with GAAP requires management to make estimates and assumptions that affect the reported amounts of assets and liabilities and disclosure of contingent assets and liabilities at the date of the financial statements and the reported amounts of revenues and expenses during the reporting period. Actual results could differ from these estimates. | |
(f) No provision has been made for Federal income taxes since the Fund has elected to be taxed as a “regulated investment company” and intends to distribute substantially all net investment company taxable income and net capital gains to shareholders and otherwise comply with the provisions of the Internal Revenue Code applicable to regulated investment companies. | |
(g) The Fund has reviewed all open tax years and major jurisdictions, which include Federal and the state of Maryland, and concluded that there are no significant uncertain tax positions that would require recognition in the financial statements as of and for the year ended September 30, 2014. Open tax years are those that are open for exam by taxing authorities and, as of March 31, 2015, open Federal tax years include the tax years ended September 30, 2011 through 2014. The Fund recognizes interest and penalties, if any, related to unrecognized tax benefits as income tax expense in the Fund’s Statement of Operations. During the six months ended March 31, 2015, the Fund did not incur any interest or penalties. The Fund has no examinations in progress and is also not aware of any tax positions for which it is reasonably possible that the total amounts of unrecognized tax benefits will significantly change in the next six months. | |
| (2) | Investment Adviser and Management Agreement and Transactions With Related Parties — |
The Fund has a management agreement with Reynolds Capital Management, LLC (“RCM”), to serve as investment adviser and manager. The sole owner of RCM is Mr. Frederick L. Reynolds. Mr. Reynolds is also an officer and interested director of the Fund. Under the terms of the agreement, the Fund will pay RCM a monthly management fee at the annual rate of 1.00% of the daily net assets. | |
The agreement further stipulates that RCM will reimburse the Fund for all expenses exceeding 2.00% of its daily average net assets (excluding interest, taxes, brokerage commissions and extraordinary items). The Fund is not obligated to reimburse RCM for any expenses reimbursed in previous fiscal years. No such reimbursements were required for the six months ended March 31, 2015. | |
| The Fund has adopted a Service and Distribution Plan (the “Plan”) pursuant to Rule 12b-1 under the Act. The Plan provides that the Fund may incur certain costs which may not exceed a maximum amount equal to 0.25% per annum of the Fund’s average daily net assets. Payments made pursuant to the Plan may only be used to pay distribution expenses incurred in the current year, and may be less than the maximum amount allowed by the Plan. |
- 21 -
Reynolds Blue Chip Growth Fund
NOTES TO FINANCIAL STATEMENTS (Continued)
March 31, 2015 (Unaudited)
| (2) | Investment Adviser and Management Agreement and Transactions With Related Parties — (Continued) |
Under the Fund’s organizational documents, each director, officer, employee or other agent of the Fund (including the Fund’s investment manager) is indemnified, to the extent permitted by the Act, against certain liabilities that may arise out of performance of their duties to the Fund. Additionally, in the normal course of business, the Fund enters into contracts that contain a variety of indemnification clauses. The Fund’s maximum exposure under these arrangements is unknown as this would involve future claims that may be made against the Fund that have not yet occurred. However, the Fund has not had prior claims or losses pursuant to these contracts and believes the risk of loss to be remote. | |
| (3) | Distributions to Shareholders — |
Net investment income and net realized gains, if any, for the Fund are distributed to shareholders at least annually and are recorded on the ex-dividend date. | |
| (4) | Investment Transactions — |
For the six months ended March 31, 2015, purchases and proceeds of sales of investment securities (excluding short-term securities) were $186,498,736 and $178,077,051, respectively. There were no purchases or sales of U.S. Government securities. | |
| (5) | Income Tax Information — |
| The following information for the Fund is presented on an income tax basis as of September 30, 2014: |
| Gross | Gross | Net Unrealized | Distributable | Distributable | |
| Cost of | Unrealized | Unrealized | Appreciation | Ordinary | Long-Term |
| Investments | Appreciation | Depreciation | on Investments | Income | Capital Gains |
| $81,535,247 | $39,541,103 | $(3,945,879) | $35,595,224 | $2,431,262 | $30,675,657 |
The difference between the cost amount for financial statement and federal income tax purposes is due primarily to timing differences in recognizing certain gains and losses in security transactions. | |
| The tax components of dividends paid during the six month period ended March 31, 2015 and the year ended September 30, 2014 are: |
| Six Months Ended March 31, 2015 | Year Ended September 30, 2014 | ||
| Ordinary Income | Long-Term Capital | Ordinary Income | Long-Term Capital |
| Distributions | Gains Distributions | Distributions | Gains Distributions |
| $2,565,737 | $34,856,396 | $1,157,907 | $8,411,759 |
The Fund designated as long-term capital gain dividend, pursuant to Internal Revenue Code Section 852(b)(3), the amount necessary to reduce the earnings and profits of the Fund related to net capital gain to zero for the tax year ended September 30, 2014. | |
As of September 30, 2014, the Fund did not have a post-October capital loss or a capital loss carryforward. | |
The Fund designated 100% of dividends declared and paid during the year ended September 30, 2014 from net investment income as qualified dividend income under the Jobs Growth and Tax Relief Reconciliation Act of 2003. | |
| Corporate shareholders may be eligible for a dividend received deduction for certain ordinary income distributions paid by the Fund. The Fund designated 100% of dividends declared and paid during the year ended September 30, 2014 from net investment income as qualifying for the dividends received deduction. The deduction is a pass through of dividends paid by domestic corporations (i.e. only equities) subject to taxation. |
- 22 -
Reynolds Blue Chip Growth Fund
ADVISORY AGREEMENT
| On December 16, 2014, the Board of Directors (“Directors”) of Reynolds Funds, Inc. approved the continuation of the Reynolds Blue Chip Growth Fund’s (“Fund”) investment advisory agreement with Reynolds Capital Management, LLC (“RCM”). In approving the advisory agreement for the Fund, the Directors: (1) requested and evaluated materials from RCM (including a detailed report pursuant to Section 15(c) of the Investment Company Act that included an in-depth analysis of the Fund’s performance, fees and expenses as compared to other funds in the Fund’s peer group); (2) consulted with counsel to the Fund; and (3) discussed the advisory agreement in executive session, at which no representatives of RCM were present. Prior to approving the continuation of the advisory agreement, the Directors considered: |
| • | the nature, extent and quality of the services provided by RCM |
| • | the investment performance of the Fund |
| • | the costs of the services to be provided and profits to be realized by RCM from its relationship with the Fund |
| • | the extent to which economies of scale would be realized as the Fund grows and whether fee levels reflect those economies of scale |
| • | the expense ratio of the Fund |
In considering the nature, extent and quality of the services provided by RCM, the Directors reviewed a report describing the portfolio management, shareholder communication and servicing services provided by RCM to the Fund. The Directors also considered the quality of the material service providers to the Fund, who provide administrative and distribution services on behalf of the Fund. In addition, they considered the overall reputation and capabilities of RCM, the commitment of RCM to provide high quality services to the Fund, their overall confidence in RCM and its responsiveness to questions and concerns raised by the Directors. Based on these considerations and other factors, the Directors concluded that they were satisfied with the nature, extent and quality of the investment advisory services provided to the Fund by RCM, and that the nature and extent of the services provided by RCM are appropriate to assure that the Fund’s operations are conducted in compliance with applicable laws, rules and regulations. |
The Directors reviewed the performance of the Fund and the profitability of RCM. The Directors also reviewed data comparing fees and expenses of the Fund to comparable mutual funds, and the investment performance of the Fund compared to its benchmark. The Directors concluded that the performance of the Fund was satisfactory. With respect to RCM’s profitability, the Directors concluded that RCM has sufficient resources to service the Fund, and that the advisory fee is reasonable. |
In concluding that the advisory fees payable by the Fund were reasonable, the Directors reviewed reports of the costs of services provided, and the profits realized, by RCM, from its relationship with the Fund and concluded that such profits were reasonable and not excessive. The Directors also reviewed reports comparing the expense ratio of, and the advisory fees paid by, the Fund, to those of, and paid by, other comparable mutual funds and concluded that the advisory fees paid by the Fund and the expense ratio of the Fund was comparable to those of comparable mutual funds. |
The Directors considered other benefits to RCM from serving as adviser to the Fund (in addition to the advisory fee). The Directors noted that RCM derives ancillary benefits from its association with the Fund in the form of proprietary and third party research products and services received from broker dealers that execute portfolio trades for the Fund. The Directors determined such products and services have been used for legitimate purposes relating to the Fund by providing assistance in the investment decision-making process. The Directors concluded that the other benefits realized by RCM from its relationship with the Fund were reasonable. |
With regard to economies of scale, the Directors noted that certain fixed costs are spread over a broader base of assets as the Fund’s total assets increase. On the other hand, certain expenses incurred to manage the Fund are asset-based fees and thus do not result in material economies of scale being realized as the net assets of the Fund increase. The Directors concluded that given the size of the Fund, investment advisory fee breakpoints were not warranted at this time. |
| All of the factors above were considered separately by the Directors, including the Directors who are not “interested persons” (as defined in the Investment Company Act) of the Fund (the “Independent Directors”) meeting in an executive session. The factors were viewed in their totality by the Directors, with no single factor being the principal or determinative factor in the Directors’ determination of whether to approve the continuation of the advisory agreement. Based on the factors discussed above, the Directors, including all of the Independent Directors, approved the continuation of the advisory agreement. |
- 23 -
REYNOLDS BLUE CHIP GROWTH FUND
c/o U.S. BANCORP FUND SERVICES, LLC
615 East Michigan Street
Milwaukee, Wisconsin 53202
www.reynoldsfunds.com
Board of Directors
THOMAS F. GILBERTSON
FREDERICK L. REYNOLDS
ROBERT E. STAUDER
Investment Adviser
REYNOLDS CAPITAL MANAGEMENT, LLC
3565 South Las Vegas Boulevard, #403
Las Vegas, Nevada 89109
Transfer Agent,
Dividend Disbursing Agent,
Administrator and Accountant
U.S. BANCORP FUND SERVICES, LLC
615 East Michigan Street
Milwaukee, Wisconsin 53202
1-800-773-9665
or 1-800-7REYNOLDS
Custodian
U.S. BANK, N.A.
1555 North RiverCenter Drive, Suite 302
Milwaukee, Wisconsin 53212
Independent Registered Public Accounting Firm
COHEN FUND AUDIT SERVICES, LTD.
1350 Euclid Avenue, Suite 800
Cleveland, Ohio 44115
Legal Counsel
FOLEY & LARDNER LLP
777 East Wisconsin Avenue
Milwaukee, Wisconsin 53202
Distributor
RAFFERTY CAPITAL MARKETS, LLC
1010 Franklin Avenue
Garden City, New York 11530
Item 2. Code of Ethics.
Not applicable for semi-annual reports.
Item 3. Audit Committee Financial Expert.
Not applicable for semi-annual reports.
Item 4. Principal Accountant Fees and Services.
Not applicable for semi-annual reports.
Item 5. Audit Committee of Listed Registrants.
Not applicable to registrants who are not listed issuers (as defined in Rule 10A-3 under the Securities Exchange Act of 1934).
Item 6. Schedule of Investments.
(a) Schedule of Investments is included as part of the report to shareholders filed under Item 1 of this Form.
(b) Not applicable to open-end investment companies.
Item 7. Disclosure of Proxy Voting Policies and Procedures for Closed-End Management Investment Companies.
Not applicable to open-end investment companies.
Item 8. Portfolio Managers of Closed-End Management Investment Companies.
Not applicable to open-end investment companies.
Item 9. Purchases of Equity Securities By Closed-End Management Investment Company and Affiliated Purchasers.
Not applicable to open-end investment companies.
Item 10. Submission of Matters to a Vote of Security Holders.
Not applicable.
Item 11. Controls and Procedures.
| (a) | The Registrant’s President and Treasurer have reviewed the Registrant's disclosure controls and procedures (as defined in Rule 30a-3(c) under the Investment Company Act of 1940 (the “Act”)) as of a date within 90 days of the filing of this report, as required by Rule 30a-3(b) under the Act and Rules 13a-15(b) or 15d-15(b) under the Securities Exchange Act of 1934. Based on their review, such officers have concluded that the disclosure controls and procedures are effective in ensuring that information required to be disclosed in this report is appropriately recorded, processed, summarized and reported and made known to them by others within the Registrant and by the Registrant’s service provider. |
| (b) | There were no changes in the Registrant's internal control over financial reporting (as defined in Rule 30a-3(d) under the Act) that occurred during the second fiscal quarter of the period covered by this report that has materially affected, or is reasonably likely to materially affect, the Registrant's internal control over financial reporting. |
Item 12. Exhibits.
| (a) | (1) Any code of ethics or amendment thereto, that is the subject of the disclosure required by Item 2, to the extent that the registrant intends to satisfy Item 2 requirements through filing an exhibit. Not applicable. |
(2) A separate certification for each principal executive and principal financial officer pursuant to Section 302 of the Sarbanes-Oxley Act of 2002. Filed herewith.
(3) Any written solicitation to purchase securities under Rule 23c-1 under the Act sent or given during the period covered by the report by or on behalf of the Registrant to 10 or more persons. Not applicable to open-end investment companies.
| (b) | Certifications pursuant to Section 906 of the Sarbanes-Oxley Act of 2002. Furnished herewith. |
SIGNATURES
Pursuant to the requirements of the Securities Exchange Act of 1934 and the Investment Company Act of 1940, the registrant has duly caused this report to be signed on its behalf by the undersigned, thereunto duly authorized.
Reynolds Funds, Inc.
Registrant
By /s/Frederick L. Reynolds
Frederick L. Reynolds, President and Treasurer
Date May 29, 2015
Pursuant to the requirements of the Securities Exchange Act of 1934 and the Investment Company Act of 1940, this report has been signed below by the following persons on behalf of the registrant and in the capacities and on the dates indicated.
Reynolds Funds, Inc.
Registrant
By /s/Frederick L. Reynolds
Frederick L. Reynolds, President and Treasurer
Date May 29, 2015
Reynolds Funds, Inc.
Registrant