Item 1: Report to Shareholders
 |
| Small-Cap Value Fund | December 31, 2005 |
The views and opinions in this report were current as of December 31, 2005. They are not guarantees of performance or investment results and should not be taken as investment advice. Investment decisions reflect a variety of factors, and the managers reserve the right to change their views about individual stocks, sectors, and the markets at any time. As a result, the views expressed should not be relied upon as a forecast of the fund’s future investment intent. The report is certified under the Sarbanes-Oxley Act of 2002, which requires mutual funds and other public companies to affirm that, to the best of their knowledge, the information in their financial reports is fairly and accurately stated in all material respects.
REPORTS ON THE WEB
Sign up for our E-mail Program, and you can begin to receive updated fund reports and prospectuses online rather than through the mail. Log in to your account at troweprice.com for more information.
Fellow Shareholders
Some commentators have referred to 2005 as an “uninspiring” or even “boring” year for the stock market, and indeed, most closely watched indexes ended the year flat or with gains in the low single digits. I am pleased to report that your fund did somewhat better than the major averages, although its gains did not match the robust advances of the previous two years. While we were not able to avoid all of the year’s pitfalls, including fallout from Hurricane Katrina and cash-squeezed consumers, the portfolio was able to leverage the still-growing domestic economy and record a decent gain. My sense is that the challenges to strong performance will mount in 2006, however.

The Small-Cap Value Fund gained 8.02% over the past six months and 8.74% over the past year. As shown in the table, the fund easily surpassed its Russell benchmark over both periods. The fund also outpaced its competitor benchmarks over both periods, although the differential was not as great. Returns for Advisor Class shares were slightly lower. The fund remained in the top quartile of its category for the 5- and 10-year periods ended December 31, 2005. (Based on total return, Lipper ranked the Small-Cap Value Fund 178 out of 634, 152 out of 503, 18 out of 370, and 19 out of 107 small-cap core funds for the 1-, 3-, 5-, and 10-year periods ended December 31, 2005, respectively. Results will vary for other time periods. Past performance cannot guarantee future results.) Although Lipper classifies the portfolio as Small-Cap Core, we favor comparisons with the Small-Cap Value Funds category, which is more compatible with our investment style and objective.
MARKET ENVIRONMENT
Despite the headwinds of high energy prices and tighter monetary policy, the economy continued to steam ahead over the past six months. For a while, Hurricane Katrina’s arrival in late August seemed likely to slow the economic expansion, primarily because of damage the storm caused to the Gulf Coast’s energy infrastructure. While it inflicted significant destruction to New Orleans and other coastal areas, the hurricane’s impact on the national economy appeared to be modest. Indeed, data showed that growth accelerated in the third quarter, with gross domestic product increasing at a 4.1% annualized rate. Payroll growth also remained healthy, and the unemployment level moved down to a modest 4.9% by year-end.
Less happily, inflation returned as a topic of dinner table conversation in 2005. Katrina’s disruptions to the Gulf’s refining facilities pushed gasoline prices above $3 per gallon, which in turn caused the consumer price index to leap upward by 1.2% in September. But the evidence so far is that high oil prices have not trickled through to the rest of the economy, and so-called core inflation, which excludes food and energy prices, has remained notably contained. In an attempt to head off any inflationary pressures, the Fed continued to raise interest rates throughout our reporting period, bringing official short-term interest rates to their highest levels in over four years. This helped cool the housing market, and inventories of homes for sale began to climb in some once-hot markets.
PORTFOLIO ACTIVITY
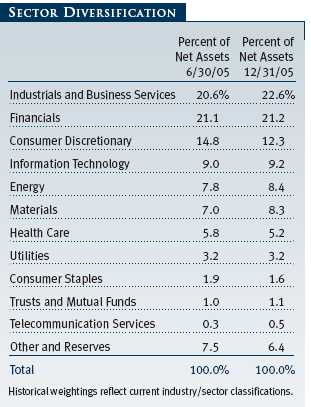
Conditions remained good for many businesses over the past six months, and a wide variety of our holdings were able to move higher. Many of our industrials, energy, financial services, health care, and information technology positions scored gains over the period as earnings came in above expectations. A notable exception came in the consumer-oriented sectors, where a broadly negative theme emerged as high energy prices put a squeeze on household spending. For the one-year period, energy and industrials firms were our top performers, while our information technology and consumer holdings generally weighed on results.
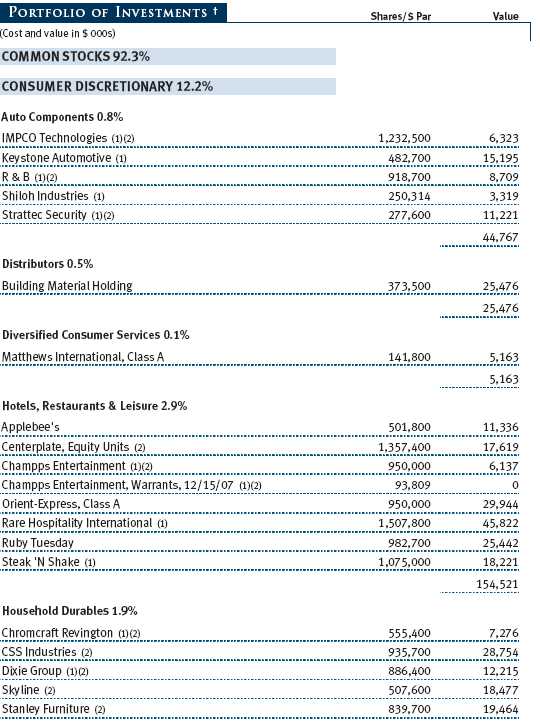
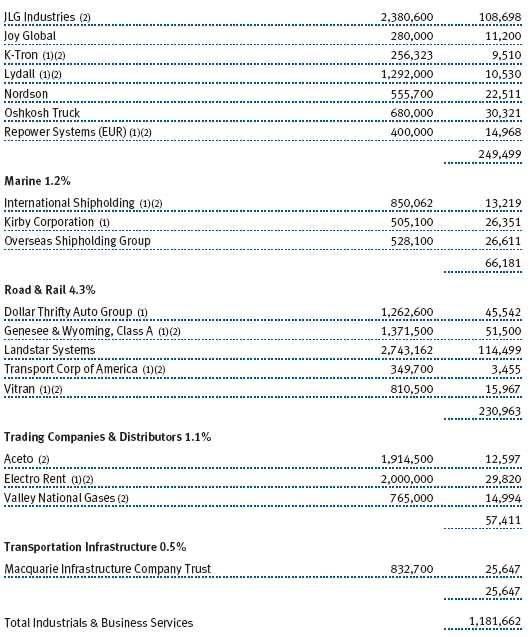
The continued economic expansion meant that many industrials firms were strong performers for the fund. Among our best-performing holdings was JLG Industries, which makes aerial work platforms, excavators, and other machinery used in the construction industry. Trucking firm Landstar Systems came back strong from losses in the first half of the year as shipping demand remained robust. Genesee & Wyoming is America’s preeminent shortline railroad, and it also has a large position in Australia’s second-largest railroad. The stock benefited from a good U.S. economy, worldwide demand for grain and coal from Australia, and a management team focused on wringing profits out of underutilized assets. (Please refer to our portfolio of investments for a complete listing of the fund’s holdings and the a mount each represents of the portfolio.)
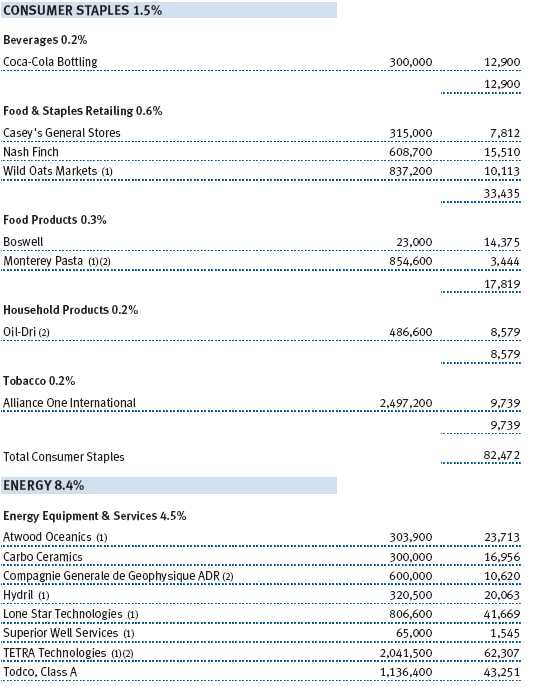
Energy stocks fell back a bit in the fourth quarter as oil prices declined from their peaks, but their six-month and full-year returns were excellent. Among our holdings in the sector, Ultra Petroleum stands out. We finished selling Ultra in October because it had grown too large for a small-cap portfolio, but we made 11 times our money on the total investment, a rare return in any environment. Several of our top-performing investments, including TETRA Technologies and Todco, were energy firms involved in providing services to larger integrated oil companies that are striving to expand production to meet growing world demand. While we have trimmed many of these positions, we see further potential in the services firms. With oil prices still well above $50 per barrel, demand for services such as exploration and drilling should remai n quite healthy.
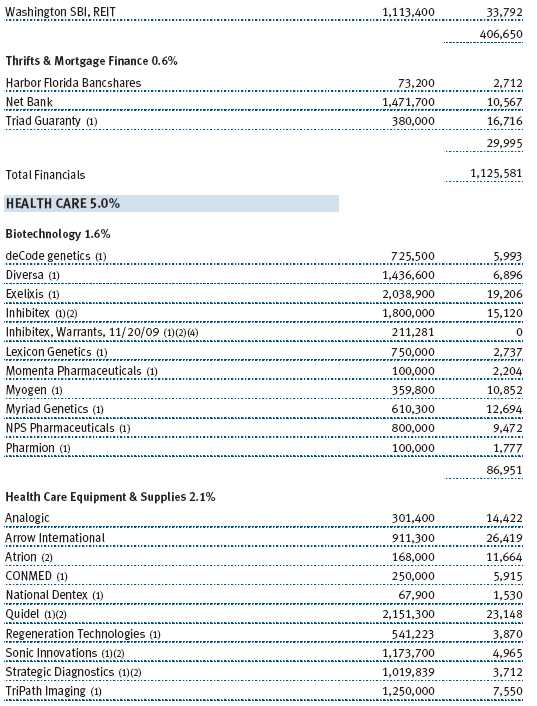
As interest rates rose and the housing sector cooled, most real estate-related firms saw a negative turn in their stock performance toward the end of the year. This was true of several of our investments in the sector, but we registered a standout success in Kilroy Realty. Kilroy has benefited from strong demand for office and industrial space in its home market of Southern California. Commodity-oriented stocks also turned lower at year-end, but we had another good return for the six-month period from Carpenter Technology, a specialty metals producer. Finally, medical supplies firm Quidel was another strong performer for the fund.
Despite the economy’s strength, many Americans felt insecure about their own financial situation. High gasoline prices weighed heavily on household budgets, especially for lower-income consumers. Several of our retailing and leisure positions retreated as customers were forced to cut back on discretionary spending. Stein Mart, which markets to middle-and lower-income consumers, moved down markedly over the past six months after having largely averted the retailing downdraft in the previous period. Restaurant firms Steak ‘N Shake, Rare Hospitality International, and Applebee’s were all disappointing.
Hurricane Katrina affected the portfolio in a number of ways. Sporting goods retailer Hibbett was hurt by hurricane-related damage to its stores in the Gulf Coast region, with some stores completely lost. Aaron Rents, one of the largest home and office furnishings rental and retail firms in the U.S, saw hurricane-related damage to its stores in the region as well—while also struggling with concerns over slowing same-store sales growth. On the other hand, Strategic Hotels, which suffered major damage to its Hyatt Regency Hotel in New Orleans, had a happier outcome—the hotel was able to make repairs quickly and became FEMA headquarters in the area.
As I have noted previously, finding new candidates for the portfolio is becoming more of a challenge because of the strong performance of many small-cap value stocks. However, this is somewhat a matter of definition. If we define a “cheap” stock as one that trades below 10 times earnings, these are indeed hard to find. On the other hand, we have been able to find stocks that have been bid down for earnings shortfalls, and that we believe may heal with time. In that sense, the unforgiving nature of today’s market, which quickly punishes such missteps, has been a blessing for value investors.
Fortunately, the market appeared to overreact in the case of Piper Jaffray, the Minneapolis broker I noted in the last report. The stock has appreciated nicely since our purchase, which followed the company’s announcement of poor first-quarter results. We hope RSA Security will turn out to be an investment of similar vintage. The maker of secure ID software tokens missed earnings in the second quarter, sending its shares lower, and we swept in to buy a piece of what we think is still a very good business. Similarly, we bought Cleco, a Central Louisiana electric utility, when fears of damage to its facilities from Hurricane Katrina appeared exaggerated.
At the same time, the market has provided us with no shortage of sale candidates. We have liquidated positions that have grown either too large in market capitalization, too richly valued, or too substantial a position in the portfolio. Examples of such sales include Steven Madden and Ultra Petroleum. We have also benefited from increased merger and leveraged buyout activity, as in the case of Amegy Bancorp and Advanced Power Technology. Of course, we also liquidated positions when we had concerns about the fundamentals of the company, as was the case with manufactured housing real estate investment trust Sun Communities, which became the subject of an accounting probe.
OUTLOOK
If the duration of past economic expansions is any guide, the current one is approaching middle age. In that light, the lack of stresses and strains usually associated with an aging business cycle is notable. Growth seems poised to slow in the coming year, but we do not expect a recession. The Fed appears likely to reverse course and lower rates again if signs of weakness appear, and corporations stand ready to increase business investment. I do not anticipate significant market gains in 2006, but ample liquidity seems likely to prevent a significant decrease in stock prices with a few exceptions. The fragile housing market in some areas is a concern, particularly in regions where speculation has run rampant, such as Las Vegas and South Florida.

In contrast to the economic cycle as a whole, the small-cap value cycle is showing its age. After consistently outperforming large-caps for over six years, small-caps came back roughly in line during the last six months. Further, small growth stocks, which clearly outperformed during the second half, seem poised to continue this trend, with technology stocks positioned to fare particularly well as investors return to this beaten-down sector. Of course, the data are far from conclusive, and as many of you know, I have been predicting the shift in market leadership for some time. Still, its absence in each passing period seems to me to make its arrival only more likely. Godot may not have shown up, but the large-cap growth cycle surely will.
While this may not be the ideal environment for small-cap value investing, I believe good opportunities exist if we keep the portfolio properly positioned. For example, I sense that some of our winning holdings have the chance to appreciate further in these conditions, and we will keep them in the portfolio for longer than we might customarily. I also expect that more of our holdings will be taken private in the coming year, presenting us with the chance to sell them at a premium. As always, I will work with our fine team of analysts to seek these opportunities, and I look forward to reporting on our results to you in six months.
Respectfully submitted,

Preston G. Athey
President of the fund and chairman of its Investment Advisory Committee
January 23, 2006
The committee chairman has day-to-day responsibility for managing the portfolio and works with committee members in developing and executing the fund’s investment program.
RISKS OF STOCK INVESTING
The fund’s share price can fall because of weakness in the stock markets, a particular industry, or specific holdings. Stock markets can decline for many reasons, including adverse political or economic developments, changes in investor psychology, or heavy institutional selling. The prospects for an industry or company may deteriorate because of a variety of factors, including disappointing earnings or changes in the competitive environment. In addition, the investment manager’s assessment of companies held in a fund may prove incorrect, resulting in losses or poor performance even in rising markets.
GLOSSARY
Lipper indexes: Fund benchmarks that consist of a small number (10 to 30) of the largest mutual funds in a particular category as tracked by Lipper Inc.
Russell 2000 Index: Consists of the smallest 2,000 companies in the Russell 3000 Index (approximately 98% of the investable U.S. equity market). Performance is reported on a total-return basis.
Russell 2000 Growth Index: An index of those firms in the Russell 2000 with higher price-to-book ratios and higher forecasted growth values.
Russell 1000 Value Index: An index of those firms in the Russell 2000 with lower price-to-book ratios and lower forecasted growth values.

| * | Position added |
| ** | Position eliminated |
| *** | Merger |
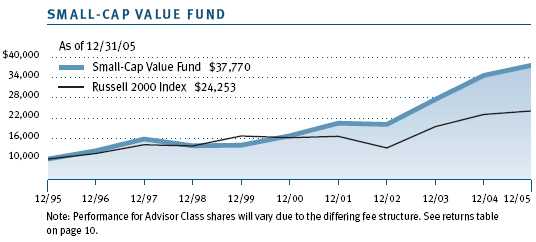
| GROWTH OF $10,000 |
This chart shows the value of a hypothetical $10,000 investment in the fund over the past 10 fiscal year periods or since inception (for funds lacking 10-year records). The result is compared with benchmarks, which may include a broad-based market index and a peer group average or index. Market indexes do not include expenses, which are deducted from fund returns as well as mutual fund averages and indexes.
| AVERAGE ANNUAL COMPOUND TOTAL RETURN |
This table shows how the fund would have performed each year if its actual (or cumulative) returns had been earned at a constant rate.

| FUND EXPENSE EXAMPLE |
As a mutual fund shareholder, you may incur two types of costs: (1) transaction costs, such as redemption fees or sales loads, and (2) ongoing costs, including management fees, distribution and service (12b-1) fees, and other fund expenses. The following example is intended to help you understand your ongoing costs (in dollars) of investing in the fund and to compare these costs with the ongoing costs of investing in other mutual funds. The example is based on an investment of $1,000 invested at the beginning of the most recent six-month period and held for the entire period.
Please note that the fund has two share classes: The original share class (“investor class”) charges no distribution and service (12b-1) fee. Advisor Class shares are offered only through unaffiliated brokers and other financial intermediaries and charge a 0.25% 12b-1 fee. Each share class is presented separately in the table.
Actual Expenses
The first line of the following table (“Actual”) provides information about actual account values and expenses based on the fund’s actual returns. You may use the information in this line, together with your account balance, to estimate the expenses that you paid over the period. Simply divide your account value by $1,000 (for example, an $8,600 account value divided by $1,000 = 8.6), then multiply the result by the number in the first line under the heading “Expenses Paid During Period” to estimate the expenses you paid on your account during this period.
Hypothetical Example for Comparison Purposes
The information on the second line of the table (“Hypothetical”) is based on hypothetical account values and expenses derived from the fund’s actual expense ratio and an assumed 5% per year rate of return before expenses (not the fund’s actual return). You may compare the ongoing costs of investing in the fund with other funds by contrasting this 5% hypothetical example and the 5% hypothetical examples that appear in the shareholder reports of the other funds. The hypothetical account values and expenses may not be used to estimate the actual ending account balance or expenses you paid for the period.
Note: T. Rowe Price charges an annual small-account maintenance fee of $10, generally for accounts with less than $2,000 ($500 for UGMA/UTMA). The fee is waived for any investor whose T. Rowe Price mutual fund accounts total $25,000 or more, accounts employing automatic investing, and IRAs and other retirement plan accounts that utilize a prototype plan sponsored by T. Rowe Price (although a separate custodial or administrative fee may apply to such accounts). This fee is not included in the accompanying table. If you are subject to the fee, keep it in mind when you are estimating the ongoing expenses of investing in the fund and when comparing the expenses of this fund with other funds.
You should also be aware that the expenses shown in the table highlight only your ongoing costs and do not reflect any transaction costs, such as redemption fees or sales loads. Therefore, the second line of the table is useful in comparing ongoing costs only and will not help you determine the relative total costs of owning different funds. To the extent a fund charges transaction costs, however, the total cost of owning that fund is higher.
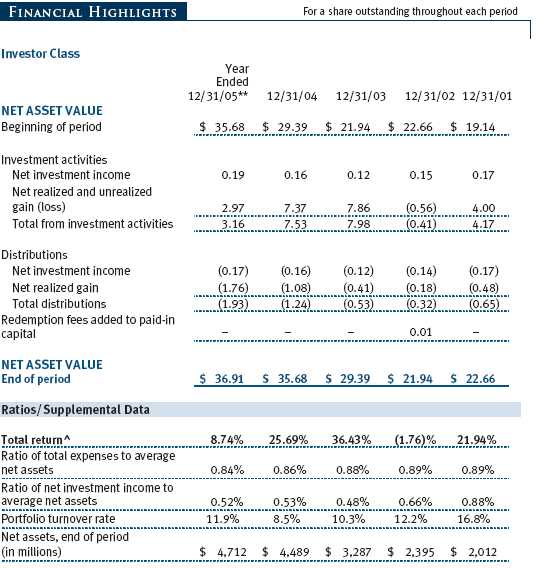
| ** | Per share amounts calculated using average shares outstanding method. |
| ^ | Total return reflects the rate that an investor would have earned on an investment in the fund |
| during each period, assuming reinvestment of all distributions and payment of no redemption or | |
| account fees. |
The accompanying notes are an integral part of these financial statements.
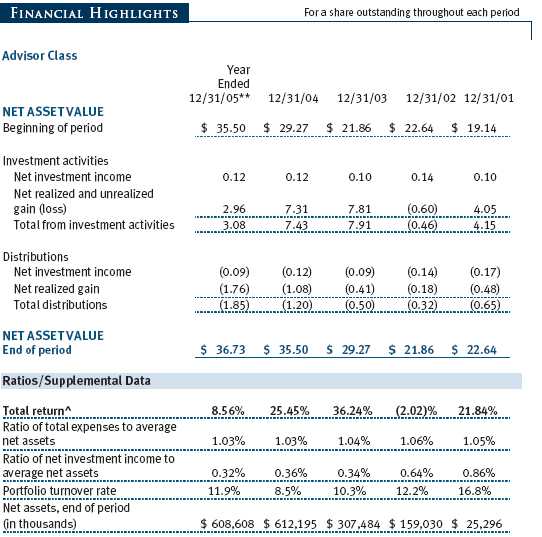


| † | Denominated in U.S. dollars unless otherwise noted |
| (1) | Non-income producing |
| (2) | Affiliated company |
| (3) | Security was purchased pursuant to Rule 144A under the Securities Act of 1933 |
| and may be resold in transactions exempt from registration only to qualified | |
| institutional buyers -- total value of such securities at period end amounts to | |
| $56,419 and represents 1.1% of net assets. | |
| (4) | Restricted security |
| (5) | Seven-day yield |
| (6) | In default with respect to payment of principal and interest. |
| ++ | All or a portion of this security is pledged to cover margin requirements on futures |
| contracts at December 31, 2005 | |
| ADR | American Depository Receipts |
| CAD | Canadian Dollar |
| EUR | Euro |
| REIT | Real Estate Investment Trust |


The accompanying notes are an integral part of these financial statements.
The accompanying notes are an integral part of these financial statements.

The accompanying notes are an integral part of these financial statements.

The accompanying notes are an integral part of these financial statements.
| NOTES TO FINANCIAL STATEMENTS |
NOTE 1 - SIGNIFICANT ACCOUNTING POLICIES
T. Rowe Price Small-Cap Value Fund, Inc. (the fund) is registered under the Investment Company Act of 1940 (the 1940 Act) as a diversified, open-end management investment company. The fund seeks long-term capital growth by investing primarily in small companies whose common stocks are believed to be undervalued. The fund has two classes of shares: the Small-Cap Value Fund original share class, referred to in this report as the Investor Class, offered since June 30, 1988, and Small-Cap Value Fund—Advisor Class (Advisor Class), offered since March 31, 2000. Advisor Class shares are sold only through unaffiliated brokers and other unaffiliated financial intermediaries that are compensated by the class for distribution, shareholder servicing, and/or certain administrative services under a Board-approved Rule 12b-1 plan. Each class has exclusive voting rights on matters related solely to that class, separate voting rights on matters that relate to both classes, and, in all other respects, the same rights and obligations as the other class.
The accompanying financial statements were prepared in accordance with accounting principles generally accepted in the United States of America, which require the use of estimates made by fund management. Fund management believes that estimates and security valuations are appropriate; however actual results may differ from those estimates, and the security valuations reflected in the financial statements may differ from the value the fund ultimately realizes upon sale of the securities.
Valuation The fund values its investments and computes its net asset value per share at the close of the New York Stock Exchange (NYSE), normally 4 p.m. ET, each day that the NYSE is open for business. Equity securities listed or regularly traded on a securities exchange or in the over-the-counter market are valued at the last quoted sale price or, for certain markets, the official closing price at the time the valuations are made, except for OTC Bulletin Board securities, which are valued at the mean of the latest bid and asked prices. A security that is listed or traded on more than one exchange is valued at the quotation on the exchange determined to be the primary market for such security. Listed securities not traded on a particular day are valued at the mean of the latest bid and asked prices for domestic securities and the last quoted sale price for international securities.
Debt securities are generally traded in the over-the-counter market. Securities with original maturities of one year or more are valued at prices furnished by dealers who make markets in such securities or by an independent pricing service, which considers yield or price of bonds of comparable quality, coupon, maturity, and type, as well as prices quoted by dealers who make markets in such securities. Securities with original maturities of less than one year are valued at amortized cost in local currency, which approximates fair value when combined with accrued interest.
Investments in mutual funds are valued at the mutual fund’s closing net asset value per share on the day of valuation. Financial futures contracts are valued at closing settlement prices.
Other investments, including restricted securities, and those for which the above valuation procedures are inappropriate or are deemed not to reflect fair value are stated at fair value as determined in good faith by the T. Rowe Price Valuation Committee, established by the fund’s Board of Directors.
Most foreign markets close before the close of trading on the NYSE. If the fund determines that developments between the close of a foreign market and the close of the NYSE will, in its judgment, materially affect the value of some or all of its portfolio securities, which in turn will affect the fund’s share price, the fund will adjust the previous closing prices to reflect the fair value of the securities as of the close of the NYSE, as determined in good faith by the T. Rowe Price Valuation Committee, established by the fund’s Board of Directors. A fund may also fair value securities in other situations, such as when a particular foreign market is closed but the fund is open. In deciding whether to make fair value adjustments, the fund reviews a variety of factors, including developments in foreign markets, the performance of U.S. securities markets, and the performance of instruments trading in U.S. markets that represent foreign securities and baskets of foreign securities . The fund uses outside pricing services to provide it with closing market prices and information used for adjusting those prices. The fund cannot predict when and how often it will use closing prices and when it will adjust those prices to reflect fair value. As a means of evaluating its fair value process, the fund routinely compares closing market prices, the next day’s opening prices in the same markets, and adjusted prices.
Currency Translation Assets, including investments, and liabilities denominated in foreign currencies are translated into U.S. dollar values each day at the prevailing exchange rate, using the mean of the bid and asked prices of such currencies against U.S. dollars as quoted by a major bank. Purchases and sales of securities, income, and expenses are translated into U.S. dollars at the prevailing exchange rate on the date of the transaction. The effect of changes in foreign currency exchange rates on realized and unrealized security gains and losses is reflected as a component of security gains and losses.
Class Accounting The Advisor Class pays distribution, shareholder servicing, and/or certain administrative expenses in the form of Rule 12b-1 fees, in an amount not exceeding 0.25% of the class’s average daily net assets. Shareholder servicing, prospectus, and shareholder report expenses incurred by each class are charged directly to the class to which they relate. Expenses common to both classes, investment income, and realized and unrealized gains and losses are allocated to the classes based upon the relative daily net assets of each class.
Rebates and Credits Subject to best execution, the fund may direct certain security trades to brokers who have agreed to rebate a portion of the related brokerage commission to the fund in cash. Commission rebates are reflected as realized gain on securities in the accompanying financial statements and totaled $110,000 for the year ended December 31, 2005. Additionally, the fund earns credits on temporarily uninvested cash balances at the custodian that reduce the fund’s custody charges. Custody expense in the accompanying financial statements is presented before reduction for credits, which are reflected as expenses paid indirectly.
Redemption Fees A 1% fee is assessed on redemptions of Investor Class and Advisor Class fund shares held less than 90 days/3 months to deter short-term trading and protect the interests of long-term shareholders. Redemption fees are withheld from proceeds that shareholders receive from the sale or exchange of fund shares. The fees are paid to the fund, and are recorded as an increase to paid-in capital. The fees may cause the redemption price per share to differ from the net asset value per share.
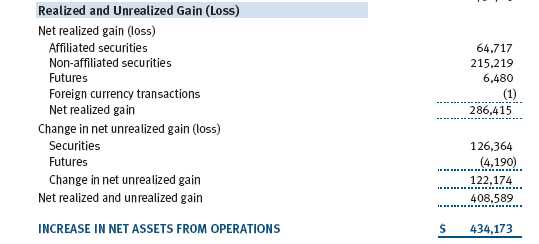
Investment Transactions, Investment Income, and Distributions Income and expenses are recorded on the accrual basis. Premiums and discounts on debt securities are amortized for financial reporting purposes. Dividends received from mutual fund investments are reflected as dividend income; capital gain distributions are reflected as realized gain/loss. Dividend income and capital gain distributions are recorded on the ex-dividend date. Investment transactions are accounted for on the trade date. Realized gains and losses are reported on the identified cost basis. Payments (“variation margin”) made or received to settle the daily fluctuations in the value of futures contracts are recorded as unrealized gains or losses until the contracts are closed. Unsettled variation margin on futures contracts is reflected as other assets or liabilities, and unrealized gains and losses on futures contracts are reflected as the change in net unrealized gain or loss in th e accompanying financial statements. Distributions to shareholders are recorded on the ex-dividend date.
Income distributions are declared and paid by each class on an annual basis. Capital gain distributions, if any, are declared and paid by the fund, typically on an annual basis.
NOTE 2 - INVESTMENT TRANSACTIONS
Consistent with its investment objective, the fund engages in the following practices to manage exposure to certain risks or enhance performance. The investment objective, policies, program, and risk factors of the fund are described more fully in the fund’s prospectus and Statement of Additional Information.
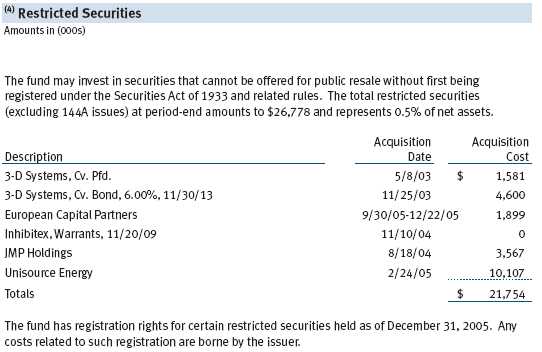
Restricted Securities The fund may invest in securities that are subject to legal or contractual restrictions on resale. Although certain of these securities may be readily sold, for example, under Rule 144A, others may be illiquid, their sale may involve substantial delays and additional costs, and prompt sale at an acceptable price may be difficult.
Futures Contracts During the year ended December 31, 2005, the fund was a party to futures contracts, which provide for the future sale by one party and purchase by another of a specified amount of a specific financial instrument at an agreed upon price, date, time, and place. Risks arise from possible illiquidity of the futures market and from movements in security values.
Other Purchases and sales of portfolio securities, other than short-term securities, aggregated $564,692,000 and $632,474,000, respectively, for the year ended December 31, 2005.
NOTE 3 - FEDERAL INCOME TAXES
No provision for federal income taxes is required since the fund intends to continue to qualify as a regulated investment company under Subchapter M of the Internal Revenue Code and distribute to shareholders all of its taxable income and gains. Federal income tax regulations differ from generally accepted accounting principles; therefore, distributions determined in accordance with tax regulations may differ significantly in amount or character from net investment income and realized gains for financial reporting purposes. Financial reporting records are adjusted for permanent book/tax differences to reflect tax character. Financial records are not adjusted for temporary differences.
Distributions during the year ended December 31, 2005 were characterized as follows for tax purposes:

At December 31, 2005, the tax-basis components of net assets were as follows:

Federal income tax regulations require the fund to treat the gain/loss on certain open futures contracts as realized on the last day of the tax year; accordingly, $2,096,000 of unrealized losses reflected in the accompanying financial statements were realized for tax purposes as of December 31, 2005.
For the year ended December 31, 2005, the fund recorded the following permanent reclassifications to reflect tax character. Reclassifications to paid-in capital relate primarily to a tax practice that treats a portion of the proceeds from each redemption of capital shares as a distribution of taxable net investment income and/or realized capital gain. Results of operations and net assets were not affected by these reclassifications.

At December 31, 2005, the cost of investments for federal income tax purposes was $3,191,523,000.
NOTE 4 - RELATED PARTY TRANSACTIONS
The fund is managed by T. Rowe Price Associates, Inc. (the manager or Price Associates), a wholly owned subsidiary of T. Rowe Price Group, Inc. The investment management agreement between the fund and the manager provides for an annual investment management fee, which is computed daily and paid monthly. The fee consists of an individual fund fee, equal to 0.35% of the fund’s average daily net assets, and a group fee. The group fee rate is calculated based on the combined net assets of certain mutual funds sponsored by Price Associates (the group) applied to a graduated fee schedule, with rates ranging from 0.48% for the first $1 billion of assets to 0.29% for assets in excess of $160 billion. Prior to May 1, 2005, the maximum group fee rate in the graduated fee schedule had been 0.295% for assets in excess of $120 billion. The fund’s group fee is determined by applying the group fee rate to the fund’s average daily net assets. At December 31, 2005, the effective annual gr oup fee rate was 0.31%.
The Advisor Class is also subject to a contractual expense limitation through April 30, 2006. During the limitation period, the manager is required to waive its management fee and reimburse a class for any expenses, excluding interest, taxes, brokerage commissions, and extraordinary expenses, that would otherwise cause the class’s ratio of total expenses to average net assets (expense ratio) to exceed its expense limitation of 1.15%. The class is required to repay the manager for expenses previously reimbursed and management fees waived to the extent the class’s net assets have grown or expenses have declined sufficiently to allow repayment without causing the class’s expense ratio to exceed its expense limitation. However, no repayment will be made more than three years after the date of any reimbursement or waiver or later than April 30, 2008. Pursuant to this agreement, at December 31, 2005, there were no amounts subject to repayment. For the year ended December 31, 20 05, the Advisor Class operated below its expense limitation.
In addition, the fund has entered into service agreements with Price Associates and two wholly owned subsidiaries of Price Associates (collectively, Price). Price Associates computes the daily share prices and maintains the financial records of the fund. T. Rowe Price Services, Inc., provides shareholder and administrative services in its capacity as the fund’s transfer and dividend disbursing agent. T. Rowe Price Retirement Plan Services, Inc., provides subaccounting and record-keeping services for certain retirement accounts invested in the Investor Class. For the year ended December 31, 2005, expenses incurred pursuant to these service agreements were $93,000 for Price Associates, $1,491,000 for T. Rowe Price Services, Inc., and $4,124,000 for T. Rowe Price Retirement Plan Services, Inc. The total amount payable at period end pursuant to these service agreements is reflected as Due to Affiliates in the accompanying financial statements.
The fund may invest in the T. Rowe Price Reserve Investment Fund and the T. Rowe Price Government Reserve Investment Fund (collectively, the T. Rowe Price Reserve Funds), open-end management investment companies managed by Price Associates and affiliates of the fund. The T. Rowe Price Reserve Funds are offered as cash management options to mutual funds, trusts, and other accounts managed by Price Associates and/or its affiliates, and are not available for direct purchase by members of the public. The T. Rowe Price Reserve Funds pay no investment management fees.
As of December 31, 2005, T. Rowe Price Group, Inc. and/or its wholly owned subsidiaries owned 132,778 shares of the fund, representing less than 1% of the fund’s net assets.
| REPORT OF INDEPENDENT REGISTERED PUBLIC ACCOUNTING FIRM |
To the Board of Directors and Shareholders of T. Rowe Price Small-Cap Value Fund, Inc.
In our opinion, the accompanying statement of assets and liabilities, including the portfolio of investments, and the related statements of operations and of changes in net assets and the financial highlights present fairly, in all material respects, the financial position of T. Rowe Price Small-Cap Value Fund, Inc. (the “Fund”) at December 31, 2005, the results of its operations for the year then ended, the changes in its net assets for each of the two years in the period then ended and the financial highlights for each of the five years in the period then ended, in conformity with accounting principles generally accepted in the United States of America. These financial statements and financial highlights (hereafter referred to as “financial statements”) are the responsibility of the Fund’s management; our responsibility is to express an opinion on these financial statements based on our audits. We conducted our audits of these financial statements in accordance with the standards of the Public Company Accounting Oversight Board (United States). Those standards require that we plan and perform the audit to obtain reasonable assurance about whether the financial statements are free of material misstatement. An audit includes examining, on a test basis, evidence supporting the amounts and disclosures in the financial statements, assessing the accounting principles used and significant estimates made by management, and evaluating the overall financial statement presentation. We believe that our audits, which included confirmation of securities at December 31, 2005 by correspondence with the custodian and brokers and by agreement to the underlying ownership records for T. Rowe Price Reserve Investment Fund, provide a reasonable basis for our opinion.
PricewaterhouseCoopers LLP
Baltimore, Maryland
February 13, 2006
| TAX INFORMATION (UNAUDITED) FOR THE TAX YEAR ENDED 12/31/05 |
We are providing this information as required by the Internal Revenue Code. The amounts shown may differ from those elsewhere in this report because of differences between tax and financial reporting requirements.
The fund’s distributions to shareholders included:
$3,755,000 from short-term capital gains
$261,822,000 from long-term capital gains, subject to the 15% rate gains category
For taxable non-corporate shareholders, $34,060,000 of the fund’s income represents qualified dividend income subject to the 15% rate category.
For corporate shareholders, $34,060,000 of the fund’s income qualifies for the dividends-received deduction.
| INFORMATION ON PROXY VOTING POLICIES, PROCEDURES, AND RECORDS |
A description of the policies and procedures used by T. Rowe Price funds and portfolios to determine how to vote proxies relating to portfolio securities is available in each fund’s Statement of Additional Information, which you may request by calling 1-800-225-5132 or by accessing the SEC’s Web site, www.sec.gov. The description of our proxy voting policies and procedures is also available on our Web site, www.troweprice.com. To access it, click on the words “Company Info” at the top of our homepage for individual investors. Then, in the window that appears, click on the “Proxy Voting Policy” navigation button in the top left corner.
Each fund’s most recent annual proxy voting record is available on our Web site and through the SEC’s Web site. To access it through our Web site, follow the directions above, then click on the words “Proxy Voting Record” at the bottom of the Proxy Voting Policy page.
| HOW TO OBTAIN QUARTERLY PORTFOLIO HOLDINGS |
The fund files a complete schedule of portfolio holdings with the Securities and Exchange Commission for the first and third quarters of each fiscal year on Form N-Q. The fund’s Form N-Q is available electronically on the SEC’s Web site (www.sec.gov); hard copies may be reviewed and copied at the SEC’s Public Reference Room, 450 Fifth St. N.W., Washington, DC 20549. For more information on the Public Reference Room, call 1-800-SEC-0330.
| ABOUT THE FUND’S DIRECTORS AND OFFICERS |
Your fund is governed by a Board of Directors that meets regularly to review investments, performance, compliance matters, advisory fees, expenses, and other business affairs, and is responsible for protecting the interests of shareholders. The majority of the fund’s directors are independent of T. Rowe Price Associates, Inc. (T. Rowe Price); “inside” directors are officers of T. Rowe Price. The Board of Directors elects the fund’s officers, who are listed in the final table. The business address of each director and officer is 100 East Pratt Street, Baltimore, MD 21202. The Statement of Additional Information includes additional information about the fund directors and is available without charge by calling a T. Rowe Price representative at 1-800-225-5132.
| Independent Directors | |
| Name | |
| (Year of Birth) | |
| Year Elected * | |
| [Number of T. Rowe Price | Principal Occupation(s) During Past 5 Years and Directorships of |
| Portfolios Overseen] | Other Public Companies |
| Jeremiah E. Casey ** | Director, National Life Insurance (2001 to 8/05); Director, The Rouse |
| (1940) | Company, real estate developers (1990 to 2004) |
| 2005 | |
| [59] | |
| Anthony W. Deering | Chairman, Exeter Capital, LLC, a private investment firm (2004 to pres- |
| (1945) | ent); Director, Chairman of the Board, and Chief Executive Officer, The |
| 2001 | Rouse Company, real estate developers (1997 to 2004); Director, |
| [113] | Mercantile Bank (4/03 to present) |
| Donald W. Dick, Jr. | Principal, EuroCapital Advisors, LLC, an acquisition and management |
| (1943) | advisory firm; Chairman, President, and Chief Executive Officer, The |
| 1994 | Haven Group, a custom manufacturer of modular homes (1/04 |
| [113] | to present) |
| David K. Fagin | Chairman and President, Nye Corporation (6/88 to present); Director, |
| (1938) | Canyon Resources Corp. and Golden Star Resources Ltd. (5/00 to |
| 1994 | present) and Pacific Rim Mining Corp. (2/02 to present) |
| [113] | |
| Karen N. Horn | Managing Director and President, Global Private Client Services, Marsh |
| (1943) | Inc. (1999 to 2003); Managing Director and Head of International Private |
| 2003 | Banking, Bankers Trust (1996 to 1999); Director, Eli Lilly and Company |
| [113] | and Georgia Pacific |
| F. Pierce Linaweaver | President, F. Pierce Linaweaver & Associates, Inc., consulting |
| (1934) | environmental and civil engineers |
| 2001 | |
| [113] | |
| Theo C. Rodgers *** | President, A&R Development Corporation |
| (1941) | |
| 2005 | |
| [97] | |
| John G. Schreiber | Owner/President, Centaur Capital Partners, Inc., a real estate invest- |
| (1946) | ment company; Partner, Blackstone Real Estate Advisors, L.P.; Director, |
| 2001 | AMLI Residential Properties Trust |
| [113] | |
| * | Each independent director serves until retirement, resignation, or election of a successor. |
| ** | Elected effective October 19, 2005. |
| *** | Elected effective April 1, 2005. |
| Inside Directors | |
| Name | |
| (Year of Birth) | |
| Year Elected * | |
| [Number of T. Rowe Price | Principal Occupation(s) During Past 5 Years and Directorships of |
| Portfolios Overseen] | Other Public Companies |
| John H. Laporte, CFA | Vice President, T. Rowe Price and T. Rowe Price Group, Inc. |
| (1945) | |
| 1994 | |
| [15] | |
| James S. Riepe | Director and Vice President, T. Rowe Price; Vice Chairman of the Board, |
| (1943) | Director, and Vice President, T. Rowe Price Group, Inc.; Chairman of the |
| 1988 | Board and Director, T. Rowe Price Global Asset Management Limited, |
| [113] | T. Rowe Price Global Investment Services Limited, T. Rowe Price |
| Investment Services, Inc., T. Rowe Price Retirement Plan Services, | |
| Inc., and T. Rowe Price Services, Inc.; Chairman of the Board, Director, | |
| President, and Trust Officer, T. Rowe Price Trust Company; Director, | |
| T. Rowe Price International, Inc.; Chairman of the Board, all funds | |
| *Each inside director serves until retirement, resignation, or election of a successor. |
| Officers | |
| Name (Year of Birth) | |
| Title and Fund(s) Served | Principal Occupation(s) |
| Preston G. Athey, CFA, CIC (1949) | Vice President, T. Rowe Price, T. Rowe Price |
| President, Small-Cap Value Fund | Group, Inc., and T. Rowe Price Trust Company |
| Joseph A. Carrier, CPA (1960) | Vice President, T. Rowe Price, T. Rowe Price |
| Treasurer, Small-Cap Value Fund | Group, Inc., T. Rowe Price Investment Services, |
| Inc., and T. Rowe Price Trust Company | |
| Hugh M. Evans III, CFA (1966) | Vice President, T. Rowe Price and T. Rowe Price |
| Vice President, Small-Cap Value Fund | Group, Inc. |
| Roger L. Fiery III, CPA (1959) | Vice President, T. Rowe Price, T. Rowe Price |
| Vice President, Small-Cap Value Fund | Group, Inc., T. Rowe Price International, Inc., |
| and T. Rowe Price Trust Company | |
| John R. Gilner (1961) | Chief Compliance Officer and Vice President, |
| Chief Compliance Officer, Small-Cap Value Fund | T. Rowe Price; Vice President, T. Rowe Price |
| Group, Inc., and T. Rowe Price Investment | |
| Services, Inc. | |
| Gregory S. Golczewski (1966) | Vice President, T. Rowe Price and T. Rowe |
| Vice President, Small-Cap Value Fund | Price Trust Company |
| Francies W. Hawks (1944) | Assistant Vice President, T. Rowe Price |
| Assistant Vice President, Small-Cap Value Fund | |
| Henry H. Hopkins (1942) | Director and Vice President, T. Rowe Price |
| Vice President, Small-Cap Value Fund | Investment Services, Inc., T. Rowe Price Services, |
| Inc., and T. Rowe Price Trust Company; Vice | |
| President, T. Rowe Price, T. Rowe Price Group, | |
| Inc., T. Rowe Price International, Inc., and T. Rowe | |
| Price Retirement Plan Services, Inc. | |
| Susan J. Klein (1950) | Vice President, T. Rowe Price |
| Vice President, Small-Cap Value Fund | |
| Patricia B. Lippert (1953) | Assistant Vice President, T. Rowe Price and |
| Secretary, Small-Cap Value Fund | T. Rowe Price Investment Services, Inc. |
| Gregory A. McCrickard, CFA (1958) | Vice President, T. Rowe Price, T. Rowe Price |
| Vice President, Small-Cap Value Fund | Group, Inc., and T. Rowe Price Trust Company |
| Curt J. Organt (1968) | Vice President, T. Rowe Price and T. Rowe Price |
| Vice President, Small-Cap Value Fund | Group, Inc. |
| J. David Wagner, CFA (1974) | Vice President, T. Rowe Price and T. Rowe Price |
| Vice President, Small-Cap Value Fund | Group, Inc. |
| David J. Wallack (1960) | Vice President, T. Rowe Price and T. Rowe Price |
| Vice President, Small-Cap Value Fund | Group, Inc. |
| Julie L. Waples (1970) | Vice President, T. Rowe Price |
| Vice President, Small-Cap Value Fund | |
| Wenhua Zhang, CFA, CPA (1970) | Vice President, T. Rowe Price and T. Rowe Price |
| Vice President, Small-Cap Value Fund | Group, Inc.; formerly student, the Wharton |
| School, University of Pennsylvania (to 2001) | |
| Unless otherwise noted, officers have been employees of T. Rowe Price or T. Rowe Price International for at |
| least five years. |
The registrant has adopted a code of ethics, as defined in Item 2 of Form N-CSR, applicable to its principal executive officer, principal financial officer, principal accounting officer or controller, or persons performing similar functions. A copy of this code of ethics is filed as an exhibit to this Form N-CSR. No substantive amendments were approved or waivers were granted to this code of ethics during the period covered by this report.
Item 3. Audit Committee Financial Expert.
The registrant’s Board of Directors/Trustees has determined that Mr. Donald W. Dick Jr. qualifies as an audit committee financial expert, as defined in Item 3 of Form N-CSR. Mr. Dick is considered independent for purposes of Item 3 of Form N-CSR.
Item 4. Principal Accountant Fees and Services.
(a) – (d) Aggregate fees billed to the registrant for the last two fiscal years for professional services rendered by the registrant’s principal accountant were as follows:
| 2005 | 2004 | |
| Audit Fees | $29,371 | $26,406 |
| Audit-Related Fees | 1,889 | 3,602 |
| Tax Fees | 8,343 | 7,161 |
| All Other Fees | 393 | - |
Audit fees include amounts related to the audit of the registrant’s annual financial statements and services normally provided by the accountant in connection with statutory and regulatory filings. Audit-related fees include amounts reasonably related to the performance of the audit of the registrant’s financial statements and specifically include the issuance of a report on internal controls. Tax fees include amounts related to services for tax compliance, tax planning, and tax advice. The nature of these services specifically includes the review of distribution calculations and the preparation of Federal, state, and excise tax returns. All other fees include the registrant’s pro-rata share of amounts for agreed-upon procedures in conjunction with service contract approvals by the registrant’s Board of Directors/Trustees.
(e)(1) The registrant’s audit committee has adopted a policy whereby audit and non-audit services performed by the registrant’s principal accountant for the registrant, its investment adviser, and any entity controlling, controlled by, or under common control with the investment adviser that provides ongoing services to the registrant require pre-approval in advance at regularly scheduled audit committee meetings. If such a service is required between regularly scheduled audit committee meetings, pre-approval may be authorized by one audit committee member with ratification at the next scheduled audit committee meeting. Waiver of pre-approval for audit or non-audit services requiring fees of a de minimis amount is not permitted.
(2) No services included in (b) – (d) above were approved pursuant to paragraph (c)(7)(i)(C) of Rule 2-01 of Regulation S-X.
(f) Less than 50 percent of the hours expended on the principal accountant’s engagement to audit the registrant’s financial statements for the most recent fiscal year were attributed to work performed by persons other than the principal accountant’s full-time, permanent employees.
(g) The aggregate fees billed for the most recent fiscal year and the preceding fiscal year by the registrant’s principal accountant for non-audit services rendered to the registrant, its investment adviser, and any entity controlling, controlled by, or under common control with the investment adviser that provides ongoing services to the registrant were $1,008,000 and $903,000, respectively, and were less than the aggregate fees billed for those same periods by the registrant’s principal accountant for audit services rendered to the T. Rowe Price Funds.
(h) All non-audit services rendered in (g) above were pre-approved by the registrant’s audit committee. Accordingly, these services were considered by the registrant’s audit committee in maintaining the principal accountant’s independence.Item 5. Audit Committee of Listed Registrants.
Not applicable.
Item 6. Schedule of Investments.
Not applicable. The complete schedule of investments is included in Item 1 of this Form N-CSR.
Item 7. Disclosure of Proxy Voting Policies and Procedures for Closed-End Management Investment Companies.
Not applicable.
Item 8. Portfolio Managers of Closed-End Management Investment Companies.
Not applicable.
Item 9. Purchases of Equity Securities by Closed-End Management Investment Company and Affiliated Purchasers.
Not applicable.
Item 10. Submission of Matters to a Vote of Security Holders.
Not applicable.
Item 11. Controls and Procedures.
(a) The registrant’s principal executive officer and principal financial officer have evaluated the registrant’s disclosure controls and procedures within 90 days of this filing and have concluded that the registrant’s disclosure controls and procedures were effective, as of that date, in ensuring that information required to be disclosed by the registrant in this Form N-CSR was recorded, processed, summarized, and reported timely.
(b) The registrant’s principal executive officer and principal financial officer are aware of no change in the registrant’s internal control over financial reporting that occurred during the registrant’s second fiscal quarter covered by this report that has materially affected, or is reasonably likely to materially affect, the registrant’s internal control over financial reporting.
Item 12. Exhibits.
(a)(1) The registrant’s code of ethics pursuant to Item 2 of Form N-CSR is attached.
(2) Separate certifications by the registrant's principal executive officer and principal financial officer, pursuant to Section 302 of the Sarbanes-Oxley Act of 2002 and required by Rule 30a-2(a) under the Investment Company Act of 1940, are attached.
(3) Written solicitation to repurchase securities issued by closed-end companies: not applicable.
(b) A certification by the registrant's principal executive officer and principal financial officer, pursuant to Section 906 of the Sarbanes-Oxley Act of 2002 and required by Rule 30a-2(b) under the Investment Company Act of 1940, is attached.
SIGNATURES | |
| Pursuant to the requirements of the Securities Exchange Act of 1934 and the Investment | |
| Company Act of 1940, the registrant has duly caused this report to be signed on its behalf by the | |
| undersigned, thereunto duly authorized. | |
| T. Rowe Price Small-Cap Value Fund, Inc. | |
| By | /s/ James S. Riepe |
| James S. Riepe | |
| Principal Executive Officer | |
| Date | February 21, 2006 |
| Pursuant to the requirements of the Securities Exchange Act of 1934 and the Investment | |
| Company Act of 1940, this report has been signed below by the following persons on behalf of | |
| the registrant and in the capacities and on the dates indicated. | |
| By | /s/ James S. Riepe |
| James S. Riepe | |
| Principal Executive Officer | |
| Date | February 21, 2006 |
| By | /s/ Joseph A. Carrier |
| Joseph A. Carrier | |
| Principal Financial Officer | |
| Date | February 21, 2006 |