Item 1: Report to Shareholders
 |
| Small-Cap Value Fund | December 31, 2006 |
The views and opinions in this report were current as of December 31, 2006. They are not guarantees of performance or investment results and should not be taken as investment advice. Investment decisions reflect a variety of factors, and the managers reserve the right to change their views about individual stocks, sectors, and the markets at any time. As a result, the views expressed should not be relied upon as a forecast of the fund’s future investment intent. The report is certified under the Sarbanes-Oxley Act, which requires mutual funds and other public companies to affirm that, to the best of their knowledge, the information in their financial reports is fairly and accurately stated in all material respects.
REPORTS ON THE WEB
Sign up for our E-mail Program, and you can begin to receive updated fund reports and prospectuses online rather than through the mail. Log in to your account at troweprice.com for more information.
Fellow Shareholders
Events worked out better than expected for the stock market in 2006. A decline in long-term interest rates in the second half of the year, strong profit performance, and high levels of merger and acquisition activity combined to offset a slowing economy and resulted in gains for every sector within our small-cap value benchmark. Once again, smaller stocks performed particularly well in relation to other equity categories, although that trend has reversed in recent months. While we did not match the returns of the small-cap value benchmark, our fund managed a very solid return in this environment.
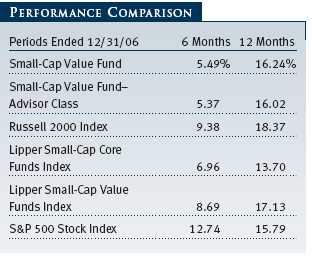
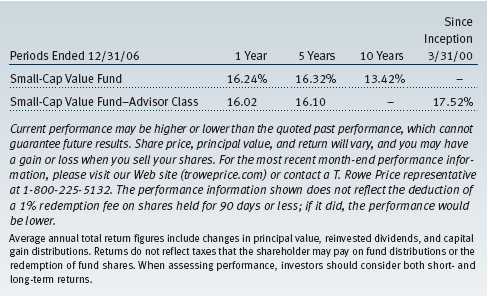
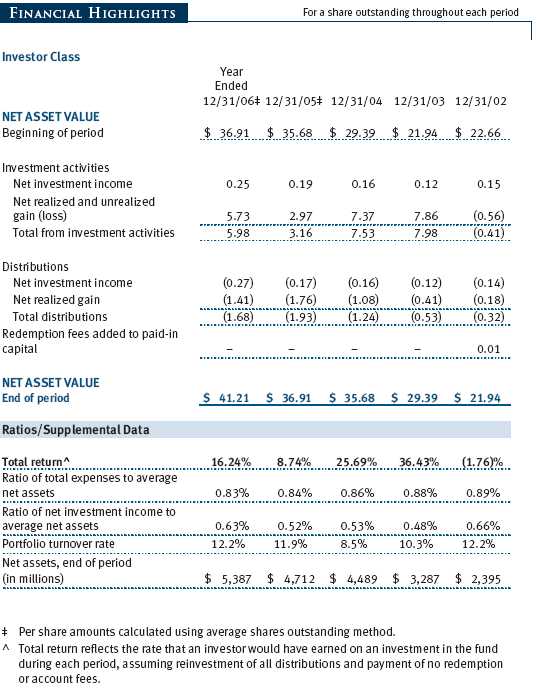
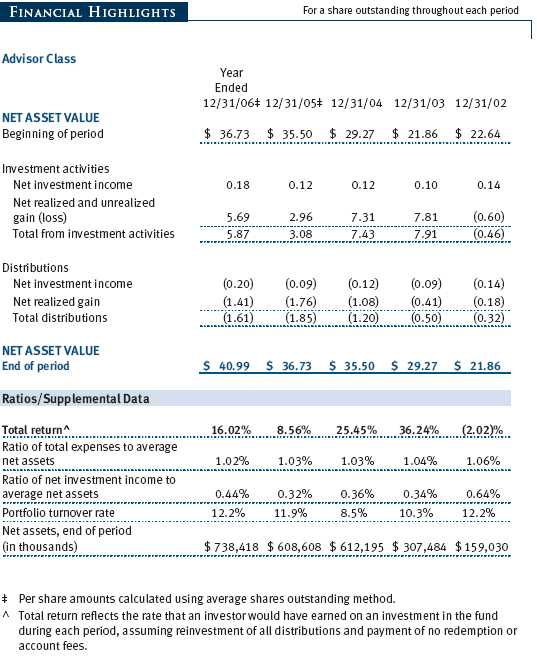
The Small-Cap Value Fund gained 5.49% over the past six months and 16.24% over the past year. Returns for Advisor Class shares were slightly lower. As shown in the table, the fund lagged the Russell 2000 Value Index and the Lipper Small-Cap Value benchmark over both periods, while outpacing the Lipper Small-Cap Core benchmark over the year but lagging it over the recent six months. (Although Lipper classifies the portfolio as “Small-Cap Core,” we also show results for the Small-Cap Value Funds category, which we think is more compatible with our investment style and objective.) The Russell index proved to be especially difficult to beat this year, due in part to the index’s fortuitous jettisoning of energy stocks in June as part of its annual rebalancing. Our fund and many other competing portfolios ended up with greater exposure than the index in energy shares, which pulled back sharply in the second half of the year. The index’s heavy weighting in strongly performing real estate investment trusts (REITs) also had an effect. The fund remained favorably ranked in its category for the one-year period, and highly ranked for the 3-, 5- and 10-year periods ended December 31, 2006. (Based on cumulative total return, Lipper ranked the Small-Cap Value Fund 259 out of 702, 47 out of 542, 29 out of 425, and 31 out of 124 small-cap core funds for the 1-, 3-, 5-, and 10-year periods ended December 31, 2006, respectively. Past performance cannot guarantee future results.)
HIGHLIGHTS
- Declining interest rates, strong profit performance, and high levels of merger and acquisition activity combined to offset a slowing economy and resulted in gains for every sector within our small-cap value benchmark.
- The fund’s returns were boosted in part by a very active merger and acquisition environment.
- We have continued to buy housing-related stocks in the belief that the industry’s difficulties are already fully—if not overly—priced into the stocks.
- The coming year should be a decent one for equities, although stocks will have to swim against the currents of a gradually slowing economy and moderating profit margins.
MARKET ENVIRONMENT
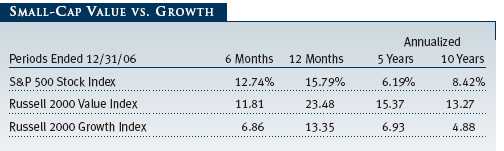
U.S. stocks rose strongly in the second half of 2006, capping the market’s fourth consecutive year of gains since the end of the 2000–2002 bear market. In fact, several major indexes reached six-year highs, if not record levels. Large-cap stocks outpaced their small-cap peers in the last six months, and value stocks outperformed growth across all market capitalizations for the year, as measured by various Russell indexes.
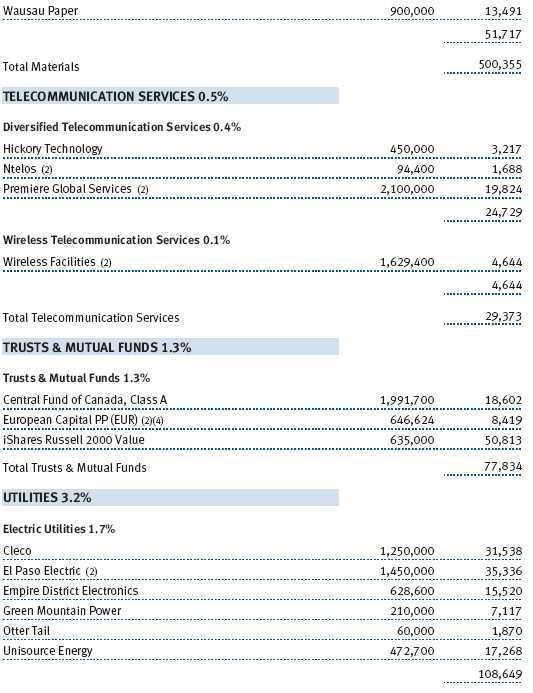
In the small-cap universe, the areas of the economy that are closely tied to economic growth—namely, the energy, materials, industrials, and utilities sectors—lost some of the momentum they had had earlier in the year as investors worried about the slowing U.S. economy. Still, materials emerged as one of the top-performing sectors for the year in the Russell 2000 Value Index, trailing only the telecommunication services sector, a very small part of both the fund and the benchmark. While turning in a respectable gain, the energy sector lagged for the year as oil and gas prices backed well off from their highs in the spring.
PORTFOLIO ACTIVITY
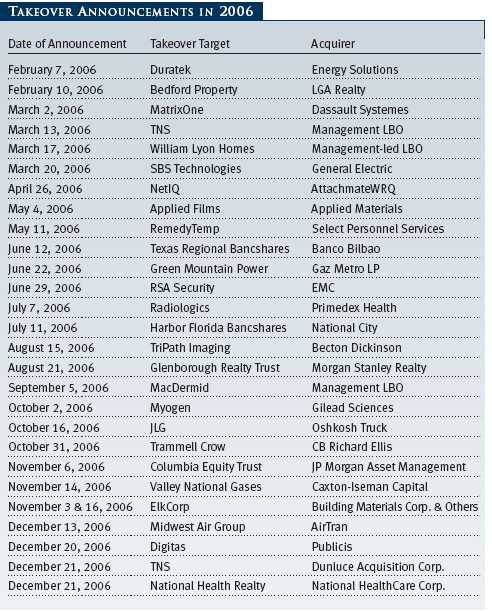
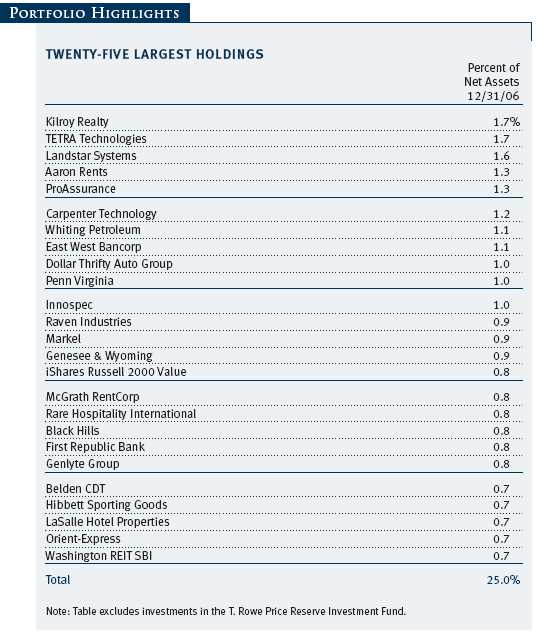
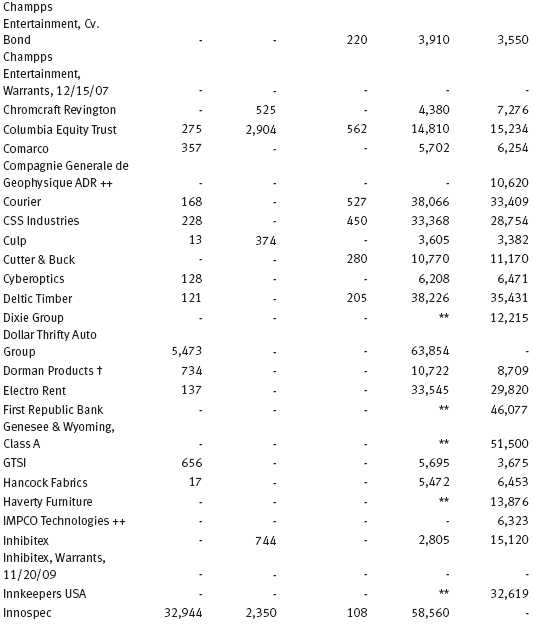
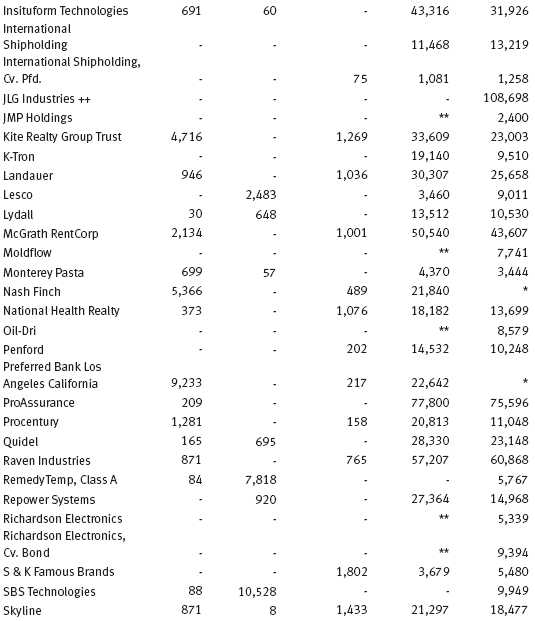
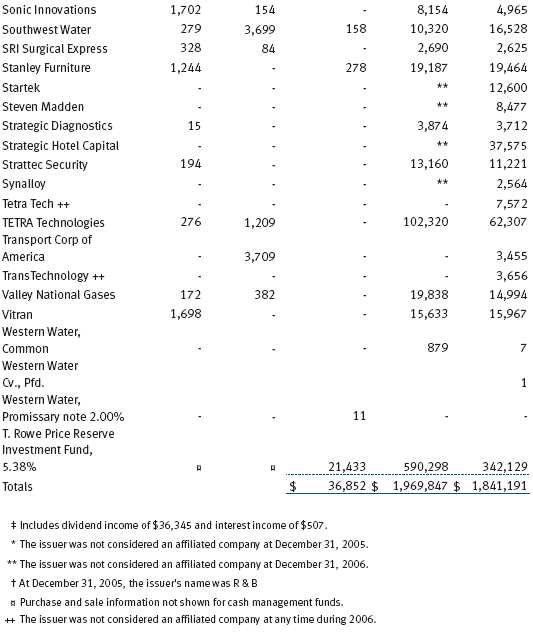
If 2006 was a decent year for the economy and a very good one for the overall stock market, it was an outstanding period for corporate takeovers. Mergers and acquisitions, many in the form of leveraged buyouts, soared during the year. Driving much of the activity were private equity groups, which were able to take advantage of low interest rates and a huge influx of investor capital to orchestrate the purchase of a wide variety of firms. Existing investors, such as our fund, benefit from these deals as soon as they are announced since the stock price quickly rises to approach the announced takeover price—typically well above the price at which the company has been trading. Reflecting this high level of activity, our portfolio witnessed a record number of announced deals during the year, which are listed in the accompanying table on the previous page.
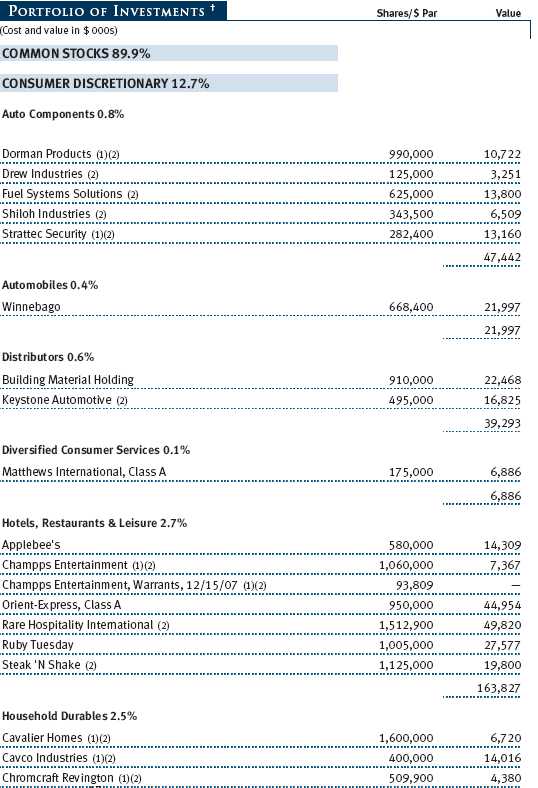
Many of our top-performing holdings for the six-month and one-year periods rode the takeover wave. In one of the largest transactions, real estate services firm Trammell Crow agreed to be purchased by competitor CB Ellis, and we liquidated our position for a good gain. Business conditions alone were enough to drive many of our other real estate holdings to good returns for the six months. Kilroy Realty, which owns Southern California office and industrial space, continued to do well, as did shopping center operator Kite Realty Group Trust. Luxury hotel operator Orient-Express rose, thanks to strong worldwide demand from affluent travelers. (Please refer to the fund’s portfolio of investments for a complete listing of our holdings and the amount each represents in the portfolio.)
In other ways, the past six months was a period of “trading places” for the portfolio. As the U.S economy cooled and investors became wary of the prospects for energy, materials, and industrials firms, some of the fund’s top performers in the first half of the year became its laggards over the past six months. This was most dramatically the case with Tetra Technologies, an oil and gas services company that gave back some of its gains—Tetra remained the fund’s top contributor for the one-year period—even though the company’s earnings are healthy and the outlook for its niche services remains very positive. Similarly, Gibraltar Industries, a steel service center that processes raw steel into specialized forms for manufacturers, declined as investors grew to expect a continuing slowdown in the industrial economy.
Not all was bleak for the energy sector at the end of the year—if one looked in unusual places, at least. One of the firm’s leading contributors in the period was machinery firm Repower Systems, a German-based producer of wind turbines. We first bought the stock in 2003 when energy prices were low and the alternative energy market was relatively moribund. Although we do not typically invest in foreign-based businesses, Repower was one of the few small-cap companies operating in the wind turbine market, which is dominated in the U.S. by industrial conglomerate GE. Thanks to its leading technology and renewed interest in wind energy, Repower has seen its stock price soar, increasing by roughly a factor of six since its low in early 2005. We have used gains in the stock to trim our holdings at increasingly higher prices.
The hurricanes in 2005 affected our holdings in a number of ways, and the unexpected tranquility of 2006’s storm season also had an impact on the fund. On the positive side, several of our insurance holdings benefited from not having to make hurricane-related payouts. Markel, a Virginia-based specialty insurer, was a particularly strong performer for the portfolio. On the other hand, several of our holdings suffered from the lack of hurricane-related business. Raven Industries was unable to match the demand that it experienced in late 2005 for the blue tarps it furnishes to the Federal Emergency Management Agency (FEMA) to provide temporary cover for damaged structures. Similarly, FEMA’s primary trucking contractor, Landstar, suffered from the lack of FEMA business as well as the general trucking slowdown.
The housing sector has recently proved anything but tranquil, and new housing starts fell sharply as the year progressed. As a result, the portfolio saw poor results from some housing-related holdings. Short-line railroad Genesee & Wyoming suffered from falling demand for shipping lumber and other building materials. The slump was also felt by Florida Rock Industries, an extraordinarily well-run company that provides aggregates and cement to the building market in Florida and elsewhere.
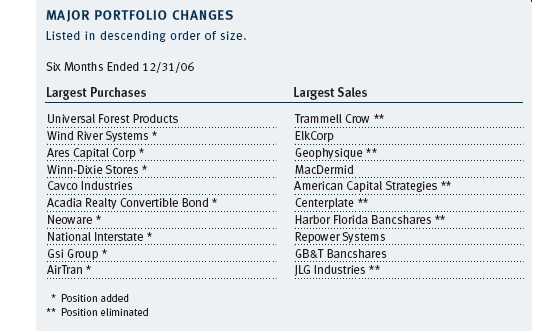
The shares of some homebuilders and housing-related companies have begun to recover from the bottoms they set in July and August, however. I noted in our last report that I suspected that the housing downturn might prove less severe than commonly thought, and we have continued to buy housing-related stocks in the belief that the industry’s difficulties are already fully—if not overly—priced into the stocks. Our leading purchase over the past six months was Universal Forest Products, a distributor and supplier of housing-related products, and our fifth-largest acquisition was Cavco Industries, a producer of manufactured housing. We continued to add to other positions as they hit their lows in the cycle.
Our largest purchase in the last quarter of the year was Winn-Dixie Stores. The Florida-based grocery chain recently emerged from bankruptcy, which left a residue of investor skepticism and a dearth of Wall Street coverage—ideal characteristics for small-cap value investors like ourselves who are willing to do a little digging. We believe that Winn-Dixie’s bankruptcy cleared away many of the firm’s problems along with its debt. For example, the company was able to close underperforming stores and renegotiate labor agreements, leaving it better armed for a very competitive marketplace.
Other significant purchases included National Interstate, a niche auto insurer in Ohio that provides insurance for fleets instead of individual owners, and Atlanta-based airline AirTran, which has done a very good job of growing and prospering in a difficult airline market. Prominent among our new investments in the technology sector was Canadian firm Zarlink Semiconductor, which has an extraordinarily strong balance sheet and, in our opinion, improving prospects.
Finally, we added Kohlberg Capital, a business development company (BDC), to our stable of five other similar firms. BDCs are pools of capital similar to venture capital and private equity firms in that they provide capital to small- and mid-size businesses, but they are required by law to pay out nearly all of their earnings to shareholders in the form of dividends. We have invested in a broad range of such firms, as we believe the entire group of companies has remained underappreciated by investors even as private equity firms have grabbed headlines.
Given the active buyout market, it is not surprising that many of our sales over the past six months have come about as the result of the announced takeover or merger of a holding. These included many of our largest sales by value, including Trammell Crow, ElkCorp, Harbor Florida Bancshares, MacDermid, and JLG. Other sales, including Geophysique, an energy services company, followed successful investments where we decided to book profits. We sold another large and successful holding, American Capital Strategies, after it grew too large for our small-cap mandate.
OUTLOOK
I expect 2007 to be a decent year for equities, although stocks will have to swim against the currents of a gradually slowing economy and moderating profit margins—and, as always, the potential exists for external shocks in the form of an overseas financial crisis or another event. Should profits increase at a slower pace, investors would have to rely on expanding multiples (price-to-earnings ratios) for any major increase in stock prices. On the other hand, stocks appear attractive relative to bonds, and a significant increase in interest rates appears unlikely. A slowing economy should favor larger growth stocks, which are less reliant than cyclical companies on good domestic economic growth to prosper.
Having said this, our investment approach will remain agnostic: In other words, we will let the market, rather than my investment outlook, dictate our moves as valuations change. As we identify individual stocks that have become inexpensive relative to earnings, past valuations, or other metrics, we will increase our holdings, and we will trim positions as prices improve. I prefer this approach to a thematic one, in which we might attempt to identify promising areas of the economy and then target the fund’s investments accordingly. I have found that being receptive to new investment ideas in a wide range of industries has resulted in a number of very successful holdings for the fund—Repower being a leading example.
In part, I use this approach because my crystal ball is no clearer than that of my peers. Indeed, I was too pessimistic about the market’s potential last year, and in particular, about the ability of small-cap value stocks to maintain their record of superior performance. However, those concerns did not unduly guide the fund’s investment approach, and we kept buying stocks where we saw good opportunities. While I have my share of concerns about this year, I will happily look forward to being surprised again by the potential of the small-cap value market.
Respectfully submitted,

Preston G. Athey
President of the fund and chairman of its Investment Advisory Committee
January 19, 2007
The committee chairman has day-to-day responsibility for managing the portfolio and works with committee members in developing and executing the fund’s investment program.
RISKS OF STOCK INVESTING
The fund’s share price can fall because of weakness in the stock markets, a particular industry, or specific holdings. Stock markets can decline for many reasons, including adverse political or economic developments, changes in investor psychology, or heavy institutional selling. The prospects for an industry or company may deteriorate because of a variety of factors, including disappointing earnings or changes in the competitive environment. In addition, the investment manager’s assessment of companies held in a fund may prove incorrect, resulting in losses or poor performance even in rising markets.
GLOSSARY
Lipper indexes: Fund benchmarks that consist of a small number (10 to 30) of the largest mutual funds in a particular category as tracked by Lipper Inc.
Russell 2000 Index: Consists of the smallest 2,000 companies in the Russell 3000 Index (approximately 98% of the investable U.S. equity market). Performance is reported on a total-return basis.
Russell 2000 Growth Index: An index of those firms in the Russell 2000 with higher price-to-book ratios and higher forecasted growth values.
Russell 2000 Value Index: An index of those firms in the Russell 2000 with lower price-to-book ratios and lower forecasted growth values.
S&P 500 Stock Index: An unmanaged index that tracks the stocks of 500 primarily large-cap U.S. companies.
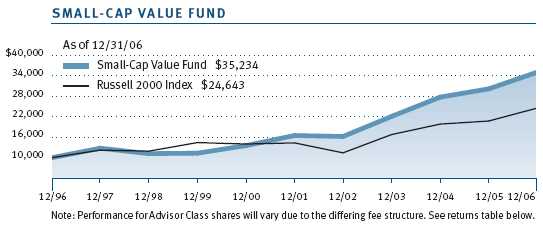
| GROWTH OF $10,000 |
This chart shows the value of a hypothetical $10,000 investment in the fund over the past 10 fiscal year periods or since inception (for funds lacking 10-year records). The result is compared with benchmarks, which may include a broad-based market index and a peer group average or index. Market indexes do not include expenses, which are deducted from fund returns as well as mutual fund averages and indexes.
| AVERAGE ANNUAL COMPOUND TOTAL RETURN |
This table shows how the fund would have performed each year if its actual (or cumulative) returns had been earned at a constant rate.
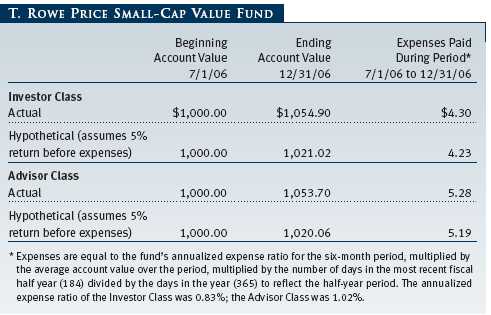
| FUND EXPENSE EXAMPLE |
As a mutual fund shareholder, you may incur two types of costs: (1) transaction costs, such as redemption fees or sales loads, and (2) ongoing costs, including management fees, distribution and service (12b-1) fees, and other fund expenses. The following example is intended to help you understand your ongoing costs (in dollars) of investing in the fund and to compare these costs with the ongoing costs of investing in other mutual funds. The example is based on an investment of $1,000 invested at the beginning of the most recent six-month period and held for the entire period.
Please note that the fund has two share classes: The original share class (“investor class”) charges no distribution and service (12b-1) fee. Advisor Class shares are offered only through unaffiliated brokers and other financial intermediaries and charge a 0.25% 12b-1 fee. Each share class is presented separately in the table.
Actual Expenses
The first line of the following table (“Actual”) provides information about actual account values and expenses based on the fund’s actual returns. You may use the information in this line, together with your account balance, to estimate the expenses that you paid over the period. Simply divide your account value by $1,000 (for example, an $8,600 account value divided by $1,000 = 8.6), then multiply the result by the number in the first line under the heading “Expenses Paid During Period” to estimate the expenses you paid on your account during this period.
Hypothetical Example for Comparison Purposes
The information on the second line of the table (“Hypothetical”) is based on hypothetical account values and expenses derived from the fund’s actual expense ratio and an assumed 5% per year rate of return before expenses (not the fund’s actual return). You may compare the ongoing costs of investing in the fund with other funds by contrasting this 5% hypothetical example and the 5% hypothetical examples that appear in the shareholder reports of the other funds. The hypothetical account values and expenses may not be used to estimate the actual ending account balance or expenses you paid for the period.
Note: T. Rowe Price charges an annual small-account maintenance fee of $10, generally for accounts with less than $2,000 ($500 for UGMA/UTMA). The fee is waived for any investor whose T. Rowe Price mutual fund accounts total $25,000 or more, accounts employing automatic investing, and IRAs and other retirement plan accounts that utilize a prototype plan sponsored by T. Rowe Price (although a separate custodial or administrative fee may apply to such accounts). This fee is not included in the accompanying table. If you are subject to the fee, keep it in mind when you are estimating the ongoing expenses of investing in the fund and when comparing the expenses of this fund with other funds.
You should also be aware that the expenses shown in the table highlight only your ongoing costs and do not reflect any transaction costs, such as redemption fees or sales loads. Therefore, the second line of the table is useful in comparing ongoing costs only and will not help you determine the relative total costs of owning different funds. To the extent a fund charges transaction costs, however, the total cost of owning that fund is higher.
The accompanying notes are an integral part of these financial statements.
The accompanying notes are an integral part of these financial statements.


The accompanying notes are an integral part of these financial statements.
The accompanying notes are an integral part of these financial statements.

The accompanying notes are an integral part of these financial statements.

The accompanying notes are an integral part of these financial statements.
| NOTES TO FINANCIAL STATEMENTS |
NOTE 1 - SIGNIFICANT ACCOUNTING POLICIES
T. Rowe Price Small-Cap Value Fund, Inc. (the fund), is registered under the Investment Company Act of 1940 (the 1940 Act) as a diversified, open-end management investment company. The fund seeks long-term capital growth by investing primarily in small companies whose common stocks are believed to be undervalued. The fund has two classes of shares: the Small-Cap Value Fund original share class, referred to in this report as the Investor Class, offered since June 30, 1998, and Small-Cap Value Fund—Advisor Class (Advisor Class), offered since March 31, 2000. Advisor Class shares are sold only through unaffiliated brokers and other unaffiliated financial intermediaries that are compensated by the class for distribution, shareholder servicing, and/or certain administrative services under a Board-approved Rule 12b-1 plan. Each class has exclusive voting rights on matters related solely to that class, separate voting rights on matters that relate to both classes, and, in all other respects, the same rights and obligations as the other class.
The accompanying financial statements were prepared in accordance with accounting principles generally accepted in the United States of America, which require the use of estimates made by fund management. Fund management believes that estimates and security valuations are appropriate; however, actual results may differ from those estimates, and the security valuations reflected in the financial statements may differ from the value the fund ultimately realizes upon sale of the securities.
Valuation The fund values its investments and computes its net asset value per share at the close of the New York Stock Exchange (NYSE), normally 4 p.m. ET, each day that the NYSE is open for business. Equity securities listed or regularly traded on a securities exchange or in the over-the-counter (OTC) market are valued at the last quoted sale price or, for certain markets, the official closing price at the time the valuations are made, except for OTC Bulletin Board securities, which are valued at the mean of the latest bid and asked prices. A security that is listed or traded on more than one exchange is valued at the quotation on the exchange determined to be the primary market for such security. Listed securities not traded on a particular day are valued at the mean of the latest bid and asked prices for domestic securities and the last quoted sale price for international securities.
Debt securities are generally traded in the over-the-counter market. Securities with original maturities of one year or more are valued at prices furnished by dealers who make markets in such securities or by an independent pricing service, which considers yield or price of bonds of comparable quality, coupon, maturity, and type, as well as prices quoted by dealers who make markets in such securities. Securities with original maturities of less than one year are valued at amortized cost in local currency, which approximates fair value when combined with accrued interest.
Investments in mutual funds are valued at the mutual fund’s closing net asset value per share on the day of valuation. Financial futures contracts are valued at closing settlement prices.
Other investments, including restricted securities, and those for which the above valuation procedures are inappropriate or are deemed not to reflect fair value are stated at fair value as determined in good faith by the T. Rowe Price Valuation Committee, established by the fund’s Board of Directors.
Most foreign markets close before the close of trading on the NYSE. If the fund determines that developments between the close of a foreign market and the close of the NYSE will, in its judgment, materially affect the value of some or all of its portfolio securities, which in turn will affect the fund’s share price, the fund will adjust the previous closing prices to reflect the fair value of the securities as of the close of the NYSE, as determined in good faith by the T. Rowe Price Valuation Committee, established by the fund’s Board of Directors. A fund may also fair value securities in other situations, such as when a particular foreign market is closed but the fund is open. In deciding whether to make fair value adjustments, the fund reviews a variety of factors, including developments in foreign markets, the performance of U.S. securities markets, and the performance of instruments trading in U.S. markets that represent foreign securities and baskets of foreign securities. The fund uses outside pricing services to provide it with closing market prices and information used for adjusting those prices. The fund cannot predict when and how often it will use closing prices and when it will adjust those prices to reflect fair value. As a means of evaluating its fair value process, the fund routinely compares closing market prices, the next day’s opening prices in the same markets, and adjusted prices.
Currency Translation Assets, including investments, and liabilities denominated in foreign currencies are translated into U.S. dollar values each day at the prevailing exchange rate, using the mean of the bid and asked prices of such currencies against U.S. dollars as quoted by a major bank. Purchases and sales of securities, income, and expenses are translated into U.S. dollars at the prevailing exchange rate on the date of the transaction. The effect of changes in foreign currency exchange rates on realized and unrealized security gains and losses is reflected as a component of security gains and losses.
Class Accounting The Advisor Class pays distribution, shareholder servicing, and/or certain administrative expenses in the form of Rule 12b-1 fees, in an amount not exceeding 0.25% of the class’s average daily net assets. Shareholder servicing, prospectus, and shareholder report expenses incurred by each class are charged directly to the class to which they relate. Expenses common to both classes, investment income, and realized and unrealized gains and losses are allocated to the classes based upon the relative daily net assets of each class.
Rebates and Credits Subject to best execution, the fund may direct certain security trades to brokers who have agreed to rebate a portion of the related brokerage commission to the fund in cash. Commission rebates are reflected as realized gain on securities in the accompanying financial statements and totaled $77,000 for the year ended December 31, 2006. Additionally, the fund earns credits on temporarily uninvested cash balances at the custodian that reduce the fund’s custody charges. Custody expense in the accompanying financial statements is presented before reduction for credits, which are reflected as expenses paid indirectly.
Redemption Fees A 1% fee is assessed on redemptions of Investor Class and Advisor Class fund shares held less than 90 days to deter short-term trading and to protect the interests of long-term shareholders. Redemption fees are withheld from proceeds that shareholders receive from the sale or exchange of fund shares. The fees are paid to the fund, and are recorded as an increase to paid-in capital. The fees may cause the redemption price per share to differ from the net asset value per share.
In-Kind Subscriptions Under certain circumstances and when considered in the best interest of the fund, the fund may accept portfolio securities rather than cash as payment for the purchase of fund shares (in-kind subscription). For financial reporting and tax purposes, the cost basis of contributed securities is equal to the market value of the securities on the date of contribution. In-kind subscriptions result in no gain or loss and no tax consequences for the fund. During the year ended December 31, 2006, the fund accepted $15,017,000 of in-kind subscriptions, including $14,523,000 from other T. Rowe Price funds.
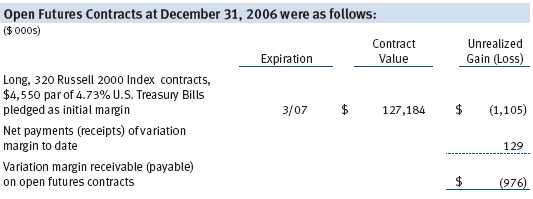
Investment Transactions, Investment Income, and Distributions Income and expenses are recorded on the accrual basis. Premiums and discounts on debt securities are amortized for financial reporting purposes. Dividends received from mutual fund investments are reflected as dividend income; capital gain distributions are reflected as realized gain/loss. Dividend income and capital gain distributions are recorded on the ex-dividend date. Investment transactions are accounted for on the trade date. Realized gains and losses are reported on the identified cost basis. Payments (“variation margin”) made or received to settle the daily fluctuations in the value of futures contracts are recorded as unrealized gains or losses until the contracts are closed. Unsettled variation margin on futures contracts is reflected as other assets or liabilities, and unrealized gains and losses on futures contracts are reflected as the change in net unrealized gain or loss in the accompanying financial statements. Distributions to shareholders are recorded on the ex-dividend date. Income distributions are declared and paid by each class on an annual basis. Capital gain distributions, if any, are declared and paid by the fund, typically on an annual basis.
New Accounting Pronouncements In June 2006, the Financial Accounting Standards Board (“FASB”) issued FASB Interpretation No. 48 (“FIN 48”), Accounting for Uncertainty in Income Taxes, a clarification of FASB Statement No. 109, Accounting for Income Taxes. FIN 48 establishes financial reporting rules regarding recognition and measurement of tax positions taken or expected to be taken on a tax return. Management is evaluating the anticipated impact, if any, that FIN 48 will have on the fund upon adoption, which, pursuant to a delay granted by the U.S. Securities and Exchange Commission, is expected to be on the last business day of the fund’s semi-annual period, June 29, 2007.
In September 2006, the FASB released the Statement of Financial Accounting Standard No. 157 (“FAS 157”), Fair Value Measurements. FAS 157 clarifies the definition of fair value and establishes the framework for measuring fair value, as well as proper disclosure of this methodology in the financial statements. It will be effective for the fund’s fiscal year beginning January 1, 2008. Management is evaluating the effects of FAS 157; however, it is not expected to have a material impact on the fund’s net assets or results of operations.
NOTE 2 - INVESTMENT TRANSACTIONS
Consistent with its investment objective, the fund engages in the following practices to manage exposure to certain risks or to enhance performance. The investment objective, policies, program, and risk factors of the fund are described more fully in the fund’s prospectus and Statement of Additional Information.
Restricted Securities The fund may invest in securities that are subject to legal or contractual restrictions on resale. Although certain of these securities may be readily sold, for example, under Rule 144A, others may be illiquid, their sale may involve substantial delays and additional costs, and prompt sale at an acceptable price may be difficult.
Futures Contracts During the year ended December 31, 2006, the fund was a party to futures contracts, which provide for the future sale by one party and purchase by another of a specified amount of a specific financial instrument at an agreed upon price, date, time, and place. Risks arise from possible illiquidity of the futures market and from movements in security values.
Other Purchases and sales of portfolio securities, other than short-term securities, aggregated $672,631,000 and $842,003,000, respectively, for the year ended December 31, 2006.
NOTE 3 - FEDERAL INCOME TAXES
No provision for federal income taxes is required since the fund intends to continue to qualify as a regulated investment company under Subchapter M of the Internal Revenue Code and distribute to shareholders all of its taxable income and gains. Federal income tax regulations differ from generally accepted accounting principles; therefore, distributions determined in accordance with tax regulations may differ significantly in amount or character from net investment income and realized gains for financial reporting purposes. Financial reporting records are adjusted for permanent book/tax differences to reflect tax character. Financial records are not adjusted for temporary differences.
Distributions during the year ended December 31, 2006, were characterized as follows for tax purposes:
![]()
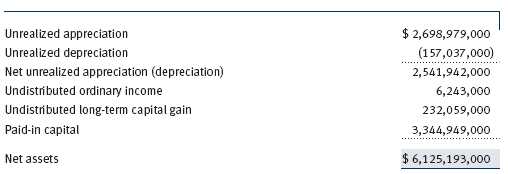
At December 31, 2006, the tax-basis components of net assets were as follows:
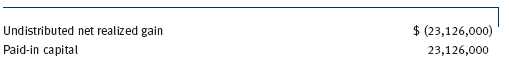
For the year ended December 31, 2006, the fund recorded the following permanent reclassifications to reflect tax character. Reclassifications to paid-in capital relate primarily to a tax practice that treats a portion of the proceeds from each redemption of capital shares as a distribution of taxable net investment income and/or realized capital gain. Results of operations and net assets were not affected by these reclassifications.
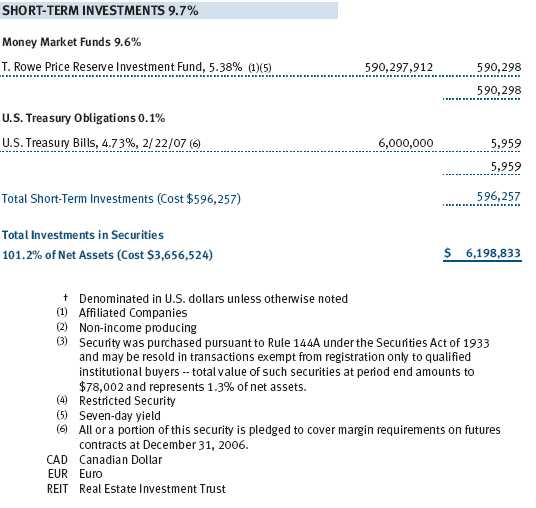
At December 31, 2006, the cost of investments for federal income tax purposes was $3,656,891,000.
NOTE 4 - RELATED PARTY TRANSACTIONS
The fund is managed by T. Rowe Price Associates, Inc. (the manager or Price Associates), a wholly owned subsidiary of T. Rowe Price Group, Inc. The investment management agreement between the fund and the manager provides for an annual investment management fee, which is computed daily and paid monthly. The fee consists of an individual fund fee, equal to 0.35% of the fund’s average daily net assets, and a group fee. The group fee rate is calculated based on the combined net assets of certain mutual funds sponsored by Price Associates (the group) applied to a graduated fee schedule, with rates ranging from 0.48% for the first $1 billion of assets to 0.29% for assets in excess of $160 billion. The fund’s group fee is determined by applying the group fee rate to the fund’s average daily net assets. At December 31, 2006, the effective annual group fee rate was 0.31%.
In addition, the fund has entered into service agreements with Price Associates and two wholly owned subsidiaries of Price Associates (collectively, Price). Price Associates computes the daily share prices and provides certain other administrative services to the fund. T. Rowe Price Services, Inc., provides shareholder and administrative services in its capacity as the fund’s transfer and dividend disbursing agent. T. Rowe Price Retirement Plan Services, Inc., provides subaccounting and recordkeeping services for certain retirement accounts invested in the Investor Class. For the year ended December 31, 2006, expenses incurred pursuant to these service agreements were $95,000 for Price Associates, $1,515,000 for T. Rowe Price Services, Inc., and $4,762,000 for T. Rowe Price Retirement Plan Services, Inc. The total amount payable at period-end pursuant to these service agreements is reflected as Due to Affiliates in the accompanying financial statements.
The fund is also one of several mutual funds sponsored by Price Associates (underlying Price funds) in which T. Rowe Price Retirement Funds (Retirement Funds) may invest. The Retirement Funds do not invest in the underlying Price funds for the purpose of exercising management or control. Pursuant to a special servicing agreement, expenses associated with the operation of the Retirement Funds are borne by each underlying Price fund to the extent of estimated savings to it and in proportion to the average daily value of its shares owned by the Retirement Funds. Expenses allocated under this agreement are reflected as shareholder servicing expense in the accompanying financial statements. For the year ended December 31, 2006, the fund was allocated $282,000 of Retirement Funds’ expenses, of which $222,000 related to services provided by Price. The amount payable at period-end pursuant to this agreement is reflected as Due to Affiliates in the accompanying financial statements. At December 31, 2006, approximately 6% of the outstanding shares of the Investor Class were held by the Retirement Funds.
The fund may invest in the T. Rowe Price Reserve Investment Fund and the T. Rowe Price Government Reserve Investment Fund (collectively, the T. Rowe Price Reserve Funds), open-end management investment companies managed by Price Associates and affiliates of the fund. The T. Rowe Price Reserve Funds are offered as cash management options to mutual funds, trusts, and other accounts managed by Price Associates and/or its affiliates, and are not available for direct purchase by members of the public. The T. Rowe Price Reserve Funds pay no investment management fees.
As of December 31, 2006, T. Rowe Price Group, Inc., and/or its wholly owned subsidiaries owned 92,155 shares of the Investor Class, representing less than 1% of the fund’s net assets.
| REPORT OF INDEPENDENT REGISTERED PUBLIC ACCOUNTING FIRM |
To the Board of Directors and Shareholders of T. Rowe Price Small-Cap Value Fund, Inc.
In our opinion, the accompanying statement of assets and liabilities, including the portfolio of investments, and the related statements of operations and of changes in net assets and the financial highlights present fairly, in all material respects, the financial position of T. Rowe Price Small-Cap Value Fund, Inc. (the “Fund”) at December 31, 2006, the results of its operations for the year then ended, the changes in its net assets for each of the two years in the period then ended and the financial highlights for each of the five years in the period then ended, in conformity with accounting principles generally accepted in the United States of America. These financial statements and financial highlights (hereafter referred to as “financial statements”) are the responsibility of the Fund’s management; our responsibility is to express an opinion on these financial statements based on our audits. We conducted our audits of these financial statements in accordance with the auditing standards of the Public Company Accounting Oversight Board (United States). Those standards require that we plan and perform the audit to obtain reasonable assurance about whether the financial statements are free of material misstatement. An audit includes examining, on a test basis, evidence supporting the amounts and disclosures in the financial statements, assessing the accounting principles used and significant estimates made by management, and evaluating the overall financial statement presentation. We believe that our audits, which included confirmation of securities at December 31, 2006 by correspondence with the custodian, brokers and by agreement to the underlying ownership records for T. Rowe Price Reserve Investment Fund, provide a reasonable basis for our opinion.
PricewaterhouseCoopers LLP
Baltimore, Maryland
February 12, 2007
| TAX INFORMATION (UNAUDITED) FOR THE TAX YEAR ENDED 12/31/06 |
We are providing this information as required by the Internal Revenue Code. The amounts shown may differ from those elsewhere in this report because of differences between tax and financial reporting requirements.
The fund’s distributions to shareholders included:
- $40,084,000 from short-term capital gains,
- $188,412,000 from long-term capital gains, of which $186,758,000 was subject to the 15% rate gains category, and $1,654,000 to the 25% rate gains category.
For taxable non-corporate shareholders, $46,749,000 of the fund’s income represents qualified dividend income subject to the 15% rate category.
For corporate shareholders, $45,649,000 of the fund’s income qualifies for the dividends-received deduction.
| INFORMATION ON PROXY VOTING POLICIES, PROCEDURES, AND RECORDS |
A description of the policies and procedures used by T. Rowe Price funds and portfolios to determine how to vote proxies relating to portfolio securities is available in each fund’s Statement of Additional Information, which you may request by calling 1-800-225-5132 or by accessing the SEC’s Web site, www.sec.gov. The description of our proxy voting policies and procedures is also available on our Web site, www.troweprice.com. To access it, click on the words “Company Info” at the top of our homepage for individual investors. Then, in the window that appears, click on the “Proxy Voting Policy” navigation button in the top left corner.
Each fund’s most recent annual proxy voting record is available on our Web site and through the SEC’s Web site. To access it through our Web site, follow the directions above, then click on the words “Proxy Voting Record” at the bottom of the Proxy Voting Policy page.
| HOW TO OBTAIN QUARTERLY PORTFOLIO HOLDINGS |
The fund files a complete schedule of portfolio holdings with the Securities and Exchange Commission for the first and third quarters of each fiscal year on Form N-Q. The fund’s Form N-Q is available electronically on the SEC’s Web site (www.sec.gov); hard copies may be reviewed and copied at the SEC’s Public Reference Room, 450 Fifth St. N.W., Washington, DC 20549. For more information on the Public Reference Room, call 1-800-SEC-0330.
| ABOUT THE FUND’S DIRECTORS AND OFFICERS |
Your fund is governed by a Board of Directors that meets regularly to review a wide variety of matters affecting the fund, including performance, investment programs, compliance matters, advisory fees and expenses, service providers, and other business affairs. The Board of Directors elects the fund’s officers, who are listed in the final table. At least 75% of Board members are independent of T. Rowe Price Associates, Inc. (T. Rowe Price), and T. Rowe Price International, Inc. (T. Rowe Price International); “inside” or “interested” directors are officers of T. Rowe Price. The business address of each director and officer is 100 East Pratt Street, Baltimore, Maryland 21202. The Statement of Additional Information includes additional information about the fund directors and is available without charge by calling a T. Rowe Price representative at 1-800-225-5132.
| Independent Directors | |
| Name | |
| (Year of Birth) | Principal Occupation(s) During Past 5 Years and Directorships of |
| Year Elected * | Other Public Companies |
| Jeremiah E. Casey | Director, Allfirst Financial Inc. (previously First Maryland Bankcorp) |
| (1940) | (1983 to 2002); Director, National Life Insurance (2001 to 2005); |
| 2005 | Director, The Rouse Company, real estate developers (1990 to 2004) |
| Anthony W. Deering | Chairman, Exeter Capital, LLC, a private investment firm (2004 to |
| (1945) | present); Director, Vornado Real Estate Investment Trust (3/04 to |
| 2001 | present); Director, Mercantile Bankshares (4/03 to present); Member, |
| Advisory Board, Deutsche Bank North America (2004 to present); | |
| Director, Chairman of the Board, and Chief Executive Officer, The | |
| Rouse Company, real estate developers (1997 to 2004) | |
| Donald W. Dick, Jr. | Principal, EuroCapital Advisors, LLC, an acquisition and management |
| (1943) | advisory firm; Chairman, President, and Chief Executive Officer, |
| 1994 | The Haven Group, a custom manufacturer of modular homes |
| (1/04 to present) | |
| David K. Fagin | Chairman and President, Nye Corporation (6/88 to present); Director, |
| (1938) | Canyon Resources Corp., Golden Star Resources Ltd. (5/92 to pres- |
| 1994 | ent), and Pacific Rim Mining Corp. (2/02 to present) |
| Karen N. Horn | Director, Federal National Mortgage Association (9/06 to present); |
| (1943) | Managing Director and President, Global Private Client Services, |
| 2003 | Marsh Inc. (1999 to 2003); Director, Georgia Pacific (5/04 to |
| 12/05), Eli Lilly and Company, and Simon Property Group | |
| Theo C. Rodgers | President, A&R Development Corporation |
| (1941) | |
| 2005 | |
| John G. Schreiber | Owner/President, Centaur Capital Partners, Inc., a real estate invest- |
| (1946) | ment company; Partner, Blackstone Real Estate Advisors, L.P. |
| 2001 |
* Each independent director oversees 115 T. Rowe Price portfolios and serves until retirement, resignation, or election of a successor.
| Inside Directors | |
| Name | |
| (Year of Birth) | |
| Year Elected * | |
| [Number of T. Rowe Price | Principal Occupation(s) During Past 5 Years and Directorships of |
| Portfolios Overseen] | Other Public Companies |
| Edward C. Bernard | Director and Vice President, T. Rowe Price and T. Rowe Price Group, |
| (1956) | Inc.; Chairman of the Board, Director, and President, T. Rowe Price |
| 2006 | Investment Services, Inc.; Chairman of the Board and Director, |
| [115] | T. Rowe Price International, Inc., T. Rowe Price Retirement Plan |
| Services, Inc., T. Rowe Price Services, Inc., and T. Rowe Price Savings | |
| Bank; Director, T. Rowe Price Global Asset Management Limited and | |
| T. Rowe Price Global Investment Services Limited; Chief Executive | |
| Officer, Chairman of the Board, Director, and President, T. Rowe | |
| Price Trust Company; Chairman of the Board, all funds | |
| John H. Laporte, CFA | Vice President, T. Rowe Price, T. Rowe Price Group, Inc., and T. Rowe |
| (1945) | Price Trust Company |
| 1994 | |
| [15] | |
* Each inside director serves until retirement, resignation, or election of a successor.
| Officers | |
| Name (Year of Birth) | |
| Title and Fund(s) Served | Principal Occupation(s) |
| Preston G. Athey, CFA, CIC (1949) | Vice President, T. Rowe Price, T. Rowe Price |
| President, Small-Cap Value Fund | Group, Inc., and T. Rowe Price Trust Company |
| Joseph A. Carrier, CPA (1960) | Vice President, T. Rowe Price, T. Rowe Price |
| Treasurer, Small-Cap Value Fund | Group, Inc., T. Rowe Price Investment Services, |
| Inc., and T. Rowe Price Trust Company | |
| Hugh M. Evans III, CFA (1966) | Vice President, T. Rowe Price and T. Rowe Price |
| Vice President, Small-Cap Value Fund | Group, Inc. |
| Roger L. Fiery III, CPA (1959) | Vice President, T. Rowe Price, T. Rowe Price |
| Vice President, Small-Cap Value Fund | Group, Inc., T. Rowe Price International, Inc., |
| and T. Rowe Price Trust Company | |
| John R. Gilner (1961) | Chief Compliance Officer and Vice President, |
| Chief Compliance Officer, | T. Rowe Price; Vice President, T. Rowe Price |
| Small-Cap Value Fund | Group, Inc., and T. Rowe Price Investment |
| Services, Inc. | |
| Gregory S. Golczewski (1966) | Vice President, T. Rowe Price and T. Rowe Price |
| Vice President, Small-Cap Value Fund | Trust Company |
| Henry H. Hopkins (1942) | Director and Vice President, T. Rowe Price |
| Vice President, Small-Cap Value Fund | Investment Services, Inc., T. Rowe Price Services, |
| Inc., and T. Rowe Price Trust Company; Vice | |
| President, T. Rowe Price, T. Rowe Price Group, | |
| Inc., T. Rowe Price International, Inc., and T. Rowe | |
| Price Retirement Plan Services, Inc. | |
| Susan J. Klein (1950) | Vice President, T. Rowe Price |
| Vice President, Small-Cap Value Fund | |
| Patricia B. Lippert (1953) | Assistant Vice President, T. Rowe Price and |
| Secretary, Small-Cap Value Fund | T. Rowe Price Investment Services, Inc. |
| Gregory A. McCrickard, CFA (1958) | Vice President, T. Rowe Price, T. Rowe Price |
| Vice President, Small-Cap Value Fund | Group, Inc., and T. Rowe Price Trust Company |
| Curt J. Organt (1968) | Vice President, T. Rowe Price and T. Rowe Price |
| Vice President, Small-Cap Value Fund | Group, Inc. |
| J. David Wagner, CFA (1974) | Vice President, T. Rowe Price and T. Rowe Price |
| Vice President, Small-Cap Value Fund | Group, Inc. |
| David J. Wallack (1960) | Vice President, T. Rowe Price and T. Rowe Price |
| Vice President, Small-Cap Value Fund | Group, Inc. |
| Julie L. Waples (1970) | Vice President, T. Rowe Price |
| Vice President, Small-Cap Value Fund | |
| Wenhua Zhang, CFA, CPA (1970) | Vice President, T. Rowe Price and T. Rowe Price |
| Vice President, Small-Cap Value Fund | Group, Inc. |
Unless otherwise noted, officers have been employees of T. Rowe Price or T. Rowe Price International for at least five years.
Item 2. Code of Ethics.
The registrant has adopted a code of ethics, as defined in Item 2 of Form N-CSR, applicable to its principal executive officer, principal financial officer, principal accounting officer or controller, or persons performing similar functions. A copy of this code of ethics is filed as an exhibit to this Form N-CSR. No substantive amendments were approved or waivers were granted to this code of ethics during the period covered by this report.
Item 3. Audit Committee Financial Expert.
The registrant’s Board of Directors/Trustees has determined that Mr. Donald W. Dick Jr. qualifies as an audit committee financial expert, as defined in Item 3 of Form N-CSR. Mr. Dick is considered independent for purposes of Item 3 of Form N-CSR.
Item 4. Principal Accountant Fees and Services.
(a) – (d) Aggregate fees billed to the registrant for the last two fiscal years for professional services rendered by the registrant’s principal accountant were as follows:
Audit fees include amounts related to the audit of the registrant’s annual financial statements and services normally provided by the accountant in connection with statutory and regulatory filings. Audit-related fees include amounts reasonably related to the performance of the audit of the registrant’s financial statements and specifically include the issuance of a report on internal controls and, if applicable for 2006, agreed-upon procedures related to fund acquisitions. Tax fees include amounts related to services for tax compliance, tax planning, and tax advice. The nature of these services specifically includes the review of distribution calculations and the preparation of Federal, state, and excise tax returns. Reclassification from tax fees to audit fees of fiscal 2005 amounts related to the auditing of tax disclosures within the registrant’s annual financial statements has been made in order to conform to fiscal 2006 presentation. All other fees include the registrant’s pro-rata share of amounts for agreed-upon procedures in conjunction with service contract approvals by the registrant’s Board of Directors/Trustees.
(e)(1) The registrant’s audit committee has adopted a policy whereby audit and non-audit services performed by the registrant’s principal accountant for the registrant, its investment adviser, and any entity controlling, controlled by, or under common control with the investment adviser that provides ongoing services to the registrant require pre-approval in advance at regularly scheduled audit committee meetings. If such a service is required between regularly scheduled audit committee meetings, pre-approval may be authorized by one audit committee member with ratification at the next scheduled audit committee meeting. Waiver of pre-approval for audit or non-audit services requiring fees of a de minimis amount is not permitted.
(2) No services included in (b) – (d) above were approved pursuant to paragraph (c)(7)(i)(C) of Rule 2-01 of Regulation S-X.
(f) Less than 50 percent of the hours expended on the principal accountant’s engagement to audit the registrant’s financial statements for the most recent fiscal year were attributed to work performed by persons other than the principal accountant’s full-time, permanent employees.
(g) The aggregate fees billed for the most recent fiscal year and the preceding fiscal year by the registrant’s principal accountant for non-audit services rendered to the registrant, its investment adviser, and any entity controlling, controlled by, or under common control with the investment adviser that provides ongoing services to the registrant were $1,401,000 and $883,000, respectively, and were less than the aggregate fees billed for those same periods by the registrant’s principal accountant for audit services rendered to the T. Rowe Price Funds. Preceding fiscal year amount reflects the reclassification of tax fees described in (a) – (d) above.
(h) All non-audit services rendered in (g) above were pre-approved by the registrant’s audit committee. Accordingly, these services were considered by the registrant’s audit committee in maintaining the principal accountant’s independence.Item 5. Audit Committee of Listed Registrants.
Not applicable.
Item 6. Schedule of Investments.
Not applicable. The complete schedule of investments is included in Item 1 of this Form N-CSR.
Item 7. Disclosure of Proxy Voting Policies and Procedures for Closed-End Management Investment Companies.
Not applicable.
Item 8. Portfolio Managers of Closed-End Management Investment Companies.
Not applicable.
Item 9. Purchases of Equity Securities by Closed-End Management Investment Company and Affiliated Purchasers.
Not applicable.
Item 10. Submission of Matters to a Vote of Security Holders.
Not applicable.
Item 11. Controls and Procedures.
(a) The registrant’s principal executive officer and principal financial officer have evaluated the registrant’s disclosure controls and procedures within 90 days of this filing and have concluded that the registrant’s disclosure controls and procedures were effective, as of that date, in ensuring that information required to be disclosed by the registrant in this Form N-CSR was recorded, processed, summarized, and reported timely.
(b) The registrant’s principal executive officer and principal financial officer are aware of no change in the registrant’s internal control over financial reporting that occurred during the registrant’s second fiscal quarter covered by this report that has materially affected, or is reasonably likely to materially affect, the registrant’s internal control over financial reporting.
Item 12. Exhibits.
(a)(1) The registrant’s code of ethics pursuant to Item 2 of Form N-CSR is attached.
(2) Separate certifications by the registrant's principal executive officer and principal financial officer, pursuant to Section 302 of the Sarbanes-Oxley Act of 2002 and required by Rule 30a-2(a) under the Investment Company Act of 1940, are attached.
(3) Written solicitation to repurchase securities issued by closed-end companies: not applicable.
(b) A certification by the registrant's principal executive officer and principal financial officer, pursuant to Section 906 of the Sarbanes-Oxley Act of 2002 and required by Rule 30a-2(b) under the Investment Company Act of 1940, is attached.
SIGNATURES | |
| Pursuant to the requirements of the Securities Exchange Act of 1934 and the Investment | |
| Company Act of 1940, the registrant has duly caused this report to be signed on its behalf by the | |
| undersigned, thereunto duly authorized. | |
| T. Rowe Price Small-Cap Value Fund, Inc. | |
| By | /s/ Edward C. Bernard |
| Edward C. Bernard | |
| Principal Executive Officer | |
| Date | February 16, 2007 |
| Pursuant to the requirements of the Securities Exchange Act of 1934 and the Investment | |
| Company Act of 1940, this report has been signed below by the following persons on behalf of | |
| the registrant and in the capacities and on the dates indicated. | |
| By | /s/ Edward C. Bernard |
| Edward C. Bernard | |
| Principal Executive Officer | |
| Date | February 16, 2007 |
| By | /s/ Joseph A. Carrier |
| Joseph A. Carrier | |
| Principal Financial Officer | |
| Date | February 16, 2007 |