UNITED STATES
SECURITIES AND EXCHANGE COMMISSION
Washington, D.C. 20549
FORM N-CSR
CERTIFIED SHAREHOLDER REPORT OF REGISTERED
MANAGEMENT INVESTMENT COMPANIES
Investment Company Act File Number: 811-02215
| T. Rowe Price Small-Cap Value Fund, Inc. |
| (Exact name of registrant as specified in charter) |
| 100 East Pratt Street, Baltimore, MD 21202 |
| (Address of principal executive offices) |
| David Oestreicher |
| 100 East Pratt Street, Baltimore, MD 21202 |
| (Name and address of agent for service) |
Registrant’s telephone number, including area code: (410) 345-2000
Date of fiscal year end: December 31
Date of reporting period: December 31, 2014
Item 1. Report to Shareholders
 |
| Small-Cap Value Fund | December 31, 2014 |

The views and opinions in this report were current as of December 31, 2014. They are not guarantees of performance or investment results and should not be taken as investment advice. Investment decisions reflect a variety of factors, and the managers reserve the right to change their views about individual stocks, sectors, and the markets at any time. As a result, the views expressed should not be relied upon as a forecast of the fund’s future investment intent. The report is certified under the Sarbanes-Oxley Act, which requires mutual funds and other public companies to affirm that, to the best of their knowledge, the information in their financial reports is fairly and accurately stated in all material respects.
REPORTS ON THE WEB
Sign up for our E-mail Program, and you can begin to receive updated fund reports and prospectuses online rather than through the mail. Log in to your account at troweprice.com for more information.
Manager’s Letter
Fellow Shareholders
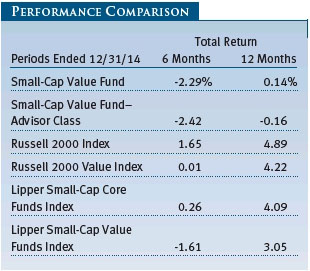
Small-cap value stocks were roughly flat in the six months since our last letter, leaving them with only modest gains for the year and making them the worst-performing major equity category of 2014. Our fund trailed its benchmark and peer group, as we were poorly positioned for declines in both long-term interest rates and commodity prices.
The Small-Cap Value Fund returned -2.29% in the second half of its fiscal year, leaving it with a full-year gain of 0.14%. Poor results from some of our consumer discretionary holdings, an overweight in industrials and materials companies, and our longstanding underweight in financials overwhelmed the positive stock selection we had elsewhere in the portfolio.
Macroeconomic developments in the latter part of 2014 caught us by surprise, and we found ourselves poorly positioned for the environment that unfolded. Our emphasis on high-quality industrials, transportation, and materials companies, which has served the portfolio well for many years, quickly became a headwind as falling commodity prices and slowing global demand caused investors to negatively reassess our holdings in those sectors. Meanwhile, declining long-term interest rates and benign inflation forecasts drove investors toward high-yielding investments such as real estate investment trusts (REITs) and utilities, industries we have de-emphasized for many years.
We believe now is the wrong time to close these bets, as some of our industrials, energy, and materials stocks appear very attractively valued despite the softening near-term outlook, whereas yield-sensitive areas look relatively expensive to us. To that end, we have used the weakness in commodity-sensitive stocks to reexamine and, in many cases, add to our highest-conviction long-term ideas, while selectively culling our lowest-conviction holdings that are benefiting from the current low interest rate environment.
MARKET ENVIRONMENT
Stocks recorded decent overall gains in the six months since our last letter, but performance varied widely among segments, and share prices became significantly more volatile as the year came to a close. Economic growth in the U.S. picked up considerably in the middle of the year, with employers adding jobs at the fastest pace since the late 1990s, according to some measures. Corporate profit growth was also generally favorable, and stronger-than-expected earnings reports provided markets with some momentum through the fall. Finally, investors appeared to take in stride the end of the Federal Reserve’s quantitative easing program. In October, the central bank ended its purchases of Treasury bonds and mortgage-backed securities in order to keep downward pressure on long-term interest rates, but rates stayed low and even fell a bit further. While some nervousness remained over an eventual hike in short-term rates, benign inflation appeared to give the Fed some leeway there as well.
Indeed, falling prices became a source of some concern late in the year, particularly as oil prices plunged. Rising supply, including from shale-based producers in the U.S., was partly responsible for plunging oil—the price more than halved in just a few months—but investors also worried that weak demand reflected a profound slowdown in the global economy. Some major European markets appeared to be tottering on the verge of recession, if not already back in one, as was the case in Italy. Japan’s reform-led recovery also seemed under threat from a hike in the country’s consumption tax, and growth in the once red-hot Chinese economy seemed to be cooling quicker than Chinese officials intended. The drop in oil revenues and sanctions over Ukraine caused turmoil in the Russian ruble, which briefly sparked fears of another emerging markets currency crisis.

Such concerns led to sell-offs in U.S. markets in October and then again in December, but waves of optimism over the U.S. economy and profits led the major indexes back to new highs shortly before the end of the year. The small-cap Russell 2000 Index finally joined the larger-cap benchmarks back in record territory, although small-caps trailed their larger peers significantly in 2014. It was an especially challenging time for small-cap value stocks, as the asset class was roughly flat for the six months and trailed all other major equity categories. Small-cap value stocks were also laggards for the year as a whole, but the performance gap relative to their growth counterparts was considerably smaller. Energy stocks performed particularly poorly within the Russell 2000 Value Index, falling over 38% for the year. Utilities stocks were very strong, reflecting the decline in long-term interest rates. The generally defensive health care sector also performed well.
PORTFOLIO ACTIVITY
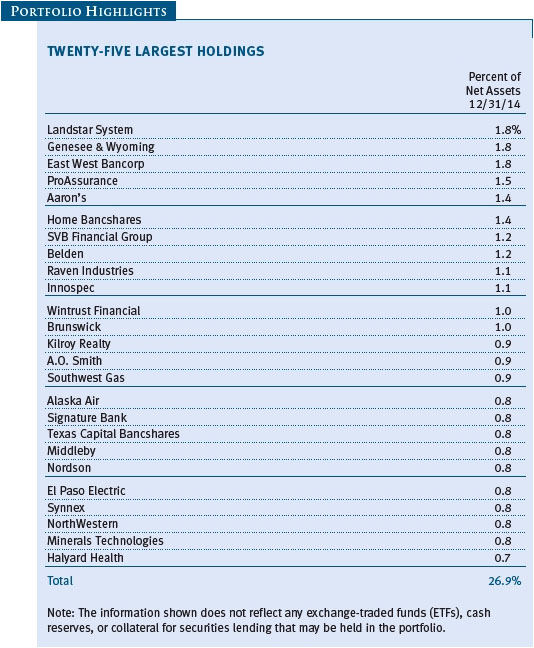
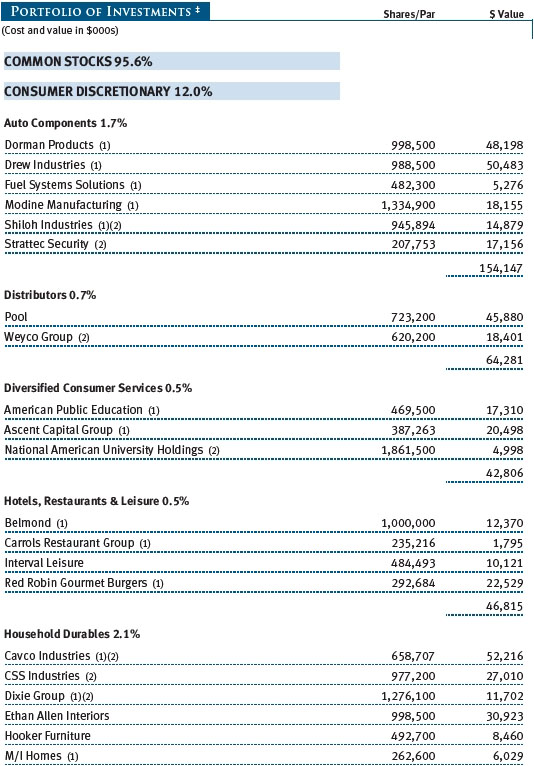
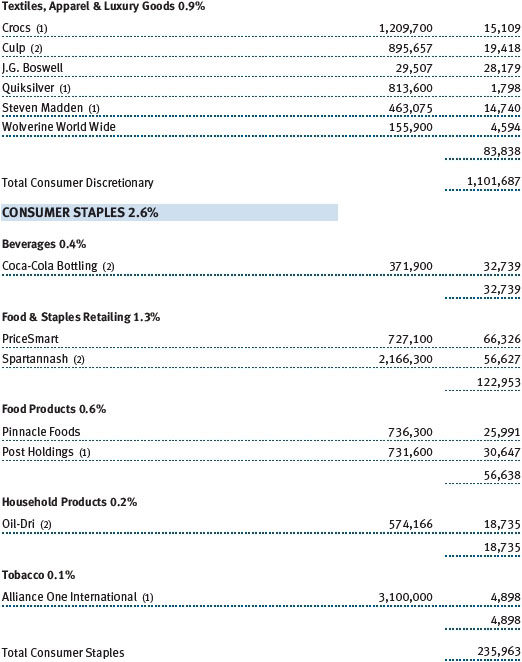
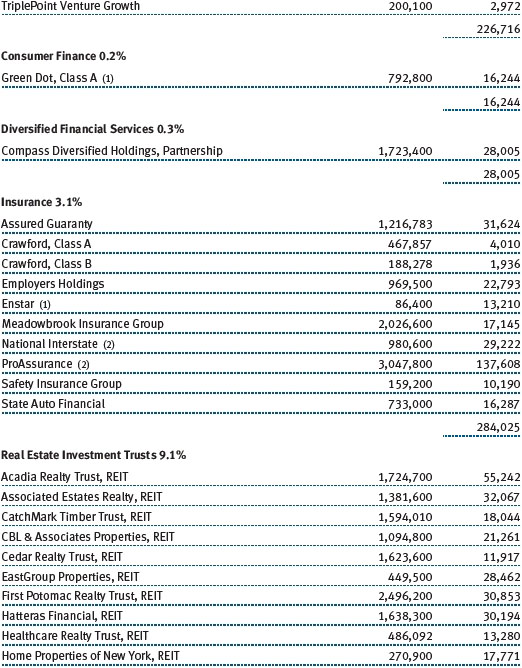
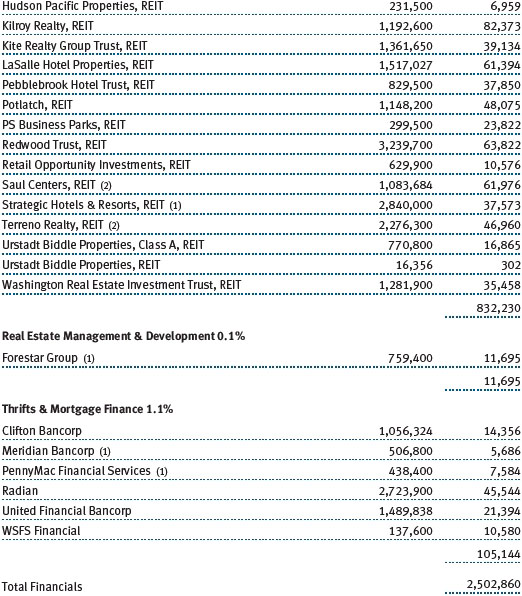
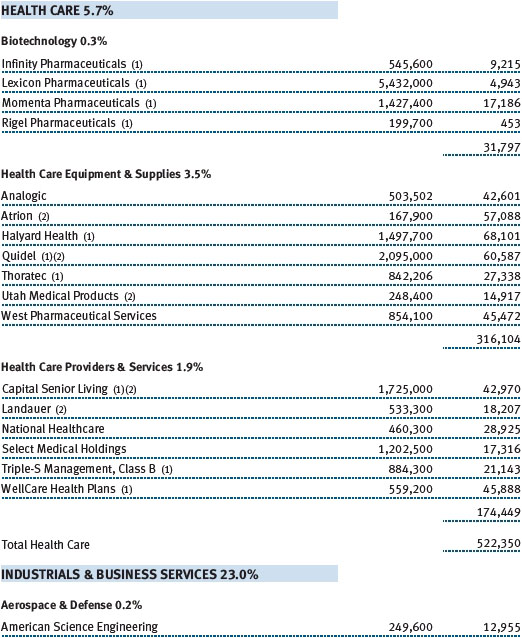
Financial stocks were both a boon and a bane for the fund in 2014—a boon because they contributed the most to our results, but a bane because our longstanding underweight in the sector meant that we missed out on much of their appreciation. This was particularly true among REITs, which make up a significant share of our investment universe. Holdings such as Kilroy Realty, LaSalle Hotel Properties, and Acadia Realty Trust performed very well as long-term bond yields fell, which makes REIT dividends all the more appealing in comparison. Valuations in the REIT sector have become elevated, and we are mindful that these stocks are very exposed to any increase in long-term interest rates. We continue to be very selective in deploying capital to the financials sector and prefer investment ideas with a company-specific catalyst for improving performance. (Please refer to the fund’s portfolio of investments for a complete list of holdings and the amount each represents in the portfolio.)
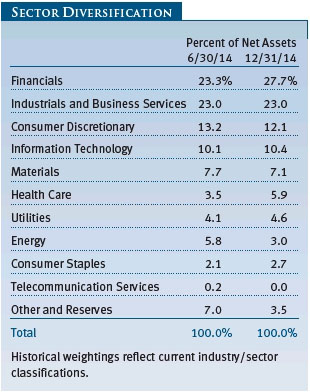
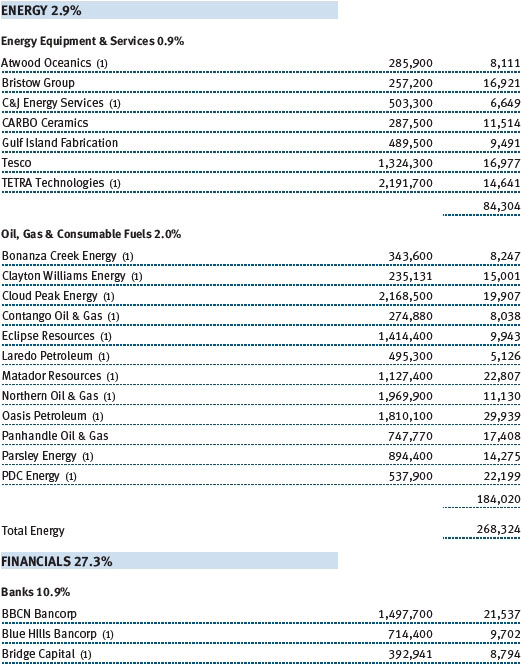
The situation with our energy holdings was somewhat the opposite of that with the financials: a bane because they were almost uniformly poor performers for the year, but a boon in that they make up only a small part of our investment universe—less than 4% of the index by the end of the year—and an even smaller part of the fund. Energy stocks made up four of our six largest detractors for the year: Northern Oil & Gas, Oasis Petroleum, and services firms TETRA Technologies and CARBO Ceramics.
We have found that sharp downturns in a sector are a good opportunity for our analysts to uncover deeply undervalued stocks that have been caught up and oversold in the panic. Rather than avoid controversy or “tough calls,” we confront these difficult situations with a disciplined and rational approach. We exploit the considerable depth, knowledge, and experience of our industry-focused analytical teams to identify those companies that not only can withstand the downturn, but also are likely to be longer-term beneficiaries of it by capitalizing on opportunities themselves. We pursued much the same strategy when the financial crisis swept through the banking sector several years ago, creating short-term harm for all firms but longer-term opportunities for a few. Many of our best investments from 2008–2010 were banks that emerged from the financial crisis larger, better capitalized, and better positioned to grow in the ensuing recovery than their weakened competitors.
We hope to once again use turmoil, in this case in the energy sector, to our advantage. One energy stock we added to during the latter part of 2014 in this vein was Matador Resources. We believe this exploration and production company has a low-cost platform, a strong balance sheet, and a shareholder-oriented management, making it uniquely positioned to capitalize on falling land prices and declining services costs.
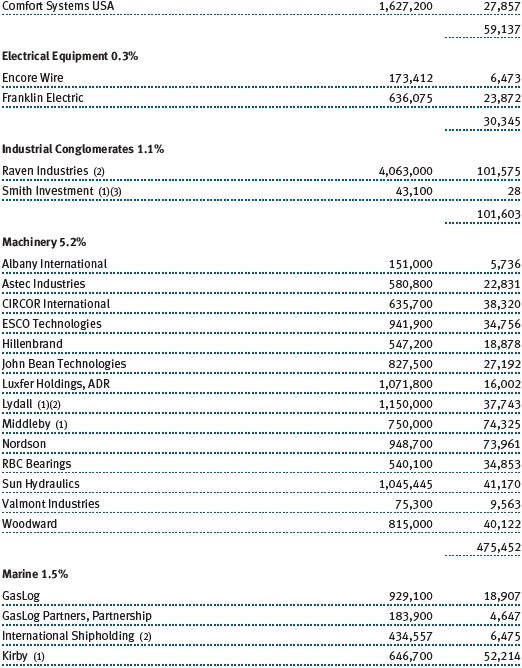
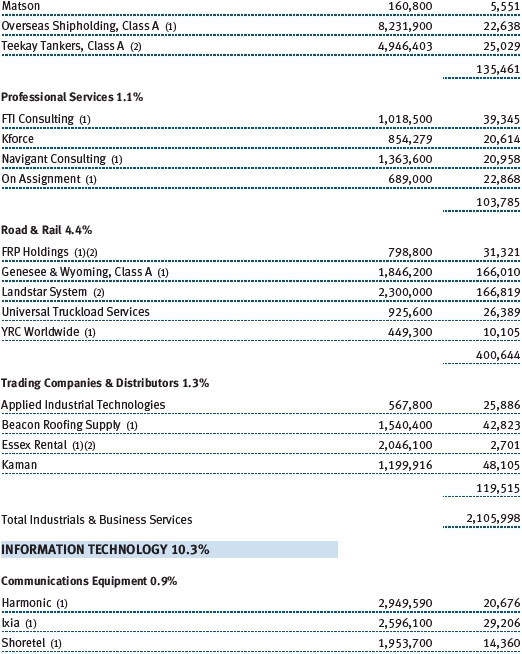
Another way the plunge in commodity prices posed a broader challenge for the portfolio in 2014 was through our industrials holdings. We saw poor performance from a number of companies with ties to the energy industry—many of them longtime holdings whose positive performance we have discussed in previous letters. Inland barge operator Kirby declined as investors worried about declining demand for transporting crude oil, roughly half of its business. Chemicals firms Innospec and American Vanguard also performed poorly, and declining corn prices made Raven Industries our worst detractor for the year. We saw much better results from several of our machinery holdings, and we eliminated our position in tank car builder Greenbrier Companies after a very strong run. The shipping industry was also kinder to trucking firm Landstar System, which has benefited from the upturn in the economy.
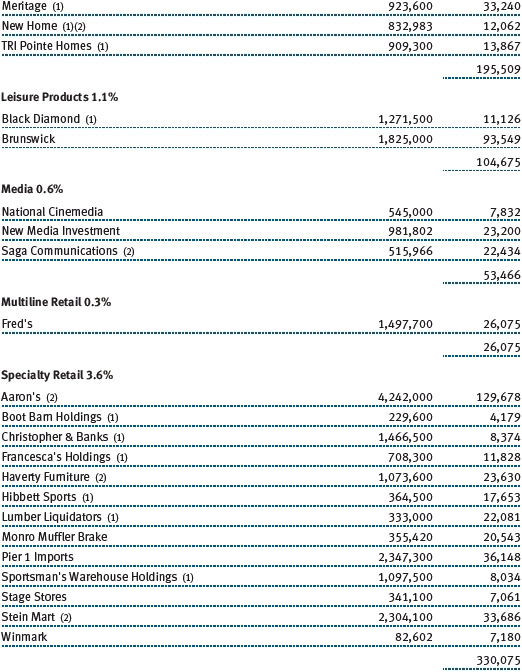
Our consumer discretionary holdings performed poorly overall and were a significant factor in trailing the benchmark. Prominent detractors included housing-related retailers Pier 1 Imports and Lumber Liquidators, both longer-term holdings. Hibbett Sports was also weak, and restrained spending by lower-income consumers took a toll on rent-to-own retailer Aaron’s. We sold our position in Winnebago, but not before the recreational vehicle maker also weighed on results.
We continue to be especially interested in finding well-managed firms that are deploying capital effectively. We perceived one such opportunity in Pinnacle Foods, which has an attractive portfolio of familiar packaged food brands, such as Birds Eye, Vlasic, Duncan Hines, and Wishbone. We like how the company has run its core businesses effectively, while controlling costs and making smart acquisitions. We are also interested in cases where we perceive an opportunity for a company to be run more profitably. Activist investors have recently taken stakes in building products firm Armstrong Worldwide Industries and REIT Associated Estates Realty, which was one factor in our taking new positions in both companies. No single theme dominated our selling, but we continued to trim or eliminate several positions where the market capitalization had grown too large or where the valuation seemed full.
OUTLOOK
We recognize the possibility that current macroeconomic trends that caught us off guard in 2014 may persist into 2015. We also know from past experience that many trends that seem sure to continue often change quickly or even reverse completely. In constructing the portfolio, we continue to emphasize a bottom-up, company-by-company approach as opposed to focusing on the broader macroeconomic environment. Our analysts perform intense, on-site due diligence to uncover the key issues that affect a specific company and assess the merits and risks of each potential investment.
In both good and bad economic times, or in the midst of bear or bull markets, some company managements make mistakes while others execute well, and certain industries attract investor interest while others repel it. We find that no matter what the current market conditions, there are usually good investment opportunities available if you are willing to look in areas of the market that are ignored or avoided by the majority of investors. We are fortunate to have a highly experienced team of industry analysts to help us seek out and uncover out-of-favor and undervalued stocks, regardless of the macroeconomic backdrop.
Patience and courage are required to successfully implement this type of contrarian approach to picking stocks, as we often face bouts of underperformance for both the fund and the small-cap value asset class as a whole. This was certainly the case in 2014. Over the longer term, however, I am confident that the bottom-up, contrarian investment process that has served our shareholders well over the past few decades will continue to do so. I look forward to updating you on our progress in six months.
Respectfully submitted,

J. David Wagner
President of the fund and chairman of its Investment Advisory Committee
January 20, 2015
The committee chairman has day-to-day responsibility for managing the portfolio and works with committee members in developing and executing the fund’s investment program.
RISKS OF STOCK INVESTING
The fund’s share price can fall because of weakness in the stock markets, a particular industry, or specific holdings. Stock markets can decline for many reasons, including adverse political or economic developments, changes in investor psychology, or heavy institutional selling. The prospects for an industry or company may deteriorate because of a variety of factors, including disappointing earnings or changes in the competitive environment. In addition, the investment manager’s assessment of companies held in a fund may prove incorrect, resulting in losses or poor performance even in rising markets.
GLOSSARY
Lipper indexes: Fund benchmarks that consist of a small number (10 to 30) of the largest mutual funds in a particular category as tracked by Lipper Inc.
Russell 2000 Growth Index: An index that tracks the performance of small-cap stocks with higher price-to-book ratios and higher forecast growth values.
Russell 2000 Index: An unmanaged index that tracks the stocks of 2,000 small U.S. companies.
Russell 2000 Value Index: An index that tracks the performance of small-cap stocks with lower price-to-book ratios and lower forecast growth values.
S&P 500 Index: An unmanaged index that tracks the stocks of 500 primarily large-cap U.S. companies.
Note: Russell Investment Group is the source and owner of the trademarks, service marks, and copyrights related to the Russell indexes. Russell® is a trademark of Russell Investment Group.
Performance and Expenses
| Growth of $10,000 |
This chart shows the value of a hypothetical $10,000 investment in the fund over the past 10 fiscal year periods or since inception (for funds lacking 10-year records). The result is compared with benchmarks, which may include a broad-based market index and a peer group average or index. Market indexes do not include expenses, which are deducted from fund returns as well as mutual fund averages and indexes.

| Fund Expense Example |
As a mutual fund shareholder, you may incur two types of costs: (1) transaction costs, such as redemption fees or sales loads, and (2) ongoing costs, including management fees, distribution and service (12b-1) fees, and other fund expenses. The following example is intended to help you understand your ongoing costs (in dollars) of investing in the fund and to compare these costs with the ongoing costs of investing in other mutual funds. The example is based on an investment of $1,000 invested at the beginning of the most recent six-month period and held for the entire period.
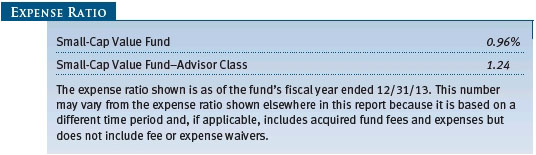
Please note that the fund has two share classes: The original share class (Investor Class) charges no distribution and service (12b-1) fee, and the Advisor Class shares are offered only through unaffiliated brokers and other financial intermediaries and charge a 0.25% 12b-1 fee. Each share class is presented separately in the table.
Actual Expenses
The first line of the following table (Actual) provides information about actual account values and expenses based on the fund’s actual returns. You may use the information on this line, together with your account balance, to estimate the expenses that you paid over the period. Simply divide your account value by $1,000 (for example, an $8,600 account value divided by $1,000 = 8.6), then multiply the result by the number on the first line under the heading “Expenses Paid During Period” to estimate the expenses you paid on your account during this period.
Hypothetical Example for Comparison Purposes
The information on the second line of the table (Hypothetical) is based on hypothetical account values and expenses derived from the fund’s actual expense ratio and an assumed 5% per year rate of return before expenses (not the fund’s actual return). You may compare the ongoing costs of investing in the fund with other funds by contrasting this 5% hypothetical example and the 5% hypothetical examples that appear in the shareholder reports of the other funds. The hypothetical account values and expenses may not be used to estimate the actual ending account balance or expenses you paid for the period.
Note: T. Rowe Price charges an annual account service fee of $20, generally for accounts with less than $10,000. The fee is waived for any investor whose T. Rowe Price mutual fund accounts total $50,000 or more; accounts electing to receive electronic delivery of account statements, transaction confirmations, prospectuses, and shareholder reports; or accounts of an investor who is a T. Rowe Price Preferred Services, Personal Services, or Enhanced Personal Services client (enrollment in these programs generally requires T. Rowe Price assets of at least $100,000). This fee is not included in the accompanying table. If you are subject to the fee, keep it in mind when you are estimating the ongoing expenses of investing in the fund and when comparing the expenses of this fund with other funds.
You should also be aware that the expenses shown in the table highlight only your ongoing costs and do not reflect any transaction costs, such as redemption fees or sales loads. Therefore, the second line of the table is useful in comparing ongoing costs only and will not help you determine the relative total costs of owning different funds. To the extent a fund charges transaction costs, however, the total cost of owning that fund is higher.


The accompanying notes are an integral part of these financial statements.
The accompanying notes are an integral part of these financial statements.


The accompanying notes are an integral part of these financial statements.
The accompanying notes are an integral part of these financial statements.
The accompanying notes are an integral part of these financial statements.
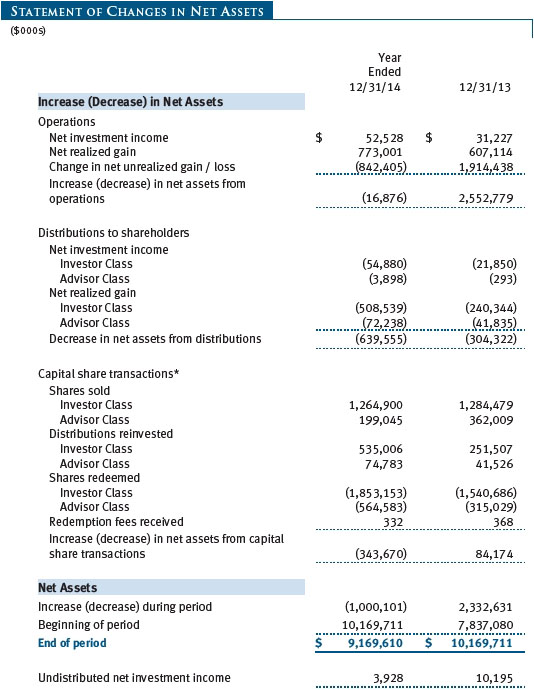
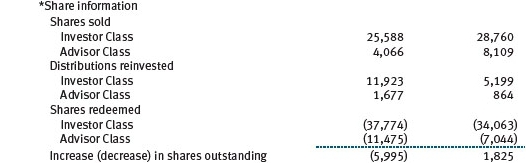
The accompanying notes are an integral part of these financial statements.
| Notes to Financial Statements |
T. Rowe Price Small-Cap Value Fund, Inc. (the fund), is registered under the Investment Company Act of 1940 (the 1940 Act) as a diversified, open-end management investment company. The fund seeks long-term capital growth by investing primarily in small companies whose common stocks are believed to be undervalued. The fund has two classes of shares: the Small-Cap Value Fund original share class, referred to in this report as the Investor Class, offered since June 30, 1988, and the Small-Cap Value Fund–Advisor Class (Advisor Class), offered since March 31, 2000. Advisor Class shares are sold only through unaffiliated brokers and other unaffiliated financial intermediaries that are compensated by the class for distribution, shareholder servicing, and/or certain administrative services under a Board-approved Rule 12b-1 plan. Each class has exclusive voting rights on matters related solely to that class; separate voting rights on matters that relate to both classes; and, in all other respects, the same rights and obligations as the other class.
NOTE 1 - SIGNIFICANT ACCOUNTING POLICIES
Basis of Preparation The fund is an investment company and follows accounting and reporting guidance in the Financial Accounting Standards Board (FASB) Accounting Standards Codification Topic 946 (ASC 946). The accompanying financial statements were prepared in accordance with accounting principles generally accepted in the United States of America (GAAP), including but not limited to ASC 946. GAAP requires the use of estimates made by management. Management believes that estimates and valuations are appropriate; however, actual results may differ from those estimates, and the valuations reflected in the accompanying financial statements may differ from the value ultimately realized upon sale or maturity.
Investment Transactions, Investment Income, and Distributions Income and expenses are recorded on the accrual basis. Premiums and discounts on debt securities are amortized for financial reporting purposes. Dividends received from mutual fund investments are reflected as dividend income; capital gain distributions are reflected as realized gain/loss. Earnings on investments recognized as partnerships for federal income tax purposes reflect the tax character of such earnings. Dividend income and capital gain distributions are recorded on the ex-dividend date. Income tax-related interest and penalties, if incurred, would be recorded as income tax expense. Investment transactions are accounted for on the trade date. Realized gains and losses are reported on the identified cost basis. Distributions to shareholders are recorded on the ex-dividend date. Distributions from REITs are initially recorded as dividend income and, to the extent such represent a return of capital or capital gain for tax purposes, are reclassified when such information becomes available. Income distributions are declared and paid by each class annually. Capital gain distributions, if any, are generally declared and paid by the fund annually.
Currency Translation Assets, including investments, and liabilities denominated in foreign currencies are translated into U.S. dollar values each day at the prevailing exchange rate, using the mean of the bid and asked prices of such currencies against U.S. dollars as quoted by a major bank. Purchases and sales of securities, income, and expenses are translated into U.S. dollars at the prevailing exchange rate on the date of the transaction. The effect of changes in foreign currency exchange rates on realized and unrealized security gains and losses is reflected as a component of security gains and losses.
Class Accounting The Advisor Class pays distribution, shareholder servicing, and/or certain administrative expenses in the form of Rule 12b-1 fees, in an amount not exceeding 0.25% of the class’s average daily net assets. Shareholder servicing, prospectus, and shareholder report expenses incurred by each class are charged directly to the class to which they relate. Expenses common to both classes, investment income, and realized and unrealized gains and losses are allocated to the classes based upon the relative daily net assets of each class.
Rebates Subject to best execution, the fund may direct certain security trades to brokers who have agreed to rebate a portion of the related brokerage commission to the fund in cash. Commission rebates are reflected as realized gain on securities in the accompanying financial statements and totaled $100,000 for the year ended December 31, 2014.
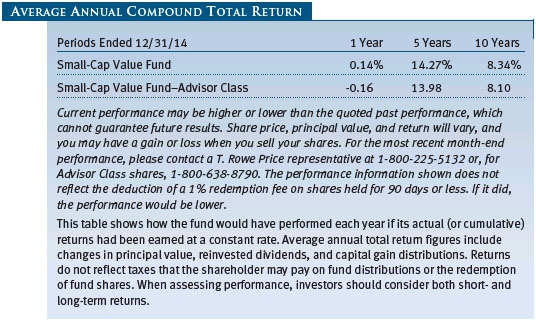
Redemption Fees A 1% fee is assessed on redemptions of fund shares held for 90 days or less to deter short-term trading and to protect the interests of long-term shareholders. Redemption fees are withheld from proceeds that shareholders receive from the sale or exchange of fund shares. The fees are paid to the fund and are recorded as an increase to paid-in capital. The fees may cause the redemption price per share to differ from the net asset value per share.
In-Kind Redemptions In accordance with guidelines described in the fund’s prospectus, the fund may distribute portfolio securities rather than cash as payment for a redemption of fund shares (in-kind redemption). For financial reporting purposes, the fund recognizes a gain on in-kind redemptions to the extent the value of the distributed securities on the date of redemption exceeds the cost of those securities; the fund recognizes a loss if cost exceeds value. Gains and losses realized on in-kind redemptions are not recognized for tax purposes and are reclassified from undistributed realized gain (loss) to paid-in capital. During the year ended December 31, 2014, the fund realized $140,587,000 of net gain on $222,138,000 of in-kind redemptions.
New Accounting Guidance In June 2014, FASB issued Accounting Standards Update (ASU) No. 2014-11, Transfers and Servicing (Topic 860), Repurchase-to-Maturity Transactions, Repurchase Financings, and Disclosures. The ASU changes the accounting for certain repurchase agreements and expands disclosure requirements related to repurchase agreements, securities lending, repurchase-to-maturity and similar transactions. The ASU is effective for interim and annual reporting periods beginning after December 15, 2014. Adoption will have no effect on the fund’s net assets or results of operations.
NOTE 2 - VALUATION
The fund’s financial instruments are valued and each class’s net asset value (NAV) per share is computed at the close of the New York Stock Exchange (NYSE), normally 4 p.m. ET, each day the NYSE is open for business.
Fair Value The fund’s financial instruments are reported at fair value, which GAAP defines as the price that would be received to sell an asset or paid to transfer a liability in an orderly transaction between market participants at the measurement date. The T. Rowe Price Valuation Committee (the Valuation Committee) has been established by the fund’s Board of Directors (the Board) to ensure that financial instruments are appropriately priced at fair value in accordance with GAAP and the 1940 Act. Subject to oversight by the Board, the Valuation Committee develops and oversees pricing-related policies and procedures and approves all fair value determinations. Specifically, the Valuation Committee establishes procedures to value securities; determines pricing techniques, sources, and persons eligible to effect fair value pricing actions; oversees the selection, services, and performance of pricing vendors; oversees valuation-related business continuity practices; and provides guidance on internal controls and valuation-related matters. The Valuation Committee reports to the Board; is chaired by the fund’s treasurer; and has representation from legal, portfolio management and trading, operations, and risk management.
Various valuation techniques and inputs are used to determine the fair value of financial instruments. GAAP establishes the following fair value hierarchy that categorizes the inputs used to measure fair value:
Level 1 – quoted prices (unadjusted) in active markets for identical financial instruments that the fund can access at the reporting date
Level 2 – inputs other than Level 1 quoted prices that are observable, either directly or indirectly (including, but not limited to, quoted prices for similar financial instruments in active markets, quoted prices for identical or similar financial instruments in inactive markets, interest rates and yield curves, implied volatilities, and credit spreads)
Level 3 – unobservable inputs
Observable inputs are developed using market data, such as publicly available information about actual events or transactions, and reflect the assumptions that market participants would use to price the financial instrument. Unobservable inputs are those for which market data are not available and are developed using the best information available about the assumptions that market participants would use to price the financial instrument. GAAP requires valuation techniques to maximize the use of relevant observable inputs and minimize the use of unobservable inputs. When multiple inputs are used to derive fair value, the financial instrument is assigned to the level within the fair value hierarchy based on the lowest-level input that is significant to the fair value of the financial instrument. Input levels are not necessarily an indication of the risk or liquidity associated with financial instruments at that level but rather the degree of judgment used in determining those values.
Valuation Techniques Equity securities listed or regularly traded on a securities exchange or in the over-the-counter (OTC) market are valued at the last quoted sale price or, for certain markets, the official closing price at the time the valuations are made. OTC Bulletin Board securities are valued at the mean of the closing bid and asked prices. A security that is listed or traded on more than one exchange is valued at the quotation on the exchange determined to be the primary market for such security. Listed securities not traded on a particular day are valued at the mean of the closing bid and asked prices for domestic securities and the last quoted sale or closing price for international securities.
For valuation purposes, the last quoted prices of non-U.S. equity securities may be adjusted to reflect the fair value of such securities at the close of the NYSE. If the fund determines that developments between the close of a foreign market and the close of the NYSE will, in its judgment, materially affect the value of some or all of its portfolio securities, the fund will adjust the previous quoted prices to reflect what it believes to be the fair value of the securities as of the close of the NYSE. In deciding whether it is necessary to adjust quoted prices to reflect fair value, the fund reviews a variety of factors, including developments in foreign markets, the performance of U.S. securities markets, and the performance of instruments trading in U.S. markets that represent foreign securities and baskets of foreign securities. The fund may also fair value securities in other situations, such as when a particular foreign market is closed but the fund is open. The fund uses outside pricing services to provide it with quoted prices and information to evaluate or adjust those prices. The fund cannot predict how often it will use quoted prices and how often it will determine it necessary to adjust those prices to reflect fair value. As a means of evaluating its security valuation process, the fund routinely compares quoted prices, the next day’s opening prices in the same markets, and adjusted prices.
Actively traded domestic equity securities generally are categorized in Level 1 of the fair value hierarchy. Non-U.S. equity securities generally are categorized in Level 2 of the fair value hierarchy despite the availability of quoted prices because, as described above, the fund evaluates and determines whether those quoted prices reflect fair value at the close of the NYSE or require adjustment. OTC Bulletin Board securities, certain preferred securities, and equity securities traded in inactive markets generally are categorized in Level 2 of the fair value hierarchy.
Debt securities generally are traded in the OTC market. Securities with remaining maturities of one year or more at the time of acquisition are valued at prices furnished by dealers who make markets in such securities or by an independent pricing service, which considers the yield or price of bonds of comparable quality, coupon, maturity, and type, as well as prices quoted by dealers who make markets in such securities. Generally, debt securities are categorized in Level 2 of the fair value hierarchy; however, to the extent the valuations include significant unobservable inputs, the securities would be categorized in Level 3.
Investments in mutual funds are valued at the mutual fund’s closing NAV per share on the day of valuation and are categorized in Level 1 of the fair value hierarchy. Assets and liabilities other than financial instruments, including short-term receivables and payables, are carried at cost, or estimated realizable value, if less, which approximates fair value.
Thinly traded financial instruments and those for which the above valuation procedures are inappropriate or are deemed not to reflect fair value are stated at fair value as determined in good faith by the Valuation Committee. The objective of any fair value pricing determination is to arrive at a price that could reasonably be expected from a current sale. Financial instruments fair valued by the Valuation Committee are primarily private placements, restricted securities, warrants, rights, and other securities that are not publicly traded.
Subject to oversight by the Board, the Valuation Committee regularly makes good faith judgments to establish and adjust the fair valuations of certain securities as events occur and circumstances warrant. For instance, in determining the fair value of an equity investment with limited market activity, such as a private placement or a thinly traded public company stock, the Valuation Committee considers a variety of factors, which may include, but are not limited to, the issuer’s business prospects, its financial standing and performance, recent investment transactions in the issuer, new rounds of financing, negotiated transactions of significant size between other investors in the company, relevant market valuations of peer companies, strategic events affecting the company, market liquidity for the issuer, and general economic conditions and events. In consultation with the investment and pricing teams, the Valuation Committee will determine an appropriate valuation technique based on available information, which may include both observable and unobservable inputs. The Valuation Committee typically will afford greatest weight to actual prices in arm’s length transactions, to the extent they represent orderly transactions between market participants; transaction information can be reliably obtained; and prices are deemed representative of fair value. However, the Valuation Committee may also consider other valuation methods such as market-based valuation multiples; a discount or premium from market value of a similar, freely traded security of the same issuer; or some combination. Fair value determinations are reviewed on a regular basis and updated as information becomes available, including actual purchase and sale transactions of the issue. Because any fair value determination involves a significant amount of judgment, there is a degree of subjectivity inherent in such pricing decisions, and fair value prices determined by the Valuation Committee could differ from those of other market participants. Depending on the relative significance of unobservable inputs, including the valuation technique(s) used, fair valued securities may be categorized in Level 2 or 3 of the fair value hierarchy.
Valuation Inputs The following table summarizes the fund’s financial instruments, based on the inputs used to determine their fair values on December 31, 2014:
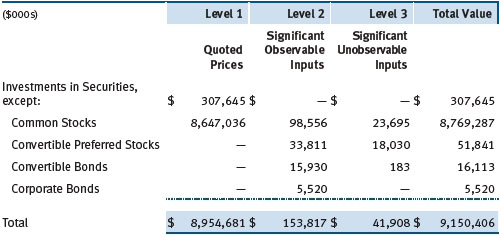
There were no material transfers between Levels 1 and 2 during the year ended December 31, 2014.
Following is a reconciliation of the fund’s Level 3 holdings for the year ended December 31, 2014. Gain (loss) reflects both realized and change in unrealized gain/loss on Level 3 holdings during the period, if any, and is included on the accompanying Statement of Operations. The change in unrealized gain/loss on Level 3 instruments held at December 31, 2014, totaled $4,411,000 for the year ended December 31, 2014. Transfers into and out of Level 3 are reflected at the value of the financial instrument at the beginning of the period. During the year, transfers out of Level 3 were because observable market data became available for the security.
![]()
NOTE 3 - OTHER INVESTMENT TRANSACTIONS
Consistent with its investment objective, the fund engages in the following practices to manage exposure to certain risks and/or to enhance performance. The investment objective, policies, program, and risk factors of the fund are described more fully in the fund’s prospectus and Statement of Additional Information.
Restricted Securities The fund may invest in securities that are subject to legal or contractual restrictions on resale. Prompt sale of such securities at an acceptable price may be difficult and may involve substantial delays and additional costs.
Bank Loans The fund may invest in bank loans, which represent an interest in amounts owed by a borrower to a syndication of lenders. Bank loans are generally noninvestment grade and often involve borrowers whose financial condition is troubled or highly leveraged. Bank loans may be in the form of either assignments or participations. A loan assignment transfers all legal, beneficial, and economic rights to the buyer, and transfer typically requires consent of both the borrower and agent. In contrast, a loan participation generally entitles the buyer to receive the cash flows from principal, interest, and any fee payments; however, the seller continues to hold legal title to the loan. As a result, the buyer of a loan participation generally has no direct rights against the borrower and is exposed to credit risk of both the borrower and seller of the participation. Bank loans often have extended settlement periods, usually may be repaid at any time at the option of the borrower, and may require additional principal to be funded at the borrowers’ discretion at a later date (unfunded commitments). Until settlement, the fund maintains liquid assets sufficient to settle its unfunded loan commitments. The fund reflects both the funded portion of a bank loan as well as its unfunded commitment in the Portfolio of Investments. However, to the extent a credit agreement provides no initial funding of a tranche and funding of the full commitment at a future date(s) is at the borrower’s discretion and considered uncertain, no loan is reflected in the Portfolio of Investments until paid.
Securities Lending The fund may lend its securities to approved brokers to earn additional income. Its securities lending activities are administered by a lending agent in accordance with a securities lending agreement. Security loans generally do not have stated maturity dates and the fund may recall a security at any time. The fund receives collateral in the form of cash or U.S. government securities, valued at 102% to 105% of the value of the securities on loan. Collateral is maintained over the life of the loan in an amount not less than the value of loaned securities; any additional collateral required due to changes in security values is delivered to the fund the next business day. Cash collateral is invested by the lending agent(s) in accordance with investment guidelines approved by fund management. Additionally, the lending agent indemnifies the fund against losses resulting from borrower default. Although risk is mitigated by the collateral and indemnification, the fund could experience a delay in recovering its securities and a possible loss of income or value if the borrower fails to return the securities, collateral investments decline in value and the lending agent fails to perform. Securities lending revenue consists of earnings on invested collateral and borrowing fees, net of any rebates to the borrower, compensation to the lending agent, and other administrative costs. In accordance with GAAP, investments made with cash collateral are reflected in the accompanying financial statements, but collateral received in the form of securities is not. At December 31, 2014, there were no securities on loan.
Other Purchases and sales of portfolio securities other than short-term securities aggregated $1,463,699,000 and $1,931,571,000, respectively, for the year ended December 31, 2014.
NOTE 4 - FEDERAL INCOME TAXES
No provision for federal income taxes is required since the fund intends to continue to qualify as a regulated investment company under Subchapter M of the Internal Revenue Code and distribute to shareholders all of its taxable income and gains. Distributions determined in accordance with federal income tax regulations may differ in amount or character from net investment income and realized gains for financial reporting purposes. Financial reporting records are adjusted for permanent book/tax differences to reflect tax character but are not adjusted for temporary differences.
The fund files U.S. federal, state, and local tax returns as required. The fund’s tax returns are subject to examination by the relevant tax authorities until expiration of the applicable statute of limitations, which is generally three years after the filing of the tax return but which can be extended to six years in certain circumstances. Tax returns for open years have incorporated no uncertain tax positions that require a provision for income taxes.
Reclassifications to paid-in capital relate primarily to redemptions in kind and a tax practice that treats a portion of the proceeds from each redemption of capital shares as a distribution of taxable net investment income or realized capital gain. Reclassifications between income and gain relate primarily to the character of dividends received from real estate investment trusts (REITs). For the year ended December 31, 2014, the following reclassifications were recorded to reflect tax character (there was no impact on results of operations or net assets):
Distributions during the years ended December 31, 2014 and December 31, 2013, were characterized for tax purposes as follows:

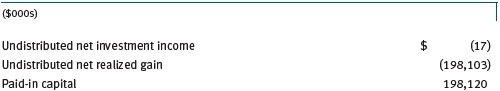
At December 31, 2014, the tax-basis cost of investments and components of net assets were as follows:
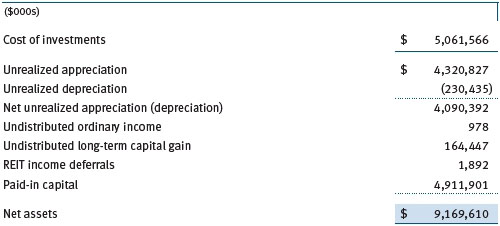
The difference between book-basis and tax-basis net unrealized appreciation (depreciation) is attributable to the realization of gains/losses on passive foreign investment companies and the recognition of income on contingent debt obligations for tax purposes. Certain dividends declared by REITs in December and paid the following January are recognized for tax purposes in the subsequent year (REIT income deferrals) but, for financial reporting purposes, are included in the fund’s dividend income on ex-date.
NOTE 5 - RELATED PARTY TRANSACTIONS
The fund is managed by T. Rowe Price Associates, Inc. (Price Associates), a wholly owned subsidiary of T. Rowe Price Group, Inc. (Price Group). The investment management agreement between the fund and Price Associates provides for an annual investment management fee, which is computed daily and paid monthly. The fee consists of an individual fund fee, equal to 0.35% of the fund’s average daily net assets, and a group fee. The group fee rate is calculated based on the combined net assets of certain mutual funds sponsored by Price Associates (the group) applied to a graduated fee schedule, with rates ranging from 0.48% for the first $1 billion of assets to 0.275% for assets in excess of $400 billion. The fund’s group fee is determined by applying the group fee rate to the fund’s average daily net assets. At December 31, 2014, the effective annual group fee rate was 0.29%.
In addition, the fund has entered into service agreements with Price Associates and two wholly owned subsidiaries of Price Associates (collectively, Price). Price Associates computes the daily share prices and provides certain other administrative services to the fund. T. Rowe Price Services, Inc., provides shareholder and administrative services in its capacity as the fund’s transfer and dividend-disbursing agent. T. Rowe Price Retirement Plan Services, Inc., provides subaccounting and recordkeeping services for certain retirement accounts invested in the Investor Class. For the year ended December 31, 2014, expenses incurred pursuant to these service agreements were $170,000 for Price Associates; $1,985,000 for T. Rowe Price Services, Inc.; and $3,661,000 for T. Rowe Price Retirement Plan Services, Inc. The total amount payable at period-end pursuant to these service agreements is reflected as Due to Affiliates in the accompanying financial statements.
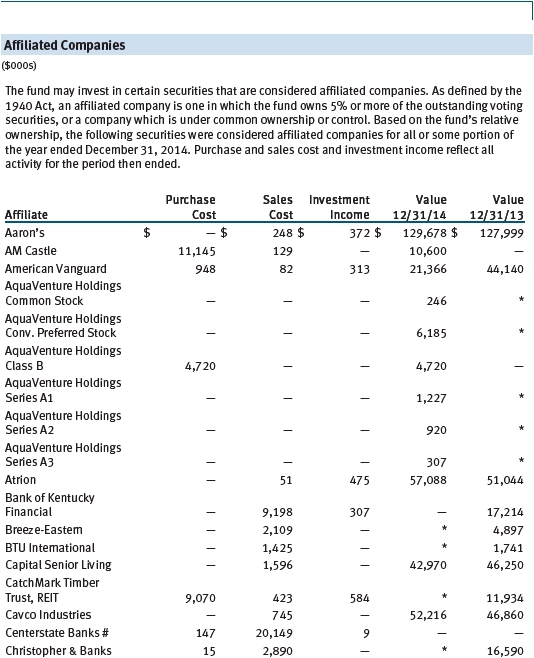
The fund is also one of several mutual funds sponsored by Price Associates (underlying Price funds) in which the T. Rowe Price Spectrum Funds (Spectrum Funds), as well as the T. Rowe Price Retirement Funds and T. Rowe Price Target Retirement Funds (Retirement Funds) may invest. Neither the Spectrum Funds nor the Retirement Funds invest in the underlying Price funds for the purpose of exercising management or control. Pursuant to separate special servicing agreements, expenses associated with the operation of the Spectrum Funds and Retirement Funds are borne by each underlying Price fund to the extent of estimated savings to it and in proportion to the average daily value of its shares owned by the Spectrum Funds and Retirement Funds, respectively. Expenses allocated under these agreements are reflected as shareholder servicing expenses in the accompanying financial statements. For the year ended December 31, 2014, the fund was allocated $90,000 of Spectrum Funds’ expenses and $2,498,000 of Retirement Funds’ expenses. Of these amounts, $1,162,000 related to services provided by Price. At period-end, the amount payable to Price pursuant to this agreement is reflected as Due to Affiliates in the accompanying financial statements. At December 31, 2014, approximately 1% of the outstanding shares of the Investor Class were held by the Spectrum Funds and 18% were held by the Retirement Funds.
The fund may invest in the T. Rowe Price Reserve Investment Fund, the T. Rowe Price Government Reserve Investment Fund, or the T. Rowe Price Short-Term Reserve Fund (collectively, the Price Reserve Investment Funds), open-end management investment companies managed by Price Associates and considered affiliates of the fund. The Price Reserve Investment Funds are offered as short-term investment options to mutual funds, trusts, and other accounts managed by Price Associates or its affiliates and are not available for direct purchase by members of the public. The Price Reserve Investment Funds pay no investment management fees.
| Report of Independent Registered Public Accounting Firm |
To the Board of Directors and Shareholders of
T. Rowe Price Small-Cap Value Fund, Inc.
In our opinion, the accompanying statement of assets and liabilities, including the portfolio of investments, and the related statements of operations and of changes in net assets and the financial highlights present fairly, in all material respects, the financial position of T. Rowe Price Small-Cap Value Fund, Inc. (the “Fund”) at December 31, 2014, the results of its operations, the changes in its net assets and the financial highlights for each of the periods indicated therein, in conformity with accounting principles generally accepted in the United States of America. These financial statements and financial highlights (hereafter referred to as “financial statements”) are the responsibility of the Fund’s management. Our responsibility is to express an opinion on these financial statements based on our audits. We conducted our audits of these financial statements in accordance with the standards of the Public Company Accounting Oversight Board (United States). Those standards require that we plan and perform the audit to obtain reasonable assurance about whether the financial statements are free of material misstatement. An audit includes examining, on a test basis, evidence supporting the amounts and disclosures in the financial statements, assessing the accounting principles used and significant estimates made by management, and evaluating the overall financial statement presentation. We believe that our audits, which included confirmation of securities at December 31, 2014 by correspondence with the custodian and brokers, and confirmation of the underlying fund by correspondence with the transfer agent, provide a reasonable basis for our opinion.
PricewaterhouseCoopers LLP
Baltimore, Maryland
February 19, 2015
| Tax Information (Unaudited) for the Tax Year Ended 12/31/14 |
We are providing this information as required by the Internal Revenue Code. The amounts shown may differ from those elsewhere in this report because of differences between tax and financial reporting requirements.
The fund’s distributions to shareholders included:
| ● | $8,449,000 from short-term capital gains, |
| ● | $630,516,000 from long-term capital gains, of which $629,689,000 was subject to a long-term capital gains tax rate of not greater than 20%, and $827,000 to a long-term capital gains tax rate of not greater than 25%. |
For taxable non-corporate shareholders, $55,280,000 of the fund’s income represents qualified dividend income subject to a long-term capital gains tax rate of not greater than 20%.
For corporate shareholders, $55,280,000 of the fund’s income qualifies for the dividends-received deduction.
| Information on Proxy Voting Policies, Procedures, and Records |
A description of the policies and procedures used by T. Rowe Price funds and portfolios to determine how to vote proxies relating to portfolio securities is available in each fund’s Statement of Additional Information. You may request this document by calling 1-800-225-5132 or by accessing the SEC’s website, sec.gov.
The description of our proxy voting policies and procedures is also available on our website, troweprice.com. To access it, click on the words “Social Responsibility” at the top of our corporate homepage. Next, click on the words “Conducting Business Responsibly” on the left side of the page that appears. Finally, click on the words “Proxy Voting Policies” on the left side of the page that appears.
Each fund’s most recent annual proxy voting record is available on our website and through the SEC’s website. To access it through our website, follow the above directions to reach the “Conducting Business Responsibly” page. Click on the words “Proxy Voting Records” on the left side of that page, and then click on the “View Proxy Voting Records” link at the bottom of the page that appears.
| How to Obtain Quarterly Portfolio Holdings |
The fund files a complete schedule of portfolio holdings with the Securities and Exchange Commission for the first and third quarters of each fiscal year on Form N-Q. The fund’s Form N-Q is available electronically on the SEC’s website (sec.gov); hard copies may be reviewed and copied at the SEC’s Public Reference Room, 100 F St. N.E., Washington, DC 20549. For more information on the Public Reference Room, call 1-800-SEC-0330.
| About the Fund’s Directors and Officers |
Your fund is overseen by a Board of Directors (Board) that meets regularly to review a wide variety of matters affecting or potentially affecting the fund, including performance, investment programs, compliance matters, advisory fees and expenses, service providers, and business and regulatory affairs. The Board elects the fund’s officers, who are listed in the final table. At least 75% of the Board’s members are independent of T. Rowe Price Associates, Inc. (T. Rowe Price), and its affiliates; “inside” or “interested” directors are employees or officers of T. Rowe Price. The business address of each director and officer is 100 East Pratt Street, Baltimore, Maryland 21202. The Statement of Additional Information includes additional information about the fund directors and is available without charge by calling a T. Rowe Price representative at 1-800-638-5660.
| Independent Directors | ||
| Name | ||
| (Year of Birth) | ||
| Year Elected* | ||
| [Number of T. Rowe Price | Principal Occupation(s) and Directorships of Public Companies and | |
| Portfolios Overseen] | Other Investment Companies During the Past Five Years | |
| William R. Brody, M.D., Ph.D. | President and Trustee, Salk Institute for Biological Studies (2009 to | |
| (1944) | present); Director, BioMed Realty Trust (2013 to present); Director, | |
| 2009 | Novartis, Inc. (2009 to present); Director, IBM (2007 to present) | |
| [165] | ||
| Anthony W. Deering | Chairman, Exeter Capital, LLC, a private investment firm (2004 to | |
| (1945) | present); Director, Brixmor Real Estate Investment Trust (2012 to | |
| 2001 | present); Director and Member of the Advisory Board, Deutsche | |
| [165] | Bank North America (2004 to present); Director, Under Armour | |
| (2008 to present); Director, Vornado Real Estate Investment Trust | ||
| (2004 to 2012) | ||
| Donald W. Dick, Jr. | Principal, EuroCapital Partners, LLC, an acquisition and management | |
| (1943) | advisory firm (1995 to present) | |
| 1994 | ||
| [165] | ||
| Bruce W. Duncan | President, Chief Executive Officer, and Director, First Industrial Realty | |
| (1951) | Trust, owner and operator of industrial properties (2009 to present); | |
| 2013 | Chairman of the Board (2005 to present), Interim Chief Executive | |
| [165] | Officer (2007), and Director, Starwood Hotels & Resorts, a hotel and | |
| leisure company (1999 to present) | ||
| Robert J. Gerrard, Jr. | Advisory Board Member, Pipeline Crisis/Winning Strategies, a | |
| (1952) | collaborative working to improve opportunities for young African | |
| 2012 | Americans (1997 to present); Chairman of Compensation Committee | |
| [165] | and Director, Syniverse Holdings, Inc., a provider of wireless voice | |
| and data services for telecommunications companies (2008 to 2011) | ||
| Karen N. Horn | Limited Partner and Senior Managing Director, Brock Capital Group, | |
| (1943) | an advisory and investment banking firm (2004 to present); Director, | |
| 2003 | Eli Lilly and Company (1987 to present); Director, Simon Property | |
| [165] | Group (2004 to present); Director, Norfolk Southern (2008 to present) | |
| Paul F. McBride | Former Company Officer and Senior Vice President, Human | |
| (1956) | Resources and Corporate Initiatives, Black & Decker Corporation | |
| 2013 | (2004 to 2010) | |
| [165] | ||
| Cecilia E. Rouse, Ph.D. | Dean, Woodrow Wilson School (2012 to present); Professor and | |
| (1963) | Researcher, Princeton University (1992 to present); Director, MDRC, a | |
| 2012 | nonprofit education and social policy research organization (2011 to | |
| [165] | present); Member, National Academy of Education (2010 to present); | |
| Research Associate, National Bureau of Economic Research’s Labor | ||
| Studies Program (2011 to present); Member, President’s Council of | ||
| Economic Advisors (2009 to 2011); Chair of Committee on the Status | ||
| of Minority Groups in the Economic Profession, American Economic | ||
| Association (2012 to present) | ||
| John G. Schreiber | Owner/President, Centaur Capital Partners, Inc., a real estate | |
| (1946) | investment company (1991 to present); Cofounder and Partner, | |
| 2001 | Blackstone Real Estate Advisors, L.P. (1992 to present); Director, | |
| [165] | General Growth Properties, Inc. (2010 to 2013); Director, BXMT | |
| (formerly, Capital Trust, Inc.), a real estate investment company | ||
| (2012 to present); Director and Chairman of the Board, Brixmor | ||
| Property Group, Inc. (2013 to present); Director, Hilton Worldwide | ||
| (2013 to present) | ||
| Mark R. Tercek | President and Chief Executive Officer, The Nature Conservancy (2008 | |
| (1957) | to present); Managing Director, The Goldman Sachs Group, Inc. | |
| 2009 | (1984 to 2008) | |
| [165] | ||
| *Each independent director serves until retirement, resignation, or election of a successor. | ||
| Inside Directors | ||
| Name | ||
| (Year of Birth) | ||
| Year Elected* | ||
| [Number of T. Rowe Price | Principal Occupation(s) and Directorships of Public Companies and | |
| Portfolios Overseen] | Other Investment Companies During the Past Five Years | |
| Edward C. Bernard | Director and Vice President, T. Rowe Price; Vice Chairman of the | |
| (1956) | Board, Director, and Vice President, T. Rowe Price Group, Inc.; | |
| 2006 | Chairman of the Board, Director, and President, T. Rowe Price | |
| [165] | Investment Services, Inc.; Chairman of the Board and Director, | |
| T. Rowe Price Retirement Plan Services, Inc., and T. Rowe Price | ||
| Services, Inc.; Chairman of the Board, Chief Executive Officer, | ||
| and Director, T. Rowe Price International; Chairman of the Board, | ||
| Chief Executive Officer, Director, and President, T. Rowe Price Trust | ||
| Company; Chairman of the Board, all funds | ||
| Brian C. Rogers, CFA, CIC | Chief Investment Officer, Director, and Vice President, T. Rowe Price; | |
| (1955) | Chairman of the Board, Chief Investment Officer, Director, and Vice | |
| 2013 | President, T. Rowe Price Group, Inc.; Vice President, T. Rowe Price | |
| [111] | Trust Company | |
| *Each inside director serves until retirement, resignation, or election of a successor. | ||
| Officers | ||
| Name (Year of Birth) | ||
| Position Held With Small-Cap Value Fund | Principal Occupation(s) | |
| Francisco M. Alonso (1978) | Vice President, T. Rowe Price and T. Rowe Price | |
| Vice President | Group, Inc. | |
| Preston G. Athey, CFA, CIC (1949) | Vice President, T. Rowe Price, T. Rowe Price | |
| Vice President | Group, Inc., and T. Rowe Price Trust Company | |
| Darrell N. Braman (1963) | Vice President, Price Hong Kong, Price | |
| Vice President | Singapore, T. Rowe Price, T. Rowe Price Group, | |
| Inc., T. Rowe Price International, T. Rowe Price | ||
| Investment Services, Inc., and T. Rowe Price | ||
| Services, Inc. | ||
| Roger L. Fiery III, CPA (1959) | Vice President, Price Hong Kong, Price | |
| Vice President | Singapore, T. Rowe Price, T. Rowe Price Group, | |
| Inc., T. Rowe Price International, and T. Rowe | ||
| Price Trust Company | ||
| Christopher T. Fortune (1973) | Vice President, T. Rowe Price and T. Rowe Price | |
| Vice President | Group, Inc. | |
| John R. Gilner (1961) | Chief Compliance Officer and Vice President, | |
| Chief Compliance Officer | T. Rowe Price; Vice President, T. Rowe Price | |
| Group, Inc., and T. Rowe Price Investment | ||
| Services, Inc. | ||
| Gregory S. Golczewski (1966) | Vice President, T. Rowe Price and T. Rowe Price | |
| Vice President | Trust Company | |
| Gregory K. Hinkle, CPA (1958) | Vice President, T. Rowe Price, T. Rowe Price | |
| Treasurer | Group, Inc., and T. Rowe Price Trust Company | |
| Nina P. Jones, CPA (1980) | Vice President, T. Rowe Price and T. Rowe Price | |
| Vice President | Group, Inc. | |
| Patricia B. Lippert (1953) | Assistant Vice President, T. Rowe Price and | |
| Secretary | T. Rowe Price Investment Services, Inc. | |
| Gregory A. McCrickard, CFA (1958) | Vice President, T. Rowe Price, T. Rowe Price | |
| Vice President | Group, Inc., and T. Rowe Price Trust Company | |
| David Oestreicher (1967) | Director, Vice President, and Secretary, T. Rowe | |
| Vice President | Price Investment Services, Inc., T. Rowe Price | |
| Retirement Plan Services, Inc., T. Rowe | ||
| Price Services, Inc., and T. Rowe Price Trust | ||
| Company; Chief Legal Officer, Vice President, | ||
| and Secretary, T. Rowe Price Group, Inc.; Vice | ||
| President and Secretary, T. Rowe Price and | ||
| T. Rowe Price International; Vice President, | ||
| Price Hong Kong and Price Singapore | ||
| Curt J. Organt, CFA (1968) | Vice President, T. Rowe Price and T. Rowe Price | |
| Vice President | Group, Inc. | |
| Timothy E. Parker, CFA (1974) | Vice President, T. Rowe Price and T. Rowe Price | |
| Vice President | Group, Inc. | |
| Deborah D. Seidel (1962) | Vice President, T. Rowe Price, T. Rowe Price | |
| Vice President | Group, Inc., T. Rowe Price Investment Services, | |
| Inc., and T. Rowe Price Services, Inc. | ||
| J. David Wagner, CFA (1974) | Vice President, T. Rowe Price, T. Rowe Price | |
| President | Group, Inc., and T. Rowe Price Trust Company | |
| Julie L. Waples (1970) | Vice President, T. Rowe Price | |
| Vice President | ||
| Unless otherwise noted, officers have been employees of T. Rowe Price or T. Rowe Price International for at least 5 years. | ||
Item 2. Code of Ethics.
The registrant has adopted a code of ethics, as defined in Item 2 of Form N-CSR, applicable to its principal executive officer, principal financial officer, principal accounting officer or controller, or persons performing similar functions. A copy of this code of ethics is filed as an exhibit to this Form N-CSR. No substantive amendments were approved or waivers were granted to this code of ethics during the period covered by this report.
Item 3. Audit Committee Financial Expert.
The registrant’s Board of Directors/Trustees has determined that Mr. Anthony W. Deering qualifies as an audit committee financial expert, as defined in Item 3 of Form N-CSR. Mr. Deering is considered independent for purposes of Item 3 of Form N-CSR.
Item 4. Principal Accountant Fees and Services.
(a) – (d) Aggregate fees billed for the last two fiscal years for professional services rendered to, or on behalf of, the registrant by the registrant’s principal accountant were as follows:
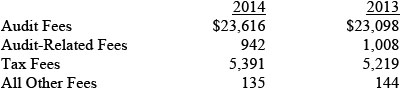
Audit fees include amounts related to the audit of the registrant’s annual financial statements and services normally provided by the accountant in connection with statutory and regulatory filings. Audit-related fees include amounts reasonably related to the performance of the audit of the registrant’s financial statements and specifically include the issuance of a report on internal controls and, if applicable, agreed-upon procedures related to fund acquisitions. Tax fees include amounts related to services for tax compliance, tax planning, and tax advice. The nature of these services specifically includes the review of distribution calculations and the preparation of Federal, state, and excise tax returns. All other fees include the registrant’s pro-rata share of amounts for agreed-upon procedures in conjunction with service contract approvals by the registrant’s Board of Directors/Trustees.
(e)(1) The registrant’s audit committee has adopted a policy whereby audit and non-audit services performed by the registrant’s principal accountant for the registrant, its investment adviser, and any entity controlling, controlled by, or under common control with the investment adviser that provides ongoing services to the registrant require pre-approval in advance at regularly scheduled audit committee meetings. If such a service is required between regularly scheduled audit committee meetings, pre-approval may be authorized by one audit committee member with ratification at the next scheduled audit committee meeting. Waiver of pre-approval for audit or non-audit services requiring fees of a de minimis amount is not permitted.
(2) No services included in (b) – (d) above were approved pursuant to paragraph (c)(7)(i)(C) of Rule 2-01 of Regulation S-X.
(f) Less than 50 percent of the hours expended on the principal accountant’s engagement to audit the registrant’s financial statements for the most recent fiscal year were attributed to work performed by persons other than the principal accountant’s full-time, permanent employees.
(g) The aggregate fees billed for the most recent fiscal year and the preceding fiscal year by the registrant’s principal accountant for non-audit services rendered to the registrant, its investment adviser, and any entity controlling, controlled by, or under common control with the investment adviser that provides ongoing services to the registrant were $2,283,000 and $1,691,000, respectively.
(h) All non-audit services rendered in (g) above were pre-approved by the registrant’s audit committee. Accordingly, these services were considered by the registrant’s audit committee in maintaining the principal accountant’s independence.
Item 5. Audit Committee of Listed Registrants.
Not applicable.
Item 6. Investments.
(a) Not applicable. The complete schedule of investments is included in Item 1 of this Form N-CSR.
(b) Not applicable.
Item 7. Disclosure of Proxy Voting Policies and Procedures for Closed-End Management Investment Companies.
Not applicable.
Item 8. Portfolio Managers of Closed-End Management Investment Companies.
Not applicable.
Item 9. Purchases of Equity Securities by Closed-End Management Investment Company and Affiliated Purchasers.
Not applicable.
Item 10. Submission of Matters to a Vote of Security Holders.
Not applicable.
Item 11. Controls and Procedures.
(a) The registrant’s principal executive officer and principal financial officer have evaluated the registrant’s disclosure controls and procedures within 90 days of this filing and have concluded that the registrant’s disclosure controls and procedures were effective, as of that date, in ensuring that information required to be disclosed by the registrant in this Form N-CSR was recorded, processed, summarized, and reported timely.
(b) The registrant’s principal executive officer and principal financial officer are aware of no change in the registrant’s internal control over financial reporting that occurred during the registrant’s second fiscal quarter covered by this report that has materially affected, or is reasonably likely to materially affect, the registrant’s internal control over financial reporting.
Item 12. Exhibits.
(a)(1) The registrant’s code of ethics pursuant to Item 2 of Form N-CSR is attached.
(b) A certification by the registrant's principal executive officer and principal financial officer, pursuant to Section 906 of the Sarbanes-Oxley Act of 2002 and required by Rule 30a-2(b) under the Investment Company Act of 1940, is attached.
SIGNATURES
Pursuant to the requirements of the Securities Exchange Act of 1934 and the Investment Company Act of 1940, the registrant has duly caused this report to be signed on its behalf by the undersigned, thereunto duly authorized.
T. Rowe Price Small-Cap Value Fund, Inc.
| By | /s/ Edward C. Bernard | |
| Edward C. Bernard | ||
| Principal Executive Officer | ||
| Date February 19, 2015 | ||
Pursuant to the requirements of the Securities Exchange Act of 1934 and the Investment Company Act of 1940, this report has been signed below by the following persons on behalf of the registrant and in the capacities and on the dates indicated.
| By | /s/ Edward C. Bernard | |
| Edward C. Bernard | ||
| Principal Executive Officer | ||
| Date February 19, 2015 | ||
| By | /s/ Gregory K. Hinkle | |
| Gregory K. Hinkle | ||
| Principal Financial Officer | ||
| Date February 19, 2015 | ||