UNITED STATES
SECURITIES AND EXCHANGE COMMISSION
Washington, D.C. 20549
FORM N-CSR
CERTIFIED SHAREHOLDER REPORT OF REGISTERED MANAGEMENT
INVESTMENT COMPANIES
Investment Company Act file number 811-05601
SEI Institutional International Trust
(Exact name of registrant as specified in charter)
SEI Investments
One Freedom Valley Drive
Oaks, PA 19456
(Address of principal executive offices) (Zip code)
Timothy D. Barto, Esq.
SEI Investments
One Freedom Valley Drive
Oaks, PA 19456
(Name and address of agent for service)
Registrant’s telephone number, including area code: 610-676-1000
Date of fiscal year end: September 30, 2021
Date of reporting period: September 30, 2021
| Item 1. | Reports to Stockholders. |

September 30, 2021
ANNUAL REPORT
SEI Institutional International Trust
 | International Equity Fund
| |
| Emerging Markets Equity Fund
| |
| International Fixed Income Fund
| |
| Emerging Markets Debt Fund |
Paper copies of the Funds’ shareholder reports are no longer sent by mail, unless you specifically request them from the Funds or from your financial intermediary, such as a broker-dealer or bank. Shareholder reports are available online and you will be notified by mail each time a report is posted on the Funds’ website and provided with a link to access the report online.
You may elect to receive all future reports in paper free of charge. If you invest through a financial intermediary, you can contact your financial intermediary to inform it that you wish to continue receiving paper copies of your shareholder reports. If you invest directly with the Funds, you can inform the Funds that you wish to continue receiving paper copies of your shareholder reports by calling 1-800-DIAL-SEI. Your election to receive reports in paper will apply to all funds held with the SEI Funds or your financial intermediary.

The Trust files its complete schedule of portfolio holdings with the Securities and Exchange Commission for the first and third quarters of each fiscal year as an exhibit to its reports on Form N-PORT. The Trust’s Form N-PORT reports are available on the Commission’s website at http://www.sec.gov.
A description of the policies and procedures that the Trust uses to determine how to vote proxies relating to portfolio securities, as well as information relating to how a Fund voted proxies relating to portfolio securities during the most recent 12-month period ended June 30, is available (i) without charge, upon request, by calling 1-800-DIAL-SEI; and (ii) on the Commission’s website at http://www.sec.gov.
September 30, 2021 (Unaudited)
To Our Shareholders:
The fiscal year ending September 30, 2021, saw strong returns for U.S. equities as investors gained exposure to businesses they believed would benefit from the improving economy and a “return to normal” enabled by the widespread availability of COVID-19 vaccines. Financial markets anticipated increased volatility around the U.S. presidential election, but with Joe Biden winning a close election for U.S. president, markets advanced higher and volatility generally declined. Expectations of further, but less expansive, fiscal stimulus from Congress and a less likely reversal of the corporate tax cuts under the Trump administration helped fuel this appreciation. Investor exuberance was also driven by a series of positive vaccine clinical trial results in November; the enthusiasm was sustained by subsequent emergency use authorizations by the FDA.
Work-from-home and mega-cap stocks gave up ground to cyclical and “go-out” names before a slight reversal later in the period. Market observers attributed this to the FOMC deciding to increase its projection for the federal-funds rate in 2023. Meanwhile, for the first time since April this year, the seven-day moving average of new COVID-19 cases reported in the U.S. stopped falling in mid-June after an impressive period of declines that had brought cases to their lowest levels since March 2020.
Tightening supply chain dynamics contributed to higher prices for both consumers and producers; this caused input prices for a wide variety of goods to increase, resulting in higher prices for consumers as well. Intermediate- and long-term interest rates increased from historically low levels due to evidence of rising global inflation. The U.S. Treasury yield curve steepened over the course of the fiscal year, especially as future expectations for a rebound in economic growth increased with the rising inflation expectations. U.S. Treasury yields further out the curve rose considerably as the yield on 10-year Treasurys rose by roughly 80 basis points. Government-bond yields (which had been rising slowly since the fall) began to spike further in February. The specter of a sharp increase in borrowing costs sent chills through markets during the second half of February, leading to selloffs of varying intensity before equity markets resumed their climb again in March.
The Federal Reserve’s (Fed) federal-funds rate target continued to range between 0.0% and 0.25% through the reporting period. Over the course of the third quarter, the Federal Open Market Committee (FOMC) moved incrementally closer to declaring a start date for tapering (reducing) asset purchases. The FOMC currently purchases $80 billion in Treasurys and $40 billion in agency mortgage-backed securities per month; Federal Reserve (Fed) Chairman Jerome Powell indicated that the tapering timeline could be determined at the November FOMC meeting. The central bank noted in its latest quarterly Summary of Economic Projections that the projected timing of the next fed-funds interest-rate hike has moved up to 2022 from 2023 (as projected in June).
Geopolitical events
In the U.S. general election in November, Joe Biden was declared the winner of the presidential race in early November. Most candidates from the Republican Party performed better in their races for state- and national-level offices compared to President Trump’s quest for a second term; in January, a violent security breach of the U.S. Capitol by a mob of protesters delayed—but did not stop—the counting of electoral votes in the U.S. Congress. Trump was impeached by the House of Representatives for inciting an insurrection—the first president in U.S. history to be impeached twice. Two weeks later, Joe Biden was inaugurated as president under heavy security provided by 25,000 National Guard troops.
In September 2020, the millionth victim of the COVID-19 outbreak was claimed globally, a figure that would climb to almost 5 million by the end of the fiscal year. The Delta wave of new COVID-19 cases drove U.S. infection and hospitalization counts to a peak at the beginning of September, just two weeks ahead of the country’s mid-September top in daily deaths. U.K. cases peaked during mid-July, and had a smaller resurgence in early September. Both episodes roughly coincided with high points in the hospitalization rate, while the number of daily deaths crested along with the early September infections surge. There were contrasting takes among global regions on how to approach the pandemic, with Asia broadly taking a zero-tolerance approach, Eastern Europe’s approach closer to Western Europe (to accept and live with it), and Latin America initially being dismissive (particularly in Brazil and Mexico), before moving to a more proactive stance.
SEI Institutional International Trust / Annual Report / September 30, 2021 |
1 |
LETTER TO SHAREHOLDERS (Continued)
September 30, 2021 (Unaudited)
President Joe Biden’s administration proposed a $6 trillion budget for the 2022 fiscal year that would serve as a starting point from which Congress can decide how to appropriate the country’s economic funding. The president incorporated his two major economic initiatives into the budget, infrastructure and families programs.
In August, the U.S. Senate approved a bipartisan infrastructure plan, which awaited approval in the House of Representatives at the end of the reporting period. Formally called the Infrastructure Investment and Jobs Act, the plan includes roughly $1 trillion with $550 billion in new spending over a five-year period. It is projected to add approximately two million jobs per year for a decade as the nation undertakes modernizing roads, railways, ports, public transit, airports and power grids; improving water quality and broadband access; and cleaning abandoned environmentally hazardous sites.
In a push to re-establish tourism ahead of the traditionally busy summer season, the EU approved a proposal made by the European Commission in May to ease travel restrictions within the bloc for vaccinated foreigners. Tensions between the EU and China—which have flared over the last six months as the EU condemned China’s record on human rights and China imposed retaliatory economic sanctions—remained unsettled. In May, the European Parliament suspended ratification of the Comprehensive Agreement on Investment that EU and Chinese leaders had finalized in December 2020. As for U.S.-EU trade relations, friction smoothed as the European Commission delayed an increase to tariffs on the U.S. that had been planned in response to the Trump administration’s tariffs on European metals; existing tariffs will remain as the two sides negotiate a long-term solution.
Finance ministers and central bank leaders from the Group of 20 (G-20), representing the world’s 20 largest economies, unanimously agreed to endorse the major components of a tax plan that would establish a global minimum corporate tax of at least 15%. The agreement was finalized just after the end of the reporting period and was expected to crack down on tax havens used by companies to avoid paying income tax in their countries of residence.
Economic performance
A 4.0% gain in U.S. gross domestic product (GDP) in the fourth quarter of 2020 resulted in a decline of 3.5% for the full year, the worst figure since at least the end of World War II. The U.S. economy expanded at a robust annualized rate of 6.3% in the first quarter of 2021; consumer spending (which accounts for nearly 70% of U.S. economic activity) spiked by 11.3% as Americans put their stimulus payments to work, providing a much-needed boost to restaurants, hotels and airlines. Overall U.S. economic growth measured an annualized 6.7% during the second quarter, just above the first-quarter pace, as service-oriented businesses anticipated saw continued gains from the rise in vaccinations and reopenings. A widely followed tracking estimate from the Federal Reserve Bank of Atlanta put third-quarter growth at 0.5% as supply-chain issues and the Delta variant again challenged economic growth.
After touching a 50-year low of 3.5% early in 2020 and then jumping as high as 14.8% at the beginning of the pandemic (prior to the start of the fiscal year), the U.S. unemployment rate remained over 6.0% through April, with the final figure settling at 4.8% in September 2021, down from 7.8% a year earlier. The labor-force participation rate ended at 61.6%, up from 61.4% a year earlier. Average hourly earnings gained 4.6% over the fiscal year, as the leisure and hospitality industry continued to reopen and looked to boost pay in order to fill vacant positions.
Two off-cycle moves before the start of the fiscal year brought the federal-funds rate to near zero and were designed to bolster the economy in response to the economic threat posed by the coronavirus outbreak; the emergency actions were the first since the global financial crisis. Additionally, the Fed committed to purchasing unlimited amounts of Treasurys and established or renewed multiple facilities designed to support the economy. The FOMC held the federal-funds rate near zero throughout the third quarter and continued its asset purchases apace ($80 billion in Treasurys and $40 billion in agency mortgage-backed securities per month). In its September statement, it indicated that the U.S. economy had made progress toward its employment and price stability goals, and that if progress continues as expected, a moderation in the pace of asset purchases may soon be warranted. Its latest Summary of Economic Projections (SEP), released in mid-September, featured a projected increase in the federal-funds rate to 1.0% in 2023 (up from 0.6% in its June projection). The SEP also depicted higher real gross domestic product (GDP) and inflation projections for 2021, although out-year projections were only modestly higher.
2 |
SEI Institutional International Trust / Annual Report / September 30, 2021 |
Market developments
The S&P 500 Index returned 30.00% during the fiscal year. Large-cap value stocks (as measured by the Russell 1000® Value Index) gained 35.01% and led large-cap growth stocks (as measured by the Russell 1000® Growth Index), which rose 27.32%. At the sector level, energy, financials and capital goods stocks led, while utilities, consumer staples and consumer discretionary lagged. Overall, U.S. equities outpaced major developed markets during the fiscal year.
Small-cap stocks, which tend to be value-oriented and sensitive to the success or decline in a local economy, outperformed large caps overall. U.S. large-cap stocks (Russell 1000® Index) finished the reporting period up 30.96%, while small-cap stocks (Russell 2000® Index) finished the period ahead 47.68%. The reason for this difference in performance was a shift in investor preference toward companies with smaller market caps and lower valuation ratios. These companies were viewed as able to benefit from the post-pandemic economic recovery and primed for a rebound following a prolonged period of prior underperformance.
Developed markets, as measured by the MSCI World Index (Net), finished up 28.82% for the year, outperforming emerging markets. The MSCI Emerging Markets Index (Net) finished the reporting period up 18.20% in U.S. dollar terms. Emerging-market equities were on a tear in the first quarter of the reporting period (after bottoming early in the pandemic) but gave up some ground over the remainder of the fiscal year. The best-performing region was EM EMEA, which was lifted by strong performance from Russia and the Gulf countries as they benefited from tightness in oil supply and rising oil prices. EM Asia was a relative benchmark laggard as pandemic restrictions continued to disrupt the area’s consumption and services sector.
The MSCI Europe Index (Net) advanced 27.25% in U.S. dollar terms. The MSCI ACWI Index (Net), a proxy for global equities in both developed and emerging markets, rose 27.44% in U.S. dollar terms. The FTSE UK Series All-Share Index recorded a 33.39% gain in U.S. dollar terms over the full reporting period.
U.S. investment-grade corporate debt, as represented by the Bloomberg US Corporate Investment Grade Index, returned 1.74%, while the U.S. high-yield market, as measured by the ICE BofA US High Yield Constrained Index, benefited from a broad reopening of the U.S. economy and was up 11.46% during the reporting period. Within the high-yield market, energy remained the largest sector, and it easily outperformed the broader market. Lower-quality issues also outperformed, as CCC rated securities led, followed by B and BB rated. U.S. asset-backed securities managed a small gain as the health of U.S. consumers improved during the fiscal year; mortgage-backed securities were down slightly, as elevated supply and fast prepayment speeds offset the Fed adding around $40 billion of MBS to its balance sheet each month.
Inflation-sensitive assets, such as commodities and Treasury inflation-protected securities (TIPS), were higher. The Bloomberg Commodity Total Return Index (which represents the broad commodity market) finished up 42.29% over the full one-year period due to increased demand expectations, as well as constrained supply in certain markets; the Bloomberg 1-10 Year US TIPS Index (USD) moved 5.75% higher during the reporting period as it benefited from higher inflation expectations in the U.S.
Global fixed income, as measured by the Bloomberg Global Aggregate Index, was down 0.91%. Emerging-market debt (EMD) delivered positive performance due to an improving growth outlook in the region relative to developed markets. The JP Morgan Global Bond Index-Emerging Markets (GBI-EM) Global Diversified Index, which tracks local-currency-denominated EM bonds, gained 2.63% in U.S. dollar terms. The JP Morgan Emerging Markets Bond Index (EMBI) Global Diversified Index, which tracks EMD denominated in external currencies (such as the U.S. dollar), was up 4.36%.
After the U.S. dollar initially rebounded from its January low (relative to a trade-weighted basket of foreign currencies), it resumed an overall downward trend and neared its earlier low again in May before recovering some in the final quarter of the fiscal year. After hitting an all-time low in 2020 before the start of the reporting period, the West Texas Intermediate crude-oil price reached a 7-year high in the final month of the fiscal year due to optimistic forecasts for global economic growth and increased demand for crude.
SEI Institutional International Trust / Annual Report / September 30, 2021 |
3 |
LETTER TO SHAREHOLDERS (Continued)
September 30, 2021 (Unaudited)
Our view
In a natural reaction to the prospect of more lockdowns and delayed returns to normal life given the surge in COVID-19 infections that began this past May, investors revisited stocks that benefited the most during 2020—namely the work-at-home, big technology companies and other large-cap stocks that do well when interest rates fall (lower interest rates make future cash flows of these types of stocks more attractive). However, the subsequent bounce-back in growth- and momentum-oriented large-cap stocks at the expense of value and cyclical stocks has already shown signs of deteriorating as rates spiked at the end of the third quarter.
We expect economic growth—in the U.S. and globally—to continue over the next year or two at a pace that meaningfully exceeds the sluggishness of the years that followed the 2007-to-2009 global financial crisis; the recent gloom about flagging economic growth is likely a bit overdone.
Household wealth is at an all-time high, owing to booming stock and home prices. A big decline in the saving rate has helped cushion the blow to consumer spending; still, saving as a percentage of disposable income remains elevated compared to pre-pandemic levels. We think households generally can adjust to a decline in pandemic relief payments without necessitating a sharp contraction in their expenditures.
The impact of COVID-19 on global supply chains has been a more significant impediment. Vendor deliveries have seldom been as slow in the 74-year history of the Institute for Supply Management’s (ISM) survey as they are now, even with the situation having eased slightly since May. Inventories remain exceedingly low relative to demand.
Input costs have been rising rapidly, but companies have been able to compensate by passing along their increased costs to customers. After-tax corporate margins an economy-wide basis hit a new all-time high in the second quarter, rising to 14.9% of sales.
Corporate pricing power is the good news. The bad news is that inflation keeps exceeding consensus expectations. We still expect inflation to run at higher rate for a longer period than has been commonly assumed, not just over the next one or two years, but well into the decade.
Growth in unit labor costs typically plummets when the economy emerges from recession. Now, however, unit labor costs are running near a 2.7% rate—the fastest pace since the peak of the 2002-to-2007 expansion.
While commodity inflation and parts shortages may indeed prove transitory, it isn’t clear whether the labor shortage and resultant pressure on compensation growth will be as quick to revert to lower levels. The tax and regulatory initiatives of the Biden administration will likely add to the cost pressures facing businesses in the years immediately ahead.
Since U.S. demand is expected to remain robust as economic growth normalizes, it would not be surprising to see companies continue passing along their increased costs. Inflation over the long haul could thus be closer to 3% than the 2% or so currently expected by the Fed and most investors.
If that turns out to be the case, the Fed may be forced to raise interest rates higher and faster over the next three years than anticipated.
A concern that is much nearer in timeframe is the fight in Washington over infrastructure spending and the debt limit. We assume President Biden will get about half of what he is seeking, but the devil will be in the details. Investors are probably right not to react too dramatically to every development. The debt-limit drama, however, could elicit a more significant disruption as the deadline for must-pass legislation nears. Although the debt ceiling will be raised, the wrangling over it will almost certainly come down to the wire.
We suggest focusing on longer-term considerations: The latest COVID-19 wave will eventually pass. Economic growth should stay relatively strong in 2022. Households are in solid financial shape and will benefit as employment and wages continue to move higher. Companies are still able to pass along increased costs and maintain high profit margins. Fed policy is still biased toward easing, allowing the economy to run hot at the risk of higher inflation. This should all create a favorable backdrop for risk assets and support a resumption in the coming months of the cyclical/ financial/value trend versus growth/technology.
Other developed countries are broadly on the same path as the U.S., and are reacting to the same catalysts.
4 |
SEI Institutional International Trust / Annual Report / September 30, 2021 |
Purchasing managers’ surveys from recent months show that U.S. economic growth is cooling, yet still strong versus pre-pandemic levels. Activity in Europe, led by Germany, appears to be on the upswing—boosted by a decline in Delta (which has allowed for more travel and tourism in Europe) and an increase in EU fiscal support.
The major outlier is Japan, which has been rather weak so far this year versus its industrial-country peers. Inflation-adjusted GDP fell in the first quarter and posted only a tepid gain in the second quarter. Economists blame COVID-19-related restrictions. The global shortage in the supply of semiconductor chips, meanwhile, has impeded auto production. Citizens nonetheless blamed Prime Minister Yoshihide Suga. In response, he pledged to cede leadership of the Liberal Democratic Party to former foreign minister Fumio Kishida, who is expected to also succeed Suga as prime minister following the November elections.
U.S. inflation may be near a peak, but a further acceleration appears in store for Europe. The immediate concern for households in the region is the cost of energy. Even without energy-production shortages, electricity prices across Europe tend to be much higher than in North America—especially for households, particularly in Germany. The U.K. is in the midst of a petrol crisis due to an inability to make deliveries to gas stations amid a severe truck-driver shortage.
Europe’s energy woes probably won’t cause the region’s governments to deviate from the climate-change agenda they have put in place. The German election underscores this point. Although it will take a couple of months to cobble together a coalition, all political parties are committed to reducing carbon admissions.
Beyond energy, Europe’s reopening should cause the price of services to rise as they have in the U.S., albeit to far less of an extent. The overwhelming assumption is that any pickup in inflation will be short-lived.
China is dominating investor perceptions of emerging markets. The Xi government’s push to enforce “common prosperity” has had far-reaching effects on corporate China. The country’s 20-year boom has exacerbated social inequality. Crackdowns on for-profit tutoring companies, major gig employers, and individuals (notably, Jack Ma) is a brutal but effective way of addressing disparities in wealth and income.
Although some of these moves have hurt foreign equity investors, it’s unclear whether the economy itself will be severely constrained. China is a huge country with tremendous internal capital upon which to draw. Foreign companies probably won’t cut and run, but they will certainly be forced to play by Beijing’s rules if they stay.
We expect diversification of supply chains away from China at the margin, but this has been happening anyway. It is in advanced countries’ interests to be more self-sufficient in producing critical products. But China is too big, too efficient and too important a manufacturer for the world to turn its back on.
China’s economic growth rate should nevertheless slow as a result of the government’s actions. Property development has been the driving force behind its rapid expansion over the past 15 years. Critics of China’s economic model have wondered for years if the bill would ever come due. It might be coming due now.
We are watching the trend in commodity prices for hints that pressure on China’s construction activity is beginning to reverberate beyond its borders. So far, there has been little sign of that occurring. Iron ore prices have plunged, but that appears to have been caused primarily by government-mandated closures of steel plants in an effort to curb pollution.
Even within China itself, investors seem to be taking the Evergrande debacle in stride. The effective yield on the country’s high-yield bonds has been rising sharply since May, but it is nowhere near the 40% yield reached in 2008. It also remains some six percentage points below the high reached in 2011, when the government clamped down on excessive credit growth and rampant speculation in the property and stock markets.
In contrast to high yield, the yield on Chinese investment-grade bonds is currently at its lowest level in the past 20 years—indicating no sign of contagion.
One explanation for the resiliency of the MSCI Emerging Markets Index is the strength of the global economy outside China. The U.S. has been leading the way, but other advanced countries—notably Europe—continue to post improved economic activity.
If history is any guide, however, upside inflation surprises in the G-10 countries suggest that emerging economies will follow suit over the next few months. Unlike advanced countries, where inflation expectations tend to better
SEI Institutional International Trust / Annual Report / September 30, 2021 |
5 |
LETTER TO SHAREHOLDERS (Concluded)
September 30, 2021 (Unaudited)
anchored, central banks in vulnerable emerging economies are forced to raise interest rates sooner than they would prefer in order to dampen inflation pressures and defend their currencies.
Given these concerns, investors might be tempted to avoid emerging-market equities. We believe that would be a mistake. Valuations, particularly relative to the developed world, look especially cheap.
Sincerely,

James Smigiel
Head and Chief Investment Officer of Non-Traditional Asset Management
6 |
SEI Institutional International Trust / Annual Report / September 30, 2021 |
Index Definitions
Bloomberg Global Aggregate Index: is a broad-based benchmark that is considered representative of global investment-grade, fixed-income markets.
Bloomberg US Corporate Investment Grade Index: is a broad-based benchmark that measures the investment-grade, fixed-rate, taxable corporate bond market.
Bloomberg US Aggregate Bond Index: The Bloomberg Barclays U.S. Aggregate Bond Index is a benchmark index composed of U.S. securities in Treasury, government-related, corporate and securitized sectors. It includes securities that are of investment-grade quality or better, have at least one year to maturity and have an outstanding par value of at least $250 million.
Dow Jones Industrial Average: The Index measures the stock performance of 30 large companies listed on stock exchanges in the United States.
FTSE UK Series All-Share Index: is a capitalization-weighted index, comprising around 600 of more than 2,000 companies traded on the London Stock Exchange.
ICE BofA US High Yield Constrained Index: tracks the performance of below-investment-grade, U.S. dollar-denominated corporate bonds publicly issued in the U.S. domestic market; exposure to individual issuers is capped at 2%.
JP Morgan EMBI Global Diversified Index: tracks the performance of external debt instruments (including U.S.-dollar-denominated and other external-currency-denominated Brady bonds, loans, eurobonds and local-market instruments) in emerging markets.
JP Morgan GBI-EM Global Diversified Index: tracks the performance of debt instruments issued in local currencies by emerging-market governments.
MSCI EAFE Index: is a free float-adjusted market capitalization index that is designed to measure the equity market performance of developed markets, excluding the US & Canada.
MSCI Europe Index: is a free float-adjusted market-capitalization-weighted index designed to measure the performance of large- and mid-capitalization stocks across developed-market countries in Europe.
MSCI Emerging Markets Index: is a free float-adjusted market-capitalization-weighted index designed to measure the performance of global emerging-market equities.
MSCI World Index: is a free float-adjusted market-capitalization-weighted index that is designed to measure the equity-market performance of developed markets.
Russell 1000® Index: includes 1,000 of the largest U.S. stocks based on market cap and current index membership; it is used to measure the activity of the U.S. large-cap equity market.
Russell 2000® Index: The Russell 2000 Index measures the performance of the 2,000 smallest companies in the Russell 3000 Index, which represents approximately 8% of the total market capitalization of the Russell 3000 Index.
S&P 500 Index: is an unmanaged, market-weighted index that consists of approximately 500 of the largest publicly-traded U.S. companies and is considered representative of the broad U.S. stock market.
SEI Institutional International Trust / Annual Report / September 30, 2021 |
7 |
MANAGEMENT’S DISCUSSION AND ANALYSIS OF FUND PERFORMANCE
September 30, 2021 (Unaudited)
International Equity Fund
I. Objective
The International Equity Fund (the “Fund”) seeks long-term capital appreciation.
II. Multi-Manager Approach Statement
The Fund uses a multi-manager approach, relying on a number of sub-advisors with differing investment approaches to manage portions of the Fund’s portfolio, under the general supervision of SEI Investments Management Corporation (“SIMC”). The Fund utilized the following sub-advisors as of September 30, 2021: Acadian Asset Management LLC (“Acadian”), Causeway Capital Management LLC (“Causeway”), INTECH Investment Management LLC (“INTECH”), JO Hambro Capital Management Limited (“JO Hambro”), Lazard Asset Management LLC (“Lazard”), Delaware Investments Fund Advisers, a series of Macquarie Investment Management Business Trust (“Macquarie”) and WCM Investment Management LLC (“WCM”).
During the period, NWQ Investment Management Company, LLC (NWQ), was removed from the Fund, while Macquarie was added to the Fund.
III. Return vs. Benchmark
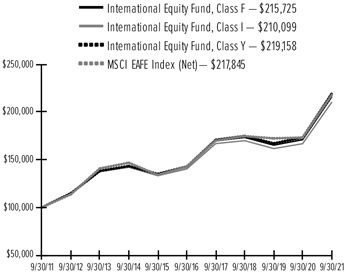
For the year ended September 30, 2021, the Fund’s Class F shares outperformed the MSCI EAFE Index (Net)—which tracks the performance of developed-market equities outside North America—returning 26.18% versus the Index return of 25.73%.
IV. Fund Attribution
Markets rose steadily throughout the fiscal year. As noted in the shareholder letter, the announcement of Pfizer’s COVID-19 vaccine led to a strong yearend rally in 2020 that continued for most of the reporting period. U.K. stocks led other regional markets during the 12 months, lifted by strong performance of vaccine progress and a reopening of the economy. Despite Delta variant concerns during the summer of 2021, U.K. equities maintained their lead as a shortage in energy supply lifted many of the region’s energy producers. Europe was also strong and initially lagged the U.K. due to slower vaccination rollouts. However, as the region caught up, and lockdown measures across the continent were lifted, cyclical sectors, such as energy and metals & mining, benefited from a sharp increase in pent-up consumer demand that drove prices higher. Cyclicals helped lift equities in the Pacific ex-Japan region. Japan was the only area to lag the benchmark as
slow vaccination progress and supply chain disruptions weighed on the country’s equity performance.
Cyclical sectors led the market as pent-up consumer and manufacturer demand drove up commodity prices. Energy and materials were the best performers, followed by financials and industrials. Information technology stocks also posted strong gains due to the strong performance of semiconductor stocks as a global semiconductor shortage emerged. Chips became scarce as supply was limited, while demand rose in the form of increased usage among autos and consumer devices. Defensive sectors lagged the market, with utilities and consumer staples posting the biggest losses. Rising rates presented a headwind for these rate-sensitive sectors, while investors preferred sectors offering faster growth.
The information technology sector was the biggest contributor to relative Fund performance due to strong results from the hardware group and an overweight to semiconductors. Consumer staples also contributed due to the Fund’s underweight to the underperforming sector. The Fund was underweight due to the sector’s expensive valuations, and the sector underperformed as higher rates decreased the sector’s appeal. Industrials benefited from positive gains among transportation stocks held by value managers. Materials was helped by positive results across metals & mining stocks, which rallied on higher commodity demand. Consumer discretionary detracted due to weak security selection across the entire sector. Energy was the only other detractor due to the Fund’s underweight. The underweight was driven by a negative outlook on volatile energy prices.
Causeway was the best-performing manager during the period and was helped by tailwinds to its value style, which resulted in strong gains from the industrials and financials sectors. NWQ was terminated from the Fund during the period but also benefited from value tailwinds, in addition to strong gains within the information technology and telecommunication services sectors. Despite headwinds to its quality style, WCM contributed through strong stock selection and bottom-up results from the information technology and health-care sectors, especially from semiconductors, which experienced a strong tailwind from rising demand. Lazard saw strong tailwinds to value offset losses from exposure to Asian consumer names, which failed to experience a strong reopening rally. Acadian outperformed on strong quant model results within the materials and utilities sectors, which offset losses in consumer discretionary and an underweight to energy.
8 |
SEI Institutional International Trust / Annual Report / September 30, 2021 |
JO Hambro was the biggest detractor during the period due to a partial headwind to momentum as momentum stocks suffered during the market rotation into “stay at home” names. JO Hambro lagged the momentum rotation into value and suffered even more losses due to stock specifics. INTECH also detracted due to a similar momentum headwind. Macquarie was added to the Fund during the fiscal year and was the smallest detractor due to headwinds to low-volatility and quality stocks, which lagged the market due to rising rates.
Investing is subject to risk, including the possible loss of principal. Past performance is no indication of future results.
AVERAGE ANNUAL TOTAL RETURN1
| 1 Year Return | Annualized 3 Year Return | Annualized 5 Year Return | Annualized 10 Year Return | Annualized Inception to Date | ||||||||||||||||
| International Equity Fund, Class F | 26.18% | 7.57% | 8.67% | 7.99% | 4.08% | |||||||||||||||
| International Equity Fund, Class I | 25.91% | 7.31% | 8.41% | 7.71% | 3.82% | |||||||||||||||
| International Equity Fund, Class Y | 26.45%2 | 7.81% | 8.94% | 8.16% | 4.13% | |||||||||||||||
| MSCI EAFE Index (Net) | 25.73% | 7.62% | 8.81% | 8.10% | 4.79% | |||||||||||||||
Comparison of Change in the Value of a $100,000 Investment in the International Equity Fund, Class F, Class I and Class Y, versus the MSCI EAFE Index (Net)
| 1 | For the year ended September 30, 2021. Past performance is no indication of future performance. Class F shares were offered beginning December 20, 1989. Class I shares were offered beginning January 4, 2002. The performance of Class I shares prior to January 4, 2002 is calculated using the performance of Class F shares adjusted for the higher expenses of the Class I shares. Returns for Class I shares are substantially similar to those of Class F shares and differ only to the extent that Class I shares have higher total annual fund operating expenses than Class F shares. The Fund’s Class Y shares commenced |
| operations on December 31, 2014. For periods prior to December 31, 2014, the performance of the Fund’s Class F Shares has been used. Returns for Class Y Shares would have been substantially similar to those of Class F shares and would have differed only to the extent that Class Y shares have lower total annual fund operating expenses than Class F shares. Returns shown do not reflect the deduction of taxes that a shareholder would pay on fund distributions or the redemption of fund shares. The returns for the period reflect fee waivers and/or reimbursements in effect for the period; absent fee waivers and reimbursements, performance would have been lower. |
| 2 | Total returns disclosed in the Financial Highlights of the Annual Report may reflect adjustments to conform to generally accepted accounting principles. |
SEI Institutional International Trust / Annual Report / September 30, 2021 |
9 |
MANAGEMENT’S DISCUSSION AND ANALYSIS OF FUND PERFORMANCE
September 30, 2021 (Unaudited)
Emerging Market Equity Fund
I. Objective
The Emerging Markets Equity Fund (the “Fund”) seeks capital appreciation.
II. Multi-Manager Approach Statement
The Fund uses a multi-manager approach, relying on a number of sub-advisors with differing investment approaches to manage portions of the Fund’s portfolio, under the general supervision of SEI Investments Management Corp. (“SIMC”). The Fund utilized the following sub-advisors as of September 30, 2021: JO Hambro Capital Management Limited (“JO Hambro”), KBI Global Investors (North America) Ltd. (“KBI”), Neuberger Berman Investment Advisers LLC (“Neuberger Berman”), Qtron Investments LLC (“Qtron”), Robeco Institutional Asset Management US Inc. (“Robeco”) and RWC Asset Advisors (US) LLC (“RWC”).
During the period, Lazard Asset Management LLC (“Lazard”) was removed from the Fund, while Robeco was added to the Fund.
III. Return vs. Benchmark
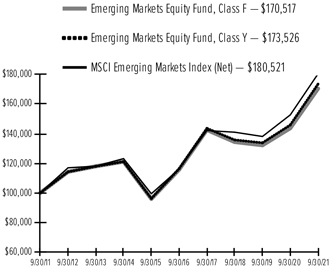
For the year ended September 30, 2021, the Fund’s Class F shares outperformed the MSCI Emerging Markets Index (Net)—which tracks the performance of global emerging market equities—returning 18.63% versus the Index return of 18.20%.
IV. Fund Attribution
As noted in the shareholder letter, emerging markets experienced positive returns during the fiscal year, although gains were concentrated within the first quarter of the reporting period. The announcement of Pfizer’s COVID-19 vaccine led to a strong yearend rally in 2020. Value stocks and smaller emerging-market countries that had lagged during the “stay at home” trade led the rally as the vaccine improved the prospects of an economic recovery in less-developed economies. The rally was short-lived, as the Chinese government’s crackdown on Alibaba’s ANT Financial IPO intensified and spread to other parts of the Chinese economy. What began as a curb on Alibaba’s dominance led to increasing regulatory focus on other dominant Chinese e-commerce and internet companies as the government began a renewed push for social equality and common prosperity. The crackdown spread to other sectors, including private education companies, while the country’s push toward deleveraging and decreasing loan issuance rattled property developers dependent on debt as funding. The default of large real-estate developer,
Evergrande, created major headlines and added to selling pressure that intensified over the summer. As a result of these regulatory pressures, the broader emerging markets fell throughout the rest of the period as the underperformance of the largest companies in China had an outsized effect on the index given their large weight. Outside of China, Taiwan benefited from higher semiconductor prices, while India had a rough time before Delta variant infections stabilized and India rebounded.
EMEA region was the best-performing region throughout the period, led by rising crude and other commodity prices. News of a vaccine, alongside expectations for further fiscal stimulus in the U.S. and pent-up consumer demand, contributed sharply to rising global yields and outperformance for stocks that would benefit most from a reopening of the global economy. This helped commodity stocks as demand for commodities surged. Outperformance continued throughout the rest of the fiscal period despite the effects that the Delta variant had on the global supply chain. Russia and the Gulf countries benefited from tightness in oil supply and rising oil prices, helping to lift the region’s equity prices to new highs. Latin America outperformed Asia but lagged EMEA throughout the period. Brazil led the regional rally in the fourth quarter of 2020, but the country fell in the first and third quarter of 2021 due to growth fears around the Delta variant, as well as concerns around political issues and the economic outlook. Mexico outperformed the region and the benchmark as Mexican consumer and industrial stocks held up better in the face of pressure from the Delta variant.
The best-performing sectors were materials and energy due to strong demand for commodities as pent-up demand from both consumers and industrials drove prices higher. Utilities and financials were also strong as the energy shortage lifted utilities over the summer of 2021 and banks benefited from prospects of an economic rebound from the pandemic lows. Consumer discretionary and real estate were the two biggest laggards. Consumer discretionary was dragged down by the underperformance of large e-commerce heavyweights in China due to government regulatory crackdowns. Real estate suffered from China’s efforts to deleverage, as fears of default and slower loan issuance weighed on the sector.
From a sector perspective, consumer discretionary was the biggest contributor due to bottom-up driven results in China’s e-commerce sector, partially driven by lower exposure to the country’s underperforming e-commerce companies. Materials also contributed due to the Fund’s
10 |
SEI Institutional International Trust / Annual Report / September 30, 2021 |
overweight. Strong bottom-up results in utilities and financials were also beneficial. Industrials and health-care were the only two sector detractors due to poor security selection.
RWC was the biggest contributor as the manager was able to navigate China’s e-commerce stocks, as well as an overweight to the metals & mining sector. JO Hambro benefitted from a tailwind to momentum stocks that lifted companies with positive earnings revisions in both the consumer and information technology spaces. KBI benefited from a tailwind to value stocks that rewarded the manager’s dividend yield investment philosophy. Qtron’s quantitative model-driven bottom-up results in the consumer discretionary, industrials and telecommunication services sectors were also beneficial. Robeco was added to the Fund during the fiscal year, and the Fund benefited from tailwinds to the manager’s value-based philosophy. Prior to its termination from the Fund during the fiscal year, Lazard contributed due to selection within the financials and telecommunication services sectors.
Neuberger Berman was the only detractor as the manager’s quality investment style faced headwinds during the period in the form of rising rates, which resulted in losses across most benchmark sectors.
Investing is subject to risk, including the possible loss of principal. Past performance is no indication of future results.
AVERAGE ANNUAL TOTAL RETURN1
| 1 Year Return | Annualized 3 Year Return | Annualized 5 Year Return | Annualized 10 Year Return | Annualized Inception to Date | ||||||||||||||||
| Emerging Markets Equity Fund, Class F | 18.63% | 8.26% | 8.05% | 5.48% | 4.84% | |||||||||||||||
| Emerging Markets Equity Fund, Class Y | 18.96% | 8.52% | 8.33% | 5.67% | 4.91% | |||||||||||||||
| MSCI Emerging Markets Index (Net) | 18.20% | 8.58% | 9.23% | 6.09% | 6.57% | |||||||||||||||
Comparison of Change in the Value of a $100,000 Investment in the Emerging Markets Equity Fund, Class F and Class Y, versus the MSCI Emerging Markets Index (Net)
| 1 | For the year ended September 30, 2021. Past performance is no indication of future performance. Class F shares were offered beginning January 17, 1995. The Fund’s Class Y shares commenced operations on December 31, 2014. For periods prior to December 31, 2014, the performance of the Fund’s Class F Shares has been used. Returns for Class Y Shares would have been substantially similar to those of Class F shares and would have differed only to the extent that Class Y shares have lower total annual fund operating expenses than Class F shares. Returns shown do not reflect the deduction of taxes that a shareholder would pay on fund distributions or the redemption of fund shares. The returns for the period reflect fee waivers and/or reimbursements in effect for the period; absent fee waivers and reimbursements, performance would have been lower. |
SEI Institutional International Trust / Annual Report / September 30, 2021 |
11 |
MANAGEMENT’S DISCUSSION AND ANALYSIS OF FUND PERFORMANCE
September 30, 2021 (Unaudited)
International Fixed Income Fund
I. Objective
The International Fixed Income Fund (the Fund) seeks capital appreciation and current income.
II. Multi-Manager Approach Statement
The Fund uses a multi-manager approach, relying on a number of sub-advisors with differing investment approaches to manage portions of the Fund’s portfolio, under the general supervision of SEI Investments Management Corporation (“SIMC”). The Fund utilized the following sub-advisors as of September 30, 2021: AllianceBernstein L.P. (“AllianceBernstein”), Colchester Global Investors Limited (“Colchester”) and Wellington Management Company LLP (“Wellington”).
No manager changes were made during the Fund’s fiscal year.
III. Return vs. Benchmark
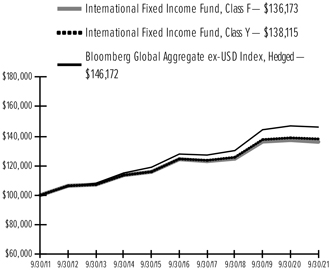
For the year ended September 30, 2021, the Fund’s Class F shares underperformed the Bloomberg Global Aggregate ex-USD Index, Hedged (the “Index”)—which tracks the performance of the global investment-grade fixed-rate debt markets outside of the U.S.—returning -0.83% versus the Index return of -0.54%.
IV. Fund Attribution
Core fixed-income indexes delivered negative returns over the fiscal year against a backdrop of rising government yields and inflation concerns. Long duration assets suffered the largest losses, while the more credit-sensitive sectors of the bond market were able to absorb the adverse rates impact through spread compression and record positive absolute performance. As noted in the shareholder letter, inflation-linked bonds outperformed nominal bonds on rising inflation expectations and falling real yields. High-yield corporates (an out-of-index sector) registered the strongest absolute returns over the period. The local-currency emerging-market debt complex also enjoyed positive performance, led by China, Mexico, South Africa, Indonesia and Russia. In the currency space, the Japanese yen, euro and Swiss franc all lost ground to the U.S. dollar, although most other G10 currencies strengthened against the greenback over the period.
The Fund underperformed during the reporting period and was challenged by its overweights to Australia and Mexican local rates. Short currency positions in the New Zealand dollar and South African rand also detracted. Positive contributors included duration underweights in the U.K., core Europe and South Korea.
An overweight to corporate credit, including off-index USD-denominated securities and high yield, also helped relative performance as spread sectors generated excess returns versus duration-matched government bonds. Positive currency trades included long positions in the Mexican peso, Chinese yuan, Norwegian krone, Swedish krona, Russian ruble and British pound, and a short position in Thai baht.
Wellington detracted during the period and was challenged by its currency positioning, while duration underweights in the UK and South Korea, a short currency position in JPY and out-of-index exposure to corporate credit benefited.
AllianceBernstein outperformed and was helped by its overweight to corporate credit and underweights to government-related and European covered bonds. Off-index exposure to high yield also boosted relative performance. Colchester outperformed and benefited from duration underweights in core Europe and the U.K., as well as an overweight to Indonesian local-currency bonds. Active currency positioning further added value, courtesy of long positons in the Norwegian krone, Mexican peso, British pound and Swedish krona, and a short position in Thai baht.
The Fund used FX forwards, financial futures, interest-rate swaps and over-the-counter options during the reporting period to hedge existing exposures and gain exposure to particular areas of the market. The use of derivatives did not have a material impact on relative performance.
Investing is subject to risk, including the possible loss of principal. Past performance is no indication of future results.
AVERAGE ANNUAL TOTAL RETURN1
| 1 Year Return | Annualized 3 Year Return | Annualized 5 Year Return | Annualized 10 Year Return | Annualized Inception to Date | ||||||||||||||||
| International Fixed Income Fund, Class F | -0.83% | 2.96% | 1.84% | 3.14% | 4.03% | |||||||||||||||
| International Fixed Income Fund, Class Y | -0.54% | 3.20% | 2.09% | 3.28% | 4.09% | |||||||||||||||
| Bloomberg Global Aggregate ex-USD Index, Hedged | -0.54% | 3.93% | 2.71% | 3.87% | 4.81% | |||||||||||||||
12 |
SEI Institutional International Trust / Annual Report / September 30, 2021 |
Comparison of Change in the Value of a $100,000 Investment in the International Fixed Income Fund, Class F and Class Y, versus the Bloomberg Global Aggregate ex-USD Index, Hedged
| ¹ | For the year ended September 30, 2021. Past performance is no indication of future performance. Class F shares were offered beginning September 1, 1993. The Fund’s Class Y shares commenced operations on October 30, 2015. For periods prior to October 30, 2015, the performance of the Fund’s Class F Shares has been used. Returns for Class Y Shares would have been substantially similar to those of Class F shares and would have differed only to the extent that Class Y shares have lower total annual fund operating expenses than Class F shares. Returns shown do not reflect the deduction of taxes that a shareholder would pay on fund distributions or the redemption of fund shares. The returns for the period reflect fee waivers and/or reimbursements in effect for the period; absent fee waivers and reimbursements, performance would have been lower. |
SEI Institutional International Trust / Annual Report / September 30, 2021 |
13 |
MANAGEMENT’S DISCUSSION AND ANALYSIS OF FUND PERFORMANCE
September 30, 2021 (Unaudited)
Emerging Markets Debt Fund
I. Objective
The Emerging Markets Debt Fund (the “Fund”) seeks to maximize total return.
II. Multi-Manager Approach
The Fund uses a multi-manager approach, relying on a number of sub-advisors with differing investment approaches to manage portions of the Fund’s portfolio, under the general supervision of SEI Investments Management Corp. (“SIMC”). The Fund utilized the following sub-advisors as of September 30, 2021: Colchester Global Investors Limited (“Colchester”), Marathon Asset Management, L.P. (“Marathon”), Neuberger Berman Investment Advisers LLC (“Neuberger Berman”), Ninety One UK Ltd. (“Ninety One”) and Stone Harbor Investment Partners LP (“Stone Harbor”).
No manager changes were made during the Fund’s fiscal year.
III. Return vs. Benchmark
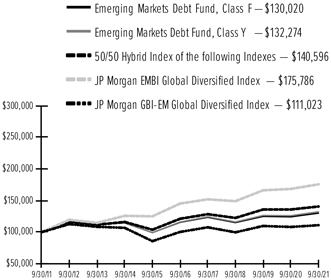
For the year ended September 30, 2021, the Fund’s Class F shares outperformed a hybrid of 50% JP Morgan EMBI Global Diversified Index (“JPM EMBI GD”) (which tracks the performance of external debt instruments in the emerging markets) and 50% JP Morgan GBI Emerging Markets Global Diversified Index (“JPM GBI-EM GD”) (which tracks the performance of debt instruments issued in domestic currencies by emerging-market governments), returning 4.71% versus the Index return of 3.51%.
IV. Fund Attribution
Emerging markets (EM) began the reporting period strong, with both hard- and local-currency indexes posting positive returns in the fourth quarter of 2020. EM foreign exchange (FX) led the way during the first three months of the period, followed by spreads, the majority of which came through in November 2020. EM FX would go on to have mixed fortunes in the following nine months of the fiscal year as risk markets coped with a series of spikes in COVID-19 cases and repeat lockdowns. As noted in the shareholder letter, there were contrasting takes among regions on how to approach the pandemic, with Asia broadly taking a zero-tolerance approach, Eastern Europe’s approach closer to Western Europe (to accept and live with it), and Latin America initially being dismissive (particularly in Brazil and Mexico), before moving to a more proactive stance. Emerging markets reacted with modest fiscal
support comparatively to the scope and depth of developed markets. Financial conditions were eased through central bank policy rates early in 2020, although the trend began to reverse in 2021, led by the Latin American and Eastern European regions, in comparison to the markets not pricing the first U.S. Federal Reserve policy move until 2023.
Though growth remains vulnerable, higher EM central bank policy rates, positive current account balances and steeper yield curves stemmed the weaker returns of local-currency markets, as measured by the JPM GBI-EM GD Index. While the total return of the local-currency index was 2.63% for the fiscal year, the nine months to September 2021 saw a return of -6.38%, highlighting the contrasting periods.
The hard-currency market, as measured by the JPM EMBI-GD Index, returned 4.36% for the fiscal year, with a milder -1.36% over the nine months to September 2021. The headwind for returns for the hard-currency market did not come from spread compression, but from linkage to the Treasury curve. The first quarter of 2021, and again in September, represented periods when U.S. Treasury rates rose rapidly. Given the high starting level, spread returns have been positive, contributing high single-digit returns that were offset by losses from the move in Treasury prices.
The Fund outperformed its blended benchmark during the fiscal year. An overweight to Mexico (in MXN-issued Pemex bonds) benefited from a recovery in oil prices, while positioning in South Africa (biased long ZAR and short duration) and Zambia (as the ZMW recovered along with copper prices) also added to performance. As the Fund was tilted toward higher-yielding spread names, underweights in the Gulf Cooperation Council countries, where spreads were already perceived to be tight but tightened further, detracted.
Stone Harbor’s hard-currency mandate outperformed the blended benchmark and benefited from overweights to Venezuela, Ghana and Brazil; exposure to Panama and Argentina and an underweight to Bahrain detracted. Ninety One’s local-currency mandate also outperformed the blended benchmark; South Africa was a notable detractor from performance, but it was more than offset by longs in Mexico, Zambia, Egypt and Ukraine, as well as underweight to Thailand. Neuberger Berman outperformed thanks to an overweight to Ukraine in USD bonds and Mexico in MXN-issued bonds; a Czech Republic overweight and underweight to Hungary both detracted from performance. Colchester outperformed due to its exposure to Mexico and South
14 |
SEI Institutional International Trust / Annual Report / September 30, 2021 |
African currency; underweights in Thailand and Chile also benefited contributed strongly. An underweight to Chinese yuan and long exposure in South Korean won both detracted. Marathon underperformed its hard-currency benchmark but outperformed the blended benchmark; performance was held back by exposure to long duration investment-grade assets in Israel and exposure in Peru. Underweights to Mexico and Oman and longs in Dominican Republic and Venezuela partially offset the detractors.
Currency forwards and swap contracts were used in the Fund for the one-year period ending September 30, 2021, as a way to either hedge particular positions or gain exposure to additional areas of the market. Currency forwards had a material impact on the Fund during the period as 50% of the Index is directly affected by foreign currencies. Positive and negative impacts differed on a country-to-country basis, depending on whether the forward increased or decreased currency exposure and whether the currency strengthened or weakened relative to the U.S. dollar.
Investing is subject to risk, including the possible loss of principal. Past performance is no indication of future results.
AVERAGE ANNUAL TOTAL RETURN1
| 1 Year Return | Annualized 3 Year | Annualized 5 Year Return | Annualized 10 Year Return | Annualized Inception to Date | ||||||||||||||||
| Emerging Markets Debt Fund, Class F | 4.71% | 4.16% | 2.40% | 2.66% | 7.06% | |||||||||||||||
| Emerging Markets Debt Fund, Class Y | 4.98% | 4.43% | 2.66% | 2.84% | 7.13% | |||||||||||||||
| JP Morgan EMBI Global Diversified Index | 4.36% | 5.65% | 3.89% | 5.80% | 5.17% | |||||||||||||||
| JP Morgan GBI-EM Global Diversified Index | 2.63% | 3.66% | 2.06% | 1.05% | 1.50% | |||||||||||||||
| 50/50 Hybrid of the JP Morgan EMBI Global Diversified Index and the JP Morgan GBI-EM Global Diversified Index | 3.51% | 4.70% | 3.02% | 3.67% | 6.85% | |||||||||||||||
Comparison of Change in the Value of a $100,000 Investment in the Emerging Markets Debt Fund, Class F and Class Y, versus a 50/50 Hybrid of the Following Indexes: the JP Morgan EMBI Global Diversified Index and the JP Morgan GBI-EM Global Diversified Index
| ¹ | For the year ended September 30, 2021. Past performance is no indication of future performance. Class F shares were offered beginning June 26, 1997. The Fund’s Class Y shares commenced operations on December 31, 2014. For periods prior to December 31, 2014, the performance of the Fund’s Class F Shares has been used. Returns for Class Y Shares would have been substantially similar to those of Class F shares and would have differed only to the extent that Class Y shares have lower total annual fund operating expenses than Class F shares. Returns shown do not reflect the deduction of taxes that a shareholder would pay on fund distributions or the redemption of fund shares. The returns for the period reflect fee waivers and/or reimbursements in effect for the period; absent fee waivers and reimbursements, performance would have been lower. |
SEI Institutional International Trust / Annual Report / September 30, 2021 |
15 |
September 30, 2021
International Equity Fund
| Description | Shares | Market Value ($ Thousands) | ||||||
COMMON STOCK — 96.5% | ||||||||
Argentina — 0.2% | ||||||||
MercadoLibre Inc * | 6,127 | $ | 10,290 | |||||
Ternium SA ADR | 16,990 | 718 | ||||||
|
|
| ||||||
| 11,008 | ||||||||
|
|
| ||||||
Australia — 2.2% | ||||||||
Australia & New Zealand Banking Group Ltd | 382,365 | 7,682 | ||||||
BHP Group Ltd (A) | 219,271 | 5,938 | ||||||
BlueScope Steel Ltd | 896,249 | 13,207 | ||||||
Champion Iron Ltd * | 598,702 | 2,070 | ||||||
CSL Ltd | 49,712 | 10,439 | ||||||
CSR Ltd | 807,866 | 3,228 | ||||||
Fortescue Metals Group Ltd | 636,358 | 6,845 | ||||||
IGO Ltd | 306,173 | 1,964 | ||||||
James Hardie Industries PLC ADR *(A) | 15,047 | 537 | ||||||
Lynas Rare Earths Ltd * | 137,584 | 656 | ||||||
Orora Ltd | 1,270,565 | 2,814 | ||||||
OZ Minerals Ltd | 398,158 | 6,444 | ||||||
South32 Ltd | 8,526,015 | 21,608 | ||||||
Westpac Banking Corp | 447,956 | 8,310 | ||||||
Whitehaven Coal Ltd * | 3,132,371 | 7,255 | ||||||
WiseTech Global Ltd | 46,419 | 1,768 | ||||||
|
|
| ||||||
| 100,765 | ||||||||
|
|
| ||||||
Austria — 0.5% | ||||||||
ANDRITZ AG | 72,724 | 3,982 | ||||||
OMV AG | 119,948 | 7,252 | ||||||
Verbund AG, Cl A | 58,369 | 5,917 | ||||||
voestalpine AG | 111,336 | 4,180 | ||||||
|
|
| ||||||
| 21,331 | ||||||||
|
|
| ||||||
Belgium — 0.0% | ||||||||
Ackermans & van Haaren NV | 3,554 | 612 | ||||||
Umicore SA | 19,349 | 1,144 | ||||||
|
|
| ||||||
| 1,756 | ||||||||
|
|
| ||||||
Brazil — 0.2% | ||||||||
JBS SA | 670,000 | 4,547 | ||||||
| Description | Shares | Market Value ($ Thousands) | ||||||
COMMON STOCK (continued) | ||||||||
Magazine Luiza SA * | 1,292,000 | $ | 3,405 | |||||
|
|
| ||||||
| 7,952 | ||||||||
|
|
| ||||||
Canada — 2.3% | ||||||||
Advantage Energy Ltd * | 224,783 | 1,136 | ||||||
Air Canada, Cl A * | 781,200 | 14,263 | ||||||
Alimentation Couche-Tard Inc, Cl B | 462,400 | 17,688 | ||||||
Birchcliff Energy Ltd | 269,560 | 1,492 | ||||||
BRP Inc | 19,300 | 1,786 | ||||||
Canadian Pacific Railway Ltd (A) | 159,857 | 10,402 | ||||||
Canfor Corp * | 120,381 | 2,644 | ||||||
Cascades Inc | 149,184 | 1,845 | ||||||
CI Financial Corp | 167,200 | 3,393 | ||||||
Empire Co Ltd, Cl A | 210,700 | 6,420 | ||||||
Fairfax Financial Holdings Ltd | 3,700 | 1,493 | ||||||
George Weston Ltd | 10,000 | 1,078 | ||||||
Intertape Polymer Group Inc | 98,500 | 2,142 | ||||||
Magna International Inc, Cl A | 212,234 | 15,969 | ||||||
MEG Energy Corp * | 225,200 | 1,758 | ||||||
Onex Corp | 206,460 | 14,592 | ||||||
Russel Metals Inc | 31,084 | 745 | ||||||
Stelco Holdings Inc | 44,300 | 1,298 | ||||||
Stella-Jones Inc | 26,800 | 902 | ||||||
Tourmaline Oil Corp | 85,100 | 2,973 | ||||||
Transcontinental Inc, Cl A | 45,473 | 722 | ||||||
Viemed Healthcare Inc * | 43,126 | 240 | ||||||
|
|
| ||||||
| 104,981 | ||||||||
|
|
| ||||||
China — 0.4% | ||||||||
Beijing Capital International Airport Co Ltd, Cl H * | 7,930,000 | 4,653 | ||||||
Shenzhou International Group Holdings Ltd | 291,400 | 6,180 | ||||||
STMicroelectronics NV | 169,785 | 7,424 | ||||||
|
|
| ||||||
| 18,257 | ||||||||
|
|
| ||||||
Denmark — 3.0% | ||||||||
Ambu A/S, Cl B | 150,825 | 4,459 | ||||||
AP Moller - Maersk A/S, Cl B | 7,452 | 20,136 | ||||||
Carlsberg AS, Cl B | 31,574 | 5,159 | ||||||
Demant A/S * | 79,944 | 4,026 | ||||||
DSV A/S | 109,462 | 26,234 | ||||||
Genmab A/S * | 7,943 | 3,478 | ||||||
GN Store Nord AS | 48,367 | 3,344 | ||||||
H Lundbeck A/S | 5,011 | 136 | ||||||
Novo Nordisk A/S, Cl B | 438,998 | 42,388 | ||||||
Novozymes A/S, Cl B | 4,874 | 334 | ||||||
Orsted AS | 67,697 | 8,975 | ||||||
Pandora A/S * | 82,175 | 9,949 | ||||||
ROCKWOOL International A/S, Cl B | 4,004 | 1,716 | ||||||
Vestas Wind Systems A/S | 263,222 | 10,558 | ||||||
|
|
| ||||||
| 140,892 | ||||||||
|
|
| ||||||
Finland — 0.9% | ||||||||
Fortum Oyj | 24,474 | 744 | ||||||
Kesko Oyj, Cl B | 417,376 | 14,409 | ||||||
Kone Oyj, Cl B | 92,018 | 6,464 | ||||||
16 |
SEI Institutional International Trust / Annual Report / September 30, 2021 |
| Description | Shares | Market Value ($ Thousands) | ||||||
COMMON STOCK (continued) | ||||||||
Neste Oyj | 146,007 | $ | 8,274 | |||||
Nokia Oyj * | 151,574 | 835 | ||||||
Orion Oyj, Cl B | 248,353 | 9,858 | ||||||
|
|
| ||||||
| 40,584 | ||||||||
|
|
| ||||||
France — 12.0% | ||||||||
Air Liquide SA | 136,420 | 21,889 | ||||||
Airbus SE * | 105,981 | 14,011 | ||||||
Alstom SA | 354,590 | 13,463 | ||||||
AXA SA | 1,687,339 | 46,867 | ||||||
BNP Paribas SA (A) | 36,165 | 2,310 | ||||||
Bollore SA | 3,938,473 | 22,829 | ||||||
Carrefour SA | 1,423,771 | 25,603 | ||||||
Cie de Saint-Gobain | 47,788 | 3,220 | ||||||
Cie Generale des Etablissements Michelin SCA, Cl B | 13,356 | 2,048 | ||||||
Criteo SA ADR * | 60,571 | 2,220 | ||||||
Danone SA | 535,335 | 36,577 | ||||||
Engie SA | 1,863,765 | 24,476 | ||||||
Eurazeo SE | 21,824 | 2,052 | ||||||
Eurofins Scientific SE | 166,682 | 21,392 | ||||||
Ipsen SA | 62,682 | 5,995 | ||||||
IPSOS | 18,645 | 849 | ||||||
L’Oreal SA | 20,274 | 8,370 | ||||||
LVMH Moet Hennessy Louis Vuitton SE | 13,414 | 9,589 | ||||||
Orange SA | 1,073,500 | 11,616 | ||||||
Orpea SA | 4,250 | 495 | ||||||
Pernod Ricard SA | 72,365 | 15,967 | ||||||
Publicis Groupe SA | 505,882 | 34,032 | ||||||
Rexel SA * | 312,272 | 6,035 | ||||||
Sanofi | 612,204 | 58,878 | ||||||
Sartorius Stedim Biotech | 43,901 | 24,605 | ||||||
Schneider Electric SE | 59,545 | 9,905 | ||||||
Societe Generale SA | 486,175 | 15,234 | ||||||
Sodexo SA * | 166,500 | 14,564 | ||||||
Stellantis NV | 1,250,527 | 23,787 | ||||||
Thales SA | 247,999 | 24,100 | ||||||
TotalEnergies SE (A) | 577,822 | 27,584 | ||||||
Valeo | 268,474 | 7,507 | ||||||
Vinci SA | 104,076 | 10,818 | ||||||
Vivendi SE (A) | 238,120 | 2,994 | ||||||
Wendel SE | 19,831 | 2,740 | ||||||
|
|
| ||||||
| 554,621 | ||||||||
|
|
| ||||||
Germany — 8.2% |
| |||||||
adidas AG | 71,242 | 22,386 | ||||||
Aroundtown SA | 58,392 | 403 | ||||||
BASF SE | 335,315 | 25,516 | ||||||
Bayer AG | 153,318 | 8,333 | ||||||
Bayerische Motoren Werke AG | 11,915 | 1,148 | ||||||
BioNTech SE ADR * | 57,825 | 15,786 | ||||||
Carl Zeiss Meditec AG | 76,144 | 14,587 | ||||||
Continental AG * | 61,690 | 6,734 | ||||||
Daimler AG | 100,123 | 8,856 | ||||||
| Description | Shares | Market Value ($ Thousands) | ||||||
COMMON STOCK (continued) | ||||||||
Deutsche Bank AG * | 1,051,721 | $ | 13,369 | |||||
Deutsche Boerse AG | 56,709 | 9,210 | ||||||
Deutsche Post AG | 387,445 | 24,377 | ||||||
E.ON SE | 60,242 | 738 | ||||||
Fresenius Medical Care AG & Co KGaA | 326,130 | 22,937 | ||||||
GEA Group AG | 88,914 | 4,063 | ||||||
Hannover Rueck SE | 3,886 | 678 | ||||||
HeidelbergCement AG | 31,040 | 2,319 | ||||||
Infineon Technologies AG | 286,237 | 11,753 | ||||||
KION Group AG | 208,559 | 19,466 | ||||||
Knorr-Bremse AG | 68,500 | 7,340 | ||||||
Linde PLC | 33,762 | 9,969 | ||||||
Merck KGaA | 139,181 | 30,222 | ||||||
Rheinmetall AG | 42,432 | 4,149 | ||||||
RTL Group SA | 20,818 | 1,249 | ||||||
RWE AG | 701,152 | 24,780 | ||||||
SAP SE | 331,362 | 44,872 | ||||||
Scout24 AG | 4,824 | 335 | ||||||
Siemens AG | 261,713 | 42,806 | ||||||
Vitesco Technologies Group AG * | 12,338 | 729 | ||||||
Wacker Chemie AG | 9,909 | 1,853 | ||||||
|
|
| ||||||
| 380,963 | ||||||||
|
|
| ||||||
Hong Kong — 2.0% | ||||||||
AIA Group Ltd | 863,800 | 9,981 | ||||||
ASM Pacific Technology Ltd | 49,000 | 538 | ||||||
Chaoda Modern Agriculture Holdings Ltd * | 2,440,000 | 15 | ||||||
Chow Tai Fook Jewellery Group Ltd | 991,400 | 1,899 | ||||||
CK Asset Holdings Ltd | 273,500 | 1,577 | ||||||
Hong Kong & China Gas Co Ltd | 1,068,650 | 1,616 | ||||||
Hong Kong Exchanges & Clearing Ltd | 272,694 | 16,775 | ||||||
Li Ning Co Ltd | 568,500 | 6,619 | ||||||
Link REIT ‡ | 143,600 | 1,229 | ||||||
Orient Overseas International Ltd | 68,500 | 1,194 | ||||||
Sands China Ltd * | 4,841,600 | 9,898 | ||||||
SJM Holdings Ltd * | 24,807,340 | 16,881 | ||||||
Techtronic Industries Co Ltd | 502,500 | 9,882 | ||||||
WH Group Ltd | 6,457,333 | 4,584 | ||||||
Wuxi Biologics Cayman Inc * | 518,598 | 8,487 | ||||||
|
|
| ||||||
| 91,175 | ||||||||
|
|
| ||||||
India — 0.1% | ||||||||
HDFC Bank Ltd ADR | 61,127 | 4,468 | ||||||
|
|
| ||||||
Indonesia — 0.1% | ||||||||
Bank Mandiri Persero Tbk PT | 13,318,100 | 5,703 | ||||||
|
|
| ||||||
Ireland — 1.8% | ||||||||
Accenture PLC, Cl A | 59,985 | 19,190 | ||||||
Experian PLC | 242,829 | 10,197 | ||||||
ICON PLC * | 148,054 | 38,793 | ||||||
Ryanair Holdings PLC ADR * | 138,759 | 15,272 | ||||||
|
|
| ||||||
| 83,452 | ||||||||
|
|
| ||||||
Israel — 1.4% | ||||||||
Bank Hapoalim BM | 2,378,928 | 20,902 | ||||||
Bank Leumi Le-Israel BM | 2,855,202 | 24,329 | ||||||
SEI Institutional International Trust / Annual Report / September 30, 2021 |
17 |
SCHEDULE OF INVESTMENTS
September 30, 2021
International Equity Fund (Continued)
| Description | Shares | Market Value ($ Thousands) | ||||||
COMMON STOCK (continued) | ||||||||
Check Point Software Technologies Ltd * | 53,327 | $ | 6,028 | |||||
FIBI Holdings Ltd | 17,608 | 744 | ||||||
First International Bank Of Israel Ltd/The | 50,557 | 1,846 | ||||||
ICL Group Ltd | 175,057 | 1,272 | ||||||
Isracard Ltd | – | – | ||||||
Israel Discount Bank Ltd, Cl A * | 882,543 | 4,684 | ||||||
Mizrahi Tefahot Bank Ltd | 198,719 | 6,714 | ||||||
|
|
| ||||||
| 66,519 | ||||||||
|
|
| ||||||
Italy — 4.0% | ||||||||
Assicurazioni Generali SpA | 397,365 | 8,430 | ||||||
Azimut Holding SpA | 141,983 | 3,895 | ||||||
Banca Mediolanum SpA | 299,871 | 3,235 | ||||||
CNH Industrial NV | 1,622,525 | 27,214 | ||||||
Davide Campari-Milano NV | 99,767 | 1,404 | ||||||
DiaSorin SpA | 34,057 | 7,140 | ||||||
Enel SpA | 3,043,494 | 23,364 | ||||||
Eni SpA | 856,773 | 11,400 | ||||||
EXOR NV | 128,476 | 10,798 | ||||||
Ferrari NV | 39,811 | 8,316 | ||||||
FinecoBank Banca Fineco SpA | 570,224 | 10,325 | ||||||
La Doria SpA | 11,734 | 229 | ||||||
Mediaset NV * | 360,579 | 1,034 | ||||||
Moncler SpA | 57,521 | 3,516 | ||||||
Nexi SpA * | 443,631 | 8,282 | ||||||
Stellantis NV | 218,617 | 4,185 | ||||||
UniCredit SpA | 4,142,965 | 54,894 | ||||||
|
|
| ||||||
| 187,661 | ||||||||
|
|
| ||||||
Japan — 16.8% | ||||||||
77 Bank Ltd/The | 86,064 | 981 | ||||||
Advantest Corp | 172,800 | 15,448 | ||||||
AEON Financial Service Co Ltd | 223,700 | 2,818 | ||||||
AGC Inc | 16,400 | 844 | ||||||
Ajinomoto Co Inc | 129,700 | 3,819 | ||||||
Asahi Group Holdings Ltd | 205,800 | 9,900 | ||||||
ASKUL Corp | 101,000 | 1,478 | ||||||
Bandai Namco Holdings Inc | 149,902 | 11,207 | ||||||
BayCurrent Consulting Inc | 9,800 | 4,920 | ||||||
Bridgestone Corp | 495,654 | 23,347 | ||||||
Brother Industries Ltd | 62,600 | 1,376 | ||||||
Canon Inc | 313,500 | 7,652 | ||||||
Canon Marketing Japan Inc | 94,900 | 2,199 | ||||||
Capcom Co Ltd | 371,000 | 10,172 | ||||||
Credit Saison Co Ltd | 55,000 | 722 | ||||||
CyberAgent Inc | 474,500 | 9,116 | ||||||
Dai-ichi Life Holdings Inc | 114,200 | 2,510 | ||||||
Daito Trust Construction Co Ltd (A) | 62,100 | 7,192 | ||||||
Daiwa House Industry Co Ltd | 110,100 | 3,668 | ||||||
DeNA Co Ltd * | 24,000 | 444 | ||||||
Disco Corp | 18,100 | 5,043 | ||||||
FANUC Corp | 102,000 | 22,220 | ||||||
FUJIFILM Holdings Corp | 11,300 | 972 | ||||||
Fujitsu Ltd | 224,005 | 40,528 | ||||||
| Description | Shares | Market Value ($ Thousands) | ||||||
COMMON STOCK (continued) | ||||||||
Glory Ltd | 93,100 | $ | 2,074 | |||||
GungHo Online Entertainment Inc * | 63,600 | 1,167 | ||||||
H.U. Group Holdings Inc (A) | 34,300 | 932 | ||||||
Hakuhodo DY Holdings Inc | 117,100 | 2,011 | ||||||
Hitachi Ltd | 497,267 | 29,333 | ||||||
Ibiden Co Ltd | 14,000 | 770 | ||||||
Iida Group Holdings Co Ltd (A) | 92,600 | 2,375 | ||||||
Inpex Corp | 153,200 | 1,195 | ||||||
Isuzu Motors Ltd | 105,300 | 1,374 | ||||||
ITOCHU Corp (A) | 245,400 | 7,137 | ||||||
Japan Exchange Group Inc | 412,542 | 10,211 | ||||||
Japan Post Insurance Co Ltd (A) | 113,300 | 2,054 | ||||||
Japan Tobacco Inc | 78,300 | 1,532 | ||||||
Kao Corp | 260,000 | 15,448 | ||||||
Kawasaki Heavy Industries Ltd | 15,700 | 361 | ||||||
KDDI Corp (A) | 428,700 | 14,110 | ||||||
Keyence Corp | 16,700 | 9,948 | ||||||
Kirin Holdings Co Ltd | 240,000 | 4,433 | ||||||
Kokuyo Co Ltd | 221,300 | 3,736 | ||||||
Konami Holdings Corp | 6,800 | 425 | ||||||
Konica Minolta Inc (A) | 417,800 | 2,245 | ||||||
K’s Holdings Corp (A) | 171,240 | 1,770 | ||||||
Lasertec Corp | 52,600 | 12,010 | ||||||
Lawson Inc | 183,700 | 8,991 | ||||||
Lixil Corp | 11,100 | 320 | ||||||
Mazda Motor Corp | 467,500 | 4,027 | ||||||
Mitsubishi Chemical Holdings Corp | 36,500 | 332 | ||||||
Mitsubishi Electric Corp | 1,332,500 | 18,482 | ||||||
Mixi Inc (A) | 127,100 | 2,854 | ||||||
Mizuno Corp | 41,500 | 991 | ||||||
MS&AD Insurance Group Holdings Inc (A) | 67,500 | 2,251 | ||||||
Murata Manufacturing Co Ltd | 244,500 | 21,743 | ||||||
Nihon Kohden Corp | 11,400 | 387 | ||||||
Nihon Unisys Ltd | 156,700 | 4,046 | ||||||
Nikon Corp (A) | 609,700 | 6,773 | ||||||
Nippon Steel Corp | 150,600 | 2,727 | ||||||
Nippon Telegraph & Telephone Corp (A) | 433,100 | 11,939 | ||||||
Nissan Motor Co Ltd * | 207,800 | 1,032 | ||||||
Nitto Denko Corp | 57,100 | 4,048 | ||||||
Nomura Holdings Inc | 1,685,000 | 8,236 | ||||||
Okuwa Co Ltd | 63,100 | 668 | ||||||
Olympus Corp | 118,100 | 2,585 | ||||||
ORIX Corp | 546,266 | 10,153 | ||||||
Otsuka Corp | 83,300 | 4,261 | ||||||
Panasonic Corp | 1,659,200 | 20,532 | ||||||
PeptiDream Inc * | 101,400 | 3,279 | ||||||
Persol Holdings Co Ltd | 168,100 | 4,181 | ||||||
Recruit Holdings Co Ltd | 362,193 | 21,994 | ||||||
Rinnai Corp | 5,600 | 612 | ||||||
Ryohin Keikaku Co Ltd | 1,036,900 | 23,082 | ||||||
Sankyo Co Ltd (A) | 129,500 | 3,221 | ||||||
Sanwa Holdings Corp | 186,100 | 2,410 | ||||||
18 |
SEI Institutional International Trust / Annual Report / September 30, 2021 |
| Description | Shares | Market Value ($ Thousands) | ||||||
COMMON STOCK (continued) | ||||||||
SBI Holdings Inc/Japan | 390,931 | $ | 9,555 | |||||
Seiko Epson Corp (A) | 46,900 | 942 | ||||||
Seven & i Holdings Co Ltd | 431,200 | 19,541 | ||||||
Shimamura Co Ltd | 67,900 | 6,365 | ||||||
Shimano Inc | 2,500 | 733 | ||||||
Shiseido Co Ltd | 44,600 | 2,995 | ||||||
SoftBank Group Corp | 20,300 | 1,168 | ||||||
Sompo Holdings Inc | 183,100 | 7,924 | ||||||
Sony Group Corp | 92,300 | 10,216 | ||||||
Sony Group Corp ADR | 284,298 | 31,438 | ||||||
Sumitomo Dainippon Pharma Co Ltd (A) | 118,900 | 2,119 | ||||||
Sumitomo Mitsui Financial Group Inc | 1,184,200 | 41,488 | ||||||
Sumitomo Rubber Industries Ltd | 221,200 | 2,797 | ||||||
Sundrug Co Ltd | 18,400 | 556 | ||||||
Sysmex Corp | 44,000 | 5,435 | ||||||
T&D Holdings Inc | 387,200 | 5,324 | ||||||
Takeda Pharmaceutical Co Ltd | 810,500 | 26,784 | ||||||
Teijin Ltd | 45,100 | 639 | ||||||
Terumo Corp | 45,100 | 2,121 | ||||||
TIS Inc | 144,900 | 3,939 | ||||||
Tokio Marine Holdings Inc | 29,500 | 1,577 | ||||||
Tokyo Electron Ltd | 44,353 | 19,671 | ||||||
Tokyo Seimitsu Co Ltd | 10,600 | 435 | ||||||
Tomy Co Ltd | 122,200 | 1,245 | ||||||
Toshiba Corp | 216,700 | 9,116 | ||||||
Toyota Industries Corp | 277,978 | 22,708 | ||||||
Toyota Tsusho Corp | 12,100 | 510 | ||||||
Universal Entertainment * | 396,253 | 8,921 | ||||||
Yamada Holdings Co Ltd | 944,200 | 3,967 | ||||||
Yamaha Motor Co Ltd | 133,300 | 3,709 | ||||||
Z Holdings Corp | 2,012,019 | 12,822 | ||||||
ZOZO Inc | 44,700 | 1,668 | ||||||
|
|
| ||||||
| 779,812 | ||||||||
|
|
| ||||||
Jordan — 0.0% | ||||||||
Hikma Pharmaceuticals PLC | 58,461 | 1,926 | ||||||
|
|
| ||||||
Luxembourg — 0.0% | ||||||||
APERAM SA | 6,874 | 379 | ||||||
|
|
| ||||||
Malta — 0.0% | ||||||||
BGP Holdings *(B) | 198,683 | – | ||||||
|
|
| ||||||
Mexico — 0.9% | ||||||||
Arca Continental SAB de CV | 2,744,250 | 16,788 | ||||||
Fomento Economico Mexicano SAB de CV ADR | 243,604 | 21,125 | ||||||
Grupo Financiero Banorte SAB de CV, Cl O | 665,083 | 4,283 | ||||||
|
|
| ||||||
| 42,196 | ||||||||
|
|
| ||||||
Netherlands — 6.0% | ||||||||
Aalberts NV | 34,907 | 2,013 | ||||||
Adyen NV * | 6,175 | 17,245 | ||||||
Akzo Nobel NV | 388,645 | 42,458 | ||||||
ArcelorMittal SA | 302,237 | 9,169 | ||||||
ASM International NV | 3,375 | 1,320 | ||||||
ASML Holding NV | 70,069 | 52,346 | ||||||
| Description | Shares | Market Value ($ Thousands) | ||||||
COMMON STOCK (continued) | ||||||||
ASML Holding NV, Cl G | 16,391 | $ | 12,213 | |||||
ASR Nederland NV | 183,203 | 8,362 | ||||||
BE Semiconductor Industries NV | 19,785 | 1,568 | ||||||
ING Groep NV | 599,157 | 8,705 | ||||||
James Hardie Industries PLC * | 128,283 | 4,606 | ||||||
Koninklijke Ahold Delhaize NV | 962,986 | 32,043 | ||||||
Koninklijke DSM NV | 51,437 | 10,289 | ||||||
PostNL NV | 1,207,552 | 5,793 | ||||||
Prosus NV * | 93,488 | 7,449 | ||||||
Randstad NV (A) | 209,833 | 14,061 | ||||||
RELX PLC | 123,754 | 3,575 | ||||||
Royal Dutch Shell PLC, Cl A | 411,839 | 9,228 | ||||||
Universal Music Group NV (A) | 238,120 | 6,379 | ||||||
Wolters Kluwer NV | 280,809 | 29,779 | ||||||
|
|
| ||||||
| 278,601 | ||||||||
|
|
| ||||||
New Zealand — 0.0% | ||||||||
Fletcher Building Ltd | 252,706 | 1,240 | ||||||
Mainfreight Ltd | 6,678 | 446 | ||||||
|
|
| ||||||
| 1,686 | ||||||||
|
|
| ||||||
Norway — 0.2% | ||||||||
Equinor ASA | 181,760 | 4,623 | ||||||
Norsk Hydro ASA | 463,387 | 3,483 | ||||||
|
|
| ||||||
| 8,106 | ||||||||
|
|
| ||||||
Peru — 0.1% | ||||||||
Credicorp Ltd | 53,982 | 5,989 | ||||||
|
|
| ||||||
Russia — 0.0% | ||||||||
Novolipetsk Steel PJSC GDR | 10,654 | 317 | ||||||
|
|
| ||||||
Saudi Arabia — 0.8% | ||||||||
Arabian Cement Co/Saudi Arabia | 103,554 | 1,139 | ||||||
National Industrialization Co * | 370,508 | 2,316 | ||||||
Rabigh Refining & Petrochemical Co * | 86,388 | 644 | ||||||
Saudi Basic Industries Corp | 640,397 | 21,709 | ||||||
Saudi Industrial Investment Group | 575,730 | 6,271 | ||||||
Saudi Kayan Petrochemical Co * | 891,200 | 4,864 | ||||||
Zamil Industrial Investment Co * | 31,862 | 335 | ||||||
|
|
| ||||||
| 37,278 | ||||||||
|
|
| ||||||
Singapore — 0.2% | ||||||||
DBS Group Holdings Ltd | 372,800 | 8,251 | ||||||
Golden Agri-Resources | 2,198,400 | 379 | ||||||
Oversea-Chinese Banking Corp Ltd | 301,900 | 2,535 | ||||||
|
|
| ||||||
| 11,165 | ||||||||
|
|
| ||||||
South Africa — 0.0% | ||||||||
DataTec Ltd | 100,188 | 256 | ||||||
Investec PLC | 505,716 | 2,162 | ||||||
|
|
| ||||||
| 2,418 | ||||||||
|
|
| ||||||
South Korea — 2.3% | ||||||||
BNK Financial Group Inc | 691,155 | 5,124 | ||||||
Hana Financial Group Inc | 90,133 | 3,498 | ||||||
Kangwon Land Inc * | 761,631 | 18,286 | ||||||
Kolon Industries Inc | 15,690 | 1,308 | ||||||
KT Corp ADR | 100,388 | 1,367 | ||||||
LG Electronics Inc | 112,632 | 11,928 | ||||||
SEI Institutional International Trust / Annual Report / September 30, 2021 |
19 |
SCHEDULE OF INVESTMENTS
September 30, 2021
International Equity Fund (Continued)
| Description | Shares | Market Value ($ Thousands) | ||||||
COMMON STOCK (continued) | ||||||||
POSCO | 3,860 | $ | 1,069 | |||||
Samsung Electronics Co Ltd | 408,127 | 25,233 | ||||||
SK Hynix Inc | 182,338 | 15,571 | ||||||
SK Telecom Co Ltd | 84,160 | 22,905 | ||||||
|
|
| ||||||
| 106,289 | ||||||||
|
|
| ||||||
Spain — 2.6% | ||||||||
Aena SME SA * | 91,663 | 15,801 | ||||||
Amadeus IT Group SA, Cl A * | 755,942 | 49,599 | ||||||
Banco Bilbao Vizcaya Argentaria SA | 1,582,762 | 10,416 | ||||||
Banco Santander SA | 4,318,851 | 15,601 | ||||||
CaixaBank SA | 5,063,673 | 15,709 | ||||||
Cellnex Telecom SA * | 6,570 | 405 | ||||||
Cia de Distribucion Integral Logista Holdings SA | 57,814 | 1,221 | ||||||
Laboratorios Farmaceuticos Rovi SA | 10,054 | 659 | ||||||
Repsol SA | 142,426 | 1,859 | ||||||
Siemens Gamesa Renewable Energy SA * | 305,351 | 7,754 | ||||||
|
|
| ||||||
| 119,024 | ||||||||
|
|
| ||||||
Sweden — 3.2% | ||||||||
Alfa Laval AB | 14,712 | 550 | ||||||
Atlas Copco AB, Cl A | 131,951 | 7,986 | ||||||
Atlas Copco AB, Cl B | 801 | 41 | ||||||
Betsson AB, Cl B | 131,332 | 1,090 | ||||||
Byggmax Group AB | 122,242 | 1,047 | ||||||
Electrolux AB, Cl B (A) | 154,415 | 3,567 | ||||||
Essity AB, Cl B | 685,294 | 21,279 | ||||||
Evolution AB | 93,684 | 14,258 | ||||||
Getinge AB, Cl B | 217,298 | 8,657 | ||||||
H & M Hennes & Mauritz AB, Cl B | 485,580 | 9,828 | ||||||
Hexagon AB, Cl B | 229,850 | 3,556 | ||||||
Husqvarna AB, Cl B | 814,153 | 9,742 | ||||||
Kinnevik AB, Cl B *(A) | 237,795 | 8,380 | ||||||
Lundin Energy AB | 38,418 | 1,432 | ||||||
Securitas AB, Cl B | 1,411,130 | 22,316 | ||||||
Svenska Cellulosa AB SCA, Cl B | 190,278 | 2,957 | ||||||
Swedbank AB, Cl A | 437,089 | 8,821 | ||||||
Swedish Match AB | 2,309,607 | 20,240 | ||||||
Telefonaktiebolaget LM Ericsson, Cl B | 102,138 | 1,152 | ||||||
|
|
| ||||||
| 146,899 | ||||||||
|
|
| ||||||
Switzerland — 8.5% | ||||||||
ABB Ltd | 263,988 | 8,830 | ||||||
Adecco Group AG | 139,851 | 7,019 | ||||||
Alcon Inc | 122,035 | 9,893 | ||||||
Cie Financiere Richemont SA, Cl A | 127,045 | 13,174 | ||||||
Coca-Cola HBC AG | 497,982 | 16,090 | ||||||
Credit Suisse Group AG | 1,036,239 | 10,291 | ||||||
dormakaba Holding AG | 2,973 | 2,161 | ||||||
Geberit AG | 17,579 | 12,921 | ||||||
Georg Fischer AG | 450 | 667 | ||||||
Kuehne + Nagel International AG | 56,478 | 19,315 | ||||||
Logitech International SA | 109,196 | 9,690 | ||||||
Lonza Group AG | 24,959 | 18,719 | ||||||
| Description | Shares | Market Value ($ Thousands) | ||||||
COMMON STOCK (continued) | ||||||||
Nestle SA | 308,270 | $ | 37,140 | |||||
Novartis AG | 323,381 | 26,458 | ||||||
Roche Holding AG | 232,200 | 84,811 | ||||||
SFS Group AG | 2,834 | 386 | ||||||
Sika AG | 29,824 | 9,463 | ||||||
Sonova Holding AG | 52,883 | 20,022 | ||||||
STMicroelectronics NV | 250,597 | 10,952 | ||||||
Straumann Holding AG | 7,102 | 12,761 | ||||||
Swatch Group AG/The | 136,582 | 35,761 | ||||||
Swiss Prime Site AG | 12,169 | 1,191 | ||||||
Tecan Group AG | 11,170 | 6,358 | ||||||
Vifor Pharma AG | 34,188 | 4,427 | ||||||
Zurich Insurance Group AG | 41,452 | 16,963 | ||||||
|
|
| ||||||
| 395,463 | ||||||||
|
|
| ||||||
Taiwan — 1.2% | ||||||||
Asustek Computer Inc | 880,000 | 10,247 | ||||||
Compal Electronics Inc | 3,110,000 | 2,622 | ||||||
Evergreen Marine Corp Taiwan Ltd | 252,000 | 1,123 | ||||||
Global Mixed Mode Technology Inc | 91,000 | 753 | ||||||
Hon Hai Precision Industry Co Ltd | 2,300,000 | 8,587 | ||||||
Lite-On Technology Corp | 1,577,000 | 3,509 | ||||||
MediaTek Inc | 267,987 | 8,696 | ||||||
Novatek Microelectronics Corp | 317,000 | 4,633 | ||||||
Sea Ltd ADR * | 1,454 | 463 | ||||||
Sitronix Technology Corp | 173,000 | 1,497 | ||||||
Taiwan Semiconductor Manufacturing Co Ltd ADR | 108,541 | 12,119 | ||||||
|
|
| ||||||
| 54,249 | ||||||||
|
|
| ||||||
United Kingdom — 12.5% | ||||||||
3i Group PLC | 981,413 | 16,873 | ||||||
Anglo American PLC | 651,700 | 22,966 | ||||||
Aon PLC, Cl A | 22,895 | 6,543 | ||||||
Aptiv PLC * | 67,044 | 9,988 | ||||||
Ashtead Group PLC | 131,365 | 9,982 | ||||||
AstraZeneca PLC | 179,555 | 21,652 | ||||||
Atlassian Corp PLC, Cl A * | 71,978 | 28,174 | ||||||
B&M European Value Retail SA | 1,255,693 | 9,984 | ||||||
Balfour Beatty PLC | 991,355 | 3,598 | ||||||
Barclays PLC | 18,782,585 | 47,646 | ||||||
BHP Group PLC | 39,371 | 996 | ||||||
BP PLC | 12,310,263 | 56,243 | ||||||
BP PLC ADR | 748,386 | 20,453 | ||||||
British American Tobacco PLC | 457,480 | 16,001 | ||||||
Compass Group PLC * | 992,938 | 20,276 | ||||||
Computacenter PLC | 62,379 | 2,282 | ||||||
Diageo PLC | 721,090 | 34,921 | ||||||
Evraz PLC | 1,669,026 | 13,297 | ||||||
Ferguson PLC | 60,781 | 8,451 | ||||||
Ferrexpo PLC | 524,939 | 2,311 | ||||||
Glencore PLC | 3,022,391 | 14,285 | ||||||
Hays PLC | 1,728,162 | 3,753 | ||||||
Howden Joinery Group PLC | 99,204 | 1,197 | ||||||
20 |
SEI Institutional International Trust / Annual Report / September 30, 2021 |
| Description | Shares | Market Value ($ Thousands) | ||||||
COMMON STOCK (continued) | ||||||||
IG Group Holdings PLC | 186,542 | $ | 2,022 | |||||
Indivior PLC * | 204,652 | 594 | ||||||
Investec PLC | 732,515 | 3,131 | ||||||
Kingfisher PLC | 2,365,536 | 10,692 | ||||||
Land Securities Group PLC ‡ | 511,152 | 4,780 | ||||||
London Stock Exchange Group PLC | 26,628 | 2,664 | ||||||
M&G PLC | 555,976 | 1,523 | ||||||
Man Group PLC/Jersey | 746,872 | 2,052 | ||||||
Next PLC * | 68,244 | 7,519 | ||||||
Ninety One PLC (A) | 375,849 | 1,301 | ||||||
Pagegroup PLC | 97,734 | 813 | ||||||
Plus500 Ltd | 133,218 | 2,497 | ||||||
Prudential PLC | 2,385,408 | 46,427 | ||||||
QinetiQ Group PLC | 196,336 | 857 | ||||||
Reckitt Benckiser Group PLC | 54,094 | 4,254 | ||||||
RELX PLC | 230,860 | 6,659 | ||||||
Rio Tinto PLC | 387 | 25 | ||||||
Rio Tinto PLC ADR (A) | 21,453 | 1,434 | ||||||
Rolls-Royce Holdings PLC * | 22,570,573 | 42,363 | ||||||
Royal Mail PLC | 885,075 | 5,013 | ||||||
Schroders PLC | 46,684 | 2,251 | ||||||
Smith & Nephew PLC | 1,070,990 | 18,420 | ||||||
THG PLC * | 629,490 | 4,319 | ||||||
Travis Perkins PLC | 33,960 | 702 | ||||||
Unilever PLC | 389,376 | 21,048 | ||||||
Vodafone Group PLC | 356,692 | 543 | ||||||
WH Smith PLC * | 471,900 | 10,890 | ||||||
Wise PLC * | 68,178 | 1,002 | ||||||
|
|
| ||||||
| 577,667 | ||||||||
|
|
| ||||||
United States — 1.9% | ||||||||
EPAM Systems Inc * | 14,226 | 8,116 | ||||||
IHS Markit Ltd | 87,290 | 10,180 | ||||||
Inmode Ltd * | 12,047 | 1,921 | ||||||
Jackson Financial Inc, Cl A * | 34,237 | 890 | ||||||
Lululemon Athletica Inc * | 23,952 | 9,693 | ||||||
Mettler-Toledo International Inc * | 6,059 | 8,345 | ||||||
Nomad Foods Ltd * | 429,994 | 11,851 | ||||||
ResMed Inc | 45,572 | 12,011 | ||||||
Shopify Inc, Cl A * | 7,623 | 10,335 | ||||||
STERIS PLC | 33,581 | 6,860 | ||||||
Wix.com Ltd * | 4,034 | 790 | ||||||
ZIM Integrated Shipping Services Ltd * | 112,619 | 5,710 | ||||||
|
|
| ||||||
| 86,702 | ||||||||
|
|
| ||||||
Total Common Stock | 4,478,254 | |||||||
|
|
| ||||||
PREFERRED STOCK — 0.4% | ||||||||
Brazil — 0.0% | ||||||||
Braskem SA*(C) | 65,200 | 710 | ||||||
| Description | Shares | Market Value ($ Thousands) | ||||||
PREFERRED STOCK (continued) |
| |||||||
Germany — 0.4% | ||||||||
Porsche Automobil Holding SE, 2.530% | 50,721 | $ | 5,037 | |||||
Sartorius AG, 0.120% | 3,305 | 2,088 | ||||||
Schaeffler AG, 3.600% | 106,067 | 816 | ||||||
Volkswagen AG, 2.590% | 43,784 | 9,751 | ||||||
|
|
| ||||||
| 17,692 | ||||||||
|
|
| ||||||
Total Preferred Stock | 18,402 | |||||||
|
|
| ||||||
EXCHANGE TRADED FUND — 0.2% |
| |||||||
United States — 0.2% | ||||||||
iShares Trust iShares ESG Aware MSCI EAFE ETF | 130,120 | 10,199 | ||||||
|
|
| ||||||
Total Exchange Traded Fund | 10,199 | |||||||
|
|
| ||||||
Face Amount | ||||||||
CONVERTIBLE BONDS — 0.1% |
| |||||||
Credit Suisse Group Guernsey VII CV to 115.607 | ||||||||
3.000%, 11/12/2021 | CHF | 381 | 437 | |||||
Credit Suisse Group Guernsey VII CV to 23,121.387 | ||||||||
3.000%, 11/12/2021 (D) | 2,200 | 2,501 | ||||||
|
|
| ||||||
Total Convertible Bonds | 2,938 | |||||||
|
|
| ||||||
| Shares | ||||||||
AFFILIATED PARTNERSHIP — 3.5% |
| |||||||
SEI Liquidity Fund, L.P. | ||||||||
0.010% **†(E) | 161,604,517 | 161,647 | ||||||
|
|
| ||||||
Total Affiliated Partnership | 161,647 | |||||||
|
|
| ||||||
CASH EQUIVALENT — 1.0% |
| |||||||
SEI Daily Income Trust, Government Fund, Cl F | ||||||||
0.010%**† | 48,038,824 | 48,039 | ||||||
|
|
| ||||||
Total Cash Equivalent | 48,039 | |||||||
|
|
| ||||||
Total Investments in Securities — 101.7% |
| $ | 4,719,479 | |||||
|
|
| ||||||
SEI Institutional International Trust / Annual Report / September 30, 2021 |
21 |
SCHEDULE OF INVESTMENTS
September 30, 2021
International Equity Fund (Concluded)
A list of the open futures contracts held by the Fund at September 30, 2021, is as follows:
| Type of Contract | Number of Contracts | Expiration Date | Notional Amount (Thousands) | Value (Thousands) | Unrealized Appreciation/ (Depreciation) (Thousands) | |||||||||||||||
Long Contracts | ||||||||||||||||||||
Euro STOXX 50 | 443 | Dec-2021 | $ | 21,744 | $ | 20,783 | $ | (571) | ||||||||||||
FTSE 100 Index | 99 | Dec-2021 | 9,634 | 9,442 | 46 | |||||||||||||||
Hang Seng Index | 10 | Oct-2021 | 1,553 | 1,575 | 23 | |||||||||||||||
SPI 200 Index | 42 | Dec-2021 | 5,665 | 5,532 | (60) | |||||||||||||||
TOPIX Index | 81 | Dec-2021 | 15,076 | 14,741 | (173) | |||||||||||||||
|
|
|
|
|
| |||||||||||||||
| $ | 53,672 | $ | 52,073 | $ | (735) | |||||||||||||||
|
|
|
|
|
| |||||||||||||||
Percentages are based on Net Assets of $4,638,425 ($ Thousands).
| * | Non-income producing security. |
| ** | The rate reported is the 7-day effective yield as of September 30, 2021. |
| † | Investment in Affiliated Security (see Note 5). |
| ‡ | Real Estate Investment Trust. |
| (A) | Certain securities or partial positions of certain securities are on loan at September 30, 2021 (see Note 9). The total market value of securities on loan at September 30, 2021 was $153,788 ($ Thousands). |
| (B) | Level 3 security in accordance with fair value hierarchy. |
| (C) | There is currently no rate available. |
| (D) | Security exempt from registration under Rule 144A of the Securities Act of 1933. These securities may be resold in transactions exempt from registration normally to qualified institutions. On September 30, 2021, the value of these securities amounted to $2,501 ($ Thousands), representing 0.1% of the Net Assets of the Fund. |
| (E) | This security was purchased with cash collateral held from securities on loan (see Note 9). The total market value of such securities as of September 30, 2021 was $161,647 ($ Thousands). |
ADR — American Depositary Receipt
Cl — Class
CV — Conversion Ratio
EAFE — Europe, Australasia and Far East
ETF — Exchange-Traded Fund
FTSE — Financial Times Stock Exchange
GDR — Global Depositary Receipt
L.P. — Limited Partnership
Ltd. — Limited
MSCI — Morgan Stanley Capital International
PJSC — Public Joint-Stock Company
PLC — Public Limited Company
REIT — Real Estate investment Trust
SPI — Share Price Index
TOPIX- Tokyo Price Index
The following is a list of the level of inputs used as of September 30, 2021, in valuing the Fund’s investments and other financial instruments carried at value ($ Thousands):
| Investments in Securities | Level 1 ($) | Level 2 ($) | Level 3 ($) | Total ($) | ||||||||||||
Common Stock | 532,684 | 3,945,570 | –^ | 4,478,254 | ||||||||||||
Preferred Stock | 710 | 17,692 | – | 18,402 | ||||||||||||
Exchange Traded Fund | 10,199 | – | – | 10,199 | ||||||||||||
Convertible Bonds | – | 2,938 | – | 2,938 | ||||||||||||
Affiliated Partnership | – | 161,647 | – | 161,647 | ||||||||||||
Cash Equivalent | 48,039 | – | – | 48,039 | ||||||||||||
|
|
|
|
|
|
|
| |||||||||
Total Investments in Securities | 591,632 | 4,127,847 | – | 4,719,479 | ||||||||||||
|
|
|
|
|
|
|
| |||||||||
| Other Financial Instruments | Level 1 ($) | Level 2 ($) | Level 3 ($) | Total ($) | ||||||||||||
Futures Contracts* | ||||||||||||||||
Unrealized Appreciation | 69 | – | – | 69 | ||||||||||||
Unrealized Depreciation | (804) | – | – | (804) | ||||||||||||
|
|
|
|
|
|
|
| |||||||||
Total Other Financial Instruments | (735) | – | – | (735) | ||||||||||||
|
|
|
|
|
|
|
| |||||||||
^One security with a market value of $0.
*Futures contracts are valued at the unrealized appreciation (depreciation) on the instrument.
For the year ended September 30, 2021, there were no transfers in or out of Level 3.
For more information on valuation inputs, see Note 2 – Significant Accounting Policies in Notes to Financial Statements.
The following is a summary of the transactions with affiliates for the year ended September 30, 2021 ($ Thousands):
| Security Description | Value 9/30/2020 | Purchases at Cost | Proceeds from Sales | Realized Loss | Change in Unrealized Appreciation | Value 9/30/2021 | Shares | Income | Capital Gains | |||||||||
SEI Liquidity Fund, L.P. | $ 94,836 | $ 768,970 | $ (702,153) | $ (10) | $ 4 | $ 161,647 | 161,604,517 | $ 743 | $ — | |||||||||
SEI Daily Income Trust, Government Fund, Cl F | 71,397 | 250,857 | (274,215) | — | — | 48,039 | 48,038,824 | 5 | — | |||||||||
|
|
|
|
|
|
|
| |||||||||||
Totals | $ 166,233 | $ 1,019,827 | $ (976,368) | $ (10) | $ 4 | $ 209,686 | $ 748 | $ — | ||||||||||
|
|
|
|
|
|
|
|
Amounts designated as “—” are $0 or have been rounded to $0.
The accompanying notes are an integral part of the financial statements.
22 |
SEI Institutional International Trust / Annual Report / September 30, 2021 |
SCHEDULE OF INVESTMENTS
September 30, 2021
Emerging Market Equity Fund
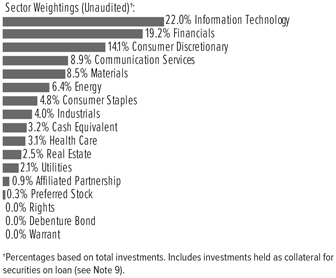
| Description | Shares | Market Value ($ Thousands) | ||||||
COMMON STOCK — 93.1% |
| |||||||
Argentina — 0.0% | ||||||||
Ternium SA ADR | 23,178 | $ | 980 | |||||
|
|
| ||||||
Austria — 0.2% | ||||||||
Erste Group Bank AG | 99,708 | 4,397 | ||||||
|
|
| ||||||
Brazil — 3.1% | ||||||||
Ambev SA | 429,100 | 1,207 | ||||||
Ambev SA ADR | 620,074 | 1,712 | ||||||
Arezzo Industria e Comercio SA | 110,900 | 1,682 | ||||||
B3 SA - Brasil Bolsa Balcao | 1,417,877 | 3,326 | ||||||
Banco Bradesco SA ADR | 793,268 | 3,038 | ||||||
Banco do Brasil SA | 642,600 | 3,420 | ||||||
Banco Santander Brasil SA | 294,100 | 1,915 | ||||||
Banco Santander Brasil SA ADR | 108,700 | 711 | ||||||
CCR SA | 288,300 | 621 | ||||||
Cia Energetica de Minas Gerais ADR | 412,639 | 1,040 | ||||||
Cosan SA | 1,063,200 | 4,443 | ||||||
CPFL Energia SA | 487,000 | 2,411 | ||||||
CSN Mineracao SA | 3,837,315 | 4,458 | ||||||
Diagnosticos da America SA | 134,400 | 1,048 | ||||||
Equatorial Energia SA | 229,293 | 1,067 | ||||||
Gerdau SA ADR | 514,659 | 2,532 | ||||||
Hapvida Participacoes e Investimentos SA | 935,800 | 2,334 | ||||||
JBS SA | 307,077 | 2,084 | ||||||
Multiplan Empreendimentos Imobiliarios SA | 227,300 | 791 | ||||||
Natura & Co Holding SA * | 267,244 | 2,237 | ||||||
Notre Dame Intermedica Participacoes SA | 26,300 | 359 | ||||||
Petrobras Distribuidora SA | 881,402 | 3,782 | ||||||
Petroleo Brasileiro SA | 21,549 | 223 | ||||||
Petroleo Brasileiro SA ADR | 318,522 | 3,294 | ||||||
Porto Seguro SA | 107,757 | 982 | ||||||
Rumo SA * | 909,437 | 2,809 | ||||||
SLC Agricola SA | 72,121 | 606 | ||||||
| Description | Shares | Market Value ($ Thousands) | ||||||
COMMON STOCK (continued) |
| |||||||
TIM SA/Brazil | 610,500 | $ | 1,313 | |||||
TIM SA/Brazil ADR | 42,119 | 452 | ||||||
Ultrapar Participacoes SA | 229,900 | 623 | ||||||
Vale SA ADR, Cl B | 177,295 | 2,473 | ||||||
WEG SA | 205,436 | 1,489 | ||||||
|
|
| ||||||
| 60,482 | ||||||||
|
|
| ||||||
Canada — 1.2% | ||||||||
Autohome Inc ADR | 56,319 | 2,643 | ||||||
Endeavour Mining PLC | 57,098 | 1,285 | ||||||
First Quantum Minerals Ltd | 541,144 | 10,017 | ||||||
Ivanhoe Mines Ltd, Cl A * | 505,751 | 3,234 | ||||||
Pan American Silver Corp | 65,646 | 1,528 | ||||||
Parex Resources Inc | 253,841 | 4,616 | ||||||
|
|
| ||||||
| 23,323 | ||||||||
|
|
| ||||||
Chile — 0.5% | ||||||||
Banco Santander Chile ADR | 65,723 | 1,300 | ||||||
CAP SA | 41,742 | 443 | ||||||
Falabella SA | 388,107 | 1,357 | ||||||
Sociedad Quimica y Minera de Chile SA ADR | 140,190 | 7,531 | ||||||
|
|
| ||||||
| 10,631 | ||||||||
|
|
| ||||||
China — 19.6% | ||||||||
360 DigiTech Inc ADR * | 28,193 | 573 | ||||||
AECC Aviation Power Co Ltd, Cl A | 113,200 | 931 | ||||||
Agricultural Bank of China Ltd, Cl H | 10,931,000 | 3,763 | ||||||
Alibaba Group Holding Ltd * | 1,005,776 | 18,579 | ||||||
Alibaba Group Holding Ltd | 123,467 | 18,279 | ||||||
Angang Steel Co Ltd, Cl H | 1,340,000 | 824 | ||||||
Anhui Conch Cement Co Ltd, Cl H | 892,500 | 4,815 | ||||||
ANTA Sports Products Ltd | 68,000 | 1,285 | ||||||
Baidu Inc ADR * | 40,579 | 6,239 | ||||||
Bank of China Ltd, Cl H | 13,394,106 | 4,740 | ||||||
Bank of Communications Co Ltd, Cl H | 2,166,000 | 1,282 | ||||||
Bank of Nanjing Co Ltd, Cl A | 602,834 | 841 | ||||||
BeiGene Ltd ADR * | 1,672 | 607 | ||||||
Beijing Sinnet Technology Co Ltd, Cl A | 709,589 | 1,409 | ||||||
Bilibili Inc ADR *(A) | 39,997 | 2,647 | ||||||
Bosideng International Holdings Ltd | 3,405,597 | 2,425 | ||||||
BYD Co Ltd, Cl H | 52,370 | 1,633 | ||||||
China CITIC Bank Corp Ltd, Cl H | 2,543,000 | 1,148 | ||||||
China Communications Services Corp Ltd, Cl H | 1,348,111 | 745 | ||||||
China Construction Bank Corp, Cl H | 14,884,050 | 10,600 | ||||||
China Jushi Co Ltd, Cl A | 1,009,077 | 2,726 | ||||||
China Lesso Group Holdings Ltd | 2,082,000 | 3,329 | ||||||
China Longyuan Power Group Corp Ltd, Cl H | 2,957,238 | 7,266 | ||||||
China Merchants Bank Co Ltd, Cl H | 968,062 | 7,697 | ||||||
China National Building Material Co Ltd, Cl H | 1,084,733 | 1,465 | ||||||
China Pacific Insurance Group Co Ltd, Cl H | 232,400 | 691 | ||||||
China Petroleum & Chemical Corp ADR | 31,609 | 1,554 | ||||||
China Petroleum & Chemical Corp, Cl H | 3,216,000 | 1,581 | ||||||
SEI Institutional International Trust / Annual Report / September 30, 2021 |
23 |
SCHEDULE OF INVESTMENTS
September 30, 2021
Emerging Market Equity Fund (Continued)
| Description | Shares | Market Value ($ Thousands) | ||||||
COMMON STOCK (continued) |
| |||||||
China Resources Sanjiu Medical & Pharmaceutical Co Ltd, Cl A | 203,500 | $ | 889 | |||||
China Shenhua Energy Co Ltd, Cl H | 673,500 | 1,573 | ||||||
Chongqing Zhifei Biological Products Co Ltd, Cl A | 94,500 | 2,314 | ||||||
Contemporary Amperex Technology Co Ltd, Cl A | 8,084 | 654 | ||||||
COSCO SHIPPING Holdings Co Ltd, Cl H *(A) | 835,250 | 1,278 | ||||||
Dongfeng Motor Group Co Ltd, Cl H | 3,728,000 | 3,336 | ||||||
Fangda Carbon New Material Co Ltd, Cl A | 950,181 | 1,482 | ||||||
Fujian Green Pine Co Ltd, Cl A | 1,242,700 | 2,686 | ||||||
Ginlong Technologies Co Ltd, Cl A | 71,220 | 2,641 | ||||||
Haier Smart Home Co Ltd, Cl A | 1,116,561 | 4,497 | ||||||
Haier Smart Home Co Ltd, Cl H | 778,156 | 2,723 | ||||||
Hangzhou Robam Appliances Co Ltd, Cl A | 364,266 | 1,901 | ||||||
Hengli Petrochemical Co Ltd, Cl A | 695,000 | 2,775 | ||||||
Huazhu Group Ltd ADR * | 101,014 | 4,633 | ||||||
Industrial & Commercial Bank of China Ltd, Cl H | 17,263,208 | 9,569 | ||||||
JD.com Inc ADR * | 79,490 | 5,742 | ||||||
Jiangsu Changshu Rural Commercial Bank Co Ltd, Cl A | 3,800,274 | 3,762 | ||||||
Kweichow Moutai Co Ltd, Cl A | 8,900 | 2,515 | ||||||
KWG Group Holdings Ltd | 3,545,303 | 3,477 | ||||||
Longfor Group Holdings Ltd | 237,000 | 1,081 | ||||||
LONGi Green Energy Technology Co Ltd, Cl A | 747,500 | 9,473 | ||||||
Lufax Holding Ltd ADR * | 379,619 | 2,650 | ||||||
Luxshare Precision Industry Co Ltd, Cl A | 967,300 | 5,291 | ||||||
Montage Technology Co Ltd, Cl A | 314,348 | 2,869 | ||||||
NARI Technology Co Ltd, Cl A | 562,380 | 3,105 | ||||||
NetEase Inc ADR | 143,238 | 12,233 | ||||||
NIO Inc ADR * | 58,872 | 2,098 | ||||||
PetroChina Co Ltd, Cl H | 3,856,000 | 1,809 | ||||||
PICC Property & Casualty Co Ltd, Cl H | 4,820,000 | 4,684 | ||||||
Pinduoduo Inc ADR * | 16,055 | 1,456 | ||||||
Ping An Insurance Group Co of China Ltd, Cl A | 1,051,700 | 7,843 | ||||||
Ping An Insurance Group Co of China Ltd, Cl H | 1,688,965 | 11,507 | ||||||
Poly Developments and Holdings Group Co Ltd, Cl A | 775,626 | 1,679 | ||||||
QuakeSafe Technologies Co Ltd, Cl A | 64,800 | 1,093 | ||||||
Raytron Technology Co Ltd, Cl A | 180,497 | 2,451 | ||||||
Sangfor Technologies Inc, Cl A | 123,991 | 4,481 | ||||||
Seazen Holdings Co Ltd, Cl A | 115,800 | 667 | ||||||
Shenzhen Kangtai Biological Products Co Ltd, Cl A | 160,300 | 2,728 | ||||||
Sichuan Kelun Pharmaceutical Co Ltd, Cl A | 747,398 | 2,075 | ||||||
Sinopec Engineering Group Co Ltd, Cl H | 844,323 | 427 | ||||||
Sinotrans Ltd, Cl H | 2,322,309 | 907 | ||||||
Sinotruk Hong Kong Ltd | 905,500 | 1,345 | ||||||
Songcheng Performance Development Co Ltd, Cl A | 1,144,800 | 2,481 | ||||||
| Description | Shares | Market Value ($ Thousands) | ||||||
COMMON STOCK (continued) |
| |||||||
Tencent Holdings Ltd | 1,068,390 | $ | 64,353 | |||||
Tingyi Cayman Islands Holding Corp | 450,754 | 837 | ||||||
Trip.com Group Ltd ADR * | 73,451 | 2,259 | ||||||
Tsingtao Brewery Co Ltd, Cl H | 353,000 | 2,765 | ||||||
Uni-President China Holdings Ltd | 884,000 | 845 | ||||||
Vipshop Holdings Ltd ADR * | 227,127 | 2,530 | ||||||
Want Want China Holdings Ltd | 1,170,000 | 884 | ||||||
Weichai Power Co Ltd, Cl H | 2,676,000 | 5,548 | ||||||
Wingtech Technology Co Ltd, Cl A | 464,900 | 6,666 | ||||||
Wuhu Sanqi Interactive Entertainment | ||||||||
Network Technology Group Co Ltd, Cl A * | 1,106,200 | 3,580 | ||||||
WUS Printed Circuit Kunshan Co Ltd, Cl A | 1,404,080 | 2,421 | ||||||
Wuxi Lead Intelligent Equipment Co Ltd, Cl A | 237,980 | 2,541 | ||||||
Xianhe Co Ltd, Cl A | 702,779 | 3,529 | ||||||
XPeng Inc ADR, Cl A * | 40,792 | 1,450 | ||||||
Xtep International Holdings Ltd (A) | 957,500 | 1,346 | ||||||
Yantai Jereh Oilfield Services Group Co Ltd, Cl A | 420,297 | 3,123 | ||||||
Yifeng Pharmacy Chain Co Ltd, Cl A | 452,600 | 3,633 | ||||||
Yuan Longping High-tech Agriculture Co Ltd, Cl A | 1,318,200 | 4,367 | ||||||
Yum China Holdings Inc | 22,528 | 1,309 | ||||||
Zai Lab Ltd ADR * | 4,164 | 439 | ||||||
Zhejiang Expressway Co Ltd, Cl H | 1,800,000 | 1,484 | ||||||
Zhejiang Juhua Co Ltd, Cl A | 1,286,713 | 2,953 | ||||||
Zhongsheng Group Holdings Ltd | 693,000 | 5,588 | ||||||
ZTE Corp, Cl H | 298,000 | 979 | ||||||
ZTO Express Cayman Inc ADR | 21,204 | 650 | ||||||
|
|
| ||||||
| 380,633 | ||||||||
|
|
| ||||||
Colombia — 0.1% | ||||||||
Grupo de Inversiones Suramericana SA | 208,753 | 1,172 | ||||||
|
|
| ||||||
Czech Republic — 0.1% | ||||||||
CEZ AS | 60,830 | 1,984 | ||||||
Moneta Money Bank AS * | 223,429 | 901 | ||||||
|
|
| ||||||
| 2,885 | ||||||||
|
|
| ||||||
Germany — 0.3% | ||||||||
Delivery Hero SE * | 39,303 | 5,021 | ||||||
|
|
| ||||||
Greece — 0.4% | ||||||||
Alpha Services and Holdings SA * | 2,794,280 | 3,545 | ||||||
Eurobank Ergasias Services and Holdings SA * | 3,294,549 | 3,082 | ||||||
Hellenic Telecommunications Organization SA | 62,188 | 1,168 | ||||||
|
|
| ||||||
| 7,795 | ||||||||
|
|
| ||||||
Hong Kong — 9.4% | ||||||||
A-Living Smart City Services Co Ltd, Cl H | 1,324,750 | 4,733 | ||||||
ASM Pacific Technology Ltd | 232,000 | 2,550 | ||||||
Beijing Enterprises Holdings Ltd | 1,046,500 | 4,175 | ||||||
Bilibili Inc, Cl Z * | 34,540 | 2,323 | ||||||
Chaoda Modern Agriculture Holdings Ltd * | 2,056,181 | 12 | ||||||
China Conch Venture Holdings Ltd | 389,000 | 1,811 | ||||||
24 |
SEI Institutional International Trust / Annual Report / September 30, 2021 |
| Description | Shares | Market Value ($ Thousands) | ||||||
COMMON STOCK (continued) |
| |||||||
China Everbright Bank Co Ltd, Cl H | 4,691,000 | $ | 1,649 | |||||
China Feihe Ltd | 1,611,000 | 2,731 | ||||||
China High Precision Automation Group Ltd *(F) | 1,385,624 | – | ||||||
China Hongqiao Group Ltd | 841,000 | 1,076 | ||||||
China International Marine Containers Group Co Ltd, Cl H | 556,079 | 1,175 | ||||||
China Medical System Holdings Ltd | 2,680,870 | 4,894 | ||||||
China Meidong Auto Holdings Ltd | 725,830 | 3,653 | ||||||
China Mengniu Dairy Co Ltd | 311,000 | 2,004 | ||||||
China Merchants Port Holdings Co Ltd | 1,608,000 | 2,756 | ||||||
China Resources Gas Group Ltd | 116,421 | 611 | ||||||
China Resources Land Ltd | 3,046,000 | 12,842 | ||||||
China Resources Pharmaceutical Group Ltd | 4,233,500 | 2,087 | ||||||
China Southern Airlines Co Ltd, Cl H | 4,012,000 | 2,262 | ||||||
China Yongda Automobiles Services Holdings Ltd | 512,000 | 745 | ||||||
China Yuhua Education Corp Ltd | 3,418,000 | 1,661 | ||||||
Chinasoft International Ltd | 1,322 | 2 | ||||||
CIFI Holdings Group Co Ltd | 2,520,000 | 1,708 | ||||||
CITIC Ltd | 1,172,000 | 1,237 | ||||||
Country Garden Services Holdings Co Ltd | 78,130 | 615 | ||||||
CSPC Pharmaceutical Group Ltd | 1,026,247 | 1,222 | ||||||
Far East Horizon Ltd | 910,884 | 924 | ||||||
Galaxy Entertainment Group Ltd | 244,200 | 1,250 | ||||||
Geely Automobile Holdings Ltd | 2,470,542 | 7,090 | ||||||
GF Securities Co Ltd, Cl H | 241,013 | 419 | ||||||
Greentown Management Holdings Co Ltd | 3,201,113 | 1,330 | ||||||
Guangzhou Automobile Group Co Ltd, Cl H | 4,448,000 | 3,925 | ||||||
Hong Kong Exchanges & Clearing Ltd | 118,600 | 7,296 | ||||||
Hopson Development Holdings Ltd | 662,214 | 2,361 | ||||||
Huazhu Group Ltd * | 133,000 | 616 | ||||||
Innovent Biologics Inc * | 64,656 | 626 | ||||||
JD.com Inc, Cl A * | 315,506 | 11,540 | ||||||
Kingboard Holdings Ltd | 177,271 | 804 | ||||||
Kingboard Laminates Holdings Ltd | 2,399,182 | 3,950 | ||||||
Kuaishou Technology, Cl B * | 108,100 | 1,162 | ||||||
Kunlun Energy Co Ltd | 6,622,020 | 6,922 | ||||||
Lenovo Group Ltd | 4,524,659 | 4,986 | ||||||
Li Ning Co Ltd | 471,988 | 5,495 | ||||||
Meituan, Cl B * | 602,200 | 19,191 | ||||||
Nine Dragons Paper Holdings Ltd | 1,712,000 | 2,092 | ||||||
People’s Insurance Co Group of China Ltd/ The, Cl H | 3,080,407 | 956 | ||||||
Postal Savings Bank of China Co Ltd, Cl H | 4,461,000 | 3,078 | ||||||
Q Technology Group Co Ltd | 817,585 | 1,177 | ||||||
Shanghai Pharmaceuticals Holding Co Ltd, Cl H | 2,254,209 | 4,370 | ||||||
Shenzhen International Holdings Ltd | 15,751 | 20 | ||||||
Sino Biopharmaceutical Ltd | 787,000 | 655 | ||||||
SITC International Holdings Co Ltd | 233,013 | 835 | ||||||
Smoore International Holdings Ltd | 117,000 | 546 | ||||||
| Description | Shares | Market Value ($ Thousands) | ||||||
COMMON STOCK (continued) | ||||||||
Sunny Optical Technology Group Co Ltd | 115,002 | $ | 3,012 | |||||
Topsports International Holdings Ltd | 705,000 | 799 | ||||||
Vinda International Holdings Ltd | 612,000 | 1,807 | ||||||
WH Group Ltd | 3,632,250 | 2,579 | ||||||
WuXi AppTec Co Ltd, Cl H | 28,100 | 656 | ||||||
Wuxi Biologics Cayman Inc * | 154,955 | 2,536 | ||||||
Xiaomi Corp, Cl B * | 916,005 | 2,541 | ||||||
Xinyi Solar Holdings Ltd | 4,086,458 | 8,357 | ||||||
Yadea Group Holdings Ltd | 2,698,000 | 4,442 | ||||||
Yuexiu Property Co Ltd | 712,025 | 669 | ||||||
|
|
| ||||||
| 181,548 | ||||||||
|
|
| ||||||
Hungary — 1.1% | ||||||||
MOL Hungarian Oil & Gas PLC | 100,460 | 836 | ||||||
OTP Bank Nyrt * | 175,056 | 10,281 | ||||||
Richter Gedeon Nyrt | 384,308 | 10,521 | ||||||
|
|
| ||||||
| 21,638 | ||||||||
|
|
| ||||||
India — 12.1% | ||||||||
ACC Ltd | 22,041 | 668 | ||||||
Ambuja Cements Ltd | 452,902 | 2,438 | ||||||
Apollo Hospitals Enterprise Ltd | 55,484 | 3,347 | ||||||
Aptus Value Housing Finance India Ltd * | 466,060 | 1,975 | ||||||
AU Small Finance Bank Ltd * | 131,378 | 2,055 | ||||||
Avenue Supermarts Ltd * | 10,954 | 627 | ||||||
Axis Bank Ltd | 79,815 | 818 | ||||||
Bajaj Auto Ltd | 22,769 | 1,174 | ||||||
Bajaj Finance Ltd | 14,024 | 1,442 | ||||||
Bajaj Finserv Ltd | 2,723 | 651 | ||||||
Bharat Electronics Ltd | 542,788 | 1,480 | ||||||
Bharat Petroleum Corp Ltd | 119,040 | 692 | ||||||
Bharti Airtel Ltd * | 317,845 | 2,940 | ||||||
Cartrade Tech Ltd * | 45,709 | 757 | ||||||
Cipla Ltd/India | 115,846 | 1,534 | ||||||
Container Corp Of India Ltd | 285,039 | 2,702 | ||||||
Divi’s Laboratories Ltd | 26,862 | 1,735 | ||||||
DLF Ltd | 198,122 | 1,108 | ||||||
EPL Ltd | 820,573 | 2,642 | ||||||
GAIL India Ltd | 1,693,417 | 3,620 | ||||||
GMM Pfaudler Ltd | 24,158 | 1,437 | ||||||
Godrej Properties Ltd * | 105,523 | 3,286 | ||||||
HCL Technologies Ltd | 714,925 | 12,293 | ||||||
HDFC Bank Ltd | 294,409 | 6,310 | ||||||
HDFC Life Insurance Co Ltd | 72,493 | 704 | ||||||
Hero MotoCorp Ltd | 89,931 | 3,428 | ||||||
Hindalco Industries Ltd | 226,263 | 1,485 | ||||||
Hindustan Unilever Ltd | 108,361 | 3,939 | ||||||
Housing Development Finance Corp Ltd | 504,165 | 18,606 | ||||||
ICICI Bank Ltd | 993,182 | 9,310 | ||||||
ICICI Bank Ltd ADR | 537,561 | 10,144 | ||||||
ICICI Lombard General Insurance Co Ltd | 126,290 | 2,698 | ||||||
Indian Hotels Co Ltd/The | 119,229 | 290 | ||||||
Indian Oil Corp Ltd | 930,878 | 1,565 | ||||||
IndusInd Bank Ltd | 310,653 | 4,625 | ||||||
SEI Institutional International Trust / Annual Report / September 30, 2021 |
25 |
SCHEDULE OF INVESTMENTS
September 30, 2021
Emerging Market Equity Fund (Continued)
| Description | Shares | Market Value ($ Thousands) | ||||||
COMMON STOCK (continued) | ||||||||
Infosys Ltd | 231,498 | $ | 5,202 | |||||
Infosys Ltd ADR | 516,915 | 11,501 | ||||||
InterGlobe Aviation Ltd | 151,528 | 4,123 | ||||||
IRB Infrastructure Developers Ltd * | 1,207,411 | 3,307 | ||||||
ITC Ltd | 198,131 | 628 | ||||||
JM Financial Ltd | 367,047 | 457 | ||||||
Jubilant Foodworks Ltd | 21,720 | 1,182 | ||||||
Kotak Mahindra Bank Ltd | 27,976 | 753 | ||||||
Larsen & Toubro Ltd | 84,662 | 1,933 | ||||||
LIC Housing Finance Ltd | 194,234 | 1,115 | ||||||
Manappuram Finance Ltd | 396,940 | 902 | ||||||
Marico Ltd | 92,161 | 681 | ||||||
NTPC Ltd | 896,628 | 1,710 | ||||||
Oil & Natural Gas Corp Ltd | 602,509 | 1,166 | ||||||
Page Industries Ltd | 2,259 | 963 | ||||||
Persistent Systems Ltd | 17,807 | 892 | ||||||
Petronet LNG Ltd | 2,166,737 | 6,960 | ||||||
Piramal Enterprises Ltd | 30,522 | 1,064 | ||||||
Power Grid Corp of India Ltd | 458,180 | 1,173 | ||||||
REC Ltd | 461,906 | 978 | ||||||
Reliance Industries Ltd | 825,460 | 26,060 | ||||||
SBI Cards & Payment Services Ltd * | 329,831 | 4,562 | ||||||
SBI Life Insurance Co Ltd | 89,865 | 1,469 | ||||||
Sona Blw Precision Forgings Ltd * | 298,373 | 2,241 | ||||||
Spandana Sphoorty Financial Ltd * | 83,720 | 644 | ||||||
State Bank of India | 1,058,946 | 6,416 | ||||||
Sun Pharmaceutical Industries Ltd | 91,442 | 1,007 | ||||||
Tata Consultancy Services Ltd | 258,972 | 13,141 | ||||||
Tata Consumer Products Ltd | 75,375 | 826 | ||||||
Tata Power Co Ltd/The | 586,907 | 1,253 | ||||||
Tata Steel Ltd | 34,389 | 596 | ||||||
Tech Mahindra Ltd | 48,422 | 897 | ||||||
Titan Co Ltd | 50,075 | 1,455 | ||||||
Torrent Power Ltd | 496,141 | 3,376 | ||||||
UltraTech Cement Ltd | 42,122 | 4,190 | ||||||
United Breweries Ltd | 110,264 | 2,336 | ||||||
UPL Ltd | 68,235 | 648 | ||||||
Vedanta Ltd | 225,314 | 869 | ||||||
Wipro Ltd | 127,637 | 1,087 | ||||||
WNS Holdings Ltd ADR * | 17,029 | 1,393 | ||||||
|
|
| ||||||
| 235,681 | ||||||||
|
|
| ||||||
Indonesia — 1.3% | ||||||||
Adaro Energy Tbk PT | 12,383,200 | 1,517 | ||||||
Astra International Tbk PT | 7,688,600 | 2,943 | ||||||
Bank Central Asia Tbk PT | 1,094,308 | 2,670 | ||||||
Bank Mandiri Persero Tbk PT | 3,080,500 | 1,319 | ||||||
Bank Rakyat Indonesia Persero Tbk PT | 28,380,693 | 7,592 | ||||||
Bukalapak.com PT Tbk * | 29,961,700 | 1,793 | ||||||
Indofood Sukses Makmur Tbk PT | 4,282,700 | 1,899 | ||||||
Sarana Menara Nusantara Tbk PT | 11,303,055 | 1,042 | ||||||
| Description | Shares | Market Value ($ Thousands) | ||||||
COMMON STOCK (continued) | ||||||||
Telkom Indonesia Persero Tbk PT | 14,423,700 | $ | 3,702 | |||||
|
|
| ||||||
| 24,477 | ||||||||
|
|
| ||||||
Jordan — 0.0% | ||||||||
Hikma Pharmaceuticals PLC | 21,959 | 723 | ||||||
|
|
| ||||||
Malaysia — 0.3% | ||||||||
CIMB Group Holdings Bhd | 1,107,174 | 1,260 | ||||||
Frontken Corp Bhd | 1,198,490 | 1,024 | ||||||
Hong Leong Bank Bhd | 186,787 | 843 | ||||||
IHH Healthcare Bhd | 631,800 | 1,007 | ||||||
Sime Darby Bhd | 790,070 | 428 | ||||||
Telekom Malaysia Bhd | 451,805 | 615 | ||||||
|
|
| ||||||
| 5,177 | ||||||||
|
|
| ||||||
Mexico — 1.9% | ||||||||
Alfa SAB de CV, Cl A | 3,458,751 | 2,412 | ||||||
America Movil SAB de CV ADR, Cl L | 94,646 | 1,672 | ||||||
Cemex SAB de CV ADR * | 1,068,331 | 7,660 | ||||||
Coca-Cola Femsa SAB de CV | 293,063 | 1,662 | ||||||
Fomento Economico Mexicano SAB de CV | 405,654 | 3,536 | ||||||
Grupo Bimbo SAB de CV, Ser A | 277,646 | 784 | ||||||
Grupo Financiero Banorte SAB de CV, Cl O | 1,566,722 | 10,088 | ||||||
Grupo Mexico SAB de CV, Ser B | 728,559 | 2,911 | ||||||
Kimberly-Clark de Mexico SAB de CV, Cl A | 269,526 | 445 | ||||||
Megacable Holdings SAB de CV | 84,738 | 259 | ||||||
Promotora y Operadora de Infraestructura SAB de CV | 130,600 | 907 | ||||||
Qualitas Controladora SAB de CV | 55,343 | 256 | ||||||
Wal-Mart de Mexico SAB de CV | 1,021,993 | 3,480 | ||||||
|
|
| ||||||
| 36,072 | ||||||||
|
|
| ||||||
Netherlands — 0.2% | ||||||||
InPost SA * | 123,913 | 2,054 | ||||||
Prosus NV | 22,475 | 1,791 | ||||||
|
|
| ||||||
| 3,845 | ||||||||
|
|
| ||||||
Norway — 0.1% | ||||||||
Yara International ASA | 38,393 | 1,907 | ||||||
|
|
| ||||||
Peru — 0.1% | ||||||||
Credicorp Ltd | 14,124 | 1,567 | ||||||
|
|
| ||||||
Philippines — 0.1% | ||||||||
BDO Unibank Inc | 283,782 | 613 | ||||||
International Container Terminal Services Inc | 115,339 | 440 | ||||||
Monde Nissin Corp * | 4,924,200 | 1,810 | ||||||
|
|
| ||||||
| 2,863 | ||||||||
|
|
| ||||||
Poland — 1.1% | ||||||||
Allegro.eu SA * | 224,011 | 3,263 | ||||||
Cyfrowy Polsat SA | 106,626 | 957 | ||||||
Dino Polska SA * | 96,253 | 8,033 | ||||||
PGE Polska Grupa Energetyczna SA * | 38,327 | 86 | ||||||
Polski Koncern Naftowy ORLEN SA | 167,600 | 3,449 | ||||||
Polskie Gornictwo Naftowe i Gazownictwo SA | 557,169 | 905 | ||||||
Powszechna Kasa Oszczednosci Bank Polski SA * | 108,752 | 1,152 | ||||||
26 |
SEI Institutional International Trust / Annual Report / September 30, 2021 |
| Description | Shares | Market Value ($ Thousands) | ||||||
COMMON STOCK (continued) | ||||||||
Powszechny Zaklad Ubezpieczen SA | 338,054 | $ | 3,098 | |||||
|
|
| ||||||
| 20,943 | ||||||||
|
|
| ||||||
Qatar — 0.1% | ||||||||
Industries Qatar QSC | 181,359 | 769 | ||||||
Ooredoo QPSC | 343,423 | 692 | ||||||
Qatar National Bank QPSC | 128,814 | 677 | ||||||
|
|
| ||||||
| 2,138 | ||||||||
|
|
| ||||||
Russia — 4.7% | ||||||||
Alrosa PJSC | 530,920 | 970 | ||||||
Detsky Mir PJSC | 1,287,672 | 2,307 | ||||||
Gazprom PJSC | 720,642 | 3,580 | ||||||
Gazprom PJSC ADR (A) | 622,630 | 6,189 | ||||||
LUKOIL PJSC ADR | 256,787 | 24,326 | ||||||
Magnit GDR * | 131,843 | 2,204 | ||||||
Magnit PJSC GDR | 13,117 | 222 | ||||||
Mobile TeleSystems PJSC ADR | 592,157 | 5,708 | ||||||
Polyus PJSC | 9,893 | 1,626 | ||||||
Rosneft Oil Co PJSC | 532,065 | 4,503 | ||||||
Sberbank of Russia PJSC | 841,978 | 3,942 | ||||||
Sberbank of Russia PJSC ADR | 1,067,796 | 20,021 | ||||||
Surgutneftegas PJSC ADR | 467,787 | 2,320 | ||||||
X5 Retail Group NV GDR | 59,483 | 1,930 | ||||||
Yandex NV, Cl A * | 140,362 | 11,186 | ||||||
|
|
| ||||||
| 91,034 | ||||||||
|
|
| ||||||
Saudi Arabia — 1.4% | ||||||||
Al Hammadi Co for Development and Investment | 78,349 | 803 | ||||||
Al Rajhi Bank | 121,794 | 3,981 | ||||||
Alinma Bank | 190,843 | 1,219 | ||||||
Banque Saudi Fransi | 61,163 | 680 | ||||||
Dr Sulaiman Al Habib Medical Services Group Co | 11,821 | 548 | ||||||
Riyad Bank | 495,103 | 3,550 | ||||||
SABIC Agri-Nutrients Co | 33,183 | 1,530 | ||||||
Sahara International Petrochemical Co | 137,842 | 1,612 | ||||||
Saudi Arabian Mining Co * | 63,520 | 1,418 | ||||||
Saudi Basic Industries Corp | 26,927 | 913 | ||||||
Saudi British Bank/The | 76,206 | 673 | ||||||
Saudi Electricity Co | 93,738 | 672 | ||||||
Saudi Industrial Investment Group | 118,275 | 1,288 | ||||||
Saudi National Bank/The | 387,908 | 6,347 | ||||||
Saudi Telecom Co | 30,741 | 1,038 | ||||||
United Electronics Co | 22,631 | 862 | ||||||
|
|
| ||||||
| 27,134 | ||||||||
|
|
| ||||||
Singapore — 0.0% | ||||||||
Yangzijiang Shipbuilding Holdings Ltd | 741,483 | 751 | ||||||
|
|
| ||||||
South Africa — 3.6% | ||||||||
Absa Group Ltd | 204,064 | 2,064 | ||||||
African Rainbow Minerals Ltd (A) | 42,322 | 533 | ||||||
Aspen Pharmacare Holdings Ltd | 109,719 | 1,972 | ||||||
Bid Corp Ltd | 179,498 | 3,875 | ||||||
Capitec Bank Holdings Ltd | 31,890 | 3,858 | ||||||
| Description | Shares | Market Value ($ Thousands) | ||||||
COMMON STOCK (continued) | ||||||||
Cie Financiere Richemont SA (A) | 139,419 | $ | 1,437 | |||||
Exxaro Resources Ltd (A) | 71,260 | 765 | ||||||
FirstRand Ltd | 1,024,512 | 4,389 | ||||||
Gold Fields Ltd | 73,411 | 600 | ||||||
Gold Fields Ltd ADR | 556,101 | 4,515 | ||||||
Kumba Iron Ore Ltd | 77,874 | 2,554 | ||||||
Mr Price Group Ltd | 320,348 | 4,293 | ||||||
MTN Group Ltd | 225,329 | 2,113 | ||||||
Naspers Ltd, Cl N | 79,252 | 13,209 | ||||||
Nedbank Group Ltd (A) | 342,000 | 3,970 | ||||||
Old Mutual Ltd | 2,730,859 | 2,996 | ||||||
Remgro Ltd | 120,792 | 1,091 | ||||||
Sasol Ltd | 100,810 | 1,907 | ||||||
Shoprite Holdings Ltd | 361,436 | 4,294 | ||||||
Sibanye Stillwater Ltd | 1,406,698 | 4,335 | ||||||
SPAR Group Ltd/The | 51,118 | 666 | ||||||
Standard Bank Group Ltd | 76,086 | 723 | ||||||
Vodacom Group Ltd | 152,991 | 1,465 | ||||||
Woolworths Holdings Ltd/South Africa | 327,499 | 1,282 | ||||||
|
|
| ||||||
| 68,906 | ||||||||
|
|
| ||||||
South Korea — 11.8% | ||||||||
BGF retail Co Ltd | 2,824 | 404 | ||||||
Celltrion Inc * | 2,772 | 604 | ||||||
Cheil Worldwide Inc | 101,103 | 1,934 | ||||||
CJ CheilJedang Corp | 16,531 | 5,694 | ||||||
CJ ENM Co Ltd | 37,966 | 4,818 | ||||||
Coway Co Ltd | 72,615 | 4,537 | ||||||
DB HiTek Co Ltd | 25,545 | 1,160 | ||||||
DB Insurance Co Ltd | 27,627 | 1,477 | ||||||
Doosan Fuel Cell Co Ltd *(A) | 37,445 | 1,618 | ||||||
E-MART Inc | 6,871 | 947 | ||||||
Fila Holdings Corp | 18,884 | 674 | ||||||
GS Engineering & Construction Corp | 23,818 | 851 | ||||||
GS Holdings Corp | 46,789 | 1,754 | ||||||
Hana Financial Group Inc | 356,593 | 13,837 | ||||||
Hankook Tire & Technology Co Ltd | 70,683 | 2,556 | ||||||
Hyundai Mobis Co Ltd | 28,675 | 6,068 | ||||||
Hyundai Motor Co | 3,637 | 607 | ||||||
Kakao Corp | 27,885 | 2,753 | ||||||
KakaoBank Corp *(A) | 27,346 | 1,543 | ||||||
KB Financial Group Inc | 66,131 | 3,084 | ||||||
KH Vatec Co Ltd *(A) | 74,954 | 1,478 | ||||||
Kia Corp | 116,741 | 7,886 | ||||||
Korea Gas Corp | 24,162 | 988 | ||||||
Korea Petrochemical Ind Co Ltd | 12,072 | 2,168 | ||||||
Krafton Inc *(A) | 1,398 | 596 | ||||||
Kumho Petrochemical Co Ltd | 6,048 | 956 | ||||||
LG Chem Ltd | 7,029 | 4,557 | ||||||
LG Electronics Inc | 50,585 | 5,357 | ||||||
LG Innotek Co Ltd | 6,777 | 1,178 | ||||||
LG Uplus Corp | 80,472 | 1,013 | ||||||
Lotte Chemical Corp | 4,177 | 843 | ||||||
SEI Institutional International Trust / Annual Report / September 30, 2021 |
27 |
SCHEDULE OF INVESTMENTS
September 30, 2021
Emerging Market Equity Fund (Continued)
| Description | Shares | Market Value ($ Thousands) | ||||||
COMMON STOCK (continued) | ||||||||
LOTTE Fine Chemical Co Ltd | 8,643 | $ | 662 | |||||
Mando Corp | 37,880 | 1,801 | ||||||
NAVER Corp | 19,216 | 6,255 | ||||||
NCSoft Corp | 15,493 | 7,871 | ||||||
NICE Information Service Co Ltd | 38,248 | 655 | ||||||
Orion Corp/Republic of Korea | 28,645 | 2,838 | ||||||
Pan Ocean Co Ltd | 347,279 | 2,188 | ||||||
PI Advanced Materials Co Ltd | 41,834 | 1,943 | ||||||
POSCO | 16,799 | 4,654 | ||||||
POSCO ADR | 23,007 | 1,587 | ||||||
Samsung Biologics Co Ltd * | 6,161 | 4,528 | ||||||
Samsung Electro-Mechanics Co Ltd | 29,006 | 4,297 | ||||||
Samsung Electronics Co Ltd | 1,109,546 | 68,598 | ||||||
Samsung Engineering Co Ltd * | 32,392 | 691 | ||||||
Samsung Fire & Marine Insurance Co Ltd | 3,331 | 659 | ||||||
Samsung SDI Co Ltd | 4,897 | 2,944 | ||||||
Shinhan Financial Group Co Ltd | 30,500 | 1,032 | ||||||
Shinsegae Inc | 3,442 | 761 | ||||||
SK Hynix Inc | 145,339 | 12,411 | ||||||
SK Innovation Co Ltd | 2,894 | 639 | ||||||
SK Telecom Co Ltd | 40,955 | 11,146 | ||||||
SK Telecom Co Ltd ADR | 21,617 | 651 | ||||||
S-Oil Corp | 17,443 | 1,603 | ||||||
Solus Advanced Materials Co Ltd | 31,776 | 1,899 | ||||||
Soulbrain Co Ltd/New (A) | 8,815 | 2,015 | ||||||
|
|
| ||||||
| 228,268 | ||||||||
|
|
| ||||||
Switzerland — 0.1% | ||||||||
Wizz Air Holdings Plc * | 33,015 | 2,224 | ||||||
|
|
| ||||||
Taiwan — 13.1% | ||||||||
Accton Technology Corp | 151,200 | 1,425 | ||||||
ASE Technology Holding Co Ltd | 207,992 | 803 | ||||||
Asia Vital Components Co Ltd | 305,000 | 858 | ||||||
ASPEED Technology Inc | 11,000 | 909 | ||||||
Cathay Financial Holding Co Ltd | 446,503 | 927 | ||||||
Chailease Holding Co Ltd | 779,445 | 6,842 | ||||||
China Steel Corp | 373,000 | 484 | ||||||
ChipMOS Technologies Inc | 460,737 | 781 | ||||||
Chunghwa Telecom Co Ltd | 844,000 | 3,350 | ||||||
CTBC Financial Holding Co Ltd | 9,694,000 | 7,946 | ||||||
Delta Electronics Inc | 665,000 | 5,975 | ||||||
E.Sun Financial Holding Co Ltd | 1,313,807 | 1,236 | ||||||
Elite Material Co Ltd | 44,000 | 342 | ||||||
eMemory Technology Inc | 13,000 | 915 | ||||||
Formosa Chemicals & Fibre Corp | 635,000 | 1,902 | ||||||
Formosa Plastics Corp | 216,000 | 876 | ||||||
Formosa Sumco Technology Corp | 209,000 | 1,201 | ||||||
Fubon Financial Holding Co Ltd | 4,008,531 | 10,956 | ||||||
Gigabyte Technology Co Ltd | 264,000 | 820 | ||||||
Global Unichip Corp | 49,000 | 871 | ||||||
Hon Hai Precision Industry Co Ltd | 854,000 | 3,189 | ||||||
Keystone Microtech Corp | 155,000 | 1,709 | ||||||
LandMark Optoelectronics Corp | 191,000 | 1,535 | ||||||
| Description | Shares | Market Value ($ Thousands) | ||||||
COMMON STOCK (continued) | ||||||||
Largan Precision Co Ltd | 35,000 | $ | 2,729 | |||||
Lite-On Technology Corp | 684,000 | 1,522 | ||||||
MediaTek Inc | 427,628 | 13,877 | ||||||
Merida Industry Co Ltd | 174,000 | 1,816 | ||||||
Micro-Star International Co Ltd | 1,093,000 | 5,031 | ||||||
Nan Ya Plastics Corp | 640,000 | 2,092 | ||||||
Nan Ya Printed Circuit Board Corp | 65,000 | 1,002 | ||||||
Nien Made Enterprise Co Ltd | 133,079 | 1,885 | ||||||
Parade Technologies Ltd | 22,600 | 1,333 | ||||||
Pou Chen | 1,024,000 | 1,235 | ||||||
Powertech Technology Inc | 378,250 | 1,410 | ||||||
Realtek Semiconductor Corp | 34,003 | 603 | ||||||
RichWave Technology Corp | 325,400 | 2,736 | ||||||
Silergy Corp | 15,790 | 2,304 | ||||||
SinoPac Financial Holdings Co Ltd | 1,517,729 | 754 | ||||||
Taishin Financial Holding Co Ltd | 2,131,624 | 1,380 | ||||||
Taiwan Cement Corp | 2,512,000 | 4,582 | ||||||
Taiwan Paiho Ltd | 815,000 | 2,363 | ||||||
Taiwan Semiconductor Manufacturing Co Ltd | 5,382,278 | 111,087 | ||||||
Taiwan Semiconductor Manufacturing Co Ltd ADR | 111,806 | 12,483 | ||||||
Tong Hsing Electronic Industries Ltd | 387,313 | 3,101 | ||||||
Unimicron Technology Corp | 644,000 | 3,038 | ||||||
Uni-President Enterprises Corp | 2,523,000 | 6,158 | ||||||
United Microelectronics Corp | 2,247,272 | 5,108 | ||||||
Vanguard International Semiconductor Corp | 225,000 | 1,219 | ||||||
Wiwynn Corp * | 164,000 | 5,098 | ||||||
Yageo Corp | 71,000 | 1,112 | ||||||
Yuanta Financial Holding Co Ltd | 742,084 | 655 | ||||||
|
|
| ||||||
| 253,565 | ||||||||
|
|
| ||||||
Thailand — 1.7% | ||||||||
Advanced Info Service PCL (F) | 520,300 | 3,003 | ||||||
Bangkok Dusit Medical Services PCL NVDR | 2,049,516 | 1,374 | ||||||
Central Pattana PCL | 1,642,300 | 2,555 | ||||||
Global Power Synergy PCL NVDR | 375,930 | 834 | ||||||
Home Product Center PCL (F) | 15,743,354 | 6,287 | ||||||
Indorama Ventures PCL NVDR | 951,700 | 1,239 | ||||||
Kasikornbank PCL | 347,800 | 1,354 | ||||||
Land & Houses PCL NVDR | 3,313,616 | 775 | ||||||
Ngern Tid Lor PCL * | 2,253,400 | 2,214 | ||||||
PTT PCL NVDR | 5,513,400 | 6,306 | ||||||
Siam Cement PCL/The (F) | 180,700 | 2,138 | ||||||
Siam Cement PCL/The NVDR | 54,000 | 639 | ||||||
Thai Beverage PCL | 3,710,150 | 1,783 | ||||||
Thai Union Group PCL, Cl F (F) | 2,725,000 | 1,744 | ||||||
|
|
| ||||||
| 32,245 | ||||||||
|
|
| ||||||
Turkey — 0.8% | ||||||||
Akbank TAS | 3,272,524 | 1,963 | ||||||
Haci Omer Sabanci Holding AS | 629,042 | 693 | ||||||
KOC Holding AS | 300,637 | 764 | ||||||
28 |
SEI Institutional International Trust / Annual Report / September 30, 2021 |
| Description | Shares | Market Value ($ Thousands) | ||||||
COMMON STOCK (continued) | ||||||||
Turk Hava Yollari AO * | 573,876 | $ | 899 | |||||
Turkcell Iletisim Hizmetleri AS (A) | 752,830 | 1,296 | ||||||
Turkiye Garanti Bankasi AS | 7,248,429 | 7,527 | ||||||
Turkiye Sise ve Cam Fabrikalari AS | 2,404,367 | 2,216 | ||||||
|
|
| ||||||
| 15,358 | ||||||||
|
|
| ||||||
United Arab Emirates — 0.6% | ||||||||
Abu Dhabi Commercial Bank PJSC | 644,794 | 1,314 | ||||||
Aldar Properties PJSC | 1,132,702 | 1,255 | ||||||
Emaar Properties PJSC | 5,378,620 | 5,952 | ||||||
Emirates NBD Bank PJSC | 314,840 | 1,211 | ||||||
Emirates Telecommunications Group Co PJSC | 98,516 | 644 | ||||||
First Abu Dhabi Bank PJSC | 312,486 | 1,510 | ||||||
|
|
| ||||||
| 11,886 | ||||||||
|
|
| ||||||
United Kingdom — 1.4% | ||||||||
Anglo American PLC | 114,797 | 4,053 | ||||||
Antofagasta PLC | 67,381 | 1,226 | ||||||
Endeavour Mining PLC | 10,400 | 240 | ||||||
Fix Price Group Ltd GDR | 534,482 | 4,822 | ||||||
Hochschild Mining PLC | 248,671 | 445 | ||||||
Kaspi.KZ JSC GDR | 50,986 | 5,790 | ||||||
NAC Kazatomprom JSC GDR | 42,749 | 1,539 | ||||||
Network International Holdings PLC * | 477,501 | 2,330 | ||||||
Novatek PJSC GDR | 2,864 | 754 | ||||||
Polymetal International PLC | 158,514 | 2,690 | ||||||
Polyus PJSC GDR | 9,560 | 785 | ||||||
Tullow Oil PLC *(A) | 3,098,101 | 2,127 | ||||||
|
|
| ||||||
| 26,801 | ||||||||
|
|
| ||||||
United States — 0.3% | ||||||||
Livent Corp * | 50,380 | 1,164 | ||||||
Pagseguro Digital Ltd, Cl A * | 69,904 | 3,615 | ||||||
Southern Copper Corp | 10,510 | 590 | ||||||
Vasta Platform Ltd, Cl A * | 88,700 | 405 | ||||||
|
|
| ||||||
| 5,774 | ||||||||
|
|
| ||||||
Vietnam — 0.3% | ||||||||
Hoa Phat Group JSC | 1,561,821 | 3,654 | ||||||
Vincom Retail JSC * | 2,421,545 | 3,081 | ||||||
|
|
| ||||||
| 6,735 | ||||||||
|
|
| ||||||
Total Common Stock | 1,806,579 | |||||||
|
|
| ||||||
PREFERRED STOCK — 1.9% | ||||||||
Brazil — 0.8% | ||||||||
Banco Bradesco SA (B) | 1,451,270 | 5,540 | ||||||
Bradespar SA (B) | 137,369 | 1,311 | ||||||
Centrais Eletricas Brasileiras SA (B) | 130,796 | 931 | ||||||
Cia Energetica de Minas Gerais (B) | 864,400 | 2,221 | ||||||
Cia Paranaense de Energia (B) | 516,770 | 693 | ||||||
Itau Unibanco Holding SA, 4.160% | 275,396 | 1,463 | ||||||
Itausa SA, 3.240% | 663,351 | 1,362 | ||||||
| Description | Shares | Market Value ($ Thousands) | ||||||
PREFERRED STOCK (continued) | ||||||||
Petroleo Brasileiro SA (B) | 219,700 | $ | 1,097 | |||||
Usinas Siderurgicas de Minas Gerais SA Usiminas(B) | 328,686 | 973 | ||||||
|
|
| ||||||
| 15,591 | ||||||||
|
|
| ||||||
Chile — 0.2% | ||||||||
Sociedad Quimica y Minera de Chile SA, Cl B(B) | 62,415 | 3,363 | ||||||
|
|
| ||||||
South Korea — 0.9% | ||||||||
Hyundai Motor Co (B) | 50,326 | 4,032 | ||||||
LG Chem Ltd (B) | 8,499 | 2,664 | ||||||
LG Electronics *(B) | 21,377 | 1,170 | ||||||
Samsung Electronics Co Ltd(B) | 170,678 | 9,964 | ||||||
|
|
| ||||||
| 17,830 | ||||||||
|
|
| ||||||
Total Preferred Stock | 36,784 | |||||||
|
|
| ||||||
| Number of Rights | ||||||||
RIGHTS — 0.0% | ||||||||
India — 0.0% | ||||||||
Bharti Airtel Ltd, Expires 10/28/2021 * | 24,682 | 51 | ||||||
|
|
| ||||||
South Korea — 0.0% | ||||||||
Hyundai Engineering & Construction Co Ltd *‡‡ | 256 | 17 | ||||||
|
|
| ||||||
Taiwan — 0.0% | ||||||||
Fubon Financial, Expires | 209,816 | 84 | ||||||
|
|
| ||||||
Total Rights | 152 | |||||||
|
|
| ||||||
| Face Amount | ||||||||
| (Thousands) | ||||||||
DEBENTURE BOND — 0.0% | ||||||||
Brazil — 0.0% | ||||||||
Vale, Ser 1997 | ||||||||
0.000% (C)(D) | BRL | 8 | – | |||||
|
|
| ||||||
Total Debenture Bond | – | |||||||
|
|
| ||||||
| Number of | ||||||||
| Warrants | ||||||||
WARRANT — 0.0% | ||||||||
Thailand — 0.0% | ||||||||
RS PCL, Expires 12/31/2024 * | 186,420 | – | ||||||
|
|
| ||||||
Total Warrant | – | |||||||
|
|
| ||||||
SEI Institutional International Trust / Annual Report / September 30, 2021 |
29 |
SCHEDULE OF INVESTMENTS
September 30, 2021
Emerging Market Equity Fund (Concluded)
Description | Shares | Market Value ($ Thousands) | ||||||
AFFILIATED PARTNERSHIP — 1.0% | ||||||||
SEI Liquidity Fund, L.P. | ||||||||
0.010% **†(E) | 17,851,952 | $ | 17,858 | |||||
|
|
| ||||||
Total Affiliated Partnership | 17,858 | |||||||
|
|
| ||||||
CASH EQUIVALENT — 3.1% | ||||||||
SEI Daily Income Trust, Government Fund, Cl F | ||||||||
0.010%**† | 60,831,741 | 60,832 | ||||||
|
|
| ||||||
Total Cash Equivalent | 60,832 | |||||||
|
|
| ||||||
Total Investments in Securities — 99.1% | $ | 1,922,205 | ||||||
|
|
| ||||||
A list of the open futures contracts held by the Fund at September 30, 2021, is as follows:
Type of Contract | Number of Contracts | Expiration Date | Notional Amount (Thousands) | Value (Thousands) | Unrealized Appreciation/ (Depreciation) (Thousands) | |||||||||||||||
Long Contracts | ||||||||||||||||||||
MSCI Emerging Markets | 1,188 | Dec-2021 | $ | 76,188 | $ | 73,988 | $ | (2,200) | ||||||||||||
|
|
|
|
|
| |||||||||||||||
Percentages are based on Net Assets of $1,940,282 ($ Thousands).
| * | Non-income producing security. |
| ** | The rate reported is the 7-day effective yield as of September 30, 2021. |
| † | Investment in Affiliated Security (see Note 5). |
| ‡‡ | Expiration date not available. |
| (A) | Certain securities or partial positions of certain securities are on loan at September 30, 2021 (see Note 9). The total market value of securities on loan at September 30, 2021 was $16,962 ($ Thousands). |
| (B) | There is currently no rate available. |
| (C) | Variable or floating rate security, the interest rate of which adjusts periodically based on changes in current interest rates and prepayments on the underlying pool of assets. |
| (D) | Perpetual security with no stated maturity date. |
| (E) | This security was purchased with cash collateral held from securities on loan (see Note 9). The total market value of such securities as of September 30, 2021 was $17,858 ($ Thousands). |
| (F) | Securities considered illiquid. The total value of such securities as of September 30, 2021 was $13,172 ($ Thousands) and represented 0.7% of the Net Assets of the Fund. |
ADR — American Depositary Receipt
BRL — Brazilian Real
Cl — Class
GDR — Global Depositary Receipt
JSC — Joint-Stock Company
L.P. — Limited Partnership
Ltd. — Limited
MSCI — Morgan Stanley Capital International
NVDR — Non-Voting Depositary Receipt
PJSC — Public Joint-Stock Company
PLC — Public Limited Company
Ser — Series
The following is a list of the level of inputs used as of September 30, 2021, in valuing the Fund’s investments and other financial instruments carried at value ($ Thousands):
Investments in | Level 1 ($) | Level 2 ($) | Level 3 ($) | Total ($) | ||||||||||||
Common Stock | 361,126 | 1,445,453 | – | 1,806,579 | ||||||||||||
Preferred Stock | 18,954 | 17,830 | – | 36,784 | ||||||||||||
Rights | 152 | – | – | 152 | ||||||||||||
Debenture Bond | – | – | – | – | ||||||||||||
Warrant | – | – | – | – | ||||||||||||
Affiliated Partnership | – | 17,858 | – | 17,858 | ||||||||||||
Cash Equivalent | 60,832 | – | – | 60,832 | ||||||||||||
|
|
|
|
|
|
|
| |||||||||
Total Investments in Securities | 441,064 | 1,481,141 | – | 1,922,205 | ||||||||||||
|
|
|
|
|
|
|
| |||||||||
Other Financial | Level 1 ($) | Level 2 ($) | Level 3 ($) | Total ($) | ||||||||||||
Futures Contracts* | ||||||||||||||||
Unrealized Depreciation | (2,200) | – | – | (2,200) | ||||||||||||
|
|
|
|
|
|
|
| |||||||||
Total Other Financial Instruments | (2,200) | – | – | (2,200) | ||||||||||||
|
|
|
|
|
|
|
| |||||||||
*Futures contracts are valued at the unrealized depreciation on the instrument.
For the year ended September 30, 2021, there were no transfers in or out of Level 3.
For more information on valuation inputs, see Note 2 – Significant Accounting Policies in Notes to Financial Statements.
30 |
SEI Institutional International Trust / Annual Report / September 30, 2021 |
The following is a summary of the transactions with affiliates for the year ended September 30, 2021 ($ Thousands):
| Security Description | Value 9/30/2020 | Purchases at Cost | Proceeds from Sales | Realized Gain/ (Loss) | Change in Unrealized Depreciation | Value 9/30/2021 | Shares | Income | Capital Gains | |||||||||
SEI Liquidity Fund, L.P. | $ 20,023 | $ 162,185 | $ (164,347) | $ 2 | $ (5) | $ 17,858 | 17,851,952 | $ 302 | $ — | |||||||||
SEI Daily Income Trust, Government Fund, Cl F | 27,199 | 225,034 | (191,401) | — | — | 60,832 | 60,831,741 | 2 | — | |||||||||
|
|
|
|
|
|
|
| |||||||||||
Totals | $ 47,222 | $ 387,219 | $ (355,748) | $ 2 | $ (5) | $ 78,690 | $ 304 | $ — | ||||||||||
|
|
|
|
|
|
|
|
Amounts designated as “—” are $0 or have been rounded to $0.
The accompanying notes are an integral part of the financial statements.
SEI Institutional International Trust / Annual Report / September 30, 2021 |
31 |
SCHEDULE OF INVESTMENTS
September 30, 2021
International Fixed Income Fund
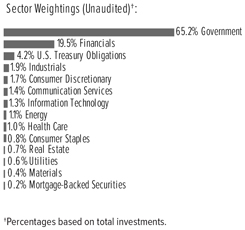
| Description | Face Amount (Thousands) | Market Value ($ Thousands) | ||||||||||
GLOBAL BONDS — 91.1% | ||||||||||||
Australia — 2.5% | ||||||||||||
Australia & New Zealand Banking Group MTN | ||||||||||||
5.000%, 08/16/2023 | AUD | 750 | $ | 588 | ||||||||
Australia Government Bond | ||||||||||||
4.750%, 04/21/2027 | 918 | 802 | ||||||||||
4.500%, 04/21/2033 | 640 | 607 | ||||||||||
3.750%, 04/21/2037 | 1,463 | 1,316 | ||||||||||
3.250%, 04/21/2025 | 843 | 669 | ||||||||||
3.000%, 03/21/2047 | 2,628 | 2,137 | ||||||||||
2.750%, 06/21/2035 | 1,243 | 1,005 | ||||||||||
2.750%, 05/21/2041 | 949 | 745 | ||||||||||
2.500%, 05/21/2030 | 1,154 | 912 | ||||||||||
2.250%, 05/21/2028 | 33 | 26 | ||||||||||
1.750%, 06/21/2051 | 831 | 520 | ||||||||||
0.500%, 09/21/2026 | 682 | 486 | ||||||||||
Commonwealth Bank of Australia MTN | ||||||||||||
3.000%, 05/03/2022 | EUR | 330 | 390 | |||||||||
0.375%, 04/11/2024 | 455 | 537 | ||||||||||
Glencore Capital Finance DAC MTN | ||||||||||||
0.750%, 03/01/2029 | 450 | 514 | ||||||||||
Glencore Finance Europe MTN | ||||||||||||
1.500%, 10/15/2026 | 120 | 146 | ||||||||||
National Australia Bank | ||||||||||||
5.000%, 03/11/2024 | AUD | 750 | 600 | |||||||||
2.990%, 05/21/2031 (A) | $ | 520 | 526 | |||||||||
National Australia Bank MTN | ||||||||||||
2.250%, 06/06/2025 | EUR | 206 | 261 | |||||||||
Westpac Banking MTN | ||||||||||||
1.250%, 01/14/2033 | 310 | 395 | ||||||||||
Westpac Banking Corp MTN | ||||||||||||
0.500%, 05/17/2024 | 505 | 598 | ||||||||||
|
|
| ||||||||||
| 13,780 | ||||||||||||
|
|
| ||||||||||
| Description | Face Amount (Thousands) | Market Value ($ Thousands) | ||||||||||
GLOBAL BONDS (continued) | ||||||||||||
Austria — 1.4% |
| |||||||||||
JAB Holdings BV | ||||||||||||
1.000%, 12/20/2027 | EUR | 400 | $ | 474 | ||||||||
Raiffeisen Bank International | ||||||||||||
2.875%, 06/18/2032 | 400 | 506 | ||||||||||
Republic of Austria Government Bond (A) | ||||||||||||
4.150%, 03/15/2037 | 403 | 741 | ||||||||||
2.400%, 05/23/2034 | 110 | 163 | ||||||||||
2.100%, 09/20/2117 | 50 | 92 | ||||||||||
0.850%, 06/30/2120 | 214 | 219 | ||||||||||
0.750%, 10/20/2026 | 1,784 | 2,195 | ||||||||||
0.750%, 03/20/2051 | 454 | 540 | ||||||||||
0.023%, 02/20/2031 (B) | 730 | 843 | ||||||||||
0.000%, 04/20/2025 (B) | 647 | 765 | ||||||||||
Republic of Austria Government Bond, Ser 97-6 | ||||||||||||
6.250%, 07/15/2027 | 649 | 1,046 | ||||||||||
|
|
| ||||||||||
| 7,584 | ||||||||||||
|
|
| ||||||||||
Belgium — 1.7% |
| |||||||||||
Ageas | ||||||||||||
1.875%, VAR Euribor 3 Month + 3.100%, 11/24/2051 | 200 | 234 | ||||||||||
Anheuser-Busch InBev MTN | ||||||||||||
2.250%, 05/24/2029 | GBP | 205 | 286 | |||||||||
1.150%, 01/22/2027 | EUR | 230 | 280 | |||||||||
Kingdom of Belgium Government Bond | ||||||||||||
4.250%, 03/28/2041 (A) | 470 | 907 | ||||||||||
3.750%, 06/22/2045 | 331 | 633 | ||||||||||
3.000%, 06/22/2034 (A) | 445 | 691 | ||||||||||
2.600%, 06/22/2024 (A) | 301 | 380 | ||||||||||
1.700%, 06/22/2050 (A) | 321 | 447 | ||||||||||
1.600%, 06/22/2047 (A) | 351 | 478 | ||||||||||
1.000%, 06/22/2026 (A) | 370 | 459 | ||||||||||
1.000%, 06/22/2031 (A) | 490 | 620 | ||||||||||
0.900%, 06/22/2029 (A) | 832 | 1,043 | ||||||||||
0.800%, 06/22/2025 (A) | 325 | 396 | ||||||||||
0.500%, 10/22/2024 (A) | 330 | 396 | ||||||||||
0.200%, 10/22/2023 (A) | 860 | 1,015 | ||||||||||
0.000%, 10/22/2027 (A)(B) | 1,133 | 1,340 | ||||||||||
Kingdom of Belgium Government Bond, Ser 44 | ||||||||||||
5.000%, 03/28/2035 (A) | 64 | 121 | ||||||||||
|
|
| ||||||||||
| 9,726 | ||||||||||||
|
|
| ||||||||||
Brazil — 0.0% |
| |||||||||||
OEC Finance | ||||||||||||
7.125%, 12/26/2046 | $ | 159 | 14 | |||||||||
4.375%, 10/25/2029 | 104 | 8 | ||||||||||
|
|
| ||||||||||
| 22 | ||||||||||||
|
|
| ||||||||||
Canada — 7.3% |
| |||||||||||
1011778 BC ULC | ||||||||||||
3.875%, 01/15/2028 (A) | 143 | 144 | ||||||||||
32 |
SEI Institutional International Trust / Annual Report / September 30, 2021 |
| Description | Face Amount (Thousands) | Market Value ($ Thousands) | ||||||||||
GLOBAL BONDS (continued) |
| |||||||||||
Bank of Nova Scotia | ||||||||||||
0.010%, 03/18/2025 | EUR | 645 | $ | 755 | ||||||||
Bell Canada MTN | ||||||||||||
4.700%, 09/11/2023 | CAD | 80 | 67 | |||||||||
Canada Housing Trust No. 1 (A) | ||||||||||||
2.250%, 12/15/2025 | 2,235 | 1,842 | ||||||||||
1.750%, 06/15/2022 | 2,465 | 1,966 | ||||||||||
Canadian Government Bond | ||||||||||||
5.750%, 06/01/2033 | 1,205 | 1,365 | ||||||||||
2.750%, 12/01/2048 | 400 | 368 | ||||||||||
2.750%, 12/01/2048 | 300 | 276 | ||||||||||
2.500%, 06/01/2024 | 1,990 | 1,646 | ||||||||||
2.250%, 06/01/2029 | 2,076 | 1,751 | ||||||||||
1.500%, 06/01/2026 (E) | 8,081 | 6,509 | ||||||||||
1.500%, 06/01/2031 | 268 | 211 | ||||||||||
1.000%, 09/01/2022 | 525 | 417 | ||||||||||
1.000%, 06/01/2027 | 1,375 | 1,076 | ||||||||||
0.500%, 09/01/2025 | 1,874 | 1,453 | ||||||||||
Canadian When Issued Government Bond | ||||||||||||
2.000%, 12/01/2051 | 487 | 386 | ||||||||||
Cenovus Energy | ||||||||||||
4.400%, 04/15/2029 | $ | 146 | 164 | |||||||||
CPPIB Capital MTN | ||||||||||||
0.250%, 04/06/2027 | EUR | 1,765 | 2,084 | |||||||||
Government of Canada | ||||||||||||
3.500%, 12/01/2045 | CAD | 158 | 162 | |||||||||
Ontario Teachers’ Finance Trust | ||||||||||||
2.000%, 04/16/2031 (A) | $ | 1,914 | 1,929 | |||||||||
0.500%, 05/06/2025 | EUR | 1,066 | 1,267 | |||||||||
Province of Alberta Canada | ||||||||||||
0.625%, 04/18/2025 | 1,301 | 1,553 | ||||||||||
Province of Alberta Canada MTN | ||||||||||||
1.000%, 11/15/2021 | GBP | 650 | 877 | |||||||||
Province of British Columbia Canada | ||||||||||||
2.950%, 12/18/2028 | CAD | 1,653 | 1,414 | |||||||||
Province of Ontario Canada | ||||||||||||
4.700%, 06/02/2037 | 1,355 | 1,374 | ||||||||||
4.650%, 06/02/2041 | 540 | 557 | ||||||||||
2.800%, 06/02/2048 | 2,200 | 1,751 | ||||||||||
2.600%, 06/02/2025 | 1,614 | 1,341 | ||||||||||
2.400%, 06/02/2026 | 585 | 484 | ||||||||||
Province of Ontario Canada MTN | ||||||||||||
0.250%, 12/15/2026 | GBP | 2,337 | 3,030 | |||||||||
Province of Quebec Canada | ||||||||||||
6.250%, 06/01/2032 | CAD | 720 | 787 | |||||||||
3.500%, 12/01/2048 | 520 | 472 | ||||||||||
Province of Quebec Canada MTN | ||||||||||||
3.700%, 05/20/2026 | AUD | 568 | 455 | |||||||||
Rogers Communications | ||||||||||||
4.000%, 06/06/2022 | CAD | 165 | 133 | |||||||||
Toronto-Dominion Bank | ||||||||||||
0.000%, 02/09/2024 (B) | EUR | 490 | 573 | |||||||||
| Description | Face Amount (Thousands) | Market Value ($ Thousands) | ||||||||||
GLOBAL BONDS (continued) |
| |||||||||||
Yamana | ||||||||||||
2.630%, 08/15/2031 (A) | $ | 221 | $ | 216 | ||||||||
|
|
| ||||||||||
| 40,855 | ||||||||||||
|
|
| ||||||||||
Cayman Islands — 0.0% |
| |||||||||||
Odebrecht Holdco Finance Ltd | ||||||||||||
2.041%, 09/10/2058 (B) | 311 | 5 | ||||||||||
|
|
| ||||||||||
China — 8.4% |
| |||||||||||
China Development Bank | ||||||||||||
4.880%, 02/09/2028 | CNY | 10,600 | 1,790 | |||||||||
3.700%, 10/20/2030 | 16,740 | 2,668 | ||||||||||
3.660%, 03/01/2031 | 4,680 | 743 | ||||||||||
3.650%, 05/21/2029 | 18,120 | 2,870 | ||||||||||
3.480%, 01/08/2029 | 23,680 | 3,704 | ||||||||||
3.390%, 07/10/2027 | 16,630 | 2,609 | ||||||||||
3.230%, 01/10/2025 | 11,360 | 1,777 | ||||||||||
China Government Bond | ||||||||||||
3.810%, 09/14/2050 | 55,020 | 9,035 | ||||||||||
3.720%, 04/12/2051 | 4,460 | 729 | ||||||||||
3.270%, 11/19/2030 | 24,370 | 3,871 | ||||||||||
3.030%, 03/11/2026 | 10,320 | 1,618 | ||||||||||
3.020%, 10/22/2025 | 100 | 16 | ||||||||||
3.010%, 05/13/2028 | 52,640 | 8,223 | ||||||||||
2.850%, 06/04/2027 | 15,400 | 2,385 | ||||||||||
2.840%, 04/08/2024 | 13,310 | 2,075 | ||||||||||
2.680%, 05/21/2030 | 9,380 | 1,417 | ||||||||||
2.570%, 05/20/2023 | 6,780 | 1,051 | ||||||||||
Prosus NV | ||||||||||||
2.031%, 08/03/2032 | EUR | 245 | 283 | |||||||||
1.985%, 07/13/2033 | 320 | 362 | ||||||||||
3.500%, 07/05/2024 | $ | 200 | 208 | |||||||||
|
|
| ||||||||||
| 47,434 | ||||||||||||
|
|
| ||||||||||
Colombia — 0.6% |
| |||||||||||
Colombian TES | ||||||||||||
10.000%, 07/24/2024 | COP | 2,268,100 | 664 | |||||||||
7.750%, 09/18/2030 | 4,413,000 | 1,181 | ||||||||||
7.500%, 08/26/2026 | 1,361,500 | 370 | ||||||||||
7.250%, 10/18/2034 | 950,600 | 236 | ||||||||||
7.000%, 06/30/2032 | 1,379,900 | 342 | ||||||||||
6.000%, 04/28/2028 | 2,090,800 | 516 | ||||||||||
5.750%, 11/03/2027 | 279,700 | 69 | ||||||||||
|
|
| ||||||||||
| 3,378 | ||||||||||||
|
|
| ||||||||||
Czech Republic — 0.2% |
| |||||||||||
Czech Republic Government Bond | ||||||||||||
4.700%, 09/12/2022 | CZK | 7,470 | 351 | |||||||||
2.500%, 08/25/2028 | 14,630 | 687 | ||||||||||
|
|
| ||||||||||
| 1,038 | ||||||||||||
|
|
| ||||||||||
SEI Institutional International Trust / Annual Report / September 30, 2021 |
33 |
SCHEDULE OF INVESTMENTS
September 30, 2021
International Fixed Income Fund (Continued)
| Description | Face Amount (Thousands) | Market Value ($ Thousands) | ||||||||||
GLOBAL BONDS (continued) |
| |||||||||||
Denmark — 0.4% | ||||||||||||
Danske Bank MTN | ||||||||||||
5.875%, VAR EUR Swap Annual 7 Yr + 5.471% (C) | EUR | 344 | $ | 408 | ||||||||
Denmark Government Bond | ||||||||||||
4.500%, 11/15/2039 | DKK | 2,040 | 554 | |||||||||
0.000%, 11/15/2031 (A)(B) | 2,049 | 316 | ||||||||||
Kommunekredit MTN | ||||||||||||
0.125%, 09/26/2040 | EUR | 275 | 289 | |||||||||
Orsted | ||||||||||||
6.250%, VAR EUR Swap Annual 5 Yr + 4.750%, 06/26/2099 | 210 | 268 | ||||||||||
1.750%, VAR EUAMDB05 + 1.952%, 12/09/3019 | 250 | 299 | ||||||||||
|
|
| ||||||||||
| 2,134 | ||||||||||||
|
|
| ||||||||||
Egypt — 0.0% |
| |||||||||||
Egypt Government International Bond MTN | ||||||||||||
4.750%, 04/11/2025 (A) | 170 | 201 | ||||||||||
|
|
| ||||||||||
Finland — 0.4% |
| |||||||||||
Finland Government Bond (A) | ||||||||||||
0.875%, 09/15/2025 | 355 | 435 | ||||||||||
0.125%, 04/15/2052 | 135 | 136 | ||||||||||
0.000%, 09/15/2030 (B) | 680 | 792 | ||||||||||
Nordea Bank Abp MTN | ||||||||||||
6.125%, VAR USD Swap Semi 30/360 5 Yr Curr + 3.388% (C) | $ | 200 | 219 | |||||||||
Nordea Kiinnitysluottopankki MTN | ||||||||||||
0.250%, 03/18/2026 | EUR | 480 | 569 | |||||||||
|
|
| ||||||||||
| 2,151 | ||||||||||||
|
|
| ||||||||||
France — 5.9% |
| |||||||||||
BNP Paribas | ||||||||||||
6.750%, VAR USD Swap Semi 30/360 5 Yr Curr + 4.916% (C) | $ | 340 | 345 | |||||||||
4.625%, 03/13/2027 (A) | 340 | 382 | ||||||||||
BNP Paribas MTN | ||||||||||||
3.375%, 01/23/2026 | GBP | 490 | 712 | |||||||||
1.250%, 03/19/2025 | EUR | 375 | 453 | |||||||||
0.500%, VAR Euribor 3 Month + 0.730%, 02/19/2028 | 200 | 232 | ||||||||||
BNP Paribas Home Loan SFH | ||||||||||||
0.375%, 05/07/2025 | 400 | 475 | ||||||||||
BPCE | ||||||||||||
1.000%, 01/20/2026 (A) | $ | 950 | 935 | |||||||||
BPCE MTN | ||||||||||||
2.000%, 06/05/2025 | AUD | 440 | 327 | |||||||||
1.125%, 01/18/2023 | EUR | 300 | 354 | |||||||||
Caisse Francaise de Financement Local MTN | ||||||||||||
3.000%, 10/02/2028 | 100 | 141 | ||||||||||
0.500%, 01/19/2026 | 500 | 598 | ||||||||||
| Description | Face Amount (Thousands) | Market Value ($ Thousands) | ||||||||||
GLOBAL BONDS (continued) |
| |||||||||||
Cie de Financement Foncier | ||||||||||||
0.375%, 12/11/2024 | EUR | 300 | $ | 356 | ||||||||
Cie de Financement Foncier MTN | ||||||||||||
5.500%, 01/26/2027 | GBP | 387 | 640 | |||||||||
CNP Assurances MTN | ||||||||||||
2.500%, VAR Euribor 3 Month + 3.650%, 06/30/2051 | EUR | 200 | 249 | |||||||||
Credit Agricole | ||||||||||||
7.875%, VAR USD Swap Semi 30/360 5 Yr Curr + | $ | 200 | 223 | |||||||||
Credit Agricole Assurances | ||||||||||||
4.750%, VAR EUR Swap Annual 5 Yr + 5.350%, 09/27/2048 | EUR | 200 | 284 | |||||||||
Credit Agricole Home Loan SFH MTN | ||||||||||||
1.250%, 03/24/2031 | 300 | 384 | ||||||||||
0.250%, 02/23/2024 | 700 | 824 | ||||||||||
Dexia Credit Local MTN | ||||||||||||
0.625%, 02/03/2024 | 200 | 237 | ||||||||||
0.500%, 01/17/2025 | 300 | 356 | ||||||||||
0.000%, 05/29/2024 (B) | 1,200 | 1,403 | ||||||||||
Electricite de France | ||||||||||||
5.625%, VAR USD Swap Semi 30/360 10 Yr Curr + | $ | 200 | 213 | |||||||||
Electricite de France MTN | ||||||||||||
5.375%, VAR EUR Swap Annual 12 Yr +3.794% (C) | EUR | 200 | 258 | |||||||||
4.000%, 11/12/2025 | 350 | 473 | ||||||||||
Engie MTN | ||||||||||||
2.375%, 05/19/2026 | 100 | 129 | ||||||||||
0.875%, 03/27/2024 | 300 | 356 | ||||||||||
French Republic Government Bond OAT | ||||||||||||
5.750%, 10/25/2032 | 236 | 442 | ||||||||||
4.500%, 04/25/2041 | 511 | 1,020 | ||||||||||
4.000%, 10/25/2038 | 99 | 181 | ||||||||||
4.000%, 04/25/2055 (A) | 139 | 303 | ||||||||||
2.750%, 10/25/2027 | 299 | 412 | ||||||||||
2.500%, 05/25/2030 | 294 | 415 | ||||||||||
1.750%, 05/25/2023 | 2,359 | 2,843 | ||||||||||
1.750%, 06/25/2039 (A) | 283 | 397 | ||||||||||
1.500%, 05/25/2050 (A) | 1,465 | 1,965 | ||||||||||
0.750%, 05/25/2028 | 345 | 426 | ||||||||||
0.500%, 05/25/2029 | 264 | 320 | ||||||||||
0.500%, 06/25/2044 (A) | 1,380 | 1,525 | ||||||||||
0.000%, 03/25/2025 (B) | 1,456 | 1,720 | ||||||||||
0.000%, 02/25/2023 (B) | 1,007 | 1,178 | ||||||||||
0.000%, 02/25/2024 (B) | 2,048 | 2,409 | ||||||||||
0.000%, 11/25/2029 (B) | 367 | 427 | ||||||||||
SNCF Reseau MTN | ||||||||||||
5.500%, 12/01/2021 | GBP | 205 | 279 | |||||||||
4.250%, 10/07/2026 | EUR | 200 | 283 | |||||||||
2.250%, 12/20/2047 | 300 | 435 | ||||||||||
2.000%, 02/05/2048 | 300 | 411 | ||||||||||
34 |
SEI Institutional International Trust / Annual Report / September 30, 2021 |
| Description | Face Amount (Thousands) | Market Value ($ Thousands) | ||||||||||
GLOBAL BONDS (continued) |
| |||||||||||
1.125%, 05/19/2027 | EUR | 300 | $ | 371 | ||||||||
1.125%, 05/25/2030 | 200 | 249 | ||||||||||
Societe Generale | ||||||||||||
4.250%, 04/14/2025 (A) | $ | 325 | 351 | |||||||||
Societe Generale MTN | ||||||||||||
1.125%, 01/23/2025 | EUR | 100 | 120 | |||||||||
Societe Nationale SNCF | ||||||||||||
1.000%, 05/25/2040 | 700 | 802 | ||||||||||
Societe Nationale SNCF MTN | ||||||||||||
0.625%, 04/17/2030 | 100 | 119 | ||||||||||
TotalEnergies MTN (C) | ||||||||||||
3.369%, VAR EUR Swap Annual 5 Yr +3.350% | 260 | 333 | ||||||||||
1.750%, VAR EUR Swap Annual 5 Yr +1.765% | 115 | 136 | ||||||||||
1.625%, VAR EUR Swap Annual 5 Yr +1.993% | 125 | 145 | ||||||||||
TotalEnergies Capital International MTN | ||||||||||||
4.250%, 11/26/2021 | AUD | 640 | 465 | |||||||||
UNEDIC ASSEO MTN | ||||||||||||
1.250%, 05/25/2033 | EUR | 700 | 896 | |||||||||
Westfield America Management | ||||||||||||
2.625%, 03/30/2029 | GBP | 155 | 212 | |||||||||
2.125%, 03/30/2025 | 210 | 288 | ||||||||||
|
|
| ||||||||||
| 33,217 | ||||||||||||
|
|
| ||||||||||
Germany — 5.7% |
| |||||||||||
ADLER Group | ||||||||||||
3.250%, 08/05/2025 | EUR | 200 | 204 | |||||||||
Bundesobligation | ||||||||||||
0.000%, 10/09/2026 (B) | 1,942 | 2,314 | ||||||||||
Bundesrepublik Deutschland Bundesanleihe | ||||||||||||
4.000%, 01/04/2037 | 234 | 439 | ||||||||||
3.250%, 07/04/2042 | 954 | 1,825 | ||||||||||
1.500%, 05/15/2023 | 8,623 | 10,355 | ||||||||||
1.250%, 08/15/2048 | 1,013 | 1,482 | ||||||||||
1.000%, 08/15/2024 | 328 | 399 | ||||||||||
0.500%, 02/15/2026 | 171 | 208 | ||||||||||
0.170%, 08/15/2050 (B) | 355 | 384 | ||||||||||
0.000%, 08/15/2031 (B) | 1,965 | 2,321 | ||||||||||
0.000%, 05/15/2035 (B) | 671 | 777 | ||||||||||
Cheplapharm Arzneimittel GmbH | ||||||||||||
3.500%, 02/11/2027 (A) | 191 | 224 | ||||||||||
Daimler International Finance BV MTN | ||||||||||||
0.250%, 11/06/2023 | 430 | 503 | ||||||||||
Deutsche Bank MTN | ||||||||||||
1.000%, VAR Euribor 3 Month + 1.600%, 11/19/2025 | �� | 400 | 474 | |||||||||
Deutsche Telekom MTN | ||||||||||||
1.750%, 12/09/2049 | 100 | 120 | ||||||||||
| Description | Face Amount (Thousands) | Market Value ($ Thousands) | ||||||||||
GLOBAL BONDS (continued) |
| |||||||||||
Deutsche Telekom International Finance BV MTN | ||||||||||||
0.625%, 04/03/2023 | EUR | 225 | $ | 264 | ||||||||
E.ON MTN | ||||||||||||
0.000%, 12/18/2023 (B) | 550 | 641 | ||||||||||
HeidelbergCement Finance Luxembourg MTN | ||||||||||||
1.750%, 04/24/2028 | 120 | 151 | ||||||||||
1.625%, 04/07/2026 | 400 | 493 | ||||||||||
HOCHTIEF MTN | ||||||||||||
1.750%, 07/03/2025 | 400 | 489 | ||||||||||
Kreditanstalt fuer Wiederaufbau | ||||||||||||
2.600%, 06/20/2037 | JPY | 198,000 | 2,442 | |||||||||
0.500%, 09/15/2027 | EUR | 510 | 618 | |||||||||
0.125%, 06/07/2023 | 1,020 | 1,196 | ||||||||||
Landwirtschaftliche Rentenbank MTN | ||||||||||||
0.625%, 05/18/2027 | 225 | 274 | ||||||||||
Merck Financial Services GmbH MTN | ||||||||||||
0.125%, 07/16/2025 | 400 | 468 | ||||||||||
Siemens Financieringsmaatschappij | ||||||||||||
1.200%, 03/11/2026 (A) | $ | 775 | 772 | |||||||||
TK Elevator Midco GmbH | ||||||||||||
4.375%, 07/15/2027 (A) | EUR | 240 | 290 | |||||||||
Volkswagen International Finance | ||||||||||||
3.875%, VAR EUR Swap Annual 9 Yr + 3.958% (C) | 300 | 385 | ||||||||||
1.125%, 10/02/2023 | 400 | 475 | ||||||||||
Volkswagen Leasing GmbH MTN | ||||||||||||
1.125%, 04/04/2024 | 520 | 619 | ||||||||||
WEPA Hygieneprodukte GmbH | ||||||||||||
2.875%, 12/15/2027 | 298 | 337 | ||||||||||
|
|
| ||||||||||
| 31,943 | ||||||||||||
|
|
| ||||||||||
Hungary — 0.2% |
| |||||||||||
Hungary Government Bond | ||||||||||||
3.000%, 06/26/2024 | HUF | 297,650 | 981 | |||||||||
|
|
| ||||||||||
Indonesia — 0.9% | ||||||||||||
Indonesia Treasury Bond | ||||||||||||
8.750%, 05/15/2031 | IDR | 3,974,000 | 325 | |||||||||
8.375%, 03/15/2034 | 26,186,000 | 2,070 | ||||||||||
7.500%, 06/15/2035 | 2,199,000 | 163 | ||||||||||
7.375%, 05/15/2048 | 9,453,000 | 679 | ||||||||||
7.000%, 09/15/2030 | 2,959,000 | 217 | ||||||||||
6.500%, 06/15/2025 | 4,846,000 | 355 | ||||||||||
6.500%, 02/15/2031 | 14,264,000 | 1,007 | ||||||||||
5.500%, 04/15/2026 | 1,557,000 | 110 | ||||||||||
|
|
| ||||||||||
| 4,926 | ||||||||||||
|
|
| ||||||||||
Ireland — 0.8% |
| |||||||||||
AerCap Ireland Capital DAC | ||||||||||||
4.500%, 09/15/2023 | $ | 205 | 218 | |||||||||
SEI Institutional International Trust / Annual Report / September 30, 2021 |
35 |
SCHEDULE OF INVESTMENTS
September 30, 2021
International Fixed Income Fund (Continued)
| Description | Face Amount (Thousands) | Market Value ($ Thousands) | ||||||||||
GLOBAL BONDS (continued) |
| |||||||||||
CRH Funding MTN | ||||||||||||
1.875%, 01/09/2024 | EUR | 310 | $ | 374 | ||||||||
Ireland Government Bond | ||||||||||||
5.400%, 03/13/2025 | 351 | 491 | ||||||||||
1.500%, 05/15/2050 | 250 | 333 | ||||||||||
1.100%, 05/15/2029 | 670 | 847 | ||||||||||
0.113%, 10/18/2031 (B) | 1,691 | 1,923 | ||||||||||
Smurfit Kappa Acquisitions ULC | ||||||||||||
2.875%, 01/15/2026 | 265 | 340 | ||||||||||
|
|
| ||||||||||
| 4,526 | ||||||||||||
|
|
| ||||||||||
Israel — 0.1% |
| |||||||||||
Israel Government Bond - Fixed | ||||||||||||
5.500%, 01/31/2042 | ILS | 675 | 327 | |||||||||
2.000%, 03/31/2027 | 925 | 307 | ||||||||||
1.000%, 03/31/2030 | 593 | 182 | ||||||||||
|
|
| ||||||||||
| 816 | ||||||||||||
|
|
| ||||||||||
Italy — 5.5% |
| |||||||||||
Assicurazioni Generali MTN | ||||||||||||
5.500%, VAR Euribor 3 Month + 5.350%, 10/27/2047 | EUR | 230 | 328 | |||||||||
Enel | ||||||||||||
1.875%, VAR EUR Swap Annual 5 Yr + 2.011% (C) | 385 | 441 | ||||||||||
Enel Finance International MTN | ||||||||||||
5.750%, 09/14/2040 | GBP | 145 | 288 | |||||||||
0.116%, 06/17/2027 (B) | EUR | 195 | 223 | |||||||||
Eni | ||||||||||||
3.375%, VAR EUR Swap Annual 5 Yr + 3.641% (C) | 135 | 167 | ||||||||||
Eni MTN | ||||||||||||
0.375%, 06/14/2028 | 130 | 151 | ||||||||||
FCA Bank MTN | ||||||||||||
1.000%, 11/15/2021 | 700 | 813 | ||||||||||
Intesa Sanpaolo MTN | ||||||||||||
2.125%, 05/26/2025 | 330 | 410 | ||||||||||
0.750%, 12/04/2024 | 350 | 416 | ||||||||||
Italy Buoni Poliennali Del Tesoro | ||||||||||||
5.000%, 09/01/2040 (A) | 1,455 | 2,663 | ||||||||||
3.850%, 09/01/2049 (A) | 298 | 503 | ||||||||||
3.500%, 03/01/2030 (A) | 272 | 389 | ||||||||||
3.100%, 03/01/2040 (A) | 122 | 178 | ||||||||||
3.000%, 08/01/2029 | 1,609 | 2,210 | ||||||||||
2.800%, 03/01/2067 (A) | 150 | 204 | ||||||||||
2.700%, 03/01/2047 (A) | 55 | 76 | ||||||||||
2.450%, 09/01/2033 (A) | 98 | 131 | ||||||||||
2.150%, 03/01/2072 (A) | 76 | 86 | ||||||||||
2.000%, 02/01/2028 | 471 | 602 | ||||||||||
1.850%, 07/01/2025 (A) | 2,274 | 2,824 | ||||||||||
1.800%, 03/01/2041 (A) | 247 | 299 | ||||||||||
1.700%, 09/01/2051 (A) | 311 | 352 | ||||||||||
1.500%, 04/30/2045 (A) | 412 | 464 | ||||||||||
| Description | Face Amount (Thousands) | Market Value ($ Thousands) | ||||||||||
GLOBAL BONDS (continued) |
| |||||||||||
0.950%, 03/01/2023 | EUR | 3,272 | $ | 3,866 | ||||||||
0.950%, 12/01/2031 (A) | 2,794 | 3,251 | ||||||||||
0.950%, 03/01/2037 (A) | 1,549 | 1,705 | ||||||||||
0.019%, 04/01/2026 (B) | 4,173 | 4,819 | ||||||||||
0.000%, 04/15/2024 (B) | 1,429 | 1,667 | ||||||||||
Societa Cattolica Di Assicurazione SPA | ||||||||||||
4.250%, VAR Euribor 3 Month + 4.455%, 12/14/2047 | 200 | 267 | ||||||||||
UniCredit MTN | ||||||||||||
4.875%, 02/20/2029 | 220 | 277 | ||||||||||
1.250%, VAR Euribor 3 Month + 1.600%, 06/16/2026 | 460 | 551 | ||||||||||
|
|
| ||||||||||
| 30,621 | ||||||||||||
|
|
| ||||||||||
Japan — 14.1% |
| |||||||||||
Development Bank of Japan | ||||||||||||
2.300%, 03/19/2026 | JPY | 160,000 | 1,574 | |||||||||
Development Bank of Japan MTN | ||||||||||||
0.875%, 10/10/2025 | EUR | 1,145 | 1,380 | |||||||||
Government of Japan 10 Year Bond | ||||||||||||
0.600%, 03/20/2023 | JPY | 875,850 | 7,931 | |||||||||
0.400%, 06/20/2025 | 64,950 | 593 | ||||||||||
0.100%, 06/20/2026 | 74,300 | 672 | ||||||||||
0.100%, 03/20/2027 | 71,550 | 647 | ||||||||||
Government of Japan 20 Year Bond | ||||||||||||
1.900%, 09/20/2022 | 406,050 | 3,709 | ||||||||||
1.700%, 06/20/2033 | 1,241,150 | 13,130 | ||||||||||
1.400%, 09/20/2034 | 477,550 | 4,941 | ||||||||||
1.000%, 12/20/2035 | 50,000 | 496 | ||||||||||
0.700%, 03/20/2037 | 38,450 | 366 | ||||||||||
0.500%, 09/20/2036 | 487,850 | 4,519 | ||||||||||
0.200%, 06/20/2036 | 185,200 | 1,645 | ||||||||||
Government of Japan 20 Year Bond, Ser 140 | ||||||||||||
1.700%, 09/20/2032 | 33,600 | 353 | ||||||||||
Government of Japan 20 Year Bond, Ser 143 | ||||||||||||
1.600%, 03/20/2033 | 40,300 | 421 | ||||||||||
Government of Japan 20 Year Bond, Ser 144 | ||||||||||||
1.500%, 03/20/2033 | 98,300 | 1,018 | ||||||||||
Government of Japan 30 Year Bond | ||||||||||||
0.800%, 09/20/2047 | 709,500 | 6,680 | ||||||||||
0.300%, 06/20/2046 | 74,600 | 629 | ||||||||||
Government of Japan 30 Year Bond, Ser 29 | ||||||||||||
2.400%, 09/20/2038 | 133,650 | 1,603 | ||||||||||
Government of Japan 30 Year Bond, Ser 30 | ||||||||||||
2.300%, 03/20/2039 | 418,950 | 4,966 | ||||||||||
Government of Japan 30 Year Bond, Ser 33 | ||||||||||||
2.000%, 09/20/2040 | 253,100 | 2,920 | ||||||||||
Government of Japan 30 Year Bond, Ser 36 | ||||||||||||
2.000%, 03/20/2042 | 311,800 | 3,629 | ||||||||||
Government of Japan 30 Year Bond, Ser 37 | ||||||||||||
1.900%, 09/20/2042 | 166,850 | 1,917 | ||||||||||
36 |
SEI Institutional International Trust / Annual Report / September 30, 2021 |
| Description | Face Amount (Thousands) | Market Value ($ Thousands) | ||||||||||
GLOBAL BONDS (continued) |
| |||||||||||
Government of Japan 30 Year Bond, Ser 38 | ||||||||||||
1.800%, 03/20/2043 | JPY | 207,550 | $ | 2,354 | ||||||||
Government of Japan 40 Year Bond | ||||||||||||
0.400%, 03/20/2056 | 331,950 | 2,688 | ||||||||||
Government of Japan 40 Year Bond, Ser 6 | ||||||||||||
1.900%, 03/20/2053 | 38,700 | 464 | ||||||||||
Japan Finance Organization for Municipalities MTN | ||||||||||||
0.050%, 02/12/2027 | EUR | 440 | 513 | |||||||||
Japan Government Ten Year Bond | ||||||||||||
0.100%, 09/20/2027 | JPY | 367,750 | 3,329 | |||||||||
0.100%, 03/20/2029 | 35,900 | 325 | ||||||||||
Japan Government Thirty Year Bond | ||||||||||||
0.600%, 09/20/2050 | 79,100 | 697 | ||||||||||
0.400%, 12/20/2049 | 79,000 | 663 | ||||||||||
0.300%, 06/20/2046 | 85,800 | 723 | ||||||||||
Mitsubishi UFJ Financial Group | ||||||||||||
0.339%, 07/19/2024 | EUR | 250 | 293 | |||||||||
Mizuho Financial Group | ||||||||||||
4.600%, 03/27/2024 (A) | $ | 450 | 487 | |||||||||
Nippon Life Insurance | ||||||||||||
2.750%, VAR US Treas Yield Curve Rate T Note Const Mat 5 Yr + 2.653%, 01/21/2051 (A) | 540 | 529 | ||||||||||
Nissan Motor | ||||||||||||
2.652%, 03/17/2026 | EUR | 165 | 207 | |||||||||
NTT Finance | ||||||||||||
1.162%, 04/03/2026 (A) | $ | 345 | 343 | |||||||||
|
|
| ||||||||||
| 79,354 | ||||||||||||
|
|
| ||||||||||
Kuwait — 0.1% |
| |||||||||||
Equate Petrochemical MTN | ||||||||||||
2.625%, 04/28/2028 (A) | 297 | 299 | ||||||||||
|
|
| ||||||||||
Luxembourg — 0.0% |
| |||||||||||
Prologis International Funding II | ||||||||||||
2.375%, 11/14/2030 | EUR | 200 | 266 | |||||||||
|
|
| ||||||||||
Malaysia — 1.6% |
| |||||||||||
Malaysia Government Bond | ||||||||||||
4.392%, 04/15/2026 | MYR | 1,972 | 500 | |||||||||
4.232%, 06/30/2031 | 635 | 161 | ||||||||||
4.181%, 07/15/2024 | 4,862 | 1,212 | ||||||||||
3.955%, 09/15/2025 | 6,366 | 1,592 | ||||||||||
3.885%, 08/15/2029 | 2,514 | 621 | ||||||||||
3.828%, 07/05/2034 | 3,332 | 789 | ||||||||||
3.795%, 09/30/2022 | 4,243 | 1,034 | ||||||||||
3.733%, 06/15/2028 | 2,014 | 493 | ||||||||||
3.502%, 05/31/2027 | 7,477 | 1,822 | ||||||||||
3.478%, 06/14/2024 | 1,305 | 320 | ||||||||||
2.632%, 04/15/2031 | 1,040 | 233 | ||||||||||
|
|
| ||||||||||
| 8,777 | ||||||||||||
|
|
| ||||||||||
| Description | Face Amount (Thousands) | Market Value ($ Thousands) | ||||||||||
GLOBAL BONDS (continued) |
| |||||||||||
Mexico — 1.7% |
| |||||||||||
Mexican Bonos | ||||||||||||
8.000%, 11/07/2047 | MXN | 19,753 | $ | 968 | ||||||||
7.750%, 11/23/2034 | 3,714 | 184 | ||||||||||
7.750%, 11/13/2042 | 30,018 | 1,444 | ||||||||||
7.500%, 06/03/2027 | 15,749 | 779 | ||||||||||
5.750%, 03/05/2026 | 14,711 | 683 | ||||||||||
Mexican Bonos, Ser M20 | ||||||||||||
10.000%, 12/05/2024 | 37,590 | 2,006 | ||||||||||
8.500%, 05/31/2029 | 10,038 | 522 | ||||||||||
7.750%, 05/29/2031 | 24,546 | 1,225 | ||||||||||
Mexican Bonos, Ser M30 | ||||||||||||
10.000%, 11/20/2036 | 21,727 | 1,281 | ||||||||||
8.500%, 11/18/2038 | 2,546 | 132 | ||||||||||
Mexico Government International Bond | ||||||||||||
2.875%, 04/08/2039 | EUR | 280 | 331 | |||||||||
|
|
| ||||||||||
| 9,555 | ||||||||||||
|
|
| ||||||||||
Netherlands — 1.9% |
| |||||||||||
ABN AMRO Bank | ||||||||||||
4.750%, 07/28/2025 | $ | 305 | 338 | |||||||||
ASR Nederland | ||||||||||||
3.375%, VAR EUR Swap Annual 5 Yr + 4.000%, 05/02/2049 | EUR | 255 | 332 | |||||||||
BNG Bank MTN | ||||||||||||
0.250%, 02/22/2023 | 1,260 | 1,476 | ||||||||||
Cooperatieve Rabobank UA | ||||||||||||
4.375%, VAR EUR Swap Annual 5 Yr + 4.679% (C) | 200 | 257 | ||||||||||
0.250%, 10/30/2026 | 200 | 234 | ||||||||||
Cooperatieve Rabobank UA MTN | ||||||||||||
5.250%, 09/14/2027 | GBP | 195 | 311 | |||||||||
4.625%, 05/23/2029 | 130 | 205 | ||||||||||
1.250%, 05/31/2032 | EUR | 300 | 385 | |||||||||
Heineken MTN | ||||||||||||
1.000%, 05/04/2026 | 335 | 406 | ||||||||||
Intertrust Group BV | ||||||||||||
3.375%, 11/15/2025 (A) | 180 | 212 | ||||||||||
Nederlandse Waterschapsbank MTN | ||||||||||||
1.250%, 05/27/2036 | 281 | 361 | ||||||||||
0.625%, 01/18/2027 | 225 | 272 | ||||||||||
Netherlands Government Bond (A) | ||||||||||||
4.000%, 01/15/2037 | 205 | 377 | ||||||||||
2.500%, 01/15/2033 | 671 | 999 | ||||||||||
2.000%, 07/15/2024 | 427 | 532 | ||||||||||
0.500%, 07/15/2026 | 613 | 746 | ||||||||||
0.314%, 01/15/2038 (B) | 596 | 666 | ||||||||||
0.118%, 01/15/2052 (B) | 421 | 437 | ||||||||||
0.000%, 01/15/2027 (B) | 685 | 813 | ||||||||||
0.000%, 07/15/2031 (B) | 1,014 | 1,183 | ||||||||||
SEI Institutional International Trust / Annual Report / September 30, 2021 |
37 |
SCHEDULE OF INVESTMENTS
September 30, 2021
International Fixed Income Fund (Continued)
| Description | Face Amount (Thousands) | Market Value ($ Thousands) | ||||||||||
GLOBAL BONDS (continued) | ||||||||||||
Q-Park Holding | ||||||||||||
2.000%, 03/01/2027 | EUR | 122 | $ | 135 | ||||||||
|
|
| ||||||||||
| 10,677 | ||||||||||||
|
|
| ||||||||||
New Zealand — 0.7% | ||||||||||||
New Zealand Government Bond | ||||||||||||
5.500%, 04/15/2023 | NZD | 2,049 | 1,510 | |||||||||
3.000%, 04/20/2029 | 345 | 257 | ||||||||||
2.750%, 04/15/2025 | 1,460 | 1,055 | ||||||||||
2.750%, 04/15/2037 | 80 | 58 | ||||||||||
2.000%, 05/15/2032 | 225 | 154 | ||||||||||
1.750%, 05/15/2041 | 124 | 74 | ||||||||||
1.500%, 05/15/2031 | 447 | 295 | ||||||||||
New Zealand Local Government Funding Agency Bond | ||||||||||||
4.500%, 04/15/2027 | 593 | 458 | ||||||||||
|
|
| ||||||||||
| 3,861 | ||||||||||||
|
|
| ||||||||||
Norway — 1.2% | ||||||||||||
Equinor MTN | ||||||||||||
6.875%, 03/11/2031 | GBP | 185 | 360 | |||||||||
Norway Government Bond (A) | ||||||||||||
3.000%, 03/14/2024 | NOK | 4,693 | 562 | |||||||||
2.000%, 05/24/2023 | 5,993 | 700 | ||||||||||
2.000%, 04/26/2028 | 3,667 | 433 | ||||||||||
1.750%, 03/13/2025 | 1,213 | 141 | ||||||||||
1.750%, 02/17/2027 | 7,612 | 886 | ||||||||||
1.750%, 09/06/2029 | 5,628 | 654 | ||||||||||
1.500%, 02/19/2026 | 10,376 | 1,195 | ||||||||||
1.375%, 08/19/2030 | 8,181 | 922 | ||||||||||
1.250%, 09/17/2031 | 5,564 | 617 | ||||||||||
|
|
| ||||||||||
| 6,470 | ||||||||||||
|
|
| ||||||||||
Oman — 0.0% | ||||||||||||
Oman Government International Bond | ||||||||||||
6.250%, 01/25/2031 (A) | $ | 200 | 214 | |||||||||
|
|
| ||||||||||
Peru — 0.0% | ||||||||||||
Volcan Cia Minera SAA | ||||||||||||
4.375%, 02/11/2026 (A) | 21 | 20 | ||||||||||
|
|
| ||||||||||
Poland — 0.2% | ||||||||||||
Republic of Poland Government Bond | ||||||||||||
2.750%, 10/25/2029 | PLN | 1,493 | 398 | |||||||||
2.500%, 07/25/2027 | 1,860 | 492 | ||||||||||
|
|
| ||||||||||
| 890 | ||||||||||||
|
|
| ||||||||||
Portugal — 0.6% | ||||||||||||
EDP Finance BV MTN | ||||||||||||
0.375%, 09/16/2026 | EUR | 440 | 515 | |||||||||
Portugal Obrigacoes do Tesouro OT (A) | ||||||||||||
4.100%, 04/15/2037 | 277 | 482 | ||||||||||
2.200%, 10/17/2022 | 775 | 925 | ||||||||||
1.950%, 06/15/2029 | 492 | 656 | ||||||||||
| Description | Face Amount (Thousands) | Market Value ($ Thousands) | ||||||||||
GLOBAL BONDS (continued) | ||||||||||||
0.700%, 10/15/2027 | EUR | 735 | $ | 898 | ||||||||
|
|
| ||||||||||
| 3,476 | ||||||||||||
|
|
| ||||||||||
Qatar — 0.1% | ||||||||||||
Qatar Petroleum | ||||||||||||
2.250%, 07/12/2031 (A) | $ | 300 | 297 | |||||||||
|
|
| ||||||||||
Romania — 0.1% | ||||||||||||
Romania Government Bond | ||||||||||||
3.650%, 07/28/2025 | RON | 1,540 | 362 | |||||||||
Romanian Government International Bond MTN | ||||||||||||
1.375%, 12/02/2029 | EUR | 287 | 326 | |||||||||
|
|
| ||||||||||
| 688 | ||||||||||||
|
|
| ||||||||||
Saudi Arabia — 0.0% | ||||||||||||
Saudi Government International Bond MTN | ||||||||||||
2.375%, 10/26/2021 (A) | $ | 275 | 275 | |||||||||
|
|
| ||||||||||
Singapore — 2.2% | ||||||||||||
Singapore Government Bond | ||||||||||||
3.500%, 03/01/2027 | SGD | 1,659 | 1,374 | |||||||||
3.375%, 09/01/2033 | 162 | 139 | ||||||||||
3.125%, 09/01/2022 | 4,399 | 3,319 | ||||||||||
3.000%, 09/01/2024 | 5,575 | 4,384 | ||||||||||
2.875%, 07/01/2029 | 200 | 163 | ||||||||||
2.750%, 07/01/2023 | 1,253 | 959 | ||||||||||
2.750%, 04/01/2042 | 166 | 138 | ||||||||||
2.750%, 03/01/2046 | 200 | 168 | ||||||||||
2.250%, 08/01/2036 | 162 | 125 | ||||||||||
2.125%, 06/01/2026 | 1,557 | 1,208 | ||||||||||
Temasek Financial I MTN | ||||||||||||
2.375%, 01/23/2023 (A) | $ | 495 | 507 | |||||||||
|
|
| ||||||||||
| 12,484 | ||||||||||||
|
|
| ||||||||||
Slovak Republic — 0.0% | ||||||||||||
Slovakia Government Bond | ||||||||||||
3.375%, 11/15/2024 | EUR | 75 | 98 | |||||||||
|
|
| ||||||||||
Slovenia — 0.1% | ||||||||||||
Slovenia Government Bond | ||||||||||||
1.250%, 03/22/2027 | 556 | 697 | ||||||||||
|
|
| ||||||||||
South Africa — 0.3% | ||||||||||||
Anglo American Capital MTN | ||||||||||||
1.625%, 09/18/2025 | 220 | 269 | ||||||||||
1.625%, 03/11/2026 | 230 | 280 | ||||||||||
Bidvest Group UK PLC | ||||||||||||
3.625%, 09/23/2026 (A) | $ | 230 | 230 | |||||||||
Republic of South Africa | ||||||||||||
7.000%, 02/28/2031 | ZAR | 20,710 | 1,158 | |||||||||
|
|
| ||||||||||
| 1,937 | ||||||||||||
|
|
| ||||||||||
38 |
SEI Institutional International Trust / Annual Report / September 30, 2021 |
| Description | Face Amount (Thousands) | Market Value ($ Thousands) | ||||||||||
GLOBAL BONDS (continued) | ||||||||||||
South Korea — 1.0% | ||||||||||||
Hyundai Capital Services MTN | ||||||||||||
3.500%, 03/30/2022 | AUD | 680 | $ | 498 | ||||||||
Korea Housing Finance | ||||||||||||
0.010%, 06/29/2026 (A) | EUR | 150 | 174 | |||||||||
Korea Treasury Bond | ||||||||||||
3.000%, 09/10/2024 | KRW | 1,492,660 | 1,309 | |||||||||
2.625%, 09/10/2035 | 368,500 | 324 | ||||||||||
2.000%, 06/10/2031 | 100,190 | 83 | ||||||||||
1.875%, 06/10/2029 | 496,110 | 409 | ||||||||||
1.500%, 12/10/2026 | 1,229,670 | 1,011 | ||||||||||
1.500%, 12/10/2030 | 1,473,440 | 1,164 | ||||||||||
1.250%, 03/10/2026 | 101,780 | 83 | ||||||||||
1.125%, 09/10/2025 | 822,930 | 676 | ||||||||||
|
|
| ||||||||||
| 5,731 | ||||||||||||
|
|
| ||||||||||
Spain — 3.5% | ||||||||||||
Banco Bilbao Vizcaya Argentaria | ||||||||||||
2.250%, 06/12/2024 | EUR | 200 | 248 | |||||||||
Banco de Sabadell | ||||||||||||
0.625%, 11/07/2025 | 400 | 468 | ||||||||||
Banco Santander | ||||||||||||
2.749%, 12/03/2030 | $ | 200 | 199 | |||||||||
CaixaBank | ||||||||||||
1.250%, 01/11/2027 | EUR | 500 | 621 | |||||||||
1.125%, 11/12/2026 | 300 | 359 | ||||||||||
CaixaBank MTN | ||||||||||||
1.375%, 06/19/2026 | 300 | 364 | ||||||||||
Grifols Escrow Issuer SA | ||||||||||||
3.875%, 10/15/2028 | 100 | 117 | ||||||||||
Spain Government Bond | ||||||||||||
6.000%, 01/31/2029 | 80 | 133 | ||||||||||
4.700%, 07/30/2041 (A) | 577 | 1,114 | ||||||||||
3.450%, 07/30/2066 (A) | 272 | 483 | ||||||||||
2.700%, 10/31/2048 (A) | 604 | 931 | ||||||||||
2.350%, 07/30/2033 (A) | 585 | 815 | ||||||||||
1.950%, 07/30/2030 (A) | 124 | 165 | ||||||||||
1.850%, 07/30/2035 (A) | 862 | 1,145 | ||||||||||
1.600%, 04/30/2025 (A) | 259 | 322 | ||||||||||
1.500%, 04/30/2027 (A) | 393 | 498 | ||||||||||
1.400%, 04/30/2028 (A) | 786 | 995 | ||||||||||
1.000%, 07/30/2042 (A) | 536 | 613 | ||||||||||
0.600%, 10/31/2029 (A) | 174 | 209 | ||||||||||
0.500%, 04/30/2030 (A) | 254 | 301 | ||||||||||
0.500%, 10/31/2031 (A) | 1,503 | 1,749 | ||||||||||
0.054%, 01/31/2028 (B) | 3,295 | 3,821 | ||||||||||
0.000%, 05/31/2024 (B) | 2,802 | 3,287 | ||||||||||
0.000%, 01/31/2026 (B) | 770 | 903 | ||||||||||
|
|
| ||||||||||
| 19,860 | ||||||||||||
|
|
| ||||||||||
Supra-National — 2.1% | ||||||||||||
Asian Development Bank MTN | ||||||||||||
2.350%, 06/21/2027 | JPY | 360,000 | 3,685 | |||||||||
| Description | Face Amount (Thousands) | Market Value ($ Thousands) | ||||||||||
GLOBAL BONDS (continued) | ||||||||||||
European Financial Stability Facility MTN | ||||||||||||
0.500%, 07/11/2025 | EUR | 1,420 | $ | 1,703 | ||||||||
European Investment Bank | ||||||||||||
1.900%, 01/26/2026 | JPY | 50,000 | 487 | |||||||||
European Investment Bank MTN | ||||||||||||
1.250%, 05/12/2025 | SEK | 13,180 | 1,554 | |||||||||
0.250%, 10/14/2024 | EUR | 156 | 185 | |||||||||
European Stability Mechanism MTN | ||||||||||||
1.000%, 09/23/2025 | 570 | 697 | ||||||||||
European Union MTN | ||||||||||||
0.700%, 07/06/2051 | 80 | 95 | ||||||||||
0.000%, 03/04/2026 (B) | 1,976 | 2,333 | ||||||||||
International Finance MTN | ||||||||||||
2.375%, 07/19/2023 | CAD | 1,000 | 815 | |||||||||
|
|
| ||||||||||
| 11,554 | ||||||||||||
|
|
| ||||||||||
Sweden — 0.6% | ||||||||||||
Balder Finland MTN | ||||||||||||
1.375%, 05/24/2030 | EUR | 380 | 443 | |||||||||
Kommunivest I Sverige AB MTN | ||||||||||||
1.000%, 10/02/2024 | SEK | 5,830 | 681 | |||||||||
Skandinaviska Enskilda Banken MTN | ||||||||||||
0.250%, 06/20/2024 | EUR | 460 | 542 | |||||||||
Stadshypotek | ||||||||||||
0.500%, 07/11/2025 | 505 | 603 | ||||||||||
Swedbank (C) | ||||||||||||
6.000%, VAR USD Swap Semi 30/360 5 Yr Curr + 4.106% | $ | 200 | 204 | |||||||||
5.625%, VAR US Treas Yield Curve Rate T Note Const Mat 5 Yr + 4.134% | 200 | 216 | ||||||||||
Swedbank Hypotek MTN | ||||||||||||
0.050%, 05/28/2025 | EUR | 195 | 229 | |||||||||
Sweden Government Bond | ||||||||||||
0.125%, 05/12/2031 (A) | SEK | 5,545 | 616 | |||||||||
|
|
| ||||||||||
| 3,534 | ||||||||||||
|
|
| ||||||||||
Switzerland — 0.4% | ||||||||||||
Credit Suisse Group (C) | ||||||||||||
7.500%, VAR USD Swap Semi 30/360 5 Yr Curr + 4.600% | $ | 286 | 306 | |||||||||
7.500%, VAR USD Swap Semi 30/360 5 Yr Curr + 4.600% (A) | 200 | 214 | ||||||||||
Credit Suisse Group Funding Guernsey MTN | ||||||||||||
1.250%, 04/14/2022 | EUR | 295 | 344 | |||||||||
Government of Switzerland | ||||||||||||
1.500%, 04/30/2042 | CHF | 408 | 570 | |||||||||
1.250%, 06/11/2024 | 405 | 457 | ||||||||||
Swiss Re Finance Luxembourg | ||||||||||||
5.000%, VAR US Treas Yield Curve Rate T Note Const Mat 5 Yr + 3.582%, 04/02/2049 (A) | $ | 200 | 229 | |||||||||
|
|
| ||||||||||
| 2,120 | ||||||||||||
|
|
| ||||||||||
SEI Institutional International Trust / Annual Report / September 30, 2021 |
39 |
SCHEDULE OF INVESTMENTS
September 30, 2021
International Fixed Income Fund (Continued)
| Description | Face Amount (Thousands) | Market Value ($ Thousands) | ||||||||||
GLOBAL BONDS (continued) | ||||||||||||
Thailand — 0.3% | ||||||||||||
Thailand Government Bond | ||||||||||||
4.875%, 06/22/2029 | THB | 16,455 | $ | 596 | ||||||||
4.675%, 06/29/2044 | 17,119 | 682 | ||||||||||
3.300%, 06/17/2038 | 3,522 | 116 | ||||||||||
2.125%, 12/17/2026 | 7,336 | 228 | ||||||||||
1.875%, 06/17/2049 | 3,746 | 93 | ||||||||||
|
|
| ||||||||||
| 1,715 | ||||||||||||
|
|
| ||||||||||
United Arab Emirates — 0.1% | ||||||||||||
DP World Crescent MTN | ||||||||||||
4.848%, 09/26/2028 | $ | 265 | 302 | |||||||||
|
|
| ||||||||||
United Kingdom — 6.5% | ||||||||||||
Aviva | ||||||||||||
6.125%, VAR UK Govt Bonds 5 Year Note Generic Bid Yield + 2.850%, 11/14/2036 | GBP | 220 | 355 | |||||||||
Barclays MTN | ||||||||||||
4.000%, 06/26/2029 | AUD | 500 | 391 | |||||||||
BAT Capital | ||||||||||||
4.906%, 04/02/2030 | $ | 105 | 120 | |||||||||
BAT International Finance MTN | ||||||||||||
2.250%, 09/09/2052 | GBP | 100 | 93 | |||||||||
1.250%, 03/13/2027 | EUR | 333 | 397 | |||||||||
BAT Netherlands Finance BV MTN | ||||||||||||
3.125%, 04/07/2028 | 160 | 210 | ||||||||||
BG Energy Capital MTN | ||||||||||||
2.250%, 11/21/2029 | 400 | 525 | ||||||||||
BP Capital Markets (C) | ||||||||||||
3.625%, VAR EUR Swap Annual 5 Yr + 4.120% | 495 | 621 | ||||||||||
3.250%, VAR EUR Swap Annual 5 Yr + 3.880% | 400 | 495 | ||||||||||
BP Capital Markets MTN | ||||||||||||
0.831%, 11/08/2027 | 130 | 155 | ||||||||||
Cadent Finance MTN | ||||||||||||
2.750%, 09/22/2046 | GBP | 100 | 135 | |||||||||
2.625%, 09/22/2038 | 100 | 136 | ||||||||||
Centrica MTN | ||||||||||||
4.375%, 03/13/2029 | 164 | 258 | ||||||||||
CK Hutchison Finance 16 II | ||||||||||||
0.875%, 10/03/2024 | EUR | 212 | 252 | |||||||||
CK Hutchison Group Telecom Finance | ||||||||||||
1.500%, 10/17/2031 | 330 | 399 | ||||||||||
CNH Industrial Finance Europe MTN | ||||||||||||
2.875%, 05/17/2023 | 220 | 267 | ||||||||||
1.750%, 09/12/2025 | 130 | 159 | ||||||||||
CPUK Finance | ||||||||||||
3.690%, 08/28/2028 | GBP | 100 | 149 | |||||||||
3.588%, 08/28/2025 | 215 | 313 | ||||||||||
DS Smith MTN | ||||||||||||
1.375%, 07/26/2024 | EUR | 430 | 515 | |||||||||
| Description | Face Amount (Thousands) | Market Value ($ Thousands) | ||||||||||
GLOBAL BONDS (continued) | ||||||||||||
Gatwick Funding MTN | ||||||||||||
5.250%, 01/23/2024 | GBP | 250 | $ | 367 | ||||||||
Heathrow Funding MTN | ||||||||||||
2.750%, 08/09/2049 | 315 | 406 | ||||||||||
1.875%, 05/23/2022 | EUR | 235 | 276 | |||||||||
HSBC Holdings | ||||||||||||
6.000%, VAR EUR Swap Annual 5 Yr + 5.338% (C) | 200 | 250 | ||||||||||
3.000%, 07/22/2028 | GBP | 167 | 238 | |||||||||
HSBC Holdings MTN | ||||||||||||
6.000%, 03/29/2040 | 70 | 129 | ||||||||||
INEOS Quattro Finance 2 | ||||||||||||
2.500%, 01/15/2026 (A) | EUR | 235 | 275 | |||||||||
Natwest Group | ||||||||||||
3.622%, VAR UK Govt Bonds 5 Year Note Generic Bid Yield + 3.550%, 08/14/2030 | GBP | 245 | 349 | |||||||||
2.452%, VAR ICE LIBOR USD 3 Month + 2.320% (C) | $ | 200 | 199 | |||||||||
Northumbrian Water Finance | ||||||||||||
6.875%, 02/06/2023 | GBP | 190 | 277 | |||||||||
Santander UK MTN | ||||||||||||
1.250%, 09/18/2024 | EUR | 500 | 606 | |||||||||
Santander UK Group Holdings PLC MTN | ||||||||||||
3.625%, 01/14/2026 | GBP | 100 | 146 | |||||||||
Sky PLC MTN | ||||||||||||
2.250%, 11/17/2025 | EUR | 275 | 348 | |||||||||
Standard Chartered (A) | ||||||||||||
1.639%, VAR ICE LIBOR USD 3 Month + 1.510% (C) | $ | 500 | 485 | |||||||||
1.456%, VAR US Treas Yield Curve Rate T Note Const Mat 1 Yr + 1.000%, 01/14/2027 | 355 | 349 | ||||||||||
Thames Water Utilities Finance MTN | ||||||||||||
4.625%, 06/04/2046 | GBP | 155 | 286 | |||||||||
United Kingdom Gilt | ||||||||||||
5.000%, 03/07/2025 | 43 | 67 | ||||||||||
4.500%, 12/07/2042 | 311 | 661 | ||||||||||
4.250%, 03/07/2036 | 56 | 106 | ||||||||||
4.250%, 09/07/2039 | 53 | 105 | ||||||||||
4.250%, 12/07/2040 | 1,418 | 2,851 | ||||||||||
4.250%, 12/07/2046 | 476 | 1,029 | ||||||||||
4.250%, 12/07/2049 | 134 | 302 | ||||||||||
3.500%, 01/22/2045 | 1,001 | 1,914 | ||||||||||
3.250%, 01/22/2044 | 457 | 835 | ||||||||||
2.750%, 09/07/2024 | 806 | 1,160 | ||||||||||
2.500%, 07/22/2065 | 1,101 | 2,095 | ||||||||||
2.250%, 09/07/2023 | 19 | 27 | ||||||||||
1.750%, 09/07/2022 | 2,090 | 2,859 | ||||||||||
1.750%, 09/07/2037 | 110 | 158 | ||||||||||
1.500%, 07/22/2047 | 194 | 267 | ||||||||||
1.250%, 10/22/2041 | 79 | 104 | ||||||||||
1.250%, 07/31/2051 | 211 | 274 | ||||||||||
40 |
SEI Institutional International Trust / Annual Report / September 30, 2021 |
| Description | Face Amount (Thousands) | Market Value ($ Thousands) | ||||||||||
GLOBAL BONDS (continued) | ||||||||||||
1.000%, 04/22/2024 | GBP | 77 | $ | 105 | ||||||||
0.875%, 10/22/2029 | 1,668 | 2,249 | ||||||||||
0.750%, 07/22/2023 | 948 | 1,289 | ||||||||||
0.625%, 06/07/2025 | 78 | 106 | ||||||||||
0.625%, 07/31/2035 | 200 | 248 | ||||||||||
0.625%, 10/22/2050 | 904 | 997 | ||||||||||
0.500%, 10/22/2061 | 828 | 843 | ||||||||||
0.375%, 10/22/2026 | 1,163 | 1,547 | ||||||||||
0.250%, 07/31/2031 | 296 | 370 | ||||||||||
0.125%, 01/31/2024 | 908 | 1,216 | ||||||||||
United Kingdom Gilt - Inflation Linked | ||||||||||||
1.250%, 11/22/2027 | 340 | 597 | ||||||||||
United Kingdom Treasury | ||||||||||||
4.750%, 12/07/2038 | 76 | 157 | ||||||||||
Vodafone Group MTN | ||||||||||||
4.200%, 12/13/2027 | AUD | 490 | 394 | |||||||||
Western Power Distribution West Midlands PLC | ||||||||||||
3.875%, 10/17/2024 | GBP | 230 | 334 | |||||||||
Wm Morrison Supermarkets MTN | ||||||||||||
3.500%, 07/27/2026 | 100 | 135 | ||||||||||
Zurich Finance PLC MTN | ||||||||||||
6.625%, 10/30/2049 (D) | 235 | 334 | ||||||||||
|
|
| ||||||||||
| 36,666 | ||||||||||||
|
|
| ||||||||||
United States — 9.7% | ||||||||||||
AbbVie | ||||||||||||
2.300%, 11/21/2022 | $ | 800 | 816 | |||||||||
Air Lease | ||||||||||||
2.100%, 09/01/2028 | 186 | 180 | ||||||||||
1.875%, 08/15/2026 | 110 | 110 | ||||||||||
Air Lease MTN | ||||||||||||
2.875%, 01/15/2026 | 40 | 42 | ||||||||||
Aircastle | ||||||||||||
5.250%, 08/11/2025 (A) | 261 | 292 | ||||||||||
4.250%, 06/15/2026 | 4 | 4 | ||||||||||
4.125%, 05/01/2024 | 22 | 23 | ||||||||||
Alleghany | ||||||||||||
3.625%, 05/15/2030 | 174 | 191 | ||||||||||
Ally Financial | ||||||||||||
4.700% (C) | 116 | 121 | ||||||||||
Altria Group | ||||||||||||
3.125%, 06/15/2031 | EUR | 310 | 411 | |||||||||
2.200%, 06/15/2027 | 330 | 412 | ||||||||||
American Express | ||||||||||||
3.553%, VAR ICE LIBOR USD 3 Month + 3.428% (C) | $ | 14 | 14 | |||||||||
American Honda Finance | ||||||||||||
1.950%, 10/18/2024 | EUR | 159 | 196 | |||||||||
0.300%, 07/07/2028 | 320 | 368 | ||||||||||
American Tower | ||||||||||||
1.300%, 09/15/2025 | $ | 535 | 535 | |||||||||
0.875%, 05/21/2029 | EUR | 420 | 489 | |||||||||
| Description | Face Amount (Thousands) | Market Value ($ Thousands) | ||||||||||
GLOBAL BONDS (continued) | ||||||||||||
Apple | ||||||||||||
0.700%, 02/08/2026 | $ | 880 | $ | 871 | ||||||||
Ardagh Metal Packaging Finance USA | ||||||||||||
2.000%, 09/01/2028 (A) | EUR | 250 | 292 | |||||||||
AT&T | ||||||||||||
2.875% (C) | 200 | 234 | ||||||||||
1.800%, 09/05/2026 | 185 | 230 | ||||||||||
1.650%, 02/01/2028 | $ | 870 | 863 | |||||||||
1.600%, 05/19/2028 | EUR | 170 | 211 | |||||||||
Aviation Capital Group | ||||||||||||
1.950%, 09/20/2026 (A) | $ | 231 | 229 | |||||||||
Aviation Capital Group LLC (A) | ||||||||||||
5.500%, 12/15/2024 | 80 | 90 | ||||||||||
3.500%, 11/01/2027 | 8 | 8 | ||||||||||
1.950%, 01/30/2026 | 108 | 108 | ||||||||||
Axalta Coating Systems LLC | ||||||||||||
3.375%, 02/15/2029 (A) | 210 | 204 | ||||||||||
Bank of America MTN | ||||||||||||
2.375%, 06/19/2024 | EUR | 835 | 1,034 | |||||||||
Becton Dickinson | ||||||||||||
1.336%, 08/13/2041 | 300 | 334 | ||||||||||
1.213%, 02/12/2036 | 129 | 148 | ||||||||||
0.632%, 06/04/2023 | 200 | 235 | ||||||||||
Berkshire Hathaway | ||||||||||||
0.500%, 01/15/2041 | 170 | 173 | ||||||||||
Berkshire Hathaway Finance | ||||||||||||
2.625%, 06/19/2059 | GBP | 144 | 213 | |||||||||
Block Financial | ||||||||||||
2.500%, 07/15/2028 | $ | 300 | 304 | |||||||||
Booking Holdings | ||||||||||||
2.375%, 09/23/2024 | EUR | 355 | 439 | |||||||||
0.500%, 03/08/2028 | 110 | 128 | ||||||||||
Bristol-Myers Squibb | ||||||||||||
0.537%, 11/13/2023 | $ | 950 | 950 | |||||||||
Broadcom | ||||||||||||
3.187%, 11/15/2036 (A) | 185 | 184 | ||||||||||
Capital One Financial | ||||||||||||
1.650%, 06/12/2029 | EUR | 300 | 368 | |||||||||
0.800%, 06/12/2024 | 291 | 344 | ||||||||||
Carnival | ||||||||||||
1.000%, 10/28/2029 | 316 | 284 | ||||||||||
CCO Holdings | ||||||||||||
4.500%, 06/01/2033 (A) | $ | 127 | 129 | |||||||||
Centene | ||||||||||||
2.625%, 08/01/2031 | 128 | 127 | ||||||||||
Charles Schwab | ||||||||||||
5.375%, VAR US Treas Yield Curve Rate T Note Const Mat 5 Yr + 4.971% (C) | 395 | 439 | ||||||||||
0.750%, 03/18/2024 | 420 | 422 | ||||||||||
Charter Communications Operating | ||||||||||||
3.900%, 06/01/2052 | 225 | 224 | ||||||||||
SEI Institutional International Trust / Annual Report / September 30, 2021 |
41 |
SCHEDULE OF INVESTMENTS
September 30, 2021
International Fixed Income Fund (Continued)
| Description | Face Amount (Thousands) | Market Value ($ Thousands) | ||||||||
GLOBAL BONDS (continued) |
| |||||||||
Chubb INA Holdings | ||||||||||
1.550%, 03/15/2028 | EUR | 325 | $ | 404 | ||||||
0.875%, 06/15/2027 | 115 | 138 | ||||||||
0.300%, 12/15/2024 | 190 | 222 | ||||||||
Citigroup | ||||||||||
4.000%, VAR US Treas Yield Curve Rate T Note Const Mat 5 Yr + 3.597% (C) | $ | 71 | 74 | |||||||
Citigroup MTN | ||||||||||
0.750%, 10/26/2023 | EUR | 115 | 136 | |||||||
0.500%, VAR Euribor 3 Month + 0.957%, 10/08/2027 | 505 | 590 | ||||||||
Comcast | ||||||||||
0.250%, 05/20/2027 | 190 | 221 | ||||||||
0.064%, 09/14/2026 (B) | 550 | 634 | ||||||||
CyrusOne | ||||||||||
1.450%, 01/22/2027 | 254 | 296 | ||||||||
Delta Airlines | ||||||||||
4.500%, 10/20/2025 (A) | $ | 480 | 513 | |||||||
DH Europe Finance II | ||||||||||
1.800%, 09/18/2049 | EUR | 105 | 128 | |||||||
Digital Dutch Finco BV | ||||||||||
0.625%, 07/15/2025 | 350 | 413 | ||||||||
Digital Euro Finco | ||||||||||
1.125%, 04/09/2028 | 510 | 608 | ||||||||
Discovery Communications | ||||||||||
5.300%, 05/15/2049 | $ | 18 | 23 | |||||||
5.200%, 09/20/2047 | 36 | 45 | ||||||||
4.650%, 05/15/2050 | 14 | 16 | ||||||||
Eli Lilly | ||||||||||
1.375%, 09/14/2061 | EUR | 195 | 211 | |||||||
Emerson Electric | ||||||||||
0.375%, 05/22/2024 | 350 | 411 | ||||||||
Enable Midstream Partners | ||||||||||
4.950%, 05/15/2028 | $ | 39 | 44 | |||||||
Essential Properties | ||||||||||
2.950%, 07/15/2031 | 215 | 216 | ||||||||
Expedia Group | ||||||||||
4.625%, 08/01/2027 | 157 | 178 | ||||||||
Exxon Mobil | ||||||||||
0.835%, 06/26/2032 | EUR | 600 | 689 | |||||||
FedEx | ||||||||||
0.450%, 05/04/2029 | 327 | 376 | ||||||||
Fidelity National Information Services | ||||||||||
0.625%, 12/03/2025 | 185 | 219 | ||||||||
0.125%, 12/03/2022 | 500 | 582 | ||||||||
GE Capital Canada Funding MTN | ||||||||||
4.600%, 01/26/2022 | CAD | 1,169 | 934 | |||||||
GE Capital UK Funding Unlimited MTN | ||||||||||
6.250%, 05/05/2038 | GBP | 165 | 328 | |||||||
5.875%, 01/18/2033 | 160 | 290 | ||||||||
| Description | Face Amount (Thousands) | Market Value ($ Thousands) | ||||||||
GLOBAL BONDS (continued) |
| |||||||||
General Motors Financial MTN | ||||||||||
0.955%, 09/07/2023 | EUR | 275 | $ | 324 | ||||||
Gilead Sciences | ||||||||||
0.750%, 09/29/2023 | $ | 725 | 725 | |||||||
Goldman Sachs Group | ||||||||||
5.500%, 10/12/2021 | GBP | 1,100 | 1,485 | |||||||
0.627%, VAR United States Secured Overnight Financing Rate + 0.538%, 11/17/2023 | $ | 715 | 715 | |||||||
Goldman Sachs Group MTN | ||||||||||
2.125%, 09/30/2024 | EUR | 885 | 1,091 | |||||||
1.625%, 07/27/2026 | 170 | 210 | ||||||||
Goodyear Europe BV | ||||||||||
2.750%, 08/15/2028 (A) | 200 | 234 | ||||||||
Harley-Davidson Financial Services | ||||||||||
3.875%, 05/19/2023 | 110 | 136 | ||||||||
0.900%, 11/19/2024 | 335 | 397 | ||||||||
Hilton Domestic Operating | ||||||||||
3.625%, 02/15/2032 (A) | $ | 215 | 212 | |||||||
Host Hotels & Resorts | ||||||||||
3.500%, 09/15/2030 | 200 | 208 | ||||||||
IHS Markit | ||||||||||
4.750%, 08/01/2028 | 17 | 20 | ||||||||
4.250%, 05/01/2029 | 72 | 82 | ||||||||
Intercontinental Exchange | ||||||||||
0.700%, 06/15/2023 | 535 | 537 | ||||||||
International Business Machines | ||||||||||
0.300%, 02/11/2028 | EUR | 240 | 279 | |||||||
IQVIA | ||||||||||
2.875%, 06/15/2028 (A) | 180 | 214 | ||||||||
Jazz Securities DAC | ||||||||||
4.375%, 01/15/2029 (A) | $ | 290 | 301 | |||||||
Johnson Controls International PLC | ||||||||||
1.375%, 02/25/2025 | EUR | 395 | 478 | |||||||
JPMorgan Chase (C) | ||||||||||
7.900%, VAR ICE LIBOR USD 3 Month + 3.470% | $ | 91 | 91 | |||||||
3.926%, VAR ICE LIBOR USD 3 Month + 3.800% | 78 | 78 | ||||||||
3.451%, VAR ICE LIBOR USD 3 Month + 3.320% | 46 | 46 | ||||||||
JPMorgan Chase MTN | ||||||||||
1.090%, VAR Euribor 3 Month + 0.760%, 03/11/2027 | EUR | 660 | 795 | |||||||
Kraft Heinz Foods | ||||||||||
2.250%, 05/25/2028 | 175 | 221 | ||||||||
Las Vegas Sands | ||||||||||
3.900%, 08/08/2029 | $ | 275 | 280 | |||||||
Liberty Mutual Group | ||||||||||
3.625%, VAR EUR Swap Annual 5 Yr + 3.700%, 05/23/2059 | EUR | 300 | 363 | |||||||
Marriott International | ||||||||||
4.650%, 12/01/2028 | $ | 120 | 137 | |||||||
42 |
SEI Institutional International Trust / Annual Report / September 30, 2021 |
| Description | Face Amount (Thousands) | Market Value ($ Thousands) | ||||||||
GLOBAL BONDS (continued) |
| |||||||||
MassMutual Global Funding II MTN | ||||||||||
0.850%, 06/09/2023 (A) | $ | 998 | $ | 1,007 | ||||||
Mattel | ||||||||||
3.750%, 04/01/2029 (A) | 138 | 144 | ||||||||
Medtronic Global Holdings SCA | ||||||||||
1.375%, 10/15/2040 | EUR | 110 | 129 | |||||||
1.125%, 03/07/2027 | 400 | 487 | ||||||||
0.250%, 07/02/2025 | 115 | 135 | ||||||||
Metropolitan Life Global Funding I MTN | ||||||||||
1.950%, 01/13/2023 (A) | $ | 1,000 | 1,020 | |||||||
Mileage Plus Holdings LLC | ||||||||||
6.500%, 06/20/2027 (A) | 350 | 381 | ||||||||
Mondelez International | ||||||||||
0.250%, 03/17/2028 | EUR | 470 | 538 | |||||||
Mondelez International Holdings Netherlands BV | ||||||||||
0.625%, 09/09/2032 (A) | 450 | 508 | ||||||||
Moody’s | ||||||||||
1.750%, 03/09/2027 | 375 | 470 | ||||||||
Morgan Stanley | ||||||||||
3.736%, VAR ICE LIBOR USD 3 Month + 3.610% (C) | $ | 23 | 23 | |||||||
0.406%, VAR Euribor 3 Month + 0.698%, 10/29/2027 | EUR | 745 | 868 | |||||||
Morgan Stanley MTN | ||||||||||
0.529%, VAR United States Secured Overnight Financing Rate + 0.455%, 01/25/2024 | $ | 1,000 | 1,001 | |||||||
Mozart Debt Merger Sub | ||||||||||
3.875%, 04/01/2029 (A) | 230 | 230 | ||||||||
National Grid North America MTN | ||||||||||
1.000%, 07/12/2024 | EUR | 300 | 357 | |||||||
Netflix | ||||||||||
3.625%, 05/15/2027 | 200 | 268 | ||||||||
Newell Brands | ||||||||||
4.700%, 04/01/2026 | $ | 140 | 154 | |||||||
NOV | ||||||||||
3.600%, 12/01/2029 | 205 | 215 | ||||||||
Office Properties Income Trust | ||||||||||
4.500%, 02/01/2025 | 270 | 289 | ||||||||
Olympus Water US Holding | ||||||||||
3.875%, 10/01/2028 (A) | EUR | 100 | 116 | |||||||
ONEOK | ||||||||||
6.350%, 01/15/2031 | $ | 89 | 114 | |||||||
Oracle | ||||||||||
3.650%, 03/25/2041 | 160 | 165 | ||||||||
Organon | ||||||||||
4.125%, 04/30/2028 (A) | 290 | 296 | ||||||||
Paysafe Finance | ||||||||||
3.000%, 06/15/2029 (A) | EUR | 245 | 274 | |||||||
Philip Morris International | ||||||||||
1.450%, 08/01/2039 | 115 | 126 | ||||||||
| Description | Face Amount (Thousands) | Market Value ($ Thousands) | ||||||||
GLOBAL BONDS (continued) |
| |||||||||
0.625%, 11/08/2024 | EUR | 285 | $ | 336 | ||||||
Philip Morris International MTN | ||||||||||
2.875%, 03/03/2026 | 170 | 221 | ||||||||
Plains All American Pipeline | ||||||||||
3.550%, 12/15/2029 | $ | 79 | 83 | |||||||
PNC Financial Services Group | ||||||||||
3.300%, 03/08/2022 | 150 | 152 | ||||||||
2.200%, 11/01/2024 | 885 | 927 | ||||||||
Principal Life Global Funding II | ||||||||||
1.250%, 06/23/2025 (A) | 315 | 315 | ||||||||
Prudential Financial | ||||||||||
5.875%, VAR ICE LIBOR USD 3 Month + 4.175%, 09/15/2042 | 199 | 207 | ||||||||
Public Storage | ||||||||||
0.500%, 09/09/2030 | EUR | 260 | 295 | |||||||
PVH Corp | ||||||||||
3.125%, 12/15/2027 | 215 | 284 | ||||||||
Realty Income Corp | ||||||||||
1.125%, 07/13/2027 | GBP | 385 | 511 | |||||||
Sabra Health Care LP | ||||||||||
3.900%, 10/15/2029 | $ | 280 | 295 | |||||||
Schlumberger Finance France SAS | ||||||||||
1.000%, 02/18/2026 | EUR | 305 | 367 | |||||||
Sealed Air | ||||||||||
1.573%, 10/15/2026 (A) | $ | 380 | 378 | |||||||
Southern | ||||||||||
1.875%, VAR EUR Swap Annual 5 Yr + 2.108%, 09/15/2081 | EUR | 200 | 231 | |||||||
Starbucks Corp | ||||||||||
1.300%, 05/07/2022 | $ | 350 | 352 | |||||||
Time Warner Cable | ||||||||||
5.750%, 06/02/2031 | GBP | 295 | 503 | |||||||
T-Mobile USA | ||||||||||
3.375%, 04/15/2029 (A) | $ | 52 | 54 | |||||||
2.875%, 02/15/2031 | 77 | 78 | ||||||||
2.625%, 02/15/2029 | 87 | 88 | ||||||||
Toyota Motor Credit MTN | ||||||||||
0.625%, 11/21/2024 | EUR | 465 | 552 | |||||||
Tyco Electronics Group | ||||||||||
0.113%, 02/16/2029 (B) | 308 | 346 | ||||||||
UnitedHealth Group | ||||||||||
1.250%, 01/15/2026 | $ | 175 | 176 | |||||||
US Bancorp MTN | ||||||||||
0.850%, 06/07/2024 | EUR | 226 | 269 | |||||||
Venture Global Calcasieu Pass | ||||||||||
3.875%, 08/15/2029 (A) | $ | 125 | 129 | |||||||
Verizon Communications | ||||||||||
4.016%, 12/03/2029 | 391 | 443 | ||||||||
2.100%, 03/22/2028 | 445 | 452 | ||||||||
0.875%, 04/08/2027 | EUR | 175 | 210 | |||||||
Verizon Communications MTN | ||||||||||
4.750%, 02/17/2034 | GBP | 170 | 292 | |||||||
SEI Institutional International Trust / Annual Report / September 30, 2021 |
43 |
SCHEDULE OF INVESTMENTS
September 30, 2021
International Fixed Income Fund (Continued)
| Description | Face Amount (Thousands) | Market Value ($ Thousands) | ||||||||||
GLOBAL BONDS (continued) |
| |||||||||||
4.050%, 02/17/2025 | AUD | 680 | $ | 536 | ||||||||
Vornado Realty | ||||||||||||
3.400%, 06/01/2031 | $ | 334 | 346 | |||||||||
Wells Fargo | ||||||||||||
3.900%, VAR US Treas Yield Curve Rate T Note Const Mat 5 Yr + 3.453% (C) | 132 | 136 | ||||||||||
Wells Fargo MTN | ||||||||||||
2.125%, 12/20/2023 | GBP | 345 | 477 | |||||||||
2.000%, 04/27/2026 | EUR | 210 | 263 | |||||||||
1.375%, 06/30/2022 | GBP | 195 | 265 | |||||||||
0.500%, 04/26/2024 | EUR | 500 | 588 | |||||||||
Welltower | ||||||||||||
4.500%, 12/01/2034 | GBP | 140 | 229 | |||||||||
Western Union | ||||||||||||
2.750%, 03/15/2031 | $ | 355 | 356 | |||||||||
WPC Eurobond BV | ||||||||||||
1.350%, 04/15/2028 | EUR | 530 | 636 | |||||||||
|
|
| ||||||||||
| 54,314 | ||||||||||||
|
|
| ||||||||||
Total Global Bonds (Cost $505,973) ($ Thousands) |
| 511,469 | ||||||||||
|
|
| ||||||||||
U.S. TREASURY OBLIGATIONS — 4.0% |
| |||||||||||
U.S. Treasury Bill | ||||||||||||
0.044%, 10/26/2021 (B) | $ | 12,107 | 12,106 | |||||||||
U.S. Treasury Bond | ||||||||||||
2.169%, 11/15/2050 (B) | 1,346 | 725 | ||||||||||
U.S. Treasury Notes | ||||||||||||
0.500%, 03/31/2025 | 94 | 93 | ||||||||||
0.375%, 01/31/2026 | 1,505 | 1,473 | ||||||||||
0.125%, 11/30/2022 | 8,322 | 8,321 | ||||||||||
|
|
| ||||||||||
Total U.S. Treasury Obligations (Cost $22,759) ($ Thousands) | 22,718 | |||||||||||
|
|
| ||||||||||
MORTGAGE-BACKED SECURITIES — 0.2% |
| |||||||||||
Agency Mortgage-Backed Obligation — 0.2% |
| |||||||||||
FHLMC Structured Agency Credit Risk Debt Notes, Ser 2016-HQA1, Cl M3 | ||||||||||||
6.436%, VAR ICE LIBOR USD 1 Month + 6.350%, 09/25/2028 | 176 | 186 | ||||||||||
FHLMC Structured Agency Credit Risk Debt Notes, Ser 2017-DNA2, Cl M2 | ||||||||||||
3.536%, VAR ICE LIBOR USD 1 Month + 3.450%, 10/25/2029 | 470 | 487 | ||||||||||
| Description | Face Amount (Thousands) | Market Value ($ Thousands) | ||||||||
MORTGAGE-BACKED SECURITIES (continued) |
| |||||||||
FNMA Connecticut Avenue Securities, Ser 2014-C04, Cl 2M2 | ||||||||||
5.086%, VAR ICE LIBOR USD 1 Month + 5.000%, 11/25/2024 | $ | 74 | $ | 75 | ||||||
FNMA Connecticut Avenue Securities, Ser 2016-C04, Cl 1M2 | ||||||||||
4.336%, VAR ICE LIBOR USD 1 Month + 4.250%, 01/25/2029 | 60 | 63 | ||||||||
FNMA Connecticut Avenue Securities, Ser 2016-C07, Cl 2M2 | ||||||||||
4.436%, VAR ICE LIBOR USD 1 Month + 4.350%, 05/25/2029 | 83 | 86 | ||||||||
|
|
| ||||||||
| 897 | ||||||||||
|
|
| ||||||||
Non-Agency Mortgage-Backed Obligation — 0.0% |
| |||||||||
Bear Stearns Adjustable Rate Mortgage Trust, Ser 2004-6, Cl 3A | ||||||||||
2.106%, 09/25/2034 (D) | 9 | 8 | ||||||||
JPMorgan Mortgage Trust, Ser 2004-A5, Cl 3A1 | ||||||||||
2.454%, 12/25/2034 (D) | 24 | 25 | ||||||||
LSTAR Commercial Mortgage Trust, Ser 2016-4, Cl A2 | ||||||||||
2.579%, 03/10/2049 (A) | 137 | 139 | ||||||||
|
|
| ||||||||
| 172 | ||||||||||
|
|
| ||||||||
Total Mortgage-Backed Securities (Cost $1,051) ($ Thousands) | 1,069 | |||||||||
|
|
| ||||||||
Total Investments in Securities — 95.3% (Cost $529,783) ($ Thousands) |
| $ | 535,256 | |||||||
|
|
| ||||||||
44 |
SEI Institutional International Trust / Annual Report / September 30, 2021 |
A list of the open futures contracts held by the Fund at September 30, 2021, is as follows:
| Type of Contract | Number of Contracts | Expiration Date | Notional Amount (Thousands) | Value (Thousands) | Unrealized Appreciation/ (Depreciation) (Thousands) | |||||||||||||
Long Contracts | ||||||||||||||||||
Australian 10-Year Bond | 24 | Dec-2021 | $ | 2,543 | $ | 2,453 | $ | (49 | ) | |||||||||
Australian 3-Year Bond | 12 | Dec-2021 | 1,027 | 1,009 | (3 | ) | ||||||||||||
Canadian 10-Year Bond | 7 | Dec-2021 | 808 | 791 | (15 | ) | ||||||||||||
Euro-BTP | 9 | Dec-2021 | 1,626 | 1,585 | (18 | ) | ||||||||||||
Euro-Bund | 70 | Dec-2021 | 14,305 | 13,777 | (194 | ) | ||||||||||||
Euro-Buxl | 9 | Dec-2021 | 2,179 | 2,121 | (30 | ) | ||||||||||||
Euro-OAT | 30 | Dec-2021 | 5,770 | 5,770 | – | |||||||||||||
Japanese 10-Year Bond | 23 | Dec-2021 | 31,652 | 31,203 | (97 | ) | ||||||||||||
Japanese 10-Year Government Bond E-MINI | 8 | Dec-2021 | 1,103 | 1,086 | (3 | ) | ||||||||||||
Long Gilt 10-Year Bond | 13 | Jan-2022 | 2,201 | 2,194 | (9 | ) | ||||||||||||
U.S. 10-Year Treasury Note | 27 | Dec-2021 | 3,591 | 3,553 | (38 | ) | ||||||||||||
U.S. Long Treasury Bond | 25 | Dec-2021 | 4,063 | 3,980 | (82 | ) | ||||||||||||
U.S. Ultra Long Treasury Bond | 8 | Dec-2021 | 1,577 | 1,529 | (49 | ) | ||||||||||||
|
|
|
|
|
|
|
|
| ||||||||||
| 72,445 | 71,051 | (587 | ) | |||||||||||||||
|
|
|
|
|
|
|
|
| ||||||||||
Short Contracts | ||||||||||||||||||
Australian 3-Year Bond | (17) | Dec-2021 | $ | (1,463 | ) | $ | (1,430 | ) | $ | 3 | ||||||||
Canadian 5-Year Bond | (22) | Dec-2021 | (2,202 | ) | (2,163 | ) | 24 | |||||||||||
Canadian 10-Year Bond | (14) | Dec-2021 | (1,625 | ) | (1,582 | ) | 36 | |||||||||||
Euro | (240) | Dec-2021 | (35,623 | ) | (34,800 | ) | 823 | |||||||||||
Euro-Bob | (34) | Dec-2021 | (5,379 | ) | (5,317 | ) | 7 | |||||||||||
Euro-Bund | (26) | Dec-2021 | (5,218 | ) | (5,117 | ) | 34 | |||||||||||
Euro-Schatz | (107) | Dec-2021 | (14,259 | ) | (13,914 | ) | 11 | |||||||||||
Long Gilt 10-Year Bond | (23) | Jan-2022 | (4,074 | ) | (3,881 | ) | 96 | |||||||||||
U.S. 2-Year Treasury Note | (53) | Jan-2022 | (11,671 | ) | (11,663 | ) | 8 | |||||||||||
U.S. 5-Year Treasury Note | (151) | Jan-2022 | (18,605 | ) | (18,534 | ) | 71 | |||||||||||
U.S. 10-Year Treasury Note | (125) | Dec-2021 | (16,443 | ) | (16,451 | ) | (8 | ) | ||||||||||
U.S. Ultra Long Treasury Bond | (9) | Dec-2021 | (1,768 | ) | (1,720 | ) | 49 | |||||||||||
Ultra 10-Year U.S. Treasury Note | (90) | Dec-2021 | (13,263 | ) | (13,073 | ) | 190 | |||||||||||
|
|
|
|
|
|
|
|
| ||||||||||
| (131,593 | ) | (129,645 | ) | 1,344 | ||||||||||||||
|
|
|
|
|
|
|
|
| ||||||||||
| $ | (59,148 | ) | $ | (58,594 | ) | $ | 757 | |||||||||||
|
|
|
|
|
|
|
|
| ||||||||||
A list of the open forward foreign currency contracts held by the Fund at September 30, 2021, is as follows:
| Counterparty | Settlement Date | Currency to Deliver (Thousands) | Currency to Receive (Thousands) | Unrealized Appreciation (Depreciation) (Thousands) | ||||||||||||||||||||
Bank of America | 10/06/21 | USD | 38 | EUR | 32 | $ | (1) | |||||||||||||||||
Bank of America | 10/06/21 | USD | 87 | ZAR | 1,290 | (1) | ||||||||||||||||||
Bank of America | 10/06/21 | USD | 134 | NZD | 189 | (3) | ||||||||||||||||||
Bank of America | 10/06/21 | EUR | 946 | USD | 1,119 | 23 | ||||||||||||||||||
Bank of America | 10/06/21 | NZD | 1,835 | USD | 1,299 | 33 | ||||||||||||||||||
Bank of America | 10/06/21 | ZAR | 4,400 | USD | 302 | 9 | ||||||||||||||||||
Bank of America | 10/08/21 | USD | 1,033 | INR | 77,912 | 16 | ||||||||||||||||||
Barclays PLC | 10/06/21 | USD | 150 | JPY | 16,700 | — | ||||||||||||||||||
Barclays PLC | 10/06/21 | USD | 152 | SGD | 205 | (2) | ||||||||||||||||||
Barclays PLC | 10/06/21 | USD | 296 | MXN | 6,030 | (3) | ||||||||||||||||||
Barclays PLC | 10/06/21 | USD | 440 | AUD | 601 | (6) | ||||||||||||||||||
Barclays PLC | 10/06/21 -11/04/21 | USD | 589 | EUR | 502 | (7) | ||||||||||||||||||
Barclays PLC | 10/06/21 | SEK | 1,310 | USD | 150 | — | ||||||||||||||||||
Barclays PLC | 10/06/21 | NOK | 1,898 | USD | 219 | 1 | ||||||||||||||||||
Barclays PLC | 10/06/21 | AUD | 6,972 | USD | 5,100 | 63 | ||||||||||||||||||
SEI Institutional International Trust / Annual Report / September 30, 2021 |
45 |
SCHEDULE OF INVESTMENTS
September 30, 2021
International Fixed Income Fund (Continued)
| Counterparty | Settlement Date | Currency to Deliver (Thousands) | Currency to Receive (Thousands) | Unrealized Appreciation (Depreciation) (Thousands) | ||||||||||||||||||||
Barclays PLC | 10/06/21 | PLN | 3,559 | USD | 927 | $ | 31 | |||||||||||||||||
Barclays PLC | 11/04/21 | PLN | 3,559 | USD | 892 | (4) | ||||||||||||||||||
Barclays PLC | 10/06/21 - 11/04/21 | TRY | 17,250 | USD | 2,033 | 95 | ||||||||||||||||||
Barclays PLC | 11/04/21 | TRY | 7,186 | USD | 796 | — | ||||||||||||||||||
Barclays PLC | 10/06/21 | CAD | 28,091 | USD | 22,262 | 88 | ||||||||||||||||||
Barclays PLC | 10/06/21 | GBP | 19,796 | USD | 27,273 | 582 | ||||||||||||||||||
Barclays PLC | 11/04/21 | GBP | 20,978 | USD | 28,204 | (77) | ||||||||||||||||||
Barclays PLC | 10/08/21 | USD | 406 | CNY | 2,622 | (1) | ||||||||||||||||||
Barclays PLC | 10/08/21 | USD | 1,059 | INR | 77,896 | (9) | ||||||||||||||||||
Barclays PLC | 11/04/21 | ILS | 2,941 | USD | 915 | 3 | ||||||||||||||||||
Barclays PLC | 11/04/21 | CZK | 25,007 | USD | 1,137 | (6) | ||||||||||||||||||
Barclays PLC | 11/04/21 | EUR | 68,741 | USD | 79,824 | 119 | ||||||||||||||||||
Barclays PLC | 11/04/21 | EUR | 246 | USD | 285 | — | ||||||||||||||||||
BNP Paribas | 10/06/21 | USD | 32 | AUD | 44 | — | ||||||||||||||||||
BNP Paribas | 10/06/21 | GBP | 1,160 | USD | 1,606 | 42 | ||||||||||||||||||
BNP Paribas | 10/06/21 | USD | 9,153 | CAD | 11,571 | (19) | ||||||||||||||||||
BNP Paribas | 10/06/21 | MYR | 8,712 | USD | 2,098 | 17 | ||||||||||||||||||
BNP Paribas | 11/03/21 | MYR | 8,712 | USD | 2,078 | (3) | ||||||||||||||||||
BNP Paribas | 10/06/21 | EUR | 70,539 | USD | 83,581 | 1,827 | ||||||||||||||||||
BNP Paribas | 10/13/21 | NOK | 8,584 | USD | 983 | — | ||||||||||||||||||
BNP Paribas | 10/15/21 | USD | 1,064 | NZD | 1,530 | (9) | ||||||||||||||||||
BNP Paribas | 10/15/21 | NZD | 1,529 | USD | 1,073 | 18 | ||||||||||||||||||
BNP Paribas | 11/04/21 | NZD | 225 | USD | 155 | — | ||||||||||||||||||
BNP Paribas | 11/04/21 | HUF | 314,649 | USD | 1,013 | (1) | ||||||||||||||||||
BNP Paribas | 11/19/21 | CAD | 1,135 | USD | 898 | 2 | ||||||||||||||||||
BNP Paribas | 12/09/21 | CNH | 111,164 | USD | 17,122 | (13) | ||||||||||||||||||
Brown Brothers Harriman | 10/15/21 - 11/08/21 | EUR | 26,210 | USD | 30,861 | 479 | ||||||||||||||||||
Brown Brothers Harriman | 10/28/21 | MXN | 104 | USD | 5 | — | ||||||||||||||||||
Brown Brothers Harriman | 10/28/21 | CHF | 981 | USD | 1,088 | 36 | ||||||||||||||||||
Brown Brothers Harriman | 11/08/21 | USD | 1,103 | EUR | 942 | (11) | ||||||||||||||||||
Citi | 10/04/21 - 11/03/21 | USD | 1,152 | BRL | 6,250 | (10) | ||||||||||||||||||
Citi | 11/08/21 | EUR | 706 | USD | 838 | 19 | ||||||||||||||||||
Citi | 11/08/21 | USD | 711 | EUR | 605 | (10) | ||||||||||||||||||
Citi | 11/09/21 | AUD | 10,290 | USD | 7,416 | (17) | ||||||||||||||||||
Citi | 11/17/21 | USD | 1,067 | JPY | 118,219 | (7) | ||||||||||||||||||
Citi | 11/17/21 | JPY | 314,501 | USD | 2,873 | 53 | ||||||||||||||||||
Citigroup | 10/06/21 | GBP | 110 | USD | 151 | 3 | ||||||||||||||||||
Citigroup | 10/06/21 | EUR | 129 | USD | 151 | 2 | ||||||||||||||||||
Citigroup | 10/06/21 | USD | 150 | CAD | 190 | — | ||||||||||||||||||
Citigroup | 10/06/21 | USD | 151 | GBP | 111 | (2) | ||||||||||||||||||
Citigroup | 10/06/21 | USD | 302 | SEK | 2,600 | (5) | ||||||||||||||||||
Citigroup | 10/06/21 | USD | 304 | EUR | 257 | (6) | ||||||||||||||||||
Citigroup | 10/06/21 | USD | 348 | ZAR | 5,150 | (6) | ||||||||||||||||||
Citigroup | 11/04/21 | USD | 150 | NOK | 1,310 | 1 | ||||||||||||||||||
Citigroup | 10/06/21 | USD | 219 | NOK | 1,898 | (2) | ||||||||||||||||||
Citigroup | 11/04/21 | USD | 42 | AUD | 59 | — | ||||||||||||||||||
Citigroup | 10/06/21 | USD | 464 | AUD | 630 | (9) | ||||||||||||||||||
Citigroup | 10/06/21 | SEK | 1,300 | USD | 151 | 2 | ||||||||||||||||||
Citigroup | 10/06/21 | ZAR | 2,170 | USD | 152 | 8 | ||||||||||||||||||
46 |
SEI Institutional International Trust / Annual Report / September 30, 2021 |
| Counterparty | Settlement Date | Currency to Deliver (Thousands) | Currency to Receive (Thousands) | Unrealized Appreciation (Depreciation) (Thousands) | ||||||||||||||||||||
Citigroup | 10/06/21 | CHF | 2,221 | USD | 2,425 | $ | 44 | |||||||||||||||||
Citigroup | 10/06/21 | DKK | 5,649 | USD | 899 | 18 | ||||||||||||||||||
Citigroup | 10/06/21 | NOK | 8,559 | USD | 989 | 8 | ||||||||||||||||||
Citigroup | 10/06/21 | JPY | 6,186,433 | USD | 56,327 | 879 | ||||||||||||||||||
Citigroup | 11/04/21 | JPY | 36,750 | USD | 329 | (1) | ||||||||||||||||||
Citigroup | 10/08/21 - 11/04/21 | USD | 25,158 | CNY | 162,756 | 25 | ||||||||||||||||||
Citigroup | 10/08/21 - 11/04/21 | CNY | 163,740 | USD | 25,259 | (58) | ||||||||||||||||||
Citigroup | 11/04/21 | CAD | 190 | USD | 149 | (1) | ||||||||||||||||||
Credit Agricole | 11/04/21 | USD | 1,043 | AUD | 1,448 | 3 | ||||||||||||||||||
Deutsche Bank | 11/03/21 | USD | 147 | BRL | 790 | (2) | ||||||||||||||||||
Goldman Sachs | 10/06/21 | USD | 1,136 | TRY | 10,064 | (5) | ||||||||||||||||||
Goldman Sachs | 10/06/21 | USD | 284 | ZAR | 4,300 | 1 | ||||||||||||||||||
Goldman Sachs | 10/06/21 - 11/24/21 | USD | 1,532 | ZAR | 23,077 | (6) | ||||||||||||||||||
Goldman Sachs | 10/06/21 | TRY | 1,280 | USD | 145 | 1 | ||||||||||||||||||
Goldman Sachs | 11/04/21 | TRY | 8,784 | USD | 973 | — | ||||||||||||||||||
Goldman Sachs | 10/06/21 - 11/24/21 | ZAR | 20,579 | USD | 1,431 | 72 | ||||||||||||||||||
Goldman Sachs | 10/06/21 | HUF | 314,649 | USD | 1,064 | 49 | ||||||||||||||||||
Goldman Sachs | 11/04/21 | USD | 195 | AUD | 270 | — | ||||||||||||||||||
Goldman Sachs | 11/04/21 | USD | 1,013 | GBP | 751 | — | ||||||||||||||||||
Goldman Sachs | 11/04/21 | USD | 1,028 | MXN | 21,200 | (1) | ||||||||||||||||||
Goldman Sachs | 11/04/21 | USD | 1,091 | EUR | 941 | — | ||||||||||||||||||
Goldman Sachs | 11/04/21 | MXN | 38,804 | USD | 1,882 | 2 | ||||||||||||||||||
Goldman Sachs | 11/10/21 | GBP | 8,311 | USD | 11,415 | 211 | ||||||||||||||||||
HSBC | 10/06/21 | THB | 3,335 | USD | 103 | 4 | ||||||||||||||||||
HSBC | 11/04/21 | USD | 107 | AUD | 149 | 1 | ||||||||||||||||||
HSBC | 11/08/21 | EUR | 18,064 | USD | 21,228 | 281 | ||||||||||||||||||
HSBC | 11/17/21 | USD | 1,071 | JPY | 117,534 | (17) | ||||||||||||||||||
JPMorgan Chase Bank | 10/06/21 | CHF | 140 | USD | 151 | 1 | ||||||||||||||||||
JPMorgan Chase Bank | 10/06/21 | USD | 151 | JPY | 16,600 | (3) | ||||||||||||||||||
JPMorgan Chase Bank | 10/06/21 | SGD | 205 | USD | 151 | 1 | ||||||||||||||||||
JPMorgan Chase Bank | 10/06/21 | EUR | 257 | USD | 304 | 6 | ||||||||||||||||||
JPMorgan Chase Bank | 10/06/21 | USD | 304 | CHF | 280 | (4) | ||||||||||||||||||
JPMorgan Chase Bank | 10/06/21 | USD | 306 | SEK | 2,620 | (6) | ||||||||||||||||||
JPMorgan Chase Bank | 10/06/21 | NZD | 435 | USD | 305 | 5 | ||||||||||||||||||
JPMorgan Chase Bank | 10/06/21 | USD | 481 | AUD | 655 | (8) | ||||||||||||||||||
JPMorgan Chase Bank | 10/06/21 | USD | 605 | EUR | 513 | (11) | ||||||||||||||||||
JPMorgan Chase Bank | 10/06/21 | NOK | 1,310 | USD | 151 | — | ||||||||||||||||||
JPMorgan Chase Bank | 10/06/21 | SEK | 2,606 | USD | 303 | 5 | ||||||||||||||||||
JPMorgan Chase Bank | 10/06/21 - 11/04/21 | RON | 3,124 | USD | 739 | 8 | ||||||||||||||||||
JPMorgan Chase Bank | 10/07/21 | PEN | 6,598 | USD | 1,616 | 19 | ||||||||||||||||||
JPMorgan Chase Bank | 11/08/21 | PEN | 6,598 | USD | 1,594 | (6) | ||||||||||||||||||
JPMorgan Chase Bank | 10/08/21 | USD | 1,055 | CNY | 6,819 | — | ||||||||||||||||||
JPMorgan Chase Bank | 10/08/21 | USD | 1,519 | CNY | 9,824 | 1 | ||||||||||||||||||
JPMorgan Chase Bank | 10/08/21 | CNY | 169,324 | USD | 26,142 | (57) | ||||||||||||||||||
JPMorgan Chase Bank | 10/13/21 | EUR | 22,833 | USD | 27,015 | 549 | ||||||||||||||||||
JPMorgan Chase Bank | 10/21/21 | USD | 1,464 | JPY | 163,759 | 4 | ||||||||||||||||||
JPMorgan Chase Bank | 10/21/21 | USD | 73 | JPY | 8,049 | — | ||||||||||||||||||
JPMorgan Chase Bank | 10/21/21 | JPY | 1,698,767 | USD | 15,433 | 205 | ||||||||||||||||||
JPMorgan Chase Bank | 10/21/21 | JPY | 556,206 | USD | 4,972 | (14) | ||||||||||||||||||
JPMorgan Chase Bank | 10/25/21 | USD | 793 | COP | 3,043,145 | 5 | ||||||||||||||||||
SEI Institutional International Trust / Annual Report / September 30, 2021 |
47 |
SCHEDULE OF INVESTMENTS
September 30, 2021
International Fixed Income Fund (Continued)
| Counterparty | Settlement Date | Currency to Deliver (Thousands) | Currency to Receive (Thousands) | Unrealized Appreciation (Depreciation) (Thousands) | ||||||||||||||||||||
JPMorgan Chase Bank | 10/25/21 | COP | 2,462,826 | USD | 643 | $ | (2) | |||||||||||||||||
JPMorgan Chase Bank | 10/26/21 - 11/01/21 | IDR | 49,478,879 | USD | 3,455 | 2 | ||||||||||||||||||
JPMorgan Chase Bank | 11/01/21 | USD | 167 | IDR | 2,390,882 | — | ||||||||||||||||||
JPMorgan Chase Bank | 11/01/21 | USD | 84 | IDR | 1,209,491 | — | ||||||||||||||||||
JPMorgan Chase Bank | 11/01/21 - 12/08/21 | USD | 1,260 | KRW | 1,492,880 | 1 | ||||||||||||||||||
JPMorgan Chase Bank | 11/04/21 | AUD | 673 | USD | 488 | 2 | ||||||||||||||||||
JPMorgan Chase Bank | 11/22/21 | ILS | 7,131 | USD | 2,218 | 7 | ||||||||||||||||||
JPMorgan Chase Bank | 11/22/21 - 12/08/21 | THB | 134,214 | USD | 4,073 | 107 | ||||||||||||||||||
JPMorgan Chase Bank | 12/08/21 | THB | 31,450 | USD | 928 | (2) | ||||||||||||||||||
JPMorgan Chase Bank | 11/22/21 | CLP | 824,004 | USD | 1,054 | 43 | ||||||||||||||||||
JPMorgan Chase Bank | 12/08/21 - 12/13/21 | CNY | 34,434 | USD | 5,294 | (13) | ||||||||||||||||||
JPMorgan Chase Bank | 12/09/21 | CNH | 8,001 | USD | 1,226 | (7) | ||||||||||||||||||
JPMorgan Chase Bank | 12/13/21 | USD | 86 | SGD | 117 | — | ||||||||||||||||||
JPMorgan Chase Bank | 12/13/21 | USD | 264 | NZD | 371 | (8) | ||||||||||||||||||
JPMorgan Chase Bank | 12/13/21 | USD | 402 | CAD | 513 | 2 | ||||||||||||||||||
JPMorgan Chase Bank | 12/13/21 | GBP | 96 | USD | 131 | 2 | ||||||||||||||||||
JPMorgan Chase Bank | 12/13/21 | GBP | 427 | USD | 574 | (2) | ||||||||||||||||||
JPMorgan Chase Bank | 12/13/21 | USD | 848 | NOK | 7,410 | 1 | ||||||||||||||||||
JPMorgan Chase Bank | 12/13/21 | USD | 756 | GBP | 563 | 3 | ||||||||||||||||||
JPMorgan Chase Bank | 12/13/21 | USD | 909 | GBP | 657 | (23) | ||||||||||||||||||
JPMorgan Chase Bank | 12/13/21 | CAD | 2,553 | USD | 2,034 | 19 | ||||||||||||||||||
JPMorgan Chase Bank | 12/13/21 | CAD | 1,111 | USD | 873 | (4) | ||||||||||||||||||
JPMorgan Chase Bank | 12/13/21 | USD | 1,063 | SEK | 9,323 | 4 | ||||||||||||||||||
JPMorgan Chase Bank | 12/13/21 | USD | 4,542 | SEK | 38,890 | �� | (93) | |||||||||||||||||
JPMorgan Chase Bank | 12/13/21 | AUD | 5,224 | USD | 3,882 | 108 | ||||||||||||||||||
JPMorgan Chase Bank | 12/13/21 | AUD | 1,220 | USD | 878 | (3) | ||||||||||||||||||
JPMorgan Chase Bank | 12/13/21 | CHF | 6,159 | USD | 6,747 | 132 | ||||||||||||||||||
JPMorgan Chase Bank | 12/13/21 | CHF | 1,478 | USD | 1,586 | (2) | ||||||||||||||||||
JPMorgan Chase Bank | 12/13/21 | SGD | 10,628 | USD | 7,900 | 71 | ||||||||||||||||||
JPMorgan Chase Bank | 12/13/21 | SGD | 2,486 | USD | 1,827 | (5) | ||||||||||||||||||
JPMorgan Chase Bank | 12/13/21 | NOK | 6,485 | USD | 749 | 6 | ||||||||||||||||||
JPMorgan Chase Bank | 12/13/21 | NOK | 8,781 | USD | 996 | (10) | ||||||||||||||||||
JPMorgan Chase Bank | 12/13/21 | NZD | 13,012 | USD | 9,279 | 312 | ||||||||||||||||||
JPMorgan Chase Bank | 12/13/21 | NZD | 2,961 | USD | 2,034 | (7) | ||||||||||||||||||
JPMorgan Chase Bank | 12/17/21 | USD | 630 | KRW | 746,440 | — | ||||||||||||||||||
JPMorgan Chase Bank | 12/17/21 | KRW | 1,738,389 | USD | 1,482 | 14 | ||||||||||||||||||
JPMorgan Chase Bank | 12/20/21 | USD | 740 | MXN | 15,297 | (3) | ||||||||||||||||||
JPMorgan Chase Bank | 12/20/21 | USD | 2,047 | RUB | 151,604 | 5 | ||||||||||||||||||
JPMorgan Chase Bank | 12/20/21 | MXN | 94,266 | USD | 4,641 | 104 | ||||||||||||||||||
Morgan Stanley | 10/04/21 | USD | 1,063 | BRL | 5,666 | (23) | ||||||||||||||||||
Morgan Stanley | 10/06/21 | USD | 39 | AUD | 53 | — | ||||||||||||||||||
Morgan Stanley | 10/06/21 | USD | 212 | GBP | 154 | (5) | ||||||||||||||||||
Morgan Stanley | 10/06/21 | SGD | 2,354 | USD | 1,752 | 18 | ||||||||||||||||||
Morgan Stanley | 10/06/21 | ILS | 2,941 | USD | 917 | 5 | ||||||||||||||||||
Morgan Stanley | 10/06/21 - 11/08/21 | USD | 3,584 | EUR | 3,037 | (63) | ||||||||||||||||||
Morgan Stanley | 10/06/21 | SEK | 5,036 | USD | 586 | 10 | ||||||||||||||||||
Morgan Stanley | 11/04/21 | SEK | 5,408 | USD | 616 | (3) | ||||||||||||||||||
Morgan Stanley | 10/06/21 - 11/30/21 | EUR | 24,890 | USD | 29,434 | 560�� | ||||||||||||||||||
Morgan Stanley | 10/06/21 | CZK | 25,007 | USD | 1,158 | 15 | ||||||||||||||||||
Morgan Stanley | 10/06/21 | ZAR | 26,948 | USD | 1,845 | 54 | ||||||||||||||||||
48 |
SEI Institutional International Trust / Annual Report / September 30, 2021 |
| Counterparty | Settlement Date | Currency to Deliver (Thousands) | Currency to Receive (Thousands) | Unrealized Appreciation (Depreciation) (Thousands) | ||||||||||||||||||||
Morgan Stanley | 11/04/21 | ZAR | 12,028 | USD | 791 | $ | (6) | |||||||||||||||||
Morgan Stanley | 10/06/21 | THB | 54,735 | USD | 1,697 | 80 | ||||||||||||||||||
Morgan Stanley | 10/08/21 | INR | 77,161 | USD | 1,028 | (11) | ||||||||||||||||||
Morgan Stanley | 10/13/21 | USD | 966 | NOK | 8,452 | 2 | ||||||||||||||||||
Morgan Stanley | 11/04/21 | USD | 0 | SEK | 4 | — | ||||||||||||||||||
Morgan Stanley | 11/04/21 | USD | 147 | JPY | 16,400 | 1 | ||||||||||||||||||
Morgan Stanley | 11/04/21 | CHF | 1,801 | USD | 1,930 | (2) | ||||||||||||||||||
Morgan Stanley | 11/04/21 | NOK | 9,869 | USD | 1,122 | (8) | ||||||||||||||||||
Morgan Stanley | 11/04/21 | JPY | 6,190,489 | USD | 55,357 | (145) | ||||||||||||||||||
Morgan Stanley | 11/19/21 | CAD | 14,551 | USD | 11,370 | (117) | ||||||||||||||||||
RBC | 10/06/21 | MXN | 38,804 | USD | 1,924 | 36 | ||||||||||||||||||
Societe Generale | 10/13/21 | SEK | 19,757 | USD | 2,296 | 37 | ||||||||||||||||||
Standard Chartered | 10/04/21 | BRL | 5,317 | USD | 1,019 | 43 | ||||||||||||||||||
Standard Chartered | 10/06/21 | GBP | 176 | USD | 242 | 4 | ||||||||||||||||||
Standard Chartered | 10/06/21 | USD | 851 | EUR | 718 | (19) | ||||||||||||||||||
Standard Chartered | 10/06/21 | MYR | 707 | USD | 170 | 1 | ||||||||||||||||||
Standard Chartered | 11/03/21 | MYR | 707 | USD | 169 | — | ||||||||||||||||||
Standard Chartered | 10/15/21 | IDR | 15,250,289 | USD | 1,070 | 5 | ||||||||||||||||||
Standard Chartered | 10/21/21 | USD | 1,070 | TWD | 29,671 | (3) | ||||||||||||||||||
State Street | 10/06/21 | GBP | 111 | USD | 153 | 3 | ||||||||||||||||||
State Street | 10/06/21 | USD | 149 | GBP | 110 | — | ||||||||||||||||||
State Street | 10/06/21 | USD | 151 | JPY | 16,700 | (1) | ||||||||||||||||||
State Street | 10/06/21 | USD | 297 | MXN | 6,030 | (4) | ||||||||||||||||||
State Street | 10/06/21 | USD | 302 | AUD | 410 | (6) | ||||||||||||||||||
State Street | 10/06/21 | USD | 360 | EUR | 305 | (7) | ||||||||||||||||||
State Street | 10/06/21 | NZD | 433 | USD | 304 | 5 | ||||||||||||||||||
State Street | 10/06/21 | USD | 305 | CAD | 390 | 3 | ||||||||||||||||||
State Street | 10/06/21 | USD | 151 | CAD | 190 | (1) | ||||||||||||||||||
State Street | 10/06/21 | CAD | 190 | USD | 150 | — | ||||||||||||||||||
State Street | 10/06/21 - 11/04/21 | CAD | 356 | USD | 280 | (1) | ||||||||||||||||||
State Street | 10/06/21 | USD | 588 | SEK | 5,059 | (9) | ||||||||||||||||||
State Street | 10/06/21 | SGD | 860 | USD | 640 | 6 | ||||||||||||||||||
State Street | 10/06/21 | JPY | 37,656 | USD | 343 | 6 | ||||||||||||||||||
UBS | 10/06/21 | USD | 60 | EUR | 51 | — | ||||||||||||||||||
UBS | 10/06/21 | USD | 60 | AUD | 83 | — | ||||||||||||||||||
UBS | 10/06/21 | SEK | 5,431 | USD | 622 | 1 | ||||||||||||||||||
UBS | 11/04/21 | USD | 205 | CAD | 260 | — | ||||||||||||||||||
UBS | 11/04/21 | USD | 550 | JPY | 61,400 | — | ||||||||||||||||||
UBS | 11/04/21 | CNY | 1,326 | USD | 205 | — | ||||||||||||||||||
Westpac Banking | 11/04/21 | USD | 9,181 | EUR | 7,927 | 10 | ||||||||||||||||||
|
| |||||||||||||||||||||||
| $ | 6,762 | |||||||||||||||||||||||
|
| |||||||||||||||||||||||
SEI Institutional International Trust / Annual Report / September 30, 2021 |
49 |
SCHEDULE OF INVESTMENTS
September 30, 2021
International Fixed Income Fund (Concluded)
A list of the open OTC swap agreements held by the Fund at September 30, 2021, is as follows:
| Interest Rate Swaps | ||||||||||||||||||||||||||||||||||||
| Counterparty | Fund Pays | Fund Receives | Payment Frequency | Termination Date | Currency | Notional Amount (Thousands) | Value (Thousands) | Upfront Payments (Thousands) | Net Unrealized Appreciation (Depreciation) (Thousands) | |||||||||||||||||||||||||||
Deutsche Bank | | China 7-Day Reverse Repo Rate | | 2.985% | Quarterly | 06/03/2024 | CNY | 23,220 | $ | 70 | $ | – | $ | 70 | ||||||||||||||||||||||
Deutsche Bank | | China 7-Day Reverse Repo Rate | | 2.755% | Quarterly | 09/09/2024 | CNY | 31,000 | 64 | – | 64 | |||||||||||||||||||||||||
|
|
|
|
|
|
|
|
| ||||||||||||||||||||||||||||
| $ | 134 | $ | – | $ | 134 | |||||||||||||||||||||||||||||||
|
|
|
|
|
|
|
|
| ||||||||||||||||||||||||||||
A list of the open centrally cleared swap agreements held by the Fund at September 30, 2021, is as follows:
| Interest Rate Swaps | ||||||||||||||||||||||||||||||
| Fund Pays | Fund Receives | Payment Frequency | Termination Date | Currency | Notional Amount (Thousands) | Value (Thousands) | Upfront Payments/ Receipts (Thousands) | Net Unrealized (Thousands) | ||||||||||||||||||||||
BRL/CDI/1D/T247/0.00000 | 4.94% | Annually | 01/02/2023 | BRL | 5,658 | $ | (52) | $ | – | $ | (52) | |||||||||||||||||||
BRL/CDI/1D/T247/0.00000 | 4.945% | Annually | 01/02/2023 | BRL | 5,062 | (47) | – | (47) | ||||||||||||||||||||||
BRL/CDI/1D/T247/0.00000 | 4.915% | Annually | 01/02/2023 | BRL | 9,678 | (90) | – | (90) | ||||||||||||||||||||||
| Annually | 02/28/2025 | GBP | 1,230 | (16) | 2 | (18) | ||||||||||||||||||||||||
.8% | NY/REPO/1W/CNRR007/0.00000 | Quarterly | 04/02/2026 | CNY | 12,090 | 24 | – | 24 | ||||||||||||||||||||||
| Annually | 10/03/2047 | GBP | 460 | (53) | (96) | 43 | ||||||||||||||||||||||||
| Annually | 07/20/2050 | GBP | 675 | (190) | (139) | (51) | ||||||||||||||||||||||||
0.5475% FIXED | GBP/SONIA/1D/SONIA/0.00000 | Annually | 08/04/2051 | GBP | 170 | 27 | – | 27 | ||||||||||||||||||||||
|
|
|
|
|
|
|
|
| ||||||||||||||||||||||
| $ | (397) | $ | (233) | $ | (164) | |||||||||||||||||||||||||
|
|
|
|
|
|
|
|
| ||||||||||||||||||||||
Percentages are based on Net Assets of $561,559 ($ Thousands). |
| (A) | Security exempt from registration under Rule 144A of the Securities Act of 1933. These securities may be resold in transactions exempt from registration normally to qualified institutions. On September 30, 2021, the value of these securities amounted to $80,756 ($ Thousands), representing 14.4% of the Net Assets of the Fund. |
| (B) | Zero coupon security. The rate shown on the Schedule of Investments is the security’s effective yield at the time of purchase. |
| (C) | Perpetual security with no stated maturity date. |
| (D) | Variable or floating rate security, the interest rate of which adjusts periodically based on changes in current interest rates and prepayments on the underlying pool of assets. |
| (E) | Security, or portion thereof, has been pledged as collateral on open futures contracts. |
AUD — Australian Dollar
BRL — Brazilian Real
CAD — Canadian Dollar
CHF — Swiss Franc
Cl — Class
CLP — Chilean Peso
CNH — Chinese Yuan Offshore
CNY — Chinese Yuan Onshore
COP — Colombian Peso
CZK — Czech Koruna
DAC — Designated Activity Company
DKK — Danish Krone
EUR — Euro
FHLMC — Federal Home Loan Mortgage Corporation
FNMA — Federal National Mortgage Association
GBP — British Pound Sterling
HUF — Hungarian Forint
ICE — Intercontinental Exchange
IDR — Indonesian Rupiah
ILS — Israeli New Sheckels
INR — Indian Rupee
JPY — Japanese Yen
KRW — Korean Won
LIBOR — London Interbank Offered Rate
LLC — Limited Liability Company
L.P. — Limited Partnership
Ltd. — Limited
MTN — Medium Term Note
MXN — Mexican Peso
MYR — Malaysian Ringgit
NOK — Norwegian Krone
NZD — New Zealand Dollar
OTC — Over The Counter
PEN — Peruvian Nuevo Sol
PLC — Public Limited Company
PLN — Polish Zloty
RON — Romanian Leu
RUB — Russian Ruble
SEK — Swedish Krona
SGD — Singapore Dollar
Ser — Series
THB — Thai Baht
TRY — Turkish Lira
TWD — Taiwan Dollar
ULC — Unlimited Liability Company
USD — U.S. Dollar
VAR — Variable Rate
ZAR — South African Rand
50 |
SEI Institutional International Trust / Annual Report / September 30, 2021 |
The following is a list of the level of inputs used as of September 30, 2021, in valuing the Fund’s investments and other financial instruments carried at value ($ Thousands):
| Investments in Securities | Level 1 ($) | Level 2 ($) | Level 3 ($) | Total ($) | ||||||||||||
Global Bonds | – | 511,469 | – | 511,469 | ||||||||||||
U.S. Treasury Obligations | – | 22,718 | – | 22,718 | ||||||||||||
Mortgage-Backed Securities | – | 1,069 | – | 1,069 | ||||||||||||
|
|
|
|
|
|
|
|
|
|
|
| |||||
Total Investments in Securities | – | 535,256 | – | 535,256 | ||||||||||||
|
|
|
|
|
|
|
|
|
|
|
| |||||
| Other Financial Instruments | Level 1 ($) | Level 2 ($) | Level 3 ($) | Total ($) | ||||||||||||
Futures Contracts* | ||||||||||||||||
Unrealized Appreciation | 1,352 | – | – | 1,352 | ||||||||||||
Unrealized Depreciation | (595 | ) | – | – | (595 | ) | ||||||||||
Forwards Contracts* | ||||||||||||||||
Unrealized Appreciation | – | 7,830 | – | 7,830 | ||||||||||||
Unrealized Depreciation | – | (1,068 | ) | – | (1,068 | ) | ||||||||||
OTC Swaps | ||||||||||||||||
Interest Rate Swaps* | ||||||||||||||||
Unrealized Appreciation | – | 134 | – | 134 | ||||||||||||
Centrally Cleared Swaps | ||||||||||||||||
Interest Rate Swaps* | ||||||||||||||||
Unrealized Appreciation | – | 94 | – | 94 | ||||||||||||
Unrealized Depreciation | – | (258 | ) | – | (258 | ) | ||||||||||
|
|
|
|
|
|
|
|
|
|
|
| |||||
Total Other Financial Instruments | 757 | 6,732 | – | 7,489 | ||||||||||||
|
|
|
|
|
|
|
|
|
|
|
| |||||
*Futures contracts, forwards contracts and swap contracts are valued at the unrealized appreciation (depreciation) on the instruments.
For the year ended September 30, 2021, there were no transfers in or out of Level 3.
For more information on valuation inputs, see Note 2 – Significant Accounting Policies in Notes to Financial Statements.
Amounts designated as “—” are $0 or have been rounded to $0.
The accompanying notes are an integral part of the financial statements.
SEI Institutional International Trust / Annual Report / September 30, 2021 |
51 |
SCHEDULE OF INVESTMENTS
September 30, 2021
Emerging Markets Debt Fund
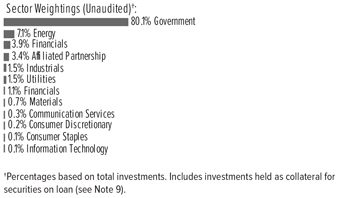
| Description | Face Amount (Thousands) | Market Value ($ Thousands) | ||||||
GLOBAL BONDS — 94.4% | ||||||||
Angola — 0.9% | ||||||||
Angolan Government International Bond | ||||||||
9.375%, 05/08/2048 | $ | 2,800 | $ | 2,886 | ||||
8.250%, 05/09/2028 | 1,085 | 1,123 | ||||||
Angolan Government International Bond MTN | ||||||||
9.125%, 11/26/2049 (A) | 670 | 680 | ||||||
9.125%, 11/26/2049 | 409 | 415 | ||||||
8.000%, 11/26/2029 | 2,097 | 2,145 | ||||||
8.000%, 11/26/2029 (A) | 731 | 748 | ||||||
Republic of Angola Via Avenir II BV MTN | ||||||||
7.867%, VAR ICE LIBOR USD 6 Month + 7.500%, 07/01/2023 | 2,941 | 2,896 | ||||||
Republic of Angola Via Avenir Issuer II | ||||||||
Ireland DAC | 2,538 | 2,386 | ||||||
|
|
| ||||||
| 13,279 | ||||||||
|
|
| ||||||
Argentina — 1.0% | ||||||||
Argentine Republic Government International Bond | ||||||||
2.500%, 07/09/2041 | 5,587 | 2,052 | ||||||
2.000%, 3.875%, 07/09/2022, 01/09/2038 (B) | 3,404 | 1,320 | ||||||
1.125%, 07/09/2035 | 1,959 | 641 | ||||||
1.125%, 1.500%, 07/09/2022, 07/09/2046 (B) | 1,056 | 351 | ||||||
1.000%, 07/09/2029 | 7,383 | 2,806 | ||||||
0.500%, 07/09/2029 | EUR | 13 | 6 | |||||
0.500%, 07/09/2030 | $ | 19,036 | 6,981 | |||||
0.125%, 07/09/2030 (C) | EUR | 403 | 167 | |||||
Mercadolibre | ||||||||
3.125%, 01/14/2031 | $ | 651 | 628 | |||||
MSU Energy | ||||||||
6.875%, 02/01/2025 (A) | 285 | 234 | ||||||
Provincia de Buenos Aires MTN | ||||||||
2.000%, 3.000%, 09/01/2022, 09/01/2037 (B) | EUR | 666 | 250 | |||||
| Description | Face Amount (Thousands) | Market Value ($ Thousands) | ||||||
GLOBAL BONDS (continued) | ||||||||
Provincia de Cordoba | ||||||||
5.000%, 12/10/2025 (A)(C) | $ | 540 | $ | 408 | ||||
|
|
| ||||||
| 15,844 | ||||||||
|
|
| ||||||
Armenia — 0.1% | ||||||||
Republic of Armenia International Bond | ||||||||
3.600%, 02/02/2031 | 1,005 | 947 | ||||||
3.600%, 02/02/2031 (A) | 449 | 423 | ||||||
|
|
| ||||||
| 1,370 | ||||||||
|
|
| ||||||
Azerbaijan — 0.7% | ||||||||
Republic of Azerbaijan International Bond | ||||||||
5.125%, 09/01/2029 | 1,711 | 1,903 | ||||||
Southern Gas Corridor CJSC | ||||||||
6.875%, 03/24/2026 (A) | 1,437 | 1,691 | ||||||
6.875%, 03/24/2026 | 4,125 | 4,853 | ||||||
State Oil of the Azerbaijan Republic | ||||||||
6.950%, 03/18/2030 | 2,380 | 2,929 | ||||||
|
|
| ||||||
| 11,376 | ||||||||
|
|
| ||||||
Bahamas — 0.0% | ||||||||
Bahamas Government International Bond | ||||||||
8.950%, 10/15/2032 (A) | 510 | 479 | ||||||
6.000%, 11/21/2028 | 200 | 172 | ||||||
|
|
| ||||||
| 651 | ||||||||
|
|
| ||||||
Bahrain — 0.8% | ||||||||
Bahrain Government International Bond | ||||||||
7.000%, 01/26/2026 (A) | 1,165 | 1,289 | ||||||
7.000%, 10/12/2028 (A) | 507 | 554 | ||||||
6.750%, 09/20/2029 (A) | 721 | 773 | ||||||
6.750%, 09/20/2029 | 200 | 214 | ||||||
6.125%, 08/01/2023 | 520 | 551 | ||||||
6.000%, 09/19/2044 | 297 | 273 | ||||||
5.625%, 09/30/2031 (A) | 1,146 | 1,134 | ||||||
5.625%, 09/30/2031 | 528 | 523 | ||||||
5.450%, 09/16/2032 (C) | 3,479 | 3,375 | ||||||
Bahrain Government International Bond MTN | ||||||||
6.250%, 01/25/2051 | 541 | 496 | ||||||
5.250%, 01/25/2033 (A) | 1,640 | 1,557 | ||||||
4.250%, 01/25/2028 | 597 | 588 | ||||||
Oil and Gas Holding BSCC (A) | ||||||||
8.375%, 11/07/2028 | 560 | 645 | ||||||
7.625%, 11/07/2024 | 794 | 870 | ||||||
|
|
| ||||||
| 12,842 | ||||||||
|
|
| ||||||
Belarus — 0.3% | ||||||||
Development Bank of the Republic of Belarus JSC | ||||||||
6.750%, 05/02/2024 | 972 | 913 | ||||||
Republic of Belarus International Bond | ||||||||
6.378%, 02/24/2031 (A) | 899 | 791 | ||||||
6.378%, 02/24/2031 | 372 | 328 | ||||||
6.200%, 02/28/2030 | 1,240 | 1,091 | ||||||
52 |
SEI Institutional International Trust / Annual Report / September 30, 2021 |
| Description | Face Amount (Thousands) | Market Value ($ Thousands) | ||||||
GLOBAL BONDS (continued) | ||||||||
6.200%, 02/28/2030 (A) | $ | 89 | $ | 78 | ||||
5.875%, 02/24/2026 | 1,842 | 1,725 | ||||||
|
|
| ||||||
| 4,926 | ||||||||
|
|
| ||||||
Belize — 0.0% | ||||||||
Belize Government International Bond | ||||||||
5.000%, 02/20/2038 | 1,173 | 575 | ||||||
|
|
| ||||||
Benin — 0.0% | ||||||||
Benin Government International Bond | ||||||||
6.875%, 01/19/2052 | EUR | 158 | 188 | |||||
4.950%, 01/22/2035 | 389 | 439 | ||||||
4.875%, 01/19/2032 | 102 | 118 | ||||||
|
|
| ||||||
| 745 | ||||||||
|
|
| ||||||
Bermuda — 0.2% | ||||||||
Bermuda Government International Bond | ||||||||
4.750%, 02/15/2029 | $ | 1,204 | 1,396 | |||||
3.717%, 01/25/2027 | 631 | 691 | ||||||
2.375%, 08/20/2030 | 221 | 219 | ||||||
|
|
| ||||||
| 2,306 | ||||||||
|
|
| ||||||
Brazil — 6.1% | ||||||||
B3 - Brasil Bolsa Balcao | ||||||||
4.125%, 09/20/2031 (A) | 437 | 428 | ||||||
Brazil Letras do Tesouro Nacional (D) | ||||||||
7.296%, 07/01/2023 | BRL | 14,000 | 2,190 | |||||
7.252%, 01/01/2024 | 58,000 | 8,592 | ||||||
5.227%, 01/01/2022 | 77,000 | 13,886 | ||||||
Brazil Loan Trust 1 | ||||||||
5.477%, 07/24/2023 (A) | $ | 108 | 111 | |||||
Brazil Minas SPE via State of Minas Gerais | ||||||||
5.333%, 02/15/2028 | 1,905 | 2,039 | ||||||
5.333%, 02/15/2028 | 1,176 | 1,259 | ||||||
5.333%, 02/15/2028 (A) | 157 | 168 | ||||||
Brazil Notas do Tesouro Nacional, Serie B | ||||||||
6.000%, 08/15/2026 | BRL | 1,000 | 717 | |||||
6.000%, 05/15/2045 | 818 | 626 | ||||||
6.000%, 08/15/2050 | 1,809 | 1,397 | ||||||
Brazil Notas do Tesouro Nacional, Serie F | ||||||||
10.000%, 01/01/2023 | 77,155 | 14,279 | ||||||
10.000%, 01/01/2025 | 46,744 | 8,519 | ||||||
10.000%, 01/01/2027 | 46,182 | 8,263 | ||||||
10.000%, 01/01/2029 | 25,306 | 4,442 | ||||||
10.000%, 01/01/2031 | 7,579 | 1,303 | ||||||
Brazilian Government International Bond | ||||||||
5.625%, 01/07/2041 | $ | 517 | 522 | |||||
5.625%, 02/21/2047 | 709 | 710 | ||||||
5.000%, 01/27/2045 | 2,338 | 2,180 | ||||||
4.750%, 01/14/2050 | 754 | 668 | ||||||
3.875%, 06/12/2030 | 1,053 | 1,021 | ||||||
3.750%, 09/12/2031 (C) | 6,586 | 6,247 | ||||||
Centrais Eletricas Brasileiras | ||||||||
4.625%, 02/04/2030 (A) | 226 | 225 | ||||||
| Description | Face Amount (Thousands) | Market Value ($ Thousands) | ||||||
GLOBAL BONDS (continued) | ||||||||
CSN Islands XI | ||||||||
6.750%, 01/28/2028 (A) | $ | 592 | $ | 631 | ||||
CSN Resources | ||||||||
4.625%, 06/10/2031 (A) | 315 | 311 | ||||||
Gol Finance | ||||||||
7.000%, 01/31/2025 (A) | 998 | 940 | ||||||
Iochpe-Maxion Austria GmbH | ||||||||
5.000%, 05/07/2028 (A) | 581 | 580 | ||||||
JBS USA Food | ||||||||
5.750%, 01/15/2028 (A) | 466 | 489 | ||||||
MC Brazil Downstream Trading SARL | ||||||||
7.250%, 06/30/2031 (A) | 3,213 | 3,231 | ||||||
Minerva Luxembourg | ||||||||
4.375%, 03/18/2031 (A) | 1,189 | 1,149 | ||||||
MV24 Capital BV | ||||||||
6.748%, 06/01/2034 (A) | 650 | 686 | ||||||
Nexa Resources | ||||||||
5.375%, 05/04/2027 (A) | 2,591 | 2,721 | ||||||
Petrobras Global Finance BV | ||||||||
5.500%, 06/10/2051 | 457 | 426 | ||||||
StoneCo | ||||||||
3.950%, 06/16/2028 (C) | 1,270 | 1,228 | ||||||
Suzano Austria GmbH (A) | ||||||||
7.000%, 03/16/2047 | 399 | 523 | ||||||
6.000%, 01/15/2029 | 288 | 338 | ||||||
5.000%, 01/15/2030 | 494 | 548 | ||||||
|
|
| ||||||
| 93,593 | ||||||||
|
|
| ||||||
Cameroon — 0.1% | ||||||||
Republic of Cameroon International Bond | ||||||||
5.950%, 07/07/2032 | EUR | 543 | 615 | |||||
5.950%, 07/07/2032 (A) | 250 | 284 | ||||||
|
|
| ||||||
| 899 | ||||||||
|
|
| ||||||
Cayman Islands — 0.1% | ||||||||
Neon Capital MTN | ||||||||
2.015%, 01/06/2028 (E) | JPY | 265,619 | 1,981 | |||||
|
|
| ||||||
Chile — 1.6% | ||||||||
Alfa Desarrollo SpA | ||||||||
4.550%, 09/27/2051 (A) | $ | 2,047 | 1,997 | |||||
ATP Tower Holdings LLC | ||||||||
4.050%, 04/27/2026 (A) | 255 | 256 | ||||||
Banco de Credito e Inversiones | ||||||||
3.500%, 10/12/2027 (A) | 1,046 | 1,119 | ||||||
Bonos de la Tesoreria de la Republica (I) | ||||||||
2.000%, 03/01/2035 | CLP | 1,393,429 | 1,633 | |||||
1.900%, 09/01/2030 | 1,901,188 | 2,307 | ||||||
1.500%, 03/01/2026 | 636,931 | 784 | ||||||
Bonos de la Tesoreria de la Republica en pesos | ||||||||
4.500%, 03/01/2026 | 625,000 | 754 | ||||||
2.800%, 10/01/2033 (A) | 1,290,000 | 1,214 | ||||||
SEI Institutional International Trust / Annual Report / September 30, 2021 |
53 |
SCHEDULE OF INVESTMENTS
September 30, 2021
Emerging Markets Debt Fund (Continued)
| Description | Face Amount (Thousands) | Market Value ($ Thousands) | ||||||
GLOBAL BONDS (continued) | ||||||||
Cencosud | ||||||||
4.375%, 07/17/2027 (A) | $ | 1,819 | $ | 1,976 | ||||
Chile Government International Bond | ||||||||
3.250%, 09/21/2071 | 1,615 | 1,459 | ||||||
3.100%, 05/07/2041 | 212 | 204 | ||||||
2.550%, 07/27/2033 | 6,983 | 6,807 | ||||||
Empresa de Transporte de Pasajeros Metro | ||||||||
3.650%, 05/07/2030 (A) | 217 | 235 | ||||||
Empresa Nacional del Petroleo | ||||||||
3.750%, 08/05/2026 | 749 | 786 | ||||||
3.450%, 09/16/2031 (A) | 331 | 325 | ||||||
Nacional del Cobre de Chile | ||||||||
5.625%, 10/18/2043 | 442 | 574 | ||||||
3.750%, 01/15/2031 (A) | 234 | 252 | ||||||
3.150%, 01/14/2030 | 800 | 826 | ||||||
3.000%, 09/30/2029 | 224 | 229 | ||||||
Sociedad Quimica y Minera de Chile | ||||||||
3.500%, 09/10/2051 (A) | 1,495 | 1,441 | ||||||
|
|
| ||||||
| 25,178 | ||||||||
|
|
| ||||||
China — 5.1% | ||||||||
Blossom Joy | ||||||||
3.100%, VAR US Treas Yield Curve Rate T Note Const Mat 5 Yr + 5.799% (F) | 202 | 207 | ||||||
China Government Bond | ||||||||
3.810%, 09/14/2050 | CNY | 9,340 | 1,534 | |||||
3.720%, 04/12/2051 | 20,100 | 3,286 | ||||||
3.390%, 03/16/2050 | 8,350 | 1,267 | ||||||
3.280%, 12/03/2027 | 50,290 | 8,017 | ||||||
3.270%, 11/19/2030 | 34,600 | 5,496 | ||||||
3.130%, 11/21/2029 | 6,500 | 1,019 | ||||||
3.120%, 12/05/2026 | 9,040 | 1,424 | ||||||
3.020%, 10/22/2025 | 43,500 | 6,815 | ||||||
3.020%, 05/27/2031 | 1,500 | 235 | ||||||
3.010%, 05/13/2028 | 12,540 | 1,959 | ||||||
2.880%, 11/05/2023 | 25,000 | 3,893 | ||||||
2.850%, 06/04/2027 | 41,980 | 6,503 | ||||||
2.680%, 05/21/2030 | 51,050 | 7,710 | ||||||
1.990%, 04/09/2025 | 60,830 | 9,195 | ||||||
China Government International Bond | ||||||||
3.250%, 10/19/2023 | $ | 1,192 | 1,262 | |||||
0.550%, 10/21/2025 | 1,150 | 1,128 | ||||||
0.400%, 10/21/2023 | 2,410 | 2,411 | ||||||
China Minmetals | ||||||||
3.750%, VAR US Treas Yield Curve Rate T Note Const Mat 5 Yr + 4.717% (F) | 2,047 | 2,080 | ||||||
Chinalco Capital Holdings | ||||||||
4.250%, 04/21/2022 | 740 | 751 | ||||||
4.100%, VAR US Treas Yield Curve Rate T Note Const Mat 5 Yr + 5.788% (F) | 224 | 235 | ||||||
| Description | Face Amount (Thousands) | Market Value ($ Thousands) | ||||||
GLOBAL BONDS (continued) | ||||||||
2.125%, 06/03/2026 | $ | 413 | $ | 409 | ||||
CNAC HK Finbridge | ||||||||
5.125%, 03/14/2028 | 246 | 281 | ||||||
4.125%, 07/19/2027 | 713 | 777 | ||||||
3.875%, 06/19/2029 | 1,156 | 1,236 | ||||||
3.000%, 09/22/2030 | 561 | 562 | ||||||
Dianjian Haiyu | ||||||||
4.300% (F) | 204 | 213 | ||||||
Dianjian International Finance | ||||||||
4.600%, VAR US Treas Yield Curve Rate T Note Const Mat 5 Yr + 6.933% (F) | 303 | 313 | ||||||
ENN Clean Energy International Investment | ||||||||
3.375%, 05/12/2026 (A) | 647 | 652 | ||||||
Huarong Finance II MTN | ||||||||
5.500%, 01/16/2025 | 640 | 632 | ||||||
Leader Goal International Ltd MTN | ||||||||
4.250% (E)(F) | 212 | 217 | ||||||
Meituan | ||||||||
3.050%, 10/28/2030 | 204 | 189 | ||||||
Minmetals Bounteous Finance BVI | ||||||||
3.375%, VAR US Treas Yield Curve Rate T Note Const Mat 5 Yr + 5.209% (F) | 805 | 833 | ||||||
Powerchina Roadbridge Group British Virgin Islands | ||||||||
3.080%, VAR US Treas Yield Curve Rate T Note Const Mat 5 Yr + 5.256% (F) | 285 | 285 | ||||||
Shimao Group Holdings | ||||||||
5.600%, 07/15/2026 | 200 | 198 | ||||||
Sinopec Group Overseas Development 2018 | ||||||||
2.700%, 05/13/2030 | 548 | 560 | ||||||
2.300%, 01/08/2031 | 2,858 | 2,829 | ||||||
Sunac China Holdings | ||||||||
7.000%, 07/09/2025 | 214 | 172 | ||||||
6.500%, 01/26/2026 | 206 | 165 | ||||||
Tencent Holdings Ltd MTN | ||||||||
3.240%, 06/03/2050 (A) | 450 | 423 | ||||||
Wanda Properties International | ||||||||
7.250%, 01/29/2024 | 600 | 580 | ||||||
Wanda Properties Overseas | ||||||||
6.950%, 12/05/2022 | 200 | 195 | ||||||
6.875%, 07/23/2023 | 232 | 224 | ||||||
|
|
| ||||||
| 78,372 | ||||||||
|
|
| ||||||
Colombia — 5.3% | ||||||||
Colombia Government International Bond | ||||||||
9.850%, 06/28/2027 (C) | COP | 5,060,000 | 1,550 | |||||
7.375%, 09/18/2037 | $ | 1,009 | 1,239 | |||||
6.125%, 01/18/2041 | 2,378 | 2,612 | ||||||
5.625%, 02/26/2044 | 132 | 138 | ||||||
5.200%, 05/15/2049 | 1,060 | 1,056 | ||||||
54 |
SEI Institutional International Trust / Annual Report / September 30, 2021 |
| Description | Face Amount (Thousands) | Market Value ($ Thousands) | ||||||
GLOBAL BONDS (continued) | ||||||||
5.000%, 06/15/2045 | $ | 4,204 | $ | 4,097 | ||||
4.500%, 03/15/2029 | 721 | 760 | ||||||
4.375%, 03/21/2023 | COP | 2,871,000 | 754 | |||||
4.125%, 02/22/2042 | $ | 8,131 | 7,310 | |||||
3.875%, 04/25/2027 | 1,466 | 1,519 | ||||||
3.875%, 02/15/2061 | 2,327 | 1,874 | ||||||
3.250%, 04/22/2032 | 269 | 251 | ||||||
3.125%, 04/15/2031 | 1,537 | 1,439 | ||||||
3.000%, 01/30/2030 | 1,457 | 1,377 | ||||||
Colombian TES | ||||||||
10.000%, 07/24/2024 | COP | 20,024,400 | 5,862 | |||||
7.750%, 09/18/2030 | 12,738,000 | 3,408 | ||||||
7.500%, 08/26/2026 | 29,694,400 | 8,068 | ||||||
7.250%, 10/18/2034 | 18,842,900 | 4,687 | ||||||
7.000%, 03/26/2031 | 17,065,600 | 4,278 | ||||||
7.000%, 06/30/2032 | 7,329,100 | 1,819 | ||||||
6.250%, 11/26/2025 | 25,567,200 | 6,717 | ||||||
6.250%, 07/09/2036 | 5,769,500 | 1,277 | ||||||
6.000%, 04/28/2028 | 25,503,900 | 6,293 | ||||||
5.750%, 11/03/2027 | 30,168,700 | 7,444 | ||||||
3.000%, 03/25/2033 | 1,380,300 | 975 | ||||||
2.250%, 04/18/2029 | 181,900 | 130 | ||||||
Ecopetrol | ||||||||
6.875%, 04/29/2030 | $ | 492 | 576 | |||||
Empresas Publicas de Medellin ESP (A) | ||||||||
8.375%, 11/08/2027 | COP | 2,351,000 | 583 | |||||
7.625%, 09/10/2024 | 3,116,000 | 825 | ||||||
Financiera de Desarrollo Territorial Findeter | ||||||||
7.875%, 08/12/2024 (A) | 1,127,000 | 307 | ||||||
7.875%, 08/12/2024 | 884,000 | 241 | ||||||
Geopark | ||||||||
5.500%, 01/17/2027 (A) | $ | 974 | 960 | |||||
Gran Tierra Energy | ||||||||
7.750%, 05/23/2027 (A) | 293 | 254 | ||||||
Grupo Aval | ||||||||
4.375%, 02/04/2030 (A) | 812 | 802 | ||||||
SierraCol Energy Andina | ||||||||
6.000%, 06/15/2028 (A) | 672 | 657 | ||||||
|
|
| ||||||
| 82,139 | ||||||||
|
|
| ||||||
Costa Rica — 0.6% | ||||||||
Costa Rica Government International Bond | ||||||||
7.158%, 03/12/2045 (A) | 665 | 664 | ||||||
7.158%, 03/12/2045 | 2,407 | 2,404 | ||||||
7.158%, 03/12/2045 | 500 | 499 | ||||||
7.000%, 04/04/2044 | 2,052 | 2,021 | ||||||
7.000%, 04/04/2044 (A) | 563 | 555 | ||||||
7.000%, 04/04/2044 | 230 | 227 | ||||||
6.125%, 02/19/2031 (C) | 1,921 | 1,969 | ||||||
4.375%, 04/30/2025 | 393 | 399 | ||||||
| Description | Face Amount (Thousands) | Market Value ($ Thousands) | ||||||
GLOBAL BONDS (continued) | ||||||||
Instituto Costarricense de Electricidad | ||||||||
6.375%, 05/15/2043 | $ | 250 | $ | 217 | ||||
|
|
| ||||||
| 8,955 | ||||||||
|
|
| ||||||
Croatia — 0.1% | ||||||||
Croatia Government International Bond | ||||||||
1.500%, 06/17/2031 | EUR | 650 | 787 | |||||
1.125%, 03/04/2033 | 452 | 521 | ||||||
|
|
| ||||||
| 1,308 | ||||||||
|
|
| ||||||
Czech Republic — 1.5% | ||||||||
Czech Republic Government Bond | ||||||||
2.750%, 07/23/2029 | CZK | 55,670 | 2,665 | |||||
2.500%, 08/25/2028 | 84,640 | 3,974 | ||||||
2.400%, 09/17/2025 | 165,160 | 7,644 | ||||||
2.000%, 10/13/2033 | 46,630 | 2,104 | ||||||
1.250%, 02/14/2025 | 48,060 | 2,139 | ||||||
1.200%, 03/13/2031 | 29,710 | 1,254 | ||||||
1.000%, 06/26/2026 | 35,200 | 1,530 | ||||||
0.950%, 05/15/2030 | 5,530 | 231 | ||||||
0.250%, 02/10/2027 | 10,460 | 434 | ||||||
0.050%, 11/29/2029 | 31,030 | 1,204 | ||||||
|
|
| ||||||
| 23,179 | ||||||||
|
|
| ||||||
Dominican Republic — 1.2% | ||||||||
Dominican Republic International Bond | ||||||||
7.450%, 04/30/2044 (A) | $ | 687 | 819 | |||||
7.450%, 04/30/2044 | 228 | 272 | ||||||
6.850%, 01/27/2045 | 1,386 | 1,546 | ||||||
6.600%, 01/28/2024 (C) | 656 | 723 | ||||||
6.500%, 02/15/2048 | 2,472 | 2,641 | ||||||
6.400%, 06/05/2049 | 1,026 | 1,086 | ||||||
5.950%, 01/25/2027 | 625 | 703 | ||||||
5.875%, 04/18/2024 (A) | 71 | 75 | ||||||
5.875%, 01/30/2060 | 1,862 | 1,822 | ||||||
5.875%, 01/30/2060 (A) | 75 | 73 | ||||||
5.500%, 01/27/2025 | 949 | 1,037 | ||||||
5.300%, 01/21/2041 | 2,694 | 2,664 | ||||||
4.875%, 09/23/2032 | 259 | 264 | ||||||
4.500%, 01/30/2030 (A) | 755 | 768 | ||||||
4.500%, 01/30/2030 | 3,319 | 3,377 | ||||||
|
|
| ||||||
| 17,870 | ||||||||
|
|
| ||||||
Ecuador — 0.8% | ||||||||
Ecuador Government International Bond | ||||||||
9.365%, 07/31/2030 (D) | 292 | 156 | ||||||
6.699%, 07/31/2030 (A)(D) | 1,613 | 861 | ||||||
5.000%, 07/31/2030 (A) | 2,448 | 2,056 | ||||||
1.000%, 2.500%, 07/31/2022, 07/31/2035 (A)(B) | 5,391 | 3,552 | ||||||
1.000%, 2.500%, 07/31/2022, 07/31/2035 (B) | 3,982 | 2,623 | ||||||
0.500%, 07/31/2040 (A) | 2,887 | 1,678 | ||||||
SEI Institutional International Trust / Annual Report / September 30, 2021 |
55 |
SCHEDULE OF INVESTMENTS
September 30, 2021
Emerging Markets Debt Fund (Continued)
| Description | Face Amount (Thousands) | Market Value ($ Thousands) | ||||||
GLOBAL BONDS (continued) | ||||||||
0.500%, 1.500%, 07/31/2022, 07/31/2040 (B) | $ | 1,611 | $ | 937 | ||||
|
|
| ||||||
| 11,863 | ||||||||
|
|
| ||||||
Egypt — 3.3% | ||||||||
Egypt Government Bond | ||||||||
14.664%, 10/06/2030 | EGP | 4,750 | 301 | |||||
14.556%, 10/13/2027 | 11,537 | 734 | ||||||
14.483%, 04/06/2026 | 31,272 | 1,986 | ||||||
14.406%, 07/07/2027 | 17,842 | 1,128 | ||||||
14.382%, 01/12/2031 | 9,502 | 594 | ||||||
14.292%, 01/05/2028 | 19,000 | 1,196 | ||||||
14.196%, 07/07/2023 | 21,779 | 1,380 | ||||||
14.060%, 01/12/2026 | 44,207 | 2,768 | ||||||
Egypt Government International Bond | ||||||||
18.000%, 11/06/2028 | 30,307 | 2,212 | ||||||
17.700%, 08/07/2025 | 29,457 | 2,042 | ||||||
16.300%, 04/09/2024 | 15,034 | 991 | ||||||
16.100%, 05/07/2029 | 14,920 | 1,013 | ||||||
15.900%, 07/02/2024 | 20,628 | 1,350 | ||||||
8.875%, 05/29/2050 (A) | $ | 1,737 | 1,718 | |||||
8.875%, 05/29/2050 | 300 | 297 | ||||||
8.700%, 03/01/2049 (A) | 816 | 792 | ||||||
8.700%, 03/01/2049 | 600 | 582 | ||||||
7.903%, 02/21/2048 (A) | 1,510 | 1,378 | ||||||
7.903%, 02/21/2048 | 762 | 695 | ||||||
7.625%, 05/29/2032 | 4,332 | 4,317 | ||||||
7.625%, 05/29/2032 (A) | 4,120 | 4,106 | ||||||
Egypt Government International Bond MTN | ||||||||
8.750%, 09/30/2051 (A) | 839 | 818 | ||||||
8.500%, 01/31/2047 | 2,970 | 2,866 | ||||||
8.150%, 11/20/2059 (A) | 1,019 | 939 | ||||||
8.150%, 11/20/2059 | 277 | 255 | ||||||
7.600%, 03/01/2029 | 200 | 207 | ||||||
7.500%, 02/16/2061 | 1,119 | 980 | ||||||
7.300%, 09/30/2033 (A) | 1,611 | 1,564 | ||||||
7.053%, 01/15/2032 (A) | 547 | 530 | ||||||
6.375%, 04/11/2031 | EUR | 900 | 1,023 | |||||
6.375%, 04/11/2031 (A) | 232 | 264 | ||||||
6.125%, 01/31/2022 (A) | $ | 385 | 388 | |||||
5.625%, 04/16/2030 | EUR | 732 | 810 | |||||
4.750%, 04/11/2025 | 457 | 539 | ||||||
4.750%, 04/11/2025 (A) | 443 | 522 | ||||||
4.750%, 04/16/2026 | 670 | 780 | ||||||
Egypt Treasury Bills (D) | ||||||||
13.412%, 10/05/2021 | EGP | 95,375 | 6,061 | |||||
13.346%, 01/11/2022 | 21,625 | 1,332 | ||||||
|
|
| ||||||
| 51,458 | ||||||||
|
|
| ||||||
El Salvador — 0.5% | ||||||||
El Salvador Government International Bond | ||||||||
9.500%, 07/15/2052 | $ | 3,093 | 2,405 | |||||
8.625%, 02/28/2029 | 41 | 31 | ||||||
| Description | Face Amount (Thousands) | Market Value ($ Thousands) | ||||||
GLOBAL BONDS (continued) | ||||||||
8.250%, 04/10/2032 | $ | 1,661 | $ | 1,238 | ||||
8.250%, 04/10/2032 (A) | 404 | 301 | ||||||
7.750%, 01/24/2023 | 1,630 | 1,373 | ||||||
7.650%, 06/15/2035 (A) | 149 | 107 | ||||||
7.625%, 02/01/2041 (A) | 545 | 383 | ||||||
7.625%, 02/01/2041 | 527 | 370 | ||||||
7.125%, 01/20/2050 | 640 | 440 | ||||||
6.375%, 01/18/2027 (A) | 256 | 190 | ||||||
5.875%, 01/30/2025 | 1,606 | 1,225 | ||||||
5.875%, 01/30/2025 (A) | 93 | 71 | ||||||
|
|
| ||||||
| 8,134 | ||||||||
|
|
| ||||||
Ethiopia — 0.0% | ||||||||
Federal Democratic Republic of Ethiopia | ||||||||
6.625%, 12/11/2024 (A) | 296 | 256 | ||||||
|
|
| ||||||
Gabon — 0.1% | ||||||||
Gabon Government International Bond | ||||||||
6.625%, 02/06/2031 (A) | 613 | 603 | ||||||
6.375%, 12/12/2024 | 1,084 | 1,152 | ||||||
|
|
| ||||||
| 1,755 | ||||||||
|
|
| ||||||
Georgia — 0.1% | ||||||||
Georgia Government International Bond | ||||||||
2.750%, 04/22/2026 (A) | 499 | 505 | ||||||
2.750%, 04/22/2026 | 480 | 485 | ||||||
|
|
| ||||||
| 990 | ||||||||
|
|
| ||||||
Ghana — 1.4% | ||||||||
Ghana Government International Bond | ||||||||
19.750%, 03/25/2024 | GHS | 5,311 | 919 | |||||
19.000%, 11/02/2026 | 11,055 | 1,822 | ||||||
10.750%, 10/14/2030 | $ | 2,404 | 2,903 | |||||
8.950%, 03/26/2051 (A) | 1,014 | 924 | ||||||
8.875%, 05/07/2042 (C) | 1,286 | 1,196 | ||||||
8.875%, 05/07/2042 (A) | 426 | 396 | ||||||
8.750%, 03/11/2061 | 693 | 619 | ||||||
8.750%, 03/11/2061 (A) | 77 | 69 | ||||||
8.627%, 06/16/2049 (A) | 593 | 531 | ||||||
8.625%, 04/07/2034 | 2,907 | 2,763 | ||||||
7.875%, 03/26/2027 (A) | 653 | 637 | ||||||
7.875%, 02/11/2035 | 1,114 | 1,001 | ||||||
7.750%, 04/07/2029 (A) | 413 | 393 | ||||||
7.750%, 04/07/2029 | 870 | 829 | ||||||
7.625%, 05/16/2029 | 995 | 945 | ||||||
7.625%, 05/16/2029 (A) | 908 | 863 | ||||||
6.375%, 02/11/2027 | 1,016 | 955 | ||||||
6.375%, 02/11/2027 (A) | 451 | 424 | ||||||
Republic of Ghana | ||||||||
8.125%, 01/18/2026 (A) | 420 | 424 | ||||||
Republic of Ghana Government Bonds | ||||||||
20.750%, 03/06/2023 | GHS | 1,920 | 337 | |||||
19.250%, 12/18/2023 | 5,450 | 933 | ||||||
56 |
SEI Institutional International Trust / Annual Report / September 30, 2021 |
| Description | Face Amount (Thousands) | Market Value ($ Thousands) | ||||||
GLOBAL BONDS (continued) | ||||||||
Tullow Oil (A) | ||||||||
10.250%, 05/15/2026 | $ | 810 | $ | 846 | ||||
7.000%, 03/01/2025 | 783 | 679 | ||||||
|
|
| ||||||
| 21,408 | ||||||||
|
|
| ||||||
Guatemala — 0.3% | ||||||||
Guatemala Government Bond | ||||||||
6.125%, 06/01/2050 | 168 | 193 | ||||||
5.375%, 04/24/2032 | 498 | 565 | ||||||
4.900%, 06/01/2030 (C) | 964 | 1,046 | ||||||
4.650%, 10/07/2041 (A) | 845 | 824 | ||||||
4.650%, 10/07/2041 | 210 | 205 | ||||||
4.500%, 05/03/2026 | 649 | 694 | ||||||
3.700%, 10/07/2033 (A) | 1,141 | 1,114 | ||||||
3.700%, 10/07/2033 | 500 | 488 | ||||||
|
|
| ||||||
| 5,129 | ||||||||
|
|
| ||||||
Honduras — 0.1% | ||||||||
Honduras Government International Bond | ||||||||
6.250%, 01/19/2027 | 326 | 353 | ||||||
5.625%, 06/24/2030 (A) | 736 | 765 | ||||||
5.625%, 06/24/2030 | 299 | 311 | ||||||
|
|
| ||||||
| 1,429 | ||||||||
|
|
| ||||||
Hong Kong — 0.0% | ||||||||
NWD | ||||||||
4.125%, 07/18/2029 | 757 | 755 | ||||||
|
|
| ||||||
Hungary — 1.3% | ||||||||
Hungary Government Bond | ||||||||
6.750%, 10/22/2028 (C) | HUF | 489,630 | 1,963 | |||||
5.500%, 06/24/2025 | 338,870 | 1,210 | ||||||
4.000%, 04/28/2051 | 124,570 | 424 | ||||||
3.250%, 10/22/2031 | 794,110 | 2,588 | ||||||
3.000%, 10/27/2027 | 354,300 | 1,155 | ||||||
3.000%, 08/21/2030 | 326,430 | 1,046 | ||||||
3.000%, 10/27/2038 | 138,140 | 406 | ||||||
2.750%, 12/22/2026 | 910,960 | 2,938 | ||||||
2.250%, 04/20/2033 | 36,320 | 105 | ||||||
1.500%, 04/22/2026 | 188,890 | 580 | ||||||
Hungary Government International Bond | ||||||||
5.375%, 02/21/2023 | $ | 694 | 740 | |||||
3.125%, 09/21/2051 (A) | 1,983 | 1,953 | ||||||
2.125%, 09/22/2031 (A) | 3,882 | 3,819 | ||||||
1.750%, 06/05/2035 | EUR | 265 | 322 | |||||
1.500%, 11/17/2050 | 255 | 275 | ||||||
|
|
| ||||||
| 19,524 | ||||||||
|
|
| ||||||
India — 0.3% | ||||||||
Adani Electricity Mumbai | ||||||||
3.949%, 02/12/2030 (A) | $ | 540 | 539 | |||||
Export-Import Bank of India MTN | ||||||||
3.250%, 01/15/2030 | 1,060 | 1,075 | ||||||
2.250%, 01/13/2031 | 615 | 571 | ||||||
| Description | Face Amount (Thousands) | Market Value ($ Thousands) | ||||||
GLOBAL BONDS (continued) | ||||||||
Network i2i | ||||||||
5.650%, VAR US Treas Yield Curve Rate T Note Const Mat 5 Yr + 4.277% (A)(F) | $ | 275 | $ | 293 | ||||
Power Finance MTN | ||||||||
3.950%, 04/23/2030 (A) | 569 | 581 | ||||||
Vedanta Resources | ||||||||
7.125%, 05/31/2023 | 200 | 191 | ||||||
6.375%, 07/30/2022 | 350 | 349 | ||||||
Vedanta Resources Finance II | ||||||||
13.875%, 01/21/2024 (A) | 286 | 309 | ||||||
|
|
| ||||||
| 3,908 | ||||||||
|
|
| ||||||
Indonesia — 7.2% | ||||||||
Indonesia Asahan Aluminium Persero | ||||||||
6.757%, 11/15/2048 | 257 | 330 | ||||||
5.800%, 05/15/2050 (A)(C) | 1,165 | 1,362 | ||||||
5.710%, 11/15/2023 (A) | 618 | 675 | ||||||
4.750%, 05/15/2025 (A) | 240 | 261 | ||||||
Indonesia Government International Bond | ||||||||
9.000%, 03/15/2029 | IDR | 42,750,000 | 3,487 | |||||
8.500%, 10/12/2035 | $ | 1,359 | 2,122 | |||||
8.375%, 03/15/2024 | IDR | 20,173,000 | 1,538 | |||||
8.375%, 04/15/2039 | 72,056,000 | 5,659 | ||||||
8.250%, 05/15/2029 | 68,743,000 | 5,408 | ||||||
8.250%, 06/15/2032 | 12,030,000 | 948 | ||||||
8.250%, 05/15/2036 | 70,055,000 | 5,467 | ||||||
8.125%, 05/15/2024 | 77,129,000 | 5,877 | ||||||
7.750%, 01/17/2038 | $ | 1,797 | 2,673 | |||||
7.500%, 08/15/2032 | IDR | 26,770,000 | 2,000 | |||||
7.500%, 05/15/2038 | 58,662,000 | 4,267 | ||||||
7.000%, 05/15/2022 | 40,233,000 | 2,876 | ||||||
7.000%, 05/15/2027 | 66,663,000 | 4,988 | ||||||
6.625%, 05/15/2033 | 24,323,000 | 1,705 | ||||||
6.125%, 05/15/2028 | 11,097,000 | 791 | ||||||
5.625%, 05/15/2023 | 1,885,000 | 135 | ||||||
5.250%, 01/08/2047 (A) | $ | 170 | 212 | |||||
3.500%, 01/11/2028 | 1,659 | 1,798 | ||||||
3.200%, 09/23/2061 | 873 | 812 | ||||||
3.050%, 03/12/2051 (C) | 2,378 | 2,246 | ||||||
2.850%, 02/14/2030 | 3,196 | 3,299 | ||||||
2.150%, 07/28/2031 | 660 | 644 | ||||||
1.300%, 03/23/2034 | EUR | 514 | 581 | |||||
1.100%, 03/12/2033 | 690 | 774 | ||||||
Indonesia Government International Bond MTN | ||||||||
5.250%, 01/17/2042 | $ | 2,985 | 3,623 | |||||
5.125%, 01/15/2045 | 210 | 254 | ||||||
4.625%, 04/15/2043 | 605 | 685 | ||||||
3.750%, 06/14/2028 | EUR | 307 | 420 | |||||
Indonesia Treasury Bond | ||||||||
8.750%, 05/15/2031 | IDR | 62,105,000 | 5,077 | |||||
8.375%, 03/15/2034 | 117,065,000 | 9,255 | ||||||
SEI Institutional International Trust / Annual Report / September 30, 2021 |
57 |
SCHEDULE OF INVESTMENTS
September 30, 2021
Emerging Markets Debt Fund (Continued)
| Description | Face Amount (Thousands) | Market Value ($ Thousands) | ||||||
GLOBAL BONDS (continued) | ||||||||
7.500%, 06/15/2035 | IDR | 12,896,000 | $ | 953 | ||||
7.500%, 04/15/2040 | 56,606,000 | 4,137 | ||||||
7.125%, 06/15/2042 | 1,189,000 | 84 | ||||||
7.000%, 09/15/2030 | 32,210,000 | 2,360 | ||||||
6.500%, 06/15/2025 | 58,731,000 | 4,309 | ||||||
6.500%, 02/15/2031 | 43,827,000 | 3,094 | ||||||
5.500%, 04/15/2026 | 60,500,000 | 4,273 | ||||||
Medco Bell Pte | ||||||||
6.375%, 01/30/2027 (A) | $ | 466 | 470 | |||||
Pertamina Persero | ||||||||
2.300%, 02/09/2031 (A) | 1,375 | 1,310 | ||||||
Pertamina Persero MTN | ||||||||
6.450%, 05/30/2044 | 959 | 1,249 | ||||||
3.650%, 07/30/2029 (A) | 1,035 | 1,106 | ||||||
Perusahaan Listrik Negara | ||||||||
1.875%, 11/05/2031 (A) | EUR | 691 | 779 | |||||
Perusahaan Listrik Negara MTN | ||||||||
6.150%, 05/21/2048 (A) | $ | 657 | 812 | |||||
6.150%, 05/21/2048 | 250 | 309 | ||||||
4.375%, 02/05/2050 (A) | 265 | 266 | ||||||
Perusahaan Penerbit SBSN Indonesia III | ||||||||
4.325%, 05/28/2025 | 1,673 | 1,854 | ||||||
Perusahaan Perseroan Persero Perusahaan | ||||||||
Listrik Negara MTN | ||||||||
3.000%, 06/30/2030 | 565 | 564 | ||||||
|
|
| ||||||
| 110,178 | ||||||||
|
|
| ||||||
Iraq — 0.1% | ||||||||
Iraq International Bond | ||||||||
5.800%, 01/15/2028 | 1,340 | 1,291 | ||||||
|
|
| ||||||
Israel — 0.4% | ||||||||
Bank Leumi Le-Israel | ||||||||
3.275%, VAR US Treas Yield Curve Rate T Note Const Mat 5 Yr + 1.631%, 01/29/2031 (A) | 431 | 441 | ||||||
Leviathan Bond (A) | ||||||||
6.750%, 06/30/2030 | 394 | 435 | ||||||
6.500%, 06/30/2027 (C) | 959 | 1,052 | ||||||
State of Israel | ||||||||
4.500%, 04/03/2120 | 3,121 | 3,918 | ||||||
2.500%, 01/15/2030 | 203 | 212 | ||||||
|
|
| ||||||
| 6,058 | ||||||||
|
|
| ||||||
Ivory Coast — 0.4% | ||||||||
Ivory Coast Government International Bond | ||||||||
6.875%, 10/17/2040 | EUR | 1,169 | 1,445 | |||||
6.625%, 03/22/2048 | 2,469 | 2,872 | ||||||
6.625%, 03/22/2048 | 481 | 560 | ||||||
5.875%, 10/17/2031 (A) | 205 | 248 | ||||||
5.750%, 12/31/2032 | $ | 850 | 850 | |||||
5.250%, 03/22/2030 | EUR | 139 | 167 | |||||
|
|
| ||||||
| 6,142 | ||||||||
|
|
| ||||||
| Description | Face Amount (Thousands) | Market Value ($ Thousands) | ||||||
GLOBAL BONDS (continued) | ||||||||
Jamaica — 0.1% | ||||||||
Digicel International Finance (A) | ||||||||
8.750%, 05/25/2024 | $ | 530 | $ | 549 | ||||
8.750%, 05/25/2024 | 435 | 450 | ||||||
|
|
| ||||||
| 999 | ||||||||
|
|
| ||||||
Jordan — 0.2% | ||||||||
Jordan Government International Bond | ||||||||
7.375%, 10/10/2047 | 342 | 354 | ||||||
7.375%, 10/10/2047 (A) | 228 | 236 | ||||||
5.850%, 07/07/2030 (A) | 1,227 | 1,270 | ||||||
4.950%, 07/07/2025 | 1,100 | 1,147 | ||||||
|
|
| ||||||
| 3,007 | ||||||||
|
|
| ||||||
Kazakhstan — 1.3% | ||||||||
Development Bank of Kazakhstan JSC | ||||||||
4.125%, 12/10/2022 | 770 | 797 | ||||||
2.950%, 05/06/2031 | 530 | 533 | ||||||
2.950%, 05/06/2031 (A) | 465 | 467 | ||||||
Kazakhstan Government International Bond | ||||||||
4.875%, 10/14/2044 | 510 | 625 | ||||||
4.875%, 10/14/2044 (A) | 318 | 390 | ||||||
KazMunayGas National JSC | ||||||||
6.375%, 10/24/2048 (A) | 1,166 | 1,498 | ||||||
5.750%, 04/19/2047 (A) | 1,852 | 2,222 | ||||||
5.750%, 04/19/2047 | 63 | 75 | ||||||
5.375%, 04/24/2030 (A) | 984 | 1,160 | ||||||
5.375%, 04/24/2030 | 3,728 | 4,394 | ||||||
3.500%, 04/14/2033 | 1,832 | 1,886 | ||||||
KazTransGas JSC | ||||||||
4.375%, 09/26/2027 | 1,205 | 1,326 | ||||||
4.375%, 09/26/2027 (A) | 165 | 182 | ||||||
National Bank of Kazakhstan | ||||||||
9.259%, 03/25/2022 | KZT | 600,000 | 1,350 | |||||
8.811%, 10/15/2021 | 415,221 | 972 | ||||||
Tengizchevroil Finance International | ||||||||
3.250%, 08/15/2030 (A) | $ | 450 | 456 | |||||
2.625%, 08/15/2025 | 1,071 | 1,092 | ||||||
|
|
| ||||||
| 19,425 | ||||||||
|
|
| ||||||
Kenya — 0.3% | ||||||||
Kenya Government International Bond | ||||||||
8.250%, 02/28/2048 | 1,154 | 1,246 | ||||||
8.250%, 02/28/2048 (A) | 780 | 843 | ||||||
8.000%, 05/22/2032 | 639 | 706 | ||||||
7.000%, 05/22/2027 | 1,394 | 1,505 | ||||||
6.300%, 01/23/2034 (A) | 854 | 842 | ||||||
|
|
| ||||||
| 5,142 | ||||||||
|
|
| ||||||
Kuwait — 0.1% | ||||||||
Meglobal Canada ULC MTN | ||||||||
5.875%, 05/18/2030 (A) | 222 | 273 | ||||||
58 |
SEI Institutional International Trust / Annual Report / September 30, 2021 |
| Description | Face Amount (Thousands) | Market Value ($ Thousands) | ||||||
GLOBAL BONDS (continued) | ||||||||
NBK SPC | ||||||||
1.625%, VAR United States Secured Overnight Financing Rate + 1.050%, | $ | 680 | $ | 671 | ||||
NBK Tier 1 Financing 2 | ||||||||
4.500%, VAR USD Swap Semi 30/360 6 Yr Curr + | 513 | 529 | ||||||
|
|
| ||||||
| 1,473 | ||||||||
|
|
| ||||||
Lebanon — 0.3% | ||||||||
Lebanon Government International Bond | ||||||||
8.250%, 05/17/2034 (G) | 7,412 | 1,199 | ||||||
8.200%, 05/17/2033 (G) | 2,700 | 439 | ||||||
6.650%, 04/22/2024 (G) | 2,250 | 369 | ||||||
6.000%, 01/27/2023 (G) | 560 | 92 | ||||||
Lebanon Government International Bond MTN | ||||||||
8.250%, 04/12/2021 (G) | 1,073 | 183 | ||||||
7.000%, 03/20/2028 (G) | 2,048 | 328 | ||||||
6.850%, 05/25/2029 (G) | 387 | 63 | ||||||
6.650%, 02/26/2030 (G) | 1,925 | 317 | ||||||
6.600%, 11/27/2026 (G) | 1,896 | 313 | ||||||
6.400%, 05/26/2023 (G) | 1,555 | 256 | ||||||
6.375%, 10/31/2021 (G) | 2,750 | 454 | ||||||
6.100%, 10/04/2022 (G) | 2,290 | 378 | ||||||
6.100%, 10/04/2022 (G) | 569 | 94 | ||||||
|
|
| ||||||
| 4,485 | ||||||||
|
|
| ||||||
Luxembourg — 0.0% | ||||||||
Millicom International Cellular | ||||||||
6.250%, 03/25/2029 (A) | 403 | 441 | ||||||
|
|
| ||||||
Macau — 0.0% | ||||||||
Studio City Finance (A) | ||||||||
6.500%, 01/15/2028 | 371 | 364 | ||||||
6.000%, 07/15/2025 | 87 | 86 | ||||||
|
|
| ||||||
| 450 | ||||||||
|
|
| ||||||
Macedonia — 0.0% | ||||||||
North Macedonia Government International Bond | ||||||||
1.625%, 03/10/2028 | EUR | 296 | 334 | |||||
|
|
| ||||||
Malaysia — 6.0% | ||||||||
1MDB Energy | ||||||||
5.990%, 05/11/2022 | $ | 1,000 | 1,023 | |||||
1MDB Global Investments | ||||||||
4.400%, 03/09/2023 | 4,000 | 4,016 | ||||||
4.400%, 03/09/2023 | 7,400 | 7,429 | ||||||
Malaysia Government Bond | ||||||||
5.248%, 09/15/2028 | MYR | 1,050 | 282 | |||||
4.935%, 09/30/2043 | 2,200 | 576 | ||||||
4.921%, 07/06/2048 | 1,768 | 464 | ||||||
4.642%, 11/07/2033 | 500 | 128 | ||||||
| Description | Face Amount (Thousands) | Market Value ($ Thousands) | ||||||
GLOBAL BONDS (continued) | ||||||||
4.392%, 04/15/2026 | MYR | 3,480 | $ | 883 | ||||
4.254%, 05/31/2035 | 8,927 | 2,210 | ||||||
4.232%, 06/30/2031 | 1,200 | 304 | ||||||
4.181%, 07/15/2024 | 20,513 | 5,113 | ||||||
4.065%, 06/15/2050 | 3,119 | 717 | ||||||
4.059%, 09/30/2024 | 8,576 | 2,134 | ||||||
3.955%, 09/15/2025 | 30,757 | 7,690 | ||||||
3.906%, 07/15/2026 | 16,854 | 4,210 | ||||||
3.900%, 11/30/2026 | 2,006 | 501 | ||||||
3.899%, 11/16/2027 | 3,026 | 751 | ||||||
3.885%, 08/15/2029 | 24,960 | 6,168 | ||||||
3.882%, 03/10/2022 (C) | 4,459 | 1,075 | ||||||
3.828%, 07/05/2034 | 33,019 | 7,814 | ||||||
3.800%, 08/17/2023 | 31,953 | 7,886 | ||||||
3.795%, 09/30/2022 | 3,200 | 780 | ||||||
3.757%, 04/20/2023 | 14,611 | 3,584 | ||||||
3.757%, 05/22/2040 | 11,882 | 2,712 | ||||||
3.733%, 06/15/2028 | 19,541 | 4,787 | ||||||
3.502%, 05/31/2027 | 7,185 | 1,751 | ||||||
3.480%, 03/15/2023 | 9,914 | 2,419 | ||||||
3.478%, 06/14/2024 | 6,671 | 1,635 | ||||||
3.418%, 08/15/2022 | 10,450 | 2,533 | ||||||
2.632%, 04/15/2031 | 13,166 | 2,950 | ||||||
Malaysia Government Investment Issue | ||||||||
4.369%, 10/31/2028 | 1,200 | 306 | ||||||
4.119%, 11/30/2034 | 5,564 | 1,357 | ||||||
4.070%, 09/30/2026 | 6,500 | 1,639 | ||||||
Malaysia Wakala Sukuk | ||||||||
2.070%, 04/28/2031 (C) | $ | 1,230 | 1,219 | |||||
Petronas Capital MTN | ||||||||
4.550%, 04/21/2050 | 1,401 | 1,714 | ||||||
3.500%, 04/21/2030 | 819 | 886 | ||||||
2.480%, 01/28/2032 | 1,266 | 1,259 | ||||||
|
|
| ||||||
| 92,905 | ||||||||
|
|
| ||||||
Mexico — 6.5% | ||||||||
America Movil | ||||||||
7.125%, 12/09/2024 | MXN | 18,110 | 867 | |||||
Banco Mercantil del Norte (A)(F) | ||||||||
7.500%, VAR US Treas Yield Curve Rate T Note Const Mat 10 Yr + 5.470% | $ | 476 | 530 | |||||
6.750%, VAR US Treas Yield Curve Rate T Note Const Mat 5 Yr + 4.967% | 609 | 642 | ||||||
Banco Nacional de Comercio Exterior SNC | ||||||||
2.720%, VAR US Treas Yield Curve Rate T Note Const Mat 5 Yr + 2.000%, 08/11/2031 (A) | 1,833 | 1,840 | ||||||
Cemex (A) | ||||||||
5.450%, 11/19/2029 | 750 | 813 | ||||||
SEI Institutional International Trust / Annual Report / September 30, 2021 |
59 |
SCHEDULE OF INVESTMENTS
September 30, 2021
Emerging Markets Debt Fund (Continued)
| Description | Face Amount (Thousands) | Market Value ($ Thousands) | ||||||
GLOBAL BONDS (continued) | ||||||||
5.125%, VAR US Treas Yield Curve Rate T Note Const Mat 5 Yr + 4.534% (F) | $ | 200 | $ | 204 | ||||
3.875%, 07/11/2031 | 572 | 572 | ||||||
Comision Federal de Electricidad | ||||||||
7.350%, 11/25/2025 | MXN | 39,785 | 1,868 | |||||
5.750%, 02/14/2042 (A) | $ | 500 | 546 | |||||
4.750%, 02/23/2027 (A) | 258 | 289 | ||||||
3.348%, 02/09/2031 (A)(C) | 391 | 384 | ||||||
FEL Energy VI Sarl | ||||||||
5.750%, 12/01/2040 (A) | 191 | 200 | ||||||
Industrias Penoles | ||||||||
5.650%, 09/12/2049 (A) | 359 | 444 | ||||||
Mexican Bonos | ||||||||
8.000%, 11/07/2047 | MXN | 61,317 | 3,005 | |||||
7.750%, 11/13/2042 | 76,027 | 3,658 | ||||||
7.500%, 06/03/2027 | 139,959 | 6,921 | ||||||
6.500%, 06/09/2022 | 8,698 | 426 | ||||||
5.750%, 03/05/2026 | 87,650 | 4,068 | ||||||
Mexican Bonos, Ser M20 | ||||||||
10.000%, 12/05/2024 (C) | 165,575 | 8,835 | ||||||
8.500%, 05/31/2029 | 81,760 | 4,257 | ||||||
8.000%, 12/07/2023 | 30,252 | 1,524 | ||||||
Mexican Bonos, Ser M30 | ||||||||
8.500%, 11/18/2038 | 163,217 | 8,445 | ||||||
Mexican Udibonos | ||||||||
4.500%, 12/04/2025 | 31,312 | 1,662 | ||||||
3.500%, 11/16/2023 | 66,254 | 3,331 | ||||||
2.000%, 06/09/2022 | 34,395 | 1,678 | ||||||
Mexico City Airport Trust | ||||||||
5.500%, 07/31/2047 (A) | $ | 715 | 730 | |||||
Mexico Government International Bond | ||||||||
5.000%, 04/27/2051 (C) | 1,632 | 1,790 | ||||||
4.750%, 04/27/2032 | 1,222 | 1,374 | ||||||
4.600%, 02/10/2048 | 394 | 406 | ||||||
4.280%, 08/14/2041 | 1,402 | 1,430 | ||||||
3.771%, 05/24/2061 | 434 | 385 | ||||||
2.659%, 05/24/2031 | 1,940 | 1,872 | ||||||
Mexico Government International Bond MTN | ||||||||
5.750%, 10/12/2110 | 1,716 | 1,952 | ||||||
4.750%, 03/08/2044 | 386 | 411 | ||||||
Minera Mexico | ||||||||
4.500%, 01/26/2050 (A) | 627 | 694 | ||||||
Petroleos Mexicanos | ||||||||
9.500%, 09/15/2027 | 280 | 323 | ||||||
9.500%, 09/15/2027 | 169 | 195 | ||||||
7.690%, 01/23/2050 | 680 | 644 | ||||||
7.690%, 01/23/2050 (A) | 427 | 404 | ||||||
7.470%, 11/12/2026 | MXN | 15,660 | 683 | |||||
7.190%, 09/12/2024 | 45,182 | 2,091 | ||||||
6.950%, 01/28/2060 | $ | 574 | 502 | |||||
| Description | Face Amount (Thousands) | Market Value ($ Thousands) | ||||||
GLOBAL BONDS (continued) | ||||||||
6.950%, 01/28/2060 (A) | $ | 864 | $ | 755 | ||||
6.840%, 01/23/2030 | 2,693 | 2,782 | ||||||
6.625%, 06/15/2035 | 3,945 | 3,743 | ||||||
6.500%, 01/23/2029 (A) | 785 | 807 | ||||||
6.500%, 06/02/2041 | 201 | 178 | ||||||
6.350%, 02/12/2048 | 981 | 829 | ||||||
6.350%, 02/12/2048 | 678 | 573 | ||||||
6.350%, 02/12/2048 (A) | 430 | 363 | ||||||
5.950%, 01/28/2031 | 2,673 | 2,591 | ||||||
5.950%, 01/28/2031 (A) | 540 | 523 | ||||||
5.950%, 01/28/2031 | 1,490 | 1,444 | ||||||
5.625%, 01/23/2046 | 253 | 203 | ||||||
5.350%, 02/12/2028 | 908 | 895 | ||||||
5.350%, 02/12/2028 (A) | 279 | 275 | ||||||
Petroleos Mexicanos MTN | ||||||||
6.875%, 08/04/2026 | 713 | �� | 775 | |||||
6.750%, 09/21/2047 | 6,432 | 5,610 | ||||||
6.750%, 09/21/2047 | 553 | 482 | ||||||
4.875%, 02/21/2028 | EUR | 755 | 884 | |||||
Poinsettia Finance | ||||||||
6.625%, 06/17/2031 | $ | 4,196 | 4,138 | |||||
|
|
| ||||||
| 100,745 | ||||||||
|
|
| ||||||
Mongolia — 0.3% | ||||||||
Development Bank of Mongolia | ||||||||
7.250%, 10/23/2023 (A) | 784 | 837 | ||||||
Mongolia Government International Bond | ||||||||
5.125%, 04/07/2026 | 381 | 400 | ||||||
3.500%, 07/07/2027 | 1,130 | 1,097 | ||||||
Mongolia Government International Bond MTN | ||||||||
8.750%, 03/09/2024 | 2,351 | 2,666 | ||||||
|
|
| ||||||
| 5,000 | ||||||||
|
|
| ||||||
Morocco — 0.3% | ||||||||
Morocco Government International Bond | ||||||||
5.500%, 12/11/2042 | 401 | 451 | ||||||
4.000%, 12/15/2050 | 1,049 | 957 | ||||||
3.000%, 12/15/2032 | 2,235 | 2,124 | ||||||
2.375%, 12/15/2027 | 745 | 729 | ||||||
OCP | ||||||||
3.750%, 06/23/2031 (A) | 202 | 201 | ||||||
|
|
| ||||||
| 4,462 | ||||||||
|
|
| ||||||
Mozambique — 0.1% | ||||||||
Mozambique International Bond | ||||||||
5.000%, 9.000%, 09/15/2023, 09/15/2031 (A)(B) | 1,839 | 1,582 | ||||||
5.000%, 09/15/2031 | 200 | 172 | ||||||
|
|
| ||||||
| 1,754 | ||||||||
|
|
| ||||||
Netherlands — 0.1% | ||||||||
Minejesa Capital BV (A) | ||||||||
5.625%, 08/10/2037 | 297 | 314 | ||||||
60 |
SEI Institutional International Trust / Annual Report / September 30, 2021 |
| Description | Face Amount (Thousands) | Market Value ($ Thousands) | ||||||
GLOBAL BONDS (continued) | ||||||||
4.625%, 08/10/2030 | $ | 386 | $ | 397 | ||||
VEON Holdings BV | ||||||||
3.375%, 11/25/2027 (A) | 549 | 556 | ||||||
|
|
| ||||||
| 1,267 | ||||||||
|
|
| ||||||
Nigeria — 0.8% | ||||||||
IHS Netherlands Holdco | ||||||||
8.000%, 09/18/2027 (A) | 299 | 319 | ||||||
Nigeria Government International Bond | ||||||||
9.248%, 01/21/2049 | 322 | 350 | ||||||
8.747%, 01/21/2031 | 628 | 688 | ||||||
8.747%, 01/21/2031 (A) | 535 | 586 | ||||||
7.875%, 02/16/2032 (A) | 723 | 751 | ||||||
7.875%, 02/16/2032 (C) | 3,315 | 3,444 | ||||||
7.696%, 02/23/2038 | 2,619 | 2,590 | ||||||
7.696%, 02/23/2038 (A) | 601 | 594 | ||||||
Nigeria Government International Bond MTN | ||||||||
8.250%, 09/28/2051 (A) | 970 | 977 | ||||||
7.375%, 09/28/2033 | 616 | 621 | ||||||
7.375%, 09/28/2033 (A) | 271 | 273 | ||||||
6.500%, 11/28/2027 (A) | 667 | 691 | ||||||
6.500%, 11/28/2027 | 130 | 135 | ||||||
6.125%, 09/28/2028 (A) | 665 | 667 | ||||||
|
|
| ||||||
| 12,686 | ||||||||
|
|
| ||||||
Oman — 1.0% | ||||||||
Oman Government International Bond | ||||||||
7.375%, 10/28/2032 (A) | 701 | 798 | ||||||
7.000%, 01/25/2051 (A) | 448 | 454 | ||||||
7.000%, 01/25/2051 | 200 | 203 | ||||||
6.750%, 10/28/2027 | 3,535 | 3,929 | ||||||
6.750%, 01/17/2048 | 3,429 | 3,390 | ||||||
6.750%, 01/17/2048 (A) | 1,089 | 1,077 | ||||||
6.250%, 01/25/2031 (A) | 954 | 1,020 | ||||||
6.250%, 01/25/2031 | 793 | 847 | ||||||
4.750%, 06/15/2026 | 900 | 922 | ||||||
Oman Government International Bond MTN | ||||||||
6.000%, 08/01/2029 (A) | 1,051 | 1,105 | ||||||
6.000%, 08/01/2029 | 392 | 412 | ||||||
4.875%, 02/01/2025 (A) | 717 | 745 | ||||||
OQ SAOC MTN | ||||||||
5.125%, 05/06/2028 (A) | 273 | 276 | ||||||
Oryx Funding Ltd | ||||||||
5.800%, 02/03/2031 (A) | 204 | 216 | ||||||
|
|
| ||||||
| 15,394 | ||||||||
|
|
| ||||||
Pakistan — 0.4% | ||||||||
Pakistan Government International Bond | ||||||||
8.250%, 09/30/2025 | 1,000 | 1,084 | ||||||
7.875%, 03/31/2036 | 200 | 196 | ||||||
6.875%, 12/05/2027 | 749 | 753 | ||||||
| Description | Face Amount (Thousands) | Market Value ($ Thousands) | ||||||
GLOBAL BONDS (continued) | ||||||||
Pakistan Government International Bond MTN | ||||||||
8.875%, 04/08/2051 | $ | 396 | $ | 398 | ||||
6.000%, 04/08/2026 (A) | 462 | 459 | ||||||
6.000%, 04/08/2026 | 2,441 | 2,426 | ||||||
Third Pakistan International Sukuk | ||||||||
5.500%, 10/13/2021 | 737 | 736 | ||||||
|
|
| ||||||
| 6,052 | ||||||||
|
|
| ||||||
Panama — 1.3% | ||||||||
Aeropuerto Internacional de Tocumen | ||||||||
5.125%, 08/11/2061 (A) | 311 | 326 | ||||||
AES Panama Generation Holdings SRL | ||||||||
4.375%, 05/31/2030 (A) | 492 | 507 | ||||||
Banco Nacional de Panama | ||||||||
2.500%, 08/11/2030 (A) | 791 | 759 | ||||||
C&W Senior Financing DAC | ||||||||
7.500%, 10/15/2026 (A) | 677 | 702 | ||||||
Cable Onda | ||||||||
4.500%, 01/30/2030 (A) | 208 | 218 | ||||||
Empresa de Transmision Electrica | ||||||||
5.125%, 05/02/2049 (A) | 635 | 710 | ||||||
Panama Bonos del Tesoro | ||||||||
3.362%, 06/30/2031 | 1,453 | 1,464 | ||||||
Panama Government International Bond | ||||||||
4.500%, 04/16/2050 | 1,825 | 1,986 | ||||||
2.252%, 09/29/2032 | 7,345 | 6,910 | ||||||
Republic of Panama | ||||||||
9.375%, 04/01/2029 | 804 | 1,169 | ||||||
8.125%, 04/28/2034 | 478 | 691 | ||||||
4.500%, 04/01/2056 | 444 | 483 | ||||||
3.870%, 07/23/2060 | 1,290 | 1,261 | ||||||
3.750%, 03/16/2025 | 1,109 | 1,190 | ||||||
3.160%, 01/23/2030 | 1,762 | 1,814 | ||||||
|
|
| ||||||
| 20,190 | ||||||||
|
|
| ||||||
Papua New Guinea — 0.0% | ||||||||
Papua New Guinea Government International Bond | ||||||||
8.375%, 10/04/2028 | 282 | 284 | ||||||
8.375%, 10/04/2028 (A) | 275 | 276 | ||||||
|
|
| ||||||
| 560 | ||||||||
|
|
| ||||||
Paraguay — 0.3% | ||||||||
Bioceanico Sovereign Certificate Ltd | ||||||||
2.471%, 06/05/2034 (D) | 1,666 | 1,254 | ||||||
Paraguay Government International Bond | ||||||||
6.100%, 08/11/2044 | 1,010 | 1,230 | ||||||
5.400%, 03/30/2050 | 571 | 655 | ||||||
4.950%, 04/28/2031 (C) | 880 | 992 | ||||||
2.739%, 01/29/2033 | 674 | 647 | ||||||
|
|
| ||||||
| 4,778 | ||||||||
|
|
| ||||||
SEI Institutional International Trust / Annual Report / September 30, 2021 |
61 |
SCHEDULE OF INVESTMENTS
September 30, 2021
Emerging Markets Debt Fund (Continued)
| Description | Face Amount (Thousands) | Market Value ($ Thousands) | ||||||
GLOBAL BONDS (continued) | ||||||||
Peru — 2.5% | ||||||||
Abengoa Transmision Sur | ||||||||
6.875%, 04/30/2043 (A) | $ | 263 | $ | 340 | ||||
Fondo MIVIVIENDA | ||||||||
7.000%, 02/14/2024 (A) | PEN | 3,704 | 916 | |||||
Inkia Energy | ||||||||
5.875%, 11/09/2027 (A) | $ | 359 | 374 | |||||
Kallpa Generacion (A) | ||||||||
4.875%, 05/24/2026 | 263 | 281 | ||||||
4.125%, 08/16/2027 | 936 | 976 | ||||||
Peru Government Bond | ||||||||
6.950%, 08/12/2031 | PEN | 1,700 | 426 | |||||
5.350%, 08/12/2040 | 708 | 136 | ||||||
5.200%, 09/12/2023 | 800 | 200 | ||||||
Peruvian Government International Bond | ||||||||
8.200%, 08/12/2026 | 15 | 4 | ||||||
8.200%, 08/12/2026 | 3,397 | 925 | ||||||
6.950%, 08/12/2031 | 154 | 39 | ||||||
6.950%, 08/12/2031 | 18,487 | 4,635 | ||||||
6.900%, 08/12/2037 | 1,944 | 450 | ||||||
6.850%, 02/12/2042 | 613 | 139 | ||||||
6.350%, 08/12/2028 | 5,940 | 1,484 | ||||||
6.350%, 08/12/2028 | 1,513 | 378 | ||||||
6.150%, 08/12/2032 | 16,603 | 3,892 | ||||||
5.940%, 02/12/2029 | 1,918 | 466 | ||||||
5.700%, 08/12/2024 (A) | 4,932 | 1,235 | ||||||
5.400%, 08/12/2034 | 1,243 | 259 | ||||||
5.400%, 08/12/2034 | 9,985 | 2,083 | ||||||
3.300%, 03/11/2041 | $ | 568 | 550 | |||||
3.230%, 07/28/2121 | 2,706 | 2,242 | ||||||
2.844%, 06/20/2030 | 173 | 174 | ||||||
2.783%, 01/23/2031 | 2,887 | 2,857 | ||||||
1.862%, 12/01/2032 | 1,585 | 1,439 | ||||||
1.250%, 03/11/2033 | EUR | 2,088 | 2,331 | |||||
Petroleos del Peru | ||||||||
5.625%, 06/19/2047 (A) | $ | 917 | 916 | |||||
5.625%, 06/19/2047 | 4,678 | 4,673 | ||||||
4.750%, 06/19/2032 (A) | 1,201 | 1,237 | ||||||
4.750%, 06/19/2032 | 754 | 777 | ||||||
Republic of Peru | ||||||||
8.750%, 11/21/2033 | 490 | 757 | ||||||
3.750%, 03/01/2030 | EUR | 200 | 275 | |||||
|
|
| ||||||
| 37,866 | ||||||||
|
|
| ||||||
Philippines — 0.8% | ||||||||
Philippine Government International Bond | ||||||||
5.000%, 01/13/2037 | $ | 519 | 640 | |||||
3.900%, 11/26/2022 | PHP | 45,000 | 887 | |||||
3.700%, 03/01/2041 | $ | 714 | 754 | |||||
3.200%, 07/06/2046 | 1,971 | 1,936 | ||||||
3.000%, 02/01/2028 | 262 | 279 | ||||||
2.950%, 05/05/2045 | 309 | 294 | ||||||
2.650%, 12/10/2045 | 1,071 | 978 | ||||||
| Description | Face Amount (Thousands) | Market Value ($ Thousands) | ||||||
GLOBAL BONDS (continued) | ||||||||
1.950%, 01/06/2032 | $ | 3,849 | $ | 3,715 | ||||
1.750%, 04/28/2041 | EUR | 402 | 464 | |||||
1.648%, 06/10/2031 (C) | $ | 1,928 | 1,833 | |||||
|
|
| ||||||
| 11,780 | ||||||||
|
|
| ||||||
Poland — 1.4% | ||||||||
Republic of Poland Government Bond | ||||||||
5.000%, 03/23/2022 | 1,871 | 1,911 | ||||||
3.250%, 07/25/2025 | PLN | 9,426 | 2,554 | |||||
2.750%, 04/25/2028 | 1,358 | 364 | ||||||
2.750%, 10/25/2029 | 9,711 | 2,590 | ||||||
2.500%, 04/25/2024 | 8,185 | 2,145 | ||||||
2.500%, 07/25/2026 | 11,319 | 2,996 | ||||||
2.500%, 07/25/2027 | 4,898 | 1,296 | ||||||
1.250%, 10/25/2030 | 25,552 | 6,010 | ||||||
0.250%, 10/25/2026 | 10,120 | 2,392 | ||||||
|
|
| ||||||
| 22,258 | ||||||||
|
|
| ||||||
Qatar — 1.3% | ||||||||
Ooredoo International Finance MTN | ||||||||
2.625%, 04/08/2031 (A) | $ | 363 | 370 | |||||
Qatar Government International Bond | ||||||||
5.103%, 04/23/2048 (A) | 1,353 | 1,794 | ||||||
5.103%, 04/23/2048 | 567 | 752 | ||||||
4.817%, 03/14/2049 (A) | 1,036 | 1,331 | ||||||
4.817%, 03/14/2049 (C) | 2,837 | 3,644 | ||||||
4.400%, 04/16/2050 (A) | 2,071 | 2,524 | ||||||
4.000%, 03/14/2029 (A) | 985 | 1,119 | ||||||
4.000%, 03/14/2029 | 267 | 303 | ||||||
3.750%, 04/16/2030 | 1,557 | 1,753 | ||||||
Qatar Petroleum | ||||||||
3.300%, 07/12/2051 (A) | 1,635 | 1,651 | ||||||
3.125%, 07/12/2041 (A) | 912 | 912 | ||||||
3.125%, 07/12/2041 | 474 | 474 | ||||||
2.250%, 07/12/2031 (A) | 3,226 | 3,195 | ||||||
State of Qatar | ||||||||
6.400%, 01/20/2040 (A) | 547 | 800 | ||||||
|
|
| ||||||
| 20,622 | ||||||||
|
|
| ||||||
Romania — 1.6% | ||||||||
Romania Government Bond | ||||||||
5.850%, 04/26/2023 | RON | 1,720 | 420 | |||||
4.850%, 04/22/2026 | 1,945 | 477 | ||||||
4.750%, 10/11/2034 | 870 | 207 | ||||||
4.400%, 09/25/2023 | 790 | 190 | ||||||
4.150%, 01/26/2028 | 8,360 | 1,995 | ||||||
4.150%, 10/24/2030 | 670 | 157 | ||||||
4.000%, 10/25/2023 | 3,430 | 818 | ||||||
3.650%, 07/28/2025 | 13,645 | 3,207 | ||||||
3.650%, 09/24/2031 | 5,510 | 1,208 | ||||||
3.250%, 06/24/2026 | 2,360 | 544 | ||||||
Romanian Government International Bond | ||||||||
5.000%, 02/12/2029 | 8,095 | 1,989 | ||||||
4.250%, 06/28/2023 | 2,730 | 652 | ||||||
62 |
SEI Institutional International Trust / Annual Report / September 30, 2021 |
| Description | Face Amount (Thousands) | Market Value ($ Thousands) | ||||||
GLOBAL BONDS (continued) | ||||||||
4.000%, 02/14/2051 | $ | 438 | $ | 436 | ||||
3.000%, 02/14/2031 (C) | 1,210 | 1,234 | ||||||
2.750%, 04/14/2041 (A) | EUR | 623 | 670 | |||||
Romanian Government International Bond MTN | ||||||||
6.750%, 02/07/2022 | $ | 988 | 1,008 | |||||
6.125%, 01/22/2044 (A) | 468 | 612 | ||||||
4.625%, 04/03/2049 | EUR | 1,419 | 1,923 | |||||
4.125%, 03/11/2039 | 613 | 792 | ||||||
3.875%, 10/29/2035 | 550 | 714 | ||||||
3.375%, 02/08/2038 (A) | 241 | 290 | ||||||
3.375%, 01/28/2050 | 2,100 | 2,392 | ||||||
2.875%, 04/13/2042 | 297 | 321 | ||||||
2.500%, 02/08/2030 (A) | 657 | 796 | ||||||
2.124%, 07/16/2031 | 158 | 183 | ||||||
2.000%, 01/28/2032 | 40 | 45 | ||||||
2.000%, 04/14/2033 | 530 | 586 | ||||||
|
|
| ||||||
| 23,866 | ||||||||
|
|
| ||||||
Russia — 5.5% | ||||||||
Gazprom OAO Via Gaz Capital (A) | ||||||||
5.150%, 02/11/2026 | $ | 2,673 | 2,978 | |||||
4.950%, 02/06/2028 | 640 | 707 | ||||||
Gazprom PJSC via Gaz Finance | ||||||||
4.599%, VAR US Treas Yield Curve Rate T Note Const Mat 5 Yr + 4.264% (A)(F) | 774 | 805 | ||||||
Gtlk Europe Capital DAC | ||||||||
4.650%, 03/10/2027 | 596 | 623 | ||||||
GTLK Europe Capital DAC | ||||||||
4.949%, 02/18/2026 | 718 | 764 | ||||||
Rusal Capital DAC | ||||||||
5.125%, 02/02/2022 | 860 | 864 | ||||||
Russian Federal Bond - OFZ | ||||||||
8.500%, 09/17/2031 | RUB | 128,684 | 1,931 | |||||
8.150%, 02/03/2027 | 821,910 | 11,790 | ||||||
7.950%, 10/07/2026 | 267,449 | 3,798 | ||||||
7.700%, 03/23/2033 | 151,607 | 2,151 | ||||||
7.700%, 03/16/2039 | 54,617 | 775 | ||||||
7.650%, 04/10/2030 | 7,375 | 105 | ||||||
7.250%, 05/10/2034 | 100,213 | 1,365 | ||||||
7.100%, 10/16/2024 | 107,422 | 1,476 | ||||||
7.050%, 01/19/2028 | 508,555 | 6,951 | ||||||
7.000%, 08/16/2023 | 219,831 | 3,016 | ||||||
7.000%, 07/30/2036 | 86,250 | 1,136 | ||||||
6.900%, 05/23/2029 | 403,763 | 5,467 | ||||||
6.900%, 07/23/2031 | 551,191 | 7,362 | ||||||
6.000%, 10/06/2027 | 16,284 | 212 | ||||||
4.500%, 07/16/2025 | 914,186 | 11,470 | ||||||
Russian Federal Inflation Linked Bond | ||||||||
2.500%, 07/17/2030 | 312,397 | 4,144 | ||||||
Russian Foreign Bond - Eurobond | ||||||||
7.500%, 03/31/2030 | $ | 1 | 1 | |||||
| Description | Face Amount (Thousands) | Market Value ($ Thousands) | ||||||
GLOBAL BONDS (continued) | ||||||||
5.250%, 06/23/2047 (C) | $ | 1,000 | $ | 1,266 | ||||
5.100%, 03/28/2035 | 4,000 | 4,786 | ||||||
4.375%, 03/21/2029 (C) | 6,800 | 7,700 | ||||||
Vnesheconombank Via VEB Finance | ||||||||
6.800%, 11/22/2025 | 580 | 681 | ||||||
6.800%, 11/22/2025 (A) | 150 | 176 | ||||||
|
|
| ||||||
| 84,500 | ||||||||
|
|
| ||||||
Saudi Arabia — 1.2% | ||||||||
Global Sukuk | ||||||||
1.602%, 06/17/2026 | 1,680 | 1,670 | ||||||
Saudi Arabian Oil MTN | ||||||||
4.250%, 04/16/2039 (A) | 920 | 1,032 | ||||||
4.250%, 04/16/2039 | 160 | 179 | ||||||
Saudi Government International Bond | ||||||||
5.250%, 01/16/2050 (A) | 869 | 1,124 | ||||||
5.250%, 01/16/2050 | 680 | 880 | ||||||
4.375%, 04/16/2029 (A) | 1,514 | 1,743 | ||||||
Saudi Government International Bond MTN | ||||||||
5.000%, 04/17/2049 (A) | 200 | 249 | ||||||
4.625%, 10/04/2047 (A) | 390 | 458 | ||||||
4.500%, 04/17/2030 (A) | 463 | 542 | ||||||
4.500%, 10/26/2046 | 580 | 669 | ||||||
4.500%, 10/26/2046 (A) | 663 | 765 | ||||||
4.000%, 04/17/2025 | 2,038 | 2,229 | ||||||
3.250%, 10/26/2026 (A) | 1,884 | 2,030 | ||||||
3.250%, 10/22/2030 | 1,567 | 1,677 | ||||||
3.250%, 10/22/2030 (A) | 1,286 | 1,376 | ||||||
2.250%, 02/02/2033 (A) | 1,199 | 1,166 | ||||||
|
|
| ||||||
| 17,789 | ||||||||
|
|
| ||||||
Senegal — 0.1% | ||||||||
Senegal Government International Bond | ||||||||
6.750%, 03/13/2048 | 1,622 | 1,637 | ||||||
5.375%, 06/08/2037 | EUR | 268 | 306 | |||||
5.375%, 06/08/2037 (A) | 152 | 174 | ||||||
4.750%, 03/13/2028 (A) | 113 | 136 | ||||||
|
|
| ||||||
| 2,253 | ||||||||
|
|
| ||||||
Serbia — 0.3% | ||||||||
Serbia International Bond | ||||||||
3.125%, 05/15/2027 | 320 | 407 | ||||||
2.125%, 12/01/2030 | $ | 917 | 858 | |||||
1.650%, 03/03/2033 | EUR | 270 | 297 | |||||
1.500%, 06/26/2029 | 903 | 1,032 | ||||||
Serbia International Bond MTN | ||||||||
2.050%, 09/23/2036 | 491 | 534 | ||||||
Serbia Treasury Bonds | ||||||||
5.875%, 02/08/2028 | RSD | 38,770 | 448 | |||||
4.500%, 01/11/2026 | 27,640 | 293 | ||||||
|
|
| ||||||
| 3,869 | ||||||||
|
|
| ||||||
SEI Institutional International Trust / Annual Report / September 30, 2021 |
63 |
SCHEDULE OF INVESTMENTS
September 30, 2021
Emerging Markets Debt Fund (Continued)
| Description | Face Amount (Thousands) | Market Value ($ Thousands) | ||||||
GLOBAL BONDS (continued) | ||||||||
South Africa — 5.7% | ||||||||
Bidvest Group UK PLC | ||||||||
3.625%, 09/23/2026 (A) | $ | 344 | $ | 344 | ||||
Eskom Holdings SOC | ||||||||
7.125%, 02/11/2025 (A) | 2,948 | 3,065 | ||||||
4.314%, 07/23/2027 | 253 | 248 | ||||||
Eskom Holdings SOC MTN | ||||||||
8.450%, 08/10/2028 (A) | 353 | 390 | ||||||
7.500%, 09/15/2033 | ZAR | 35,200 | 1,739 | |||||
6.750%, 08/06/2023 (A) | $ | 1,063 | 1,096 | |||||
6.750%, 08/06/2023 | 846 | 872 | ||||||
Republic of South Africa | ||||||||
10.500%, 12/21/2026 | ZAR | 157,533 | 11,756 | |||||
9.000%, 01/31/2040 | 62,829 | 3,568 | ||||||
8.875%, 02/28/2035 | 161,894 | 9,560 | ||||||
8.750%, 01/31/2044 | 126,009 | 6,907 | ||||||
8.750%, 02/28/2048 | 163,191 | 8,925 | ||||||
8.500%, 01/31/2037 | 232,316 | 12,934 | ||||||
8.250%, 03/31/2032 | 86,525 | 5,142 | ||||||
8.000%, 01/31/2030 | 40,088 | 2,476 | ||||||
7.000%, 02/28/2031 | 51,041 | 2,855 | ||||||
6.500%, 02/28/2041 | 23,055 | 1,000 | ||||||
6.300%, 06/22/2048 | $ | 1,464 | 1,508 | |||||
6.250%, 03/31/2036 | ZAR | 70,195 | 3,224 | |||||
5.875%, 09/16/2025 | $ | 790 | 885 | |||||
5.750%, 09/30/2049 | 3,793 | 3,613 | ||||||
5.650%, 09/27/2047 | 946 | 900 | ||||||
5.000%, 10/12/2046 | 357 | 316 | ||||||
4.850%, 09/27/2027 | 682 | 714 | ||||||
4.850%, 09/30/2029 | 2,362 | 2,427 | ||||||
Sasol Financing USA | ||||||||
6.500%, 09/27/2028 | 360 | 397 | ||||||
4.375%, 09/18/2026 | 351 | 356 | ||||||
SASOL Financing USA | ||||||||
5.875%, 03/27/2024 | 442 | 466 | ||||||
|
|
| ||||||
| 87,683 | ||||||||
|
|
| ||||||
South Korea — 0.2% | ||||||||
Export-Import Bank of Korea MTN | ||||||||
8.400%, 11/30/2021 | IDR | 22,400,000 | 1,573 | |||||
7.250%, 12/07/2024 | 700,000 | 52 | ||||||
Korea International Bond | ||||||||
1.000%, 09/16/2030 | $ | 791 | 746 | |||||
|
|
| ||||||
| 2,371 | ||||||||
|
|
| ||||||
Spain — 0.1% | ||||||||
AI Candelaria Spain SLU | ||||||||
7.500%, 12/15/2028 (A) | 975 | 1,058 | ||||||
|
|
| ||||||
Sri Lanka — 0.7% | ||||||||
Sri Lanka Government International Bond | ||||||||
7.850%, 03/14/2029 | 1,598 | 968 | ||||||
7.550%, 03/28/2030 | 3,079 | 1,865 | ||||||
| Description | Face Amount (Thousands) | Market Value ($ Thousands) | ||||||
GLOBAL BONDS (continued) | ||||||||
6.850%, 03/14/2024 | $ | 512 | $ | 324 | ||||
6.850%, 11/03/2025 | 1,339 | 835 | ||||||
6.825%, 07/18/2026 (A) | 909 | 567 | ||||||
6.825%, 07/18/2026 | 500 | 312 | ||||||
6.750%, 04/18/2028 | 3,312 | 2,005 | ||||||
6.750%, 04/18/2028 (A) | 5,097 | 3,086 | ||||||
6.350%, 06/28/2024 (A) | 864 | 548 | ||||||
6.200%, 05/11/2027 | 1,186 | 718 | ||||||
|
|
| ||||||
| 11,228 | ||||||||
|
|
| ||||||
Supra-National — 0.6% | ||||||||
Africa Finance | ||||||||
2.875%, 04/28/2028 (A) | 1,679 | 1,689 | ||||||
African Export-Import Bank | ||||||||
3.798%, 05/17/2031 (A) | 200 | 207 | ||||||
African Export-Import Bank MTN | ||||||||
3.994%, 09/21/2029 (A) | 363 | 383 | ||||||
Banque Ouest Africaine de Developpement | ||||||||
5.000%, 07/27/2027 (A) | 865 | 969 | ||||||
4.700%, 10/22/2031 (A) | 683 | 750 | ||||||
4.700%, 10/22/2031 | 280 | 307 | ||||||
European Bank for Reconstruction & Development MTN | ||||||||
6.450%, 12/13/2022 | IDR | 9,486,000 | 678 | |||||
5.200%, 05/28/2024 | 11,593,600 | 817 | ||||||
Inter-American Development Bank MTN | ||||||||
7.875%, 03/14/2023 | 44,650,000 | 3,264 | ||||||
|
|
| ||||||
| 9,064 | ||||||||
|
|
| ||||||
Tanzania — 0.0% | ||||||||
AngloGold Ashanti Holdings | ||||||||
3.750%, 10/01/2030 | $ | 229 | 235 | |||||
|
|
| ||||||
Thailand — 2.2% | ||||||||
Thailand Government Bond | ||||||||
5.670%, 03/13/2028 | THB | 3,000 | 112 | |||||
3.775%, 06/25/2032 | 181,773 | 6,295 | ||||||
3.650%, 06/20/2031 | 78,000 | 2,668 | ||||||
3.625%, 06/16/2023 | 30,000 | 932 | ||||||
3.400%, 06/17/2036 | 193,984 | 6,449 | ||||||
3.300%, 06/17/2038 | 92,472 | 3,034 | ||||||
2.875%, 12/17/2028 | 62,796 | 2,025 | ||||||
2.875%, 06/17/2046 | 3,431 | 105 | ||||||
2.400%, 12/17/2023 | 88,000 | 2,704 | ||||||
2.125%, 12/17/2026 | 15,000 | 467 | ||||||
2.000%, 12/17/2031 | 66,700 | 1,985 | ||||||
1.875%, 06/17/2022 | 20,000 | 597 | ||||||
1.600%, 12/17/2029 | 7,000 | 205 | ||||||
1.600%, 06/17/2035 | 27,023 | 737 | ||||||
1.450%, 12/17/2024 | 85,200 | 2,573 | ||||||
1.250%, 03/12/2028 | 59,042 | 1,725 | ||||||
0.950%, 06/17/2025 | 67,000 | 1,990 | ||||||
|
|
| ||||||
| 34,603 | ||||||||
|
|
| ||||||
64 |
SEI Institutional International Trust / Annual Report / September 30, 2021 |
| Description | Face Amount (Thousands) | Market Value ($ Thousands) | ||||||
GLOBAL BONDS (continued) | ||||||||
Trinidad & Tobago — 0.0% | ||||||||
Trinidad & Tobago Government International Bond | ||||||||
4.500%, 08/04/2026 | $ | 482 | $ | 507 | ||||
|
|
| ||||||
Tunisia — 0.3% | ||||||||
Banque Centrale de Tunisie | ||||||||
5.750%, 01/30/2025 (A) | 786 | 664 | ||||||
Banque Centrale de Tunisie International Bond | ||||||||
6.375%, 07/15/2026 (A) | EUR | 1,448 | 1,401 | |||||
6.375%, 07/15/2026 | 622 | 602 | ||||||
5.750%, 01/30/2025 | $ | 200 | 169 | |||||
5.625%, 02/17/2024 | EUR | 1,105 | 1,082 | |||||
|
|
| ||||||
| 3,918 | ||||||||
|
|
| ||||||
Turkey — 2.0% | ||||||||
Aydem Yenilenebilir Enerji | ||||||||
7.750%, 02/02/2027 (A) | $ | 655 | 638 | |||||
Export Credit Bank of Turkey (A) | ||||||||
6.125%, 05/03/2024 | 247 | 253 | ||||||
5.375%, 10/24/2023 | 1,033 | 1,055 | ||||||
Hazine Mustesarligi Varlik Kiralama (A) | ||||||||
5.800%, 02/21/2022 | 1,479 | 1,498 | ||||||
5.125%, 06/22/2026 | 855 | 845 | ||||||
QNB Finansbank | ||||||||
6.875%, 09/07/2024 (A) | 613 | 662 | ||||||
TC Ziraat Bankasi MTN | ||||||||
5.125%, 05/03/2022 (A) | 1,063 | 1,076 | ||||||
Turkey Government Bond | ||||||||
12.600%, 10/01/2025 | TRY | 34,229 | 3,283 | |||||
11.700%, 11/13/2030 | 4,073 | 334 | ||||||
9.000%, 05/04/2022 | 3,294 | 354 | ||||||
Turkey Government International Bond | ||||||||
10.600%, 02/11/2026 | 13,916 | 1,229 | ||||||
7.250%, 12/23/2023 | $ | 1,061 | 1,128 | |||||
6.875%, 03/17/2036 | 2,482 | 2,408 | ||||||
6.500%, 09/20/2033 | 3,685 | 3,534 | ||||||
6.375%, 10/14/2025 | 200 | 205 | ||||||
6.350%, 08/10/2024 | 294 | 304 | ||||||
6.000%, 01/14/2041 | 558 | 483 | ||||||
5.950%, 01/15/2031 | 2,756 | 2,606 | ||||||
5.875%, 06/26/2031 | 1,788 | 1,678 | ||||||
5.750%, 03/22/2024 | 200 | 204 | ||||||
5.750%, 05/11/2047 | 69 | 57 | ||||||
5.125%, 02/17/2028 | 242 | 229 | ||||||
4.875%, 10/09/2026 | 1,017 | 974 | ||||||
4.750%, 01/26/2026 | 3,813 | 3,682 | ||||||
Turkiye Sise ve Cam Fabrikalari | ||||||||
6.950%, 03/14/2026 (A) | 500 | 548 | ||||||
Turkiye Vakiflar Bankasi TAO | ||||||||
6.500%, 01/08/2026 (A) | 379 | 385 | ||||||
| Description | Face Amount (Thousands) | Market Value ($ Thousands) | ||||||
GLOBAL BONDS (continued) | ||||||||
Ulker Biskuvi Sanayi | ||||||||
6.950%, 10/30/2025 | $ | 871 | $ | 923 | ||||
Yapi ve Kredi Bankasi MTN | ||||||||
5.850%, 06/21/2024 (A)(C) | 429 | 438 | ||||||
|
|
| ||||||
| 31,013 | ||||||||
|
|
| ||||||
Uganda — 0.4% | ||||||||
Republic of Uganda Government Bonds | ||||||||
17.000%, 01/16/2025 | UGX | 440,400 | 145 | |||||
17.000%, 04/03/2031 | 8,683,400 | 2,926 | ||||||
16.375%, 03/04/2032 | 1,427,900 | 465 | ||||||
16.250%, 11/08/2035 | 1,123,900 | 360 | ||||||
16.000%, 05/06/2027 | 2,226,000 | 739 | ||||||
14.250%, 06/22/2034 | 5,311,800 | 1,548 | ||||||
10.000%, 09/07/2023 | 1,112,600 | 313 | ||||||
|
|
| ||||||
| 6,496 | ||||||||
|
|
| ||||||
Ukraine — 1.9% | ||||||||
NAK Naftogaz Ukraine via Kondor Finance | ||||||||
7.625%, 11/08/2026 (A) | $ | 990 | 985 | |||||
7.125%, 07/19/2024 | EUR | 720 | 842 | |||||
State Agency of Roads of Ukraine | ||||||||
6.250%, 06/24/2028 (A) | $ | 2,131 | 2,108 | |||||
Ukraine Government International Bond | ||||||||
17.000%, 05/11/2022 | UAH | 71,848 | 2,789 | |||||
15.840%, 02/26/2025 | 66,553 | 2,659 | ||||||
9.750%, 11/01/2028 | $ | 751 | 881 | |||||
7.750%, 09/01/2024 (A) | 131 | 142 | ||||||
7.750%, 09/01/2025 (A) | 2,103 | 2,285 | ||||||
7.750%, 09/01/2026 | 1,905 | 2,066 | ||||||
7.750%, 09/01/2026 (A) | 169 | 183 | ||||||
7.750%, 09/01/2027 (A) | 223 | 242 | ||||||
7.750%, 09/01/2027 | 1,804 | 1,954 | ||||||
7.375%, 09/25/2032 | 3,520 | 3,604 | ||||||
7.253%, 03/15/2033 | 724 | 733 | ||||||
7.253%, 03/15/2033 (A) | 297 | 301 | ||||||
6.876%, 05/21/2029 (A) | 281 | 285 | ||||||
6.876%, 05/21/2029 | 3,069 | 3,110 | ||||||
6.750%, 06/20/2026 | EUR | 1,299 | 1,633 | |||||
3.000%, 05/31/2040 (A) | $ | 2,206 | 2,406 | |||||
1.258%, 05/31/2040 | 410 | 447 | ||||||
Ukreximbank Via Biz Finance | ||||||||
9.750%, 01/22/2025 | 238 | 256 | ||||||
|
|
| ||||||
| 29,911 | ||||||||
|
|
| ||||||
United Arab Emirates — 1.5% | ||||||||
Abu Dhabi Crude Oil Pipeline | ||||||||
4.600%, 11/02/2047 (A) | 3,507 | 4,135 | ||||||
4.600%, 11/02/2047 | 330 | 389 | ||||||
3.650%, 11/02/2029 (A) | 207 | 230 | ||||||
Abu Dhabi Government International Bond | ||||||||
4.125%, 10/11/2047 (A) | 591 | 698 | ||||||
SEI Institutional International Trust / Annual Report / September 30, 2021 |
65 |
SCHEDULE OF INVESTMENTS
September 30, 2021
Emerging Markets Debt Fund (Continued)
| Description | Face Amount (Thousands) | Market Value ($ Thousands) | ||||||
GLOBAL BONDS (continued) | ||||||||
Abu Dhabi Government International Bond MTN | ||||||||
3.875%, 04/16/2050 | $ | 260 | $ | 297 | ||||
3.000%, 09/15/2051 (A) | 1,576 | 1,545 | ||||||
3.000%, 09/15/2051 | 720 | 706 | ||||||
1.875%, 09/15/2031 (A) | 941 | 918 | ||||||
1.625%, 06/02/2028 | 1,152 | 1,142 | ||||||
DAE Funding LLC | ||||||||
3.375%, 03/20/2028 (A) | 550 | 567 | ||||||
DP World MTN (A) | ||||||||
6.850%, 07/02/2037 | 210 | 280 | ||||||
5.625%, 09/25/2048 | 439 | 541 | ||||||
4.700%, 09/30/2049 | 134 | 147 | ||||||
DP World Crescent MTN | ||||||||
4.848%, 09/26/2028 | 475 | 541 | ||||||
DP World Salaam | ||||||||
6.000%, VAR US Treas Yield Curve Rate T Note Const Mat 5 Yr + 5.750% (F) | 877 | 960 | ||||||
Emirate of Dubai Government International Bonds MTN | ||||||||
5.250%, 01/30/2043 | 490 | 557 | ||||||
Finance Department Government of Sharjah MTN | ||||||||
4.000%, 07/28/2050 (A) | 1,627 | 1,447 | ||||||
Galaxy Pipeline Assets Bidco | ||||||||
2.940%, 09/30/2040 (A) | 593 | 592 | ||||||
2.940%, 09/30/2040 | 3,622 | 3,615 | ||||||
2.625%, 03/31/2036 (A) | 580 | 571 | ||||||
2.160%, 03/31/2034 | 1,660 | 1,629 | ||||||
MDC-GMTN BV MTN | ||||||||
4.500%, 11/07/2028 (A) | 548 | 639 | ||||||
MDGH - GMTN BV MTN | ||||||||
3.950%, 05/21/2050 | 200 | 227 | ||||||
Sharjah Sukuk Program MTN | ||||||||
3.854%, 04/03/2026 | 359 | 382 | ||||||
|
|
| ||||||
| 22,755 | ||||||||
|
|
| ||||||
United Kingdom — 0.2% | ||||||||
Standard Chartered Bank MTN (A) | ||||||||
8.375%, 10/18/2039 | IDR | 20,797,000 | 1,633 | |||||
8.250%, 05/18/2029 | 14,336,000 | 1,128 | ||||||
|
|
| ||||||
| 2,761 | ||||||||
|
|
| ||||||
United States — 0.5% | ||||||||
JPMorgan Chase Bank MTN (A) | ||||||||
7.500%, 06/15/2035 | 41,500,000 | 3,068 | ||||||
7.000%, 09/18/2030 (E) | 57,637,000 | 4,222 | ||||||
Sagicor Financial | ||||||||
5.300%, 05/13/2028 (A) | $ | 520 | 545 | |||||
|
|
| ||||||
| 7,835 | ||||||||
|
|
| ||||||
| Description | Face Amount (Thousands) | Market Value ($ Thousands) | ||||||
GLOBAL BONDS (continued) | ||||||||
Uruguay — 0.6% | ||||||||
Republic of Uruguay | ||||||||
5.100%, 06/18/2050 | $ | 350 | $ | 445 | ||||
Uruguay Government International Bond | ||||||||
9.875%, 06/20/2022 | UYU | 13,061 | 310 | |||||
4.975%, 04/20/2055 | $ | 446 | 558 | |||||
4.375%, 10/27/2027 | 1,819 | 2,085 | ||||||
4.375%, 01/23/2031 (C) | 4,405 | 5,093 | ||||||
|
|
| ||||||
| 8,491 | ||||||||
|
|
| ||||||
Uzbekistan — 0.2% | ||||||||
Republic of Uzbekistan Bond MTN | ||||||||
5.375%, 02/20/2029 | 833 | 906 | ||||||
3.700%, 11/25/2030 (A) | 205 | 198 | ||||||
Republic of Uzbekistan International Bond | ||||||||
3.900%, 10/19/2031 (A) | 1,363 | 1,326 | ||||||
Uzauto Motors AJ | ||||||||
4.850%, 05/04/2026 (A) | 727 | 720 | ||||||
|
|
| ||||||
| 3,150 | ||||||||
|
|
| ||||||
Venezuela — 0.2% | ||||||||
Petroleos de Venezuela (G) | ||||||||
9.750%, 05/17/2035 | 1,000 | 58 | ||||||
9.000%, 11/17/2021 (C) | 4,300 | 247 | ||||||
6.000%, 05/16/2024 | 10,192 | 586 | ||||||
6.000%, 05/16/2024 | 7,785 | 448 | ||||||
6.000%, 11/15/2026 | 13,215 | 760 | ||||||
5.500%, 04/12/2037 | 1,740 | 97 | ||||||
5.375%, 04/12/2027 | 4,563 | 262 | ||||||
Venezuela Government International Bond(G) | ||||||||
9.250%, 09/15/2027 | 2,300 | 244 | ||||||
9.250%, 05/07/2028 | 2,941 | 313 | ||||||
8.250%, 10/13/2024 | 3,304 | 350 | ||||||
7.750%, 10/13/2019 | 3,976 | 408 | ||||||
|
|
| ||||||
| 3,773 | ||||||||
|
|
| ||||||
Vietnam — 0.1% | ||||||||
Mong Duong Finance Holdings BV | ||||||||
5.125%, 05/07/2029 (A) | 1,111 | 1,106 | ||||||
|
|
| ||||||
Zambia — 0.9% | ||||||||
First Quantum Minerals (A) | ||||||||
7.500%, 04/01/2025 | 404 | 414 | ||||||
6.875%, 03/01/2026 | 403 | 419 | ||||||
6.875%, 10/15/2027 | 529 | 559 | ||||||
Zambia Government Bond | ||||||||
13.000%, 08/29/2026 | ZMW | 1,375 | 61 | |||||
13.000%, 12/18/2027 | 5,630 | 228 | ||||||
13.000%, 01/25/2031 | 30,744 | 1,032 | ||||||
11.000%, 01/25/2026 | 18,620 | 790 | ||||||
11.000%, 06/28/2026 | 78,885 | 3,242 | ||||||
10.000%, 06/28/2024 | 66,325 | 3,105 | ||||||
66 |
SEI Institutional International Trust / Annual Report / September 30, 2021 |
| Description | Face Amount (Thousands) | Market Value ($ Thousands) | ||||||
GLOBAL BONDS (continued) | ||||||||
Zambia Government International Bond | ||||||||
8.970%, 07/30/2027 | $ | 1,821 | $ | 1,405 | ||||
5.375%, 09/20/2022 (G) | 3,087 | 2,313 | ||||||
5.375%, 09/20/2022 (A) | 299 | 224 | ||||||
|
|
| ||||||
| 13,792 | ||||||||
|
|
| ||||||
Total Global Bonds | ||||||||
(Cost $1,504,278) ($ Thousands) | 1,455,768 | |||||||
|
|
| ||||||
| Description | Shares | Market Value ($ Thousands) | ||||||
AFFILIATED PARTNERSHIP — 3.3% |
| |||||||
SEI Liquidity Fund, L.P. | ||||||||
0.010% **†(H) | 51,011,398 | $ | 51,021 | |||||
|
|
| ||||||
Total Affiliated Partnership | 51,021 | |||||||
|
|
| ||||||
Total Investments in Securities — 97.7% |
| $ | 1,506,789 | |||||
|
|
| ||||||
A list of the open futures contracts held by the Fund at September 30, 2021, is as follows:
| Type of Contract | Number of Contracts | Expiration Date | Notional Amount (Thousands) | Value (Thousands) | Unrealized Appreciation/ (Depreciation) (Thousands) | |||||||||||||||
Long Contracts | ||||||||||||||||||||
R2040 Bond Future | 229 | Nov-2021 | $ | 1,336 | $ | 1,333 | $ | 19 | ||||||||||||
R213 Bond Future | 837 | Nov-2021 | 4,843 | 4,741 | (23 | ) | ||||||||||||||
U.S. 2-Year Treasury Note | 14 | Jan-2022 | 3,083 | 3,081 | (2 | ) | ||||||||||||||
U.S. 5-Year Treasury Note | 93 | Jan-2022 | 11,470 | 11,415 | (55 | ) | ||||||||||||||
U.S. 10-Year Treasury Note | 22 | Dec-2021 | 2,924 | 2,895 | (29 | ) | ||||||||||||||
U.S. Ultra Long Treasury Bond | 55 | Dec-2021 | 10,888 | 10,508 | (380 | ) | ||||||||||||||
|
|
|
|
|
| |||||||||||||||
| 34,544 | 33,973 | (470 | ) | |||||||||||||||||
|
|
|
|
|
| |||||||||||||||
Short Contracts | ||||||||||||||||||||
Euro-Bob | (38 | ) | Dec-2021 | $ | (6,110 | ) | $ | (5,942 | ) | $ | 36 | |||||||||
Euro-Bund | (63 | ) | Dec-2021 | (12,896 | ) | (12,399 | ) | 201 | ||||||||||||
Euro-Buxl | (37 | ) | Dec-2021 | (9,207 | ) | (8,719 | ) | 279 | ||||||||||||
Korea 10-Year Bond | (14 | ) | Dec-2021 | (1,508 | ) | (1,469 | ) | 23 | ||||||||||||
|
|
|
|
|
| |||||||||||||||
| (29,721 | ) | (28,529 | ) | 539 | ||||||||||||||||
|
|
|
|
|
| |||||||||||||||
| $ | 4,823 | $ | 5,444 | $ | 69 | |||||||||||||||
|
|
|
|
|
| |||||||||||||||
A list of the open forward foreign currency contracts held by the Fund at September 30, 2021, is as follows:
| Counterparty | Settlement Date | Currency to Deliver (Thousands) | Currency to Receive (Thousands) | Unrealized Appreciation (Depreciation) (Thousands) | ||||||||||||||||||||
Barclays PLC | 10/04/21 | USD | 622 | EUR | 526 | $ | (12 | ) | ||||||||||||||||
Barclays PLC | 10/04/21 - 12/15/21 | EUR | 4,800 | USD | 5,672 | 104 | ||||||||||||||||||
Barclays PLC | 10/20/21 - 12/22/21 | USD | 14,260 | TRY | 126,845 | (446 | ) | |||||||||||||||||
Barclays PLC | 12/15/21 | USD | 2,950 | HUF | 873,710 | (137 | ) | |||||||||||||||||
Barclays PLC | 12/15/21 | USD | 3,232 | CLP | 2,554,245 | (106 | ) | |||||||||||||||||
Barclays PLC | 12/15/21 | USD | 10,503 | RUB | 780,448 | 75 | ||||||||||||||||||
Barclays PLC | 12/15/21 | USD | 10,595 | PLN | 40,788 | (324 | ) | |||||||||||||||||
Barclays PLC | 12/22/21 | TRY | 21,114 | USD | 2,331 | 48 | ||||||||||||||||||
Barclays PLC | 12/15/21 - 12/22/21 | TRY | 43,773 | USD | 4,724 | (20 | ) | |||||||||||||||||
Brown Brothers Harriman | 10/08/21 | USD | 1,984 | CNY | 12,826 | 1 | ||||||||||||||||||
Citi | 11/03/21 | USD | 7,907 | BRL | 41,826 | (266 | ) | |||||||||||||||||
Citigroup | 12/15/21 | USD | 495 | ZAR | 7,542 | 1 | ||||||||||||||||||
Citigroup | 10/01/21 - 12/15/21 | USD | 2,957 | ZAR | 43,329 | (81 | ) | |||||||||||||||||
Citigroup | 10/01/21 - 10/27/21 | USD | 4,437 | KRW | 5,207,792 | (38 | ) | |||||||||||||||||
Citigroup | 10/01/21 | KRW | 2,783,176 | USD | 2,357 | 6 | ||||||||||||||||||
Citigroup | 10/12/21 | KRW | 1,401,713 | USD | 1,181 | (3 | ) | |||||||||||||||||
Citigroup | 10/04/21 - 12/15/21 | USD | 2,205 | EUR | 1,878 | (27 | ) | |||||||||||||||||
Citigroup | 10/04/21 - 12/03/21 | EUR | 14,693 | USD | 17,431 | 387 | ||||||||||||||||||
SEI Institutional International Trust / Annual Report / September 30, 2021 |
67 |
SCHEDULE OF INVESTMENTS
September 30, 2021
Emerging Markets Debt Fund (Continued)
| Counterparty | Settlement Date | Currency to Deliver (Thousands) | Currency to Receive (Thousands) | Unrealized Appreciation (Depreciation) (Thousands) | ||||||||||||||||||||
Citigroup | 10/06/21 | EUR | 580 | RON | 2,891 | $ | 5 | |||||||||||||||||
Citigroup | 06/30/22 | EUR | 348 | RON | 1,762 | – | ||||||||||||||||||
Citigroup | 10/06/21 - 01/13/22 | EGP | 145,398 | USD | 9,026 | (117 | ) | |||||||||||||||||
Citigroup | 12/15/21 | CNY | 101,279 | USD | 15,607 | 6 | ||||||||||||||||||
Citigroup | 10/08/21 | CNY | 3,282 | USD | 505 | (3 | ) | |||||||||||||||||
Citigroup | 10/15/21 | USD | 1,190 | THB | 40,279 | – | ||||||||||||||||||
Citigroup | 12/15/21 - 12/28/21 | USD | 3,727 | THB | 122,355 | (111 | ) | |||||||||||||||||
Citigroup | 10/15/21 - 12/15/21 | USD | 7,248 | IDR | 103,932,148 | (17 | ) | |||||||||||||||||
Citigroup | 10/15/21 - 10/25/21 | THB | 80,975 | USD | 2,442 | 49 | ||||||||||||||||||
Citigroup | 10/25/21 | USD | 2,443 | SGD | 3,304 | (9 | ) | |||||||||||||||||
Citigroup | 11/15/21 - 12/03/21 | IDR | 26,446,390 | USD | 1,828 | (11 | ) | |||||||||||||||||
Citigroup | 12/09/21 | USD | 1,372 | UAH | 38,652 | 59 | ||||||||||||||||||
Citigroup | 12/13/21 | USD | 996 | INR | 73,914 | (7 | ) | |||||||||||||||||
Citigroup | 12/15/21 | EUR | 1,014 | CZK | 25,951 | 8 | ||||||||||||||||||
Citigroup | 12/15/21 | USD | 588 | RUB | 43,468 | 1 | ||||||||||||||||||
Citigroup | 12/15/21 | USD | 661 | RUB | 48,694 | (1 | ) | |||||||||||||||||
Citigroup | 12/15/21 | USD | 1,280 | MXN | 25,897 | (34 | ) | |||||||||||||||||
Citigroup | 12/15/21 | EUR | 506 | HUF | 182,921 | 1 | ||||||||||||||||||
Citigroup | 12/15/21 | EUR | 1,309 | HUF | 456,706 | (49 | ) | |||||||||||||||||
Citigroup | 12/15/21 | USD | 1,994 | CLP | 1,585,130 | (54 | ) | |||||||||||||||||
Citigroup | 12/15/21 | RON | 3,116 | USD | 742 | 15 | ||||||||||||||||||
Citigroup | 12/15/21 | EUR | 6,136 | PLN | 27,794 | (122 | ) | |||||||||||||||||
Citigroup | 12/15/21 | USD | 6,826 | PEN | 28,096 | (22 | ) | |||||||||||||||||
Citigroup | 12/15/21 | PEN | 878 | USD | 213 | – | ||||||||||||||||||
Citigroup | 12/15/21 | PEN | 11,854 | USD | 2,862 | (8 | ) | |||||||||||||||||
Citigroup | 12/15/21 | USD | 14,012 | PLN | 53,794 | (465 | ) | |||||||||||||||||
Citigroup | 12/15/21 | ZAR | 63,682 | USD | 4,437 | 246 | ||||||||||||||||||
Citigroup | 12/15/21 | CLP | 927,675 | USD | 1,167 | 32 | ||||||||||||||||||
Citigroup | 12/15/21 | COP | 34,097,344 | USD | 8,845 | (62 | ) | |||||||||||||||||
Deutsche Bank | 10/04/21 | EUR | 458 | USD | 542 | 11 | ||||||||||||||||||
Deutsche Bank | 10/04/21 | USD | 611 | EUR | 521 | (7 | ) | |||||||||||||||||
Deutsche Bank | 12/28/21 | USD | 326 | THB | 11,006 | (1 | ) | |||||||||||||||||
Goldman Sachs | 10/01/21 | USD | 1,681 | ZAR | 24,795 | (34 | ) | |||||||||||||||||
Goldman Sachs | 10/01/21 | ZAR | 61,090 | USD | 4,242 | 181 | ||||||||||||||||||
Goldman Sachs | 10/04/21 | USD | 496 | EUR | 418 | (11 | ) | |||||||||||||||||
Goldman Sachs | 10/06/21 | EUR | 2,111 | RON | 10,507 | 14 | ||||||||||||||||||
Goldman Sachs | 04/06/22 | EUR | 4,311 | RON | 21,656 | (1 | ) | |||||||||||||||||
Goldman Sachs | 10/20/21 | PHP | 61,710 | USD | 1,233 | 26 | ||||||||||||||||||
Goldman Sachs | 10/21/21 | THB | 47,055 | USD | 1,415 | 24 | ||||||||||||||||||
Goldman Sachs | 10/25/21 | CNY | 5,083 | USD | 787 | 1 | ||||||||||||||||||
Goldman Sachs | 11/03/21 | USD | 6,028 | BRL | 31,225 | (323 | ) | |||||||||||||||||
Goldman Sachs | 11/03/21 - 12/02/21 | BRL | 77,880 | USD | 14,639 | 477 | ||||||||||||||||||
Goldman Sachs | 11/03/21 | BRL | 1,759 | USD | 320 | (1 | ) | |||||||||||||||||
Goldman Sachs | 11/15/21 | IDR | 20,311,979 | USD | 1,396 | (18 | ) | |||||||||||||||||
Goldman Sachs | 12/03/21 | USD | 241 | IDR | 3,468,446 | – | ||||||||||||||||||
Goldman Sachs | 12/15/21 | EUR | 879 | USD | 1,020 | – | ||||||||||||||||||
Goldman Sachs | 12/15/21 | USD | 1,288 | RUB | 94,743 | (4 | ) | |||||||||||||||||
Goldman Sachs | 12/15/21 | USD | 1,503 | PEN | 6,181 | (6 | ) | |||||||||||||||||
Goldman Sachs | 12/15/21 | EUR | 2,097 | CZK | 53,514 | 8 | ||||||||||||||||||
Goldman Sachs | 12/15/21 | EUR | 1,719 | CZK | 43,660 | (2 | ) | |||||||||||||||||
68 |
SEI Institutional International Trust / Annual Report / September 30, 2021 |
| Counterparty | Settlement Date | Currency to Deliver (Thousands) | Currency to Receive (Thousands) | Unrealized Appreciation (Depreciation) (Thousands) | ||||||||||||||||||||
Goldman Sachs | 12/15/21 | USD | 6,265 | PLN | 24,119 | $ | (191 | ) | ||||||||||||||||
Goldman Sachs | 12/15/21 | USD | 9,644 | TWD | 265,264 | (70 | ) | |||||||||||||||||
Goldman Sachs | 12/15/21 | USD | 9,732 | CZK | 209,627 | (164 | ) | |||||||||||||||||
Goldman Sachs | 12/15/21 | USD | 15,909 | SGD | 21,330 | (196 | ) | |||||||||||||||||
Goldman Sachs | 12/15/21 | USD | 16,874 | MXN | 339,895 | (506 | ) | |||||||||||||||||
Goldman Sachs | 12/15/21 | MXN | 29,723 | USD | 1,472 | 41 | ||||||||||||||||||
Goldman Sachs | 12/15/21 | RUB | 335,474 | USD | 4,499 | (48 | ) | |||||||||||||||||
Goldman Sachs | 12/15/21 | CLP | 858,459 | USD | 1,080 | 30 | ||||||||||||||||||
Goldman Sachs | 12/16/21 - 02/16/22 | USD | 2,505 | UAH | 70,529 | 80 | ||||||||||||||||||
Goldman Sachs | 12/22/21 | TRY | 10,826 | USD | 1,176 | 6 | ||||||||||||||||||
Goldman Sachs | 01/21/22 | EUR | 2,541 | PLN | 11,770 | 12 | ||||||||||||||||||
Goldman Sachs | 06/30/22 | RON | 3,350 | EUR | 663 | 1 | ||||||||||||||||||
Goldman Sachs | 06/30/22 | RON | 708 | EUR | 140 | – | ||||||||||||||||||
JPMorgan Chase Bank | 11/15/21 | USD | 57 | ZAR | 865 | 1 | ||||||||||||||||||
JPMorgan Chase Bank | 10/01/21 - 12/15/21 | USD | 7,827 | ZAR | 115,665 | (180 | ) | |||||||||||||||||
JPMorgan Chase Bank | 10/01/21 - 10/18/21 | ZAR | 327,300 | USD | 22,620 | 901 | ||||||||||||||||||
JPMorgan Chase Bank | 10/01/21 - 11/15/21 | ZAR | 39,621 | USD | 2,600 | (33 | ) | |||||||||||||||||
JPMorgan Chase Bank | 10/14/21 - 12/01/21 | USD | 4,095 | MYR | 17,200 | 12 | ||||||||||||||||||
JPMorgan Chase Bank | 10/04/21 | USD | 2,237 | MYR | 9,347 | (4 | ) | |||||||||||||||||
JPMorgan Chase Bank | 10/04/21 - 01/28/22 | EUR | 13,216 | USD | 15,557 | 217 | ||||||||||||||||||
JPMorgan Chase Bank | 11/03/21 | EUR | 307 | USD | 356 | – | ||||||||||||||||||
JPMorgan Chase Bank | 10/04/21 - 01/28/22 | USD | 20,018 | EUR | 16,985 | (332 | ) | |||||||||||||||||
JPMorgan Chase Bank | 10/22/21 - 11/03/21 | IDR | 221,725,534 | USD | 15,502 | 29 | ||||||||||||||||||
JPMorgan Chase Bank | 10/04/21 - 11/08/21 | IDR | 84,342,373 | USD | 5,876 | (13 | ) | |||||||||||||||||
JPMorgan Chase Bank | 10/06/21 - 06/30/22 | EUR | 2,897 | RON | 14,539 | 14 | ||||||||||||||||||
JPMorgan Chase Bank | 10/08/21 - 12/08/21 | USD | 21,459 | CNY | 139,534 | 60 | ||||||||||||||||||
JPMorgan Chase Bank | 10/25/21 | CNY | 224 | USD | 35 | – | ||||||||||||||||||
JPMorgan Chase Bank | 10/08/21 - 10/29/21 | CNY | 40,968 | USD | 6,317 | (21 | ) | |||||||||||||||||
JPMorgan Chase Bank | 10/12/21 | USD | 1,226 | KRW | 1,431,906 | (17 | ) | |||||||||||||||||
JPMorgan Chase Bank | 10/13/21 | USD | 56 | PEN | 231 | (1 | ) | |||||||||||||||||
JPMorgan Chase Bank | 10/13/21 - 10/26/21 | PEN | 7,435 | USD | 1,808 | 6 | ||||||||||||||||||
JPMorgan Chase Bank | 10/26/21 | PEN | 218 | USD | 53 | – | ||||||||||||||||||
JPMorgan Chase Bank | 11/03/21 | USD | 91 | IDR | 1,304,496 | – | ||||||||||||||||||
JPMorgan Chase Bank | 10/15/21 - 12/15/21 | USD | 1,828 | IDR | 26,210,284 | (7 | ) | |||||||||||||||||
JPMorgan Chase Bank | 10/15/21 | IDR | 34,874,913 | USD | 2,436 | 1 | ||||||||||||||||||
JPMorgan Chase Bank | 11/15/21 - 12/03/21 | IDR | 62,761,515 | USD | 4,332 | (36 | ) | |||||||||||||||||
JPMorgan Chase Bank | 10/25/21 | USD | 110 | COP | 423,575 | 1 | ||||||||||||||||||
JPMorgan Chase Bank | 10/25/21 | PHP | 58,940 | USD | 1,170 | 17 | ||||||||||||||||||
JPMorgan Chase Bank | 10/25/21 | COP | 11,906,467 | USD | 3,111 | (9 | ) | |||||||||||||||||
JPMorgan Chase Bank | 10/26/21 | TRY | 941 | USD | 104 | (1 | ) | |||||||||||||||||
JPMorgan Chase Bank | 10/26/21 | USD | 1,500 | TRY | 13,117 | (40 | ) | |||||||||||||||||
JPMorgan Chase Bank | 10/26/21 | USD | 2,613 | IDR | 38,273,994 | 58 | ||||||||||||||||||
JPMorgan Chase Bank | 11/15/21 | USD | 1,042 | IDR | 14,966,061 | – | ||||||||||||||||||
JPMorgan Chase Bank | 11/03/21 | USD | 1,093 | BRL | 5,987 | 1 | ||||||||||||||||||
JPMorgan Chase Bank | 11/03/21 | USD | 1,239 | BRL | 6,584 | (36 | ) | |||||||||||||||||
JPMorgan Chase Bank | 11/03/21 | BRL | 11,899 | USD | 2,252 | 78 | ||||||||||||||||||
JPMorgan Chase Bank | 11/15/21 | USD | 88 | PLN | 350 | – | ||||||||||||||||||
JPMorgan Chase Bank | 11/15/21 | USD | 2,725 | PLN | 10,584 | (60 | ) | |||||||||||||||||
JPMorgan Chase Bank | 11/15/21 - 12/15/21 | PLN | 4,160 | USD | 1,076 | 28 | ||||||||||||||||||
JPMorgan Chase Bank | 11/15/21 | PLN | 982 | USD | 246 | (1 | ) | |||||||||||||||||
JPMorgan Chase Bank | 11/15/21 | USD | 6,587 | RON | 27,641 | (128 | ) | |||||||||||||||||
SEI Institutional International Trust / Annual Report / September 30, 2021 |
69 |
SCHEDULE OF INVESTMENTS
September 30, 2021
Emerging Markets Debt Fund (Continued)
| Counterparty | Settlement Date | Currency to Deliver (Thousands) | Currency to Receive (Thousands) | Unrealized Appreciation (Depreciation) (Thousands) | ||||||||||||||||||||
JPMorgan Chase Bank | 12/15/21 | USD | 563 | MXN | 11,699 | $ | – | |||||||||||||||||
JPMorgan Chase Bank | 11/16/21 - 12/15/21 | USD | 4,891 | MXN | 99,753 | (76 | ) | |||||||||||||||||
JPMorgan Chase Bank | 11/19/21 | USD | 1,335 | VND | 30,595,162 | 8 | ||||||||||||||||||
JPMorgan Chase Bank | 11/22/21 - 12/13/21 | USD | 3,535 | BRL | 18,798 | (114 | ) | |||||||||||||||||
JPMorgan Chase Bank | 11/22/21 | USD | 75 | KRW | 88,899 | – | ||||||||||||||||||
JPMorgan Chase Bank | 11/22/21 | USD | 10,437 | KRW | 12,291,637 | (55 | ) | |||||||||||||||||
JPMorgan Chase Bank | 12/02/21 - 12/13/21 | BRL | 55,078 | USD | 10,433 | 434 | ||||||||||||||||||
JPMorgan Chase Bank | 12/13/21 | USD | 115 | CZK | 2,461 | (2 | ) | |||||||||||||||||
JPMorgan Chase Bank | 12/13/21 - 12/15/21 | USD | 10,451 | HUF | 3,086,951 | (513 | ) | |||||||||||||||||
JPMorgan Chase Bank | 12/13/21 | CLP | 1,345,499 | USD | 1,741 | 94 | ||||||||||||||||||
JPMorgan Chase Bank | 12/14/21 | USD | 2,651 | INR | 197,196 | (13 | ) | |||||||||||||||||
JPMorgan Chase Bank | 12/15/21 | EUR | 3,102 | HUF | 1,104,261 | (46 | ) | |||||||||||||||||
JPMorgan Chase Bank | 12/15/21 | PLN | 4,754 | EUR | 1,038 | 7 | ||||||||||||||||||
JPMorgan Chase Bank | 01/21/22 | PLN | 1,779 | EUR | 385 | (1 | ) | |||||||||||||||||
JPMorgan Chase Bank | 12/15/21 | CZK | 52,939 | EUR | 2,085 | 4 | ||||||||||||||||||
JPMorgan Chase Bank | 12/15/21 | CZK | 26,438 | EUR | 1,037 | (4 | ) | |||||||||||||||||
JPMorgan Chase Bank | 12/15/21 | COP | 14,241,654 | USD | 3,709 | (11 | ) | |||||||||||||||||
JPMorgan Chase Bank | 12/20/21 | USD | 188 | RUB | 13,872 | – | ||||||||||||||||||
JPMorgan Chase Bank | 12/20/21 | USD | 491 | PHP | 24,673 | (11 | ) | |||||||||||||||||
JPMorgan Chase Bank | 12/20/21 | USD | 1,546 | THB | 50,939 | (41 | ) | |||||||||||||||||
JPMorgan Chase Bank | 12/20/21 | RUB | 240,132 | USD | 3,242 | (8 | ) | |||||||||||||||||
JPMorgan Chase Bank | 12/28/21 | USD | 428 | THB | 14,432 | (1 | ) | |||||||||||||||||
JPMorgan Chase Bank | 01/28/22 | JPY | 224,738 | USD | 2,054 | 37 | ||||||||||||||||||
JPMorgan Chase Bank | 02/16/22 | USD | 173 | UAH | 4,808 | 2 | ||||||||||||||||||
JPMorgan Chase Bank | 06/30/22 | RON | 1,566 | EUR | 309 | (1 | ) | |||||||||||||||||
Merrill Lynch | 12/15/21 | USD | 3,008 | HUF | 892,395 | (135 | ) | |||||||||||||||||
Merrill Lynch | 12/15/21 | RON | 31,943 | USD | 7,609 | 158 | ||||||||||||||||||
Morgan Stanley | 10/01/21 | USD | 1,321 | ZAR | 19,785 | (6 | ) | |||||||||||||||||
Morgan Stanley | 10/01/21 | ZAR | 23,225 | USD | 1,586 | 42 | ||||||||||||||||||
Morgan Stanley | 10/08/21 | USD | 4,675 | CNY | 30,408 | 30 | ||||||||||||||||||
Morgan Stanley | 10/18/21 | CNY | 16,526 | USD | 2,559 | 2 | ||||||||||||||||||
Morgan Stanley | 10/08/21 | CNY | 4,602 | USD | 705 | (7 | ) | |||||||||||||||||
Morgan Stanley | 10/27/21 | EGP | 11,531 | USD | 728 | (2 | ) | |||||||||||||||||
Morgan Stanley | 11/03/21 | USD | 594 | EUR | 508 | (5 | ) | |||||||||||||||||
Morgan Stanley | 12/15/21 | USD | 1,228 | RUB | 91,054 | 6 | ||||||||||||||||||
Morgan Stanley | 12/22/21 | USD | 362 | TRY | 3,211 | (15 | ) | |||||||||||||||||
Morgan Stanley | 01/21/22 | PLN | 2,041 | EUR | 439 | (4 | ) | |||||||||||||||||
Standard Bank | 10/01/21 | USD | 3,527 | ZAR | 52,168 | (60 | ) | |||||||||||||||||
Standard Bank | 10/04/21 - 11/03/21 | USD | 10,567 | EUR | 9,027 | (100 | ) | |||||||||||||||||
Standard Bank | 10/05/21 | EUR | 10,865 | USD | 12,916 | 324 | ||||||||||||||||||
Standard Bank | 12/02/21 | USD | 1,079 | BRL | 5,921 | (3 | ) | |||||||||||||||||
Standard Bank | 12/15/21 | USD | 475 | PHP | 23,878 | (11 | ) | |||||||||||||||||
Standard Bank | 12/15/21 | USD | 627 | IDR | 9,007,366 | (1 | ) | |||||||||||||||||
Standard Bank | 12/15/21 | USD | 759 | MXN | 15,575 | (9 | ) | |||||||||||||||||
Standard Bank | 12/15/21 | MYR | 2,790 | USD | 664 | (1 | ) | |||||||||||||||||
Standard Bank | 12/15/21 | ZAR | 1,140 | USD | 76 | 1 | ||||||||||||||||||
Standard Bank | 12/15/21 | ZAR | 1,670 | USD | 109 | – | ||||||||||||||||||
Standard Bank | 12/15/21 | USD | 3,157 | MYR | 13,157 | (16 | ) | |||||||||||||||||
Standard Bank | 12/15/21 | USD | 6,556 | CLP | 5,060,152 | (364 | ) | |||||||||||||||||
Standard Bank | 12/15/21 | COP | 22,214,649 | USD | 5,831 | 28 | ||||||||||||||||||
70 |
SEI Institutional International Trust / Annual Report / September 30, 2021 |
| Counterparty | Settlement Date | Currency to Deliver (Thousands) | Currency to Receive (Thousands) | Unrealized Appreciation (Depreciation) (Thousands) | ||||||||||||||||||||
Standard Bank | 02/16/22 | USD | 404 | UAH | 11,220 | $ | 4 | |||||||||||||||||
Standard Bank | 02/16/22 | USD | 1,121 | ZMW | 21,243 | 62 | ||||||||||||||||||
Standard Chartered | 10/14/21 | USD | 1,027 | MYR | 4,354 | 13 | ||||||||||||||||||
Standard Chartered | 10/14/21 | MYR | 2,843 | USD | 672 | (7 | ) | |||||||||||||||||
Standard Chartered | 10/15/21 | THB | 42,230 | USD | 1,289 | 41 | ||||||||||||||||||
Standard Chartered | 10/25/21 | CNY | 7,932 | USD | 1,220 | (7 | ) | |||||||||||||||||
Standard Chartered | 11/03/21 | USD | 5,703 | BRL | 30,307 | (166 | ) | |||||||||||||||||
Standard Chartered | 11/15/21 | USD | 2,038 | IDR | 29,157,932 | (7 | ) | |||||||||||||||||
Standard Chartered | 11/15/21 | IDR | 27,557,779 | USD | 1,893 | (26 | ) | |||||||||||||||||
Standard Chartered | 12/07/21 | PHP | 29,379 | USD | 584 | 13 | ||||||||||||||||||
Standard Chartered | 12/15/21 | EUR | 1,040 | HUF | 365,603 | (30 | ) | |||||||||||||||||
Standard Chartered | 12/15/21 | USD | 1,220 | RUB | 90,447 | 6 | ||||||||||||||||||
Standard Chartered | 12/15/21 | RUB | 75,845 | USD | 1,015 | (13 | ) | |||||||||||||||||
State Street | 10/01/21 | USD | 2,075 | ZAR | 30,367 | (57 | ) | |||||||||||||||||
State Street | 10/04/21 - 10/06/21 | EUR | 2,470 | USD | 2,893 | 31 | ||||||||||||||||||
State Street | 10/08/21 | USD | 354 | CNY | 2,289 | – | ||||||||||||||||||
State Street | 10/18/21 | CNY | 4,279 | USD | 663 | 1 | ||||||||||||||||||
State Street | 10/08/21 | CNY | 23,246 | USD | 3,572 | (25 | ) | |||||||||||||||||
State Street | 11/03/21 | USD | 2,405 | EUR | 2,056 | (22 | ) | |||||||||||||||||
State Street | 11/03/21 | BRL | 24,560 | USD | 4,519 | 32 | ||||||||||||||||||
State Street | 12/15/21 | MXN | 24,442 | USD | 1,198 | 21 | ||||||||||||||||||
State Street | 12/15/21 | HUF | 364,915 | EUR | 1,043 | 36 | ||||||||||||||||||
State Street | 12/28/21 | THB | 21,873 | USD | 650 | 4 | ||||||||||||||||||
|
| |||||||||||||||||||||||
| $ | (2,229) | |||||||||||||||||||||||
|
| |||||||||||||||||||||||
A list of the open OTC swap agreements held by the Fund at September 30, 2021, is as follows:
| Interest Rate Swaps | ||||||||||||||||||||||||||||||||
| Counterparty | Fund Pays | Fund Receives | Payment Frequency | Termination Date | Currency | Notional Amount (Thousands) | Value (Thousands) | Upfront Payments (Thousands) | Net Unrealized Appreciation (Depreciation) (Thousands) | |||||||||||||||||||||||
| Goldman Sachs | 3-MONTH ROB - MosPrime | 6.29% | Annually | 12/14/2021 | RUB | 535,000 | $ | 346 | $ | – | $ | 346 | ||||||||||||||||||||
| JPMorgan Chase | 1-DAY-CLP - Sinacofi Chile Interbank Rate Avg | 3.430% | Semi-Annually | 05/10/2022 | CLP | 420,527 | 11 | – | 11 | |||||||||||||||||||||||
| Goldman Sachs | 28-DAY MXN - TIIE | 5.900% | Monthly | 09/12/2022 | MXN | 75,956 | 3 | – | 3 | |||||||||||||||||||||||
| Goldman Sachs | 1-DAY BRL - CETIP | 11.985% | Annually | 01/02/2023 | BRL | 3,000 | 270 | – | 270 | |||||||||||||||||||||||
| Goldman Sachs | 1-DAY BRL - CETIP | 10.04% | Annually | 01/03/2023 | BRL | 5,012 | 330 | – | 330 | |||||||||||||||||||||||
| Goldman Sachs | 3-MONTH ROB - MosPrime | 7.072% | Annually | 04/02/2023 | RUB | 715,570 | 217 | – | 217 | |||||||||||||||||||||||
| Goldman Sachs | 28-DAY MXN - TIIE | 6.355% | Monthly | 05/21/2025 | MXN | 23,145 | (19 | ) | – | (19 | ) | |||||||||||||||||||||
| Goldman Sachs | 28-DAY MXN - TIIE | 6.205% | Monthly | 12/08/2025 | MXN | 16,624 | (23 | ) | – | (23 | ) | |||||||||||||||||||||
| Goldman Sachs | 28-DAY MXN - TIIE | 6.165% | Monthly | 03/05/2026 | MXN | 47,200 | (73 | ) | – | (73 | ) | |||||||||||||||||||||
| JPMorgan Chase | 28-DAY MXN - TIIE | 6.13% | Monthly | 06/18/2026 | MXN | 40,000 | (71 | ) | – | (71 | ) | |||||||||||||||||||||
| Citibank | 1.8775 % FIXED | PRIBOR CZK 7/9/2026 | Annually | 07/09/2026 | CZK | 39,645 | (58 | ) | – | (58 | ) | |||||||||||||||||||||
| Citibank | 1.822 % FIXED | PRIBOR CZK 7/12/2026 | Annually | 07/12/2026 | CZK | 65,750 | (105 | ) | – | (105 | ) | |||||||||||||||||||||
| Citibank | 1.8282% FIXED | PRIBOR CZK 7/12/2026 CZECH INTERBANK | Annually | 07/12/2026 | CZK | 70,763 | (112 | ) | – | (112 | ) | |||||||||||||||||||||
| Goldman Sachs | 2.158 % FIXED | OFFERED(CZK-PRIBOR) | Annually | 08/30/2026 | CZK | 89,310 | (89 | ) | – | (89 | ) | |||||||||||||||||||||
| Goldman Sachs | 28-DAY MXN - TIIE | 6.381% | Monthly | 09/16/2026 | MXN | 26,000 | (36 | ) | – | (36 | ) | |||||||||||||||||||||
|
|
|
|
|
|
|
|
| ||||||||||||||||||||||||
| $ | 591 | $ | – | $ | 591 | |||||||||||||||||||||||||||
|
|
|
|
|
|
|
|
| ||||||||||||||||||||||||
SEI Institutional International Trust / Annual Report / September 30, 2021 |
71 |
SCHEDULE OF INVESTMENTS
September 30, 2021
Emerging Markets Debt Fund (Continued)
A list of the open centrally cleared swap agreements held by the Fund at September 30, 2021, is as follows:
| Interest Rate Swaps | ||||||||||||||||||||||||
| Fund Pays | Fund Receives | Payment Frequency | Termination Date | Currency | Notional Amount (Thousands) | Value (Thousands) | Upfront Payments/ Receipts (Thousands) | Net Unrealized Appreciation (Depreciation) (Thousands) | ||||||||||||||||
1.960% | 1-DAY-CLP - Sinacofi Chile Interbank Rate Avg | Semi-Annually | 12/12/2021 | CLP | 2,569,905 | $ | 2 | $ | – | $ | 2 | |||||||||||||
1-DAY BRL - CETIP | .455% | Annually | 01/02/2025 | BRL | 3,591 | (71 | ) | – | (71 | ) | ||||||||||||||
28-DAY MXN - TIIE | .45% FIXED | Monthly | 04/01/2025 | MXN | 27,064 | (17 | ) | – | (17 | ) | ||||||||||||||
1-DAY-CLP - Sinacofi Chile Interbank Rate Avg | .36% | Semi-Annually | 06/17/2025 | CLP | 1,931,133 | (276 | ) | – | (276 | ) | ||||||||||||||
1-DAY-CLP - Sinacofi Chile Interbank Rate Avg | 1.16% | Semi-Annually | 06/23/2025 | CLP | 2,335,691 | (356 | ) | – | (356 | ) | ||||||||||||||
28-DAY MXN - TIIE | 4.85% FIXED | Monthly | 07/25/2025 | MXN | 6,144 | (21 | ) | – | (21 | ) | ||||||||||||||
0.995% | 6-MONTH THB - BKIBOR | Semi-Annually | 03/01/2026 | THB | 91,000 | 26 | – | 26 | ||||||||||||||||
1.1% | 6-MONTH THB - BKIBOR | Semi-Annually | 03/10/2026 | THB | 95,000 | 15 | – | 15 | ||||||||||||||||
1-DAY-CLP - Sinacofi Chile Interbank Rate Avg | .26% | Semi-Annually | 03/16/2026 | CLP | 1,623,158 | (211 | ) | – | (211 | ) | ||||||||||||||
28-DAY MXN - TIIE | .815% | Monthly | 04/06/2026 | MXN | 27,590 | (63 | ) | – | (63 | ) | ||||||||||||||
5.145% FIXED | 1-DAY FBIL - MIBOR | Semi-Annually | 08/27/2026 | INR | 200,000 | 12 | – | 12 | ||||||||||||||||
5.148% FIXED | 1-DAY FBIL - MIBOR | Semi-Annually | 09/02/2026 | INR | 200,000 | 12 | – | 12 | ||||||||||||||||
0.733% FIXED | 3-MONTH TWD - TAIBOR | Quarterly | 09/30/2026 | TWD | 67,400 | (8 | ) | – | (8 | ) | ||||||||||||||
28-DAY MXN - TIIE | 7.72% | Monthly | 12/03/2026 | MXN | 8,000 | 11 | – | 11 | ||||||||||||||||
1-DAY BRL - CETIP | 6.82% | Annually | 01/02/2025 | BRL | 3,362 | (66 | ) | – | (66 | ) | ||||||||||||||
10.29% FIXED | 1-DAY BRL - CETIP | Annually | 01/04/2027 | BRL | 2,660 | 6 | – | 6 | ||||||||||||||||
5.37% | 1-DAY COP- COLUMBIA IBR | Quarterly | 06/21/2029 | COP | 1,800,000 | 28 | – | 28 | ||||||||||||||||
6.9225% | 28-DAY MXN - TIIE | Monthly | 08/31/2029 | MXN | 42,602 | 52 | – | 52 | ||||||||||||||||
6.82% | 28-DAY MXN - TIIE | Monthly | 09/10/2029 | MXN | 33,993 | 52 | – | 52 | ||||||||||||||||
6-MONTH PLN - WIBOR | 1.75% | Annually | 02/26/2030 | PLN | 4,531 | (34 | ) | – | (34 | ) | ||||||||||||||
1-DAY COP - COLUMBIA IBR | 5.47% | Quarterly | 03/11/2030 | COP | 879,919 | 14 | – | 14 | ||||||||||||||||
.33% | 1-DAY-CLP - Sinacofi Chile Interbank Rate Avg | Semi-Annually | 06/05/2030 | CLP | 830,041 | 157 | – | 157 | ||||||||||||||||
.21% | 1-DAY COP - COLUMBIA IBR | Quarterly | 07/08/2030 | COP | 266,911 | (11 | ) | – | (11 | ) | ||||||||||||||
1-DAY-CLP - Sinacofi Chile Interbank Rate Avg | .145% | Semi-Annually | 08/24/2030 | CLP | 444,725 | (129 | ) | – | (129 | ) | ||||||||||||||
1.3965% | 3-MONTH KRW - KWCDC | Quarterly | 02/05/2031 | KRW | 1,600,000 | 60 | – | 60 | ||||||||||||||||
1.495% FIXED | 3-MONTH KRW - KWCDC | Quarterly | 02/19/2031 | KRW | 1,600,000 | 49 | – | 49 | ||||||||||||||||
4.88% | 1-DAY COP – COLOMBIA IBR | Quarterly | 03/16/2031 | COP | 1,954,438 | (62 | ) | – | (62 | ) | ||||||||||||||
6-MONTH PLN - WIBOR | 1.905% | Annually | 05/18/2031 | PLN | 2,145 | (14 | ) | – | (14 | ) | ||||||||||||||
6.69% FIXED | 28-DAY MXN - TIIE | Monthly | 05/27/2031 | MXN | 7,233 | (19 | ) | – | (19 | ) | ||||||||||||||
28-DAY MXN - TIIE | 7.51% | Monthly | 04/20/2027 | MXN | 8,110 | 7 | – | 7 | ||||||||||||||||
2.7% FIXED | 6-MONTH BUDAPEST - BUBOR | Annually | 08/06/2031 | HUF | 459,111 | (73 | ) | – | (73 | ) | ||||||||||||||
1-DAY BRL - CETIP | .65% | Annually | 01/02/2025 | BRL | 12,389 | (320 | ) | – | (320 | ) | ||||||||||||||
1-DAY BRL - CETIP | .77% FIXED | Annually | 01/02/2025 | BRL | 4,102 | (82 | ) | – | (82 | ) | ||||||||||||||
1-DAY BRL - CETIP | 5.89% | Annually | 01/03/2022 | BRL | 27,057 | (17 | ) | – | (17 | ) | ||||||||||||||
1-DAY BRL - CETIP | 2.99% | Annually | 01/03/2022 | BRL | 20,697 | (40 | ) | – | (40 | ) | ||||||||||||||
1-DAY BRL - CETIP | .885% FIXED | Annually | 01/03/2022 | BRL | 15,625 | (31 | ) | – | (31 | ) | ||||||||||||||
28-DAY MXN - TIIE | 6.745% | Monthly | 06/23/2022 | MXN | 26,758 | 10 | – | 10 | ||||||||||||||||
28-DAY MXN - TIIE | 6.71% | Monthly | 07/07/2022 | MXN | 37,637 | 14 | – | 14 | ||||||||||||||||
1-DAY BRL - CETIP | .43% | Annually | 01/02/2023 | BRL | 12,558 | 130 | – | 130 | ||||||||||||||||
1-DAY BRL - CETIP | 5.25% | Annually | 01/02/2023 | BRL | 11,519 | (103 | ) | – | (103 | ) | ||||||||||||||
6.23% FIXED | 1-DAY BRL - CETIP | Annually | 01/02/2023 | BRL | 41,890 | 270 | – | 270 | ||||||||||||||||
1-DAY BRL - CETIP | 6.61% | Annually | 01/02/2023 | BRL | 4,693 | (28 | ) | – | (28 | ) | ||||||||||||||
1-DAY BRL - CETIP | 5.655% | Annually | 01/02/2023 | BRL | 2,705 | (22 | ) | – | (22 | ) | ||||||||||||||
1-DAY BRL - CETIP | 9.255% | Annually | 01/02/2023 | BRL | 2,368 | 1 | – | 1 | ||||||||||||||||
1-DAY BRL - CETIP | .77% FIXED | Annually | 01/02/2023 | BRL | 6,361 | (35 | ) | – | (35 | ) | ||||||||||||||
1-DAY BRL - CETIP | .23% FIXED | Annually | 01/02/2023 | BRL | 5,579 | (38 | ) | – | (38 | ) | ||||||||||||||
7.7325% FIXED | 1-DAY BRL - CETIP | Annually | 01/02/2025 | BRL | 10,902 | (151 | ) | – | (151 | ) | ||||||||||||||
72 |
SEI Institutional International Trust / Annual Report / September 30, 2021 |
| Fund Pays | Fund Receives | Payment Frequency | Termination Date | Currency | Notional Amount (Thousands) | Value (Thousands) | Upfront (Thousands) | Net Unrealized Appreciation (Depreciation) (Thousands) | ||||||||||||||||||||||||
28-DAY MXN - TIIE | .55% FIXED | Monthly | 04/13/2023 | MXN | 52,615 | $ | (24) | $ | – | $ | (24) | |||||||||||||||||||||
28-DAY MXN - TIIE | .01% | Monthly | 11/22/2023 | MXN | 148,276 | (135) | – | (135) | ||||||||||||||||||||||||
.45% FIXED | | 1-DAY BRL - CETIP | | Annually | 01/02/2024 | BRL | 9,407 | (89) | – | (89) | ||||||||||||||||||||||
1-DAY BRL - CETIP | .76% | Annually | 01/02/2024 | BRL | 8,953 | (149) | – | (149) | ||||||||||||||||||||||||
1-DAY BRL - CETIP | 5.56% | Annually | 01/02/2024 | BRL | 18,819 | (325) | – | (325) | ||||||||||||||||||||||||
1-DAY BRL - CETIP | 5.9725% | Annually | 01/02/2024 | BRL | 5,677 | (87) | – | (87) | ||||||||||||||||||||||||
1-DAY BRL - CETIP | .5% FIXED | Annually | 01/02/2024 | BRL | 4,808 | (67) | – | (67) | ||||||||||||||||||||||||
1-DAY BRL - CETIP | 5.715% | Annually | 01/02/2024 | BRL | 3,999 | (65) | – | (65) | ||||||||||||||||||||||||
1-DAY BRL - CETIP | 4.835% | Annually | 01/02/2024 | BRL | 21,544 | (424) | – | (424) | ||||||||||||||||||||||||
1-DAY BRL - CETIP | .99% | Annually | 01/02/2024 | BRL | 6,670 | (126) | – | (126) | ||||||||||||||||||||||||
28-DAY MXN - TIIE | .1525% | Monthly | 02/22/2024 | MXN | 123,473 | (111) | – | (111) | ||||||||||||||||||||||||
1.9865% | | 6-MONTH PLN - WIBOR | | Semi-Annually | 03/25/2024 | PLN | 12,430 | (44) | – | (44) | ||||||||||||||||||||||
28-DAY MXN - TIIE | .47% | Monthly | 06/19/2024 | MXN | 95,833 | (79) | – | (79) | ||||||||||||||||||||||||
2.465% FXIED | | 6-MONTH CZK - PRIBOR | | Annually | 09/21/2024 | CZK | 89,830 | (26) | – | (26) | ||||||||||||||||||||||
7.192 % FIXED | | 3-MONTH RUB - MosPrime | | Annually | 07/27/2023 | RUB | 1,287,604 | (99) | – | (99) | ||||||||||||||||||||||
3.305% FIXED | | 6-MONTH HUF - BUBOR | | Annually | 10/04/2031 | HUF | 424,147 | – | – | – | ||||||||||||||||||||||
|
|
|
|
|
| |||||||||||||||||||||||||||
| $ | (3,220) | $ | – | $ | (3,220) | |||||||||||||||||||||||||||
|
|
|
|
|
| |||||||||||||||||||||||||||
Percentages are based on Net Assets of $1,541,141 ($ Thousands). |
| ** | The rate reported is the 7-day effective yield as of September 30, 2021. |
| † | Investment in Affiliated Security (see Note 5). |
| (A) | Security exempt from registration under Rule 144A of the Securities Act of 1933. These securities may be resold in transactions exempt from registration normally to qualified institutions. On September 30, 2021, the value of these securities amounted to $230,588 ($ Thousands), representing 15.0% of the Net Assets of the Fund. |
| (B) | Step Bonds – Represents the current rate, the step rate, the step date and the final maturity date. |
| (C) | Certain securities or partial positions of certain securities are on loan at September 30, 2021 (see Note 9). The total market value of securities on loan at September 30, 2021 was $40,260 ($ Thousands). |
| (D) | Zero coupon security. The rate shown on the Schedule of Investments is the security’s effective yield at the time of purchase. |
| (E) | Variable or floating rate security, the interest rate of which adjusts periodically based on changes in current interest rates and prepayments on the underlying pool of assets. |
| (F) | Perpetual security with no stated maturity date. |
| (G) | Security is in default on interest payment. |
| (H) | This security was purchased with cash collateral held from securities on loan (see Note 9). The total market value of such securities as of September 30, 2021 was $51,021 ($ Thousands). |
| (I) | Securities considered illiquid. The total value of such securities as of September 30, 2021 was $4,724 ($ Thousands) and represented 0.3% of the Net Assets of the Fund. |
BRL — Brazilian Real
BUBOR — Budapest Interbank Offered Rate
CETIP — Central of Custody and Financial Settlement of Securities
CLP — Chilean Peso
CNY — Chinese Yuan Onshore
COP — Colombian Peso
CZK — Czech Koruna
DAC — Designated Activity Company
EGP — Egyptian Pound
EUR — Euro
FBIL — Financial Benchmarks India Ltd
GHS — Ghanaian Cedi
HUF — Hungarian Forint
ICE — Intercontinental Exchange
IDR — Indonesian Rupiah
INR — Indian Rupee
JPY — Japanese Yen
JSC — Joint-Stock Company
KRW — Korean Won
KWCDC — South Korean Won 3 Month Certificate of Deposit
KZT — Kazakhstani Tenge
LIBOR — London Interbank Offered Rate
LLC — Limited Liability Company
L.P. — Limited Partnership
Ltd. — Limited
MIBOR — Mumbai InterBank Overnight Rate
MosPrime — Moscow Prime Offered Rate
MTN — Medium Term Note
MXN — Mexican Peso
MYR — Malaysian Ringgit
OTC — Over The Counter
PEN — Peruvian Nuevo Sol
PHP — Philippine Peso
PJSC — Public Joint-Stock Company
PLC — Public Limited Company
PLN — Polish Zloty
PRIBOR — Prague Interbank Offered Rate
RON — Romanian Leu
RSD — Serbian Dinar
RUB — Russian Ruble
SGD — Singapore Dollar
Ser — Series
TAIBOR — Taipei Interbank Offered Rate
THB — Thai Baht
TIIE — Interbank Equilibrium Interest Rate
TRY — Turkish Lira
TWD — Taiwan Dollar
UAH — Ukrainian Hryvnia
UGX — Ugandan Shilling
ULC — Unlimited Liability Company
USD — U.S. Dollar
UYU — Uruguayan Peso
WIBOR — Warsaw Interbank Offered Rate
VAR — Variable Rate
VND — Vietnamese Dong
SEI Institutional International Trust / Annual Report / September 30, 2021 |
73 |
SCHEDULE OF INVESTMENTS
September 30, 2021
Emerging Markets Debt Fund (Concluded)
ZAR — South African Rand
ZMW — Zambian Kwacha
| Investments in Securities | Level 1 ($) | Level 2 ($) | Level 3 ($) | Total ($) | ||||||||||||
Global Bonds | – | 1,455,768 | – | 1,455,768 | ||||||||||||
Affiliated Partnership | – | 51,021 | – | 51,021 | ||||||||||||
|
|
|
|
|
|
|
| |||||||||
Total Investments in Securities | – | 1,506,789 | – | 1,506,789 | ||||||||||||
|
|
|
|
|
|
|
| |||||||||
| Other Financial Instruments | Level 1 ($) | Level 2 ($) | Level 3 ($) | Total ($) | ||||||||||||
Futures Contracts* | ||||||||||||||||
Unrealized Appreciation | 558 | – | – | 558 | ||||||||||||
Unrealized Depreciation | (489 | ) | – | – | (489 | ) | ||||||||||
Forwards Contracts* | ||||||||||||||||
Unrealized Appreciation | – | 4,821 | – | 4,821 | ||||||||||||
Unrealized Depreciation | – | (7,050 | ) | – | (7,050 | ) | ||||||||||
| Other Financial Instruments | Level 1 ($) | Level 2 ($) | Level 3 ($) | Total ($) | ||||||||||||
OTC Swaps | ||||||||||||||||
Interest Rate Swaps* | ||||||||||||||||
Unrealized Appreciation | – | 1,177 | – | 1,177 | ||||||||||||
Unrealized Depreciation | – | (586) | – | (586) | ||||||||||||
Centrally Cleared Swaps | ||||||||||||||||
Interest Rate Swaps* | ||||||||||||||||
Unrealized Appreciation | – | 928 | – | 928 | ||||||||||||
Unrealized Depreciation | – | (4,148) | – | (4,148) | ||||||||||||
|
|
|
|
|
|
|
| |||||||||
Total Other Financial Instruments | 69 | (4,858) | – | (4,789) | ||||||||||||
|
|
|
|
|
|
|
| |||||||||
* Futures contracts, forwards contracts and swap contracts are valued at the unrealized appreciation (depreciation) on the instrument.
For the year ended September 30, 2021, there were no transfers in or out of Level 3.
For more information on valuation inputs, see Note 2 – Significant Accounting Policies in Notes to Financial Statements.
The following is a summary of the transactions with affiliates for the year ended September 30, 2021 ($ Thousands):
| Security Description | Value 9/30/2020 | Purchases at Cost | Proceeds from Sales | Realized Gain/ (Loss) | Change in Unrealized Appreciation/ (Depreciation) | Value 9/30/2021 | Shares | Income | Capital Gains | |||||||||
SEI Liquidity Fund, L.P. | $ 15,318 | $ 180,410 | $ (144,706) | $ 1 | $ (2) | $ 51,021 | 5 1,011,398 | $ 96 | $ – | |||||||||
|
|
|
|
|
|
|
|
Amounts designated as “ —” are $0 or have been rounded to $0.
The accompanying notes are an integral part of the financial statements.
74 |
SEI Institutional International Trust / Annual Report / September 30, 2021 |
STATEMENTS OF ASSETS AND LIABILITIES ($ Thousands)
September 30, 2021
International Equity | Emerging Markets | International Fixed | Emerging Markets | |||||||||||||||||||||||||||||
Assets: | ||||||||||||||||||||||||||||||||
Investments, at value † | $ | 4,509,793 | * | $ | 1,843,515 | * | $ | 535,256 | $ | 1,455,768 | * | |||||||||||||||||||||
Affiliated investments, at value †† | 209,686 | 78,690 | – | 51,021 | ||||||||||||||||||||||||||||
Cash | 50,223 | 22,889 | 26,334 | 69,122 | ||||||||||||||||||||||||||||
Cash pledged as collateral for forward foreign currency contracts | – | – | – | 2,027 | ||||||||||||||||||||||||||||
Cash pledged as collateral for futures contracts | 3,647 | 4,251 | 513 | 2,065 | ||||||||||||||||||||||||||||
Cash pledged as collateral for swap contracts | – | – | 101 | 590 | ||||||||||||||||||||||||||||
Foreign currency, at value ††† | 6,657 | 12,662 | 8,165 | 4,043 | ||||||||||||||||||||||||||||
Receivable for fund shares sold | 1,675 | 8,705 | 392 | 967 | ||||||||||||||||||||||||||||
Receivable for investment securities sold | 92,711 | 9,657 | 4,408 | 13,275 | ||||||||||||||||||||||||||||
Dividends and interest receivable | 9,429 | 3,877 | 2,953 | 21,025 | ||||||||||||||||||||||||||||
Unrealized gain on forward foreign currency contracts | – | – | 7,830 | 4,821 | ||||||||||||||||||||||||||||
Unrealized gain on foreign spot currency contracts | – | – | 305 | 108 | ||||||||||||||||||||||||||||
Due from broker | – | – | – | 1,079 | ||||||||||||||||||||||||||||
Swap contracts, at value †††† | – | – | 134 | 1,177 | ||||||||||||||||||||||||||||
Foreign tax reclaim receivable | 15,542 | 94 | – | – | ||||||||||||||||||||||||||||
Receivable for variation margin | 89 | 518 | 106 | 741 | ||||||||||||||||||||||||||||
Prepaid expenses | 60 | 26 | 7 | 19 | ||||||||||||||||||||||||||||
Total Assets | 4,899,512 | 1,984,884 | 586,504 | 1,627,848 | ||||||||||||||||||||||||||||
Liabilities: | ||||||||||||||||||||||||||||||||
Payable upon return on securities loaned | 161,632 | 17,853 | – | 51,014 | ||||||||||||||||||||||||||||
Payable for investment securities purchased | 92,772 | 16,046 | 22,910 | 24,627 | ||||||||||||||||||||||||||||
Payable for fund shares redeemed | 2,420 | 772 | 252 | 800 | ||||||||||||||||||||||||||||
Swap contracts, at value †††† | – | – | – | 586 | ||||||||||||||||||||||||||||
Payable for variation margin | 145 | – | 145 | 695 | ||||||||||||||||||||||||||||
Administration fees payable | 1,105 | 700 | 103 | 554 | ||||||||||||||||||||||||||||
Unrealized loss on foreign currency spot contracts | 17 | – | 160 | 7 | ||||||||||||||||||||||||||||
Unrealized loss on forward foreign currency contracts | – | – | 1,068 | 7,050 | ||||||||||||||||||||||||||||
Trustees fees payable | 2 | 1 | – | 1 | ||||||||||||||||||||||||||||
Chief compliance officer fees payable | 6 | 2 | 1 | 2 | ||||||||||||||||||||||||||||
Administrative servicing fees payable | 4 | – | – | – | ||||||||||||||||||||||||||||
Shareholder servicing fees payable | 556 | 374 | 97 | 299 | ||||||||||||||||||||||||||||
Investment advisory fees payable | 1,995 | 1,546 | 103 | 798 | ||||||||||||||||||||||||||||
Accrued expense payable | 433 | 396 | 106 | 274 | ||||||||||||||||||||||||||||
Accrued foreign capital gains tax on appreciated securities | – | 6,912 | – | – | ||||||||||||||||||||||||||||
Total Liabilities | 261,087 | 44,602 | 24,945 | 86,707 | ||||||||||||||||||||||||||||
Net Assets | $ | 4,638,425 | $ | 1,940,282 | $ | 561,559 | $ | 1,541,141 | ||||||||||||||||||||||||
† Cost of investments | $ | 3,847,528 | $ | 1,471,666 | $ | 529,783 | $ | 1,504,278 | ||||||||||||||||||||||||
†† Cost of affiliated investments | 209,673 | 78,687 | – | 51,020 | ||||||||||||||||||||||||||||
††† Cost of foreign currency | 6,687 | 12,659 | 8,168 | 4,042 | ||||||||||||||||||||||||||||
†††† Cost (premiums received) | – | – | – | – | ||||||||||||||||||||||||||||
* Includes market value of securities on loan | 153,788 | 16,962 | – | 40,260 | ||||||||||||||||||||||||||||
SEI Institutional International Trust / Annual Report / September 30, 2021 |
75 |
STATEMENTS OF ASSETS AND LIABILITIES ($ Thousands) (Concluded)
September 30, 2021
International Equity Fund | Emerging Markets | International Fixed | Emerging Markets | |||||||||||||||||||||||||||||
Net Assets: | ||||||||||||||||||||||||||||||||
Paid-in Capital — (unlimited authorization — no par value) | $ | 3,463,686 | $ | 1,443,973 | $ | 561,481 | $ | 1,627,110 | ||||||||||||||||||||||||
Total distributable earnings/(loss) | 1,174,739 | 496,309 | 78 | (85,969) | ||||||||||||||||||||||||||||
Net Assets | $ | 4,638,425 | $ | 1,940,282 | $ | 561,559 | $ | 1,541,141 | ||||||||||||||||||||||||
Net Asset Value, Offering and Redemption Price Per Share — Class F | $ | 13.57 | $ | 14.23 | $ | 10.37 | $ | 10.06 | ||||||||||||||||||||||||
| | ($4,242,910,889 ÷ 312,726,352 shares) | | | ($1,786,492,955 ÷ 125,577,286 shares) | | | ($485,178,045 ÷ 46,805,756 shares) | | | ($1,433,738,769 ÷ 142,455,262 shares) | | |||||||||||||||||||||
Net Asset Value, Offering and Redemption Price Per Share — Class I | $ | 13.59 | N/A | N/A | N/A | |||||||||||||||||||||||||||
| | ($1,610,692 ÷ 118,558 shares) | | ||||||||||||||||||||||||||||||
Net Asset Value, Offering and Redemption Price Per Share — Class Y | $ | 13.58 | $ | 14.25 | $ | 10.41 | $ | 10.03 | ||||||||||||||||||||||||
| | ($393,902,937 ÷ 29,016,556 shares) | | | ($153,788,772 ÷ 10,795,537 shares) | | | ($76,380,797 ÷ 7,340,110 shares) | | | ($107,402,155 ÷ 10,704,225 shares) | | |||||||||||||||||||||
N/A — Not applicable. Share classes currently not offered.
Amounts designated as “—” are $0 or have been rounded to $0.
The accompanying notes are an integral part of the financial statements.
76 |
SEI Institutional International Trust / Annual Report / September 30, 2021 |
STATEMENTS OF OPERATIONS ($ Thousands)
For the year ended September 30, 2021
| International Equity Fund | Emerging Markets Equity Fund | International Fixed Income Fund | Emerging Markets Debt Fund | |||||||||||||||||||||||||||||
Investment Income: | ||||||||||||||||||||||||||||||||
Dividends | $ | 116,467 | $ | 54,080 | $ | – | $ | – | ||||||||||||||||||||||||
Income from affiliated investments(1) | 5 | 2 | – | – | ||||||||||||||||||||||||||||
Interest Income | 49 | 1 | 7,164 | 81,599 | ||||||||||||||||||||||||||||
Security lending income — net(2)(3) | 743 | 302 | – | 96 | ||||||||||||||||||||||||||||
Less: foreign taxes withheld | (14,128 | ) | (6,414 | ) | (51 | ) | (1,211 | ) | ||||||||||||||||||||||||
Total Investment Income | 103,136 | 47,971 | 7,113 | 80,484 | ||||||||||||||||||||||||||||
Expenses: | ||||||||||||||||||||||||||||||||
Investment advisory fees | 22,949 | 20,683 | 1,588 | 13,065 | ||||||||||||||||||||||||||||
Administration fees | 13,103 | 8,465 | 2,382 | 6,884 | ||||||||||||||||||||||||||||
Shareholder servicing fees — Class F | 10,390 | 4,531 | 1,147 | 3,576 | ||||||||||||||||||||||||||||
Shareholder servicing fees — Class I | 4 | – | – | – | ||||||||||||||||||||||||||||
Administrative servicing fees — Class I | 4 | – | – | – | ||||||||||||||||||||||||||||
Printing fees | 559 | 244 | 64 | 186 | ||||||||||||||||||||||||||||
Custodian/wire agent fees | 509 | 873 | 123 | 443 | ||||||||||||||||||||||||||||
Professional fees | 215 | 92 | 24 | 70 | ||||||||||||||||||||||||||||
Registration fees | 133 | 57 | 17 | 50 | ||||||||||||||||||||||||||||
Trustees’ fees | 89 | 39 | 11 | 30 | ||||||||||||||||||||||||||||
Chief compliance officer fees | 22 | 10 | 3 | 7 | ||||||||||||||||||||||||||||
Other expenses | 146 | 97 | 150 | 195 | ||||||||||||||||||||||||||||
Total Expenses | 48,123 | 35,091 | 5,509 | 24,506 | ||||||||||||||||||||||||||||
Less: | ||||||||||||||||||||||||||||||||
Waiver of investment advisory fees | – | (1,970 | ) | (234 | ) | (3,534 | ) | |||||||||||||||||||||||||
Waiver of administration fees | – | – | (47 | ) | (252 | ) | ||||||||||||||||||||||||||
Waiver of shareholder servicing fees — Class F | (83 | ) | – | – | – | |||||||||||||||||||||||||||
Net Expenses | 48,040 | 33,121 | 5,228 | 20,720 | ||||||||||||||||||||||||||||
Net Investment Income | 55,096 | 14,850 | 1,885 | 59,764 | ||||||||||||||||||||||||||||
Net Realized Gain (Loss) on: | ||||||||||||||||||||||||||||||||
Investments | 546,836 | 289,956 | 6,314 | 17,126 | ||||||||||||||||||||||||||||
Affiliated investments | (10 | ) | 2 | – | 1 | |||||||||||||||||||||||||||
Futures contracts | 10,958 | 3,385 | 963 | 1,497 | ||||||||||||||||||||||||||||
Swap contracts | – | – | (103 | ) | 3,863 | |||||||||||||||||||||||||||
Swaption contracts | – | – | (14 | ) | – | |||||||||||||||||||||||||||
Foreign currency transactions | (2,060 | ) | (260 | ) | 6,996 | (9,329 | ) | |||||||||||||||||||||||||
Forward foreign currency contracts | (173 | ) | – | (1,148 | ) | 2,824 | ||||||||||||||||||||||||||
Net Change in Unrealized Appreciation (Depreciation) on: | ||||||||||||||||||||||||||||||||
Investments | 387,170 | 8,879 | (22,443 | ) | (3,734 | ) | ||||||||||||||||||||||||||
Affiliated investments | 4 | (5 | ) | – | (2 | ) | ||||||||||||||||||||||||||
Futures contracts | 240 | (2,666 | ) | 384 | 470 | |||||||||||||||||||||||||||
Swap contracts | – | – | 248 | (5,829 | ) | |||||||||||||||||||||||||||
Foreign capital gains tax on appreciated securities | – | (4,277 | ) | – | – | |||||||||||||||||||||||||||
Foreign currency translation of other assets and liabilities denominated in foreign currencies | (489 | ) | (71 | ) | (883 | ) | (222 | ) | ||||||||||||||||||||||||
Forward foreign currency contracts | – | – | 3,534 | 4,138 | ||||||||||||||||||||||||||||
Net Increase (Decrease) in Net Assets Resulting from Operations | $ | 997,572 | $ | 309,793 | $ | (4,267) | $ | 70,567 | ||||||||||||||||||||||||
(1) See Note 5 in the Notes to Financial Statements for additional information.
(2) Income is from the investment of collateral in an affiliated security.
(3) See Note 9 in the Notes to Financial Statements for additional information.
Amounts designated as “—” are $0 or have been rounded to $0.
The accompanying notes are an integral part of the financial statements.
SEI Institutional International Trust / Annual Report / September 30, 2021 |
77 |
STATEMENTS OF CHANGES IN NET ASSETS ($ Thousands)
For the years ended September 30,
| International Equity Fund | Emerging Markets Equity Fund | |||||||||||||||
| 2021 | 2020 | 2021 | 2020 | |||||||||||||
Operations: | ||||||||||||||||
Net investment income | $ | 55,096 | $ | 37,587 | $ | 14,850 | $ | 7,595 | ||||||||
Net realized gain (loss) on investments and futures contracts | 557,784 | 33,628 | 293,343 | (48,977 | ) | |||||||||||
Net realized loss on forward foreign currency contracts and foreign currency transactions | (2,233 | ) | (39 | ) | (260 | ) | (944 | ) | ||||||||
Net change in unrealized appreciation on investments and futures contracts | 387,414 | 47,305 | 6,208 | 183,373 | ||||||||||||
Net change in unrealized appreciation (depreciation) on forward foreign currency contracts, foreign currencies and translation of other assets and liabilities denominated in foreign currencies | (489 | ) | 892 | (71 | ) | 80 | ||||||||||
Net change in unrealized depreciation on foreign capital tax gains on appreciated securities | – | – | (4,277 | ) | (2,067 | ) | ||||||||||
Net Increase in Net Assets Resulting from Operations | 997,572 | 119,373 | 309,793 | 139,060 | ||||||||||||
Distributions: | ||||||||||||||||
Class F | (39,497 | ) | (67,877 | ) | (9,485 | ) | (18,642 | ) | ||||||||
Class I | (11 | ) | (25 | ) | N/A | N/A | ||||||||||
Class Y | (4,488 | ) | (7,618 | ) | (1,168 | ) | (2,039 | ) | ||||||||
Total Dividends | (43,996 | ) | (75,520 | ) | (10,653 | ) | (20,681 | ) | ||||||||
Capital Share Transactions: | ||||||||||||||||
Class F: | ||||||||||||||||
Proceeds from shares issued | 531,002 | 568,725 | 306,949 | 259,125 | ||||||||||||
Reinvestment of dividends & distributions | 36,357 | 62,626 | 8,760 | 17,191 | ||||||||||||
Cost of shares redeemed | (764,767) | (794,429) | (346,741) | (408,775) | ||||||||||||
Net Decrease from Class F Transactions | (197,408 | ) | (163,078 | ) | (31,032 | ) | (132,459 | ) | ||||||||
Class I: | ||||||||||||||||
Proceeds from shares issued | 114 | 491 | N/A | N/A | ||||||||||||
Reinvestment of dividends & distributions | 7 | 13 | N/A | N/A | ||||||||||||
Cost of shares redeemed | (195 | ) | (1,060 | ) | N/A | N/A | ||||||||||
Net Decrease from Class I Transactions | (74 | ) | (556 | ) | N/A | N/A | ||||||||||
Class Y: | ||||||||||||||||
Proceeds from shares issued | 43,805 | 72,880 | 25,446 | 30,639 | ||||||||||||
Reinvestment of dividends & distributions | 4,147 | 7,068 | 1,082 | 1,901 | ||||||||||||
Cost of shares redeemed | (65,413 | ) | (118,964 | ) | (31,587 | ) | (51,350 | ) | ||||||||
Net Decrease from Class Y Transactions | (17,461 | ) | (39,016 | ) | (5,059 | ) | (18,810 | ) | ||||||||
Net Decrease in Net Assets Derived from Capital Share Transactions | (214,943 | ) | (202,650 | ) | (36,091 | ) | (151,269 | ) | ||||||||
Net Increase (Decrease) in Net Assets | 738,633 | (158,797 | ) | 263,049 | (32,890 | ) | ||||||||||
Net Assets: | ||||||||||||||||
Beginning of Year | 3,899,792 | 4,058,589 | 1,677,233 | 1,710,123 | ||||||||||||
End of Year | $ | 4,638,425 | $ | 3,899,792 | $ | 1,940,282 | $ | 1,677,233 | ||||||||
Capital Share Transactions: | ||||||||||||||||
Class F: | ||||||||||||||||
Shares issued | 40,400 | 56,479 | �� | 20,901 | 23,437 | |||||||||||
Reinvestment of distributions | 2,874 | 5,441 | 620 | 1,385 | ||||||||||||
Shares redeemed | (59,276 | ) | (78,402 | ) | (23,885 | ) | (36,491 | ) | ||||||||
Total Class F Transactions | (16,002 | ) | (16,482 | ) | (2,364 | ) | (11,669 | ) | ||||||||
Class I: | ||||||||||||||||
Shares issued | 9 | 51 | N/A | N/A | ||||||||||||
Reinvestment of distributions | 1 | 1 | N/A | N/A | ||||||||||||
Shares redeemed | (15 | ) | (109 | ) | N/A | N/A | ||||||||||
Total Class I Transactions | (5 | ) | (57 | ) | N/A | N/A | ||||||||||
Class Y: | ||||||||||||||||
Shares issued | 3,311 | 7,463 | 1,723 | 2,869 | ||||||||||||
Reinvestment of distributions | 328 | 615 | 77 | 153 | ||||||||||||
Shares redeemed | (5,021 | ) | (12,369 | ) | (2,163 | ) | (4,844 | ) | ||||||||
Total Class Y Transactions | (1,382 | ) | (4,291 | ) | (363 | ) | (1,822 | ) | ||||||||
Net Decrease in Shares Outstanding from Share Transactions | (17,389 | ) | (20,830 | ) | (2,727 | ) | (13,491 | ) | ||||||||
N/A — Not applicable. Share classes currently not offered.
Amounts designated as “—” are $0 or have been rounded to $0.
The accompanying notes are an integral part of the financial statements.
78 |
SEI Institutional International Trust / Annual Report / September 30, 2021 |
| International Fixed Income Fund | Emerging Markets Debt Fund | |||||||||||||||
| 2021 | 2020 | 2021 | 2020 | |||||||||||||
Operations: | ||||||||||||||||
Net investment income | $ | 1,885 | $ | 1,679 | $ | 59,764 | $ | 62,597 | ||||||||
Net realized gain (loss) on investments, futures contracts and swap contracts | 7,160 | (346) | 22,487 | (5,032) | ||||||||||||
Net realized gain (loss) on forward foreign currency contracts and foreign currency transactions | 5,848 | (14,396) | (6,505) | (47,383) | ||||||||||||
Net change in unrealized appreciation (depreciation) on investments, futures contracts, option contracts and swap contracts | (21,811) | 17,705 | (9,095) | (23,423) | ||||||||||||
Net change in unrealized appreciation (depreciation) on forward foreign currency contracts, foreign currencies and translation of other assets and liabilities denominated in foreign currencies | 2,651 | (1,446) | 3,916 | (2,066) | ||||||||||||
Net Increase (Decrease) in Net Assets Resulting from Operations | (4,267) | 3,196 | 70,567 | (15,307) | ||||||||||||
Distributions: | ||||||||||||||||
Class F | (129) | (14,461) | (27,983) | (11,445) | ||||||||||||
Class Y | (20) | (2,410) | (2,564) | (1,066) | ||||||||||||
Total Dividends | (149) | (16,871) | (30,547) | (12,511) | ||||||||||||
Capital Share Transactions: | ||||||||||||||||
Class F: | ||||||||||||||||
Proceeds from shares issued | 119,835 | 80,130 | 234,390 | 207,358 | ||||||||||||
Reinvestment of dividends & distributions | 119 | 13,322 | 25,224 | 10,357 | ||||||||||||
Cost of shares redeemed | (76,680) | (87,928) | (238,050) | (300,839) | ||||||||||||
Net Increase (Decrease) from Class F Transactions | 43,274 | 5,524 | 21,564 | (83,124) | ||||||||||||
Class Y: | ||||||||||||||||
Proceeds from shares issued | 18,226 | 16,132 | 18,734 | 23,514 | ||||||||||||
Reinvestment of dividends & distributions | 18 | 2,180 | 2,391 | 985 | ||||||||||||
Cost of shares redeemed | (10,071) | (17,464) | (15,003) | (35,537) | ||||||||||||
Net Increase (Decrease) from Class Y Transactions | 8,173 | 848 | 6,122 | (11,038) | ||||||||||||
Net Increase (Decrease) in Net Assets Derived from Capital Share Transactions | 51,447 | 6,372 | 27,686 | (94,162) | ||||||||||||
Net Increase (Decrease) in Net Assets | 47,031 | (7,303) | 67,706 | (121,980) | ||||||||||||
Net Assets: | ||||||||||||||||
Beginning of Year | 514,528 | 521,831 | 1,473,435 | 1,595,415 | ||||||||||||
End of Year | $ | 561,559 | $ | 514,528 | $ | 1,541,141 | $ | 1,473,435 | ||||||||
Capital Share Transactions: | ||||||||||||||||
Class F: | ||||||||||||||||
Shares issued | 11,494 | 7,694 | 22,842 | 21,356 | ||||||||||||
Reinvestment of distributions | 11 | 1,290 | 2,489 | 1,060 | ||||||||||||
Shares redeemed | (7,341) | (8,463) | (23,157) | (31,470) | ||||||||||||
Total Class F Transactions | 4,164 | 521 | 2,174 | (9,054) | ||||||||||||
Class Y: | ||||||||||||||||
Shares issued | 1,742 | 1,551 | 1,830 | 2,528 | ||||||||||||
Reinvestment of distributions | 2 | 211 | 237 | 102 | ||||||||||||
Shares redeemed | (962) | (1,687) | (1,463) | (3,816) | ||||||||||||
Total Class Y Transactions | 782 | 75 | 604 | (1,186) | ||||||||||||
Net Increase (Decrease) in Shares Outstanding from Share Transactions | 4,946 | 596 | 2,778 | (10,240) | ||||||||||||
Amounts designated as “—” are $0 or have been rounded to $0.
The accompanying notes are an integral part of the financial statements.
SEI Institutional International Trust / Annual Report / September 30, 2021 |
79 |
For the years ended September 30
For a Share Outstanding Throughout Each Year
| Net Asset Value, Beginning of Year | Net Investment | Net Realized on | Total from | Dividends from Net Investment Income | Distributions from Net Realized Gains | Total Dividends and Distributions | Net Asset Value, End of Year | Total Return† | Net Assets ($ Thousands) | Ratio of Net Expenses to Average Net Assets* | Ratio of Expenses to Average Net Assets (Excluding Fees Paid Indirectly and Including Waivers)** | Ratio of Expenses to Average Net Assets (Excluding Fees Paid Indirectly and Waivers)** | Ratio of Net Investment Income (Loss) to Average Net Assets | Portfolio Turnover Rate† | ||||||||||||||||||||||||||||||||||||||||
International Equity Fund |
| |||||||||||||||||||||||||||||||||||||||||||||||||||||
Class F(2) |
| |||||||||||||||||||||||||||||||||||||||||||||||||||||
2021 | $10.86 | $0.16 | $ | 2.67 | $ | 2.83 | $ | (0.12 | ) | $— | $ | (0.12 | ) | $ | 13.57 | 26.18 | % | $4,242,911 | 1.08% | 1.08% | 1.08% | 1.19% | 105% | |||||||||||||||||||||||||||||||
2020 | 10.68 | 0.10 | 0.28 | 0.38 | (0.20 | ) | — | (0.20 | ) | 10.86 | 3.44 | 3,568,373 | 1.11 | 1.11 | 1.11 | 0.94 | 102 | |||||||||||||||||||||||||||||||||||||
2019 | 11.38 | 0.20 | (0.75 | ) | (0.55 | ) | (0.15 | ) | — | (0.15 | ) | 10.68 | (4.63 | ) | 3,686,195 | 1.10(3) | 1.10(3) | 1.10(3) | 1.92 | 73 | ||||||||||||||||||||||||||||||||||
2018 | 11.29 | 0.16 | 0.08 | 0.24 | (0.15 | ) | — | (0.15 | ) | 11.38 | 2.11 | 4,024,987 | 1.09(3) | 1.09(3) | 1.09(3) | 1.35 | 40 | |||||||||||||||||||||||||||||||||||||
2017 | 9.58 | 0.13 | 1.69 | 1.82 | (0.11 | ) | — | (0.11 | ) | 11.29 | 19.23 | 3,795,858 | 1.15(3) | 1.15(3) | 1.15(3) | 1.27 | 57 | |||||||||||||||||||||||||||||||||||||
Class I |
| |||||||||||||||||||||||||||||||||||||||||||||||||||||
2021 | $10.87 | $0.12 | $ | 2.69 | $ | 2.81 | $ | (0.09 | ) | $— | $ | (0.09 | ) | $ | 13.59 | 25.91 | % | $1,611 | 1.33% | 1.33% | 1.33% | 0.93% | 105% | |||||||||||||||||||||||||||||||
2020 | 10.68 | 0.07 | 0.28 | 0.35 | (0.16 | ) | — | (0.16 | ) | 10.87 | 3.19 | 1,350 | 1.36 | 1.36 | 1.36 | 0.63 | 102 | |||||||||||||||||||||||||||||||||||||
2019 | 11.37 | 0.17 | (0.74 | ) | (0.57 | ) | (0.12 | ) | — | (0.12 | ) | 10.68 | (4.90 | ) | 1,932 | 1.35(4) | 1.35(4) | 1.35(4) | 1.61 | 73 | ||||||||||||||||||||||||||||||||||
2018 | 11.27 | 0.12 | 0.09 | 0.21 | (0.11 | ) | — | (0.11 | ) | 11.37 | 1.86 | 2,662 | 1.34(4) | 1.34(4) | 1.34(4) | 1.06 | 40 | |||||||||||||||||||||||||||||||||||||
2017 | 9.55 | 0.10 | 1.70 | 1.80 | (0.08 | ) | — | (0.08 | ) | 11.27 | 19.00 | 2,954 | 1.40(4) | 1.40(4) | 1.40(4) | 0.96 | 57 | |||||||||||||||||||||||||||||||||||||
Class Y |
| |||||||||||||||||||||||||||||||||||||||||||||||||||||
2021 | $10.86 | $0.19 | $ | 2.68 | $ | 2.87 | $ | (0.15 | ) | $— | $ | (0.15 | ) | $ | 13.58 | 26.55 | % | $393,903 | 0.83% | 0.83% | 0.83% | 1.44% | 105% | |||||||||||||||||||||||||||||||
2020 | 10.68 | 0.12 | 0.29 | 0.41 | (0.23 | ) | — | (0.23 | ) | 10.86 | 3.68 | 330,069 | 0.86 | 0.86 | 0.86 | 1.16 | 102 | |||||||||||||||||||||||||||||||||||||
2019 | 11.39 | 0.23 | (0.76 | ) | (0.53 | ) | (0.18 | ) | — | (0.18 | ) | 10.68 | (4.43 | ) | 370,462 | 0.85(5) | 0.85(5) | 0.85(5) | 2.24 | 73 | ||||||||||||||||||||||||||||||||||
2018 | 11.31 | 0.18 | 0.09 | 0.27 | (0.19 | ) | — | (0.19 | ) | 11.39 | 2.40 | 344,977 | 0.84(5) | 0.84(5) | 0.84(5) | 1.60 | 40 | |||||||||||||||||||||||||||||||||||||
2017 | 9.59 | 0.16 | 1.69 | 1.85 | (0.13 | ) | — | (0.13 | ) | 11.31 | 19.59 | 319,689 | 0.90(5) | 0.90(5) | 0.90(5) | 1.53 | 57 | |||||||||||||||||||||||||||||||||||||
Emerging Markets Equity Fund |
| |||||||||||||||||||||||||||||||||||||||||||||||||||||
Class F(2) |
| |||||||||||||||||||||||||||||||||||||||||||||||||||||
2021 | $12.06 | $0.11 | $ | 2.14 | $ | 2.25 | $ | (0.08 | ) | $— | $ | (0.08 | ) | $ | 14.23 | 18.63 | % | $1,786,493 | 1.70%(6) | 1.70%(6) | 1.80%(7) | 0.73% | 100% | |||||||||||||||||||||||||||||||
2020 | 11.21 | 0.05 | 0.93 | 0.98 | (0.13 | ) | — | (0.13 | ) | 12.06 | 8.75 | 1,542,551 | 1.71(6) | 1.71(6) | 1.81(7) | 0.43 | 90 | |||||||||||||||||||||||||||||||||||||
2019 | 11.47 | 0.10 | (0.29 | ) | (0.19 | ) | (0.07 | ) | — | (0.07 | ) | 11.21 | (1.64 | ) | 1,564,523 | 1.70(6) | 1.70(6) | 1.81(7) | 0.92 | 89 | ||||||||||||||||||||||||||||||||||
2018 | 12.32 | 0.08 | (0.77 | ) | (0.69 | ) | (0.16 | ) | — | (0.16 | ) | 11.47 | (5.71 | ) | 1,668,960 | 1.69(6) | 1.69(6) | 1.80(7) | 0.61 | 70 | ||||||||||||||||||||||||||||||||||
2017 | 10.09 | 0.07 | 2.24 | 2.31 | (0.08 | ) | — | (0.08 | ) | 12.32 | 23.10 | 1,821,009 | 1.74(6) | 1.74(6) | 1.82(7) | 0.65 | 66 | |||||||||||||||||||||||||||||||||||||
Class Y |
| |||||||||||||||||||||||||||||||||||||||||||||||||||||
2021 | $12.07 | $0.14 | $ | 2.15 | $ | 2.29 | $ | (0.11 | ) | $— | $ | (0.11 | ) | $ | 14.25 | 18.96 | % | $153,789 | 1.45%(8) | 1.45%(8) | 1.55%(9) | 0.98% | 100% | |||||||||||||||||||||||||||||||
2020 | 11.22 | 0.08 | 0.93 | 1.01 | (0.16 | ) | — | (0.16 | ) | 12.07 | 8.99 | 134,682 | 1.46(8) | 1.46(8) | 1.56(9) | 0.66 | 90 | |||||||||||||||||||||||||||||||||||||
2019 | 11.49 | 0.14 | (0.31 | ) | (0.17 | ) | (0.10 | ) | — | (0.10 | ) | 11.22 | (1.44 | ) | 145,600 | 1.45(8) | 1.45(8) | 1.56(9) | 1.25 | 89 | ||||||||||||||||||||||||||||||||||
2018 | 12.35 | 0.11 | (0.76 | ) | (0.65 | ) | (0.21 | ) | — | (0.21 | ) | 11.49 | (5.46 | ) | 125,594 | 1.44(8) | 1.44(8) | 1.55(9) | 0.89 | 70 | ||||||||||||||||||||||||||||||||||
2017 | 10.11 | 0.10 | 2.24 | 2.34 | (0.10 | ) | — | (0.10 | ) | 12.35 | 23.46 | 125,400 | 1.49(8) | 1.49(8) | 1.57(9) | 0.93 | 66 | |||||||||||||||||||||||||||||||||||||
| † | Returns and portfolio turnover rates are for the period indicated and have not been annualized. Returns do not reflect the deduction of taxes that a shareholder would pay on fund distributions or the redemption of fund shares. |
| * | Includes Fees Paid Indirectly, if applicable. See Note 5 in Notes to Financial Statements |
| ** | See Note 5 in Notes to Financial Statements. |
| (1) | Per share net investment income and net realized and unrealized gains (losses) calculated using average shares. |
| (2) | Effective January 31, 2017, Class A Shares converted to Class F Shares of the same Fund. |
| (3) | The expense ratio includes overdraft fees. Had this expense been excluded the ratios would have been 1.10%, 1.09% and 1.15% for 2019, 2018 and 2017. |
| (4) | The expense ratio includes overdraft fees. Had this expense been excluded the ratios would have been 1.35%, 1.34% and 1.40% for 2019, 2018 and 2017. |
| (5) | The expense ratio includes overdraft fees. Had this expense been excluded the ratios would have been 0.85%, 0.84% and 0.90% for 2019, 2018 and 2017. |
| (6) | The expense ratio includes overdraft fees. Had this expense been excluded the ratios would have been 1.70%, 1.71%, 1.70%, 1.69% and 1.74% for 2021, 2020, 2019, 2018 and 2017. |
| (7) | The expense ratio includes overdraft fees. Had this expense been excluded the ratios would have been 1.80%, 1.81%, 1.81%, 1.80% and 1.82% for 2021, 2020, 2019, 2018 and 2017. |
| (8) | The expense ratio includes overdraft fees. Had this expense been excluded the ratios would have been 1.45%, 1.46%, 1.45%, 1.44% and 1.49% for 2021, 2020, 2019, 2018 and 2017. |
| (9) | The expense ratio includes overdraft fees. Had this expense been excluded the ratios would have been 1.55%, 1.56%, 1.56%, 1.55% and 1.57% for 2021, 2020, 2019, 2018 and 2017. |
Amounts designated as “—” are either $0 or have been rounded to $0.
The accompanying notes are an integral part of the financial statements.
80 |
SEI Institutional International Trust / Annual Report / September 30, 2021 |
FINANCIAL HIGHLIGHTS
For the years ended September 30
For a Share Outstanding Throughout Each Year
| Net Asset Value, Beginning of Year | Net Investment | Net Realized on | Total from | Dividends from Net Investment Income | Distributions from Net Realized Gains | Total Dividends and Distributions | Net Asset End | Total Return† | Net Assets ($ Thousands) | Ratio of Net Expenses to Average Net Assets* | Ratio of Expenses to Average Net Assets (Excluding Fees Paid Indirectly and Including Waivers)** | Ratio of Expenses to Average Net Assets (Excluding Fees Paid Indirectly and Waivers)** | Ratio of Net Investment Income (Loss) to Average Net Assets | Portfolio Turnover Rate† | ||||||||||||||||||||||||||||||||||||||||
International Fixed Income Fund |
| |||||||||||||||||||||||||||||||||||||||||||||||||||||
Class F(2) |
| |||||||||||||||||||||||||||||||||||||||||||||||||||||
2021 | $10.46 | $ | 0.03 | $ | (0.12 | ) | $ | (0.09 | ) | $ | — | $ | —^ | $ | — | $ | 10.37 | (0.83 | )% | $485,178 | 1.02% | 1.02% | 1.07% | 0.32% | 65% | |||||||||||||||||||||||||||||
2020 | 10.73 | 0.03 | 0.04 | 0.07 | (0.26 | ) | (0.08 | ) | (0.34 | ) | 10.46 | 0.73 | 445,864 | 1.02 | 1.02 | 1.08 | 0.29 | 64 | ||||||||||||||||||||||||||||||||||||
2019 | 10.27 | 0.04 | 0.88 | 0.92 | (0.40 | ) | (0.06 | ) | (0.46 | ) | 10.73 | 9.28 | 452,150 | 1.02(3) | 1.02(3) | 1.07(4) | 0.42 | 58 | ||||||||||||||||||||||||||||||||||||
2018 | 10.13 | 0.07 | 0.07 | 0.14 | — | — | — | 10.27 | 1.38 | 438,908 | 1.02(3) | 1.02(3) | 1.07(4) | 0.66 | 71 | |||||||||||||||||||||||||||||||||||||||
2017 | 10.51 | 0.07 | (0.18 | ) | (0.11 | ) | (0.17 | ) | (0.10 | ) | (0.27 | ) | 10.13 | (1.03 | ) | 415,582 | 1.02(3) | 1.02(3) | 1.08(4) | 0.66 | 113 | |||||||||||||||||||||||||||||||||
Class Y |
| |||||||||||||||||||||||||||||||||||||||||||||||||||||
2021 | $10.47 | $ | 0.06 | $ | (0.12 | ) | $ | (0.06 | ) | $ | — | $ | —^ | $ | — | $ | 10.41 | (0.54 | )% | $76,381 | 0.77% | 0.77% | 0.82% | 0.57% | 65% | |||||||||||||||||||||||||||||
2020 | 10.75 | 0.06 | 0.03 | 0.09 | (0.29 | ) | (0.08 | ) | (0.37 | ) | 10.47 | 0.88 | 68,664 | 0.77 | 0.77 | 0.83 | 0.54 | 64 | ||||||||||||||||||||||||||||||||||||
2019 | 10.29 | 0.07 | 0.88 | 0.95 | (0.43 | ) | (0.06 | ) | (0.49 | ) | 10.75 | 9.54 | 69,681 | 0.77(5) | 0.77(5) | 0.82(6) | 0.66 | 58 | ||||||||||||||||||||||||||||||||||||
2018 | 10.12 | 0.09 | 0.08 | 0.17 | — | — | — | 10.29 | 1.68 | 43,003 | 0.77(5) | 0.77(5) | 0.82(6) | 0.91 | 71 | |||||||||||||||||||||||||||||||||||||||
2017 | 10.50 | 0.09 | (0.17 | ) | (0.08 | ) | (0.20 | ) | (0.10 | ) | (0.30 | ) | 10.12 | (0.76 | ) | 37,982 | 0.77(5) | 0.77(5) | 0.83(6) | 0.94 | 113 | |||||||||||||||||||||||||||||||||
Emerging Markets Debt Fund |
| |||||||||||||||||||||||||||||||||||||||||||||||||||||
Class F(2) |
| |||||||||||||||||||||||||||||||||||||||||||||||||||||
2021 | $9.80 | $ | 0.40 | $ | 0.06 | $ | 0.46 | $ | (0.20 | ) | $ | — | $ | (0.20 | ) | $ | 10.06 | 4.71 | % | $1,433,739 | 1.36% | 1.36% | 1.61% | 3.87% | 91% | |||||||||||||||||||||||||||||
2020 | 9.93 | 0.40 | (0.45 | ) | (0.05 | ) | (0.08 | ) | — | (0.08 | ) | 9.80 | (0.53 | ) | 1,374,566 | 1.36 | 1.36 | 1.61 | 4.07 | 95 | ||||||||||||||||||||||||||||||||||
2019 | 9.30 | 0.47 | 0.32 | 0.79 | (0.16 | ) | — | (0.16 | ) | 9.93 | 8.51 | 1,483,467 | 1.36(7) | 1.36(7) | 1.62(8) | 4.93 | 114 | |||||||||||||||||||||||||||||||||||||
2018 | 10.55 | 0.51 | (1.19 | ) | (0.68 | ) | (0.57 | ) | — | (0.57 | ) | 9.30 | (6.81 | ) | 1,451,128 | 1.36(7) | 1.36(7) | 1.61(8) | 5.08 | 80 | ||||||||||||||||||||||||||||||||||
2017 | 10.08 | 0.51 | 0.17 | 0.68 | (0.21 | ) | — | (0.21 | ) | 10.55 | 6.93 | 1,458,611 | 1.36(7) | 1.36(7) | 1.63(8) | 5.06 | 79 | |||||||||||||||||||||||||||||||||||||
Class Y |
| |||||||||||||||||||||||||||||||||||||||||||||||||||||
2021 | $9.79 | $ | 0.42 | $ | 0.07 | $ | 0.49 | $ | (0.25 | ) | $ | — | $ | (0.25 | ) | $ | 10.03 | 4.98 | % | $107,402 | 1.11% | 1.11% | 1.36% | 4.12% | 91% | |||||||||||||||||||||||||||||
2020 | 9.92 | 0.42 | (0.45 | ) | (0.03 | ) | (0.10 | ) | — | (0.10 | ) | 9.79 | (0.33 | ) | 98,869 | 1.11 | 1.11 | 1.36 | 4.33 | 95 | ||||||||||||||||||||||||||||||||||
2019 | 9.28 | 0.50 | 0.32 | 0.82 | (0.18 | ) | — | (0.18 | ) | 9.92 | 8.84 | 111,948 | 1.11(9) | 1.11(9) | 1.37(10) | 5.18 | 114 | |||||||||||||||||||||||||||||||||||||
2018 | 10.57 | 0.53 | (1.18 | ) | (0.65 | ) | (0.64 | ) | — | (0.64 | ) | 9.28 | (6.57 | ) | 113,872 | 1.11(9) | 1.11(9) | 1.36(10) | 5.34 | 80 | ||||||||||||||||||||||||||||||||||
2017 | 10.12 | 0.53 | 0.17 | 0.70 | (0.25 | ) | — | (0.25 | ) | 10.57 | 7.18 | 108,361 | 1.11(9) | 1.11(9) | 1.38(10) | 5.31 | 79 | |||||||||||||||||||||||||||||||||||||
| † | Returns and portfolio turnover rates are for the period indicated and have not been annualized. Returns do not reflect the deduction of taxes that a shareholder would pay on fund distributions or the redemption of fund shares. |
| * | Includes Fees Paid Indirectly, if applicable. See Note 5 in Notes to Financial Statements |
| ** | See Note 5 in Notes to Financial Statements. |
| ^ | Amount represents less than $0.005. |
| (1) | Per share net investment income and net realized and unrealized gains (losses) calculated using average shares. |
| (2) | Effective January 31, 2017, Class A Shares converted to Class F Shares of the same Fund. |
| (3) | The expense ratio includes overdraft fees. Had this expense been excluded the ratios would have been 1.02%, 1.02% and 1.02% for 2019, 2018 and 2017. |
| (4) | The expense ratio includes overdraft fees. Had this expense been excluded the ratios would have been 1.07%, 1.07% and 1.08% for 2019, 2018 and 2017. |
| (5) | The expense ratio includes overdraft fees. Had this expense been excluded the ratios would have been 0.77%, 0.77% and 0.77% for 2019, 2018 and 2017. |
| (6) | The expense ratio includes overdraft fees. Had this expense been excluded the ratios would have been 0.82%, 0.82% and 0.83% for 2019, 2018 and 2017. |
| (7) | The expense ratio includes overdraft fees. Had this expense been excluded the ratios would have been 1.36%, 1.36% and 1.36% for 2019, 2018 and 2017. |
| (8) | The expense ratio includes overdraft fees. Had this expense been excluded the ratios would have been 1.62%, 1.61% and 1.63% for 2019, 2018 and 2017. |
| (9) | The expense ratio includes overdraft fees. Had this expense been excluded the ratios would have been 1.11%, 1.11% and 1.11% for 2019, 2018 and 2017. |
| (10) | The expense ratio includes overdraft fees. Had this expense been excluded the ratios would have been 1.37%, 1.36% and 1.38% for 2019, 2018 and 2017. |
Amounts designated as “—” are either $0 or have been rounded to $0.
The accompanying notes are an integral part of the financial statements.
SEI Institutional International Trust / Annual Report / September 30, 2021 |
81 |
September 30, 2021
1. ORGANIZATION
SEI Institutional International Trust (the “Trust”) was organized as a Massachusetts business trust under a Declaration of Trust dated June 30, 1988.
The Trust is registered under the Investment Company Act of 1940, as amended, as an open-end investment company with four funds: International Equity Fund, Emerging Markets Equity Fund, International Fixed Income Fund and Emerging Markets Debt Fund (together the “Funds”) each of which are diversified Funds with the exception of the International Fixed Income Fund and the Emerging Markets Debt Fund. Each Fund’s prospectus provides a description of its investment goal, principal investment strategies and risks. The Trust is registered to offer Class F (formerly Class A) and Class Y shares of each of the Funds and Class I shares of the International Equity Fund.
2. SIGNIFICANT ACCOUNTING POLICIES
The following are significant accounting policies, which are consistently followed in the preparation of its financial statements by the Funds. The Funds are investment companies that apply the accounting and reporting guidance issued in Topic 946 by the U.S. Financial Accounting Standards Board (“FASB”).
Use of Estimates — The Funds are investment companies in conformity with accounting principles generally accepted in the United States of America (“U.S. GAAP”). Therefore, the Funds follow the accounting and reporting guidelines for investment companies. The preparation of financial statements, in conformity with U.S. GAAP requires management to make estimates and assumptions that affect the reported amounts of assets and liabilities and disclosure of contingent assets and liabilities as of the date of the financial statements and the reported amounts of increases and decreases in net assets from operations during the reporting period. Actual results could differ from those estimates.
Security Valuation — When valuing portfolio securities, a Fund values securities listed on a securities exchange, market or automated quotation system for which quotations are readily available (other than securities traded on National Association of Securities Dealers Automated Quotations (NASDAQ) or as otherwise noted below) at the last quoted sale price on an exchange or market (foreign or domestic) on which the securities are traded or, if there is no such reported sale, at the most recent quoted bid price. A Fund values securities traded on NASDAQ at the NASDAQ Official Closing Price. If available, debt securities, swaps (which are not centrally cleared), bank loans or collateralized debt obligations (including collateralized loan obligations), such as those held by the Funds, are priced based upon
valuations provided by independent, third-party pricing agents. Such values generally reflect the last reported sales price if the security is actively traded. The third-party pricing agents may also value debt securities at an evaluated bid price by employing methodologies that utilize actual market transactions, broker-supplied valuations or other methodologies designed to identify the market value for such securities. Redeemable securities issued by open-end investment companies are valued at the investment company’s applicable Net Asset Value (“NAV”) per share, with the exception of ETFs, which are priced as equity securities. These open-end investment companies’ shares are offered in separate prospectuses, each of which describes the process by which the applicable investment company’s NAV is determined. The prices of foreign securities are reported in local currency and converted to U.S. dollars using currency exchange rates. If a security’s price cannot be obtained, as noted above, a Fund will value the securities using a bid price from at least one independent broker.
On the first day a new debt security purchase is recorded, if a price is not available from a third-party pricing agent or an independent broker, the security may be valued at its purchase price. Each day thereafter, the debt security will be valued according to the Funds’ Fair Value Pricing Policies and Procedures (“Fair Value Procedures”) until an independent source can be secured. Debt securities held by a Fund with remaining maturities of 60 days or less will be valued by the amortized cost method, which involves valuing a security at its cost on the date of purchase and thereafter (absent unusual circumstances) assuming a constant amortization to maturity of any discount or premium, regardless of the impact of fluctuations in general market rates of interest on the value of the instrument. While this method provides certainty in valuation, it may result in periods during which value, as determined by this method, is higher or lower than the price the Fund would receive if it sold the instrument, and the value of securities in the Fund can be expected to vary inversely with changes in prevailing interest rates. Should existing credit, liquidity or interest rate conditions in the relevant markets and issuer specific circumstances suggest that amortized cost does not approximate fair value, then the amortized cost method may not be used.
Options are valued at the last quoted sales price. If there is no such reported sale on the valuation date, long positions are valued at the most recent bid price, and short positions are valued at the most recent ask price. Futures and swaps cleared through a central clearing house (“centrally cleared swaps”) are valued at the settlement price established each day by the board of exchange on which they are traded. The daily settlement
82 |
SEI Institutional International Trust / Annual Report / September 30, 2021 |
prices for financial futures and centrally cleared swaps are provided by an independent source. On days when there is excessive volume, market volatility or the future or centrally cleared swap does not end trading by the time the Fund calculates its NAV, the settlement price may not be available at the time at which a Fund calculates its NAV. On such days, the best available price (which is typically the last sales price) may be used to value a Fund’s futures or centrally cleared swaps position.
Foreign currency forward contracts are valued at the current day’s interpolated foreign exchange rate, as calculated using forward rates provided by an independent source.
Prices for most securities held by a Fund are provided daily by third-party independent pricing agents. SEI Investments Management Corporation (“SIMC”) or a Sub-Adviser (“Sub-Adviser”), as applicable, reasonably believes that prices provided by independent pricing agents are reliable. However, there can be no assurance that such pricing service’s prices will be reliable. SIMC or a Sub-Adviser, as applicable, will continuously monitor the reliability of prices obtained from any pricing service and shall promptly notify the Funds’ administrator if it believes that a particular pricing service is no longer a reliable source of prices. The Funds’ administrator, in turn, will notify the Fair Value Pricing Committee (the “Committee”) if it receives such notification from SIMC or a Sub-Adviser, as applicable, or if the Funds’ administrator reasonably believes that a particular pricing service is no longer a reliable source for prices.
The Funds’ Fair Value Procedures provide that any change in a primary pricing agent or a pricing methodology requires prior approval by the Board of Trustees (“Board”) or its designated committee. However, when the change would not materially affect the valuation of a Fund’s net assets or involve a material departure in pricing methodology from that of a Fund’s existing pricing agent or pricing methodology, ratification may be obtained at the next regularly scheduled meeting of the Board.
Securities for which market prices are not “readily available” are determined to be unreliable or cannot be valued using the methodologies described above are valued in accordance with Fair Value Procedures established by the Board. The Funds’ Fair Value Procedures are implemented through the Committee designated by the Board. The Committee is currently composed of one member of the Board, as well as representatives from SIMC and its affiliates. Some of the more common reasons that may necessitate that a security be valued using Fair Value Procedures include: (i) the security’s trading has been halted or suspended,
(ii) the security has been delisted from a national exchange, (iii) the security’s primary trading market is temporarily closed at a time when under normal conditions it would be open, or (iv) the security’s primary pricing source is not able or willing to provide a price. When a security is valued in accordance with the Fair Value Procedures, the Committee will determine the value after taking into consideration relevant information reasonably available to the Committee. Examples of factors the Committee may consider include: (i) the facts giving rise to the need to fair value, (ii) the last trade price, (iii) the performance of the market or the issuer’s industry, (iv) the liquidity of the security, (v) the size of the holding in a Fund; or (vi) any other appropriate information.
The determination of a security’s fair value price often involves the consideration of a number of subjective factors and is therefore subject to the unavoidable risk that the value assigned to a security may be higher or lower than the security’s value would be if a reliable market quotation for the security was readily available.
The International Equity and Emerging Markets Equity Funds use a third-party fair valuation vendor. The vendor provides a fair value for foreign securities held by the International Equity and Emerging Markets Equity Funds based on certain factors and methodologies (involving, generally, tracking valuation correlations between the U.S. market and each non-U.S. security). Values from the vendor are applied in the event that there is a movement in the U.S. market that exceeds a specific threshold that has been established by the Committee. The Committee has also established a “confidence interval,” which is used to determine the level of historical correlation between the value of a specific foreign security and movements in the U.S. market before a particular security will be fair-valued when the threshold is exceeded. In the event that the threshold established by the Committee is exceeded on a specific day, the International Equity and Emerging Markets Equity Funds shall value the non-U.S. securities in their portfolios that exceed the applicable “confidence interval” based upon the adjusted prices provided by the vendor. Additionally, if a local market in which the International Equity or Emerging Markets Equity Funds own securities is closed for one or more days (scheduled or unscheduled) while the Fund is open, and if such securities in a Fund’s portfolio exceed the predetermined confidence interval discussed above, then such Fund shall value such securities based on the fair value prices provided by the vendor.
For securities that principally trade on a foreign market or exchange, a significant gap in time can exist between the time of a particular security’s last trade and the time
SEI Institutional International Trust / Annual Report / September 30, 2021 |
83 |
NOTES TO FINANCIAL STATEMENTS (Continued)
September 30, 2021
at which a Fund calculates its NAV. The closing prices of such securities may no longer reflect their market value at the time a Fund calculates NAV if an event that could materially affect the value of those securities (a “Significant Event”), including substantial fluctuations in domestic or foreign markets or occurrences not tied directly to the securities markets, such as natural disasters, armed conflicts or significant governmental actions, has occurred between the time of the security’s last close and the time that a Fund calculates NAV. A Fund may invest in securities that are primarily listed on foreign exchanges that trade on weekends or other days when the Fund does not price its shares. As a result, the NAV of the Fund’s shares may change on days when shareholders will not be able to purchase or redeem Fund shares.
A Significant Event may relate to a single issuer or to an entire market sector. If SIMC or a Sub-Adviser becomes aware of a Significant Event that has occurred with respect to a security or group of securities after the closing of the exchange or market on which the security or securities principally trade, but before the time at which a Fund calculates NAV, it may request that a Committee meeting be called. In addition, with respect to certain securities, the Funds’ administrator performs price comparisons and price movement review (among other processes), to monitor the pricing data supplied by various sources. Any identified discrepancies are researched and subject to the procedures described above.
In accordance with U.S. GAAP, fair value is defined as the price that the Fund would receive upon selling an investment in an orderly transaction to an independent buyer in the principal or most advantageous market of the investment. A three-tier hierarchy has been established to maximize the use of the observable market data and minimize the use of unobservable inputs and to establish classification of the fair value measurements for disclosure purposes. Inputs refer broadly to the assumptions that market participants would use in pricing an asset. Inputs may be observable or unobservable. Observable inputs are inputs that reflect the assumptions market participants would use in pricing the asset or liability developed based on market data obtained from sources independent of the reporting entity. Unobservable inputs are inputs that reflect the reporting entity’s own assumptions about the assumptions market participants would use in pricing the asset or liability developed based on the best information available in the circumstances.
The three-tier hierarchy of inputs is summarized in the three broad Levels listed below:
Level 1 — quoted prices in active markets for identical investments
Level 2 — other significant observable inputs (including quoted prices for similar investments, interest rates, prepayment speeds, credit risks, etc.)
Level 3 — significant unobservable inputs (including the Fund’s own assumptions in determining the fair value of investments)
Investments are classified within the level of the lowest significant input considered in determining fair value. Investments classified within Level 3 whose fair value measurement considers several inputs may include Level 1 or Level 2 inputs as components of the overall fair value measurement.
The valuation techniques used by the Funds to measure fair value during the year ended September 30, 2021 maximized the use of observable inputs and minimized the use of unobservable inputs.
For the year ended September 30, 2021, there have been no significant changes to the inputs or the Trust’s fair valuation methodologies.
Security Transactions and Investment Income — Security transactions are recorded on the trade date. Cost used in determining net realized capital gains and losses on the sale of securities is determined on the basis of specific identification. Dividend income and expense is recognized on the ex-dividend date, and interest income or expense is recognized using the accrual basis of accounting.
Distributions received on securities that represent a return of capital or capital gain are recorded as a reduction of cost of investments and/ or as a realized gain. The Trust estimates the components of distributions received that may be considered nontaxable distributions or capital gain distributions.
Amortization and accretion is calculated using the scientific interest method, which is not materially different from the effective interest method. Amortization of premiums and discounts is included in interest income.
Cash and Cash Equivalents — Idle cash and currency balances may be swept into various overnight sweep accounts and are classified as cash and cash equivalents on the Statement of Assets and Liabilities. These amounts, at times, may exceed United States federally insured limits. Amounts swept are available on the next business day.
Expenses — Expenses that are directly related to one of the Funds are charged directly to that Fund. Other
84 |
SEI Institutional International Trust / Annual Report / September 30, 2021 |
operating expenses of the Trust are prorated to the Funds on the basis of relative daily net assets.
Classes —Class-specific expenses are borne by that class. Income, non-class specific expenses, and realized and unrealized gains/losses are allocated to the respective classes on the basis of relative daily net assets.
Foreign Currency Translation — The books and records of the Funds investing in international securities are maintained in U.S. dollars on the following basis:
(i) market value of investment securities, assets and liabilities at the current rate of exchange; and
(ii) purchases and sales of investment securities, income and expenses at the relevant rates of exchange prevailing on the respective dates of such transactions.
The Funds do not isolate that portion of gains and losses on investments in investment securities that is due to changes in the foreign exchange rates from that which is due to changes in market prices of investment securities.
The Funds report certain foreign-currency-related transactions as components of realized gains for financial reporting purposes, whereas such components are treated as ordinary income for Federal income tax purposes.
Forward Foreign Currency Contracts — To the extent consistent with its investment objective and strategies, a Fund may enter into forward foreign currency contracts as hedges against either specific transactions, fund positions, speculative purposes or anticipated fund positions. All commitments are “marked-to-market” daily at the applicable foreign exchange rate, and any resulting unrealized gains or losses are recorded currently. The Fund realizes gains and losses at the time forward contracts are extinguished. Unrealized gains or losses on outstanding positions in forward foreign currency contracts held at the close of the year are recognized as ordinary income or loss for federal income tax purposes. The Fund could be exposed to risk if the counterparties to the contracts are unable to meet the terms of the contract and from unanticipated movements in the value of a foreign currency relative to the U.S. dollar.
Finally, the risk exists that losses could exceed amounts disclosed on the Statement of Assets and Liabilities. Refer to each Fund’s Schedule of Investments for details regarding open forward foreign currency contracts as of September 30, 2021, if applicable.
Futures Contracts — To the extent consistent with its investment objective and strategies, the Funds may purchase futures contracts to gain exposure to market
changes, which may be more efficient or cost effective than actually buying the securities. To the extent consistent with its investment objective and strategies, a Fund may utilize futures contracts for tactical hedging purposes as well as to enhance the Funds’ returns and may also utilize futures contracts to efficiently assist in managing the Funds’ duration and yield curve exposure. Upon entering into such a contract, a Fund is required to deposit and maintain as collateral such initial margin as required by the exchange on which the contract is held. The contracts are marked to market daily and the resulting changes in value are accounted for as unrealized gains and losses. Variation margin payments are paid or received, depending upon whether unrealized losses or gains are incurred. When the contract is closed, the Funds record a realized gain or loss equal to the difference between the proceeds from (or cost of) the closing transaction and the amount invested in the contract.
Risks of entering into futures contracts include the possibility that there will be an imperfect price correlation between the futures and the underlying securities. Second, it is possible that a lack of liquidity for futures contracts could exist in the secondary market, resulting in an inability to close a position prior to its maturity date. Third, the futures contract involves the risk that a Fund could lose more than the original margin deposit required to initiate a futures transaction.
Finally, the risk exists that losses could exceed amounts disclosed on the Statement of Assets and Liabilities. Refer to each Fund’s Schedule of Investments for details regarding open futures contracts as of September 30, 2021, if applicable.
Options/Swaptions Written/Purchased — To the extent consistent with its investment objective and strategies, a Fund may invest in financial options/swaptions contracts for the purpose of hedging its existing portfolio securities, or securities that a Fund intends to purchase, against fluctuations in fair market value caused by changes in prevailing market interest rates. A Fund may also invest in financial option/swaption contracts to enhance its returns. When the Fund writes or purchases an option/swaption, an amount equal to the premium received or paid by the Fund is recorded as a liability or an asset and is subsequently adjusted to the current market value of the option/swaption written or purchased. Premiums received or paid from writing or purchasing options/swaptions which expire unexercised are treated by the Fund on the expiration date as realized gains or losses. The difference between the premium and the amount paid or received on effecting a closing purchase or sale transaction, including brokerage commissions, is also treated as a
SEI Institutional International Trust / Annual Report / September 30, 2021 |
85 |
NOTES TO FINANCIAL STATEMENTS (Continued)
September 30, 2021
realized gain or loss. If an option/swaption is exercised, the premium paid or received is added to the cost of the purchase or proceeds from the sale in determining whether the Fund has realized a gain or a loss.
The risk in writing a call option/swaption is a Fund may give up the opportunity for profit if the market price of the security increases. The risk in writing a put option/swaption is a Fund may incur a loss if the market price of the security decreases and the option/swaption is exercised. The risk in purchasing an option/swaption is a Fund may pay a premium whether or not the option/swaption is exercised. The Funds also have the additional risk of being unable to enter into a closing transaction at an acceptable price if a liquid secondary market does not exist. Option/swaption contracts also involve the risk that they may not work as intended due to unanticipated developments in market conditions or other causes.
Finally, the risk exists that losses on written options could exceed amounts disclosed on the Statements of Assets and Liabilities. Refer to each Fund’s Schedule of Investments for details regarding open option/swaption contracts as of September 30, 2021, if applicable.
Swap Agreements — To the extent consistent with its investment objective and strategies, a Fund may invest in swap contracts as an efficient means to take and manage risk in the portfolio, including interest rate risk, credit risk and overall yield sensitivity. A swap agreement is a two-party contract under which an agreement is made to exchange returns from predetermined investments or instruments, including a particular interest rate, foreign currency, or “basket” of securities representing a particular index. Swap agreements are privately negotiated in the over-the-counter market (“OTC swaps”) or may be executed in a multilateral or other trade facility platform, such as a registered commodities exchange (“Centrally Cleared swaps”). Interest rate swaps involve the exchange by a Fund with another party of their respective commitments to pay or receive interest (e.g., an exchange of floating rate payments for fixed rate payments) with respect to a notional amount of principal. Credit default swaps involve the periodic payment by a Fund or counterparty of interest based on a specified rate multiplied by a notional amount assigned to an underlying debt instrument or group of debt instruments in exchange for the assumption of credit risk on the same instruments. In the event of a credit event, usually in the form of a credit rating downgrade, the party receiving periodic payments (i.e. floating rate payer) must pay the other party (i.e. fixed rate payer) an amount equal to the outstanding principal of the downgraded debt instrument. Total return swaps allow an investor to benefit from the
cash flow without ever actually owning the underlying security. The receiver must pay any decline in value to the payer at the end of the total return swap. However, the investor does not need to make a payment if there is no decline in price. Payments can be made on various indices, bonds (i.e. mortgage backed securities, bank debt and corporate), loans or commodities. The value of a total return swap is equal to the change in value of the underlying asset versus the accrued income payment based on LIBOR (London Interbank Offered Rate) or some other form of index on the notional amount. Interest rate swaps involve the exchange by a Fund with another party of their respective commitments to pay or receive interest (e.g., an exchange of floating rate payments for fixed rate payments) with respect to a notional amount of principal to manage a Fund’s exposure to interest rates. Payments received or made are recorded as realized gains or losses. A Fund could be exposed to credit or market risk due to unfavorable changes in the fluctuation of interest rates or if the counterparty defaults on its obligation to perform. Risk of loss may exceed amounts recognized on the statement of assets and liabilities. In connection with swap agreements, securities/cash may be set aside as collateral by the Fund’s custodian. A Fund may enter into swap agreements in order to, among other things, change the maturity or duration of the investment portfolio; protect a Fund’s value from changes in interest rates; or expose a Fund to a different security or market.
Swaps are marked-to-market daily based upon quotations from market makers and the resulting changes in market values, if any, are recorded as unrealized gains or losses in the Statement of Operations. Centrally cleared swaps are valued at the settlement price established each day by the board of exchange on which they are traded. The daily settlement prices for centrally cleared swaps are provided by an independent source. Net payments of interest are recorded as realized gains or losses. Daily changes in valuation of Centrally Cleared swaps, if any, are recorded as a receivable or payable for the change in value as appropriate (“variation margin”) on the Statements of Assets and Liabilities.
Entering into swap agreements involves, to varying degrees, elements of credit and market risk in excess of the amounts recognized on the Schedule of Investments or the Statement of Assets and Liabilities. Such risks involve the possibility that there will be no liquid market for these agreements, that the counterparty to the agreement may default on its obligation to perform and that there may be unfavorable changes in the fluctuation of interest rates. Risks also arise from potential losses from adverse market movements.
| 86 |
SEI Institutional International Trust / Annual Report / September 30, 2021 |
Counterparty risk may be mitigated by having a master netting arrangement between a Fund and the counterparty and by having the counterparty post collateral to cover a Fund’s exposure to the counterparty. Refer to each Fund’s Schedule of Investments for details regarding open swap contracts as of September 30, 2021, if applicable.
Delayed Delivery Transactions — A Fund may purchase or sell securities on a when-issued or delayed delivery basis. These transactions involve a commitment by the Fund to purchase or sell securities for a predetermined price or yield, with payment and delivery taking place beyond the customary settlement period. When delayed delivery purchases are outstanding, the Fund will set aside liquid assets in an amount sufficient to meet the purchase price. When purchasing a security on a delayed delivery basis, the Fund assumes the rights and risks of ownership of the security, including the risk of price and yield fluctuations, and takes such fluctuations into account when determining its net asset value. The Fund may dispose of or renegotiate a delayed delivery transaction after it is entered into, and may sell when-issued securities before they are delivered, which may result in a capital gain or loss. When the Fund has sold a security on a delayed delivery basis, the Fund does not participate in future gains and losses with respect to the security.
Loan Participations and Brady Bonds — To the extent consistent with its investment objective and strategies, a Fund may invest in U.S. dollar-denominated fixed- and floating-rate loans (“Loans”) arranged through private negotiations between a foreign sovereign entity and one or more financial institutions (“Lenders”). The Fund invests in such Loans in the form of participations in Loans (“Participations”) or assignments of all or a portion of Loans from third parties. Participations typically result in a Fund having a contractual relationship only with the Lenders, not with the sovereign borrowers. The Fund has the right to receive payments of principal, interest and any fees to which it is entitled from the Lender selling the Participation and only upon receipt by the Lender of the payments from the borrower. In connection with purchasing Participations, the Fund generally has no right to enforce compliance by the borrower with the terms of the loan agreement relating to the Loan, nor any rights of set-off against the borrower, and the Fund will not benefit directly from any collateral supporting the Loan in which it has purchased the Participation. As a result, the Fund assumes the credit risk of both the borrower and the Lender that is selling the Participation. Certain debt obligations, customarily referred to as “Brady Bonds”, are created through the exchange of existing commercial bank loans to foreign entities for new obligations in connection with debt restructuring
under a plan introduced by former U.S. Secretary of the Treasury Nicholas F. Brady. Brady Bonds have only been issued since 1989, and, accordingly, do not have a long payment history. They are issued by governments that may have previously defaulted on the loans being restructured by the Brady Bonds, so they are subject to the risk of default by the issuer. They may be fully or partially collateralized or uncollateralized and issued in various currencies.
Dividends and Distributions to Shareholders — The International Equity, Emerging Markets Equity and International Fixed Income Funds will distribute substantially all of their net investment income and all net realized capital gains, if any, at least annually. The Emerging Markets Debt Fund will distribute substantially all of its net investment income, if any, at least quarterly and all net realized gains, if any, at least annually. All dividends and distributions are recorded on ex-dividend date.
Investments in Real Estate Investment Trusts (“REITs”) — Dividend income is recorded based on the income included in distributions received from the REIT investments using published REIT reclassifications including management estimates when actual amounts are not available. Distributions received in excess of this estimated amount are recorded as a reduction of the cost of investments or reclassified to capital gains. The actual amounts of income, return of capital, and capital gains are only determined by each REIT after its fiscal year-end, and may differ from the estimated amounts.
Participation Notes (P-Notes) — To the extent consistent with its investment objective and strategies, a Fund may acquire P-Notes issued by participating banks or broker-dealers. P-Notes are participation interest notes that are designed to offer a return linked to a particular underlying equity, debt, currency or market. The P-Notes in which the Fund may invest will typically have a maturity of one year. When purchasing a P-Note, the posting of margin is not required because the full cost of the P-Note (plus commission) is paid at the time of purchase. When the P-Note matures, the issuer will pay to, or receive from, the purchaser the difference between the minimal value of the underlying instrument at the time of purchase and that instrument’s value at maturity. Investments in P-Notes involve the same risks associated with a direct investment in the underlying foreign companies of foreign securities markets that they seek to replicate. In addition, there can be no assurance that the trading price of P-Notes will equal the underlying value of the foreign companies or foreign securities markets that they seek to replicate. The holder of a participation note that is linked to a particular underlying security is entitled to receive any dividends paid in connection with an underlying security
SEI Institutional International Trust / Annual Report / September 30, 2021 |
87 |
NOTES TO FINANCIAL STATEMENTS (Continued)
September 30, 2021
or instrument. However, the holder of a participation note does not receive voting rights as it would if it directly owned the underlying security or instrument. P-Notes are generally traded over-the-counter. P-Notes constitute general unsecured contractual obligations of the banks or broker-dealers that issue them and the counterparty. There is also counterparty risk associated with these investments because the Fund is relying on the creditworthiness of such counterparty and has no rights under a participation note against the issuer of the underlying security.
3. CREDIT DERIVATIVES
A Fund may use credit default swaps to reduce risk where a Fund has exposure to the issuer, or to take an active long or short position with respect to the likelihood of an event of default. The reference obligation of the swap can be a single issuer, a “basket” of issuers, or an index. The underlying referenced assets are corporate debt, sovereign debt and asset backed securities.
The buyer of a credit default swap is generally obligated to pay the seller a periodic stream of payments over the term of the contract in return for a contingent payment upon the occurrence of a credit event with respect to an underlying reference obligation. Generally, a credit event for corporate or sovereign reference obligations means bankruptcy, failure to pay, obligation acceleration, repudiation/moratorium or restructuring. For credit default swaps on asset-backed securities, a credit event may be triggered by events such as failure to pay principal, maturity extension, rating downgrade or write-down.
If a Fund is a seller of protection, and a credit event occurs, as defined under the terms of that particular swap agreement, a Fund will generally either (i) pay to the buyer an amount equal to the notional amount of the swap and take delivery of the referenced obligation, other deliverable obligations, or underlying securities comprising a referenced index or (ii) pay a net settlement amount in the form of cash or securities equal to the notional amount of the swap less the recovery value of the referenced obligation or underlying securities comprising a referenced index.
If a Fund is a buyer of protection and a credit event occurs, as defined under the terms of that particular swap agreement, a Fund will either (i) receive from the seller of protection an amount equal to the notional amount of the swap and deliver the referenced obligation, other deliverable obligations or underlying securities comprising the referenced index or (ii) receive a net settlement amount in the form of cash or securities equal to the notional amount of the swap less the recovery value of the referenced obligation or underlying securities comprising the referenced index. Recovery values are calculated by market makers considering either industry standard recovery rates or entity specific factors and considerations until a credit event occurs. If a credit event has occurred, the recovery value is determined by a facilitated auction whereby a minimum number of allowable broker bids, together with a specified valuation method, are used to calculate the settlement value.
88 |
SEI Institutional International Trust / Annual Report / September 30, 2021 |
4. DERIVATIVE CONTRACTS
The following tables include only Funds that had exposure to more than one type of risk on derivatives held throughout the year. For Funds that held derivatives throughout the year with only one type of risk exposure, additional information can be found on the Schedules of Investments and the Statements of Operations. The fair value of derivative instruments as of period end was as follows ($ Thousand):
| Asset Derivatives | Liability Derivatives | |||||||||||||||
| Year Ended September 30, 2021 | Year Ended September 30, 2021 | |||||||||||||||
| | Statements of Assets and Liabilities Location | | Fair Value | | Statements of Assets and Liabilities Location | | Fair Value | |||||||||
International Fixed Income Fund | ||||||||||||||||
Interest rate contracts |
| Net Assets — Unrealized appreciation on swaps contracts Net Assets — Unrealized appreciation |
| $ | 228† | | Net Assets — Unrealized depreciation on swaps contracts Net Assets — Unrealized depreciation |
| $ | 258† | ||||||
| on futures contracts | 1,352* | on futures contracts | 595* | |||||||||||||
Foreign exchange contracts | | Unrealized gain on forward foreign currency contracts | | 7,830 | | Unrealized loss on forward foreign currency contracts | | 1,068 | ||||||||
|
|
|
| |||||||||||||
| Total derivatives not accounted for as hedging instruments | $ | 9,410 | $ | 1,921 | ||||||||||||
|
|
|
| |||||||||||||
|
|
|
| ||||||||||||||
| Asset Derivatives | Liability Derivatives | |||||||||||||||
| Year Ended September 30, 2021 | Year Ended September 30, 2021 | |||||||||||||||
| | Statements of Assets and Liabilities Location | | Fair Value | | Statements of Assets and Liabilities Location | | Fair Value | |||||||||
Emerging Markets Debt Fund | ||||||||||||||||
Interest rate contracts | | Net Assets — Unrealized appreciation on futures contracts | | $ | 558* | | Net Assets — Unrealized depreciation on futures contracts | | $ | 489 * | | |||||
| Net Assets — Unrealized appreciation | Net Assets — Unrealized depreciation | |||||||||||||||
| on swaps contracts | 2,105† | on swaps contracts | 4,734 † | |||||||||||||
Foreign exchange contracts | | Unrealized gain on forward foreign currency contracts | | 4,821 | | Unrealized loss on forward foreign currency contracts | | 7,050 | ||||||||
|
|
|
| |||||||||||||
Total derivatives not accounted for as hedging instruments | $ | 7,484 | $ | 12,273 | ||||||||||||
|
|
|
|
| * | Includes cumulative appreciation/depreciation of futures contracts as reported in the Schedules of Investments. Only current day’s variation margin is reported within the Statements of Assets & Liabilities. |
| † | Includes cumulative appreciation/depreciation of swap contracts as reported in the Schedules of Investments. Market Value is reported within the Statements of Assets |
| & | Liabilities for OTC swap contracts that have paid premiums. For centrally cleared swap contracts current days variation margin is reported within the Statements of Assets & Liabilities. |
The effect of derivative instruments on the Statements of Operations for the year ended September 30, 2021.
Amount of realized gain or (loss) on derivatives recognized in income ($ Thousands):
| Derivatives Not Accounted for as Hedging Instruments | Swaptions | Futures | Forward Currency Contracts | Swaps | Total | |||||||||||||||
International Fixed Income Fund | ||||||||||||||||||||
Interest rate contracts | $ | (14) | $ | 765 | $ | — | $ | (103) | $ | 648 | ||||||||||
Foreign exchange contracts | — | 198 | (1,148) | — | (950) | |||||||||||||||
Credit contracts | — | — | — | — | — | |||||||||||||||
Total | $ | (14) | $ | 963 | $ | (1,148) | $ | (103) | $ | (302) | ||||||||||
SEI Institutional International Trust / Annual Report / September 30, 2021 |
89 |
NOTES TO FINANCIAL STATEMENTS (Continued)
September 30, 2021
| Derivatives Not Accounted for as Hedging Instruments | Futures | Forward Currency Contracts | Swaps | Total | ||||||||||||
Emerging Markets Debt Fund | ||||||||||||||||
Interest rate contracts | $ | 1,483 | $ | — | $ | 3,863 | $ | 5,346 | ||||||||
Foreign exchange contracts | 14 | 2,824 | — | 2,838 | ||||||||||||
Credit contracts | — | — | — | — | ||||||||||||
Total | $ | 1,497 | $ | 2,824 | $ | 3,863 | $ | 8,184 | ||||||||
Change in unrealized appreciation or (depreciation) on derivatives recognized in income ($ Thousands):
| Derivatives Not Accounted for as Hedging Instruments | Futures | Forward Currency Contracts | Swaps | Total | ||||||||||||
International Fixed Income Fund | ||||||||||||||||
Interest rate contracts | $ | 384 | $ | — | $ | (75) | $ | 309 | ||||||||
Foreign exchange contracts | — | 3,534 | — | 3,534 | ||||||||||||
Credit contracts | — | — | 323 | 323 | ||||||||||||
Total | $ | 384 | $ | 3,534 | $ | 248 | $ | 4,166 | ||||||||
| ||||||||||||||||
| Derivatives Not Accounted for as Hedging Instruments | Futures | Forward Currency Contracts | Swaps | Total | ||||||||||||
Emerging Markets Debt Fund | ||||||||||||||||
Interest rate contracts | $ | 470 | $ | — | $ | (5,669) | $ | (5,199) | ||||||||
Credit contracts | — | — | 72 | 72 | ||||||||||||
Foreign exchange contracts | — | 4,138 | (232) | 3,906 | ||||||||||||
Total | $ | 470 | $ | 4,138 | $ | (5,829) | $ | (1,221) | ||||||||
A Fund is subject to various netting arrangements with select counterparties (“Master Agreements”). Master Agreements govern the terms of certain transactions, and reduce the counterparty risk associated with relevant transactions by specifying credit protection mechanisms and providing standardization that improves legal certainty. Since different types of transactions have different mechanics and are sometimes traded out of different legal entities of a particular counterparty organization, each type of transaction may be covered by a different Master Agreement, resulting in the need for multiple agreements with a single counterparty. As the Master Agreements are specific to unique operations of different asset types, they allow a Fund to close out and net its total exposure to a specific counterparty entity in the event of a default with respect to all the transactions governed under a single agreement with a specific counterparty entity.
Master Agreements can also help limit counterparty risk by specifying collateral posting arrangements at pre-arranged exposure levels. Under the Master Agreements, collateral is routinely transferred if the total net exposure to certain transactions (net of existing collateral already in place) governed under the relevant Master Agreement with a counterparty in
a given account exceeds a specified threshold, which typically ranges from zero to $250,000 depending on the counterparty and the type of Master Agreement. United States Treasury Securities and U.S. dollar cash are generally the preferred forms of collateral. Securities and cash pledged as collateral are reflected as assets in the Statements of Assets and Liabilities as either a component of investments at value (securities) or deposits due from counterparties (cash). Cash collateral received is not typically held in a segregated account and as such is reflected as a liability in the Statement of Assets and Liabilities as deposits due to counterparties. The market value of any securities received as collateral is not reflected as a component of net asset value. A Fund’s overall exposure to counterparty risk can change substantially within a short period, as it is affected by each transaction subject to the relevant Master Agreement.
Customer Account Agreements and related addendums govern exchange traded derivatives transactions such as futures, options on futures, and centrally cleared swaps. Exchange traded derivative transactions require posting of initial margin as determined by each relevant clearing agency which is segregated at a broker account registered with the Commodities Futures Trading Commission (CFTC), or the applicable regulator. In the
90 |
SEI Institutional International Trust / Annual Report / September 30, 2021 |
US, counterparty risk is significantly reduced as creditors of the futures broker do not have claim to Fund assets in the segregated account. Additionally, portability of exposure in the event of default further reduces risk to
the Funds. Variation margin, or changes in market value, are exchanged daily, but may not be netted between futures and cleared OTC derivatives.
The following is a summary of the market value and variation margin of exchange-traded or centrally cleared financial derivative instruments of the Funds as of September 30, 2021 ($ Thousands):
| Financial Derivatives Assets | Financial Derivatives Liabilities | |||||||||||||||||||||||||||
| Variation Margin Asset | Variation Margin Liability | |||||||||||||||||||||||||||
| Fund | Futures | Swap Agreements | Total | Futures | Swap Agreements | Total | ||||||||||||||||||||||
International Equity Fund | $ | 89 | $ | — | $ | 89 | $ | 145 | $ | — | $ | 145 | ||||||||||||||||
Emerging Markets Equity Fund | 518 | — | 518 | — | — | — | ||||||||||||||||||||||
International Fixed Income Fund | 94 | 12 | 106 | 128 | 17 | 145 | ||||||||||||||||||||||
Emerging Markets Debt Fund | 123 | 618 | 741 | 9 | 686 | 695 | ||||||||||||||||||||||
Cash pledged as collateral for exchange-traded and centrally cleared derivative instruments as of September 30, 2021 amounted to $3,647 ($ Thousands) for the International Equity Fund. Cash pledged as collateral for exchange-traded and centrally cleared derivative instruments as of September 30, 2021 amounted to $4,251 ($ Thousands) for the Emerging Markets Equity Fund. Cash pledged as collateral for exchange-traded and centrally cleared derivative instruments as of September 30, 2021 amounted to $614 ($ Thousands) for the International Fixed Income Fund. Cash pledged as collateral for exchange-traded and centrally cleared derivative instruments as of September 30, 2021 amounted to $4,682 ($ Thousands) for the Emerging Markets Debt Fund.
International Swaps and Derivatives Association, Inc. Master Agreements and Credit Support Annexes
(“ISDA Master Agreements”) govern OTC financial derivative transactions entered into by a Fund and select counterparties. ISDA Master Agreements maintain provisions for general obligations, representations, agreements, collateral and events of default or termination. Events of termination include conditions that may entitle counterparties to elect to terminate early and cause settlement of all outstanding transactions under the applicable ISDA Master Agreement. Any election to terminate early could be material to the financial statements. In limited circumstances, the ISDA Master Agreement may contain additional provisions that add additional counterparty protection beyond coverage of existing daily exposure if the counterparty has a decline in credit quality below a predefined level. These amounts, if any, may be segregated with a third party custodian.
The following is a summary by derivative type of the market value of OTC financial derivative instruments and collateral (received)/pledged as of September 30, 2021 ($ Thousands):
| Financial Derivative Assets | Financial Derivative Liabilities | |||||||||||||||||||||||||||||||||||||
|
| |||||||||||||||||||||||||||||||||||||
| International Fixed Income Fund | Forward Foreign Currency Contracts | Swap Agreements | Total Counter | Forward Foreign Currency Contracts | Swap Agreements | Total Over the Counter | Net Market Value of OTC Derivatives | Collateral (Received)/ Pledged* | Net Exposures^ | |||||||||||||||||||||||||||||
Bank of America | $ | 81 | $ | — | $ | 81 | $ 5 | $ | — | $ | 5 | $ | 76 | $ | — | $ | 76 | |||||||||||||||||||||
Barclays PLC | 982 | — | 982 | 115 | — | 115 | 867 | — | 867 | |||||||||||||||||||||||||||||
BNP Paribas | 1,906 | — | 1,906 | 45 | — | 45 | 1,861 | — | 1,861 | |||||||||||||||||||||||||||||
Brown Brothers Harriman | 515 | — | 515 | 11 | — | 11 | 504 | — | 504 | |||||||||||||||||||||||||||||
Citi | 72 | — | 72 | 44 | — | 44 | 28 | — | 28 | |||||||||||||||||||||||||||||
Citigroup | 990 | — | 990 | 90 | — | 90 | 900 | — | 900 | |||||||||||||||||||||||||||||
Credit Agricole | 3 | — | 3 | — | — | — | 3 | — | 3 | |||||||||||||||||||||||||||||
Deutsche Bank | — | 134 | 134 | 2 | — | 2 | 132 | — | 132 | |||||||||||||||||||||||||||||
Goldman Sachs | 336 | — | 336 | 12 | — | 12 | 324 | — | 324 | |||||||||||||||||||||||||||||
HSBC | 286 | — | 286 | 17 | — | 17 | 269 | — | 269 | |||||||||||||||||||||||||||||
JPMorgan Chase Bank | 1,754 | — | 1,754 | 293 | — | 293 | 1,461 | — | 1,461 | |||||||||||||||||||||||||||||
Morgan Stanley | 745 | — | 745 | 383 | — | 383 | 362 | — | 362 | |||||||||||||||||||||||||||||
RBC | 36 | — | 36 | — | — | — | 36 | — | 36 | |||||||||||||||||||||||||||||
Societe Generale | 37 | — | 37 | — | — | — | 37 | — | 37 | |||||||||||||||||||||||||||||
Standard Chartered | 53 | — | 53 | 22 | — | 22 | 31 | — | 31 | |||||||||||||||||||||||||||||
State Street | 23 | — | 23 | 29 | — | 29 | (6) | — | (6) | |||||||||||||||||||||||||||||
SEI Institutional International Trust / Annual Report / September 30, 2021 |
91 |
NOTES TO FINANCIAL STATEMENTS (Continued)
September 30, 2021
| Financial Derivative Assets | Financial Derivative Liabilities | |||||||||||||||||||||||||||||||||||||||
|
| |||||||||||||||||||||||||||||||||||||||
| International Fixed Income Fund | Forward Foreign Currency Contracts | Swap Agreements | Total Counter | Forward Foreign Currency Contracts | Swap Agreements | Total Over the Counter | Net Market Value of OTC Derivatives | Collateral (Received)/ Pledged* | Net Exposures^ | |||||||||||||||||||||||||||||||
UBS | $ | 1 | $ | — | $ | 1 | $ | — | $ | — | $ | — | $ | 1 | $ | — | $ | 1 | ||||||||||||||||||||||
Westpac Banking | 10 | — | 10 | — | — | — | 10 | — | 10 | |||||||||||||||||||||||||||||||
|
|
|
| |||||||||||||||||||||||||||||||||||||
Total Over the Counter | 7,830 | 134 | 7,964 | 1,068 | — | 1,068 | ||||||||||||||||||||||||||||||||||
| Financial Derivative Assets | Financial Derivative Liabilities | |||||||||||||||||||||||||||||||||||||||
| Emerging Markets Debt Fund | Forward Foreign Currency Contracts | Swap Agreements | Total Counter | Forward Foreign Currency Contracts | Swap Agreements | Total Over the Counter | Net Market Value of OTC Derivatives | Collateral (Received)/ Pledged* | Net Exposures^ | |||||||||||||||||||||||||||||||
Barclays PLC | $ | 227 | $ | — | $ | 227 | $ | 1,045 | $ | — | $ | 1,045 | $ | (818) | $ | — | $ | (818) | ||||||||||||||||||||||
Brown Brothers Harriman | 1 | — | 1 | — | — | — | 1 | — | 1 | |||||||||||||||||||||||||||||||
Citi | — | — | — | 266 | — | 266 | (266) | — | (266) | |||||||||||||||||||||||||||||||
Citibank | — | — | — | — | 275 | 275 | (275) | — | (275) | |||||||||||||||||||||||||||||||
Citigroup | 816 | — | 816 | 1,241 | — | 1,241 | (425) | — | (425) | |||||||||||||||||||||||||||||||
Deutsche Bank | 11 | — | 11 | 8 | — | 8 | 3 | — | 3 | |||||||||||||||||||||||||||||||
Goldman Sachs | 901 | 1,166 | 2,067 | 1,575 | 240 | 1,815 | 252 | — | 252 | |||||||||||||||||||||||||||||||
JPMorgan Chase Bank | 2,010 | 11 | 2,021 | 1,816 | 71 | 1,887 | 134 | — | 134 | |||||||||||||||||||||||||||||||
Merrill Lynch | 158 | — | 158 | 135 | — | 135 | 23 | — | 23 | |||||||||||||||||||||||||||||||
Morgan Stanley | 80 | — | 80 | 39 | — | 39 | 41 | — | 41 | |||||||||||||||||||||||||||||||
Standard Bank | 419 | — | 419 | 565 | — | 565 | (146) | — | (146) | |||||||||||||||||||||||||||||||
Standard Chartered | 73 | — | 73 | 256 | — | 256 | (183) | — | (183) | |||||||||||||||||||||||||||||||
State Street | 125 | — | 125 | 104 | — | 104 | 21 | — | 21 | |||||||||||||||||||||||||||||||
Total Over the Counter | 4,821 | 1,177 | 5,998 | 7,050 | 586 | 7,636 | ||||||||||||||||||||||||||||||||||
| ^ | Net Exposures represents the net receivable/(payable) that would be due from/to the counterparty in the event of default. Exposure from OTC financial derivative instruments can only be netted across transactions governed under the same master agreement with the same legal entity. |
| * | Excess collateral pledged is not shown for financial reporting purposes. |
No securities have been pledged or have been received as collateral for OTC financial derivative instruments as governed by ISDA Master Agreements as of September 30, 2021.
The following table discloses the volume of the Funds’ futures contracts, forward foreign currency contracts and swap activity during the year ended September 30, 2021 ($ Thousands):
| International Equity Fund | Emerging Markets Equity Fund | International Fixed Income Fund | Emerging Markets Debt Fund | |||||||||||||
Futures Contracts: | ||||||||||||||||
Equity Contracts | ||||||||||||||||
Average Notional Balance Long | $ | 53,032 | $ | 35,286 | $ | – | $ | – | ||||||||
Ending Notional Balance Long | 53,672 | 76,188 | – | – | ||||||||||||
Interest Contracts | ||||||||||||||||
Average Notional Balance Long | – | – | 74,290 | 45,968 | ||||||||||||
Average Notional Balance Short | – | – | 74,621 | 35,483 | ||||||||||||
Ending Notional Balance Long | – | – | 72,445 | 34,544 | ||||||||||||
Ending Notional Balance Short | – | – | 95,970 | 29,721 | ||||||||||||
Currency Contracts | ||||||||||||||||
Average Notional Balance Short | – | – | 36,231 | – | ||||||||||||
Ending Notional Balance Short | – | – | 35,623 | – | ||||||||||||
Forward Foreign Currency Contracts: | ||||||||||||||||
Average Notional Balance Long | – | – | 873,688 | 700,116 | ||||||||||||
Average Notional Balance Short | – | – | 870,145 | 701,784 | ||||||||||||
Ending Notional Balance Long | – | – | 998,213 | 679,953 | ||||||||||||
Ending Notional Balance Short | – | – | 991,315 | 682,082 | ||||||||||||
92 |
SEI Institutional International Trust / Annual Report / September 30, 2021 |
| International Equity Fund | Emerging Markets Equity Fund | International Fixed Income Fund | Emerging Markets Debt Fund | |||||||||||||
Swaps: | ||||||||||||||||
Credit Contracts | ||||||||||||||||
Average Notional Balance Long | $ | – | $ | – | $ | – | $ | 5,901 | ||||||||
Average Notional Balance Short | – | – | 221 | – | ||||||||||||
Interest Contracts | ||||||||||||||||
Average Notional Balance | – | – | 15,422 | 214,099 | ||||||||||||
Ending Notional Balance | – | – | 17,423 | 181,775 | ||||||||||||
Foreign Exchange Contracts | ||||||||||||||||
Average Notional Balance Long | – | – | – | 557 | ||||||||||||
Options/Swaptions: | ||||||||||||||||
Interest | ||||||||||||||||
Average Notional Balance Long† | – | – | 5 | – | ||||||||||||
Average Notional Balance Short† | – | – | 1 | – | ||||||||||||
† Represents cost.
5. INVESTMENT ADVISORY, ADMINISTRATION AND DISTRIBUTION AGREEMENTS, INVESTMENT SUB-ADVISORY AGREEMENTS AND OTHER TRANSACTIONS WITH AFFILIATES
Investment Advisory, Administration and Distribution Agreements — SIMC serves as investment adviser (the “Adviser”) to each Fund. In connection with serving as Adviser, SIMC is entitled to a fee, which is calculated daily and paid monthly, based on the average daily net assets of each fund.
SEI Investments Global Funds Services (the “Administrator”) provides administrative and transfer agency services to the Funds for annual fees, based on the average daily net assets of each fund.
SEI Investments Distribution Co. (the “Distributor”) is the distributor of the shares of the Funds. The Funds have adopted a shareholder services plan and agreement (the Service Plan) with respect to Class F (formerly Class A) and Class I Shares that allows such shares to pay service providers a fee, based on average daily net assets of each respective Class of Shares, in connection with the ongoing servicing of shareholder accounts owning such shares. The International Equity Fund has also adopted an administrative services plan and agreement (the Administrative Service Plan) with respect to Class I Shares that allows such Shares to pay service providers a fee, based on average daily net assets of the Class I Shares, in connection with ongoing administrative services for shareholder accounts owning such Shares.
The Service Plan and Administrative Service Plan provide that shareholder service fees and administrative service fees, respectively, on Class F (formerly Class A) and Class I Shares will be paid to the Distributor, which may then be used by the Distributor to compensate financial intermediaries for providing shareholder services and administrative services, as applicable, with respect to the Shares.
The Adviser, Administrator and/or Distributor have voluntarily agreed to waive a portion of their fees in order to keep total direct operating expenses (exclusive of interest from borrowings, brokerage commissions, taxes, Trustees fees and extraordinary expenses not incurred in the ordinary course of the Funds’ business) at a specified level. The voluntary waivers by the Funds’ Adviser, Administrator and/or Distributor are limited to the Funds’ direct operating expenses and, therefore, do not apply to indirect expenses incurred by the Funds, such as acquired fund fees and expenses (AFFE). The waivers are voluntary and the Funds’ Adviser, Administrator and/or Distributor may discontinue all or part of any of these waivers at any time.
SEI Institutional International Trust / Annual Report / September 30, 2021 |
93 |
NOTES TO FINANCIAL STATEMENTS (Continued)
September 30, 2021
The following is a summary of annual fees payable to the Adviser and Distributor and the contractual and voluntary expense limitations for each Fund:
| Advisory Fee | Shareholder Servicing Fee | Administrative Servicing Fee | Voluntary Expense Limitation | |||||||||||||
International Equity Fund | ||||||||||||||||
Class F | 0.51% | 0.25% | — | 1.15% | ||||||||||||
Class I | 0.51% | 0.25% | 0.25% | 1.40% | ||||||||||||
Class Y | 0.51% | — | — | 0.90% | ||||||||||||
Emerging Markets Equity Fund* | ||||||||||||||||
Class F | 1.05% | 0.25% | — | N/A | ||||||||||||
Class Y | 1.05% | — | — | N/A | ||||||||||||
International Fixed Income Fund | ||||||||||||||||
Class F | 0.30% | 0.25% | — | 1.02% | ||||||||||||
Class Y | 0.30% | — | — | 0.77% | ||||||||||||
Emerging Markets Debt Fund | ||||||||||||||||
Class F | 0.85% | 0.25% | — | 1.36% | ||||||||||||
Class Y | 0.85% | — | — | 1.11% | ||||||||||||
| * | Renewed as of January 31, 2021, SIMC has contractually agreed to waive its advisory fee as necessary to keep the advisory fee paid by the Fund during its fiscal year from exceeding 0.95%. This fee waiver agreement shall remain in effect until January 31, 2022 and, unless earlier terminated, shall be automatically renewed for successive one-year periods thereafter. The agreement may be amended or terminated only with the consent of the Board of Trustees. |
N/A — Not applicable.
The following is a summary of annual fees payable to the Administrator:
| First $1.5 Billion of Assets | Next $500 Million of Assets | Next $500 Million of Assets | Next $500 Million of Assets | Over $3 Billion of Assets | ||||||||||||||||
International Equity Fund | 0.450 | % | 0.370 | % | 0.2900 | % | 0.210 | % | 0.130 | % | ||||||||||
Emerging Markets Equity Fund | 0.450 | % | 0.370 | % | 0.2900 | % | 0.210 | % | 0.130 | % | ||||||||||
International Fixed Income Fund | 0.450 | % | 0.370 | % | 0.2900 | % | 0.210 | % | 0.130 | % | ||||||||||
Emerging Markets Debt Fund | 0.450 | % | 0.370 | % | 0.2900 | % | 0.210 | % | 0.130 | % | ||||||||||
Investment Sub-Advisory Agreements — As of September 30, 2021, SIMC has entered into Investment Sub-Advisory Agreements with the following parties:
Investment Sub-Adviser
International Equity Fund
Acadian Asset Management LLC
Causeway Capital Management LLC
INTECH Investment Management LLC
JO Hambro Capital Management Limited
Lazard Asset Management LLC
Delaware Investments Fund Advisers, a series of
Macquarie Investment Management Business Trust
WCM Investment Management LLC
Emerging Markets Equity Fund
JO Hambro Capital Management Limited
KBI Global Investors (North America) Ltd.
Neuberger Berman Investment Advisers LLC
Qtron Investments LLC
Robeco Institutional Asset Management US Inc.
RWC Asset Advisors (US) LLC
International Fixed Income Fund
AllianceBernstein L.P.
Colchester Global Investors Ltd.
Wellington Management Company, LLP
Emerging Markets Debt Fund
Colchester Global Investors Ltd.
Marathon Asset Management, L.P.
Neuberger Berman Investment Advisers LLC
Ninety One UK Ltd.
Stone Harbor Investment Partners LP
Under the investment sub-advisory agreements, each sub-adviser receives a fee, paid by SIMC.
Brokerage Commissions Paid to Affiliates — The Distributor may receive compensation on fund transactions effected for the Trust in accordance with the rules of the Securities and Exchange Commission (“SEC”). Accordingly, it is expected that fund transactions may result in brokerage commissions being paid to the Distributor. The SEC rules require that such commissions not exceed usual and customary commissions.
Such commissions for the year ended September 30, 2021 were as follows ($ Thousands):
International Equity Fund | $ | 325 | ||
Emerging Markets Equity Fund | 160 |
94 |
SEI Institutional International Trust / Annual Report / September 30, 2021 |
Fees Paid Indirectly — The Funds may direct certain fund trades to the Distributor who pays a portion of the Fund’s expenses. Accordingly, the expenses reduced, which were used to pay third party expenses, and the effect on the Fund’s expense ratio, as a percentage of the Fund’s average daily net assets for the year ended September 30, 2021 can be found on the Statement of Operations and Financial Highlights, if applicable.
Investment in Affiliated Securities — The Funds may invest in the SEI Daily Income Trust Government Fund, an affiliated money market fund to manage excess cash or to serve as margin or collateral for derivative positions. Additionally, the Funds may invest cash collateral from the securities lending program in the SEI Liquidity Fund, L.P., also an affiliated fund.
Payment to Affiliates — Certain Officers and Trustees of the Trust are also Officers and/or Directors of the Administrator, Adviser and/or the Distributor.
The Trust pays each unaffiliated Trustee an annual fee for attendance at quarterly, interim, and committee meetings. The Administrator or the Distributor pays compensation of Officers and affiliated Trustees.
A portion of the services provided by the Chief Compliance Officer (“CCO”) and his staff, whom are
employees of the Administrator, are paid for by the Trust as incurred. The services include regulatory oversight of the Trust’s Adviser, sub-advisers and service providers.
Interfund Lending — The SEC has granted an exemption that permits the Trust to participate in an interfund lending program (“The Program”) with existing or future investment companies registered under the 1940 Act that are advised by SIMC (the “SEI Funds”). The Program allows the SEI Funds to lend money to and borrow money from each other for temporary or emergency purposes. Participation in The Program is voluntary for both borrowing and lending funds. Interfund loans may be made only when the rate of interest to be charged is more favorable to the lending fund than an investment in overnight repurchase agreements (“Repo Rate”), and more favorable to the borrowing fund than the rate of interest that would be charged by a bank for short-term borrowings (“Bank Loan Rate”). The Bank Loan Rate will be determined using a formula reviewed annually by the SEI Funds’ Board of Trustees. The interest rate imposed on interfund loans is the average of the Repo Rate and the Bank Loan Rate. As of and during the year ended September 30, 2021, the Trust has not participated in the Program.
6. INVESTMENT TRANSACTIONS
The cost of security purchases and the proceeds from the sale of securities, other than temporary cash investments, during the year ended September 30, 2021, were as follows:
International Equity Fund ($ Thousands) | Emerging Markets Equity ($ Thousands) | International Fixed Income ($ Thousands) | Emerging Markets Debt Fund ($ Thousands) | |||||||||||||
Purchases | ||||||||||||||||
U.S. Government | $— | $— | $13,620 | $— | ||||||||||||
Other | 4,622,493 | 1,914,416 | 369,081 | 1,383,443 | ||||||||||||
Sales | ||||||||||||||||
U.S. Government | — | — | 5,308 | 1,679 | ||||||||||||
Other | 4,723,393 | 1,994,706 | 314,169 | 1,293,589 | ||||||||||||
7. FEDERAL TAX INFORMATION:
It is each Fund’s intention to continue to qualify as a regulated investment company under Subchapter M of the Internal Revenue Code and distribute all of its taxable income (including net capital gains). Accordingly, no provision for Federal income taxes is required.
The Funds may be subject to taxes imposed by countries in which they invest with respect to their investments in issuers existing or operating in such countries. Such taxes are generally based on income earned. The Funds accrue such taxes when the related income is earned.
Dividends from net investment income and distributions from net realized capital gains are determined in
accordance with U.S. Federal income tax regulations, which may differ from those amounts determined under U.S. GAAP. These book/tax differences are either temporary or permanent in nature. To the extent these differences are permanent, they are charged or credited to paid-in capital and distributable earnings, as appropriate, in the period that the differences arise.
Accordingly, the following permanent differences, primarily attributable to different treatment for gains and losses on paydowns of mortgage and asset-backed securities for tax purposes, investments in swaps, investments in passive foreign investment companies, distribution reclassification, REIT income reclassification and foreign currency transactions. The permanent difference that is credited or charged to Paid in Capital
SEI Institutional International Trust / Annual Report / September 30, 2021 |
95 |
NOTES TO FINANCIAL STATEMENTS (Continued)
September 30, 2021
and Distributable Earnings as of September 30, 2021 is primarily related to nondeductible excise tax paid during the year.
Paid-in Capital ($ Thousands) | Distributable Earning (Accumulated Losses) | |||||||
Emerging Markets Equity Fund | $ | (17) | $ 17 | |||||
These reclassifications have no impact on net assets of the net asset value per share.
The tax character of dividends and distributions declared during the last two years were as follows:
Ordinary Income ($Thousands) | Long-term Capital Gain ($ Thousands) | Total ($Thousands) | ||||||||||||||
International Equity Fund | 2021 | $ | 43,996 | $ | — | $ | 43,996 | |||||||||
| 2020 | 75,520 | — | 75,520 | |||||||||||||
Emerging Markets Equity Fund | 2021 | 10,653 | — | 10,653 | ||||||||||||
| 2020 | 20,681 | — | 20,681 | |||||||||||||
International Fixed Income Fund | 2021 | — | 149 | 149 | ||||||||||||
| 2020 | 16,125 | 746 | 16,871 | |||||||||||||
Emerging Markets Debt Fund | 2021 | 30,547 | — | 30,547 | ||||||||||||
| 2020 | 12,511 | — | 12,511 | |||||||||||||
As of September 30, 2021, the components of Distributable Earnings (Accumulated Losses) were as follows:
Undistributed ($ Thousands) | Undistributed Long-Term Capital Gain ($ Thousands) | Capital Loss | Post October ($ Thousands) | Late Year Ordinary Losses ($ Thousands) | Unrealized ($ Thousands) | Other Temporary Differences ($ Thousands) | Total ($ Thousands) | |||||||||||||||||||||||||
International Equity Fund | $ | 258,794 | $ | 315,458 | $ | — | $ | — | $ | — | $ | 600,485 | $ | 2 | $ | 1,174,739 | ||||||||||||||||
Emerging Markets Equity Fund | 15,702 | 144,053 | — | — | — | 336,556 | (2 | ) | 496,309 | |||||||||||||||||||||||
International Fixed Income Fund | 469 | 4,994 | — | — | — | 3,712 | (9,097 | ) | 78 | |||||||||||||||||||||||
Emerging Markets Debt Fund | 3,052 | — | (9,725 | ) | — | — | (65,043 | ) | (14,253 | ) | (85,969 | ) | ||||||||||||||||||||
Post-October losses represent losses realized on investment transactions from November 1, 2020 through September 30, 2021 that, in accordance with Federal income tax regulations, the Funds may elect to defer and treat as having arisen in the following fiscal year.
For Federal income tax purposes, capital loss carryforwards may be carried forward and applied against future capital gains.
The Funds have capital losses carried forward as follows:
| Short-Term ($ Thousands) | Long-Term ($ Thousands) | Total Capital Loss ($ Thousands) | ||||||||||
Emerging Markets Debt Fund | $— | $9,725 | $9,725 | |||||||||
For fiscal year ended September 30, 2021, the following Funds utilized capital loss carryforward from prior year to offset current year realized gain:
| Amount Utilized ($ Thousands) | ||||
International Equity Fund | $29,195 | |||
Emerging Markets Equity Fund | 83,049 | |||
International Fixed Income Fund | 419 | |||
Emerging Markets Debt Fund | 13,287 | |||
For Federal income tax purposes, the cost of securities owned at September 30, 2021, and the net realized gains or losses on securities sold for the period were not materially different from amounts reported for financial reporting purposes. These differences are primarily due to investments in derivatives, passive foreign investment companies and wash sales which cannot be used for Federal income tax purposes in the current year and have been deferred for use in future years. The aggregate gross unrealized appreciation and depreciation on total investments held by the Funds at September 30, 2021, was as follows:
96 |
SEI Institutional International Trust / Annual Report / September 30, 2021 |
| Federal Tax Cost ($ Thousands) | Appreciated Securities ($ Thousands) | Depreciated Securities ($ Thousands) | Net Unrealized Appreciation/ (Depreciation) ($ Thousands) | |||||||||||
International Equity Fund | $ | 4,118,845 | $ | 768,004 | $ | (167,519 | ) | $ 600,485 | ||||||
Emerging Markets Equity Fund | 1,578,732 | 452,795 | (116,239 | ) | 336,556 | |||||||||
International Fixed Income Fund | 530,858 | 14,681 | (10,969 | ) | 3,712 | |||||||||
Emerging Markets Debt Fund | 1,567,424 | 41,792 | (106,835 | ) | (65,043) | |||||||||
Management has analyzed the Funds’ tax positions taken on federal income tax returns for all open tax years and has concluded that as of September 30, 2021, no provision for income tax would be required in the Funds’ financial statements. The Funds’ federal and state income and federal excise tax returns for tax years for which the applicable statutes of limitations have not expired are subject to examination by the Internal Revenue Service and state departments of revenue.
8. CONCENTRATION/RISKS
In the normal course of business, the Trust enters into contracts that provide general indemnifications by the Trust to the counterparty to the contract. The Trust’s maximum exposure under these arrangements is dependent on future claims that may be made against the Trust and, therefore, cannot be estimated; however, management believes that, based on experience, the risk of loss from such claims is considered remote.
To the extent consistent with its Investment Strategy, a Fund may have one of more of the following principal risks:
Asset-Backed Securities Risk — Payment of principal and interest on asset-backed securities is dependent largely on the cash flows generated by the assets backing the securities. Securitization trusts generally do not have any assets or sources of funds other than the receivables and related property they own, and asset-backed securities are generally not insured or guaranteed by the related sponsor or any other entity. Asset-backed securities may be more illiquid than more conventional types of fixed-income securities that the Funds acquire.
Credit Risk — The risk that the issuer of a security or the counterparty to a contract will default or otherwise become unable to honor a financial obligation.
Currency Risk — As a result of a Fund’s investments in active positions in currencies and securities or other investments denominated in, and/or receiving revenues in, foreign currencies and the Fund’s active management of its currency exposures, the Fund will be subject to currency risk. Currency risk is the risk that foreign currencies will decline in value relative to the U.S. dollar or, in the case of hedging positions, that the U.S. dollar will decline in value relative to the currency hedged.
In either event, the dollar value of an investment in the Fund would be adversely affected. Due to the Fund’s active positions in currencies, it will be subject to the risk that currency exchange rates may fluctuate in response to, among other things, changes in interest rates, intervention (or failure to intervene) by U.S. or foreign governments, central banks or supranational entities, or by the imposition of currency controls or other political developments in the United States or abroad.
Economic Risks of Global Health Events — Global health events and pandemics, such as COVID-19, have the ability to affect—quickly, drastically and substantially the economies of many nations, states, individual companies and the markets in general and can cause disruptions that cannot necessarily be foreseen. The spread of COVID-19 around the world in 2020 resulted in a substantial number of nations implementing social distancing measures, quarantines, and the shutdown of non-essential businesses and governmental services. Further, it has caused significant volatility in U.S. and international markets. The impact of the outbreak may be short term or may last for an extended period of time.
Foreign Investment/Emerging Markets Risk — The risk that non-U.S. securities may be subject to additional risks due to, among other things, political, social and economic developments abroad, currency movements and different legal, regulatory, tax, accounting and audit environments. These additional risks may be heightened with respect to emerging market countries because political turmoil and rapid changes in economic conditions are more likely to occur in these countries. Investments in emerging markets are subject to the added risk that information in emerging market investments may be unreliable or outdated due to differences in regulatory, accounting or auditing and financial record keeping standards, or because less information about emerging market investments is publicly available. In addition, the rights and remedies associated with emerging market investments may be different than investments in developed markets. A lack of reliable information, rights and remedies increase the risks of investing in emerging markets in comparison to more developed markets. In addition, periodic U.S. Government restrictions on investments in issuers from certain foreign countries may require the Fund to sell such investments at inopportune times, which could result in losses to the Fund.
Interest Rate Risk — The risk that a rise in interest rates will cause a fall in the value of fixed income securities, including U.S. Government securities, in which the Funds invest. A low interest rate environment may present greater interest rate risk, because there may be
SEI Institutional International Trust / Annual Report / September 30, 2021 |
97 |
NOTES TO FINANCIAL STATEMENTS (Concluded)
September 30, 2021
a greater likelihood of rates increasing and rates may increase more rapidly.
Market Risk — The risk that the market value of a security may move up and down, sometimes rapidly and unpredictably. Market risk may affect a single issuer, an industry, a sector or the equity or bond market as a whole. Equity markets may decline significantly in response to adverse issuer, political, regulatory, market, economic or other developments that may cause broad changes in market value, public perceptions concerning these developments, and adverse investor sentiment or publicity. Similarly, environmental and public health risks, such as natural disasters, epidemics, pandemics or widespread fear that such events may occur, may impact markets adversely and cause market volatility in both the short- and long-term. The prices of the Fund’s fixed income securities respond to economic developments, particularly interest rate changes, as well as to perceptions about the creditworthiness of individual issuers, including governments and their agencies. Generally, the Fund’s fixed income securities will decrease in value if interest rates rise and vice versa. In a low interest rate environment, risks associated with rising rates are heightened. Declines in dealer market-making capacity as a result of structural or regulatory changes could further decrease liquidity and/or increase volatility in the fixed income markets. Markets for fixed income securities may decline significantly in response to adverse issuer, political, regulatory, market, economic or other developments that may cause broad changes in market value, public perceptions concerning these developments, and adverse investor sentiment or publicity. Similarly, environmental and public health risks, such as natural disasters, epidemics, pandemics or widespread fear that such events may occur, may impact markets adversely and cause market volatility in both the short- and long-term. In response to these events, the Fund’s value may fluctuate and/or the Fund may experience increased redemptions from shareholders, which may impact the Fund’s liquidity or force the Fund to sell securities into a declining or illiquid market.
Mortgage-Backed Securities Risk — Mortgage-backed securities are affected significantly by the rate of prepayments and modifications of the mortgage loans backing those securities, as well as by other factors such as borrower defaults, delinquencies, realized or liquidation losses and other shortfalls. Mortgage-backed securities are particularly sensitive to prepayment risk, which is described below, given that the term to maturity for mortgage loans is generally substantially longer than the expected lives of those securities; however, the timing and amount of prepayments cannot be accurately predicted. The timing of changes in the rate of prepayments of the mortgage loans may
significantly affect the Funds’ actual yield to maturity on any mortgage-backed securities, even if the average rate of principal payments is consistent with the Funds’ expectation. Along with prepayment risk, mortgage-backed securities are significantly affected by interest rate risk, which is described above. In a low interest rate environment, mortgage loan prepayments would generally be expected to increase due to factors such as refinancing and loan modifications at lower interest rates. In contrast, if prevailing interest rates rise, prepayments of mortgage loans would generally be expected to decline and therefore extend the weighted average lives of mortgage-backed securities held or acquired by the Funds.
Please refer to each Fund’s current prospectus for additional disclosure regarding the risks associated with investing in the Funds. The foregoing is not intended to be a complete discussion of the risks associated with the investment strategies of the Funds.
9. SECURITIES LENDING
A Fund may lend portfolio securities to brokers, dealers and other financial organizations that meet capital and other credit requirements or other criteria established by the Trust’s Board of Trustees. These loans may not exceed 33 1/3% of the total asset value of a Fund (including the loan collateral). No Fund will lend portfolio securities to its Adviser, sub-adviser or their affiliates unless it has applied for and received specific authority to do so from the SEC. Loans of portfolio securities will be fully collateralized by cash. Collateral will be maintained in an amount equal to at least 100% of the current market value of the loaned securities by marking to market daily, although the borrower will be required to deliver collateral between 102% and 105% of the market value of borrowed securities for domestic and foreign securities, respectively. However, due to market fluctuations during the day, the value of securities loaned on a particular day may, during the course of the day, exceed the value of collateral. On each business day, the amount of collateral is adjusted based on the prior day’s market fluctuations and the current day’s lending activity. Income from lending activity is determined by the amount of interest earned on collateral, less any amounts payable to the borrowers of the securities and the lending agent. Lending securities involves certain risks, including the risk that a Fund may be delayed or restricted from recovering the loaned securities or disposing of the collateral for the loan which could give rise to loss because of adverse market actions expenses and/or delays in connection with the disposition of the underlying securities.
Cash collateral received in connection with securities lending is invested in eligible securities by the lending
98 |
SEI Institutional International Trust / Annual Report / September 30, 2021 |
agent. These investments may include the SEI Liquidity Fund, L.P. (“Liquidity Fund”) and the Fund bears its pro rata portion of the Liquidity Fund’s expenses and is subject to the risk of loss in the underlying investments of the Liquidity Fund and losses on such investment. There is no guarantee that these investments will not lose value.
The following is a summary of securities lending agreements held by certain Funds which would be subject to offset as of September 30, 2021
($ Thousands):
| Securities Loaned at Value | Cash Collateral Received(1) | Net Amount | |||||||||||||||||||||||
International Equity Fund | $ | 153,788 | $ | 153,788 | $ | — | |||||||||||||||||||
Emerging Markets Equity Fund | 16,962 | 16,962 | — | ||||||||||||||||||||||
Emerging Markets Debt Fund | 40,260 | 40,260 | — | ||||||||||||||||||||||
| (1) | Excess collateral received in connection with the above securities lending transactions is not shown for financial reporting purposes. See each Fund’s Schedule of Investments for the total collateral received. |
10. CONCENTRATION OF SHAREHOLDERS
SEI Private Trust Company (“SPTC”) and SIMC are subsidiaries of SEI Investments Company. As of September 30, 2021, SPTC held of record the following:
| Fund | Class F | Class I | Class Y | |||||||||
International Equity Fund | 96.39% | —% | 47.12% | |||||||||
Emerging Markets Equity Fund | 94.73% | —% | 61.18% | |||||||||
International Fixed Income Fund | 97.36% | —% | 98.89% | |||||||||
Emerging Markets Debt Fund | 98.15% | —% | 53.67% | |||||||||
SPTC is not a direct service provider to the SEI Funds. However, SPTC performs a role in the comprehensive investment solution that SEI provides to investors. SPTC holds shares in the Funds as custodian for shareholders that are clients of independent registered investment advisers, financial planners, bank trust departments and other financial advisers. SPTC maintains omnibus accounts at the Fund’s transfer agent.
11. REGULATORY MATTERS
On July 27, 2017, the U.K. Financial Conduct Authority announced that it intends to stop compelling or inducing banks to submit London Inter-Bank Offered Rate (LIBOR) rates after 2021. On March 5, 2021, the ICE Benchmark Administration clarified that the publication of LIBOR on a representative basis will cease for the one-week and two-month U.S. dollar LIBOR settings immediately after December 31, 2021, and for the remaining U.S. dollar LIBOR settings immediately after June 30, 2023. The elimination of the LIBOR may adversely affect the interest rates on, and value of, certain Fund investments
for which the value is tied to LIBOR. Such investments may include bank loans, derivatives, floating rate securities, and other assets or liabilities tied to LIBOR. Actions by regulators have resulted in the establishment of alternative reference rates to LIBOR in most major currencies. The U.S. Federal Reserve, based on the recommendations of the New York Federal Reserve’s Alternative Reference Rate Committee (comprised of major derivative market participants and their regulators), has begun publishing a Secured Overnight Financing Rate (SOFR), which is intended to replace U.S. dollar LIBOR. Alternative reference rates for other currencies have also been announced or have already begun publication. Markets are slowly developing in response to these new rates. Questions around liquidity impacted by these rates, and how to appropriately adjust these rates at the time of transition, remain a concern for a Fund. The effect of any changes to, or discontinuation of, LIBOR on a Fund will vary depending on, among other things, (1) existing fallback or termination provisions in individual contracts and (2) whether, how, and when industry participants develop and adopt new reference rates and fallbacks for both legacy and new products and instruments. Accordingly, it is difficult to predict the full impact of the transition away from LIBOR on a Fund until new reference rates and fallbacks for both legacy and new products, instruments and contracts are commercially accepted.
12. SUBSEQUENT EVENTS
Management has evaluated the need for disclosures and/or adjustments resulting from subsequent events through the date the financial statements were issued. Based on this evaluation, no disclosure and/or adjustments were required to the financial statements as of September 30, 2021.
| SEI Institutional International Trust / Annual Report / September 30, 2021 |
99 |
REPORT OF INDEPENDENT REGISTERED PUBLIC ACCOUNTING FIRM
To the Shareholders of the Funds and Board of Trustees
SEI Institutional International Trust:
Opinion on the Financial Statements
We have audited the accompanying statements of assets and liabilities of SEI Institutional International Trust, comprised of the International Equity Fund, Emerging Markets Equity Fund, International Fixed Income Fund, and Emerging Markets Debt Fund (collectively, the Funds), including the schedules of investments, as of September 30, 2021, the related statements of operations for the year then ended, the statements of changes in net assets for each of the years in the two-year period then ended, and the related notes (collectively, the financial statements) and the financial highlights for each of the years in the five-year period then ended. In our opinion, the financial statements and financial highlights present fairly, in all material respects, the financial position of the Funds as of September 30, 2021, the results of their operations for the year then ended, the changes in their net assets for each of the years in the two-year period then ended, and the financial highlights for each of the years in the five-year period then ended, in conformity with U.S. generally accepted accounting principles.
Basis for Opinion
These financial statements and financial highlights are the responsibility of the Funds’ management. Our responsibility is to express an opinion on these financial statements and financial highlights based on our audits. We are a public accounting firm registered with the Public Company Accounting Oversight Board (United States) (PCAOB) and are required to be independent with respect to the Company in accordance with the U.S. federal securities laws and the applicable rules and regulations of the Securities and Exchange Commission and the PCAOB.
We conducted our audits in accordance with the standards of the PCAOB. Those standards require that we plan and perform the audit to obtain reasonable assurance about whether the financial statements and financial highlights are free of material misstatement, whether due to error or fraud. Our audits included performing procedures to assess the risks of material misstatement of the financial statements and financial highlights, whether due to error or fraud, and performing procedures that respond to those risks. Such procedures included examining, on a test basis, evidence regarding the amounts and disclosures in the financial statements and financial highlights. Such procedures also included confirmation of securities owned as of September 30, 2021, by correspondence with the custodian, transfer agent, and brokers or by other appropriate auditing procedures when replies were not received. Our audits also included evaluating the accounting principles used and significant estimates made by management, as well as evaluating the overall presentation of the financial statements and financial highlights. We believe that our audits provide a reasonable basis for our opinion.
/s/ KPMG LLP
We have served as the auditor of one or more SEI Funds investment companies since 2005.
Philadelphia, Pennsylvania
November 29, 2021
100 |
SEI Institutional International Trust / Annual Report / September 30, 2021 |
TRUSTEES AND OFFICERS OF THE TRUST (Unaudited)
The following chart lists Trustees and Officers as of September 30, 2021.
Set forth below are the names, addresses, ages, position with the Trust, Term of Office and Length of Time Served, the principal occupations for the last five years, number of positions in fund complex overseen by trustee, and other directorships outside the fund complex of each of the persons currently serving as Trustees and Officers of the Trust. The Trust’s Statement of Additional Information (“SAI”) includes additional information about the Trustees and Officers. The SAI may be obtained without charge by calling 1-800-342-5794.
Name, Address, and Age | Position(s) Held with Trusts | Term of Office and Length of Time Served1 | Principal Occupation(s) During Past Five Years | Number of Portfolios in Fund by Trustee2 | Other Directorships Held by Trustee | |||||
| INTERESTED TRUSTEES | ||||||||||
| Robert A. Nesher One Freedom Valley Drive Oaks, PA 19456 75 yrs. old | Chairman of the Board of Trustees* | since 1989 | Currently performs various services on behalf of SEI for which Mr. Nesher is compensated. | 93 | President and Director of SEI Structured Credit Fund, LP. Director of SEI Global Master Fund plc, SEI Global Assets Fund plc, SEI Global Investments Fund plc, SEI Investments—Global Funds Services, Limited, SEI Investments Global, Limited, SEI Investments (Europe) Ltd., SEI Multi-Strategy Funds PLC, SEI Global Nominee Ltd and SEI Investments—Unit Trust Management (UK) Limited. President, Director and Chief Executive Officer of SEI Alpha Strategy Portfolios, LP from 2007 to 2013. Trustee of SEI Liquid Asset Trust from 1989 to 2016. Trustee of SEI Insurance Products Trust from 2013 to 2020. Vice Chairman of O’Connor EQUUS (closed-end investment company) from 2014 to 2016. Vice Chairman of Winton Series Trust from 2014 to 2017. Vice Chairman of The Advisors’ Inner Circle Fund III and Winton Diversified Opportunities Fund (closed-end investment company) from 2014 to 2018. Vice Chairman of Gallery Trust, Schroder Series Trust and Schroder Global Series Trust from 2015 to 2018. Trustee of The Advisors’ Inner Circle Fund, The Advisors’ Inner Circle Fund II, Bishop Street Funds, and the KP Funds. President, Chief Executive Officer and Trustee of SEI Asset Allocation Trust, SEI Daily Income Trust, SEI Institutional Managed Trust, SEI Institutional International Trust, SEI Institutional Investments Trust, SEI Tax Exempt Trust, Adviser Managed Trust, The New Covenant Funds and SEI Catholic Values Trust. | |||||
| William M. Doran One Freedom Valley Drive Oaks, PA 19456 81 yrs. old | Trustee* | since 1982 | Self-employed consultant since 2003.Partner, Morgan, Lewis & Bockius LLP (law firm) from 1976 to 2003, counsel to the Trust, SEI, SIMC, the Administrator and the Distributor. | 93 | Director of SEI since 1974; Secretary of SEI since 1978. Director of SEI Investments Distribution Co. since 2003. Director of SEI Investments—Global Funds Services, Limited, SEI Investments Global, Limited, SEI Investments (Europe), Limited, SEI Investments (Asia) Limited, SEI Global Nominee Ltd. and SEI Investments—Unit Trust Management (UK) Limited. Trustee of SEI Liquid Asset Trust from 1982 to 2016. Trustee of O’Connor EQUUS from 2014 to 2016. Director of SEI Alpha Strategy Portfolios, LP from 2007 to 2013. Trustee of Winton Series Trust from 2014 to 2017. Trustee of The Advisors’ Inner Circle Fund, The Advisors’ Inner Circle Fund II and Bishop Street Funds from 1991 to 2018. Trustee of The KP Funds from 2013 to 2018. Trustee of Winton Diversified Opportunities Fund from 2014 to 2018. Trustee of SEI Insurance Products Trust from 2013 to 2020. Trustee of The Advisors’ Inner Circle Fund III, Gallery Trust, SEI Asset Allocation Trust, SEI Daily Income Trust, SEI Institutional Managed Trust, SEI Institutional International Trust, SEI Institutional Investments Trust, SEI Tax Exempt Trust, Adviser Managed Trust, New Covenant Funds, Schroder Series Trust, Schroder Global Series Trust and SEI Catholic Values Trust. | |||||
| TRUSTEES | ||||||||||
| George J. Sullivan Jr.3 One Freedom Valley Drive, Oaks, PA 19456 78 yrs. old | Trustee | since 1996 | Retired since January 2012. Self-Employed Consultant, Newfound Consultants Inc. April 1997-December 2011. | 93 | Member of the independent review committee for SEI’s Canadian-registered mutual funds from 2011 to 2017. Director of SEI Alpha Strategy Portfolios, LP from 2007 to 2013. Trustee of SEI Liquid Asset Trust from 1996 to 2016. Trustee/Director of State Street Navigator Securities Lending Trust from 1996 to 2017. Trustee of SEI Insurance Products Trust from 2013 to 2020. Trustee/Director of The Advisors’ Inner Circle Fund, The Advisors’ Inner Circle Fund II, Bishop Street Funds, SEI Structured Credit Fund, LP, SEI Asset Allocation Trust, SEI Daily Income Trust, SEI Institutional Managed Trust, SEI Institutional International Trust, SEI Institutional Investments Trust, SEI Tax Exempt Trust, Adviser Managed Trust, New Covenant Funds, The KP Funds and SEI Catholic Values Trust. | |||||
| * | Messrs. Nesher and Doran are Trustees who may be deemed as “interested” persons of the Trust as that term is defined in the 1940 Act by virtue of their affiliation with SIMC and the Trust’s Distributor. |
| 1 | Each trustee shall hold office during the lifetime of this Trust until the election and qualification of his or her successor, or until he or she sooner dies, resigns or is removed in accordance with the Trust’s Declaration of Trust |
| 2 | The Fund Complex includes the following Trusts: SEI Asset Allocation Trust, SEI Daily Income Trust, SEI Institutional Investments Trust, Adviser Managed Trust, SEI Institutional International Trust, SEI Institutional Managed Trust, SEI Tax Exempt Trust, SEI Catholic Values Trust and New Covenant Funds. |
| 3 | George J. Sullivan, Jr. passed away on October 13, 2021. |
SEI Institutional International Trust / Annual Report / September 30, 2021 |
101 |
TRUSTEES AND OFFICERS OF THE TRUST (Unaudited) (Concluded)
| Name Address, and Age | Position(s) Held with Trusts | Term of Office and Length of Time Served1 | Principal Occupation(s) During Past Five Years | Number of Portfolios in Fund Complex Overseen by Trustee2 | Other Directorships Held by Trustee | |||||
| TRUSTEES (continued) | ||||||||||
Nina Lesavoy One Freedom Oaks, PA 19456 | Trustee | since 2003 | Founder and Managing Director, Avec Capital (strategic fundraising firm) since 2008. Managing Director, Cue Capital (strategic fundraising firm) from March 2002-March 2008. | 93 | Director of SEI Alpha Strategy Portfolios, LP from 2007 to 2013. Trustee of SEI Liquid Asset Trust from 2003 to 2016. Trustee of SEI Insurance Products Trust from 2013 to 2020. Trustee/Director of SEI Structured Credit Fund, L.P., SEI Asset Allocation Trust, SEI Daily Income Trust, SEI Institutional Managed Trust, SEI Institutional International Trust, SEI Institutional Investments Trust, SEI Tax Exempt Trust, New Covenant Funds, Adviser Managed Trust and SEI Catholic Values Trust. | |||||
James M. Williams Oaks, PA 19456 | Trustee | since 2004 | Vice President and Chief Investment Officer, J. Paul Getty Trust, Non-Profit Foundation for Visual Arts, since December 2002. President, Harbor Capital Advisors and Harbor Mutual Funds, 2000-2002. Manager, Pension Asset Management, Ford Motor Company, 1997-1999. | 93 | Director of SEI Alpha Strategy Portfolios, LP from 2007 to 2013, Trustee of SEI Liquid Asset Trust from 2004 to 2016. Trustee of SEI Insurance Products Trust from 2013 to 2020. Trustee/Director of Ariel Mutual Funds, SEI Structured Credit Fund, LP, SEI Asset Allocation Trust, SEI Daily Income Trust, SEI Institutional Managed Trust, SEI Institutional International Trust, SEI Institutional Investments Trust, SEI Tax Exempt Trust, New Covenant Funds, Adviser Managed Trust and SEI Catholic Values Trust. | |||||
Mitchell A. Johnson One Freedom Oaks, PA 19456 | Trustee | since 2007 | Retired Private Investor since 1994. | 93 | Director, Federal Agricultural Mortgage Corporation (Farmer Mac) since 1997. Director of SEI Alpha Strategy Portfolios, LP from 2007 to 2013. Trustee of SEI Liquid Asset Trust from 2007 to 2016. Trustee of SEI Insurance Products Trust from 2013 to 2020. Trustee of the Advisors’ Inner Circle Fund, The Advisors’ Inner Circle Fund II, Bishop Street Funds, SEI Asset Allocation Trust, SEI Daily Income Trust, SEI Institutional Managed Trust, SEI Institutional International Trust, SEI Institutional Investments Trust, SEI Tax Exempt Trust, Adviser Managed Trust, The KP Funds, New Covenant Funds and SEI Catholic Values Trust. | |||||
Hubert L. Harris, Jr. One Freedom Oaks, PA 19456 | Trustee | since 2008 | Retired since December 2005. Owner of Harris Plantation, Inc. since 1995. Chief Executive Officer of Harris CAPM, a consulting asset and property management entity. Chief Executive Officer, INVESCO North America, August 2003-December 2005. Chief Executive Officer and Chair of the Board of Directors, AMVESCAP Retirement, Inc., January 1998- August 2003. | 93 | Director of AMVESCAP PLC from 1993-2004. Served as a director of a bank holding company, 2003-2009. Director, Aaron’s Inc., 2012-present. President and CEO of Oasis Ornamentals LLC since 2011. Member of the Board of Councilors of the Carter Center (nonprofit corporation) and served on the board of other non-profit organizations. Director of SEI Alpha Strategy Portfolios, LP from 2008 to 2013. Trustee of SEI Liquid Asset Trust from 2008 to 2016. Trustee of SEI Insurance Products Trust from 2013 to 2020. Trustee of SEI Asset Allocation Trust, SEI Daily Income Trust, SEI Institutional Managed Trust, SEI Institutional International Trust, SEI Institutional Investments Trust, SEI Tax Exempt Trust, New Covenant Funds, Adviser Managed Trust and SEI Catholic Values Trust. | |||||
Susan C. Cote 66 years old | Trustee | since 2016 | Retired since July 2015. Americas Director of Asset Management, Ernst & Young LLP from 2006-2013. Global Asset Management Assurance Leader, Ernst & Young LLP from 2006- 2015. Partner Ernst & Young LLP from 1997-2015. Prudential, 1983-1997.Member of the Ernst & Young LLP Retirement Investment Committee, Treasurer and Chair of Finance, Investment and Audit Committee of the New York Women’s Foundation. | 93 | Trustee of SEI Insurance Products Trust from 2016 to 2020. Trustee of SEI Structured Credit Fund, LP, SEI Tax Exempt Trust, SEI Daily Income Trust, SEI Institutional International Trust, SEI Institutional Managed Trust, SEI Asset Allocation Trust, SEI Institutional Investments Trust, New Covenant Funds, Adviser Managed Trust and SEI Catholic Values Trust. | |||||
| James B. Taylor One Freedom Valley Drive Oaks, PA 19456 70 years old | Trustee | since 2018 | Retired since December 2017. Chief Investment Officer at Georgia Tech Foundation from 2008 to 2017. Chief Investment Officer at Delta Air Lines from 1983 to 2007. Member of the Investment Committee at the Institute of Electrical and Electronic Engineers from 1999 to 2004. President, Vice President and Treasurer at Southern Benefits Conference from 1998 to 2000. | 93 | Trustee of SEI Insurance Products Trust from 2018 to 2020. Trustee of SEI Daily Income Trust, SEI Tax Exempt Trust, SEI Institutional Managed Trust, SEI Institutional International Trust, SEI Institutional Investments Trust, SEI Asset Allocation Trust, Adviser Managed Trust, New Covenant Funds and SEI Catholic Values Trust. | |||||
Christine Reynolds | Trustee | since 2019 | Retired since December 2016. Executive Vice President, Fidelity Investments from 2014-2016. President, Fidelity Pricing and Cash Management Services and Chief Financial Officer of Fidelity Funds from 2008-2014. Chief Operating Officer, Fidelity Pricing and Cash Management Services from 2007-2008. President and Treasurer, Fidelity Funds from 2004-2007. Anti-Money Laundering Officer, Fidelity Funds in 2004. Executive Vice President, Fidelity Funds from 2002-2004. Audit Partner, PricewaterhouseCoopers from 1992-2002. | 93 | Trustee of SEI Insurance Products Trust from 2019 to 2020. Trustee of SEI Daily Income Trust, SEI Tax Exempt Trust, SEI Institutional Managed Trust, SEI Institutional International Trust, SEI Institutional Investments Trust, SEI Asset Allocation Trust, Adviser Managed Trust, New Covenant Funds and SEI Catholic Values Trust. | |||||
Thomas Melendez One Freedom 61 years old | Trustee | since 2021 | Retired since 2019. Investment Officer and Institutional Equity Portfolio Manager at MFS Investment Management from 2002 to 2019. Director of Emerging Markets Group, General Manager of Operations in Argentina and Portfolio Manager for Latin America at Schroders Investment Management from 1994 to 2002. | 84 | Trustee of Boston Children’s Hospital, The Partnership Inc. and Brae Burn Country Club (non-profit organizations). Trustee of SEI Daily Income Trust, SEI Tax Exempt Trust, SEI Institutional Managed Trust, SEI Institutional International Trust, SEI Institutional Investments Trust and SEI Asset Allocation Trust. Independent Consultant of Adviser Managed Trust, New Covenant Funds and SEI Catholic Values Trust. | |||||
| 1 | Each trustee shall hold office during the lifetime of this Trust until the election and qualification of his or her successor, or until he or she sooner dies, resigns or is removed in accordance with the Trust’s Declaration of Trust. |
| 2 | The Fund Complex includes the following Trusts: SEI Asset Allocation Trust, SEI Daily Income Trust, SEI Institutional Investments Trust, Adviser Managed Trust, SEI Institutional International Trust, SEI Institutional Managed Trust, SEI Tax Exempt Trust, SEI Catholic Values Trust and New Covenant Funds. |
102 |
SEI Institutional International Trust / Annual Report / September 30, 2021 |
| Name Address, and Age | Position(s) Held with Trusts | Term of Office and Length of Time Served1 | Principal Occupation(s) During Past Five Years | Number of Portfolios in Fund Complex Overseen by Trustee2 | Other Directorships Held by Trustee | |||||
| OFFICERS | ||||||||||
Robert A. Nesher 75 yrs. Old | President and CEO | since 2005 | Currently performs various services on behalf of SEI for which Mr. Nesher is compensated. | N/A | N/A | |||||
| Peter A. Rodriguez One Freedom Valley Drive Oaks, PA 19456 59 yrs. old | Controller and Chief Financial Officer | since 2020 | Director, Fund Accounting, SEI Investments Global Funds Services since April 2020 and previously from March 2011 to March 2015; Director, Financial Reporting from June 2017 to March 2020. Director, Centralized Operations from March 2015 to June 2017. | N/A | N/A | |||||
Glenn R. Kurdziel One Freedom Valley Drive | Assistant Controller | since 2017 | Assistant Controller, Funds Accounting, SEI Investments Global Funds Services (March 2017); Senior Manager, Funds Accounting, SEI Investments Global Funds Services since 2005. | N/A | N/A | |||||
| Russell Emery One Freedom Valley Drive Oaks, PA 19456 58 yrs. old | Chief Compliance Officer | since 2006 | Chief Compliance Officer of SEI Daily Income Trust, SEI Institutional Investments Trust, SEI Institutional Managed Trust, SEI Asset Allocation Trust, SEI Institutional International Trust, SEI Tax Exempt Trust, The Advisors’ Inner Circle Fund, The Advisors’ Inner Circle Fund II and Bishop Street Funds since March 2006. Chief Compliance Officer of SEI Liquid Asset Trust from 2006 to 2016. Chief Compliance Officer of SEI Structured Credit Fund, LP since June 2007. Chief Compliance Officer of Adviser Managed Trust since December 2010. Chief Compliance Officer of SEI Alpha Strategy Portfolios, LP from 2007 to 2013. Chief Compliance Officer of New Covenant Funds since February 2012. Chief Compliance Officer of SEI Insurance Products Trust from 2013 to 2020. Chief Compliance Officer of The KP Funds from 2013 to 2020. Chief Compliance Officer of O’Connor EQUUS from 2014 to 2016. Chief Compliance Officer of The Advisors’ Inner Circle Fund III since 2014. Chief Compliance Officer of Winton Series Trust from 2014 to 2017. Chief Compliance Officer of Winton Diversified Opportunities Fund from 2014 to 2018. Chief Compliance Officer of SEI Catholic Values Trust and Gallery Trust since 2015. Chief Compliance Officer of Schroder Series Trust and Schroder Global Series Trust since 2017. | N/A | N/A | |||||
| Timothy D Barto One Freedom Valley Drive Oaks, PA 19456 53 yrs. old | Vice President and Secretary | since 2002 | Vice President and Secretary of SEI Institutional Transfer Agent, Inc. since 2009. General Counsel and Secretary of SIMC and the Administrator since 2004. Vice President of SIMC and the Administrator since 1999. Vice President and Assistant Secretary of SEI since 2001. | N/A | N/A | |||||
Aaron Buser Oaks, PA 19456 | Vice President and Assistant Secretary | since 2008 | Vice President and Assistant Secretary of SEI Institutional Transfer Agent, Inc. since 2009. Vice President and Assistant Secretary of SIMC since 2007. Attorney Stark & Stark (law firm), March 2004-July 2007. | N/A | N/A | |||||
David F. McCann Valley Drive, | Vice President and Assistant Secretary | since 2009 | Vice President and Assistant Secretary of SEI Institutional Transfer Agent, Inc. since 2009. Vice President and Assistant Secretary of SIMC since 2008. Attorney, Drinker Biddle & Reath, LLP (law firm), May 2005 - October 2008. | N/A | N/A | |||||
| Stephen G. MacRae One Freedom Valley Drive, Oaks, PA 19456 53 yrs. old | Vice President | since 2012 | Director of Global Investment Product Management since January 2004. | N/A | N/A | |||||
Bridget E. Sudall Oaks, PA 19456 | Anti-Money Laundering Compliance Officer and Privacy Officer | since 2015 | Anti-Money Laundering Compliance Officer and Privacy Officer (since 2015), Senior Associate and AML Officer, Morgan Stanley Alternative Investment Partners, April 2011-March 2015, Investor Services Team Lead, Morgan Stanley Alternative Investment Partners, July 2007-April 2011. | N/A | N/A | |||||
| 1 | Each trustee shall hold office during the lifetime of this Trust until the election and qualification of his or her successor, or until he or she sooner dies, resigns or is removed in accordance with the Trust’s Declaration of Trust. |
| 2 | The Fund Complex includes the following Trusts: SEI Asset Allocation Trust, SEI Daily Income Trust, SEI Institutional Investments Trust, Adviser Managed Trust, SEI Institutional International Trust, SEI Institutional Managed Trust, SEI Tax Exempt Trust, SEI Catholic Values Trust and New Covenant Funds. |
SEI Institutional International Trust / Annual Report / September 30, 2021 |
103 |
DISCLOSURE OF FUND EXPENSES (Unaudited)
September 30, 2021
All mutual funds have operating expenses. As a shareholder of a fund, your investment is affected by these ongoing costs, which include (among others) costs for portfolio management, administrative services, and shareholder reports like this one. It is important for you to understand the impact of these costs on your investment returns.
Operating expenses such as these are deducted from the fund’s gross income and directly reduce your final investment return. These expenses are expressed as a percentage of the fund’s average net assets; this percentage is known as the fund’s expense ratio.
The following examples use the expense ratio and are intended to help you understand the ongoing costs (in dollars) of investing in your fund and to compare these costs with those of other mutual funds. The examples are based on an investment of $1,000 made at the beginning of the period shown and held for the entire period April 1, 2021 to September 30, 2021.
The table on this page illustrates your fund’s costs in two ways:
• Actual fund return. This section helps you to estimate the actual expenses after fee waivers that your Fund incurred over the period. The “Expenses Paid During Period” column shows the actual dollar expense cost incurred by a $1,000 investment in the Fund, and the “Ending Account Value” number is derived from deducting that expense cost from the Fund’s gross investment return.
You can use this information, together with the actual amount you invested in the Fund, to estimate the expenses you paid over that period. Simply divide your actual account value by $1,000 to arrive at a ratio (for example, an $8,600 account value divided by $1,000 = 8.6), then multiply that ratio by the number shown for your Fund under “Expenses Paid During Period”.
• Hypothetical 5% return. This section helps you compare your Fund’s costs with those of other mutual funds. It assumes that the fund had an annual 5% return before expenses during the year, but that the expense ratio (Column 3) for the period is unchanged. This example is useful in making comparisons because the Securities and Exchange Commission requires all mutual funds to make this 5% calculation. You can assess your Fund’s comparative cost by comparing the hypothetical result for your Fund in the “Expense Paid During Period” column with those that appear in the same charts in the shareholder reports for other funds.
NOTE: Because the return is set at 5% for comparison purposes — NOT your Fund’s actual return — the account values shown may not apply to your specific investment.
Beginning Account | Ending Account | Annualized Expense Ratios | Expenses Paid | |||||||||||||
International Equity Fund |
| |||||||||||||||
Actual Fund Return |
| |||||||||||||||
Class F | $1,000.00 | $1,028.80 | 1.07% | $5.44 | ||||||||||||
Class I | 1,000.00 | 1,027.20 | 1.32 | 6.71 | ||||||||||||
Class Y | 1,000.00 | 1,029.60 | 0.82 | 4.17 | ||||||||||||
Hypothetical 5% Return |
| |||||||||||||||
Class F | $1,000.00 | $1,019.70 | 1.07% | $5.42 | ||||||||||||
Class I | 1,000.00 | 1,018.45 | 1.32 | 6.68 | ||||||||||||
Class Y | 1,000.00 | 1,020.96 | 0.82 | 4.15 | ||||||||||||
Emerging Markets Equity Fund |
| |||||||||||||||
Actual Fund Return |
| |||||||||||||||
Class F | $1,000.00 | $953.80 | 1.71% | $8.38 | ||||||||||||
Class Y | 1,000.00 | 955.10 | 1.46 | 7.16 | ||||||||||||
Hypothetical 5% Return |
| |||||||||||||||
Class F | $1,000.00 | $1,016.50 | 1.71% | $8.64 | ||||||||||||
Class Y | 1,000.00 | 1,017.75 | 1.46 | 7.38 | ||||||||||||
| Beginning Account Value 4/1/21 | Ending Account Value 9/30/21 | Annualized Expense Ratios | Expenses Paid During Period * | |||||||||||||
International Fixed Income Fund |
| |||||||||||||||
Actual Fund Return |
| |||||||||||||||
Class F | $1,000.00 | $1,000.00 | 1.02% | $5.11 | ||||||||||||
Class Y | 1,000.00 | 1,001.90 | 0.77 | 3.86 | ||||||||||||
Hypothetical 5% Return |
| |||||||||||||||
Class F | $1,000.00 | $1,019.96 | 1.02% | $5.16 | ||||||||||||
Class Y | 1,000.00 | 1,021.21 | 0.77 | 3.90 | ||||||||||||
Emerging Markets Debt Fund |
| |||||||||||||||
Actual Fund Return |
| |||||||||||||||
Class F | $1,000.00 | $1,020.40 | 1.36% | $6.94 | ||||||||||||
Class Y | 1,000.00 | 1,021.70 | 1.11 | 5.68 | ||||||||||||
Hypothetical 5% Return |
| |||||||||||||||
Class F | $1,000.00 | $1,018.20 | 1.36% | $6.93 | ||||||||||||
Class Y | 1,000.00 | 1,019.45 | 1.11 | 5.67 | ||||||||||||
| * | Expenses are equal to the Fund’s annualized expense ratio multiplied by the average account value over the period, multiplied by 183/365 (to reflect the one-half year period shown). |
104 |
SEI Institutional International Trust / Annual Report / September 30, 2021 |
LIQUIDITY RISK MANAGEMENT PROGRAM (Unaudited)
September 30, 2021
Pursuant to Rule 22e-4 under the 1940 Act, the Trust, on behalf of the Funds, has adopted a liquidity risk management program (the “Program”) to govern the Trust’s approach to managing liquidity risk. The Program is overseen by the SIMC Liquidity Risk Oversight Committee, and the Program’s principal objectives include assessing, managing and periodically reviewing each Fund’s liquidity risk, based on factors specific to the circumstances of the Fund.
At a meeting of the Board held on March 23, 2021, the Trustees received a report from the SIMC Liquidity Risk Oversight Committee addressing the operations of the Program and assessing its adequacy and effectiveness of implementation. The SIMC Liquidity Risk Oversight Committee determined, and reported to the Board, that the Program is reasonably designed to assess and manage each Fund’s liquidity risk and has operated adequately and effectively to manage each Fund’s liquidity risk since the Program was implemented on December 1, 2018. The SIMC Liquidity Risk Oversight Committee reported that during the period covered by the report, there were no liquidity events that impacted the Funds or their ability to timely meet redemptions without dilution to existing shareholders. The SIMC Liquidity Risk Oversight Committee further noted that no material changes have been made to the Program since its implementation.
There can be no assurance that the Program will achieve its objectives in the future. Please refer to the prospectus for more information regarding a Fund’s exposure to liquidity risk and other principal risks to which an investment in the Funds may be subject.
SEI Institutional International Trust / Annual Report / September 30, 2021 |
105 |
BOARD OF TRUSTEES’ CONSIDERATIONS IN APPROVING THE ADVISORY AND SUB-ADVISORY AGREEMENTS
(Unaudited)
SEI Institutional International Trust (the “Trust”) and SEI Investments Management Corporation (“SIMC”) have entered into an investment advisory agreement (the “Advisory Agreement”), pursuant to which SIMC provides investment advisory services to the series of the Trust (the “Funds”). Pursuant to separate sub-advisory agreements with SIMC (the “Sub-Advisory Agreements” and, together with the Advisory Agreement, the “Investment Advisory Agreements”), and under the supervision of SIMC and the Trust’s Board of Trustees (each member, a “Trustee” and, collectively, the “Trustees” or the “Board”), the sub-advisers (each, a “Sub-Adviser” and collectively, the “Sub-Advisers”) provide security selection and certain other advisory services with respect to all or a discrete portion of the assets of the Funds. The Sub-Advisers are also responsible for managing their employees who provide services to the Funds. The Sub-Advisers are selected based primarily upon the research and recommendations of SIMC, which evaluates quantitatively and qualitatively the Sub-Advisers’ skills and investment results in managing assets for specific asset classes, investment styles and strategies.
The Investment Company Act of 1940, as amended (the “1940 Act”), requires that the initial approval of a Fund’s Investment Advisory Agreements be specifically approved by the vote of a majority of the outstanding shareholders of the Funds and the vote of a majority of the Trustees who are not parties to the Investment Advisory Agreements or “interested persons” of any party (the “Independent Trustees”) cast in person (or otherwise, as consistent with applicable laws, regulations and related guidance and relief) at a meeting called for such purpose. In addition, the 1940 Act requires that the continuation or renewal of any Investment Advisory Agreement be approved at least annually (after an initial period of up to two years), which also requires the vote of a majority of the Board, including a majority of the Independent Trustees. In the case of the initial approval of a Sub-Advisory Agreement, only the approval of a majority of the Board, including a majority of the Independent Trustees, is required, pursuant to an exemptive order that has been granted to the Trust by the Securities and Exchange Commission. In connection with their consideration of such initial approvals and renewals, the Funds’ Trustees must request and evaluate, and SIMC and the Sub-Advisers are required to furnish, such information as may be reasonably necessary to evaluate the terms of the Investment Advisory Agreements. In addition, the Securities and Exchange Commission takes the position that, as part of their fiduciary duties with respect to a mutual fund’s fees, mutual fund boards are required to evaluate the material factors applicable to a decision to approve an investment advisory agreement.
Consistent with these responsibilities, the Board calls and holds meetings each year to consider whether to approve new and/or renew existing Investment Advisory Agreements between the Trust and SIMC and SIMC and the Sub-Advisers with respect to the Funds of the Trust. In preparation for these meetings, the Board requests and reviews a wide variety of materials provided by SIMC and the Sub-Advisers, including information about SIMC’s and the Sub-Advisers’ affiliates, personnel and operations and the services provided pursuant to the Investment Advisory Agreements. The Board also receives data from third parties. This information is provided in addition to the detailed information about the Funds that the Board reviews during the course of each year, including information that relates to Fund operations and Fund performance. The Trustees also receive a memorandum from counsel regarding the responsibilities of Trustees in connection with their consideration of whether to approve the Trust’s Investment Advisory Agreements. Finally, the Independent Trustees receive advice from independent counsel to the Independent Trustees, meet in executive sessions outside the presence of Fund management and participate in question and answer sessions with representatives of SIMC and the Sub-Advisers.
Specifically, during the course of the Trust’s fiscal year, the Board requested and received written materials from SIMC and the Sub-Advisers regarding: (i) the quality of SIMC’s and the Sub-Advisers’ investment management and other services; (ii) SIMC’s and the Sub-Advisers’ investment management personnel; (iii) SIMC’s and the Sub-Advisers’ operations and financial condition; (iv) SIMC’s and the Sub-Advisers’ brokerage practices (including any soft dollar arrangements) and investment strategies; (v) the level of the advisory fees that SIMC charges the Funds and the level of the sub-advisory fees that SIMC pays the Sub-Advisers, compared with fees each charge to comparable accounts; (vi) the advisory fees charged by SIMC and the Funds’ overall fees and operating expenses compared with peer groups of mutual funds prepared by Broadridge, an independent provider of investment company data; (vii) the level of SIMC’s and the Sub-Advisers’ profitability from their Fund-related operations; (viii) SIMC’s and the Sub-Advisers’ compliance program, including a description of material compliance matters and material compliance violations; (ix) SIMC’s potential economies of scale; (x) SIMC’s and the Sub-Advisers’ policies on and compliance procedures for personal securities transactions; (xi) SIMC’s and the Sub-Advisers’ expertise and resources in domestic and/or international financial markets; and (xii) the Funds’ performance over various periods of time compared with peer groups of mutual funds prepared by Broadridge and the Funds’ benchmark indexes.
106 |
SEI Institutional International Trust / Annual Report / September 30, 2021 |
At the March 22-24, 2021 meeting of the Board, the Trustees, including a majority of the Independent Trustees, approved the renewal of the Advisory Agreement. Also, each Sub-Advisory Agreement was either initially approved or, if the Sub-Advisory Agreement was already in effect (unless operating under an initial two-year term), renewed at meetings of the Board held during the course of the Trust’s fiscal year on December 8-9, 2020, June 22-23, 2021 and September 14-15, 2021. In each case, the Board’s approval (or renewal) was based on its consideration and evaluation of the factors described above, as discussed at the meetings and at prior meetings. The following discusses some, but not all, of the factors that were considered by the Board in connection with its assessment of the Investment Advisory Agreements.
Nature, Extent and Quality of Services. The Board considered the nature, extent and quality of the services provided by SIMC and the Sub-Advisers to the Funds and the resources of SIMC and the Sub-Advisers and their affiliates dedicated to the Funds. In this regard, the Trustees evaluated, among other things, SIMC’s and each Sub-Adviser’s personnel, experience, track record and compliance program. Following evaluation, the Board concluded that, within the context of its full deliberations, the nature, extent and quality of services provided by SIMC and the Sub-Advisers to the Funds and the resources of SIMC and the Sub-Advisers and their affiliates dedicated to the Funds were sufficient to support the renewal of the Investment Advisory Agreements. In addition to advisory services, the Board considered the nature and quality of certain administrative, transfer agency and other non-investment advisory services provided to the Funds by SIMC and/or its affiliates.
Performance. In determining whether to renew SIMC’s Advisory Agreement, the Trustees considered the Funds’ performance relative to their peer groups and appropriate indexes/benchmarks. The Trustees reviewed performance information for each Fund, noting that they receive performance reports that permit them to monitor each Fund’s performance at board meetings throughout the year. As part of this review, the Trustees considered the composition of each peer group and selection criteria. In assessing Fund performance, the Trustees considered a report compiled by Broadridge, an independent third-party that was engaged to prepare an assessment of the Funds in connection with the renewal of the Advisory Agreement (the “Broadridge Report”). The Broadridge Report included metrics on risk analysis, volatility versus total return, net total return and performance consistency for the Funds and a universe of comparable funds. Based on the materials considered and discussed at the meetings, the Trustees found Fund performance satisfactory, or, where performance was materially below the benchmark and/or peer group, the Trustees were satisfied with the reasons provided to explain such performance. In connection with the approval or renewal of Sub-Advisory Agreements, the Board considered the performance of the Sub-Adviser relative to appropriate indexes/benchmarks. Following evaluation, the Board concluded that, within the context of its full deliberations, the performance of the Funds was sufficient to support renewal of SIMC’s Advisory Agreement, and the performance of each Sub-Adviser was sufficient to support approval or renewal of the Sub-Advisory Agreement.
Fees. With respect to the Funds’ expenses under the Investment Advisory Agreements, the Trustees considered the rate of compensation called for by the Investment Advisory Agreements and the Funds’ net operating expense ratios in comparison to those of the Funds’ respective peer groups. In assessing Fund expenses, the Trustees considered the information in the Broadridge Report, which included various metrics related to fund expenses, including, but not limited to, contractual management fees at various asset levels, actual management fees (including transfer agent expenses), and actual total expenses for the Funds and a universe of comparable funds. Based on the materials considered and discussion at the meetings, the Trustees further determined that fees were either shown to be below the peer average in the comparative fee analysis, or that there was a reasonable basis for the fee level. The Trustees also considered the effects of SIMC’s and its affiliates’ voluntary waivers of management and other fees to prevent total Fund operating expenses from exceeding any applicable cap, as well as SIMC’s contractual waiver of its management fee with respect to the Emerging Markets Equity Fund to prevent the management fee from exceeding a specified cap, and concluded that SIMC, through waivers, has maintained the Funds’ net operating expenses at competitive levels for its distribution channels. In determining the appropriateness of fees, the Board also took into consideration the impact of fees incurred indirectly by the Funds as a result of investments into underlying funds, including funds from which SIMC or its affiliates earn fees. The Board also took into consideration compensation earned from the Funds by SIMC or its affiliates for non-advisory services, such as administration, transfer agency, shareholder services or brokerage, and considered whether SIMC and its affiliates may have realized other benefits from their relationship with the Funds, such as any research and brokerage services received under soft dollar arrangements. When considering fees paid to Sub-Advisers, the Board took into account the fact that the Sub-Advisers are compensated by SIMC and not by the Funds directly, and that such compensation with respect to any unaffiliated Sub-Adviser reflects an arms-length negotiation between the Sub-Adviser and SIMC. Following
SEI Institutional International Trust / Annual Report / September 30, 2021 |
107 |
BOARD OF TRUSTEES’ CONSIDERATIONS IN APPROVING THE ADVISORY AND SUB-ADVISORY AGREEMENTS
(Unaudited) (Concluded)
evaluation, the Board concluded that, within the context of its full deliberations, the expenses of the Funds are reasonable and supported renewal of the Investment Advisory Agreements. The Board also considered whether the Sub-Advisers and their affiliates may have realized other benefits from their relationship with the Funds, such as any research and brokerage services received under soft dollar arrangements.
Profitability. With regard to profitability, the Trustees considered compensation flowing to SIMC and the Sub-Advisers and their affiliates, directly or indirectly. The Trustees considered whether the levels of compensation and profitability were reasonable. As with the fee levels, when considering the profitability of the Sub-Advisers, the Board took into account the fact that compensation with respect to any unaffiliated Sub-Adviser reflects an arms-length negotiation between the Sub-Adviser and SIMC. In connection with the approval or renewal of each Sub-Advisory Agreement, the Board also took into consideration the impact that the fees paid to the Sub-Adviser have on SIMC’s advisory fee margin and profitability. Based on this evaluation, the Board concluded that, within the context of its full deliberations, the profitability of each of SIMC and the Sub-Advisers is reasonable and supported renewal of the Investment Advisory Agreements.
Economies of Scale. With respect to the Advisory Agreement, the Trustees considered whether any economies of scale were being realized by SIMC and its affiliates and, if so, whether the benefits of such economies of scale were passed along to the Funds’ shareholders through a graduated investment advisory fee schedule or other means, including any fee waivers by SIMC and its affiliates. The Trustees recognized that economies of scale are difficult to identify and quantify and are rarely identifiable on a fund-by-fund basis. Based on this evaluation, the Board determined that the fees were reasonable in light of the information that was provided by SIMC with respect to economies of scale.
Based on the Trustees’ deliberation and their evaluation of the information described above, the Board, including all of the Independent Trustees, with the assistance of Fund counsel and Independent Trustees’ counsel, unanimously approved the approval or renewal, as applicable, of the Investment Advisory Agreements and concluded that the compensation under the Investment Advisory Agreements is fair and reasonable in light of such services and expenses and such other matters as the Trustees considered to be relevant in the exercise of their reasonable judgment. In the course of its deliberations, the Board did not identify any particular factor (or conclusion with respect thereto) or single piece of information that was all-important, controlling or determinative of its decision, but considered all of the factors together, and each Trustee may have attributed different weights to the various factors (and conclusions with respect thereto) and information.
108 |
SEI Institutional International Trust / Annual Report / September 30, 2021 |
NOTICE TO SHAREHOLDERS (Unaudited)
For shareholders who do not have a September 30, 2021, taxable year end, this notice is for informational purposes only. For shareholders with a September 30, 2021, taxable year end, please consult your tax adviser as to the pertinence of this notice.
For the fiscal year ended September 30, 2021, the Funds are designating long term and qualifying dividend income with regard to distributions paid during the year as follows:
| (A) Return of Capital | (B) Long Term | (C) Ordinary | (D) Total | (E) Dividends Qualifying for Corporate Dividends Rec. Deduction(1) | (F) Qualifying Dividend Income (15% Tax Rate for QDI)(2) | (G) U.S. | (H) Interest | (I) Short-Term Capital Gain | ||||||||||
International Equity Fund | 0.00% | 0.00% | 100.00% | 100.00% | 0.00% | 89.82% | 0.00% | 0.00% | 0.00% | |||||||||
Emerging Markets Equity Fund | 0.00% | 0.00% | 100.00% | 100.00% | 0.00% | 100.00% | 0.00% | 0.00% | 0.00% | |||||||||
International Fixed Income Fund | 0.00% | 100.00% | 0.00% | 100.00% | 0.00% | 0.00% | 0.00% | 0.00% | 0.00% | |||||||||
Emerging Markets Debt Fund | 0.00% | 0.00% | 100.00% | 100.00% | 0.00% | 0.00% | 0.00% | 0.00% | 0.00% |
The Funds intend to pass through foreign tax credit to shareholders. For the fiscal year ended September 30, 2021, the amount of foreign source income and foreign tax credit are as follows (Thousands):
| Fund | Foreign Source Income | Foreign Tax Credit Pass Through | ||||||
International Equity | $ | 104,171 | $7,876 | |||||
Emerging Markets Equity | 23,570 | 9,255 | ||||||
| (1) | “Dividends Received Deduction” represent dividends which qualify for the corporate dividends received deduction. |
| (2) | “Qualifying Dividend Income” represent qualifying dividends as created by the Jobs and Growth Tax Relief Reconciliation Act of 2003. It is the intention of the Fund to designate the max amount permitted by law. |
| (3) | “U.S. Government Interest” represent the amount of interest that was derived from direct U.S. Government obligations and distributed during the fiscal year. Generally, interest from direct U.S. Government obligations is exempt from state income tax. However, for shareholders who are residents of California, Connecticut or New York, the statutory threshold requirements were not satisfied to permit exemption of these amounts from state income. |
| (4) | The percentage in this column represents the amount of “Interest Related Dividend” is reflected as a percentage of ordinary income distribution. Interest related dividends is exempted from U.S. withholding tax when paid to foreign investors. |
| (5) | The percentage of this column represents the amount of “Short Term Capital Gain Dividend” is reflected as a percentage of short term capital gain distribution that is exempted from U.S. withholding tax when paid to foreign investors. |
Items (A), (B), (C) and (D) are based on the percentage of each fund’s total distribution.
Items (E) and (F) are based on the percentage of “Ordinary Income Distributions.”
Item (G) is based on the percentage of gross income of each Fund.
Item (H) is based on the percentage of net investment income distributions.
Item (I) is based on the percentage of short-term capital gains distributions.
Please consult your tax adviser for proper treatment of this information. This notification should be kept with your permanent tax records.
SEI Institutional International Trust / Annual Report / September 30, 2021 |
109 |
(This page intentionally left blank)
SEI INSTITUTIONAL INTERNATIONAL TRUST / ANNUAL REPORT / SEPTEMBER 30, 2021
Robert A. Nesher, Chairman
Trustees
William M. Doran
George J. Sullivan, Jr.
Nina Lesavoy
James M. Williams
Mitchell A. Johnson
Hubert L. Harris, Jr.
Susan C. Cote
James B. Taylor
Christine Reynolds
Thomas Melendez
Officers
Robert A. Nesher
President and Chief Executive Officer
Peter A. Rodriguez
Controller and Chief Financial Officer
Glenn R. Kurdziel
Assistant Controller
Russell Emery
Chief Compliance Officer
Timothy D. Barto
Vice President and Secretary
David F. McCann
Vice President and Assistant Secretary
Aaron Buser
Vice President and Assistant Secretary
Stephen G. MacRae
Vice President
Bridget E. Sudall
Anti-Money Laundering Compliance Officer
and Privacy Officer
Investment Adviser
SEI Investments Management Corporation
Administrator
SEI Investments Global Funds Services
Distributor
SEI Investments Distribution Co.
Legal Counsel
Morgan, Lewis & Bockius LLP
Independent Registered Public Accounting Firm
KPMG LLP
This report and the financial statements contained herein are submitted for the general information of the shareholders of the Trust and must be preceded or accompanied by a current prospectus. Shares of the Funds are not deposits or obligations of, or guaranteed or endorsed by, any bank. The shares are not federally insured by the Federal Deposit Insurance Corporation (FDIC), the Federal Reserve Board, or any other government agency. Investment in the shares involves risk, including the possible loss of principal.
For more information call
1 800 DIAL SEI
(1 800 342 5734)

1 Freedom Valley Drive, P.O. Box 1100, Oaks, PA 19456
SEI-F-018 (9/21)
| Item 2. | Code of Ethics. |
The Registrant has adopted a code of ethics that applies to the Registrant’s principal executive officer, principal financial officer, principal accounting officer, or controller, or persons performing similar functions.
| Item 3. | Audit Committee Financial Expert. |
(a)(1) The Registrant’s Board of Trustees has determined that the Registrant has two audit committee financial experts serving on the audit committee.
(a) (2) The audit committee financial experts are Susan C. Cote and Hubert L. Harris, Jr. Ms. Cote and Mr. Harris are independent as defined in Form N-CSR Item 3 (a) (2).
| Item 4. | Principal Accountant Fees and Services. |
Fees billed by KPMG LLP (“KPMG”) related to the Registrant.
KPMG billed the Registrant aggregate fees for services rendered to the Registrant for the last two fiscal years as follows:
Fiscal Year 2021
| Fiscal Year 2020
| |||||||||||||
All fees and approved | All fees and approved | All other fees to service require pre- approval | All fees and the Registrant approved | All fees and approved | All other fees to service require pre- approval | |||||||||
| (a) | Audit
| $211,080 | $0 | N/A | $208,580 | $0 | N/A | |||||||
| (b) | Audit-Related Fees | $0 | $0 | $0 | $0 | $0 | $0 | |||||||
| (c) | Tax
| $0 | $0 | $0 | $0 | $0 | $0 | |||||||
| (d) | All Other
| $0 | $331,000 | $0 | $0 | $534,502 | $0 | |||||||
Notes:
| (1) | Audit fees include amounts related to the audit of the Registrant’s annual financial statements and services normally provided by the accountant in connection with statutory and regulatory filings. |
| (2) | See Item 4(g) for a description of the services comprising the fees disclosed in this category. |
(e)(1) The Registrant’s Audit Committee has adopted and the Board of Trustees has ratified an Audit and Non-Audit Services Pre-Approval Policy (the “Policy”), which sets forth the procedures and the conditions pursuant to which services proposed to be performed by the independent auditor of the Registrant may be pre-approved. In any instance where services require pre-approval, the Audit Committee will consider whether such services are consistent with SEC’s rules on auditor independence and whether the provision of such services would compromise the auditor’s independence.
The Policy provides that all requests or applications for proposed services to be provided by the independent auditor must be submitted to the Registrant’s Chief Financial Officer (“CFO”) and must include a detailed description of the services proposed to be rendered. The CFO will determine whether such services: (1) require specific pre-approval; (2) are included within the list of services that have received the general pre-approval of the Audit Committee pursuant to the Policy; or (3) have been previously pre-approved in connection with the independent auditor’s annual engagement letter for the applicable year or otherwise.
Requests or applications to provide services that require specific pre-approval by the Audit Committee will be submitted to the Audit Committee by the CFO. The Audit Committee has delegated specific pre-approval authority to either the Audit Committee Chair or financial experts, provided that the estimated fee for any such proposed pre-approved service does not exceed $100,000 and any pre-approval decisions are reported to the Audit Committee at its next regularly scheduled meeting.
Services that have received the general pre-approval of the Audit Committee are identified and described in the Policy. In addition, the Policy sets forth a maximum fee per engagement with respect to each identified service that has received general pre-approval. The Audit Committee will annually review and pre-approve the services that may be provided by the independent auditor during the following twelve months without obtaining specific pre-approval from the Audit Committee.
The Audit Committee will be informed by the CFO on a quarterly basis of all services rendered by the independent auditor.
All services to be provided by the independent auditor shall be provided pursuant to a signed written engagement letter with the Registrant, the investment advisor or applicable control affiliate (except that matters as to which an engagement letter would be impractical because of timing issues or because the matter is small may not be the subject of an engagement letter) that sets forth both the services to be provided by the independent auditor and the total fees (or the manner of their determination) to be paid to the independent auditor for those services.
In addition, the Audit Committee has determined to take additional measures on an annual basis to meet its responsibility to oversee the work of the independent auditor and to assure the auditor’s independence from the Registrant, such as reviewing a formal written statement from the independent auditor delineating all relationships between the independent auditor and the Registrant, and discussing with the independent auditor its methods and procedures for ensuring independence.
(e)(2) Percentage of fees billed applicable to non-audit services pursuant to waiver of pre-approval requirement were as follows:
| Fiscal 2021 | Fiscal 2020 | |||
Audit-Related Fees
| 0%
| 0%
| ||
Tax Fees
| 0%
| 0%
| ||
All Other Fees
| 0%
| 0%
|
(f) Not Applicable.
(g)(1) The aggregate non-audit fees and services billed by KPMG for the fiscal years 2021 and 2020 were $331,000 and $534,502, respectively. Non-audit fees consist of SSAE No. 16 review of fund accounting and administration operations, and an attestation report in accordance with Rule 17Ad-13.
(h) During the past fiscal year, the Registrant’s principal accountant provided certain non-audit services to the Registrant’s investment adviser or to entities controlling, controlled by, or under common control with the Registrant’s investment adviser that provide ongoing services to the Registrant that were not subject to pre-approval pursuant to paragraph (c)(7)(ii) of Rule 2-01 of Regulation S-X. The Audit Committee of the Registrant’s Board of Trustees reviewed and considered these non-audit services provided by the Registrant’s principal accountant to the Registrant’s affiliates, including whether the provision of these non-audit services is compatible with maintaining the principal accountant’s independence.
| Item 5. | Audit Committee of Listed Registrants. |
Not applicable.
| Item 6. | Investments |
The Schedules of Investments in securities of unaffiliated issuers as of the close of the reporting period for the International Equity Fund, Emerging Markets Equity Fund, International Fixed Income Fund, and Emerging Markets Debt Fund are included as part of the report to shareholders filed under Item 1 of this form.
| Item 7. | Disclosure of Proxy Voting Policies and Procedures for Closed-End Management Investment Companies. |
Not applicable.
| Item 8. | Portfolio Managers of Closed-End Management Investment Companies |
Not applicable.
| Item 9. | Purchases of Equity Securities by Closed-End Management Company and Affiliated Purchasers. |
Not applicable.
| Item 10. | Submission of Matters to a Vote of Security Holders. |
There have been no material changes to the procedures by which shareholders may recommend nominees to the Registrant’s Board of Trustees (the “Board”). The Registrant has a standing Governance Committee (the “Committee”) currently consisting of the Independent Trustees. The Committee is responsible for evaluating and recommending nominees for election to the Board. Pursuant to the Committee’s Charter, adopted on June 18th 2004, as amended, the Committee will review all shareholder recommendations for nominations to fill vacancies on the Board if such recommendations are submitted in writing and addressed to the Committee at the Registrant’s office.
| Item 11. | Controls and Procedures. |
(a) The Registrant’s principal executive and principal financial officers, or persons performing similar functions, have concluded that the Registrant’s disclosure controls and procedures (as defined in Rule
30a-3(c) under the Investment Company Act of 1940 (the “1940 Act”)) are effective, based on the evaluation of these controls and procedures required by Rule 30a-3(b) under the 1940 Act and Rules 13a-15(b) or 15d-15(b) under the Securities Exchange Act of 1934 as of a date within 90 days of the filing date of this report.
(b) There were no changes in the Registrant’s internal control over financial reporting (as defined in Rule 30a-3(d) under the 1940 Act) that occurred during the period covered by this report that have materially affected, or are reasonably likely to materially affect, the Registrant’s internal control over financial reporting.
| Item 12. | Disclosure of Securities Lending Activities for Closed-End Management Investment Companies. |
Not applicable.
| Item 13. | Exhibits. |
(a)(1) Code of Ethics attached hereto.
SIGNATURES
Pursuant to the requirements of the Securities Exchange Act of 1934 and the Investment Company Act of 1940, the Registrant has duly caused this report to be signed on its behalf by the undersigned, thereunto duly authorized.
| SEI Institutional International Trust | ||||||
| By: | /s/ Robert A. Nesher | |||||
| Robert A. Nesher | ||||||
| President & CEO | ||||||
Date: December 8, 2021
Pursuant to the requirements of the Securities Exchange Act of 1934 and the Investment Company Act of 1940, this report has been signed below by the following persons on behalf of the Registrant and in the capacities and on the dates indicated.
| By: | /s/ Robert A. Nesher | |||||
| Robert A. Nesher | ||||||
| President & CEO |
Date: December 8, 2021
| By: | /s/ Peter A. Rodriguez | |||||
| Peter A. Rodriguez | ||||||
| Controller & CFO |
Date: December 8, 2021