UNITED STATES
SECURITIES AND EXCHANGE COMMISSION
Washington, D.C. 20549
FORM N-CSR
CERTIFIED SHAREHOLDER REPORT OF REGISTERED MANAGEMENT INVESTMENT COMPANIES
Investment Company Act file number 811-05617
| SCM Trust |
| (Exact name of registrant as specified in charter) |
| 1875 Lawrence Street, Suite 300, Denver, CO 80202 |
| (Address of principal executive offices) (Zip code) |
Steve Rogers 1875 Lawrence Street, Suite 300 Denver, CO 80202 |
| (Name and address of agent for service) |
Registrant's telephone number, including area code: (800) 955-9988
Date of fiscal year end: December 31
Date of reporting period: December 31, 2021
ITEM 1. REPORTS TO STOCKHOLDERS
(a)


ANNUAL REPORT
December 31, 2021
Shelton Emerging Markets Fund
Shelton International Select Equity Fund
Shelton Tactical Credit Fund
This report is intended only for the information of shareholders or those who have received the offering prospectus covering shares of beneficial interest of The SCM Trust which contains information about the management fee and other costs. Investments in shares of The SCM Trust are neither insured nor guaranteed by the U.S. Government.
Table of Contents | December 31, 2021 |
Historical Performance and Manager’s Discussion | 2 |
About Your Fund’s Expenses | 9 |
Top Holdings and Sector Breakdown | 10 |
Portfolio of Investments | 11 |
Statements of Assets and Liabilities | 15 |
Statements of Operations | 16 |
Statements of Changes in Net Assets | 17 |
Financial Highlights | 19 |
Notes to Financial Statements | 25 |
Liquidity Risk Management Program Disclosure | 32 |
Report of Independent Registered Public Accounting Firm | 32 |
Additional Information | 33 |
Board of Trustees and Executive Officers | 34 |
1
Historical Performance and Manager’s Discussion (Unaudited) | December 31, 2021 |
Shelton Emerging Market Fund and Shelton International Select Equities Fund (Portfolio Manager Derek Izuel)
2021 was supposed to be the COVID recovery year. Everyone envisioned a summer of getting back to all the things that we had not done for most of 2020. It did not quite work out like that. Over the summer the Delta variant forced countries to reinstate restrictions and further their vaccination efforts.
How this effected markets depended on where you stood. While it was not the only contributing factor, market performance around the world roughly followed the success of different regions to vaccinate their population and return their economy to normal. US large caps, given their global scope, continued their steady appreciation, while small caps reflected the ongoing difficulties in controlling the virus domestically. European stocks also performed well during the first part of the year, but faced with restrictions over the summer, struggled from September on. Emerging markets struggled the most.
Emerging markets faced two headwinds last year. To start with, vaccination and other efforts to control the spread of COVID were either less successful, such as in India, or more Draconian like the zero-COVID policy in China. Either way, emerging economies did not experience the same recovery as developed economies. On top of this, interest rates in developed markets finished their bottoming process in February and began to accelerate upwards. The dollar also bottomed, rising about 7% over the year.
Yet commodity prices were up some 30%. Since the early 1990s, commodity prices and the dollar have moved in opposite directions…until 2021. The dislocation of these two related instruments could indicate a reversion of commodity prices downward, weakness in the dollar, or a regime change in market behavior.
Which brings us to inflation. Inflation has been a headline in the US and overseas for the past 18 months. Price levels have risen 5-6% worldwide, topping out at nearly a 10% rate in the second quarter. Forecasts for 2022 are closer to 4%, but with central banks finally agreeing late in 2021 that these price increases look more robust than transitory, we should expect both a continued rise in 2022, as well as an increase in central bank activity to combat them.
China saw some concerning developments in 2021. Over the summer the Chinese government enacted sweeping restrictions on the technology and education sectors, changing the ways they use data and access capital. Education firms were forced to scale back operations and slash prices. These changes swept nearly $1 trillion of market cap off well-known tech firms such as Tencent, Alibaba and torpedoed the US registration of Didi Global, a ride-sharing company. We believe, the moves were founded in a position of weakness, not strength, as the Chinese Communist Party feared the loss of power over their own nation.
Additional government actions struck the Chinese real estate sector. A crackdown on borrowing sent Evergrande, one of the larger developers in the country, to the brink of insolvency. This development cannot be taken lightly, as the exposure extends throughout the Chinese financial system, and a disorderly collapse could have global ramifications.
Combine these developments with the uncertainty built into China’s zero-COVID policy, and 2021 saw the MSCI China index plummet 22%. Value trap, or opportunity?
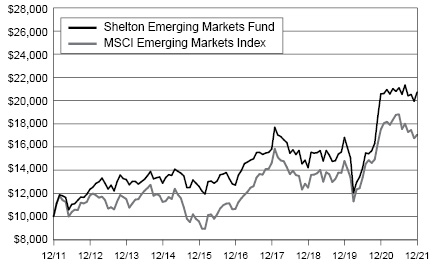
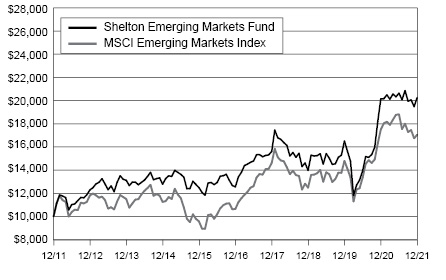
Performance - Shelton Emerging Markets Fund
The Shelton Emerging Market Equity Fund Institutional Share Class returned 0.77% in 2021, outperforming the MSCI Emerging Markets Equity Index return of -2.34% by 3.11%.
Underweight to China was the greatest contributor to the fund’s performance last year as described in the earlier discussion. At the same time, the fund’s overweight to Taiwan also contributed to performance.
The semiconductor industry generated strong performance for the fund’s portfolio. While Taiwan Semiconductor is well known, smaller firms in Taiwan such as eMemory Technology, a developer of logical non-volatile memory chips, also performed well in 2021.
China Meidong Holdings, a collection of automobile dealerships, saw strong growth in demand among their higher margin premium autos, and saw its value grow by over 27%. Dentium, a Korean provider of dental implants and instruments continued to make progress in its goal of becoming the standard within the dental equipment market. Dentium’s stock appreciated 69% in 2021.
One of the fund’s few China positions was unfortunately New Oriental Education & Technology. Their business model was devastated by the imposition of restriction and price limits on education firms by the Chinese government. Much uncertainty remains, but we believe that such firms could see their revenues fall 50 to 80%.
Another Chinese holding that detracted from performance is Ping An Insurance Group. Ping An has seen life insurance premiums decline over the past few years, and we believe that the trouble in the Chinese real estate market may extend to their own holdings as well, but premiums are beginning to recover, and valuations imply almost excessive real estate losses.
Another Fund position during the period, HDFC, which is a global corporate bank based in India, saw its stock price fall about 10% due to slow growth in fees. We believe that the firm is likely to see a reversal in these trends, and revenue momentum stands to improve in 2022.
2
Historical Performance (Expressed in U.S. Dollars) (Unaudited) | December 31, 2021 |
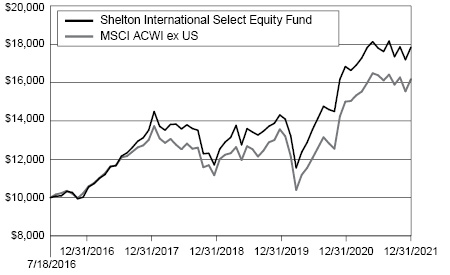
Performance - Shelton International Select Equity Fund
The Shelton International Select Equity Fund Institutional Share Class returned 6.23% in 2021, underperforming the MSCI World ex-US Index return of 7.82% by 1.59%.
Underweight to China was the greatest contributor to the fund’s performance last year as described in the earlier discussion. In addition, inflows into the fund left us with a higher-than-normal cash exposure during most of the year, creating a slight drag.
The semiconductor industry generated strong performance for the fund’s portfolio. ASML Holdings, a Dutch semiconductor equipment manufacturer, returned nearly 65% over the year. Faced with a dramatic disconnect between escalating demand and constrained production, chip manufacturers ramped up orders to build additional production lines.
CRH, a building material producer, ended 2021 up 30%, and with a strengthened balance sheet poised to drive further M&A. The firm was the fund’s top position for most of the year.
BNP Paribas, one of the fund’s larger bank holdings, has taken steps to move from an expansive strategy to a return on capital strategy through the sale of their BancWest subsidiary. The market responded positively to the news of that deal, potentially due to expectations for the deployment of that capital.
One of the fund’s few China positions was unfortunately New Oriental Education & Technology. Their business model was devastated by the imposition of restrictions and price limits on education firms by the Chinese government. Much uncertainty remains, but we believe that such firms could see their revenues fall 50 to 80%
Another Chinese holding that detracted from performance is Ping An Insurance Group. Ping An has seen life insurance premiums decline over the past few years, and we believe that the trouble in the Chinese real estate market may extend to their own holdings as well, but premiums are beginning to recover, and end of year valuations imply almost excessive real estate losses.
Valeo was another holding of the Fund during the period. While we believe that Valeo’s portfolio of electric vehicle and automation products show great promise, they have taken longer to deliver profits, and the expectations built into the stock price were impaired in 2021.
3
Historical Performance and Manager’s Discussion (Unaudited) | December 31, 2021 |
All of the returns in this report represent past performance, which is not a guarantee of future results that may be achieved by the fund. Current performance may be lower or higher than the performance data cited. For more recent performance information, visit our website at www.sheltoncap.com. Note, too, that both investment returns and principal value can fluctuate widely, so an investor’s shares, when sold, could be worth more or less than their original cost. The returns shown do not reflect taxes that a shareholder would pay on fund distributions or on the sale of fund shares.
INSTITUTIONAL SHARES
Average Annual Total Returns
for years ended 12/31/21
Fund/ | One | Five Year | Ten Year | Since |
Shelton Emerging Markets Fund | 0.77% | 10.28% | 7.57% | 6.34% |
MSCI Emerging Markets Index | -2.54% | 9.87% | 13.26% | N/A |
INVESTOR SHARES
Average Annual Total Returns
for years ended 12/31/21
Fund/ | One | Five Year | Ten Year | Since |
Shelton Emerging Markets Fund | 0.52% | 10.03% | 7.31% | 6.11% |
MSCI Emerging Markets Index | -2.54% | 9.87% | 13.26% | N/A |
4
Historical Performance (Expressed in U.S. Dollars) (Unaudited) | December 31, 2021 |
All of the returns in this report represent past performance, which is not a guarantee of future results that may be achieved by the fund. Current performance may be lower or higher than the performance data cited. For more recent performance information, visit our website at www.sheltoncap.com. Note, too, that both investment returns and principal value can fluctuate widely, so an investor’s shares, when sold, could be worth more or less than their original cost. The returns shown do not reflect taxes that a shareholder would pay on fund distributions or on the sale of fund shares.
INSTITUTIONAL SHARES
Average Annual Total Returns
for years ended 12/31/21
Fund/Benchmark | One | Five Year | Since |
Shelton International Select Equity Fund | 6.23% | 12.54% | 11.49% |
MSCI ACWI Index (US) | 7.82% | 9.60% | 9.22% |
INVESTOR SHARES
Average Annual Total Returns
for years ended 12/31/21
Fund/Benchmark | One | Five Year | Since |
Shelton International Select Equity Fund | 5.97% | 12.23% | 11.20% |
MSCI ACWI Index (US) | 7.82% | 9.60% | 9.22% |

5
Historical Performance and Manager’s Discussion (Unaudited) | December 31, 2021 |
Shelton Tactical Credit Fund (Portfolio Managers Jeffrey Rosenkranz, David Falk, and Bill Mock)
The Shelton Tactical Credit Fund seeks to generate total returns in the fixed income markets through income and capital appreciation. The Fund employs a fundamental research process to identify undervalued sectors and individual securities in the U.S. corporate and municipal bond markets. The Fund adjusts allocations to these markets, duration, curve positioning, short positions, and interest rate hedges based upon macroeconomic and other fundamental considerations.
Performance
During the reported fiscal year period December 31, 2020, through December 31, 2021, the Fund returned 7.09% for Institutional Shares (DEBIX) and 6.75% for Investor Shares (DEBTX), outperforming the Morningstar Nontraditional bond category return of 1.80% and the Bloomberg Barclays US Aggregate Total Return Index (AGG) return of -1.54%. The Fund had positive contributions to return from long positions in corporate bonds, partially offset by very modest drag from short positions in corporate bonds and interest rate hedges. Most municipal bond positions were positive contributors as well.
Corporate Credit Market Recap
2021 was a year of surfing the waves of the Coronavirus. The year began with optimism on a vaccine-driven reopening of society, which led to a wonderful Spring and early Summer. Then the Delta wave arrived and knocked us down again for several months. Just as we started to get through Delta, the Omicron variant roared in with its ease of spread. Fortunately, the severity of this variant seems to be much milder, and coupled with vaccinations and boosters, many are optimistic that 2022 might be the year of transition from pandemic to endemic.
We took advantage of our Tactical mandate to position the Fund defensively where appropriate and going on offense when compelling risk/reward opportunities were created by the waves of volatility. Early in the year we anticipated rising rates and a reopening of the economy, so we positioned the Fund underweight duration (investment grade bonds, municipal bonds, and BB-rated high yield corporate bonds), and overweight reopening sectors (cruise lines, airlines, casinos, theme parks, energy, and certain retailers). This produced strong 1Q and 2Q performance. When we became concerned about the Delta variant over the summer, we flipped the playbook and went on defense, increasing duration and reducing credit sensitivity. The Fund was not completely immune to the bouts of volatility and suffered a modest drawdown from mid-July through the end of August. However, we did take the opportunity to buy some quality bonds at more attractive prices, viewing the Delta wave as temporary. This led to outperformance in September. We also anticipated that a second wave was likely as the northern portion of the country spent more time indoors in late Fall. This cold-temperature-induced wave ended up bleeding right into the quick-spreading new Omicron variant. Piling on top was the typical seasonal weakness of fixed income markets in November, when tax-loss selling is heavy, and dealers and many investors become risk-averse close to year-end. Again, we viewed the challenging November period as temporary and another opportunity to add risk, positioning the Fund to recover well in December, capping-off a strong 2021.
Municipal Market Recap
Navigating the municipal bond market in 2021 required focus on the overall economy and interest rates, technical supply and demand factors, credit quality, politics and policy.
While high-grade tax-exempt bond yields were essentially unchanged over the fourth quarter, when we look at the entire year, we see that municipals significantly outperformed Treasuries across the yield curve. Treasury rates increased 91, 56 and 25 basis points in the 5-year, 10-year and 30-year maturities respectively, while the benchmark municipal yields increased only 37, 32 and 9 basis points in the same spots. Year-end relative value measured by the AAA/Treasury ratios of 47%, 69% and 79% in 5, 10 and 30 years shows that while high-grade municipal yields ended the year higher than they began, tax-exempts continued to be expensive by historical standards.
One of the main reasons for the relative stability and outperformance of tax-exempt bonds relative to Treasuries over the year was the steady investor demand. Inflows into tax-exempt mutual funds for 2021 totaled $101.7 billion setting a record since Lipper began tracking this information 30 years ago.
New long-term municipal issuance in 2021 totaled $464 billion. Tax-exempt issuance accounted for 75% of total issuance. Volume came in a bit below what some market observers anticipated as certain issuers stayed on the sidelines hoping for the restoration of the ability to advance refund outstanding debt on a tax-exempt basis or a new federal direct subsidy program for taxable bonds. Neither of these municipal issuer wish-list items made the final cut for the enacted Infrastructure and Jobs Act (“IIJA”) and were excluded from the currently sidelined Build Back Better agenda. We anticipate that those issuers that held off will come to market in 2022.
The overall state of municipal credit continued to improve in 2021 as the vaccine roll-out and economic reopening resulted in more return to in-office work as well as pent-up consumer demand for dining, travel, and other services. Spending was further supported by the wealth effect derived from the strong equity market performance. In December, the U.S. Census Bureau reported that state sales tax revenues increased about 17% year-over-year as of the third quarter. State and local governments also have been recently supported and will continue to benefit from massive federal aid. The March 2020 CARES Act, the December 2020 stimulus and the American Rescue Plan in aggregate provided an estimated $1.2 trillion across various municipal sectors including health care, mass transit, surface transportation, utilities, primary/secondary education, higher education, housing, airports, and ports. In addition, the most recently passed IIJA includes an additional $550 billion in new money for physical infrastructure purposes.
Economic Observations and the Fed
The pandemic’s effect on supply chains is well-documented at this point. The strength of US consumers, companies, and state & local governments provided ample firepower to the demand side of the equation, particularly as vaccines allowed for the reopening of society. This supply/demand imbalance drove inflation to levels not seen in decades. For much of the year, the Fed and many forecasters believed these inflationary effects would be transitory. At the same time, the desire to allow the labor market to recover not just to full-employment, but full-employment across all ethnic and socio-economic groups pushed the Fed to allow the economy to simmer longer. Late in the year the Fed realized and acknowledged that the labor market had in fact healed much more rapidly than anticipated, and therefore they could turn their focus to the other half of their dual mandate – price stability. This pivot commenced the start of a tightening cycle of higher interest rates and balance sheet normalization. These higher rates and concomitant volatility will require skill and dexterity to navigate in 2022 and beyond, and we are confident we are up to the challenge.
6
Historical Performance (Expressed in U.S. Dollars) (Unaudited) | December 31, 2021 |
Corporate Credit Market Outlook
Credit spreads across Investment Grade and High Yield corporate bonds entered 2022 relatively tight by historical standards, with High Yield at +375bps and Investment Grade at +175bps. Duration in the investment grade bond market is at historically high levels and coupled with a further expected rise in interest rates, leads us to a cautious outlook for IG bonds. We expect that rising rates and volatility will create more attractive entry points throughout the course of the year. We believe that the high yield market will also not be immune to the collateral damage of higher rates, as duration in the HY market has also become elevated. This is particularly true in the higher-quality BB segment of the market, and we are cautious there as well. Spreads in the BB segment ended 2021 at +253bps, B +407bps, and CCC +723bps. On a historical basis, BBs measure the richest here and CCCs the least expensive, although none screen as particularly cheap. Our goal is to take advantage of our tactical mandate to position defensively where appropriate, and to take advantage of bouts of volatility and price dislocation caused by outflows from ETFs and mutual funds.
The year 2021 produced only $12.7bn of bonds and loans that defaulted or completed a distressed exchange, which represents just 0.44% of the leveraged credit universe. This is comfortably below the long-term average of 3.6% for HY bonds. Additionally, liquidity amongst high yield issuers is at a two-decade high.
We believe that there has been a massive shortfall of investment in upstream energy over the last several years due to ESG concerns, constraints on capital providers, and newfound discipline found or imposed upon energy companies. For these reasons, we believe energy prices will remain high, which creates risks and opportunities; risks in the form of inflation for consumers and energy-intensive manufacturers, but opportunities to invest in certain producers or service providers who would benefit from higher commodity prices.
We expect the significant pace of new issuance to moderate somewhat in 2022. Many companies have already locked in historically low interest rates and pushed out maturities by refinancing their debt. But the pressure to drive flagging stock prices in the latter stages of the economic cycle may drive management teams to increase shareholder rewards and M&A activity, financed with debt. This may provide opportunities to actively participate and trade around these new issues. Furthermore, we continue to seek to identify process-driven investments and other special situations, whose outcome is tied more to progress achieving milestones and less valuation, as a means to add uncorrelated returns to the portfolio.
Municipal Market Outlook
We have several municipal market observations for the coming year:
First, as the Fed continues tapering and commences rate hikes, both Treasury and municipal rates will go up. We note that given what could be described as investor exhaustion with the recent absolute low level of tax-exempt rates, an increase in absolute yields may very well be just what the municipal market needs. Furthermore, historically tax-exempt bonds have tended to outperform Treasuries in rising interest rate cycles. This happens in part because municipal bond prices are more stable relative to Treasuries due to the large retail investor base.
As the Fed tightens, we anticipate that the municipal yield curve will flatten. Longer maturity bonds should provide better opportunity for price performance. For this reason, we seek to actively manage interest rate risk on this portion of the Fund’s portfolio in an effort to capture as much of the price move or credit performance of each position as possible.
We expect that tax-exempt fund flows will continue to be firm, although not likely as strong as 2021 where they were positive in 51 of 52 weeks. We began to see retail demand moderate somewhat in the fourth quarter 2021 as expectations for higher individual tax rates diminished when it became clear that the Build Back Better agenda was not moving forward this Congressional session. However, we always remain vigilant to market conditions that might stimulate fund outflow cycles that can create a negative feedback loop.
Last, while we believe the general state of municipal credit is positive, as we continue to move forward in this COVID-19 world it remains critical to carefully and continually follow specific municipal sectors that are more greatly affected by changes in behavior due to limitations on activity or stresses on operations due to the impact of virus variants and related community policy responses as well as labor shortages. Airline and airport, public transit system, hospital, higher education, and convention center credits are among such more sensitive sectors that require ongoing surveillance and analysis.
Thank you very much for your investment in the Shelton Tactical Credit Fund.
7
Historical Performance and Manager’s Discussion (Unaudited) | December 31, 2021 |
All of the returns in this report represent past performance, which is not a guarantee of future results that may be achieved by the fund. Current performance may be lower or higher than the performance data cited. For more recent performance information, visit our website at www.sheltoncap.com. Note, too, that both investment returns and principal value can fluctuate widely, so an investor’s shares, when sold, could be worth more or less than their original cost. The returns shown do not reflect taxes that a shareholder would pay on fund distributions or on the sale of fund shares.

INSTITUTIONAL SHARES
Average Annual Total Returns
for years ended 12/31/21
Fund/Benchmark | One | Five Year | Since |
Shelton Tactical Credit Fund | 7.09% | 4.51% | 4.56% |
Barclays US Aggregate Bond Index | -1.54% | 3.57% | 3.33% |
INVESTOR SHARES
Average Annual Total Returns
for years ended 12/31/21
Fund/Benchmark | One | Five Year | Since |
Shelton Tactical Credit Fund | 6.75% | 4.24% | 4.31% |
Barclays US Aggregate Bond Index | -1.54% | 3.57% | 3.33% |

8
About Your Fund’s Expenses (Unaudited) | December 31, 2021 |
As a shareholder of the Funds, you incur two types of costs: (1) transaction costs, including sales charges (loads) on purchase payments, reinvested dividends, or other distributions, redemption fees, and exchange fees; and (2) ongoing costs, including management fees, distribution fees and other Fund expenses. Operating expenses, which are deducted from the Funds’ gross income, directly reduce the investment return of the Funds. The Funds’ expenses are expressed as a percentage of its average net assets. This figure is known as the expense ratio. This example is intended to help you understand your ongoing costs (in dollars) of investing in the Funds and to compare these costs with the ongoing costs of investing in other mutual funds. The examples are based on an investment of $1,000 invested at the beginning of the period and held for the entire period from July 1, 2021 to December 31, 2021.
Actual Expenses
The first line of the tables below provides information about actual account values and actual expenses. You may use the information in this line, together with the amount you invested, to estimate the expenses you have paid over the period. Simply divide your account value by $1,000 (for example, an $8,600 account value divided by $1,000 = 8.6), then multiply the result by the number in the first line under the heading entitled “Expenses Paid During Period” to estimate the expenses you paid on your account during this period.
Hypothetical Example for Comparison Purposes
The second line of the table provides information about hypothetical account values and hypothetical expenses based on the Funds’ actual expense ratio and an assumed rate of return of 5% per year before expenses, which is not the Funds’ actual return. The hypothetical account values and expenses may not be used to estimate the actual ending account balance or expenses you paid for the period. You may use this information to compare the ongoing costs of investing in the Funds and other funds. To do so, compare this 5% hypothetical example with the 5% hypothetical examples that appear in the shareholder reports of the other funds. The Funds do not charge any sales charges. Please note that the expenses shown in the tables are meant to highlight your ongoing costs only and do not reflect any transactional cost, such as sales charges (loads), redemption fees, or exchange fees. Therefore, the second line of the tables are useful in comparing ongoing costs only, and will not help you determine the relative total costs of owning different funds. In addition, if these transactional costs were included, your costs would have been higher. The calculations assume no shares were bought or sold during the period.
Beginning | Ending | Expenses Paid | Net Annual | |
Shelton Emerging Markets Fund | ||||
Institutional Shares | ||||
Based on Actual Fund Return | $ 1,000 | $ 983 | $ 7.80 | 1.56% |
Based on Hypothetical 5% Return before expenses | $ 1,000 | $ 1,017 | $ 7.93 | 1.56% |
Investor Shares | ||||
Based on Actual Fund Return | $ 1,000 | $ 982 | $ 9.04 | 1.81% |
Based on Hypothetical 5% Return before expenses | $ 1,000 | $ 1,016 | $ 9.20 | 1.81% |
Shelton International Select Equity Fund | ||||
Institutional Shares | ||||
Based on Actual Fund Return | $ 1,000 | $ 1,004 | $ 5.00 | 0.99% |
Based on Hypothetical 5% Return before expenses | $ 1,000 | $ 1,020 | $ 5.04 | 0.99% |
Investor Shares | ||||
Based on Actual Fund Return | $ 1,000 | $ 1,003 | $ 6.21 | 1.23% |
Based on Hypothetical 5% Return before expenses | $ 1,000 | $ 1,019 | $ 6.26 | 1.23% |
Shelton Tactical Credit Fund | ||||
Institutional Shares | ||||
Based on Actual Fund Return | $ 1,000 | $ 999 | $ 10.28 | 2.04% |
Based on Hypothetical 5% Return before expenses | $ 1,000 | $ 1,015 | $ 10.36 | 2.04% |
Investor Shares | ||||
Based on Actual Fund Return | $ 1,000 | $ 997 | $ 11.63 | 2.31% |
Based on Hypothetical 5% Return before expenses | $ 1,000 | $ 1,013 | $ 11.72 | 2.31% |
* | Expenses are equal to the Fund’s annualized expense ratio listed in the “Net Annual Expense Ratio” column, multiplied by the average account value over the period, multiplied by 181/365 (to reflect the one-half year period). |
9
Top Holdings and Sector Breakdown (Unaudited) | December 31, 2021 |
Shelton Emerging Markets Fund
Security | Market Value | Percentage |
| ||||||||||
1 | Taiwan Semiconductor Manufacturing Co Ltd | $2,019,647 | 7.0 | % | |||||||||
2 | Samsung Electronics Co Ltd | 1,879,092 | 6.6 | % | |||||||||
3 | MediaTek Inc | 1,433,178 | 5.0 | % | |||||||||
4 | Infosys Ltd | 1,416,044 | 4.9 | % | |||||||||
5 | First Eagle Private Credit LLC | 1,365,742 | 4.8 | % | |||||||||
6 | Haier Smart Home Co Ltd | 1,338,160 | 4.7 | % | |||||||||
7 | Chailease Holding Co Ltd | 1,220,022 | 4.3 | % | |||||||||
8 | eMemory Technology Inc | 1,081,268 | 3.8 | % | |||||||||
9 | HDFC Bank Ltd | 1,040,795 | 3.6 | % | |||||||||
10 | Kimberly-Clark de Mexico SAB de CV | 999,750 | 3.5 | % | |||||||||

Shelton International Select Equity Fund
Security | Market Value | Percentage |
| ||||||||||
1 | CRH PLC | $ | 8,008,601 | 5.1% | |||||||||
2 | DBS Group Holdings Ltd | 7,520,364 | 4.8% | ||||||||||
3 | Nestle SA | 7,310,189 | 4.6% | ||||||||||
4 | KBC Group NV | 6,476,146 | 4.1% | ||||||||||
5 | BNP Paribas SA | 6,301,721 | 4.0% | ||||||||||
6 | Element Fleet Management Corp | 6,110,992 | 3.9% | ||||||||||
7 | Bank Rakyat Indonesia Persero Tbk PT | 5,770,952 | 3.6% | ||||||||||
8 | ASML Holding NV | 5,610,399 | 3.5% | ||||||||||
9 | Taiwan Semiconductor Manufacturing Co Ltd | 5,358,848 | 3.4% | ||||||||||
10 | Valeo | 4,923,309 | 3.1% | ||||||||||

Shelton Tactical Credit Fund
Security | Market Value | Percentage |
| ||||||||||
1 | Iron Mountain Inc | $ | 2,069,960 | 3.9% | |||||||||
2 | State of California | 2,000,000 | 3.8% | ||||||||||
3 | Illinois Finance Authority | 2,000,000 | 3.8% | ||||||||||
4 | Massachusetts Health & Educational Facilities Authority | 2,000,000 | 3.8% | ||||||||||
5 | City of Murray UT | 2,000,000 | 3.8% | ||||||||||
6 | City of New York NY | 2,000,000 | 3.8% | ||||||||||
7 | New York City Transitional Finance Authority Future Tax Secured Revenue | 2,000,000 | 3.8% | ||||||||||
8 | New York City Water & Sewer System | 2,000,000 | 3.8% | ||||||||||
9 | University of California | 2,000,000 | 3.8% | ||||||||||
10 | Permanent University Fund - University of Texas System | 2,000,000 | 3.8% | ||||||||||

10
Shelton Emerging Markets Fund Portfolio of Investments (Expressed in U.S. Dollars) December 31, 2021 |
| Security Description | Shares | Value | ||||||
| Common Stock (90.34%) | ||||||||
| Argentina (2.15%) | ||||||||
| MercadoLibre Inc* | 505 | $ | 680,942 | |||||
| Brazil (8.88%) | ||||||||
| Arco Platform Ltd* | 33,230 | 694,175 | ||||||
| Banco Bradesco SA | 183,300 | 626,886 | ||||||
| Notre Dame Intermedica Participacoes SA | 37,400 | 405,223 | ||||||
| Sendas Distribuidora SA | 244,000 | 567,727 | ||||||
| Sul America SA | 105,769 | 522,009 | ||||||
| Total Brazil | 2,816,020 | |||||||
| Cayman Islands (2.49%) | ||||||||
| ASM Pacific Technology Ltd | 73,000 | 788,894 | ||||||
| China (7.18%) | ||||||||
| Haier Smart Home Co Ltd | 316,400 | 1,338,160 | ||||||
| Ping An Insurance Group Co of China Ltd | 33,200 | 239,243 | ||||||
| Xinyi Solar Holdings Ltd | 412,083 | 699,612 | ||||||
| Total China | 2,277,015 | |||||||
| India (7.75%) | ||||||||
| HDFC Bank Ltd | 15,995 | 1,040,795 | ||||||
| Infosys Ltd | 55,948 | 1,416,044 | ||||||
| Total India | 2,456,839 | |||||||
| Indonesia (10.95%) | ||||||||
| Ace Hardware Indonesia Tbk PT | 7,477,000 | 670,855 | ||||||
| Bank Rakyat Indonesia Persero Tbk PT | 4,743,375 | 1,365,742 | ||||||
| Indofood CBP Sukses Makmur Tbk PT | 993,000 | 606,520 | ||||||
| Sarana Menara Nusantara Tbk PT | 10,537,900 | 830,952 | ||||||
| Total Indonesia | 3,474,069 | |||||||
| Mexico (6.10%) | ||||||||
| Kimberly-Clark de Mexico SAB de CV | 658,000 | 999,750 | ||||||
| Regional SAB de CV | 180,000 | 933,516 | ||||||
| Total Mexico | 1,933,266 | |||||||
| Security Description | Shares | Value | ||||||
| South Africa (1.50%) | ||||||||
| Gold Fields Ltd | 43,000 | $ | 475,761 | |||||
| South Korea (14.00%) | ||||||||
| DB HiTek Co Ltd | 15,500 | 944,760 | ||||||
| Dentium Co Ltd | 15,000 | 879,599 | ||||||
| Samsung Electronics Co Ltd | 28,612 | 1,879,092 | ||||||
| Samsung SDI Co Ltd* | 1,342 | 738,063 | ||||||
| Total South Korea | 4,441,514 | |||||||
| Taiwan (25.32%) | ||||||||
| Accton Technology Corp | 100,400 | 940,769 | ||||||
| Chailease Holding Co Ltd | 128,100 | 1,220,022 | ||||||
| eMemory Technology Inc | 13,700 | 1,081,268 | ||||||
| MediaTek Inc | 33,400 | 1,433,178 | ||||||
| Sporton International Inc | 64,050 | 501,857 | ||||||
| Taiwan Semiconductor Manufacturing Co Ltd | 91,300 | 2,019,647 | ||||||
| Voltronic Power Technology Corp | 15,000 | 836,820 | ||||||
| Total Taiwan | 8,033,561 | |||||||
| Thailand (4.02%) | ||||||||
| Bangkok Bank PCL | 223,000 | 805,304 | ||||||
| Charoen Pokphand Foods PCL | 614,000 | 469,138 | ||||||
| Total Thailand | 1,274,442 | |||||||
| Total Common Stock (Cost $21,457,828) | 28,652,323 | |||||||
Total Investments (Cost $21,457,828)(a) (90.34%) | $ | 28,652,323 | ||||||
| Other Net Assets (3.17%) | 3,065,184 | |||||||
| Net Assets (100.00%) | $ | 31,717,507 | ||||||
* | Non-income producing security |
Shelton International Select Equity Fund Portfolio of Investments (Expressed in U.S. Dollars) December 31, 2021 |
| Security Description | Shares | Value | ||||||
| Common Stock (88.06%) | ||||||||
| Belgium (3.60%) | ||||||||
| KBC Group NV | 75,468 | $ | 6,476,146 | |||||
| Canada (12.57%) | ||||||||
| CAE Inc* | 139,811 | 3,531,939 | ||||||
| Constellation Software Inc/Canada | 2,043 | 3,795,906 | ||||||
| Element Fleet Management Corp | 599,309 | 6,110,992 | ||||||
| Kinross Gold Corp | 478,000 | 2,777,596 | ||||||
| Linamar Corp | 57,700 | 3,422,761 | ||||||
| Topicus.com Inc* | 31,858 | 2,928,167 | ||||||
| Total Canada | 22,567,361 | |||||||
| Security Description | Shares | Value | ||||||
| Cayman Islands (2.01%) | ||||||||
| ASM Pacific Technology Ltd | 335,000 | $ | 3,620,147 | |||||
| China (0.94%) | ||||||||
| Ping An Insurance Group Co of China Ltd | 233,900 | 1,684,579 | ||||||
| France (8.33%) | ||||||||
| BNP Paribas SA | 91,187 | 6,301,721 | ||||||
| L’Oreal SA | 7,912 | 3,751,520 | ||||||
| Valeo | 162,879 | 4,923,309 | ||||||
| Total France | 14,976,550 | |||||||
| Germany (3.54%) | ||||||||
| adidas AG | 6,862 | 1,975,838 | ||||||
| MTU Aero Engines AG | 21,496 | 4,385,480 | ||||||
| Total Germany | 6,361,318 | |||||||
See accompanying notes to financial statements.
11
Shelton International Select Equity Fund Portfolio of Investments (Expressed in U.S. Dollars) (Continued) December 31, 2021 |
| Security Description | Shares | Value | ||||||
| Great Britain (4.21%) | ||||||||
| Intertek Group PLC | 40,935 | $ | 3,121,523 | |||||
| Unilever PLC | 82,562 | 4,441,010 | ||||||
| Total Great Britain | 7,562,533 | |||||||
| Hong Kong (4.23%) | ||||||||
| AIA Group Ltd | 465,300 | 4,691,018 | ||||||
| Techtronic Industries Co Ltd | 146,400 | 2,914,367 | ||||||
| Total Hong Kong | 7,605,385 | |||||||
| India (2.40%) | ||||||||
| HDFC Bank Ltd | 66,259 | 4,311,473 | ||||||
| Indonesia (3.21%) | ||||||||
| Bank Rakyat Indonesia Persero Tbk PT | 20,012,284 | 5,770,952 | ||||||
| Ireland (7.17%) | ||||||||
| CRH PLC | 151,384 | 8,008,601 | ||||||
| Smurfit Kappa Group PLC | 88,215 | 4,859,410 | ||||||
| Total Ireland | 12,868,011 | |||||||
| Japan (11.85%) | ||||||||
| Daikin Industries Ltd | 11,400 | 2,582,832 | ||||||
| Mitsubishi Electric Corp | 240,000 | 3,039,729 | ||||||
| Murata Manufacturing Co Ltd | 28,500 | 2,266,289 | ||||||
| Nabtesco Corp | 122,000 | 3,607,399 | ||||||
| Nomura Research Institute Ltd | 94,300 | 4,041,253 | ||||||
| PHC Holdings Corp* | 47,000 | 850,983 | ||||||
| Santen Pharmaceutical Co Ltd | 155,500 | 1,899,948 | ||||||
| Tokyo Electron Ltd | 5,200 | 2,992,975 | ||||||
| Total Japan | 21,281,408 | |||||||
| Mexico (2.55%) | ||||||||
| Kimberly-Clark de Mexico SAB de CV | 3,020,500 | 4,591,632 | ||||||
| Security Description | Shares | Value | ||||||
| Netherlands (3.12%) | ||||||||
| ASML Holding NV | 7,047 | $ | 5,610,399 | |||||
| Singapore (4.18%) | ||||||||
| DBS Group Holdings Ltd | 310,428 | 7,520,364 | ||||||
| South Korea (1.94%) | ||||||||
| Samsung Electronics Co Ltd | 53,000 | 3,490,978 | ||||||
| Switzerland (6.56%) | ||||||||
| Givaudan SA | 576 | 3,029,350 | ||||||
| Nestle SA | 52,078 | 7,310,189 | ||||||
| Straumann Holding AG | 684 | 1,454,105 | ||||||
| Total Switzerland | 11,793,644 | |||||||
| Taiwan (2.98%) | ||||||||
| Taiwan Semiconductor Manufacturing Co Ltd | 44,542 | 5,358,848 | ||||||
| Thailand (2.67%) | ||||||||
| Bangkok Bank PCL | 1,327,100 | 4,807,038 | ||||||
| Total Common Stock (Cost $135,648,154) | 158,258,766 | |||||||
Total Investments (Cost $135,648,154)(a) (88.06%) | $ | 158,258,766 | ||||||
| Other Net Assets (3.92%) | 21,465,202 | |||||||
| Net Assets (100.00%) | $ | 179,723,968 | ||||||
* | Non-income producing security |
Shelton Tactical Credit Fund Portfolio of Investments (Expressed in U.S. Dollars) December 31, 2021 |
| Security Description/ Long Positions | Shares | Value | ||||||
| Common Stock (1.50%) | ||||||||
| Financial (1.25%) | ||||||||
| CBL & Associates Properties Inc* | 21,234 | $ | 662,499 | |||||
CBL & Associates LP(a) | 1,000,000 | 10,000 | ||||||
CBL & Associates LP(a) | 1,526,000 | 15,260 | ||||||
| 687,759 | ||||||||
| Consumer, Non-cyclical (0.25%) | ||||||||
| Pyxus International Inc* | 83,441 | 136,009 | ||||||
| Energy (0.00%) | ||||||||
CHC Group LLC*(b) | 9,358 | 2 | ||||||
| Total Common Stock (Cost $2,201,370) | 823,770 | |||||||
| Security Description/ Long Positions | Par Value | Value | ||||||
| Corporate Debt (42.36%) | ||||||||
| Basic Materials (4.44%) | ||||||||
Cleveland-Cliffs Inc, 9.875%, 10/17/2025 (144A)# | $ | 1,239,000 | $ | 1,402,288 | ||||
| Ferroglobe PLC / Globe Specialty Metals Inc, 9.375%, 12/31/2025 | 1,000,000 | 1,030,000 | ||||||
| Total Basic Materials | 2,432,288 | |||||||
| Communications (4.64%) | ||||||||
| Directv Financing LLC / Directv Financing Co-Obligor Inc, 5.875%, 8/15/2027 (144A) | 1,500,000 | 1,534,995 | ||||||
| Frontier Communications Holdings LLC, 6.000%, 1/15/2030 (144A) | 1,000,000 | 1,005,000 | ||||||
| Total Communications | 2,539,995 | |||||||
See accompanying notes to financial statements.
12
Shelton Tactical Credit Fund Portfolio of Investments (Expressed in U.S. Dollars) (Continued) December 31, 2021 |
| Security Description/ Long Positions | Par Value | Value | ||||||
| Consumer, Cyclical (14.79%) | ||||||||
Bon-Ton Department Stores Inc/The, 8.000%, 6/15/2021(a) | $ | 4,958,932 | $ | 37,192 | ||||
Six Flags Entertainment Corp, 4.875%, 7/31/2024 (144A)# | 1,000,000 | 1,010,000 | ||||||
| Guitar Center Inc, 8.500%, 1/15/2026 (144A) | 1,500,000 | 1,609,470 | ||||||
Hawaiian Brand Intellectual Property Ltd / HawaiianMiles Loyalty Ltd, 5.750%, 1/20/2026 (144A)# | 1,000,000 | 1,046,250 | ||||||
Carnival Corp, 5.750%, 3/1/2027 (144A)# | 500,000 | 500,000 | ||||||
Titan International Inc, 7.000%, 4/30/2028# | 1,000,000 | 1,065,000 | ||||||
PetSmart Inc / PetSmart Finance Corp, 7.750%, 2/15/2029 (144A)# | 750,000 | 814,688 | ||||||
Boyd Gaming Corp, 4.750%, 6/15/2031 (144A)# | 500,000 | 510,000 | ||||||
| Station Casinos LLC, 4.625%, 12/1/2031 (144A) | 1,500,000 | 1,512,300 | ||||||
| Total Consumer, Cyclical | 8,104,900 | |||||||
| Consumer, Non-cyclical (6.72%) | ||||||||
| Mozart Debt Merger Sub Inc, 3.875%, 4/1/2029 (144A) | 1,000,000 | 996,470 | ||||||
| Triton Water Holdings Inc, 6.250%, 4/1/2029 (144A) | 1,000,000 | 959,100 | ||||||
| JBS USA LUX SA / JBS USA Food Co / JBS USA Finance Inc, 3.750%, 12/1/2031 (144A) | 1,700,000 | 1,725,500 | ||||||
| Total Consumer, Non-cyclical | 3,681,070 | |||||||
| Energy (3.82%) | ||||||||
Transocean Inc, 7.500%, 1/15/2026 (144A)# | 1,500,000 | 1,117,500 | ||||||
Energy Ventures Gom LLC / EnVen Finance Corp, 11.750%, 4/15/2026 (144A)# | 950,000 | 976,676 | ||||||
| Total Energy | 2,094,176 | |||||||
| Financial (6.07%) | ||||||||
Iron Mountain Inc, 4.875%, 9/15/2029 (144A)# | 2,000,000 | 2,069,960 | ||||||
| CBL & Associates HoldCo II LLC, 10.000%, 11/15/2029 | 731,425 | 733,254 | ||||||
| AerCap Ireland Capital DAC / AerCap Global Aviation Trust, 3.850%, 10/29/2041 | 500,000 | 522,233 | ||||||
| Total Financial | 3,325,447 | |||||||
| Industrial (1.88%) | ||||||||
Eletson Holdings Inc / Eletson Finance US LLC / Agathonissos Finance LLC, 9.625%, 1/15/2022(b),(c) | 548,153 | — | ||||||
| Great Lakes Dredge & Dock Corp, 5.250%, 6/1/2029 (144A) | 1,000,000 | 1,030,000 | ||||||
| Total Industrial | 1,030,000 | |||||||
| Total Corporate Debt (Cost $23,132,335) | 23,207,876 | |||||||
| Municipal Bonds (56.64%) | ||||||||
| Development (4.22%) | ||||||||
| California Pollution Control Financing Authority, 7.500%, 7/1/2032 (144A) | 250,000 | 212,500 | ||||||
California Pollution Control Financing Authority, 8.000%, 7/1/2039 (144A)(a) | 2,050,000 | 1,230,000 | ||||||
| Security Description/ Long Positions | Par Value | Value | ||||||
| New York Transportation Development Corp, 4.375%, 10/1/2045 | $ | 750,000 | $ | 867,254 | ||||
| Total Development | 2,309,754 | |||||||
| General Obligation (13.09%) | ||||||||
Puerto Rico Public Finance Corp, 5.500%, 8/1/2031#, (a), (b) | 400,000 | 15,000 | ||||||
State of California, 0.010%, 5/1/2040(d) | 2,000,000 | 2,000,000 | ||||||
New York City Transitional Finance Authority Future Tax Secured Revenue, 0.010%, 8/1/2042(d) | 2,000,000 | 2,000,000 | ||||||
City of New York NY, 0.010%, 8/1/2044(d) | 2,000,000 | 2,000,000 | ||||||
Puerto Rico Sales Tax Financing Corp Sales Tax Revenue, 5.000%, 7/1/2058# | 1,000,000 | 1,157,557 | ||||||
| Total General Obligation | 7,172,557 | |||||||
| Higher Education (10.95%) | ||||||||
Permanent University Fund - University of Texas System, 0.070%, 7/1/2037(d) | 2,000,000 | 2,000,000 | ||||||
University of California, 0.010%, 5/15/2048(d) | 2,000,000 | 2,000,000 | ||||||
Massachusetts Health & Educational Facilities Authority, 0.010%, 11/1/2049(d) | 2,000,000 | 2,000,000 | ||||||
| Total Higher Education | 6,000,000 | |||||||
| Housing (2.16%) | ||||||||
California Municipal Finance Authority, 5.000%, 5/15/2051# | 1,000,000 | 1,182,197 | ||||||
| Medical (16.40%) | ||||||||
New York State Dormitory Authority, 5.000%, 8/1/2035#,(d) | 1,000,000 | 1,212,800 | ||||||
| City of Murray UT, 0.010%, 5/15/2037 | 2,000,000 | 2,000,000 | ||||||
Massachusetts Development Finance Agency, 5.000%, 7/1/2044#,(d) | 1,000,000 | 1,129,545 | ||||||
| California Health Facilities Financing Authority, 4.000%, 4/1/2049 | 1,000,000 | 1,149,970 | ||||||
| California Municipal Finance Authority, 4.000%, 2/1/2051 | 250,000 | 292,940 | ||||||
County of Cuyahoga OH, 5.500%, 2/15/2052# | 1,000,000 | 1,195,120 | ||||||
| Illinois Finance Authority, 0.010%, 7/15/2055 | 2,000,000 | 2,000,000 | ||||||
| Total Medical | 8,980,375 | |||||||
| Tobacco Settlement (2.10%) | ||||||||
| Iowa Tobacco Settlement Authority, 4.000%, 6/1/2049 | 1,000,000 | 1,149,454 | ||||||
| Transportation (4.07%) | ||||||||
Texas Private Activity Bond Surface Transportation Corp, 7.000%, 12/31/2038# | 500,000 | 553,248 | ||||||
Riverside County Transportation Commission, 4.000%, 6/1/2046(d) | 1,000,000 | 1,177,405 | ||||||
Bay Area Toll Authority, 0.010%, 4/1/2053(d) | 500,000 | 500,000 | ||||||
| Total Transportation | 2,230,653 | |||||||
| Water (3.65%) | ||||||||
New York City Water & Sewer System, 0.010%, 6/15/2044(d) | 2,000,000 | 2,000,000 | ||||||
| Total Municipal Debt (Cost $31,592,627) | 31,024,990 | |||||||
See accompanying notes to financial statements.
13
Shelton Tactical Credit Fund Portfolio of Investments (Expressed in U.S. Dollars) (Continued) December 31, 2021 |
| Security Description/ Long Positions | Par Value | Value | ||||||
| Term Loans (1.30%) | ||||||||
| Pyxus International Loan, 3M US LIBOR (floor 1.500%) + 9.500%, 2/24/25 | $ | 724,718 | $ | 712,637 | ||||
| Total Term Loans (Cost $714,174) | 712,637 | |||||||
Contracts | ||||||||
| Purchased Options - Puts (0.04%) | ||||||||
| 10-Year US Treasury Note Futures | ||||||||
| Notional amount $12,750,000, premiums paid $50,000, exercise price $127.50, expires 1/21/22* | 100 | 3,125 | ||||||
| 10-Year US Treasury Note Futures | ||||||||
| Notional amount $12,850,000, premiums paid $31,250, exercise price $128.50, expires 1/21/22* | 100 | 7,813 | ||||||
| 10-Year US Treasury Note Futures | ||||||||
| Notional amount $9,712,500, premiums paid $39,844, exercise price $129.50, expires 1/21/22* | 75 | 17,578 | ||||||
| Total Purchased Options - Puts (Cost $121,094) | 28,516 | |||||||
| Total Long Positions (Cost $57,761,601) (101.84%) | $ | 55,797,789 | ||||||
| Liabilities in Excess of Other Assets (-1.84%) | (1,010,055 | ) | ||||||
| Net Assets (100.00%) | $ | 54,787,734 | ||||||
| Security Description/ Short Positions | Par Value | Value | ||||||
| Short Corporate Debt (-4.95%) | ||||||||
| Consumer, Cyclical (-3.00%) | ||||||||
| Wynn Las Vegas LLC / Wynn Las Vegas Capital Corp, 5.500%, 3/1/2025 (144A) | $ | (1,600,000 | ) | $ | (1,648,000 | ) | ||
| Financial (-1.95%) | ||||||||
| Navient Corp, 5.875%, 10/25/2024 | (1,000,000 | ) | (1,066,250 | ) | ||||
| Total Short Corporate Debt (Proceeds $2,633,403) | $ | (2,714,250 | ) | |||||
* | Non income security. |
(144A) Security was purchased pursuant to Rule 144A or Section 4(a)(2) under the Securities Act of 1933 and may be resold in transactions exempt from registration only to qualified institutional buyers. As of December 31, 2021, these securities had a total aggregate market value of $19,614,697, which represented approximately 35.80% of net assets.
# | All or a portion of this security has been segregated as collateral. The total fair value of securities pledged as collateral amounts to $15,555,541 as of fiscal year end. |
(a) | Defaulted security. |
(b) | Security is illiquid. |
(c) | Level 3 security fair valued under procedures established by the Board of Trustees, represents 0.00% of net assets. The total value of the fair value security is $0. |
(d) | Variable rate security. |
See accompanying notes to financial statements.
14
Statements of Assets and Liabilities December 31, 2021 |
Shelton | Shelton | Shelton | ||||||||||
Assets | ||||||||||||
Investments in securities | ||||||||||||
Cost of investments | $ | 21,457,828 | $ | 135,648,154 | $ | 57,640,507 | ||||||
Cost of purchased options | — | — | 121,094 | |||||||||
Value of investments (Note 1) | 28,652,323 | 158,258,766 | 55,769,273 | |||||||||
Value of purchased options (Note 1) | — | — | 28,516 | |||||||||
Cash | 3,412,939 | 25,123,170 | 599,311 | |||||||||
Cash held at broker for securities sold short | — | — | 741,100 | |||||||||
Interest receivable | — | — | 599,415 | |||||||||
Dividend receivable | 21,917 | 92,112 | — | |||||||||
Reclaim receivable | 970 | 389,732 | — | |||||||||
Receivable from investment advisor | — | — | — | |||||||||
Receivable for fund shares sold | 447,360 | 142,074 | 21,578 | |||||||||
Prepaid expenses | 30,251 | 69,630 | 4,115 | |||||||||
Other receivables | 143 | 831 | — | |||||||||
Total assets | $ | 32,565,903 | $ | 184,076,315 | $ | 57,763,308 | ||||||
Liabilities | ||||||||||||
Payables and other liabilites | ||||||||||||
Short positions, at value (proceeds $2,633,403) | — | — | 2,714,250 | |||||||||
Interest payable | — | — | 40,104 | |||||||||
Payable for fund shares repurchased | 50,174 | 410,400 | 110,408 | |||||||||
Payable to investment advisor | 28,340 | 109,824 | 54,541 | |||||||||
Distributions payable | 8,815 | 48,389 | 3,091 | |||||||||
Payable for securities purchased | 697,848 | 3,660,312 | — | |||||||||
Dividend tax payable | — | — | — | |||||||||
Accrued 12b-1 fees | 270 | 6,263 | 968 | |||||||||
Accrued administration fees | 2,365 | 13,465 | 4,213 | |||||||||
| — | — | — | ||||||||||
Accrued CCO fees | 1,118 | 26,316 | 1,913 | |||||||||
Accrued custody fees | — | — | 5 | |||||||||
Accrued expenses | 22,267 | 22,927 | 22,772 | |||||||||
Accrued fund accounting fees | 7,454 | 14,017 | 17,867 | |||||||||
Accrued printing fees | — | — | — | |||||||||
Accrued registration fees | — | — | — | |||||||||
Accrued shareholder servicing fees | — | — | — | |||||||||
Accrued transfer agent fees | 29,245 | 39,107 | 4,662 | |||||||||
Accrued trustee fees | 500 | 1,327 | 780 | |||||||||
Total liabilities | 848,396 | 4,352,347 | 2,975,574 | |||||||||
Net assets | $ | 31,717,507 | $ | 179,723,968 | $ | 54,787,734 | ||||||
Net assets at December 31, 2021 consist of | ||||||||||||
Paid-in capital | 27,022,435 | 196,523,519 | 62,922,361 | |||||||||
Distributable earnings/(loss) | 4,695,072 | (16,799,551 | ) | (8,134,627 | ) | |||||||
Total net assets | $ | 31,717,507 | $ | 179,723,968 | $ | 54,787,734 | ||||||
Net assets | ||||||||||||
Institutional | $ | 30,457,902 | $ | 149,505,232 | $ | 50,232,182 | ||||||
Investor | $ | 1,259,605 | $ | 30,218,736 | $ | 4,555,552 | ||||||
Shares outstanding | ||||||||||||
Institutional Shares (no par value, unlimited shares authorized) | 1,533,506 | 5,497,032 | 4,538,409 | |||||||||
Investor Shares (no par value, unlimited shares authorized) | 64,145 | 1,117,534 | 412,139 | |||||||||
Net asset value per share | ||||||||||||
Institutional Shares | $ | 19.86 | $ | 27.20 | $ | 11.07 | ||||||
Investor Shares | $ | 19.64 | $ | 27.04 | $ | 11.05 | ||||||
See accompanying notes to financial statements.
15
Statements of Operations |
Shelton | Shelton | Shelton | ||||||||||
Year Ended | Year Ended | Year Ended | ||||||||||
Investment income | ||||||||||||
Interest income | $ | 62 | $ | 1,389 | $ | 2,089,219 | ||||||
Dividend income (net of foreign tax witheld: $76,591, $339,151 and $— respectively) | 467,137 | 2,621,765 | 21,162 | |||||||||
Other income | — | — | — | |||||||||
Income from securities lending, net | 585 | 3,709 | — | |||||||||
Total | $ | 467,784 | $ | 2,626,863 | $ | 2,110,381 | ||||||
Expenses | ||||||||||||
Management fees (Note 2) | $ | 298,605 | $ | 1,214,570 | $ | 599,651 | ||||||
Interest on short positions | — | — | 190,512 | |||||||||
Administration fees (Note 2) | 27,140 | 149,056 | 46,536 | |||||||||
Transfer agent fees | 39,310 | 80,359 | 15,240 | |||||||||
Accounting services | 22,637 | 40,214 | 38,194 | |||||||||
Custodian fees | 15,891 | 27,965 | 6,204 | |||||||||
Legal and audit fees | 9,887 | 31,643 | 13,672 | |||||||||
CCO fees (Note 2) | 2,539 | 13,991 | 4,414 | |||||||||
Trustees fees | 3,781 | 3,783 | 3,802 | |||||||||
Insurance | 887 | 5,020 | 1,614 | |||||||||
Printing | 8,874 | 9,629 | 12,824 | |||||||||
Broker Fees | — | 220 | 136,207 | |||||||||
Registration and dues | 42,735 | 43,703 | 22,136 | |||||||||
12b-1 fees Investor Shares (Note 2) | 3,791 | 62,599 | 12,052 | |||||||||
Other expenses | — | 650 | 3,847 | |||||||||
Total expenses | $ | 476,077 | $ | 1,683,402 | $ | 1,106,905 | ||||||
Less reimbursement from manager (Note 2) | (6,292 | ) | — | (47,163 | ) | |||||||
Net expenses | $ | 469,785 | $ | 1,683,402 | $ | 1,059,742 | ||||||
Net Investment Income/(loss) | $ | (2,001 | ) | $ | 943,461 | $ | 1,050,639 | |||||
Realized and unrealized gain/(loss) on investments | ||||||||||||
Net realized gain/(loss) from security transactions and foreign currency | $ | 1,083,131 | $ | 13,530,520 | $ | 341,934 | ||||||
Net realized gain/(loss) from futures contracts | — | — | (48,363 | ) | ||||||||
Net realized gain/(loss) from purchased option contracts | — | — | (170,979 | ) | ||||||||
Net realized gain/(loss) from written options contracts | — | — | 74,599 | |||||||||
Total Net Realized gain/(loss) | 1,083,131 | 13,530,520 | 197,191 | |||||||||
Change in unrealized appreciation/(depreciation) of investments | (895,880 | ) | (5,399,908 | ) | 1,949,932 | |||||||
Change in unrealized appreciation/(depreciation) of futures | — | — | — | |||||||||
Change in unrealized appreciation/(depreciation) of purchased option contracts | — | — | 117,570 | |||||||||
Change in unrealized appreciation/(depreciation) of written option contracts | — | — | (88,726 | ) | ||||||||
Net realized and unrealized gain/(loss) on investments | $ | 187,251 | $ | 8,130,612 | $ | 2,175,967 | ||||||
Net increase/(decrease) in net assets resulting from operations | $ | 185,250 | $ | 9,074,073 | $ | 3,226,606 | ||||||
See accompanying notes to financial statements.
16
Statements of Changes in Net Assets |
Shelton Emerging Markets Fund | Shelton International | |||||||||||||||||||
Year Ended | For the period | Year Ended | Year Ended | Year Ended | ||||||||||||||||
Operations | ||||||||||||||||||||
Net investment income/(loss) | $ | (2,001 | ) | $ | (41,404 | ) | $ | 50,062 | $ | 943,461 | $ | 425,800 | ||||||||
Net realized gain/(loss) from security transactions and foreign currency | 1,083,131 | 3,489,313 | (3,886,642 | ) | 13,530,520 | 38,555 | ||||||||||||||
Change in unrealized appreciation/(depreciation) of investments | (895,880 | ) | 3,281,869 | 4,945,157 | (5,399,908 | ) | 19,176,951 | |||||||||||||
Net increase/(decrease) in net assets resulting from operations | 185,250 | 6,729,778 | 1,108,577 | 9,074,073 | 19,641,306 | |||||||||||||||
Distributions to shareholders | ||||||||||||||||||||
Distributions | ||||||||||||||||||||
Institutional Shares | (571,045 | ) | (47,123 | ) | (802,092 | ) | (960,307 | ) | (810,174 | ) | ||||||||||
Investor Shares | (24,193 | ) | (2,929 | ) | (49,976 | ) | (121,712 | ) | (75,408 | ) | ||||||||||
Total Distributions | (595,238 | ) | (50,052 | ) | (852,068 | ) | (1,082,019 | ) | (885,582 | ) | ||||||||||
Capital share transactions | ||||||||||||||||||||
Increase/(decrease) in net assets resulting from capital share transactions | 4,790,318 | (2,092,602 | ) | (21,276,449 | ) | 27,975,743 | 64,229,063 | |||||||||||||
Total increase/(decrease) | 4,380,330 | 4,587,124 | (21,019,939 | ) | 35,967,797 | 82,984,787 | ||||||||||||||
Net assets | ||||||||||||||||||||
Beginning of year | 27,337,177 | 22,750,053 | 43,769,992 | 143,756,171 | 60,771,384 | |||||||||||||||
End of year | $ | 31,717,507 | $ | 27,337,177 | $ | 22,750,053 | $ | 179,723,968 | $ | 143,756,171 | ||||||||||
Shelton Tactical Credit Fund | ||||||||
Year Ended | Year Ended | |||||||
Operations | ||||||||
Net investment income/(loss) | $ | 1,050,639 | $ | 2,304,569 | ||||
Net realized gain/(loss) from security transactions and foreign currency | 341,934 | 786,483 | ||||||
Net realized gain/(loss) from futures contracts | (48,363 | ) | (1,876,622 | ) | ||||
Net realized gain/(loss) from purchased option contracts | (170,979 | ) | (1,086,795 | ) | ||||
Net realized gain/(loss) from written options contracts | 74,599 | 385,413 | ||||||
Change in unrealized appreciation/(depreciation) of investments | 1,949,932 | (1,465,185 | ) | |||||
Change in unrealized appreciation/(depreciation) of futures | — | (401,601 | ) | |||||
Change in unrealized appreciation/(depreciation) of purchased option contracts | 117,570 | (210,148 | ) | |||||
Change in unrealized appreciation/(depreciation) of written option contracts | (88,726 | ) | 88,726 | |||||
Net increase/(decrease) in net assets resulting from operations | 3,226,606 | (1,475,160 | ) | |||||
Distributions to shareholders | ||||||||
Distributions | ||||||||
Institutional Shares | (1,608,706 | ) | (1,860,085 | ) | ||||
Investor Shares | (156,372 | ) | (443,874 | ) | ||||
Total Distributions | (1,765,078 | ) | (2,303,959 | ) | ||||
Capital share transactions | ||||||||
Increase/(Decrease) in net assets resulting from capital share transactions | 6,343,472 | (39,592,702 | ) | |||||
Total increase/(decrease) | 7,805,000 | (43,371,821 | ) | |||||
Net assets | ||||||||
Beginning of year | 46,982,734 | 90,354,555 | ||||||
End of year | $ | 54,787,734 | $ | 46,982,734 | ||||
See accompanying notes to financial statements.
17
Statements of Changes in Net Assets (Continued) |
Shelton Emerging Markets Fund | Institutional Shares | |||||||||||||||||||||||
Year Ended | For the period | Year Ended | ||||||||||||||||||||||
Shares | Value | Shares | Value | Shares | Value | |||||||||||||||||||
Shares sold | 589,630 | $ | 11,944,791 | 55,023 | $ | 972,867 | 361,269 | $ | 5,104,041 | |||||||||||||||
Shares issued in reinvestment of distributions | 28,375 | 563,525 | 2,309 | 46,398 | 47,764 | 772,818 | ||||||||||||||||||
Shares repurchased | (365,861 | ) | (7,406,200 | ) | (166,946 | ) | (2,859,468 | ) | (1,842,250 | ) | (26,676,989 | ) | ||||||||||||
Net increase/(decrease) | 252,145 | $ | 5,102,116 | (109,614 | ) | $ | (1,840,203 | ) | (1,433,217 | ) | $ | (20,800,130 | ) | |||||||||||
Investor Shares | ||||||||||||||||||||||||
Year Ended | For the period | Year Ended | ||||||||||||||||||||||
Shares | Value | Shares | Value | Shares | Value | |||||||||||||||||||
Shares sold | 37,005 | $ | 746,324 | 1,033 | $ | 18,262 | 14,115 | $ | 217,500 | |||||||||||||||
Shares issued in reinvestment of distributions | 1,193 | 23,422 | 137 | 2,728 | 2,782 | 44,734 | ||||||||||||||||||
Shares repurchased | (53,793 | ) | (1,081,544 | ) | (15,623 | ) | (273,389 | ) | (53,368 | ) | (738,553 | ) | ||||||||||||
Net increase/(decrease) | (15,596 | ) | $ | (311,798 | ) | (14,453 | ) | $ | (252,399 | ) | (36,471 | ) | $ | (476,319 | ) | |||||||||
Shelton International Select Equity Fund | Institutional Shares | |||||||||||||||
Year Ended | Year Ended | |||||||||||||||
Shares | Value | Shares | Value | |||||||||||||
Shares sold | 2,980,379 | $ | 80,420,547 | 2,852,650 | $ | 61,496,737 | ||||||||||
Shares issued in reinvestment of distributions | 33,630 | 914,749 | 33,046 | 794,614 | ||||||||||||
Shares gained with reorganization (Note 6) | 1,027,306 | 21,305,921 | ||||||||||||||
Shares repurchased | (2,479,669 | ) | (66,635,278 | ) | (1,475,934 | ) | (27,928,354 | ) | ||||||||
Net increase/(decrease) | 534,341 | $ | 14,700,019 | 2,437,068 | $ | 55,668,918 | ||||||||||
Investor Shares | ||||||||||||||||
Year Ended | Year Ended | |||||||||||||||
Shares | Value | Shares | Value | |||||||||||||
Shares sold | 738,870 | $ | 19,758,599 | 411,822 | $ | 9,231,323 | ||||||||||
Shares issued in reinvestment of distributions | 4,396 | 118,881 | 2,976 | 71,947 | ||||||||||||
Shares gained with reorganization (Note 6) | 94,062 | 1,938,316 | ||||||||||||||
Shares repurchased | (244,815 | ) | (6,601,755 | ) | (124,979 | ) | (2,681,441 | ) | ||||||||
Net increase/(decrease) | 498,452 | $ | 13,275,724 | 383,881 | $ | 8,560,145 | ||||||||||
Shelton Tactical Credit Fund | Institutional Shares | |||||||||||||||
Year Ended | Year Ended | |||||||||||||||
Shares | Value | Shares | Value | |||||||||||||
Shares sold | 1,079,371 | $ | 12,043,444 | 772,060 | $ | 7,819,310 | ||||||||||
Shares issued in reinvestment of distributions | 142,999 | 1,594,388 | 188,740 | 1,841,491 | ||||||||||||
Shares repurchased | (466,453 | ) | (5,151,960 | ) | (3,803,066 | ) | (36,872,793 | ) | ||||||||
Net increase/(decrease) | 755,917 | $ | 8,485,873 | (2,842,266 | ) | $ | (27,211,992 | ) | ||||||||
Investor Shares | ||||||||||||||||
Year Ended | Year Ended | |||||||||||||||
Shares | Value | Shares | Value | |||||||||||||
Shares sold | 66,255 | $ | 735,922 | 268,050 | $ | 2,797,120 | ||||||||||
Shares issued in reinvestment of distributions | 13,884 | 154,544 | 44,314 | 427,078 | ||||||||||||
Shares repurchased | (276,037 | ) | (3,032,866 | ) | (1,644,597 | ) | (15,604,908 | ) | ||||||||
Net increase/(decrease) | (195,898 | ) | $ | (2,142,401 | ) | (1,332,233 | ) | $ | (12,380,710 | ) | ||||||
See accompanying notes to financial statements.
18
Financial Highlights For a Share Outstanding Throughout Each Year |
Shelton Emerging | Year Ended | For the period | Year Ended | Year Ended | Year Ended | Year Ended | ||||||||||||||||||
Net asset value, beginning of year | $ | 20.09 | $ | 15.33 | $ | 14.82 | $ | 16.22 | $ | 15.90 | $ | 14.28 | ||||||||||||
INCOME FROM INVESTMENT OPERATIONS | ||||||||||||||||||||||||
Net investment income/(loss)(d) | — | (e) | (0.04 | ) | 0.01 | 0.31 | 0.31 | 0.07 | ||||||||||||||||
Net gain/(loss) on securities (both realized and unrealized) | 0.15 | 4.84 | 0.87 | (1.24 | ) | 0.04 | 1.55 | |||||||||||||||||
Total from investment operations | 0.15 | 4.80 | 0.88 | (0.93 | ) | 0.35 | 1.62 | |||||||||||||||||
LESS DISTRIBUTIONS | ||||||||||||||||||||||||
Dividends from net investment income | (0.38 | ) | (0.04 | ) | (0.37 | ) | (0.31 | ) | (0.03 | ) | — | |||||||||||||
Distributions from capital gains | — | — | — | (0.16 | ) | — | — | |||||||||||||||||
Total distributions | (0.38 | ) | (0.04 | ) | (0.37 | ) | (0.47 | ) | (0.03 | ) | — | |||||||||||||
Net asset value, end of year or period | $ | 19.86 | $ | 20.09 | $ | 15.33 | $ | 14.82 | $ | 16.22 | $ | 15.90 | ||||||||||||
Total return | 0.77 | % | 31.29 | %(f) | 5.78 | % | (5.60 | )% | 2.21 | % | 11.34 | % | ||||||||||||
RATIOS / SUPPLEMENTAL DATA | ||||||||||||||||||||||||
Net assets, end of year (000s) | $ | 30,458 | $ | 25,749 | $ | 21,354 | $ | 41,845 | $ | 50,897 | $ | 51,833 | ||||||||||||
Ratio of expenses to average net assets: | ||||||||||||||||||||||||
Before expense reimbursements | 1.58 | % | 1.48 | %(g) | 1.89 | % | 1.78 | % | 1.61 | % | 1.72 | % | ||||||||||||
After expense reimbursements(h) | 1.56 | % | 1.48 | %(g) | 1.61 | % | 1.56 | % | 1.55 | % | 1.55 | % | ||||||||||||
Ratio of net investment income/(loss) to average net assets | ||||||||||||||||||||||||
Before expense reimbursements | (0.04 | )% | (0.88 | )%(g) | (0.20 | )% | 1.81 | % | 1.83 | % | 0.29 | % | ||||||||||||
After expense reimbursements | 0.04 | % | (0.88 | )%(g) | 0.08 | % | 2.03 | % | 1.89 | % | 0.46 | % | ||||||||||||
Portfolio turnover | 21 | % | 27 | %(f) | 58 | % | 78 | % | 63 | % | 169 | % | ||||||||||||
(a) | Formerly named ICON Emerging Markets Fund. |
(b) | Formerly named ICON Emerging Markets Fund - Class S. |
(c) | Fund changed its fiscal year end from September 30 to December 31. |
(d) | Calculated based upon average shares outstanding. |
(e) | Amount less than $(0.005). |
(f) | Not annualized. |
(g) | Annualized. |
(h) | Effective for the year ended September 30, 2020 and thereafter, CCO Fees are not included in the expense limitation. For the year ended September 30, 2020, reorganization costs not included. For all years presented, interest expense, when applicable, is not included in the expense limitation. |
See accompanying notes to financial statements.
19
Financial Highlights For a Share Outstanding Throughout Each Year |
Shelton Emerging | Year Ended | For the period | Year Ended | Year Ended | Year Ended | Year Ended | ||||||||||||||||||
Net asset value, beginning of year | $ | 19.92 | $ | 15.20 | $ | 14.73 | $ | 16.08 | $ | 15.77 | $ | 14.20 | ||||||||||||
INCOME FROM INVESTMENT OPERATIONS | ||||||||||||||||||||||||
Net investment income/(loss)(d) | (0.05 | ) | (0.05 | ) | (0.01 | ) | 0.14 | 0.24 | 0.06 | |||||||||||||||
Net gain/(loss) on securities (both realized and unrealized) | 0.15 | 4.81 | 0.84 | (1.10 | ) | 0.07 | 1.51 | |||||||||||||||||
Total from investment operations | 0.10 | 4.76 | 0.83 | (0.96 | ) | 0.31 | 1.57 | |||||||||||||||||
LESS DISTRIBUTIONS | ||||||||||||||||||||||||
Dividends from net investment income | (0.38 | ) | (0.04 | ) | (0.36 | ) | (0.23 | ) | (0.00 | )(e) | — | |||||||||||||
Distributions from capital gains | — | — | — | (0.16 | ) | — | — | |||||||||||||||||
Total distributions | (0.38 | ) | (0.04 | ) | (0.36 | ) | (0.39 | ) | (0.00 | ) | — | |||||||||||||
Net asset value, end of year or period | $ | 19.64 | $ | 19.92 | $ | 15.20 | $ | 14.73 | $ | 16.08 | $ | 15.77 | ||||||||||||
Total return(i) | 0.52 | % | 31.29 | %(f) | 5.48 | % | (5.87 | )% | 1.97 | % | 11.06 | % | ||||||||||||
RATIOS / SUPPLEMENTAL DATA | ||||||||||||||||||||||||
Net assets, end of year (000s) | $ | 1,260 | $ | 1,588 | $ | 1,432 | $ | 1,925 | $ | 6,436 | $ | 12,887 | ||||||||||||
Ratio of expenses to average net assets: | ||||||||||||||||||||||||
Before expense reimbursements | 1.84 | % | 1.73 | %(g) | 2.54 | % | 2.26 | % | 1.96 | % | 2.12 | % | ||||||||||||
After expense reimbursements(h) | 1.81 | % | 1.73 | %(g) | 1.89 | % | 1.81 | % | 1.80 | % | 1.80 | % | ||||||||||||
Ratio of net investment income/(loss) to average net assets | ||||||||||||||||||||||||
Before expense reimbursements | (0.28 | )% | (1.12 | )%(g) | (0.74 | )% | 0.45 | % | 1.32 | % | 0.08 | % | ||||||||||||
After expense reimbursements | (0.25 | )% | (1.12 | )%(g) | (0.08 | )% | 0.90 | % | 1.48 | % | 0.40 | % | ||||||||||||
Portfolio turnover | 21 | % | 27 | %(f) | 58 | % | 78 | % | 63 | % | 169 | % | ||||||||||||
(a) | Formerly named ICON Emerging Markets Fund. |
(b) | Formerly named ICON Emerging Markets Fund - Class A. |
(c) | Fund changed its fiscal year end from September 30 to December 31. |
(d) | Calculated based upon average shares outstanding. |
(e) | Amount less than $(0.005). |
(f) | Not annualized. |
(g) | Annualized. |
(h) | Effective for the year ended September 30, 2020 and thereafter, CCO Fees are not included in the expense limitation. For the year ended September 30, 2020, reorganization costs not included. For all years presented, interest expense, when applicable, is not included in the expense limitation. |
(i) | The total return calculation excludes any sales charges. |
See accompanying notes to financial statements.
20
Financial Highlights For a Share Outstanding Throughout Each Year |
Shelton International | Year Ended | Year Ended | Year Ended | Year Ended | Period Ended | Year Ended | ||||||||||||||||||
Net asset value, beginning of year | $ | 25.77 | $ | 22.02 | $ | 18.35 | $ | 21.34 | $ | 18.03 | $ | 15.90 | ||||||||||||
INCOME FROM INVESTMENT OPERATIONS | ||||||||||||||||||||||||
Net investment income/(loss)(c) | 0.16 | 0.12 | 0.29 | 0.19 | 0.10 | 0.22 | ||||||||||||||||||
Net gain/(loss) on securities (both realized and unrealized) | 1.45 | 3.84 | 3.84 | (2.97 | ) | 3.61 | 2.13 | |||||||||||||||||
Total from investment operations | 1.61 | 3.96 | 4.13 | (2.78 | ) | 3.71 | 2.35 | |||||||||||||||||
LESS DISTRIBUTIONS | ||||||||||||||||||||||||
Dividends from net investment income | (0.18 | ) | (0.21 | ) | (0.46 | ) | (0.21 | ) | (0.39 | ) | (0.22 | ) | ||||||||||||
Distributions from return of capital | — | — | — | — | (0.01 | ) | — | |||||||||||||||||
Distributions from capital gains | — | — | — | — | — | — | ||||||||||||||||||
Total distributions | (0.18 | ) | (0.21 | ) | (0.46 | ) | (0.21 | ) | (0.40 | ) | (0.22 | ) | ||||||||||||
Redemption Fees | — | — | — | — | — | — | ||||||||||||||||||
Net asset value, end of year | $ | 27.20 | $ | 25.77 | $ | 22.02 | $ | 18.35 | $ | 21.34 | $ | 18.03 | ||||||||||||
Total return | 6.23 | % | 18.07 | % | 22.53 | % | (13.17 | )% | 20.74 | % | 14.89 | %(d) | ||||||||||||
RATIOS / SUPPLEMENTAL DATA | ||||||||||||||||||||||||
Net assets, end of year or period (000s) | $ | 149,505 | $ | 127,893 | $ | 55,619 | $ | 41,424 | $ | 42,824 | $ | 38,737 | ||||||||||||
Ratio of expenses to average net assets: | ||||||||||||||||||||||||
Before expense reimbursements | 0.99 | % | 1.04 | % | 1.12 | % | 1.36 | % | 1.32 | % | 1.76 | %(e) | ||||||||||||
After expense reimbursements | 0.99 | % | 0.99 | % | 1.01 | % | 1.17 | % | 0.99 | % | 0.99 | % | ||||||||||||
Ratio of net investment income/(loss) to average net assets | ||||||||||||||||||||||||
Before expense reimbursements | 0.61 | % | 0.49 | % | 1.28 | % | 0.73 | % | 0.41 | % | ||||||||||||||
After expense reimbursements | 0.61 | % | 0.54 | % | 1.40 | % | 0.92 | % | 0.74 | % | 1.32 | % | ||||||||||||
Portfolio turnover | 46 | % | 46 | % | 49 | % | 65 | % | 24 | % | 41 | % | ||||||||||||
(a) | As of July 28, 2017 Class A shares and I shares were renamed to Investor shares and Institutional shares, respectively. |
(b) | For the eight month period ended December 31, 2017. |
(c) | Calculated based upon average shares outstanding. |
(d) | Total investment return is calculated assuming a purchase of shares on the first day and a sale of shares on the last day of each period reported and includes reinvestment of dividends and distributions, if any. For Investor Shares (Formerly Class A Shares), total investment return does not reflect the impact of the maximum front-end sales load of 5.75%. If reflected, the return would be lower. |
(e) | During the period, certain fees were waived and/or reimbursed; or recouped, if any. If such fee waivers and/or reimbursements or recoupments had not occurred, the ratios would have been as indicated. |
See accompanying notes to financial statements.
21
Financial Highlights For a Share Outstanding Throughout Each Year |
Shelton International Investor Shares(a) | Year Ended | Year Ended | Year Ended | Year Ended | Period Ended | Year Ended | ||||||||||||||||||
Net asset value, beginning of year | $ | 25.62 | $ | 21.91 | $ | 18.29 | $ | 21.30 | $ | 18.02 | $ | 15.88 | ||||||||||||
INCOME FROM INVESTMENT OPERATIONS | ||||||||||||||||||||||||
Net investment income/(loss)(c) | 0.11 | 0.05 | 0.24 | 0.11 | 0.08 | 0.17 | ||||||||||||||||||
Net gain/(loss) on securities (both realized and unrealized) | 1.42 | 3.80 | 3.83 | (2.94 | ) | 3.60 | 2.13 | |||||||||||||||||
Total from investment operations | 1.53 | 3.85 | 4.07 | (2.83 | ) | 3.68 | 2.30 | |||||||||||||||||
LESS DISTRIBUTIONS | ||||||||||||||||||||||||
Dividends from net investment income | (0.11 | ) | (0.14 | ) | (0.45 | ) | (0.18 | ) | (0.39 | ) | (0.16 | ) | ||||||||||||
Distributions from return of capital | — | — | — | — | (0.01 | ) | — | |||||||||||||||||
Distributions from capital gains | — | — | — | — | — | — | ||||||||||||||||||
Total distributions | (0.11 | ) | (0.14 | ) | (0.45 | ) | (0.18 | ) | (0.40 | ) | (0.16 | ) | ||||||||||||
Redemption Fees | — | — | — | — | — | — | ||||||||||||||||||
Net asset value, end of year | $ | 27.04 | $ | 25.62 | $ | 21.91 | $ | 18.29 | $ | 21.30 | $ | 18.02 | ||||||||||||
Total return | 5.97 | % | 17.64 | % | 22.25 | % | (13.41 | )% | 20.53 | % | 14.55 | %(d) | ||||||||||||
RATIOS / SUPPLEMENTAL DATA | ||||||||||||||||||||||||
Net assets, end of year or period (000s) | $ | 30,219 | $ | 15,863 | $ | 5,152 | $ | 5,904 | $ | 3,785 | $ | 4,488 | ||||||||||||
Ratio of expenses to average net assets: | ||||||||||||||||||||||||
Before expense reimbursements | 1.23 | % | 1.29 | % | 1.38 | % | 1.56 | % | 1.59 | % | 2.02 | %(e) | ||||||||||||
After expense reimbursements | 1.23 | % | 1.24 | % | 1.26 | % | 1.38 | % | 1.24 | % | 1.24 | % | ||||||||||||
Ratio of net investment income/(loss) to average net assets | ||||||||||||||||||||||||
Before expense reimbursements | 0.40 | % | 0.19 | % | 1.06 | % | 0.33 | % | 0.23 | % | ||||||||||||||
After expense reimbursements | 0.40 | % | 0.24 | % | 1.17 | % | 0.51 | % | 0.58 | % | 1.06 | % | ||||||||||||
Portfolio turnover | 46 | % | 46 | % | 49 | % | 65 | % | 24 | % | 41 | % | ||||||||||||
(a) | As of July 28, 2017 Class A shares and I shares were renamed to Investor shares and Institutional shares, respectively. |
(b) | For the eight month period ended December 31, 2017. |
(c) | Calculated based upon average shares outstanding. |
(d) | Total investment return is calculated assuming a purchase of shares on the first day and a sale of shares on the last day of each period reported and includes reinvestment of dividends and distributions, if any. For Investor Shares (Formerly Class A Shares), total investment return does not reflect the impact of the maximum front-end sales load of 5.75%. If reflected, the return would be lower. |
(e) | During the period, certain fees were waived and/or reimbursed; or recouped, if any. If such fee waivers and/or reimbursements or recoupments had not occurred, the ratios would have been as indicated. |
See accompanying notes to financial statements.
22
Financial Highlights For a Share Outstanding Throughout Each Year |
Shelton Tactical Credit Fund Institutional Shares | Year Ended | Year Ended | For the Period | Year Ended | Year Ended | For the Period | Year Ended | |||||||||||||||||||||
Net asset value, beginning of year | $ | 10.70 | $ | 10.55 | $ | 10.53 | $ | 10.97 | $ | 10.75 | $ | 10.68 | $ | 10.48 | ||||||||||||||
INCOME FROM INVESTMENT OPERATIONS | ||||||||||||||||||||||||||||
Net investment income/(loss)(c) | 0.23 | 0.40 | 0.04 | 0.12 | 0.17 | 0.22 | 0.25 | |||||||||||||||||||||
Net gain/(loss) on securities (both realized and unrealized) | 0.53 | 0.18 | 0.02 | (0.09 | ) | 0.38 | 0.27 | 0.21 | ||||||||||||||||||||
Total from investment operations | 0.76 | 0.58 | 0.06 | 0.03 | 0.55 | 0.49 | 0.46 | |||||||||||||||||||||
LESS DISTRIBUTIONS | ||||||||||||||||||||||||||||
Dividends from net investment income | (0.39 | ) | (0.43 | ) | (0.04 | ) | (0.36 | ) | (0.29 | ) | (0.28 | ) | (0.26 | ) | ||||||||||||||
Distributions from capital gains | — | — | — | (0.11 | ) | (0.04 | ) | (0.14 | ) | — | ||||||||||||||||||
Total distributions | (0.39 | ) | (0.43 | ) | (0.04 | ) | (0.47 | ) | (0.33 | ) | (0.42 | ) | (0.26 | ) | ||||||||||||||
Redemption fees(c) | — | — | — | — | — | (d) | — | (d) | — | (d) | ||||||||||||||||||
Net asset value, end of year | $ | 11.07 | $ | 10.70 | $ | 10.55 | $ | 10.53 | $ | 10.97 | $ | 10.75 | $ | 10.68 | ||||||||||||||
Total return | 7.09 | % | 5.89 | % | 0.60 | %(e) | 0.37 | % | 5.20 | % | 4.63 | %(e) | 4.41 | % | ||||||||||||||
RATIOS / SUPPLEMENTAL DATA | ||||||||||||||||||||||||||||
Net assets, end of year or period (000s) | $ | 50,232 | $ | 40,473 | $ | 69,877 | $ | 77,405 | $ | 66,195 | $ | 67,084 | $ | 57,555 | ||||||||||||||
Ratio of expenses to average net assets: | ||||||||||||||||||||||||||||
Before expense reimbursements | 2.13 | %(f) | 3.45 | %(f) | 2.83 | %(f),(g),(h) | 3.12 | %(f),(h) | 5.18 | %(f) | 4.35 | %(f),(g) | 4.26 | %(f) | ||||||||||||||
After expense reimbursements | 2.04 | %(f) | 3.35 | %(f) | 2.72 | %(f),(g),(h) | 3.01 | %(f),(h) | 4.95 | %(f) | 4.15 | %(f),(g) | 3.93 | %(f) | ||||||||||||||
Ratio of net investment income/(loss) to average net assets | ||||||||||||||||||||||||||||
Before expense reimbursements | 1.97 | % | 3.83 | % | 2.34 | %(g) | 1.00 | % | 1.38 | % | 2.03 | %(g) | 2.02 | % | ||||||||||||||
After expense reimbursements | 2.06 | % | 3.93 | % | 2.45 | %(g) | 1.11 | % | 1.61 | % | 2.23 | %(g) | 2.35 | % | ||||||||||||||
Portfolio turnover | 118 | % | 249 | % | 20 | %(e) | 116 | % | 63 | % | 69 | %(e) | 70 | % | ||||||||||||||
(a) | Fiscal year end changed from October 31 to December 31. |
(b) | Fiscal year end changed from November 30 to October 31. |
(c) | Based on average shares outstanding for the period. |
(d) | Amount less than $0.01 per share. |
(e) | Not annualized. |
(f) | If interest expense and dividends on securities sold short had been excluded, the expense ratios would have been lowered by 0.21% for the year ended December 31, 2021, 1.93% for the year ended December 31, 2020, 1.29% for the period ended December 31, 2019, 1.53% for the year ended October 31, 2019, 3.56% for the year ended October 31, 2018, 2.76% for the period December 1, 2016 through October 31, 2017, and by 2.54% for the period ended November 30, 2016. |
(g) | Annualized. |
(h) | As restated to reflect the inclusion of interest and fees on borrowings and short sale arrangements previously netted against interest income, which increased the ratios by 0.29% for the two months ended December 31, 2019 and 0.87% for the year ended October 31, 2019. The restatement had no effect on the net asset value, per share data, net investment income ratios and total returns. |
See accompanying notes to financial statements.
23
Financial Highlights For a Share Outstanding Throughout Each Year |
Shelton Tactical Credit Fund Investor Shares | Year Ended | Year Ended | For the Period | Year Ended | Year Ended | For the Period | Year Ended | |||||||||||||||||||||
Net asset value, beginning of year | $ | 10.71 | $ | 10.55 | $ | 10.54 | $ | 10.96 | $ | 10.74 | $ | 10.68 | $ | 10.48 | ||||||||||||||
INCOME FROM INVESTMENT OPERATIONS | ||||||||||||||||||||||||||||
Net investment income/(loss)(c) | 0.21 | 0.36 | 0.04 | 0.08 | 0.15 | 0.20 | 0.23 | |||||||||||||||||||||
Net gain/(loss) on securities (both realized and unrealized) | 0.51 | 0.21 | — | (0.06 | ) | 0.37 | 0.25 | 0.21 | ||||||||||||||||||||
Total from investment operations | 0.72 | 0.57 | 0.04 | 0.02 | 0.52 | 0.45 | 0.44 | |||||||||||||||||||||
LESS DISTRIBUTIONS | ||||||||||||||||||||||||||||
Dividends from net investment income | (0.38 | ) | (0.41 | ) | (0.03 | ) | (0.33 | ) | (0.26 | ) | (0.25 | ) | (0.24 | ) | ||||||||||||||
Distributions from capital gains | — | — | — | (0.11 | ) | (0.04 | ) | (0.14 | ) | — | ||||||||||||||||||
Total distributions | (0.38 | ) | (0.41 | ) | (0.03 | ) | (0.44 | ) | (0.30 | ) | (0.39 | ) | (0.24 | ) | ||||||||||||||
Redemption fees(c) | — | — | — | — | — | (d) | — | (d) | — | (d) | ||||||||||||||||||
Net asset value, end of year | $ | 11.05 | $ | 10.71 | $ | 10.55 | $ | 10.54 | $ | 10.96 | $ | 10.74 | $ | 10.68 | ||||||||||||||
Total return | 6.75 | % | 5.77 | % | 0.43 | %(e) | 0.22 | % | 4.93 | % | 4.28 | %(e) | 4.17 | % | ||||||||||||||
RATIOS / SUPPLEMENTAL DATA | ||||||||||||||||||||||||||||
Net assets, end of year or period (000s) | $ | 4,556 | $ | 6,510 | $ | 20,478 | $ | 20,942 | $ | 12,044 | $ | 22,964 | $ | 18,206 | ||||||||||||||
Ratio of expenses to average net assets: | ||||||||||||||||||||||||||||
Before expense reimbursements | 2.41 | %(f) | 3.70 | %(f) | 3.08 | %(f),(g),(h) | 3.51 | %(f),(h) | 5.43 | %(f) | 4.60 | %(f),(g) | 4.51 | %(f) | ||||||||||||||
After expense reimbursements | 2.31 | %(f) | 3.60 | %(f) | 2.97 | %(f),(g),(h) | 3.45 | %(f),(h) | 5.20 | %(f) | 4.40 | %(f),(g) | 4.18 | %(f) | ||||||||||||||
Ratio of net investment income/(loss) to average net assets | ||||||||||||||||||||||||||||
Before expense reimbursements | 1.83 | % | 3.51 | % | 1.99 | %(g) | 0.70 | % | 1.13 | % | 1.78 | %(g) | 1.77 | % | ||||||||||||||
After expense reimbursements | 1.93 | % | 3.61 | % | 2.10 | %(g) | 0.76 | % | 1.36 | % | 1.98 | %(g) | 2.10 | % | ||||||||||||||
Portfolio turnover | 118 | % | 249 | % | 20 | %(e) | 116 | % | 63 | % | 69 | %(e) | 70 | % | ||||||||||||||
(a) | Fiscal year end changed from October 31 to December 31. |
(b) | Fiscal year end changed from November 30 to October 31. |
(c) | Based on average shares outstanding for the period. |
(d) | Amount less than $0.01 per share. |
(e) | Not annualized. |
(f) | If interest expense and dividends on securities sold short had been excluded, the expense ratios would have been lowered by 0.21% for the year ended December 31, 2021, 1.93% for the year ended December 31, 2020, 1.29% for the period ended December 31, 2019, 1.53% for the year ended October 31, 2019, 3.56% for the year ended October 31, 2018, 2.76% for the period December 1, 2016 through October 31, 2017, and by 2.54% for the period ended November 30, 2016. |
(g) | Annualized. |
(h) | As restated to reflect the inclusion of interest and fees on borrowings and short sale arrangements previously netted against interest income, which increased the ratios by 0.29% for the two months ended December 31, 2019 and 0.87% for the year ended October 31, 2019. The restatement had no effect on the net asset value, per share data, net investment income ratios and total returns. |
See accompanying notes to financial statements.
24
SCM Trust | Notes to Financial Statements | December 31, 2021 |
NOTE 1 – SUMMARY OF SIGNIFICANT ACCOUNTING POLICIES
SCM Trust (the “Trust”), a Massachusetts business trust formed in July 1988 is registered as an investment company under the Investment Company Act of 1940, as amended. As of December 31, 2021, the Trust consists of ten separate series, 3 of which are included in these financial statements.
The Shelton Emerging Markets Fund (“Emerging Markets Fund”) is an open-end diversified series of the Trust. The inception date of the Fund is June 26, 2020. The Fund’s investment objective is to seek long-term capital appreciation. The Fund is the successor fund to the ICON Emerging Markets Fund, a series of ICON Funds, pursuant to a reorganization that occurred after the close of business on June 26, 2020. All historic performance and financial information presented is that of the ICON Emerging Markets Fund, which was the accounting and performance survivor of the reorganizations. Historic information presented for the Institutional Class and Investor Classes shares is based on that of the Class S and Class A shares, respectively, of the ICON Emerging Markets Fund.
Shelton Tactical Credit Fund (“Tactical Credit Fund”) is an open-end, diversified series of the Trust. The inception date is December 16, 2014. The Fund’s investment objective is to seek current income and capital appreciation. Effective July 1, 2016, Shelton became the advisor to the Fund. The Tactical Credit Fund is a successor to a series of the FundVantage Trust, a Delaware statutory trust, pursuant to a reorganization that took place after the close of business on March 17, 2017. Prior to March 17, 2017, the Successor Fund had no investment operations. As a result of the reorganization, holders of Class A Shares and Class C Shares of the former Tactical Credit Fund received Investor Shares of the successor Tactical Credit Fund and holders of Advisor Class Shares of the former Tactical Credit Fund received Institutional Shares of the successor Tactical Credit Fund. On June 19, 2019, the shareholders of the Cedar Ridge Unconstrained Credit Fund (the “Cedar Ridge Fund”) approved the agreement and plan of reorganization providing for the transfer of assets and assumption of liabilities into the Shelton Tactical Credit Fund. Cedar Ridge Unconstrained Credit Fund is the performance and accounting survivor of the reorganization, Shelton Tactical Credit is the legal and tax survivor. The reorganization was effective as of the close of business on June 21, 2019.
Shelton International Select Equity Fund (“International Select Fund”, and together with the Emerging Markets Fund, and the Tactical Credit Fund, each a “Fund” and collectively, the “Funds”) is an open-end, diversified series of the Trust. The inception date is July 31, 2009. The Fund’s investment objective is to achieve long-term capital appreciation. Effective July 18, 2016, Shelton became the advisor to the Fund. The International Select Fund is a successor to a series of the FundVantage Trust, a Delaware statutory trust, pursuant to a reorganization that took place after the close of business on July 28, 2017. Prior to July 28, 2017, the Successor Fund had no investment operations. As a result of the reorganization, holders of Class A Shares of the former International Select Fund received Investor Shares of the successor International Select Equity Fund and holders of Class I Shares of the former International Select Equity Fund received Institutional Shares of the successor International Select Equity Fund.
On June 3, 2020, the shareholders of the ICON International Equity Fund, a series of ICON Funds approved the agreement and plan of reorganization providing for the transfer of assets and assumption of liabilities into the Shelton International Select Equity Fund. The International Select Fund is the performance and accounting, legal and tax survivor of the reorganization. The reorganization was effective as of the open of business on June 29, 2020. See Note 6 for more information.
The Trust follows the investment company accounting and reporting guidance of the Financial Accounting Standards Board (“FASB”) Accounting Standards Codification Topic 946, “Financial Services – Investment Companies”.
(a) Security Valuation — Inputs used to value corporate debt securities generally include relative credit information, observed market movements, sector news, U.S. Treasury yield curve or relevant benchmark curve, and other market information, which may include benchmark yields, reported trades, broker-dealer quotes, issuer spreads, benchmark securities, bids, offers, and reference data, such as market research publications, when available (“Other Market Information”). Equity securities listed on a national or international exchange are valued at the last reported sales price. Futures contracts are valued at the settle price, depending on the exchange the contract trades on, typically as of 4:15 p.m., Eastern Time. Municipal securities are valued by an independent pricing service at a price determined by a matrix pricing method. This technique generally considers such factors as yields or prices of bonds of comparable quality, type of issue, coupon, maturity, ratings and general market conditions. U.S. government securities for which market quotations are readily available are valued at the mean between the closing bid and asked prices provided by an independent pricing service. U.S. agency securities consisting of mortgage pass-through certificates are valued using dealer quotations provided by an independent pricing service. U.S. Treasury Bills are valued at amortized cost which approximates market value. Securities with remaining maturities of 60 days or less are valued on the amortized cost basis as reflecting fair value.
Securities for which market quotes are not readily available from the Trust’s third-party pricing service are valued at fair value, determined in good faith and in accordance with procedures adopted by the Board of Trustees. The Board has delegated to the Advisor’s Pricing Committee the responsibility for determining the fair value, subject to the Board oversight and the review of the pricing decisions at its quarterly meetings. For a description of the Advisor, see Note 2.
(b) Federal Income Taxes — No provision is considered necessary for federal income taxes. The Funds intend to qualify for and elect the tax treatment applicable to regulated investment companies under the Internal Revenue Code and to distribute all their taxable income to shareholders.
(c) Short Sales — Short sales are transactions under which the Tactical Credit Fund sells a security it does not own in anticipation of a decline in the value of that security. To complete such a transaction, the Fund must borrow the security to make delivery to the buyer. The Fund then is obligated to replace the security borrowed by purchasing the security at market price at the time of replacement. The price at such time may be more or less than the price at which the security was sold by the Fund. When a security is sold short a decrease in the value of the security will be recognized as a gain and an increase in the value of the security will be recognized as a loss, which is potentially limitless. Until the security is replaced, the Fund is required to pay the lender amounts equal to dividend or interest that accrue during the period of the loan which is recorded as an expense. To borrow the security, the Fund also may be required to pay a premium or an interest fee, which are recorded as interest expense. Cash or securities are segregated for the broker to meet the necessary margin requirements. The Fund is subject to the risk that it may not always be able to close out a short position at a particular time or at an acceptable price.
(d) Municipal Bonds — Municipal bonds are debt obligations issued by the states, possessions, or territories of the United States (including the District of Columbia) or a political subdivision, public instrumentality, agency, public authority or other governmental unit of such states, possessions, or territories (e.g., counties, cities, towns, villages, districts and authorities). Municipal bonds may be issued as taxable securities, or as federally tax-exempt securities. States, possessions, territories and municipalities may issue municipal bonds to raise funds for various public purposes such as
25
SCM Trust | Notes to Financial Statements (Continued) | December 31, 2021 |
airports, housing, hospitals, mass transportation, schools, water and sewer works, gas, and electric utilities. They may also issue municipal bonds to refund outstanding obligations and to meet general operating expenses. Municipal bonds may be general obligation bonds or revenue bonds. General obligation bonds are secured by the issuer’s pledge of its full faith, credit and taxing power for the payment of principal and interest. Revenue bonds are payable from revenues derived from particular facilities, from the proceeds of a special excise tax or from other specific revenue sources. They are not usually payable from the general taxing power of a municipality. In addition, certain types of “private activity” bonds may be issued by public authorities to obtain funding for privately operated facilities, such as housing and pollution control facilities, for industrial facilities and for water supply, gas, electricity and waste disposal facilities. Other types of private activity bonds are used to finance the construction, repair or improvement of, or to obtain equipment for, privately operated industrial or commercial facilities. Current federal tax laws place substantial limitations on the size of certain of such issues. In certain cases, the interest on a private activity bond may not be exempt from federal income tax or the alternative minimum tax.
(e) Security Transactions, Investment Income and Distributions to Shareholders — Security transactions are recorded on the trade date. Interest income is recorded on the accrual basis. Dividend income is recorded on the ex-dividend date. Withholding taxes on foreign dividends have been provided for, in accordance with the Trust’s understanding of the applicable country’s tax rules and rates. Discounts or premiums on debt securities are accreted or amortized to interest income over the lives of the respective securities using the effective interest method or, where applicable, to the first call date of the securities. Distributions to shareholders are recorded on the ex-dividend date for the Funds. Income distributions and capital gain distributions are determined in accordance with income tax regulations which may differ from accounting principles generally accepted in the United States of America. These differences are primarily due to differing treatments for PFICs, wash sales, REIT adjustments and post-October capital losses.
Distributions received from investments in securities that represent a return of capital or capital gains are recorded as a reduction of cost of investment or as a realized gain, respectively. The calendar year-end amounts of ordinary income, capital gains, and return of capital included in distributions received from a Fund’s investments in real estate investment trusts (“REITs”) are reported to the Fund after the end of the calendar year; accordingly, the Funds estimate these amounts for accounting purposes until the characterization of REIT distributions is reported to the Fund after the end of the calendar year. Estimates are based on the most recent REIT distribution information available.
These “Book/tax” differences are considered either temporary (i.e., deferred losses, capital loss carry forwards) or permanent in nature. To the extent these differences are permanent in nature, such amounts are reclassified within the composition of net assets based on their federal tax basis treatment; temporary differences do not require reclassification.
(f) Foreign Currency Translation — Investment securities and other assets and liabilities denominated in foreign currencies are translated into U.S. dollar amounts at the date of valuation. Purchases and sales of investment securities and income and expense items denominated in foreign currencies are translated into U.S. dollar amounts on the respective dates of such transactions. The Trust does not isolate that portion of the results of operations resulting from changes in foreign exchange rates on investments from the fluctuations arising from changes in market prices of securities held. Such fluctuations are included with the net realized and unrealized gain or loss from investments.
Reported net realized foreign exchange gains or losses arise from sales of foreign currencies, currency gains or losses realized between the trade and settlement dates on securities transactions, and the difference between the amounts of dividends, interest, and foreign withholding taxes recorded on the company’s books and the U.S. dollar equivalent of the amounts actually received or paid. Net unrealized foreign exchange gains and losses arise from changes in the fair values of assets and liabilities, other than investments in securities at fiscal period end, resulting from changes in exchange rates.
(g) Concentration — The Shelton Emerging Markets Fund seeks to replicate the performance of their respective sectors. From time to time this replication may lead a Fund to concentrate in stocks of a particular sector, category or group of companies, which could cause each Fund to underperform the overall stock market.
The Tactical Credit Fund aims to use related credit asset classes on both the long and short side to generate an attractive rate of return with low volatility. Portfolio construction is implemented with a relative value framework and looks across the entire balance sheet of a corporation from senior secured down through subordinated, equity-linked bonds. This hedged approach is designed to generate performance that is less reliant on the direction of the overall market than a typical credit-based fund.
Cash & Cash Equivalents: The Funds consider their investment in a Federal Deposit Insurance Corporation (“FDIC”) insured interest bearing account to be cash and cash equivalents. Cash and cash equivalents are valued at cost plus any accrued interest. The Funds maintain cash balances, which, at times may exceed federally insured limits. The Funds maintain these balances with a high-quality financial institution.
Concentration of Credit Risk: Each Fund places its cash with a banking institution, which is insured by FDIC. The FDIC limit is $250,000. At various times throughout the year, the amount on deposit may exceed the FDIC limit and subject the Funds to a credit risk. The Funds do not believe that such deposits are subject to any unusual risk associated with investment activities.
(h) Use of Estimates in Financial Statements — In preparing financial statements in conformity with accounting principles generally accepted in the United States of America, Shelton Capital makes estimates and assumptions that affect the reported amounts of assets and liabilities and disclosure of contingent assets and liabilities at the date of the financial statements, as well as the reported amounts of income and expense during the year. Actual results may differ from these estimates.
(i) Share Valuations — The net asset value (“NAV”) per share of each Fund is calculated by dividing the sum of the value of the securities held by the Fund, plus cash or other assets, minus all liabilities (including estimated accrued expenses) by the total number of shares outstanding of the Fund, rounded to the nearest cent. A Fund’s shares will not be priced on the days on which the NYSE is closed for trading. The offering and redemption price per share of each Fund is equal to a Fund’s NAV per share.
(j) Accounting for Uncertainty in Income Taxes — The Funds recognize the tax benefits of uncertain tax positions only where the position is “more likely than not” to be sustained assuming examination by tax authorities. Shelton Capital has analyzed the Fund’s tax positions, and has concluded that no liability for unrecognized tax benefits should be recorded related to uncertain tax positions taken on returns filed for open tax years (2018-2020) or expected to be taken in the Fund’s 2021 tax returns. The Funds identify its major tax jurisdictions as U.S. Federal, however the Funds are not aware of any tax positions for which it is reasonably possible that the total amounts of unrecognized tax benefits will change materially in the next twelve months.
(k) Fair Value Measurements — The Funds utilize various methods to measure the fair value of most of its investments on a recurring basis. U.S. GAAP establishes a hierarchy that prioritizes inputs to valuation methods. The three levels of inputs are:
26
SCM Trust | Notes to Financial Statements (Continued) | December 31, 2021 |
Level 1 – Unadjusted quoted prices in active markets for identical assets or liabilities that the Trust has the ability to access.
Level 2 – Observable inputs other than quoted prices included in Level 1 that are observable for the asset or liability, either directly or indirectly. These inputs may include quoted prices for the identical instrument on an inactive market, prices for similar instruments, interest rates, prepayment speeds, credit risk, yield curves, default rates and similar data.
Level 3 – Unobservable inputs for the asset or liability, to the extent relevant observable inputs are not available, representing the Fund’s own assumptions about the assumptions a market participant would use in valuing the asset or liability, and would be based on the best information available.
The availability of observable inputs can vary from security to security and is affected by a wide variety of factors, including, for example, the type of security, whether the security is new and not yet established in the marketplace, the liquidity of markets, and other characteristics particular to the security. To the extent that valuation is based on models or inputs that are less observable or unobservable in the market, the determination of fair value requires more judgment. Accordingly, the degree of judgment exercised in determining fair value is greatest for instruments categorized in Level 3.
The inputs used to measure fair value may fall into different levels of the fair value hierarchy. In such cases, for disclosure purposes, the level in the fair value hierarchy within which the fair value measurement falls in its entirety, is determined based on the lowest level input that is significant to the fair value measurement in its entirety.
The following table summarizes the valuation of the Trust’s securities at December 31, 2021 using fair value hierarchy:
Level 1(a) | Level 2(a) | Level 3(a) | ||||||||||||||
Fund | Investments in | Investments in | Investments | Total | ||||||||||||
Emerging Markets Fund | $ | 4,458,842 | $ | 24,193,481 | $ | — | $ | 28,652,323 | ||||||||
International Select Fund | $ | 54,190,912 | $ | 104,067,854 | $ | — | $ | 158,258,766 | ||||||||
Tactical Credit Fund - Assets | $ | 827,024 | $ | 54,970,765 | $ | 0 | $ | 55,797,789 | ||||||||
Tactical Credit Fund - Liabilities | $ | — | $ | 2,714,250 | $ | — | $ | 2,714,250 | ||||||||
(a) | It is the Funds’ policy to recognize transfers between levels on the last day of the fiscal reporting period. |
(b) | All publicly traded common stocks and purchased options held by the Funds are classified as level 1 securities, except as otherwise noted on the Portfolios of Investments for Tactical Credit Fund. For a detailed break-out of common stocks by major industry classification, please refer to the Portfolio of Investments. |
(c) | All corporate bonds, municipal bonds, and term loans held in the Funds are Level 2 securities. For a detailed break-out of fixed income securities by type, please refer to the Portfolio of Investments. |
Level 3 Securities | International | Tactical Credit | ||||||
Beginning Balance | $ | 171,856 | $ | 5,346 | ||||
Net Purchases | 1,829,586 | — | ||||||
Net Sales | — | (9,801 | ) | |||||
Total Realized Gain/(Loss) | — | 4,455 | ||||||
Change in Unrealized Appreciation/(Depreciation) | 926,725 | — | ||||||
Accrued Interest | — | — | ||||||
Transfers into Level 3 | — | 0 | ||||||
Transfers out of Level 3 | (2,928,167 | ) | — | |||||
Ending Balance | $ | — | $ | 0 | ||||
(a) | Topicus.com, Inc. transferred out of Level 3 because the security started to actively trade during the fiscal year. |
(b) | Eletson Holdings Inc / Eletson Finance US LLC / Agathonissos Finance LLC transferred into Level 3 during the fiscal year due to maturity, with the expectation of a future escrow payment. |
Fair Value as | Unobservable Input | Valuation Techniques | Input Values | Impact to | |||||||
Tactical Credit Fund | |||||||||||
Eletson Holdings Inc / Eletson Finance US LLC / Agathonissos Finance LLC | $ | 0 | Potential for future escrow payment | Market assessment | $0 | Increase | |||||
27
SCM Trust | Notes to Financial Statements (Continued) | December 31, 2021 |
(l) Disclosure about Derivative Instruments and Hedging Activities — The Fund has adopted enhanced disclosure regarding derivative and hedging activity intended to improve financial reporting of derivative instruments by enabling investors to understand how and why an entity uses derivatives, how derivatives are accounted for, and how derivative instruments affect an entity’s results of operations and financial position.
The effect of derivative instruments on the Statements of Assets & Liabilities as of December 31, 2021:
Derivatives Not Accounted for as Hedging Instruments | Tactical | |||
Asset Derivatives | ||||
Purchased Options | $ | 28,516 | ||
Liability Derivatives | ||||
Written Options | $ | — | ||
The effect of derivative instruments on the Statements of Operations for the year ended December 31, 2021:
Derivatives Not Accounted for as Hedging Instruments | Tactical | |||
Amount of Realized Gain/(Loss) Recognized on Derivatives | ||||
Interest Rate Futures | $ | (48,363 | ) | |
Purchased Interest Rate Options | (170,979 | ) | ||
Written Interest Rate Options | 74,599 | |||
Total | $ | (144,743 | ) | |
Amount of Change in Unrealized Appreciation/Depreciation Recognized on Derivatives | ||||
Purchased Interest Rate Options | $ | (33,984 | ) | |
Written Interest Rate Options | (25,781 | ) | ||
Purchased Equity Options | 151,554 | |||
Written Equity Options | (62,945 | ) | ||
Total | $ | 28,844 | ||
The previously disclosed derivative instruments outstanding as of December 31, 2021, and their effect on the Statements of Operations for the year January 1, 2021 through December 31, 2021, serve as indicators of the volume of financial derivative activity for the Funds. The following table indicates the average volume for the year:
| Average Month | |||
Purchased Options | $ | 28,800,000 | ||
Written Options | $ | 1,100,000 | ||
(m) LIBOR Transition Risk — The United Kingdom’s Financial Conduct Authority announced a phase out of the London Interbank Offered Rate (“LIBOR”) by the end of 2021. On November 30, 2020 the administrator of LIBOR announced its intention to delay the phase out of the majority of the U.S. dollar LIBOR publications until June 30, 2023, with the remainder of LIBOR publications to still end at the end of 2021. The Funds may be exposed to financial instruments tied to LIBOR to determine payment obligations, financing terms, hedging strategies or investment value. The transition process away from LIBOR might lead to increased volatility and illiquidity in markets for, and reduce the effectiveness of new hedges placed against, instruments whose terms currently include LIBOR. The ultimate effect of the LIBOR transition process on the Funds Is uncertain.
(n) COVID-19 Risks — An outbreak of respiratory disease caused by a novel coronavirus was first detected in December 2019 and has now spread globally. This coronavirus has resulted in closing borders, enhanced health screenings, partial population vaccination, healthcare service preparation and delivery, quarantines, cancellations, disruptions to supply chains and customer activity, government sponsored fiscal stimulus programs, various moratoria on the applicability of certain laws and regulations, as well as general concern and uncertainty. The impact of this coronavirus (and the variants of such virus), and other epidemics and pandemics that may arise in the future, could affect the economies of many nations, individual companies, their securities (including equity and debt) and the market in general in ways that cannot necessarily be foreseen at the present time. In addition, the impact of infectious diseases in developing or emerging market countries may be greater due to less established health care systems. Health crises caused by the recent coronavirus outbreak may exacerbate other pre-existing political, social, financial and economic risks in certain countries. The impact of the outbreak or may last for an extended period of time.
28
SCM Trust | Notes to Financial Statements (Continued) | December 31, 2021 |
NOTE 2 - INVESTMENT MANAGEMENT FEE AND OTHER RELATED PARTY TRANSACTIONS
Shelton provides each Fund with management and administrative services pursuant to investment management and administration servicing agreements.
In accordance with the terms of the management agreement, the Advisor receives compensation at the following annual rates:
Fund | Net | |||
Emerging Markets Fund | 1.00 | % | ||
International Select Fund | 0.74 | % | ||
Tactical Credit Fund | 1.17 | % | ||
The Advisor contractually agreed to reduce total operating expense to certain Funds of the Trust. This additional contractual reimbursement (excluding certain compliance costs, extraordinary expenses such as litigation or merger and reorganization expenses, for example and with respect to the International Select Equity Fund, acquired fund fees and expenses) is effective until the dates listed below, unless renewed, and is subject to recoupment within three fiscal years following reimbursement. Recoupment is limited to the extent the reimbursement does not exceed any applicable expense limit and the effect of the reimbursement is measured after all ordinary operating expenses are calculated; any such reimbursement is subject to the Board of Trustees’ review and approval. Reimbursements from the Advisor to affected Funds, and the contractual expense limits, for the year ended December 31, 2021 are as follows:
Contractual Expense Limitation | ||||||||||||
Fund | Institutional | Investor | Expiration | |||||||||
International Select Fund | 0.99% | 1.24% | 5/1/22 | |||||||||
Tactical Credit Fund | 1.39% | 1.64% | 5/1/22 | |||||||||
At December 31, 2021, the remaining cumulative unreimbursed amount paid and/or waived by the Advisor on behalf of the Funds that may be reimbursed was $324,456. The Advisor may recapture a portion of the above amount no later than the dates as stated below.
Fund | Expires | Expires | Expires | Expires | Expires | Total | ||||||||||||||||||
Emerging Markets Fund | $ | — | $ | — | $ | 634 | $ | — | $ | — | $ | 634 | ||||||||||||
International Select Fund | — | 66,303 | — | 44,901 | — | 111,204 | ||||||||||||||||||
Tactical Credit Fund | 82,500 | 20,815 | — | 62,140 | 47,163 | 212,618 | ||||||||||||||||||
Total | $ | 82,500 | $ | 87,118 | $ | 634 | $ | 107,041 | $ | 47,163 | $ | 324,456 | ||||||||||||
A Fund must pay its current ordinary operating expenses before the Advisor is entitled to any reimbursement of fees and/or expenses. Any such reimbursement is contingent upon the Board of Trustees review and approval prior to the time the reimbursement is initiated.
As compensation for administrative duties not covered by the management agreement, Shelton receives an administration fee, which was revised on January 1, 2011. The administration fee is based on assets held, in aggregate, by the SCM Trust and other funds within the same “family” of investment companies managed and administered by Shelton. The fee rates are 0.10% on the first $500 million, 0.08% on the next $500 million, and 0.06% on combined assets over $1 billion. Administration fees are disclosed in the Statements of Operations.
Certain officers and trustees of the Trust are also partners of Shelton. Steve Rogers has served as a trustee and Chairman of the Board of Trustees of the Trust since 1998, and President of the Trust since 1999. Mr. Rogers is also Chief Executive Officer of the Adviser. Gregory T. Pusch has served as the Chief Compliance Officer (“CCO”) of the Trust since March 2017. Mr. Pusch is also employed by Shelton, the Advisor and Administrator to the Trust. The Trust is responsible for the portion of his salary allocated to his duties as the CCO of the Trust during his employment, and Shelton is reimbursed by the Trust for this portion of his salary. The level of reimbursement is reviewed and determined by the Board of Trustees at least annually.
The Trust has adopted a Distribution Plan (the “Plan”), as amended July 29, 2017, pursuant to Rule 12b-1 under the Investment Company Act of 1940, whereby the Investor Shares of each Fund pays RFS Partners, the Funds’ distributor (the “Distributor”), an affiliate of Shelton, for expenses that relate to the promotion and distribution of shares. Under the Plan, the Investor Shares of the Funds will pay the Distributor a fee at an annual rate of 0.25%, payable monthly, of the daily net assets attributable to such Fund’s Investor Shares.
For the year ended December 31, 2021 the following were paid:
Fund | Investor Class | |||
Emerging Markets Fund* | $ | 3,791 | ||
International Select Fund | 62,599 | |||
Tactical Credit Fund | 12,052 | |||
Management fees, Administration fees, Expense reimbursement from the manager, CCO fees and Trustees fees incurred during the year are included in the Statements of Operations.
29
SCM Trust | Notes to Financial Statements (Continued) | December 31, 2021 |
NOTE 3 - PURCHASES AND SALES OF SECURITIES
Purchases and sales of securities other than short-term instruments for the year ended December 31, 2021 were as follows:
Fund | Purchases | Sales | ||||||
Emerging Markets Fund | $ | 7,718,499 | $ | 5,569,493 | ||||
International Select Fund | 83,700,314 | 66,521,917 | ||||||
Tactical Credit Fund | 39,926,196 | 46,955,451 | ||||||
NOTE 4 - TAX CHARACTER
Reclassifications: Accounting principles generally accepted in the United States of America require certain components of net assets be reclassified between financial and tax reporting. These reclassifications have no effect on net assets or net asset value per share. The reclassifications were as follows:
| Increase/ | Increase/ | ||||||
International Select Fund | $ | (650 | ) | $ | 650 | |||
Tactical Credit Fund | (3,847 | ) | 3,847 | |||||
The reclassification of net assets consists primarily of non-deductible excise tax paid.
Tax Basis of Distributable Earnings: For U.S. Federal income tax purposes, the cost of securities owned, gross appreciation, gross depreciation, and net unrealized appreciation of investments on December 31, 2021 were as follows:
| Tax Cost | Gross | Gross | Net Unrealized | ||||||||||||
Emerging Markets Fund | $ | 22,370,392 | $ | 7,703,242 | $ | (1,421,312 | ) | $ | 6,281,930 | |||||||
International Select Fund | 137,198,944 | 28,833,233 | (7,773,413 | ) | 21,059,820 | |||||||||||
Tactical Credit Fund | 57,704,303 | 2,048,661 | (3,983,692 | ) | (1,935,031 | ) | ||||||||||
The tax character of distributable earnings at December 31, 2021 was as follows:
Undistributed | Undistributed | Capital | Unrealized | Other | Total | |||||||||||||||||||
Emerging Markets Fund | $ | 351,507 | $ | — | $ | (1,937,088 | ) | $ | 6,281,930 | $ | (1,277 | ) | $ | 4,695,072 | ||||||||||
International Select Fund | 123,282 | — | (37,918,947 | ) | 21,059,820 | (63,706 | ) | (16,799,551 | ) | |||||||||||||||
Tactical Credit Fund | 19,321 | — | (6,138,070 | ) | (1,935,031 | ) | (80,847 | ) | (8,134,627 | ) | ||||||||||||||
The difference between book basis and tax basis unrealized appreciation/(depreciation) is attributable primarily to wash sales and PFICs. Other accumulated losses is the result of unrealized gain/loss attributable to foreign currency translation on foreign equities, organization costs expensed not yet deducted for tax purposes, and securities sold short.
Capital Losses: Capital loss carry forwards, as of December 31, 2021, available to offset future capital gains, if any, are as follows:
| Emerging | International | Tactical Credit | |||||||||
Long Term with No Limitation | $ | (1,937,088 | ) | $ | (33,932,737 | ) | $ | (4,486,894 | ) | |||
Short Term with No Limitation | — | (3,744,184 | ) | — | ||||||||
Long Term Subject to Annual Limitation | — | — | — | |||||||||
Short Term Subject to Annual Limitation | — | (242,026 | ) | (1,651,176 | ) | |||||||
Total | $ | (1,937,088 | ) | $ | (37,918,947 | ) | $ | (6,138,070 | ) | |||
* | Subject to annual limitation under §382 of The Code of $214,635 until December 31, 2022, and $27,391 for the year ending December 31, 2023. |
** | Subject to annual limitation of $561,798 under §382 of The Code through December 31, 2023, and $527,580 for the year ending December 31, 2024. |
Shelton Emerging Markets Fund and Shelton International Select Equity Fund utilized Capital Loss Carry Forwards in the amount of $1,083,132 and $13,302,814 respectively in the fiscal year.
Distributions to Shareholders: Income distributions and capital gain distributions are determined in accordance with income tax regulations, which may differ from U.S. generally accepted accounting principles. These differences are primarily due to differing treatments of income and gains on various investment securities held by each Fund, timing differences and differing characterization of distributions made by each Fund.
30
SCM Trust | Notes to Financial Statements (Continued) | December 31, 2021 |
The tax character of distributions paid during the year ended December 31, 2021 are as follows:
Fund | Year or | Return of | Ordinary | Long-Term | Exempt-Interest | Total | |||||||||||||||
Emerging Markets Fund | September 30, 2020 | $ | — | $ | 852,068 | $ | — | $ | — | $ | 852,068 | ||||||||||
December 31, 2020 | — | 50,052 | — | — | 50,052 | ||||||||||||||||
December 31, 2021 | — | 595,238 | — | — | 595,238 | ||||||||||||||||
International Select Fund | December 31, 2020 | — | 885,582 | — | — | 885,582 | |||||||||||||||
December 31, 2021 | — | 1,082,019 | — | — | 1,082,019 | ||||||||||||||||
Tactical Credit Fund | December 31, 2020 | — | 2,303,959 | — | — | 2,303,959 | |||||||||||||||
December 31, 2021 | — | 1,765,078 | — | — | 1,765,078 | ||||||||||||||||
(a) | Period ended December 31, 2020 represents activity for the three month period beginning October 1, 2020 through December 31, 2020. |
(b) | The Funds did not designate any Long-Term Capital Gain dividends pursuant to Section 852(b)(3) of the Internal Revenue Code for the year ended September 30, 2020, December 31, 2020, or December 31, 2021, respectively. |
NOTE 5 - BORROWINGS
In connection with the short sale arrangement of Shelton Tactical Credit Fund, the Fund may borrow in excess of the short sale proceeds. At December 31, 2021, the total amount outstanding in excess of the short sale proceeds was $0. Amounts borrowed under this arrangement bear interest at an interest rate based on the bank’s margin rate. For the year ended December 31, 2021, the weighted average interest rate of this arrangement was 1.82%, the average amount outstanding was $55,368 and the maximum outstanding balance was $4,982,779. The total amount of interest charged under the arrangement was $732 and is included in the balance of Interest and fees on borrowings and short sale arrangement in the Statement of Operations.
NOTE 6 - REORGANIZATION
On May 23, 2020, the shareholders of the ICON International Equity Fund approved the agreement and plan of reorganization providing for the transfer of assets and assumption of liabilities into the Shelton International Select Equity Fund. Shelton International Select Equity Fund is the survivor of the reorganization. The reorganization was effective as of the close of business on June 26, 2020. The following table illustrates the specifics of the Fund’s reorganization:
ICON International | New Shares issued | Shelton International | Combined | Tax Status |
$23,244,237(a) | 1,121,368 | $62,750,633 | $85,994,870 | Non-taxable |
(a) | Includes undistributed net investment income, accumulated realized losses and unrealized appreciation in the amounts of $528,663, $(9,724,470) and $2,157,152, respectively, from the merged fund. |
As of close of business on June 26, 2020, the classes were converted at the following rates:
Pre-Merger Class | Pre-Merger | Rate | Shares | Dollars | Post-Merger | Post Merger Class | ||||||||||||||||||
ICON International Equity Fund – Class S | $9.40 | 0.4532 | 1,027,306 | $21,305,921 | $20.74 | Shelton International Select Equity Fund – Institutional Class | ||||||||||||||||||
ICON International Equity Fund – Class A | $9.18 | 0.4454 | 69,706 | $1,435,990 | $20.61 | Shelton International Select Equity Fund – Investor Class | ||||||||||||||||||
ICON International Equity Fund – Class C | $8.08 | 0.3920 | 24,356 | $502,326 | $20.61 | Shelton International Select Equity Fund – Investor Class | ||||||||||||||||||
NOTE 7 - SUBSEQUENT EVENTS
Subsequent events after the date of the Statements of Assets and Liabilities have been evaluated through the date the financial statements were issued.
31
Liquidity Risk Management Program Disclosure (Unaudited) |
The SCM Trust (the “Trust”) has adopted and implemented a liquidity risk management program (the “Program”), as consistent with Rule 22e-4 to govern the Trust’s approach to managing liquidity risk for each series of the Trust (each, a “Fund” and collectively, the “Funds”). The Program is overseen by the Liquidity Committee (the “Committee”), which is comprised of investment, operations and legal and compliance professionals from Shelton Capital Management. The Board of Trustees of the Trust (the “Board”) has approved the designation of the Committee to oversee the Program.
The Program’s principal objectives include supporting each Fund’s compliance with limits on investments in illiquid assets and mitigating the risk that a Fund will be unable to meet its redemption obligations in a timely manner. The Program also includes a number of elements that support the management and assessment of liquidity risk, including an annual assessment of factors that influence a Fund’s liquidity and the periodic classification and re-classification of the Fund’s investments into groupings that reflect the Committee’s assessment of their relative liquidity under current market conditions.
At a meeting of the Board held on November 11, 2021, the Committee provided a report (the “Report”) to the Board addressing the operation, adequacy, and effectiveness the Program, including any material changes to the Program for the period from the inception of the Trust’s program in December 2019 through November 2021 (“Reporting Period”). The Report concluded that the Trust’s Program was reasonably designed to assess and manage each Fund’s liquidity risk and was adequately and effectively implemented during the Reporting Period. There were no material changes to the Program during the Reporting Period. The Report further concluded that each Fund’s investment strategy continues to be appropriate given each Fund’s status as an open-end fund.
There can be no assurance that the Program will achieve its objectives in the future. Additional information regarding risks of investing in each Fund, including liquidity risks presented by the Trust’s investment portfolios, is found in the Trust’s Prospectus and Statement of Additional Information.
Report of Independent Registered Public Accounting Firm |
To the Shareholders of the Shelton Funds and Board of Trustees of SCM Trust
Opinion on the Financial Statements
We have audited the accompanying statement of assets and liabilities, including the portfolios of investments, of Shelton Emerging Markets Fund, Shelton International Select Equity Fund, and Shelton Tactical Credit Fund, each a series of SCM Trust, (the “Funds”) as of December 31, 2021, the related statements of operations and changes in net assets, the related notes, and the financial highlights for the year then ended (collectively referred to as the “financial statements”). In our opinion, the financial statements present fairly, in all material respects, the financial position of the each of the Funds as of December 31, 2021, and the results of their operations, the changes in net assets, and the financial highlights for the year then ended, in conformity with accounting principles generally accepted in the United States of America.
The Funds’ financial statements and financial highlights for the years ended December 31, 2020, and prior, were audited by other auditors whose report dated March 1, 2021, expressed an unqualified opinion on those financial statements and financial highlights.
Basis for Opinion
These financial statements are the responsibility of the Funds’ management. Our responsibility is to express an opinion on the Funds’ financial statements based on our audits. We are a public accounting firm registered with the Public Company Accounting Oversight Board (United States) (“PCAOB”) and are required to be independent with respect to the Funds in accordance with the U.S. federal securities laws and the applicable rules and regulations of the Securities and Exchange Commission and the PCAOB.
We conducted our audits in accordance with the standards of the PCAOB. Those standards require that we plan and perform the audit to obtain reasonable assurance about whether the financial statements are free of material misstatement whether due to error or fraud.
Our audits included performing procedures to assess the risks of material misstatement of the financial statements, whether due to error or fraud, and performing procedures that respond to those risks. Such procedures included examining, on a test basis, evidence regarding the amounts and disclosures in the financial statements. Our procedures included confirmation of securities owned as of December 31, 2021, by correspondence with the custodians and brokers; when replies were not received from brokers, we performed other auditing procedures. Our audits also included evaluating the accounting principles used and significant estimates made by management, as well as evaluating the overall presentation of the financial statements. We believe that our audits provide a reasonable basis for our opinion.
We have served as the Funds’ auditor since 2021.

COHEN & COMPANY, LTD.
Cleveland, Ohio
March 1, 2022
32
Report of Independent Registered Public Accounting Firm (Continued) |
Additional Information |
Fund Holdings
The Fund holdings shown in this report are as of December 31, 2021. Holdings are subject to change at any time, so holdings shown in the report may not reflect current Fund holdings. The Fund’s Form N-PORT is available on the SEC’s website at www.sec.gov. The information filed in the form N-PORT also may be obtained by calling (800) 955-9988.
Proxy Voting Policy
The Fund’s Statement of Additional Information (“SAI”) containing a description of the policies and procedures that the SCM Trust uses to determine how to vote proxies relating to portfolio securities, along with each Fund’s proxy voting record relating to portfolio securities held during the 12-month period ended June 30, 2021 is available upon request, at no charge, at the phone number above, or on the SEC’s website at www.sec.gov.
About this Report
This report is submitted for the general information of the shareholders of the SCM Trust. It is authorized for distribution only if preceded or accompanied by a current SCM Trust prospectus. Additional copies of the prospectus may be obtained by calling (800) 955-9988 or can be downloaded from the Fund’s website at www.sheltoncap.com. Please read the prospectus carefully before you invest or send money, as it explains the risks, fees and expenses of investing in the Fund.
33
Board of Trustees and Executive Officers |
Overall responsibility for management of the Funds rests with the Board of Trustees. The Trustees serve during the lifetime of the Trust and until its termination, or until death, resignation, retirement or removal. The Trustees, in turn, elect the officers of the Fund to actively supervise its day-to-day operations. The officers have been elected for an annual term. The following are the Trustees and Executive Officers of the Funds:
Name | Address | Year of Birth | Position Held with the Trust | Length of |
Stephen C. Rogers | 1875 Lawrence Street, | 1966 | Chairman of the Board, | Since August 1999 |
Kevin T. Kogler | 1875 Lawrence Street, | 1966 | Trustee | Since May 2006 |
Marco L. Quazzo | 1875 Lawrence Street, | 1962 | Trustee | Since August 2014 |
Stephen H. Sutro | 1875 Lawrence Street, | 1969 | Trustee | Since May 2006 |
William P. Mock | 1875 Lawrence Street, | 1966 | Treasurer | Since February 2010 |
Gregory T. Pusch | 1875 Lawrence Street, | 1966 | Chief Compliance Officer, Secretary | Since March 2017 |
Each Trustee oversees the Trust’s ten Funds. The principal occupations of the Trustees and Executive Officers of the Funds during the past five years and public directorships held by the Trustees are set forth below:
Stephen C. Rogers* | Chief Executive Officer, Shelton Capital Management, 1999 to present. |
Kevin T. Kogler | President & Founder of MicroBiz, LLC, 2012 to present; Principal, Robertson Piper Software Group, 2006 to 2012; Senior Vice President, Investment Banking, Friedman, Billings Ramsey, 2003 to 2006. |
Marco L. Quazzo | Principal, Bartko Zankel Bunzel & Miller, March 2015-Present; Partner, Barg Coffin Lewis & Trapp LLP (law firm), 2008 to March 2015. |
Stephen H. Sutro | Managing Partner, Duane Morris, LLP (law firm) 2014 to present; Partner, Duane Morris LLP (law firm), 2003 to present. |
William P. Mock | Portfolio Manager, Shelton Capital Management, 2010 to present. |
Gregory T. Pusch | Principal Occupations Past five years: Global Head of Risk & Compliance, Matthews Asia 2015-2016; Head of Legal & Regulatory Compliance / CCO, HarbourVest Partners 2012-2015. |
Additional information about the Trustees may be found in the SAI, which is available without charge by calling (800) 955-9988.
* | Trustee deemed to be an “interested person” of the Trust, as defined in the Investment Company Act of 1940. Mr. Rogers is an interested person because he is the CEO of Shelton Capital Management, the Trust’s Advisor and Administrator. |
34
THIS PAGE INTENTIONALLY LEFT BLANK
THIS PAGE INTENTIONALLY LEFT BLANK
THIS PAGE INTENTIONALLY LEFT BLANK
THIS PAGE INTENTIONALLY LEFT BLANK


ANNUAL REPORT
December 31, 2021
ICON Consumer Select Fund
ICON Equity Fund
ICON Equity Income Fund
ICON Flexible Bond Fund
ICON Health and Information Technology Fund
ICON Natural Resources and Infrastructure Fund
ICON Utilities and Income Fund
Table of Contents | December 31, 2021 |
Historical Performance and Manager’s Discussion | 1 |
About Your Fund’s Expenses | 10 |
Top Holdings and Sector Breakdown | 12 |
Portfolio of Investments | 14 |
Statements of Assets and Liabilities | 20 |
Statements of Operations | 22 |
Statements of Changes in Net Assets | 24 |
Financial Highlights | 32 |
Notes to Financial Statements | 39 |
Liquidity Risk Management Program Disclosure | 49 |
Report of Independent Registered Public Accounting Firm | 50 |
Additional Information | 51 |
Board of Trustees and Executive Officers | 51 |
Historical Performance and Manager’s Discussion (Unaudited) | December 31, 2021 |
Equity Market Review, Craig Callahan, DBA, Founder and CEO of ICON Advisers, Inc.:
During the calendar year, stocks, on average, were priced below ICON Advisers, Inc.’s (“ICON”), estimate of intrinsic value so the 28.42% advance for the S&P 1500 Index appeared very sensible, in our view. There were pockets of over pricing, generally among companies whose earnings were just beginning to turn positive with rapid growth expectations. Otherwise, there was no shortage of attractively priced stocks with good earnings growth prospects.
Sector performance during the rebound in our view is very sensible based on ICON valuation readings. Economically sensitive, cyclical sectors like Energy, Financials. Information Technology and Materials led in 2021 while defensive, while so called recession proof sectors like Utilities, Consumer Staples and Health Care lagged.
Fixed Income Market Review, Jerry Paul, CFA, Senior Vice President of Fixed Income at ICON Advisers, Inc.:
Throughout 2021 the fixed income market continued to be dominated by Covid 19 concerns and Federal Reserve actions. The market has been very focused on the Fed and the timing of the end of Quantitative Easing (QE).
The US Treasury 10 year yield traded in a narrower range this past year vs. last. The US Treasury 10 year traded in a range starting at 0.90% in January, hitting a high of 1.77% in March, and closing the year at 1.51%. Tapering began in November as the Fed announced a gradual reduction in its purchases. Based on recent statements from Federal Reserve members it appears raising interest rates will begin in 2022, perhaps as early as March. As usual there are many moving parts that could change these plans.
Corporate bond yield spreads (the yield in excess of comparable US Treasuries) continued to decline through the year and are at historically narrow levels. Combined with the low level of US Treasury yields it has been difficult for investors to find yield.
ICON Equity Fund Review – For the fiscal year, the fund returned 26.73% versus 26.31% for its benchmark, the S&P 1500 Index. The fund was beating the index through September 30, 2021, but gave back its advantage in the fourth quarter. Throughout the year, ICON saw stocks, on average, to be priced below ICON’s estimate of fair value. Accordingly, cash in the fund was kept near zero. The fund was concentrated in six of the eleven S&P 1500 sectors, generally those that are cyclical or economically sensitive. Information Technology, which averaged 39.4% of the fund, was the largest. Consumer Discretionary and Industrials were next at 19.8% and 17.9% respectively. The absent sectors were generally the defensive, so called recession proof sectors.
The three biggest contributing industries were IT Consulting, Communication Equipment and Oil & Gas Exploration and Production. The three biggest detracting industries were Data Processing & Outsourced Services, Human Resources & Employment and Regional Banks.
ICON Consumer Select Fund – For the fiscal year period December 31, 2020 through December 31, 2021, the fund returned 22.80% vs. the S&P 1500 benchmark return of 26.31%. ICON’s sector valuations throughout the year remained consistent from ICON’s themes coming off the 2020 market bottom, leading the fund to be concentrated heavily in the Consumer Discretionary and Financials sectors with minimal exposure to Consumer Staples. Financials, which made up an average of 34% of the fund’s holdings during the year, contributed the most to the positive performance. Overweight positions in Investment Banking & Brokerage, Consumer Finance, and Diversified Banks industries contributed the most to performance. From the Consumer Discretionary sector, the Homebuilding, Distributors, and Specialty Stores industries were the most significant contributors to the fund’s returns. The greatest detractors to performance came from the Data Processing & Outsourced services industry, where holdings in large credit card providers produced negative returns after failing to maintain their strong growth in earnings throughout the 2020 COVID-related market recovery.
ICON Health & Information Technology Fund – For the fiscal year, the fund returned 17.71 vs. the S&P 1500 benchmark return of 26.31%%. The fund was concentrated heavily in Information Technology, with an average of 71.8% of holdings in the sector, compared to an average of 13.9% of the fund’s holdings in the Health Care sector. As the year progressed, ICON’s sector valuations became more favorable towards the IT sector and the fund’s holdings became more concentrated in technology industries. Overweight positions in the Communications Equipment and IT Consulting & Other Services industries contributed the most to the fund’s performance. The biggest detractors from performance were holdings in the Data & Outsourced
1
Historical Performance and Manager’s Discussion (Continued) | December 31, 2021 |
Services and Application Software industries. The fund’s Health Care allocations were overall a positive benefit to performance, with Biotechnology and Managed Health care contributing the most to total returns. Going into the new year, the fund retained its overweight in Information Technology holdings, as our valuation readings show more opportunities for growth within the sector.
ICON Natural Resources and Infrastructure – During the fiscal year period, December 31, 2020 through December 31, 2021, the Fund returned 30.62% vs. the S&P 1500 benchmark return of 26.31%. For the fiscal year, the average portfolio weightings were approximately 28% in the Energy sector, 45% in the Industrials sector, and 19% in the Materials sector. In the 4th quarter, Materials holdings were increased, the positions in the integrated oil & gas industry were sold. For the entire period fund holdings in the Energy sector returned 40.77%, fund holdings in the Industrials sector returned 26.39% and fund holdings in the Materials sector returned 31.72%. The three biggest contributors to performance during the year were holdings in the oil & gas exploration & production, trucking, and construction industries respectively. The three biggest detractors were construction machinery & heavy trucks, oil & gas refining & marketing, and human resources & employment services industries. Based on ICON’s valuation methodology, the fund can rotate among companies and industries in the Energy, Materials, and Industrial sectors. As of December 31, 2021, our valuations suggest a slight increase in holdings in the Energy and Materials sectors.
ICON Utilities and Income Fund – During the fiscal year, the fund returned 21.51%, beating the S&P 1500 Utilities Index, the fund’s benchmark, which returned 17.95%. The fund was most heavily concentrated in the Electric Utilities and Multi Utilities through out the year, with minimal exposure to the Water Utilities and Independent Power Produces industries. In addition, the fund is permitted a limited exposure to companies outside of the Utilities sector and in response to the market recovery favoring more economically sensitive industries, the fund positioned itself into income producing, Utilities-related industries from the Communications Services and Industrials sector. These outside holdings helped contribute to the fund’s outperformance from its benchmark index, with its holdings in the Broadcasting industry contributing 8.76% to the fund’s total returns alone. Other top contributing industries were Electrical Components & Equipment and Gas Utilities. The two largest detractors from performance were holdings in the Wireless Telecommunications and Water Utilities industries.
ICON Equity Income Fund – Total returns for the fund during the fiscal year was 24.14% vs 28.42% for the S&P 1500 Index[, the fund’s benchmark?]. The fund was most concentrated in cyclical, economically sensitive sectors with Financials and Consumer Discretionary being the two heaviest weighted, at an average of 26.0% and 17.8% of the fund holdings, respectively. With ICON’s market valuations favoring equities over bonds, the balance of the fund was kept at approximately 95% equities and 5% in fixed income. As per the fund’s objective to seek modest capital appreciation and income, the equity portion of the fund held high yield dividend paying stocks, with ICON’s market valuations used as guidance as to which sectors and industries to concentrate in.
The three biggest contributing industries during the period were Diversified Banks, Life & Health Insurance, and Broadcasting. The three biggest detracting industries were Apparel Accessories & Luxury Goods, Paper Products, and Drug Retail.
Flexible Bond Fund – Total returns for the fund was 4.17% for the year ending December 31, 2021 compared to -1.10% for its benchmark, the Bloomberg US Universal Index. We believe that the fund experienced a good year despite the prevailing fixed income market conditions. Our portfolio duration, a measure of interest rate risk, was relatively short throughout the year. We were able to sustain a high dividend yield due to success in our yield to call strategy, use of high yielding closed end bond funds, and as a consequence of our preferred stock strategy involving dividend capture.
We believe that the fund’s event driven, value oriented strategy continues to be successful with an abundance of the closed end fund arbitrage available and many yield to call opportunities. The fund benefited by a tender Delta Airlines made for its high coupon airline equipment trust issue. Templeton Global Income conducted a tender for their shares that enabled the fund to realize a gain on its position. We believe the delayed closing of the merger for Monmouth REIT enabled us to improve the fund’s realized yield substantially through 2021.
2
Historical Performance (Expressed in U.S. Dollars) | December 31, 2021 |
All of the returns in this report represent past performance, which is not a guarantee of future results that may be achieved by the fund. Current performance may be lower or higher than the performance data cited. For more recent performance information, visit our website at www.iconfunds.com. Note, too, that both investment returns and principal value can fluctuate widely, so an investor’s shares, when sold, could be worth more or less than their original cost. The returns shown do not reflect taxes that a shareholder would pay on fund distributions or on the sale of fund shares.

INSTITUTIONAL SHARES*
Average Annual Total Returns
for the periods ended 12/31/21
Fund/ | One | Five Year | Ten Year | Since |
ICON Consumer Select Fund | 22.80% | 8.89% | 10.92% | 8.33% |
S&P 1500 Financial Sector Index | 34.55% | 12.93% | 15.96% | 6.68% |
INVESTOR SHARES*
Average Annual Total Returns
for the periods ended 12/31/21
Fund/ | One | Five Year | Ten Year | Since |
ICON Consumer Select Fund | 22.40% | 8.59% | 10.58% | 8.63% |
S&P 1500 Financial Sector Index | 34.55% | 12.93% | 15.96% | 6.68% |

* | Past performance does not predict future performance. The returns shown do not reflect the deduction of taxes that a shareholder would pay on fund distributions or the redemption of fund shares. |
3
Historical Performance (Expressed in U.S. Dollars) | December 31, 2021 |
All of the returns in this report represent past performance, which is not a guarantee of future results that may be achieved by the fund. Current performance may be lower or higher than the performance data cited. For more recent performance information, visit our website at www.iconfunds.com. Note, too, that both investment returns and principal value can fluctuate widely, so an investor’s shares, when sold, could be worth more or less than their original cost. The returns shown do not reflect taxes that a shareholder would pay on fund distributions or on the sale of fund shares.

INSTITUTIONAL SHARES*
Average Annual Total Returns
for the periods ended 12/31/21
Fund/ | One | Five Year | Ten Year | Since |
ICON Equity Fund | 26.73% | 16.51% | 13.36% | 11.70% |
S&P 1500 Sector Index | 28.45% | 17.94% | 16.34% | 10.85% |
INVESTOR SHARES*
Average Annual Total Returns
for the periods ended 12/31/21
Fund/ | One | Five Year | Ten Year | Since |
ICON Equity Fund | 26.42% | 16.19% | 13.03% | 11.38% |
S&P 1500 Sector Index | 28.45% | 17.94% | 16.34% | 10.85% |

* | Past performance does not predict future performance. The returns shown do not reflect the deduction of taxes that a shareholder would pay on fund distributions or the redemption of fund shares. |
4
Historical Performance (Expressed in U.S. Dollars) | December 31, 2021 |
All of the returns in this report represent past performance, which is not a guarantee of future results that may be achieved by the fund. Current performance may be lower or higher than the performance data cited. For more recent performance information, visit our website at www.iconfunds.com. Note, too, that both investment returns and principal value can fluctuate widely, so an investor’s shares, when sold, could be worth more or less than their original cost. The returns shown do not reflect taxes that a shareholder would pay on fund distributions or on the sale of fund shares.

INSTITUTIONAL SHARES*
Average Annual Total Returns
for the periods ended 12/31/21
Fund/ | One | Five Year | Ten Year | Since |
ICON Equity Income Fund | 24.14% | 10.79% | 11.57% | 10.95% |
S&P 1500 Sector Index | 28.45% | 17.94% | 16.34% | 11.02% |
INVESTOR SHARES*
Average Annual Total Returns
for the periods ended 12/31/21
Fund/ | One | Five Year | Ten Year | Since |
ICON Equity Income Fund | 23.84% | 10.51% | 11.29% | 10.68% |
S&P 1500 Sector Index | 28.45% | 17.94% | 16.34% | 11.02% |

* | Past performance does not predict future performance. The returns shown do not reflect the deduction of taxes that a shareholder would pay on fund distributions or the redemption of fund shares. |
5
Historical Performance (Expressed in U.S. Dollars) | December 31, 2021 |
All of the returns in this report represent past performance, which is not a guarantee of future results that may be achieved by the fund. Current performance may be lower or higher than the performance data cited. For more recent performance information, visit our website at www.iconfunds.com. Note, too, that both investment returns and principal value can fluctuate widely, so an investor’s shares, when sold, could be worth more or less than their original cost. The returns shown do not reflect taxes that a shareholder would pay on fund distributions or on the sale of fund shares.

INSTITUTIONAL SHARES*
Average Annual Total Returns
for the periods ended 12/31/21
Fund/ | One | Five Year | Ten Year | Since |
ICON Flexible Bond Fund | 4.17% | 4.36% | 4.11% | 3.80% |
Bloomberg Barclays US Universal Index ex-MBS | -1.10% | 4.24% | 3.64% | N/A |
INVESTOR SHARES*
Average Annual Total Returns
for the periods ended 12/31/21
Fund/ | One | Five Year | Ten Year | Since |
ICON Flexible Bond Fund | 4.06% | 4.10% | 3.85% | 3.55% |
Bloomberg Barclays US Universal Index ex-MBS | -1.10% | 4.24% | 3.64% | N/A |

* | Past performance does not predict future performance. The returns shown do not reflect the deduction of taxes that a shareholder would pay on fund distributions or the redemption of fund shares. |
6
Historical Performance (Expressed in U.S. Dollars) | December 31, 2021 |
All of the returns in this report represent past performance, which is not a guarantee of future results that may be achieved by the fund. Current performance may be lower or higher than the performance data cited. For more recent performance information, visit our website at www.iconfunds.com. Note, too, that both investment returns and principal value can fluctuate widely, so an investor’s shares, when sold, could be worth more or less than their original cost. The returns shown do not reflect taxes that a shareholder would pay on fund distributions or on the sale of fund shares.

INSTITUTIONAL SHARES*
Average Annual Total Returns
for the periods ended 12/31/21
Fund/ | One | Five Year | Ten Year | Since |
ICON Health and Information Technology | 17.71% | 21.75% | 18.23% | 16.63% |
S&P 1500 Technology Sector Index | 33.76% | 31.33% | 23.61% | 12.22% |
INVESTOR SHARES*
Average Annual Total Returns
for the periods ended 12/31/21
Fund/ | One | Five Year | Ten Year | Since |
ICON Health and Information Technology | 17.37% | 21.41% | 17.82% | 16.86% |
S&P 1500 Technology Sector Index | 33.76% | 31.33% | 23.61% | 12.22% |
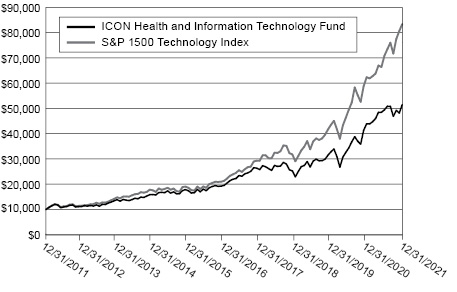
* | Past performance does not predict future performance. The returns shown do not reflect the deduction of taxes that a shareholder would pay on fund distributions or the redemption of fund shares. |
7
Historical Performance (Expressed in U.S. Dollars) | December 31, 2021 |
All of the returns in this report represent past performance, which is not a guarantee of future results that may be achieved by the fund. Current performance may be lower or higher than the performance data cited. For more recent performance information, visit our website at www.iconfunds.com. Note, too, that both investment returns and principal value can fluctuate widely, so an investor’s shares, when sold, could be worth more or less than their original cost. The returns shown do not reflect taxes that a shareholder would pay on fund distributions or on the sale of fund shares.
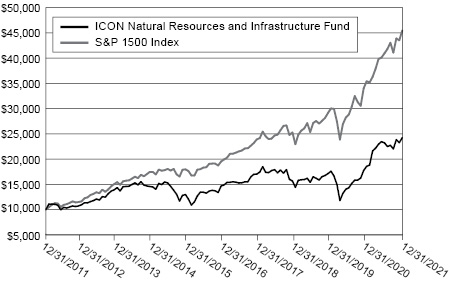
INSTITUTIONAL SHARES*
Average Annual Total Returns
for the periods ended 12/31/21
Fund/ | One | Five Year | Ten Year | Since |
ICON Natural Resources and Infrastructure Fund | 30.62% | 10.24% | 9.25% | 9.67% |
S&P 1500 Sector Index | 28.45% | 17.94% | 16.34% | 9.58% |
INVESTOR SHARES*
Average Annual Total Returns
for the periods ended 12/31/21
Fund/ | One | Five Year | Ten Year | Since |
ICON Natural Resources and Infrastructure Fund | 30.41% | 9.96% | 8.95% | 8.32% |
S&P 1500 Sector Index | 28.45% | 17.94% | 16.34% | 9.58% |

* | Past performance does not predict future performance. The returns shown do not reflect the deduction of taxes that a shareholder would pay on fund distributions or the redemption of fund shares. |
8
Historical Performance (Expressed in U.S. Dollars) | December 31, 2021 |
All of the returns in this report represent past performance, which is not a guarantee of future results that may be achieved by the fund. Current performance may be lower or higher than the performance data cited. For more recent performance information, visit our website at www.iconfunds.com. Note, too, that both investment returns and principal value can fluctuate widely, so an investor’s shares, when sold, could be worth more or less than their original cost. The returns shown do not reflect taxes that a shareholder would pay on fund distributions or on the sale of fund shares.

INSTITUTIONAL SHARES*
Average Annual Total Returns
for the periods ended 12/31/21
Fund/ | One | Five Year | Ten Year | Since |
ICON Utilities and Income Fund | 21.51% | 11.19% | 10.80% | 11.51% |
S&P 1500 Utilities Sector Index | 17.95% | 11.37% | 11.13% | 8.91% |
INVESTOR SHARES*
Average Annual Total Returns
for the periods ended 12/31/21
Fund/ | One | Five Year | Ten Year | Since |
ICON Utilities and Income Fund | 21.24% | 10.91% | 10.52% | 10.89% |
S&P 1500 Utilities Sector Index | 17.95% | 11.37% | 11.13% | 8.91% |

* | Past performance does not predict future performance. The returns shown do not reflect the deduction of taxes that a shareholder would pay on fund distributions or the redemption of fund shares. |
9
About Your Fund’s Expenses | December 31, 2021 |
As a shareholder of the Funds, you incur two types of costs: (1) transaction costs, including sales charges (loads) on purchase payments, reinvested dividends, or other distributions, redemption fees, and exchange fees; and (2) ongoing costs, including management fees, distribution fees and other Fund expenses. Operating expenses, which are deducted from the Funds’ gross income, directly reduce the investment return of the Funds. The Funds’ expenses are expressed as a percentage of its average net assets. This figure is known as the expense ratio. This example is intended to help you understand your ongoing costs (in dollars) of investing in the Funds and to compare these costs with the ongoing costs of investing in other mutual funds. The examples are based on an investment of $1,000 invested at the beginning of the period and held for the entire period from July 1, 2021 to December 31, 2021.
Actual Expenses
The first line of the tables below provides information about actual account values and actual expenses. You may use the information in this line, together with the amount you invested, to estimate the expenses you have paid over the period. Simply divide your account value by $1,000 (for example, an $8,600 account value divided by $1,000 = 8.6), then multiply the result by the number in the first line under the heading entitled “Expenses Paid During Period” to estimate the expenses you paid on your account during this period.
Hypothetical Example for Comparison Purposes
The second line of the table provides information about hypothetical account values and hypothetical expenses based on the Funds’ actual expense ratio and an assumed rate of return of 5% per year before expenses, which is not the Funds’ actual return. The hypothetical account values and expenses may not be used to estimate the actual ending account balance or expenses you paid for the period. You may use this information to compare the ongoing costs of investing in the Funds and other funds. To do so, compare this 5% hypothetical example with the 5% hypothetical examples that appear in the shareholder reports of the other funds. The Funds do not charge any sales charges. Please note that the expenses shown in the tables are meant to highlight your ongoing costs only and do not reflect any transactional cost, such as sales charges (loads), redemption fees, or exchange fees. Therefore, the second line of the tables are useful in comparing ongoing costs only, and will not help you determine the relative total costs of owning different funds. In addition, if these transactional costs were included, your costs would have been higher. The calculations assume no shares were bought or sold during the period.
Beginning | Ending | Expenses Paid | Net Annual | |
ICON Consumer Select Fund |
| |||
Institutional Shares | ||||
Based on Actual Fund Return | $ 1,000 | $ 1,039 | $ 6.78 | 1.32% |
Based on Hypothetical 5% Return before expenses | $ 1,000 | $ 1,018 | $ 6.71 | 1.32% |
Investor Shares | ||||
Based on Actual Fund Return | $ 1,000 | $ 1,038 | $ 8.12 | 1.58% |
Based on Hypothetical 5% Return before expenses | $ 1,000 | $ 1,017 | $ 8.03 | 1.58% |
ICON Equity Fund | ||||
Institutional Shares | ||||
Based on Actual Fund Return | $ 1,000 | $ 1,052 | $ 5.38 | 1.04% |
Based on Hypothetical 5% Return before expenses | $ 1,000 | $ 1,020 | $ 5.30 | 1.04% |
Investor Shares | ||||
Based on Actual Fund Return | $ 1,000 | $ 1,051 | $ 6.67 | 1.29% |
Based on Hypothetical 5% Return before expenses | $ 1,000 | $ 1,018 | $ 6.56 | 1.29% |
ICON Equity Income Fund | ||||
Institutional Shares | ||||
Based on Actual Fund Return | $ 1,000 | $ 1,041 | $ 5.14 | 1.00% |
Based on Hypothetical 5% Return before expenses | $ 1,000 | $ 1,020 | $ 5.09 | 1.00% |
Investor Shares | ||||
Based on Actual Fund Return | $ 1,000 | $ 1,040 | $ 6.43 | 1.25% |
Based on Hypothetical 5% Return before expenses | $ 1,000 | $ 1,019 | $ 6.36 | 1.25% |
ICON Flexible Bond Fund | ||||
Institutional Shares | ||||
Based on Actual Fund Return | $ 1,000 | $ 1,008 | $ 3.90 | 0.77% |
Based on Hypothetical 5% Return before expenses | $ 1,000 | $ 1,021 | $ 3.92 | 0.77% |
Investor Shares | ||||
Based on Actual Fund Return | $ 1,000 | $ 1,008 | $ 5.16 | 1.02% |
Based on Hypothetical 5% Return before expenses | $ 1,000 | $ 1,020 | $ 5.19 | 1.02% |
* | Expenses are equal to the Fund’s annualized expense ratio listed in the “Net Annual Expense Ratio” column, multiplied by the average account value over the |
10
About Your Fund’s Expenses (Continued) | December 31, 2021 |
Beginning | Ending | Expenses Paid | Net Annual | |
ICON Health and Information Technology Fund | ||||
Institutional Shares | ||||
Based on Actual Fund Return | $ 1,000 | $ 1,043 | $ 6.44 | 1.25% |
Based on Hypothetical 5% Return before expenses | $ 1,000 | $ 1,019 | $ 6.36 | 1.25% |
Investor Shares | ||||
Based on Actual Fund Return | $ 1,000 | $ 1,042 | $ 7.72 | 1.50% |
Based on Hypothetical 5% Return before expenses | $ 1,000 | $ 1,017 | $ 7.63 | 1.50% |
ICON Natural Resources and Infrastructure Fund | ||||
Institutional Shares | ||||
Based on Actual Fund Return | $ 1,000 | $ 1,061 | $ 6.65 | 1.28% |
Based on Hypothetical 5% Return before expenses | $ 1,000 | $ 1,019 | $ 6.51 | 1.28% |
Investor Shares | ||||
Based on Actual Fund Return | $ 1,000 | $ 1,043 | $ 7.83 | 1.52% |
Based on Hypothetical 5% Return before expenses | $ 1,000 | $ 1,017 | $ 7.73 | 1.52% |
ICON Utilities and Income Fund | ||||
Institutional Shares | ||||
Based on Actual Fund Return | $ 1,000 | $ 1,061 | $ 6.39 | 1.23% |
Based on Hypothetical 5% Return before expenses | $ 1,000 | $ 1,019 | $ 6.26 | 1.23% |
Investor Shares | ||||
Based on Actual Fund Return | $ 1,000 | $ 1,059 | $ 7.68 | 1.48% |
Based on Hypothetical 5% Return before expenses | $ 1,000 | $ 1,018 | $ 7.53 | 1.48% |
* | Expenses are equal to the Fund’s annualized expense ratio listed in the “Net Annual Expense Ratio” column, multiplied by the average account value over the period, multiplied by 181/365 (to reflect the one-half year period). |
11
Top Holdings and Sector Breakdown | December 31, 2021 |
ICON Consumer Select Fund
Security | Market | Percentage |
| ||||||||||
1 | Ulta Beauty Inc | $3,339,954 | 5.3 | % | |||||||||
2 | Monarch Casino & Resort Inc | 3,128,085 | 4.9 | % | |||||||||
3 | Alleghany Corp | 3,070,914 | 4.8 | % | |||||||||
4 | NIKE Inc | 3,066,728 | 4.8 | % | |||||||||
5 | Five Below Inc | 2,710,259 | 4.3 | % | |||||||||
6 | Mastercard Inc | 2,694,900 | 4.2 | % | |||||||||
7 | LPL Financial Holdings Inc | 2,625,476 | 4.1 | % | |||||||||
8 | Green Brick Partners Inc | 2,587,392 | 4.1 | % | |||||||||
9 | LKQ Corp | 2,485,242 | 3.9 | % | |||||||||
10 | Lululemon Athletica Inc | 2,466,135 | 3.9 | % | |||||||||
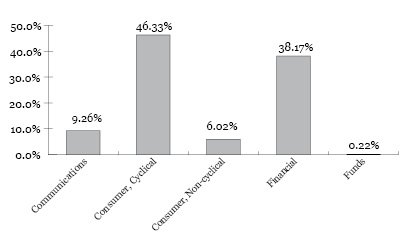
ICON Equity Fund
Security | Market | Percentage |
| ||||||||||
1 | EPAM Systems Inc | $6,504,019 | 7.8 | % | |||||||||
2 | Extreme Networks Inc | 4,574,980 | 5.5 | % | |||||||||
3 | NIKE Inc | 4,483,423 | 5.4 | % | |||||||||
4 | Chart Industries Inc | 4,242,434 | 5.1 | % | |||||||||
5 | Mastercard Inc | 4,178,532 | 5.0 | % | |||||||||
6 | Skyworks Solutions Inc | 3,701,020 | 4.5 | % | |||||||||
7 | Diamondback Energy Inc | 3,073,725 | 3.7 | % | |||||||||
8 | Adobe Inc | 3,005,418 | 3.6 | % | |||||||||
9 | NXP Semiconductors NV | 2,938,362 | 3.5 | % | |||||||||
10 | Bank of America Corp | 2,913,561 | 3.5 | % | |||||||||

ICON Equity Income Fund
Security | Market | Percentage |
| ||||||||||
1 | Lincoln National Corp | $4,832,808 | 5.7 | % | |||||||||
2 | JPMorgan Chase & Co | 3,856,298 | 4.6 | % | |||||||||
3 | Bristol-Myers Squibb Co | 3,834,525 | 4.6 | % | |||||||||
4 | Genuine Parts Co | 3,631,180 | 4.3 | % | |||||||||
5 | MDC Holdings Inc | 3,448,954 | 4.1 | % | |||||||||
6 | Prudential Financial Inc | 3,409,560 | 4.1 | % | |||||||||
7 | QUALCOMM Inc | 3,273,373 | 3.9 | % | |||||||||
8 | Otter Tail Corp | 3,078,202 | 3.7 | % | |||||||||
9 | AbbVie Inc | 3,054,759 | 3.6 | % | |||||||||
10 | Cummins Inc | 2,857,634 | 3.4 | % | |||||||||

ICON Flexible Bond Fund
Security | Market | Percentage |
| ||||||||||
1 | Monmouth Real Estate Investment Corp | $15,135,772 | 6.5 | % | |||||||||
2 | Principal Financial Group Inc | 7,047,620 | 3.0 | % | |||||||||
3 | Principal Financial Group Inc | 6,825,600 | 2.9 | % | |||||||||
4 | Fifth Third Bancorp | 6,692,770 | 2.9 | % | |||||||||
5 | Templeton Global Income Fund | 6,634,823 | 2.8 | % | |||||||||
6 | Fifth Third Bancorp | 6,415,690 | 2.7 | % | |||||||||
7 | JPMorgan Chase & Co | 6,403,874 | 2.7 | % | |||||||||
8 | USB Capital IX | 5,778,202 | 2.5 | % | |||||||||
9 | Dell International LLC / EMC Corp | 5,504,650 | 2.4 | % | |||||||||
10 | JetBlue 2019-1 Class B Pass Through Trust | 4,785,971 | 2.0 | % | |||||||||

12
Top Holdings and Sector Breakdown (Continued) | December 31, 2021 |
ICON Health and Information Technology Fund
Security | Market | Percentage |
| ||||||||||
1 | EPAM Systems Inc | $10,294,130 | 4.0 | % | |||||||||
2 | Apple Inc | 8,558,505 | 3.3 | % | |||||||||
3 | Microsoft Corp | 8,073,846 | 3.1 | % | |||||||||
4 | UnitedHealth Group Inc | 7,632,528 | 3.0 | % | |||||||||
5 | Global Payments Inc | 6,504,176 | 2.5 | % | |||||||||
6 | NXP Semiconductors NV | 6,306,545 | 2.4 | % | |||||||||
7 | II-VI Inc | 6,069,204 | 2.4 | % | |||||||||
8 | Extreme Networks Inc | 5,701,565 | 2.2 | % | |||||||||
9 | Adobe Inc | 5,613,894 | 2.2 | % | |||||||||
10 | UnitedHealth Group Inc | 5,575,812 | 2.2 | % | |||||||||

ICON Natural Resources and Infrastructure Fund
Security | Market | Percentage |
| ||||||||||
1 | Diamondback Energy Inc | $7,549,500 | 3.2 | % | |||||||||
3 | Chart Industries Inc | 6,254,649 | 2.6 | % | |||||||||
4 | Martin Marietta Materials Inc | 6,167,280 | 2.6 | % | |||||||||
5 | Packaging Corp of America | 6,068,040 | 2.5 | % | |||||||||
6 | Chart Industries Inc | 6,060,620 | 2.5 | % | |||||||||
7 | Eagle Materials Inc | 5,826,100 | 2.4 | % | |||||||||
8 | International Paper Co | 5,469,200 | 2.3 | % | |||||||||
9 | EOG Resources Inc | 4,974,480 | 2.1 | % | |||||||||
10 | Exxon Mobil Corp | 4,699,080 | 2.0 | % | |||||||||
11 | Louisiana-Pacific Corp | 4,622,650 | 1.9 | % | |||||||||

ICON Utilities and Income Fund
Security | Market | Percentage |
| ||||||||||
1 | MDU Resources Group Inc | $2,621,400 | 3.4 | % | |||||||||
2 | National Fuel Gas Co | 2,608,752 | 3.4 | % | |||||||||
3 | NextEra Energy Inc | 2,455,368 | 3.2 | % | |||||||||
4 | Xcel Energy Inc | 2,423,660 | 3.2 | % | |||||||||
5 | Duke Energy Corp | 2,402,210 | 3.1 | % | |||||||||
6 | Xcel Energy Inc | 2,386,786 | 3.1 | % | |||||||||
7 | Ameren Corp | 2,278,656 | 3.0 | % | |||||||||
8 | Atlantica Sustainable Infrastructure PLC | 2,256,456 | 2.9 | % | |||||||||
9 | MDU Resources Group Inc | 2,238,900 | 2.9 | % | |||||||||
10 | Atlantica Sustainable Infrastructure PLC | 2,202,840 | 2.9 | % | |||||||||

13
ICON Consumer Select Fund Portfolio of Investment December 31, 2021 |
Security Description | Shares | Value | ||||||
Common Stock (100.37%) | ||||||||
Communications (9.31%) | ||||||||
Alphabet Inc* | 440 | $ | 1,273,180 | |||||
Amazon.com Inc* | 513 | 1,710,516 | ||||||
Comcast Corp | 31,700 | 1,595,461 | ||||||
eBay Inc | 19,700 | 1,310,050 | ||||||
Total Communications | 5,889,207 | |||||||
Consumer, Cyclical (46.60%) | ||||||||
Brunswick Corp | 22,500 | 2,266,425 | ||||||
Dollar Tree Inc* | 9,800 | 1,377,096 | ||||||
Five Below Inc* | 13,100 | 2,710,259 | ||||||
Green Brick Partners Inc* | 85,308 | 2,587,392 | ||||||
LKQ Corp | 41,400 | 2,485,242 | ||||||
Lululemon Athletica Inc* | 6,300 | 2,466,135 | ||||||
Monarch Casino & Resort Inc* | 42,300 | 3,128,085 | ||||||
NIKE Inc | 18,400 | 3,066,728 | ||||||
PulteGroup Inc | 43,100 | 2,463,596 | ||||||
Skechers USA Inc* | 45,400 | 1,970,360 | ||||||
Texas Roadhouse Inc | 18,000 | 1,607,040 | ||||||
Ulta Beauty Inc* | 8,100 | 3,339,954 | ||||||
Total Consumer, Cyclical | 29,468,312 | |||||||
Consumer, Non-cyclical (6.06%) | ||||||||
Darling Ingredients Inc* | 31,100 | 2,154,919 | ||||||
Global Payments Inc | 12,400 | 1,676,232 | ||||||
Total Consumer, Non-cyclical | 3,831,151 | |||||||
Financial (38.40%) | ||||||||
Alleghany Corp* | 4,600 | $ | 3,070,914 | |||||
American Express Co | 14,200 | 2,323,120 | ||||||
Assurant Inc | 11,800 | 1,839,148 | ||||||
Bank of America Corp | 50,000 | 2,224,500 | ||||||
Equitable Holdings Inc | 27,400 | 898,446 | ||||||
JPMorgan Chase & Co | 12,900 | 2,042,715 | ||||||
Kearny Financial Corp | 160,000 | 2,120,000 | ||||||
LPL Financial Holdings Inc | 16,400 | 2,625,476 | ||||||
Marsh & McLennan Cos Inc | 7,300 | 1,268,886 | ||||||
Mastercard Inc | 7,500 | 2,694,900 | ||||||
Morgan Stanley | 13,500 | 1,325,160 | ||||||
Visa Inc | 8,500 | 1,842,035 | ||||||
Total Financial | 24,275,300 | |||||||
Total Common Stock (Cost $44,321,841) | 63,463,970 | |||||||
Investment Companies (0.22%) | ||||||||
Money Market Funds (0.22%) | ||||||||
First American Government Obligations Fund (7-Day Yield, 0.030%) | 139,323 | 139,323 | ||||||
Total Investment Companies (Cost $139,323) | 139,323 | |||||||
Total Investments (Cost $44,461,164) (100.59%) | $ | 63,603,293 | ||||||
Liabilities in Excess of Other Assets (-0.59%) | (370,069 | ) | ||||||
Net Assets (100.00%) | $ | 63,233,224 | ||||||
* | Non-income producing security. |
ICON Equity Fund Portfolio of Investment December 31, 2021 |
Security Description | Shares | Value | ||||||
Common Stock (96.55%) | ||||||||
Basic Materials (0.94%) | ||||||||
The Chemours Co | 23,000 | $ | 771,880 | |||||
Communications (5.58%) | ||||||||
Extreme Networks Inc* | 291,400 | 4,574,980 | ||||||
Consumer, Cyclical (17.16%) | ||||||||
Five Below Inc* | 9,900 | 2,048,211 | ||||||
KB Home | 22,700 | 1,015,371 | ||||||
Magna International Inc | 28,200 | 2,282,508 | ||||||
Monarch Casino & Resort Inc* | 31,100 | 2,299,845 | ||||||
NIKE Inc | 26,900 | 4,483,423 | ||||||
Ulta Beauty Inc* | 4,700 | 1,937,998 | ||||||
Total Consumer, Cyclical | 14,067,356 | |||||||
Consumer, Non-cyclical (7.32%) | ||||||||
Euronet Worldwide Inc* | 13,350 | 1,590,920 | ||||||
Global Payments Inc | 18,862 | 2,549,765 | ||||||
ManpowerGroup Inc | 19,100 | 1,859,003 | ||||||
Total Consumer, Non-cyclical | 5,999,688 | |||||||
Energy (6.45%) | ||||||||
Baker Hughes Co | 92,200 | 2,218,332 | ||||||
Diamondback Energy Inc | 28,500 | $ | 3,073,725 | |||||
Total Energy | 5,292,057 | |||||||
Financial (16.99%) | ||||||||
Bank of America Corp | 65,488 | 2,913,561 | ||||||
JPMorgan Chase & Co | 14,600 | 2,311,910 | ||||||
LPL Financial Holdings Inc | 14,000 | 2,241,260 | ||||||
Mastercard Inc | 11,629 | 4,178,532 | ||||||
Truist Financial Corp | 39,100 | 2,289,305 | ||||||
Total Financial | 13,934,568 | |||||||
Industrial (20.43%) | ||||||||
Advanced Drainage Systems Inc | 19,900 | 2,708,987 | ||||||
Alamo Group Inc | 19,500 | 2,870,010 | ||||||
Armstrong World Industries Inc | 18,000 | 2,090,160 | ||||||
CSX Corp | 38,100 | 1,432,560 | ||||||
Chart Industries Inc* | 26,600 | 4,242,434 | ||||||
L3Harris Technologies Inc | 5,400 | 1,151,496 | ||||||
Trinity Industries Inc | 74,800 | 2,258,960 | ||||||
Total Industrial | 16,754,607 | |||||||
Technology (21.68%) | ||||||||
Adobe Inc* | 5,300 | 3,005,418 | ||||||
EPAM Systems Inc* | 9,730 | 6,504,019 | ||||||
Qorvo Inc* | 10,400 | 1,626,456 | ||||||
See accompanying notes to financial statements.
14
ICON Equity Fund Portfolio of Investment December 31, 2021 |
Security Description | Shares | Value | ||||||
Skyworks Solutions Inc | 23,856 | $ | 3,701,020 | |||||
NXP Semiconductors NV | 12,900 | 2,938,362 | ||||||
Total Technology | 17,775,275 | |||||||
Total Common Stock (Cost $44,653,634) | 79,170,411 | |||||||
Investment Companies (4.53%) | ||||||||
Exchange-Traded Funds (4.47%) | ||||||||
Direxion Daily Small Cap Bull 3X Shares# | 12,600 | 1,067,850 | ||||||
Direxion Daily S&P 500 Bull 3X# | 18,094 | 2,594,861 | ||||||
Total Exchange-Traded Funds | 3,662,711 | |||||||
Money Market Funds (0.06%) | ||||||||
First American Government Obligations Fund (7-Day Yield, 0.030%) | 48,591 | 48,591 | ||||||
Total Investment Companies (Cost $1,232,260) | 3,711,302 | |||||||
Collateral Received for Securities on Loan (4.36%) | ||||||||
First American Government Obligations Fund - Class X (Cost $3,571,330) | 3,571,330 | $ | 3,571,330 | |||||
Total Investments (Cost $49,457,224) (105.44%) | $ | 86,453,043 | ||||||
Liabilities in Excess of Other Assets (-5.44%) | (4,457,892 | ) | ||||||
Net Assets (100.00%) | $ | 81,995,151 | ||||||
* | Non-income producing security. |
# | Loaned security; a portion of the security is on loan at December 31, 2021 in the amount of $3,488,870. |
ICON Equity Income Fund Portfolio of Investment December 31, 2021 |
Security Description | Shares | Value | ||||||
Common Stock (95.59%) | ||||||||
Basic Materials (5.86%) | ||||||||
Eastman Chemical Co | 21,100 | $ | 2,551,201 | |||||
Neenah Inc | 50,700 | 2,346,396 | ||||||
Total Basic Materials | 4,897,597 | |||||||
Communications (3.25%) | ||||||||
Nexstar Media Group Inc | 18,000 | 2,717,640 | ||||||
Consumer, Cyclical (20.14%) | ||||||||
Genuine Parts Co | 25,900 | 3,631,180 | ||||||
Leggett & Platt Inc | 45,400 | 1,868,664 | ||||||
MDC Holdings Inc | 61,776 | 3,448,954 | ||||||
VF Corp | 30,000 | 2,196,600 | ||||||
Whirlpool Corp | 12,000 | 2,815,920 | ||||||
Cummins Inc | 13,100 | 2,857,634 | ||||||
Total Consumer, Cyclical | 16,818,952 | |||||||
Consumer, Non-Cyclical (11.77%) | ||||||||
Rent-A-Center Inc | 24,000 | 1,152,960 | ||||||
Altria Group Inc | 7,600 | 360,164 | ||||||
Philip Morris International Inc | 15,000 | 1,425,000 | ||||||
AbbVie Inc | 22,561 | 3,054,759 | ||||||
Bristol-Myers Squibb Co | 61,500 | 3,834,525 | ||||||
Total Consumer, Non-Cyclical | 9,827,408 | |||||||
Energy (1.33%) | ||||||||
Baker Hughes Co | 46,108 | 1,109,358 | ||||||
Financial (28.76%) | ||||||||
Bank of America Corp | 20,800 | 925,392 | ||||||
Huntington Bancshares Inc | 150,900 | 2,326,878 | ||||||
JPMorgan Chase & Co | 24,353 | 3,856,298 | ||||||
Kearny Financial Corp | 149,400 | 1,979,550 | ||||||
Lincoln National Corp | 70,800 | 4,832,808 | ||||||
OceanFirst Financial Corp | 122,300 | 2,715,060 | ||||||
Prudential Financial Inc | 31,500 | $ | 3,409,560 | |||||
US Bancorp | 46,000 | 2,583,820 | ||||||
Webster Financial Corp | 24,900 | 1,390,416 | ||||||
Total Financial | 24,019,782 | |||||||
Industrial (10.44%) | ||||||||
Hubbell Inc | 10,800 | 2,249,316 | ||||||
Lockheed Martin Corp | 6,800 | 2,416,788 | ||||||
Union Pacific Corp | 9,229 | 2,325,062 | ||||||
Packaging Corp of America | 12,700 | 1,729,105 | ||||||
Total Industrial | 8,720,271 | |||||||
Technology (7.93%) | ||||||||
International Business Machines Corp | 5,900 | 788,594 | ||||||
Kyndryl Holdings Inc* | 1,180 | 21,358 | ||||||
QUALCOMM Inc | 17,900 | 3,273,373 | ||||||
Texas Instruments Inc | 13,500 | 2,544,345 | ||||||
Total Technology | 6,627,670 | |||||||
Utilities (6.11%) | ||||||||
Evergy Inc | 29,500 | 2,023,995 | ||||||
Otter Tail Corp | 43,100 | 3,078,202 | ||||||
Total Utilities | 5,102,197 | |||||||
Total Common Stock (Cost $61,460,975) | 79,840,875 | |||||||
Preferred Stock (2.61%) | ||||||||
Financial (2.61%) | ||||||||
Annaly Capital Management Inc, 6.950% | 14,000 | 358,120 | ||||||
Argo Group US Inc, 6.500% | 24,907 | 642,850 | ||||||
Monmouth Real Estate Investment Corp, 6.125% | 46,835 | 1,182,115 | ||||||
Total Financial | 2,183,085 | |||||||
Total Preferred Stock (Cost $2,168,985) | 2,183,085 | |||||||
See accompanying notes to financial statements.
15
ICON Equity Income Fund Portfolio of Investment December 31, 2021 |
| Security Description | Par Value | Value | ||||||
| Corporate Debt (0.78%) | ||||||||
| Basic Materials (0.02%) | ||||||||
| CVR Partners LP / CVR Nitrogen Finance Corp, 9.250%, 6/15/2023 (144A) | $ | 20,000 | $ | 20,042 | ||||
| Consumer, Non-cyclical (0.26%) | ||||||||
| Conagra Brands Inc, 7.125%, 10/1/2026 | 175,000 | 214,002 | ||||||
| Financial (0.50%) | ||||||||
JPMorgan Chase & Co, 3M US LIBOR + 3.470%(a),(b) | 170,000 | 170,850 | ||||||
Principal Financial Group Inc, 3M US LIBOR + 3.044%, 5/15/2055(b) | 250,000 | 247,807 | ||||||
| Total Financial | 418,657 | |||||||
| Total Corporate Debt (Cost $628,946) | 652,701 | |||||||
Shares | ||||||||
| Investment Companies (1.79%) | ||||||||
| Mutual Funds (1.44%) | ||||||||
Blackstone Strategic Credit Fund# | 10,476 | 141,321 | ||||||
| Templeton Global Income Fund | 125,000 | 648,750 | ||||||
| Vertical Capital Income Fund | 29,305 | 298,911 | ||||||
| RiverNorth Specialty Finance Corp | 5,736 | 110,131 | ||||||
| Total Mutual Funds | 1,199,113 | |||||||
| Security Description | Shares | Value | ||||||
| Money Market Funds (0.35%) | ||||||||
| First American Government Obligations Fund (7-Day Yield, 0.030%) | 296,441 | $ | 296,441 | |||||
| Total Investment Companies (Cost $1,500,233) | 1,495,554 | |||||||
| Collateral Received for Securities on Loan (0.17%) | ||||||||
| First American Government Obligations Fund - Class X (Cost $144,588) | 144,588 | 144,588 | ||||||
| Total Investments (Cost $65,903,728) (100.94%) | $ | 84,316,803 | ||||||
| Liabilities in Excess of Other Assets (-0.94%) | (787,675 | ) | ||||||
| Net Assets (100.00%) | $ | 83,529,128 | ||||||
* | Non-income producing security. |
# | Loaned security; a portion of the security is on loan at December 31, 2021 in the amount of $139,905. |
(144A)Security was purchased pursuant to Rule 144A or Section 4(a)(2) under the Securities Act of 1933 and may be resold in transactions exempt from registration only to qualified institutional buyers. As of December 31, 2021, these securities had a total aggregate market value of $20,042, which represented approximately 0.03% of net assets.
(a) | This security has no contractual maturity date, is not redeemable and contractually pays an indefinite stream of interest. |
(b) | Floating or variable rate security. The reference rate is described above. The rate in effect as of December 31, 2021 is based on the reference rate plus the displayed spread as of the security’s last reset date. |
ICON Flexible Bond Fund Portfolio of Investment December 31, 2021 |
Security Description | Shares | Value | ||||||
Common Stock (0.96%) | ||||||||
Communications (0.17%) | ||||||||
AT&T Inc | 10,100 | $ | 248,460 | |||||
Financial (0.79%) | ||||||||
Annaly Capital Management Inc | 148,789 | 1,163,530 | ||||||
Total Common Stock (Cost $1,456,382) | 1,411,990 | |||||||
| Par Value |
| ||||||
Corporate Debt (69.53%) | ||||||||
Basic Materials (0.17%) | ||||||||
CVR Partners LP / CVR Nitrogen Finance Corp, 9.250%, 6/15/2023 (144A) | $ | 248,000 | 248,521 | |||||
Communications (6.43%) | ||||||||
Cincinnati Bell Telephone Co LLC, 6.300%, 12/1/2028 | 2,616,000 | 2,799,120 | ||||||
Hughes Satellite Systems Corp, 5.250%, 8/1/2026 | 3,000,000 | 3,281,250 | ||||||
Walt Disney Co/The, 7.750%, 2/1/2024 | 3,000,000 | 3,400,529 | ||||||
Total Communications | 9,480,899 | |||||||
| Security Description | Par Value | Value | ||||||
| Consumer, Cyclical (14.64%) | ||||||||
| Air Canada 2015-1 Class B Pass Through Trust, 3.875%, 3/15/2023 (144A) | $ | 820,928 | $ | 825,147 | ||||
| American Airlines 2017-1 Class B Pass Through Trust, 4.950%, 2/15/2025 | 3,030,000 | 3,018,662 | ||||||
| Foot Locker Inc, 8.500%, 1/15/2022 | 2,400,000 | 2,406,000 | ||||||
| G-III Apparel Group Ltd, 7.875%, 8/15/2025 (144A) | 1,850,000 | 1,968,391 | ||||||
| IHO Verwaltungs GmbH, 4.750%, 9/15/2026 (144A) | 1,000,000 | 1,020,000 | ||||||
| JetBlue 2019-1 Class B Pass Through Trust, 8.000%, 11/15/2027 | 4,165,079 | 4,785,971 | ||||||
| JetBlue 2020-1 Class B Pass Through Trust, 7.750%, 11/15/2028 | 1,791,323 | 2,081,957 | ||||||
| UAL 2007-1 Pass Through Trust, 6.636%, 7/2/2022 | 1,388,865 | 1,418,504 | ||||||
| United Airlines 2014-1 Class B Pass Through Trust, 4.750%, 4/11/2022 | 2,058,539 | 2,079,152 | ||||||
| US Airways 2011-1 Class A Pass Through Trust, 7.125%, 10/22/2023 | 1,872,230 | 1,972,316 | ||||||
| Total Consumer, Cyclical | 21,576,100 | |||||||
See accompanying notes to financial statements.
16
ICON Flexible Bond Fund Portfolio of Investment December 31, 2021 |
| Security Description | Par Value | Value | ||||||
| Consumer, Non-cyclical (7.23%) | ||||||||
| Conagra Brands Inc, 7.125%, 10/1/2026 | $ | 1,150,000 | $ | 1,406,301 | ||||
| Cooke Omega Investments Inc / Alpha VesselCo Holdings Inc, 8.500%, 12/15/2022 (144A) | 4,000,000 | 4,070,000 | ||||||
| McKesson Corp, 7.650%, 3/1/2027 | 2,000,000 | 2,535,990 | ||||||
| Spectrum Brands Inc, 5.750%, 7/15/2025 | 1,500,000 | 1,531,875 | ||||||
| Varex Imaging Corp, 7.875%, 10/15/2027 (144A) | 1,000,000 | 1,111,100 | ||||||
| Total Consumer, Non-cyclical | 10,655,266 | |||||||
| Energy (5.79%) | ||||||||
| Andeavor LLC, 5.125%, 12/15/2026 | 4,000,000 | 4,425,969 | ||||||
| Hess Corp, 7.300%, 8/15/2031 | 1,500,000 | 1,999,194 | ||||||
| Marathon Petroleum Corp, 3.625%, 9/15/2024 | 2,000,000 | 2,103,120 | ||||||
| Total Energy | 8,528,283 | |||||||
| Financial (21.11%) | ||||||||
BAC Capital Trust XIV, 3M US LIBOR (floor 4.000%) + 0.400%#,(a),(b) | 1,850,000 | 1,841,607 | ||||||
| Credit Acceptance Corp, 6.625%, 3/15/2026 | 2,000,000 | 2,081,680 | ||||||
| Doric Nimrod Air Finance Alpha Ltd 2012-1 Class A Pass Through Trust, 5.125%, 11/30/2022 (144A) | 575,249 | 569,584 | ||||||
| Fidelity & Guaranty Life Holdings Inc, 5.500%, 5/1/2025 (144A) | 1,000,000 | 1,116,994 | ||||||
Fifth Third Bancorp, 3M US LIBOR + 3.129%#,(a),(b) | 6,718,000 | 6,692,770 | ||||||
| Genworth Holdings Inc, 4.800%, 2/15/2024 | 1,000,000 | 1,040,000 | ||||||
| Icahn Enterprises LP / Icahn Enterprises Finance Corp, 6.750%, 2/1/2024 | 500,000 | 501,250 | ||||||
JPMorgan Chase & Co, 3M US LIBOR + 3.470%(a),(b) | 2,417,000 | 2,429,085 | ||||||
Principal Financial Group Inc, 3M US LIBOR + 3.044%, 5/15/2055(b) | 7,110,000 | 7,047,620 | ||||||
| TMX Finance LLC / TitleMax Finance Corp, 11.125%, 4/1/2023 (144A) | 2,000,000 | 2,040,940 | ||||||
USB Capital IX, 3.500%, 3M US LIBOR + 1.020%(a),(b) | 6,000,000 | 5,778,202 | ||||||
| Total Financial | 31,139,732 | |||||||
| Industrial (3.65%) | ||||||||
Fluor Corp, 3.500%, 12/15/2024# | 688,000 | 720,460 | ||||||
| Fortress Transportation and Infrastructure Investors LLC, 6.500%, 10/1/2025 (144A) | 1,500,000 | 1,550,625 | ||||||
| Kratos Defense & Security Solutions Inc, 6.500%, 11/30/2025 (144A) | 1,554,000 | 1,596,735 | ||||||
| Mauser Packaging Solutions Holding Co, 5.500%, 4/15/2024 (144A) | 1,500,000 | 1,513,755 | ||||||
| Total Industrial | 5,381,575 | |||||||
| Technology (5.43%) | ||||||||
| Dell Inc, 7.100%, 4/15/2028 | 2,000,000 | 2,505,667 | ||||||
| Dell International LLC / EMC Corp, 6.100%, 7/15/2027 | 4,612,000 | 5,504,650 | ||||||
| Total Technology | 8,010,317 | |||||||
| Utilities (5.08%) | ||||||||
| Calpine Corp, 5.250%, 6/1/2026 (144A) | 703,000 | 721,271 | ||||||
| PacifiCorp, 8.069%, 9/9/2022 | 3,685,000 | 3,853,850 | ||||||
| Vistra Operations Co LLC, 5.500%, 9/1/2026 (144A) | 1,350,000 | 1,394,064 | ||||||
| Vistra Operations Co LLC, 5.000%, 7/31/2027 (144A) | 1,460,000 | 1,515,217 | ||||||
| Total Utilities | 7,484,402 | |||||||
| Total Corporate Debt (Cost $102,166,223) | 102,505,095 | |||||||
| Asset Backed Securities (1.98%) | ||||||||
| SMB Private Education Loan Trust 2014-A, 4.500%, 9/15/2045 (144A) | 3,000,000 | 2,922,479 | ||||||
| Total Asset Backed Securities (Cost $2,902,709) | 2,922,479 | |||||||
Shares | ||||||||
| Preferred Stock (13.53%) | ||||||||
| Argo Group US Inc, 6.500% | 173,969 | 4,490,140 | ||||||
| Bank of America Corp, 7.250% | 217 | 313,652 | ||||||
| Monmouth Real Estate Investment Corp, 6.125% | 599,674 | 15,135,772 | ||||||
| Total Preferred Stock (Cost $19,653,388) | 19,939,564 | |||||||
| Investment Companies (12.27%) | ||||||||
| Mutual Funds (9.45%) | ||||||||
Blackstone Strategic Credit Fund# | 27,638 | 372,837 | ||||||
| Highland Income Fund | 40,172 | 441,490 | ||||||
| Nuveen Emerging Markets Debt 2022 Target Term Fund | 197,334 | 1,493,818 | ||||||
| RiverNorth Specialty Finance Corp | 120,606 | 2,315,635 | ||||||
| Templeton Global Income Fund | 1,278,386 | 6,634,823 | ||||||
| Vertical Capital Income Fund | 262,066 | 2,673,073 | ||||||
| Total Mutual Funds | 13,931,676 | |||||||
| Money Market Funds (2.82%) | ||||||||
| First American Government Obligations Fund (7-Day Yield, 0.030%) | 4,161,836 | 4,161,836 | ||||||
| Total Investment Companies (Cost $18,130,940) | 18,093,512 | |||||||
| Collateral Received for Securities on Loan (5.95%) | ||||||||
| First American Government Obligations Fund - Class X (Cost $8,765,781) | 8,765,781 | 8,765,781 | ||||||
| Total Investments (Cost $153,075,422) (104.22%) | $ | 153,638,421 | ||||||
| Liabilities in Excess of Other Assets (-4.22%) | (6,227,367 | ) | ||||||
| Net Assets (100.00%) | $ | 147,411,054 |
# | Loaned security; a portion of the security is on loan at December 31, 2021 in the amount of $8,619,767. |
(144A) Security was purchased pursuant to Rule 144A or Section 4(a)(2) under the Securities Act of 1933 and may be resold in transactions exempt from registration only to qualified institutional buyers. As of December 31, 2021, these securities had a total aggregate market value of $24,184,823, which represented approximately 16.48% of net assets.
(a) | This security has no contractual maturity date, is not redeemable and contractually pays an indefinite stream of interest. |
(b) | Floating or variable rate security. The reference rate is described above. The rate in effect as of December 31, 2021 is based on the reference rate plus the displayed spread as of the security’s last reset date. |
See accompanying notes to financial statements.
17
ICON Health and Information Technology Fund Portfolio of Investment December 31, 2021 |
Security Description | Shares | Value | ||||||
Common Stock (100.71%) | ||||||||
Communications (12.60%) | ||||||||
Alphabet Inc* | 1,500 | $ | 4,340,385 | |||||
Amazon.com Inc* | 1,000 | 3,334,340 | ||||||
Charter Communications Inc* | 2,700 | 1,760,319 | ||||||
Extreme Networks Inc* | 363,157 | 5,701,565 | ||||||
Perficient Inc* | 8,800 | 1,137,752 | ||||||
Total Communications | 16,274,361 | |||||||
Consumer, Non-cyclical (23.54%) | ||||||||
AbbVie Inc | 35,965 | 4,869,661 | ||||||
Anthem Inc | 9,100 | 4,218,214 | ||||||
Cigna Corp | 10,100 | 2,319,263 | ||||||
Euronet Worldwide Inc* | 39,400 | 4,695,298 | ||||||
Global Payments Inc | 30,193 | 4,081,490 | ||||||
IQVIA Holdings Inc* | 9,138 | 2,578,195 | ||||||
UnitedHealth Group Inc | 15,200 | 7,632,528 | ||||||
Total Consumer, Non-cyclical | 30,394,649 | |||||||
Energy (3.37%) | ||||||||
SolarEdge Technologies Inc* | 15,500 | 4,348,835 | ||||||
Financial (7.26%) | ||||||||
Mastercard Inc | 14,900 | 5,353,868 | ||||||
Visa Inc | 18,580 | 4,026,472 | ||||||
Total Financial | 9,380,340 | |||||||
Industrial (9.88%) | ||||||||
EnerSys | 41,100 | 3,249,366 | ||||||
Universal Display Corp | 23,900 | 3,944,217 | ||||||
Sensata Technologies Holding PLC* | 66,600 | 4,108,554 | ||||||
TE Connectivity Ltd | 9,000 | $ | 1,452,060 | |||||
Total Industrial | 12,754,197 | |||||||
Technology (44.06%) | ||||||||
Adobe Inc* | 9,900 | 5,613,894 | ||||||
Applied Materials Inc | 27,300 | 4,295,928 | ||||||
Autodesk Inc* | 18,600 | 5,230,134 | ||||||
EPAM Systems Inc* | 15,400 | 10,294,130 | ||||||
Micron Technology Inc | 45,600 | 4,247,640 | ||||||
NCR Corp* | 100,500 | 4,040,100 | ||||||
Qorvo Inc* | 21,900 | 3,424,941 | ||||||
Science Applications International Corp | 39,900 | 3,335,241 | ||||||
Skyworks Solutions Inc | 33,010 | 5,121,171 | ||||||
Genpact Ltd | 93,900 | 4,984,212 | ||||||
NXP Semiconductors NV | 27,687 | 6,306,545 | ||||||
Total Technology | 56,893,936 | |||||||
Total Common Stock (Cost $88,530,558) | 130,046,318 | |||||||
Investment Companies (0.18%) | ||||||||
Money Market (0.18%) | ||||||||
First American Government Obligations Fund (7-Day Yield, 0.030%) | 238,890 | 238,890 | ||||||
Total Investment Companies (Cost $238,890) | 238,890 | |||||||
Total Investments (Cost $88,769,448) (100.89%) | $ | 130,285,208 | ||||||
Liabilities in Excess of Other Assets (-0.89%) | (1,143,783 | ) | ||||||
Net Assets (100.00%) | $ | 129,141,425 | ||||||
* | Non-income producing security. |
ICON Natural Resources and Infrastructure Fund Portfolio of Investment December 31, 2021 |
Security Description | Shares | Value | ||||||
Common Stock (97.77%) | ||||||||
Basic Materials (6.78%) | ||||||||
Alcoa Corp | 40,000 | $ | 2,383,200 | |||||
Ashland Global Holdings Inc | 17,000 | 1,830,220 | ||||||
International Paper Co | 35,000 | 1,644,300 | ||||||
Kaiser Aluminum Corp | 31,000 | 2,912,140 | ||||||
Total Basic Materials | 8,769,860 | |||||||
Consumer, Cyclical (8.12%) | ||||||||
Fastenal Co | 47,000 | 3,010,820 | ||||||
MillerKnoll Inc | 117,000 | 4,585,230 | ||||||
WW Grainger Inc | 5,600 | 2,902,144 | ||||||
Total Consumer, Cyclical | 10,498,194 | |||||||
Consumer, Non-cyclical (3.21%) | ||||||||
Darling Ingredients Inc* | 22,000 | 1,524,380 | ||||||
ManpowerGroup Inc | 27,000 | 2,627,910 | ||||||
Total Consumer, Non-cyclical | 4,152,290 | |||||||
Energy (25.03%) | ||||||||
Atlantica Sustainable Infrastructure PLC | 120,000 | 4,291,200 | ||||||
Delek US Holdings Inc* | 300,000 | $ | 4,497,000 | |||||
Diamondback Energy Inc | 70,000 | 7,549,500 | ||||||
EOG Resources Inc | 56,000 | 4,974,480 | ||||||
Phillips 66 | 55,000 | 3,985,300 | ||||||
Pioneer Natural Resources Co | 15,000 | 2,728,200 | ||||||
Valero Energy Corp | 58,000 | 4,356,380 | ||||||
Total Energy | 32,382,060 | |||||||
Industrial (54.63%) | ||||||||
Armstrong World Industries Inc | 30,000 | 3,483,600 | ||||||
Berry Global Group Inc* | 57,000 | 4,205,460 | ||||||
Chart Industries Inc* | 38,000 | 6,060,620 | ||||||
Eagle Materials Inc | 35,000 | 5,826,100 | ||||||
EMCOR Group Inc | 18,300 | 2,331,237 | ||||||
JB Hunt Transport Services Inc | 22,000 | 4,496,800 | ||||||
Louisiana-Pacific Corp | 59,000 | 4,622,650 | ||||||
Martin Marietta Materials Inc | 14,000 | 6,167,280 | ||||||
Masco Corp | 56,000 | 3,932,320 | ||||||
MasTec Inc* | 37,000 | 3,414,360 | ||||||
Myers Industries Inc | 167,000 | 3,341,670 | ||||||
Old Dominion Freight Line Inc | 12,000 | 4,300,560 | ||||||
Oshkosh Corp | 24,000 | 2,705,040 | ||||||
See accompanying notes to financial statements.
18
ICON Natural Resources and Infrastructure Fund Portfolio of Investment December 31, 2021 |
Security Description | Shares | Value | ||||||
Packaging Corp of America | 15,000 | $ | 2,042,250 | |||||
Primoris Services Corp | 85,000 | 2,038,300 | ||||||
Saia Inc* | 12,000 | 4,044,360 | ||||||
Trane Technologies PLC | 19,000 | 3,838,570 | ||||||
Valmont Industries Inc | 15,250 | 3,820,125 | ||||||
Total Industrial | 70,671,302 | |||||||
Total Common Stock (Cost $98,849,115) | 126,473,706 | |||||||
Investment Companies (2.46%) | ||||||||
Exchange-Traded Funds (1.49%) | ||||||||
Direxion Daily Energy Bull 2X Shares | 65,000 | 1,926,600 | ||||||
Money Market Funds (0.97%) | ||||||||
First American Government Obligations Fund (7-Day Yield, 0.030%) | 1,255,857 | $ | 1,255,857 | |||||
Total Investment Companies (Cost $3,210,238) | 3,182,457 | |||||||
Total Investments (Cost $102,059,353) (100.23%) | $ | 129,656,163 | ||||||
Liabilities in Excess of Other Assets (-0.23%) | (303,739 | ) | ||||||
Net Assets (100.00%) | $ | 129,352,424 | ||||||
* | Non-income producing security. |
ICON Utilities and Income Fund Portfolio of Investment December 31, 2021 |
Security Description | Shares | Value | ||||||
Common Stock (100.06%) | ||||||||
Communications (2.23%) | ||||||||
Vodafone Group PLC | 69,400 | $ | 1,036,142 | |||||
Energy (8.21%) | ||||||||
Atlantica Sustainable Infrastructure PLC | 63,100 | 2,256,456 | ||||||
Baker Hughes Co | 56,800 | 1,366,608 | ||||||
Magellan Midstream Partners LP | 3,900 | 181,116 | ||||||
Total Energy | 3,804,180 | |||||||
Financial (3.00%) | ||||||||
Kearny Financial Corp/MD | 104,800 | 1,388,600 | ||||||
Industrial (15.52%) | ||||||||
Crane Co | 14,600 | 1,485,258 | ||||||
Eaton Corp PLC | 6,000 | 1,036,920 | ||||||
Hubbell Inc | 6,700 | 1,395,409 | ||||||
MDU Resources Group Inc | 85,000 | 2,621,400 | ||||||
Union Pacific Corp | 2,600 | 655,018 | ||||||
Total Industrial | 7,194,005 | |||||||
Utilities (71.10%) | ||||||||
ALLETE Inc | 21,800 | 1,446,430 | ||||||
Ameren Corp | 25,600 | 2,278,656 | ||||||
American Electric Power Co Inc | 21,300 | 1,895,061 | ||||||
Avangrid Inc | 35,200 | 1,755,776 | ||||||
Black Hills Corp | 17,400 | 1,227,918 | ||||||
Duke Energy Corp | 22,900 | $ | 2,402,210 | |||||
Evergy Inc | 27,000 | 1,852,470 | ||||||
Eversource Energy | 19,400 | 1,765,012 | ||||||
National Fuel Gas Co | 40,800 | 2,608,752 | ||||||
New Jersey Resources Corp | 31,600 | 1,297,496 | ||||||
NextEra Energy Inc | 26,300 | 2,455,368 | ||||||
NiSource Inc | 58,100 | 1,604,141 | ||||||
NRG Energy Inc | 12,600 | 542,808 | ||||||
ONE Gas Inc | 20,200 | 1,567,318 | ||||||
Sempra Energy | 16,000 | 2,116,480 | ||||||
The AES Corp | 82,900 | 2,014,470 | ||||||
UGI Corp | 37,295 | 1,712,213 | ||||||
Xcel Energy Inc | 35,800 | 2,423,660 | ||||||
Total Utilities | 32,966,239 | |||||||
Total Common Stock (Cost $39,675,368) | 46,389,166 | |||||||
Money Market Funds (0.30%) | ||||||||
First American Government Obligations Fund (7-Day Yield, 0.030%) | 137,304 | 137,304 | ||||||
Total Money Market Funds (Cost $137,304) | 137,304 | |||||||
Total Investments (Cost $39,812,672) (100.36%) | $ | 46,526,470 | ||||||
Liabilities in Excess of Other Assets (-0.36%) | (166,368 | ) | ||||||
Net Assets (100.00%) | $ | 46,360,102 | ||||||
See accompanying notes to financial statements.
19
Statements of Assets and Liabilities December 31, 2021 |
ICON | ICON | ICON | ICON | |||||||||||||
Assets | ||||||||||||||||
Investments in securities | ||||||||||||||||
Cost of investments | $ | 44,461,164 | $ | 49,457,224 | $ | 65,903,728 | $ | 153,075,422 | ||||||||
Value of Investments (Note 1) | 63,603,293 | 86,453,043 | 84,316,803 | 153,638,421 | ||||||||||||
Cash | — | 14,970 | 606 | 36,744 | ||||||||||||
Interest receivable | 7 | 1 | 5,387 | 1,383,705 | ||||||||||||
Dividend receivable | 6,465 | 6,168 | 148,364 | 67,239 | ||||||||||||
Receivable from investment advisor | — | — | — | 13,940 | ||||||||||||
Receivable for fund shares sold | 9,854 | 15,585 | 100,171 | 98,989 | ||||||||||||
Receivable for investment securities Sold | — | — | — | 2,726,209 | ||||||||||||
Securities Lending income receivable | — | 1,937 | 331 | 12,340 | ||||||||||||
Reclaim receivable | — | 4,766 | 15,568 | — | ||||||||||||
Prepaid expenses | 33,915 | 35,958 | 39,058 | 33,523 | ||||||||||||
Total assets | $ | 63,653,534 | $ | 86,532,428 | $ | 84,626,288 | $ | 158,011,110 | ||||||||
Liabilities | ||||||||||||||||
Collateral for securities loaned | $ | — | $ | 3,586,301 | $ | 145,193 | $ | 8,802,528 | ||||||||
Payable to investment advisor | 52,646 | 51,490 | 55,365 | 75,005 | ||||||||||||
Payable for fund shares purchased | 154,877 | 282,919 | 326,761 | 258,938 | ||||||||||||
Payable for securities purchased | — | — | — | 1,277,071 | ||||||||||||
Distributions payable | 109,942 | 520,078 | 439,677 | 68,189 | ||||||||||||
Accrued 12b-1 fees | 518 | 4,808 | 7,994 | 1,984 | ||||||||||||
Accrued administration fees | 4,776 | 6,229 | 6,343 | 11,342 | ||||||||||||
Accrued audit fees | 17,418 | 20,043 | 25,116 | 33,853 | ||||||||||||
Accrued CCO fees | 1,992 | 2,611 | 2,977 | 4,879 | ||||||||||||
Accrued fund accounting fees | 5,616 | 7,121 | 9,672 | 13,611 | ||||||||||||
Accrued registration fees | 3,968 | 1,976 | 10,226 | 3,534 | ||||||||||||
Accrued state registration fees | 34,748 | 28,797 | 25,909 | 12,443 | ||||||||||||
Accrued transfer agent fees | 29,840 | 19,813 | 29,170 | 22,275 | ||||||||||||
Accrued trustee fees | 1,164 | 1,375 | 3,400 | 4,160 | ||||||||||||
Accrued expenses | 2,805 | 3,716 | 9,357 | 10,244 | ||||||||||||
Total liabilities | 420,310 | 4,537,277 | 1,097,160 | 10,600,056 | ||||||||||||
Net assets | $ | 63,233,224 | $ | 81,995,151 | $ | 83,529,128 | $ | 147,411,054 | ||||||||
Net assets at December 31, 2021 consist of | ||||||||||||||||
Paid-in capital | $ | 45,832,507 | $ | 46,104,453 | $ | 64,868,321 | $ | 151,931,043 | ||||||||
Distributable earnings/(loss) | 17,400,717 | 35,890,698 | 18,660,807 | (4,519,989 | ) | |||||||||||
Total net assets | $ | 63,233,224 | $ | 81,995,151 | $ | 83,529,128 | $ | 147,411,054 | ||||||||
Net assets | ||||||||||||||||
Institutional | $ | 60,746,909 | $ | 59,305,712 | $ | 45,535,007 | $ | 138,093,388 | ||||||||
Investor | $ | 2,486,315 | $ | 22,689,439 | $ | 37,994,121 | $ | 9,317,666 | ||||||||
Shares outstanding | ||||||||||||||||
Institutional Shares (no par value, unlimited shares authorized) | 5,037,206 | 1,590,760 | 2,194,235 | 14,810,578 | ||||||||||||
Investor Shares (no par value, unlimited shares authorized) | 207,496 | 641,512 | 1,832,771 | 1,005,522 | ||||||||||||
Net asset value per share | ||||||||||||||||
Institutional Shares | $ | 12.06 | $ | 37.28 | $ | 20.75 | $ | 9.32 | ||||||||
Investor Shares | $ | 11.98 | $ | 35.37 | $ | 20.73 | $ | 9.27 | ||||||||
(b) | Includes securities on loan of $3,488,870. |
(c) | Includes securities on loan of $139,905. |
(d) | Includes securities on loan of $8,619,767. |
See accompanying notes to financial statements.
20
Statements of Assets and Liabilities December 31, 2021 |
ICON Health | ICON Natural | ICON Utilities | ||||||||||
Assets | ||||||||||||
Investments in securities | ||||||||||||
Cost of investments | $ | 88,769,448 | $ | 102,059,353 | $ | 39,812,672 | ||||||
Value of investments (Note 1) | 130,285,208 | 129,656,163 | 46,526,470 | |||||||||
Interest receivable | 3 | 17 | 7 | |||||||||
Dividend receivable | 17,798 | 90,258 | 145,658 | |||||||||
Receivable from investment advisor | — | — | 1,714 | |||||||||
Receivable for fund shares sold | 75,280 | 39,668 | 155,111 | |||||||||
Securities Lending income receivable | — | — | 26 | |||||||||
Reclaim receivable | 3,493 | 66,047 | 1,936 | |||||||||
Prepaid expenses | 26,598 | 54,966 | 22,036 | |||||||||
Total assets | $ | 130,408,380 | $ | 129,907,119 | $ | 46,852,958 | ||||||
Liabilities | ||||||||||||
Collateral for securities loaned | $ | — | $ | — | $ | — | ||||||
Payable to investment advisor | 107,941 | 108,361 | 38,386 | |||||||||
Payable for fund shares purchased | 491,088 | 231,607 | 104,769 | |||||||||
Distributions payable | 545,009 | 54,404 | 280,554 | |||||||||
Accrued 12b-1 fees | 655 | 1,468 | 1,282 | |||||||||
Accrued administration fees | 9,793 | 9,831 | 3,483 | |||||||||
Accrued audit fees | 24,504 | 25,964 | 16,359 | |||||||||
Accrued CCO fees | 3,892 | 4,692 | 1,453 | |||||||||
Accrued fund accounting fees | 10,961 | 9,199 | 5,502 | |||||||||
Accrued registration fees | 3,072 | 6,432 | 3,519 | |||||||||
Accrued state registration fees | 24,928 | 1,974 | 17,667 | |||||||||
Accrued transfer agent fees | 36,922 | 92,477 | 14,437 | |||||||||
Accrued trustee fees | 2,605 | 2,505 | 963 | |||||||||
Accrued expenses | 5,585 | 5,781 | 4,482 | |||||||||
Total liabilities | 1,266,955 | 554,695 | 492,856 | |||||||||
Net assets | $ | 129,141,425 | $ | 129,352,424 | $ | 46,360,102 | ||||||
Net assets at December 31, 2021 consist of | ||||||||||||
Paid-in capital | $ | 73,252,136 | $ | 321,781,833 | $ | 39,678,360 | ||||||
Distributable earnings/(loss) | 55,889,289 | (192,429,409 | ) | 6,681,742 | ||||||||
Total net assets | $ | 129,141,425 | $ | 129,352,424 | $ | 46,360,102 | ||||||
Net assets | ||||||||||||
Institutional | $ | 126,016,527 | $ | 122,464,739 | $ | 40,207,608 | ||||||
Investor | $ | 3,124,898 | $ | 6,887,685 | $ | 6,152,494 | ||||||
Shares outstanding | ||||||||||||
Institutional Shares (no par value, unlimited shares authorized) | 5,820,636 | 6,901,885 | 3,723,299 | |||||||||
Investor Shares (no par value, unlimited shares authorized) | 154,371 | 393,153 | 581,405 | |||||||||
Net asset value per share | ||||||||||||
Institutional Shares | $ | 21.65 | $ | 17.74 | $ | 10.80 | ||||||
Investor Shares | $ | 20.24 | $ | 17.52 | $ | 10.58 | ||||||
See accompanying notes to financial statements.
21
Statements of Operations For the Year Ended December 31, 2021 |
ICON | ICON | ICON | ICON | |||||||||||||
Investment income | ||||||||||||||||
Interest income | $ | 56 | $ | 41 | $ | 74,117 | $ | 4,149,132 | ||||||||
Dividend income (net of foreign tax withheld: $229, $11,629, $3,553, $—, respectively) | 509,666 | 661,021 | 2,434,474 | 3,236,062 | ||||||||||||
Income from securities lending, net | 17 | 20,531 | 1,521 | 96,610 | ||||||||||||
Total | 509,739 | 681,593 | 2,510,112 | 7,481,804 | ||||||||||||
Expenses | ||||||||||||||||
Management fees (Note 2) | 603,318 | 592,523 | 647,620 | 868,406 | ||||||||||||
Administration fees (Note 2) | 54,823 | 71,800 | 78,448 | 131,443 | ||||||||||||
Transfer agent fees | 37,031 | 42,743 | 45,951 | 61,622 | ||||||||||||
Accounting services | 23,932 | 26,049 | 30,663 | 40,339 | ||||||||||||
Custodian fees | 3,763 | 4,675 | 6,307 | 9,091 | ||||||||||||
Legal and audit fees | 14,715 | 17,533 | 17,834 | 27,740 | ||||||||||||
CCO fees (Note 2) | 5,098 | 6,675 | 7,198 | 12,221 | ||||||||||||
Trustees fees | 3,778 | 3,781 | 3,784 | 3,780 | ||||||||||||
Insurance | 1,802 | 2,335 | 2,370 | 4,267 | ||||||||||||
Printing | 8,819 | 8,813 | 13,194 | 11,234 | ||||||||||||
Registration and dues | 42,928 | 42,885 | 43,086 | 43,289 | ||||||||||||
Misc. fees and expense | — | — | — | 19,690 | ||||||||||||
Investor Class 12b-1 fees (Note 2) | 6,369 | 57,044 | 98,897 | 24,690 | ||||||||||||
Total expenses | 806,376 | 876,856 | 995,352 | 1,257,812 | ||||||||||||
Less reimbursement from manager (Note 2) | — | — | (33,805 | ) | (115,484 | ) | ||||||||||
Net expenses | 806,376 | 876,856 | 961,547 | 1,142,328 | ||||||||||||
Net investment income/(loss) | (296,637 | ) | (195,263 | ) | 1,548,565 | 6,339,476 | ||||||||||
Realized and unrealized gain/(loss) on investments | ||||||||||||||||
Net realized gain/(loss) from security transactions and foreign currency | 7,748,660 | 9,142,472 | 10,870,079 | 1,594,848 | ||||||||||||
Change in unrealized appreciation/(depreciation) of investments | 4,522,838 | 9,122,436 | 6,023,418 | (1,974,679 | ) | |||||||||||
Net realized and unrealized gain/(loss) on investments | 12,271,498 | 18,264,908 | 16,893,497 | (379,831 | ) | |||||||||||
Net increase/(decrease) in net assets resulting from operations | $ | 11,974,861 | $ | 18,069,645 | $ | 18,442,062 | $ | 5,959,645 | ||||||||
See accompanying notes to financial statements.
22
Statements of Operations |
ICON Health | ICON Natural | ICON Utilities | ||||||||||
Investment income | ||||||||||||
Interest income | $ | 140 | $ | 533 | $ | 111 | ||||||
Dividend income (net of foreign tax withheld: $9,344, $23,979, $1,536 respectively) | 834,654 | 3,440,088 | 1,299,822 | |||||||||
Income from securities lending, net | 58 | 5,419 | 513 | |||||||||
Total | 834,852 | 3,446,040 | 1,300,446 | |||||||||
Expenses | ||||||||||||
Management fees (Note 2) | 1,281,948 | 1,386,200 | 395,410 | |||||||||
Administration fees (Note 2) | 116,471 | 126,025 | 35,917 | |||||||||
Transfer agent fees | 67,054 | 124,527 | 24,614 | |||||||||
Accounting services | 31,056 | 31,327 | 21,298 | |||||||||
Custodian fees | 7,410 | 6,286 | 2,405 | |||||||||
Legal and audit fees | 24,482 | 25,214 | 11,859 | |||||||||
CCO fees (Note 2) | 10,744 | 11,549 | 3,400 | |||||||||
Trustees fees | 3,784 | 3,777 | 3,785 | |||||||||
Insurance | 3,628 | 3,702 | 1,275 | |||||||||
Printing | 8,824 | 8,787 | 8,786 | |||||||||
Registration and dues | 43,475 | 43,416 | 42,874 | |||||||||
Investor Class 12b-1 fees (Note 2) | 8,030 | 17,218 | 14,838 | |||||||||
Total expenses | 1,606,906 | 1,788,028 | 566,461 | |||||||||
Less reimbursement from manager (Note 2) | — | — | (64,960 | ) | ||||||||
Net expenses | 1,606,906 | 1,788,028 | 501,501 | |||||||||
Net investment income/(loss) | (772,054 | ) | 1,658,012 | 798,945 | ||||||||
Realized and unrealized gain/(loss) on investments | ||||||||||||
Net realized gain/(loss) from security transactions and foreign currency | 28,283,022 | 25,975,595 | 2,438,273 | |||||||||
Change in unrealized appreciation/(depreciation) of investments | (6,677,259 | ) | 5,486,379 | 3,469,762 | ||||||||
Net realized and unrealized gain/(loss) on investments | 21,605,763 | 31,461,974 | 5,908,035 | |||||||||
Net increase/(decrease) in net assets resulting from operations | $ | 20,833,709 | $ | 33,119,986 | $ | 6,706,980 | ||||||
See accompanying notes to financial statements.
23
Statements of Changes in Net Assets |
ICON Consumer Select Fund | ||||||||||||
Year Ended | For the period | Year Ended | ||||||||||
Operations | ||||||||||||
Net investment income/(loss) | $ | (296,637 | ) | $ | (65,239 | ) | $ | 117,902 | ||||
Net realized gain/(loss) from security transactions and foreign currency | 7,748,660 | 2,597,061 | (1,302,968 | ) | ||||||||
Change in unrealized appreciation/(depreciation) of investments | 4,522,838 | 5,085,250 | (1,298,319 | ) | ||||||||
Net increase/(decrease) in net assets resulting from operations | 11,974,861 | 7,617,072 | (2,483,385 | ) | ||||||||
Distributions to shareholders | ||||||||||||
Distributions | ||||||||||||
Institutional Shares(a) | (6,037,209 | ) | — | (781,560 | ) | |||||||
Investor Shares(b) | (248,135 | ) | — | (25,869 | ) | |||||||
Capital share transactions | ||||||||||||
Increase/(decrease) in net assets resulting from capital share transactions | 1,968,917 | (3,358,027 | ) | 18,541,459 | ||||||||
Total increase/(decrease) | 7,658,434 | 4,259,045 | 15,250,645 | |||||||||
Net assets | ||||||||||||
Beginning of year | 55,574,790 | 51,315,745 | 36,065,100 | |||||||||
End of year | $ | 63,233,224 | $ | 55,574,790 | $ | 51,315,745 | ||||||
ICON Equity Fund | ||||||||||||
Year Ended | For the period | Year Ended | ||||||||||
Operations | ||||||||||||
Net investment income/(loss) | $ | (195,263 | ) | $ | (58,638 | ) | $ | (69,954 | ) | |||
Net realized gain/(loss) from security transactions and foreign currency | 9,142,472 | 3,788,641 | (2,102,548 | ) | ||||||||
Change in unrealized appreciation/(depreciation) of investments | 9,122,436 | 8,112,047 | 7,898,128 | |||||||||
Net increase/(decrease) in net assets resulting from operations | 18,069,645 | 11,842,050 | 5,725,626 | |||||||||
Distributions to shareholders | ||||||||||||
Distributions | ||||||||||||
Institutional Shares(a) | (7,406,419 | ) | — | (458,387 | ) | |||||||
Investor Shares(b) | (2,966,504 | ) | — | (180,913 | ) | |||||||
Class C Shares | — | — | (117,821 | ) | ||||||||
Capital share transactions | ||||||||||||
Increase/(decrease) in net assets resulting from capital share transactions | 4,026,788 | (5,826,385 | ) | 38,767,407 | ||||||||
Total increase/(decrease) | 11,723,510 | 6,015,665 | 43,735,912 | |||||||||
Net assets | ||||||||||||
Beginning of year | 70,271,641 | 64,255,976 | 20,520,064 | |||||||||
End of year | $ | 81,995,151 | $ | 70,271,641 | $ | 64,255,976 | ||||||
(a) | Formerly Class S Shares (Note 6). |
(b) | Formerly Class A Shares (Note 6). |
See accompanying notes to financial statements.
24
Statements of Changes in Net Assets (Continued) |
ICON Equity Income Fund | ||||||||||||
Year Ended | For the period | Year Ended | ||||||||||
Operations | ||||||||||||
Net investment income/(loss) | $ | 1,548,565 | $ | 531,274 | $ | 1,574,077 | ||||||
Net realized gain/(loss) from security transactions and foreign currency | 10,870,079 | 1,810,926 | (2,803,532 | ) | ||||||||
Change in unrealized appreciation/(depreciation) of investments | 6,023,418 | 10,547,305 | (3,055,329 | ) | ||||||||
Net increase/(decrease) in net assets resulting from operations | 18,442,062 | 12,889,505 | (4,284,784 | ) | ||||||||
Distributions to shareholders | ||||||||||||
Distributions | ||||||||||||
Institutional Shares(a) | (5,347,621 | ) | (889,831 | ) | (2,270,542 | ) | ||||||
Investor Shares(b) | (4,404,866 | ) | (738,335 | ) | (549,194 | ) | ||||||
Class C Shares | — | — | (630,549 | ) | ||||||||
Capital share transactions | ||||||||||||
Increase/(decrease) in net assets resulting from capital share transactions | (7,257,800 | ) | (9,350,283 | ) | 6,943,667 | |||||||
Total increase/(decrease) | 1,431,775 | 1,911,056 | (791,402 | ) | ||||||||
Net assets | ||||||||||||
Beginning of year | 82,097,353 | 80,186,297 | 80,977,699 | |||||||||
End of year | $ | 83,529,128 | $ | 82,097,353 | $ | 80,186,297 | ||||||
ICON Flexible Bond Fund | ||||||||||||
Year Ended | For the period | Year Ended | ||||||||||
Operations | ||||||||||||
Net investment income/(loss) | $ | 6,339,476 | $ | 1,651,089 | $ | 6,971,943 | ||||||
Net realized gain/(loss) from security transactions and foreign currency | 1,594,848 | (531,135 | ) | (2,700,973 | ) | |||||||
Change in unrealized appreciation/(depreciation) of investments | (1,974,679 | ) | 5,317,281 | (3,591,635 | ) | |||||||
Net increase/(decrease) in net assets resulting from operations | 5,959,645 | 6,437,235 | 679,335 | |||||||||
Distributions to shareholders | ||||||||||||
Distributions | ||||||||||||
Institutional Shares(a) | (6,531,778 | ) | (1,283,045 | ) | (6,627,115 | ) | ||||||
Investor Shares(b) | (451,025 | ) | (93,736 | ) | (287,378 | ) | ||||||
Class C Shares | — | — | (148,073 | ) | ||||||||
Capital share transactions | ||||||||||||
Increase/(decrease) in net assets resulting from capital share transactions | 6,673,648 | (15,118,631 | ) | 4,162,276 | ||||||||
Total increase/(decrease) | 5,650,490 | (10,058,177 | ) | (2,220,955 | ) | |||||||
Net assets | ||||||||||||
Beginning of year | 141,760,564 | 151,818,741 | 154,039,696 | |||||||||
End of year | $ | 147,411,054 | $ | 141,760,564 | $ | 151,818,741 | ||||||
(a) | Formerly Class S Shares (Note 6). |
(b) | Formerly Class A Shares (Note 6). |
See accompanying notes to financial statements.
25
Statements of Changes in Net Assets (Continued) |
ICON Health and Information Technology Fund | ||||||||||||
Year Ended | For the period | Year Ended | ||||||||||
Operations | ||||||||||||
Net investment income/(loss) | $ | (772,054 | ) | $ | (162,126 | ) | $ | (378,092 | ) | |||
Net realized gain/(loss) from security transactions and foreign currency | 28,283,022 | 7,008,704 | 4,942,975 | |||||||||
Change in unrealized appreciation/(depreciation) of investments | (6,677,259 | ) | 13,587,755 | 12,027,242 | ||||||||
Net increase/(decrease) in net assets resulting from operations | 20,833,709 | 20,434,333 | 16,592,125 | |||||||||
Distributions to shareholders | ||||||||||||
Distributions | ||||||||||||
Institutional Shares(a) | (18,088,294 | ) | (4,213,865 | ) | (2,400,424 | ) | ||||||
Investor Shares(b) | (478,138 | ) | (115,253 | ) | (68,657 | ) | ||||||
Capital share transactions | ||||||||||||
Increase/(decrease) in net assets resulting from capital share transactions | (1,382,419 | ) | (415,225 | ) | 42,717,600 | |||||||
Total increase/(decrease) | 884,858 | 15,689,990 | 56,840,644 | |||||||||
Net assets | ||||||||||||
Beginning of year | 128,256,566 | 112,566,576 | 55,725,932 | |||||||||
End of year | $ | 129,141,425 | $ | 128,256,566 | $ | 112,566,576 | ||||||
ICON Natural Resources and | ||||||||||||
Year Ended | For the period | Year Ended | ||||||||||
Operations | ||||||||||||
Net investment income/(loss) | $ | 1,658,012 | $ | 130,184 | $ | 402,615 | ||||||
Net realized gain/(loss) from security transactions and foreign currency | 25,975,595 | 3,178,678 | (34,405,685 | ) | ||||||||
Change in unrealized appreciation/(depreciation) of investments | 5,486,379 | 13,794,734 | 38,453,067 | |||||||||
Net increase/(decrease) in net assets resulting from operations | 33,119,986 | 17,103,596 | 4,449,997 | |||||||||
Distributions to shareholders | ||||||||||||
Distributions | ||||||||||||
Institutional Shares(a) | (1,593,802 | ) | (331,545 | ) | (860,865 | ) | ||||||
Investor Shares(b) | (69,062 | ) | (18,251 | ) | (42,308 | ) | ||||||
Class C Shares | — | — | (14,111 | ) | ||||||||
Capital share transactions | ||||||||||||
Increase/(decrease) in net assets resulting from capital share transactions | (12,003,699 | ) | (10,641,282 | ) | 41,250,272 | |||||||
Total increase/(decrease) | 19,453,423 | 6,112,518 | 44,782,985 | |||||||||
Net assets | ||||||||||||
Beginning of year | 109,899,001 | 103,786,483 | 59,003,498 | |||||||||
End of year | $ | 129,352,424 | $ | 109,899,001 | $ | 103,786,483 | ||||||
(a) | Formerly Class S Shares (Note 6). |
(b) | Formerly Class A Shares (Note 6). |
See accompanying notes to financial statements.
26
Statements of Changes in Net Assets (Continued) |
ICON Utilities and Income Fund | ||||||||||||
Year Ended | For the period | Year Ended | ||||||||||
Operations | ||||||||||||
Net investment income/(loss) | $ | 798,945 | $ | 159,196 | $ | 838,890 | ||||||
Net realized gain/(loss) from security transactions and foreign currency | 2,438,273 | 289,880 | 861,306 | |||||||||
Change in unrealized appreciation/(depreciation) of investments | 3,469,762 | 2,825,367 | (6,169,332 | ) | ||||||||
Net increase/(decrease) in net assets resulting from operations | 6,706,980 | 3,274,443 | (4,469,136 | ) | ||||||||
Distributions to shareholders | ||||||||||||
Distributions | ||||||||||||
Institutional Shares(a) | (2,776,594 | ) | (1,172,561 | ) | (2,221,845 | ) | ||||||
Investor Shares(b) | (433,950 | ) | (231,070 | ) | (280,239 | ) | ||||||
Capital share transactions | ||||||||||||
Increase/(decrease) in net assets resulting from capital share transactions | 12,508,509 | (1,350,769 | ) | (15,251,500 | ) | |||||||
Total increase/(decrease) | 16,004,945 | 520,043 | (22,222,720 | ) | ||||||||
Net assets | ||||||||||||
Beginning of year | 30,355,157 | 29,835,114 | 52,057,834 | |||||||||
End of year | $ | 46,360,102 | $ | 30,355,157 | $ | 29,835,114 | ||||||
(a) | Formerly Class S Shares (Note 6). |
(b) | Formerly Class A Shares (Note 6). |
See accompanying notes to financial statements.
27
Statements of Changes in Net Assets (Continued) |
ICON Consumer Select Fund | Institutional Shares | |||||||||||||||||||||||
Year Ended | For the period October 1, 2020 | Year Ended | ||||||||||||||||||||||
Shares | Value | Shares | Value | Shares | Value | |||||||||||||||||||
Shares sold | 552,633 | $ | 7,090,152 | 108,075 | $ | 1,066,160 | 729,367 | $ | 8,113,245 | |||||||||||||||
Shares issued in reinvestment of distributions | 492,322 | 5,937,406 | — | — | 64,552 | 760,428 | ||||||||||||||||||
Shares issued in connection with reorganization | N/A | N/A | 2,619,242 | 23,056,150 | ||||||||||||||||||||
Shares repurchased | (887,302 | ) | (10,902,010 | ) | (389,629 | ) | (3,970,275 | ) | (1,468,232 | ) | (14,471,065 | ) | ||||||||||||
Net increase/(decrease) | 157,652 | $ | 2,125,548 | (281,554 | ) | $ | (2,904,115 | ) | 1,944,929 | $ | 17,458,758 | |||||||||||||
Investor Shares | ||||||||||||||||||||||||
Year Ended | For the period October 1, 2020 | Year Ended | ||||||||||||||||||||||
Shares | Value | Shares | Value | Shares | Value | |||||||||||||||||||
Shares sold | 2,394 | $ | 30,603 | 753 | $ | 7,514 | 17,235 | $ | 179,656 | |||||||||||||||
Shares issued in reinvestment of distributions | 19,866 | 237,996 | — | — | 2,161 | 25,451 | ||||||||||||||||||
Shares issued in connection with reorganization | N/A | N/A | 188,420 | 1,683,467 | ||||||||||||||||||||
Shares repurchased | (33,443 | ) | (425,230 | ) | (45,329 | ) | (461,426 | ) | (82,945 | ) | (805,903 | ) | ||||||||||||
Net increase/(decrease) | (11,183 | ) | $ | (156,631 | ) | (44,576 | ) | $ | (453,912 | ) | 124,871 | $ | 1,082,671 | |||||||||||
ICON Equity Fund | Institutional Shares | |||||||||||||||||||||||
Year Ended | For the period October 1, 2020 | Year Ended | ||||||||||||||||||||||
Shares | Value | Shares | Value | Shares | Value | |||||||||||||||||||
Shares sold | 126,026 | $ | 5,034,716 | 26,026 | $ | 794,360 | 88,061 | $ | 2,281,246 | |||||||||||||||
Shares issued in reinvestment of distributions | 188,577 | 7,030,142 | — | — | 11,579 | 332,661 | ||||||||||||||||||
Shares issued in connection with reorganization | N/A | N/A | 1,405,548 | 35,818,141 | ||||||||||||||||||||
Transfers in/(out) from Class C reorganization | N/A | N/A | N/A | N/A | ||||||||||||||||||||
Shares repurchased | (194,118 | ) | (7,592,163 | ) | (165,388 | ) | (4,895,575 | ) | (371,304 | ) | (9,451,813 | ) | ||||||||||||
Net increase/(decrease) | 120,485 | $ | 4,472,695 | (139,362 | ) | $ | (4,101,215 | ) | 1,133,884 | $ | 28,980,235 | |||||||||||||
Investor Shares | ||||||||||||||||||||||||
Year Ended | For the period October 1, 2020 | Year Ended | ||||||||||||||||||||||
Shares | Value | Shares | Value | Shares | Value | |||||||||||||||||||
Shares sold | 13,812 | $ | 519,383 | 1,031 | $ | 30,792 | 4,011 | $ | 100,130 | |||||||||||||||
Shares issued in reinvestment of distributions | 79,805 | 2,822,702 | — | — | 5,916 | 163,167 | ||||||||||||||||||
Shares issued in connection with reorganization | N/A | N/A | 537,772 | 13,134,931 | ||||||||||||||||||||
Transfers in/(out) from Class C reorganization | N/A | N/A | 94,965 | 2,319,492 | ||||||||||||||||||||
Shares repurchased | (102,617 | ) | (3,787,992 | ) | (60,116 | ) | (1,755,962 | ) | (122,685 | ) | (3,236,280 | ) | ||||||||||||
Net increase/(decrease) | (9,000 | ) | $ | (445,907 | ) | (59,085 | ) | $ | (1,725,170 | ) | 519,979 | $ | 12,481,440 | |||||||||||
See accompanying notes to financial statements.
28
Statements of Changes in Net Assets (Continued) |
ICON Equity Income Fund | Institutional Shares | |||||||||||||||||||||||
Year Ended | For the period October 1, 2020 | Year Ended | ||||||||||||||||||||||
Shares | Value | Shares | Value | Shares | Value | |||||||||||||||||||
Shares sold | 162,414 | $ | 3,626,666 | 41,300 | $ | 737,880 | 404,960 | $ | 6,749,354 | |||||||||||||||
Shares issued in reinvestment of distributions | 248,324 | 5,187,892 | 45,775 | 863,960 | 122,717 | 2,140,586 | ||||||||||||||||||
Shares issued in connection with reorganization | N/A | N/A | 445,319 | 7,274,057 | ||||||||||||||||||||
Transfers in/(out) from Class C reorganization | N/A | N/A | N/A | N/A | ||||||||||||||||||||
Shares repurchased | (564,140 | ) | (12,327,999 | ) | (332,548 | ) | (5,876,172 | ) | (1,260,129 | ) | (20,414,175 | ) | ||||||||||||
Net increase/(decrease) | $ | (153,402 | ) | $ | (3,513,441 | ) | (245,473 | ) | $ | (4,274,332 | ) | (287,133 | ) | $ | (4,250,178 | ) | ||||||||
Investor Shares | ||||||||||||||||||||||||
Year Ended | For the period October 1, 2020 | Year Ended | ||||||||||||||||||||||
Shares | Value | Shares | Value | Shares | Value | |||||||||||||||||||
Shares sold | 10,196 | $ | 220,734 | 5,205 | $ | 93,505 | 33,726 | $ | 552,171 | |||||||||||||||
Shares issued in reinvestment of distributions | 194,893 | 4,064,545 | 36,055 | 680,562 | 29,133 | 504,628 | ||||||||||||||||||
Shares issued in connection with reorganization | N/A | N/A | 977,450 | 15,916,988 | ||||||||||||||||||||
Transfers in/(out) from Class C reorganization | N/A | N/A | 905,454 | 13,688,996 | ||||||||||||||||||||
Shares repurchased | (372,899 | ) | (8,029,637 | ) | (327,885 | ) | (5,850,018 | ) | (262,824 | ) | (4,220,319 | ) | ||||||||||||
Net increase/(decrease) | (167,810 | ) | $ | (3,744,359 | ) | (286,625 | ) | $ | (5,075,951 | ) | 1,682,939 | $ | 26,442,464 | |||||||||||
ICON Flexible Bond Fund | Institutional Shares | |||||||||||||||||||||||
Year Ended | For the period October 1, 2020 | Year Ended | ||||||||||||||||||||||
Shares | Value | Shares | Value | Shares | Value | |||||||||||||||||||
Shares sold | 4,185,296 | $ | 39,595,238 | 818,558 | $ | 7,556,077 | 6,840,816 | $ | 62,398,427 | |||||||||||||||
Shares issued in reinvestment of distributions | 643,780 | 6,073,487 | 130,346 | 1,205,834 | 677,781 | 6,157,571 | ||||||||||||||||||
Transfers in/(out) from Class C reorganization | N/A | N/A | N/A | N/A | ||||||||||||||||||||
Shares repurchased | (3,983,478 | ) | (37,702,645 | ) | (2,546,434 | ) | (23,521,463 | ) | (7,301,000 | ) | (65,053,730 | ) | ||||||||||||
Net increase/(decrease) | 845,599 | $ | 7,966,081 | (1,597,530 | ) | $ | (14,759,552 | ) | 217,597 | $ | 3,502,268 | |||||||||||||
Investor Shares | ||||||||||||||||||||||||
Year Ended | For the period October 1, 2020 | Year Ended | ||||||||||||||||||||||
Shares | Value | Shares | Value | Shares | Value | |||||||||||||||||||
Shares sold | 40,629 | $ | 382,261 | 9,959 | $ | 90,597 | 288,798 | $ | 2,621,924 | |||||||||||||||
Shares issued in reinvestment of distributions | 43,326 | 406,300 | 9,161 | 84,276 | 29,009 | 262,179 | ||||||||||||||||||
Transfers in/(out) from Class C reorganization | N/A | N/A | 499,394 | 4,442,281 | ||||||||||||||||||||
Shares repurchased | (221,249 | ) | (2,080,994 | ) | (58,381 | ) | (533,952 | ) | (250,623 | ) | (2,250,280 | ) | ||||||||||||
Net increase/(decrease) | (137,294 | ) | $ | (1,292,433 | ) | (39,261 | ) | $ | (359,079 | ) | 566,578 | $ | 5,076,104 | |||||||||||
See accompanying notes to financial statements.
29
Statements of Changes in Net Assets (Continued) |
ICON Health and Information Technology Fund | Institutional Shares | |||||||||||||||||||||||
Year Ended | For the period October 1, 2020 | Year Ended | ||||||||||||||||||||||
Shares | Value | Shares | Value | Shares | Value | |||||||||||||||||||
Shares sold | 126,231 | $ | 2,966,237 | 42,075 | $ | 844,603 | 240,217 | $ | 3,996,694 | |||||||||||||||
Shares issued in reinvestment of distributions | 812,125 | 17,582,514 | 203,806 | 4,114,834 | 142,055 | 2,326,868 | ||||||||||||||||||
Shares issued in connection with reorganization | N/A | N/A | 3,034,144 | 53,595,126 | ||||||||||||||||||||
Shares repurchased | (947,771 | ) | (21,826,080 | ) | (261,414 | ) | (5,225,619 | ) | (1,081,373 | ) | (18,313,702 | ) | ||||||||||||
Net increase/(decrease) | (9,415 | ) | $ | (1,277,329 | ) | (15,533 | ) | $ | (266,182 | ) | 2,335,043 | $ | 41,604,986 | |||||||||||
Investor Shares | ||||||||||||||||||||||||
Year Ended | For the period October 1, 2020 | Year Ended | ||||||||||||||||||||||
Shares | Value | Shares | Value | Shares | Value | |||||||||||||||||||
Shares sold | 5,805 | $ | 132,533 | 1,882 | $ | 36,527 | 14,429 | $ | 223,822 | |||||||||||||||
Shares issued in reinvestment of distributions | 21,685 | 438,909 | 5,598 | 107,042 | 4,157 | 64,770 | ||||||||||||||||||
Shares issued in connection with reorganization | N/A | N/A | 93,171 | 1,563,188 | ||||||||||||||||||||
Shares repurchased | (30,677 | ) | (676,531 | ) | (15,566 | ) | (292,612 | ) | (45,376 | ) | (739,166 | ) | ||||||||||||
Net increase/(decrease) | (3,187 | ) | $ | (105,089 | ) | (8,086 | ) | $ | (149,043 | ) | 66,381 | $ | 1,112,614 | |||||||||||
ICON Natural Resources and Infrastructure Fund | Institutional Shares | |||||||||||||||||||||||
Year Ended | For the period October 1, 2020 | Year Ended | ||||||||||||||||||||||
Shares | Value | Shares | Value | Shares | Value | |||||||||||||||||||
Shares sold | 4,140,431 | $ | 68,517,177 | 82,823 | $ | 1,086,966 | 704,577 | $ | 8,087,116 | |||||||||||||||
Shares issued in reinvestment of distributions | 87,091 | 1,545,003 | 23,415 | 322,186 | 64,260 | 836,659 | ||||||||||||||||||
Shares issued in connection with reorganization | N/A | N/A | 5,604,395 | 58,579,943 | ||||||||||||||||||||
Transfers in/(out) from Class C reorganization | N/A | N/A | N/A | N/A | ||||||||||||||||||||
Shares repurchased | (4,903,264 | ) | (81,700,428 | ) | (912,197 | ) | (11,892,173 | ) | (2,420,027 | ) | (27,529,677 | ) | ||||||||||||
Net increase/(decrease) | (675,742 | ) | $ | (11,638,249 | ) | (805,959 | ) | $ | (10,483,021 | ) | 3,953,205 | $ | 39,974,041 | |||||||||||
Investor Shares | ||||||||||||||||||||||||
Year Ended | For the period October 1, 2020 | Year Ended | ||||||||||||||||||||||
Shares | Value | Shares | Value | Shares | Value | |||||||||||||||||||
Shares sold | 171,415 | $ | 2,857,492 | 16,838 | $ | 226,485 | 53,665 | $ | 142,860 | |||||||||||||||
Shares issued in reinvestment of distributions | 3,622 | 63,457 | 1,228 | 16,662 | 3,101 | 39,945 | ||||||||||||||||||
Shares issued in connection with reorganization | N/A | N/A | 344,815 | 3,561,866 | ||||||||||||||||||||
Transfers in/(out) from Class C reorganization | N/A | N/A | 40,930 | 422,797 | ||||||||||||||||||||
Shares repurchased | (198,683 | ) | (3,286,400 | ) | (31,072 | ) | (401,408 | ) | (192,860 | ) | (2,140,173 | ) | ||||||||||||
Net increase/(decrease) | (23,646 | ) | $ | (365,450 | ) | (13,006 | ) | $ | (158,261 | ) | 249,651 | $ | 2,027,295 | |||||||||||
See accompanying notes to financial statements.
30
Statements of Changes in Net Assets (Continued) |
ICON Utilities and Income Fund | Institutional Shares | |||||||||||||||||||||||
Year Ended | For the period October 1, 2020 | Year Ended | ||||||||||||||||||||||
Shares | Value | Shares | Value | Shares | Value | |||||||||||||||||||
Shares sold | 1,871,230 | $ | 20,603,179 | 66,471 | $ | 648,534 | 873,929 | $ | 8,530,658 | |||||||||||||||
Shares issued in reinvestment of distributions | 245,316 | 2,643,091 | 118,890 | 1,121,867 | 223,698 | 2,143,258 | ||||||||||||||||||
Shares repurchased | (1,054,638 | ) | (11,401,121 | ) | (308,856 | ) | (2,945,579 | ) | (2,799,408 | ) | (25,388,551 | ) | ||||||||||||
Net increase/(decrease) | 1,061,907 | $ | 11,845,149 | (123,495 | ) | $ | (1,175,178 | ) | (1,701,781 | ) | $ | (14,714,635 | ) | |||||||||||
Investor Shares | ||||||||||||||||||||||||
Year Ended | For the period October 1, 2020 | Year Ended | ||||||||||||||||||||||
Shares | Value | Shares | Value | Shares | Value | |||||||||||||||||||
Shares sold | 348,299 | $ | 3,787,804 | 11,724 | $ | 108,522 | 43,120 | $ | 402,945 | |||||||||||||||
Shares issued in reinvestment of distributions | 21,883 | 231,097 | 12,162 | 112,536 | 14,170 | 133,179 | ||||||||||||||||||
Shares repurchased | (313,827 | ) | (3,355,540 | ) | (41,842 | ) | (396,649 | ) | (115,456 | ) | (1,072,989 | ) | ||||||||||||
Net increase/(decrease) | 56,355 | $ | 663,360 | (17,956 | ) | $ | (175,591 | ) | (58,166 | ) | $ | (536,865 | ) | |||||||||||
See accompanying notes to financial statements.
31
Financial Highlights For a Share Outstanding Throughout Each Year or Period |
Icon Consumer Select Fund(a) | ||||||||||||||||||||||||
Institutional Shares(b) | Year Ended | For the period | Year Ended | Year Ended | Year Ended | Year Ended | ||||||||||||||||||
Net asset value, beginning of year | $ | 10.90 | $ | 9.46 | $ | 10.75 | $ | 10.97 | $ | 9.95 | $ | 7.67 | ||||||||||||
INCOME FROM INVESTMENT OPERATIONS | ||||||||||||||||||||||||
Net investment income/(loss)(c) | (0.06 | ) | (0.01 | ) | 0.03 | 0.08 | 0.05 | 0.03 | ||||||||||||||||
Net gain/(loss) on securities (both realized and unrealized) | 2.54 | 1.45 | (1.09 | ) | (0.23 | ) | 0.99 | 2.34 | ||||||||||||||||
Total from investment operations | 2.48 | 1.44 | (1.06 | ) | (0.15 | ) | 1.04 | 2.37 | ||||||||||||||||
LESS DISTRIBUTIONS | ||||||||||||||||||||||||
Dividends from net investment income | — | — | (0.08 | ) | (0.07 | ) | (0.02 | ) | (0.09 | ) | ||||||||||||||
Distributions from capital gains | (1.32 | ) | — | (0.15 | ) | — | — | — | ||||||||||||||||
Total distributions | (1.32 | ) | — | (0.23 | ) | (0.07 | ) | (0.02 | ) | (0.09 | ) | |||||||||||||
Net asset value, end of year or period | $ | 12.06 | $ | 10.90 | $ | 9.46 | $ | 10.75 | $ | 10.97 | $ | 9.95 | ||||||||||||
Total return | 22.80 | % | 15.22 | %(d) | (10.29 | )% | (1.26 | )% | 10.48 | % | 30.96 | % | ||||||||||||
RATIOS / SUPPLEMENTAL DATA | ||||||||||||||||||||||||
Net assets, end of year or period (000s) | $ | 60,747 | $ | 53,198 | $ | 48,832 | $ | 34,578 | $ | 43,500 | $ | 39,072 | ||||||||||||
Ratio of expenses to average net assets: | ||||||||||||||||||||||||
Before expense reimbursements | 1.32 | % | 1.32 | %(e) | 1.56 | % | 1.54 | % | 1.44 | % | 1.40 | % | ||||||||||||
After expense reimbursements(f) | 1.32 | % | 1.32 | %(e) | 1.52 | % | 1.50 | % | 1.44 | % | 1.40 | % | ||||||||||||
Ratio of net investment income/(loss) to average net assets | ||||||||||||||||||||||||
Before expense reimbursements | (0.48 | )% | (0.48 | )%(e) | 0.28 | % | 0.77 | % | 0.41 | % | 0.28 | % | ||||||||||||
After expense reimbursements | (0.48 | )% | (0.48 | )%(e) | 0.33 | % | 0.81 | % | 0.41 | % | 0.28 | % | ||||||||||||
Portfolio turnover | 40 | % | 14 | %(d) | 82 | % | 28 | % | 44 | % | 68 | % | ||||||||||||
Icon Consumer Select Fund | ||||||||||||||||||||||||
Investor Shares(g) | Year Ended | For the period | Year Ended | Year Ended | Year Ended | Year Ended | ||||||||||||||||||
Net asset value, beginning of year | $ | 10.87 | $ | 9.44 | $ | 10.74 | $ | 10.98 | $ | 9.99 | $ | 7.71 | ||||||||||||
INCOME FROM INVESTMENT OPERATIONS | ||||||||||||||||||||||||
Net investment income/(loss)(c) | (0.09 | ) | (0.02 | ) | — | 0.06 | 0.01 | (0.01 | ) | |||||||||||||||
Net gain/(loss) on securities (both realized and unrealized) | 2.52 | 1.45 | (1.08 | ) | (0.24 | ) | 0.99 | 2.37 | ||||||||||||||||
Total from investment operations | 2.43 | 1.43 | (1.08 | ) | (0.18 | ) | 1.00 | 2.36 | ||||||||||||||||
LESS DISTRIBUTIONS | ||||||||||||||||||||||||
Dividends from net investment income | — | — | (0.07 | ) | (0.06 | ) | (0.01 | ) | (0.08 | ) | ||||||||||||||
Distributions from capital gains | (1.32 | ) | — | (0.15 | ) | — | — | — | ||||||||||||||||
Total distributions | (1.32 | ) | — | (0.22 | ) | (0.06 | ) | (0.01 | ) | (0.08 | ) | |||||||||||||
Net asset value, end of year or period | $ | 11.98 | $ | 10.87 | $ | 9.44 | $ | 10.74 | $ | 10.98 | $ | 9.99 | ||||||||||||
Total return(h) | 22.40 | % | 15.15 | %(d) | (10.46 | )% | (1.51 | )% | 10.04 | % | 30.68 | % | ||||||||||||
RATIOS / SUPPLEMENTAL DATA | ||||||||||||||||||||||||
Net assets, end of year or period (000s) | $ | 2,486 | $ | 2,376 | $ | 2,484 | $ | 1,487 | $ | 1,512 | $ | 2,119 | ||||||||||||
Ratio of expenses to average net assets: | ||||||||||||||||||||||||
Before expense reimbursements | 1.58 | % | 1.57 | %(e) | 2.17 | % | 2.24 | % | 1.98 | % | 2.05 | % | ||||||||||||
After expense reimbursements (f) | 1.58 | % | 1.57 | %(e) | 1.80 | % | 1.75 | % | 1.75 | % | 1.75 | % | ||||||||||||
Ratio of net investment income/(loss) to average net assets | ||||||||||||||||||||||||
Before expense reimbursements | (0.73 | )% | (0.68 | )%(e) | (0.41 | )% | 0.06 | % | (0.13 | )% | (0.37 | )% | ||||||||||||
After expense reimbursements | (0.73 | )% | (0.68 | )%(e) | (0.05 | )% | 0.55 | % | 0.10 | % | (0.07 | )% | ||||||||||||
Portfolio turnover | 40 | % | 14 | %(d) | 82 | % | 28 | % | 44 | % | 68 | % | ||||||||||||
(a) | Formerly Named ICON Financials Fund. |
(b) | Information prior to the reorganization date of July 10, 2020 is that of the accounting and performance survior, ICON Financials Fund - Class S. |
(c) | Calculated based upon average shares outstanding. |
(d) | Not annualized. |
(e) | Annualized. |
(f) | Effective for the year ended September 30, 2020, CCO Fees and reorganization costs are not included in the expense limitation. For all years presented, interest expense, when applicable, is not included in the expense limitation. |
(g) | Information prior to the reorganization date of July 10, 2020 is that of the accounting and performance survior, ICON Financials Fund - Class A |
(h) | The total return calculation excludes and sales charge. |
See accompanying notes to financial statements.
32
Financial Highlights For a Share Outstanding Throughout Each Year or Period |
Icon Equity Fund(a) | ||||||||||||||||||||||||
Institutional Shares(b) | Year Ended | For the period | Year Ended | Year Ended | Year Ended | Year Ended | ||||||||||||||||||
Net asset value, beginning of year | $ | 33.57 | $ | 28.07 | $ | 26.83 | $ | 27.11 | $ | 25.13 | $ | 18.70 | ||||||||||||
INCOME FROM INVESTMENT OPERATIONS | ||||||||||||||||||||||||
Net investment income/(loss)(c) | (0.07 | ) | (0.02 | ) | (0.03 | ) | (0.02 | ) | (0.06 | ) | (0.04 | ) | ||||||||||||
Net gain/(loss) on securities (both realized and unrealized) | 9.04 | 5.52 | 2.27 | 0.09 | 2.04 | 6.47 | ||||||||||||||||||
Total from investment operations | 8.97 | 5.50 | 2.24 | 0.07 | 1.98 | 6.43 | ||||||||||||||||||
LESS DISTRIBUTIONS | ||||||||||||||||||||||||
Distributions from capital gains | (5.26 | ) | — | (1.00 | ) | (0.35 | ) | — | — | |||||||||||||||
Total distributions | (5.26 | ) | — | (1.00 | ) | (0.35 | ) | — | — | |||||||||||||||
Net asset value, end of year or period | $ | 37.28 | $ | 33.57 | $ | 28.07 | $ | 26.83 | $ | 27.11 | $ | 25.13 | ||||||||||||
Total return | 26.73 | % | 19.59 | %(f) | 8.27 | % | 0.56 | % | 7.88 | % | 34.39 | % | ||||||||||||
RATIOS / SUPPLEMENTAL DATA | ||||||||||||||||||||||||
Net assets, end of year or period (000s) | $ | 59,306 | $ | 49,362 | $ | 45,176 | $ | 12,764 | $ | 18,580 | $ | 11,259 | ||||||||||||
Ratio of expenses to average net assets: | ||||||||||||||||||||||||
Before expense reimbursements | 1.04 | % | 1.10 | %(d) | 1.35 | % | 1.53 | % | 1.38 | % | 1.50 | % | ||||||||||||
After expense reimbursements(e) | 1.04 | % | 1.10 | %(d) | 1.22 | % | 1.25 | % | 1.25 | % | 1.25 | % | ||||||||||||
Ratio of net investment income/(loss) to average net assets | ||||||||||||||||||||||||
Before expense reimbursements | (0.17 | )% | (0.28 | )%(d) | (0.23 | )% | (0.36 | )% | (0.33 | )% | (0.43 | )% | ||||||||||||
After expense reimbursements | (0.17 | )% | (0.28 | )%(d) | (0.10 | )% | (0.08 | )% | (0.20 | )% | (0.18 | )% | ||||||||||||
Portfolio turnover | 24 | % | 14 | %(f) | 65 | % | 31 | % | 36 | % | 24 | % | ||||||||||||
Icon Equity Fund(a) | ||||||||||||||||||||||||
Investor Shares(g) | Year Ended | For the period | Year Ended | Year Ended | Year Ended | Year Ended | ||||||||||||||||||
Net asset value, beginning of year | $ | 32.14 | $ | 26.89 | $ | 25.81 | $ | 26.16 | $ | 24.33 | $ | 18.16 | ||||||||||||
INCOME FROM INVESTMENT OPERATIONS | ||||||||||||||||||||||||
Net investment income/(loss)(c) | (0.16 | ) | (0.04 | ) | (0.09 | ) | (0.09 | ) | (0.14 | ) | (0.11 | ) | ||||||||||||
Net gain/(loss) on securities (both realized and unrealized) | 8.65 | 5.29 | 2.17 | 0.09 | 1.97 | 6.28 | ||||||||||||||||||
Total from investment operations | 8.49 | 5.25 | 2.08 | — | 1.83 | 6.17 | ||||||||||||||||||
LESS DISTRIBUTIONS | ||||||||||||||||||||||||
Distributions from capital gains | (5.26 | ) | — | (1.00 | ) | (0.35 | ) | — | — | |||||||||||||||
Total distributions | (5.26 | ) | — | (1.00 | ) | (0.35 | ) | — | — | |||||||||||||||
Net asset value, end of year or period | $ | 35.37 | $ | 32.14 | $ | 26.89 | $ | 25.81 | $ | 26.16 | $ | 24.33 | ||||||||||||
Total return(h) | 26.42 | % | 19.52 | %(f) | 7.97 | % | 0.31 | % | 7.52 | % | 33.98 | % | ||||||||||||
RATIOS / SUPPLEMENTAL DATA | ||||||||||||||||||||||||
Net assets, end of year or period (000s) | $ | 22,689 | $ | 20,910 | $ | 19,080 | $ | 4,894 | $ | 5,351 | $ | 7,003 | ||||||||||||
Ratio of expenses to average net assets: | ||||||||||||||||||||||||
Before expense reimbursements | 1.29 | % | 1.35 | %(d) | 1.67 | % | 2.08 | % | 1.83 | % | 1.93 | % | ||||||||||||
After expense reimbursements(e) | 1.29 | % | 1.35 | %(d) | 1.46 | % | 1.55 | % | 1.55 | % | 1.55 | % | ||||||||||||
Ratio of net investment income/(loss) to average net assets | ||||||||||||||||||||||||
Before expense reimbursements | (0.43 | )% | (0.52 | )%(d) | (0.54 | )% | (0.92 | )% | (0.80 | )% | (0.87 | )% | ||||||||||||
After expense reimbursements | (0.43 | )% | (0.52 | )%(d) | (0.34 | )% | (0.39 | )% | (0.52 | )% | (0.49 | )% | ||||||||||||
Portfolio turnover | 24 | % | 14 | %(f) | 65 | % | 31 | % | 36 | % | 24 | % | ||||||||||||
(a) | Formerly named ICON Long/Short Fund. |
(b) | Information prior to the reorganization date of July 10, 2020 is that of the accounting and performance survior, ICON Long/Short Fund - Class S. |
(c) | Calculated based upon average shares outstanding. |
(d) | Annualized. |
(e) | Effective for the year ended September 30, 2020, CCO Fees and reorganization costs are not included in the expense limitation. For all years presented, interest expense, when applicable, is not included in the expense limitation. |
(f) | Not annualized. |
(g) | Information prior to the reorganization date of July 10, 2020 is that of the accounting and performance survior, ICON Long/Short Fund - Class A. |
(h) | The total return calculation excludes and sales charge. |
See accompanying notes to financial statements.
33
Financial Highlights For a Share Outstanding Throughout Each Year or Period |
Icon Equity Income Fund | ||||||||||||||||||||||||
Institutional Shares(a) | Year Ended | For the period | Year Ended | Year Ended | Year Ended | Year Ended | ||||||||||||||||||
Net asset value, beginning of year | $ | 18.89 | $ | 16.44 | $ | 18.00 | $ | 17.96 | $ | 17.61 | $ | 15.62 | ||||||||||||
INCOME FROM INVESTMENT OPERATIONS | ||||||||||||||||||||||||
Net investment income/(loss)(b) | 0.42 | 0.12 | 0.43 | 0.50 | 0.53 | 0.61 | ||||||||||||||||||
Net gain/(loss) on securities (both realized and unrealized) | 4.12 | 2.72 | (1.12 | ) | 0.09 | 0.38 | 1.95 | |||||||||||||||||
Total from investment operations | 4.54 | 2.84 | (0.69 | ) | 0.59 | 0.91 | 2.56 | |||||||||||||||||
LESS DISTRIBUTIONS | ||||||||||||||||||||||||
Dividends from net investment income | (0.43 | ) | (0.39 | ) | (0.58 | ) | (0.53 | ) | (0.56 | ) | (0.57 | ) | ||||||||||||
Distributions from capital gains | (2.25 | ) | — | (0.29 | ) | (0.02 | ) | — | — | |||||||||||||||
Total distributions | (2.68 | ) | (0.39 | ) | (0.87 | ) | (0.55 | ) | (0.56 | ) | (0.57 | ) | ||||||||||||
Net asset value, end of year or period | $ | 20.75 | $ | 18.89 | $ | 16.44 | $ | 18.00 | $ | 17.96 | $ | 17.61 | ||||||||||||
Total return | 24.14 | % | 17.25 | %(c) | (4.03 | )% | 3.45 | % | 5.19 | % | 16.53 | % | ||||||||||||
RATIOS / SUPPLEMENTAL DATA | ||||||||||||||||||||||||
Net assets, end of year or period (000s) | $ | 45,535 | $ | 44,345 | $ | 42,624 | $ | 51,853 | $ | 51,185 | $ | 57,062 | ||||||||||||
Ratio of expenses to average net assets: | ||||||||||||||||||||||||
Before expense reimbursements | 1.04 | % | 1.06 | %(d) | 1.30 | % | 1.21 | % | 1.16 | % | 1.15 | % | ||||||||||||
After expense reimbursements(e) | 1.00 | % | 1.00 | %(d) | 1.05 | % | 0.99 | % | 0.99 | % | 1.05 | %(f) | ||||||||||||
Ratio of net investment income/(loss) to average net assets | ||||||||||||||||||||||||
Before expense reimbursements | 1.87 | % | 2.66 | %(d) | 2.28 | % | 2.66 | % | 2.76 | % | 3.50 | % | ||||||||||||
After expense reimbursements | 1.91 | % | 2.72 | %(d) | 2.53 | % | 2.88 | % | 2.93 | % | 3.60 | % | ||||||||||||
Portfolio turnover | 25 | % | 7 | %(c) | 78 | % | 117 | % | 171 | % | 206 | % | ||||||||||||
Icon Equity Income Fund | ||||||||||||||||||||||||
Investor Shares(g) | Year Ended | For the period | Year Ended | Year Ended | Year Ended | Year Ended | ||||||||||||||||||
Net asset value, beginning of year | $ | 18.87 | $ | 16.42 | $ | 17.96 | $ | 17.92 | $ | 17.56 | $ | 15.58 | ||||||||||||
INCOME FROM INVESTMENT OPERATIONS | ||||||||||||||||||||||||
Net investment income/(loss)(b) | 0.36 | 0.11 | 0.38 | 0.46 | 0.49 | 0.54 | ||||||||||||||||||
Net gain/(loss) on securities (both realized and unrealized) | 4.12 | 2.72 | (1.12 | ) | 0.08 | 0.38 | 1.96 | |||||||||||||||||
Total from investment operations | 4.48 | 2.83 | (0.74 | ) | 0.54 | 0.87 | 2.50 | |||||||||||||||||
LESS DISTRIBUTIONS | ||||||||||||||||||||||||
Dividends from net investment income | (0.37 | ) | (0.38 | ) | (0.51 | ) | (0.48 | ) | (0.51 | ) | (0.52 | ) | ||||||||||||
Distributions from capital gains | (2.25 | ) | — | (0.29 | ) | (0.02 | ) | — | — | |||||||||||||||
Total distributions | (2.62 | ) | (0.38 | ) | (0.80 | ) | (0.50 | ) | (0.51 | ) | (0.52 | ) | ||||||||||||
Net asset value, end of year or period | $ | 20.73 | $ | 18.87 | $ | 16.42 | $ | 17.96 | $ | 17.92 | $ | 17.56 | ||||||||||||
Total return(h) | 23.84 | % | 17.21 | %(c) | (4.33 | )% | 3.20 | % | 4.98 | % | 16.20 | % | ||||||||||||
RATIOS / SUPPLEMENTAL DATA | ||||||||||||||||||||||||
Net assets, end of year or period (000s) | $ | 37,994 | $ | 37,752 | $ | 37,563 | $ | 10,852 | $ | 10,685 | $ | 14,206 | ||||||||||||
Ratio of expenses to average net assets: | ||||||||||||||||||||||||
Before expense reimbursements | 1.29 | % | 1.31 | %(d) | 1.50 | % | 1.50 | % | 1.45 | % | 1.45 | % | ||||||||||||
After expense reimbursements(e) | 1.25 | % | 1.25 | %(d) | 1.29 | % | 1.24 | % | 1.24 | % | 1.31 | %(i) | ||||||||||||
Ratio of net investment income/(loss) to average net assets | ||||||||||||||||||||||||
Before expense reimbursements | 1.62 | % | 2.41 | %(d) | 2.07 | % | 2.38 | % | 2.48 | % | 3.06 | % | ||||||||||||
After expense reimbursements | 1.66 | % | 2.46 | %(d) | 2.29 | % | 2.64 | % | 2.69 | % | 3.20 | % | ||||||||||||
Portfolio turnover | 25 | % | 7 | %(c) | 78 | % | 117 | % | 171 | % | 206 | % | ||||||||||||
(a) | Formerly named ICON Equity Income Fund - Class S. |
(b) | Calculated based upon average shares outstanding. |
(c) | Not annualized. |
(d) | Annualized. |
(e) | Effective for the year ended September 30, 2020, CCO Fees and reorganization costs are not included in the expense limitation. For all years presented, interest expense, when applicable, is not included in the expense limitation. |
(f) | Effective January 26, 2017, the annual expense limitation rate changed from 1.20% to 0.99%. |
(g) | Formerly named ICON Equity Income Fund - Class A |
(h) | The total return calculation excludes any sales charges. |
(i) | Effective January 26, 2017, the annual expense limitation rate changed from 1.45% to 1.24%. |
See accompanying notes to financial statements.
34
Financial Highlights For a Share Outstanding Throughout Each Year or Period |
Icon Flexible Bond Fund | ||||||||||||||||||||||||
Institutional Shares(a) | Year Ended | For the period | Year Ended | Year Ended | Year Ended | Year Ended | ||||||||||||||||||
Net asset value, beginning of year | $ | 9.39 | $ | 9.07 | $ | 9.36 | $ | 9.26 | $ | 9.43 | $ | 9.55 | ||||||||||||
INCOME FROM INVESTMENT OPERATIONS | ||||||||||||||||||||||||
Net investment income/(loss)(b) | 0.42 | 0.10 | 0.40 | 0.36 | 0.36 | 0.37 | ||||||||||||||||||
Net gain/(loss) on securities (both realized and unrealized) | (0.03 | ) | 0.31 | (0.28 | ) | 0.18 | (0.19 | ) | (0.11 | ) | ||||||||||||||
Total from investment operations | 0.39 | 0.41 | 0.12 | 0.54 | 0.17 | 0.26 | ||||||||||||||||||
LESS DISTRIBUTIONS | ||||||||||||||||||||||||
Dividends from net investment income | (0.46 | ) | (0.09 | ) | (0.41 | ) | (0.44 | ) | (0.34 | ) | (0.38 | ) | ||||||||||||
Distributions from capital gains | — | — | — | — | — | — | ||||||||||||||||||
Total distributions | (0.46 | ) | (0.09 | ) | (0.41 | ) | (0.44 | ) | (0.34 | ) | (0.38 | ) | ||||||||||||
Net asset value, end of year or period | $ | 9.32 | $ | 9.39 | $ | 9.07 | $ | 9.36 | $ | 9.26 | $ | 9.43 | ||||||||||||
Total return | 4.17 | % | 4.52 | %(c) | 1.32 | % | 6.02 | % | 1.89 | % | 2.82 | % | ||||||||||||
RATIOS / SUPPLEMENTAL DATA | ||||||||||||||||||||||||
Net assets, end of year or period (000s) | $ | 138,093 | $ | 131,094 | $ | 141,158 | $ | 143,633 | $ | 97,303 | $ | 80,467 | ||||||||||||
Ratio of expenses to average net assets: | ||||||||||||||||||||||||
Before expense reimbursements | 0.85 | % | 0.86 | %(d) | 1.01 | % | 0.96 | % | 0.92 | % | 0.91 | % | ||||||||||||
After expense reimbursements(e) | 0.77 | % | 0.76 | %(d) | 0.80 | % | 0.75 | % | 0.75 | % | 0.75 | % | ||||||||||||
Ratio of net investment income/(loss) to average net assets | ||||||||||||||||||||||||
Before expense reimbursements | 4.32 | % | 4.38 | %(d) | 4.20 | % | 3.70 | % | 3.65 | % | 3.80 | % | ||||||||||||
After expense reimbursements | 4.40 | % | 4.48 | %(d) | 4.41 | % | 3.91 | % | 3.82 | % | 3.96 | % | ||||||||||||
Portfolio turnover | 262 | % | 29 | %(c) | 133 | % | 144 | % | 153 | % | 169 | % | ||||||||||||
Icon Flexible Bond Fund | ||||||||||||||||||||||||
Investor Shares(f) | Year Ended | For the period | Year Ended | Year Ended | Year Ended | Year Ended | ||||||||||||||||||
Net asset value, beginning of year | $ | 9.33 | $ | 9.02 | $ | 9.31 | $ | 9.21 | $ | 9.39 | $ | 9.51 | ||||||||||||
INCOME FROM INVESTMENT OPERATIONS | ||||||||||||||||||||||||
Net investment income/(loss)(b) | 0.39 | 0.10 | 0.38 | 0.34 | 0.33 | 0.33 | ||||||||||||||||||
Net gain/(loss) on securities (both realized and unrealized) | (0.01 | ) | 0.29 | (0.28 | ) | 0.18 | (0.19 | ) | (0.10 | ) | ||||||||||||||
Total from investment operations | 0.38 | 0.39 | 0.10 | 0.52 | 0.14 | 0.23 | ||||||||||||||||||
LESS DISTRIBUTIONS | ||||||||||||||||||||||||
Dividends from net investment income | (0.44 | ) | (0.08 | ) | (0.39 | ) | (0.42 | ) | (0.32 | ) | (0.35 | ) | ||||||||||||
Distributions from capital gains | — | — | — | — | — | — | ||||||||||||||||||
Total distributions | (0.44 | ) | (0.08 | ) | (0.39 | ) | (0.42 | ) | (0.32 | ) | (0.35 | ) | ||||||||||||
Net asset value, end of year or period | $ | 9.27 | $ | 9.33 | $ | 9.02 | $ | 9.31 | $ | 9.21 | $ | 9.39 | ||||||||||||
Total return(h) | 4.06 | % | 4.36 | %(c) | 1.12 | % | 5.76 | % | 1.55 | % | 2.48 | % | ||||||||||||
RATIOS / SUPPLEMENTAL DATA | ||||||||||||||||||||||||
Net assets, end of year or period (000s) | $ | 9,318 | $ | 10,667 | $ | 10,661 | $ | 5,733 | $ | 3,685 | $ | 3,859 | ||||||||||||
Ratio of expenses to average net assets: | ||||||||||||||||||||||||
Before expense reimbursements | 1.10 | % | 1.11 | %(d) | 1.32 | % | 1.39 | % | 1.45 | % | 1.41 | % | ||||||||||||
After expense reimbursements(e) | 1.02 | % | 1.01 | %(d) | 1.05 | % | 1.00 | % | 1.00 | % | 1.00 | % | ||||||||||||
Ratio of net investment income/(loss) to average net assets | ||||||||||||||||||||||||
Before expense reimbursements | 4.07 | % | 4.13 | %(d) | 3.90 | % | 3.29 | % | 3.13 | % | 3.13 | % | ||||||||||||
After expense reimbursements | 4.15 | % | 4.23 | %(d) | 4.17 | % | 3.68 | % | 3.58 | % | 3.54 | % | ||||||||||||
Portfolio turnover | 262 | % | 29 | %(c) | 133 | % | 144 | % | 153 | % | 169 | % | ||||||||||||
(a) | Prior to January 23, 2018, the ICON Flexible Bond Fund was known as the ICON Bond Fund. |
(b) | Calculated based upon average shares outstanding. |
(c) | Not annualized. |
(d) | Annualized. |
(e) | Effective for the year ended September 30, 2020, CCO Fees and reorganization costs are not included in the expense limitation. For all years presented, interest expense, when applicable, is not included in the expense limitation. |
(f) | Formerly named ICON Flexible Bond Fund - Class A. |
(g) | The total return calculation excludes any sales charges. |
See accompanying notes to financial statements.
35
Financial Highlights For a Share Outstanding Throughout Each Year or Period |
Icon Health & Information Technology Fund(a) | ||||||||||||||||||||||||
Institutional Shares(b) | Year Ended | For the period | Year Ended | Year Ended | Year Ended | Year Ended | ||||||||||||||||||
Net asset value, beginning of year | $ | 21.45 | $ | 18.75 | $ | 15.46 | $ | 17.19 | $ | 19.14 | $ | 17.96 | ||||||||||||
INCOME FROM INVESTMENT OPERATIONS | ||||||||||||||||||||||||
Net investment income/(loss)(c) | (0.14 | ) | (0.03 | ) | (0.09 | ) | (0.04 | ) | (0.10 | ) | (0.10 | ) | ||||||||||||
Net gain/(loss) on securities (both realized and unrealized) | 3.94 | 3.47 | 4.10 | 0.35 | 2.09 | 4.53 | ||||||||||||||||||
Total from investment operations | 3.80 | 3.44 | 4.01 | 0.31 | 1.99 | 4.43 | ||||||||||||||||||
LESS DISTRIBUTIONS | ||||||||||||||||||||||||
Dividends from net investment income | — | — | — | — | (0.08 | ) | — | |||||||||||||||||
Distributions from capital gains | (3.60 | ) | (0.74 | ) | (0.72 | ) | (2.04 | ) | (3.86 | ) | (3.25 | ) | ||||||||||||
Total distributions | (3.60 | ) | (0.74 | ) | (0.72 | ) | (2.04 | ) | (3.94 | ) | (3.25 | ) | ||||||||||||
Net asset value, end of year or period | $ | 21.65 | $ | 21.45 | $ | 18.75 | $ | 15.46 | $ | 17.19 | $ | 19.14 | ||||||||||||
Total return | 17.71 | % | 18.59 | % | 26.59 | % | 5.12 | % | 11.82 | % | 29.46 | % | ||||||||||||
RATIOS / SUPPLEMENTAL DATA | ||||||||||||||||||||||||
Net assets, end of year or period (000s) | $ | 126,017 | $ | 125,057 | $ | 109,619 | $ | 54,263 | $ | 61,474 | $ | 71,249 | ||||||||||||
Ratio of expenses to average net assets: | ||||||||||||||||||||||||
Before expense reimbursements | 1.25 | % | 1.29 | %(d) | 1.46 | % | 1.49 | % | 1.41 | % | 1.42 | % | ||||||||||||
After expense reimbursements(f) | 1.25 | % | 1.29 | %(d) | 1.46 | % | 1.49 | % | 1.41 | % | 1.42 | % | ||||||||||||
Ratio of net investment income/(loss) to average net assets | ||||||||||||||||||||||||
Before expense reimbursements | (0.60 | )% | (0.53 | )%(d) | (0.54 | )% | (0.25 | )% | (0.60 | )% | (0.58 | )% | ||||||||||||
After expense reimbursements | (0.60 | )% | (0.53 | )%(d) | (0.54 | )% | (0.25 | )% | (0.60 | )% | (0.58 | )% | ||||||||||||
Portfolio turnover | 33 | % | 13 | %(f) | 67 | % | 92 | % | 98 | % | 116 | % | ||||||||||||
Icon Health & Information Technology Fund(a) | ||||||||||||||||||||||||
Investor Shares(g) | Year Ended | For the period | Year Ended | Year Ended | Year Ended | Year Ended | ||||||||||||||||||
Net asset value, beginning of year | $ | 20.31 | $ | 17.80 | $ | 14.74 | $ | 16.55 | $ | 18.55 | $ | 17.55 | ||||||||||||
INCOME FROM INVESTMENT OPERATIONS | ||||||||||||||||||||||||
Net investment income/(loss)(c) | (0.19 | ) | (0.04 | ) | (0.13 | ) | (0.07 | ) | (0.16 | ) | (0.15 | ) | ||||||||||||
Net gain/(loss) on securities (both realized and unrealized) | 3.72 | 3.29 | 3.91 | 0.30 | 2.02 | 4.40 | ||||||||||||||||||
Total from investment operations | 3.53 | 3.25 | 3.78 | 0.23 | 1.86 | 4.25 | ||||||||||||||||||
LESS DISTRIBUTIONS | ||||||||||||||||||||||||
Dividends from net investment income | — | — | — | — | (0.00 | )(h) | — | |||||||||||||||||
Distributions from capital gains | (3.60 | ) | (0.74 | ) | (0.72 | ) | (2.04 | ) | (3.86 | ) | (3.25 | ) | ||||||||||||
Total distributions | (3.60 | ) | (0.74 | ) | (0.72 | ) | (2.04 | ) | (3.86 | ) | (3.25 | ) | ||||||||||||
Net asset value, end of year or period | $ | 20.24 | $ | 20.31 | $ | 17.80 | $ | 14.74 | $ | 16.55 | $ | 18.55 | ||||||||||||
Total return(i) | 17.37 | % | 18.52 | %(d) | 26.31 | % | 4.79 | % | 11.43 | % | 29.08 | % | ||||||||||||
RATIOS / SUPPLEMENTAL DATA | ||||||||||||||||||||||||
Net assets, end of year or period (000s) | $ | 3,125 | $ | 3,199 | $ | 2,948 | $ | 1,463 | $ | 2,101 | $ | 2,836 | ||||||||||||
Ratio of expenses to average net assets: | ||||||||||||||||||||||||
Before expense reimbursements | 1.50 | % | 1.54 | %(e) | 2.13 | % | 2.30 | % | 2.00 | % | 2.01 | % | ||||||||||||
After expense reimbursements(f) | 1.50 | % | 1.54 | %(e) | 1.76 | % | 1.75 | % | 1.75 | % | 1.75 | % | ||||||||||||
Ratio of net investment income/(loss) to average net assets | ||||||||||||||||||||||||
Before expense reimbursements | (0.84 | )% | (0.76 | )%(e) | (1.21 | )% | (1.05 | )% | (1.20 | )% | (1.16 | )% | ||||||||||||
After expense reimbursements | (0.84 | )% | (0.76 | )%(e) | (0.83 | )% | (0.50 | )% | (0.95 | )% | (0.90 | )% | ||||||||||||
Portfolio turnover | 33 | % | 13 | %(d) | 67 | % | 92 | % | 98 | % | 116 | % | ||||||||||||
(a) | Formerly named ICON Information Technology Fund. |
(b) | Information prior to the reorganization date of July 10, 2020 is that of the accounting and performance survior, ICON Information Technology Fund - Class S. |
(c) | Calculated based upon average shares outstanding. |
(d) | Not annualized. |
(e) | Annualized. |
(f) | Effective for the year ended September 30, 2020, CCO Fees and reorganization costs are not included in the expense limitation. For all years presented, interest expense, when applicable, is not included in the expense limitation. |
(g) | Information prior to the reorganization date of July 10, 2020 is that of the accounting and performance survior, ICON Information Technology Fund - Class A. |
(h) | Amount less than $(0.005). |
(i) | The total return calculation excludes any sales charges. |
See accompanying notes to financial statements.
36
Financial Highlights For a Share Outstanding Throughout Each Year or Period |
Icon Natural Resources and Infrastructure Fund(a) | ||||||||||||||||||||||||
Institutional Shares(b) | Year Ended | For the period | Year Ended | Year Ended | Year Ended | Year Ended | ||||||||||||||||||
Net asset value, beginning of year | $ | 13.76 | $ | 11.78 | $ | 12.49 | $ | 16.45 | $ | 15.32 | $ | 12.82 | ||||||||||||
INCOME FROM INVESTMENT OPERATIONS | ||||||||||||||||||||||||
Net investment income/(loss)(c) | 0.20 | 0.02 | 0.08 | 0.19 | 0.31 | 0.01 | ||||||||||||||||||
Net gain/(loss) on securities (both realized and unrealized) | 4.01 | 2.00 | (0.59 | ) | (1.80 | ) | 1.01 | 2.56 | ||||||||||||||||
Total from investment operations | 4.21 | 2.02 | (0.51 | ) | (1.61 | ) | 1.32 | 2.57 | ||||||||||||||||
LESS DISTRIBUTIONS | ||||||||||||||||||||||||
Dividends from net investment income | (0.23 | ) | (0.04 | ) | (0.20 | ) | (0.33 | ) | — | (0.07 | ) | |||||||||||||
Distributions from capital gains | — | — | — | (2.02 | ) | (0.19 | ) | — | ||||||||||||||||
Total distributions | (0.23 | ) | (0.04 | ) | (0.20 | ) | (2.02 | ) | (0.19 | ) | (0.07 | ) | ||||||||||||
Net asset value, end of year or period | $ | 17.74 | $ | 13.76 | $ | 11.78 | $ | 12.49 | $ | 16.45 | $ | 15.32 | ||||||||||||
Total return | 30.62 | % | 17.18 | %(d) | (4.21 | )% | (7.63 | )% | 8.68 | % | 20.13 | % | ||||||||||||
RATIOS / SUPPLEMENTAL DATA | ||||||||||||||||||||||||
Net assets, end of year or period (000s) | $ | 122,465 | $ | 104,241 | $ | 98,786 | $ | 55,353 | $ | 76,916 | $ | 69,444 | ||||||||||||
Ratio of expenses to average net assets: | ||||||||||||||||||||||||
Before expense reimbursements | 1.28 | % | 1.35 | %(e) | 1.58 | % | 1.70 | % | 1.58 | % | 1.52 | % | ||||||||||||
After expense reimbursements(f) | 1.28 | % | 1.35 | %(e) | 1.48 | % | 1.50 | % | 1.50 | % | 1.50 | % | ||||||||||||
Ratio of net investment income/(loss) to average net assets | ||||||||||||||||||||||||
Before expense reimbursements | 1.20 | % | 0.55 | %(e) | 0.58 | % | 1.33 | % | 1.86 | % | 0.06 | % | ||||||||||||
After expense reimbursements | 1.20 | % | 0.55 | %(e) | 0.68 | % | 1.53 | % | 1.94 | % | 0.08 | % | ||||||||||||
Portfolio turnover | 94 | % | 22 | %(d) | 133 | % | 111 | % | 117 | % | 68 | % | ||||||||||||
Icon Natural Resources and Infrastructure Fund(a) | ||||||||||||||||||||||||
Investor Shares(g) | Year Ended | For the period | Year Ended | Year Ended | Year Ended | Year Ended | ||||||||||||||||||
Net asset value, beginning of year | $ | 13.57 | $ | 11.64 | $ | 12.36 | $ | 16.25 | $ | 15.17 | $ | 12.73 | ||||||||||||
INCOME FROM INVESTMENT OPERATIONS | ||||||||||||||||||||||||
Net investment income/(loss)(c) | 0.17 | 0.01 | 0.05 | 0.16 | 0.29 | (0.03 | ) | |||||||||||||||||
Net gain/(loss) on securities (both realized and unrealized) | 3.96 | 1.97 | (0.57 | ) | (1.78 | ) | 0.98 | 2.54 | ||||||||||||||||
Total from investment operations | 4.13 | 1.98 | (0.52 | ) | (1.62 | ) | 1.27 | 2.51 | ||||||||||||||||
LESS DISTRIBUTIONS | ||||||||||||||||||||||||
Dividends from net investment income | (0.18 | ) | (0.04 | ) | (0.20 | ) | (1.62 | ) | — | (0.07 | ) | |||||||||||||
Distributions from capital gains | — | — | — | (2.02 | ) | (0.19 | ) | — | ||||||||||||||||
Total distributions | (0.18 | ) | (0.04 | ) | (0.20 | ) | (2.27 | ) | (0.19 | ) | (0.07 | ) | ||||||||||||
Net asset value, end of year or period | $ | 17.52 | $ | 13.57 | $ | 11.64 | $ | 12.36 | $ | 16.25 | $ | 15.17 | ||||||||||||
Total return(h) | 30.41 | % | 16.96 | %(d) | (4.40 | )% | (7.92 | )% | 8.43 | % | 19.81 | % | ||||||||||||
RATIOS / SUPPLEMENTAL DATA | ||||||||||||||||||||||||
Net assets, end of year or period (000s) | $ | 6,888 | $ | 5,658 | $ | 5,001 | $ | 2,733 | $ | 4,231 | $ | 5,629 | ||||||||||||
Ratio of expenses to average net assets: | ||||||||||||||||||||||||
Before expense reimbursements | 1.52 | % | 1.60 | %(e) | 2.10 | % | 2.19 | % | 1.86 | % | 1.91 | % | ||||||||||||
After expense reimbursements(f) | 1.52 | % | 1.60 | %(e) | 1.75 | % | 1.75 | % | 1.75 | % | 1.75 | % | ||||||||||||
Ratio of net investment income/(loss) to average net assets | ||||||||||||||||||||||||
Before expense reimbursements | 1.00 | % | 0.30 | %(e) | 0.05 | % | 0.85 | % | 1.71 | % | (0.35 | )% | ||||||||||||
After expense reimbursements | 1.00 | % | 0.30 | %(e) | 0.40 | % | 1.29 | % | 1.82 | % | (0.19 | )% | ||||||||||||
Portfolio turnover | 94 | % | 22 | %(d) | 133 | % | 111 | % | 117 | % | 68 | % | ||||||||||||
(a) | Formerly named ICON Natural Resources Fund. |
(b) | Information prior to the reorganization date of July 10, 2020 is that of the accounting and performance survior, ICON Natural Resources Fund - Class S. |
(c) | Calculated based upon average shares outstanding. |
(d) | Not annualized. |
(e) | Annualized. |
(f) | Effective for the year ended September 30, 2020, CCO Fees and reorganization costs are not included in the expense limitation. For all years presented, interest expense, when applicable, is not included in the expense limitation. |
(g) | Information prior to the reorganization date of July 10, 2020 is that of the accounting and performance survior, ICON Natural Resources Fund - Class A. |
(h) | The total return calculation excludes any sales charges. |
See accompanying notes to financial statements.
37
Financial Highlights For a Share Outstanding Throughout Each Year or Period |
Icon Utilities and Income Fund(a) | ||||||||||||||||||||||||
Institutional Shares(b) | Year Ended | For the period | Year Ended | Year Ended | Year Ended | Year Ended | ||||||||||||||||||
Net asset value, beginning of year | $ | 9.56 | $ | 8.99 | $ | 10.25 | $ | 8.85 | $ | 9.29 | $ | 9.49 | ||||||||||||
INCOME FROM INVESTMENT OPERATIONS | ||||||||||||||||||||||||
Net investment income/(loss)(c) | 0.22 | 0.05 | 0.18 | 0.26 | 0.28 | 0.27 | ||||||||||||||||||
Net gain/(loss) on securities (both realized and unrealized) | 1.82 | 0.97 | (0.91 | ) | 1.45 | 0.07 | 0.59 | |||||||||||||||||
Total from investment operations | 2.04 | 1.02 | (0.73 | ) | 1.71 | 0.35 | 0.86 | |||||||||||||||||
LESS DISTRIBUTIONS | ||||||||||||||||||||||||
Dividends from net investment income | (0.21 | ) | (0.05 | ) | (0.20 | ) | (0.26 | ) | (0.31 | ) | (0.27 | ) | ||||||||||||
Distributions from capital gains | (0.59 | ) | (0.40 | ) | (0.33 | ) | (0.05 | ) | (0.48 | ) | (0.79 | ) | ||||||||||||
Total distributions | (0.80 | ) | (0.45 | ) | (0.53 | ) | (0.31 | ) | (0.79 | ) | (1.06 | ) | ||||||||||||
Net asset value, end of year or period | $ | 10.80 | $ | 9.56 | $ | 8.99 | $ | 10.25 | $ | 8.85 | $ | 9.29 | ||||||||||||
Total return | 21.51 | % | 11.42 | %(d) | (7.35 | )% | 19.76 | % | 4.17 | % | 9.88 | % | ||||||||||||
RATIOS / SUPPLEMENTAL DATA | ||||||||||||||||||||||||
Net assets, end of year or period (000s) | $ | 40,208 | $ | 25,430 | $ | 25,038 | $ | 46,006 | $ | 30,883 | $ | 35,816 | ||||||||||||
Ratio of expenses to average net assets: | ||||||||||||||||||||||||
Before expense reimbursements | 1.39 | % | 1.47 | %(e) | 1.63 | % | 1.57 | % | 1.60 | % | 1.54 | % | ||||||||||||
After expense reimbursements(f) | 1.23 | % | 1.23 | %(e) | 1.28 | % | 1.22 | % | 1.22 | % | 1.44 | %(g) | ||||||||||||
Ratio of net investment income/(loss) to average net assets | ||||||||||||||||||||||||
Before expense reimbursements | 1.89 | % | 1.87 | %(e) | 1.62 | % | 2.38 | % | 2.82 | % | 2.83 | % | ||||||||||||
After expense reimbursements | 2.06 | % | 2.11 | %(e) | 1.96 | % | 2.73 | % | 3.20 | % | 2.93 | % | ||||||||||||
Portfolio turnover | 33 | % | 3 | %(d) | 24 | % | 144 | % | 156 | % | 160 | % | ||||||||||||
Icon Utilities and Income Fund(a) | ||||||||||||||||||||||||
Investor Shares(h) | Year Ended | For the period | Year Ended | Year Ended | Year Ended | Year Ended | ||||||||||||||||||
Net asset value, beginning of year | $ | 9.38 | $ | 8.83 | $ | 10.07 | $ | 8.70 | $ | 9.14 | $ | 9.35 | ||||||||||||
INCOME FROM INVESTMENT OPERATIONS | ||||||||||||||||||||||||
Net investment income/(loss)(c) | 0.19 | 0.04 | 0.16 | 0.23 | 0.25 | 0.24 | ||||||||||||||||||
Net gain/(loss) on securities (both realized and unrealized) | 1.79 | 0.96 | (0.91 | ) | 1.43 | 0.08 | 0.59 | |||||||||||||||||
Total from investment operations | 1.98 | 1.00 | (0.75 | ) | 1.66 | 0.33 | 0.83 | |||||||||||||||||
LESS DISTRIBUTIONS | ||||||||||||||||||||||||
Dividends from net investment income | (0.19 | ) | (0.05 | ) | (0.16 | ) | (0.24 | ) | (0.29 | ) | (0.25 | ) | ||||||||||||
Distributions from capital gains | (0.59 | ) | (0.40 | ) | (0.33 | ) | (0.05 | ) | (0.48 | ) | (0.79 | ) | ||||||||||||
Total distributions | (0.78 | ) | (0.45 | ) | (0.49 | ) | (0.29 | ) | (0.77 | ) | (1.04 | ) | ||||||||||||
Net asset value, end of year or period | $ | 10.58 | $ | 9.38 | $ | 8.83 | $ | 10.07 | $ | 8.70 | $ | 9.14 | ||||||||||||
Total return(i) | 21.24 | % | 11.33 | %(d) | (7.69 | )% | 19.47 | % | 3.97 | % | 9.63 | % | ||||||||||||
RATIOS / SUPPLEMENTAL DATA | ||||||||||||||||||||||||
Net assets, end of year (000s) | $ | 6,152 | $ | 4,925 | $ | 4,797 | $ | 6,052 | $ | 5,540 | $ | 8,293 | ||||||||||||
Ratio of expenses to average net assets: | ||||||||||||||||||||||||
Before expense reimbursements | 1.65 | % | 1.72 | %(e) | 1.83 | % | 1.77 | % | 1.73 | % | 1.84 | % | ||||||||||||
After expense reimbursements(f) | 1.48 | % | 1.48 | %(e) | 1.53 | % | 1.47 | % | 1.47 | % | 1.69 | %(j) | ||||||||||||
Ratio of net investment income/(loss) to average net assets | ||||||||||||||||||||||||
Before expense reimbursements | 1.63 | % | 1.65 | %(e) | 1.45 | % | 2.20 | % | 2.62 | % | 2.48 | % | ||||||||||||
After expense reimbursements | 1.80 | % | 1.89 | %(e) | 1.75 | % | 2.50 | % | 2.88 | % | 2.63 | % | ||||||||||||
Portfolio turnover | 33 | % | 3 | %(d) | 24 | % | 144 | % | 156 | % | 160 | % | ||||||||||||
(a) | Formerly named ICON Utilities Fund. |
(b) | Formerly named ICON Utilities Fund - Class S. |
(c) | Calculated based upon average shares outstanding. |
(d) | Not annualized. |
(e) | Annualized. |
(f) | Effective for the year ended September 30, 2020, CCO Fees and reorganization costs are not included in the expense limitation. For all years presented, interest expense, when applicable, is not included in the expense limitation. |
(g) | Effective July 1, 2017, the annual expense limitation rate changed from 1.50% to 1.22%. |
(h) | Formerly named ICON Utilities Fund - Class A. |
(i) | The total return calculation excludes any sales charges. |
(j) | Effective July 1, 2017, the annual expense limitation rate changed from 1.75% to 1.47% |
See accompanying notes to financial statements.
38
ICON Funds | Notes to Financial Statements | December 31, 2021 |
NOTE 1 – SUMMARY OF SIGNIFICANT ACCOUNTING POLICIES
SCM Trust (the “Trust”), a Massachusetts business trust formed in July 1988 is registered as an investment company under the Investment Company Act of 1940, as amended. The Trust consists of ten separate series, seven of which are included in these financial statements. On August 13, 2020, the fiscal year end of the ICON Equity Fund, the ICON Equity Income Fund, the ICON Consumer Select Fund, the ICON Flexible Bond Fund, ICON Health and Information Technology Fund, The ICON Natural Resources Fund, and the ICON Utilities and Income Fund was changed from September 30 to December 31, effective June 30, 2020.
ICON Consumer Select Fund is an open-end non-diversified series of the Trust. The inception date of the Fund is July 10, 2020. The Fund’s investment objective is to seek long-term capital appreciation. The Fund is the successor fund to three series of ICON Funds, the ICON Consumer Discretionary Fund, the ICON Financial Fund, and the ICON Consumer Staples Fund. The ICON Consumer Discretionary Fund and the ICON Financial Fund were reorganized into the Fund pursuant to a reorganization that that took place after the close of business on July 10, 2020. The ICON Consumer Staples Fund was reorganized into the Fund pursuant to a reorganization that took place after the close of business on July 31, 2020. All historic performance and financial information presented is that of the ICON Financial Fund, which was the accounting and performance survivor of the reorganizations. Historic information presented for the Institutional Class and Investor Classes shares is based on that of the Class S and Class A shares, respectively, of the ICON Financial Fund.
ICON Equity Fund is an open-end diversified series of the Trust. The inception date of the Fund is July 10, 2020. The Fund’s investment objective is to seek capital appreciation, with a secondary objective of capital preservation to provide long-term growth. The Fund is the successor fund to three series of ICON Funds, the ICON Fund, the ICON Long/Short Fund, and the ICON Opportunities Fund, pursuant to a reorganization that that took place after the close of business on July 10, 2020. All historic performance and financial information presented is that of the ICON Long/Short Fund, which was the accounting and performance survivor of the reorganizations. Historic information presented for the Institutional Class and Investor Classes shares is based on that of the Class S and Class A shares, respectively, of the ICON Long/Short Fund. The ICON Fund and the ICON Long/Short Fund each also had Class C shares, each of which were reorganized into the Investor Class of the ICON Equity Fund.
ICON Equity Income Fund is an open-end diversified series of the Trust. The inception date of the Fund is July 10, 2020. The Fund’s investment objective is to seek modest capital appreciation and income. The Fund is the successor fund to two series of ICON Funds, the ICON Equity Income Fund (the “Predecessor Equity Income Fund”) and the ICON Risk-Managed Balanced Fund, pursuant to reorganizations that that took place after the close of business on July 10, 2020 and September 25, 2020, respectively. All historic performance and financial information presented is that of the Predecessor Equity Income Fund, which was the accounting and performance survivor of the reorganizations. Historic information presented for the Institutional Class and Investor Classes shares is based on that of the Class S and Class A shares, respectively, of the Predecessor Equity Income Fund. The Predecessor Equity Income Fund and the ICON Risk-Managed Balanced Fund each also had Class C shares, each of which were reorganized into the Investor Class of the ICON Equity Income Fund.
ICON Flexible Bond Fund is an open-end diversified series of the Trust. The inception date of the Fund is July 10, 2020. The Fund’s investment objective is to seek maximum total return. The Fund is the successor fund to the ICON Flexible Bond Fund, a series of ICON Funds (the “Predecessor Flexible Bond Fund”), pursuant to a reorganization that that took place after the close of business on July 10, 2020. All historic performance and financial information presented is that of the Predecessor Flexible Bond Fund, which was the accounting and performance survivor of the reorganization. Historic information presented for the Institutional Class and Investor Classes shares is based on that of the Class S and Class A shares, respectively, of the Predecessor Flexible Bond Fund. The Predecessor Flexible Bond Fund also had Class C shares, each of which were reorganized into the Investor Class of the ICON Flexible Bond Fund.
ICON Health and Information Technology Fund is an open-end non-diversified series of the Trust. The inception date of the Fund is July 10, 2020. The Fund’s investment objective is to seek long-term capital appreciation. The Fund is the successor fund to two series of ICON Funds, the ICON Information Technology Fund and the ICON Healthcare Fund pursuant to a reorganization that that took place after the close of business on July 10, 2020. All historic performance and financial information presented is that of the ICON Information Technology Fund, which was the accounting and performance survivor of the reorganizations. Historic information presented for the Institutional Class and Investor Classes shares is based on that of the Class S and Class A shares, respectively, of the ICON Information Technology Fund.
ICON Natural Resources and Infrastructure Fund is an open-end non-diversified series of the Trust. The inception date of the Fund is July 10, 2020. The Fund’s investment objective is to seek long-term capital appreciation. The Fund is the successor fund to three series of ICON Funds, the ICON Energy Fund, the ICON Natural Resources Fund, and the ICON Industrials Fund, pursuant to a reorganization that that took place after the close of business on July 10, 2020. All historic performance and financial information presented is that of the ICON Natural Resources Fund, which was the accounting and performance survivor of the reorganizations. Historic information presented for the Institutional Class and Investor Classes shares is based on that of the Class S and Class A shares, respectively, of the ICON Natural Resources Fund. The ICON Energy Fund and the ICON Natural Resources Fund each also had Class C shares, each of which were reorganized into the Investor Class of the ICON Natural Resources and Infrastructure Fund.
ICON Utilities and Income Fund is an open-end non-diversified series of the Trust. The inception date of the Fund is July 10, 2020. The Fund’s investment objective is to seek long-term capital appreciation. The Fund is the successor fund to the ICON Utilities Fund, a series of ICON Funds, pursuant to a reorganization that occurred after the close of business on July 10, 2020. All historic performance and financial information presented is that of the ICON Utilities Fund, which was the accounting and performance survivor of the reorganizations. Historic information presented for the Institutional Class and Investor Classes shares is based on that of the Class S and Class A shares, respectively, of the ICON Utilities Fund.
The Trust follows the investment company accounting and reporting guidance of the Financial Accounting Standards Board (“FASB”) Accounting Standards Codification Topic 946, “Financial Services – Investment Companies”.
(a) Security Valuation — Inputs used to value corporate debt securities generally include relative credit information, observed market movements, sector news, U.S. Treasury yield curve or relevant benchmark curve, and other market information, which may include benchmark yields, reported trades, broker-dealer quotes, issuer spreads, benchmark securities, bids, offers, and reference data, such as market research publications, when available (“Other Market Information”). Equity securities listed on a national or international exchange are valued at the last reported sales price. Futures contracts are valued at the settle price, depending on the exchange the contract trades on, typically as of 4:15 p.m., Eastern Time. Municipal securities are valued by an independent pricing service at a price determined by a matrix pricing method. This technique generally considers such factors as yields or prices of bonds of comparable quality, type of issue, coupon, maturity, ratings and general market conditions. U.S. government securities for which
39
ICON Funds | Notes to Financial Statements (Continued) | December 31, 2021 |
market quotations are readily available are valued at the mean between the closing bid and asked prices provided by an independent pricing service. U.S. agency securities consisting of mortgage pass-through certificates are valued using dealer quotations provided by an independent pricing service. U.S. Treasury Bills are valued at amortized cost which approximates market value. Securities with remaining maturities of 60 days or less are valued on the amortized cost basis as reflecting fair value.
Securities for which market quotes are not readily available from the Trust’s third-party pricing service are valued at fair value, determined in good faith and in accordance with procedures adopted by the Board of Trustees. The Board has delegated to the Advisor’s Pricing Committee the responsibility for determining the fair value, subject to the Board oversight and the review of the pricing decisions at its quarterly meetings. For a description of the Advisor, see Note 2.
(b) Federal Income Taxes — No provision is considered necessary for federal income taxes. The Funds intend to qualify for and elect the tax treatment applicable to regulated investment companies under the Internal Revenue Code and to distribute all their taxable income to shareholders.
(c) Short Sales — Short sales are transactions under which a Fund sells a security it does not own in anticipation of a decline in the value of that security. To complete such a transaction, the Fund must borrow the security to make delivery to the buyer. The Fund then is obligated to replace the security borrowed by purchasing the security at market price at the time of replacement. The price at such time may be more or less than the price at which the security was sold by the Fund. When a security is sold short a decrease in the value of the security will be recognized as a gain and an increase in the value of the security will be recognized as a loss, which is potentially limitless. Until the security is replaced, the Fund is required to pay the lender amounts equal to dividend or interest that accrue during the period of the loan which is recorded as an expense. To borrow the security, the Fund also may be required to pay a premium or an interest fee, which are recorded as interest expense. Cash or securities are segregated for the broker to meet the necessary margin requirements. The Fund is subject to the risk that it may not always be able to close out a short position at a particular time or at an acceptable price.
(d) Municipal Bonds — Municipal bonds are debt obligations issued by the states, possessions, or territories of the United States (including the District of Columbia) or a political subdivision, public instrumentality, agency, public authority or other governmental unit of such states, possessions, or territories (e.g., counties, cities, towns, villages, districts and authorities). Municipal bonds may be issued as taxable securities, or as federally tax-exempt securities. States, possessions, territories and municipalities may issue municipal bonds to raise funds for various public purposes such as airports, housing, hospitals, mass transportation, schools, water and sewer works, gas, and electric utilities. They may also issue municipal bonds to refund outstanding obligations and to meet general operating expenses. Municipal bonds may be general obligation bonds or revenue bonds. General obligation bonds are secured by the issuer’s pledge of its full faith, credit and taxing power for the payment of principal and interest. Revenue bonds are payable from revenues derived from particular facilities, from the proceeds of a special excise tax or from other specific revenue sources. They are not usually payable from the general taxing power of a municipality. In addition, certain types of “private activity” bonds may be issued by public authorities to obtain funding for privately operated facilities, such as housing and pollution control facilities, for industrial facilities and for water supply, gas, electricity and waste disposal facilities. Other types of private activity bonds are used to finance the construction, repair or improvement of, or to obtain equipment for, privately operated industrial or commercial facilities. Current federal tax laws place substantial limitations on the size of certain of such issues. In certain cases, the interest on a private activity bond may not be exempt from federal income tax or the alternative minimum tax.
(e) Security Transactions, Investment Income and Distributions to Shareholders — Security transactions are recorded on the trade date. Interest income is recorded on the accrual basis. Dividend income is recorded on the ex-dividend date. Withholding taxes on foreign dividends have been provided for, in accordance with the Trust’s understanding of the applicable country’s tax rules and rates. Discounts or premiums on debt securities are accreted or amortized to interest income over the lives of the respective securities using the effective interest method or, where applicable, to the first call date of the securities. Distributions to shareholders are recorded on the ex-dividend date for the Funds. Income distributions and capital gain distributions are determined in accordance with income tax regulations which may differ from accounting principles generally accepted in the United States of America. These differences are primarily due to differing treatments for PFICs, wash sales, REIT adjustments and post-October capital losses.
Distributions received from investments in securities that represent a return of capital or capital gains are recorded as a reduction of cost of investment or as a realized gain, respectively. The calendar year-end amounts of ordinary income, capital gains, and return of capital included in distributions received from a Fund’s investments in real estate investment trusts (“REITs”) are reported to the Fund after the end of the calendar year; accordingly, the Funds estimate these amounts for accounting purposes until the characterization of REIT distributions is reported to the Fund after the end of the calendar year. Estimates are based on the most recent REIT distribution information available.
These “Book/tax” differences are considered either temporary (i.e., deferred losses, capital loss carry forwards) or permanent in nature. To the extent these differences are permanent in nature, such amounts are reclassified within the composition of net assets based on their federal tax basis treatment; temporary differences do not require reclassification.
(f) Foreign Currency Translation — Investment securities and other assets and liabilities denominated in foreign currencies are translated into U.S. dollar amounts at the date of valuation. Purchases and sales of investment securities and income and expense items denominated in foreign currencies are translated into U.S. dollar amounts on the respective dates of such transactions. The Trust does not isolate that portion of the results of operations resulting from changes in foreign exchange rates on investments from the fluctuations arising from changes in market prices of securities held. Such fluctuations are included with the net realized and unrealized gain or loss from investments.
Reported net realized foreign exchange gains or losses arise from sales of foreign currencies, currency gains or losses realized between the trade and settlement dates on securities transactions, and the difference between the amounts of dividends, interest, and foreign withholding taxes recorded on the company’s books and the U.S. dollar equivalent of the amounts actually received or paid. Net unrealized foreign exchange gains and losses arise from changes in the fair values of assets and liabilities, other than investments in securities at fiscal period end, resulting from changes in exchange rates.
(g) Concentration — Cash & Cash Equivalents: The Funds consider their investment in a Federal Deposit Insurance Corporation (“FDIC”) insured interest bearing account to be cash and cash equivalents. Cash and cash equivalents are valued at cost plus any accrued interest. The Funds maintain cash balances, which, at times may exceed federally insured limits. The Funds maintain these balances with a high-quality financial institution.
40
ICON Funds | Notes to Financial Statements (Continued) | December 31, 2021 |
The ICON Consumer Select Fund, ICON Equity Income Fund, ICON Health and Information Technology Fund, ICON Natural Resources & Infrastructure Fund, and ICON Utilities and Income Fund seek to replicate the performance of their respective sectors. From time to time this replication may lead a Fund to concentrate in stocks of a particular sector, category or group of companies, which could cause such Fund to underperform the overall stock market. Refer to each Fund’s Portfolio of Investments for instances where these concentration might exist as of December 31, 2021.
Concentration of Credit Risk: Each Fund places its cash with a banking institution, which is insured by FDIC. The FDIC limit is $250,000. At various times throughout the year, the amount on deposit may exceed the FDIC limit and subject the Funds to a credit risk. The Funds do not believe that such deposits are subject to any unusual risk associated with investment activities.
(h) Use of Estimates in Financial Statements — In preparing financial statements in conformity with accounting principles generally accepted in the United States of America, Shelton Capital makes estimates and assumptions that affect the reported amounts of assets and liabilities at the date of the financial statements, as well as the reported amounts of income and expense during the year. Actual results may differ from these estimates.
(i) Share Valuations — The net asset value (“NAV”) per share of each Fund is calculated by dividing the sum of the value of the securities held by the Fund, plus cash or other assets, minus all liabilities (including estimated accrued expenses) by the total number of shares outstanding of the Fund, rounded to the nearest cent. A Fund’s shares will not be priced on the days on which the NYSE is closed for trading. The offering and redemption price per share of each Fund is equal to a Fund’s NAV per share.
(j) Accounting for Uncertainty in Income Taxes — The Funds recognize the tax benefits of uncertain tax positions only where the position is “more likely than not” to be sustained assuming examination by tax authorities. Shelton Capital has analyzed the Fund’s tax positions, and has concluded that no liability for unrecognized tax benefits should be recorded related to uncertain tax positions taken on returns filed for open tax years (2018-2020) or expected to be taken in the Fund’s 2020 tax returns. The Funds identify its major tax jurisdictions as U.S. Federal, however the Funds are not aware of any tax positions for which it is reasonably possible that the total amounts of unrecognized tax benefits will change materially in the next twelve months.
(k) Fair Value Measurements — The Funds utilize various methods to measure the fair value of most of its investments on a recurring basis. U.S. GAAP establishes a hierarchy that prioritizes inputs to valuation methods. The three levels of inputs are:
Level 1 – Unadjusted quoted prices in active markets for identical assets or liabilities that the Trust has the ability to access.
Level 2 – Observable inputs other than quoted prices included in Level 1 that are observable for the asset or liability, either directly or indirectly. These inputs may include quoted prices for the identical instrument on an inactive market, prices for similar instruments, interest rates, prepayment speeds, credit risk, yield curves, default rates and similar data.
Level 3 – Unobservable inputs for the asset or liability, to the extent relevant observable inputs are not available, representing the Fund’s own assumptions about the assumptions a market participant would use in valuing the asset or liability, and would be based on the best information available.
The availability of observable inputs can vary from security to security and is affected by a wide variety of factors, including, for example, the type of security, whether the security is new and not yet established in the marketplace, the liquidity of markets, and other characteristics particular to the security. To the extent that valuation is based on models or inputs that are less observable or unobservable in the market, the determination of fair value requires more judgment. Accordingly, the degree of judgment exercised in determining fair value is greatest for instruments categorized in Level 3.
The inputs used to measure fair value may fall into different levels of the fair value hierarchy. In such cases, for disclosure purposes, the level in the fair value hierarchy within which the fair value measurement falls in its entirety, is determined based on the lowest level input that is significant to the fair value measurement in its entirety.
The following table summarizes the valuation of the Trust’s securities at December 31, 2021 using fair value hierarchy:
Level 1(a) | Level 2(a) | Level 3(a) | ||||||||||||||
Fund | Investments in | Investments in | Investments | Total | ||||||||||||
ICON Consumer Select Fund | $ | 63,603,293 | $ | — | $ | — | $ | 63,603,293 | ||||||||
ICON Equity Fund | 86,453,043 | — | — | 86,453,043 | ||||||||||||
ICON Equity Income Fund | 83,664,102 | 652,701 | — | 84,316,803 | ||||||||||||
ICON Flexible Bond Fund | 48,210,847 | 105,427,574 | — | 153,638,421 | ||||||||||||
ICON Health and Information Technology Fund | 130,285,208 | — | — | 130,285,208 | ||||||||||||
ICON Natural Resources & Infrastructure Fund | 129,656,163 | — | — | 129,656,163 | ||||||||||||
ICON Utilities and Income Fund | 46,526,470 | — | — | 46,526,470 | ||||||||||||
(a) | It is the Fund’s policy to recognize transfers between levels on the last day of the fiscal reporting period. There were no transfers in or out of Level 2, and Level 3 as of FYE. |
(b) | All publicly traded common stocks, preferred stocks, and investments in investment companies held in the Funds are Level 1 securities. For a detailed break-out of equity securities by major industry classification, please refer to the Portfolio of Investments. |
(c) | All corporate debt and asset-backed securities held in the Funds are Level 2 securities. For a detailed break-out of fixed income securities by type, please refer to the Portfolio of Investments. |
(l) Disclosure about Derivative Instruments and Hedging Activities — The Fund has adopted enhanced disclosure regarding derivative and hedging activity intended to improve financial reporting of derivative instruments by enabling investors to understand how and why an entity uses derivatives, how derivatives are accounted for, and how derivative instruments affect an entity’s results of operations and financial position.
(m) LIBOR Transition Risk — The United Kingdom’s Financial Conduct Authority announced a phase out of the London Interbank Offered Rate (“LIBOR”) by the end of 2021. On November 30, 2020, the administrator of LIBOR announced its intention to delay the phase out of the majority of the U.S. dollar LIBOR publications until June30, 2023, with the remainder of LIBOR publications to still end at the end of 2021. The Funds may be exposed
41
ICON Funds | Notes to Financial Statements (Continued) | December 31, 2021 |
to financial instruments tied to LIBOR to determine payment obligations, financing terms, hedging strategies or investment value. The transition process away from LIBOR might lead to increased volatility and illiquidity in markets for, and reduce the effectiveness of new hedges placed against, instruments whose terms currently include LIBOR. The ultimate effect of the LIBOR transition process on the Funds is uncertain.
(n) COVID-19 Risks — An outbreak of respiratory disease caused by a novel coronavirus was first detected in December 2019 and has now spread globally. This coronavirus has resulted in closing borders, enhanced health screenings, partial population vaccination, healthcare service preparation and delivery, quarantines, cancellations, disruptions to supply chains and customer activity, government sponsored fiscal stimulus programs, virus moraoria on the applicability of certain laws and regulations, as well as general concern and uncertainty. The impact of this coronavirus (and the variants of such virus), and other epidemics and pandemics that may arise in the future, could affect the economies of many nations, individual companies, their securities (including equity and debt), and the market in general in ways that cannot necessarily be foreseen at the present time. In addition, the impact of infectious diseases in developing or emerging market countries may be greater due to less established health care systems. Health crises caused by the recent coronavirus outbreak may exacerbate other pre-existing political, social, financial, and economic risks in certain countries. The impact of the outbreak may last for an extended period of time.
NOTE 2 – INVESTMENT MANAGEMENT FEE AND OTHER RELATED PARTY TRANSACTIONS
Shelton provides each Fund with management and administrative services pursuant to investment management and administration servicing agreements.
In accordance with the terms of the management agreement, the Advisor receives compensation at the following annual rates:
Fund | % of Net Assets | |||
ICON Consumer Select Fund | 1.00 | % | ||
ICON Equity Fund | 0.75 | % | ||
ICON Equity Income Fund | 0.75 | % | ||
ICON Flexible Bond Fund | 0.60 | % | ||
ICON Health and Information Technology Fund | 1.00 | % | ||
ICON Natural Resources & Infrastructure Fund | 1.00 | % | ||
ICON Utilities and Income Fund | 1.00 | % | ||
The Advisor contractually agreed to reduce total operating expense to certain Funds of the Trust. This additional contractual reimbursement (excluding certain compliance costs, extraordinary expenses such as litigation or merger and reorganization expenses, for example) is effective until the dates listed below, unless renewed, and is subject to recoupment within three fiscal years following reimbursement. Recoupment is limited to the extent the reimbursement does not exceed any applicable expense limit and the effect of the reimbursement is measured after all ordinary operating expenses are calculated; any such reimbursement is subject to the Board of Trustees’ review and approval. Reimbursements from the Advisor to affected Funds, and the expense limits, for the year ended December 31, 2021 are as follows:
Expense Limitation | ||||||||||||
Fund | Institutional | Investor | Expiration | |||||||||
ICON Consumer Select Fund | — | — | — | |||||||||
ICON Equity Fund | — | — | — | |||||||||
ICON Equity Income Fund | 0.99 | % | 1.24 | % | 5/1/22 | |||||||
ICON Flexible Bond Fund | 0.75 | % | 1.00 | % | 5/1/22 | |||||||
ICON Health and Information Technology Fund | — | — | — | |||||||||
ICON Natural Resources & Infrastructure Fund | — | — | — | |||||||||
ICON Utilities and Income Fund | 1.22 | % | 1.47 | % | 5/1/22 | |||||||
At December 31, 2021, the remaining cumulative unreimbursed amount paid and/or waived by the Advisor on behalf of the Funds that may be reimbursed was $359,945. The Advisor may recapture a portion of the above amount no later than the dates as stated below.
Fund | Expires | Expires | Expires | Total | ||||||||||||
ICON Consumer Select Fund | $ | — | $ | — | $ | — | $ | — | ||||||||
ICON Equity Fund | — | — | — | — | ||||||||||||
ICON Equity Income Fund | 17,775 | 11,132 | 33,805 | 62,712 | ||||||||||||
ICON Flexible Bond Fund | 45,652 | 38,363 | 115,484 | 199,499 | ||||||||||||
ICON Health and Information Technology Fund | — | — | — | — | ||||||||||||
ICON Natural Resources & Infrastructure Fund | — | — | — | — | ||||||||||||
ICON Utilities and Income Fund | 14,724 | 18,050 | 64,960 | 97,734 | ||||||||||||
Total | $ | 78,151 | $ | 67,545 | $ | 214,249 | $ | 359,945 | ||||||||
A Fund must pay its current ordinary operating expenses before the Advisor is entitled to any reimbursement of fees and/or expenses. Any such reimbursement is contingent upon the Board of Trustees review and approval prior to the time the reimbursement is initiated.
As compensation for administrative duties not covered by the management agreement, Shelton receives an administration fee, which was revised on January 1, 2011. The administration fee is based on assets held, in aggregate, by the SCM Trust and other funds within the same “family” of investment companies managed and administered by Shelton. The fee rates are 0.10% on the first $500 million, 0.08% on the next $500 million, and 0.06% on combined assets over $1 billion. Administration fees are disclosed in the Statements of Operations.
42
ICON Funds | Notes to Financial Statements (Continued) | December 31, 2021 |
Certain officers and trustees of the Trust are also partners of Shelton. Steve Rogers has served as a trustee and Chairman of the Board of Trustees of the Trust since 1998, and President of the Trust since 1999. Mr. Rogers is also Chief Executive Officer of the Adviser. Gregory T. Pusch has served as the Chief Compliance Officer (“CCO”) of the Trust since March 2017. Mr. Pusch is also employed by Shelton, the Advisor and Administrator to the Trust. The Trust is responsible for the portion of his salary allocated to his duties as the CCO of the Trust during his employment, and Shelton is reimbursed by the Trust for this portion of his salary. The level of reimbursement is reviewed and determined by the Board of Trustees at least annually.
The Trust has adopted a Distribution Plan (the “Plan”), as amended July 29, 2017, pursuant to Rule 12b-1 under the Investment Company Act of 1940, whereby the Investor Shares of each Fund pays RFS Partners, the Funds’ distributor (the “Distributor”), an affiliate of the Advisor, for expenses that relate to the promotion and distribution of shares. Under the Plan, the Investor Shares of the Funds will pay the Distributor a fee at an annual rate of 0.25%, payable monthly, of the daily net assets attributable to such Fund’s Investor Shares.
For the year ended December 31, 2021 the following were paid:
Fund | Investor Class | |||
ICON Consumer Select Fund | $ | 6,369 | ||
ICON Equity Fund | $ | 57,044 | ||
ICON Equity Income Fund | $ | 98,987 | ||
ICON Flexible Bond Fund | $ | 24,690 | ||
ICON Health and Information Technology Fund | $ | 8,030 | ||
ICON Natural Resources & Infrastructure Fund | $ | 17,218 | ||
ICON Utilities and Income Fund | $ | 14,838 | ||
Management fees, administration fees, expense reimbursement from the Advisor, CCO fees and Trustees fees incurred during the period are included in the Statements of Operations.
NOTE 3 – PURCHASES AND SALES OF SECURITIES
Purchases and sales of securities other than short-term instruments for the year ended December 31, 2021 were as follows:
Fund | Purchases | Sales | ||||||
ICON Consumer Select Fund | $ | 23,606,441 | $ | 28,052,959 | ||||
ICON Equity Fund | 18,421,330 | 24,178,979 | ||||||
ICON Equity Income Fund | 21,372,990 | 35,937,220 | ||||||
ICON Flexible Bond Fund | 266,372,724 | 256,246,301 | ||||||
ICON Health and Information Technology Fund | 42,330,440 | 61,508,006 | ||||||
ICON Natural Resources & Infrastructure Fund | 124,543,884 | 136,860,819 | ||||||
ICON Utilities and Income Fund | 23,088,097 | 12,934,761 | ||||||
NOTE 4 – TAX CHARACTER
Reclassifications: Accounting principles generally accepted in the United States of America require certain components of net assets be reclassified between financial and tax reporting. These reclassifications have no effect on net assets or net asset value per share. The reclassification was as follows:
| Increase/ | Increase/ | ||||||
ICON Equity Fund | $ | (10,400 | ) | $ | 10,400 | |||
ICON Flexible Bond Fund | (145,754 | ) | 145,754 | |||||
ICON Natural Resources & Infrastructure Fund | 11,952 | (11,952 | ) | |||||
ICON Utilities and Income Fund | (55,960 | ) | 55,960 | |||||
The reclassification of net assets consists primarily of return of capital distributions, non-deductible excise tax paid and prior year tax return adjustments impacting distributable earnings.
Tax Basis of Distributable Earnings: For U.S. Federal income tax purposes, the cost of securities owned, gross appreciation, gross depreciation, and net unrealized appreciation of investments on December 31, 2021 were as follows:
| Tax Cost | Gross | Gross | Net Unrealized | ||||||||||||
ICON Consumer Select Fund | $ | 44,462,854 | $ | 20,556,246 | $ | (1,415,808 | ) | $ | 19,140,438 | |||||||
ICON Equity Fund | 45,909,067 | 37,725,297 | (752,648 | ) | 36,972,645 | |||||||||||
ICON Equity Income Fund | 65,849,008 | 19,302,959 | (979,748 | ) | 18,323,211 | |||||||||||
ICON Flexible Bond Fund | 144,413,829 | 1,513,997 | (1,055,189 | ) | 458,808 | |||||||||||
ICON Health and Information Technology Fund | 88,769,448 | 45,967,707 | (4,451,947 | ) | 41,515,760 | |||||||||||
ICON Natural Resources & Infrastructure Fund | 102,060,386 | 33,261,427 | (5,665,650 | ) | 27,595,777 | |||||||||||
ICON Utilities and Income Fund | 39,820,821 | 7,281,333 | (575,684 | ) | 6,705,649 | |||||||||||
43
ICON Funds | Notes to Financial Statements (Continued) | December 31, 2021 |
The tax character of distributable earnings as of December 31, 2021 was as follows:
| Undistributed | Undistributed | Capital | Unrealized | Post October | Total | ||||||||||||||||||
ICON Consumer Select Fund | $ | 78,901 | $ | 1,519,916 | $ | (3,338,538 | ) | $ | 19,140,438 | $ | — | $ | 17,400,717 | |||||||||||
ICON Equity Fund | — | — | (1,081,949 | ) | 36,972,645 | — | 35,890,696 | |||||||||||||||||
ICON Equity Income Fund | — | 337,596 | — | 18,323,211 | — | 18,660,807 | ||||||||||||||||||
ICON Flexible Bond Fund | — | — | (4,978,797 | ) | 458,808 | — | (4,519,989 | ) | ||||||||||||||||
ICON Health and Information Technology Fund | 2,957,771 | 12,221,086 | (805,328 | ) | 41,515,760 | — | 55,889,289 | |||||||||||||||||
ICON Natural Resources & Infrastructure Fund | 127,570 | — | (220,152,756 | ) | 27,595,777 | — | (192,429,409 | ) | ||||||||||||||||
ICON Utilities and Income Fund | — | — | — | 6,705,649 | (23,907 | ) | 6,681,742 | |||||||||||||||||
The difference between book basis and tax basis unrealized appreciation/(depreciation) is attributable primarily to wash sales, PFICs, and bond adjustments. During the current year, the ICON Utilities and Income Fund deferred $23,907 of short-term post-October capital losses, which will be recognized on the first day of the following fiscal year.
Capital Losses: Capital loss carry forwards, as of December 31, 2021, available to offset future capital gains, if any, are as follows:
| ICON Consumer | ICON Equity | ICON Flexible | ICON Health | ICON Natural | |||||||||||||||
Long Term with No Limitation | $ | — | $ | — | $ | (3,808,458 | ) | $ | — | $ | (12,114,381 | ) | ||||||||
Short Term with No Limitation | — | — | (1,170,339 | ) | — | — | ||||||||||||||
Long Term Subject to Annual Limitation | (931,455 | ) | — | — | — | (119,401,206 | ) | |||||||||||||
Short Term Subject to Annual Limitation | (2,407,083 | ) | (1,081,949 | ) | — | (805,328 | ) | (88,637,169 | ) | |||||||||||
Total | $ | (3,338,538 | ) | $ | (1,081,949 | ) | $ | (4,978,797 | ) | $ | (805,328 | ) | $ | (220,152,756 | ) | |||||
* | Subject to an annual limitation of $270,264 under §382 of the Code through December 31, 2032, year ending December 31, 2033 limit is $252,613, and $113,021 for the year ending December 31, 2034. |
** | Subject to an annual limitation of $133,945 under §382 of the Code through December 31, 2029, and $10,389 for the year ending December 31, 2030. |
*** | Subject to an annual limitation of $601,938 under §382 of the Code, through December 31, 2022, and $203,390 for year ending December 31, 2023. |
**** | Subject to an annual limitation of $678,984 under §382 of the Code through December 31, 2026, year ending December 31, 2027 limit is $644,536, and an annual limitation if $577,350 thereafter. |
ICON Consumer Select Fund, ICON Equity Fund, ICON Equity Income Fund, ICON Flexible Bond Fund, ICON Health and Information Technology Fund, and ICON Natural Resources & Infrastructure Fund utilized Capital Loss Carry Forwards in the amount of $270,264, $133,945, $2,238,923, $589,691, $601,938 and $25,914,568 respectively in the fiscal year.
Distributions to Shareholders: Income distributions and capital gain distributions are determined in accordance with income tax regulations, which may differ from U.S. generally accepted accounting principles. These differences are primarily due to differing treatments of income and gains on various investment securities held by each Fund, timing differences and differing characterization of distributions made by each Fund. The tax character of distributions paid during the period and years ended December 31, 2021, December 31, 2020 and September 30, 2020 are as follows:
Fund | Year or Period | Return of | Ordinary | Long-Term | Exempt-Interest | Total | |||||||||||||||
ICON Consumer Select Fund | September 30, 2020 | $ | — | $ | 336,028 | $ | 471,401 | $ | — | $ | 807,429 | ||||||||||
December 31, 2020 | — | — | — | — | — | ||||||||||||||||
December 31, 2021 | — | 2,442,189 | 3,843,155 | — | 6,285,344 | ||||||||||||||||
ICON Equity Fund | September 30, 2020 | — | — | 757,121 | — | 757,121 | |||||||||||||||
December 31, 2020 | — | — | — | — | — | ||||||||||||||||
December 31, 2021 | 10,400 | 3,472,936 | 6,889,587 | — | 10,372,923 | ||||||||||||||||
ICON Equity Income Fund | September 30, 2020 | — | 2,533,730 | 916,555 | — | 3,450,285 | |||||||||||||||
December 31, 2020 | — | 1,628,166 | — | — | 1,628,166 | ||||||||||||||||
December 31, 2021 | — | 7,641,522 | 2,110,965 | — | 9,752,487 | ||||||||||||||||
ICON Flexible Bond Fund | September 30, 2020 | — | 7,062,566 | — | — | 7,062,566 | |||||||||||||||
December 31, 2020 | — | 1,376,881 | — | — | 1,376,881 | ||||||||||||||||
December 31, 2021 | 126,154 | 6,856,649 | — | — | 6,982,803 | ||||||||||||||||
ICON Health and Information Technology Fund | September 30, 2020 | — | — | 2,469,081 | — | 2,469,081 | |||||||||||||||
December 31, 2020 | — | — | 4,329,118 | — | 4,329,118 | ||||||||||||||||
December 31, 2021 | — | 2,926,353 | 15,640,079 | — | 18,566,432 | ||||||||||||||||
44
ICON Funds | Notes to Financial Statements (Continued) | December 31, 2021 |
Fund | Year or Period | Return of | Ordinary | Long-Term | Exempt-Interest | Total | |||||||||||||||
ICON Natural Resources & Infrastructure Fund | September 30, 2020 | $ | — | $ | 917,284 | $ | — | $ | — | $ | 917,284 | ||||||||||
December 31, 2020 | — | 349,796 | — | — | 349,796 | ||||||||||||||||
December 31, 2021 | — | 1,662,864 | — | — | 1,662,864 | ||||||||||||||||
ICON Utilities and Income Fund | September 30, 2020 | — | $ | 1,935,482 | 566,602 | — | 2,502,084 | ||||||||||||||
December 31, 2020 | — | 541,608 | 862,023 | — | 1,403,631 | ||||||||||||||||
December 31, 2021 | 55,960 | 3,154,584 | — | — | 3,210,544 | ||||||||||||||||
(a) | Period ended December 31, 2020 represents activity for the three month period beginning October 1, 2020 through December 31, 2020. |
(b) | The Funds designate any Long-Term Capital Gain dividends pursuant to Section 852(b)(3) of the Internal Revenue Code for the year ended December 31, 2021. |
NOTE 5 – SECURITIES LENDINGS
The Funds have entered into an agreement with U.S. Bank, N.A. (the “Lending Agent”), dated September 29, 2020 (the “Securities Lending Agreement”), to provide securities lending services to the Funds. Under this program, the Funds may lend securities in their portfolios to approved brokers, dealers and financial institutions (but not individuals). The securities lending agreement requires that loans are collateralized in an amount equal to at least (i) 105% of then current market value of any loaned foreign securities, or (ii) 102% of the then current market value of any other loaned securities at the outset of the loan and at least 100%, at all times thereafter. The Funds have the right under the terms of the securities lending agreement to recall the securities from the borrower on demand. Cash collateral received by the Funds for securities loaned is invested by the Lending Agent in the First American Government Obligations Fund – Class X. The Funds continue to benefit from interest or dividends on the securities loaned and may also earn a return from the collateral. Such investments are subject to risk of payment delays, declines in the value of collateral provided, default on the part of the issuer or counterparty, and the risk that the investment may not generate sufficient interest to support the costs associated with securities lending. The Funds could also experience delays in recovering their securities and possible loss of income or value if the borrower fails to return the borrowed securities. The Funds are not subject to a master netting arrangement.
Amounts earned from security lending is disclosed in each Fund’s Statement of Operations as a securities lending credit.
As of December 31, 2021, the value of the securities on loan and payable for collateral were as follows:
Fund | Value of | Fund Collateral | ||||||
ICON Equity Fund: | $ | 3,488,870 | $ | 3,586,301 | ||||
ICON Equity Income Fund: | $ | 139,905 | $ | 145,193 | ||||
ICON Flexible Bond Fund: | $ | 8,619,767 | $ | 8,802,528 | ||||
* | The cash collateral received was invested in the First American Government Obligations Fund – Class X as shown on Portfolios of Investments. |
Amounts relate to master netting agreements and collateral agreements which have been determined by the company to be legally enforceable in the event of default but where certain other criteria are not met in accordance with applicable offsetting accounting guidance. The collateral amounts may exceed the related net amounts of financial assets and liabilities presented in the statement of assets and liabilities. Where this is the case, the total amount reported is limited to the net amounts of financial assets and liabilities with that counterparty.
NOTE 6 – REORGANIZATIONS
On June 3, 2020, the shareholders of the ICON Consumer Discretionary Fund approved the agreement and plan of reorganization providing for the transfer of assets and assumption of liabilities into the ICON Consumer Select Fund. ICON Consumer Select Fund is the performance and accounting survivor of the reorganization, as well as the legal and tax survivor. The reorganization was effective as of the close of business on July 10, 2020. The following table illustrates the specifics of the Fund’s reorganization:
ICON Consumer | New Shares issued | Consumer Select | Combined Net Assets | Tax Status of Transfer |
$18,792,740(a) | 2,150,511 | $25,279,178 | $44,071,918 | Non-taxable |
(a) | Includes accumulated realized losses and unrealized appreciation in the amounts of $(2,884,684) and $3,674,286, respectively, from the merged fund. |
45
ICON Funds | Notes to Financial Statements (Continued) | December 31, 2021 |
As of close of business on July 10, 2020, the classes were converted at the following rates:
Pre-Merger Class | Pre-Merger | Rate | Shares | Dollars | Post-Merger | Post Merger Class | |||||||||||||||
ICON Consumer Discretionary Fund– A Class | $ | 13.13 | 1.5057 | 60,322 | $ | 526,159 | $ | 8.72 | ICON Consumer Select Fund – Investor Class | ||||||||||||
ICON Consumer Discretionary Fund– S Class | $ | 13.88 | 1.5880 | 2,090,189 | $ | 18,266,581 | $ | 8.74 | ICON Consumer Select Fund – Institutional Class | ||||||||||||
On June 16, 2020, the shareholders of the ICON Fund approved the agreement and plan of reorganization providing for the transfer of assets and assumption of liabilities into the ICON Equity Fund. The ICON Equity Fund is the performance and accounting survivor of the reorganization, as well as the legal and tax survivor. The reorganization was effective as of the close of business on July 10, 2020. The following table illustrates the specifics of the Fund’s reorganization:
ICON Fund Pre- | New Shares issued | ICON Equity Fund | Combined Net Assets | Tax Status of Transfer |
$36,394,016(a) | 1,450,487 | $14,773,317 | $63,726,389(b) | Non-taxable |
(a) | Includes appreciation in the amount of $8,350,876 from the merged fund. |
(b) | Combined net assets include the reorganization net assets of the ICON Fund and ICON Opportunities Fund. |
As of close of business on July 10, 2020, the classes were converted at the following rates:
Pre-Merger Class | Pre-Merger | Rate | Shares | Dollars | Post-Merger | Post Merger Class | |||||||||||||||
ICON Fund– A Class | $ | 16.76 | 0.6860 | 282,617 | $ | 6,902,840 | $ | 24.42 | ICON Equity Fund – Investor Class | ||||||||||||
ICON Fund– C Class | $ | 15.10 | 0.6184 | 255,155 | $ | 6,232,091 | $ | 24.42 | ICON Equity Fund – Investor Class | ||||||||||||
ICON Fund– S Class | $ | 18.05 | 0.7084 | 912,715 | $ | 23,259,085 | $ | 25.48 | ICON Equity Fund – Institutional Class | ||||||||||||
On June 3, 2020, the shareholders of the ICON Opportunities Fund approved the agreement and plan of reorganization providing for the transfer of assets and assumption of liabilities into the ICON Equity Fund. The ICON Equity Fund is the performance and accounting survivor of the reorganization, as well as the legal and tax survivor. The reorganization was effective as of the close of business on July 10, 2020. The following table illustrates the specifics of the Fund’s reorganization:
ICON Opportunities | New Shares issued to | ICON Equity Fund | Combined Net Assets | Tax Status of Transfer |
$12,559,056(a) | 492,833 | $14,773,317 | $63,726,389(b) | Non-taxable |
(a) | Includes accumulated realized losses and unrealized depreciation in the amounts of $(1,285,585) and $(97,689), respectively, from the merged fund. |
(b) | Combined net assets include the reorganization net assets of the ICON Fund and ICON Opportunities Fund. |
As of close of business on July 10, 2020, the classes were converted at the following rates:
Pre-Merger Class | Pre-Merger | Rate | Shares | Dollars | Post-Merger | Post Merger Class | |||||||||||||||
ICON Opportunities Fund– S Class | $ | 11.67 | 0.4580 | 492,833 | $ | 12,559,056 | $ | 25.48 | ICON Equity Fund – Institutional Class | ||||||||||||
On July 10, 2020, the shareholders of the ICON Energy Fund approved the agreement and plan of reorganization providing for the transfer of assets and assumption of liabilities into the ICON Natural Resources and Infrastructure Fund. The ICON Natural Resources and Infrastructure Fund is the performance and accounting survivor of the reorganization, as well as the legal and tax survivor. The reorganization was effective as of the close of business on July 10, 2020. The following table illustrates the specifics of the Fund’s reorganization:
ICON Energy Fund Pre- | New Shares issued | ICON Natural Resources | Combined Net Assets | Tax Status of Transfer |
$52,836,082(a) | 5,058,302 | $38,697,651 | $100,389,461(b) | Non-taxable |
(a) | Includes accumulated realized losses and unrealized depreciation in the amounts of $(208,827,696) and $(30,537,973), respectively, from the merged fund. |
(b) | Combined net assets include the reorganization net assets of the ICON Energy Fund and ICON Industrials Fund. |
46
ICON Funds | Notes to Financial Statements (Continued) | December 31, 2021 |
As of close of business on July 10, 2020, the classes were converted at the following rates:
Pre-Merger Class | Pre-Merger | Rate | Shares | Dollars | Post-Merger | Post Merger Class | |||||||||||||||
ICON Energy Fund– A Class | $ | 5.72 | 0.5543 | 147,022 | $ | 1,518,698 | $ | 10.33 | ICON Natural Resources and Infrastructure Fund – Investor Class | ||||||||||||
ICON Energy Fund– C Class | $ | 5.42 | 0.5245 | 144,933 | $ | 1,497,135 | $ | 10.33 | ICON Natural Resources and Infrastructure Fund – Investor Class | ||||||||||||
ICON Energy Fund– S Class | $ | 5.78 | 0.5534 | 4,766,347 | $ | 49,820,249 | $ | 10.45 | ICON Natural Resources and Infrastructure Fund – Institutional Class | ||||||||||||
On June 3, 2020, the shareholders of the ICON Industrials Fund approved the agreement and plan of reorganization providing for the transfer of assets and assumption of liabilities into the ICON Natural Resources and Infrastructure Fund. The ICON Natural Resources and Infrastructure Fund is the performance and accounting survivor of the reorganization, as well as the legal and tax survivor. The reorganization was effective as of the close of business on July 10, 2020. The following table illustrates the specifics of the Fund’s reorganization:
ICON Industrials Fund Pre- | New Shares issued to | ICON Natural Resources | Combined Net Assets | Tax Status of Transfer |
$9,305,728(a) | 890,908 | $38,697,651 | $100,389,461(b) | Non-taxable |
(a) | Includes accumulated realized losses and unrealized appreciation in the amounts of $(728,016) and $103,405, respectively, from the merged fund. |
(b) | Combined net assets include the reorganization net assets of the ICON Energy Fund and ICON Industrials Fund. |
As of close of business on July 10, 2020, the classes were converted at the following rates:
Pre-Merger Class | Pre-Merger | Rate | Shares | Dollars | Post-Merger | Post Merger Class | |||||||||||||||
ICON Industrials Fund– A Class | $ | 13.29 | 1.2869 | 52,860 | $ | 546,034 | $ | 10.33 | ICON Natural Resources and Infrastructure Fund – Investor Class | ||||||||||||
ICON Industrials Fund– S Class | $ | 13.54 | 1.2958 | 838,048 | $ | 8,759,694 | $ | 10.45 | ICON Natural Resources and Infrastructure Fund – Institutional Class | ||||||||||||
On July 10, 2020, the shareholders of the ICON Healthcare Fund approved the agreement and plan of reorganization providing for the transfer of assets and assumption of liabilities into the ICON Healthcare and Information Technology Fund. ICON Healthcare and Information Technology Fund is the performance and accounting survivor of the reorganization, as well as the legal and tax survivor. The reorganization was effective as of the close of business on July 10, 2020. The following table illustrates the specifics of the Fund’s reorganization:
ICON Healthcare Fund Pre- | New Shares issued to | ICON Healthcare and | Combined Net Assets | Tax Status of Transfer |
$55,158,314(a) | 3,127,315 | $55,902,415 | $111,060,729 | Non-taxable |
(a) | Includes accumulated realized losses and unrealized appreciation in the amounts of $(1,709,471) and $11,006,000, respectively, from the merged fund. |
As of close of business on July 10, 2020, the classes were converted at the following rates:
Pre-Merger Class | Pre-Merger | Rate | Shares | Dollars | Post-Merger | Post Merger Class | |||||||||||||||
ICON Healthcare Fund – A Class | $ | 16.62 | 0.9910 | 93,171 | $ | 1,563,188 | $ | 16.78 | ICON Healthcare and Information Technology Fund – Investor Class | ||||||||||||
ICON Healthcare Fund – S Class | $ | 17.54 | 0.9930 | 3,034,144 | $ | 53,595,126 | $ | 17.66 | ICON Healthcare and Information Technology Fund – Institutional Class | ||||||||||||
47
ICON Funds | Notes to Financial Statements (Continued) | December 31, 2021 |
On July 24, 2020, the shareholders of the ICON Consumer Staples Fund approved the agreement and plan of reorganization providing for the transfer of assets and assumption of liabilities into the ICON Consumer Select Fund. ICON Consumer Select Fund is the performance and accounting survivor of the reorganization, as well as the legal and tax survivor. The reorganization was effective as of the close of business on July 31, 2020. The following table illustrates the specifics of the Fund’s reorganization:
ICON Consumer Staples | New Shares issued to | Consumer Select | Combined Net Assets | Tax Status of Transfer |
$5,946,877(a) | 657,151 | $45,061,186 | $51,008,063 | Non-taxable |
(a) | Includes accumulated realized losses and unrealized appreciation in the amounts of $(886,480) and $642,576, respectively, from the merged fund. |
As of close of business on July 31, 2020, the classes were converted at the following rates:
Pre-Merger Class | Pre-Merger | Rate | Shares | Dollars | Post-Merger | Post Merger Class | |||||||||||||||
ICON Consumer Staples Fund– A Class | $ | 6.69 | 0.7405 | 128,098 | $ | 1,157,308 | $ | 9.03 | ICON Consumer Select Fund – Investor Class | ||||||||||||
ICON Consumer Staples Fund– S Class | $ | 6.74 | 0.7440 | 529,053 | $ | 4,789,569 | $ | 9.05 | ICON Consumer Select Fund – Institutional Class | ||||||||||||
On August 20th, 2020, the shareholders of the ICON Risk-Managed Balanced Fund approved the agreement and plan of reorganization providing for the transfer of assets and assumption of liabilities into the ICON Equity Income Fund. The ICON Equity Income Fund is the performance and accounting survivor of the reorganization, as well as the legal and tax survivor. The reorganization was effective as of the close of business on September 25, 2020. The following table illustrates the specifics of the Fund’s reorganization:
ICON Risk-Managed | New Shares issued | ICON Equity Income | Combined Net Assets | Tax Status of Transfer |
$23,191,045(a) | 1,422,769 | $56,406,450 | $79,597,495 | Non-taxable |
(a) | Includes accumulated realized losses and unrealized appreciation in the amounts of $(43,667) and $1,000,554, respectively, from the merged fund. |
As of close of business on September 25, 2020, the classes were converted at the following rates:
Pre-Merger Class | Pre-Merger | Rate | Shares | Dollars | Post-Merger | Post Merger Class | |||||||||||||||
ICON Risk-Managed Balanced Fund – A Class | $ | 15.03 | 0.9230 | 152,538 | $ | 2,483,964 | $ | 16.28 | ICON Equity Income Fund – Investor Class | ||||||||||||
ICON Risk-Managed Balanced Fund – C Class | $ | 14.00 | 0.8599 | 824,912 | $ | 13,433,024 | $ | 16.28 | ICON Equity Income Fund – Investor Class | ||||||||||||
ICON Risk-Managed Balanced Fund – S Class | $ | 15.43 | 0.9449 | 445,319 | $ | 7,274,057 | $ | 16.33 | ICON Equity Income Fund – Institutional Class | ||||||||||||
Assuming the reorganizations had been completed on October 1, 2019, the beginning of the reporting period for each of the reorganizations, the pro forma results of operations for the year ended September 30, 2020, would be as follows:
| ICON Consumer | ICON Equity Fund | ICON Health | ICON Natural | ||||||||||||
Net investment income/(loss) | $ | 16,351 | $ | (181,960 | ) | $ | (516,488 | ) | $ | 1,704,171 | ||||||
Net realized gain/loss on investments | (2,394,731 | ) | (1,462,864 | ) | 3,555,717 | (47,358,723 | ) | |||||||||
Change in unrealized appreciation/(depreciation) on investments | 1,428,108 | 4,049,456 | 20,800,850 | 16,294,264 | ||||||||||||
Net increase/(decrease) in net assets resulting from operations | $ | (950,272 | ) | $ | 2,404,632 | $ | 23,840,079 | $ | (29,360,288 | ) | ||||||
NOTE 7 – SUBSEQUENT EVENTS
Subsequent events after the date of the Statements of Assets and Liabilities have been evaluated through the date the financial statements were issued.
48
ICON Funds | Liquidity Risk Management Program Disclosure (Unaudited) | December 31, 2021 |
The SCM Trust (the “Trust”) has adopted and implemented a liquidity risk management program (the “Program”), as consistent with Rule 22e-4 to govern the Trust’s approach to managing liquidity risk for each series of the Trust (each, a “Fund” and collectively, the “Funds”). The Program is overseen by the Liquidity Committee (the “Committee”), which is comprised of investment, operations, and legal and compliance professionals from Shelton Capital Management. The Board of Trustees of the Trust (the “Board”) has approved the designation of the Committee to oversee the Program.
The Program’s principal objectives include supporting each Fund’s compliance with limits on investments in illiquid assets and mitigating the risk that a Fund will be unable to meet its redemption obligations in a timely manner. The Program also includes several elements that support the management and assessment of liquidity risk, including an annual assessment of factors that influence a Fund’s liquidity and the periodic classification and re-classification of the Fund’s investments into groupings that reflect the Committee’s assessment of their relative liquidity under current market conditions.
At a meeting of the Board held on November 11, 2021, the Committee provided a report (the “Report”) to the Board addressing the operation, adequacy, and effectiveness the Program, including any material changes to the Program for the period from the inception of the Trust’s program in December 2019 through November 2021 (“Reporting Period”). The Report concluded that the Trust’s Program was reasonably designed to assess and manage each Fund’s liquidity risk and was adequately and effectively implemented during the Reporting Period. There were no material changes to the Program during the Reporting Period. The Report further concluded that each Fund’s investment strategy continues to be appropriate given each Fund’s status as an open-end fund.
There can be no assurance that the Program will achieve its objectives in the future. Additional information regarding risks of investing in each Fund, including liquidity risks presented by the Trust’s investment portfolios, is found in the Trust’s Prospectus and Statement of Additional Information.
49
| Report of Independent Registered Public Accounting Firm |
|
To the Shareholders of the ICON Funds and Board of Trustees of SCM Trust
Opinion on the Financial Statements
We have audited the accompanying statement of assets and liabilities, including the portfolios of investments, of ICON Consumer Select Fund, ICON Equity Fund, ICON Equity Income Fund, ICON Flexible Bond Fund, ICON Health and Information Technology Fund, ICON Natural Resources and Infrastructure Fund, and ICON Utilities and Income Fund, each a series of SCM Trust, (the “Funds”) as of December 31, 2021, the related statements of operations and change in net assets for the year then ended, the related notes, and the financial highlights for the years ended December 31, 2021, September 30, 2019, September 30, 2018, and September 30, 2017 (collectively referred to as the “financial statements”). In our opinion, the financial statements present fairly, in all material respects, the financial position of the each of the Funds as of December 31, 2021, the results of their operations and changes in net assets for the year then ended, and the financial highlights for each of the years indicated above, in conformity with accounting principles generally accepted in the United States of America.
The Funds’ financial statements and financial highlights for the period ended December 31, 2020 and year ended September 30, 2020, were audited by other auditors whose report dated March 1, 2021, expressed an unqualified opinion on those financial statements and financial highlights.
Basis for Opinion
These financial statements are the responsibility of the Funds’ management. Our responsibility is to express an opinion on the Funds’ financial statements based on our audits. We are a public accounting firm registered with the Public Company Accounting Oversight Board (United States) (“PCAOB”) and are required to be independent with respect to the Funds in accordance with the U.S. federal securities laws and the applicable rules and regulations of the Securities and Exchange Commission and the PCAOB.
We conducted our audits in accordance with the standards of the PCAOB. Those standards require that we plan and perform the audit to obtain reasonable assurance about whether the financial statements are free of material misstatement whether due to error or fraud.
Our audits included performing procedures to assess the risks of material misstatement of the financial statements, whether due to error or fraud, and performing procedures that respond to those risks. Such procedures included examining, on a test basis, evidence regarding the amounts and disclosures in the financial statements. Our procedures included confirmation of securities owned as of December 31, 2021, by correspondence with the custodians and brokers; when replies were not received from brokers, we performed other auditing procedures. Our audits also included evaluating the accounting principles used and significant estimates made by management, as well as evaluating the overall presentation of the financial statements. We believe that our audits provide a reasonable basis for our opinion.
We have served as the Funds’ auditor since 2021.

COHEN & COMPANY, LTD.
Cleveland, Ohio
March 1, 2022
50
ICON Funds | Additional Information | December 31, 2021 |
Fund Holdings
The Fund holdings shown in this report are as of December 31, 2021. Holdings are subject to change at any time, so holdings shown in the report may not reflect current Fund holdings. The Funds’ Form N-PORT filings, when available, will be available on the SEC’s website at www.sec.gov. The information filed in the Form N-PORT, when available, also may be obtained by calling (800) 955-9988.
Proxy Voting Policy
The Fund’s Statement of Additional Information (“SAI”) containing a description of the policies and procedures that the SCM Trust uses to determine how to vote proxies relating to portfolio securities, along with each Fund’s proxy voting record relating to portfolio securities held during the 12-month period ended June 30, 2021 is available upon request, at no charge, at the phone number above, or on the SEC’s website at www.sec.gov.
Board of Trustees and Executive Officers |
Overall responsibility for management of the Funds rests with the Board of Trustees. The Trustees serve during the lifetime of the Trust and until its termination, or until death, resignation, retirement or removal. The Trustees, in turn, elect the officers of the Fund to actively supervise its day-to-day operations. The officers have been elected for an annual term. The following are the Trustees and Executive Officers of the Funds:
Name | Address | Year of Birth | Position Held with the Trust | Length of |
Stephen C. Rogers | 1875 Lawrence Street, | 1966 | Chairman of the Board, | Since August 1999 |
Kevin T. Kogler | 1875 Lawrence Street, | 1966 | Trustee | Since May 2006 |
Marco L. Quazzo | 1875 Lawrence Street, | 1962 | Trustee | Since August 2014 |
Stephen H. Sutro | 1875 Lawrence Street, | 1969 | Trustee | Since May 2006 |
William P. Mock | 1875 Lawrence Street, | 1966 | Treasurer | Since February 2010 |
Gregory T. Pusch | 1875 Lawrence Street, | 1966 | Chief Compliance Officer, Secretary | Since March 2017 |
Each Trustee oversees the Trust’s four Funds. The principal occupations of the Trustees and Executive Officers of the Funds during the past five years and public directorships held by the Trustees are set forth below:
Stephen C. Rogers* | Chief Executive Officer, Shelton Capital Management, 1999 to present. |
Kevin T. Kogler | President & Founder of MicroBiz, LLC, 2012 to present; Principal, Robertson Piper Software Group, 2006 to 2012; Senior Vice President, Investment Banking, Friedman, Billings Ramsey, 2003 to 2006. |
Marco L. Quazzo | Principal, Bartko Zankel Bunzel & Miller, March 2015-Present; Partner, Barg Coffin Lewis & Trapp LLP (law firm), 2008 to March 2015. |
Stephen H. Sutro | Managing Partner, Duane Morris, LLP (law firm) 2014 to present; Partner, Duane Morris LLP (law firm), 2003 to present. |
William P. Mock | Portfolio Manager, Shelton Capital Management, 2010 to present. |
Gregory T. Pusch | Principal Occupations Past five years: Global Head of Risk & Compliance, Matthews Asia 2015-2016; Head of Legal & Regulatory Compliance / CCO, HarbourVest Partners 2012-2015. |
Additional information about the Trustees may be found in the SAI, which is available without charge by calling (800) 955-9988.
* | Trustee deemed to be an “interested person” of the Trust, as defined in the Investment Company Act of 1940. Mr. Rogers is an interested person because he is the CEO of Shelton Capital Management, the Trust’s Advisor and Administrator. |
51
THIS PAGE INTENTIONALLY LEFT BLANK
THIS PAGE INTENTIONALLY LEFT BLANK
THIS PAGE INTENTIONALLY LEFT BLANK

(b) Not Applicable.
ITEM 2. CODE OF ETHICS.
(a) The Registrant has adopted a code of ethics that applies to its principal executive officers and principal financial and accounting officer.
(b) Not applicable.
(c) Not applicable.
(d) Not applicable.
(e) Not applicable.
(f) Pursuant to Item 13(a)(1), the Registrant is attaching as an exhibit a copy of its code of ethics that applies to its principal executive officer and principal financial and accounting officer. A copy of the code of ethics is available upon request, at no charge, at 1(800) 955-9988.
ITEM 3. AUDIT COMMITTEE FINANCIAL EXPERT.
(a)(1) Registrant does not have an audit committee financial expert serving on its audit committee.
(a)(2) Not applicable.
(a)(3) The audit committee has determined that no single independent trustee meets the criteria of "audit committee financial expert", but the collective skills of the committee are sufficient.
ITEM 4. PRINCIPAL ACCOUNTANT FEES AND SERVICES.
(a) Audit Fees
The aggregate fees paid to the principal accountant for professional services rendered by the principal accountant for the audit of the Registrant's annual financial statements or for services that are normally provided by the principal accountant in connection with statutory and regulatory filings or engagements were $138,000 for the fiscal year ended December 31, 2021 and $62,125 for the fiscal year ended December 31, 2020.
(b) Audit-Related Fees
There were no fees paid to the principal accountant for assurance and related services rendered by the principal accountant to the Registrant that are reasonably related to the performance of the audit of the Registrant's financial statements and are not reported under paragraph (a) of Item 4.
(c) Tax Fees
The aggregate fees paid to the principal accountant for tax compliance, tax advice, and tax planning services rendered by the principal accountant to the Registrant were $34,000 for the fiscal year ended December 31, 2021 and $19,000 for the fiscal year ended December 31, 2020. These fees were related to the preparation of Federal Forms 1220-RIC and 8613 and review of excise distribution calculations.
(d) All Other Fees
The aggregate fees paid to the principal accountant other than the services reported in paragraphs (a) through (c) were $936 for the fiscal year ended December 31, 2021 and $0 for the fiscal year ended December 31, 2020. These fees were related to expenses associated with the August Board of Trustees meeting and the November Board of Trustees meeting.
(e)(1) The Registrant's audit committee is directly responsible for approving the services to be provided by the auditors, including:
| (i) | pre-approval of all audit and audit-related services; |
| (ii) | pre-approval of all non-audit related services to be provided to the Registrant by the auditors; and |
| (iii) | pre-approval of all non-audit related services to be provided to the Registrant by the auditors to the Registrant 's investment adviser or to any entity that controls, is controlled by or is under common control with the Registrant 's investment adviser and that provides ongoing services to the Registrant where the non-audit services relate directly to the operations or financial reporting of the Registrant. |
| (e)(2) | All of the services provided to the Registrant described in paragraphs (b)-(d) of Item 4 were pre-approved by the audit committee. |
(f) Not applicable.
| (g) | The aggregate non-audit fees paid to the principal accountant for services rendered by the principal accountant to the Registrant and the Registrant's investment adviser and any entity controlling, controlled by or under common control with the investment adviser that provides ongoing services to the Registrant were $34,936 for the fiscal year ended December 31, 2021 and $19,000 for the fiscal year ended December 31, 2020. |
(h) Not applicable.
(i) Not applicable.
(j) Not applicable.
ITEM 5. AUDIT COMMITTEE OF LISTED REGISTRANTS.
Not applicable.
ITEM 6. SCHEDULE OF INVESTMENTS.
| (a) | Investments in securities of unaffiliated issuers as of the close of the reporting period are included as part of the report to shareholders filed under Item 1 of this Form N-CSR. |
| (b) | Not applicable. |
ITEM 7. DISCLOSURE OF PROXY VOTING POLICIES AND PROCEDURES FOR CLOSED-END MANAGEMENT INVESTMENT COMPANIES.
Not applicable.
ITEM 8. PORTFOLIO MANAGERS OF CLOSED-END MANAGEMENT INVESTMENT COMPANIES.
Not applicable.
ITEM 9. PURCHASES OF EQUITY SECURITIES BY CLOSED-END MANAGEMENT INVESTMENT COMPANY AND AFFILIATED PURCHASERS.
Not applicable.
ITEM 10. SUBMISSION OF MATTERS TO A VOTE OF SECURITY HOLDERS.
There have been no material changes to the procedures by which the shareholders may recommend nominees to the Registrant's board of trustees since the Registrant last provided disclosure in response to the requirements of Item 7(d)(2)(ii)(G) of Schedule 14A or this Item.
ITEM 11. CONTROLS AND PROCEDURES.
| (a) | The Registrant's principal executive and principal financial officers, or persons performing similar functions, have concluded that the Registrant's disclosure controls and procedures (as defined in Rule 30a-3(c) under the Investment Company Act of 1940, as amended (the "1940 Act") (17 CFR 270.30a-3(c)) are effective as of a date within 90 days of the filing date of the report that includes the disclosure required by this paragraph, based on their evaluation of these controls and procedures required by Rule 30a-3(b) under the 1940 Act (17 CFR 270.30a-3(b)) and Rules 13a-15(b) or 15d-15(b) under the Securities Exchange Act of 1934, as amended (17 CFR 240.13a-15(b) or 240.15d-15(b)). |
| (b) | There were no changes in the Registrant's internal control over financial reporting (as defined in Rule 30a-3(d) under the 1940 Act that occurred during the Registrant's last fiscal half-year (the Registrant's second fiscal half- year in the case of an annual report) that has materially affected, or is reasonably likely to materially affect, the Registrant's internal control over financial reporting |
ITEM 12. Disclosure of Securities Lending Activities for Closed-End Management Investment Companies.
Not applicable.
ITEM 13. EXHIBITS.
| (a)(1) | Code of Ethics is filed as Exhibit 13(a)(1) to this Form N-CSR. |
| (a)(2) | Certifications pursuant to Rule 30a-2(a) under the 1940 Act and Section 302 of the Sarbanes-Oxley Act of 2002, as amended (“SOX”), are filed as Exhibit 13(a)(2) to this Form N-CSR. |
| (a)(3) | Not applicable |
| (a)(4) | Change in Independent Registered Public Accounting Firm is filed as Exhibit 13(a)(4) to this Form N-CSR. |
SIGNATURES
Pursuant to the requirements of the Securities Exchange Act of 1934 and the Investment Company Act of 1940, the registrant has duly caused this report to be signed on its behalf by the undersigned, thereunto duly authorized.
SCM Trust
| By | /s/ Stephen C. Rogers | |
| Stephen C. Rogers, Chairman | ||
| Date: March 07, 2022 | ||
| Pursuant to the requirements of the Securities Exchange Act of 1934 and the Investment Company Act of 1940, this report has been signed below by the following persons on behalf of the Registrant and in the capacities and on the dates indicated. | ||
| By | /s/ Stephen C. Rogers | |
| Stephen C. Rogers, Chairman | ||
| Date: March 07, 2022 | ||
| By | /s/ William P. Mock | |
| William P. Mock, Treasurer | ||
| Date: March 07, 2022 | ||