UNITED STATES
SECURITIES AND EXCHANGE COMMISSION
Washington, D.C. 20549
Form N-CSR
CERTIFIED SHAREHOLDER REPORT OF
REGISTERED MANAGEMENT INVESTMENT COMPANIES
Investment Company Act file number: 811-05629
Voya Investors Trust
(Exact name of registrant as specified in charter)
| 7337 East Doubletree Ranch Road, Suite 100, Scottsdale, AZ | 85258 |
| (Address of principal executive offices) | (Zip code) |
CT Corporation System, 101 Federal Street, Boston, MA 02110
(Name and address of agent for service)
Registrant’s telephone number, including area code: 1-800-366-0066
Date of fiscal year end: December 31
Date of reporting period: December 31, 2021
Item 1. Reports to Stockholders.
The following is a copy of the report transmitted to stockholders pursuant to Rule 30e-1 under the Act (17 CFR 270.30e-1):


December 31, 2021
Classes ADV, I, R6, S and S2
| ■ | Voya Government Liquid Assets Portfolio | |
| ■ | VY® Clarion Global Real Estate Portfolio | |
| ■ | VY® Invesco Growth and Income Portfolio | |
| ■ | VY® JPMorgan Emerging Markets Equity Portfolio |
| ■ | VY® Morgan Stanley Global Franchise Portfolio | |
| ■ | VY® T. Rowe Price Capital Appreciation Portfolio | |
| ■ | VY® T. Rowe Price Equity Income Portfolio | |
| ■ | VY® T. Rowe Price International Stock Portfolio |
As permitted by regulations adopted by the U.S. Securities and Exchange Commission, paper copies of each portfolio’s annual and semi-annual shareholder reports, like this annual report, are no longer sent by mail, unless you specifically request paper copies of the reports. Instead, the reports will be made available on a website and you will be notified by mail each time a report is posted and provided with a website link to access the report. |
This report is submitted for general information to shareholders of the Voya mutual funds. It is not authorized for distribution to prospective shareholders unless accompanied or preceded by a prospectus which includes details regarding the funds’ investment objectives, risks, charges, expenses and other information. This information should be read carefully. |
INVESTMENT MANAGEMENT voyainvestments.com |  |
| 1 | ||
| 3 | ||
| 20 | ||
| 22 | ||
| 23 | ||
| 27 | ||
| 29 | ||
| 33 | ||
| 38 | ||
| 56 | ||
| 97 | ||
| 99 | ||
| 103 |
PROXY VOTING INFORMATION
A description of the policies and procedures that the Portfolios use to determine how to vote proxies related to portfolio securities is available: (1) without charge, upon request, by calling Shareholder Services toll-free at (800) 992-0180; (2) on the Portfolios’ website at www.voyainvestments.com; and (3) on the U.S. Securities and Exchange Commission’s (“SEC’s”) website at www.sec.gov. Information regarding how the Portfolios voted proxies related to portfolio securities during the most recent 12-month year ended June 30 is available without charge on the Portfolios’ website at www.voyainvestments.com and on the SEC’s website at www.sec.gov.
QUARTERLY PORTFOLIO HOLDINGS
The Portfolios file their complete schedule of portfolio holdings with the SEC for the first and third quarters of each fiscal year on Form NPORT-P. The Portfolios’ Forms NPORT-P are available on the SEC’s website at www.sec.gov. Each Portfolio’s complete schedule of portfolio holdings is available at: www.voyainvestments.com and without charge upon request from the Portfolio by calling Shareholder Services toll-free at (800) 992-0180. Voya Government Liquid Assets Portfolio does not file on Form N-PORT.

A Solid Year Ends for the Financial Markets, Gauging the Policy Shifts to Come

President
Voya Family of Funds
January 21, 2022
| Index | Description | |
|---|---|---|
| Bloomberg U.S. Government/Credit Index | An index made up of the Barclays Government and Credit indices, including securities issued by the U.S. government and its agencies and publicly issued U.S. corporate and foreign debentures and secured notes that meet specified maturity, liquidity and quality requirements. | |
| FTSE EPRA Nareit Developed Index | The index is designed to track the performance of listed real estate companies and real-estate investment trusts (REITs) worldwide. Relevant activities are defined as the ownership, disposal and development of income-producing real estate. Constituents are classified into distinct property sectors based on gross invested book assets, as disclosed in the latest published financial statement. Index constituents are free-float adjusted, liquidity, size and revenue screened. | |
| iMoneyNet Government Institutional Index | The average return for a category of money market funds that includes all government institutional funds: Treasury Institutional, Treasury and Repo Institutional and Government and Agencies Institutional. | |
MSCI All Country World (ex-US) IndexSM | A free float-adjusted market capitalization index that is designed to measure equity market performance in global developed and emerging markets, excluding the U.S. It includes the reinvestment of dividends net of withholding taxes, but does not reflect fees, brokerage commissions or other expenses of investing. | |
MSCI Emerging Markets IndexSM (“MSCI EM IndexSM”) | An index that measures the performance of securities listed on exchanges in developing nations throughout the world. It includes the reinvestment of dividends and distributions net of withholding taxes, but does not reflect fees, brokerage commissions or other expenses of investing. | |
MSCI World IndexSM (“MSCI World”) | An index that measures the performance of over 1,600 securities listed on exchanges in the U.S., Europe, Canada, Australia, New Zealand and the Far East. | |
Russell 1000® Value Index | An index that measures the performance of those Russell 1000® securities with lower price-to-book ratios and lower forecasted growth values. | |
S&P 500® Index | An index that measures the performance of securities of approximately 500 large-capitalization companies whose securities are traded on major U.S. stock markets. |
VOYA GOVERNMENT LIQUID ASSETS PORTFOLIO |
Investment Type Allocation as of December 31, 2021 (as a percentage of net assets) | |||||
| U.S. Government Agency Debt | 44.6 | % | |||
| U.S. Treasury Debt | 35.2 | ||||
| U.S. Treasury Repurchase Agreement | 14.5 | ||||
| Investment Companies | 7.2 | ||||
| Liabilities in Excess of Other Assets | (1.5 | ) | |||
| Net Assets | 100.0 | % | |||
| Portfolio holdings are subject to change daily. | |||||
| * | Please see Note 5 for more information regarding the contractual waiver in place to reimburse certain expenses of the Portfolio to the extent necessary to assist the Portfolio in maintaining a yield of not less than zero. |
VY® CLARION GLOBAL REAL ESTATE PORTFOLIO | PORTFOLIO MANAGERS’ REPORT |
Geographic Diversification as of December 31, 2021 (as a percentage of net assets) | |||||
| United States | 63.2 | % | |||
| Japan | 9.3 | % | |||
| Hong Kong | 5.3 | % | |||
| Australia | 4.5 | % | |||
| Germany | 4.0 | % | |||
| United Kingdom | 3.8 | % | |||
| Sweden | 2.9 | % | |||
| Singapore | 2.4 | % | |||
| Canada | 2.2 | % | |||
| Belgium | 1.4 | % | |||
| Countries between 0.2%–0.5%ˆ | 1.1 | % | |||
| Liabilities in Excess of Other Assets* | (0.1) | % | |||
| Net Assets | 100.0 | % | |||
| * Includes short-term investments. | |||||
| ˆ Includes 3 countries, which each represents 0.2%–0.5% of net assets. | |||||
| Portfolio holdings are subject to change daily. | |||||
Top Ten Holdings as of December 31, 2021 (as a percentage of net assets) | |||||
| ProLogis, Inc. | 7.5 | % | |||
| Simon Property Group, Inc. | 6.3 | % | |||
| Extra Space Storage, Inc. | 5.1 | % | |||
| Invitation Homes, Inc. | 3.9 | % | |||
| Realty Income Corp. | 3.8 | % | |||
| Camden Property Trust | 3.3 | % | |||
| Sun Communities, Inc. | 3.1 | % | |||
| CubeSmart | 2.6 | % | |||
| Duke Realty Corp. | 2.6 | % | |||
| Mid-America Apartment Communities, Inc. | 2.3 | % | |||
| Portfolio holdings are subject to change daily. | |||||
PORTFOLIO MANAGERS’ REPORT | VY® CLARION GLOBAL REAL ESTATE PORTFOLIO |
| * | On January 27, 2022, the Board of Trustees approved a name change for the Portfolio. Effective on or about May 1, 2022, the Portfolio will be known as “VY® CBRE Global Real Estate Portfolio.” Effective September 21, 2021, the Sub-Adviser’s name changed from CBRE Clarion Securities LLC to CBRE Investment Management Listed Real Assets LLC. |
| ** | Effective January 1, 2022, T. Ritson Ferguson was removed as a portfolio manager to the Portfolio and Kenneth S. Weinberg was added as a portfolio manager to the Portfolio. |
VY® CLARION GLOBAL REAL ESTATE PORTFOLIO | PORTFOLIO MANAGERS’ REPORT |
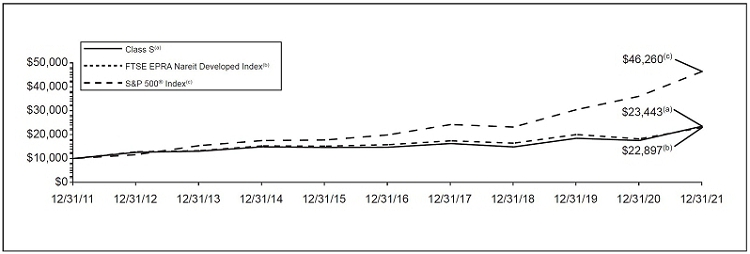
| Average Annual Total Returns for the Periods Ended December 31, 2021 | ||||||||||||||
|---|---|---|---|---|---|---|---|---|---|---|---|---|---|---|
| 1 Year | 5 Year | 10 Year | ||||||||||||
| Class ADV | 33.56 | % | 9.44 | % | 8.50 | % | ||||||||
| Class I | 34.47 | % | 10.10 | % | 9.17 | % | ||||||||
| Class S | 34.14 | % | 9.82 | % | 8.89 | % | ||||||||
| Class S2 | 33.90 | % | 9.67 | % | 8.73 | % | ||||||||
| FTSE EPRA Nareit Developed Index | 26.09 | % | 7.81 | % | 8.64 | % | ||||||||
| S&P 500® Index | 28.71 | % | 18.47 | % | 16.55 | % | ||||||||
PORTFOLIO MANAGERS’ REPORT | VY® INVESCO GROWTH AND INCOME PORTFOLIO |
Sector Diversification as of December 31, 2021 (as a percentage of net assets) | |||||
| Financials | 21.8 | % | |||
| Health Care | 15.7 | % | |||
| Information Technology | 13.6 | % | |||
| Industrials | 11.9 | % | |||
| Consumer Discretionary | 8.0 | % | |||
| Energy | 7.2 | % | |||
| Communication Services | 6.8 | % | |||
| Consumer Staples | 5.2 | % | |||
| Real Estate | 2.9 | % | |||
| Materials | 2.8 | % | |||
| Utilities | 2.5 | % | |||
| Assets in Excess of Other Liabilities* | 1.6 | % | |||
| Net Assets | 100.0 | % | |||
| * Includes short-term investments. | |||||
| Portfolio holdings are subject to change daily. | |||||
Top Ten Holdings as of December 31, 2021 (as a percentage of net assets) | |||||
| Wells Fargo & Co. | 3.7 | % | |||
| General Motors Co. | 3.6 | % | |||
| Cognizant Technology Solutions Corp. | 3.4 | % | |||
| Bank of America Corp. | 3.0 | % | |||
| CBRE Group, Inc. | 2.9 | % | |||
| CSX Corp. | 2.4 | % | |||
| American International Group, Inc. | 2.4 | % | |||
| Cisco Systems, Inc. | 2.3 | % | |||
| Philip Morris International, Inc. | 2.2 | % | |||
| Raytheon Technologies Corp. | 2.2 | % | |||
| Portfolio holdings are subject to change daily. | |||||
VY® INVESCO GROWTH AND INCOME PORTFOLIO | PORTFOLIO MANAGERS’ REPORT |

| Average Annual Total Returns for the Periods Ended December 31, 2021 | ||||||||||||||
|---|---|---|---|---|---|---|---|---|---|---|---|---|---|---|
| 1 Year | 5 Year | 10 Year | ||||||||||||
| Class ADV | 28.50 | % | 9.86 | % | 11.95 | % | ||||||||
| Class I | 29.21 | % | 10.52 | % | 12.63 | % | ||||||||
| Class S | 28.97 | % | 10.25 | % | 12.34 | % | ||||||||
| Class S2 | 28.78 | % | 10.08 | % | 12.18 | % | ||||||||
Russell 1000® Value Index | 25.16 | % | 11.16 | % | 12.97 | % | ||||||||
| PORTFOLIO MANAGERS’ REPORT | VY® JPMORGAN EMERGING MARKETS EQUITY PORTFOLIO |
Geographic Diversification as of December 31, 2021 (as a percentage of net assets) | |||||
| China | 35.5 | % | |||
| India | 18.8 | % | |||
| Taiwan | 8.8 | % | |||
| South Korea | 7.7 | % | |||
| Hong Kong | 5.4 | % | |||
| Indonesia | 3.0 | % | |||
| Argentina | 2.9 | % | |||
| United States | 2.7 | % | |||
| Brazil | 2.0 | % | |||
| Singapore | 1.9 | % | |||
| Countries between 0.0%–1.4%ˆ | 8.6 | % | |||
| Assets in Excess of Other Liabilities* | 2.7 | % | |||
| Net Assets | 100.0 | % | |||
| * Includes short-term investments. | |||||
| ˆ Includes 10 countries, which each represents 0.0%–1.4% of net assets. | |||||
| Portfolio holdings are subject to change daily. | |||||
Top Ten Holdings as of December 31, 2021 (as a percentage of net assets) | |||||
| Samsung Electronics Co., Ltd. 005930 | 5.9 | % | |||
| Tencent Holdings Ltd. | 4.2 | % | |||
| Taiwan Semiconductor Manufacturing Co., Ltd. | 4.0 | % | |||
| Taiwan Semiconductor Manufacturing Co., Ltd. ADR | 3.6 | % | |||
| HDFC Bank Ltd. ADR | 3.4 | % | |||
| Housing Development Finance Corp. | 3.4 | % | |||
| MercadoLibre, Inc. | 2.9 | % | |||
| EPAM Systems, Inc. | 2.7 | % | |||
| Tata Consultancy Services Ltd. | 2.5 | % | |||
| Techtronic Industries Co., Ltd. | 2.5 | % | |||
| Portfolio holdings are subject to change daily. | |||||
| VY® JPMORGAN EMERGING MARKETS EQUITY PORTFOLIO | PORTFOLIO MANAGERS’ REPORT |

| Average Annual Total Returns for the Periods Ended December 31, 2021 | ||||||||||||||
|---|---|---|---|---|---|---|---|---|---|---|---|---|---|---|
| 1 Year | 5 Year | 10 Year | ||||||||||||
| Class ADV | -10.30 | % | 13.08 | % | 6.59 | % | ||||||||
| Class I | -9.78 | % | 13.77 | % | 7.59 | % | ||||||||
| Class S | -10.00 | % | 13.49 | % | 7.33 | % | ||||||||
| Class S2 | -10.11 | % | 13.32 | % | 7.17 | % | ||||||||
MSCI EM IndexSM | -2.54 | % | 9.87 | % | 5.49 | % | ||||||||
| PORTFOLIO MANAGERS’ REPORT | VY® MORGAN STANLEY GLOBAL FRANCHISE PORTFOLIO |
Geographic Diversification as of December 31, 2021 (as a percentage of net assets) | |||||
| United States | 75.2 | % | |||
| United Kingdom | 10.3 | % | |||
| France | 5.9 | % | |||
| Germany | 4.8 | % | |||
| Netherlands | 2.0 | % | |||
| Italy | 0.6 | % | |||
| Assets in Excess of Other Liabilities* | 1.2 | % | |||
| Net Assets | 100.0 | % | |||
| * Includes short-term investments. | |||||
| Portfolio holdings are subject to change daily. | |||||
Top Ten Holdings as of December 31, 2021 (as a percentage of net assets) | |||||
| Microsoft Corp. | 9.3 | % | |||
| Philip Morris International, Inc. | 7.6 | % | |||
| Reckitt Benckiser Group PLC | 6.5 | % | |||
| Accenture PLC | 5.7 | % | |||
| Visa, Inc. — Class A | 5.2 | % | |||
| Thermo Fisher Scientific, Inc. | 4.9 | % | |||
| SAP SE | 4.8 | % | |||
| Procter & Gamble Co. | 4.7 | % | |||
| Danaher Corp. | 4.7 | % | |||
| Abbott Laboratories | 4.6 | % | |||
| Portfolio holdings are subject to change daily. | |||||
| * | Effective March 31, 2021, Dirk Hoffmann-Becking retired and no longer serves as a portfolio manager of the Portfolio. |
| VY® MORGAN STANLEY GLOBAL FRANCHISE PORTFOLIO | PORTFOLIO MANAGERS’ REPORT |

| Average Annual Total Returns for the Periods Ended December 31, 2021 | ||||||||||||||
|---|---|---|---|---|---|---|---|---|---|---|---|---|---|---|
| 1 Year | 5 Year | 10 Year | ||||||||||||
| Class ADV | 21.26 | % | 16.73 | % | 13.14 | % | ||||||||
Class R6(1) | 22.01 | % | 17.43 | % | 13.71 | % | ||||||||
| Class S | 21.66 | % | 17.13 | % | 13.54 | % | ||||||||
| Class S2 | 21.53 | % | 16.96 | % | 13.36 | % | ||||||||
| MSCI World | 21.82 | % | 15.03 | % | 12.70 | % | ||||||||
| (1) | Class R6 incepted on May 3, 2016. The Class R6 shares performance shown for the period prior to their inception date is the performance of Class S shares without adjustment for any differences in the expenses between the two classes. If adjusted for such differences, returns would be different. |
| PORTFOLIO MANAGERS’ REPORT | VY® T. ROWE PRICE CAPITAL APPRECIATION PORTFOLIO |
Investment Type Allocation as of December 31, 2021 (as a percentage of net assets) | |||||
| Common Stock | 71.9 | % | |||
| Bank Loans | 11.5 | % | |||
| Corporate Bonds/Notes | 8.0 | % | |||
| Preferred Stock | 1.4 | % | |||
| Asset-Backed Securities | 0.2 | % | |||
| Assets in Excess of Other Liabilities* | 7.0 | % | |||
| Net Assets | 100.0 | % | |||
| * Includes short-term investments. | |||||
| Portfolio holdings are subject to change daily. | |||||
Top Ten Holdings as of December 31, 2021* (as a percentage of net assets) | |||||
| Microsoft Corp. | 7.6 | % | |||
| Amazon.com, Inc. | 5.3 | % | |||
| General Electric Co. | 4.4 | % | |||
| PNC Financial Services Group, Inc. | 3.8 | % | |||
| Yum! Brands, Inc. | 3.7 | % | |||
| UnitedHealth Group, Inc. | 3.7 | % | |||
| Thermo Fisher Scientific, Inc. | 3.5 | % | |||
| Alphabet, Inc. — Class C | 3.2 | % | |||
| Humana, Inc. | 2.7 | % | |||
| Marsh & McLennan Cos., Inc. | 2.5 | % | |||
| * Excludes short-term investments. | |||||
| Portfolio holdings are subject to change daily. | |||||
| VY® T. ROWE PRICE CAPITAL APPRECIATION PORTFOLIO | PORTFOLIO MANAGERS’ REPORT |

| Average Annual Total Returns for the Periods Ended December 31, 2021 | ||||||||||||||
|---|---|---|---|---|---|---|---|---|---|---|---|---|---|---|
| 1 Year | 5 Year | 10 Year | ||||||||||||
Class ADV | 17.97 | % | 14.57 | % | 13.22 | % | ||||||||
Class I | 18.67 | % | 15.27 | % | 13.90 | % | ||||||||
Class R6(1) | 18.66 | % | 15.27 | % | 13.90 | % | ||||||||
Class S | 18.40 | % | 14.98 | % | 13.62 | % | ||||||||
Class S2 | 18.19 | % | 14.81 | % | 13.45 | % | ||||||||
S&P 500® Index | 28.71 | % | 18.47 | % | 16.55 | % | ||||||||
Bloomberg U.S. Government/Credit Index | -1.75 | % | 3.99 | % | 3.13 | % | ||||||||
60% S&P 500® Index/40% Bloomberg U.S. Government/Credit Index | 15.76 | % | 12.79 | % | 11.24 | % | ||||||||
| (1) | Class R6 incepted on May 3, 2016. The Class R6 shares performance shown for the period prior to their inception date is the performance of Class I shares without adjustment for any differences in the expenses between the two classes. If adjusted for such differences, returns would be different. |
PORTFOLIO MANAGERS’ REPORT | VY® T. ROWE PRICE EQUITY INCOME PORTFOLIO |
Sector Diversification as of December 31, 2021 (as a percentage of net assets) | |||||
| Financials | 22.6 | % | |||
| Health Care | 17.0 | % | |||
| Industrials | 10.6 | % | |||
| Information Technology | 9.3 | % | |||
| Utilities | 9.0 | % | |||
| Consumer Staples | 6.9 | % | |||
| Energy | 5.4 | % | |||
| Materials | 5.1 | % | |||
| Real Estate | 4.7 | % | |||
| Communication Services | 4.6 | % | |||
| Consumer Discretionary | 3.5 | % | |||
| Assets in Excess of Other Liabilities* | 1.3 | % | |||
| Net Assets | 100.0 | % | |||
| * Includes short-term investments. | |||||
| Portfolio holdings are subject to change daily. | |||||
Top Ten Holdings as of December 31, 2021 (as a percentage of net assets) | |||||
| Wells Fargo & Co. | 3.9 | % | |||
| Qualcomm, Inc. | 3.0 | % | |||
| United Parcel Service, Inc. — Class B | 2.6 | % | |||
| Southern Co. | 2.5 | % | |||
| General Electric Co. | 2.5 | % | |||
| American International Group, Inc. | 2.5 | % | |||
| Anthem, Inc. | 2.4 | % | |||
| TotalEnergies SE ADR | 2.3 | % | |||
| AbbVie, Inc. | 1.9 | % | |||
| Tyson Foods, Inc. | 1.9 | % | |||
| Portfolio holdings are subject to change daily. | |||||
VY® T. ROWE PRICE EQUITY INCOME PORTFOLIO | PORTFOLIO MANAGERS’ REPORT |

| Average Annual Total Returns for the Periods Ended December 31, 2021 | ||||||||||||||
|---|---|---|---|---|---|---|---|---|---|---|---|---|---|---|
| 1 Year | 5 Year | 10 Year | ||||||||||||
| Class ADV | 24.97 | % | 10.64 | % | 11.39 | % | ||||||||
| Class I | 25.66 | % | 11.28 | % | 12.06 | % | ||||||||
| Class S | 25.27 | % | 11.00 | % | 11.78 | % | ||||||||
| Class S2 | 25.15 | % | 10.84 | % | 11.61 | % | ||||||||
Russell 1000® Value Index | 25.16 | % | 11.16 | % | 12.97 | % | ||||||||
S&P 500® Index | 28.71 | % | 18.47 | % | 16.55 | % | ||||||||
PORTFOLIO MANAGERS’ REPORT | VY® T. ROWE PRICE INTERNATIONAL |
Geographic Diversification as of December 31, 2021 (as a percentage of net assets) | |||||
| Japan | 14.7 | % | |||
| Netherlands | 9.3 | % | |||
| Switzerland | 8.5 | % | |||
| France | 8.3 | % | |||
| United Kingdom | 8.3 | % | |||
| China | 7.1 | % | |||
| Canada | 6.2 | % | |||
| Germany | 5.5 | % | |||
| India | 4.8 | % | |||
| Taiwan | 4.0 | % | |||
| Countries between 0.3%–3.9%ˆ | 20.4 | % | |||
| Assets in Excess of Other Liabilities* | 2.9 | % | |||
| Net Assets | 100.0 | % | |||
| * Includes short-term investments. | |||||
| ˆ Includes 15 countries, which each represents 0.3%–3.9% of net assets. | |||||
| Portfolio holdings are subject to change daily. | |||||
Top Ten Holdings as of December 31, 2021 (as a percentage of net assets) | |||||
| Taiwan Semiconductor Manufacturing Co., Ltd. | 4.0 | % | |||
| Prosus NV | 2.7 | % | |||
| Nestle SA | 2.7 | % | |||
| ASML Holding NV | 2.7 | % | |||
| Thales S.A. | 2.0 | % | |||
| Housing Development Finance Corp. | 1.8 | % | |||
| Sanofi | 1.8 | % | |||
| Lonza Group AG | 1.7 | % | |||
| Nippon Telegraph & Telephone Corp. | 1.7 | % | |||
| Akzo Nobel NV | 1.7 | % | |||
| Portfolio holdings are subject to change daily. | |||||
| * | On January 27, 2022, the Board of Trustees approved a proposal to reorganize the Portfolio (the “Merging Portfolio”) with and into Voya International Index Portfolio, which is not included in this report (the “Reorganization”). The proposed Reorganization is subject to approval by shareholders of the Merging Portfolio at a shareholder meeting scheduled to be held on or about June 28, 2022. The Merging Portfolio will notify its shareholders if shareholder approval of its proposed Reorganization is not obtained. If shareholder approval of the Reorganization is obtained, it is expected that the Reorganization will take place on or about July 8, 2022. |
VY® T. ROWE PRICE INTERNATIONAL | PORTFOLIO MANAGERS’ REPORT |
PORTFOLIO MANAGERS’ REPORT | VY® T. ROWE PRICE INTERNATIONAL |

| Average Annual Total Returns for the Periods Ended December 31, 2021 | ||||||||||||||
|---|---|---|---|---|---|---|---|---|---|---|---|---|---|---|
| 1 Year | 5 Year | 10 Year | ||||||||||||
| Class ADV | 0.87 | % | 9.80 | % | 7.83 | % | ||||||||
| Class I | 1.48 | % | 10.46 | % | 8.48 | % | ||||||||
| Class S | 1.19 | % | 10.18 | % | 8.21 | % | ||||||||
| MSCI ACWI ex-U.S. | 7.82 | % | 9.61 | % | 7.28 | % | ||||||||
| Actual Portfolio Return | Hypothetical (5% return before expenses) | |||||||||||||||||||||||||||||||
| Beginning Account Value July 1, 2021 | Ending Account Value December 31, 2021 | Annualized Expense Ratio | Expenses Paid During the Period Ended December 31, 2021* | Beginning Account Value July 1, 2021 | Ending Account Value December 31, 2021 | Annualized Expense Ratio | Expenses Paid During the Period Ended December 31, 2021* | |||||||||||||||||||||||||
Voya Government Liquid Assets Portfolio | ||||||||||||||||||||||||||||||||
| Class I | $1,000.00 | $1,000.20 | 0.05 | % | $0.25 | $1,000.00 | $1,024.95 | 0.05 | % | $0.26 | ||||||||||||||||||||||
| Class S | 1,000.00 | 1,000.20 | 0.05 | 0.25 | 1,000.00 | 1,024.95 | 0.05 | 0.26 | ||||||||||||||||||||||||
| Class S2 | 1,000.00 | 1,000.20 | 0.05 | 0.25 | 1,000.00 | 1,024.95 | 0.05 | 0.26 | ||||||||||||||||||||||||
VY® Clarion Global Real Estate Portfolio | ||||||||||||||||||||||||||||||||
| Class ADV | 1,000.00 | 1,136.30 | 1.47 | % | 7.92 | 1,000.00 | 1,017.80 | 1.47 | % | 7.48 | ||||||||||||||||||||||
| Class I | 1,000.00 | 1,140.40 | 0.87 | 4.69 | 1,000.00 | 1,020.82 | 0.87 | 4.43 | ||||||||||||||||||||||||
| Class S | 1,000.00 | 1,139.50 | 1.12 | 6.04 | 1,000.00 | 1,019.56 | 1.12 | 5.70 | ||||||||||||||||||||||||
| Class S2 | 1,000.00 | 1,138.40 | 1.27 | 6.85 | 1,000.00 | 1,018.80 | 1.27 | 6.46 | ||||||||||||||||||||||||
VY® Invesco Growth and Income Portfolio | ||||||||||||||||||||||||||||||||
| Class ADV | 1,000.00 | 1,075.30 | 1.21 | % | 6.33 | 1,000.00 | 1,019.11 | 1.21 | % | 6.16 | ||||||||||||||||||||||
| Class I | 1,000.00 | 1,078.10 | 0.61 | 3.20 | 1,000.00 | 1,022.13 | 0.61 | 3.11 | ||||||||||||||||||||||||
| Class S | 1,000.00 | 1,077.00 | 0.86 | 4.50 | 1,000.00 | 1,020.87 | 0.86 | 4.38 | ||||||||||||||||||||||||
| Class S2 | 1,000.00 | 1,076.40 | 1.01 | 5.29 | 1,000.00 | 1,020.11 | 1.01 | 5.14 | ||||||||||||||||||||||||
| Actual Portfolio Return | Hypothetical (5% return before expenses) | |||||||||||||||||||||||||||||||||
| Beginning Account Value July 1, 2021 | Ending Account Value December 31, 2021 | Annualized Expense Ratio | Expenses Paid During the Period Ended December 31, 2021* | Beginning Account Value July 1, 2021 | Ending Account Value December 31, 2021 | Annualized Expense Ratio | Expenses Paid During the Period Ended December 31, 2021* | |||||||||||||||||||||||||||
VY® JPMorgan Emerging Markets Equity Portfolio | ||||||||||||||||||||||||||||||||||
| Class ADV | $1,000.00 | $868.90 | 1.86 | % | $8.76 | $ | 1,000.00 | $1,015.83 | 1.86 | % | $9.45 | |||||||||||||||||||||||
| Class I | 1,000.00 | 871.50 | 1.26 | 5.94 | 1,000.00 | 1,018.85 | 1.26 | 6.41 | ||||||||||||||||||||||||||
| Class S | 1,000.00 | 870.40 | 1.51 | 7.12 | 1,000.00 | 1,017.59 | 1.51 | 7.68 | ||||||||||||||||||||||||||
| Class S2 | 1,000.00 | 869.90 | 1.66 | 7.82 | 1,000.00 | 1,016.84 | 1.66 | 8.44 | ||||||||||||||||||||||||||
VY® Morgan Stanley Global Franchise Portfolio | ||||||||||||||||||||||||||||||||||
| Class ADV | 1,000.00 | 1,108.00 | 1.54 | % | 8.18 | 1,000.00 | 1,017.44 | 1.54 | % | 7.83 | ||||||||||||||||||||||||
| Class R6 | 1,000.00 | 1,111.30 | 0.94 | 5.00 | 1,000.00 | 1,020.47 | 0.94 | 4.79 | ||||||||||||||||||||||||||
| Class S | 1,000.00 | 1,109.40 | 1.19 | 6.33 | 1,000.00 | 1,019.21 | 1.19 | 6.06 | ||||||||||||||||||||||||||
| Class S2 | 1,000.00 | 1,108.70 | 1.34 | 7.12 | 1,000.00 | 1,018.45 | 1.34 | 6.82 | ||||||||||||||||||||||||||
VY® T. Rowe Price Capital Appreciation Portfolio | ||||||||||||||||||||||||||||||||||
| Class ADV | 1,000.00 | 1,075.40 | 1.24 | % | 6.49 | 1,000.00 | 1,018.95 | 1.24 | % | 6.31 | ||||||||||||||||||||||||
| Class I | 1,000.00 | 1,079.00 | 0.64 | 3.35 | 1,000.00 | 1,021.98 | 0.64 | 3.26 | ||||||||||||||||||||||||||
| Class R6 | 1,000.00 | 1,078.60 | 0.64 | 3.35 | 1,000.00 | 1,021.98 | 0.64 | 3.26 | ||||||||||||||||||||||||||
| Class S | 1,000.00 | 1,077.40 | 0.89 | 4.66 | 1,000.00 | 1,020.72 | 0.89 | 4.53 | ||||||||||||||||||||||||||
| Class S2 | 1,000.00 | 1,076.60 | 1.04 | 5.44 | 1,000.00 | 1,019.96 | 1.04 | 5.30 | ||||||||||||||||||||||||||
VY® T. Rowe Price Equity Income Portfolio | ||||||||||||||||||||||||||||||||||
| Class ADV | 1,000.00 | 1,058.40 | 1.21 | % | 6.28 | 1,000.00 | 1,019.11 | 1.21 | % | 6.16 | ||||||||||||||||||||||||
| Class I | 1,000.00 | 1,060.80 | 0.61 | 3.17 | 1,000.00 | 1,022.13 | 0.61 | 3.11 | ||||||||||||||||||||||||||
| Class S | 1,000.00 | 1,059.10 | 0.86 | 4.46 | 1,000.00 | 1,020.87 | 0.86 | 4.38 | ||||||||||||||||||||||||||
| Class S2 | �� | 1,000.00 | 1,058.70 | 1.01 | 5.24 | 1,000.00 | 1,020.11 | 1.01 | 5.14 | |||||||||||||||||||||||||
VY® T. Rowe Price International Stock Portfolio | ||||||||||||||||||||||||||||||||||
| Class ADV | 1,000.00 | 944.70 | 1.35 | % | 6.62 | 1,000.00 | 1,018.40 | 1.35 | % | 6.87 | ||||||||||||||||||||||||
| Class I | 1,000.00 | 947.70 | 0.75 | 3.68 | 1,000.00 | 1,021.42 | 0.75 | 3.82 | ||||||||||||||||||||||||||
| Class S | 1,000.00 | 946.30 | 1.00 | 4.91 | 1,000.00 | 1,020.16 | 1.00 | 5.09 | ||||||||||||||||||||||||||
| * | Expenses are equal to each Portfolio’s respective annualized expense ratios multiplied by the average account value over the period, multiplied by 184/365 to reflect the most recent fiscal half-year. |

February 24, 2022
| Voya Government Liquid Assets Portfolio | VY® Clarion Global Real Estate Portfolio | VY® Invesco Growth and Income Portfolio | VY® JPMorgan Emerging Markets Equity Portfolio | |||||||||||||||
|---|---|---|---|---|---|---|---|---|---|---|---|---|---|---|---|---|---|---|
ASSETS: | ||||||||||||||||||
| Investments in securities at fair value+* | $ | — | $ | 234,942,561 | $ | 445,037,093 | $ | 453,182,170 | ||||||||||
| Short-term investments at fair value† | — | 3,589,330 | 8,817,807 | 7,903,412 | ||||||||||||||
| Short-term investments at amortized cost | 703,448,234 | — | — | — | ||||||||||||||
| Repurchase agreements | 117,326,000 | — | — | — | ||||||||||||||
| Cash | 299 | — | — | — | ||||||||||||||
| Foreign currencies at value‡ | — | — | 699 | 100,318 | ||||||||||||||
| Receivables: | ||||||||||||||||||
| Investment securities and currencies sold | 53,453,972 | 592,760 | — | 182,622 | ||||||||||||||
| Fund shares sold | 1,892,666 | 109,887 | 23,912 | 8,831,679 | ||||||||||||||
| Dividends | — | 763,466 | 433,759 | 336,573 | ||||||||||||||
| Interest | 16,734 | — | — | — | ||||||||||||||
| Foreign tax reclaims | — | 133,294 | 87,092 | 61,487 | ||||||||||||||
| Unrealized appreciation on forward foreign currency contracts | — | 148 | 15,299 | — | ||||||||||||||
| Reimbursement due from Investment Adviser | 370,811 | 31,493 | — | — | ||||||||||||||
| Other assets | 22,877 | 12,707 | 23,675 | 25,584 | ||||||||||||||
| Total assets | 876,531,593 | 240,175,646 | 454,439,336 | 470,623,845 | ||||||||||||||
LIABILITIES: | ||||||||||||||||||
| Payable for investment securities and currencies purchased | 66,439,126 | 665,615 | — | 34,847 | ||||||||||||||
| Payable for fund shares redeemed | 1,008,156 | 3,015,811 | 1,918,256 | 30,735 | ||||||||||||||
| Payable upon receipt of securities loaned | — | 1,486,945 | 42,956 | 1,190,512 | ||||||||||||||
| Unrealized depreciation on forward foreign currency contracts | — | 3 | 247,380 | — | ||||||||||||||
| Payable for unified fees | 191,628 | — | 226,754 | 489,380 | ||||||||||||||
| Payable for investment management fees | — | 168,949 | — | — | ||||||||||||||
| Payable for distribution and shareholder service fees | 217,197 | 28,481 | 94,198 | 97,868 | ||||||||||||||
| Payable to trustees under the deferred compensation plan (Note 6) | 22,877 | 12,707 | 23,675 | 25,584 | ||||||||||||||
| Payable for trustee fees | 23,653 | 1,081 | — | — | ||||||||||||||
| Payable for foreign capital gains tax | — | — | — | 2,908,912 | ||||||||||||||
| Other accrued expenses and liabilities | — | 118,585 | — | — | ||||||||||||||
| Total liabilities | 67,902,637 | 5,498,177 | 2,553,219 | 4,777,838 | ||||||||||||||
NET ASSETS | $ | 808,628,956 | $ | 234,677,469 | $ | 451,886,117 | $ | 465,846,007 | ||||||||||
NET ASSETS WERE COMPRISED OF: | ||||||||||||||||||
| Paid-in capital | $ | 808,643,541 | $ | 155,228,625 | $ | 272,181,629 | $ | 240,967,723 | ||||||||||
| Total distributable earnings (loss) | (14,585 | ) | 79,448,844 | 179,704,488 | 224,878,284 | |||||||||||||
NET ASSETS | $ | 808,628,956 | $ | 234,677,469 | $ | 451,886,117 | $ | 465,846,007 | ||||||||||
| + Including securities loaned at value | $ | — | $ | 1,427,117 | $ | 42,006 | $ | 1,147,740 | ||||||||||
| * Cost of investments in securities | $ | — | $ | 163,283,945 | $ | 322,780,172 | $ | 322,623,215 | ||||||||||
| † Cost of short-term investments | $ | — | $ | 3,589,330 | $ | 8,817,807 | $ | 7,903,412 | ||||||||||
| ‡ Cost of foreign currencies | $ | — | $ | — | $ | 692 | $ | 99,843 | ||||||||||
| Voya Government Liquid Assets Portfolio | VY® Clarion Global Real Estate Portfolio | VY® Invesco Growth and Income Portfolio | VY® JPMorgan Emerging Markets Equity Portfolio | |||||||||||||||
|---|---|---|---|---|---|---|---|---|---|---|---|---|---|---|---|---|---|---|
Class ADV | ||||||||||||||||||
| Net assets | n/a | $ | 16,348,479 | $ | 18,353,973 | $ | 54,012,399 | |||||||||||
| Shares authorized | n/a | unlimited | unlimited | unlimited | ||||||||||||||
| Par value | n/a | $ | 0.001 | $ | 0.001 | $ | 0.001 | |||||||||||
| Shares outstanding | n/a | 1,221,405 | 700,254 | 2,512,055 | ||||||||||||||
| Net asset value and redemption price per share | n/a | $ | 13.38 | $ | 26.21 | $ | 21.50 | |||||||||||
Class I | ||||||||||||||||||
| Net assets | $ | 50,336,899 | $ | 122,954,076 | $ | 41,488,440 | $ | 80,785,154 | ||||||||||
| Shares authorized | unlimited | unlimited | unlimited | unlimited | ||||||||||||||
| Par value | $ | 0.001 | $ | 0.001 | $ | 0.001 | $ | 0.001 | ||||||||||
| Shares outstanding | 50,333,569 | 8,916,911 | 1,563,016 | 3,496,734 | ||||||||||||||
| Net asset value and redemption price per share | $ | 1.00 | $ | 13.79 | $ | 26.54 | $ | 23.10 | ||||||||||
Class S | ||||||||||||||||||
| Net assets | $ | 320,547,773 | $ | 94,358,956 | $ | 367,119,533 | $ | 320,977,356 | ||||||||||
| Shares authorized | unlimited | unlimited | unlimited | unlimited | ||||||||||||||
| Par value | $ | 0.001 | $ | 0.001 | $ | 0.001 | $ | 0.001 | ||||||||||
| Shares outstanding | 320,527,033 | 6,877,130 | 13,657,995 | 14,040,677 | ||||||||||||||
| Net asset value and redemption price per share | $ | 1.00 | $ | 13.72 | $ | 26.88 | $ | 22.86 | ||||||||||
Class S2 | ||||||||||||||||||
| Net assets | $ | 437,744,284 | $ | 1,015,958 | $ | 24,924,171 | $ | 10,071,098 | ||||||||||
| Shares authorized | unlimited | unlimited | unlimited | unlimited | ||||||||||||||
| Par value | $ | 0.001 | $ | 0.001 | $ | 0.001 | $ | 0.001 | ||||||||||
| Shares outstanding | 437,716,088 | 73,317 | 938,116 | 447,643 | ||||||||||||||
| Net asset value and redemption price per share | $ | 1.00 | $ | 13.86 | $ | 26.57 | $ | 22.50 | ||||||||||
| VY® Morgan Stanley Global Franchise Portfolio | VY® T. Rowe Price Capital Appreciation Portfolio | VY® T. Rowe Price Equity Income Portfolio | VY® T. Rowe Price International Stock Portfolio | |||||||||||||||
|---|---|---|---|---|---|---|---|---|---|---|---|---|---|---|---|---|---|---|
ASSETS: | ||||||||||||||||||
| Investments in securities at fair value+* | $ | 435,290,000 | $ | 8,217,707,088 | $ | 374,425,083 | $ | 199,509,162 | ||||||||||
| Short-term investments at fair value† | 7,108,644 | 1,012,981,490 | 18,819,391 | 5,772,650 | ||||||||||||||
| Cash | — | 15,239,148 | 2,437,550 | 973,683 | ||||||||||||||
| Foreign currencies at value‡ | — | 95,606 | — | 319,995 | ||||||||||||||
| Receivables: | ||||||||||||||||||
| Investment securities and currencies sold | — | 3,066,895 | 979,589 | 218,941 | ||||||||||||||
| Fund shares sold | 1,322 | 1,072,124 | 2,866 | 2,595,086 | ||||||||||||||
| Dividends | 611,673 | 1,619,706 | 663,995 | 283,020 | ||||||||||||||
| Interest | — | 10,802,522 | — | — | ||||||||||||||
| Foreign tax reclaims | 203,049 | — | 79,985 | 359,807 | ||||||||||||||
| Unrealized appreciation on forward foreign currency contracts | — | — | — | 66 | ||||||||||||||
| Prepaid expenses | — | — | — | 20 | ||||||||||||||
| Other assets | 17,217 | 239,617 | 42,723 | 10,814 | ||||||||||||||
| Total assets | 443,231,905 | 9,262,824,196 | 397,451,182 | 210,043,244 | ||||||||||||||
LIABILITIES: | ||||||||||||||||||
| Payable for investment securities and currencies purchased | — | 77,511,733 | 881,594 | 244,099 | ||||||||||||||
| Payable for fund shares redeemed | 2,290,925 | 5,942,527 | 2,162,840 | 34 | ||||||||||||||
| Payable upon receipt of securities loaned | — | 174,981,936 | 14,739,853 | 3,910,198 | ||||||||||||||
| Unrealized depreciation on forward foreign currency contracts | — | — | — | 196 | ||||||||||||||
| Payable for unified fees | 341,234 | 4,685,352 | 189,991 | — | ||||||||||||||
| Payable for investment management fees | — | — | — | 102,866 | ||||||||||||||
| Payable for distribution and shareholder service fees | 136,419 | 1,963,371 | 91,608 | 40,560 | ||||||||||||||
| Payable to trustees under the deferred compensation plan (Note 6) | 17,217 | 239,617 | 42,723 | 10,814 | ||||||||||||||
| Payable for trustee fees | — | — | — | 1,113 | ||||||||||||||
| Payable for foreign capital gains tax | — | — | — | 68,593 | ||||||||||||||
| Other accrued expenses and liabilities | — | — | — | 135,198 | ||||||||||||||
| Written options, at fair value^ | — | 160,277,008 | — | — | ||||||||||||||
| Total liabilities | 2,785,795 | 425,601,544 | 18,108,609 | 4,513,671 | ||||||||||||||
NET ASSETS | $ | 440,446,110 | $ | 8,837,222,652 | $ | 379,342,573 | $ | 205,529,573 | ||||||||||
NET ASSETS WERE COMPRISED OF: | ||||||||||||||||||
| Paid-in capital | $ | 234,456,659 | $ | 6,178,502,136 | $ | 237,490,310 | $ | 144,267,521 | ||||||||||
| Total distributable earnings | 205,989,451 | 2,658,720,516 | 141,852,263 | 61,262,052 | ||||||||||||||
NET ASSETS | $ | 440,446,110 | $ | 8,837,222,652 | $ | 379,342,573 | $ | 205,529,573 | ||||||||||
| + Including securities loaned at value | $ | — | $ | 171,064,192 | $ | 14,430,935 | $ | 3,742,862 | ||||||||||
| * Cost of investments in securities | $ | 261,666,528 | $ | 6,441,614,444 | $ | 268,403,435 | $ | 157,987,956 | ||||||||||
| † Cost of short-term investments | $ | 7,108,644 | $ | 1,012,981,490 | $ | 18,819,391 | $ | 5,772,650 | ||||||||||
| ‡ Cost of foreign currencies | $ | — | $ | 95,607 | $ | — | $ | 318,056 | ||||||||||
| ^ Premiums received on written options | $ | — | $ | 75,480,656 | $ | — | $ | — | ||||||||||
| VY® Morgan Stanley Global Franchise Portfolio | VY® T. Rowe Price Capital Appreciation Portfolio | VY® T. Rowe Price Equity Income Portfolio | VY® T. Rowe Price International Stock Portfolio | |||||||||||||||
|---|---|---|---|---|---|---|---|---|---|---|---|---|---|---|---|---|---|---|
Class ADV | ||||||||||||||||||
| Net assets | $ | 138,475,297 | $ | 1,891,868,152 | $ | 58,287,453 | $ | 24,945,558 | ||||||||||
| Shares authorized | unlimited | unlimited | unlimited | unlimited | ||||||||||||||
| Par value | $ | 0.001 | $ | 0.001 | $ | 0.001 | $ | 0.001 | ||||||||||
| Shares outstanding | 7,612,601 | 61,261,594 | 5,079,296 | 1,436,332 | ||||||||||||||
| Net asset value and redemption price per share | $ | 18.19 | $ | 30.88 | $ | 11.48 | $ | 17.37 | ||||||||||
Class I | ||||||||||||||||||
| Net assets | n/a | $ | 1,553,598,060 | $ | 73,571,837 | $ | 45,208,838 | |||||||||||
| Shares authorized | n/a | unlimited | unlimited | unlimited | ||||||||||||||
| Par value | n/a | $ | 0.001 | $ | 0.001 | $ | 0.001 | |||||||||||
| Shares outstanding | n/a | 47,136,322 | 6,245,799 | 2,586,215 | ||||||||||||||
| Net asset value and redemption price per share | n/a | $ | 32.96 | $ | 11.78 | $ | 17.48 | |||||||||||
Class R6 | ||||||||||||||||||
| Net assets | $ | 1,827,827 | $ | 620,373,379 | n/a | n/a | ||||||||||||
| Shares authorized | unlimited | unlimited | n/a | n/a | ||||||||||||||
| Par value | $ | 0.001 | $ | 0.001 | n/a | n/a | ||||||||||||
| Shares outstanding | 91,496 | 18,808,747 | n/a | n/a | ||||||||||||||
| Net asset value and redemption price per share | $ | 19.98 | $ | 32.98 | n/a | n/a | ||||||||||||
Class S | ||||||||||||||||||
| Net assets | $ | 260,007,805 | $ | 4,700,019,071 | $ | 158,846,601 | $ | 135,375,177 | ||||||||||
| Shares authorized | unlimited | unlimited | unlimited | unlimited | ||||||||||||||
| Par value | $ | 0.001 | $ | 0.001 | $ | 0.001 | $ | 0.001 | ||||||||||
| Shares outstanding | 12,985,637 | 142,609,009 | 13,275,971 | 7,779,489 | ||||||||||||||
| Net asset value and redemption price per share | $ | 20.02 | $ | 32.96 | $ | 11.96 | $ | 17.40 | ||||||||||
Class S2 | ||||||||||||||||||
| Net assets | $ | 40,135,181 | $ | 71,363,990 | $ | 88,636,682 | n/a | |||||||||||
| Shares authorized | unlimited | unlimited | unlimited | n/a | ||||||||||||||
| Par value | $ | 0.001 | $ | 0.001 | $ | 0.001 | n/a | |||||||||||
| Shares outstanding | 2,029,922 | 2,187,219 | 7,646,881 | n/a | ||||||||||||||
| Net asset value and redemption price per share | $ | 19.77 | $ | 32.63 | $ | 11.59 | n/a | |||||||||||
| Voya Government Liquid Assets Portfolio | VY® Clarion Global Real Estate Portfolio | VY® Invesco Growth and Income Portfolio | VY® JPMorgan Emerging Markets Equity Portfolio | |||||||||||||||
|---|---|---|---|---|---|---|---|---|---|---|---|---|---|---|---|---|---|---|
INVESTMENT INCOME: | ||||||||||||||||||
| Dividends, net of foreign taxes withheld* | $ | 8,729 | $ | 6,358,156 | $ | 8,530,675 | $ | 4,652,771 | ||||||||||
| Interest | 393,822 | — | — | — | ||||||||||||||
| Securities lending income, net | — | 22,248 | 16,874 | 59,831 | ||||||||||||||
| Total investment income | 402,551 | 6,380,404 | 8,547,549 | 4,712,602 | ||||||||||||||
EXPENSES: | ||||||||||||||||||
| Investment management fees | — | 1,946,226 | — | — | ||||||||||||||
| Unified fees | 2,406,036 | — | 2,761,117 | 6,826,420 | ||||||||||||||
| Distribution and shareholder service fees: | ||||||||||||||||||
| Class ADV | — | 93,825 | 105,916 | 358,484 | ||||||||||||||
| Class S | 853,780 | 220,268 | 888,600 | 957,773 | ||||||||||||||
| Class S2 | 1,880,005 | 3,500 | 101,723 | 48,515 | ||||||||||||||
| Transfer agent fees: | ||||||||||||||||||
| Class ADV | — | 19,049 | — | — | ||||||||||||||
| Class I | — | 135,971 | — | — | ||||||||||||||
| Class S | — | 107,322 | — | — | ||||||||||||||
| Class S2 | — | 1,064 | — | — | ||||||||||||||
| Shareholder reporting expense | — | 10,310 | — | — | ||||||||||||||
| Professional fees | — | 10,950 | — | — | ||||||||||||||
| Custody and accounting expense | — | 45,080 | — | — | ||||||||||||||
| Trustee fees and expenses | 45,304 | 11,315 | 22,237 | 29,134 | ||||||||||||||
| Miscellaneous expense | — | 5,798 | — | — | ||||||||||||||
| Interest expense | — | — | — | 958 | ||||||||||||||
| Total expenses | 5,185,125 | 2,610,678 | 3,879,593 | 8,221,284 | ||||||||||||||
| Waived and reimbursed fees | (4,782,574 | ) | (413,444 | ) | (130,883 | ) | — | |||||||||||
| Brokerage commission recapture | — | (1,334 | ) | — | (1,270 | ) | ||||||||||||
| Net expenses | 402,551 | 2,195,900 | 3,748,710 | 8,220,014 | ||||||||||||||
| Net investment income (loss) | — | 4,184,504 | 4,798,839 | (3,507,412 | ) | |||||||||||||
REALIZED AND UNREALIZED GAIN (LOSS): | ||||||||||||||||||
| Net realized gain (loss) on: | ||||||||||||||||||
| Investments (net of foreign capital gains taxes withheld^) | 230,323 | 25,372,383 | 55,918,354 | 99,458,062 | ||||||||||||||
| Forward foreign currency contracts | — | (20,222 | ) | 649,368 | (1,548 | ) | ||||||||||||
| Foreign currency related transactions | — | (11,924 | ) | 8,403 | (24,960 | ) | ||||||||||||
| Net realized gain | 230,323 | 25,340,237 | 56,576,125 | 99,431,554 | ||||||||||||||
| Net change in unrealized appreciation (depreciation) on: | ||||||||||||||||||
Investments (net of foreign capital gains taxes accrued#) | — | 33,785,617 | 46,590,861 | (148,343,958 | ) | |||||||||||||
| Forward foreign currency contracts | — | (62 | ) | (21,757 | ) | (4 | ) | |||||||||||
| Foreign currency related transactions | — | (8,405 | ) | (15,338 | ) | (9,885 | ) | |||||||||||
| Net change in unrealized appreciation (depreciation) | — | 33,777,150 | 46,553,766 | (148,353,847 | ) | |||||||||||||
| Net realized and unrealized gain (loss) | 230,323 | 59,117,387 | 103,129,891 | (48,922,293 | ) | |||||||||||||
Increase (decrease) in net assets resulting from operations | $ | 230,323 | $ | 63,301,891 | $ | 107,928,730 | $ | (52,429,705 | ) | |||||||||
| * Foreign taxes withheld | $ | — | $ | 276,354 | $ | 105,299 | $ | 727,464 | ||||||||||
| ^ Foreign capital gains taxes withheld | $ | — | $ | — | $ | — | $ | 412,295 | ||||||||||
| # Change in foreign capital gains taxes accrued | $ | — | $ | — | $ | — | $ | 511,463 | ||||||||||
| VY® Morgan Stanley Global Franchise Portfolio | VY® T. Rowe Price Capital Appreciation Portfolio | VY® T. Rowe Price Equity Income Portfolio | VY® T. Rowe Price International Stock Portfolio | |||||||||||||||
|---|---|---|---|---|---|---|---|---|---|---|---|---|---|---|---|---|---|---|
INVESTMENT INCOME: | ||||||||||||||||||
| Dividends, net of foreign taxes withheld* | $ | 7,324,486 | $ | 69,304,950 | $ | 8,679,730 | $ | 3,381,633 | ||||||||||
| Interest | — | 73,998,191 | 19,174 | — | ||||||||||||||
| Securities lending income, net | 2,677 | 215,481 | 22,090 | 24,545 | ||||||||||||||
| Total investment income | 7,327,163 | 143,518,622 | 8,720,994 | 3,406,178 | ||||||||||||||
EXPENSES: | ||||||||||||||||||
| Investment management fees | — | — | — | 1,424,803 | ||||||||||||||
| Unified fees | 4,103,806 | 53,259,068 | 2,376,590 | — | ||||||||||||||
| Distribution and shareholder service fees: | ||||||||||||||||||
| Class ADV | 776,419 | 10,428,021 | 337,523 | 152,456 | ||||||||||||||
| Class S | 645,316 | 11,463,650 | 389,175 | 375,899 | ||||||||||||||
| Class S2 | 156,444 | 288,259 | 350,696 | — | ||||||||||||||
| Transfer agent fees: | ||||||||||||||||||
| Class ADV | — | — | — | 11,044 | ||||||||||||||
| Class I | — | — | — | 20,368 | ||||||||||||||
| Class S | — | — | — | 65,366 | ||||||||||||||
| Shareholder reporting expense | — | — | — | 8,819 | ||||||||||||||
| Professional fees | — | — | — | 23,249 | ||||||||||||||
| Custody and accounting expense | — | — | — | 123,039 | ||||||||||||||
| Trustee fees and expenses | 23,615 | 412,126 | 19,766 | 11,027 | ||||||||||||||
| Miscellaneous expense | — | — | — | 6,995 | ||||||||||||||
| Total expenses | 5,705,600 | 75,851,124 | 3,473,750 | 2,223,065 | ||||||||||||||
| Waived and reimbursed fees | (111,327 | ) | — | (112,644 | ) | (27,624 | ) | |||||||||||
| Brokerage commission recapture | — | (92 | ) | — | — | |||||||||||||
| Net expenses | 5,594,273 | 75,851,032 | 3,361,106 | 2,195,441 | ||||||||||||||
| Net investment income | 1,732,890 | 67,667,590 | 5,359,888 | 1,210,737 | ||||||||||||||
REALIZED AND UNREALIZED GAIN (LOSS): | ||||||||||||||||||
| Net realized gain (loss) on: | ||||||||||||||||||
| Investments (net of foreign capital gains taxes withheld^) | 31,567,071 | 947,698,895 | 36,881,129 | 22,218,001 | ||||||||||||||
| Forward foreign currency contracts | — | — | — | 7,224 | ||||||||||||||
| Foreign currency related transactions | 2,150 | (87,377 | ) | 1,827 | (66,026 | ) | ||||||||||||
| Written options | — | 40,144,672 | — | 42,773 | ||||||||||||||
| Net realized gain | 31,569,221 | 987,756,190 | 36,882,956 | 22,201,972 | ||||||||||||||
| Net change in unrealized appreciation (depreciation) on: | ||||||||||||||||||
Investments (net of foreign capital gains taxes accrued#) | 50,590,726 | 394,925,500 | 41,264,380 | (19,877,168 | ) | |||||||||||||
| Forward foreign currency contracts | — | — | — | 137 | ||||||||||||||
| Foreign currency related transactions | (14,982 | ) | 29,037 | (535 | ) | (20,120 | ) | |||||||||||
| Written options | — | (38,240,362 | ) | — | 13,793 | |||||||||||||
| Net change in unrealized appreciation (depreciation) | 50,575,744 | 356,714,175 | 41,263,845 | (19,883,358 | ) | |||||||||||||
| Net realized and unrealized gain | 82,144,965 | 1,344,470,365 | 78,146,801 | 2,318,614 | ||||||||||||||
Increase in net assets resulting from operations | $ | 83,877,855 | $ | 1,412,137,955 | $ | 83,506,689 | $ | 3,529,351 | ||||||||||
| * Foreign taxes withheld | $ | 123,148 | $ | 136,614 | $ | 146,106 | $ | 492,902 | ||||||||||
| ^ Foreign capital gains taxes withheld | $ | — | $ | — | $ | — | $ | 290 | ||||||||||
| # Change in foreign capital gains taxes accrued | $ | — | $ | — | $ | — | $ | 68,593 | ||||||||||
| Voya Government Liquid Assets Portfolio | VY® Clarion Global Real Estate Portfolio | |||||||||||||||||
|---|---|---|---|---|---|---|---|---|---|---|---|---|---|---|---|---|---|---|
| Year Ended December 31, 2021 | Year Ended December 31, 2020 | Year Ended December 31, 2021 | Year Ended December 31, 2020 | |||||||||||||||
FROM OPERATIONS: | ||||||||||||||||||
| Net investment income | $ | — | $ | 1,420,460 | $ | 4,184,504 | $ | 3,655,947 | ||||||||||
| Net realized gain (loss) | 230,323 | 330,328 | 25,340,237 | (7,007,785 | ) | |||||||||||||
| Net change in unrealized appreciation (depreciation) | — | — | 33,777,150 | (9,668,409 | ) | |||||||||||||
| Increase (decrease) in net assets resulting from operations | 230,323 | 1,750,788 | 63,301,891 | (13,020,247 | ) | |||||||||||||
FROM DISTRIBUTIONS TO SHAREHOLDERS: | ||||||||||||||||||
| Total distributions (excluding return of capital): | ||||||||||||||||||
| Class ADV | — | — | (377,513 | ) | (1,943,130 | ) | ||||||||||||
| Class I | (16,647 | ) | (160,481 | ) | (3,281,141 | ) | (13,539,081 | ) | ||||||||||
| Class S | (102,429 | ) | (795,507 | ) | (2,361,249 | ) | (11,140,696 | ) | ||||||||||
| Class S2 | (141,054 | ) | (801,847 | ) | (21,700 | ) | (103,320 | ) | ||||||||||
| Total distributions | (260,130 | ) | (1,757,835 | ) | (6,041,603 | ) | (26,726,227 | ) | ||||||||||
FROM CAPITAL SHARE TRANSACTIONS: | ||||||||||||||||||
| Net proceeds from sale of shares | 207,160,815 | 588,651,285 | 15,944,587 | 15,969,658 | ||||||||||||||
| Reinvestment of distributions | 260,130 | 1,757,835 | 6,041,603 | 26,726,227 | ||||||||||||||
| 207,420,945 | 590,409,120 | 21,986,190 | 42,695,885 | |||||||||||||||
| Cost of shares redeemed | (365,488,398 | ) | (350,271,057 | ) | (38,100,037 | ) | (43,792,715 | ) | ||||||||||
| Net increase (decrease) in net assets resulting from capital share transactions | (158,067,453 | ) | 240,138,063 | (16,113,847 | ) | (1,096,830 | ) | |||||||||||
| Net increase (decrease) in net assets | (158,097,260 | ) | 240,131,016 | 41,146,441 | (40,843,304 | ) | ||||||||||||
NET ASSETS: | ||||||||||||||||||
| Beginning of year or period | 966,726,216 | 726,595,200 | 193,531,028 | 234,374,332 | ||||||||||||||
| End of year or period | $ | 808,628,956 | $ | 966,726,216 | $ | 234,677,469 | $ | 193,531,028 | ||||||||||
| VY® Invesco Growth and Income Portfolio | VY® JPMorgan Emerging Markets Equity Portfolio | |||||||||||||||||
|---|---|---|---|---|---|---|---|---|---|---|---|---|---|---|---|---|---|---|
| Year Ended December 31, 2021 | Year Ended December 31, 2020 | Year Ended December 31, 2021 | Year Ended December 31, 2020 | |||||||||||||||
FROM OPERATIONS: | ||||||||||||||||||
| Net investment income (loss) | $ | 4,798,839 | $ | 6,389,512 | $ | (3,507,412 | ) | $ | (2,155,611 | ) | ||||||||
| Net realized gain (loss) | 56,576,125 | (3,654,870 | ) | 99,431,554 | 43,071,876 | |||||||||||||
| Net change in unrealized appreciation (depreciation) | 46,553,766 | 480,905 | (148,353,847 | ) | 103,209,620 | |||||||||||||
| Increase (decrease) in net assets resulting from operations | 107,928,730 | 3,215,547 | (52,429,705 | ) | 144,125,885 | |||||||||||||
FROM DISTRIBUTIONS TO SHAREHOLDERS: | ||||||||||||||||||
| Total distributions (excluding return of capital): | ||||||||||||||||||
| Class ADV | (192,270 | ) | (1,511,379 | ) | (4,625,629 | ) | (3,335,242 | ) | ||||||||||
| Class I | (593,144 | ) | (2,995,867 | ) | (6,493,054 | ) | (5,482,509 | ) | ||||||||||
| Class S | (4,704,412 | ) | (31,609,283 | ) | (27,977,315 | ) | (23,848,555 | ) | ||||||||||
| Class S2 | (304,187 | ) | (2,436,023 | ) | (908,609 | ) | (770,608 | ) | ||||||||||
| Total distributions | (5,794,013 | ) | (38,552,552 | ) | (40,004,607 | ) | (33,436,914 | ) | ||||||||||
FROM CAPITAL SHARE TRANSACTIONS: | ||||||||||||||||||
| Net proceeds from sale of shares | 29,359,114 | 13,095,950 | 44,423,900 | 29,912,036 | ||||||||||||||
| Reinvestment of distributions | 5,794,013 | 38,552,552 | 40,004,607 | 33,436,914 | ||||||||||||||
| 35,153,127 | 51,648,502 | 84,428,507 | 63,348,950 | |||||||||||||||
| Cost of shares redeemed | (73,541,854 | ) | (71,563,036 | ) | (103,276,595 | ) | (108,814,057 | ) | ||||||||||
| Net decrease in net assets resulting from capital share transactions | (38,388,727 | ) | (19,914,534 | ) | (18,848,088 | ) | (45,465,107 | ) | ||||||||||
| Net increase (decrease) in net assets | 63,745,990 | (55,251,539 | ) | (111,282,400 | ) | 65,223,864 | ||||||||||||
NET ASSETS: | ||||||||||||||||||
| Beginning of year or period | 388,140,127 | 443,391,666 | 577,128,407 | 511,904,543 | ||||||||||||||
| End of year or period | $ | 451,886,117 | $ | 388,140,127 | $ | 465,846,007 | $ | 577,128,407 | ||||||||||
| VY® Morgan Stanley Global Franchise Portfolio | VY® T. Rowe Price Capital Appreciation Portfolio | |||||||||||||||||
|---|---|---|---|---|---|---|---|---|---|---|---|---|---|---|---|---|---|---|
| Year Ended December 31, 2021 | Year Ended December 31, 2020 | Year Ended December 31, 2021 | Year Ended December 31, 2020 | |||||||||||||||
FROM OPERATIONS: | ||||||||||||||||||
| Net investment income | $ | 1,732,890 | $ | 2,549,812 | $ | 67,667,590 | $ | 78,262,680 | ||||||||||
| Net realized gain | 31,569,221 | 35,992,073 | 987,756,190 | 973,820,862 | ||||||||||||||
| Net change in unrealized appreciation (depreciation) | 50,575,744 | 9,934,729 | 356,714,175 | 187,123,331 | ||||||||||||||
| Increase in net assets resulting from operations | 83,877,855 | 48,476,614 | 1,412,137,955 | 1,239,206,873 | ||||||||||||||
FROM DISTRIBUTIONS TO SHAREHOLDERS: | ||||||||||||||||||
| Total distributions (excluding return of capital): | ||||||||||||||||||
| Class ADV | (12,325,665 | ) | (9,746,549 | ) | (222,578,297 | ) | (125,242,472 | ) | ||||||||||
| Class I | — | — | (181,327,758 | ) | (146,443,507 | ) | ||||||||||||
| Class R6 | (142,984 | ) | (83,242 | ) | (74,289,334 | ) | (22,268,407 | ) | ||||||||||
| Class S | (22,981,508 | ) | (21,154,417 | ) | (562,658,520 | ) | (361,997,134 | ) | ||||||||||
| Class S2 | (3,457,895 | ) | (3,140,746 | ) | (8,732,930 | ) | (5,800,989 | ) | ||||||||||
| Total distributions | (38,908,052 | ) | (34,124,954 | ) | (1,049,586,839 | ) | (661,752,509 | ) | ||||||||||
FROM CAPITAL SHARE TRANSACTIONS: | ||||||||||||||||||
| Net proceeds from sale of shares | 8,943,456 | 14,807,838 | 370,730,745 | 780,080,807 | ||||||||||||||
| Reinvestment of distributions | 38,908,052 | 34,124,954 | 1,049,586,839 | 661,752,509 | ||||||||||||||
| 47,851,508 | 48,932,792 | 1,420,317,584 | 1,441,833,316 | |||||||||||||||
| Cost of shares redeemed | (73,769,042 | ) | (58,139,153 | ) | (821,030,049 | ) | (1,589,155,945 | ) | ||||||||||
| Net increase (decrease) in net assets resulting from capital share transactions | (25,917,534 | ) | (9,206,361 | ) | 599,287,535 | (147,322,629 | ) | |||||||||||
| Net increase in net assets | 19,052,269 | 5,145,299 | 961,838,651 | 430,131,735 | ||||||||||||||
NET ASSETS: | ||||||||||||||||||
| Beginning of year or period | 421,393,841 | 416,248,542 | 7,875,384,001 | 7,445,252,266 | ||||||||||||||
| End of year or period | $ | 440,446,110 | $ | 421,393,841 | $ | 8,837,222,652 | $ | 7,875,384,001 | ||||||||||
| VY® T. Rowe Price Equity Income Portfolio | VY® T. Rowe Price International Stock Portfolio | |||||||||||||||||
|---|---|---|---|---|---|---|---|---|---|---|---|---|---|---|---|---|---|---|
| Year Ended December 31, 2021 | Year Ended December 31, 2020 | Year Ended December 31, 2021 | Year Ended December 31, 2020 | |||||||||||||||
FROM OPERATIONS: | ||||||||||||||||||
| Net investment income | $ | 5,359,888 | $ | 6,886,831 | $ | 1,210,737 | $ | 997,100 | ||||||||||
| Net realized gain | 36,882,956 | 6,251,840 | 22,201,972 | 5,851,108 | ||||||||||||||
| Net change in unrealized appreciation (depreciation) | 41,263,845 | (14,818,868 | ) | (19,883,358 | ) | 20,045,597 | ||||||||||||
| Increase (decrease) in net assets resulting from operations | 83,506,689 | (1,680,197 | ) | 3,529,351 | 26,893,805 | |||||||||||||
FROM DISTRIBUTIONS TO SHAREHOLDERS: | ||||||||||||||||||
| Total distributions (excluding return of capital): | ||||||||||||||||||
| Class ADV | (1,725,808 | ) | (2,417,696 | ) | (739,677 | ) | (951,655 | ) | ||||||||||
| Class I | (2,459,976 | ) | (4,638,752 | ) | (1,559,070 | ) | (1,967,794 | ) | ||||||||||
| Class S | (4,945,638 | ) | (6,991,587 | ) | (4,681,463 | ) | (6,557,580 | ) | ||||||||||
| Class S2 | (2,717,084 | ) | (4,344,569 | ) | — | — | ||||||||||||
| Total distributions | (11,848,506 | ) | (18,392,604 | ) | (6,980,210 | ) | (9,477,029 | ) | ||||||||||
FROM CAPITAL SHARE TRANSACTIONS: | ||||||||||||||||||
| Net proceeds from sale of shares | 26,358,264 | 17,085,747 | 14,304,379 | 10,128,091 | ||||||||||||||
| Reinvestment of distributions | 11,848,506 | 18,392,604 | 6,980,210 | 9,477,029 | ||||||||||||||
| 38,206,770 | 35,478,351 | 21,284,589 | 19,605,120 | |||||||||||||||
| Cost of shares redeemed | (77,056,559 | ) | (53,320,095 | ) | (35,266,663 | ) | (30,264,106 | ) | ||||||||||
| Net decrease in net assets resulting from capital share transactions | (38,849,789 | ) | (17,841,744 | ) | (13,982,074 | ) | (10,658,986 | ) | ||||||||||
| Net increase (decrease) in net assets | 32,808,394 | (37,914,545 | ) | (17,432,933 | ) | 6,757,790 | ||||||||||||
NET ASSETS: | ||||||||||||||||||
| Beginning of year or period | 346,534,179 | 384,448,724 | 222,962,506 | 216,204,716 | ||||||||||||||
| End of year or period | $ | 379,342,573 | $ | 346,534,179 | $ | 205,529,573 | $ | 222,962,506 | ||||||||||
| Income (loss) from investment operations | Less distributions | Ratios to average net assets | Supplemental data | |||||||||||||||||||||||||||||||||||||||||||||||||||||||||||||||||||
| Net asset value, beginning of year or period | Net investment income (loss) | Net realized and unrealized gain (loss) | Total from investment operations | From net investment income | From net realized gains | From return of capital | Total distributions | Payment by affiliate | Net asset value, end of year or period | Total Return(1) | Expenses before reductions/ additions(2)(3)(4) | Expenses net of fee waivers and/or recoupments if any(2)(3)(4) | Expenses net of all reductions/ additions(2)(3)(4) | Net investment income (loss)(2)(3) | Net assets, end of year or period | Portfolio turnover rate | ||||||||||||||||||||||||||||||||||||||||||||||||||||||
| Year or period ended | ($) | ($) | ($) | ($) | ($) | ($) | ($) | ($) | ($) | ($) | (%) | (%) | (%) | (%) | (%) | ($000’s) | (%) | |||||||||||||||||||||||||||||||||||||||||||||||||||||
Voya Government Liquid Assets Portfolio | ||||||||||||||||||||||||||||||||||||||||||||||||||||||||||||||||||||||
Class I | ||||||||||||||||||||||||||||||||||||||||||||||||||||||||||||||||||||||
| 12-31-21 | 1.00 | — | • | 0.00 | * | 0.00 | — | 0.00 | * | — | 0.00 | * | — | 1.00 | 0.03 | 0.28 | 0.05 | 0.05 | 0.00 | 50,337 | — | |||||||||||||||||||||||||||||||||||||||||||||||||
| 12-31-20 | 1.00 | 0.00 | * | 0.00 | * | 0.00 | * | 0.00 | * | 0.00 | * | — | 0.00 | * | — | 1.00 | 0.30 | 0.28 | 0.17 | 0.17 | 0.23 | 64,002 | — | |||||||||||||||||||||||||||||||||||||||||||||||
| 12-31-19 | 1.00 | 0.02 | 0.00 | * | 0.02 | 0.02 | 0.00 | * | — | 0.02 | — | 1.00 | 2.01 | 0.29 | 0.29 | 0.29 | 1.93 | 52,515 | — | |||||||||||||||||||||||||||||||||||||||||||||||||||
| 12-31-18 | 1.00 | 0.02 | 0.00 | * | 0.02 | 0.02 | 0.00 | * | — | 0.02 | — | 1.00 | 1.61 | 0.29 | 0.29 | 0.29 | 1.61 | 62,115 | — | |||||||||||||||||||||||||||||||||||||||||||||||||||
| 12-31-17 | 1.00 | 0.01 | 0.00 | * | 0.01 | 0.01 | 0.00 | * | — | 0.01 | — | 1.00 | 0.66 | 0.29 | 0.29 | 0.29 | 0.62 | 50,773 | — | |||||||||||||||||||||||||||||||||||||||||||||||||||
Class S | ||||||||||||||||||||||||||||||||||||||||||||||||||||||||||||||||||||||
| 12-31-21 | 1.00 | — | • | 0.00 | * | 0.00 | — | 0.00 | * | — | 0.00 | * | — | 1.00 | 0.03 | 0.53 | 0.05 | 0.05 | 0.00 | 320,548 | — | |||||||||||||||||||||||||||||||||||||||||||||||||
| 12-31-20 | 1.00 | 0.00 | * | 0.00 | * | 0.00 | * | 0.00 | * | 0.00 | * | — | 0.00 | * | — | 1.00 | 0.24 | 0.53 | 0.21 | 0.21 | 0.17 | 375,267 | — | |||||||||||||||||||||||||||||||||||||||||||||||
| 12-31-19 | 1.00 | 0.02 | 0.00 | * | 0.02 | 0.02 | 0.00 | * | — | 0.02 | — | 1.00 | 1.75 | 0.54 | 0.54 | 0.54 | 1.68 | 314,786 | — | |||||||||||||||||||||||||||||||||||||||||||||||||||
| 12-31-18 | 1.00 | 0.01 | 0.00 | * | 0.01 | 0.01 | 0.00 | * | — | 0.01 | — | 1.00 | 1.36 | 0.54 | 0.54 | 0.54 | 1.33 | 354,423 | — | |||||||||||||||||||||||||||||||||||||||||||||||||||
| 12-31-17 | 1.00 | 0.00 | * | 0.00 | * | 0.00 | * | 0.00 | * | 0.00 | * | — | 0.00 | * | — | 1.00 | 0.41 | 0.54 | 0.54 | 0.54 | 0.37 | 372,943 | — | |||||||||||||||||||||||||||||||||||||||||||||||
Class S2 | ||||||||||||||||||||||||||||||||||||||||||||||||||||||||||||||||||||||
| 12-31-21 | 1.00 | — | • | 0.00 | * | 0.00 | — | 0.00 | * | — | 0.00 | * | — | 1.00 | 0.03 | 0.68 | 0.05 | 0.05 | 0.00 | 437,744 | — | |||||||||||||||||||||||||||||||||||||||||||||||||
| 12-31-20 | 1.00 | 0.00 | * | 0.00 | * | 0.00 | * | 0.00 | * | 0.00 | * | — | 0.00 | * | — | 1.00 | 0.21 | 0.68 | 0.23 | 0.23 | 0.13 | 527,457 | — | |||||||||||||||||||||||||||||||||||||||||||||||
| 12-31-19 | 1.00 | 0.02 | 0.00 | * | 0.02 | 0.02 | 0.00 | * | — | 0.02 | — | 1.00 | 1.60 | 0.69 | 0.69 | 0.69 | 1.52 | 359,294 | — | |||||||||||||||||||||||||||||||||||||||||||||||||||
| 12-31-18 | 1.00 | 0.01 | 0.00 | * | 0.01 | 0.01 | 0.00 | * | — | 0.01 | — | 1.00 | 1.21 | 0.69 | 0.69 | 0.69 | 1.19 | 386,368 | — | |||||||||||||||||||||||||||||||||||||||||||||||||||
| 12-31-17 | 1.00 | 0.00 | * | 0.00 | * | 0.00 | * | 0.00 | * | 0.00 | * | — | 0.00 | * | — | 1.00 | 0.28 | 0.69 | 0.67 | 0.67 | 0.25 | 358,525 | — | |||||||||||||||||||||||||||||||||||||||||||||||
VY® Clarion Global Real Estate Portfolio | ||||||||||||||||||||||||||||||||||||||||||||||||||||||||||||||||||||||
Class ADV | ||||||||||||||||||||||||||||||||||||||||||||||||||||||||||||||||||||||
| 12-31-21 | 10.26 | 0.17 | • | 3.24 | 3.41 | 0.29 | — | — | 0.29 | — | 13.38 | 33.56 | 1.66 | 1.47 | 1.47 | 1.48 | 16,348 | 74 | ||||||||||||||||||||||||||||||||||||||||||||||||||||
| 12-31-20 | 12.77 | 0.15 | • | (1.11 | ) | (0.96 | ) | 0.60 | 0.95 | — | 1.55 | — | 10.26 | (5.37 | ) | 1.68 | 1.47 | 1.47 | 1.47 | 14,367 | 97 | |||||||||||||||||||||||||||||||||||||||||||||||||
| 12-31-19 | 10.53 | 0.17 | • | 2.34 | 2.51 | 0.27 | — | — | 0.27 | — | 12.77 | 23.99 | 1.62 | 1.49 | 1.49 | 1.40 | 17,308 | 77 | ||||||||||||||||||||||||||||||||||||||||||||||||||||
| 12-31-18 | 12.17 | 0.18 | • | (1.24 | ) | (1.06 | ) | 0.58 | — | — | 0.58 | — | 10.53 | (9.10 | ) | 1.62 | 1.49 | 1.49 | 1.54 | 16,608 | 107 | |||||||||||||||||||||||||||||||||||||||||||||||||
| 12-31-17 | 11.41 | 0.19 | • | 0.95 | 1.14 | 0.38 | — | — | 0.38 | — | 12.17 | 10.20 | 1.57 | 1.49 | 1.49 | 1.63 | 22,826 | 90 | ||||||||||||||||||||||||||||||||||||||||||||||||||||
Class I | ||||||||||||||||||||||||||||||||||||||||||||||||||||||||||||||||||||||
| 12-31-21 | 10.55 | 0.25 | • | 3.35 | 3.60 | 0.36 | — | — | 0.36 | — | 13.79 | 34.47 | 1.06 | 0.87 | 0.87 | 2.09 | 122,954 | 74 | ||||||||||||||||||||||||||||||||||||||||||||||||||||
| 12-31-20 | 13.11 | 0.28 | (1.21 | ) | (0.93 | ) | 0.68 | 0.95 | — | 1.63 | — | 10.55 | (4.83 | ) | 1.08 | 0.87 | 0.87 | 2.09 | 96,799 | 97 | ||||||||||||||||||||||||||||||||||||||||||||||||||
| 12-31-19 | 10.81 | 0.25 | • | 2.41 | 2.66 | 0.36 | — | — | 0.36 | — | 13.11 | 24.74 | 1.02 | 0.89 | 0.89 | 2.02 | 119,642 | 77 | ||||||||||||||||||||||||||||||||||||||||||||||||||||
| 12-31-18 | 12.49 | 0.25 | • | (1.27 | ) | (1.02 | ) | 0.66 | — | — | 0.66 | — | 10.81 | (8.52 | ) | 1.02 | 0.89 | 0.89 | 2.14 | 103,029 | 107 | |||||||||||||||||||||||||||||||||||||||||||||||||
| 12-31-17 | 11.72 | 0.27 | • | 0.96 | 1.23 | 0.46 | — | — | 0.46 | — | 12.49 | 10.77 | 0.97 | 0.89 | 0.89 | 2.28 | 183,921 | 90 | ||||||||||||||||||||||||||||||||||||||||||||||||||||
Class S | ||||||||||||||||||||||||||||||||||||||||||||||||||||||||||||||||||||||
| 12-31-21 | 10.50 | 0.22 | • | 3.33 | 3.55 | 0.33 | — | — | 0.33 | — | 13.72 | 34.14 | 1.31 | 1.12 | 1.12 | 1.83 | 94,359 | 74 | ||||||||||||||||||||||||||||||||||||||||||||||||||||
| 12-31-20 | 13.04 | 0.22 | (1.16 | ) | (0.94 | ) | 0.65 | 0.95 | — | 1.60 | — | 10.50 | (5.04 | ) | 1.33 | 1.12 | 1.12 | 1.85 | 81,568 | 97 | ||||||||||||||||||||||||||||||||||||||||||||||||||
| 12-31-19 | 10.76 | 0.22 | • | 2.39 | 2.61 | 0.33 | — | — | 0.33 | — | 13.04 | 24.35 | 1.27 | 1.14 | 1.14 | 1.76 | 96,519 | 77 | ||||||||||||||||||||||||||||||||||||||||||||||||||||
| 12-31-18 | 12.43 | 0.22 | • | (1.26 | ) | (1.04 | ) | 0.63 | — | — | 0.63 | — | 10.76 | (8.74 | ) | 1.27 | 1.14 | 1.14 | 1.91 | 90,159 | 107 | |||||||||||||||||||||||||||||||||||||||||||||||||
| 12-31-17 | 11.66 | 0.24 | • | 0.96 | 1.20 | 0.43 | — | — | 0.43 | — | 12.43 | 10.50 | 1.22 | 1.14 | 1.14 | 2.00 | 113,281 | 90 | ||||||||||||||||||||||||||||||||||||||||||||||||||||
Class S2 | ||||||||||||||||||||||||||||||||||||||||||||||||||||||||||||||||||||||
| 12-31-21 | 10.61 | 0.21 | • | 3.35 | 3.56 | 0.31 | — | — | 0.31 | — | 13.86 | 33.90 | 1.46 | 1.27 | 1.27 | 1.70 | 1,016 | 74 | ||||||||||||||||||||||||||||||||||||||||||||||||||||
| 12-31-20 | 13.15 | 0.20 | (1.17 | ) | (0.97 | ) | 0.62 | 0.95 | — | 1.57 | — | 10.61 | (5.19 | ) | 1.48 | 1.27 | 1.27 | 1.76 | 796 | 97 | ||||||||||||||||||||||||||||||||||||||||||||||||||
| 12-31-19 | 10.85 | 0.20 | • | 2.41 | 2.61 | 0.31 | — | — | 0.31 | — | 13.15 | 24.15 | 1.42 | 1.29 | 1.29 | 1.61 | 906 | 77 | ||||||||||||||||||||||||||||||||||||||||||||||||||||
| 12-31-18 | 12.52 | 0.21 | • | (1.27 | ) | (1.06 | ) | 0.61 | — | — | 0.61 | — | 10.85 | (8.84 | ) | 1.42 | 1.29 | 1.29 | 1.76 | 850 | 107 | |||||||||||||||||||||||||||||||||||||||||||||||||
| 12-31-17 | 11.73 | 0.22 | • | 0.98 | 1.20 | 0.41 | — | — | 0.41 | — | 12.52 | 10.42 | 1.37 | 1.29 | 1.29 | 1.87 | 1,048 | 90 | ||||||||||||||||||||||||||||||||||||||||||||||||||||
VY® Invesco Growth and Income Portfolio | ||||||||||||||||||||||||||||||||||||||||||||||||||||||||||||||||||||||
Class ADV | ||||||||||||||||||||||||||||||||||||||||||||||||||||||||||||||||||||||
| 12-31-21 | 20.62 | 0.18 | • | 5.67 | 5.85 | 0.26 | — | — | 0.26 | — | 26.21 | 28.50 | 1.24 | 1.21 | 1.21 | 0.75 | 18,354 | 30 | ||||||||||||||||||||||||||||||||||||||||||||||||||||
| 12-31-20 | 22.73 | 0.32 | (0.32 | ) | 0.00 | * | 0.35 | 1.76 | — | 2.11 | — | 20.62 | 2.55 | 1.24 | 1.24 | 1.24 | 1.45 | 15,543 | 32 | |||||||||||||||||||||||||||||||||||||||||||||||||||
| 12-31-19 | 21.15 | 0.32 | • | 4.64 | 4.96 | 0.50 | 2.88 | — | 3.38 | — | 22.73 | 24.30 | 1.24 | 1.24 | 1.24 | 1.43 | 18,401 | 22 | ||||||||||||||||||||||||||||||||||||||||||||||||||||
| 12-31-18 | 27.94 | 0.32 | • | (3.71 | ) | (3.39 | ) | 0.30 | 3.10 | — | 3.40 | — | 21.15 | (13.88 | ) | 1.24 | 1.24 | 1.24 | 1.22 | 16,868 | 31 | |||||||||||||||||||||||||||||||||||||||||||||||||
| 12-31-17 | 26.55 | 0.38 | • | 3.04 | 3.42 | 0.51 | 1.52 | — | 2.03 | — | 27.94 | 13.46 | 1.24 | 1.24 | 1.24 | 1.43 | 22,246 | 17 | ||||||||||||||||||||||||||||||||||||||||||||||||||||
| Income (loss) from investment operations | Less distributions | Ratios to average net assets | Supplemental data | |||||||||||||||||||||||||||||||||||||||||||||||||||||||||||||||||||
| Net asset value, beginning of year or period | Net investment income (loss) | Net realized and unrealized gain (loss) | Total from investment operations | From net investment income | From net realized gains | From return of capital | Total distributions | Payment by affiliate | Net asset value, end of year or period | Total Return(1) | Expenses before reductions/ additions(2)(3)(4) | Expenses net of fee waivers and/or recoupments if any(2)(3)(4) | Expenses net of all reductions/ additions(2)(3)(4) | Net investment income (loss)(2)(3) | Net assets, end of year or period | Portfolio turnover rate | ||||||||||||||||||||||||||||||||||||||||||||||||||||||
| Year or period ended | ($) | ($) | ($) | ($) | ($) | ($) | ($) | ($) | ($) | ($) | (%) | (%) | (%) | (%) | (%) | ($000’s) | (%) | |||||||||||||||||||||||||||||||||||||||||||||||||||||
VY® Invesco Growth and Income Portfolio (continued) | ||||||||||||||||||||||||||||||||||||||||||||||||||||||||||||||||||||||
Class I | ||||||||||||||||||||||||||||||||||||||||||||||||||||||||||||||||||||||
| 12-31-21 | 20.86 | 0.33 | • | 5.73 | 6.06 | 0.38 | — | — | 0.38 | — | 26.54 | 29.21 | 0.64 | 0.61 | 0.61 | 1.35 | 41,488 | 30 | ||||||||||||||||||||||||||||||||||||||||||||||||||||
| 12-31-20 | 23.01 | 0.39 | • | (0.28 | ) | 0.11 | 0.50 | 1.76 | — | 2.26 | — | 20.86 | 3.22 | 0.64 | 0.64 | 0.64 | 2.05 | 30,672 | 32 | |||||||||||||||||||||||||||||||||||||||||||||||||||
| 12-31-19 | 21.41 | 0.46 | • | 4.69 | 5.15 | 0.67 | 2.88 | — | 3.55 | — | 23.01 | 24.98 | 0.64 | 0.64 | 0.64 | 2.02 | 29,773 | 22 | ||||||||||||||||||||||||||||||||||||||||||||||||||||
| 12-31-18 | 28.23 | 0.48 | • | (3.73 | ) | (3.25 | ) | 0.47 | 3.10 | — | 3.57 | — | 21.41 | (13.31 | ) | 0.64 | 0.64 | 0.64 | 1.82 | 27,943 | 31 | |||||||||||||||||||||||||||||||||||||||||||||||||
| 12-31-17 | 26.77 | 0.55 | • | 3.07 | 3.62 | 0.64 | 1.52 | — | 2.16 | — | 28.23 | 14.13 | 0.64 | 0.64 | 0.64 | 2.02 | 33,894 | 17 | ||||||||||||||||||||||||||||||||||||||||||||||||||||
Class S | ||||||||||||||||||||||||||||||||||||||||||||||||||||||||||||||||||||||
| 12-31-21 | 21.12 | 0.27 | • | 5.82 | 6.09 | 0.33 | — | — | 0.33 | — | 26.88 | 28.97 | 0.89 | 0.86 | 0.86 | 1.10 | 367,120 | 30 | ||||||||||||||||||||||||||||||||||||||||||||||||||||
| 12-31-20 | 23.25 | 0.39 | (0.33 | ) | 0.06 | 0.43 | 1.76 | — | 2.19 | — | 21.12 | 2.90 | 0.89 | 0.89 | 0.89 | 1.81 | 317,890 | 32 | ||||||||||||||||||||||||||||||||||||||||||||||||||||
| 12-31-19 | 21.58 | 0.41 | • | 4.73 | 5.14 | 0.59 | 2.88 | — | 3.47 | — | 23.25 | 24.73 | 0.89 | 0.89 | 0.89 | 1.78 | 367,941 | 22 | ||||||||||||||||||||||||||||||||||||||||||||||||||||
| 12-31-18 | 28.43 | 0.42 | • | (3.78 | ) | (3.36 | ) | 0.39 | 3.10 | — | 3.49 | — | 21.58 | (13.58 | ) | 0.89 | 0.89 | 0.89 | 1.56 | 350,968 | 31 | |||||||||||||||||||||||||||||||||||||||||||||||||
| 12-31-17 | 26.94 | 0.48 | • | 3.10 | 3.58 | 0.57 | 1.52 | — | 2.09 | — | 28.43 | 13.89 | 0.89 | 0.89 | 0.89 | 1.76 | 476,317 | 17 | ||||||||||||||||||||||||||||||||||||||||||||||||||||
Class S2 | ||||||||||||||||||||||||||||||||||||||||||||||||||||||||||||||||||||||
| 12-31-21 | 20.88 | 0.23 | • | 5.76 | 5.99 | 0.30 | — | — | 0.30 | — | 26.57 | 28.78 | 1.04 | 1.01 | 1.01 | 0.95 | 24,924 | 30 | ||||||||||||||||||||||||||||||||||||||||||||||||||||
| 12-31-20 | 23.00 | 0.34 | (0.30 | ) | 0.04 | 0.40 | 1.76 | — | 2.16 | — | 20.88 | 2.77 | 1.04 | 1.04 | 1.04 | 1.66 | 24,035 | 32 | ||||||||||||||||||||||||||||||||||||||||||||||||||||
| 12-31-19 | 21.39 | 0.37 | • | 4.67 | 5.04 | 0.55 | 2.88 | — | 3.43 | — | 23.00 | 24.47 | 1.04 | 1.04 | 1.04 | 1.63 | 27,277 | 22 | ||||||||||||||||||||||||||||||||||||||||||||||||||||
| 12-31-18 | 28.19 | 0.37 | • | (3.73 | ) | (3.36 | ) | 0.34 | 3.10 | — | 3.44 | — | 21.39 | (13.67 | ) | 1.04 | 1.04 | 1.04 | 1.41 | 25,812 | 31 | |||||||||||||||||||||||||||||||||||||||||||||||||
| 12-31-17 | 26.73 | 0.44 | • | 3.06 | 3.50 | 0.52 | 1.52 | — | 2.04 | — | 28.19 | 13.67 | 1.04 | 1.04 | 1.04 | 1.62 | 33,409 | 17 | ||||||||||||||||||||||||||||||||||||||||||||||||||||
VY® JPMorgan Emerging Markets Equity Portfolio | ||||||||||||||||||||||||||||||||||||||||||||||||||||||||||||||||||||||
Class ADV | ||||||||||||||||||||||||||||||||||||||||||||||||||||||||||||||||||||||
| 12-31-21 | 25.92 | (0.25 | )• | (2.19 | ) | (2.44 | ) | — | 1.98 | — | 1.98 | — | 21.50 | (10.30 | ) | 1.86 | 1.86 | 1.86 | (1.01 | ) | 54,012 | 25 | ||||||||||||||||||||||||||||||||||||||||||||||||
| 12-31-20 | 21.02 | (0.17 | ) | 6.57 | 6.40 | 0.01 | 1.49 | — | 1.50 | — | 25.92 | 32.71 | 1.85 | 1.85 | 1.85 | (0.80 | ) | 58,266 | 22 | |||||||||||||||||||||||||||||||||||||||||||||||||||
| 12-31-19 | 16.95 | 0.01 | 5.24 | 5.25 | — | 1.18 | — | 1.18 | — | 21.02 | 31.47 | 1.86 | 1.86 | 1.86 | 0.03 | 50,224 | 21 | |||||||||||||||||||||||||||||||||||||||||||||||||||||
| 12-31-18 | 20.52 | (0.01 | ) | (3.49 | ) | (3.50 | ) | 0.07 | — | — | 0.07 | — | 16.95 | (17.12 | ) | 1.86 | 1.86 | 1.86 | (0.07 | ) | 40,881 | 21 | ||||||||||||||||||||||||||||||||||||||||||||||||
| 12-31-17 | 14.43 | (0.05 | ) | 6.19 | 6.14 | 0.05 | — | — | 0.05 | — | 20.52 | 42.55 | 1.86 | 1.86 | 1.86 | (0.24 | ) | 57,093 | 26 | |||||||||||||||||||||||||||||||||||||||||||||||||||
Class I | ||||||||||||||||||||||||||||||||||||||||||||||||||||||||||||||||||||||
| 12-31-21 | 27.55 | (0.11 | )• | (2.36 | ) | (2.47 | ) | — | 1.98 | — | 1.98 | — | 23.10 | (9.78 | ) | 1.26 | 1.26 | 1.26 | (0.40 | ) | 80,785 | 25 | ||||||||||||||||||||||||||||||||||||||||||||||||
| 12-31-20 | 22.24 | (0.04 | ) | 6.98 | 6.94 | 0.14 | 1.49 | — | 1.63 | — | 27.55 | 33.52 | 1.25 | 1.25 | 1.25 | (0.20 | ) | 94,067 | 22 | |||||||||||||||||||||||||||||||||||||||||||||||||||
| 12-31-19 | 17.80 | 0.13 | 5.52 | 5.65 | 0.03 | 1.18 | — | 1.21 | — | 22.24 | 32.23 | 1.26 | 1.26 | 1.26 | 0.62 | 79,674 | 21 | |||||||||||||||||||||||||||||||||||||||||||||||||||||
| 12-31-18 | 21.52 | 0.12 | (3.67 | ) | (3.55 | ) | 0.17 | — | — | 0.17 | — | 17.80 | (16.58 | ) | 1.26 | 1.26 | 1.26 | 0.53 | 61,663 | 21 | ||||||||||||||||||||||||||||||||||||||||||||||||||
| 12-31-17 | 15.10 | 0.08 | 6.47 | 6.55 | 0.13 | — | — | 0.13 | — | 21.52 | 43.45 | 1.26 | 1.26 | 1.26 | 0.34 | 82,567 | 26 | |||||||||||||||||||||||||||||||||||||||||||||||||||||
Class S | ||||||||||||||||||||||||||||||||||||||||||||||||||||||||||||||||||||||
| 12-31-21 | 27.35 | (0.17 | )• | (2.34 | ) | (2.51 | ) | — | 1.98 | — | 1.98 | — | 22.86 | (10.00 | ) | 1.51 | 1.51 | 1.51 | (0.64 | ) | 320,977 | 25 | ||||||||||||||||||||||||||||||||||||||||||||||||
| 12-31-20 | 22.08 | (0.10 | )• | 6.94 | 6.84 | 0.08 | 1.49 | — | 1.57 | — | 27.35 | 33.23 | 1.50 | 1.50 | 1.50 | (0.45 | ) | 411,371 | 22 | |||||||||||||||||||||||||||||||||||||||||||||||||||
| 12-31-19 | 17.70 | 0.08 | 5.48 | 5.56 | 0.00 | * | 1.18 | — | 1.18 | — | 22.08 | 31.91 | 1.51 | 1.51 | 1.51 | 0.38 | 370,441 | 21 | ||||||||||||||||||||||||||||||||||||||||||||||||||||
| 12-31-18 | 21.40 | 0.05 | • | (3.63 | ) | (3.58 | ) | 0.12 | — | — | 0.12 | — | 17.70 | (16.81 | ) | 1.51 | 1.51 | 1.51 | 0.27 | 319,682 | 21 | |||||||||||||||||||||||||||||||||||||||||||||||||
| 12-31-17 | 15.02 | 0.03 | 6.44 | 6.47 | 0.09 | — | — | 0.09 | — | 21.40 | 43.11 | 1.51 | 1.51 | 1.51 | 0.11 | 454,764 | 26 | |||||||||||||||||||||||||||||||||||||||||||||||||||||
Class S2 | ||||||||||||||||||||||||||||||||||||||||||||||||||||||||||||||||||||||
| 12-31-21 | 26.98 | (0.20 | )• | (2.30 | ) | (2.50 | ) | — | 1.98 | — | 1.98 | — | 22.50 | (10.11 | ) | 1.66 | 1.66 | 1.66 | (0.79 | ) | 10,071 | 25 | ||||||||||||||||||||||||||||||||||||||||||||||||
| 12-31-20 | 21.80 | (0.13 | )• | 6.85 | 6.72 | 0.05 | 1.49 | — | 1.54 | — | 26.98 | 33.03 | 1.65 | 1.65 | 1.65 | (0.60 | ) | 13,424 | 22 | |||||||||||||||||||||||||||||||||||||||||||||||||||
| 12-31-19 | 17.52 | 0.05 | 5.41 | 5.46 | — | 1.18 | — | 1.18 | — | 21.80 | 31.64 | 1.66 | 1.66 | 1.66 | 0.24 | 11,567 | 21 | |||||||||||||||||||||||||||||||||||||||||||||||||||||
| 12-31-18 | 21.17 | 0.04 | (3.61 | ) | (3.57 | ) | 0.08 | — | — | 0.08 | — | 17.52 | (16.92 | ) | 1.66 | 1.66 | 1.66 | 0.12 | 10,587 | 21 | ||||||||||||||||||||||||||||||||||||||||||||||||||
| 12-31-17 | 14.86 | (0.01 | )• | 6.37 | 6.36 | 0.05 | — | — | 0.05 | — | 21.17 | 42.85 | 1.66 | 1.66 | 1.66 | (0.03 | ) | 15,050 | 26 | |||||||||||||||||||||||||||||||||||||||||||||||||||
VY® Morgan Stanley Global Franchise Portfolio | ||||||||||||||||||||||||||||||||||||||||||||||||||||||||||||||||||||||
Class ADV | ||||||||||||||||||||||||||||||||||||||||||||||||||||||||||||||||||||||
| 12-31-21 | 16.52 | 0.03 | • | 3.34 | 3.37 | 0.09 | 1.61 | — | 1.70 | — | 18.19 | 21.26 | 1.57 | 1.54 | 1.54 | 0.18 | 138,475 | 11 | ||||||||||||||||||||||||||||||||||||||||||||||||||||
| 12-31-20 | 16.06 | 0.06 | 1.86 | 1.92 | 0.09 | 1.37 | — | 1.46 | — | 16.52 | 12.87 | 1.57 | 1.54 | 1.54 | 0.40 | 120,606 | 16 | |||||||||||||||||||||||||||||||||||||||||||||||||||||
| 12-31-19 | 14.01 | 0.06 | 3.89 | 3.95 | 0.10 | 1.80 | — | 1.90 | — | 16.06 | 28.89 | 1.57 | 1.54 | 1.54 | 0.48 | 110,093 | 16 | |||||||||||||||||||||||||||||||||||||||||||||||||||||
| 12-31-18 | 16.98 | 0.07 | (0.23 | ) | (0.16 | ) | 0.14 | 2.67 | — | 2.81 | — | 14.01 | (2.07 | ) | 1.57 | 1.54 | 1.54 | 0.47 | 78,112 | 27 | ||||||||||||||||||||||||||||||||||||||||||||||||||
| 12-31-17 | 14.58 | 0.10 | 3.53 | 3.63 | 0.17 | 1.06 | — | 1.23 | — | 16.98 | 25.47 | 1.57 | 1.55 | 1.55 | 0.60 | 83,492 | 29 | |||||||||||||||||||||||||||||||||||||||||||||||||||||
| Income (loss) from investment operations | Less distributions | Ratios to average net assets | Supplemental data | |||||||||||||||||||||||||||||||||||||||||||||||||||||||||||||||||||
| Net asset value, beginning of year or period | Net investment income (loss) | Net realized and unrealized gain (loss) | Total from investment operations | From net investment income | From net realized gains | From return of capital | Total distributions | Payment by affiliate | Net asset value, end of year or period | Total Return(1) | Expenses before reductions/ additions(2)(3)(4) | Expenses net of fee waivers and/or recoupments if any(2)(3)(4) | Expenses net of all reductions/ additions(2)(3)(4) | Net investment income (loss)(2)(3) | Net assets, end of year or period | Portfolio turnover rate | ||||||||||||||||||||||||||||||||||||||||||||||||||||||
| Year or period ended | ($) | ($) | ($) | ($) | ($) | ($) | ($) | ($) | ($) | ($) | (%) | (%) | (%) | (%) | (%) | ($000’s) | (%) | |||||||||||||||||||||||||||||||||||||||||||||||||||||
VY® Morgan Stanley Global Franchise Portfolio (continued) | ||||||||||||||||||||||||||||||||||||||||||||||||||||||||||||||||||||||
Class R6 | ||||||||||||||||||||||||||||||||||||||||||||||||||||||||||||||||||||||
| 12-31-21 | 17.97 | 0.15 | • | 3.65 | 3.80 | 0.18 | 1.61 | — | 1.79 | — | 19.98 | 22.01 | 0.97 | 0.94 | 0.94 | 0.79 | 1,828 | 11 | ||||||||||||||||||||||||||||||||||||||||||||||||||||
| 12-31-20 | 17.33 | 0.17 | • | 2.01 | 2.18 | 0.17 | 1.37 | — | 1.54 | — | 17.97 | 13.55 | 0.97 | 0.94 | 0.94 | 0.98 | 1,301 | 16 | ||||||||||||||||||||||||||||||||||||||||||||||||||||
| 12-31-19 | 14.97 | 0.18 | • | 4.17 | 4.35 | 0.19 | 1.80 | — | 1.99 | — | 17.33 | 29.74 | 0.97 | 0.94 | 0.94 | 1.07 | 635 | 16 | ||||||||||||||||||||||||||||||||||||||||||||||||||||
| 12-31-18 | 17.96 | 0.19 | • | (0.27 | ) | (0.08 | ) | 0.24 | 2.67 | — | 2.91 | — | 14.97 | (1.51 | ) | 0.97 | 0.94 | 0.94 | 1.14 | 84 | 27 | |||||||||||||||||||||||||||||||||||||||||||||||||
| 12-31-17 | 15.35 | 0.21 | • | 3.71 | 3.92 | 0.25 | 1.06 | — | 1.31 | — | 17.96 | 26.16 | 0.97 | 0.95 | 0.95 | 1.21 | 44 | 29 | ||||||||||||||||||||||||||||||||||||||||||||||||||||
Class S | ||||||||||||||||||||||||||||||||||||||||||||||||||||||||||||||||||||||
| 12-31-21 | 18.01 | 0.10 | • | 3.65 | 3.75 | 0.13 | 1.61 | — | 1.74 | — | 20.02 | 21.66 | 1.22 | 1.19 | 1.19 | 0.52 | 260,008 | 11 | ||||||||||||||||||||||||||||||||||||||||||||||||||||
| 12-31-20 | 17.36 | 0.14 | 2.01 | 2.15 | 0.13 | 1.37 | — | 1.50 | — | 18.01 | 13.28 | 1.22 | 1.19 | 1.19 | 0.74 | 260,901 | 16 | |||||||||||||||||||||||||||||||||||||||||||||||||||||
| 12-31-19 | 15.00 | 0.14 | • | 4.16 | 4.30 | 0.14 | 1.80 | — | 1.94 | — | 17.36 | 29.34 | 1.22 | 1.19 | 1.19 | 0.82 | 266,633 | 16 | ||||||||||||||||||||||||||||||||||||||||||||||||||||
| 12-31-18 | 17.97 | 0.14 | • | (0.25 | ) | (0.11 | ) | 0.19 | 2.67 | — | 2.86 | — | 15.00 | (1.69 | ) | 1.22 | 1.19 | 1.19 | 0.81 | 243,512 | 27 | |||||||||||||||||||||||||||||||||||||||||||||||||
| 12-31-17 | 15.36 | 0.16 | • | 3.71 | 3.87 | 0.20 | 1.06 | — | 1.26 | — | 17.97 | 25.81 | 1.22 | 1.20 | 1.20 | 0.95 | 282,442 | 29 | ||||||||||||||||||||||||||||||||||||||||||||||||||||
Class S2 | ||||||||||||||||||||||||||||||||||||||||||||||||||||||||||||||||||||||
| 12-31-21 | 17.80 | 0.07 | • | 3.61 | 3.68 | 0.10 | 1.61 | — | 1.71 | — | 19.77 | 21.53 | 1.37 | 1.34 | 1.34 | 0.37 | 40,135 | 11 | ||||||||||||||||||||||||||||||||||||||||||||||||||||
| 12-31-20 | 17.18 | 0.11 | 1.98 | 2.09 | 0.10 | 1.37 | — | 1.47 | — | 17.80 | 13.06 | 1.37 | 1.34 | 1.34 | 0.60 | 38,585 | 16 | |||||||||||||||||||||||||||||||||||||||||||||||||||||
| 12-31-19 | 14.86 | 0.11 | • | 4.13 | 4.24 | 0.12 | 1.80 | — | 1.92 | — | 17.18 | 29.15 | 1.37 | 1.34 | 1.34 | 0.67 | 38,888 | 16 | ||||||||||||||||||||||||||||||||||||||||||||||||||||
| 12-31-18 | 17.83 | 0.12 | (0.26 | ) | (0.14 | ) | 0.16 | 2.67 | — | 2.83 | — | 14.86 | (1.89 | ) | 1.37 | 1.34 | 1.34 | 0.66 | 35,431 | 27 | ||||||||||||||||||||||||||||||||||||||||||||||||||
| 12-31-17 | 15.24 | 0.14 | • | 3.69 | 3.83 | 0.18 | 1.06 | — | 1.24 | — | 17.83 | 25.69 | 1.37 | 1.35 | 1.35 | 0.80 | 41,831 | 29 | ||||||||||||||||||||||||||||||||||||||||||||||||||||
VY® T. Rowe Price Capital Appreciation Portfolio | ||||||||||||||||||||||||||||||||||||||||||||||||||||||||||||||||||||||
Class ADV | ||||||||||||||||||||||||||||||||||||||||||||||||||||||||||||||||||||||
| 12-31-21 | 29.91 | 0.14 | • | 4.98 | 5.12 | 0.16 | 3.99 | — | 4.15 | — | 30.88 | 17.97 | 1.24 | 1.24 | 1.24 | 0.47 | 1,891,868 | 58 | ||||||||||||||||||||||||||||||||||||||||||||||||||||
| 12-31-20 | 27.98 | 0.20 | • | 4.33 | 4.53 | 0.29 | 2.31 | — | 2.60 | — | 29.91 | 17.54 | 1.24 | 1.24 | 1.24 | 0.71 | 1,555,873 | 98 | ||||||||||||||||||||||||||||||||||||||||||||||||||||
| 12-31-19 | 24.10 | 0.25 | 5.46 | 5.71 | 0.34 | 1.49 | — | 1.83 | — | 27.98 | 23.99 | 1.24 | 1.24 | 1.24 | 1.02 | 1,353,246 | 53 | |||||||||||||||||||||||||||||||||||||||||||||||||||||
| 12-31-18 | 26.53 | 0.48 | (0.36 | ) | 0.12 | 0.50 | 2.05 | — | 2.55 | — | 24.10 | 0.10 | 1.24 | 1.24 | 1.24 | 1.94 | 990,787 | 75 | ||||||||||||||||||||||||||||||||||||||||||||||||||||
| 12-31-17 | 24.54 | 0.19 | 3.36 | 3.55 | 0.25 | 1.31 | — | 1.56 | — | 26.53 | 14.72 | 1.24 | 1.24 | 1.24 | 0.78 | 954,071 | 61 | |||||||||||||||||||||||||||||||||||||||||||||||||||||
Class I | ||||||||||||||||||||||||||||||||||||||||||||||||||||||||||||||||||||||
| 12-31-21 | 31.64 | 0.35 | • | 5.29 | 5.64 | 0.33 | 3.99 | — | 4.32 | — | 32.96 | 18.67 | 0.64 | 0.64 | 0.64 | 1.07 | 1,553,598 | 58 | ||||||||||||||||||||||||||||||||||||||||||||||||||||
| 12-31-20 | 29.41 | 0.38 | • | 4.61 | 4.99 | 0.45 | 2.31 | — | 2.76 | — | 31.64 | 18.28 | 0.64 | 0.64 | 0.64 | 1.31 | 1,280,224 | 98 | ||||||||||||||||||||||||||||||||||||||||||||||||||||
| 12-31-19 | 25.23 | 0.43 | 5.73 | 6.16 | 0.49 | 1.49 | — | 1.98 | — | 29.41 | 24.71 | 0.64 | 0.64 | 0.64 | 1.62 | 1,673,642 | 53 | |||||||||||||||||||||||||||||||||||||||||||||||||||||
| 12-31-18 | 27.64 | 0.67 | (0.38 | ) | 0.29 | 0.65 | 2.05 | — | 2.70 | — | 25.23 | 0.74 | 0.64 | 0.64 | 0.64 | 2.57 | 1,245,366 | 75 | ||||||||||||||||||||||||||||||||||||||||||||||||||||
| 12-31-17 | 25.49 | 0.36 | 3.50 | 3.86 | 0.40 | 1.31 | — | 1.71 | — | 27.64 | 15.39 | 0.64 | 0.64 | 0.64 | 1.38 | 1,217,289 | 61 | |||||||||||||||||||||||||||||||||||||||||||||||||||||
Class R6 | ||||||||||||||||||||||||||||||||||||||||||||||||||||||||||||||||||||||
| 12-31-21 | 31.66 | 0.35 | • | 5.29 | 5.64 | 0.33 | 3.99 | — | 4.32 | — | 32.98 | 18.66 | 0.64 | 0.64 | 0.64 | 1.07 | 620,373 | 58 | ||||||||||||||||||||||||||||||||||||||||||||||||||||
| 12-31-20 | 29.43 | 0.38 | • | 4.61 | 4.99 | 0.45 | 2.31 | — | 2.76 | — | 31.66 | 18.27 | 0.64 | 0.64 | 0.64 | 1.30 | 542,043 | 98 | ||||||||||||||||||||||||||||||||||||||||||||||||||||
| 12-31-19 | 25.24 | 0.46 | • | 5.71 | 6.17 | 0.49 | 1.49 | — | 1.98 | — | 29.43 | 24.74 | 0.64 | 0.64 | 0.64 | 1.62 | 181,835 | 53 | ||||||||||||||||||||||||||||||||||||||||||||||||||||
| 12-31-18 | 27.66 | 0.70 | • | (0.42 | ) | 0.28 | 0.65 | 2.05 | — | 2.70 | — | 25.24 | 0.70 | 0.64 | 0.64 | 0.64 | 2.57 | 94,159 | 75 | |||||||||||||||||||||||||||||||||||||||||||||||||||
| 12-31-17 | 25.49 | 0.38 | • | 3.50 | 3.88 | 0.40 | 1.31 | — | 1.71 | — | 27.66 | 15.47 | 0.64 | 0.64 | 0.64 | 1.38 | 59,752 | 61 | ||||||||||||||||||||||||||||||||||||||||||||||||||||
Class S | ||||||||||||||||||||||||||||||||||||||||||||||||||||||||||||||||||||||
| 12-31-21 | 31.64 | 0.27 | • | 5.29 | 5.56 | 0.25 | 3.99 | — | 4.24 | — | 32.96 | 18.40 | 0.89 | 0.89 | 0.89 | 0.82 | 4,700,019 | 58 | ||||||||||||||||||||||||||||||||||||||||||||||||||||
| 12-31-20 | 29.42 | 0.32 | 4.59 | 4.91 | 0.38 | 2.31 | — | 2.69 | — | 31.64 | 17.97 | 0.89 | 0.89 | 0.89 | 1.06 | 4,426,278 | 98 | |||||||||||||||||||||||||||||||||||||||||||||||||||||
| 12-31-19 | 25.25 | 0.39 | • | 5.69 | 6.08 | 0.42 | 1.49 | — | 1.91 | — | 29.42 | 24.36 | 0.89 | 0.89 | 0.89 | 1.37 | 4,163,308 | 53 | ||||||||||||||||||||||||||||||||||||||||||||||||||||
| 12-31-18 | 27.65 | 0.63 | • | (0.40 | ) | 0.23 | 0.58 | 2.05 | — | 2.63 | — | 25.25 | 0.51 | 0.89 | 0.89 | 0.89 | 2.29 | 3,640,431 | 75 | |||||||||||||||||||||||||||||||||||||||||||||||||||
| 12-31-17 | 25.50 | 0.31 | • | 3.48 | 3.79 | 0.33 | 1.31 | — | 1.64 | — | 27.65 | 15.10 | 0.89 | 0.89 | 0.89 | 1.13 | 4,050,729 | 61 | ||||||||||||||||||||||||||||||||||||||||||||||||||||
Class S2 | ||||||||||||||||||||||||||||||||||||||||||||||||||||||||||||||||||||||
| 12-31-21 | 31.37 | 0.22 | • | 5.23 | 5.45 | 0.20 | 3.99 | — | 4.19 | — | 32.63 | 18.19 | 1.04 | 1.04 | 1.04 | 0.67 | 71,364 | 58 | ||||||||||||||||||||||||||||||||||||||||||||||||||||
| 12-31-20 | 29.19 | 0.28 | 4.54 | 4.82 | 0.33 | 2.31 | — | 2.64 | — | 31.37 | 17.82 | 1.04 | 1.04 | 1.04 | 0.91 | 70,966 | 98 | |||||||||||||||||||||||||||||||||||||||||||||||||||||
| 12-31-19 | 25.06 | 0.34 | • | 5.65 | 5.99 | 0.37 | 1.49 | — | 1.86 | — | 29.19 | 24.19 | 1.04 | 1.04 | 1.04 | 1.22 | 73,222 | 53 | ||||||||||||||||||||||||||||||||||||||||||||||||||||
| 12-31-18 | 27.47 | 0.58 | • | (0.40 | ) | 0.18 | 0.54 | 2.05 | — | 2.59 | — | 25.06 | 0.33 | 1.04 | 1.04 | 1.04 | 2.13 | 68,741 | 75 | |||||||||||||||||||||||||||||||||||||||||||||||||||
| 12-31-17 | 25.33 | 0.26 | • | 3.47 | 3.73 | 0.28 | 1.31 | — | 1.59 | — | 27.47 | 14.96 | 1.04 | 1.04 | 1.04 | 0.98 | 74,919 | 61 | ||||||||||||||||||||||||||||||||||||||||||||||||||||
| Income (loss) from investment operations | Less distributions | Ratios to average net assets | Supplemental data | |||||||||||||||||||||||||||||||||||||||||||||||||||||||||||||||||||
| Net asset value, beginning of year or period | Net investment income (loss) | Net realized and unrealized gain (loss) | Total from investment operations | From net investment income | From net realized gains | From return of capital | Total distributions | Payment by affiliate | Net asset value, end of year or period | Total Return(1) | Expenses before reductions/ additions(2)(3)(4) | Expenses net of fee waivers and/or recoupments if any(2)(3)(4) | Expenses net of all reductions/ additions(2)(3)(4) | Net investment income (loss)(2)(3) | Net assets, end of year or period | Portfolio turnover rate | ||||||||||||||||||||||||||||||||||||||||||||||||||||||
| Year or period ended | ($) | ($) | ($) | ($) | ($) | ($) | ($) | ($) | ($) | ($) | (%) | (%) | (%) | (%) | (%) | ($000’s) | (%) | |||||||||||||||||||||||||||||||||||||||||||||||||||||
VY® T. Rowe Price Equity Income Portfolio | ||||||||||||||||||||||||||||||||||||||||||||||||||||||||||||||||||||||
Class ADV | ||||||||||||||||||||||||||||||||||||||||||||||||||||||||||||||||||||||
| 12-31-21 | 9.46 | 0.12 | • | 2.23 | 2.35 | 0.14 | 0.19 | — | 0.33 | — | 11.48 | 24.97 | 1.24 | 1.21 | 1.21 | 1.12 | 58,287 | 19 | ||||||||||||||||||||||||||||||||||||||||||||||||||||
| 12-31-20 | 9.97 | 0.17 | (0.19 | ) | (0.02 | ) | 0.37 | 0.12 | — | 0.49 | — | 9.46 | 0.64 | 1.24 | 1.21 | 1.21 | 1.87 | 47,110 | 25 | |||||||||||||||||||||||||||||||||||||||||||||||||||
| 12-31-19 | 10.74 | 0.21 | • | 2.42 | 2.63 | 0.26 | 3.14 | — | 3.40 | — | 9.97 | 25.93 | 1.24 | 1.21 | 1.21 | 1.82 | 51,293 | 17 | ||||||||||||||||||||||||||||||||||||||||||||||||||||
| 12-31-18 | 14.34 | 0.23 | (1.38 | ) | (1.15 | ) | 0.23 | 2.22 | — | 2.45 | — | 10.74 | (9.69 | )(a) | 1.24 | 1.09 | (b) | 1.09 | 1.80 | (c) | 43,287 | 16 | ||||||||||||||||||||||||||||||||||||||||||||||||
| 12-31-17 | 13.63 | 0.20 | 1.86 | 2.06 | 0.25 | 1.10 | — | 1.35 | — | 14.34 | 15.89 | 1.24 | 1.24 | 1.24 | 1.38 | 53,101 | 19 | |||||||||||||||||||||||||||||||||||||||||||||||||||||
Class I | ||||||||||||||||||||||||||||||||||||||||||||||||||||||||||||||||||||||
| 12-31-21 | 9.70 | 0.19 | • | 2.29 | 2.48 | 0.21 | 0.19 | — | 0.40 | — | 11.78 | 25.66 | 0.64 | 0.61 | 0.61 | 1.71 | 73,572 | 19 | ||||||||||||||||||||||||||||||||||||||||||||||||||||
| 12-31-20 | 10.27 | 0.23 | (0.20 | ) | 0.03 | 0.48 | 0.12 | — | 0.60 | — | 9.70 | 1.27 | 0.64 | 0.61 | 0.61 | 2.47 | 77,346 | 25 | ||||||||||||||||||||||||||||||||||||||||||||||||||||
| 12-31-19 | 10.97 | 0.29 | • | 2.47 | 2.76 | 0.32 | 3.14 | — | 3.46 | — | 10.27 | 26.66 | 0.64 | 0.61 | 0.61 | 2.42 | 81,596 | 17 | ||||||||||||||||||||||||||||||||||||||||||||||||||||
| 12-31-18 | 14.59 | 0.31 | (1.41 | ) | (1.10 | ) | 0.30 | 2.22 | — | 2.52 | — | 10.97 | (9.09 | )(a) | 0.64 | 0.49 | (b) | 0.49 | 2.40 | (c) | 82,300 | 16 | ||||||||||||||||||||||||||||||||||||||||||||||||
| 12-31-17 | 13.85 | 0.28 | • | 1.90 | 2.18 | 0.34 | 1.10 | — | 1.44 | — | 14.59 | 16.48 | 0.64 | 0.64 | 0.64 | 1.94 | 99,204 | 19 | ||||||||||||||||||||||||||||||||||||||||||||||||||||
Class S | ||||||||||||||||||||||||||||||||||||||||||||||||||||||||||||||||||||||
| 12-31-21 | 9.85 | 0.17 | • | 2.31 | 2.48 | 0.18 | 0.19 | — | 0.37 | — | 11.96 | 25.27 | 0.89 | 0.86 | 0.86 | 1.47 | 158,847 | 19 | ||||||||||||||||||||||||||||||||||||||||||||||||||||
| 12-31-20 | 10.31 | 0.22 | (0.20 | ) | 0.02 | 0.36 | 0.12 | — | 0.48 | — | 9.85 | 0.95 | 0.89 | 0.86 | 0.86 | 2.22 | 141,486 | 25 | ||||||||||||||||||||||||||||||||||||||||||||||||||||
| 12-31-19 | 11.00 | 0.25 | • | 2.50 | 2.75 | 0.30 | 3.14 | — | 3.44 | — | 10.31 | 26.42 | 0.89 | 0.86 | 0.86 | 2.13 | 161,388 | 17 | ||||||||||||||||||||||||||||||||||||||||||||||||||||
| 12-31-18 | 14.62 | 0.29 | (1.42 | ) | (1.13 | ) | 0.27 | 2.22 | — | 2.49 | — | 11.00 | (9.32 | )(a) | 0.89 | 0.74 | (b) | 0.74 | 2.15 | (c) | 541,914 | 16 | ||||||||||||||||||||||||||||||||||||||||||||||||
| 12-31-17 | 13.87 | 0.25 | • | 1.90 | 2.15 | 0.30 | 1.10 | — | 1.40 | — | 14.62 | 16.23 | 0.89 | 0.89 | 0.89 | 1.73 | 694,870 | 19 | ||||||||||||||||||||||||||||||||||||||||||||||||||||
Class S2 | ||||||||||||||||||||||||||||||||||||||||||||||||||||||||||||||||||||||
| 12-31-21 | 9.55 | 0.14 | • | 2.26 | 2.40 | 0.17 | 0.19 | — | 0.36 | — | 11.59 | 25.15 | 1.04 | 1.01 | 1.01 | 1.32 | 88,637 | 19 | ||||||||||||||||||||||||||||||||||||||||||||||||||||
| 12-31-20 | 10.07 | 0.20 | (0.20 | ) | 0.00 | * | 0.40 | 0.12 | — | 0.52 | — | 9.55 | 0.85 | 1.04 | 1.01 | 1.01 | 2.07 | 80,591 | 25 | |||||||||||||||||||||||||||||||||||||||||||||||||||
| 12-31-19 | 10.82 | 0.23 | • | 2.44 | 2.67 | 0.28 | 3.14 | — | 3.42 | — | 10.07 | 26.13 | 1.04 | 1.01 | 1.01 | 2.01 | 90,172 | 17 | ||||||||||||||||||||||||||||||||||||||||||||||||||||
| 12-31-18 | 14.42 | 0.26 | (1.39 | ) | (1.13 | ) | 0.25 | 2.22 | — | 2.47 | — | 10.82 | (9.45 | )(a) | 1.04 | 0.89 | (b) | 0.89 | 2.00 | (c) | 91,924 | 16 | ||||||||||||||||||||||||||||||||||||||||||||||||
| 12-31-17 | 13.70 | 0.23 | 1.87 | 2.10 | 0.28 | 1.10 | — | 1.38 | — | 14.42 | 16.07 | 1.04 | 1.04 | 1.04 | 1.58 | 113,247 | 19 | |||||||||||||||||||||||||||||||||||||||||||||||||||||
VY® T. Rowe Price International Stock Portfolio | ||||||||||||||||||||||||||||||||||||||||||||||||||||||||||||||||||||||
Class ADV | ||||||||||||||||||||||||||||||||||||||||||||||||||||||||||||||||||||||
| 12-31-21 | 17.72 | 0.03 | • | 0.15 | 0.18 | 0.07 | 0.46 | — | 0.53 | — | 17.37 | 0.87 | 1.36 | 1.35 | 1.35 | 0.18 | 24,946 | 27 | ||||||||||||||||||||||||||||||||||||||||||||||||||||
| 12-31-20 | 16.26 | 0.02 | • | 2.15 | 2.17 | 0.34 | 0.37 | — | 0.71 | — | 17.72 | 14.11 | 1.38 | 1.36 | 1.36 | 0.14 | 24,010 | 30 | ||||||||||||||||||||||||||||||||||||||||||||||||||||
| 12-31-19 | 13.63 | 0.12 | 3.49 | 3.61 | 0.06 | 0.92 | — | 0.98 | — | 16.26 | 27.20 | 1.41 | 1.36 | 1.36 | 0.87 | 23,415 | 30 | |||||||||||||||||||||||||||||||||||||||||||||||||||||
| 12-31-18 | 16.16 | 0.10 | (2.41 | ) | (2.31 | ) | 0.22 | — | — | 0.22 | — | 13.63 | (14.46 | ) | 1.45 | 1.40 | 1.40 | 0.70 | 18,465 | 35 | ||||||||||||||||||||||||||||||||||||||||||||||||||
| 12-31-17 | 12.79 | 0.08 | 3.42 | 3.50 | 0.13 | — | — | 0.13 | — | 16.16 | 27.42 | 1.40 | 1.40 | 1.40 | 0.64 | 21,086 | 37 | |||||||||||||||||||||||||||||||||||||||||||||||||||||
Class I | ||||||||||||||||||||||||||||||||||||||||||||||||||||||||||||||||||||||
| 12-31-21 | 17.81 | 0.14 | • | 0.15 | 0.29 | 0.16 | 0.46 | — | 0.62 | — | 17.48 | 1.48 | 0.76 | 0.75 | 0.75 | 0.78 | 45,209 | 27 | ||||||||||||||||||||||||||||||||||||||||||||||||||||
| 12-31-20 | 16.35 | 0.13 | 2.13 | 2.26 | 0.43 | 0.37 | — | 0.80 | — | 17.81 | 14.74 | 0.78 | 0.76 | 0.76 | 0.75 | 45,033 | 30 | |||||||||||||||||||||||||||||||||||||||||||||||||||||
| 12-31-19 | 13.69 | 0.23 | 3.50 | 3.73 | 0.15 | 0.92 | — | 1.07 | — | 16.35 | 28.04 | 0.81 | 0.76 | 0.76 | 1.47 | 41,352 | 30 | |||||||||||||||||||||||||||||||||||||||||||||||||||||
| 12-31-18 | 16.22 | 0.20 | • | (2.42 | ) | (2.22 | ) | 0.31 | — | — | 0.31 | — | 13.69 | (13.96 | ) | 0.85 | 0.80 | 0.80 | 1.30 | 35,717 | 35 | |||||||||||||||||||||||||||||||||||||||||||||||||
| 12-31-17 | 12.82 | 0.19 | • | 3.41 | 3.60 | 0.20 | — | — | 0.20 | — | 16.22 | 28.21 | 0.80 | 0.80 | 0.80 | 1.26 | 44,832 | 37 | ||||||||||||||||||||||||||||||||||||||||||||||||||||
Class S | ||||||||||||||||||||||||||||||||||||||||||||||||||||||||||||||||||||||
| 12-31-21 | 17.74 | 0.10 | • | 0.13 | 0.23 | 0.11 | 0.46 | — | 0.57 | — | 17.40 | 1.19 | 1.01 | 1.00 | 1.00 | 0.53 | 135,375 | 27 | ||||||||||||||||||||||||||||||||||||||||||||||||||||
| 12-31-20 | 16.28 | 0.08 | • | 2.14 | 2.22 | 0.39 | 0.37 | — | 0.76 | — | 17.74 | 14.49 | 1.03 | 1.01 | 1.01 | 0.49 | 153,919 | 30 | ||||||||||||||||||||||||||||||||||||||||||||||||||||
| 12-31-19 | 13.64 | 0.18 | • | 3.49 | 3.67 | 0.11 | 0.92 | — | 1.03 | — | 16.28 | 27.64 | 1.06 | 1.01 | 1.01 | 1.20 | 151,437 | 30 | ||||||||||||||||||||||||||||||||||||||||||||||||||||
| 12-31-18 | 16.15 | 0.17 | • | (2.42 | ) | (2.25 | ) | 0.26 | — | — | 0.26 | — | 13.64 | (14.12 | ) | 1.10 | 1.05 | 1.05 | 1.07 | 137,550 | 35 | |||||||||||||||||||||||||||||||||||||||||||||||||
| 12-31-17 | 12.77 | 0.15 | • | 3.40 | 3.55 | 0.17 | — | — | 0.17 | — | 16.15 | 27.87 | 1.05 | 1.05 | 1.05 | 1.01 | 175,297 | 37 | ||||||||||||||||||||||||||||||||||||||||||||||||||||
(1) | Total return is calculated assuming reinvestment of all dividends, capital gain distributions and return of capital distributions, if any, at net asset value and does not reflect the effect of insurance contract charges. Total return for periods less than one year is not annualized. | |
(2) | Annualized for periods less than one year. | |
(3) | Ratios reflect operating expenses of a Portfolio. Expenses before reductions/additions do not reflect amounts reimbursed or recouped |
| by the Investment Adviser and/or Distributor or reductions from brokerage service arrangements or other expense offset arrangements and do not represent the amount paid by a Portfolio during periods when reimbursements or reductions occur. Expenses net of fee waivers reflect expenses after reimbursement by the Investment Adviser and/or Distributor or recoupment of previously reimbursed fees by the Investment Adviser, but prior to reductions from brokerage service arrangements or other expense offset arrangements. Expenses net of all reductions/additions |
| represent the net expenses paid by a Portfolio. Net investment income (loss) is net of all such additions or reductions. | ||
(4) | Ratios do not include fees and expenses charged under the variable annuity contract or variable life insurance policy. | |
(a) | Excluding amounts related to a securities lending settlement and a cumulative underpayment of prior years’ waivers of management fees recorded in the year ended December 31, 2018, total return for VY® T.Rowe Price Equity Income Portfolio would have been (9.84)%, (9.24)%, (9.47)% and (9.60)% for Classes ADV, I, S and S2, respectively. | |
(b) | Excluding amounts related to a cumulative underpayment of prior years’ waivers of management fees recorded in the year ended December 31, 2018, the net expense ratios for VY® T.Rowe Price |
| Equity Income Portfolio would have been 1.23%, 0.63%, 0.88% and 1.03% for Class ADV, I, S and S2, respectively. | ||
(c) | Excluding amounts related to a securities lending settlement and a cumulative underpayment of prior years’ waivers of management fees recorded in the year ended December 31, 2018, the net investment income ratios for VY® T.Rowe Price Equity Income Portfolio would have been 1.65%, 2.25%, 2.00% and 1.85% for Classes ADV, I, S and S2, respectively. | |
• | Calculated using average number of shares outstanding throughout the year or period. | |
| * | Amount is less than $0.005 or 0.005% or more than $(0.005) or (0.005)%. |
| (1) | Market value of investment securities, other assets and liabilities — at the exchange rates prevailing at Market Close. |
| (2) | Purchases and sales of investment securities, income and expenses — at the rates of exchange prevailing on the respective dates of such transactions. |
| Purchased | Sold | |||||||
|---|---|---|---|---|---|---|---|---|
| Clarion Global Real Estate | $ | 72,601 | $ | 340,276 | ||||
| Invesco Growth and Income | 770,355 | 20,650,496 | ||||||
| JPMorgan Emerging Markets Equity | 180,552 | 1,741,319 | ||||||
| T. Rowe Price International Stock | 55,827 | 38,866 | ||||||
| Purchases | Sales | |||||||
|---|---|---|---|---|---|---|---|---|
| Clarion Global Real Estate | $ | 157,882,374 | $ | 168,576,520 | ||||
| Invesco Growth and Income | 124,936,116 | 163,037,690 | ||||||
| JPMorgan Emerging Markets Equity | 134,603,023 | 220,014,809 | ||||||
| Morgan Stanley Global Franchise | 46,323,748 | 104,815,923 | ||||||
| T. Rowe Price Capital Appreciation | 4,383,723,995 | 4,799,351,553 | ||||||
| T. Rowe Price Equity Income | 70,788,899 | 116,327,550 | ||||||
| T. Rowe Price International Stock | 58,935,571 | 77,665,803 | ||||||
| Portfolio | Fee | |
|---|---|---|
Clarion Global Real Estate(1) | 0.90% on the first $250 million; 0.875% on the next $250 million; 0.80% on the amount in excess of $500 million | |
T. Rowe Price International Stock(1) | 0.64% on the first $4 billion; 0.63% on the amount in excess of $4 billion |
(1) | The Investment Adviser is contractually obligated to waive 0.033% and 0.04% of the management fee for Clarion Global Real Estate and T. Rowe Price International Stock, respectively. Any fees waived or reimbursed are not eligible for recoupment. Termination or modification of these obligations requires approval by the Board. |
| Portfolio | Fee | |
|---|---|---|
Government Liquid Assets(2) | 0.35% on the first $200 million; 0.30% on the next $300 million; 0.25% on the amount in excess of $500 million | |
| JPMorgan Emerging Markets Equity | 1.25% | |
Morgan Stanley Global Franchise(3) | 1.00% on the first $250 million; 0.90% on the next $250 million; 0.75% on the amount in excess of $500 million | |
Invesco Growth and Income,(3) T. Rowe Price Capital Appreciation, and T. Rowe Price Equity Income(3)(4) | 0.75% first $750 million; 0.70% on the next $1.25 billion; 0.65% on the next $1.5 billion; 0.60% on the amount in excess of $3.5 billion |
(2) | The assets of Government Liquid Assets are aggregated with those of Voya Limited Maturity Bond Portfolio, which is not included in this report, to determine the Unified Fee applicable to the Portfolio. |
(3) | The Investment Adviser is contractually obligated to waive 0.026% and 0.030% of the Unified Fee for Morgan Stanley Global Franchise, and T. Rowe Price Equity Income, respectively. Effective January 1, 2021, the Investment Adviser is contractually obligated to waive 0.030% of the Unified Fee for Invesco Growth and Income. Any fees waived or reimbursed are not eligible for recoupment. Termination or modification of these obligations requires approval by the Board. |
(4) | The assets of Invesco Growth and Income, T. Rowe Price Capital Appreciation and T. Rowe Price Equity Income are aggregated with those of VY® Clarion Real Estate Portfolio, which is not included in this report, to determine the Unified Fee applicable to the respective Portfolios. |
| Portfolio | Sub-Adviser | |
|---|---|---|
| Government Liquid Assets | Voya Investment Management Co. LLC* | |
| Clarion Global Real Estate | CBRE Clarion Securities LLC | |
| Invesco Growth and Income | Invesco Advisers, Inc. | |
| JPMorgan Emerging Markets Equity | J.P. Morgan Investment Management Inc. | |
| Morgan Stanley Global Franchise | Morgan Stanley Investment Management Inc. | |
| T. Rowe Price Capital Appreciation | T. Rowe Price Associates, Inc. | |
| T. Rowe Price Equity Income | T. Rowe Price Associates, Inc. | |
| T. Rowe Price International Stock | T. Rowe Price Associates, Inc. |
| Distribution Fee | Shareholder Servicing Fee | |||||||
|---|---|---|---|---|---|---|---|---|
| Class S | $ | — | $ | 853,780 | ||||
| Class S2 | 705,004 | 1,175,001 | ||||||
| December 31, | ||||||||||||||||
|---|---|---|---|---|---|---|---|---|---|---|---|---|---|---|---|---|
| 2022 | 2023 | 2024 | Total | |||||||||||||
| Government Liquid Assets | $ | — | $ | 1,091,693 | $ | 2,048,789 | $ | 3,140,482 | ||||||||
| Subsidiary | Portfolio | Percentage | ||||
|---|---|---|---|---|---|---|
| ReliaStar Life Insurance | Clarion Global Real Estate | 5.57 | % | |||
| Company | Invesco Growth and Income | 5.15 | ||||
| T. Rowe Price Equity Income | 7.12 | |||||
| T. Rowe Price International Stock | 14.22 | |||||
| Security Life of Denver | Government Liquid Assets | 5.10 | ||||
| Insurance Company | Clarion Global Real Estate | 6.07 | ||||
| JPMorgan Emerging Markets Equity | 8.49 | |||||
| T. Rowe Price Equity Income | 9.22 | |||||
| T. Rowe Price International Stock | 7.35 | |||||
| Voya Institutional Trust | Government Liquid Assets | 53.45 | ||||
| Company | Clarion Global Real Estate | 10.80 | ||||
| Invesco Growth and Income | 5.40 | |||||
| JPMorgan Emerging Markets Equity | 12.25 | |||||
| Morgan Stanley Global Franchise | 33.43 | |||||
| T. Rowe Price Capital Appreciation | 31.31 | |||||
| T. Rowe Price Equity Income | 40.09 | |||||
| T. Rowe Price International Stock | 12.65 | |||||
| Voya Retirement | Clarion Global Real Estate | 36.49 | ||||
| Insurance and Annuity | Invesco Growth and Income | 19.22 | ||||
| Company | JPMorgan Emerging Markets Equity | 16.50 | ||||
| T. Rowe Price Capital Appreciation | 31.80 | |||||
| T. Rowe Price Equity Income | 43.46 | |||||
| T. Rowe Price International Stock | 8.87 | |||||
| Portfolio | Amount | |||
|---|---|---|---|---|
| Clarion Global Real Estate | $ | 263,012 | ||
| T. Rowe Price International Stock | 96,104 | |||
| Portfolio | Class ADV | Class I | Class S | Class S2 | ||||||||||||
|---|---|---|---|---|---|---|---|---|---|---|---|---|---|---|---|---|
| Clarion Global Real Estate | 1.50 | % | 0.90 | % | 1.15 | % | 1.30 | % | ||||||||
| T. Rowe Price International Stock | 1.40 | % | 0.80 | % | 1.05 | % | N/A | |||||||||
| December 31, | ||||||||||||||||
|---|---|---|---|---|---|---|---|---|---|---|---|---|---|---|---|---|
| 2022 | 2023 | 2024 | Total | |||||||||||||
| Clarion Global Real Estate | $ | 271,097 | $ | 332,373 | $ | 342,083 | $ | 945,553 | ||||||||
| Portfolio | Days Utilized | Approximate Average Daily Balance For Days Utilized | Approximate Weighted Average Interest Rate For Days Utilized | |||||||||
|---|---|---|---|---|---|---|---|---|---|---|---|---|
| JPMorgan Emerging Markets Equity | 13 | $ | 2,025,462 | 1.31 | % | |||||||
| T. Rowe Price Equity Income | 3 | 1,212,000 | 1.29 | |||||||||
| Year or | Shares sold | Shares issued in merger | Reinvestment of distributions | Shares redeemed | Net increase (decrease) in shares outstanding | Shares sold | Proceeds from shares issued in merger | Reinvestment of distributions | Shares redeemed | Net increase (decrease) | ||||||||||||||||||||||||||||||
|---|---|---|---|---|---|---|---|---|---|---|---|---|---|---|---|---|---|---|---|---|---|---|---|---|---|---|---|---|---|---|---|---|---|---|---|---|---|---|---|---|
| period ended | # | # | # | # | # | ($) | ($) | ($) | ($) | ($) | ||||||||||||||||||||||||||||||
Government Liquid Assets | ||||||||||||||||||||||||||||||||||||||||
Class I | ||||||||||||||||||||||||||||||||||||||||
| 12/31/2021 | 23,190,070 | — | 16,647 | (36,870,033 | ) | (13,663,316 | ) | 23,190,070 | — | 16,647 | (36,870,033 | ) | (13,663,316 | ) | ||||||||||||||||||||||||||
| 12/31/2020 | 43,551,255 | — | 160,481 | (32,223,268 | ) | 11,488,468 | 43,551,255 | — | 160,481 | (32,223,268 | ) | 11,488,468 | ||||||||||||||||||||||||||||
Class S | ||||||||||||||||||||||||||||||||||||||||
| 12/31/2021 | 97,462,266 | — | 102,429 | (152,272,917 | ) | (54,708,222 | ) | 97,462,266 | — | 102,429 | (152,272,917 | ) | (54,708,222 | ) | ||||||||||||||||||||||||||
| 12/31/2020 | 218,599,473 | — | 795,507 | (158,907,023 | ) | 60,487,956 | 218,599,472 | — | 795,507 | (158,907,023 | ) | 60,487,956 | ||||||||||||||||||||||||||||
Class S2 | ||||||||||||||||||||||||||||||||||||||||
| 12/31/2021 | 86,508,479 | — | 141,054 | (176,345,448 | ) | (89,695,915 | ) | 86,508,479 | — | 141,054 | (176,345,448 | ) | (89,695,915 | ) | ||||||||||||||||||||||||||
| 12/31/2020 | 326,500,557 | — | 801,848 | (159,140,766 | ) | 168,161,639 | 326,500,558 | — | 801,847 | (159,140,766 | ) | 168,161,639 | ||||||||||||||||||||||||||||
Clarion Global Real Estate | ||||||||||||||||||||||||||||||||||||||||
Class ADV | ||||||||||||||||||||||||||||||||||||||||
| 12/31/2021 | 36,402 | — | 31,148 | (246,757 | ) | (179,207 | ) | 440,881 | — | 377,513 | (2,969,373 | ) | (2,150,979 | ) | ||||||||||||||||||||||||||
| 12/31/2020 | 129,528 | — | 223,348 | (307,974 | ) | 44,902 | 1,270,587 | — | 1,943,130 | (3,108,493 | ) | 105,224 | ||||||||||||||||||||||||||||
Class I | ||||||||||||||||||||||||||||||||||||||||
| 12/31/2021 | 870,641 | — | 263,545 | (1,391,609 | ) | (257,423 | ) | 10,351,322 | — | 3,281,141 | (17,034,398 | ) | (3,401,935 | ) | ||||||||||||||||||||||||||
| 12/31/2020 | 963,954 | — | 1,516,134 | (2,433,184 | ) | 46,904 | 9,270,177 | — | 13,539,081 | (25,979,247 | ) | (3,169,989 | ) | |||||||||||||||||||||||||||
Class S | ||||||||||||||||||||||||||||||||||||||||
| 12/31/2021 | 400,678 | — | 190,423 | (1,480,173 | ) | (889,072 | ) | 5,035,135 | — | 2,361,249 | (17,946,886 | ) | (10,550,502 | ) | ||||||||||||||||||||||||||
| 12/31/2020 | 531,792 | — | 1,251,764 | (1,417,015 | ) | 366,541 | 5,413,868 | — | 11,140,696 | (14,634,393 | ) | 1,920,171 | ||||||||||||||||||||||||||||
Class S2 | ||||||||||||||||||||||||||||||||||||||||
| 12/31/2021 | 8,920 | — | 1,732 | (12,413 | ) | (1,761 | ) | 117,249 | — | 21,700 | (149,380 | ) | (10,431 | ) | ||||||||||||||||||||||||||
| 12/31/2020 | 1,463 | — | 11,493 | (6,770 | ) | 6,186 | 15,026 | — | 103,320 | (70,582 | ) | 47,764 | ||||||||||||||||||||||||||||
| Year or | Shares sold | Shares issued in merger | Reinvestment of distributions | Shares redeemed | Net increase (decrease) in shares outstanding | Shares sold | Proceeds from shares issued in merger | Reinvestment of distributions | Shares redeemed | Net increase (decrease) | ||||||||||||||||||||||||||||||
|---|---|---|---|---|---|---|---|---|---|---|---|---|---|---|---|---|---|---|---|---|---|---|---|---|---|---|---|---|---|---|---|---|---|---|---|---|---|---|---|---|
| period ended | # | # | # | # | # | ($) | ($) | ($) | ($) | ($) | ||||||||||||||||||||||||||||||
Invesco Growth and Income | ||||||||||||||||||||||||||||||||||||||||
Class ADV | ||||||||||||||||||||||||||||||||||||||||
| 12/31/2021 | 93,633 | — | 7,922 | (155,021 | ) | (53,466 | ) | 2,283,226 | — | 192,270 | (3,740,417 | ) | (1,264,921 | ) | ||||||||||||||||||||||||||
| 12/31/2020 | 69,867 | — | 93,526 | (219,291 | ) | (55,898 | ) | 1,261,128 | — | 1,511,379 | (3,962,904 | ) | (1,190,397 | ) | ||||||||||||||||||||||||||
Class I | ||||||||||||||||||||||||||||||||||||||||
| 12/31/2021 | 257,685 | — | 24,200 | (189,580 | ) | 92,305 | 6,267,142 | — | 593,144 | (4,677,696 | ) | 2,182,590 | ||||||||||||||||||||||||||||
| 12/31/2020 | 278,527 | — | 183,796 | (285,492 | ) | 176,831 | 5,017,662 | — | 2,995,867 | (5,157,613 | ) | 2,855,916 | ||||||||||||||||||||||||||||
Class S | ||||||||||||||||||||||||||||||||||||||||
| 12/31/2021 | 811,169 | — | 189,312 | (2,391,268 | ) | (1,390,787 | ) | 20,227,445 | — | 4,704,412 | (59,053,401 | ) | (34,121,544 | ) | ||||||||||||||||||||||||||
| 12/31/2020 | 340,779 | — | 1,912,238 | (3,031,679 | ) | (778,662 | ) | 6,067,646 | — | 31,609,283 | (58,221,302 | ) | (20,544,373 | ) | ||||||||||||||||||||||||||
Class S2 | ||||||||||||||||||||||||||||||||||||||||
| 12/31/2021 | 23,460 | — | 12,375 | (248,583 | ) | (212,748 | ) | 581,301 | — | 304,187 | (6,070,340 | ) | (5,184,852 | ) | ||||||||||||||||||||||||||
| 12/31/2020 | 41,348 | — | 148,992 | (225,207 | ) | (34,867 | ) | 749,514 | — | 2,436,023 | (4,221,217 | ) | (1,035,680 | ) | ||||||||||||||||||||||||||
JPMorgan Emerging Markets Equity | ||||||||||||||||||||||||||||||||||||||||
Class ADV | ||||||||||||||||||||||||||||||||||||||||
| 12/31/2021 | 398,659 | — | 190,433 | (324,566 | ) | 264,526 | 10,209,266 | — | 4,625,629 | (8,016,811 | ) | 6,818,084 | ||||||||||||||||||||||||||||
| 12/31/2020 | 267,174 | — | 168,788 | (577,958 | ) | (141,996 | ) | 5,770,513 | — | 3,335,242 | (11,945,482 | ) | (2,839,727 | ) | ||||||||||||||||||||||||||
Class I | ||||||||||||||||||||||||||||||||||||||||
| 12/31/2021 | 473,196 | — | 249,445 | (640,202 | ) | 82,439 | 12,725,273 | — | 6,493,054 | (17,402,497 | ) | 1,815,830 | ||||||||||||||||||||||||||||
| 12/31/2020 | 550,474 | — | 261,820 | (980,967 | ) | (168,673 | ) | 12,167,260 | — | 5,482,509 | (21,408,539 | ) | (3,758,770 | ) | ||||||||||||||||||||||||||
Class S | ||||||||||||||||||||||||||||||||||||||||
| 12/31/2021 | 810,713 | — | 1,084,813 | (2,897,162 | ) | (1,001,636 | ) | 20,975,903 | — | 27,977,315 | (75,127,105 | ) | (26,173,887 | ) | ||||||||||||||||||||||||||
| 12/31/2020 | 534,104 | — | 1,146,014 | (3,414,754 | ) | (1,734,636 | ) | 11,580,698 | — | 23,848,555 | (73,515,273 | ) | (38,086,020 | ) | ||||||||||||||||||||||||||
Class S2 | ||||||||||||||||||||||||||||||||||||||||
| 12/31/2021 | 20,594 | — | 35,772 | (106,192 | ) | (49,826 | ) | 513,458 | — | 908,609 | (2,730,182 | ) | (1,308,115 | ) | ||||||||||||||||||||||||||
| 12/31/2020 | 18,152 | — | 37,499 | (88,666 | ) | (33,015 | ) | 393,565 | — | 770,608 | (1,944,763 | ) | (780,590 | ) | ||||||||||||||||||||||||||
Morgan Stanley Global Franchise | ||||||||||||||||||||||||||||||||||||||||
Class ADV | ||||||||||||||||||||||||||||||||||||||||
| 12/31/2021 | 362,182 | — | 734,983 | (785,409 | ) | 311,756 | 6,143,775 | — | 12,325,665 | (13,504,448 | ) | 4,964,992 | ||||||||||||||||||||||||||||
| 12/31/2020 | 548,605 | — | 650,203 | (752,027 | ) | 446,781 | 8,726,056 | — | 9,746,549 | (11,298,930 | ) | 7,173,675 | ||||||||||||||||||||||||||||
Class R6 | ||||||||||||||||||||||||||||||||||||||||
| 12/31/2021 | 23,034 | — | 7,784 | (11,744 | ) | 19,074 | 421,413 | — | 142,984 | (218,243 | ) | 346,154 | ||||||||||||||||||||||||||||
| 12/31/2020 | 54,732 | — | 5,119 | (24,069 | ) | 35,782 | 931,719 | — | 83,242 | (418,085 | ) | 596,876 | ||||||||||||||||||||||||||||
Class S | ||||||||||||||||||||||||||||||||||||||||
| 12/31/2021 | 111,714 | — | 1,246,962 | (2,860,955 | ) | (1,502,279 | ) | 2,083,227 | — | 22,981,508 | (53,664,794 | ) | (28,600,059 | ) | ||||||||||||||||||||||||||
| 12/31/2020 | 251,313 | — | 1,297,021 | (2,418,030 | ) | (869,696 | ) | 4,372,052 | — | 21,154,417 | (40,749,327 | ) | (15,222,858 | ) | ||||||||||||||||||||||||||
Class S2 | ||||||||||||||||||||||||||||||||||||||||
| 12/31/2021 | 15,867 | — | 189,890 | (342,983 | ) | (137,226 | ) | 295,041 | — | 3,457,895 | (6,381,557 | ) | (2,628,621 | ) | ||||||||||||||||||||||||||
| 12/31/2020 | 46,784 | — | 194,594 | (337,650 | ) | (96,272 | ) | 778,011 | — | 3,140,746 | (5,672,811 | ) | (1,754,054 | ) | ||||||||||||||||||||||||||
T. Rowe Price Capital Appreciation | ||||||||||||||||||||||||||||||||||||||||
Class ADV | ||||||||||||||||||||||||||||||||||||||||
| 12/31/2021 | 3,907,585 | — | 7,606,265 | (2,263,017 | ) | 9,250,833 | 120,879,451 | — | 222,578,297 | (69,340,875 | ) | 274,116,873 | ||||||||||||||||||||||||||||
| 12/31/2020 | 3,740,800 | — | 4,755,912 | (4,851,630 | ) | 3,645,082 | 102,816,047 | — | 125,242,472 | (126,741,872 | ) | 101,316,647 | ||||||||||||||||||||||||||||
Class I | ||||||||||||||||||||||||||||||||||||||||
| 12/31/2021 | 3,638,741 | — | 5,781,019 | (2,746,988 | ) | 6,672,772 | 118,764,330 | — | 181,327,758 | (88,908,320 | ) | 211,183,768 | ||||||||||||||||||||||||||||
| 12/31/2020 | 6,028,340 | — | 5,239,834 | (27,708,303 | ) | (16,440,129 | ) | 171,166,595 | — | 146,443,507 | (843,395,333 | ) | (525,785,231 | ) | ||||||||||||||||||||||||||
Class R6 | ||||||||||||||||||||||||||||||||||||||||
| 12/31/2021 | 2,158,514 | — | 2,367,244 | (2,838,265 | ) | 1,687,493 | 70,531,505 | — | 74,289,334 | (92,862,424 | ) | 51,958,415 | ||||||||||||||||||||||||||||
| 12/31/2020 | 13,692,166 | — | 779,163 | (3,529,227 | ) | 10,942,102 | 427,082,165 | — | 22,268,407 | (109,303,753 | ) | 340,046,819 | ||||||||||||||||||||||||||||
Class S | ||||||||||||||||||||||||||||||||||||||||
| 12/31/2021 | 1,754,026 | — | 17,982,319 | (17,005,161 | ) | 2,731,184 | 57,374,711 | — | 562,658,520 | (555,142,856 | ) | 64,890,375 | ||||||||||||||||||||||||||||
| 12/31/2020 | 2,541,238 | — | 12,945,953 | (17,100,702 | ) | (1,613,511 | ) | 75,038,932 | — | 361,997,134 | (493,096,419 | ) | (56,060,353 | ) | ||||||||||||||||||||||||||
Class S2 | ||||||||||||||||||||||||||||||||||||||||
| 12/31/2021 | 96,357 | — | 282,378 | (453,978 | ) | (75,243 | ) | 3,180,748 | — | 8,732,930 | (14,775,574 | ) | (2,861,896 | ) | ||||||||||||||||||||||||||
| 12/31/2020 | 136,942 | — | 209,860 | (592,588 | ) | (245,786 | ) | 3,977,068 | — | 5,800,989 | (16,618,568 | ) | (6,840,511 | ) | ||||||||||||||||||||||||||
T. Rowe Price Equity Income | ||||||||||||||||||||||||||||||||||||||||
Class ADV | ||||||||||||||||||||||||||||||||||||||||
| 12/31/2021 | 1,114,789 | — | 154,753 | (1,171,214 | ) | 98,328 | 12,227,521 | — | 1,725,809 | (12,810,997 | ) | 1,142,333 | ||||||||||||||||||||||||||||
| 12/31/2020 | 472,756 | — | 294,459 | (929,253 | ) | (162,038 | ) | 3,958,435 | — | 2,417,696 | (7,709,752 | ) | (1,333,621 | ) | ||||||||||||||||||||||||||
Class I | ||||||||||||||||||||||||||||||||||||||||
| 12/31/2021 | 715,388 | — | 213,445 | (2,660,105 | ) | (1,731,272 | ) | 7,970,005 | — | 2,459,976 | (29,890,253 | ) | (19,460,272 | ) | ||||||||||||||||||||||||||
| 12/31/2020 | 791,408 | — | 546,897 | (1,303,524 | ) | 34,781 | 6,818,383 | — | 4,638,752 | (11,392,802 | ) | 64,333 | ||||||||||||||||||||||||||||
Class S | ||||||||||||||||||||||||||||||||||||||||
| 12/31/2021 | 474,787 | — | 423,645 | (1,993,772 | ) | (1,095,340 | ) | 5,432,775 | — | 4,945,637 | (22,283,889 | ) | (11,905,477 | ) | ||||||||||||||||||||||||||
| 12/31/2020 | 391,297 | — | 809,460 | (2,489,739 | ) | (1,288,982 | ) | 3,372,422 | — | 6,991,587 | (22,456,940 | ) | (12,092,931 | ) | ||||||||||||||||||||||||||
| Year or | Shares sold | Shares issued in merger | Reinvestment of distributions | Shares redeemed | Net increase (decrease) in shares outstanding | Shares sold | Proceeds from shares issued in merger | Reinvestment of distributions | Shares redeemed | Net increase (decrease) | ||||||||||||||||||||||||||||||
|---|---|---|---|---|---|---|---|---|---|---|---|---|---|---|---|---|---|---|---|---|---|---|---|---|---|---|---|---|---|---|---|---|---|---|---|---|---|---|---|---|
| period ended | # | # | # | # | # | ($) | ($) | ($) | ($) | ($) | ||||||||||||||||||||||||||||||
T. Rowe Price Equity Income (continued) | ||||||||||||||||||||||||||||||||||||||||
Class S2 | ||||||||||||||||||||||||||||||||||||||||
| 12/31/2021 | 67,166 | — | 240,652 | (1,101,605 | ) | (793,787 | ) | 727,963 | — | 2,717,084 | (12,071,420 | ) | (8,626,373 | ) | ||||||||||||||||||||||||||
| 12/31/2020 | 370,460 | — | 522,177 | (1,403,557 | ) | (510,920 | ) | 2,936,507 | — | 4,344,569 | (11,760,601 | ) | (4,479,525 | ) | ||||||||||||||||||||||||||
T. Rowe Price International Stock | ||||||||||||||||||||||||||||||||||||||||
Class ADV | ||||||||||||||||||||||||||||||||||||||||
| 12/31/2021 | 181,901 | — | 40,464 | (140,921 | ) | 81,444 | 3,313,921 | — | 739,677 | (2,556,791 | ) | 1,496,807 | ||||||||||||||||||||||||||||
| 12/31/2020 | 139,759 | — | 63,528 | (288,340 | ) | (85,053 | ) | 2,138,357 | — | 951,655 | (4,273,302 | ) | (1,183,290 | ) | ||||||||||||||||||||||||||
Class I | ||||||||||||||||||||||||||||||||||||||||
| 12/31/2021 | 229,956 | — | 84,963 | (256,619 | ) | 58,300 | 4,222,910 | — | 1,559,070 | (4,715,629 | ) | 1,066,351 | ||||||||||||||||||||||||||||
| 12/31/2020 | 146,615 | — | 131,012 | (279,650 | ) | (2,023 | ) | 2,285,500 | — | 1,967,794 | (4,273,597 | ) | (20,303 | ) | ||||||||||||||||||||||||||
Class S | ||||||||||||||||||||||||||||||||||||||||
| 12/31/2021 | 374,083 | — | 255,958 | (1,527,087 | ) | (897,046 | ) | 6,767,548 | — | 4,681,463 | (27,994,243 | ) | (16,545,232 | ) | ||||||||||||||||||||||||||
| 12/31/2020 | 372,173 | — | 438,048 | (1,437,827 | ) | (627,606 | ) | 5,704,234 | — | 6,557,580 | (21,717,207 | ) | (9,455,393 | ) | ||||||||||||||||||||||||||
| Clarion Global Real Estate | ||||||||||||
|---|---|---|---|---|---|---|---|---|---|---|---|---|
| Counterparty | Securities Loaned at Value | Cash Collateral Received(1) | Net Amount | |||||||||
| BNP Paribas Arbitrage | $ | 12,349 | $ | (12,349 | ) | $ | — | |||||
| Citigroup Global Markets Limited | 852,375 | (852,375 | ) | — | ||||||||
| National Bank of Canada Financial INC | 562,393 | (562,393 | ) | — | ||||||||
| Total | $ | 1,427,117 | $ | (1,427,117 | ) | $ | — | |||||
(1) | Cash collateral with a fair value of $1,486,945 has been received in connection with the above securities lending transactions. Excess cash collateral received from the individual counterparty is not shown for financial reporting purposes. |
| Invesco Growth and Income | |||||||||||||||
|---|---|---|---|---|---|---|---|---|---|---|---|---|---|---|---|
| Counterparty | Securities Loaned at Value | Cash Collateral Received(1) | Net Amount | ||||||||||||
| SG Americas Securities, LLC | $ | 42,006 | $ | (42,006 | ) | $ | — | ||||||||
| Total | $ | 42,006 | $ | (42,006 | ) | $ | — | ||||||||
(1) | Cash collateral with a fair value of $42,956 has been received in connection with the above securities lending transactions. Excess cash collateral received from the individual counterparty is not shown for financial reporting purposes. |
| JPMorgan Emerging Markets Equity | |||||||||||||
|---|---|---|---|---|---|---|---|---|---|---|---|---|---|
| Counterparty | Securities Loaned at Value | Cash Collateral Received(1) | Net Amount | ||||||||||
| BNP Paribas Prime Brokerage Intl Ltd | $ | 1,147,740 | $ | (1,147,740 | ) | $ | — | ||||||
| Total | $ | 1,147,740 | $ | (1,147,740 | ) | $ | — | ||||||
(1) | Cash collateral with a fair value of $1,190,512 has been received in connection with the above securities lending transactions. Excess cash collateral received from the individual counterparty is not shown for financial reporting purposes. |
| T. Rowe Price Capital Appreciation | |||||||||||||
|---|---|---|---|---|---|---|---|---|---|---|---|---|---|
| Counterparty | Securities Loaned at Value | Cash Collateral Received(1) | Net Amount | ||||||||||
| Barclays Bank PLC | $ | 7,144,520 | $ | (7,144,520 | ) | $ | — | ||||||
| Barclays Capital Inc. | 1,590,984 | (1,590,984 | ) | — | |||||||||
| BMO Capital Markets Corp | 912,307 | (912,307 | ) | — | |||||||||
| BNP Paribas | 10,717,497 | (10,717,497 | ) | — | |||||||||
| BNP Paribas Prime Brokerage Intl Ltd | 5,428,479 | (5,428,479 | ) | — | |||||||||
| BofA Securities Inc | 5,495,206 | (5,495,206 | ) | — | |||||||||
| Cantor Fitzgerald & Co | 95,038 | (95,038 | ) | — | |||||||||
| Citadel Clearing LLC | 7,466,899 | (7,466,899 | ) | — | |||||||||
| Citigroup Global Markets Inc. | 15,226,720 | (15,226,720 | ) | — | |||||||||
| Credit Suisse Securities (USA) LLC | 1,922,149 | (1,922,149 | ) | — | |||||||||
| Deutsche Bank Securities Inc. | 2,585,912 | (2,585,912 | ) | — | |||||||||
| GoldmanSachs & Co. LLC | 21,651,325 | (21,651,325 | ) | — | |||||||||
| Jefferies LLC | 272,960 | (272,960 | ) | — | |||||||||
| J.P. Morgan Securities LLC | 36,988,776 | (36,988,776 | ) | — | |||||||||
| MUFG Securities Americas Inc. | 17,066,410 | (17,066,410 | ) | — | |||||||||
| Morgan Stanley & Co. LLC | 7,912,596 | (7,912,596 | ) | — | |||||||||
| Nomura Securities International, Inc. | 8,482,883 | (8,482,883 | ) | — | |||||||||
| RBC Capital Markets, LLC | 6,434,667 | (6,434,667 | ) | — | |||||||||
| Scotia Capital (USA) INC | 237,772 | (237,772 | ) | — | |||||||||
| SunTrust Robinson Humphrey,Inc | 155,688 | (155,688 | ) | — | |||||||||
| T. Rowe Price Capital Appreciation (continued) | |||||||||||||
|---|---|---|---|---|---|---|---|---|---|---|---|---|---|
| Counterparty | Securities Loaned at Value | Cash Collateral Received(1) | Net Amount | ||||||||||
| UBS Securities LLC. | $ | 129,698 | $ | (129,698 | ) | $ | — | ||||||
| Wells Fargo Bank NA | 7,603,319 | (7,603,319 | ) | — | |||||||||
| Wells Fargo Securities LLC | 5,542,387 | (5,542,387 | ) | — | |||||||||
| Total | $ | 171,064,192 | $ | (171,064,192 | ) | $ | — | ||||||
(1) | Cash collateral with a fair value of $174,981,936 has been received in connection with the above securities lending transactions. Excess cash collateral received from the individual counterparty is not shown for financial reporting purposes. |
| T. Rowe Price Equity Income | |||||||||||||
|---|---|---|---|---|---|---|---|---|---|---|---|---|---|
| Counterparty | Securities Loaned at Value | Cash Collateral Received(1) | Net Amount | ||||||||||
| HSBC Bank PLC | $ | 2,294,423 | $ | (2,294,423 | ) | $ | — | ||||||
| J.P. Morgan Securities LLC | 933,964 | (933,964 | ) | — | |||||||||
| UBS AG | 10,809,983 | (10,809,983 | ) | — | |||||||||
| Wells Fargo Securities LLC | 392,565 | (392,565 | ) | — | |||||||||
| Total | $ | 14,430,935 | $ | (14,430,935 | ) | $ | — | ||||||
(1) | Cash collateral with a fair value of $14,739,853 has been received in connection with the above securities lending transactions. Excess cash collateral received from the individual counterparty is not shown for financial reporting purposes. | |
| T. Rowe Price International Stock | |||||||||||||
|---|---|---|---|---|---|---|---|---|---|---|---|---|---|
| Counterparty | Securities Loaned at Value | Cash Collateral Received(1) | Net Amount | ||||||||||
| Citigroup Global Markets Limited | $ | 2,931,823 | $ | (2,931,823 | ) | $ | — | ||||||
| J.P. Morgan Securities LLC | 234,237 | (234,237 | ) | — | |||||||||
| Scotia Capital (USA) INC | 199,523 | (199,523 | ) | — | |||||||||
| Wells Fargo Securities LLC | 377,279 | (377,279 | ) | — | |||||||||
| Total | $ | 3,742,862 | $ | (3,742,862 | ) | $ | — | ||||||
(1) | Cash collateral with a fair value of $3,910,198 has been received in connection with the above securities lending transactions. Excess cash collateral received from the individual counterparty is not shown for financial reporting purposes. |
| Paid-in Capital | Distributable Earnings | ||||||||
|---|---|---|---|---|---|---|---|---|---|
| Government Liquid Assets | $ | (34,072 | ) | $ | 34,072 | ||||
| JPMorgan Emerging Markets Equity | (1,513,219 | ) | 1,513,219 | ||||||
| Year Ended December 31, 2021 | Year Ended December 31, 2020 | |||||||||||||||
|---|---|---|---|---|---|---|---|---|---|---|---|---|---|---|---|---|
| Ordinary Income | Long-term Capital Gains | Ordinary Income | Long-term Capital Gains | |||||||||||||
| Government Liquid Assets | $ | 260,130 | $ | — | $ | 1,757,835 | $ | — | ||||||||
| Clarion Global Real Estate | 6,041,603 | — | 12,158,955 | 14,567,272 | ||||||||||||
| Invesco Growth and Income | 5,794,013 | — | 7,565,414 | 30,987,138 | ||||||||||||
| JPMorgan Emerging Markets Equity | 1,437,832 | 38,566,775 | 1,701,704 | 31,735,210 | ||||||||||||
| Morgan Stanley Global Franchise | 3,006,032 | 35,902,020 | 3,590,119 | 30,534,835 | ||||||||||||
| T. Rowe Price Capital Appreciation | 308,314,113 | 741,272,726 | 192,004,958 | 469,747,551 | ||||||||||||
| T. Rowe Price Equity Income | 5,696,840 | 6,151,666 | 17,191,718 | 1,200,886 | ||||||||||||
| T. Rowe Price International Stock | 1,414,892 | 5,565,318 | 5,238,296 | 4,238,733 | ||||||||||||
| Undistributed Ordinary Income | Undistributed Long-term Capital Gains | Unrealized Appreciation/ (Depreciation) | Other | Total Distributable Earnings/(Loss) | ||||||||||||||||
|---|---|---|---|---|---|---|---|---|---|---|---|---|---|---|---|---|---|---|---|---|
| Government Liquid Assets | $ | — | $ | — | $ | — | $ | (14,585 | ) | $ | (14,585 | ) | ||||||||
| Clarion Global Real Estate | 6,892,159 | 8,599,379 | 63,964,972 | (7,666 | ) | 79,448,844 | ||||||||||||||
| Invesco Growth and Income | 9,854,314 | 49,484,673 | 120,380,351 | (14,850 | ) | 179,704,488 | ||||||||||||||
| JPMorgan Emerging Markets Equity | — | 97,646,805 | 130,156,507 | (2,925,028 | ) | 224,878,284 | ||||||||||||||
| Morgan Stanley Global Franchise | 2,049,342 | 31,288,121 | 172,662,258 | (10,270 | ) | 205,989,451 | ||||||||||||||
| T. Rowe Price Capital Appreciation | 273,053,367 | 710,613,021 | 1,675,192,143 | (138,015 | ) | 2,658,720,516 | ||||||||||||||
| T. Rowe Price Equity Income | 3,415,264 | 33,459,457 | 105,013,496 | (35,954 | ) | 141,852,263 | ||||||||||||||
| T. Rowe Price International Stock | 4,390,306 | 16,074,165 | 40,872,941 | (75,360 | ) | 61,262,052 | ||||||||||||||
| VOYA GOVERNMENT LIQUID ASSETS PORTFOLIO | PORTFOLIO OF INVESTMENTS AS OF DECEMBER 31, 2021 |
| Principal Amount† | Value | Percentage of Net Assets | ||||||||||||
|---|---|---|---|---|---|---|---|---|---|---|---|---|---|---|
U.S. TREASURY REPURCHASE AGREEMENT: 14.5% | ||||||||||||||
| 117,326,000 | Deutsche Bank Repurchase Agreement dated 12/31/21, 0.010%, due 01/03/22, $117,326,098 to be received upon repurchase (Collateralized by $97,063,300, U.S. Treasury Interest, 0.125%–0.375%, Market Value plus accrued interest $119,672,541 due 7/15/23–7/15/30, 0.010%, 01/03/2022) | $ | 117,326,000 | 14.5 | ||||||||||
| Total U.S. Treasury Repurchase Agreement (Cost $117,326,000) | 117,326,000 | 14.5 | ||||||||||||
U.S. TREASURY DEBT: 35.2% | ||||||||||||||
| 93,000,000 | (1) | United States Cash Management Bill, 0.070%, 04/26/2022 | 92,968,738 | 11.5 | ||||||||||
| 13,000,000 | (1) | United States Cash Management Bill, 0.120%, 05/03/2022 | 12,994,843 | 1.6 | ||||||||||
| 22,000,000 | (1) | United States Treasury Bill, 0.010%, 01/13/2022 | 21,999,652 | 2.7 | ||||||||||
| 26,500,000 | (1) | United States Treasury Bill, 0.040%, 01/25/2022 | 26,499,364 | 3.3 | ||||||||||
| 55,000,000 | (1) | United States Treasury Bill, 0.050%, 02/22/2022 | 54,996,226 | 6.8 | ||||||||||
| 21,500,000 | (1) | United States Treasury Bill, 0.190%, 06/30/2022 | 21,479,563 | 2.7 | ||||||||||
| 53,500,000 | (1) | United States Treasury Bill, 0.210%, 07/07/2022 | 53,444,283 | 6.6 | ||||||||||
| Total U.S. Treasury Debt (Cost $284,382,669) | 284,382,669 | 35.2 | ||||||||||||
U.S. GOVERNMENT AGENCY DEBT: 44.6% | ||||||||||||||
| 5,250,000 | Fannie Mae, 0.280%, (SOFRRATE + 0.230%), 05/06/2022 | 5,253,950 | 0.7 | |||||||||||
| 27,000,000 | Federal Farm Credit Banks Funding Corp., 0.058%, (SOFRRATE + 0.008%), 11/22/2022 | 26,997,563 | 3.3 | |||||||||||
| 20,000,000 | Federal Farm Credit Banks Funding Corp., 0.060%, (PRIME + (3.190)%), 05/25/2022 | 19,999,198 | 2.5 | |||||||||||
| 13,000,000 | Federal Farm Credit Banks Funding Corp., 0.075%, (SOFRRATE + 0.025%), 12/16/2022 | 13,000,315 | 1.6 | |||||||||||
| 11,117,000 | Federal Farm Credit Banks Funding Corp., 0.120%, 09/22/2022 | 11,117,000 | 1.4 | |||||||||||
| 10,000,000 | Federal Home Loan Bank Discount Notes, 0.030%, 01/04/2022 | 9,999,975 | 1.2 | |||||||||||
| 50,000,000 | Federal Home Loan Bank Discount Notes, 0.030%, 01/05/2022 | 49,999,833 | 6.2 | |||||||||||
| 14,000,000 | Federal Home Loan Bank Discount Notes, 0.030%, 01/14/2022 | 13,999,863 | 1.7 | |||||||||||
| Principal Amount† | Value | Percentage of Net Assets | ||||||||||||
|---|---|---|---|---|---|---|---|---|---|---|---|---|---|---|
U.S. GOVERNMENT AGENCY DEBT: (continued) | ||||||||||||||
| 11,000,000 | Federal Home Loan Bank Discount Notes, 0.040%, 01/20/2022 | $ | 10,999,768 | 1.4 | ||||||||||
| 90,000,000 | Federal Home Loan Bank Discount Notes, 0.040%, 01/21/2022 | 89,998,100 | 11.1 | |||||||||||
| 70,000,000 | Federal Home Loan Banks, 0.060%, (SOFRRATE + 0.010%), 09/06/2022 | 70,000,000 | 8.7 | |||||||||||
| 13,500,000 | Federal Home Loan Banks, 0.060%, (SOFRRATE + 0.010%), 10/07/2022 | 13,500,000 | 1.7 | |||||||||||
| 12,500,000 | Federal Home Loan Banks, 0.060%, (SOFRRATE + 0.010%), 10/07/2022 | 12,500,000 | 1.5 | |||||||||||
| 13,000,000 | Federal Home Loan Banks, 0.220%, 12/16/2022 | 13,000,000 | 1.6 | |||||||||||
| Total U.S. Government Agency Debt (Cost $360,365,565) | 360,365,565 | 44.6 | ||||||||||||
| Shares | Value | Percentage of Net Assets | ||||||||||||
INVESTMENT COMPANIES: 7.2% | ||||||||||||||
| 26,700,000 | (2) | BlackRock Liquidity Funds, FedFund, Institutional Class, 0.030% | 26,700,000 | 3.3 | ||||||||||
| 32,000,000 | (2) | Morgan Stanley Institutional Liquidity Funds–Government Portfolio (Institutional Share Class), 0.030% | 32,000,000 | 3.9 | ||||||||||
| Total Investment Companies (Cost $58,700,000) | 58,700,000 | 7.2 | ||||||||||||
Total Investments in Securities (Cost $820,774,234) | $ | 820,774,234 | 101.5 | |||||||||||
Liabilities in Excess of Other Assets | (12,145,278 | ) | (1.5 | ) | ||||||||||
Net Assets | $ | 808,628,956 | 100.0 | |||||||||||
| † | Unless otherwise indicated, principal amount is shown in USD. | |
| (1) | Represents a zero coupon bond. Rate shown reflects the effective yield as of December 31, 2021. | |
| (2) | Rate shown is the 7-day yield as of December 31, 2021. | |
Reference Rate Abbreviations: | ||
| PRIME | Federal Reserve Bank Prime Loan Rate |
| SOFRRATE | 1-day Secured Overnight Financing Rate |
| VOYA GOVERNMENT LIQUID ASSETS PORTFOLIO | PORTFOLIO OF INVESTMENTS AS OF DECEMBER 31, 2021 (CONTINUED) |
| Quoted Prices in Active Markets for Identical Investments (Level 1) | Significant Other Observable Inputs (Level 2) | Significant Unobservable Inputs (Level 3) | Fair Value at December 31, 2021 | ||||||||||||||||||
|---|---|---|---|---|---|---|---|---|---|---|---|---|---|---|---|---|---|---|---|---|---|
Asset Table | |||||||||||||||||||||
Investments, at fair value | |||||||||||||||||||||
| Investment Companies | $ | 58,700,000 | $ | — | $ | — | $ | 58,700,000 | |||||||||||||
| U.S. Government Agency Debt | — | 360,365,565 | — | 360,365,565 | |||||||||||||||||
| U.S. Treasury Debt | — | 284,382,669 | — | 284,382,669 | |||||||||||||||||
| U.S. Treasury Repurchase Agreement | — | 117,326,000 | — | 117,326,000 | |||||||||||||||||
| Total Investments, at fair value | $ | 58,700,000 | $ | 762,074,234 | $ | — | $ | 820,774,234 | |||||||||||||
| ^ | See Note 2, “Significant Accounting Policies” in the Notes to Financial Statements for additional information. |
| Counterparty | Government Repurchase Agreement, at fair value | Fair Value of Non-Cash Collateral Received Including Accrued Interest(1) | Net Amount | |||||||||||||
| Deutsche Bank | $ | 117,326,000 | $ | (117,326,000 | ) | $ | — | |||||||||
| Totals | $ | 117,326,000 | $ | (117,326,000 | ) | $ | — | |||||||||
(1) | Collateral with a fair value of $119,672,541 has been pledged in connection with the above government repurchase agreement. Excess collateral received from the individual counterparty is not shown for financial reporting purposes. |
| VY® CLARION GLOBAL REAL ESTATE PORTFOLIO | PORTFOLIO OF INVESTMENTS AS OF DECEMBER 31, 2021 |
| Shares | Value | Percentage of Net Assets | ||||||||||||
|---|---|---|---|---|---|---|---|---|---|---|---|---|---|---|
COMMON STOCK: 100.1% | ||||||||||||||
Australia: 4.5% | ||||||||||||||
| 205,276 | Charter Hall Group | $ | 3,070,920 | 1.3 | ||||||||||
| 263,041 | Dexus | 2,126,909 | 0.9 | |||||||||||
| 53,036 | Goodman Group | 1,022,363 | 0.4 | |||||||||||
| 45,065 | Lifestyle Communities Ltd. | 681,133 | 0.3 | |||||||||||
| 971,266 | Mirvac Group | 2,055,945 | 0.9 | |||||||||||
| 1,348,947 | Vicinity Centres | 1,658,978 | 0.7 | |||||||||||
| 10,616,248 | 4.5 | |||||||||||||
Belgium: 1.4% | ||||||||||||||
| 6,176 | Montea NV | 929,394 | 0.4 | |||||||||||
| 21,546 | Shurgard Self Storage SA | 1,410,480 | 0.6 | |||||||||||
| 20,850 | Warehouses De Pauw CVA | 1,000,681 | 0.4 | |||||||||||
| 3,340,555 | 1.4 | |||||||||||||
Canada: 2.2% | ||||||||||||||
| 26,256 | Boardwalk Real Estate Investment Trust | 1,138,082 | 0.5 | |||||||||||
| 27,043 | Canadian Apartment Properties REIT | 1,281,867 | 0.5 | |||||||||||
| 126,723 | H&R Real Estate Investment Trust | 1,627,929 | 0.7 | |||||||||||
| 58,249 | Summit Industrial Income REIT | 1,082,139 | 0.5 | |||||||||||
| 5,130,017 | 2.2 | |||||||||||||
France: 0.5% | ||||||||||||||
| 16,257 | (1) | Unibail-Rodamco-Westfield | 1,137,652 | 0.5 | ||||||||||
Germany: 4.0% | ||||||||||||||
| 291,167 | Aroundtown SA | 1,756,425 | 0.7 | |||||||||||
| 44,317 | Deutsche Euroshop AG | 738,659 | 0.3 | |||||||||||
| 16,486 | LEG Immobilien SE | 2,298,522 | 1.0 | |||||||||||
| 83,714 | Vonovia SE | 4,612,818 | 2.0 | |||||||||||
| 9,406,424 | 4.0 | |||||||||||||
Hong Kong: 5.3% | ||||||||||||||
| 190,981 | CK Asset Holdings Ltd. | 1,204,702 | 0.5 | |||||||||||
| 341,395 | (1),(2) | ESR Cayman Ltd. | 1,154,806 | 0.5 | ||||||||||
| 703,594 | Hang Lung Properties Ltd. | 1,447,333 | 0.6 | |||||||||||
| 468,663 | Link REIT | 4,128,579 | 1.8 | |||||||||||
| 291,297 | New World Development Co. Ltd. | 1,153,325 | 0.5 | |||||||||||
| 1,345,466 | Sino Land Co. | 1,675,320 | 0.7 | |||||||||||
| 628,592 | Swire Properties Ltd. | 1,575,806 | 0.7 | |||||||||||
| 12,339,871 | 5.3 | |||||||||||||
Ireland: 0.2% | ||||||||||||||
| 354,531 | Hibernia REIT plc | 527,382 | 0.2 | |||||||||||
Japan: 9.3% | ||||||||||||||
| 466 | Activia Properties, Inc. | 1,684,761 | 0.7 | |||||||||||
| 795 | AEON REIT Investment Corp. | 1,113,750 | 0.5 | |||||||||||
| 205,400 | Hulic Co. Ltd. | 1,953,250 | 0.8 | |||||||||||
| 695 | Japan Hotel REIT Investment Corp. | 339,556 | 0.2 | |||||||||||
| Shares | Value | Percentage of Net Assets | ||||||||||||
|---|---|---|---|---|---|---|---|---|---|---|---|---|---|---|
COMMON STOCK: (continued) | ||||||||||||||
Japan: (continued) | ||||||||||||||
| 313 | (3) | Kenedix Office Investment Corp. | $ | 1,934,287 | 0.8 | |||||||||
| 1,882 | LaSalle Logiport REIT | 3,315,287 | 1.4 | |||||||||||
| 202,901 | �� | Mitsui Fudosan Co., Ltd. | 4,021,654 | 1.7 | ||||||||||
| 96,900 | Nomura Real Estate Holdings, Inc. | 2,232,766 | 1.0 | |||||||||||
| 946 | Orix JREIT, Inc. | 1,478,832 | 0.6 | |||||||||||
| 1,092 | Sankei Real Estate, Inc. | 1,135,044 | 0.5 | |||||||||||
| 447,096 | Tokyu Fudosan Holdings Corp. | 2,504,819 | 1.1 | |||||||||||
| 21,714,006 | 9.3 | |||||||||||||
Luxembourg: 0.4% | ||||||||||||||
| 43,258 | Grand City Properties SA | 1,027,488 | 0.4 | |||||||||||
Singapore: 2.4% | ||||||||||||||
| 1,108,274 | Ascendas Real Estate Investment Trust | 2,428,212 | 1.0 | |||||||||||
| 1,241,491 | CapitaLand Integrated Commercial Trust | 1,878,341 | 0.8 | |||||||||||
| 1,722,709 | Mapletree North Asia Commercial Trust | 1,418,972 | 0.6 | |||||||||||
| 5,725,525 | 2.4 | |||||||||||||
Sweden: 2.9% | ||||||||||||||
| 86,658 | (3) | Castellum AB | 2,330,253 | 1.0 | ||||||||||
| 27,281 | Catena AB | 1,699,472 | 0.7 | |||||||||||
| 388,800 | Samhallsbyggnadsbolaget i Norden AB | 2,850,978 | 1.2 | |||||||||||
| 6,880,703 | 2.9 | |||||||||||||
United Kingdom: 3.8% | ||||||||||||||
| 74,926 | Big Yellow Group PLC | 1,731,168 | 0.7 | |||||||||||
| 39,216 | Land Securities Group PLC | 413,883 | 0.2 | |||||||||||
| 81,199 | Safestore Holdings PLC | 1,548,584 | 0.7 | |||||||||||
| 163,135 | Segro PLC | 3,174,881 | 1.4 | |||||||||||
| 575,065 | Tritax Big Box REIT Plc | 1,940,037 | 0.8 | |||||||||||
| 8,808,553 | 3.8 | |||||||||||||
United States: 63.2% | ||||||||||||||
| 20,413 | Alexandria Real Estate Equities, Inc. | 4,551,282 | 1.9 | |||||||||||
| 31,801 | American Campus Communities, Inc. | 1,821,879 | 0.8 | |||||||||||
| 6,480 | American Tower Corp. | 1,895,400 | 0.8 | |||||||||||
| 27,340 | Apartment Income REIT Corp. | 1,494,678 | 0.6 | |||||||||||
| 13,164 | AvalonBay Communities, Inc. | 3,325,095 | 1.4 | |||||||||||
| 43,286 | Camden Property Trust | 7,734,342 | 3.3 | |||||||||||
| 25,356 | Crown Castle International Corp. | 5,292,811 | 2.3 | |||||||||||
| 108,237 | CubeSmart | 6,159,768 | 2.6 | |||||||||||
| 93,114 | (1) | DiamondRock Hospitality Co. | 894,826 | 0.4 | ||||||||||
| 24,334 | Digital Realty Trust, Inc. | 4,303,955 | 1.8 | |||||||||||
| 93,717 | Duke Realty Corp. | 6,151,584 | 2.6 | |||||||||||
| 4,064 | Equinix, Inc. | 3,437,494 | 1.5 | |||||||||||
| 52,668 | Extra Space Storage, Inc. | 11,941,416 | 5.1 | |||||||||||
| VY® CLARION GLOBAL REAL ESTATE PORTFOLIO | PORTFOLIO OF INVESTMENTS AS OF DECEMBER 31, 2021 (CONTINUED) |
| Shares | Value | Percentage of Net Assets | ||||||||||||
|---|---|---|---|---|---|---|---|---|---|---|---|---|---|---|
COMMON STOCK: (continued) | ||||||||||||||
United States: (continued) | ||||||||||||||
| 102,756 | Healthcare Trust of America, Inc. | $ | 3,431,023 | 1.5 | ||||||||||
| 275,211 | (1) | Host Hotels & Resorts, Inc. | 4,785,919 | 2.0 | ||||||||||
| 38,372 | Hudson Pacific Properties, Inc. | 948,172 | 0.4 | |||||||||||
| 201,418 | Invitation Homes, Inc. | 9,132,292 | 3.9 | |||||||||||
| 21,679 | Life Storage, Inc. | 3,320,789 | 1.4 | |||||||||||
| 23,839 | Mid-America Apartment Communities, Inc. | 5,469,620 | 2.3 | |||||||||||
| 42,502 | National Retail Properties, Inc. | 2,043,071 | 0.9 | |||||||||||
| 72,758 | (3) | Pebblebrook Hotel Trust | 1,627,596 | 0.7 | ||||||||||
| 51,690 | Piedmont Office Realty Trust, Inc. | 950,062 | 0.4 | |||||||||||
| 103,900 | ProLogis, Inc. | 17,492,604 | 7.5 | |||||||||||
| 124,428 | Realty Income Corp. | 8,907,800 | 3.8 | |||||||||||
| 31,188 | Regency Centers Corp. | 2,350,016 | 1.0 | |||||||||||
| 92,614 | Simon Property Group, Inc. | 14,796,939 | 6.3 | |||||||||||
| 52,461 | Spirit Realty Capital, Inc. | 2,528,096 | 1.1 | |||||||||||
| 35,114 | Sun Communities, Inc. | 7,372,887 | 3.1 | |||||||||||
| 128,946 | (1) | Sunstone Hotel Investors, Inc. | 1,512,537 | 0.7 | ||||||||||
| 30,479 | Welltower, Inc. | 2,614,184 | 1.1 | |||||||||||
| 148,288,137 | 63.2 | |||||||||||||
| Total Common Stock (Cost $163,283,945) | 234,942,561 | 100.1 | ||||||||||||
| Principal Amount† | Value | Percentage of Net Assets | ||||||||||||
|---|---|---|---|---|---|---|---|---|---|---|---|---|---|---|
SHORT-TERM INVESTMENTS: 1.5% | ||||||||||||||
Repurchase Agreements: 0.6% | ||||||||||||||
| 486,945 | (4) | Citigroup, Inc., Repurchase Agreement dated 12/31/21, 0.06%, due 01/03/22 (Repurchase Amount $486,947, collateralized by various U.S. Government/U.S. Government Agency Obligations, 0.000%–3.500%, Market Value plus accrued interest $496,684, due 02/15/22–12/20/51) | 486,945 | 0.2 | ||||||||||
| 1,000,000 | (4) | RBC Dominion Securities Inc., Repurchase Agreement dated 12/31/21, 0.05%, due 01/03/22 (Repurchase Amount $1,000,004, collateralized by various U.S. Government/U.S. Government Agency Obligations, 0.000%–6.500%, Market Value plus accrued interest $1,020,000, due 05/15/22–12/01/51) | 1,000,000 | 0.4 | ||||||||||
| Total Repurchase Agreements (Cost $1,486,945) | 1,486,945 | 0.6 | ||||||||||||
| Shares | Value | Percentage of Net Assets | ||||||||||||
|---|---|---|---|---|---|---|---|---|---|---|---|---|---|---|
SHORT-TERM INVESTMENTS: (continued) | ||||||||||||||
Mutual Funds: 0.9% | ||||||||||||||
| 2,102,385 | (5) | BlackRock Liquidity Funds, FedFund, Institutional Class, 0.030% (Cost $2,102,385) | $ | 2,102,385 | 0.9 | |||||||||
| Total Short-Term Investments (Cost $3,589,330) | 3,589,330 | 1.5 | ||||||||||||
Total Investments in Securities (Cost $166,873,275) | $ | 238,531,891 | 101.6 | |||||||||||
Liabilities in Excess of Other Assets | (3,854,422 | ) | (1.6 | ) | ||||||||||
Net Assets | $ | 234,677,469 | 100.0 | |||||||||||
| † | Unless otherwise indicated, principal amount is shown in USD. | |
| (1) | Non-income producing security. | |
| (2) | Securities with purchases pursuant to Rule 144A or section 4(a)(2), under the Securities Act of 1933 and may not be resold subject to that rule except to qualified institutional buyers. | |
| (3) | Security, or a portion of the security, is on loan. | |
| (4) | All or a portion of the security represents securities purchased with cash collateral received for securities on loan. | |
| (5) | Rate shown is the 7-day yield as of December 31, 2021. |
| REIT Diversification | Percentage of Net Assets | |||||
|---|---|---|---|---|---|---|
| Retail REITs | 17.4 | % | ||||
| Specialized REITs | 16.9 | |||||
| Residential REITs | 16.5 | |||||
| Industrial REITs | 16.4 | |||||
| Real Estate Operating Companies | 9.5 | |||||
| Office REITs | 5.7 | |||||
| Diversified Real Estate Activities | 5.3 | |||||
| Diversified REITs | 4.4 | |||||
| Hotel & Resort REITs | 3.9 | |||||
| Health Care REITs | 2.6 | |||||
| Real Estate Development | 1.5 | |||||
| Liabilities in Excess of Other Assets* | (0.1 | ) | ||||
Net Assets | 100.0 | % | ||||
| * | Includes short-term investments. |
| VY® CLARION GLOBAL REAL ESTATE PORTFOLIO | PORTFOLIO OF INVESTMENTS AS OF DECEMBER 31, 2021 (CONTINUED) |
| Quoted Prices in Active Markets for Identical Investments (Level 1) | Significant Other Observable Inputs# (Level 2) | Significant Unobservable Inputs (Level 3) | Fair Value at December 31, 2021 | |||||||||||||||||
|---|---|---|---|---|---|---|---|---|---|---|---|---|---|---|---|---|---|---|---|---|
Asset Table | ||||||||||||||||||||
Investments, at fair value | ||||||||||||||||||||
| Common Stock | ||||||||||||||||||||
| Australia | $ | — | $ | 10,616,248 | $ | — | $ | 10,616,248 | ||||||||||||
| Belgium | 1,410,480 | 1,930,075 | — | 3,340,555 | ||||||||||||||||
| Canada | 5,130,017 | — | — | 5,130,017 | ||||||||||||||||
| France | — | 1,137,652 | — | 1,137,652 | ||||||||||||||||
| Germany | 738,659 | 8,667,765 | — | 9,406,424 | ||||||||||||||||
| Hong Kong | 1,447,333 | 10,892,538 | — | 12,339,871 | ||||||||||||||||
| Ireland | 527,382 | — | — | 527,382 | ||||||||||||||||
| Japan | — | 21,714,006 | — | 21,714,006 | ||||||||||||||||
| Luxembourg | — | 1,027,488 | — | 1,027,488 | ||||||||||||||||
| Singapore | 1,418,972 | 4,306,553 | — | 5,725,525 | ||||||||||||||||
| Sweden | — | 6,880,703 | — | 6,880,703 | ||||||||||||||||
| United Kingdom | 3,279,752 | 5,528,801 | — | 8,808,553 | ||||||||||||||||
| United States | 148,288,137 | — | — | 148,288,137 | ||||||||||||||||
| Total Common Stock | 162,240,732 | 72,701,829 | — | 234,942,561 | ||||||||||||||||
| Short-Term Investments | 2,102,385 | 1,486,945 | — | 3,589,330 | ||||||||||||||||
| Total Investments, at fair value | $ | 164,343,117 | $ | 74,188,774 | $ | — | $ | 238,531,891 | ||||||||||||
Other Financial Instruments+ | ||||||||||||||||||||
| Forward Foreign Currency Contracts | — | 148 | — | 148 | ||||||||||||||||
| Total Assets | $ | 164,343,117 | $ | 74,188,922 | $ | — | $ | 238,532,039 | ||||||||||||
Liabilities Table | ||||||||||||||||||||
Other Financial Instruments+ | ||||||||||||||||||||
| Forward Foreign Currency Contracts | $ | — | $ | (3 | ) | $ | — | $ | (3 | ) | ||||||||||
| Total Liabilities | $ | — | $ | (3 | ) | $ | — | $ | (3 | ) | ||||||||||
| ˆ | See Note 2, “Significant Accounting Policies” in the Notes to Financial Statements for additional information. | |
| + | Other Financial Instruments may include open forward foreign currency contracts, futures, centrally cleared swaps, OTC swaps and written options. Forward foreign currency contracts, futures and centrally cleared swaps are fair valued at the unrealized appreciation (depreciation) on the instrument. OTC swaps and written options are valued at the fair value of the instrument. | |
| # | The earlier close of the foreign markets gives rise to the possibility that significant events, including broad market moves, may have occurred in the interim and may materially affect the value of those securities. To account for this, the Portfolio may frequently value many of its foreign equity securities using fair value prices based on third party vendor modeling tools to the extent available. Accordingly, a portion of the Portfolio’s investments are categorized as Level 2 investments. |
| Currency Purchased | Currency Sold | Counterparty | Settlement Date | Unrealized Appreciation (Depreciation) | |||||||||
|---|---|---|---|---|---|---|---|---|---|---|---|---|---|
| GBP 30,662 | USD 41,387 | Brown Brothers Harriman & Co. | 01/04/22 | $ | 116 | ||||||||
| JPY 163,768 | USD 1,426 | Brown Brothers Harriman & Co. | 01/04/22 | (3 | ) | ||||||||
| GBP 15,501 | USD 20,951 | Brown Brothers Harriman & Co. | 01/05/22 | 29 | |||||||||
| JPY 1,016,765 | USD 8,837 | Brown Brothers Harriman & Co. | 01/05/22 | 3 | |||||||||
| $ | 145 | ||||||||||||
| GBP | — | British Pound | ||
| JPY | — | Japanese Yen | ||
| USD | — | United States Dollar |
| VY® CLARION GLOBAL REAL ESTATE PORTFOLIO | PORTFOLIO OF INVESTMENTS AS OF DECEMBER 31, 2021 (CONTINUED) |
| Derivatives not accounted for as hedging instruments | Location on Statement of Assets and Liabilities | Fair Value | ||||||
|---|---|---|---|---|---|---|---|---|
Asset Derivatives | ||||||||
| Foreign exchange contracts | Unrealized appreciation on forward foreign currency contracts | $ | 148 | |||||
Total Asset Derivatives | $ | 148 | ||||||
Liability Derivatives | ||||||||
| Foreign exchange contracts | Unrealized depreciation on forward foreign currency contracts | $ | 3 | |||||
Total Liability Derivatives | $ | 3 | ||||||
| Amount of Realized Gain or (Loss) on Derivatives Recognized in Income | ||||||
|---|---|---|---|---|---|---|
| Derivatives not accounted for as hedging instruments | Forward foreign currency contracts | |||||
| Foreign exchange contracts | $ | (20,222 | ) | |||
Total | $ | (20,222 | ) | |||
| Change in Unrealized Appreciation or (Depreciation) on Derivatives Recognized in Income | ||||||
| Derivatives not accounted for as hedging instruments | Forward foreign currency contracts | |||||
| Foreign exchange contracts | $ | (62 | ) | |||
Total | $ | (62 | ) | |||
| Cost for federal income tax purposes was $174,565,533. | ||||||
| Net unrealized appreciation consisted of: | ||||||
| Gross Unrealized Appreciation | $ | 69,089,394 | ||||
| Gross Unrealized Depreciation | (5,124,422 | ) | ||||
| Net Unrealized Appreciation | $ | 63,964,972 | ||||
| VY® INVESCO GROWTH AND INCOME PORTFOLIO | PORTFOLIO OF INVESTMENTS AS OF DECEMBER 31, 2021 |
| Shares | Value | Percentage of Net Assets | ||||||||||||
|---|---|---|---|---|---|---|---|---|---|---|---|---|---|---|
COMMON STOCK: 98.4% | ||||||||||||||
Communication Services: 6.8% | ||||||||||||||
| 9,297 | (1) | Charter Communications, Inc. | $ | 6,061,365 | 1.3 | |||||||||
| 141,326 | Comcast Corp. — Class A | 7,112,938 | 1.6 | |||||||||||
| 7,901 | (1) | NetFlix, Inc. | 4,759,878 | 1.1 | ||||||||||
| 47,796 | (1) | T-Mobile US, Inc. | 5,543,380 | 1.2 | ||||||||||
| 46,375 | (1) | Walt Disney Co. | 7,183,024 | 1.6 | ||||||||||
| 30,660,585 | 6.8 | |||||||||||||
Consumer Discretionary: 8.0% | ||||||||||||||
| 991 | (1) | Amazon.com, Inc. | 3,304,331 | 0.7 | ||||||||||
| 2,427 | (1) | Booking Holdings, Inc. | 5,822,931 | 1.3 | ||||||||||
| 273,379 | (1) | General Motors Co. | 16,028,211 | 3.6 | ||||||||||
| 82,750 | (1) | Las Vegas Sands Corp. | 3,114,710 | 0.7 | ||||||||||
| 103,611 | TJX Cos., Inc. | 7,866,147 | 1.7 | |||||||||||
| 36,136,330 | 8.0 | |||||||||||||
Consumer Staples: 5.2% | ||||||||||||||
| 99,395 | Diageo PLC | 5,434,513 | 1.2 | |||||||||||
| 102,789 | Philip Morris International, Inc. | 9,764,955 | 2.2 | |||||||||||
| 53,005 | Sysco Corp. | 4,163,543 | 0.9 | |||||||||||
| 113,338 | (1) | US Foods Holding Corp. | 3,947,562 | 0.9 | ||||||||||
| 23,310,573 | 5.2 | |||||||||||||
Energy: 7.2% | ||||||||||||||
| 113,574 | Canadian Natural Resources Ltd. | 4,799,028 | 1.1 | |||||||||||
| 62,691 | Chevron Corp. | 7,356,789 | 1.6 | |||||||||||
| 127,933 | ConocoPhillips | 9,234,204 | 2.0 | |||||||||||
| 148,774 | Devon Energy Corp. | 6,553,494 | 1.5 | |||||||||||
| 25,459 | Pioneer Natural Resources Co. | 4,630,483 | 1.0 | |||||||||||
| 32,573,998 | 7.2 | |||||||||||||
Financials: 21.8% | ||||||||||||||
| 41,629 | American Express Co. | 6,810,504 | 1.5 | |||||||||||
| 191,067 | American International Group, Inc. | 10,864,070 | 2.4 | |||||||||||
| 303,080 | Bank of America Corp. | 13,484,029 | 3.0 | |||||||||||
| 77,999 | Charles Schwab Corp. | 6,559,716 | 1.5 | |||||||||||
| 193,446 | Citizens Financial Group, Inc. | 9,140,323 | 2.0 | |||||||||||
| 23,666 | Goldman Sachs Group, Inc. | 9,053,428 | 2.0 | |||||||||||
| 90,903 | Morgan Stanley | 8,923,038 | 2.0 | |||||||||||
| 21,188 | PNC Financial Services Group, Inc. | 4,248,618 | 0.9 | |||||||||||
| 131,072 | Truist Financial Corp. | 7,674,266 | 1.7 | |||||||||||
| 351,910 | Wells Fargo & Co. | 16,884,642 | 3.7 | |||||||||||
| 21,546 | Willis Towers Watson PLC | 5,116,960 | 1.1 | |||||||||||
| 98,759,594 | 21.8 | |||||||||||||
Health Care: 15.7% | ||||||||||||||
| 11,924 | Anthem, Inc. | 5,527,251 | 1.2 | |||||||||||
| 107,248 | Bristol-Myers Squibb Co. | 6,686,913 | 1.5 | |||||||||||
| 49,743 | (1) | Centene Corp. | 4,098,823 | 0.9 | ||||||||||
| 26,682 | Cigna Corp. | 6,126,988 | 1.3 | |||||||||||
| 54,257 | CVS Health Corp. | 5,597,152 | 1.2 | |||||||||||
| 175,589 | GlaxoSmithKline PLC | 3,823,047 | 0.9 | |||||||||||
| 23,041 | Johnson & Johnson | 3,941,624 | 0.9 | |||||||||||
| 24,859 | McKesson Corp. | 6,179,202 | 1.4 | |||||||||||
| 47,876 | Medtronic PLC | 4,952,772 | 1.1 | |||||||||||
| 92,136 | Merck & Co., Inc. | 7,061,303 | 1.6 | |||||||||||
| 65,219 | Pfizer, Inc. | 3,851,182 | 0.8 | |||||||||||
| Shares | Value | Percentage of Net Assets | ||||||||||||
|---|---|---|---|---|---|---|---|---|---|---|---|---|---|---|
COMMON STOCK: (continued) | ||||||||||||||
Health Care: (continued) | ||||||||||||||
| 65,102 | Sanofi | $ | 6,532,587 | 1.4 | ||||||||||
| 26,724 | Universal Health Services, Inc. | 3,465,034 | 0.8 | |||||||||||
| 24,009 | Zimmer Biomet Holdings, Inc. | 3,050,103 | 0.7 | |||||||||||
| 70,893,981 | 15.7 | |||||||||||||
Industrials: 11.9% | ||||||||||||||
| 290,802 | CSX Corp. | 10,934,155 | 2.4 | |||||||||||
| 40,096 | Emerson Electric Co. | 3,727,725 | 0.8 | |||||||||||
| 17,179 | General Dynamics Corp. | 3,581,306 | 0.8 | |||||||||||
| 85,405 | Johnson Controls International plc | 6,944,281 | 1.5 | |||||||||||
| 17,695 | Parker Hannifin Corp. | 5,629,133 | 1.2 | |||||||||||
| 45,378 | Quanta Services, Inc. | 5,203,042 | 1.2 | |||||||||||
| 113,169 | Raytheon Technologies Corp. | 9,739,324 | 2.2 | |||||||||||
| 104,795 | Textron, Inc. | 8,090,174 | 1.8 | |||||||||||
| 53,849,140 | 11.9 | |||||||||||||
Information Technology: 13.6% | ||||||||||||||
| 162,420 | Cisco Systems, Inc. | 10,292,555 | 2.3 | |||||||||||
| 172,796 | Cognizant Technology Solutions Corp. | 15,330,461 | 3.4 | |||||||||||
| 91,444 | Corning, Inc. | 3,404,460 | 0.7 | |||||||||||
| 43,092 | (1) | Fiserv, Inc. | 4,472,519 | 1.0 | ||||||||||
| 136,876 | Intel Corp. | 7,049,114 | 1.6 | |||||||||||
| 23,754 | NXP Semiconductor NV | 5,410,686 | 1.2 | |||||||||||
| 39,425 | Qualcomm, Inc. | 7,209,650 | 1.6 | |||||||||||
| 28,093 | (1) | Splunk, Inc. | 3,250,922 | 0.7 | ||||||||||
| 30,168 | TE Connectivity Ltd. | 4,867,305 | 1.1 | |||||||||||
| 61,287,672 | 13.6 | |||||||||||||
Materials: 2.8% | ||||||||||||||
| 112,664 | (1) | Axalta Coating Systems Ltd. | 3,731,432 | 0.8 | ||||||||||
| 155,108 | (2) | Barrick Gold Corp. | 2,947,052 | 0.6 | ||||||||||
| 131,129 | Corteva, Inc. | 6,199,779 | 1.4 | |||||||||||
| 12,878,263 | 2.8 | |||||||||||||
Real Estate: 2.9% | ||||||||||||||
| 122,415 | (1) | CBRE Group, Inc. | 13,283,252 | 2.9 | ||||||||||
Utilities: 2.5% | ||||||||||||||
| 41,162 | American Electric Power Co., Inc. | 3,662,183 | 0.8 | |||||||||||
| 68,041 | Exelon Corp. | 3,930,048 | 0.9 | |||||||||||
| 91,644 | FirstEnergy Corp. | 3,811,474 | 0.8 | |||||||||||
| 11,403,705 | 2.5 | |||||||||||||
| Total Common Stock (Cost $322,780,172) | 445,037,093 | 98.4 | ||||||||||||
| VY® INVESCO GROWTH AND INCOME PORTFOLIO | PORTFOLIO OF INVESTMENTS AS OF DECEMBER 31, 2021 (CONTINUED) |
| Principal Amount† | Value | Percentage of Net Assets | ||||||||||||
|---|---|---|---|---|---|---|---|---|---|---|---|---|---|---|
SHORT-TERM INVESTMENTS: 2.0% | ||||||||||||||
Repurchase Agreements: 0.0% | ||||||||||||||
| 42,956 | (3) | HSBC Securities USA, Repurchase Agreement dated 12/31/21, 0.04%, due 01/03/22 (Repurchase Amount $42,956, collateralized by various U.S. Government Securities, 0.125%–3.875%, Market Value plus accrued interest $43,815, due 05/15/23–08/15/47) (Cost $42,956) | $ | 42,956 | 0.0 | |||||||||
| Shares | Value | Percentage of Net Assets | ||||||||||||
|---|---|---|---|---|---|---|---|---|---|---|---|---|---|---|
SHORT-TERM INVESTMENTS: (continued) | ||||||||||||||
Mutual Funds: 2.0% | ||||||||||||||
| 8,774,851 | (4) | BlackRock Liquidity Funds, FedFund, Institutional Class, 0.030% (Cost $8,774,851) | $ | 8,774,851 | 2.0 | |||||||||
| Total Short-Term Investments (Cost $8,817,807) | 8,817,807 | 2.0 | ||||||||||||
Total Investments in Securities (Cost $331,597,979) | $ | 453,854,900 | 100.4 | |||||||||||
Liabilities in Excess of Other Assets | (1,968,783 | ) | (0.4 | ) | ||||||||||
Net Assets | $ | 451,886,117 | 100.0 | |||||||||||
| † | Unless otherwise indicated, principal amount is shown in USD. | |
| (1) | Non-income producing security. | |
| (2) | Security, or a portion of the security, is on loan. | |
| (3) | All or a portion of the security represents securities purchased with cash collateral received for securities on loan. | |
| (4) | Rate shown is the 7-day yield as of December 31, 2021. |
| Quoted Prices in Active Markets for Identical Investments (Level 1) | Significant Other Observable Inputs# (Level 2) | Significant Unobservable Inputs (Level 3) | Fair Value at December 31, 2021 | |||||||||||||||||
|---|---|---|---|---|---|---|---|---|---|---|---|---|---|---|---|---|---|---|---|---|
Asset Table | ||||||||||||||||||||
Investments, at fair value | ||||||||||||||||||||
| Common Stock | ||||||||||||||||||||
| Communication Services | $ | 30,660,585 | $ | — | $ | — | $ | 30,660,585 | ||||||||||||
| Consumer Discretionary | 36,136,330 | — | — | 36,136,330 | ||||||||||||||||
| Consumer Staples | 17,876,060 | 5,434,513 | — | 23,310,573 | ||||||||||||||||
| Energy | 32,573,998 | — | — | 32,573,998 | ||||||||||||||||
| Financials | 98,759,594 | — | — | 98,759,594 | ||||||||||||||||
| Health Care | 60,538,347 | 10,355,634 | — | 70,893,981 | ||||||||||||||||
| Industrials | 53,849,140 | — | — | 53,849,140 | ||||||||||||||||
| Information Technology | 61,287,672 | — | — | 61,287,672 | ||||||||||||||||
| Materials | 12,878,263 | — | — | 12,878,263 | ||||||||||||||||
| Real Estate | 13,283,252 | — | — | 13,283,252 | ||||||||||||||||
| Utilities | 11,403,705 | — | — | 11,403,705 | ||||||||||||||||
| Total Common Stock | 429,246,946 | 15,790,147 | — | 445,037,093 | ||||||||||||||||
| Short-Term Investments | 8,774,851 | 42,956 | — | 8,817,807 | ||||||||||||||||
| Total Investments, at fair value | $ | 438,021,797 | $ | 15,833,103 | $ | — | $ | 453,854,900 | ||||||||||||
Other Financial Instruments+ | ||||||||||||||||||||
| Forward Foreign Currency Contracts | — | 15,299 | — | 15,299 | ||||||||||||||||
| Total Assets | $ | 438,021,797 | $ | 15,848,402 | $ | — | $ | 453,870,199 | ||||||||||||
Liabilities Table | ||||||||||||||||||||
Other Financial Instruments+ | ||||||||||||||||||||
| Forward Foreign Currency Contracts | $ | — | $ | (247,380 | ) | $ | — | $ | (247,380 | ) | ||||||||||
| Total Liabilities | $ | — | $ | (247,380 | ) | $ | — | $ | (247,380 | ) | ||||||||||
| ^ | See Note 2, “Significant Accounting Policies” in the Notes to Financial Statements for additional information. | |
| + | Other Financial Instruments may include open forward foreign currency contracts, futures, centrally cleared swaps, OTC swaps and written options. Forward foreign currency contracts, futures and centrally cleared swaps are fair valued at the unrealized appreciation (depreciation) on the instrument. OTC swaps and written options are valued at the fair value of the instrument. |
| VY® INVESCO GROWTH AND INCOME PORTFOLIO | PORTFOLIO OF INVESTMENTS AS OF DECEMBER 31, 2021 (CONTINUED) |
| # | The earlier close of the foreign markets gives rise to the possibility that significant events, including broad market moves, may have occurred in the interim and may materially affect the value of those securities. To account for this, the Portfolio may frequently value many of its foreign equity securities using fair value prices based on third party vendor modeling tools to the extent available. Accordingly, a portion of the Portfolio’s investments are categorized as Level 2 investments. |
| Currency Purchased | Currency Sold | Counterparty | Settlement Date | Unrealized Appreciation (Depreciation) | |||||||||
|---|---|---|---|---|---|---|---|---|---|---|---|---|---|
| USD 74,850 | CAD 95,402 | State Street Bank and Trust Co. | 01/07/22 | $ | (569 | ) | |||||||
| USD 131,150 | GBP 97,158 | State Street Bank and Trust Co. | 01/07/22 | (357 | ) | ||||||||
| USD 69,230 | CAD 88,588 | State Street Bank and Trust Co. | 01/07/22 | (802 | ) | ||||||||
| USD 73,635 | EUR 64,938 | State Street Bank and Trust Co. | 01/07/22 | (301 | ) | ||||||||
| USD 102,211 | CAD 131,178 | State Street Bank and Trust Co. | 01/07/22 | (1,491 | ) | ||||||||
| CAD 105,623 | USD 81,623 | State Street Bank and Trust Co. | 01/07/22 | 1,876 | |||||||||
| CAD 360,927 | USD 280,776 | State Street Bank and Trust Co. | 01/07/22 | 4,552 | |||||||||
| CAD 62,215 | USD 48,395 | State Street Bank and Trust Co. | 01/07/22 | 790 | |||||||||
| USD 106,461 | EUR 94,236 | State Street Bank and Trust Co. | 01/07/22 | (833 | ) | ||||||||
| CAD 150,201 | USD 118,058 | State Street Bank and Trust Co. | 01/07/22 | 682 | |||||||||
| CAD 83,961 | USD 66,093 | State Street Bank and Trust Co. | 01/07/22 | 282 | |||||||||
| EUR 69,567 | USD 78,606 | State Street Bank and Trust Co. | 01/07/22 | 601 | |||||||||
| USD 104,020 | GBP 78,562 | State Street Bank and Trust Co. | 01/07/22 | (2,317 | ) | ||||||||
| USD 90,159 | CAD 113,983 | State Street Bank and Trust Co. | 01/07/22 | 51 | |||||||||
| USD 88,868 | EUR 78,239 | State Street Bank and Trust Co. | 01/07/22 | (213 | ) | ||||||||
| USD 124,624 | GBP 94,086 | State Street Bank and Trust Co. | 01/07/22 | (2,725 | ) | ||||||||
| USD 131,967 | CAD 166,871 | State Street Bank and Trust Co. | 01/07/22 | 48 | |||||||||
| EUR 101,858 | USD 115,060 | State Street Bank and Trust Co. | 01/07/22 | 913 | |||||||||
| USD 50,743 | CAD 64,743 | State Street Bank and Trust Co. | 01/07/22 | (439 | ) | ||||||||
| CAD 100,936 | USD 78,837 | State Street Bank and Trust Co. | 01/07/22 | 957 | |||||||||
| CAD 253,045 | USD 197,659 | State Street Bank and Trust Co. | 01/07/22 | 2,384 | |||||||||
| USD 393,198 | GBP 295,384 | State Street Bank and Trust Co. | 01/07/22 | (6,615 | ) | ||||||||
| USD 110,216 | EUR 97,429 | State Street Bank and Trust Co. | 01/07/22 | (714 | ) | ||||||||
| CAD 114,395 | USD 89,261 | State Street Bank and Trust Co. | 01/07/22 | 1,173 | |||||||||
| EUR 86,111 | USD 97,548 | State Street Bank and Trust Co. | 01/07/22 | 495 | |||||||||
| USD 6,032,715 | GBP 4,554,780 | State Street Bank and Trust Co. | 01/07/22 | (132,349 | ) | ||||||||
| USD 3,939,264 | CAD 5,042,967 | State Street Bank and Trust Co. | 01/07/22 | (47,416 | ) | ||||||||
| USD 4,715,574 | EUR 4,183,066 | State Street Bank and Trust Co. | 01/07/22 | (47,138 | ) | ||||||||
| USD 82,494 | GBP 62,307 | State Street Bank and Trust Co. | 01/07/22 | (1,842 | ) | ||||||||
| USD 33,329 | EUR 29,524 | State Street Bank and Trust Co. | 01/07/22 | (286 | ) | ||||||||
| USD 72,742 | CAD 93,246 | State Street Bank and Trust Co. | 01/07/22 | (973 | ) | ||||||||
| USD 70,542 | EUR 62,011 | State Street Bank and Trust Co. | 01/07/22 | 495 | |||||||||
| $ | (232,081 | ) | |||||||||||
| CAD | — Canadian Dollar | |
| EUR | — EU Euro | |
| GBP | — British Pound | |
| USD | — United States Dollar |
| Derivatives not accounted for as hedging instruments | Location on Statement of Assets and Liabilities | Fair Value | ||||||
|---|---|---|---|---|---|---|---|---|
Asset Derivatives | ||||||||
| Foreign exchange contracts | Unrealized appreciation on forward foreign currency contracts | $ | 15,299 | |||||
Total Asset Derivatives | $ | 15,299 | ||||||
Liability Derivatives | ||||||||
| Foreign exchange contracts | Unrealized depreciation on forward foreign currency contracts | $ | 247,380 | |||||
Total Liability Derivatives | $ | 247,380 | ||||||
| VY® INVESCO GROWTH AND INCOME PORTFOLIO | PORTFOLIO OF INVESTMENTS AS OF DECEMBER 31, 2021 (CONTINUED) |
| Amount of Realized Gain or (Loss) on Derivatives Recognized in Income | |||||
|---|---|---|---|---|---|
| Derivatives not accounted for as hedging instruments | Forward foreign currency contracts | ||||
| Foreign exchange contracts | $ | 649,368 | |||
Total | $ | 649,368 | |||
| Change in Unrealized Appreciation or (Depreciation) on Derivatives Recognized in Income | |||||
| Derivatives not accounted for as hedging instruments | Forward foreign currency contracts | ||||
| Foreign exchange contracts | $ | (21,757 | ) | ||
Total | $ | (21,757 | ) | ||
| State Street Bank and Trust Co. | Totals | ||||||||||
|---|---|---|---|---|---|---|---|---|---|---|---|
Assets: | |||||||||||
| Forward foreign currency contracts | $ | 15,299 | $ | 15,299 | |||||||
Total Assets | $ | 15,299 | $ | 15,299 | |||||||
Liabilities: | |||||||||||
| Forward foreign currency contracts | $ | 247,380 | $ | 247,380 | |||||||
Total Liabilities | $ | 247,380 | $ | 247,380 | |||||||
Net OTC derivative instruments by counterparty, at fair value | $ | (232,081 | ) | (232,081 | ) | ||||||
Total collateral pledged by the Portfolio/(Received from counterparty) | $ | — | $ | — | |||||||
Net Exposure(1) | $ | (232,081 | ) | $ | (232,081 | ) | |||||
(1) | Positive net exposure represents amounts due from each respective counterparty. Negative exposure represents amounts due from the Portfolio. Please refer to Note 2 for additional details regarding counterparty credit risk and credit related contingent features. |
| Cost for federal income tax purposes was $333,249,625. | ||||||
| Net unrealized appreciation consisted of: | ||||||
| Gross Unrealized Appreciation | $ | 125,627,168 | ||||
| Gross Unrealized Depreciation | (5,246,817 | ) | ||||
| Net Unrealized Appreciation | $ | 120,380,351 | ||||
| VY® JPMORGAN EMERGING MARKETS EQUITY PORTFOLIO | PORTFOLIO OF INVESTMENTS AS OF DECEMBER 31, 2021 |
| Shares | Value | Percentage of Net Assets | ||||||||||||
|---|---|---|---|---|---|---|---|---|---|---|---|---|---|---|
COMMON STOCK: 97.3% | ||||||||||||||
Argentina: 2.9% | ||||||||||||||
| 9,902 | (1) | MercadoLibre, Inc. | $ | 13,351,857 | 2.9 | |||||||||
Brazil: 2.0% | ||||||||||||||
| 1,298,722 | B3 SA — Brasil Bolsa Balcao | 2,597,444 | 0.6 | |||||||||||
| 1,162,300 | Magazine Luiza SA | 1,506,608 | 0.3 | |||||||||||
| 123,334 | (1),(2) | NU Holdings Ltd./Cayman Islands | 1,156,873 | 0.2 | ||||||||||
| 81,645 | (1) | Pagseguro Digital Ltd. | 2,140,732 | 0.5 | ||||||||||
| 414,557 | Raia Drogasil SA | 1,808,570 | 0.4 | |||||||||||
| 9,210,227 | 2.0 | |||||||||||||
China: 35.5% | ||||||||||||||
| 355,696 | (1) | Alibaba Group Holding Ltd. | 5,227,160 | 1.1 | ||||||||||
| 555,100 | Beijing Oriental Yuhong Waterproof Technology Co. Ltd. — A Shares | 4,594,688 | 1.0 | |||||||||||
| 28,285 | (1) | Bilibili, Inc. ADR | 1,312,424 | 0.3 | ||||||||||
| 26,900 | (1) | Bilibili, Inc. | 1,249,374 | 0.3 | ||||||||||
| 1,401,400 | (3) | Budweiser Brewing Co. APAC Ltd. | 3,684,220 | 0.8 | ||||||||||
| 1,815,600 | China Gas Holdings Ltd. | 3,776,603 | 0.8 | |||||||||||
| 33,467 | Contemporary Amperex Technology Co. Ltd. — A Shares | 3,082,802 | 0.7 | |||||||||||
| 139,724 | (1) | Dada Nexus Ltd. ADR | 1,838,768 | 0.4 | ||||||||||
| 350,414 | Foshan Haitian Flavouring & Food Co. Ltd. — A Shares | 5,774,092 | 1.2 | |||||||||||
| 418,292 | Hundsun Technologies, Inc. — A Shares | 4,085,213 | 0.9 | |||||||||||
| 32,871 | (1) | JD.com, Inc. ADR | 2,303,271 | 0.5 | ||||||||||
| 287,264 | (1) | JD.com, Inc. — Class A | 9,896,921 | 2.1 | ||||||||||
| 601,887 | Jiangsu Hengli Hydraulic Co. Ltd. — A Shares | 7,717,219 | 1.7 | |||||||||||
| 132,726 | (1) | KE Holdings, Inc. ADR | 2,670,447 | 0.6 | ||||||||||
| 1,288,000 | (1) | Kingdee International Software Group Co., Ltd. | 3,964,670 | 0.8 | ||||||||||
| 350,577 | (1),(3) | Meituan Class B | 10,137,807 | 2.2 | ||||||||||
| 288,400 | Midea Group Co. Ltd. — A Shares | 3,339,835 | 0.7 | |||||||||||
| 399,465 | NetEase, Inc. | 8,076,642 | 1.7 | |||||||||||
| 200,400 | Pharmaron Beijing Co. Ltd. — A Shares | 4,442,014 | 0.9 | |||||||||||
| 1,625,675 | Ping An Bank Co. Ltd. — A Shares | 4,203,049 | 0.9 | |||||||||||
| 105,621 | Shenzhen Mindray Bio-Medical Electronics Co. Ltd. — A Shares | 6,312,232 | 1.4 | |||||||||||
| 279,800 | Shenzhou International Group Holdings Ltd. | 5,417,958 | 1.2 | |||||||||||
| 132,400 | Sichuan Swellfun Co. Ltd. — A Shares | 2,498,317 | 0.5 | |||||||||||
| 40,000 | Silergy Corp. | 7,239,853 | 1.5 | |||||||||||
| 233,400 | Sunny Optical Technology Group Co. Ltd. | 7,392,846 | 1.6 | |||||||||||
| 336,600 | Tencent Holdings Ltd. | 19,640,987 | 4.2 | |||||||||||
| 331,194 | Wanhua Chemical Group Co. Ltd. — A Shares | 5,246,283 | 1.1 | |||||||||||
| 732,500 | (1),(3) | Wuxi Biologics Cayman, Inc. | 8,671,997 | 1.9 | ||||||||||
| Shares | Value | Percentage of Net Assets | ||||||||||||
|---|---|---|---|---|---|---|---|---|---|---|---|---|---|---|
COMMON STOCK: (continued) | ||||||||||||||
China: (continued) | ||||||||||||||
| 4,068,000 | Xinyi Solar Holdings Ltd. | $ | 6,906,426 | 1.5 | ||||||||||
| 96,761 | Yum China Holdings, Inc. | 4,822,568 | 1.0 | |||||||||||
| 165,526,686 | 35.5 | |||||||||||||
Germany: 1.1% | ||||||||||||||
| 47,775 | (1),(3) | Delivery Hero SE | 5,288,234 | 1.1 | ||||||||||
Hong Kong: 5.4% | ||||||||||||||
| 652,800 | AIA Group Ltd. | 6,588,611 | 1.4 | |||||||||||
| 71,800 | Hong Kong Exchanges and Clearing Ltd. | 4,199,150 | 0.9 | |||||||||||
| 1,572,169 | (3) | JS Global Lifestyle Co. Ltd. | 2,647,409 | 0.6 | ||||||||||
| 592,000 | Techtronic Industries Co., Ltd. | 11,801,463 | 2.5 | |||||||||||
| 25,236,633 | 5.4 | |||||||||||||
India: 18.8% | ||||||||||||||
| 55,798 | Apollo Hospitals Enterprise Ltd. | 3,755,893 | 0.8 | |||||||||||
| 153,900 | Asian Paints Ltd. | 6,993,176 | 1.5 | |||||||||||
| 47,785 | Britannia Industries Ltd. | 2,312,671 | 0.5 | |||||||||||
| 244,481 | HDFC Bank Ltd. ADR | 15,908,379 | 3.4 | |||||||||||
| 800,953 | (3) | HDFC Life Insurance Co., Ltd. | 6,981,222 | 1.5 | ||||||||||
| 129,940 | Hindustan Unilever Ltd. | 4,113,318 | 0.9 | |||||||||||
| 452,564 | Housing Development Finance Corp. | 15,658,310 | 3.4 | |||||||||||
| 110,647 | Infosys Ltd. | 2,802,217 | 0.6 | |||||||||||
| 106,506 | Infosys Ltd. ADR | 2,695,667 | 0.6 | |||||||||||
| 276,687 | Kotak Mahindra Bank Ltd. | 6,660,086 | 1.4 | |||||||||||
| 243,694 | Reliance Industries Ltd. | 7,741,330 | 1.7 | |||||||||||
| 235,496 | Tata Consultancy Services Ltd. | 11,811,431 | 2.5 | |||||||||||
| 87,433,700 | 18.8 | |||||||||||||
Indonesia: 3.0% | ||||||||||||||
| 15,293,100 | Bank Central Asia Tbk PT | 7,832,372 | 1.7 | |||||||||||
| 21,560,451 | Bank Rakyat Indonesia | 6,207,819 | 1.3 | |||||||||||
| 14,040,191 | 3.0 | |||||||||||||
Macau: 0.3% | ||||||||||||||
| 678,400 | (1) | Sands China Ltd. | 1,574,430 | 0.3 | ||||||||||
Mexico: 1.4% | ||||||||||||||
| 1,793,397 | Wal-Mart de Mexico SAB de CV | 6,675,916 | 1.4 | |||||||||||
Panama: 0.7% | ||||||||||||||
| 38,029 | (1) | Copa Holdings S.A. — Class A | 3,143,477 | 0.7 | ||||||||||
Poland: 0.7% | ||||||||||||||
| 337,356 | (1),(3) | Allegro.eu SA | 3,247,600 | 0.7 | ||||||||||
Portugal: 0.5% | ||||||||||||||
| 107,750 | Jeronimo Martins SGPS SA | 2,465,731 | 0.5 | |||||||||||
| VY® JPMORGAN EMERGING MARKETS EQUITY PORTFOLIO | PORTFOLIO OF INVESTMENTS AS OF DECEMBER 31, 2021 (CONTINUED) |
| Shares | Value | Percentage of Net Assets | ||||||||||||
|---|---|---|---|---|---|---|---|---|---|---|---|---|---|---|
COMMON STOCK: (continued) | ||||||||||||||
Russia: 1.2% | ||||||||||||||
| 1,368,982 | Sberbank of Russia PJSC | $ | 5,362,967 | 1.2 | ||||||||||
Singapore: 1.9% | ||||||||||||||
| 38,700 | (1) | Sea Ltd. ADR | 8,657,577 | 1.9 | ||||||||||
South Africa: 1.4% | ||||||||||||||
| 195,346 | Bid Corp. Ltd. | 4,002,448 | 0.8 | |||||||||||
| 20,735 | Capitec Bank Holdings Ltd. | 2,654,236 | 0.6 | |||||||||||
| 6,656,684 | 1.4 | |||||||||||||
South Korea: 7.7% | ||||||||||||||
| 8,347 | LG Chem Ltd. | 4,315,082 | 0.9 | |||||||||||
| 7,407 | NCSoft Corp. | 4,000,732 | 0.9 | |||||||||||
| 416,031 | Samsung Electronics Co., Ltd. 005930 | 27,322,824 | 5.9 | |||||||||||
| 35,638,638 | 7.7 | |||||||||||||
Taiwan: 8.8% | ||||||||||||||
| 586,300 | Chailease Holding Co. Ltd. | 5,576,780 | 1.2 | |||||||||||
| 847,223 | Taiwan Semiconductor Manufacturing Co., Ltd. | 18,741,419 | 4.0 | |||||||||||
| 137,818 | Taiwan Semiconductor Manufacturing Co., Ltd. ADR | 16,580,884 | 3.6 | |||||||||||
| 40,899,083 | 8.8 | |||||||||||||
Turkey: 0.0% | ||||||||||||||
| 41,714 | BIM Birlesik Magazalar AS | 193,293 | 0.0 | |||||||||||
United Kingdom: 1.3% | ||||||||||||||
| 339,641 | Prudential PLC | 5,873,348 | 1.3 | |||||||||||
United States: 2.7% | ||||||||||||||
| 19,008 | (1) | EPAM Systems, Inc. | 12,705,898 | 2.7 | ||||||||||
| Total Common Stock (Cost $322,623,215) | 453,182,170 | 97.3 | ||||||||||||
| Principal Amount† | Value | Percentage of Net Assets | ||||||||||||
|---|---|---|---|---|---|---|---|---|---|---|---|---|---|---|
SHORT-TERM INVESTMENTS: 1.7% | ||||||||||||||
Repurchase Agreements: 0.3% | ||||||||||||||
| 190,512 | (4) | Citigroup, Inc., Repurchase Agreement dated 12/31/21, 0.05%, due 01/03/22 (Repurchase Amount $190,513, collateralized by various U.S. Government Securities, 0.000%–2.375%, Market Value plus accrued interest $194,322, due 01/04/22–11/15/51) | 190,512 | 0.1 | ||||||||||
| Principal Amount† | Value | Percentage of Net Assets | ||||||||||||
|---|---|---|---|---|---|---|---|---|---|---|---|---|---|---|
SHORT-TERM INVESTMENTS: (continued) | ||||||||||||||
Repurchase Agreements: (continued) | ||||||||||||||
| 1,000,000 | (4) | RBC Dominion Securities Inc., Repurchase Agreement dated 12/31/21, 0.05%, due 01/03/22 (Repurchase Amount $1,000,004, collateralized by various U.S. Government/U.S. Government Agency Obligations, 0.000%–6.500%, Market Value plus accrued interest $1,020,000, due 05/15/22–12/01/51) | $ | 1,000,000 | 0.2 | |||||||||
| Total Repurchase Agreements (Cost $1,190,512) | 1,190,512 | 0.3 | ||||||||||||
| Shares | Value | Percentage of Net Assets | ||||||||||||
|---|---|---|---|---|---|---|---|---|---|---|---|---|---|---|
Mutual Funds: 1.4% | ||||||||||||||
| 6,712,900 | (5) | BlackRock Liquidity Funds, FedFund, Institutional Class, 0.030% (Cost $6,712,900) | 6,712,900 | 1.4 | ||||||||||
| Total Short-Term Investments (Cost $7,903,412) | 7,903,412 | 1.7 | ||||||||||||
Total Investments in Securities (Cost $330,526,627) | $ | 461,085,582 | 99.0 | |||||||||||
Assets in Excess of Other Liabilities | 4,760,425 | 1.0 | ||||||||||||
Net Assets | $ | 465,846,007 | 100.0 | |||||||||||
| † | Unless otherwise indicated, principal amount is shown in USD. | |
| ADR | American Depositary Receipt | |
| (1) | Non-income producing security. | |
| (2) | Security, or a portion of the security, is on loan. | |
| (3) | Securities with purchases pursuant to Rule 144A or section 4(a)(2), under the Securities Act of 1933 and may not be resold subject to that rule except to qualified institutional buyers. | |
| (4) | All or a portion of the security represents securities purchased with cash collateral received for securities on loan. | |
| (5) | Rate shown is the 7-day yield as of December 31, 2021. |
| VY® JPMORGAN EMERGING MARKETS EQUITY PORTFOLIO | PORTFOLIO OF INVESTMENTS AS OF DECEMBER 31, 2021 (CONTINUED) |
| Sector Diversification | Percentage of Net Assets | |||||
|---|---|---|---|---|---|---|
| Information Technology | 26.7 | % | ||||
| Financials | 20.9 | |||||
| Consumer Discretionary | 15.2 | |||||
| Communication Services | 9.2 | |||||
| Consumer Staples | 7.2 | |||||
| Industrials | 5.5 | |||||
| Health Care | 5.0 | |||||
| Materials | 4.5 | |||||
| Energy | 1.7 | |||||
| Sector Diversification | Percentage of Net Assets | |||||
|---|---|---|---|---|---|---|
| Utilities | 0.8 | % | ||||
| Real Estate | 0.6 | |||||
| Short-Term Investments | 1.7 | |||||
| Assets in Excess of Other Liabilities | 1.0 | |||||
Net Assets | 100.0 | % | ||||
| Quoted Prices in Active Markets for Identical Investments (Level 1) | Significant Other Observable Inputs# (Level 2) | Significant Unobservable Inputs (Level 3) | Fair Value at December 31, 2021 | |||||||||||||||||
|---|---|---|---|---|---|---|---|---|---|---|---|---|---|---|---|---|---|---|---|---|
Asset Table | ||||||||||||||||||||
Investments, at fair value | ||||||||||||||||||||
| Common Stock | ||||||||||||||||||||
| Argentina | $ | 13,351,857 | $ | — | $ | — | $ | 13,351,857 | ||||||||||||
| Brazil | 9,210,227 | — | — | 9,210,227 | ||||||||||||||||
| China | 17,389,492 | 148,137,194 | — | 165,526,686 | ||||||||||||||||
| Germany | — | 5,288,234 | — | 5,288,234 | ||||||||||||||||
| Hong Kong | — | 25,236,633 | — | 25,236,633 | ||||||||||||||||
| India | 18,604,046 | 68,829,654 | — | 87,433,700 | ||||||||||||||||
| Indonesia | — | 14,040,191 | — | 14,040,191 | ||||||||||||||||
| Macau | — | 1,574,430 | — | 1,574,430 | ||||||||||||||||
| Mexico | 6,675,916 | — | — | 6,675,916 | ||||||||||||||||
| Panama | 3,143,477 | — | — | 3,143,477 | ||||||||||||||||
| Poland | — | 3,247,600 | — | 3,247,600 | ||||||||||||||||
| Portugal | 2,465,731 | — | — | 2,465,731 | ||||||||||||||||
| Russia | — | 5,362,967 | — | 5,362,967 | ||||||||||||||||
| Singapore | 8,657,577 | — | — | 8,657,577 | ||||||||||||||||
| South Africa | 2,654,236 | 4,002,448 | — | 6,656,684 | ||||||||||||||||
| South Korea | — | 35,638,638 | — | 35,638,638 | ||||||||||||||||
| Taiwan | 16,580,884 | 24,318,199 | — | 40,899,083 | ||||||||||||||||
| Turkey | 193,293 | — | — | 193,293 | ||||||||||||||||
| United Kingdom | — | 5,873,348 | — | 5,873,348 | ||||||||||||||||
| United States | 12,705,898 | — | — | 12,705,898 | ||||||||||||||||
| Total Common Stock | 111,632,634 | 341,549,536 | — | 453,182,170 | ||||||||||||||||
| Short-Term Investments | 6,712,900 | 1,190,512 | — | 7,903,412 | ||||||||||||||||
| Total Investments, at fair value | $ | 118,345,534 | $ | 342,740,048 | $ | — | $ | 461,085,582 | ||||||||||||
| ^ | See Note 2, “Significant Accounting Policies” in the Notes to Financial Statements for additional information. | |
| # | The earlier close of the foreign markets gives rise to the possibility that significant events, including broad market moves, may have occurred in the interim and may materially affect the value of those securities. To account for this, the Portfolio may frequently value many of its foreign equity securities using fair value prices based on third party vendor modeling tools to the extent available. Accordingly, a portion of the Portfolio’s investments are categorized as Level 2 investments. |
| Amount of Realized Gain or (Loss) on Derivatives Recognized in Income | ||||||
|---|---|---|---|---|---|---|
| Derivatives not accounted for as hedging instruments | Forward foreign currency contracts | |||||
| Foreign exchange contracts | $ | (1,548 | ) | |||
Total | $ | (1,548 | ) | |||
| VY® JPMORGAN EMERGING MARKETS EQUITY PORTFOLIO | PORTFOLIO OF INVESTMENTS AS OF DECEMBER 31, 2021 (CONTINUED) |
| Change in Unrealized Appreciation or (Depreciation) on Derivatives Recognized in Income | ||||||
|---|---|---|---|---|---|---|
| Derivatives not accounted for as hedging instruments | Forward foreign currency contracts | |||||
| Foreign exchange contracts | $ | (4 | ) | |||
Total | $ | (4 | ) | |||
| Cost for federal income tax purposes was $331,025,730. | ||||||
| Net unrealized appreciation consisted of: | ||||||
| Gross Unrealized Appreciation | $ | 173,078,901 | ||||
| Gross Unrealized Depreciation | (42,922,394 | ) | ||||
| Net Unrealized Appreciation | $ | 130,156,507 | ||||
| VY® MORGAN STANLEY GLOBAL FRANCHISE PORTFOLIO | PORTFOLIO OF INVESTMENTS AS OF DECEMBER 31, 2021 |
| Shares | Value | Percentage of Net Assets | ||||||||||||
|---|---|---|---|---|---|---|---|---|---|---|---|---|---|---|
COMMON STOCK: 98.8% | ||||||||||||||
France: 5.9% | ||||||||||||||
| 15,955 | L’Oreal S.A. | $ | 7,607,538 | 1.7 | ||||||||||
| 9,202 | LVMH Moet Hennessy Louis Vuitton SE | 7,604,833 | 1.7 | |||||||||||
| 44,591 | Pernod Ricard SA | 10,727,591 | 2.5 | |||||||||||
| 25,939,962 | 5.9 | |||||||||||||
Germany: 4.8% | ||||||||||||||
| 149,445 | SAP SE | 21,032,791 | 4.8 | |||||||||||
Italy: 0.6% | ||||||||||||||
| 176,751 | Davide Campari-Milano NV | 2,579,195 | 0.6 | |||||||||||
Netherlands: 2.0% | ||||||||||||||
| 80,699 | Heineken NV | 9,081,833 | 2.0 | |||||||||||
United Kingdom: 10.3% | ||||||||||||||
| 105,179 | Experian PLC | 5,180,671 | 1.2 | |||||||||||
| 332,158 | Reckitt Benckiser Group PLC | 28,593,294 | 6.5 | |||||||||||
| 73,281 | Relx PLC (EUR Exchange) | 2,379,416 | 0.5 | |||||||||||
| 281,180 | Relx PLC (GBP Exchange) | 9,179,639 | 2.1 | |||||||||||
| 45,333,020 | 10.3 | |||||||||||||
United States: 75.2% | ||||||||||||||
| 144,730 | Abbott Laboratories | 20,369,300 | 4.6 | |||||||||||
| 60,113 | Accenture PLC | 24,919,844 | 5.7 | |||||||||||
| 72,521 | Automatic Data Processing, Inc. | 17,882,228 | 4.1 | |||||||||||
| 214,292 | Baxter International, Inc. | 18,394,825 | 4.2 | |||||||||||
| 67,016 | Becton Dickinson & Co. | 16,853,184 | 3.8 | |||||||||||
| 23,494 | Broadridge Financial Solutions, Inc. ADR | 4,295,173 | 1.0 | |||||||||||
| 131,127 | Coca-Cola Co. | 7,764,030 | 1.8 | |||||||||||
| 63,247 | Danaher Corp. | 20,808,895 | 4.7 | |||||||||||
| 14,490 | Estee Lauder Cos., Inc. | 5,364,198 | 1.2 | |||||||||||
| 5,017 | Factset Research Systems, Inc. | 2,438,312 | 0.5 | |||||||||||
| 88,625 | Fidelity National Information Services, Inc. | 9,673,419 | 2.2 | |||||||||||
| 117,166 | Intercontinental Exchange, Inc. | 16,024,794 | 3.6 | |||||||||||
| 122,247 | Microsoft Corp. | 41,114,111 | 9.3 | |||||||||||
| 13,648 | Moody’s Corp. | 5,330,636 | 1.2 | |||||||||||
| 30,728 | Nike, Inc. — Class B | 5,121,436 | 1.2 | |||||||||||
| 351,105 | Philip Morris International, Inc. | 33,354,975 | 7.6 | |||||||||||
| 128,091 | Procter & Gamble Co. | 20,953,126 | 4.7 | |||||||||||
| 18,789 | Roper Technologies, Inc. | 9,241,558 | 2.1 | |||||||||||
| 3,827 | STERIS Public Ltd. Co. | 931,530 | 0.2 | |||||||||||
| 32,627 | Thermo Fisher Scientific, Inc. | 21,770,039 | 4.9 | |||||||||||
| 104,869 | Visa, Inc. — Class A | 22,726,161 | 5.2 | |||||||||||
| 24,552 | Zoetis, Inc. | 5,991,425 | 1.4 | |||||||||||
| 331,323,199 | 75.2 | |||||||||||||
| Total Common Stock (Cost $261,666,528) | 435,290,000 | 98.8 | ||||||||||||
| Shares | Value | Percentage of Net Assets | ||||||||||||
|---|---|---|---|---|---|---|---|---|---|---|---|---|---|---|
SHORT-TERM INVESTMENTS: 1.6% | ||||||||||||||
Mutual Funds: 1.6% | ||||||||||||||
| 7,108,644 | (1) | BlackRock Liquidity Funds, FedFund, Institutional Class, 0.030% (Cost $7,108,644) | $ | 7,108,644 | 1.6 | |||||||||
| Total Short-Term Investments (Cost $7,108,644) | 7,108,644 | 1.6 | ||||||||||||
Total Investments in Securities (Cost $268,775,172) | $ | 442,398,644 | 100.4 | |||||||||||
Liabilities in Excess of Other Assets | (1,952,534 | ) | (0.4 | ) | ||||||||||
Net Assets | $ | 440,446,110 | 100.0 | |||||||||||
| ADR | American Depositary Receipt | |
| (1) | Rate shown is the 7-day yield as of December 31, 2021. |
| Sector Diversification | Percentage of Net Assets | |||||
|---|---|---|---|---|---|---|
| Information Technology | 32.1 | % | ||||
| Consumer Staples | 28.6 | |||||
| Health Care | 23.9 | |||||
| Industrials | 5.9 | |||||
| Financials | 5.4 | |||||
| Consumer Discretionary | 2.9 | |||||
| Short-Term Investments | 1.6 | |||||
| Liabilities in Excess of Other Assets | (0.4 | ) | ||||
Net Assets | 100.0 | % | ||||
| VY® MORGAN STANLEY GLOBAL FRANCHISE PORTFOLIO | PORTFOLIO OF INVESTMENTS AS OF DECEMBER 31, 2021 (CONTINUED) |
| Quoted Prices in Active Markets for Identical Investments (Level 1) | Significant Other Observable Inputs# (Level 2) | Significant Unobservable Inputs (Level 3) | Fair Value at December 31, 2021 | |||||||||||||||||
|---|---|---|---|---|---|---|---|---|---|---|---|---|---|---|---|---|---|---|---|---|
Asset Table | ||||||||||||||||||||
Investments, at fair value | ||||||||||||||||||||
| Common Stock | ||||||||||||||||||||
| France | $ | — | $ | 25,939,962 | $ | — | $ | 25,939,962 | ||||||||||||
| Germany | — | 21,032,791 | — | 21,032,791 | ||||||||||||||||
| Italy | — | 2,579,195 | — | 2,579,195 | ||||||||||||||||
| Netherlands | — | 9,081,833 | — | 9,081,833 | ||||||||||||||||
| United Kingdom | — | 45,333,020 | — | 45,333,020 | ||||||||||||||||
| United States | 331,323,199 | — | — | 331,323,199 | ||||||||||||||||
| Total Common Stock | 331,323,199 | 103,966,801 | — | 435,290,000 | ||||||||||||||||
| Short-Term Investments | 7,108,644 | — | — | 7,108,644 | ||||||||||||||||
| Total Investments, at fair value | $ | 338,431,843 | $ | 103,966,801 | $ | — | $ | 442,398,644 | ||||||||||||
| ^ | See Note 2, “Significant Accounting Policies” in the Notes to Financial Statements for additional information. | |
| # | The earlier close of the foreign markets gives rise to the possibility that significant events, including broad market moves, may have occurred in the interim and may materially affect the value of those securities. To account for this, the Portfolio may frequently value many of its foreign equity securities using fair value prices based on third party vendor modeling tools to the extent available. Accordingly, a portion of the Portfolio’s investments are categorized as Level 2 investments. |
| Cost for federal income tax purposes was $269,734,117. | ||||||
| Net unrealized appreciation consisted of: | ||||||
| Gross Unrealized Appreciation | $ | 172,664,527 | ||||
| Gross Unrealized Depreciation | (2,269 | ) | ||||
| Net Unrealized Appreciation | $ | 172,662,258 | ||||
| VY® T. ROWE PRICE CAPITAL APPRECIATION PORTFOLIO | PORTFOLIO OF INVESTMENTS AS OF DECEMBER 31, 2021 |
| Shares | Value | Percentage of Net Assets | ||||||||||||
|---|---|---|---|---|---|---|---|---|---|---|---|---|---|---|
COMMON STOCK: 71.9% | ||||||||||||||
Communication Services: 6.6% | ||||||||||||||
| 71,658 | (1),(2) | Alphabet, Inc. — Class A | $ | 207,596,092 | 2.4 | |||||||||
| 98,946 | (1),(2) | Alphabet, Inc. — Class C | 286,309,156 | 3.2 | ||||||||||
| 267,865 | (2) | Meta Platforms, Inc. | 90,096,393 | 1.0 | ||||||||||
| 584,001,641 | 6.6 | |||||||||||||
Consumer Discretionary: 10.4% | ||||||||||||||
| 140,079 | (1),(2) | Amazon.com, Inc. | 467,071,013 | 5.3 | ||||||||||
| 367,968 | (1),(2) | Hilton Worldwide Holdings, Inc. | 57,399,328 | 0.6 | ||||||||||
| 268,928 | (1),(2) | Marriott International, Inc. | 44,437,663 | 0.5 | ||||||||||
| 86,033 | (1) | McDonald’s Corp. | 23,062,866 | 0.3 | ||||||||||
| 32,600 | (1) | Ross Stores, Inc. | 3,725,528 | 0.0 | ||||||||||
| 2,360,908 | (3) | Yum! Brands, Inc. | 327,835,685 | 3.7 | ||||||||||
| 923,532,083 | 10.4 | |||||||||||||
Consumer Staples: 1.9% | ||||||||||||||
| 315,300 | Coca-Cola Co. | 18,668,913 | 0.2 | |||||||||||
| 3,635,236 | Keurig Dr Pepper, Inc. | 133,994,799 | 1.5 | |||||||||||
| 93,800 | PepsiCo, Inc. | 16,293,998 | 0.2 | |||||||||||
| 168,957,710 | 1.9 | |||||||||||||
Financials: 9.4% | ||||||||||||||
| 3,099,565 | Bank of America Corp. | 137,899,647 | 1.6 | |||||||||||
| 66,600 | CME Group, Inc. | 15,215,436 | 0.2 | |||||||||||
| 873,783 | (3) | Intercontinental Exchange, Inc. | 119,507,301 | 1.3 | ||||||||||
| 1,264,505 | Marsh & McLennan Cos., Inc. | 219,796,259 | 2.5 | |||||||||||
| 1,690,262 | PNC Financial Services Group, Inc. | 338,931,336 | 3.8 | |||||||||||
| 831,349,979 | 9.4 | |||||||||||||
Health Care: 16.4% | ||||||||||||||
| 726,823 | Becton Dickinson & Co. | 182,781,448 | 2.1 | |||||||||||
| 598,407 | Danaher Corp. | 196,881,887 | 2.2 | |||||||||||
| 447,942 | (2) | Hologic, Inc. | 34,294,439 | 0.4 | ||||||||||
| 524,352 | (3) | Humana, Inc. | 243,225,919 | 2.7 | ||||||||||
| 67,200 | Medtronic PLC | 6,951,840 | 0.1 | |||||||||||
| 738,414 | PerkinElmer, Inc. | 148,465,519 | 1.7 | |||||||||||
| 466,578 | Thermo Fisher Scientific, Inc. | 311,319,505 | 3.5 | |||||||||||
| 643,607 | UnitedHealth Group, Inc. | 323,180,819 | 3.7 | |||||||||||
| 1,447,101,376 | 16.4 | |||||||||||||
Industrials: 7.3% | ||||||||||||||
| 1,704,719 | (2) | Aurora Innovation, Inc. | 19,195,136 | 0.2 | ||||||||||
| 1,251,142 | (2),(4) | Aurora Innovation, Inc. Lockup Shares | 13,383,466 | 0.2 | ||||||||||
| 4,147,888 | General Electric Co. | 391,850,979 | 4.4 | |||||||||||
| 1,030,000 | (3) | Ingersoll Rand, Inc. | 63,726,100 | 0.7 | ||||||||||
| 46,300 | Lockheed Martin Corp. | 16,455,483 | 0.2 | |||||||||||
| 35,500 | Northrop Grumman Corp. | 13,740,985 | 0.2 | |||||||||||
| 71,520 | Roper Technologies, Inc. | 35,177,827 | 0.4 | |||||||||||
| 16,682 | TransUnion | 1,978,152 | 0.0 | |||||||||||
| 616,179 | Waste Connections, Inc. | 83,966,712 | 1.0 | |||||||||||
| 22,700 | Waste Management, Inc. | 3,788,630 | 0.0 | |||||||||||
| 643,263,470 | 7.3 | |||||||||||||
Information Technology: 13.7% | ||||||||||||||
| 477,430 | Apple, Inc. | 84,777,245 | 1.0 | |||||||||||
| 518,200 | Cisco Systems, Inc. | 32,838,334 | 0.4 | |||||||||||
| Shares | Value | Percentage of Net Assets | ||||||||||||
|---|---|---|---|---|---|---|---|---|---|---|---|---|---|---|
COMMON STOCK: (continued) | ||||||||||||||
Information Technology: (continued) | ||||||||||||||
| 222,906 | (1),(2) | Fiserv, Inc. | $ | 23,135,414 | 0.3 | |||||||||
| 226,472 | (2) | FleetCor Technologies, Inc. | 50,693,493 | 0.6 | ||||||||||
| 37,100 | Mastercard, Inc. — Class A | 13,330,772 | 0.1 | |||||||||||
| 2,003,532 | (1) | Microsoft Corp. | 673,827,882 | 7.6 | ||||||||||
| 83,100 | NXP Semiconductor NV — NXPI — US | 18,928,518 | 0.2 | |||||||||||
| 500,664 | (2) | Salesforce.com, Inc. | 127,233,742 | 1.4 | ||||||||||
| 480,467 | TE Connectivity Ltd. | 77,518,546 | 0.9 | |||||||||||
| 36,902 | (2) | Teledyne Technologies, Inc. | 16,122,115 | 0.2 | ||||||||||
| 424,100 | (1),(3) | Visa, Inc. — Class A | 91,906,711 | 1.0 | ||||||||||
| 1,210,312,772 | 13.7 | |||||||||||||
Utilities: 6.2% | ||||||||||||||
| 1,766,233 | (3) | Ameren Corp. | 157,212,399 | 1.8 | ||||||||||
| 493,389 | American Electric Power Co., Inc. | 43,896,819 | 0.5 | |||||||||||
| 1,410,085 | CMS Energy Corp. | 91,726,029 | 1.0 | |||||||||||
| 1,977,000 | Exelon Corp. | 114,191,520 | 1.3 | |||||||||||
| 2,113,276 | Public Service Enterprise Group, Inc. | 141,018,908 | 1.6 | |||||||||||
| 548,045,675 | 6.2 | |||||||||||||
| Total Common Stock (Cost $4,643,285,787) | 6,356,564,706 | 71.9 | ||||||||||||
PREFERRED STOCK: 1.4% | ||||||||||||||
Consumer Discretionary: 0.5% | ||||||||||||||
| 413,251 | (2), (4),(5) | Waymo LLC., Series A-2 | 37,904,208 | 0.5 | ||||||||||
Financials: 0.0% | ||||||||||||||
| 23,000 | (2), (3),(6) | Charles Schwab Corp. — Series D | 586,040 | 0.0 | ||||||||||
Utilities: 0.9% | ||||||||||||||
| 223,176 | (2) | American Electric Power Co., Inc. | 11,185,581 | 0.1 | ||||||||||
| 806,455 | (2),(6) | CMS Energy Corp. | 21,693,640 | 0.3 | ||||||||||
| 590,712 | (2), (3),(6) | CMS Energy Corp. | 15,801,546 | 0.2 | ||||||||||
| 113,203 | (2),(3) | NiSource, Inc. | 12,677,604 | 0.1 | ||||||||||
| 289,105 | (2), (6),(7) | NiSource, Inc. — Series B | 7,869,438 | 0.1 | ||||||||||
| 402,878 | (2),(3), (6),(7) | SCE Trust IV | 10,096,123 | 0.1 | ||||||||||
| 79,323,932 | 0.9 | |||||||||||||
| Total Preferred Stock (Cost $110,721,047) | 117,814,180 | 1.4 | ||||||||||||
| Principal Amount† | Value | Percentage of Net Assets | ||||||||||||
|---|---|---|---|---|---|---|---|---|---|---|---|---|---|---|
CORPORATE BONDS/NOTES: 8.0% | ||||||||||||||
Communications: 3.2% | ||||||||||||||
| 7,630,000 | (8) | Altice France Holding SA, 10.500%, 05/15/2027 | 8,213,008 | 0.1 | ||||||||||
| 8,415,000 | (3),(8) | CCO Holdings LLC / CCO Holdings Capital Corp., 4.000%, 03/01/2023 | 8,425,771 | 0.1 | ||||||||||
| VY® T. ROWE PRICE CAPITAL APPRECIATION PORTFOLIO | PORTFOLIO OF INVESTMENTS AS OF DECEMBER 31, 2021 (CONTINUED) |
| Principal Amount† | Value | Percentage of Net Assets | ||||||||||||
|---|---|---|---|---|---|---|---|---|---|---|---|---|---|---|
CORPORATE BONDS/NOTES: (continued) | ||||||||||||||
Communications: (continued) | ||||||||||||||
| 41,495,000 | (3),(8) | CCO Holdings LLC / CCO Holdings Capital Corp., 5.125%, 05/01/2027 | $ | 42,790,682 | 0.5 | |||||||||
| 45,653,000 | (8) | CCO Holdings LLC / CCO Holdings Capital Corp., 5.000%, 02/01/2028 | 47,570,426 | 0.5 | ||||||||||
| 25,880,000 | (3) | Netflix, Inc., 4.375%, 11/15/2026 | 28,696,132 | 0.3 | ||||||||||
| 31,765,000 | Netflix, Inc., 4.875%, 04/15/2028 | 36,266,895 | 0.4 | |||||||||||
| 650,000 | (8) | Netflix, Inc., 4.875%, 06/15/2030 | 759,184 | 0.0 | ||||||||||
| 1,990,000 | (3) | Netflix, Inc., 5.500%, 02/15/2022 | 2,003,303 | 0.0 | ||||||||||
| 10,975,000 | Netflix, Inc., 5.875%, 02/15/2025 | 12,346,765 | 0.2 | |||||||||||
| 39,620,000 | Netflix, Inc., 5.875%, 11/15/2028 | 47,709,612 | 0.6 | |||||||||||
| 23,355,000 | Netflix, Inc., 6.375%, 05/15/2029 | 29,055,255 | 0.3 | |||||||||||
| 7,450,000 | (3),(8) | Photo Holdings Merger Sub, Inc., 8.500%, 10/01/2026 | 7,757,424 | 0.1 | ||||||||||
| 9,740,000 | (8) | Sirius XM Radio, Inc., 5.000%, 08/01/2027 | 10,135,249 | 0.1 | ||||||||||
| 281,729,706 | 3.2 | |||||||||||||
Consumer, Cyclical: 2.7% | ||||||||||||||
| 14,520,000 | (3) | Cedar Fair L.P. / Canada’s Wonderland Co. / Magnum Management Corp. / Millennium Op, 5.375%, 04/15/2027 | 14,897,738 | 0.2 | ||||||||||
| 13,970,000 | (3) | Cedar Fair L.P., 5.250%, 07/15/2029 | 14,340,275 | 0.2 | ||||||||||
| 5,665,000 | (8) | Cedar Fair L.P. / Canada’s Wonderland Co. / Magnum Management Corp. / Millennium Op, 5.500%, 05/01/2025 | 5,870,441 | 0.1 | ||||||||||
| 10,835,000 | (3) | Cedar Fair L.P. / Canada’s Wonderland Co. / Magnum Management Corp. / Millennium Op, 6.500%, 10/01/2028 | 11,555,257 | 0.1 | ||||||||||
| 3,708,000 | (3),(8) | Clarios Global L.P. / Clarios US Finance Co., 6.250%, 05/15/2026 | 3,884,186 | 0.0 | ||||||||||
| 2,719,000 | (8) | Clarios Global L.P. / Clarios US Finance Co., 6.750%, 05/15/2025 | 2,850,912 | 0.0 | ||||||||||
| 6,420,000 | (3),(8) | Clarios Global L.P. / Clarios US Finance Co., 8.500%, 05/15/2027 | 6,813,450 | 0.1 | ||||||||||
| 12,595,000 | (8) | Delta Air Lines, Inc. / SkyMiles IP Ltd., 4.500%, 10/20/2025 | 13,245,303 | 0.1 | ||||||||||
| 7,010,000 | (8) | Delta Air Lines, Inc. / SkyMiles IP Ltd., 4.750%, 10/20/2028 | 7,660,400 | 0.1 | ||||||||||
| 615,000 | (8) | Hilton Domestic Operating Co., Inc., 5.375%, 05/01/2025 | 640,605 | 0.0 | ||||||||||
| 445,000 | (8) | IRB Holding Corp., 6.750%, 02/15/2026 | 453,813 | 0.0 | ||||||||||
| Principal Amount† | Value | Percentage of Net Assets | ||||||||||||
|---|---|---|---|---|---|---|---|---|---|---|---|---|---|---|
CORPORATE BONDS/NOTES: (continued) | ||||||||||||||
Consumer, Cyclical: (continued) | ||||||||||||||
| 32,360,000 | (3),(8) | KFC Holding Co/Pizza Hut Holdings LLC/Taco Bell of America LLC, 4.750%, 06/01/2027 | $ | 33,484,510 | 0.4 | |||||||||
| 7,584,000 | (8) | Life Time, Inc., 5.750%, 01/15/2026 | 7,858,351 | 0.1 | ||||||||||
| 2,175,000 | Marriott International, Inc./MD, 3.125%, 06/15/2026 | 2,261,176 | 0.0 | |||||||||||
| 7,550,000 | (3),(8) | Mileage Plus Holdings LLC / Mileage Plus Intellectual Property Assets Ltd., 6.500%, 06/20/2027 | 8,070,988 | 0.1 | ||||||||||
| 33,701,000 | (3),(8) | Six Flags Entertainment Corp., 4.875%, 07/31/2024 | 34,076,429 | 0.4 | ||||||||||
| 21,402,000 | (3),(8) | Six Flags Entertainment Corp., 5.500%, 04/15/2027 | 22,172,472 | 0.3 | ||||||||||
| 11,039,000 | (8) | Six Flags Theme Parks, Inc., 7.000%, 07/01/2025 | 11,801,381 | 0.1 | ||||||||||
| 2,265,491 | United Airlines 2012-1 Class A Pass Through Trust, 4.150%, 10/11/2025 | 2,351,235 | 0.0 | |||||||||||
| 305,597 | US Airways 2012-2 Class A Pass Through Trust, 4.625%, 12/03/2026 | 304,660 | 0.0 | |||||||||||
| 1,348,107 | US Airways 2010-1 Class A Pass Through Trust, 6.250%, 10/22/2024 | 1,381,764 | 0.0 | |||||||||||
| 1,740,322 | US Airways 2013-1 Class A Pass Through Trust, 3.950%, 05/15/2027 | 1,759,301 | 0.0 | |||||||||||
| 8,160,000 | (3) | Yum! Brands, Inc., 3.875%, 11/01/2023 | 8,527,608 | 0.1 | ||||||||||
| 2,175,000 | (3),(8) | Yum! Brands, Inc., 4.750%, 01/15/2030 | 2,357,559 | 0.0 | ||||||||||
| 13,525,000 | (3) | Yum! Brands, Inc., 5.350%, 11/01/2043 | 14,976,097 | 0.2 | ||||||||||
| 5,885,000 | (3) | Yum! Brands, Inc., 6.875%, 11/15/2037 | 7,466,652 | 0.1 | ||||||||||
| 2,355,000 | (8) | Yum! Brands, Inc., 7.750%, 04/01/2025 | 2,484,372 | 0.0 | ||||||||||
| 243,546,935 | 2.7 | |||||||||||||
Consumer, Non-cyclical: 0.4% | ||||||||||||||
| 7,235,000 | (3),(8) | Avantor Funding, Inc., 4.625%, 07/15/2028 | 7,554,534 | 0.1 | ||||||||||
| 8,605,000 | (3),(8) | Hadrian Merger Sub, Inc., 8.500%, 05/01/2026 | 8,893,052 | 0.1 | ||||||||||
| 2,345,000 | (8) | Korn Ferry, 4.625%, 12/15/2027 | 2,418,715 | 0.0 | ||||||||||
| 6,760,000 | (3),(8) | Surgery Center Holdings, Inc., 10.000%, 04/15/2027 | 7,189,260 | 0.1 | ||||||||||
| 4,695,000 | Teleflex, Inc., 4.625%, 11/15/2027 | 4,889,537 | 0.1 | |||||||||||
| 2,700,000 | (3),(8) | Tenet Healthcare Corp., 4.625%, 09/01/2024 | 2,763,639 | 0.0 | ||||||||||
| 33,708,737 | 0.4 | |||||||||||||
Financial: 1.0% | ||||||||||||||
| 12,600,000 | (3),(8) | Acrisure LLC / Acrisure Finance, Inc., 7.000%, 11/15/2025 | 12,604,851 | 0.2 | ||||||||||
| VY® T. ROWE PRICE CAPITAL APPRECIATION PORTFOLIO | PORTFOLIO OF INVESTMENTS AS OF DECEMBER 31, 2021 (CONTINUED) |
| Principal Amount† | Value | Percentage of Net Assets | ||||||||||||
|---|---|---|---|---|---|---|---|---|---|---|---|---|---|---|
CORPORATE BONDS/NOTES: (continued) | ||||||||||||||
Financial: (continued) | ||||||||||||||
| 1,500,000 | (8) | Alliant Holdings Intermediate LLC / Alliant Holdings Co-Issuer, 4.250%, 10/15/2027 | $ | 1,501,560 | 0.0 | |||||||||
| 1,500,000 | (3),(8) | Alliant Holdings Intermediate LLC / Alliant Holdings Co-Issuer, 5.875%, 11/01/2029 | 1,528,230 | 0.0 | ||||||||||
| 1,625,000 | (3),(8) | Alliant Holdings Intermediate LLC / Alliant Holdings Co-Issuer, 6.750%, 10/15/2027 | 1,687,627 | 0.0 | ||||||||||
| 2,380,000 | (3),(8) | AmWINS Group, Inc., 4.875%, 06/30/2029 | 2,407,882 | 0.0 | ||||||||||
| 42,033,000 | (8) | HUB International Ltd., 7.000%, 05/01/2026 | 43,242,500 | 0.5 | ||||||||||
| 2,790,000 | (3),(8) | HUB International Ltd., 5.625%, 12/01/2029 | 2,878,582 | 0.0 | ||||||||||
| 3,510,000 | (3) | SBA Communications Corp., 3.875%, 02/15/2027 | 3,619,951 | 0.1 | ||||||||||
| 2,214,000 | (7) | State Street Corp., 3.800%, 12/31/2199 | 2,219,382 | 0.0 | ||||||||||
| 15,610,000 | (3),(8) | USI, Inc./NY, 6.875%, 05/01/2025 | 15,744,168 | 0.2 | ||||||||||
| 87,434,733 | 1.0 | |||||||||||||
Industrial: 0.5% | ||||||||||||||
| 23,480,000 | (3),(7) | General Electric Co., 3.533%, 12/31/2199 | 23,362,600 | 0.3 | ||||||||||
| 1,500,000 | Lennox International, Inc., 3.000%, 11/15/2023 | 1,543,530 | 0.0 | |||||||||||
| 4,220,000 | (8) | Sensata Technologies BV, 4.875%, 10/15/2023 | 4,436,169 | 0.0 | ||||||||||
| 5,100,000 | (8) | Sensata Technologies BV, 5.000%, 10/01/2025 | 5,538,855 | 0.1 | ||||||||||
| 1,430,000 | (8) | Sensata Technologies BV, 5.625%, 11/01/2024 | 1,575,746 | 0.0 | ||||||||||
| 2,105,000 | (3),(8) | TK Elevator US Newco, Inc., 5.250%, 07/15/2027 | 2,215,576 | 0.0 | ||||||||||
| 5,885,000 | (3) | Welbilt, Inc., 9.500%, 02/15/2024 | 5,951,059 | 0.1 | ||||||||||
| 44,623,535 | 0.5 | |||||||||||||
Technology: 0.1% | ||||||||||||||
| 4,176,000 | (8) | Clarivate Science Holdings Corp., 3.875%, 07/01/2028 | 4,205,295 | 0.1 | ||||||||||
| 1,280,000 | (3),(8) | Clarivate Science Holdings Corp., 4.875%, 07/01/2029 | 1,300,320 | 0.0 | ||||||||||
| 5,505,615 | 0.1 | |||||||||||||
Utilities: 0.1% | ||||||||||||||
| 9,465,000 | (7) | NiSource, Inc., 5.650%, 12/31/2199 | 9,772,612 | 0.1 | ||||||||||
| Total Corporate Bonds/Notes (Cost $658,154,269) | 706,321,873 | 8.0 | ||||||||||||
| Principal Amount† | Value | Percentage of Net Assets | ||||||||||||
|---|---|---|---|---|---|---|---|---|---|---|---|---|---|---|
BANK LOANS: 11.5% | ||||||||||||||
Aerospace & Defense: 0.2% | ||||||||||||||
| 16,875,000 | SkyMiles IP Ltd. 2020 Skymiles Term Loan B, 4.750%, (US0003M + 3.750%), 10/20/2027 | $ | 17,885,391 | 0.2 | ||||||||||
Basic Materials: 0.0% | ||||||||||||||
| 1,897,345 | HB Fuller Co. 1st Lien Term Loan B, 2.104%, (US0001M + 2.000%), 10/20/2024 | 1,899,914 | 0.0 | |||||||||||
Business Equipment & Services: 0.4% | ||||||||||||||
| 32,280,000 | Ascend Learning, LLC 2021 Term Loan, 4.000%, (US0003M + 3.500%), 12/11/2028 | 32,255,790 | 0.4 | |||||||||||
| 2,810,000 | Polaris Newco LLC USD Term Loan B, 4.500%, (US0003M + 4.000%), 06/02/2028 | 2,812,987 | 0.0 | |||||||||||
| 35,068,777 | 0.4 | |||||||||||||
Communications: 0.1% | ||||||||||||||
| 3,694,789 | Mega Broadband Investments TL B 1L, 3.750%, (US0001M + 3.000%), 11/12/2027 | 3,698,255 | 0.1 | |||||||||||
Consumer, Cyclical: 1.3% | ||||||||||||||
| 350,000 | Cedar Fair L.P., 1.961%, (US0003M + 1.750%), 04/13/2024 | 343,583 | 0.0 | |||||||||||
| 37,950,000 | Formula One TL B3 1L, 3.500%, (US0003M + 2.500%), 02/01/2024 | 37,960,171 | 0.4 | |||||||||||
| 5,117,724 | Four Seasons Hotels Ltd. — TL B 1L, 2.224%, (US0003M + 2.000%), 11/30/2023 | 5,105,246 | 0.1 | |||||||||||
| 10,869,958 | Insprire Brands TL B 1L, 3.750%, (US0001M + 2.750%), 02/05/2025 | 10,866,186 | 0.1 | |||||||||||
| 3,731,830 | Life Time, Inc. — TL B 1L, 5.750%, (US0001M + 4.750%), 12/22/2024 | 3,765,151 | 0.1 | |||||||||||
| 41,685,000 | Mileage Plus Holdings LLC 2020 Term Loan B, 6.250%, (US0003M + 5.250%), 06/21/2027 | 44,107,941 | 0.5 | |||||||||||
| 8,280,443 | SeaWorld Parks & Entertainment, Inc. TL B 1L, 3.500%, (US0001M + 3.000%), 08/25/2028 | 8,257,672 | 0.1 | |||||||||||
| 3,308,375 | WellPet — TL B 1L, 4.500%, (US0003M + 3.750%), 12/21/2027 | 3,315,614 | 0.0 | |||||||||||
| 113,721,564 | 1.3 | |||||||||||||
Consumer, Non-cyclical: 1.4% | ||||||||||||||
| 18,489,413 | ADMI Corp., 4.250%, (US0001M + 3.500%), 12/23/2027 | 18,484,272 | 0.2 | |||||||||||
| 981,694 | Avantor Funding, Inc. TL B4 1L, 2.500%, (US0001M + 2.000%), 11/21/2024 | 981,694 | 0.0 | |||||||||||
| VY® T. ROWE PRICE CAPITAL APPRECIATION PORTFOLIO | PORTFOLIO OF INVESTMENTS AS OF DECEMBER 31, 2021 (CONTINUED) |
| Principal Amount† | Value | Percentage of Net Assets | ||||||||||||
|---|---|---|---|---|---|---|---|---|---|---|---|---|---|---|
BANK LOANS: (continued) | ||||||||||||||
Consumer, Non-cyclical: (continued) | ||||||||||||||
| 17,735,550 | CoreLogic, Inc. TL B 1L, 4.000%, (US0001M + 3.500%), 06/02/2028 | $ | 17,748,852 | 0.2 | ||||||||||
| 1,040,000 | CoreLogic, Inc. TL 2L, 7.000%, (US0001M + 6.500%), 04/13/2029 | 1,052,350 | 0.0 | |||||||||||
| 1,670,781 | Eyecare Partners LLC TL 1L, 3.854%, (US0001M + 3.750%), 02/20/2027 | 1,661,513 | 0.0 | |||||||||||
| 450,000 | Eyecare Partners LLC TL 1L, 6.000%, (US0001M + 3.750%), 10/14/2028 | 449,015 | 0.0 | |||||||||||
| 30,240,813 | Heartland Dental LLC — TL 1L, 3.882%, (US0003M + 3.750%), 04/30/2025 | 29,978,565 | 0.4 | |||||||||||
| 20,667,260 | Loire Finco Luxembourg Sarl—TL B 1L, 3.354%, (US0003M + 3.250%), 01/24/2027 | 20,370,169 | 0.2 | |||||||||||
| 2,492,475 | Pacific Dental Services TL B 1L, 4.000%, (US0001M + 3.500%), 04/20/2028 | 2,496,368 | 0.0 | |||||||||||
| 2,130,919 | Pathway Vet Alliance LLC TL B 1L, 3.854%, (US0001M + 3.750%), 03/31/2027 | 2,126,702 | 0.0 | |||||||||||
| 5,032,870 | PetVet Care Centers LLC, 3.400%, (US0003M + 3.250%), 02/14/2025 | 4,994,338 | 0.1 | |||||||||||
| 1,794,373 | PetVet Care Centers LLC TL 1L, 2.854%, (US0003M + 2.750%), 02/14/2025 | 1,780,636 | 0.0 | |||||||||||
| 23,294,391 | Sunshine Luxembourg VII Sarl — TL B 1L, 4.500%, (US0003M + 4.250%), 07/17/2026 | 23,345,359 | 0.3 | |||||||||||
| 125,469,833 | 1.4 | |||||||||||||
Financial: 3.4% | ||||||||||||||
| 4,309,200 | Acrisure, LLC 2021 Incremental Term Loan B, 4.250%, (US0003M + 3.750%), 02/15/2027 | 4,310,545 | 0.0 | |||||||||||
| 16,103,853 | Alliant Holdings Intermediate, LLC Term Loan B 1L, 3.354%, (US0003M + 3.000%), 05/09/2025 | 15,966,970 | 0.2 | |||||||||||
| 25,044,370 | Howden Group Holdings Ltd. — TL B 1L, 4.000%, (US0001M + 3.250%), 11/12/2027 | 24,966,107 | 0.3 | |||||||||||
| 78,652,493 | HUB International Ltd. —TL B3 1L, 4.000%, (US0003M + 3.250%), 04/25/2025 | 78,730,359 | 0.9 | |||||||||||
| 120,483,438 | HUB International Ltd. TL B 1L, 2.875%, (US0001M + 3.000%), 04/25/2025 | 119,153,060 | 1.3 | |||||||||||
| 5,273,176 | Ryan Specialty Group, LLC TL B 1L, 3.750%, (US0001M + 3.250%), 07/23/2027 | 5,282,514 | 0.1 | |||||||||||
| Principal Amount† | Value | Percentage of Net Assets | ||||||||||||
|---|---|---|---|---|---|---|---|---|---|---|---|---|---|---|
BANK LOANS: (continued) | ||||||||||||||
Financial: (continued) | ||||||||||||||
| 49,691,686 | USI Inc/NY — TL B 1L, 3.224%, (US0003M + 3.000%), 05/16/2024 | $ | 49,391,448 | 0.6 | ||||||||||
| 297,801,003 | 3.4 | |||||||||||||
Food Products: 0.1% | ||||||||||||||
| 11,573,680 | IRB Holding Corp 2020 Fourth Amendment Incremental Term Loan, 4.250%, (US0003M + 3.250%), 12/15/2027 | 11,588,147 | 0.1 | |||||||||||
Health Care: 1.0% | ||||||||||||||
| 9,925,000 | ADMI Corp. 2021 Term Loan B2, 3.875%, (US0001M + 3.375%), 12/23/2027 | 9,875,375 | 0.1 | |||||||||||
| 2,810,875 | Heartland Dental, LLC 2021 Incremental Term Loan, 4.104%, (US0001M + 4.000%), 04/30/2025 | 2,807,653 | 0.1 | |||||||||||
| 55,730,000 | Medline Borrower, LP USD Term Loan B, 3.750%, (US0001M + 3.250%), 10/23/2028 | 55,747,388 | 0.6 | |||||||||||
| 11,398,423 | PetVet Care Centers, LLC 2021 Term Loan B3, 4.250%, (US0001M + 3.500%), 02/14/2025 | 11,412,671 | 0.1 | |||||||||||
| 3,859,584 | Press Ganey Holdings, Inc. 2021 Term Loan B, 4.500%, (US0003M + 3.750%), 07/24/2026 | 3,870,843 | 0.1 | |||||||||||
| 83,713,930 | 1.0 | |||||||||||||
Industrial: 0.5% | ||||||||||||||
| EUR 9,388,624 | Filtration Group — TL B 1L, 3.500%, (US0003M + 3.000%), 03/29/2025 | 10,675,572 | 0.1 | |||||||||||
| 4,839,066 | Filtration Group Corp. 2018 1st Lien Term Loan, 3.090%, (US0003M + 3.000%), 03/31/2025 | 4,808,217 | 0.1 | |||||||||||
| 27,602,244 | TK Elevator US NewCo, Inc. TL B 1L, 4.000%, (US0001M + 3.500%), 07/30/2027 | 27,653,998 | 0.3 | |||||||||||
| 3,265,000 | Welbilt, Inc. 2018 Term Loan B 1L, 2.604%, (US0003M + 2.500%), 10/23/2025 | 3,258,878 | 0.0 | |||||||||||
| 46,396,665 | 0.5 | |||||||||||||
Industrial Equipment: 0.0% | ||||||||||||||
| 2,840,000 | Filtration Group Corporation 2021 Incremental Term Loan, 4.000%, (US0001M + 3.500%), 10/21/2028 | 2,840,710 | 0.0 | |||||||||||
Insurance: 0.7% | ||||||||||||||
| 8,636,547 | Alliant Holdings Intermediate, LLC Term Loan B, 3.354%, (US0001M + 3.250%), 05/09/2025 | 8,563,136 | 0.1 | |||||||||||
| VY® T. ROWE PRICE CAPITAL APPRECIATION PORTFOLIO | PORTFOLIO OF INVESTMENTS AS OF DECEMBER 31, 2021 (CONTINUED) |
| Principal Amount† | Value | Percentage of Net Assets | ||||||||||||
|---|---|---|---|---|---|---|---|---|---|---|---|---|---|---|
BANK LOANS: (continued) | ||||||||||||||
Insurance: (continued) | ||||||||||||||
| 26,376,263 | Alliant Holdings Intermediate, LLC 2021 Term Loan B4, 4.000%, (US0001M + 3.500%), 11/06/2027 | $ | 26,376,263 | 0.3 | ||||||||||
| 1,738,908 | Applied Systems, Inc. 2021 2nd Lien Term Loan, 6.250%, (US0003M + 5.500%), 09/19/2025 | 1,758,109 | 0.0 | |||||||||||
| 26,925,902 | USI, Inc. 2019 Incremental Term Loan B, 3.382%, (US0003M + 3.250%), 12/02/2026 | 26,787,907 | 0.3 | |||||||||||
| 63,485,415 | 0.7 | |||||||||||||
Technology: 2.4% | ||||||||||||||
| 16,229,120 | Applied Systems, Inc. 2017 1st Lien Term Loan, 3.750%, (US0003M + 3.250%), 09/19/2024 | 16,243,061 | 0.2 | |||||||||||
| 4,575,000 | Ascend Learning LLC TL B 1L, 6.250%, (US0001M + 3.500%), 11/18/2029 | 4,609,312 | 0.0 | |||||||||||
| 17,547,750 | Clarivate / Camelot Finance SA TL B 1L, 4.000%, (US0003M + 3.000%), 10/31/2026 | 17,543,363 | 0.2 | |||||||||||
| 23,908,147 | Emerald TopCo Inc Term Loan, 3.656%, (US0001M + 3.500%), 07/24/2026 | 23,827,457 | 0.3 | |||||||||||
| 2,678,183 | Project Boost Purchaser LLC, 4.000%, (US0001M + 3.500%), 05/30/2026 | 2,681,530 | 0.0 | |||||||||||
| 24,920,000 | RealPage, Inc. Term Loan B 1L, 3.750%, (US0001M + 3.250%), 04/24/2028 | 24,876,390 | 0.3 | |||||||||||
| 1,125,000 | RealPage, Inc. Term Loan B 2L, 7.250%, (US0003M + 3.250%), 02/17/2029 | 1,147,500 | 0.0 | |||||||||||
| 5,288,388 | Sophia L.P. TL B 1L, 4.000%, (US0001M + 3.500%), 10/07/2027 | 5,293,581 | 0.1 | |||||||||||
| 110,296,482 | UKG, Inc. TL 1L, 3.750%, (US0001M + 3.250%), 05/03/2026 | 109,882,871 | 1.2 | |||||||||||
| 4,820,000 | UKG, Inc. TL 2L, 5.750%, (US0001M + 6.750%), 05/03/2027 | 4,850,125 | 0.1 | |||||||||||
| 2,810,313 | Ultimate Software Group, Inc. — TL 1L, 3.854%, (US0003M + 3.750%), 05/04/2026 | 2,806,448 | 0.0 | |||||||||||
| 213,761,638 | 2.4 | |||||||||||||
| Total Bank Loans (Cost $1,010,662,732) | 1,017,331,242 | 11.5 | ||||||||||||
ASSET-BACKED SECURITIES: 0.2% | ||||||||||||||
Other Asset-Backed Securities: 0.2% | ||||||||||||||
| 7,866,513 | (8) | Domino’s Pizza Master Issuer LLC 2017-1A A23, 4.118%, 07/25/2047 | 8,265,166 | 0.1 | ||||||||||
| 7,362,300 | (8) | Domino’s Pizza Master Issuer LLC 2018-1A A2I, 4.116%, 07/25/2048 | 7,559,624 | 0.1 | ||||||||||
| Principal Amount† | Value | Percentage of Net Assets | ||||||||||||
|---|---|---|---|---|---|---|---|---|---|---|---|---|---|---|
ASSET-BACKED SECURITIES: (continued) | ||||||||||||||
Other Asset-Backed Securities: (continued) | ||||||||||||||
| 3,645,075 | (8) | Domino’s Pizza Master Issuer LLC 2019-1A A2, 3.668%, 10/25/2049 | $ | 3,850,297 | 0.0 | |||||||||
| Total Asset-Backed Securities (Cost $18,790,609) | 19,675,087 | 0.2 | ||||||||||||
| Total Long-Term Investments (Cost $6,441,614,444) | 8,217,707,088 | 93.0 | ||||||||||||
SHORT-TERM INVESTMENTS: 11.5% | ||||||||||||||
Commercial Paper: 0.3% | ||||||||||||||
| 325,000 | (9) | ANZ Bank, 0.120%, 01/25/2022 | 324,984 | 0.0 | ||||||||||
| 750,000 | (9) | ANZ Bank, 0.120%, 02/10/2022 | 749,927 | 0.0 | ||||||||||
| 250,000 | (9) | Atlantic Asset Securitization LLC, 0.270%, 04/12/2022 | 249,817 | 0.0 | ||||||||||
| 350,000 | (9) | Caisse des Dépôts et Consignations, 0.120%, 01/26/2022 | 349,981 | 0.0 | ||||||||||
| 400,000 | (9) | Collateralized Commercial Paper FLEX Co., LLC, 0.150%, 03/08/2022 | 399,842 | 0.0 | ||||||||||
| 600,000 | (9) | Collateralized Commercial Paper V Co., LLC, 0.360%, 06/08/2022 | 599,099 | 0.0 | ||||||||||
| 725,000 | (9) | Credit Suisse AG, 0.330%, 06/09/2022 | 724,001 | 0.0 | ||||||||||
| 750,000 | (9) | DBS Bank Ltd., 0.120%, 02/01/2022 | 749,931 | 0.1 | ||||||||||
| 575,000 | (9) | DBS Bank Ltd., 0.310%, 06/01/2022 | 574,308 | 0.0 | ||||||||||
| 725,000 | (9) | DNB Bank ASA, 0.140%, 03/16/2022 | 724,781 | 0.0 | ||||||||||
| 575,000 | (9) | DNB Bank ASA, 0.140%, 03/22/2022 | 574,805 | 0.0 | ||||||||||
| 425,000 | (9) | HSBC Bank PLC, 0.140%, 03/03/2022 | 424,829 | 0.0 | ||||||||||
| 725,000 | (9) | JPMorgan Securities LLC, 0.220%, 03/14/2022 | 724,668 | 0.0 | ||||||||||
| 600,000 | (9) | Liberty Street Funding LLC, 0.220%, 03/17/2022 | 599,713 | 0.0 | ||||||||||
| 400,000 | (9) | Lloyds Bank PLC, 0.150%, 03/14/2022 | 399,857 | 0.0 | ||||||||||
| 400,000 | (9) | Lloyds Bank PLC, 0.150%, 03/29/2022 | 399,798 | 0.0 | ||||||||||
| 747,000 | (9) | LMA-Americas LLC, 0.100%, 01/26/2022 | 746,940 | 0.0 | ||||||||||
| 475,000 | (9) | LMA-Americas LLC, 0.150%, 03/14/2022 | 474,786 | 0.0 | ||||||||||
| 400,000 | (9) | LMA-Americas LLC, 0.270%, 05/04/2022 | 399,622 | 0.0 | ||||||||||
| 700,000 | (9) | Matchpoint Finance PLC, 0.150%, 03/15/2022 | 699,679 | 0.0 | ||||||||||
| 625,000 | (9) | Mizuho Bank Ltd., 0.150%, 03/16/2022 | 624,694 | 0.0 | ||||||||||
| 725,000 | (9) | National Australia Bank Ltd., 0.120%, 02/18/2022 | 724,890 | 0.0 | ||||||||||
| 750,000 | (9) | Nieuw Amsterdam Receivables Corporation B.V., 0.100%, 01/07/2022 | 749,988 | 0.1 | ||||||||||
| VY® T. Rowe Price Capital Appreciation Portfolio | PORTFOLIO OF INVESTMENTS as of December 31, 2021 (continued) |
| Principal Amount† | Value | Percentage of Net Assets | ||||||||||
SHORT-TERM INVESTMENTS: (continued) | ||||||||||||
Commercial Paper: (continued) | ||||||||||||
| 750,000 | (9) | NRW.Bank, 0.130%, 03/21/2022 | $ | 749,822 | 0.0 | |||||||
| 750,000 | (9) | Old Line Funding LLC, 0.130%, 03/10/2022 | 749,691 | 0.0 | ||||||||
| 275,000 | (9) | Old Line Funding LLC, 0.250%, 04/27/2022 | 274,761 | 0.0 | ||||||||
| 250,000 | (9) | Santander UK PLC, 0.130%, 02/01/2022 | 249,981 | 0.0 | ||||||||
| 500,000 | (9) | Santander UK PLC, 0.300%, 05/03/2022 | 499,553 | 0.0 | ||||||||
| 700,000 | (9) | Sheffield Receivables Company LLC, 0.240%, 03/15/2022 | 699,679 | 0.0 | ||||||||
| 800,000 | (9) | Skandinaviska Enskilda Banken AB, 0.140%, 04/04/2022 | 799,574 | 0.1 | ||||||||
| 300,000 | (9) | Skandinaviska Enskilda Banken AB, 0.220%, 03/15/2022 | 299,900 | 0.0 | ||||||||
| 750,000 | (9) | Societe Generale, 0.170%, 03/31/2022 | 749,737 | 0.0 | ||||||||
| 550,000 | (9) | Starbird Funding Corp., 0.250%, 03/21/2022 | 549,715 | 0.0 | ||||||||
| 500,000 | (9) | Sumitomo Mitsui Trust Bank Ltd., 0.150%, 03/07/2022 | 499,859 | 0.0 | ||||||||
| 675,000 | (9) | Sumitomo Mitsui Trust Bank Ltd., 0.290%, 04/08/2022 | 674,590 | 0.0 | ||||||||
| 725,000 | (9) | Swedbank AB, 0.150%, 03/23/2022 | 724,754 | 0.0 | ||||||||
| 750,000 | (9) | Swedbank AB, 0.150%, 03/24/2022 | 749,739 | 0.0 | ||||||||
| 725,000 | (9) | Thunder Bay Funding LLC, 0.130%, 03/18/2022 | 724,677 | 0.0 | ||||||||
| 450,000 | (9) | Victory Receivables Corporation, 0.120%, 01/06/2022 | 449,994 | 0.0 | ||||||||
| 725,000 | (9) | Westpac Banking Corp., 0.130%, 03/25/2022 | 724,726 | 0.0 | ||||||||
| Total Commercial Paper (Cost $23,161,692) | 23,161,692 | 0.3 | ||||||||||
Floating Rate Notes: 0.1% | ||||||||||||
| 675,000 | (9) | Bank of Montreal, 0.120%, 01/05/2022 | 675,015 | 0.0 | ||||||||
| 750,000 | (9) | Bank of Nova Scotia, 0.130%, 02/28/2022 | 750,075 | 0.1 | ||||||||
| 725,000 | (9) | Barclays Bank PLC, 0.160%, 03/22/2022 | 724,982 | 0.0 | ||||||||
| 375,000 | (9) | Barclays Bank PLC, 0.160%, 03/24/2022 | 374,989 | 0.0 | ||||||||
| 600,000 | (9) | Canadian Imperial Bank of Commerce, 0.130%, 02/10/2022 | 600,043 | 0.0 | ||||||||
| 625,000 | (9) | Cooperatieve Rabobank U.A./New York, 0.200%, 06/21/2022 | 624,904 | 0.0 | ||||||||
| Principal Amount† | Value | Percentage of Net Assets | ||||||||||
SHORT-TERM INVESTMENTS: (continued) | ||||||||||||
Floating Rate Notes: (continued) | ||||||||||||
| 725,000 | (9) | DBS Bank Ltd., 0.140%, 03/16/2022 | $ | 724,962 | 0.0 | |||||||
| 375,000 | (9) | National Australia Bank Ltd., 0.130%, 03/10/2022 | 374,994 | 0.0 | ||||||||
| 500,000 | (9) | Sumitomo Mitsui Trust Bank Ltd., 0.150%, 03/14/2022 | 500,007 | 0.0 | ||||||||
| 500,000 | (9) | Sumitomo Mitsui Trust Bank Ltd., 0.150%, 03/16/2022 | 500,005 | 0.0 | ||||||||
| 675,000 | (9) | Sumitomo Mitsui Trust Bank Ltd., 0.150%, 03/22/2022 | 674,998 | 0.0 | ||||||||
| 300,000 | (9) | Sumitomo Mitsui Trust Bank Ltd., 0.160%, 03/08/2022 | 300,013 | 0.0 | ||||||||
| 400,000 | (9) | Sumitomo Mitsui Trust Bank Ltd., 0.270%, 06/24/2022 | 400,035 | 0.0 | ||||||||
| Total Floating Rate Notes (Cost $7,225,022) | 7,225,022 | 0.1 | ||||||||||
Repurchase Agreements: 1.4% | ||||||||||||
| 3,490,492 | (9) | Amherst Pierpoint Securities LLC, Repurchase Agreement dated 12/31/21, 0.06%, due 01/03/22 (Repurchase Amount $3,490,509, collateralized by various U.S. Government/U.S. Government Agency Obligations, 0.000%–7.250%, Market Value plus accrued interest $3,560,303, due 07/31/22–07/20/71) | 3,490,492 | 0.0 | ||||||||
| 13,262,246 | (9) | Bank of Nova Scotia, Repurchase Agreement dated 12/31/21, 0.06%, due 01/03/22 (Repurchase Amount $13,262,311, collateralized by various U.S. Government/U.S. Government Agency Obligations, 0.000%–7.000%, Market Value plus accrued interest $13,527,554, due 04/07/22–04/01/51) | 13,262,246 | 0.2 | ||||||||
| 4,492,422 | (9) | Bethesda Securities LLC, Repurchase Agreement dated 12/31/21, 0.09%, due 01/03/22 (Repurchase Amount $4,492,455, collateralized by various U.S. Government Agency Obligations, 2.000%–5.500%, Market Value plus accrued interest $4,582,270, due 01/01/25–12/01/51) | 4,492,422 | 0.1 | ||||||||
| VY® T. Rowe Price Capital Appreciation Portfolio | PORTFOLIO OF INVESTMENTS as of December 31, 2021 (continued) |
| Principal Amount† | Value | Percentage of Net Assets | ||||||||||
SHORT-TERM INVESTMENTS: (continued) | ||||||||||||
Repurchase Agreements: (continued) | ||||||||||||
| 29,022,261 | (9) | Cantor Fitzgerald Securities, Repurchase Agreement dated 12/31/21, 0.05%, due 01/03/22 (Repurchase Amount $29,022,380, collateralized by various U.S. Government/U.S. Government Agency Obligations, 0.000%–9.000%, Market Value plus accrued interest $29,602,706, due 02/01/22–07/20/71) | $ | 29,022,261 | 0.3 | |||||||
| 9,984,362 | (9) | CF Secured LLC, Repurchase Agreement dated 12/31/21, 0.05%, due 01/03/22 (Repurchase Amount $9,984,403, collateralized by various U.S. Government/U.S. Government Agency Obligations, 0.000%–5.500%, Market Value plus accrued interest $10,184,051, due 01/20/22–06/20/69) | 9,984,362 | 0.1 | ||||||||
| 8,755,341 | (9) | Citadel Securities LLC, Repurchase Agreement dated 12/31/21, 0.07%, due 01/03/22 (Repurchase Amount $8,755,391, collateralized by various U.S. Government Securities, 0.000%–7.250%, Market Value plus accrued interest $8,930,500, due 01/04/22–11/15/51) | 8,755,341 | 0.1 | ||||||||
| 3,236,297 | (9) | ED&F Man Capital Markets Inc., Repurchase Agreement dated 12/31/21, 0.06%, due 01/03/22 (Repurchase Amount $3,236,313, collateralized by various U.S. Government/U.S. Government Agency Obligations, 0.125%–5.500%, Market Value plus accrued interest $3,301,023, due 11/01/23–11/15/51) | 3,236,297 | 0.0 | ||||||||
| Principal Amount† | Value | Percentage of Net Assets | ||||||||||
SHORT-TERM INVESTMENTS: (continued) | ||||||||||||
Repurchase Agreements: (continued) | ||||||||||||
| 4,149,155 | (9) | Industrial & Comm. Bank of China, Repurchase Agreement dated 12/31/21, 0.05%, due 01/03/22 (Repurchase Amount $4,149,172, collateralized by various U.S. Government/U.S. Government Agency Obligations, 0.000%–9.000%, Market Value plus accrued interest $4,232,138, due 01/13/22–11/01/50) | $ | 4,149,155 | 0.0 | |||||||
| 13,069,235 | (9) | Mirae Asset Securities USA Inc., Repurchase Agreement dated 12/31/21, 0.06%, due 01/03/22 (Repurchase Amount $13,069,299, collateralized by various U.S. Government Agency Obligations, 0.550%–7.500%, Market Value plus accrued interest $13,330,686, due 01/01/23–10/20/71) | 13,069,235 | 0.2 | ||||||||
| 24,680,522 | (9) | State of Wisconsin Investment Board, Repurchase Agreement dated 12/31/21, 0.07%, due 01/03/22 (Repurchase Amount $24,680,664, collateralized by various U.S. Government Securities, 0.125%–3.875%, Market Value plus accrued interest $25,174,261, due 07/15/23–02/15/48) | 24,680,522 | 0.3 | ||||||||
| 5,895,126 | (9) | Stonex Financial Inc., Repurchase Agreement dated 12/31/21, 0.09%, due 01/03/22 (Repurchase Amount $5,895,170, collateralized by various U.S. Government/U.S. Government Agency Obligations, 0.000%–9.000%, Market Value plus accrued interest $6,013,030, due 01/13/22–11/20/71) | 5,895,126 | 0.1 | ||||||||
| Total Repurchase Agreements (Cost $120,037,459) | 120,037,459 | 1.4 | ||||||||||
Certificates of Deposit: 0.1% | ||||||||||||
| 325,000 | (9) | Bank of Montreal, 0.130%, 02/28/2022 | 324,990 | 0.0 | ||||||||
| 725,000 | (9) | Bank of Montreal, 0.220%, 03/21/2022 | 725,028 | 0.0 | ||||||||
| 500,000 | (9) | BNP Paribas, 0.130%, 03/03/2022 | 500,004 | 0.0 | ||||||||
| VY® T. Rowe Price Capital Appreciation Portfolio | PORTFOLIO OF INVESTMENTS as of December 31, 2021 (continued) |
| Principal Amount† | Value | Percentage of Net Assets | ||||||||||
SHORT-TERM INVESTMENTS: (continued) | ||||||||||||
Certificates of Deposit: (continued) | ||||||||||||
| 425,000 | (9) | Commonwealth Bank of Australia, 0.130%, 04/08/2022 | $ | 424,927 | 0.0 | |||||||
| 750,000 | (9) | Credit Agricole, 0.320%, 06/07/2022 | 750,362 | 0.0 | ||||||||
| 725,000 | (9) | Landesbank Baden-Wurttemberg, 0.160%, 03/21/2022 | 724,984 | 0.0 | ||||||||
| 700,000 | (9) | Lloyds Bank PLC, 0.130%, 02/22/2022 | 700,123 | 0.0 | ||||||||
| 375,000 | (9) | Mitsubishi UFJ Trust and Banking Corp., 0.130%, 01/26/2022 | 375,017 | 0.0 | ||||||||
| 275,000 | (9) | Mitsubishi UFJ Trust and Banking Corp., 0.150%, 03/02/2022 | 274,994 | 0.0 | ||||||||
| 475,000 | (9) | Mizuho Bank Ltd., 0.150%, 03/07/2022 | 474,981 | 0.0 | ||||||||
| 675,000 | (9) | Mizuho Bank Ltd., 0.150%, 03/14/2022 | 674,951 | 0.0 | ||||||||
| 725,000 | (9) | MUFG Bank LTD, 0.130%, 01/07/2022 | 725,024 | 0.0 | ||||||||
| 725,000 | (9) | Norinchukin Bank of New York, 0.110%, 01/27/2022 | 725,003 | 0.0 | ||||||||
| 800,000 | (9) | Norinchukin Bank of New York, 0.240%, 03/14/2022 | 800,099 | 0.1 | ||||||||
| 250,000 | (9) | Oversea-Chinese Banking Corp. Ltd., 0.140%, 02/24/2022 | 250,012 | 0.0 | ||||||||
| 725,000 | (9) | Oversea-Chinese Banking Corp. Ltd., 0.250%, 03/17/2022 | 725,099 | 0.0 | ||||||||
| 700,000 | (9) | Oversea-Chinese Banking Corp. Ltd., 0.260%, 03/24/2022 | 700,069 | 0.0 | ||||||||
| 440,000 | (9) | Svenska Handelsbanken AB, 0.110%, 02/10/2022 | 440,049 | 0.0 | ||||||||
| 525,000 | (9) | Toronto-Dominion Bank, 0.150%, 03/03/2022 | 525,059 | 0.0 | ||||||||
| 325,000 | (9) | Toronto-Dominion Bank, 0.280%, 05/10/2022 | 324,988 | 0.0 | ||||||||
| Total Certificates of Deposit (Cost $11,165,763) | 11,165,763 | 0.1 | ||||||||||
| Shares | Value | Percentage of Net Assets | ||||||||||
Mutual Funds: 9.6% | ||||||||||||
| 4,464,000 | (9),(10) | BlackRock Liquidity Funds, FedFund, Institutional Class, 0.030% | 4,464,000 | 0.0 | ||||||||
| 4,464,000 | (9),(10) | Goldman Sachs Financial Square Government Fund — Institutional Shares, 0.020% | 4,464,000 | 0.0 | ||||||||
| 4,464,000 | (9),(10) | Morgan Stanley Institutional Liquidity Funds — Government Portfolio (Institutional Share Class), 0.030% | 4,464,000 | 0.1 | ||||||||
| Shares | Value | Percentage of Net Assets | ||||||||||
Mutual Funds: (continued) | ||||||||||||
| 837,999,554 | (10) | T. Rowe Price Government Reserve Fund, 0.070% | $ | 837,999,554 | 9.5 | |||||||
| Total Mutual Funds (Cost $851,391,554) | 851,391,554 | 9.6 | ||||||||||
| Total Short-Term Investments (Cost $1,012,981,490) | 1,012,981,490 | 11.5 | ||||||||||
Total Investments in Securities (Cost $7,454,595,934) | $ | 9,230,688,578 | 104.5 | |||||||||
Liabilities in Excess of Other Assets | (393,465,926 | ) | (4.5 | ) | ||||||||
Net Assets | $ | 8,837,222,652 | 100.0 | |||||||||
| † | Unless otherwise indicated, principal amount is shown in USD. | |
| (1) | All or a portion of this security is pledged to cover open written call options at December 31, 2021. | |
| (2) | Non-income producing security. | |
| (3) | Security, or a portion of the security, is on loan. | |
| (4) | Restricted security as to resale, excluding Rule 144A securities. As of December 31, 2021, the Portfolio held restricted securities with a fair value of $51,287,674 or 0.6% of net assets. Please refer to the table below for additional details. | |
| (5) | For fair value measurement disclosure purposes, security is categorized as Level 3, whose value was determined using significant unobservable inputs. | |
| (6) | Preferred Stock may be called prior to convertible date. | |
| (7) | Variable rate security. Rate shown is the rate in effect as of December 31, 2021. | |
| (8) | Securities with purchases pursuant to Rule 144A or section 4(a)(2), under the Securities Act of 1933 and may not be resold subject to that rule except to qualified institutional buyers. | |
| (9) | All or a portion of the security represents securities purchased with cash collateral received for securities on loan. | |
| (10) | Rate shown is the 7-day yield as of December 31, 2021. |
| EUR | EU Euro |
| US0001M | 1-month LIBOR | |
| US0003M | 3-month LIBOR |
| VY® T. Rowe Price Capital Appreciation Portfolio | PORTFOLIO OF INVESTMENTS as of December 31, 2021 (continued) |
| Quoted Prices in Active Markets for Identical Investments (Level 1) | Significant Other Observable Inputs# (Level 2) | Significant Unobservable Inputs (Level 3) | Fair Value at December 31, 2021 | |||||||||||||||||
Asset Table | ||||||||||||||||||||
Investments, at fair value | ||||||||||||||||||||
| Common Stock | ||||||||||||||||||||
| Communication Services | $ | 584,001,641 | $ | — | $ | — | $ | 584,001,641 | ||||||||||||
| Consumer Discretionary | 923,532,083 | — | — | 923,532,083 | ||||||||||||||||
| Consumer Staples | 168,957,710 | — | — | 168,957,710 | ||||||||||||||||
| Financials | 831,349,979 | — | — | 831,349,979 | ||||||||||||||||
| Health Care | 1,447,101,376 | — | — | 1,447,101,376 | ||||||||||||||||
| Industrials | 629,880,004 | 13,383,466 | — | 643,263,470 | ||||||||||||||||
| Information Technology | 1,210,312,772 | — | — | 1,210,312,772 | ||||||||||||||||
| Utilities | 548,045,675 | — | — | 548,045,675 | ||||||||||||||||
| Total Common Stock | 6,343,181,240 | 13,383,466 | — | 6,356,564,706 | ||||||||||||||||
| Preferred Stock | 79,909,972 | — | 37,904,208 | 117,814,180 | ||||||||||||||||
| Corporate Bonds/Notes | — | 706,321,873 | — | 706,321,873 | ||||||||||||||||
| Bank Loans | — | 1,017,331,242 | — | 1,017,331,242 | ||||||||||||||||
| Asset-Backed Securities | — | 19,675,087 | — | 19,675,087 | ||||||||||||||||
| Short-Term Investments | 851,391,554 | 161,589,936 | — | 1,012,981,490 | ||||||||||||||||
| Total Investments, at fair value | $ | 7,274,482,766 | $ | 1,918,301,604 | $ | 37,904,208 | $ | 9,230,688,578 | ||||||||||||
Liabilities Table | ||||||||||||||||||||
Other Financial Instruments+ | ||||||||||||||||||||
| Written Options | $ | — | $ | (160,277,008 | ) | $ | — | $ | (160,277,008 | ) | ||||||||||
| Total Liabilities | $ | — | $ | (160,277,008 | ) | $ | — | $ | (160,277,008 | ) | ||||||||||
| ^ | See Note 2, “Significant Accounting Policies” in the Notes to Financial Statements for additional information. | |
| + | Other Financial Instruments may include open forward foreign currency contracts, futures, centrally cleared swaps, OTC swaps and written options. Forward foreign currency contracts, futures and centrally cleared swaps are fair valued at the unrealized appreciation (depreciation) on the instrument. OTC swaps and written options are valued at the fair value of the instrument. | |
| # | The earlier close of the foreign markets gives rise to the possibility that significant events, including broad market moves, may have occurred in the interim and may materially affect the value of those securities. To account for this, the Portfolio may frequently value many of its foreign equity securities using fair value prices based on third party vendor modeling tools to the extent available. Accordingly, a portion of the Portfolio’s investments are categorized as Level 2 investments. |
| Security | Acquisition Date | Acquisition Cost | Fair Value | ||||||||
| Aurora Innovation, Inc. Lockup Shares | 3/1/2019 | $ | 5,325,553 | $ | 13,383,466 | ||||||
| Waymo LLC., Series A-2 | 5/8/2020 | 35,484,706 | 37,904,208 | ||||||||
| $ | 40,810,259 | $ | 51,287,674 | ||||||||
| Description | Counterparty | Put/Call | Expiration Date | Exercise Price | Number of Contracts | Notional Amount | Premiums Received | Fair Value | ||||||||||||
| Alphabet, Inc. — Class A | Goldman Sachs & Co. | Call | 09/16/22 | USD 1,960.000 | 11 | USD 3,186,744 | $ | 202,857 | $ | (1,080,452 | ) | |||||||||
| Alphabet, Inc. — Class A | Goldman Sachs & Co. | Call | 09/16/22 | USD 1,960.000 | 11 | USD 3,186,744 | 264,995 | (1,080,452 | ) | |||||||||||
| Alphabet, Inc. — Class A | Goldman Sachs & Co. | Call | 09/16/22 | USD 1,980.000 | 11 | USD 3,186,744 | 255,626 | (1,060,210 | ) | |||||||||||
| Alphabet, Inc. — Class A | Goldman Sachs & Co. | Call | 09/16/22 | USD 1,980.000 | 11 | USD 3,186,744 | 195,805 | (1,060,210 | ) | |||||||||||
| Alphabet, Inc. — Class A | Goldman Sachs & Co. | Call | 09/16/22 | USD 2,000.000 | 11 | USD 3,186,744 | 243,231 | (1,039,968 | ) | |||||||||||
| Alphabet, Inc. — Class A | Goldman Sachs & Co. | Call | 09/16/22 | USD 2,000.000 | 11 | USD 3,186,744 | 188,429 | (1,039,968 | ) | |||||||||||
| Alphabet, Inc. — Class A | Goldman Sachs & Co. | Call | 09/16/22 | USD 2,100.000 | 11 | USD 3,186,744 | 154,801 | (940,591 | ) | |||||||||||
| Alphabet, Inc. — Class A | Goldman Sachs & Co. | Call | 09/16/22 | USD 2,100.000 | 11 | USD 3,186,744 | 205,990 | (940,591 | ) | |||||||||||
| Alphabet, Inc. — Class A | Susquehanna International Group LLP | Call | 09/16/22 | USD 2,450.000 | 5 | USD 1,448,520 | 133,735 | (281,194 | ) | |||||||||||
| Alphabet, Inc. — Class A | Susquehanna International Group LLP | Call | 09/16/22 | USD 2,500.000 | 5 | USD 1,448,520 | 123,235 | (262,251 | ) | |||||||||||
| Alphabet, Inc. — Class A | Susquehanna International Group LLP | Call | 09/16/22 | USD 2,550.000 | 5 | USD 1,448,520 | 113,610 | (243,794 | ) | |||||||||||
| Alphabet, Inc. — Class A | Susquehanna International Group LLP | Call | 09/16/22 | USD 2,600.000 | 5 | USD 1,448,520 | 104,610 | (226,215 | ) | |||||||||||
| Alphabet, Inc. — Class A | Goldman Sachs & Co. | Call | 01/20/23 | USD 3,200.000 | 20 | USD 5,794,080 | 361,940 | (415,983 | ) | |||||||||||
| VY® T. Rowe Price Capital Appreciation Portfolio | PORTFOLIO OF INVESTMENTS as of December 31, 2021 (continued) |
| Description | Counterparty | Put/Call | Expiration Date | Exercise Price | Number of Contracts | Notional Amount | Premiums Received | Fair Value | ||||||||||||
| Alphabet, Inc. — Class A | Goldman Sachs & Co. | Call | 01/20/23 | USD 3,300.000 | 20 | USD 5,794,080 | $ | 309,940 | $ | (350,455 | ) | |||||||||
| Alphabet, Inc. — Class A | Goldman Sachs & Co. | Call | 01/20/23 | USD 3,400.000 | 20 | USD 5,794,080 | 260,940 | (294,105 | ) | |||||||||||
| Alphabet, Inc. — Class A | Goldman Sachs & Co. | Call | 01/20/23 | USD 3,500.000 | 20 | USD 5,794,080 | 221,940 | (246,094 | ) | |||||||||||
| Alphabet, Inc. — Class C | Goldman Sachs & Co. | Call | 01/21/22 | USD 1,760.000 | 85 | USD 24,595,515 | 856,157 | (9,651,460 | ) | |||||||||||
| Alphabet, Inc. — Class C | Goldman Sachs & Co. | Call | 01/21/22 | USD 1,780.000 | 85 | USD 24,595,515 | 805,902 | �� | (9,481,509 | ) | ||||||||||
| Alphabet, Inc. — Class C | Goldman Sachs & Co. | Call | 01/21/22 | USD 1,800.000 | 85 | USD 24,595,515 | 759,898 | (9,311,558 | ) | |||||||||||
| Alphabet, Inc. — Class C | Goldman Sachs & Co. | Call | 06/17/22 | USD 1,980.000 | 11 | USD 3,182,949 | 177,977 | (1,033,748 | ) | |||||||||||
| Alphabet, Inc. — Class C | Goldman Sachs & Co. | Call | 06/17/22 | USD 1,980.000 | 11 | USD 3,182,949 | 233,307 | (1,033,748 | ) | |||||||||||
| Alphabet, Inc. — Class C | Goldman Sachs & Co. | Call | 06/17/22 | USD 2,000.000 | 11 | USD 3,182,949 | 223,887 | (1,012,749 | ) | |||||||||||
| Alphabet, Inc. — Class C | Goldman Sachs & Co. | Call | 06/17/22 | USD 2,000.000 | 11 | USD 3,182,949 | 169,481 | (1,012,749 | ) | |||||||||||
| Alphabet, Inc. — Class C | Goldman Sachs & Co. | Call | 06/17/22 | USD 2,100.000 | 11 | USD 3,182,949 | 137,570 | (909,332 | ) | |||||||||||
| Alphabet, Inc. — Class C | Goldman Sachs & Co. | Call | 06/17/22 | USD 2,100.000 | 11 | USD 3,182,949 | 182,976 | (909,332 | ) | |||||||||||
| Alphabet, Inc. — Class C | Susquehanna International Group LLP | Call | 06/17/22 | USD 2,550.000 | 7 | USD 2,025,513 | 154,672 | (306,535 | ) | |||||||||||
| Alphabet, Inc. — Class C | Susquehanna International Group LLP | Call | 06/17/22 | USD 2,600.000 | 8 | USD 2,314,872 | 161,544 | (320,371 | ) | |||||||||||
| Alphabet, Inc. — Class C | Susquehanna International Group LLP | Call | 06/17/22 | USD 2,650.000 | 8 | USD 2,314,872 | 147,120 | (291,458 | ) | |||||||||||
| Amazon.com, Inc. | Citigroup Global Markets | Call | 01/21/22 | USD 4,000.000 | 24 | USD 8,002,416 | 655,848 | (1,602 | ) | |||||||||||
| Amazon.com, Inc. | Citigroup Global Markets | Call | 01/21/22 | USD 4,100.000 | 24 | USD 8,002,416 | 604,008 | (937 | ) | |||||||||||
| Amazon.com, Inc. | Citigroup Global Markets | Call | 01/21/22 | USD 4,200.000 | 24 | USD 8,002,416 | 555,048 | (567 | ) | |||||||||||
| Amazon.com, Inc. | Citigroup Global Markets | Call | 01/21/22 | USD 4,300.000 | 23 | USD 7,668,982 | 490,061 | (347 | ) | |||||||||||
| Amazon.com, Inc. | Credit Suisse Securities (USA) LLC | Call | 01/21/22 | USD 3,800.000 | 12 | USD 4,001,208 | 397,375 | (2,732 | ) | |||||||||||
| Amazon.com, Inc. | Credit Suisse Securities (USA) LLC | Call | 01/21/22 | USD 3,800.000 | 12 | USD 4,001,208 | 498,318 | (2,732 | ) | |||||||||||
| Amazon.com, Inc. | Credit Suisse Securities (USA) LLC | Call | 01/21/22 | USD 3,800.000 | 14 | USD 4,668,076 | 483,582 | (3,187 | ) | |||||||||||
| Amazon.com, Inc. | Credit Suisse Securities (USA) LLC | Call | 01/21/22 | USD 3,900.000 | 14 | USD 4,668,076 | 446,600 | (1,683 | ) | |||||||||||
| Amazon.com, Inc. | Credit Suisse Securities (USA) LLC | Call | 01/21/22 | USD 3,900.000 | 12 | USD 4,001,208 | 363,328 | (1,443 | ) | |||||||||||
| Amazon.com, Inc. | Credit Suisse Securities (USA) LLC | Call | 01/21/22 | USD 3,900.000 | 12 | USD 4,001,208 | 460,058 | (1,443 | ) | |||||||||||
| Amazon.com, Inc. | Credit Suisse Securities (USA) LLC | Call | 01/21/22 | USD 4,000.000 | 12 | USD 4,001,208 | 332,230 | (801 | ) | |||||||||||
| Amazon.com, Inc. | Credit Suisse Securities (USA) LLC | Call | 01/21/22 | USD 4,000.000 | 12 | USD 4,001,208 | 428,471 | (801 | ) | |||||||||||
| Amazon.com, Inc. | Credit Suisse Securities (USA) LLC | Call | 01/21/22 | USD 4,000.000 | 15 | USD 5,001,510 | 442,314 | (1,001 | ) | |||||||||||
| Amazon.com, Inc. | RBC Capital Markets LLC | Call | 01/21/22 | USD 3,900.000 | 15 | USD 5,001,510 | 359,955 | (1,803 | ) | |||||||||||
| Amazon.com, Inc. | RBC Capital Markets LLC | Call | 01/21/22 | USD 4,000.000 | 15 | USD 5,001,510 | 326,955 | (1,001 | ) | |||||||||||
| Amazon.com, Inc. | RBC Capital Markets LLC | Call | 01/21/22 | USD 4,100.000 | 16 | USD 5,334,944 | 315,152 | (625 | ) | |||||||||||
| Amazon.com, Inc. | RBC Capital Markets LLC | Call | 01/21/22 | USD 4,200.000 | 15 | USD 5,001,510 | 267,405 | (354 | ) | |||||||||||
| Amazon.com, Inc. | RBC Capital Markets LLC | Call | 01/21/22 | USD 4,300.000 | 16 | USD 5,334,944 | 262,352 | (241 | ) | |||||||||||
| Amazon.com, Inc. | Citigroup Global Markets | Call | 01/20/23 | USD 4,500.000 | 11 | USD 3,667,774 | 314,360 | (106,051 | ) | |||||||||||
| Amazon.com, Inc. | Citigroup Global Markets | Call | 01/20/23 | USD 4,600.000 | 11 | USD 3,667,774 | 287,609 | (93,754 | ) | |||||||||||
| Amazon.com, Inc. | Citigroup Global Markets | Call | 01/20/23 | USD 4,700.000 | 11 | USD 3,667,774 | 263,240 | (82,574 | ) | |||||||||||
| Amazon.com, Inc. | Citigroup Global Markets | Call | 01/20/23 | USD 4,800.000 | 11 | USD 3,667,774 | 240,834 | (72,988 | ) | |||||||||||
| Amazon.com, Inc. | Citigroup Global Markets | Call | 01/20/23 | USD 4,900.000 | 11 | USD 3,667,774 | 220,353 | (64,578 | ) | |||||||||||
| Amazon.com, Inc. | Citigroup Global Markets | Call | 01/20/23 | USD 5,000.000 | 11 | USD 3,667,774 | 201,633 | (57,215 | ) | |||||||||||
| Amazon.com, Inc. | Citigroup Global Markets | Call | 01/20/23 | USD 5,100.000 | 11 | USD 3,667,774 | 184,617 | (50,797 | ) | |||||||||||
| Amazon.com, Inc. | Goldman Sachs & Co. | Call | 01/20/23 | USD 4,000.000 | 9 | USD 3,000,906 | 306,198 | (165,135 | ) | |||||||||||
| Amazon.com, Inc. | Goldman Sachs & Co. | Call | 01/20/23 | USD 4,100.000 | 10 | USD 3,334,340 | 305,438 | (161,748 | ) | |||||||||||
| Amazon.com, Inc. | Goldman Sachs & Co. | Call | 01/20/23 | USD 4,200.000 | 9 | USD 3,000,906 | 247,703 | (127,827 | ) | |||||||||||
| Amazon.com, Inc. | Goldman Sachs & Co. | Call | 01/20/23 | USD 4,300.000 | 9 | USD 3,000,906 | 223,212 | (112,197 | ) | |||||||||||
| Amazon.com, Inc. | Goldman Sachs & Co. | Call | 01/20/23 | USD 4,400.000 | 9 | USD 3,000,906 | 200,072 | (98,964 | ) | |||||||||||
| Amazon.com, Inc. | Goldman Sachs & Co. | Call | 01/20/23 | USD 4,500.000 | 10 | USD 3,334,340 | 199,590 | (96,410 | ) | |||||||||||
| American Electric Power Co., Inc. | JPMorgan Chase Bank N.A. | Call | 01/21/22 | USD 100.000 | 543 | USD 4,831,071 | 32,814 | (18 | ) | |||||||||||
| American Electric Power Co., Inc. | JPMorgan Chase Bank N.A. | Call | 01/21/22 | USD 90.000 | 127 | USD 1,129,919 | 43,876 | (9,309 | ) | |||||||||||
| American Electric Power Co., Inc. | JPMorgan Chase Bank N.A. | Call | 01/21/22 | USD 90.000 | 196 | USD 1,743,812 | 70,315 | (14,366 | ) | |||||||||||
| American Electric Power Co., Inc. | JPMorgan Chase Bank N.A. | Call | 01/21/22 | USD 90.000 | 1,134 | USD 10,089,198 | 412,810 | (83,119 | ) | |||||||||||
| American Electric Power Co., Inc. | JPMorgan Chase Bank N.A. | Call | 01/21/22 | USD 95.000 | 393 | USD 3,496,521 | 88,869 | (705 | ) | |||||||||||
| American Electric Power Co., Inc. | JPMorgan Chase Bank N.A. | Call | 01/21/22 | USD 95.000 | 254 | USD 2,259,838 | 53,162 | (456 | ) | |||||||||||
| American Electric Power Co., Inc. | JPMorgan Chase Bank N.A. | Call | 01/21/22 | USD 95.000 | 1,134 | USD 10,089,198 | 250,070 | (2,035 | ) | |||||||||||
| American Electric Power Co., Inc. | JPMorgan Chase Bank N.A. | Call | 01/21/22 | USD 97.500 | 543 | USD 4,831,071 | 53,040 | (120 | ) | |||||||||||
| Bank of America Corp. | Credit Suisse Securities (USA) LLC | Call | 01/21/22 | USD 35.000 | 4,692 | USD 20,874,708 | 734,767 | (4,470,433 | ) | |||||||||||
| Bank of America Corp. | Credit Suisse Securities (USA) LLC | Call | 01/21/22 | USD 40.000 | 815 | USD 3,625,935 | 278,412 | (378,466 | ) | |||||||||||
| Bank of America Corp. | Credit Suisse Securities (USA) LLC | Call | 01/21/22 | USD 45.000 | 815 | USD 3,625,935 | 153,081 | (67,429 | ) | |||||||||||
| Bank of America Corp. | RBC Capital Markets LLC | Call | 01/21/22 | USD 37.000 | 3,333 | USD 14,828,517 | 928,807 | (2,515,964 | ) | |||||||||||
| VY® T. Rowe Price Capital Appreciation Portfolio | PORTFOLIO OF INVESTMENTS as of December 31, 2021 (continued) |
| Description | Counterparty | Put/Call | Expiration Date | Exercise Price | Number of Contracts | Notional Amount | Premiums Received | Fair Value | ||||||||||||
| Bank of America Corp. | Credit Suisse Securities (USA) LLC | Call | 01/20/23 | USD 45.000 | 7,547 | USD 33,576,603 | $ | 2,430,134 | $ | (3,393,230 | ) | |||||||||
| Bank of America Corp. | Credit Suisse Securities (USA) LLC | Call | 01/20/23 | USD 50.000 | 1,865 | USD 8,297,385 | 474,158 | (480,368 | ) | |||||||||||
| Bank of America Corp. | JPMorgan Chase Bank N.A. | Call | 01/20/23 | USD 45.000 | 4,280 | USD 19,041,720 | 1,776,286 | (1,924,344 | ) | |||||||||||
| Bank of America Corp. | JPMorgan Chase Bank N.A. | Call | 01/20/23 | USD 50.000 | 2,117 | USD 9,418,533 | 745,184 | (545,275 | ) | |||||||||||
| Cisco Systems, Inc. | JPMorgan Chase Bank N.A. | Call | 01/21/22 | USD 45.000 | 445 | USD 2,803,447 | 203,365 | (817,465 | ) | |||||||||||
| Cisco Systems, Inc. | JPMorgan Chase Bank N.A. | Call | 01/21/22 | USD 45.000 | 835 | USD 5,260,400 | 389,945 | (1,533,895 | ) | |||||||||||
| Cisco Systems, Inc. | JPMorgan Chase Bank N.A. | Call | 01/21/22 | USD 45.000 | 448 | USD 2,822,346 | 191,296 | (822,976 | ) | |||||||||||
| Cisco Systems, Inc. | JPMorgan Chase Bank N.A. | Call | 01/21/22 | USD 47.500 | 834 | USD 5,254,100 | 297,738 | (1,323,558 | ) | |||||||||||
| Cisco Systems, Inc. | JPMorgan Chase Bank N.A. | Call | 01/21/22 | USD 47.500 | 445 | USD 2,803,447 | 154,415 | (706,215 | ) | |||||||||||
| Cisco Systems, Inc. | JPMorgan Chase Bank N.A. | Call | 01/21/22 | USD 47.500 | 448 | USD 2,822,346 | 146,496 | (710,976 | ) | |||||||||||
| Cisco Systems, Inc. | JPMorgan Chase Bank N.A. | Call | 01/21/22 | USD 50.000 | 448 | USD 2,822,346 | 108,416 | (598,976 | ) | |||||||||||
| Cisco Systems, Inc. | JPMorgan Chase Bank N.A. | Call | 01/21/22 | USD 50.000 | 445 | USD 2,803,447 | 116,590 | (594,965 | ) | |||||||||||
| Cisco Systems, Inc. | JPMorgan Chase Bank N.A. | Call | 01/21/22 | USD 50.000 | 834 | USD 5,254,100 | 222,678 | (1,115,058 | ) | |||||||||||
| CME Group Inc. | JPMorgan Chase Bank N.A. | Call | 01/21/22 | USD 220.000 | 333 | USD 7,607,718 | 365,757 | (354,089 | ) | |||||||||||
| CME Group Inc. | JPMorgan Chase Bank N.A. | Call | 01/21/22 | USD 230.000 | 333 | USD 7,607,718 | 282,437 | (122,395 | ) | |||||||||||
| Danaher Corporation | Credit Suisse Securities (USA) LLC | Call | 01/21/22 | USD 270.000 | 69 | USD 2,270,169 | 111,870 | (407,838 | ) | |||||||||||
| Danaher Corporation | Credit Suisse Securities (USA) LLC | Call | 01/21/22 | USD 280.000 | 69 | USD 2,270,169 | 91,087 | (339,455 | ) | |||||||||||
| Danaher Corporation | Credit Suisse Securities (USA) LLC | Call | 01/21/22 | USD 280.000 | 108 | USD 3,553,308 | 136,026 | (531,322 | ) | |||||||||||
| Danaher Corporation | Credit Suisse Securities (USA) LLC | Call | 01/21/22 | USD 290.000 | 108 | USD 3,553,308 | 102,719 | (425,405 | ) | |||||||||||
| Danaher Corporation | JPMorgan Chase Bank N.A. | Call | 01/21/22 | USD 300.000 | 377 | USD 12,403,677 | 373,309 | (1,123,853 | ) | |||||||||||
| Danaher Corporation | JPMorgan Chase Bank N.A. | Call | 01/21/22 | USD 300.000 | 392 | USD 12,897,192 | 447,503 | (1,168,569 | ) | |||||||||||
| Exelon Corporation | Citigroup Global Markets | Call | 01/21/22 | USD 50.000 | 543 | USD 3,136,368 | 42,365 | (423,116 | ) | |||||||||||
| Fiserv, Inc. | Goldman Sachs & Co. | Call | 01/21/22 | USD 130.000 | 217 | USD 2,252,243 | 110,733 | (127 | ) | |||||||||||
| Fiserv, Inc. | Goldman Sachs & Co. | Call | 01/21/22 | USD 135.000 | 217 | USD 2,252,243 | 81,269 | (59 | ) | |||||||||||
| FleetCor Technologies, Inc. | JPMorgan Chase Bank N.A. | Call | 01/21/22 | USD 300.000 | 81 | USD 1,813,104 | 161,757 | (19 | ) | |||||||||||
| FleetCor Technologies, Inc. | JPMorgan Chase Bank N.A. | Call | 01/21/22 | USD 310.000 | 54 | USD 1,208,736 | 86,238 | (6 | ) | |||||||||||
| General Electric Co. | JPMorgan Chase Bank N.A. | Call | 01/21/22 | USD 12.000 | 2,769 | USD 425,080 | 422,909 | (70,196 | ) | |||||||||||
| General Electric Co. | JPMorgan Chase Bank N.A. | Call | 01/21/22 | USD 12.000 | 2,769 | USD 425,080 | 449,741 | (70,196 | ) | |||||||||||
| General Electric Co. | JPMorgan Chase Bank N.A. | Call | 01/21/22 | USD 15.000 | 2,769 | USD 425,080 | 232,679 | (566 | ) | |||||||||||
| General Electric Co. | JPMorgan Chase Bank N.A. | Call | 01/21/22 | USD 15.000 | 2,769 | USD 425,080 | 230,325 | (566 | ) | |||||||||||
| General Electric Co. | Susquehanna International Group LLP | Call | 01/21/22 | USD 15.000 | 11,110 | USD 1,705,538 | 1,210,990 | (2,272 | ) | |||||||||||
| Hilton Worldwide Holdings, Inc. | Citigroup Global Markets | Call | 01/21/22 | USD 125.000 | 83 | USD 1,294,717 | 83,253 | (258,473 | ) | |||||||||||
| Hilton Worldwide Holdings, Inc. | Citigroup Global Markets | Call | 01/21/22 | USD 125.000 | 67 | USD 1,045,133 | 65,769 | (208,647 | ) | |||||||||||
| Hilton Worldwide Holdings, Inc. | Citigroup Global Markets | Call | 01/21/22 | USD 125.000 | 139 | USD 2,168,261 | 142,855 | (432,865 | ) | |||||||||||
| Hilton Worldwide Holdings, Inc. | Citigroup Global Markets | Call | 01/21/22 | USD 130.000 | 83 | USD 1,294,717 | 69,659 | (217,788 | ) | |||||||||||
| Hilton Worldwide Holdings, Inc. | Citigroup Global Markets | Call | 01/21/22 | USD 130.000 | 139 | USD 2,168,261 | 120,186 | (364,730 | ) | |||||||||||
| Hilton Worldwide Holdings, Inc. | Citigroup Global Markets | Call | 01/21/22 | USD 130.000 | 67 | USD 1,045,133 | 55,074 | (175,805 | ) | |||||||||||
| Hilton Worldwide Holdings, Inc. | Citigroup Global Markets | Call | 01/21/22 | USD 130.000 | 220 | USD 3,431,780 | 325,833 | (577,270 | ) | |||||||||||
| Hilton Worldwide Holdings, Inc. | Citigroup Global Markets | Call | 01/21/22 | USD 135.000 | 220 | USD 3,431,780 | 288,136 | (471,008 | ) | |||||||||||
| Hilton Worldwide Holdings, Inc. | Goldman Sachs & Co. | Call | 01/21/22 | USD 135.000 | 652 | USD 10,170,548 | 914,697 | (1,395,896 | ) | |||||||||||
| Hilton Worldwide Holdings, Inc. | Goldman Sachs & Co. | Call | 01/21/22 | USD 140.000 | 652 | USD 10,170,548 | 787,818 | (1,089,476 | ) | |||||||||||
| Intercontinental Exchange, Inc. | JPMorgan Chase Bank N.A. | Call | 01/21/22 | USD 125.000 | 271 | USD 3,706,467 | 86,015 | (324,244 | ) | |||||||||||
| Intercontinental Exchange, Inc. | JPMorgan Chase Bank N.A. | Call | 01/21/22 | USD 130.000 | 278 | USD 3,802,206 | 169,347 | (202,347 | ) | |||||||||||
| Intercontinental Exchange, Inc. | JPMorgan Chase Bank N.A. | Call | 01/21/22 | USD 130.000 | 271 | USD 3,706,467 | 54,327 | (197,252 | ) | |||||||||||
| Intercontinental Exchange, Inc. | JPMorgan Chase Bank N.A. | Call | 01/21/22 | USD 135.000 | 278 | USD 3,802,206 | 126,726 | (88,831 | ) | |||||||||||
| Lockheed Martin Corporation | JPMorgan Chase Bank N.A. | Call | 01/21/22 | USD 340.000 | 154 | USD 5,473,314 | 483,098 | (268,317 | ) | |||||||||||
| Lockheed Martin Corporation | JPMorgan Chase Bank N.A. | Call | 01/21/22 | USD 360.000 | 154 | USD 5,473,314 | 352,198 | (47,383 | ) | |||||||||||
| Lockheed Martin Corporation | JPMorgan Chase Bank N.A. | Call | 01/21/22 | USD 375.000 | 155 | USD 5,508,855 | 275,435 | (7,573 | ) | |||||||||||
| Marriott International, Inc. — Class A | Credit Suisse Securities (USA) LLC | Call | 01/21/22 | USD 145.000 | 152 | USD 2,511,648 | 193,674 | (314,004 | ) | |||||||||||
| Marriott International, Inc. — Class A | Credit Suisse Securities (USA) LLC | Call | 01/21/22 | USD 145.000 | 260 | USD 4,296,240 | 319,628 | (537,112 | ) | |||||||||||
| Marriott International, Inc. — Class A | Credit Suisse Securities (USA) LLC | Call | 01/21/22 | USD 145.000 | 32 | USD 528,768 | 38,016 | (66,106 | ) | |||||||||||
| Marriott International, Inc. — Class A | Credit Suisse Securities (USA) LLC | Call | 01/21/22 | USD 150.000 | 260 | USD 4,296,240 | 280,459 | (415,164 | ) | |||||||||||
| Marriott International, Inc. — Class A | Credit Suisse Securities (USA) LLC | Call | 01/21/22 | USD 150.000 | 152 | USD 2,511,648 | 170,169 | (242,711 | ) | |||||||||||
| Marriott International, Inc. — Class A | Credit Suisse Securities (USA) LLC | Call | 01/21/22 | USD 150.000 | 32 | USD 528,768 | 33,547 | (51,097 | ) | |||||||||||
| Marriott International, Inc. — Class A | Credit Suisse Securities (USA) LLC | Call | 01/21/22 | USD 155.000 | 217 | USD 3,585,708 | 246,323 | (250,128 | ) | |||||||||||
| Marriott International, Inc. — Class A | Credit Suisse Securities (USA) LLC | Call | 01/21/22 | USD 160.000 | 217 | USD 3,585,708 | 207,482 | (163,705 | ) | |||||||||||
| Marriott International, Inc. — Class A | Credit Suisse Securities (USA) LLC | Call | 01/21/22 | USD 165.000 | 165 | USD 2,726,460 | 279,442 | (71,230 | ) | |||||||||||
| VY® T. Rowe Price Capital Appreciation Portfolio | PORTFOLIO OF INVESTMENTS as of December 31, 2021 (continued) |
| Description | Counterparty | Put/Call | Expiration Date | Exercise Price | Number of Contracts | Notional Amount | Premiums Received | Fair Value | ||||||||||||
| Marriott International, Inc. — Class A | Credit Suisse Securities (USA) LLC | Call | 01/21/22 | USD 170.000 | 165 | USD 2,726,460 | $ | 252,605 | $ | (35,124 | ) | |||||||||
| McDonald’s Corporation | Citigroup Global Markets | Call | 01/21/22 | USD 230.000 | 137 | USD 3,672,559 | 144,809 | (523,064 | ) | |||||||||||
| McDonald’s Corporation | RBC Capital Markets LLC | Call | 01/21/22 | USD 220.000 | 111 | USD 2,975,577 | 153,957 | (534,285 | ) | |||||||||||
| McDonald’s Corporation | RBC Capital Markets LLC | Call | 01/21/22 | USD 230.000 | 112 | USD 3,002,384 | 114,464 | (427,615 | ) | |||||||||||
| McDonald’s Corporation | Goldman Sachs & Co. | Call | 01/20/23 | USD 260.000 | 139 | USD 3,726,173 | 180,079 | (353,786 | ) | |||||||||||
| McDonald’s Corporation | Goldman Sachs & Co. | Call | 01/20/23 | USD 260.000 | 107 | USD 2,868,349 | 147,339 | (272,339 | ) | |||||||||||
| McDonald’s Corporation | Goldman Sachs & Co. | Call | 01/20/23 | USD 270.000 | 107 | USD 2,868,349 | 108,819 | (213,176 | ) | |||||||||||
| McDonald’s Corporation | Goldman Sachs & Co. | Call | 01/20/23 | USD 270.000 | 139 | USD 3,726,173 | 137,465 | (276,929 | ) | |||||||||||
| Medtronic PLC | Credit Suisse Securities (USA) LLC | Call | 01/21/22 | USD 115.000 | 224 | �� | USD 2,317,280 | 271,488 | (782 | ) | ||||||||||
| Medtronic PLC | Credit Suisse Securities (USA) LLC | Call | 01/21/22 | USD 125.000 | 224 | USD 2,317,280 | 167,328 | (46 | ) | |||||||||||
| Medtronic PLC | Credit Suisse Securities (USA) LLC | Call | 01/21/22 | USD 130.000 | 224 | USD 2,317,280 | 124,768 | (15 | ) | |||||||||||
| Meta Platforms Inc. | JPMorgan Chase Bank N.A. | Call | 01/21/22 | USD 340.000 | 197 | USD 6,626,095 | 507,687 | (145,704 | ) | |||||||||||
| Meta Platforms Inc. | JPMorgan Chase Bank N.A. | Call | 01/21/22 | USD 345.000 | 197 | USD 6,626,095 | 475,808 | (107,080 | ) | |||||||||||
| Meta Platforms Inc. | JPMorgan Chase Bank N.A. | Call | 01/21/22 | USD 380.000 | 94 | USD 3,161,690 | 182,268 | (5,192 | ) | |||||||||||
| Meta Platforms Inc. | JPMorgan Chase Bank N.A. | Call | 01/21/22 | USD 400.000 | 616 | USD 20,719,160 | 766,513 | (10,979 | ) | |||||||||||
| Meta Platforms Inc. | JPMorgan Chase Bank N.A. | Call | 01/21/22 | USD 400.000 | 898 | USD 30,204,230 | 1,933,125 | (16,005 | ) | |||||||||||
| Meta Platforms Inc. | JPMorgan Chase Bank N.A. | Call | 09/16/22 | USD 345.000 | 108 | USD 3,632,580 | 420,530 | (367,910 | ) | |||||||||||
| Meta Platforms Inc. | JPMorgan Chase Bank N.A. | Call | 09/16/22 | USD 360.000 | 108 | USD 3,632,580 | 361,867 | (302,549 | ) | |||||||||||
| Microsoft Corp. | Bank of America N.A. | Call | 01/21/22 | USD 270.000 | 163 | USD 5,482,016 | 218,876 | (1,090,174 | ) | |||||||||||
| Microsoft Corp. | Bank of America N.A. | Call | 01/21/22 | USD 275.000 | 163 | USD 5,482,016 | 191,336 | (1,009,337 | ) | |||||||||||
| Microsoft Corp. | Bank of America N.A. | Call | 01/21/22 | USD 280.000 | 163 | USD 5,482,016 | 166,296 | (928,651 | ) | |||||||||||
| Microsoft Corp. | Citigroup Global Markets | Call | 01/21/22 | USD 280.000 | 1,167 | USD 39,248,544 | 2,394,684 | (6,648,683 | ) | |||||||||||
| Microsoft Corp. | Susquehanna International Group LLP | Call | 01/21/22 | USD 250.000 | 367 | USD 12,342,944 | 479,669 | (3,185,294 | ) | |||||||||||
| Microsoft Corp. | Susquehanna International Group LLP | Call | 01/21/22 | USD 255.000 | 367 | USD 12,342,944 | 431,959 | (3,002,347 | ) | |||||||||||
| Microsoft Corp. | Susquehanna International Group LLP | Call | 01/21/22 | USD 260.000 | 367 | USD 12,342,944 | 387,919 | (2,819,598 | ) | |||||||||||
| Microsoft Corp. | Susquehanna International Group LLP | Call | 01/21/22 | USD 265.000 | 281 | USD 9,450,592 | 416,442 | (2,019,070 | ) | |||||||||||
| Microsoft Corp. | Susquehanna International Group LLP | Call | 01/21/22 | USD 270.000 | 280 | USD 9,416,960 | 371,560 | (1,872,692 | ) | |||||||||||
| Microsoft Corp. | Susquehanna International Group LLP | Call | 01/21/22 | USD 275.000 | 280 | USD 9,416,960 | 340,760 | (1,733,830 | ) | |||||||||||
| Microsoft Corp. | Citigroup Global Markets | Call | 01/20/23 | USD 330.000 | 108 | USD 3,632,256 | 191,984 | (454,521 | ) | |||||||||||
| Microsoft Corp. | Citigroup Global Markets | Call | 01/20/23 | USD 330.000 | 126 | USD 4,237,632 | 186,181 | (530,274 | ) | |||||||||||
| Microsoft Corp. | Citigroup Global Markets | Call | 01/20/23 | USD 330.000 | 126 | USD 4,237,632 | 185,100 | (530,274 | ) | |||||||||||
| Microsoft Corp. | Citigroup Global Markets | Call | 01/20/23 | USD 340.000 | 108 | USD 3,632,256 | 162,832 | (399,002 | ) | |||||||||||
| Microsoft Corp. | Citigroup Global Markets | Call | 01/20/23 | USD 340.000 | 126 | USD 4,237,632 | 157,080 | (465,502 | ) | |||||||||||
| Microsoft Corp. | Citigroup Global Markets | Call | 01/20/23 | USD 340.000 | 119 | USD 4,002,208 | 241,622 | (439,641 | ) | |||||||||||
| Microsoft Corp. | Citigroup Global Markets | Call | 01/20/23 | USD 340.000 | 126 | USD 4,237,632 | 156,440 | (465,502 | ) | |||||||||||
| Microsoft Corp. | Citigroup Global Markets | Call | 01/20/23 | USD 340.000 | 267 | USD 8,979,744 | 540,843 | (986,422 | ) | |||||||||||
| Microsoft Corp. | Citigroup Global Markets | Call | 01/20/23 | USD 350.000 | 267 | USD 8,979,744 | 460,113 | (860,977 | ) | |||||||||||
| Microsoft Corp. | Citigroup Global Markets | Call | 01/20/23 | USD 350.000 | 126 | USD 4,237,632 | 131,560 | (406,304 | ) | |||||||||||
| Microsoft Corp. | Citigroup Global Markets | Call | 01/20/23 | USD 350.000 | 119 | USD 4,002,208 | 207,035 | (383,731 | ) | |||||||||||
| Microsoft Corp. | Citigroup Global Markets | Call | 01/20/23 | USD 350.000 | 126 | USD 4,237,632 | 132,978 | (406,304 | ) | |||||||||||
| Microsoft Corp. | Citigroup Global Markets | Call | 01/20/23 | USD 350.000 | 108 | USD 3,632,256 | 137,458 | (348,260 | ) | |||||||||||
| Microsoft Corp. | Citigroup Global Markets | Call | 01/20/23 | USD 360.000 | 119 | USD 4,002,208 | 176,257 | (333,088 | ) | |||||||||||
| Microsoft Corp. | Citigroup Global Markets | Call | 01/20/23 | USD 360.000 | 267 | USD 8,979,744 | 389,903 | (747,349 | ) | |||||||||||
| Microsoft Corp. | Citigroup Global Markets | Call | 01/20/23 | USD 365.000 | 264 | USD 8,878,848 | 351,271 | (689,532 | ) | |||||||||||
| Microsoft Corp. | JPMorgan Chase Bank N.A. | Call | 01/20/23 | USD 350.000 | 387 | USD 13,015,584 | 590,949 | (1,247,933 | ) | |||||||||||
| Microsoft Corp. | JPMorgan Chase Bank N.A. | Call | 01/20/23 | USD 355.000 | 388 | USD 13,049,216 | 538,156 | (1,168,072 | ) | |||||||||||
| Microsoft Corp. | JPMorgan Chase Bank N.A. | Call | 01/20/23 | USD 360.000 | 387 | USD 13,015,584 | 486,459 | (1,083,236 | ) | |||||||||||
| Microsoft Corp. | Susquehanna International Group LLP | Call | 01/20/23 | USD 300.000 | 556 | USD 18,699,392 | 1,015,812 | (3,341,744 | ) | |||||||||||
| Microsoft Corp. | Susquehanna International Group LLP | Call | 01/20/23 | USD 300.000 | 555 | USD 18,665,760 | 1,044,510 | (3,335,733 | ) | |||||||||||
| Microsoft Corp. | Susquehanna International Group LLP | Call | 01/20/23 | USD 320.000 | 192 | USD 6,457,344 | 366,591 | (915,069 | ) | |||||||||||
| Microsoft Corp. | Susquehanna International Group LLP | Call | 01/20/23 | USD 320.000 | 192 | USD 6,457,344 | 341,299 | (915,069 | ) | |||||||||||
| Microsoft Corp. | Susquehanna International Group LLP | Call | 01/20/23 | USD 330.000 | 192 | USD 6,457,344 | 290,433 | (808,037 | ) | |||||||||||
| Microsoft Corp. | Susquehanna International Group LLP | Call | 01/20/23 | USD 330.000 | 192 | USD 6,457,344 | 310,840 | (808,037 | ) | |||||||||||
| Microsoft Corp. | Susquehanna International Group LLP | Call | 01/20/23 | USD 340.000 | 192 | USD 6,457,344 | 262,769 | (709,337 | ) | |||||||||||
| Microsoft Corp. | Susquehanna International Group LLP | Call | 01/20/23 | USD 340.000 | 192 | USD 6,457,344 | 247,482 | (709,337 | ) | |||||||||||
| Microsoft Corp. | Susquehanna International Group LLP | Call | 01/20/23 | USD 350.000 | 192 | USD 6,457,344 | 208,136 | (619,129 | ) | |||||||||||
| Microsoft Corp. | Susquehanna International Group LLP | Call | 01/20/23 | USD 350.000 | 192 | USD 6,457,344 | 222,390 | (619,129 | ) | |||||||||||
| Northrop Grumman Corporation | Credit Suisse Securities (USA) LLC | Call | 01/21/22 | USD 315.000 | 94 | USD 3,638,458 | 203,698 | (678,100 | ) | |||||||||||
| Northrop Grumman Corporation | Credit Suisse Securities (USA) LLC | Call | 01/21/22 | USD 315.000 | 83 | USD 3,212,681 | 170,731 | (598,748 | ) | |||||||||||
| Northrop Grumman Corporation | Credit Suisse Securities (USA) LLC | Call | 01/21/22 | USD 325.000 | 94 | USD 3,638,458 | 170,798 | (584,492 | ) | |||||||||||
| Northrop Grumman Corporation | Credit Suisse Securities (USA) LLC | Call | 01/21/22 | USD 325.000 | 84 | USD 3,251,388 | 147,588 | (522,312 | ) | |||||||||||
| NXP Semiconductors NV — NXPI — US | JPMorgan Chase Bank N.A. | Call | 01/21/22 | USD 195.000 | 139 | USD 3,166,142 | 245,082 | (461,126 | ) | |||||||||||
| VY® T. Rowe Price Capital Appreciation Portfolio | PORTFOLIO OF INVESTMENTS as of December 31, 2021 (continued) |
| Description | Counterparty | Put/Call | Expiration Date | Exercise Price | Number of Contracts | Notional Amount | Premiums Received | Fair Value | ||||||||||||
| NXP Semiconductors NV — NXPI — US | JPMorgan Chase Bank N.A. | Call | 01/21/22 | USD 195.000 | 138 | USD 3,143,364 | $ | 267,382 | $ | (457,809 | ) | |||||||||
| NXP Semiconductors NV — NXPI — US | JPMorgan Chase Bank N.A. | Call | 01/21/22 | USD 200.000 | 138 | USD 3,143,364 | 241,410 | (391,862 | ) | |||||||||||
| NXP Semiconductors NV — NXPI — US | JPMorgan Chase Bank N.A. | Call | 01/21/22 | USD 200.000 | 139 | USD 3,166,142 | 228,790 | (394,702 | ) | |||||||||||
| NXP Semiconductors NV — NXPI — US | JPMorgan Chase Bank N.A. | Call | 01/21/22 | USD 210.000 | 139 | USD 3,166,142 | 194,689 | (267,906 | ) | |||||||||||
| NXP Semiconductors NV — NXPI — US | JPMorgan Chase Bank N.A. | Call | 01/21/22 | USD 210.000 | 138 | USD 3,143,364 | 206,029 | (265,979 | ) | |||||||||||
| PepsiCo, Inc. | Susquehanna International Group LLP | Call | 01/21/22 | USD 145.000 | 246 | USD 4,273,266 | 210,822 | (712,046 | ) | |||||||||||
| PepsiCo, Inc. | Susquehanna International Group LLP | Call | 01/21/22 | USD 145.000 | 223 | USD 3,873,733 | 203,376 | (645,472 | ) | |||||||||||
| PepsiCo, Inc. | Susquehanna International Group LLP | Call | 01/21/22 | USD 155.000 | 223 | USD 3,873,733 | 120,866 | (424,295 | ) | |||||||||||
| PepsiCo, Inc. | Susquehanna International Group LLP | Call | 01/21/22 | USD 155.000 | 246 | USD 4,273,266 | 123,492 | (468,056 | ) | |||||||||||
| PNC Financial Services Group, Inc. | Citigroup Global Markets | Call | 01/21/22 | USD 175.000 | 222 | USD 4,451,544 | 264,850 | (573,732 | ) | |||||||||||
| PNC Financial Services Group, Inc. | Citigroup Global Markets | Call | 01/21/22 | USD 180.000 | 233 | USD 4,672,116 | 306,705 | (489,949 | ) | |||||||||||
| PNC Financial Services Group, Inc. | Citigroup Global Markets | Call | 01/21/22 | USD 180.000 | 222 | USD 4,451,544 | 226,393 | (466,818 | ) | |||||||||||
| PNC Financial Services Group, Inc. | Citigroup Global Markets | Call | 01/21/22 | USD 185.000 | 222 | USD 4,451,544 | 193,484 | (362,664 | ) | |||||||||||
| PNC Financial Services Group, Inc. | Citigroup Global Markets | Call | 01/21/22 | USD 185.000 | 233 | USD 4,672,116 | 264,933 | (380,634 | ) | |||||||||||
| PNC Financial Services Group, Inc. | Citigroup Global Markets | Call | 01/21/22 | USD 190.000 | 233 | USD 4,672,116 | 227,879 | (276,477 | ) | |||||||||||
| PNC Financial Services Group, Inc. | Citigroup Global Markets | Call | 01/20/23 | USD 220.000 | 129 | USD 2,586,708 | 167,292 | (135,451 | ) | |||||||||||
| PNC Financial Services Group, Inc. | Citigroup Global Markets | Call | 01/20/23 | USD 220.000 | 44 | USD 882,288 | 56,782 | (46,200 | ) | |||||||||||
| PNC Financial Services Group, Inc. | Citigroup Global Markets | Call | 01/20/23 | USD 220.000 | 149 | USD 2,987,748 | 193,697 | (156,452 | ) | |||||||||||
| PNC Financial Services Group, Inc. | Citigroup Global Markets | Call | 01/20/23 | USD 220.000 | 212 | USD 4,251,024 | 282,416 | (222,602 | ) | |||||||||||
| PNC Financial Services Group, Inc. | Citigroup Global Markets | Call | 01/20/23 | USD 230.000 | 44 | USD 882,288 | 44,879 | (33,859 | ) | |||||||||||
| PNC Financial Services Group, Inc. | Citigroup Global Markets | Call | 01/20/23 | USD 230.000 | 212 | USD 4,251,024 | 223,582 | (163,141 | ) | |||||||||||
| PNC Financial Services Group, Inc. | Citigroup Global Markets | Call | 01/20/23 | USD 230.000 | 129 | USD 2,586,708 | 131,685 | (99,270 | ) | |||||||||||
| PNC Financial Services Group, Inc. | Citigroup Global Markets | Call | 01/20/23 | USD 230.000 | 149 | USD 2,987,748 | 153,214 | (114,660 | ) | |||||||||||
| Ross Stores, Inc. | Bank of America N.A. | Call | 01/21/22 | USD 135.000 | 53 | USD 605,684 | 55,330 | (45 | ) | |||||||||||
| Ross Stores, Inc. | Bank of America N.A. | Call | 01/21/22 | USD 140.000 | 53 | USD 605,684 | 45,868 | (16 | ) | |||||||||||
| Ross Stores, Inc. | Credit Suisse Securities (USA) LLC | Call | 01/21/22 | USD 130.000 | 110 | USD 1,257,080 | 112,618 | (303 | ) | |||||||||||
| Ross Stores, Inc. | Credit Suisse Securities (USA) LLC | Call | 01/21/22 | USD 135.000 | 110 | USD 1,257,080 | 102,652 | (92 | ) | |||||||||||
| The Coca-Cola Company | Credit Suisse Securities (USA) LLC | Call | 01/21/22 | USD 52.500 | 909 | USD 5,382,189 | 201,798 | (614,361 | ) | |||||||||||
| The Coca-Cola Company | Credit Suisse Securities (USA) LLC | Call | 01/21/22 | USD 52.500 | 668 | USD 3,955,228 | 200,747 | (451,478 | ) | |||||||||||
| The Coca-Cola Company | Credit Suisse Securities (USA) LLC | Call | 01/21/22 | USD 55.000 | 909 | USD 5,382,189 | 142,713 | (392,280 | ) | |||||||||||
| The Coca-Cola Company | Credit Suisse Securities (USA) LLC | Call | 01/21/22 | USD 55.000 | 667 | USD 3,949,307 | 142,658 | (287,845 | ) | |||||||||||
| Thermo Fisher Scientific, Inc. | Citigroup Global Markets | Call | 01/21/22 | USD 560.000 | 123 | USD 8,207,052 | 240,295 | (1,333,977 | ) | |||||||||||
| Thermo Fisher Scientific, Inc. | Citigroup Global Markets | Call | 01/21/22 | USD 580.000 | 48 | USD 3,202,752 | 129,955 | (426,304 | ) | |||||||||||
| Thermo Fisher Scientific, Inc. | Citigroup Global Markets | Call | 01/21/22 | USD 580.000 | 85 | USD 5,671,540 | 241,064 | (754,913 | ) | |||||||||||
| Thermo Fisher Scientific, Inc. | Citigroup Global Markets | Call | 01/21/22 | USD 580.000 | 123 | USD 8,207,052 | 173,353 | (1,092,403 | ) | |||||||||||
| Thermo Fisher Scientific, Inc. | Citigroup Global Markets | Call | 01/21/22 | USD 600.000 | 85 | USD 5,671,540 | 199,502 | (590,870 | ) | |||||||||||
| Thermo Fisher Scientific, Inc. | Citigroup Global Markets | Call | 01/21/22 | USD 600.000 | 48 | USD 3,202,752 | 107,392 | (333,668 | ) | |||||||||||
| UnitedHealth Group, Inc. | Citigroup Global Markets | Call | 01/21/22 | USD 400.000 | 111 | USD 5,573,754 | 267,273 | (1,154,223 | ) | |||||||||||
| UnitedHealth Group, Inc. | Citigroup Global Markets | Call | 01/21/22 | USD 410.000 | 111 | USD 5,573,754 | 220,532 | (1,043,857 | ) | |||||||||||
| UnitedHealth Group, Inc. | Citigroup Global Markets | Call | 01/21/22 | USD 420.000 | 111 | USD 5,573,754 | 201,988 | (933,810 | ) | |||||||||||
| UnitedHealth Group, Inc. | Citigroup Global Markets | Call | 01/21/22 | USD 460.000 | 54 | USD 2,711,556 | 86,199 | (244,634 | ) | |||||||||||
| UnitedHealth Group, Inc. | Citigroup Global Markets | Call | 01/21/22 | USD 470.000 | 54 | USD 2,711,556 | 70,512 | (195,087 | ) | |||||||||||
| Visa, Inc. — Class A | Citigroup Global Markets | Call | 01/21/22 | USD 250.000 | 774 | USD 16,773,354 | 660,818 | (4,206 | ) | |||||||||||
| Visa, Inc. — Class A | Credit Suisse Securities (USA) LLC | Call | 01/21/22 | USD 225.000 | 378 | USD 8,191,638 | 504,679 | (49,533 | ) | |||||||||||
| Visa, Inc. — Class A | Credit Suisse Securities (USA) LLC | Call | 01/21/22 | USD 230.000 | 378 | USD 8,191,638 | 446,358 | (23,020 | ) | |||||||||||
| Visa, Inc. — Class A | Credit Suisse Securities (USA) LLC | Call | 01/21/22 | USD 235.000 | 378 | USD 8,191,638 | 384,978 | (11,300 | ) | |||||||||||
| Visa, Inc. — Class A | Credit Suisse Securities (USA) LLC | Call | 01/21/22 | USD 240.000 | 220 | USD 4,767,620 | 275,924 | (3,493 | ) | |||||||||||
| Visa, Inc. — Class A | Credit Suisse Securities (USA) LLC | Call | 01/21/22 | USD 245.000 | 134 | USD 2,903,914 | 147,842 | (1,214 | ) | |||||||||||
| VY® T. Rowe Price Capital Appreciation Portfolio | PORTFOLIO OF INVESTMENTS as of December 31, 2021 (continued) |
| Description | Counterparty | Put/Call | Expiration Date | Exercise Price | Number of Contracts | Notional Amount | Premiums Received | Fair Value | ||||||||||||
| Visa, Inc. — Class A | Goldman Sachs & Co. | Call | 01/21/22 | USD 225.000 | 120 | USD 2,600,520 | $ | 161,640 | $ | (15,725 | ) | |||||||||
| Visa, Inc. — Class A | Goldman Sachs & Co. | Call | 01/21/22 | USD 225.000 | 248 | USD 5,374,408 | 323,085 | (32,498 | ) | |||||||||||
| Visa, Inc. — Class A | Goldman Sachs & Co. | Call | 01/21/22 | USD 225.000 | 123 | USD 2,665,533 | 146,616 | (16,118 | ) | |||||||||||
| Visa, Inc. — Class A | Goldman Sachs & Co. | Call | 01/21/22 | USD 230.000 | 248 | USD 5,374,408 | 289,044 | (15,103 | ) | |||||||||||
| Visa, Inc. — Class A | Goldman Sachs & Co. | Call | 01/21/22 | USD 230.000 | 123 | USD 2,665,533 | 125,706 | (7,490 | ) | |||||||||||
| Visa, Inc. — Class A | Goldman Sachs & Co. | Call | 01/21/22 | USD 230.000 | 120 | USD 2,600,520 | 140,640 | (7,308 | ) | |||||||||||
| Visa, Inc. — Class A | JPMorgan Chase Bank N.A. | Call | 01/21/22 | USD 220.000 | 324 | USD 7,021,404 | 454,248 | (90,620 | ) | |||||||||||
| Visa, Inc. — Class A | JPMorgan Chase Bank N.A. | Call | 01/21/22 | USD 225.000 | 324 | USD 7,021,404 | 399,168 | (42,457 | ) | |||||||||||
| Visa, Inc. — Class A | JPMorgan Chase Bank N.A. | Call | 01/21/22 | USD 230.000 | 324 | USD 7,021,404 | 348,948 | (19,731 | ) | |||||||||||
| Waste Management, Inc. | Credit Suisse Securities (USA) LLC | Call | 01/21/22 | USD 130.000 | 111 | USD 1,852,590 | 46,287 | (410,025 | ) | |||||||||||
| Waste Management, Inc. | Credit Suisse Securities (USA) LLC | Call | 01/21/22 | USD 130.000 | 116 | USD 1,936,040 | 43,732 | (428,495 | ) | |||||||||||
| Yum! Brands, Inc. | JPMorgan Chase Bank N.A. | Call | 01/21/22 | USD 105.000 | 123 | USD 1,707,978 | 138,006 | (419,804 | ) | |||||||||||
| Yum! Brands, Inc. | JPMorgan Chase Bank N.A. | Call | 01/21/22 | USD 110.000 | 123 | USD 1,707,978 | 109,101 | (358,428 | ) | |||||||||||
| Yum! Brands, Inc. | JPMorgan Chase Bank N.A. | Call | 01/21/22 | USD 120.000 | 344 | USD 4,776,784 | 164,088 | (660,367 | ) | |||||||||||
| Yum! Brands, Inc. | JPMorgan Chase Bank N.A. | Call | 01/21/22 | USD 120.000 | 100 | USD 1,388,600 | 45,700 | (191,967 | ) | |||||||||||
| Yum! Brands, Inc. | JPMorgan Chase Bank N.A. | Call | 01/21/22 | USD 120.000 | 390 | USD 5,415,540 | 167,064 | (748,672 | ) | |||||||||||
| Yum! Brands, Inc. | JPMorgan Chase Bank N.A. | Call | 01/21/22 | USD 120.000 | 246 | USD 3,415,956 | 112,422 | (472,239 | ) | |||||||||||
| Yum! Brands, Inc. | JPMorgan Chase Bank N.A. | Call | 01/21/22 | USD 125.000 | 444 | USD 6,165,384 | 142,968 | (633,862 | ) | |||||||||||
| $ | 75,480,656 | $ | (160,277,008 | ) | ||||||||||||||||
| Currency Abbreviations | ||
| USD | — United States Dollar | |
| Derivatives not accounted for as hedging instruments | Location on Statement of Assets and Liabilities | Fair Value | ||||
Liability Derivatives | ||||||
| Equity contracts | Written options, at fair value | $ | 160,277,008 | |||
Total Liability Derivatives | $ | 160,277,008 | ||||
| Amount of Realized Gain or (Loss) on Derivatives Recognized in Income | |||||
| Derivatives not accounted for as hedging instruments | Written options | ||||
| Equity contracts | $ | 40,144,672 | |||
Total | $ | 40,144,672 | |||
| Change in Unrealized Appreciation or (Depreciation) on Derivatives Recognized in Income | |||||
| Derivatives not accounted for as hedging instruments | Written options | ||||
| Equity contracts | $ | (38,240,362 | ) | ||
Total | $ | (38,240,362 | ) | ||
| * | Amounts recognized for purchased options are included in net realized gain (loss) on investments and net change in unrealized appreciation or depreciation on investments. |
| VY® T. Rowe Price Capital Appreciation Portfolio | PORTFOLIO OF INVESTMENTS as of December 31, 2021 (continued) |
| Bank of America N.A. | Citigroup Global Markets | Credit Suisse Securities (USA) LLC | Goldman Sachs & Co. | JPMorgan Chase Bank N.A. | RBC Capital Markets | Susquehanna Financial Group, LLP | Totals | |||||||||||||||||||||||||||||||||
Liabilities: | ||||||||||||||||||||||||||||||||||||||||
| Written options | $ | 3,028,222 | $ | 30,909,406 | $ | 17,714,083 | $ | 48,363,577 | $ | 25,182,423 | $ | 3,481,889 | $ | 31,597,408 | $ | 160,277,008 | ||||||||||||||||||||||||
Total Liabilities | $ | 3,028,222 | $ | 30,909,406 | $ | 17,714,083 | $ | 48,363,577 | $ | 25,182,423 | $ | 3,481,889 | $ | 31,597,408 | $ | 160,277,008 | ||||||||||||||||||||||||
Net OTC derivative instruments by counterparty, at fair value | $ | (3,028,222 | ) | $ | (30,909,406 | ) | $ | (17,714,083 | ) | $ | (48,363,577 | ) | $ | (25,182,423 | ) | $ | (3,481,889 | ) | $ | (31,597,408 | ) | $ | (160,277,008 | ) | ||||||||||||||||
Total collateral pledged by the Portfolio/(Received from counterparty) | $ | — | $ | — | $ | — | $ | — | $ | — | $ | — | $ | — | $ | — | ||||||||||||||||||||||||
Net Exposure(1) | $ | (3,028,222 | ) | $ | (30,909,406 | ) | $ | (17,714,083 | ) | $ | (48,363,577 | ) | $ | (25,182,423 | ) | $ | (3,481,889 | ) | $ | (31,597,408 | ) | $ | (160,277,008 | ) | ||||||||||||||||
(1) | Positive net exposure represents amounts due from each respective counterparty. Negative exposure represents amounts due from the Portfolio. Please refer to Note 2 for additional details regarding counterparty credit risk and credit related contingent features. |
| Cost for federal income tax purposes was $7,395,315,028. | ||||
| Net unrealized appreciation consisted of: | ||||
| Gross Unrealized Appreciation | $ | 1,812,684,901 | ||
| Gross Unrealized Depreciation | (137,492,758 | ) | ||
| Net Unrealized Appreciation | $ | 1,675,192,143 | ||
| VY® T. ROWE PRICE EQUITY INCOME PORTFOLIO | PORTFOLIO OF INVESTMENTS AS OF DECEMBER 31, 2021 |
| Shares | Value | Percentage of Net Assets | ||||||||||||
|---|---|---|---|---|---|---|---|---|---|---|---|---|---|---|
COMMON STOCK: 97.2% | ||||||||||||||
Communication Services: 4.6% | ||||||||||||||
| 47,301 | AT&T, Inc. | $ | 1,163,605 | 0.3 | ||||||||||
| 112,486 | Comcast Corp. — Class A | 5,661,420 | 1.5 | |||||||||||
| 60,312 | Fox Corp. — Class B | 2,066,892 | 0.5 | |||||||||||
| 183,639 | News Corp — Class A | 4,096,986 | 1.1 | |||||||||||
| 8,605 | Verizon Communications, Inc. | 447,116 | 0.1 | |||||||||||
| 26,538 | (1) | Walt Disney Co. | 4,110,471 | 1.1 | ||||||||||
| 17,546,490 | 4.6 | |||||||||||||
Consumer Discretionary: 3.5% | ||||||||||||||
| 46,104 | (2) | Kohl’s Corp. | 2,277,076 | 0.6 | ||||||||||
| 66,131 | (1) | Las Vegas Sands Corp. | 2,489,171 | 0.7 | ||||||||||
| 115,441 | (1) | Mattel, Inc. | 2,488,908 | 0.6 | ||||||||||
| 34,700 | TJX Cos., Inc. | 2,634,424 | 0.7 | |||||||||||
| 173,284 | Volkswagen AG ADR | 3,479,543 | 0.9 | |||||||||||
| 13,369,122 | 3.5 | |||||||||||||
Consumer Staples: 6.9% | ||||||||||||||
| 19,464 | Altria Group, Inc. | 922,399 | 0.3 | |||||||||||
| 34,700 | Coca-Cola Co. | 2,054,587 | 0.5 | |||||||||||
| 115,162 | Conagra Brands, Inc. | 3,932,782 | 1.0 | |||||||||||
| 40,140 | Kimberly-Clark Corp. | 5,736,809 | 1.5 | |||||||||||
| 3,900 | Mondelez International, Inc. | 258,609 | 0.1 | |||||||||||
| 47,513 | Philip Morris International, Inc. | 4,513,735 | 1.2 | |||||||||||
| 83,982 | Tyson Foods, Inc. | 7,319,871 | 1.9 | |||||||||||
| 10,111 | Walmart, Inc. | 1,462,961 | 0.4 | |||||||||||
| 26,201,753 | 6.9 | |||||||||||||
Energy: 5.4% | ||||||||||||||
| 5,274 | Chevron Corp. | 618,904 | 0.2 | |||||||||||
| 46,417 | EOG Resources, Inc. | 4,123,222 | 1.1 | |||||||||||
| 49,551 | Exxon Mobil Corp. | 3,032,026 | 0.8 | |||||||||||
| 13,431 | Halliburton Co. | 307,167 | 0.1 | |||||||||||
| 2,972 | Hess Corp. | 220,017 | 0.0 | |||||||||||
| 23,586 | Occidental Petroleum Corp. | 683,758 | 0.2 | |||||||||||
| 6,076 | Targa Resources Corp. | 317,410 | 0.1 | |||||||||||
| 50,786 | (2) | TC Energy Corp. | 2,363,581 | 0.6 | ||||||||||
| 176,822 | (2) | TotalEnergies SE ADR | 8,745,616 | 2.3 | ||||||||||
| 20,411,701 | 5.4 | |||||||||||||
Financials: 22.6% | ||||||||||||||
| 164,613 | American International Group, Inc. | 9,359,895 | 2.5 | |||||||||||
| 48,818 | Bank of America Corp. | 2,171,913 | 0.6 | |||||||||||
| 7,400 | Bank of New York Mellon Corp. | 429,792 | 0.1 | |||||||||||
| 25,772 | Charles Schwab Corp. | 2,167,425 | 0.6 | |||||||||||
| 37,819 | Chubb Ltd. | 7,310,791 | 1.9 | |||||||||||
| 19,700 | Citigroup, Inc. | 1,189,683 | 0.3 | |||||||||||
| 11,206 | Citizens Financial Group, Inc. | 529,483 | 0.1 | |||||||||||
| 138,081 | Equitable Holdings, Inc. | 4,527,676 | 1.2 | |||||||||||
| 151,421 | Fifth Third Bancorp | 6,594,385 | 1.7 | |||||||||||
| 15,351 | Franklin Resources, Inc. | 514,105 | 0.1 | |||||||||||
| 12,000 | Goldman Sachs Group, Inc. | 4,590,600 | 1.2 | |||||||||||
| 25,200 | Hartford Financial Services Group, Inc. | 1,739,808 | 0.5 | |||||||||||
| Shares | Value | Percentage of Net Assets | ||||||||||||
|---|---|---|---|---|---|---|---|---|---|---|---|---|---|---|
COMMON STOCK: (continued) | ||||||||||||||
Financials: (continued) | ||||||||||||||
| 252,752 | Huntington Bancshares, Inc. | $ | 3,897,436 | 1.0 | ||||||||||
| 13,807 | JPMorgan Chase & Co. | 2,186,338 | 0.6 | |||||||||||
| 107,442 | Loews Corp. | 6,205,850 | 1.6 | |||||||||||
| 3,487 | Marsh & McLennan Cos., Inc. | 606,110 | 0.2 | |||||||||||
| 108,340 | Metlife, Inc. | 6,770,167 | 1.8 | |||||||||||
| 38,093 | Morgan Stanley | 3,739,209 | 1.0 | |||||||||||
| 6,654 | PNC Financial Services Group, Inc. | 1,334,260 | 0.3 | |||||||||||
| 6,730 | Raymond James Financial, Inc. | 675,692 | 0.2 | |||||||||||
| 49,343 | State Street Corp. | 4,588,899 | 1.2 | |||||||||||
| 305,925 | Wells Fargo & Co. | 14,678,282 | 3.9 | |||||||||||
| 85,807,799 | 22.6 | |||||||||||||
Health Care: 16.6% | ||||||||||||||
| 54,115 | AbbVie, Inc. | 7,327,171 | 1.9 | |||||||||||
| 19,371 | Anthem, Inc. | 8,979,233 | 2.4 | |||||||||||
| 22,200 | AstraZeneca PLC ADR | 1,293,150 | 0.3 | |||||||||||
| 23,656 | Becton Dickinson & Co. | 5,949,011 | 1.6 | |||||||||||
| 3,600 | (1) | Biogen, Inc. | 863,712 | 0.2 | ||||||||||
| 33,400 | Cardinal Health, Inc. | 1,719,766 | 0.5 | |||||||||||
| 29,200 | (1) | Centene Corp. | 2,406,080 | 0.6 | ||||||||||
| 16,582 | Cigna Corp. | 3,807,725 | 1.0 | |||||||||||
| 50,370 | CVS Health Corp. | 5,196,169 | 1.4 | |||||||||||
| 9,383 | Gilead Sciences, Inc. | 681,300 | 0.2 | |||||||||||
| 19,187 | GlaxoSmithKline PLC | 417,753 | 0.1 | |||||||||||
| 26,625 | Johnson & Johnson | 4,554,739 | 1.2 | |||||||||||
| 45,406 | Medtronic PLC | 4,697,251 | 1.2 | |||||||||||
| 37,000 | Merck & Co., Inc. | 2,835,680 | 0.8 | |||||||||||
| 1,660 | Organon & Co. | 50,547 | 0.0 | |||||||||||
| 84,452 | Pfizer, Inc. | 4,986,890 | 1.3 | |||||||||||
| 61,471 | Sanofi ADR | 3,079,697 | 0.8 | |||||||||||
| 3,900 | UnitedHealth Group, Inc. | 1,958,346 | 0.5 | |||||||||||
| 18,438 | Zimmer Biomet Holdings, Inc. | 2,342,363 | 0.6 | |||||||||||
| 63,146,583 | 16.6 | |||||||||||||
Industrials: 10.6% | ||||||||||||||
| 4,200 | 3M Co. | 746,046 | 0.2 | |||||||||||
| 16,874 | (1) | Boeing Co. | 3,397,074 | 0.9 | ||||||||||
| 10,247 | Flowserve Corp. | 313,558 | 0.1 | |||||||||||
| 101,725 | General Electric Co. | 9,609,961 | 2.5 | |||||||||||
| 25,160 | L3Harris Technologies, Inc. | 5,365,118 | 1.4 | |||||||||||
| 88,425 | Nielsen Holdings PLC | 1,813,597 | 0.5 | |||||||||||
| 19,760 | Paccar, Inc. | 1,744,017 | 0.4 | |||||||||||
| 30,258 | Siemens AG ADR | 2,620,343 | 0.7 | |||||||||||
| 3,672 | Snap-On, Inc. | 790,875 | 0.2 | |||||||||||
| 23,262 | (1) | Southwest Airlines Co. | 996,544 | 0.3 | ||||||||||
| 51,115 | (1) | Stericycle, Inc. | 3,048,499 | 0.8 | ||||||||||
| 46,229 | United Parcel Service, Inc. — Class B | 9,908,724 | 2.6 | |||||||||||
| 40,354,356 | 10.6 | |||||||||||||
Information Technology: 9.3% | ||||||||||||||
| 26,238 | Applied Materials, Inc. | 4,128,812 | 1.1 | |||||||||||
| 37,587 | Cisco Systems, Inc. | 2,381,888 | 0.6 | |||||||||||
| 30,100 | Citrix Systems, Inc. | 2,847,159 | 0.8 | |||||||||||
| 14,900 | (1) | Fiserv, Inc. | 1,546,471 | 0.4 | ||||||||||
| VY® T. ROWE PRICE EQUITY INCOME PORTFOLIO | PORTFOLIO OF INVESTMENTS AS OF DECEMBER 31, 2021 (CONTINUED) |
| Shares | Value | Percentage of Net Assets | ||||||||||||
|---|---|---|---|---|---|---|---|---|---|---|---|---|---|---|
COMMON STOCK: (continued) | ||||||||||||||
Information Technology: (continued) | ||||||||||||||
| 18,018 | Microsoft Corp. | $ | 6,059,814 | 1.6 | ||||||||||
| 6,745 | NXP Semiconductor NV — NXPI — US | 1,536,376 | 0.4 | |||||||||||
| 62,379 | Qualcomm, Inc. | 11,407,248 | 3.0 | |||||||||||
| 7,400 | TE Connectivity Ltd. | 1,193,916 | 0.3 | |||||||||||
| 21,648 | Texas Instruments, Inc. | 4,079,998 | 1.1 | |||||||||||
| 35,181,682 | 9.3 | |||||||||||||
Materials: 5.1% | ||||||||||||||
| 12,563 | Akzo Nobel NV | 1,380,231 | 0.4 | |||||||||||
| 94,298 | CF Industries Holdings, Inc. | 6,674,412 | 1.8 | |||||||||||
| 11,322 | DuPont de Nemours, Inc. | 914,591 | 0.2 | |||||||||||
| 27,698 | International Flavors & Fragrances, Inc. | 4,172,704 | 1.1 | |||||||||||
| 121,921 | International Paper Co. | 5,727,849 | 1.5 | |||||||||||
| 4,300 | RPM International, Inc. | 434,300 | 0.1 | |||||||||||
| 275 | (1) | Sylvamo Corp. | 7,670 | 0.0 | ||||||||||
| 19,311,757 | 5.1 | |||||||||||||
Real Estate: 4.7% | ||||||||||||||
| 66,830 | Equity Residential | 6,048,115 | 1.6 | |||||||||||
| 76,065 | Rayonier, Inc. | 3,069,983 | 0.8 | |||||||||||
| 9,900 | Vornado Realty Trust | 414,414 | 0.1 | |||||||||||
| 15,700 | Welltower, Inc. | 1,346,589 | 0.4 | |||||||||||
| 164,021 | Weyerhaeuser Co. | 6,754,385 | 1.8 | |||||||||||
| 17,633,486 | 4.7 | |||||||||||||
Utilities: 7.9% | ||||||||||||||
| 26,874 | Ameren Corp. | 2,392,055 | 0.6 | |||||||||||
| 46,700 | Dominion Energy, Inc. | 3,668,752 | 1.0 | |||||||||||
| 9,200 | Entergy Corp. | 1,036,380 | 0.3 | |||||||||||
| 23,480 | NextEra Energy, Inc. | 2,192,093 | 0.6 | |||||||||||
| 145,520 | NiSource, Inc. | 4,017,807 | 1.1 | |||||||||||
| 46,919 | Sempra Energy | 6,206,445 | 1.6 | |||||||||||
| 141,547 | Southern Co. | 9,707,293 | 2.5 | |||||||||||
| 10,000 | Xcel Energy, Inc. | 677,000 | 0.2 | |||||||||||
| 29,897,825 | 7.9 | |||||||||||||
| Total Common Stock (Cost $263,347,075) | 368,862,554 | 97.2 | ||||||||||||
PREFERRED STOCK: 1.5% | ||||||||||||||
Health Care: 0.4% | ||||||||||||||
| 26,624 | (1),(2) | Becton Dickinson and Co. | 1,404,416 | 0.4 | ||||||||||
Utilities: 1.1% | ||||||||||||||
| 23,003 | (1) | NextEra Energy, Inc. | 1,323,593 | 0.4 | ||||||||||
| 10,753 | (1) | NiSource, Inc. | 1,204,229 | 0.3 | ||||||||||
| 30,331 | (1) | Southern Co/The | 1,630,291 | 0.4 | ||||||||||
| 4,158,113 | 1.1 | |||||||||||||
| Total Preferred Stock (Cost $5,056,360) | 5,562,529 | 1.5 | ||||||||||||
| Total Long-Term Investments (Cost $268,403,435) | 374,425,083 | 98.7 | ||||||||||||
| Principal Amount† | Value | Percentage of Net Assets | ||||||||||||
|---|---|---|---|---|---|---|---|---|---|---|---|---|---|---|
SHORT-TERM INVESTMENTS: 5.0% | ||||||||||||||
Repurchase Agreements: 3.9% | ||||||||||||||
| 3,430,700 | (3) | Cantor Fitzgerald Securities, Repurchase Agreement dated 12/31/21, 0.05%, due 01/03/22 (Repurchase Amount $3,430,714, collateralized by various U.S. Government/U.S. Government Agency Obligations, 0.000%–9.000%, Market Value plus accrued interest $3,499,314, due 02/01/22–07/20/71) | $ | 3,430,700 | 0.9 | |||||||||
| 3,430,700 | (3) | Citadel Securities LLC, Repurchase Agreement dated 12/31/21, 0.07%, due 01/03/22 (Repurchase Amount $3,430,720, collateralized by various U.S. Government Securities, 0.000%–7.250%, Market Value plus accrued interest $3,499,335, due 01/04/22–11/15/51) | 3,430,700 | 0.9 | ||||||||||
| 1,388,761 | (3) | Citigroup, Inc., Repurchase Agreement dated 12/31/21, 0.06%, due 01/03/22 (Repurchase Amount $1,388,768, collateralized by various U.S. Government/U.S. Government Agency Obligations, 0.000%–3.500%, Market Value plus accrued interest $1,416,536, due 02/15/22–12/20/51) | 1,388,761 | 0.4 | ||||||||||
| 3,430,702 | (3) | RBC Dominion Securities Inc., Repurchase Agreement dated 12/31/21, 0.05%, due 01/03/22 (Repurchase Amount $3,430,716, collateralized by various U.S. Government/U.S. Government Agency Obligations, 0.000%–6.500%, Market Value plus accrued interest $3,499,316, due 05/15/22–12/01/51) | 3,430,702 | 0.9 | ||||||||||
| VY® T. ROWE PRICE EQUITY INCOME PORTFOLIO | PORTFOLIO OF INVESTMENTS AS OF DECEMBER 31, 2021 (CONTINUED) |
| Principal Amount† | Value | Percentage of Net Assets | ||||||||||||
|---|---|---|---|---|---|---|---|---|---|---|---|---|---|---|
SHORT-TERM INVESTMENTS: (continued) | ||||||||||||||
Repurchase Agreements: (continued) | ||||||||||||||
| 3,058,990 | (3) | State of Wisconsin Investment Board, Repurchase Agreement dated 12/31/21, 0.07%, due 01/03/22 (Repurchase Amount $3,059,008, collateralized by various U.S. Government Securities, 0.125%–3.875%, Market Value plus accrued interest $3,120,186, due 07/15/23–02/15/48) | $ | 3,058,990 | 0.8 | |||||||||
| Total Repurchase Agreements (Cost $14,739,853) | 14,739,853 | 3.9 | ||||||||||||
| Shares | Value | Percentage of Net Assets | ||||||||||||
|---|---|---|---|---|---|---|---|---|---|---|---|---|---|---|
SHORT-TERM INVESTMENTS: (continued) | ||||||||||||||
Mutual Funds: 1.1% | ||||||||||||||
| 4,079,538 | (4) | T. Rowe Price Government Reserve Fund, 0.070% (Cost $4,079,538) | $ | 4,079,538 | 1.1 | |||||||||
| Total Short-Term Investments (Cost $18,819,391) | 18,819,391 | 5.0 | ||||||||||||
Total Investments in Securities (Cost $287,222,826) | $ | 393,244,474 | 103.7 | |||||||||||
Liabilities in Excess of Other Assets | (13,901,901 | ) | (3.7 | ) | ||||||||||
Net Assets | $ | 379,342,573 | 100.0 | |||||||||||
| † | Unless otherwise indicated, principal amount is shown in USD. | |
| ADR | American Depositary Receipt | |
| (1) | Non-income producing security. | |
| (2) | Security, or a portion of the security, is on loan. | |
| (3) | All or a portion of the security represents securities purchased with cash collateral received for securities on loan. | |
| (4) | Rate shown is the 7-day yield as of December 31, 2021. |
| Quoted Prices in Active Markets for Identical Investments (Level 1) | Significant Other Observable Inputs# (Level 2) | Significant Unobservable Inputs (Level 3) | Fair Value at December 31, 2021 | |||||||||||||||
|---|---|---|---|---|---|---|---|---|---|---|---|---|---|---|---|---|---|---|
Asset Table | ||||||||||||||||||
Investments, at fair value | ||||||||||||||||||
| Common Stock | ||||||||||||||||||
| Communication Services | $ | 17,546,490 | $ | — | $— | $ | 17,546,490 | |||||||||||
| Consumer Discretionary | 13,369,122 | — | — | 13,369,122 | ||||||||||||||
| Consumer Staples | 26,201,753 | — | — | 26,201,753 | ||||||||||||||
| Energy | 20,411,701 | — | — | 20,411,701 | ||||||||||||||
| Financials | 85,807,799 | — | — | 85,807,799 | ||||||||||||||
| Health Care | 62,728,830 | 417,753 | — | 63,146,583 | ||||||||||||||
| Industrials | 40,354,356 | — | — | 40,354,356 | ||||||||||||||
| Information Technology | 35,181,682 | — | — | 35,181,682 | ||||||||||||||
| Materials | 17,931,526 | 1,380,231 | — | 19,311,757 | ||||||||||||||
| Real Estate | 17,633,486 | — | — | 17,633,486 | ||||||||||||||
| Utilities | 29,897,825 | — | — | 29,897,825 | ||||||||||||||
| Total Common Stock | 367,064,570 | 1,797,984 | — | 368,862,554 | ||||||||||||||
| Preferred Stock | 5,562,529 | — | — | 5,562,529 | ||||||||||||||
| Short-Term Investments | 4,079,538 | 14,739,853 | — | 18,819,391 | ||||||||||||||
| Total Investments, at fair value | $ | 376,706,637 | $ | 16,537,837 | $— | $ | 393,244,474 | |||||||||||
| ^ | See Note 2, “Significant Accounting Policies” in the Notes to Financial Statements for additional information. | |
| # | The earlier close of the foreign markets gives rise to the possibility that significant events, including broad market moves, may have occurred in the interim and may materially affect the value of those securities. To account for this, the Portfolio may frequently value many of its foreign equity securities using fair value prices based on third party vendor modeling tools to the extent available. Accordingly, a portion of the Portfolio’s investments are categorized as Level 2 investments. |
| VY® T. ROWE PRICE EQUITY INCOME PORTFOLIO | PORTFOLIO OF INVESTMENTS AS OF DECEMBER 31, 2021 (CONTINUED) |
| Cost for federal income tax purposes was $288,231,205. | ||||
| Net unrealized appreciation consisted of: | ||||
| Gross Unrealized Appreciation | $ | 110,340,024 | ||
| Gross Unrealized Depreciation | (5,326,528 | ) | ||
| Net Unrealized Appreciation | $ | 105,013,496 |
| VY® T. ROWE PRICE INTERNATIONAL STOCK PORTFOLIO | PORTFOLIO OF INVESTMENTS AS OF DECEMBER 31, 2021 |
| Shares | Value | Percentage of Net Assets | ||||||||||||
|---|---|---|---|---|---|---|---|---|---|---|---|---|---|---|
COMMON STOCK: 96.8% | ||||||||||||||
Austria: 0.5% | ||||||||||||||
| 20,106 | Erste Group Bank AG | $ | 942,576 | 0.5 | ||||||||||
Brazil: 1.6% | ||||||||||||||
| 468,621 | Magazine Luiza SA | 607,441 | 0.3 | |||||||||||
| 96,512 | (1) | Rede D’Or Sao Luiz SA | 776,774 | 0.4 | ||||||||||
| 114,136 | (2) | Suzano SA | 1,231,726 | 0.6 | ||||||||||
| 23,881 | (2) | XP, Inc. | 686,340 | 0.3 | ||||||||||
| 3,302,281 | 1.6 | |||||||||||||
Canada: 6.2% | ||||||||||||||
| 33,400 | (3) | Canadian Pacific Railway Ltd. | 2,402,796 | 1.2 | ||||||||||
| 460 | Constellation Software, Inc./Canada | 853,466 | 0.4 | |||||||||||
| 9,460 | (2) | Definity Financial Corp. | 220,842 | 0.1 | ||||||||||
| 1,364 | (2) | Shopify, Inc. | 1,878,760 | 0.9 | ||||||||||
| 32,303 | Sun Life Financial, Inc. | 1,798,059 | 0.9 | |||||||||||
| 18,868 | (2) | TELUS International CDA, Inc. | 623,489 | 0.3 | ||||||||||
| 26,620 | TMX Group Ltd. | 2,698,933 | 1.3 | |||||||||||
| 16,456 | Waste Connections, Inc. | 2,242,459 | 1.1 | |||||||||||
| 12,718,804 | 6.2 | |||||||||||||
China: 7.1% | ||||||||||||||
| 23,938 | (2) | Alibaba Group Holding Ltd. BABA ADR | 2,843,595 | 1.4 | ||||||||||
| 7,584 | (2) | Baidu, Inc. ADR | 1,128,424 | 0.5 | ||||||||||
| 219,200 | (2) | BTG Hotels Group Co. Ltd. — A Shares | 900,567 | 0.4 | ||||||||||
| 14,000 | China Mengniu Dairy Co., Ltd. | 79,364 | 0.0 | |||||||||||
| 287,900 | Gree Electric Appliances, Inc. of Zhuhai — A Shares | 1,675,136 | 0.8 | |||||||||||
| 67,500 | (1),(2) | JD Health International, Inc. — H Shares | 532,470 | 0.3 | ||||||||||
| 6,682 | (2),(3) | Kanzhun Ltd. ADR | 233,068 | 0.1 | ||||||||||
| 4,289 | Kweichow Moutai Co. Ltd. — A Shares (Nth SSE-SEHK) | 1,378,305 | 0.7 | |||||||||||
| 242,340 | NARI Technology Co. Ltd. — A Shares | 1,523,830 | 0.8 | |||||||||||
| 120,900 | Shandong Pharmaceutical Glass Co. Ltd. | 833,099 | 0.4 | |||||||||||
| 34,800 | Tencent Holdings Ltd. | 2,030,619 | 1.0 | |||||||||||
| 31,100 | (2) | Trip.com Group Ltd. ADR | 765,682 | 0.4 | ||||||||||
| 51,000 | (1),(2) | Wuxi Biologics Cayman, Inc. | 603,784 | 0.3 | ||||||||||
| 14,527,943 | 7.1 | |||||||||||||
Denmark: 0.5% | ||||||||||||||
| 2,742 | Chr Hansen Holding A/S | 216,208 | 0.1 | |||||||||||
| 2,186 | (2) | Genmab A/S | 872,548 | 0.4 | ||||||||||
| 1,088,756 | 0.5 | |||||||||||||
France: 8.3% | ||||||||||||||
| 5,611 | Air Liquide SA | 978,581 | 0.5 | |||||||||||
| 23,095 | Alstom SA | 820,113 | 0.4 | |||||||||||
| 21,750 | Dassault Aviation SA | 2,352,417 | 1.1 | |||||||||||
| 15,304 | EssilorLuxottica SA | 3,257,865 | 1.6 | |||||||||||
| 1,028 | Kering SA | 824,817 | 0.4 | |||||||||||
| Shares | Value | Percentage of Net Assets | ||||||||||||
|---|---|---|---|---|---|---|---|---|---|---|---|---|---|---|
COMMON STOCK: (continued) | ||||||||||||||
France: (continued) | ||||||||||||||
| 1,138 | LVMH Moet Hennessy Louis Vuitton SE | $ | 940,480 | 0.5 | ||||||||||
| 36,480 | Sanofi | 3,660,545 | 1.8 | |||||||||||
| 48,892 | Thales S.A. | 4,159,071 | 2.0 | |||||||||||
| 16,993,889 | 8.3 | |||||||||||||
Germany: 5.2% | ||||||||||||||
| 7,441 | Bayer AG | 397,381 | 0.2 | |||||||||||
| 14,847 | Beiersdorf AG | 1,521,891 | 0.7 | |||||||||||
| 14,622 | Deutsche Boerse AG | 2,441,497 | 1.2 | |||||||||||
| 110,485 | Deutsche Telekom AG | 2,041,484 | 1.0 | |||||||||||
| 33,351 | (2) | Evotec AG | 1,609,980 | 0.8 | ||||||||||
| 10,487 | Knorr-Bremse AG | 1,035,742 | 0.5 | |||||||||||
| 10,795 | (2) | Morphosys AG | 408,797 | 0.2 | ||||||||||
| 33,228 | (1),(2) | TeamViewer AG | 445,876 | 0.2 | ||||||||||
| 10,118 | (1),(2) | Zalando SE | 815,069 | 0.4 | ||||||||||
| 10,717,717 | 5.2 | |||||||||||||
Hong Kong: 1.7% | ||||||||||||||
| 346,600 | AIA Group Ltd. | 3,498,181 | 1.7 | |||||||||||
India: 4.8% | ||||||||||||||
| 220,833 | (2) | Axis Bank Ltd. | 2,006,768 | 1.0 | ||||||||||
| 110,171 | Housing Development Finance Corp. | 3,811,818 | 1.8 | |||||||||||
| 31,479 | Kotak Mahindra Bank Ltd. | 757,726 | 0.4 | |||||||||||
| 11,318 | Maruti Suzuki India Ltd. | 1,126,797 | 0.5 | |||||||||||
| 1,351,248 | NTPC Ltd. | 2,254,511 | 1.1 | |||||||||||
| 9,957,620 | 4.8 | |||||||||||||
Indonesia: 2.0% | ||||||||||||||
| 4,915,800 | Bank Central Asia Tbk PT | 2,517,631 | 1.2 | |||||||||||
| 19,028,900 | Sarana Menara Nusantara Tbk PT | 1,500,499 | 0.8 | |||||||||||
| 4,018,130 | 2.0 | |||||||||||||
Italy: 1.4% | ||||||||||||||
| 167,373 | Banca Mediolanum SpA | 1,650,036 | 0.8 | |||||||||||
| 6,535 | DiaSorin SpA | 1,243,257 | 0.6 | |||||||||||
| 2,893,293 | 1.4 | |||||||||||||
Japan: 14.7% | ||||||||||||||
| 10,900 | Chugai Pharmaceutical Co., Ltd. | 355,297 | 0.2 | |||||||||||
| 43,200 | Daiichi Sankyo Co., Ltd. | 1,099,502 | 0.5 | |||||||||||
| 1,900 | Daikin Industries Ltd. | 430,387 | 0.2 | |||||||||||
| 2,900 | Disco Corp. | 886,392 | 0.4 | |||||||||||
| 62,900 | Fujitsu General Ltd. | 1,494,764 | 0.7 | |||||||||||
| 4,000 | Hikari Tsushin, Inc. | 616,030 | 0.3 | |||||||||||
| 14,000 | Hoshizaki Corp. | 1,053,330 | 0.5 | |||||||||||
| 29,000 | Kansai Paint Co., Ltd. | 630,634 | 0.3 | |||||||||||
| 24,700 | Murata Manufacturing Co., Ltd. | 1,970,133 | 1.0 | |||||||||||
| 129,900 | Nippon Telegraph & Telephone Corp. | 3,552,540 | 1.7 | |||||||||||
| 62,700 | NTT Data Corp. | 1,344,992 | 0.7 | |||||||||||
| 81,800 | (3) | Otsuka Holdings Co. Ltd. | 2,975,960 | 1.4 | ||||||||||
| 67,400 | Outsourcing, Inc. | 909,424 | 0.4 | |||||||||||
| 41,000 | Pan Pacific International Holdings Corp. | 565,138 | 0.3 | |||||||||||
| VY® T. ROWE PRICE INTERNATIONAL STOCK PORTFOLIO | PORTFOLIO OF INVESTMENTS AS OF DECEMBER 31, 2021 (CONTINUED) |
| Shares | Value | Percentage of Net Assets | ||||||||||||
|---|---|---|---|---|---|---|---|---|---|---|---|---|---|---|
COMMON STOCK: (continued) | ||||||||||||||
Japan: (continued) | ||||||||||||||
| 60,300 | Persol Holdings Co. Ltd. | $ | 1,753,117 | 0.9 | ||||||||||
| 51,400 | Seven & I Holdings Co., Ltd. | 2,260,984 | 1.1 | |||||||||||
| 24,800 | Shimadzu Corp. | 1,047,503 | 0.5 | |||||||||||
| 6,200 | Shiseido Co., Ltd. | 345,876 | 0.2 | |||||||||||
| 18,700 | Sony Group Corp. | 2,361,404 | 1.2 | |||||||||||
| 43,700 | Stanley Electric Co., Ltd. | 1,097,179 | 0.5 | |||||||||||
| 26,100 | Suzuki Motor Corp. | 1,006,490 | 0.5 | |||||||||||
| 412,200 | Z Holdings Corp. | 2,378,391 | 1.2 | |||||||||||
| 30,135,467 | 14.7 | |||||||||||||
Netherlands: 9.3% | ||||||||||||||
| 205 | (1),(2) | Adyen NV | 538,125 | 0.3 | ||||||||||
| 32,236 | Akzo Nobel NV | 3,541,601 | 1.7 | |||||||||||
| 6,768 | ASML Holding NV | 5,421,301 | 2.7 | |||||||||||
| 51,200 | Koninklijke Philips NV | 1,894,993 | 0.9 | |||||||||||
| 7,305 | NXP Semiconductor NV — NXPI — US | 1,663,933 | 0.8 | |||||||||||
| 67,576 | Prosus NV | 5,596,978 | 2.7 | |||||||||||
| 3,709 | (1),(2) | Shop Apotheke Europe NV | 477,217 | 0.2 | ||||||||||
| 19,134,148 | 9.3 | |||||||||||||
Philippines: 0.3% | ||||||||||||||
| 34,885 | SM Investments Corp. | 645,125 | 0.3 | |||||||||||
Portugal: 2.4% | ||||||||||||||
| 230,638 | Galp Energia SGPS SA | 2,237,911 | 1.1 | |||||||||||
| 116,888 | Jeronimo Martins SGPS SA | 2,674,844 | 1.3 | |||||||||||
| 4,912,755 | 2.4 | |||||||||||||
South Africa: 1.0% | ||||||||||||||
| 10,695 | Capitec Bank Holdings Ltd. | 1,369,041 | 0.7 | |||||||||||
| 4,809 | Naspers Ltd. | 746,410 | 0.3 | |||||||||||
| 2,115,451 | 1.0 | |||||||||||||
South Korea: 3.9% | ||||||||||||||
| 1,217 | LG Household & Health Care Ltd. | 1,123,250 | 0.6 | |||||||||||
| 11,027 | NAVER Corp. | 3,500,206 | 1.7 | |||||||||||
| 49,985 | Samsung Electronics Co., Ltd. 005930 | 3,282,763 | 1.6 | |||||||||||
| 7,906,219 | 3.9 | |||||||||||||
Spain: 0.8% | ||||||||||||||
| 18,018 | (2) | Amadeus IT Group SA | 1,219,173 | 0.6 | ||||||||||
| 12,946 | Fluidra SA | 516,315 | 0.2 | |||||||||||
| 1,735,488 | 0.8 | |||||||||||||
Sweden: 1.9% | ||||||||||||||
| 36,134 | Assa Abloy AB | 1,101,400 | 0.5 | |||||||||||
| 28,647 | Essity AB | 934,603 | 0.5 | |||||||||||
| 10,772 | (2),(3) | Olink Holding AB ADR | 196,050 | 0.1 | ||||||||||
| 87,233 | Swedbank AB | 1,753,020 | 0.8 | |||||||||||
| 3,985,073 | 1.9 | |||||||||||||
| Shares | Value | Percentage of Net Assets | ||||||||||||
|---|---|---|---|---|---|---|---|---|---|---|---|---|---|---|
COMMON STOCK: (continued) | ||||||||||||||
Switzerland: 8.5% | ||||||||||||||
| 24,530 | Alcon, Inc. | $ | 2,163,678 | 1.0 | ||||||||||
| 445 | Barry Callebaut AG | 1,080,305 | 0.5 | |||||||||||
| 48,614 | Julius Baer Group Ltd. | 3,250,930 | 1.6 | |||||||||||
| 4,288 | Lonza Group AG | 3,570,139 | 1.7 | |||||||||||
| 39,437 | Nestle SA | 5,506,088 | 2.7 | |||||||||||
| 3,664 | (1),(2) | PolyPeptide Group AG | 548,706 | 0.3 | ||||||||||
| 3,252 | Roche Holding AG | 1,349,129 | 0.7 | |||||||||||
| 17,468,975 | 8.5 | |||||||||||||
Taiwan: 4.0% | ||||||||||||||
| 375,000 | Taiwan Semiconductor Manufacturing Co., Ltd. | 8,295,375 | 4.0 | |||||||||||
Thailand: 0.6% | ||||||||||||||
| 690,700 | CP ALL PCL — Foreign | 1,219,028 | 0.6 | |||||||||||
United Arab Emirates: 0.5% | ||||||||||||||
| 282,839 | (1),(2) | Network International Holdings PLC | 1,118,646 | 0.5 | ||||||||||
United Kingdom: 8.3% | ||||||||||||||
| 55,038 | AstraZeneca PLC ADR | 3,205,963 | 1.6 | |||||||||||
| 317,572 | (2) | Boohoo Group PLC | 532,501 | 0.3 | ||||||||||
| 78,963 | (1),(2) | Bridgepoint Group PLC | 526,919 | 0.2 | ||||||||||
| 40,620 | Burberry Group PLC | 1,002,590 | 0.5 | |||||||||||
| 157,023 | (1),(2) | Deliveroo PLC | 448,243 | 0.2 | ||||||||||
| 22,855 | Hargreaves Lansdown PLC | 419,986 | 0.2 | |||||||||||
| 7,406 | Linde PLC | 2,569,935 | 1.3 | |||||||||||
| 35,751 | London Stock Exchange Group PLC | 3,363,094 | 1.6 | |||||||||||
| 128,102 | Smith & Nephew PLC | 2,235,679 | 1.1 | |||||||||||
| 105,457 | (2) | THG PLC | 327,162 | 0.2 | ||||||||||
| 43,344 | Unilever PLC | 2,323,507 | 1.1 | |||||||||||
| 16,955,579 | 8.3 | |||||||||||||
United States: 1.3% | ||||||||||||||
| 1,600 | Accenture PLC | 663,280 | 0.3 | |||||||||||
| 9,427 | (2),(4) | Didi Global, Inc., Lockup Shares | 182,152 | 0.1 | ||||||||||
| 50,497 | (2), (4),(5) | Investindustrial Acquisition Corp. (Issuer) — Ermenegildo Zegna Group — PIPE | 513,333 | 0.2 | ||||||||||
| 3,800 | Mastercard, Inc. — Class A | 1,365,416 | 0.7 | |||||||||||
| 2,724,181 | 1.3 | |||||||||||||
| Total Common Stock (Cost $157,894,578) | 199,010,700 | 96.8 | ||||||||||||
PREFERRED STOCK: 0.3% | ||||||||||||||
Germany: 0.3% | ||||||||||||||
| 737 | Sartorius AG | 498,462 | 0.3 | |||||||||||
| Total Preferred Stock (Cost $93,378) | 498,462 | 0.3 | ||||||||||||
| Total Long-Term Investments (Cost $157,987,956) | 199,509,162 | 97.1 | ||||||||||||
| VY® T. ROWE PRICE INTERNATIONAL STOCK PORTFOLIO | PORTFOLIO OF INVESTMENTS AS OF DECEMBER 31, 2021 (CONTINUED) |
| Principal Amount† | Value | Percentage of Net Assets | ||||||||||||
|---|---|---|---|---|---|---|---|---|---|---|---|---|---|---|
SHORT-TERM INVESTMENTS: 2.8% | ||||||||||||||
Repurchase Agreements: 1.9% | ||||||||||||||
1,000,000 | (6) | Bank of America Inc., Repurchase Agreement dated 12/31/21, 0.05%, due 01/03/22 (Repurchase Amount $1,000,004, collateralized by various U.S. Government Agency Obligations, 1.000%–5.000%, Market Value plus accrued interest $1,020,000, due 09/01/28–01/01/61) | $ | 1,000,000 | 0.5 | |||||||||
| 910,198 | (6) | Daiwa Capital Markets, Repurchase Agreement dated 12/31/21, 0.04%, due 01/03/22 (Repurchase Amount $910,201, collateralized by various U.S. Government/U.S. Government Agency Obligations, 0.000%–6.500%, Market Value plus accrued interest $928,402, due 02/10/22–01/01/52) | 910,198 | 0.4 | ||||||||||
1,000,000 | (6) | MUFG Securities America Inc., Repurchase Agreement dated 12/31/21, 0.05%, due 01/03/22 (Repurchase Amount $1,000,004, collateralized by various U.S. Government/U.S. Government Agency Obligations, 2.500%–6.500%, Market Value plus accrued interest $1,020,000, due 05/20/24–10/01/51) | 1,000,000 | 0.5 | ||||||||||
| 1,000,000 | (6) | RBC Dominion Securities Inc., Repurchase Agreement dated 12/31/21, 0.05%, due 01/03/22 (Repurchase Amount $1,000,004, collateralized by various U.S. Government/U.S. Government Agency Obligations, 0.000%–6.500%, Market Value plus accrued interest $1,020,000, due 05/15/22–12/01/51) | 1,000,000 | 0.5 | ||||||||||
| Total Repurchase Agreements (Cost $3,910,198) | 3,910,198 | 1.9 | ||||||||||||
| Shares | Value | Percentage of Net Assets | ||||||||||||
|---|---|---|---|---|---|---|---|---|---|---|---|---|---|---|
SHORT-TERM INVESTMENTS: (continued) | ||||||||||||||
Mutual Funds: 0.9% | ||||||||||||||
| 1,862,452 | (7) | T. Rowe Price Government Reserve Fund, 0.070% (Cost $1,862,452) | $ | 1,862,452 | 0.9 | |||||||||
| Total Short-Term Investments (Cost $5,772,650) | 5,772,650 | 2.8 | ||||||||||||
Total Investments in Securities (Cost $163,760,606) | $ | 205,281,812 | 99.9 | |||||||||||
Assets in Excess of Other Liabilities | 247,761 | 0.1 | ||||||||||||
Net Assets | $ | 205,529,573 | 100.0 | |||||||||||
| † | Unless otherwise indicated, principal amount is shown in USD. | |
| ADR | American Depositary Receipt | |
| (1) | Securities with purchases pursuant to Rule 144A or section 4(a)(2), under the Securities Act of 1933 and may not be resold subject to that rule except to qualified institutional buyers. | |
| (2) | Non-income producing security. | |
| (3) | Security, or a portion of the security, is on loan. | |
| (4) | Restricted security as to resale, excluding Rule 144A securities. As of December 31, 2021, the Portfolio held restricted securities with a fair value of $695,485 or 0.3% of net assets. Please refer to the table below for additional details. | |
| (5) | Represents the asset to be received in a PIPE commitment. As of December 31, 2021, the total related cost for PIPE commitments held was $504,970. | |
| (6) | All or a portion of the security represents securities purchased with cash collateral received for securities on loan. | |
| (7) | Rate shown is the 7-day yield as of December 31, 2021. |
| Sector Diversification | Percentage of Net Assets | |||
|---|---|---|---|---|
| Financials | 16.4 | % | ||
| Information Technology | 15.9 | |||
| Health Care | 14.9 | |||
| Consumer Discretionary | 14.6 | |||
| Industrials | 10.3 | |||
| Consumer Staples | 10.2 | |||
| Communication Services | 8.0 | |||
| Materials | 4.4 | |||
| Utilities | 1.1 | |||
| Energy | 1.1 | |||
| Consumer, Cyclical | 0.2 | |||
| Short-Term Investments | 2.8 | |||
| Assets in Excess of Other Liabilities | 0.1 | |||
Net Assets | 100.0 | % | ||
| VY® T. ROWE PRICE INTERNATIONAL STOCK PORTFOLIO | PORTFOLIO OF INVESTMENTS AS OF DECEMBER 31, 2021 (CONTINUED) |
| Quoted Prices in Active Markets for Identical Investments (Level 1) | Significant Other Observable Inputs# (Level 2) | Significant Unobservable Inputs (Level 3) | Fair Value at December 31, 2021 | |||||||||||||||
|---|---|---|---|---|---|---|---|---|---|---|---|---|---|---|---|---|---|---|
| Asset Table | ||||||||||||||||||
| Investments, at fair value | ||||||||||||||||||
| Common Stock | ||||||||||||||||||
| Austria | $ | — | $ | 942,576 | $ | — | $ | 942,576 | ||||||||||
| Brazil | 3,302,281 | — | — | 3,302,281 | ||||||||||||||
| Canada | 12,718,804 | — | — | 12,718,804 | ||||||||||||||
| China | 4,970,769 | 9,557,174 | — | 14,527,943 | ||||||||||||||
| Denmark | — | 1,088,756 | — | 1,088,756 | ||||||||||||||
| France | — | 16,993,889 | — | 16,993,889 | ||||||||||||||
| Germany | — | 10,717,717 | — | 10,717,717 | ||||||||||||||
| Hong Kong | — | 3,498,181 | — | 3,498,181 | ||||||||||||||
| India | — | 9,957,620 | — | 9,957,620 | ||||||||||||||
| Indonesia | — | 4,018,130 | — | 4,018,130 | ||||||||||||||
| Italy | — | 2,893,293 | — | 2,893,293 | ||||||||||||||
| Japan | — | 30,135,467 | — | 30,135,467 | ||||||||||||||
| Netherlands | 1,663,933 | 17,470,215 | — | 19,134,148 | ||||||||||||||
| Philippines | 645,125 | — | — | 645,125 | ||||||||||||||
| Portugal | 2,674,844 | 2,237,911 | — | 4,912,755 | ||||||||||||||
| South Africa | 1,369,041 | 746,410 | — | 2,115,451 | ||||||||||||||
| South Korea | — | 7,906,219 | — | 7,906,219 | ||||||||||||||
| Spain | — | 1,735,488 | — | 1,735,488 | ||||||||||||||
| Sweden | 196,050 | 3,789,023 | — | 3,985,073 | ||||||||||||||
| Switzerland | — | 17,468,975 | — | 17,468,975 | ||||||||||||||
| Taiwan | — | 8,295,375 | — | 8,295,375 | ||||||||||||||
| Thailand | — | 1,219,028 | — | 1,219,028 | ||||||||||||||
| United Arab Emirates | 1,118,646 | — | — | 1,118,646 | ||||||||||||||
| United Kingdom | 4,060,044 | 12,895,535 | — | 16,955,579 | ||||||||||||||
| United States | 2,028,696 | 695,485 | — | 2,724,181 | ||||||||||||||
| Total Common Stock | 34,748,233 | 164,262,467 | — | 199,010,700 | ||||||||||||||
| Preferred Stock | — | 498,462 | — | 498,462 | ||||||||||||||
| Short-Term Investments | 1,862,452 | 3,910,198 | — | 5,772,650 | ||||||||||||||
| Total Investments, at fair value | $ | 36,610,685 | $ | 168,671,127 | $ | — | $ | 205,281,812 | ||||||||||
| Other Financial Instruments+ | ||||||||||||||||||
| Forward Foreign Currency Contracts | — | 66 | — | 66 | ||||||||||||||
| Total Assets | $ | 36,610,685 | $ | 168,671,193 | $ | — | $ | 205,281,878 | ||||||||||
| Liabilities Table | ||||||||||||||||||
| Other Financial Instruments+ | ||||||||||||||||||
| Forward Foreign Currency Contracts | $ | — | $ | (196 | ) | $ | — | $ | (196 | ) | ||||||||
| Total Liabilities | $ | — | $ | (196 | ) | $ | — | $ | (196 | ) | ||||||||
| ^ | See Note 2, “Significant Accounting Policies” in the Notes to Financial Statements for additional information. | |
| + | Other Financial Instruments may include open forward foreign currency contracts, futures, centrally cleared swaps, OTC swaps and written options. Forward foreign currency contracts, futures and centrally cleared swaps are fair valued at the unrealized appreciation (depreciation) on the instrument. OTC swaps and written options are valued at the fair value of the instrument. | |
| # | The earlier close of the foreign markets gives rise to the possibility that significant events, including broad market moves, may have occurred in the interim and may materially affect the value of those securities. To account for this, the Portfolio may frequently value many of its foreign equity securities using fair value prices based on third party vendor modeling tools to the extent available. Accordingly, a portion of the Portfolio’s investments are categorized as Level 2 investments. |
| Security | Acquisition Date | Acquisition Cost | Fair Value | |||||||||||
|---|---|---|---|---|---|---|---|---|---|---|---|---|---|---|
| Didi Global, Inc., Lockup Shares | 10/19/2015 | $ | 258,547 | $ | 182,152 | |||||||||
| Investindustrial Acquisition Corp. (Issuer) — Ermenegildo Zegna Group — PIPE | 7/19/2021 | 504,970 | 513,333 | |||||||||||
| $ | 763,517 | $ | 695,485 | |||||||||||
| VY® T. ROWE PRICE INTERNATIONAL STOCK PORTFOLIO | PORTFOLIO OF INVESTMENTS AS OF DECEMBER 31, 2021 (CONTINUED) |
| Currency Purchased | Currency Sold | Counterparty | Settlement Date | Unrealized Appreciation (Depreciation) | |||||||
|---|---|---|---|---|---|---|---|---|---|---|---|
| HKD 86,248 | USD 11,062 | The Bank of New York Mellon | 01/03/22 | $ | (1 | ) | |||||
| HKD 171,842 | USD 22,040 | The Bank of New York Mellon | 01/03/22 | (3 | ) | ||||||
| USD 5,705 | HKD 44,478 | The Bank of New York Mellon | 01/03/22 | 1 | |||||||
| USD 2,586 | DKK 17,021 | The Bank of New York Mellon | 01/03/22 | (20 | ) | ||||||
| USD 6,447 | DKK 42,279 | The Bank of New York Mellon | 01/03/22 | (25 | ) | ||||||
| USD 3,622 | GBP 2,684 | The Bank of New York Mellon | 01/04/22 | (11 | ) | ||||||
| USD 18,159 | DKK 119,377 | The Bank of New York Mellon | 01/04/22 | (116 | ) | ||||||
| USD 4,057 | GBP 3,004 | The Bank of New York Mellon | 01/04/22 | (9 | ) | ||||||
| JPY 1,003,665 | USD 8,736 | The Bank of New York Mellon | 01/04/22 | (11 | ) | ||||||
| JPY 4,508,638 | USD 39,153 | The Bank of New York Mellon | 01/05/22 | 43 | |||||||
| USD 3,861 | GBP 2,858 | The Bank of New York Mellon | 01/05/22 | 8 | |||||||
| USD 6,293 | GBP 4,659 | The Bank of New York Mellon | 01/05/22 | 14 | |||||||
| $ | (130 | ) | |||||||||
| Currency Abbreviations | ||
| DKK | — Danish Krone | |
| GBP | — British Pound | |
| HKD | — Hong Kong Sar Dollar | |
| JPY | — Japanese Yen | |
| USD | — United States Dollar | |
| Derivatives not accounted for as hedging instruments | Location on Statement of Assets and Liabilities | Fair Value | |||||
|---|---|---|---|---|---|---|---|
| Asset Derivatives | |||||||
| Foreign exchange contracts | Unrealized appreciation on forward foreign currency contracts | $ | 66 | ||||
Total Asset Derivatives | $ | 66 | |||||
Liability Derivatives | |||||||
| Foreign exchange contracts | Unrealized depreciation on forward foreign currency contracts | $ | 196 | ||||
Total Liability Derivatives | $ | 196 | |||||
| Amount of Realized Gain or (Loss) on Derivatives Recognized in Income | |||||||||||||||
|---|---|---|---|---|---|---|---|---|---|---|---|---|---|---|---|
| Derivatives not accounted for as hedging instruments | Forward foreign currency contracts | Written Options | Total | ||||||||||||
| Equity contracts | $ | — | $ | 42,773 | $ | 42,773 | |||||||||
| Foreign exchange contracts | 7,224 | — | 7,224 | ||||||||||||
Total | $ | 7,224 | $ | 42,773 | $ | 49,997 | |||||||||
| Change in Unrealized Appreciation or (Depreciation) on Derivatives Recognized in Income | |||||||||||||||
|---|---|---|---|---|---|---|---|---|---|---|---|---|---|---|---|
| Derivatives not accounted for as hedging instruments | Forward foreign currency contracts | Written options | Total | ||||||||||||
| Equity contracts | $ | — | $ | 13,793 | $ | 13,793 | |||||||||
| Foreign exchange contracts | 137 | — | 137 | ||||||||||||
Total | $ | 137 | $ | 13,793 | $ | 13,930 | |||||||||
| VY® T. ROWE PRICE INTERNATIONAL STOCK PORTFOLIO | PORTFOLIO OF INVESTMENTS AS OF DECEMBER 31, 2021 (CONTINUED) |
The following is a summary by counterparty of the fair value of OTC derivative instruments subject to Master Netting Agreements and collateral pledged (received), if any, at December 31, 2021:
| The Bank of New York Mellon | Totals | |||||||||
|---|---|---|---|---|---|---|---|---|---|---|
Assets: | ||||||||||
| Forward foreign currency contracts | $ | 66 | $ | 66 | ||||||
Total Assets | $ | 66 | $ | 66 | ||||||
Liabilities: | ||||||||||
| Forward foreign currency contracts | $ | 196 | $ | 196 | ||||||
Total Liabilities | $ | 196 | $ | 196 | ||||||
Net OTC derivative instruments by counterparty, at fair value | $ | (130 | ) | (130 | ) | |||||
Total collateral pledged by the Portfolio/(Received from counterparty) | $ | — | $ | — | ||||||
Net Exposure(1) | $ | (130 | ) | $ | (130 | ) | ||||
(1) | Positive net exposure represents amounts due from each respective counterparty. Negative exposure represents amounts due from the Portfolio. Please refer to Note 2 for additional details regarding counterparty credit risk and credit related contingent features. |
At December 31, 2021, the aggregate cost of securities and other investments and the composition of unrealized appreciation and depreciation of securities and other investments on a tax basis were:
| Cost for federal income tax purposes was $164,727,379. | ||||
| Net unrealized appreciation consisted of: | ||||
| Gross Unrealized Appreciation | $ | 51,853,817 | ||
| Gross Unrealized Depreciation | (10,980,876 | ) | ||
| Net Unrealized Appreciation | $ | 40,872,941 | ||
| Portfolio Name | Type | Per Share Amount | ||||||
|---|---|---|---|---|---|---|---|---|
| Voya Government Liquid Assets Portfolio | ||||||||
| Class I | NII | $ | — | |||||
| Class S | NII | $ | — | |||||
| Class S2 | NII | $ | — | |||||
| All Classes | STCG | $ | 0.0003 | |||||
VY® Clarion Global Real Estate Portfolio | ||||||||
| Class ADV | NII | $ | 0.2931 | |||||
| Class I | NII | $ | 0.3576 | |||||
| Class S | NII | $ | 0.3296 | |||||
| Class S2 | NII | $ | 0.3137 | |||||
VY® Invesco Growth and Income Portfolio | ||||||||
| Class ADV | NII | $ | 0.2648 | |||||
| Class I | NII | $ | 0.3816 | |||||
| Class S | NII | $ | 0.3304 | |||||
| Class S2 | NII | $ | 0.2956 | |||||
VY® JPMorgan Emerging Markets Equity Portfolio | ||||||||
| Class ADV | NII | $ | — | |||||
| Class I | NII | $ | — | |||||
| Class S | NII | $ | — | |||||
| Class S2 | NII | $ | — | |||||
| All Classes | STCG | $ | 0.0711 | |||||
| All Classes | LTCG | $ | 1.9078 | |||||
VY® Morgan Stanley Global Franchise Portfolio | ||||||||
| Class ADV | NII | $ | 0.0854 | |||||
| Class R6 | NII | $ | 0.1757 | |||||
| Class S | NII | $ | 0.1280 | |||||
| Class S2 | NII | $ | 0.1021 | |||||
| All Classes | STCG | $ | 0.0211 | |||||
| All Classes | LTCG | $ | 1.5914 | |||||
| Portfolio Name | Type | Per Share Amount | ||||||
|---|---|---|---|---|---|---|---|---|
VY® T. Rowe Price Capital Appreciation Portfolio | ||||||||
| Class ADV | NII | $ | 0.1647 | |||||
| Class I | NII | $ | 0.3349 | |||||
| Class R6 | NII | $ | 0.3349 | |||||
| Class S | NII | $ | 0.2541 | |||||
| Class S2 | NII | $ | 0.2023 | |||||
| All Classes | STCG | $ | 0.9779 | |||||
| All Classes | LTCG | $ | 3.0134 | |||||
VY® T. Rowe Price Equity Income Portfolio | ||||||||
| Class ADV | NII | $ | 0.1449 | |||||
| Class I | NII | $ | 0.2116 | |||||
| Class S | NII | $ | 0.1821 | |||||
| Class S2 | NII | $ | 0.1653 | |||||
| All Classes | LTCG | $ | 0.1851 | |||||
VY® T. Rowe Price International Stock Portfolio | ||||||||
| Class ADV | NII | $ | 0.0657 | |||||
| Class I | NII | $ | 0.1578 | |||||
| Class S | NII | $ | 0.1149 | |||||
| All Classes | LTCG | $ | 0.4647 | |||||
NII — Net investment income
STCG — Short-term capital gain
LTCG — Long-term capital gain
VY® Invesco Growth and Income Portfolio | 99.99% | |||||||
VY® JPMorgan Emerging Markets Equity Portfolio | 1.52% | |||||||
VY® Morgan Stanley Global Franchise Portfolio | 100.00% | |||||||
VY® T. Rowe Price Capital Appreciation Portfolio | 18.89% | |||||||
VY® T. Rowe Price Equity Income Portfolio | 84.32% | |||||||
VY® T. Rowe Price International Stock Portfolio | 10.56% |
VY® JPMorgan Emerging Markets Equity Portfolio | $ | 38,566,775 | ||||
VY® Morgan Stanley Global Franchise Portfolio | $ | 35,902,020 | ||||
VY® T. Rowe Price Capital Appreciation Portfolio | $ | 741,272,726 | ||||
VY® T. Rowe Price Equity Income Portfolio | $ | 6,151,666 | ||||
VY® T. Rowe Price International Stock Portfolio | $ | 5,565,318 |
| Creditable Foreign Taxes Paid | Per Share Amount | Portion of Ordinary Income Distribution Derived from Foreign Sourced Income* | ||||||||||
|---|---|---|---|---|---|---|---|---|---|---|---|---|
VY® JPMorgan Emerging Markets Equity Portfolio | $927,700 | $0.0461 | 70.59% | |||||||||
VY® T. Rowe Price International Stock Portfolio | $330,736 | $0.0284 | 53.78% | |||||||||
| * | None of the Portfolios listed above derived any income from ineligible foreign sources as defined under Section 901(j) of the Internal Revenue Code. |
| Name, Address and Age | Position(s) Held with the Trust | Term of Office and Length of Time Served(1) | Principal Occupation(s) — During the Past 5 Years | Number of funds in Fund Complex Overseen by Trustee(2) | Other Board Positions Held by Trustee | |||||
|---|---|---|---|---|---|---|---|---|---|---|
Independent Trustees: | ||||||||||
Colleen D. Baldwin 7337 East Doubletree Ranch Rd. Suite 100 Scottsdale, Arizona 85258 Age: 61 | Trustee Chairperson | November 2007–Present January 2020–Present | President, Glantuam Partners, LLC, a business consulting firm (January 2009–Present). | 131 | Dentaquest (February 2014–Present); RSR Partners, Inc. (2016–Present). | |||||
John V. Boyer 7337 East Doubletree Ranch Rd. Suite 100 Scottsdale, Arizona 85258 Age: 68 | Trustee | January 2005–Present | Retired. Formerly, President and Chief Executive Officer, Bechtler Arts Foundation, an arts and education foundation (January 2008–December 2019). | 131 | None. | |||||
Patricia W. Chadwick 7337 East Doubletree Ranch Rd. Suite 100 Scottsdale, Arizona 85258 Age: 73 | Trustee | January 2006–Present | Consultant and President, Ravengate Partners LLC, a consulting firm that provides advice regarding financial markets and the global economy (January 2000–Present). | 131 | Wisconsin Energy Corporation (June 2006–Present); The Royce Funds (22 funds) (December 2009–Present); and AMICA Mutual Insurance Company (1992–Present). | |||||
Martin J. Gavin 7337 East Doubletree Ranch Rd. Suite 100 Scottsdale, AZ 85258 Age: 71 | Trustee | August 2015–Present | Retired. | 131 | None. | |||||
Joseph E. Obermeyer 7337 East Doubletree Ranch Rd. Suite 100 Scottsdale, Arizona 85258 Age: 64 | Trustee | May 2013–Present | President, Obermeyer & Associates, Inc., a provider of financial and economic consulting services (November 1999–Present). | 131 | None. | |||||
Sheryl K. Pressler 7337 East Doubletree Ranch Rd. Suite 100 Scottsdale, Arizona 85258 Age: 71 | Trustee | January 2006–Present | Consultant (May 2001–Present). | 131 | Centerra Gold Inc. (May 2008–Present). | |||||
Christopher P. Sullivan 7337 East Doubletree Ranch Rd. Suite 100 Scottsdale, Arizona 85258 Age: 68 | Trustee | October 2015–Present | Retired. | 131 | None. | |||||
Trustee who is an “interested person”: | ||||||||||
Dina Santoro 230 Park Avenue New York, New York 10169 Age: 48 | Trustee | July 2018–Present | President, Voya Investments, LLC and Voya Capital, LLC (March 2018–Present); Senior Vice President, Voya Investments Distributor, LLC (April 2018–Present); Chief Operating Officer and Senior Managing Director, Voya Investment Management (January 2022–Present). Formerly, Senior Managing Director, Head of Product and Marketing Strategy, Voya Investment Management (September 2017–January 2022); Managing Director, Quantitative Management Associates, LLC (January 2004–August 2017). | 131 | Voya Investments, LLC, Voya Capital, LLC, and Voya Funds Services, LLC (March 2018–Present); Voya Investments Distributor, LLC (April 2018–Present). | |||||
(1) | Trustees serve until their successors are duly elected and qualified. The tenure of each Trustee who is not an “interested person” as defined in the 1940 Act, of each Portfolio (“Independent Trustee”) is subject to the Board’s retirement policy which states that each duly elected or appointed Independent Trustee shall retire from and cease to be a member of the Board of Trustees at the close of business on December 31 of the calendar year in which the Independent Trustee attains the age of 75. A majority vote of the Board’s other Independent Trustees may extend the retirement |
| date of an Independent Trustee if the retirement would trigger a requirement to hold a meeting of shareholders of the Trust under applicable law, whether for the purposes of appointing a successor to the Independent Trustee or otherwise comply under applicable law, in which case the extension would apply until such time as the shareholder meeting can be held or is no longer required (as determined by a vote of a majority of the other Independent Trustees). | ||
(2) | For the purposes of this table, “Fund Complex” means the Voya family of funds including the following investment companies: Voya Asia Pacific High Dividend Equity Income Fund; Voya Balanced Portfolio, Inc.; Voya Emerging Markets High Dividend Equity Fund; Voya Equity Trust; Voya Funds Trust; Voya Global Advantage and Premium Opportunity Fund; Voya Global Equity Dividend and Premium Opportunity Fund; Voya Government Money Market Portfolio; Voya Infrastructure, Industrials and Materials Fund; Voya Intermediate Bond Portfolio; Voya Investors Trust; Voya Mutual Funds; Voya Partners, Inc.; Voya Senior Income Fund; Voya Separate Portfolios Trust; Voya Strategic Allocation Portfolios, Inc.; Voya Variable Funds; Voya Variable Insurance Trust; Voya Variable Portfolios, Inc.; and Voya Variable Products Trust. The number of funds in the Fund Complex is as of January 31, 2022. |
| Name, Address and Age | Position(s) Held With the Trust | Term of Office and Length of Time Served(1) | Principal Occupation(s) — During the Past 5 Years | |||
|---|---|---|---|---|---|---|
Michael Bell One Orange Way Windsor, Connecticut 06095 Age: 53 | Chief Executive Officer | March 2018–Present | Chief Executive Officer and Director, Voya Investments, LLC, Voya Capital, LLC, and Voya Funds Services, LLC (March 2018–Present); Senior Vice President, Voya Investments Distributor, LLC (March 2020–Present); Chief Financial Officer, Voya Investment Management (September 2014–Present). Formerly, Senior Vice President and Chief Financial Officer, Voya Investments Distributor, LLC (September 2019–March 2020); Senior Vice President and Treasurer, Voya Investments Distributor, LLC (November 2015–September 2019); Senior Vice President, Chief Financial Officer and Treasurer, Voya Investments, LLC (November 2015–March 2018). | |||
Dina Santoro 230 Park Avenue New York, New York 10169 Age: 48 | President | March 2018–Present | President and Director, Voya Investments, LLC and Voya Capital, LLC (March 2018–Present); Director, Voya Funds Services, LLC (March 2018–Present); Director and Senior Vice President, Voya Investments Distributor, LLC (April 2018–Present); Chief Operating Officer and Senior Managing Director, Voya Investment Management (January 2022–Present). Formerly, Senior Managing Director, Head of Product and Marketing Strategy, Voya Investment Management (September 2017–January 2022); Managing Director, Quantitative Management Associates, LLC (January 2004–August 2017). | |||
Jonathan Nash 230 Park Avenue New York, New York 10169 Age: 54 | Executive Vice President Chief Investment Risk Officer | March 2020–Present March 2020–Present | Executive Vice President and Chief Investment Risk Officer, Voya Investments, LLC (March 2020–Present and Senior Vice President, Investment Risk Management, Voya Investment Management (March 2017–Present). Formerly, Vice President, Voya Investments, LLC (September 2018–March 2020); Consultant, DA Capital LLC (January 2016–March 2017). | |||
James M. Fink 5780 Powers Ferry Road NW Atlanta, Georgia 30327 Age: 63 | Executive Vice President | March 2018–Present | Managing Director, Voya Investments, LLC, Voya Capital, LLC, and Voya Funds Services, LLC (March 2018–Present); Senior Vice President, Voya Investments Distributor, LLC (April 2018–Present); Chief Administrative Officer, Voya Investment Management (September 2017–Present). Formerly, Managing Director, Operations, Voya Investment Management (March 1999–September 2017). | |||
Kevin M. Gleason 7337 East Doubletree Ranch Rd. Suite 100 Scottsdale, Arizona 85258 Age: 55 | Chief Compliance Officer | February 2012–Present | Senior Vice President, Voya Investment Management and Chief Compliance Officer, Voya Family of Funds (February 2012–Present). | |||
Todd Modic 7337 East Doubletree Ranch Rd. Suite 100 Scottsdale, Arizona 85258 Age: 54 | Senior Vice President, Chief/Principal Financial Officer and Assistant Secretary | March 2005–Present | President, Voya Funds Services, LLC (March 2018–Present) and Senior Vice President, Voya Investments, LLC (April 2005–Present). | |||
Kimberly A. Anderson 7337 East Doubletree Ranch Rd. Suite 100 Scottsdale, Arizona 85258 Age: 57 | Senior Vice President | November 2003–Present | Senior Vice President, Voya Investments, LLC (September 2003–Present). | |||
Micheline S. Faver 7337 East Doubletree Ranch Rd. Suite 100 Scottsdale, Arizona 85258 Age: 44 | Senior Vice President | September 2020–Present | Senior Vice President, Head of Fund Compliance and Chief Compliance Officer, Voya Investments, LLC (March 2021–Present). Formerly, Vice President, Head of Fund Compliance and Chief Compliance Officer, Voya Investments, LLC (June 2016–March 2021). |
| Name, Address and Age | Position(s) Held With the Trust | Term of Office and Length of Time Served(1) | Principal Occupation(s) — During the Past 5 Years | |||
|---|---|---|---|---|---|---|
Robert Terris 5780 Powers Ferry Road NW Atlanta, Georgia 30327 Age: 51 | Senior Vice President | May 2006–Present | Senior Vice President, Voya Investments Distributor, LLC (April 2018–Present); Senior Vice President, Head of Investment Services, Voya Investments, LLC (April 2018–Present) and Voya Funds Services, LLC (March 2006–Present). Formerly, Senior Vice President, Head of Division Operations, Voya Investments, LLC (October 2015–April 2018). | |||
Fred Bedoya 7337 East Doubletree Ranch Rd. Suite 100 Scottsdale, Arizona 85258 Age: 49 | Vice President Treasurer | September 2012–Present | Vice President, Voya Investments, LLC (October 2015–Present) and Voya Funds Services, LLC (July 2012–Present). | |||
Maria M. Anderson 7337 East Doubletree Ranch Rd. Suite 100 Scottsdale, Arizona 85258 Age: 63 | Vice President | September 2004–Present | Vice President, Voya Investments, LLC (October 2015–Present) and Voya Funds Services, LLC (September 2004–Present). | |||
Sara M. Donaldson 7337 East Doubletree Ranch Rd. Suite 100 Scottsdale, Arizona 85258 Age: 62 | Vice President | September 2014–Present | Vice President, Voya Investments, LLC (October 2015–Present). | |||
Robyn L. Ichilov 7337 East Doubletree Ranch Rd. Suite 100 Scottsdale, Arizona 85258 Age: 54 | Vice President | November 1999–Present | Vice President, Voya Funds Services, LLC (November 1995–Present) and Voya Investments, LLC (August 1997–Present). | |||
Jason Kadavy 7337 East Doubletree Ranch Rd. Suite 100 Scottsdale, Arizona 85258 Age: 45 | Vice President | September 2012–Present | Vice President, Voya Investments, LLC (October 2015–Present) and Voya Funds Services, LLC (July 2007–Present). | |||
Andrew K. Schlueter 7337 East Doubletree Ranch Rd. Suite 100 Scottsdale, Arizona 85258 Age: 45 | Vice President | March 2018–Present | Vice President, Voya Investments Distributor, LLC (April 2018–Present); Vice President, Voya Investments, LLC and Voya Funds Services, LLC (March 2018–Present); Vice President, Head of Mutual Fund Operations, Voya Investment Management (February 2018–Present). Formerly, Vice President, Voya Investment Management (March 2014–February 2018). | |||
Craig Wheeler 7337 East Doubletree Ranch Rd. Suite 100 Scottsdale, Arizona 85258 Age: 52 | Vice President | May 2013–Present | Vice President–Director of Tax, Voya Investments, LLC (October 2015–Present). | |||
Monia Piacenti One Orange Way Windsor, Connecticut 06095 Age: 45 | Anti-Money Laundering Officer | June 2018–Present | Anti-Money Laundering Officer, Voya Investments Distributor, LLC, Voya Investment Management and Voya Investment Management Trust Co. (June 2018–Present); Compliance Consultant, Voya Financial, Inc. (January 2019–Present). Formerly, Senior Compliance Officer, Voya Investment Management (December 2009–December 2018). | |||
Joanne F. Osberg 7337 East Doubletree Ranch Rd. Suite 100 Scottsdale, Arizona 85258 Age: 40 | Secretary | September 2020–Present | Vice President and Senior Counsel, Voya Investment Management — Mutual Fund Legal Department (September 2020–Present). Formerly, Vice President, Counsel, Voya Investment Management — Mutual Fund Legal Department (January 2013–September 2020). | |||
Paul A. Caldarelli 7337 East Doubletree Ranch Rd. Suite 100 Scottsdale, Arizona 85258 Age: 70 | Assistant Secretary | June 2010–Present | Vice President and Senior Counsel, Voya Investment Management — Mutual Fund Legal Department (March 2010–Present). |
(1) | The Officers hold office until the next annual meeting of the Board of Trustees and until their successors shall have been elected and qualified. |
Investment Adviser Voya Investments, LLC 7337 East Doubletree Ranch Road, Suite 100 Scottsdale, Arizona 85258
Distributor Voya Investments Distributor, LLC 7337 East Doubletree Ranch Road, Suite 100 Scottsdale, Arizona 85258
Transfer Agent BNY Mellon Investment Servicing (U.S.) Inc. 301 Bellevue Parkway Wilmington, Delaware 19809 | Independent Registered Public Accounting Firm Ernst & Young LLP 200 Clarendon Street Boston, Massachusetts 02116
Custodian The Bank of New York Mellon 225 Liberty Street New York, New York 10286
Legal Counsel Ropes & Gray LLP Prudential Tower 800 Boylston Street Boston, Massachusetts 02199 |
Before investing, carefully consider the investment objectives, risks, charges and expenses of the variable annuity contract or variable life insurance policy and the underlying variable investment options. This and other information is contained in the prospectus for the variable annuity contract or variable life insurance policy and the underlying variable investment options. Obtain these prospectuses from your agent/registered representative and read them carefully before investing.
RETIREMENT | INVESTMENTS | INSURANCE | |
| VPAR-VIT1AISS2 (1221-022322) |
![[MISSING IMAGE: ing_cov.jpg]](https://capedge.com/proxy/N-CSR/0001104659-22-030437/ing_cov.jpg)
| | ■ Voya Balanced Income Portfolio | | | ■ Voya Limited Maturity Bond Portfolio | |
| | ■ Voya High Yield Portfolio | | | ■ Voya U.S. Stock Index Portfolio | |
| | ■ Voya Large Cap Growth Portfolio | | | ■ VY® Clarion Real Estate Portfolio | |
| | ■ Voya Large Cap Value Portfolio | | | ■ VY® JPMorgan Small Cap Core Equity Portfolio | |
| | | As permitted by regulations adopted by the U.S. Securities and Exchange Commission, paper copies of each portfolio’s annual and semi-annual shareholder reports, like this annual report, are not sent by mail, unless you specifically request paper copies of the reports. Instead, the reports will be made available on a website and you will be notified by mail each time a report is posted and provided with a website link to access the report. | | |
| | | If you already elected to receive shareholder reports electronically, you need not take any action. You may elect to receive shareholder reports and other communications from your insurance carrier electronically by contacting them directly. | | |
| | | You may elect to receive all future reports in paper free of charge. If you received this document in the mail, please follow the instructions provided to elect to continue receiving paper copies of your shareholder reports. You can inform us that you wish to continue receiving paper copies by calling 1-866-345-5954. Your election to receive reports in paper will apply to all the funds in which you invest. | | |
| | | This report is submitted for general information to shareholders of the Voya mutual funds. It is not authorized for distribution to prospective shareholders unless accompanied or preceded by a prospectus which includes details regarding the funds’ investment objectives, risks, charges, expenses and other information. This information should be read carefully. | | |
![[MISSING IMAGE: voya_covinvmgt.jpg]](https://capedge.com/proxy/N-CSR/0001104659-22-030437/voya_covinvmgt.jpg)
| | | | | | 1 | | | |
| | | | | | 3 | | | |
| | | | | | 20 | | | |
| | | | | | 22 | | | |
| | | | | | 23 | | | |
| | | | | | 27 | | | |
| | | | | | 29 | | | |
| | | | | | 33 | | | |
| | | | | | 40 | | | |
| | | | | | 60 | | | |
| | | | | | 154 | | | |
| | | | | | 156 | | | |
| | | | | | 157 | | | |
| | | | | | 162 | | |
![[MISSING IMAGE: ph_dinasantoro-bw.jpg]](https://capedge.com/proxy/N-CSR/0001104659-22-030437/ph_dinasantoro-bw.jpg)
President
Voya Family of Funds
January 21, 2022
| | | Index | | | | Description | | |
| | | Bloomberg High Yield Bond — 2% Issuer Constrained Composite Index | | | | An index that includes all fixed-income securities having a maximum quality rating of Ba1, a minimum amount outstanding of $150 million, and at least one year to maturity. | | |
| | | Bloomberg U.S. 1-3 Year Government/Credit Bond Index | | | | A widely recognized index of publicly issued fixed rate, investment grade debt securities, including Treasuries, Agencies and credit securities with a maturity of one to three years. | | |
| | | Bloomberg U.S. Aggregate Bond Index (“Bloomberg U.S. Aggregate Bond”) | | | | An index of publicly issued investment grade U.S. government, mortgage-backed, asset-backed and corporate debt securities. | | |
| | | MSCI Europe, Australasia and Far East® (“MSCI EAFE®”) Index | | | | An index that measures the performance of securities listed on exchanges in Europe, Australasia and the Far East. It includes the reinvestment of dividends net of withholding taxes, but does not reflect fees, brokerage commissions or other expenses of investing. | | |
| | | MSCI U.S. REIT® Index | | | | A free float-adjusted market capitalization weighted index that is comprised of equity real estate investment trusts that are included in the MSCI U.S. Investable Market 2500 Index (with the exception of specialty REITs that do not generate a majority of their revenue and income from real estate rental and leasing obligations). The index represents approximately 85% of the U.S. REIT market. | | |
| | | Russell 1000® Index | | | | A comprehensive large-cap index measuring the performance of the largest 1,000 U.S. incorporated companies. | | |
| | | Russell 1000® Growth Index | | | | Measures the performance of the 1,000 largest companies in the Russell 3000® Index with higher price-to-book ratios and higher forecasted growth. | | |
| | | Russell 1000® Value Index | | | | An index that measures the performance of those Russell 1000® securities with lower price-to-book ratios and lower forecasted growth values. | | |
| | | Russell 2000® Index | | | | An index that measures the performance of securities of small U.S. companies. | | |
| | | S&P 500® Index | | | | An index that measures the performance of securities of approximately 500 large-capitalization companies whose securities are traded on major U.S. stock markets. | | |
| Portfolio Managers’ Report | Voya Balanced Income Portfolio |
| | Investment Type Allocation as of December 31, 2021 (as a percentage of net assets) | | |||
| | | | | | |
| | Common Stock | | | 44.6% | |
| | Collateralized Mortgage Obligations | | | 12.0% | |
| | Asset-Backed Securities | | | 9.9% | |
| | Mutual Funds | | | 9.8% | |
| | Commercial Mortgage-Backed Securities | | | 9.6% | |
| | Corporate Bonds/Notes | | | 7.6% | |
| | U.S. Treasury Obligations | | | 2.6% | |
| | Sovereign Bonds | | | 1.5% | |
| | Exchange-Traded Funds | | | 0.8% | |
| | Preferred Stock | | | 0.2% | |
| | Purchased Options* | | | 0.0% | |
| | Assets in Excess of Other Liabilities** | | | 1.4% | |
| | Net Assets | | | 100.0% | |
| | * Amount is less than 0.05%. | | |||
| | ** Includes short-term investments and exchange-traded funds. | | |||
| | Portfolio holdings are subject to change daily. | | |||
| | Top Ten Holdings as of December 31, 2021 (as a percentage of net assets) | | |||
| | | | | | |
| | Voya Floating Rate Fund - Class P | | | 8.5% | |
| | Microsoft Corp. | | | 1.6% | |
| | United States Treasury Note, 1.000%, 12/15/24 | | | 1.2% | |
| | Apple, Inc. | | | 1.2% | |
| | Amazon.com, Inc. | | | 1.0% | |
| | JP Morgan Chase Commercial Mortgage Securities Corp. 2021-MHC E, 2.560%, 04/15/38 | | | 0.9% | |
| | Alphabet, Inc. - Class A | | | 0.8% | |
| | Voya High Yield Bond Fund - Class P | | | 0.7% | |
| | Johnson & Johnson | | | 0.7% | |
| | iShares Russell 1000 Value ETF | | | 0.7% | |
| | Portfolio holdings are subject to change daily. | | |||
| Voya Balanced Income Portfolio | Portfolio Managers’ Report |
| | | ![[MISSING IMAGE: tm222386d8-lc_fibw.jpg]](https://capedge.com/proxy/N-CSR/0001104659-22-030437/tm222386d8-lc_fibw.jpg) | | |
| | | Average Annual Total Returns for the Periods Ended December 31, 2021 | | | |||||||||||||||
| | | | | | 1 Year | | | 5 Year | | | 10 Year | | | ||||||
| | | Class ADV | | | | | 8.65% | | | | | | 6.52% | | | | 7.06% | | |
| | | Class I | | | | | 9.42% | | | | | | 7.16% | | | | 7.70% | | |
| | | Class S | | | | | 9.09% | | | | | | 6.88% | | | | 7.45% | | |
| | | Class S2 | | | | | 8.88% | | | | | | 6.73% | | | | 7.29% | | |
| | | 60% Bloomberg U.S. Aggregate Bond Index/30% Russell 1000® Index/10% MSCI EAFE® Index | | | | | 7.64% | | | | | | 8.77% | | | | 7.61% | | |
| | | Bloomberg U.S. Aggregate Bond | | | | | -1.54% | | | | | | 3.57% | | | | 2.90% | | |
| | | Russell 1000® Index | | | | | 26.45% | | | | | | 18.43% | | | | 16.54% | | |
| | | MSCI EAFE® | | | | | 11.26% | | | | | | 9.55% | | | | 8.03% | | |
| | | | | | |||||||||||||||
| Portfolio Managers’ Report | Voya High Yield Portfolio |
| | Investment Type Allocation as of December 31, 2021 (as a percentage of net assets) | | |||
| | | | | | |
| | Corporate Bonds/Notes | | | 94.7% | |
| | Bank Loans | | | 1.1% | |
| | Common Stock | | | 0.5% | |
| | Convertible Bonds/Notes | | | 0.1% | |
| | Assets in Excess of Other Liabilities* | | | 3.6% | |
| | Net Assets | | | 100.0% | |
| | * Includes short-term investments. | | |||
| | Portfolio holdings are subject to change daily. | | |||
| | Top Ten Holdings as of December 31, 2021* (as a percentage of net assets) | | |||
| | | | | | |
| | Occidental Petroleum Corp., 6.625%, 09/01/30 | | | 0.7% | |
| | Sprint Corp., 7.125%, 06/15/24 | | | 0.6% | |
| | HCA, Inc., 5.375%, 02/01/25 | | | 0.6% | |
| | Occidental Petroleum Corp., 4.200%, 03/15/48 | | | 0.5% | |
| | Bausch Health Americas, Inc., 8.500%, 01/31/27 | | | 0.5% | |
| | Southeastern Grocers, Inc. | | | 0.5% | |
| | CCO Holdings LLC / CCO Holdings Capital Corp., 4.500%, 05/01/32 | | | 0.5% | |
| | EnLink Midstream LLC, 5.375%, 06/01/29 | | | 0.4% | |
| | Univision Communications, Inc., 6.625%, 06/01/27 | | | 0.5% | |
| | CCO Holdings LLC / CCO Holdings Capital Corp., 5.125%, 05/01/27 | | | 0.4% | |
| | * Excludes short-term investments. | | |||
| | Portfolio holdings are subject to change daily. | | |||
| Voya High Yield Portfolio | Portfolio Managers’ Report |
| | | ![[MISSING IMAGE: tm222386d8-lc_hybw.jpg]](https://capedge.com/proxy/N-CSR/0001104659-22-030437/tm222386d8-lc_hybw.jpg) | | |
| | | Average Annual Total Returns for the Periods Ended December 31, 2021 | | | |||||||||||||||
| | | | | | 1 Year | | | 5 Year | | | 10 Year | | | ||||||
| | | Class ADV | | | | | 4.65% | | | | | | 5.25% | | | | 5.67% | | |
| | | Class I | | | | | 5.28% | | | | | | 5.89% | | | | 6.31% | | |
| | | Class S | | | | | 5.01% | | | | | | 5.61% | | | | 6.04% | | |
| | | Class S2 | | | | | 4.86% | | | | | | 5.45% | | | | 5.88% | | |
| | | Bloomberg High Yield Bond - 2% Issuer Constrained Composite Index | | | | | 5.26% | | | | | | 6.28% | | | | 6.82% | | |
| | | | | | |||||||||||||||
| Portfolio Managers’ Report | Voya Large Cap Growth Portfolio |
| | Sector Diversification as of December 31, 2021 (as a percentage of net assets) | | |||
| | | | | | |
| | Information Technology | | | 45.7% | |
| | Consumer Discretionary | | | 19.5% | |
| | Communication Services | | | 9.7% | |
| | Health Care | | | 8.3% | |
| | Industrials | | | 6.9% | |
| | Consumer Staples | | | 3.9% | |
| | Financials | | | 2.1% | |
| | Real Estate | | | 1.5% | |
| | Materials | | | 1.1% | |
| | Energy | | | 0.7% | |
| | Assets in Excess of Other Liabilities* | | | 0.6% | |
| | Net Assets | | | 100.0% | |
| | * Includes short-term investments. | | |||
| | Portfolio holdings are subject to change daily. | | |||
| | Top Ten Holdings as of December 31, 2021 (as a percentage of net assets) | | |||
| | | | | | |
| | Microsoft Corp. | | | 9.3% | |
| | Apple, Inc. | | | 8.2% | |
| | Amazon.com, Inc. | | | 7.0% | |
| | Alphabet, Inc. - Class A | | | 5.6% | |
| | Nvidia Corp. | | | 3.6% | |
| | Adobe, Inc. | | | 3.4% | |
| | Intuit, Inc. | | | 3.3% | |
| | Eli Lilly & Co. | | | 3.1% | |
| | Advanced Micro Devices, Inc. | | | 2.6% | |
| | Marvell Technology, Inc. | | | 2.6% | |
| | Portfolio holdings are subject to change daily. | | |||
| Voya Large Cap Growth Portfolio | Portfolio Managers’ Report |
| | | ![[MISSING IMAGE: tm222386d8-lc_lcgbw.jpg]](https://capedge.com/proxy/N-CSR/0001104659-22-030437/tm222386d8-lc_lcgbw.jpg) | | |
| | | Average Annual Total Returns for the Periods Ended December 31, 2021 | | | |||||||||||||||
| | | | | | 1 Year | | | 5 Year | | | 10 Year | | | ||||||
| | | Class ADV | | | | | 18.89% | | | | | | 20.85% | | | | 17.16% | | |
| | | Class I | | | | | 19.55% | | | | | | 21.57% | | | | 17.83% | | |
| | | Class R6(1) | | | | | 19.58% | | | | | | 21.58% | | | | 17.84% | | |
| | | Class S | | | | | 19.28% | | | | | | 21.27% | | | | 17.54% | | |
| | | Class S2 | | | | | 19.10% | | | | | | 21.09% | | | | 17.37% | | |
| | | Russell 1000® Growth Index | | | | | 27.60% | | | | | | 25.32% | | | | 19.79% | | |
| | | | | | |||||||||||||||
| Portfolio Managers’ Report | Voya Large Cap Value Portfolio |
| | Sector Diversification as of December 31, 2021 (as a percentage of net assets) | | |||
| | | | | | |
| | Financials | | | 21.0% | |
| | Health Care | | | 17.4% | |
| | Industrials | | | 11.7% | |
| | Information Technology | | | 8.4% | |
| | Consumer Staples | | | 7.4% | |
| | Communication Services | | | 7.2% | |
| | Energy | | | 5.9% | |
| | Utilities | | | 5.3% | |
| | Consumer Discretionary | | | 5.3% | |
| | Real Estate | | | 4.7% | |
| | Materials | | | 4.1% | |
| | Assets in Excess of Other Liabilities* | | | 1.6% | |
| | Net Assets | | | 100.0% | |
| | * Includes short-term investments. | | |||
| | Portfolio holdings are subject to change daily. | | |||
| | Top Ten Holdings as of December 31, 2021 (as a percentage of net assets) | | |||
| | | | | | |
| | UnitedHealth Group, Inc. | | | 3.9% | |
| | Philip Morris International, Inc. | | | 2.9% | |
| | Motorola Solutions, Inc. | | | 2.7% | |
| | Walt Disney Co. | | | 2.5% | |
| | Bank of America Corp. | | | 2.5% | |
| | Walmart, Inc. | | | 2.5% | |
| | Truist Financial Corp. | | | 2.5% | |
| | Raytheon Technologies Corp. | | | 2.5% | |
| | Bank of New York Mellon Corp. | | | 2.5% | |
| | AT&T, Inc. | | | 2.4% | |
| | Portfolio holdings are subject to change daily. | | |||
| Voya Large Cap Value Portfolio | Portfolio Managers’ Report |
| | | ![[MISSING IMAGE: tm222386d8-lc_largecapbw.jpg]](https://capedge.com/proxy/N-CSR/0001104659-22-030437/tm222386d8-lc_largecapbw.jpg) | | |
| | | Average Annual Total Returns for the Periods Ended December 31, 2021 | | | ||||||||||||||||||||||||
| | | | | | 1 Year | | | 5 Year | | | 10 Year | | | Since Inception of Class S2 September 9, 2013 | | | ||||||||||||
| | | Class ADV | | | | | 26.24% | | | | | | 11.41% | | | | | | 11.59% | | | | | | — | | | |
| | | Class I | | | | | 26.99% | | | | | | 12.07% | | | | | | 12.26% | | | | | | — | | | |
| | | Class R6(1) | | | | | 27.02% | | | | | | 12.08% | | | | | | 12.26% | | | | | | — | | | |
| | | Class S | | | | | 26.67% | | | | | | 11.78% | | | | | | 11.97% | | | | | | — | | | |
| | | Class S2 | | | | | 26.43% | | | | | | 11.63% | | | | | | — | | | | | | 10.18% | | | |
| | | Russell 1000® Value Index | | | | | 25.16% | | | | | | 11.16% | | | | | | 12.97% | | | | | | 11.08% | | | |
| | | | | | ||||||||||||||||||||||||
| Portfolio Managers’ Report | Voya Limited Maturity Bond Portfolio |
| | Investment Type Allocation as of December 31, 2021 (as a percentage of net assets) | | |||
| | | | | | |
| | Corporate Bonds/Notes | | | 33.6% | |
| | U.S. Treasury Obligations | | | 23.2% | |
| | Asset-Backed Securities | | | 20.0% | |
| | Commercial Mortgage-Backed Securities | | | 14.2% | |
| | Collateralized Mortgage Obligations | | | 5.6% | |
| | U.S. Government Agency Obligations* | | | 0.0% | |
| | Assets in Excess of Other Liabilities** | | | 3.4% | |
| | Net Assets | | | 100.0% | |
| | * Amount is less than 0.05%. | | |||
| | ** Includes short-term investments. | | |||
| | Portfolio holdings are subject to change daily. | | |||
| | Top Ten Holdings as of December 31, 2021* (as a percentage of net assets) | | |||
| | | | | | |
| | United States Treasury Note, 0.125%, 11/30/22 | | | 9.6% | |
| | United States Treasury Note, 1.000%, 12/15/24 | | | 8.7% | |
| | United States Treasury Note, 0.750%, 12/31/23 | | | 3.9% | |
| | WFRBS Commercial Mortgage Trust 2013-C14 C, 3.960%, 06/15/46 | | | 1.4% | |
| | CSWF 2021-SOP2 D, 2.427%, 06/15/34 | | | 1.0% | |
| | VMC Finance 2021-FL4 C LLC, 2.354%, 06/16/36 | | | 1.0% | |
| | BPR Trust 2021-WILL C, 4.110%, 06/15/38 | | | 0.8% | |
| | Ginnie Mae Series 2016-H06 FD, 1.001%, 07/20/65 | | | 0.7% | |
| | BX Commercial Mortgage Trust 2020-VIV2 C, 3.542%, 03/09/44 | | | 0.5% | |
| | HGI CRE CLO 2021-FL1 D Ltd., 2.458%, 06/16/36 | | | 0.5% | |
| | * Excludes short-term investments. | | |||
| | Portfolio holdings are subject to change daily | | |||
| Voya Limited Maturity Bond Portfolio | Portfolio Managers’ Report |
| | | ![[MISSING IMAGE: tm222386d8-lc_lbdbw.jpg]](https://capedge.com/proxy/N-CSR/0001104659-22-030437/tm222386d8-lc_lbdbw.jpg) | | |
| | | Average Annual Total Returns for the Periods Ended December 31, 2021 | | | ||||||||||||||||||
| | | | | | 1 Year | | | 5 Year | | | 10 Year | | | |||||||||
| | | Class ADV | | | | | -0.55% | | | | | | 1.51% | | | | | | 1.05% | | | |
| | | Class I | | | | | 0.08% | | | | | | 2.12% | | | | | | 1.65% | | | |
| | | Class S | | | | | -0.16% | | | | | | 1.86% | | | | | | 1.40% | | | |
| | | Bloomberg U.S. 1-3 Year Government/Credit Bond Index | | | | | -0.47% | | | | | | 1.85% | | | | | | 1.39% | | | |
| | | | | | ||||||||||||||||||
| Portfolio Managers’ Report | Voya U.S. Stock Index Portfolio |
| | Sector Diversification as of December 31, 2021 (as a percentage of net assets) | | |||
| | | | | | |
| | Information Technology | | | 28.6% | |
| | Health Care | | | 13.0% | |
| | Consumer Discretionary | | | 12.3% | |
| | Financials | | | 10.5% | |
| | Communication Services | | | 10.0% | |
| | Industrials | | | 7.6% | |
| | Consumer Staples | | | 5.8% | |
| | Real Estate | | | 2.7% | |
| | Energy | | | 2.6% | |
| | Materials | | | 2.5% | |
| | Utilities | | | 2.4% | |
| | Assets in Excess of Other Liabilities* | | | 2.0% | |
| | Net Assets | | | 100.0% | |
| | * Includes short-term investments. | | |||
| | Portfolio holdings are subject to change daily. | | |||
| | Top Ten Holdings as of December 31, 2021* (as a percentage of net assets) | | |||
| | | | | | |
| | Apple, Inc. | | | 6.7% | |
| | Microsoft Corp. | | | 6.1% | |
| | Amazon.com, Inc. | | | 3.5% | |
| | Alphabet, Inc. - Class A | | | 2.1% | |
| | Tesla, Inc. | | | 2.1% | |
| | Alphabet, Inc. - Class C | | | 2.0% | |
| | Meta Platforms, Inc. | | | 1.9% | |
| | Nvidia Corp. | | | 1.8% | |
| | Berkshire Hathaway, Inc. - Class B | | | 1.3% | |
| | UnitedHealth Group, Inc. | | | 1.2% | |
| | * Excludes short-term investments. | | |||
| | Portfolio holdings are subject to change daily. | | |||
| Voya U.S. Stock Index Portfolio | Portfolio Managers’ Report |
| | | ![[MISSING IMAGE: tm222386d8-lc_ussbw.jpg]](https://capedge.com/proxy/N-CSR/0001104659-22-030437/tm222386d8-lc_ussbw.jpg) | | |
| | | Average Annual Total Returns for the Periods Ended December 31, 2021 | | | |||||||||||||||
| | | | | | 1 Year | | | 5 Year | | | 10 Year | | | ||||||
| | | Class ADV | | | | | 27.66% | | | | | | 17.53% | | | | 15.64% | | |
| | | Class I | | | | | 28.37% | | | | | | 18.16% | | | | 16.25% | | |
| | | Class P2(1) | | | | | 28.50% | | | | | | 18.28% | | | | 16.31% | | |
| | | Class S | | | | | 28.02% | | | | | | 17.88% | | | | 15.97% | | |
| | | Class S2 | | | | | 27.85% | | | | | | 17.69% | | | | 15.78% | | |
| | | S&P 500® Index | | | | | 28.71% | | | | | | 18.47% | | | | 16.55% | | |
| | | | | | |||||||||||||||
| Portfolio Managers’ Report | VY® Clarion Real Estate Portfolio |
| | REIT Diversification as of December 31, 2021 (as a percentage of net assets) | | |||
| | | | | | |
| | Residential REITs | | | 24.6% | |
| | Specialized REITs | | | 24.2% | |
| | Industrial REITs | | | 18.3% | |
| | Retail REITs | | | 16.6% | |
| | Health Care REITs | | | 6.6% | |
| | Hotel & Resort REITs | | | 5.2% | |
| | Office REITs | | | 5.0% | |
| | Diversified REITs | | | 0.7% | |
| | Liabilities in Excess of Other Assets* | | | (1.2)% | |
| | Net Assets | | | 100.0% | |
| | * Includes short-term investments. | | |||
| | Portfolio holdings are subject to change daily. | | |||
| | Top Ten Holdings as of December 31, 2021 (as a percentage of net assets) | | |||
| | | | | | |
| | ProLogis, Inc. | | | 11.0% | |
| | Simon Property Group, Inc. | | | 7.3% | |
| | Extra Space Storage, Inc. | | | 6.1% | |
| | Sun Communities, Inc. | | | 5.0% | |
| | CubeSmart | | | 4.8% | |
| | Essex Property Trust, Inc. | | | 4.1% | |
| | Camden Property Trust | | | 3.9% | |
| | Digital Realty Trust, Inc. | | | 3.8% | |
| | Realty Income Corp. | | | 3.7% | |
| | Invitation Homes, Inc. | | | 3.7% | |
| | Portfolio holdings are subject to change daily. | | |||
| VY® Clarion Real Estate Portfolio | Portfolio Managers’ Report |
| | | ![[MISSING IMAGE: tm222386d8-lc_crepbw.jpg]](https://capedge.com/proxy/N-CSR/0001104659-22-030437/tm222386d8-lc_crepbw.jpg) | | |
| | | Average Annual Total Returns for the Periods Ended December 31, 2021 | | | |||||||||||||||
| | | | | | 1 Year | | | 5 Year | | | 10 Year | | | ||||||
| | | Class ADV | | | | | 51.46% | | | | | | 11.68% | | | | 10.87% | | |
| | | Class I | | | | | 52.34% | | | | | | 12.35% | | | | 11.53% | | |
| | | Class S | | | | | 51.96% | | | | | | 12.07% | | | | 11.26% | | |
| | | Class S2 | | | | | 51.74% | | | | | | 11.90% | | | | 11.09% | | |
| | | MSCI U.S. REIT® Index | | | | | 43.06% | | | | | | 10.78% | | | | 11.32% | | |
| | | | | | |||||||||||||||
| Portfolio Managers’ Report | VY® JPMorgan Small Cap Core Equity Portfolio |
| | Sector Diversification as of December 31, 2021 (as a percentage of net assets) | | |||
| | | | | | |
| | Industrials | | | 20.5% | |
| | Financials | | | 16.9% | |
| | Health Care | | | 15.4% | |
| | Information Technology | | | 12.5% | |
| | Consumer Discretionary | | | 9.8% | |
| | Real Estate | | | 7.0% | |
| | Materials | | | 4.5% | |
| | Consumer Staples | | | 4.2% | |
| | Communication Services | | | 2.1% | |
| | Energy | | | 1.9% | |
| | Utilities | | | 1.8% | |
| | Assets in Excess of Other Liabilities* | | | 3.4% | |
| | Net Assets | | | 100.0% | |
| | * Includes short-term investments. | | |||
| | Portfolio holdings are subject to change daily. | | |||
| | Top Ten Holdings as of December 31, 2021* (as a percentage of net assets) | | |||
| | | | | | |
| | WillScot Mobile Mini Holdings Corp. | | | 1.0% | |
| | EastGroup Properties, Inc. | | | 1.0% | |
| | Performance Food Group Co. | | | 0.9% | |
| | BJ’s Wholesale Club Holdings, Inc. | | | 0.9% | |
| | Aptargroup, Inc. | | | 0.8% | |
| | Kinsale Capital Group, Inc. | | | 0.8% | |
| | Power Integrations, Inc. | | | 0.8% | |
| | Lincoln Electric Holdings, Inc. | | | 0.8% | |
| | ICU Medical, Inc. | | | 0.8% | |
| | First Horizon Corp. | | | 0.8% | |
| | * Excludes short-term investments. | | |||
| | Portfolio holdings are subject to change daily. | | |||
| VY® JPMorgan Small Cap Core Equity Portfolio | Portfolio Managers’ Report |
| Portfolio Managers’ Report | VY® JPMorgan Small Cap Core Equity Portfolio |
| | | ![[MISSING IMAGE: tm222386d8-lc_jpmscceqbw.jpg]](https://capedge.com/proxy/N-CSR/0001104659-22-030437/tm222386d8-lc_jpmscceqbw.jpg) | | |
| | | Average Annual Total Returns for the Periods Ended December 31, 2021 | | | |||||||||||||||
| | | | | | 1 Year | | | 5 Year | | | 10 Year | | | ||||||
| | | Class ADV | | | | | 17.94% | | | | | | 12.07% | | | | 13.77% | | |
| | | Class I | | | | | 18.71% | | | | | | 12.74% | | | | 14.46% | | |
| | | Class R6(1) | | | | | 18.67% | | | | | | 12.73% | | | | 14.45% | | |
| | | Class S | | | | | 18.32% | | | | | | 12.45% | | | | 14.17% | | |
| | | Class S2 | | | | | 18.17% | | | | | | 12.29% | | | | 14.00% | | |
| | | Russell 2000® Index | | | | | 14.82% | | | | | | 12.02% | | | | 13.23% | | |
| | | | | | |||||||||||||||
| | | | Actual Portfolio Return | | | Hypothetical (5% return before expenses) | | ||||||||||||||||||||||||||||||||||||||||||
| | | | Beginning Account Value July 1, 2021 | | | Ending Account Value December 31, 2021 | | | Annualized Expense Ratio | | | Expenses Paid During the Period Ended December 31, 2021* | | | Beginning Account Value July 1, 2021 | | | Ending Account Value December 31, 2021 | | | Annualized Expense Ratio | | | Expenses Paid During the Period Ended December 31, 2021* | | ||||||||||||||||||||||||
| Voya Balanced Income Portfolio | | ||||||||||||||||||||||||||||||||||||||||||||||||
| Class ADV | | | | $ | 1,000.00 | | | | | $ | 1,033.60 | | | | | | 1.20% | | | | | $ | 6.15 | | | | | $ | 1,000.00 | | | | | $ | 1,019.16 | | | | | | 1.20% | | | | | $ | 6.11 | | |
| Class I | | | | | 1,000.00 | | | | | | 1,037.80 | | | | | | 0.60 | | | | | | 3.08 | | | | | | 1,000.00 | | | | | | 1,022.18 | | | | | | 0.60 | | | | | | 3.06 | | |
| Class S | | | | | 1,000.00 | | | | | | 1,035.40 | | | | | | 0.85 | | | | | | 4.36 | | | | | | 1,000.00 | | | | | | 1,020.92 | | | | | | 0.85 | | | | | | 4.33 | | |
| Class S2 | | | | | 1,000.00 | | | | | | 1,035.20 | | | | | | 1.00 | | | | | | 5.13 | | | | | | 1,000.00 | | | | | | 1,020.16 | | | | | | 1.00 | | | | | | 5.09 | | |
| Voya High Yield Portfolio | | ||||||||||||||||||||||||||||||||||||||||||||||||
| Class ADV | | | | $ | 1,000.00 | | | | | $ | 1,014.20 | | | | | | 1.08% | | | | | $ | 5.48 | | | | | $ | 1,000.00 | | | | | $ | 1,019.76 | | | | | | 1.08% | | | | | $ | 5.50 | | |
| Class I | | | | | 1,000.00 | | | | | | 1,017.30 | | | | | | 0.48 | | | | | | 2.44 | | | | | | 1,000.00 | | | | | | 1,022.79 | | | | | | 0.48 | | | | | | 2.45 | | |
| Class S | | | | | 1,000.00 | | | | | | 1,016.00 | | | | | | 0.73 | | | | | | 3.71 | | | | | | 1,000.00 | | | | | | 1,021.53 | | | | | | 0.73 | | | | | | 3.72 | | |
| Class S2 | | | | | 1,000.00 | | | | | | 1,015.20 | | | | | | 0.88 | | | | | | 4.47 | | | | | | 1,000.00 | | | | | | 1,020.77 | | | | | | 0.88 | | | | | | 4.48 | | |
| Voya Large Cap Growth Portfolio | | ||||||||||||||||||||||||||||||||||||||||||||||||
| Class ADV | | | | $ | 1,000.00 | | | | | $ | 1,073.90 | | | | | | 1.27% | | | | | $ | 6.64 | | | | | $ | 1,000.00 | | | | | $ | 1,018.80 | | | | | | 1.27% | | | | | $ | 6.46 | | |
| Class I | | | | | 1,000.00 | | | | | | 1,077.00 | | | | | | 0.67 | | | | | | 3.51 | | | | | | 1,000.00 | | | | | | 1,021.83 | | | | | | 0.67 | | | | | | 3.41 | | |
| Class R6 | | | | | 1,000.00 | | | | | | 1,076.90 | | | | | | 0.67 | | | | | | 3.51 | | | | | | 1,000.00 | | | | | | 1,021.83 | | | | | | 0.67 | | | | | | 3.41 | | |
| Class S | | | | | 1,000.00 | | | | | | 1,075.50 | | | | | | 0.92 | | | | | | 4.81 | | | | | | 1,000.00 | | | | | | 1,020.57 | | | | | | 0.92 | | | | | | 4.69 | | |
| Class S2 | | | | | 1,000.00 | | | | | | 1,075.00 | | | | | | 1.07 | | | | | | 5.60 | | | | | | 1,000.00 | | �� | | | | 1,019.81 | | | | | | 1.07 | | | | | | 5.45 | | |
| | | | Actual Portfolio Return | | | Hypothetical (5% return before expenses) | | ||||||||||||||||||||||||||||||||||||||||||
| | | | Beginning Account Value July 1, 2021 | | | Ending Account Value December 31, 2021 | | | Annualized Expense Ratio | | | Expenses Paid During the Period Ended December 31, 2021* | | | Beginning Account Value July 1, 2021 | | | Ending Account Value December 31, 2021 | | | Annualized Expense Ratio | | | Expenses Paid During the Period Ended December 31, 2021* | | ||||||||||||||||||||||||
| Voya Large Cap Value Portfolio | | ||||||||||||||||||||||||||||||||||||||||||||||||
| Class ADV | | | | $ | 1,000.00 | | | | | $ | 1,073.00 | | | | | | 1.24% | | | | | $ | 6.48 | | | | | $ | 1,000.00 | | | | | $ | 1,018.95 | | | | | | 1.24% | | | | | $ | 6.31 | | |
| Class I | | | | | 1,000.00 | | | | | | 1,076.30 | | | | | | 0.64 | | | | | | 3.35 | | | | | | 1,000.00 | | | | | | 1,021.98 | | | | | | 0.64 | | | | | | 3.26 | | |
| Class R6 | | | | | 1,000.00 | | | | | | 1,076.40 | | | | | | 0.64 | | | | | | 3.35 | | | | | | 1,000.00 | | | | | | 1,021.98 | | | | | | 0.64 | | | | | | 3.26 | | |
| Class S | | | | | 1,000.00 | | | | | | 1,074.70 | | | | | | 0.89 | | | | | | 4.65 | | | | | | 1,000.00 | | | | | | 1,020.72 | | | | | | 0.89 | | | | | | 4.53 | | |
| Class S2 | | | | | 1,000.00 | | | | | | 1,073.80 | | | | | | 1.04 | | | | | | 5.44 | | | | | | 1,000.00 | | | | | | 1,019.96 | | | | | | 1.04 | | | | | | 5.30 | | |
| Voya Limited Maturity Bond Portfolio | | ||||||||||||||||||||||||||||||||||||||||||||||||
| Class ADV | | | | $ | 1,000.00 | | | | | $ | 993.50 | | | | | | 0.88% | | | | | $ | 4.42 | | | | | $ | 1,000.00 | | | | | $ | 1,020.77 | | | | | | 0.88% | | | | | $ | 4.48 | | |
| Class I | | | | | 1,000.00 | | | | | | 996.70 | | | | | | 0.28 | | | | | | 1.41 | | | | | | 1,000.00 | | | | | | 1,023.79 | | | | | | 0.28 | | | | | | 1.43 | | |
| Class S | | | | | 1,000.00 | | | | | | 995.50 | | | | | | 0.53 | | | | | | 2.67 | | | | | | 1,000.00 | | | | | | 1,022.53 | | | | | | 0.53 | | | | | | 2.70 | | |
| Voya U.S. Stock Index Portfolio | | ||||||||||||||||||||||||||||||||||||||||||||||||
| Class ADV | | | | $ | 1,000.00 | | | | | $ | 1,112.30 | | | | | | 0.80% | | | | | $ | 4.26 | | | | | $ | 1,000.00 | | | | | $ | 1,021.17 | | | | | | 0.80% | | | | | $ | 4.08 | | |
| Class I | | | | | 1,000.00 | | ��� | | | | 1,115.30 | | | | | | 0.27 | | | | | | 1.44 | | | | | | 1,000.00 | | | | | | 1,023.84 | | | | | | 0.27 | | | | | | 1.38 | | |
| Class P2 | | | | | 1,000.00 | | | | | | 1,115.60 | | | | | | 0.15 | | | | | | 0.80 | | | | | | 1,000.00 | | | | | | 1,024.45 | | | | | | 0.15 | | | | | | 0.77 | | |
| Class S | | | | | 1,000.00 | | | | | | 1,113.80 | | | | | | 0.51 | | | | | | 2.72 | | | | | | 1,000.00 | | | | | | 1,022.63 | | | | | | 0.51 | | | | | | 2.60 | | |
| Class S2 | | | | | 1,000.00 | | | | | | 1,113.00 | | | | | | 0.67 | | | | | | 3.57 | | | | | | 1,000.00 | | | | | | 1,021.83 | | | | | | 0.67 | | | | | | 3.41 | | |
| VY® Clarion Real Estate Portfolio | | ||||||||||||||||||||||||||||||||||||||||||||||||
| Class ADV | | | | $ | 1,000.00 | | | | | $ | 1,216.10 | | | | | | 1.28% | | | | | $ | 7.15 | | | | | $ | 1,000.00 | | | | | $ | 1,018.75 | | | | | | 1.28% | | | | | $ | 6.51 | | |
| Class I | | | | | 1,000.00 | | | | | | 1,219.60 | | | | | | 0.68 | | | | | | 3.80 | | | | | | 1,000.00 | | | | | | 1,021.78 | | | | | | 0.68 | | | | | | 3.47 | | |
| Class S | | | | | 1,000.00 | | | | | | 1,218.10 | | | | | | 0.93 | | | | | | 5.20 | | | | | | 1,000.00 | | | | | | 1,020.52 | | | | | | 0.93 | | | | | | 4.74 | | |
| Class S2 | | | | | 1,000.00 | | | | | | 1,217.10 | | | | | | 1.08 | | | | | | 6.04 | | | | | | 1,000.00 | | | | | | 1,019.76 | | | | | | 1.08 | | | | | | 5.50 | | |
| VY® JPMorgan Small Cap Core Equity Portfolio | | ||||||||||||||||||||||||||||||||||||||||||||||||
| Class ADV | | | | $ | 1,000.00 | | | | | $ | 1,025.00 | | | | | | 1.46% | | | | | $ | 7.45 | | | | | $ | 1,000.00 | | | | | $ | 1,017.85 | | | | | | 1.46% | | | | | $ | 7.43 | | |
| Class I | | | | | 1,000.00 | | | | | | 1,028.60 | | | | | | 0.86 | | | | | | 4.40 | | | | | | 1,000.00 | | | | | | 1,020.87 | | | | | | 0.86 | | | | | | 4.38 | | |
| Class R6 | | | | | 1,000.00 | | | | | | 1,028.20 | | | | | | 0.86 | | | | | | 4.40 | | | | | | 1,000.00 | | | | | | 1,020.87 | | | | | | 0.86 | | | | | | 4.38 | | |
| Class S | | | | | 1,000.00 | | | | | | 1,026.60 | | | | | | 1.11 | | | | | | 5.67 | | | | | | 1,000.00 | | | | | | 1,019.61 | | | | | | 1.11 | | | | | | 5.65 | | |
| Class S2 | | | | | 1,000.00 | | | | | | 1,026.10 | | | | | | 1.26 | | | | | | 6.43 | | | | | | 1,000.00 | | | | | | 1,018.85 | | | | | | 1.26 | | | | | | 6.41 | | |
Boston, Massachusetts
February 24, 2022
| | | | Voya Balanced Income Portfolio | | | Voya High Yield Portfolio | | | Voya Large Cap Growth Portfolio | | | Voya Large Cap Value Portfolio | | ||||||||||||
| ASSETS: | | | | | | | | | | | | | | | | | | | | | | | | | |
| Investments in securities at fair value+* | | | | $ | 296,344,265 | | | | | $ | 497,047,369 | | | | | $ | 5,939,145,204 | | | | | $ | 475,440,009 | | |
| Investments in affiliates at fair value** | | | | | 32,642,055 | | | | | | — | | | | | | — | | | | | | — | | |
| Short-term investments at fair value† | | | | | 2,765,828 | | | | | | 31,251,621 | | | | | | 135,123,923 | | | | | | 12,946,493 | | |
| Cash | | | | | 2,156,541 | | | | | | 165,700 | | | | | | 237,660 | | | | | | 210,916 | | |
| Cash collateral for futures contracts | | | | | 405,703 | | | | | | — | | | | | | — | | | | | | — | | |
| Cash pledged for centrally cleared swaps (Note 2) | | | | | 250,000 | | | | | | — | | | | | | — | | | | | | — | | |
| Foreign currencies at value‡ | | | | | 29,266 | | | | | | — | | | | | | — | | | | | | 143,446 | | |
| Receivables: | | | | | | | | | | | | | | | | | | | | | | | | | |
| Fund shares sold | | | | | 1,156,967 | | | | | | 1,806,207 | | | | | | 215,301 | | | | | | 197,357 | | |
| Dividends | | | | | 158,238 | | | | | | — | | | | | | 1,575,211 | | | | | | 486,616 | | |
| Interest | | | | | 890,712 | | | | | | 7,564,746 | | | | | | — | | | | | | — | | |
| Foreign tax reclaims | | | | | 151,901 | | | | | | — | | | | | | 26,118 | | | | | | 202,356 | | |
| Unrealized appreciation on forward foreign currency contracts | | | | | 1,669,928 | | | | | | — | | | | | | — | | | | | | — | | |
| Prepaid expenses | | | | | 30 | | | | | | — | | | | | | 574 | | | | | | 87 | | |
| Reimbursement due from Investment Adviser | | | | | 3,148 | | | | | | — | | | | | | 66,836 | | | | | | 100,410 | | |
| Other assets | | | | | 21,515 | | | | | | 30,719 | | | | | | 245,679 | | | | | | 65,113 | | |
| Total assets | | | | | 338,646,097 | | | | | | 537,866,362 | | | | | | 6,076,636,506 | | | | | | 489,792,803 | | |
| LIABILITIES: | | | | | | | | | | | | | | | | | | | | | | | | | |
| Payable for investment securities purchased | | | | | 10,299 | | | | | | 2,570,145 | | | | | | — | | | | | | — | | |
| Payable for fund shares redeemed | | | | | 17,864 | | | | | | 257,294 | | | | | | 8,229,048 | | | | | | 716,844 | | |
| Payable upon receipt of securities loaned | | | | | 2,765,828 | | | | | | 18,728,834 | | | | | | 90,855,923 | | | | | | 5,241,493 | | |
| Unrealized depreciation on forward foreign currency contracts | | | | | 1,700,584 | | | | | | — | | | | | | — | | | | | | — | | |
| Unrealized depreciation on OTC swap agreements | | | | | 16,510 | | | | | | — | | | | | | — | | | | | | — | | |
| Variation margin payable on centrally cleared swaps | | | | | 546 | | | | | | — | | | | | | — | | | | | | — | | |
| Variation margin payable on futures contracts | | | | | 4,625 | | | | | | — | | | | | | — | | | | | | — | | |
| Payable for unified fees | | | | | — | | | | | | 258,547 | | | | | | — | | | | | | — | | |
| Payable for investment management fees | | | | | 154,645 | | | | | | — | | | | | | 3,270,873 | | | | | | 295,032 | | |
| Payable for distribution and shareholder service fees | | | | | 88,494 | | | | | | 92,283 | | | | | | 1,460,174 | | | | | | 32,603 | | |
| Payable to trustees under the deferred compensation plan (Note 6) | | | | | 21,515 | | | | | | 30,719 | | | | | | 245,679 | | | | | | 65,113 | | |
| Payable for trustee fees | | | | | 1,704 | | | | | | — | | | | | | 30,891 | | | | | | 4,794 | | |
| Other accrued expenses and liabilities | | | | | 71,972 | | | | | | — | | | | | | 852,646 | | | | | | 251,530 | | |
| Written options, at fair value^ | | | | | 44,951 | | | | | | — | | | | | | — | | | | | | — | | |
| Total liabilities | | | | | 4,899,537 | | | | | | 21,937,822 | | | | | | 104,945,234 | | | | | | 6,607,409 | | |
| NET ASSETS | | | | $ | 333,746,560 | | | | | $ | 515,928,540 | | | | | $ | 5,971,691,272 | | | | | $ | 483,185,394 | | |
| NET ASSETS WERE COMPRISED OF: | | | | | | | | | | | | | | | | | | | | | | | | | |
| Paid-in capital | | | | $ | 287,286,153 | | | | | $ | 539,660,135 | | | | | $ | 3,295,215,071 | | | | | $ | 132,619,587 | | |
| Total distributable earnings (loss) | | | | | 46,460,407 | | | | | | (23,731,595) | | | | | | 2,676,476,201 | | | | | | 350,565,807 | | |
| NET ASSETS | | | | $ | 333,746,560 | | | | | $ | 515,928,540 | | | | | $ | 5,971,691,272 | | | | | $ | 483,185,394 | | |
+ Including securities loaned at value | | | | $ | 2,668,465 | | | | | $ | 18,279,957 | | | | | $ | 88,968,205 | | | | | $ | 5,135,416 | | |
* Cost of investments in securities | | | | $ | 277,523,896 | | | | | $ | 476,943,765 | | | | | $ | 4,824,269,444 | | | | | $ | 417,407,112 | | |
** Cost of investments in affiliates | | | | $ | 33,758,742 | | | | | $ | — | | | | | $ | — | | | | | $ | — | | |
† Cost of short-term investments | | | | $ | 2,765,828 | | | | | $ | 31,251,623 | | | | | $ | 135,123,923 | | | | | $ | 12,946,493 | | |
‡ Cost of foreign currencies | | | | $ | 28,974 | | | | | $ | — | | | | | $ | — | | | | | $ | 138,932 | | |
^ Premiums received on written options | | | | $ | 114,734 | | | | | $ | — | | | | | $ | — | | | | | $ | — | | |
| | | | Voya Balanced Income Portfolio | | | Voya High Yield Portfolio | | | Voya Large Cap Growth Portfolio | | | Voya Large Cap Value Portfolio | | ||||||||||||
| Class ADV | | | | | | | | | | | | | | | | | | | | | | | | | |
| Net assets | | | | $ | 65,610,800 | | | | | $ | 79,215,638 | | | | | $ | 2,085,855,716 | | | | | $ | 52,417,563 | | |
| Shares authorized | | | | | unlimited | | | | | | unlimited | | | | | | unlimited | | | | | | unlimited | | |
| Par value | | | | $ | 0.001 | | | | | $ | 0.001 | | | | | $ | 0.001 | | | | | $ | 0.001 | | |
| Shares outstanding | | | | | 6,313,427 | | | | | | 7,969,728 | | | | | | 107,363,577 | | | | | | 3,835,377 | | |
| Net asset value and redemption price per share | | | | $ | 10.39 | | | | | $ | 9.94 | | | | | $ | 19.43 | | | | | $ | 13.67 | | |
| Class I | | | | | | | | | | | | | | | | | | | | | | | | | |
| Net assets | | | | $ | 7,877,677 | | | | | $ | 189,224,427 | | | | | $ | 1,937,889,001 | | | | | $ | 386,933,650 | | |
| Shares authorized | | | | | unlimited | | | | | | unlimited | | | | | | unlimited | | | | | | unlimited | | |
| Par value | | | | $ | 0.001 | | | | | $ | 0.001 | | | | | $ | 0.001 | | | | | $ | 0.001 | | |
| Shares outstanding | | | | | 717,018 | | | | | | 19,022,958 | | | | | | 86,189,197 | | | | | | 27,556,402 | | |
| Net asset value and redemption price per share | | | | $ | 10.99 | | | | | $ | 9.95 | | | | | $ | 22.48 | | | | | $ | 14.04 | | |
| Class R6 | | | | | | | | | | | | | | | | | | | | | | | | | |
| Net assets | | | | | n/a | | | | | | n/a | | | | | $ | 95,588,104 | | | | | $ | 12,976,480 | | |
| Shares authorized | | | | | n/a | | | | | | n/a | | | | | | unlimited | | | | | | unlimited | | |
| Par value | | | | | n/a | | | | | | n/a | | | | | $ | 0.001 | | | | | $ | 0.001 | | |
| Shares outstanding | | | | | n/a | | | | | | n/a | | | | | | 4,247,572 | | | | | | 924,692 | | |
| Net asset value and redemption price per share | | | | | n/a | | | | | | n/a | | | | | $ | 22.50 | | | | | $ | 14.03 | | |
| Class S | | | | | | | | | | | | | | | | | | | | | | | | | |
| Net assets | | | | $ | 256,145,584 | | | | | $ | 244,800,073 | | | | | $ | 1,787,955,792 | | | | | $ | 30,661,433 | | |
| Shares authorized | | | | | unlimited | | | | | | unlimited | | | | | | unlimited | | | | | | unlimited | | |
| Par value | | | | $ | 0.001 | | | | | $ | 0.001 | | | | | $ | 0.001 | | | | | $ | 0.001 | | |
| Shares outstanding | | | | | 23,450,081 | | | | | | 24,628,357 | | | | | | 83,262,909 | | | | | | 2,225,188 | | |
| Net asset value and redemption price per share | | | | $ | 10.92 | | | | | $ | 9.94 | | | | | $ | 21.47 | | | | | $ | 13.78 | | |
| Class S2 | | | | | | | | | | | | | | | | | | | | | | | | | |
| Net assets | | | | $ | 4,112,499 | | | | | $ | 2,688,402 | | | | | $ | 64,402,659 | | | | | $ | 196,268 | | |
| Shares authorized | | | | | unlimited | | | | | | unlimited | | | | | | unlimited | | | | | | unlimited | | |
| Par value | | | | $ | 0.001 | | | | | $ | 0.001 | | | | | $ | 0.001 | | | | | $ | 0.001 | | |
| Shares outstanding | | | | | 377,556 | | | | | | 270,106 | | | | | | 3,043,723 | | | | | | 14,218 | | |
| Net asset value and redemption price per share | | | | $ | 10.89 | | | | | $ | 9.95 | | | | | $ | 21.16 | | | | | $ | 13.80 | | |
| | | | Voya Limited Maturity Bond Portfolio | | | Voya U.S. Stock Index Portfolio | | | VY® Clarion Real Estate Portfolio | | | VY® JPMorgan Small Cap Core Equity Portfolio | | ||||||||||||
| ASSETS: | | | | | | | | | | | | | | | | | | | | | | | | | |
| Investments in securities at fair value+* | | | | $ | 401,640,671 | | | | | $ | 8,547,113,977 | | | | | $ | 320,319,774 | | | | | $ | 662,778,680 | | |
| Short-term investments at fair value† | | | | | 15,518,570 | | | | | | 281,220,299 | | | | | | 2,052,330 | | | | | | 35,323,109 | | |
| Cash | | | | | 6,812 | | | | | | 2,627,085 | | | | | | — | | | | | | — | | |
| Cash collateral for futures contracts | | | | | 359,767 | | | | | | 9,246,000 | | | | | | — | | | | | | 586,500 | | |
| Receivables: | | | | | | | | | | | | | | | | | | | | | | | | | |
| Investment securities sold | | | | | — | | | | | | — | | | | | | 363,027 | | | | | | 82,884 | | |
| Fund shares sold | | | | | 607,453 | | | | | | 996,027 | | | | | | 23 | | | | | | 152,454 | | |
| Dividends | | | | | 270 | | | | | | 5,139,642 | | | | | | 913,479 | | | | | | 487,071 | | |
| Interest | | | | | 1,027,676 | | | | | | — | | | | | | — | | | | | | — | | |
| Foreign tax reclaims | | | | | — | | | | | | — | | | | | | — | | | | | | 4,780 | | |
| Variation margin on futures contracts | | | | | 14,015 | | | | | | — | | | | | | — | | | | | | — | | |
| Prepaid expenses | | | | | — | | | | | | — | | | | | | 21 | | | | | | — | | |
| Reimbursement due from Investment Adviser | | | | | — | | | | | | 336,970 | | | | | | 68,717 | | | | | | — | | |
| Other assets | | | | | 13,794 | | | | | | 187,635 | | | | | | 23,373 | | | | | | 26,480 | | |
| Total assets | | | | | 419,189,028 | | | | | | 8,846,867,635 | | | | | | 323,740,744 | | | | | | 699,441,958 | | |
| LIABILITIES: | | | | | | | | | | | | | | | | | | | | | | | | | |
| Payable for investment securities purchased | | | | | — | | | | | | — | | | | | | 817,819 | | | | | | 299,832 | | |
| Payable for fund shares redeemed | | | | | 270,220 | | | | | | 16,597,501 | | | | | | 5,833,370 | | | | | | 564,918 | | |
| Payable upon receipt of securities loaned | | | | | 2,875,570 | | | | | | 101,636,299 | | | | | | — | | | | | | 12,375,533 | | |
| Variation margin payable on futures contracts | | | | | — | | | | | | 556,269 | | | | | | — | | | | | | 19,680 | | |
| Payable for unified fees | | | | | 98,990 | | | | | | 1,878,129 | | | | | | — | | | | | | 484,556 | | |
| Payable for investment management fees | | | | | — | | | | | | — | | | | | | 200,674 | | | | | | — | | |
| Payable for distribution and shareholder service fees | | | | | 22,564 | | | | | | 166,017 | | | | | | 83,552 | | | | | | 98,703 | | |
| Payable to trustees under the deferred compensation plan (Note 6) | | | | | 13,794 | | | | | | 187,635 | | | | | | 23,373 | | | | | | 26,480 | | |
| Payable for trustee fees | | | | | — | | | | | | — | | | | | | 1,402 | | | | | | — | | |
| Other accrued expenses and liabilities | | | | | — | | | | | | — | | | | | | 166,334 | | | | | | — | | |
| Total liabilities | | | | | 3,281,138 | | | | | | 121,021,850 | | | | | | 7,126,524 | | | | | | 13,869,702 | | |
| NET ASSETS | | | | $ | 415,907,890 | | | | | $ | 8,725,845,785 | | | | | $ | 316,614,220 | | | | | $ | 685,572,256 | | |
| NET ASSETS WERE COMPRISED OF: | | | | | | | | | | | | | | | | | | | | | | | | | |
| Paid-in capital | | | | $ | 417,148,292 | | | | | $ | 3,761,176,726 | | | | | $ | 198,410,981 | | | | | $ | 444,234,640 | | |
| Total distributable earnings (loss) | | | | | (1,240,402) | | | | | | 4,964,669,059 | | | | | | 118,203,239 | | | | | | 241,337,616 | | |
| NET ASSETS | | | | $ | 415,907,890 | | | | | $ | 8,725,845,785 | | | | | $ | 316,614,220 | | | | | $ | 685,572,256 | | |
+ Including securities loaned at value | | | | $ | 2,926,065 | | | | | $ | 99,554,039 | | | | | $ | — | | | | | $ | 12,073,000 | | |
* Cost of investments in securities | | | | $ | 402,252,280 | | | | | $ | 4,241,522,101 | | | | | $ | 241,212,552 | | | | | $ | 516,397,394 | | |
† Cost of short-term investments | | | | $ | 15,518,570 | | | | | $ | 281,220,299 | | | | | $ | 2,052,330 | | | | | $ | 35,323,109 | | |
| | | | Voya Limited Maturity Bond Portfolio | | | Voya U.S. Stock Index Portfolio | | | VY® Clarion Real Estate Portfolio | | | VY® JPMorgan Small Cap Core Equity Portfolio | | ||||||||||||
| Class ADV | | | | | | | | | | | | | | | | | | | | | | | | | |
| Net assets | | | | $ | 14,957,904 | | | | | $ | 99,372,558 | | | | | $ | 63,317,802 | | | | | $ | 140,945,170 | | |
| Shares authorized | | | | | unlimited | | | | | | unlimited | | | | | | unlimited | | | | | | unlimited | | |
| Par value | | | | $ | 0.001 | | | | | $ | 0.001 | | | | | $ | 0.001 | | | | | $ | 0.001 | | |
| Shares outstanding | | | | | 1,515,414 | | | | | | 4,750,623 | | | | | | 1,459,408 | | | | | | 7,302,726 | | |
| Net asset value and redemption price per share | | | | $ | 9.87 | | | | | $ | 20.92 | | | | | $ | 43.39 | | | | | $ | 19.30 | | |
| Class I | | | | | | | | | | | | | | | | | | | | | | | | | |
| Net assets | | | | $ | 329,912,703 | | | | | $ | 4,525,778,638 | | | | | $ | 11,745,072 | | | | | $ | 282,032,122 | | |
| Shares authorized | | | | | unlimited | | | | | | unlimited | | | | | | unlimited | | | | | | unlimited | | |
| Par value | | | | $ | 0.001 | | | | | $ | 0.001 | | | | | $ | 0.001 | | | | | $ | 0.001 | | |
| Shares outstanding | | | | | 32,755,914 | | | | | | 206,969,422 | | | | | | 254,252 | | | | | | 13,255,654 | | |
| Net asset value and redemption price per share | | | | $ | 10.07 | | | | | $ | 21.87 | | | | | $ | 46.19 | | | | | $ | 21.28 | | |
| Class P2 | | | | | | | | | | | | | | | | | | | | | | | | | |
| Net assets | | | | | n/a | | | | | $ | 3,615,634,541 | | | | | | n/a | | | | | | n/a | | |
| Shares authorized | | | | | n/a | | | | | | unlimited | | | | | | n/a | | | | | | n/a | | |
| Par value | | | | | n/a | | | | | $ | 0.001 | | | | | | n/a | | | | | | n/a | | |
| Shares outstanding | | | | | n/a | | | | | | 164,236,350 | | | | | | n/a | | | | | | n/a | | |
| Net asset value and redemption price per share | | | | | n/a | | | | | $ | 22.01 | | | | | | n/a | | | | | | n/a | | |
| Class R6 | | | | | | | | | | | | | | | | | | | | | | | | | |
| Net assets | | | | | n/a | | | | | | n/a | | | | | | n/a | | | | | $ | 129,717,859 | | |
| Shares authorized | | | | | n/a | | | | | | n/a | | | | | | n/a | | | | | | unlimited | | |
| Par value | | | | | n/a | | | | | | n/a | | | | | | n/a | | | | | $ | 0.001 | | |
| Shares outstanding | | | | | n/a | | | | | | n/a | | | | | | n/a | | | | | | 6,103,483 | | |
| Net asset value and redemption price per share | | | | | n/a | | | | | | n/a | | | | | | n/a | | | | | $ | 21.25 | | |
| Class S | | | | | | | | | | | | | | | | | | | | | | | | | |
| Net assets | | | | $ | 71,037,283 | | | | | $ | 303,248,172 | | | | | $ | 227,725,601 | | | | | $ | 124,185,065 | | |
| Shares authorized | | | | | unlimited | | | | | | unlimited | | | | | | unlimited | | | | | | unlimited | | |
| Par value | | | | $ | 0.001 | | | | | $ | 0.001 | | | | | $ | 0.001 | | | | | $ | 0.001 | | |
| Shares outstanding | | | | | 7,000,134 | | | | | | 14,038,045 | | | | | | 4,938,615 | | | | | | 5,954,777 | | |
| Net asset value and redemption price per share | | | | $ | 10.15 | | | | | $ | 21.60 | | | | | $ | 46.11 | | | | | $ | 20.85 | | |
| Class S2 | | | | | | | | | | | | | | | | | | | | | | | | | |
| Net assets | | | | | n/a | | | | | $ | 181,811,876 | | | | | $ | 13,825,745 | | | | | $ | 8,692,040 | | |
| Shares authorized | | | | | n/a | | | | | | unlimited | | | | | | unlimited | | | | | | unlimited | | |
| Par value | | | | | n/a | | | | | $ | 0.001 | | | | | $ | 0.001 | | | | | $ | 0.001 | | |
| Shares outstanding | | | | | n/a | | | | | | 8,543,276 | | | | | | 301,983 | | | | | | 423,553 | | |
| Net asset value and redemption price per share | | | | | n/a | | | | | $ | 21.28 | | | | | $ | 45.78 | | | | | $ | 20.52 | | |
| | | | Voya Balanced Income Portfolio | | | Voya High Yield Portfolio | | | Voya Large Cap Growth Portfolio | | | Voya Large Cap Value Portfolio | | ||||||||||||
| INVESTMENT INCOME: | | | | | | | | | | | | | | | | | | | | | | | | | |
| Dividends, net of foreign taxes withheld* | | | | $ | 3,443,984 | | | | | $ | 215,319 | | | | | $ | 36,503,857 | | | | | $ | 18,161,912 | | |
| Dividends from affiliated underlying funds | | | | | 1,197,493 | | | | | | — | | | | | | — | | | | | | — | | |
| Interest, net of foreign taxes withheld* | | | | | 5,211,975 | | | | | | 29,061,510 | | | | | | — | | | | | | — | | |
| Securities lending income, net | | | | | 14,340 | | | | | | 121,018 | | | | | | 104,441 | | | | | | 15,529 | | |
| Total investment income | | | | | 9,867,792 | | | | | | 29,397,847 | | | | | | 36,608,298 | | | | | | 18,177,441 | | |
| EXPENSES: | | | | | | | | | | | | | | | | | | | | | | | | | |
| Investment management fees | | | | | 1,874,829 | | | | | | — | | | | | | 39,954,577 | | | | | | 6,959,413 | | |
| Unified fees | | | | | — | | | | | | 2,570,588 | | | | | | — | | | | | | — | | |
| Distribution and shareholder service fees: | | | | | | | | | | | | | | | | | | | | | | | | | |
| Class ADV | | | | | 396,861 | | | | | | 473,466 | | | | | | 12,489,317 | | | | | | 311,690 | | |
| Class S | | | | | 655,775 | | | | | | 634,077 | | | | | | 4,547,669 | | | | | | 1,332,070 | | |
| Class S2 | | | | | 17,909 | | | | | | 12,011 | | | | | | 258,300 | | | | | | 717 | | |
| Transfer agent fees: | | | | | | | | | | | | | | | | | | | | | | | | | |
| Class ADV | | | | | 16,465 | | | | | | — | | | | | | 639,883 | | | | | | 33,064 | | |
| Class I | | | | | 1,978 | | | | | | — | | | | | | 678,934 | | | | | | 233,956 | | |
| Class R6 | | | | | — | | | | | | — | | | | | | 97 | | | | | | 9 | | |
| Class S | | | | | 65,298 | | | | | | — | | | | | | 561,815 | | | | | | 339,026 | | |
| Class S2 | | | | | 1,116 | | | | | | — | | | | | | 20,027 | | | | | | 114 | | |
| Shareholder reporting expense | | | | | 10,500 | | | | | | — | | | | | | 143,522 | | | | | | 55,785 | | |
| Professional fees | | | | | 18,250 | | | | | | — | | | | | | 196,797 | | | | | | 34,072 | | |
| Custody and accounting expense | | | | | 73,821 | | | | | | — | | | | | | 492,300 | | | | | | 95,763 | | |
| Trustee fees and expenses | | | | | 13,635 | | | | | | 28,706 | | | | | | 247,127 | | | | | | 38,354 | | |
| Proxy and solicitation costs (Note 1) | | | | | — | | | | | | — | | | | | | 294,200 | | | | | | — | | |
| Miscellaneous expense | | | | | 23,063 | | | | | | — | | | | | | 180,666 | | | | | | 28,926 | | |
| Interest expense | | | | | — | | | | | | — | | | | | | 1,891 | | | | | | 513 | | |
| Total expenses | | | | | 3,169,500 | | | | | | 3,718,848 | | | | | | 60,707,122 | | | | | | 9,463,472 | | |
| Waived and reimbursed fees | | | | | (44,723) | | | | | | (78,699) | | | | | | (1,869,058) | | | | | | (1,658,940) | | |
| Net expenses | | | | | 3,124,777 | | | | | | 3,640,149 | | | | | | 58,838,064 | | | | | | 7,804,532 | | |
| Net investment income (loss) | | | | | 6,743,015 | | | | | | 25,757,698 | | | | | | (22,229,766) | | | | | | 10,372,909 | | |
| REALIZED AND UNREALIZED GAIN (LOSS): | | | | | | | | | | | | | | | | | | | | | | | | | |
| Net realized gain (loss) on: | | | | | | | | | | | | | | | | | | | | | | | | | |
| Investments | | | | | 37,591,588 | | | | | | 15,208,199 | | | | | | 1,604,384,633 | | | | | | 314,512,667 | | |
| Forward foreign currency contracts | | | | | (596,788) | | | | | | — | | | | | | — | | | | | | — | | |
| Foreign currency related transactions | | | | | 46,491 | | | | | | — | | | | | | — | | | | | | 900 | | |
| Futures | | | | | (1,516,085) | | | | | | — | | | | | | — | | | | �� | | — | | |
| Swaps | | | | | (1,008,482) | | | | | | — | | | | | | — | | | | | | — | | |
| Written options | | | | | 1,029,288 | | | | | | — | | | | | | — | | | | | | — | | |
| Net realized gain | | | | | 35,546,012 | | | | | | 15,208,199 | | | | | | 1,604,384,633 | | | | | | 314,513,567 | | |
| Net change in unrealized appreciation (depreciation) on: | | | | | | | | | | | | | | | | | | | | | | | | | |
| Investments | | | | | (12,630,986) | | | | | | (15,074,437) | | | | | | (524,394,925) | | | | | | (93,880,280) | | |
| Affiliated underlying funds | | | | | 172,755 | | | | | | — | | | | | | — | | | | | | — | | |
| Forward foreign currency contracts | | | | | 55,287 | | | | | | — | | | | | | — | | | | | | — | | |
| Foreign currency related transactions | | | | | (103,021) | | | | | | — | | | | | | — | | | | | | (13,829) | | |
| Futures | | | | | (276,442) | | | | | | — | | | | | | — | | | | | | — | | |
| Swaps | | | | | (14,433) | | | | | | — | | | | | | — | | | | | | — | | |
| Written options | | | | | 12,717 | | | | | | — | | | | | | — | | | | | | — | | |
| Net change in unrealized appreciation (depreciation) | | | | | (12,784,123) | | | | | | (15,074,437) | | | | | | (524,394,925) | | | | | | (93,894,109) | | |
| Net realized and unrealized gain | | | | | 22,761,889 | | | | | | 133,762 | | | | | | 1,079,989,708 | | | | | | 220,619,458 | | |
| Increase in net assets resulting from operations | | | | $ | 29,504,904 | | | | | $ | 25,891,460 | | | | | $ | 1,057,759,942 | | | | | $ | 230,992,367 | | |
* Foreign taxes withheld | | | | $ | 74,260 | | | | | $ | — | | | | | $ | 39,177 | | | | | $ | 31,901 | | |
| | | | Voya Limited Maturity Bond Portfolio | | | Voya U.S. Stock Index Portfolio | | | VY® Clarion Real Estate Portfolio | | | VY® JPMorgan Small Cap Core Equity Portfolio | | ||||||||||||
| INVESTMENT INCOME: | | | | | | | | | | | | | | | | | | | | | | | | | |
| Dividends, net of foreign taxes withheld* | | | | $ | 3,925 | | | | | $ | 112,873,224 | | | | | $ | 6,449,855 | | | | | $ | 6,830,932 | | |
| Interest | | | | | 5,453,665 | | | | | | — | | | | | | — | | | | | | — | | |
| Securities lending income, net | | | | | 18,206 | | | | | | 126,040 | | | | | | 3,088 | | | | | | 91,805 | | |
| Total investment income | | | | | 5,475,796 | | | | | | 112,999,264 | | | | | | 6,452,943 | | | | | | 6,922,737 | | |
| EXPENSES: | | | | | | | | | | | | | | | | | | | | | | | | | |
| Investment management fees | | | | | — | | | | | | — | | | | | | 2,342,208 | | | | | | — | | |
| Unified fees | | | | | 1,127,305 | | | | | | 20,970,686 | | | | | | — | | | | | | 5,787,556 | | |
| Distribution and shareholder service fees: | | | | | | | | | | | | | | | | | | | | | | | | | |
| Class ADV | | | | | 87,983 | | | | | | 527,196 | | | | | | 336,238 | | | | | | 853,481 | | |
| Class S | | | | | 180,430 | | | | | | 729,157 | | | | | | 497,198 | | | | | | 327,047 | | |
| Class S2 | | | | | — | | | | | | 676,736 | | | | | | 49,940 | | | | | | 35,586 | | |
| Transfer agent fees: | | | | | | | | | | | | | | | | | | | | | | | | | |
| Class ADV | | | | | — | | | | | | — | | | | | | 82,298 | | | | | | — | | |
| Class I | | | | | — | | | | | | — | | | | | | 18,901 | | | | | | — | | |
| Class S | | | | | — | | | | | | — | | | | | | 292,065 | | | | | | — | | |
| Class S2 | | | | | — | | | | | | — | | | | | | 18,334 | | | | | | — | | |
| Shareholder reporting expense | | | | | — | | | | | | — | | | | | | 30,013 | | | | | | — | | |
| Professional fees | | | | | — | | | | | | — | | | | | | 13,870 | | | | | | — | | |
| Custody and accounting expense | | | | | — | | | | | | — | | | | | | 35,270 | | | | | | — | | |
| Trustee fees and expenses | | | | | 22,646 | | | | | | 395,479 | | | | | | 11,211 | | | | | | 31,606 | | |
| Miscellaneous expense | | | | | — | | | | | | — | | | | | | 15,812 | | | | | | — | | |
| Interest expense | | | | | — | | | | | | 3,008 | | | | | | 693 | | | | | | — | | |
| Total expenses | | | | | 1,418,364 | | | | | | 23,302,262 | | | | | | 3,744,051 | | | | | | 7,035,276 | | |
| Waived and reimbursed fees | | | | | — | | | | | | (3,561,211) | | | | | | (939,567) | | | | | | — | | |
| Brokerage commission recapture | | | | | — | | | | | | — | | | | | | (5,968) | | | | | | (33,645) | | |
| Net expenses | | | | | 1,418,364 | | | | | | 19,741,051 | | | | | | 2,798,516 | | | | | | 7,001,631 | | |
| Net investment income (loss) | | | | | 4,057,432 | | | | | | 93,258,213 | | | | | | 3,654,427 | | | | | | (78,894) | | |
| REALIZED AND UNREALIZED GAIN (LOSS): | | | | | | | | | | | | | | | | | | | | | | | | | |
| Net realized gain (loss) on: | | | | | | | | | | | | | | | | | | | | | | | | | |
| Investments | | | | | 470,143 | | | | | | 659,459,003 | | | | | | 59,330,382 | | | | | | 103,139,222 | | |
| Futures | | | | | (3,658) | | | | | | 17,174,777 | | | | | | — | | | | | | 516,896 | | |
| Net realized gain | | | | | 466,485 | | | | | | 676,633,780 | | | | | | 59,330,382 | | | | | | 103,656,118 | | |
| Net change in unrealized appreciation (depreciation) on: | | | | | | | | | | | | | | | | | | | | | | | | | |
| Investments | | | | | (4,469,822) | | | | | | 1,239,739,709 | | | | | | 53,814,243 | | | | | | 6,816,212 | | |
| Futures | | | | | (227,765) | | | | | | 1,576,476 | | | | | | — | | | | | | 207,686 | | |
| Net change in unrealized appreciation (depreciation) | | | | | (4,697,587) | | | | | | 1,241,316,185 | | | | | | 53,814,243 | | | | | | 7,023,898 | | |
| Net realized and unrealized gain (loss) | | | | | (4,231,102) | | | | | | 1,917,949,965 | | | | | | 113,144,625 | | | | | | 110,680,016 | | |
| Increase (decrease) in net assets resulting from operations | | | | $ | (173,670) | | | | | $ | 2,011,208,178 | | | | | $ | 116,799,052 | | | | | $ | 110,601,122 | | |
* Foreign taxes withheld | | | | $ | — | | | | | $ | 14,848 | | | | | $ | — | | | | | $ | 18,142 | | |
| | | | Voya Balanced Income Portfolio | | | Voya High Yield Portfolio | | ||||||||||||||||||
| | | | Year Ended December 31, 2021 | | | Year Ended December 31, 2020 | | | Year Ended December 31, 2021 | | | Year Ended December 31, 2020 | | ||||||||||||
| FROM OPERATIONS: | | | | | | | | | | | | | | | | | | | | | | | | | |
| Net investment income | | | | $ | 6,743,015 | | | | | $ | 8,644,202 | | | | | $ | 25,757,698 | | | | | $ | 27,740,605 | | |
| Net realized gain (loss) | | | | | 35,546,012 | | | | | | (13,552,226) | | | | | | 15,208,199 | | | | | | (20,138,392) | | |
| Net change in unrealized appreciation (depreciation) | | | | | (12,784,123) | | | | | | 11,717,846 | | | | | | (15,074,437) | | | | | | 18,077,591 | | |
| Increase in net assets resulting from operations | | | | | 29,504,904 | | | | | | 6,809,822 | | | | | | 25,891,460 | | | | | | 25,679,804 | | |
| FROM DISTRIBUTIONS TO SHAREHOLDERS: | | | | | | | | | | | | | | | | | | | | | | | | | |
| Total distributions (excluding return of capital): | | | | | | | | | | | | | | | | �� | | | | | | | | | |
| Class ADV | | | | | (1,409,617) | | | | | | (7,134,246) | | | | | | (3,613,459) | | | | | | (3,864,352) | | |
| Class I | | | | | (209,798) | | | | | | (809,293) | | | | | | (9,789,069) | | | | | | (10,017,767) | | |
| Class S | | | | | (6,192,671) | | | | | | (27,521,585) | | | | | | (12,506,127) | | | | | | (14,033,668) | | |
| Class S2 | | | | | (93,865) | | | | | | (530,338) | | | | | | (143,803) | | | | | | (151,411) | | |
| Return of capital: | | | | | | | | | | | | | | | | | | | | | | | | | |
| Class ADV | | | | | — | | | | | | — | | | | | | (135,496) | | | | | | (43,781) | | |
| Class I | | | | | — | | | | | | — | | | | | | (324,502) | | | | | | (101,134) | | |
| Class S | | | | | — | | | | | | — | | | | | | (434,273) | | | | | | (147,736) | | |
| Class S2 | | | | | — | | | | | | — | | | | | | (5,123) | | | | | | (1,649) | | |
| Total distributions | | | | | (7,905,951) | | | | | | (35,995,462) | | | | | | (26,951,852) | | | | | | (28,361,498) | | |
| FROM CAPITAL SHARE TRANSACTIONS: | | | | | | | | | | | | | | | | | | | | | | | | | |
| Net proceeds from sale of shares | | | | | 10,679,554 | | | | | | 17,474,471 | | | | | | 38,328,906 | | | | | | 52,668,235 | | |
| Reinvestment of distributions | | | | | 7,905,951 | | | | | | 35,995,462 | | | | | | 26,951,852 | | | | | | 28,361,498 | | |
| | | | | | 18,585,505 | | | | | | 53,469,933 | | | | | | 65,280,758 | | | | | | 81,029,733 | | |
| Cost of shares redeemed | | | | | (52,621,761) | | | | | | (66,713,173) | | | | | | (89,322,737) | | | | | | (124,621,505) | | |
Net decrease in net assets resulting from capital share transactions | | | | | (34,036,256) | | | | | | (13,243,240) | | | | | | (24,041,979) | | | | | | (43,591,772) | | |
| Net decrease in net assets | | | | | (12,437,303) | | | | | | (42,428,880) | | | | | | (25,102,371) | | | | | | (46,273,466) | | |
| NET ASSETS: | | | | | | | | | | | | | | | | | | | | | | | | | |
| Beginning of year or period | | | | | 346,183,863 | | | | | | 388,612,743 | | | | | | 541,030,911 | | | | | | 587,304,377 | | |
| End of year or period | | | | $ | 333,746,560 | | | | | $ | 346,183,863 | | | | | $ | 515,928,540 | | | | | $ | 541,030,911 | | |
| | | | Voya Large Cap Growth Portfolio | | | Voya Large Cap Value Portfolio | | ||||||||||||||||||
| | | | Year Ended December 31, 2021 | | | Year Ended December 31, 2020 | | | Year Ended December 31, 2021 | | | Year Ended December 31, 2020 | | ||||||||||||
| FROM OPERATIONS: | | | | | | | | | | | | | | | | | | | | | | | | | |
| Net investment income (loss) | | | | $ | (22,229,766) | | | | | $ | (5,867,599) | | | | | $ | 10,372,909 | | | | | $ | 16,840,193 | | |
| Net realized gain (loss) | | | | | 1,604,384,633 | | | | | | 1,147,315,271 | | | | | | 314,513,567 | | | | | | (7,237,969) | | |
| Net change in unrealized appreciation (depreciation) | | | | | (524,394,925) | | | | | | 447,817,571 | | | | | | (93,894,109) | | | | | | 33,011,880 | | |
| Increase in net assets resulting from operations | | | | | 1,057,759,942 | | | | | | 1,589,265,243 | | | | | | 230,992,367 | | | | | | 42,614,104 | | |
| FROM DISTRIBUTIONS TO SHAREHOLDERS: | | | | | | | | | | | | | | | | | | | | | | | | | |
| Total distributions (excluding return of capital): | | | | | | | | | | | | | | | | | | | | | | | | | |
| Class ADV | | | | | (429,952,557) | | | | | | (235,045,550) | | | | | | (1,581,277) | | | | | | (4,976,325) | | |
| Class I | | | | | (350,150,390) | | | | | | (247,062,817) | | | | | | (13,251,427) | | | | | | (35,461,124) | | |
| Class R6 | | | | | (16,669,588) | | | | | | (8,738,453) | | | | | | (387,396) | | | | | | (21,589) | | |
| Class S | | | | | (344,904,423) | | | | | | (203,650,756) | | | | | | (9,120,566) | | | | | | (64,530,149) | | |
| Class S2 | | | | | (12,028,880) | | | | | | (7,235,193) | | | | | | (6,040) | | | | | | (15,065) | | |
| Total distributions | | | | | (1,153,705,838) | | | | | | (701,732,769) | | | | | | (24,346,706) | | | | | | (105,004,252) | | |
| FROM CAPITAL SHARE TRANSACTIONS: | | | | | | | | | | | | | | | | | | | | | | | | | |
| Net proceeds from sale of shares | | | | | 107,613,864 | | | | | | 282,173,067 | | | | | | 28,627,367 | | | | | | 18,878,124 | | |
| Reinvestment of distributions | | | | | 1,153,705,838 | | | | | | 701,732,769 | | | | | | 24,346,706 | | | | | | 105,004,252 | | |
| | | | | | 1,261,319,702 | | | | | | 983,905,836 | | | | | | 52,974,073 | | | | | | 123,882,376 | | |
| Cost of shares redeemed | | | | | (1,724,612,567) | | | | | | (1,192,592,025) | | | | | | (765,388,438) | | | | | | (158,984,653) | | |
| Net decrease in net assets resulting from capital share transactions | | | | | (463,292,865) | | | | | | (208,686,189) | | | | | | (712,414,365) | | | | | | (35,102,277) | | |
| Net increase (decrease) in net assets | | | | | (559,238,761) | | | | | | 678,846,285 | | | | | | (505,768,704) | | | | | | (97,492,425) | | |
| NET ASSETS: | | | | | | | | | | | | | | | | | | | | | | | | | |
| Beginning of year or period | | | | | 6,530,930,033 | | | | | | 5,852,083,748 | | | | | | 988,954,098 | | | | | | 1,086,446,523 | | |
| End of year or period | | | | $ | 5,971,691,272 | | | | | $ | 6,530,930,033 | | | | | $ | 483,185,394 | | | | | $ | 988,954,098 | | |
| | | | Voya Limited Maturity Bond Portfolio | | | Voya U.S. Stock Index Portfolio | | ||||||||||||||||||
| | | | Year Ended December 31, 2021 | | | Year Ended December 31, 2020 | | | Year Ended December 31, 2021 | | | Year Ended December 31, 2020 | | ||||||||||||
| FROM OPERATIONS: | | | | | | | | | | | | | | | | | | | | | | | | | |
| Net investment income | | | | $ | 4,057,432 | | | | | $ | 6,076,550 | | | | | $ | 93,258,213 | | | | | $ | 109,749,181 | | |
| Net realized gain | | | | | 466,485 | | | | | | 3,048,233 | | | | | | 676,633,780 | | | | | | 730,953,817 | | |
| Net change in unrealized appreciation (depreciation) | | | | | (4,697,587) | | | | | | 2,427,379 | | | | | | 1,241,316,185 | | | | | | 428,538,281 | | |
| Increase (decrease) in net assets resulting from operations | | | | | (173,670) | | | | | | 11,552,162 | | | | | | 2,011,208,178 | | | | | | 1,269,241,279 | | |
| FROM DISTRIBUTIONS TO SHAREHOLDERS: | | | | | | | | | | | | | | | | | | | | | | | | | |
| Total distributions (excluding return of capital): | | | | | | | | | | | | | | | | | | | | | | | | | |
| Class ADV | | | | | (154,223) | | | | | | (242,778) | | | | | | (10,440,961) | | | | | | (5,102,873) | | |
| Class I | | | | | (5,247,269) | | | | | | (6,269,649) | | | | | | (453,677,922) | | | | | | (236,749,487) | | |
| Class P2 | | | | | — | | | | | | — | | | | | | (309,410,092) | | | | | | (145,581,699) | | |
| Class S | | | | | (1,015,514) | | | | | | (1,467,187) | | | | | | (29,892,766) | | | | | | (14,342,616) | | |
| Class S2 | | | | | — | | | | | | — | | | | | | (17,679,101) | | | | | | (7,572,526) | | |
| Total distributions | | | | | (6,417,006) | | | | | | (7,979,614) | | | | | | (821,100,842) | | | | | | (409,349,201) | | |
| FROM CAPITAL SHARE TRANSACTIONS: | | | | | | | | | | | | | | | | | | | | | | | | | |
| Net proceeds from sale of shares | | | | | 103,680,258 | | | | | | 232,269,160 | | | | | | 1,127,258,843 | | | | | | 1,646,848,722 | | |
| Reinvestment of distributions | | | | | 6,414,934 | | | | | | 7,953,023 | | | | | | 821,100,842 | | | | | | 409,349,201 | | |
| | | | | | 110,095,192 | | | | | | 240,222,183 | | | | | | 1,948,359,685 | | | | | | 2,056,197,923 | | |
| Cost of shares redeemed | | | | | (106,718,859) | | | | | | (112,500,304) | | | | | | (2,112,087,904) | | | | | | (2,212,680,724) | | |
| Net increase (decrease) in net assets resulting from capital share transactions | | | | | 3,376,333 | | | | | | 127,721,879 | | | | | | (163,728,219) | | | | | | (156,482,801) | | |
| Net increase (decrease) in net assets | | | | | (3,214,343) | | | | | | 131,294,427 | | | | | | 1,026,379,117 | | | | | | 703,409,277 | | |
| NET ASSETS: | | | | | | | | | | | | | | | | | | | | | | | | | |
| Beginning of year or period | | | | | 419,122,233 | | | | | | 287,827,806 | | | | | | 7,699,466,668 | | | | | | 6,996,057,391 | | |
| End of year or period | | | | $ | 415,907,890 | | | | | $ | 419,122,233 | | | | | $ | 8,725,845,785 | | | | | $ | 7,699,466,668 | | |
| | | | VY® Clarion Real Estate Portfolio | | | VY® JPMorgan Small Cap Core Equity Portfolio | | ||||||||||||||||||
| | | | Year Ended December 31, 2021 | | | Year Ended December 31, 2020 | | | Year Ended December 31, 2021 | | | Year Ended December 31, 2020 | | ||||||||||||
| FROM OPERATIONS: | | | | | | | | | | | | | | | | | | | | | | | | | |
| Net investment income (loss) | | | | $ | 3,654,427 | | | | | $ | 4,258,919 | | | | | $ | (78,894) | | | | | $ | 1,780,059 | | |
| Net realized gain (loss) | | | | | 59,330,382 | | | | | | (18,888,871) | | | | | | 103,656,118 | | | | | | 28,044,841 | | |
| Net change in unrealized appreciation (depreciation) | | | | | 53,814,243 | | | | | | (10,732,222) | | | | | | 7,023,898 | | | | | | 54,066,275 | | |
| Increase (decrease) in net assets resulting from operations | | | | | 116,799,052 | | | | | | (25,362,174) | | | | | | 110,601,122 | | | | | | 83,891,175 | | |
| FROM DISTRIBUTIONS TO SHAREHOLDERS: | | | | | | | | | | | | | | | | | | | | | | | | | |
| Total distributions (excluding return of capital): | | | | | | | | | | | | | | | | | | | | | | | | | |
| Class ADV | | | | | (866,071) | | | | | | (6,700,379) | | | | | | (7,449,294) | | | | | | — | | |
| Class I | | | | | (178,785) | | | | | | (2,012,016) | | | | | | (14,055,559) | | | | | | — | | |
| Class R6 | | | | | — | | | | | | — | | | | | | (6,530,307) | | | | | | — | | |
| Class S | | | | | (3,474,168) | | | | | | (23,267,019) | | | | | | (6,508,589) | | | | | | — | | |
| Class S2 | | | | | (193,147) | | | | | | (1,602,043) | | | | | | (428,894) | | | | | | — | | |
| Total distributions | | | | | (4,712,171) | | | | | | (33,581,457) | | | | | | (34,972,643) | | | | | | — | | |
| FROM CAPITAL SHARE TRANSACTIONS: | | | | | | | | | | | | | | | | | | | | | | | | | |
| Net proceeds from sale of shares | | | | | 18,272,772 | | | | | | 18,588,194 | | | | | | 159,746,121 | | | | | | 174,298,740 | | |
| Reinvestment of distributions | | | | | 4,712,171 | | | | | | 33,581,457 | | | | | | 34,972,643 | | | | | | — | | |
| | | | | | 22,984,943 | | | | | | 52,169,651 | | | | | | 194,718,764 | | | | | | 174,298,740 | | |
| Cost of shares redeemed | | | | | (66,187,534) | | | | | | (79,521,435) | | | | | | (173,565,349) | | | | | | (217,374,403) | | |
Net increase (decrease) in net assets resulting from capital share transactions | | | | | (43,202,591) | | | | | | (27,351,784) | | | | | | 21,153,415 | | | | | | (43,075,663) | | |
| Net increase (decrease) in net assets | | | | | 68,884,290 | | | | | | (86,295,415) | | | | | | 96,781,894 | | | | | | 40,815,512 | | |
| NET ASSETS: | | | | | | | | | | | | | | | | | | | | | | | | | |
| Beginning of year or period | | | | | 247,729,930 | | | | | | 334,025,345 | | | | | | 588,790,362 | | | | | | 547,974,850 | | |
| End of year or period | | | | $ | 316,614,220 | | | | | $ | 247,729,930 | | | | | $ | 685,572,256 | | | | | $ | 588,790,362 | | |
| | | | | | | | | | Income (loss) from investment operations | | | | | | | | | Less Distributions | | | | | | Ratios to average net assets | | | Supplemental Data | | |||||||||||||||||||||||||||||||||||||||||||||||||||||||||||||||||||||||||||
| | | | Net asset value, beginning of year or period | | | Net investment income (loss) | | | Net realized and unrealized gain (loss) | | | Total from investment operations | | | From net investment income | | | From net realized gains | | | From return of capital | | | Total distributions | | | Payment by affiliate | | | Net asset value, end of year or period | | | Total Return(1) | | | Expenses before reductions/additions(2)(3)(4) | | | Expenses net of fee waivers and/or recoupments if any(2)(3)(4) | | | Expenses net of all reductions/additions(2)(3)(4) | | | Net investment income (loss)(2)(3) | | | Net assets, end of year or period | | | Portfolio turnover rate | | |||||||||||||||||||||||||||||||||||||||||||||||||||
| Year or period ended | | | ($) | | | ($) | | | ($) | | | ($) | | | ($) | | | ($) | | | ($) | | | ($) | | | ($) | | | ($) | | | (%) | | | (%) | | | (%) | | | (%) | | | (%) | | | ($000’s) | | | (%) | | |||||||||||||||||||||||||||||||||||||||||||||||||||
| Voya Balanced Income Portfolio | | | | | | | | | | | | | | | | | | | | | | | | | | | | | | | | | | | | | | | | | | | | | | | | | | | | | | | | | | | | | | | | | | | | | | | | | | | | | | | | | | | | | | | | | | | | | | | | | | | | | | | |
| Class ADV | | | | | | | | | | | | | | | | | | | | | | | | | | | | | | | | | | | | | | | | | | | | | | | | | | | | | | | | | | | | | | | | | | | | | | | | | | | | | | | | | | | | | | | | | | | | | | | | | | | | | | | |
| 12-31-21 | | | | | 9.77 | | | | | | 0.17• | | | | | | 0.67 | | | | | | 0.84 | | | | | | 0.22 | | | | | | — | | | | | | — | | | | | | 0.22 | | | | | | — | | | | | | 10.39 | | | | | | 8.65 | | | | | | 1.22 | | | | | | 1.20 | | | | | | 1.20 | | | | | | 1.69 | | | | | | 65,611 | | | | | | 133 | | |
| 12-31-20 | | | | | 10.65 | | | | | | 0.21• | | | | | | (0.01) | | | | | | 0.20 | | | | | | 0.36 | | | | | | 0.72 | | | | | | — | | | | | | 1.08 | | | | | | — | | | | | | 9.77 | | | | | | 2.80 | | | | | | 1.22 | | | | | | 1.20 | | | | | | 1.20 | | | | | | 2.20 | | | | | | 66,515 | | | | | | 69 | | |
| 12-31-19 | | | | | 10.05 | | | | | | 0.30 | | | | | | 1.47 | | | | | | 1.77 | | | | | | 0.50 | | | | | | 0.67 | | | | | | — | | | | | | 1.17 | | | | | | — | | | | | | 10.65 | | | | | | 17.93 | | | | | | 1.26 | | | | | | 1.22 | | | | | | 1.22 | | | | | | 2.79 | | | | | | 78,155 | | | | | | 231 | | |
| 12-31-18 | | | | | 11.18 | | | | | | 0.43• | | | | | | (1.00) | | | | | | (0.57) | | | | | | 0.56 | | | | | | — | | | | | | — | | | | | | 0.56 | | | | | | — | | | | | | 10.05 | | | | | | (5.39) | | | | | | 1.39 | | | | | | 1.26 | | | | | | 1.26 | | | | | | 3.91 | | | | | | 69,593 | | | | | | 45 | | |
| 12-31-17 | | | | | 10.62 | | | | | | 0.46• | | | | | | 0.58 | | | | | | 1.04 | | | | | | 0.48 | | | | | | — | | | | | | — | | | | | | 0.48 | | | | | | — | | | | | | 11.18 | | | | | | 10.03 | | | | | | 1.39 | | | | | | 1.26 | | | | | | 1.26 | | | | | | 4.16 | | | | | | 81,767 | | | | | | 22 | | |
| Class I | | | | | | | | | | | | | | | | | | | | | | | | | | | | | | | | | | | | | | | | | | | | | | | | | | | | | | | | | | | | | | | | | | | | | | | | | | | | | | | | | | | | | | | | | | | | | | | | | | | | | | | |
| 12-31-21 | | | | | 10.31 | | | | | | 0.25• | | | | | | 0.71 | | | | | | 0.96 | | | | | | 0.28 | | | | | | — | | | | | | — | | | | | | 0.28 | | | | | | — | | | | | | 10.99 | | | | | | 9.42 | | | | | | 0.62 | | | | | | 0.60 | | | | | | 0.60 | | | | | | 2.29 | | | | | | 7,878 | | | | | | 133 | | |
| 12-31-20 | | | | | 11.19 | | | | | | 0.29• | | | | | | (0.03) | | | | | | 0.26 | | | | | | 0.42 | | | | | | 0.72 | | | | | | — | | | | | | 1.14 | | | | | | — | | | | | | 10.31 | | | | | | 3.33 | | | | | | 0.62 | | | | | | 0.60 | | | | | | 0.60 | | | | | | 2.79 | | | | | | 7,943 | | | | | | 69 | | |
| 12-31-19 | | | | | 10.50 | | | | | | 0.38• | | | | | | 1.55 | | | | | | 1.93 | | | | | | 0.57 | | | | | | 0.67 | | | | | | — | | | | | | 1.24 | | | | | | — | | | | | | 11.19 | | | | | | 18.73 | | | | | | 0.66 | | | | | | 0.62 | | | | | | 0.62 | | | | | | 3.38 | | | | | | 8,836 | | | | | | 231 | | |
| 12-31-18 | | | | | 11.65 | | | | | | 0.51• | | | | | | (1.03) | | | | | | (0.52) | | | | | | 0.63 | | | | | | — | | | | | | — | | | | | | 0.63 | | | | | | — | | | | | | 10.50 | | | | | | (4.79) | | | | | | 0.79 | | | | | | 0.66 | | | | | | 0.66 | | | | | | 4.51 | | | | | | 7,921 | | | | | | 45 | | |
| 12-31-17 | | | | | 11.05 | | | | | | 0.54• | | | | | | 0.60 | | | | | | 1.14 | | | | | | 0.54 | | | | | | — | | | | | | — | | | | | | 0.54 | | | | | | — | | | | | | 11.65 | | | | | | 10.56 | | | | | | 0.79 | | | | | | 0.66 | | | | | | 0.66 | | | | | | 4.76 | | | | | | 9,393 | | | | | | 22 | | |
| Class S | | | | | | | | | | | | | | | | | | | | | | | | | | | | | | | | | | | | | | | | | | | | | | | | | | | | | | | | | | | | | | | | | | | | | | | | | | | | | | | | | | | | | | | | | | | | | | | | | | | | | | | |
| 12-31-21 | | | | | 10.25 | | | | | | 0.22• | | | | | | 0.70 | | | | | | 0.92 | | | | | | 0.25 | | | | | | — | | | | | | — | | | | | | 0.25 | | | | | | — | | | | | | 10.92 | | | | | | 9.09 | | | | | | 0.87 | | | | | | 0.85 | | | | | | 0.85 | | | | | | 2.04 | | | | | | 256,146 | | | | | | 133 | | |
| 12-31-20 | | | | | 11.13 | | | | | | 0.26• | | | | | | (0.03) | | | | | | 0.23 | | | | | | 0.39 | | | | | | 0.72 | | | | | | — | | | | | | 1.11 | | | | | | — | | | | | | 10.25 | | | | | | 3.03 | | | | | | 0.87 | | | | | | 0.85 | | | | | | 0.85 | | | | | | 2.55 | | | | | | 266,536 | | | | | | 69 | | |
| 12-31-19 | | | | | 10.45 | | | | | | 0.36• | | | | | | 1.52 | | | | | | 1.88 | | | | | | 0.53 | | | | | | 0.67 | | | | | | — | | | | | | 1.20 | | | | | | — | | | | | | 11.13 | | | | | | 18.40 | | | | | | 0.91 | | | | | | 0.87 | | | | | | 0.87 | | | | | | 3.18 | | | | | | 295,942 | | | | | | 231 | | |
| 12-31-18 | | | | | 11.59 | | | | | | 0.48• | | | | | | (1.02) | | | | | | (0.54) | | | | | | 0.60 | | | | | | — | | | | | | — | | | | | | 0.60 | | | | | | — | | | | | | 10.45 | | | | | | (5.01) | | | | | | 1.04 | | | | | | 0.91 | | | | | | 0.91 | | | | | | 4.26 | | | | | | 285,793 | | | | | | 45 | | |
| 12-31-17 | | | | | 10.99 | | | | | | 0.51• | | | | | | 0.60 | | | | | | 1.11 | | | | | | 0.51 | | | | | | — | | | | | | — | | | | | | 0.51 | | | | | | — | | | | | | 11.59 | | | | | | 10.33 | | | | | | 1.04 | | | | | | 0.91 | | | | | | 0.91 | | | | | | 4.52 | | | | | | 361,336 | | | | | | 22 | | |
| Class S2 | | | | | | | | | | | | | | | | | | | | | | | | | | | | | | | | | | | | | | | | | | | | | | | | | | | | | | | | | | | | | | | | | | | | | | | | | | | | | | | | | | | | | | | | | | | | | | | | | | | | | | | |
| 12-31-21 | | | | | 10.22 | | | | | | 0.20• | | | | | | 0.70 | | | | | | 0.90 | | | | | | 0.23 | | | | | | — | | | | | | — | | | | | | 0.23 | | | | | | — | | | | | | 10.89 | | | | | | 8.88 | | | | | | 1.02 | | | | | | 1.00 | | | | | | 1.00 | | | | | | 1.89 | | | | | | 4,112 | | | | | | 133 | | |
| 12-31-20 | | | | | 11.10 | | | | | | 0.27 | | | | | | (0.04) | | | | | | 0.23 | | | | | | 0.39 | | | | | | 0.72 | | | | | | — | | | | | | 1.11 | | | | | | — | | | | | | 10.22 | | | | | | 3.02 | | | | | | 1.02 | | | | | | 1.00 | | | | | | 1.00 | | | | | | 2.40 | | | | | | 5,189 | | | | | | 69 | | |
| 12-31-19 | | | | | 10.43 | | | | | | 0.32 | | | | | | 1.54 | | | | | | 1.86 | | | | | | 0.52 | | | | | | 0.67 | | | | | | — | | | | | | 1.19 | | | | | | — | | | | | | 11.10 | | | | | | 18.15 | | | | | | 1.06 | | | | | | 1.02 | | | | | | 1.02 | | | | | | 2.97 | | | | | | 5,679 | | | | | | 231 | | |
| 12-31-18 | | | | | 11.56 | | | | | | 0.46• | | | | | | (1.02) | | | | | | (0.56) | | | | | | 0.57 | | | | | | — | | | | | | — | | | | | | 0.57 | | | | | | — | | | | | | 10.43 | | | | | | (5.15) | | | | | | 1.19 | | | | | | 1.06 | | | | | | 1.06 | | | | | | 4.11 | | | | | | 4,647 | | | | | | 45 | | |
| 12-31-17 | | | | | 10.96 | | | | | | 0.50• | | | | | | 0.59 | | | | | | 1.09 | | | | | | 0.49 | | | | | | — | | | | | | — | | | | | | 0.49 | | | | | | — | | | | | | 11.56 | | | | | | 10.16 | | | | | | 1.19 | | | | | | 1.06 | | | | | | 1.06 | | | | | | 4.38 | | | | | | 5,389 | | | | | | 22 | | |
| Voya High Yield Portfolio | | | | | | | | | | | | | | | | | | | | | | | | | | | | | | | | | | | | | | | | | | | | | | | | | | | | | | | | | | | | | | | | | | | | | | | | | | | | | | | | | | | | | | | | | | | | | | | | | | | | | | | |
| Class ADV | | | | | | | | | | | | | | | | | | | | | | | | | | | | | | | | | | | | | | | | | | | | | | | | | | | | | | | | | | | | | | | | | | | | | | | | | | | | | | | | | | | | | | | | | | | | | | | | | | | | | | | |
| 12-31-21 | | | | | 9.96 | | | | | | 0.45• | | | | | | 0.01 | | | | | | 0.46 | | | | | | 0.46 | | | | | | — | | | | | | 0.02 | | | | | | 0.48 | | | | | | — | | | | | | 9.94 | | | | | | 4.65 | | | | | | 1.10 | | | | | | 1.08 | | | | | | 1.08 | | | | | | 4.52 | | | | | | 79,216 | | | | | | 63 | | |
| 12-31-20 | | | | | 9.94 | | | | | | 0.46• | | | | | | 0.03 | | | | | | 0.49 | | | | | | 0.46 | | | | | | — | | | | | | 0.01 | | | | | | 0.47 | | | | | | — | | | | | | 9.96 | | | | | | 5.26 | | | | | | 1.10 | | | | | | 1.08 | | | | | | 1.08 | | | | | | 4.80 | | | | | | 80,017 | | | | | | 90 | | |
| 12-31-19 | | | | | 9.09 | | | | | | 0.50 | | | | | | 0.83 | | | | | | 1.33 | | | | | | 0.48 | | | | | | — | | | | | | — | | | | | | 0.48 | | | | | | — | | | | | | 9.94 | | | | | | 14.82 | | | | | | 1.10 | | | | | | 1.08 | | | | | | 1.08 | | | | | | 5.20 | | | | | | 87,540 | | | | | | 59 | | |
| 12-31-18 | | | | | 9.94 | | | | | | 0.48 | | | | | | (0.81) | | | | | | (0.33) | | | | | | 0.52 | | | | | | — | | | | | | — | | | | | | 0.52 | | | | | | — | | | | | | 9.09 | | | | | | (3.53) | | | | | | 1.10 | | | | | | 1.08 | | | | | | 1.08 | | | | | | 5.02 | | | | | | 80,872 | | | | | | 35 | | |
| 12-31-17 | | | | | 10.01 | | | | | | 0.54 | | | | | | 0.03 | | | | | | 0.57 | | | | | | 0.62 | | | | | | — | | | | | | 0.02 | | | | | | 0.64 | | | | | | — | | | | | | 9.94 | | | | | | 5.83 | | | | | | 1.10 | | | | | | 1.08 | | | | | | 1.08 | | | | | | 5.36 | | | | | | 96,011 | | | | | | 37 | | |
| Class I | | | | | | | | | | | | | | | | | | | | | | | | | | | | | | | | | | | | | | | | | | | | | | | | | | | | | | | | | | | | | | | | | | | | | | | | | | | | | | | | | | | | | | | | | | | | | | | | | | | | | | | |
| 12-31-21 | | | | | 9.97 | | | | | | 0.51• | | | | | | 0.01 | | | | | | 0.52 | | | | | | 0.52 | | | | | | — | | | | | | 0.02 | | | | | | 0.54 | | | | | | — | | | | | | 9.95 | | | | | | 5.28 | | | | | | 0.50 | | | | | | 0.48 | | | | | | 0.48 | | | | | | 5.12 | | | | | | 189,224 | | | | | | 63 | | |
| 12-31-20 | | | | | 9.94 | | | | | | 0.51• | | | | | | 0.05 | | | | | | 0.56 | | | | | | 0.52 | | | | | | — | | | | | | 0.01 | | | | | | 0.53 | | | | | | — | | | | | | 9.97 | | | | | | 6.00 | | | | | | 0.50 | | | | | | 0.48 | | | | | | 0.48 | | | | | | 5.40 | | | | | | 191,358 | | | | | | 90 | | |
| 12-31-19 | | | | | 9.10 | | | | | | 0.57• | | | | | | 0.81 | | | | | | 1.38 | | | | | | 0.54 | | | | | | — | | | | | | — | | | | | | 0.54 | | | | | | — | | | | | | 9.94 | | | | | | 15.37 | | | | | | 0.50 | | | | | | 0.48 | | | | | | 0.48 | | | | | | 5.84 | | | | | | 189,247 | | | | | | 59 | | |
| 12-31-18 | | | | | 9.95 | | | | | | 0.54 | | | | | | (0.82) | | | | | | (0.28) | | | | | | 0.57 | | | | | | — | | | | | | — | | | | | | 0.57 | | | | | | — | | | | | | 9.10 | | | | | | (2.96) | | | | | | 0.50 | | | | | | 0.48 | | | | | | 0.48 | | | | | | 5.62 | | | | | | 56,385 | | | | | | 35 | | |
| 12-31-17 | | | | | 10.01 | | | | | | 0.60 | | | | | | 0.04 | | | | | | 0.64 | | | | | | 0.68 | | | | | | — | | | | | | 0.02 | | | | | | 0.70 | | | | | | — | | | | | | 9.95 | | | | | | 6.58 | | | | | | 0.50 | | | | | | 0.48 | | | | | | 0.48 | | | | | | 5.96 | | | | | | 62,380 | | | | | | 37 | | |
| | | | | | | | | | Income (loss) from investment operations | | | | | | | | | Less Distributions | | | | | | Ratios to average net assets | | | Supplemental Data | | |||||||||||||||||||||||||||||||||||||||||||||||||||||||||||||||||||||||||||
| | | | Net asset value, beginning of year or period | | | Net investment income (loss) | | | Net realized and unrealized gain (loss) | | | Total from investment operations | | | From net investment income | | | From net realized gains | | | From return of capital | | | Total distributions | | | Payment by affiliate | | | Net asset value, end of year or period | | | Total Return(1) | | | Expenses before reductions/additions(2)(3)(4) | | | Expenses net of fee waivers and/or recoupments if any(2)(3)(4) | | | Expenses net of all reductions/additions(2)(3)(4) | | | Net investment income (loss)(2)(3) | | | Net assets, end of year or period | | | Portfolio turnover rate | | |||||||||||||||||||||||||||||||||||||||||||||||||||
| Year or period ended | | | ($) | | | ($) | | | ($) | | | ($) | | | ($) | | | ($) | | | ($) | | | ($) | | | ($) | | | ($) | | | (%) | | | (%) | | | (%) | | | (%) | | | (%) | | | ($000’s) | | | (%) | | |||||||||||||||||||||||||||||||||||||||||||||||||||
| Voya High Yield Portfolio (continued) | | | | | | | | | | | | | | | | | | | | | | | | | | | | | | | | | | | | | | | | | | | | | | | | | | | | | | | | | | | | | | | | | | | | | | | | | | | | | | | | | | | | | | | | | | | | | | | | | | | | | | | |
| Class S | | | | | | | | | | | | | | | | | | | | | | | | | | | | | | | | | | | | | | | | | | | | | | | | | | | | | | | | | | | | | | | | | | | | | | | | | | | | | | | | | | | | | | | | | | | | | | | | | | | | | | | |
| 12-31-21 | | | | | 9.96 | | | | | | 0.48• | | | | | | 0.01 | | | | | | 0.49 | | | | | | 0.49 | | | | | | — | | | | | | 0.02 | | | | | | 0.51 | | | | | | — | | | | | | 9.94 | | | | | | 5.01 | | | | | | 0.75 | | | | | | 0.73 | | | | | | 0.73 | | | | | | 4.87 | | | | | | 244,800 | | | | | | 63 | | |
| 12-31-20 | | | | | 9.94 | | | | | | 0.49• | | | | | | 0.04 | | | | | | 0.53 | | | | | | 0.50 | | | | | | — | | | | | | 0.01 | | | | | | 0.51 | | | | | | — | | | | | | 9.96 | | | | | | 5.63 | | | | | | 0.75 | | | | | | 0.73 | | | | | | 0.73 | | | | | | 5.15 | | | | | | 266,537 | | | | | | 90 | | |
| 12-31-19 | | | | | 9.09 | | | | | | 0.54 | | | | | | 0.82 | | | | | | 1.36 | | | | | | 0.51 | | | | | | — | | | | | | — | | | | | | 0.51 | | | | | | — | | | | | | 9.94 | | | | | | 15.22 | | | | | | 0.75 | | | | | | 0.73 | | | | | | 0.73 | | | | | | 5.54 | | | | | | 307,506 | | | | | | 59 | | |
| 12-31-18 | | | | | 9.94 | | | | | | 0.51 | | | | | | (0.81) | | | | | | (0.30) | | | | | | 0.55 | | | | | | — | | | | | | — | | | | | | 0.55 | | | | | | — | | | | | | 9.09 | | | | | | (3.20) | | | | | | 0.75 | | | | | | 0.73 | | | | | | 0.73 | | | | | | 5.36 | | | | | | 332,669 | | | | | | 35 | | |
| 12-31-17 | | | | | 10.01 | | | | | | 0.58 | | | | | | 0.02 | | | | | | 0.60 | | | | | | 0.65 | | | | | | — | | | | | | 0.02 | | | | | | 0.67 | | | | | | — | | | | | | 9.94 | | | | | | 6.20 | | | | | | 0.75 | | | | | | 0.73 | | | | | | 0.73 | | | | | | 5.71 | | | | | | 403,630 | | | | | | 37 | | |
| Class S2 | | | | | | | | | | | | | | | | | | | | | | | | | | | | | | | | | | | | | | | | | | | | | | | | | | | | | | | | | | | | | | | | | | | | | | | | | | | | | | | | | | | | | | | | | | | | | | | | | | | | | | | |
| 12-31-21 | | | | | 9.97 | | | | | | 0.47• | | | | | | 0.01 | | | | | | 0.48 | | | | | | 0.48 | | | | | | — | | | | | | 0.02 | | | | | | 0.50 | | | | | | — | | | | | | 9.95 | | | | | | 4.86 | | | | | | 0.90 | | | | | | 0.88 | | | | | | 0.88 | | | | | | 4.72 | | | | | | 2,688 | | | | | | 63 | | |
| 12-31-20 | | | | | 9.95 | | | | | | 0.48• | | | | | | 0.03 | | | | | | 0.51 | | | | | | 0.48 | | | | | | — | | | | | | 0.01 | | | | | | 0.49 | | | | | | — | | | | | | 9.97 | | | | | | 5.48 | | | | | | 0.90 | | | | | | 0.88 | | | | | | 0.88 | | | | | | 4.99 | | | | | | 3,119 | | | | | | 90 | | |
| 12-31-19 | | | | | 9.11 | | | | | | 0.51 | | | | | | 0.83 | | | | | | 1.34 | | | | | | 0.50 | | | | | | — | | | | | | — | | | | | | 0.50 | | | | | | — | | | | | | 9.95 | | | | | | 14.91 | | | | | | 0.90 | | | | | | 0.88 | | | | | | 0.88 | | | | | | 5.37 | | | | | | 3,012 | | | | | | 59 | | |
| 12-31-18 | | | | | 9.95 | | | | | | 0.50 | | | | | | (0.80) | | | | | | (0.30) | | | | | | 0.54 | | | | | | — | | | | | | — | | | | | | 0.54 | | | | | | — | | | | | | 9.11 | | | | | | (3.23) | | | | | | 0.90 | | | | | | 0.88 | | | | | | 0.88 | | | | | | 5.20 | | | | | | 4,226 | | | | | | 35 | | |
| 12-31-17 | | | | | 10.02 | | | | | | 0.56 | | | | | | 0.03 | | | | | | 0.59 | | | | | | 0.64 | | | | | | — | | | | | | 0.02 | | | | | | 0.66 | | | | | | — | | | | | | 9.95 | | | | | | 6.04 | | | | | | 0.90 | | | | | | 0.88 | | | | | | 0.88 | | | | | | 5.56 | | | | | | 5,792 | | | | | | 37 | | |
| Voya Large Cap Growth Portfolio | | | | | | | | | | | | | | | | | | | | | | | | | | | | | | | | | | | | | | | | | | | | | | | | | | | | | | | | | | | | | | | | | | | | | | | | | | | | | | | | | | | | | | | | | | | | | | | | | | | | | | | |
| Class ADV | | | | | | | | | | | | | | | | | | | | | | | | | | | | | | | | | | | | | | | | | | | | | | | | | | | | | | | | | | | | | | | | | | | | | | | | | | | | | | | | | | | | | | | | | | | | | | | | | | | | | | | |
| 12-31-21 | | | | | 20.45 | | | | | | (0.14)• | | | | | | 3.76 | | | | | | 3.62 | | | | | | — | | | | | | 4.64 | | | | | | — | | | | | | 4.64 | | | | | | — | | | | | | 19.43 | | | | | | 18.89 | | | | | | 1.30 | | | | | | 1.27 | | | | | | 1.27 | | | | | | (0.68) | | | | | | 2,085,856 | | | | | | 72 | | |
| 12-31-20 | | | | | 17.96 | | | | | | (0.08) | | | | | | 5.00 | | | | | | 4.92 | | | | | | — | | | | | | 2.43 | | | | | | — | | | | | | 2.43 | | | | | | — | | | | | | 20.45 | | | | | | 30.11 | | | | | | 1.32 | | | | | | 1.27 | | | | | | 1.27 | | | | | | (0.43) | | | | | | 2,073,088 | | | | | | 86 | | |
| 12-31-19 | | | | | 16.37 | | | | | | (0.01) | | | | | | 4.97 | | | | | | 4.96 | | | | | | 0.02 | | | | | | 3.35 | | | | | | — | | | | | | 3.37 | | | | | | — | | | | | | 17.96 | | | | | | 31.90 | | | | | | 1.27 | | | | | | 1.27 | | | | | | 1.27 | | | | | | (0.05) | | | | | | 1,890,631 | | | | | | 78 | | |
| 12-31-18 | | | | | 19.36 | | | | | | 0.01 | | | | | | (0.11) | | | | | | (0.10) | | | | | | 0.01 | | | | | | 2.88 | | | | | | — | | | | | | 2.89 | | | | | | — | | | | | | 16.37 | | | | | | (2.07) | | | | | | 1.27 | | | | | | 1.27 | | | | | | 1.27 | | | | | | 0.04 | | | | | | 1,686,805 | | | | | | 85 | | |
| 12-31-17 | | | | | 16.22 | | | | | | 0.02 | | | | | | 4.53 | | | | | | 4.55 | | | | | | 0.01 | | | | | | 1.40 | | | | | | — | | | | | | 1.41 | | | | | | — | | | | | | 19.36 | | | | | | 29.01 | | | | | | 1.27 | | | | | | 1.27 | | | | | | 1.27 | | | | | | 0.04 | | | | | | 2,015,843 | | | | | | 65 | | |
| Class I | | | | | | | | | | | | | | | | | | | | | | | | | | | | | | | | | | | | | | | | | | | | | | | | | | | | | | | | | | | | | | | | | | | | | | | | | | | | | | | | | | | | | | | | | | | | | | | | | | | | | | | |
| 12-31-21 | | | | | 22.90 | | | | | | (0.02)• | | | | | | 4.24 | | | | | | 4.22 | | | | | | — | | | | | | 4.64 | | | | | | — | | | | | | 4.64 | | | | | | — | | | | | | 22.48 | | | | | | 19.55 | | | | | | 0.70 | | | | | | 0.67 | | | | | | 0.67 | | | | | | (0.07) | | | | | | 1,937,889 | | | | | | 72 | | |
| 12-31-20 | | | | | 19.83 | | | | | | 0.04 | | | | | | 5.57 | | | | | | 5.61 | | | | | | 0.11 | | | | | | 2.43 | | | | | | — | | | | | | 2.54 | | | | | | — | | | | | | 22.90 | | | | | | 30.88 | | | | | | 0.72 | | | | | | 0.67 | | | | | | 0.67 | | | | | | 0.17 | | | | | | 2,436,873 | | | | | | 86 | | |
| 12-31-19 | | | | | 17.78 | | | | | | 0.11 | | | | | | 5.43 | | | | | | 5.54 | | | | | | 0.14 | | | | | | 3.35 | | | | | | — | | | | | | 3.49 | | | | | | — | | | | | | 19.83 | | | | | | 32.77 | | | | | | 0.67 | | | | | | 0.67 | | | | | | 0.67 | | | | | | 0.54 | | | | | | 2,000,466 | | | | | | 78 | | |
| 12-31-18 | | | | | 20.80 | | | | | | 0.13• | | | | | | (0.13) | | | | | | 0.00* | | | | | | 0.14 | | | | | | 2.88 | | | | | | — | | | | | | 3.02 | | | | | | — | | | | | | 17.78 | | | | | | (1.48) | | | | | | 0.67 | | | | | | 0.67 | | | | | | 0.67 | | | | | | 0.63 | | | | | | 1,623,952 | | | | | | 85 | | |
| 12-31-17 | | | | | 17.34 | | | | | | 0.12 | | | | | | 4.87 | | | | | | 4.99 | | | | | | 0.13 | | | | | | 1.40 | | | | | | — | | | | | | 1.53 | | | | | | — | | | | | | 20.80 | | | | | | 29.74 | | | | | | 0.67 | | | | | | 0.67 | | | | | | 0.67 | | | | | | 0.63 | | | | | | 2,124,109 | | | | | | 65 | | |
| Class R6 | | | | | | | | | | | | | | | | | | | | | | | | | | | | | | | | | | | | | | | | | | | | | | | | | | | | | | | | | | | | | | | | | | | | | | | | | | | | | | | | | | | | | | | | | | | | | | | | | | | | | | | |
| 12-31-21 | | | | | 22.91 | | | | | | (0.02)• | | | | | | 4.25 | | | | | | 4.23 | | | | | | — | | | | | | 4.64 | | | | | | — | | | | | | 4.64 | | | | | | — | | | | | | 22.50 | | | | | | 19.58 | | | | | | 0.67 | | | | | | 0.67 | | | | | | 0.67 | | | | | | (0.08) | | | | | | 95,588 | | | | | | 72 | | |
| 12-31-20 | | | | | 19.84 | | | | | | 0.03 | | | | | | 5.58 | | | | | | 5.61 | | | | | | 0.11 | | | | | | 2.43 | | | | | | — | | | | | | 2.54 | | | | | | — | | | | | | 22.91 | | | | | | 30.86 | | | | | | 0.67 | | | | | | 0.67 | | | | | | 0.67 | | | | | | 0.16 | | | | | | 88,303 | | | | | | 86 | | |
| 12-31-19 | | | | | 17.78 | | | | | | 0.11 | | | | | | 5.44 | | | | | | 5.55 | | | | | | 0.14 | | | | | | 3.35 | | | | | | — | | | | | | 3.49 | | | | | | — | | | | | | 19.84 | | | | | | 32.82 | | | | | | 0.67 | | | | | | 0.67 | | | | | | 0.67 | | | | | | 0.54 | | | | | | 59,938 | | | | | | 78 | | |
| 12-31-18 | | | | | 20.81 | | | | | | 0.12 | | | | | | (0.13) | | | | | | (0.01) | | | | | | 0.14 | | | | | | 2.88 | | | | | | — | | | | | | 3.02 | | | | | | — | | | | | | 17.78 | | | | | | (1.53) | | | | | | 0.67 | | | | | | 0.67 | | | | | | 0.67 | | | | | | 0.68 | | | | | | 46,242 | | | | | | 85 | | |
| 12-31-17 | | | | | 17.34 | | | | | | 0.13• | | | | | | 4.87 | | | | | | 5.00 | | | | | | 0.13 | | | | | | 1.40 | | | | | | — | | | | | | 1.53 | | | | | | — | | | | | | 20.81 | | | | | | 29.80 | | | | | | 0.67 | | | | | | 0.67 | | | | | | 0.67 | | | | | | 0.65 | | | | | | 33,736 | | | | | | 65 | | |
| Class S | | | | | | | | | | | | | | | | | | | | | | | | | | | | | | | | | | | | | | | | | | | | | | | | | | | | | | | | | | | | | | | | | | | | | | | | | | | | | | | | | | | | | | | | | | | | | | | | | | | | | | | |
| 12-31-21 | | | | | 22.10 | | | | | | (0.07)• | | | | | | 4.08 | | | | | | 4.01 | | | | | | — | | | | | | 4.64 | | | | | | — | | | | | | 4.64 | | | | | | — | | | | | | 21.47 | | | | | | 19.28 | | | | | | 0.95 | | | | | | 0.92 | | | | | | 0.92 | | | | | | (0.33) | | | | | | 1,787,956 | | | | | | 72 | | |
| 12-31-20 | | | | | 19.21 | | | | | | (0.01) | | | | | | 5.38 | | | | | | 5.37 | | | | | | 0.05 | | | | | | 2.43 | | | | | | — | | | | | | 2.48 | | | | | | — | | | | | | 22.10 | | | | | | 30.59 | | | | | | 0.97 | | | | | | 0.92 | | | | | | 0.92 | | | | | | (0.08) | | | | | | 1,867,154 | | | | | | 86 | | |
| 12-31-19 | | | | | 17.31 | | | | | | 0.06 | | | | | | 5.27 | | | | | | 5.33 | | | | | | 0.08 | | | | | | 3.35 | | | | | | — | | | | | | 3.43 | | | | | | — | | | | | | 19.21 | | | | | | 32.41 | | | | | | 0.92 | | | | | | 0.92 | | | | | | 0.92 | | | | | | 0.30 | | | | | | 1,839,829 | | | | | | 78 | | |
| 12-31-18 | | | | | 20.32 | | | | | | 0.08• | | | | | | (0.13) | | | | | | (0.05) | | | | | | 0.08 | | | | | | 2.88 | | | | | | — | | | | | | 2.96 | | | | | | — | | | | | | 17.31 | | | | | | (1.73) | | | | | | 0.92 | | | | | | 0.92 | | | | | | 0.92 | | | | | | 0.39 | | | | | | 1,677,848 | | | | | | 85 | | |
| 12-31-17 | | | | | 16.97 | | | | | | 0.07• | | | | | | 4.76 | | | | | | 4.83 | | | | | | 0.08 | | | | | | 1.40 | | | | | | — | | | | | | 1.48 | | | | | | — | | | | | | 20.32 | | | | | | 29.42 | | | | | | 0.92 | | | | | | 0.92 | | | | | | 0.92 | | | | | | 0.39 | | | | | | 2,040,159 | | | | | | 65 | | |
| | | | | | | | | | Income (loss) from investment operations | | | | | | | | | Less Distributions | | | | | | Ratios to average net assets | | | Supplemental Data | | |||||||||||||||||||||||||||||||||||||||||||||||||||||||||||||||||||||||||||
| | | | Net asset value, beginning of year or period | | | Net investment income (loss) | | | Net realized and unrealized gain (loss) | | | Total from investment operations | | | From net investment income | | | From net realized gains | | | From return of capital | | | Total distributions | | | Payment by affiliate | | | Net asset value, end of year or period | | | Total Return(1) | | | Expenses before reductions/additions(2)(3)(4) | | | Expenses net of fee waivers and/or recoupments if any(2)(3)(4) | | | Expenses net of all reductions/additions(2)(3)(4) | | | Net investment income (loss)(2)(3) | | | Net assets, end of year or period | | | Portfolio turnover rate | | |||||||||||||||||||||||||||||||||||||||||||||||||||
| Year or period ended | | | ($) | | | ($) | | | ($) | | | ($) | | | ($) | | | ($) | | | ($) | | | ($) | | | ($) | | | ($) | | | (%) | | | (%) | | | (%) | | | (%) | | | (%) | | | ($000’s) | | | (%) | | |||||||||||||||||||||||||||||||||||||||||||||||||||
| Voya Large Cap Growth Portfolio (continued) | | | | | | | | | | | | | | | | | | | | | | | | | | | | | | | | | | | | | | | | | | | | | | | | | | | | | | | | | | | | | | | | | | | | | | | | | | | | | | | | | | | | | | | | | | | | | | | | | | | | | | | |
| Class S2 | | | | | | | | | | | | | | | | | | | | | | | | | | | | | | | | | | | | | | | | | | | | | | | | | | | | | | | | | | | | | | | | | | | | | | | | | | | | | | | | | | | | | | | | | | | | | | | | | | | | | | | |
| 12-31-21 | | | | | 21.87 | | | | | | (0.10)• | | | | | | 4.03 | | | | | | 3.93 | | | | | | — | | | | | | 4.64 | | | | | | — | | | | | | 4.64 | | | | | | — | | | | | | 21.16 | | | | | | 19.10 | | | | | | 1.10 | | | | | | 1.07 | | | | | | 1.07 | | | | | | (0.48) | | | | | | 64,403 | | | | | | 72 | | |
| 12-31-20 | | | | | 19.03 | | | | | | (0.04) | | | | | | 5.33 | | | | | | 5.29 | | | | | | 0.02 | | | | | | 2.43 | | | | | | — | | | | | | 2.45 | | | | | | — | | | | | | 21.87 | | | | | | 30.43 | | | | | | 1.12 | | | | | | 1.07 | | | | | | 1.07 | | | | | | (0.22) | | | | | | 65,511 | | | | | | 86 | | |
| 12-31-19 | | | | | 17.18 | | | | | | 0.04 | | | | | | 5.21 | | | | | | 5.25 | | | | | | 0.05 | | | | | | 3.35 | | | | | | — | | | | | | 3.40 | | | | | | — | | | | | | 19.03 | | | | | | 32.16 | | | | | | 1.07 | | | | | | 1.07 | | | | | | 1.07 | | | | | | 0.15 | | | | | | 61,219 | | | | | | 78 | | |
| 12-31-18 | | | | | 20.18 | | | | | | 0.05 | | | | | | (0.12) | | | | | | (0.07) | | | | | | 0.05 | | | | | | 2.88 | | | | | | — | | | | | | 2.93 | | | | | | — | | | | | | 17.18 | | | | | | (1.86) | | | | | | 1.07 | | | | | | 1.07 | | | | | | 1.07 | | | | | | 0.25 | | | | | | 58,647 | | | | | | 85 | | |
| 12-31-17 | | | | | 16.86 | | | | | | 0.04• | | | | | | 4.73 | | | | | | 4.77 | | | | | | 0.05 | | | | | | 1.40 | | | | | | — | | | | | | 1.45 | | | | | | — | | | | | | 20.18 | | | | | | 29.22 | | | | | | 1.07 | | | | | | 1.07 | | | | | | 1.07 | | | | | | 0.24 | | | | | | 66,024 | | | | | | 65 | | |
| Voya Large Cap Value Portfolio | | | | | | | | | | | | | | | | | | | | | | | | | | | | | | | | | | | | | | | | | | | | | | | | | | | | | | | | | | | | | | | | | | | | | | | | | | | | | | | | | | | | | | | | | | | | | | | | | | | | | | | |
| Class ADV | | | | | | | | | | | | | | | | | | | | | | | | | | | | | | | | | | | | | | | | | | | | | | | | | | | | | | | | | | | | | | | | | | | | | | | | | | | | | | | | | | | | | | | | | | | | | | | | | | | | | | | |
| 12-31-21 | | | | | 11.16 | | | | | | 0.08• | | | | | | 2.83 | | | | | | 2.91 | | | | | | 0.22 | | | | | | 0.18 | | | | | | — | | | | | | 0.40 | | | | | | — | | | | | | 13.67 | | | | | | 26.24 | | | | | | 1.42 | | | | | | 1.24 | | | | | | 1.24 | | | | | | 0.66 | | | | | | 52,418 | | | | | | 82 | | |
| 12-31-20 | | | | | 11.96 | | | | | | 0.15 | | | | | | 0.26 | | | | | | 0.41 | | | | | | 0.18 | | | | | | 1.03 | | | | | | — | | | | | | 1.21 | | | | | | — | | | | | | 11.16 | | | | | | 5.61 | | | | | | 1.43 | | | | | | 1.24 | | | | | | 1.24 | | | | | | 1.43 | | | | | | 47,671 | | | | | | 130 | | |
| 12-31-19 | | | | | 10.48 | | | | | | 0.17 | | | | | | 2.34 | | | | | | 2.51 | | | | | | 0.18 | | | | | | 0.85 | | | | | | — | | | | | | 1.03 | | | | | | — | | | | | | 11.96 | | | | | | 24.45 | | | | | | 1.35 | | | | | | 1.24 | | | | | | 1.24 | | | | | | 1.40 | | | | | | 53,098 | | | | | | 95 | | |
| 12-31-18 | | | | | 13.06 | | | | | | 0.18 | | | | | | (1.15) | | | | | | (0.97) | | | | | | 0.17 | | | | | | 1.44 | | | | | | — | | | | | | 1.61 | | | | | | — | | | | | | 10.48 | | | | | | (8.33)(a) | | | | | | 1.35 | | | | | | 1.24 | | | | | | 1.24 | | | | | | 1.41(b) | | | | | | 49,230 | | | | | | 97 | | |
| 12-31-17 | | | | | 11.79 | | | | | | 0.18• | | | | | | 1.33 | | | | | | 1.51 | | | | | | 0.24 | | | | | | — | | | | | | — | | | | | | 0.24 | | | | | | — | | | | | | 13.06 | | | | | | 12.84 | | | | | | 1.35 | | | | | | 1.24 | | | | | | 1.24 | | | | | | 1.44 | | | | | | 61,244 | | | | | | 79 | | |
| Class I | | | | | | | | | | | | | | | | | | | | | | | | | | | | | | | | | | | | | | | | | | | | | | | | | | | | | | | | | | | | | | | | | | | | | | | | | | | | | | | | | | | | | | | | | | | | | | | | | | | | | | | |
| 12-31-21 | | | | | 11.45 | | | | | | 0.17• | | | | | | 2.90 | | | | | | 3.07 | | | | | | 0.30 | | | | | | 0.18 | | | | | | — | | | | | | 0.48 | | | | | | — | | | | | | 14.04 | | | | | | 26.99 | | | | | | 0.82 | | | | | | 0.64 | | | | | | 0.64 | | | | | | 1.26 | | | | | | 386,934 | | | | | | 82 | | |
| 12-31-20 | | | | | 12.22 | | | | | | 0.22 | | | | | | 0.28 | | | | | | 0.50 | | | | | | 0.24 | | | | | | 1.03 | | | | | | — | | | | | | 1.27 | | | | | | — | | | | | | 11.45 | | | | | | 6.28 | | | | | | 0.83 | | | | | | 0.64 | | | | | | 0.64 | | | | | | 2.02 | | | | | | 329,385 | | | | | | 130 | | |
| 12-31-19 | | | | | 10.69 | | | | | | 0.24 | | | | | | 2.39 | | | | | | 2.63 | | | | | | 0.25 | | | | | | 0.85 | | | | | | — | | | | | | 1.10 | | | | | | — | | | | | | 12.22 | | | | | | 25.12 | | | | | | 0.75 | | | | | | 0.64 | | | | | | 0.64 | | | | | | 2.00 | | | | | | 367,345 | | | | | | 95 | | |
| 12-31-18 | | | | | 13.30 | | | | | | 0.25• | | | | | | (1.17) | | | | | | (0.92) | | | | | | 0.25 | | | | | | 1.44 | | | | | | — | | | | | | 1.69 | | | | | | — | | | | | | 10.69 | | | | | | (7.81)(a) | | | | | | 0.75 | | | | | | 0.64 | | | | | | 0.64 | | | | | | 2.01(b) | | | | | | 330,038 | | | | | | 97 | | |
| 12-31-17 | | | | | 12.00 | | | | | | 0.26• | | | | | | 1.36 | | | | | | 1.62 | | | | | | 0.32 | | | | | | — | | | | | | — | | | | | | 0.32 | | | | | | — | | | | | | 13.30 | | | | | | 13.55 | | | | | | 0.75 | | | | | | 0.64 | | | | | | 0.64 | | | | | | 2.06 | | | | | | 428,068 | | | | | | 79 | | |
| Class R6 | | | | | | | | | | | | | | | | | | | | | | | | | | | | | | | | | | | | | | | | | | | | | | | | | | | | | | | | | | | | | | | | | | | | | | | | | | | | | | | | | | | | | | | | | | | | | | | | | | | | | | | |
| 12-31-21 | | | | | 11.44 | | | | | | 0.19• | | | | | | 2.88 | | | | | | 3.07 | | | | | | 0.30 | | | | | | 0.18 | | | | | | — | | | | | | 0.48 | | | | | | — | | | | | | 14.03 | | | | | | 27.02 | | | | | | 0.76 | | | | | | 0.64 | | | | | | 0.64 | | | | | | 1.41 | | | | | | 12,976 | | | | | | 82 | | |
| 12-31-20 | | | | | 12.21 | | | | | | 0.21• | | | | | | 0.29 | | | | | | 0.50 | | | | | | 0.24 | | | | | | 1.03 | | | | | | — | | | | | | 1.27 | | | | | | — | | | | | | 11.44 | | | | | | 6.27 | | | | | | 0.77 | | | | | | 0.64 | | | | | | 0.64 | | | | | | 2.01 | | | | | | 230 | | | | | | 130 | | |
| 12-31-19 | | | | | 10.68 | | | | | | 0.25• | | | | | | 2.38 | | | | | | 2.63 | | | | | | 0.25 | | | | | | 0.85 | | | | | | — | | | | | | 1.10 | | | | | | — | | | | | | 12.21 | | | | | | 25.14 | | | | | | 0.75 | | | | | | 0.64 | | | | | | 0.64 | | | | | | 2.16 | | | | | | 306 | | | | | | 95 | | |
| 12-31-18 | | | | | 13.28 | | | | | | 0.25• | | | | | | (1.16) | | | | | | (0.91) | | | | | | 0.25 | | | | | | 1.44 | | | | | | — | | | | | | 1.69 | | | | | | — | | | | | | 10.68 | | | | | | (7.74)(a) | | | | | | 0.75 | | | | | | 0.64 | | | | | | 0.64 | | | | | | 2.03(b) | | | | | | 1,182 | | | | | | 97 | | |
| 12-31-17 | | | | | 11.99 | | | | | | 0.26• | | | | | | 1.35 | | | | | | 1.61 | | | | | | 0.32 | | | | | | — | | | | | | — | | | | | | 0.32 | | | | | | — | | | | | | 13.28 | | | | | | 13.47 | | | | | | 0.75 | | | | | | 0.64 | | | | | | 0.64 | | | | | | 2.06 | | | | | | 836 | | | | | | 79 | | |
| Class S | | | | | | | | | | | | | | | | | | | | | | | | | | | | | | | | | | | | | | | | | | | | | | | | | | | | | | | | | | | | | | | | | | | | | | | | | | | | | | | | | | | | | | | | | | | | | | | | | | | | | | | |
| 12-31-21 | | | | | 11.25 | | | | | | 0.13• | | | | | | 2.85 | | | | | | 2.98 | | | | | | 0.27 | | | | | | 0.18 | | | | | | — | | | | | | 0.45 | | | | | | — | | | | | | 13.78 | | | | | | 26.67 | | | | | | 1.07 | | | | | | 0.89 | | | | | | 0.89 | | | | | | 0.99 | | | | | | 30,661 | | | | | | 82 | | |
| 12-31-20 | | | | | 12.04 | | | | | | 0.19 | | | | | | 0.27 | | | | | | 0.46 | | | | | | 0.22 | | | | | | 1.03 | | | | | | — | | | | | | 1.25 | | | | | | — | | | | | | 11.25 | | | | | | 5.97 | | | | | | 1.08 | | | | | | 0.89 | | | | | | 0.89 | | | | | | 1.78 | | | | | | 611,514 | | | | | | 130 | | |
| 12-31-19 | | | | | 10.55 | | | | | | 0.20• | | | | | | 2.36 | | | | | | 2.56 | | | | | | 0.22 | | | | | | 0.85 | | | | | | — | | | | | | 1.07 | | | | | | — | | | | | | 12.04 | | | | | | 24.78 | | | | | | 1.00 | | | | | | 0.89 | | | | | | 0.89 | | | | | | 1.75 | | | | | | 665,553 | | | | | | 95 | | |
| 12-31-18 | | | | | 13.14 | | | | | | 0.22• | | | | | | (1.15) | | | | | | (0.93) | | | | | | 0.22 | | | | | | 1.44 | | | | | | — | | | | | | 1.66 | | | | | | — | | | | | | 10.55 | | | | | | (8.00)(a) | | | | | | 1.00 | | | | | | 0.89 | | | | | | 0.89 | | | | | | 1.76(b) | | | | | | 630,221 | | | | | | 97 | | |
| 12-31-17 | | | | | 11.86 | | | | | | 0.23• | | | | | | 1.34 | | | | | | 1.57 | | | | | | 0.29 | | | | | | — | | | | | | — | | | | | | 0.29 | | | | | | — | | | | | | 13.14 | | | | | | 13.23 | | | | | | 1.00 | | | | | | 0.89 | | | | | | 0.89 | | | | | | 1.80 | | | | | | 800,421 | | | | | | 79 | | |
| Class S2 | | | | | | | | | | | | | | | | | | | | | | | | | | | | | | | | | | | | | | | | | | | | | | | | | | | | | | | | | | | | | | | | | | | | | | | | | | | | | | | | | | | | | | | | | | | | | | | | | | | | | | | |
| 12-31-21 | | | | | 11.27 | | | | | | 0.11• | | | | | | 2.85 | | | | | | 2.96 | | | | | | 0.25 | | | | | | 0.18 | | | | | | — | | | | | | 0.43 | | | | | | — | | | | | | 13.80 | | | | | | 26.43 | | | | | | 1.22 | | | | | | 1.04 | | | | | | 1.04 | | | | | | 0.87 | | | | | | 196 | | | | | | 82 | | |
| 12-31-20 | | | | | 12.06 | | | | | | 0.17• | | | | | | 0.27 | | | | | | 0.44 | | | | | | 0.20 | | | | | | 1.03 | | | | | | — | | | | | | 1.23 | | | | | | — | | | | | | 11.27 | | | | | | 5.86 | | | | | | 1.23 | | | | | | 1.04 | | | | | | 1.04 | | | | | | 1.63 | | | | | | 154 | | | | | | 130 | | |
| 12-31-19 | | | | | 10.56 | | | | | | 0.19• | | | | | | 2.36 | | | | | | 2.55 | | | | | | 0.20 | | | | | | 0.85 | | | | | | — | | | | | | 1.05 | | | | | | — | | | | | | 12.06 | | | | | | 24.63 | | | | | | 1.15 | | | | | | 1.04 | | | | | | 1.04 | | | | | | 1.60 | | | | | | 145 | | | | | | 95 | | |
| 12-31-18 | | | | | 13.15 | | | | | | 0.20 | | | | | | (1.15) | | | | | | (0.95) | | | | | | 0.20 | | | | | | 1.44 | | | | | | — | | | | | | 1.64 | | | | | | — | | | | | | 10.56 | | | | | | (8.12)(a) | | | | | | 1.15 | | | | | | 1.04 | | | | | | 1.04 | | | | | | 1.60(b) | | | | | | 151 | | | | | | 97 | | |
| 12-31-17 | | | | | 11.86 | | | | | | 0.20• | | | | | | 1.35 | | | | | | 1.55 | | | | | | 0.26 | | | | | | — | | | | | | — | | | | | | 0.26 | | | | | | — | | | | | | 13.15 | | | | | | 13.10 | | | | | | 1.15 | | | | | | 1.04 | | | | | | 1.04 | | | | | | 1.64 | | | | | | 229 | | | | | | 79 | | |
| | | | | | | | | | Income (loss) from investment operations | | | | | | | | | Less Distributions | | | | | | Ratios to average net assets | | | Supplemental Data | | |||||||||||||||||||||||||||||||||||||||||||||||||||||||||||||||||||||||||||
| | | | Net asset value, beginning of year or period | | | Net investment income (loss) | | | Net realized and unrealized gain (loss) | | | Total from investment operations | | | From net investment income | | | From net realized gains | | | From return of capital | | | Total distributions | | | Payment by affiliate | | | Net asset value, end of year or period | | | Total Return(1) | | | Expenses before reductions/additions(2)(3)(4) | | | Expenses net of fee waivers and/or recoupments if any(2)(3)(4) | | | Expenses net of all reductions/additions(2)(3)(4) | | | Net investment income (loss)(2)(3) | | | Net assets, end of year or period | | | Portfolio turnover rate | | |||||||||||||||||||||||||||||||||||||||||||||||||||
| Year or period ended | | | ($) | | | ($) | | | ($) | | | ($) | | | ($) | | | ($) | | | ($) | | | ($) | | | ($) | | | ($) | | | (%) | | | (%) | | | (%) | | | (%) | | | (%) | | | ($000’s) | | | (%) | | |||||||||||||||||||||||||||||||||||||||||||||||||||
| Voya Limited Maturity Bond Portfolio | | | | | | | | | | | | | | | | | | | | | | | | | | | | | | | | | | | | | | | | | | | | | | | | | | | | | | | | | | | | | | | | | | | | | | | | | | | | | | | | | | | | | | | | | | | | | | | | | | | | | | | |
| Class ADV | | | | | | | | | | | | | | | | | | | | | | | | | | | | | | | | | | | | | | | | | | | | | | | | | | | | | | | | | | | | | | | | | | | | | | | | | | | | | | | | | | | | | | | | | | | | | | | | | | | | | | | |
| 12-31-21 | | | | | 10.03 | | | | | | 0.05• | | | | | | (0.10) | | | | | | (0.05) | | | | | | 0.11 | | | | | | — | | | | | | — | | | | | | 0.11 | | | | | | — | | | | | | 9.87 | | | | | | (0.55) | | | | | | 0.88 | | | | | | 0.88 | | | | | | 0.88 | | | | | | 0.47 | | | | | | 14,958 | | | | | | 253 | | |
| 12-31-20 | | | | | 9.91 | | | | | | 0.12 | | | | | | 0.16 | | | | | | 0.28 | | | | | | 0.16 | | | | | | — | | | | | | — | | | | | | 0.16 | | | | | | — | | | | | | 10.03 | | | | | | 2.87 | | | | | | 0.88 | | | | | | 0.88 | | | | | | 0.88 | | | | | | 1.15 | | | | | | 15,016 | | | | | | 263 | | |
| 12-31-19 | | | | | 9.68 | | | | | | 0.19 | | | | | | 0.16 | | | | | | 0.35 | | | | | | 0.12 | | | | | | — | | | | | | — | | | | | | 0.12 | | | | | | — | | | | | | 9.91 | | | | | | 3.66 | | | | | | 0.89 | | | | | | 0.89 | | | | | | 0.89 | | | | | | 1.85 | | | | | | 15,579 | | | | | | 330 | | |
| 12-31-18 | | | | | 9.72 | | | | | | 0.17 | | | | | | (0.10) | | | | | | 0.07 | | | | | | 0.11 | | | | | | — | | | | | | — | | | | | | 0.11 | | | | | | — | | | | | | 9.68 | | | | | | 0.71 | | | | | | 0.89 | | | | | | 0.89 | | | | | | 0.89 | | | | | | 1.67 | | | | | | 16,812 | | | | | | 281 | | |
| 12-31-17 | | | | | 9.76 | | | | | | 0.10 | | | | | | 0.00* | | | | | | 0.10 | | | | | | 0.13 | | | | | | — | | | | | | 0.01 | | | | | | 0.14 | | | | | | — | | | | | | 9.72 | | | | | | 0.94 | | | | | | 0.89 | | | | | | 0.89 | | | | | | 0.89 | | | | | | 1.03 | | | | | | 19,695 | | | | | | 305 | | |
| Class I | | | | | | | | | | | | | | | | | | | | | | | | | | | | | | | | | | | | | | | | | | | | | | | | | | | | | | | | | | | | | | | | | | | | | | | | | | | | | | | | | | | | | | | | | | | | | | | | | | | | | | | |
| 12-31-21 | | | | | 10.23 | | | | | | 0.11• | | | | | | (0.10) | | | | | | 0.01 | | | | | | 0.17 | | | | | | — | | | | | | — | | | | | | 0.17 | | | | | | — | | | | | | 10.07 | | | | | | 0.08 | | | | | | 0.28 | | | | | | 0.28 | | | | | | 0.28 | | | | | | 1.06 | | | | | | 329,913 | | | | | | 253 | | |
| 12-31-20 | | | | | 10.11 | | | | | | 0.17• | | | | | | 0.18 | | | | | | 0.35 | | | | | | 0.23 | | | | | | — | | | | | | — | | | | | | 0.23 | | | | | | — | | | | | | 10.23 | | | | | | 3.46 | | | | | | 0.28 | | | | | | 0.28 | | | | | | 0.28 | | | | | | 1.70 | | | | | | 332,196 | | | | | | 263 | | |
| 12-31-19 | | | | | 9.87 | | | | | | 0.24 | | | | | | 0.19 | | | | | | 0.43 | | | | | | 0.19 | | | | | | — | | | | | | — | | | | | | 0.19 | | | | | | — | | | | | | 10.11 | | | | | | 4.33 | | | | | | 0.29 | | | | | | 0.29 | | | | | | 0.29 | | | | | | 2.44 | | | | | | 197,182 | | | | | | 330 | | |
| 12-31-18 | | | | | 9.91 | | | | | | 0.22 | | | | | | (0.09) | | | | | | 0.13 | | | | | | 0.17 | | | | | | — | | | | | | — | | | | | | 0.17 | | | | | | — | | | | | | 9.87 | | | | | | 1.33 | | | | | | 0.29 | | | | | | 0.29 | | | | | | 0.29 | | | | | | 2.30 | | | | | | 195,851 | | | | | | 281 | | |
| 12-31-17 | | | | | 9.96 | | | | | | 0.16 | | | | | | (0.01) | | | | | | 0.15 | | | | | | 0.19 | | | | | | — | | | | | | 0.01 | | | | | | 0.20 | | | | | | — | | | | | | 9.91 | | | | | | 1.45 | | | | | | 0.29 | | | | | | 0.29 | | | | | | 0.29 | | | | | | 1.63 | | | | | | 188,672 | | | | | | 305 | | |
| Class S | | | | | | | | | | | | | | | | | | | | | | | | | | | | | | | | | | | | | | | | | | | | | | | | | | | | | | | | | | | | | | | | | | | | | | | | | | | | | | | | | | | | | | | | | | | | | | | | | | | | | | | |
| 12-31-21 | | | | | 10.31 | | | | | | 0.08• | | | | | | (0.10) | | | | | | (0.02) | | | | | | 0.14 | | | | | | — | | | | | | — | | | | | | 0.14 | | | | | | — | | | | | | 10.15 | | | | | | (0.16) | | | | | | 0.53 | | | | | | 0.53 | | | | | | 0.53 | | | | | | 0.82 | | | | | | 71,037 | | | | | | 253 | | |
| 12-31-20 | | | | | 10.19 | | | | | | 0.16 | | | | | | 0.16 | | | | | | 0.32 | | | | | | 0.20 | | | | | | — | | | | | | — | | | | | | 0.20 | | | | | | — | | | | | | 10.31 | | | | | | 3.19 | | | | | | 0.53 | | | | | | 0.53 | | | | | | 0.53 | | | | | | 1.50 | | | | | | 71,911 | | | | | | 263 | | |
| 12-31-19 | | | | | 9.95 | | | | | | 0.22 | | | | | | 0.18 | | | | | | 0.40 | | | | | | 0.16 | | | | | | — | | | | | | — | | | | | | 0.16 | | | | | | — | | | | | | 10.19 | | | | | | 4.06 | | | | | | 0.54 | | | | | | 0.54 | | | | | | 0.54 | | | | | | 2.20 | | | | | | 75,066 | | | | | | 330 | | |
| 12-31-18 | | | | | 9.99 | | | | | | 0.20 | | | | | | (0.09) | | | | | | 0.11 | | | | | | 0.15 | | | | | | — | | | | | | — | | | | | | 0.15 | | | | | | — | | | | | | 9.95 | | | | | | 1.07 | | | | | | 0.54 | | | | | | 0.54 | | | | | | 0.54 | | | | | | 2.02 | | | | | | 74,885 | | | | | | 281 | | |
| 12-31-17 | | | | | 10.04 | | | | | | 0.14 | | | | | | (0.02) | | | | | | 0.12 | | | | | | 0.16 | | | | | | — | | | | | | 0.01 | | | | | | 0.17 | | | | | | — | | | | | | 9.99 | | | | | | 1.20 | | | | | | 0.54 | | | | | | 0.54 | | | | | | 0.54 | | | | | | 1.38 | | | | | | 83,412 | | | | | | 305 | | |
| Voya U.S. Stock Index Portfolio | | | | | | | | | | | | | | | | | | | | | | | | | | | | | | | | | | | | | | | | | | | | | | | | | | | | | | | | | | | | | | | | | | | | | | | | | | | | | | | | | | | | | | | | | | | | | | | | | | | | | | | |
| Class ADV | | | | | | | | | | | | | | | | | | | | | | | | | | | | | | | | | | | | | | | | | | | | | | | | | | | | | | | | | | | | | | | | | | | | | | | | | | | | | | | | | | | | | | | | | | | | | | | | | | | | | | | |
| 12-31-21 | | | | | 18.21 | | | | | | 0.12• | | | | | | 4.72 | | | | | | 4.84 | | | | | | 0.11 | | | | | | 2.02 | | | | | | — | | | | | | 2.13 | | | | | | — | | | | | | 20.92 | | | | | | 27.66 | | | | | | 0.80 | | | | | | 0.80 | | | | | | 0.80 | | | | | | 0.61 | | | | | | 99,373 | | | | | | 3 | | |
| 12-31-20 | | | | | 16.38 | | | | | | 0.18 | | | | | | 2.55 | | | | | | 2.73 | | | | | | 0.24 | | | | | | 0.66 | | | | | | — | | | | | | 0.90 | | | | | | — | | | | | | 18.21 | | | | | | 17.48 | | | | | | 0.79 | | | | | | 0.79 | | | | | | 0.79 | | | | | | 1.03 | | | | | | 100,049 | | | | | | 9 | | |
| 12-31-19 | | | | | 13.44 | | | | | | 0.19• | | | | | | 3.82 | | | | | | 4.01 | | | | | | 0.17 | | | | | | 0.90 | | | | | | — | | | | | | 1.07 | | | | | | — | | | | | | 16.38 | | | | | | 30.43 | | | | | | 0.80 | | | | | | 0.80 | | | | | | 0.80 | | | | | | 1.22 | | | | | | 102,813 | | | | | | 9 | | |
| 12-31-18 | | | | | 15.19 | | | | | | 0.17• | | | | | | (0.86) | | | | | | (0.69) | | | | | | 0.18 | | | | | | 0.88 | | | | | | — | | | | | | 1.06 | | | | | | — | | | | | | 13.44 | | | | | | (5.10) | | | | | | 0.80 | | | | | | 0.80 | | | | | | 0.80 | | | | | | 1.14 | | | | | | 92,071 | | | | | | 12 | | |
| 12-31-17 | | | | | 13.38 | | | | | | 0.18• | | | | | | 2.53 | | | | | | 2.71 | | | | | | 0.18 | | | | | | 0.72 | | | | | | — | | | | | | 0.90 | | | | | | — | | | | | | 15.19 | | | | | | 20.82 | | | | | | 0.80 | | | | | | 0.80 | | | | | | 0.80 | | | | | | 1.23 | | | | | | 116,091 | | | | | | 6 | | |
| Class I | | | | | | | | | | | | | | | | | | | | | | | | | | | | | | | | | | | | | | | | | | | | | | | | | | | | | | | | | | | | | | | | | | | | | | | | | | | | | | | | | | | | | | | | | | | | | | | | | | | | | | | |
| 12-31-21 | | | | | 18.94 | | | | | | 0.23• | | | | | | 4.95 | | | | | | 5.18 | | | | | | 0.23 | | | | | | 2.02 | | | | | | — | | | | | | 2.25 | | | | | | — | | | | | | 21.87 | | | | | | 28.37 | | | | | | 0.27 | | | | | | 0.27 | | | | | | 0.27 | | | | | | 1.14 | | | | | | 4,525,779 | | | | | | 3 | | |
| 12-31-20 | | | | | 16.99 | | | | | | 0.28 | | | | | | 2.66 | | | | | | 2.94 | | | | | | 0.33 | | | | | | 0.66 | | | | | | — | | | | | | 0.99 | | | | | | — | | | | | | 18.94 | | | | | | 18.11 | | | | | | 0.26 | | | | | | 0.26 | | | | | | 0.26 | | | | | | 1.55 | | | | | | 4,258,517 | | | | | | 9 | | |
| 12-31-19 | | | | | 13.90 | | | | | | 0.26 | | | | | | 3.99 | | | | | | 4.25 | | | | | | 0.26 | | | | | | 0.90 | | | | | | — | | | | | | 1.16 | | | | | | — | | | | | | 16.99 | | | | | | 31.12 | | | | | | 0.27 | | | | | | 0.27 | | | | | | 0.27 | | | | | | 1.75 | | | | | | 4,065,091 | | | | | | 9 | | |
| 12-31-18 | | | | | 15.69 | | | | | | 0.26• | | | | | | (0.90) | | | | | | (0.64) | | | | | | 0.27 | | | | | | 0.88 | | | | | | — | | | | | | 1.15 | | | | | | — | | | | | | 13.90 | | | | | | (4.62) | | | | | | 0.27 | | | | | | 0.27 | | | | | | 0.27 | | | | | | 1.67 | | | | | | 2,966,664 | | | | | | 12 | | |
| 12-31-17 | | | | | 13.79 | | | | | | 0.26• | | | | | | 2.63 | | | | | | 2.89 | | | | | | 0.27 | | | | | | 0.72 | | | | | | — | | | | | | 0.99 | | | | | | — | | | | | | 15.69 | | | | | | 21.46 | | | | | | 0.27 | | | | | | 0.27 | | | | | | 0.27 | | | | | | 1.75 | | | | | | 3,469,721 | | | | | | 6 | | |
| Class P2 | | | | | | | | | | | | | | | | | | | | | | | | | | | | | | | | | | | | | | | | | | | | | | | | | | | | | | | | | | | | | | | | | | | | | | | | | | | | | | | | | | | | | | | | | | | | | | | | | | | | | | | |
| 12-31-21 | | | | | 19.03 | | | | | | 0.26• | | | | | | 4.97 | | | | | | 5.23 | | | | | | 0.23 | | | | | | 2.02 | | | | | | — | | | | | | 2.25 | | | | | | — | | | | | | 22.01 | | | | | | 28.50 | | | | | | 0.27 | | | | | | 0.15 | | | | | | 0.15 | | | | | | 1.25 | | | | | | 3,615,635 | | | | | | 3 | | |
| 12-31-20 | | | | | 17.05 | | | | | | 0.28• | | | | | | 2.69 | | | | | | 2.97 | | | | | | 0.33 | | | | | | 0.66 | | | | | | — | | | | | | 0.99 | | | | | | — | | | | | | 19.03 | | | | | | 18.23 | | | | | | 0.26 | | | | | | 0.15 | | | | | | 0.15 | | | | | | 1.67 | | | | | | 2,908,826 | | | | | | 9 | | |
| 12-31-19 | | | | | 13.93 | | | | | | 0.30• | | | | | | 3.98 | | | | | | 4.28 | | | | | | 0.26 | | | | | | 0.90 | | | | | | — | | | | | | 1.16 | | | | | | — | | | | | | 17.05 | | | | | | 31.27 | | | | | | 0.27 | | | | | | 0.15 | | | | | | 0.15 | | | | | | 1.86 | | | | | | 2,395,089 | | | | | | 9 | | |
| 12-31-18 | | | | | 15.71 | | | | | | 0.26 | | | | | | (0.89) | | | | | | (0.63) | | | | | | 0.27 | | | | | | 0.88 | | | | | | — | | | | | | 1.15 | | | | | | — | | | | | | 13.93 | | | | | | (4.55) | | | | | | 0.27 | | | | | | 0.15 | | | | | | 0.15 | | | | | | 1.80 | | | | | | 1,442,733 | | | | | | 12 | | |
| 05-03-17(5) - 12-31-17 | | | | | 14.79 | | | | | | 0.19• | | | | | | 1.72 | | | | | | 1.91 | | | | | | 0.27 | | | | | | 0.72 | | | | | | — | | | | | | 0.99 | | | | | | — | | | | | | 15.71 | | | | | | 13.39 | | | | | | 0.27 | | | | | | 0.15 | | | | | | 0.15 | | | | | | 1.92 | | | | | | 1,225,483 | | | | | | 6 | | |
| | | | | | | | | | Income (loss) from investment operations | | | | | | | | | Less Distributions | | | | | | Ratios to average net assets | | | Supplemental Data | | |||||||||||||||||||||||||||||||||||||||||||||||||||||||||||||||||||||||||||
| | | | Net asset value, beginning of year or period | | | Net investment income (loss) | | | Net realized and unrealized gain (loss) | | | Total from investment operations | | | From net investment income | | | From net realized gains | | | From return of capital | | | Total distributions | | | Payment by affiliate | | | Net asset value, end of year or period | | | Total Return(1) | | | Expenses before reductions/additions(2)(3)(4) | | | Expenses net of fee waivers and/or recoupments if any(2)(3)(4) | | | Expenses net of all reductions/additions(2)(3)(4) | | | Net investment income (loss)(2)(3) | | | Net assets, end of year or period | | | Portfolio turnover rate | | |||||||||||||||||||||||||||||||||||||||||||||||||||
| Year or period ended | | | ($) | | | ($) | | | ($) | | | ($) | | | ($) | | | ($) | | | ($) | | | ($) | | | ($) | | | ($) | | | (%) | | | (%) | | | (%) | | | (%) | | | (%) | | | ($000’s) | | | (%) | | |||||||||||||||||||||||||||||||||||||||||||||||||||
| Voya U.S. Stock Index Portfolio (continued) | | | | | | | | | | | | | | | | | | | | | | | | | | | | | | | | | | | | | | | | | | | | | | | | | | | | | | | | | | | | | | | | | | | | | | | | | | | | | | | | | | | | | | | | | | | | | | | | | | | | | | | |
| Class S | | | | | | | | | | | | | | | | | | | | | | | | | | | | | | | | | | | | | | | | | | | | | | | | | | | | | | | | | | | | | | | | | | | | | | | | | | | | | | | | | | | | | | | | | | | | | | | | | | | | | | | |
| 12-31-21 | | | | | 18.74 | | | | | | 0.18• | | | | | | 4.88 | | | | | | 5.06 | | | | | | 0.18 | | | | | | 2.02 | | | | | | — | | | | | | 2.20 | | | | | | — | | | | | | 21.60 | | | | | | 28.02 | | | | | | 0.52 | | | | | | 0.51 | | | | | | 0.51 | | | | | | 0.90 | | | | | | 303,248 | | | | | | 3 | | |
| 12-31-20 | | | | | 16.82 | | | | | | 0.24 | | | | | | 2.63 | | | | | | 2.87 | | | | | | 0.29 | | | | | | 0.66 | | | | | | — | | | | | | 0.95 | | | | | | — | | | | | | 18.74 | | | | | | 17.87 | | | | | | 0.51 | | | | | | 0.50 | | | | | | 0.50 | | | | | | 1.32 | | | | | | 280,432 | | | | | | 9 | | |
| 12-31-19 | | | | | 13.80 | | | | | | 0.23• | | | | | | 3.94 | | | | | | 4.17 | | | | | | 0.25 | | | | | | 0.90 | | | | | | — | | | | | | 1.15 | | | | | | — | | | | | | 16.82 | | | | | | 30.77 | | | | | | 0.52 | | | | | | 0.51 | | | | | | 0.51 | | | | | | 1.46 | | | | | | 283,768 | | | | | | 9 | | |
| 12-31-18 | | | | | 15.57 | | | | | | 0.22• | | | | | | (0.88) | | | | | | (0.66) | | | | | | 0.23 | | | | | | 0.88 | | | | | | — | | | | | | 1.11 | | | | | | — | | | | | | 13.80 | | | | | | (4.84) | | | | | | 0.52 | | | | | | 0.51 | | | | | | 0.51 | | | | | | 1.42 | | | | | | 47,740 | | | | | | 12 | | |
| 12-31-17 | | | | | 13.69 | | | | | | 0.21 | | | | | | 2.62 | | | | | | 2.83 | | | | | | 0.23 | | | | | | 0.72 | | | | | | — | | | | | | 0.95 | | | | | | — | | | | | | 15.57 | | | | | | 21.22 | | | | | | 0.52 | | | | | | 0.51 | | | | | | 0.51 | | | | | | 1.52 | | | | | | 78,577 | | | | | | 6 | | |
| Class S2 | | | | | | | | | | | | | | | | | | | | | | | | | | | | | | | | | | | | | | | | | | | | | | | | | | | | | | | | | | | | | | | | | | | | | | | | | | | | | | | | | | | | | | | | | | | | | | | | | | | | | | | |
| 12-31-21 | | | | | 18.49 | | | | | | 0.15• | | | | | | 4.81 | | | | | | 4.96 | | | | | | 0.15 | | | | | | 2.02 | | | | | | — | | | | | | 2.17 | | | | | | — | | | | | | 21.28 | | | | | | 27.85 | | | | | | 0.67 | | | | | | 0.67 | | | | | | 0.67 | | | | | | 0.74 | | | | | | 181,812 | | | | | | 3 | | |
| 12-31-20 | | | | | 16.62 | | | | | | 0.20 | | | | | | 2.59 | | | | | | 2.79 | | | | | | 0.26 | | | | | | 0.66 | | | | | | — | | | | | | 0.92 | | | | | | — | | | | | | 18.49 | | | | | | 17.62 | | | | | | 0.66 | | | | | | 0.66 | | | | | | 0.66 | | | | | | 1.16 | | | | | | 151,642 | | | | | | 9 | | |
| 12-31-19 | | | | | 13.62 | | | | | | 0.21• | | | | | | 3.88 | | | | | | 4.09 | | | | | | 0.19 | | | | | | 0.90 | | | | | | — | | | | | | 1.09 | | | | | | — | | | | | | 16.62 | | | | | | 30.60 | | | | | | 0.67 | | | | | | 0.67 | | | | | | 0.67 | | | | | | 1.35 | | | | | | 149,297 | | | | | | 9 | | |
| 12-31-18 | | | | | 15.39 | | | | | | 0.20• | | | | | | (0.88) | | | | | | (0.68) | | | | | | 0.21 | | | | | | 0.88 | | | | | | — | | | | | | 1.09 | | | | | | — | | | | | | 13.62 | | | | | | (5.03) | | | | | | 0.67 | | | | | | 0.67 | | | | | | 0.67 | | | | | | 1.27 | | | | | | 150,127 | | | | | | 12 | | |
| 12-31-17 | | | | | 13.54 | | | | | | 0.21 | | | | | | 2.56 | | | | | | 2.77 | | | | | | 0.20 | | | | | | 0.72 | | | | | | — | | | | | | 0.92 | | | | | | — | | | | | | 15.39 | | | | | | 21.03 | | | | | | 0.67 | | | | | | 0.67 | | | | | | 0.67 | | | | | | 1.35 | | | | | | 189,330 | | | | | | 6 | | |
VY® Clarion Real Estate Portfolio | | | | | | | | | | | | | | | | | | | | | | | | | | | | | | | | | | | | | | | | | | | | | | | | | | | | | | | | | | | | | | | | | | | | | | | | | | | | | | | | | | | | | | | | | | | | | | | | | | | | | | | |
| Class ADV | | | | | | | | | | | | | | | | | | | | | | | | | | | | | | | | | | | | | | | | | | | | | | | | | | | | | | | | | | | | | | | | | | | | | | | | | | | | | | | | | | | | | | | | | | | | | | | | | | | | | | | |
| 12-31-21 | | | | | 29.09 | | | | | | 0.37• | | | | | | 14.50 | | | | | | 14.87 | | | | | | 0.57 | | | | | | — | | | | | | — | | | | | | 0.57 | | | | | | — | | | | | | 43.39 | | | | | | 51.46 | | | | | | 1.62 | | | | | | 1.28 | | | | | | 1.28 | | | | | | 1.02 | | | | | | 63,318 | | | | | | 67 | | |
| 12-31-20 | | | | | 36.39 | | | | | | 0.41• | | | | | | (3.54) | | | | | | (3.13) | | | | | | 0.66 | | | | | | 3.51 | | | | | | — | | | | | | 4.17 | | | | | | — | | | | | | 29.09 | | | | | | (6.89) | | | | | | 1.63 | | | | | | 1.28 | | | | | | 1.28 | | | | | | 1.38 | | | | | | 48,781 | | | | | | 103 | | |
| 12-31-19 | | | | | 29.16 | | | | | | 0.51• | | | | | | 7.53 | | | | | | 8.04 | | | | | | 0.63 | | | | | | 0.18 | | | | | | — | | | | | | 0.81 | | | | | | — | | | | | | 36.39 | | | | | | 27.71 | | | | | | 1.46 | | | | | | 1.31 | | | | | | 1.31 | | | | | | 1.49 | | | | | | 63,873 | | | | | | 69 | | |
| 12-31-18 | | | | | 36.01 | | | | | | 0.49• | | | | | | (3.01) | | | | | | (2.52) | | | | | | 0.83 | | | | | | 3.50 | | | | | | — | | | | | | 4.33 | | | | | | — | | | | | | 29.16 | | | | | | (7.97) | | | | | | 1.47 | | | | | | 1.31 | | | | | | 1.31 | | | | | | 1.50 | | | | | | 56,062 | | | | | | 103 | | |
| 12-31-17 | | | | | 35.00 | | | | | | 0.53• | | | | | | 1.14 | | | | | | 1.67 | | | | | | 0.66 | | | | | | — | | | | | | — | | | | | | 0.66 | | | | | | — | | | | | | 36.01 | | | | | | 4.82 | | | | | | 1.45 | | | | | | 1.31 | | | | | | 1.31 | | | | | | 1.50 | | | | | | 75,575 | | | | | | 82 | | |
| Class I | | | | | | | | | | | | | | | | | | | | | | | | | | | | | | | | | | | | | | | | | | | | | | | | | | | | | | | | | | | | | | | | | | | | | | | | | | | | | | | | | | | | | | | | | | | | | | | | | | | | | | | |
| 12-31-21 | | | | | 30.88 | | | | | | 0.62• | | | | | | 15.41 | | | | | | 16.03 | | | | | | 0.72 | | | | | | — | | | | | | — | | | | | | 0.72 | | | | | | — | | | | | | 46.19 | | | | | | 52.34 | | | | | | 1.02 | | | | | | 0.68 | | | | | | 0.68 | | | | | | 1.65 | | | | | | 11,745 | | | | | | 67 | | |
| 12-31-20 | | | | | 38.38 | | | | | | 0.55• | | | | | | (3.64) | | | | | | (3.09) | | | | | | 0.90 | | | | | | 3.51 | | | | | | — | | | | | | 4.41 | | | | | | — | | | | | | 30.88 | | | | | | (6.32) | | | | | | 1.03 | | | | | | 0.68 | | | | | | 0.68 | | | | | | 1.76 | | | | | | 14,403 | | | | | | 103 | | |
| 12-31-19 | | | | | 30.72 | | | | | | 0.68• | | | | | | 8.01 | | | | | | 8.69 | | | | | | 0.85 | | | | | | 0.18 | | | | | | — | | | | | | 1.03 | | | | | | — | | | | | | 38.38 | | | | | | 28.47 | | | | | | 0.86 | | | | | | 0.71 | | | | | | 0.71 | | | | | | 1.88 | | | | | | 24,412 | | | | | | 69 | | |
| 12-31-18 | | | | | 37.76 | | | | | | 0.71• | | | | | | (3.15) | | | | | | (2.44) | | | | | | 1.10 | | | | | | 3.50 | | | | | | — | | | | | | 4.60 | | | | | | — | | | | | | 30.72 | | | | | | (7.42) | | | | | | 0.87 | | | | | | 0.71 | | | | | | 0.71 | | | | | | 2.05 | | | | | | 38,978 | | | | | | 103 | | |
| 12-31-17 | | | | | 36.68 | | | | | | 0.79• | | | | | | 1.19 | | | | | | 1.98 | | | | | | 0.90 | | | | | | — | | | | | | — | | | | | | 0.90 | | | | | | — | | | | | | 37.76 | | | | | | 5.47 | | | | | | 0.85 | | | | | | 0.71 | | | | | | 0.71 | | | | | | 2.14 | | | | | | 100,423 | | | | | | 82 | | |
| Class S | | | | | | | | | | | | | | | | | | | | | | | | | | | | | | | | | | | | | | | | | | | | | | | | | | | | | | | | | | | | | | | | | | | | | | | | | | | | | | | | | | | | | | | | | | | | | | | | | | | | | | | |
| 12-31-21 | | | | | 30.87 | | | | | | 0.52• | | | | | | 15.39 | | | | | | 15.91 | | | | | | 0.67 | | | | | | — | | | | | | — | | | | | | 0.67 | | | | | | — | | | | | | 46.11 | | | | | | 51.96 | | | | | | 1.27 | | | | | | 0.93 | | | | | | 0.93 | | | | | | 1.37 | | | | | | 227,726 | | | | | | 67 | | |
| 12-31-20 | | | | | 38.32 | | | | | | 0.53• | | | | | | (3.68) | | | | | | (3.15) | | | | | | 0.79 | | | | | | 3.51 | | | | | | — | | | | | | 4.30 | | | | | | — | | | | | | 30.87 | | | | | | (6.53) | | | | | | 1.28 | | | | | | 0.93 | | | | | | 0.93 | | | | | | 1.71 | | | | | | 173,126 | | | | | | 103 | | |
| 12-31-19 | | | | | 30.67 | | | | | | 0.66• | | | | | | 7.93 | | | | | | 8.59 | | | | | | 0.76 | | | | | | 0.18 | | | | | | — | | | | | | 0.94 | | | | | | — | | | | | | 38.32 | | | | | | 28.15 | | | | | | 1.11 | | | | | | 0.96 | | | | | | 0.96 | | | | | | 1.82 | | | | | | 230,346 | | | | | | 69 | | |
| 12-31-18 | | | | | 37.67 | | | | | | 0.63• | | | | | | (3.16) | | | | | | (2.53) | | | | | | 0.97 | | | | | | 3.50 | | | | | | — | | | | | | 4.47 | | | | | | — | | | | | | 30.67 | | | | | | (7.65) | | | | | | 1.12 | | | | | | 0.96 | | | | | | 0.96 | | | | | | 1.85 | | | | | | 212,673 | | | | | | 103 | | |
| 12-31-17 | | | | | 36.58 | | | | | | 0.68• | | | | | | 1.19 | | | | | | 1.87 | | | | | | 0.78 | | | | | | — | | | | | | — | | | | | | 0.78 | | | | | | — | | | | | | 37.67 | | | | | | 5.18 | | | | | | 1.10 | | | | | | 0.96 | | | | | | 0.96 | | | | | | 1.83 | | | | | | 290,716 | | | | | | 82 | | |
| Class S2 | | | | | | | | | | | | | | | | | | | | | | | | | | | | | | | | | | | | | | | | | | | | | | | | | | | | | | | | | | | | | | | | | | | | | | | | | | | | | | | | | | | | | | | | | | | | | | | | | | | | | | | |
| 12-31-21 | | | | | 30.64 | | | | | | 0.46• | | | | | | 15.28 | | | | | | 15.74 | | | | | | 0.60 | | | | | | — | | | | | | — | | | | | | 0.60 | | | | | | — | | | | | | 45.78 | | | | | | 51.74 | | | | | | 1.42 | | | | | | 1.08 | | | | | | 1.08 | | | | | | 1.21 | | | | | | 13,826 | | | | | | 67 | | |
| 12-31-20 | | | | | 38.07 | | | | | | 0.46• | | | | | | (3.64) | | | | | | (3.18) | | | | | | 0.74 | | | | | | 3.51 | | | | | | — | | | | | | 4.25 | | | | | | — | | | | | | 30.64 | | | | | | (6.69) | | | | | | 1.43 | | | | | | 1.08 | | | | | | 1.08 | | | | | | 1.49 | | | | | | 11,420 | | | | | | 103 | | |
| 12-31-19 | | | | | 30.47 | | | | | | 0.60• | | | | | | 7.88 | | | | | | 8.48 | | | | | | 0.70 | | | | | | 0.18 | | | | | | — | | | | | | 0.88 | | | | | | — | | | | | | 38.07 | | | | | | 27.97 | | | | | | 1.26 | | | | | | 1.11 | | | | | | 1.11 | | | | | | 1.67 | | | | | | 15,394 | | | | | | 69 | | |
| 12-31-18 | | | | | 37.44 | | | | | | 0.58• | | | | | | (3.14) | | | | | | (2.56) | | | | | | 0.91 | | | | | | 3.50 | | | | | | — | | | | | | 4.41 | | | | | | — | | | | | | 30.47 | | | | | | (7.78) | | | | | | 1.27 | | | | | | 1.11 | | | | | | 1.11 | | | | | | 1.71 | | | | | | 13,745 | | | | | | 103 | | |
| 12-31-17 | | | | | 36.35 | | | | | | 0.62• | | | | | | 1.18 | | | | | | 1.80 | | | | | | 0.71 | | | | | | — | | | | | | — | | | | | | 0.71 | | | | | | — | | | | | | 37.44 | | | | | | 5.02 | | | | | | 1.25 | | | | | | 1.11 | | | | | | 1.11 | | | | | | 1.68 | | | | | | 17,937 | | | | | | 82 | | |
| | | | | | | | | | Income (loss) from investment operations | | | | | | | | | Less Distributions | | | | | | Ratios to average net assets | | | Supplemental Data | | |||||||||||||||||||||||||||||||||||||||||||||||||||||||||||||||||||||||||||
| | | | Net asset value, beginning of year or period | | | Net investment income (loss) | | | Net realized and unrealized gain (loss) | | | Total from investment operations | | | From net investment income | | | From net realized gains | | | From return of capital | | | Total distributions | | | Payment by affiliate | | | Net asset value, end of year or period | | | Total Return(1) | | | Expenses before reductions/additions(2)(3)(4) | | | Expenses net of fee waivers and/or recoupments if any(2)(3)(4) | | | Expenses net of all reductions/additions(2)(3)(4) | | | Net investment income (loss)(2)(3) | | | Net assets, end of year or period | | | Portfolio turnover rate | | |||||||||||||||||||||||||||||||||||||||||||||||||||
| Year or period ended | | | ($) | | | ($) | | | ($) | | | ($) | | | ($) | | | ($) | | | ($) | | | ($) | | | ($) | | | ($) | | | (%) | | | (%) | | | (%) | | | (%) | | | (%) | | | ($000’s) | | | (%) | | |||||||||||||||||||||||||||||||||||||||||||||||||||
VY® JPMorgan Small Cap Core Equity Portfolio | | | | | | | | | | | | | | | | | | | | | | | | | | | | | | | | | | | | | | | | | | | | | | | | | | | | | | | | | | | | | | | | | | | | | | | | | | | | | | | | | | | | | | | | | | | | | | | | | | | | | | | |
| Class ADV | | | | | | | | | | | | | | | | | | | | | | | | | | | | | | | | | | | | | | | | | | | | | | | | | | | | | | | | | | | | | | | | | | | | | | | | | | | | | | | | | | | | | | | | | | | | | | | | | | | | | | | |
| 12-31-21 | | | | | 17.26 | | | | | | (0.08)• | | | | | | 3.14 | | | | | | 3.06 | | | | | | — | | | | | | 1.02 | | | | | | — | | | | | | 1.02 | | | | | | — | | | | | | 19.30 | | | | | | 17.94 | | | | | | 1.46 | | | | | | 1.46 | | | | | | 1.45 | | | | | | (0.44) | | | | | | 140,945 | | | | | | 52 | | |
| 12-31-20 | | | | | 14.90 | | | | | | (0.01) | | | | | | 2.37 | | | | | | 2.36 | | | | | | — | | | | | | — | | | | | | — | | | | | | — | | | | | | — | | | | | | 17.26 | | | | | | 15.84 | | | | | | 1.47 | | | | | | 1.47 | | | | | | 1.46 | | | | | | (0.03) | | | | | | 128,295 | | | | | | 71 | | |
| 12-31-19 | | | | | 15.79 | | | | | | 0.00* | | | | | | 3.92 | | | | | | 3.92 | | | | | | 0.03 | | | | | | 4.55 | | | | | | 0.23 | | | | | | 4.81 | | | | | | — | | | | | | 14.90 | | | | | | 25.96 | | | | | | 1.45 | | | | | | 1.45 | | | | | | 1.44 | | | | | | 0.05 | | | | | | 130,058 | | | | | | 50 | | |
| 12-31-18 | | | | | 20.12 | | | | | | (0.02) | | | | | | (1.67) | | | | | | (1.69) | | | | | | 0.02 | | | | | | 2.62 | | | | | | — | | | | | | 2.64 | | | | | | — | | | | | | 15.79 | | | | | | (10.82) | | | | | | 1.45 | | | | | | 1.45 | | | | | | 1.45 | | | | | | (0.07) | | | | | | 114,664 | | | | | | 43 | | |
| 12-31-17 | | | | | 18.54 | | | | | | 0.01 | | | | | | 2.71 | | | | | | 2.72 | | | | | | 0.04 | | | | | | 1.10 | | | | | | — | | | | | | 1.14 | | | | | | — | | | | | | 20.12 | | | | | | 15.17 | | | | | | 1.45 | | | | | | 1.45 | | | | | | 1.45 | | | | | | 0.03 | | | | | | 131,488 | | | | | | 36 | | |
| Class I | | | | | | | | | | | | | | | | | | | | | | | | | | | | | | | | | | | | | | | | | | | | | | | | | | | | | | | | | | | | | | | | | | | | | | | | | | | | | | | | | | | | | | | | | | | | | | | | | | | | | | | |
| 12-31-21 | | | | | 18.89 | | | | | | 0.04• | | | | | | 3.45 | | | | | | 3.49 | | | | | | 0.08 | | | | | | 1.02 | | | | | | — | | | | | | 1.10 | | | | | | — | | | | | | 21.28 | | | | | | 18.71 | | | | | | 0.86 | | | | | | 0.86 | | | | | | 0.85 | | | | | | 0.18 | | | | | | 282,032 | | | | | | 52 | | |
| 12-31-20 | | | | | 16.21 | | | | | | 0.10 | | | | | | 2.58 | | | | | | 2.68 | | | | | | — | | | | | | — | | | | | | — | | | | | | — | | | | | | — | | | | | | 18.89 | | | | | | 16.53 | | | | | | 0.87 | | | | | | 0.87 | | | | | | 0.86 | | | | | | 0.57 | | | | | | 211,266 | | | | | | 71 | | |
| 12-31-19 | | | | | 16.89 | | | | | | 0.12 | | | | | | 4.20 | | | | | | 4.32 | | | | | | 0.22 | | | | | | 4.55 | | | | | | 0.23 | | | | | | 5.00 | | | | | | — | | | | | | 16.21 | | | | | | 26.75 | | | | | | 0.85 | | | | | | 0.85 | | | | | | 0.84 | | | | | | 0.66 | | | | | | 240,957 | | | | | | 50 | | |
| 12-31-18 | | | | | 21.35 | | | | | | 0.11 | | | | | | (1.81) | | | | | | (1.70) | | | | | | 0.14 | | | | | | 2.62 | | | | | | — | | | | | | 2.76 | | | | | | — | | | | | | 16.89 | | | | | | (10.34) | | | | | | 0.85 | | | | | | 0.85 | | | | | | 0.85 | | | | | | 0.53 | | | | | | 165,568 | | | | | | 43 | | |
| 12-31-17 | | | | | 19.59 | | | | | | 0.13 | | | | | | 2.88 | | | | | | 3.01 | | | | | | 0.15 | | | | | | 1.10 | | | | | | — | | | | | | 1.25 | | | | | | — | | | | | | 21.35 | | | | | | 15.86 | | | | | | 0.85 | | | | | | 0.85 | | | | | | 0.85 | | | | | | 0.62 | | | | | | 188,213 | | | | | | 36 | | |
| Class R6 | | | | | | | | | | | | | | | | | | | | | | | | | | | | | | | | | | | | | | | | | | | | | | | | | | | | | | | | | | | | | | | | | | | | | | | | | | | | | | | | | | | | | | | | | | | | | | | | | | | | | | | |
| 12-31-21 | | | | | 18.87 | | | | | | 0.03• | | | | | | 3.45 | | | | | | 3.48 | | | | | | 0.08 | | | | | | 1.02 | | | | | | — | | | | | | 1.10 | | | | | | — | | | | | | 21.25 | | | | | | 18.67 | | | | | | 0.86 | | | | | | 0.86 | | | | | | 0.85 | | | | | | 0.16 | | | | | | 129,718 | | | | | | 52 | | |
| 12-31-20 | | | | | 16.20 | | | | | | 0.11• | | | | | | 2.56 | | | | | | 2.67 | | | | | | — | | | | | | — | | | | | | — | | | | | | — | | | | | | — | | | | | | 18.87 | | | | | | 16.48 | | | | | | 0.87 | | | | | | 0.87 | | | | | | 0.86 | | | | | | 0.70 | | | | | | 118,342 | | | | | | 71 | | |
| 12-31-19 | | | | | 16.88 | | | | | | 0.12 | | | | | | 4.20 | | | | | | 4.32 | | | | | | 0.22 | | | | | | 4.55 | | | | | | 0.23 | | | | | | 5.00 | | | | | | — | | | | | | 16.20 | | | | | | 26.78 | | | | | | 0.85 | | | | | | 0.85 | | | | | | 0.84 | | | | | | 0.66 | | | | | | 38,161 | | | | | | 50 | | |
| 12-31-18 | | | | | 21.34 | | | | | | 0.09 | | | | | | (1.79) | | | | | | (1.70) | | | | | | 0.14 | | | | | | 2.62 | | | | | | — | | | | | | 2.76 | | | | | | — | | | | | | 16.88 | | | | | | (10.34) | | | | | | 0.85 | | | | | | 0.85 | | | | | | 0.85 | | | | | | 0.55 | | | | | | 23,951 | | | | | | 43 | | |
| 12-31-17 | | | | | 19.58 | | | | | | 0.15• | | | | | | 2.86 | | | | | | 3.01 | | | | | | 0.15 | | | | | | 1.10 | | | | | | — | | | | | | 1.25 | | | | | | — | | | | | | 21.34 | | | | | | 15.87 | | | | | | 0.85 | | | | | | 0.85 | | | | | | 0.85 | | | | | | 0.73 | | | | | | 17,009 | | | | | | 36 | | |
| Class S | | | | | | | | | | | | | | | | | | | | | | | | | | | | | | | | | | | | | | | | | | | | | | | | | | | | | | | | | | | | | | | | | | | | | | | | | | | | | | | | | | | | | | | | | | | | | | | | | | | | | | | |
| 12-31-21 | | | | | 18.55 | | | | | | (0.02)• | | | | | | 3.38 | | | | | | 3.36 | | | | | | 0.04 | | | | | | 1.02 | | | | | | — | | | | | | 1.06 | | | | | | — | | | | | | 20.85 | | | | | | 18.32 | | | | | | 1.11 | | | | | | 1.11 | | | | | | 1.10 | | | | | | (0.09) | | | | | | 124,185 | | | | | | 52 | | |
| 12-31-20 | | | | | 15.95 | | | | | | 0.05 | | | | | | 2.55 | | | | | | 2.60 | | | | | | — | | | | | | — | | | | | | — | | | | | | — | | | | | | — | | | | | | 18.55 | | | | | | 16.30 | | | | | | 1.12 | | | | | | 1.12 | | | | | | 1.11 | | | | | | 0.31 | | | | | | 122,575 | | | | | | 71 | | |
| 12-31-19 | | | | | 16.65 | | | | | | 0.07 | | | | | | 4.14 | | | | | | 4.21 | | | | | | 0.13 | | | | | | 4.55 | | | | | | 0.23 | | | | | | 4.91 | | | | | | — | | | | | | 15.95 | | | | | | 26.39 | | | | | | 1.10 | | | | | | 1.10 | | | | | | 1.09 | | | | | | 0.37 | | | | | | 129,784 | | | | | | 50 | | |
| 12-31-18 | | | | | 21.07 | | | | | | 0.06 | | | | | | (1.78) | | | | | | (1.72) | | | | | | 0.08 | | | | | | 2.62 | | | | | | — | | | | | | 2.70 | | | | | | — | | | | | | 16.65 | | | | | | (10.52) | | | | | | 1.10 | | | | | | 1.10 | | | | | | 1.10 | | | | | | 0.28 | | | | | | 327,752 | | | | | | 43 | | |
| 12-31-17 | | | | | 19.35 | | | | | | 0.07• | | | | | | 2.85 | | | | | | 2.92 | | | | | | 0.10 | | | | | | 1.10 | | | | | | — | | | | | | 1.20 | | | | | | — | | | | | | 21.07 | | | | | | 15.56 | | | | | | 1.10 | | | | | | 1.10 | | | | | | 1.10 | | | | | | 0.37 | | | | | | 385,636 | | | | | | 36 | | |
| Class S2 | | | | | | | | | | | | | | | | | | | | | | | | | | | | | | | | | | | | | | | | | | | | | | | | | | | | | | | | | | | | | | | | | | | | | | | | | | | | | | | | | | | | | | | | | | | | | | | | | | | | | | | |
| 12-31-21 | | | | | 18.27 | | | | | | (0.05)• | | | | | | 3.33 | | | | | | 3.28 | | | | | | 0.01 | | | | | | 1.02 | | | | | | — | | | | | | 1.03 | | | | | | — | | | | | | 20.52 | | | | | | 18.17 | | | | | | 1.26 | | | | | | 1.26 | | | | | | 1.25 | | | | | | (0.24) | | | | | | 8,692 | | | | | | 52 | | |
| 12-31-20 | | | | | 15.74 | | | | | | 0.03 | | | | | | 2.50 | | | | | | 2.53 | | | | | | — | | | | | | — | | | | | | — | | | | | | — | | | | | | — | | | | | | 18.27 | | | | | | 16.07 | | | | | | 1.27 | | | | | | 1.27 | | | | | | 1.26 | | | | | | 0.16 | | | | | | 8,312 | | | | | | 71 | | |
| 12-31-19 | | | | | 16.46 | | | | | | 0.04• | | | | | | 4.09 | | | | | | 4.13 | | | | | | 0.07 | | | | | | 4.55 | | | | | | 0.23 | | | | | | 4.85 | | | | | | — | | | | | | 15.74 | | | | | | 26.20 | | | | | | 1.25 | | | | | | 1.25 | | | | | | 1.24 | | | | | | 0.22 | | | | | | 9,014 | | | | | | 50 | | |
| 12-31-18 | | | | | 20.85 | | | | | | 0.03 | | | | | | (1.76) | | | | | | (1.73) | | | | | | 0.04 | | | | | | 2.62 | | | | | | — | | | | | | 2.66 | | | | | | — | | | | | | 16.46 | | | | | | (10.64) | | | | | | 1.25 | | | | | | 1.25 | | | | | | 1.25 | | | | | | 0.13 | | | | | | 27,453 | | | | | | 43 | | |
| 12-31-17 | | | | | 19.15 | | | | | | 0.04• | | | | | | 2.82 | | | | | | 2.86 | | | | | | 0.06 | | | | | | 1.10 | | | | | | — | | | | | | 1.16 | | | | | | — | | | | | | 20.85 | | | | | | 15.42 | | | | | | 1.25 | | | | | | 1.25 | | | | | | 1.25 | | | | | | 0.22 | | | | | | 35,440 | | | | | | 36 | | |
| | | | Purchased | | | Sold | | ||||||
| Balanced Income | | | | $ | 98,030,692 | | | | | $ | 20,838,316 | | |
| Limited Maturity Bond | | | | | 124,782,411 | | | | | | 27,058,400 | | |
| U.S. Stock Index | | | | | 122,088,939 | | | | | | — | | |
| JPMorgan Small Cap Core Equity | | | | | 6,393,305 | | | | | | — | | |
| | | | Purchases | | | Sales | | ||||||
| Balanced Income | | | | $ | 298,424,162 | | | | | $ | 335,273,421 | | |
| High Yield | | | | | 321,814,939 | | | | | | 344,880,725 | | |
| Large Cap Growth | | | | | 4,387,606,413 | | | | | | 6,048,795,297 | | |
| Large Cap Value | | | | | 759,327,426 | | | | | | 1,488,490,226 | | |
| Limited Maturity Bond | | | | | 172,876,129 | | | | | | 175,111,945 | | |
| U.S. Stock Index | | | | | 199,143,216 | | | | | | 1,026,178,019 | | |
| Clarion Real Estate | | | | | 186,837,135 | | | | | | 217,944,747 | | |
| JPMorgan Small Cap Core Equity | | | | | 341,137,236 | | | | | | 359,786,901 | | |
| | | | Purchases | | | Sales | | ||||||
| Balanced Income | | | | $ | 146,182,668 | | | | | $ | 140,085,259 | | |
| Limited Maturity Bond | | | | | 821,625,276 | | | | | | 840,387,738 | | |
| Portfolio | | | Fee | |
| Balanced Income Large Cap Growth | | | 0.55% on all assets 0.65% on the first $5.5 billion; 0.62% on the next $1.5 billion; 0.60% on the next $3 billion; and 0.59% on the amount in excess of $10 billion | |
Large Cap Value(1) | | | 0.75% on the first $500 million; 0.70% on the next $1.5 billion; and 0.65% on the amount in excess of $2 billion | |
| Clarion Real Estate(1) | | | 0.85% on the first $200 million; 0.80% on the next $550 million; and 0.75% on the amount in excess of $750 million | |
| Portfolio | | | Fee | |
| High Yield(2) | | | 0.490% on the first $1 billion; 0.480% on the next $1 billion; 0.470% on the amount in excess of $2 billion | |
Limited Maturity Bond(3) | | | 0.350% on the first $200 million; 0.300% on the next $300 million; 0.250% on the amount in excess of $500 million | |
| U.S. Stock Index | | | 0.260% | |
| JPMorgan Small Cap Core Equity | | | 0.900% on the first $200 million; 0.850% on the next $300 million; 0.800% on the next $250 million; 0.750% on the amount in excess of $750 million | |
| Portfolio | | | Sub-Adviser | |
| Balanced Income High Yield | | | Voya Investment Management Co. LLC* Voya Investment Management Co. LLC* | |
| Large Cap Growth | | | Voya Investment Management Co. LLC* | |
| Large Cap Value | | | Voya Investment Management Co. LLC* | |
| Limited Maturity Bond | | | Voya Investment Management Co. LLC* | |
| U.S. Stock Index | | | Voya Investment Management Co. LLC* | |
| Clarion Real Estate | | | CBRE Clarion Securities LLC | |
| JPMorgan Small Cap Core Equity | | | J.P. Morgan Investment Management Inc. | |
| Subsidiary/Affiliated Investment Company | | | Portfolio | | | Percentage | | |||
| ReliaStar Life Insurance Company | | | JPMorgan Small Cap Core Equity | | | | | 9.60% | | |
Security Life of Denver Insurance Company | | | Limited Maturity Bond | | | | | 7.25 | | |
| | | | JPMorgan Small Cap Core Equity | | | | | 6.37 | | |
| Voya Index Solution 2025 Portfolio | | | U.S. Stock Index | | | | | 5.33 | | |
| Voya Index Solution 2035 Portfolio | | | U.S. Stock Index | | | | | 7.57 | | |
| Voya Index Solution 2045 Portfolio | | | U.S. Stock Index | | | | | 7.11 | | |
| Voya Institutional Trust Company | | | Balanced Income | | | | | 20.06 | | |
| | | | High Yield | | | | | 15.38 | | |
| | | | Large Cap Growth | | | | | 13.64 | | |
| | | | Large Cap Value | | | | | 11.78 | | |
| | | | Clarion Real Estate | | | | | 21.64 | | |
| | | | JPMorgan Small Cap Core Equity | | | | | 34.32 | | |
| Voya Retirement Growth Portfolio | | | U.S. Stock Index | | | | | 15.17 | | |
Voya Retirement Insurance and Annuity Company | | | High Yield | | | | | 33.83 | | |
| | | | Large Cap Growth | | | | | 28.20 | | |
| | | | Large Cap Value | | | | | 73.46 | | |
| | | | U.S. Stock Index | | | | | 7.58 | | |
| | | | Clarion Real Estate | | | | | 37.26 | | |
| | | | JPMorgan Small Cap Core Equity | | | | | 31.95 | | |
Voya Retirement Moderate Growth Portfolio | | | U.S. Stock Index | | | | | 10.23 | | |
| Portfolio | | | Amount | | |||
| Balanced Income | | | | $ | 84,382 | | |
| Large Cap Growth | | | | | 1,894,290 | | |
| Large Cap Value | | | | | 604,872 | | |
| Clarion Real Estate | | | | | 411,146 | | |
| Portfolio | | | Class ADV | | | Class I | | | Class P2 | | | Class R6 | | | Class S | | | Class S2 | | ||||||||||||||||||
| Balanced Income | | | | | 1.20% | | | | | | 0.60% | | | | | | N/A | | | | | | N/A | | | | | | 0.85% | | | | | | 1.00% | | |
| Large Cap Growth(1) | | | | | 1.27% | | | | | | 0.67% | | | | | | N/A | | | | | | 0.67% | | | | | | 0.92% | | | | | | 1.07% | | |
| Large Cap Value(2) | | | | | 1.29% | | | | | | 0.69% | | | | | | N/A | | | | | | 0.69% | | | | | | 0.94% | | | | | | 1.09% | | |
| U.S. Stock Index | | | | | N/A | | | | | | N/A | | | | | | 0.15% | | | | | | N/A | | | | | | N/A | | | | | | N/A | | |
| Clarion Real Estate | | | | | 1.35% | | | | | | 0.75% | | | | | | N/A | | | | | | N/A | | | | | | 1.00% | | | | | | 1.15% | | |
| | | | December 31, | | | | | | | | |||||||||||||||
| | | | 2022 | | | 2023 | | | 2024 | | | Total | | ||||||||||||
| Balanced Income | | | | $ | 98,813 | | | | | $ | 46,785 | | | | | $ | 34,723 | | | | | $ | 180,321 | | |
| U.S. Stock Index | | | | | 2,287,877 | | | | | | 2,811,766 | | | | | | 3,532,042 | | | | | | 8,631,685 | | |
| Clarion Real Estate | | | | | 365,899 | | | | | | 719,807 | | | | | | 751,784 | | | | | | 1,837,490 | | |
| Portfolio | | | Days Utilized | | | Approximate Average Daily Balance For Days Utilized | | | Approximate Weighted Average Interest Rate For Days Utilized | | ||||||
| Large Cap Growth | | | 9 | | | | $ | 5,819,556 | | | | | | 1.30% | | |
| Large Cap Value | | | 10 | | | | | 1,421,400 | | | | | | 1.30 | | |
| U.S. Stock Index | | | 4 | | | | | 21,318,000 | | | | | | 1.27 | | |
| Clarion Real Estate | | | 3 | | | | | 6,162,000 | | | | | | 1.35 | | |
| | | | Shares sold | | | Shares issued in merger | | | Reinvestment of distributions | | | Shares redeemed | | | Net increase (decrease) in shares outstanding | | | Shares sold | | | Proceeds from shares issued in merger | | | Reinvestment of distributions | | | Shares redeemed | | | Net increase (decrease) | | ||||||||||||||||||||||||||||||
| Year or period ended | | | # | | | # | | | # | | | # | | | # | | | ($) | | | ($) | | | ($) | | | ($) | | | ($) | | ||||||||||||||||||||||||||||||
| Balanced Income | | ||||||||||||||||||||||||||||||||||||||||||||||||||||||||||||
| Class ADV | | | | | | | | | | | | | | | | | | | | | | | | | | | | | | | | | | | | | | | | | | | | | | | | | | | | | | | | | | | | | |
| 12/31/2021 | | | | | 279,715 | | | | | | — | | | | | | 139,566 | | | | | | (916,360) | | | | | | (497,079) | | | | | | 2,848,682 | | | | | | — | | | | | | 1,409,617 | | | | | | (9,270,094) | | | | | | (5,011,795) | | |
| 12/31/2020 | | | | | 288,153 | | | | | | — | | | | | | 800,701 | | | | | | (1,615,563) | | | | | | (526,709) | | | | | | 2,865,188 | | | | | | — | | | | | | 7,134,246 | | | | | | (15,420,756) | | | | | | (5,421,322) | | |
| Class I | | | | | | | | | | | | | | | | | | | | | | | | | | | | | | | | | | | | | | | | | | | | | | | | | | | | | | | | | | | | | |
| 12/31/2021 | | | | | 42,256 | | | | | | — | | | | | | 19,718 | | | | | | (115,249) | | | | | | (53,275) | | | | | | 455,348 | | | | | | — | | | | | | 209,798 | | | | | | (1,233,785) | | | | | | (568,639) | | |
| 12/31/2020 | | | | | 41,869 | | | | | | — | | | | | | 86,279 | | | | | | (147,582) | | | | | | (19,434) | | | | | | 431,117 | | | | | | — | | | | | | 809,293 | | | | | | (1,424,770) | | | | | | (184,360) | | |
| Class S | | | | | | | | | | | | | | | | | | | | | | | | | | | | | | | | | | | | | | | | | | | | | | | | | | | | | | | | | | | | | |
| 12/31/2021 | | | | | 650,061 | | | | | | — | | | | | | 584,766 | | | | | | (3,780,658) | | | | | | (2,545,831) | | | | | | 6,980,290 | | | | | | — | | | | | | 6,192,671 | | | | | | (40,255,667) | | | | | | (27,082,706) | | |
| 12/31/2020 | | | | | 1,349,030 | | | | | | — | | | | | | 2,946,637 | | | | | | (4,899,808) | | | | | | (604,141) | | | | | | 14,123,514 | | | | | | — | | | | | | 27,521,585 | | | | | | (49,186,069) | | | | | | (7,540,970) | | |
| Class S2 | | | | | | | | | | | | | | | | | | | | | | | | | | | | | | | | | | | | | | | | | | | | | | | | | | | | | | | | | | | | | |
| 12/31/2021 | | | | | 38,165 | | | | | | — | | | | | | 8,880 | | | | | | (177,341) | | | | | | (130,296) | | | | | | 395,234 | | | | | | — | | | | | | 93,865 | | | | | | (1,862,215) | | | | | | (1,373,116) | | |
| 12/31/2020 | | | | | 5,203 | | | | | | — | | | | | | 56,964 | | | | | | (65,736) | | | | | | (3,569) | | | | | | 54,652 | | | | | | — | | | | | | 530,338 | | | | | | (681,578) | | | | | | (96,588) | | |
| High Yield | | ||||||||||||||||||||||||||||||||||||||||||||||||||||||||||||
| Class ADV | | | | | | | | | | | | | | | | | | | | | | | | | | | | | | | | | | | | | | | | | | | | | | | | | | | | | | | | | | | | | |
| 12/31/2021 | | | | | 583,622 | | | | | | — | | | | | | 377,182 | | | | | | (1,025,629) | | | | | | (64,825) | | | | | | 5,800,399 | | | | | | — | | | | | | 3,748,955 | | | | | | (10,197,422) | | | | | | (648,068) | | |
| 12/31/2020 | | | | | 771,091 | | | | | | — | | | | | | 412,648 | | | | | | (1,960,222) | | | | | | (776,483) | | | | | | 7,269,990 | | | | | | — | | | | | | 3,908,133 | | | | | | (18,446,185) | | | | | | (7,268,062) | | |
| Class I | | | | | | | | | | | | | | | | | | | | | | | | | | | | | | | | | | | | | | | | | | | | | | | | | | | | | | | | | | | | | |
| 12/31/2021 | | | | | 1,775,515 | | | | | | — | | | | | | 1,016,805 | | | | | | (2,968,643) | | | | | | (176,323) | | | | | | 17,687,685 | | | | | | — | | | | | | 10,113,571 | | | | | | (29,521,461) | | | | | | (1,720,205) | | |
| 12/31/2020 | | | | | 2,919,331 | | | | | | — | | | | | | 1,066,867 | | | | | | (3,820,408) | | | | | | 165,790 | | | | | | 27,954,639 | | | | | | — | | | | | | 10,118,901 | | | | | | (35,323,365) | | | | | | 2,750,175 | | |
| Class S | | | | | | | | | | | | | | | | | | | | | | | | | | | | | | | | | | | | | | | | | | | | | | | | | | | | | | | | | | | | | |
| 12/31/2021 | | | | | 1,451,399 | | | | | | — | | | | | | 1,301,925 | | | | | | (4,887,361) | | | | | | (2,134,037) | | | | | | 14,430,141 | | | | | | — | | | | | | 12,940,400 | | | | | | (48,613,102) | | | | | | (21,242,561) | | |
| 12/31/2020 | | | | | 1,738,229 | | | | | | — | | | | | | 1,497,311 | | | | | | (7,422,990) | | | | | | (4,187,450) | | | | | | 16,647,706 | | | | | | — | | | | | | 14,181,404 | | | | | | (69,989,395) | | | | | | (39,160,285) | | |
| Class S2 | | | | | | | | | | | | | | | | | | | | | | | | | | | | | | | | | | | | | | | | | | | | | | | | | | | | | | | | | | | | | |
| 12/31/2021 | | | | | 41,312 | | | | | | — | | | | | | 14,963 | | | | | | (98,895) | | | | | | (42,620) | | | | | | 410,681 | | | | | | — | | | | | | 148,926 | | | | | | (990,752) | | | | | | (431,145) | | |
| 12/31/2020 | | | | | 83,380 | | | | | | — | | | | | | 16,119 | | | | | | (89,468) | | | | | | 10,031 | | | | | | 795,900 | | | | | | — | | | | | | 153,060 | | | | | | (862,560) | | | | | | 86,400 | | |
| Large Cap Growth | | ||||||||||||||||||||||||||||||||||||||||||||||||||||||||||||
| Class ADV | | | | | | | | | | | | | | | | | | | | | | | | | | | | | | | | | | | | | | | | | | | | | | | | | | | | | | | | | | | | | |
| 12/31/2021 | | | | | 908,101 | | | | | | — | | | | | | 23,303,662 | | | | | | (18,207,779) | | | | | | 6,003,984 | | | | | | 18,458,423 | | | | | | — | | | | | | 429,952,557 | | | | | | (365,043,084) | | | | | | 83,367,896 | | |
| 12/31/2020 | | | | | 1,207,604 | | | | | | — | | | | | | 13,785,663 | | | | | | (18,882,473) | | | | | | (3,889,206) | | | | | | 21,673,309 | | | | | | — | | | | | | 235,045,550 | | | | | | (344,565,368) | | | | | | (87,846,509) | | |
| Class I | | | | | | | | | | | | | | | | | | | | | | | | | | | | | | | | | | | | | | | | | | | | | | | | | | | | | | | | | | | | | |
| 12/31/2021 | | | | | 2,689,220 | | | | | | — | | | | | | 16,446,707 | | | | | | (39,368,162) | | | | | | (20,232,235) | | | | | | 62,387,090 | | | | | | — | | | | | | 350,150,390 | | | | | | (912,881,309) | | | | | | (500,343,829) | | |
| 12/31/2020 | | | | | 11,468,183 | | | | | | — | | | | | | 12,982,807 | | | | | | (18,934,323) | | | | | | 5,516,667 | | | | | | 217,805,648 | | | | | | — | | | | | | 247,062,817 | | | | | | (374,975,631) | | | | | | 89,892,834 | | |
| Class R6 | | | | | | | | | | | | | | | | | | | | | | | | | | | | | | | | | | | | | | | | | | | | | | | | | | | | | | | | | | | | | |
| 12/31/2021 | | | | | 391,820 | | | | | | — | | | | | | 782,242 | | | | | | (780,318) | | | | | | 393,744 | | | | | | 8,889,620 | | | | | | — | | | | | | 16,669,588 | | | | | | (17,781,438) | | | | | | 7,777,770 | | |
| 12/31/2020 | | | | | 1,189,799 | | | | | | — | | | | | | 458,711 | | | | | | (816,503) | | | | | | 832,007 | | | | | | 22,619,454 | | | | | | — | | | | | | 8,738,453 | | | | | | (16,352,499) | | | | | | 15,005,408 | | |
| Class S | | | | | | | | | | | | | | | | | | | | | | | | | | | | | | | | | | | | | | | | | | | | | | | | | | | | | | | | | | | | | |
| 12/31/2021 | | | | | 641,021 | | | | | | — | | | | | | 16,940,296 | | | | | | (18,797,382) | | | | | | (1,216,065) | | | | | | 14,184,112 | | | | | | — | | | | | | 344,904,423 | | | | | | (412,746,778) | | | | | | (53,658,243) | | |
| 12/31/2020 | | | | | 831,207 | | | | | | — | | | | | | 11,073,994 | | | | | | (23,181,554) | | | | | | (11,276,353) | | | | | | 15,951,048 | | | | | | — | | | | | | 203,650,756 | | | | | | (440,742,715) | | | | | | (221,140,911) | | |
| | | | Shares sold | | | Shares issued in merger | | | Reinvestment of distributions | | | Shares redeemed | | | Net increase (decrease) in shares outstanding | | | Shares sold | | | Proceeds from shares issued in merger | | | Reinvestment of distributions | | | Shares redeemed | | | Net increase (decrease) | | ||||||||||||||||||||||||||||||
| Year or period ended | | | # | | | # | | | # | | | # | | | # | | | ($) | | | ($) | | | ($) | | | ($) | | | ($) | | ||||||||||||||||||||||||||||||
| Large Cap Growth (continued) | | ||||||||||||||||||||||||||||||||||||||||||||||||||||||||||||
| Class S2 | | | | | | | | | | | | | | | | | | | | | | | | | | | | | | | | | | | | | | | | | | | | | | | | | | | | | | | | | | | | | |
| 12/31/2021 | | | | | 169,967 | | | | | | — | | | | | | 599,048 | | | | | | (721,069) | | | | | | 47,946 | | | | | | 3,694,619 | | | | | | — | | | | | | 12,028,880 | | | | | | (16,159,958) | | | | | | (436,459) | | |
| 12/31/2020 | | | | | 219,527 | | | | | | — | | | | | | 397,320 | | | | | | (837,286) | | | | | | (220,439) | | | | | | 4,123,608 | | | | | | — | | | | | | 7,235,193 | | | | | | (15,955,812) | | | | | | (4,597,011) | | |
| Large Cap Value | | ||||||||||||||||||||||||||||||||||||||||||||||||||||||||||||
| Class ADV | | | | | | | | | | | | | | | | | | | | | | | | | | | | | | | | | | | | | | | | | | | | | | | | | | | | | | | | | | | | | |
| 12/31/2021 | | | | | 201,267 | | | | | | — | | | | | | 118,496 | | | | | | (757,608) | | | | | | (437,845) | | | | | | 2,599,957 | | | | | | — | | | | | | 1,581,277 | | | | | | (9,720,281) | | | | | | (5,539,047) | | |
| 12/31/2020 | | | | | 238,237 | | | | | | — | | | | | | 535,379 | | | | | | (941,265) | | | | | | (167,649) | | | | | | 2,353,718 | | | | | | — | | | | | | 4,976,325 | | | | | | (9,448,165) | | | | | | (2,118,122) | | |
| Class I | | | | | | | | | | | | | | | | | | | | | | | | | | | | | | | | | | | | | | | | | | | | | | | | | | | | | | | | | | | | | |
| 12/31/2021 | | | | | 380,843 | | | | | | — | | | | | | 961,189 | | | | | | (2,557,064) | | | | | | (1,215,032) | | | | | | 5,020,931 | | | | | | — | | | | | | 13,251,427 | | | | | | (33,488,201) | | | | | | (15,215,843) | | |
| 12/31/2020 | | | | | 637,912 | | | | | | — | | | | | | 3,681,759 | | | | | | (5,604,265) | | | | | | (1,284,594) | | | | | | 6,560,375 | | | | | | — | | | | | | 35,461,124 | | | | | | (58,604,196) | | | | | | (16,582,697) | | |
| Class R6 | | | | | | | | | | | | | | | | | | | | | | | | | | | | | | | | | | | | | | | | | | | | | | | | | | | | | | | | | | | | | |
| 12/31/2021 | | | | | 1,026,544 | | | | | | — | | | | | | 27,964 | | | | | | (149,938) | | | | | | 904,570 | | | | | | 13,978,384 | | | | | | — | | | | | | 387,396 | | | | | | (2,041,286) | | | | | | 12,324,494 | | |
| 12/31/2020 | | | | | 6,497 | | | | | | — | | | | | | 2,231 | | | | | | (13,681) | | | | | | (4,953) | | | | | | 64,658 | | | | | | — | | | | | | 21,589 | | | | | | (157,306) | | | | | | (71,059) | | |
| Class S | | | | | | | | | | | | | | | | | | | | | | | | | | | | | | | | | | | | | | | | | | | | | | | | | | | | | | | | | | | | | |
| 12/31/2021 | | | | | 545,245 | | | | | | — | | | | | | 696,754 | | | | | | (53,362,945) | | | | | | (52,120,946) | | | | | | 7,026,135 | | | | | | — | | | | | | 9,120,566 | | | | | | (720,137,742) | | | | | | (703,991,041) | | |
| 12/31/2020 | | | | | 1,043,450 | | | | | | — | | | | | | 6,841,823 | | | | | | (8,807,365) | | | | | | (922,092) | | | | | | 9,898,341 | | | | | | — | | | | | | 64,530,149 | | | | | | (90,774,725) | | | | | | (16,346,235) | | |
| Class S2 | | | | | | | | | | | | | | | | | | | | | | | | | | | | | | | | | | | | | | | | | | | | | | | | | | | | | | | | | | | | | |
| 12/31/2021 | | | | | 149 | | | | | | — | | | | | | 447 | | | | | | (70) | | | | | | 526 | | | | | | 1,960 | | | | | | — | | | | | | 6,040 | | | | | | (928) | | | | | | 7,072 | | |
| 12/31/2020 | | | | | 108 | | | | | | — | | | | | | 1,595 | | | | | | (25) | | | | | | 1,678 | | | | | | 1,032 | | | | | | — | | | | | | 15,065 | | | | | | (261) | | | | | | 15,836 | | |
| Limited Maturity Bond | | ||||||||||||||||||||||||||||||||||||||||||||||||||||||||||||
| Class ADV | | | | | | | | | | | | | | | | | | | | | | | | | | | | | | | | | | | | | | | | | | | | | | | | | | | | | | | | | | | | | |
| 12/31/2021 | | | | | 214,621 | | | | | | — | | | | | | 15,454 | | | | | | (211,656) | | | | | | 18,419 | | | | | | 2,136,743 | | | | | | — | | | | | | 154,223 | | | | | | (2,111,245) | | | | | | 179,721 | | |
| 12/31/2020 | | | | | 150,033 | | | | | | — | | | | | | 24,334 | | | | | | (249,264) | | | | | | (74,897) | | | | | | 1,497,488 | | | | | | — | | | | | | 242,778 | | | | | | (2,468,058) | | | | | | (727,792) | | |
| Class I | | | | | | | | | | | | | | | | | | | | | | | | | | | | | | | | | | | | | | | | | | | | | | | | | | | | | | | | | | | | | |
| 12/31/2021 | | | | | 9,142,650 | | | | | | — | | | | | | 515,626 | | | | | | (9,361,739) | | | | | | 296,537 | | | | | | 93,025,513 | | | | | | — | | | | | | 5,245,197 | | | | | | (95,353,185) | | | | | | 2,917,525 | | |
| 12/31/2020 | | | | | 21,616,820 | | | | | | — | | | | | | 612,954 | | | | | | (9,268,414) | | | | | | 12,961,360 | | | | | | 220,273,815 | | | | | | — | | | | | | 6,243,058 | | | | | | (94,074,378) | | | | | | 132,442,495 | | |
| Class S | | | | | | | | | | | | | | | | | | | | | | | | | | | | | | | | | | | | | | | | | | | | | | | | | | | | | | | | | | | | | |
| 12/31/2021 | | | | | 830,068 | | | | | | — | | | | | | 99,029 | | | | | | (902,201) | | | | | | 26,896 | | | | | | 8,518,002 | | | | | | — | | | | | | 1,015,514 | | | | | | (9,254,429) | | | | | | 279,087 | | |
| 12/31/2020 | | | | | 1,021,891 | | | | | | — | | | | | | 143,024 | | | | | | (1,558,667) | | | | | | (393,752) | | | | | | 10,497,857 | | | | | | — | | | | | | 1,467,187 | | | | | | (15,957,868) | | | | | | (3,992,824) | | |
| U.S. Stock Index | | ||||||||||||||||||||||||||||||||||||||||||||||||||||||||||||
| Class ADV | | | | | | | | | | | | | | | | | | | | | | | | | | | | | | | | | | | | | | | | | | | | | | | | | | | | | | | | | | | | | |
| 12/31/2021 | | | | | 328,198 | | | | | | — | | | | | | 540,533 | | | | | | (1,613,600) | | | | | | (744,869) | | | | | | 6,544,675 | | | | | | — | | | | | | 10,440,961 | | | | | | (31,546,584) | | | | | | (14,560,948) | | |
| 12/31/2020 | | | | | 677,999 | | | | | | — | | | | | | 321,105 | | | | | | (1,781,888) | | | | | | (782,784) | | | | | | 10,678,167 | | | | | | — | | | | | | 5,102,873 | | | | | | (28,430,410) | | | | | | (12,649,370) | | |
| Class I | | | | | | | | | | | | | | | | | | | | | | | | | | | | | | | | | | | | | | | | | | | | | | | | | | | | | | | | | | | | | |
| 12/31/2021 | | | | | 15,845,138 | | | | | | — | | | | | | 22,322,283 | | | | | | (56,051,758) | | | | | | (17,884,337) | | | | | | 321,966,399 | | | | | | — | | | | | | 453,677,922 | | | | | | (1,159,316,452) | | | | | | (383,672,131) | | |
| 12/31/2020 | | | | | 58,658,629 | | | | | | — | | | | | | 14,180,842 | | | | | | (87,251,957) | | | | | | (14,412,486) | | | | | | 955,381,741 | | | | | | — | | | | | | 236,749,487 | | | | | | (1,492,728,968) | | | | | | (300,597,740) | | |
| Class P2 | | | | | | | | | | | | | | | | | | | | | | | | | | | | | | | | | | | | | | | | | | | | | | | | | | | | | | | | | | | | | |
| 12/31/2021 | | | | | 36,437,116 | | | | | | — | | | | | | 15,110,976 | | | | | | (40,137,473) | | | | | | 11,410,619 | | | | | | 762,954,067 | | | | | | — | | | | | | 309,410,092 | | | | | | (825,339,515) | | | | | | 247,024,644 | | |
| 12/31/2020 | | | | | 39,809,410 | | | | | | — | | | | | | 8,643,180 | | | | | | (36,093,364) | | | | | | 12,359,226 | | | | | | 654,982,138 | | | | | | — | | | | | | 145,581,700 | | | | | | (600,509,325) | | | | | | 200,054,513 | | |
| Class S | | | | | | | | | | | | | | | | | | | | | | | | | | | | | | | | | | | | | | | | | | | | | | | | | | | | | | | | | | | | | |
| 12/31/2021 | | | | | 589,474 | | | | | | — | | | | | | 1,493,042 | | | | | | (3,010,801) | | | | | | (928,285) | | | | | | 12,214,547 | | | | | | — | | | | | | 29,892,766 | | | | | | (61,225,497) | | | | | | (19,118,184) | | |
| 12/31/2020 | | | | | 658,266 | | | | | | — | | | | | | 870,434 | | | | | | (3,429,671) | | | | | | (1,900,971) | | | | | | 10,370,387 | | | | | | — | | | | | | 14,342,615 | | | | | | (55,575,289) | | | | | | (30,862,287) | | |
| Class S2 | | | | | | | | | | | | | | | | | | | | | | | | | | | | | | | | | | | | | | | | | | | | | | | | | | | | | | | | | | | | | |
| 12/31/2021 | | | | | 1,166,088 | | | | | | — | | | | | | 897,499 | | | | | | (1,720,720) | | | | | | 342,867 | | | | | | 23,579,155 | | | | | | — | | | | | | 17,679,101 | | | | | | (34,659,856) | | | | | | 6,598,400 | | |
| 12/31/2020 | | | | | 968,231 | | | | | | — | | | | | | 466,994 | | | | | | (2,218,217) | | | | | | (782,992) | | | | | | 15,436,289 | | | | | | — | | | | | | 7,572,526 | | | | | | (35,436,732) | | | | | | (12,427,917) | | |
| Clarion Real Estate | | ||||||||||||||||||||||||||||||||||||||||||||||||||||||||||||
| Class ADV | | | | | | | | | | | | | | | | | | | | | | | | | | | | | | | | | | | | | | | | | | | | | | | | | | | | | | | | | | | | | |
| 12/31/2021 | | | | | 129,323 | | | | | | — | | | | | | 23,612 | | | | | | (370,157) | | | | | | (217,222) | | | | | | 4,726,279 | | | | | | — | | | | | | 866,071 | | | | | | (13,384,798) | | | | | | (7,792,448) | | |
| 12/31/2020 | | | | | 134,170 | | | | | | — | | | | | | 264,628 | | | | | | (477,527) | | | | | | (78,729) | | | | | | 3,900,258 | | | | | | — | | | | | | 6,700,379 | | | | | | (14,055,127) | | | | | | (3,454,490) | | |
| Class I | | | | | | | | | | | | | | | | | | | | | | | | | | | | | | | | | | | | | | | | | | | | | | | | | | | | | | | | | | | | | |
| 12/31/2021 | | | | | 73,715 | | | | | | — | | | | | | 4,591 | | | | | | (290,416) | | | | | | (212,110) | | | | | | 2,761,886 | | | | | | — | | | | | | 178,785 | | | | | | (10,888,422) | | | | | �� | (7,947,751) | | |
| 12/31/2020 | | | | | 251,739 | | | | | | — | | | | | | 75,075 | | | | | | (496,504) | | | | | | (169,690) | | | | | | 7,964,181 | | | | | | — | | | | | | 2,012,016 | | | | | | (16,483,579) | | | | | | (6,507,382) | | |
| Class S | | | | | | | | | | | | | | | | | | | | | | | | | | | | | | | | | | | | | | | | | | | | | | | | | | | | | | | | | | | | | |
| 12/31/2021 | | | | | 248,483 | | | | | | — | | | | | | 89,264 | | | | | | (1,007,102) | | | | | | (669,355) | | | | | | 9,744,772 | | | | | | — | | | | | | 3,474,168 | | | | | | (38,074,518) | | | | | | (24,855,578) | | |
| 12/31/2020 | | | | | 185,770 | | | | | | — | | | | | | 867,525 | | | | | | (1,455,915) | | | | | | (402,620) | | | | | | 5,686,150 | | | | | | — | | | | | | 23,267,019 | | | | | | (45,173,752) | | | | | | (16,220,583) | | |
| | | | Shares sold | | | Shares issued in merger | | | Reinvestment of distributions | | | Shares redeemed | | | Net increase (decrease) in shares outstanding | | | Shares sold | | | Proceeds from shares issued in merger | | | Reinvestment of distributions | | | Shares redeemed | | | Net increase (decrease) | | ||||||||||||||||||||||||||||||
| Year or period ended | | | # | | | # | | | # | | | # | | | # | | | ($) | | | ($) | | | ($) | | | ($) | | | ($) | | ||||||||||||||||||||||||||||||
| Clarion Real Estate (continued) | | ||||||||||||||||||||||||||||||||||||||||||||||||||||||||||||
| Class S2 | | | | | | | | | | | | | | | | | | | | | | | | | | | | | | | | | | | | | | | | | | | | | | | | | | | | | | | | | | | | | |
| 12/31/2021 | | | | | 26,386 | | | | | | — | | | | | | 4,995 | | | | | | (102,079) | | | | | | (70,698) | | | | | | 1,039,835 | | | | | | — | | | | | | 193,147 | | | | | | (3,839,796) | | | | | | (2,606,814) | | |
| 12/31/2020 | | | | | 33,197 | | | | | | — | | | | | | 60,137 | | | | | | (125,023) | | | | | | (31,689) | | | | | | 1,037,605 | | | | | | — | | | | | | 1,602,043 | | | | | | (3,808,977) | | | | | | (1,169,329) | | |
| JPMorgan Small Cap Core Equity | | ||||||||||||||||||||||||||||||||||||||||||||||||||||||||||||
| Class ADV | | | | | | | | | | | | | | | | | | | | | | | | | | | | | | | | | | | | | | | | | | | | | | | | | | | | | | | | | | | | | |
| 12/31/2021 | | | | | 516,401 | | | | | | — | | | | | | 401,796 | | | | | | (1,049,273) | | | | | | (131,076) | | | | | | 9,911,668 | | | | | | — | | | | | | 7,449,294 | | | | | | (19,876,330) | | | | | | (2,515,368) | | |
| 12/31/2020 | | | | | 560,706 | | | | | | — | | | | | | — | | | | | | (1,855,900) | | | | | | (1,295,194) | | | | | | 6,891,934 | | | | | | — | | | | | | — | | | | | | (25,626,677) | | | | | | (18,734,743) | | |
| Class I | | | | | | | | | | | | | | | | | | | | | | | | | | | | | | | | | | | | | | | | | | | | | | | | | | | | | | | | | | | | | |
| 12/31/2021 | | | | | 3,194,127 | | | | | | — | | | | | | 689,674 | | | | | | (1,810,430) | | | | | | 2,073,371 | | | | | | 66,678,668 | | | | | | — | | | | | | 14,055,559 | | | | | | (38,014,806) | | | | | | 42,719,421 | | |
| 12/31/2020 | | | | | 3,469,734 | | | | | | — | | | | | | — | | | | | | (7,150,628) | | | | | | (3,680,894) | | | | | | 51,001,521 | | | | | | — | | | | | | — | | | | | | (108,785,155) | | | | | | (57,783,634) | | |
| Class R6 | | | | | | | | | | | | | | | | | | | | | | | | | | | | | | | | | | | | | | | | | | | | | | | | | | | | | | | | | | | | | |
| 12/31/2021 | | | | | 3,533,063 | | | | | | — | | | | | | 320,742 | | | | | | (4,020,693) | | | | | | (166,888) | | | | | | 73,777,559 | | | | | | — | | | | | | 6,530,307 | | | | | | (85,001,647) | | | | | | (4,693,781) | | |
| 12/31/2020 | | | | | 6,796,906 | | | | | | — | | | | | | — | | | | | | (2,882,333) | | | | | | 3,914,573 | | | | | | 108,537,576 | | | | | | — | | | | | | — | | | | | | (50,615,963) | | | | | | 57,921,613 | | |
| Class S | | | | | | | | | | | | | | | | | | | | | | | | | | | | | | | | | | | | | | | | | | | | | | | | | | | | | | | | | | | | | |
| 12/31/2021 | | | | | 419,827 | | | | | | — | | | | | | 325,429 | | | | | | (1,399,921) | | | | | | (654,665) | | | | | | 8,645,272 | | | | | | — | | | | | | 6,508,589 | | | | | | (28,825,077) | | | | | | (13,671,216) | | |
| 12/31/2020 | | | | | 510,443 | | | | | | — | | | | | | — | | | | | | (2,035,474) | | | | | | (1,525,031) | | | | | | 7,061,829 | | | | | | — | | | | | | — | | | | | | (29,738,877) | | | | | | (22,677,048) | | |
| Class S2 | | | | | | | | | | | | | | | | | | | | | | | | | | | | | | | | | | | | | | | | | | | | | | | | | | | | | | | | | | | | | |
| 12/31/2021 | | | | | 36,086 | | | | | | — | | | | | | 21,771 | | | | | | (89,319) | | | | | | (31,462) | | | | | | 732,954 | | | | | | — | | | | | | 428,894 | | | | | | (1,847,489) | | | | | | (685,641) | | |
| 12/31/2020 | | | | | 58,798 | | | | | | — | | | | | | — | | | | | | (176,495) | | | | | | (117,697) | | | | | | 805,880 | | | | | | — | | | | | | — | | | | | | (2,607,731) | | | | | | (1,801,851) | | |
| Counterparty | | | Securities Loaned at Value | | | Cash Collateral Received(1) | | | Net Amount | | |||||||||
| Barclays Bank PLC | | | | $ | 313,881 | | | | | $ | (313,881) | | | | | $ | — | | |
| Barclays Capital Inc. | | | | | 137,894 | | | | | | (137,894) | | | | | | — | | |
| BNP Paribas Prime Brokerage Intl Ltd | | | | | 69,213 | | | | | | (69,213) | | | | | | — | | |
| Citadel Clearing LLC | | | | | 71,736 | | | | | | (71,736) | | | | | | — | | |
| Citigroup Global Markets Inc. | | | | | 282,018 | | | | | | (282,018) | | | | | | — | | |
| Citigroup Global Markets Limited | | | | | 159,044 | | | | | | (159,044) | | | | | | — | | |
| Deutsche Bank Securities Inc. | | | | | 72,607 | | | | | | (72,607) | | | | | | — | | |
| Goldman Sachs & Co. LLC | | | | | 119,393 | | | | | | (119,393) | | | | | | — | | |
| J.P. Morgan Securities LLC | | | | | 266,641 | | | | | | (266,641) | | | | | | — | | |
| JP Morgan Securities, Plc. | | | | | 61,184 | | | | | | (61,184) | | | | | | — | | |
| Morgan Stanley & Co. LLC | | | | | 171,051 | | | | | | (171,051) | | | | | | — | | |
| MUFG Securities Americas Inc. | | | | | 286 | | | | | | (286) | | | | | | — | | |
| Nomura Securities International, Inc. | | | | | 396,469 | | | | | | (396,469) | | | | | | — | | |
| RBC Capital Markets, LLC | | | | | 66,152 | | | | | | (66,152) | | | | | | — | | |
| RBC Dominion Securities Inc | | | | | 72,114 | | | | | | (72,114) | | | | | | — | | |
| Scotia Capital (USA) INC | | | | | 30,034 | | | | | | (30,034) | | | | | | — | | |
| State Street Bank and Trust Company | | | | | 185,817 | | | | | | (185,817) | | | | | | — | | |
| UBS AG | | | | | 127,055 | | | | | | (127,055) | | | | | | — | | |
| UBS Securities LLC. | | | | | 65,876 | | | | | | (65,876) | | | | | | — | | |
| Total | | | | $ | 2,668,465 | | | | | $ | (2,668,465) | | | | | $ | — | | |
| Counterparty | | | Securities Loaned at Value | | | Cash Collateral Received(1) | | | Net Amount | | |||||||||
| Barclays Capital Inc. | | | | $ | 393,847 | | | | | $ | (393,847) | | | | | $ | — | | |
| BNP Paribas | | | | | 369,031 | | | | | | (369,031) | | | | | | — | | |
| BNP Paribas Securities Corp. | | | | | 468,723 | | | | | | (468,723) | | | | | | — | | |
BNP Paribas Prime Brokerage Intl Ltd | | | | | 3,071,207 | | | | | | (3,071,207) | | | | | | — | | |
| Citigroup Global Markets Inc. | | | | | 22,130 | | | | | | (22,130) | | | | | | — | | |
| Deutsche Bank Securities Inc. | | | | | 891,232 | | | | | | (891,232) | | | | | | — | | |
| Goldman Sachs & Co. LLC | | | | | 3,249,764 | | | | | | (3,249,764) | | | | | | — | | |
| J.P. Morgan Securities LLC | | | | | 460,820 | | | | | | (460,820) | | | | | | — | | |
| MUFG Securities Americas Inc. | | | | | 167,076 | | | | | | (167,076) | | | | | | — | | |
| Morgan Stanley & Co. LLC | | | | | 3,648,686 | | | | | | (3,648,686) | | | | | | — | | |
| Nomura Securities International, Inc. | | | | | 281,970 | | | | | | (281,970) | | | | | | — | | |
| RBC Capital Markets, LLC | | | | | 773,229 | | | | | | (773,229) | | | | | | — | | |
| Scotia Capital (USA) INC | | | | | 550,416 | | | | | | (550,416) | | | | | | — | | |
| SunTrust Robinson Humphrey,Inc | | | | | 24,246 | | | | | | (24,246) | | | | | | — | | |
| UBS AG | | | | | 3,604,995 | | | | | | (3,604,995) | | | | | | — | | |
| UBS Securities LLC. | | | | | 199,982 | | | | | | (199,982) | | | | | | — | | |
| Counterparty | | | Securities Loaned at Value | | | Cash Collateral Received(1) | | | Net Amount | | |||||||||
| Wells Fargo Securities LLC | | | | $ | 102,603 | | | | | $ | (102,603) | | | | | $ | — | | |
| Total | | | | $ | 18,279,957 | | | | | $ | (18,279,957) | | | | | $ | — | | |
| | |||||||||||||||||||
| Counterparty | | | Securities Loaned at Value | | | Cash Collateral Received(1) | | | Net Amount | | |||||||||
| Citigroup Global Markets Inc. | | | | $ | 23,140,496 | | | | | $ | (23,140,496) | | | | | $ | — | | |
| Credit Suisse Securities (USA) LLC | | | | | 31,136,123 | | | | | | (31,136,123) | | | | | | — | | |
| SG Americas Securities, LLC | | | | | 1,759,275 | | | | | | (1,759,275) | | | | | | — | | |
| State Street Bank and Trust Company | | | | | 10,185,319 | | | | | | (10,185,319) | | | | | | — | | |
| Wells Fargo Bank NA | | | | | 11,807,366 | | | | | | (11,807,366) | | | | | | — | | |
| Wells Fargo Securities LLC | | | | | 10,939,626 | | | | | | (10,939,626) | | | | | | — | | |
| Total | | | | $ | 88,968,205 | | | | | $ | (88,968,205) | | | | | $ | — | | |
| Counterparty | | | Securities Loaned at Value | | | Cash Collateral Received(1) | | | Net Amount | | |||||||||
| BofA Securities Inc | | | | $ | 1,506,168 | | | | | $ | (1,506,168) | | | | | $ | — | | |
| Citigroup Global Markets Inc. | | | | | 1,370,525 | | | | | | (1,370,525) | | | | | | — | | |
| Goldman Sachs & Co. LLC | | | | | 2,258,724 | | | | | | (2,258,724) | | | | | | — | | |
| Total | | | | $ | 5,135,416 | | | | | $ | (5,135,416) | | | | | $ | — | | |
| Counterparty | | | Securities Loaned at Value | | | Cash Collateral Received(1) | | | Net Amount | | |||||||||
| BNP Paribas Prime Brokerage Intl Ltd | | | | $ | 466,981 | | | | | $ | (466,981) | | | | | $ | — | | |
| Goldman Sachs & Co. LLC | | | | | 345,889 | | | | | | (345,889) | | | | | | — | | |
| HSBC Securities (USA) Inc. | | | | | 193,863 | | | | | | (193,863) | | | | | | — | | |
| J.P. Morgan Securities LLC | | | | | 50,627 | | | | | | (50,627) | | | | | | — | | |
| Societe Generale | | | | | 1,801,901 | | | | | | (1,801,901) | | | | | | — | | |
| TD Prime Services LLC | | | | | 300 | | | | | | (300) | | | | | | — | | |
| TD Securities (USA) Inc. | | | | | 66,504 | | | | | | (66,504) | | | | | | — | | |
| Total | | | | $ | 2,926,065 | | | | | $ | (2,926,065) | | | | | $ | — | | |
| Counterparty | | | Securities Loaned at Value | | | Cash Collateral Received(1) | | | Net Amount | | |||||||||
| Citadel Securities LLC | | | | $ | 9,451 | | | | | $ | (9,451) | | | | | $ | — | | |
| Citigroup Global Markets Inc. | | | | | 7,273,014 | | | | | | (7,273,014) | | | | | | — | | |
| J.P. Morgan Securities LLC | | | | | 537,070 | | | | | | (537,070) | | | | | | — | | |
| MUFG Securities Americas Inc. | | | | | 59,170,878 | | | | | | (59,170,878) | | | | | | — | | |
| Morgan Stanley & Co. LLC | | | | | 3,310,003 | | | | | | (3,310,003) | | | | | | — | | |
| National Financial Services LLC | | | | | 2,734,411 | | | | | | (2,734,411) | | | | | | — | | |
| Natixis Securities America LLC | | | | | 85,405 | | | | | | (85,405) | | | | | | — | | |
| State Street Bank and Trust Company | | | | | 7,134,958 | | | | | | (7,134,958) | | | | | | — | | |
| TD Prime Services LLC | | | | | 5,659,422 | | | | | | (5,659,422) | | | | | | — | | |
| Wells Fargo Bank NA | | | | | 13,601,465 | | | | | | (13,601,465) | | | | | | — | | |
| Wells Fargo Securities LLC | | | | | 37,962 | | | | | | (37,962) | | | | | | — | | |
| Total | | | | $ | 99,554,039 | | | | | $ | (99,554,039) | | | | | $ | — | | |
| Counterparty | | | Securities Loaned at Value | | | Cash Collateral Received(1) | | | Net Amount | | |||||||||
| Barclays Capital Inc. | | | | $ | 17,995 | | | | | $ | (17,995) | | | | | $ | — | | |
| BMO Capital Markets Corp | | | | | 89,412 | | | | | | (89,412) | | | | | | — | | |
BNP Paribas Prime Brokerage Intl Ltd | | | | | 1,764,658 | | | | | | (1,764,658) | | | | | | — | | |
| BNP Paribas Securities Corp. | | | | | 705,505 | | | | | | (705,505) | | | | | | — | | |
| BofA Securities Inc | | | | | 2,202,878 | | | | | | (2,202,878) | | | | | | — | | |
| Citadel Securiites LLC | | | | | 104,351 | | | | | | (104,351) | | | | | | — | | |
| Citigroup Global Markets Inc. | | | | | 1,172,662 | | | | | | (1,172,662) | | | | | | — | | |
| Cowen Excecution Services LLC | | | | | 460,324 | | | | | | (460,324) | | | | | | — | | |
| Goldman Sachs & Co. LLC | | | | | 50,946 | | | | | | (50,946) | | | | | | — | | |
| Janney Montgomery Scott LLC | | | | | 181,870 | | | | | | (181,870) | | | | | | — | | |
| Jefferies LLC | | | | | 5,949 | | | | | | (5,949) | | | | | | — | | |
| Counterparty | | | Securities Loaned at Value | | | Cash Collateral Received(1) | | | Net Amount | | |||||||||
| Morgan Stanley & Co. LLC | | | | $ | 1,093,875 | | | | | $ | (1,093,875) | | | | | $ | — | | |
National Bank of Canada Financial INC | | | | | 122,792 | | | | | | (122,792) | | | | | | — | | |
| National Financial Services LLC | | | | | 981,636 | | | | | | (981,636) | | | | | | — | | |
| Natixis Securities America LLC | | | | | 2,278,312 | | | | | | (2,278,312) | | | | | | — | | |
| Nomura Securities International, Inc. | | | | | 129,641 | | | | | | (129,641) | | | | | | — | | |
| RBC Capital Markets, LLC | | | | | 8,528 | | | | | | (8,528) | | | | | | — | | |
| TD Prime Services LLC | | | | | 634,605 | | | | | | (634,605) | | | | | | — | | |
| Wells Fargo Securities LLC | | | | | 67,061 | | | | | | (67,061) | | | | | | — | | |
| Total | | | | $ | 12,073,000 | | | | | $ | (12,073,000) | | | | | $ | — | | |
| | |||||||||||||||||||
| | | | Paid-in Capital | | | Distributable Earnings | | ||||||
| Limited Maturity Bond | | | | $ | (105,320) | | | | | $ | 105,320 | | |
| | | | Year Ended December 31, 2021 | | | Year Ended December 31, 2020 | | ||||||||||||||||||||||||||||||
| | | | Ordinary Income | | | Long-term Capital Gains | | | Return of Capital | | | Ordinary Income | | | Long-term Capital Gains | | | Return of Capital | | ||||||||||||||||||
| Balanced Income | | | | $ | 7,905,951 | | | | | $ | — | | | | | $ | — | | | | | $ | 21,828,359 | | | | | $ | 14,167,103 | | | | | $ | — | | |
| High Yield | | | | | 26,052,458 | | | | | | — | | | | | | 899,394 | | | | | | 28,067,198 | | | | | | — | | | | | | 294,300 | | |
| Large Cap Growth | | | | | 245,081,324 | | | | | | 908,624,514 | | | | | | — | | | | | | 31,912,449 | | | | | | 669,820,320 | | | | | | — | | |
| Large Cap Value | | | | | 11,621,055 | | | | | | 12,725,651 | | | | | | — | | | | | | 19,583,697 | | | | | | 85,420,555 | | | | | | — | | |
| Limited Maturity Bond | | | | | 6,417,006 | | | | | | — | | | | | | — | | | | | | 7,979,614 | | | | | | — | | | | | | — | | |
| U.S. Stock Index | | | | | 96,193,161 | | | | | | 724,907,681 | | | | | | — | | | | | | 137,870,577 | | | | | | 271,478,624 | | | | | | — | | |
| Clarion Real Estate | | | | | 4,712,171 | | | | | | — | | | | | | — | | | | | | 14,713,230 | | | | | | 18,868,227 | | | | | | — | | |
| JPMorgan Small Cap Core Equity | | | | | 9,459,470 | | | | | | 25,513,173 | | | | | | — | | | | | | — | | | | | | — | | | | | | — | | |
| | | | Undistributed Ordinary Income | | | Undistributed Long-term Capital Gains | | | Unrealized Appreciation/ (Depreciation) | | | Capital Loss Carryforwards | | | Other | | | Total Distributable Earnings/(Loss) | | |||||||||||||||||||||||||||
| | | | Amount | | | Character | | | Expiration | | ||||||||||||||||||||||||||||||||||||
| Balanced Income | | | | $ | 8,313,737 | | | | | $ | 21,081,561 | | | | | $ | 17,097,518 | | | | | $ | — | | | | — | | | | | — | | | | | $ | (32,409) | | | | | $ | 46,460,407 | | |
| High Yield | | | | | — | | | | | | — | | | | | | 19,819,943 | | | | | | (43,532,801) | | | | Long-term | | | | | None | | | | | | (18,737) | | | | | | (23,731,595) | | |
| Large Cap Growth | | | | | 369,512,810 | | | | | | 1,203,826,915 | | | | | | 1,103,289,646 | | | | | | — | | | | — | | | | | — | | | | | | (153,170) | | | | | | 2,676,476,201 | | |
| Large Cap Value | | | | | 129,197,009 | | | | | | 166,437,226 | | | | | | 54,973,358 | | | | | | — | | | | — | | | | | — | | | | | | (41,786) | | | | | | 350,565,807 | | |
| Limited Maturity Bond | | | | | — | | | | | | — | | | | | | (617,451) | | | | | | (416,690) | | | | Short-term | | | | | None | | | | | | (8,584) | | | | | | (1,240,402) | | |
| | | | | | | | | | | | | | | | | | | | | | | | (197,677) | | | | Long-term | | | | | None | | | | | | | | | | | | | | |
| | | | | | | | | | | | | | | | | | | | | | | $ | (614,367) | | | | | | | | | | | | | | | | | | | | | | | |
| U.S. Stock Index | | | | | 13,695,282 | | | | | | 666,920,521 | | | | | | 4,284,158,567 | | | | | | — | | | | — | | | | | — | | | | | | (105,311) | | | | | | 4,964,669,059 | | |
| Clarion Real Estate | | | | | 8,811,689 | | | | | | 35,906,239 | | | | | | 73,500,058 | | | | | | — | | | | — | | | | | — | | | | | | (14,747) | | | | | | 118,203,239 | | |
| JPMorgan Small Cap Core Equity | | | | | 31,093,711 | | | | | | 69,287,392 | | | | | | 140,971,844 | | | | | | — | | | | — | | | | | — | | | | | | (15,331) | | | | | | 241,337,616 | | |
| | | | Per Share Amount | | | Payable Date | | | Record Date | | ||||||
| High Yield | | | | | | | | | | | | | | | | |
| Class ADV | | | | $ | 0.0382 | | | | February 1, 2022 | | | | | Daily | | |
| Class I | | | | $ | 0.0433 | | | | February 1, 2022 | | | | | Daily | | |
| Class S | | | | $ | 0.0411 | | | | February 1, 2022 | | | | | Daily | | |
| Class S2 | | | | $ | 0.0399 | | | | February 1, 2022 | | | | | Daily | | |
| Limited Maturity Bond | | | | | | | | | | | | | | | | |
| Class ADV | | | | $ | 0.0042 | | | | February 1, 2022 | | | | | Daily | | |
| Class I | | | | $ | 0.0094 | | | | February 1, 2022 | | | | | Daily | | |
| Class S | | | | $ | 0.0073 | | | | February 1, 2022 | | | | | Daily | | |
| Voya Balanced Income Portfolio | as of December 31, 2021 |
| Shares | | | Value | | | Percentage of Net Assets | | |||||||||
| COMMON STOCK: 44.6% | | |||||||||||||||
| | | | Communication Services: 3.6% | | ||||||||||||
| 944 (1) | | | Alphabet, Inc. - Class A | | | | $ | 2,734,806 | | | | | | 0.8 | | |
| 47,376 | | | AT&T, Inc. | | | | | 1,165,450 | | | | | | 0.3 | | |
| 4,566 (2) | | | Auto Trader Group PLC | | | | | 45,728 | | | | | | 0.0 | | |
| 2,700 | | | Capcom Co., Ltd. | | | | | 63,589 | | | | | | 0.0 | | |
| 27,399 | | | Comcast Corp. - Class A | | | | | 1,378,992 | | | | | | 0.4 | | |
| 8,406 | | | Deutsche Telekom AG | | | | | 155,322 | | | | | | 0.1 | | |
| 4,655 | | | Electronic Arts, Inc. | | | | | 613,994 | | | | | | 0.2 | | |
| 968 | | | Elisa OYJ | | | | | 59,605 | | | | | | 0.0 | | |
| 24,000 | | | HKT Trust & HKT Ltd. - Stapled Security | | | | | 32,248 | | | | | | 0.0 | | |
| 500 | | | KDDI Corp. | | | | | 14,622 | | | | | | 0.0 | | |
| 6,492 | | | Lumen Technologies, Inc. | | | | | 81,475 | | | | | | 0.0 | | |
| 1,498 (1) | | | NetFlix, Inc. | | | | | 902,455 | | | | | | 0.3 | | |
| 10,511 | | | New York Times Co. | | | | | 507,681 | | | | | | 0.2 | | |
| 200 | | | Nintendo Co., Ltd. | | | | | 93,571 | | | | | | 0.0 | | |
| 5,800 | | | Nippon Telegraph & Telephone Corp. | | | | | 158,620 | | | | | | 0.1 | | |
| 4,471 | | | Omnicom Group | | | | | 327,590 | | | | | | 0.1 | | |
| 11,727 | | | Orange SA | | | | | 125,270 | | | | | | 0.1 | | |
| 2,763 (1) | | | ROBLOX Corp. | | | | | 285,031 | | | | | | 0.1 | | |
| 350 (2) | | | Scout24 SE | | | | | 24,439 | | | | | | 0.0 | | |
| 73,974 (3) | | | Sirius XM Holdings, Inc. | | | | | 469,735 | | | | | | 0.1 | | |
| 5,060 (1) | | | Snap, Inc. | | | | | 237,972 | | | | | | 0.1 | | |
| 5,000 | | | SoftBank Corp. | | | | | 63,153 | | | | | | 0.0 | | |
| 14,139 | | | Spark New Zealand Ltd. | | | | | 43,725 | | | | | | 0.0 | | |
| 204 | | | Swisscom AG | | | | | 115,081 | | | �� | | | 0.1 | | |
| 3,109 (1) | | | Take-Two Interactive Software, Inc. | | | | | 552,531 | | | | | | 0.2 | | |
| 2,421 | | | Tele2 AB | | | | | 34,537 | | | | | | 0.0 | | |
| 24,408 | | | Telefonica Deutschland Holding AG | | | | | 67,703 | | | | | | 0.0 | | |
| 25,840 | | | Telstra Corp., Ltd. | | | | | 78,533 | | | | | | 0.0 | | |
| 24,972 | | | Verizon Communications, Inc. | | | | | 1,297,545 | | | | | | 0.4 | | |
| 75,896 | | | Vodafone Group PLC | | | | | 114,317 | | | | | | 0.0 | | |
| | | | | | | | | 11,845,320 | | | | | | 3.6 | | |
| | | | Consumer Discretionary: 4.0% | | ||||||||||||
| 1,036 (1) | | | Amazon.com, Inc. | | | | | 3,454,376 | | | | | | 1.0 | | |
| 1,247 | | | Bayerische Motoren Werke AG | | | | | 124,753 | | | | | | 0.0 | | |
| 3,100 (3) | | | Bridgestone Corp. | | | | | 133,091 | | | | | | 0.1 | | |
| 352 (1) | | | Chipotle Mexican Grill, Inc. | | | | | 615,384 | | | | | | 0.2 | | |
| 874 | | | Cie Generale des Etablissements Michelin SCA | | | | | 143,147 | | | | | | 0.1 | | |
| Shares | | | Value | | | Percentage of Net Assets | | |||||||||
| COMMON STOCK: (continued) | | |||||||||||||||
| | | | Consumer Discretionary (continued) | | ||||||||||||
| 1,929 | | | Daimler AG | | | | $ | 147,383 | | | | | | 0.1 | | |
| 4,491 | | | Darden Restaurants, Inc. | | | | | 676,524 | | | | | | 0.2 | | |
| 383 | | | Domino’s Pizza, Inc. | | | | | 216,138 | | | | | | 0.1 | | |
| 3,384 (1) | | | Expedia Group, Inc. | | | | | 611,557 | | | | | | 0.2 | | |
| 62 | | | Ferrari NV | | | | | 15,959 | | | | | | 0.0 | | |
| 19,227 | | | H&R Block, Inc. | | | | | 452,988 | | | | | | 0.1 | | |
| 5,057 | | | Hasbro, Inc. | | | | | 514,702 | | | | | | 0.1 | | |
| 600 | | | Honda Motor Co., Ltd. | | | | | 17,070 | | | | | | 0.0 | | |
| 542 (2) | | | La Francaise des Jeux SAEM | | | | | 24,020 | | | | | | 0.0 | | |
| 8,615 | | | LKQ Corp. | | | | | 517,158 | | | | | | 0.1 | | |
| 5,605 | | | Nike, Inc. - Class B | | | | | 934,185 | | | | | | 0.3 | | |
| 1,235 (1) | | | O’Reilly Automotive, Inc. | | | | | 872,194 | | | | | | 0.3 | | |
| 2,989 | | | Persimmon PLC | | | | | 115,851 | | | | | | 0.0 | | |
| 6,683 | | | Ross Stores, Inc. | | | | | 763,733 | | | | | | 0.2 | | |
| 5,781 (1) | | | Royal Caribbean Cruises Ltd. | | | | | 444,559 | | | | | | 0.1 | | |
| 310 | | | SEB SA | | | | | 48,308 | | | | | | 0.0 | | |
| 4,800 | | | Sekisui House Ltd. | | | | | 103,276 | | | | | | 0.0 | | |
| 7,740 | | | Service Corp. International | | | | | 549,463 | | | | | | 0.2 | | |
| 3,600 | | | Subaru Corp. | | | | | 64,324 | | | | | | 0.0 | | |
| 2,862 | | | Target Corp. | | | | | 662,381 | | | | | | 0.2 | | |
| 661 (1) | | | Tesla, Inc. | | | | | 698,532 | | | | | | 0.2 | | |
| 1,207 | | | Wesfarmers Ltd. | | | | | 52,078 | | | | | | 0.0 | | |
| 3,731 | | | Yum! Brands, Inc. | | | | | 518,087 | | | | | | 0.2 | | |
| | | | | | | | | 13,491,221 | | | | | | 4.0 | | |
| | | | Consumer Staples: 3.0% | | ||||||||||||
| 3,500 | | | Ajinomoto Co., Inc. | | | | | 106,547 | | | | | | 0.0 | | |
| 7,711 | | | Altria Group, Inc. | | | | | 365,424 | | | | | | 0.1 | | |
| 6,507 | | | British American Tobacco PLC | | | | | 241,616 | | | | | | 0.1 | | |
| 6,978 | | | Coles Group Ltd. | | | | | 91,049 | | | | | | 0.0 | | |
| 6,816 | | | Colgate-Palmolive Co. | | | | | 581,678 | | | | | | 0.2 | | |
| 4,436 | | | Constellation Brands, Inc. | | | | | 1,113,303 | | | | | | 0.3 | | |
| 18,560 | | | Flowers Foods, Inc. | | | | | 509,843 | | | | | | 0.2 | | |
| 9,961 | | | General Mills, Inc. | | | | | 671,172 | | | | | | 0.2 | | |
| 2,555 | | | Hershey Co. | | | | | 494,316 | | | | | | 0.1 | | |
| 6,123 | | | Imperial Brands PLC | | | | | 134,184 | | | | | | 0.1 | | |
| 27,462 | | | J Sainsbury Plc | | | | | 102,652 | | | | | | 0.0 | | |
| 6,900 (3) | | | Japan Tobacco, Inc. | | | | | 139,324 | | | | | | 0.1 | | |
| 4,551 | | | Koninklijke Ahold Delhaize NV | | | | | 156,174 | | | | | | 0.1 | | |
| 1,500 | | | Lawson, Inc. | | | | | 71,174 | | | | | | 0.0 | | |
| Voya Balanced Income Portfolio | as of December 31, 2021 (continued) |
| Shares | | | Value | | | Percentage of Net Assets | | |||||||||
| COMMON STOCK: (continued) | | |||||||||||||||
| | | | Consumer Staples (continued) | | ||||||||||||
| 98 | | | L’Oreal S.A. | | | | $ | 46,728 | | | | | | 0.0 | | |
| 10,272 | | | Mondelez International, Inc. | | | | | 681,136 | | | | | | 0.2 | | |
| 370 | | | Nestle SA | | | | | 51,658 | | | | | | 0.0 | | |
| 3,854 | | | PepsiCo, Inc. | | | | | 669,479 | | | | | | 0.2 | | |
| 17,525 | | | Philip Morris International, Inc. | | | | | 1,664,875 | | | | | | 0.5 | | |
| 1,500 (3) | | | Pola Orbis Holdings, Inc. | | | | | 24,999 | | | | | | 0.0 | | |
| 12,447 | | | Procter & Gamble Co. | | | | | 2,036,080 | | | | | | 0.6 | | |
| 5,626 | | | Swedish Match AB | | | | | 44,663 | | | | | | 0.0 | | |
| 800 | | | Toyo Suisan Kaisha Ltd. | | | | | 33,919 | | | | | | 0.0 | | |
| 500 | | | Tsuruha Holdings, Inc. | | | | | 48,009 | | | | | | 0.0 | | |
| 28 | | | Unilever PLC - ULVRL | | | | | 1,502 | | | | | | 0.0 | | |
| 1,457 | | | Unilever PLC | | | | | 78,104 | | | | | | 0.0 | | |
| | | | | | | | | 10,159,608 | | | | | | 3.0 | | |
| | | | Energy: 1.4% | | ||||||||||||
| 41,418 | | | BP PLC | | | | | 185,578 | | | | | | 0.1 | | |
| 25,530 | | | Coterra Energy, Inc. | | | | | 485,070 | | | | | | 0.1 | | |
| 6,511 | | | Chevron Corp. | | | | | 764,066 | | | | | | 0.2 | | |
| 2,192 | | | ConocoPhillips | | | | | 158,219 | | | | | | 0.0 | | |
| 2,986 | | | Diamondback Energy, Inc. | | | | | 322,040 | | | | | | 0.1 | | |
| 29,000 | | | ENEOS Holdings, Inc. | | | | | 108,339 | | | | | | 0.1 | | |
| 12,047 | | | ENI S.p.A. | | | | | 167,426 | | | | | | 0.1 | | |
| 8,016 | | | Galp Energia SGPS SA | | | | | 77,780 | | | | | | 0.0 | | |
| 3,700 | | | Idemitsu Kosan Co., Ltd. | | | | | 94,423 | | | | | | 0.0 | | |
| 31,628 | | | Kinder Morgan, Inc. | | | | | 501,620 | | | | | | 0.2 | | |
| 2,170 | | | Lundin Energy AB | | | | | 77,649 | | | | | | 0.0 | | |
| 2,846 | | | Marathon Petroleum Corp. | | | | | 182,115 | | | | | | 0.1 | | |
| 1,046 | | | OMV AG | | | | | 59,154 | | | | | | 0.0 | | |
| 1,413 | | | Oneok, Inc. | | | | | 83,028 | | | | | | 0.0 | | |
| 3,404 | | | Repsol SA | | | | | 40,314 | | | | | | 0.0 | | |
| 5,245 | | | Targa Resources Corp. | | | | | 273,999 | | | | | | 0.1 | | |
| 4,886 | | | Valero Energy Corp. | | | | | 366,987 | | | | | | 0.1 | | |
| 22,219 | | | Williams Cos., Inc. | | | | | 578,583 | | | | | | 0.2 | | |
| | | | | | | | | 4,526,390 | | | | | | 1.4 | | |
| | | | Financials: 6.6% | | ||||||||||||
| 5,583 | | | 3i Group PLC | | | | | 109,445 | | | | | | 0.0 | | |
| 21,073 | | | Abrdn PLC | | | | | 68,656 | | | | | | 0.0 | | |
| 2,472 | | | Admiral Group Plc | | | | | 105,812 | | | | | | 0.0 | | |
| 4,771 | | | Allstate Corp. | | | | | 561,308 | | | | | | 0.2 | | |
| 1,774 | | | Ameriprise Financial, Inc. | | | | | 535,145 | | | | | | 0.2 | | |
| 650 (2) | | | Amundi SA | | | | | 53,615 | | | | | | 0.0 | | |
| 2,077 | | | Aon PLC | | | | | 624,263 | | | | | | 0.2 | | |
| 6,560 | | | Assicurazioni Generali S.p.A. | | | | | 138,644 | | | | | | 0.1 | | |
| Shares | | | Value | | | Percentage of Net Assets | | |||||||||
| COMMON STOCK: (continued) | | |||||||||||||||
| | | | Financials (continued) | | ||||||||||||
| 3,212 | | | Assurant, Inc. | | | | $ | 500,622 | | | | | | 0.2 | | |
| 1,453 | | | ASX Ltd. | | | | | 98,200 | | | | | | 0.0 | | |
| 2,887 | | | AXA S.A. | | | | | 85,926 | | | | | | 0.0 | | |
| 10,525 | | | Bank Hapoalim BM | | | | | 108,323 | | | | | | 0.0 | | |
| 11,398 | | | Bank Leumi Le-Israel BM | | | | | 122,255 | | | | | | 0.1 | | |
| 9,379 | | | Bank OZK | | | | | 436,405 | | | | | | 0.1 | | |
| 21,597 | | | Barclays PLC | | | | | 55,013 | | | | | | 0.0 | | |
| 1,121 | | | Blackrock, Inc. | | | | | 1,026,343 | | | | | | 0.3 | | |
| 1,045 | | | BNP Paribas | | | | | 72,252 | | | | | | 0.0 | | |
| 36,500 | | | BOC Hong Kong Holdings Ltd. | | | | | 119,702 | | | | | | 0.1 | | |
| 3,928 | | | Cboe Global Markets, Inc. | | | | | 512,211 | | | | | | 0.2 | | |
| 4,588 | | | Citigroup, Inc. | | | | | 277,069 | | | | | | 0.1 | | |
| 4,332 | | | Credit Agricole SA | | | | | 61,763 | | | | | | 0.0 | | |
| 5,047 (3) | | | Danske Bank A/S | | | | | 87,131 | | | | | | 0.0 | | |
| 546 | | | Deutsche Boerse AG | | | | | 91,168 | | | | | | 0.0 | | |
| 10,217 | | | Essent Group Ltd. | | | | | 465,180 | | | | | | 0.1 | | |
| 352 | | | Everest Re Group Ltd. | | | | | 96,420 | | | | | | 0.0 | | |
| 971 | | | Factset Research Systems, Inc. | | | | | 471,916 | | | | | | 0.1 | | |
| 2,265 | | | Fifth Third Bancorp | | | | | 98,641 | | | | | | 0.0 | | |
| 5,314 | | | FinecoBank Banca Fineco SpA | | | | | 93,061 | | | | | | 0.0 | | |
| 3,783 | | | First American Financial Corp. | | | | | 295,944 | | | | | | 0.1 | | |
| 5,238 | | | FirstCash Holdings, Inc. | | | | | 391,855 | | | | | | 0.1 | | |
| 618 | | | Groupe Bruxelles Lambert S.A. | | | | | 69,022 | | | | | | 0.0 | | |
| 2,523 | | | Hancock Whitney Corp. | | | | | 126,200 | | | | | | 0.0 | | |
| 404 | | | Hannover Rueck SE | | | | | 76,597 | | | | | | 0.0 | | |
| 2,188 | | | Hanover Insurance Group, Inc. | | | | | 286,759 | | | | | | 0.1 | | |
| 946 | | | Hargreaves Lansdown PLC | | | | | 17,384 | | | | | | 0.0 | | |
| 7,401 | | | Hartford Financial Services Group, Inc. | | | | | 510,965 | | | | | | 0.2 | | |
| 5,012 | | | Intercontinental Exchange, Inc. | | | | | 685,491 | | | | | | 0.2 | | |
| 3,329 | | | International Bancshares Corp. | | | | | 141,116 | | | | | | 0.0 | | |
| 13,208 | | | Israel Discount Bank Ltd. | | | | | 88,682 | | | | | | 0.0 | | |
| 10,500 | | | Japan Post Bank Co. Ltd. | | | | | 96,250 | | | | | | 0.0 | | |
| 676 | | | JPMorgan Chase & Co. | | | | | 107,045 | | | | | | 0.0 | | |
| 2,627 | | | Lazard Ltd. | | | | | 114,616 | | | | | | 0.0 | | |
| 868 | | | LPL Financial Holdings, Inc. | | | | | 138,958 | | | | | | 0.0 | | |
| 4,858 | | | Marsh & McLennan Cos., Inc. | | | | | 844,418 | | | | | | 0.3 | | |
| Voya Balanced Income Portfolio | as of December 31, 2021 (continued) |
| Shares | | | Value | | | Percentage of Net Assets | | |||||||||
| COMMON STOCK: (continued) | | |||||||||||||||
| | | | Financials (continued) | | ||||||||||||
| 35,781 | | | Medibank Pvt Ltd. | | | | $ | 87,148 | | | | | | 0.0 | | |
| 2,331 | | | Mercury General Corp. | | | | | 123,683 | | | | | | 0.0 | | |
| 33,634 | | | MGIC Investment Corp. | | | | | 485,002 | | | | | | 0.1 | | |
| 15,100 | | | Mitsubishi HC Capital, Inc. | | | | | 74,708 | | | | | | 0.0 | | |
| 40,000 | | | Mitsubishi UFJ Financial Group, Inc. | | | | | 217,691 | | | | | | 0.1 | | |
| 1,695 | | | Mizrahi Tefahot Bank Ltd. | | | | | 65,276 | | | | | | 0.0 | | |
| 11,100 | | | Mizuho Financial Group, Inc. | | | | | 140,984 | | | | | | 0.1 | | |
| 3,600 | | | MS&AD Insurance Group Holdings, Inc. | | | | | 110,852 | | | | | | 0.1 | | |
| 2,295 | | | MSCI, Inc. - Class A | | | | | 1,406,124 | | | | | | 0.4 | | |
| 254 | | | Muenchener Rueckversicherungs- Gesellschaft AG | | | | | 74,983 | | | | | | 0.0 | | |
| 2,694 | | | Nasdaq, Inc. | | | | | 565,767 | | | | | | 0.2 | | |
| 19,516 | | | Natwest Group PLC | | | | | 59,764 | | | | | | 0.0 | | |
| 2,183 | | | NN Group NV | | | | | 118,057 | | | | | | 0.1 | | |
| 14,471 | | | Nordea Bank Abp | | | | | 176,525 | | | | | | 0.1 | | |
| 19,786 | | | Old Republic International Corp. | | | | | 486,340 | | | | | | 0.2 | | |
| 5,200 | | | Oversea-Chinese Banking Corp., Ltd. | | | | | 44,012 | | | | | | 0.0 | | |
| 7,854 (2) | | | Poste Italiane SpA | | | | | 102,889 | | | | | | 0.0 | | |
| 6,719 | | | Progressive Corp. | | | | | 689,705 | | | | | | 0.2 | | |
| 5,347 | | | Prosperity Bancshares, Inc. | | | | | 386,588 | | | | | | 0.1 | | |
| 17,682 | | | Regions Financial Corp. | | | | | 385,468 | | | | | | 0.1 | | |
| 2,367 | | | RLI Corp. | | | | | 265,341 | | | | | | 0.1 | | |
| 1,326 | | | S&P Global, Inc. | | | | | 625,779 | | | | | | 0.2 | | |
| 1,152 | | | Schroders PLC | | | | | 55,604 | | | | | | 0.0 | | |
| 2,300 | | | Singapore Exchange Ltd. | | | | | 15,877 | | | | | | 0.0 | | |
| 2,600 | | | Sompo Holdings, Inc. | | | | | 109,652 | | | | | | 0.0 | | |
| 4,824 | | | Standard Chartered PLC | | | | | 29,334 | | | | | | 0.0 | | |
| 14,329 | | | Starwood Property Trust, Inc. | | | | | 348,195 | | | | �� | | 0.1 | | |
| 5,100 | | | Sumitomo Mitsui Financial Group, Inc. | | | | | 174,151 | | | | | | 0.1 | | |
| 3,300 | | | Sumitomo Mitsui Trust Holdings, Inc. | | | | | 110,347 | | | | | | 0.1 | | |
| 6,551 | | | Synovus Financial Corp. | | | | | 313,596 | | | | | | 0.1 | | |
| 2,990 | | | T. Rowe Price Group, Inc. | | | | | 587,954 | | | | | | 0.2 | | |
| 2,100 | | | Tokio Marine Holdings, Inc. | | | | | 116,906 | | | | | | 0.1 | | |
| 5,681 | | | Tradeweb Markets, Inc. | | | | | 568,895 | | | | | | 0.2 | | |
| 2,522 | | | Tryg A/S | | | | | 62,237 | | | | | | 0.0 | | |
| 2,703 | | | UBS Group AG | | | | | 48,517 | | | | | | 0.0 | | |
| Shares | | | Value | | | Percentage of Net Assets | | |||||||||
| COMMON STOCK: (continued) | | |||||||||||||||
| | | | Financials (continued) | | ||||||||||||
| 2,586 | | | UMB Financial Corp. | | | | $ | 274,400 | | | | | | 0.1 | | |
| 800 | | | United Overseas Bank Ltd. | | | | | 15,977 | | | | | | 0.0 | | |
| 12,747 | | | US Bancorp | | | | | 715,999 | | | | | | 0.2 | | |
| 6,991 | | | Washington Federal, Inc. | | | | | 233,360 | | | | | | 0.1 | | |
| 5,820 | | | Wells Fargo & Co. | | | | | 279,244 | | | | | | 0.1 | | |
| 496 | | | Zurich Insurance Group AG | | | | | 217,287 | | | | | | 0.1 | | |
| | | | | | | | | 22,038,009 | | | | | | 6.6 | | |
| | | | Health Care: 6.4% | | ||||||||||||
| 7,114 | | | Abbott Laboratories | | | | | 1,001,224 | | | | | | 0.3 | | |
| 3,821 | | | AbbVie, Inc. | | | | | 517,363 | | | | | | 0.2 | | |
| 3,043 | | | Agilent Technologies, Inc. | | | | | 485,815 | | | | | | 0.1 | | |
| 2,421 | | | Amgen, Inc. | | | | | 544,652 | | | | | | 0.2 | | |
| 866 | | | Anthem, Inc. | | | | | 401,426 | | | | | | 0.1 | | |
| 7,378 | | | Baxter International, Inc. | | | | | 633,328 | | | | | | 0.2 | | |
| 2,901 | | | Becton Dickinson & Co. | | | | | 729,544 | | | | | | 0.2 | | |
| 16,206 | | | Bristol-Myers Squibb Co. | | | | | 1,010,444 | | | | | | 0.3 | | |
| 1,115 | | | Cerner Corp. | | | | | 103,550 | | | | | | 0.0 | | |
| 155 | | | Coloplast A/S | | | | | 27,292 | | | | | | 0.0 | | |
| 396 | | | CSL Ltd. | | | | | 83,754 | | | | | | 0.0 | | |
| 3,193 | | | CVS Health Corp. | | | | | 329,390 | | | | | | 0.1 | | |
| 3,110 | | | Danaher Corp. | | | | | 1,023,221 | | | | | | 0.3 | | |
| 1,659 (1) | | | DexCom, Inc. | | | | | 890,800 | | | | | | 0.3 | | |
| 7,943 | | | Eli Lilly & Co. | | | | | 2,194,015 | | | | | | 0.7 | | |
| 846 | | | Fisher & Paykel Healthcare Corp. Ltd. | | | | | 18,953 | | | | | | 0.0 | | |
| 11,282 | | | Gilead Sciences, Inc. | | | | | 819,186 | | | | | | 0.2 | | |
| 14,216 | | | GlaxoSmithKline PLC | | | | | 309,521 | | | | | | 0.1 | | |
| 2,203 | | | Hikma Pharmaceuticals PLC | | | | | 66,158 | | | | | | 0.0 | | |
| 6,495 (1) | | | Horizon Therapeutics Plc | | | | | 699,901 | | | | | | 0.2 | | |
| 600 | | | Hoya Corp. | | | | | 89,035 | | | | | | 0.1 | | |
| 320 | | | Ipsen SA | | | | | 29,283 | | | | | | 0.0 | | |
| 13,174 | | | Johnson & Johnson | | | | | 2,253,676 | | | | | | 0.7 | | |
| 1,171 | | | Koninklijke Philips NV | | | | | 43,340 | | | | | | 0.0 | | |
| 2,182 | | | McKesson Corp. | | | | | 542,380 | | | | | | 0.2 | | |
| 2,326 | | | Medtronic PLC | | | | | 240,625 | | | | | | 0.1 | | |
| 16,037 | | | Merck & Co., Inc. | | | | | 1,229,076 | | | | | | 0.4 | | |
| 2,232 | | | Novartis AG | | | | | 196,130 | | | | | | 0.1 | | |
| 1,620 (3) | | | Orion Oyj | | | | | 67,293 | | | | | | 0.0 | | |
| 1,800 (3) | | | Otsuka Holdings Co. Ltd. | | | | | 65,486 | | | | | | 0.0 | | |
| 29,809 | | | Pfizer, Inc. | | | | | 1,760,221 | | | | | | 0.5 | | |
| Voya Balanced Income Portfolio | as of December 31, 2021 (continued) |
| Shares | | | Value | | | Percentage of Net Assets | | |||||||||
| COMMON STOCK: (continued) | | |||||||||||||||
| | | | Health Care (continued) | | ||||||||||||
| 1,074 | | | Recordati Industria Chimica e Farmaceutica SpA | | | | $ | 68,966 | | | | | | 0.0 | | |
| 211 | | | Roche Holding AG | | | | | 87,536 | | | | | | 0.1 | | |
| 2,422 | | | Sanofi | | | | | 243,033 | | | | | | 0.1 | | |
| 2,300 | | | Santen Pharmaceutical Co., Ltd. | | | | | 28,080 | | | | | | 0.0 | | |
| 113 | | | Sonova Holding AG - Reg | | | | | 44,160 | | | | | | 0.0 | | |
| 2,800 | | | Takeda Pharmaceutical Co., Ltd. | | | | | 76,463 | | | | | | 0.0 | | |
| 286 | | | Teleflex, Inc. | | | | | 93,945 | | | | | | 0.0 | | |
| 1,252 | | | Thermo Fisher Scientific, Inc. | | | | | 835,385 | | | | | | 0.2 | | |
| 1,717 | | | UnitedHealth Group, Inc. | | | | | 862,174 | | | | | | 0.3 | | |
| 2,017 | | | Zoetis, Inc. | | | | | 492,209 | | | | | | 0.1 | | |
| | | | | | | | | 21,238,033 | | | | | | 6.4 | | |
| | | | Industrials: 4.7% | | ||||||||||||
| 4,542 | | | 3M Co. | | | | | 806,795 | | | | | | 0.2 | | |
| 1,704 | | | ABB Ltd. | | | | | 64,944 | | | | | | 0.0 | | |
| 2,823 | | | Allegion Public Ltd. | | | | | 373,878 | | | | | | 0.1 | | |
| 4,828 | | | Ametek, Inc. | | | | | 709,909 | | | | | | 0.2 | | |
| 6,480 | | | AO Smith Corp. | | | | | 556,308 | | | | | | 0.2 | | |
| 35 | | | AP Moller - Maersk A/S - Class B | | | | | 124,926 | | | | | | 0.1 | | |
| 38,493 | | | Aurizon Holdings Ltd. | | | | | 97,796 | | | | | | 0.1 | | |
| 18,396 | | | BAE Systems PLC | | | | | 137,182 | | | | | | 0.1 | | |
| 5,456 | | | Booz Allen Hamilton Holding Corp. | | | | | 462,614 | | | | | | 0.1 | | |
| 11,339 | | | Brambles Ltd. | | | | | 87,722 | | | | | | 0.0 | | |
| 1,054 | | | Bureau Veritas SA | | | | | 34,992 | | | | | | 0.0 | | |
| 506 | | | Cie de Saint-Gobain | | | | | 35,595 | | | | | | 0.0 | | |
| 7,458 (1) | | | CoStar Group, Inc. | | | | | 589,406 | | | | | | 0.2 | | |
| 5,554 | | | CSX Corp. | | | | | 208,830 | | | | | | 0.1 | | |
| 1,617 | | | Cummins, Inc. | | | | | 352,732 | | | | | | 0.1 | | |
| 2,100 | | | Dai Nippon Printing Co., Ltd. | | | | | 52,850 | | | | | | 0.0 | | |
| 703 (1) | | | Daimler Truck Holding AG | | | | | 25,844 | | | | | | 0.0 | | |
| 789 | | | DCC PLC | | | | | 64,590 | | | | | | 0.0 | | |
| 3,189 | | | Deutsche Post AG | | | | | 205,119 | | | | | | 0.1 | | |
| 273 | | | DSV A/S | | | | | 63,617 | | | | | | 0.0 | | |
| 4,637 | | | Eaton Corp. PLC | | | | | 801,366 | | | | | | 0.2 | | |
| 4,330 | | | Emerson Electric Co. | | | | | 402,560 | | | | | | 0.1 | | |
| 295 | | | Ferguson PLC | | | | | 52,400 | | | | | | 0.0 | | |
| 3,804 | | | Fortive Corp. | | | | | 290,207 | | | | | | 0.1 | | |
| 959 | | | GEA Group AG | | | | | 52,380 | | | | | | 0.0 | | |
| 107 | | | Geberit AG - Reg | | | | | 87,219 | | | | | | 0.0 | | |
| Shares | | | Value | | | Percentage of Net Assets | | |||||||||
| COMMON STOCK: (continued) | | |||||||||||||||
| | | | Industrials (continued) | | ||||||||||||
| 1,487 | | | IHS Markit Ltd. | | | | $ | 197,652 | | | | | | 0.1 | | |
| 1,100 | | | Jardine Matheson Holdings Ltd. | | | | | 60,486 | | | | | | 0.0 | | |
| 9,530 | | | Johnson Controls International plc | | | | | 774,884 | | | | | | 0.2 | | |
| 1,376 | | | Kone Oyj | | | | | 98,740 | | | | | | 0.1 | | |
| 1,995 | | | L3Harris Technologies, Inc. | | | | | 425,414 | | | | | | 0.1 | | |
| 787 | | | Legrand S.A. | | | | | 92,174 | | | | | | 0.0 | | |
| 1,259 | | | Leidos Holdings, Inc. | | | | | 111,925 | | | | | | 0.0 | | |
| 238 | | | Lockheed Martin Corp. | | | | | 84,588 | | | | | | 0.0 | | |
| 2,447 | | | Manpowergroup, Inc. | | | | | 238,167 | | | | | | 0.1 | | |
| 1,800 | | | Mitsubishi Corp. | | | | | 57,156 | | | | | | 0.0 | | |
| 800 | | | Nippon Yusen KK | | | | | 61,002 | | | | | | 0.0 | | |
| 2,840 | | | Pentair PLC | | | | | 207,405 | | | | | | 0.1 | | |
| 5,266 | | | Quanta Services, Inc. | | | | | 603,800 | | | | | | 0.2 | | |
| 1,502 | | | Randstad NV | | | | | 102,462 | | | | | | 0.1 | | |
| 2,336 | | | Relx PLC (GBP Exchange) | | | | | 76,263 | | | | | | 0.0 | | |
| 4,274 | | | Robert Half International, Inc. | | | | | 476,637 | | | | | | 0.1 | | |
| 1,621 | | | Rockwell Automation, Inc. | | | | | 565,486 | | | | | | 0.2 | | |
| 1,363 | | | Roper Technologies, Inc. | | | | | 670,405 | | | | | | 0.2 | | |
| 85 | | | Schneider Electric SE | | | | | 16,711 | | | | | | 0.0 | | |
| 1,400 | | | Secom Co., Ltd. | | | | | 97,281 | | | | | | 0.0 | | |
| 3,800 | | | SG Holdings Co. Ltd. | | | | | 89,104 | | | | | | 0.0 | | |
| 600 | | | Sohgo Security Services Co., Ltd. | | | | | 23,842 | | | | | | 0.0 | | |
| 6,900 | | | Sumitomo Corp. | | | | | 102,116 | | | | | | 0.1 | | |
| 815 (1) | | | TransDigm Group, Inc. | | | | | 518,568 | | | | | | 0.2 | | |
| 4,036 | | | TransUnion | | | | | 478,589 | | | | | | 0.1 | | |
| 2,302 | | | United Parcel Service, Inc. - Class B | | | | | 493,411 | | | | | | 0.1 | | |
| 2,488 | | | Verisk Analytics, Inc. | | | | | 569,080 | | | | | | 0.2 | | |
| 6,590 | | | Waste Connections, Inc. | | | | | 898,019 | | | | | | 0.3 | | |
| 772 | | | Wolters Kluwer NV | | | | | 90,865 | | | | | | 0.0 | | |
| 1,094 | | | WW Grainger, Inc. | | | | | 566,955 | | | | | | 0.2 | | |
| 3,500 | | | Yamato Holdings Co., Ltd. | | | | | 82,220 | | | | | | 0.0 | | |
| | | | | | | | | 15,673,188 | | | | | | 4.7 | | |
| | | | Information Technology: 9.6% | | ||||||||||||
| 1,632 | | | Accenture PLC | | | | | 676,546 | | | | | | 0.2 | | |
| 2,892 (1) | | | Adobe, Inc. | | | | | 1,639,938 | | | | | | 0.5 | | |
| 8,914 (1) | | | Advanced Micro Devices, Inc. | | | | | 1,282,725 | | | | | | 0.4 | | |
| 6,135 | | | Amdocs Ltd. | | | | | 459,143 | | | | | | 0.1 | | |
| 22,897 | | | Apple, Inc. | | | | | 4,065,820 | | | | | | 1.2 | | |
| Voya Balanced Income Portfolio | as of December 31, 2021 (continued) |
| Shares | | | Value | | | Percentage of Net Assets | | |||||||||
| COMMON STOCK: (continued) | | |||||||||||||||
| | | | Information Technology (continued) | | ||||||||||||
| 39 | | | ASM International NV | | | | $ | 17,215 | | | | | | 0.0 | | |
| 2,330 | | | Automatic Data Processing, Inc. | | | | | 574,531 | | | | | | 0.2 | | |
| 1,498 (1) | | | Bill.com Holdings, Inc. | | | | | 373,227 | | | | | | 0.1 | | |
| 1,200 | | | Brother Industries Ltd. | | | | | 23,129 | | | | | | 0.0 | | |
| 2,545 | | | CDW Corp. | | | | | 521,165 | | | | | | 0.2 | | |
| 24,467 | | | Cisco Systems, Inc. | | | | | 1,550,474 | | | | | | 0.5 | | |
| 8,213 | | | Cognizant Technology Solutions Corp. | | | | | 728,657 | | | | | | 0.2 | | |
| 1,559 | | | Dassault Systemes SE | | | | | 92,519 | | | | | | 0.0 | | |
| 2,059 (1) | | | Datadog, Inc. | | | | | 366,728 | | | | | | 0.1 | | |
| 5,164 | | | Dolby Laboratories, Inc. | | | | | 491,716 | | | | | | 0.1 | | |
| 3,284 | | | Entegris, Inc. | | | | | 455,097 | | | | | | 0.1 | | |
| 1,631 (1) | | | Gartner, Inc. | | | | | 545,276 | | | | | | 0.2 | | |
| 9,690 | | | Genpact Ltd. | | | | | 514,345 | | | | | | 0.2 | | |
| 6,592 | | | International Business Machines Corp. | | | | | 881,087 | | | | | | 0.3 | | |
| 3,212 | | | Intuit, Inc. | | | | | 2,066,023 | | | | | | 0.6 | | |
| 2,955 | | | Jack Henry & Associates, Inc. | | | | | 493,455 | | | | | | 0.1 | | |
| 14,287 | | | Marvell Technology, Inc. | | | | | 1,249,970 | | | | | | 0.4 | | |
| 15,742 | | | Microsoft Corp. | | | | | 5,294,349 | | | | | | 1.6 | | |
| 1,612 | | | Motorola Solutions, Inc. | | | | | 437,980 | | | | | | 0.1 | | |
| 2,771 | | | NetApp, Inc. | | | | | 254,904 | | | | | | 0.1 | | |
| 19,088 | | | NortonLifeLock, Inc. | | | | | 495,906 | | | | | | 0.1 | | |
| 6,018 | | | Nvidia Corp. | | | | | 1,769,954 | | | | | | 0.5 | | |
| 4,866 | | | Oracle Corp. | | | | | 424,364 | | | | | | 0.1 | | |
| 1,135 (1) | | | Palo Alto Networks, Inc. | | | | | 631,923 | | | | | | 0.2 | | |
| 3,673 | | | Paychex, Inc. | | | | | 501,365 | | | | | | 0.2 | | |
| 1,672 (1) | | | Paycom Software, Inc. | | | | | 694,198 | | | | | | 0.2 | | |
| 5,207 | | | Qualcomm, Inc. | | | | | 952,204 | | | | | | 0.3 | | |
| 200 | | | Rohm Co., Ltd. | | | | | 18,194 | | | | | | 0.0 | | |
| 9,050 | | | Sage Group PLC/The | | | | | 104,717 | | | | | | 0.0 | | |
| 1,374 (1) | | | ServiceNow, Inc. | | | | | 891,877 | | | | | | 0.3 | | |
| 1,900 (1) | | | Trend Micro, Inc. | | | | | 105,481 | | | | | | 0.1 | | |
| 825 (1) | | | Zebra Technologies Corp. | | | | | 491,040 | | | | | | 0.1 | | |
| | | | | | | | | 32,137,242 | | | | | | 9.6 | | |
| | | | Materials: 1.5% | | ||||||||||||
| 974 | | | Air Liquide SA | | | | | 169,870 | | | | | | 0.1 | | |
| 2,388 | | | Air Products & Chemicals, Inc. | | | | | 726,573 | | | | | | 0.2 | | |
| 5,301 (3) | | | BHP Group Ltd. | | | | | 160,046 | | | | | | 0.1 | | |
| 697 (2) | | | Covestro AG | | | | | 42,899 | | | | | | 0.0 | | |
| 1,307 | | | CRH PLC | | | | | 69,192 | | | | | | 0.0 | | |
| 5,022 | | | Crown Holdings, Inc. | | | | | 555,534 | | | | | | 0.2 | | |
| 3,148 | | | Evonik Industries AG | | | | | 101,697 | | | | | | 0.1 | | |
| Shares | | | Value | | | Percentage of Net Assets | | |||||||||
| COMMON STOCK: (continued) | | |||||||||||||||
| | | | Materials (continued) | | ||||||||||||
| 11,329 | | | Evraz PLC | | | | $ | 92,624 | | | | | | 0.0 | | |
| 1,163 | | | Fortescue Metals Group Ltd. | | | | | 16,348 | | | | | | 0.0 | | |
| 438 | | | HeidelbergCement AG | | | | | 29,642 | | | | | | 0.0 | | |
| 2,110 | | | Holcim Ltd. | | | | | 107,313 | | | | | | 0.1 | | |
| 11,348 | | | International Paper Co. | | | | | 533,129 | | | | | | 0.2 | | |
| 700 | | | Nitto Denko Corp. | | | | | 54,077 | | | | | | 0.0 | | |
| 1,113 | | | Novozymes A/S | | | | | 91,388 | | | | | | 0.0 | | |
| 3,870 | | | Packaging Corp. of America | | | | | 526,900 | | | | | | 0.2 | | |
| 711 | | | PPG Industries, Inc. | | | | | 122,605 | | | | | | 0.0 | | |
| 3,910 | | | Rio Tinto Ltd. | | | | | 285,321 | | | | | | 0.1 | | |
| 1,482 | | | Sherwin-Williams Co. | | | | | 521,901 | | | | | | 0.1 | | |
| 217 | | | Sika AG | | | | | 90,189 | | | | | | 0.0 | | |
| 643 | | | Smurfit Kappa PLC | | | | | 35,440 | | | | | | 0.0 | | |
| 8,050 | | | Sonoco Products Co. | | | | | 466,014 | | | | | | 0.1 | | |
| 6,000 | | | Sumitomo Chemical Co., Ltd. | | | | | 28,295 | | | | | | 0.0 | | |
| 598 | | | Symrise AG | | | | | 88,441 | | | | | | 0.0 | | |
| 759 | | | Yara International ASA | | | | | 38,267 | | | | | | 0.0 | | |
| | | | | | | | | 4,953,705 | | | | | | 1.5 | | |
| | | | Real Estate: 1.9% | | ||||||||||||
| 1,600 | | | Daiwa House Industry Co., Ltd. | | | | | 45,982 | | | | | | 0.0 | | |
| 477 | | | Digital Realty Trust, Inc. | | | | | 84,367 | | | | | | 0.0 | | |
| 4,471 | | | First Industrial Realty Trust, Inc. | | | | | 295,980 | | | | | | 0.1 | | |
| 10,165 | | | Gaming and Leisure Properties, Inc. | | | | | 494,629 | | | | | | 0.2 | | |
| 4,625 | | | Goodman Group | | | | | 89,155 | | | | | | 0.0 | | |
| 6,679 | | | GPT Group | | | | | 26,337 | | | | | | 0.0 | | |
| 9,700 | | | Hongkong Land Holdings Ltd. - HKHGF | | | | | 50,436 | | | | | | 0.0 | | |
| 7,078 | | | Invitation Homes, Inc. | | | | | 320,917 | | | | | | 0.1 | | |
| 5,273 | | | Iron Mountain, Inc. | | | | | 275,936 | | | | | | 0.1 | | |
| 435 | | | LEG Immobilien SE | | | | | 60,649 | | | | | | 0.0 | | |
| 3,415 | | | Life Storage, Inc. | | | | | 523,110 | | | | | | 0.2 | | |
| 14,100 | | | Link REIT | | | | | 124,211 | | | | | | 0.1 | | |
| 614 | | | Mid-America Apartment Communities, Inc. | | | | | 140,876 | | | | | | 0.0 | | |
| 6,811 | | | National Retail Properties, Inc. | | | | | 327,405 | | | | | | 0.1 | | |
| 6,887 | | | National Storage Affiliates Trust | | | | | 476,580 | | | | | | 0.1 | | |
| 1,300 | | | Nomura Real Estate Holdings, Inc. | | | | | 29,955 | | | | | | 0.0 | | |
| 2,835 | | | ProLogis, Inc. | | | | | 477,301 | | | | | | 0.1 | | |
| 1,850 | | | PS Business Parks, Inc. | | | | | 340,714 | | | | | | 0.1 | | |
| Voya Balanced Income Portfolio | as of December 31, 2021 (continued) |
| Shares | | | Value | | | Percentage of Net Assets | | |||||||||
| COMMON STOCK: (continued) | | |||||||||||||||
| | | | Real Estate (continued) | | ||||||||||||
| 8,885 | | | Realty Income Corp. | | | | $ | 636,077 | | | | | | 0.2 | | |
| 2,954 | | | SBA Communications Corp. | | | | | 1,149,165 | | | | | | 0.3 | | |
| 5,868 | | | Segro PLC | | | | | 114,201 | | | | | | 0.1 | | |
| 3,846 | | | Spirit Realty Capital, Inc. | | | | | 185,339 | | | | | | 0.1 | | |
| 6,000 | | | Sun Hung Kai Properties Ltd. | | | | | 72,805 | | | | | | 0.0 | | |
| 9,600 | | | Swire Properties Ltd. | | | | | 24,066 | | | | | | 0.0 | | |
| | | | | | | | | 6,366,193 | | | | | | 1.9 | | |
| | | | Utilities: 1.9% | | ||||||||||||
| 4,000 | | | CK Infrastructure Holdings Ltd. | | | | | 25,485 | | | | | | 0.0 | | |
| 12,000 | | | CLP Holdings Ltd. | | | | | 121,257 | | | | | | 0.1 | | |
| 4,624 | | | DTE Energy Co. | | | | | 552,753 | | | | | | 0.2 | | |
| 7,908 | | | Duke Energy Corp. | | | | | 829,549 | | | | | | 0.2 | | |
| 1,391 | | | E.ON AG | | | | | 19,331 | | | | | | 0.0 | | |
| 296 (3) | | | Elia Group SA/NV | | | | | 39,014 | | | | | | 0.0 | | |
| 2,831 | | | Enagas | | | | | 65,768 | | | | | | 0.0 | | |
| 712 | | | Endesa S.A. | | | | | 16,391 | | | | | | 0.0 | | |
| 6,902 | | | Engie SA | | | | | 102,187 | | | | | | 0.0 | | |
| 3,796 | | | Entergy Corp. | | | | | 427,620 | | | | | | 0.1 | | |
| 17,500 | | | HK Electric Investments & HK Electric Investments Ltd. - Stapled Security | | | | | 17,169 | | | | | | 0.0 | | |
| 1,971 | | | Iberdrola S.A. - IBEE | | | | | 23,337 | | | | | | 0.0 | | |
| 9,395 | | | MDU Resources Group, Inc. | | | | | 289,742 | | | | | | 0.1 | | |
| 5,078 | | | National Fuel Gas Co. | | | | | 324,687 | | | | | | 0.1 | | |
| 13,855 | | | National Grid PLC | | | | | 199,779 | | | | | | 0.1 | | |
| 3,700 | | | Osaka Gas Co., Ltd. | | | | | 61,195 | | | | | | 0.0 | | |
| 12,000 | | | Power Assets Holdings Ltd. | | | | | 74,800 | | | | | | 0.0 | | |
| 18,203 | | | PPL Corp. | | | | | 547,182 | | | | | | 0.2 | | |
| 9,137 | | | Public Service Enterprise Group, Inc. | | | | | 609,712 | | | | | | 0.2 | | |
| 3,651 | | | Red Electrica Corp. SA | | | | | 78,951 | | | | | | 0.0 | | |
| 2,019 | | | Sempra Energy | | | | | 267,073 | | | | | | 0.1 | | |
| 439 | | | Severn Trent PLC | | | | | 17,530 | | | | | | 0.0 | | |
| 3,943 | | | Snam SpA | | | | | 23,749 | | | | | | 0.0 | | |
| 9,417 | | | Southern Co. | | | | | 645,818 | | | | | | 0.2 | | |
| 14,380 | | | Terna - Rete Elettrica Nazionale | | | | | 116,329 | | | | | | 0.1 | | |
| 3,200 | | | Tokyo Gas Co., Ltd. | | | | | 57,441 | | | | | | 0.0 | | |
| Shares | | | Value | | | Percentage of Net Assets | | |||||||||
| COMMON STOCK: (continued) | | |||||||||||||||
| | | | Utilities (continued) | | ||||||||||||
| 2,139 | | | UGI Corp. | | | | $ | 98,202 | | | | | | 0.0 | | |
| 7,236 | | | United Utilities Group PLC | | | | | 106,770 | | | | | | 0.0 | | |
| 5,759 | | | WEC Energy Group, Inc. | | | | | 559,026 | | | | | | 0.2 | | |
| | | | | | | | | 6,317,847 | | | | | | 1.9 | | |
| | | | Total Common Stock (Cost $126,676,430) | | | | | 148,746,756 | | | | | | 44.6 | | |
| EXCHANGE-TRADED FUNDS: 0.8% | | |||||||||||||||
| 5,682 | | | iShares MSCI EAFE Value Index ETF | | | | | 286,316 | | | | | | 0.1 | | |
| 13,116 | | | iShares Russell 1000 Value ETF | | | | | 2,202,570 | | | | | | 0.7 | | |
| | | | Total Exchange-Traded Funds (Cost $2,420,717) | | | | | 2,488,886 | | | | | | 0.8 | | |
| MUTUAL FUNDS: 9.8% | | |||||||||||||||
| | | | Affiliated Investment Companies: 9.8% | | ||||||||||||
| 214,502 | | | Voya Emerging Markets Hard Currency Debt Fund - Class P | | | | | 2,012,032 | | | | | | 0.6 | | |
| 3,127,243 | | | Voya Floating Rate Fund - Class P | | | | | 28,239,002 | | | | | | 8.5 | | |
| 297,761 | | | Voya High Yield Bond Fund - Class P | | | | | 2,391,021 | | | | | | 0.7 | | |
| | | | Total Mutual Funds (Cost $33,758,742) | | | | | 32,642,055 | | | | | | 9.8 | | |
| PREFERRED STOCK: 0.2% | | |||||||||||||||
| | | | Consumer Staples: 0.0% | | ||||||||||||
| 1,618 | | | Henkel AG & Co. KGaA | | | | | 130,558 | | | | | | 0.0 | | |
| | | |||||||||||||||
| | | | Financials: 0.2% | | ||||||||||||
| 50 (1)(4) | | | Fannie Mae | | | | | 512,500 | | | | | | 0.2 | | |
| | | |||||||||||||||
| | | | Materials: 0.0% | | ||||||||||||
| 441 | | | Fuchs Petrolub SE | | | | | 19,928 | | | | | | 0.0 | | |
| | | | Total Preferred Stock (Cost $4,271,829) | | | | | 662,986 | | | | | | 0.2 | | |
| OTHER(5): —% | | |||||||||||||||
| | | | Consumer Discretionary: —% | | ||||||||||||
| 120,000 (6)(7) | | | General Motors Co. Escrow | | | | | — | | | | | | — | | |
| | | | Total Other (Cost $—) | | | | | — | | | | | | — | | |
| | ||||||||||||||||
| Voya Balanced Income Portfolio | as of December 31, 2021 (continued) |
| Principal Amount† | | | Value | | | Percentage of Net Assets | | |||||||||
| CORPORATE BONDS/NOTES: 7.6% | | |||||||||||||||
| | | | Basic Materials: 0.6% | | ||||||||||||
| 200,000 (2) | | | Celulosa Arauco y Constitucion SA, 4.250%, 04/30/2029 | | | | $ | 213,311 | | | | | | 0.1 | | |
| 70,000 (2)(3) | | | Cleveland-Cliffs, Inc., 4.875%, 03/01/2031 | | | | | 72,827 | | | | | | 0.0 | | |
| 70,000 (2)(3) | | | Coeur Mining, Inc., 5.125%, 02/15/2029 | | | | | 64,252 | | | | | | 0.0 | | |
| 70,000 (2) | | | Compass Minerals International, Inc., 6.750%, 12/01/2027 | | | | | 74,217 | | | | | | 0.1 | | |
| 70,000 (2) | | | Diamond BC BV, 4.625%, 10/01/2029 | | | | | 69,544 | | | | | | 0.0 | | |
| 250,000 (2) | | | Evraz PLC, 5.250%, 04/02/2024 | | | | | 263,571 | | | | | | 0.1 | | |
| 70,000 | | | Freeport-McMoRan, Inc., 4.125%, 03/01/2028 | | | | | 72,725 | | | | | | 0.0 | | |
| 200,000 (2) | | | Gold Fields Orogen Holdings BVI Ltd., 5.125%, 05/15/2024 | | | | | 213,478 | | | | | | 0.1 | | |
| 70,000 (2) | | | Hudbay Minerals, Inc., 4.500%, 04/01/2026 | | | | | 70,080 | | | | | | 0.0 | | |
| 70,000 (2) | | | Illuminate Buyer LLC / Illuminate Holdings IV, Inc., 9.000%, 07/01/2028 | | | | | 74,748 | | | | | | 0.1 | | |
| 70,000 (2)(8) | | | Iris Holdings, Inc., 8.750% (PIK Rate 9.500%, Cash Rate 8.750%), 02/15/2026 | | | | | 70,873 | | | | | | 0.0 | | |
| 12,000 (2) | | | Joseph T Ryerson & Son, Inc., 8.500%, 08/01/2028 | | | | | 13,068 | | | | | | 0.0 | | |
| 70,000 (2) | | | Kraton Polymers LLC / Kraton Polymers Capital Corp., 4.250%, 12/15/2025 | | | | | 72,546 | | | | | | 0.0 | | |
| 70,000 (2) | | | LSF11 A5 Holdco LLC, 6.625%, 10/15/2029 | | | | | 69,048 | | | | | | 0.0 | | |
| 70,000 (2) | | | Novelis Corp., 3.875%, 08/15/2031 | | | | | 69,671 | | | | | | 0.0 | | |
| 70,000 | | | Olin Corp., 5.125%, 09/15/2027 | | | | | 71,908 | | | | | | 0.0 | | |
| 70,000 (2) | | | Schweitzer-Mauduit International, Inc., 6.875%, 10/01/2026 | | | | | 73,327 | | | | | | 0.0 | | |
| 200,000 | | | Suzano Austria GmbH, 5.000%, 01/15/2030 | | | | | 219,584 | | | | | | 0.1 | | |
| 70,000 (2) | | | Taseko Mines Ltd., 7.000%, 02/15/2026 | | | | | 72,873 | | | | | | 0.0 | | |
| 50,000 (2) | | | Trinseo Materials Operating SCA / Trinseo Materials Finance, Inc., 5.125%, 04/01/2029 | | | | | 51,076 | | | | | | 0.0 | | |
| 55,000 (2) | | | Tronox, Inc., 4.625%, 03/15/2029 | | | | | 55,031 | | | | | | 0.0 | | |
| 15,000 (2) | | | Unifrax Escrow Issuer Corp., 5.250%, 09/30/2028 | | | | | 15,191 | | | | | | 0.0 | | |
| 35,000 (2) | | | Venator Finance Sarl / Venator Materials LLC, 5.750%, 07/15/2025 | | | | | 33,636 | | | | | | 0.0 | | |
| | | | | | | | | 2,076,585 | | | | | | 0.6 | | |
| Principal Amount† | | | Value | | | Percentage of Net Assets | | |||||||||
| CORPORATE BONDS/NOTES: (continued) | | |||||||||||||||
| | | | Communications: 0.8% | | ||||||||||||
| 200,000 (3) | | | Alibaba Group Holding Ltd., 2.125%, 02/09/2031 | | | | $ | 193,290 | | | | | | 0.1 | | |
| 70,000 | | | AMC Networks, Inc., 4.250%, 02/15/2029 | | | | | 69,689 | | | | | | 0.0 | | |
| 70,000 (2) | | | Beasley Mezzanine Holdings LLC, 8.625%, 02/01/2026 | | | | | 69,198 | | | | | | 0.0 | | |
| 70,000 (2) | | | CCO Holdings LLC / CCO Holdings Capital Corp., 4.250%, 01/15/2034 | | | | | 68,995 | | | | | | 0.0 | | |
| 70,000 (2) | | | Clear Channel Outdoor Holdings, Inc., 7.500%, 06/01/2029 | | | | | 74,845 | | | | | | 0.0 | | |
| 70,000 (2)(3) | | | CommScope Technologies LLC, 5.000%, 03/15/2027 | | | | | 65,520 | | | | | | 0.0 | | |
| 70,000 | | | CSC Holdings LLC, 5.250%, 06/01/2024 | | | | | 72,886 | | | | | | 0.0 | | |
| 85,000 (2) | | | DIRECTV Holdings LLC / DIRECTV Financing Co., Inc., 5.875%, 08/15/2027 | | | | | 87,142 | | | | | | 0.1 | | |
| 70,000 | | | DISH DBS Corp., 5.125%, 06/01/2029 | | | | | 63,813 | | | | | | 0.0 | | |
| 70,000 | | | Embarq Corp., 7.995%, 06/01/2036 | | | | | 78,515 | | | | | | 0.1 | | |
| 60,000 (2) | | | Audacy Capital Corp., 6.500%, 05/01/2027 | | | | | 59,412 | | | | | | 0.0 | | |
| 70,000 (2) | | | Frontier Communications Holdings LLC, 5.000%, 05/01/2028 | | | | | 72,227 | | | | | | 0.0 | | |
| 70,000 (2) | | | GCI LLC, 4.750%, 10/15/2028 | | | | | 71,939 | | | | | | 0.0 | | |
| 70,000 (2)(3) | | | Gray Escrow II, Inc., 5.375%, 11/15/2031 | | | | | 72,138 | | | | | | 0.0 | | |
| 70,000 (3) | | | Hughes Satellite Systems Corp., 6.625%, 08/01/2026 | | | | | 78,417 | | | | | | 0.1 | | |
| 70,000 | | | iHeartCommunications, Inc., 8.375%, 05/01/2027 | | | | | 73,894 | | | | | | 0.0 | | |
| 75,000 (2) | | | McGraw-Hill Education, Inc., 8.000%, 08/01/2029 | | | | | 74,532 | | | | | | 0.0 | | |
| 70,000 (2) | | | Midas OpCo Holdings LLC, 5.625%, 08/15/2029 | | | | | 71,773 | | | | | | 0.0 | | |
| 70,000 (2) | | | Midcontinent Communications / Midcontinent Finance Corp., 5.375%, 08/15/2027 | | | | | 72,170 | | | | | | 0.0 | | |
| 70,000 | | | Netflix, Inc., 5.875%, 11/15/2028 | | | | | 84,293 | | | | | | 0.1 | | |
| 70,000 (2)(3) | | | Radiate Holdco LLC / Radiate Finance, Inc., 4.500%, 09/15/2026 | | | | | 70,785 | | | | | | 0.0 | | |
| 70,000 (2) | | | Scripps Escrow II, Inc., 3.875%, 01/15/2029 | | | | | 70,021 | | | | | | 0.0 | | |
| 70,000 (2) | | | Sinclair Television Group, Inc., 4.125%, 12/01/2030 | | | | | 66,431 | | | | | | 0.0 | | |
| 70,000 (2) | | | Sirius XM Radio, Inc., 5.000%, 08/01/2027 | | | | | 72,841 | | | | | | 0.0 | | |
| Voya Balanced Income Portfolio | as of December 31, 2021 (continued) |
| Principal Amount† | | | Value | | | Percentage of Net Assets | | |||||||||
| CORPORATE BONDS/NOTES: (continued) | | |||||||||||||||
| | | | Communications (continued) | | ||||||||||||
| 70,000 (2) | | | Spanish Broadcasting System, Inc., 9.750%, 03/01/2026 | | | | $ | 72,085 | | | | | | 0.0 | | |
| 70,000 | | | Sprint Corp., 7.625%, 03/01/2026 | | | | | 84,131 | | | | | | 0.1 | | |
| 70,000 (3) | | | TEGNA, Inc., 5.000%, 09/15/2029 | | | | | 71,702 | | | | | | 0.0 | | |
| 70,000 | | | Telecom Italia Capital SA, 6.375%, 11/15/2033 | | | | | 75,482 | | | | | | 0.0 | | |
| 70,000 (2) | | | Univision Communications, Inc., 6.625%, 06/01/2027 | | | | | 75,496 | | | | | | 0.1 | | |
| 70,000 (2) | | | Urban One, Inc., 7.375%, 02/01/2028 | | | | | 72,202 | | | | | | 0.0 | | |
| 70,000 (9) | | | ViacomCBS, Inc., 6.250%, 02/28/2057 | | | | | 78,934 | | | | | | 0.1 | | |
| 70,000 (2) | | | ViaSat, Inc., 5.625%, 09/15/2025 | | | | | 70,436 | | | | | | 0.0 | | |
| 70,000 (2) | | | Viavi Solutions, Inc., 3.750%, 10/01/2029 | | | | | 70,097 | | | | | | 0.0 | | |
| | | | | | | | | 2,525,331 | | | | | | 0.8 | | |
| | | | Consumer, Cyclical: 1.5% | | ||||||||||||
| 70,000 (2) | | | 1011778 BC ULC / New Red Finance, Inc., 4.000%, 10/15/2030 | | | | | 68,921 | | | | | | 0.0 | | |
| 70,000 (2) | | | Academy Ltd., 6.000%, 11/15/2027 | | | | | 74,774 | | | | | | 0.1 | | |
| 70,000 (2) | | | Adams Homes, Inc., 7.500%, 02/15/2025 | | | | | 73,226 | | | | | | 0.0 | | |
| 70,000 (2) | | | Affinity Gaming, 6.875%, 12/15/2027 | | | | | 72,899 | | | | | | 0.0 | | |
| 70,000 (2) | | | Allison Transmission, Inc., 5.875%, 06/01/2029 | | | | | 76,222 | | | | | | 0.1 | | |
| 70,000 (2) | | | American Airlines, Inc./ AAdvantage Loyalty IP Ltd., 5.500%, 04/20/2026 | | | | | 72,900 | | | | | | 0.0 | | |
| 70,000 (2) | | | Arko Corp., 5.125%, 11/15/2029 | | | | | 67,738 | | | | | | 0.0 | | |
| 70,000 | | | Asbury Automotive Group, Inc., 4.750%, 03/01/2030 | | | | | 71,244 | | | | | | 0.0 | | |
| 70,000 (2) | | | Boyd Gaming Corp., 4.750%, 06/15/2031 | | | | | 71,522 | | | | | | 0.0 | | |
| 45,000 (2) | | | Boyne USA, Inc., 4.750%, 05/15/2029 | | | | | 46,427 | | | | | | 0.0 | | |
| 70,000 (2) | | | Caesars Entertainment, Inc., 4.625%, 10/15/2029 | | | | | 70,147 | | | | | | 0.0 | | |
| 70,000 (2) | | | Caesars Entertainment, Inc., 6.250%, 07/01/2025 | | | | | 73,563 | | | | | | 0.1 | | |
| 70,000 (2) | | | CCM Merger, Inc., 6.375%, 05/01/2026 | | | | | 73,094 | | | | | | 0.0 | | |
| 70,000 (2) | | | Century Communities, Inc., 3.875%, 08/15/2029 | | | | | 70,625 | | | | | | 0.0 | | |
| 200,000 (2) | | | CK Hutchison International 21 Ltd., 2.500%, 04/15/2031 | | | | | 202,495 | | | | | | 0.1 | | |
| 165,000 (2) | | | Delta Air Lines, Inc. / SkyMiles IP Ltd., 4.750%, 10/20/2028 | | | | | 180,309 | | | | | | 0.1 | | |
| Principal Amount† | | | Value | | | Percentage of Net Assets | | |||||||||
| CORPORATE BONDS/NOTES: (continued) | | |||||||||||||||
| | | | Consumer, Cyclical (continued) | | ||||||||||||
| 200,000 (2) | | | Falabella SA, 3.375%, 01/15/2032 | | | | $ | 198,287 | | | | | | 0.1 | | |
| 70,000 (2)(3) | | | Foot Locker, Inc., 4.000%, 10/01/2029 | | | | | 70,221 | | | | | | 0.0 | | |
| 70,000 (2) | | | Foundation Building Materials, Inc., 6.000%, 03/01/2029 | | | | | 68,873 | | | | | | 0.0 | | |
| 70,000 (2)(3) | | | Gap, Inc./The, 3.875%, 10/01/2031 | | | | | 69,152 | | | | | | 0.0 | | |
| 70,000 (2) | | | Golden Entertainment, Inc., 7.625%, 04/15/2026 | | | | | 73,456 | | | | | | 0.1 | | |
| 200,000 (2) | | | InRetail Consumer, 3.250%, 03/22/2028 | | | | | 198,289 | | | | | | 0.1 | | |
| 70,000 (2) | | | Installed Building Products, Inc., 5.750%, 02/01/2028 | | | | | 72,903 | | | | | | 0.0 | | |
| 70,000 (2) | | | Interface, Inc., 5.500%, 12/01/2028 | | | | | 73,428 | | | | | | 0.0 | | |
| 70,000 (2) | | | IRB Holding Corp., 7.000%, 06/15/2025 | | | | | 74,129 | | | | | | 0.1 | | |
| 70,000 | | | Bath & Body Works, Inc., 6.750%, 07/01/2036 | | | | | 86,552 | | | | | | 0.1 | | |
| 70,000 (2) | | | LBM Acquisition LLC, 6.250%, 01/15/2029 | | | | | 69,311 | | | | | | 0.0 | | |
| 70,000 (2) | | | LCM Investments Holdings II LLC, 4.875%, 05/01/2029 | | | | | 72,049 | | | | | | 0.0 | | |
| 70,000 (2) | | | LGI Homes, Inc, 4.000%, 07/15/2029 | | | | | 69,841 | | | | | | 0.0 | | |
| 70,000 (2) | | | Lions Gate Capital Holdings LLC, 5.500%, 04/15/2029 | | | | | 71,349 | | | | | | 0.0 | | |
| 70,000 | | | M/I Homes, Inc., 3.950%, 02/15/2030 | | | | | 69,056 | | | | | | 0.0 | | |
| 70,000 | | | Meritage Homes Corp., 5.125%, 06/06/2027 | | | | | 77,198 | | | | | | 0.1 | | |
| 70,000 (2) | | | Meritor, Inc., 4.500%, 12/15/2028 | | | | | 70,281 | | | | | | 0.0 | | |
| 70,000 | | | MGM Resorts International, 5.500%, 04/15/2027 | | | | | 74,626 | | | | | | 0.1 | | |
| 70,000 (2) | | | Midwest Gaming Borrower LLC / Midwest Gaming Finance Corp., 4.875%, 05/01/2029 | | | | | 70,456 | | | | | | 0.0 | | |
| 70,000 | | | Murphy Oil USA, Inc., 5.625%, 05/01/2027 | | | | | 72,876 | | | | | | 0.0 | | |
| 70,000 (2)(3) | | | Penn National Gaming, Inc., 4.125%, 07/01/2029 | | | | | 68,006 | | | | | | 0.0 | | |
| 70,000 (2) | | | Real Hero Merger Sub 2, Inc., 6.250%, 02/01/2029 | | | | | 69,989 | | | | | | 0.0 | | |
| 45,000 (2)(3) | | | Royal Caribbean Cruises Ltd., 5.500%, 04/01/2028 | | | | | 45,598 | | | | | | 0.0 | | |
| 25,000 (2) | | | Royal Caribbean Cruises Ltd., 9.125%, 06/15/2023 | | | | | 26,469 | | | | | | 0.0 | | |
| 35,000 (2) | | | Scientific Games International, Inc., 5.000%, 10/15/2025 | | | | | 36,079 | | | | | | 0.0 | | |
| Voya Balanced Income Portfolio | as of December 31, 2021 (continued) |
| Principal Amount† | | | Value | | | Percentage of Net Assets | | |||||||||
| CORPORATE BONDS/NOTES: (continued) | | |||||||||||||||
| | | | Consumer, Cyclical (continued) | | ||||||||||||
| 35,000 (2) | | | Scientific Games International, Inc., 8.250%, 03/15/2026 | | | | $ | 36,882 | | | | | | 0.0 | | |
| 70,000 (2) | | | Scotts Miracle-Gro Co/The, 4.375%, 02/01/2032 | | | | | 69,931 | | | | | | 0.0 | | |
| 70,000 (2) | | | Shea Homes L.P. / Shea Homes Funding Corp., 4.750%, 04/01/2029 | | | | | 71,437 | | | | | | 0.0 | | |
| 70,000 (2) | | | Sizzling Platter LLC / Sizzling Platter Finance Corp., 8.500%, 11/28/2025 | | | | | 72,092 | | | | | | 0.0 | | |
| 70,000 (2) | | | Sonic Automotive, Inc., 4.625%, 11/15/2029 | | | | | 70,784 | | | | | | 0.0 | | |
| 70,000 (2) | | | Specialty Building Products Holdings LLC / SBP Finance Corp., 6.375%, 09/30/2026 | | | | | 73,436 | | | | | | 0.1 | | |
| 70,000 (2) | | | Speedway Motorsports LLC / Speedway Funding II, Inc., 4.875%, 11/01/2027 | | | | | 71,506 | | | | | | 0.0 | | |
| 70,000 (2)(3) | | | SRS Distribution, Inc., 6.125%, 07/01/2029 | | | | | 71,438 | | | | | | 0.0 | | |
| 70,000 (2)(3) | | | Staples, Inc., 10.750%, 04/15/2027 | | | | | 66,048 | | | | | | 0.0 | | |
| 70,000 (2) | | | Station Casinos LLC, 4.500%, 02/15/2028 | | | | | 70,533 | | | | | | 0.0 | | |
| 70,000 (2) | | | STL Holding Co. LLC, 7.500%, 02/15/2026 | | | | | 74,113 | | | | | | 0.1 | | |
| 70,000 (2) | | | Tempur Sealy International, Inc., 3.875%, 10/15/2031 | | | | | 70,241 | | | | | | 0.0 | | |
| 70,000 | | | Tri Pointe Homes, Inc., 5.700%, 06/15/2028 | | | | | 77,097 | | | | | | 0.1 | | |
| 70,000 (3) | | | United Airlines Holdings, Inc., 4.875%, 01/15/2025 | | | | | 72,086 | | | | | | 0.0 | | |
| 70,000 (2) | | | Univar Solutions USA, Inc./Washington, 5.125%, 12/01/2027 | | | | | 73,142 | | | | | | 0.0 | | |
| 70,000 (2) | | | Victoria’s Secret & Co., 4.625%, 07/15/2029 | | | | | 71,682 | | | | | | 0.0 | | |
| 35,000 (2) | | | Viking Cruises Ltd., 5.875%, 09/15/2027 | | | | | 33,362 | | | | | | 0.0 | | |
| 35,000 (2) | | | Viking Cruises Ltd., 13.000%, 05/15/2025 | | | | | 39,660 | | | | | | 0.0 | | |
| 70,000 (2) | | | Wheel Pros, Inc., 6.500%, 05/15/2029 | | | | | 67,298 | | | | | | 0.0 | | |
| 70,000 (2) | | | William Carter Co/The, 5.625%, 03/15/2027 | | | | | 72,433 | | | | | | 0.0 | | |
| 70,000 (2) | | | Williams Scotsman International, Inc., 4.625%, 08/15/2028 | | | | | 72,376 | | | | | | 0.0 | | |
| 70,000 (2) | | | Wolverine World Wide, Inc., 4.000%, 08/15/2029 | | | | | 68,165 | | | | | | 0.0 | | |
| 35,000 (2) | | | Wyndham Hotels & Resorts, Inc., 4.375%, 08/15/2028 | | | | | 36,107 | | | | | | 0.0 | | |
| | | | | | | | | 4,816,429 | | | | | | 1.5 | | |
| Principal Amount† | | | Value | | | Percentage of Net Assets | | |||||||||
| CORPORATE BONDS/NOTES: (continued) | | |||||||||||||||
| | | | Consumer, Non-cyclical: 1.0% | | ||||||||||||
| 70,000 (2) | | | Acadia Healthcare Co., Inc., 5.500%, 07/01/2028 | | | | $ | 73,678 | | | | | | 0.1 | | |
| 70,000 (2) | | | ACCO Brands Corp., 4.250%, 03/15/2029 | | | | | 69,581 | | | | | | 0.0 | | |
| 200,000 (2) | | | Adani Ports & Special Economic Zone Ltd., 4.375%, 07/03/2029 | | | | | 208,869 | | | | | | 0.1 | | |
| 70,000 (2) | | | ADT Security Corp./The, 4.125%, 08/01/2029 | | | | | 69,076 | | | | | | 0.0 | | |
| 70,000 (2) | | | Albertsons Cos, Inc. / Safeway, Inc. / New Albertsons L.P. / Albertsons LLC, 3.500%, 03/15/2029 | | | | | 70,258 | | | | | | 0.0 | | |
| 25,000 (2) | | | Allied Universal Holdco LLC / Allied Universal Finance Corp., 6.625%, 07/15/2026 | | | | | 26,262 | | | | | | 0.0 | | |
| 50,000 (2) | | | Allied Universal Holdco LLC / Allied Universal Finance Corp., 9.750%, 07/15/2027 | | | | | 53,479 | | | | | | 0.0 | | |
| 70,000 (2) | | | Alta Equipment Group, Inc., 5.625%, 04/15/2026 | | | | | 72,072 | | | | | | 0.0 | | |
| 70,000 (2) | | | AMN Healthcare, Inc., 4.625%, 10/01/2027 | | | | | 72,625 | | | | | | 0.0 | | |
| 70,000 (2) | | | APi Escrow Corp., 4.750%, 10/15/2029 | | | | | 71,507 | | | | | | 0.0 | | |
| 70,000 (2) | | | Bausch Health Cos, Inc., 5.250%, 01/30/2030 | | | | | 61,708 | | | | | | 0.0 | | |
| 55,000 (2)(3) | | | Block, Inc., 3.500%, 06/01/2031 | | | | | 56,470 | | | | | | 0.0 | | |
| 70,000 (2) | | | Catalent Pharma Solutions, Inc., 5.000%, 07/15/2027 | | | | | 72,800 | | | | | | 0.1 | | |
| 35,000 | | | Centene Corp., 2.625%, 08/01/2031 | | | | | 34,358 | | | | | | 0.0 | | |
| 35,000 | | | Centene Corp., 4.625%, 12/15/2029 | | | | | 37,807 | | | | | | 0.0 | | |
| 25,000 (2) | | | Chobani LLC / Chobani Finance Corp., Inc., 4.625%, 11/15/2028 | | | | | 25,723 | | | | | | 0.0 | | |
| 70,000 (2) | | | CoreLogic, Inc., 4.500%, 05/01/2028 | | | | | 69,840 | | | | | | 0.0 | | |
| 70,000 (2) | | | CPI Acquisition, Inc., 8.625%, 03/15/2026 | | | | | 74,115 | | | | | | 0.1 | | |
| 70,000 (2) | | | DaVita, Inc., 4.625%, 06/01/2030 | | | | | 71,789 | | | | | | 0.0 | | |
| 225,000 (2) | | | DP World Crescent Ltd., 3.750%, 01/30/2030 | | | | | 238,523 | | | | | | 0.1 | | |
| 20,000 | | | Encompass Health Corp., 4.625%, 04/01/2031 | | | | | 20,380 | | | | | | 0.0 | | |
| 70,000 (2) | | | Graham Holdings Co., 5.750%, 06/01/2026 | | | | | 72,783 | | | | | | 0.0 | | |
| 70,000 | | | HCA, Inc., 3.500%, 09/01/2030 | | | | | 74,121 | | | | | | 0.1 | | |
| 200,000 (2) | | | Hutama Karya Persero PT, 3.750%, 05/11/2030 | | | | | 214,170 | | | | | | 0.1 | | |
| Voya Balanced Income Portfolio | as of December 31, 2021 (continued) |
| Principal Amount† | | | Value | | | Percentage of Net Assets | | |||||||||
| CORPORATE BONDS/NOTES: (continued) | | |||||||||||||||
| | | | Consumer, Non-cyclical (continued) | | ||||||||||||
| 56,000 (2) | | | KeHE Distributors LLC / KeHE Finance Corp., 8.625%, 10/15/2026 | | | | $ | 60,186 | | | | | | 0.0 | | |
| 51,000 | | | Kraft Heinz Foods Co., 5.000%, 07/15/2035 | | | | | 62,492 | | | | | | 0.0 | | |
| 70,000 (2) | | | Lamb Weston Holdings, Inc., 4.125%, 01/31/2030 | | | | | 71,954 | | | | | | 0.0 | | |
| 70,000 (2) | | | Legacy LifePoint Health LLC, 4.375%, 02/15/2027 | | | | | 70,600 | | | | | | 0.0 | | |
| 70,000 (2) | | | Mozart Debt Merger Sub, Inc., 3.875%, 04/01/2029 | | | | | 69,893 | | | | | | 0.0 | | |
| 70,000 (2)(3) | | | MPH Acquisition Holdings LLC, 5.750%, 11/01/2028 | | | | | 66,676 | | | | | | 0.0 | | |
| 40,000 (2) | | | NESCO Holdings II, Inc., 5.500%, 04/15/2029 | | | | | 41,371 | | | | | | 0.0 | | |
| 70,000 (2) | | | Nielsen Finance LLC / Nielsen Finance Co., 4.750%, 07/15/2031 | | | | | 69,231 | | | | | | 0.0 | | |
| 15,000 (2)(3) | | | PECF USS Intermediate Holding III Corp., 8.000%, 11/15/2029 | | | | | 15,556 | | | | | | 0.0 | | |
| 70,000 (2) | | | Pilgrim’s Pride Corp., 3.500%, 03/01/2032 | | | | | 70,816 | | | | | | 0.0 | | |
| 70,000 (2) | | | Post Holdings, Inc., 4.625%, 04/15/2030 | | | | | 71,422 | | | | | | 0.0 | | |
| 70,000 (2) | | | Primo Water Holdings, Inc., 4.375%, 04/30/2029 | | | | | 69,415 | | | | | | 0.0 | | |
| 70,000 (2) | | | Select Medical Corp., 6.250%, 08/15/2026 | | | | | 74,236 | | | | | | 0.1 | | |
| 70,000 (2) | | | Simmons Foods, Inc./ Simmons Prepared Foods, Inc./Simmons Pet Food, Inc./Simmons Feed, 4.625%, 03/01/2029 | | | | | 69,067 | | | | | | 0.0 | | |
| 70,000 | | | Spectrum Brands, Inc., 5.750%, 07/15/2025 | | | | | 71,559 | | | | | | 0.0 | | |
| 70,000 (2) | | | Tenet Healthcare Corp., 6.125%, 10/01/2028 | | | | | 74,078 | | | | | | 0.1 | | |
| 70,000 (2) | | | Triton Water Holdings, Inc., 6.250%, 04/01/2029 | | | | | 67,236 | | | | | | 0.0 | | |
| 45,000 (2) | | | United Natural Foods, Inc., 6.750%, 10/15/2028 | | | | | 48,252 | | | | | | 0.0 | | |
| 70,000 | | | United Rentals North America, Inc., 3.750%, 01/15/2032 | | | | | 70,591 | | | | | | 0.0 | | |
| 70,000 (2) | | | Vizient, Inc., 6.250%, 05/15/2027 | | | | | 73,133 | | | | | | 0.1 | | |
| | | | | | | | | 3,199,758 | | | | | | 1.0 | | |
| | | | Energy: 1.5% | | ||||||||||||
| 70,000 (2) | | | Aethon United BR L.P. / Aethon United Finance Corp., 8.250%, 02/15/2026 | | | | | 75,275 | | | | | | 0.0 | | |
| 70,000 (2) | | | Antero Midstream Partners L.P. / Antero Midstream Finance Corp., 5.750%, 03/01/2027 | | | | | 72,607 | | | | | | 0.0 | | |
| 70,000 | | | Apache Corp., 4.375%, 10/15/2028 | | | | | 76,260 | | | | | | 0.1 | | |
| Principal Amount† | | | Value | | | Percentage of Net Assets | | |||||||||
| CORPORATE BONDS/NOTES: (continued) | | |||||||||||||||
| | | | Energy (continued) | | ||||||||||||
| 70,000 (2) | | | Archrock Partners L.P. / Archrock Partners Finance Corp., 6.250%, 04/01/2028 | | | | $ | 73,090 | | | | | | 0.0 | | |
| 70,000 (2) | | | Baytex Energy Corp., 8.750%, 04/01/2027 | | | | | 73,395 | | | | | | 0.0 | | |
| 35,000 (2) | | | Blue Racer Midstream LLC / Blue Racer Finance Corp., 6.625%, 07/15/2026 | | | | | 36,155 | | | | | | 0.0 | | |
| 60,000 | | | Callon Petroleum Co., 6.125%, 10/01/2024 | | | | | 59,162 | | | | | | 0.0 | | |
| 70,000 (2) | | | CNX Resources Corp., 7.250%, 03/14/2027 | | | | | 74,321 | | | | | | 0.0 | | |
| 70,000 | | | Crestwood Midstream Partners L.P. / Crestwood Midstream Finance Corp., 5.750%, 04/01/2025 | | | | | 71,645 | | | | | | 0.0 | | |
| 70,000 | | | DCP Midstream Operating L.P., 5.625%, 07/15/2027 | | | | | 79,170 | | | | | | 0.1 | | |
| 46,000 | | | Devon Energy Corp., 5.250%, 10/15/2027 | | | | | 48,530 | | | | | | 0.0 | | |
| 70,000 (2) | | | DT Midstream, Inc., 4.125%, 06/15/2029 | | | | | 71,779 | | | | | | 0.0 | | |
| 350,000 | | | Empresa Nacional del Petroleo, 3.750%, 08/05/ 2026 | | | | | 359,557 | | | | | | 0.1 | | |
| 70,000 (2) | | | Encino Acquisition Partners Holdings LLC, 8.500%, 05/01/2028 | | | | | 72,812 | | | | | | 0.0 | | |
| 450,000 (9) | | | Energy Transfer L.P., 7.125%, 12/31/2199 | | | | | 457,875 | | | | | | 0.2 | | |
| 70,000 | | | EnLink Midstream LLC, 5.375%, 06/01/2029 | | | | | 71,693 | | | | | | 0.0 | | |
| 70,000 (2) | | | Enviva Partners L.P. / Enviva Partners Finance Corp., 6.500%, 01/15/2026 | | | | | 72,359 | | | | | | 0.0 | | |
| 35,000 (2) | | | EQM Midstream Partners L.P., 6.000%, 07/01/2025 | | | | | 38,102 | | | | | | 0.0 | | |
| 70,000 (2) | | | Hess Midstream Operations L.P., 4.250%, 02/15/2030 | | | | | 69,594 | | | | | | 0.0 | | |
| 70,000 (2) | | | Hilcorp Energy I L.P. / Hilcorp Finance Co., 5.750%, 02/01/2029 | | | | | 72,249 | | | | | | 0.0 | | |
| 70,000 (2) | | | Howard Midstream Energy Partners LLC, 6.750%, 01/15/2027 | | | | | 71,815 | | | | | | 0.0 | | |
| 70,000 (2) | | | Independence Energy Finance LLC, 7.250%, 05/01/2026 | | | | | 72,806 | | | | | | 0.0 | | |
| 350,000 | | | KazMunayGas National Co. JSC, 5.375%, 04/24/2030 | | | | | 408,844 | | | | | | 0.1 | | |
| 200,000 (2) | | | Lukoil Capital DAC, 3.600%, 10/26/2031 | | | | | 195,187 | | | | | | 0.1 | | |
| 70,000 | | | Murphy Oil Corp., 6.375%, 07/15/2028 | | | | | 74,505 | | | | | | 0.0 | | |
| 60,000 (2) | | | Nabors Industries, Inc., 7.375%, 05/15/2027 | | | | | 62,171 | | | | | | 0.0 | | |
| Voya Balanced Income Portfolio | as of December 31, 2021 (continued) |
| Principal Amount† | | | Value | | | Percentage of Net Assets | | |||||||||
| CORPORATE BONDS/NOTES: (continued) | | |||||||||||||||
| | | | Energy (continued) | | ||||||||||||
| 70,000 (2) | | | Oasis Petroleum, Inc., 6.375%, 06/01/2026 | | | | $ | 73,603 | | | | | | 0.0 | | |
| 70,000 | | | Occidental Petroleum Corp., 6.625%, 09/01/2030 | | | | | 86,743 | | | | | | 0.1 | | |
| 225,000 | | | Petroleos del Peru SA, 4.750%, 06/19/2032 | | | | | 235,166 | | | | | | 0.1 | | |
| 425,000 | | | Petroleos Mexicanos, 5.950%, 01/28/2031 | | | | | 413,822 | | | | | | 0.2 | | |
| 135,500 (2) | | | Petroleos Mexicanos, 6.700%, 02/16/2032 | | | | | 137,123 | | | | | | 0.1 | | |
| 200,000 (2) | | | Qatar Energy, 3.125%, 07/12/2041 | | | | | 202,652 | | | | | | 0.1 | | |
| 70,000 (2) | | | Rockcliff Energy II LLC, 5.500%, 10/15/2029 | | | | | 72,217 | | | | | | 0.0 | | |
| 70,000 | | | Southwestern Energy Co., 5.375%, 02/01/2029 | | | | | 74,124 | | | | | | 0.0 | | |
| 70,000 (2) | | | Strathcona Resources Ltd., 6.875%, 08/01/2026 | | | | | 68,877 | | | | | | 0.0 | | |
| 70,000 (2) | | | SunCoke Energy, Inc., 4.875%, 06/30/2029 | | | | | 69,755 | | | | | | 0.0 | | |
| 70,000 | | | Sunoco L.P. / Sunoco Finance Corp., 4.500%, 05/15/2029 | | | | | 71,205 | | | | | | 0.0 | | |
| 70,000 (2) | | | Tallgrass Energy Partners L.P. / Tallgrass Energy Finance Corp., 5.500%, 01/15/2028 | | | | | 69,487 | | | | | | 0.0 | | |
| 70,000 | | | Targa Resources Partners L.P. / Targa Resources Partners Finance Corp., 4.875%, 02/01/2031 | | | | | 76,138 | | | | | | 0.0 | | |
| 100,000 (2) | | | Venture Global Calcasieu Pass LLC, 4.125%, 08/15/2031 | | | | | 106,173 | | | | | | 0.1 | | |
| 70,000 (2) | | | Vine Energy Holdings LLC, 6.750%, 04/15/2029 | | | | | 76,073 | | | | | | 0.0 | | |
| 70,000 (2) | | | Viper Energy Partners L.P., 5.375%, 11/01/2027 | | | | | 72,388 | | | | | | 0.0 | | |
| 70,000 (2) | | | Weatherford International Ltd., 8.625%, 04/30/2030 | | | | | 72,786 | | | | | | 0.0 | | |
| 70,000 | | | Western Midstream Operating L.P., 5.450%, 04/01/2044 | | | | | 83,749 | | | | | | 0.1 | | |
| | | | | | | | | 4,973,039 | | | | | | 1.5 | | |
| | | | Financial: 0.6% | | ||||||||||||
| 70,000 | | | Ally Financial, Inc., 5.750%, 11/20/2025 | | | | | 79,020 | | | | | | 0.1 | | |
| 70,000 (2) | | | AmWINS Group, Inc., 4.875%, 06/30/2029 | | | | | 70,820 | | | | | | 0.0 | | |
| 70,000 (2) | | | Aretec Escrow Issuer, Inc., 7.500%, 04/01/2029 | | | | | 71,908 | | | | | | 0.0 | | |
| 200,000 | | | Bancolombia SA, 3.000%, 01/29/2025 | | | | | 201,012 | | | | | | 0.1 | | |
| 70,000 (2) | | | BroadStreet Partners, Inc., 5.875%, 04/15/2029 | | | | | 68,873 | | | | | | 0.0 | | |
| 200,000 (2) | | | Credit Bank of Moscow Via CBOM Finance PLC, 3.875%, 09/21/2026 | | | | | 189,450 | | | | | | 0.1 | | |
| Principal Amount† | | | Value | | | Percentage of Net Assets | | |||||||||
| CORPORATE BONDS/NOTES: (continued) | | |||||||||||||||
| | | | Financial (continued) | | ||||||||||||
| 70,000 (2) | | | Cushman & Wakefield US Borrower LLC, 6.750%, 05/15/2028 | | | | $ | 75,000 | | | | | | 0.1 | | |
| 30,000 (2) | | | Freedom Mortgage Corp., 6.625%, 01/15/2027 | | | | | 29,356 | | | | | | 0.0 | | |
| 40,000 (2) | | | Freedom Mortgage Corp., 8.250%, 04/15/2025 | | | | | 40,992 | | | | | | 0.0 | | |
| 70,000 (2) | | | Iron Mountain, Inc., 5.250%, 07/15/2030 | | | | | 73,893 | | | | | | 0.0 | | |
| 200,000 (2)(9) | | | Kookmin Bank, 4.350%, 12/31/2199 | | | | | 208,704 | | | | | | 0.1 | | |
| 70,000 (2) | | | Ladder Capital Finance Holdings LLLP / Ladder Capital Finance Corp., 4.750%, 06/15/2029 | | | | | 71,869 | | | | | | 0.0 | | |
| 70,000 (2) | | | LPL Holdings, Inc., 4.625%, 11/15/2027 | | | | | 72,551 | | | | | | 0.0 | | |
| 70,000 (2) | | | MGM Growth Properties Operating Partnership L.P. / MGP Finance Co-Issuer, Inc., 3.875%, 02/15/2029 | | | | | 73,600 | | | | | | 0.0 | | |
| 35,000 (2) | | | Midcap Financial Issuer Trust, 6.500%, 05/01/2028 | | | | | 36,547 | | | | | | 0.0 | | |
| 70,000 | | | MPT Operating Partnership L.P. / MPT Finance Corp., 3.500%, 03/15/2031 | | | | | 70,895 | | | | | | 0.0 | | |
| 70,000 | | | Navient Corp., 4.875%, 03/15/2028 | | | | | 69,930 | | | | | | 0.0 | | |
| 70,000 | | | OneMain Finance Corp., 6.625%, 01/15/2028 | | | | | 78,500 | | | | | | 0.1 | | |
| 70,000 (2) | | | Realogy Group LLC / Realogy Co-Issuer Corp., 5.750%, 01/15/2029 | | | | | 71,857 | | | | | | 0.0 | | |
| 70,000 | | | SBA Communications Corp., 3.875%, 02/15/2027 | | | | | 72,193 | | | | | | 0.0 | | |
| 70,000 (2) | | | United Wholesale Mortgage LLC, 5.750%, 06/15/2027 | | | | | 70,245 | | | | | | 0.0 | | |
| 70,000 (2) | | | Uniti Group L.P. / Uniti Fiber Holdings, Inc. / CSL Capital LLC, 6.000%, 01/15/2030 | | | | | 67,463 | | | | | | 0.0 | | |
| 70,000 (2) | | | XHR L.P., 4.875%, 06/01/2029 | | | | | 71,345 | | | | | | 0.0 | | |
| | | | | | | | | 1,936,023 | | | | | | 0.6 | | |
| | | | Industrial: 0.6% | | ||||||||||||
| 70,000 (2) | | | Brundage-Bone Concrete Pumping Holdings, Inc., 6.000%, 02/01/2026 | | | | | 72,877 | | | | | | 0.0 | | |
| 70,000 (2) | | | Builders FirstSource, Inc., 5.000%, 03/01/2030 | | | | | 75,202 | | | | | | 0.1 | | |
| 70,000��(2) | | | Cargo Aircraft Management, Inc., 4.750%, 02/01/2028 | | | | | 71,357 | | | | | | 0.0 | | |
| 70,000 (2) | | | Cascades, Inc./Cascades USA, Inc., 5.375%, 01/15/2028 | | | | | 71,933 | | | | | | 0.0 | | |
| Voya Balanced Income Portfolio | as of December 31, 2021 (continued) |
| Principal Amount† | | | Value | | | Percentage of Net Assets | | |||||||||
| CORPORATE BONDS/NOTES: (continued) | | |||||||||||||||
| | | | Industrial (continued) | | ||||||||||||
| 55,000 (2) | | | Clark Equipment Co., 5.875%, 06/01/2025 | | | | $ | 57,293 | | | | | | 0.0 | | |
| 70,000 (2) | | | Clean Harbors, Inc., 5.125%, 07/15/2029 | | | | | 74,377 | | | | | | 0.0 | | |
| 70,000 (2) | | | Fortress Transportation and Infrastructure Investors LLC, 5.500%, 05/01/2028 | | | | | 71,475 | | | | | | 0.0 | | |
| 70,000 (2) | | | GFL Environmental, Inc., 4.000%, 08/01/2028 | | | | | 68,719 | | | | | | 0.0 | | |
| 70,000 (2) | | | Global Infrastructure Solutions, Inc., 5.625%, 06/01/2029 | | | | | 71,853 | | | | | | 0.0 | | |
| 70,000 (2) | | | GrafTech Finance, Inc., 4.625%, 12/15/2028 | | | | | 71,175 | | | | | | 0.0 | | |
| 70,000 (2) | | | Graham Packaging Co., Inc., 7.125%, 08/15/2028 | | | | | 72,555 | | | | | | 0.0 | | |
| 70,000 (2) | | | Granite US Holdings Corp., 11.000%, 10/01/2027 | | | | | 76,195 | | | | | | 0.1 | | |
| 70,000 (2) | | | II-VI, Inc., 5.000%, 12/15/2029 | | | | | 71,631 | | | | | | 0.0 | | |
| 70,000 (2) | | | Imola Merger Corp., 4.750%, 05/15/2029 | | | | | 71,950 | | | | | | 0.0 | | |
| 70,000 (2) | | | Intelligent Packaging Ltd. Finco, Inc. / Intelligent Packaging Ltd. Co-Issuer LLC, 6.000%, 09/15/2028 | | | | | 72,100 | | | | | | 0.0 | | |
| 200,000 (2) | | | Klabin Austria GmbH, 5.750%, 04/03/2029 | | | | | 218,042 | | | | | | 0.1 | | |
| 70,000 (2) | | | Koppers, Inc., 6.000%, 02/15/2025 | | | | | 71,297 | | | | | | 0.0 | | |
| 42,000 (2) | | | Maxar Space Robotics LLC, 9.750%, 12/31/2023 | | | | | 45,298 | | | | | | 0.0 | | |
| 70,000 (2) | | | New Enterprise Stone & Lime Co., Inc., 9.750%, 07/15/2028 | | | | | 74,999 | | | | | | 0.1 | | |
| 70,000 (2) | | | PGT Innovations, Inc., 4.375%, 10/01/2029 | | | | | 70,470 | | | | | | 0.0 | | |
| 70,000 (2) | | | Roller Bearing Co. of America, Inc., 4.375%, 10/15/2029 | | | | | 71,487 | | | | | | 0.0 | | |
| 45,000 (2) | | | Sensata Technologies, Inc., 3.750%, 02/15/2031 | | | | | 44,905 | | | | | | 0.0 | | |
| 70,000 | | | Silgan Holdings, Inc., 4.125%, 02/01/2028 | | | | | 71,597 | | | | | | 0.0 | | |
| 70,000 (2) | | | Standard Industries, Inc./NJ, 3.375%, 01/15/2031 | | | | | 67,550 | | | | | | 0.0 | | |
| 70,000 (2) | | | Stevens Holding Co., Inc., 6.125%, 10/01/2026 | | | | | 74,707 | | | | | | 0.1 | | |
| 70,000 | | | TransDigm, Inc., 5.500%, 11/15/2027 | | | | | 72,224 | | | | | | 0.0 | | |
| 80,000 (2) | | | Vertiv Group Corp., 4.125%, 11/15/2028 | | | | | 80,937 | | | | | | 0.1 | | |
| 70,000 (2) | | | Weekley Homes LLC / Weekley Finance Corp., 4.875%, 09/15/2028 | | | | | 72,206 | | | | | | 0.0 | | |
| | | | | | | | | 2,106,411 | | | | | | 0.6 | | |
| Principal Amount† | | | Value | | | Percentage of Net Assets | | |||||||||
| CORPORATE BONDS/NOTES: (continued) | | |||||||||||||||
| | | | Technology: 0.2% | | ||||||||||||
| 70,000 (2) | | | Austin BidCo, Inc., 7.125%, 12/15/2028 | | | | $ | 72,374 | | | | | | 0.0 | | |
| 70,000 (2) | | | Booz Allen Hamilton, Inc., 3.875%, 09/01/2028 | | | | | 71,326 | | | | | | 0.0 | | |
| 70,000 (2) | | | Castle US Holding Corp., 9.500%, 02/15/2028 | | | | | 73,074 | | | | | | 0.1 | | |
| 70,000 | | | CDW LLC / CDW Finance Corp., 3.250%, 02/15/2029 | | | | | 70,726 | | | | | | 0.0 | | |
| 70,000 (2) | | | Consensus Cloud Solutions, Inc., 6.500%, 10/15/2028 | | | | | 73,249 | | | | | | 0.1 | | |
| 55,000 (2) | | | NCR Corp., 5.125%, 04/15/2029 | | | | | 57,036 | | | | | | 0.0 | | |
| 70,000 (2) | | | Open Text Corp., 3.875%, 02/15/2028 | | | | | 71,455 | | | | | | 0.0 | | |
| 70,000 (2) | | | Playtika Holding Corp., 4.250%, 03/15/2029 | | | | | 68,706 | | | | | | 0.0 | | |
| 15,000 (2) | | | Rackspace Technology Global, Inc., 5.375%, 12/01/2028 | | | | | 14,647 | | | | | | 0.0 | | |
| 70,000 (2) | | | ROBLOX Corp., 3.875%, 05/01/2030 | | | | | 71,121 | | | | | | 0.0 | | |
| 70,000 (2) | | | Rocket Software, Inc., 6.500%, 02/15/2029 | | | | | 68,390 | | | | | | 0.0 | | |
| 70,000 (2) | | | Veritas US, Inc. / Veritas Bermuda Ltd., 7.500%, 09/01/2025 | | | | | 72,541 | | | | | | 0.0 | | |
| | | | | | | | | 784,645 | | | | | | 0.2 | | |
| | | | Utilities: 0.8% | | ||||||||||||
| 70,000 (2) | | | Clearway Energy Operating LLC, 4.750%, 03/15/2028 | | | | | 73,690 | | | | | | 0.0 | | |
| 200,000 (2) | | | Colbun SA, 3.150%, 03/06/2030 | | | | | 200,325 | | | | | | 0.1 | | |
| 475,000 (9) | | | Dominion Energy, Inc., 4.650%, 12/31/2199 | | | | | 496,375 | | | | | | 0.1 | | |
| 380,000 (9) | | | Duke Energy Corp., 4.875%, 12/31/2199 | | | | | 395,200 | | | | | | 0.1 | | |
| 200,000 | | | Inkia Energy Ltd., 5.875%, 11/09/2027 | | | | | 205,283 | | | | | | 0.1 | | |
| 275,000 (9) | | | NextEra Energy Capital Holdings, Inc., 5.650%, 05/01/2079 | | | | | 311,857 | | | | | | 0.1 | | |
| 400,000 | | | Perusahaan Listrik Negara PT, 5.450%, 05/21/2028 | | | | | 458,872 | | | | | | 0.1 | | |
| 286,000 | | | South Jersey Industries, Inc., 5.020%, 04/15/2031 | | | | | 310,401 | | | | | | 0.1 | | |
| 275,000 (9) | | | Southern Co/The, 4.000%, 01/15/2051 | | | | | 281,875 | | | | | | 0.1 | | |
| 70,000 (2) | | | Vistra Operations Co. LLC, 5.625%, 02/15/2027 | | | | | 72,189 | | | | | | 0.0 | | |
| | | | | | | | | 2,806,067 | | | | | | 0.8 | | |
| | | | Total Corporate Bonds/ Notes (Cost $24,514,203) | | | | | 25,224,288 | | | | | | 7.6 | | |
| | ||||||||||||||||
| Voya Balanced Income Portfolio | as of December 31, 2021 (continued) |
| Principal Amount† | | | Value | | | Percentage of Net Assets | | |||||||||
| COLLATERALIZED MORTGAGE OBLIGATIONS: 12.0% | | |||||||||||||||
| 780,872 (2)(9) | | | Agate Bay Mortgage Trust 2015-1 B4, 3.563%, 01/25/2045 | | | | $ | 783,580 | | | | | | 0.2 | | |
| 317,384 (2)(9) | | | Chase Mortgage Finance Corp. 2016-SH1 M2, 3.750%, 04/25/2045 | | | | | 320,413 | | | | | | 0.1 | | |
| 295,548 (2)(9) | | | CIM Trust 2019-INV2 A3, 4.000%, 05/25/2049 | | | | | 300,304 | | | | | | 0.1 | | |
| 461,144 (2)(9) | | | CIM Trust 2019-J1 B2, 3.983%, 08/25/2049 | | | | | 467,692 | | | | | | 0.1 | | |
| 161,483 (2)(9) | | | CIM Trust 2019-J2 A13, 3.500%, 10/25/2049 | | | | | 163,322 | | | | | | 0.0 | | |
| 735,592 (2) | | | Connecticut Avenue Securities Trust 2020-R02 2M2, 2.103%, (US0001M + 2.000%), 01/25/2040 | | | | | 738,045 | | | | | | 0.2 | | |
| 1,135,877 | | | Fannie Mae Connecticut Avenue Securities 2016-C05 2M2, 4.553%, (US0001M + 4.450%), 01/25/2029 | | | | | 1,177,585 | | | | | | 0.4 | | |
| 322,018 | | | Fannie Mae Connecticut Avenue Securities 2017-CO6 2M2, 2.903%, (US0001M + 2.800%), 02/25/2030 | | | | | 329,221 | | | | | | 0.1 | | |
| 655,735 | | | Fannie Mae Connecticut Avenue Securities 2018-C06 1M2, 2.103%, (US0001M + 2.000%), 03/25/2031 | | | | | 661,409 | | | | | | 0.2 | | |
| 211,281 | | | Fannie Mae Connecticut Avenue Securities 2018-CO1 1M2, 2.353%, (US0001M + 2.250%), 07/25/2030 | | | | | 213,878 | | | | | | 0.1 | | |
| 191,038 (2) | | | Fannie Mae Connecticut Avenue Securities 2019-R02 1M2, 2.403%, (US0001M + 2.300%), 08/25/2031 | | | | | 191,912 | | | | | | 0.1 | | |
| 78,729 (2) | | | Fannie Mae Connecticut Avenue Securities 2019-R04 2M2, 2.202%, (US0001M + 2.100%), 06/25/2039 | | | | | 78,796 | | | | | | 0.0 | | |
| 180,250 (2) | | | Fannie Mae Connecticut Avenue Securities Trust 2018-R07 1M2, 2.502%, (US0001M + 2.400%), 04/25/2031 | | | | | 181,086 | | | | | | 0.1 | | |
| 4,058,800 (10) | | | Fannie Mae Interest Strip Series 367 2, 5.500%, 01/25/2036 | | | | | 839,193 | | | | | | 0.3 | | |
| 1,005,612 (10) | | | Fannie Mae REMICS 2005-66 LS, 6.528%, (-1.000*US0001M + 6.630%), 07/25/2035 | | | | | 177,350 | | | | | | 0.1 | | |
| 1,549,400 (10) | | | Fannie Mae REMICS 2008-36 YI, 7.098%, (-1.000*US0001M + 7.200%), 07/25/2036 | | | | | 220,027 | | | | | | 0.1 | | |
| Principal Amount† | | | Value | | | Percentage of Net Assets | | |||||||||
| COLLATERALIZED MORTGAGE OBLIGATIONS: (continued) | | |||||||||||||||
| 634,101 (10) | | | Fannie Mae REMICS 2010-59 NS, 5.668%, (-1.000*US0001M + 5.770%), 06/25/2040 | | | | $ | 108,072 | | | | | | 0.0 | | |
| 3,160,952 (10) | | | Fannie Mae REMICS 2012-121 ID, 3.000%, 11/25/2027 | | | | | 191,000 | | | | | | 0.1 | | |
| 3,607,956 (10) | | | Fannie Mae REMICS 2012-144 SC, 5.998%, (-1.000*US0001M + 6.100%), 01/25/2043 | | | | | 736,703 | | | | | | 0.2 | | |
| 1,699,700 (10) | | | Fannie Mae REMICS 2012-151 WS, 6.098%, (-1.000*US0001M + 6.200%), 03/25/2042 | | | | | 232,711 | | | | | | 0.1 | | |
| 3,827,213 (10) | | | Fannie Mae REMICS 2012-35 LS, 6.498%, (-1.000*US0001M + 6.600%), 04/25/2041 | | | | | 445,544 | | | | | | 0.1 | | |
| 2,807,837 (10) | | | Fannie Mae REMICS 2013-20 SK, 6.098%, (-1.000*US0001M + 6.200%), 05/25/2041 | | | | | 260,602 | | | | | | 0.1 | | |
| 3,580,054 (10) | | | Fannie Mae REMICS 2013-71 AI, 3.000%, 07/25/2028 | | | | | 236,145 | | | | | | 0.1 | | |
| 7,425,865 (10) | | | Fannie Mae REMICS 2014-38 S, 5.998%, (-1.000*US0001M + 6.100%), 07/25/2044 | | | | | 1,444,223 | | | | | | 0.4 | | |
| 1,070,441 (10) | | | Fannie Mae REMICS 2015-65 KI, 6.898%, (-1.000*US0001M + 7.000%), 08/25/2035 | | | | | 192,388 | | | | | | 0.1 | | |
| 8,676,215 (10) | | | Fannie Mae REMICS 2016-29 SB, 5.948%, (-1.000*US0001M + 6.050%), 05/25/2046 | | | | | 1,678,105 | | | | | | 0.5 | | |
| 355,872 (10) | | | Fannie Mae REMICS 2018-86 DS, 5.998%, (-1.000*US0001M + 6.100%), 12/25/2048 | | | | | 43,157 | | | | | | 0.0 | | |
| 291,581 (2)(9) | | | Flagstar Mortgage Trust 2017-1 1A7, 3.500%, 03/25/2047 | | | | | 295,371 | | | | | | 0.1 | | |
| 864,858 (2)(9) | | | Flagstar Mortgage Trust 2017-1 B3, 3.663%, 03/25/2047 | | | | | 880,781 | | | | | | 0.3 | | |
| 548,332 (2)(9) | | | Flagstar Mortgage Trust 2018-3INV A3, 4.000%, 05/25/2048 | | | | | 557,493 | | | | | | 0.2 | | |
| 929,331 (2)(9) | | | Flagstar Mortgage Trust 2021-2 A4, 2.500%, 04/25/2051 | | | | | 921,813 | | | | | | 0.3 | | |
| 589,018 (2)(9) | | | Flagstar Mortgage Trust 2021-2 B3, 2.800%, 04/25/2051 | | | | | 573,145 | | | | | | 0.2 | | |
| 5,092,205 (10) | | | Freddie Mac REMICS 4143 MS, 6.590%, (-1.000*US0001M + 6.700%), 12/15/2042 | | | | | 1,018,057 | | | | | | 0.3 | | |
| Voya Balanced Income Portfolio | as of December 31, 2021 (continued) |
| Principal Amount† | | | Value | | | Percentage of Net Assets | | |||||||||
| COLLATERALIZED MORTGAGE OBLIGATIONS: (continued) | | |||||||||||||||
| 428,839 (2) | | | Freddie Mac STACR REMIC Trust 2020-HQA1 M2, 2.003%, (US0001M + 1.900%), 01/25/2050 | | | | $ | 429,837 | | | | | | 0.1 | | |
| 500,000 (2) | | | Freddie Mac STACR REMIC Trust 2021-HQA1 M2, 2.300%, (SOFR30A + 2.250%), 08/25/2033 | | | | | 503,895 | | | | | | 0.2 | | |
| 600,000 (2) | | | Freddie Mac STACR REMIC Trust 2021-HQA4 B1, 3.800%, (SOFR30A + 3.750%), 12/25/2041 | | | | | 604,714 | | | | | | 0.2 | | |
| 1,000,000 (2) | | | Freddie Mac STACR REMIC Trust 2021-HQA4 M2, 2.400%, (SOFR30A + 2.350%), 12/25/2041 | | | | | 1,004,089 | | | | | | 0.3 | | |
| 165,460 | | | Freddie Mac Structured Agency Credit Risk Debt Notes 2015-DNA2 M3, 4.003%, (US0001M + 3.900%), 12/25/2027 | | | | | 166,339 | | | | | | 0.0 | | |
| 1,152,702 (2) | | | Freddie Mac Structured Agency Credit Risk Debt Notes 2019-DNA1 M2, 2.753%, (US0001M + 2.650%), 01/25/2049 | | | | | 1,167,722 | | | | | | 0.3 | | |
| 837,933 (2) | | | Freddie Mac Structured Agency Credit Risk Debt Notes 2019-HQA2 M2, 2.153%, (US0001M + 2.050%), 04/25/2049 | | | | | 842,150 | | | | | | 0.3 | | |
| 511,321 (10) | | | Freddie Mac REMICS 3318 KS, 6.300%, (-1.000*US0001M + 6.410%), 05/15/2037 | | | | | 62,749 | | | | | | 0.0 | | |
| 832,145 (10) | | | Freddie Mac REMICS 3879 SL, 6.490%, (-1.000*US0001M + 6.600%), 01/15/2041 | | | | | 104,292 | | | | | | 0.0 | | |
| 3,131,189 (10) | | | Freddie Mac REMICS 4120 JS, 6.090%, (-1.000*US0001M + 6.200%), 10/15/2032 | | | | | 558,584 | | | | | | 0.2 | | |
| 1,962,671 (10) | | | Freddie Mac REMICS 4141 EI, 3.000%, 09/15/2027 | | | | | 85,293 | | | | | | 0.0 | | |
| 2,648,268 (10) | | | Freddie Mac REMICS 4153 IB, 2.500%, 01/15/2028 | | | | | 127,038 | | | | | | 0.0 | | |
| 1,765,508 (10) | | | Freddie Mac REMICS 4517 KI, 1.032%, (-0.357*US0001M + 1.071%), 04/15/2043 | | | | | 30,549 | | | | | | 0.0 | | |
| 3,081,672 (10) | | | Freddie Mac REMICS 4596 DI, 3.500%, 06/15/2046 | | | | | 405,613 | | | | | | 0.1 | | |
| 1,717,574 (10) | | | Freddie Mac REMICS 4619 KS, 4.151%, (-1.000*US0001M + 4.250%), 06/15/2039 | | | | | 290,711 | | | | | | 0.1 | | |
| 1,009,047 (10) | | | Ginnie Mae Series 2013-148 DS, 5.573%, (-1.000*US0001M + 5.680%), 10/16/2043 | | | | | 185,248 | | | | | | 0.1 | | |
| Principal Amount† | | | Value | | | Percentage of Net Assets | | |||||||||
| COLLATERALIZED MORTGAGE OBLIGATIONS: (continued) | | |||||||||||||||
| 6,522,616 (10) | | | Ginnie Mae Series 2015-20 CI, 3.500%, 02/20/2030 | | | | $ | 651,806 | | | | | | 0.2 | | |
| 537,837 (10) | | | Ginnie Mae Series 2015-42 IY, 5.500%, 08/20/2039 | | | | | 46,104 | | | | | | 0.0 | | |
| 6,166,448 (10) | | | Ginnie Mae Series 2019-23 MT, 0.600%, (-1.000*US0001M + 6.700%), 03/20/2042 | | | | | 110,794 | | | | | | 0.0 | | |
| 82,338 (2)(9) | | | GS Mortgage-Backed Securities Corp. Trust 2019-PJ2 A1, 4.000%, 11/25/2049 | | | | | 82,503 | | | | | | 0.0 | | |
| 396,075 (2)(9) | | | GS Mortgage-Backed Securities Trust 2020-NQM1 A2, 1.791%, 09/27/2060 | | | | | 394,105 | | | | | | 0.1 | | |
| 500,000 (2) | | | Home RE 2019-1 M2 Ltd., 3.352%, (US0001M + 3.250%), 05/25/2029 | | | | | 503,335 | | | | | | 0.2 | | |
| 938,903 (2)(9) | | | Hundred Acre Wood Trust 2021-INV1 A27, 2.500%, 07/25/2051 | | | | | 935,111 | | | | | | 0.3 | | |
| 79,977 (2)(9) | | | J.P. Morgan Mortgage Trust 2019-2 A15, 4.000%, 08/25/2049 | | | | | 80,393 | | | | | | 0.0 | | |
| 528,026 (2)(9) | | | JP Morgan Mortgage Trust 2016-4 A13, 3.500%, 10/25/2046 | | | | | 532,940 | | | | | | 0.2 | | |
| 856,265 (2)(9) | | | JP Morgan Mortgage Trust 2017-5 B2, 3.063%, 10/26/2048 | | | | | 879,688 | | | | | | 0.3 | | |
| 1,101,173 (2)(9) | | | JP Morgan Mortgage Trust 2018-3 B2, 3.739%, 09/25/2048 | | | | | 1,123,164 | | | | | | 0.3 | | |
| 714,851 (2)(9) | | | JP Morgan Mortgage Trust 2018-4 B2, 3.738%, 10/25/2048 | | | | | 725,519 | | | | | | 0.2 | | |
| 930,781 (2)(9) | | | JP Morgan Mortgage Trust 2018-5 A13, 3.500%, 10/25/2048 | | | | | 939,831 | | | | | | 0.3 | | |
| 231,978 (2)(9) | | | JP Morgan Mortgage Trust 2018-8 A13, 4.000%, 01/25/2049 | | | | | 233,585 | | | | | | 0.1 | | |
| 100,556 (2)(9) | | | JP Morgan Mortgage Trust 2019-1 A3, 4.000%, 05/25/2049 | | | | | 101,101 | | | | | | 0.0 | | |
| 98,496 (2)(9) | | | JP Morgan Mortgage Trust 2019-5 A3, 4.000%, 11/25/2049 | | | | | 99,387 | | | | | | 0.0 | | |
| 29,366 (2)(9) | | | JP Morgan Mortgage Trust 2019-8 A15, 3.500%, 03/25/2050 | | | | | 29,747 | | | | | | 0.0 | | |
| 954,240 (2)(9) | | | JP Morgan Mortgage Trust 2019-INV1 B2, 5.032%, 10/25/2049 | | | | | 1,001,920 | | | | | | 0.3 | | |
| 46,381 (2)(9) | | | JP Morgan Mortgage Trust 2019-LTV1 A3, 4.000%, 06/25/2049 | | | | | 46,437 | | | | | | 0.0 | | |
| 100,970 (2)(9) | | | JP Morgan Mortgage Trust 2019-LTV2 A18, 4.000%, 12/25/2049 | | | | | 101,435 | | | | | | 0.0 | | |
| Voya Balanced Income Portfolio | as of December 31, 2021 (continued) |
| Principal Amount† | | | Value | | | Percentage of Net Assets | | |||||||||
| COLLATERALIZED MORTGAGE OBLIGATIONS: (continued) | | |||||||||||||||
| 573,445 (2)(9) | | | JP Morgan Mortgage Trust 2019-LTV2 B3, 4.752%, 12/25/2049 | | | | $ | 579,668 | | | | | | 0.2 | | |
| 232,233 (2)(9) | | | JP Morgan Mortgage Trust 2020-3 A15, 3.500%, 08/25/2050 | | | | | 234,163 | | | | | | 0.1 | | |
| 1,000,000 (2)(9) | | | JP Morgan Mortgage Trust 2021-3 A5, 2.500%, 07/01/2051 | | | | | 985,026 | | | | | | 0.3 | | |
| 464,035 (2)(9) | | | Mello Mortgage Capital Acceptance 2018-MTG2 B1, 4.384%, 10/25/2048 | | | | | 465,323 | | | | | | 0.1 | | |
| 182,728 (2)(9) | | | OBX 2019-INV2 A25 Trust, 4.000%, 05/27/2049 | | | | | 184,525 | | | | | | 0.1 | | |
| 400,000 (2)(9) | | | Provident Funding Mortgage Trust 2021-J1 A10, 2.000%, 10/25/2051 | | | | | 381,245 | | | | | | 0.1 | | |
| 500,000 (2)(9) | | | RATE Mortgage Trust 2021-HB1 A31, 2.500%, 12/25/2051 | | | | | 493,759 | | | | | | 0.1 | | |
| 778,845 (2)(9) | | | RCKT Mortgage Trust 2021-4 A21, 2.500%, 09/25/2051 | | | | | 769,982 | | | | | | 0.2 | | |
| 490,094 (2)(9) | | | RCKT Mortgage Trust 2021-1 B3, 2.726%, 03/25/2051 | | | | | 478,727 | | | | | | 0.1 | | |
| 1,121,836 (2)(9) | | | Sequoia Mortgage Trust 2019-2 B2, 4.259%, 06/25/2049 | | | | | 1,148,886 | | | | | | 0.3 | | |
| 1,123,488 (2)(9) | | | Sequoia Mortgage Trust 2019-2 B3, 4.259%, 06/25/2049 | | | | | 1,144,836 | | | | | | 0.3 | | |
| 113,488 (2)(9) | | | Sequoia Mortgage Trust 2019-4 A19, 3.500%, 11/25/2049 | | | | | 113,192 | | | | | | 0.0 | | |
| 86,035 (2)(9) | | | Sequoia Mortgage Trust 2019-CH2 A1, 4.500%, 08/25/2049 | | | | | 86,963 | | | | | | 0.0 | | |
| 689,977 (2)(9) | | | Sequoia Mortgage Trust 2021-3 B3, 2.655%, 05/25/2051 | | | | | 675,774 | | | | | | 0.2 | | |
| 551,889 (2)(9) | | | Wells Fargo Mortgage Backed Securities 2018-1 B3, 3.668%, 07/25/2047 | | | | | 555,944 | | | | | | 0.2 | | |
| | | | Total Collateralized Mortgage Obligations (Cost $40,583,198) | | | | | 40,144,864 | | | | | | 12.0 | | |
| U.S. TREASURY OBLIGATIONS: 2.6% | | |||||||||||||||
| | | | U.S. Treasury Bonds: 0.3% | | ||||||||||||
| 1,000 | | | 1.250%, 05/15/2050 | | | | | 850 | | | | | | 0.0 | | |
| 1,900 | | | 1.625%, 11/15/2050 | | | | | 1,771 | | | | | | 0.0 | | |
| 892,200 | | | 2.000%, 08/15/2051 | | | | | 909,765 | | | | | | 0.3 | | |
| 56,000 | | | 2.000%, 11/15/2041 | | | | | 56,656 | | | | | | 0.0 | | |
| | | | | | | | | 969,042 | | | | | | 0.3 | | |
| | | | U.S. Treasury Notes: 2.3% | | ||||||||||||
| 942,000 | | | 0.250%, 06/15/2024 | | | | | 928,238 | | | | | | 0.3 | | |
| 2,300 | | | 0.500%, 11/30/2023 | | | | | 2,291 | | | | | | 0.0 | | |
| 20,800 | | | 0.750%, 12/31/2023 | | | | | 20,806 | | | | | | 0.0 | | |
| 4,133,800 | | | 1.000%, 12/15/2024 | | | | | 4,138,806 | | | | | | 1.2 | | |
| Principal Amount† | | | Value | | | Percentage of Net Assets | | |||||||||
| U.S. TREASURY OBLIGATIONS: (continued) | | |||||||||||||||
| | | | U.S. Treasury Notes (continued) | | ||||||||||||
| 87,000 | | | 1.125%, 02/15/2031 | | | | $ | 84,454 | | | | | | 0.0 | | |
| 173,200 | | | 1.250%, 11/30/2026 | | | | | 173,119 | | | | | | 0.1 | | |
| 1,695,700 | | | 1.250%, 12/31/2026 | | | | | 1,694,110 | | | | | | 0.5 | | |
| 583,200 | | | 1.375%, 12/31/2028 | | | | | 580,740 | | | | | | 0.2 | | |
| 167,900 | | | 1.500%, 11/30/2028 | | | | | 168,608 | | | | | | 0.0 | | |
| | | | | | | | | 7,791,172 | | | | | | 2.3 | | |
| | | | Total U.S. Treasury Obligations (Cost $8,749,094) | | | | | 8,760,214 | | | | | | 2.6 | | |
| COMMERCIAL MORTGAGE-BACKED SECURITIES: 9.6% | | |||||||||||||||
| 650,000 (2) | | | BANK 2017-BNK4 D, 3.357%, 05/15/2050 | | | | | 611,042 | | | | | | 0.2 | | |
| 1,170,000 (2) | | | BANK 2017-BNK8 D, 2.600%, 11/15/2050 | | | | | 1,063,921 | | | | | | 0.3 | | |
| 1,000,000 (2)(9) | | | Benchmark 2018-B3 D Mortgage Trust, 3.037%, 04/10/2051 | | | | | 924,959 | | | | | | 0.3 | | |
| 12,345,607 (9)(10) | | | Benchmark 2019-B10 XA Mortgage Trust, 1.226%, 03/15/2062 | | | | | 853,701 | | | | | | 0.3 | | |
| 5,491,660 (9)(10) | | | Benchmark 2020-B17 XA Mortgage Trust, 1.418%, 03/15/2053 | | | | | 441,855 | | | | | | 0.1 | | |
| 180,000 (2) | | | Benchmark 2020-B18 AGNE Mortgage Trust, 3.759%, 07/15/2053 | | | | | 180,492 | | | | | | 0.1 | | |
| 3,244,100 (9)(10) | | | Benchmark 2020-B18 XA Mortgage Trust, 1.792%, 07/15/2053 | | | | | 335,255 | | | | | | 0.1 | | |
| 2,097,809 (9)(10) | | | Benchmark 2021-B24 XA Mortgage Trust, 1.155%, 03/15/2054 | | | | | 170,694 | | | | | | 0.1 | | |
| 204,000 (2)(11) | | | BMD2 Re-Remic Trust 2019-FRR1 3AB, 0.000%, 05/25/2052 | | | | | 157,133 | | | | | | 0.0 | | |
| 210,000 (2)(9) | | | BX Trust 2019-OC11 E, 4.076%, 12/09/2041 | | | | | 208,903 | | | | | | 0.1 | | |
| 16,144,052 (9)(10) | | | Citigroup Commercial Mortgage Trust 2019-C7 XA, 0.874%, 12/15/2072 | | | | | 928,964 | | | | | | 0.3 | | |
| 1,530,000 (9) | | | Commercial Mortgage Pass Through Certificates 2016-CR28 D, 3.888%, 02/10/2049 | | | | | 1,526,854 | | | | | | 0.5 | | |
| 130,000 (2)(9) | | | COMM 2013-CR10 E Mortgage Trust, 4.900%, 08/10/2046 | | | | | 126,656 | | | | | | 0.0 | | |
| 100,000 (2)(9) | | | Credit Suisse Mortgage Capital Certificates 2020-NET C, 3.526%, 08/15/2037 | | | | | 102,522 | | | | | | 0.0 | | |
| 2,000,000 (9) | | | CSAIL 2015-C2 C Commercial Mortgage Trust, 4.187%, 06/15/2057 | | | | | 1,916,145 | | | | | | 0.6 | | |
| 300,000 (2) | | | CSAIL 2020-C19 E Commercial Mortgage Trust, 2.500%, 03/15/2053 | | | | | 262,710 | | | | | | 0.1 | | |
| Voya Balanced Income Portfolio | as of December 31, 2021 (continued) |
| Principal Amount† | | | Value | | | Percentage of Net Assets | | |||||||||
| COMMERCIAL MORTGAGE-BACKED SECURITIES: (continued) | | |||||||||||||||
| 700,000 (2) | | | CSWF 2021-SOP2 D, 2.427%, (US0001M + 2.317%), 06/15/2034 | | | | $ | 698,253 | | | | | | 0.2 | | |
| 291,158 (2)(6) | | | DBUBS 2011-LC2A F Mortgage Trust, 3.749%, (US0001M + 3.650%), 07/10/2044 | | | | | 272,014 | | | | | | 0.1 | | |
| 1,000,000 (2)(9) | | | DBWF 2015-LCM D Mortgage Trust, 3.421%, 06/10/2034 | | | | | 907,697 | | | | | | 0.3 | | |
| 1,189,073 (9)(10) | | | Freddie Mac Multiclass Certificates Series 2021-P011 X1, 1.846%, 09/25/2045 | | | | | 185,840 | | | | | | 0.1 | | |
| 1,456,651 (9)(10) | | | Freddie Mac Multifamily Structured Pass Through Certificates K109 X1, 1.582%, 04/25/2030 | | | | | 163,163 | | | | | | 0.1 | | |
| 4,284,577 (9)(10) | | | Freddie Mac Multifamily Structured Pass Through Certificates K-1516 X1, 1.512%, 05/25/2035 | | | | | 673,268 | | | | | | 0.2 | | |
| 1,699,060 (9)(10) | | | Freddie Mac Multifamily Structured Pass Through Certificates K-1521 X1, 0.981%, 08/25/2036 | | | | | 183,713 | | | | | | 0.1 | | |
| 2,837,168 (2)(10) | | | FREMF 2016-K57 X2B Mortgage Trust, 0.100%, 08/25/2049 | | | | | 11,035 | | | | | | 0.0 | | |
| 1,119,480 (2)(11) | | | FREMF 2016-K57 D Mortgage Trust, 0.000%, 08/25/2049 | | | | | 859,084 | | | | | | 0.3 | | |
| 11,884,455 (2)(10) | | | FREMF 2016-K57 X2A Mortgage Trust, 0.100%, 08/25/2049 | | | | | 43,002 | | | | | | 0.0 | | |
| 525,000 (2)(11) | | | FREMF 2016-K60 D Mortgage Trust, 0.000%, 12/25/2049 | | | | | 390,971 | | | | | | 0.1 | | |
| 200,000 (2)(11) | | | FREMF 2019-KG01 C Mortgage Trust, 0.000%, 05/25/2029 | | | | | 124,545 | | | | | | 0.0 | | |
| 2,546,604 (2)(10) | | | FREMF 2019-KG01 X2A Mortgage Trust, 0.100%, 04/25/2029 | | | | | 10,869 | | | | | | 0.0 | | |
| 280,000 (2)(10) | | | FREMF 2019-KG01 X2B Mortgage Trust, 0.100%, 05/25/2029 | | | | | 1,473 | | | | | | 0.0 | | |
| 1,757,440 (2)(6) | | | GAM 2021-WF1 A LLC, 5.250%, 12/30/2026 | | | | | 1,757,440 | | | | | | 0.5 | | |
| 147,000 (2) | | | GAM RE-REMIC TR 2021-FFR2 BK44, 2.071%, 10/27/2028 | | | | | 141,434 | | | | | | 0.0 | | |
| 166,000 (2) | | | GAM RE-REMIC TR 2021-FFR2 BK78, 2.435%, 10/27/2028 | | | | | 151,511 | | | | | | 0.0 | | |
| 126,000 (2)(11) | | | GAM RE-REMIC TR 2021-FFR2 C730, 0.000%, 10/27/2028 | | | | | 113,229 | | | | | | 0.0 | | |
| 153,000 (2)(11) | | | GAM RE-REMIC TR 2021-FFR2 CK44, 0.000%, 10/27/2028 | | | | | 134,407 | | | | | | 0.0 | | |
| Principal Amount† | | | Value | | | Percentage of Net Assets | | |||||||||
| COMMERCIAL MORTGAGE-BACKED SECURITIES: (continued) | | |||||||||||||||
| 125,000 (2) | | | GAM RE-REMIC TR 2021-FFR2 CK49, 1.079%, 10/27/2028 | | | | $ | 115,308 | | | | | | 0.0 | | |
| 106,000 (2)(11) | | | GAM RE-REMIC TR 2021-FFR2 CK78, 0.000%, 10/27/2028 | | | | | 76,803 | | | | | | 0.0 | | |
| 126,000 (2)(11) | | | GAM RE-REMIC TR 2021-FFR2 D730, 0.000%, 10/27/2028 | | | | | 109,856 | | | | | | 0.0 | | |
| 125,000 (2)(11) | | | GAM RE-REMIC TR 2021-FFR2 DK49, 0.000%, 10/27/2028 | | | | | 106,860 | | | | | | 0.0 | | |
| 182,000 (2) | | | MF1 Multifamily Housing Mortgage Loan Trust 2021-FL5 D, 2.665%, (SOFR30A + 2.500%), 07/15/2036 | | | | | 180,992 | | | | | | 0.1 | | |
| 414,636 (2)(9) | | | GS Mortgage Securities Trust 2012-GC6 D, 5.865%, 01/10/2045 | | | | | 413,800 | | | | | | 0.1 | | |
| 500,000 (2)(9) | | | GS Mortgage Securities Trust 2012-GCJ7 D, 5.542%, 05/10/2045 | | | | | 486,854 | | | | | | 0.1 | | |
| 13,678,223 (9)(10) | | | GS Mortgage Securities Trust 2019-GC39 XA, 1.134%, 05/10/2052 | | | | | 848,382 | | | | | | 0.3 | | |
| 3,070,000 (2) | | | JP Morgan Chase Commercial Mortgage Securities Corp. 2021-MHC E, 2.560%, (US0001M + 2.450%), 04/15/2038 | | | | | 3,072,016 | | | | | | 0.9 | | |
| 200,000 (2)(9) | | | JPMBB Commercial Mortgage Securities Trust 2013-C17 F, 3.867%, 01/15/2047 | | | | | 163,583 | | | | | | 0.1 | | |
| 25,887,173 (9)(10) | | | JPMDB Commercial Mortgage Securities Trust 2018-C8 XA, 0.600%, 06/15/2051 | | | | | 680,108 | | | | | | 0.2 | | |
| 560,000 (2) | | | Morgan Stanley Bank of America Merrill Lynch Trust 2013-C13 F, 3.707%, 11/15/2046 | | | | | 427,443 | | | | | | 0.1 | | |
| 253,862 (2)(6) | | | Morgan Stanley Capital I Trust 2011-C1 M, 4.193%, 09/15/2047 | | | | | 2,537 | | | | | | 0.0 | | |
| 1,955,000 (2)(9) | | | Morgan Stanley Capital I Trust 2016-BNK2 D, 3.000%, 11/15/2049 | | | | | 1,710,822 | | | | | | 0.5 | | |
| 7,590,429 (9)(10) | | | Morgan Stanley Capital I Trust 2019-L3 XA, 0.641%, 11/15/2052 | | | | | 340,410 | | | | | | 0.1 | | |
| 140,000 (2)(9) | | | UBS-Barclays Commercial Mortgage Trust 2012-C4 D, 4.461%, 12/10/2045 | | | | | 126,617 | | | | | | 0.0 | | |
| 240,000 (2)(9) | | | UBS-Barclays Commercial Mortgage Trust 2012-C4 E, 4.461%, 12/10/2045 | | | | | 168,200 | | | | | | 0.1 | | |
| 906,547 (2)(9) | | | WFRBS Commercial Mortgage Trust 2011-C5 E, 5.520%, 11/15/2044 | | | | | 905,275 | | | | | | 0.3 | | |
| Voya Balanced Income Portfolio | as of December 31, 2021 (continued) |
| Principal Amount† | | | Value | | | Percentage of Net Assets | | |||||||||
| COMMERCIAL MORTGAGE-BACKED SECURITIES: (continued) | | |||||||||||||||
| 2,210,000 (2) | | | WFRBS Commercial Mortgage Trust 2013- C12 E, 3.500%, 03/15/2048 | | | | $ | 2,006,142 | | | | | | 0.6 | | |
| 1,750,000 (2)(9) | | | WFRBS Commercial Mortgage Trust 2013 -C14 D, 3.960%, 06/15/2046 | | | | | 1,453,527 | | | | | | 0.4 | | |
| 1,920,000 (9) | | | WFRBS Commercial Mortgage Trust 2014-C19 C, 4.646%, 03/15/2047 | | | | | 1,958,329 | | | | | | 0.6 | | |
| | | | Total Commercial Mortgage-Backed Securities (Cost $31,975,997) | | | | | 31,988,618 | | | | | | 9.6 | | |
| ASSET-BACKED SECURITIES: 9.9% | | |||||||||||||||
| | | | Automobile Asset-Backed Securities: 1.7% | | ||||||||||||
| 300,000 | | | Americredit Automobile Receivables Trust 2018- 2 D, 4.010%, 07/18/2024 | | | | | 308,468 | | | | | | 0.1 | | |
| 450,000 | | | Americredit Automobile Receivables Trust 2019- 2 D, 2.990%, 06/18/2025 | | | | | 461,405 | | | | | | 0.1 | | |
| 1,200,000 | | | Carmax Auto Owner Trust 2019-3 D, 2.850%, 01/15/2026 | | | | | 1,227,520 | | | | | | 0.4 | | |
| 500,000 | | | GM Financial Consumer Automobile Receivables Trust 2019-3 C, 2.620%, 01/16/2025 | | | | | 508,664 | | | | | | 0.1 | | |
| 550,000 (2) | | | Oscar US Funding XI LLC 2019-2A A4, 2.680%, 09/10/2026 | | | | | 564,288 | | | | | | 0.2 | | |
| 550,000 | | | Santander Drive Auto Receivables Trust 2019- 1 D, 3.650%, 04/15/2025 | | | | | 557,824 | | | | | | 0.2 | | |
| 1,000,000 | | | Santander Drive Auto Receivables Trust 2019- 2 D, 3.220%, 07/15/2025 | | | | | 1,019,858 | | | | | | 0.3 | | |
| 80,368 | | | Santander Drive Auto Receivables Trust 2019- 3 C, 2.490%, 10/15/2025 | | | | | 80,723 | | | | | | 0.0 | | |
| 350,000 | | | Santander Drive Auto Receivables Trust 2019- 3 D, 2.680%, 10/15/2025 | | | | | 354,706 | | | | | | 0.1 | | |
| 600,000 (2) | | | Santander Retail Auto Lease Trust 2019-B C, 2.770%, 08/21/2023 | | | | | 605,003 | | | | | | 0.2 | | |
| | | | | | | | | 5,688,459 | | | | | | 1.7 | | |
| | | | Home Equity Asset-Backed Securities: 0.1% | | ||||||||||||
| 558,282 (2)(9) | | | ACE Securities Corp. Mortgage Loan Trust Series 2007-D1 A2, 6.336%, 02/25/2038 | | | | | 533,835 | | | | | | 0.1 | | |
| | | | | | ||||||||||||
| Principal Amount† | | | Value | | | Percentage of Net Assets | | |||||||||
| ASSET-BACKED SECURITIES: (continued) | | |||||||||||||||
| | | | Other Asset-Backed Securities: 7.9% | | ||||||||||||
| 700,000 (2) | | | Allegro CLO IV Ltd. 2016-1A CR2, 2.124%, (US0003M + 2.000%), 01/15/2030 | | | | $ | 700,011 | | | | | | 0.2 | | |
| 300,000 (2) | | | Apidos CLO XXXVI 2021-36A C, 2.119%, (US0003M + 2.000%), 07/20/2034 | | | | | 298,842 | | | | | | 0.1 | | |
| 396,000 (2) | | | Applebee’s Funding LLC / IHOP Funding LLC 2019-1A A2I, 4.194%, 06/05/2049 | | | | | 402,027 | | | | | | 0.1 | | |
| 148,500 (2) | | | Applebee’s Funding LLC / IHOP Funding LLC 2019-1A A2II, 4.723%, 06/05/2049 | | | | | 153,273 | | | | | | 0.0 | | |
| 300,000 (2) | | | Babson CLO Ltd. 2018-3A C, 2.032%, (US0003M + 1.900%), 07/20/2029 | | | | | 297,498 | | | | | | 0.1 | | |
| 750,000 (2) | | | Benefit Street Partners CLO II Ltd. 2013-IIA BR2, 2.024%, (US0003M + 1.900%), 07/15/2029 | | | | | 741,429 | | | | | | 0.2 | | |
| 400,000 (2) | | | Benefit Street Partners CLO Ltd. 2021-23A C, 2.324%, (US0003M + 2.200%), 04/25/2034 | | | | | 400,467 | | | | | | 0.1 | | |
| 250,000 (2) | | | BlueMountain CLO Ltd. 2021-28A C, 2.124%, (US0003M + 2.000%), 04/15/2034 | | | | | 248,138 | | | | | | 0.1 | | |
| 500,000 (2) | | | BlueMountain CLO XXV Ltd. 2019-25A CR, 2.374%, (US0003M + 2.250%), 07/15/2036 | | | | | 499,610 | | | | | | 0.2 | | |
| 320,000 (2) | | | CIFC Funding 2017-4A BR Ltd., 2.124%, (US0003M + 2.000%), 10/24/2030 | | | | | 320,007 | | | | | | 0.1 | | |
| 598,490 (2) | | | Domino’s Pizza Master Issuer LLC 2018-1A A2I, 4.116%, 07/25/2048 | | | | | 614,531 | | | | | | 0.2 | | |
| 1,000,000 (2) | | | Dryden Senior Loan Fund 2021-87A C, 2.060%, (US0003M + 1.900%), 05/20/2034 | | | | | 988,545 | | | | | | 0.3 | | |
| 399,198 (2) | | | J.G. Wentworth XXXVIII LLC 2017-1A A, 3.990%, 08/16/2060 | | | | | 449,288 | | | | | | 0.1 | | |
| 750,000 (2) | | | LCM XV L.P. 15A CR, 2.532%, (US0003M + 2.400%), 07/20/2030 | | | | | 749,298 | | | | | | 0.2 | | |
| 750,000 (2) | | | LCM XXII Ltd. 22A BR, 2.132%, (US0003M + 2.000%), 10/20/2028 | | | | | 749,060 | | | | | | 0.2 | | |
| 950,000 (2) | | | Magnetite XXVI Ltd. 2020-26A CR, 1.990%, (US0003M + 1.900%), 07/25/2034 | | | | | 941,976 | | | | | | 0.3 | | |
| Voya Balanced Income Portfolio | as of December 31, 2021 (continued) |
| Principal Amount† | | | Value | | | Percentage of Net Assets | | |||||||||
| ASSET-BACKED SECURITIES: (continued) | | |||||||||||||||
| | | | Other Asset-Backed Securities (continued) | | ||||||||||||
| 312,764 (2) | | | Marlette Funding Trust 2019-3A B, 3.070%, 09/17/2029 | | | | $ | 313,710 | | | | | | 0.1 | | |
| 367,283 (2) | | | Mill City Solar Loan 2019-2GS A Ltd., 3.690%, 07/20/2043 | | | | | 385,859 | | | | | | 0.1 | | |
| 591,265 (2) | | | Mosaic Solar Loans 2017-2A A LLC, 3.820%, 06/22/2043 | | | | | 616,215 | | | | | | 0.2 | | |
| 750,000 (2) | | | Neuberger Berman CLO XVII Ltd. 2014-17A CR2, 2.128%, (US0003M + 2.000%), 04/22/2029 | | | | | 750,201 | | | | | | 0.2 | | |
| 1,000,000 (2) | | | Neuberger Berman Loan Advisers CLO 25 Ltd. 2017-25A CR, 1.872%, (US0003M + 1.750%), 10/18/2029 | | | | | 997,044 | | | | | | 0.3 | | |
| 750,000 (2) | | | Neuberger Berman Loan Advisers CLO 33 Ltd. 2019-33A CR, 2.022%, (US0003M + 1.900%), 10/16/2033 | | | | | 748,106 | | | | | | 0.2 | | |
| 500,000 (2) | | | NYACK Park CLO Ltd. 2021-1A C, 2.074%, (US0003M + 1.950%), 10/20/2034 | | | | | 497,623 | | | | | | 0.1 | | |
| 250,000 (2) | | | Oak Hill Credit Partners 2021-8A C, 2.022%, (US0003M + 1.900%), 01/18/2034 | | | | | 247,272 | | | | | | 0.1 | | |
| 250,000 (2) | | | Octagon Investment Partners 30 Ltd. 2017-1A BR, 2.082%, (US0003M + 1.950%), 03/17/2030 | | | | | 248,822 | | | | | | 0.1 | | |
| 580,000 (2) | | | Octagon Investment Partners 31 Ltd. 2017-1A CR, 2.182%, (US0003M + 2.050%), 07/20/2030 | | | | | 578,911 | | | | | | 0.2 | | |
| 250,000 (2) | | | Octagon Loan Funding Ltd. 2014-1A CRR, 2.360%, (US0003M + 2.200%), 11/18/2031 | | | | | 248,537 | | | | | | 0.1 | | |
| 1,000,000 (2) | | | Palmer Square CLO 2015-1A BR4 Ltd., 2.010%, (US0003M + 1.850%), 05/21/2034 | | | | | 986,809 | | | | | | 0.3 | | |
| 800,000 (2) | | | Palmer Square Loan Funding 2019-2A B Ltd., 2.382%, (US0003M + 2.250%), 04/20/2027 | | | | | 800,155 | | | | | | 0.2 | | |
| 750,000 (2) | | | Palmer Square Loan Funding 2020-2A B Ltd., 2.382%, (US0003M + 2.250%), 04/20/2028 | | | | | 750,167 | | | | | | 0.2 | | |
| 550,000 (2) | | | Shackleton 2019-15A CR CLO Ltd., 2.274%, (US0003M + 2.150%), 01/15/2032 | | | | | 547,124 | | | | | | 0.2 | | |
| 500,000 (2) | | | Silver Creek CLO Ltd. 2014-1A CR, 2.432%, (US0003M + 2.300%), 07/20/2030 | | | | | 500,055 | | | | | | 0.2 | | |
| Principal Amount† | | | Value | | | Percentage of Net Assets | | |||||||||
| ASSET-BACKED SECURITIES: (continued) | | |||||||||||||||
| | | | Other Asset-Backed Securities (continued) | | ||||||||||||
| 1,000,000 (2) | | | SoFi Consumer Loan Program 2019-3 D Trust, 3.890%, 05/25/2028 | | | | $ | 1,018,189 | | | | | | 0.3 | | |
| 200,000 (2) | | | SoFi Consumer Loan Program 2019-4 C Trust, 2.840%, 08/25/2028 | | | | | 202,804 | | | | | | 0.1 | | |
| 100,000 (2) | | | SoFi Consumer Loan Program 2019-4 D Trust, 3.480%, 08/25/2028 | | | | | 101,141 | | | | | | 0.0 | | |
| 400,000 (2) | | | SoFi Consumer Loan Program 2020-1 C Trust, 2.500%, 01/25/2029 | | | | | 404,369 | | | | | | 0.1 | | |
| 450,000 (2) | | | Sound Point Clo XIV Ltd. 2016-3A CR, 2.174%, (US0003M + 2.050%), 01/23/2029 | | | | | 448,619 | | | | | | 0.1 | | |
| 320,934 (2) | | | Sunrun Xanadu Issuer 2019-1A A LLC, 3.980%, 06/30/2054 | | | | | 338,698 | | | | | | 0.1 | | |
| 1,000,000 (2) | | | Symphony Static CLO I Ltd. 2021-1A C, 1.979%, (US0003M + 1.850%), 10/25/2029 | | | | | 998,364 | | | | | | 0.3 | | |
| 750,000 (2) | | | THL Credit Wind River 2016-1A CR CLO Ltd., 2.224%, (US0003M + 2.100%), 07/15/2028 | | | | | 750,022 | | | | | | 0.2 | | |
| 600,000 (2) | | | THL Credit Wind River 2017-3A CR Clo Ltd., 2.624%, (US0003M + 2.500%), 04/15/2035 | | | | | 597,761 | | | | | | 0.2 | | |
| 2,000,000 (2)(9) | | | Towd Point Mortgage Trust 2015-4 M2, 3.750%, 04/25/2055 | | | | | 2,044,780 | | | | | | 0.6 | | |
| 180,000 (2)(9) | | | Towd Point Mortgage Trust 2015-6 M2, 3.750%, 04/25/2055 | | | | | 185,676 | | | | | | 0.1 | | |
| 1,152,000 (2) | | | Wendy’s Funding LLC 2018-1A A2II, 3.884%, 03/15/2048 | | | | | 1,201,176 | | | | | | 0.4 | | |
| 230,000 (2) | | | Wendy’s Funding LLC 2019-1A A2I, 3.783%, 06/15/2049 | | | | | 239,398 | | | | | | 0.1 | | |
| | | | | | | | | 26,301,607 | | | | | | 7.9 | | |
| | | | Student Loan Asset-Backed Securities: 0.2% | | ||||||||||||
| 600,000 (2) | | | Sofi Professional Loan Program 2019-C BFX LLC, 3.050%, 11/16/2048 | | | | | 605,727 | | | | | | 0.2 | | |
| | | | Total Asset-Backed Securities (Cost $32,869,344) | | | | | 33,129,628 | | | | | | 9.9 | | |
| SOVEREIGN BONDS: 1.5% | | |||||||||||||||
| 300,000 | | | Brazilian Government International Bond, 3.875%, 06/12/2030 | | | | | 291,525 | | | | | | 0.1 | | |
| 275,000 | | | Chile Government International Bond, 2.450%, 01/31/2031 | | | | | 273,971 | | | | | | 0.1 | | |
| Voya Balanced Income Portfolio | as of December 31, 2021 (continued) |
| Principal Amount† | | | Value | | | Percentage of Net Assets | | |||||||||
| SOVEREIGN BONDS: (continued) | | |||||||||||||||
| 450,000 | | | Colombia Government International Bond, 3.875%, 04/25/2027 | | | | $ | 454,275 | | | | | | 0.1 | | |
EUR 225,000 | | | Croatia Government International Bond, 1.125%, 06/19/2029 | | | | | 261,568 | | | | | | 0.1 | | |
| 200,000 | | | Croatia Government International Bond, 5.500%, 04/04/2023 | | | | | 211,536 | | | | | | 0.1 | | |
| 200,000 (2) | | | Dominican Republic International Bond, 4.500%, 01/30/2030 | | | | | 203,750 | | | | | | 0.0 | | |
| 350,000 (2)(3) | | | Egypt Government International Bond, 5.875%, 02/16/2031 | | | | | 311,122 | | | | | | 0.1 | | |
| 225,000 | | | Egypt Government International Bond, 7.500%, 01/31/2027 | | | | | 234,840 | | | | | | 0.1 | | |
| 325,000 (2) | | | Ghana Government International Bond, 6.375%, 02/11/2027 | | | | | 275,095 | | | | | | 0.1 | | |
| 275,000 (2) | | | Hungary Government International Bond, 2.125%, 09/22/2031 | | | | | 271,198 | | | | | | 0.1 | | |
| 136,389 | | | Ivory Coast Government International Bond, 5.750%, 12/31/2032 | | | | | 137,366 | | | | | | 0.0 | | |
| 200,000 | | | Mexico Government International Bond, 4.500%, 04/22/2029 | | | | | 222,907 | | | | | | 0.1 | | |
| 125,000 | | | Panama Government International Bond, 9.375%, 04/01/2029 | | | | | 179,509 | | | | | | 0.0 | | |
| 200,000 | | | Perusahaan Penerbit SBSN Indonesia III, 4.150%, 03/29/2027 | | | | | 221,860 | | | | | | 0.1 | | |
| 450,000 | | | Republic of South Africa Government International Bond, 4.850%, 09/30/2029 | | | | | 465,885 | | | | | | 0.1 | | |
| 200,000 | | | Russian Foreign Bond - Eurobond, 4.375%, 03/21/2029 | | | | | 220,831 | | | | | | 0.1 | | |
| 200,000 | | | Sri Lanka Government International Bond, 6.350%, 06/28/2024 | | | | | 105,672 | | | | | | 0.0 | | |
| 475,000 | | | Turkey Government International Bond, 4.875%, 10/09/2026 | | | | | 431,697 | | | | | | 0.1 | | |
| 350,000 | | | Ukraine Government International Bond, 7.750%, 09/01/2025 | | | | | 337,172 | | | | | | 0.1 | | |
| | | | Total Sovereign Bonds (Cost $5,305,941) | | | | | 5,111,779 | | | | | | 1.5 | | |
| PURCHASED OPTIONS(12): 0.0% | | |||||||||||||||
| | | | Total Purchased Options (Cost $157,143) | | | | | 86,246 | | | | | | 0.0 | | |
| | | | Total Long-Term Investments (Cost $311,282,638) | | | | | 328,986,320 | | | | | | 98.6 | | |
| | ||||||||||||||||
| Principal Amount† | | | Value | | | Percentage of Net Assets | | |||||||||
| SHORT-TERM INVESTMENTS: 0.8% | | |||||||||||||||
| | | | Repurchase Agreements: 0.8% | | ||||||||||||
| 765,828 (13) | | | Daiwa Capital Markets, Repurchase Agreement dated 12/31/21, 0.04%, due 01/03/22 (Repurchase Amount $765,831, collateralized by various U.S. Government/U.S. Government Agency Obligations, 0.000%-6.500%, Market Value plus accrued interest $781,145, due 02/10/22-01/01/52) | | | | $ | 765,828 | | | | | | 0.2 | | |
| 1,000,000 (13) | | | MUFG Securities America Inc., Repurchase Agreement dated 12/31/21, 0.05%, due 01/03/22 (Repurchase Amount $1,000,004, collateralized by various U.S. Government/U.S. Government Agency Obligations, 2.500%-6.500%, Market Value plus accrued interest $1,020,000, due 05/20/24-10/01/51) | | | | | 1,000,000 | | | | | | 0.3 | | |
| 1,000,000 (13) | | | RBC Dominion Securities Inc., Repurchase Agreement dated 12/31/ 21, 0.05%, due 01/03/22 (Repurchase Amount $1,000,004, collateralized by various U.S. Government/U.S. Government Agency Obligations, 0.000%-6.500%, Market Value plus accrued interest $1,020,000, due 05/15/22-12/01/51) | | | | | 1,000,000 | | | | | | 0.3 | | |
| | | | Total Repurchase Agreements | | | | | | | | | | | | | |
| | | | Total Short-Term Investments (Cost $2,765,828) | | | | $ | 2,765,828 | | | | | | 0.8 | | |
| | | | Total Investments in Securities (Cost $314,048,466) | | | | | 331,752,148 | | | | | | 99.4 | | |
| | | | Assets in Excess of Other Liabilities | | | | | 1,994,412 | | | | | | 0.6 | | |
| | | | Net Assets | | | | $ | 333,746,560 | | | | | | 100.0 | | |
| | ||||||||||||||||
| Voya Balanced Income Portfolio | as of December 31, 2021 (continued) |
| Voya Balanced Income Portfolio | as of December 31, 2021 (continued) |
| | | | Quoted Prices in Active Markets for Identical Investments (Level 1) | | | Significant Other Observable Inputs# (Level 2) | | | Significant Unobservable Inputs (Level 3) | | | Fair Value at December 31, 2021 | | ||||||||||||
| Asset Table | | | | | | | | | | | | | | | | | | | | | | | | | |
| Investments, at fair value | | | | | | | | | | | | | | | | | | | | | | | | | |
| Common Stock | | | | | | | | | | | | | | | | | | | | | | | | | |
| Communication Services | | | | $ | 10,555,257 | | | | | $ | 1,290,063 | | | | | $ | — | | | | | $ | 11,845,320 | | |
| Consumer Discretionary | | | | | 12,501,961 | | | | | | 989,260 | | | | | | — | | | | | | 13,491,221 | | |
| Consumer Staples | | | | | 8,787,306 | | | | | | 1,372,302 | | | | | | — | | | | | | 10,159,608 | | |
| Energy | | | | | 3,715,727 | | | | | | 810,663 | | | | | | — | | | | | | 4,526,390 | | |
| Financials | | | | | 17,990,330 | | | | | | 4,047,679 | | | | | | — | | | | | | 22,038,009 | | |
| Health Care | | | | | 19,693,550 | | | | | | 1,544,483 | | | | | | — | | | | | | 21,238,033 | | |
| Industrials | | | | | 13,461,434 | | | | | | 2,211,754 | | | | | | — | | | | | | 15,673,188 | | |
| Information Technology | | | | | 31,775,987 | | | | | | 361,255 | | | | | | — | | | | | | 32,137,242 | | |
| Materials | | | | | 3,452,656 | | | | | | 1,501,049 | | | | | | — | | | | | | 4,953,705 | | |
| Real Estate | | | | | 5,728,396 | | | | | | 637,797 | | | | | | — | | | | | | 6,366,193 | | |
| Utilities | | | | | 5,168,533 | | | | | | 1,149,314 | | | | | | — | | | | | | 6,317,847 | | |
| Total Common Stock | | | | | 132,831,137 | | | | | | 15,915,619 | | | | | | — | | | | | | 148,746,756 | | |
| Exchange-Traded Funds | | | | | 2,488,886 | | | | | | — | | | | | | — | | | | | | 2,488,886 | | |
| Mutual Funds | | | | | 32,642,055 | | | | | | — | | | | | | — | | | | | | 32,642,055 | | |
| Preferred Stock | | | | | — | | | | | | 662,986 | | | | | | — | | | | | | 662,986 | | |
| Purchased Options | | | | | — | | | | | | 86,246 | | | | | | — | | | | | | 86,246 | | |
| Corporate Bonds/Notes | | | | | — | | | | | | 25,224,288 | | | | | | — | | | | | | 25,224,288 | | |
| Collateralized Mortgage Obligations | | | | | — | | | | | | 40,144,864 | | | | | | — | | | | | | 40,144,864 | | |
| Asset-Backed Securities | | | | | — | | | | | | 33,129,628 | | | | | | — | | | | | | 33,129,628 | | |
| Sovereign Bonds | | | | | — | | | | | | 5,111,779 | | | | | | — | | | | | | 5,111,779 | | |
| Commercial Mortgage-Backed Securities | | | | | — | | | | | | 29,956,627 | | | | | | 2,031,991 | | | | | | 31,988,618 | | |
| Other | | | | | — | | | | | | — | | | | | | — | | | | | | — | | |
| U.S. Treasury Obligations | | | | | — | | | | | | 8,760,214 | | | | | | — | | | | | | 8,760,214 | | |
| Short-Term Investments | | | | | — | | | | | | 2,765,828 | | | | | | — | | | | | | 2,765,828 | | |
| Total Investments, at fair value | | | | $ | 167,962,078 | | | | | $ | 161,758,079 | | | | | $ | 2,031,991 | | | | | $ | 331,752,148 | | |
| Other Financial Instruments+ | | | | | | | | | | | | | | | | | | | | | | | | | |
| Centrally Cleared Swaps | | | | | — | | | | | | 10,539 | | | | | | — | | | | | | 10,539 | | |
| Forward Foreign Currency Contracts | | | | | — | | | | | | 1,669,928 | | | | | | — | | | | | | 1,669,928 | | |
| Futures | | | | | 282,638 | | | | | | — | | | | | | — | | | | | | 282,638 | | |
| Total Assets | | | | $ | 168,244,716 | | | | | $ | 163,438,546 | | | | | $ | 2,031,991 | | | | | $ | 333,715,253 | | |
| Liabilities Table | | | | | | | | | | | | | | | | | | | | | | | | | |
| Other Financial Instruments+ | | | | | | | | | | | | | | | | | | | | | | | | | |
| Centrally Cleared Swaps | | | | $ | — | | | | | $ | (5,353) | | | | | $ | — | | | | | $ | (5,353) | | |
| Forward Foreign Currency Contracts | | | | | — | | | | | | (1,700,584) | | | | | | — | | | | | | (1,700,584) | | |
| Futures | | | | | (322,681) | | | | | | — | | | | | | — | | | | | | (322,681) | | |
| Volatility Swaps | | | | | — | | | | | | (16,510) | | | | | | — | | | | | | (16,510) | | |
| Written Options | | | | | — | | | | | | (44,951) | | | | | | — | | | | | | (44,951) | | |
| Total Liabilities | | | | $ | (322,681) | | | | | $ | (1,767,398) | | | | | $ | — | | | | | $ | (2,090,079) | | |
| Voya Balanced Income Portfolio | as of December 31, 2021 (continued) |
| Security | | | Acquisition Date | | | Acquisition Cost | | | Fair Value | | |||||||||
| General Motors Co. Escrow | | | | | 11/24/2020 | | | | | $ | — | | | | | $ | — | | |
| | | | | | | | | | | $ | — | | | | | $ | — | | |
| Issuer | | | Beginning Fair Value at 12/31/2020 | | | Purchases at Cost | | | Sales at Cost | | | Change in Unrealized Appreciation/ (Depreciation) | | | Ending Fair Value at 12/31/2021 | | | Investment Income | | | Realized Gains/ (Losses) | | | Net Capital Gain Distributions | | ||||||||||||||||||||||||
| Voya Emerging Markets Hard Currency Debt Fund - Class P | | | | $ | — | | | | | $ | 2,007,759 | | | | | $ | — | | | | | $ | 4,273 | | | | | $ | 2,012,032 | | | | | $ | 7,733 | | | | | $ | — | | | | | $ | — | | |
| Voya Floating Rate Fund - Class P | | | | | 24,307,381 | | | | | | 3,754,594 | | | | | | — | | | | | | 177,027 | | | | | | 28,239,002 | | | | | | 1,054,594 | | | | | | — | | | | | | — | | |
| Voya High Yield Bond Fund - Class P | | | | | 2,264,400 | | | | | | 135,166 | | | | | | — | | | | | | (8,545) | | | | | | 2,391,021 | | | | | | 135,166 | | | | | | — | | | | | | — | | |
| | | | | $ | 26,571,781 | | | | | $ | 5,897,519 | | | | | $ | — | | | | | $ | 172,755 | | | | | $ | 32,642,055 | | | | | $ | 1,197,493 | | | | | $ | — | | | | | $ | — | | |
| Currency Purchased | | | Currency Sold | | | Counterparty | | | Settlement Date | | | Unrealized Appreciation (Depreciation) | | ||||||
| NZD 3,648,295 | | | USD 2,484,307 | | | BNP Paribas | | | | | 01/14/22 | | | | | $ | 14,075 | | |
| USD 535,768 | | | EUR 471,550 | | | BNP Paribas | | | | | 01/14/22 | | | | | | (1,203) | | |
| USD 8,819,493 | | | EUR 7,803,353 | | | BNP Paribas | | | | | 01/14/22 | | | | | | (66,468) | | |
| GBP 1,536,036 | | | USD 2,033,482 | | | BNP Paribas | | | | | 01/14/22 | | | | | | 45,568 | | |
| EUR 1,972,875 | | | USD 2,241,950 | | | BNP Paribas | | | | | 01/14/22 | | | | | | 4,633 | | |
| USD 4,174,531 | | | SEK 38,107,769 | | | BNP Paribas | | | | | 01/14/22 | | | | | | (43,037) | | |
| USD 1,073,079 | | | CAD 1,362,542 | | | BNP Paribas | | | | | 01/14/22 | | | | | | (4,061) | | |
| USD 5,121,186 | | | CAD 6,476,237 | | | BNP Paribas | | | | | 01/14/22 | | | | | | 1,483 | | |
| USD 5,258,970 | | | EUR 4,642,333 | | | BNP Paribas | | | | | 01/14/22 | | | | | | (27,422) | | |
| CAD 705,756 | | | USD 551,681 | | | BNP Paribas | | | | | 01/14/22 | | | | | | 6,245 | | |
| USD 3,350,806 | | | AUD 4,708,767 | | | BNP Paribas | | | | | 01/14/22 | | | | | | (75,164) | | |
| USD 1,496,943 | | | NOK 13,485,733 | | | BNP Paribas | | | | | 01/14/22 | | | | | | (34,108) | | |
| CAD 3,006,390 | | | USD 2,340,314 | | | BNP Paribas | | | | | 01/14/22 | | | | | | 36,348 | | |
| AUD 3,704,372 | | | USD 2,660,287 | | | BNP Paribas | | | | | 01/14/22 | | | | | | 34,913 | | |
| SEK 30,617,549 | | | USD 3,349,502 | | | BNP Paribas | | | | | 01/14/22 | | | | | | 39,088 | | |
| AUD 2,278,402 | | | USD 1,622,336 | | | BNP Paribas | | | | | 01/14/22 | | | | | | 35,367 | | |
| GBP 4,685,663 | | | USD 6,246,247 | | | BNP Paribas | | | | | 01/14/22 | | | | | | 95,872 | | |
| GBP 834,373 | | | USD 1,105,929 | | | BNP Paribas | | | | | 01/14/22 | | | | | | 23,409 | | |
| EUR 2,656,559 | | | USD 3,011,634 | | | BNP Paribas | | | | | 01/14/22 | | | | | | 13,485 | | |
| CHF 3,766,723 | | | USD 4,138,483 | | | BNP Paribas | | | | | 01/14/22 | | | | | | (3,588) | | |
| GBP 1,375,503 | | | USD 1,848,756 | | | BNP Paribas | | | | | 01/14/22 | | | | | | 13,009 | | |
| Voya Balanced Income Portfolio | as of December 31, 2021 (continued) |
| Currency Purchased | | | Currency Sold | | | Counterparty | | | Settlement Date | | | Unrealized Appreciation (Depreciation) | | ||||||
| USD 4,951,842 | | | JPY 561,899,817 | | | BNP Paribas | | | | | 01/14/22 | | | | | $ | 66,634 | | |
| USD 5,137,728 | | | CHF 4,723,635 | | | BNP Paribas | | | | | 01/14/22 | | | | | | (47,609) | | |
| NZD 2,200,681 | | | USD 1,494,906 | | | BNP Paribas | | | | | 01/14/22 | | | | | | 12,139 | | |
| GBP 453,525 | | | USD 604,514 | | | BNP Paribas | | | | | 01/14/22 | | | | | | 9,339 | | |
| USD 3,354,956 | | | SEK 30,293,742 | | | BNP Paribas | | | | | 01/14/22 | | | | | | 2,204 | | |
| AUD 1,599,686 | | | USD 1,144,012 | | | BNP Paribas | | | | | 01/14/22 | | | | | | 19,876 | | |
| CHF 4,669,967 | | | USD 5,098,370 | | | BNP Paribas | | | | | 01/14/22 | | | | | | 28,054 | | |
| USD 1,771,428 | | | AUD 2,489,429 | | | BNP Paribas | | | | | 01/14/22 | | | | | | (39,812) | | |
| SEK 19,943,194 | | | USD 2,203,210 | | | Brown Brothers Harriman & Co. | | | | | 01/14/22 | | | | | | 3,998 | | |
| NOK 12,010,100 | | | USD 1,320,620 | | | Brown Brothers Harriman & Co. | | | | | 01/14/22 | | | | | | 42,901 | | |
| USD 612,631 | | | NOK 5,576,451 | | | Brown Brothers Harriman & Co. | | | | | 01/14/22 | | | | | | (20,470) | | |
| SEK 11,094,407 | | | USD 1,229,583 | | | Citibank N.A. | | | | | 01/14/22 | | | | | | (1,713) | | |
| CAD 5,518,221 | | | USD 4,303,646 | | | Citibank N.A. | | | | | 01/14/22 | | | | | | 58,710 | | |
| CHF 4,039,419 | | | USD 4,397,077 | | | Citibank N.A. | | | | | 01/14/22 | | | | | | 37,167 | | |
| USD 717,512 | | | SEK 6,534,797 | | | Citibank N.A. | | | | | 01/14/22 | | | | | | (5,725) | | |
| USD 2,528,559 | | | GBP 1,895,094 | | | Citibank N.A. | | | | | 01/14/22 | | | | | | (36,481) | | |
| USD 4,408,343 | | | CHF 4,071,435 | | | Citibank N.A. | | | | | 01/14/22 | | | | | | (61,048) | | |
| JPY 600,120,615 | | | USD 5,289,480 | | | Citibank N.A. | | | | | 01/14/22 | | | | | | (71,978) | | |
| USD 3,363,241 | | | NZD 4,937,028 | | | Citibank N.A. | | | | | 01/14/22 | | | | | | (17,675) | | |
| USD 808,358 | | | SEK 7,337,159 | | | Citibank N.A. | | | | | 01/14/22 | | | | | | (3,680) | | |
| PEN 252,020 | | | USD 61,765 | | | Citibank N.A. | | | | | 02/04/22 | | | | | | 1,284 | | |
| AUD 535,555 | | | USD 382,287 | | | Goldman Sachs International | | | | | 01/14/22 | | | | | | 7,368 | | |
| USD 2,570,789 | | | NOK 22,611,887 | | | Goldman Sachs International | | | | | 01/14/22 | | | | | | 3,635 | | |
| AUD 3,870,223 | | | USD 2,801,039 | | | Goldman Sachs International | | | | | 01/14/22 | | | | | | 14,829 | | |
| NOK 3,182,799 | | | USD 352,417 | | | Goldman Sachs International | | | | | 01/14/22 | | | | | | 8,930 | | |
| USD 695,708 | | | NZD 1,020,943 | | | Goldman Sachs International | | | | | 01/14/22 | | | | | | (3,441) | | |
| NZD 2,231,938 | | | USD 1,523,899 | | | Goldman Sachs International | | | | | 01/14/22 | | | | | | (10,159) | | |
| USD 3,346,831 | | | SEK 30,515,527 | | | Goldman Sachs International | | | | | 01/14/22 | | | | | | (30,467) | | |
| NOK 3,311,523 | | | USD 365,335 | | | Goldman Sachs International | | | | | 01/14/22 | | | | | | 10,626 | | |
| USD 735,502 | | | GBP 556,182 | | | Goldman Sachs International | | | | | 01/14/22 | | | | | | (17,300) | | |
| EUR 569,862 | | | USD 644,802 | | | Goldman Sachs International | | | | | 01/14/22 | | | | | | 4,121 | | |
| USD 2,225,276 | | | GBP 1,676,984 | | | Goldman Sachs International | | | | | 01/14/22 | | | | | | (44,548) | | |
| CHF 1,575,748 | | | USD 1,706,709 | | | Goldman Sachs International | | | | | 01/14/22 | | | | | | 23,057 | | |
| USD 2,470,309 | | | EUR 2,192,894 | | | Goldman Sachs International | | | | | 01/14/22 | | | | | | (26,818) | | |
| NOK 4,081,734 | | | USD 459,683 | | | Goldman Sachs International | | | | | 01/14/22 | | | | | | 3,721 | | |
| JPY 70,776,670 | | | USD 620,778 | | | Goldman Sachs International | | | | | 01/14/22 | | | | | | (5,439) | | |
| NOK 29,288,719 | | | USD 3,252,874 | | | Goldman Sachs International | | | | | 01/14/22 | | | | | | 72,307 | | |
| GBP 1,226,337 | | | USD 1,633,058 | | | Goldman Sachs International | | | | | 01/14/22 | | | | | | 26,809 | | |
| USD 247,814 | | | EUR 218,556 | | | Goldman Sachs International | | | | | 01/14/22 | | | | | | (1,064) | | |
| USD 21,121 | | | TRY 274,672 | | | Goldman Sachs International | | | | | 01/21/22 | | | | | | 671 | | |
| IDR 87,562,411 | | | USD 6,079 | | | JPMorgan Chase Bank N.A. | | | | | 01/21/22 | | | | | | 70 | | |
| RUB 3,540,906 | | | USD 47,072 | | | JPMorgan Chase Bank N.A. | | | | | 01/21/22 | | | | | | 16 | | |
| CHF 327,129 | | | USD 356,566 | | | Morgan Stanley Capital Services LLC | | | | | 01/14/22 | | | | | | 2,538 | | |
| USD 1,018,948 | | | AUD 1,406,158 | | | Morgan Stanley Capital Services LLC | | | | | 01/14/22 | | | | | | (4,133) | | |
| USD 518,540 | | | CAD 662,805 | | | Morgan Stanley Capital Services LLC | | | | | 01/14/22 | | | | | | (5,431) | | |
| NOK 21,930,367 | | | USD 2,436,577 | | | Morgan Stanley Capital Services LLC | | | | | 01/14/22 | | | | | | 53,203 | | |
| USD 1,129,414 | | | CHF 1,043,714 | | | Morgan Stanley Capital Services LLC | | | | | 01/14/22 | | | | | | (16,316) | | |
| USD 1,137,975 | | | CAD 1,471,337 | | | Morgan Stanley Capital Services LLC | | | | | 01/14/22 | | | | | | (25,172) | | |
| EUR 4,725,262 | | | USD 5,341,247 | | | Morgan Stanley Capital Services LLC | | | | | 01/14/22 | | | | | | 39,580 | | |
| USD 386,111 | | | NOK 3,432,673 | | | Morgan Stanley Capital Services LLC | | | | | 01/14/22 | | | | | | (3,604) | | |
| Voya Balanced Income Portfolio | as of December 31, 2021 (continued) |
| Currency Purchased | | | Currency Sold | | | Counterparty | | | Settlement Date | | | Unrealized Appreciation (Depreciation) | | ||||||
| USD 3,335,291 | | | CHF 3,060,417 | | | Morgan Stanley Capital Services LLC | | | | | 01/14/22 | | | | | $ | (24,262) | | |
| EUR 2,939,395 | | | USD 3,331,583 | | | Morgan Stanley Capital Services LLC | | | | | 01/14/22 | | | | | | 15,612 | | |
| NZD 1,038,602 | | | USD 701,511 | | | Morgan Stanley Capital Services LLC | | | | | 01/14/22 | | | | | | 9,732 | | |
| USD 548,026 | | | JPY 62,254,099 | | | Morgan Stanley Capital Services LLC | | | | | 01/14/22 | | | | | | 6,783 | | |
| USD 5,276,947 | | | JPY 599,740,901 | | | Morgan Stanley Capital Services LLC | | | | | 01/14/22 | | | | | | 62,746 | | |
| USD 1,980,046 | | | NOK 17,793,764 | | | Morgan Stanley Capital Services LLC | | | | | 01/14/22 | | | | | | (40,100) | | |
| SEK 13,713,940 | | | USD 1,518,200 | | | Morgan Stanley Capital Services LLC | | | | | 01/14/22 | | | | | | (413) | | |
| USD 4,491,323 | | | GBP 3,384,738 | | | Morgan Stanley Capital Services LLC | | | | | 01/14/22 | | | | | | (89,973) | | |
| USD 321,017 | | | NOK 2,835,059 | | | Morgan Stanley Capital Services LLC | | | | | 01/14/22 | | | | | | (851) | | |
| GBP 3,027,477 | | | USD 4,005,382 | | | Morgan Stanley Capital Services LLC | | | | | 01/14/22 | | | | | | 92,355 | | |
| CAD 1,482,053 | | | USD 1,150,957 | | | Morgan Stanley Capital Services LLC | | | | | 01/14/22 | | | | | | 20,660 | | |
| AUD 2,359,325 | | | USD 1,688,058 | | | Morgan Stanley Capital Services LLC | | | | | 01/14/22 | | | | | | 28,522 | | |
| USD 3,288,759 | | | EUR 2,918,516 | | | Morgan Stanley Capital Services LLC | | | | | 01/14/22 | | | | | | (34,661) | | |
| EUR 2,825,744 | | | USD 3,194,602 | | | Morgan Stanley Capital Services LLC | | | | | 01/14/22 | | | | | | 23,174 | | |
| SEK 30,461,217 | | | USD 3,356,238 | | | Morgan Stanley Capital Services LLC | | | | | 01/14/22 | | | | | | 15,049 | | |
| USD 367,874 | | | SEK 3,341,358 | | | Morgan Stanley Capital Services LLC | | | | | 01/14/22 | | | | | | (1,930) | | |
| USD 2,583,356 | | | NOK 23,358,319 | | | Morgan Stanley Capital Services LLC | | | | | 01/14/22 | | | | | | (68,541) | | |
| NZD 2,564,913 | | | USD 1,741,227 | | | Morgan Stanley Capital Services LLC | | | | | 01/14/22 | | | | | | 15,246 | | |
| USD 525,252 | | | CHF 485,531 | | | Morgan Stanley Capital Services LLC | | | | | 01/14/22 | | | | | | (7,737) | | |
| USD 242,101 | | | NOK 2,135,235 | | | Morgan Stanley Capital Services LLC | | | | | 01/14/22 | | | | | | (314) | | |
| SEK 15,374,529 | | | USD 1,701,784 | | | Morgan Stanley Capital Services LLC | | | | | 01/14/22 | | | | | | (212) | | |
| NZD 711,469 | | | USD 486,062 | | | Morgan Stanley Capital Services LLC | | | | | 01/14/22 | | | | | | 1,158 | | |
| USD 3,670,695 | | | CAD 4,697,959 | | | Morgan Stanley Capital Services LLC | | | | | 01/14/22 | | | | | | (43,214) | | |
| JPY 86,376,009 | | | USD 761,299 | | | Morgan Stanley Capital Services LLC | | | | | 01/14/22 | | | | | | (10,338) | | |
| SEK 11,655,053 | | | USD 1,286,895 | | | Morgan Stanley Capital Services LLC | | | | | 01/14/22 | | | | | | 3,025 | | |
| USD 622,637 | | | NOK 5,507,038 | | | Morgan Stanley Capital Services LLC | | | | | 01/14/22 | | | | | | (2,583) | | |
| EUR 3,792,173 | | | USD 4,301,018 | | | Morgan Stanley Capital Services LLC | | | | | 01/14/22 | | | | | | 17,266 | | |
| USD 1,049,540 | | | AUD 1,463,289 | | | Morgan Stanley Capital Services LLC | | | | | 01/14/22 | | | | | | (15,108) | | |
| AUD 2,394,418 | | | USD 1,736,060 | | | Morgan Stanley Capital Services LLC | | | | | 01/14/22 | | | | | | 6,053 | | |
| NOK 23,194,434 | | | USD 2,590,972 | | | Morgan Stanley Capital Services LLC | | | | | 01/14/22 | | | | | | 42,319 | | |
| USD 2,562,067 | | | EUR 2,258,607 | | | Morgan Stanley Capital Services LLC | | | | | 01/14/22 | | | | | | (9,890) | | |
| USD 1,254,801 | | | JPY 142,528,530 | | | Morgan Stanley Capital Services LLC | | | | | 01/14/22 | | | | | | 15,645 | | |
| EUR 6,355,611 | | | USD 7,169,405 | | | Morgan Stanley Capital Services LLC | | | | | 01/14/22 | | | | | | 67,958 | | |
| USD 2,514,141 | | | NZD 3,722,144 | | | Morgan Stanley Capital Services LLC | | | | | 01/14/22 | | | | | | (34,813) | | |
| AUD 2,946,126 | | | USD 2,090,310 | | | Morgan Stanley Capital Services LLC | | | | | 01/14/22 | | | | | | 53,210 | | |
| USD 4,497,635 | | | CHF 4,153,456 | | | Morgan Stanley Capital Services LLC | | | | | 01/14/22 | | | | | | (61,793) | | |
| AUD 4,764,233 | | | USD 3,453,923 | | | Morgan Stanley Capital Services LLC | | | | | 01/14/22 | | | | | | 12,402 | | |
| NOK 7,010,148 | | | USD 770,749 | | | Morgan Stanley Capital Services LLC | | | | | 01/14/22 | | | | | | 25,121 | | |
| USD 3,203,997 | | | EUR 2,836,707 | | | Morgan Stanley Capital Services LLC | | | | | 01/14/22 | | | | | | (26,264) | | |
| SEK 4,914,827 | | | USD 544,895 | | | Morgan Stanley Capital Services LLC | | | | | 01/14/22 | | | | | | (948) | | |
| USD 1,006,418 | | | CAD 1,289,514 | | | Morgan Stanley Capital Services LLC | | | | | 01/14/22 | | | | | | (12,990) | | |
| PLN 475 | | | USD 114 | | | Morgan Stanley Capital Services LLC | | | | | 01/21/22 | | | | | | 4 | | |
| ZAR 50,210 | | | USD 3,084 | | | Morgan Stanley Capital Services LLC | | | | | 01/21/22 | | | | | | 59 | | |
| BRL 3,379 | | | USD 589 | | | Morgan Stanley Capital Services LLC | | | | | 02/04/22 | | | | | | 13 | | |
| COP 1,245,879 | | | USD 318 | | | Morgan Stanley Capital Services LLC | | | | | 02/04/22 | | | | | | (13) | | |
| USD 980,776 | | | GBP 739,805 | | | Standard Chartered Bank | | | | | 01/14/22 | | | | | | (20,561) | | |
| USD 2,652,514 | | | NOK 23,946,561 | | | Standard Chartered Bank | | | | | 01/14/22 | | | | | | (66,166) | | |
| USD 401,231 | | | NZD 585,859 | | | Standard Chartered Bank | | | | | 01/14/22 | | | | | | 30 | | |
| SEK 2,331,367 | | | USD 257,358 | | | Standard Chartered Bank | | | | | 01/14/22 | | | | | | 665 | | |
| USD 3,519,073 | | | SEK 31,729,559 | | | Standard Chartered Bank | | | | | 01/14/22 | | | | | | 7,412 | | |
| Voya Balanced Income Portfolio | as of December 31, 2021 (continued) |
| Currency Purchased | | | Currency Sold | | | Counterparty | | | Settlement Date | | | Unrealized Appreciation (Depreciation) | | ||||||
| JPY 230,364,096 | | | USD 2,007,054 | | | Standard Chartered Bank | | | | | 01/14/22 | | | | | $ | (4,247) | | |
| USD 375,939 | | | JPY 43,173,015 | | | Standard Chartered Bank | | | | | 01/14/22 | | | | | | 589 | | |
| USD 2,658,110 | | | JPY 300,072,794 | | | Standard Chartered Bank | | | | | 01/14/22 | | | | | | 49,250 | | |
| CLP 2,819,558 | | | USD 3,323 | | | Standard Chartered Bank | | | | | 02/04/22 | | | | | | (28) | | |
| CAD 508,220 | | | USD 396,907 | | | State Street Bank and Trust Co. | | | | | 01/14/22 | | | | | | 4,859 | | |
| USD 292,502 | | | AUD 417,688 | | | State Street Bank and Trust Co. | | | | | 01/14/22 | | | | | | (11,396) | | |
| JPY 599,502,664 | | | USD 5,276,177 | | | State Street Bank and Trust Co. | | | | | 01/14/22 | | | | | | (64,047) | | |
| USD 2,134,880 | | | EUR 1,883,799 | | | State Street Bank and Trust Co. | | | | | 01/14/22 | | | | | | (10,269) | | |
| CAD 739,700 | | | USD 579,705 | | | State Street Bank and Trust Co. | | | | | 01/14/22 | | | | | | 5,055 | | |
| USD 1,363,370 | | | CAD 1,724,492 | | | State Street Bank and Trust Co. | | | | | 01/14/22 | | | | | | 96 | | |
| CHF 921,778 | | | USD 1,003,777 | | | State Street Bank and Trust Co. | | | | | 01/14/22 | | | | | | 8,099 | | |
| NZD 864,030 | | | USD 588,505 | | | State Street Bank and Trust Co. | | | | | 01/14/22 | | | | | | 3,190 | | |
| USD 624,316 | | | GBP 470,305 | | | State Street Bank and Trust Co. | | | | | 01/14/22 | | | | | | (12,250) | | |
| USD 572,812 | | | CAD 728,128 | | | State Street Bank and Trust Co. | | | | | 01/14/22 | | | | | | (2,800) | | |
| JPY 36,729,456 | | | USD 324,226 | | | State Street Bank and Trust Co. | | | | | 01/14/22 | | | | | | (4,896) | | |
| EUR 554,947 | | | USD 628,874 | | | State Street Bank and Trust Co. | | | | | 01/14/22 | | | | | | 3,063 | | |
| USD 620,818 | | | AUD 873,300 | | | State Street Bank and Trust Co. | | | | | 01/14/22 | | | | | | (14,572) | | |
| USD 25 | | | EUR 22 | | | State Street Bank and Trust Co. | | | | | 01/14/22 | | | | | | — | | |
| JPY 67,080,635 | | | USD 590,176 | | | State Street Bank and Trust Co. | | | | | 01/14/22 | | | | | | (6,971) | | |
| USD 586,443 | | | AUD 818,427 | | | State Street Bank and Trust Co. | | | | | 01/14/22 | | | | | | (9,023) | | |
| USD 527,667 | | | NZD 782,937 | | | State Street Bank and Trust Co. | | | | | 01/14/22 | | | | | | (8,495) | | |
| CAD 2,708,121 | | | USD 2,108,362 | | | State Street Bank and Trust Co. | | | | | 01/14/22 | | | | | | 32,507 | | |
| USD 952,999 | | | GBP 721,297 | | | State Street Bank and Trust Co. | | | | | 01/14/22 | | | | | | (23,288) | | |
| AUD 387,177 | | | USD 280,626 | | | State Street Bank and Trust Co. | | | | | 01/14/22 | | | | | | 1,074 | | |
| JPY 551,369,576 | | | USD 4,788,429 | | | State Street Bank and Trust Co. | | | | | 01/14/22 | | | | | | 5,228 | | |
| USD 262,968 | | | CHF 240,585 | | | State Street Bank and Trust Co. | | | | | 01/14/22 | | | | | | (1,132) | | |
| CHF 777,157 | | | USD 846,515 | | | State Street Bank and Trust Co. | | | | | 01/14/22 | | | | | | 6,604 | | |
| CAD 576,574 | | | USD 450,025 | | | State Street Bank and Trust Co. | | | | | 01/14/22 | | | | | | 5,779 | | |
| USD 2,027,974 | | | CAD 2,582,150 | | | State Street Bank and Trust Co. | | | | | 01/14/22 | | | | | | (13,310) | | |
| CAD 696,899 | | | USD 545,034 | | | State Street Bank and Trust Co. | | | | | 01/14/22 | | | | | | 5,890 | | |
| SEK 19,406,928 | | | USD 2,136,441 | | | State Street Bank and Trust Co. | | | | | 01/14/22 | | | | | | 11,416 | | |
| EUR 545,353 | | | USD 615,630 | | | State Street Bank and Trust Co. | | | | | 01/14/22 | | | | | | 5,383 | | |
| USD 1,631,037 | | | AUD 2,261,773 | | | State Street Bank and Trust Co. | | | | | 01/14/22 | | | | | | (14,567) | | |
| USD 2,723,710 | | | AUD 3,795,923 | | | State Street Bank and Trust Co. | | | | | 01/14/22 | | | | | | (38,100) | | |
| USD 1,944,444 | | | GBP 1,455,980 | | | State Street Bank and Trust Co. | | | | | 01/14/22 | | | | | | (26,248) | | |
| USD 4,204,107 | | | GBP 3,130,949 | | | State Street Bank and Trust Co. | | | | | 01/14/22 | | | | | | (33,682) | | |
| USD 2,582,837 | | | AUD 3,576,368 | | | State Street Bank and Trust Co. | | | | | 01/14/22 | | | | | | (19,231) | | |
| EUR 315,097 | | | USD 356,306 | | | State Street Bank and Trust Co. | | | | | 01/14/22 | | | | | | 2,506 | | |
| CHF 4,115,551 | | | USD 4,488,989 | | | State Street Bank and Trust Co. | | | | | 01/14/22 | | | | | | 28,829 | | |
| USD 2,752,724 | | | JPY 316,461,869 | | | State Street Bank and Trust Co. | | | | | 01/14/22 | | | | | | 1,376 | | |
| GBP 2,880,208 | | | USD 3,884,888 | | | State Street Bank and Trust Co. | | | | | 01/14/22 | | | | | | 13,519 | | |
| USD 4,472,075 | | | GBP 3,316,332 | | | State Street Bank and Trust Co. | | | | | 01/14/22 | | | | | | (16,633) | | |
| USD 2,134,747 | | | EUR 1,887,048 | | | State Street Bank and Trust Co. | | | | | 01/14/22 | | | | | | (14,102) | | |
| CAD 1,654,019 | | | USD 1,291,448 | | | State Street Bank and Trust Co. | | | | | 01/14/22 | | | | | | 16,115 | | |
| USD 2,523,663 | | | NZD 3,718,002 | | | State Street Bank and Trust Co. | | | | | 01/14/22 | | | | | | (22,455) | | |
| USD 708 | | | MXN 14,950 | | | State Street Bank and Trust Co. | | | | | 02/04/22 | | | | | | (18) | | |
| USD 4,111 | | | GBP 3,048 | | | The Bank of New York Mellon | | | | | 01/04/22 | | | | | | (15) | | |
| | | | | | | | | | | | | | | | | $ | (30,656) | | |
| | |||||||||||||||||||
| Voya Balanced Income Portfolio | as of December 31, 2021 (continued) |
| Description | | | Number of Contracts | | | Expiration Date | | | Notional Amount | | | Unrealized Appreciation/ (Depreciation) | | ||||||||||||
| Long Contracts: | | | | | | | | | | | | | | | | | | | | | | | | | |
| U.S. Treasury 10-Year Note | | | | | 88 | | | | | | 03/22/22 | | | | | $ | 11,481,250 | | | | | $ | 36,196 | | |
| U.S. Treasury 2-Year Note | | | | | 70 | | | | | | 03/31/22 | | | | | | 15,272,031 | | | | | | (20,977) | | |
| U.S. Treasury 5-Year Note | | | | | 490 | | | | | | 03/31/22 | | | | | | 59,278,516 | | | | | | 246,442 | | |
| | | | | | | | | | | | | | | | | $ | 86,031,797 | | | | | $ | 261,661 | | |
| Short Contracts: | | | | | | | | | | | | | | | | | | | | | | | | | |
| U.S. Treasury Long Bond | | | | | (19) | | | | | | 03/22/22 | | | | | | (3,048,313) | | | | | | (46,055) | | |
| U.S. Treasury Ultra 10-Year Note | | | | | (87) | | | | | | 03/22/22 | | | | | | (12,740,063) | | | | | | (224,238) | | |
| U.S. Treasury Ultra Long Bond | | | | | (9) | | | | | | 03/22/22 | | | | | | (1,774,125) | | | | | | (31,411) | | |
| | | | | | | | | | | | | | | | | $ | (17,562,501) | | | | | $ | (301,704) | | |
| Reference Entity/Obligation | | | Buy/Sell Protection | | | (Pay)/ Receive Financing Rate (%)(2) | | | Termination Date | | | Notional Amount(3) | | | Fair Value(4) | | | Unrealized Appreciation/ (Depreciation) | | |||||||||||||||
| Prudential Financial Inc. 3.50%, due 05/15/2024 | | | | | Buy | | | | | | (1.000) | | | | | | 12/20/24 | | | | USD 1,140,000 | | | | $ | (23,306) | | | | | $ | 6,981 | | |
| | | | | | | | | | | | | | | | | | | | | | | | | | $ | (23,306) | | | | | $ | 6,981 | | |
| Pay/Receive Floating Rate | | | Floating Rate Index | | | Floating Rate Index Payment Frequency | | | Fixed Rate | | | Fixed Rate Payment Frequency | | | Maturity Date | | | Notional Amount | | | Fair Value | | | Unrealized Appreciation/ (Depreciation) | | |||||||||||||||
| Pay | | | 3-month USD-LIBOR | | | Quarterly | | | | | 1.466% | | | | Semi-Annual | | | | | 12/22/31 | | | | | | USD 183,500 | | | | | $ | (1,874) | | | | | $ | (1,874) | | |
| Pay | | | 3-month USD-LIBOR | | | Quarterly | | | | | 1.540 | | | | Semi-Annual | | | | | 12/24/31 | | | | | | USD 122,000 | | | | | | (403) | | | | | | (403) | | |
| Pay | | | 3-month USD-LIBOR | | | Quarterly | | | | | 1.581 | | | | Semi-Annual | | | | | 01/05/32 | | | | | | USD 356,000 | | | | | | 124 | | | | | | 124 | | |
| Receive | | | 3-month USD-LIBOR | | | Quarterly | | | | | 1.497 | | | | Semi-Annual | | | | | 12/22/31 | | | | | | USD 228,000 | | | | | | 1,656 | | | | | | 1,656 | | |
| Receive | | | 3-month USD-LIBOR | | | Quarterly | | | | | 1.548 | | | | Semi-Annual | | | | | 12/23/31 | | | | | | USD 652,000 | | | | | | 1,633 | | | | | | 1,633 | | |
| Receive | | | 3-month USD-LIBOR | | | Quarterly | | | | | 1.569 | | | | Semi-Annual | | | | | 12/29/31 | | | | | | USD 259,009 | | | | | | 145 | | | | | | 145 | | |
| Receive | | | 3-month USD-LIBOR | | | Quarterly | | | | | 1.628 | | | | Semi-Annual | | | | | 12/31/31 | | | | | | USD 612,000 | | | | | | (3,076) | | | | | | (3,076) | | |
| Receive | | | 3-month USD-LIBOR | | | Quarterly | | | | | 1.578 | | | | Semi-Annual | | | | | 01/05/32 | | | | | | USD 101,800 | | | | | | — | | | | | | — | | |
| | | | | | | | | | | | | | | | | | | | | | | | | | | | | | | | $ | (1,795) | | | | | $ | (1,795) | | |
| Voya Balanced Income Portfolio | as of December 31, 2021 (continued) |
| Pay/Receive Volatility(1) | | | Reference Entity | | | Volatility Strike Rate | | | Counterparty | | | Maturity Date | | | Currency | | | Notional Amount | | | Fair Value | | | Unrealized Appreciation (Depreciation) | | ||||||||||||
| Receive | | | EUR vs. USD | | | | | 6.500% | | | | BNP Paribas | | | 03/14/22 | | | | | EUR | | | | 1,434,500 | | | | $ | (6,318) | | | | | $ | (6,318) | | |
| Receive | | | EUR vs. USD | | | | | 6.400% | | | | Goldman Sachs International | | | 06/14/22 | | | | | EUR | | | | 1,272,600 | | | | | (5,277) | | | | | | (5,277) | | |
| Receive | | | EUR vs. USD | | | | | 6.300% | | | | Standard Chartered Bank | | | 06/14/22 | | | | | EUR | | | | 1,440,300 | | | | | (4,915) | | | | | | (4,915) | | |
| | | | | | | | | | | | | | | | | | | | | | | | | | | | | $ | (16,510) | | | | | $ | (16,510) | | |
| Description | | | Counterparty | | | Put/Call | | | Expiration Date | | | Exercise Price | | | Number of Contracts | | | Notional Amount | | | Cost | | | Fair Value | | ||||||||||||
iShares iBoxx $High Yield Corporate Bond ETF | | | Citibank N.A. | | | Put | | | | | 03/18/22 | | | | USD 80.500 | | | | | 304,921 | | | | USD 26,531,176 | | | | $ | 157,143 | | | | | $ | 86,246 | | |
| | | | | | | | | | | | | | | | | | | | | | | | | | | | | $ | 157,143 | | | | | $ | 86,246 | | |
| Description | | | Counterparty | | | Put/Call | | | Expiration Date | | | Exercise Price | | | Number of Contracts | | | Notional Amount | | | Premiums Received | | | Fair Value | | ||||||||||||
iShares iBoxx $High Yield Corporate Bond ETF | | | Citibank N.A. | | | Put | | | | | 01/21/22 | | | | USD 85.250 | | | | | 165,773 | | | | USD 14,423,909 | | | | $ | 84,544 | | | | | $ | (22,111) | | |
| | | | | | | | | | | | | | | | | | | | | | | | | | | | | $ | 84,544 | | | | | $ | (22,111) | | |
| Description | | | Counterparty | | | Pay/ Receive Exercise Rate | | | Exercise Rate | | | Floating Rate Index | | | Expiration Date | | | Notional Amount | | | Premiums Received | | | Fair Value | | ||||||||||||||||||
| Call on 10-Year Interest Rate Swap(2) | | | Goldman Sachs International | | | | | Pay | | | | | | 1.497% | | | | | | 3-month USD-LIBOR | | | | | | 01/06/22 | | | | USD 2,354,000 | | | | $ | 15,095 | | | | | $ | (2,221) | | |
| Put on 10-Year Interest Rate Swap(3) | | | Goldman Sachs International | | | | | Receive | | | | | | 1.497% | | | | | | 3-month USD-LIBOR | | | | | | 01/06/22 | | | | USD 2,354,000 | | | | | 15,095 | | | | | | (20,619) | | |
| | | | | | | | | | | | | | | | | | | | | | | | | | | | | | | | | | | $ | 30,190 | | | | | $ | (22,840) | | |
| | AUD | | | – | | | Australian Dollar | |
| | BRL | | | – | | | Brazilian Real | |
| | CAD | | | – | | | Canadian Dollar | |
| | CHF | | | – | | | Swiss Franc | |
| | CLP | | | – | | | Chilean Peso | |
| | COP | | | – | | | Colombian Peso | |
| | EUR | | | – | | | EU Euro | |
| | GBP | | | – | | | British Pound | |
| | IDR | | | – | | | Indonesian Rupiah | |
| | JPY | | | – | | | Japanese Yen | |
| | MXN | | | – | | | Mexican Peso | |
| | NOK | | | – | | | Norwegian Krone | |
| | NZD | | | – | | | New Zealand Dollar | |
| Voya Balanced Income Portfolio | as of December 31, 2021 (continued) |
| | PEN | | | – | | | Peruvian Nuevo Sol | |
| | PLN | | | – | | | Polish Zloty | |
| | RUB | | | – | | | Russian Ruble | |
| | SEK | | | – | | | Swedish Krona | |
| | TRY | | | – | | | Turkish Lira | |
| | USD | | | – | | | United States Dollar | |
| | ZAR | | | – | | | South African Rand | |
| Derivatives not accounted for as hedging instruments | | | Location on Statement of Assets and Liabilities | | | Fair Value | | |||
| Asset Derivatives | | | | | | | | | | |
| Equity Contracts | | | Investments in securities at value* | | | | $ | 86,246 | | |
| Foreign exchange contracts | | | Unrealized appreciation on forward foreign currency contracts | | | | | 1,669,928 | | |
| Interest rate contracts | | | Variation margin receivable on futures contracts** | | | | | 282,638 | | |
| Credit contracts | | | Variation margin receivable on centrally cleared swaps** | | | | | 6,981 | | |
| Interest rate contracts | | | Variation margin receivable on centrally cleared swaps** | | | | | 3,558 | | |
| Total Asset Derivatives | | | | | | | $ | 2,049,351 | | |
| Liability Derivatives | | | | | | | | | | |
| Foreign exchange contracts | | | Unrealized depreciation on forward foreign currency contracts | | | | $ | 1,700,584 | | |
| Interest rate contracts | | | Variation margin payable on futures contracts** | | | | | 322,681 | | |
| Foreign exchange contracts | | | Unrealized depreciation on OTC swap agreements | | | | | 16,510 | | |
| Interest rate contracts | | | Variation margin payable on centrally cleared swaps** | | | | | 5,353 | | |
| Equity contracts | | | Written options, at fair value | | | | | 22,111 | | |
| Interest rate contracts | | | Written options, at fair value | | | | | 22,840 | | |
| Total Liability Derivatives | | | | | | | $ | 2,090,079 | | |
| Derivatives not accounted for as hedging instruments | | | Investments* | | | Forward foreign currency contracts | | | Futures | | | Swaps | | | Written options | | | Total | | ||||||||||||||||||
| Credit contracts | | | | $ | (210,901) | | | | | $ | — | | | | | $ | — | | | | | $ | (85,675) | | | | | $ | — | | | | | $ | (296,576) | | |
| Equity contracts | | | | | (25,964) | | | | | | — | | | | | | — | | | | | | — | | | | | | 29,255 | | | | | | 3,291 | | |
| Foreign exchange contracts | | | | | (143,434) | | | | | | (596,788) | | | | | | — | | | | | | — | | | | | | 62,670 | | | | | | (677,552) | | |
| Interest rate contracts | | | | | 90,824 | | | | | | — | | | | | | (1,516,085) | | | | | | (922,807) | | | | | | 937,363 | | | | | | (1,410,705) | | |
| Total | | | | $ | (289,475) | | | | | $ | (596,788) | | | | | $ | (1,516,085) | | | | | $ | (1,008,482) | | | | | $ | 1,029,288 | | | | | $ | (2,381,542) | | |
| Voya Balanced Income Portfolio | as of December 31, 2021 (continued) |
| Derivatives not accounted for as hedging instruments | | | Investments* | | | Forward foreign currency contracts | | | Futures | | | Swaps | | | Written options | | | Total | | ||||||||||||||||||
| Credit contracts | | | | $ | 29,057 | | | | | $ | — | | | | | $ | — | | | | | $ | 3,872 | | | | | $ | — | | | | | $ | 32,929 | | |
| Equity contracts | | | | | (70,897) | | | | | | — | | | | | | — | | | | | | — | | | | | | 62,433 | | | | | | (8,464) | | |
| Foreign exchange contracts | | | | | 80,626 | | | | | | 55,287 | | | | | | — | | | | | | (16,510) | | | | | | (57,066) | | | | | | 62,337 | | |
| Interest rate contracts | | | | | — | | | | | | — | | | | | | (276,442) | | | | | | (1,795) | | | | | | 7,350 | | | | | | (270,887) | | |
| Total | | | | $ | 38,786 | | | | | $ | 55,287 | | | | | $ | (276,442) | | | | | $ | (14,433) | | | | | $ | 12,717 | | | | | $ | (184,085) | | |
| | | | BNP Paribas | | | Brown Brothers Harriman | | | Citibank N.A. | | | Goldman Sachs International | | | JPMorgan Chase Bank N.A. | | | Morgan Stanley Capital Services LLC | | | Standard Chartered Bank | | | State Street Bank and Trust Co. | | | The Bank of New York Mellon | | | Totals | | ||||||||||||||||||||||||||||||
| Assets: | | | | | | | | | | | | | | | | | | | | | | | | | | | | | | | | | | | | | | | | | | | | | | | | | | | | | | | | | | | | | |
| Purchased options | | | | $ | — | | | | | $ | — | | | | | $ | 86,246 | | | | | $ | — | | | | | $ | — | | | | | $ | — | | | | | $ | — | | | | | $ | — | | | | | $ | — | | | | | $ | 86,246 | | |
| Forward foreign currency contracts | | | | | 501,741 | | | | | | 46,899 | | | | | | 97,161 | | | | | | 176,074 | | | | | | 86 | | | | | | 629,433 | | | | | | 57,946 | | | | | | 160,588 | | | | | | — | | | | | | 1,669,928 | | |
| Total Assets | | | | $ | 501,741 | | | | | $ | 46,899 | | | | | $ | 183,407 | | | | | $ | 176,074 | | | | | $ | 86 | | | | | $ | 629,433 | | | | | $ | 57,946 | | | | | $ | 160,588 | | | | | $ | — | | | | | $ | 1,756,174 | | |
| Liabilities: | | | | | | | | | | | | | | | | | | | | | | | | | | | | | | | | | | | | | | | | | | | | | | | | | | | | | | | | | | | | | |
| Forward foreign currency contracts | | | | $ | 342,472 | | | | | $ | 20,470 | | | | | $ | 198,300 | | | | | $ | 139,236 | | | | | $ | — | | | | | $ | 541,604 | | | | | $ | 91,002 | | | | | $ | 367,485 | | | | | $ | 15 | | | | | $ | 1,700,584 | | |
| Volatility Swaps | | | | | 6,318 | | | | | | — | | | | | | — | | | | | | 5,277 | | | | | | — | | | | | | — | | | | | | 4,915 | | | | | | — | | | | | | — | | | | | | 16,510 | | |
| Written options | | | | | — | | | | | | — | | | | | | 22,111 | | | | | | 22,840 | | | | | | — | | | | | | — | | | | | | — | | | | | | — | | | | | | — | | | | | | 44,951 | | |
| Total Liabilities | | | | $ | 348,790 | | | | | $ | 20,470 | | | | | $ | 220,411 | | | | | $ | 167,353 | | | | | $ | — | | | | | $ | 541,604 | | | | | $ | 95,917 | | | | | $ | 367,485 | | | | | $ | 15 | | | | | $ | 1,762,045 | | |
Net OTC derivative instruments by counterparty, at fair value | | | | $ | 152,951 | | | | | $ | 26,429 | | | | | $ | (37,004) | | | | | $ | 8,721 | | | | | $ | 86 | | | | | $ | 87,829 | | | | | $ | (37,971) | | | | | $ | (206,897) | | | | | $ | (15) | | | | | | (5,871) | | |
| Total collateral pledged by the Portfolio/(Received from counterparty) | | | | $ | — | | | | | $ | — | | | | | $ | — | | | | | $ | — | | | | | $ | — | | | | | $ | — | | | | | $ | — | | | | | $ | — | | | | | $ | — | | | | | $ | — | | |
Net Exposure(1) | | | | $ | 152,951 | | | | | $ | 26,429 | | | | | $ | (37,004) | | | | | $ | 8,721 | | | | | $ | 86 | | | | | $ | 87,829 | | | | | $ | (37,971) | | | | | $ | (206,897) | | | | | $ | (15) | | | | | $ | (5,871) | | |
| | Cost for federal income tax purposes was $314,525,971. | | | |||||
| | Net unrealized appreciation consisted of: | | | |||||
| | Gross Unrealized Appreciation | | | | $ | 28,918,592 | | |
| | Gross Unrealized Depreciation | | | | | (11,821,074) | | |
| | Net Unrealized Appreciation | | | | $ | 17,097,518 | | |
| Voya High Yield Portfolio | as of December 31, 2021 |
| Principal Amount† | | | Value | | | Percentage of Net Assets | | |||||||||
| CORPORATE BONDS/NOTES: 94.7% | | |||||||||||||||
| | | | Basic Materials: 6.3% | | ||||||||||||
| 900,000 (1)(2) | | | Cleveland-Cliffs, Inc., 4.625%, 03/01/2029 | | | | $ | 919,332 | | | | | | 0.2 | | |
| 750,000 (1)(2) | | | Cleveland-Cliffs, Inc., 4.875%, 03/01/2031 | | | | | 780,285 | | | | | | 0.2 | | |
| 1,325,000 (1)(2) | | | Coeur Mining, Inc., 5.125%, 02/15/2029 | | | | | 1,216,204 | | | | | | 0.2 | | |
| 1,000,000 (2) | | | Compass Minerals International, Inc., 6.750%, 12/01/2027 | | | | | 1,060,245 | | | | | | 0.2 | | |
| 1,225,000 (2) | | | Consolidated Energy Finance S.A., 5.625%, 10/15/2028 | | | | | 1,199,159 | | | | | | 0.2 | | |
| 1,150,000 (2) | | | Constellium SE, 5.625%, 06/15/2028 | | | | | 1,210,910 | | | | | | 0.2 | | |
| 1,225,000 (2) | | | Diamond BC BV, 4.625%, 10/01/2029 | | | | | 1,217,019 | | | | | | 0.2 | | |
| 900,000 (2) | | | First Quantum Minerals Ltd., 6.875%, 10/15/2027 | | | | | 969,610 | | | | | | 0.2 | | |
| 2,170,000 | | | Freeport-McMoRan, Inc., 4.125%, 03/01/2028 | | | | | 2,254,489 | | | | | | 0.4 | | |
| 135,000 | | | Freeport-McMoRan, Inc., 4.250%, 03/01/2030 | | | | | 142,619 | | | | | | 0.0 | | |
| 500,000 | | | Freeport-McMoRan, Inc., 4.550%, 11/14/2024 | | | | | 536,337 | | | | | | 0.1 | | |
| 1,175,000 (2) | | | Hudbay Minerals, Inc., 4.500%, 04/01/2026 | | | | | 1,176,351 | | | | | | 0.2 | | |
| 1,150,000 (2) | | | Illuminate Buyer LLC / Illuminate Holdings IV, Inc., 9.000%, 07/01/2028 | | | | | 1,228,010 | | | | | | 0.2 | | |
| 1,600,000 (2) | | | INEOS Quattro Finance 2 Plc, 3.375%, 01/15/2026 | | | | | 1,607,720 | | | | | | 0.3 | | |
| 1,350,000 (2)(3) | | | Iris Holdings, Inc., 8.750% (PIK Rate 9.500%, Cash Rate 8.750%), 02/15/2026 | | | | | 1,366,841 | | | | | | 0.3 | | |
| 848,000 (2) | | | Joseph T Ryerson & Son, Inc., 8.500%, 08/01/2028 | | | | | 923,447 | | | | | | 0.2 | | |
| 1,300,000 (2) | | | Kraton Polymers LLC / Kraton Polymers Capital Corp., 4.250%, 12/15/2025 | | | | | 1,347,275 | | | | | | 0.3 | | |
| 1,650,000 (2) | | | LSF11 A5 Holdco LLC, 6.625%, 10/15/2029 | | | | | 1,627,568 | | | | | | 0.3 | | |
| 1,375,000 (2) | | | Novelis Corp., 3.875%, 08/15/2031 | | | | | 1,368,544 | | | | | | 0.3 | | |
| 535,000 (2) | | | OCI NV, 4.625%, 10/15/2025 | | | | | 555,627 | | | | | | 0.1 | | |
| 850,000 | | | Olin Corp., 5.125%, 09/15/2027 | | | | | 873,163 | | | | | | 0.2 | | |
| 1,300,000 | | | Olin Corp., 5.000%, 02/01/2030 | | | | | 1,366,853 | | | | | | 0.3 | | |
| 1,825,000 (2) | | | Schweitzer-Mauduit International, Inc., 6.875%, 10/01/2026 | | | | | 1,911,742 | | | | | | 0.4 | | |
| 1,400,000 (1)(2) | | | Taseko Mines Ltd., 7.000%, 02/15/2026 | | | | | 1,457,456 | | | | | | 0.3 | | |
| 820,000 (2) | | | Trinseo Materials Operating SCA / Trinseo Materials Finance, Inc., 5.125%, 04/01/2029 | | | | | 837,638 | | | | | | 0.2 | | |
| Principal Amount† | | | Value | | | Percentage of Net Assets | | |||||||||
| CORPORATE BONDS/NOTES: (continued) | | |||||||||||||||
| | | | Basic Materials (continued) | | ||||||||||||
| 1,275,000 (2) | | | Tronox, Inc., 4.625%, 03/15/2029 | | | | $ | 1,275,714 | | | | | | 0.2 | | |
| 255,000 (2) | | | Unifrax Escrow Issuer Corp., 5.250%, 09/30/2028 | | | | | 258,239 | | | | | | 0.1 | | |
| 875,000 (2) | | | Unifrax Escrow Issuer Corp., 7.500%, 09/30/2029 | | | | | 884,993 | | | | | | 0.2 | | |
| 750,000 (1)(2) | | | Venator Finance Sarl / Venator Materials LLC, 5.750%, 07/15/2025 | | | | | 720,780 | | | | | | 0.1 | | |
| | | | | | | | | 32,294,170 | | | | | | 6.3 | | |
| | | | Communications: 15.9% | | ||||||||||||
| 1,200,000 (2) | | | Acuris Finance US, Inc. / Acuris Finance SARL, 5.000%, 05/01/2028 | | | | | 1,195,824 | | | | | | 0.2 | | |
| 1,200,000 (2) | | | Altice France Holding SA, 6.000%, 02/15/2028 | | | | | 1,148,160 | | | | | | 0.2 | | |
| 1,700,000 (2) | | | Altice France SA/France, 5.500%, 10/15/2029 | | | | | 1,677,398 | | | | | | 0.3 | | |
| 1,225,000 (2) | | | Altice France SA/France, 8.125%, 02/01/2027 | | | | | 1,310,781 | | | | | | 0.3 | | |
| 1,300,000 | | | AMC Networks, Inc., 4.250%, 02/15/2029 | | | | | 1,294,228 | | | | | | 0.2 | | |
| 1,425,000 (2) | | | Beasley Mezzanine Holdings LLC, 8.625%, 02/01/2026 | | | | | 1,408,669 | | | | | | 0.3 | | |
| 1,675,000 (2) | | | CCO Holdings LLC / CCO Holdings Capital Corp., 4.250%, 01/15/2034 | | | | | 1,650,943 | | | | | | 0.3 | | |
| 2,300,000 | | | CCO Holdings LLC / CCO Holdings Capital Corp., 4.500%, 05/01/2032 | | | | | 2,369,954 | | | | | | 0.5 | | |
| 2,250,000 (2) | | | CCO Holdings LLC / CCO Holdings Capital Corp., 5.125%, 05/01/2027 | | | | | 2,320,256 | | | | | | 0.4 | | |
| 1,075,000 (2) | | | CCO Holdings LLC / CCO Holdings Capital Corp., 5.000%, 02/01/2028 | | | | | 1,120,150 | | | | | | 0.2 | | |
| 800,000 (2) | | | Clear Channel Outdoor Holdings, Inc., 7.500%, 06/01/2029 | | | | | 855,376 | | | | | | 0.2 | | |
| 750,000 (2) | | | Clear Channel Outdoor Holdings, Inc., 7.750%, 04/15/2028 | | | | | 803,647 | | | | | | 0.2 | | |
| 575,000 (2) | | | CommScope Tech Finance LLC, 6.000%, 06/15/2025 | | | | | 575,641 | | | | | | 0.1 | | |
| 175,000 (1)(2) | | | CommScope Technologies LLC, 5.000%, 03/15/2027 | | | | | 163,800 | | | | | | 0.0 | | |
| 675,000 (2) | | | CommScope, Inc., 4.750%, 09/01/2029 | | | | | 672,000 | | | | | | 0.1 | | |
| 1,325,000 (2) | | | CommScope, Inc., 7.125%, 07/01/2028 | | | | | 1,303,687 | | | | | | 0.3 | | |
| 1,925,000 (2) | | | Connect Finco SARL / Connect US Finco LLC, 6.750%, 10/01/2026 | | | | | 2,026,255 | | | | | | 0.4 | | |
| 1,450,000 (2) | | | CSC Holdings LLC, 4.625%, 12/01/2030 | | | | | 1,374,513 | | | | | | 0.3 | | |
| Voya High Yield Portfolio | as of December 31, 2021 (continued) |
| Principal Amount† | | | Value | | | Percentage of Net Assets | | |||||||||
| CORPORATE BONDS/NOTES: (continued) | | |||||||||||||||
| | | | Communications (continued) | | ||||||||||||
| 675,000 | | | CSC Holdings LLC, 5.250%, 06/01/2024 | | | | $ | 702,830 | | | | | | 0.1 | | |
| 925,000 (2) | | | CSC Holdings LLC, 5.750%, 01/15/2030 | | | | | 923,349 | | | | | | 0.2 | | |
| 450,000 (2) | | | CSC Holdings LLC, 7.500%, 04/01/2028 | | | | | 483,338 | | | | | | 0.1 | | |
| 475,000 (2) | | | Diamond Sports Group LLC / Diamond Sports Finance Co., 5.375%, 08/15/2026 | | | | | 238,046 | | | | | | 0.0 | | |
| 325,000 (2) | | | Diamond Sports Group LLC / Diamond Sports Finance Co., 6.625%, 08/15/2027 | | | | | 91,813 | | | | | | 0.0 | | |
| 2,190,000 (2) | | | DIRECTV Holdings LLC / DIRECTV Financing Co., Inc., 5.875%, 08/15/2027 | | | | | 2,245,188 | | | | | | 0.4 | | |
| 1,750,000 | | | DISH DBS Corp., 5.125%, 06/01/2029 | | | | | 1,595,335 | | | | | | 0.3 | | |
| 450,000 (2) | | | DISH DBS Corp., 5.250%, 12/01/2026 | | | | | 457,947 | | | | | | 0.1 | | |
| 775,000 (2) | | | DISH DBS Corp., 5.750%, 12/01/2028 | | | | | 784,203 | | | | | | 0.2 | | |
| 960,000 (1) | | | DISH DBS Corp., 7.375%, 07/01/2028 | | | | | 973,541 | | | | | | 0.2 | | |
| 1,350,000 | | | Embarq Corp., 7.995%, 06/01/2036 | | | | | 1,514,214 | | | | | | 0.3 | | |
| 1,460,000 (2) | | | Audacy Capital Corp., 6.500%, 05/01/2027 | | | | | 1,445,692 | | | | | | 0.3 | | |
| 325,000 (2) | | | Frontier Communications Holdings LLC, 5.000%, 05/01/2028 | | | | | 335,338 | | | | | | 0.1 | | |
| 450,000 (1)(2) | | | Frontier Communications Holdings LLC, 6.000%, 01/15/2030 | | | | | 453,024 | | | | | | 0.1 | | |
| 1,300,000 (2) | | | Frontier Communications Holdings LLC, 6.750%, 05/01/2029 | | | | | 1,353,989 | | | | | | 0.3 | | |
| 1,225,000 (2) | | | GCI LLC, 4.750%, 10/15/2028 | | | | | 1,258,926 | | | | | | 0.2 | | |
| 1,225,000 (2) | | | Gray Escrow II, Inc., 5.375%, 11/15/2031 | | | | | 1,262,418 | | | | | | 0.2 | | |
| 1,275,000 (1) | | | Hughes Satellite Systems Corp., 6.625%, 08/01/2026 | | | | | 1,428,319 | | | | | | 0.3 | | |
| 500,000 (2) | | | iHeartCommunications, Inc., 5.250%, 08/15/2027 | | | | | 520,550 | | | | | | 0.1 | | |
| 1,800,000 | | | iHeartCommunications, Inc., 8.375%, 05/01/2027 | | | | | 1,900,125 | | | | | | 0.4 | | |
| 1,200,000 (2) | | | ION Trading Technologies Sarl, 5.750%, 05/15/2028 | | | | | 1,237,770 | | | | | | 0.2 | | |
| 700,000 (2) | | | LCPR Senior Secured Financing DAC, 5.125%, 07/15/2029 | | | | | 704,550 | | | | | | 0.1 | | |
| 1,440,000 (2) | | | LCPR Senior Secured Financing DAC, 6.750%, 10/15/2027 | | | | | 1,513,440 | | | | | | 0.3 | | |
| 1,415,000 (2) | | | McGraw-Hill Education, Inc., 8.000%, 08/01/2029 | | | | | 1,406,163 | | | | | | 0.3 | | |
| Principal Amount† | | | Value | | | Percentage of Net Assets | | |||||||||
| CORPORATE BONDS/NOTES: (continued) | | |||||||||||||||
| | | | Communications (continued) | | ||||||||||||
| 1,275,000 (2) | | | Midas OpCo Holdings LLC, 5.625%, 08/15/2029 | | | | $ | 1,307,302 | | | | | | 0.3 | | |
| 1,025,000 (2) | | | Midcontinent Communications / Midcontinent Finance Corp., 5.375%, 08/15/2027 | | | | | 1,056,775 | | | | | | 0.2 | | |
| 350,000 (2) | | | Netflix, Inc., 4.875%, 06/15/2030 | | | | | 408,791 | | | | | | 0.1 | | |
| 1,500,000 | | | Netflix, Inc., 5.875%, 11/15/2028 | | | | | 1,806,270 | | | | | | 0.3 | | |
| 1,100,000 | | | Northwestern Bell Telephone, 7.750%, 05/01/2030 | | | | | 1,369,872 | | | | | | 0.3 | | |
| 1,875,000 (2) | | | Radiate Holdco LLC / Radiate Finance, Inc., 6.500%, 09/15/2028 | | | | | 1,886,344 | | | | | | 0.4 | | |
| 225,000 (2) | | | Scripps Escrow II, Inc., 3.875%, 01/15/2029 | | | | | 225,069 | | | | | | 0.0 | | |
| 300,000 (1)(2) | | | Scripps Escrow II, Inc., 5.375%, 01/15/2031 | | | | | 305,324 | | | | | | 0.1 | | |
| 1,425,000 (2) | | | Scripps Escrow, Inc., 5.875%, 07/15/2027 | | | | | 1,498,477 | | | | | | 0.3 | | |
| 610,000 (2) | | | Sinclair Television Group, Inc., 4.125%, 12/01/2030 | | | | | 578,899 | | | | | | 0.1 | | |
| 860,000 (2) | | | Sinclair Television Group, Inc., 5.500%, 03/01/2030 | | | | | 835,408 | | | | | | 0.2 | | |
| 1,175,000 (2) | | | Sirius XM Radio, Inc., 5.000%, 08/01/2027 | | | | | 1,222,682 | | | | | | 0.2 | | |
| 1,300,000 (2) | | | Spanish Broadcasting System, Inc., 9.750%, 03/01/2026 | | | | | 1,338,727 | | | | | | 0.3 | | |
| 2,950,000 | | | Sprint Corp., 7.125%, 06/15/2024 | | | | | 3,315,564 | | | | | | 0.6 | | |
| 850,000 | | | Sprint Corp., 7.625%, 03/01/2026 | | | | | 1,021,585 | | | | | | 0.2 | | |
| 220,000 | | | TEGNA, Inc., 4.625%, 03/15/2028 | | | | | 222,830 | | | | | | 0.0 | | |
| 500,000 (2) | | | TEGNA, Inc., 4.750%, 03/15/2026 | | | | | 520,528 | | | | | | 0.1 | | |
| 1,325,000 | | | TEGNA, Inc., 5.000%, 09/15/2029 | | | | | 1,357,211 | | | | | | 0.3 | | |
| 825,000 | | | Telecom Italia Capital SA, 6.000%, 09/30/2034 | | | | | 873,824 | | | | | | 0.2 | | |
| 950,000 | | | Telecom Italia Capital SA, 6.375%, 11/15/2033 | | | | | 1,024,404 | | | | | | 0.2 | | |
| 475,000 (2) | | | Univision Communications, Inc., 4.500%, 05/01/2029 | | | | | 480,596 | | | | | | 0.1 | | |
| 2,175,000 (2) | | | Univision Communications, Inc., 6.625%, 06/01/2027 | | | | | 2,345,770 | | | | | | 0.5 | | |
| 1,300,000 (2) | | | Urban One, Inc., 7.375%, 02/01/2028 | | | | | 1,340,892 | | | | | | 0.3 | | |
| 875,000 (4) | | | ViacomCBS, Inc., 6.250%, 02/28/2057 | | | | | 986,676 | | | | | | 0.2 | | |
| 1,250,000 (2) | | | ViaSat, Inc., 5.625%, 09/15/2025 | | | | | 1,257,781 | | | | | | 0.2 | | |
| Voya High Yield Portfolio | as of December 31, 2021 (continued) |
| Principal Amount† | | | Value | | | Percentage of Net Assets | | |||||||||
| CORPORATE BONDS/NOTES: (continued) | | |||||||||||||||
| | | | Communications (continued) | | ||||||||||||
| 250,000 (2) | | | ViaSat, Inc., 5.625%, 04/15/2027 | | | | $ | 257,945 | | | | | | 0.0 | | |
| 625,000 (2) | | | ViaSat, Inc., 6.500%, 07/15/2028 | | | | | 627,447 | | | | | | 0.1 | | |
| 1,100,000 (2) | | | Viavi Solutions, Inc., 3.750%, 10/01/2029 | | | | | 1,101,524 | | | | | | 0.2 | | |
| 2,100,000 (2) | | | Virgin Media Vendor Financing Notes IV DAC, 5.000%, 07/15/2028 | | | | | 2,119,005 | | | | | | 0.4 | | |
| 1,000,000 (2) | | | Vmed O2 UK Financing I PLC, 4.750%, 07/15/2031 | | | | | 1,014,310 | | | | | | 0.2 | | |
| | | | | | | | | 81,809,222 | | | | | | 15.9 | | |
| | | | Consumer, Cyclical: 21.4% | | ||||||||||||
| 1,175,000 (2) | | | 1011778 BC ULC / New Red Finance, Inc., 4.000%, 10/15/2030 | | | | | 1,156,881 | | | | | | 0.2 | | |
| 1,350,000 (2) | | | Academy Ltd., 6.000%, 11/15/2027 | | | | | 1,442,063 | | | | | | 0.3 | | |
| 1,475,000 (2) | | | Adams Homes, Inc., 7.500%, 02/15/2025 | | | | | 1,542,975 | | | | | | 0.3 | | |
| 1,775,000 (1)(2) | | | Adient Global Holdings Ltd., 4.875%, 08/15/2026 | | | | | 1,812,790 | | | | | | 0.3 | | |
| 400,000 (2) | | | Adient US LLC, 9.000%, 04/15/2025 | | | | | 425,448 | | | | | | 0.1 | | |
| 1,825,000 (2) | | | Affinity Gaming, 6.875%, 12/15/2027 | | | | | 1,900,591 | | | | | | 0.4 | | |
| 325,000 (2) | | | Allison Transmission, Inc., 3.750%, 01/30/2031 | | | | | 317,452 | | | | | | 0.1 | | |
| 1,400,000 (2) | | | Allison Transmission, Inc., 5.875%, 06/01/2029 | | | | | 1,524,432 | | | | | | 0.3 | | |
| 620,425 | | | American Airlines 2015-2 Class A Pass Through Trust, 4.000%, 03/22/2029 | | | | | 609,561 | | | | | | 0.1 | | |
| 975,000 (1)(2) | | | American Airlines Group, Inc., 3.750%, 03/01/2025 | | | | | 912,693 | | | | | | 0.2 | | |
| 1,725,000 (2) | | | American Airlines, Inc./AAdvantage Loyalty IP Ltd., 5.750%, 04/20/2029 | | | | | 1,847,052 | | | | | | 0.4 | | |
| 1,525,000 (2) | | | Arko Corp., 5.125%, 11/15/2029 | | | | | 1,475,727 | | | | | | 0.3 | | |
| 760,000 | | | Asbury Automotive Group, Inc., 4.500%, 03/01/2028 | | | | | 776,291 | | | | | | 0.1 | | |
| 265,000 (2) | | | Asbury Automotive Group, Inc., 4.625%, 11/15/2029 | | | | | 270,411 | | | | | | 0.0 | | |
| 640,000 | | | Asbury Automotive Group, Inc., 4.750%, 03/01/2030 | | | | | 651,370 | | | | | | 0.1 | | |
| 300,000 (2)(3) | | | BCPE Ulysses Intermediate, Inc., 7.750% (PIK Rate 8.500%, Cash Rate 7.750%), 04/01/2027 | | | | | 296,550 | | | | | | 0.1 | | |
| 1,225,000 (2) | | | Boyd Gaming Corp., 4.750%, 06/15/2031 | | | | | 1,251,638 | | | | | | 0.2 | | |
| 451,000 (2) | | | Boyd Gaming Corp., 8.625%, 06/01/2025 | | | | | 483,797 | | | | | | 0.1 | | |
| 865,000 (2) | | | Boyne USA, Inc., 4.750%, 05/15/2029 | | | | | 892,433 | | | | | | 0.2 | | |
| Principal Amount† | | | Value | | | Percentage of Net Assets | | |||||||||
| CORPORATE BONDS/NOTES: (continued) | | |||||||||||||||
| | | | Consumer, Cyclical (continued) | | ||||||||||||
| 1,375,000 (2) | | | Caesars Entertainment, Inc., 4.625%, 10/15/2029 | | | | $ | 1,377,881 | | | | | | 0.3 | | |
| 1,300,000 (2) | | | Caesars Entertainment, Inc., 6.250%, 07/01/2025 | | | | | 1,366,170 | | | | | | 0.3 | | |
| 1,250,000 (2) | | | Carnival Corp., 7.625%, 03/01/2026 | | | | | 1,311,944 | | | | | | 0.3 | | |
| 700,000 (2) | | | Carnival Corp., 9.875%, 08/01/2027 | | | | | 800,625 | | | | | | 0.2 | | |
| 1,325,000 (2) | | | CCM Merger, Inc., 6.375%, 05/01/2026 | | | | | 1,383,572 | | | | | | 0.3 | | |
| 1,025,000 (2) | | | Century Communities, Inc., 3.875%, 08/15/2029 | | | | | 1,034,158 | | | | | | 0.2 | | |
| 1,225,000 (2) | | | Cinemark USA, Inc., 8.750%, 05/01/2025 | | | | | 1,299,823 | | | | | | 0.2 | | |
| 650,000 (2) | | | Delta Air Lines, Inc. / SkyMiles IP Ltd., 4.750%, 10/20/2028 | | | | | 710,308 | | | | | | 0.1 | | |
| 260,000 (1) | | | Delta Air Lines, Inc., 7.375%, 01/15/2026 | | | | | 306,372 | | | | | | 0.1 | | |
| 1,000,000 (1)(2) | | | Foot Locker, Inc., 4.000%, 10/01/2029 | | | | | 1,003,150 | | | | | | 0.2 | | |
| 1,900,000 | | | Ford Motor Credit Co. LLC, 2.700%, 08/10/2026 | | | | | 1,919,000 | | | | | | 0.4 | | |
| 1,100,000 | | | Ford Motor Credit Co. LLC, 3.625%, 06/17/2031 | | | | | 1,159,785 | | | | | | 0.2 | | |
| 1,100,000 | | | Ford Motor Credit Co. LLC, 4.125%, 08/17/2027 | | | | | 1,188,682 | | | | | | 0.2 | | |
| 1,775,000 | | | Ford Motor Credit Co. LLC, 4.542%, 08/01/2026 | | | | | 1,929,966 | | | | | | 0.4 | | |
| 1,150,000 | | | Ford Motor Credit Co. LLC, 5.113%, 05/03/2029 | | | | | 1,308,660 | | | | | | 0.3 | | |
| 1,700,000 | | | Ford Motor Credit Co. LLC, 5.584%, 03/18/2024 | | | | | 1,833,883 | | | | | | 0.4 | | |
| 1,400,000 (2) | | | Foundation Building Materials, Inc., 6.000%, 03/01/2029 | | | | | 1,377,467 | | | | | | 0.3 | | |
| 1,200,000 (1)(2) | | | Gap, Inc./The, 3.875%, 10/01/2031 | | | | | 1,185,468 | | | | | | 0.2 | | |
| 990,000 (2) | | | Golden Entertainment, Inc., 7.625%, 04/15/2026 | | | | | 1,038,881 | | | | | | 0.2 | | |
| 1,025,000 (2) | | | Installed Building Products, Inc., 5.750%, 02/01/2028 | | | | | 1,067,507 | | | | | | 0.2 | | |
| 1,400,000 (2) | | | Interface, Inc., 5.500%, 12/01/2028 | | | | | 1,468,565 | | | | | | 0.3 | | |
| 775,000 (2) | | | IRB Holding Corp., 6.750%, 02/15/2026 | | | | | 790,349 | | | | | | 0.2 | | |
| 1,850,000 | | | Bath & Body Works, Inc., 6.750%, 07/01/2036 | | | | | 2,287,451 | | | | | | 0.4 | | |
| 162,000 (2) | | | Bath & Body Works, Inc., 9.375%, 07/01/2025 | | | | | 197,802 | | | | | | 0.0 | | |
| 1,300,000 (2) | | | LBM Acquisition LLC, 6.250%, 01/15/2029 | | | | | 1,287,208 | | | | | | 0.2 | | |
| 1,650,000 (2) | | | LCM Investments Holdings II LLC, 4.875%, 05/01/2029 | | | | | 1,698,304 | | | | | | 0.3 | | |
| 1,250,000 (2) | | | LGI Homes, Inc, 4.000%, 07/15/2029 | | | | | 1,247,156 | | | | | | 0.2 | | |
| Voya High Yield Portfolio | as of December 31, 2021 (continued) |
| Principal Amount† | | | Value | | | Percentage of Net Assets | | |||||||||
| CORPORATE BONDS/NOTES: (continued) | | |||||||||||||||
| | | | Consumer, Cyclical (continued) | | ||||||||||||
| 1,600,000 (2) | | | Lions Gate Capital Holdings LLC, 5.500%, 04/15/2029 | | | | $ | 1,630,840 | | | | | | 0.3 | | |
| 400,000 | | | M/I Homes, Inc., 3.950%, 02/15/2030 | | | | | 394,606 | | | | | | 0.1 | | |
| 1,150,000 | | | M/I Homes, Inc., 4.950%, 02/01/2028 | | | | | 1,200,450 | | | | | | 0.2 | | |
| 575,000 | | | Macy’s Retail Holdings LLC, 4.500%, 12/15/2034 | | | | | 568,684 | | | | | | 0.1 | | |
| 825,000 | | | Mattel, Inc., 5.450%, 11/01/2041 | | | | | 986,015 | | | | | | 0.2 | | |
| 1,200,000 (2) | | | Melco Resorts Finance Ltd., 5.375%, 12/04/2029 | | | | | 1,165,860 | | | | | | 0.2 | | |
| 975,000 | | | Meritage Homes Corp., 5.125%, 06/06/2027 | | | | | 1,075,259 | | | | | | 0.2 | | |
| 1,700,000 (2) | | | Meritor, Inc., 4.500%, 12/15/2028 | | | | | 1,706,825 | | | | | | 0.3 | | |
| 300,000 | | | MGM Resorts International, 5.500%, 04/15/2027 | | | | | 319,824 | | | | | | 0.1 | | |
| 425,000 | | | MGM Resorts International, 6.000%, 03/15/2023 | | | | | 444,663 | | | | | | 0.1 | | |
| 1,300,000 (2) | | | Midwest Gaming Borrower LLC / Midwest Gaming Finance Corp., 4.875%, 05/01/2029 | | | | | 1,308,476 | | | | | | 0.3 | | |
| 100,000 (2) | | | Murphy Oil USA, Inc., 3.750%, 02/15/2031 | | | | | 99,518 | | | | | | 0.0 | | |
| 925,000 | | | Murphy Oil USA, Inc., 4.750%, 09/15/2029 | | | | | 974,890 | | | | | | 0.2 | | |
| 250,000 | | | Murphy Oil USA, Inc., 5.625%, 05/01/2027 | | | | | 260,270 | | | | | | 0.0 | | |
| 1,000,000 (1)(2) | | | Penn National Gaming, Inc., 4.125%, 07/01/2029 | | | | | 971,515 | | | | | | 0.2 | | |
| 900,000 (2) | | | Penn National Gaming, Inc., 5.625%, 01/15/2027 | | | | | 918,985 | | | | | | 0.2 | | |
| 2,000,000 (2) | | | PetSmart, Inc. / PetSmart Finance Corp., 7.750%, 02/15/2029 | | | | | 2,176,030 | | | | | | 0.4 | | |
| 1,044,000 (2) | | | Picasso Finance Sub, Inc., 6.125%, 06/15/2025 | | | | | 1,092,040 | | | | | | 0.2 | | |
| 1,750,000 (2) | | | Real Hero Merger Sub 2, Inc., 6.250%, 02/01/2029 | | | | | 1,749,729 | | | | | | 0.3 | | |
| 600,000 (1)(2) | | | Royal Caribbean Cruises Ltd., 5.500%, 04/01/2028 | | | | | 607,968 | | | | | | 0.1 | | |
| 355,000 (2) | | | Royal Caribbean Cruises Ltd., 9.125%, 06/15/2023 | | | | | 375,858 | | | | | | 0.1 | | |
| 704,000 (2) | | | Royal Caribbean Cruises Ltd., 11.500%, 06/01/2025 | | | | | 789,371 | | | | | | 0.2 | | |
| 875,000 (2) | | | Scientific Games International, Inc., 7.000%, 05/15/2028 | | | | | 933,327 | | | | | | 0.2 | | |
| 625,000 (2) | | | Scientific Games International, Inc., 8.250%, 03/15/2026 | | | | | 658,609 | | | | | | 0.1 | | |
| 600,000 (2) | | | Scientific Games International, Inc., 8.625%, 07/01/2025 | | | | | 641,220 | | | | | | 0.1 | | |
| Principal Amount† | | | Value | | | Percentage of Net Assets | | |||||||||
| CORPORATE BONDS/NOTES: (continued) | | |||||||||||||||
| | | | Consumer, Cyclical (continued) | | ||||||||||||
| 1,100,000 (2) | | | Scotts Miracle-Gro Co/The, 4.375%, 02/01/2032 | | | | $ | 1,098,917 | | | | | | 0.2 | | |
| 1,300,000 (2) | | | Shea Homes L.P. / Shea Homes Funding Corp., 4.750%, 04/01/2029 | | | | | 1,326,689 | | | | | | 0.3 | | |
| 1,125,000 (2) | | | Sizzling Platter LLC / Sizzling Platter Finance Corp., 8.500%, 11/28/2025 | | | | | 1,158,626 | | | | | | 0.2 | | |
| 1,525,000 (2) | | | Sonic Automotive, Inc., 4.625%, 11/15/2029 | | | | | 1,542,072 | | | | | | 0.3 | | |
| 1,875,000 (2) | | | Specialty Building Products Holdings LLC / SBP Finance Corp., 6.375%, 09/30/2026 | | | | | 1,967,034 | | | | | | 0.4 | | |
| 1,140,000 (2) | | | Speedway Motorsports LLC / Speedway Funding II, Inc., 4.875%, 11/01/2027 | | | | | 1,164,533 | | | | | | 0.2 | | |
| 1,300,000 (2) | | | SRS Distribution, Inc., 6.125%, 07/01/2029 | | | | | 1,326,702 | | | | | | 0.3 | | |
| 550,000 (2) | | | SRS Distribution, Inc., 6.000%, 12/01/2029 | | | | | 553,611 | | | | | | 0.1 | | |
| 2,050,000 (1)(2) | | | Staples, Inc., 10.750%, 04/15/2027 | | | | | 1,934,257 | | | | | | 0.4 | | |
| 1,350,000 (2) | | | Station Casinos LLC, 4.500%, 02/15/2028 | | | | | 1,360,287 | | | | | | 0.3 | | |
| 1,375,000 (2) | | | STL Holding Co. LLC, 7.500%, 02/15/2026 | | | | | 1,455,781 | | | | | | 0.3 | | |
| 1,200,000 (2) | | | Tempur Sealy International, Inc., 3.875%, 10/15/2031 | | | | | 1,204,134 | | | | | | 0.2 | | |
| 1,100,000 | | | Tri Pointe Homes, Inc., 5.700%, 06/15/2028 | | | | | 1,211,518 | | | | | | 0.2 | | |
| 950,000 (1) | | | United Airlines Holdings, Inc., 4.875%, 01/15/2025 | | | | | 978,310 | | | | | | 0.2 | | |
| 450,000 (2) | | | United Airlines, Inc., 4.375%, 04/15/2026 | | | | | 469,823 | | | | | | 0.1 | | |
| 1,000,000 (2) | | | United Airlines, Inc., 4.625%, 04/15/2029 | | | | | 1,033,330 | | | | | | 0.2 | | |
| 1,400,000 (2) | | | Univar Solutions USA, Inc./Washington, 5.125%, 12/01/2027 | | | | | 1,462,839 | | | | | | 0.3 | | |
| 1,537,214 | | | US Airways 2012-1 Class A Pass Through Trust, 5.900%, 04/01/2026 | | | | | 1,613,066 | | | | | | 0.3 | | |
| 1,425,000 (2) | | | Victoria’s Secret & Co., 4.625%, 07/15/2029 | | | | | 1,459,243 | | | | | | 0.3 | | |
| 1,700,000 (2) | | | Viking Cruises Ltd., 5.875%, 09/15/2027 | | | | | 1,620,440 | | | | | | 0.3 | | |
| 550,000 (2) | | | Viking Cruises Ltd., 13.000%, 05/15/2025 | | | | | 623,224 | | | | | | 0.1 | | |
| 250,000 (2) | | | VOC Escrow Ltd., 5.000%, 02/15/2028 | | | | | 247,863 | | | | | | 0.0 | | |
| 1,500,000 (2) | | | Wheel Pros, Inc., 6.500%, 05/15/2029 | | | | | 1,442,108 | | | | | | 0.3 | | |
| 1,200,000 (2) | | | White Cap Buyer LLC, 6.875%, 10/15/2028 | | | | | 1,252,704 | | | | | | 0.2 | | |
| Voya High Yield Portfolio | as of December 31, 2021 (continued) |
| Principal Amount† | | | Value | | | Percentage of Net Assets | | |||||||||
| CORPORATE BONDS/NOTES: (continued) | | |||||||||||||||
| | | | Consumer, Cyclical (continued) | | ||||||||||||
| 600,000 (2)(3) | | | White Cap Parent LLC, 8.250% (PIK Rate 9.000%, Cash Rate 8.250%), 03/15/2026 | | | | $ | 616,473 | | | | | | 0.1 | | |
| 1,150,000 (2) | | | William Carter Co/The, 5.625%, 03/15/2027 | | | | | 1,189,963 | | | | | | 0.2 | | |
| 675,000 (2) | | | Williams Scotsman International, Inc., 4.625%, 08/15/2028 | | | | | 697,913 | | | | | | 0.1 | | |
| 1,350,000 (2) | | | Wolverine World Wide, Inc., 4.000%, 08/15/2029 | | | | | 1,314,610 | | | | | | 0.3 | | |
| 1,000,000 (2) | | | Wyndham Hotels & Resorts, Inc., 4.375%, 08/15/2028 | | | | | 1,031,625 | | | | | | 0.2 | | |
| | | | | | | | | 110,578,819 | | | | | | 21.4 | | |
| | | | Consumer, Non-cyclical: 16.1% | | ||||||||||||
| 1,600,000 (2) | | | Acadia Healthcare Co., Inc., 5.500%, 07/01/2028 | | | | | 1,684,064 | | | | | | 0.3 | | |
| 1,350,000 (2) | | | ACCO Brands Corp., 4.250%, 03/15/2029 | | | | | 1,341,920 | | | | | | 0.3 | | |
| 1,745,000 (2) | | | ADT Security Corp./The, 4.125%, 08/01/2029 | | | | | 1,721,975 | | | | | | 0.3 | | |
| 1,125,000 (2) | | | Albertsons Cos, Inc. / Safeway, Inc. / New Albertsons L.P. / Albertsons LLC, 3.500%, 03/15/2029 | | | | | 1,129,151 | | | | | | 0.2 | | |
| 475,000 (2) | | | Albertsons Cos, Inc. / Safeway, Inc. / New Albertsons L.P. / Albertsons LLC, 4.875%, 02/15/2030 | | | | | 513,598 | | | | | | 0.1 | | |
| 1,200,000 (2) | | | Albertsons Cos, Inc. / Safeway, Inc. / New Albertsons L.P. / Albertsons LLC, 5.875%, 02/15/2028 | | | | | 1,273,656 | | | | | | 0.2 | | |
| 600,000 (1)(2) | | | Allied Universal Holdco LLC / Allied Universal Finance Corp., 6.000%, 06/01/2029 | | | | | 584,409 | | | | | | 0.1 | | |
| 575,000 (2) | | | Allied Universal Holdco LLC / Allied Universal Finance Corp., 6.625%, 07/15/2026 | | | | | 604,023 | | | | | | 0.1 | | |
| 1,525,000 (2) | | | Allied Universal Holdco LLC / Allied Universal Finance Corp., 9.750%, 07/15/2027 | | | | | 1,631,125 | | | | | | 0.3 | | |
| 1,600,000 (2) | | | Alta Equipment Group, Inc., 5.625%, 04/15/2026 | | | | | 1,647,368 | | | | | | 0.3 | | |
| 300,000 (2) | | | AMN Healthcare, Inc., 4.000%, 04/15/2029 | | | | | 304,555 | | | | | | 0.1 | | |
| 1,335,000 (2) | | | AMN Healthcare, Inc., 4.625%, 10/01/2027 | | | | | 1,385,062 | | | | | | 0.3 | | |
| 775,000 (2) | | | APi Escrow Corp., 4.750%, 10/15/2029 | | | | | 791,686 | | | | | | 0.2 | | |
| 520,000 (2) | | | APi Group DE, Inc., 4.125%, 07/15/2029 | | | | | 523,367 | | | | | | 0.1 | | |
| 2,500,000 (2) | | | Bausch Health Americas, Inc., 8.500%, 01/31/2027 | | | | | 2,628,613 | | | | | | 0.5 | | |
| Principal Amount† | | | Value | | | Percentage of Net Assets | | |||||||||
| CORPORATE BONDS/NOTES: (continued) | | |||||||||||||||
| | | | Consumer, Non-cyclical (continued) | | ||||||||||||
| 425,000 (2) | | | Bausch Health Cos, Inc., 4.875%, 06/01/2028 | | | | $ | 434,269 | | | | | | 0.1 | | |
| 1,750,000 (2) | | | Bausch Health Cos, Inc., 5.250%, 01/30/2030 | | | | | 1,542,712 | | | | | | 0.3 | | |
| 950,000 (2) | | | Bausch Health Cos, Inc., 7.000%, 01/15/2028 | | | | | 946,594 | | | | | | 0.2 | | |
| 300,000 (2) | | | Block, Inc., 2.750%, 06/01/2026 | | | | | 300,752 | | | | | | 0.1 | | |
| 800,000 (2) | | | Block, Inc., 3.500%, 06/01/2031 | | | | | 821,384 | | | | | | 0.2 | | |
| 750,000 (2) | | | Catalent Pharma Solutions, Inc., 5.000%, 07/15/2027 | | | | | 780,000 | | | | | | 0.2 | | |
| 700,000 | | | Centene Corp., 2.500%, 03/01/2031 | | | | | 682,626 | | | | | | 0.1 | | |
| 655,000 | | | Centene Corp., 2.625%, 08/01/2031 | | | | | 642,991 | | | | | | 0.1 | | |
| 1,825,000 | | | Centene Corp., 4.625%, 12/15/2029 | | | | | 1,971,347 | | | | | | 0.4 | | |
| 1,400,000 (2) | | | Cheplapharm Arzneimittel GmbH, 5.500%, 01/15/2028 | | | | | 1,419,488 | | | | | | 0.3 | | |
| 450,000 (2) | | | Chobani LLC / Chobani Finance Corp., Inc., 4.625%, 11/15/2028 | | | | | 463,005 | | | | | | 0.1 | | |
| 1,225,000 (2) | | | Chobani LLC / Chobani Finance Corp., Inc., 7.500%, 04/15/2025 | | | | | 1,262,418 | | | | | | 0.2 | | |
| 525,000 (2) | | | CHS/Community Health Systems, Inc., 4.750%, 02/15/2031 | | | | | 530,444 | | | | | | 0.1 | | |
| 575,000 (2) | | | CHS/Community Health Systems, Inc., 5.625%, 03/15/2027 | | | | | 609,241 | | | | | | 0.1 | | |
| 1,585,000 (2) | | | CHS/Community Health Systems, Inc., 6.625%, 02/15/2025 | | | | | 1,642,274 | | | | | | 0.3 | | |
| 1,875,000 (2) | | | CHS/Community Health Systems, Inc., 6.875%, 04/15/2029 | | | | | 1,913,025 | | | | | | 0.4 | | |
| 1,735,000 (2) | | | CoreLogic, Inc., 4.500%, 05/01/2028 | | | | | 1,731,036 | | | | | | 0.3 | | |
| 1,225,000 (2) | | | CPI Acquisition, Inc., 8.625%, 03/15/2026 | | | | | 1,297,012 | | | | | | 0.3 | | |
| 275,000 (2) | | | DaVita, Inc., 3.750%, 02/15/2031 | | | | | 268,438 | | | | | | 0.1 | | |
| 650,000 (2) | | | DaVita, Inc., 4.625%, 06/01/2030 | | | | | 666,614 | | | | | | 0.1 | | |
| 335,000 | | | Encompass Health Corp., 4.625%, 04/01/2031 | | | | | 341,370 | | | | | | 0.1 | | |
| 497,000 (2) | | | Endo Dac / Endo Finance LLC / Endo Finco, Inc., 6.000%, 06/30/2028 | | | | | 371,025 | | | | | | 0.1 | | |
| 331,000 (1)(2) | | | Endo Dac / Endo Finance LLC / Endo Finco, Inc., 9.500%, 07/31/2027 | | | | | 337,276 | | | | | | 0.1 | | |
| 1,175,000 (2) | | | Graham Holdings Co., 5.750%, 06/01/2026 | | | | | 1,221,706 | | | | | | 0.2 | | |
| 2,650,000 | | | HCA, Inc., 5.375%, 02/01/2025 | | | | | 2,915,795 | | | | | | 0.6 | | |
| Voya High Yield Portfolio | as of December 31, 2021 (continued) |
| Principal Amount† | | | Value | | | Percentage of Net Assets | | |||||||||
| CORPORATE BONDS/NOTES: (continued) | | |||||||||||||||
| | | | Consumer, Non-cyclical (continued) | | ||||||||||||
| 625,000 | | | HCA, Inc., 5.625%, 09/01/2028 | | | | $ | 731,356 | | | | | | 0.1 | | |
| 900,000 (2) | | | Jazz Securities DAC, 4.375%, 01/15/2029 | | | | | 933,453 | | | | | | 0.2 | | |
| 1,148,000 (2) | | | KeHE Distributors LLC / KeHE Finance Corp., 8.625%, 10/15/2026 | | | | | 1,233,813 | | | | | | 0.2 | | |
| 625,000 | | | Kraft Heinz Foods Co., 4.375%, 06/01/2046 | | | | | 733,469 | | | | | | 0.1 | | |
| 1,315,000 | | | Kraft Heinz Foods Co., 5.000%, 07/15/2035 | | | | | 1,611,304 | | | | | | 0.3 | | |
| 625,000 | | | Kraft Heinz Foods Co., 5.500%, 06/01/2050 | | | | | 847,994 | | | | | | 0.2 | | |
| 1,700,000 (2) | | | Lamb Weston Holdings, Inc., 4.125%, 01/31/2030 | | | | | 1,747,464 | | | | | | 0.3 | | |
| 1,095,000 (2) | | | Legacy LifePoint Health LLC, 4.375%, 02/15/2027 | | | | | 1,104,384 | | | | | | 0.2 | | |
| 425,000 (1)(2) | | | LifePoint Health, Inc., 5.375%, 01/15/2029 | | | | | 423,487 | | | | | | 0.1 | | |
| 1,135,000 (2) | | | Mozart Debt Merger Sub, Inc., 3.875%, 04/01/2029 | | | | | 1,133,263 | | | | | | 0.2 | | |
| 1,225,000 (2) | | | Mozart Debt Merger Sub, Inc., 5.250%, 10/01/2029 | | | | | 1,244,257 | | | | | | 0.2 | | |
| 1,200,000 (1)(2) | | | MPH Acquisition Holdings LLC, 5.750%, 11/01/2028 | | | | | 1,143,018 | | | | | | 0.2 | | |
| 1,325,000 (2) | | | NESCO Holdings II, Inc., 5.500%, 04/15/2029 | | | | | 1,370,414 | | | | | | 0.3 | | |
| 850,000 | | | New Albertsons L.P., 7.450%, 08/01/2029 | | | | | 988,057 | | | | | | 0.2 | | |
| 225,000 (2) | | | Nielsen Finance LLC / Nielsen Finance Co., 4.750%, 07/15/2031 | | | | | 222,528 | | | | | | 0.0 | | |
| 1,150,000 (2) | | | Nielsen Finance LLC / Nielsen Finance Co., 5.875%, 10/01/2030 | | | | | 1,215,895 | | | | | | 0.2 | | |
| 1,300,000 (2) | | | Organon & Co. / Organon Foreign Debt Co-Issuer BV, 5.125%, 04/30/2031 | | | | | 1,360,418 | | | | | | 0.3 | | |
| 1,021,000 (2) | | | Par Pharmaceutical, Inc., 7.500%, 04/01/2027 | | | | | 1,044,922 | | | | | | 0.2 | | |
| 270,000 (1)(2) | | | PECF USS Intermediate Holding III Corp., 8.000%, 11/15/2029 | | | | | 280,001 | | | | | | 0.1 | | |
| 325,000 (2) | | | Pilgrim’s Pride Corp., 3.500%, 03/01/2032 | | | | | 328,790 | | | | | | 0.1 | | |
| 650,000 (2) | | | Pilgrim’s Pride Corp., 4.250%, 04/15/2031 | | | | | 683,504 | | | | | | 0.1 | | |
| 1,325,000 (2) | | | Pilgrim’s Pride Corp., 5.875%, 09/30/2027 | | | | | 1,400,512 | | | | | | 0.3 | | |
| 625,000 (2) | | | Post Holdings, Inc., 4.625%, 04/15/2030 | | | | | 637,694 | | | | | | 0.1 | | |
| 1,500,000 (2) | | | Post Holdings, Inc., 5.625%, 01/15/2028 | | | | | 1,592,145 | | | | | | 0.3 | | |
| 1,300,000 (2) | | | Primo Water Holdings, Inc., 4.375%, 04/30/2029 | | | | | 1,289,132 | | | | | | 0.3 | | |
| Principal Amount† | | | Value | | | Percentage of Net Assets | | |||||||||
| CORPORATE BONDS/NOTES: (continued) | | |||||||||||||||
| | | | Consumer, Non-cyclical (continued) | | ||||||||||||
| 1,825,000 (2) | | | Select Medical Corp., 6.250%, 08/15/2026 | | | | $ | 1,935,449 | | | | | | 0.4 | | |
| 1,300,000 (2) | | | Simmons Foods, Inc./ Simmons Prepared Foods, Inc./Simmons Pet Food, Inc./Simmons Feed, 4.625%, 03/01/2029 | | | | | 1,282,671 | | | | | | 0.2 | | |
| 500,000 (2) | | | Spectrum Brands, Inc., 3.875%, 03/15/2031 | | | | | 494,488 | | | | | | 0.1 | | |
| 700,000 (2) | | | Spectrum Brands, Inc., 5.500%, 07/15/2030 | | | | | 751,772 | | | | | | 0.1 | | |
| 775,000 (2) | | | Tenet Healthcare Corp., 4.250%, 06/01/2029 | | | | | 788,384 | | | | | | 0.2 | | |
| 1,450,000 (2) | | | Tenet Healthcare Corp., 6.125%, 10/01/2028 | | | | | 1,534,470 | | | | | | 0.3 | | |
| 1,975,000 | | | Tenet Healthcare Corp., 6.750%, 06/15/2023 | | | | | 2,113,171 | | | | | | 0.4 | | |
| 1,575,000 (2) | | | Triton Water Holdings, Inc., 6.250%, 04/01/2029 | | | | | 1,512,803 | | | | | | 0.3 | | |
| 1,450,000 (2) | | | United Natural Foods, Inc., 6.750%, 10/15/2028 | | | | | 1,554,799 | | | | | | 0.3 | | |
| 435,000 | | | United Rentals North America, Inc., 3.750%, 01/15/2032 | | | | | 438,670 | | | | | | 0.1 | | |
| 875,000 | | | United Rentals North America, Inc., 4.875%, 01/15/2028 | | | | | 921,025 | | | | | | 0.2 | | |
| 225,000 | | | United Rentals North America, Inc., 5.250%, 01/15/2030 | | | | | 243,881 | | | | | | 0.0 | | |
| 1,100,000 (2) | | | Vizient, Inc., 6.250%, 05/15/2027 | | | | | 1,149,225 | | | | | | 0.2 | | |
| | | | | | | | | 82,899,496 | | | | | | 16.1 | | |
| | | | Energy: 15.3% | | ||||||||||||
| 1,900,000 (2) | | | Aethon United BR L.P. / Aethon United Finance Corp., 8.250%, 02/15/2026 | | | | | 2,043,184 | | | | | | 0.4 | | |
| 825,000 (2) | | | Antero Midstream Partners L.P. / Antero Midstream Finance Corp., 5.375%, 06/15/2029 | | | | | 871,777 | | | | | | 0.2 | | |
| 1,150,000 (2) | | | Antero Midstream Partners L.P. / Antero Midstream Finance Corp., 5.750%, 03/01/2027 | | | | | 1,192,837 | | | | | | 0.2 | | |
| 1,250,000 (2) | | | Antero Resources Corp., 5.375%, 03/01/2030 | | | | | 1,338,356 | | | | | | 0.3 | | |
| 250,000 (2) | | | Antero Resources Corp., 7.625%, 02/01/2029 | | | | | 277,896 | | | | | | 0.0 | | |
| 1,500,000 | | | Apache Corp., 4.375%, 10/15/2028 | | | | | 1,634,137 | | | | | | 0.3 | | |
| 675,000 | | | Apache Corp., 5.100%, 09/01/2040 | | | | | 763,816 | | | | | | 0.1 | | |
| Voya High Yield Portfolio | as of December 31, 2021 (continued) |
| Principal Amount† | | | Value | | | Percentage of Net Assets | | |||||||||
| CORPORATE BONDS/NOTES: (continued) | | |||||||||||||||
| | | | Energy (continued) | | ||||||||||||
| 795,000 (2) | | | Archrock Partners L.P. / Archrock Partners Finance Corp., 6.250%, 04/01/2028 | | | | $ | 830,091 | | | | | | 0.2 | | |
| 400,000 (2) | | | Archrock Partners L.P. / Archrock Partners Finance Corp., 6.875%, 04/01/2027 | | | | | 420,400 | | | | | | 0.1 | | |
| 1,000,000 (2) | | | Atlantica Sustainable Infrastructure PLC, 4.125%, 06/15/2028 | | | | | 1,008,935 | | | | | | 0.2 | | |
| 844,000 (2) | | | Baytex Energy Corp., 5.625%, 06/01/2024 | | | | | 845,063 | | | | | | 0.2 | | |
| 1,325,000 (2) | | | Baytex Energy Corp., 8.750%, 04/01/2027 | | | | | 1,389,262 | | | | | | 0.3 | | |
| 1,300,000 (2) | | | Blue Racer Midstream LLC / Blue Racer Finance Corp., 6.625%, 07/15/2026 | | | | | 1,342,900 | | | | | | 0.3 | | |
| 600,000 (2) | | | Blue Racer Midstream LLC / Blue Racer Finance Corp., 7.625%, 12/15/2025 | | | | | 636,624 | | | | | | 0.1 | | |
| 1,360,000 | | | Callon Petroleum Co., 6.125%, 10/01/2024 | | | | | 1,341,014 | | | | | | 0.3 | | |
| 610,000 (2) | | | CNX Midstream Partners L.P., 4.750%, 04/15/2030 | | | | | 608,746 | | | | | | 0.1 | | |
| 350,000 (2) | | | CNX Resources Corp., 6.000%, 01/15/2029 | | | | | 364,492 | | | | | | 0.1 | | |
| 1,550,000 (2) | | | CNX Resources Corp., 7.250%, 03/14/2027 | | | | | 1,645,682 | | | | | | 0.3 | | |
| 690,000 (2) | | | Colgate Energy Partners III LLC, 5.875%, 07/01/2029 | | | | | 711,680 | | | | | | 0.1 | | |
| 1,525,000 (2) | | | Crestwood Midstream Partners L.P. / Crestwood Midstream Finance Corp., 6.000%, 02/01/2029 | | | | | 1,586,229 | | | | | | 0.3 | | |
| 725,000 | | | DCP Midstream Operating L.P., 5.125%, 05/15/2029 | | | | | 820,276 | | | | | | 0.2 | | |
| 595,000 | | | DCP Midstream Operating L.P., 5.375%, 07/15/2025 | | | | | 650,728 | | | | | | 0.1 | | |
| 125,000 | | | DCP Midstream Operating L.P., 5.600%, 04/01/2044 | | | | | 155,677 | | | | | | 0.0 | | |
| 1,175,000 | | | DCP Midstream Operating L.P., 5.625%, 07/15/2027 | | | | | 1,328,925 | | | | | | 0.3 | | |
| 1,030,000 (1) | | | Delek Logistics Partners L.P. / Delek Logistics Finance Corp., 6.750%, 05/15/2025 | | | | | 1,057,913 | | | | | | 0.2 | | |
| 575,000 (2) | | | Delek Logistics Partners L.P. / Delek Logistics Finance Corp., 7.125%, 06/01/2028 | | | | | 598,816 | | | | | | 0.1 | | |
| Principal Amount† | | | Value | | | Percentage of Net Assets | | |||||||||
| CORPORATE BONDS/NOTES: (continued) | | |||||||||||||||
| | | | Energy (continued) | | ||||||||||||
| 625,000 (2) | | | DT Midstream, Inc., 4.125%, 06/15/2029 | | | | $ | 640,884 | | | | | | 0.1 | | |
| 1,100,000 (2) | | | DT Midstream, Inc., 4.375%, 06/15/2031 | | | | | 1,145,694 | | | | | | 0.2 | | |
| 1,275,000 (2) | | | Encino Acquisition Partners Holdings LLC, 8.500%, 05/01/2028 | | | | | 1,326,217 | | | | | | 0.2 | | |
| 2,300,000 | | | EnLink Midstream LLC, 5.375%, 06/01/2029 | | | | | 2,355,614 | | | | | | 0.4 | | |
| 1,425,000 (2) | | | Enviva Partners L.P. / Enviva Partners Finance Corp., 6.500%, 01/15/2026 | | | | | 1,473,023 | | | | | | 0.3 | | |
| 500,000 | | | EQM Midstream Partners L.P., 5.500%, 07/15/2028 | | | | | 546,960 | | | | | | 0.1 | | |
| 650,000 (2) | | | EQM Midstream Partners L.P., 6.000%, 07/01/2025 | | | | | 707,603 | | | | | | 0.1 | | |
| 150,000 (2) | | | EQT Corp., 3.125%, 05/15/2026 | | | | | 154,165 | | | | | | 0.0 | | |
| 150,000 (1)(2) | | | EQT Corp., 3.625%, 05/15/2031 | | | | | 155,858 | | | | | | 0.0 | | |
| 300,000 | | | EQT Corp., 5.000%, 01/15/2029 | | | | | 332,677 | | | | | | 0.1 | | |
| 750,000 (2) | | | Hess Midstream Operations L.P., 4.250%, 02/15/2030 | | | | | 745,654 | | | | | | 0.1 | | |
| 800,000 (2) | | | Hess Midstream Operations L.P., 5.125%, 06/15/2028 | | | | | 834,168 | | | | | | 0.2 | | |
| 500,000 (2) | | | Hilcorp Energy I L.P. / Hilcorp Finance Co., 5.750%, 02/01/2029 | | | | | 516,063 | | | | | | 0.1 | | |
| 900,000 (2) | | | Hilcorp Energy I L.P. / Hilcorp Finance Co., 6.000%, 02/01/2031 | | | | | 932,625 | | | | | | 0.2 | | |
| 1,375,000 (2) | | | Howard Midstream Energy Partners LLC, 6.750%, 01/15/2027 | | | | | 1,410,654 | | | | | | 0.3 | | |
| 1,575,000 (2) | | | Independence Energy Finance LLC, 7.250%, 05/01/2026 | | | | | 1,638,134 | | | | | | 0.3 | | |
| 2,200,000 (2) | | | Moss Creek Resources Holdings, Inc., 7.500%, 01/15/2026 | | | | | 2,059,288 | | | | | | 0.4 | | |
| 875,000 | | | Murphy Oil Corp., 5.875%, 12/01/2027 | | | | | 904,807 | | | | | | 0.2 | | |
| 975,000 | | | Murphy Oil Corp., 6.375%, 07/15/2028 | | | | | 1,037,751 | | | | | | 0.2 | | |
| 1,000,000 (2) | | | Nabors Industries Ltd., 7.500%, 01/15/2028 | | | | | 906,415 | | | | | | 0.2 | | |
| 590,000 | | | Nabors Industries, Inc., 5.100%, 09/15/2023 | | | | | 599,396 | | | | | | 0.1 | | |
| 500,000 (2) | | | Nabors Industries, Inc., 7.375%, 05/15/2027 | | | | | 518,095 | | | | | | 0.1 | | |
| 1,300,000 (2) | | | Oasis Petroleum, Inc., 6.375%, 06/01/2026 | | | | | 1,366,911 | | | | | | 0.3 | | |
| Voya High Yield Portfolio | as of December 31, 2021 (continued) |
| Principal Amount† | | | Value | | | Percentage of Net Assets | | |||||||||
| CORPORATE BONDS/NOTES: (continued) | | |||||||||||||||
| | | | Energy (continued) | | ||||||||||||
| 2,700,000 | | | Occidental Petroleum Corp., 4.200%, 03/15/2048 | | | | $ | 2,704,374 | | | | | | 0.5 | | |
| 1,975,000 | | | Occidental Petroleum Corp., 5.500%, 12/01/2025 | | | | | 2,192,991 | | | | | | 0.4 | | |
| 2,770,000 | | | Occidental Petroleum Corp., 6.625%, 09/01/2030 | | | | | 3,432,529 | | | | | | 0.7 | | |
| 1,150,000 | | | Occidental Petroleum Corp., 8.500%, 07/15/2027 | | | | | 1,435,775 | | | | | | 0.3 | | |
| 1,200,000 (2) | | | Rockcliff Energy II LLC, 5.500%, 10/15/2029 | | | | | 1,237,998 | | | | | | 0.2 | | |
| 300,000 | | | Southwestern Energy Co., 4.750%, 02/01/2032 | | | | | 316,512 | | | | | | 0.1 | | |
| 1,625,000 | | | Southwestern Energy Co., 5.375%, 02/01/2029 | | | | | 1,720,737 | | | | | | 0.3 | | |
| 325,000 | | | Southwestern Energy Co., 5.375%, 03/15/2030 | | | | | 348,803 | | | | | | 0.1 | | |
| 1,391,000 (2) | | | Strathcona Resources Ltd., 6.875%, 08/01/2026 | | | | | 1,368,688 | | | | | | 0.3 | | |
| 1,300,000 (2) | | | SunCoke Energy, Inc., 4.875%, 06/30/2029 | | | | | 1,295,457 | | | | | | 0.2 | | |
| 350,000 | | | Sunoco L.P. / Sunoco Finance Corp., 4.500%, 05/15/2029 | | | | | 356,027 | | | | | | 0.1 | | |
| 1,150,000 (2) | | | Sunoco L.P. / Sunoco Finance Corp., 4.500%, 04/30/2030 | | | | | 1,180,395 | | | | | | 0.2 | | |
| 600,000 (2) | | | Tallgrass Energy Partners L.P. / Tallgrass Energy Finance Corp., 5.500%, 01/15/2028 | | | | | 595,599 | | | | | | 0.1 | | |
| 900,000 (2) | | | Tallgrass Energy Partners L.P. / Tallgrass Energy Finance Corp., 7.500%, 10/01/2025 | | | | | 975,164 | | | | | | 0.2 | | |
| 1,925,000 | | | Targa Resources Partners L.P. / Targa Resources Partners Finance Corp., 4.875%, 02/01/2031 | | | | | 2,093,784 | | | | | | 0.4 | | |
| 1,075,000 (2) | | | Transocean Poseidon Ltd., 6.875%, 02/01/2027 | | | | | 1,039,837 | | | | | | 0.2 | | |
| 1,800,000 (2) | | | Transocean, Inc., 7.500%, 01/15/2026 | | | | | 1,342,872 | | | | | | 0.3 | | |
| 675,000 (2) | | | Venture Global Calcasieu Pass LLC, 3.875%, 08/15/2029 | | | | | 701,436 | | | | | | 0.1 | | |
| 1,070,000 (2) | | | Venture Global Calcasieu Pass LLC, 4.125%, 08/15/2031 | | | | | 1,136,051 | | | | | | 0.2 | | |
| 1,300,000 (2) | | | Vine Energy Holdings LLC, 6.750%, 04/15/2029 | | | | | 1,412,782 | | | | | | 0.3 | | |
| 825,000 (2) | | | Viper Energy Partners L.P., 5.375%, 11/01/2027 | | | | | 853,149 | | | | | | 0.2 | | |
| Principal Amount† | | | Value | | | Percentage of Net Assets | | |||||||||
| CORPORATE BONDS/NOTES: (continued) | | |||||||||||||||
| | | | Energy (continued) | | ||||||||||||
| 1,375,000 (2) | | | Weatherford International Ltd., 8.625%, 04/30/2030 | | | | $ | 1,429,732 | | | | | | 0.3 | | |
| 1,700,000 | | | Western Midstream Operating L.P., 5.450%, 04/01/2044 | | | | | 2,033,914 | | | | | | 0.4 | | |
| | | | | | | | | 78,978,718 | | | | | | 15.3 | | |
| | | | Financial: 6.9% | | ||||||||||||
| 1,025,000 | | | Ally Financial, Inc., 5.750%, 11/20/2025 | | | | | 1,157,077 | | | | | | 0.2 | | |
| 1,300,000 (2) | | | AmWINS Group, Inc., 4.875%, 06/30/2029 | | | | | 1,315,230 | | | | | | 0.2 | | |
| 1,300,000 (2) | | | Aretec Escrow Issuer, Inc., 7.500%, 04/01/2029 | | | | | 1,335,438 | | | | | | 0.3 | | |
| 1,050,000 (2) | | | AssuredPartners, Inc., 5.625%, 01/15/2029 | | | | | 1,022,884 | | | | | | 0.2 | | |
| 1,425,000 (2) | | | BroadStreet Partners, Inc., 5.875%, 04/15/2029 | | | | | 1,402,065 | | | | | | 0.3 | | |
| 1,675,000 (2) | | | Cushman & Wakefield US Borrower LLC, 6.750%, 05/15/2028 | | | | | 1,794,637 | | | | | | 0.3 | | |
| 545,000 (2) | | | Freedom Mortgage Corp., 6.625%, 01/15/2027 | | | | | 533,304 | | | | | | 0.1 | | |
| 675,000 (2) | | | Freedom Mortgage Corp., 7.625%, 05/01/2026 | | | | | 690,053 | | | | | | 0.1 | | |
| 1,075,000 (2) | | | Freedom Mortgage Corp., 8.250%, 04/15/2025 | | | | | 1,101,649 | | | | | | 0.2 | | |
| 395,000 (2) | | | Iron Mountain, Inc., 5.000%, 07/15/2028 | | | | | 406,457 | | | | | | 0.1 | | |
| 540,000 (2) | | | Iron Mountain, Inc., 5.250%, 07/15/2030 | | | | | 570,033 | | | | | | 0.1 | | |
| 510,000 (2) | | | Iron Mountain, Inc., 5.625%, 07/15/2032 | | | | | 546,538 | | | | | | 0.1 | | |
| 1,300,000 (2) | | | Ladder Capital Finance Holdings LLLP / Ladder Capital Finance Corp., 4.750%, 06/15/2029 | | | | | 1,334,717 | | | | | | 0.3 | | |
| 600,000 (2) | | | LPL Holdings, Inc., 4.000%, 03/15/2029 | | | | | 615,249 | | | | | | 0.1 | | |
| 300,000 (2) | | | LPL Holdings, Inc., 4.375%, 05/15/2031 | | | | | 307,308 | | | | | | 0.1 | | |
| 1,150,000 (2) | | | LPL Holdings, Inc., 4.625%, 11/15/2027 | | | | | 1,191,900 | | | | | | 0.2 | | |
| 300,000 (2) | | | MGM Growth Properties Operating Partnership L.P. / MGP Finance Co-Issuer, Inc., 3.875%, 02/15/2029 | | | | | 315,431 | | | | | | 0.1 | | |
| 665,000 (2) | | | MGM Growth Properties Operating Partnership L.P. / MGP Finance Co-Issuer, Inc., 4.625%, 06/15/2025 | | | | | 709,774 | | | | | | 0.1 | | |
| Voya High Yield Portfolio | as of December 31, 2021 (continued) |
| Principal Amount† | | | Value | | | Percentage of Net Assets | | |||||||||
| CORPORATE BONDS/NOTES: (continued) | | |||||||||||||||
| | | | Financial (continued) | | ||||||||||||
| 775,000 | | | MGM Growth Properties Operating Partnership L.P. / MGP Finance Co-Issuer, Inc., 5.625%, 05/01/2024 | | | | $ | 829,238 | | | | | | 0.2 | | |
| 300,000 (2) | | | Midcap Financial Issuer Trust, 5.625%, 01/15/2030 | | | | | 301,236 | | | | | | 0.1 | | |
| 1,300,000 (2) | | | Midcap Financial Issuer Trust, 6.500%, 05/01/2028 | | | | | 1,357,473 | | | | | | 0.3 | | |
| 325,000 | | | MPT Operating Partnership L.P. / MPT Finance Corp., 3.500%, 03/15/2031 | | | | | 329,157 | | | | | | 0.1 | | |
| 1,325,000 | | | MPT Operating Partnership L.P. / MPT Finance Corp., 5.000%, 10/15/2027 | | | | | 1,387,911 | | | | | | 0.3 | | |
| 1,250,000 (2) | | | Nationstar Mortgage Holdings, Inc., 5.125%, 12/15/2030 | | | | | 1,236,175 | | | | | | 0.2 | | |
| 1,475,000 | | | Navient Corp., 4.875%, 03/15/2028 | | | | | 1,473,532 | | | | | | 0.3 | | |
| 850,000 | | | Navient Corp., 5.000%, 03/15/2027 | | | | | 867,744 | | | | | | 0.2 | | |
| 270,000 | | | Navient Corp., 7.250%, 09/25/2023 | | | | | 291,362 | | | | | | 0.0 | | |
| 575,000 | | | OneMain Finance Corp., 4.000%, 09/15/2030 | | | | | 566,404 | | | | | | 0.1 | | |
| 2,100,000 | | | OneMain Finance Corp., 5.375%, 11/15/2029 | | | | | 2,286,375 | | | | | | 0.4 | | |
| 1,325,000 (2) | | | PRA Group, Inc., 5.000%, 10/01/2029 | | | | | 1,330,313 | | | | | | 0.3 | | |
| 1,650,000 (2) | | | Realogy Group LLC / Realogy Co-Issuer Corp., 5.750%, 01/15/2029 | | | | | 1,693,766 | | | | | | 0.3 | | |
| 1,400,000 | | | SBA Communications Corp., 3.875%, 02/15/2027 | | | | | 1,443,855 | | | | | | 0.3 | | |
| 1,250,000 (2) | | | United Wholesale Mortgage LLC, 5.750%, 06/15/2027 | | | | | 1,254,375 | | | | | | 0.2 | | |
| 500,000 (2) | | | Uniti Group L.P. / Uniti Fiber Holdings, Inc. / CSL Capital LLC, 6.000%, 01/15/2030 | | | | | 481,875 | | | | | | 0.1 | | |
| 950,000 (2) | | | Uniti Group L.P. / Uniti Group Finance, Inc. / CSL Capital LLC, 6.500%, 02/15/2029 | | | | | 948,176 | | | | | | 0.2 | | |
| 1,125,000 (2) | | | XHR L.P., 4.875%, 06/01/2029 | | | | | 1,146,611 | | | | | | 0.2 | | |
| | | | | | | | | 35,575,322 | | | | | | 6.9 | | |
| | | | Industrial: 8.9% | | ||||||||||||
| 1,950,000 (2)(3) | | | ARD Finance SA, 6.500% (PIK Rate 7.250%, Cash Rate 6.500%), 06/30/2027 | | | | | 2,010,528 | | | | | | 0.4 | | |
| Principal Amount† | | | Value | | | Percentage of Net Assets | | |||||||||
| CORPORATE BONDS/NOTES: (continued) | | |||||||||||||||
| | | | Industrial (continued) | | ||||||||||||
| 1,575,000 (2) | | | Brundage-Bone Concrete Pumping Holdings, Inc., 6.000%, 02/01/2026 | | | | $ | 1,639,725 | | | | | | 0.3 | | |
| 450,000 (2) | | | Builders FirstSource, Inc., 4.250%, 02/01/2032 | | | | | 466,654 | | | | | | 0.1 | | |
| 1,000,000 (2) | | | Builders FirstSource, Inc., 5.000%, 03/01/2030 | | | | | 1,074,310 | | | | | | 0.2 | | |
| 1,510,000 (2) | | | Cargo Aircraft Management, Inc., 4.750%, 02/01/2028 | | | | | 1,539,279 | | | | | | 0.3 | | |
| 1,950,000 (2) | | | Cascades, Inc./Cascades USA, Inc., 5.375%, 01/15/2028 | | | | | 2,003,849 | | | | | | 0.4 | | |
| 885,000 (2) | | | Clark Equipment Co., 5.875%, 06/01/2025 | | | | | 921,891 | | | | | | 0.2 | | |
| 400,000 (2) | | | Clean Harbors, Inc., 4.875%, 07/15/2027 | | | | | 412,400 | | | | | | 0.1 | | |
| 460,000 (2) | | | Clean Harbors, Inc., 5.125%, 07/15/2029 | | | | | 488,761 | | | | | | 0.1 | | |
| 1,425,000 (2) | | | Fortress Transportation and Infrastructure Investors LLC, 5.500%, 05/01/2028 | | | | | 1,455,025 | | | | | | 0.3 | | |
| 925,000 (2) | | | GFL Environmental, Inc., 4.000%, 08/01/2028 | | | | | 908,068 | | | | | | 0.2 | | |
| 275,000 (2) | | | GFL Environmental, Inc., 4.375%, 08/15/2029 | | | | | 272,838 | | | | | | 0.0 | | |
| 865,000 (2) | | | Global Infrastructure Solutions, Inc., 5.625%, 06/01/2029 | | | | | 887,901 | | | | | | 0.2 | | |
| 1,300,000 (2) | | | GrafTech Finance, Inc., 4.625%, 12/15/2028 | | | | | 1,321,820 | | | | | | 0.3 | | |
| 1,575,000 (2) | | | Graham Packaging Co., Inc., 7.125%, 08/15/2028 | | | | | 1,632,487 | | | | | | 0.3 | | |
| 1,275,000 (2) | | | Granite US Holdings Corp., 11.000%, 10/01/2027 | | | | | 1,387,838 | | | | | | 0.3 | | |
| 1,250,000 (2) | | | II-VI, Inc., 5.000%, 12/15/2029 | | | | | 1,279,125 | | | | | | 0.2 | | |
| 1,600,000 (2) | | | Imola Merger Corp., 4.750%, 05/15/2029 | | | | | 1,644,584 | | | | | | 0.3 | | |
| 575,000 (2)(3) | | | Intelligent Packaging Holdco Issuer L.P., 9.000% (PIK Rate 9.750%, Cash Rate 9.000%), 01/15/2026 | | | | | 601,930 | | | | | | 0.1 | | |
| 1,475,000 (2) | | | Intelligent Packaging Ltd. Finco, Inc. / Intelligent Packaging Ltd. Co-Issuer LLC, 6.000%, 09/15/2028 | | | | | 1,519,250 | | | | | | 0.3 | | |
| 1,200,000 (2) | | | Koppers, Inc., 6.000%, 02/15/2025 | | | | | 1,222,236 | | | | | | 0.2 | | |
| 807,000 (2) | | | Maxar Space Robotics LLC, 9.750%, 12/31/2023 | | | | | 870,362 | | | | | | 0.2 | | |
| 1,500,000 (2) | | | New Enterprise Stone & Lime Co., Inc., 9.750%, 07/15/2028 | | | | | 1,607,123 | | | | | | 0.3 | | |
| Voya High Yield Portfolio | as of December 31, 2021 (continued) |
| Principal Amount† | | | Value | | | Percentage of Net Assets | | |||||||||
| CORPORATE BONDS/NOTES: (continued) | | |||||||||||||||
| | | | Industrial (continued) | | ||||||||||||
| 2,000,000 (2) | | | PGT Innovations, Inc., 4.375%, 10/01/2029 | | | | $ | 2,013,430 | | | | | | 0.4 | | |
| 1,075,000 (2) | | | Roller Bearing Co. of America, Inc., 4.375%, 10/15/2029 | | | | | 1,097,844 | | | | | | 0.2 | | |
| 1,300,000 (2) | | | Rolls-Royce PLC, 5.750%, 10/15/2027 | | | | | 1,438,970 | | | | | | 0.3 | | |
| 1,110,000 (2) | | | Sensata Technologies, Inc., 3.750%, 02/15/2031 | | | | | 1,107,652 | | | | | | 0.2 | | |
| 1,255,000 | | | Silgan Holdings, Inc., 4.125%, 02/01/2028 | | | | | 1,283,627 | | | | | | 0.2 | | |
| 1,450,000 (2) | | | Standard Industries, Inc./NJ, 3.375%, 01/15/2031 | | | | | 1,399,250 | | | | | | 0.3 | | |
| 425,000 (2) | | | Standard Industries, Inc./NJ, 4.375%, 07/15/2030 | | | | | 434,469 | | | | | | 0.1 | | |
| 1,325,000 (2) | | | Stevens Holding Co., Inc., 6.125%, 10/01/2026 | | | | | 1,414,106 | | | | | | 0.3 | | |
| 950,000 (2) | | | Summit Materials LLC / Summit Materials Finance Corp., 5.250%, 01/15/2029 | | | | | 996,417 | | | | | | 0.2 | | |
| 925,000 (2) | | | Summit Materials LLC / Summit Materials Finance Corp., 6.500%, 03/15/2027 | | | | | 961,140 | | | | | | 0.2 | | |
| 1,025,000 (2) | | | TK Elevator Holdco GmbH, 7.625%, 07/15/2028 | | | | | 1,099,482 | | | | | | 0.2 | | |
| 900,000 | | | TransDigm, Inc., 4.625%, 01/15/2029 | | | | | 898,641 | | | | | | 0.2 | | |
| 875,000 | | | TransDigm, Inc., 5.500%, 11/15/2027 | | | | | 902,803 | | | | | | 0.2 | | |
| 1,200,000 | | | TransDigm, Inc., 6.375%, 06/15/2026 | | | | | 1,234,500 | | | | | | 0.2 | | |
| 1,030,000 (2) | | | Vertiv Group Corp., 4.125%, 11/15/2028 | | | | | 1,042,066 | | | | | | 0.2 | | |
| 1,250,000 (2) | | | Weekley Homes LLC / Weekley Finance Corp., 4.875%, 09/15/2028 | | | | | 1,289,388 | | | | | | 0.2 | | |
| | | | | | | | | 45,781,769 | | | | | | 8.9 | | |
| | | | Technology: 3.0% | | ||||||||||||
| 1,600,000 (2) | | | Austin BidCo, Inc., 7.125%, 12/15/2028 | | | | | 1,654,272 | | | | | | 0.3 | | |
| 900,000 (2) | | | Booz Allen Hamilton, Inc., 3.875%, 09/01/2028 | | | | | 917,041 | | | | | | 0.2 | | |
| 300,000 (2) | | | Booz Allen Hamilton, Inc., 4.000%, 07/01/2029 | | | | | 310,296 | | | | | | 0.1 | | |
| 200,000 (2) | | | CA Magnum Holdings, 5.375%, 10/31/2026 | | | | | 207,250 | | | | | | 0.0 | | |
| 1,300,000 (2) | | | Castle US Holding Corp., 9.500%, 02/15/2028 | | | | | 1,357,090 | | | | | | 0.3 | | |
| 1,150,000 (2) | | | Consensus Cloud Solutions, Inc., 6.500%, 10/15/2028 | | | | | 1,203,383 | | | | | | 0.2 | | |
| Principal Amount† | | | Value | | | Percentage of Net Assets | | |||||||||
| CORPORATE BONDS/NOTES: (continued) | | |||||||||||||||
| | | | Technology (continued) | | ||||||||||||
| 1,220,000 (2) | | | NCR Corp., 5.125%, 04/15/2029 | | | | $ | 1,265,152 | | | | | | 0.2 | | |
| 200,000 (2) | | | Open Text Corp., 3.875%, 02/15/2028 | | | | | 204,158 | | | | | | 0.0 | | |
| 1,200,000 (2) | | | Open Text Holdings, Inc., 4.125%, 02/15/2030 | | | | | 1,237,848 | | | | | | 0.2 | | |
| 575,000 (2) | | | OpenText Corp., 3.875%, 12/01/2029 | | | | | 583,142 | | | | | | 0.1 | | |
| 1,300,000 (2) | | | Playtika Holding Corp., 4.250%, 03/15/2029 | | | | | 1,275,970 | | | | | | 0.3 | | |
| 1,400,000 (1)(2) | | | Rackspace Technology Global, Inc., 5.375%, 12/01/2028 | | | | | 1,367,016 | | | | | | 0.3 | | |
| 1,000,000 (2) | | | ROBLOX Corp., 3.875%, 05/01/2030 | | | | | 1,016,010 | | | | | | 0.2 | | |
| 1,645,000 (2) | | | Rocket Software, Inc., 6.500%, 02/15/2029 | | | | | 1,607,173 | | | | | | 0.3 | | |
| 1,400,000 (2) | | | Veritas US, Inc. / Veritas Bermuda Ltd., 7.500%, 09/01/2025 | | | | | 1,450,827 | | | | | | 0.3 | | |
| | | | | | | | | 15,656,628 | | | | | | 3.0 | | |
| | | | Utilities: 0.9% | | ||||||||||||
| 170,000 (2) | | | Clearway Energy Operating LLC, 3.750%, 01/15/2032 | | | | | 168,969 | | | | | | 0.0 | | |
| 1,300,000 (2) | | | Clearway Energy Operating LLC, 4.750%, 03/15/2028 | | | | | 1,368,536 | | | | | | 0.2 | | |
| 1,350,000 (2) | | | Drax Finco PLC, 6.625%, 11/01/2025 | | | | | 1,395,475 | | | | | | 0.3 | | |
| 225,000 (2) | | | NRG Energy, Inc., 3.375%, 02/15/2029 | | | | | 220,800 | | | | | | 0.0 | | |
| 336,000 | | | NRG Energy, Inc., 6.625%, 01/15/2027 | | | | | 349,709 | | | | | | 0.1 | | |
| 450,000 (2) | | | Vistra Operations Co. LLC, 5.500%, 09/01/2026 | | | | | 465,293 | | | | | | 0.1 | | |
| 900,000 (2) | | | Vistra Operations Co. LLC, 5.625%, 02/15/2027 | | | | | 928,139 | | | | | | 0.2 | | |
| | | | | | | | | 4,896,921 | | | | | | 0.9 | | |
| | | | Total Corporate Bonds/Notes (Cost $469,768,063) | | | | | 488,471,065 | | | | | | 94.7 | | |
| BANK LOANS: 1.1% | | |||||||||||||||
| | | | Business Equipment & Services: 0.3% | | ||||||||||||
| 600,000 | | | Ascend Learning LLC, 6.250%, (US0003M + 0.058%), 11/18/2029 | | | | | 602,250 | | | | | | 0.1 | | |
| 700,000 | | | Ascend Learning LLC, 6.250%, (US0003M + 0.058%), 12/10/2029 | | | | | 698,250 | | | | | | 0.2 | | |
| | | | | | | | | 1,300,500 | | | | | | 0.3 | | |
| Voya High Yield Portfolio | as of December 31, 2021 (continued) |
| Principal Amount† | | | Value | | | Percentage of Net Assets | | |||||||||
| BANK LOANS: (continued) | | |||||||||||||||
| | | | Consumer, Cyclical: 0.6% | | ||||||||||||
| 1,900,000 | | | AP Core Holdings II LLC TL B2 1L, 6.250%, (US0001M + 5.500%), 09/01/2027 | | | | $ | 1,905,937 | | | | | | 0.3 | | |
| 1,475,857 | | | Golden Nugget LLC TL B 1L, 3.250%, (US0001M + 2.500%), 10/04/2023 | | | | | 1,468,813 | | | | | | 0.3 | | |
| | | | | | | | | 3,374,750 | | | | | | 0.6 | | |
| | | | | | ||||||||||||
| | | | Health Care: 0.1% | | ||||||||||||
| 602,674 | | | Bausch Health Companies, Inc. 2018 Term Loan B, 3.104%, (US0001M + 3.000%), 06/02/2025 | | | | | 600,749 | | | | | | 0.1 | | |
| | | | | | ||||||||||||
| | | | Technology: 0.1% | | ||||||||||||
| 430,000 | | | BMC Software TL 2L, 5.601%, (US0001M + 5.500%), 03/30/2026 | | | | | 434,515 | | | | | | 0.1 | | |
| | | | Total Bank Loans (Cost $5,609,264) | | | | | 5,710,514 | | | | | | 1.1 | | |
| CONVERTIBLE BONDS/NOTES: 0.1% | | |||||||||||||||
| | | | Communications: 0.1% | | ||||||||||||
| 350,000 | | | DISH Network Corp., 3.375%, 08/15/2026 | | | | | 332,169 | | | | | | 0.1 | | |
| | | | | | ||||||||||||
| | | | Financial: 0.0% | | ||||||||||||
| 499,200 (2)(5) | | | Lehman Brothers Holdings, Inc., 8.160%, 05/30/2009 | | | | | 549 | | | | | | 0.0 | | |
| | | | Total Convertible Bonds/ Notes (Cost $797,903) | | | | | 332,718 | | | | | | 0.1 | | |
| | ||||||||||||||||
| Shares | | | Value | | | Percentage of Net Assets | | |||||||||
| COMMON STOCK: 0.5% | | |||||||||||||||
| | | | Consumer Discretionary: —% | | ||||||||||||
| 1,476 (2)(6)(7) | | | Perseus Holding Corp. | | | | | — | | | | | | — | | |
| | | | | | ||||||||||||
| | | | Consumer Staples: 0.5% | | ||||||||||||
| 107,541 (6)(7) | | | Southeastern Grocers, Inc. | | | | | 2,527,213 | | | | | | 0.5 | | |
| | | | | | ||||||||||||
| | | | Energy: 0.0% | | ||||||||||||
| 2 (7) | | | Amplify Energy Corp. | | | | | 6 | | | | | | 0.0 | | |
| 424,441 (6)(7) | | | Ascent Resources - Utica LLC | | | | | 5,094 | | | | | | 0.0 | | |
| | | | | | | | | 5,100 | | | | | | 0.0 | | |
| Shares | | | Value | | | Percentage of Net Assets | | |||||||||
| COMMON STOCK: (continued) | | |||||||||||||||
| | | | Health Care: 0.0% | | ||||||||||||
| 26 (7) | | | Option Care Health, Inc. | | | | $ | 739 | | | | | | 0.0 | | |
| | | | | | ||||||||||||
| | | | Information Technology: 0.0% | | ||||||||||||
| 1 (7) | | | Avaya Holdings Corp. | | | | | 20 | | | | | | 0.0 | | |
| | | | Total Common Stock (Cost $768,535) | | | | | 2,533,072 | | | | | | 0.5 | | |
| PREFERRED STOCK: —% | | |||||||||||||||
| | | | Consumer Discretionary: —% | | ||||||||||||
| 775 (2)(6)(7) | | | Perseus Holding Corp. | | | | | — | | | | | | — | | |
| | | | Total Preferred Stock (Cost $—) | | | | | — | | | | | | — | | |
| WARRANTS: —% | | |||||||||||||||
| | | | Health Care: —% | | ||||||||||||
| 126 (6)(7) | | | Option Care Health, Inc. - Class A | | | | | — | | | | | | — | | |
| 126 (6)(7) | | | Option Care Health, Inc. - Class B | | | | | — | | | | | | — | | |
| | | | Total Warrants (Cost $—) | | | | | — | | | | | | — | | |
| OTHER (8): —% | | |||||||||||||||
| | | | Energy: —% | | ||||||||||||
| 2,000 (6)(9) | | | Green Field Energy Services, Inc. (Escrow) | | | | | — | | | | | | — | | |
| | | | Total Other (Cost $—) | | | | | — | | | | | | — | | |
| | | | Total Long-Term Investments (Cost $476,943,765) | | | | | 497,047,369 | | | | | | 96.4 | | |
| | ||||||||||||||||
| Principal Amount† | | | Value | | | Percentage of Net Assets | | |||||||||
| SHORT-TERM INVESTMENTS: 6.0% | | |||||||||||||||
| | | | Commercial Paper: 1.5% | | ||||||||||||
| 1,500,000 | | | AT&T, Inc., 0.380%, 03/15/2022 | | | | | 1,498,834 | | | | | | 0.3 | | |
| 1,475,000 | | | Consolidated Edison Company, 0.280%, 02/07/2022 | | | | | 1,474,575 | | | | | | 0.3 | | |
| 1,650,000 | | | Enbridge (US) Inc., 0.290%, 02/02/2022 | | | | | 1,649,569 | | | | | | 0.3 | | |
| 1,800,000 | | | Entergy Corp., 0.190%, 01/19/2022 | | | | | 1,799,826 | | | | | | 0.3 | | |
| 1,500,000 | | | Societe Generale, 0.070%, 01/06/2022 | | | | | 1,499,983 | | | | | | 0.3 | | |
| | | | Total Commercial Paper (Cost $7,922,831) | | | | | 7,922,787 | | | | | | 1.5 | | |
| Voya High Yield Portfolio | as of December 31, 2021 (continued) |
| Principal Amount† | | | Value | | | Percentage of Net Assets | | |||||||||
| SHORT-TERM INVESTMENTS: (continued) | | |||||||||||||||
| | | | U.S. Government Agency Obligations: 0.9% | | ||||||||||||
| 4,600,000 (10) | | | Federal Home Loan Bank Discount Notes, 0.000%, 01/12/2022 (Cost $4,599,958) | | | | $ | 4,600,000 | | | | | | 0.9 | | |
| | | | | | ||||||||||||
| | | | Repurchase Agreements: 3.4% | | ||||||||||||
| 4,325,558 (11) | | | Cantor Fitzgerald Securities, Repurchase Agreement dated 12/31/21, 0.05%, due 01/03/22 (Repurchase Amount $4,325,576, collateralized by various U.S. Government/U.S. Government Agency Obligations, 0.000%-9.000%, Market Value plus accrued interest $4,412,069, due 02/01/22-07/20/71) | | | | | 4,325,558 | | | | | | 0.8 | | |
| 4,359,200 (11) | | | Citadel Securities LLC, Repurchase Agreement dated 12/31/21, 0.07%, due 01/03/22 (Repurchase Amount $4,359,225, collateralized by various U.S. Government Securities, 0.000%-7.250%, Market Value plus accrued interest $4,446,410, due 01/04/22-11/15/51) | | | | | 4,359,200 | | | | | | 0.9 | | |
| 1,022,433 (11) | | | Nomura Securities, Repurchase Agreement dated 12/31/21, 0.05%, due 01/03/22 (Repurchase Amount $1,022,437, collateralized by various U.S. Government/U.S. Government Agency Obligations, 0.000%-5.000%, Market Value plus accrued interest $1,042,882, due 09/06/24-09/20/69) | | | | | 1,022,433 | | | | | | 0.2 | | |
| 4,359,188 (11) | | | RBC Dominion Securities Inc., Repurchase Agreement dated 12/31/21, 0.05%, due 01/03/22 (Repurchase Amount $4,359,206, collateralized by various U.S. Government/U.S. Government Agency Obligations, 0.000%-6.500%, Market Value plus accrued interest $4,446,372, due 05/15/22-12/01/51) | | | | | 4,359,188 | | | | | | 0.8 | | |
| Principal Amount† | | | Value | | | Percentage of Net Assets | | |||||||||
| SHORT-TERM INVESTMENTS: (continued) | | |||||||||||||||
| | | | Repurchase Agreements (continued) | | ||||||||||||
| 3,678,455 (11) | | | State of Wisconsin Investment Board, Repurchase Agreement dated 12/31/21, 0.07%, due 01/03/22 (Repurchase Amount $3,678,476, collateralized by various U.S. Government Securities, 0.125%-3.875%, Market Value plus accrued interest $3,752,043, due 07/15/23-02/15/48) | | | | $ | 3,678,455 | | | | | | 0.7 | | |
| | | | Total Repurchase Agreements (Cost $17,744,834) | | | | | 17,744,834 | | | | | | 3.4 | | |
| | ||||||||||||||||
| Shares | | | Value | | | Percentage of Net Assets | | |||||||||
| | | | Mutual Funds: 0.2% | | ||||||||||||
| 327,000 (11)(12) | | | BlackRock Liquidity Funds, FedFund, Institutional Class, 0.030% | | | | | 327,000 | | | | | | 0.1 | | |
| 413,000 (11)(12) | | | Goldman Sachs Financial Square Government Fund - Institutional Shares, 0.020% | | | | | 413,000 | | | | | | 0.1 | | |
| 244,000 (11)(12) | | | Morgan Stanley Institutional Liquidity Funds - Government Portfolio (Institutional Share Class), 0.030% | | | | | 244,000 | | | | | | 0.0 | | |
| | | | Total Mutual Funds (Cost $984,000) | | | | | 984,000 | | | | | | 0.2 | | |
| | | | Total Short-Term Investments (Cost $31,251,623) | | | | | 31,251,621 | | | | | | 6.0 | | |
| | | | Total Investments in Securities (Cost $508,195,388) | | | | $ | 528,298,990 | | | | | | 102.4 | | |
| | | | Liabilities in Excess of Other Assets | | | | | (12,370,450) | | | | | | (2.4) | | |
| | | | Net Assets | | | | $ | 515,928,540 | | | | | | 100.0 | | |
payment rates.
| Voya High Yield Portfolio | as of December 31, 2021 (continued) |
US0001M 1-month LIBOR
US0003M 3-month LIBOR
| | | | Quoted Prices in Active Markets for Identical Investments (Level 1) | | | Significant Other Observable Inputs (Level 2) | | | Significant Unobservable Inputs (Level 3) | | | Fair Value at December 31, 2021 | | ||||||||||||
| Asset Table | | | | | | | | | | | | | | | | | | | | | | | | | |
| Investments, at fair value | | | | | | | | | | | | | | | | | | | | | | | | | |
| Common Stock | | | | | | | | | | | | | | | | | | | | | | | | | |
| Consumer Discretionary | | | | $ | — | | | | | $ | — | | | | | $ | — | | | | | $ | — | | |
| Consumer Staples | | | | | — | | | | | | — | | | | | | 2,527,213 | | | | | | 2,527,213 | | |
| Energy | | | | | 6 | | | | | | — | | | | | | 5,094 | | | | | | 5,100 | | |
| Health Care | | | | | 739 | | | | | | — | | | | | | — | | | | | | 739 | | |
| Information Technology | | | | | 20 | | | | | | — | | | | | | — | | | | | | 20 | | |
| Total Common Stock | | | | | 765 | | | | | | — | | | | | | 2,532,307 | | | | | | 2,533,072 | | |
| Preferred Stock | | | | | — | | | | | | — | | | | | | — | | | | | | — | | |
| Warrants | | | | | — | | | | | | — | | | | | | — | | | | | | — | | |
| Corporate Bonds/Notes | | | | | — | | | | | | 488,471,065 | | | | | | — | | | | | | 488,471,065 | | |
| Convertible Bonds/Notes | | | | | — | | | | | | 332,718 | | | | | | — | | | | | | 332,718 | | |
| Other | | | | | — | | | | | | — | | | | | | — | | | | | | — | | |
| Bank Loans | | | | | — | | | | | | 5,710,514 | | | | | | — | | | | | | 5,710,514 | | |
| Short-Term Investments | | | | | 984,000 | | | | | | 30,267,621 | | | | | | — | | | | | | 31,251,621 | | |
| Total Investments, at fair value | | | | $ | 984,765 | | | | | $ | 524,781,918 | | | | | $ | 2,532,307 | | | | | $ | 528,298,990 | | |
| Security | | | Acquisition Date | | | Acquisition Cost | | | Fair Value | | |||||||||
| Green Field Energy Services, Inc. (Escrow) | | | | | 8/25/2019 | | | | | $ | — | | | | | $ | — | | |
| | | | | | | | | | | $ | — | | | | | $ | — | | |
| Voya High Yield Portfolio | as of December 31, 2021 (continued) |
| | Cost for federal income tax purposes was $508,479,047. | | | |||||
| | Net unrealized appreciation consisted of: | | | | | | | |
| | Gross Unrealized Appreciation | | | | $ | 22,689,342 | | |
| | Gross Unrealized Depreciation | | | | | (2,869,399) | | |
| | Net Unrealized Appreciation | | | | $ | 19,819,943 | | |
| Voya Large Cap Growth Portfolio | as of December 31, 2021 |
| Shares | | | Value | | | Percentage of Net Assets | | |||||||||
| COMMON STOCK: 99.4% | | |||||||||||||||
| | | | Communication Services: 9.7% | | ||||||||||||
| 115,413 (1) | | | Alphabet, Inc. - Class A | | | | $ | 334,356,077 | | | | | | 5.6 | | |
| 181,549 (1) | | | NetFlix, Inc. | | | | | 109,372,380 | | | | | | 1.8 | | |
| 337,632 (1)(2) | | | ROBLOX Corp. | | | | | 34,830,117 | | | | | | 0.6 | | |
| 619,596 (1)(2) | | | Snap, Inc. | | | | | 29,139,600 | | | | | | 0.5 | | |
| 387,189 (1) | | | Take-Two Interactive Software, Inc. | | | | | 68,811,229 | | | | | | 1.2 | | |
| | | | | | | | | 576,509,403 | | | | | | 9.7 | | |
| | | | Consumer Discretionary: 19.5% | | ||||||||||||
| 124,718 (1) | | | Amazon.com, Inc. | | | | | 415,852,216 | | | | | | 7.0 | | |
| 42,913 (1)(2) | | | Chipotle Mexican Grill, Inc. | | | | | 75,022,652 | | | | | | 1.2 | | |
| 547,991 | | | Darden Restaurants, Inc. | | | | | 82,549,364 | | | | | | 1.4 | | |
| 420,312 (1)(2) | | | Expedia Group, Inc. | | | | | 75,958,785 | | | | | | 1.3 | | |
| 1,038,502 (2) | | | LKQ Corp. | | | | | 62,341,275 | | | | | | 1.0 | | |
| 679,017 (2) | | | Nike, Inc. - Class B | | | | | 113,171,763 | | | | | | 1.9 | | |
| 150,871 (1) | | | O’Reilly Automotive, Inc. | | | | | 106,549,626 | | | | | | 1.8 | | |
| 825,234 | | | Ross Stores, Inc. | | | | | 94,307,742 | | | | | | 1.6 | | |
| 702,725 (1) | | | Royal Caribbean Cruises Ltd. | | | | | 54,039,553 | | | | | | 0.9 | | |
| 79,852 (1) | | | Tesla, Inc. | | | | | 84,385,997 | | | | | | 1.4 | | |
| | | | | | | | | 1,164,178,973 | | | | | | 19.5 | | |
| | | | Consumer Staples: 3.9% | | ||||||||||||
| 536,980 (2) | | | Constellation Brands, Inc. | | | | | 134,765,871 | | | | | | 2.2 | | |
| 1,063,836 (2) | | | Philip Morris International, Inc. | | | | | 101,064,420 | | | | | | 1.7 | | |
| | | | | | | | | 235,830,291 | | | | | | 3.9 | | |
| | | | Energy: 0.7% | | ||||||||||||
| 361,363 | | | Diamondback Energy, Inc. | | | | | 38,972,999 | | | | | | 0.7 | | |
| | | | | | | | ||||||||||
| | | | Financials: 2.1% | | ||||||||||||
| 105,060 | | | LPL Financial Holdings, Inc. | | | | | 16,819,055 | | | | | | 0.3 | | |
| 180,363 | | | MSCI, Inc. - Class A | | | | | 110,506,607 | | | | | | 1.8 | | |
| | | | | | | | | 127,325,662 | | | | | | 2.1 | | |
| | | | Health Care: 8.3% | | ||||||||||||
| 330,881 | | | Danaher Corp. | | | | | 108,863,158 | | | | | | 1.8 | | |
| 201,001 (1) | | | DexCom, Inc. | | | | | 107,927,487 | | | | | | 1.8 | | |
| 665,116 | | | Eli Lilly & Co. | | | | | 183,718,342 | | | | | | 3.1 | | |
| 794,821 (1) | | | Horizon Therapeutics Plc | | | | | 85,649,911 | | | | | | 1.4 | | |
| 35,049 | | | Teleflex, Inc. | | | | | 11,512,895 | | | | | | 0.2 | | |
| | | | | | | | | 497,671,793 | | | | | | 8.3 | | |
| Shares | | | Value | | | Percentage of Net Assets | | |||||||||
| COMMON STOCK: (continued) | | |||||||||||||||
| | | | Industrials: 6.9% | | ||||||||||||
| 408,498 (2) | | | Ametek, Inc. | | | | $ | 60,065,546 | | | | | | 1.0 | | |
| 903,010 (1) | | | CoStar Group, Inc. | | | | | 71,364,880 | | | | | | 1.2 | | |
| 561,228 | | | Eaton Corp. PLC | | | | | 96,991,423 | | | | | | 1.6 | | |
| 637,446 (2) | | | Quanta Services, Inc. | | | | | 73,089,559 | | | | | | 1.2 | | |
| 98,576 (1) | | | TransDigm Group, Inc. | | | | | 62,721,937 | | | | | | 1.1 | | |
| 338,515 | | | Waste Connections, Inc. | | | | | 46,129,439 | | | | | | 0.8 | | |
| | | | | | | | | 410,362,784 | | | | | | 6.9 | | |
| | | | Information Technology: 45.7% | | ||||||||||||
| 362,119 (1) | | | Adobe, Inc. | | | | | 205,343,200 | | | | | | 3.4 | | |
| 1,092,278 (1)(2) | | | Advanced Micro Devices, Inc. | | | | | 157,178,804 | | | | | | 2.6 | | |
| 2,775,157 | | | Apple, Inc. | | | | | 492,784,629 | | | | | | 8.2 | | |
| 181,189 (1)(2) | | | Bill.com Holdings, Inc. | | | | | 45,143,239 | | | | | | 0.8 | | |
| 310,622 | | | CDW Corp. | | | | | 63,609,173 | | | | | | 1.1 | | |
| 248,177 (1)(2) | | | Datadog, Inc. | | | | | 44,202,806 | | | | | | 0.7 | | |
| 400,413 | | | Entegris, Inc. | | | | | 55,489,234 | | | | | | 0.9 | | |
| 199,518 (1) | | | Gartner, Inc. | | | | | 66,702,858 | | | | | | 1.1 | | |
| 302,787 | | | Intuit, Inc. | | | | | 194,758,654 | | | | | | 3.3 | | |
| 1,750,886 (2) | | | Marvell Technology, Inc. | | | | | 153,185,016 | | | | | | 2.6 | | |
| 1,643,295 | | | Microsoft Corp. | | | | | 552,672,974 | | | | | | 9.3 | | |
| 197,102 | | | Motorola Solutions, Inc. | | | | | 53,552,613 | | | | | | 0.9 | | |
| 730,001 | | | Nvidia Corp. | | | | | 214,700,594 | | | | | | 3.6 | | |
| 136,825 (1)(2) | | | Palo Alto Networks, Inc. | | | | | 76,178,687 | | | | | | 1.3 | | |
| 204,334 (1) | | | Paycom Software, Inc. | | | | | 84,837,434 | | | | | | 1.4 | | |
| 639,074 | | | Qualcomm, Inc. | | | | | 116,867,462 | | | | | | 2.0 | | |
| 142,519 (1) | | | ServiceNow, Inc. | | | | | 92,510,508 | | | | | | 1.5 | | |
| 101,734 (1) | | | Zebra Technologies Corp. | | | | | 60,552,077 | | | | | | 1.0 | | |
| | | | | | | | | 2,730,269,962 | | | | | | 45.7 | | |
| | | | Materials: 1.1% | | ||||||||||||
| 607,879 | | | Crown Holdings, Inc. | | | | | 67,243,575 | | | | | | 1.1 | | |
| | | | | | | | ||||||||||
| | | | Real Estate: 1.5% | | ||||||||||||
| 233,355 | | | SBA Communications Corp. | | | | | 90,779,762 | | | | | | 1.5 | | |
| | | | Total Common Stock | | | | | | | | | |||||
| | | | (Cost $4,824,269,444) | | | | | 5,939,145,204 | | | | | | 99.4 | | |
| | ||||||||||||||||
| Voya Large Cap Growth Portfolio | as of December 31, 2021 (continued) |
| Principal Amount† | | | Value | | | Percentage of Net Assets | | |||||||||
| SHORT-TERM INVESTMENTS: 2.3% | | |||||||||||||||
| | | | Commercial Paper: 0.2% | | ||||||||||||
| 400,000 (3) | | | ANZ Bank, 0.120%, 02/10/2022 | | | | $ | 399,961 | | | | | | 0.0 | | |
| 450,000 (3) | | | Bayeriche Landesbank of New York, 0.160%, 04/01/2022 | | | | | 449,806 | | | | | | 0.0 | | |
| 400,000 (3) | | | Collateralized Commercial Paper V Co., LLC, 0.360%, 06/08/2022 | | | | | 399,399 | | | | | | 0.0 | | |
| 475,000 (3) | | | Commonwealth Bank of Australia, 0.160%, 04/19/2022 | | | | | 474,699 | | | | | | 0.0 | | |
| 375,000 (3) | | | Credit Suisse AG, 0.330%, 06/09/2022 | | | | | 374,483 | | | | | | 0.0 | | |
| 325,000 (3) | | | Credit Suisse AG, 2.800%, 04/08/2022 | | | | | 326,970 | | | | | | 0.0 | | |
| 300,000 (3) | | | DBS Bank Ltd., 0.120%, 02/01/2022 | | | | | 299,972 | | | | | | 0.0 | | |
| 300,000 (3) | | | DNB Bank ASA, 0.140%, 03/16/2022 | | | | | 299,909 | | | | | | 0.0 | | |
| 475,000 (3) | | | JPMorgan Securities LLC, 0.220%, 03/14/2022 | | | | | 474,783 | | | | | | 0.0 | | |
| 400,000 (3) | | | Liberty Street Funding LLC, 0.220%, 03/17/2022 | | | | | 399,808 | | | | | | 0.0 | | |
| 275,000 (3) | | | Lloyds Bank PLC, 0.150%, 03/29/2022 | | | | | 274,861 | | | | | | 0.0 | | |
| 498,000 (3) | | | LMA-Americas LLC, 0.100%, 01/26/2022 | | | | | 497,960 | | | | | | 0.0 | | |
| 300,000 (3) | | | LMA-Americas LLC, 0.270%, 05/04/2022 | | | | | 299,717 | | | | | | 0.0 | | |
| 350,000 (3) | | | Matchpoint Finance PLC, 0.120%, 01/18/2022 | | | | | 349,985 | | | | | | 0.0 | | |
| 300,000 (3) | | | Matchpoint Finance PLC, 0.150%, 03/15/2022 | | | | | 299,863 | | | | | | 0.0 | | |
| 500,000 (3) | | | Mizuho Bank Ltd., 0.140%, 01/21/2022 | | | | | 499,968 | | | | | | 0.0 | | |
| 300,000 (3) | | | Mizuho Bank Ltd., 0.150%, 03/16/2022 | | | | | 299,853 | | | | | | 0.0 | | |
| 375,000 (3) | | | National Australia Bank Ltd., 0.120%, 02/18/2022 | | | | | 374,943 | | | | | | 0.0 | | |
| 325,000 (3) | | | Nieuw Amsterdam Receivables Corporation B.V., 0.100%, 01/07/2022 | | | | | 324,995 | | | | | | 0.0 | | |
| 475,000 (3) | | | Nieuw Amsterdam Receivables Corporation B.V., 0.100%, 01/11/2022 | | | | | 474,988 | | | | | | 0.0 | | |
| 300,000 (3) | | | Old Line Funding LLC, 0.130%, 03/10/2022 | | | | | 299,876 | | | | | | 0.0 | | |
| 350,000 (3) | | | Old Line Funding LLC, 0.250%, 04/27/2022 | | | | | 349,695 | | | | | | 0.0 | | |
| 325,000 (3) | | | Santander UK PLC, 0.300%, 05/03/2022 | | | | | 324,709 | | | | | | 0.0 | | |
| 425,000 (3) | | | Sheffield Receivables Company LLC, 0.240%, 03/15/2022 | | | | | 424,805 | | | | | | 0.0 | | |
| Principal Amount† | | | Value | | | Percentage of Net Assets | | |||||||||
| SHORT-TERM INVESTMENTS: (continued) | | |||||||||||||||
| | | | Commercial Paper (continued) | | ||||||||||||
| 525,000 (3) | | | Skandinaviska Enskilda Banken AB, 0.140%, 04/04/2022 | | | | $ | 524,720 | | | | | | 0.1 | | |
| 300,000 (3) | | | Skandinaviska Enskilda Banken AB, 0.140%, 04/12/2022 | | | | | 299,820 | | | | | | 0.0 | | |
| 500,000 (3) | | | Societe Generale, 0.170%, 03/31/2022 | | | | | 499,825 | | | | | | 0.0 | | |
| 275,000 (3) | | | Starbird Funding Corp., 0.250%, 03/21/2022 | | | | | 274,858 | | | | | | 0.0 | | |
| 500,000 (3) | | | Sumitomo Mitsui Trust Bank Ltd., 0.140%, 01/13/2022 | | | | | 499,986 | | | | | | 0.1 | | |
| 275,000 (3) | | | Sumitomo Mitsui Trust Bank Ltd., 0.290%, 04/08/2022 | | | | | 274,833 | | | | | | 0.0 | | |
| 275,000 (3) | | | Swedbank AB, 0.150%, 03/23/2022 | | | | | 274,907 | | | | | | 0.0 | | |
| 500,000 (3) | | | Swedbank AB, 0.150%, 03/24/2022 | | | | | 499,826 | | | | | | 0.0 | | |
| 275,000 (3) | | | Thunder Bay Funding LLC, 0.130%, 03/18/2022 | | | | | 274,878 | | | | | | 0.0 | | |
| 475,000 (3) | | | Toronto-Dominion Bank, 0.160%, 04/14/2022 | | | | | 474,720 | | | | | | 0.0 | | |
| 350,000 (3) | | | Victory Receivables Corporation, 0.120%, 01/06/2022 | | | | | 349,996 | | | | | | 0.0 | | |
| 475,000 (3) | | | Westpac Banking Corp., 0.130%, 03/25/2022 | | | | | 474,820 | | | | | | 0.0 | | |
| | | | Total Commercial Paper (Cost $13,719,197) | | | | | 13,719,197 | | | | | | 0.2 | | |
| | | | | | | | ||||||||||
| | | | Floating Rate Notes: 0.1% | | ||||||||||||
| 650,000 (3) | | | ANZ Bank, 0.130%, 03/30/2022 | | | | | 649,953 | | | | | | 0.1 | | |
| 350,000 (3) | | | Bank of Montreal, 0.120%, 01/05/2022 | | | | | 350,008 | | | | | | 0.0 | | |
| 250,000 (3) | | | Bank of Nova Scotia, 0.130%, 02/28/2022 | | | | | 250,025 | | | | | | 0.0 | | |
| 300,000 (3) | | | Barclays Bank PLC, 0.160%, 03/22/2022 | | | | | 299,992 | | | | | | 0.0 | | |
| 475,000 (3) | | | Barclays Bank PLC, 0.160%, 03/24/2022 | | | | | 474,986 | | | | | | 0.0 | | |
| 250,000 (3) | | | Canadian Imperial Bank of Commerce, 0.130%, 02/10/2022 | | | | | 250,018 | | | | | | 0.0 | | |
| 425,000 (3) | | | Cooperatieve Rabobank U.A./New York, 0.200%, 06/21/2022 | | | | | 424,935 | | | | | | 0.0 | | |
| 500,000 (3) | | | Credit Suisse AG, 0.170%, 04/08/2022 | | | | | 500,071 | | | | | | 0.0 | | |
| 300,000��(3) | | | DBS Bank Ltd., 0.140%, 03/16/2022 | | | | | 299,984 | | | | | | 0.0 | | |
| Voya Large Cap Growth Portfolio | as of December 31, 2021 (continued) |
| Principal Amount† | | | Value | | | Percentage of Net Assets | | |||||||||
| SHORT-TERM INVESTMENTS: (continued) | | |||||||||||||||
| | | | Floating Rate Notes (continued) | | ||||||||||||
| 450,000 (3) | | | Sumitomo Mitsui Trust Bank Ltd., 0.150%, 03/22/2022 | | | | $ | 449,999 | | | | | | 0.0 | | |
| 475,000 (3) | | | Sumitomo Mitsui Trust Bank Ltd., 0.150%, 04/01/2022 | | | | | 474,988 | | | | | | 0.0 | | |
| 500,000 (3) | | | Sumitomo Mitsui Trust Bank Ltd., 0.160%, 04/14/2022 | | | | | 499,993 | | | | | | 0.0 | | |
| | | | Total Floating Rate Notes (Cost $4,924,952) | | | | | 4,924,952 | | | | | | 0.1 | | |
| | | | | | | | ||||||||||
| | | | Repurchase Agreements: 1.0% | | ||||||||||||
| 2,791,913 (3) | | | Bethesda Securities LLC, Repurchase Agreement dated 12/31/21, 0.09%, due 01/03/22 (Repurchase Amount $2,791,934, collateralized by various U.S. Government Agency Obligations, 2.000%- 5.500%, Market Value plus accrued interest $2,847,751, due 01/01/25-12/01/51) | | | | | 2,791,913 | | | | | | 0.0 | | |
| 13,970,092 (3) | | | Cantor Fitzgerald Securities, Repurchase Agreement dated 12/31/21, 0.05%, due 01/03/22 (Repurchase Amount $13,970,149, collateralized by various U.S. Government/U.S. Government Agency Obligations, 0.000%-9.000%, Market Value plus accrued interest $14,249,494, due 02/01/22-07/20/71) | | | | | 13,970,092 | | | | | | 0.2 | | |
| 4,806,052 (3) | | | CF Secured LLC, Repurchase Agreement dated 12/31/21, 0.05%, due 01/03/22 (Repurchase Amount $4,806,072, collateralized by various U.S. Government/U.S. Government Agency Obligations, 0.000%- 5.500%, Market Value plus accrued interest $4,902,174, due 01/20/22-06/20/69) | | | | | 4,806,052 | | | | | | 0.1 | | |
| Principal Amount† | | | Value | | | Percentage of Net Assets | | |||||||||
| SHORT-TERM INVESTMENTS: (continued) | | |||||||||||||||
| | | | Repurchase Agreements (continued) | | ||||||||||||
| 6,392,170 (3) | | | Citadel Securities LLC, Repurchase Agreement dated 12/31/21, 0.07%, due 01/03/22 (Repurchase Amount $6,392,207, collateralized by various U.S. Government Securities, 0.000%-7.250%, Market Value plus accrued interest $6,520,052, due 01/04/22-11/15/51) | | | | $ | 6,392,170 | | | | | | 0.1 | | |
| 8,944,913 (3) | | | Citigroup, Inc., Repurchase Agreement dated 12/31/21, 0.06%, due 01/03/22 (Repurchase Amount $8,944,957, collateralized by various U.S. Government/U.S. Government Agency Obligations, 0.000%- 3.500%, Market Value plus accrued interest $9,123,812, due 02/15/22-12/20/51) | | | | | 8,944,913 | | | | | | 0.2 | | |
| 6,290,978 (3) | | | Mirae Asset Securities USA Inc., Repurchase Agreement dated 12/31/21, 0.06%, due 01/03/22 (Repurchase Amount $6,291,009, collateralized by various U.S. Government Agency Obligations, 0.550%- 7.500%, Market Value plus accrued interest $6,416,830, due 01/01/23-10/20/71) | | | | | 6,290,978 | | | | | | 0.1 | | |
| 11,880,164 (3) | | | State of Wisconsin Investment Board, Repurchase Agreement dated 12/31/21, 0.07%, due 01/03/22 (Repurchase Amount $11,880,232, collateralized by various U.S. Government Securities, 0.125%- 3.875%, Market Value plus accrued interest $12,117,829, due 07/15/23-02/15/48) | | | | | 11,880,164 | | | | | | 0.2 | | |
| Voya Large Cap Growth Portfolio | as of December 31, 2021 (continued) |
| Principal Amount† | | | Value | | | Percentage of Net Assets | | |||||||||
| SHORT-TERM INVESTMENTS: (continued) | | |||||||||||||||
| | | | Repurchase Agreements (continued) | | ||||||||||||
| 2,837,665 (3) | | | Stonex Financial Inc., Repurchase Agreement dated 12/31/21, 0.09%, due 01/03/22 (Repurchase Amount $2,837,686, collateralized by various U.S. Government/U.S. Government Agency Obligations, 0.000%- 9.000%, Market Value plus accrued interest $2,894,419, due 01/13/22-11/20/71) | | | | $ | 2,837,665 | | | | | | 0.1 | | |
| | | | Total Repurchase Agreements (Cost $57,913,947) | | | | | 57,913,947 | | | | | | 1.0 | | |
| | | | | | | | ||||||||||
| | | | Certificates of Deposit: 0.2% | | ||||||||||||
| 475,000 (3) | | | Bank of Montreal, 0.220%, 03/21/2022 | | | | | 475,018 | | | | | | 0.0 | | |
| 250,000 (3) | | | BNP Paribas, 0.130%, 03/03/2022 | | | | | 250,002 | | | | | | 0.0 | | |
| 400,000 (3) | | | Commonwealth Bank of Australia, 0.130%, 04/08/2022 | | | | | 399,931 | | | | | | 0.0 | | |
| 425,000 (3) | | | Credit Agricole, 0.230%, 03/09/2022 | | | | | 425,057 | | | | | | 0.0 | | |
| 475,000 (3) | | | DZ Bank AG, 0.100%, 01/07/2022 | | | | | 475,003 | | | | | | 0.0 | | |
| 475,000 (3) | | | DZ Bank AG, 0.100%, 01/12/2022 | | | | | 475,004 | | | | | | 0.0 | | |
| 300,000 (3) | | | Landesbank Baden-Wurttemberg, 0.160%, 03/21/2022 | | | | | 299,993 | | | | | | 0.0 | | |
| 475,000 (3) | | | Landesbank Baden-Wurttemberg, 0.170%, 04/12/2022 | | | | | 474,952 | | | | | | 0.0 | | |
| 425,000 (3) | | | Landesbank Baden-Wurttemberg, 0.180%, 04/19/2022 | | | | | 424,955 | | | | | | 0.0 | | |
| 500,000 (3) | | | Lloyds Bank PLC, 0.130%, 02/22/2022 | | | | | 500,087 | | | | | | 0.1 | | |
| 475,000 (3) | | | Mitsubishi UFJ Trust and Banking Corp., 0.160%, 04/06/2022 | | | | | 474,896 | | | | | | 0.0 | | |
| 250,000 (3) | | | Mizuho Bank Ltd., 0.150%, 03/14/2022 | | | | | 249,982 | | | | | | 0.0 | | |
| 300,000 (3) | | | MUFG Bank LTD, 0.130%, 01/07/2022 | | | | | 300,010 | | | | | | 0.0 | | |
| 475,000 (3) | | | Norinchukin Bank of New York, 0.110%, 01/27/2022 | | | | | 475,002 | | | | | | 0.0 | | |
| 475,000 (3) | | | Norinchukin Bank of New York, 0.120%, 02/04/2022 | | | | | 475,002 | | | | | | 0.0 | | |
| Principal Amount† | | | Value | | | Percentage of Net Assets | | |||||||||
| SHORT-TERM INVESTMENTS: (continued) | | |||||||||||||||
| | | | Certificates of Deposit (continued) | | ||||||||||||
| 475,000 (3) | | | Oversea-Chinese Banking Corp. Ltd., 0.150%, 04/07/2022 | | | | $ | 474,866 | | | | | | 0.0 | | |
| 275,000 (3) | | | Oversea-Chinese Banking Corp. Ltd., 0.250%, 03/17/2022 | | | | | 275,038 | | | | | | 0.0 | | |
| 475,000 (3) | | | Oversea-Chinese Banking Corp. Ltd., 0.260%, 03/24/2022 | | | | | 475,047 | | | | | | 0.1 | | |
| 475,000 (3) | | | Societe Generale, 0.170%, 04/18/2022 | | | | | 474,969 | | | | | | 0.0 | | |
| 475,000 (3) | | | Svenska Handelsbanken AB, 0.160%, 04/20/2022 | | | | | 474,974 | | | | | | 0.0 | | |
| 350,000 (3) | | | Toronto-Dominion Bank, 0.150%, 03/03/2022 | | | | | 350,039 | | | | | | 0.0 | | |
| | | | Total Certificates of Deposit (Cost $8,699,827) | | | | | 8,699,827 | | | | | | 0.2 | | |
| | ||||||||||||||||
| Shares | | | Value | | | Percentage of Net Assets | | |||||||||
| | | | Mutual Funds: 0.8% | | ||||||||||||
| 46,134,000 (3)(4) | | | BlackRock Liquidity Funds, FedFund, Institutional Class, 0.030% | | | | | 46,134,000 | | | | | | 0.8 | | |
| 1,866,000 (3)(4) | | | Goldman Sachs Financial Square Government Fund - Institutional Shares, 0.020% | | | | | 1,866,000 | | | | | | 0.0 | | |
| 1,866,000 (3)(4) | | | Morgan Stanley Institutional Liquidity Funds - Government Portfolio (Institutional Share Class), 0.030% | | | | | 1,866,000 | | | | | | 0.0 | | |
| | | | Total Mutual Funds | | | | | | | | | |||||
| | | | (Cost $49,866,000) | | | | | 49,866,000 | | | | | | 0.8 | | |
| | | | Total Short-Term Investments | | | | | | | | | |||||
| | | | (Cost $135,123,923) | | | | | 135,123,923 | | | | | | 2.3 | | |
| | | | Total Investments in Securities (Cost $4,959,393,367) | | | | $ | 6,074,269,127 | | | | | | 101.7 | | |
| | | | Liabilities in Excess of Other Assets | | | | | (102,577,855) | | | | | | (1.7) | | |
| | | | Net Assets | | | | $ | 5,971,691,272 | | | | | | 100.0 | | |
| Voya Large Cap Growth Portfolio | as of December 31, 2021 (continued) |
| | | | Quoted Prices in Active Markets for Identical Investments (Level 1) | | | Significant Other Observable Inputs (Level 2) | | | Significant Unobservable Inputs (Level 3) | | | Fair Value at December 31, 2021 | | ||||||||||||
| Asset Table | | | | | | | | | | | | | | | | | | | | | | | | | |
| Investments, at fair value | | | | | | | | | | | | | | | | | | | | | | | | | |
| Common Stock* | | | | $ | 5,939,145,204 | | | | | $ | — | | | | | $ | — | | | | | $ | 5,939,145,204 | | |
| Short-Term Investments | | | | | 49,866,000 | | | | | | 85,257,923 | | | | | | — | | | | | | 135,123,923 | | |
| Total Investments, at fair value | | | | $ | 5,989,011,204 | | | | | $ | 85,257,923 | | | | | $ | — | | | | | $ | 6,074,269,127 | | |
| | Cost for federal income tax purposes was $4,970,979,481. | | | | | | | |
| | Net unrealized appreciation consisted of: | | | | | | | |
| | Gross Unrealized Appreciation | | | | $ | 1,158,403,044 | | |
| | Gross Unrealized Depreciation | | | | | (55,113,398) | | |
| | Net Unrealized Appreciation | | | | $ | 1,103,289,646 | | |
| Voya Large Cap Value Portfolio | as of December 31, 2021 |
| Shares | | | Value | | | Percentage of Net Assets | | |||||||||
| COMMON STOCK: 98.4% | | |||||||||||||||
| | | | Communication Services: 7.2% | | ||||||||||||
| 459,326 | | | AT&T, Inc. | | | | $ | 11,299,420 | | | | | | 2.4 | | |
| 173,061 | | | Fox Corp. - Class A | | | | | 6,385,951 | | | | | | 1.3 | | |
| 163,709 | | | ViacomCBS, Inc. - Class B | | | | | 4,940,738 | | | | | | 1.0 | | |
| 79,150 (1) | | | Walt Disney Co. | | | | | 12,259,543 | | | | | | 2.5 | | |
| | | | | | | | | 34,885,652 | | | | | | 7.2 | | |
| | | | Consumer Discretionary: 5.3% | | ||||||||||||
| 62,139 (1) | | | Caesars Entertainment, Inc. | | | | | 5,811,861 | | | | | | 1.2 | | |
| 31,932 (1) | | | Expedia Group, Inc. | | | | | 5,770,751 | | | | | | 1.2 | | |
| 207,839 | | | Gap, Inc. | | | | | 3,668,358 | | | | | | 0.8 | | |
| 38,273 | | | McDonald’s Corp. | | | | | 10,259,843 | | | | | | 2.1 | | |
| | | | | | | | | 25,510,813 | | | | | | 5.3 | | |
| | | | Consumer Staples: 7.4% | | ||||||||||||
| 103,290 | | | Coca-Cola Co. | | | | | 6,115,801 | | | | | | 1.3 | | |
| 57,440 | | | Lamb Weston Holdings, Inc. | | | | | 3,640,547 | | | | | | 0.7 | | |
| 146,767 | | | Philip Morris International, Inc. | | | | | 13,942,865 | | | | | | 2.9 | | |
| 83,181 | | | Walmart, Inc. | | | | | 12,035,459 | | | | | | 2.5 | | |
| | | | | | | | | 35,734,672 | | | | | | 7.4 | | |
| | | | Energy: 5.9% | | ||||||||||||
| 202,181 | | | BP PLC ADR | | | | | 5,384,080 | | | | | | 1.1 | | |
| 43,810 | | | Chevron Corp. | | | | | 5,141,104 | | | | | | 1.1 | | |
| 142,773 | | | ConocoPhillips | | | | | 10,305,355 | | | | | | 2.1 | | |
| 46,720 | | | Diamondback Energy, Inc. | | | | | 5,038,752 | | | | | | 1.1 | | |
| 32,026 | | | Valero Energy Corp. | | | | | 2,405,473 | | | | | | 0.5 | | |
| | | | | | | | | 28,274,764 | | | | | | 5.9 | | |
| | | | Financials: 21.0% | | ||||||||||||
| 112,062 | | | Apollo Global Management, Inc. | | | | | 8,116,651 | | | | | | 1.7 | | |
| 43,612 | | | Arthur J. Gallagher & Co. | | | | | 7,399,648 | | | | | | 1.5 | | |
| 49,890 | | | Assurant, Inc. | | | | | 7,775,855 | | | | | | 1.6 | | |
| 274,079 | | | Bank of America Corp. | | | | | 12,193,775 | | | | | | 2.5 | | |
| 205,123 | | | Bank of New York Mellon Corp. | | | | | 11,913,544 | | | | | | 2.5 | | |
| 55,789 | | | Chubb Ltd. | | | | | 10,784,572 | | | | | | 2.2 | | |
| 300,002 | | | Equitable Holdings, Inc. | | | | | 9,837,065 | | | | | | 2.0 | | |
| 56,331 | | | PNC Financial Services Group, Inc. | | | | | 11,295,492 | | | | | | 2.4 | | |
| 221,574 | | | Synchrony Financial | | | | | 10,278,818 | | | | | | 2.1 | | |
| 205,470 | | | Truist Financial Corp. | | | | | 12,030,268 | | | | | | 2.5 | | |
| | | | | | | | | 101,625,688 | | | | | | 21.0 | | |
| | | | Health Care: 17.4% | | ||||||||||||
| 74,853 (2) | | | Alcon, Inc. | | | | | 6,521,193 | | | | | | 1.3 | | |
| 67,796 | | | Baxter International, Inc. | | | | | 5,819,609 | | | | | | 1.2 | | |
| 120,547 (1) | | | Boston Scientific Corp. | | | | | 5,120,837 | | | | | | 1.1 | | |
| 165,587 | | | Bristol-Myers Squibb Co. | | | | | 10,324,349 | | | | | | 2.1 | | |
| Shares | | | Value | | | Percentage of Net Assets | | |||||||||
| COMMON STOCK: (continued) | | |||||||||||||||
| | | | Health Care (continued) | | ||||||||||||
| 33,914 | | | Eli Lilly & Co. | | | | $ | 9,367,725 | | | | | | 1.9 | | |
| 36,150 | | | McKesson Corp. | | | | | 8,985,805 | | | | | | 1.9 | | |
| 15,569 | | | Thermo Fisher Scientific, Inc. | | | | | 10,388,260 | | | | | | 2.2 | | |
| 37,241 | | | UnitedHealth Group, Inc. | | | | | 18,700,196 | | | | | | 3.9 | | |
| 26,824 | | | Zimmer Biomet Holdings, Inc. | | | | | 3,407,721 | | | | | | 0.7 | | |
| 21,147 | | | Zoetis, Inc. | | | | | 5,160,502 | | | | | | 1.1 | | |
| | | | | | | | | 83,796,197 | | | | | | 17.4 | | |
| | | | Industrials: 11.7% | | ||||||||||||
| 246,303 | | | Howmet Aerospace, Inc. | | | | | 7,839,824 | | | | | | 1.6 | | |
| 41,144 | | | L3Harris Technologies, Inc. | | | | | 8,773,547 | | | | | | 1.8 | | |
| 296,165 | | | nVent Electric PLC | | | | | 11,254,270 | | | | | | 2.3 | | |
| 13,735 | | | Old Dominion Freight Line | | | | | 4,922,349 | | | | | | 1.0 | | |
| 139,725 | | | Raytheon Technologies Corp. | | | | | 12,024,733 | | | | | | 2.5 | | |
| 11,596 | | | Roper Technologies, Inc. | | | | | 5,703,609 | | | | | | 1.2 | | |
| 18,534 (1) | | | United Rentals, Inc. | | | | | 6,158,663 | | | | | | 1.3 | | |
| | | | | | | | | 56,676,995 | | | | | | 11.7 | | |
| | | | Information Technology: 8.4% | | ||||||||||||
| 9,354 | | | Broadcom, Inc. | | | | | 6,224,245 | | | | | | 1.3 | | |
| 59,533 | | | Dolby Laboratories, Inc. | | | | | 5,668,732 | | | | | | 1.2 | | |
| 49,058 | | | Microchip Technology, Inc. | | | | | 4,270,990 | | | | | | 0.9 | | |
| 47,832 | | | Motorola Solutions, Inc. | | | | | 12,995,954 | | | | | | 2.7 | | |
| 22,696 | | | NXP Semiconductor NV - NXPI - US | | | | | 5,169,695 | | | | | | 1.0 | | |
| 55,961 | | | TD SYNNEX Corp. | | | | | 6,399,700 | | | | | | 1.3 | | |
| | | | | | | | | 40,729,316 | | | | | | 8.4 | | |
| | | | Materials: 4.1% | | ||||||||||||
| 13,533 | | | Air Products & Chemicals, Inc. | | | | | 4,117,551 | | | | | | 0.9 | | |
| 52,061 | | | Alcoa Corp. | | | | | 3,101,795 | | | | | | 0.6 | | |
| 60,635 | | | CF Industries Holdings, Inc. | | | | | 4,291,745 | | | | | | 0.9 | | |
| 42,031 | | | Eastman Chemical Co. | | | | | 5,081,968 | | | | | | 1.1 | | |
| 18,755 | | | Reliance Steel & Aluminum Co. | | | | | 3,042,436 | | | | | | 0.6 | | |
| | | | | | | | | 19,635,495 | | | | | | 4.1 | | |
| | | | Real Estate: 4.7% | | ||||||||||||
| 101,252 | | | American Homes 4 Rent | | | | | 4,415,600 | | | | | | 0.9 | | |
| 25,592 | | | ProLogis, Inc. | | | | | 4,308,669 | | | | | | 0.9 | | |
| 47,702 (1) | | | Ryman Hospitality Properties | | | | | 4,386,676 | | | | | | 0.9 | | |
| 81,089 | | | UDR, Inc. | | | | | 4,864,529 | | | | | | 1.0 | | |
| 56,615 | | | Welltower, Inc. | | | | | 4,855,868 | | | | | | 1.0 | | |
| | | | | | | | | 22,831,342 | | | | | | 4.7 | | |
| Voya Large Cap Value Portfolio | as of December 31, 2021 (continued) |
| Shares | | | Value | | | Percentage of Net Assets | | |||||||||
| COMMON STOCK: (continued) | | |||||||||||||||
| | | | Utilities: 5.3% | | ||||||||||||
| 36,048 | | | Ameren Corp. | | | | $ | 3,208,633 | | | | | | 0.6 | | |
| 36,287 | | | American Electric Power Co., Inc. | | | | | 3,228,454 | | | | | | 0.7 | | |
| 42,095 | | | CMS Energy Corp. | | | | | 2,738,280 | | | | | | 0.6 | | |
| 44,213 | | | Entergy Corp. | | | | | 4,980,595 | | | | | | 1.0 | | |
| 116,991 | | | Exelon Corp. | | | | | 6,757,400 | | | | | | 1.4 | | |
| 440,822 (1)(3) | | | PRIME AET&D Holdings NO 1 | | | | | — | | | | | | — | | |
| 72,317 | | | Public Service Enterprise Group, Inc. | | | | | 4,825,713 | | | | | | 1.0 | | |
| | | | | | | | | 25,739,075 | | | | | | 5.3 | | |
| | | | Total Common Stock (Cost $416,588,362) | | | | | 475,440,009 | | | | | | 98.4 | | |
| OTHER (4): —% | | |||||||||||||||
| | | | Communications: —% | | ||||||||||||
| 32,517 (3)(5) | | | Tribune Co. (Escrow) | | | | | — | | | | | | — | | |
| | | | | | | | ||||||||||
| | | | Energy: —% | | ||||||||||||
| 1,685,000 (3)(5) | | | Samson Investment Co. (Escrow) | | | | | — | | | | | | — | | |
| | | | Total Other | | | | | | | | | |||||
| | | | (Cost $30,842) | | | | | — | | | | | | — | | |
| | ||||||||||||||||
| Principal Amount† | | | Value | | | Percentage of Net Assets | | |||||||||
| CORPORATE BONDS/NOTES: —% | | |||||||||||||||
| | | | Financial: —% | | ||||||||||||
| 1,216,000 (3)(6) | | | Tropicana Entertainment LLC / Tropicana Finance Corp., 9.625%, 12/15/2014 | | | | | — | | | | | | — | | |
| | | | Total Corporate Bonds/Notes (Cost $787,908) | | | | | — | | | | | | — | | |
| | | | Total Long-Term Investments (Cost $417,407,112) | | | | | 475,440,009 | | | | | | 98.4 | | |
| SHORT-TERM INVESTMENTS: 2.7% | | |||||||||||||||
| | | | Repurchase Agreements: 1.1% | | ||||||||||||
| 1,219,959 (7) | | | Bank of America Inc., Repurchase Agreement dated 12/31/21, 0.05%, due 01/03/22 (Repurchase Amount $1,219,964, collateralized by various U.S. Government Agency Obligations, 1.000%-5.000%, Market Value plus accrued interest $1,244,358, due 09/01/28-01/01/61) | | | | | 1,219,959 | | | | | | 0.3 | | |
| Principal Amount† | | | Value | | | Percentage of Net Assets | | |||||||||
| SHORT-TERM INVESTMENTS: (continued) | | |||||||||||||||
| | | | Repurchase Agreements (continued) | | ||||||||||||
| 361,657 (7) | | | Bank of Nova Scotia, Repurchase Agreement dated 12/31/21, 0.06%, due 01/03/22 (Repurchase Amount $361,659, collateralized by various U.S. Government/U.S. Government Agency Obligations, 0.000%-7.000%, Market Value plus accrued interest $368,892, due 04/07/22-04/01/51) | | | | $ | 361,657 | | | | | | 0.1 | | |
| 1,219,959 (7) | | | Daiwa Capital Markets, Repurchase Agreement dated 12/31/21, 0.04%, due 01/03/22 (Repurchase Amount $1,219,963, collateralized by various U.S. Government/U.S. Government Agency Obligations, 0.000%-6.500%, Market Value plus accrued interest $1,244,358, due 02/10/22-01/01/52) | | | | | 1,219,959 | | | | | | 0.3 | | |
| 1,219,959 (7) | | | HSBC Securities USA, Repurchase Agreement dated 12/31/21, 0.05%, due 01/03/22 (Repurchase Amount $1,219,964, collateralized by various U.S. Government Agency Obligations, 1.875%-6.500%, Market Value plus accrued interest $1,244,358, due 01/20/27-05/20/51) | | | | | 1,219,959 | | | | | | 0.2 | | |
| 1,219,959 (7) | | | RBC Dominion Securities Inc., Repurchase Agreement dated 12/31/ 21, 0.05%, due 01/03/22 (Repurchase Amount $1,219,964, collateralized by various U.S. Government/U.S. Government Agency Obligations, 0.000%-6.500%, Market Value plus accrued interest $1,244,358, due 05/15/22-12/01/51) | | | | | 1,219,959 | | | | | | 0.2 | | |
| | | | Total Repurchase Agreements | | | | | | | | | |||||
| | | | (Cost $5,241,493) | | | | | 5,241,493 | | | | | | 1.1 | | |
| | ||||||||||||||||
| Voya Large Cap Value Portfolio | as of December 31, 2021 (continued) |
| Shares | | | Value | | | Percentage of Net Assets | | |||||||||
| SHORT-TERM INVESTMENTS: (continued) | | |||||||||||||||
| | | | Mutual Funds: 1.6% | | ||||||||||||
| 7,705,000 (8) | | | BlackRock Liquidity Funds, FedFund, Institutional Class, 0.030% (Cost $7,705,000) | | | | $ | 7,705,000 | | | | | | 1.6 | | |
| | | | Total Short-Term Investments | | | | | | | | | |||||
| | | | (Cost $12,946,493) | | | | | 12,946,493 | | | | | | 2.7 | | |
| | | | Total Investments in Securities (Cost $430,353,605) | | | | $ | 488,386,502 | | | | | | 101.1 | | |
| | | | Liabilities in Excess of Other Assets | | | | | (5,201,108) | | | | | | (1.1) | | |
| | | | Net Assets | | | | $ | 483,185,394 | | | | | | 100.0 | | |
| | | | Quoted Prices in Active Markets for Identical Investments (Level 1) | | | Significant Other Observable Inputs (Level 2) | | | Significant Unobservable Inputs (Level 3) | | | Fair Value at December 31, 2021 | | ||||||||||||
| Asset Table | | | | | | | | | | | | | | | | | | | | | | | | | |
| Investments, at fair value | | | | | | | | | | | | | | | | | | | | | | | | | |
| Common Stock | | | | | | | | | | | | | | | | | | | | | | | | | |
| Communication Services | | | | $ | 34,885,652 | | | | | $ | — | | | | | $ | — | | | | | $ | 34,885,652 | | |
| Consumer Discretionary | | | | | 25,510,813 | | | | | | — | | | | | | — | | | | | | 25,510,813 | | |
| Consumer Staples | | | | | 35,734,672 | | | | | | — | | | | | | — | | | | | | 35,734,672 | | |
| Energy | | | | | 28,274,764 | | | | | | — | | | | | | — | | | | | | 28,274,764 | | |
| Financials | | | | | 101,625,688 | | | | | | — | | | | | | — | | | | | | 101,625,688 | | |
| Health Care | | | | | 83,796,197 | | | | | | — | | | | | | — | | | | | | 83,796,197 | | |
| Industrials | | | | | 56,676,995 | | | | | | — | | | | | | — | | | | | | 56,676,995 | | |
| Information Technology | | | | | 40,729,316 | | | | | | — | | | | | | — | | | | | | 40,729,316 | | |
| Materials | | | | | 19,635,495 | | | | | | — | | | | | | — | | | | | | 19,635,495 | | |
| Real Estate | | | | | 22,831,342 | | | | | | — | | | | | | — | | | | | | 22,831,342 | | |
| Utilities | | | | | 25,739,075 | | | | | | — | | | | | | — | | | | | | 25,739,075 | | |
| Total Common Stock | | | | | 475,440,009 | | | | | | — | | | | | | — | | | | | | 475,440,009 | | |
| Corporate Bonds/Notes | | | | | — | | | | | | — | | | | | | — | | | | | | — | | |
| Other | | | | | — | | | | | | — | | | | | | — | | | | | | — | | |
| Short-Term Investments | | | | | 7,705,000 | | | | | | 5,241,493 | | | | | | — | | | | | | 12,946,493 | | |
| Total Investments, at fair value | | | | $ | 483,145,009 | | | | | $ | 5,241,493 | | | | | $ | — | | | | | $ | 488,386,502 | | |
| Voya Large Cap Value Portfolio | as of December 31, 2021 (continued) |
| Security | | | Acquisition Date | | | Acquisition Cost | | | Fair Value | | |||||||||
| Samson Investment Co. (Escrow) | | | | | 6/28/2017 | | | | | $ | 30,842 | | | | | $ | — | | |
| Tribune Co. (Escrow) | | | | | 8/16/2015 | | | | | | — | | | | | | — | | |
| | | | | | | | | | | $ | 30,842 | | | | | $ | — | | |
| | Cost for federal income tax purposes was $433,552,163. | | | |||||
| | Net unrealized appreciation consisted of: | | | | | | | |
| | Gross Unrealized Appreciation | | | | $ | 66,729,932 | | |
| | Gross Unrealized Depreciation | | | | | (11,756,574) | | |
| | Net Unrealized Appreciation | | | | $ | 54,973,358 | | |
| Voya Limited Maturity Bond Portfolio | as of December 31, 2021 |
| Principal Amount† | | | Value | | | Percentage of Net Assets | | |||||||||
| CORPORATE BONDS/NOTES: 33.6% | | |||||||||||||||
| | | | Basic Materials: 0.4% | | ||||||||||||
| 475,000 | | | Ecolab, Inc., 1.650%, 02/01/2027 | | | | $ | 477,422 | | | | | | 0.1 | | |
| 500,000 (1) | | | Georgia-Pacific LLC, 1.750%, 09/30/2025 | | | | | 502,333 | | | | | | 0.1 | | |
| 280,000 | | | Nucor Corp., 2.000%, 06/01/2025 | | | | | 285,726 | | | | | | 0.1 | | |
| 425,000 | | | Nutrien Ltd., 3.150%, 10/01/2022 | | | | | 430,303 | | | | | | 0.1 | | |
| | | | | | | | | 1,695,784 | | | | | | 0.4 | | |
| | | | Communications: 1.9% | | ||||||||||||
| 560,000 | | | Alibaba Group Holding Ltd., 2.800%, 06/06/2023 | | | | | 573,983 | | | | | | 0.1 | | |
| 669,000 | | | Amazon.com, Inc., 0.450%, 05/12/2024 | | | | | 662,727 | | | | | | 0.2 | | |
| 370,000 | | | AT&T, Inc., 1.700%, 03/25/2026 | | | | | 368,444 | | | | | | 0.1 | | |
| 335,000 | | | AT&T, Inc., 4.050%, 12/15/2023 | | | | | 354,606 | | | | | | 0.1 | | |
| 472,000 | | | Bell Canada, 0.750%, 03/17/2024 | | | | | 467,370 | | | | | | 0.1 | | |
| 413,000 | | | British Telecommunications PLC, 4.500%, 12/04/2023 | | | | | 437,070 | | | | | | 0.1 | | |
| 500,000 | | | Charter Communications Operating LLC / Charter Communications Operating Capital, 4.464%, 07/23/2022 | | | | | 507,432 | | | | | | 0.1 | | |
| 599,000 | | | Fox Corp., 4.030%, 01/25/2024 | | | | | 632,896 | | | | | | 0.2 | | |
| 330,000 | | | Motorola Solutions, Inc., 4.000%, 09/01/2024 | | | | | 351,694 | | | | | | 0.1 | | |
| 653,000 (1) | | | NTT Finance Corp., 0.583%, 03/01/2024 | | | | | 645,735 | | | | | | 0.2 | | |
| 185,000 (1) | | | Sky Ltd., 3.125%, 11/26/2022 | | | | | 189,132 | | | | | | 0.0 | | |
| 408,000 | | | T-Mobile USA, Inc., 3.500%, 04/15/2025 | | | | | 432,563 | | | | | | 0.1 | | |
| 405,000 | | | TWDC Enterprises 18 Corp., 2.125%, 09/13/2022 | | | | | 409,045 | | | | | | 0.1 | | |
| 600,000 | | | TWDC Enterprises 18 Corp., 2.450%, 03/04/2022 | | | | | 602,139 | | | | | | 0.1 | | |
| 471,000 | | | Verizon Communications, Inc., 0.850%, 11/20/2025 | | | | | 459,882 | | | | | | 0.1 | | |
| 472,000 | | | Verizon Communications, Inc., 3.500%, 11/01/2024 | | | | | 502,561 | | | | | | 0.1 | | |
| 259,000 | | | Walt Disney Co/The, 4.000%, 10/01/2023 | | | | | 273,046 | | | | | | 0.1 | | |
| | | | | | | | | 7,870,325 | | | | | | 1.9 | | |
| Principal Amount† | | | Value | | | Percentage of Net Assets | | |||||||||
| CORPORATE BONDS/NOTES: (continued) | | |||||||||||||||
| | | | Consumer, Cyclical: 2.3% | | ||||||||||||
| 358,000 (1) | | | 7-Eleven, Inc., 0.950%, 02/10/2026 | | | | $ | 346,979 | | | | | | 0.1 | | |
| 433,000 | | | American Honda Finance Corp., 0.650%, 09/08/2023 | | | | | 431,858 | | | | | | 0.1 | | |
| 509,000 | | | American Honda Finance Corp., 0.875%, 07/07/2023 | | | | | 509,351 | | | | | | 0.1 | | |
| 140,000 | | | American Honda Finance Corp., 1.300%, 09/09/2026 | | | | | 138,405 | | | | | | 0.0 | | |
| 390,000 | | | American Honda Finance Corp., 2.050%, 01/10/2023 | | | | | 395,850 | | | | | | 0.1 | | |
| 236,000 (1) | | | BMW US Capital LLC, 0.800%, 04/01/2024 | | | | | 234,544 | | | | | | 0.0 | | |
| 431,000 (1)(2) | | | BMW US Capital LLC, 3.900%, 04/09/2025 | | | | | 463,815 | | | | | | 0.1 | | |
| 460,000 (1) | | | Daimler Finance North America LLC, 3.400%, 02/22/2022 | | | | | 461,889 | | | | | | 0.1 | | |
| 250,000 | | | Delta Air Lines 2019-1 Class A Pass Through Trust, 3.404%, 10/25/2025 | | | | | 254,439 | | | | | | 0.1 | | |
| 168,570 | | | Delta Air Lines 2020-1 Class A Pass Through Trust, 2.500%, 12/10/2029 | | | | | 168,019 | | | | | | 0.0 | | |
| 256,000 (1) | | | Delta Air Lines, Inc. / SkyMiles IP Ltd., 4.500%, 10/20/2025 | | | | | 269,218 | | | | | | 0.1 | | |
| 453,000 | | | General Motors Financial Co., Inc., 1.050%, 03/08/2024 | | | | | 450,828 | | | | | | 0.1 | | |
| 466,000 | | | General Motors Financial Co., Inc., 1.700%, 08/18/2023 | | | | | 470,615 | | | | | | 0.1 | | |
| 750,000 (1) | | | Mileage Plus Holdings LLC / Mileage Plus Intellectual Property Assets Ltd., 6.500%, 06/20/2027 | | | | | 801,754 | | | | | | 0.2 | | |
| 536,000 | | | PACCAR Financial Corp., 0.350%, 08/11/2023 | | | | | 531,876 | | | | | | 0.1 | | |
| 450,000 (1) | | | Panasonic Corp., 2.536%, 07/19/2022 | | | | | 453,621 | | | | | | 0.1 | | |
| 623,000 | | | Ross Stores, Inc., 4.600%, 04/15/2025 | | | | | 683,050 | | | | | | 0.2 | | |
| 330,000 (1)(2) | | | Toyota Industries Corp., 3.110%, 03/12/2022 | | | | | 331,017 | | | | | | 0.1 | | |
| 474,000 | | | Toyota Motor Corp., 0.681%, 03/25/2024 | | | | | 471,398 | | | | | | 0.1 | | |
| 742,000 | | | Toyota Motor Credit Corp., 0.500%, 08/14/2023 | | | | | 739,544 | | | | | | 0.2 | | |
| Voya Limited Maturity Bond Portfolio | as of December 31, 2021 (continued) |
| Principal Amount† | | | Value | | | Percentage of Net Assets | | |||||||||
| CORPORATE BONDS/NOTES: (continued) | | |||||||||||||||
| | | | Consumer, Cyclical (continued) | | ||||||||||||
| 25,592 | | | United Airlines 2012-1 Class A Pass Through Trust, 4.150%, 10/11/2025 | | | | $ | 26,561 | | | | | | 0.0 | | |
| 225,458 | | | US Airways 2012-1 Class A Pass Through Trust, 5.900%, 04/01/2026 | | | | | 236,583 | | | | | | 0.1 | | |
| 728,000 | | | WW Grainger, Inc., 1.850%, 02/15/2025 | | | | | 742,100 | | | | | | 0.2 | | |
| | | | | | | | | 9,613,314 | | | | | | 2.3 | | |
| | | | Consumer, Non-cyclical: 4.6% | | ||||||||||||
| 640,000 | | | AbbVie, Inc., 2.300%, 11/21/2022 | | | | | 649,070 | | | | | | 0.2 | | |
| 517,000 | | | AbbVie, Inc., 2.600%, 11/21/2024 | | | | | 536,771 | | | | | | 0.1 | | |
| 165,000 | | | AbbVie, Inc., 2.900%, 11/06/2022 | | | | | 168,071 | | | | | | 0.0 | | |
| 850,000 | | | AbbVie, Inc., 3.450%, 03/15/2022 | | | | | 850,784 | | | | | | 0.2 | | |
| 500,000 | | | Altria Group, Inc., 2.350%, 05/06/2025 | | | | | 512,118 | | | | | | 0.1 | | |
| 326,000 | | | AmerisourceBergen Corp., 0.737%, 03/15/2023 | | | | | 325,235 | | | | | | 0.1 | | |
| 385,000 | | | Anthem, Inc., 3.500%, 08/15/2024 | | | | | 406,784 | | | | | | 0.1 | | |
| 644,000 | | | BAT International Finance PLC, 1.668%, 03/25/2026 | | | | | 632,855 | | | | | | 0.1 | | |
| 410,000 (1) | | | Baxter International, Inc., 1.322%, 11/29/2024 | | | | | 409,677 | | | | | | 0.1 | | |
| 386,000 | | | Boston Scientific Corp., 1.900%, 06/01/2025 | | | | | 390,695 | | | | | | 0.1 | | |
| 506,000 | | | Bristol-Myers Squibb Co., 0.750%, 11/13/2025 | | | | | 493,226 | | | | | | 0.1 | | |
| 355,000 | | | Bristol-Myers Squibb Co., 2.600%, 05/16/2022 | | | | | 357,977 | | | | | | 0.1 | | |
| 587,000 | | | Bunge Ltd. Finance Corp., 1.630%, 08/17/2025 | | | | | 585,397 | | | | | | 0.1 | | |
| 219,000 (1) | | | Cargill, Inc., 1.375%, 07/23/2023 | | | | | 220,796 | | | | | | 0.0 | | |
| 274,000 | | | Cigna Corp., 1.250%, 03/15/2026 | | | | | 270,299 | | | | | | 0.1 | | |
| 673,000 | | | Conagra Brands, Inc., 0.500%, 08/11/2023 | | | | | 667,468 | | | | | | 0.2 | | |
| 394,000 | | | Constellation Brands, Inc., 3.200%, 02/15/2023 | | | | | 402,551 | | | | | | 0.1 | | |
| 685,000 | | | DH Europe Finance II Sarl, 2.050%, 11/15/2022 | | | | | 693,928 | | | | | | 0.2 | | |
| 250,000 | | | Diageo Capital PLC, 1.375%, 09/29/2025 | | | | | 248,833 | | | | | | 0.1 | | |
| 587,000 (1) | | | Element Fleet Management Corp., 3.850%, 06/15/2025 | | | | | 624,697 | | | | | | 0.1 | | |
| Principal Amount† | | | Value | | | Percentage of Net Assets | | |||||||||
| CORPORATE BONDS/NOTES: (continued) | | |||||||||||||||
| | | | Consumer, Non-cyclical (continued) | | ||||||||||||
| 309,000 | | | Gilead Sciences, Inc., 0.750%, 09/29/2023 | | | | $ | 307,823 | | | | | | 0.1 | | |
| 770,000 | | | Gilead Sciences, Inc., 1.950%, 03/01/2022 | | | | | 770,908 | | | | | | 0.2 | | |
| 458,000 | | | Global Payments, Inc., 1.200%, 03/01/2026 | | | | | 444,990 | | | | | | 0.1 | | |
| 417,000 | | | Hershey Co/The, 0.900%, 06/01/2025 | | | | | 411,806 | | | | | | 0.1 | | |
| 262,000 | | | Humana, Inc., 0.650%, 08/03/2023 | | | | | 260,732 | | | | | | 0.1 | | |
| 446,000 | | | Illumina, Inc., 0.550%, 03/23/2023 | | | | | 443,866 | | | | | | 0.1 | | |
| 370,000 (1) | | | Imperial Brands Finance PLC, 3.750%, 07/21/2022 | | | | | 374,126 | | | | | | 0.1 | | |
| 140,000 | | | Keurig Dr Pepper, Inc., 4.057%, 05/25/2023 | | | | | 146,006 | | | | | | 0.0 | | |
| 400,000 | | | Laboratory Corp. of America Holdings, 3.600%, 02/01/2025 | | | | | 422,545 | | | | | | 0.1 | | |
| 484,000 | | | Merck & Co., Inc., 1.700%, 06/10/2027 | | | | | 487,189 | | | | | | 0.1 | | |
| 440,000 (1) | | | Mondelez International Holdings Netherlands BV, 2.125%, 09/19/2022 | | | | | 444,690 | | | | | | 0.1 | | |
| 633,000 (1) | | | Mylan, Inc., 3.125%, 01/15/2023 | | | | | 646,332 | | | | | | 0.2 | | |
| 334,000 (1)(2) | | | Nestle Holdings, Inc., 1.150%, 01/14/2027 | | | | | 326,079 | | | | | | 0.1 | | |
| 345,000 | | | PayPal Holdings, Inc., 2.200%, 09/26/2022 | | | | | 349,932 | | | | | | 0.1 | | |
| 465,000 | | | PerkinElmer, Inc., 0.850%, 09/15/2024 | | | | | 458,662 | | | | | | 0.1 | | |
| 129,000 | | | RELX Capital, Inc., 3.500%, 03/16/2023 | | | | | 132,824 | | | | | | 0.0 | | |
| 875,000 | | | Royalty Pharma PLC, 0.750%, 09/02/2023 | | | | | 869,814 | | | | | | 0.2 | | |
| 702,000 | | | Stryker Corp., 0.600%, 12/01/2023 | | | | | 698,509 | | | | | | 0.2 | | |
| 121,000 (1) | | | Triton Container International Ltd., 0.800%, 08/01/2023 | | | | | 119,850 | | | | | | 0.0 | | |
| 470,000 (1) | | | Triton Container International Ltd., 1.150%, 06/07/2024 | | | | | 463,553 | | | | | | 0.1 | | |
| 165,000 | | | UnitedHealth Group, Inc., 2.375%, 08/15/2024 | | | | | 170,942 | | | | | | 0.0 | | |
| 323,000 | | | UnitedHealth Group, Inc., 3.375%, 04/15/2027 | | | | | 350,378 | | | | | | 0.1 | | |
| 750,000 | | | Viatris, Inc., 1.650%, 06/22/2025 | | | | | 747,758 | | | | | | 0.2 | | |
| | | | | | | | | 19,296,546 | | | | | | 4.6 | | |
| Voya Limited Maturity Bond Portfolio | as of December 31, 2021 (continued) |
| Principal Amount† | | | Value | | | Percentage of Net Assets | | |||||||||
| CORPORATE BONDS/NOTES: (continued) | | |||||||||||||||
| | | | Energy: 1.8% | | ||||||||||||
| 331,000 | | | Baker Hughes Holdings LLC / Baker Hughes Co-Obligor, Inc., 2.061%, 12/15/2026 | | | | $ | 334,168 | | | | | | 0.1 | | |
| 580,000 | | | Canadian Natural Resources Ltd., 2.050%, 07/15/2025 | | | | | 586,053 | | | | | | 0.1 | | |
| 500,000 | | | Chevron USA, Inc., 0.426%, 08/11/2023 | | | | | 497,886 | | | | | | 0.1 | | |
| 614,000 | | | Enbridge, Inc., 0.550%, 10/04/2023 | | | | | 609,500 | | | | | | 0.2 | | |
| 834,000 | | | Energy Transfer L.P., 4.250%, 03/15/2023 | | | | | 857,210 | | | | | | 0.2 | | |
| 469,000 | | | Equinor ASA, 2.875%, 04/06/2025 | | | | | 489,808 | | | | | | 0.1 | | |
| 395,000 | | | Kinder Morgan, Inc., 1.750%, 11/15/2026 | | | | | 393,711 | | | | | | 0.1 | | |
| 306,000 | | | Ovintiv Exploration, Inc., 5.375%, 01/01/2026 | | | | | 339,512 | | | | | | 0.1 | | |
| 141,000 | | | Ovintiv Exploration, Inc., 5.625%, 07/01/2024 | | | | | 155,306 | | | | | | 0.0 | | |
| 425,000 | | | Phillips 66, 0.900%, 02/15/2024 | | | | | 422,055 | | | | | | 0.1 | | |
| 326,000 | | | Phillips 66, 3.850%, 04/09/2025 | | | | | 347,854 | | | | | | 0.1 | | |
| 191,000 | | | Pioneer Natural Resources Co., 0.550%, 05/15/2023 | | | | | 190,329 | | | | | | 0.0 | | |
| 495,000 | | | Pioneer Natural Resources Co., 1.125%, 01/15/2026 | | | | | 481,103 | | | | | | 0.1 | | |
| 519,000 | | | Shell International Finance BV, 0.375%, 09/15/2023 | | | | | 515,734 | | | | | | 0.1 | | |
| 379,000 (1) | | | Southern Natural Gas Co. LLC, 0.625%, 04/28/2023 | | | | | 376,926 | | | | | | 0.1 | | |
| 270,000 | | | TransCanada PipeLines Ltd., 1.000%, 10/12/2024 | | | | | 267,785 | | | | | | 0.1 | | |
| 210,000 | | | Valero Energy Corp., 2.850%, 04/15/2025 | | | | | 217,696 | | | | | | 0.1 | | |
| 467,000 | | | Williams Cos, Inc./The, 4.550%, 06/24/2024 | | | | | 500,022 | | | | | | 0.1 | | |
| | | | | | | | | 7,582,658 | | | | | | 1.8 | | |
| | | | Financial: 16.1% | | ||||||||||||
| 393,000 | | | AerCap Ireland Capital DAC / AerCap Global Aviation Trust, 1.650%, 10/29/2024 | | | | | 392,488 | | | | | | 0.1 | | |
| 410,000 | | | Aflac, Inc., 1.125%, 03/15/2026 | | | | | 402,883 | | | | | | 0.1 | | |
| 525,000 (1) | | | AIG Global Funding, 0.900%, 09/22/2025 | | | | | 510,070 | | | | | | 0.1 | | |
| 433,000 | | | Ally Financial, Inc., 3.875%, 05/21/2024 | | | | | 456,560 | | | | | | 0.1 | | |
| Principal Amount† | | | Value | | | Percentage of Net Assets | | |||||||||
| CORPORATE BONDS/NOTES: (continued) | | |||||||||||||||
| | | | Financial (continued) | | ||||||||||||
| 536,000 | | | American Express Co., 2.500%, 07/30/2024 | | | | $ | 554,089 | | | | | | 0.1 | | |
| 247,000 | | | American International Group, Inc., 3.750%, 07/10/2025 | | | | | 264,511 | | | | | | 0.1 | | |
| 258,000 | | | American Tower Corp., 3.500%, 01/31/2023 | | | | | 264,993 | | | | | | 0.1 | | |
| 234,000 | | | Ameriprise Financial, Inc., 3.000%, 04/02/2025 | | | | | 244,451 | | | | | | 0.1 | | |
| 485,000 | | | Ameriprise Financial, Inc., 4.000%, 10/15/2023 | | | | | 511,614 | | | | | | 0.1 | | |
| 440,000 | | | Assurant, Inc., 4.200%, 09/27/2023 | | | | | 462,379 | | | | | | 0.1 | | |
| 284,000 (1) | | | Athene Global Funding, 2.550%, 06/29/2025 | | | | | 292,221 | | | | | | 0.1 | | |
| 738,000 (1) | | | Aviation Capital Group LLC, 5.500%, 12/15/2024 | | | | | 807,993 | | | | | | 0.2 | | |
| 475,000 (1) | | | Avolon Holdings Funding Ltd., 4.375%, 05/01/2026 | | | | | 509,468 | | | | | | 0.1 | | |
| 400,000 | | | Banco Santander SA, 3.500%, 04/11/2022 | | | | | 403,076 | | | | | | 0.1 | | |
| 1,404,000 (3) | | | Bank of America Corp., 0.810%, 10/24/2024 | | | | | 1,395,227 | | | | | | 0.3 | | |
| 1,731,000 (3) | | | Bank of America Corp., 0.976%, 04/22/2025 | | | | | 1,718,002 | | | | | | 0.4 | | |
| 425,000 (3) | | | Bank of America Corp., 0.981%, 09/25/2025 | | | | | 420,105 | | | | | | 0.1 | | |
| 660,000 (3) | | | Bank of America Corp., 1.530%, 12/06/2025 | | | | | 661,500 | | | | | | 0.2 | | |
| 496,000 (3) | | | Bank of America Corp., 2.015%, 02/13/2026 | | | | | 502,741 | | | | | | 0.1 | | |
| 916,000 (3) | | | Bank of America Corp., 3.004%, 12/20/2023 | | | | | 935,143 | | | | | | 0.2 | | |
| 280,000 | | | Bank of New York Mellon Corp./The, 1.600%, 04/24/2025 | | | | | 282,781 | | | | | | 0.1 | | |
| 432,000 | | | Bank of Nova Scotia/The, 0.550%, 09/15/2023 | | | | | 429,675 | | | | | | 0.1 | | |
| 473,000 | | | Bank of Nova Scotia/The, 0.700%, 04/15/2024 | | | | | 469,060 | | | | | | 0.1 | | |
| 355,000 (1) | | | Banque Federative du Credit Mutuel SA, 2.125%, 11/21/2022 | | | | | 359,999 | | | | | | 0.1 | | |
| 663,000 (3) | | | Barclays PLC, 1.007%, 12/10/2024 | | | | | 658,459 | | | | | | 0.1 | | |
| 420,000 (1) | | | BPCE SA, 1.000%, 01/20/2026 | | | | | 406,640 | | | | | | 0.1 | | |
| 250,000 (1) | | | BPCE SA, 2.750%, 01/11/2023 | | | | | 255,243 | | | | | | 0.1 | | |
| 1,120,000 (1) | | | BPCE SA, 5.700%, 10/22/2023 | | | | | 1,204,490 | | | | | | 0.3 | | |
| Voya Limited Maturity Bond Portfolio | as of December 31, 2021 (continued) |
| Principal Amount† | | | Value | | | Percentage of Net Assets | | |||||||||
| CORPORATE BONDS/NOTES: (continued) | | |||||||||||||||
| | | | Financial (continued) | | ||||||||||||
| 350,000 | | | Brookfield Finance, Inc., 4.000%, 04/01/2024 | | | | $ | 369,125 | | | | | | 0.1 | | |
| 503,000 | | | Canadian Imperial Bank of Commerce, 0.500%, 12/14/2023 | | | | | 497,019 | | | | | | 0.1 | | |
| 386,000 | | | Canadian Imperial Bank of Commerce, 0.950%, 06/23/2023 | | | | | 386,581 | | | | | | 0.1 | | |
| 270,000 (3) | | | Canadian Imperial Bank of Commerce, 2.606%, 07/22/2023 | | | | | 272,821 | | | | | | 0.1 | | |
| 396,000 (3) | | | Capital One Financial Corp., 1.878%, 11/02/2027 | | | | | 394,210 | | | | | | 0.1 | | |
| 720,000 | | | Capital One Financial Corp., 3.200%, 01/30/2023 | | | | | 737,642 | | | | | | 0.2 | | |
| 261,000 | | | Charles Schwab Corp./ The, 0.750%, 03/18/2024 | | | | | 259,962 | | | | | | 0.1 | | |
| 473,000 (3) | | | Citigroup, Inc., 0.981%, 05/01/2025 | | | | | 469,513 | | | | | | 0.1 | | |
| 388,000 (3) | | | Citigroup, Inc., 1.678%, 05/15/2024 | | | | | 392,427 | | | | | | 0.1 | | |
| 107,000 (3) | | | Citigroup, Inc., 3.106%, 04/08/2026 | | | | | 112,245 | | | | | | 0.0 | | |
| 298,000 | | | Credit Suisse AG/ New York NY, 0.520%, 08/09/2023 | | | | | 295,988 | | | | | | 0.1 | | |
| 233,000 | | | Credit Suisse AG/ New York NY, 2.950%, 04/09/2025 | | | | | 244,069 | | | | | | 0.1 | | |
| 1,246,000 | | | Credit Suisse AG/ New York NY, 3.625%, 09/09/2024 | | | | | 1,322,059 | | | | | | 0.3 | | |
| 467,000 (1)(3) | | | Danske Bank A/S, 0.976%, 09/10/2025 | | | | | 460,078 | | | | | | 0.1 | | |
| 467,000 (3) | | | Deutsche Bank AG/ New York NY, 2.222%, 09/18/2024 | | | | | 473,202 | | | | | | 0.1 | | |
| 459,000 | | | Discover Financial Services, 3.950%, 11/06/2024 | | | | | 488,563 | | | | | | 0.1 | | |
| 355,000 (1) | | | DNB Bank ASA, 2.150%, 12/02/2022 | | | | | 360,284 | | | | | | 0.1 | | |
| 475,000 | | | Equinix, Inc., 1.250%, 07/15/2025 | | | | | 466,935 | | | | | | 0.1 | | |
| 388,000 | | | Federal Realty Investment Trust, 3.950%, 01/15/2024 | | | | | 406,531 | | | | | | 0.1 | | |
| 305,000 (1) | | | Federation des Caisses Desjardins du Quebec, 2.050%, 02/10/2025 | | | | | 309,017 | | | | | | 0.1 | | |
| 487,000 (3) | | | Goldman Sachs Group, Inc./ The, 0.673%, 03/08/2024 | | | | | 484,928 | | | | | | 0.1 | | |
| Principal Amount† | | | Value | | | Percentage of Net Assets | | |||||||||
| CORPORATE BONDS/NOTES: (continued) | | |||||||||||||||
| | | | Financial (continued) | | ||||||||||||
| 236,000 (3) | | | Goldman Sachs Group, Inc./The, 0.925%, 10/21/2024 | | | | $ | 235,079 | | | | | | 0.0 | | |
| 257,000 | | | Hanover Insurance Group, Inc./The, 4.500%, 04/15/2026 | | | | | 281,997 | | | | | | 0.1 | | |
| 480,000 (3) | | | HSBC Holdings PLC, 0.732%, 08/17/2024 | | | | | 475,892 | | | | | | 0.1 | | |
| 746,000 (3) | | | HSBC Holdings PLC, 1.162%, 11/22/2024 | | | | | 744,099 | | | | | | 0.2 | | |
| 531,000 (3) | | | HSBC Holdings PLC, 1.645%, 04/18/2026 | | | | | 527,013 | | | | | | 0.1 | | |
| 287,000 | | | ING Groep NV, 3.150%, 03/29/2022 | | | | | 288,893 | | | | | | 0.1 | | |
| 580,000 | | | Intercontinental Exchange, Inc., 0.700%, 06/15/2023 | | | | | 577,655 | | | | | | 0.1 | | |
| 800,000 | | | Intercontinental Exchange, Inc., 3.450%, 09/21/2023 | | | | | 831,723 | | | | | | 0.2 | | |
| 566,000 (1) | | | Jackson Financial, Inc., 1.125%, 11/22/2023 | | | | | 565,180 | | | | | | 0.1 | | |
| 854,000 (3) | | | JPMorgan Chase & Co., 0.824%, 06/01/2025 | | | | | 844,482 | | | | | | 0.2 | | |
| 1,640,000 (3) | | | JPMorgan Chase & Co., 0.969%, 06/23/2025 | | | | | 1,624,927 | | | | | | 0.4 | | |
| 504,000 (3) | | | JPMorgan Chase & Co., 1.470%, 09/22/2027 | | | | | 494,258 | | | | | | 0.1 | | |
| 389,000 (3) | | | JPMorgan Chase & Co., 1.514%, 06/01/2024 | | | | | 392,082 | | | | | | 0.1 | | |
| 284,000 (3) | | | JPMorgan Chase & Co., 1.578%, 04/22/2027 | | | | | 280,801 | | | | | | 0.1 | | |
| 178,000 (3) | | | JPMorgan Chase & Co., 2.083%, 04/22/2026 | | | | | 180,800 | | | | | | 0.0 | | |
| 176,000 (3) | | | JPMorgan Chase & Co., 2.301%, 10/15/2025 | | | | | 180,111 | | | | | | 0.0 | | |
| 460,000 (3) | | | JPMorgan Chase & Co., 2.776%, 04/25/2023 | | | | | 462,974 | | | | | | 0.1 | | |
| 280,000 | | | JPMorgan Chase & Co., 3.200%, 01/25/2023 | | | | | 287,656 | | | | | | 0.1 | | |
| 737,000 (3) | | | JPMorgan Chase & Co., 3.797%, 07/23/2024 | | | | | 768,358 | | | | | | 0.2 | | |
| 624,000 (3) | | | Lloyds Banking Group PLC, 0.695%, 05/11/2024 | | | | | 621,713 | | | | | | 0.1 | | |
| 425,000 | | | Lloyds Banking Group PLC, 3.000%, 01/11/2022 | | | | | 425,226 | | | | | | 0.1 | | |
| 176,000 (3) | | | Lloyds Banking Group PLC, 3.870%, 07/09/2025 | | | | | 186,028 | | | | | | 0.0 | | |
| 480,000 (1) | | | LSEGA Financing PLC, 0.650%, 04/06/2024 | | | | | 473,346 | | | | | | 0.1 | | |
| 460,000 | | | Marsh & McLennan Cos, Inc., 4.050%, 10/15/2023 | | | | | 481,746 | | | | | | 0.1 | | |
| Voya Limited Maturity Bond Portfolio | as of December 31, 2021 (continued) |
| Principal Amount† | | | Value | | | Percentage of Net Assets | | |||||||||
| CORPORATE BONDS/NOTES: (continued) | | |||||||||||||||
| | | | Financial (continued) | | ||||||||||||
| 330,000 (1) | | | Metropolitan Life Global Funding I, 1.950%, 01/13/2023 | | | | $ | 334,312 | | | | | | 0.1 | | |
| 430,000 (3) | | | Mitsubishi UFJ Financial Group, Inc., 0.848%, 09/15/2024 | | | | | 428,048 | | | | | | 0.1 | | |
| 415,000 (3) | | | Mitsubishi UFJ Financial Group, Inc., 0.953%, 07/19/2025 | | | | | 410,141 | | | | | | 0.1 | | |
| 365,000 (3) | | | Mitsubishi UFJ Financial Group, Inc., 0.962%, 10/11/2025 | | | | | 360,145 | | | | | | 0.1 | | |
| 323,000 | | | Mitsubishi UFJ Financial Group, Inc., 1.412%, 07/17/2025 | | | | | 321,477 | | | | | | 0.1 | | |
| 200,000 | | | Mitsubishi UFJ Financial Group, Inc., 2.623%, 07/18/2022 | | | | | 202,304 | | | | | | 0.0 | | |
| 820,000 | | | Mizuho Financial Group, Inc., 0.810%, (US0003M + 0.630%), 05/25/2024 | | | | | 823,859 | | | | | | 0.2 | | |
| 392,000 (3) | | | Mizuho Financial Group, Inc., 0.849%, 09/08/2024 | | | | | 390,123 | | | | | | 0.1 | | |
| 304,000 (3) | | | Mizuho Financial Group, Inc., 2.555%, 09/13/2025 | | | | | 312,293 | | | | | | 0.1 | | |
| 665,000 (3) | | | Morgan Stanley, 0.731%, 04/05/2024 | | | | | 663,115 | | | | | | 0.2 | | |
| 898,000 (3) | | | Morgan Stanley, 0.791%, 01/22/2025 | | | | | 889,309 | | | | | | 0.2 | | |
| 1,256,000 (3) | | | Morgan Stanley, 0.790%, 05/30/2025 | | | | | 1,240,249 | | | | | | 0.3 | | |
| 766,000 (3) | | | Morgan Stanley, 1.164%, 10/21/2025 | | | | | 760,420 | | | | | | 0.2 | | |
| 845,000 | | | Morgan Stanley, 3.750%, 02/25/2023 | | | | | 874,221 | | | | | | 0.2 | | |
| 496,000 | | | Morgan Stanley, 4.000%, 07/23/2025 | | | | | 537,989 | | | | | | 0.1 | | |
| 330,000 | | | MUFG Union Bank NA, 2.100%, 12/09/2022 | | | | | 334,281 | | | | | | 0.1 | | |
| 250,000 | | | MUFG Union Bank NA, 3.150%, 04/01/2022 | | | | | 251,093 | | | | | | 0.1 | | |
| 684,000 (3) | | | National Bank of Canada, 0.550%, 11/15/2024 | | | | | 676,330 | | | | | | 0.2 | | |
| 349,000 | | | National Bank of Canada, 0.750%, 08/06/2024 | | | | | 344,453 | | | | | | 0.1 | | |
| 350,000 (1) | | | National Securities Clearing Corp., 1.200%, 04/23/2023 | | | | | 352,490 | | | | | | 0.1 | | |
| 250,000 (1) | | | National Securities Clearing Corp., 1.500%, 04/23/2025 | | | | | 251,690 | | | | | | 0.1 | | |
| Principal Amount† | | | Value | | | Percentage of Net Assets | | |||||||||
| CORPORATE BONDS/NOTES: (continued) | | |||||||||||||||
| | | | Financial (continued) | | ||||||||||||
| 213,000 (1) | | | Nationwide Building Society, 1.500%, 10/13/2026 | | | | $ | 209,124 | | | | | | 0.0 | | |
| 399,000 (1) | | | Nationwide Building Society, 2.000%, 01/27/2023 | | | | | 404,238 | | | | | | 0.1 | | |
| 417,000 (3) | | | NatWest Group PLC, 2.359%, 05/22/2024 | | | | | 423,793 | | | | | | 0.1 | | |
| 244,000 | | | NatWest Group PLC, 3.875%, 09/12/2023 | | | | | 254,536 | | | | | | 0.1 | | |
| 395,000 (1) | | | Nordea Bank Abp, 0.625%, 05/24/2024 | | | | | 390,371 | | | | | | 0.1 | | |
| 293,000 (1) | | | Nordea Bank Abp, 0.750%, 08/28/2025 | | | | | 285,788 | | | | | | 0.1 | | |
| 786,000 (1) | | | Nordea Bank Abp, 4.250%, 09/21/2022 | | | | | 805,572 | | | | | | 0.2 | | |
| 587,000 | | | Old Republic International Corp., 4.875%, 10/01/2024 | | | | | 639,812 | | | | | | 0.1 | | |
| 237,000 (1) | | | Owl Rock Technology Finance Corp., 6.750%, 06/30/2025 | | | | | 264,936 | | | | | | 0.1 | | |
| 498,000 (1) | | | Pacific Life Global Funding II, 0.500%, 09/23/2023 | | | | | 494,873 | | | | | | 0.1 | | |
| 472,000 (1) | | | Pacific Life Global Funding II, 1.375%, 04/14/2026 | | | | | 469,995 | | | | | | 0.1 | | |
| 470,000 | | | PNC Financial Services Group, Inc./The, 3.500%, 01/23/2024 | | | | | 492,354 | | | | | | 0.1 | | |
| 495,000 (1) | | | Reliance Standard Life Global Funding II, 2.150%, 01/21/2023 | | | | | 501,857 | | | | | | 0.1 | | |
| 444,000 | | | Royal Bank of Canada, 0.500%, 10/26/2023 | | | | | 441,512 | | | | | | 0.1 | | |
| 225,000 | | | Royal Bank of Canada, 0.793%, (US0003M + 0.660%), 10/05/2023 | | | | | 226,776 | | | | | | 0.0 | | |
| 384,000 | | | Royal Bank of Canada, 1.150%, 06/10/2025 | | | | | 380,982 | | | | | | 0.1 | | |
| 284,000 | | | Royal Bank of Canada, 1.150%, 07/14/2026 | | | | | 278,073 | | | | | | 0.1 | | |
| 280,000 | | | Royal Bank of Canada, 1.600%, 04/17/2023 | | | | | 283,227 | | | | | | 0.1 | | |
| 345,000 | | | Royal Bank of Canada, 1.950%, 01/17/2023 | | | | | 349,714 | | | | | | 0.1 | | |
| 553,000 | | | Royal Bank of Canada, 3.700%, 10/05/2023 | | | | | 580,288 | | | | | | 0.1 | | |
| 236,000 (1) | | | Scentre Group Trust 1 / Scentre Group Trust 2, 3.625%, 01/28/2026 | | | | | 252,153 | | | | | | 0.1 | | |
| Voya Limited Maturity Bond Portfolio | as of December 31, 2021 (continued) |
| Principal Amount† | | | Value | | | Percentage of Net Assets | | |||||||||
| CORPORATE BONDS/NOTES: (continued) | | |||||||||||||||
| | | | Financial (continued) | | ||||||||||||
| 440,000 | | | Sixth Street Specialty Lending, Inc., 3.875%, 11/01/2024 | | | | $ | 460,389 | | | | | | 0.1 | | |
| 954,000 (1) | | | Skandinaviska Enskilda Banken AB, 0.550%, 09/01/2023 | | | | | 948,319 | | | | | | 0.2 | | |
| 619,000 (1) | | | Skandinaviska Enskilda Banken AB, 0.650%, 09/09/2024 | | | | | 608,966 | | | | | | 0.1 | | |
| 402,000 (1)(3) | | | Standard Chartered PLC, 0.991%, 01/12/2025 | | | | | 397,884 | | | | | | 0.1 | | |
| 320,000 | | | Sumitomo Mitsui Financial Group, Inc., 2.348%, 01/15/2025 | | | | | 328,127 | | | | | | 0.1 | | |
| 355,000 | | | Sumitomo Mitsui Financial Group, Inc., 2.696%, 07/16/2024 | | | | | 366,821 | | | | | | 0.1 | | |
| 465,000 (1) | | | Sumitomo Mitsui Trust Bank Ltd., 0.800%, 09/16/2024 | | | | | 457,523 | | | | | | 0.1 | | |
| 800,000 (1) | | | Svenska Handelsbanken AB, 0.625%, 06/30/2023 | | | | | 797,961 | | | | | | 0.2 | | |
| 425,000 (1) | | | Swedbank AB, 0.600%, 09/25/2023 | | | | | 422,844 | | | | | | 0.1 | | |
| 525,000 (1) | | | Swiss Re Treasury US Corp., 2.875%, 12/06/2022 | | | | | 533,314 | | | | | | 0.1 | | |
| 467,000 (2) | | | Toronto-Dominion Bank/ The, 0.700%, 09/10/2024 | | | | | 461,202 | | | | | | 0.1 | | |
| 821,000 | | | Toronto-Dominion Bank/ The, 1.150%, 06/12/2025 | | | | | 814,741 | | | | | | 0.2 | | |
| 799,000 | | | Truist Bank, 1.250%, 03/09/2023 | | | | | 804,024 | | | | | | 0.2 | | |
| 369,000 (1) | | | UBS AG/London, 0.700%, 08/09/2024 | | | | | 364,912 | | | | | | 0.1 | | |
| 351,000 (1) | | | UBS AG/London, 1.750%, 04/21/2022 | | | | | 352,121 | | | | | | 0.1 | | |
| 600,000 (1)(3) | | | UBS Group AG, 1.008%, 07/30/2024 | | | | | 598,304 | | | | | | 0.1 | | |
| 565,000 (1)(3) | | | UBS Group AG, 2.859%, 08/15/2023 | | | | | 571,856 | | | | | | 0.1 | | |
| 280,000 (1) | | | USAA Capital Corp., 1.500%, 05/01/2023 | | | | | 282,850 | | | | | | 0.1 | | |
| 649,000 (3) | | | Wells Fargo & Co., 2.406%, 10/30/2025 | | | | | 665,633 | | | | | | 0.2 | | |
| 409,000 | | | XLIT Ltd., 4.450%, 03/31/2025 | | | | | 443,773 | | | | | | 0.1 | | |
| | | | | | | | | 67,080,979 | | | | | | 16.1 | | |
| | | | Industrial: 1.6% | | ||||||||||||
| 388,000 | | | Boeing Co/The, 4.875%, 05/01/2025 | | | | | 424,829 | | | | | | 0.1 | | |
| Principal Amount† | | | Value | | | Percentage of Net Assets | | |||||||||
| CORPORATE BONDS/NOTES: (continued) | | |||||||||||||||
| | | | Industrial (continued) | | ||||||||||||
| 423,000 | | | Caterpillar Financial Services Corp., 0.650%, 07/07/2023 | | | | $ | 423,121 | | | | | | 0.1 | | |
| 380,000 | | | Caterpillar Financial Services Corp., 3.650%, 12/07/2023 | | | | | 400,178 | | | | | | 0.1 | | |
| 223,000 | | | General Dynamics Corp., 3.250%, 04/01/2025 | | | | | 235,878 | | | | | | 0.1 | | |
| 392,000 (1) | | | Graphic Packaging International LLC, 0.821%, 04/15/2024 | | | | | 386,014 | | | | | | 0.1 | | |
| 386,000 | | | Honeywell International, Inc., 1.350%, 06/01/2025 | | | | | 387,823 | | | | | | 0.1 | | |
| 651,000 (1) | | | Huntington Ingalls Industries, Inc., 0.670%, 08/16/2023 | | | | | 645,526 | | | | | | 0.1 | | |
| 335,000 | | | John Deere Capital Corp., 2.050%, 01/09/2025 | | | | | 344,477 | | | | | | 0.1 | | |
| 500,000 | | | Raytheon Technologies Corp., 3.200%, 03/15/2024 | | | | | 520,602 | | | | | | 0.1 | | |
| 435,000 | | | Raytheon Technologies Corp., 3.700%, 12/15/2023 | | | | | 456,050 | | | | | | 0.1 | | |
| 400,000 | | | Republic Services, Inc., 2.500%, 08/15/2024 | | | | | 411,875 | | | | | | 0.1 | | |
| 305,000 | | | Rockwell Automation, Inc., 0.350%, 08/15/2023 | | | | | 303,096 | | | | | | 0.1 | | |
| 480,000 (1) | | | Siemens Financieringsmaatschappij NV, 0.650%, 03/11/2024 | | | | | 476,289 | | | | | | 0.1 | | |
| 713,000 | | | Teledyne Technologies, Inc., 0.950%, 04/01/2024 | | | | | 706,137 | | | | | | 0.2 | | |
| 506,000 | | | WestRock RKT LLC, 4.000%, 03/01/2023 | | | | | 519,719 | | | | | | 0.1 | | |
| | | | | | | | | 6,641,614 | | | | | | 1.6 | | |
| | | | Technology: 1.9% | | ||||||||||||
| 233,000 | | | Analog Devices, Inc., 2.950%, 04/01/2025 | | | | | 244,854 | | | | | | 0.1 | | |
| 157,000 | | | Apple, Inc., 0.700%, 02/08/2026 | | | | | 153,906 | | | | | | 0.0 | | |
| 449,000 | | | Apple, Inc., 2.750%, 01/13/2025 | | | | | 469,378 | | | | | | 0.1 | | |
| 290,000 (1) | | | CGI, Inc., 1.450%, 09/14/2026 | | | | | 283,889 | | | | | | 0.1 | | |
| 457,000 | | | Fidelity National Information Services, Inc., 0.600%, 03/01/2024 | | | | | 450,088 | | | | | | 0.1 | | |
| 445,000 | | | Fiserv, Inc., 2.750%, 07/01/2024 | | | | | 460,538 | | | | | | 0.1 | | |
| 398,000 | | | HP, Inc., 2.200%, 06/17/2025 | | | | | 406,550 | | | | | | 0.1 | | |
| Voya Limited Maturity Bond Portfolio | as of December 31, 2021 (continued) |
| Principal Amount† | | | Value | | | Percentage of Net Assets | | |||||||||
| CORPORATE BONDS/NOTES: (continued) | | |||||||||||||||
| | | | Technology (continued) | | ||||||||||||
| 99,000 | | | Intel Corp., 3.400%, 03/25/2025 | | | | $ | 105,307 | | | | | | 0.0 | | |
| 146,000 | | | Intel Corp., 3.700%, 07/29/2025 | | | | | 157,665 | | | | | | 0.1 | | |
| 465,000 (1) | | | Kyndryl Holdings, Inc., 2.050%, 10/15/2026 | | | | | 453,025 | | | | | | 0.1 | | |
| 473,000 | | | Oracle Corp., 1.650%, 03/25/2026 | | | | | 469,743 | | | | | | 0.1 | | |
| 288,000 | | | Oracle Corp., 2.500%, 04/01/2025 | | | | | 294,940 | | | | | | 0.1 | | |
| 350,000 | | | Roper Technologies, Inc., 0.450%, 08/15/2022 | | | | | 349,890 | | | | | | 0.1 | | |
| 430,000 | | | Roper Technologies, Inc., 3.125%, 11/15/2022 | | | | | 436,411 | | | | | | 0.1 | | |
| 650,000 | | | salesforce.com, Inc., 0.625%, 07/15/2024 | | | | | 644,314 | | | | | | 0.2 | | |
| 875,000 | | | salesforce.com, Inc., 3.250%, 04/11/2023 | | | | | 902,783 | | | | | | 0.2 | | |
| 507,000 | | | VMware, Inc., 1.000%, 08/15/2024 | | | | | 502,398 | | | | | | 0.1 | | |
| 428,000 | | | VMware, Inc., 2.950%, 08/21/2022 | | | | | 433,087 | | | | | | 0.1 | | |
| 424,000 | | | VMware, Inc., 4.500%, 05/15/2025 | | | | | 462,065 | | | | | | 0.1 | | |
| | | | | | | | | 7,680,831 | | | | | | 1.9 | | |
| | | | Utilities: 3.0% | | ||||||||||||
| 475,000 (1) | | | AEP Texas, Inc., 3.850%, 10/01/2025 | | | | | 507,445 | | | | | | 0.1 | | |
| 502,000 | | | American Electric Power Co., Inc., 0.750%, 11/01/2023 | | | | | 498,763 | | | | | | 0.1 | | |
| 425,000 | | | Arizona Public Service Co., 3.350%, 06/15/2024 | | | | | 442,840 | | | | | | 0.1 | | |
| 568,000 | | | Atmos Energy Corp., 0.625%, 03/09/2023 | | | | | 565,971 | | | | | | 0.1 | | |
| 425,000 | | | Avangrid, Inc., 3.200%, 04/15/2025 | | | | | 446,977 | | | | | | 0.1 | | |
| 279,000 | | | Black Hills Corp., 1.037%, 08/23/2024 | | | | | 275,677 | | | | | | 0.1 | | |
| 500,000 (1) | | | Dominion Energy, Inc., 2.450%, 01/15/2023 | | | | | 508,408 | | | | | | 0.1 | | |
| 385,000 | | | Duke Energy Ohio, Inc., 3.800%, 09/01/2023 | | | | | 400,462 | | | | | | 0.1 | | |
| 290,000 | | | Duke Energy Progress LLC, 3.375%, 09/01/2023 | | | | | 301,185 | | | | | | 0.1 | | |
| 329,000 | | | Entergy Corp., 0.900%, 09/15/2025 | | | | | 318,937 | | | | | | 0.1 | | |
| 555,000 | | | Entergy Louisiana LLC, 0.950%, 10/01/2024 | | | | | 549,226 | | | | | | 0.1 | | |
| 250,000 | | | Entergy Louisiana LLC, 3.300%, 12/01/2022 | | | | | 254,060 | | | | | | 0.1 | | |
| Principal Amount† | | | Value | | | Percentage of Net Assets | | |||||||||
| CORPORATE BONDS/NOTES: (continued) | | |||||||||||||||
| | | | Utilities (continued) | | ||||||||||||
| 250,000 | | | Entergy Louisiana LLC, 4.050%, 09/01/2023 | | | | $ | 260,139 | | | | | | 0.1 | | |
| 485,000 | | | Interstate Power and Light Co., 3.250%, 12/01/2024 | | | | | 509,540 | | | | | | 0.1 | | |
| 72,000 | | | IPALCO Enterprises, Inc., 3.700%, 09/01/2024 | | | | | 75,361 | | | | | | 0.0 | | |
| 428,000 | | | National Rural Utilities Cooperative Finance Corp., 1.000%, 10/18/2024 | | | | | 424,475 | | | | | | 0.1 | | |
| 835,000 | | | National Rural Utilities Cooperative Finance Corp., 2.300%, 09/15/2022 | | | | | 844,118 | | | | | | 0.2 | | |
| 473,000 | | | NextEra Energy Capital Holdings, Inc., 1.875%, 01/15/2027 | | | | | 476,094 | | | | | | 0.1 | | |
| 325,000 (1) | | | Niagara Mohawk Power Corp., 2.721%, 11/28/2022 | | | | | 330,649 | | | | | | 0.1 | | |
| 284,000 | | | OGE Energy Corp., 0.703%, 05/26/2023 | | | | | 282,792 | | | | | | 0.1 | | |
| 378,000 | | | ONE Gas, Inc., 0.850%, 03/11/2023 | | | | | 377,661 | | | | | | 0.1 | | |
| 485,000 | | | Public Service Electric and Gas Co., 3.750%, 03/15/2024 | | | | | 507,465 | | | | | | 0.1 | | |
| 335,000 | | | Public Service Enterprise Group, Inc., 0.800%, 08/15/2025 | | | | | 326,431 | | | | | | 0.1 | | |
| 369,000 (2) | | | Southern California Edison Co., 2.400%, 02/01/2022 | | | | | 369,558 | | | | | | 0.1 | | |
| 330,000 | | | Southern Co. Gas Capital Corp., 2.450%, 10/01/2023 | | | | | 337,004 | | | | | | 0.1 | | |
| 384,000 | | | Southern Co. Gas Capital Corp., 3.250%, 06/15/2026 | | | | | 408,094 | | | | | | 0.1 | | |
| 646,000 | | | Southern Co/The, 0.600%, 02/26/2024 | | | | | 637,990 | | | | | | 0.1 | | |
| 259,000 | | | WEC Energy Group, Inc., 0.550%, 09/15/2023 | | | | | 257,042 | | | | | | 0.1 | | |
| 150,000 | | | Wisconsin Power and Light Co., 2.250%, 11/15/2022 | | | | | 151,213 | | | | | | 0.0 | | |
| 658,000 | | | Xcel Energy, Inc., 0.500%, 10/15/2023 | | | | | 653,850 | | | | | | 0.2 | | |
| | | | | | | | | 12,299,427 | | | | | | 3.0 | | |
| | | | Total Corporate Bonds/ Notes | | | | | | | | | |||||
| | | | (Cost $139,535,257) | | | | | 139,761,478 | | | | | | 33.6 | | |
| COLLATERALIZED MORTGAGE OBLIGATIONS: 5.6% | | |||||||||||||||
| 1,114,038 | | | Fannie Mae REMICS 2006-43-FJ, 0.512%, (US0001M + 0.410%), 06/25/2036 | | | | | 1,124,587 | | | | | | 0.3 | | |
| Voya Limited Maturity Bond Portfolio | as of December 31, 2021 (continued) |
| Principal Amount† | | | Value | | | Percentage of Net Assets | | |||||||||
| COLLATERALIZED MORTGAGE OBLIGATIONS: (continued) | | |||||||||||||||
| 441,037 | | | Fannie Mae REMICS 2007-14 PF, 0.292%, (US0001M + 0.190%), 03/25/2037 | | | | $ | 441,636 | | | | | | 0.1 | | |
| 283,781 | | | Fannie Mae REMICS 2010-123 FL, 0.532%, (US0001M + 0.430%), 11/25/2040 | | | | | 286,494 | | | | | | 0.1 | | |
| 775,638 | | | Fannie Mae REMICS 2010-136 FG, 0.602%, (US0001M + 0.500%), 12/25/2030 | | | | | 772,927 | | | | | | 0.2 | | |
| 1,061,350 | | | Fannie Mae REMICS 2011-51 FM, 0.752%, (US0001M + 0.650%), 06/25/2041 | | | | | 1,080,750 | | | | | | 0.3 | | |
| 1,059,362 | | | Fannie Mae REMICS 2011-68 F, 0.372%, (US0001M + 0.270%), 07/25/2031 | | | | | 1,056,311 | | | | | | 0.3 | | |
| 113,038 | | | Fannie Mae REMICS 2011-96 FN, 0.602%, (US0001M + 0.500%), 10/25/2041 | | | | | 114,718 | | | | | | 0.0 | | |
| 27,950 (1)(3) | | | Flagstar Mortgage Trust 2017-2 A3, 3.500%, 10/25/2047 | | | | | 28,183 | | | | | | 0.0 | | |
| 347,870 (1)(3) | | | Flagstar Mortgage Trust 2020-2 A2, 3.000%, 08/25/2050 | | | | | 350,656 | | | | | | 0.1 | | |
| 587,259 | | | Freddie Mac REMICS 3626 FA, 0.760%, (US0001M + 0.650%), 05/15/2036 | | | | | 598,502 | | | | | | 0.1 | | |
| 373,907 | | | Freddie Mac REMICS 4508 CF, 0.510%, (US0001M + 0.400%), 09/15/2045 | | | | | 378,310 | | | | | | 0.1 | | |
| 32,446 (3) | | | Freddie Mac Whole Loan Securities Trust 2016-SC02 M1, 3.661%, 10/25/2046 | | | | | 32,514 | | | | | | 0.0 | | |
| 1,922,612 | | | Ginnie Mae Series 2012-H31 FD, 0.421%, (US0001M + 0.340%), 12/20/2062 | | | | | 1,921,608 | | | | | | 0.5 | | |
| 1,116,738 | | | Ginnie Mae Series 2014-H05 FB, 0.681%, (US0001M + 0.600%), 12/20/2063 | | | | | 1,120,779 | | | | | | 0.3 | | |
| Principal Amount† | | | Value | | | Percentage of Net Assets | | |||||||||
| COLLATERALIZED MORTGAGE OBLIGATIONS: (continued) | | |||||||||||||||
| 2,716,024 | | | Ginnie Mae Series 2016-H06 FD, 1.001%, (US0001M + 0.920%), 07/20/2065 | | | | $ | 2,756,129 | | | | | | 0.7 | | |
| 711,242 | | | Ginnie Mae Series 2016-H08 FT, 0.801%, (US0001M + 0.720%), 02/20/2066 | | | | | 714,704 | | | | | | 0.2 | | |
| 2,015,191 | | | Ginnie Mae Series 2016-H16 FE, 0.627%, (US0012M + 0.380%), 06/20/2066 | | | | | 2,005,485 | | | | | | 0.5 | | |
| 576,820 | | | Ginnie Mae Series 2017-H09 FG, 0.551%, (US0001M + 0.470%), 03/20/2067 | | | | | 578,434 | | | | | | 0.1 | | |
| 610,426 | | | Ginnie Mae Series 2018-H04 FM, 0.381%, (US0001M + 0.300%), 03/20/2068 | | | | | 609,539 | | | | | | 0.1 | | |
| 1,361,643 | | | Ginnie Mae Series 2019-H02 FA, 0.531%, (US0001M + 0.450%), 01/20/2069 | | | | | 1,365,950 | | | | | | 0.3 | | |
| 796,886 | | | Ginnie Mae Series 2020-H09 NF, 1.354%, (US0001M + 1.250%), 04/20/2070 | | | | | 819,774 | | | | | | 0.2 | | |
| 29,854 (1)(3) | | | GS Mortgage-Backed Securities Corp. Trust 2019-PJ3 A1, 3.500%, 03/25/2050 | | | | | 30,062 | | | | | | 0.0 | | |
| 732,086 (1)(3) | | | GS Mortgage-Backed Securities Corp. Trust 2021-PJ4 A4, 2.500%, 09/25/2051 | | | | | 726,383 | | | | | | 0.2 | | |
| 311,048 (1)(3) | | | JP Morgan Mortgage Trust 2019-INV3 A3, 3.500%, 05/25/2050 | | | | | 316,581 | | | | | | 0.1 | | |
| 900,000 (1) | | | Mello Warehouse Securitization Trust 2020-1 A, 1.002%, (US0001M + 0.900%), 10/25/2053 | | | | | 900,464 | | | | | | 0.2 | | |
| 450,000 (1) | | | Mello Warehouse Securitization Trust 2020-2 A, 0.902%, (US0001M + 0.800%), 11/25/2053 | | | | | 448,757 | | | | | | 0.1 | | |
| 363,806 (1)(3) | | | Morgan Stanley Residential Mortgage Loan Trust 2021-2 A9, 2.500%, 05/25/2051 | | | | | 360,972 | | | | | | 0.1 | | |
| Voya Limited Maturity Bond Portfolio | as of December 31, 2021 (continued) |
| Principal Amount† | | | Value | | | Percentage of Net Assets | | |||||||||
| COLLATERALIZED MORTGAGE OBLIGATIONS: (continued) | | |||||||||||||||
| 600,000 (1)(3) | | | RATE Mortgage Trust 2021-HB1 A31, 2.500%, 12/25/2051 | | | | $ | 592,511 | | | | | | 0.1 | | |
| 768,909 (1)(3) | | | Rate Mortgage Trust 2021-J2 A31, 2.500%, 08/25/2051 | | | | | 762,920 | | | | | | 0.2 | | |
| 181,811 (1)(3) | | | Sequoia Mortgage Trust 2014-3 B3, 4.003%, 10/25/2044 | | | | | 183,023 | | | | | | 0.0 | | |
| 215,874 (1)(3) | | | Sequoia Mortgage Trust 2014-4 B3, 3.895%, 11/25/2044 | | | | | 218,767 | | | | | | 0.0 | | |
| 100,348 (1)(3) | | | Sequoia Mortgage Trust 2018-CH1 A19, 4.000%, 03/25/2048 | | | | | 101,145 | | | | | | 0.0 | | |
| 118,127 (3) | | | WaMu Mortgage Pass-Through Certificates Series 2004-AR4 A6 Trust, 2.595%, 06/25/2034 | | | | | 120,040 | | | | | | 0.0 | | |
| 246,613 (1)(3) | | | Wells Fargo Mortgage Backed Securities 2020-1 A17 Trust, 3.000%, 12/25/2049 | | | | | 249,383 | | | | | | 0.1 | | |
| | | | Total Collateralized Mortgage Obligations | | | | | | | | | |||||
| | | | (Cost $23,151,278) | | | | | 23,168,998 | | | | | | 5.6 | | |
| U.S. TREASURY OBLIGATIONS: 23.2% | | |||||||||||||||
| | | | U.S. Treasury Notes: 23.2% | | ||||||||||||
| 40,098,000 | | | 0.125%, 11/30/2022 | | | | | 40,008,963 | | | | | | 9.6 | | |
| 1,808,200 (2) | | | 0.500%, 11/30/2023 | | | | | 1,801,419 | | | | | | 0.4 | | |
| 16,150,400 | | | 0.750%, 12/31/2023 | | | | | 16,154,816 | | | | | | 3.9 | | |
| 35,927,400 | | | 1.000%, 12/15/2024 | | | | | 35,970,906 | | | | | | 8.7 | | |
| 189,400 (2) | | | 1.250%, 11/30/2026 | | | | | 189,311 | | | | | | 0.0 | | |
| 1,854,900 | | | 1.250%, 12/31/2026 | | | | | 1,853,161 | | | | | | 0.5 | | |
| 448,000 | | | 1.375%, 12/31/2028 | | | | | 446,110 | | | | | | 0.1 | | |
| 128,900 | | | 1.500%, 11/30/2028 | | | | | 129,444 | | | | | | 0.0 | | |
| | | | Total U.S. Treasury Obligations | | | | | | | | | |||||
| | | | (Cost $96,563,759) | | | | | 96,554,130 | | | | | | 23.2 | | |
| COMMERCIAL MORTGAGE-BACKED SECURITIES: 14.2% | | |||||||||||||||
| 2,000,000 (1) | | | BHMS 2018-ATLS D, 2.360%, (US0001M + 2.250%), 07/15/2035 | | | | | 1,979,354 | | | | | | 0.5 | | |
| 3,500,000 (1) | | | BPR Trust 2021-WILL C, 4.110%, (US0001M + 4.000%), 06/15/2038 | | | | | 3,507,890 | | | | | | 0.8 | | |
| 2,200,000 (1)(3) | | | BX Commercial Mortgage Trust 2020-VIV2 C, 3.542%, 03/09/2044 | | | | | 2,236,273 | | | | | | 0.5 | | |
| 922,000 (1) | | | BX Trust 2021-LBA EJV, 2.110%, (US0001M + 2.000%), 02/15/2036 | | | | | 917,628 | | | | | | 0.2 | | |
| Principal Amount† | | | Value | | | Percentage of Net Assets | | |||||||||
| COMMERCIAL MORTGAGE-BACKED SECURITIES: (continued) | | |||||||||||||||
| 922,000 (1) | | | BX Trust 2021-LBA EV, 2.110%, (US0001M + 2.000%), 02/15/2036 | | | | $ | 917,628 | | | | | | 0.2 | | |
| 1,500,000 (1) | | | BXMT 2021-FL4 D Ltd., 2.360%, (US0001M + 2.250%), 05/15/2038 | | | | | 1,489,688 | | | | | | 0.4 | | |
| 312,622 (1) | | | COMM 2012-CR2 A3 Mortgage Trust, 2.841%, 08/15/2045 | | | | | 312,629 | | | | | | 0.1 | | |
| 725,000 | | | COMM 2012-CR5 A4 Mortgage Trust, 2.771%, 12/10/2045 | | | | | 735,548 | | | | | | 0.2 | | |
| 10,091 | | | COMM 2012-LC4 A4, 3.288%, 12/10/2044 | | | | | 10,086 | | | | | | 0.0 | | |
| 1,663,000 (1)(3) | | | COMM 2013-CR10 D Mortgage Trust, 4.900%, 08/10/2046 | | | | | 1,686,635 | | | | | | 0.4 | | |
| 955,000 | | | COMM 2013-LC6 AM Mortgage Trust, 3.282%, 01/10/2046 | | | | | 972,284 | | | | | | 0.2 | | |
| 1,705,000 (3) | | | COMM 2013-LC6 C Mortgage Trust, 4.242%, 01/10/2046 | | | | | 1,737,942 | | | | | | 0.4 | | |
| 1,458,000 (1)(3) | | | COMM 2013-LC6 D Mortgage Trust, 4.289%, 01/10/2046 | | | | | 1,447,279 | | | | | | 0.3 | | |
| 4,100,000 (1) | | | CSWF 2021-SOP2 D, 2.427%, (US0001M + 2.317%), 06/15/2034 | | | | | 4,089,766 | | | | | | 1.0 | | |
| 225,000 (1) | | | MF1 Multifamily Housing Mortgage Loan Trust 2021-FL5 D, 2.665%, (SOFR30A + 2.500%), 07/15/2036 | | | | | 223,754 | | | | | | 0.1 | | |
| 23,176 (3) | | | Ginnie Mae 2011-53 B, 3.892%, 05/16/2051 | | | | | 23,414 | | | | | | 0.0 | | |
| 13,631 | | | Ginnie Mae 2014-54 AC, 2.874%, 02/16/2049 | | | | | 13,666 | | | | | | 0.0 | | |
| 62,914 | | | Ginnie Mae 2015-183 AC, 2.350%, 07/16/2056 | | | | | 63,341 | | | | | | 0.0 | | |
| 27,864 (3) | | | Ginnie Mae 2015-21 AF, 2.174%, 07/16/2048 | | | | | 28,149 | | | | | | 0.0 | | |
| 118,300 | | | Ginnie Mae 2016-110 AB, 2.000%, 05/16/2049 | | | | | 119,286 | | | | | | 0.0 | | |
| 11,427 | | | Ginnie Mae 2016-86 AB, 2.500%, 09/16/2056 | | | | | 11,465 | | | | | | 0.0 | | |
| 182,655 | | | Ginnie Mae 2017-51 AB, 2.350%, 04/16/2057 | | | | | 184,643 | | | | | | 0.0 | | |
| 56,951 | | | Ginnie Mae 2017-69 AB, 2.350%, 05/16/2053 | | | | | 57,530 | | | | | | 0.0 | | |
| Voya Limited Maturity Bond Portfolio | as of December 31, 2021 (continued) |
| Principal Amount† | | | Value | | | Percentage of Net Assets | | |||||||||
| COMMERCIAL MORTGAGE-BACKED SECURITIES: (continued) | | |||||||||||||||
| 92,638 | | | Ginnie Mae 2017-70 A, 2.500%, 10/16/2057 | | | | $ | 93,696 | | | | | | 0.0 | | |
| 215,829 | | | Ginnie Mae 2017-86 AB, 2.300%, 11/16/2051 | | | | | 218,085 | | | | | | 0.1 | | |
| 304,433 | | | Ginnie Mae 2017-89 A, 2.500%, 08/16/2057 | | | | | 307,216 | | | | | | 0.1 | | |
| 1,637,061 (1) | | | Great Wolf Trust 2019-WOLF C, 1.743%, (US0001M + 1.633%), 12/15/2036 | | | | | 1,629,044 | | | | | | 0.4 | | |
| 530,000 (1) | | | GS Mortgage Securities Corp. Trust 2017-GPTX B, 3.104%, 05/10/2034 | | | | | 524,842 | | | | | | 0.1 | | |
| 1,420,000 (1) | | | GS Mortgage Securities Corp. Trust 2019-70P C, 1.610%, (US0001M + 1.500%), 10/15/2036 | | | | | 1,379,683 | | | | | | 0.3 | | |
| 1,040,000 (3) | | | GS Mortgage Securities Trust 2012-GCJ7 C, 5.542%, 05/10/2045 | | | | | 1,050,312 | | | | | | 0.3 | | |
| 527,360 (1)(3) | | | JP Morgan Chase Commercial Mortgage Securities Trust 2010-C2 C, 5.694%, 11/15/2043 | | | | | 526,777 | | | | | | 0.1 | | |
| 679,860 (1) | | | JP Morgan Chase Commercial Mortgage Securities Trust 2014-C20 A4A2, 3.538%, 07/15/2047 | | | | | 691,817 | | | | | | 0.2 | | |
| 1,820,000 (1)(3) | | | JPMBB Commercial Mortgage Securities Trust 2013-C15 D, 5.192%, 11/15/2045 | | | | | 1,882,960 | | | | | | 0.5 | | |
| 1,630,000 (3) | | | JPMBB Commercial Mortgage Securities Trust 2013-C17 C, 4.886%, 01/15/2047 | | | | | 1,669,779 | | | | | | 0.4 | | |
| 900,000 (1)(3) | | | JPMBB Commercial Mortgage Securities Trust 2014-C19 D, 4.655%, 04/15/2047 | | | | | 903,974 | | | | | | 0.2 | | |
| 742,241 | | | Morgan Stanley Bank of America Merrill Lynch Trust 2012-C5 A4, 3.176%, 08/15/2045 | | | | | 744,864 | | | | | | 0.2 | | |
| 1,250,000 (3) | | | Morgan Stanley Bank of America Merrill Lynch Trust 2013-C10 A4, 4.075%, 07/15/2046 | | | | | 1,286,519 | | | | | | 0.3 | | |
| Principal Amount† | | | Value | | | Percentage of Net Assets | | |||||||||
| COMMERCIAL MORTGAGE-BACKED SECURITIES: (continued) | | |||||||||||||||
| 950,000 | | | Morgan Stanley Bank of America Merrill Lynch Trust 2013-C7 A4, 2.918%, 02/15/2046 | | | | $ | 962,061 | | | | | | 0.2 | | |
| 1,250,000 | | | Morgan Stanley Bank of America Merrill Lynch Trust 2013-C8 A4 A4, 3.134%, 12/15/2048 | | | | | 1,269,337 | | | | | | 0.3 | | |
| 530,000 (1)(3) | | | Morgan Stanley Bank of America Merrill Lynch Trust 2013-C8 D, 4.022%, 12/15/2048 | | | | | 534,537 | | | | | | 0.1 | | |
| 462,113 | | | Morgan Stanley Capital I Trust 2017-H1 A2, 3.089%, 06/15/2050 | | | | | 476,902 | | | | | | 0.1 | | |
| 1,220,000 | | | Morgan Stanley Capital I Trust 2019-H6 A2, 3.228%, 06/15/2052 | | | | | 1,251,024 | | | | | | 0.3 | | |
| 500,000 (1) | | | PFP 2021-8 Ltd. E, 2.609%, (US0001M + 2.500%), 08/09/2037 | | | | | 496,611 | | | | | | 0.1 | | |
| 1,756,274 (1) | | | Ready Capital Mortgage Financing 2020-FL4 A LLC, 2.252%, (US0001M + 2.150%), 02/25/2035 | | | | | 1,758,294 | | | | | | 0.4 | | |
| 290,000 | | | UBS Commercial Mortgage Trust 2018-C8 A2, 3.713%, 02/15/2051 | | | | | 296,203 | | | | | | 0.1 | | |
| 1,930,000 (1) | | | UBS-Barclays Commercial Mortgage Trust 2012-C4 AS, 3.317%, 12/10/2045 | | | | | 1,957,059 | | | | | | 0.5 | | |
| 1,890,000 (1)(3) | | | UBS-Barclays Commercial Mortgage Trust 2012-C4 B, 3.718%, 12/10/2045 | | | | | 1,911,732 | | | | | | 0.5 | | |
| 4,000,000 (1) | | | VMC Finance 2021-FL4 C LLC, 2.354%, (US0001M + 2.250%), 06/16/2036 | | | | | 3,993,816 | | | | | | 1.0 | | |
| 701,069 (1) | | | West Town Mall Trust 2017-KNOX A, 3.823%, 07/05/2030 | | | | | 703,164 | | | | | | 0.2 | | |
| 5,720,000 (3) | | | WFRBS Commercial Mortgage Trust 2013-C14 C, 3.960%, 06/15/2046 | | | | | 5,690,139 | | | | | | 1.4 | | |
| 2,000,000 (3) | | | WFRBS Commercial Mortgage Trust 2014-C21 C, 4.234%, 08/15/2047 | | | | | 1,992,713 | | | | | | 0.5 | | |
| | | | Total Commercial Mortgage-Backed Securities | | | | | | | | | |||||
| | | | (Cost $59,876,440) | | | | | 58,969,038 | | | | | | 14.2 | | |
| | ||||||||||||||||
| Voya Limited Maturity Bond Portfolio | as of December 31, 2021 (continued) |
| Principal Amount† | | | Value | | | Percentage of Net Assets | | |||||||||
| ASSET-BACKED SECURITIES: 20.0% | | |||||||||||||||
| | | | Automobile Asset-Backed Securities: 7.2% | | ||||||||||||
| 395,334 | | | Ally Auto Receivables Trust 2018-3 A4, 3.120%, 07/17/2023 | | | | $ | 395,760 | | | | | | 0.1 | | |
| 200,000 | | | Ally Auto Receivables Trust 2019-1 A4, 3.020%, 04/15/2024 | | | | | 203,085 | | | | | | 0.0 | | |
| 750,000 | | | Americredit Automobile Receivables Trust 2019-1 B, 3.130%, 02/18/2025 | | | | | 755,171 | | | | | | 0.2 | | |
| 600,000 | | | AmeriCredit Automobile Receivables Trust 2019-3 B, 2.130%, 07/18/2025 | | | | | 605,448 | | | | | | 0.1 | | |
| 1,118,312 | | | AmeriCredit Automobile Receivables Trust 2020-1 A3, 1.110%, 08/19/2024 | | | | | 1,120,950 | | | | | | 0.3 | | |
| 900,000 | | | AmeriCredit Automobile Receivables Trust 2020-1 C, 1.590%, 10/20/2025 | | | | | 906,160 | | | | | | 0.2 | | |
| 1,350,000 | | | AmeriCredit Automobile Receivables Trust 2020-2 B, 0.970%, 02/18/2026 | | | | | 1,352,525 | | | | | | 0.3 | | |
| 550,000 | | | AmeriCredit Automobile Receivables Trust 2021-3 B, 1.170%, 08/18/2027 | | | | | 546,574 | | | | | | 0.1 | | |
| 871,775 | | | BMW Vehicle Owner Trust 2020-A A3, 0.480%, 10/25/2024 | | | | | 871,497 | | | | | | 0.2 | | |
| 400,000 | | | Capital One Prime Auto Receivables Trust 2019-1 A4, 2.560%, 10/15/2024 | | | | | 407,493 | | | | | | 0.1 | | |
| 800,000 | | | Capital One Prime Auto Receivables Trust 2020-1 A4, 1.630%, 08/15/2025 | | | | | 808,823 | | | | | | 0.2 | | |
| 550,000 | | | Carmax Auto Owner Trust 2019-3 A4, 2.300%, 04/15/2025 | | | | | 561,531 | | | | | | 0.1 | | |
| 800,000 | | | Carmax Auto Owner Trust 2019-4 A4, 2.130%, 07/15/2025 | | | | | 815,868 | | | | | | 0.2 | | |
| 800,000 | | | Carmax Auto Owner Trust 2021-1 A3, 0.340%, 12/15/2025 | | | | | 793,269 | | | | | | 0.2 | | |
| 300,000 | | | CarMax Auto Owner Trust 2021-2 B, 1.030%, 12/15/2026 | | | | | 295,737 | | | | | | 0.1 | | |
| 61,234 | | | Drive Auto Receivables Trust 2020-2 A3, 0.830%, 05/15/2024 | | | | | 61,248 | | | | | | 0.0 | | |
| 1,500,000 | | | Drive Auto Receivables Trust 2021-1 B, 0.650%, 07/15/2025 | | | | | 1,498,172 | | | | | | 0.4 | | |
| Principal Amount† | | | Value | | | Percentage of Net Assets | | |||||||||
| ASSET-BACKED SECURITIES: (continued) | | |||||||||||||||
| | | | Automobile Asset-Backed Securities (continued) | | ||||||||||||
| 1,100,000 | | | Exeter Automobile Receivables Trust 2021-4 A3, 0.680%, 07/15/2025 | | | | $ | 1,098,205 | | | | | | 0.3 | | |
| 400,000 | | | Ford Credit Auto Owner Trust 2021-A A4, 0.490%, 09/15/2026 | | | | | 392,773 | | | | | | 0.1 | | |
| 450,000 | | | GM Financial Automobile Leasing Trust 2019-4 A4, 1.760%, 01/16/2025 | | | | | 455,393 | | | | | | 0.1 | | |
| 1,050,000 | | | GM Financial Automobile Leasing Trust 2020-1 A4, 1.700%, 12/20/2023 | | | | | 1,055,366 | | | | | | 0.3 | | |
| 400,000 | | | GM Financial Automobile Leasing Trust 2020-2 A3, 0.800%, 07/20/2023 | | | | | 400,639 | | | | | | 0.1 | | |
| 206,277 | | | GM Financial Consumer Automobile Receivables Trust 2019-3 A3, 2.180%, 04/16/2024 | | | | | 207,613 | | | | | | 0.1 | | |
| 650,000 | | | Honda Auto Receivables 2018-4 A4 Owner Trust, 3.300%, 07/15/2025 | | | | | 656,392 | | | | | | 0.2 | | |
| 288,354 | | | Honda Auto Receivables 2019-3 A3 Owner Trust, 1.780%, 08/15/2023 | | | | | 290,010 | | | | | | 0.1 | | |
| 852,916 | | | Honda Auto Receivables 2020-2 A3 Owner Trust, 0.820%, 07/15/2024 | | | | | 854,577 | | | | | | 0.2 | | |
| 650,000 | | | Honda Auto Receivables 2021-1 A3 Owner Trust, 0.270%, 04/21/2025 | | | | | 646,619 | | | | | | 0.2 | | |
| 850,000 | | | Hyundai Auto Receivables Trust 2021-C B, 1.490%, 12/15/2027 | | | | | 843,597 | | | | | | 0.2 | | |
| 514,493 (1) | | | JPMorgan Chase Bank NA - CACLN 2021-3 B, 0.760%, 02/26/2029 | | | | | 511,500 | | | | | | 0.1 | | |
| 414,767 | | | Mercedes-Benz Auto Receivables Trust 2018-1 A4, 3.150%, 10/15/2024 | | | | | 418,752 | | | | | | 0.1 | | |
| 500,000 | | | Nissan Auto Receivables 2018-C A4 Owner Trust, 3.270%, 06/16/2025 | | | | | 508,478 | | | | | | 0.1 | | |
| 400,000 (1) | | | Oscar US Funding XIII LLC 2021-2A A3, 0.860%, 09/10/2025 | | | | | 398,130 | | | | | | 0.1 | | |
| 550,000 | | | Santander Drive Auto Receivables Trust 2020-1 C, 4.110%, 12/15/2025 | | | | | 566,289 | | | | | | 0.1 | | |
| Voya Limited Maturity Bond Portfolio | as of December 31, 2021 (continued) |
| Principal Amount† | | | Value | | | Percentage of Net Assets | | |||||||||
| ASSET-BACKED SECURITIES: (continued) | | |||||||||||||||
| | | | Automobile Asset-Backed Securities (continued) | | ||||||||||||
| 1,700,921 | | | Santander Drive Auto Receivables Trust 2020-2 B, 0.960%, 11/15/2024 | | | | $ | 1,702,474 | | | | | | 0.4 | | |
| 1,250,000 | | | Santander Drive Auto Receivables Trust 2020-3 B, 0.690%, 03/17/2025 | | | | | 1,250,866 | | | | | | 0.3 | | |
| 600,000 | | | Santander Drive Auto Receivables Trust 2021-2 B, 0.590%, 09/15/2025 | | | | | 598,838 | | | | | | 0.1 | | |
| 1,100,000 | | | Santander Drive Auto Receivables Trust 2021-3 B, 0.600%, 12/15/2025 | | | | | 1,096,132 | | | | | | 0.3 | | |
| 500,000 (1) | | | Santander Retail Auto Lease Trust 2019-B A4, 2.380%, 08/21/2023 | | | | | 502,425 | | | | | | 0.1 | | |
| 1,300,000 (1) | | | Santander Retail Auto Lease Trust 2019-C A4, 1.930%, 11/20/2023 | | | | | 1,309,274 | | | | | | 0.3 | | |
| 950,000 | | | Toyota Auto Receivables 2019-C A4 Owner Trust, 1.880%, 11/15/2024 | | | | | 962,423 | | | | | | 0.2 | | |
| 1,050,000 | | | Toyota Auto Receivables 2021-D A3 Owner Trust, 0.710%, 04/15/2026 | | | | | 1,043,767 | | | | | | 0.3 | | |
| | | | | | | | | 29,769,843 | | | | | | 7.2 | | |
| | | | Credit Card Asset-Backed Securities: 0.3% | | ||||||||||||
| 1,350,000 (1) | | | CARDS II Trust 2021-1A A, 0.602%, 04/15/2027 | | | | | 1,334,933 | | | | | | 0.3 | | |
| | | | | | ||||||||||||
| | | | Home Equity Asset-Backed Securities: 0.0% | | ||||||||||||
| 11 | | | Chase Funding Loan Acquisition Trust Series 2003-C2 1A, 4.750%, 01/25/2022 | | | | | 11 | | | | | | 0.0 | | |
| | | | | | ||||||||||||
| | | | Other Asset-Backed Securities: 12.0% | | ||||||||||||
| 800,000 (1) | | | AGL CLO 13 Ltd. 2021-13A A1, 1.320%, (US0003M + 1.160%), 10/20/2034 | | | | | 799,527 | | | | | | 0.2 | | |
| 2,000,000 (1) | | | Aimco CLO 11 Ltd. 2020-11A AR, 1.253%, (US0003M + 1.130%), 10/17/2034 | | | | | 1,995,314 | | | | | | 0.5 | | |
| 500,000 (1) | | | Allegany Park CLO Ltd. 2019-1A A, 1.462%, (US0003M + 1.330%), 01/20/2033 | | | | | 500,080 | | | | | | 0.1 | | |
| Principal Amount† | | | Value | | | Percentage of Net Assets | | |||||||||
| ASSET-BACKED SECURITIES: (continued) | | |||||||||||||||
| | | | Other Asset-Backed Securities (continued) | | ||||||||||||
| 840,000 (1) | | | Apidos Clo XXV 2016-25A A1R, 1.302%, (US0003M + 1.170%), 10/20/2031 | | | | $ | 840,003 | | | | | | 0.2 | | |
| 100,000 (1) | | | Arbor Realty Commercial Real Estate Notes 2021-FL3 C Ltd., 1.960%, (US0001M + 1.850%), 08/15/2034 | | | | | 99,563 | | | | | | 0.0 | | |
| 2,000,000 (1) | | | Arbor Realty Commercial Real Estate Notes 2021-FL4 E Ltd., 3.490%, (US0001M + 3.400%), 11/15/2036 | | | | | 1,995,000 | | | | | | 0.5 | | |
| 700,000 (1) | | | ARES XLVI CLO Ltd. 2017-46A A2, 1.354%, (US0003M + 1.230%), 01/15/2030 | | | | | 697,101 | | | | | | 0.2 | | |
| 250,000 (1) | | | Babson CLO Ltd. 2017-1A A2, 1.472%, (US0003M + 1.350%), 07/18/2029 | | | | | 250,007 | | | | | | 0.1 | | |
| 100,000 (1) | | | BDS 2021-FL9 B Ltd., 1.804%, (US0001M + 1.700%), 11/16/2038 | | | | | 99,597 | | | | | | 0.0 | | |
| 1,000,000 (1) | | | Benefit Street Partners CLO XIX Ltd. 2019-19A A, 1.474%, (US0003M + 1.350%), 01/15/2033 | | | | | 1,000,087 | | | | | | 0.2 | | |
| 500,000 (1) | | | BlueMountain CLO XXXI Ltd. 2021-31A A2, 1.524%, (US0003M + 1.400%), 04/19/2034 | | | | | 500,193 | | | | | | 0.1 | | |
| 250,000 (1) | | | Carbone CLO Ltd. 2017-1A A1, 1.272%, (US0003M + 1.140%), 01/20/2031 | | | | | 250,001 | | | | | | 0.1 | | |
| 492,818 (1) | | | Carlyle Global Market Strategies CLO 2014-2RA A1 Ltd., 1.206%, (US0003M + 1.050%), 05/15/2031 | | | | | 492,911 | | | | | | 0.1 | | |
| 1,200,000 (1) | | | Carlyle Global Market Strategies CLO 2016-1 Ltd. 2016-1A A1R2, 1.272%, (US0003M + 1.140%), 04/20/2034 | | | | | 1,198,039 | | | | | | 0.3 | | |
| 800,000 (1) | | | Carlyle US Clo 2017-2A CR Ltd., 1.534%, (US0003M + 1.400%), 07/20/2031 | | | | | 800,006 | | | | | | 0.2 | | |
| Voya Limited Maturity Bond Portfolio | as of December 31, 2021 (continued) |
| Principal Amount† | | | Value | | | Percentage of Net Assets | | |||||||||
| ASSET-BACKED SECURITIES: (continued) | | |||||||||||||||
| | | | Other Asset-Backed Securities (continued) | | ||||||||||||
| 850,000 (1) | | | Carlyle US CLO 2020-2A A1R Ltd., 1.349%, (US0003M + 1.140%), 01/25/2035 | | | | $ | 848,489 | | | | | | 0.2 | | |
| 1,550,000 (1) | | | Carlyle US Clo 2021-4A A2 Ltd., 1.532%, (US0003M + 1.400%), 04/20/2034 | | | | | 1,550,398 | | | | | | 0.4 | | |
| 1,000,000 (1) | | | Cedar Funding IV CLO Ltd.2014-4A ARR, 1.284%, (US0003M + 1.160%), 07/23/2034 | | | | | 999,425 | | | | | | 0.2 | | |
| 600,000 (1) | | | CIFC Funding 2018-4A A1 Ltd., 1.272%, (US0003M + 1.150%), 10/17/2031 | | | | | 599,999 | | | | | | 0.1 | | |
| 900,000 (1) | | | CIFC Funding 2020-2A AR Ltd., 1.308%, (US0003M + 1.170%), 10/20/2034 | | | | | 900,490 | | | | | | 0.2 | | |
| 600,000 (1) | | | Clear Creek CLO Ltd. 2015-1A AR, 1.332%, (US0003M + 1.200%), 10/20/2030 | | | | | 600,089 | | | | | | 0.1 | | |
| 550,000 | | | CNH Equipment Trust 2021-C A3, 0.810%, 12/15/2026 | | | | | 546,446 | | | | | | 0.1 | | |
| 250,000 (1) | | | Deer Creek Clo Ltd. 2017-1A A, 1.312%, (US0003M + 1.180%), 10/20/2030 | | | | | 250,050 | | | | | | 0.1 | | |
| 1,000,000 (1) | | | Dryden 78 CLO Ltd. 2020-78A A, 1.302%, (US0003M + 1.180%), 04/17/2033 | | | | | 1,000,387 | | | | | | 0.2 | | |
| 480,000 (1) | | | Dryden XXVIII Senior Loan Fund 2013-28A A1LR, 1.356%, (US0003M + 1.200%), 08/15/2030 | | | | | 480,090 | | | | | | 0.1 | | |
| 300,000 (1) | | | Eaton Vance Clo 2015-1A A2R Ltd., 1.382%, (US0003M + 1.250%), 01/20/2030 | | | | | 300,001 | | | | | | 0.1 | | |
| 700,000 (1) | | | Elevation CLO 2014-2A A1R Ltd., 1.354%, (US0003M + 1.230%), 10/15/2029 | | | | | 699,770 | | | | | | 0.2 | | |
| 450,000 (1) | | | Elmwood CLO IX Ltd. 2021-2A A, 1.269%, (US0003M + 1.130%), 07/20/2034 | | | | | 449,744 | | | | | | 0.1 | | |
| Principal Amount† | | | Value | | | Percentage of Net Assets | | |||||||||
| ASSET-BACKED SECURITIES: (continued) | | |||||||||||||||
| | | | Other Asset-Backed Securities (continued) | | ||||||||||||
| 2,000,000 (1) | | | FS RIALTO 2021-FL2 E, 3.558%, (US0001M + 3.450%), 04/16/2028 | | | | $ | 1,998,391 | | | | | | 0.5 | | |
| 1,360,000 (1) | | | HGI CRE CLO 2021-FL1 B Ltd., 1.708%, (US0001M + 1.600%), 06/16/2036 | | | | | 1,351,501 | | | | | | 0.3 | | |
| 2,100,000 (1) | | | HGI CRE CLO 2021-FL1 D Ltd., 2.458%, (US0001M + 2.350%), 06/16/2036 | | | | | 2,085,563 | | | | | | 0.5 | | |
| 366,960 (1) | | | JGWPT XXXIII LLC 2014-3A A, 3.500%, 06/15/2077 | | | | | 396,775 | | | | | | 0.1 | | |
| 1,300,000 (1) | | | Kayne CLO 6 Ltd. 2019-6A A1, 1.512%, (US0003M + 1.380%), 01/20/2033 | | | | | 1,300,155 | | | | | | 0.3 | | |
| 1,000,000 (1) | | | Kayne CLO 7 Ltd. 2020-7A A1, 1.322%, (US0003M + 1.200%), 04/17/2033 | | | | | 1,001,255 | | | | | | 0.2 | | |
| 600,000 (1) | | | LCM 26A A2 Ltd., 1.382%, (US0003M + 1.250%), 01/20/2031 | | | | | 599,045 | | | | | | 0.1 | | |
| 180,772 (1) | | | LoanCore 2019-CRE2 A Issuer Ltd., 1.240%, (US0001M + 1.130%), 05/15/2036 | | | | | 180,570 | | | | | | 0.0 | | |
| 500,000 (1) | | | Magnetite XXVI Ltd. 2020-26A A2R, 1.490%, (US0003M + 1.400%), 07/25/2034 | | | | | 500,613 | | | | | | 0.1 | | |
| 1,500,000 (1) | | | Magnetite XXVII Ltd. 27A AR, 1.272%, (US0003M + 1.140%), 10/20/2034 | | | | | 1,499,997 | | | | | | 0.4 | | |
| 720,000 (1) | | | Marble Point CLO XIV Ltd. 2018-2A A1R, 1.412%, (US0003M + 1.280%), 01/20/2032 | | | | | 720,319 | | | | | | 0.2 | | |
| 397,689 (1) | | | Marlette Funding Trust 2020-1A B, 2.380%, 03/15/2030 | | | | | 399,167 | | | | | | 0.1 | | |
| 1,050,000 (1) | | | Marlette Funding Trust 2021-1A B, 1.000%, 06/16/2031 | | | | | 1,046,614 | | | | | | 0.3 | | |
| 700,000 (1) | | | Oaktree CLO Ltd. 2021-1A A1, 1.284%, (US0003M + 1.160%), 07/15/2034 | | | | | 699,602 | | | | | | 0.2 | | |
| 350,000 (1) | | | OCP CLO 2021-22A A Ltd., 1.296%, (US0003M + 1.180%), 12/02/2034 | | | | | 350,070 | | | | | | 0.1 | | |
| Voya Limited Maturity Bond Portfolio | as of December 31, 2021 (continued) |
| Principal Amount† | | | Value | | | Percentage of Net Assets | | |||||||||
| ASSET-BACKED SECURITIES: (continued) | | |||||||||||||||
| | | | Other Asset-Backed Securities (continued) | | ||||||||||||
| 1,100,000 (1) | | | Octagon Investment Partners 32 Ltd. 2017-1A A2R, 1.324%, (US0003M + 1.200%), 07/15/2029 | | | | $ | 1,100,003 | | | | | | 0.3 | | |
| 400,000 (1) | | | Octagon Investment Partners 33 Ltd. 2017-1A A1, 1.322%, (US0003M + 1.190%), 01/20/2031 | | | | | 400,000 | | | | | | 0.1 | | |
| 1,000,000 (1) | | | Octagon Investment Partners 48 Ltd. 2020-3A AR, 1.277%, (US0003M + 1.150%), 10/20/2034 | | | | | 998,825 | | | | | | 0.2 | | |
| 400,000 (1) | | | Octagon Investment Partners XV Ltd. 2013-1A A2R, 1.474%, (US0003M + 1.350%), 07/19/2030 | | | | | 399,690 | | | | | | 0.1 | | |
| 300,000 (1) | | | OHA Credit Funding 2019-3A AR Ltd., 1.272%, (US0003M + 1.140%), 07/02/2035 | | | | | 299,999 | | | | | | 0.1 | | |
| 2,000,000 (1) | | | OHA Credit Partners XVI 2021-16A A, 1.314%, (US0003M + 1.150%), 10/18/2034 | | | | | 2,000,332 | | | | | | 0.5 | | |
| 1,600,000 (1) | | | OHA Loan Funding 2015-1A AR3 Ltd., 6.659%, (US0003M + 1.150%), 01/19/2037 | | | | | 1,600,318 | | | | | | 0.4 | | |
| 975,000 (1) | | | Palmer Square CLO 2015-2A A1R2 Ltd., 1.232%, (US0003M + 1.100%), 07/20/2030 | | | | | 974,713 | | | | | | 0.2 | | |
| 600,000 (1) | | | PFS Financing Corp. 2021-B A, 0.770%, 08/15/2026 | | | | | 591,064 | | | | | | 0.1 | | |
| 154,407 (1) | | | SoFi Consumer Loan Program 2020-1 A Trust, 2.020%, 01/25/2029 | | | | | 155,024 | | | | | | 0.0 | | |
| 800,000 (1) | | | SoFi Consumer Loan Program 2020-1 B Trust, 2.250%, 01/25/2029 | | | | | 806,283 | | | | | | 0.2 | | |
| 800,000 (1) | | | Sound Point CLO XXIII 2019-2A AR, 1.294%, (US0003M + 1.170%), 07/15/2034 | | | | | 799,998 | | | | | | 0.2 | | |
| 850,000 (1) | | | THL Credit Wind River 2018-2 A A2Clo Ltd., 1.574%, (US0003M + 1.450%), 07/15/2030 | | | | | 850,023 | | | | | | 0.2 | | |
| Principal Amount† | | | Value | | | Percentage of Net Assets | | |||||||||
| ASSET-BACKED SECURITIES: (continued) | | |||||||||||||||
| | | | Other Asset-Backed Securities (continued) | | ||||||||||||
| 1,850,000 (1) | | | THL Credit Wind River 2019-1A AR CLO Ltd., 1.292%, (US0003M + 1.160%), 07/20/2034 | | | | $ | 1,849,996 | | | | | | 0.5 | | |
| 850,000 (1) | | | THL Credit Wind River 2019-2A A2 Clo Ltd., 1.774%, (US0003M + 1.650%), 01/15/2033 | | | | | 850,094 | | | | | | 0.2 | | |
| 650,000 (1) | | | Trafigura Securitisation Finance PLC 2021-1A A2, 1.080%, 01/15/2025 | | | | | 643,031 | | | | | | 0.2 | | |
| 250,000 (1) | | | Venture 34 CLO Ltd. 2018-34A A, 1.354%, (US0003M + 1.230%), 10/15/2031 | | | | | 250,001 | | | | | | 0.1 | | |
| 2,044 | | | Verizon Owner Trust 2018-A A1A, 3.230%, 04/20/2023 | | | | | 2,047 | | | | | | 0.0 | | |
| 500,000 (1) | | | Wellman Park CLO Ltd. 2021-1A A, 1.224%, (US0003M + 1.100%), 07/15/2034 | | | | | 499,164 | | | | | | 0.1 | | |
| | | | | | | | | 49,943,049 | | | | | | 12.0 | | |
| | | | Student Loan Asset-Backed Securities: 0.5% | | ||||||||||||
| 499,651 (1) | | | Navient Private Education Refi Loan Trust 2019-FA A2, 2.600%, 08/15/2068 | | | | | 506,349 | | | | | | 0.1 | | |
| 552,334 (1) | | | Navient Private Education Refi Loan Trust 2020-GA A, 1.170%, 09/16/2069 | | | | | 549,993 | | | | | | 0.1 | | |
| 252,599 (1) | | | Navient Private Education Refi Loan Trust 2021-A A, 0.840%, 05/15/2069 | | | | | 249,605 | | | | | | 0.1 | | |
| 337,137 (1) | | | Navient Private Education Refi Loan Trust 2021-F A, 1.110%, 02/18/2070 | | | | | 331,732 | | | | | | 0.1 | | |
| 474,067 (1) | | | SoFi Professional Loan Program 2021-B AFX Trust, 1.140%, 02/15/2047 | | | | | 466,204 | | | | | | 0.1 | | |
| | | | | | | | | 2,103,883 | | | | | | 0.5 | | |
| | | | Total Asset-Backed Securities | | | | | | | | | |||||
| | | | (Cost $83,092,642) | | | | | 83,151,719 | | | | | | 20.0 | | |
| U.S. GOVERNMENT AGENCY OBLIGATIONS: 0.0% | | |||||||||||||||
| | | | Uniform Mortgage-Backed Securities: 0.0% | | ||||||||||||
| 3,903 | | | 6.500%, 10/01/2022 | | | | | 4,306 | | | | | | 0.0 | | |
| 20,068 | | | 6.500%, 10/01/2032 | | | | | 22,638 | | | | | | 0.0 | | |
| 8,337 | | | 7.000%, 10/01/2032 | | | | | 8,364 | | | | | | 0.0 | | |
| Voya Limited Maturity Bond Portfolio | as of December 31, 2021 (continued) |
| Principal Amount† | | | Value | | | Percentage of Net Assets | | |||||||||
| U.S. GOVERNMENT AGENCY OBLIGATIONS: (continued) | | |||||||||||||||
| | | | Uniform Mortgage-Backed Securities (continued) | | ||||||||||||
| | | | Total U.S. Government Agency Obligations | | | | | | | | | |||||
| | | | (Cost $32,904) | | | | $ | 35,308 | | | | | | 0.0 | | |
| | | | Total Long-Term Investments (Cost $402,252,280) | | | | | 401,640,671 | | | | | | 96.6 | | |
| SHORT-TERM INVESTMENTS: 3.7% | | |||||||||||||||
| | | | Repurchase Agreements: 0.7% | | ||||||||||||
| 1,000,000 (4) | | | Bank of America Inc., Repurchase Agreement dated 12/31/21, 0.05%, due 01/03/22 (Repurchase Amount $1,000,004, collateralized by various U.S. Government Agency Obligations, 1.000%-5.000%, Market Value plus accrued interest $1,020,000, due 09/01/28-01/01/61) | | | | | 1,000,000 | | | | | | 0.2 | | |
| 791,570 (4) | | | Daiwa Capital Markets, Repurchase Agreement dated 12/31/21, 0.04%, due 01/03/22 (Repurchase Amount $791,573, collateralized by various U.S. Government/U.S. Government Agency Obligations, 0.000%-6.500%, Market Value plus accrued interest $807,401, due 02/10/22-01/01/52) | | | | | 791,570 | | | | | | 0.2 | | |
| 1,000,000 (4) | | | RBC Dominion Securities Inc., Repurchase Agreement dated 12/31/21, 0.05%, due 01/03/22 (Repurchase Amount $1,000,004, collateralized by various U.S. Government/U.S. Government Agency Obligations, 0.000%-6.500%, Market Value plus accrued interest $1,020,000, due 05/15/22-12/01/51) | | | | | 1,000,000 | | | | | | 0.3 | | |
| Principal Amount† | | | Value | | | Percentage of Net Assets | | |||||||||
| SHORT-TERM INVESTMENTS: (continued) | | |||||||||||||||
| | | | Repurchase Agreements (continued) | | ||||||||||||
| | | | Total Repurchase Agreements (Cost $2,791,570) | | | | $ | 2,791,570 | | | | | | 0.7 | | |
| | ||||||||||||||||
| Shares | | | Value | | | Percentage of Net Assets | | |||||||||
| | | | Mutual Funds: 3.0% | | ||||||||||||
| 12,643,000 (5) | | | BlackRock Liquidity Funds, FedFund, Institutional Class, 0.030% | | | | | 12,643,000 | | | | | | 3.0 | | |
| 84,000 (4)(5) | | | Goldman Sachs Financial Square Government Fund - Institutional Shares, 0.020% | | | | | 84,000 | | | | | | 0.0 | | |
| | | | Total Mutual Funds (Cost $12,727,000) | | | | | 12,727,000 | | | | | | 3.0 | | |
| | | | Total Short-Term Investments (Cost $15,518,570) | | | | | 15,518,570 | | | | | | 3.7 | | |
| | | | Total Investments in Securities (Cost $417,770,850) | | | | $ | 417,159,241 | | | | | | 100.3 | | |
| | | | Liabilities in Excess of Other Assets | | | | | (1,251,351) | | | | | | (0.3) | | |
| | | | Net Assets | | | | $ | 415,907,890 | | | | | | 100.0 | | |
| Voya Limited Maturity Bond Portfolio | as of December 31, 2021 (continued) |
| | | | Quoted Prices in Active Markets for Identical Investments (Level 1) | | | Significant Other Observable Inputs (Level 2) | | | Significant Unobservable Inputs (Level 3) | | | Fair Value at December 31, 2021 | | ||||||||||||
| Asset Table | | | | | | | | | | | | | | | | | | | | | | | | | |
| Investments, at fair value | | | | | | | | | | | | | | | | | | | | | | | | | |
| Corporate Bonds/Notes | | | | $ | — | | | | | $ | 139,761,478 | | | | | $ | — | | | | | $ | 139,761,478 | | |
| Collateralized Mortgage Obligations | | | | | — | | | | | | 23,168,998 | | | | | | — | | | | | | 23,168,998 | | |
| Asset-Backed Securities | | | | | — | | | | | | 83,151,719 | | | | | | — | | | | | | 83,151,719 | | |
| Commercial Mortgage-Backed Securities | | | | | — | | | | | | 58,969,038 | | | | | | — | | | | | | 58,969,038 | | |
| U.S. Government Agency Obligations | | | | | — | | | | | | 35,308 | | | | | | — | | | | | | 35,308 | | |
| U.S. Treasury Obligations | | | | | — | | | | | | 96,554,130 | | | | | | — | | | | | | 96,554,130 | | |
| Short-Term Investments | | | | | 12,727,000 | | | | | | 2,791,570 | | | | | | — | | | | | | 15,518,570 | | |
| Total Investments, at fair value | | | | $ | 12,727,000 | | | | | $ | 404,432,241 | | | | | $ | — | | | | | $ | 417,159,241 | | |
| Liabilities Table | | | | | | | | | | | | | | | | | | | | | | | | | |
| Other Financial Instruments+ | | | | | | | | | | | | | | | | | | | | | | | | | |
| Futures | | | | $ | (204,198) | | | | | $ | — | | | | | $ | — | | | | | $ | (204,198) | | |
| Total Liabilities | | | | $ | (204,198) | | | | | $ | — | | | | | $ | — | | | | | $ | (204,198) | | |
| Description | | | Number of Contracts | | | Expiration Date | | | Notional Amount | | | Unrealized Appreciation/ (Depreciation) | | ||||||||||||
| Long Contracts: | | | | | | | | | | | | | | | | | | | | | | | | | |
| U.S. Treasury 2-Year Note | | | | | 611 | | | | | | 03/31/22 | | | | | $ | 133,303,016 | | | | | $ | (102,288) | | |
| | | | | | | | | | | | | | | | | $ | 133,303,016 | | | | | $ | (102,288) | | |
| Short Contracts: | | | | | | | | | | | | | | | | | | | | | | | | | |
| U.S. Treasury 10-Year Note | | | | | (20) | | | | | | 03/22/22 | | | | | | (2,609,375) | | | | | | (30,040) | | |
| U.S. Treasury 5-Year Note | | | | | (160) | | | | | | 03/31/22 | | | | | | (19,356,250) | | | | | | (71,870) | | |
| | | | | | | | | | | | | | | | | $ | (21,965,625) | | | | | $ | (101,910) | | |
| Derivatives not accounted for as hedging instruments | | | Location on Statement of Assets and Liabilities | | | Fair Value | | |||
| Liability Derivatives | | | | | | | | | | |
| Interest rate contracts | | | Variation margin payable on futures contracts* | | | | $ | 204,198 | | |
| Total Liability Derivatives | | | | | | | $ | 204,198 | | |
| Voya Limited Maturity Bond Portfolio | as of December 31, 2021 (continued) |
| Derivatives not accounted for as hedging instruments | | | Futures | | | |||||
| Interest rate contracts | | | | $ | (3,658) | | | | | |
| Total | | | | $ | (3,658) | | | | | |
| Derivatives not accounted for as hedging instruments | | | Futures | | | |||||
| Interest rate contracts | | | | $ | (227,765) | | | | | |
| Total | | | | $ | (227,765) | | | | | |
| | Cost for federal income tax purposes was $417,572,494. | | | |||||
| | Net unrealized depreciation consisted of: | | | |||||
| | Gross Unrealized Appreciation | | | | $ | 1,438,447 | | |
| | Gross Unrealized Depreciation | | | | | (2,055,898) | | |
| | Net Unrealized Depreciation | | | | $ | (617,451) | | |
| Voya U.S. Stock Index Portfolio | as of December 31, 2021 |
| Shares | | | Value | | | Percentage of Net Assets | | |||||||||
| COMMON STOCK: 98.0% | | |||||||||||||||
| | | | Communication Services: 10.0% | | ||||||||||||
| 164,962 | | | Activision Blizzard, Inc. | | | | $ | 10,974,922 | | | | | | 0.1 | | |
| 63,709 (1) | | | Alphabet, Inc. - Class A | | | | | 184,567,521 | | | | | | 2.1 | | |
| 59,219 (1) | | | Alphabet, Inc. - Class C | | | | | 171,355,506 | | | | | | 2.0 | | |
| 1,512,398 | | | AT&T, Inc. | | | | | 37,204,991 | | | | | | 0.4 | | |
| 26,201 (1) | | | Charter Communications, Inc. | | | | | 17,082,266 | | | | | | 0.2 | | |
| 965,656 | | | Comcast Corp. – Class A | | | | | 48,601,467 | | | | | | 0.6 | | |
| 35,713 (1)(2) | | | Discovery Communications, Inc. - Class A | | | | | 840,684 | | | | | | 0.0 | | |
| 64,151 (1) | | | Discovery Communications, Inc. - Class C | | | | | 1,469,058 | | | | | | 0.0 | | |
| 52,576 (1) | | | Dish Network Corp. - Class A | | | | | 1,705,566 | | | | | | 0.0 | | |
| 60,106 | | | Electronic Arts, Inc. | | | | | 7,927,981 | | | | | | 0.1 | | |
| 501,156 (1) | | | Meta Platforms, Inc. | | | | | 168,563,821 | | | | | | 1.9 | | |
| 68,306 | | | Fox Corp. - Class A | | | | | 2,520,491 | | | | | | 0.0 | | |
| 31,585 | | | Fox Corp. - Class B | | | | | 1,082,418 | | | | | | 0.0 | | |
| 83,136 | | | Interpublic Group of Cos., Inc. | | | | | 3,113,443 | | | | | | 0.0 | | |
| 28,610 (1) | | | Live Nation Entertainment, Inc. | | | | | 3,424,331 | | | | | | 0.1 | | |
| 195,166 (2) | | | Lumen Technologies, Inc. | | | | | 2,449,333 | | | | | | 0.0 | | |
| 59,955 (1) | | | Match Group, Inc. | | | | | 7,929,049 | | | | | | 0.1 | | |
| 93,813 (1) | | | NetFlix, Inc. | | | | | 56,516,704 | | | | | | 0.7 | | |
| 82,627 | | | News Corp - Class A | | | | | 1,843,408 | | | | | | 0.0 | | |
| 25,720 | | | News Corp - Class B | | | | | 578,700 | | | | | | 0.0 | | |
| 45,285 | | | Omnicom Group | | | | | 3,318,032 | | | | | | 0.0 | | |
| 24,610 (1) | | | Take-Two Interactive Software, Inc. | | | | | 4,373,689 | | | | | | 0.1 | | |
| 124,333 (1) | | | T-Mobile US, Inc. | | | | | 14,420,141 | | | | | | 0.2 | | |
| 169,350 (1) | | | Twitter, Inc. | | | | | 7,319,307 | | | | | | 0.1 | | |
| 876,849 | | | Verizon Communications, Inc. | | | | | 45,561,074 | | | | | | 0.5 | | |
| 127,953 | | | ViacomCBS, Inc. - Class B | | | | | 3,861,622 | | | | | | 0.1 | | |
| 384,851 (1) | | | Walt Disney Co. | | | | | 59,609,571 | | | | | | 0.7 | | |
| | | | | | | | | 868,215,096 | | | | | | 10.0 | | |
| | | | Consumer Discretionary: 12.3% | | ||||||||||||
| 13,343 | | | Advance Auto Parts, Inc. | | | | | 3,200,719 | | | | | | 0.0 | | |
| 92,372 (1) | | | Amazon.com, Inc. | | | | | 307,999,655 | | | | | | 3.5 | | |
| 57,292 (1) | | | Aptiv PLC | | | | | 9,450,315 | | | | | | 0.1 | | |
| 4,441 (1) | | | Autozone, Inc. | | | | | 9,310,068 | | | | | | 0.1 | | |
| 55,917 | | | Bath & Body Works, Inc. | | | | | 3,902,447 | | | | | | 0.1 | | |
| 46,884 | | | Best Buy Co., Inc. | | | | | 4,763,414 | | | | | | 0.1 | | |
| 8,697 (1) | | | Booking Holdings, Inc. | | | | | 20,866,103 | | | | | | 0.2 | | |
| Shares | | | Value | | | Percentage of Net Assets | | |||||||||
| COMMON STOCK: (continued) | | |||||||||||||||
| | | | Consumer Discretionary (continued) | | ||||||||||||
| 50,646 | | | BorgWarner, Inc. | | | | $ | 2,282,615 | | | | | | 0.0 | | |
| 45,078 (1) | | | Caesars Entertainment, Inc. | | | | | 4,216,145 | | | | | | 0.1 | | |
| 34,413 (1) | | | Carmax, Inc. | | | | | 4,481,605 | | | | | | 0.1 | | |
| 170,377 (1)(2) | | | Carnival Corp. | | | | | 3,427,985 | | | | | | 0.0 | | |
| 5,959 (1) | | | Chipotle Mexican Grill, Inc. | | | | | 10,417,822 | | | | | | 0.1 | | |
| 27,525 | | | Darden Restaurants, Inc. | | | | | 4,146,366 | | | | | | 0.1 | | |
| 49,413 | | | Dollar General Corp. | | | | | 11,653,068 | | | | | | 0.1 | | |
| 47,634 (1) | | | Dollar Tree, Inc. | | | | | 6,693,530 | | | | | | 0.1 | | |
| 7,784 | | | Domino’s Pizza, Inc. | | | | | 4,392,745 | | | | | | 0.1 | | |
| 68,843 | | | D.R. Horton, Inc. | | | | | 7,466,023 | | | | | | 0.1 | | |
| 132,582 | | | eBay, Inc. | | | | | 8,816,703 | | | | | | 0.1 | | |
| 26,851 (1) | | | Etsy, Inc. | | | | | 5,878,758 | | | | | | 0.1 | | |
| 30,922 (1) | | | Expedia Group, Inc. | | | | | 5,588,224 | | | | | | 0.1 | | |
| 831,361 | | | Ford Motor Co. | | | | | 17,267,368 | | | | | | 0.2 | | |
| 44,727 | | | Gap, Inc. | | | | | 789,432 | | | | | | 0.0 | | |
| 32,090 | | | Garmin Ltd. | | | | | 4,369,695 | | | | | | 0.1 | | |
| 307,491 (1) | | | General Motors Co. | | | | | 18,028,197 | | | | | | 0.2 | | |
| 30,248 | | | Genuine Parts Co. | | | | | 4,240,770 | | | | | | 0.1 | | |
| 27,335 | | | Hasbro, Inc. | | | | | 2,782,156 | | | | | | 0.0 | | |
| 59,031 (1) | | | Hilton Worldwide Holdings, Inc. | | | | | 9,208,246 | | | | | | 0.1 | | |
| 223,515 | | | Home Depot, Inc. | | | | | 92,760,960 | | | | | | 1.1 | | |
| 72,612 (1) | | | Las Vegas Sands Corp. | | | | | 2,733,116 | | | | | | 0.0 | | |
| 57,576 | | | Lennar Corp. - Class A | | | | | 6,688,028 | | | | | | 0.1 | | |
| 57,103 | | | LKQ Corp. | | | | | 3,427,893 | | | | | | 0.0 | | |
| 146,651 | | | Lowe’s Cos, Inc. | | | | | 37,906,350 | | | | | | 0.4 | | |
| 57,940 (1) | | | Marriott International, Inc. | | | | | 9,574,006 | | | | | | 0.1 | | |
| 158,260 | | | McDonald’s Corp. | | | | | 42,424,758 | | | | | | 0.5 | | |
| 82,437 | | | MGM Resorts International | | | | | 3,699,773 | | | | | | 0.0 | | |
| 11,809 (1) | | | Mohawk Industries, Inc. | | | | | 2,151,364 | | | | | | 0.0 | | |
| 79,965 | | | Newell Brands, Inc. | | | | | 1,746,436 | | | | | | 0.0 | | |
| 270,628 | | | Nike, Inc. - Class B | | | | | 45,105,569 | | | | | | 0.5 | | |
| 78,153 (1)(2) | | | Norwegian Cruise Line Holdings Ltd. | | | | | 1,620,893 | | | | | | 0.0 | | |
| 693 (1) | | | NVR, Inc. | | | | | 4,094,847 | | | | | | 0.1 | | |
| 14,270 (1) | | | O’Reilly Automotive, Inc. | | | | | 10,077,902 | | | | | | 0.1 | | |
| 35,075 (1) | | | Penn National Gaming, Inc. | | | | | 1,818,639 | | | | | | 0.0 | | |
| 8,470 | | | Pool Corp. | | | | | 4,794,020 | | | | | | 0.1 | | |
| 53,622 | | | Pulte Group, Inc. | | | | | 3,065,034 | | | | | | 0.0 | | |
| 15,072 | | | PVH Corp. | | | | | 1,607,429 | | | | | | 0.0 | | |
| 10,271 | | | Ralph Lauren Corp. | | | | | 1,220,811 | | | | | | 0.0 | | |
| Voya U.S. Stock Index Portfolio | as of December 31, 2021 (continued) |
| Shares | | | Value | | | Percentage of Net Assets | | |||||||||
| COMMON STOCK: (continued) | | |||||||||||||||
| | | | Consumer Discretionary (continued) | | ||||||||||||
| 75,427 | | | Ross Stores, Inc. | | | | $ | 8,619,798 | | | | | | 0.1 | | |
| 47,338 (1)(2) | | | Royal Caribbean Cruises Ltd. | | | | | 3,640,292 | | | | | | 0.0 | | |
| 249,913 | | | Starbucks Corp. | | | | | 29,232,324 | | | | | | 0.3 | | |
| 58,897 | | | Tapestry, Inc. | | | | | 2,391,218 | | | | | | 0.0 | | |
| 103,362 | | | Target Corp. | | | | | 23,922,101 | | | | | | 0.3 | | |
| 172,282 (1) | | | Tesla, Inc. | | | | | 182,064,172 | | | | | | 2.1 | | |
| 254,820 | | | TJX Cos., Inc. | | | | | 19,345,934 | | | | | | 0.2 | | |
| 24,149 | | | Tractor Supply Co. | | | | | 5,761,951 | | | | | | 0.1 | | |
| 11,565 (1) | | | Ulta Beauty, Inc. | | | | | 4,768,712 | | | | | | 0.1 | | |
| 39,843 (1) | | | Under Armour, Inc. - Class A | | | | | 844,273 | | | | | | 0.0 | | |
| 45,549 (1) | | | Under Armour, Inc. - Class C | | | | | 821,704 | | | | | | 0.0 | | |
| 68,831 | | | VF Corp. | | | | | 5,039,806 | | | | | | 0.1 | | |
| 12,865 | | | Whirlpool Corp. | | | | | 3,018,901 | | | | | | 0.0 | | |
| 22,232 (1) | | | Wynn Resorts Ltd. | | | | | 1,890,609 | | | | | | 0.0 | | |
| 62,083 | | | Yum! Brands, Inc. | | | | | 8,620,845 | | | | | | 0.1 | | |
| | | | | | | | | 1,072,140,642 | | | | | | 12.3 | | |
| | | | Consumer Staples: 5.8% | | ||||||||||||
| 389,485 | | | Altria Group, Inc. | | | | | 18,457,694 | | | | | | 0.2 | | |
| 118,484 | | | Archer-Daniels-Midland Co. | | | | | 8,008,334 | | | | | | 0.1 | | |
| 38,591 (2) | | | Brown-Forman Corp. - Class B | | | | | 2,811,740 | | | | | | 0.0 | | |
| 42,885 | | | Campbell Soup Co. | | | | | 1,863,782 | | | | | | 0.0 | | |
| 51,861 | | | Church & Dwight Co., Inc. | | | | | 5,315,752 | | | | | | 0.1 | | |
| 25,939 | | | Clorox Co. | | | | | 4,522,724 | | | | | | 0.0 | | |
| 823,332 | | | Coca-Cola Co. | | | | | 48,749,488 | | | | | | 0.6 | | |
| 178,508 | | | Colgate-Palmolive Co. | | | | | 15,233,873 | | | | | | 0.2 | | |
| 101,451 | | | Conagra Brands, Inc. | | | | | 3,464,552 | | | | | | 0.0 | | |
| 34,790 | | | Constellation Brands, Inc. | | | | | 8,731,246 | | | | | | 0.1 | | |
| 93,574 | | | Costco Wholesale Corp. | | | | | 53,121,960 | | | | | | 0.6 | | |
| 49,073 | | | Estee Lauder Cos., Inc. | | | | | 18,166,825 | | | | | | 0.2 | | |
| 128,051 | | | General Mills, Inc. | | | | | 8,628,076 | | | | | | 0.1 | | |
| 30,715 | | | Hershey Co. | | | | | 5,942,431 | | | | | | 0.1 | | |
| 59,535 (2) | | | Hormel Foods Corp. | | | | | 2,905,903 | | | | | | 0.0 | | |
| 22,883 | | | JM Smucker Co. | | | | | 3,107,969 | | | | | | 0.0 | | |
| 53,997 | | | Kellogg Co. | | | | | 3,478,487 | | | | | | 0.0 | | |
| 71,314 | | | Kimberly-Clark Corp. | | | | | 10,192,197 | | | | | | 0.1 | | |
| 149,941 | | | Kraft Heinz Co. | | | | | 5,382,882 | | | | | | 0.1 | | |
| 143,619 | | | Kroger Co. | | | | | 6,500,196 | | | | | | 0.1 | | |
| 30,650 | | | Lamb Weston Holdings, Inc. | | | | | 1,942,597 | | | | | | 0.0 | | |
| 52,632 (2) | | | McCormick & Co., Inc. | | | | | 5,084,777 | | | | | | 0.1 | | |
| 39,790 (2) | | | Molson Coors Beverage Co. | | | | | 1,844,266 | | | | | | 0.0 | | |
| Shares | | | Value | | | Percentage of Net Assets | | |||||||||
| COMMON STOCK: (continued) | | |||||||||||||||
| | | | Consumer Staples (continued) | | ||||||||||||
| 295,231 | | | Mondelez International, Inc. | | | | $ | 19,576,768 | | | | | | 0.2 | | |
| 79,567 (1) | | | Monster Beverage Corp. | | | | | 7,641,615 | | | | | | 0.1 | | |
| 292,833 | | | PepsiCo, Inc. | | | | | 50,868,020 | | | | | | 0.6 | | |
| 329,722 | | | Philip Morris International, Inc. | | | | | 31,323,590 | | | | | | 0.4 | | |
| 512,692 | | | Procter & Gamble Co. | | | | | 83,866,157 | | | | | | 1.0 | | |
| 108,576 | | | Sysco Corp. | | | | | 8,528,645 | | | | | | 0.1 | | |
| 62,268 | | | Tyson Foods, Inc. | | | | | 5,427,279 | | | | | | 0.1 | | |
| 152,163 | | | Walgreens Boots Alliance, Inc. | | | | | 7,936,822 | | | | | | 0.1 | | |
| 301,195 | | | Walmart, Inc. | | | | | 43,579,905 | | | | | | 0.5 | | |
| | | | | | | | | 502,206,552 | | | | | | 5.8 | | |
| | | | Energy: 2.6% | | ||||||||||||
| 76,938 | | | APA Corp. | | | | | 2,068,863 | | | | | | 0.0 | | |
| 185,118 | | | Baker Hughes Co. | | | | | 4,453,939 | | | | | | 0.1 | | |
| 171,589 | | | Coterra Energy, Inc. | | | | | 3,260,191 | | | | | | 0.0 | | |
| 408,458 | | | Chevron Corp. | | | | | 47,932,546 | | | | | | 0.5 | | |
| 279,341 | | | ConocoPhillips | | | | | 20,162,833 | | | | | | 0.2 | | |
| 132,979 | | | Devon Energy Corp. | | | | | 5,857,725 | | | | | | 0.1 | | |
| 35,946 | | | Diamondback Energy, Inc. | | | | | 3,876,776 | | | | | | 0.0 | | |
| 123,917 | | | EOG Resources, Inc. | | | | | 11,007,547 | | | | | | 0.1 | | |
| 896,631 | | | Exxon Mobil Corp. | | | | | 54,864,851 | | | | | | 0.6 | | |
| 189,577 | | | Halliburton Co. | | | | | 4,335,626 | | | | | | 0.1 | | |
| 58,211 | | | Hess Corp. | | | | | 4,309,360 | | | | | | 0.0 | | |
| 412,989 | | | Kinder Morgan, Inc. | | | | | 6,550,006 | | | | | | 0.1 | | |
| 166,516 | | | Marathon Oil Corp. | | | | | 2,734,193 | | | | | | 0.0 | | |
| 130,376 | | | Marathon Petroleum Corp. | | | | | 8,342,760 | | | | | | 0.1 | | |
| 187,352 | | | Occidental Petroleum Corp. | | | | | 5,431,335 | | | | | | 0.1 | | |
| 94,127 | | | Oneok, Inc. | | | | | 5,530,903 | | | | | | 0.1 | | |
| 92,800 | | | Phillips 66 | | | | | 6,724,288 | | | | | | 0.1 | | |
| 48,086 | | | Pioneer Natural Resources Co. | | | | | 8,745,882 | | | | | | 0.1 | | |
| 297,065 | | | Schlumberger NV | | | | | 8,897,097 | | | | | | 0.1 | | |
| 86,347 | | | Valero Energy Corp. | | | | | 6,485,523 | | | | | | 0.1 | | |
| 256,609 | | | Williams Cos., Inc. | | | | | 6,682,098 | | | | | | 0.1 | | |
| | | | | | | | | 228,254,342 | | | | | | 2.6 | | |
| | | | Financials: 10.5% | | ||||||||||||
| 128,897 | | | Aflac, Inc. | | | | | 7,526,296 | | | | | | 0.1 | | |
| 60,715 | | | Allstate Corp. | | | | | 7,143,120 | | | | | | 0.1 | | |
| 132,876 | | | American Express Co. | | | | | 21,738,514 | | | | | | 0.3 | | |
| 175,849 | | | American International Group, Inc. | | | | | 9,998,774 | | | | | | 0.1 | | |
| 23,697 | | | Ameriprise Financial, Inc. | | | | | 7,148,437 | | | | | | 0.1 | | |
| 46,664 | | | Aon PLC | | | | | 14,025,332 | | | | | | 0.2 | | |
| 43,900 | | | Arthur J. Gallagher & Co. | | | | | 7,448,513 | | | | | | 0.1 | | |
| Voya U.S. Stock Index Portfolio | as of December 31, 2021 (continued) |
| Shares | | | Value | | | Percentage of Net Assets | | |||||||||
| COMMON STOCK: (continued) | | |||||||||||||||
| | | | Financials (continued) | | ||||||||||||
| 12,067 | | | Assurant, Inc. | | | | $ | 1,880,763 | | | | | | 0.0 | | |
| 1,525,316 | | | Bank of America Corp. | | | | | 67,861,309 | | | | | | 0.8 | | |
| 160,909 | | | Bank of New York Mellon Corp. | | | | | 9,345,595 | | | | | | 0.1 | | |
| 387,868 (1) | | | Berkshire Hathaway, Inc. – Class B | | | | | 115,972,532 | | | | | | 1.3 | | |
| 30,244 | | | Blackrock, Inc. | | | | | 27,690,197 | | | | | | 0.3 | | |
| 49,367 | | | Brown & Brown, Inc. | | | | | 3,469,513 | | | | | | 0.0 | | |
| 90,143 | | | Capital One Financial Corp. | | | | | 13,078,848 | | | | | | 0.2 | | |
| 22,520 | | | Cboe Global Markets, Inc. | | | | | 2,936,608 | | | | | | 0.0 | | |
| 318,403 | | | Charles Schwab Corp. | | | | | 26,777,692 | | | | | | 0.3 | | |
| 91,227 | | | Chubb Ltd. | | | | | 17,635,091 | | | | | | 0.2 | | |
| 31,660 | | | Cincinnati Financial Corp. | | | | | 3,607,024 | | | | | | 0.0 | | |
| 420,250 | | | Citigroup, Inc. | | | | | 25,378,897 | | | | | | 0.3 | | |
| 89,992 | | | Citizens Financial Group, Inc. | | | | | 4,252,122 | | | | | | 0.1 | | |
| 76,117 | | | CME Group, Inc. | | | | | 17,389,690 | | | | | | 0.2 | | |
| 28,286 | | | Comerica, Inc. | | | | | 2,460,882 | | | | | | 0.0 | | |
| 62,071 | | | Discover Financial Services | | | | | 7,172,925 | | | | | | 0.1 | | |
| 8,422 | | | Everest Re Group Ltd. | | | | | 2,306,954 | | | | | | 0.0 | | |
| 7,972 | | | Factset Research Systems, Inc. | | | | | 3,874,472 | | | | | | 0.0 | | |
| 144,813 | | | Fifth Third Bancorp | | | | | 6,306,606 | | | | | | 0.1 | | |
| 37,966 | | | First Republic Bank | | | | | 7,840,359 | | | | | | 0.1 | | |
| 59,015 (2) | | | Franklin Resources, Inc. | | | | | 1,976,412 | | | | | | 0.0 | | |
| 19,766 | | | Globe Life, Inc. | | | | | 1,852,469 | | | | | | 0.0 | | |
| 71,894 | | | Goldman Sachs Group, Inc. | | | | | 27,503,050 | | | | | | 0.3 | | |
| 72,084 | | | Hartford Financial Services Group, Inc. | | | | | 4,976,679 | | | | | | 0.1 | | |
| 306,347 | | | Huntington Bancshares, Inc. | | | | | 4,723,871 | | | | | | 0.1 | | |
| 119,324 | | | Intercontinental Exchange, Inc. | | | | | 16,319,943 | | | | | | 0.2 | | |
| 72,113 | | | Invesco Ltd. | | | | | 1,660,041 | | | | | | 0.0 | | |
| 625,898 | | | JPMorgan Chase & Co. | | | | | 99,110,948 | | | | | | 1.1 | | |
| 197,190 | | | Keycorp | | | | | 4,561,005 | | | | | | 0.1 | | |
| 35,976 | | | Lincoln National Corp. | | | | | 2,455,722 | | | | | | 0.0 | | |
| 42,927 | | | Loews Corp. | | | | | 2,479,463 | | | | | | 0.0 | | |
| 27,178 (2) | | | M&T Bank Corp. | | | | | 4,173,997 | | | | | | 0.1 | | |
| 8,026 | | | MarketAxess Holdings, Inc. | | | | | 3,300,853 | | | | | | 0.0 | | |
| 107,004 | | | Marsh & McLennan Cos., Inc. | | | | | 18,599,435 | | | | | | 0.2 | | |
| 151,427 | | | Metlife, Inc. | | | | | 9,462,673 | | | | | | 0.1 | | |
| 34,214 | | | Moody’s Corp. | | | | | 13,363,304 | | | | | | 0.2 | | |
| 304,032 | | | Morgan Stanley | | | | | 29,843,781 | | | | | | 0.3 | | |
| Shares | | | Value | | | Percentage of Net Assets | | |||||||||
| COMMON STOCK: (continued) | | |||||||||||||||
| | | | Financials (continued) | | ||||||||||||
| 17,462 | | | MSCI, Inc. - Class A | | | | $ | 10,698,793 | | | | | | 0.1 | | |
| 24,720 (2) | | | Nasdaq, Inc. | | | | | 5,191,447 | | | | | | 0.1 | | |
| 44,015 | | | Northern Trust Corp. | | | | | 5,264,634 | | | | | | 0.1 | | |
| 90,388 | | | People’s United Financial, Inc. | | | | | 1,610,714 | | | | | | 0.0 | | |
| 89,511 | | | PNC Financial Services Group, Inc. | | | | | 17,948,746 | | | | | | 0.2 | | |
| 52,719 | | | Principal Financial Group, Inc. | | | | | 3,813,165 | | | | | | 0.0 | | |
| 123,911 | | | Progressive Corp. | | | | | 12,719,464 | | | | | | 0.1 | | |
| 80,057 | | | Prudential Financial, Inc. | | | | | 8,665,370 | | | | | | 0.1 | | |
| 39,118 | | | Raymond James Financial, Inc. | | | | | 3,927,447 | | | | | | 0.0 | | |
| 201,607 | | | Regions Financial Corp. | | | | | 4,395,033 | | | | | | 0.1 | | |
| 51,042 | | | S&P Global, Inc. | | | | | 24,088,251 | | | | | | 0.3 | | |
| 12,841 | | | Signature Bank | | | | | 4,153,678 | | | | | | 0.0 | | |
| 77,437 | | | State Street Corp. | | | | | 7,201,641 | | | | | | 0.1 | | |
| 12,429 (1) | | | SVB Financial Group | | | | | 8,429,845 | | | | | | 0.1 | | |
| 115,904 | | | Synchrony Financial | | | | | 5,376,787 | | | | | | 0.1 | | |
| 47,600 | | | T. Rowe Price Group, Inc. | | | | | 9,360,064 | | | | | | 0.1 | | |
| 52,102 | | | Travelers Cos, Inc. | | | | | 8,150,316 | | | | | | 0.1 | | |
| 282,718 | | | Truist Financial Corp. | | | | | 16,553,139 | | | | | | 0.2 | | |
| 285,779 | | | US Bancorp | | | | | 16,052,206 | | | | | | 0.2 | | |
| 844,459 | | | Wells Fargo & Co. | | | | | 40,517,143 | | | | | | 0.5 | | |
| 26,390 | | | Willis Towers Watson PLC | | | | | 6,267,361 | | | | | | 0.1 | | |
| 29,622 | | | WR Berkley Corp. | | | | | 2,440,557 | | | | | | 0.0 | | |
| 33,137 | | | Zions Bancorp NA | | | | | 2,092,933 | | | | | | 0.0 | | |
| | | | | | | | | 913,549,445 | | | | | | 10.5 | | |
| | | | Health Care: 13.0% | | ||||||||||||
| 374,434 | | | Abbott Laboratories | | | | | 52,697,841 | | | | | | 0.6 | | |
| 374,421 | | | AbbVie, Inc. | | | | | 50,696,603 | | | | | | 0.6 | | |
| 9,585 (1) | | | Abiomed, Inc. | | | | | 3,442,645 | | | | | | 0.0 | | |
| 64,090 | | | Agilent Technologies, Inc. | | | | | 10,231,969 | | | | | | 0.1 | | |
| 15,520 (1) | | | Align Technology, Inc. | | | | | 10,199,434 | | | | | | 0.1 | | |
| 31,598 | | | AmerisourceBergen Corp. | | | | | 4,199,058 | | | | | | 0.1 | | |
| 119,295 | | | Amgen, Inc. | | | | | 26,837,796 | | | | | | 0.3 | | |
| 51,496 | | | Anthem, Inc. | | | | | 23,870,456 | | | | | | 0.3 | | |
| 106,042 | | | Baxter International, Inc. | | | | | 9,102,645 | | | | | | 0.1 | | |
| 60,824 | | | Becton Dickinson & Co. | | | | | 15,296,020 | | | | | | 0.2 | | |
| 31,111 (1) | | | Biogen, Inc. | | | | | 7,464,151 | | | | | | 0.1 | | |
| 4,576 (1) | | | Bio-Rad Laboratories, Inc. | | | | | 3,457,488 | | | | | | 0.0 | | |
| 8,322 | | | Bio-Techne Corp. | | | | | 4,305,304 | | | | | | 0.1 | | |
| 301,800 (1) | | | Boston Scientific Corp. | | | | | 12,820,464 | | | | | | 0.2 | | |
| 470,100 | | | Bristol-Myers Squibb Co. | | | | | 29,310,735 | | | | | | 0.3 | | |
| 59,680 | | | Cardinal Health, Inc. | | | | | 3,072,923 | | | | | | 0.0 | | |
| 36,256 (1) | | | Catalent, Inc. | | | | | 4,641,856 | | | | | | 0.1 | | |
| 123,581 (1) | | | Centene Corp. | | | | | 10,183,074 | | | | | | 0.1 | | |
| 62,430 | | | Cerner Corp. | | | | | 5,797,874 | | | | | | 0.1 | | |
| Voya U.S. Stock Index Portfolio | as of December 31, 2021 (continued) |
| Shares | | | Value | | | Percentage of Net Assets | | |||||||||
| COMMON STOCK: (continued) | | |||||||||||||||
| | | | Health Care (continued) | | ||||||||||||
| 10,644 (1) | | | Charles River Laboratories International, Inc. | | | | $ | 4,010,446 | | | | | | 0.0 | | |
| 70,193 | | | Cigna Corp. | | | | | 16,118,419 | | | | | | 0.2 | | |
| 10,402 | | | Cooper Cos., Inc. | | | | | 4,357,814 | | | | | | 0.1 | | |
| 279,576 | | | CVS Health Corp. | | | | | 28,841,060 | | | | | | 0.3 | | |
| 134,693 | | | Danaher Corp. | | | | | 44,315,344 | | | | | | 0.5 | | |
| 14,166 (1) | | | DaVita, Inc. | | | | | 1,611,524 | | | | | | 0.0 | | |
| 46,160 | | | Dentsply Sirona, Inc. | | | | | 2,575,266 | | | | | | 0.0 | | |
| 20,527 (1) | | | DexCom, Inc. | | | | | 11,021,973 | | | | | | 0.1 | | |
| 132,228 (1) | | | Edwards Lifesciences Corp. | | | | | 17,130,137 | | | | | | 0.2 | | |
| 168,156 | | | Eli Lilly & Co. | | | | | 46,448,050 | | | | | | 0.5 | | |
| 265,667 | | | Gilead Sciences, Inc. | | | | | 19,290,081 | | | | | | 0.2 | | |
| 50,721 | | | HCA Healthcare, Inc. | | | | | 13,031,239 | | | | | | 0.2 | | |
| 29,504 (1) | | | Henry Schein, Inc. | | | | | 2,287,445 | | | | | | 0.0 | | |
| 53,539 (1) | | | Hologic, Inc. | | | | | 4,098,946 | | | | | | 0.1 | | |
| 27,222 | | | Humana, Inc. | | | | | 12,627,197 | | | | | | 0.1 | | |
| 17,969 (1) | | | Idexx Laboratories, Inc. | | | | | 11,831,868 | | | | | | 0.1 | | |
| 33,103 (1) | | | Illumina, Inc. | | | | | 12,593,705 | | | | | | 0.1 | | |
| 39,646 (1) | | | Incyte Corp., Ltd. | | | | | 2,910,016 | | | | | | 0.0 | | |
| 75,603 (1) | | | Intuitive Surgical, Inc. | | | | | 27,164,158 | | | | | | 0.3 | | |
| 40,470 (1) | | | IQVIA Holdings, Inc. | | | | | 11,418,206 | | | | | | 0.1 | | |
| 557,560 | | | Johnson & Johnson | | | | | 95,381,789 | | | | | | 1.1 | | |
| 20,268 (1) | | | Laboratory Corp. of America Holdings | | | | | 6,368,408 | | | | | | 0.1 | | |
| 32,337 | | | McKesson Corp. | | | | | 8,038,008 | | | | | | 0.1 | | |
| 285,030 | | | Medtronic PLC | | | | | 29,486,354 | | | | | | 0.3 | | |
| 534,972 | | | Merck & Co., Inc. | | | | | 41,000,254 | | | | | | 0.5 | | |
| 4,883 (1) | | | Mettler Toledo International, Inc. | | | | | 8,287,476 | | | | | | 0.1 | | |
| 74,707 (1) | | | Moderna, Inc. | | | | | 18,974,084 | | | | | | 0.2 | | |
| 53,545 | | | Organon & Co. | | | | | 1,630,445 | | | | | | 0.0 | | |
| 26,728 | | | PerkinElmer, Inc. | | | | | 5,373,932 | | | | | | 0.1 | | |
| 1,188,754 | | | Pfizer, Inc. | | | | | 70,195,924 | | | | | | 0.8 | | |
| 25,981 | | | Quest Diagnostics, Inc. | | | | | 4,494,973 | | | | | | 0.1 | | |
| 22,391 (1) | | | Regeneron Pharmaceuticals, Inc. | | | | | 14,140,364 | | | | | | 0.2 | | |
| 30,863 | | | Resmed, Inc. | | | | | 8,039,194 | | | | | | 0.1 | | |
| 21,184 | | | STERIS Public Ltd. Co. | | | | | 5,156,397 | | | | | | 0.1 | | |
| 71,107 | | | Stryker Corp. | | | | | 19,015,434 | | | | | | 0.2 | | |
| 9,885 | | | Teleflex, Inc. | | | | | 3,247,025 | | | | | | 0.0 | | |
| 83,456 | | | Thermo Fisher Scientific, Inc. | | | | | 55,685,182 | | | | | | 0.6 | | |
| 199,475 | | | UnitedHealth Group, Inc. | | | | | 100,164,377 | | | | | | 1.2 | | |
| Shares | | | Value | | | Percentage of Net Assets | | |||||||||
| COMMON STOCK: (continued) | | |||||||||||||||
| | | | Health Care (continued) | | ||||||||||||
| 15,486 | | | Universal Health Services, Inc. | | | | $ | 2,007,915 | | | | | | 0.0 | | |
| 53,848 (1) | | | Vertex Pharmaceuticals, Inc. | | | | | 11,825,021 | | | | | | 0.1 | | |
| 255,412 | | | Viatris, Inc. | | | | | 3,455,724 | | | | | | 0.0 | | |
| 12,960 (1) | | | Waters Corp. | | | | | 4,828,896 | | | | | | 0.1 | | |
| 15,689 | | | West Pharmaceutical Services, Inc. | | | | | 7,358,298 | | | | | | 0.1 | | |
| 44,109 | | | Zimmer Biomet Holdings, Inc. | | | | | 5,603,607 | | | | | | 0.1 | | |
| 100,204 | | | Zoetis, Inc. | | | | | 24,452,782 | | | | | | 0.3 | | |
| | | | | | | | | 1,135,523,093 | | | | | | 13.0 | | |
| | | | Industrials: 7.6% | | ||||||||||||
| 122,213 | | | 3M Co. | | | | | 21,708,695 | | | | | | 0.3 | | |
| 26,480 (1) | | | Alaska Air Group, Inc. | | | | | 1,379,608 | | | | | | 0.0 | | |
| 18,945 | | | Allegion Public Ltd. | | | | | 2,509,076 | | | | | | 0.0 | | |
| 136,749 (1)(2) | | | American Airlines Group, Inc. | | | | | 2,456,012 | | | | | | 0.0 | | |
| 48,993 | | | Ametek, Inc. | | | | | 7,203,931 | | | | | | 0.1 | | |
| 28,133 | | | AO Smith Corp. | | | | | 2,415,218 | | | | | | 0.0 | | |
| 117,001 (1) | | | Boeing Co. | | | | | 23,554,641 | | | | | | 0.3 | | |
| 183,266 | | | Carrier Global Corp. | | | | | 9,940,348 | | | | | | 0.1 | | |
| 114,567 | | | Caterpillar, Inc. | | | | | 23,685,582 | | | | | | 0.3 | | |
| 27,819 | | | CH Robinson Worldwide, Inc. | | | | | 2,994,159 | | | | | | 0.0 | | |
| 18,616 | | | Cintas Corp. | | | | | 8,250,053 | | | | | | 0.1 | | |
| 45,194 (1) | | | Copart, Inc. | | | | | 6,852,314 | | | | | | 0.1 | | |
| 469,748 | | | CSX Corp. | | | | | 17,662,525 | | | | | | 0.2 | | |
| 30,331 | | | Cummins, Inc. | | | | | 6,616,404 | | | | | | 0.1 | | |
| 59,758 | | | Deere & Co. | | | | | 20,490,421 | | | | | | 0.2 | | |
| 135,155 (1) | | | Delta Air Lines, Inc. | | | | | 5,281,857 | | | | | | 0.1 | | |
| 30,406 | | | Dover Corp. | | | | | 5,521,730 | | | | | | 0.1 | | |
| 84,420 | | | Eaton Corp. PLC | | | | | 14,589,464 | | | | | | 0.2 | | |
| 126,609 | | | Emerson Electric Co. | | | | | 11,770,839 | | | | | | 0.1 | | |
| 25,839 | | | Equifax, Inc. | | | | | 7,565,401 | | | | | | 0.1 | | |
| 35,882 | | | Expeditors International Washington, Inc. | | | | | 4,818,594 | | | | | | 0.1 | | |
| 121,814 (2) | | | Fastenal Co. | | | | | 7,803,405 | | | | | | 0.1 | | |
| 51,761 | | | FedEx Corp. | | | | | 13,387,465 | | | | | | 0.2 | | |
| 75,695 | | | Fortive Corp. | | | | | 5,774,771 | | | | | | 0.1 | | |
| 29,121 | | | Fortune Brands Home & Security, Inc. | | | | | 3,113,035 | | | | | | 0.0 | | |
| 13,332 (1) | | | Generac Holdings, Inc. | | | | | 4,691,797 | | | | | | 0.1 | | |
| 49,004 | | | General Dynamics Corp. | | | | | 10,215,864 | | | | | | 0.1 | | |
| 232,575 | | | General Electric Co. | | | | | 21,971,360 | | | | | | 0.3 | | |
| Voya U.S. Stock Index Portfolio | as of December 31, 2021 (continued) |
| Shares | | | Value | | | Percentage of Net Assets | | |||||||||
| COMMON STOCK: (continued) | | |||||||||||||||
| | | | Industrials (continued) | | ||||||||||||
| 145,818 | | | Honeywell International, Inc. | | | | $ | 30,404,511 | | | | | | 0.3 | | |
| 81,531 | | | Howmet Aerospace, Inc. | | | | | 2,595,132 | | | | | | 0.0 | | |
| 8,478 | | | Huntington Ingalls Industries, Inc. | | | | | 1,583,182 | | | | | | 0.0 | | |
| 16,051 | | | IDEX Corp. | | | | | 3,793,172 | | | | | | 0.0 | | |
| 84,363 | | | IHS Markit Ltd. | | | | | 11,213,530 | | | | | | 0.1 | | |
| 60,537 | | | Illinois Tool Works, Inc. | | | | | 14,940,532 | | | | | | 0.2 | | |
| 86,323 | | | Ingersoll Rand, Inc. | | | | | 5,340,804 | | | | | | 0.1 | | |
| 27,523 | | | Jacobs Engineering Group, Inc. | | | | | 3,832,027 | | | | | | 0.0 | | |
| 17,775 | | | JB Hunt Transport Services, Inc. | | | | | 3,633,210 | | | | | | 0.0 | | |
| 150,428 | | | Johnson Controls International plc | | | | | 12,231,301 | | | | | | 0.1 | | |
| 41,559 | | | L3Harris Technologies, Inc. | | | | | 8,862,041 | | | | | | 0.1 | | |
| 29,900 | | | Leidos Holdings, Inc. | | | | | 2,658,110 | | | | | | 0.0 | | |
| 52,054 | | | Lockheed Martin Corp. | | | | | 18,500,512 | | | | | | 0.2 | | |
| 52,203 | | | Masco Corp. | | | | | 3,665,695 | | | | | | 0.0 | | |
| 76,410 | | | Nielsen Holdings PLC | | | | | 1,567,169 | | | | | | 0.0 | | |
| 51,538 | | | Norfolk Southern Corp. | | | | | 15,343,378 | | | | | | 0.2 | | |
| 31,562 | | | Northrop Grumman Corp. | | | | | 12,216,703 | | | | | | 0.1 | | |
| 19,813 | | | Old Dominion Freight Line | | | | | 7,100,583 | | | | | | 0.1 | | |
| 90,139 | | | Otis Worldwide Corp. | | | | | 7,848,403 | | | | | | 0.1 | | |
| 73,326 | | | Paccar, Inc. | | | | | 6,471,753 | | | | | | 0.1 | | |
| 27,342 | | | Parker Hannifin Corp. | | | | | 8,698,037 | | | | | | 0.1 | | |
| 35,032 | | | Pentair PLC | | | | | 2,558,387 | | | | | | 0.0 | | |
| 30,180 | | | Quanta Services, Inc. | | | | | 3,460,439 | | | | | | 0.0 | | |
| 317,004 | | | Raytheon Technologies Corp. | | | | | 27,281,364 | | | | | | 0.3 | | |
| 44,379 | | | Republic Services, Inc. | | | | | 6,188,652 | | | | | | 0.1 | | |
| 23,649 | | | Robert Half International, Inc. | | | | | 2,637,336 | | | | | | 0.0 | | |
| 24,564 | | | Rockwell Automation, Inc. | | | | | 8,569,151 | | | | | | 0.1 | | |
| 47,808 | | | Rollins, Inc. | | | | | 1,635,512 | | | | | | 0.0 | | |
| 22,341 | | | Roper Technologies, Inc. | | | | | 10,988,644 | | | | | | 0.1 | | |
| 11,399 | | | Snap-On, Inc. | | | | | 2,455,117 | | | | | | 0.0 | | |
| 124,960 (1) | | | Southwest Airlines Co. | | | | | 5,353,286 | | | | | | 0.1 | | |
| 34,529 | | | Stanley Black & Decker, Inc. | | | | | 6,512,860 | | | | | | 0.1 | | |
| 46,684 | | | Textron, Inc. | | | | | 3,604,005 | | | | | | 0.0 | | |
| 50,309 | | | Trane Technologies PLC | | | | | 10,163,927 | | | | | | 0.1 | | |
| 11,058 (1) | | | TransDigm Group, Inc. | | | | | 7,035,984 | | | | | | 0.1 | | |
| 136,155 | | | Union Pacific Corp. | | | | | 34,301,529 | | | | | | 0.4 | | |
| 68,350 (1) | | | United Airlines Holdings, Inc. | | | | | 2,992,363 | | | | | | 0.0 | | |
| 154,429 | | | United Parcel Service, Inc. - Class B | | | | | 33,100,312 | | | | | | 0.4 | | |
| Shares | | | Value | | | Percentage of Net Assets | | |||||||||
| COMMON STOCK: (continued) | | |||||||||||||||
| | | | Industrials (continued) | | ||||||||||||
| 15,289 (1) | | | United Rentals, Inc. | | | | $ | 5,080,382 | | | | | | 0.1 | | |
| 34,078 | | | Verisk Analytics, Inc. | | | | | 7,794,661 | | | | | | 0.1 | | |
| 81,508 | | | Waste Management, Inc. | | | | | 13,603,685 | | | | | | 0.2 | | |
| 39,926 | | | Westinghouse Air Brake Technologies Corp. | | | | | 3,677,584 | | | | | | 0.0 | | |
| 9,239 | | | WW Grainger, Inc. | | | | | 4,788,019 | | | | | | 0.1 | | |
| 38,052 | | | Xylem, Inc. | | | | | 4,563,196 | | | | | | 0.1 | | |
| | | | | | | | | 665,070,749 | | | | | | 7.6 | | |
| | | | Information Technology: 28.6% | | ||||||||||||
| 133,776 | | | Accenture PLC | | | | | 55,456,841 | | | | | | 0.6 | | |
| 100,770 (1) | | | Adobe, Inc. | | | | | 57,142,636 | | | | | | 0.7 | | |
| 255,761 (1) | | | Advanced Micro Devices, Inc. | | | | | 36,804,008 | | | | | | 0.4 | | |
| 34,391 (1) | | | Akamai Technologies, Inc. | | | | | 4,025,123 | | | | | | 0.0 | | |
| 126,657 (2) | | | Amphenol Corp. | | | | | 11,077,421 | | | | | | 0.1 | | |
| 113,819 | | | Analog Devices, Inc. | | | | | 20,005,966 | | | | | | 0.2 | | |
| 18,479 (1) | | | ANSYS, Inc. | | | | | 7,412,296 | | | | | | 0.1 | | |
| 3,300,988 | | | Apple, Inc. | | | | | 586,156,439 | | | | | | 6.7 | | |
| 191,232 | | | Applied Materials, Inc. | | | | | 30,092,268 | | | | | | 0.3 | | |
| 47,508 (1) | | | Arista Networks, Inc. | | | | | 6,829,275 | | | | | | 0.1 | | |
| 46,562 (1) | | | Autodesk, Inc. | | | | | 13,092,769 | | | | | | 0.2 | | |
| 89,358 | | | Automatic Data Processing, Inc. | | | | | 22,033,896 | | | | | | 0.3 | | |
| 87,176 | | | Broadcom, Inc. | | | | | 58,007,782 | | | | | | 0.7 | | |
| 24,690 | | | Broadridge Financial Solutions, Inc. ADR | | | | | 4,513,826 | | | | | | 0.1 | | |
| 58,696 (1) | | | Cadence Design Systems, Inc. | | | | | 10,938,000 | | | | | | 0.1 | | |
| 28,745 | | | CDW Corp. | | | | | 5,886,401 | | | | | | 0.1 | | |
| 28,845 (1) | | | Ceridian HCM Holding, Inc. | | | | | 3,013,149 | | | | | | 0.0 | | |
| 893,255 | | | Cisco Systems, Inc. | | | | | 56,605,569 | | | | | | 0.6 | | |
| 26,239 | | | Citrix Systems, Inc. | | | | | 2,481,947 | | | | | | 0.0 | | |
| 111,010 | | | Cognizant Technology Solutions Corp. | | | | | 9,848,807 | | | | | | 0.1 | | |
| 162,341 | | | Corning, Inc. | | | | | 6,043,955 | | | | | | 0.1 | | |
| 53,204 (1) | | | DXC Technology Co. | | | | | 1,712,637 | | | | | | 0.0 | | |
| 28,573 (1) | | | Enphase Energy, Inc. | | | | | 5,227,145 | | | | | | 0.1 | | |
| 12,013 (1) | | | EPAM Systems, Inc. | | | | | 8,030,090 | | | | | | 0.1 | | |
| 12,738 (1) | | | F5, Inc. | | | | | 3,117,116 | | | | | | 0.0 | | |
| 128,967 | | | Fidelity National Information Services, Inc. | | | | | 14,076,748 | | | | | | 0.2 | | |
| 125,877 (1) | | | Fiserv, Inc. | | | | | 13,064,774 | | | | | | 0.2 | | |
| 17,197 (1) | | | FleetCor Technologies, Inc. | | | | | 3,849,376 | | | | | | 0.0 | | |
| 28,741 (1) | | | Fortinet, Inc. | | | | | 10,329,515 | | | | | | 0.1 | | |
| 17,417 (1) | | | Gartner, Inc. | | | | | 5,822,851 | | | | | | 0.1 | | |
| 61,451 | | | Global Payments, Inc. | | | | | 8,306,946 | | | | | | 0.1 | | |
| Voya U.S. Stock Index Portfolio | as of December 31, 2021 (continued) |
| Shares | | | Value | | | Percentage of Net Assets | | |||||||||
| COMMON STOCK: (continued) | | |||||||||||||||
| | | | Information Technology (continued) | | ||||||||||||
| 275,823 | | | Hewlett Packard Enterprise Co. | | | | $ | 4,349,729 | | | | | | 0.1 | | |
| 244,093 | | | HP, Inc. | | | | | 9,194,983 | | | | | | 0.1 | | |
| 861,353 | | | Intel Corp. | | | | | 44,359,679 | | | | | | 0.5 | | |
| 189,934 | | | International Business Machines Corp. | | | | | 25,386,578 | | | | | | 0.3 | | |
| 59,972 | | | Intuit, Inc. | | | | | 38,575,190 | | | | | | 0.4 | | |
| 7,633 (1) | | | IPG Photonics Corp. | | | | | 1,313,945 | | | | | | 0.0 | | |
| 15,689 | | | Jack Henry & Associates, Inc. | | | | | 2,619,906 | | | | | | 0.0 | | |
| 68,675 | | | Juniper Networks, Inc. | | | | | 2,452,384 | | | | | | 0.0 | | |
| 39,011 (1) | | | Keysight Technologies, Inc. | | | | | 8,056,162 | | | | | | 0.1 | | |
| 32,112 | | | KLA Corp. | | | | | 13,811,692 | | | | | | 0.2 | | |
| 29,820 | | | Lam Research Corp. | | | | | 21,445,053 | | | | | | 0.2 | | |
| 183,727 | | | Mastercard, Inc. - Class A | | | | | 66,016,786 | | | | | | 0.8 | | |
| 117,517 | | | Microchip Technology, Inc. | | | | | 10,231,030 | | | | | | 0.1 | | |
| 236,914 | | | Micron Technology, Inc. | | | | | 22,068,539 | | | | | | 0.3 | | |
| 1,590,121 | | | Microsoft Corp. | | | | | 534,789,495 | | | | | | 6.1 | | |
| 9,176 | | | Monolithic Power Systems, Inc. | | | | | 4,526,796 | | | | | | 0.1 | | |
| 35,763 | | | Motorola Solutions, Inc. | | | | | 9,716,807 | | | | | | 0.1 | | |
| 47,314 | | | NetApp, Inc. | | | | | 4,352,415 | | | | | | 0.1 | | |
| 122,770 | | | NortonLifeLock, Inc. | | | | | 3,189,565 | | | | | | 0.0 | | |
| 529,477 | | | Nvidia Corp. | | | | | 155,724,480 | | | | | | 1.8 | | |
| 56,322 | | | NXP Semiconductor NV - NXPI - US | | | | | 12,829,025 | | | | | | 0.1 | | |
| 341,592 | | | Oracle Corp. | | | | | 29,790,238 | | | | | | 0.3 | | |
| 67,969 | | | Paychex, Inc. | | | | | 9,277,769 | | | | | | 0.1 | | |
| 10,153 (1) | | | Paycom Software, Inc. | | | | | 4,215,424 | | | | | | 0.0 | | |
| 248,839 (1) | | | PayPal Holdings, Inc. | | | | | 46,926,059 | | | | | | 0.5 | | |
| 22,313 (1) | | | PTC, Inc. | | | | | 2,703,220 | | | | | | 0.0 | | |
| 23,474 (1) | | | Qorvo, Inc. | | | | | 3,671,099 | | | | | | 0.0 | | |
| 237,206 | | | Qualcomm, Inc. | | | | | 43,377,861 | | | | | | 0.5 | | |
| 207,343 (1) | | | Salesforce.com, Inc. | | | | | 52,692,077 | | | | | | 0.6 | | |
| 43,380 | | | Seagate Technology Holdings PLC | | | | | 4,901,072 | | | | | | 0.1 | | |
| 42,146 (1) | | | ServiceNow, Inc. | | | | | 27,357,390 | | | | | | 0.3 | | |
| 34,880 | | | Skyworks Solutions, Inc. | | | | | 5,411,283 | | | | | | 0.1 | | |
| 11,123 (1) | | | SolarEdge Technologies, Inc. | | | | | 3,120,780 | | | | | | 0.0 | | |
| 32,299 (1) | | | Synopsys, Inc. | | | | | 11,902,182 | | | | | | 0.1 | | |
| 69,276 | | | TE Connectivity Ltd. | | | | | 11,176,990 | | | | | | 0.1 | | |
| 9,844 (1) | | | Teledyne Technologies, Inc. | | | | | 4,300,745 | | | | | | 0.1 | | |
| 34,523 (2) | | | Teradyne, Inc. | | | | | 5,645,546 | | | | | | 0.1 | | |
| 195,594 | | | Texas Instruments, Inc. | | | | | 36,863,601 | | | | | | 0.4 | | |
| 53,144 (1) | | | Trimble, Inc. | | | | | 4,633,625 | | | | | | 0.1 | | |
| Shares | | | Value | | | Percentage of Net Assets | | |||||||||
| COMMON STOCK: (continued) | | |||||||||||||||
| | | | Information Technology (continued) | | ||||||||||||
| 8,678 (1) | | | Tyler Technologies, Inc. | | | | $ | 4,668,330 | | | | | | 0.1 | | |
| 20,557 (1) | | | VeriSign, Inc. | | | | | 5,217,778 | | | | | | 0.1 | | |
| 355,173 (2) | | | Visa, Inc. - Class A | | | | | 76,969,541 | | | | | | 0.9 | | |
| 65,999 (1) | | | Western Digital Corp. | | | | | 4,303,795 | | | | | | 0.1 | | |
| 52,499 | | | Xilinx, Inc. | | | | | 11,131,363 | | | | | | 0.1 | | |
| 11,318 (1) | | | Zebra Technologies Corp. | | | | | 6,736,474 | | | | | | 0.1 | | |
| | | | | | | | | 2,493,010,053 | | | | | | 28.6 | | |
| | | | Materials: 2.5% | | ||||||||||||
| 46,883 | | | Air Products & Chemicals, Inc. | | | | | 14,264,622 | | | | | | 0.2 | | |
| 24,701 | | | Albemarle Corp. | | | | | 5,774,353 | | | | | | 0.1 | | |
| 325,639 | | | Amcor PLC | | | | | 3,910,924 | | | | | | 0.1 | | |
| 17,506 | | | Avery Dennison Corp. | | | | | 3,791,274 | | | | | | 0.0 | | |
| 68,983 | | | Ball Corp. | | | | | 6,640,993 | | | | | | 0.1 | | |
| 23,058 | | | Celanese Corp. - Series A | | | | | 3,875,128 | | | | | | 0.0 | | |
| 45,431 | | | CF Industries Holdings, Inc. | | | | | 3,215,606 | | | | | | 0.0 | | |
| 155,066 | | | Corteva, Inc. | | | | | 7,331,520 | | | | | | 0.1 | | |
| 156,643 | | | Dow, Inc. | | | | | 8,884,791 | | | | | | 0.1 | | |
| 109,730 | | | DuPont de Nemours, Inc. | | | | | 8,863,989 | | | | | | 0.1 | | |
| 28,678 | | | Eastman Chemical Co. | | | | | 3,467,457 | | | | | | 0.0 | | |
| 52,802 | | | Ecolab, Inc. | | | | | 12,386,821 | | | | | | 0.1 | | |
| 27,182 | | | FMC Corp. | | | | | 2,987,030 | | | | | | 0.0 | | |
| 311,009 | | | Freeport-McMoRan, Inc. | | | | | 12,978,406 | | | | | | 0.2 | | |
| 53,906 | | | International Flavors & Fragrances, Inc. | | | | | 8,120,939 | | | | | | 0.1 | | |
| 82,548 | | | International Paper Co. | | | | | 3,878,105 | | | | | | 0.1 | | |
| 108,554 | | | Linde PLC | | | | | 37,606,362 | | | | | | 0.4 | | |
| 55,815 | | | LyondellBasell Industries NV - Class A | | | | | 5,147,817 | | | | | | 0.1 | | |
| 13,175 | | | Martin Marietta Materials, Inc. | | | | | 5,803,851 | | | | | | 0.1 | | |
| 78,240 | | | Mosaic Co. | | | | | 3,074,050 | | | | | | 0.0 | | |
| 168,782 | | | Newmont Corp. | | | | | 10,467,860 | | | | | | 0.1 | | |
| 60,530 (2) | | | Nucor Corp. | | | | | 6,909,500 | | | | | | 0.1 | | |
| 20,063 | | | Packaging Corp. of America | | | | | 2,731,577 | | | | | | 0.0 | | |
| 50,279 | | | PPG Industries, Inc. | | | | | 8,670,111 | | | | | | 0.1 | | |
| 31,659 | | | Sealed Air Corp. | | | | | 2,136,033 | | | | | | 0.0 | | |
| 51,163 | | | Sherwin-Williams Co. | | | | | 18,017,562 | | | | | | 0.2 | | |
| 28,023 | | | Vulcan Materials Co. | | | | | 5,817,014 | | | | | | 0.1 | | |
| 56,394 | | | WestRock Co. | | | | | 2,501,638 | | | | | | 0.0 | | |
| | | | | | | | | 219,255,333 | | | | | | 2.5 | | |
| | | | Real Estate: 2.7% | | ||||||||||||
| 29,866 | | | Alexandria Real Estate Equities, Inc. | | | | | 6,658,923 | | | | | | 0.1 | | |
| 96,452 | | | American Tower Corp. | | | | | 28,212,210 | | | | | | 0.3 | | |
| Voya U.S. Stock Index Portfolio | as of December 31, 2021 (continued) |
| Shares | | | Value | | | Percentage of Net Assets | | |||||||||
| COMMON STOCK: (continued) | | |||||||||||||||
| | | | Real Estate (continued) | | ||||||||||||
| 29,596 | | | AvalonBay Communities, Inc. | | | | $ | 7,475,654 | | | | | | 0.1 | | |
| 30,016 | | | Boston Properties, Inc. | | | | | 3,457,243 | | | | | | 0.0 | | |
| 70,910 (1) | | | CBRE Group, Inc. | | | | | 7,694,444 | | | | | | 0.1 | | |
| 91,537 | | | Crown Castle International Corp. | | | | | 19,107,433 | | | | | | 0.2 | | |
| 60,103 | | | Digital Realty Trust, Inc. | | | | | 10,630,418 | | | | | | 0.1 | | |
| 80,661 | | | Duke Realty Corp. | | | | | 5,294,588 | | | | | | 0.1 | | |
| 19,070 | | | Equinix, Inc. | | | | | 16,130,169 | | | | | | 0.2 | | |
| 72,277 | | | Equity Residential | | | | | 6,541,068 | | | | | | 0.1 | | |
| 13,736 | | | Essex Property Trust, Inc. | | | | | 4,838,231 | | | | | | 0.1 | | |
| 28,357 | | | Extra Space Storage, Inc. | | | | | 6,429,383 | | | | | | 0.1 | | |
| 14,783 | | | Federal Realty Investment Trust | | | | | 2,015,219 | | | | | | 0.0 | | |
| 113,835 | | | Healthpeak Properties, Inc. | | | | | 4,108,305 | | | | | | 0.1 | | |
| 150,797 (1) | | | Host Hotels & Resorts, Inc. | | | | | 2,622,360 | | | | | | 0.0 | | |
| 61,136 (2) | | | Iron Mountain, Inc. | | | | | 3,199,247 | | | | | | 0.0 | | |
| 130,554 | | | Kimco Realty Corp. | | | | | 3,218,156 | | | | | | 0.0 | | |
| 24,504 | | | Mid-America Apartment Communities, Inc. | | | | | 5,622,198 | | | | | | 0.1 | | |
| 156,583 | | | ProLogis, Inc. | | | | | 26,362,314 | | | | | | 0.3 | | |
| 32,311 | | | Public Storage, Inc. | | | | | 12,102,408 | | | | | | 0.1 | | |
| 119,824 | | | Realty Income Corp. | | | | | 8,578,200 | | | | | | 0.1 | | |
| 32,635 | | | Regency Centers Corp. | | | | | 2,459,047 | | | | | | 0.0 | | |
| 23,139 | | | SBA Communications Corp. | | | | | 9,001,534 | | | | | | 0.1 | | |
| 69,597 | | | Simon Property Group, Inc. | | | | | 11,119,513 | | | | | | 0.1 | | |
| 61,554 | | | UDR, Inc. | | | | | 3,692,624 | | | | | | 0.0 | | |
| 84,542 | | | Ventas, Inc. | | | | | 4,321,787 | | | | | | 0.1 | | |
| 33,581 | | | Vornado Realty Trust | | | | | 1,405,701 | | | | | | 0.0 | | |
| 92,187 | | | Welltower, Inc. | | | | | 7,906,879 | | | | | | 0.1 | | |
| 158,361 | | | Weyerhaeuser Co. | | | | | 6,521,306 | | | | | | 0.1 | | |
| | | | | | | | | 236,726,562 | | | | | | 2.7 | | |
| | | | | | ||||||||||||
| | | | Utilities: 2.4% | | ||||||||||||
| 140,741 | | | AES Corp. | | | | | 3,420,006 | | | | | | 0.0 | | |
| 52,857 | | | Alliant Energy Corp. | | | | | 3,249,120 | | | | | | 0.0 | | |
| 54,559 | | | Ameren Corp. | | | | | 4,856,297 | | | | | | 0.1 | | |
| 106,669 | | | American Electric Power Co., Inc. | | | | | 9,490,341 | | | | | | 0.1 | | |
| 38,448 | | | American Water Works Co., Inc. | | | | | 7,261,289 | | | | | | 0.1 | | |
| 28,047 | | | Atmos Energy Corp. | | | | | 2,938,484 | | | | | | 0.0 | | |
| 133,188 | | | Centerpoint Energy, Inc. | | | | | 3,717,277 | | | | | | 0.0 | | |
| Shares | | | Value | | | Percentage of Net Assets | | |||||||||
| COMMON STOCK: (continued) | | |||||||||||||||
| | | | Utilities (continued) | | ||||||||||||
| 61,177 | | | CMS Energy Corp. | | | | $ | 3,979,564 | | | | | | 0.0 | | |
| 74,921 | | | Consolidated Edison, Inc. | | | | | 6,392,260 | | | | | | 0.1 | | |
| 171,531 | | | Dominion Energy, Inc. | | | | | 13,475,475 | | | | | | 0.1 | | |
| 40,922 | | | DTE Energy Co. | | | | | 4,891,816 | | | | | | 0.1 | | |
| 162,914 | | | Duke Energy Corp. | | | | | 17,089,679 | | | | | | 0.2 | | |
| 80,197 (2) | | | Edison International | | | | | 5,473,445 | | | | | | 0.1 | | |
| 42,443 | | | Entergy Corp. | | | | | 4,781,204 | | | | | | 0.1 | | |
| 48,430 | | | Evergy, Inc. | | | | | 3,322,782 | | | | | | 0.0 | | |
| 72,815 | | | Eversource Energy | | | | | 6,624,709 | | | | | | 0.1 | | |
| 207,199 | | | Exelon Corp. | | | | | 11,967,814 | | | | | | 0.1 | | |
| 114,938 | | | FirstEnergy Corp. | | | | | 4,780,271 | | | | | | 0.1 | | |
| 415,563 | | | NextEra Energy, Inc. | | | | | 38,796,962 | | | | | | 0.4 | | |
| 82,880 | | | NiSource, Inc. | | | | | 2,288,317 | | | | | | 0.0 | | |
| 51,699 | | | NRG Energy, Inc. | | | | | 2,227,193 | | | | | | 0.0 | | |
| 23,821 | | | Pinnacle West Capital Corp. | | | | | 1,681,524 | | | | | | 0.0 | | |
| 158,995 | | | PPL Corp. | | | | | 4,779,390 | | | | | | 0.1 | | |
| 107,095 | | | Public Service Enterprise Group, Inc. | | | | | 7,146,449 | | | | | | 0.1 | | |
| 67,633 | | | Sempra Energy | | | | | 8,946,493 | | | | | | 0.1 | | |
| 224,457 | | | Southern Co. | | | | | 15,393,261 | | | | | | 0.2 | | |
| 66,622 | | | WEC Energy Group, Inc. | | | | | 6,466,998 | | | | | | 0.1 | | |
| 114,087 | | | Xcel Energy, Inc. | | | | | 7,723,690 | | | | | | 0.1 | | |
| | | | | | | | | 213,162,110 | | | | | | 2.4 | | |
| | | | Total Common Stock (Cost $4,241,522,101) | | | | | 8,547,113,977 | | | | | | 98.0 | | |
| | ||||||||||||||||
| Principal Amount† | | | Value | | | Percentage of Net Assets | | |||||||||
| SHORT-TERM INVESTMENTS: 3.2% | | |||||||||||||||
| | | | Commercial Paper: 0.2% | | ||||||||||||
| 500,000 (3) | | | ANZ Bank, 0.120%, 02/10/2022 | | | | | 499,952 | | | | | | 0.0 | | |
| 450,000 (3) | | | Bayeriche Landesbank of New York, 0.160%, 04/01/2022 | | | | | 449,806 | | | | | | 0.0 | | |
| 400,000 (3) | | | Collateralized Commercial Paper V Co., LLC, 0.360%, 06/08/2022 | | | | | 399,399 | | | | | | 0.0 | | |
| 475,000 (3) | | | Credit Suisse AG, 0.330%, 06/09/2022 | | | | | 474,345 | | | | | | 0.0 | | |
| 475,000 (3) | | | DBS Bank Ltd., 0.120%, 02/01/2022 | | | | | 474,956 | | | | | | 0.0 | | |
| 475,000 (3) | | | DNB Bank ASA, 0.140%, 03/16/2022 | | | | | 474,857 | | | | | | 0.0 | | |
| Voya U.S. Stock Index Portfolio | as of December 31, 2021 (continued) |
| Principal Amount† | | | Value | | | Percentage of Net Assets | | |||||||||
| SHORT-TERM INVESTMENTS: (continued) | | |||||||||||||||
| | | | Commercial Paper (continued) | | ||||||||||||
| 375,000 (3) | | | DNB Bank ASA, 0.140%, 03/22/2022 | | | | $ | 374,873 | | | | | | 0.0 | | |
| 475,000 (3) | | | JPMorgan Securities LLC, 0.220%, 03/14/2022 | | | | | 474,782 | | | | | | 0.0 | | |
| 400,000 (3) | | | Liberty Street Funding LLC, 0.220%, 03/17/2022 | | | | | 399,808 | | | | | | 0.0 | | |
| 275,000 (3) | | | Lloyds Bank PLC, 0.150%, 03/29/2022 | | | | | 274,861 | | | | | | 0.0 | | |
| 498,000 (3) | | | LMA-Americas LLC, 0.100%, 01/26/2022 | | | | | 497,960 | | | | | | 0.0 | | |
| 350,000 (3) | | | LMA-Americas LLC, 0.150%, 03/14/2022 | | | | | 349,843 | | | | | | 0.0 | | |
| 475,000 (3) | | | Matchpoint Finance PLC, 0.120%, 01/18/2022 | | | | | 474,979 | | | | | | 0.0 | | |
| 475,000 (3) | | | Matchpoint Finance PLC, 0.150%, 03/15/2022 | | | | | 474,782 | | | | | | 0.0 | | |
| 250,000 (3) | | | Mitsubishi UFJ Trust and Banking Corp., 0.300%, 04/26/2022 | | | | | 249,780 | | | | | | 0.0 | | |
| 300,000 (3) | | | Mizuho Bank Ltd., 0.140%, 01/21/2022 | | | | | 299,981 | | | | | | 0.0 | | |
| 475,000 (3) | | | Mizuho Bank Ltd., 0.150%, 03/16/2022 | | | | | 474,767 | | | | | | 0.0 | | |
| 475,000 (3) | | | National Australia Bank Ltd., 0.120%, 02/18/2022 | | | | | 474,928 | | | | | | 0.0 | | |
| 500,000 (3) | | | Nieuw Amsterdam Receivables Corporation B.V., 0.100%, 01/07/2022 | | | | | 499,992 | | | | | | 0.1 | | |
| 400,000 (3) | | | Nieuw Amsterdam Receivables Corporation B.V., 0.100%, 01/11/2022 | | | | | 399,990 | | | | | | 0.0 | | |
| 500,000 (3) | | | NRW.Bank, 0.130%, 03/21/2022 | | | | | 499,881 | | | | | | 0.0 | | ��� |
| 475,000 (3) | | | Old Line Funding LLC, 0.130%, 03/10/2022 | | | | | 474,804 | | | | | | 0.0 | | |
| 325,000 (3) | | | Santander UK PLC, 0.300%, 05/03/2022 | | | | | 324,709 | | | | | | 0.0 | | |
| 450,000 (3) | | | Sheffield Receivables Company LLC, 0.240%, 03/15/2022 | | | | | 449,794 | | | | | | 0.0 | | |
| 525,000 (3) | | | Skandinaviska Enskilda Banken AB, 0.140%, 04/04/2022 | | | | | 524,720 | | | | | | 0.1 | | |
| Principal Amount† | | | Value | | | Percentage of Net Assets | | |||||||||
| SHORT-TERM INVESTMENTS: (continued) | | |||||||||||||||
| | | | Commercial Paper (continued) | | ||||||||||||
| 500,000 (3) | | | Societe Generale, 0.170%, 03/31/2022 | | | | $ | 499,825 | | | | | | 0.0 | | |
| 250,000 (3) | | | Starbird Funding Corp., 0.250%, 03/21/2022 | | | | | 249,871 | | | | | | 0.0 | | |
| 500,000 (3) | | | Sumitomo Mitsui Trust Bank Ltd., 0.140%, 01/13/2022 | | | | | 499,986 | | | | | | 0.0 | | |
| 275,000 (3) | | | Sumitomo Mitsui Trust Bank Ltd., 0.290%, 04/08/2022 | | | | | 274,833 | | | | | | 0.0 | | |
| 475,000 (3) | | | Swedbank AB, 0.150%, 03/23/2022 | | | | | 474,839 | | | | | | 0.0 | | |
| 500,000 (3) | | | Swedbank AB, 0.150%, 03/24/2022 | | | | | 499,826 | | | | | | 0.0 | | |
| 475,000 (3) | | | Thunder Bay Funding LLC, 0.130%, 03/18/2022 | | | | | 474,789 | | | | | | 0.0 | | |
| 475,000 (3) | | | Victory Receivables Corporation, 0.120%, 01/06/2022 | | | | | 474,994 | | | | | | 0.0 | | |
| 475,000 (3) | | | Westpac Banking Corp., 0.130%, 03/25/2022 | | | | | 474,820 | | | | | | 0.0 | | |
| | | | Total Commercial Paper (Cost $14,692,332) | | | | | 14,692,332 | | | | | | 0.2 | | |
| | | | Floating Rate Notes: 0.0% | | ||||||||||||
| 650,000 (3) | | | ANZ Bank, 0.130%, 03/30/2022 | | | | | 649,953 | | | | | | 0.0 | | |
| 450,000 (3) | | | Bank of Montreal, 0.120%, 01/05/2022 | | | | | 450,010 | | | | | | 0.0 | | |
| 250,000 (3) | | | Bank of Nova Scotia, 0.130%, 02/28/2022 | | | | | 250,025 | | | | | | 0.0 | | |
| 475,000 (3) | | | Barclays Bank PLC, 0.160%, 03/22/2022 | | | | | 474,988 | | | | | | 0.0 | | |
| 250,000 (3) | | | Barclays Bank PLC, 0.160%, 03/24/2022 | | | | | 249,993 | | | | | | 0.0 | | |
| 350,000 (3) | | | Canadian Imperial Bank of Commerce, 0.130%, 02/10/2022 | | | | | 350,025 | | | | | | 0.0 | | |
| 500,000 (3) | | | Credit Suisse AG, 0.170%, 04/08/2022 | | | | | 500,071 | | | | | | 0.0 | | |
| 475,000 (3) | | | DBS Bank Ltd., 0.140%, 03/16/2022 | | | | | 474,975 | | | | | | 0.0 | | |
| 300,000 (3) | | | Sumitomo Mitsui Trust Bank Ltd., 0.150%, 03/14/2022 | | | | | 300,004 | | | | | | 0.0 | | |
| Voya U.S. Stock Index Portfolio | as of December 31, 2021 (continued) |
| Principal Amount† | | | Value | | | Percentage of Net Assets | | |||||||||
| SHORT-TERM INVESTMENTS: (continued) | | |||||||||||||||
| | | | Floating Rate Notes (continued) | | ||||||||||||
| 400,000 (3) | | | Sumitomo Mitsui Trust Bank Ltd., 0.150%, 03/16/2022 | | | | $ | 400,004 | | | | | | 0.0 | | |
| 450,000 (3) | | | Sumitomo Mitsui Trust Bank Ltd., 0.150%, 03/22/2022 | | | | | 449,999 | | | | | | 0.0 | | |
| 475,000 (3) | | | Sumitomo Mitsui Trust Bank Ltd., 0.150%, 04/01/2022 | | | | | 474,988 | | | | | | 0.0 | | |
| | | | Total Floating Rate Notes (Cost $5,025,035) | | | | | 5,025,035 | | | | | | 0.0 | | |
| | | | Repurchase Agreements: 0.8% | | ||||||||||||
| 3,240,592 (3) | | | Bethesda Securities LLC, Repurchase Agreement dated 12/31/21, 0.09%, due 01/03/22 (Repurchase Amount $3,240,616, collateralized by various U.S. Government Agency Obligations, 2.000%-5.500%, Market Value plus accrued interest $3,305,404, due 01/01/25-12/01/51) | | | | | 3,240,592 | | | | | | 0.0 | | |
| 16,215,180 (3) | | | Cantor Fitzgerald Securities, Repurchase Agreement dated 12/31/21, 0.05%, due 01/03/22 (Repurchase Amount $16,215,247, collateralized by various U.S. Government/U.S. Government Agency Obligations, 0.000%-9.000%, Market Value plus accrued interest $16,539,484, due 02/01/22-07/20/71) | | | | | 16,215,180 | | | | | | 0.2 | | |
| 5,578,417 (3) | | | CF Secured LLC, Repurchase Agreement dated 12/31/21, 0.05%, due 01/03/22 (Repurchase Amount $5,578,440, collateralized by various U.S. Government/U.S. Government Agency Obligations, 0.000%-5.500%, Market Value plus accrued interest $5,689,986, due 01/20/22-06/20/69) | | | | | 5,578,417 | | | | | | 0.1 | | |
| Principal Amount† | | | Value | | | Percentage of Net Assets | | |||||||||
| SHORT-TERM INVESTMENTS: (continued) | | |||||||||||||||
| | | | Repurchase Agreements (continued) | | ||||||||||||
| 7,419,437 (3) | | | Citadel Securities LLC, Repurchase Agreement dated 12/31/21, 0.07%, due 01/03/22 (Repurchase Amount $7,419,480, collateralized by various U.S. Government Securities, 0.000%-7.250%, Market Value plus accrued interest $7,567,870, due 01/04/22-11/15/51) | | | | $ | 7,419,437 | | | | | | 0.1 | | |
| 10,306,168 (3) | | | Citigroup, Inc., Repurchase Agreement dated 12/31/21, 0.06%, due 01/03/22 (Repurchase Amount $10,306,219, collateralized by various U.S. Government/U.S. Government Agency Obligations, 0.000%-3.500%, Market Value plus accrued interest $10,512,292, due 02/15/22-12/20/51) | | | | | 10,306,168 | | | | | | 0.1 | | |
| 7,301,980 (3) | | | Mirae Asset Securities USA Inc., Repurchase Agreement dated 12/31/21, 0.06%, due 01/03/22 (Repurchase Amount $7,302,016, collateralized by various U.S. Government Agency Obligations, 0.550%-7.500%, Market Value plus accrued interest $7,448,057, due 01/01/23-10/20/71) | | | | | 7,301,980 | | | | | | 0.1 | | |
| 13,789,385 (3) | | | State of Wisconsin Investment Board, Repurchase Agreement dated 12/31/21, 0.07%, due 01/03/22 (Repurchase Amount $13,789,464, collateralized by various U.S. Government Securities, 0.125%-3.875%, Market Value plus accrued interest $14,065,245, due 07/15/23-02/15/48) | | | | | 13,789,385 | | | | | | 0.2 | | |
| Voya U.S. Stock Index Portfolio | as of December 31, 2021 (continued) |
| Principal Amount† | | | Value | | | Percentage of Net Assets | | |||||||||
| SHORT-TERM INVESTMENTS: (continued) | | |||||||||||||||
| | | | Repurchase Agreements (continued) | | ||||||||||||
| 3,293,696 (3) | | | Stonex Financial Inc., Repurchase Agreement dated 12/31/21, 0.09%, due 01/03/22 (Repurchase Amount $3,293,720, collateralized by various U.S. Government/U.S. Government Agency Obligations, 0.000%-9.000%, Market Value plus accrued interest $3,359,571, due 01/13/22-11/20/71) | | | | $ | 3,293,696 | | | | | | 0.0 | | |
| | | | Total Repurchase Agreements (Cost $67,144,855) | | | | | 67,144,855 | | | | | | 0.8 | | |
| | | | Certificates of Deposit: 0.1% | | ||||||||||||
| 475,000 (3) | | | Bank of Montreal, 0.220%, 03/21/2022 | | | | | 475,018 | | | | | | 0.0 | | |
| 400,000 (3) | | | Commonwealth Bank of Australia, 0.130%, 04/08/2022 | | | | | 399,931 | | | | | | 0.0 | | |
| 375,000 (3) | | | Credit Agricole, 0.230%, 03/09/2022 | | | | | 375,050 | | | | | | 0.0 | | |
| 475,000 (3) | | | Landesbank Baden-Wurttemberg, 0.160%, 03/21/2022 | | | | | 474,990 | | | | | | 0.0 | | |
| 500,000 (3) | | | Lloyds Bank PLC, 0.130%, 02/22/2022 | | | | | 500,087 | | | | | | 0.1 | | |
| 475,000 (3) | | | Mizuho Bank Ltd., 0.150%, 03/14/2022 | | | | | 474,965 | | | | | | 0.0 | | |
| 475,000 (3) | | | MUFG Bank LTD, 0.130%, 01/07/2022 | | | | | 475,016 | | | | | | 0.0 | | |
| 475,000 (3) | | | Norinchukin Bank of New York, 0.110%, 01/27/2022 | | | | | 475,002 | | | | | | 0.0 | | |
| 475,000 (3) | | | Norinchukin Bank of New York, 0.120%, 02/04/2022 | | | | | 475,002 | | | | | | 0.0 | | |
| 475,000 (3) | | | Oversea-Chinese Banking Corp. Ltd., 0.150%, 04/07/2022 | | | | | 474,866 | | | | | | 0.0 | | |
| 275,000 (3) | | | Oversea-Chinese Banking Corp. Ltd., 0.250%, 03/17/2022 | | | | | 275,038 | | | | | | 0.0 | | |
| 475,000 (3) | | | Oversea-Chinese Banking Corp. Ltd., 0.260%, 03/24/2022 | | | | | 475,047 | | | | | | 0.0 | | |
| 230,000 (3) | | | Svenska Handelsbanken AB, 0.110%, 02/10/2022 | | | | | 230,025 | | | | | | 0.0 | | |
| Principal Amount† | | | Value | | | Percentage of Net Assets | | |||||||||
| SHORT-TERM INVESTMENTS: (continued) | | |||||||||||||||
| | | | Certificates of Deposit (continued) | | ||||||||||||
| 350,000 (3) | | | Toronto-Dominion Bank, 0.150%, 03/03/2022 | | | | $ | 350,040 | | | | | | 0.0 | | |
| | | | Total Certificates of Deposit (Cost $5,930,077) | | | | | 5,930,077 | | | | | | 0.1 | | |
| | ||||||||||||||||
| Shares | | | Value | | | Percentage of Net Assets | | |||||||||
| | | | Mutual Funds: 2.1% | | ||||||||||||
| 182,532,000 (3)(4) | | | BlackRock Liquidity Funds, FedFund, Institutional Class, 0.030% | | | | $ | 182,532,000 | | | | | | 2.1 | | |
| 2,948,000 (3)(4) | | | Goldman Sachs Financial Square Government Fund - Institutional Shares, 0.020% | | | | | 2,948,000 | | | | | | 0.0 | | |
| 2,948,000 (3)(4) | | | Morgan Stanley Institutional Liquidity Funds - Government Portfolio (Institutional Share Class), 0.030% | | | | | 2,948,000 | | | | | | 0.0 | | |
| | | | Total Mutual Funds (Cost $188,428,000) | | | | | 188,428,000 | | | | | | 2.1 | | |
| | | | Total Short-Term Investments (Cost $281,220,299) | | | | | 281,220,299 | | | | | | 3.2 | | |
| | | | Total Investments in Securities (Cost $4,522,742,400) | | | | $ | 8,828,334,276 | | | | | | 101.2 | | |
| | | | Liabilities in Excess of Other Assets | | | | | (102,488,491) | | | | | | (1.2) | | |
| | | | Net Assets | | | | $ | 8,725,845,785 | | | | | | 100.0 | | |
| Voya U.S. Stock Index Portfolio | as of December 31, 2021 (continued) |
| | | | Quoted Prices in Active Markets for Identical Investments (Level 1) | | | Significant Other Observable Inputs (Level 2) | | | Significant Unobservable Inputs (Level 3) | | | Fair Value at December 31, 2021 | | ||||||||||||
| Asset Table | | | | | | | | | | | | | | | | | | | | | | | | | |
| Investments, at fair value | | | | | | | | | | | | | | | | | | | | | | | | | |
| Common Stock* | | | | $ | 8,547,113,977 | | | | | $ | — | | | | | $ | — | | | | | $ | 8,547,113,977 | | |
| Short-Term Investments | | | | | 188,428,000 | | | | | | 92,792,299 | | | | | | — | | | | | | 281,220,299 | | |
| Total Investments, at fair value | | | | $ | 8,735,541,977 | | | | | $ | 92,792,299 | | | | | $ | — | | | | | $ | 8,828,334,276 | | |
| Other Financial Instruments+ | | | | | | | | | | | | | | | | | | | | | | | | | |
| Futures | | | | | 2,766,626 | | | | | | — | | | | | | — | | | | | | 2,766,626 | | |
| Total Assets | | | | $ | 8,738,308,603 | | | | | $ | 92,792,299 | | | | | $ | — | | | | | $ | 8,831,100,902 | | |
| Description | | | Number of Contracts | | | Expiration Date | | | Notional Amount | | | Unrealized Appreciation/ (Depreciation) | | ||||||||||||
| Long Contracts: | | | | | | | | | | | | | | | | | | | | | | | | | |
| S&P 500®E-Mini | | | | | 814 | | | | | | 03/18/22 | | | | | $ | 193,670,950 | | | | | $ | 2,766,626 | | |
| | | | | | | | | | | | | | | | | $ | 193,670,950 | | | | | $ | 2,766,626 | | |
| Derivatives not accounted for as hedging instruments | | | Location on Statement of Assets and Liabilities | | | Fair Value | | |||
| Asset Derivatives | | | | | | | | | | |
| Equity contracts | | | Variation margin receivable on futures contracts* | | | | $ | 2,766,626 | | |
| Total Asset Derivatives | | | | | | | $ | 2,766,626 | | |
| | | | Amount of Realized Gain or (Loss) on Derivatives Recognized in Income | | |||
| Derivatives not accounted for as hedging instruments | | | Futures | | |||
| Equity contracts | | | | $ | 17,174,777 | | |
| Total | | | | $ | 17,174,777 | | |
| Voya U.S. Stock Index Portfolio | as of December 31, 2021 (continued) |
| | | | Change in Unrealized Appreciation or (Depreciation) on Derivatives Recognized in Income | | |||
| Derivatives not accounted for as hedging instruments | | | Futures | | |||
| Equity contracts | | | | $ | 1,576,476 | | |
| Total | | | | $ | 1,576,476 | | |
| | Cost for federal income tax purposes was $4,546,942,334. | | | |||||
| | Net unrealized appreciation consisted of: | | | |||||
| | Gross Unrealized Appreciation | | | | $ | 4,421,037,909 | | |
| | Gross Unrealized Depreciation | | | | | (136,879,342) | | |
| | Net Unrealized Appreciation | | | | $ | 4,284,158,567 | | |
| VY® Clarion Real Estate Portfolio | as of December 31, 2021 |
| Shares | | | Value | | | Percentage of Net Assets | | |||||||||
| COMMON STOCK: 101.2% | | |||||||||||||||
| | | | Diversified REITs: 0.7% | | ||||||||||||
| 81,808 | | | Alexander & Baldwin, Inc. | | | | $ | 2,052,563 | | | | | | 0.7 | | |
| | | | | | | | ||||||||||
| | | | Health Care REITs: 6.6% | | ||||||||||||
| 95,700 | | | Healthcare Realty Trust, Inc. | | | | | 3,027,948 | | | | | | 1.0 | | |
| 210,320 | | | Healthcare Trust of America, Inc. | | | | | 7,022,585 | | | | | | 2.2 | | |
| 120,078 | | | Ventas, Inc. | | | | | 6,138,387 | | | | | | 1.9 | | |
| 55,397 | | | Welltower, Inc. | | | | | 4,751,401 | | | | | | 1.5 | | |
| | | | | | | | | 20,940,321 | | | | | | 6.6 | | |
| | | | Hotel & Resort REITs: 5.2% | | ||||||||||||
| 236,500 (1) | | | DiamondRock Hospitality Co. | | | | | 2,272,765 | | | | | | 0.7 | | |
| 264,800 (1) | | | Park Hotels & Resorts, Inc. | | | | | 4,999,424 | | | | | | 1.6 | | |
| 393,100 (1) | | | Sunstone Hotel Investors, Inc. | | | | | 4,611,063 | | | | | | 1.5 | | |
| 254,000 (1) | | | Xenia Hotels & Resorts, Inc. | | | | | 4,599,940 | | | | | | 1.4 | | |
| | | | | | | | | 16,483,192 | | | | | | 5.2 | | |
| | | | Industrial REITs: 18.3% | | ||||||||||||
| 140,126 | | | Duke Realty Corp. | | | | | 9,197,871 | | | | | | 2.9 | | |
| 253,500 | | | LXP Industrial Trust | | | | | 3,959,670 | | | | | | 1.3 | | |
| 207,510 | | | ProLogis, Inc. | | | | | 34,936,383 | | | | | | 11.0 | | |
| 78,000 | | | Rexford Industrial Realty, Inc. | | | | | 6,326,580 | | | | | | 2.0 | | |
| 73,505 | | | STAG Industrial, Inc. | | | | | 3,525,300 | | | | | | 1.1 | | |
| | | | | | | | | 57,945,804 | | | | | | 18.3 | | |
| | | | Office REITs: 5.0% | | ||||||||||||
| 21,459 | | | Alexandria Real Estate Equities, Inc. | | | | | 4,784,499 | | | | | | 1.5 | | |
| 187,302 | | | Hudson Pacific Properties, Inc. | | | | | 4,628,232 | | | | | | 1.5 | | |
| 183,400 | | | Paramount Group, Inc. | | | | | 1,529,556 | | | | | | 0.5 | | |
| 257,939 | | | Piedmont Office Realty Trust, Inc. | | | | | 4,740,919 | | | | | | 1.5 | | |
| | | | | | | | | 15,683,206 | | | | | | 5.0 | | |
| | | | Residential REITs: 24.6% | | ||||||||||||
| 115,424 | | | American Campus Communities, Inc. | | | | | 6,612,641 | | | | | | 2.1 | | |
| 100,873 | | | Apartment Income REIT Corp. | | | | | 5,514,727 | | | | | | 1.7 | | |
| 43,584 | | | AvalonBay Communities, Inc. | | | | | 11,008,882 | | | | | | 3.5 | | |
| 69,748 | | | Camden Property Trust | | | | | 12,462,573 | | | | | | 3.9 | | |
| 36,945 | | | Essex Property Trust, Inc. | | | | | 13,013,137 | | | | | | 4.1 | | |
| 256,134 | | | Invitation Homes, Inc. | | | | | 11,613,116 | | | | | | 3.7 | | |
| 24,852 | | | NexPoint Residential Trust, Inc. | | | | | 2,083,343 | | | | | | 0.6 | | |
| Shares | | | Value | | | Percentage of Net Assets | | |||||||||
| COMMON STOCK: (continued) | | |||||||||||||||
| | | | Residential REITs (continued) | | ||||||||||||
| 74,806 | | | Sun Communities, Inc. | | | | $ | 15,707,016 | | | | | | 5.0 | | |
| | | | | | | | | 78,015,435 | | | | | | 24.6 | | |
| | | | Retail REITs: 16.6% | | ||||||||||||
| 58,600 | | | Getty Realty Corp. | | | | | 1,880,474 | | | | | | 0.6 | | |
| 89,700 | | | National Retail Properties, Inc. | | | | | 4,311,879 | | | | | | 1.4 | | |
| 165,681 | | | Realty Income Corp. | | | | | 11,861,103 | | | | | | 3.7 | | |
| 80,926 | | | Regency Centers Corp. | | | | | 6,097,774 | | | | | | 1.9 | | |
| 121,100 | | | Retail Opportunity Investments Corp. | | | | | 2,373,560 | | | | | | 0.7 | | |
| 143,979 | | | Simon Property Group, Inc. | | | | | 23,003,525 | | | | | | 7.3 | | |
| 65,913 | | | Spirit Realty Capital, Inc. | | | | | 3,176,347 | | | | | | 1.0 | | |
| | | | | | | | | 52,704,662 | | | | | | 16.6 | | |
| | | | Specialized REITs: 24.2% | | ||||||||||||
| 13,973 | | | American Tower Corp. | | | | | 4,087,102 | | | | | | 1.3 | | |
| 25,375 | | | Crown Castle International Corp. | | | | | 5,296,777 | | | | | | 1.7 | | |
| 269,701 | | | CubeSmart | | | | | 15,348,684 | | | | | | 4.8 | | |
| 68,300 | | | Digital Realty Trust, Inc. | | | | | 12,080,221 | | | | | | 3.8 | | |
| 11,409 | | | Equinix, Inc. | | | | | 9,650,189 | | | | | | 3.0 | | |
| 84,673 | | | Extra Space Storage, Inc. | | | | | 19,197,909 | | | | | | 6.1 | | |
| 123,900 | | | Four Corners Property Trust, Inc. | | | | | 3,643,899 | | | | | | 1.2 | | |
| 46,937 | | | Life Storage, Inc. | | | | | 7,189,810 | | | | | | 2.3 | | |
| | | | | | | | | 76,494,591 | | | | | | 24.2 | | |
| | | | Total Common Stock (Cost $241,212,552) | | | | | 320,319,774 | | | | | | 101.2 | | |
| SHORT-TERM INVESTMENTS: 0.6% | | |||||||||||||||
| | | | Mutual Funds: 0.6% | | ||||||||||||
| 2,052,330 (2) | | | BlackRock Liquidity Funds, FedFund, Institutional Class, 0.030% (Cost $2,052,330) | | | | | 2,052,330 | | | | �� | | 0.6 | | |
| | | | Total Short-Term Investments | | | | | | | | | | | | | |
| | | | (Cost $2,052,330) | | | | | 2,052,330 | | | | | | 0.6 | | |
| | | | Total Investments in Securities (Cost $243,264,882) | | | | $ | 322,372,104 | | | | | | 101.8 | | |
| | | | Liabilities in Excess of Other Assets | | | | | (5,757,884) | | | | | | (1.8) | | |
| | | | Net Assets | | | | $ | 316,614,220 | | | | | | 100.0 | | |
| | ||||||||||||||||
| VY® Clarion Real Estate Portfolio | as of December 31, 2021 (continued) |
| | | | Quoted Prices in Active Markets for Identical Investments (Level 1) | | | Significant Other Observable Inputs (Level 2) | | | Significant Unobservable Inputs (Level 3) | | | Fair Value at December 31, 2021 | | ||||||||||||
| Asset Table | | | | | | | | | | | | | | | | | | | | | | | | | |
| Investments, at fair value | | | | | | | | | | | | | | | | | | | | | | | | | |
| Common Stock* | | | | $ | 320,319,774 | | | | | $ | — | | | | | $ | — | | | | | $ | 320,319,774 | | |
| Short-Term Investments | | | | | 2,052,330 | | | | | | — | | | | | | — | | | | | | 2,052,330 | | |
| Total Investments, at fair value | | | | $ | 322,372,104 | | | | | $ | — | | | | | $ | — | | | | | $ | 322,372,104 | | |
| | Cost for federal income tax purposes was $248,872,046. | | | |||||
| | Net unrealized appreciation consisted of: | | | | | | | |
| | Gross Unrealized Appreciation | | | | $ | 80,734,523 | | |
| | Gross Unrealized Depreciation | | | | | (7,234,465) | | |
| | Net Unrealized Appreciation | | | | $ | 73,500,058 | | |
| VY® JPMorgan Small Cap | PORTFOLIO OF INVESTMENTS |
| Core Equity Portfolio | as of December 31, 2021 |
| Shares | | | Value | | | Percentage of Net Assets | | |||||||||
| COMMON STOCK: 96.6% | | |||||||||||||||
| | | | Communication Services: 2.1% | | ||||||||||||
| 44,800 (1)(2) | | | AMC Entertainment Holdings, Inc. | | | | $ | 1,218,560 | | | | | | 0.2 | | |
| 28,400 (2) | | | Cars.com, Inc. | | | | | 456,956 | | | | | | 0.1 | | |
| 29,300 (1)(2) | | | Cinemark Holdings, Inc. | | | | | 472,316 | | | | | | 0.1 | | |
| 49,500 (2) | | | EverQuote, Inc. | | | | | 775,170 | | | | | | 0.1 | | |
| 43,300 (2) | | | Fluent, Inc. | | | | | 86,167 | | | | | | 0.0 | | |
| 23,600 | | | Gray Television, Inc. | | | | | 475,776 | | | | | | 0.1 | | |
| 41,700 (2) | ��� | | IDT Corp. | | | | | 1,841,472 | | | | | | 0.3 | | |
| 69,800 (2) | | | Imax Corp. | | | | | 1,245,232 | | | | | | 0.2 | | |
| 30,433 (2) | | | Liberty Latin America Ltd. | | | | | 346,936 | | | | | | 0.0 | | |
| 33,800 (2) | | | Liberty Latin America Ltd. - Class A | | | | | 394,108 | | | | | | 0.1 | | |
| 569,300 (2) | | | Liberty TripAdvisor Holdings, Inc. | | | | | 1,235,381 | | | | | | 0.2 | | |
| 64,500 (2) | | | Lions Gate Entertainment Corp. - Class A | | | | | 1,073,280 | | | | | | 0.1 | | |
| 94,800 | | | National CineMedia, Inc. | | | | | 266,388 | | | | | | 0.0 | | |
| 19,100 (2) | | | Ooma, Inc. | | | | | 390,404 | | | | | | 0.0 | | |
| 17,900 | | | Sinclair Broadcast Group, Inc. | | | | | 473,097 | | | | | | 0.1 | | |
| 77,300 | | | TEGNA, Inc. | | | | | 1,434,688 | | | | | | 0.2 | | |
| 24,100 (2) | | | Yelp, Inc. | | | | | 873,384 | | | | | | 0.1 | | |
| 11,500 (2) | | | Ziff Davis, Inc. | | | | | 1,274,890 | | | | | | 0.2 | | |
| | | | | | | | | 14,334,205 | | | | | | 2.1 | | |
| | | | Consumer Discretionary: 9.8% | | ||||||||||||
| 5,150 | | | Aaron’s Co., Inc./The | | | | | 126,947 | | | | | | 0.0 | | |
| 59,352 | | | Acushnet Holdings Corp. | | | | | 3,150,404 | | | | | | 0.5 | | |
| 57,100 (2) | | | American Axle & Manufacturing Holdings, Inc. | | | | | 532,743 | | | | | | 0.1 | | |
| 19,500 | | | American Eagle Outfitters, Inc. | | | | | 493,740 | | | | | | 0.1 | | |
| 29,900 | | | Big Lots, Inc. | | | | | 1,346,995 | | | | | | 0.2 | | |
| 36,300 (2) | | | Bloomin Brands, Inc. | | | | | 761,574 | | | | | | 0.1 | | |
| 5,200 (2) | | | Boyd Gaming Corp. | | | | | 340,964 | | | | | | 0.0 | | |
| 27,570 (2) | | | Bright Horizons Family Solutions, Inc. | | | | | 3,470,512 | | | | | | 0.5 | | |
| 49,958 | | | Brunswick Corp. | | | | | 5,032,269 | | | | | | 0.7 | | |
| 24,788 | | | Carter’s, Inc. | | | | | 2,509,041 | | | | | | 0.4 | | |
| 22,489 (2) | | | Coursera, Inc. | | | | | 549,631 | | | | | | 0.1 | | |
| 3,300 (2) | | | CROCS, Inc. | | | | | 423,126 | | | | | | 0.1 | | |
| 7,450 (2) | | | Deckers Outdoor Corp. | | | | | 2,729,010 | | | | | | 0.4 | | |
| 2,600 (1) | | | Dillards, Inc. | | | | | 637,052 | | | | | | 0.1 | | |
| 6,900 | | | Dine Brands Global, Inc. | | | | | 523,089 | | | | | | 0.1 | | |
| 10,800 (2) | | | Genesco, Inc. | | | | | 693,036 | | | | | | 0.1 | | |
| 4,500 (2) | | | G-III Apparel Group Ltd. | | | | | 124,380 | | | | | | 0.0 | | |
| 43,749 (2) | | | Goodyear Tire & Rubber Co. | | | | | 932,729 | | | | | | 0.1 | | |
| Shares | | | Value | | | Percentage of Net Assets | | |||||||||
| COMMON STOCK: (continued) | | |||||||||||||||
| | | | Consumer Discretionary (continued) | | ||||||||||||
| 17,600 | | | Guess?, Inc. | | | | $ | 416,768 | | | | | | 0.1 | | |
| 135,820 (2) | | | Hayward Holdings, Inc. | | | | | 3,562,559 | | | | | | 0.5 | | |
| 2,300 (2) | | | Helen of Troy Ltd. | | | | | 562,281 | | | | | | 0.1 | | |
| 11,700 | | | Hibbett, Inc. | | | | | 841,581 | | | | | | 0.1 | | |
| 12,900 | | | Hooker Furnishings Corp. | | | | | 300,312 | | | | | | 0.0 | | |
| 11,200 | | | Kontoor Brands, Inc. | | | | | 574,000 | | | | | | 0.1 | | |
| 29,790 | | | LCI Industries | | | | | 4,643,367 | | | | | | 0.7 | | |
| 3,200 | | | Lear Corp. | | | | | 585,440 | | | | | | 0.1 | | |
| 103,791 (2) | | | Leslie’s, Inc. | | | | | 2,455,695 | | | | | | 0.4 | | |
| 33,700 | | | Lifetime Brands, Inc. | | | | | 538,189 | | | | | | 0.1 | | |
| 38,800 | | | Macy’s, Inc. | | | | | 1,015,784 | | | | | | 0.1 | | |
| 6,900 | | | Marriott Vacations Worldwide Corp. | | | | | 1,165,962 | | | | | | 0.2 | | |
| 19,943 (2) | | | Monarch Casino & Resort, Inc. | | | | | 1,474,785 | | | | | | 0.2 | | |
| 13,500 | | | Movado Group, Inc. | | | | | 564,705 | | | | | | 0.1 | | |
| 41,673 (2) | | | National Vision Holdings, Inc. | | | | | 1,999,887 | | | | | | 0.3 | | |
| 4,796 (2) | | | ODP Corp./The | | | | | 188,387 | | | | | | 0.0 | | |
| 3,500 (2) | | | Overstock.com, Inc. | | | | | 206,535 | | | | | | 0.0 | | |
| 7,300 | | | Patrick Industries, Inc. | | | | | 589,037 | | | | | | 0.1 | | |
| 6,392 (2) | | | Penn National Gaming, Inc. | | | | | 331,425 | | | | | | 0.0 | | |
| 37,752 (2) | | | Planet Fitness, Inc. | | | | | 3,419,576 | | | | | | 0.5 | | |
| 12,700 (1)(2) | | | PLBY Group, Inc. | | | | | 338,328 | | | | | | 0.0 | | |
| 17,309 (1)(2) | | | Portillo’s, Inc. | | | | | 649,780 | | | | | | 0.1 | | |
| 10,500 (2) | | | Purple Innovation, Inc. | | | | | 139,335 | | | | | | 0.0 | | |
| 2,700 | | | RCI Hospitality Holdings, Inc. | | | | | 210,276 | | | | | | 0.0 | | |
| 39,600 | | | Rent-A-Center, Inc. | | | | | 1,902,384 | | | | | | 0.3 | | |
| 1,350 (2) | | | RH | | | | | 723,519 | | | | | | 0.1 | | |
| 8,000 (2) | | | Scientific Games Corp. | | | | | 534,640 | | | | | | 0.1 | | |
| 9,500 | | | Shutterstock, Inc. | | | | | 1,053,360 | | | | | | 0.2 | | |
| 18,900 | | | Signet Jewelers Ltd. | | | | | 1,644,867 | | | | | | 0.2 | | |
| 22,800 (2) | | | Sonos, Inc. | | | | | 679,440 | | | | | | 0.1 | | |
| 4,900 (2) | | | Stitch Fix, Inc. | | | | | 92,708 | | | | | | 0.0 | | |
| 24,394 | | | Thor Industries, Inc. | | | | | 2,531,365 | | | | | | 0.4 | | |
| 12,822 (1)(2) | | | ThredUp, Inc. | | | | | 163,609 | | | | | | 0.0 | | |
| 7,784 (1)(2) | | | Traeger, Inc. | | | | | 94,653 | | | | | | 0.0 | | |
| 9,000 (2) | | | Tupperware Brands Corp. | | | | | 137,610 | | | | | | 0.0 | | |
| 10,500 (2) | | | Universal Electronics, Inc. | | | | | 427,875 | | | | | | 0.1 | | |
| 44,550 (1)(2) | | | Vizio Holding Corp. | | | | | 865,607 | | | | | | 0.1 | | |
| 153,094 | | | Wendy’s Company | | | | | 3,651,292 | | | | | | 0.5 | | |
| 10,200 (2) | | | WW International, Inc. | | | | | 164,526 | | | | | | 0.0 | | |
| 21,714 (1)(2) | | | Xometry, Inc. | | | | | 1,112,843 | | | | | | 0.2 | | |
| 13,500 (2) | | | Zumiez, Inc. | | | | | 647,865 | | | | | | 0.1 | | |
| | | | | | | | | 67,579,399 | | | | | | 9.8 | | |
| VY® JPMorgan Small Cap | PORTFOLIO OF INVESTMENTS |
| Core Equity Portfolio | as of December 31, 2021 (continued) |
| Shares | | | Value | | | Percentage of Net Assets | | |||||||||
| COMMON STOCK: (continued) | | |||||||||||||||
| | | | Consumer Staples: 4.2% | | ||||||||||||
| 8,800 | | | Andersons, Inc. | | | | $ | 340,648 | | | | | | 0.1 | | |
| 89,739 (2) | | | BJ’s Wholesale Club Holdings, Inc. | | | | | 6,009,821 | | | | | | 0.9 | | |
| 3,400 | | | Bunge Ltd. | | | | | 317,424 | | | | | | 0.1 | | |
| 17,793 | | | Casey’s General Stores, Inc. | | | | | 3,511,449 | | | | | | 0.5 | | |
| 20,300 (2) | | | Central Garden & Pet Co. - Class A - CENTA | | | | | 971,355 | | | | | | 0.1 | | |
| 700 | | | Coca-Cola Consolidated, Inc. | | | | | 433,433 | | | | | | 0.1 | | |
| 17,400 (2) | | | Darling Ingredients, Inc. | | | | | 1,205,646 | | | | | | 0.2 | | |
| 20,300 | | | Edgewell Personal Care Co. | | | | | 927,913 | | | | | | 0.1 | | |
| 25,400 (2) | | | elf Beauty, Inc. | | | | | 843,534 | | | | | | 0.1 | | |
| 2,400 | | | Medifast, Inc. | | | | | 502,632 | | | | | | 0.1 | | |
| 131,187 (2) | | | Performance Food Group Co. | | | | | 6,020,171 | | | | | | 0.9 | | |
| 211,000 | | | Primo Water Corp. | | | | | 3,719,930 | | | | | | 0.5 | | |
| 62,800 (2) | | | Rite Aid Corp. | | | | | 922,532 | | | | | | 0.1 | | |
| 5,000 | | | Sanderson Farms, Inc. | | | | | 955,400 | | | | | | 0.1 | | |
| 3,600 (2) | | | Seneca Foods Corp. | | | | | 172,620 | | | | | | 0.0 | | |
| 137,766 (1) | | | Utz Brands, Inc. | | | | | 2,197,368 | | | | | | 0.3 | | |
| | | | | | | | | 29,051,876 | | | | | | 4.2 | | |
| | | | Energy: 1.9% | | ||||||||||||
| 71,400 (2) | | | Antero Resources Corp. | | | | | 1,249,500 | | | | | | 0.2 | | |
| 7,400 (1) | | | Arch Resources, Inc. | | | | | 675,768 | | | | | | 0.1 | | |
| 48,400 | | | Berry Corp. | | | | | 407,528 | | | | | | 0.1 | | |
| 31,900 (2) | | | ChampionX Corp. | | | | | 644,699 | | | | | | 0.1 | | |
| 14,300 (2) | | | CNX Resources Corp. | | | | | 196,625 | | | | | | 0.0 | | |
| 12,600 | | | CVR Energy, Inc. | | | | | 211,806 | | | | | | 0.0 | | |
| 1,320 (2) | | | Delek US Holdings, Inc. | | | | | 19,787 | | | | | | 0.0 | | |
| 18,700 (2) | | | Green Plains, Inc. | | | | | 650,012 | | | | | | 0.1 | | |
| 49,600 | | | Magnolia Oil & Gas Corp. | | | | | 935,952 | | | | | | 0.1 | | |
| 13,900 | | | Matador Resources Co. | | | | | 513,188 | | | | | | 0.1 | | |
| 13,700 (2) | | | National Energy Services Reunited Corp. | | | | | 129,465 | | | | | | 0.0 | | |
| 86,200 (2) | | | NexTier Oilfield Solutions, Inc. | | | | | 306,010 | | | | | | 0.1 | | |
| 3,500 | | | Oasis Petroleum, Inc. | | | | | 440,965 | | | | | | 0.1 | | |
| 25,400 (2) | | | Oil States International, Inc. | | | | | 126,238 | | | | | | 0.0 | | |
| 102,000 | | | Ovintiv, Inc. | | | | | 3,437,400 | | | | | | 0.5 | | |
| 21,200 | | | Patterson-UTI Energy, Inc. | | | | | 179,140 | | | | | | 0.0 | | |
| 23,000 | | | PDC Energy, Inc. | | | | | 1,121,940 | | | | | | 0.2 | | |
| 9,300 (2) | | | ProPetro Holding Corp. | | | | | 75,330 | | | | | | 0.0 | | |
| 3,400 (2) | | | Renewable Energy Group, Inc. | | | | | 144,296 | | | | | | 0.0 | | |
| 1,100 (2) | | | REX American Resources Corp. | | | | | 105,600 | | | | | | 0.0 | | |
| Shares | | | Value | | | Percentage of Net Assets | | |||||||||
| COMMON STOCK: (continued) | | |||||||||||||||
| | | | Energy (continued) | | ||||||||||||
| 71,900 (2) | | | Select Energy Services, Inc. | | | | $ | 447,937 | | | | | | 0.1 | | |
| 19,500 | | | SFL Corp. Ltd. | | | | | 158,925 | | | | | | 0.0 | | |
| 30,800 | | | Solaris Oilfield Infrastructure, Inc. | | | | | 201,740 | | | | | | 0.0 | | |
| 138,900 (2) | | | Southwestern Energy Co. | | | | | 647,274 | | | | | | 0.1 | | |
| | | | | | | | | 13,027,125 | | | | | | 1.9 | | |
| | | | Financials: 16.9% | | ||||||||||||
| 14,600 | | | American Equity Investment Life Holding Co. | | | | | 568,232 | | | | | | 0.1 | | |
| 6,882 | | | Ameris Bancorp. | | | | | 341,898 | | | | | | 0.1 | | |
| 23,700 | | | Ares Commercial Real Estate Corp. | | | | | 344,598 | | | | | | 0.1 | | |
| 8,800 | | | Argo Group International Holdings Ltd. | | | | | 511,368 | | | | | | 0.1 | | |
| 66,083 (2) | | | AssetMark Financial Holdings, Inc. | | | | | 1,732,035 | | | | | | 0.3 | | |
| 10,400 | | | Associated Banc-Corp. | | | | | 234,936 | | | | | | 0.0 | | |
| 9,400 (2) | | | Axos Financial, Inc. | | | | | 525,554 | | | | | | 0.1 | | |
| 29,300 | | | Bank of NT Butterfield & Son Ltd. | | | | | 1,116,623 | | | | | | 0.2 | | |
| 82,056 | | | BankUnited, Inc. | | | | | 3,471,789 | | | | | | 0.5 | | |
| 4,300 | | | Bar Harbor Bankshares | | | | | 124,399 | | | | | | 0.0 | | |
| 23,500 | | | Blackstone Mortgage Trust, Inc. | | | | | 719,570 | | | | | | 0.1 | | |
| 27,900 (2) | | | Blucora, Inc. | | | | | 483,228 | | | | | | 0.1 | | |
| 21,637 (1) | | | Brightsphere Investment Group, Inc. | | | | | 553,907 | | | | | | 0.1 | | |
| 6,900 | | | BrightSpire Capital, Inc. | | | | | 70,794 | | | | | | 0.0 | | |
| 6,000 | | | Business First Bancshares, Inc. | | | | | 169,860 | | | | | | 0.0 | | |
| 2,400 | | | Capital Bancorp, Inc. | | | | | 62,880 | | | | | | 0.0 | | |
| 9,300 | | | Capstar Financial Holdings, Inc. | | | | | 195,579 | | | | | | 0.0 | | |
| 5,100 | | | Cathay General Bancorp. | | | | | 219,249 | | | | | | 0.0 | | |
| 1,900 | | | CIT Group, Inc. | | | | | 97,546 | | | | | | 0.0 | | |
| 18,100 | | | CNO Financial Group, Inc. | | | | | 431,504 | | | | | | 0.1 | | |
| 2,500 | | | Cohen & Steers, Inc. | | | | | 231,275 | | | | | | 0.0 | | |
| 42,823 | | | Commerce Bancshares, Inc. | | | | | 2,943,653 | | | | | | 0.4 | | |
| 1,047 | | | Community Trust Bancorp, Inc. | | | | | 45,660 | | | | | | 0.0 | | |
| 48,600 | | | ConnectOne Bancorp, Inc. | | | | | 1,589,706 | | | | | | 0.2 | | |
| 16,300 | | | Cowen, Inc. | | | | | 588,430 | | | | | | 0.1 | | |
| 23,470 | | | Cullen/Frost Bankers, Inc. | | | | | 2,958,863 | | | | | | 0.4 | | |
| 21,600 (2) | | | Customers Bancorp, Inc. | | | | | 1,411,992 | | | | | | 0.2 | | |
| 3,800 | | | Dime Community Bancshares, Inc. | | | | | 133,608 | | | | | | 0.0 | | |
| VY® JPMorgan Small Cap | PORTFOLIO OF INVESTMENTS |
| Core Equity Portfolio | as of December 31, 2021 (continued) |
| Shares | | | Value | | | Percentage of Net Assets | | |||||||||
| COMMON STOCK: (continued) | | |||||||||||||||
| | | | Financials (continued) | | ||||||||||||
| 23,900 (2) | | | Donnelley Financial Solutions, Inc. | | | | $ | 1,126,646 | | | | | | 0.2 | | |
| 8,400 (2) | | | eHealth, Inc. | | | | | 214,200 | | | | | | 0.0 | | |
| 34,100 | | | Ellington Financial, Inc. | | | | | 582,769 | | | | | | 0.1 | | |
| 7,400 (2) | | | Enova International, Inc. | | | | | 303,104 | | | | | | 0.1 | | |
| 3,792 | | | Enterprise Financial Services Corp. | | | | | 178,565 | | | | | | 0.0 | | |
| 26,900 | | | Essent Group Ltd. | | | | | 1,224,757 | | | | | | 0.2 | | |
| 28,500 (2) | | | Ezcorp, Inc. | | | | | 210,045 | | | | | | 0.0 | | |
| 3,500 | | | FB Financial Corp. | | | | | 153,370 | | | | | | 0.0 | | |
| 6,300 | | | Federated Hermes, Inc. | | | | | 236,754 | | | | | | 0.0 | | |
| 11,200 | | | Financial Institutions, Inc. | | | | | 356,160 | | | | | | 0.1 | | |
| 111,800 | | | First BanCorp. Puerto Rico | | | | | 1,540,604 | | | | | | 0.2 | | |
| 3,000 | | | First Bank/Hamilton NJ | | | | | 43,530 | | | | | | 0.0 | | |
| 9,700 | | | First Commonwealth Financial Corp. | | | | | 156,073 | | | | | | 0.0 | | |
| 2,300 | | | First Community Bancshares, Inc. | | | | | 76,866 | | | | | | 0.0 | | |
| 112,797 | | | First Financial Bancorp. | | | | | 2,749,991 | | | | | | 0.4 | | |
| 129,993 | | | First Hawaiian, Inc. | | | | | 3,552,709 | | | | | | 0.5 | | |
| 316,501 | | | First Horizon Corp. | | | | | 5,168,461 | | | | | | 0.8 | | |
| 3,400 | | | First Internet Bancorp | | | | | 159,936 | | | | | | 0.0 | | |
| 28,300 | | | Flagstar Bancorp, Inc. | | | | | 1,356,702 | | | | | | 0.2 | | |
| 46,700 | | | FNB Corp. | | | | | 566,471 | | | | | | 0.1 | | |
| 79,618 (2) | | | Focus Financial Partners, Inc. | | | | | 4,754,787 | | | | | | 0.7 | | |
| 2,300 | | | FS Bancorp, Inc. | | | | | 77,349 | | | | | | 0.0 | | |
| 3,900 | | | Great Southern Bancorp., Inc. | | | | | 231,075 | | | | | | 0.0 | | |
| 13,200 (2) | | | Green Dot Corp. | | | | | 478,368 | | | | | | 0.1 | | |
| 16,800 | | | Hancock Whitney Corp. | | | | | 840,336 | | | | | | 0.1 | | |
| 21,250 | | | Hanmi Financial Corp. | | | | | 503,200 | | | | | | 0.1 | | |
| 11,600 | | | Hannon Armstrong Sustainable Infrastructure Capital, Inc. | | | | | 616,192 | | | | | | 0.1 | | |
| 11,500 | | | HBT Financial, Inc. | | | | | 215,395 | | | | | | 0.0 | | |
| 12,400 | | | Hilltop Holdings, Inc. | | | | | 435,736 | | | | | | 0.1 | | |
| 5,900 | | | HomeStreet, Inc. | | | | | 306,800 | | | | | | 0.1 | | |
| 136,100 | | | Investors Bancorp, Inc. | | | | | 2,061,915 | | | | | | 0.3 | | |
| 20,300 | | | Kearny Financial Corp./MD | | | | | 268,975 | | | | | | 0.0 | | |
| 22,837 | | | Kinsale Capital Group, Inc. | | | | | 5,432,694 | | | | | | 0.8 | | |
| 26,000 | | | KKR Real Estate Finance Trust, Inc. | | | | | 541,580 | | | | | | 0.1 | | |
| 39,700 | | | Ladder Capital Corp. | | | | | 476,003 | | | | | | 0.1 | | |
| 68,316 | | | Lazard Ltd. | | | | | 2,980,627 | | | | | | 0.4 | | |
| 7,700 | | | Luther Burbank Corp. | | | | | 108,108 | | | | | | 0.0 | | |
| 800 | | | Merchants Bancorp/IN | | | | | 37,864 | | | | | | 0.0 | | |
| 6,100 | | | Meta Financial Group, Inc. | | | | | 363,926 | | | | | | 0.1 | | |
| Shares | | | Value | | | Percentage of Net Assets | | |||||||||
| COMMON STOCK: (continued) | | |||||||||||||||
| | | | Financials (continued) | | ||||||||||||
| 2,400 (2) | | | Metropolitan Bank Holding Corp. | | | | $ | 255,672 | | | | | | 0.0 | | |
| 83,600 | | | MFA Financial, Inc. | | | | | 381,216 | | | | | | 0.1 | | |
| 33,800 | | | MGIC Investment Corp. | | | | | 487,396 | | | | | | 0.1 | | |
| 2,000 | | | Mid Penn Bancorp, Inc. | | | | | 63,480 | | | | | | 0.0 | | |
| 45,274 | | | Moelis & Co. | | | | | 2,830,078 | | | | | | 0.4 | | |
| 9,763 | | | Morningstar, Inc. | | | | | 3,338,848 | | | | | | 0.5 | | |
| 22,800 (2) | | | Mr Cooper Group, Inc. | | | | | 948,708 | | | | | | 0.1 | | |
| 800 | | | MVB Financial Corp. | | | | | 33,216 | | | | | | 0.0 | | |
| 57,900 | | | Navient Corp. | | | | | 1,228,638 | | | | | | 0.2 | | |
| 7,700 | | | Nelnet, Inc. | | | | | 752,136 | | | | | | 0.1 | | |
| 22,800 (2) | | | NMI Holdings, Inc. | | | | | 498,180 | | | | | | 0.1 | | |
| 51,900 | | | OceanFirst Financial Corp. | | | | | 1,152,180 | | | | | | 0.2 | | |
| 19,400 | | | Old National Bancorp. | | | | | 351,528 | | | | | | 0.1 | | |
| 11,200 (2) | | | Oportun Financial Corp. | | | | | 226,800 | | | | | | 0.0 | | |
| 2,500 | | | Origin Bancorp, Inc. | | | | | 107,300 | | | | | | 0.0 | | |
| 15,525 | | | PacWest Bancorp | | | | | 701,264 | | | | | | 0.1 | | |
| 4,600 | | | Peapack-Gladstone Financial Corp. | | | | | 162,840 | | | | | | 0.0 | | |
| 3,400 | | | Peoples Bancorp., Inc. | | | | | 108,154 | | | | | | 0.0 | | |
| 3,300 | | | Piper Sandler Cos | | | | | 589,083 | | | | | | 0.1 | | |
| 19,100 | | | Popular, Inc. | | | | | 1,566,964 | | | | | | 0.2 | | |
| 21,800 | | | PROG Holdings, Inc. | | | | | 983,398 | | | | | | 0.1 | | |
| 16,100 | | | Provident Bancorp, Inc. | | | | | 299,460 | | | | | | 0.1 | | |
| 49,300 | | | Provident Financial Services, Inc. | | | | | 1,194,046 | | | | | | 0.2 | | |
| 2,000 | | | QCR Holdings, Inc. | | | | | 112,000 | | | | | | 0.0 | | |
| 43,600 | | | Radian Group, Inc. | | | | | 921,268 | | | | | | 0.1 | | |
| 3,300 | | | RBB Bancorp | | | | | 86,460 | | | | | | 0.0 | | |
| 17,200 | | | Ready Capital Corp. | | | | | 268,836 | | | | | | 0.0 | | |
| 59,900 | | | Redwood Trust, Inc. | | | | | 790,081 | | | | | | 0.1 | | |
| 1,300 | | | Republic Bancorp., Inc. | | | | | 66,092 | | | | | | 0.0 | | |
| 39,149 | | | RLI Corp. | | | | | 4,388,603 | | | | | | 0.6 | | |
| 6,500 | | | Selective Insurance Group | | | | | 532,610 | | | | | | 0.1 | | |
| 2,000 | | | Sierra Bancorp. | | | | | 54,300 | | | | | | 0.0 | | |
| 14,932 | | | Signature Bank | | | | | 4,830,054 | | | | | | 0.7 | | |
| 7,200 | | | SmartFinancial, Inc. | | | | | 196,992 | | | | | | 0.0 | | |
| 79,781 | | | StepStone Group, Inc. | | | | | 3,316,496 | | | | | | 0.5 | | |
| 16,000 | | | Sterling Bancorp | | | | | 412,640 | | | | | | 0.1 | | |
| 18,100 | | | Stewart Information Services Corp. | | | | | 1,443,113 | | | | | | 0.2 | | |
| 11,750 | | | Stifel Financial Corp. | | | | | 827,435 | | | | | | 0.1 | | |
| 14,300 | | | Synovus Financial Corp. | | | | | 684,541 | | | | | | 0.1 | | |
| 33,000 | | | TPG RE Finance Trust, Inc. | | | | | 406,560 | | | | | | 0.1 | | |
| 49,300 | | | Umpqua Holdings Corp. | | | | | 948,532 | | | | | | 0.1 | | |
| 11,000 | | | United Community Banks, Inc./GA | | | | | 395,340 | | | | | | 0.1 | | |
| VY® JPMorgan Small Cap | PORTFOLIO OF INVESTMENTS |
| Core Equity Portfolio | as of December 31, 2021 (continued) |
| Shares | | | Value | | | Percentage of Net Assets | | |||||||||
| COMMON STOCK: (continued) | | |||||||||||||||
| | | | Financials (continued) | | ||||||||||||
| 45,500 | | | Valley National Bancorp | | | | $ | 625,625 | | | | | | 0.1 | | |
| 14,200 | | | Veritex Holdings, Inc. | | | | | 564,876 | | | | | | 0.1 | | |
| 2,925 | | | Virtus Investment Partners, Inc. | | | | | 869,018 | | | | | | 0.1 | | |
| 12,400 | | | Walker & Dunlop, Inc. | | | | | 1,870,912 | | | | | | 0.3 | | |
| 42,482 | | | Western Alliance Bancorp. | | | | | 4,573,187 | | | | | | 0.7 | | |
| 45,736 | | | Wintrust Financial Corp. | | | | | 4,153,744 | | | | | | 0.6 | | |
| 25,900 | | | Zions Bancorp NA | | | | | 1,635,844 | | | | | | 0.2 | | |
| | | | | | | | | 115,803,123 | | | | | | 16.9 | | |
| | | | Health Care: 15.4% | | ||||||||||||
| 406 (1)(2) | | | 2seventy bio, Inc. | | | | | 10,406 | | | | | | 0.0 | | |
| 88,600 (2) | | | AdaptHealth Corp. | | | | | 2,167,156 | | | | | | 0.3 | | |
| 5,900 (2) | | | Adaptive Biotechnologies Corp. | | | | | 165,554 | | | | | | 0.0 | | |
| 121,551 (2) | | | Agiliti, Inc. | | | | | 2,815,121 | | | | | | 0.4 | | |
| 233,000 (2) | | | Akebia Therapeutics, Inc. | | | | | 526,580 | | | | | | 0.1 | | |
| 16,800 (2) | | | Alector, Inc. | | | | | 346,920 | | | | | | 0.1 | | |
| 16,400 (2) | | | Allogene Therapeutics, Inc. | | | | | 244,688 | | | | | | 0.0 | | |
| 47,800 (2) | | | Allscripts Healthcare Solutions, Inc. | | | | | 881,910 | | | | | | 0.1 | | |
| 22,800 (2) | | | Alphatec Holdings, Inc. | | | | | 260,604 | | | | | | 0.0 | | |
| 156,600 (2) | | | Amicus Therapeutics, Inc. | | | | | 1,808,730 | | | | | | 0.3 | | |
| 10,600 (2) | | | AMN Healthcare Services, Inc. | | | | | 1,296,698 | | | | | | 0.2 | | |
| 44,200 (2) | | | AnaptysBio, Inc. | | | | | 1,535,950 | | | | | | 0.2 | | |
| 27,000 (2) | | | Angion Biomedica Corp. | | | | | 78,300 | | | | | | 0.0 | | |
| 17,400 (2) | | | Apyx Medical Corp. | | | | | 223,068 | | | | | | 0.0 | | |
| 7,100 (2) | | | Arena Pharmaceuticals, Inc. | | | | | 659,874 | | | | | | 0.1 | | |
| 17,800 (2) | | | Arrowhead Pharmaceuticals, Inc. | | | | | 1,180,140 | | | | | | 0.2 | | |
| 700 (2) | | | Arvinas, Inc. | | | | | 57,498 | | | | | | 0.0 | | |
| 3,200 (2) | | | Atara Biotherapeutics, Inc. | | | | | 50,432 | | | | | | 0.0 | | |
| 30,500 (1)(2) | | | Axsome Therapeutics, Inc. | | | | | 1,152,290 | | | | | | 0.2 | | |
| 10,500 (2) | | | Berkeley Lights, Inc. | | | | | 190,890 | | | | | | 0.0 | | |
| 1,220 (1)(2) | | | Bluebird Bio, Inc. | | | | | 12,188 | | | | | | 0.0 | | |
| 7,300 (2) | | | Blueprint Medicines Corp. | | | | | 781,903 | | | | | | 0.1 | | |
| 10,418 (1)(2) | | | Bolt Biotherapeutics, Inc. | | | | | 51,048 | | | | | | 0.0 | | |
| 9,000 (1)(2) | | | Bridgebio Pharma, Inc. | | | | | 150,120 | | | | | | 0.0 | | |
| 9,600 (2) | | | Cara Therapeutics, Inc. | | | | | 116,928 | | | | | | 0.0 | | |
| 21,800 (2) | | | Cardiovascular Systems, Inc. | | | | | 409,404 | | | | | | 0.1 | | |
| 5,000 (2) | | | CareDx, Inc. | | | | | 227,400 | | | | | | 0.0 | | |
| 71,800 (2) | | | Catalyst Pharmaceuticals, Inc. | | | | | 486,086 | | | | | | 0.1 | | |
| 86,809 (2) | | | Certara, Inc. | | | | | 2,467,112 | | | | | | 0.4 | | |
| 7,954 | | | Chemed Corp. | | | | | 4,207,984 | | | | | | 0.6 | | |
| 21,860 (2) | | | Chinook Therapeutics, Inc. | | | | | 356,536 | | | | | | 0.1 | | |
| 22,200 (2) | | | Coherus Biosciences, Inc. | | | | | 354,312 | | | | | | 0.1 | | |
| Shares | | | Value | | | Percentage of Net Assets | | |||||||||
| COMMON STOCK: (continued) | | |||||||||||||||
| | | | Health Care (continued) | | ||||||||||||
| 133,037 (2) | | | Covetrus, Inc. | | | | $ | 2,656,749 | | | | | | 0.4 | | |
| 17,800 (2) | | | Cross Country Healthcare, Inc. | | | | | 494,128 | | | | | | 0.1 | | |
| 30,200 (2) | | | Cutera, Inc. | | | | | 1,247,864 | | | | | | 0.2 | | |
| 30,926 (2) | | | Decibel Therapeutics, Inc. | | | | | 143,806 | | | | | | 0.0 | | |
| 39,510 (1)(2) | | | Definitive Healthcare Corp. | | | | | 1,079,808 | | | | | | 0.2 | | |
| 535,900 (2) | | | Durect Corp. | | | | | 528,344 | | | | | | 0.1 | | |
| 40,700 (2) | | | Eliem Therapeutics, Inc. | | | | | 425,722 | | | | | | 0.1 | | |
| 67,965 | | | Encompass Health Corp. | | | | | 4,435,396 | | | | | | 0.6 | | |
| 83,312 (2) | | | Envista Holdings Corp. | | | | | 3,754,039 | | | | | | 0.5 | | |
| 42,800 (2) | | | Fate Therapeutics, Inc. | | | | | 2,504,228 | | | | | | 0.4 | | |
| 74,800 (1)(2) | | | Frequency Therapeutics, Inc. | | | | | 383,724 | | | | | | 0.1 | | |
| 4,600 (1)(2) | | | Gritstone bio, Inc. | | | | | 59,156 | | | | | | 0.0 | | |
| 15,800 (2) | | | Hanger, Inc. | | | | | 286,454 | | | | | | 0.0 | | |
| 61,390 (2) | | | HealthEquity, Inc. | | | | | 2,715,893 | | | | | | 0.4 | | |
| 4,500 (2) | | | Heska Corp. | | | | | 821,205 | | | | | | 0.1 | | |
| 21,851 (2) | | | ICU Medical, Inc. | | | | | 5,186,116 | | | | | | 0.8 | | |
| 30,500 (2) | | | Inogen, Inc. | | | | | 1,037,000 | | | | | | 0.2 | | |
| 61,800 (2) | | | Inozyme Pharma, Inc. | | | | | 421,476 | | | | | | 0.1 | | |
| 3,100 (2) | | | Inspire Medical Systems, Inc. | | | | | 713,186 | | | | | | 0.1 | | |
| 14,500 (2) | | | Intellia Therapeutics, Inc. | | | | | 1,714,480 | | | | | | 0.3 | | |
| 7,400 (2) | | | Intersect ENT, Inc. | | | | | 202,094 | | | | | | 0.0 | | |
| 18,000 (2) | | | Invitae Corp. | | | | | 274,860 | | | | | | 0.0 | | |
| 18,400 (2) | | | iRhythm Technologies, Inc. | | | | | 2,165,496 | | | | | | 0.3 | | |
| 13,500 (2) | | | Jounce Therapeutics, Inc. | | | | | 112,725 | | | | | | 0.0 | | |
| 23,500 (1)(2) | | | Kronos Bio, Inc. | | | | | 319,365 | | | | | | 0.0 | | |
| 2,300 (2) | | | Kura Oncology, Inc. | | | | | 32,200 | | | | | | 0.0 | | |
| 22,300 (2) | | | Kymera Therapeutics, Inc. | | | | | 1,415,827 | | | | | | 0.2 | | |
| 36,027 (2) | | | Landos Biopharma, Inc. | | | | | 172,930 | | | | | | 0.0 | | |
| 165,300 (2) | | | Lannett Co., Inc. | | | | | 267,786 | | | | | | 0.0 | | |
| 7,600 (2) | | | Lantheus Holdings, Inc. | | | | | 219,564 | | | | | | 0.0 | | |
| 1,700 (2) | | | LHC Group, Inc. | | | | | 233,291 | | | | | | 0.0 | | |
| 6,900 (2) | | | Mednax, Inc. | | | | | 187,749 | | | | | | 0.0 | | |
| 11,600 (2) | | | MeiraGTx Holdings plc | | | | | 275,384 | | | | | | 0.0 | | |
| 7,100 (2) | | | ModivCare, Inc. | | | | | 1,052,859 | | | | | | 0.2 | | |
| 44,267 (1)(2) | | | Molecular Templates, Inc. | | | | | 173,527 | | | | | | 0.0 | | |
| 113,300 (2) | | | Mustang Bio, Inc. | | | | | 188,078 | | | | | | 0.0 | | |
| 41,700 (2) | | | Myriad Genetics, Inc. | | | | | 1,150,920 | | | | | | 0.2 | | |
| 8,100 (2) | | | Natera, Inc. | | | | | 756,459 | | | | | | 0.1 | | |
| 5,300 | | | National Healthcare Corp. | | | | | 360,082 | | | | | | 0.1 | | |
| 13,400 (2) | | | Natus Medical, Inc. | | | | | 317,982 | | | | | | 0.0 | | |
| 28,397 (2) | | | Neogen Corp. | | | | | 1,289,508 | | | | | | 0.2 | | |
| 39,800 (2) | | | NextGen Healthcare, Inc. | | | | | 708,042 | | | | | | 0.1 | | |
| 22,700 (2) | | | NGM Biopharmaceuticals, Inc. | | | | | 402,017 | | | | | | 0.1 | | |
| 38,200 (2) | | | NuVasive, Inc. | | | | | 2,004,736 | | | | | | 0.3 | | |
| VY® JPMorgan Small Cap | PORTFOLIO OF INVESTMENTS |
| Core Equity Portfolio | as of December 31, 2021 (continued) |
| Shares | | | Value | | | Percentage of Net Assets | | |||||||||
| COMMON STOCK: (continued) | | |||||||||||||||
| | | | Health Care (continued) | | ||||||||||||
| 2,400 (2) | | | Omnicell, Inc. | | | | $ | 433,056 | | | | | | 0.1 | | |
| 49,900 (2) | | | Option Care Health, Inc. | | | | | 1,419,156 | | | | | | 0.2 | | |
| 172,428 (2) | | | Ortho Clinical Diagnostics Holdings PLC | | | | | 3,688,235 | | | | | | 0.5 | | |
| 27,700 (2) | | | Orthofix Medical, Inc. | | | | | 861,193 | | | | | | 0.1 | | |
| 5,700 (2) | | | Outset Medical, Inc. | | | | | 262,713 | | | | | | 0.0 | | |
| 20,600 | | | Owens & Minor, Inc. | | | | | 896,100 | | | | | | 0.1 | | |
| 6,600 (2) | | | Pacific Biosciences of California, Inc. | | | | | 135,036 | | | | | | 0.0 | | |
| 45,900 (2) | | | Personalis, Inc. | | | | | 654,993 | | | | | | 0.1 | | |
| 6,000 | | | Phibro Animal Health Corp. | | | | | 122,520 | | | | | | 0.0 | | |
| 45,600 (2) | | | PMV Pharmaceuticals, Inc. | | | | | 1,053,360 | | | | | | 0.2 | | |
| 47,648 (2) | | | Progyny, Inc. | | | | | 2,399,077 | | | | | | 0.4 | | |
| 12,900 (2) | | | PTC Therapeutics, Inc. | | | | | 513,807 | | | | | �� | 0.1 | | |
| 10,400 (2) | | | Quanterix Corp. | | | | | 440,960 | | | | | | 0.1 | | |
| 1,800 (2) | | | Radius Health, Inc. | | | | | 12,456 | | | | | | 0.0 | | |
| 30,184 (2) | | | Rapid Micro Biosystems, Inc. | | | | | 321,158 | | | | | | 0.0 | | |
| 33,100 (2) | | | Relay Therapeutics, Inc. | | | | | 1,016,501 | | | | | | 0.2 | | |
| 77,500 (2) | | | Revance Therapeutics, Inc. | | | | | 1,264,800 | | | | | | 0.2 | | |
| 25,200 (1)(2) | | | REVOLUTION Medicines, Inc. | | | | | 634,284 | | | | | | 0.1 | | |
| 7,300 (2) | | | Sage Therapeutics, Inc. | | | | | 310,542 | | | | | | 0.0 | | |
| 17,300 (2) | | | Sarepta Therapeutics, Inc. | | | | | 1,557,865 | | | | | | 0.2 | | |
| 17,600 (2) | | | Schrodinger, Inc./United States | | | | | 613,008 | | | | | | 0.1 | | |
| 11,408 (1)(2) | | | Seer, Inc. | | | | | 260,216 | | | | | | 0.0 | | |
| 41,700 | | | Select Medical Holdings Corp. | | | | | 1,225,980 | | | | | | 0.2 | | |
| 81,800 (1)(2) | | | Sera Prognostics, Inc. | | | | | 561,966 | | | | | | 0.1 | | |
| 21,600 (2) | | | SI-BONE, Inc. | | | | | 479,736 | | | | | | 0.1 | | |
| 22,400 (1)(2) | | | Spruce Biosciences, Inc. | | | | | 99,904 | | | | | | 0.0 | | |
| 3,900 (2) | | | Sutro Biopharma, Inc. | | | | | 58,032 | | | | | | 0.0 | | |
| 50,330 (2) | | | Syneos Health, Inc. | | | | | 5,167,884 | | | | | | 0.8 | | |
| 8,000 (2) | | | TCR2 Therapeutics, Inc. | | | | | 37,280 | | | | | | 0.0 | | |
| 33,100 (2) | | | Tenet Healthcare Corp. | | | | | 2,703,939 | | | | | | 0.4 | | |
| 4,200 (2) | | | Tivity Health, Inc. | | | | | 111,048 | | | | | | 0.0 | | |
| 49,800 (2) | | | Travere Therapeutics, Inc. | | | | | 1,545,792 | | | | | | 0.2 | | |
| 9,700 (2) | | | Turning Point Therapeutics, Inc. | | | | | 462,690 | | | | | | 0.1 | | |
| 11,200 (1)(2) | | | Vericel Corp. | | | | | 440,160 | | | | | | 0.1 | | |
| 22,500 (2) | | | Vir Biotechnology, Inc. | | | | | 942,075 | | | | | | 0.1 | | |
| 60,900 (2) | | | Xencor, Inc. | | | | | 2,443,308 | | | | | | 0.4 | | |
| 1,400 (2) | | | Y-mAbs Therapeutics, Inc. | | | | | 22,694 | | | | | | 0.0 | | |
| 14,000 (2) | | | Zogenix, Inc. | | | | | 227,500 | | | | | | 0.0 | | |
| | | | | | | | | 105,567,109 | | | | | | 15.4 | | |
| | | | Industrials: 20.5% | | ||||||||||||
| 5,500 (2) | | | AAR Corp. | | | | | 214,665 | | | | | | 0.0 | | |
| Shares | | | Value | | | Percentage of Net Assets | | |||||||||
| COMMON STOCK: (continued) | | |||||||||||||||
| | | | Industrials (continued) | | ||||||||||||
| 55,400 | | | ABM Industries, Inc. | | | | $ | 2,263,090 | | | | | | 0.3 | | |
| 42,250 | | | ACCO Brands Corp. | | | | | 348,985 | | | | | | 0.1 | | |
| 1,500 | | | Advanced Drainage Systems, Inc. | | | | | 204,195 | | | | | | 0.0 | | |
| 51,108 (2) | | | Alaska Air Group, Inc. | | | | | 2,662,727 | | | | | | 0.4 | | |
| 3,800 (2) | | | Allegiant Travel Co. | | | | | 710,752 | | | | | | 0.1 | | |
| 57,019 | | | Altra Industrial Motion Corp. | | | | | 2,940,470 | | | | | | 0.4 | | |
| 6,500 | | | Apogee Enterprises, Inc. | | | | | 312,975 | | | | | | 0.0 | | |
| 37,502 | | | Applied Industrial Technologies, Inc. | | | | | 3,851,455 | | | | | | 0.6 | | |
| 22,700 | | | ArcBest Corp. | | | | | 2,720,595 | | | | | | 0.4 | | |
| 34,500 | | | Argan, Inc. | | | | | 1,334,805 | | | | | | 0.2 | | |
| 16,200 (2) | | | Atkore, Inc. | | | | | 1,801,278 | | | | | | 0.3 | | |
| 7,200 (2) | | | Atlas Air Worldwide Holdings, Inc. | | | | | 677,664 | | | | | | 0.1 | | |
| 12,100 | | | AZZ, Inc. | | | | | 669,009 | | | | | | 0.1 | | |
| 16,100 | | | Barrett Business Services, Inc. | | | | | 1,111,866 | | | | | | 0.2 | | |
| 19,500 (2) | | | Beacon Roofing Supply, Inc. | | | | | 1,118,325 | | | | | | 0.2 | | |
| 22,450 (2) | | | Bloom Energy Corp. | | | | | 492,329 | | | | | | 0.1 | | |
| 5,900 | | | Boise Cascade Co. | | | | | 420,080 | | | | | | 0.1 | | |
| 59,308 | | | Brady Corp. | | | | | 3,196,701 | | | | | | 0.5 | | |
| 5,900 | | | Brink’s Co. | | | | | 386,863 | | | | | | 0.1 | | |
| 43,818 (2) | | | Builders FirstSource, Inc. | | | | | 3,755,641 | | | | | | 0.5 | | |
| 54,165 (2) | | | Casella Waste Systems, Inc. | | | | | 4,626,774 | | | | | | 0.7 | | |
| 11,800 | | | Columbus McKinnon Corp. | | | | | 545,868 | | | | | | 0.1 | | |
| 15,500 | | | Comfort Systems USA, Inc. | | | | | 1,533,570 | | | | | | 0.2 | | |
| 26,200 (2) | | | Cornerstone Building Brands, Inc. | | | | | 456,928 | | | | | | 0.1 | | |
| 36,900 | | | Costamare, Inc. | | | | | 466,785 | | | | | | 0.1 | | |
| 37,542 | | | Douglas Dynamics, Inc. | | | | | 1,466,391 | | | | | | 0.2 | | |
| 88,223 (2) | | | Driven Brands Holdings, Inc. | | | | | 2,966,057 | | | | | | 0.4 | | |
| 5,300 (2) | | | Ducommun, Inc. | | | | | 247,881 | | | | | | 0.0 | | |
| 13,400 | | | EMCOR Group, Inc. | | | | | 1,707,026 | | | | | | 0.3 | | |
| 110,327 (2) | | | First Advantage Corp. | | | | | 2,100,626 | | | | | | 0.3 | | |
| 38,455 (2) | | | Fluence Energy, Inc. | | | | | 1,367,460 | | | | | | 0.2 | | |
| 3,400 | | | Forward Air Corp. | | | | | 411,706 | | | | | | 0.1 | | |
| 124,927 (2) | | | Gates Industrial Corp. PLC | | | | | 1,987,589 | | | | | | 0.3 | | |
| 25,700 (2) | | | GMS, Inc. | | | | | 1,544,827 | | | | | | 0.2 | | |
| 48,500 (2) | | | Great Lakes Dredge & Dock Corp. | | | | | 762,420 | | | | | | 0.1 | | |
| 14,300 | | | Heidrick & Struggles International, Inc. | | | | | 625,339 | | | | | | 0.1 | | |
| 20,500 | | | Herc Holdings, Inc. | | | | | 3,209,275 | | | | | | 0.5 | | |
| VY® JPMorgan Small Cap | PORTFOLIO OF INVESTMENTS |
| Core Equity Portfolio | as of December 31, 2021 (continued) |
| Shares | | | Value | | | Percentage of Net Assets | | |||||||||
| COMMON STOCK: (continued) | | |||||||||||||||
| | | | Industrials (continued) | | ||||||||||||
| 26,992 | | | MillerKnoll, Inc. | | | | $ | 1,057,816 | | | | | | 0.2 | | |
| 196,056 (1)(2) | | | Hillman Solutions Corp. | | | | | 2,107,602 | | | | | | 0.3 | | |
| 46,480 (2) | | | HireRight Holdings Corp. | | | | | 743,680 | | | | | | 0.1 | | |
| 9,400 | | | HNI Corp. | | | | | 395,270 | | | | | | 0.1 | | |
| 20,200 (2) | | | HUB Group, Inc. | | | | | 1,701,648 | | | | | | 0.2 | | |
| 79,006 (2) | | | IAA, Inc. | | | | | 3,999,284 | | | | | | 0.6 | | |
| 9,800 (2) | | | KAR Auction Services, Inc. | | | | | 153,076 | | | | | | 0.0 | | |
| 40,800 | | | KBR, Inc. | | | | | 1,942,896 | | | | | | 0.3 | | |
| 6,900 | | | Kelly Services, Inc. | | | | | 115,713 | | | | | | 0.0 | | |
| 10,200 | | | Kforce, Inc. | | | | | 767,244 | | | | | | 0.1 | | |
| 62,845 | | | Knight-Swift Transportation Holdings, Inc. | | | | | 3,829,774 | | | | | | 0.6 | | |
| 28,500 | | | Korn Ferry | | | | | 2,158,305 | | | | | | 0.3 | | |
| 20,303 | | | Landstar System, Inc. | | | | | 3,634,643 | | | | | | 0.5 | | |
| 38,108 | | | Lincoln Electric Holdings, Inc. | | | | | 5,314,923 | | | | | | 0.8 | | |
| 21,500 (2) | | | Manitowoc Co., Inc./The | | | | | 399,685 | | | | | | 0.1 | | |
| 2,700 (2) | | | Masonite International Corp. | | | | | 318,465 | | | | | | 0.0 | | |
| 17,700 (2) | | | Mastec, Inc. | | | | | 1,633,356 | | | | | | 0.2 | | |
| 16,600 (2) | | | Meritor, Inc. | | | | | 411,348 | | | | | | 0.1 | | |
| 2,300 | | | Moog, Inc. | | | | | 186,231 | | | | | | 0.0 | | |
| 10,500 (2) | | | MRC Global, Inc. | | | | | 72,240 | | | | | | 0.0 | | |
| 31,678 | | | MSA Safety, Inc. | | | | | 4,782,111 | | | | | | 0.7 | | |
| 4,800 | | | Mueller Industries, Inc. | | | | | 284,928 | | | | | | 0.0 | | |
| 79,500 (2) | | | NOW, Inc. | | | | | 678,930 | | | | | | 0.1 | | |
| 3,300 | | | Powell Industries, Inc. | | | | | 97,317 | | | | | | 0.0 | | |
| 22,500 | | | Primoris Services Corp. | | | | | 539,550 | | | | | | 0.1 | | |
| 16,000 | | | Quanex Building Products Corp. | | | | | 396,480 | | | | | | 0.1 | | |
| 21,661 (2) | | | RBC Bearings, Inc. | | | | | 4,374,872 | | | | | | 0.6 | | |
| 8,300 (2) | | | Resideo Technologies, Inc. | | | | | 216,049 | | | | | | 0.0 | | |
| 37,087 | | | Ritchie Bros Auctioneers, Inc. | | | | | 2,270,095 | | | | | | 0.3 | | |
| 47,800 | | | Rush Enterprises, Inc. - Class A | | | | | 2,659,592 | | | | | | 0.4 | | |
| 15,600 (2) | | | SP Plus Corp. | | | | | 440,232 | | | | | | 0.1 | | |
| 39,700 (2) | | | Spirit Airlines, Inc. | | | | | 867,445 | | | | | | 0.1 | | |
| 36,600 | | | Steelcase, Inc. | | | | | 428,952 | | | | | | 0.1 | | |
| 54,088 (2) | | | Stericycle, Inc. | | | | | 3,225,808 | | | | | | 0.5 | | |
| 12,500 (2) | | | Sterling Construction Co., Inc. | | | | | 328,750 | | | | | | 0.0 | | |
| 49,700 | | | Terex Corp. | | | | | 2,184,315 | | | | | | 0.3 | | |
| 4,600 | | | Tetra Tech, Inc. | | | | | 781,080 | | | | | | 0.1 | | |
| 46,852 | | | Toro Co. | | | | | 4,680,983 | | | | | | 0.7 | | |
| 8,700 (2) | | | TriNet Group, Inc. | | | | | 828,762 | | | | | | 0.1 | | |
| 22,800 (2) | | | TrueBlue, Inc. | | | | | 630,876 | | | | | | 0.1 | | |
| 10,500 | | | UFP Industries, Inc. | | | | | 966,105 | | | | | | 0.1 | | |
| Shares | | | Value | | | Percentage of Net Assets | | |||||||||
| COMMON STOCK: (continued) | | |||||||||||||||
| | | | Industrials (continued) | | ||||||||||||
| 9,582 | | | Unifirst Corp. | | | | $ | 2,016,053 | | | | | | 0.3 | | |
| 1,100 (2) | | | Vectrus, Inc. | | | | | 50,347 | | | | | | 0.0 | | |
| 10,100 (2) | | | Veritiv Corp. | | | | | 1,237,957 | | | | | | 0.2 | | |
| 7,200 | | | Wabash National Corp. | | | | | 140,544 | | | | | | 0.0 | | |
| 15,600 | | | Watts Water Technologies, Inc. | | | | | 3,029,052 | | | | | | 0.4 | | |
| 27,000 (2) | | | Wesco International, Inc. | | | | | 3,552,930 | | | | | | 0.5 | | |
| 168,328 (2) | | | WillScot Mobile Mini Holdings Corp. | | | | | 6,874,516 | | | | | | 1.0 | | |
| 32,887 | | | Woodward, Inc. | | | | | 3,599,811 | | | | | | 0.5 | | |
| | | | | | | | | 140,328,633 | | | | | | 20.5 | | |
| | | | Information Technology: 12.5% | | ||||||||||||
| 5,700 (1)(2) | | | 3D Systems Corp. | | | | | 122,778 | | | | | | 0.0 | | |
| 3,000 (2) | | | 8x8, Inc. | | | | | 50,280 | | | | | | 0.0 | | |
| 3,300 (2) | | | ACI Worldwide, Inc. | | | | | 114,510 | | | | | | 0.0 | | |
| 8,900 | | | Advanced Energy Industries, Inc. | | | | | 810,434 | | | | | | 0.1 | | |
| 91,182 (2) | | | Allegro MicroSystems, Inc. | | | | | 3,298,965 | | | | | | 0.5 | | |
| 23,700 (2) | | | Alpha & Omega Co. | | | | | 1,435,272 | | | | | | 0.2 | | |
| 3,300 (2) | | | Ambarella, Inc. | | | | | 669,537 | | | | | | 0.1 | | |
| 39,900 | | | Amkor Technology, Inc. | | | | | 989,121 | | | | | | 0.2 | | |
| 20,800 (2) | | | Asana, Inc. | | | | | 1,550,640 | | | | | | 0.2 | | |
| 17,908 (2) | | | Aspen Technology, Inc. | | | | | 2,725,598 | | | | | | 0.4 | | |
| 43,100 (2) | | | Avaya Holdings Corp. | | | | | 853,380 | | | | | | 0.1 | | |
| 17,900 (2) | | | Avid Technology, Inc. | | | | | 583,003 | | | | | | 0.1 | | |
| 23,310 | | | Badger Meter, Inc. | | | | | 2,483,914 | | | | | | 0.4 | | |
| 48,400 | | | Benchmark Electronics, Inc. | | | | | 1,311,640 | | | | | | 0.2 | | |
| 11,800 (2) | | | BigCommerce Holdings, Inc. | | | | | 417,366 | | | | | | 0.1 | | |
| 6,500 (2) | | | Blackbaud, Inc. | | | | | 513,370 | | | | | | 0.1 | | |
| 3,900 (2) | | | Blackline, Inc. | | | | | 403,806 | | | | | | 0.1 | | |
| 4,770 (1)(2) | | | BM Technologies, Inc. | | | | | 43,932 | | | | | | 0.0 | | |
| 17,709 (1)(2) | | | Cerence, Inc. | | | | | 1,357,218 | | | | | | 0.2 | | |
| 61,062 (2) | | | Clearwater Analytics Holdings, Inc. | | | | | 1,403,205 | | | | | | 0.2 | | |
| 20,477 | | | CMC Materials, Inc. | | | | | 3,925,236 | | | | | | 0.6 | | |
| 3,766 (2) | | | Consensus Cloud Solutions, Inc. | | | | | 217,938 | | | | | | 0.0 | | |
| 11,300 (2) | | | Digital Turbine, Inc. | | | | | 689,187 | | | | | | 0.1 | | |
| 17,953 (2) | | | DigitalOcean Holdings, Inc. | | | | | 1,442,164 | | | | | | 0.2 | | |
| 5,100 (2) | | | Diodes, Inc. | | | | | 560,031 | | | | | | 0.1 | | |
| 48,945 (2) | | | Duck Creek Technologies, Inc. | | | | | 1,473,734 | | | | | | 0.2 | | |
| 88,400 (2) | | | eGain Corp. | | | | | 882,232 | | | | | | 0.1 | | |
| 39,945 (2) | | | Envestnet, Inc. | | | | | 3,169,236 | | | | | | 0.5 | | |
| 10,700 (2) | | | Fabrinet | | | | | 1,267,629 | | | | | | 0.2 | | |
| 28,745 (2) | | | Guidewire Software, Inc. | | | | | 3,263,420 | | | | | | 0.5 | | |
| VY® JPMorgan Small Cap | PORTFOLIO OF INVESTMENTS |
| Core Equity Portfolio | as of December 31, 2021 (continued) |
| Shares | | | Value | | | Percentage of Net Assets | | |||||||||
| COMMON STOCK: (continued) | | |||||||||||||||
| | | | Information Technology (continued) | | ||||||||||||
| 11,800 (2) | | | Ichor Holdings Ltd. | | | | $ | 543,154 | | | | | | 0.1 | | |
| 2,900 (2) | | | Itron, Inc. | | | | | 198,708 | | | | | | 0.0 | | |
| 3,500 (2) | | | JFrog Ltd. | | | | | 103,950 | | | | | | 0.0 | | |
| 17,300 (1)(2) | | | Marathon Digital Holdings, Inc. | | | | | 568,478 | | | | | | 0.1 | | |
| 15,500 | | | MAXIMUS, Inc. | | | | | 1,234,885 | | | | | | 0.2 | | |
| 375 (1)(2) | | | MicroStrategy, Inc. | | | | | 204,184 | | | | | | 0.0 | | |
| 28,400 (2) | | | Mimecast Ltd. | | | | | 2,259,788 | | | | | | 0.3 | | |
| 3,300 (2) | | | Model N, Inc. | | | | | 99,099 | | | | | | 0.0 | | |
| 27,073 (2) | | | nCino, Inc. | | | | | 1,485,225 | | | | | | 0.2 | | |
| 83,389 (2) | | | nLight, Inc. | | | | | 1,997,167 | | | | | | 0.3 | | |
| 24,854 (2) | | | Novanta, Inc. | | | | | 4,382,506 | | | | | | 0.6 | | |
| 9,200 (2) | | | OSI Systems, Inc. | | | | | 857,440 | | | | | | 0.1 | | |
| 15,700 (2) | | | PagerDuty, Inc. | | | | | 545,575 | | | | | | 0.1 | | |
| 59,377 (1)(2) | | | Paycor HCM, Inc. | | | | | 1,710,651 | | | | | | 0.3 | | |
| 9,000 (2) | | | PDF Solutions, Inc. | | | | | 286,110 | | | | | | 0.0 | | |
| 57,625 | | | Power Integrations, Inc. | | | | | 5,352,786 | | | | | | 0.8 | | |
| 45,860 (2) | | | Q2 Holdings, Inc. | | | | | 3,643,118 | | | | | | 0.5 | | |
| 7,200 (2) | | | Rambus, Inc. | | | | | 211,608 | | | | | | 0.0 | | |
| 9,000 (2) | | | SailPoint Technologies Holding, Inc. | | | | | 435,060 | | | | | | 0.1 | | |
| 38,100 (2) | | | Sanmina Corp. | | | | | 1,579,626 | | | | | | 0.2 | | |
| 10,100 (2) | | | Scansource, Inc. | | | | | 354,308 | | | | | | 0.1 | | |
| 9,500 (2) | | | Semtech Corp. | | | | | 844,835 | | | | | | 0.1 | | |
| 19,100 (2) | | | SMART Global Holdings, Inc. | | | | | 1,355,909 | | | | | | 0.2 | | |
| 800 (2) | | | SPS Commerce, Inc. | | | | | 113,880 | | | | | | 0.0 | | |
| 67,200 (2) | | | Super Micro Computer, Inc. | | | | | 2,953,440 | | | | | | 0.4 | | |
| 800 (2) | | | Synaptics, Inc. | | | | | 231,608 | | | | | | 0.0 | | |
| 18,800 | | | TTEC Holdings, Inc. | | | | | 1,702,340 | | | | | | 0.3 | | |
| 171,200 (2) | | | TTM Technologies, Inc. | | | | | 2,550,880 | | | | | | 0.4 | | |
| 13,900 (2) | | | Ultra Clean Holdings, Inc. | | | | | 797,304 | | | | | | 0.1 | | |
| 31,900 (2) | | | Unisys Corp. | | | | | 656,183 | | | | | | 0.1 | | |
| 8,955 (2) | | | Viant Technology, Inc. | | | | | 86,908 | | | | | | 0.0 | | |
| 39,700 | | | Vishay Intertechnology, Inc. | | | | | 868,239 | | | | | | 0.1 | | |
| 17,800 (2) | | | Vishay Precision Group, Inc. | | | | | 660,736 | | | | | | 0.1 | | |
| 29,165 (2) | | | WEX, Inc. | | | | | 4,094,474 | | | | | | 0.6 | | |
| 800 (2) | | | Workiva, Inc. | | | | | 104,392 | | | | | | 0.0 | | |
| 81,400 | | | Xperi Holding Corp. | | | | | 1,539,274 | | | | | | 0.2 | | |
| 70,900 (2) | | | Zuora, Inc. | | | | | 1,324,412 | | | | | | 0.2 | | |
| | | | | | | | | 85,967,016 | | | | | | 12.5 | | |
| | | | Materials: 4.5% | | ||||||||||||
| 2,900 | | | AdvanSix, Inc. | | | | | 137,025 | | | | | | 0.0 | | |
| 13,100 | | | Alcoa Corp. | | | | | 780,498 | | | | | | 0.1 | | |
| 46,861 | | | Aptargroup, Inc. | | | | | 5,739,535 | | | | | | 0.8 | | |
| 11,700 (2) | | | Arconic Corp. | | | | | 386,217 | | | | | | 0.1 | | |
| Shares | | | Value | | | Percentage of Net Assets | | |||||||||
| COMMON STOCK: (continued) | | |||||||||||||||
| | | | Materials (continued) | | ||||||||||||
| 24,000 | | | Avient Corp. | | | | $ | 1,342,800 | | | | | | 0.2 | | |
| 3,000 | | | Cabot Corp. | | | | | 168,600 | | | | | | 0.0 | | |
| 1,700 (2) | | | Clearwater Paper Corp. | | | | | 62,339 | | | | | | 0.0 | | |
| 26,500 (2) | | | Cleveland-Cliffs, Inc. | | | | | 576,905 | | | | | | 0.1 | | |
| 22,800 | | | Commercial Metals Co. | | | | | 827,412 | | | | | | 0.1 | | |
| 133,330 (2) | | | Diversey Holdings Ltd. | | | | | 1,774,622 | | | | | | 0.3 | | |
| 113,073 | | | Ecovyst, Inc. | | | | | 1,157,868 | | | | | | 0.2 | | |
| 24,800 | | | Glatfelter Corp. | | | | | 426,560 | | | | | | 0.1 | | |
| 10,500 | | | Greif, Inc. - Class A | | | | | 633,885 | | | | | | 0.1 | | |
| 14,900 | | | HB Fuller Co. | | | | | 1,206,900 | | | | | | 0.2 | | |
| 10,200 (2) | | | Ingevity Corp. | | | | | 731,340 | | | | | | 0.1 | | |
| 6,700 (2) | | | Koppers Holdings, Inc. | | | | | 209,710 | | | | | | 0.0 | | |
| 9,800 | | | Louisiana-Pacific Corp. | | | | | 767,830 | | | | | | 0.1 | | |
| 9,900 | | | Minerals Technologies, Inc. | | | | | 724,185 | | | | | | 0.1 | | |
| 6,900 | | | Myers Industries, Inc. | | | | | 138,069 | | | | | | 0.0 | | |
| 1,900 | | | Neenah, Inc. | | | | | 87,932 | | | | | | 0.0 | | |
| 23,000 (2) | | | Orion Engineered Carbons SA | | | | | 422,280 | | | | | | 0.1 | | |
| 122,449 | | | Pactiv Evergreen, Inc. | | | | | 1,552,653 | | | | | | 0.2 | | |
| 15,633 | | | Quaker Chemical Corp. | | | | | 3,607,784 | | | | | | 0.5 | | |
| 2,700 | | | Schnitzer Steel Industries, Inc. | | | | | 140,184 | | | | | | 0.0 | | |
| 32,000 | | | Schweitzer-Mauduit International, Inc. | | | | | 956,800 | | | | | | 0.2 | | |
| 2,500 | | | Sensient Technologies Corp. | | | | | 250,150 | | | | | | 0.0 | | |
| 56,100 | | | SunCoke Energy, Inc. | | | | | 369,699 | | | | | | 0.1 | | |
| 7,100 | | | Trinseo PLC | | | | | 372,466 | | | | | | 0.1 | | |
| 39,000 | | | Tronox Holdings PLC | | | | | 937,170 | | | | | | 0.1 | | |
| 5,100 | | | United States Steel Corp. | | | | | 121,431 | | | | | | 0.0 | | |
| 78,494 | | | Valvoline, Inc. | | | | | 2,927,041 | | | | | | 0.4 | | |
| 13,400 | | | Verso Corp. | | | | | 362,068 | | | | | | 0.1 | | |
| 8,900 | | | Warrior Met Coal, Inc. | | | | | 228,819 | | | | | | 0.0 | | |
| 2,300 | | | Worthington Industries, Inc. | | | | | 125,718 | | | | | | 0.0 | | |
| 47,300 (1)(2) | | | Zymergen, Inc. | | | | | 316,437 | | | | | | 0.1 | | |
| | | | | | | | | 30,570,932 | | | | | | 4.5 | | |
| | | | Real Estate: 7.0% | | ||||||||||||
| 2,000 | | | Agree Realty Corp. | | | | | 142,720 | | | | | | 0.0 | | |
| 15,200 | | | Alexander & Baldwin, Inc. | | | | | 381,368 | | | | | | 0.1 | | |
| 3,600 | | | American Assets Trust, Inc. | | | | | 135,108 | | | | | | 0.0 | | |
| 61,989 | | | American Campus Communities, Inc. | | | | | 3,551,350 | | | | | | 0.5 | | |
| 45,000 | | | Apple Hospitality REIT, Inc. | | | | | 726,750 | | | | | | 0.1 | | |
| 29,900 | | | Armada Hoffler Properties, Inc. | | | | | 455,078 | | | | | | 0.1 | | |
| 19,400 | | | Broadstone Net Lease, Inc. | | | | | 481,508 | | | | | | 0.1 | | |
| 3,700 | | | CareTrust REIT, Inc. | | | | | 84,471 | | | | | | 0.0 | | |
| 3,200 | | | Centerspace | | | | | 354,880 | | | | | | 0.1 | | |
| VY® JPMorgan Small Cap | PORTFOLIO OF INVESTMENTS |
| Core Equity Portfolio | as of December 31, 2021 (continued) |
| Shares | | | Value | | | Percentage of Net Assets | | |||||||||
| COMMON STOCK: (continued) | | |||||||||||||||
| | | | Real Estate (continued) | | ||||||||||||
| 3,800 (2) | | | Chatham Lodging Trust | | | | $ | 52,136 | | | | | | 0.0 | | |
| 31,300 | | | City Office REIT, Inc. | | | | | 617,236 | | | | | | 0.1 | | |
| 2,600 | | | Community Healthcare Trust, Inc. | | | | | 122,902 | | | | | | 0.0 | | |
| 11,256 | | | Cousins Properties, Inc. | | | | | 453,392 | | | | | | 0.1 | | |
| 63,860 | | | CubeSmart | | | | | 3,634,272 | | | | | | 0.5 | | |
| 157,866 (2) | | | Cushman & Wakefield PLC | | | | | 3,510,940 | | | | | | 0.5 | | |
| 21,200 (2) | | | DiamondRock Hospitality Co. | | | | | 203,732 | | | | | | 0.0 | | |
| 86,100 (2) | | | DigitalBridge Group, Inc. | | | | | 717,213 | | | | | | 0.1 | | |
| 28,591 | | | EastGroup Properties, Inc. | | | | | 6,514,459 | | | | | | 1.0 | | |
| 10,800 | | | Essential Properties Realty Trust, Inc. | | | | | 311,364 | | | | | | 0.1 | | |
| 11,475 | | | First Industrial Realty Trust, Inc. | | | | | 759,645 | | | | | | 0.1 | | |
| 17,300 | | | Four Corners Property Trust, Inc. | | | | | 508,793 | | | | | | 0.1 | | |
| 2,400 | | | Getty Realty Corp. | | | | | 77,016 | | | | | | 0.0 | | |
| 17,100 | | | Gladstone Commercial Corp. | | | | | 440,667 | | | | | | 0.1 | | |
| 3,000 | | | Global Medical REIT, Inc. | | | | | 53,250 | | | | | | 0.0 | | |
| 8,300 | | | Healthcare Realty Trust, Inc. | | | | | 262,612 | | | | | | 0.0 | | |
| 1,700 | | | Highwoods Properties, Inc. | | | | | 75,803 | | | | | | 0.0 | | |
| 1,100 | | | Innovative Industrial Properties, Inc. | | | | | 289,201 | | | | | | 0.0 | | |
| 1,053 (2) | | | Jones Lang LaSalle, Inc. | | | | | 283,615 | | | | | | 0.0 | | |
| 13,100 | | | Kennedy-Wilson Holdings, Inc. | | | | | 312,828 | | | | | | 0.1 | | |
| 44,328 | | | Kite Realty Group Trust | | | | | 965,464 | | | | | | 0.1 | | |
| 85,621 | | | National Retail Properties, Inc. | | | | | 4,115,801 | | | | | | 0.6 | | |
| 26,700 | | | National Storage Affiliates Trust | | | | | 1,847,640 | | | | | | 0.3 | | |
| 4,000 | | | NETSTREIT Corp. | | | | | 91,600 | | | | | | 0.0 | | |
| 107,580 | | | Outfront Media, Inc. | | | | | 2,885,296 | | | | | | 0.4 | | |
| 13,000 | | | Phillips Edison & Co., Inc. | | | | | 429,520 | | | | | | 0.1 | | |
| 20,800 | | | Physicians Realty Trust | | | | | 391,664 | | | | | | 0.1 | | |
| 11,200 | | | Piedmont Office Realty Trust, Inc. | | | | | 205,856 | | | | | | 0.0 | | |
| 20,600 | | | Plymouth Industrial REIT, Inc. | | | | | 659,200 | | | | | | 0.1 | | |
| 21,900 | | | PotlatchDeltic Corp. | | | | | 1,318,818 | | | | | | 0.2 | | |
| 62,000 (2) | | | Realogy Holdings Corp. | | | | | 1,042,220 | | | | | | 0.2 | | |
| 30,700 | | | Retail Opportunity Investments Corp. | | | | | 601,720 | | | | | | 0.1 | | |
| 7,000 | | | RLJ Lodging Trust | | | | | 97,510 | | | | | | 0.0 | | |
| Shares | | | Value | | | Percentage of Net Assets | | | | |||||||||||||
| COMMON STOCK: (continued) | | | | |||||||||||||||||||
| | | | Real Estate (continued) | | | | ||||||||||||||||
| 2,300 | | | RMR Group, Inc. | | | | $ | 79,764 | | | | | | 0.0 | | | | | ||||
| 29,755 (2) | | | Ryman Hospitality Properties | | | | | 2,736,270 | | | | | | 0.4 | | | | | ||||
| 12,600 | | | Sabra Healthcare REIT, Inc. | | | | | 170,604 | | | | | | 0.0 | | | | | ||||
| 20,300 | | | SITE Centers Corp. | | | | | 321,349 | | | | | | 0.1 | | | | | ||||
| 31,100 | | | STAG Industrial, Inc. | | | | | 1,491,556 | | | | | | 0.2 | | | | | ||||
| 7,300 (2) | | | Summit Hotel Properties, Inc. | | | | | 71,248 | | | | | | 0.0 | | | | | ||||
| 53,303 (2) | | | Sunstone Hotel Investors, Inc. | | | | | 625,244 | | | | | | 0.1 | | | | | ||||
| 11,600 | | | Tanger Factory Outlet Centers, Inc. | | | | | 223,648 | | | | | | 0.0 | | | | | ||||
| 10,000 | | | Terreno Realty Corp. | | | | | 852,900 | | | | | | 0.1 | | | | | ||||
| 11,000 | | | UMH Properties, Inc. | | | | | 300,630 | | | | | | 0.0 | | | | | ||||
| 42,400 (2) | | | Xenia Hotels & Resorts, Inc. | | | | | 767,864 | | | | | | 0.1 | | | | | ||||
| | | | | | | | | 47,807,695 | | | | | | 7.0 | | | | | ||||
| | | | Utilities: 1.8% | | | | ||||||||||||||||
| 9,800 (1) | | | Brookfield Infrastructure Corp. | | | | | 668,948 | | | | | | 0.1 | | | | | ||||
| 3,400 | | | Chesapeake Utilities Corp. | | | | | 495,754 | | | | | | 0.1 | | | | | ||||
| 19,100 | | | Clearway Energy, Inc. - Class A | | | | | 639,468 | | | | | | 0.1 | | | | | ||||
| 51,100 | | | Clearway Energy, Inc. - Class C | | | | | 1,841,133 | | | | | | 0.3 | | | | | ||||
| 3,300 | | | Idacorp, Inc. | | | | | 373,923 | | | | | | 0.0 | | | | | ||||
| 59,445 | | | NorthWestern Corp. | | | | | 3,397,876 | | | | | | 0.5 | | | | | ||||
| 81,557 | | | Portland General Electric Co. | | | | | 4,315,997 | | | | | | 0.6 | | | | | ||||
| 3,800 | | | Southwest Gas Holdings, Inc. | | | | | 266,190 | | | | | | 0.0 | | | | | ||||
| 53,100 | | | Via Renewables, Inc. | | | | | 606,933 | | | | | | 0.1 | | | | | ||||
| 5,944 | | | Vistra Corp. | | | | | 135,345 | | | | | | 0.0 | | | | | ||||
| | | | | | | | | 12,741,567 | | | | | | 1.8 | | | | | ||||
| | | | Total Common Stock (Cost $516,397,394) | | | | | 662,778,680 | | | | | | 96.6 | | | | | ||||
| RIGHTS: —% | | | | |||||||||||||||||||
| | | | Health Care: —% | | | | | | | | ||||||||||||
| 28,260 (2)(3)(4) | | | Aduro Biotech, Inc. - CVR | | | | | — | | | | | | — | | | | | ||||
| | | | Total Rights (Cost $—) | | | | | — | | | | | | — | | | | | ||||
| | | | Total Long-Term Investments (Cost $516,397,394) | | | | | 662,778,680 | | | | | | 96.6 | | | | | ||||
| | ||||||||||||||||||||||
| VY® JPMorgan Small Cap | PORTFOLIO OF INVESTMENTS |
| Core Equity Portfolio | as of December 31, 2021 (continued) |
| Principal Amount† | | | Value | | | Percentage of Net Assets | | |||||||||
| SHORT-TERM INVESTMENTS: 5.2% | | |||||||||||||||
| | | | Repurchase Agreements: 1.8% | | ||||||||||||
| 2,880,400 (5) | | | Cantor Fitzgerald Securities, Repurchase Agreement dated 12/31/21, 0.05%, due 01/03/22 (Repurchase Amount $2,880,412, collateralized by various U.S. Government/U.S. Government Agency Obligations, 0.000%-9.000%, Market Value plus accrued interest $2,938,008, due 02/01/22-07/20/71) | | | | $ | 2,880,400 | | | | | | 0.4 | | |
| 2,880,400 (5) | | | Citadel Securities LLC, Repurchase Agreement dated 12/31/21, 0.07%, due 01/03/22 (Repurchase Amount $2,880,417, collateralized by various U.S. Government Securities, 0.000%-7.250%, Market Value plus accrued interest $2,938,025, due 01/04/22-11/15/51) | | | | | 2,880,400 | | | | | | 0.4 | | |
| 994,203 (5) | | | Morgan Stanley, Repurchase Agreement dated 12/31/21, 0.05%, due 01/03/22 (Repurchase Amount $994,207, collateralized by various U.S. Government Agency Obligations, 2.000%-8.000%, Market Value plus accrued interest $1,014,087, due 11/01/22-01/01/52) | | | | | 994,203 | | | | | | 0.2 | | |
| 2,880,410 (5) | | | RBC Dominion Securities Inc., Repurchase Agreement dated 12/31/21, 0.05%, due 01/03/22 (Repurchase Amount $2,880,422, collateralized by various U.S. Government/U.S. Government Agency Obligations, 0.000%-6.500%, Market Value plus accrued interest $2,938,018, due 05/15/22-12/01/51) | | | | | 2,880,410 | | | | | | 0.4 | | |
| Principal Amount† | | | Value | | | Percentage of Net Assets | | |||||||||
| SHORT-TERM INVESTMENTS: (continued) | | |||||||||||||||
| | | | Repurchase Agreements (continued) | | ||||||||||||
| 2,522,120 (5) | | | State of Wisconsin Investment Board, Repurchase Agreement dated 12/31/21, 0.07%, due 01/03/22 (Repurchase Amount $2,522,135, collateralized by various U.S. Government Securities, 0.125%-3.875%, Market Value plus accrued interest $2,572,576, due 07/15/23-02/15/48) | | | | $ | 2,522,120 | | | | | | 0.4 | | |
| | | | Total Repurchase Agreements (Cost $12,157,533) | | | | | 12,157,533 | | | | | | 1.8 | | |
| | ||||||||||||||||
| Shares | | | Value | | | Percentage of Net Assets | | |||||||||
| | | | Mutual Funds: 3.4% | | ||||||||||||
| 23,165,576 (5)(6) | | | BlackRock Liquidity Funds, FedFund, Institutional Class, 0.030% (Cost $23,165,576) | | | | | 23,165,576 | | | | | | 3.4 | | |
| | | | Total Short-Term Investments (Cost $35,323,109) | | | | | 35,323,109 | | | | | | 5.2 | | |
| | | | Total Investments in Securities (Cost $551,720,503) | | | | $ | 698,101,789 | | | | | | 101.8 | | |
| | | | Liabilities in Excess of Other Assets | | | | | (12,529,533) | | | | | | (1.8) | | |
| | | | Net Assets | | | | $ | 685,572,256 | | | | | | 100.0 | | |
| VY® JPMorgan Small Cap | PORTFOLIO OF INVESTMENTS |
| Core Equity Portfolio | as of December 31, 2021 (continued) |
| | | | Quoted Prices in Active Markets for Identical Investments (Level 1) | | | Significant Other Observable Inputs (Level 2) | | | Significant Unobservable Inputs (Level 3) | | | Fair Value at December 31, 2021 | | ||||||||||||
| Asset Table | | | | | | | | | | | | | | | | | | | | | | | | | |
| Investments, at fair value | | | | | | | | | | | | | | | | | | | | | | | | | |
| Common Stock* | | | | $ | 662,778,680 | | | | | $ | — | | | | | $ | — | | | | | $ | 662,778,680 | | |
| Rights | | | | | — | | | | | | — | | | | | | — | | | | | | — | | |
| Short-Term Investments | | | | | 23,165,576 | | | | | | 12,157,533 | | | | | | — | | | | | | 35,323,109 | | |
| Total Investments, at fair value | | | | $ | 685,944,256 | | | | | $ | 12,157,533 | | | | | $ | — | | | | | $ | 698,101,789 | | |
| Other Financial Instruments+ | | | | | | | | | | | | | | | | | | | | | | | | | |
| Futures | | | | | 191,296 | | | | | | — | | | | | | — | | | | | | 191,296 | | |
| Total Assets | | | | $ | 686,135,552 | | | | | $ | 12,157,533 | | | | | $ | — | | | | | $ | 698,293,085 | | |
| Security | | | Acquisition Date | | | Acquisition Cost | | | Fair Value | | |||||||||
| Aduro Biotech, Inc. - CVR | | | | | 10/6/2020 | | | | | $ | — | | | | | $ | — | | |
| | | | | | | | | | | $ | — | | | | | $ | — | | |
| Description | | | Number of Contracts | | | Expiration Date | | | Notional Amount | | | Unrealized Appreciation/ (Depreciation) | | ||||||||||||
| Long Contracts: | | | | | | | | | | | | | | | | | | | | | | | | | |
| E-mini Russell 2000® Index | | | | | 96 | | | | | | 03/18/22 | | | | | $ | 10,765,440 | | | | | $ | 191,296 | | |
| | | | | | | | | | | | | | | | | $ | 10,765,440 | | | | | $ | 191,296 | | |
| Derivatives not accounted for as hedging instruments | | | Location on Statement of Assets and Liabilities | | | Fair Value | | |||
| Asset Derivatives | | | | | | | | | | |
| Equity contracts | | | Variation margin receivable on futures contracts* | | | | $ | 191,296 | | |
| Total Asset Derivatives | | | | | | | $ | 191,296 | | |
| VY® JPMorgan Small Cap | PORTFOLIO OF INVESTMENTS |
| Core Equity Portfolio | as of December 31, 2021 (continued) |
| | | | Amount of Realized Gain or (Loss) on Derivatives Recognized in Income | | |||
| Derivatives not accounted for as hedging instruments | | | Futures | | |||
| Equity contracts | | | | $ | 516,896 | | |
| Total | | | | $ | 516,896 | | |
| | | | Change in Unrealized Appreciation or (Depreciation) on Derivatives Recognized in Income | | |||
| Derivatives not accounted for as hedging instruments | | | Futures | | |||
| Equity contracts | | | | $ | 207,686 | | |
| Total | | | | $ | 207,686 | | |
| | Cost for federal income tax purposes was $557,321,240. | | ||||||
| | Net unrealized appreciation consisted of: | | ||||||
| | Gross Unrealized Appreciation | | | | $ | 176,075,554 | | |
| | Gross Unrealized Depreciation | | | | | (35,103,710) | | |
| | Net Unrealized Appreciation | | | | $ | 140,971,844 | | |
| Portfolio Name | | | Type | | | Per Share Amount | | |||
| Voya Balanced Income Portfolio | | |||||||||
| Class ADV | | | NII | | | | $ | 0.2188 | | |
| Class I | | | NII | | | | $ | 0.2817 | | |
| Class S | | | NII | | | | $ | 0.2542 | | |
| Class S2 | | | NII | | | | $ | 0.2310 | | |
| Voya High Yield Portfolio | | |||||||||
| Class ADV | | | NII | | | | $ | 0.4554 | | |
| Class I | | | NII | | | | $ | 0.5154 | | |
| Class S | | | NII | | | | $ | 0.4902 | | |
| Class S2 | | | NII | | | | $ | 0.4759 | | |
| All Classes | | | ROC | | | | $ | 0.0171 | | |
| Voya Large Cap Growth Portfolio | | |||||||||
| Class ADV | | | NII | | | | $ | — | | |
| Class I | | | NII | | | | $ | — | | |
| Class R6 | | | NII | | | | $ | — | | |
| Class S | | | NII | | | | $ | — | | |
| Class S2 | | | NII | | | | $ | — | | |
| All Classes | | | STCG | | | | $ | 0.9851 | | |
| All Classes | | | LTCG | | | | $ | 3.6522 | | |
| Voya Large Cap Value Portfolio | | |||||||||
| Class ADV | | | NII | | | | $ | 0.2214 | | |
| Class I | | | NII | | | | $ | 0.3033 | | |
| Class R6 | | | NII | | | | $ | 0.3038 | | |
| Class S | | | NII | | | | $ | 0.2733 | | |
| Class S2 | | | NII | | | | $ | 0.2524 | | |
| All Classes | | | STCG | | | | $ | 0.0305 | | |
| All Classes | | | LTCG | | | | $ | 0.1539 | | |
| Portfolio Name | | | Type | | | Per Share Amount | | |||
| Voya Limited Maturity Bond Portfolio | | |||||||||
| Class ADV | | | NII | | | | $ | 0.1054 | | |
| Class I | | | NII | | | | $ | 0.1686 | | |
| Class S | | | NII | | | | $ | 0.1442 | | |
| Voya U.S. Stock Index Portfolio | | |||||||||
| Class ADV | | | NII | | | | $ | 0.1148 | | |
| Class I | | | NII | | | | $ | 0.2263 | | |
| Class P2 | | | NII | | | | $ | 0.2263 | | |
| Class S | | | NII | | | | $ | 0.1767 | | |
| Class S2 | | | NII | | | | $ | 0.1468 | | |
| All Classes | | | STCG | | | | $ | 0.0239 | | |
| All Classes | | | LTCG | | | | $ | 1.9994 | | |
| VY® Clarion Real Estate Portfolio | | |||||||||
| Class ADV | | | NII | | | | $ | 0.5667 | | |
| Class I | | | NII | | | | $ | 0.7178 | | |
| Class S | | | NII | | | | $ | 0.6738 | | |
| Class S2 | | | NII | | | | $ | 0.6016 | | |
| VY® JPMorgan Small Cap Core Equity Portfolio | | |||||||||
| Class ADV | | | NII | | | | $ | — | | |
| Class I | | | NII | | | | $ | 0.0802 | | |
| Class R6 | | | NII | | | | $ | 0.0802 | | |
| Class S | | | NII | | | | $ | 0.0379 | | |
| Class S2 | | | NII | | | | $ | 0.0112 | | |
| All Classes | | | STCG | | | | $ | 0.2357 | | |
| All Classes | | | LTCG | | | | $ | 0.7796 | | |
| | Voya Balanced Income Portfolio | | | | | 36.33% | | |
| | Voya Large Cap Growth Portfolio | | | | | 17.90% | | |
| | Voya Large Cap Value Portfolio | | | | | 20.14% | | |
| | Voya U.S. Stock Index Portfolio | | | | | 99.45% | | |
| | VY® JPMorgan Small Cap Core Equity Portfolio | | | | | 56.10% | | |
| | Voya Large Cap Growth Portfolio | | | | $ | 908,624,514 | | |
| | Voya Large Cap Value Portfolio | | | | | 12,725,651 | | |
| | Voya U.S. Stock Index Portfolio | | | | | 724,907,681 | | |
| | VY® JPMorgan Small Cap Core Equity Portfolio | | | | | 25,513,173 | | |
| | Proposals: | | | | |
| | 1 | | | At this meeting, a proposal was submitted to approve a change in the sub-classification under the Investment Company Act of 1940, as amended, of their respective Portfolio from “diversified” to “non-diversified”, including the elimination of the related fundamental investment restriction. | |
| | 2 | | | At this meeting, a proposal was submitted to approve Voya Investments, LLC, in its capacity as Voya Large Cap Growth Portfolio investment adviser, to hire and replace sub-advisers and modify sub-advisory agreements, with the approval of the Board of Voya Large Cap Growth Portfolio, but without obtaining shareholder approval. | |
| | | | Proposal | | | Shares voted for | | | Shares voted against or withheld | | | Shares abstained | | | Broker non-vote | | | Total Shares Voted | | ||||||||||||||||||
Voya Large Cap Growth Portfolio | | | | | 1* | | | | | | 148,551,345.477 | | | | | | 19,020,067.419 | | | | | | 18,399,400.820 | | | | | | 0.000 | | | | | | 185,970,813.716 | | |
| | | | | | 2* | | | | | | 150,248,238.141 | | | | | | 19,687,612.526 | | | | | | 16,034,963.049 | | | | | | 0.000 | | | | | | 185,970,813.716 | | |
| Name, Address and Age | | | Position(s) Held with the Trust | | | Term of Office and Length of Time Served(1) | | | Principal Occupation(s) − During the Past 5 Years | | | Number of funds in Fund Complex Overseen by Trustee(2) | | | Other Board Positions Held by Trustee | |
| Independent Trustees: | | | | | | | | | | | | | | | | |
| Colleen D. Baldwin 7337 East Doubletree Ranch Rd. Suite 100 Scottsdale, Arizona 85258 Age: 61 | | | Trustee Chairperson | | | November 2007 – Present January 2020 – Present | | | President, Glantuam Partners, LLC, a business consulting firm (January 2009 – Present). | | | 131 | | | Dentaquest (February 2014 – Present); RSR Partners, Inc. (2016 – Present). | |
| John V. Boyer 7337 East Doubletree Ranch Rd. Suite 100 Scottsdale, Arizona 85258 Age: 68 | | | Trustee | | | January 2005 – Present | | | Retired. Formerly, President and Chief Executive Officer, Bechtler Arts Foundation, an arts and education foundation (January 2008 – December 2019). | | | 131 | | | None. | |
| Patricia W. Chadwick 7337 East Doubletree Ranch Rd. Suite 100 Scottsdale, Arizona 85258 Age: 73 | | | Trustee | | | January 2006 – Present | | | Consultant and President, Ravengate Partners LLC, a consulting firm that provides advice regarding financial markets and the global economy (January 2000 – Present). | | | 131 | | | Wisconsin Energy Corporation (June 2006 – Present); The Royce Funds (22 funds) (December 2009 – Present); and AMICA Mutual Insurance Company (1992 – Present). | |
| Martin J. Gavin 7337 East Doubletree Ranch Rd. Suite 100 Scottsdale, AZ 85258 Age: 71 | | | Trustee | | | August 2015 – Present | | | Retired. | | | 131 | | | None. | |
| Joseph E. Obermeyer 7337 East Doubletree Ranch Rd. Suite 100 Scottsdale, Arizona 85258 Age: 64 | | | Trustee | | | May 2013 – Present | | | President, Obermeyer & Associates, Inc., a provider of financial and economic consulting services (November 1999 – Present). | | | 131 | | | None. | |
| Sheryl K. Pressler 7337 East Doubletree Ranch Rd. Suite 100 Scottsdale, Arizona 85258 Age: 71 | | | Trustee | | | January 2006 – Present | | | Consultant (May 2001 – Present). | | | 131 | | | Centerra Gold Inc. (May 2008 – Present). | |
| Christopher P. Sullivan 7337 East Doubletree Ranch Rd. Suite 100 Scottsdale, Arizona 85258 Age: 68 | | | Trustee | | | October 2015 – Present | | | Retired. | | | 131 | | | None. | |
| Name, Address and Age | | | Position(s) Held with the Trust | | | Term of Office and Length of Time Served(1) | | | Principal Occupation(s) − During the Past 5 Years | | | Number of funds in Fund Complex Overseen by Trustee(2) | | | Other Board Positions Held by Trustee | |
| Trustee who is an “interested person”: | | |||||||||||||||
| Dina Santoro 230 Park Avenue New York, New York 10169 Age: 48 | | | Trustee | | | July 2018 – Present | | | President, Voya Investments, LLC and Voya Capital, LLC (March 2018 – Present); Senior Vice President, Voya Investments Distributor, LLC (April 2018 – Present); Chief Operating Officer and Senior Managing Director, Voya Investment Management (January 2022 – Present). Formerly, Senior Managing Director, Head of Product and Marketing Strategy, Voya Investment Management (September 2017 – January 2022); Managing Director, Quantitative Management Associates, LLC (January 2004 – August 2017). | | | 131 | | | Voya Investments, LLC, Voya Capital, LLC, and Voya Funds Services, LLC (March 2018 – Present); Voya Investments Distributor, LLC (April 2018 – Present). | |
| Name, Address and Age | | | Position(s) Held With the Trust | | | Term of Office and Length of Time Served(1) | | | Principal Occupation(s) – During the Past 5 Years | |
| Michael Bell One Orange Way Windsor, Connecticut 06095 Age: 53 | | | Chief Executive Officer | | | March 2018 – Present | | | Chief Executive Officer and Director, Voya Investments, LLC, Voya Capital, LLC, and Voya Funds Services, LLC (March 2018 – Present); Senior Vice President, Voya Investments Distributor, LLC (March 2020 – Present); Chief Financial Officer, Voya Investment Management (September 2014 – Present). Formerly, Senior Vice President and Chief Financial Officer, Voya Investments Distributor, LLC (September 2019 – March 2020); Senior Vice President and Treasurer, Voya Investments Distributor, LLC (November 2015 – September 2019); Senior Vice President, Chief Financial Officer and Treasurer, Voya Investments, LLC (November 2015 – March 2018). | |
| Dina Santoro 230 Park Avenue New York, New York 10169 Age: 48 | | | President | | | March 2018 – Present | | | President and Director, Voya Investments, LLC and Voya Capital, LLC (March 2018 – Present); Director, Voya Funds Services, LLC (March 2018 – Present); Director and Senior Vice President, Voya Investments Distributor, LLC (April 2018 – Present); Chief Operating Officer and Senior Managing Director, Voya Investment Management (January 2022 – Present). Formerly, Senior Managing Director, Head of Product and Marketing Strategy, Voya Investment Management (September 2017 – January 2022); Managing Director, Quantitative Management Associates, LLC (January 2004 – August 2017). | |
| Jonathan Nash 230 Park Avenue New York, New York 10169 Age: 54 | | | Executive Vice President Chief Investment Risk Officer | | | March 2020 – Present March 2020 – Present | | | Executive Vice President and Chief Investment Risk Officer, Voya Investments, LLC (March 2020 – Present and Senior Vice President, Investment Risk Management, Voya Investment Management (March 2017 – Present). Formerly, Vice President, Voya Investments, LLC (September 2018 – March 2020); Consultant, DA Capital LLC (January 2016 – March 2017). | |
| James M. Fink 5780 Powers Ferry Road NW Atlanta, Georgia 30327 Age: 63 | | | Executive Vice President | | | March 2018 – Present | | | Managing Director, Voya Investments, LLC, Voya Capital, LLC, and Voya Funds Services, LLC (March 2018 – Present); Senior Vice President, Voya Investments Distributor, LLC (April 2018 – Present); Chief Administrative Officer, Voya Investment Management (September 2017 – Present). Formerly, Managing Director, Operations, Voya Investment Management (March 1999 – September 2017). | |
| Kevin M. Gleason 7337 East Doubletree Ranch Rd. Suite 100 Scottsdale, Arizona 85258 Age: 55 | | | Chief Compliance Officer | | | February 2012 – Present | | | Senior Vice President, Voya Investment Management and Chief Compliance Officer, Voya Family of Funds (February 2012 – Present). | |
| Todd Modic 7337 East Doubletree Ranch Rd. Suite 100 Scottsdale, Arizona 85258 Age: 54 | | | Senior Vice President, Chief/Principal Financial Officer and Assistant Secretary | | | March 2005 – Present | | | President, Voya Funds Services, LLC (March 2018 – Present) and Senior Vice President, Voya Investments, LLC (April 2005 – Present). | |
| Kimberly A. Anderson 7337 East Doubletree Ranch Rd. Suite 100 Scottsdale, Arizona 85258 Age: 57 | | | Senior Vice President | | | November 2003 – Present | | | Senior Vice President, Voya Investments, LLC (September 2003 – Present). | |
| Micheline S. Faver 7337 East Doubletree Ranch Rd. Suite 100 Scottsdale, Arizona 85258 Age: 44 | | | Senior Vice President | | | September 2020 – Present | | | Senior Vice President, Head of Fund Compliance and Chief Compliance Officer, Voya Investments, LLC (March 2021 – Present). Formerly, Vice President, Head of Fund Compliance and Chief Compliance Officer, Voya Investments, LLC (June 2016 – March 2021). | |
| Name, Address and Age | | | Position(s) Held With the Trust | | | Term of Office and Length of Time Served(1) | | | Principal Occupation(s) – During the Past 5 Years | |
| Robert Terris 5780 Powers Ferry Road NW Atlanta, Georgia 30327 Age: 51 | | | Senior Vice President | | | May 2006 – Present | | | Senior Vice President, Voya Investments Distributor, LLC (April 2018 – Present); Senior Vice President, Head of Investment Services, Voya Investments, LLC (April 2018 – Present) and Voya Funds Services, LLC (March 2006 – Present). Formerly, Senior Vice President, Head of Division Operations, Voya Investments, LLC (October 2015 – April 2018). | |
| Fred Bedoya 7337 East Doubletree Ranch Rd. Suite 100 Scottsdale, Arizona 85258 Age: 49 | | | Vice President Treasurer | | | September 2012 – Present | | | Vice President, Voya Investments, LLC (October 2015 – Present) and Voya Funds Services, LLC (July 2012 – Present). | |
| Maria M. Anderson 7337 East Doubletree Ranch Rd. Suite 100 Scottsdale, Arizona 85258 Age: 63 | | | Vice President | | | September 2004 – Present | | | Vice President, Voya Investments, LLC (October 2015 – Present) and Voya Funds Services, LLC (September 2004 – Present). | |
| Sara M. Donaldson 7337 East Doubletree Ranch Rd. Suite 100 Scottsdale, Arizona 85258 Age: 62 | | | Vice President | | | September 2014 – Present | | | Vice President, Voya Investments, LLC (October 2015 – Present). | |
| Robyn L. Ichilov 7337 East Doubletree Ranch Rd. Suite 100 Scottsdale, Arizona 85258 Age: 54 | | | Vice President | | | November 1999 – Present | | | Vice President, Voya Funds Services, LLC (November 1995 – Present) and Voya Investments, LLC (August 1997 – Present). | |
| Jason Kadavy 7337 East Doubletree Ranch Rd. Suite 100 Scottsdale, Arizona 85258 Age: 45 | | | Vice President | | | September 2012 – Present | | | Vice President, Voya Investments, LLC (October 2015 – Present) and Voya Funds Services, LLC (July 2007 – Present). | |
| Andrew K. Schlueter 7337 East Doubletree Ranch Rd. Suite 100 Scottsdale, Arizona 85258 Age: 45 | | | Vice President | | | March 2018 – Present | | | Vice President, Voya Investments Distributor, LLC (April 2018 – Present); Vice President, Voya Investments, LLC and Voya Funds Services, LLC (March 2018 – Present); Vice President, Head of Mutual Fund Operations, Voya Investment Management (February 2018 – Present). Formerly, Vice President, Voya Investment Management (March 2014 – February 2018). | |
| Craig Wheeler 7337 East Doubletree Ranch Rd. Suite 100 Scottsdale, Arizona 85258 Age: 52 | | | Vice President | | | May 2013 – Present | | | Vice President – Director of Tax, Voya Investments, LLC (October 2015 – Present). | |
| Monia Piacenti One Orange Way Windsor, Connecticut 06095 Age: 45 | | | Anti-Money Laundering Officer | | | June 2018 – Present | | | Anti-Money Laundering Officer, Voya Investments Distributor, LLC, Voya Investment Management and Voya Investment Management Trust Co. (June 2018 – Present); Compliance Consultant, Voya Financial, Inc. (January 2019 – Present). Formerly, Senior Compliance Officer, Voya Investment Management (December 2009 – December 2018). | |
| Joanne F. Osberg 7337 East Doubletree Ranch Rd. Suite 100 Scottsdale, Arizona 85258 Age: 40 | | | Secretary | | | September 2020 – Present | | | Vice President and Senior Counsel, Voya Investment Management – Mutual Fund Legal Department (September 2020 – Present). Formerly, Vice President, Counsel, Voya Investment Management – Mutual Fund Legal Department (January 2013 – September 2020). | |
| Name, Address and Age | | | Position(s) Held With the Trust | | | Term of Office and Length of Time Served(1) | | | Principal Occupation(s) – During the Past 5 Years | |
| Paul A. Caldarelli 7337 East Doubletree Ranch Rd. Suite 100 Scottsdale, Arizona 85258 Age: 70 | | | Assistant Secretary | | | June 2010 – Present | | | Vice President and Senior Counsel, Voya Investment Management – Mutual Fund Legal Department (March 2010 – Present). | |
Voya Investments, LLC
7337 East Doubletree Ranch Road, Suite 100
Scottsdale, Arizona 85258
Voya Investments Distributor, LLC
7337 East Doubletree Ranch Road, Suite 100
Scottsdale, Arizona 85258
BNY Mellon Investment Servicing (U.S.) Inc.
301 Bellevue Parkway
Wilmington, Delaware 19809
Ernst & Young LLP
200 Clarendon Street
Boston, Massachusetts 02116
The Bank of New York Mellon
225 Liberty Street
New York, New York 10286
Ropes & Gray LLP
Prudential Tower
800 Boylston Street
Boston, Massachusetts 02199
Voya Investors Trust | Voya Variable Insurance Trust | ||||
| ■ | VY® BlackRock Inflation Protected Bond Portfolio Classes ADV, I and S | ■ | VY® BrandywineGLOBAL — Bond Portfolio | ||
As permitted by regulations adopted by the U.S. Securities and Exchange Commission, paper copies of each portfolio’s annual and semi-annual shareholder reports, like this annual report, are not sent by mail, unless you specifically request paper copies of the reports. Instead, the reports will be made available on a website and you will be notified by mail each time a report is posted and provided with a website link to access the report. |
| This report is submitted for general information to shareholders of the Voya mutual funds. It is not authorized for distribution to prospective shareholders unless accompanied or preceded by a prospectus which includes details regarding the funds’ investment objectives, risks, charges, expenses and other information. This information should be read carefully. |
INVESTMENT MANAGEMENT voyainvestments.com | |
TABLE OF CONTENTS
| 1 | ||||||
| 3 | ||||||
| 8 | ||||||
| 9 | ||||||
| 10 | ||||||
| 12 | ||||||
| 13 | ||||||
| 14 | ||||||
| 15 | ||||||
| 28 | ||||||
| 56 | ||||||
| 57 | ||||||
| 61 |
PROXY VOTING INFORMATION
A description of the policies and procedures that the Portfolios use to determine how to vote proxies related to portfolio securities is available: (1) without charge, upon request, by calling Shareholder Services toll-free at (800) 992-0180; (2) on the Portfolios’ website at www.voyainvestments.com; and (3) on the U.S. Securities and Exchange Commission’s (“SEC’s”) website at www.sec.gov. Information regarding how the Portfolios voted proxies related to portfolio securities during the most recent 12-month period ended June 30 is available without charge on the Portfolios’ website at www.voyainvestments.com and on the SEC’s website at www.sec.gov.
QUARTERLY PORTFOLIO HOLDINGS
The Portfolios file their complete schedule of portfolio holdings with the SEC for the first and third quarters of each fiscal year on Form NPORT-P. The Portfolios’ Forms NPORT-P are available on the SEC’s website at www.sec.gov. Each Portfolio’s complete schedule of portfolio holdings is available at: www.voyainvestments.com and without charge upon request from the Portfolio by calling Shareholder Services toll-free at (800) 992-0180.
A Solid Year Ends for the Financial Markets, Gauging the Policy Shifts to Come
Dear Shareholder,
The 12-month period ended December 31, 2021, marked another strong year for stocks. Forcefully accommodative and persistent monetary and fiscal policy, along with the COVID-19 vaccine rollouts and an impressively adaptable global economy, drove big gains within risk assets. The ascent wasn’t particularly smooth, as several new COVID-19 variants thwarted attempts at a full-fledged reopening. Besides the distress induced by a public health crisis, prolongation of the pandemic negatively impacted the supply of labor and costs of core goods. These two factors, combined with others such as economic stimulus and rising commodity prices, drove inflation higher. As economic activity proved resilient, however, investors shrugged off soaring prices and continued to buy stocks.
The U.S. unemployment rate declined to 3.9% in December and job openings continued to exceed job seekers, indicating the labor market is approaching full employment. This dynamic is pressuring wages upward and has contributed to inflation running above the U.S Federal Reserve Board’s (the “Fed”) 2% target since April. Sharply higher prices have caused the Fed to hasten its plans to withdraw stimulus. We recognize that in 2022, monetary and fiscal policy are likely to become less supportive of the global economy. Yet in our view, we also see potential offsets to tightening financial conditions, including consumer spending and corporate inventory rebuilding, which make us believe there is scope for continued global equity gains.
The pace and path to policy normalization will be a key market factor for the year ahead. A sharp rise in wages from prolonged labor market tightness is possible, but firms, particularly larger ones, have been able to pass through rising input costs to maintain margins. In our view, this is likely to continue and, combined with still above trend GDP growth, will support earnings growth in 2022.
As we’ve often noted, it’s important to have a plan for investing consistently through headwinds and tailwinds. Keep focused on your long-term goals and don’t get distracted by short-term fluctuations, however compelling or distracting they may seem. Should your long-term goals change, discuss the situation thoroughly with your investment advisor before making any changes to your investment portfolio.
Regardless of events, at Voya we remain well prepared for and fully committed to serving our clients without disruption. We appreciate your continued confidence in us, and we look forward to working with you in the future.
Sincerely,
Dina Santoro
President
Voya Family of Funds
January 21, 2022
The views expressed in the President’s Letter reflect those of the President as of the date of the letter. Any such views are subject to change at any time based upon market or other conditions and the Voya mutual funds disclaim any responsibility to update such views. These views may not be relied on as investment advice and because investment decisions for a Voya mutual fund are based on numerous factors, may not be relied on as an indication of investment intent on behalf of any Voya mutual fund. Reference to specific company securities should not be construed as recommendations or investment advice. International investing poses special risks including currency fluctuation, economic and political risks not found in investments that are solely domestic.
International investing poses special risks including currency fluctuation, economic and political risks not found in investments that are solely domestic.
BENCHMARK DESCRIPTIONS
| Index | Description | |
|---|---|---|
| Bloomberg U.S. Aggregate Bond Index (“Bloomberg U.S. Aggregate Bond”) | An index of publicly issued investment grade U.S. government, mortgage-backed, asset-backed and corporate debt securities. | |
| Bloomberg U.S. Treasury Inflation Protected Securities Index (“TIPS Index”) | A market index comprised of all U.S. Treasury Inflation Linked Securities. |
VY® BLACKROCK INFLATION PROTECTED |
VVY® BlackRock Inflation Protected Bond Portfolio (the “Portfolio”) seeks to maximize real return, consistent with preservation of real capital and prudent investment management. The Portfolio is managed by Chris Allen, Managing Director and Akiva Dickstein, Managing Director, Portfolio Managers of BlackRock Financial Management, Inc. — the Sub-Adviser.
Performance: For the year ended December 31, 2021, the Portfolio’s Class I shares provided a total return of 5.25% compared to the Bloomberg U.S. Treasury Inflation Protected Securities Index (“TIPS Index” or “TIPS”) which returned 5.96% for the same period.
Portfolio Specifics: The Portfolio was broadly positioned for a risk-on, reflationary environment entering 2021. The Portfolio’s tactical underweight positions in U.S. treasury inflation protected securities detracted from performance as heightened inflation prints and concerns of prolonged inflation pushed real rates lower across the curve. This triggered a significant rally in US real rates, especially in the second quarter. The Portfolio’s outright short in UK breakevens also detracted from performance as inflation expectations in the UK rose significantly over 2021. This was materially exacerbated in late third quarter as the acute energy shortage in the UK caused a material spike in front-end breakevens. Against a similar backdrop, persistent upside surprises in European inflation data fueled a sizeable expansion in EU inflation expectations that hurt the Portfolio’s short in Germany breakevens.
Investment Type Allocation as of December 31, 2021 (as a percentage of net assets) | |||||
| U.S. Treasury Obligations | 50.8 | % | |||
| Corporate Bonds/Notes | 26.7 | % | |||
| U.S. Government Agency Obligations | 9.8 | % | |||
| Commercial Mortgage-Backed Securities | 4.5 | % | |||
| Sovereign Bonds | 2.3 | % | |||
| Asset-Backed Securities | 2.0 | % | |||
| Certificates of Deposit | 1.8 | % | |||
| Purchased Options | 0.4 | % | |||
| Assets in Excess of Other Liabilities* | 1.7 | % | |||
| Net Assets | 100.0 | % | |||
| * Includes short-term investments. | |||||
| Portfolio holdings are subject to change daily. | |||||
The Portfolio’s relative value positions between U.S. vs. EU breakevens detracted from performance. Our tactical interest rate volatility positions erased their gains from the first half of the year and the third quarter as interest rate volatility increased over November and December. Our structural underweight in U.S. nominal rates was the most notable contributor to performance over the year. Hawkish comments from the U.S. Federal Reserve Board (the “Fed”) brought forward market participants’ timeline on the tapering of asset purchase program and rate hike projections, triggering a significant repricing in the rates market. Our tactical positions in Italy, Spain, and New Zealand breakevens further pared some of the underperformance. The Portfolio also benefitted from overweight allocations in agency mortgages, investment grade credit, and securitized assets.
Top Ten Holdings as of December 31, 2021* (as a percentage of net assets) | |||||
| United States Treasury Inflation Indexed Bonds, 0.500%, 01/15/28 | 3.4 | % | |||
| United States Treasury Inflation Indexed Bonds, 0.750%, 07/15/28 | 3.3 | % | |||
| United States Treasury Inflation Indexed Bonds, 0.375%, 07/15/27 | 3.0 | % | |||
| United States Treasury Inflation Indexed Bonds, 0.125%, 01/15/30 | 2.9 | % | |||
| United States Treasury Inflation Indexed Bonds, 0.125%, 07/15/30 | 2.8 | % | |||
| United States Treasury Inflation Indexed Bonds, 0.125%, 01/15/31 | 2.7 | % | |||
| United States Treasury Inflation Indexed Bonds, 0.125%, 07/15/31 | 2.4 | % | |||
| United States Treasury Inflation Indexed Bonds, 0.375%, 01/15/27 | 2.3 | % | |||
| United States Treasury Inflation Indexed Bonds, 1.375%, 02/15/44 | 2.2 | % | |||
| United States Treasury Inflation Indexed Bonds, 0.750%, 02/15/45 | 2.1 | % | |||
| * Excludes short-term investments. | |||||
| Portfolio holdings are subject to change daily. | |||||
Market Overview: The global markets in 2021 were influenced by the COVID-19 pandemic and geopolitical uncertainty. The year started with a reflationary outlook and increased expectations for stronger growth as interest rates moved higher and spread sectors moved marginally tighter. A few key events led to the rise in yields throughout January and February, in our view. Notably, the vaccine rollout that had accelerated, and the passing of the $1.9 trillion fiscal stimulus package with the potential of more infrastructure stimulus in the coming months. The significant pick-up in government bond yields rattled investors’ confidence as the market pulled forward its estimate on when the Fed would start lifting rates, but the Fed remained dovish for much of 2021 which kept interest rates in the long end of the curve anchored along with general demand from pensions funds. Inflation expectations moved higher over this period given the strong risk sentiment. As we moved into the summer, COVID-19 was not as much of a risk in the market given the vaccination progress and the economy continued to reopen. Spread sectors continued to perform well given this optimism and the curve flattened as inflation moved higher and continued to price in a more hawkish Fed. Risk assts remained resilient for much of the rest of the year but wobbled around concerns stemming from the Delta and Omicron variants and their risks to the economy and slowing growth in China. Late in the year the Fed became even more hawkish to combat higher inflation announcing it was doubling the pace of tapering to end in March and signaling three rate hikes in 2022. Overall, the consumer was extremely healthy in 2021, the employment picture continued to improve with record numbers of jobs added and inflation was running at elevated levels. Inflation prints in Europe and the UK surpassed consensus expectations over the period, pointing toward a steady increase in price levels, in our opinion. In December, the Bank of England (“BoE”) became one of the first major central banks to raise interest rates to 0.25% since the pandemic.
Current Strategy and Outlook: U.S.: In our view, the sharp hawkish pivot from the Fed in late 2021 will result in a bearish shift and significant repricing in the rates market. We believe by increasing the pace of taper and pulling forward rate hikes,
| VY® BLACKROCK INFLATION PROTECTED BOND PORTFOLIO | PORTFOLIO MANAGERS’ REPORT |
the Fed’s hawkish pivot will likely exert pressure on duration-sensitive assets and push yields higher across the curve. We believe the Fed indicated the shift in policy as warranted given incoming data on wages, inflation, and employment, all of which suggested that the economy was rapidly closing in on full employment, and inflationary pressures were proving more persistent than expected. The Fed now sees the inflation side of its dual mandate as being met and is now priming the market for rate hikes to reach maximum employment. In our view, the Fed has established a degree of distinction between short-run and long-run maximum employment and, as a result, could lift off from the zero-lower bound before participation has fully rebounded. We expect three 25 bps rate hikes in 2022, with the first one coming in March.
| PORTFOLIO MANAGERS’ REPORT | VY® BLACKROCK INFLATION PROTECTED |

| Average Annual Total Returns for the Periods Ended December 31, 2021 | ||||||||||||||||
| 1 Year | 5 Year | 10 Year | ||||||||||||||
| Class ADV | 4.54 | % | 4.40 | % | 2.05 | % | ||||||||||
| Class I | 5.25 | % | 5.02 | % | 2.66 | % | ||||||||||
| Class S | 4.94 | % | 4.77 | % | 2.41 | % | ||||||||||
| TIPS | 5.96 | % | 5.34 | % | 3.09 | % | ||||||||||
Based on a $10,000 initial investment, the graph and table above illustrate the total return of VY® BlackRock Inflation Protected Bond Portfolio against the index indicated. The index is unmanaged and has no cash in its portfolio and imposes no sales charges. An investor cannot invest directly in an index.
The Portfolio’s performance is shown without the imposition of any expenses or charges which are, or may be, imposed under your variable annuity contract or variable life insurance policy. Total returns would have been lower if such expenses or charges were included.
The performance graph and table do not reflect the deduction of taxes that a shareholder will pay on Portfolio distributions or the redemption of Portfolio shares.
The performance shown includes, if applicable, the effect of fee waivers and/or expense reimbursements by the Investment Adviser and/or other
service providers, which have the effect of increasing total return. Had all fees and expenses been considered, the total returns would have been lower.
The performance update illustrates performance for a variable investment option available through a variable annuity contract or a variable life insurance policy. The performance shown indicates past performance and is not a projection or prediction of future results. Actual investment returns and principal value will fluctuate so that shares and/or units, at redemption, may be worth more or less than their original cost. Please log on to www.voyainvestments.com or call (800) 366-0066 to get performance through the most recent month end.
Portfolio holdings are subject to change daily.
| VY® BRANDYWINEGLOBAL — BOND PORTFOLIO | PORTFOLIO MANAGERS’ REPORT |
Investment Type Allocation
as of December 31, 2021
(as a percentage of net assets)
| U.S. Treasury Obligations | 49.8 | % | ||||
| Corporate Bonds/Notes | 25.9 | % | ||||
| U.S. Government Agency Obligations | 17.0 | % | ||||
| Commercial Mortgage-Backed Securities | 4.8 | % | ||||
| Collateralized Mortgage Obligations | 0.5 | % | ||||
| Asset-Backed Securities | 0.2 | % | ||||
| Assets in Excess of Other Liabilities* | 1.8 | % | ||||
| Net Assets | 100.0 | % |
| * | Includes short-term investments. |
Portfolio holdings are subject to change daily.
VY® BrandywineGLOBAL — Bond Portfolio (the “Portfolio”) seeks total return consisting of capital appreciation and income. The Portfolio is managed by David F. Hoffman, CFA, John P. McIntyre, CFA, and Anujeet Sareen, CFA, Portfolio Managers of Brandywine Global Investment Management, LLC (“Brandywine”). — the Sub-Adviser.
Performance: For the year-ended December 31, 2021, the Portfolio’s shares provided a total return of 1.15% compared to the Bloomberg U.S. Aggregate Bond Index (“Bloomberg U.S. Aggregate Bond”), which returned -1.54% for the same period.
Portfolio Specifics — We maintained an underweight duration position versus the Bloomberg U.S. Aggregate Bond for the full calendar year in 2021. We felt that interest rates had the potential to rise as the economy re-opened and normalized and we wanted to minimize interest rate sensitivity in the Portfolio. This underweight positioning was the primary driver of both absolute and relative returns for the full calendar year as rates moved higher during the year. However, the move higher in rates was not linear as U.S. rates increased in the first few months of the year, declined in the summer months, and then moved higher again to finish the calendar year.
We began the year with a significant underweight in U.S. treasury duration which included a short exposure to longer dated U.S. treasuries. This positioning contributed to significant outperformance during the first quarter of the year as rates moved significantly higher. The short exposure was used as an offset to the duration of our corporate credit positions, with an aim to reduce interest sensitivity of the Portfolio. As rates declined in the summer months and began to move higher in the fall, our macro outlook shifted, and we modestly increased U.S. treasury duration and closed our short treasury position.
Top Ten Holdings
as of December 31, 2021
(as a percentage of net assets)
| United States Treasury Floating Rate Note, 0.140%, 10/31/22 | 18.6 | % | ||||
| United States Treasury Floating Rate Note, 0.134%, 01/31/23 | 15.1 | % | ||||
| Federal Home Loan Banks, 0.125%, 03/17/23 | 8.5 | % | ||||
| Freddie Mac, 0.375%, 05/05/23 | 8.5 | % | ||||
| United States Treasury Floating Rate Note, 0.140%, 07/31/22 | 7.7 | % | ||||
| United States Treasury Bond, 2.000%, 08/15/51 | 4.1 | % | ||||
| FREMF 2012-K23 B Mortgage Trust, 3.656%, 10/25/45 | 2.8 | % | ||||
| Marathon Oil Corp., 6.600%, 10/01/37 | 2.4 | % | ||||
| United States Treasury Bond, 1.875%, 11/15/51 | 2.2 | % | ||||
| United States Treasury Floating Rate Note, 0.119%, 04/30/23 | 2.1 | % |
Portfolio holdings are subject to change daily.
Our investment grade corporate credit exposures contributed to performance in 2021 but we continued to reduce exposure to this sector throughout the year due to rich valuations. Corporate credit spreads are close to all time highs and we tend to exit the sector when spreads tighten. We finished the year with approximately one year of corporate credit duration exposure which is down from a high of over four years in calendar year 2020.
Current Strategy and Outlook: Our outlook for 2022 remains constructive for growth in the U.S. and Globally. We expect global markets to move from a recovery phase to an expansion phase with the U.S. leading and China lagging from a growth perspective. We are closely monitoring a number of important macro considerations as we move into the new year. A few of the key areas of focus will be on household savings, bank lending, inflation, global monetary policy, and the continuing COVID-19 pandemic. We are maintaining an underweight duration position to protect against the potential of a further rise in rates.
The views expressed in this commentary are informed opinions. They should not be considered promises or advice. The views expressed reflect those of the portfolio managers, only through the end of the period as stated on the cover. The portfolio managers’ views are subject to change at any time based on market and other conditions.
Portfolio holdings and characteristics are subject to change and may not be representative of current holdings and characteristics. Portfolio holdings are subject to change daily. The outlook for this Portfolio may differ from that presented for other Voya mutual funds. This report contains statements that may be “forward-looking” statements. Actual results may differ materially from those projected in the “forward-looking” statements. The Portfolio’s performance returns shown reflect applicable fee waivers and/or expense limits in effect during this period. Absent such fee waivers/expense limitations, if any, performance would have been lower. Performance for the different classes of shares will vary based on differences in fees associated with each class. An index has no cash in its portfolio and imposes no sales charges. An investor cannot invest directly in an index.
| PORTFOLIO MANAGERS’ REPORT | VY® BRANDYWINEGLOBAL — BOND PORTFOLIO |

| Average Annual Total Returns for the Periods Ended December 31, 2021 | ||||||||||||||
|---|---|---|---|---|---|---|---|---|---|---|---|---|---|---|
| 1 Year | 5 Year | Since Inception February 20, 2015 | ||||||||||||
VY® BrandywineGLOBAL - Bond Portfolio | 1.15 | % | 5.78 | % | 4.62 | % | ||||||||
| Bloomberg U.S. Aggregate Bond Index | -1.54 | % | 3.57 | % | 2.99 | % | ||||||||
| Actual Portfolio Return | Hypothetical (5% return before expenses) | |||||||||||||||||||||||||||||||||
| Beginning Account Value July 1, 2021 | Ending Account Value December 31, 2021 | Annualized Expense Ratio | Expenses Paid During the Period Ended December 31, 2021* | Beginning Account Value July 1, 2021 | Ending Account Value December 31, 2021 | Annualized Expense Ratio | Expenses Paid During the Period Ended December 31, 2021* | |||||||||||||||||||||||||||
VY® BlackRock Inflation Protected Bond Portfolio | ||||||||||||||||||||||||||||||||||
| Class ADV | $ | 1,000.00 | $ | 1,034.10 | 1.18 | % | $ | 6.05 | $ | 1,000.00 | $ | 1,019.26 | 1.18 | % | $ | 6.01 | ||||||||||||||||||
| Class I | 1,000.00 | 1,036.70 | 0.58 | 2.98 | 1,000.00 | 1,022.28 | 0.58 | 2.96 | ||||||||||||||||||||||||||
| Class S | 1,000.00 | 1,035.70 | 0.83 | 4.26 | 1,000.00 | 1,021.02 | 0.83 | 4.23 | ||||||||||||||||||||||||||
VY® BrandywineGLOBAL — Bond Portfolio | ||||||||||||||||||||||||||||||||||
| $ | 1,000.00 | $ | 998.30 | 0.58 | % | $ | 2.92 | $ | 1,000.00 | $ | 1,022.28 | 0.58 | % | $ | 2.96 | |||||||||||||||||||
| * | Expenses are equal to each Portfolio’s respective annualized expense ratios multiplied by the average account value over the period, multiplied by 184/365 to reflect the most recent fiscal half-year. |

February 24, 2022
| VY® BlackRock Inflation Protected Bond Portfolio | VY® BrandywineGLOBAL — Bond Portfolio | ||||||||||
ASSETS: | |||||||||||
| Investments in securities at fair value* | $ | 319,111,129 | $ | 337,265,517 | |||||||
| Short-term investments at fair value† | 25,893,895 | 5,134,368 | |||||||||
| Cash collateral for futures contracts | — | 480,927 | |||||||||
| Cash pledged for centrally cleared swaps (Note 2) | 4,179,490 | — | |||||||||
| Cash pledged as collateral for OTC derivatives (Note 2) | 360,000 | — | |||||||||
| Foreign currencies at value‡ | 621,216 | — | |||||||||
| Receivables: | |||||||||||
| Investment securities sold | 1,701,739 | — | |||||||||
| Investment securities sold on a delayed-delivery or when-issued basis | 15,969,709 | — | |||||||||
| Fund shares sold | 667,717 | 100,930 | |||||||||
| Dividends | 173 | 136 | |||||||||
| Interest | 1,142,898 | 817,590 | |||||||||
| Unrealized appreciation on forward foreign currency contracts | 114,662 | — | |||||||||
| Unrealized appreciation on OTC swap agreements | 1,463,650 | — | |||||||||
| Prepaid expenses | 27 | 28 | |||||||||
| Other assets | 18,983 | 6,467 | |||||||||
| Total assets | 371,245,288 | 343,805,963 | |||||||||
LIABILITIES: | |||||||||||
| Payable for investment securities purchased | 2,051,836 | — | |||||||||
| Payable for investment securities purchased on a delayed-delivery or when-issued basis | 40,384,957 | — | |||||||||
| Payable for fund shares redeemed | 62,082 | 128,419 | |||||||||
| Unrealized depreciation on forward foreign currency contracts | 43,132 | — | |||||||||
| Unrealized depreciation on OTC swap agreements | 180,826 | — | |||||||||
| Variation margin payable on centrally cleared swaps | 153,258 | — | |||||||||
| Variation margin payable on futures contracts | 192,922 | 75,224 | |||||||||
| Cash received as collateral for OTC derivatives (Note 2) | 1,532,000 | — | |||||||||
| Payable for investment management fees | 131,574 | 178,142 | |||||||||
| Payable for distribution and shareholder service fees | 64,770 | — | |||||||||
| Payable to trustees under the deferred compensation plan (Note 6) | 18,983 | 6,467 | |||||||||
| Payable for trustee fees | 1,543 | 1,691 | |||||||||
| Other accrued expenses and liabilities | 100,854 | 87,053 | |||||||||
| Written options, at fair valueˆ | 1,685,413 | — | |||||||||
| Total liabilities | 46,604,150 | 476,996 | |||||||||
NET ASSETS | $ | 324,641,138 | $ | 343,328,967 | |||||||
NET ASSETS WERE COMPRISED OF: | |||||||||||
| Paid-in capital | $ | 362,024,315 | $ | 321,276,107 | |||||||
| Total distributable earnings (loss) | (37,383,177 | ) | 22,052,860 | ||||||||
NET ASSETS | $ | 324,641,138 | $ | 343,328,967 | |||||||
| * Cost of investments in securities | $ | 301,545,535 | $ | 332,305,058 | |||||||
† Cost of short-term investments | $ | 26,000,285 | $ | 5,134,368 | |||||||
‡ Cost of foreign currencies | $ | 614,657 | $ | — | |||||||
| ^ Premiums received on written options | $ | 1,729,882 | $ | — | |||||||
| VY® BlackRock Inflation Protected Bond Portfolio | VY® BrandywineGLOBAL — Bond Portfolio | |||||||||
Class ADV | ||||||||||
| Net assets | $ | 56,856,802 | n/a | |||||||
| Shares authorized | unlimited | n/a | ||||||||
| Par value | $ | 0.001 | n/a | |||||||
| Shares outstanding | 5,411,724 | n/a | ||||||||
| Net asset value and redemption price per share | $ | 10.51 | n/a | |||||||
Class I | ||||||||||
| Net assets | $ | 94,962,489 | n/a | |||||||
| Shares authorized | unlimited | n/a | ||||||||
| Par value | $ | 0.001 | n/a | |||||||
| Shares outstanding | 8,683,399 | n/a | ||||||||
| Net asset value and redemption price per share | $ | 10.94 | n/a | |||||||
Class S | ||||||||||
| Net assets | $ | 172,821,847 | n/a | |||||||
| Shares authorized | unlimited | n/a | ||||||||
| Par value | $ | 0.001 | n/a | |||||||
| Shares outstanding | 15,933,497 | n/a | ||||||||
| Net asset value and redemption price per share | $ | 10.85 | n/a | |||||||
Portfolio(1) | ||||||||||
| Net assets | n/a | $ | 343,328,967 | |||||||
| Shares authorized | n/a | unlimited | ||||||||
| Par value | n/a | $ | 0.001 | |||||||
| Shares outstanding | n/a | 30,601,792 | ||||||||
| Net asset value and redemption price per share | n/a | $ | 11.22 | |||||||
| (1) | Portfolio does not have a share class designation. |
| VY® BlackRock Inflation Protected Bond Portfolio | VY® BrandywineGLOBAL — Bond Portfolio | ||||||||||
INVESTMENT INCOME: | |||||||||||
| Dividends | $ | 2,257 | $ | 2,339 | |||||||
| Interest, net of foreign taxes withheld* | 10,228,729 | (1) | 4,797,971 | ||||||||
| Total investment income | 10,230,986 | 4,800,310 | |||||||||
EXPENSES: | |||||||||||
| Investment management fees | 1,642,904 | 1,690,421 | |||||||||
| Distribution and shareholder service fees: | |||||||||||
| Class ADV | 301,871 | — | |||||||||
| Class S | 407,397 | — | |||||||||
| Transfer agent fees: | — | 1,762 | |||||||||
| Class ADV | 13,273 | — | |||||||||
| Class I | 25,146 | — | |||||||||
| Class S | 42,989 | — | |||||||||
| Shareholder reporting expense | 12,211 | 1,930 | |||||||||
| Registration fees | — | 5,169 | |||||||||
| Professional fees | 51,081 | 51,072 | |||||||||
| Custody and accounting expense | 111,120 | 58,690 | |||||||||
| Trustee fees | 12,343 | 13,523 | |||||||||
| Miscellaneous expense | 10,063 | 6,276 | |||||||||
| Interest expense | 156 | — | |||||||||
| Total expenses | 2,630,554 | 1,828,843 | |||||||||
| Recouped/(Waived and reimbursed fees) | (134,225 | ) | 138,785 | ||||||||
| Net expenses | 2,496,329 | 1,967,628 | |||||||||
| Net investment income | 7,734,657 | 2,832,682 | |||||||||
REALIZED AND UNREALIZED GAIN (LOSS): | |||||||||||
| Net realized gain (loss) on: | |||||||||||
| Investments | 6,941,094 | 9,687,393 | |||||||||
| Forward foreign currency contracts | 486,557 | — | |||||||||
| Foreign currency related transactions | 31,580 | — | |||||||||
| Futures | (340,900 | ) | 5,033,822 | ||||||||
| Swaps | 2,067,768 | — | |||||||||
| Written options | 368,489 | — | |||||||||
| Net realized gain | 9,554,588 | 14,721,215 | |||||||||
| Net change in unrealized appreciation (depreciation) on: | |||||||||||
| Investments | (8,006,328 | ) | (13,348,508 | ) | |||||||
| Forward foreign currency contracts | 308,830 | — | |||||||||
| Foreign currency related transactions | 4,914 | — | |||||||||
| Futures | (304,458 | ) | (453,656 | ) | |||||||
| Swaps | 5,651,419 | — | |||||||||
| Written options | (171,019 | ) | — | ||||||||
| Net change in unrealized appreciation (depreciation) | (2,516,642 | ) | (13,802,164 | ) | |||||||
| Net realized and unrealized gain | 7,037,946 | 919,051 | |||||||||
Increase in net assets resulting from operations | $ | 14,772,603 | $ | 3,751,733 | |||||||
| * Foreign taxes withheld | $ | 159 | $ | — | |||||||
| (1) | Includes net inflationary and deflationary adjustments. See Note 2 of the Notes to Financial Statements. |
| VY® BlackRock Inflation Protected Bond Portfolio |
| VY® BrandywineGLOBAL — Bond Portfolio | ||||||||||||||
| Year Ended December 31, 2021 | Year Ended December 31, 2020 | Year Ended December 31, 2021 | Year Ended December 31, 2020 | |||||||||||||
FROM OPERATIONS: | ||||||||||||||||
| Net investment income | $ | 7,734,657 | $ | 2,498,353 | $ | 2,832,682 | $ | 5,435,938 | ||||||||
| Net realized gain | 9,554,588 | 8,870,565 | 14,721,215 | 21,289,037 | ||||||||||||
| Net change in unrealized appreciation (depreciation) | (2,516,642 | ) | 18,038,735 | (13,802,164 | ) | 18,184,526 | ||||||||||
| Increase in net assets resulting from operations | 14,772,603 | 29,407,653 | 3,751,733 | 44,909,501 | ||||||||||||
FROM DISTRIBUTIONS TO SHAREHOLDERS: | ||||||||||||||||
| Total distributions (excluding return of capital): | (27,082,394 | ) | (7,776,746 | ) | ||||||||||||
| Class ADV | (1,140,854 | ) | (369,573 | ) | — | — | ||||||||||
| Class I | (2,600,461 | ) | (1,038,565 | ) | — | — | ||||||||||
| Class S | (4,058,689 | ) | (1,464,646 | ) | — | — | ||||||||||
| Return of capital: | ||||||||||||||||
| Class ADV | — | (258,130 | ) | — | — | |||||||||||
| Class I | — | (465,220 | ) | — | — | |||||||||||
| Class S | — | (834,668 | ) | — | — | |||||||||||
| Total distributions | (7,800,004 | ) | (4,430,802 | ) | (27,082,394 | ) | (7,776,746 | ) | ||||||||
FROM CAPITAL SHARE TRANSACTIONS: | ||||||||||||||||
| Net proceeds from sale of shares | 83,578,121 | 59,965,213 | 86,294,017 | 216,779,069 | ||||||||||||
| Reinvestment of distributions | 7,796,663 | 4,430,802 | 27,082,394 | 7,776,746 | ||||||||||||
| 91,374,784 | 64,396,015 | 113,376,411 | 224,555,815 | |||||||||||||
| Cost of shares redeemed | (73,208,287 | ) | (67,828,595 | ) | (65,382,155 | ) | (125,915,207 | ) | ||||||||
| Net increase (decrease) in net assets resulting from capital share transactions | 18,166,497 | (3,432,580 | ) | 47,994,256 | 98,640,608 | |||||||||||
| Net increase in net assets | 25,139,096 | 21,544,271 | 24,663,595 | 135,773,363 | ||||||||||||
NET ASSETS: | ||||||||||||||||
| Beginning of year or period | 299,502,042 | 277,957,771 | 318,665,372 | 182,892,009 | ||||||||||||
| End of year or period | $ | 324,641,138 | $ | 299,502,042 | $ | 343,328,967 | $ | 318,665,372 | ||||||||
| Income (loss) from investment operations | Less distributions | Ratios to average net assets | Supplemental data | |||||||||||||||||||||||||||||||||||||||||||||||||||||||||||||||||
| Year or period | Net asset value, beginning of year or period | Net investment income (loss) | Net realized and unrealized gain (loss) | Total from investment operations | From net investment income | From net realized gains | From return of capital | Total distributions | Payment by affiliate | Net asset value, end of year or period | Total Return(1) | Expenses before reductions/ additions(2)(3)(4) | Expenses net of fee waivers and/or recoupments if any(2)(3)(4) | Expenses net of all reductions/ additions(2)(3)(4) | Net investment income (loss)(2)(3) | Net assets, end of year or period | Portfolio turnover rate | |||||||||||||||||||||||||||||||||||||||||||||||||||
| ended | ($) | ($) | ($) | ($) | ($) | ($) | ($) | ($) | ($) | ($) | (%) | (%) | (%) | (%) | (%) | ($000’s) | (%) | |||||||||||||||||||||||||||||||||||||||||||||||||||
VY® BlackRock Inflation Protected Bond Portfolio | ||||||||||||||||||||||||||||||||||||||||||||||||||||||||||||||||||||
Class ADV | ||||||||||||||||||||||||||||||||||||||||||||||||||||||||||||||||||||
| 12-31-21 | 10.28 | 0.22 | • | 0.24 | 0.46 | 0.23 | — | — | 0.23 | — | 10.51 | 4.54 | 1.22 | 1.18 | 1.18 | 2.14 | 56,857 | 156 | ||||||||||||||||||||||||||||||||||||||||||||||||||
| 12-31-20 | 9.42 | 0.05 | 0.95 | 1.00 | 0.08 | — | 0.06 | 0.14 | — | 10.28 | 10.65 | 1.26 | 1.22 | 1.22 | 0.52 | 47,352 | 87 | |||||||||||||||||||||||||||||||||||||||||||||||||||
| 12-31-19 | 8.93 | 0.11 | 0.56 | 0.67 | 0.18 | — | — | 0.18 | — | 9.42 | 7.53 | 1.20 | 1.16 | 1.16 | 1.23 | 44,885 | 72 | |||||||||||||||||||||||||||||||||||||||||||||||||||
| 12-31-18 | 9.30 | 0.14 | (0.36 | ) | (0.22 | ) | 0.15 | — | — | 0.15 | — | 8.93 | (2.39 | ) | 1.18 | 1.14 | 1.14 | 1.47 | 44,035 | 63 | ||||||||||||||||||||||||||||||||||||||||||||||||
| 12-31-17 | 9.17 | 0.09 | 0.11 | 0.20 | 0.07 | — | — | 0.07 | — | 9.30 | 2.16 | 1.17 | 1.13 | 1.13 | 0.94 | 49,769 | 101 | |||||||||||||||||||||||||||||||||||||||||||||||||||
Class I | ||||||||||||||||||||||||||||||||||||||||||||||||||||||||||||||||||||
| 12-31-21 | 10.68 | 0.30 | • | 0.25 | 0.55 | 0.29 | — | — | 0.29 | — | 10.94 | 5.25 | 0.62 | 0.58 | 0.58 | 2.75 | 94,962 | 156 | ||||||||||||||||||||||||||||||||||||||||||||||||||
| 12-31-20 | 9.78 | 0.12 | 0.97 | 1.09 | 0.13 | — | 0.06 | 0.19 | — | 10.68 | 11.15 | 0.66 | 0.62 | 0.62 | 1.11 | 92,767 | 87 | |||||||||||||||||||||||||||||||||||||||||||||||||||
| 12-31-19 | 9.26 | 0.18 | 0.57 | 0.75 | 0.23 | — | — | 0.23 | — | 9.78 | 8.21 | 0.60 | 0.56 | 0.56 | 1.98 | 88,759 | 72 | |||||||||||||||||||||||||||||||||||||||||||||||||||
| 12-31-18 | 9.66 | 0.20 | • | (0.37 | ) | (0.17 | ) | 0.23 | — | — | 0.23 | — | 9.26 | (1.75 | ) | 0.58 | 0.54 | 0.54 | 2.14 | 40,731 | 63 | |||||||||||||||||||||||||||||||||||||||||||||||
| 12-31-17 | 9.55 | 0.15 | 0.11 | 0.26 | 0.15 | — | — | 0.15 | — | 9.66 | 2.72 | 0.57 | 0.53 | 0.53 | 1.55 | 223,463 | 101 | |||||||||||||||||||||||||||||||||||||||||||||||||||
Class S | ||||||||||||||||||||||||||||||||||||||||||||||||||||||||||||||||||||
| 12-31-21 | 10.60 | 0.26 | • | 0.26 | 0.52 | 0.27 | — | — | 0.27 | — | 10.85 | 4.94 | 0.87 | 0.83 | 0.83 | 2.48 | 172,822 | 156 | ||||||||||||||||||||||||||||||||||||||||||||||||||
| 12-31-20 | 9.70 | 0.09 | 0.97 | 1.06 | 0.10 | — | 0.06 | 0.16 | — | 10.60 | 10.95 | 0.91 | 0.87 | 0.87 | 0.86 | 159,383 | 87 | |||||||||||||||||||||||||||||||||||||||||||||||||||
| 12-31-19 | 9.18 | 0.15 | 0.58 | 0.73 | 0.21 | — | — | 0.21 | — | 9.70 | 8.01 | 0.85 | 0.81 | 0.81 | 1.57 | 144,313 | 72 | |||||||||||||||||||||||||||||||||||||||||||||||||||
| 12-31-18 | 9.57 | 0.17 | (0.36 | ) | (0.19 | ) | 0.20 | — | — | 0.20 | — | 9.18 | (2.04 | ) | 0.83 | 0.79 | 0.79 | 1.83 | 153,793 | 63 | ||||||||||||||||||||||||||||||||||||||||||||||||
| 12-31-17 | 9.45 | 0.13 | 0.10 | 0.23 | 0.11 | — | — | 0.11 | — | 9.57 | 2.48 | 0.82 | 0.78 | 0.78 | 1.29 | 160,890 | 101 | |||||||||||||||||||||||||||||||||||||||||||||||||||
VY® BrandywineGLOBAL- Bond Portfolio | ||||||||||||||||||||||||||||||||||||||||||||||||||||||||||||||||||||
| 12-31-21 | 12.03 | 0.10 | • | 0.04 | 0.14 | 0.19 | 0.76 | — | 0.95 | — | 11.22 | 1.15 | 0.54 | 0.58 | 0.58 | 0.84 | 343,329 | 57 | ||||||||||||||||||||||||||||||||||||||||||||||||||
| 12-31-20 | 10.51 | 0.22 | • | 1.59 | 1.81 | 0.21 | 0.08 | — | 0.29 | — | 12.03 | 17.47 | 0.56 | 0.58 | 0.58 | 1.92 | 318,665 | 134 | ||||||||||||||||||||||||||||||||||||||||||||||||||
| 12-31-19 | 9.73 | 0.25 | • | 0.73 | 0.98 | 0.20 | — | — | 0.20 | — | 10.51 | 10.12 | 0.61 | 0.58 | 0.58 | 2.48 | 182,892 | 449 | ||||||||||||||||||||||||||||||||||||||||||||||||||
| 12-31-18 | 10.12 | 0.26 | • | (0.43 | ) | (0.17 | ) | 0.22 | — | — | 0.22 | — | 9.73 | (1.65 | ) | 0.71 | 0.58 | 0.58 | 2.61 | 194,159 | 457 | |||||||||||||||||||||||||||||||||||||||||||||||
| 12-31-17 | 10.06 | 0.22 | • | 0.07 | 0.29 | 0.23 | — | — | 0.23 | — | 10.12 | 2.93 | 0.69 | 0.58 | 0.58 | 2.16 | 214,952 | 345 | ||||||||||||||||||||||||||||||||||||||||||||||||||
(1) | Total return is calculated assuming reinvestment of all dividends, capital gain distributions and return of capital distributions, if any, at net asset value and does not reflect the effect of insurance contract charges. Total return for periods less than one year is not annualized. | |
(2) | Annualized for periods less than one year. | |
(3) | Ratios reflect operating expenses of a Portfolio. Expenses before reductions/additions do not reflect amounts reimbursed or recouped by the Investment Adviser and/or Distributor or reductions from brokerage service arrangements or other expense offset arrangements and do not represent the amount paid by a Portfolio during periods when reimbursements or reductions occur. |
| Expenses net of fee waivers reflect expenses after reimbursement by the Investment Adviser and/or Distributor or recoupment of previously reimbursed fees by the Investment Adviser, but prior to reductions from brokerage service arrangements or other expense offset arrangements. Expenses net of all reductions/additions represent the net expenses paid by a Portfolio. Net investment income (loss) is net of all such additions or reductions. | ||
(4) | Ratios do not include fees and expenses charged under the variable annuity contract or variable life insurance policy. | |
• | Calculated using average number of shares outstanding throughout the year or period. |
brokers. Futures contracts are valued at the final settlement price set by an exchange on which they are principally traded. Listed options are valued at the mean between the last bid and ask prices from the exchange on which they are principally traded. Investments in open-end registered investment companies that do not trade on an exchange are valued at the end of day NAV per share. Investments in registered investment companies that trade on an exchange are valued at the last sales price or official closing price as of the close of the regular trading session on the exchange where the security is principally traded.
Quoted prices in active markets for identical securities are classified as “Level 1,” inputs other than quoted prices for an asset or liability that are observable are classified as “Level 2” and significant unobservable inputs, including the sub-advisers’ or Pricing Committee’s judgment about the assumptions that a market participant would use in pricing an asset or liability are classified as “Level 3.” The inputs used for valuing securities are not necessarily an indication of the risks associated with investing in those securities. Short-term securities of sufficient credit quality are generally considered to be Level 2 securities under applicable accounting rules. A table summarizing the Portfolios’ investments under these levels of classification is included within the Portfolio of Investments.
| (1) | Market value of investment securities, other assets and liabilities — at the exchange rates prevailing at Market Close. | |
| (2) | Purchases and sales of investment securities, income and expenses — at the rates of exchange prevailing on the respective dates of such transactions. |
| Purchased | Sold | |||||||
| BlackRock Inflation Protected Bond | $ | 79,136,617 | $ | 61,341,819 | ||||
| Bond Portfolio | 7,687,875 | 30,842,961 | ||||||
| Purchased | Written | |||||||
| Inflation rate caps | $ | 17,550,000 | $ | 17,550,000 | ||||
| Purchases | Sales | |||||||
| BlackRock Inflation Protected Bond | $ | 176,565,308 | $ | 154,620,082 | ||||
| Bond Portfolio | 47,788,323 | 128,273,576 | ||||||
| Purchases | Sales | |||||||
| BlackRock Inflation Protected Bond | $ | 319,665,746 | $ | 313,583,977 | ||||
| Bond Portfolio | 181,419,531 | 58,451,263 | ||||||
| Portfolio | Fee | |
BlackRock Inflation Protected Bond(1) | 0.55% on the first $200 million; 0.50% on the next $800 million; and 0.40% thereafter | |
| Bond Portfolio | 0.50% on the first $750 million; and 0.48% thereafter |
(1) | Effective September 1, 2021, the Investment Adviser has contractually agreed to waive 0.05% of the management fee. Any fees waived or reimbursed are not eligible for recoupment. Termination or modification of this obligation requires approval by the Board. Prior to September 1, 2021, the management fee waiver was 0.04%. |
| Portfolio | Sub-Adviser | |
| BlackRock Inflation Protected Bond | BlackRock Financial Management, Inc. | |
| Bond Portfolio | Brandywine Global Investment Management, LLC |
| Subsidiary/Affiliated Investment Company | Portfolio | Percentage | ||||
| Voya Institutional Trust Company | BlackRock Inflation Protected Bond | 18.47 | % | |||
| Voya Solution 2025 Portfolio | Bond Portfolio | 17.70 | ||||
| Voya Solution 2035 Portfolio | Bond Portfolio | 7.86 | ||||
| Voya Solution Income Portfolio | Bond Portfolio | 11.46 | ||||
| Portfolio | Amount | |||
| BlackRock Inflation Protected Bond | $ | 79,957 | ||
| Bond Portfolio | — | |||
| Portfolio | Maximum Operating Expense Limit (as a percentage of net assets) | |
| BlackRock Inflation Protected Bond | Class ADV: 1.23% Class I: 0.63% Class S: 0.88% | |
| Bond Portfolio | 0.58% |
| December 31, | ||||||||||||||||
| Portfolio | 2022 | 2023 | 2024 | Total | ||||||||||||
| Bond Portfolio | $ | 46,992 | $ | — | $ | — | $ | 46,992 | ||||||||
| Portfolio | Days Utilized | Approximate Average Daily Balance For Days Utilized | Approximate Weighted Average Interest Rate For Days Utilized | |||||||||
| BlackRock Inflation Protected Bond | 2 | $ | 2,146,500 | 1.31 | % | |||||||
| Shares sold | Shares issued in merger | Reinvestment of distributions | Shares redeemed | Net increase (decrease) in shares outstanding | Shares sold | Proceeds from shares issued in merger | Reinvestment of distributions | Shares redeemed | Net increase (decrease) | |||||||||||||||||||||||||||||||
| Year or period ended | # | # | # | # | # | ($) | ($) | ($) | ($) | ($) | ||||||||||||||||||||||||||||||
BlackRock Inflation Protected Bond | ||||||||||||||||||||||||||||||||||||||||
Class ADV | ||||||||||||||||||||||||||||||||||||||||
| 12/31/2021 | 1,290,830 | — | 109,761 | (597,143 | ) | 803,448 | 13,417,739 | — | 1,140,854 | (6,152,184 | ) | 8,406,409 | ||||||||||||||||||||||||||||
| 12/31/2020 | 577,915 | — | 63,818 | (796,757 | ) | (155,024 | ) | 5,686,844 | — | 627,703 | (7,736,821 | ) | (1,422,274 | ) | ||||||||||||||||||||||||||
Class I | ||||||||||||||||||||||||||||||||||||||||
| 12/31/2021 | 3,024,968 | — | 240,645 | (3,264,739 | ) | 874 | 32,490,424 | — | 2,597,120 | (35,144,233 | ) | (56,689 | ) | |||||||||||||||||||||||||||
| 12/31/2020 | 3,301,547 | — | 146,726 | (3,843,806 | ) | (395,533 | ) | 33,787,048 | — | 1,503,785 | (38,878,240 | ) | (3,587,407 | ) | ||||||||||||||||||||||||||
Class S | ||||||||||||||||||||||||||||||||||||||||
| 12/31/2021 | 3,522,483 | — | 378,853 | (3,005,965 | ) | 895,371 | 37,669,958 | — | 4,058,689 | (31,911,870 | ) | 9,816,777 | ||||||||||||||||||||||||||||
| 12/31/2020 | 2,037,324 | — | 225,742 | (2,105,881 | ) | 157,185 | 20,491,321 | — | 2,299,314 | (21,213,534 | ) | 1,577,101 | ||||||||||||||||||||||||||||
Bond Portfolio | ||||||||||||||||||||||||||||||||||||||||
| 12/31/2021 | 7,344,730 | — | 2,407,324 | (5,631,258 | ) | 4,120,796 | 86,294,017 | — | 27,082,394 | (65,382,155 | ) | 47,994,256 | ||||||||||||||||||||||||||||
| 12/31/2020 | 19,460,953 | — | 684,573 | (11,060,737 | ) | 9,084,789 | 216,779,069 | — | 7,776,746 | (125,915,207 | ) | 98,640,608 | ||||||||||||||||||||||||||||
| Year Ended December 31, 2021 | Year Ended December 31, 2020 | |||||||||||||||
| Ordinary Income | Long-term Capital Gain | Ordinary Income | Return of Capital | |||||||||||||
| BlackRock Inflation Protected Bond | $ | 7,800,004 | $ | — | $ | 2,872,784 | $ | 1,558,018 | ||||||||
| Bond Portfolio | 24,050,464 | 3,031,930 | 7,776,746 | — | ||||||||||||
| Undistributed Ordinary | Undistributed Long-term | Unrealized Appreciation/ | Capital Loss Carryforwards | Total Distributable | ||||||||||||||||||||||||||
| Income | Capital Gain | (Depreciation) | Amount | Character | Expiration | Other | Earnings/(Loss) | |||||||||||||||||||||||
| BlackRock Inflation Protected Bond | $ | 514,798 | $ | — | $ | 24,935,546 | $ | (1,477,247 | ) | Short-term | None | $ | (779,238 | ) | $ | (37,383,177 | ) | |||||||||||||
| (60,577,036 | ) | Long-term | None | |||||||||||||||||||||||||||
| $ | (62,054,283 | ) | ||||||||||||||||||||||||||||
| Bond Portfolio | 11,931,574 | 5,175,566 | 4,960,459 | $ | — | — | — | (14,739) | 22,052,860 | |||||||||||||||||||||
| Per Share Amount | Payable Date | Record Date | ||||||
BlackRock Inflation Protected Bond | ||||||||
| Class ADV | $ | 0.0313 | February 1, 2022 | January 28, 2022 | ||||
| Class I | $ | 0.0365 | February 1, 2022 | January 28, 2022 | ||||
| Class S | $ | 0.0343 | February 1, 2022 | January 28, 2022 | ||||
| VY® BLACKROCK INFLATION PROTECTED BOND PORTFOLIO | PORTFOLIO OF INVESTMENTS AS OF DECEMBER 31, 2021 |
| Principal Amount† | Value | Percentage of Net Assets | ||||||||||||
|---|---|---|---|---|---|---|---|---|---|---|---|---|---|---|
CORPORATE BONDS/NOTES: 26.7% | ||||||||||||||
| Basic Materials: 0.8% | ||||||||||||||
| 45,000 |
| Air Products and Chemicals, Inc., 2.800%, 05/15/2050 | $ | 46,237 | 0.0 | |||||||||
| 200,000 | (1) | Corp Nacional del Cobre de Chile, 3.750%, 01/15/2031 | 213,360 | 0.1 | ||||||||||
| 246,000 | DuPont de Nemours, Inc., 4.493%, 11/15/2025 | 272,037 | 0.1 | |||||||||||
| 4,000 | Ecolab, Inc., 2.700%, 12/15/2051 | 3,937 | 0.0 | |||||||||||
| 81,000 | Ecolab, Inc., 2.750%, 08/18/2055 | 79,722 | 0.0 | |||||||||||
| 746,000 | (1) | Georgia-Pacific LLC, 0.625%, 05/15/2024 | 736,637 | 0.2 | ||||||||||
| 371,000 | (1) | Glencore Funding LLC, 2.500%, 09/01/2030 | 359,719 | 0.1 | ||||||||||
| 51,000 | LYB International Finance III LLC, 4.200%, 05/01/2050 | 59,104 | 0.0 | |||||||||||
| 200,000 | (1) | MEGlobal Canada ULC, 5.875%, 05/18/2030 | 242,875 | 0.1 | ||||||||||
| 222,000 | (1) | Orbia Advance Corp. SAB de CV, 1.875%, 05/11/2026 | 218,991 | 0.1 | ||||||||||
| 213,000 | (1) | Suzano Austria GmbH, 5.750%, 07/14/2026 | 243,409 | 0.1 | ||||||||||
| 71,000 | Westlake Chemical Corp., 3.375%, 08/15/2061 | 67,919 | 0.0 | |||||||||||
| 2,543,947 | 0.8 | |||||||||||||
| Communications: 2.9% | ||||||||||||||
| 33,000 | AT&T, Inc., 1.650%, 02/01/2028 | 32,330 | 0.0 | |||||||||||
| 33,000 | AT&T, Inc., 2.250%, 02/01/2032 | 31,924 | 0.0 | |||||||||||
| 249,000 | AT&T, Inc., 3.100%, 02/01/2043 | 242,574 | 0.1 | |||||||||||
| 355,000 | AT&T, Inc., 3.300%, 02/01/2052 | 348,652 | 0.1 | |||||||||||
| 32,000 | AT&T, Inc., 3.500%, 06/01/2041 | 32,958 | 0.0 | |||||||||||
| 142,000 | AT&T, Inc., 3.800%, 12/01/2057 | 148,168 | 0.1 | |||||||||||
| 348,000 | AT&T, Inc., 4.300%, 02/15/2030 | 392,074 | 0.1 | |||||||||||
| 430,000 | AT&T, Inc., 4.350%, 03/01/2029 | 483,416 | 0.2 | |||||||||||
| 28,000 | AT&T, Inc., 4.500%, 05/15/2035 | 32,397 | 0.0 | |||||||||||
| 120,000 | AT&T, Inc., 5.150%, 02/15/2050 | 153,695 | 0.1 | |||||||||||
| 200,000 | (1) | Bharti Airtel Ltd., 3.250%, 06/03/2031 | 202,431 | 0.1 | ||||||||||
| 99,000 | Charter Communications Operating LLC / Charter Communications Operating Capital, 3.950%, 06/30/2062 | 95,618 | 0.0 | |||||||||||
| 728,000 | Charter Communications Operating LLC / Charter Communications Operating Capital, 5.750%, 04/01/2048 | 909,909 | 0.3 | |||||||||||
| 223,000 | Comcast Corp., 2.450%, 08/15/2052 | 200,269 | 0.1 | |||||||||||
| Principal Amount† | Value | Percentage of Net Assets | ||||||||||||
|---|---|---|---|---|---|---|---|---|---|---|---|---|---|---|
CORPORATE BONDS/NOTES: (continued) | ||||||||||||||
| Communications: (continued) | ||||||||||||||
| 499,000 | Comcast Corp., 3.400%, 04/01/2030 | $ | 545,143 | 0.2 | ||||||||||
| 395,000 | Comcast Corp., 4.150%, 10/15/2028 | 448,700 | 0.1 | |||||||||||
| 98,000 | Comcast Corp., 4.600%, 10/15/2038 | 119,121 | 0.0 | |||||||||||
| 83,000 | (1) | Cox Communications, Inc., 3.600%, 06/15/2051 | 87,130 | 0.0 | ||||||||||
| 74,000 | eBay, Inc., 1.400%, 05/10/2026 | 72,936 | 0.0 | |||||||||||
| 31,000 | Expedia Group, Inc., 3.250%, 02/15/2030 | 31,669 | 0.0 | |||||||||||
| 483,000 | Motorola Solutions, Inc., 2.750%, 05/24/2031 | 484,374 | 0.2 | |||||||||||
| 15,000 | (1) | T-Mobile USA, Inc., 3.400%, 10/15/2052 | 14,959 | 0.0 | ||||||||||
| 1,124,000 | T-Mobile USA, Inc., 3.750%, 04/15/2027 | 1,217,743 | 0.4 | |||||||||||
| 1,051,000 | Verizon Communications, Inc., 2.100%, 03/22/2028 | 1,053,767 | 0.3 | |||||||||||
| 929,000 | (1) | Verizon Communications, Inc., 2.355%, 03/15/2032 | 916,420 | 0.3 | ||||||||||
| 137,000 | Verizon Communications, Inc., 3.550%, 03/22/2051 | 147,877 | 0.0 | |||||||||||
| 500,000 | Verizon Communications, Inc., 4.400%, 11/01/2034 | 583,298 | 0.2 | |||||||||||
| 102,000 | ViacomCBS, Inc., 4.375%, 03/15/2043 | 116,308 | 0.0 | |||||||||||
| 111,000 | Vodafone Group PLC, 4.250%, 09/17/2050 | 128,455 | 0.0 | |||||||||||
| 9,274,315 | 2.9 | |||||||||||||
| Consumer, Cyclical: 1.6% | ||||||||||||||
| 53,000 | (1) | Alimentation Couche-Tard, Inc., 3.439%, 05/13/2041 | 54,650 | 0.0 | ||||||||||
| 70,000 | American Honda Finance Corp., 2.900%, 02/16/2024 | 72,659 | 0.0 | |||||||||||
| 391,000 | (1) | Daimler Finance North America LLC, 1.450%, 03/02/2026 | 387,443 | 0.1 | ||||||||||
| 531,000 | General Motors Financial Co., Inc., 1.500%, 06/10/2026 | 522,988 | 0.2 | |||||||||||
| 79,000 | General Motors Financial Co., Inc., 2.750%, 06/20/2025 | 81,583 | 0.0 | |||||||||||
| 2,500,000 | (1) | Hyundai Capital America, 2.650%, 02/10/2025 | 2,563,860 | 0.8 | ||||||||||
| 400,000 | Lowe’s Cos, Inc., 1.700%, 09/15/2028 | 392,266 | 0.1 | |||||||||||
| 35,000 | Lowe’s Cos, Inc., 2.800%, 09/15/2041 | 34,208 | 0.0 | |||||||||||
| 38,000 | Marriott International, Inc./MD, 2.750%, 10/15/2033 | 36,910 | 0.0 | |||||||||||
| 240,000 | McDonald’s Corp., 3.600%, 07/01/2030 | 265,447 | 0.1 | |||||||||||
| 30,000 | McDonald’s Corp., 3.625%, 09/01/2049 | 33,262 | 0.0 | |||||||||||
| 46,000 | McDonald’s Corp., 4.200%, 04/01/2050 | 55,827 | 0.0 | |||||||||||
| 434,000 | (1) | Nissan Motor Co. Ltd., 4.810%, 09/17/2030 | 485,889 | 0.2 | ||||||||||
| VY® BLACKROCK INFLATION PROTECTED BOND PORTFOLIO | PORTFOLIO OF INVESTMENTS AS OF DECEMBER 31, 2021 (CONTINUED) |
| Principal Amount† | Value | Percentage of Net Assets | ||||||||||||
|---|---|---|---|---|---|---|---|---|---|---|---|---|---|---|
CORPORATE BONDS/NOTES: (continued) | ||||||||||||||
| Consumer, Cyclical: (continued) | ||||||||||||||
| 144,000 | Starbucks Corp., 2.550%, 11/15/2030 | $ | 147,032 | 0.1 | ||||||||||
| 68,000 | Walmart, Inc., 4.050%, 06/29/2048 | 86,636 | 0.0 | |||||||||||
| 5,220,660 | 1.6 | |||||||||||||
| Consumer, Non-cyclical: 2.9% | ||||||||||||||
| 574,000 | AbbVie, Inc., 4.500%, 05/14/2035 | 687,731 | 0.2 | |||||||||||
| 708,000 | Altria Group, Inc., 3.400%, 02/04/2041 | 654,239 | 0.2 | |||||||||||
| 84,000 | Amgen, Inc., 4.663%, 06/15/2051 | 107,756 | 0.0 | |||||||||||
| 154,000 | Anheuser-Busch Cos LLC / Anheuser-Busch InBev Worldwide, Inc., 4.700%, 02/01/2036 | 186,143 | 0.1 | |||||||||||
| 885,000 | Anheuser-Busch InBev Worldwide, Inc., 4.000%, 04/13/2028 | 984,981 | 0.3 | |||||||||||
| 183,000 | Anheuser-Busch InBev Worldwide, Inc., 4.500%, 06/01/2050 | 226,071 | 0.1 | |||||||||||
| 82,000 | Anthem, Inc., 3.600%, 03/15/2051 | 91,232 | 0.0 | |||||||||||
| 32,000 | Astrazeneca Finance LLC, 2.250%, 05/28/2031 | 32,259 | 0.0 | |||||||||||
| 109,000 | AstraZeneca PLC, 1.375%, 08/06/2030 | 103,022 | 0.0 | |||||||||||
| 201,000 | BAT Capital Corp., 4.540%, 08/15/2047 | 210,698 | 0.1 | |||||||||||
| 633,000 | BAT International Finance PLC, 1.668%, 03/25/2026 | 622,045 | 0.2 | |||||||||||
| 74,000 | Biogen, Inc., 3.150%, 05/01/2050 | 71,327 | 0.0 | |||||||||||
| 31,000 | Boston Scientific Corp., 2.650%, 06/01/2030 | 31,637 | 0.0 | |||||||||||
| 51,000 | (1) | Cargill, Inc., 0.400%, 02/02/2024 | 50,517 | 0.0 | ||||||||||
| 299,000 | Cigna Corp., 4.125%, 11/15/2025 | 327,232 | 0.1 | |||||||||||
| 191,000 | Coca-Cola Co/The, 1.450%, 06/01/2027 | 190,013 | 0.1 | |||||||||||
| 42,000 | Coca-Cola Co/The, 2.250%, 01/05/2032 | 42,734 | 0.0 | |||||||||||
| 431,000 | CVS Health Corp., 3.875%, 07/20/2025 | 463,570 | 0.1 | |||||||||||
| 177,000 | CVS Health Corp., 4.250%, 04/01/2050 | 214,509 | 0.1 | |||||||||||
| 200,000 | (1) | DP World Crescent Ltd., 3.750%, 01/30/2030 | 212,020 | 0.1 | ||||||||||
| 150,000 | (1) | Embotelladora Andina SA, 3.950%, 01/21/2050 | 155,559 | 0.0 | ||||||||||
| 33,000 | Equifax, Inc., 2.350%, 09/15/2031 | 32,590 | 0.0 | |||||||||||
| 185,000 | Gilead Sciences, Inc., 2.600%, 10/01/2040 | 178,606 | 0.1 | |||||||||||
| 142,000 | Global Payments, Inc., 2.150%, 01/15/2027 | 142,646 | 0.0 | |||||||||||
| 208,000 | Global Payments, Inc., 2.900%, 05/15/2030 | 212,010 | 0.1 | |||||||||||
| 200,000 | (1) | Grupo Bimbo SAB de CV, 4.000%, 09/06/2049 | 214,355 | 0.1 | ||||||||||
| 986,000 | HCA, Inc., 5.250%, 06/15/2026 | 1,109,882 | 0.3 | |||||||||||
| Principal Amount† | Value | Percentage of Net Assets | ||||||||||||
|---|---|---|---|---|---|---|---|---|---|---|---|---|---|---|
CORPORATE BONDS/NOTES: (continued) | ||||||||||||||
| Consumer, Non-cyclical: (continued) | ||||||||||||||
| 92,000 | Humana, Inc., 1.350%, 02/03/2027 | $ | 89,503 | 0.0 | ||||||||||
| 26,000 | Merck & Co., Inc., 2.750%, 12/10/2051 | 25,776 | 0.0 | |||||||||||
| 80,000 | Moody’s Corp., 3.100%, 11/29/2061 | 79,548 | 0.0 | |||||||||||
| 104,000 | Philip Morris International, Inc., 1.500%, 05/01/2025 | 104,176 | 0.0 | |||||||||||
| 187,000 | Philip Morris International, Inc., 2.625%, 03/06/2023 | 191,335 | 0.1 | |||||||||||
| 144,000 | RELX Capital, Inc., 3.000%, 05/22/2030 | 151,135 | 0.0 | |||||||||||
| 297,000 | (1) | Roche Holdings, Inc., 1.930%, 12/13/2028 | 299,015 | 0.1 | ||||||||||
| 286,000 | Shire Acquisitions Investments Ireland DAC, 3.200%, 09/23/2026 | 303,690 | 0.1 | |||||||||||
| 206,000 | Takeda Pharmaceutical Co. Ltd., 2.050%, 03/31/2030 | 201,958 | 0.1 | |||||||||||
| 284,000 | Thermo Fisher Scientific, Inc., 2.000%, 10/15/2031 | 280,092 | 0.1 | |||||||||||
| 212,000 | UnitedHealth Group, Inc., 2.900%, 05/15/2050 | 216,547 | 0.1 | |||||||||||
| 9,498,159 | 2.9 | |||||||||||||
| Energy: 1.7% | ||||||||||||||
| 34,000 | BP Capital Markets America, Inc., 3.001%, 03/17/2052 | 33,346 | 0.0 | |||||||||||
| 117,000 | BP Capital Markets America, Inc., 2.772%, 11/10/2050 | 110,522 | 0.0 | |||||||||||
| 44,000 | Cenovus Energy, Inc./CA, 3.750%, 02/15/2052 | 44,209 | 0.0 | |||||||||||
| 274,000 | Cheniere Corpus Christi Holdings LLC, 5.125%, 06/30/2027 | 309,369 | 0.1 | |||||||||||
| 60,000 | Chevron USA, Inc., 2.343%, 08/12/2050 | 55,494 | 0.0 | |||||||||||
| 54,000 | Devon Energy Corp., 4.750%, 05/15/2042 | 62,659 | 0.0 | |||||||||||
| 46,000 | Devon Energy Corp., 5.000%, 06/15/2045 | 55,733 | 0.0 | |||||||||||
| 2,000 | Devon Energy Corp., 5.875%, 06/15/2028 | 2,167 | 0.0 | |||||||||||
| 35,000 | Diamondback Energy, Inc., 2.875%, 12/01/2024 | 36,334 | 0.0 | |||||||||||
| 267,000 | Diamondback Energy, Inc., 3.125%, 03/24/2031 | 275,462 | 0.1 | |||||||||||
| 7,000 | Diamondback Energy, Inc., 3.250%, 12/01/2026 | 7,388 | 0.0 | |||||||||||
| 651,000 | Diamondback Energy, Inc., 3.500%, 12/01/2029 | 691,036 | 0.2 | |||||||||||
| 65,000 | Energy Transfer L.P., 5.000%, 05/15/2050 | 74,977 | 0.0 | |||||||||||
| 772,000 | Energy Transfer L.P., 5.500%, 06/01/2027 | 881,207 | 0.3 | |||||||||||
| 175,000 | Enterprise Products Operating LLC, 3.300%, 02/15/2053 | 174,437 | 0.1 | |||||||||||
| 200,000 | (1) | KazMunayGas National Co. JSC, 3.500%, 04/14/2033 | 207,894 | 0.1 | ||||||||||
| VY® BLACKROCK INFLATION PROTECTED BOND PORTFOLIO | PORTFOLIO OF INVESTMENTS AS OF DECEMBER 31, 2021 (CONTINUED) |
| Principal Amount† | Value | Percentage of Net Assets | ||||||||||||
|---|---|---|---|---|---|---|---|---|---|---|---|---|---|---|
CORPORATE BONDS/NOTES: (continued) | ||||||||||||||
| Energy: (continued) | ||||||||||||||
| 96,000 | (1) | NGPL PipeCo LLC, 3.250%, 07/15/2031 | $ | 97,637 | 0.0 | |||||||||
| 200,000 | (1) | Pertamina Persero PT, 4.150%, 02/25/2060 | 201,569 | 0.1 | ||||||||||
| 200,000 | (1) | Petronas Capital Ltd., 3.500%, 04/21/2030 | 216,600 | 0.1 | ||||||||||
| 200,000 | (1) | Qatar Energy, 3.300%, 07/12/2051 | 206,605 | 0.1 | ||||||||||
| 797,000 | Sabine Pass Liquefaction LLC, 4.200%, 03/15/2028 | 873,720 | 0.3 | |||||||||||
| 196,000 | Sabine Pass Liquefaction LLC, 5.875%, 06/30/2026 | 225,086 | 0.1 | |||||||||||
| 152,000 | (1) | Schlumberger Finance Canada Ltd., 2.650%, 11/20/2022 | 154,479 | 0.0 | ||||||||||
| 438,000 | (1) | Texas Eastern Transmission L.P., 3.500%, 01/15/2028 | 468,276 | 0.1 | ||||||||||
| 78,000 | Transcontinental Gas Pipe Line Co. LLC, 7.850%, 02/01/2026 | 95,295 | 0.0 | |||||||||||
| 5,561,501 | 1.7 | |||||||||||||
| Financial: 10.4% | ||||||||||||||
| 72,000 | (1) | AIG Global Funding, 0.450%, 12/08/2023 | 71,332 | 0.0 | ||||||||||
| 49,000 | Air Lease Corp., 2.875%, 01/15/2026 | 50,589 | 0.0 | |||||||||||
| 26,000 | American International Group, Inc., 4.375%, 06/30/2050 | 32,498 | 0.0 | |||||||||||
| 113,000 | American International Group, Inc., 4.500%, 07/16/2044 | 139,494 | 0.0 | |||||||||||
| 183,000 | American Tower Corp., 2.700%, 04/15/2031 | 183,751 | 0.1 | |||||||||||
| 593,000 | American Tower Corp., 3.800%, 08/15/2029 | 645,766 | 0.2 | |||||||||||
| 148,000 | Aon Corp., 2.800%, 05/15/2030 | 152,699 | 0.0 | |||||||||||
| 317,000 | Ares Capital Corp., 2.150%, 07/15/2026 | 313,028 | 0.1 | |||||||||||
| 200,000 | (1) | Banco Nacional de Panama, 2.500%, 08/11/2030 | 188,002 | 0.1 | ||||||||||
| 1,000,000 | (2) | Banco Santander SA, 0.701%, 06/30/2024 | 995,000 | 0.3 | ||||||||||
| 484,000 | (2) | Bank of America Corp., 0.523%, 06/14/2024 | 480,944 | 0.1 | ||||||||||
| 1,719,000 | (2) | Bank of America Corp., 1.319%, 06/19/2026 | 1,702,090 | 0.5 | ||||||||||
| 1,314,000 | (2) | Bank of America Corp., 1.734%, 07/22/2027 | 1,305,154 | 0.4 | ||||||||||
| 25,000 | (2) | Bank of America Corp., 1.898%, 07/23/2031 | 23,954 | 0.0 | ||||||||||
| 376,000 | (2) | Bank of America Corp., 2.015%, 02/13/2026 | 381,110 | 0.1 | ||||||||||
| 838,000 | (2) | Bank of America Corp., 2.299%, 07/21/2032 | 824,825 | 0.3 | ||||||||||
| 103,000 | (2) | Bank of America Corp., 2.572%, 10/20/2032 | 103,570 | 0.0 | ||||||||||
| 66,000 | (2) | Bank of America Corp., 2.687%, 04/22/2032 | 67,049 | 0.0 | ||||||||||
| 199,000 | (2) | Bank of America Corp., 3.559%, 04/23/2027 | 212,920 | 0.1 | ||||||||||
| Principal Amount† | Value | Percentage of Net Assets | ||||||||||||
|---|---|---|---|---|---|---|---|---|---|---|---|---|---|---|
CORPORATE BONDS/NOTES: (continued) | ||||||||||||||
| Financial: (continued) | ||||||||||||||
| 55,000 | (2) | Bank of America Corp., 3.705%, 04/24/2028 | $ | 59,731 | 0.0 | |||||||||
| 290,000 | (2) | Bank of America Corp., 3.864%, 07/23/2024 | 302,247 | 0.1 | ||||||||||
| 368,000 | Bank of America Corp., 3.950%, 04/21/2025 | 393,665 | 0.1 | |||||||||||
| 379,000 | (2) | Bank of America Corp., 4.078%, 04/23/2040 | 436,211 | 0.1 | ||||||||||
| 253,000 | (2) | Barclays PLC, 2.667%, 03/10/2032 | 251,178 | 0.1 | ||||||||||
| 200,000 | (2) | Barclays PLC, 3.811%, 03/10/2042 | 213,608 | 0.1 | ||||||||||
| 342,000 | (2) | Barclays PLC, 4.338%, 05/16/2024 | 356,126 | 0.1 | ||||||||||
| 194,000 | (1) | Blackstone Private Credit Fund, 3.250%, 03/15/2027 | 196,123 | 0.1 | ||||||||||
| 9,000 | (2) | Citigroup, Inc., 2.520%, 11/03/2032 | 8,999 | 0.0 | ||||||||||
| 689,000 | (2) | Citigroup, Inc., 2.561%, 05/01/2032 | 693,302 | 0.2 | ||||||||||
| 302,000 | (2) | Citigroup, Inc., 2.666%, 01/29/2031 | 306,889 | 0.1 | ||||||||||
| 31,000 | (2) | Citigroup, Inc., 2.976%, 11/05/2030 | 32,224 | 0.0 | ||||||||||
| 29,000 | (2) | Citigroup, Inc., 3.980%, 03/20/2030 | 32,042 | 0.0 | ||||||||||
| 500,000 | Credit Suisse AG/New York NY, 1.250%, 08/07/2026 | 487,930 | 0.2 | |||||||||||
| 53,000 | Crown Castle International Corp., 1.350%, 07/15/2025 | 52,329 | 0.0 | |||||||||||
| 178,000 | Crown Castle International Corp., 2.250%, 01/15/2031 | 173,632 | 0.1 | |||||||||||
| 118,000 | Crown Castle International Corp., 3.700%, 06/15/2026 | 126,593 | 0.0 | |||||||||||
| 545,000 | Crown Castle International Corp., 3.800%, 02/15/2028 | 593,501 | 0.2 | |||||||||||
| 1,020,000 | (1),(2) | Danske Bank A/S, 0.976%, 09/10/2025 | 1,004,882 | 0.3 | ||||||||||
| 200,000 | (1),(2) | Danske Bank A/S, 1.171%, 12/08/2023 | 199,997 | 0.1 | ||||||||||
| 150,000 | Deutsche Bank AG/New York NY, 1.686%, 03/19/2026 | 149,405 | 0.0 | |||||||||||
| 150,000 | (2) | Deutsche Bank AG/New York NY, 2.129%, 11/24/2026 | 149,813 | 0.0 | ||||||||||
| 405,000 | Equinix, Inc., 3.200%, 11/18/2029 | 426,074 | 0.1 | |||||||||||
| 73,000 | GLP Capital L.P. / GLP Financing II, Inc., 3.250%, 01/15/2032 | 73,512 | 0.0 | |||||||||||
| 30,000 | GLP Capital L.P. / GLP Financing II, Inc., 4.000%, 01/15/2031 | 32,053 | 0.0 | |||||||||||
| 1,000,000 | (2) | Goldman Sachs Group, Inc./The, 2.905%, 07/24/2023 | 1,011,395 | 0.3 | ||||||||||
| 542,000 | (2) | Goldman Sachs Group, Inc./The, 2.908%, 07/21/2042 | 539,885 | 0.2 | ||||||||||
| VY® BLACKROCK INFLATION PROTECTED BOND PORTFOLIO | PORTFOLIO OF INVESTMENTS AS OF DECEMBER 31, 2021 (CONTINUED) |
| Principal Amount† | Value | Percentage of Net Assets | ||||||||||||
|---|---|---|---|---|---|---|---|---|---|---|---|---|---|---|
CORPORATE BONDS/NOTES: (continued) | ||||||||||||||
| Financial: (continued) | ||||||||||||||
| 1,794,000 | Goldman Sachs Group, Inc./The, 3.500%, 04/01/2025 | $ | 1,898,376 | 0.6 | ||||||||||
| 497,000 | (2) | HSBC Holdings PLC, 1.589%, 05/24/2027 | 486,326 | 0.2 | ||||||||||
| 200,000 | (2) | HSBC Holdings PLC, 2.251%, 11/22/2027 | 200,534 | 0.1 | ||||||||||
| 123,000 | Intercontinental Exchange, Inc., 2.100%, 06/15/2030 | 121,681 | 0.0 | |||||||||||
| 41,000 | Invitation Homes Operating Partnership L.P., 2.300%, 11/15/2028 | 40,587 | 0.0 | |||||||||||
| 387,000 | (2) | JPMorgan Chase & Co., 1.578%, 04/22/2027 | 382,640 | 0.1 | ||||||||||
| 40,000 | (2) | JPMorgan Chase & Co., 1.953%, 02/04/2032 | 38,567 | 0.0 | ||||||||||
| 2,623,000 | (2) | JPMorgan Chase & Co., 2.005%, 03/13/2026 | 2,655,870 | 0.8 | ||||||||||
| 87,000 | (2) | JPMorgan Chase & Co., 2.525%, 11/19/2041 | 82,905 | 0.0 | ||||||||||
| 107,000 | (2) | JPMorgan Chase & Co., 2.580%, 04/22/2032 | 108,489 | 0.0 | ||||||||||
| 31,000 | (2) | JPMorgan Chase & Co., 3.157%, 04/22/2042 | 32,421 | 0.0 | ||||||||||
| 31,000 | (2) | JPMorgan Chase & Co., 3.220%, 03/01/2025 | 32,244 | 0.0 | ||||||||||
| 167,000 | (2) | JPMorgan Chase & Co., 3.328%, 04/22/2052 | 179,131 | 0.1 | ||||||||||
| 495,000 | (2) | JPMorgan Chase & Co., 3.559%, 04/23/2024 | 511,682 | 0.2 | ||||||||||
| 241,000 | JPMorgan Chase & Co., 3.900%, 07/15/2025 | 260,997 | 0.1 | |||||||||||
| 25,000 | (2) | JPMorgan Chase & Co., 4.493%, 03/24/2031 | 28,959 | 0.0 | ||||||||||
| 200,000 | Lloyds Banking Group PLC, 4.375%, 03/22/2028 | 224,546 | 0.1 | |||||||||||
| 105,000 | Marsh & McLennan Cos, Inc., 2.250%, 11/15/2030 | 104,903 | 0.0 | |||||||||||
| 225,000 | (2) | Mitsubishi UFJ Financial Group, Inc., 1.538%, 07/20/2027 | 221,118 | 0.1 | ||||||||||
| 2,000,000 | Mitsubishi UFJ Financial Group, Inc., 3.218%, 03/07/2022 | 2,010,052 | 0.6 | |||||||||||
| 30,000 | Mitsubishi UFJ Financial Group, Inc., 3.407%, 03/07/2024 | 31,421 | 0.0 | |||||||||||
| 567,000 | (2) | Mizuho Financial Group, Inc., 2.260%, 07/09/2032 | 554,670 | 0.2 | ||||||||||
| 690,000 | (2) | Morgan Stanley, 0.790%, 05/30/2025 | 681,347 | 0.2 | ||||||||||
| 1,755,000 | (2) | Morgan Stanley, 1.512%, 07/20/2027 | 1,728,007 | 0.5 | ||||||||||
| 24,000 | (2) | Morgan Stanley, 1.593%, 05/04/2027 | 23,776 | 0.0 | ||||||||||
| 49,000 | (2) | Morgan Stanley, 2.511%, 10/20/2032 | 49,006 | 0.0 | ||||||||||
| 37,000 | (2) | Morgan Stanley, 3.217%, 04/22/2042 | 38,835 | 0.0 | ||||||||||
| 72,000 | (2) | Morgan Stanley, 3.772%, 01/24/2029 | 78,410 | 0.0 | ||||||||||
| 167,000 | Morgan Stanley, 4.000%, 07/23/2025 | 181,137 | 0.1 | |||||||||||
| Principal Amount† | Value | Percentage of Net Assets | ||||||||||||
|---|---|---|---|---|---|---|---|---|---|---|---|---|---|---|
CORPORATE BONDS/NOTES: (continued) | ||||||||||||||
| Financial: (continued) | ||||||||||||||
| 1,029,000 | (2) | Morgan Stanley, 4.431%, 01/23/2030 | $ | 1,173,637 | 0.4 | |||||||||
| 188,000 | National Retail Properties, Inc., 3.000%, 04/15/2052 | 178,269 | 0.1 | |||||||||||
| 204,000 | Nomura Holdings, Inc., 2.608%, 07/14/2031 | 201,530 | 0.1 | |||||||||||
| 85,000 | (1) | Principal Life Global Funding II, 0.750%, 04/12/2024 | 84,428 | 0.0 | ||||||||||
| 232,000 | (2) | Santander UK Group Holdings PLC, 1.089%, 03/15/2025 | 229,970 | 0.1 | ||||||||||
| 261,000 | Sumitomo Mitsui Financial Group, Inc., 1.902%, 09/17/2028 | 256,071 | 0.1 | |||||||||||
| 800,000 | Sumitomo Mitsui Financial Group, Inc., 2.846%, 01/11/2022 | 800,366 | 0.2 | |||||||||||
| 113,000 | (1) | SURA Asset Management SA, 4.875%, 04/17/2024 | 119,275 | 0.0 | ||||||||||
| 310,000 | (1),(2) | UBS Group AG, 1.494%, 08/10/2027 | 302,571 | 0.1 | ||||||||||
| 31,000 | (2) | Wells Fargo & Co., 2.393%, 06/02/2028 | 31,529 | 0.0 | ||||||||||
| 187,000 | (2) | Wells Fargo & Co., 2.572%, 02/11/2031 | 191,101 | 0.1 | ||||||||||
| 187,000 | (2) | Wells Fargo & Co., 3.068%, 04/30/2041 | 192,161 | 0.1 | ||||||||||
| 104,000 | Wells Fargo & Co., 3.000%, 10/23/2026 | 109,335 | 0.0 | |||||||||||
| 351,000 | Wells Fargo & Co., 3.500%, 03/08/2022 | 353,020 | 0.1 | |||||||||||
| 236,000 | (2) | Wells Fargo & Co., 3.584%, 05/22/2028 | 253,893 | 0.1 | ||||||||||
| 159,000 | Wells Fargo & Co., 4.150%, 01/24/2029 | 178,139 | 0.1 | |||||||||||
| 33,821,053 | 10.4 | |||||||||||||
| Industrial: 1.3% | ||||||||||||||
| 150,000 | Agilent Technologies, Inc., 2.300%, 03/12/2031 | 148,697 | 0.0 | |||||||||||
| 270,000 | Amcor Flexibles North America, Inc., 2.690%, 05/25/2031 | 273,939 | 0.1 | |||||||||||
| 20,000 | Burlington Northern Santa Fe LLC, 2.875%, 06/15/2052 | 20,056 | 0.0 | |||||||||||
| 209,000 | Burlington Northern Santa Fe LLC, 3.300%, 09/15/2051 | 227,470 | 0.1 | |||||||||||
| 184,000 | CSX Corp., 2.500%, 05/15/2051 | 170,540 | 0.1 | |||||||||||
| 45,000 | CSX Corp., 3.250%, 06/01/2027 | 48,290 | 0.0 | |||||||||||
| 214,000 | FedEx Corp., 2.400%, 05/15/2031 | 214,660 | 0.1 | |||||||||||
| 122,000 | General Dynamics Corp., 3.750%, 05/15/2028 | 134,924 | 0.0 | |||||||||||
| 363,000 | (1) | Huntington Ingalls Industries, Inc., 2.043%, 08/16/2028 | 355,651 | 0.1 | ||||||||||
| 54,000 | L3Harris Technologies, Inc., 3.850%, 12/15/2026 | 58,762 | 0.0 | |||||||||||
| VY® BLACKROCK INFLATION PROTECTED BOND PORTFOLIO | PORTFOLIO OF INVESTMENTS AS OF DECEMBER 31, 2021 (CONTINUED) |
| Principal Amount† | Value | Percentage of Net Assets | ||||||||||||
|---|---|---|---|---|---|---|---|---|---|---|---|---|---|---|
CORPORATE BONDS/NOTES: (continued) | ||||||||||||||
| Industrial: (continued) | ||||||||||||||
| 241,000 | Lockheed Martin Corp., 2.800%, 06/15/2050 | $ | 240,897 | 0.1 | ||||||||||
| 163,000 | Norfolk Southern Corp., 3.050%, 05/15/2050 | 166,521 | 0.0 | |||||||||||
| 234,000 | Northrop Grumman Corp., 2.930%, 01/15/2025 | 243,922 | 0.1 | |||||||||||
| 230,000 | Northrop Grumman Corp., 5.250%, 05/01/2050 | 322,990 | 0.1 | |||||||||||
| 59,000 | nVent Finance Sarl, 2.750%, 11/15/2031 | 58,819 | 0.0 | |||||||||||
| 102,000 | Packaging Corp. of America, 3.050%, 10/01/2051 | 101,763 | 0.0 | |||||||||||
| 32,000 | (1) | Penske Truck Leasing Co. Lp / PTL Finance Corp., 1.700%, 06/15/2026 | 31,664 | 0.0 | ||||||||||
| 34,000 | Raytheon Technologies Corp., 2.820%, 09/01/2051 | 32,914 | 0.0 | |||||||||||
| 242,000 | Raytheon Technologies Corp., 3.125%, 07/01/2050 | 247,871 | 0.1 | |||||||||||
| 607,000 | Raytheon Technologies Corp., 4.125%, 11/16/2028 | 679,561 | 0.2 | |||||||||||
| 26,000 | Raytheon Technologies Corp., 4.625%, 11/16/2048 | 33,391 | 0.0 | |||||||||||
| 55,000 | Republic Services, Inc., 2.375%, 03/15/2033 | 54,812 | 0.0 | |||||||||||
| 201,000 | Union Pacific Corp., 3.200%, 05/20/2041 | 214,391 | 0.1 | |||||||||||
| 202,000 | Union Pacific Corp., 3.250%, 02/05/2050 | 217,112 | 0.1 | |||||||||||
| 4,299,617 | 1.3 | |||||||||||||
| Technology: 2.9% | ||||||||||||||
| 38,000 | Activision Blizzard, Inc., 2.500%, 09/15/2050 | 33,381 | 0.0 | |||||||||||
| 121,000 | Analog Devices, Inc., 3.500%, 12/05/2026 | 132,050 | 0.0 | |||||||||||
| 186,000 | Autodesk, Inc., 2.400%, 12/15/2031 | 185,669 | 0.1 | |||||||||||
| 528,000 | Broadcom Corp. / Broadcom Cayman Finance Ltd., 3.500%, 01/15/2028 | 564,571 | 0.2 | |||||||||||
| 221,000 | Broadcom Corp. / Broadcom Cayman Finance Ltd., 3.875%, 01/15/2027 | 239,759 | 0.1 | |||||||||||
| 348,000 | (1) | Broadcom, Inc., 3.419%, 04/15/2033 | 365,200 | 0.1 | ||||||||||
| 157,000 | (1) | Broadcom, Inc., 3.469%, 04/15/2034 | 164,535 | 0.1 | ||||||||||
| 10,000 | Broadcom, Inc., 4.150%, 11/15/2030 | 11,099 | 0.0 | |||||||||||
| 15,000 | Dell International LLC / EMC Corp., 8.350%, 07/15/2046 | 24,991 | 0.0 | |||||||||||
| 33,000 | DXC Technology Co., 2.375%, 09/15/2028 | 32,285 | 0.0 | |||||||||||
| Principal Amount† | Value | Percentage of Net Assets | ||||||||||||
|---|---|---|---|---|---|---|---|---|---|---|---|---|---|---|
CORPORATE BONDS/NOTES: (continued) | ||||||||||||||
| Technology: (continued) | ||||||||||||||
| 265,000 | Electronic Arts, Inc., 1.850%, 02/15/2031 | $ | 254,269 | 0.1 | ||||||||||
| 143,000 | Fidelity National Information Services, Inc., 3.100%, 03/01/2041 | 144,657 | 0.0 | |||||||||||
| 485,000 | Fiserv, Inc., 3.500%, 07/01/2029 | 522,101 | 0.2 | |||||||||||
| 142,000 | Intel Corp., 3.200%, 08/12/2061 | 145,852 | 0.1 | |||||||||||
| 100,000 | International Business Machines Corp., 3.300%, 05/15/2026 | 107,012 | 0.0 | |||||||||||
| 169,000 | International Business Machines Corp., 4.150%, 05/15/2039 | 195,526 | 0.1 | |||||||||||
| 76,000 | KLA Corp., 3.300%, 03/01/2050 | 81,424 | 0.0 | |||||||||||
| 33,000 | Lam Research Corp., 2.875%, 06/15/2050 | 32,975 | 0.0 | |||||||||||
| 341,000 | Leidos, Inc., 2.300%, 02/15/2031 | 328,862 | 0.1 | |||||||||||
| 568,000 | NVIDIA Corp., 1.550%, 06/15/2028 | 563,912 | 0.2 | |||||||||||
| 122,000 | (1) | NXP BV / NXP Funding LLC / NXP USA, Inc., 2.500%, 05/11/2031 | 122,429 | 0.0 | ||||||||||
| 133,000 | (1) | NXP BV / NXP Funding LLC / NXP USA, Inc., 3.150%, 05/01/2027 | 139,971 | 0.0 | ||||||||||
| 617,000 | (1) | NXP BV / NXP Funding LLC / NXP USA, Inc., 4.300%, 06/18/2029 | 691,921 | 0.2 | ||||||||||
| 1,322,000 | Oracle Corp., 1.650%, 03/25/2026 | 1,312,897 | 0.4 | |||||||||||
| 1,000,000 | Oracle Corp., 2.500%, 05/15/2022 | 1,004,165 | 0.3 | |||||||||||
| 31,000 | Oracle Corp., 3.600%, 04/01/2040 | 31,143 | 0.0 | |||||||||||
| 55,000 | Oracle Corp., 3.600%, 04/01/2050 | 53,957 | 0.0 | |||||||||||
| 1,208,000 | Oracle Corp., 3.650%, 03/25/2041 | 1,223,118 | 0.4 | |||||||||||
| 80,000 | QUALCOMM, Inc., 3.250%, 05/20/2050 | 88,060 | 0.0 | |||||||||||
| 36,000 | salesforce.com, Inc., 3.050%, 07/15/2061 | 37,135 | 0.0 | |||||||||||
| 219,000 | ServiceNow, Inc., 1.400%, 09/01/2030 | 204,098 | 0.1 | |||||||||||
| 212,000 | VMware, Inc., 1.800%, 08/15/2028 | 206,474 | 0.1 | |||||||||||
| 114,000 | VMware, Inc., 2.200%, 08/15/2031 | 112,094 | 0.0 | |||||||||||
| 21,000 | Western Digital Corp., 2.850%, 02/01/2029 | 21,236 | 0.0 | |||||||||||
| 9,378,828 | 2.9 | |||||||||||||
| Utilities: 2.2% | ||||||||||||||
| 41,000 | AEP Texas, Inc., 3.450%, 05/15/2051 | 41,396 | 0.0 | |||||||||||
| 467,000 | AEP Transmission Co. LLC, 2.750%, 08/15/2051 | 445,428 | 0.1 | |||||||||||
| 308,000 | Alabama Power Co., 3.125%, 07/15/2051 | 314,857 | 0.1 | |||||||||||
| 32,000 | Ameren Illinois Co., 2.900%, 06/15/2051 | 32,525 | 0.0 | |||||||||||
| VY® BLACKROCK INFLATION PROTECTED BOND PORTFOLIO | PORTFOLIO OF INVESTMENTS AS OF DECEMBER 31, 2021 (CONTINUED) |
| Principal Amount† | Value | Percentage of Net Assets | ||||||||||||
|---|---|---|---|---|---|---|---|---|---|---|---|---|---|---|
CORPORATE BONDS/NOTES: (continued) | ||||||||||||||
| Utilities: (continued) | ||||||||||||||
| 94,000 | (1) | American Transmission Systems, Inc., 2.650%, 01/15/2032 | $ | 94,978 | 0.0 | |||||||||
| 67,000 | Atmos Energy Corp., 2.850%, 02/15/2052 | 65,280 | 0.0 | |||||||||||
| 79,000 | CenterPoint Energy Resources Corp., 1.750%, 10/01/2030 | 74,912 | 0.0 | |||||||||||
| 35,000 | CenterPoint Energy Houston Electric LLC, 3.350%, 04/01/2051 | 38,565 | 0.0 | |||||||||||
| 77,000 | Commonwealth Edison Co., 2.750%, 09/01/2051 | 74,637 | 0.0 | |||||||||||
| 220,000 | (1) | Consorcio Transmantaro SA, 4.700%, 04/16/2034 | 242,043 | 0.1 | ||||||||||
| 199,000 | Consumers Energy Co., 2.650%, 08/15/2052 | 194,182 | 0.1 | |||||||||||
| 42,000 | DTE Electric Co., 3.950%, 03/01/2049 | 49,758 | 0.0 | |||||||||||
| 71,000 | Duke Energy Carolinas LLC, 3.450%, 04/15/2051 | 77,838 | 0.0 | |||||||||||
| 137,000 | Duke Energy Florida LLC, 1.750%, 06/15/2030 | 131,633 | 0.0 | |||||||||||
| 68,000 | Duke Energy Florida LLC, 3.000%, 12/15/2051 | 68,706 | 0.0 | |||||||||||
| 262,000 | Duke Energy Florida LLC, 3.800%, 07/15/2028 | 288,920 | 0.1 | |||||||||||
| 262,000 | Duke Energy Progress LLC, 2.900%, 08/15/2051 | 260,412 | 0.1 | |||||||||||
| 185,000 | Entergy Louisiana LLC, 2.350%, 06/15/2032 | 184,654 | 0.1 | |||||||||||
| 32,000 | Exelon Corp., 4.700%, 04/15/2050 | 40,277 | 0.0 | |||||||||||
| 2,089,000 | Florida Power & Light Co., 0.300%, (SOFRRATE + 0.250%), 05/10/2023 | 2,083,375 | 0.6 | |||||||||||
| 265,000 | Florida Power & Light Co., 2.875%, 12/04/2051 | 269,439 | 0.1 | |||||||||||
| 30,000 | Florida Power & Light Co., 3.950%, 03/01/2048 | 35,666 | 0.0 | |||||||||||
| 200,000 | (1) | Interchile SA, 4.500%, 06/30/2056 | 212,817 | 0.1 | ||||||||||
| 241,000 | MidAmerican Energy Co., 2.700%, 08/01/2052 | 234,583 | 0.1 | |||||||||||
| 53,000 | Northern States Power Co/MN, 2.600%, 06/01/2051 | 50,712 | 0.0 | |||||||||||
| 213,000 | (1) | NRG Energy, Inc., 4.450%, 06/15/2029 | 231,986 | 0.1 | ||||||||||
| 150,000 | Ohio Power Co., 2.900%, 10/01/2051 | 145,024 | 0.1 | |||||||||||
| 15,000 | (1) | Oncor Electric Delivery Co. LLC, 2.700%, 11/15/2051 | 14,463 | 0.0 | ||||||||||
| 47,000 | Oncor Electric Delivery Co. LLC, 3.100%, 09/15/2049 | 49,178 | 0.0 | |||||||||||
| 8,000 | Pacific Gas and Electric Co., 2.500%, 02/01/2031 | 7,630 | 0.0 | |||||||||||
| 67,000 | Pacific Gas and Electric Co., 3.250%, 06/01/2031 | 67,291 | 0.0 | |||||||||||
| 102,000 | Pacific Gas and Electric Co., 4.950%, 07/01/2050 | 111,349 | 0.0 | |||||||||||
| 238,000 | PECO Energy Co., 2.850%, 09/15/2051 | 236,303 | 0.1 | |||||||||||
| Principal Amount† | Value | Percentage of Net Assets | ||||||||||||
|---|---|---|---|---|---|---|---|---|---|---|---|---|---|---|
CORPORATE BONDS/NOTES: (continued) | ||||||||||||||
| Utilities: (continued) | ||||||||||||||
| 200,000 | Saudi Electricity Global Sukuk Co. 5, 2.413%, 09/17/2030 | $ | 200,998 | 0.1 | ||||||||||
| 200,000 | Southern California Edison Co., 1.200%, 02/01/2026 | 196,169 | 0.1 | |||||||||||
| 31,000 | Southwestern Public Service Co., 3.150%, 05/01/2050 | 32,396 | 0.0 | |||||||||||
| 27,000 | Tampa Electric Co., 4.300%, 06/15/2048 | 33,173 | 0.0 | |||||||||||
| 149,000 | Virginia Electric and Power Co., 2.450%, 12/15/2050 | 137,673 | 0.1 | |||||||||||
| 7,071,226 | 2.2 | |||||||||||||
| Total Corporate Bonds/Notes | ||||||||||||||
| (Cost $86,781,777) | 86,669,306 | 26.7 | ||||||||||||
U.S. TREASURY OBLIGATIONS: 50.8% | ||||||||||||||
| Treasury Inflation Indexed Protected Securities: 49.5% | ||||||||||||||
| 2,107,414 | 0.125%, 10/15/2026 | 2,292,753 | 0.7 | |||||||||||
| 8,350,381 | 0.125%, 01/15/2030 | 9,274,957 | 2.9 | |||||||||||
| 8,195,910 | 0.125%, 07/15/2030 | 9,176,973 | 2.8 | |||||||||||
| 7,737,326 | 0.125%, 01/15/2031 | 8,670,251 | 2.7 | |||||||||||
| 6,910,636 | 0.125%, 07/15/2031 | 7,774,768 | 2.4 | |||||||||||
| 3,817,606 | 0.125%, 02/15/2051 | 4,531,182 | 1.4 | |||||||||||
| 29,223 | 0.250%, 01/15/2025 | 31,316 | 0.0 | |||||||||||
| 5,974,572 | 0.250%, 07/15/2029 | 6,698,951 | 2.1 | |||||||||||
| 3,133,692 | 0.250%, 02/15/2050 | 3,800,136 | 1.2 | |||||||||||
| 11,897 | 0.375%, 07/15/2023 | 12,510 | 0.0 | |||||||||||
| 1,021,536 | 0.375%, 07/15/2025 | 1,109,853 | 0.3 | |||||||||||
| 6,651,795 | 0.375%, 01/15/2027 | 7,319,639 | 2.3 | |||||||||||
| 8,692,224 | 0.375%, 07/15/2027 | 9,648,324 | 3.0 | |||||||||||
| 9,728,264 | 0.500%, 01/15/2028 | 10,891,008 | 3.4 | |||||||||||
| 23,630 | 0.625%, 04/15/2023 | 24,705 | 0.0 | |||||||||||
| 3,672,810 | 0.625%, 02/15/2043 | 4,572,587 | 1.4 | |||||||||||
| 9,468,826 | 0.750%, 07/15/2028 | 10,849,956 | 3.3 | |||||||||||
| 4,802,612 | 0.750%, 02/15/2042 | 6,077,769 | 1.9 | |||||||||||
| 5,361,238 | (3) | 0.750%, 02/15/2045 | 6,912,149 | 2.1 | ||||||||||
| 2,666,481 | 0.875%, 01/15/2029 | 3,085,438 | 1.0 | |||||||||||
| 3,331,803 | 0.875%, 02/15/2047 | 4,507,841 | 1.4 | |||||||||||
| 2,868,569 | 1.000%, 02/15/2046 | 3,926,557 | 1.2 | |||||||||||
| 2,615,938 | 1.000%, 02/15/2048 | 3,674,887 | 1.1 | |||||||||||
| 2,222,485 | 1.000%, 02/15/2049 | 3,160,692 | 1.0 | |||||||||||
| 5,001,227 | (3) | 1.375%, 02/15/2044 | 7,147,868 | 2.2 | ||||||||||
| 2,965,558 | (3) | 1.750%, 01/15/2028 | 3,559,428 | 1.1 | ||||||||||
| 2,012,725 | 2.125%, 02/15/2040 | 3,084,282 | 0.9 | |||||||||||
| 2,825,599 | 2.125%, 02/15/2041 | 4,379,348 | 1.3 | |||||||||||
| 3,894,832 | 2.375%, 01/15/2027 | 4,705,974 | 1.4 | |||||||||||
| 2,282,450 | 2.500%, 01/15/2029 | 2,919,511 | 0.9 | |||||||||||
| 1,980,908 | 3.375%, 04/15/2032 | 2,948,695 | 0.9 | |||||||||||
| 1,049,303 | 3.625%, 04/15/2028 | 1,394,762 | 0.4 | |||||||||||
| 1,823,913 | 3.875%, 04/15/2029 | 2,541,745 | 0.8 | |||||||||||
| 160,706,815 | 49.5 | |||||||||||||
| U.S. Treasury Bonds: 1.3% | ||||||||||||||
| 4,350,000 | 1.750%, 08/15/2041 | 4,218,820 | 1.3 | |||||||||||
| Total U.S. Treasury Obligations | ||||||||||||||
| (Cost $147,310,419) | 164,925,635 | 50.8 | ||||||||||||
| VY® BLACKROCK INFLATION PROTECTED BOND PORTFOLIO | PORTFOLIO OF INVESTMENTS AS OF DECEMBER 31, 2021 (CONTINUED) |
| Principal Amount† | Value | Percentage of Net Assets | ||||||||||||
|---|---|---|---|---|---|---|---|---|---|---|---|---|---|---|
U.S. GOVERNMENT AGENCY OBLIGATIONS: 9.8% | ||||||||||||||
| Government National Mortgage Association: 2.2% | ||||||||||||||
| 1,894,000 | (4) | 2.000%, 01/15/2052 | $ | 1,911,247 | 0.6 | |||||||||
| 1,342,000 | (4) | 2.500%, 01/15/2052 | 1,374,395 | 0.4 | ||||||||||
| 300,000 | (4) | 2.500%, 02/15/2052 | 306,574 | 0.1 | ||||||||||
| 1,345,000 | (4) | 3.000%, 01/15/2052 | 1,391,713 | 0.4 | ||||||||||
| 740,761 | 3.500%, 05/20/2047 | 778,395 | 0.3 | |||||||||||
| 300,000 | (4) | 3.500%, 01/15/2052 | 312,397 | 0.1 | ||||||||||
| 323,728 | 4.000%, 09/20/2048 | 342,979 | 0.1 | |||||||||||
| 184,000 | (4) | 4.000%, 01/20/2050 | 193,773 | 0.1 | ||||||||||
| 254,826 | 4.500%, 08/20/2048 | 270,017 | 0.1 | |||||||||||
| 79,000 | (4) | 4.500%, 01/15/2052 | 83,449 | 0.0 | ||||||||||
| 6,964,939 | 2.2 | |||||||||||||
| Uniform Mortgage-Backed Securities: 7.6% | ||||||||||||||
| 992,000 | (4) | 1.500%, 01/15/2037 | 994,732 | 0.3 | ||||||||||
| 1,044,000 | (4) | 1.500%, 01/15/2052 | 1,008,240 | 0.3 | ||||||||||
| 1,427,000 | (4) | 2.000%, 01/15/2037 | 1,461,254 | 0.4 | ||||||||||
| 202,000 | (4) | 2.000%, 01/15/2052 | 201,393 | 0.1 | ||||||||||
| 6,417,000 | (4) | 2.000%, 02/15/2052 | 6,383,442 | 2.0 | ||||||||||
| 132,000 | (4) | 2.500%, 01/15/2037 | 136,448 | 0.0 | ||||||||||
| 192,000 | (4) | 2.500%, 01/15/2052 | 195,901 | 0.1 | ||||||||||
| 4,548,000 | (4) | 2.500%, 02/15/2052 | 4,628,856 | 1.4 | ||||||||||
| 72,000 | (4) | 3.000%, 01/15/2037 | 75,288 | 0.0 | ||||||||||
| 1,428,000 | (4) | 3.000%, 01/15/2052 | 1,479,467 | 0.5 | ||||||||||
| 400,000 | (4) | 3.000%, 02/15/2052 | 413,807 | 0.1 | ||||||||||
| 61,000 | (4) | 3.500%, 01/15/2037 | 64,210 | 0.0 | ||||||||||
| 794,000 | (4) | 3.500%, 01/15/2052 | 835,925 | 0.3 | ||||||||||
| 2,000 | (4) | 4.000%, 01/15/2052 | 2,128 | 0.0 | ||||||||||
| 572,000 | (4) | 4.000%, 02/15/2052 | 608,128 | 0.2 | ||||||||||
| 329,000 | (4) | 4.500%, 01/15/2052 | 352,486 | 0.1 | ||||||||||
| 744,133 | 2.500%, 10/01/2036 | 777,439 | 0.2 | |||||||||||
| 496,713 | 3.000%, 01/01/2036 | 523,275 | 0.2 | |||||||||||
| 1,108,406 | 3.000%, 09/01/2051 | 1,170,168 | 0.4 | |||||||||||
| 182,890 | 3.500%, 05/01/2036 | 195,286 | 0.1 | |||||||||||
| 1,321,625 | 3.500%, 09/01/2051 | 1,433,718 | 0.4 | |||||||||||
| 907,532 | 4.000%, 04/01/2050 | 984,899 | 0.3 | |||||||||||
| 721,835 | 4.500%, 03/01/2048 | 781,013 | 0.2 | |||||||||||
| 24,707,503 | 7.6 | |||||||||||||
| Total U.S. Government Agency Obligations | ||||||||||||||
| (Cost $31,733,333) | 31,672,442 | 9.8 | ||||||||||||
CERTIFICATES OF DEPOSIT: 1.8% | ||||||||||||||
| 2,600,000 | MUFG BK LTD 0.3% 10/25/22, 0.300%, 10/25/2022 | 2,596,863 | 0.8 | |||||||||||
| 3,300,000 | TORONTO DOMINI 10/28/22, 0.340%, 10/28/2022 | 3,297,629 | 1.0 | |||||||||||
| Total Certificates of Deposit | ||||||||||||||
| (Cost $5,900,000) | 5,894,492 | 1.8 | ||||||||||||
SOVEREIGN BONDS: 2.3% | ||||||||||||||
| 200,000 | (1) | Abu Dhabi Government International Bond, 3.875%, 04/16/2050 | 233,479 | 0.1 | ||||||||||
| 200,000 | Chile Government International Bond, 3.860%, 06/21/2047 | 222,252 | 0.1 | |||||||||||
EUR 1,085,000 | (1) | Finland Government Bond, 0.125%, 04/15/2052 | 1,110,417 | 0.3 | ||||||||||
| Principal Amount† | Value | Percentage of Net Assets | ||||||||||||
|---|---|---|---|---|---|---|---|---|---|---|---|---|---|---|
SOVEREIGN BONDS: (continued) | ||||||||||||||
| 52,000 | Hungary Government International Bond, 7.625%, 03/29/2041 | $ | 85,166 | 0.0 | ||||||||||
| 200,000 | (1) | Indonesia Government International Bond, 6.750%, 01/15/2044 | 296,259 | 0.1 | ||||||||||
| 200,000 | (1) | Kazakhstan Government International Bond, 4.875%, 10/14/2044 | 246,070 | 0.1 | ||||||||||
EUR 530,000 | Mexico Government International Bond, 1.450%, 10/25/2033 | 561,646 | 0.2 | |||||||||||
| 300,000 | Mexico Government International Bond, 4.600%, 02/10/2048 | 320,792 | 0.1 | |||||||||||
NZD 289,000 | New Zealand Government Inflation Linked Bond, 2.500%, 09/20/2040 | 289,388 | 0.1 | |||||||||||
NZD 395,000 | New Zealand Government Bond, 1.750%, 05/15/2041 | 228,601 | 0.1 | |||||||||||
NZD 2,762,000 | New Zealand Government Inflation Linked Bond, 2.000%, 09/20/2025 | 2,355,268 | 0.7 | |||||||||||
| 200,000 | Panama Government International Bond, 4.500%, 04/01/2056 | 221,052 | 0.1 | |||||||||||
EUR 140,000 | Peru Government Bond, 1.250%, 03/11/2033 | 152,844 | 0.0 | |||||||||||
| 46,000 | Peruvian Government International Bond, 4.125%, 08/25/2027 | 50,707 | 0.0 | |||||||||||
| 103,000 | Peruvian Government International Bond, 2.783%, 01/23/2031 | 102,744 | 0.0 | |||||||||||
| 53,000 | Peruvian Government International Bond, 3.300%, 03/11/2041 | 53,199 | 0.0 | |||||||||||
| 200,000 | Philippine Government International Bond, 3.700%, 02/02/2042 | 218,675 | 0.1 | |||||||||||
| 200,000 | (1) | Qatar Government International Bond, 5.103%, 04/23/2048 | 271,135 | 0.1 | ||||||||||
| 50,000 | (1) | Romanian Government International Bond, 3.000%, 02/14/2031 | 50,900 | 0.0 | ||||||||||
EUR 280,000 | Romanian Government International Bond, 3.624%, 05/26/2030 | 346,347 | 0.1 | |||||||||||
| 94,000 | (1) | Romanian Government International Bond, 4.000%, 02/14/2051 | 94,292 | 0.0 | ||||||||||
| 51,256 | Uruguay Government International Bond, 4.375%, 01/23/2031 | 59,137 | 0.0 | |||||||||||
| 45,049 | Uruguay Government International Bond, 5.100%, 06/18/2050 | 59,681 | 0.0 | |||||||||||
| Total Sovereign Bonds | ||||||||||||||
| (Cost $7,677,362) | 7,630,051 | 2.3 | ||||||||||||
| VY® BLACKROCK INFLATION PROTECTED BOND PORTFOLIO | PORTFOLIO OF INVESTMENTS AS OF DECEMBER 31, 2021 (CONTINUED) |
| Principal Amount† | Value | Percentage of Net Assets | ||||||||||||
|---|---|---|---|---|---|---|---|---|---|---|---|---|---|---|
COMMERCIAL MORTGAGE-BACKED SECURITIES: 4.5% | ||||||||||||||
| 366,000 | BANK 2019-BNK23 A3, 2.920%, 12/15/2052 | $ | 386,870 | 0.1 | ||||||||||
| 300,000 | Barclays Commercial Mortgage Trust 2019-C3 B, 4.096%, 05/15/2052 | 328,231 | 0.1 | |||||||||||
| 1,000,000 | BENCHMARK 2018-B3 A5 Mortgage Trust, 4.025%, 04/10/2051 | 1,111,603 | 0.3 | |||||||||||
| 350,000 | Benchmark 2019-B15 A5 Mortgage Trust, 2.928%, 12/15/2072 | 368,911 | 0.1 | |||||||||||
| 1,000,000 | (1) | BX Commercial Mortgage Trust 2021-XL2 A, 0.799%, (US0001M + 0.689%), 10/15/2038 | 995,243 | 0.3 | ||||||||||
| 800,000 | (1) | BX Trust 2021-ARIA A, 1.009%, (US0001M + 0.899%), 10/15/2036 | 799,737 | 0.3 | ||||||||||
| 410,000 | CD 2017-CD3 A4 Mortgage Trust, 3.631%, 02/10/2050 | 441,719 | 0.1 | |||||||||||
| 500,000 | CD 2017-CD6 Mortgage Trust A5, 3.456%, 11/13/2050 | 538,962 | 0.2 | |||||||||||
| 800,000 | (1) | Credit Suisse Mortgage Capital Certificates 2019-ICE4 A, 1.090%, (US0001M + 0.980%), 05/15/2036 | 800,673 | 0.3 | ||||||||||
| 730,000 | (1),(5) | Credit Suisse Mortgage Capital Certificates 2021-BHAR A, 1.260%, (US0001M + 1.150%), 11/15/2038 | 730,000 | 0.2 | ||||||||||
| 205,000 | CSAIL 2015-C3 A4 Commercial Mortgage Trust, 3.718%, 08/15/2048 | 218,110 | 0.1 | |||||||||||
| 550,000 | (1) | ELP Commercial Mortgage Trust 2021-ELP A, 0.811%, (US0001M + 0.701%), 11/15/2038 | 547,557 | 0.2 | ||||||||||
| 387,982 | (1) | Extended Stay America Trust 2021-ESH A, 1.190%, (US0001M + 1.080%), 07/15/2038 | 389,097 | 0.1 | ||||||||||
| 1,000,000 | GS Mortgage Securities Trust 2017-GS7 A4, 3.430%, 08/10/2050 | 1,073,488 | 0.3 | |||||||||||
| 498,000 | GS Mortgage Securities Trust 2015-GC32 A4, 3.764%, 07/10/2048 | 531,331 | 0.2 | |||||||||||
| 1,000,000 | GS Mortgage Securities Trust 2016-GS2 A4, 3.050%, 05/10/2049 | 1,046,881 | 0.3 | |||||||||||
| 600,000 | (1) | JP Morgan Chase Commercial Mortgage Securities Corp. 2021-HYAH A, 0.870%, (US0001M + 0.760%), 06/15/2038 | 599,355 | 0.2 | ||||||||||
| 380,000 | (1) | Med Trust 2021-MDLN A, 1.060%, (US0001M + 0.950%), 11/15/2038 | 380,154 | 0.1 | ||||||||||
| Principal Amount† | Value | Percentage of Net Assets | ||||||||||||
|---|---|---|---|---|---|---|---|---|---|---|---|---|---|---|
COMMERCIAL MORTGAGE-BACKED SECURITIES: (continued) | ||||||||||||||
| 100,000 | (1) | MF1 2021-W10 A, 1.123%, (SOFR30A + 1.070%), 12/15/2034 | $ | 99,914 | 0.0 | |||||||||
| 1,100,000 | Morgan Stanley Bank of America Merrill Lynch Trust 2014-C15 A4, 4.051%, 04/15/2047 | 1,155,161 | 0.4 | |||||||||||
| 800,000 | (1) | SREIT Trust 2021-PALM A, 0.700%, (US0001M + 0.590%), 10/15/2034 | 795,562 | 0.3 | ||||||||||
| 422,500 | Wells Fargo Commercial Mortgage Trust 2015-C26 B, 3.783%, 02/15/2048 | 436,762 | 0.1 | |||||||||||
| 700,000 | Wells Fargo Commercial Mortgage Trust 2017-C39 A5, 3.418%, 09/15/2050 | 754,231 | 0.2 | |||||||||||
| Total Commercial Mortgage-Backed Securities | ||||||||||||||
| (Cost $14,280,083) | 14,529,552 | 4.5 | ||||||||||||
ASSET-BACKED SECURITIES: 2.0% | ||||||||||||||
| Automobile Asset-Backed Securities: 0.1% | ||||||||||||||
| 430,000 | (1) | Credit Acceptance Auto Loan Trust 2021-4 A, 1.260%, 10/15/2030 | 426,981 | 0.1 | ||||||||||
| Student Loan Asset-Backed Securities: 1.9% | ||||||||||||||
| 177,721 | (1) | College Avenue Student Loans LLC 2021-B A2, 1.760%, 06/25/2052 | 175,169 | 0.1 | ||||||||||
| 1,032,026 | (1) | Navient Private Education Refi Loan Trust 2021-EA A, 0.970%, 12/16/2069 | 1,015,386 | 0.3 | ||||||||||
| 207,285 | (1) | Navient Student Loan Trust 2019-BA A2A, 3.390%, 12/15/2059 | 213,700 | 0.1 | ||||||||||
| 878,273 | (1) | Nelnet Student Loan Trust 2021-BA AFL, 0.884%, (US0001M + 0.780%), 04/20/2062 | 880,234 | 0.3 | ||||||||||
| 1,067,564 | (1) | Nelnet Student Loan Trust 2021-CA AFL, 0.844%, (US0001M + 0.740%), 04/20/2062 | 1,071,408 | 0.3 | ||||||||||
| 738,563 | SLM Private Credit Student Loan Trust 2005-A A4, 0.513%, (US0003M + 0.310%), 12/15/2038 | 726,579 | 0.2 | |||||||||||
| 613,747 | (1) | SMB Private Education Loan Trust 2021-D A1A, 1.340%, 03/17/2053 | 604,866 | 0.2 | ||||||||||
| 860,000 | (1) | SMB Private Education Loan Trust 2021-E A1A, 1.680%, 02/15/2051 | 853,819 | 0.3 | ||||||||||
| 428,675 | (1) | Sofi Professional Loan Program 2018-C A2FX Trust, 3.590%, 01/25/2048 | 439,401 | 0.1 | ||||||||||
| 5,980,562 | 1.9 | |||||||||||||
| Total Asset-Backed Securities | ||||||||||||||
| (Cost $6,420,017) | 6,407,543 | 2.0 | ||||||||||||
| VY® BLACKROCK INFLATION PROTECTED BOND PORTFOLIO | PORTFOLIO OF INVESTMENTS AS OF DECEMBER 31, 2021 (CONTINUED) |
| Value | Percentage of Net Assets | |||||||||||||
|---|---|---|---|---|---|---|---|---|---|---|---|---|---|---|
PURCHASED OPTIONS (6): 0.4% | ||||||||||||||
| Total Purchased Options | ||||||||||||||
| (Cost $1,442,544) | $ | 1,382,108 | 0.4 | |||||||||||
| Total Long-Term Investments | ||||||||||||||
| (Cost $301,545,535) | 319,111,129 | 98.3 | ||||||||||||
| Principal Amount† | Value | Percentage of Net Assets | ||||||||||||
|---|---|---|---|---|---|---|---|---|---|---|---|---|---|---|
SHORT-TERM INVESTMENTS: 8.0% | ||||||||||||||
| Commercial Paper: 3.2% | ||||||||||||||
| 3,300,000 | Australia & New Zealand Banking Group Ltd., 0.280%, 07/28/2022 | 3,294,655 | 1.0 | |||||||||||
| 3,600,000 | Commonwealth Bank of Australia, 0.410%, 10/21/2022 | 3,588,181 | 1.1 | |||||||||||
| 3,600,000 | Nordea Bank ABP, 0.340%, 10/21/2022 | 3,590,121 | 1.1 | |||||||||||
| Total Commercial Paper | ||||||||||||||
| (Cost $10,477,625) | 10,472,957 | 3.2 | ||||||||||||
| Shares | Value | Percentage of Net Assets | ||||||||||||
|---|---|---|---|---|---|---|---|---|---|---|---|---|---|---|
| Mutual Funds: 2.8% | ||||||||||||||
| 9,030,640 | (7) | BlackRock Liquidity Funds, FedFund, Institutional Class, 0.030% (Cost $9,030,640) | 9,030,640 | 2.8 | ||||||||||
| Sovereign Bill: 2.0% | ||||||||||||||
| 735,000,000 | (8) | Japan Treasury Discount Bill (0.100)% (Cost $6,492,020) | 6,390,298 | 2.0 | ||||||||||
| Total Short-Term Investments | ||||||||||||||
| (Cost $26,000,285) | 25,893,895 | 8.0 | ||||||||||||
Total Investments in Securities (Cost $327,545,820) | $ | 345,005,024 | 106.3 | |||||||||||
Liabilities in Excess of Other Assets | (20,363,886 | ) | (6.3 | ) | ||||||||||
Net Assets | $ | 324,641,138 | 100.0 | |||||||||||
| † | Unless otherwise indicated, principal amount is shown in USD. | |
| (1) | Securities with purchases pursuant to Rule 144A or section 4(a)(2), under the Securities Act of 1933 and may not be resold subject to that rule except to qualified institutional buyers. | |
| (2) | Variable rate security. Rate shown is the rate in effect as of December 31, 2021. | |
| (3) | All or a portion of this security has been pledged as collateral in connection with open futures contracts. Please refer to Note 2 for additional details. | |
| (4) | Represents or includes a TBA transaction. | |
| (5) | For fair value measurement disclosure purposes, security is categorized as Level 3, whose value was determined using significant unobservable inputs. | |
| (6) | The tables within the Portfolio of Investments detail open purchased options which are non-income producing securities. | |
| (7) | Rate shown is the 7-day yield as of December 31, 2021. | |
| (8) | Represents a zero coupon bond. Rate shown reflects the effective yield as of December 31, 2021. |
| Currency Abbreviations: | ||
| EUR | EU Euro | |
| NZD | New Zealand Dollar | |
| Reference Rate Abbreviations: | ||
| SOFRRATE | 1-day Secured Overnight Financing Rate | |
| SOFR30A | 30-day Secured Overnight Financing Rate | |
| US0001M | 1-month LIBOR | |
| US0003M | 3-month LIBOR | |
| VY® BLACKROCK INFLATION PROTECTED BOND PORTFOLIO | PORTFOLIO OF INVESTMENTS AS OF DECEMBER 31, 2021 (CONTINUED) |
| Quoted Prices in Active Markets for Identical Investments (Level 1) | Significant Other Observable Inputs (Level 2) | Significant Unobservable Inputs (Level 3) | Fair Value at December 31, 2021 | |||||||||||||||||
|---|---|---|---|---|---|---|---|---|---|---|---|---|---|---|---|---|---|---|---|---|
Asset Table | ||||||||||||||||||||
Investments, at fair value | ||||||||||||||||||||
| Purchased Options | $ | 5,844 | $ | 1,376,264 | $ | — | $ | 1,382,108 | ||||||||||||
| Corporate Bonds/Notes | — | 86,669,306 | — | 86,669,306 | ||||||||||||||||
| U.S. Government Agency Obligations | — | 31,672,442 | — | 31,672,442 | ||||||||||||||||
| Commercial Mortgage-Backed Securities | — | 13,799,552 | 730,000 | 14,529,552 | ||||||||||||||||
| Sovereign Bonds | — | 7,630,051 | — | 7,630,051 | ||||||||||||||||
| Asset-Backed Securities | — | 6,407,543 | — | 6,407,543 | ||||||||||||||||
| Certificates of Deposit | — | 5,894,492 | — | 5,894,492 | ||||||||||||||||
| U.S. Treasury Obligations | — | 164,925,635 | — | 164,925,635 | ||||||||||||||||
| Short-Term Investments | 9,030,640 | 16,863,255 | — | 25,893,895 | ||||||||||||||||
| Total Investments, at fair value | $ | 9,036,484 | $ | 335,238,540 | $ | 730,000 | $ | 345,005,024 | ||||||||||||
Other Financial Instruments+ | ||||||||||||||||||||
| Centrally Cleared Swaps | — | 9,035,054 | — | 9,035,054 | ||||||||||||||||
| Forward Foreign Currency Contracts | — | 114,662 | — | 114,662 | ||||||||||||||||
| Futures | 419,059 | — | — | 419,059 | ||||||||||||||||
| OTC Swaps | — | 1,463,650 | — | 1,463,650 | ||||||||||||||||
| Total Assets | $ | 9,455,543 | $ | 345,851,906 | $ | 730,000 | $ | 356,037,449 | ||||||||||||
Liabilities Table | ||||||||||||||||||||
Other Financial Instruments+ | ||||||||||||||||||||
| Centrally Cleared Swaps | $ | — | $ | (2,724,557 | ) | $ | — | $ | (2,724,557 | ) | ||||||||||
| Forward Foreign Currency Contracts | — | (43,132 | ) | — | (43,132 | ) | ||||||||||||||
| Futures | (661,282 | ) | — | — | (661,282 | ) | ||||||||||||||
| OTC Swaps | — | (180,826 | ) | — | (180,826 | ) | ||||||||||||||
| Written Options | (1,859 | ) | (1,683,554 | ) | — | (1,685,413 | ) | |||||||||||||
| Total Liabilities | $ | (663,141 | ) | $ | (4,632,069 | ) | $ | — | $ | (5,295,210 | ) | |||||||||
| ˆ | See Note 2, “Significant Accounting Policies” in the Notes to Financial Statements for additional information. | |
| + | Other Financial Instruments may include open forward foreign currency contracts, futures, centrally cleared swaps, OTC swaps and written options. Forward foreign currency contracts, futures and centrally cleared swaps are fair valued at the unrealized appreciation (depreciation) on the instrument. OTC swaps and written options are valued at the fair value of the instrument. |
| Currency Purchased | Currency Sold | Counterparty | Settlement Date | Unrealized Appreciation (Depreciation) | ||||||||||
|---|---|---|---|---|---|---|---|---|---|---|---|---|---|---|
| USD | 1,808,033 | EUR | 1,601,000 | Bank of America N.A. | 02/02/22 | $ | (15,807 | ) | ||||||
| USD | 89,153 | EUR | 79,000 | Bank of America N.A. | 02/02/22 | (843 | ) | |||||||
| USD | 257,200 | GBP | 194,074 | Standard Chartered Bank | 02/02/22 | (5,471 | ) | |||||||
| USD | 12,525 | EUR | 11,000 | Standard Chartered Bank | 02/02/22 | (6 | ) | |||||||
| USD | 2,838,074 | NZD | 4,169,000 | Standard Chartered Bank | 02/02/22 | (16,172 | ) | |||||||
| USD | 6,500,046 | JPY | 734,387,328 | Standard Chartered Bank | 02/07/22 | 114,004 | ||||||||
| GBP | 19,165 | USD | 25,376 | Toronto Dominion Securities | 02/02/22 | 563 | ||||||||
| USD | 170,537 | EUR | 151,193 | Toronto Dominion Securities | 02/02/22 | (1,701 | ) | |||||||
| USD | 55,743 | AUD | 78,569 | Toronto Dominion Securities | 02/02/22 | (1,426 | ) | |||||||
| USD | 149,715 | EUR | 132,414 | UBS AG | 02/02/22 | (1,129 | ) | |||||||
| USD | 62,078 | EUR | 55,000 | UBS AG | 02/02/22 | (577 | ) | |||||||
| USD | 5,423 | JPY | 612,672 | UBS AG | 02/07/22 | 95 | ||||||||
| $ | 71,530 | |||||||||||||
| VY® BLACKROCK INFLATION PROTECTED BOND PORTFOLIO | PORTFOLIO OF INVESTMENTS AS OF DECEMBER 31, 2021 (CONTINUED) |
| Description | Number of Contracts | Expiration Date | Notional Amount | Unrealized Appreciation/ (Depreciation) | ||||||||||||||
|---|---|---|---|---|---|---|---|---|---|---|---|---|---|---|---|---|---|---|
| Long Contracts: | ||||||||||||||||||
| 3-Month SONIA Index | 47 | 12/20/22 | $ | 15,731,609 | $ | (31,740 | ) | |||||||||||
| 90-Day Bank Accepted Bills | 46 | 12/08/22 | 33,384,883 | 14,776 | ||||||||||||||
| Canadian Bankers’ Acceptance | 40 | 06/13/22 | 7,807,423 | (37,425 | ) | |||||||||||||
| Euro-Bund | 1 | 03/08/22 | 195,104 | (2,625 | ) | |||||||||||||
| U.S. Treasury 2-Year Note | 24 | 03/31/22 | 5,236,125 | 1,212 | ||||||||||||||
| U.S. Treasury 5-Year Note | 340 | 03/31/22 | 41,132,031 | 154,993 | ||||||||||||||
| $ | 103,487,175 | $ | 99,191 | |||||||||||||||
| Short Contracts: | ||||||||||||||||||
| 90-Day Eurodollar | (13 | ) | 12/16/24 | (3,194,425 | ) | 8,350 | ||||||||||||
| Canadian Bankers’ Acceptance | (40 | ) | 03/14/22 | (7,840,231 | ) | (3,768 | ) | |||||||||||
| Euro-Bobl 5-Year | (2 | ) | 03/08/22 | (303,387 | ) | 1,826 | ||||||||||||
Euro-Buxl® 30-year German Government Bond | (20 | ) | 03/08/22 | (4,707,463 | ) | 212,740 | ||||||||||||
| Long Gilt | (18 | ) | 03/29/22 | (3,043,043 | ) | 25,162 | ||||||||||||
| U.S. Treasury 10-Year Note | (71 | ) | 03/22/22 | (9,263,281 | ) | (19,792 | ) | |||||||||||
| U.S. Treasury Long Bond | (86 | ) | 03/22/22 | (13,797,625 | ) | (196,776 | ) | |||||||||||
| U.S. Treasury Ultra 10-Year Note | (97 | ) | 03/22/22 | (14,204,437 | ) | (177,799 | ) | |||||||||||
| U.S. Treasury Ultra Long Bond | (81 | ) | 03/22/22 | (15,967,125 | ) | (191,357 | ) | |||||||||||
| $ | (72,321,017 | ) | $ | (341,414 | ) | |||||||||||||
| Pay/Receive Floating Rate | Floating Rate Index | Floating Rate Index Payment Frequency | Fixed Rate | Fixed Rate Payment Frequency | Maturity Date | Notional Amount | Fair Value | Unrealized Appreciation/ (Depreciation) | ||||||||||||||||||
|---|---|---|---|---|---|---|---|---|---|---|---|---|---|---|---|---|---|---|---|---|---|---|---|---|---|---|
| Pay | 6-month EUR-EURIBOR | Semi-Annual | (0.085 | )% | Annual | 08/15/26 | EUR 2,905,000 | $ | (11,494 | ) | $ | (11,494 | ) | |||||||||||||
| Pay | 3-month USD-LIBOR | Quarterly | 0.259 | Semi-Annual | 03/23/23 | USD 3,450,000 | (15,635 | ) | (15,593 | ) | ||||||||||||||||
| Pay | 3-month USD-LIBOR | Quarterly | 0.353 | Semi-Annual | 11/18/23 | USD 2,610,000 | (26,183 | ) | (26,183 | ) | ||||||||||||||||
| Pay | 3-month USD-LIBOR | Quarterly | 0.500 | Semi-Annual | 12/08/23 | USD 2,500,000 | (19,513 | ) | (19,513 | ) | ||||||||||||||||
| Pay | 3-month USD-LIBOR | Quarterly | 0.450 | Semi-Annual | 12/14/23 | USD 2,482,000 | (22,242 | ) | (22,242 | ) | ||||||||||||||||
| Pay | 3-month USD-LIBOR | Quarterly | 1.000 | Semi-Annual | 12/31/23 | USD 5,110,000 | (3,170 | ) | (2,936 | ) | ||||||||||||||||
| Pay | 3-month USD-LIBOR | Quarterly | 0.592 | Semi-Annual | 04/20/24 | USD 1,490,000 | (16,277 | ) | (16,277 | ) | ||||||||||||||||
| Pay | 3-month USD-LIBOR | Quarterly | 1.170 | Semi-Annual | 06/21/24 | USD 405,000 | (591 | ) | (591 | ) | ||||||||||||||||
| Pay | 3-month USD-LIBOR | Quarterly | 1.180 | Semi-Annual | 06/21/24 | USD 405,000 | (515 | ) | (515 | ) | ||||||||||||||||
| Pay | 3-month USD-LIBOR | Quarterly | 3.090 | Semi-Annual | 11/29/24 | USD 3,970,000 | 221,817 | 221,817 | ||||||||||||||||||
| Pay | 3-month USD-LIBOR | Quarterly | 0.358 | Semi-Annual | 06/02/25 | USD 860,000 | (24,962 | ) | (24,962 | ) | ||||||||||||||||
| Pay | 1-day Secured Overnight Financing Rate | Annual | 1.073 | Annual | 12/15/26 | USD 310,000 | (419 | ) | (419 | ) | ||||||||||||||||
| Pay | 3-month USD-LIBOR | Quarterly | 1.405 | Semi-Annual | 01/20/27 | USD 612,000 | 798 | 798 | ||||||||||||||||||
| Pay | 3-month USD-LIBOR | Quarterly | 1.430 | Semi-Annual | 01/20/27 | USD 613,000 | 1,546 | 1,546 | ||||||||||||||||||
| Pay | 3-month USD-LIBOR | Quarterly | 1.445 | Semi-Annual | 01/20/27 | USD 612,000 | 1,990 | 1,990 | ||||||||||||||||||
| Pay | 3-month USD-LIBOR | Quarterly | 1.335 | Semi-Annual | 01/21/27 | USD 613,000 | (1,319 | ) | (1,319 | ) | ||||||||||||||||
| Pay | 3-month USD-LIBOR | Quarterly | 1.535 | Semi-Annual | 02/24/27 | USD 670,000 | 4,166 | 4,166 | ||||||||||||||||||
| Pay | 3-month USD-LIBOR | Quarterly | 1.561 | Semi-Annual | 02/25/27 | USD 670,000 | 4,979 | 4,979 | ||||||||||||||||||
| Pay | 3-month USD-LIBOR | Quarterly | 1.366 | Semi-Annual | 03/22/27 | USD 490,000 | (1,493 | ) | (1,493 | ) | ||||||||||||||||
| Pay | 3-month USD-LIBOR | Quarterly | 1.541 | Semi-Annual | 05/20/27 | USD 420,000 | 1,358 | 1,358 | ||||||||||||||||||
| Pay | 3-month USD-LIBOR | Quarterly | 1.630 | Semi-Annual | 05/26/27 | USD 335,000 | 2,459 | 2,459 | ||||||||||||||||||
| Pay | 3-month USD-LIBOR | Quarterly | 1.635 | Semi-Annual | 05/26/27 | USD 1,340,000 | 10,128 | 10,128 | ||||||||||||||||||
| Pay | 1-day Secured Overnight Financing Rate | Annual | 1.231 | Annual | 06/14/27 | USD 165,000 | 7 | 7 | ||||||||||||||||||
| Pay | 3-month USD-LIBOR | Quarterly | 0.652 | Semi-Annual | 06/20/27 | USD 870,000 | (35,567 | ) | (35,567 | ) | ||||||||||||||||
| Pay | 3-month USD-LIBOR | Quarterly | 0.680 | Semi-Annual | 06/20/27 | USD 870,000 | (34,408 | ) | (34,408 | ) | ||||||||||||||||
| Pay | 1-day Secured Overnight Financing Rate | Annual | 1.247 | Annual | 07/05/27 | USD 335,000 | — | — | ||||||||||||||||||
| Pay | 3-month USD-LIBOR | Quarterly | 1.350 | Semi-Annual | 07/08/27 | USD 1,210,000 | (9,229 | ) | (9,229 | ) | ||||||||||||||||
| Pay | 3-month USD-LIBOR | Quarterly | 1.190 | Semi-Annual | 07/19/27 | USD 960,000 | (15,064 | ) | (15,064 | ) | ||||||||||||||||
| Pay | 3-month USD-LIBOR | Quarterly | 1.578 | Semi-Annual | 07/27/27 | USD 120,000 | 338 | 338 | ||||||||||||||||||
| Pay | 1-day Secured Overnight Financing Rate | Annual | 1.297 | Annual | 07/28/27 | USD 170,000 | 351 | 351 | ||||||||||||||||||
| VY® BLACKROCK INFLATION PROTECTED BOND PORTFOLIO | PORTFOLIO OF INVESTMENTS AS OF DECEMBER 31, 2021 (CONTINUED) |
| Pay/Receive Floating Rate | Floating Rate Index | Floating Rate Index Payment Frequency | Fixed Rate | Fixed Rate Payment Frequency | Maturity Date | Notional Amount | Fair Value | Unrealized Appreciation/ (Depreciation) | |||||||||||||||||
|---|---|---|---|---|---|---|---|---|---|---|---|---|---|---|---|---|---|---|---|---|---|---|---|---|---|
| Pay | 3-month USD-LIBOR | Quarterly | 1.483 | % | Semi-Annual | 08/01/27 | USD 1,020,000 | $ | (1,978 | ) | $ | (1,978 | ) | ||||||||||||
| Pay | 3-month USD-LIBOR | Quarterly | 1.493 | Semi-Annual | 08/01/27 | USD 1,020,000 | (1,485 | ) | (1,485 | ) | |||||||||||||||
| Pay | 1-day Secured Overnight Financing Rate | Annual | 1.220 | Annual | 08/05/27 | USD 250,000 | (477 | ) | (477 | ) | |||||||||||||||
| Pay | 3-month USD-LIBOR | Quarterly | 1.224 | Semi-Annual | 08/16/27 | USD 320,000 | (4,754 | ) | (4,754 | ) | |||||||||||||||
| Pay | 3-month USD-LIBOR | Quarterly | 1.677 | Semi-Annual | 11/21/27 | USD 420,000 | 1,886 | 1,886 | |||||||||||||||||
| Pay | 3-month USD-LIBOR | Quarterly | 0.654 | Semi-Annual | 07/12/28 | USD 900,000 | (43,366 | ) | (43,383 | ) | |||||||||||||||
| Pay | 1-day Secured Overnight Financing Rate | Annual | 1.196 | Annual | 11/15/28 | USD 490,000 | (1,634 | ) | (1,634 | ) | |||||||||||||||
| Pay | 3-month USD-LIBOR | Quarterly | 0.819 | Semi-Annual | 04/14/30 | USD 610,000 | (33,946 | ) | (33,946 | ) | |||||||||||||||
| Pay | 1-day Secured Overnight Financing Rate | Annual | 1.254 | Annual | 08/15/31 | USD 290,000 | (2,089 | ) | (2,089 | ) | |||||||||||||||
| Pay | 1-day Secured Overnight Financing Rate | Annual | 1.460 | Annual | 08/15/31 | USD 1,120,000 | 12,527 | 9,470 | |||||||||||||||||
| Pay | 3-month USD-LIBOR | Quarterly | 1.513 | Semi-Annual | 08/19/31 | USD 60,000 | (270 | ) | (270 | ) | |||||||||||||||
| Pay | 1-day Secured Overnight Financing Rate | Annual | 1.315 | Annual | 11/30/31 | USD 280,000 | 431 | 431 | |||||||||||||||||
| Pay | 1-day Secured Overnight Financing Rate | Annual | 1.275 | Annual | 12/02/31 | USD 170,000 | (411 | ) | (411 | ) | |||||||||||||||
| Pay | 1-day Secured Overnight Financing Rate | Annual | 1.275 | Annual | 12/02/31 | USD 170,000 | (403 | ) | (403 | ) | |||||||||||||||
| Pay | 1-day Secured Overnight Financing Rate | Annual | 1.277 | Annual | 12/02/31 | USD 170,000 | (379 | ) | (379 | ) | |||||||||||||||
| Pay | 1-day Secured Overnight Financing Rate | Annual | 1.298 | Annual | 12/02/31 | USD 170,000 | (39 | ) | (39 | ) | |||||||||||||||
| Pay | 1-day Secured Overnight Financing Rate | Annual | 1.186 | Annual | 12/07/31 | USD 112,000 | (1,240 | ) | (1,240 | ) | |||||||||||||||
| Pay | 1-day Secured Overnight Financing Rate | Annual | 1.238 | Annual | 12/07/31 | USD 340,000 | (2,081 | ) | (2,081 | ) | |||||||||||||||
| Pay | 1-day Secured Overnight Financing Rate | Annual | 1.307 | Annual | 12/13/31 | USD 170,000 | 31 | 31 | |||||||||||||||||
| Pay | 1-day Secured Overnight Financing Rate | Annual | 1.272 | Annual | 12/16/31 | USD 165,000 | (546 | ) | (546 | ) | |||||||||||||||
| Pay | 1-day Secured Overnight Financing Rate | Annual | 1.239 | Annual | 12/20/31 | USD 85,000 | (561 | ) | (561 | ) | |||||||||||||||
| Pay | 1-day Secured Overnight Financing Rate | Annual | 1.247 | Annual | 12/20/31 | USD 85,000 | (496 | ) | (496 | ) | |||||||||||||||
| Pay | 1-day Secured Overnight Financing Rate | Annual | 1.196 | Annual | 12/21/31 | USD 90,000 | (965 | ) | (965 | ) | |||||||||||||||
| Pay | 1-day Secured Overnight Financing Rate | Annual | 1.208 | Annual | 12/21/31 | USD 165,000 | (1,580 | ) | (1,580 | ) | |||||||||||||||
| Pay | 1-day Secured Overnight Financing Rate | Annual | 1.192 | Annual | 12/22/31 | USD 82,500 | (922 | ) | (922 | ) | |||||||||||||||
| Pay | 3-month USD-LIBOR | Quarterly | 1.775 | Semi-Annual | 01/26/32 | USD 270,000 | 4,757 | 4,757 | |||||||||||||||||
| Pay | 1-day Secured Overnight Financing Rate | Annual | 1.362 | Annual | 05/15/47 | USD 520,000 | (14,481 | ) | (14,481 | ) | |||||||||||||||
| Pay | 3-month USD-LIBOR | Quarterly | 1.828 | Semi-Annual | 02/10/50 | USD 120,000 | 2,556 | 2,556 | |||||||||||||||||
| Pay | 3-month USD-LIBOR | Quarterly | 1.250 | Semi-Annual | 09/08/50 | USD 92,000 | (10,403 | ) | (10,403 | ) | |||||||||||||||
| Pay | 3-month USD-LIBOR | Quarterly | 1.870 | Semi-Annual | 02/19/51 | USD 220,000 | 7,296 | 7,296 | |||||||||||||||||
| Pay | 3-month USD-LIBOR | Quarterly | 1.905 | Semi-Annual | 02/22/51 | USD 110,000 | 4,565 | 4,565 | |||||||||||||||||
| Pay | 3-month USD-LIBOR | Quarterly | 1.904 | Semi-Annual | 06/11/51 | USD 50,000 | 2,097 | 2,097 | |||||||||||||||||
| Pay | 1-day Secured Overnight Financing Rate | Annual | 1.389 | Annual | 12/15/51 | USD 70,000 | (1,103 | ) | (1,103 | ) | |||||||||||||||
| Pay | 3-month USD-LIBOR | Quarterly | 1.929 | Semi-Annual | 12/01/56 | USD 25,000 | 1,032 | 1,032 | |||||||||||||||||
| Receive | 6-month EUR-EURIBOR | Semi-Annual | 0.185 | Annual | 01/16/30 | EUR 270,000 | 55 | 55 | |||||||||||||||||
| Receive | 6-month EUR-EURIBOR | Semi-Annual | 0.440 | Annual | 05/16/33 | EUR 140,000 | 560 | 560 | |||||||||||||||||
| Receive | 3-month USD-LIBOR | Quarterly | 1.771 | Semi-Annual | 07/12/23 | USD 8,275,000 | (64,375 | ) | (64,375 | ) | |||||||||||||||
| Receive | 3-month USD-LIBOR | Quarterly | 0.473 | Semi-Annual | 10/14/23 | USD 1,440,000 | 9,763 | 9,763 | |||||||||||||||||
| Receive | 3-month USD-LIBOR | Quarterly | 0.649 | Semi-Annual | 01/18/24 | USD 1,630,000 | 10,177 | 10,177 | |||||||||||||||||
| Receive | 3-month USD-LIBOR | Quarterly | 1.059 | Semi-Annual | 02/24/24 | USD 1,640,000 | (754 | ) | (754 | ) | |||||||||||||||
| Receive | 3-month USD-LIBOR | Quarterly | 1.069 | Semi-Annual | 02/25/24 | USD 1,640,000 | (1,007 | ) | (1,007 | ) | |||||||||||||||
| Receive | 3-month USD-LIBOR | Quarterly | 1.053 | Semi-Annual | 02/28/24 | USD 3,260,000 | (600 | ) | (600 | ) | |||||||||||||||
| Receive | 3-month USD-LIBOR | Quarterly | 1.060 | Semi-Annual | 02/29/24 | USD 815,000 | (258 | ) | (258 | ) | |||||||||||||||
| Receive | 3-month USD-LIBOR | Quarterly | 0.563 | Semi-Annual | 03/24/24 | USD 360,000 | 3,788 | 3,788 | |||||||||||||||||
| Receive | 3-month USD-LIBOR | Quarterly | 1.097 | Semi-Annual | 04/04/24 | USD 410,000 | — | — | |||||||||||||||||
| VY® BLACKROCK INFLATION PROTECTED BOND PORTFOLIO | PORTFOLIO OF INVESTMENTS AS OF DECEMBER 31, 2021 (CONTINUED) |
| Pay/Receive Floating Rate | Floating Rate Index | Floating Rate Index Payment Frequency | Fixed Rate | Fixed Rate Payment Frequency | Maturity Date | Notional Amount | Fair Value | Unrealized Appreciation/ (Depreciation) | ||||||||||||||||||
|---|---|---|---|---|---|---|---|---|---|---|---|---|---|---|---|---|---|---|---|---|---|---|---|---|---|---|
| Receive | 3-month USD-LIBOR | Quarterly | 1.087% | Semi-Annual | 04/05/24 | USD 850,000 | $ | 449 | $ | 449 | ||||||||||||||||
| Receive | 3-month USD-LIBOR | Quarterly | 0.640 | Semi-Annual | 04/08/24 | USD 2,910,000 | 27,655 | 27,655 | ||||||||||||||||||
| Receive | 3-month USD-LIBOR | Quarterly | 0.649 | Semi-Annual | 04/11/24 | USD 1,610,000 | 15,161 | 15,161 | ||||||||||||||||||
| Receive | 3-month USD-LIBOR | Quarterly | 0.677 | Semi-Annual | 04/12/24 | USD 1,620,000 | 14,413 | 14,413 | ||||||||||||||||||
| Receive | 3-month USD-LIBOR | Quarterly | 0.689 | Semi-Annual | 04/12/24 | USD 1,620,000 | 14,031 | 14,032 | ||||||||||||||||||
| Receive | 3-month USD-LIBOR | Quarterly | 0.728 | Semi-Annual | 04/14/24 | USD 1,010,000 | 8,079 | 8,079 | ||||||||||||||||||
| Receive | 3-month USD-LIBOR | Quarterly | 0.789 | Semi-Annual | 04/14/24 | USD 1,620,000 | 10,999 | 10,999 | ||||||||||||||||||
| Receive | 3-month USD-LIBOR | Quarterly | 0.797 | Semi-Annual | 04/14/24 | USD 1,620,000 | 10,719 | 10,719 | ||||||||||||||||||
| Receive | 3-month USD-LIBOR | Quarterly | 0.761 | Semi-Annual | 04/19/24 | USD 890,000 | 6,659 | 6,659 | ||||||||||||||||||
| Receive | 3-month USD-LIBOR | Quarterly | 0.762 | Semi-Annual | 04/19/24 | USD 890,000 | 6,638 | 6,639 | ||||||||||||||||||
| Receive | 3-month USD-LIBOR | Quarterly | 0.808 | Semi-Annual | 04/20/24 | USD 820,000 | 5,431 | 5,431 | ||||||||||||||||||
| Receive | 3-month USD-LIBOR | Quarterly | 0.815 | Semi-Annual | 04/20/24 | USD 820,000 | 5,324 | 5,324 | ||||||||||||||||||
| Receive | 3-month USD-LIBOR | Quarterly | 0.919 | Semi-Annual | 04/20/24 | USD 15,000 | 66 | 66 | ||||||||||||||||||
| Receive | 3-month USD-LIBOR | Quarterly | 0.935 | Semi-Annual | 04/20/24 | USD 1,190,000 | 4,884 | 4,884 | ||||||||||||||||||
| Receive | 3-month USD-LIBOR | Quarterly | 0.913 | Semi-Annual | 04/25/24 | USD 1,640,000 | 7,675 | 7,675 | ||||||||||||||||||
| Receive | 3-month USD-LIBOR | Quarterly | 0.945 | Semi-Annual | 04/25/24 | USD 1,633,000 | 6,607 | 6,607 | ||||||||||||||||||
| Receive | 3-month USD-LIBOR | Quarterly | 0.975 | Semi-Annual | 04/26/24 | USD 820,000 | 2,853 | 2,853 | ||||||||||||||||||
| Receive | 3-month USD-LIBOR | Quarterly | 0.985 | Semi-Annual | 04/26/24 | USD 820,000 | 2,694 | 2,694 | ||||||||||||||||||
| Receive | 3-month USD-LIBOR | Quarterly | 0.993 | Semi-Annual | 04/26/24 | USD 820,000 | 2,560 | 2,560 | ||||||||||||||||||
| Receive | 3-month USD-LIBOR | Quarterly | 0.997 | Semi-Annual | 04/29/24 | USD 820,000 | 2,569 | 2,569 | ||||||||||||||||||
| Receive | 3-month USD-LIBOR | Quarterly | 1.007 | Semi-Annual | 05/03/24 | USD 2,485,000 | 7,682 | 7,682 | ||||||||||||||||||
| Receive | 3-month USD-LIBOR | Quarterly | 1.018 | Semi-Annual | 05/03/24 | USD 2,485,000 | 7,166 | 7,166 | ||||||||||||||||||
| Receive | 3-month USD-LIBOR | Quarterly | 1.053 | Semi-Annual | 05/12/24 | USD 1,650,000 | 4,140 | 4,140 | ||||||||||||||||||
| Receive | 3-month USD-LIBOR | Quarterly | 1.059 | Semi-Annual | 05/12/24 | USD 820,000 | 1,963 | 1,963 | ||||||||||||||||||
| Receive | 3-month USD-LIBOR | Quarterly | 1.075 | Semi-Annual | 05/12/24 | USD 820,000 | 1,712 | 1,712 | ||||||||||||||||||
| Receive | 3-month USD-LIBOR | Quarterly | 1.224 | Semi-Annual | 06/07/24 | USD 820,000 | (37 | ) | (37 | ) | ||||||||||||||||
| Receive | 3-month USD-LIBOR | Quarterly | 1.252 | Semi-Annual | 06/07/24 | USD 820,000 | (491 | ) | (491 | ) | ||||||||||||||||
| Receive | 1-day Secured Overnight Financing Rate | Annual | 1.012 | Annual | 06/09/24 | USD 810,000 | (531 | ) | (531 | ) | ||||||||||||||||
| Receive | 3-month USD-LIBOR | Quarterly | 1.271 | Semi-Annual | 06/17/24 | USD 810,000 | (527 | ) | (527 | ) | ||||||||||||||||
| Receive | 3-month USD-LIBOR | Quarterly | 1.277 | Semi-Annual | 06/17/24 | USD 810,000 | (615 | ) | (615 | ) | ||||||||||||||||
| Receive | 3-month USD-LIBOR | Quarterly | 0.729 | Semi-Annual | 06/21/24 | USD 1,500,000 | 15,266 | 15,266 | ||||||||||||||||||
| Receive | 3-month USD-LIBOR | Quarterly | 0.744 | Semi-Annual | 08/12/24 | USD 1,800,000 | 20,497 | 20,497 | ||||||||||||||||||
| Receive | 3-month USD-LIBOR | Quarterly | 0.782 | Semi-Annual | 08/15/24 | USD 990,000 | 10,588 | 10,588 | ||||||||||||||||||
| Receive | 3-month USD-LIBOR | Quarterly | 0.623 | Semi-Annual | 04/14/25 | USD 1,180,000 | 22,124 | 22,124 | ||||||||||||||||||
| Receive | 3-month USD-LIBOR | Quarterly | 0.820 | Semi-Annual | 09/08/25 | USD 540,000 | 8,428 | 8,428 | ||||||||||||||||||
| Receive | 3-month USD-LIBOR | Quarterly | 1.548 | Semi-Annual | 02/25/26 | USD 830,000 | 890 | 890 | ||||||||||||||||||
| Receive | 3-month USD-LIBOR | Quarterly | 1.710 | Semi-Annual | 03/06/26 | USD 620,000 | (297 | ) | (297 | ) | ||||||||||||||||
| Receive | 3-month USD-LIBOR | Quarterly | 1.455 | Semi-Annual | 05/31/26 | USD 2,170,000 | (6,010 | ) | (5,879 | ) | ||||||||||||||||
| Receive | 3-month USD-LIBOR | Quarterly | 1.330 | Semi-Annual | 11/23/26 | USD 200,000 | 229 | 229 | ||||||||||||||||||
| Receive | 1-day Secured Overnight Financing Rate | Annual | 1.018 | Annual | 12/02/26 | USD 630,000 | 2,246 | 2,246 | ||||||||||||||||||
| Receive | 1-day Secured Overnight Financing Rate | Annual | 1.080 | Annual | 12/03/26 | USD 315,000 | 172 | 172 | ||||||||||||||||||
| Receive | 1-day Secured Overnight Financing Rate | Annual | 1.082 | Annual | 12/03/26 | USD 315,000 | 141 | 141 | ||||||||||||||||||
| Receive | 1-day Secured Overnight Financing Rate | Annual | 1.038 | Annual | 12/06/26 | USD 390,000 | 1,070 | 1,070 | ||||||||||||||||||
| Receive | 1-day Secured Overnight Financing Rate | Annual | 1.030 | Annual | 12/20/26 | USD 310,000 | 1,139 | 1,139 | ||||||||||||||||||
| Receive | 1-day Secured Overnight Financing Rate | Annual | 1.092 | Annual | 12/23/26 | USD 310,000 | 222 | 222 | ||||||||||||||||||
| Receive | 3-month USD-LIBOR | Quarterly | 1.350 | Semi-Annual | 01/10/27 | USD 380,000 | 376 | 376 | ||||||||||||||||||
| Receive | 3-month USD-LIBOR | Quarterly | 1.425 | Semi-Annual | 01/10/27 | USD 400,000 | (1,066 | ) | (1,066 | ) | ||||||||||||||||
| Receive | 3-month USD-LIBOR | Quarterly | 1.400 | Semi-Annual | 01/12/27 | USD 610,000 | (844 | ) | (844 | ) | ||||||||||||||||
| Receive | 1-day Secured Overnight Financing Rate | Annual | 1.168 | Annual | 03/09/27 | USD 660,000 | (93 | ) | (93 | ) | ||||||||||||||||
| Receive | 3-month USD-LIBOR | Quarterly | 1.445 | Semi-Annual | 04/12/27 | USD 650,000 | 18 | 18 | ||||||||||||||||||
| Receive | 3-month USD-LIBOR | Quarterly | 1.285 | Semi-Annual | 04/20/27 | USD 610,000 | 4,935 | 4,935 | ||||||||||||||||||
| Receive | 1-day Secured Overnight Financing Rate | Annual | 1.239 | Annual | 06/29/27 | USD 165,000 | (6 | ) | (6 | ) | ||||||||||||||||
| Receive | 1-day Secured Overnight Financing Rate | Annual | 1.247 | Annual | 06/29/27 | USD 165,000 | (70 | ) | (70 | ) | ||||||||||||||||
| Receive | 3-month USD-LIBOR | Quarterly | 0.512 | Semi-Annual | 08/17/27 | USD 230,000 | 11,118 | 11,118 | ||||||||||||||||||
| VY® BLACKROCK INFLATION PROTECTED BOND PORTFOLIO | PORTFOLIO OF INVESTMENTS AS OF DECEMBER 31, 2021 (CONTINUED) |
| Pay/Receive Floating Rate | Floating Rate Index | Floating Rate Index Payment Frequency | Fixed Rate | Fixed Rate Payment Frequency | Maturity Date | Notional Amount | Fair Value | Unrealized Appreciation/ (Depreciation) | ||||||||||||||||||
|---|---|---|---|---|---|---|---|---|---|---|---|---|---|---|---|---|---|---|---|---|---|---|---|---|---|---|
| Receive | 3-month USD-LIBOR | Quarterly | 0.845% | Semi-Annual | 11/15/27 | USD 470,000 | $ | 15,118 | $ | 15,112 | ||||||||||||||||
| Receive | 1-day Secured Overnight Financing Rate | Annual | 1.245 | Annual | 11/15/27 | USD 420,000 | 1,279 | 1,279 | ||||||||||||||||||
| Receive | 3-month USD-LIBOR | Quarterly | 1.271 | Semi-Annual | 02/15/28 | USD 1,350,000 | 12,196 | 12,196 | ||||||||||||||||||
| Receive | 1-day Secured Overnight Financing Rate | Annual | 1.355 | Annual | 11/15/28 | USD 2,940,000 | (20,317 | ) | (17,530 | ) | ||||||||||||||||
| Receive | 3-month USD-LIBOR | Quarterly | 0.648 | Semi-Annual | 06/02/30 | USD 440,000 | 31,000 | 31,000 | ||||||||||||||||||
| Receive | 3-month USD-LIBOR | Quarterly | 2.788 | Semi-Annual | 03/10/31 | USD 522,000 | (56,309 | ) | (56,309 | ) | ||||||||||||||||
| Receive | 3-month USD-LIBOR | Quarterly | 2.504 | Semi-Annual | 03/20/31 | USD 3,000 | (101 | ) | (101 | ) | ||||||||||||||||
| Receive | 1-day Secured Overnight Financing Rate | Annual | 1.520 | Annual | 08/15/31 | USD 570,000 | (9,422 | ) | (9,422 | ) | ||||||||||||||||
| Receive | 3-month USD-LIBOR | Quarterly | 1.429 | Semi-Annual | 09/21/31 | USD 490,000 | 6,173 | 6,173 | ||||||||||||||||||
| Receive | 3-month USD-LIBOR | Quarterly | 1.391 | Semi-Annual | 09/22/31 | USD 270,000 | 4,341 | 4,341 | ||||||||||||||||||
| Receive | 3-month USD-LIBOR | Quarterly | 1.521 | Semi-Annual | 09/24/31 | USD 990,000 | 4,165 | 4,165 | ||||||||||||||||||
| Receive | 3-month USD-LIBOR | Quarterly | 1.775 | Semi-Annual | 10/18/31 | USD 540,000 | (10,306 | ) | (10,306 | ) | ||||||||||||||||
| Receive | 1-day Secured Overnight Financing Rate | Annual | 1.424 | Annual | 11/18/31 | USD 230,000 | (2,848 | ) | (2,848 | ) | ||||||||||||||||
| Receive | 1-day Secured Overnight Financing Rate | Annual | 1.452 | Annual | 11/19/31 | USD 90,000 | (1,351 | ) | (1,351 | ) | ||||||||||||||||
| Receive | 1-day Secured Overnight Financing Rate | Annual | 1.401 | Annual | 11/22/31 | USD 210,000 | (2,110 | ) | (2,110 | ) | ||||||||||||||||
| Receive | 1-day Secured Overnight Financing Rate | Annual | 1.431 | Annual | 11/22/31 | USD 210,000 | (2,717 | ) | (2,717 | ) | ||||||||||||||||
| Receive | 1-day Secured Overnight Financing Rate | Annual | 1.421 | Annual | 11/24/31 | USD 170,000 | (2,019 | ) | (2,019 | ) | ||||||||||||||||
| Receive | 1-day Secured Overnight Financing Rate | Annual | 1.442 | Annual | 11/24/31 | USD 170,000 | (2,359 | ) | (2,359 | ) | ||||||||||||||||
| Receive | 1-day Secured Overnight Financing Rate | Annual | 1.477 | Annual | 11/26/31 | USD 230,000 | (3,939 | ) | (3,939 | ) | ||||||||||||||||
| Receive | 1-day Secured Overnight Financing Rate | Annual | 1.333 | Annual | 12/10/31 | USD 170,000 | (469 | ) | (468 | ) | ||||||||||||||||
| Receive | 1-day Secured Overnight Financing Rate | Annual | 1.314 | Annual | 12/28/31 | USD 170,000 | (27 | ) | (27 | ) | ||||||||||||||||
| Receive | 1-day Secured Overnight Financing Rate | Annual | 1.357 | Annual | 12/31/31 | USD 83,000 | (347 | ) | (347 | ) | ||||||||||||||||
| Receive | 1-day Secured Overnight Financing Rate | Annual | 1.367 | Annual | 12/31/31 | USD 82,000 | (416 | ) | (416 | ) | ||||||||||||||||
| Receive | 1-day Secured Overnight Financing Rate | Annual | 1.354 | Annual | 01/03/32 | USD 82,000 | (303 | ) | (303 | ) | ||||||||||||||||
| Receive | 1-day Secured Overnight Financing Rate | Annual | 1.311 | Annual | 01/04/32 | USD 83,000 | — | — | ||||||||||||||||||
| Receive | 1-day Secured Overnight Financing Rate | Annual | 1.310 | Annual | 01/26/32 | USD 196,000 | 278 | 278 | ||||||||||||||||||
| Receive | 3-month USD-LIBOR | Quarterly | 1.594 | Semi-Annual | 02/22/32 | USD 550,000 | 351 | 351 | ||||||||||||||||||
| Receive | 3-month USD-LIBOR | Quarterly | 1.621 | Semi-Annual | 02/22/32 | USD 275,000 | (522 | ) | (522 | ) | ||||||||||||||||
| Receive | 3-month USD-LIBOR | Quarterly | 0.760 | Semi-Annual | 05/03/32 | USD 800,000 | 65,498 | 65,498 | ||||||||||||||||||
| Receive | 3-month USD-LIBOR | Quarterly | 0.765 | Semi-Annual | 05/04/32 | USD 820,000 | 66,789 | 66,789 | ||||||||||||||||||
| Receive | 3-month USD-LIBOR | Quarterly | 0.770 | Semi-Annual | 05/06/32 | USD 190,000 | 15,401 | 15,401 | ||||||||||||||||||
| Receive | 3-month USD-LIBOR | Quarterly | 1.645 | Semi-Annual | 08/22/34 | USD 300,000 | 4,394 | 4,394 | ||||||||||||||||||
| Receive | 3-month USD-LIBOR | Quarterly | 1.907 | Semi-Annual | 10/21/34 | USD 320,000 | (2,734 | ) | (2,734 | ) | ||||||||||||||||
| Receive | 3-month USD-LIBOR | Quarterly | 1.921 | Semi-Annual | 10/22/34 | USD 300,000 | (2,940 | ) | (2,940 | ) | ||||||||||||||||
| Receive | 3-month USD-LIBOR | Quarterly | 1.982 | Semi-Annual | 10/23/34 | USD 15,000 | (229 | ) | (229 | ) | ||||||||||||||||
| Receive | 3-month USD-LIBOR | Quarterly | 0.973 | Semi-Annual | 08/17/40 | USD 150,000 | 18,954 | 18,954 | ||||||||||||||||||
| Receive | 3-month USD-LIBOR | Quarterly | 2.110 | Semi-Annual | 11/15/44 | USD 90,000 | (1,350 | ) | (1,350 | ) | ||||||||||||||||
| Receive | 1-day Secured Overnight Financing Rate | Annual | 1.473 | Annual | 05/15/47 | USD 170,000 | 749 | 749 | ||||||||||||||||||
| Receive | 1-day Secured Overnight Financing Rate | Annual | 1.640 | Annual | 05/15/47 | USD 980,000 | (30,458 | ) | (23,853 | ) | ||||||||||||||||
| Receive | 3-month USD-LIBOR | Quarterly | 2.378 | Semi-Annual | 07/05/49 | USD 140,000 | (6,185 | ) | (6,185 | ) | ||||||||||||||||
| Receive | 3-month USD-LIBOR | Quarterly | 1.709 | Semi-Annual | 08/16/49 | USD 130,000 | 393 | 393 | ||||||||||||||||||
| Receive | 3-month USD-LIBOR | Quarterly | 1.667 | Semi-Annual | 08/17/49 | USD 100,000 | 603 | 603 | ||||||||||||||||||
| Receive | 3-month USD-LIBOR | Quarterly | 1.090 | Semi-Annual | 06/20/52 | USD 160,000 | 25,428 | 25,428 | ||||||||||||||||||
| Receive | 3-month USD-LIBOR | Quarterly | 1.136 | Semi-Annual | 06/20/52 | USD 160,000 | 23,654 | 23,654 | ||||||||||||||||||
| VY® BLACKROCK INFLATION PROTECTED BOND PORTFOLIO | PORTFOLIO OF INVESTMENTS AS OF DECEMBER 31, 2021 (CONTINUED) |
| Pay/Receive Floating Rate | Floating Rate Index | Floating Rate Index Payment Frequency | Fixed Rate | Fixed Rate Payment Frequency | Maturity Date | Notional Amount | Fair Value | Unrealized Appreciation/ (Depreciation) | ||||||||||||||||||
|---|---|---|---|---|---|---|---|---|---|---|---|---|---|---|---|---|---|---|---|---|---|---|---|---|---|---|
| Receive | 3-month USD-LIBOR | Quarterly | 0.881% | Semi-Annual | 07/12/53 | USD 160,000 | $ | 33,876 | $ | 33,872 | ||||||||||||||||
| $ | 318,637 | $ | 325,355 | |||||||||||||||||||||||
| Pay/Receive Floating Rate | Floating Rate Index | Floating Rate Index Payment Frequency | Fixed Rate | Fixed Rate Payment Frequency | Maturity Date | Notional Amount | Fair Value | Unrealized Appreciation/ (Depreciation) | ||||||||||||||||||
|---|---|---|---|---|---|---|---|---|---|---|---|---|---|---|---|---|---|---|---|---|---|---|---|---|---|---|
| Pay | Eurostat Eurozone HICP ex Tobacco NSA (CPTFEMU) | At Termination Date | 1.793% | At Termination Date | 07/15/51 | EUR 130,000 | $ | (33,017 | ) | $ | (33,017 | ) | ||||||||||||||
| Pay | Eurostat Eurozone HICP ex Tobacco NSA (CPTFEMU) | At Termination Date | 1.886 | At Termination Date | 08/15/51 | EUR 260,000 | (53,060 | ) | (53,060 | ) | ||||||||||||||||
| Pay | Eurostat Eurozone HICP ex Tobacco NSA (CPTFEMU) | At Termination Date | 2.132 | At Termination Date | 10/15/51 | EUR 180,000 | (11,715 | ) | (11,715 | ) | ||||||||||||||||
| Pay | Eurostat Eurozone HICP ex Tobacco NSA (CPTFEMU) | At Termination Date | 2.205 | At Termination Date | 10/15/51 | EUR 835,000 | (19,628 | ) | (19,628 | ) | ||||||||||||||||
| Pay | Eurostat Eurozone HICP ex Tobacco NSA (CPTFEMU) | At Termination Date | 2.221 | At Termination Date | 10/15/51 | EUR 180,000 | (2,545 | ) | (2,545 | ) | ||||||||||||||||
| Pay | Eurostat Eurozone HICP ex Tobacco NSA (CPTFEMU) | At Termination Date | 2.277 | At Termination Date | 10/15/51 | EUR 180,000 | 3,287 | 3,287 | ||||||||||||||||||
| Pay | Eurostat Eurozone HICP ex Tobacco NSA (CPTFEMU) | At Termination Date | 2.320 | At Termination Date | 10/15/51 | EUR 175,000 | 7,602 | 7,602 | ||||||||||||||||||
| Pay | Eurostat Eurozone HICP ex Tobacco NSA (CPTFEMU) | At Termination Date | 2.206 | At Termination Date | 11/15/51 | EUR 75,000 | (1,733 | ) | (1,910 | ) | ||||||||||||||||
| Pay | Eurostat Eurozone HICP ex Tobacco NSA (CPTFEMU) | At Termination Date | 2.096 | At Termination Date | 12/15/51 | EUR 40,000 | (3,266 | ) | (3,266 | ) | ||||||||||||||||
| Pay | Eurostat Eurozone HICP ex Tobacco NSA (CPTFEMU) | At Termination Date | 2.125 | At Termination Date | 12/15/51 | EUR 135,000 | (8,864 | ) | (8,864 | ) | ||||||||||||||||
| Pay | Eurostat Eurozone HICP ex Tobacco NSA (CPTFEMU) | At Termination Date | 2.170 | At Termination Date | 12/15/51 | EUR 135,000 | (5,430 | ) | (5,430 | ) | ||||||||||||||||
| Pay | U.K. RPI All Items Monthly | At Termination Date | 3.574 | At Termination Date | 10/15/30 | GBP 1,415,000 | (210,038 | ) | (211,479 | ) | ||||||||||||||||
| Pay | U.K. RPI All Items Monthly | At Termination Date | 3.746 | At Termination Date | 04/15/31 | GBP 400,000 | (51,549 | ) | (51,549 | ) | ||||||||||||||||
| Pay | U.K. RPI All Items Monthly | At Termination Date | 4.415 | At Termination Date | 11/15/31 | GBP 440,000 | 12,014 | 12,014 | ||||||||||||||||||
| Pay | U.K. RPI All Items Monthly | At Termination Date | 4.265 | At Termination Date | 12/15/31 | GBP 600,000 | 10,053 | 11,714 | ||||||||||||||||||
| Pay | U.K. RPI All Items Monthly | At Termination Date | 3.360 | At Termination Date | 10/15/39 | GBP 2,025,000 | (388,352 | ) | (388,352 | ) | ||||||||||||||||
| Pay | U.K. RPI All Items Monthly | At Termination Date | 3.310 | At Termination Date | 01/15/40 | GBP 900,000 | (209,863 | ) | (209,863 | ) | ||||||||||||||||
| Pay | U.K. RPI All Items Monthly | At Termination Date | 3.341 | At Termination Date | 01/15/40 | GBP 800,000 | (175,965 | ) | (175,965 | ) | ||||||||||||||||
| Pay | U.K. RPI All Items Monthly | At Termination Date | 3.336 | At Termination Date | 11/15/40 | GBP 310,000 | (82,123 | ) | (82,144 | ) | ||||||||||||||||
| Pay | U.K. RPI All Items Monthly | At Termination Date | 3.560 | At Termination Date | 03/15/41 | GBP 330,000 | (57,510 | ) | (57,510 | ) | ||||||||||||||||
| Pay | U.K. RPI All Items Monthly | At Termination Date | 3.270 | At Termination Date | 10/15/44 | GBP 1,560,000 | (381,827 | ) | (381,826 | ) | ||||||||||||||||
| Pay | U.K. RPI All Items Monthly | At Termination Date | 3.220 | At Termination Date | 01/15/45 | GBP 700,000 | (205,909 | ) | (205,909 | ) | ||||||||||||||||
| Pay | U.K. RPI All Items Monthly | At Termination Date | 3.239 | At Termination Date | 01/15/45 | GBP 600,000 | (169,794 | ) | (169,794 | ) |
| VY® BLACKROCK INFLATION PROTECTED BOND PORTFOLIO | PORTFOLIO OF INVESTMENTS AS OF DECEMBER 31, 2021 (CONTINUED) |
| Pay/Receive Floating Rate | Floating Rate Index | Floating Rate Index Payment Frequency | Fixed Rate | Fixed Rate Payment Frequency | Maturity Date | Notional Amount | Fair Value | Unrealized Appreciation/ (Depreciation) | ||||||||||||||||||
|---|---|---|---|---|---|---|---|---|---|---|---|---|---|---|---|---|---|---|---|---|---|---|---|---|---|---|
| Pay | U.S. CPI Urban Consumers NSA (CPURNSA) | At Termination Date | 2.755% | At Termination Date | 10/22/31 | USD 290,000 | $ | (3,221 | ) | $ | (3,221 | ) | ||||||||||||||
| Pay | U.S. CPI Urban Consumers NSA (CPURNSA) | At Termination Date | 2.827 | At Termination Date | 10/25/31 | USD 290,000 | (860 | ) | (860 | ) | ||||||||||||||||
| Pay | U.S. CPI Urban Consumers NSA (CPURNSA) | At Termination Date | 2.855 | At Termination Date | 10/26/31 | USD 290,000 | 54 | 54 | ||||||||||||||||||
| Pay | U.S. CPI Urban Consumers NSA (CPURNSA) | At Termination Date | 2.890 | At Termination Date | 10/28/31 | USD 290,000 | 1,201 | 1,201 | ||||||||||||||||||
| Pay | U.S. CPI Urban Consumers NSA (CPURNSA) | At Termination Date | 2.825 | At Termination Date | 11/03/31 | USD 560,000 | (1,792 | ) | (1,792 | ) | ||||||||||||||||
| Pay | U.S. CPI Urban Consumers NSA (CPURNSA) | At Termination Date | 2.628 | At Termination Date | 11/15/51 | USD 195,000 | 5,218 | 5,218 | ||||||||||||||||||
| Pay | U.S. CPI Urban Consumers NSA (CPURNSA) | At Termination Date | 2.676 | At Termination Date | 11/17/51 | USD 195,000 | 9,090 | 9,090 | ||||||||||||||||||
| Pay | U.S. CPI Urban Consumers NSA (CPURNSA) | At Termination Date | 2.626 | At Termination Date | 11/22/51 | USD 60,000 | 1,568 | 1,568 | ||||||||||||||||||
| Pay | U.S. CPI Urban Consumers NSA (CPURNSA) | At Termination Date | 2.613 | At Termination Date | 11/24/51 | USD 200,000 | 4,174 | 4,174 | ||||||||||||||||||
| Receive | Eurostat Eurozone HICP ex Tobacco NSA (CPTFEMU) | At Termination Date | 1.956 | At Termination Date | 10/15/31 | EUR 180,000 | 3,372 | 3,372 | ||||||||||||||||||
| Receive | Eurostat Eurozone HICP ex Tobacco NSA (CPTFEMU) | At Termination Date | 2.044 | At Termination Date | 10/15/31 | EUR 180,000 | 1,234 | 1,234 | ||||||||||||||||||
| Receive | Eurostat Eurozone HICP ex Tobacco NSA (CPTFEMU) | At Termination Date | 2.091 | At Termination Date | 10/15/31 | EUR 180,000 | 85 | 85 | ||||||||||||||||||
| Receive | Eurostat Eurozone HICP ex Tobacco NSA (CPTFEMU) | At Termination Date | 2.134 | At Termination Date | 10/15/31 | EUR 175,000 | (944 | ) | (944 | ) | ||||||||||||||||
| Receive | Eurostat Eurozone HICP ex Tobacco NSA (CPTFEMU) | At Termination Date | 2.004 | At Termination Date | 11/15/31 | EUR 330,000 | 3,912 | 3,961 | ||||||||||||||||||
| Receive | Eurostat Eurozone HICP ex Tobacco NSA (CPTFEMU) | At Termination Date | 2.127 | At Termination Date | 11/15/51 | EUR 135,000 | 9,182 | 9,182 | ||||||||||||||||||
| Receive | Eurostat Eurozone HICP ex Tobacco NSA (CPTFEMU) | At Termination Date | 2.170 | At Termination Date | 11/15/51 | EUR 50,000 | 2,185 | 2,185 | ||||||||||||||||||
| Receive | Eurostat Eurozone HICP ex Tobacco NSA (CPTFEMU) | At Termination Date | 2.184 | At Termination Date | 11/15/51 | EUR 130,000 | 4,658 | 4,658 | ||||||||||||||||||
| Receive | Eurostat Eurozone HICP ex Tobacco NSA (CPTFEMU) | At Termination Date | 2.194 | At Termination Date | 11/15/51 | EUR 135,000 | 4,049 | 4,049 | ||||||||||||||||||
| Receive | U.K. RPI All Items Monthly | At Termination Date | 3.623 | At Termination Date | 04/15/31 | GBP 560,000 | 84,041 | 84,041 | ||||||||||||||||||
| Receive | U.K. RPI All Items Monthly | At Termination Date | 4.228 | At Termination Date | 12/15/31 | GBP 440,000 | (4,416 | ) | (4,416 | ) | ||||||||||||||||
| Receive | U.K. RPI All Items Monthly | At Termination Date | 3.420 | At Termination Date | 10/15/34 | GBP 2,025,000 | 298,294 | 298,294 | ||||||||||||||||||
| Receive | U.K. RPI All Items Monthly | At Termination Date | 3.360 | At Termination Date | 01/15/35 | GBP 900,000 | 164,117 | 164,117 | ||||||||||||||||||
| Receive | U.K. RPI All Items Monthly | At Termination Date | 3.390 | At Termination Date | 01/15/35 | GBP 800,000 | 139,007 | 139,007 | ||||||||||||||||||
| Receive | U.K. RPI All Items Monthly | At Termination Date | 3.725 | At Termination Date | 12/15/41 | GBP 300,000 | 9,725 | 9,033 |
| VY® BLACKROCK INFLATION PROTECTED BOND PORTFOLIO | PORTFOLIO OF INVESTMENTS AS OF DECEMBER 31, 2021 (CONTINUED) |
| Pay/Receive Floating Rate | Floating Rate Index | Floating Rate Index Payment Frequency | Fixed Rate | Fixed Rate Payment Frequency | Maturity Date | Notional Amount | Fair Value | Unrealized Appreciation/ (Depreciation) | ||||||||||||||||||
|---|---|---|---|---|---|---|---|---|---|---|---|---|---|---|---|---|---|---|---|---|---|---|---|---|---|---|
| Receive | U.K. RPI All Items Monthly | At Termination Date | 3.774% | At Termination Date | 12/15/41 | GBP 165,000 | $ | 1,673 | $ | 2,412 | ||||||||||||||||
| Receive | U.K. RPI All Items Monthly | At Termination Date | 3.855 | At Termination Date | 12/15/41 | GBP 165,000 | (4,536 | ) | (4,536 | ) | ||||||||||||||||
| Receive | U.K. RPI All Items Monthly | At Termination Date | 3.160 | At Termination Date | 10/15/49 | GBP 1,560,000 | 475,696 | 475,696 | ||||||||||||||||||
| Receive | U.K. RPI All Items Monthly | At Termination Date | 3.111 | At Termination Date | 01/15/50 | GBP 700,000 | 253,898 | 253,898 | ||||||||||||||||||
| Receive | U.K. RPI All Items Monthly | At Termination Date | 3.133 | At Termination Date | 01/15/50 | GBP 600,000 | 207,697 | 207,697 | ||||||||||||||||||
| Receive | U.S. CPI Urban Consumers NSA (CPURNSA) | At Termination Date | 2.260 | At Termination Date | 05/03/23 | USD 9,000,000 | 387,301 | 387,301 | ||||||||||||||||||
| Receive | U.S. CPI Urban Consumers NSA (CPURNSA) | At Termination Date | 1.957 | At Termination Date | 02/06/24 | USD 12,000,000 | 825,096 | 825,096 | ||||||||||||||||||
| Receive | U.S. CPI Urban Consumers NSA (CPURNSA) | At Termination Date | 2.339 | At Termination Date | 02/17/24 | USD 5,300,000 | 320,711 | 320,711 | ||||||||||||||||||
| Receive | U.S. CPI Urban Consumers NSA (CPURNSA) | At Termination Date | 1.991 | At Termination Date | 03/04/24 | USD 3,000,000 | 211,102 | 211,102 | ||||||||||||||||||
| Receive | U.S. CPI Urban Consumers NSA (CPURNSA) | At Termination Date | 2.248 | At Termination Date | 03/21/24 | USD 4,900,000 | 259,516 | 259,516 | ||||||||||||||||||
| Receive | U.S. CPI Urban Consumers NSA (CPURNSA) | At Termination Date | 2.023 | At Termination Date | 05/02/24 | USD 3,500,000 | 248,121 | 248,121 | ||||||||||||||||||
| Receive | U.S. CPI Urban Consumers NSA (CPURNSA) | At Termination Date | 1.829 | At Termination Date | 07/31/24 | USD 600,000 | 47,628 | 47,628 | ||||||||||||||||||
| Receive | U.S. CPI Urban Consumers NSA (CPURNSA) | At Termination Date | 1.706 | At Termination Date | 08/12/24 | USD 1,300,000 | 112,812 | 112,812 | ||||||||||||||||||
| Receive | U.S. CPI Urban Consumers NSA (CPURNSA) | At Termination Date | 2.351 | At Termination Date | 09/28/24 | USD 4,500,000 | 219,097 | 219,097 | ||||||||||||||||||
| Receive | U.S. CPI Urban Consumers NSA (CPURNSA) | At Termination Date | 0.945 | At Termination Date | 03/12/25 | USD 1,650,000 | 213,419 | 213,419 | ||||||||||||||||||
| Receive | U.S. CPI Urban Consumers NSA (CPURNSA) | At Termination Date | 1.908 | At Termination Date | 05/24/25 | USD 4,500,000 | 395,667 | 395,667 | ||||||||||||||||||
| Receive | U.S. CPI Urban Consumers NSA (CPURNSA) | At Termination Date | 2.658 | At Termination Date | 06/29/25 | USD 3,900,000 | 173,122 | 173,122 | ||||||||||||||||||
| Receive | U.S. CPI Urban Consumers NSA (CPURNSA) | At Termination Date | 1.783 | At Termination Date | 11/04/25 | USD 1,300,000 | 132,285 | 132,238 | ||||||||||||||||||
| Receive | U.S. CPI Urban Consumers NSA (CPURNSA) | At Termination Date | 2.098 | At Termination Date | 11/29/25 | USD 1,600,000 | 123,177 | 123,177 | ||||||||||||||||||
| Receive | U.S. CPI Urban Consumers NSA (CPURNSA) | At Termination Date | 2.534 | At Termination Date | 04/01/26 | USD 16,750,000 | 1,018,223 | 1,018,223 | ||||||||||||||||||
| Receive | U.S. CPI Urban Consumers NSA (CPURNSA) | At Termination Date | 2.600 | At Termination Date | 06/17/26 | USD 5,495,000 | 274,879 | 274,879 | ||||||||||||||||||
| Receive | U.S. CPI Urban Consumers NSA (CPURNSA) | At Termination Date | 1.853 | At Termination Date | 06/28/26 | USD 450,000 | 44,302 | 44,302 | ||||||||||||||||||
| Receive | U.S. CPI Urban Consumers NSA (CPURNSA) | At Termination Date | 2.687 | At Termination Date | 08/31/26 | USD 5,050,000 | 145,920 | 145,920 | ||||||||||||||||||
| Receive | U.S. CPI Urban Consumers NSA (CPURNSA) | At Termination Date | 3.136 | At Termination Date | 11/10/26 | USD 1,700,000 | 956 | 956 |
| VY® BLACKROCK INFLATION PROTECTED BOND PORTFOLIO | PORTFOLIO OF INVESTMENTS AS OF DECEMBER 31, 2021 (CONTINUED) |
| Pay/Receive Floating Rate | Floating Rate Index | Floating Rate Index Payment Frequency | Fixed Rate | Fixed Rate Payment Frequency | Maturity Date | Notional Amount | Fair Value | Unrealized Appreciation/ (Depreciation) | ||||||||||||||||||
|---|---|---|---|---|---|---|---|---|---|---|---|---|---|---|---|---|---|---|---|---|---|---|---|---|---|---|
| Receive | U.S. CPI Urban Consumers NSA (CPURNSA) | At Termination Date | 3.045% | At Termination Date | 12/02/26 | USD 2,165,000 | $ | 10,244 | $ | 10,244 | ||||||||||||||||
| Receive | U.S. CPI Urban Consumers NSA (CPURNSA) | At Termination Date | 2.894 | At Termination Date | 12/14/26 | USD 1,490,000 | 13,857 | 13,857 | ||||||||||||||||||
| Receive | U.S. CPI Urban Consumers NSA (CPURNSA) | At Termination Date | 1.285 | At Termination Date | 05/05/30 | USD 4,860,000 | 907,195 | 907,195 | ||||||||||||||||||
| Receive | U.S. CPI Urban Consumers NSA (CPURNSA) | At Termination Date | 1.983 | At Termination Date | 10/13/30 | USD 1,430,000 | 181,599 | 181,541 | ||||||||||||||||||
| Receive | U.S. CPI Urban Consumers NSA (CPURNSA) | At Termination Date | 2.468 | At Termination Date | 04/19/31 | USD 535,000 | 37,969 | 37,969 | ||||||||||||||||||
| Receive | U.S. CPI Urban Consumers NSA (CPURNSA) | At Termination Date | 2.530 | At Termination Date | 09/02/31 | USD 1,850,000 | 74,297 | 74,297 | ||||||||||||||||||
| Receive | U.S. CPI Urban Consumers NSA (CPURNSA) | At Termination Date | 2.813 | At Termination Date | 11/02/31 | USD 2,570,000 | 11,886 | 11,886 | ||||||||||||||||||
| Receive | U.S. CPI Urban Consumers NSA (CPURNSA) | At Termination Date | 2.570 | At Termination Date | 10/22/51 | USD 290,000 | (788 | ) | (788 | ) | ||||||||||||||||
| Receive | U.S. CPI Urban Consumers NSA (CPURNSA) | At Termination Date | 2.606 | At Termination Date | 10/25/51 | USD 1,255,000 | (21,758 | ) | (21,758 | ) | ||||||||||||||||
| Receive | U.S. CPI Urban Consumers NSA (CPURNSA) | At Termination Date | 2.624 | At Termination Date | 10/25/51 | USD 290,000 | (7,161 | ) | (7,161 | ) | ||||||||||||||||
| Receive | U.S. CPI Urban Consumers NSA (CPURNSA) | At Termination Date | 2.620 | At Termination Date | 10/26/51 | USD 290,000 | (6,689 | ) | (6,689 | ) | ||||||||||||||||
| Receive | U.S. CPI Urban Consumers NSA (CPURNSA) | At Termination Date | 2.625 | At Termination Date | 10/28/51 | USD 290,000 | (7,300 | ) | (7,300 | ) | ||||||||||||||||
| Receive | U.S. CPI Urban Consumers NSA (CPURNSA) | At Termination Date | 2.540 | At Termination Date | 11/03/51 | USD 165,000 | 1,519 | 1,519 | ||||||||||||||||||
| Receive | U.S. CPI Urban Consumers NSA (CPURNSA) | At Termination Date | 2.445 | At Termination Date | 12/20/51 | USD 200,000 | 7,795 | 7,795 | ||||||||||||||||||
| $ | 5,985,128 | $ | 5,985,142 |
| Counterparty | Pay/ Receive Floating Rate | Floating Rate Index | Floating Rate Index Payment Frequency | Fixed Rate | Fixed Rate Payment Frequency | Maturity Date | Notional Amount | Fair Value | Upfront Payments Paid/ (Received) | Unrealized Appreciation/ (Depreciation) | ||||||||||||||||||||||
|---|---|---|---|---|---|---|---|---|---|---|---|---|---|---|---|---|---|---|---|---|---|---|---|---|---|---|---|---|---|---|---|---|
| Citibank N.A. | Receive | U.S. CPI Urban Consumers NSA (CPURNSA) | At Termination Date | 1.560% | At Termination Date | 01/15/23 | USD 10,250,000 | $ | 933,191 | $ | — | $ | 933,191 | |||||||||||||||||||
| Citibank N.A. | Receive | U.S. CPI Urban Consumers NSA (CPURNSA) | At Termination Date | 4.167 | At Termination Date | 07/15/23 | USD 5,500,000 | (22,308 | ) | — | (22,308 | ) | ||||||||||||||||||||
| Citibank N.A. | Receive | U.S. CPI Urban Consumers NSA (CPURNSA) | At Termination Date | 1.660 | At Termination Date | 09/22/23 | USD 5,500,000 | 530,459 | — | 530,459 | ||||||||||||||||||||||
| Citibank N.A. | Receive | U.S. CPI Urban Consumers NSA (CPURNSA) | At Termination Date | 3.562 | At Termination Date | 01/15/25 | USD 14,500,000 | (120,993 | ) | — | (120,993 | ) | ||||||||||||||||||||
| VY® BLACKROCK INFLATION PROTECTED BOND PORTFOLIO | PORTFOLIO OF INVESTMENTS AS OF DECEMBER 31, 2021 (CONTINUED) |
| Counterparty | Pay/ Receive Floating Rate | Floating Rate Index | Floating Rate Index Payment Frequency | Fixed Rate | Fixed Rate Payment Frequency | Maturity Date | Notional Amount | Fair Value | Upfront Payments Paid/ (Received) | Unrealized Appreciation/ (Depreciation) | ||||||||||||||||||||||
|---|---|---|---|---|---|---|---|---|---|---|---|---|---|---|---|---|---|---|---|---|---|---|---|---|---|---|---|---|---|---|---|---|
| Citibank N.A. | Receive | U.S. CPI Urban Consumers NSA (CPURNSA) | At Termination Date | 3.410% | At Termination Date | 01/15/26 | USD 3,600,000 | $ | (37,525 | ) | $ | — | $ | (37,525 | ) | |||||||||||||||||
| $ | 1,282,824 | $ | — | $ | 1,282,824 | |||||||||||||||||||||||||||
| Description | Put/Call | Expiration Date | Exercise Price | Number of Contracts | Notional Amount | Cost | Fair Value | ||||||||||||
|---|---|---|---|---|---|---|---|---|---|---|---|---|---|---|---|---|---|---|---|
| U.S. Treasury 10-Year Note | Call | 01/21/22 | 131.00 USD | 17 | USD 2,217,969 | $ | 9,588 | $ | 5,844 | ||||||||||
| $ | 9,588 | $ | 5,844 | ||||||||||||||||
| Description | Put/Call | Expiration Date | Exercise Price | Number of Contracts | Notional Amount | Premiums Received | Fair Value | ||||||||||||
|---|---|---|---|---|---|---|---|---|---|---|---|---|---|---|---|---|---|---|---|
| U.S. Treasury 10-Year Note | Call | 01/21/22 | 132.00 USD | 17 | USD 2,217,969 | $ 3,959 | $ | (1,859 | ) | ||||||||||
| $ 3,959 | $ | (1,859 | ) | ||||||||||||||||
| Description | Counterparty | Pay/ Receive Exercise Rate | Exercise Rate | Floating Rate Index | Expiration Date | Notional Amount | Cost | Fair Value | ||||||||||||||||
|---|---|---|---|---|---|---|---|---|---|---|---|---|---|---|---|---|---|---|---|---|---|---|---|---|
Call on 10-Year Interest Rate Swap(1) | Barclays Bank PLC | Receive | 2.950% | 3-month USD-LIBOR | 03/12/24 | USD 870,000 | $ | 39,215 | $ | 101,041 | ||||||||||||||
Call on 10-Year Interest Rate Swap(1) | Barclays Bank PLC | Receive | 2.978% | 3-month USD-LIBOR | 03/07/24 | USD 874,500 | 40,205 | 103,486 | ||||||||||||||||
Call on 10-Year Interest Rate Swap(1) | Barclays Bank PLC | Receive | 3.052% | 3-month USD-LIBOR | 01/10/29 | USD 220,000 | 12,430 | 26,782 | ||||||||||||||||
Call on 10-Year Interest Rate Swap(1) | Barclays Bank PLC | Receive | 3.083% | 3-month USD-LIBOR | 01/29/29 | USD 220,000 | 12,496 | 27,232 | ||||||||||||||||
Call on 10-Year Interest Rate Swap(1) | Barclays Bank PLC | Receive | 3.088% | 3-month USD-LIBOR | 12/06/38 | USD 570,000 | 26,505 | 71,469 | ||||||||||||||||
Call on 10-Year Interest Rate Swap(1) | Citibank N.A. | Receive | 1.492% | 3-month USD-LIBOR | 02/25/25 | USD 550,000 | 28,889 | 17,441 | ||||||||||||||||
Call on 10-Year Interest Rate Swap(1) | Citibank N.A. | Receive | 2.824% | 3-month USD-LIBOR | 01/31/39 | USD 120,000 | 6,149 | 13,357 | ||||||||||||||||
Call on 10-Year Interest Rate Swap(1) | Citibank N.A. | Receive | 2.978% | 3-month USD-LIBOR | 01/31/29 | USD 100,000 | 5,780 | 11,691 | ||||||||||||||||
Call on 10-Year Interest Rate Swap(1) | Citibank N.A. | Receive | 2.985% | 3-month USD-LIBOR | 04/27/38 | USD 10,000 | 493 | 1,192 | ||||||||||||||||
Call on 10-Year Interest Rate Swap(1) | Deutsche Bank AG | Receive | 0.890% | 3-month USD-LIBOR | 04/30/25 | USD 360,000 | 19,422 | 5,638 | ||||||||||||||||
Call on 10-Year Interest Rate Swap(1) | Deutsche Bank AG | Receive | 1.423% | 3-month USD-LIBOR | 06/05/25 | USD 255,000 | 13,668 | 7,765 | ||||||||||||||||
Call on 10-Year Interest Rate Swap(1) | Deutsche Bank AG | Receive | 1.550% | 3-month USD-LIBOR | 07/29/24 | USD 750,000 | 27,225 | 23,363 | ||||||||||||||||
Call on 10-Year Interest Rate Swap(1) | Deutsche Bank AG | Receive | 1.938% | 3-month USD-LIBOR | 11/15/23 | USD 990,000 | 39,724 | 44,629 | ||||||||||||||||
Call on 10-Year Interest Rate Swap(1) | Deutsche Bank AG | Receive | 2.602% | 3-month USD-LIBOR | 04/07/26 | USD 620,000 | 34,689 | 57,787 | ||||||||||||||||
Call on 10-Year Interest Rate Swap(1) | Goldman Sachs International | Receive | 1.283% | 3-month USD-LIBOR | 06/04/25 | USD 255,000 | 13,795 | 6,598 | ||||||||||||||||
Call on 10-Year Interest Rate Swap(1) | Goldman Sachs International | Receive | 1.675% | 3-month USD-LIBOR | 07/22/24 | USD 490,000 | 21,756 | 17,730 | ||||||||||||||||
Call on 10-Year Interest Rate Swap(1) | Goldman Sachs International | Receive | 1.970% | 3-month USD-LIBOR | 06/24/24 | USD 420,000 | 19,194 | 21,087 | ||||||||||||||||
Call on 10-Year Interest Rate Swap(1) | Goldman Sachs International | Receive | 2.000% | 3-month USD-LIBOR | 06/28/24 | USD 420,000 | 18,501 | 21,794 | ||||||||||||||||
Call on 10-Year Interest Rate Swap(1) | JPMorgan Chase Bank N.A. | Receive | 2.860% | 3-month USD-LIBOR | 02/22/39 | USD 232,500 | 11,503 | 26,332 | ||||||||||||||||
Call on 10-Year Interest Rate Swap(1) | JPMorgan Chase Bank N.A. | Receive | 2.985% | 3-month USD-LIBOR | 04/27/38 | USD 200,000 | 9,400 | 23,839 | ||||||||||||||||
Call on 10-Year Interest Rate Swap(1) | Morgan Stanley & Co. International PLC | Receive | 1.680% | 3-month USD-LIBOR | 08/02/24 | USD 490,000 | 21,970 | 17,910 | ||||||||||||||||
| VY® BLACKROCK INFLATION PROTECTED BOND PORTFOLIO | PORTFOLIO OF INVESTMENTS AS OF DECEMBER 31, 2021 (CONTINUED) |
| Description | Counterparty | Pay/ Receive Exercise Rate | Exercise Rate | Floating Rate Index | Expiration Date | Notional Amount | Cost | Fair Value | ||||||||||||||||
|---|---|---|---|---|---|---|---|---|---|---|---|---|---|---|---|---|---|---|---|---|---|---|---|---|
Call on 10-Year Interest Rate Swap(1) | Morgan Stanley & Co. International PLC | Receive | 3.037% | 3-month USD-LIBOR | 01/11/29 | USD 220,000 | $ | 12,523 | $ | 26,562 | ||||||||||||||
Call on 30-Year Interest Rate Swap(1) | Deutsche Bank AG | Receive | 1.705% | 3-month USD-LIBOR | 05/31/22 | USD 290,000 | 16,429 | 12,164 | ||||||||||||||||
Call on 5-Year Interest Rate Swap(1) | Deutsche Bank AG | Receive | 1.200% | 3-month USD-LIBOR | 04/28/22 | USD 3,320,000 | 32,503 | 11,461 | ||||||||||||||||
Call on 5-Year Interest Rate Swap(1) | Deutsche Bank AG | Receive | 1.540% | 3-month USD-LIBOR | 08/03/22 | USD 1,500,000 | 19,200 | 17,843 | ||||||||||||||||
Call on 5-Year Interest Rate Swap(1) | JPMorgan Chase Bank N.A. | Receive | 1.324% | 3-month USD-LIBOR | 07/01/22 | USD 2,880,000 | 32,724 | 18,593 | ||||||||||||||||
Call on 5-Year Interest Rate Swap(1) | JPMorgan Chase Bank N.A. | Receive | 1.525% | 3-month USD-LIBOR | 04/05/22 | USD 1,210,000 | 17,636 | 12,216 | ||||||||||||||||
Call on 5-Year Interest Rate Swap(1) | Morgan Stanley & Co. International PLC | Receive | 1.385% | 3-month USD-LIBOR | 04/08/22 | USD 2,360,000 | 35,211 | 15,095 | ||||||||||||||||
Put on 10-Year Interest Rate Swap(2) | Barclays Bank PLC | Pay | 1.042% | 1-day Overnight Tokyo Average Rate | 06/29/22 | JPY 692,890,000 | — | 31 | ||||||||||||||||
Put on 10-Year Interest Rate Swap(3) | Barclays Bank PLC | Pay | 2.250% | 3-month USD-LIBOR | 08/08/22 | USD 960,000 | 22,728 | 6,282 | ||||||||||||||||
Put on 10-Year Interest Rate Swap(3) | Barclays Bank PLC | Pay | 2.950% | 3-month USD-LIBOR | 03/12/24 | USD 870,000 | 39,215 | 9,326 | ||||||||||||||||
Put on 10-Year Interest Rate Swap(3) | Barclays Bank PLC | Pay | 2.978% | 3-month USD-LIBOR | 03/07/24 | USD 874,500 | 40,205 | 9,030 | ||||||||||||||||
Put on 10-Year Interest Rate Swap(3) | Barclays Bank PLC | Pay | 3.052% | 3-month USD-LIBOR | 01/10/29 | USD 220,000 | 12,430 | 5,982 | ||||||||||||||||
Put on 10-Year Interest Rate Swap(3) | Barclays Bank PLC | Pay | 3.083% | 3-month USD-LIBOR | 01/29/29 | USD 220,000 | 12,496 | 5,882 | ||||||||||||||||
Put on 10-Year Interest Rate Swap(3) | Barclays Bank PLC | Pay | 3.088% | 3-month USD-LIBOR | 12/06/38 | USD 570,000 | 26,505 | 17,937 | ||||||||||||||||
Put on 10-Year Interest Rate Swap(3) | Citibank N.A. | Pay | 1.492% | 3-month USD-LIBOR | 02/25/25 | USD 550,000 | 28,889 | 33,816 | ||||||||||||||||
Put on 10-Year Interest Rate Swap(3) | Citibank N.A. | Pay | 2.824% | 3-month USD-LIBOR | 01/31/39 | USD 120,000 | 6,025 | 4,326 | ||||||||||||||||
Put on 10-Year Interest Rate Swap(3) | Citibank N.A. | Pay | 2.978% | 3-month USD-LIBOR | 01/31/29 | USD 100,000 | 5,778 | 2,876 | ||||||||||||||||
Put on 10-Year Interest Rate Swap(3) | Citibank N.A. | Pay | 2.985% | 3-month USD-LIBOR | 04/27/38 | USD 10,000 | 461 | 333 | ||||||||||||||||
Put on 10-Year Interest Rate Swap(3) | Deutsche Bank AG | Pay | 0.890% | 3-month USD-LIBOR | 04/30/25 | USD 360,000 | 19,422 | 35,897 | ||||||||||||||||
Put on 10-Year Interest Rate Swap(3) | Deutsche Bank AG | Pay | 1.423% | 3-month USD-LIBOR | 06/05/25 | USD 255,000 | 13,668 | 17,122 | ||||||||||||||||
Put on 10-Year Interest Rate Swap(3) | Deutsche Bank AG | Pay | 1.800% | 3-month USD-LIBOR | 08/05/24 | USD 1,080,000 | 42,552 | 46,002 | ||||||||||||||||
Put on 10-Year Interest Rate Swap(3) | Deutsche Bank AG | Pay | 1.938% | 3-month USD-LIBOR | 11/15/23 | USD 990,000 | 39,724 | 30,435 | ||||||||||||||||
Put on 10-Year Interest Rate Swap(3) | Deutsche Bank AG | Pay | 2.602% | 3-month USD-LIBOR | 04/07/26 | USD 620,000 | 34,689 | 17,237 | ||||||||||||||||
Put on 10-Year Interest Rate Swap(3) | Goldman Sachs International | Pay | 1.283% | 3-month USD-LIBOR | 06/04/25 | USD 255,000 | 13,795 | 19,132 | ||||||||||||||||
Put on 10-Year Interest Rate Swap(3) | Goldman Sachs International | Pay | 1.675% | 3-month USD-LIBOR | 07/22/24 | USD 490,000 | 21,756 | 23,460 | ||||||||||||||||
Put on 10-Year Interest Rate Swap(3) | Goldman Sachs International | Pay | 1.970% | 3-month USD-LIBOR | 06/24/24 | USD 420,000 | 19,194 | 14,682 | ||||||||||||||||
Put on 10-Year Interest Rate Swap(3) | Goldman Sachs International | Pay | 2.000% | 3-month USD-LIBOR | 06/28/24 | USD 420,000 | 18,501 | 14,269 | ||||||||||||||||
Put on 10-Year Interest Rate Swap(3) | JPMorgan Chase Bank N.A. | Pay | 2.250% | 3-month USD-LIBOR | 08/02/22 | USD 950,000 | 25,650 | 5,995 | ||||||||||||||||
Put on 10-Year Interest Rate Swap(3) | JPMorgan Chase Bank N.A. | Pay | 2.860% | 3-month USD-LIBOR | 02/22/39 | USD 232,500 | 11,503 | 8,221 | ||||||||||||||||
Put on 10-Year Interest Rate Swap(3) | JPMorgan Chase Bank N.A. | Pay | 2.985% | 3-month USD-LIBOR | 04/27/38 | USD 200,000 | 9,400 | 6,664 | ||||||||||||||||
Put on 10-Year Interest Rate Swap(3) | Morgan Stanley & Co. International PLC | Pay | 1.680% | 3-month USD-LIBOR | 08/02/24 | USD 490,000 | 21,970 | 23,472 | ||||||||||||||||
Put on 10-Year Interest Rate Swap(3) | Morgan Stanley & Co. International PLC | Pay | 2.500% | 3-month USD-LIBOR | 06/13/24 | USD 930,000 | 41,811 | 18,294 | ||||||||||||||||
Put on 10-Year Interest Rate Swap(3) | Morgan Stanley & Co. International PLC | Pay | 2.500% | 3-month USD-LIBOR | 06/20/24 | USD 930,000 | 37,600 | 18,415 | ||||||||||||||||
Put on 10-Year Interest Rate Swap(3) | Morgan Stanley & Co. International PLC | Pay | 3.037% | 3-month USD-LIBOR | 01/11/29 | USD 220,000 | 12,523 | 6,049 | ||||||||||||||||
Put on 30-Year Interest Rate Swap(3) | Barclays Bank PLC | Pay | 2.850% | 3-month USD-LIBOR | 05/09/22 | USD 1,170,000 | 67,934 | 1,584 | ||||||||||||||||
| VY® BLACKROCK INFLATION PROTECTED BOND PORTFOLIO | PORTFOLIO OF INVESTMENTS AS OF DECEMBER 31, 2021 (CONTINUED) |
| Description | Counterparty | Pay/ Receive Exercise Rate | Exercise Rate | Floating Rate Index | Expiration Date | Notional Amount | Cost | Fair Value | ||||||||||||||||
|---|---|---|---|---|---|---|---|---|---|---|---|---|---|---|---|---|---|---|---|---|---|---|---|---|
Put on 30-Year Interest Rate Swap(3) | Deutsche Bank AG | Pay | 1.705% | 3-month USD-LIBOR | 05/31/22 | USD 290,000 | $ | 16,429 | $ | 15,103 | ||||||||||||||
Put on 5-Year Interest Rate Swap(3) | Barclays Bank PLC | Pay | 1.250% | 3-month USD-LIBOR | 07/15/22 | USD 3,630,000 | 43,016 | 65,922 | ||||||||||||||||
Put on 5-Year Interest Rate Swap(3) | Deutsche Bank AG | Pay | 1.540% | 3-month USD-LIBOR | 08/03/22 | USD 1,500,000 | 19,200 | 16,757 | ||||||||||||||||
Put on 5-Year Interest Rate Swap(3) | JPMorgan Chase Bank N.A. | Pay | 1.324% | 3-month USD-LIBOR | 07/01/22 | USD 2,880,000 | 32,724 | 44,001 | ||||||||||||||||
Put on 5-Year Interest Rate Swap(3) | JPMorgan Chase Bank N.A. | Pay | 1.335% | 3-month USD-LIBOR | 01/19/22 | USD 1,225,000 | 7,381 | 5,487 | ||||||||||||||||
Put on 5-Year Interest Rate Swap(3) | JPMorgan Chase Bank N.A. | Pay | 1.450% | 3-month USD-LIBOR | 07/06/22 | USD 2,880,000 | 26,675 | 34,753 | ||||||||||||||||
Put on 5-Year Interest Rate Swap(3) | JPMorgan Chase Bank N.A. | Pay | 1.525% | 3-month USD-LIBOR | 04/05/22 | USD 1,210,000 | 17,636 | 7,357 | ||||||||||||||||
Put on 5-Year Interest Rate Swap(3) | Morgan Stanley & Co. International PLC | Pay | 1.385% | 3-month USD-LIBOR | 04/08/22 | USD 2,360,000 | 34,236 | 22,036 | ||||||||||||||||
| $ | 1,432,956 | $ | 1,376,264 | |||||||||||||||||||||
| Description | Counterparty | Pay/ Receive Exercise Rate | Exercise Rate | Floating Rate Index | Expiration Date | Notional Amount | Premiums Received | Fair Value | ||||||||||||||||
|---|---|---|---|---|---|---|---|---|---|---|---|---|---|---|---|---|---|---|---|---|---|---|---|---|
Call on 10-Year interest Rate Swap(3) | Barclays Bank PLC | Pay | 3.050% | 3-month USD-LIBOR | 03/12/29 | USD 700,000 | $ | 37,135 | $ | (85,060 | ) | |||||||||||||
Call on 10-Year Interest Rate Swap(3) | Barclays Bank PLC | Pay | 1.248% | 3-month USD-LIBOR | 01/27/22 | USD 600,000 | 14,130 | (252 | ) | |||||||||||||||
Call on 10-Year Interest Rate Swap(3) | Barclays Bank PLC | Pay | 1.438% | 3-month USD-LIBOR | 01/09/23 | USD 870,000 | 28,362 | (14,150 | ) | |||||||||||||||
Call on 10-Year Interest Rate Swap(3) | Barclays Bank PLC | Pay | 1.620% | 3-month USD-LIBOR | 02/18/22 | USD 580,000 | 15,384 | (6,639 | ) | |||||||||||||||
Call on 10-Year Interest Rate Swap(3) | Barclays Bank PLC | Pay | 2.012% | 3-month USD-LIBOR | 03/01/23 | USD 900,000 | 34,290 | (40,619 | ) | |||||||||||||||
Call on 10-Year Interest Rate Swap(3) | Citibank N.A. | Pay | 1.254% | 3-month USD-LIBOR | 12/30/22 | USD 470,000 | 15,498 | (5,067 | ) | |||||||||||||||
Call on 10-Year Interest Rate Swap(3) | Deutsche Bank AG | Pay | 0.740% | 3-month USD-LIBOR | 05/02/22 | USD 550,000 | 19,030 | (374 | ) | |||||||||||||||
Call on 10-Year Interest Rate Swap(3) | Deutsche Bank AG | Pay | 1.000% | 3-month USD-LIBOR | 01/27/22 | USD 660,000 | 9,042 | (19 | ) | |||||||||||||||
Call on 10-Year Interest Rate Swap(3) | Deutsche Bank AG | Pay | 1.064% | 3-month USD-LIBOR | 10/11/22 | USD 460,000 | 15,473 | (2,633 | ) | |||||||||||||||
Call on 10-Year Interest Rate Swap(3) | Deutsche Bank AG | Pay | 1.400% | 3-month USD-LIBOR | 03/01/22 | USD 680,000 | 3,604 | (3,008 | ) | |||||||||||||||
Call on 10-Year Interest Rate Swap(3) | Deutsche Bank AG | Pay | 1.795% | 3-month USD-LIBOR | 10/13/22 | USD 670,000 | 18,241 | (20,085 | ) | |||||||||||||||
Call on 10-Year Interest Rate Swap(3) | Deutsche Bank AG | Pay | 1.800% | 3-month USD-LIBOR | 10/07/22 | USD 670,000 | 18,425 | (20,173 | ) | |||||||||||||||
Call on 10-Year Interest Rate Swap(3) | Deutsche Bank AG | Pay | 1.848% | 3-month USD-LIBOR | 11/15/22 | USD 1,380,000 | 40,779 | (46,320 | ) | |||||||||||||||
Call on 10-Year Interest Rate Swap(3) | Goldman Sachs International | Pay | 1.233% | 3-month USD-LIBOR | 12/16/22 | USD 427,500 | 13,979 | (4,289 | ) | |||||||||||||||
Call on 10-Year Interest Rate Swap(3) | Goldman Sachs International | Pay | 1.245% | 3-month USD-LIBOR | 12/16/22 | USD 427,500 | 13,979 | (4,412 | ) | |||||||||||||||
Call on 10-Year Interest Rate Swap(3) | JPMorgan Chase Bank N.A. | Pay | 1.400% | 3-month USD-LIBOR | 06/07/22 | USD 775,000 | 7,362 | (7,231 | ) | |||||||||||||||
Call on 10-Year Interest Rate Swap(3) | JPMorgan Chase Bank N.A. | Pay | 1.421% | 1-day Secured Overnight Financing Rate | 12/15/22 | USD 1,090,000 | 30,629 | (27,668 | ) | |||||||||||||||
Call on 10-Year Interest Rate Swap(3) | JPMorgan Chase Bank N.A. | Pay | 1.450% | 1-day Secured Overnight Financing Rate | 12/05/22 | USD 680,000 | 20,740 | (18,019 | ) | |||||||||||||||
Call on 10-Year Interest Rate Swap(3) | Morgan Stanley & Co. International PLC | Pay | 1.433% | 1-day Secured Overnight Financing Rate | 12/13/22 | USD 1,090,000 | 30,847 | (28,242 | ) | |||||||||||||||
Call on 10-Year Interest Rate Swap(3) | Morgan Stanley & Co. International PLC | Pay | 1.525% | 3-month USD-LIBOR | 09/01/22 | USD 1,310,000 | 34,764 | (21,302 | ) | |||||||||||||||
Call on 2-Year Interest Rate Swap(3) | Citibank N.A. | Pay | 0.518% | 3-month USD-LIBOR | 03/03/22 | USD 3,045,000 | 8,869 | (272 | ) | |||||||||||||||
| VY® BLACKROCK INFLATION PROTECTED BOND PORTFOLIO | PORTFOLIO OF INVESTMENTS AS OF DECEMBER 31, 2021 (CONTINUED) |
| Description | Counterparty | Pay/ Receive Exercise Rate | Exercise Rate | Floating Rate Index | Expiration Date | Notional Amount | Premiums Received | Fair Value | ||||||||||||||||
|---|---|---|---|---|---|---|---|---|---|---|---|---|---|---|---|---|---|---|---|---|---|---|---|---|
Call on 2-Year Interest Rate Swap(3) | Deutsche Bank AG | Pay | 0.508% | 3-month USD-LIBOR | 03/01/22 | USD 5,910,000 | $ | 18,543 | $ | (470 | ) | |||||||||||||
Call on 2-Year Interest Rate Swap(3) | Deutsche Bank AG | Pay | 0.562% | 3-month USD-LIBOR | 03/21/22 | USD 3,045,000 | 10,239 | (520 | ) | |||||||||||||||
Call on 2-Year Interest Rate Swap(3) | Deutsche Bank AG | Pay | 0.568% | 3-month USD-LIBOR | 03/23/22 | USD 5,960,000 | 19,370 | (1,084 | ) | |||||||||||||||
Call on 2-Year Interest Rate Swap(3) | Deutsche Bank AG | Pay | 1.020% | 3-month USD-LIBOR | 05/03/22 | USD 4,500,000 | 17,775 | (9,373 | ) | |||||||||||||||
Call on 2-Year Interest Rate Swap(3) | JPMorgan Chase Bank N.A. | Pay | 0.606% | 3-month USD-LIBOR | 04/01/22 | USD 8,750,000 | 20,825 | (2,163 | ) | |||||||||||||||
Call on 2-Year Interest Rate Swap(3) | Morgan Stanley & Co. International PLC | Pay | 0.508% | 3-month USD-LIBOR | 01/10/22 | USD 6,630,000 | 19,669 | — | ||||||||||||||||
Call on 2-Year Interest Rate Swap(3) | Morgan Stanley & Co. International PLC | Pay | 1.235% | 3-month USD-LIBOR | 10/25/22 | USD 2,160,000 | 12,906 | (7,903 | ) | |||||||||||||||
Call on 2-Year Interest Rate Swap(3) | Morgan Stanley & Co. International PLC | Pay | 1.238% | 3-month USD-LIBOR | 10/25/22 | USD 3,230,000 | 19,219 | (11,889 | ) | |||||||||||||||
Call on 2-Year Interest Rate Swap(3) | Morgan Stanley & Co. International PLC | Pay | 1.250% | 3-month USD-LIBOR | 11/04/22 | USD 3,195,000 | 17,573 | (12,018 | ) | |||||||||||||||
Call on 30-Year Interest Rate Swap(3) | Barclays Bank PLC | Pay | 2.000% | 3-month USD-LIBOR | 09/30/24 | USD 220,000 | 22,825 | (29,332 | ) | |||||||||||||||
Call on 30-Year Interest Rate Swap(3) | Deutsche Bank AG | Pay | 1.848% | 3-month USD-LIBOR | 09/17/24 | USD 310,000 | 32,317 | (34,887 | ) | |||||||||||||||
Call on 30-Year Interest Rate Swap(3) | Goldman Sachs International | Pay | 1.375% | 1-day Secured Overnight Financing Rate | 12/02/26 | USD 120,000 | 16,692 | (12,968 | ) | |||||||||||||||
Call on 30-Year Interest Rate Swap(3) | JPMorgan Chase Bank N.A. | Pay | 1.975% | 3-month USD-LIBOR | 10/19/26 | USD 130,000 | 16,380 | (19,738 | ) | |||||||||||||||
Call on 5-Year Interest Rate Swap(3) | Barclays Bank PLC | Pay | 0.900% | 3-month USD-LIBOR | 04/22/22 | USD 1,660,000 | 8,632 | (1,507 | ) | |||||||||||||||
Call on 5-Year Interest Rate Swap(3) | Deutsche Bank AG | Pay | 0.900% | 3-month USD-LIBOR | 04/28/22 | USD 4,990,000 | 22,284 | (4,835 | ) | |||||||||||||||
Put on 10-Year interest Rate Swap(1) | Barclays Bank PLC | Receive | 3.050% | 3-month USD-LIBOR | 03/12/29 | USD 700,000 | 37,135 | (19,324 | ) | |||||||||||||||
Put on 10-Year Interest Rate Swap(4) | Barclays Bank PLC | Receive | 0.700% | 6-month EUR-EURIBOR | 05/15/23 | EUR 1,070,000 | 28,654 | (25,334 | ) | |||||||||||||||
Put on 10-Year Interest Rate Swap(1) | Barclays Bank PLC | Receive | 1.248% | 3-month USD-LIBOR | 01/27/22 | USD 600,000 | 14,130 | (19,520 | ) | |||||||||||||||
Put on 10-Year Interest Rate Swap(1) | Barclays Bank PLC | Receive | 1.438% | 3-month USD-LIBOR | 01/09/23 | USD 870,000 | 28,362 | (37,262 | ) | |||||||||||||||
Put on 10-Year Interest Rate Swap(1) | Barclays Bank PLC | Receive | 1.620% | 3-month USD-LIBOR | 02/18/22 | USD 580,000 | 15,384 | (5,593 | ) | |||||||||||||||
Put on 10-Year Interest Rate Swap(1) | Barclays Bank PLC | Receive | 2.012% | 3-month USD-LIBOR | 03/01/23 | USD 900,000 | 34,290 | (17,756 | ) | |||||||||||||||
Put on 10-Year Interest Rate Swap(1) | Barclays Bank PLC | Receive | 2.100% | 3-month USD-LIBOR | 01/06/22 | USD 900,000 | 20,644 | — | ||||||||||||||||
Put on 10-Year Interest Rate Swap(1) | Barclays Bank PLC | Receive | 2.150% | 3-month USD-LIBOR | 01/10/22 | USD 890,000 | 20,692 | — | ||||||||||||||||
Put on 10-Year Interest Rate Swap(1) | Barclays Bank PLC | Receive | 2.750% | 3-month USD-LIBOR | 05/09/22 | USD 2,550,000 | 73,975 | (2,014 | ) | |||||||||||||||
Put on 10-Year Interest Rate Swap(1) | Barclays Bank PLC | Receive | 2.750% | 3-month USD-LIBOR | 08/08/22 | USD 960,000 | 11,568 | (2,221 | ) | |||||||||||||||
Put on 10-Year Interest Rate Swap(1) | Barclays Bank PLC | Receive | 3.250% | 3-month USD-LIBOR | 08/08/22 | USD 960,000 | 5,712 | (860 | ) | |||||||||||||||
Put on 10-Year Interest Rate Swap(1) | Citibank N.A. | Receive | 1.254% | 3-month USD-LIBOR | 12/30/22 | USD 470,000 | 15,498 | (25,490 | ) | |||||||||||||||
Put on 10-Year Interest Rate Swap(1) | Deutsche Bank AG | Receive | 0.740% | 3-month USD-LIBOR | 05/02/22 | USD 550,000 | 19,030 | (46,454 | ) | |||||||||||||||
Put on 10-Year Interest Rate Swap(1) | Deutsche Bank AG | Receive | 1.064% | 3-month USD-LIBOR | 10/11/22 | USD 460,000 | 15,473 | (29,735 | ) | |||||||||||||||
Put on 10-Year Interest Rate Swap(1) | Deutsche Bank AG | Receive | 1.500% | 3-month USD-LIBOR | 01/27/22 | USD 660,000 | 9,042 | (8,277 | ) | |||||||||||||||
Put on 10-Year Interest Rate Swap(1) | Deutsche Bank AG | Receive | 1.570% | 1-day Secured Overnight Financing Rate | 03/01/22 | USD 830,000 | 3,922 | (2,358 | ) | |||||||||||||||
Put on 10-Year Interest Rate Swap(1) | Deutsche Bank AG | Receive | 1.600% | 3-month USD-LIBOR | 02/28/22 | USD 600,000 | 10,950 | (7,105 | ) | |||||||||||||||
Put on 10-Year Interest Rate Swap(1) | Deutsche Bank AG | Receive | 1.795% | 3-month USD-LIBOR | 10/13/22 | USD 670,000 | 18,241 | (14,089 | ) | |||||||||||||||
Put on 10-Year Interest Rate Swap(1) | Deutsche Bank AG | Receive | 1.800% | 3-month USD-LIBOR | 10/07/22 | USD 670,000 | 18,425 | (13,757 | ) | |||||||||||||||
| VY® BLACKROCK INFLATION PROTECTED BOND PORTFOLIO | PORTFOLIO OF INVESTMENTS AS OF DECEMBER 31, 2021 (CONTINUED) |
| Description | Counterparty | Pay/ Receive Exercise Rate | Exercise Rate | Floating Rate Index | Expiration Date | Notional Amount | Premiums Received | Fair Value | ||||||||||||||||
|---|---|---|---|---|---|---|---|---|---|---|---|---|---|---|---|---|---|---|---|---|---|---|---|---|
Put on 10-Year Interest Rate Swap(1) | Deutsche Bank AG | Receive | 1.848% | 3-month USD-LIBOR | 11/15/22 | USD 1,380,000 | $ | 40,779 | $ | (28,532 | ) | |||||||||||||
Put on 10-Year Interest Rate Swap(1) | Goldman Sachs International | Receive | 1.233% | 3-month USD-LIBOR | 12/16/22 | USD 427,500 | 13,979 | (23,564 | ) | |||||||||||||||
Put on 10-Year Interest Rate Swap(1) | Goldman Sachs International | Receive | 1.245% | 3-month USD-LIBOR | 12/16/22 | USD 427,500 | 13,979 | (23,191 | ) | |||||||||||||||
Put on 10-Year Interest Rate Swap(1) | JPMorgan Chase Bank N.A. | Receive | 1.421% | 1-day Secured Overnight Financing Rate | 12/15/22 | USD 1,090,000 | 30,629 | (31,549 | ) | |||||||||||||||
Put on 10-Year Interest Rate Swap(1) | JPMorgan Chase Bank N.A. | Receive | 1.450% | 1-day Secured Overnight Financing Rate | 12/05/22 | USD 680,000 | 20,740 | (18,463 | ) | |||||||||||||||
Put on 10-Year Interest Rate Swap(1) | JPMorgan Chase Bank N.A. | Receive | 2.400% | 3-month USD-LIBOR | 06/07/22 | USD 775,000 | 8,680 | (2,211 | ) | |||||||||||||||
Put on 10-Year Interest Rate Swap(1) | JPMorgan Chase Bank N.A. | Receive | 2.750% | 3-month USD-LIBOR | 08/02/22 | USD 950,000 | 13,015 | (2,087 | ) | |||||||||||||||
Put on 10-Year Interest Rate Swap(1) | JPMorgan Chase Bank N.A. | Receive | 3.250% | 3-month USD-LIBOR | 08/02/22 | USD 950,000 | 6,222 | (797 | ) | |||||||||||||||
Put on 10-Year Interest Rate Swap(1) | Morgan Stanley & Co. International PLC | Receive | 1.433% | 1-day Secured Overnight Financing Rate | 12/13/22 | USD 1,090,000 | 30,847 | (30,844 | ) | |||||||||||||||
Put on 10-Year Interest Rate Swap(1) | Morgan Stanley & Co. International PLC | Receive | 1.525% | 3-month USD-LIBOR | 09/01/22 | USD 1,310,000 | 34,764 | (40,772 | ) | |||||||||||||||
Put on 10-Year Interest Rate Swap(1) | Morgan Stanley & Co. International PLC | Receive | 2.250% | 3-month USD-LIBOR | 08/20/24 | USD 980,000 | 29,054 | (26,576 | ) | |||||||||||||||
Put on 10-Year Interest Rate Swap(1) | Morgan Stanley & Co. International PLC | Receive | 3.000% | 3-month USD-LIBOR | 06/13/24 | USD 930,000 | 25,539 | (10,693 | ) | |||||||||||||||
Put on 10-Year Interest Rate Swap(1) | Morgan Stanley & Co. International PLC | Receive | 3.000% | 3-month USD-LIBOR | 06/20/24 | USD 930,000 | 22,714 | (10,785 | ) | |||||||||||||||
Put on 10-Year Interest Rate Swap(1) | Morgan Stanley & Co. International PLC | Receive | 3.500% | 3-month USD-LIBOR | 06/13/24 | USD 930,000 | 15,565 | (6,363 | ) | |||||||||||||||
Put on 10-Year Interest Rate Swap(1) | Morgan Stanley & Co. International PLC | Receive | 3.500% | 3-month USD-LIBOR | 06/20/24 | USD 930,000 | 13,630 | (6,429 | ) | |||||||||||||||
Put on 2-Year interest Rate Swap(1) | Citibank N.A. | Receive | 0.518% | 3-month USD-LIBOR | 03/03/22 | USD 3,045,000 | 8,869 | (32,856 | ) | |||||||||||||||
Put on 2-Year interest Rate Swap(1) | Deutsche Bank AG | Receive | 0.562% | 3-month USD-LIBOR | 03/21/22 | USD 3,045,000 | 10,239 | (32,485 | ) | |||||||||||||||
Put on 2-Year Interest Rate Swap(1) | Deutsche Bank AG | Receive | 0.500% | 3-month USD-LIBOR | 01/19/22 | USD 1,770,000 | 3,328 | (16,539 | ) | |||||||||||||||
Put on 2-Year Interest Rate Swap(1) | Deutsche Bank AG | Receive | 0.508% | 3-month USD-LIBOR | 03/01/22 | USD 5,910,000 | 18,543 | (64,369 | ) | |||||||||||||||
Put on 2-Year Interest Rate Swap(1) | Deutsche Bank AG | Receive | 0.568% | 3-month USD-LIBOR | 03/23/22 | USD 5,960,000 | 19,370 | (63,189 | ) | |||||||||||||||
Put on 2-Year Interest Rate Swap(1) | Deutsche Bank AG | Receive | 0.750% | 3-month USD-LIBOR | 02/25/22 | USD 4,490,000 | 10,566 | (28,202 | ) | |||||||||||||||
Put on 2-Year Interest Rate Swap(1) | Deutsche Bank AG | Receive | 1.020% | 3-month USD-LIBOR | 05/03/22 | USD 4,500,000 | 17,775 | (22,561 | ) | |||||||||||||||
Put on 2-Year Interest Rate Swap(1) | JPMorgan Chase Bank N.A. | Receive | 0.606% | 3-month USD-LIBOR | 04/01/22 | USD 8,750,000 | 20,825 | (90,156 | ) | |||||||||||||||
Put on 2-Year Interest Rate Swap(1) | JPMorgan Chase Bank N.A. | Receive | 0.740% | 3-month USD-LIBOR | 04/06/22 | USD 8,750,000 | 14,000 | (70,631 | ) | |||||||||||||||
Put on 2-Year Interest Rate Swap(1) | JPMorgan Chase Bank N.A. | Receive | 1.480% | 3-month USD-LIBOR | 11/02/22 | USD 1,930,000 | 9,747 | (9,855 | ) | |||||||||||||||
Put on 2-Year Interest Rate Swap(1) | Morgan Stanley & Co. International PLC | Receive | 0.508% | 3-month USD-LIBOR | 01/10/22 | USD 6,630,000 | 18,640 | (58,363 | ) | |||||||||||||||
Put on 2-Year Interest Rate Swap(1) | Morgan Stanley & Co. International PLC | Receive | 1.235% | 3-month USD-LIBOR | 10/25/22 | USD 2,160,000 | 12,906 | (15,640 | ) | |||||||||||||||
Put on 2-Year Interest Rate Swap(1) | Morgan Stanley & Co. International PLC | Receive | 1.238% | 3-month USD-LIBOR | 10/25/22 | USD 3,230,000 | 19,218 | (23,300 | ) | |||||||||||||||
Put on 2-Year Interest Rate Swap(1) | Morgan Stanley & Co. International PLC | Receive | 1.250% | 3-month USD-LIBOR | 11/04/22 | USD 3,195,000 | 17,573 | (23,342 | ) | |||||||||||||||
Put on 30-Year Interest Rate Swap(1) | Barclays Bank PLC | Receive | 2.000% | 3-month USD-LIBOR | 09/30/24 | USD 220,000 | 22,825 | (17,460 | ) | |||||||||||||||
Put on 30-Year Interest Rate Swap(1) | Deutsche Bank AG | Receive | 1.848% | 3-month USD-LIBOR | 09/17/24 | USD 310,000 | 32,317 | (29,131 | ) | |||||||||||||||
Put on 30-Year Interest Rate Swap(1) | Goldman Sachs International | Receive | 1.375% | 1-day Secured Overnight Financing Rate | 12/02/26 | USD 120,000 | 16,692 | (16,951 | ) | |||||||||||||||
Put on 30-Year Interest Rate Swap(1) | JPMorgan Chase Bank N.A. | Receive | 1.975% | 3-month USD-LIBOR | 10/19/26 | USD 130,000 | 16,380 | (13,041 | ) | |||||||||||||||
| VY® BLACKROCK INFLATION PROTECTED BOND PORTFOLIO | PORTFOLIO OF INVESTMENTS AS OF DECEMBER 31, 2021 (CONTINUED) |
| Description | Counterparty | Pay/ Receive Exercise Rate | Exercise Rate | Floating Rate Index | Expiration Date | Notional Amount | Premiums Received | Fair Value | ||||||||||||||||
|---|---|---|---|---|---|---|---|---|---|---|---|---|---|---|---|---|---|---|---|---|---|---|---|---|
Put on 5-Year Interest Rate Swap(4) | Goldman Sachs International | Receive | 0.270% | 6-month EUR-EURIBOR | 04/19/22 | EUR 2,830,000 | $ | 9,036 | $ | (10,957 | ) | |||||||||||||
| $ | 1,725,923 | $ | (1,683,554 | ) | ||||||||||||||||||||
(1) | Portfolio receives the exercise rate semi-annually and pays the floating rate index quarterly. | |
(2) | Portfolio pays the exercise rate semi-annually and receives the floating rate index semi-annually. | |
(3) | Portfolio pays the exercise rate semi-annually and receives the floating rate index quarterly. | |
(4) | Portfolio receives the exercise rate annually and pays the floating rate index semi-annually. | |
Currency Abbreviations
AUD — Australian Dollar
EUR — EU Euro
GBP — British Pound
JPY — Japanese Yen
NZD — New Zealand Dollar
USD — United States Dollar
| Derivatives not accounted for as hedging instruments | Location on Statement of Assets and Liabilities | Fair Value | ||||||||
|---|---|---|---|---|---|---|---|---|---|---|
Asset Derivatives | ||||||||||
| Interest rate contracts | Investments in securities at value* | $ | 1,382,108 | |||||||
| Foreign exchange contracts | Unrealized appreciation on forward foreign currency contracts | 114,662 | ||||||||
| Interest rate contracts | Variation margin receivable on futures contracts** | 419,059 | ||||||||
| Interest rate contracts | Variation margin receivable on centrally cleared swaps** | 9,035,053 | ||||||||
| Interest rate contracts | Unrealized appreciation on OTC swap agreements | 1,463,650 | ||||||||
Total Asset Derivatives | $ | 12,414,532 | ||||||||
Liability Derivatives | ||||||||||
| Foreign exchange contracts | Unrealized depreciation on forward foreign currency contracts | $ | 43,132 | |||||||
| Interest rate contracts | Variation margin payable on futures contracts** | 661,282 | ||||||||
| Interest rate contracts | Variation margin payable on centrally cleared swaps** | 2,905,383 | ||||||||
| Interest rate contracts | Written options, at fair value | 1,685,413 | ||||||||
Total Liability Derivatives | $ | 5,295,210 | ||||||||
| * | Includes purchased options. | |
| ** | The fair value presented above represents the cumulative unrealized appreciation (depreciation) on futures contracts and centrally cleared swaps as reported in the tables within the Portfolio of Investments. In the |
| Amount of Realized Gain or (Loss) on Derivatives Recognized in Income | ||||||||||||||||||||||
|---|---|---|---|---|---|---|---|---|---|---|---|---|---|---|---|---|---|---|---|---|---|---|
| Derivatives not accounted for as hedging instruments | Investments* | Forward foreign currency contracts | Futures | Swaps | Written options | Total | ||||||||||||||||
| Foreign exchange contracts | $(14,122 | ) | $486,557 | $ | — | $ | — | $ — | $ 472,435 | |||||||||||||
| Interest rate contracts | 6,082 | — | (340,900 | ) | 2,067,768 | 368,489 | 2,101,439 | |||||||||||||||
Total | $ (8,040 | ) | $486,557 | $ | (340,900 | ) | $ | 2,067,768 | $368,489 | $2,573,874 | ||||||||||||
| VY® BLACKROCK INFLATION PROTECTED BOND PORTFOLIO | PORTFOLIO OF INVESTMENTS AS OF DECEMBER 31, 2021 (CONTINUED) |
| Change in Unrealized Appreciation or (Depreciation) on Derivatives Recognized in Income | ||||||||||||||||||||||
|---|---|---|---|---|---|---|---|---|---|---|---|---|---|---|---|---|---|---|---|---|---|---|
| Derivatives not accounted for as hedging instruments | Investments* | Forward foreign currency contracts | Futures | Swaps | Written options | Total | ||||||||||||||||
| Foreign exchange contracts | $ — | $308,830 | $ | — | $ | — | $ — | $ 308,830 | ||||||||||||||
| Interest rate contracts | (70,008 | ) | — | (304,458 | ) | 5,651,419 | (171,019) | 5,105,934 | ||||||||||||||
Total | $ (70,008 | ) | $308,830 | $ | (304,458 | ) | $ | 5,651,419 | $(171,019) | $5,414,764 | ||||||||||||
| * | Amounts recognized for purchased options are included in net realized gain (loss) on investments and net change in unrealized appreciation or depreciation on investments. |
| Bank of America N.A. | Barclays Bank PLC | Citibank N.A. | Deutsche Bank AG | Goldman Sachs International | JPMorgan Chase Bank N.A. | Morgan Stanley & Co. International PLC | Standard Chartered Bank | Toronto Dominion Securities | UBS AG | Totals | ||||||||||||||||||||||||||||||||
|---|---|---|---|---|---|---|---|---|---|---|---|---|---|---|---|---|---|---|---|---|---|---|---|---|---|---|---|---|---|---|---|---|---|---|---|---|---|---|---|---|---|---|
Assets: | ||||||||||||||||||||||||||||||||||||||||||
| Purchased options | $ | — | $ | 451,986 | $ | 85,032 | $ | 359,203 | $ | 138,752 | $ | 193,458 | $ | 147,833 | $ | — | $ | — | $ — | $ 1,376,264 | ||||||||||||||||||||||
| Forward foreign currency contracts | — | — | — | — | — | — | — | 114,004 | 563 | 95 | 114,662 | |||||||||||||||||||||||||||||||
| OTC Interest rate swaps | — | — | 1,463,650 | — | — | — | — | — | — | — | 1,463,650 | |||||||||||||||||||||||||||||||
Total Assets | $ | — | $ | 451,986 | $ | 1,548,682 | $ | 359,203 | $ | 138,752 | $ | 193,458 | $ | 147,833 | $ | 114,004 | $ | 563 | $ 95 | $ 2,954,576 | ||||||||||||||||||||||
Liabilities: | ||||||||||||||||||||||||||||||||||||||||||
| Forward foreign currency contracts | $ | 16,650 | $ | — | $ | — | $ | — | $ | — | $ | — | $ | — | $ | 21,649 | $ | 3,127 | $ 1,706 | $ 43,132 | ||||||||||||||||||||||
| OTC Interest rate swaps | — | — | 180,826 | — | — | — | — | — | — | — | 180,826 | |||||||||||||||||||||||||||||||
| Written options | — | 324,903 | 63,685 | 550,564 | 96,332 | 313,609 | 334,461 | — | — | — | 1,683,554 | |||||||||||||||||||||||||||||||
Total Liabilities | $ | 16,650 | $ | 324,903 | $ | 244,511 | $ | 550,564 | $ | 96,332 | $ | 313,609 | $ | 334,461 | $ | 21,649 | $ | 3,127 | $ 1,706 | $ 1,907,512 | ||||||||||||||||||||||
Net OTC derivative instruments by counterparty, at fair value | $ | (16,650 | ) | $ | 127,083 | $ | 1,304,171 | $ | (191,361 | ) | $ | 42,420 | $ | (120,151 | ) | $ | (186,628 | ) | $ | 92,355 | $ | (2,564 | ) | $(1,611) | $ 1,047,064 | |||||||||||||||||
Total collateral pledged by the Portfolio/(Received from counterparty) | $ | — | $ | (127,083 | ) | $ | (1,304,171 | ) | $ | 191,361 | $ | (40,000 | ) | $ | 120,000 | $ | 40,000 | $ | — | $ | — | $ — | $(1,119,893) | |||||||||||||||||||
Net Exposure(1)(2) | $ | (16,650 | ) | $ | — | $ | — | $ | — | $ | 2,420 | $ | (151 | ) | $ | (146,628 | ) | $ | 92,355 | $ | (2,564 | ) | $(1,611) | $(72,829) | ||||||||||||||||||
(1) | Positive net exposure represents amounts due from each respective counterparty. Negative exposure represents amounts due from the Portfolio. Please refer to Note 2 for additional details regarding counterparty credit risk and credit related contingent features. | |
(2) | At December 31, 2021, the Portfolio had pledged $200,000 in cash collateral to Deutsche Bank AG. In addition, the Portfolio had received $142,000 and $1,350,000 in cash collateral from Barclays Bank PLC and Citibank N.A., respectively. Excess cash collateral is not shown for financial reporting purposes. |
| Cost for federal income tax purposes was $326,425,696. | ||||||
| Net unrealized appreciation consisted of: | ||||||
| Gross Unrealized Appreciation | $ | 30,276,276 | ||||
| Gross Unrealized Depreciation | (5,340,730 | ) | ||||
| Net Unrealized Appreciation | $ | 24,935,546 |
| VY® BRANDYWINEGLOBAL — BOND PORTFOLIO | PORTFOLIO OF INVESTMENTS AS OF DECEMBER 31, 2021 |
| Principal Amount† | Value | Percentage of Net Assets | |||||||||||
CORPORATE BONDS/NOTES: 25.9% | |||||||||||||
| Consumer, Cyclical: 3.2% | |||||||||||||
| 3,010,000 | (1) | Delta Air Lines, Inc. / SkyMiles IP Ltd., 4.750%, 10/20/2028 | $ | 3,289,273 | 1.0 | ||||||||
| 1,335,000 | General Motors Co., 6.250%, 10/02/2043 | 1,830,763 | 0.5 | ||||||||||
| 920,000 | General Motors Co., 6.800%, 10/01/2027 | 1,130,060 | 0.3 | ||||||||||
| 4,605,000 | General Motors Financial Co., Inc., 1.250%, (SOFRRATE + 1.200%), 11/17/2023 | 4,655,751 | 1.4 | ||||||||||
| 10,905,847 | 3.2 | ||||||||||||
| Energy: 4.6% | |||||||||||||
| 6,245,000 | Marathon Oil Corp., 6.600%, 10/01/2037 | 8,173,695 | 2.4 | ||||||||||
| 3,905,000 | Occidental Petroleum Corp., 3.500%, 08/15/2029 | 4,018,362 | 1.2 | ||||||||||
| 3,610,000 | Petroleos Mexicanos, 7.690%, 01/23/2050 | 3,490,780 | 1.0 | ||||||||||
| 15,682,837 | 4.6 | ||||||||||||
| Financial: 11.2% | |||||||||||||
| 5,510,000 | (1) | Athene Global Funding, 0.750%, (SOFRRATE + 0.700%), 05/24/2024 | 5,526,978 | 1.6 | |||||||||
| 5,635,000 | Bank of Montreal, 0.730%, (SOFRRATE + 0.680%), 03/10/2023 | 5,662,884 | 1.6 | ||||||||||
| 7,100,000 | Bank of Nova Scotia/The, 0.600%, (SOFRRATE + 0.550%), 09/15/2023 | 7,124,784 | 2.1 | ||||||||||
| 2,280,000 | (1) | Blue Owl Finance LLC, 3.125%, 06/10/2031 | 2,233,524 | 0.6 | |||||||||
| 5,095,000 | Canadian Imperial Bank of Commerce, 0.850%, (SOFRRATE + 0.800%), 03/17/2023 | 5,122,824 | 1.5 | ||||||||||
| 6,990,000 | (1) | Commonwealth Bank of Australia, 0.449%, (SOFRRATE + 0.400%), 07/07/2025 | 7,001,115 | 2.0 | |||||||||
| 2,695,000 | Golub Capital BDC, Inc., 2.500%, 08/24/2026 | 2,651,328 | 0.8 | ||||||||||
| 3,300,000 | (1) | Metropolitan Life Global Funding I, 0.619%, (SOFRRATE + 0.570%), 01/13/2023 | 3,313,772 | 1.0 | |||||||||
| 38,637,209 | 11.2 | ||||||||||||
| Industrial: 3.2% | |||||||||||||
| 1,230,000 | Boeing Co/The, 3.950%, 08/01/2059 | 1,281,564 | 0.4 | ||||||||||
| 800,000 | Boeing Co/The, 5.705%, 05/01/2040 | 1,029,010 | 0.3 | ||||||||||
| 2,065,000 | Boeing Co/The, 5.805%, 05/01/2050 | 2,801,599 | 0.8 | ||||||||||
| 1,225,000 | Boeing Co/The, 5.930%, 05/01/2060 | 1,704,618 | 0.5 | ||||||||||
| 4,280,000 | Caterpillar Financial Services Corp., 0.200%, (SOFRRATE + 0.150%), 11/17/2022 | 4,275,312 | 1.2 | ||||||||||
| 11,092,103 | 3.2 | ||||||||||||
| Principal Amount† | Value | Percentage of Net Assets | |||||||||||
CORPORATE BONDS/NOTES: (continued) | |||||||||||||
| Technology: 2.0% | |||||||||||||
| 5,885,000 | Dell International LLC / EMC Corp., 5.300%, 10/01/2029 | $ | 6,905,149 | 2.0 | |||||||||
| Utilities: 1.7% | |||||||||||||
| 2,960,000 | (1) | AES Corp./The, 3.950%, 07/15/2030 | 3,159,282 | 0.9 | |||||||||
| 2,530,000 | (1) | AES Panama Generation Holdings SRL, 4.375%, 05/31/2030 | 2,638,284 | 0.8 | |||||||||
| 5,797,566 | 1.7 | ||||||||||||
| Total Corporate Bonds/Notes (Cost $83,683,569) | 89,020,711 | 25.9 | |||||||||||
COLLATERALIZED MORTGAGE OBLIGATIONS: 0.5% | |||||||||||||
| 608,081 | (1),(2) | Angel Oak Mortgage Trust 2019-6 A1, 2.620%, 11/25/2059 | 607,953 | 0.2 | |||||||||
| 230,883 | (1),(2) | Angel Oak Mortgage Trust I LLC 2019-2 A1, 3.628%, 03/25/2049 | 231,994 | 0.1 | |||||||||
| 851,027 | (1),(2) | Residential Mortgage Loan Trust 2019-3 A1, 2.633%, 09/25/2059 | 852,149 | 0.2 | |||||||||
| Total Collateralized Mortgage Obligations (Cost $1,666,338) | 1,692,096 | 0.5 | |||||||||||
U.S. TREASURY OBLIGATIONS: 49.8% | |||||||||||||
| U.S. Treasury Bonds: 6.3% | |||||||||||||
| 7,660,000 | 1.875%, 11/15/2051 | 7,601,353 | 2.2 | ||||||||||
| 13,940,000 | 2.000%, 08/15/2051 | 14,214,444 | 4.1 | ||||||||||
| 21,815,797 | 6.3 | ||||||||||||
| U.S. Treasury Floating Rate Notes: 43.5% | |||||||||||||
| 7,175,000 | 0.119%, (USBMMY3M + 0.034%), 04/30/2023 | 7,175,744 | 2.1 | ||||||||||
| 51,910,000 | 0.134%, (USBMMY3M + 0.049%), 01/31/2023 | 51,932,867 | 15.1 | ||||||||||
| 26,545,000 | 0.140%, (USBMMY3M + 0.055%), 07/31/2022 | 26,554,028 | 7.7 | ||||||||||
| 63,640,000 | 0.140%, (USBMMY3M + 0.055%), 10/31/2022 | 63,665,903 | 18.6 | ||||||||||
| 149,328,542 | 43.5 | ||||||||||||
| Total U.S. Treasury Obligations (Cost $171,186,293) | 171,144,339 | 49.8 | |||||||||||
U.S. GOVERNMENT AGENCY OBLIGATIONS: 17.0% | |||||||||||||
| Federal Home Loan Bank: 8.5% | |||||||||||||
| 29,280,000 | 0.125%, 03/17/2023 | 29,146,934 | 8.5 | ||||||||||
| Federal Home Loan Mortgage Corporation: 8.5%(3) | |||||||||||||
| 29,190,000 | 0.375%, 05/05/2023 | 29,128,459 | 8.5 | ||||||||||
| Total U.S. Government Agency Obligations (Cost $58,508,182) | 58,275,393 | 17.0 | |||||||||||
COMMERCIAL MORTGAGE-BACKED SECURITIES: 4.8% | |||||||||||||
| 3,089,000 | (2) | Benchmark 2020-B18 C Mortgage Trust, 3.647%, 07/15/2053 | 3,220,568 | 0.9 | |||||||||
| VY® BRANDYWINEGLOBAL — BOND PORTFOLIO | PORTFOLIO OF INVESTMENTS AS OF DECEMBER 31, 2021 (CONTINUED) |
| Principal Amount† | Value | Percentage of Net Assets | |||||||||||
COMMERCIAL MORTGAGE-BACKED SECURITIES: (continued) | |||||||||||||
| 1,520,000 | (1) | Credit Suisse Mortgage Capital Certificates 2019-ICE4 A, 1.090%, (US0001M + 0.980%), 05/15/2036 | $ | 1,521,279 | 0.5 | ||||||||
| 9,370,000 | (1),(2) | FREMF 2012-K23 B Mortgage Trust, 3.656%, 10/25/2045 | 9,524,104 | 2.8 | |||||||||
| 2,000,000 | (2) | JPMDB Commercial Mortgage Securities Trust 2018-C8 C, 4.726%, 06/15/2051 | 2,106,243 | 0.6 | |||||||||
| Total Commercial Mortgage-Backed Securities (Cost $16,564,491) | 16,372,194 | 4.8 | |||||||||||
ASSET-BACKED SECURITIES: 0.2% | |||||||||||||
| Other Asset-Backed Securities: 0.2% | |||||||||||||
| 720,000 | (1),(2) | Towd Point Mortgage Trust 2018-3 A2, 3.875%, 05/25/2058 | 760,784 | 0.2 | |||||||||
| Total Asset-Backed Securities (Cost $696,185) | 760,784 | 0.2 | |||||||||||
| Total Long-Term Investments (Cost $332,305,058) | 337,265,517 | 98.2 | |||||||||||
| Shares | Value | Percentage of Net Assets | |||||||||||
SHORT-TERM INVESTMENTS: 1.5% | |||||||||||||
| Mutual Funds: 1.5% | |||||||||||||
| 5,134,368 | (4) | BlackRock Liquidity Funds, FedFund, Institutional Class, 0.030% (Cost $5,134,368) | $ | 5,134,368 | 1.5 | ||||||||
| Total Short-Term Investments (Cost $5,134,368) | 5,134,368 | 1.5 | |||||||||||
Total Investments in Securities (Cost $337,439,426) | $ | 342,399,885 | 99.7 | ||||||||||
Assets in Excess of Other Liabilities | 929,082 | 0.3 | |||||||||||
Net Assets | $ | 343,328,967 | 100.0 | ||||||||||
| † | Unless otherwise indicated, principal amount is shown in USD. | |
| (1) | Securities with purchases pursuant to Rule 144A or section 4(a)(2), under the Securities Act of 1933 and may not be resold subject to that rule except to qualified institutional buyers. | |
| (2) | Variable rate security. Rate shown is the rate in effect as of December 31, 2021. | |
| (3) | The Federal Housing Finance Agency (“FHFA”) placed the Federal Home Loan Mortgage Corporation and Federal National Mortgage Association into conservatorship with FHFA as the conservator. As such, the FHFA oversees the continuing affairs of these companies. | |
| (4) | Rate shown is the 7-day yield as of December 31, 2021. |
Reference Rate Abbreviations:
| SOFRRATE | 1-day Secured Overnight Financing Rate | |
| US0001M | 1-month LIBOR | |
| USBMMY3M | U.S. Treasury 3-month Bill Money Market Yield |
| Quoted Prices in Active Markets for Identical Investments (Level 1) | Significant Other Observable Inputs (Level 2) | Significant Unobservable Inputs (Level 3) | Fair Value at December 31, 2021 | |||||||||||||
|---|---|---|---|---|---|---|---|---|---|---|---|---|---|---|---|---|
Asset Table | ||||||||||||||||
Investments, at fair value | ||||||||||||||||
| Corporate Bonds/Notes | $ | — | $ | 89,020,711 | $— | $ | 89,020,711 | |||||||||
| Collateralized Mortgage Obligations | — | 1,692,096 | — | 1,692,096 | ||||||||||||
| Commercial Mortgage-Backed Securities | — | 16,372,194 | — | 16,372,194 | ||||||||||||
| U.S. Government Agency Obligations | — | 58,275,393 | — | 58,275,393 | ||||||||||||
| Asset-Backed Securities | — | 760,784 | — | 760,784 | ||||||||||||
| U.S. Treasury Obligations | — | 171,144,339 | — | 171,144,339 | ||||||||||||
| Short-Term Investments | 5,134,368 | — | — | 5,134,368 | ||||||||||||
| Total Investments, at fair value | $ | 5,134,368 | $ | 337,265,517 | $— | $ | 342,399,885 | |||||||||
Liabilities Table | ||||||||||||||||
Other Financial Instruments+ | ||||||||||||||||
| Futures | $ | (75,297 | ) | $ | — | $— | $ | (75,297 | ) | |||||||
| Total Liabilities | $ | (75,297 | ) | $ | — | $— | $ | (75,297 | ) | |||||||
| ˆ | See Note 2, “Significant Accounting Policies” in the Notes to Financial Statements for additional information. |
| VY® BRANDYWINEGLOBAL — BOND PORTFOLIO | PORTFOLIO OF INVESTMENTS AS OF DECEMBER 31, 2021 (CONTINUED) |
| + | Other Financial Instruments may include open forward foreign currency contracts, futures, centrally cleared swaps, OTC swaps and written options. Forward foreign currency contracts, futures and centrally cleared swaps are fair valued at the unrealized appreciation (depreciation) on the instrument. OTC swaps and written options are valued at the fair value of the instrument. |
| Description | Number of Contracts | Expiration Date | Notional Amount | Unrealized Appreciation/ (Depreciation) | ||||||||||||||
|---|---|---|---|---|---|---|---|---|---|---|---|---|---|---|---|---|---|---|
| Long Contracts: | ||||||||||||||||||
| U.S. Treasury Ultra Long Bond | 39 | 03/22/22 | $ | 7,687,875 | $ | (75,297 | ) | |||||||||||
| $ | 7,687,875 | $ | (75,297 | ) | ||||||||||||||
| Derivatives not accounted for as hedging instruments | Location on Statement of Assets and Liabilities | Fair Value | ||||||
|---|---|---|---|---|---|---|---|---|
Liability Derivatives | ||||||||
| Interest rate contracts | Variation margin payable on futures contracts* | $ | 75,297 | |||||
Total Liability Derivatives | $ | 75,297 | ||||||
| * | The fair value presented above represents the cumulative unrealized appreciation (depreciation) on futures contracts as reported in the table within the Portfolio of Investments. In the Statement of Assets and Liabilities, only current day’s unsettled variation margin is reported in receivables or payables on futures contracts and the net cumulative unrealized appreciation (depreciation) is included in total distributable earnings (loss). |
| Amount of Realized Gain or (Loss) on Derivatives Recognized in Income | ||||||
|---|---|---|---|---|---|---|
| Derivatives not accounted for as hedging instruments | Futures | |||||
| Interest rate contracts | $ | 5,033,822 | ||||
Total | $ | 5,033,822 | ||||
| Change in Unrealized Appreciation or (Depreciation) on Derivatives Recognized in Income | ||||||
|---|---|---|---|---|---|---|
| Derivatives not accounted for as hedging instruments | Futures | |||||
| Interest rate contracts | $ | (453,656 | ) | |||
Total | $ | (453,656 | ) | |||
| Cost for federal income tax purposes was $337,364,129. | |||||
| Net unrealized appreciation consisted of: | |||||
| Gross Unrealized Appreciation | $5,597,307 | ||||
| Gross Unrealized Depreciation | (636,848 | ) | |||
| Net Unrealized Appreciation | $4,960,459 | ||||
| Portfolio Name | Type | Per Share Amount | ||||||||
|---|---|---|---|---|---|---|---|---|---|---|
VY® BlackRock Inflation Protected Bond Portfolio | ||||||||||
| Class ADV | NII | $ | 0.2317 | |||||||
| Class I | NII | $ | 0.2934 | |||||||
| Class S | NII | $ | 0.2667 | |||||||
VY® BrandywineGLOBAL — Bond Portfolio | NII | $ | 0.1910 | |||||||
| STCG | $ | 0.6538 | ||||||||
| LTCG | $ | 0.1065 | ||||||||
NII — Net investment income
STCG — Short-term capital gain
LTCG — Long-term capital gain
| Name, Address and Age | Position(s) Held with the Trust | Term of Office and Length of Time Served(1) | Principal Occupation(s) — During the Past 5 Years | Number of funds in Fund Complex Overseen by Trustee(2) | Other Board Positions Held by Trustee | |||||
Independent Trustees: | ||||||||||
| Colleen D. Baldwin 7337 East Doubletree Ranch Rd. Suite 100 Scottsdale, Arizona 85258 Age: 61 | Trustee Chairperson | November 2007–Present January 2020–Present | President, Glantuam Partners, LLC, a business consulting firm (January 2009–Present). | 131 | Dentaquest (February 2014–Present); RSR Partners, Inc. (2016–Present). | |||||
| John V. Boyer 7337 East Doubletree Ranch Rd. Suite 100 Scottsdale, Arizona 85258 Age: 68 | Trustee | January 2005–Present | Retired. Formerly, President and Chief Executive Officer, Bechtler Arts Foundation, an arts and education foundation (January 2008–December 2019). | 131 | None. | |||||
| Patricia W. Chadwick 7337 East Doubletree Ranch Rd. Suite 100 Scottsdale, Arizona 85258 Age: 73 | Trustee | January 2006–Present | Consultant and President, Ravengate Partners LLC, a consulting firm that provides advice regarding financial markets and the global economy (January 2000–Present). | 131 | Wisconsin Energy Corporation (June 2006–Present); The Royce Funds (22 funds) (December 2009–Present); and AMICA Mutual Insurance Company (1992–Present). | |||||
| Martin J. Gavin 7337 East Doubletree Ranch Rd. Suite 100 Scottsdale, AZ 85258 Age: 71 | Trustee | August 2015–Present | Retired. | 131 | None. | |||||
| Joseph E. Obermeyer 7337 East Doubletree Ranch Rd. Suite 100 Scottsdale, Arizona 85258 Age: 64 | Trustee | May 2013–Present | President, Obermeyer & Associates, Inc., a provider of financial and economic consulting services (November 1999–Present). | 131 | None. | |||||
| Sheryl K. Pressler 7337 East Doubletree Ranch Rd. Suite 100 Scottsdale, Arizona 85258 Age: 71 | Trustee | January 2006–Present | Consultant (May 2001–Present). | 131 | Centerra Gold Inc. (May 2008–Present). | |||||
| Christopher P. Sullivan 7337 East Doubletree Ranch Rd. Suite 100 Scottsdale, Arizona 85258 Age: 68 | Trustee | October 2015–Present | Retired. | 131 | None. | |||||
| Name, Address and Age | Position(s) Held with the Trust | Term of Office and Length of Time Served(1) | Principal Occupation(s) — During the Past 5 Years | Number of funds in Fund Complex Overseen by Trustee(2) | Other Board Positions Held by Trustee | |||||
| Trustee who is an “interested person”: | ||||||||||
| Dina Santoro 230 Park Avenue New York, New York 10169 Age: 48 | Trustee | July 2018–Present | President, Voya Investments, LLC and Voya Capital, LLC (March 2018–Present); Senior Vice President, Voya Investments Distributor, LLC (April 2018–Present); Chief Operating Officer and Senior Managing Director, Voya Investment Management (January 2022–Present). Formerly, Senior Managing Director, Head of Product and Marketing Strategy, Voya Investment Management (September 2017–January 2022); Managing Director, Quantitative Management Associates, LLC (January 2004–August 2017). | 131 | Voya Investments, LLC, Voya Capital, LLC, and Voya Funds Services, LLC (March 2018–Present); Voya Investments Distributor, LLC (April 2018–Present). | |||||
(1) | Trustees serve until their successors are duly elected and qualified. The tenure of each Trustee who is not an “interested person” as defined in the 1940 Act, of each Portfolio (“Independent Trustee”) is subject to the Board’s retirement policy which states that each duly elected or appointed Independent Trustee shall retire from and cease to be a member of the Board of Trustees at the close of business on December 31 of the calendar year in which the Independent Trustee attains the age of 75. A majority vote of the Board’s other Independent Trustees may extend the retirement date of an Independent Trustee if the retirement would trigger a requirement to hold a meeting of shareholders of the Trust under applicable law, whether for the purposes of appointing a successor to the Independent Trustee or otherwise comply under applicable law, in which case the extension would apply until such time as the shareholder meeting can be held or is no longer required (as determined by a vote of a majority of the other Independent Trustees). | |
(2) | For the purposes of this table, “Fund Complex” means the Voya family of funds including the following investment companies: Voya Asia Pacific High Dividend Equity Income Fund; Voya Balanced Portfolio, Inc.; Voya Emerging Markets High Dividend Equity Fund; Voya Equity Trust; Voya Funds Trust; Voya Global Advantage and Premium Opportunity Fund; Voya Global Equity Dividend and Premium Opportunity Fund; Voya Government Money Market Portfolio; Voya Infrastructure, Industrials and Materials Fund; Voya Intermediate Bond Portfolio; Voya Investors Trust; Voya Mutual Funds; Voya Partners, Inc.; Voya Senior Income Fund; Voya Separate Portfolios Trust; Voya Strategic Allocation Portfolios, Inc.; Voya Variable Funds; Voya Variable Insurance Trust; Voya Variable Portfolios, Inc.; and Voya Variable Products Trust. The number of funds in the Fund Complex is as of January 31, 2022. |
| Name, Address and Age | Position(s) Held With the Trust | Term of Office and Length of Time Served(1) | Principal Occupation(s) — During the Past 5 Years | |||
| Michael Bell One Orange Way Windsor, Connecticut 06095 Age: 53 | Chief Executive Officer | March 2018–Present | Chief Executive Officer and Director, Voya Investments, LLC, Voya Capital, LLC, and Voya Funds Services, LLC (March 2018–Present); Senior Vice President, Voya Investments Distributor, LLC (March 2020–Present); Chief Financial Officer, Voya Investment Management (September 2014–Present). Formerly, Senior Vice President and Chief Financial Officer, Voya Investments Distributor, LLC (September 2019–March 2020); Senior Vice President and Treasurer, Voya Investments Distributor, LLC (November 2015–September 2019); Senior Vice President, Chief Financial Officer and Treasurer, Voya Investments, LLC (November 2015–March 2018). | |||
| Dina Santoro 230 Park Avenue New York, New York 10169 Age: 48 | President | March 2018–Present | President and Director, Voya Investments, LLC and Voya Capital, LLC (March 2018–Present); Director, Voya Funds Services, LLC (March 2018–Present); Director and Senior Vice President, Voya Investments Distributor, LLC (April 2018–Present); Chief Operating Officer and Senior Managing Director, Voya Investment Management (January 2022–Present). Formerly, Senior Managing Director, Head of Product and Marketing Strategy, Voya Investment Management (September 2017–January 2022); Managing Director, Quantitative Management Associates, LLC (January 2004–August 2017). | |||
| Jonathan Nash 230 Park Avenue New York, New York 10169 Age: 54 | Executive Vice President Chief Investment Risk Officer | March 2020 – Present March 2020–Present | Executive Vice President and Chief Investment Risk Officer, Voya Investments, LLC (March 2020–Present) and Senior Vice President, Investment Risk Management, Voya Investment Management (March 2017–Present). Formerly, Vice President, Voya Investments, LLC (September 2018–March 2020); Consultant, DA Capital LLC (January 2016–March 2017). | |||
| James M. Fink 5780 Powers Ferry Road NW Atlanta, Georgia 30327 Age: 63 | Executive Vice President | March 2018–Present | Managing Director, Voya Investments, LLC, Voya Capital, LLC, and Voya Funds Services, LLC (March 2018–Present); Senior Vice President, Voya Investments Distributor, LLC (April 2018–Present); Chief Administrative Officer, Voya Investment Management (September 2017–Present). Formerly, Managing Director, Operations, Voya Investment Management (March 1999–September 2017). | |||
| Kevin M. Gleason 7337 East Doubletree Ranch Rd. Suite 100 Scottsdale, Arizona 85258 Age: 55 | Chief Compliance Officer | February 2012–Present | Senior Vice President, Voya Investment Management and Chief Compliance Officer, Voya Family of Funds (February 2012–Present). | |||
| Todd Modic 7337 East Doubletree Ranch Rd. Suite 100 Scottsdale, Arizona 85258 Age: 54 | Senior Vice President, Chief/Principal Financial Officer and Assistant Secretary | March 2005–Present | President, Voya Funds Services, LLC (March 2018–Present) and Senior Vice President, Voya Investments, LLC (April 2005–Present). | |||
| Kimberly A. Anderson 7337 East Doubletree Ranch Rd. Suite 100 Scottsdale, Arizona 85258 Age: 57 | Senior Vice President | November 2003–Present | Senior Vice President, Voya Investments, LLC (September 2003–Present). | |||
| Micheline S. Faver 7337 East Doubletree Ranch Rd. Suite 100 Scottsdale, Arizona 85258 Age: 44 | Senior Vice President | September 2020 – Present | Senior Vice President, Head of Fund Compliance and Chief Compliance Officer, Voya Investments, LLC (March 2021–Present). Formerly, Vice President, Head of Fund Compliance and Chief Compliance Officer, Voya Investments, LLC (June 2016–March 2021). |
| Name, Address and Age | Position(s) Held With the Trust | Term of Office and Length of Time Served(1) | Principal Occupation(s) — During the Past 5 Years | |||
| Robert Terris 5780 Powers Ferry Road NW Atlanta, Georgia 30327 Age: 51 | Senior Vice President | May 2006–Present | Senior Vice President, Voya Investments Distributor, LLC (April 2018–Present); Senior Vice President, Head of Investment Services, Voya Investments, LLC (April 2018–Present) and Voya Funds Services, LLC (March 2006–Present). Formerly, Senior Vice President, Head of Division Operations, Voya Investments, LLC (October 2015–April 2018). | |||
| Fred Bedoya 7337 East Doubletree Ranch Rd. Suite 100 Scottsdale, Arizona 85258 Age: 49 | Vice President Treasurer | September 2012 –Present | Vice President, Voya Investments, LLC (October 2015–Present) and Voya Funds Services, LLC (July 2012–Present). | |||
| Maria M. Anderson 7337 East Doubletree Ranch Rd. Suite 100 Scottsdale, Arizona 85258 Age: 63 | Vice President | September 2004–Present | Vice President, Voya Investments, LLC (October 2015–Present) and Voya Funds Services, LLC (September 2004–Present). | |||
| Sara M. Donaldson 7337 East Doubletree Ranch Rd. Suite 100 Scottsdale, Arizona 85258 Age: 62 | Vice President | September 2014–Present | Vice President, Voya Investments, LLC (October 2015–Present). | |||
| Robyn L. Ichilov 7337 East Doubletree Ranch Rd. Suite 100 Scottsdale, Arizona 85258 Age: 54 | Vice President | VIT: November 1999–Present VVIT: October 2000–Present | Vice President, Voya Funds Services, LLC (November 1995–Present) and Voya Investments, LLC (August 1997–Present). | |||
| Jason Kadavy 7337 East Doubletree Ranch Rd. Suite 100 Scottsdale, Arizona 85258 Age: 45 | Vice President | September 2012–Present | Vice President, Voya Investments, LLC (October 2015–Present) and Voya Funds Services, LLC (July 2007–Present). | |||
| Andrew K. Schlueter 7337 East Doubletree Ranch Rd. Suite 100 Scottsdale, Arizona 85258 Age: 45 | Vice President | March 2018–Present | Vice President, Voya Investments Distributor, LLC (April 2018–Present); Vice President, Voya Investments, LLC and Voya Funds Services, LLC (March 2018–Present); Vice President, Head of Mutual Fund Operations, Voya Investment Management (February 2018–Present). Formerly, Vice President, Voya Investment Management (March 2014–February 2018). | |||
| Craig Wheeler 7337 East Doubletree Ranch Rd. Suite 100 Scottsdale, Arizona 85258 Age: 52 | Vice President | May 2013–Present | Vice President—Director of Tax, Voya Investments, LLC (October 2015–Present). | |||
| Monia Piacenti One Orange Way Windsor, Connecticut 06095 Age: 45 | Anti-Money Laundering Officer | June 2018–Present | Anti-Money Laundering Officer, Voya Investments Distributor, LLC, Voya Investment Management and Voya Investment Management Trust Co. (June 2018–Present); Compliance Consultant, Voya Financial, Inc. (January 2019–Present). Formerly, Senior Compliance Officer, Voya Investment Management (December 2009–December 2018). | |||
| Joanne F. Osberg 7337 East Doubletree Ranch Rd. Suite 100 Scottsdale, Arizona 85258 Age: 40 | Secretary | September 2020–Present | Vice President and Senior Counsel, Voya Investment Management — Mutual Fund Legal Department (September 2020–Present). Formerly, Vice President, Counsel, Voya Investment Management — Mutual Fund Legal Department (January 2013–September 2020). | |||
| Paul A. Caldarelli 7337 East Doubletree Ranch Rd. Suite 100 Scottsdale, Arizona 85258 Age: 70 | Assistant Secretary | June 2010–Present | Vice President and Senior Counsel, Voya Investment Management — Mutual Fund Legal Department (March 2010–Present). |
(1) | The Officers hold office until the next annual meeting of the Board of Trustees and until their successors shall have been elected and qualified. |
Voya Investments, LLC
7337 East Doubletree Ranch Road, Suite 100
Scottsdale, Arizona 85258
Voya Investments Distributor, LLC
7337 East Doubletree Ranch Road, Suite 100
Scottsdale, Arizona 85258
BNY Mellon Investment Servicing (U.S.) Inc.
301 Bellevue Parkway
Wilmington, Delaware 19809
Ernst & Young LLP
200 Clarendon Street
Boston, Massachusetts 02116
The Bank of New York Mellon
225 Liberty Street
New York, New York 10286
Ropes & Gray LLP
Prudential Tower
800 Boylston Street
Boston, Massachusetts 02199
| RETIREMENT | INVESTMENTS | INSURANCE | |
| voyainvestments.com | VPAR-VIT3AIS (1221-022422) |
Annual Report
December 31, 2021
Classes ADV, I and S
Voya Investors Trust
| ■ | Voya Global Perspectives® Portfolio |
As permitted by regulations adopted by the U.S. Securities and Exchange Commission, paper copies of the portfolio’s annual and semi-annual shareholder reports, like this annual report, are not sent by mail, unless you specifically request paper copies of the reports. Instead, the reports will be made available on a website and you will be notified by mail each time a report is posted and provided with a website link to access the report. |
This report is submitted for general information to shareholders of the Voya mutual funds. It is not authorized for distribution to prospective shareholders unless accompanied or preceded by a prospectus which includes details regarding the fund’s investment objectives, risks, charges, expenses and other information. This information should be read carefully. |
INVESTMENT MANAGEMENT voyainvestments.com | |
TABLE OF CONTENTS
| 1 | |||
| 3 | |||
| 5 | |||
| 6 | |||
| 7 | |||
| 8 | |||
| 9 | |||
| 10 | |||
| 11 | |||
| 18 | |||
| 20 | |||
| 21 | |||
| 25 |
PROXY VOTING INFORMATION
A description of the policies and procedures that the Portfolio uses to determine how to vote proxies related to portfolio securities is available: (1) without charge, upon request, by calling Shareholder Services toll-free at (800) 992-0180; (2) on the Portfolio’s website at www.voyainvestments.com; and (3) on the U.S. Securities and Exchange Commission’s (“SEC’s”) website at www.sec.gov. Information regarding how the Portfolio voted proxies related to portfolio securities during the most recent 12-month period ended June 30 is available without charge on the Portfolio’s website at www.voyainvestments.com and on the SEC’s website at www.sec.gov.
QUARTERLY PORTFOLIO HOLDINGS
The Portfolio files its complete schedule of portfolio holdings with the SEC for the first and third quarters of each fiscal year on Form NPORT-P. The Portfolio’s Forms NPORT-P are available on the SEC’s website at www.sec.gov. The Portfolio’s complete schedule of portfolio holdings, as filed on Form NPORT-P is available at: www.voyainvestments.com and without charge upon request from the Portfolio by calling Shareholder Services toll-free at (800) 992-0180.
(THIS PAGE INTENTIONALLY LEFT BLANK)
A Solid Year Ends for the Financial Markets, Gauging the Policy Shifts to Come
Dear Shareholder,
The 12-month period ended December 31, 2021 marked another strong year for stocks. Forcefully accommodative and persistent monetary and fiscal policy, along with the COVID-19 vaccine rollouts and an impressively adaptable global economy, drove big gains within risk assets. The ascent wasn’t particularly smooth, as several new COVID-19 variants thwarted attempts at a full-fledged reopening. Besides the distress induced by a public health crisis, prolongation of the pandemic negatively impacted the supply of labor and costs of core goods. These two factors, combined with others such as economic stimulus and rising commodity prices, drove inflation higher. As economic activity proved resilient, however, investors shrugged off soaring prices and continued to buy stocks.
The U.S. unemployment rate declined to 3.9% in December and job openings continued to exceed job seekers, indicating the labor market is approaching full employment. This dynamic is pressuring wages upward and has contributed to inflation running above the U.S Federal Reserve Board’s (the “Fed”) 2% target since April. Sharply higher prices have caused the Fed to hasten its plans to withdraw stimulus. We recognize that in 2022, monetary and fiscal policy are likely to become less supportive of the global economy. Yet in our view, we also see potential offsets to tightening financial conditions, including consumer spending and corporate inventory rebuilding, which make us believe there is scope for continued global equity gains.
The pace and path to policy normalization will be a key market factor for the year ahead. A sharp rise in wages from prolonged labor market tightness is possible, but firms, particularly larger ones, have been able to pass through rising input costs to maintain margins. In our view, this is likely to continue and, combined with still above trend GDP growth, will support earnings growth in 2022.
As we’ve often noted, it’s important to have a plan for investing consistently through headwinds and tailwinds. Keep focused on your long-term goals and don’t get distracted by short-term fluctuations, however compelling or distracting they may seem. Should your long-term goals change, discuss the situation thoroughly with your investment advisor before making any changes to your investment portfolio.
Regardless of events, at Voya we remain well prepared for and fully committed to serving our clients without disruption. We appreciate your continued confidence in us, and we look forward to working with you in the future.
Sincerely,
Dina Santoro
President
Voya Family of Funds
January 21, 2022
The views expressed in the President’s Letter reflect those of the President as of the date of the letter. Any such views are subject to change at any time based upon market or other conditions and the Voya mutual funds disclaim any responsibility to update such views. These views may not be relied on as investment advice and because investment decisions for a Voya mutual fund are based on numerous factors, may not be relied on as an indication of investment intent on behalf of any Voya mutual fund. Reference to specific company securities should not be construed as recommendations or investment advice.
BENCHMARK DESCRIPTIONS
| Index | Description | |
|---|---|---|
MSCI EAFE® Index (“MSCI EAFE®”) | An index that measures the performance of securities listed on exchanges in Europe, Australasia and the Far East. It includes the reinvestment of dividends net of withholding taxes, but does not reflect fees, brokerage commissions or other expenses of investing. | |
MSCI Emerging Markets IndexSM (“MSCI EMSM”) | An index that measures the performance of securities listed on exchanges in developing nations throughout the world. It includes the reinvestment of dividends and distributions net of withholding taxes, but does not reflect fees, brokerage commissions or other expenses of investing. | |
S&P 500® Index | An index that measures the performance of securities of approximately 500 large capitalization companies whose securities are traded on major U.S. stock markets. | |
S&P Target Risk® Growth Index | Seeks to measure the performance of an asset allocation strategy targeted to a growth focused risk profile. |
| PORTFOLIO MANAGERS’ REPORT | VOYA GLOBAL PERSPECTIVES® PORTFOLIO |
Target Allocations
as of December 31, 2021
(as percentage of net assets)
| U.S. Large Cap Equities | 10 | % | ||||
| U.S. Mid Cap Equities | 10 | % | ||||
| U.S. Small Cap Equities | 10 | % | ||||
| Global Real Estate | 10 | % | ||||
| International Equities | 10 | % | ||||
| Emerging Market Equities | 10 | % | ||||
| U.S. Investment Grade Bonds | 10 | % | ||||
| U.S. Government Bonds | 10 | % | ||||
| Global Bonds | 10 | % | ||||
| U.S. High Yield Bonds | 10 | % |
Portfolio holdings are subject to change daily.
Voya Global Perspectives® Portfolio (the “Portfolio”) seeks total return. Under normal conditions, the sub-adviser invests the assets of the Portfolio in a combination of underlying funds (“Underlying Funds”) that in turn, invest directly in securities such as stocks and bonds. The Portfolio is managed by Douglas Coté, CFA, Portfolio Manager of Voya Investment Management Co. LLC — the Sub-Adviser.
Under normal market conditions, approximately 60% of the Portfolio’s net assets are allocated to Underlying Funds that invest predominantly in equity securities, and approximately 40% of the Portfolio’s net assets are allocated to Underlying Funds that invest predominantly in debt instruments. These approximate weights are referred to as target allocations (“Target Allocations”). Depending upon the rules-based investment strategy, the equity target allocation may drop to approximately 30% and the debt target allocation may rise to approximately 70% — such weightings are called “defensive allocations.” No adjustments to the Target Allocations or defensive allocations will be made between quarterly allocation dates.
Performance: For the year ended December 31, 2021, the Portfolio’s Class S shares provided a total return of 5.84%, compared to the S&P Target Risk® Growth Index which returned 11.37%.
Portfolio Specifics: The Portfolio underperformed the S&P Target Risk® Growth Index for the reporting period. The market in 2021 was defined by a monotonic bull market, primarily in U.S. equities, including large cap, mid cap and small cap, with only short interim bouts of volatility. The strong markets have been driven by an impressive economic boom stoked by massive monetary and fiscal stimulus. Inflation reared its ugly head in the U.S. Federal Reserve Board’s (the “Fed”) preferred indicator, Employment Cost index, but by then it was too late to act with anything other than minor adjustments to policy.
On average, equities gained 6.5% for the quarter to end the year up an impressive 20.5%. The quarter was led by outsider global real estate investment trusts surging by a stunning 13%, followed closely by the stalwart S&P 500® Index at 11%. International was the weakest with a small gain by the MSCI EAFE® Index and a small loss by MSCI Emerging Markets IndexSM. S&P 500® Index Growth stocks, with a 13.7% return, beat value stocks with an 8.3% return. Real estate and technology were the best performers, with financials among the weakest for the quarter, while energy led for the year with 54.6%. Interest rates, as proxied by the U.S. ten-year Treasury, ended the year to a modest 1.5% yield, despite strong inflation data.
Performance of the Portfolio was positive for the year but underperformed the S&P Target Risk® Growth Index. The Portfolio underperformed due to an underweight in equities during the first quarter of the year and due to our tactical defensive position as equities rallied. The tactical positioning returned to base at the beginning of the second quarter, which helped absolute performance, but relative performance was negative due to adverse stock selection. Performance lagged for the year due to an underweight in U.S. large-cap and overweight to emerging market equities. Performance in fixed-income holdings also detracted from results for the year due to allocations to non-benchmark U.S. government bonds and global bonds. By contrast, the biggest contributors to relative results were non-benchmark exposures to global real estate investment trusts and U.S. corporates.
Current Strategy and Outlook: In our view, the Fed — as both solution and problem — is walking a tight rope, and it is very important for it not to waiver. Markets are expecting a steady Fed hand and, in our opinion, it must deliver on taper and rate increases, or the consequences could be devastating. This may seem counterintuitive that the market would want a “tightening” posture from the Fed. We believe the reason is the fear of inflation, not in goods but in the market, which is creating identifiable imbalances, raising risks of a far more severe correction if not reined in. Therefore, we believe the primary risk is unabated inflation, and the primary strength is the ongoing economic boom.
The views expressed in this commentary are informed opinions. They should not be considered promises or advice. The views expressed reflect those of the portfolio managers, only through the end of the period as stated on the cover. The portfolio managers’ views are subject to change at any time based on market and other conditions.
Portfolio holdings and characteristics are subject to change and may not be representative of current holdings and characteristics. Portfolio holdings are subject to change daily. The outlook for this Portfolio may differ from that presented for other Voya mutual funds. This report contains statements that may be “forward-looking” statements. Actual results may differ materially from those projected in the “forward-looking” statements. The Portfolio’s performance returns shown reflect applicable fee waivers and/or expense limits in effect during this period. Absent such fee waivers/expense limitations, if any, performance would have been lower. Performance for the different classes of shares will vary based on differences in fees associated with each class. An index has no cash in its portfolio and imposes no sales charges. An investor cannot invest directly in an index.
| VOYA GLOBAL PERSPECTIVES® PORTFOLIO | PORTFOLIO MANAGERS’ REPORT |

| Average Annual Total Returns for the Periods Ended December 31, 2021 | ||||||||||||
| 1 Year | 5 Year | Since Inception of Classes ADV, I and S May 1, 2013 | ||||||||||
| Class ADV | 5.74 | % | 8.89 | % | 6.42 | % | ||||||
| Class I | 6.09 | % | 9.24 | % | 6.78 | % | ||||||
| Class S | 5.84 | % | 8.96 | % | 6.50 | % | ||||||
| S&P Target Risk® Growth Index | 11.37 | % | 10.17 | % | 8.25 | % | ||||||
Based on a $10,000 initial investment, the graph and table above illustrate the total return of the Voya Global Perspectives® Portfolio against the index indicated. An index is unmanaged and has no cash in its portfolio and imposes no sales charges. An investor cannot invest directly in an index.
The Portfolio’s performance is shown without the imposition of any expenses or charges which are, or may be, imposed under your variable annuity contract or variable life insurance policy. Total returns would have been lower if such expenses or charges were included.
The performance graph and table do not reflect the deduction of taxes that a shareholder will pay on Portfolio distributions or the redemption of Portfolio shares.
The performance shown includes, if applicable, the effect of fee waivers and/or expense reimbursements by the Investment Adviser and/or other
service providers, which have the effect of increasing total return. Had all fees and expenses been considered, the total returns would have been lower.
The performance update illustrates performance for a variable investment option available through a variable annuity contract or a variable life insurance policy. The performance shown indicates past performance and is not a projection or prediction of future results. Actual investment returns and principal value will fluctuate so that shares and/or units, at redemption, may be worth more or less than their original cost. Please log on to www.voyainvestments.com or call (800) 366-0066 to get performance through the most recent month end.
Portfolio holdings are subject to change daily.
SHAREHOLDER EXPENSE EXAMPLE (UNAUDITED)
As a shareholder of the Portfolio, you incur two types of costs: (1) transaction costs, including redemption fees and exchange fees; and (2) ongoing costs, including management fees, distribution and/or service (12b-1) fees, and other Portfolio expenses. These Examples are intended to help you understand your ongoing costs (in dollars) of investing in the Portfolio and to compare these costs with the ongoing costs of investing in other mutual funds.
The Examples are based on an investment of $1,000 invested at the beginning of the period and held for the entire period from July 1, 2021 to December 31, 2021. The Portfolio’s expenses are shown without the imposition of any charges which are, or may be, imposed under your variable annuity contract, variable life insurance policy, qualified pension, or retirement plan. Expenses would have been higher if such charges were included.
Actual Expenses
The left section of the table shown below, “Actual Portfolio Return,” provides information about actual account values and actual expenses. You may use the information in this section, together with the amount you invested, to estimate the expenses that you paid over the period. Simply divide your account value by $1,000 (for example, an $8,600 account value divided by $1,000 = 8.6), then multiply the result by the number in the first section under the heading entitled “Expenses Paid During the Period” to estimate the expenses you paid on your account during this period.
Hypothetical Example for Comparison Purposes
The right section of the table shown below, “Hypothetical (5% return before expenses)” provides information about hypothetical account values and hypothetical expenses based on the Portfolio’s actual expense ratio and an assumed rate of return of 5% per year before expenses, which is not the Portfolio’s actual return. The hypothetical account values and expenses may not be used to estimate the actual ending account balance or expenses you paid for the period. You may use this information to compare the ongoing costs of investing in the Portfolio and other mutual funds. To do so, compare this 5% hypothetical example with the 5% hypothetical examples that appear in the shareholder reports of the other mutual funds.
Please note that the expenses shown in the table are meant to highlight your ongoing costs only and do not reflect any transactional costs, such as redemption fees or exchange fees. Therefore, the hypothetical section of the table is useful in comparing ongoing costs only, and will not help you determine the relative total costs of owning different mutual funds. In addition, if these transactional costs were included, your costs would have been higher.
| Actual Portfolio Return | Hypothetical (5% return before expenses) | |||||||||||||||||||||||||||||||
|---|---|---|---|---|---|---|---|---|---|---|---|---|---|---|---|---|---|---|---|---|---|---|---|---|---|---|---|---|---|---|---|---|
| Beginning Account Value July 1, 2021 | Ending Account Value December 31, 2021 | Annualized Expense Ratio* | Expenses Paid During the Period Ended December 31, 2021** | Beginning Account Value July 1, 2021 | Ending Account Value December 31, 2021 | Annualized Expense Ratio* | Expenses Paid During the Period Ended December 31, 2021** | |||||||||||||||||||||||||
| Class ADV | $1,000.00 | $1,015.60 | 0.52 | % | $ | 2.64 | $ | 1,000.00 | $ | 1,022.58 | 0.52 | % | $2.65 | |||||||||||||||||||
| Class I | 1,000.00 | 1,017.70 | 0.22 | 1.12 | 1,000.00 | 1,024.10 | 0.22 | 1.12 | ||||||||||||||||||||||||
| Class S | 1,000.00 | 1,015.70 | 0.47 | 2.39 | 1,000.00 | 1,022.84 | 0.47 | 2.40 | ||||||||||||||||||||||||
| * | The annualized expense ratios do not include expenses of underlying funds. | |
| ** | Expenses are equal to the Portfolio’s respective annualized expense ratios multiplied by the average account value over the period, multiplied by 184/365 to reflect the most recent fiscal half-year. |
February 24, 2022
| ASSETS: | ||||
| Investments in affiliated underlying funds at fair value* | $ | 97,987,865 | ||
| Receivables: | ||||
| Fund shares sold | 371,388 | |||
| Prepaid expenses | 9 | |||
| Reimbursement due from Investment Adviser | 4,538 | |||
| Other assets | 10,913 | |||
| Total assets | 98,374,713 | |||
| LIABILITIES: | ||||
| Payable for investments in affiliated underlying funds purchased | 371,385 | |||
| Payable for fund shares redeemed | 10 | |||
| Payable for investment management fees | 16,420 | |||
| Payable for distribution and shareholder service fees | 22,401 | |||
| Payable to trustees under the deferred compensation plan (Note 6) | 10,913 | |||
| Payable for trustee fees | 514 | |||
| Other accrued expenses and liabilities | 28,069 | |||
| Total liabilities | 449,712 | |||
| NET ASSETS | $ | 97,925,001 | ||
| NET ASSETS WERE COMPRISED OF: | ||||
| Paid-in capital | $ | 80,139,590 | ||
| Total distributable earnings | 17,785,411 | |||
| NET ASSETS | $ | 97,925,001 | ||
| * Cost of investments in affiliated underlying funds | $ | 88,264,830 | ||
| Class ADV | ||||
| Net assets | $ | 88,973,956 | ||
| Shares authorized | unlimited | |||
| Par value | $ | 0.001 | ||
| Shares outstanding | 7,365,675 | |||
| Net asset value and redemption price per share | $ | 12.08 | ||
| Class I | ||||
| Net assets | $ | 8,866,112 | ||
| Shares authorized | unlimited | |||
| Par value | $ | 0.001 | ||
| Shares outstanding | 727,545 | |||
| Net asset value and redemption price per share | $ | 12.19 | ||
| Class S | ||||
| Net assets | $ | 84,933 | ||
| Shares authorized | unlimited | |||
| Par value | $ | 0.001 | ||
| Shares outstanding | 7,032 | |||
| Net asset value and redemption price per share | $ | 12.08 |
See Accompanying Notes to Financial Statements
7
| INVESTMENT INCOME: | ||||
| Dividends from affiliated underlying funds | $ | 1,838,824 | ||
| Total investment income | 1,838,824 | |||
| EXPENSES: | ||||
| Investment management fees | 205,467 | |||
| Distribution and shareholder service fees: | ||||
| Class ADV | 562,762 | |||
| Class S | 202 | |||
| Transfer agent fees: | ||||
| Class ADV | 10,994 | |||
| Class I | 1,046 | |||
| Class S | 9 | |||
| Shareholder reporting expense | 7,008 | |||
| Professional fees | 23,249 | |||
| Custody and accounting expense | 14,196 | |||
| Trustee fees | 4,109 | |||
| Miscellaneous expense | 8,387 | |||
| Total expenses | 837,429 | |||
| Waived and reimbursed fees | (327,548 | ) | ||
| Net expenses | 509,881 | |||
| Net investment income | 1,328,943 | |||
| REALIZED AND UNREALIZED GAIN (LOSS): | ||||
| Net realized gain (loss) on: | ||||
| Sale of affiliated underlying funds | 5,363,523 | |||
| Capital gain distributions from affiliated underlying funds | 2,216,382 | |||
| Net realized gain | 7,579,905 | |||
| Net change in unrealized appreciation (depreciation) on: | ||||
| Affiliated underlying funds | (3,097,654 | ) | ||
| Net change in unrealized appreciation (depreciation) | (3,097,654 | ) | ||
| Net realized and unrealized gain | 4,482,251 | |||
| Increase in net assets resulting from operations | $ | 5,811,194 |
| Year Ended December 31, 2021 | Year Ended December 31, 2020 | |||||||
|---|---|---|---|---|---|---|---|---|
| FROM OPERATIONS: | ||||||||
| Net investment income | $ | 1,328,943 | $ | 3,059,808 | ||||
| Net realized gain | 7,579,905 | 4,564,863 | ||||||
| Net change in unrealized appreciation (depreciation) | (3,097,654 | ) | 7,179,071 | |||||
| Increase in net assets resulting from operations | 5,811,194 | 14,803,742 | ||||||
| FROM DISTRIBUTIONS TO SHAREHOLDERS: | ||||||||
| Total distributions (excluding return of capital): | ||||||||
| Class ADV | (5,520,893 | ) | (5,772,190 | ) | ||||
| Class I | (543,110 | ) | (552,917 | ) | ||||
| Class S | (4,814 | ) | (4,152 | ) | ||||
| Total distributions | (6,068,817 | ) | (6,329,259 | ) | ||||
| FROM CAPITAL SHARE TRANSACTIONS: | ||||||||
| Net proceeds from sale of shares | 3,191,330 | 5,276,382 | ||||||
| Reinvestment of distributions | 6,068,817 | 6,329,259 | ||||||
| 9,260,147 | 11,605,641 | |||||||
| Cost of shares redeemed | (17,888,931 | ) | (16,868,995 | ) | ||||
| Net decrease in net assets resulting from capital share transactions | (8,628,784 | ) | (5,263,354 | ) | ||||
| Net increase (decrease) in net assets | (8,886,407 | ) | 3,211,129 | |||||
| NET ASSETS: | ||||||||
| Beginning of year or period | 106,811,408 | 103,600,279 | ||||||
| End of year or period | $ | 97,925,001 | $ | 106,811,408 | ||||
Selected data for a share of beneficial interest outstanding throughout each year or period.
| Income (loss) from investment operations | Less distributions | Ratios to average net assets | Supplemental Data | ||||||||||||||||||||||||||||||||||||||||||||||||||||||||||||||||||||
| Year or period | Net asset value, beginning of year or period | Net investment income (loss) | Net realized and unrealized gain (loss) | Total from investment operations | From net investment income | From net realized gains | From return of capital | Total distributions | Payment by affiliate | Net asset value, end of year or period | Total Return(1) | Expenses before reductions/ additions(2)(3)(4) | Expenses net of fee waivers and/or recoupments if any(2)(3)(4) | Expenses net of all reductions/ additions(2)(3)(4) | Net investment income (loss)(2)(3) | Net assets, end of year or period | Portfolio turnover rate | ||||||||||||||||||||||||||||||||||||||||||||||||||||||
| ended | ($) | ($) | ($) | ($) | ($) | ($) | ($) | ($) | ($) | ($) | (%) | (%) | (%) | (%) | (%) | ($000’s) | (%) | ||||||||||||||||||||||||||||||||||||||||||||||||||||||
Class ADV | |||||||||||||||||||||||||||||||||||||||||||||||||||||||||||||||||||||||
| 12-31-21 | 12.13 | 0.15 | • | 0.54 | 0.69 | 0.41 | 0.33 | — | 0.74 | — | 12.08 | 5.74 | 0.87 | 0.52 | 0.52 | 1.27 | 88,974 | 40 | |||||||||||||||||||||||||||||||||||||||||||||||||||||
| 12-31-20 | 11.17 | 0.34 | • | 1.34 | 1.68 | 0.35 | 0.37 | — | 0.72 | — | 12.13 | 15.80 | 0.88 | 0.51 | 0.51 | 3.01 | 97,298 | 107 | |||||||||||||||||||||||||||||||||||||||||||||||||||||
| 12-31-19 | 10.21 | 0.23 | • | 1.57 | 1.80 | 0.37 | 0.47 | — | 0.84 | — | 11.17 | 17.97 | 0.87 | 0.48 | 0.48 | 2.07 | 95,446 | 13 | |||||||||||||||||||||||||||||||||||||||||||||||||||||
| 12-31-18 | 11.46 | 0.23 | • | (1.06 | ) | (0.83 | ) | 0.29 | 0.13 | — | 0.42 | — | 10.21 | (7.50 | ) | 0.87 | 0.48 | 0.48 | 2.10 | 94,684 | 16 | ||||||||||||||||||||||||||||||||||||||||||||||||||
| 12-31-17 | 10.26 | 0.23 | • | 1.25 | 1.48 | 0.28 | — | — | 0.28 | — | 11.46 | 14.60 | 0.86 | 0.48 | 0.48 | 2.11 | 122,258 | 13 | |||||||||||||||||||||||||||||||||||||||||||||||||||||
Class I | |||||||||||||||||||||||||||||||||||||||||||||||||||||||||||||||||||||||
| 12-31-21 | 12.23 | 0.19 | • | 0.55 | 0.74 | 0.45 | 0.33 | — | 0.78 | — | 12.19 | 6.09 | 0.27 | 0.22 | 0.22 | 1.54 | 8,866 | 40 | |||||||||||||||||||||||||||||||||||||||||||||||||||||
| 12-31-20 | 11.26 | 0.38 | • | 1.35 | 1.73 | 0.39 | 0.37 | — | 0.76 | — | 12.23 | 16.13 | 0.28 | 0.21 | 0.21 | 3.31 | 9,437 | 107 | |||||||||||||||||||||||||||||||||||||||||||||||||||||
| 12-31-19 | 10.29 | 0.26 | • | 1.59 | 1.85 | 0.41 | 0.47 | — | 0.88 | — | 11.26 | 18.33 | 0.27 | 0.18 | 0.18 | 2.33 | 8,090 | 13 | |||||||||||||||||||||||||||||||||||||||||||||||||||||
| 12-31-18 | 11.55 | 0.28 | • | (1.08 | ) | (0.80 | ) | 0.33 | 0.13 | — | 0.46 | — | 10.29 | (7.21 | ) | 0.27 | 0.18 | 0.18 | 2.48 | 8,051 | 16 | ||||||||||||||||||||||||||||||||||||||||||||||||||
| 12-31-17 | 10.34 | 0.25 | • | 1.28 | 1.53 | 0.32 | — | — | 0.32 | — | 11.55 | 14.98 | 0.26 | 0.18 | 0.18 | 2.29 | 8,755 | 13 | |||||||||||||||||||||||||||||||||||||||||||||||||||||
Class S | |||||||||||||||||||||||||||||||||||||||||||||||||||||||||||||||||||||||
| 12-31-21 | 12.13 | 0.16 | • | 0.54 | 0.70 | 0.42 | 0.33 | — | 0.75 | — | 12.08 | 5.84 | 0.52 | 0.47 | 0.47 | 1.29 | 85 | 40 | |||||||||||||||||||||||||||||||||||||||||||||||||||||
| 12-31-20 | 11.18 | 0.34 | • | 1.34 | 1.68 | 0.36 | 0.37 | — | 0.73 | — | 12.13 | 15.79 | 0.53 | 0.46 | 0.46 | 3.04 | 77 | 107 | |||||||||||||||||||||||||||||||||||||||||||||||||||||
| 12-31-19 | 10.22 | 0.23 | 1.58 | 1.81 | 0.38 | 0.47 | — | 0.85 | — | 11.18 | 18.08 | 0.52 | 0.43 | 0.43 | 2.10 | 65 | 13 | ||||||||||||||||||||||||||||||||||||||||||||||||||||||
| 12-31-18 | 11.48 | 0.23 | (1.06 | ) | (0.83 | ) | 0.30 | 0.13 | — | 0.43 | — | 10.22 | (7.47 | ) | 0.52 | 0.43 | 0.43 | 2.13 | 55 | 16 | |||||||||||||||||||||||||||||||||||||||||||||||||||
| 12-31-17 | 10.28 | 0.23 | 1.27 | 1.50 | 0.30 | — | — | 0.30 | — | 11.48 | 14.71 | 0.51 | 0.43 | 0.43 | 2.14 | 58 | 13 | ||||||||||||||||||||||||||||||||||||||||||||||||||||||
(1) | Total return is calculated assuming reinvestment of all dividends, capital gain distributions and return of capital distributions, if any, at net asset value and does not reflect the effect of insurance contract charges. Total return for periods less than one year is not annualized. | |
(2) | Annualized for periods less than one year. | |
(3) | Ratios reflect operating expenses of a Portfolio. Expenses before reductions/additions do not reflect amounts reimbursed or recouped by the Investment Adviser and/or Distributor or reductions from brokerage service arrangements or other expense offset arrangements and do not represent the amount paid by a Portfolio during periods when reimbursements or reductions occur. |
| Expenses net of fee waivers reflect expenses after reimbursement by the Investment Adviser and/or Distributor or recoupment of previously reimbursed fees by the Investment Adviser, but prior to reductions from brokerage service arrangements or other expense offset arrangements. Expenses net of all reductions/additions represent the net expenses paid by a Portfolio. Net investment income (loss) is net of all such additions or reductions. | ||
(4) | Ratios do not include expenses of underlying funds and do not include fees and expenses charged under the variable annuity contract or variable life insurance policy. | |
| • | Calculated using average number of shares outstanding throughout the year or period. |
| (1) | Market value of investment securities, other assets and liabilities — at the exchange rates prevailing at Market Close. | ||
| (2) | Purchases and sales of investment securities, income and expenses — at the rates of exchange prevailing on the respective dates of such transactions. |
| Purchases | Sales | |
|---|---|---|
| $40,519,334 | $54,366,759 |
| Subsidiary | Percentage | |||
|---|---|---|---|---|
| Voya Retirement Insurance and Annuity Company | 6.66 | % | ||
| Class ADV(1)(2) | Class I(1)(2) | Class S(1)(2) | |||||||||||
|---|---|---|---|---|---|---|---|---|---|---|---|---|---|
| 1.55 | % | 0.95 | % | 1.20 | % | ||||||||
(1) | The operating expense limits shown take into account the operating expenses incurred at the Underlying Fund level. The amount of fees and expenses of an Underlying Fund borne by the Portfolio will vary based on the Portfolio’s allocation of assets to, and the net expenses of, a particular Underlying Fund. | |
(2) | Pursuant to a side letter through May 1, 2022, the total expense limits including the operating expenses incurred at the Underlying Fund level are 1.09%, 0.83% and 1.08% for Class ADV, Class I, and Class S, respectively. Termination or modification of this obligation requires approval by the Board. |
| December 31, | ||||||||||||||
|---|---|---|---|---|---|---|---|---|---|---|---|---|---|---|
| 2022 | 2023 | 2024 | Total | |||||||||||
| $97,079 | $ | 69,268 | $ | 46,165 | $ | 212,512 | ||||||||
| Year or | Shares sold | Shares issued in merger | Reinvestment of distributions | Shares redeemed | Net increase (decrease) in shares outstanding | Shares sold | Proceeds from shares issued in merger | Reinvestment of distributions | Shares redeemed | Net increase (decrease) | ||||||||||||||||||||||||||||||
|---|---|---|---|---|---|---|---|---|---|---|---|---|---|---|---|---|---|---|---|---|---|---|---|---|---|---|---|---|---|---|---|---|---|---|---|---|---|---|---|---|
| period ended | # | # | # | # | # | ($) | ($) | ($) | ($) | ($) | ||||||||||||||||||||||||||||||
Class ADV | ||||||||||||||||||||||||||||||||||||||||
| 12/31/2021 | 83,402 | — | 463,941 | (1,203,757 | ) | (656,414 | ) | 1,015,615 | — | 5,520,893 | (14,623,690 | ) | (8,087,182 | ) | ||||||||||||||||||||||||||
| 12/31/2020 | 205,940 | — | 526,180 | (1,252,326 | ) | (520,206 | ) | 2,318,317 | — | 5,772,190 | (13,966,694 | ) | (5,876,187 | ) | ||||||||||||||||||||||||||
Class I | ||||||||||||||||||||||||||||||||||||||||
| 12/31/2021 | 176,055 | — | 45,297 | (265,439 | ) | (44,087 | ) | 2,171,968 | — | 543,110 | (3,264,837 | ) | (549,759 | ) | ||||||||||||||||||||||||||
| 12/31/2020 | 259,890 | — | 50,083 | (256,584 | ) | 53,389 | 2,953,946 | — | 552,917 | (2,900,727 | ) | 606,136 | ||||||||||||||||||||||||||||
Class S | ||||||||||||||||||||||||||||||||||||||||
| 12/31/2021 | 314 | — | 404 | (33 | ) | 685 | 3,747 | — | 4,814 | (404 | ) | 8,157 | ||||||||||||||||||||||||||||
| 12/31/2020 | 353 | — | 379 | (162 | ) | 570 | 4,119 | — | 4,152 | (1,574 | ) | 6,697 | ||||||||||||||||||||||||||||
| Year Ended December 31, 2021 | Year Ended December 31, 2020 | ||||||
|---|---|---|---|---|---|---|---|
| Ordinary Income | Long-term Capital Gains | Ordinary Income | Long-term Capital Gains | ||||
| $5,067,038 | $1,001,779 | $3,100,007 | $3,229,252 | ||||
| Undistributed Ordinary Income | Undistributed Long-term Capital Gains | Unrealized Appreciation/ (Depreciation) | Other | Total Distributable Earnings/(Loss) | ||||||||||||||||
|---|---|---|---|---|---|---|---|---|---|---|---|---|---|---|---|---|---|---|---|---|
| $4,012,644 | $ | 4,730,623 | $ | 9,048,301 | $ | (6,157 | ) | $ | 17,785,411 | |||||||||||
| VOYA GLOBAL PERSPECTIVES® PORTFOLIO | PORTFOLIO OF INVESTMENTS AS OF DECEMBER 31, 2021 |
| Shares | Value | Percentage of Net Assets | |||||||||||
MUTUAL FUNDS: 100.1% | |||||||||||||
| Affiliated Investment Companies: 100.1% | |||||||||||||
| 710,059 | Voya Emerging Markets Index Portfolio — Class I | $ | 9,358,578 | 9.6 | |||||||||
| 1,029,320 | Voya Global Bond Fund — Class R6 | 9,459,451 | 9.7 | ||||||||||
| 1,128,328 | Voya GNMA Income Fund — Class R6 | 9,477,959 | 9.7 | ||||||||||
| 967,826 | Voya High Yield Portfolio — Class I | 9,629,864 | 9.8 | ||||||||||
| 299,938 | Voya Index Plus LargeCap Portfolio — Class I | 10,530,837 | 10.8 | ||||||||||
| 814,918 | Voya International Index Portfolio — Class I | 9,811,608 | 10.0 | ||||||||||
| 525,028 | Voya MidCap Opportunities Portfolio — Class R6 | 9,508,263 | 9.7 | ||||||||||
| Shares | Value | Percentage of Net Assets | |||||||||||
MUTUAL FUNDS: (continued) | |||||||||||||
| Affiliated Investment Companies: (continued) | |||||||||||||
| 467,450 | Voya Small Company Portfolio — Class R6 | $ | 9,923,972 | 10.1 | |||||||||
| 884,750 | Voya U.S. Bond Index Portfolio — Class I | 9,511,058 | 9.7 | ||||||||||
| 781,456 | VY® Clarion Global Real Estate Portfolio — Class I | 10,776,275 | 11.0 | ||||||||||
Total Mutual Funds (Cost $88,264,830) | 97,987,865 | 100.1 | |||||||||||
Liabilities in Excess of Other Assets | (62,864 | ) | (0.1 | ) | |||||||||
Net Assets | $ | 97,925,001 | 100.0 | ||||||||||
| Quoted Prices in Active Markets for Identical Investments (Level 1) | Significant Other Observable Inputs (Level 2) | Significant Unobservable Inputs (Level 3) | Fair Value at December 31, 2021 | |||||||||||||
|---|---|---|---|---|---|---|---|---|---|---|---|---|---|---|---|---|
Asset Table | ||||||||||||||||
Investments, at fair value | ||||||||||||||||
| Mutual Funds | $97,987,865 | $— | $— | $97,987,865 | ||||||||||||
| Total Investments, at fair value | $97,987,865 | $— | $— | $97,987,865 | ||||||||||||
| Issuer | Beginning Fair Value at 12/31/2020 | Purchases at Cost | Sales at Cost | Change in Unrealized Appreciation/ (Depreciation) | Ending Fair Value at 12/31/2021 | Investment Income | Realized Gains/ (Losses) | Net Capital Gain Distributions | ||||||||||||||||||||||||
|---|---|---|---|---|---|---|---|---|---|---|---|---|---|---|---|---|---|---|---|---|---|---|---|---|---|---|---|---|---|---|---|---|
| Voya Emerging Markets Index Portfolio — Class I | $ | 5,968,219 | $ | 6,140,453 | $ | (1,352,937 | ) | $ | (1,397,157 | ) | $ | 9,358,578 | $ | 93,583 | $ | 741,818 | $ | — | ||||||||||||||
| Voya Global Bond Fund — Class R6 | 18,187,469 | 1,053,145 | (8,750,618 | ) | (1,030,545 | ) | 9,459,451 | 18,142 | 236,169 | — | ||||||||||||||||||||||
| Voya GNMA Income Fund — Class R6 | 17,346,211 | 2,048,135 | (9,655,777 | ) | (260,610 | ) | 9,477,959 | 161,534 | 23,227 | — | ||||||||||||||||||||||
| Voya High Yield Portfolio — Class I | 18,399,706 | 1,306,217 | (9,884,276 | ) | (191,783 | ) | 9,629,864 | 660,098 | 141,255 | — | ||||||||||||||||||||||
| Voya Index Plus LargeCap Portfolio — Class I | 5,676,567 | 5,694,791 | (1,543,358 | ) | 702,837 | 10,530,837 | 108,847 | 730,468 | 678,049 | |||||||||||||||||||||||
| Voya International Index Portfolio — Class I | 5,752,163 | 5,329,247 | (1,268,113 | ) | (1,689 | ) | 9,811,608 | 212,976 | 610,586 | — | ||||||||||||||||||||||
| Voya MidCap Opportunities Portfolio — Class R6 | 6,058,058 | 6,642,447 | (1,686,953 | ) | (1,505,289 | ) | 9,508,263 | — | 1,144,598 | 1,381,539 | ||||||||||||||||||||||
| Voya Small Company Portfolio — Class R6 | 6,576,518 | 5,309,608 | (1,495,711 | ) | (466,443 | ) | 9,923,972 | 15,717 | 1,207,343 | 38,711 | ||||||||||||||||||||||
| Voya U.S. Bond Index Portfolio — Class I | 17,285,290 | 2,201,983 | (9,268,828 | ) | (707,387 | ) | 9,511,058 | 269,591 | (95,882 | ) | 118,083 | |||||||||||||||||||||
| VOYA GLOBAL PERSPECTIVES® PORTFOLIO | PORTFOLIO OF INVESTMENTS AS OF DECEMBER 31, 2021 (CONTINUED) |
| Issuer | Beginning Fair Value at 12/31/2020 | Purchases at Cost | Sales at Cost | Change in Unrealized Appreciation/ (Depreciation) | Ending Fair Value at 12/31/2021 | Investment Income | Realized Gains/ (Losses) | Net Capital Gain Distributions | ||||||||||||||||||||||||
|---|---|---|---|---|---|---|---|---|---|---|---|---|---|---|---|---|---|---|---|---|---|---|---|---|---|---|---|---|---|---|---|---|
VY® Clarion Global Real Estate Portfolio — Class I | $ | 5,628,217 | $ | 5,267,930 | $ | (1,880,284 | ) | $ | 1,760,412 | $ | 10,776,275 | $ | 298,336 | $ | 623,941 | $ | — | |||||||||||||||
| $ | 106,878,418 | $ | 40,993,956 | $ | (46,786,855 | ) | $ | (3,097,654 | ) | $ | 97,987,865 | $ | 1,838,824 | $ | 5,363,523 | $ | 2,216,382 | |||||||||||||||
| Cost for federal income tax purposes was $88,939,565. |
| Net unrealized appreciation consisted of: | ||||
| Gross Unrealized Appreciation | $ | 10,467,346 | ||
| Gross Unrealized Depreciation | (1,419,045 | ) | ||
| Net Unrealized Appreciation | $ | 9,048,301 |
| Portfolio Name | Type | Per Share Amount | ||||||
|---|---|---|---|---|---|---|---|---|
Voya Global Perspectives® Portfolio | ||||||||
| Class ADV | NII | $0.4092 | ||||||
| Class I | NII | $0.4462 | ||||||
| Class S | NII | $0.4205 | ||||||
| All Classes | STCG | $0.2042 | ||||||
| All Classes | LTCG | $0.1219 | ||||||
NII — Net investment income
STCG — Short-term capital gain
LTCG — Long-term capital gain
| Creditable Foreign Taxes Paid | Per Share Amount | Portion of Ordinary Income Distribution Derived from Foreign Sourced Income* | ||
|---|---|---|---|---|
| $39,343 | $0.0049 | 6.87% |
| * | The Portfolio listed above did not derive any income from ineligible foreign sources as defined under Section 901(j) of the Internal Revenue Code. |
| Name, Address and Age | Position(s) Held with the Trust | Term of Office and Length of Time Served(1) | Principal Occupation(s) — During the Past 5 Years | Number of funds in Fund Complex Overseen by Trustee(2) | Other Board Positions Held by Trustee | |||||
|---|---|---|---|---|---|---|---|---|---|---|
Independent Trustees: | ||||||||||
| Colleen D. Baldwin 7337 East Doubletree Ranch Rd. Suite 100 Scottsdale, Arizona 85258 Age: 61 | Trustee Chairperson | November 2007–Present January 2020–Present | President, Glantuam Partners, LLC, a business consulting firm (January 2009–Present). | 131 | Dentaquest (February 2014–Present); RSR Partners, Inc. (2016–Present). | |||||
| John V. Boyer 7337 East Doubletree Ranch Rd. Suite 100 Scottsdale, Arizona 85258 Age: 68 | Trustee | January 2005–Present | Retired. Formerly, President and Chief Executive Officer, Bechtler Arts Foundation, an arts and education foundation (January 2008–December 2019). | 131 | None. | |||||
| Patricia W. Chadwick 7337 East Doubletree Ranch Rd. Suite 100 Scottsdale, Arizona 85258 Age: 73 | Trustee | January 2006–Present | Consultant and President, Ravengate Partners LLC, a consulting firm that provides advice regarding financial markets and the global economy (January 2000–Present). | 131 | Wisconsin Energy Corporation (June 2006–Present); The Royce Funds (22 funds) (December 2009–Present); and AMICA Mutual Insurance Company (1992–Present). | |||||
| Martin J. Gavin 7337 East Doubletree Ranch Rd. Suite 100 Scottsdale, AZ 85258 Age: 71 | Trustee | August 2015–Present | Retired. | 131 | None. | |||||
| Joseph E. Obermeyer 7337 East Doubletree Ranch Rd. Suite 100 Scottsdale, Arizona 85258 Age: 64 | Trustee | May 2013–Present | President, Obermeyer & Associates, Inc., a provider of financial and economic consulting services (November 1999–Present). | 131 | None. | |||||
| Sheryl K. Pressler 7337 East Doubletree Ranch Rd. Suite 100 Scottsdale, Arizona 85258 Age: 71 | Trustee | January 2006–Present | Consultant (May 2001–Present). | 131 | Centerra Gold Inc. (May 2008–Present). | |||||
| Christopher P. Sullivan 7337 East Doubletree Ranch Rd. Suite 100 Scottsdale, Arizona 85258 Age: 68 | Trustee | October 2015–Present | Retired. | 131 | None. |
| Name, Address and Age | Position(s) Held with the Trust | Term of Office and Length of Time Served(1) | Principal Occupation(s) — During the Past 5 Years | Number of funds in Fund Complex Overseen by Trustee(2) | Other Board Positions Held by Trustee | |||||
|---|---|---|---|---|---|---|---|---|---|---|
| Trustee who is an “interested person”: | ||||||||||
| Dina Santoro 230 Park Avenue New York, New York 10169 Age: 48 | Trustee | July 2018–Present | President, Voya Investments, LLC and Voya Capital, LLC (March 2018–Present); Senior Vice President, Voya Investments Distributor, LLC (April 2018–Present); Chief Operating Officer and Senior Managing Director, Voya Investment Management (January 2022–Present). Formerly, Senior Managing Director, Head of Product and Marketing Strategy, Voya Investment Management (September 2017–January 2022); Managing Director, Quantitative Management Associates, LLC (January 2004–August 2017). | 131 | Voya Investments, LLC, Voya Capital, LLC, and Voya Funds Services, LLC (March 2018–Present); Voya Investments Distributor, LLC (April 2018–Present). | |||||
(1) | Trustees serve until their successors are duly elected and qualified. The tenure of each Trustee who is not an “interested person” as defined in the 1940 Act, of each Portfolio (“Independent Trustee”) is subject to the Board’s retirement policy which states that each duly elected or appointed Independent Trustee shall retire from and cease to be a member of the Board of Trustees at the close of business on December 31 of the calendar year in which the Independent Trustee attains the age of 75. A majority vote of the Board’s other Independent Trustees may extend the retirement date of an Independent Trustee if the retirement would trigger a requirement to hold a meeting of shareholders of the Trust under applicable law, whether for the purposes of appointing a successor to the Independent Trustee or otherwise comply under applicable law, in which case the extension would apply until such time as the shareholder meeting can be held or is no longer required (as determined by a vote of a majority of the other Independent Trustees). | |
(2) | For the purposes of this table, “Fund Complex” means the Voya family of funds including the following investment companies: Voya Asia Pacific High Dividend Equity Income Fund; Voya Balanced Portfolio, Inc.; Voya Emerging Markets High Dividend Equity Fund; Voya Equity Trust; Voya Funds Trust; Voya Global Advantage and Premium Opportunity Fund; Voya Global Equity Dividend and Premium Opportunity Fund; Voya Government Money Market Portfolio; Voya Infrastructure, Industrials and Materials Fund; Voya Intermediate Bond Portfolio; Voya Investors Trust; Voya Mutual Funds; Voya Partners, Inc.; Voya Senior Income Fund; Voya Separate Portfolios Trust; Voya Strategic Allocation Portfolios, Inc.; Voya Variable Funds; Voya Variable Insurance Trust; Voya Variable Portfolios, Inc.; and Voya Variable Products Trust. The number of funds in the Fund Complex is as of January 31, 2022. |
| Name, Address and Age | Position(s) Held With the Trust | Term of Office and Length of Time Served(1) | Principal Occupation(s) — During the Past 5 Years | |||
|---|---|---|---|---|---|---|
| Michael Bell One Orange Way Windsor, Connecticut 06095 Age: 53 | Chief Executive Officer | March 2018–Present | Chief Executive Officer and Director, Voya Investments, LLC, Voya Capital, LLC, and Voya Funds Services, LLC (March 2018–Present); Senior Vice President, Voya Investments Distributor, LLC (March 2020–Present); Chief Financial Officer, Voya Investment Management (September 2014–Present). Formerly, Senior Vice President and Chief Financial Officer, Voya Investments Distributor, LLC (September 2019–March 2020); Senior Vice President and Treasurer, Voya Investments Distributor, LLC (November 2015–September 2019); Senior Vice President, Chief Financial Officer and Treasurer, Voya Investments, LLC (November 2015–March 2018). | |||
| Dina Santoro 230 Park Avenue New York, New York 10169 Age: 48 | President | March 2018–Present | President and Director, Voya Investments, LLC and Voya Capital, LLC (March 2018–Present); Director, Voya Funds Services, LLC (March 2018–Present); Director and Senior Vice President, Voya Investments Distributor, LLC (April 2018–Present); Chief Operating Officer and Senior Managing Director, Voya Investment Management (January 2022–Present). Formerly, Senior Managing Director, Head of Product and Marketing Strategy, Voya Investment Management (September 2017–January 2022); Managing Director, Quantitative Management Associates, LLC (January 2004–August 2017). | |||
| Jonathan Nash 230 Park Avenue New York, New York 10169 Age: 54 | Executive Vice President Chief Investment Risk Officer | March 2020–Present March 2020–Present | Executive Vice President and Chief Investment Risk Officer, Voya Investments, LLC (March 2020–Present and Senior Vice President, Investment Risk Management, Voya Investment Management (March 2017–Present). Formerly, Vice President, Voya Investments, LLC (September 2018–March 2020); Consultant, DA Capital LLC (January 2016–March 2017). | |||
| James M. Fink 5780 Powers Ferry Road NW Atlanta, Georgia 30327 Age: 63 | Executive Vice President | March 2018–Present | Managing Director, Voya Investments, LLC, Voya Capital, LLC, and Voya Funds Services, LLC (March 2018–Present); Senior Vice President, Voya Investments Distributor, LLC (April 2018–Present); Chief Administrative Officer, Voya Investment Management (September 2017–Present). Formerly, Managing Director, Operations, Voya Investment Management (March 1999–September 2017). | |||
| Kevin M. Gleason 7337 East Doubletree Ranch Rd. Suite 100 Scottsdale, Arizona 85258 Age: 55 | Chief Compliance Officer | February 2012–Present | Senior Vice President, Voya Investment Management and Chief Compliance Officer, Voya Family of Funds (February 2012–Present). | |||
| Todd Modic 7337 East Doubletree Ranch Rd. Suite 100 Scottsdale, Arizona 85258 Age: 54 | Senior Vice President, Chief/Principal Financial Officer and Assistant Secretary | March 2005–Present | President, Voya Funds Services, LLC (March 2018–Present) and Senior Vice President, Voya Investments, LLC (April 2005–Present). | |||
| Kimberly A. Anderson 7337 East Doubletree Ranch Rd. Suite 100 Scottsdale, Arizona 85258 Age: 57 | Senior Vice President | November 2003–Present | Senior Vice President, Voya Investments, LLC (September 2003–Present). | |||
| Micheline S. Faver 7337 East Doubletree Ranch Rd. Suite 100 Scottsdale, Arizona 85258 Age: 44 | Senior Vice President | September 2020–Present | Senior Vice President, Head of Fund Compliance and Chief Compliance Officer, Voya Investments, LLC (March 2021–Present). Formerly, Vice President, Head of Fund Compliance and Chief Compliance Officer, Voya Investments, LLC (June 2016–March 2021). |
| Name, Address and Age | Position(s) Held With the Trust | Term of Office and Length of Time Served(1) | Principal Occupation(s) — During the Past 5 Years | |||
|---|---|---|---|---|---|---|
| Robert Terris 5780 Powers Ferry Road NW Atlanta, Georgia 30327 Age: 51 | Senior Vice President | May 2006–Present | Senior Vice President, Voya Investments Distributor, LLC (April 2018–Present); Senior Vice President, Head of Investment Services, Voya Investments, LLC (April 2018–Present) and Voya Funds Services, LLC (March 2006–Present). Formerly, Senior Vice President, Head of Division Operations, Voya Investments, LLC (October 2015–April 2018). | |||
| Fred Bedoya 7337 East Doubletree Ranch Rd. Suite 100 Scottsdale, Arizona 85258 Age: 49 | Vice President Treasurer | September 2012–Present | Vice President, Voya Investments, LLC (October 2015–Present) and Voya Funds Services, LLC (July 2012–Present). | |||
| Maria M. Anderson 7337 East Doubletree Ranch Rd. Suite 100 Scottsdale, Arizona 85258 Age: 63 | Vice President | September 2004–Present | Vice President, Voya Investments, LLC (October 2015–Present) and Voya Funds Services, LLC (September 2004–Present). | |||
| Sara M. Donaldson 7337 East Doubletree Ranch Rd. Suite 100 Scottsdale, Arizona 85258 Age: 62 | Vice President | September 2014–Present | Vice President, Voya Investments, LLC (October 2015–Present). | |||
| Robyn L. Ichilov 7337 East Doubletree Ranch Rd. Suite 100 Scottsdale, Arizona 85258 Age: 54 | Vice President | November 1999–Present | Vice President, Voya Funds Services, LLC (November 1995–Present) and Voya Investments, LLC (August 1997–Present). | |||
| Jason Kadavy 7337 East Doubletree Ranch Rd. Suite 100 Scottsdale, Arizona 85258 Age: 45 | Vice President | September 2012–Present | Vice President, Voya Investments, LLC (October 2015–Present) and Voya Funds Services, LLC (July 2007–Present). | |||
| Andrew K. Schlueter 7337 East Doubletree Ranch Rd. Suite 100 Scottsdale, Arizona 85258 Age: 45 | Vice President | March 2018–Present | Vice President, Voya Investments Distributor, LLC (April 2018–Present); Vice President, Voya Investments, LLC and Voya Funds Services, LLC (March 2018–Present); Vice President, Head of Mutual Fund Operations, Voya Investment Management (February 2018–Present). Formerly, Vice President, Voya Investment Management (March 2014–February 2018). | |||
| Craig Wheeler 7337 East Doubletree Ranch Rd. Suite 100 Scottsdale, Arizona 85258 Age: 52 | Vice President | May 2013–Present | Vice President–Director of Tax, Voya Investments, LLC (October 2015–Present). | |||
| Monia Piacenti One Orange Way Windsor, Connecticut 06095 Age: 45 | Anti-Money Laundering Officer | June 2018–Present | Anti-Money Laundering Officer, Voya Investments Distributor, LLC, Voya Investment Management and Voya Investment Management Trust Co. (June 2018–Present); Compliance Consultant, Voya Financial, Inc. (January 2019–Present). Formerly, Senior Compliance Officer, Voya Investment Management (December 2009–December 2018). | |||
| Joanne F. Osberg 7337 East Doubletree Ranch Rd. Suite 100 Scottsdale, Arizona 85258 Age: 40 | Secretary | September 2020–Present | Vice President and Senior Counsel, Voya Investment Management — Mutual Fund Legal Department (September 2020–Present). Formerly, Vice President, Counsel, Voya Investment Management — Mutual Fund Legal Department (January 2013–September 2020). | |||
| Paul A. Caldarelli 7337 East Doubletree Ranch Rd. Suite 100 Scottsdale, Arizona 85258 Age: 70 | Assistant Secretary | June 2010–Present | Vice President and Senior Counsel, Voya Investment Management — Mutual Fund Legal Department (March 2010–Present). |
(1) | The Officers hold office until the next annual meeting of the Board of Trustees and until their successors shall have been elected and qualified. |
Management Contract, including oversight of the Portfolio’s operations and risk management and the oversight of its various other service providers.
Voya Investments, LLC
7337 East Doubletree Ranch Road, Suite 100
Scottsdale, Arizona 85258
Voya Investments Distributor, LLC
7337 East Doubletree Ranch Road, Suite 100
Scottsdale, Arizona 85258
BNY Mellon Investment Servicing (U.S.) Inc.
301 Bellevue Parkway
Wilmington, Delaware 19809
Ernst & Young LLP
200 Clarendon Street
Boston, Massachusetts 02116
The Bank of New York Mellon
225 Liberty Street
New York, New York 10286
Ropes & Gray LLP
Prudential Tower
800 Boylston Street
Boston, Massachusetts 02199
RETIREMENT | INVESTMENTS | INSURANCE | |
| VPAR-VITFOFAIS (1221-022322) |
Annual Report
| ■ | Voya Retirement Conservative Portfolio |
| ■ | Voya Retirement Growth Portfolio |
| ■ | Voya Retirement Moderate Portfolio |
| ■ | Voya Retirement Moderate Growth Portfolio |
As permitted by regulations adopted by the U.S. Securities and Exchange Commission, paper copies of each portfolio’s annual and semi-annual shareholder reports, like this annual report, are not sent by mail, unless you specifically request paper copies of the reports. Instead, the reports will be made available on a website and you will be notified by mail each time a report is posted and provided with a website link to access the report. |
This report is submitted for general information to shareholders of the Voya mutual funds. It is not authorized for distribution to prospective shareholders unless accompanied or preceded by a prospectus which includes details regarding the fund’s investment objectives, risks, charges, expenses and other information. This information should be read carefully. |
INVESTMENT MANAGEMENT voyainvestments.com | |
TABLE OF CONTENTS
| 1 | |||
| 3 | |||
| 9 | |||
| 10 | |||
| 11 | |||
| 12 | |||
| 13 | |||
| 15 | |||
| 17 | |||
| 24 | |||
| 32 | |||
| 33 | |||
| 37 |
A description of the policies and procedures that the Portfolios use to determine how to vote proxies related to portfolio securities is available: (1) without charge, upon request, by calling Shareholder Services toll-free at (800) 992-0180; (2) on the Portfolios’ website at www.voyainvestments.com; and (3) on the U.S. Securities and Exchange Commission’s (“SEC’s”) website at www.sec.gov. Information regarding how the Portfolios voted proxies related to portfolio securities during the most recent 12-month period ended June 30 is available without charge on the Portfolios’ website at www.voyainvestments.com and on the SEC’s website at www.sec.gov.
QUARTERLY PORTFOLIO HOLDINGS
The Portfolios file their complete schedule of portfolio holdings with the SEC for the first and third quarters of each fiscal year on Form NPORT-P. The Portfolios’ Forms NPORT-P are available on the SEC’s website at www.sec.gov. Each Portfolio’s complete schedule of portfolio holdings is available at: www.voyainvestments.com and without charge upon request from the Portfolio by calling Shareholder Services toll-free at (800) 992-0180.
(THIS PAGE INTENTIONALLY LEFT BLANK)
A Solid Year Ends for the Financial Markets, Gauging the Policy Shifts to ComeDear Shareholder,
The 12-month period ended December 31, 2021 marked another strong year for stocks. Forcefully accommodative and persistent monetary and fiscal policy, along with the COVID-19 vaccine rollouts and an impressively adaptable global economy, drove big gains within risk assets. The ascent wasn’t particularly smooth, as several new COVID-19 variants thwarted attempts at a full-fledged reopening. Besides the distress induced by a public health crisis, prolongation of the pandemic negatively impacted the supply of labor and costs of core goods. These two factors, combined with others such as economic stimulus and rising commodity prices, drove inflation higher. As economic activity proved resilient, however, investors shrugged off soaring prices and continued to buy stocks.
The U.S. unemployment rate declined to 3.9% in December and job openings continued to exceed job seekers, indicating the labor market is approaching full employment. This dynamic is pressuring wages upward and has contributed to inflation running above the U.S Federal Reserve Board’s (the “Fed”) 2% target since April. Sharply higher prices have caused the Fed to hasten its plans to withdraw stimulus. We recognize that in 2022, monetary and fiscal policy are likely to become less supportive of the global economy. Yet in our view, we also see potential offsets to tightening financial conditions, including consumer spending and corporate inventory rebuilding, which make us believe there is scope for continued global equity gains.
The pace and path to policy normalization will be a key market factor for the year ahead. A sharp rise in wages from prolonged labor market tightness is possible, but firms, particularly larger ones, have been able to pass through rising input costs to maintain margins. In our view, this is likely to continue and, combined with still above trend GDP growth, will support earnings growth in 2022.
As we’ve often noted, it’s important to have a plan for investing consistently through headwinds and tailwinds. Keep focused on your long-term goals and don’t get distracted by short-term fluctuations, however compelling or distracting they may seem. Should your long-term goals change, discuss the situation thoroughly with your investment advisor before making any changes to your investment portfolio.
Regardless of events, at Voya we remain well prepared for and fully committed to serving our clients without disruption. We appreciate your continued confidence in us, and we look forward to working with you in the future.
Sincerely,
Dina Santoro
President
Voya Family of Funds
January 21, 2022
The views expressed in the President’s Letter reflect those of the President as of the date of the letter. Any such views are subject to change at any time based upon market or other conditions and the Voya mutual funds disclaim any responsibility to update such views. These views may not be relied on as investment advice and because investment decisions for a Voya mutual fund are based on numerous factors, may not be relied on as an indication of investment intent on behalf of any Voya mutual fund. Reference to specific company securities should not be construed as recommendations or investment advice.
International investing poses special risks including currency fluctuation, economic and political risks not found in investments that are solely domestic.
1
BENCHMARK DESCRIPTIONS
| Index | Description | |
| Bloomberg U.S. Aggregate Bond Index (“Bloomberg U.S. Aggregate Bond”) | An index of publicly issued investment grade U.S. government, mortgage-backed, asset-backed and corporate debt securities. | |
MSCI Europe, Australasia and Far East® (“MSCI EAFE®”) Index | An index that measures the performance of securities listed on exchanges in Europe, Australasia and the Far East. It includes the reinvestment of dividends net of withholding taxes, but does not reflect fees, brokerage commissions or other expenses of investing. | |
Russell 3000® Index | An index that measures the performance of the largest 3000 U.S. companies representing approximately 98% of the investable U.S. equity market. | |
S&P Target Risk® Aggressive Index | Seeks to emphasize exposure to equity securities, maximizing opportunities for long-term capital accumulation. It may include small allocations in fixed-income securities to enhance portfolio efficiency. | |
S&P Target Risk® Conservative Index | Seeks to emphasize exposure to fixed income securities in order to produce a current income stream and avoid excessive volatility of returns. Equity securities are included to protect long-term purchasing power. | |
S&P Target Risk® Growth Index | Seeks to measure the performance of an asset allocation strategy targeted to a growth focused risk profile. | |
S&P Target Risk® Moderate Index | Seeks to measure the performance of an asset allocation strategy targeted to a moderate risk profile. |
2
| PORTFOLIO MANAGERS’ REPORT | VOYA RETIREMENT PORTFOLIOS |
Voya Retirement Portfolios consist of Voya Retirement Conservative Portfolio, Voya Retirement Growth Portfolio, Voya Retirement Moderate Portfolio and Voya Retirement Moderate Growth Portfolio (each a “Portfolio” or collectively, the “Portfolios” or the “Retirement Portfolios”). Each Portfolio* seeks to achieve its investment objective by investing in a combination of underlying funds which are actively managed funds or passively managed funds (index funds).(1) The Portfolios are managed by Halvard Kvaale, CIMA, Paul Zemsky, CFA, and Barbara Reinhard, CFA, Portfolio Managers** of Voya Investment Management Co. LLC (“Voya IM”) — the Sub-Adviser (“Sub-Adviser).
Portfolio Specifics: Over the reporting period, the Portfolios met their performance objectives by minimizing performance deviation relative to their strategic asset allocation benchmarks. Due to the strategic nature of the Portfolios, no tactical asset allocation moves were made during the period. As part of the annual review, we made changes to the strategic asset allocations at the end of June. Strategic changes included increasing equities in the Retirement Growth and Retirement Moderate Growth Portfolios and decreasing equities in the Retirement Moderate and Retirement Conservative Portfolios. These changes were funded by increasing U.S. large-cap, mid-cap, and emerging market equities in the Retirement Growth and Retirement Moderate Growth. For the Moderate and Conservative Portfolios, we decreased U.S. large-cap and increased core fixed income. In addition, we added short duration bonds and removed Treasury Inflation-Protected Securities across all Portfolios.
The underlying index funds performed as expected, minimizing performance deviation relative to their respective strategic allocation benchmarks before the deduction of fees.
Current Strategy and Outlook: The end of December marked another strong month, quarter, and year for the stocks. Forcefully accommodative and persistent monetary and fiscal policy, along with the COVID-19 vaccine rollouts, and an impressively adaptable global economy, drove big gains in risk assets. In our opinion, the ascent wasn’t particularly smooth, as several new coronavirus variants emerged to thwart attempts at broad-based, full-fledged re-opening. Aside from the high levels of distress that come from a public health crisis, prolongation of the pandemic resulted in additional negative impacts on the supply of labor and costs of core goods. These two forces, coupled with related and exogenous rises in commodity prices, united to drive inflation higher, in our view. Soaring prices and a still highly tumultuous political environment gave some investors pause, but market participants eventually shrugged off each worry, continuing to buy stocks, as economic activity proved resilient.
| * | Each Portfolio’s relative performance versus its respective benchmarks can be found on page 4. | |
| ** | Effective on or about May 31, 2022, Halvard Kvaale will retire and no longer be a portfolio manager for the Portfolios. | |
(1) | The investment objective of each Portfolio is described in the Portfolios’ prospectuses, each dated May 1, 2021. |
The views expressed in this commentary are informed opinions. They should not be considered promises or advice. The views expressed reflect those of the portfolio managers, only through the end of the period as stated on the cover. The portfolio managers’ views are subject to change at any time based on market and other conditions.
Portfolio holdings and characteristics are subject to change and may not be representative of current holdings and characteristics. Portfolio holdings are subject to change daily. The outlook for this Portfolio may differ from that presented for other Voya mutual funds. This report contains statements that may be “forward-looking” statements. Actual results may differ materially from those projected in the “forward-looking” statements. The Portfolio’s performance returns shown reflect applicable fee waivers and/or expense limits in effect during this period. Absent such fee waivers/expense limitations, if any, performance would have been lower. Performance for the different classes of shares will vary based on differences in fees associated with each class. An index has no cash in its portfolio and imposes no sales charges. An investor cannot invest directly in an index.
3
| VOYA RETIREMENT PORTFOLIOS | PORTFOLIO MANAGERS’ REPORT |
| Annual Target Allocations as of December 31, 2021 (as a percentage of net assets)(1) | |||||||||||||||||||
| Sub Asset Class | Growth | Moderate Growth | Moderate | Conservative | |||||||||||||||
| US Large Blend | 51.0 | % | 50.0 | % | 35.0 | % | 19.0 | % | |||||||||||
| US Mid Cap Blend | 9.0 | % | 6.0 | % | 4.0 | % | 3.0 | % | |||||||||||
| US Small Cap | 2.0 | % | — | — | — | ||||||||||||||
| International | 11.0 | % | 7.0 | % | 5.0 | % | 3.0 | % | |||||||||||
| Emerging Markets | 6.0 | % | 4.0 | % | 3.0 | % | 2.0 | % | |||||||||||
| Core Fixed Income | 16.0 | % | 28.0 | % | 45.0 | % | 65.0 | % | |||||||||||
| Short Duration | 5.0 | % | 5.0 | % | 8.0 | % | 8.0 | % | |||||||||||
| Total Equity | 79.0 | % | 67.0 | % | 47.0 | % | 27.0 | % | |||||||||||
| Total Fixed Income | 21.0 | % | 33.0 | % | 53.0 | % | 73.0 | % | |||||||||||
Total | 100.0 | % | 100.0 | % | 100.0 | % | 100.0 | % | |||||||||||
(1) | As these are target allocations, the actual allocations of each Portfolio’s assets may deviate from the percentages shown. Although the Retirement Portfolios expect to be fully invested at all times, they may maintain liquidity reserves to meet redemption requests. |
Portfolio holdings are subject to change.
| Total Returns for the Year Ended December 31, 2021 | ||||||||
|---|---|---|---|---|---|---|---|---|
| 1 Year | ||||||||
| Voya Retirement Conservative Portfolio, Class I | 4.87 | % | ||||||
S&P Target Risk® Conservative Index | 4.99 | % | ||||||
| Voya Retirement Growth Portfolio, Class I | 15.96 | % | ||||||
S&P Target Risk Aggressive® Index | 15.62 | % | ||||||
Russell 3000® Index | 25.66 | % | ||||||
MSCI EAFE® | 11.26 | % | ||||||
| Bloomberg U.S. Aggregate Bond | –1.54 | % | ||||||
| Voya Retirement Moderate Portfolio, Class I | 10.05 | % | ||||||
S&P Target Risk® Moderate Index | 7.12 | % | ||||||
Russell 3000® Index | 25.66 | % | ||||||
MSCI EAFE® | 11.26 | % | ||||||
| Bloomberg U.S. Aggregate Bond | –1.54 | % | ||||||
| Voya Retirement Moderate Growth Portfolio, Class I | 14.41 | % | ||||||
S&P Target Risk® Growth Index | 11.37 | % | ||||||
Russell 3000® Index | 25.66 | % | ||||||
MSCI EAFE® | 11.26 | % | ||||||
| Bloomberg U.S. Aggregate Bond | –1.54 | % | ||||||
4
| Portfolio Managers’ Report | Voya Retirement Conservative Portfolio |
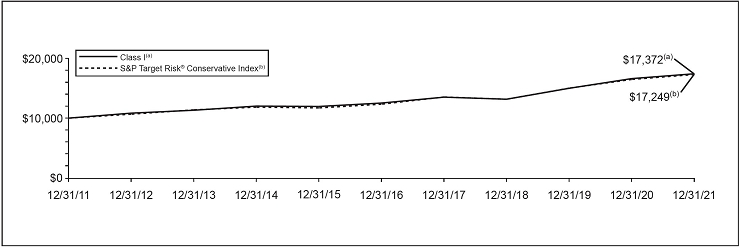
| Average Annual Total Returns for the Periods Ended December 31, 2021 | ||||||||||||||
| 1 Year | 5 Year | 10 Year | ||||||||||||
| Class ADV | 4.69 | % | 6.58 | % | 5.47 | % | ||||||||
| Class I | 4.87 | % | 6.80 | % | 5.67 | % | ||||||||
S&P Target Risk® Conservative Index | 4.99 | % | 6.97 | % | 5.60 | % | ||||||||
Based on a $10,000 initial investment, the graph and table above illustrate the total return of the Voya Retirement Conservative Portfolio against the index indicated. The index is unmanaged and has no cash in its portfolio and imposes no sales charges. An investor cannot invest directly in an index.
The Portfolio’s performance is shown without the imposition of any expenses or charges which are, or may be, imposed under your variable annuity contract or variable life insurance policy. Total returns would have been lower if such expenses or charges were included.
The performance graph and table do not reflect the deduction of taxes that a shareholder will pay on Portfolio distributions or the redemption of Portfolio shares.
The performance shown includes, if applicable, the effect of fee waivers and/or expense reimbursements by the Investment Adviser and/or other
service providers, which have the effect of increasing total return. Had all fees and expenses been considered, the total returns would have been lower.
The performance update illustrates performance for a variable investment option available through a variable annuity contract or a variable life insurance policy. The performance shown indicates past performance and is not a projection or prediction of future results. Actual investment returns and principal value will fluctuate so that shares and/or units, at redemption, may be worth more or less than their original cost. Please log on to www.voyainvestments.com or call (800) 366-0066 to get performance through the most recent month end.
Portfolio holdings are subject to change daily.
5
| Voya Retirement Growth Portfolio | Portfolio Managers’ Report |

| Average Annual Total Returns for the Periods Ended December 31, 2021 | ||||||||||||||
| 1 Year | 5 Year | 10 Year | ||||||||||||
| Class ADV | 15.52 | % | 11.49 | % | 9.84 | % | ||||||||
| Class I | 15.96 | % | 11.95 | % | 10.30 | % | ||||||||
S&P Target Risk Aggressive® Index | 15.62 | % | 12.23 | % | 11.04 | % | ||||||||
Russell 3000® Index | 25.66 | % | 17.97 | % | 16.30 | % | ||||||||
MSCI EAFE® | 11.26 | % | 9.55 | % | 8.03 | % | ||||||||
| Bloomberg U.S. Aggregate Bond | –1.54 | % | 3.57 | % | 2.90 | % | ||||||||
Based on a $10,000 initial investment, the graph and table above illustrate the total return of the Voya Retirement Growth Portfolio against the indices indicated. An index is unmanaged and has no cash in its portfolio and imposes no sales charges. An investor cannot invest directly in an index.
The Portfolio’s performance is shown without the imposition of any expenses or charges which are, or may be, imposed under your variable annuity contract or variable life insurance policy. Total returns would have been lower if such expenses or charges were included.
The performance graph and table do not reflect the deduction of taxes that a shareholder will pay on Portfolio distributions or the redemption of Portfolio shares.
The performance shown includes, if applicable, the effect of fee waivers and/or expense reimbursements by the Investment Adviser and/or other
service providers, which have the effect of increasing total return. Had all fees and expenses been considered, the total returns would have been lower.
The performance update illustrates performance for a variable investment option available through a variable annuity contract or a variable life insurance policy. The performance shown indicates past performance and is not a projection or prediction of future results. Actual investment returns and principal value will fluctuate so that shares and/or units, at redemption, may be worth more or less than their original cost. Please log on to www.voyainvestments.com or call (800) 366-0066 to get performance through the most recent month end.
Portfolio holdings are subject to change daily.
6
| Portfolio Managers’ Report | Voya Retirement Moderate Portfolio |

| Average Annual Total Returns for the Periods Ended December 31, 2021 | ||||||||||||||
| 1 Year | 5 Year | 10 Year | ||||||||||||
| Class ADV | 9.64 | % | 8.87 | % | 7.35 | % | ||||||||
| Class I | 10.05 | % | 9.24 | % | 7.71 | % | ||||||||
S&P Target Risk® Moderate Index | 7.12 | % | 8.05 | % | 6.81 | % | ||||||||
Russell 3000® Index | 25.66 | % | 17.97 | % | 16.30 | % | ||||||||
MSCI EAFE® | 11.26 | % | 9.55 | % | 8.03 | % | ||||||||
| Bloomberg U.S. Aggregate Bond | –1.54 | % | 3.57 | % | 2.90 | % | ||||||||
Based on a $10,000 initial investment, the graph and table above illustrate the total return of the Voya Retirement Moderate Portfolio against the indices indicated. An index is unmanaged and has no cash in its portfolio and imposes no sales charges. An investor cannot invest directly in an index.
The Portfolio’s performance is shown without the imposition of any expenses or charges which are, or may be, imposed under your variable annuity contract or variable life insurance policy. Total returns would have been lower if such expenses or charges were included.
The performance graph and table do not reflect the deduction of taxes that a shareholder will pay on Portfolio distributions or the redemption of Portfolio shares.
The performance shown includes, if applicable, the effect of fee waivers and/or expense reimbursements by the Investment Adviser and/or other
service providers, which have the effect of increasing total return. Had all fees and expenses been considered, the total returns would have been lower.
The performance update illustrates performance for a variable investment option available through a variable annuity contract or a variable life insurance policy. The performance shown indicates past performance and is not a projection or prediction of future results. Actual investment returns and principal value will fluctuate so that shares and/or units, at redemption, may be worth more or less than their original cost. Please log on to www.voyainvestments.com or call (800) 366-0066 to get performance through the most recent month end.
Portfolio holdings are subject to change daily.
7
| Voya Retirement Moderate Growth Portfolio | Portfolio Managers’ Report |

| Average Annual Total Returns for the Periods Ended December 31, 2021 | ||||||||||||||
| 1 Year | 5 Year | 10 Year | ||||||||||||
| Class ADV | 13.92 | % | 10.68 | % | 9.07 | % | ||||||||
| Class I | 14.41 | % | 11.12 | % | 9.50 | % | ||||||||
S&P Target Risk® Growth Index | 11.37 | % | 10.17 | % | 8.96 | % | ||||||||
Russell 3000® Index | 25.66 | % | 17.97 | % | 16.30 | % | ||||||||
MSCI EAFE® | 11.26 | % | 9.55 | % | 8.03 | % | ||||||||
| Bloomberg U.S. Aggregate Bond | –1.54 | % | 3.57 | % | 2.90 | % | ||||||||
Based on a $10,000 initial investment, the graph and table above illustrate the total return of the Voya Retirement Moderate Growth Portfolio against the indices indicated. An index is unmanaged and has no cash in its portfolio and imposes no sales charges. An investor cannot invest directly in an index.
The Portfolio’s performance is shown without the imposition of any expenses or charges which are, or may be, imposed under your variable annuity contract or variable life insurance policy. Total returns would have been lower if such expenses or charges were included.
The performance graph and table do not reflect the deduction of taxes that a shareholder will pay on Portfolio distributions or the redemption of Portfolio shares.
The performance shown includes, if applicable, the effect of fee waivers and/or expense reimbursements by the Investment Adviser and/or other service providers, which have the effect of increasing total return. Had all fees and expenses been considered, the total returns would have been lower.
The performance update illustrates performance for a variable investment option available through a variable annuity contract or a variable life insurance policy. The performance shown indicates past performance and is not a projection or prediction of future results. Actual investment returns and principal value will fluctuate so that shares and/or units, at redemption, may be worth more or less than their original cost. Please log on to www.voyainvestments.com or call (800) 366-0066 to get performance through the most recent month end.
This report contains statements that may be “forward-looking” statements. Actual results may differ materially from those projected in the “forward-looking” statements.
The views expressed in this report reflect those of the portfolio managers, only through the end of the period as stated on the cover. The portfolio managers’ views are subject to change at any time based on market and other conditions.
Portfolio holdings are subject to change daily.
8
As a shareholder of a Portfolio, you incur two types of costs: (1) transaction costs, including redemption fees and exchange fees; and (2) ongoing costs, including management fees, distribution and/or service (12b-1) fees, and other Portfolio expenses. These Examples are intended to help you understand your ongoing costs (in dollars) of investing in a Portfolio and to compare these costs with the ongoing costs of investing in other mutual funds.
The Examples are based on an investment of $1,000 invested at the beginning of the period and held for the entire period from July 1, 2021 to December 31, 2021. The Portfolios’ expenses are shown without the imposition of any charges which are, or may be, imposed under your variable annuity contract, variable life insurance policy, qualified pension or retirement plan. Expenses would have been higher if such charges were included.
Actual Expenses
The left section of the table shown below, “Actual Portfolio Return,” provides information about actual account values and actual expenses. You may use the information in this section, together with the amount you invested, to estimate the expenses that you paid over the period. Simply divide your account value by $1,000 (for example, an $8,600 account value divided by $1,000 = 8.6), then multiply the result by the number in the first section under the heading entitled “Expenses Paid During the Period” to estimate the expenses you paid on your account during this period.
Hypothetical Example for Comparison Purposes
The right section of the table shown below, “Hypothetical (5% return before expenses),” provides information about hypothetical account values and hypothetical expenses based on a Portfolio’s actual expense ratio and an assumed rate of return of 5% per year before expenses, which is not a Portfolio’s actual return. The hypothetical account values and expenses may not be used to estimate the actual ending account balance or expenses you paid for the period. You may use this information to compare the ongoing costs of investing in a Portfolio and other mutual funds. To do so, compare this 5% hypothetical example with the 5% hypothetical examples that appear in the shareholder reports of the other mutual funds.
Please note that the expenses shown in the table are meant to highlight your ongoing costs only and do not reflect any transactional costs, such as redemption fees or exchange fees. Therefore, the hypothetical section of the table is useful in comparing ongoing costs only and will not help you determine the relative total costs of owning different mutual funds. In addition, if these transactional costs were included, your costs would have been higher.
| Actual Portfolio Return | Hypothetical (5% return before expenses) | |||||||||||||||||||||||||||||||||
| Beginning Account Value July 1, 2021 | Ending Account Value December 31, 2021 | Annualized Expense Ratio* | Expenses Paid During the Period Ended December 31, 2021** | Beginning Account Value July 1, 2021 | Ending Account Value December 31, 2021 | Annualized Expense Ratio* | Expenses Paid During the Period Ended December 31, 2021** | |||||||||||||||||||||||||||
Voya Retirement Conservative Portfolio | ||||||||||||||||||||||||||||||||||
| Class ADV | $ | 1,000.00 | $ | 1,017.90 | 0.54 | % | $ | 2.75 | $ | 1,000.00 | $ | 1,022.48 | 0.54 | % | $ | 2.75 | ||||||||||||||||||
| Class I | 1,000.00 | 1,019.20 | 0.29 | 1.48 | $ | 1,000.00 | 1,023.74 | 0.29 | 1.48 | |||||||||||||||||||||||||
Voya Retirement Growth Portfolio | ||||||||||||||||||||||||||||||||||
| Class ADV | $ | 1,000.00 | $ | 1,055.10 | 0.69 | % | $ | 3.57 | $ | 1,000.00 | $ | 1,021.73 | 0.69 | % | $ | 3.52 | ||||||||||||||||||
| Class I | 1,000.00 | 1,056.90 | 0.27 | 1.40 | 1,000.00 | 1,023.84 | 0.27 | 1.38 | ||||||||||||||||||||||||||
Voya Retirement Moderate Portfolio | ||||||||||||||||||||||||||||||||||
| Class ADV | $ | 1,000.00 | $ | 1,035.50 | 0.62 | % | $ | 3.18 | $ | 1,000.00 | $ | 1,022.08 | 0.62 | % | $ | 3.16 | ||||||||||||||||||
| Class I | 1,000.00 | 1,037.70 | 0.28 | 1.44 | 1,000.00 | 1,023.79 | 0.28 | 1.43 | ||||||||||||||||||||||||||
Voya Retirement Moderate Growth Portfolio | ||||||||||||||||||||||||||||||||||
| Class ADV | $ | 1,000.00 | $ | 1,053.50 | 0.66 | % | $ | 3.42 | $ | 1,000.00 | $ | 1,021.88 | 0.66 | % | $ | 3.36 | ||||||||||||||||||
| Class I | 1,000.00 | 1,055.80 | 0.27 | 1.40 | 1,000.00 | 1,023.84 | 0.27 | 1.38 | ||||||||||||||||||||||||||
| * | The annualized expense ratios do not include expenses of the underlying funds. | |
| ** | Expenses are equal to each Portfolios’ respective annualized expense ratios multiplied by the average account value over the period, multiplied by 184/365 to reflect the most recent fiscal half-year. |
9
To the Shareholders of Voya Retirement Conservative Portfolio, Voya Retirement Growth Portfolio, Voya Retirement Moderate Portfolio and Voya Retirement Moderate Growth Portfolio and the Board of Trustees of Voya Investors Trust
Opinion on the Financial Statements
We have audited the accompanying statements of assets and liabilities of Voya Retirement Conservative Portfolio, Voya Retirement Growth Portfolio, Voya Retirement Moderate Portfolio and Voya Retirement Moderate Growth Portfolio (collectively referred to as the “Portfolios”) (four of the portfolios constituting Voya Investors Trust (the “Trust”)), including the portfolios of investments, as of December 31, 2021, and the related statements of operations for the year then ended, and the statements of changes in net assets and the financial highlights for each of the two years in the period then ended and the related notes (collectively referred to as the “financial statements”). In our opinion, the financial statements present fairly, in all material respects, the financial position of the Portfolios (four of the portfolios constituting Voya Investors Trust) at December 31, 2021, the results of their operations for the year then ended, and the changes in their net assets and their financial highlights for each of the two years in the period then ended, in conformity with U.S. generally accepted accounting principles.
The financial highlights for each of the periods in the three-year period ended December 31, 2019, were audited by another independent registered public accounting firm whose report, dated February 26, 2020, expressed an unqualified opinion on those financial highlights.
Basis for Opinion
These financial statements are the responsibility of the Trust’s management. Our responsibility is to express an opinion on the Portfolios’ financial statements based on our audits. We are a public accounting firm registered with the Public Company Accounting Oversight Board (United States) (“PCAOB”) and are required to be independent with respect to the Trust in accordance with the U.S. federal securities laws and the applicable rules and regulations of the Securities and Exchange Commission and the PCAOB.
We conducted our audits in accordance with the standards of the PCAOB. Those standards require that we plan and perform the audits to obtain reasonable assurance about whether the financial statements are free of material misstatement, whether due to error or fraud. The Trust is not required to have, nor were we engaged to perform, an audit of the Trust’s internal control over financial reporting. As part of our audits, we are required to obtain an understanding of internal control over financial reporting, but not for the purpose of expressing an opinion on the effectiveness of the Trust’s internal control over financial reporting. Accordingly, we express no such opinion.
Our audits included performing procedures to assess the risks of material misstatement of the financial statements, whether due to error or fraud, and performing procedures that respond to those risks. Such procedures included examining, on a test basis, evidence regarding the amounts and disclosures in the financial statements. Our procedures included confirmation of securities owned as of December 31, 2021, by correspondence with the custodian and others or by other appropriate auditing procedures where replies from others were not received. Our audits also included evaluating the accounting principles used and significant estimates made by management, as well as evaluating the overall presentation of the financial statements. We believe that our audits provide a reasonable basis for our opinion.
We have served as the auditor of one or more Voya investment companies since 2019.
Boston, Massachusetts
February 24, 2022
10
| Voya Retirement Conservative Portfolio | Voya Retirement Growth Portfolio | Voya Retirement Moderate Portfolio | Voya Retirement Moderate Growth Portfolio | ||||||||||||||
ASSETS: | |||||||||||||||||
| Investments in affiliated underlying funds at fair value* | $ | 421,840,661 | $ | 2,538,570,691 | $ | 988,769,889 | $ | 1,749,361,524 | |||||||||
| Receivables: | |||||||||||||||||
| Investments in affiliated underlying funds sold | — | 1,619,737 | 253,146 | 431,029 | |||||||||||||
| Fund shares sold | 146,961 | 85,795 | 22,965 | 20,465 | |||||||||||||
| Prepaid expenses | 39 | 226 | 97 | 157 | |||||||||||||
| Other assets | 17,509 | 148,220 | 59,164 | 101,887 | |||||||||||||
| Total assets | 422,005,170 | 2,540,424,669 | 989,105,261 | 1,749,915,062 | |||||||||||||
LIABILITIES: | |||||||||||||||||
| Payable for investments in affiliated underlying funds purchased | 142,809 | — | — | — | |||||||||||||
| Payable for fund shares redeemed | 4,152 | 1,705,531 | 276,111 | 451,493 | |||||||||||||
| Payable for investment management fees | 85,746 | 513,001 | 200,875 | 353,600 | |||||||||||||
| Payable for distribution and shareholder service fees | 89,786 | 889,073 | 278,098 | 564,515 | |||||||||||||
| Payable to trustees under the deferred compensation plan (Note 6) | 17,509 | 148,220 | 59,164 | 101,887 | |||||||||||||
| Payable for trustee fees | 2,163 | 12,825 | 5,006 | 8,810 | |||||||||||||
| Other accrued expenses and liabilities | 42,834 | 135,233 | 66,958 | 101,896 | |||||||||||||
| Total liabilities | 384,999 | 3,403,883 | 886,212 | 1,582,201 | |||||||||||||
NET ASSETS | $ | 421,620,171 | $ | 2,537,020,786 | $ | 988,219,049 | $ | 1,748,332,861 | |||||||||
NET ASSETS WERE COMPRISED OF: | |||||||||||||||||
| Paid-in capital | $ | 319,966,456 | $ | 1,821,663,557 | $ | 791,114,257 | $ | 1,307,476,625 | |||||||||
| Total distributable earnings | 101,653,715 | 715,357,229 | 197,104,792 | 440,856,236 | |||||||||||||
NET ASSETS | $ | 421,620,171 | $ | 2,537,020,786 | $ | 988,219,049 | $ | 1,748,332,861 | |||||||||
| * Cost of investments in affiliated underlying funds | $ | 357,278,494 | $ | 2,100,297,873 | $ | 885,298,153 | $ | 1,483,305,973 | |||||||||
Class ADV | |||||||||||||||||
| Net assets | $ | 420,230,217 | $ | 2,483,104,054 | $ | 962,097,650 | $ | 1,720,104,719 | |||||||||
| Shares authorized | unlimited | unlimited | unlimited | unlimited | |||||||||||||
| Par value | $ | 0.001 | $ | 0.001 | $ | 0.001 | $ | 0.001 | |||||||||
| Shares outstanding | 42,583,497 | 165,258,776 | 76,154,999 | 125,448,988 | |||||||||||||
| Net asset value and redemption price per share | $ | 9.87 | $ | 15.03 | $ | 12.63 | $ | 13.71 | |||||||||
Class I | |||||||||||||||||
| Net assets | $ | 1,389,954 | $ | 53,916,732 | $ | 26,121,399 | $ | 28,228,142 | |||||||||
| Shares authorized | unlimited | unlimited | unlimited | unlimited | |||||||||||||
| Par value | $ | 0.001 | $ | 0.001 | $ | 0.001 | $ | 0.001 | |||||||||
| Shares outstanding | 138,385 | 3,565,265 | 2,039,003 | 2,079,020 | |||||||||||||
| Net asset value and redemption price per share | $ | 10.04 | $ | 15.12 | $ | 12.81 | $ | 13.58 | |||||||||
See Accompanying Notes to Financial Statements
11
| Voya Retirement Conservative Portfolio | Voya Retirement Growth Portfolio | Voya Retirement Moderate Portfolio | Voya Retirement Moderate Growth Portfolio | |||||||||||||
INVESTMENT INCOME: | ||||||||||||||||
| Dividends from affiliated underlying funds | $ | 7,212,724 | $ | 33,628,406 | $ | 14,685,257 | $ | 24,115,785 | ||||||||
| Dividends from unaffiliated underlying funds | 431,671 | 1,239,296 | 998,383 | 1,159,856 | ||||||||||||
| Total investment income | 7,644,395 | 34,867,702 | 15,683,640 | 25,275,641 | ||||||||||||
EXPENSES: | ||||||||||||||||
| Investment management fees | 1,058,794 | 6,210,452 | 2,449,552 | 4,283,332 | ||||||||||||
| Distribution and shareholder service fees: | ||||||||||||||||
| Class ADV | 2,156,240 | 12,562,712 | 4,881,737 | 8,676,083 | ||||||||||||
| Transfer agent fees: | ||||||||||||||||
| Class ADV | 51,490 | 37,847 | 51,353 | 50,206 | ||||||||||||
| Class I | 167 | 792 | 1,306 | 773 | ||||||||||||
| Shareholder reporting expense | 19,012 | 18,556 | 20,601 | 9,451 | ||||||||||||
| Professional fees | 18,250 | 82,737 | 35,315 | 59,801 | ||||||||||||
| Custody and accounting expense | 31,390 | 130,743 | 46,144 | 99,951 | ||||||||||||
| Trustee fees | 17,307 | 102,603 | 40,048 | 70,477 | ||||||||||||
| Miscellaneous expense | 76,172 | 367,883 | 158,498 | 266,801 | ||||||||||||
| Interest expense | — | — | 30 | — | ||||||||||||
| Total expenses | 3,428,822 | 19,514,325 | 7,684,584 | 13,516,875 | ||||||||||||
| Waived and reimbursed fees | (1,069,494 | ) | (1,886,892 | ) | (1,549,451 | ) | (1,919,131 | ) | ||||||||
| Net expenses | 2,359,328 | 17,627,433 | 6,135,133 | 11,597,744 | ||||||||||||
| Net investment income | 5,285,067 | 17,240,269 | 9,548,507 | 13,677,897 | ||||||||||||
REALIZED AND UNREALIZED GAIN (LOSS): | ||||||||||||||||
| Net realized gain (loss) on: | ||||||||||||||||
| Sale of affiliated underlying funds | 18,408,676 | 133,291,489 | 43,781,308 | 75,366,023 | ||||||||||||
| Sale of unaffiliated underlying funds | 5,677,101 | 9,043,323 | 10,512,772 | 9,442,811 | ||||||||||||
| Capital gain distributions from affiliated underlying funds | 11,670,316 | 143,165,124 | 40,534,114 | 94,464,295 | ||||||||||||
| Net realized gain | 35,756,093 | 285,499,936 | 94,828,194 | 179,273,129 | ||||||||||||
| Net change in unrealized appreciation (depreciation) on: | ||||||||||||||||
| Affiliated underlying funds | (16,037,760 | ) | 74,486,084 | (1,644,249 | ) | 45,326,692 | ||||||||||
| Unaffiliated underlying funds | (5,396,238 | ) | (8,169,569 | ) | (9,852,895 | ) | (8,668,460 | ) | ||||||||
| Net change in unrealized appreciation (depreciation) | (21,433,998 | ) | 66,316,515 | (11,497,144 | ) | 36,658,232 | ||||||||||
| Net realized and unrealized gain | 14,322,095 | 351,816,451 | 83,331,050 | 215,931,361 | ||||||||||||
Increase in net assets resulting from operations | $ | 19,607,162 | $ | 369,056,720 | $ | 92,879,557 | $ | 229,609,258 | ||||||||
See Accompanying Notes to Financial Statements
12
| Voya Retirement Conservative Portfolio | Voya Retirement Growth Portfolio | |||||||||||||||
| Year Ended December 31, 2021 | Year Ended December 31, 2020 | Year Ended December 31, 2021 | Year Ended December 31, 2020 | |||||||||||||
FROM OPERATIONS: | ||||||||||||||||
| Net investment income | $ | 5,285,067 | $ | 8,119,791 | $ | 17,240,269 | $ | 39,079,264 | ||||||||
| Net realized gain | 35,756,093 | 9,598,654 | 285,499,936 | 105,349,183 | ||||||||||||
| Net change in unrealized appreciation (depreciation) | (21,433,998 | ) | 25,055,594 | 66,316,515 | 159,092,911 | |||||||||||
| Increase in net assets resulting from operations | 19,607,162 | 42,774,039 | 369,056,720 | 303,521,358 | ||||||||||||
FROM DISTRIBUTIONS TO SHAREHOLDERS: | ||||||||||||||||
| Total distributions (excluding return of capital): | ||||||||||||||||
| Class ADV | (18,141,610 | ) | (17,990,939 | ) | (145,167,348 | ) | (153,007,477 | ) | ||||||||
| Class I | (80,971 | ) | (10,866 | ) | (3,262,838 | ) | (3,182,685 | ) | ||||||||
| Total distributions | (18,222,581 | ) | (18,001,805 | ) | (148,430,186 | ) | (156,190,162 | ) | ||||||||
FROM CAPITAL SHARE TRANSACTIONS: | ||||||||||||||||
| Net proceeds from sale of shares | 24,500,673 | 40,843,106 | 11,020,574 | 5,729,227 | ||||||||||||
| Reinvestment of distributions | 18,222,536 | 18,001,763 | 148,430,186 | 156,190,162 | ||||||||||||
| 42,723,209 | 58,844,869 | 159,450,760 | 161,919,389 | |||||||||||||
| Cost of shares redeemed | (68,708,472 | ) | (62,275,274 | ) | (394,429,184 | ) | (359,765,955 | ) | ||||||||
| Net decrease in net assets resulting from capital share transactions | (25,985,263 | ) | (3,430,405 | ) | (234,978,424 | ) | (197,846,566 | ) | ||||||||
| Net increase (decrease) in net assets | (24,600,682 | ) | 21,341,829 | (14,351,890 | ) | (50,515,370 | ) | |||||||||
NET ASSETS: | ||||||||||||||||
| Beginning of year or period | 446,220,853 | 424,879,024 | 2,551,372,676 | 2,601,888,046 | ||||||||||||
| End of year or period | $ | 421,620,171 | $ | 446,220,853 | $ | 2,537,020,786 | $ | 2,551,372,676 | ||||||||
See Accompanying Notes to Financial Statements
13
STATEMENTS OF CHANGES IN NET ASSETS
| Voya Retirement Moderate Portfolio | Voya Retirement Moderate Growth Portfolio | |||||||||||||||
| Year Ended December 31, 2021 | Year Ended December 31, 2020 | Year Ended December 31, 2021 | Year Ended December 31, 2020 | |||||||||||||
FROM OPERATIONS: | ||||||||||||||||
| Net investment income | $ | 9,548,507 | $ | 16,997,250 | $ | 13,677,897 | $ | 27,998,656 | ||||||||
| Net realized gain | 94,828,194 | 43,844,295 | 179,273,129 | 77,932,621 | ||||||||||||
| Net change in unrealized appreciation (depreciation) | (11,497,144 | ) | 49,381,079 | 36,658,232 | 99,587,089 | |||||||||||
| Increase in net assets resulting from operations | 92,879,557 | 110,222,624 | 229,609,258 | 205,518,366 | ||||||||||||
FROM DISTRIBUTIONS TO SHAREHOLDERS: | ||||||||||||||||
| Total distributions (excluding return of capital): | ||||||||||||||||
| Class ADV | (57,925,502 | ) | (52,487,462 | ) | (103,884,225 | ) | (108,214,037 | ) | ||||||||
| Class I | (1,574,654 | ) | (1,264,412 | ) | (1,729,803 | ) | (1,553,761 | ) | ||||||||
| Total distributions | (59,500,156 | ) | (53,751,874 | ) | (105,614,028 | ) | (109,767,798 | ) | ||||||||
FROM CAPITAL SHARE TRANSACTIONS: | ||||||||||||||||
| Net proceeds from sale of shares | 22,289,625 | 17,324,081 | 14,089,421 | 12,142,256 | ||||||||||||
| Reinvestment of distributions | 59,500,156 | 53,751,874 | 105,614,028 | 109,767,798 | ||||||||||||
| 81,789,781 | 71,075,955 | 119,703,449 | 121,910,054 | |||||||||||||
| Cost of shares redeemed | (138,009,479 | ) | (146,655,932 | ) | (256,597,436 | ) | (248,009,042 | ) | ||||||||
| Net decrease in net assets resulting from capital share transactions | (56,219,698 | ) | (75,579,977 | ) | (136,893,987 | ) | (126,098,988 | ) | ||||||||
| Net decrease in net assets | (22,840,297 | ) | (19,109,227 | ) | (12,898,757 | ) | (30,348,420 | ) | ||||||||
NET ASSETS: | ||||||||||||||||
| Beginning of year or period | 1,011,059,346 | 1,030,168,573 | 1,761,231,618 | 1,791,580,038 | ||||||||||||
| End of year or period | $ | 988,219,049 | $ | 1,011,059,346 | $ | 1,748,332,861 | $ | 1,761,231,618 | ||||||||
See Accompanying Notes to Financial Statements
14
Selected data for a share of beneficial interest outstanding throughout each year or period.
| Income (loss) from investment operations | Less distributions | Ratios to average net assets | Supplemental data | |||||||||||||||||||||||||||||||||||||||||||||||||||||||||||||||||
| Year or period | Net asset value, beginning of year or period | Net investment income (loss) | Net realized and unrealized gain (loss) | Total from investment operations | From net investment income | From net realized gains | From return of capital | Total distributions | Payment by affiliate | Net asset value, end of year or period | Total Return(1) | Expenses before reductions/ additions(2)(3)(4) | Expenses net of fee waivers and/or recoupments if any(2)(3)(4) | Expenses net of all reductions/ additions(2)(3)(4) | Net investment income (loss)(2)(3) | Net assets, end of year or period | Portfolio turnover rate | |||||||||||||||||||||||||||||||||||||||||||||||||||
| ended | ($) | ($) | ($) | ($) | ($) | ($) | ($) | ($) | ($) | ($) | (%) | (%) | (%) | (%) | (%) | ($000’s) | (%) | |||||||||||||||||||||||||||||||||||||||||||||||||||
Voya Retirement Conservative Portfolio | ||||||||||||||||||||||||||||||||||||||||||||||||||||||||||||||||||||
Class ADV | ||||||||||||||||||||||||||||||||||||||||||||||||||||||||||||||||||||
| 12-31-21 | 9.84 | 0.12 | • | 0.33 | 0.45 | 0.21 | 0.21 | — | 0.42 | — | 9.87 | 4.69 | 0.79 | 0.54 | 0.54 | 1.22 | 420,230 | 26 | ||||||||||||||||||||||||||||||||||||||||||||||||||
| 12-31-20 | 9.31 | 0.18 | 0.75 | 0.93 | 0.17 | 0.23 | — | 0.40 | — | 9.84 | 10.33 | 0.77 | 0.52 | 0.52 | 1.90 | 444,944 | 27 | |||||||||||||||||||||||||||||||||||||||||||||||||||
| 12-31-19 | 8.57 | 0.17 | 0.98 | 1.15 | 0.17 | 0.24 | — | 0.41 | — | 9.31 | 13.61 | 0.78 | 0.53 | 0.53 | 1.82 | 424,756 | 24 | |||||||||||||||||||||||||||||||||||||||||||||||||||
| 12-31-18 | 9.24 | 0.17 | (0.41 | ) | (0.24 | ) | 0.17 | 0.26 | — | 0.43 | — | 8.57 | (2.74 | ) | 0.77 | 0.52 | 0.52 | 1.74 | 400,267 | 33 | ||||||||||||||||||||||||||||||||||||||||||||||||
| 12-31-17 | 8.89 | 0.14 | • | 0.54 | 0.68 | 0.13 | 0.20 | — | 0.33 | — | 9.24 | 7.76 | 0.76 | 0.51 | 0.51 | 1.57 | 456,710 | 15 | ||||||||||||||||||||||||||||||||||||||||||||||||||
Class I | ||||||||||||||||||||||||||||||||||||||||||||||||||||||||||||||||||||
| 12-31-21 | 10.01 | 0.15 | • | 0.33 | 0.48 | 0.24 | 0.21 | — | 0.45 | — | 10.04 | 4.87 | 0.29 | 0.29 | 0.29 | 1.46 | 1,390 | 26 | ||||||||||||||||||||||||||||||||||||||||||||||||||
| 12-31-20 | 9.45 | 0.24 | • | 0.75 | 0.99 | 0.20 | 0.23 | — | 0.43 | — | 10.01 | 10.77 | 0.27 | 0.27 | 0.27 | 2.47 | 1,276 | 27 | ||||||||||||||||||||||||||||||||||||||||||||||||||
| 12-31-19 | 8.70 | 0.21 | • | 0.98 | 1.19 | 0.20 | 0.24 | — | 0.44 | — | 9.45 | 13.81 | 0.28 | 0.28 | 0.28 | 2.31 | 123 | 24 | ||||||||||||||||||||||||||||||||||||||||||||||||||
| 12-31-18 | 9.38 | 0.19 | • | (0.41 | ) | (0.22 | ) | 0.20 | 0.26 | — | 0.46 | — | 8.70 | (2.54 | ) | 0.27 | 0.27 | 0.27 | 2.11 | 34 | 33 | |||||||||||||||||||||||||||||||||||||||||||||||
| 12-31-17 | 9.04 | 0.31 | • | 0.39 | 0.70 | 0.16 | 0.20 | — | 0.36 | — | 9.38 | 7.81 | 0.26 | 0.26 | 0.26 | 3.44 | 17 | 15 | ||||||||||||||||||||||||||||||||||||||||||||||||||
Voya Retirement Growth Portfolio | ||||||||||||||||||||||||||||||||||||||||||||||||||||||||||||||||||||
Class ADV | ||||||||||||||||||||||||||||||||||||||||||||||||||||||||||||||||||||
| 12-31-21 | 13.80 | 0.10 | • | 2.00 | 2.10 | 0.25 | 0.62 | — | 0.87 | — | 15.03 | 15.52 | 0.77 | 0.69 | 0.69 | 0.66 | 2,483,104 | 21 | ||||||||||||||||||||||||||||||||||||||||||||||||||
| 12-31-20 | 13.00 | 0.20 | • | 1.44 | 1.64 | 0.30 | 0.54 | — | 0.84 | — | 13.80 | 13.64 | 0.76 | 0.68 | 0.68 | 1.62 | 2,499,847 | 27 | ||||||||||||||||||||||||||||||||||||||||||||||||||
| 12-31-19 | 11.74 | 0.26 | • | 2.20 | 2.46 | 0.24 | 0.96 | — | 1.20 | — | 13.00 | 21.55 | 0.76 | 0.68 | 0.68 | 2.04 | 2,553,927 | 40 | ||||||||||||||||||||||||||||||||||||||||||||||||||
| 12-31-18 | 13.99 | 0.20 | • | (1.13 | ) | (0.93 | ) | 0.23 | 1.09 | — | 1.32 | — | 11.74 | (7.47 | ) | 0.76 | 0.68 | 0.68 | 1.49 | 2,449,356 | 20 | |||||||||||||||||||||||||||||||||||||||||||||||
| 12-31-17 | 13.10 | 0.19 | • | 1.91 | 2.10 | 0.25 | 0.96 | — | 1.21 | — | 13.99 | 16.66 | 0.76 | 0.68 | 0.68 | 1.37 | 3,018,225 | 11 | ||||||||||||||||||||||||||||||||||||||||||||||||||
Class I | ||||||||||||||||||||||||||||||||||||||||||||||||||||||||||||||||||||
| 12-31-21 | 13.88 | 0.16 | • | 2.01 | 2.17 | 0.31 | 0.62 | — | 0.93 | — | 15.12 | 15.96 | 0.27 | 0.27 | 0.27 | 1.12 | 53,917 | 21 | ||||||||||||||||||||||||||||||||||||||||||||||||||
| 12-31-20 | 13.08 | 0.27 | 1.43 | 1.70 | 0.36 | 0.54 | — | 0.90 | — | 13.88 | 14.11 | 0.26 | 0.26 | 0.26 | 2.07 | 51,526 | 27 | |||||||||||||||||||||||||||||||||||||||||||||||||||
| 12-31-19 | 11.81 | 0.31 | • | 2.22 | 2.53 | 0.30 | 0.96 | — | 1.26 | — | 13.08 | 22.09 | 0.26 | 0.26 | 0.26 | 2.48 | 47,961 | 40 | ||||||||||||||||||||||||||||||||||||||||||||||||||
| 12-31-18 | 14.07 | 0.26 | (1.13 | ) | (0.87 | ) | 0.30 | 1.09 | — | 1.39 | — | 11.81 | (7.05 | ) | 0.26 | 0.26 | 0.26 | 1.94 | 44,463 | 20 | ||||||||||||||||||||||||||||||||||||||||||||||||
| 12-31-17 | 13.18 | 0.25 | • | 1.91 | 2.16 | 0.31 | 0.96 | — | 1.27 | — | 14.07 | 17.11 | 0.26 | 0.26 | 0.26 | 1.84 | 49,040 | 11 | ||||||||||||||||||||||||||||||||||||||||||||||||||
Voya Retirement Moderate Portfolio | ||||||||||||||||||||||||||||||||||||||||||||||||||||||||||||||||||||
Class ADV | ||||||||||||||||||||||||||||||||||||||||||||||||||||||||||||||||||||
| 12-31-21 | 12.24 | 0.12 | • | 1.03 | 1.15 | 0.24 | 0.52 | — | 0.76 | — | 12.63 | 9.64 | 0.78 | 0.62 | 0.62 | 0.94 | 962,098 | 26 | ||||||||||||||||||||||||||||||||||||||||||||||||||
| 12-31-20 | 11.55 | 0.20 | • | 1.14 | 1.34 | 0.25 | 0.40 | — | 0.65 | — | 12.24 | 12.17 | 0.77 | 0.61 | 0.61 | 1.73 | 988,153 | 28 | ||||||||||||||||||||||||||||||||||||||||||||||||||
| 12-31-19 | 10.51 | 0.22 | • | 1.54 | 1.76 | 0.22 | 0.50 | — | 0.72 | — | 11.55 | 17.14 | 0.77 | 0.61 | 0.61 | 1.96 | 1,008,727 | 31 | ||||||||||||||||||||||||||||||||||||||||||||||||||
| 12-31-18 | 11.79 | 0.19 | • | (0.75 | ) | (0.56 | ) | 0.21 | 0.51 | — | 0.72 | — | 10.51 | (5.07 | ) | 0.77 | 0.61 | 0.61 | 1.68 | 972,232 | 27 | |||||||||||||||||||||||||||||||||||||||||||||||
| 12-31-17 | 11.35 | 0.17 | • | 1.14 | 1.31 | 0.20 | 0.67 | — | 0.87 | — | 11.79 | 11.82 | 0.76 | 0.60 | 0.60 | 1.50 | 1,170,685 | 12 | ||||||||||||||||||||||||||||||||||||||||||||||||||
Class I | ||||||||||||||||||||||||||||||||||||||||||||||||||||||||||||||||||||
| 12-31-21 | 12.40 | 0.17 | • | 1.05 | 1.22 | 0.29 | 0.52 | — | 0.81 | — | 12.81 | 10.05 | 0.28 | 0.28 | 0.28 | 1.31 | 26,121 | 26 | ||||||||||||||||||||||||||||||||||||||||||||||||||
| 12-31-20 | 11.70 | 0.24 | 1.15 | 1.39 | 0.29 | 0.40 | — | 0.69 | — | 12.40 | 12.51 | 0.27 | 0.27 | 0.27 | 2.06 | 22,906 | 28 | |||||||||||||||||||||||||||||||||||||||||||||||||||
| 12-31-19 | 10.64 | 0.25 | 1.58 | 1.83 | 0.27 | 0.50 | — | 0.77 | — | 11.70 | 17.56 | 0.27 | 0.27 | 0.27 | 2.35 | 21,441 | 31 | |||||||||||||||||||||||||||||||||||||||||||||||||||
| 12-31-18 | 11.93 | 0.24 | (0.76 | ) | (0.52 | ) | 0.26 | 0.51 | — | 0.77 | — | 10.64 | (4.73 | ) | 0.27 | 0.27 | 0.27 | 2.03 | 17,307 | 27 | ||||||||||||||||||||||||||||||||||||||||||||||||
| 12-31-17 | 11.48 | 0.22 | 1.14 | 1.36 | 0.24 | 0.67 | — | 0.91 | — | 11.93 | 12.21 | 0.26 | 0.26 | 0.26 | 1.86 | 19,580 | 12 | |||||||||||||||||||||||||||||||||||||||||||||||||||
See Accompanying Notes to Financial Statements
15
FINANCIAL HIGHLIGHTS (CONTINUED)
Selected data for a share of beneficial interest outstanding throughout each year or period.
| Income (loss) from investment operations | Less distributions | Ratios to average net assets | Supplemental data | |||||||||||||||||||||||||||||||||||||||||||||||||||||||||||||||||
| Year or period | Net asset value, beginning of year or period | Net investment income (loss) | Net realized and unrealized gain (loss) | Total from investment operations | From net investment income | From net realized gains | From return of capital | Total distributions | Payment by affiliate | Net asset value, end of year or period | Total Return(1) | Expenses before reductions/ additions(2)(3)(4) | Expenses net of fee waivers and/or recoupments if any(2)(3)(4) | Expenses net of all reductions/ additions(2)(3)(4) | Net investment income (loss)(2)(3) | Net assets, end of year or period | Portfolio turnover rate | |||||||||||||||||||||||||||||||||||||||||||||||||||
| ended | ($) | ($) | ($) | ($) | ($) | ($) | ($) | ($) | ($) | ($) | (%) | (%) | (%) | (%) | (%) | ($000’s) | (%) | |||||||||||||||||||||||||||||||||||||||||||||||||||
Voya Retirement Moderate Growth Portfolio | ||||||||||||||||||||||||||||||||||||||||||||||||||||||||||||||||||||
Class ADV | ||||||||||||||||||||||||||||||||||||||||||||||||||||||||||||||||||||
| 12-31-21 | 12.79 | 0.10 | • | 1.64 | 1.74 | 0.24 | 0.58 | — | 0.82 | — | 13.71 | 13.92 | 0.77 | 0.66 | 0.66 | 0.77 | 1,720,105 | 20 | ||||||||||||||||||||||||||||||||||||||||||||||||||
| 12-31-20 | 12.10 | 0.20 | • | 1.29 | 1.49 | 0.27 | 0.53 | — | 0.80 | — | 12.79 | 13.15 | 0.76 | 0.65 | 0.65 | 1.66 | 1,736,505 | 28 | ||||||||||||||||||||||||||||||||||||||||||||||||||
| 12-31-19 | 10.97 | 0.23 | • | 1.91 | 2.14 | 0.23 | 0.78 | — | 1.01 | — | 12.10 | 20.02 | 0.76 | 0.65 | 0.65 | 1.98 | 1,769,060 | 39 | ||||||||||||||||||||||||||||||||||||||||||||||||||
| 12-31-18 | 12.80 | 0.19 | • | (0.91 | ) | (0.72 | ) | 0.22 | 0.89 | — | 1.11 | — | 10.97 | (6.30 | ) | 0.76 | 0.65 | 0.65 | 1.56 | 1,716,501 | 22 | |||||||||||||||||||||||||||||||||||||||||||||||
| 12-31-17 | 12.23 | 0.18 | • | 1.53 | 1.71 | 0.23 | 0.91 | — | 1.14 | — | 12.80 | 14.56 | 0.76 | 0.65 | 0.65 | 1.42 | 2,111,439 | 10 | ||||||||||||||||||||||||||||||||||||||||||||||||||
Class I | ||||||||||||||||||||||||||||||||||||||||||||||||||||||||||||||||||||
| 12-31-21 | 12.67 | 0.16 | • | 1.62 | 1.78 | 0.29 | 0.58 | — | 0.87 | — | 13.58 | 14.41 | 0.27 | 0.27 | 0.27 | 1.20 | 28,228 | 20 | ||||||||||||||||||||||||||||||||||||||||||||||||||
| 12-31-20 | 12.00 | 0.25 | 1.27 | 1.52 | 0.32 | 0.53 | — | 0.85 | — | 12.67 | 13.59 | 0.26 | 0.26 | 0.26 | 2.10 | 24,726 | 28 | |||||||||||||||||||||||||||||||||||||||||||||||||||
| 12-31-19 | 10.90 | 0.29 | 1.87 | 2.16 | 0.28 | 0.78 | — | 1.06 | — | 12.00 | 20.40 | 0.26 | 0.26 | 0.26 | 2.41 | 22,520 | 39 | |||||||||||||||||||||||||||||||||||||||||||||||||||
| 12-31-18 | 12.73 | 0.24 | • | (0.90 | ) | (0.66 | ) | 0.28 | 0.89 | — | 1.17 | — | 10.90 | (5.90 | ) | 0.26 | 0.26 | 0.26 | 1.97 | 19,816 | 22 | |||||||||||||||||||||||||||||||||||||||||||||||
| 12-31-17 | 12.17 | 0.24 | 1.52 | 1.76 | 0.29 | 0.91 | — | 1.20 | — | 12.73 | 15.05 | 0.26 | 0.26 | 0.26 | 1.84 | 24,017 | 10 | |||||||||||||||||||||||||||||||||||||||||||||||||||
(1) | Total return is calculated assuming reinvestment of all dividends, capital gain distributions and return of capital distributions, if any, at net asset value and does not reflect the effect of insurance contract charges. Total return for periods less than one year is not annualized. |
(2) | Annualized for periods less than one year. | |
(3) | Ratios reflect operating expenses of a Portfolio. Expenses before reductions/additions do not reflect amounts reimbursed or recouped by the Investment Adviser and/or Distributor or reductions from brokerage service arrangements or other expense offset arrangements and do not represent the amount paid by a Portfolio during periods when reimbursements or reductions occur. |
| Expenses net of fee waivers reflect expenses after reimbursement by the Investment Adviser and/or Distributor or recoupment of previously reimbursed fees by the Investment Adviser, but prior to reductions from brokerage service arrangements or other expense offset arrangements. Expenses net of all reductions/additions represent the net expenses paid by a Portfolio. Net investment income (loss) is net of all such additions or reductions. | ||
(4) | Ratios do not include expenses of underlying funds and do not include fees and expenses charged under the variable annuity contract or variable life insurance policy. | |
| • | Calculated using average number of shares outstanding throughout the year or period. |
See Accompanying Notes to Financial Statements
16
NOTE 1 — ORGANIZATION
Voya Investors Trust (the “Trust”) is registered under the Investment Company Act of 1940, as amended (“1940 Act”), as an open-end management investment company. The Trust was organized as a Massachusetts business trust on August 3, 1988. The Trust currently consists of twenty-two active separate investment series. The four series (each, a “Portfolio” and collectively, the “Portfolios”) included in this report are: Voya Retirement Conservative Portfolio (“Conservative”), Voya Retirement Growth Portfolio (“Growth”), Voya Retirement Moderate Portfolio (“Moderate”) and Voya Retirement Moderate Growth Portfolio (“Moderate Growth”), each a diversified series of the Trust.
The classes of shares included in this report are: Adviser (“Class ADV”) and Institutional (“Class I”). With the exception of class specific matters, each class has equal voting rights as to voting privileges. For class specific proposals, only the applicable class would have voting privileges. The classes differ principally in the applicable distribution and shareholder service fees, as well as differences in the amount of waiver of fees and reimbursement of expenses, if any. Generally, shareholders of each class also bear certain expenses that pertain to that particular class. All shareholders are allocated the common expenses of a portfolio and earn income and realized gains/losses from a portfolio pro rata based on the daily ending net assets of each class, without distinction between share classes. Expenses that are specific to a portfolio or a class are charged directly to that portfolio or class. Other operating expenses shared by several portfolios are generally allocated among those portfolios based on average net assets. Distributions are determined separately for each class based on income and expenses allocated to each class. Realized gain distributions are allocated to each class pro rata based on the shares outstanding of each class on the date of distribution. Differences in per share dividend rates generally result from differences in separate class expenses, including distribution and shareholder service fees, if any, as well as differences in the amount of waiver of fees and reimbursement of expenses between the separate classes, if any.
Voya Investments, LLC (“Voya Investments” or the “Investment Adviser”), an Arizona limited liability company serves as the Investment Adviser to the Portfolios. Voya Investment Management Co. LLC (“Voya IM” or the “Sub-Adviser”), a Delaware limited liability company, serves as the Sub-Adviser to the Portfolios. Voya Investments Distributor, LLC (“VID” or the “Distributor”), a Delaware limited liability company, serves as the principal underwriter to the Portfolios.
Each Portfolio seeks to achieve its investment objective by investing in other investment companies (“Underlying Funds”) and uses asset allocation strategies to determine how much to invest in the Underlying Funds. The investment objective of the Portfolios is described in the respective Portfolio’s Prospectus.
NOTE 2 — SIGNIFICANT ACCOUNTING POLICIES
The following significant accounting policies are consistently followed by the Portfolios in the preparation of their financial statements. Each Portfolio is considered an investment company under U.S. generally accepted accounting principles (“GAAP”) and follows the accounting and reporting guidance applicable to investment companies.
A. Security Valuation. Each Portfolio is open for business every day the New York Stock Exchange (“NYSE”) opens for regular trading (each such day, a “Business Day”). The net asset value (“NAV”) per share for each class of each Portfolio is determined each Business Day as of the close of the regular trading session (“Market Close”), as determined by the Consolidated Tape Association (“CTA”), the central distributor of transaction prices for exchange-traded securities (normally 4:00 p.m. Eastern time unless otherwise designated by the CTA). The data reflected on the consolidated tape provided by the CTA is generated by various market centers, including all securities exchanges, electronic communications networks, and third-market broker-dealers. The NAV per share of each class of each Portfolio is calculated by taking the value of the Portfolio’s assets attributable to that class, subtracting the Portfolio’s liabilities attributable to that class, and dividing by the number of shares of that class that are outstanding. On days when a Portfolio is closed for business, Portfolio shares will not be priced and a Portfolio does not transact purchase and redemption orders. To the extent a Portfolio’s assets are traded in other markets on days when a Portfolio does not price its shares, the value of a Portfolio’s assets will likely change and you will not be able to purchase or redeem shares of a Portfolio.
Assets for which market quotations are readily available are valued at market value. A security listed or traded on an exchange is valued at its last sales price or official closing price as of the close of the regular trading session on the exchange where the security is principally traded or, if such price is not available, at the last sale price as of the Market Close for such security provided by the CTA. Bank loans are valued at the average of the averages of the bid and ask prices provided to an independent loan pricing service by brokers. Futures contracts are valued at the final settlement price set by an exchange on which they are principally traded. Listed options are valued at the mean
17
NOTES TO FINANCIAL STATEMENTS AS OF DECEMBER 31, 2021 (CONTINUED)
NOTE 2 — SIGNIFICANT ACCOUNTING POLICIES (continued)
between the last bid and ask prices from the exchange on which they are principally traded. Investments in open-end registered investment companies that do not trade on an exchange are valued at the end of day NAV per share. Investments in registered investment companies that trade on an exchange are valued at the last sales price or official closing price as of the close of the regular trading session on the exchange where the security is principally traded.
When a market quotation is not readily available or is deemed unreliable, each Portfolio will determine a fair value for the relevant asset in accordance with procedures adopted by the Portfolios’ Board of Trustees (“Board”). Such procedures provide, for example, that: (a) Exchange-traded securities are valued at the mean of the closing bid and ask; (b) Debt obligations are valued using an evaluated price provided by an independent pricing service. Evaluated prices provided by the pricing service may be determined without exclusive reliance on quoted prices, and may reflect factors such as institution-size trading in similar groups of securities, developments related to specific securities, benchmark yield, quality, type of issue, coupon rate, maturity, individual trading characteristics and other market data; (c) Securities traded in the over-the-counter (“OTC”) market are valued based on prices provided by independent pricing services or market makers; (d) Options not listed on an exchange are valued by an independent source using an industry accepted model, such as Black-Scholes; (e) Centrally cleared swap agreements are valued using a price provided by an independent pricing service; (f) OTC swap agreements are valued using a price provided by an independent pricing service; (g) Forward foreign currency exchange contracts are valued utilizing current and forward rates obtained from an independent pricing service. Such prices from the third party pricing service are for specific settlement periods and each Portfolio’s forward foreign currency exchange contracts are valued at an interpolated rate between the closest preceding and subsequent period reported by the independent pricing service; and (h) Securities for which market prices are not provided by any of the above methods may be valued based upon quotes furnished by brokers.
The prospectuses of the open-end registered investment companies in which each Portfolio may invest explain the circumstances under which they will use fair value pricing and the effects of using fair value pricing.
Foreign securities’ (including forward foreign currency exchange contracts) prices are converted into U.S. dollar amounts using the applicable exchange rates as of Market Close. If market quotations are available and believed to be reliable for foreign exchange-traded equity securities, the
securities will be valued at the market quotations. Because trading hours for certain foreign securities end before Market Close, closing market quotations may become unreliable. An independent pricing service determines the degree of certainty, based on historical data, that the closing price in the principal market where a foreign security trades is not the current value as of Market Close. Foreign securities’ prices meeting the approved degree of certainty that the price is not reflective of current value will be valued by the independent pricing service using pricing models designed to estimate likely changes in the values of those securities between the times in which the trading in those securities is substantially completed and Market Close. Multiple factors may be considered by the independent pricing service in determining the value of such securities and may include information relating to sector indices, American Depositary Receipts and domestic and foreign index futures.
All other assets for which market quotations are not readily available or became unreliable (or if the above fair valuation methods are unavailable or determined to be unreliable) are valued at fair value as determined in good faith by or under the supervision of the Board following procedures approved by the Board. The Board has delegated to the Investment Adviser responsibility for overseeing the implementation of the Portfolios’ valuation procedures; a “Pricing Committee” comprised of employees of the Investment Adviser or its affiliates has responsibility for applying the fair valuation methods set forth in the procedures and, if a fair valuation cannot be determined pursuant to the fair valuation methods, determining the fair value of assets held by the Portfolios. Issuer specific events, transaction price, position size, nature and duration of restrictions on disposition of the security, market trends, bid/ask quotes of brokers and other market data may be reviewed in the course of making a good faith determination of a security’s fair value. Valuations change in response to many factors including the historical and prospective earnings of the issuer, the value of the issuer’s assets, general economic conditions, interest rates, investor perceptions and market liquidity. Because of the inherent uncertainties of fair valuation, the values used to determine each Portfolio’s NAV may materially differ from the value received upon actual sale of those investments. Thus, fair valuation may have an unintended dilutive or accretive effect on the value of shareholders’ investments in each Portfolio.
Each investment asset or liability of the Portfolios is assigned a level at measurement date based on the significance and source of the inputs to its valuation. Quoted prices in active markets for identical securities are classified as “Level 1,” inputs other than quoted prices for an asset or liability that are observable are classified as
18
NOTES TO FINANCIAL STATEMENTS AS OF DECEMBER 31, 2021 (CONTINUED)
NOTE 2 — SIGNIFICANT ACCOUNTING POLICIES (continued)
“Level 2” and significant unobservable inputs, including the Sub-Adviser’s or Pricing Committee’s judgment about the assumptions that a market participant would use in pricing an asset or liability are classified as “Level 3.” The inputs used for valuing securities are not necessarily an indication of the risks associated with investing in those securities. Short-term securities of sufficient credit quality are generally considered to be Level 2 securities under applicable accounting rules. The Portfolios classify each of their investments in the Underlying Funds as Level 1, without consideration as to the classification level of the specific investments held by the Underlying Funds. A table summarizing the Portfolios’ investments under these levels of classification is included within the Portfolio of Investments.
GAAP requires a reconciliation of the beginning to ending balances for reported fair values that presents changes attributable to total realized and unrealized gains or losses, purchases and sales, and transfers in or out of the Level 3 category during the period. A reconciliation of Level 3 investments within the Portfolio of Investments is presented only when a Portfolio has a significant amount of Level 3 investments.
B. Securities Transactions and Revenue Recognition. Securities transactions are accounted for on the trade date. Dividend income received from the Underlying Funds is recognized on the ex-dividend date and is recorded as dividends from underlying funds in the Statements of Operations. Capital gain distributions received from the Underlying Funds are recognized on the ex-dividend date and are recorded on the Statements of Operations as such. Realized gains and losses are reported on the basis of identified cost of securities sold.
C. Distributions to Shareholders. The Portfolios record distributions to their shareholders on the ex-dividend date. Each Portfolio declares and pays dividends and capital gain distributions, if any, annually. The Portfolios may make distributions on a more frequent basis to comply with the distribution requirements of the Internal Revenue Code. The characteristics of income and gains to be distributed are determined in accordance with income tax regulations, which may differ from GAAP for investment companies.
D. Federal Income Taxes. It is the policy of each Portfolio to comply with the requirements of subchapter M of the Internal Revenue Code that are applicable to regulated investment companies and to distribute substantially all of its net investment income and any net realized capital gains to its shareholders. Therefore, a federal income tax or excise tax provision is not required. Management has
considered the sustainability of the Portfolios’ tax positions taken on federal income tax returns for all open tax years in making this determination. No capital gain distributions shall be made until the capital loss carryforwards have been fully utilized.
The Portfolios may utilize equalization accounting for tax purposes, whereby a portion of redemption payments are treated as distributions of income or gain.
E. Use of Estimates. The preparation of financial statements in conformity with GAAP requires management to make estimates and assumptions that affect the reported amounts of assets and liabilities and disclosure of contingent assets and liabilities at the date of the financial statements and the reported amounts of increases and decreases in net assets from operations during the reporting period. Actual results could differ from those estimates.
F. Indemnifications. In the normal course of business, the Trust may enter into contracts that provide certain indemnifications. The Trust’s maximum exposure under these arrangements is dependent on future claims that may be made against the Portfolios and, therefore, cannot be estimated; however, based on experience, management considers the risk of loss from such claims remote.
NOTE 3 — INVESTMENTS IN UNDERLYING FUNDS
For the year ended December 31, 2021, the cost of purchases and the proceeds from the sales of the Underlying Funds were as follows:
| Purchases | Sales | |||||||||
|---|---|---|---|---|---|---|---|---|---|---|
| Conservative | $113,637,034 | $152,765,772 | ||||||||
| Growth | 547,365,544 | 911,068,543 | ||||||||
| Moderate | 259,819,504 | 365,628,988 | ||||||||
| Moderate Growth | 348,354,534 | 576,321,094 |
NOTE 4 — INVESTMENT MANAGEMENT FEES
The Portfolios have entered into an investment management agreement (“Management Agreement”) with the Investment Adviser. The Investment Adviser has overall responsibility for the management of the Portfolios. The Investment Adviser oversees all investment management and portfolio management services for the Portfolios and assists in managing and supervising all aspects of the general day-to-day business activities and operations of the Portfolios, including custodial, transfer agency, dividend disbursing, accounting, auditing, compliance and related services. This Management Agreement compensates the Investment Adviser with a management fee, computed daily and payable monthly, based on: 0.24% of each Portfolio’s average daily net assets invested in affiliated Underlying Funds and 0.34% of
19
NOTES TO FINANCIAL STATEMENTS AS OF DECEMBER 31, 2021 (CONTINUED)
NOTE 4 — INVESTMENT MANAGEMENT FEES (continued)
each Portfolio’s average daily net assets invested in unaffiliated Underlying Funds and/or other direct investments.
The Investment Adviser has entered into a sub-advisory agreement with Voya IM with respect to each Portfolio. Voya IM provides investment advice for the Portfolios and is paid by the Investment Adviser based on the average daily net assets of each respective Portfolio. Subject to such policies as the Board or the Investment Adviser may determine, Voya IM manages the Portfolios’ assets in accordance with the Portfolios’ investment objectives, policies, and limitations.
NOTE 5 — DISTRIBUTION AND SERVICE FEES
The Trust has entered into a shareholder service and distribution plan (the “Agreement”) for the Class ADV shares of each Portfolio. The Agreement compensates the Distributor for the provision of shareholder services and/or account maintenance services and the distribution of shares to direct or indirect beneficial owners of Class ADV shares. Under the Agreement, each Portfolio makes payments to the Distributor a shareholder service fee of 0.25% and a distribution fee of 0.25% of each Portfolio’s average daily net assets attributable to Class ADV shares. The Distributor has contractually agreed to waive 0.2480%, 0.0751%, 0.1587% and 0.1106% of the distribution fee for the Class ADV shares of Conservative, Growth, Moderate and Moderate Growth, respectively. The actual distribution fee to be paid by Conservative, Growth, Moderate and Moderate Growth is at an annual rate of 0.002%, 0.1749%, 0.0913% and 0.1394%, respectively. Any fees waived are not subject to recoupment. Termination or modification of this obligation requires approval by the Board.
NOTE 6 — OTHER TRANSACTIONS WITH AFFILIATES AND RELATED PARTIES
At December 31, 2021, the following direct or indirect, wholly-owned subsidiary of Voya Financial, Inc. owned more than 5% of the following Portfolios:
| Subsidiary | Portfolio | Percentage | ||||
|---|---|---|---|---|---|---|
| Voya Institutional Trust Company | Conservative | 24.66 | % | |||
| Moderate | 10.12 | |||||
| Moderate Growth | 5.42 | |||||
The Portfolios have adopted a deferred compensation plan (the “DC Plan”), which allows eligible independent trustees, as described in the DC Plan, to defer the receipt of all or a portion of the trustees’ fees that they are entitled to receive from the Portfolios. For purposes of determining the amount owed to the trustee under the DC Plan, the amounts deferred are invested in shares of the funds
selected by the trustee (the “Notional Funds”). When the Portfolios purchase shares of the Notional Funds, which are all advised by Voya Investments, in amounts equal to the trustees’ deferred fees, this results in a Portfolio asset equal to the deferred compensation liability. Such assets, if applicable, are included as a component of “Other assets” on the accompanying Statements of Assets and Liabilities. Deferral of trustees’ fees under the DC Plan will not affect net assets of the Portfolios, and will not materially affect the Portfolios’ assets, liabilities or net investment income per share. Amounts will be deferred until distributed in accordance with the DC Plan.
The Portfolios may pay per account fees to affiliates of Voya Investments for recordkeeping services provided on certain assets. For the year ended December 31, 2021, the per account fees for affiliated recordkeeping services paid by each Portfolio were as follows:
| Portfolio | Amount | |||||
|---|---|---|---|---|---|---|
| Conservative | $ | 51,198 | ||||
| Growth | 36,514 | |||||
| Moderate | 51,819 | |||||
| Moderate Growth | 49,326 | |||||
NOTE 7 — EXPENSE LIMITATION AGREEMENT
The Investment Adviser has entered into a written expense limitation agreement (“Expense Limitation Agreement”) with each Portfolio whereby the Investment Adviser has agreed to limit expenses, excluding interest, taxes, investment-related costs, leverage expenses and extraordinary expenses to the levels listed below:
| Portfolio(1) | Class ADV | Class I | ||||
|---|---|---|---|---|---|---|
| Conservative | 0.92% | 0.67% | ||||
| Growth | 1.07% | 0.82% | ||||
| Moderate | 1.00% | 0.75% | ||||
| Moderate Growth | 1.04% | 0.79% |
(1) | The operating expense limits take into account the operating expenses incurred at the Underlying Fund level. The amount of fees and expenses of an Underlying Fund borne by each Portfolio will vary based on each Portfolio’s allocation of assets to, and the net expenses of, a particular Underlying Fund. |
The Investment Adviser may at a later date recoup from a Portfolio for fees waived and/or other expenses reimbursed by the Investment Adviser during the previous 36 months but only if, after such recoupment, a Portfolio’s expense ratio does not exceed the percentage described above. Waived and reimbursed fees net of any recoupment by the Investment Adviser of such waived and reimbursed fees are reflected on the accompanying Statements of Operations. Amounts payable by the Investment Adviser are reflected on the accompanying Statements of Assets and Liabilities.
20
NOTES TO FINANCIAL STATEMENTS AS OF DECEMBER 31, 2021 (CONTINUED)
NOTE 7 — EXPENSE LIMITATION AGREEMENT (continued)
As of December 31, 2021, the Portfolios did not have any amount of waived and/or reimbursed fees that would be subject to possible recoupment.
The Expense Limitation Agreement is contractual through May 1, 2022 and shall renew automatically for one-year terms. Termination or modification of this obligation requires approval by the Board.
NOTE 8 — LINE OF CREDIT
Effective June 14, 2021, the Portfolios, in addition to certain other funds managed by the Investment Adviser, entered into a 364-day unsecured committed revolving line of credit agreement (the “Credit Agreement”) with The Bank of New York Mellon (“BNY”) for an aggregate amount of $400,000,000 through June 13, 2022. The proceeds may be used only to finance temporarily: (1) the purchase or sale of investment securities; or (2) the repurchase or redemption of shares of a Portfolio or certain other funds managed by the Investment Adviser. The funds to which the
line of credit is available pay a commitment fee equal to 0.15% per annum on the daily unused portion of the committed line amount payable quarterly in arrears. Prior to June 14, 2021, the predecessor line of credit was for an aggregate amount of $400,000,000 and the funds to which the line of credit was available paid a commitment fee equal to 0.15% per annum on the daily unused portion of the committed line amount through June 14, 2021.
Borrowings under the Credit Agreement accrue interest at the federal funds rate plus a specified margin. Repayments generally must be made within 60 days after the date of a revolving credit advance.
The following Portfolio utilized the line of credit during the year ended December 31, 2021:
| Portfolio | Days Utilized | Approximate Average Daily Balance For Days Utilized | Approximate Weighted Average Interest Rate For Days Utilized | |||||||||||
|---|---|---|---|---|---|---|---|---|---|---|---|---|---|---|
| Moderate | 1 | $ | 842,000 | 1.28 | % | |||||||||
NOTE 9 — CAPITAL SHARES
Transactions in capital shares and dollars were as follows:
| Shares sold | Shares issued in merger | Reinvestment of distributions | Shares redeemed | Net increase (decrease) in shares outstanding | Shares sold | Proceeds from shares issued in merger | Reinvestment of distributions | Shares redeemed | Net increase (decrease) | |||||||||||||||||||||||||||||
| Year or period ended | # | # | # | # | # | ($) | ($) | ($) | ($) | ($) | ||||||||||||||||||||||||||||
Conservative | ||||||||||||||||||||||||||||||||||||||
Class ADV | ||||||||||||||||||||||||||||||||||||||
12/31/2021 | 2,390,724 | — | 1,862,588 | (6,882,246 | ) | (2,628,934 | ) | 23,614,196 | — | 18,141,610 | (67,863,314) | (26,107,508 | ) | |||||||||||||||||||||||||
12/31/2020 | 4,256,388 | — | 1,944,966 | (6,634,142 | ) | (432,788 | ) | 39,635,918 | — | 17,990,939 | (62,155,170) | (4,528,313 | ) | |||||||||||||||||||||||||
Class I | ||||||||||||||||||||||||||||||||||||||
12/31/2021 | 87,363 | — | 8,174 | (84,668 | ) | 10,869 | 886,477 | — | 80,926 | (845,158) | 122,245 | |||||||||||||||||||||||||||
12/31/2020 | 125,961 | — | 1,152 | (12,611 | ) | 114,502 | 1,207,188 | — | 10,824 | (120,104) | 1,097,908 | |||||||||||||||||||||||||||
Growth | ||||||||||||||||||||||||||||||||||||||
Class ADV | ||||||||||||||||||||||||||||||||||||||
12/31/2021 | 646,812 | — | 10,116,192 | (26,649,135 | ) | (15,886,131 | ) | 9,434,803 | — | 145,167,348 | (387,480,726) | (232,878,575 | ) | |||||||||||||||||||||||||
12/31/2020 | 321,392 | — | 12,825,438 | (28,472,537 | ) | (15,325,707 | ) | 4,052,122 | — | 153,007,477 | (355,248,330) | (198,188,731 | ) | |||||||||||||||||||||||||
Class I | ||||||||||||||||||||||||||||||||||||||
12/31/2021 | 107,768 | — | 226,272 | (480,763 | ) | (146,723 | ) | 1,585,771 | — | 3,262,838 | (6,948,458) | (2,099,849 | ) | |||||||||||||||||||||||||
12/31/2020 | 133,896 | — | 265,888 | (355,170 | ) | 44,614 | 1,677,105 | — | 3,182,685 | (4,517,625) | 342,165 | |||||||||||||||||||||||||||
Moderate | ||||||||||||||||||||||||||||||||||||||
Class ADV | ||||||||||||||||||||||||||||||||||||||
12/31/2021 | 1,590,620 | — | 4,720,905 | (10,918,360 | ) | (4,606,835 | ) | 19,787,504 | — | 57,925,502 | (136,357,563) | (58,644,557 | ) | |||||||||||||||||||||||||
12/31/2020 | 1,301,983 | — | 4,732,864 | (12,598,365 | ) | (6,563,518 | ) | 14,929,166 | — | 52,487,462 | (143,122,779) | (75,706,151 | ) | |||||||||||||||||||||||||
Class I | ||||||||||||||||||||||||||||||||||||||
12/31/2021 | 194,342 | — | 126,682 | (129,888 | ) | 191,136 | 2,502,121 | — | 1,574,654 | (1,651,916) | 2,424,859 | |||||||||||||||||||||||||||
12/31/2020 | 207,289 | — | 112,693 | (305,055 | ) | 14,927 | 2,394,915 | — | 1,264,412 | (3,533,153) | 126,174 | |||||||||||||||||||||||||||
Moderate Growth | ||||||||||||||||||||||||||||||||||||||
Class ADV | ||||||||||||||||||||||||||||||||||||||
12/31/2021 | 943,234 | — | 7,918,005 | (19,174,038 | ) | (10,312,799 | ) | 12,618,352 | — | 103,884,225 | (255,066,226) | (138,563,649 | ) | |||||||||||||||||||||||||
12/31/2020 | 930,035 | — | 9,576,463 | (20,975,881 | ) | (10,469,383 | ) | 11,039,280 | — | 108,214,036 | (246,168,011) | (126,914,695 | ) | |||||||||||||||||||||||||
Class I | ||||||||||||||||||||||||||||||||||||||
12/31/2021 | 110,468 | — | 133,369 | (116,047 | ) | 127,790 | 1,471,069 | — | 1,729,803 | (1,531,210) | 1,669,662 | |||||||||||||||||||||||||||
12/31/2020 | 93,413 | — | 139,101 | (158,133 | ) | 74,381 | 1,102,976 | — | 1,553,762 | (1,841,031) | 815,707 | |||||||||||||||||||||||||||
21
NOTES TO FINANCIAL STATEMENTS AS OF DECEMBER 31, 2021 (CONTINUED)
NOTE 10 — FEDERAL INCOME TAXES
The amount of distributions from net investment income and net realized capital gains are determined in accordance with federal income tax regulations, which may differ from GAAP for investment companies. These book/tax differences may be either temporary or permanent. Permanent differences are reclassified within the capital accounts based on their federal tax-basis treatment; temporary differences are not reclassified. Key differences include the treatment of short-term capital gains and wash sale deferrals.
Dividends paid by the Portfolios from net investment income and distributions of net realized short-term capital gains are, for federal income tax purposes, taxable as ordinary income to shareholders.
The tax composition of dividends and distributions to shareholders was as follows:
| Year Ended December 31, 2021 | Year Ended December 31, 2020 | ||||||||||||||||||||
|---|---|---|---|---|---|---|---|---|---|---|---|---|---|---|---|---|---|---|---|---|---|
| Ordinary Income | Long-term Capital Gains | Ordinary Income | Long-term Capital Gains | ||||||||||||||||||
| Conservative | $ | 10,978,229 | $ | 7,244,352 | $ | 9,996,344 | $ | 8,005,461 | |||||||||||||
| Growth | 43,273,510 | 105,156,676 | 56,076,516 | 100,113,646 | |||||||||||||||||
| Moderate | 18,955,420 | 40,544,736 | 21,827,057 | 31,924,817 | |||||||||||||||||
| Moderate Growth | 31,051,381 | 74,562,647 | 37,863,570 | 71,904,228 | |||||||||||||||||
The tax-basis components of distributable earnings as of December 31, 2021 were:
| Undistributed Ordinary Income | Undistributed Long-term Capital Gains | Unrealized Appreciation/ (Depreciation) | Other | Total Distributable Earnings/(Loss) | |||||||||||||||||
|---|---|---|---|---|---|---|---|---|---|---|---|---|---|---|---|---|---|---|---|---|---|
| Conservative | $ | 9,792,019 | $ | 31,827,514 | $ | 60,043,369 | $ | (9,187 | ) | $101,653,715 | |||||||||||
| Growth | 23,174,589 | 271,861,706 | 420,410,095 | (89,161 | ) | 715,357,229 | |||||||||||||||
| Moderate | 13,909,318 | 90,371,992 | 92,855,577 | (32,095 | ) | 197,104,792 | |||||||||||||||
| Moderate Growth | 19,277,382 | 169,897,861 | 251,736,839 | (55,846 | ) | 440,856,236 | |||||||||||||||
At December 31, 2021, the Portfolios did not have any capital loss carryovers for U.S. federal income tax purposes.
The Portfolios’ major tax jurisdictions are U.S. federal, Arizona state, and Massachusetts state.
As of December 31, 2021, no provision for income tax is required in the Portfolios’ financial statements as a result of tax positions taken on federal and state income tax returns for open tax years. The Portfolios’ federal and state income and federal excise tax returns for tax years for which the applicable statutes of limitations have not expired are subject to examination by the Internal Revenue Service and state department of revenue. Generally, the preceding four tax years remain subject to examination by these jurisdictions.
NOTE 11 — LONDON INTERBANK OFFERED RATE (“LIBOR”)
In 2017, the UK Financial Conduct Authority announced its intention to cease compelling banks to provide the quotations needed to sustain LIBOR after 2021. On March 5, 2021, ICE Benchmark Administration, the administrator of LIBOR, stated that non-U.S. dollar LIBOR reference rates and the one-week and two-month LIBOR reference rates will cease to be provided or no longer be representative immediately after December 31, 2021 and the remaining more commonly used LIBOR settings will cease to be provided or no longer be representative immediately after June 30, 2023. In addition, global regulators have announced that, with limited exceptions, no new LIBOR-based contracts should be entered into after 2021. Actions by regulators have resulted in the establishment of alternative reference rates to LIBOR in most major currencies (e.g., the Secured Overnight Financing Rate for U.S. Dollar LIBOR and the Sterling Overnight Interbank Average Rate for Sterling LIBOR).
Discontinuance of LIBOR and adoption/implementation of alternative rates pose a number of risks, including among others whether any substitute rate will experience the market participation and liquidity necessary to provide a workable substitute for LIBOR; the effect on parties’ existing contractual arrangements, hedging transactions, and investment strategies generally from a conversion from LIBOR to alternative rates; the effect on a Portfolio’s existing investments (including, for example, fixed-income investments; senior loans; CLOs and CDOs; and derivatives transactions), including the possibility that some of those investments may terminate or their terms may be adjusted to the disadvantage of a Portfolio; and the risk of general market disruption during the period of the conversion. It is difficult to predict at this time the likely impact of the transition away from LIBOR on a Portfolio.
22
NOTES TO FINANCIAL STATEMENTS AS OF DECEMBER 31, 2021 (CONTINUED)
NOTE 12 — MARKET DISRUPTION
A Portfolio is subject to the risk that geopolitical events will disrupt securities markets and adversely affect global economies and markets. Due to the increasing interdependence among global economies and markets, conditions in one country, market, or region might adversely impact markets, issuers and/or foreign exchange rates in other countries, including the United States. Wars, terrorism, global health crises and pandemics, and other geopolitical events have led, and in the future may lead, to increased market volatility and may have adverse short- or long-term effects on U.S. and world economies and markets generally. For example, the COVID-19 pandemic has resulted, and may continue to result, in significant market volatility, exchange trading suspensions and closures, declines in global financial markets, higher default rates, and a substantial economic downturn in economies throughout the world. Natural and environmental disasters and systemic market dislocations are also highly disruptive to economies and markets. Those events as well as other changes in non-U.S. and domestic economic, social, and political conditions also could adversely affect individual issuers or related groups of issuers, securities markets, interest rates, credit ratings, inflation, investor sentiment, and other factors affecting the value of the investments of the portfolio and of the Portfolios. Any of these occurrences could disrupt the operations of a Portfolio and of the Portfolios’ service providers.
NOTE 13 — OTHER ACCOUNTING PRONOUNCEMENTS
In March 2020, the Financial Accounting Standards Board issued Accounting Standards Update No. 2020-04 (“ASU 2020-04”), Reference Rate Reform (Topic 848) — Facilitation of the Effects of Reference Rate Reform on Financial Reporting. The amendments in ASU 2020-04 provide optional temporary financial reporting relief from the effect of certain types of contract modifications due to the planned discontinuation of LIBOR and other interbank-offered based reference rates as of the end of 2021. ASU 2020-04 is effective for certain reference rate-related contract modifications that occur during the period March 12, 2020 through December 31, 2022. Management is currently evaluating the impact, if any, of applying ASU 2020-04.
NOTE 14 — SUBSEQUENT EVENTS
The Portfolios have evaluated events occurring after the Statements of Assets and Liabilities date through the date that the financial statements were issued (“subsequent events”) to determine whether any subsequent events necessitated adjustment to or disclosure in the financial statements. No such subsequent events were identified.
23
| VOYA RETIREMENT CONSERVATIVE PORTFOLIO | PORTFOLIO OF INVESTMENTS AS OF DECEMBER 31, 2021 |
| Shares | Value | Percentage of Net Assets | ||||||||||||
|---|---|---|---|---|---|---|---|---|---|---|---|---|---|---|
MUTUAL FUNDS: 100.1% | ||||||||||||||
Affiliated Investment Companies: 100.1% | ||||||||||||||
| 611,524 | Voya Emerging Markets Index Portfolio — Class I | $ | 8,059,890 | 1.9 | ||||||||||
| 1,034,227 | Voya International Index Portfolio — Class I | 12,452,094 | 3.0 | |||||||||||
| 869,711 | Voya RussellTM Mid Cap Index Portfolio — Class I | 12,610,807 | 3.0 | |||||||||||
| 3,389,558 | Voya Short Term Bond Fund — Class R6 | 33,488,829 | 8.0 | |||||||||||
| 25,346,088 | Voya U.S. Bond Index Portfolio — Class I | 272,470,443 | 64.6 | |||||||||||
| Shares | Value | Percentage of Net Assets | ||||||||||||
|---|---|---|---|---|---|---|---|---|---|---|---|---|---|---|
MUTUAL FUNDS: (continued) | ||||||||||||||
Affiliated Investment Companies: (continued) | ||||||||||||||
| 3,784,115 | Voya U.S. Stock Index Portfolio — Class I | $ | 82,758,598 | 19.6 | ||||||||||
Total Mutual Funds (Cost $357,278,494) | 421,840,661 | 100.1 | ||||||||||||
Liabilities in Excess of Other Assets | (220,490 | ) | (0.1 | ) | ||||||||||
Net Assets | $ | 421,620,171 | 100.0 | |||||||||||
Fair Value Measurements^
The following is a summary of the fair valuations according to the inputs used as of December 31, 2021 in valuing the assets and liabilities:
| Quoted Prices in Active Markets for Identical Investments (Level 1) | Significant Other Observable Inputs (Level 2) | Significant Unobservable Inputs (Level 3) | Fair Value at December 31, 2021 | ||||||||||||||||||
|---|---|---|---|---|---|---|---|---|---|---|---|---|---|---|---|---|---|---|---|---|---|
Asset Table | |||||||||||||||||||||
Investments, at fair value | |||||||||||||||||||||
| Mutual Funds | $ | 421,840,661 | $ | — | $ | — | $ | 421,840,661 | |||||||||||||
| Total Investments, at fair value | $ | 421,840,661 | $ | — | $ | — | $ | 421,840,661 | |||||||||||||
| ^ | See Note 2, “Significant Accounting Policies” in the Notes to Financial Statements for additional information. |
Transactions with Affiliates
An investment of at least 5% of the voting securities of an issuer, or a company which is under common control with the issuer, results in that issuer becoming an affiliated person as defined by the 1940 Act.
The following table provides transactions during the year ended December 31, 2021, where the following issuers were considered an affiliate:
| Issuer | Beginning Fair Value at 12/31/2020 | Purchases at Cost | Sales at Cost | Change in Unrealized Appreciation/ (Depreciation) | Ending Fair Value at 12/31/2021 | Investment Income | Realized Gains/ (Losses) | Net Capital Gain Distributions | ||||||||||||||||||||||||||
|---|---|---|---|---|---|---|---|---|---|---|---|---|---|---|---|---|---|---|---|---|---|---|---|---|---|---|---|---|---|---|---|---|---|---|
| Voya Emerging Markets Index Portfolio — Class I | $ | 9,280,900 | $ | 1,405,922 | $ | (2,017,684 | ) | $ | (609,248 | ) | $ | 8,059,890 | $ | 78,419 | $ | 274,635 | $ | — | ||||||||||||||||
| Voya International Index Portfolio — Class I | 13,658,141 | 787,657 | (2,727,771 | ) | 734,067 | 12,452,094 | 264,723 | 331,986 | — | |||||||||||||||||||||||||
| Voya RussellTM Mid Cap Index Portfolio — Class I | 9,153,616 | 5,524,588 | (2,488,364 | ) | 420,967 | 12,610,807 | 80,737 | 695,819 | 774,471 | |||||||||||||||||||||||||
| Voya Short Term Bond Fund — Class R6 | — | 36,103,503 | (2,282,676 | ) | (331,998 | ) | 33,488,829 | 225,118 | (9,482 | ) | — | |||||||||||||||||||||||
| Voya U.S. Bond Index Portfolio — Class I | 269,762,180 | 58,419,036 | (42,638,087 | ) | (13,072,686 | ) | 272,470,443 | 5,715,640 | (917,751 | ) | 3,253,412 | |||||||||||||||||||||||
| Voya U.S. Stock Index Portfolio — Class I | 104,095,213 | 11,656,598 | (29,814,351 | ) | (3,178,862 | ) | 82,758,598 | 848,087 | 18,033,469 | 7,642,433 | ||||||||||||||||||||||||
| $ | 405,950,050 | $ | 113,897,304 | $ | (81,968,933 | ) | $ | (16,037,760 | ) | $ | 421,840,661 | $ | 7,212,724 | $ | 18,408,676 | $ | 11,670,316 | |||||||||||||||||
The financial statements for the above mutual fund[s] can be found at www.sec.gov.
See Accompanying Notes to Financial Statements
24
| VOYA RETIREMENT CONSERVATIVE PORTFOLIO | PORTFOLIO OF INVESTMENTS AS OF DECEMBER 31, 2021 (CONTINUED) |
At December 31, 2021, the aggregate cost of securities and other investments and the composition of unrealized appreciation and depreciation of securities and other investments on a tax basis were:
| Cost for federal income tax purposes was $361,797,292. | ||||||
| Net unrealized appreciation consisted of: | ||||||
| Gross Unrealized Appreciation | $ | 64,894,165 | ||||
| Gross Unrealized Depreciation | (4,850,796 | ) | ||||
| Net Unrealized Appreciation | $ | 60,043,369 | ||||
See Accompanying Notes to Financial Statements
25
| VOYA RETIREMENT GROWTH PORTFOLIO | PORTFOLIO OF INVESTMENTS AS OF DECEMBER 31, 2021 |
| Shares | Value | Percentage of Net Assets | ||||||||||||
|---|---|---|---|---|---|---|---|---|---|---|---|---|---|---|
MUTUAL FUNDS: 100.1% | ||||||||||||||
Affiliated Investment Companies: 100.1% | ||||||||||||||
| 10,930,680 | Voya Emerging Markets Index Portfolio — Class I | $ | 144,066,359 | 5.7 | ||||||||||
| 22,595,731 | Voya International Index Portfolio — Class I | 272,052,604 | 10.7 | |||||||||||
| 15,546,489 | Voya RussellTM Mid Cap Index Portfolio — Class I | 225,424,090 | 8.9 | |||||||||||
| 2,761,155 | Voya RussellTM Small Cap Index Portfolio — Class I | 48,844,840 | 1.9 | |||||||||||
| 12,621,327 | Voya Short Term Bond Fund — Class R6 | 124,698,711 | 4.9 | |||||||||||
| 37,170,371 | Voya U.S. Bond Index Portfolio — Class I | 399,581,489 | 15.8 | |||||||||||
| Shares | Value | Percentage of Net Assets | ||||||||||||
|---|---|---|---|---|---|---|---|---|---|---|---|---|---|---|
MUTUAL FUNDS: (continued) | ||||||||||||||
Affiliated Investment Companies: (continued) | ||||||||||||||
| 60,535,098 | Voya U.S. Stock Index Portfolio — Class I | $ | 1,323,902,598 | 52.2 | ||||||||||
Total Mutual Funds (Cost $2,100,297,873) | 2,538,570,691 | 100.1 | ||||||||||||
Liabilities in Excess of Other Assets | (1,549,905 | ) | (0.1 | ) | ||||||||||
Net Assets | $ | 2,537,020,786 | 100.0 | |||||||||||
Fair Value Measurements^
The following is a summary of the fair valuations according to the inputs used as of December 31, 2021 in valuing the assets and liabilities:
| Quoted Prices in Active Markets for Identical Investments (Level 1) | Significant Other Observable Inputs (Level 2) | Significant Unobservable Inputs (Level 3) | Fair Value at December 31, 2021 | ||||||||||||||||||
|---|---|---|---|---|---|---|---|---|---|---|---|---|---|---|---|---|---|---|---|---|---|
Asset Table | |||||||||||||||||||||
Investments, at fair value | |||||||||||||||||||||
| Mutual Funds | $ | 2,538,570,691 | $ | — | $ | — | $ | 2,538,570,691 | |||||||||||||
| Total Investments, at fair value | $ | 2,538,570,691 | $ | — | $ | — | $ | 2,538,570,691 | |||||||||||||
| ^ | See Note 2, “Significant Accounting Policies” in the Notes to Financial Statements for additional information. |
Transactions with Affiliates
An investment of at least 5% of the voting securities of an issuer, or a company which is under common control with the issuer, results in that issuer becoming an affiliated person as defined by the 1940 Act.
The following table provides transactions during the year ended December 31, 2021, where the following issuers were considered an affiliate:
| Issuer | Beginning Fair Value at 12/31/2020 | Purchases at Cost | Sales at Cost | Change in Unrealized Appreciation/ (Depreciation) | Ending Fair Value at 12/31/2021 | Investment Income | Realized Gains/ (Losses) | Net Capital Gain Distributions | ||||||||||||||||||||||||||
|---|---|---|---|---|---|---|---|---|---|---|---|---|---|---|---|---|---|---|---|---|---|---|---|---|---|---|---|---|---|---|---|---|---|---|
| Voya Emerging Markets Index Portfolio — Class I | $ | 131,025,942 | $ | 52,607,988 | $ | (27,649,853 | ) | $ | (11,917,718 | ) | $ | 144,066,359 | $ | 1,174,836 | $ | 3,869,184 | $ | — | ||||||||||||||||
| Voya International Index Portfolio — Class I | 282,789,434 | 18,018,785 | (43,859,419 | ) | 15,103,804 | 272,052,604 | 5,816,506 | 7,973,136 | — | |||||||||||||||||||||||||
| Voya RussellTM Mid Cap Index Portfolio — Class I | 180,962,300 | 69,905,486 | (47,399,793 | ) | 21,956,097 | 225,424,090 | 1,693,145 | (1,380,294 | ) | 16,241,514 | ||||||||||||||||||||||||
| Voya RussellTM Small Cap Index Portfolio — Class I | 53,641,387 | 4,209,255 | (11,845,720 | ) | 2,839,918 | 48,844,840 | 307,268 | 3,862,823 | — | |||||||||||||||||||||||||
| Voya Short Term Bond Fund — Class R6 | — | 135,507,917 | (9,580,483 | ) | (1,228,723 | ) | 124,698,711 | 838,678 | (41,955 | ) | — | |||||||||||||||||||||||
| Voya U.S. Bond Index Portfolio — Class I | 523,151,303 | 105,556,674 | (195,731,509 | ) | (33,394,979 | ) | 399,581,489 | 10,209,727 | 8,749,113 | 4,782,295 | ||||||||||||||||||||||||
| Voya U.S. Stock Index Portfolio — Class I | 1,277,778,093 | 158,761,177 | (193,764,357 | ) | 81,127,685 | 1,323,902,598 | 13,588,246 | 110,259,482 | 122,141,315 | |||||||||||||||||||||||||
| $ | 2,449,348,459 | $ | 544,567,282 | $ | (529,831,134 | ) | $ | 74,486,084 | $ | 2,538,570,691 | $ | 33,628,406 | $ | 133,291,489 | $ | 143,165,124 | ||||||||||||||||||
The financial statements for the above mutual fund[s] can be found at www.sec.gov.
See Accompanying Notes to Financial Statements
26
| VOYA RETIREMENT GROWTH PORTFOLIO | PORTFOLIO OF INVESTMENTS AS OF DECEMBER 31, 2021 (CONTINUED) |
At December 31, 2021, the aggregate cost of securities and other investments and the composition of unrealized appreciation and depreciation of securities and other investments on a tax basis were:
| Cost for federal income tax purposes was $2,118,160,596. | ||||||
| Net unrealized appreciation consisted of: | ||||||
| Gross Unrealized Appreciation | $ | 447,896,056 | ||||
| Gross Unrealized Depreciation | (27,485,961 | ) | ||||
| Net Unrealized Appreciation | $ | 420,410,095 | ||||
See Accompanying Notes to Financial Statements
27
| VOYA RETIREMENT MODERATE PORTFOLIO | PORTFOLIO OF INVESTMENTS AS OF DECEMBER 31, 2021 |
| Shares | Value | Percentage of Net Assets | ||||||||||||
|---|---|---|---|---|---|---|---|---|---|---|---|---|---|---|
MUTUAL FUNDS: 100.1% | ||||||||||||||
Affiliated Investment Companies: 100.1% | ||||||||||||||
| 2,137,980 | Voya Emerging Markets Index Portfolio — Class I | $ | 28,178,572 | 2.8 | ||||||||||
| 4,017,716 | Voya International Index Portfolio — Class I | 48,373,296 | 4.9 | |||||||||||
| 2,702,876 | Voya RussellTM Mid Cap Index Portfolio — Class I | 39,191,704 | 4.0 | |||||||||||
| 7,899,350 | Voya Short Term Bond Fund — Class R6 | 78,045,580 | 7.9 | |||||||||||
| 40,893,082 | Voya U.S. Bond Index Portfolio — Class I | 439,600,632 | 44.5 | |||||||||||
| Shares | Value | Percentage of Net Assets | ||||||||||||
|---|---|---|---|---|---|---|---|---|---|---|---|---|---|---|
MUTUAL FUNDS: (continued) | ||||||||||||||
Affiliated Investment Companies: (continued) | ||||||||||||||
| 16,249,662 | Voya U.S. Stock Index Portfolio — Class I | $ | 355,380,105 | 36.0 | ||||||||||
Total Mutual Funds (Cost $885,298,153) | 988,769,889 | 100.1 | ||||||||||||
Liabilities in Excess of Other Assets | (550,840 | ) | (0.1 | ) | ||||||||||
Net Assets | $ | 988,219,049 | 100.0 | |||||||||||
Fair Value Measurements^
The following is a summary of the fair valuations according to the inputs used as of December 31, 2021 in valuing the assets and liabilities:
| Quoted Prices in Active Markets for Identical Investments (Level 1) | Significant Other Observable Inputs (Level 2) | Significant Unobservable Inputs (Level 3) | Fair Value at December 31, 2021 | ||||||||||||||||||
|---|---|---|---|---|---|---|---|---|---|---|---|---|---|---|---|---|---|---|---|---|---|
Asset Table | |||||||||||||||||||||
Investments, at fair value | |||||||||||||||||||||
| Mutual Funds | $ | 988,769,889 | $ | — | $ | — | $ | 988,769,889 | |||||||||||||
| Total Investments, at fair value | $ | 988,769,889 | $ | — | $ | — | $ | 988,769,889 | |||||||||||||
| ^ | See Note 2, “Significant Accounting Policies” in the Notes to Financial Statements for additional information. |
Transactions with Affiliates
An investment of at least 5% of the voting securities of an issuer, or a company which is under common control with the issuer, results in that issuer becoming an affiliated person as defined by the 1940 Act.
The following table provides transactions during the year ended December 31, 2021, where the following issuers were considered an affiliate:
| Issuer | Beginning Fair Value at 12/31/2020 | Purchases at Cost | Sales at Cost | Change in Unrealized Appreciation/ (Depreciation) | Ending Fair Value at 12/31/2021 | Investment Income | Realized Gains/ (Losses) | Net Capital Gain Distributions | ||||||||||||||||||||||||||
|---|---|---|---|---|---|---|---|---|---|---|---|---|---|---|---|---|---|---|---|---|---|---|---|---|---|---|---|---|---|---|---|---|---|---|
| Voya Emerging Markets Index Portfolio — Class I | $ | 31,385,258 | $ | 4,947,299 | $ | (5,790,173 | ) | $ | (2,363,812 | ) | $ | 28,178,572 | $ | 273,141 | $ | 1,171,893 | $ | — | ||||||||||||||||
| Voya International Index Portfolio — Class I | 51,316,689 | 2,303,870 | (7,922,051 | ) | 2,674,788 | 48,373,296 | 1,024,455 | 1,427,490 | — | |||||||||||||||||||||||||
| Voya RussellTM Mid Cap Index Portfolio — Class I | 30,957,952 | 13,287,313 | (7,445,623 | ) | 2,392,062 | 39,191,704 | 281,193 | 1,181,875 | 2,697,351 | |||||||||||||||||||||||||
| Voya Short Term Bond Fund — Class R6 | — | 83,741,640 | (4,923,873 | ) | (772,187 | ) | 78,045,580 | 523,505 | (22,090 | ) | — | |||||||||||||||||||||||
| Voya U.S. Bond Index Portfolio — Class I | 407,923,533 | 115,689,533 | (61,349,206 | ) | (22,663,228 | ) | 439,600,632 | 8,939,663 | 960,337 | 5,210,134 | ||||||||||||||||||||||||
| Voya U.S. Stock Index Portfolio — Class I | 397,896,436 | 39,461,203 | (101,065,662 | ) | 19,088,128 | 355,380,105 | 3,643,300 | 39,061,803 | 32,626,629 | |||||||||||||||||||||||||
| $ | 919,479,868 | $ | 259,430,858 | $ | (188,496,588 | ) | $ | (1,644,249 | ) | $ | 988,769,889 | $ | 14,685,257 | $ | 43,781,308 | $ | 40,534,114 | |||||||||||||||||
The financial statements for the above mutual fund[s] can be found at www.sec.gov.
See Accompanying Notes to Financial Statements
28
| VOYA RETIREMENT MODERATE PORTFOLIO | PORTFOLIO OF INVESTMENTS AS OF DECEMBER 31, 2021 (CONTINUED) |
At December 31, 2021, the aggregate cost of securities and other investments and the composition of unrealized appreciation and depreciation of securities and other investments on a tax basis were:
| Cost for federal income tax purposes was $895,914,312. | ||||||
| Net unrealized appreciation consisted of: | ||||||
| Gross Unrealized Appreciation | $ | 107,716,444 | ||||
| Gross Unrealized Depreciation | (14,860,867 | ) | ||||
| Net Unrealized Appreciation | $ | 92,855,577 | ||||
See Accompanying Notes to Financial Statements
29
| VOYA RETIREMENT MODERATE GROWTH PORTFOLIO | PORTFOLIO OF INVESTMENTS AS OF DECEMBER 31, 2021 |
| Shares | Value | Percentage of Net Assets | ||||||||||||
|---|---|---|---|---|---|---|---|---|---|---|---|---|---|---|
MUTUAL FUNDS: 100.1% | ||||||||||||||
Affiliated Investment Companies: 100.1% | ||||||||||||||
| 5,017,069 | Voya Emerging Markets Index Portfolio — Class I | $ | 66,124,966 | 3.8 | ||||||||||
| 9,898,859 | Voya International Index Portfolio — Class I | 119,182,258 | 6.8 | |||||||||||
| 7,134,686 | Voya RussellTM Mid Cap Index Portfolio — Class I | 103,452,952 | 5.9 | |||||||||||
| 8,688,210 | Voya Short Term Bond Fund — Class R6 | 85,839,511 | 4.9 | |||||||||||
| 44,777,512 | Voya U.S. Bond Index Portfolio — Class I | 481,358,254 | 27.6 | |||||||||||
| Shares | Value | Percentage of Net Assets | ||||||||||||
|---|---|---|---|---|---|---|---|---|---|---|---|---|---|---|
MUTUAL FUNDS: (continued) | ||||||||||||||
Affiliated Investment Companies: (continued) | ||||||||||||||
| 40,850,644 | Voya U.S. Stock Index Portfolio — Class I | $ | 893,403,583 | 51.1 | ||||||||||
Total Mutual Funds (Cost $1,483,305,973) | 1,749,361,524 | 100.1 | ||||||||||||
Liabilities in Excess of Other Assets | (1,028,663 | ) | (0.1 | ) | ||||||||||
Net Assets | $ | 1,748,332,861 | 100.0 | |||||||||||
Fair Value Measurements^
The following is a summary of the fair valuations according to the inputs used as of December 31, 2021 in valuing the assets and liabilities:
| Quoted Prices in Active Markets for Identical Investments (Level 1) | Significant Other Observable Inputs (Level 2) | Significant Unobservable Inputs (Level 3) | Fair Value at December 31, 2021 | ||||||||||||||||||
|---|---|---|---|---|---|---|---|---|---|---|---|---|---|---|---|---|---|---|---|---|---|
Asset Table | |||||||||||||||||||||
Investments, at fair value | |||||||||||||||||||||
| Mutual Funds | $ | 1,749,361,524 | $ | — | $ | — | $ | 1,749,361,524 | |||||||||||||
| Total Investments, at fair value | $ | 1,749,361,524 | $ | — | $ | — | $ | 1,749,361,524 | |||||||||||||
| ^ | See Note 2, “Significant Accounting Policies” in the Notes to Financial Statements for additional information. |
Transactions with Affiliates
An investment of at least 5% of the voting securities of an issuer, or a company which is under common control with the issuer, results in that issuer becoming an affiliated person as defined by the 1940 Act.
The following table provides transactions during the year ended December 31, 2021, where the following issuers were considered an affiliate:
| Issuer | Beginning Fair Value at 12/31/2020 | Purchases at Cost | Sales at Cost | Change in Unrealized Appreciation/ (Depreciation) | Ending Fair Value at 12/31/2021 | Investment Income | Realized Gains/ (Losses) | Net Capital Gain Distributions | ||||||||||||||||||||||||||
|---|---|---|---|---|---|---|---|---|---|---|---|---|---|---|---|---|---|---|---|---|---|---|---|---|---|---|---|---|---|---|---|---|---|---|
| Voya Emerging Markets Index Portfolio — Class I | $ | 72,636,240 | $ | 12,693,078 | $ | (13,898,448 | ) | $ | (5,305,904 | ) | $ | 66,124,966 | $ | 643,454 | $ | 2,448,441 | $ | — | ||||||||||||||||
| Voya International Index Portfolio — Class I | 124,705,545 | 7,378,307 | (19,469,034 | ) | 6,567,440 | 119,182,258 | 2,534,032 | 3,495,270 | — | |||||||||||||||||||||||||
| Voya RussellTM Mid Cap Index Portfolio — Class I | 71,650,321 | 42,651,398 | (17,879,758 | ) | 7,030,991 | 103,452,952 | 662,388 | 1,819,999 | 6,353,964 | |||||||||||||||||||||||||
| Voya Short Term Bond Fund — Class R6 | — | 93,069,128 | (6,383,708 | ) | (845,909 | ) | 85,839,511 | 575,224 | (25,496 | ) | — | |||||||||||||||||||||||
| Voya U.S. Bond Index Portfolio — Class I | 501,027,094 | 97,930,086 | (89,506,859 | ) | (28,092,067 | ) | 481,358,254 | 10,539,683 | 2,600,363 | 5,744,908 | ||||||||||||||||||||||||
| Voya U.S. Stock Index Portfolio — Class I | 885,471,919 | 92,586,277 | (150,626,754 | ) | 65,972,141 | 893,403,583 | 9,161,004 | 65,027,446 | 82,365,423 | |||||||||||||||||||||||||
| $ | 1,655,491,119 | $ | 346,308,274 | $ | (297,764,561 | ) | $ | 45,326,692 | $ | 1,749,361,524 | $ | 24,115,785 | $ | 75,366,023 | $ | 94,464,295 | ||||||||||||||||||
The financial statements for the above mutual fund[s] can be found at www.sec.gov.
See Accompanying Notes to Financial Statements
30
| VOYA RETIREMENT MODERATE GROWTH PORTFOLIO | PORTFOLIO OF INVESTMENTS AS OF DECEMBER 31, 2021 (CONTINUED) |
At December 31, 2021, the aggregate cost of securities and other investments and the composition of unrealized appreciation and depreciation of securities and other investments on a tax basis were:
| Cost for federal income tax purposes was $1,497,624,685. | ||||||
| Net unrealized appreciation consisted of: | ||||||
| Gross Unrealized Appreciation | $ | 270,669,658 | ||||
| Gross Unrealized Depreciation | (18,932,819 | ) | ||||
| Net Unrealized Appreciation | $ | 251,736,839 | ||||
See Accompanying Notes to Financial Statements
31
| Portfolio Name | Type | Per Share Amount | ||||
|---|---|---|---|---|---|---|
| Voya Retirement Conservative Portfolio | ||||||
| Class ADV | NII | $ | 0.2132 | |||
| Class I | NII | $ | 0.2392 | |||
| All Classes | STCG | $ | 0.0431 | |||
| All Classes | LTCG | $ | 0.1692 | |||
| Voya Retirement Growth Portfolio | ||||||
| Class ADV | NII | $ | 0.2530 | |||
| Class I | NII | $ | 0.3129 | |||
| All Classes | LTCG | $ | 0.6178 | |||
| Portfolio Name | Type | Per Share Amount | ||||
|---|---|---|---|---|---|---|
| Voya Retirement Moderate Portfolio | ||||||
| Class ADV | NII | $ | 0.2438 | |||
| Class I | NII | $ | 0.2871 | |||
| All Classes | LTCG | $ | 0.5238 | |||
| Voya Retirement Moderate Growth Portfolio | ||||||
| Class ADV | NII | $ | 0.2415 | |||
| Class I | NII | $ | 0.2926 | |||
| All Classes | LTCG | $ | 0.5818 | |||
NII — Net investment income
STCG — Short-term capital gain
LTCG — Long-term capital gain
| Voya Retirement Conservative Portfolio | 17.87% | ||
| Voya Retirement Growth Portfolio | 57.32% | ||
| Voya Retirement Moderate Portfolio | 39.52% | ||
| Voya Retirement Moderate Growth Portfolio | 53.21% |
| Voya Retirement Conservative Portfolio | $ | 7,244,352 | ||
| Voya Retirement Growth Portfolio | $ | 105,156,676 | ||
| Voya Retirement Moderate Portfolio | $ | 40,544,736 | ||
| Voya Retirement Moderate Growth Portfolio | $ | 74,562,647 |
| Creditable Foreign Taxes Paid | Per Share Amount | Portion of Ordinary Income Distribution Derived from Foreign Sourced Income* | |||||||||
|---|---|---|---|---|---|---|---|---|---|---|---|
| Voya Retirement Conservative Portfolio | $ | 40,583 | $ | 0.0010 | 2.81% | ||||||
| Voya Retirement Growth Portfolio | $ | 807,550 | $ | 0.0048 | 16.59% | ||||||
| Voya Retirement Moderate Portfolio | $ | 149,930 | $ | 0.0019 | 6.39% | ||||||
| Voya Retirement Moderate Growth Portfolio | $ | 361,152 | $ | 0.0028 | 10.08% | ||||||
| * | None of the Portfolios listed above derived any income from ineligible foreign sources as defined under Section 901(j) of the Internal Revenue Code. |
| Name, Address and Age | Position(s) Held with the Trust | Term of Office and Length of Time Served(1) | Principal Occupation(s) — During the Past 5 Years | Number of funds in Fund Complex Overseen by Trustee(2) | Other Board Positions Held by Trustee | |||||
|---|---|---|---|---|---|---|---|---|---|---|
Independent Trustees: | ||||||||||
| Colleen D. Baldwin 7337 East Doubletree Ranch Rd. Suite 100 Scottsdale, Arizona 85258 Age: 61 | Trustee Chairperson | November 2007–Present January 2020– Present | President, Glantuam Partners, LLC, a business consulting firm (January 2009–Present). | 131 | Dentaquest (February 2014–Present); RSR Partners, Inc. (2016– Present). | |||||
| John V. Boyer 7337 East Doubletree Ranch Rd. Suite 100 Scottsdale, Arizona 85258 Age: 68 | Trustee | January 2005–Present | Retired. Formerly, President and Chief Executive Officer, Bechtler Arts Foundation, an arts and education foundation (January 2008–December 2019). | 131 | None. | |||||
| Patricia W. Chadwick 7337 East Doubletree Ranch Rd. Suite 100 Scottsdale, Arizona 85258 Age: 73 | Trustee | January 2006–Present | Consultant and President, Ravengate Partners LLC, a consulting firm that provides advice regarding financial markets and the global economy (January 2000– Present). | 131 | Wisconsin Energy Corporation (June 2006– Present); The Royce Funds (22 funds) (December 2009–Present); and AMICA Mutual Insurance Company (1992–Present). | |||||
| Martin J. Gavin 7337 East Doubletree Ranch Rd. Suite 100 Scottsdale, AZ 85258 Age: 71 | Trustee | August 2015–Present | Retired. | 131 | None. | |||||
| Joseph E. Obermeyer 7337 East Doubletree Ranch Rd. Suite 100 Scottsdale, Arizona 85258 Age: 64 | Trustee | May 2013–Present | President, Obermeyer & Associates, Inc., a provider of financial and economic consulting services (November 1999–Present). | 131 | None. | |||||
| Sheryl K. Pressler 7337 East Doubletree Ranch Rd. Suite 100 Scottsdale, Arizona 85258 Age: 71 | Trustee | January 2006–Present | Consultant (May 2001– Present). | 131 | Centerra Gold Inc. (May 2008–Present). | |||||
| Christopher P. Sullivan 7337 East Doubletree Ranch Rd. Suite 100 Scottsdale, Arizona 85258 Age: 68 | Trustee | October 2015–Present | Retired. | 131 | None. |
| Name, Address and Age | Position(s) Held with the Trust | Term of Office and Length of Time Served(1) | Principal Occupation(s) — During the Past 5 Years | Number of funds in Fund Complex Overseen by Trustee(2) | Other Board Positions Held by Trustee | |||||
|---|---|---|---|---|---|---|---|---|---|---|
Trustee who is an “interested person”: | ||||||||||
| Dina Santoro 230 Park Avenue New York, New York 10169 Age: 48 | Trustee | July 2018–Present | President, Voya Investments, LLC and Voya Capital, LLC (March 2018–Present); Senior Vice President, Voya Investments Distributor, LLC (April 2018–Present); Chief Operating Officer and Senior Managing Director, Voya Investment Management (January 2022–Present). Formerly, Senior Managing Director, Head of Product and Marketing Strategy, Voya Investment Management (September 2017–January 2022); Managing Director, Quantitative Management Associates, LLC (January 2004–August 2017). | 131 | Voya Investments, LLC, Voya Capital, LLC, and Voya Funds Services, LLC (March 2018–Present); Voya Investments Distributor, LLC (April 2018–Present). | |||||
(1) | Trustees serve until their successors are duly elected and qualified. The tenure of each Trustee who is not an “interested person” as defined in the 1940 Act, of each Portfolio (“Independent Trustee”) is subject to the Board’s retirement policy which states that each duly elected or appointed Independent Trustee shall retire from and cease to be a member of the Board of Trustees at the close of business on December 31 of the calendar year in which the Independent Trustee attains the age of 75. A majority vote of the Board’s other Independent Trustees may extend the retirement date of an Independent Trustee if the retirement would trigger a requirement to hold a meeting of shareholders of the Trust under applicable law, whether for the purposes of appointing a successor to the Independent Trustee or otherwise comply under applicable law, in which case the extension would apply until such time as the shareholder meeting can be held or is no longer required (as determined by a vote of a majority of the other Independent Trustees). |
(2) | For the purposes of this table, “Fund Complex” means the Voya family of funds including the following investment companies: Voya Asia Pacific High Dividend Equity Income Fund; Voya Balanced Portfolio, Inc.; Voya Emerging Markets High Dividend Equity Fund; Voya Equity Trust; Voya Funds Trust; Voya Global Advantage and Premium Opportunity Fund; Voya Global Equity Dividend and Premium Opportunity Fund; Voya Government Money Market Portfolio; Voya Infrastructure, Industrials and Materials Fund; Voya Intermediate Bond Portfolio; Voya Investors Trust; Voya Mutual Funds; Voya Partners, Inc.; Voya Senior Income Fund; Voya Separate Portfolios Trust; Voya Strategic Allocation Portfolios, Inc.; Voya Variable Funds; Voya Variable Insurance Trust; Voya Variable Portfolios, Inc.; and Voya Variable Products Trust. The number of funds in the Fund Complex is as of January 31, 2022. |
| Name, Address and Age | Position(s) Held With the Trust | Term of Office and Length of Time Served(1) | Principal Occupation(s) — During the Past 5 Years | |||
|---|---|---|---|---|---|---|
| Michael Bell One Orange Way Windsor, Connecticut 06095 Age: 53 | Chief Executive Officer | March 2018–Present | Chief Executive Officer and Director, Voya Investments, LLC, Voya Capital, LLC, and Voya Funds Services, LLC (March 2018–Present); Senior Vice President, Voya Investments Distributor, LLC (March 2020–Present); Chief Financial Officer, Voya Investment Management (September 2014-Present). Formerly, Senior Vice President and Chief Financial Officer, Voya Investments Distributor, LLC (September 2019–March 2020); Senior Vice President and Treasurer, Voya Investments Distributor, LLC (November 2015–September 2019); Senior Vice President, Chief Financial Officer and Treasurer, Voya Investments, LLC (November 2015–March 2018). | |||
| Dina Santoro 230 Park Avenue New York, New York 10169 Age: 48 | President | March 2018–Present | President and Director, Voya Investments, LLC and Voya Capital, LLC (March 2018–Present); Director, Voya Funds Services, LLC (March 2018–Present); Director and Senior Vice President, Voya Investments Distributor, LLC (April 2018–Present); Chief Operating Officer and Senior Managing Director, Voya Investment Management (January 2022–Present). Formerly, Senior Managing Director, Head of Product and Marketing Strategy, Voya Investment Management (September 2017–January 2022); Managing Director, Quantitative Management Associates, LLC (January 2004–August 2017). | |||
| Jonathan Nash 230 Park Avenue New York, New York 10169 Age: 54 | Executive Vice President Chief Investment Risk Officer | March 2020–Present March 2020–Present | Executive Vice President and Chief Investment Risk Officer, Voya Investments, LLC (March 2020–Present and Senior Vice President, Investment Risk Management, Voya Investment Management (March 2017–Present). Formerly, Vice President, Voya Investments, LLC (September 2018–March 2020); Consultant, DA Capital LLC (January 2016–March 2017). | |||
| James M. Fink 5780 Powers Ferry Road NW Atlanta, Georgia 30327 Age: 63 | Executive Vice President | March 2018–Present | Managing Director, Voya Investments, LLC, Voya Capital, LLC, and Voya Funds Services, LLC (March 2018–Present); Senior Vice President, Voya Investments Distributor, LLC (April 2018–Present); Chief Administrative Officer, Voya Investment Management (September 2017–Present). Formerly, Managing Director, Operations, Voya Investment Management (March 1999–September 2017). | |||
| Kevin M. Gleason 7337 East Doubletree Ranch Rd. Suite 100 Scottsdale, Arizona 85258 Age: 55 | Chief Compliance Officer | February 2012–Present | Senior Vice President, Voya Investment Management and Chief Compliance Officer, Voya Family of Funds (February 2012–Present). | |||
| Todd Modic 7337 East Doubletree Ranch Rd. Suite 100 Scottsdale, Arizona 85258 Age: 54 | Senior Vice President, Chief/Principal Financial Officer and Assistant Secretary | March 2005–Present | President, Voya Funds Services, LLC (March 2018–Present) and Senior Vice President, Voya Investments, LLC (April 2005–Present). | |||
| Kimberly A. Anderson 7337 East Doubletree Ranch Rd. Suite 100 Scottsdale, Arizona 85258 Age: 57 | Senior Vice President | November 2003–Present | Senior Vice President, Voya Investments, LLC (September 2003–Present). | |||
| Micheline S. Faver 7337 East Doubletree Ranch Rd. Suite 100 Scottsdale, Arizona 85258 Age: 44 | Senior Vice President | September 2020–Present | Senior Vice President, Head of Fund Compliance and Chief Compliance Officer, Voya Investments, LLC (March 2021–Present). Formerly, Vice President, Head of Fund Compliance and Chief Compliance Officer, Voya Investments, LLC (June 2016–March 2021). |
| Name, Address and Age | Position(s) Held With the Trust | Term of Office and Length of Time Served(1) | Principal Occupation(s) — During the Past 5 Years | |||
|---|---|---|---|---|---|---|
| Robert Terris 5780 Powers Ferry Road NW Atlanta, Georgia 30327 Age: 51 | Senior Vice President | May 2006–Present | Senior Vice President, Voya Investments Distributor, LLC (April 2018–Present); Senior Vice President, Head of Investment Services, Voya Investments, LLC (April 2018–Present) and Voya Funds Services, LLC (March 2006–Present). Formerly, Senior Vice President, Head of Division Operations, Voya Investments, LLC (October 2015–April 2018). | |||
| Fred Bedoya 7337 East Doubletree Ranch Rd. Suite 100 Scottsdale, Arizona 85258 Age: 49 | Vice President Treasurer | September 2012–Present | Vice President, Voya Investments, LLC (October 2015–Present) and Voya Funds Services, LLC (July 2012–Present). | |||
| Maria M. Anderson 7337 East Doubletree Ranch Rd. Suite 100 Scottsdale, Arizona 85258 Age: 63 | Vice President | September 2004–Present | Vice President, Voya Investments, LLC (October 2015–Present) and Voya Funds Services, LLC (September 2004–Present). | |||
| Sara M. Donaldson 7337 East Doubletree Ranch Rd. Suite 100 Scottsdale, Arizona 85258 Age: 62 | Vice President | September 2014–Present | Vice President, Voya Investments, LLC (October 2015–Present). | |||
| Robyn L. Ichilov 7337 East Doubletree Ranch Rd. Suite 100 Scottsdale, Arizona 85258 Age: 54 | Vice President | November 1999–Present | Vice President, Voya Funds Services, LLC (November 1995–Present) and Voya Investments, LLC (August 1997–Present). | |||
| Jason Kadavy 7337 East Doubletree Ranch Rd. Suite 100 Scottsdale, Arizona 85258 Age: 45 | Vice President | September 2012–Present | Vice President, Voya Investments, LLC (October 2015–Present) and Voya Funds Services, LLC (July 2007–Present). | |||
| Andrew K. Schlueter 7337 East Doubletree Ranch Rd. Suite 100 Scottsdale, Arizona 85258 Age: 45 | Vice President | March 2018–Present | Vice President, Voya Investments Distributor, LLC (April 2018–Present); Vice President, Voya Investments, LLC and Voya Funds Services, LLC (March 2018–Present); Vice President, Head of Mutual Fund Operations, Voya Investment Management (February 2018–Present). Formerly, Vice President, Voya Investment Management (March 2014–February 2018). | |||
| Craig Wheeler 7337 East Doubletree Ranch Rd. Suite 100 Scottsdale, Arizona 85258 Age: 52 | Vice President | May 2013–Present | Vice President–Director of Tax, Voya Investments, LLC (October 2015–Present). | |||
| Monia Piacenti One Orange Way Windsor, Connecticut 06095 Age: 45 | Anti-Money Laundering Officer | June 2018–Present | Anti-Money Laundering Officer, Voya Investments Distributor, LLC, Voya Investment Management and Voya Investment Management Trust Co. (June 2018–Present); Compliance Consultant, Voya Financial, Inc. (January 2019–Present). Formerly, Senior Compliance Officer, Voya Investment Management (December 2009–December 2018). | |||
| Joanne F. Osberg 7337 East Doubletree Ranch Rd. Suite 100 Scottsdale, Arizona 85258 Age: 40 | Secretary | September 2020–Present | Vice President and Senior Counsel, Voya Investment Management–Mutual Fund Legal Department (September 2020–Present). Formerly, Vice President, Counsel, Voya Investment Management–Mutual Fund Legal Department (January 2013–September 2020). | |||
| Paul A. Caldarelli 7337 East Doubletree Ranch Rd. Suite 100 Scottsdale, Arizona 85258 Age: 70 | Assistant Secretary | June 2010–Present | Vice President and Senior Counsel, Voya Investment Management–Mutual Fund Legal Department (March 2010–Present). |
(1) | The Officers hold office until the next annual meeting of the Board of Trustees and until their successors shall have been elected and qualified. |
RETIREMENT | INVESTMENTS | INSURANCE | |
| VPAR-RETADVI (1221-022322) |
Item 2. Code of Ethics.
As of the end of the period covered by this report, Registrant had adopted a code of ethics, as defined in Item 2 of Form N-CSR, that applies to the Registrant’s principal executive officer and principal financial officer. There were no amendments to the Code during the period covered by the report. The Registrant did not grant any waivers, including implicit waivers, from any provisions of the Code during the period covered by this report. The code of ethics is filed herewith pursuant to Item 10(a)(1), Ex-99.CODE ETH.
Item 3. Audit Committee Financial Expert.
The Board of Trustees has determined that Colleen D. Baldwin, Martin J. Gavin, and Joseph E. Obermeyer are audit committee financial experts, as defined in Item 3 of Form N-CSR. Ms. Baldwin, Mr. Gavin, and Mr. Obermeyer are “independent” for purposes of Item 3 of Form N-CSR.
Item 4. Principal Accountant Fees and Services.
Below are the amount of fees that Ernst & Young LLP (“EY”), the Fund’s current Independent Registered Public Accounting Firm, billed to the Fund during the Fund’s fiscal year ended December 31, 2021 and December 31, 2020 and the amount of fees that the previous independent public accounting firm billed to the Fund during the Fund’s fiscal year ended December 31, 2021 and December 31, 2020.
| (a) | Audit Fees: The aggregate fees billed for each of the last two fiscal years for professional services rendered by EY, the principal accountant for the audit of the registrant’s annual financial statements or services that are normally provided by the accountant in connection with statutory and regulatory filings or engagements for those fiscal years were $464,483 for the year ended December 31, 2021 and $464,372 for the year ended December 31, 2020. |
| (b) | Audit-Related Fees: The aggregate fees billed in each of the last two fiscal years for assurance and related services by EY that are reasonably related to the performance of each respective audit of the registrant’s financial statements and are not reported under paragraph (a) of this Item were $0 for the year ended December 31, 2021 and $0 for the year ended December 31, 2020. |
| (c) | Tax Fees(1): The aggregate fees billed in each of the last two fiscal years for professional services rendered by EY for tax compliance, tax advice, and tax planning were $123,360 for the year ended December 31, 2021 and $46,126 for the year ended December 31, 2020. Such services included review of excise distribution calculations (if applicable), preparation of the Funds’ federal, state, and excise tax returns, tax services related to mergers and routine consulting. |
| (d) | All Other Fees): The aggregate fees billed in each of the last two fiscal years for products and services provided by EY, other than the services reported in paragraphs (a) through (c) of this Item were $0 for the year ended December 31, 2021 and $0 for the year ended December 31, 2020. |
(1) For the fiscal years ended December 31, 2021, and December 31, 2020, the previous independent public accounting firm billed $0 and $19,191, respectively, for Tax Fees.
| (e)(1) | Audit Committee Pre-Approval Policies and Procedures |
Appendix A
AUDIT AND NON-AUDIT SERVICES
PRE-APPROVAL POLICY
I. Statement of Principles
Under the Sarbanes-Oxley Act of 2002 (the “Act”), the Audit Committee of the Board of Directors or Trustees (the “Committee”) of the Voya funds (each a “Fund,” collectively, the “Funds”) set out on Exhibit A to this Audit and Non-Audit Services Pre-Approval Policy (“Policy”) is responsible for the oversight of the work of the Funds’ independent auditors. As part of its responsibilities, the Committee must pre-approve the audit and non-audit services performed by the auditors in order to assure that the provision of these services does not impair the auditors’ independence from the Funds. The Committee has adopted, and the Board has ratified, this Policy, which sets out the procedures and conditions under which the services of the independent auditors may be pre-approved.
Under Securities and Exchange Commission (“SEC”) rules promulgated in accordance with the Act, the Funds may establish two different approaches to pre-approving audit and non-audit services. The Committee may approve services without consideration of specific case-by-case services (“general pre-approval”) or it may pre-approve specific services (“specific pre-approval”). The Committee believes that the combination of these approaches contemplated in this Policy results in an effective and efficient method for pre-approving audit and non-audit services to be performed by the Funds’ independent auditors. Under this Policy, services that are not of a type that may receive general pre-approval require specific pre-approval by the Committee. Any proposed services that exceed pre-approved cost levels or budgeted amounts will also require the Committee’s specific pre-approval.
For both types of approval, the Committee considers whether the subject services are consistent with the SEC’s rules on auditor independence and that such services are compatible with maintaining the auditors independence. The Committee also considers whether a particular audit firm is in the best position to provide effective and efficient services to the Funds. Reasons that the auditors are in the best position include the auditors’ familiarity with the Funds’ business, personnel, culture, accounting systems, risk profile, and other factors, and whether the services will enhance the Funds’ ability to manage and control risk or improve audit quality. Such factors will be considered as a whole, with no one factor being determinative.
The appendices attached to this Policy describe the audit, audit-related, tax-related, and other services that have the Committee’s general pre-approval. For any service that has been approved through general pre-approval, the general pre-approval will remain in place for a period 12 months from the date of pre-approval, unless the Committee determines that a different period is appropriate. The Committee will annually review and pre-approve the services that may be provided by the independent auditors without specific pre-approval. The Committee will revise the list of services subject to general pre-approval as appropriate. This Policy does not serve as a delegation to Fund management of the Committee’s duty to pre-approve services performed by the Funds’ independent auditors.
II. Audit Services
The annual audit services engagement terms and fees are subject to the Committee’s specific pre-approval. Audit services are those services that are normally provided by auditors in connection with statutory and regulatory filings or engagements or those that generally only independent auditors can reasonably provide. They include the Funds’ annual financial statement audit and procedures that the independent auditors must perform in order to form an opinion on the Funds’ financial statements (e.g., information systems and procedural reviews and testing). The Committee will monitor the audit services engagement and approve any changes in terms, conditions or fees deemed by the Committee to be necessary or appropriate.
The Committee may grant general pre-approval to other audit services, such as statutory audits and services associated with SEC registration statements, periodic reports and other documents filed with the SEC or issued in connection with securities offerings.
The Committee has pre-approved the audit services listed on Appendix A. The Committee must specifically approve all audit services not listed on Appendix A.
III. Audit-related Services
Audit-related services are assurance and related services that are reasonably related to the performance of the audit or the review of the Funds’ financial statements or are traditionally performed by the independent auditors. The Committee believes that the provision of audit-related services will not impair the independent auditors’ independence, and therefore may grant pre-approval to audit-related services. Audit-related services include accounting consultations related to accounting, financial reporting or disclosure matters not classified as “audit services;” assistance with understanding and implementing new accounting and financial reporting guidance from rulemaking authorities; agreed-upon or expanded audit procedures relating to accounting and/or billing records required to respond to or comply with financial, accounting or regulatory reporting matters; and assistance with internal control reporting requirements under Form N-CEN or Form N-CSR.
The Committee has pre-approved the audit-related services listed on Appendix B. The Committee must specifically approve all audit-related services not listed on Appendix B.
IV. Tax Services
The Committee believes the independent auditors can provide tax services to the Funds, including tax compliance, tax planning, and tax advice, without compromising the auditors’ independence. Therefore, the Committee may grant general pre-approval with respect to tax services historically provided by the Funds’ independent auditors that do not, in the Committee’s view, impair auditor independence and that are consistent with the SEC’s rules on auditor independence.
The Committee will not grant pre-approval if the independent auditors initially recommends a transaction the sole business purpose of which is tax avoidance and the tax treatment of which may not be supported in the Internal Revenue Code and related regulations. The Committee may consult outside counsel to determine that tax planning and reporting positions are consistent with this Policy.
The Committee has pre-approved the tax-related services listed on Appendix C. The Committee must specifically approve all tax-related services not listed on Appendix C.
V. Other Services
The Committee believes it may grant approval of non-audit services that are permissible services for independent auditors to a Fund. The Committee has determined to grant general pre-approval to other services that it believes are routine and recurring, do not impair auditor independence, and are consistent with SEC rules on auditor independence.
The Committee has pre-approved the non-audit services listed on Appendix D. The Committee must specifically approve all non-audit services not listed on Appendix D.
A list of the SEC’s prohibited non-audit services is attached to this Policy as Appendix E. The SEC’s rules and relevant guidance should be consulted to determine the precise definitions of these impermissible services and the applicability of exceptions to certain of the SEC’s prohibitions.
VI. Pre-approval of Fee levels and Budgeted Amounts
The Committee will annually establish pre-approval fee levels or budgeted amounts for audit, audit-related, tax and non-audit services to be provided to the Funds by the independent auditors. Any proposed services exceeding these levels or amounts require the Committee’s specific pre-approval. The Committee considers fees for audit and non-audit services when deciding whether to pre-approve services. The Committee may determine, for a pre-approval period of 12 months, the appropriate ratio between the total amount of fees for the Fund’s audit, audit-related, and tax services (including fees for services provided to Fund affiliates that are subject to pre-approval), and the total amount of fees for certain permissible non-audit services for the Fund classified as other services (including any such services provided to Fund affiliates that are subject to pre-approval).
VII. Procedures
Requests or applications for services to be provided by the independent auditors will be submitted to management. If management determines that the services do not fall within those services generally pre-approved by the Committee and set out in the appendices to these procedures, management will submit the services to the Committee or its delagee. Any such submission will include a detailed description of the services to be rendered. Notwithstanding this paragraph, the Committee will, on a quarterly basis, receive from the independent auditors a list of services provided for the previous calendar quarter on a cumulative basis by the auditors during the Pre-Approval Period.
VIII. Delegation
The Committee may delegate pre-approval authority to one or more of the Committee’s members. Any member or members to whom such pre-approval authority is delegated must report any pre-approval decisions, including any pre-approved services, to the Committee at its next scheduled meeting. The Committee will identify any member to whom pre-approval authority is delegated in writing. The member will retain such authority for a period of 12 months from the date of pre-approval unless the Committee determines that a different period is appropriate. The period of delegated authority may be terminated by the Committee or at the option of the member.
IX. Additional Requirements
The Committee will take any measures the Committee deems necessary or appropriate to oversee the work of the independent auditors and to assure the auditors’ independence from the Funds. This may include reviewing a formal written statement from the independent auditors delineating all relationships between the auditors and the Funds, consistent with Independence Standards Board No. 1, and discussing with the auditors their methods and procedures for ensuring independence.
Last Approved: November 19, 2020
Appendix A
Pre-Approved Audit Services for the Pre-Approval Period January 1, 2021 through December 31, 2021
| Service | ||
| The Fund(s) | Fee Range | |
| Statutory audits or financial audits (including tax services associated with audit services) | √ | As presented to Audit Committee1 |
| Services associated with SEC registration statements, periodic reports and other documents filed with the SEC or other documents issued in connection with securities offerings (e.g., consents), and assistance in responding to SEC comment letters. | √ | Not to exceed $9,750 per filing |
| Consultations by Fund management with respect to accounting or disclosure treatment of transactions or events and/or the actual or potential effect of final or proposed rules, standards or interpretations by the SEC, Financial Accounting Standards Board, or other regulatory or standard setting bodies. | √ | Not to exceed $8,000 during the Pre-Approval Period |
| Seed capital audit and related review and issuance of consent on the N-2 registration statement | √ | Not to exceed $14,750 per audit |
| Audit of summary portfolio of investments | √ | Not to exceed $750 per fund |
| 1 | For new Funds launched during the Pre-Approval Period, the fee ranges pre-approved will be the same as those for existing Funds, pro-rated in accordance with inception dates as provided in the auditors’ Proposal or any Engagement Letter covering the period at issue. Fees in the Engagement Letter will be controlling. |
Appendix B
Pre-Approved Audit-Related Services for the Pre-Approval Period January 1, 2021 through December 31, 2021
| Service | |||
| The Fund(s) | Fund Affiliates | Fee Range | |
| Services related to Fund mergers (Excludes tax services - See Appendix C for tax services associated with Fund mergers) | √ | √ | Not to exceed $10,000 per merger |
| Consultations by Fund management with respect to accounting or disclosure treatment of transactions or events and/or the actual or potential effect of final or proposed rules, standards or interpretations by the SEC, Financial Accounting Standards Board, or other regulatory or standard setting bodies. [Note: Under SEC rules some consultations may be “audit” services and others may be “audit-related” services.] | √ | Not to exceed $5,000 per occurrence during the Pre-Approval Period | |
| Review of the Funds’ semi-annual and quarterly financial statements | √ | Not to exceed $2,700 per set of financial statements per fund | |
| Reports to regulatory or government agencies related to the annual engagement | √ | Up to $5,000 per occurrence during the Pre-Approval Period | |
| Regulatory compliance assistance | √ | √ | Not to exceed $5,000 per quarter |
| Training courses | √ | Not to exceed $5,000 per course | |
Appendix C
Pre-Approved Tax Services for the Pre-Approval Period January 1, 2021 through December 31, 2021
| Service | |||
| The Fund(s) | Fund Affiliates | Fee Range | |
| Preparation of federal and state income tax returns and federal excise tax returns for the Funds including assistance and review with excise tax distributions | √ | As presented to Audit Committee2 | |
| Review of IRC Sections 851(b) and 817(h) diversification testing on a real-time basis | √ | As presented to Audit Committee2 | |
| Tax assistance and advice regarding statutory, regulatory or administrative developments | √ | √ | Not to exceed $5,000 for the Funds or for the Funds’ investment adviser during the Pre-Approval Period |
| 2 | For new Funds launched during the Pre-Approval Period, the fee ranges pre-approved will be the same as those for existing Funds, pro-rated in accordance with inception dates as provided in the auditors’ Proposal or any Engagement Letter covering the period at issue. Fees in the Engagement Letter will be controlling. |
Appendix C, continued
Pre-Approved Tax Services for the Pre-Approval Period January 1, 2021 through December 31, 2021
| Service | |||
| The Fund(s) | Fund Affiliates | Fee Range | |
| Tax and technology training sessions | √ | Not to exceed $5,000 per course during the Pre-Approval Period | |
| Tax services associated with Fund mergers | √ | √ | Not to exceed $4,000 per fund per merger during the Pre-Approval Period |
| Ernst & Young LLP Passive Foreign Investment Company (“PFIC”) Analyzer | √ | Not to exceed $95,000 during the Pre-Approval Period | |
| Other tax-related assistance and consultation, including, without limitation, assistance in evaluating derivative financial instruments and international tax issues, qualification and distribution issues, year-end reporting for 1099’s, tax compliance services in foreign jurisdictions and similar routine tax consultations as requested. | √ | Not to exceed $300,000 during the Pre-Approval Period | |
Appendix D
Pre-Approved Other Services for the Pre-Approval Period January 1, 2021 through December 31, 2021
| Service | |||
| The Fund(s) | Fund Affiliates | Fee Range | |
| Agreed-upon procedures for Class B share 12b-1 programs | √ | Not to exceed $60,000 during the Pre-Approval Period | |
Security counts performed pursuant to Rule 17f-2 of the 1940 Act (i.e., counts for Funds holding securities with affiliated sub-custodians)
Cost to be borne 50% by the Funds and 50% by Voya Investments, LLC. | √
| √
| Not to exceed $5,700 per Fund during the Pre-Approval Period |
| Agreed upon procedures for 15 (c) FACT Books | √ | Not to exceed $50,000 during the Pre-Approval Period | |
Appendix E
Prohibited Non-Audit Services
Dated: January 1, 2021 to December 31, 2021
| ● | Bookkeeping or other services related to the accounting records or financial statements of the Funds |
| ● | Financial information systems design and implementation |
| ● | Appraisal or valuation services, fairness opinions, or contribution-in-kind reports |
| ● | Actuarial services |
| ● | Internal audit outsourcing services |
| ● | Management functions |
| ● | Human resources |
| ● | Broker-dealer, investment adviser, or investment banking services |
| ● | Legal services |
| ● | Expert services unrelated to the audit |
| ● | Any other service that the Public Company Accounting Oversight Board determines, by regulation, is impermissible |
EXHIBIT A
VOYA ASIA PACIFIC HIGH DIVIDEND EQUITY INCOME FUND
VOYA BALANCED PORTFOLIO, INC.
VOYA EMERGING MARKETS HIGH DIVIDEND EQUITY FUND
VOYA EQUITY TRUST
VOYA FUNDS TRUST
VOYA GLOBAL ADVANTAGE AND PREMIUM OPPORTUNITY FUND
VOYA GLOBAL EQUITY DIVIDEND AND PREMIUM OPPORTUNITY FUND
VOYA INFRASTRUCTURE, INDUSTRIALS, AND MATERIALS FUND
VOYA INTERMEDIATE BOND PORTFOLIO
VOYA INVESTORS TRUST
VOYA GOVERNMENT MONEY MARKET PORTFOLIO
VOYA MUTUAL FUNDS
VOYA PARTNERS, INC.
VOYA SENIOR INCOME FUND
VOYA SEPARATE PORTFOLIOS TRUST
VOYA STRATEGIC ALLOCATIONS PORTFOLIOS, INC.
VOYA VARIABLE FUNDS
VOYA VARIABLE INSURANCE TRUST
VOYA VARIABLE PORTFOLIOS INC.
VOYA VARIABLE PRODUCTS TRUST
| (e)(2) | Percentage of services referred to in 4(b) – (4)(d) that were approved by the audit committee |
100% of the services were approved by the audit committee.
| (f) | Percentage of hours expended attributable to work performed by other than full time employees of EY if greater than 50% |
Not applicable.
| (g) | Non-Audit Fees: The following table presents (i) the aggregate non-audit fees (i.e., fees for audit-related, tax, and other services) billed to each Registrant by the independent registered public accounting firm for each Registrant’s fiscal years ended December 31, 2021 and December 31, 2020; and (ii) the aggregate non-audit fees billed to the investment adviser, or any of its affiliates that provide ongoing services to the registrant, by the independent registered public accounting firm for the same time periods. |
| Registrant/Investment Adviser | 2021(1) | 2020(1) | ||||||
| Voya Investors Trust | $ | 123,360 | $ | 46,126 | ||||
| Voya Investments, LLC (2) | $ | 13,583,983 | $ | 14,804,511 | ||||
(1) For the years ended December 31, 2021 and December 31, 2020, the previous independent public accounting firm billed the Registrant $0 and $19,191, respectively, for Non-Audit Fees.
(2) Each Registrant’s investment adviser and any of its affiliates, which are subsidiaries of Voya Financial, Inc.
| (h) | Principal Accountants Independence: The Registrant’s Audit committee has considered whether the provision of non-audit services that were rendered to the registrant’s investment adviser and any entity controlling, controlled by, or under common control with the investment adviser that provides ongoing services to the registrant that were not pre-approved pursuant to Rule 2-01(c)(7)(ii) of Regulation S-X is compatible with maintaining EY’s independence. |
Item 5. Audit Committee of Listed Registrants.
Not applicable.
Item 6. Schedule of Investments.
Schedule is included as part of the report to shareholders filed under Item 1 of this Form.
Item 7. Disclosure of Proxy Voting Policies and Procedures for Closed-End Management Investment Companies.
Not applicable.
Item 8. Portfolio Managers of Closed-End Management Investment Companies.
Not applicable.
Item 9. Purchases of Equity Securities by Closed-End Management Investment Company and Affiliated Purchasers.
Not applicable.
Item 10. Submission of Matters to a Vote of Security Holders.
Not applicable.
Item 11. Controls and Procedures.
| (a) | Based on our evaluation conducted within 90 days of the filing date, hereof, the design and operation of the registrant’s disclosure controls and procedures are effective to ensure that material information relating to the registrant is made known to the certifying officers by others within the appropriate entities, particularly during the period in which Forms N-CSR are being prepared, and the registrant’s disclosure controls and procedures allow timely preparation and review of the information for the registrant’s Form N-CSR and the officer certifications of such Form N-CSR. |
| (b) | There were no significant changes in the registrant’s internal controls that occurred during the second fiscal quarter of the period covered by this report that has materially affected, or is reasonably likely to materially affect, the registrant’s internal control over financial reporting. |
Item 12. Disclosure of Securities Lending Activities for Closed-End Management Investment Companies.
Not applicable.
Item 13. Exhibits.
| (a)(1) | The Code of Ethics pursuant to Item 2 of Form N-CSR is filed and attached hereto as EX-99.CODE ETH. |
| (a)(3) | Not applicable. |
| (b) | The officer certifications required by Section 906 of the Sarbanes-Oxley Act of 2002 are attached hereto as EX-99.906CERT. |
SIGNATURES
Pursuant to the requirements of the Securities Exchange Act of 1934 and the Investment Company Act of 1940, the registrant has duly caused this report to be signed on its behalf by the undersigned, thereunto duly authorized.
(Registrant): Voya Investors Trust
| By | /s/ Michael Bell | |
| Michael Bell | ||
| Chief Executive Officer |
Date: March 4, 2022
Pursuant to the requirements of the Securities Exchange Act of 1934 and the Investment Company Act of 1940, this report has been signed below by the following persons on behalf of the registrant and in the capacities and on the dates indicated.
| By | /s/ Michael Bell | |
| Michael Bell | ||
| Chief Executive Officer |
Date: March 4, 2022
| By | /s/ Todd Modic | |
| Todd Modic | ||
| Senior Vice President and Chief Financial Officer |
Date: March 4, 2022