UNITED STATES
SECURITIES AND EXCHANGE COMMISSION
Washington, D.C. 20549
FORM N-CSR
CERTIFIED SHAREHOLDER REPORT OF REGISTERED MANAGEMENT INVESTMENT COMPANIES
Investment Company Act file number 811-05742
Name of Fund: BlackRock Funds
BlackRock Emerging Markets Long/Short Equity Fund
BlackRock Global Long/Short Equity Fund
BlackRock India Fund
Fund Address: 100 Bellevue Parkway, Wilmington, DE 19809
Name and address of agent for service: John M. Perlowski, Chief Executive Officer, BlackRock Funds, 55 East 52nd Street, New York, NY 10055
Registrant’s telephone number, including area code: (800) 441-7762
Date of fiscal year end: 07/31/2013
Date of reporting period: 01/31/2013
Item 1 – Report to Stockholders
JANUARY 31, 2013
| SEMI-ANNUAL REPORT (UNAUDITED) | |  |
BlackRock FundsSM
> | | BlackRock Emerging Markets Long/Short Equity Fund |
> | | BlackRock Global Long/Short Equity Fund |
Not FDIC Insured • May Lose Value • No Bank Guarantee | | | |
Table of Contents
| | Page |
Dear Shareholder | | | | | 3 | |
Semi-Annual Report:
| | | | | | |
Fund Summaries | | | | | 4 | |
About Fund Performance | | | | | 7 | |
Disclosure of Expenses | | | | | 7 | |
Derivative Financial Instruments | | | | | 8 | |
Portfolio Information | | | | | 8 | |
Financial Statements:
| | | | | | |
Schedules of Investments | | | | | 9 | |
Statements of Assets and Liabilities | | | | | 36 | |
Statements of Operations | | | | | 37 | |
Statements of Changes in Net Assets | | | | | 38 | |
Financial Highlights | | | | | 40 | |
Notes to Financial Statements | | | | | 44 | |
Disclosure of Investment Advisory and Sub-Advisory Agreement | | | | | 52 | |
Officers and Trustees | | | | | 55 | |
Additional Information | | | | | 56 | |
A World-Class Mutual Fund Family | | | | | 59 | |
| 2 | BLACKROCK FUNDS | JANUARY 31, 2013
|
Financial markets have substantially improved over the past year, providing investors with considerable relief compared to where things were during the global turmoil seen in 2011. Despite a number of headwinds, higher-risk asset classes boasted strong returns as investors sought meaningful yields in the ongoing low-interest-rate environment.
Rising investor confidence drove equity markets higher in early 2012, while climbing US Treasury yields pressured higher-quality fixed income assets. The second quarter, however, brought a market reversal as Europe’s debt crisis boiled over once again. Political instability in Greece and severe deficit and liquidity problems in Spain raised the specter of a euro collapse. Alongside the drama in Europe, investors were discouraged by gloomy economic reports from various parts of the world. A slowdown in China, a key powerhouse for global growth, emerged as a particular concern. But as the outlook for the global economy worsened, investors grew increasingly optimistic that the world’s largest central banks would soon intervene to stimulate growth. This theme, along with the European Central Bank’s (“ECB’s”) firm commitment to preserve the euro currency bloc, drove most asset classes higher through the summer. Policy relief came in early September, when the ECB announced its decision to support the eurozone’s troubled peripheral countries with unlimited purchases of short term sovereign debt. Days later, the US Federal Reserve announced its own much-anticipated stimulus package.
Although financial markets world-wide were buoyed by accommodative monetary policy, risk assets weakened in the fall. Global trade slowed as many European countries fell into recession and growth continued to decelerate in China, where a once-a-decade leadership change compounded uncertainty. In the United States, stocks slid on lackluster corporate earnings reports and market volatility rose during the lead up to the US Presidential election. In the post-election environment, investors grew increasingly concerned over automatic tax increases and spending cuts that had been scheduled to take effect at the beginning of 2013 (known as the “fiscal cliff”). There was widespread fear that the fiscal cliff would push the nation into recession unless politicians could agree upon alternate measures to reduce the deficit before the end of 2012. Worries that bipartisan gridlock would preclude a timely budget deal triggered higher levels of volatility in financial markets around the world in the months leading up to the last day of the year. Ultimately, the United States averted the worst of the fiscal cliff with a last-minute tax deal; however, decisions relating to spending cuts and the debt ceiling continue to weigh on investors’ minds.
Investors shook off the nerve-wracking finale to 2012 and began the New Year with a powerful equity rally. Key indicators signaled broad-based improvements in the world’s major economies, particularly China. In the United States, economic data was mixed, but pointed to a continued recovery. The risk of inflation remained low and the US Federal Reserve showed no signs of curtailing its stimulus programs. Additionally, January saw the return of funds that investors had pulled out of the market in late 2012 amid uncertainty about tax-rate increases ahead of the fiscal cliff deadline. In fixed income markets, rising US Treasuries yields dragged down higher-quality asset classes, while high yield bonds continued to benefit from investor demand for yield in the low-rate environment.
On the whole, riskier asset classes outperformed lower-risk investments for the 6- and 12-month periods ended January 31, 2013. International equities were the strongest performers. US stocks and high yield bonds also generated significant returns. Emerging market equities were particularly volatile, but still posted gains for both the 6- and 12-month periods. US Treasury yields remained low, but experienced increasing volatility in recent months. Rising yields near the end of the period resulted in negative returns for Treasuries and investment-grade bonds for the 6-month period. Tax-exempt municipal bonds, however, benefited from favorable supply-and-demand dynamics. Near-zero short term interest rates continued to keep yields on money market securities near their all-time lows.
While investors continue to face a host of unknowns, we believe new opportunities abound. BlackRock was built to provide the global market insight, breadth of capabilities, unbiased investment advice and deep risk management expertise these times require. We encourage you to visit www.blackrock.com/newworld for more information.
Sincerely,
Rob Kapito
President, BlackRock Advisors, LLC
| “Despite a number of headwinds, higher-risk asset classes boasted strong returns as investors sought meaningful yields in the ongoing low-interest-rate environment.” |
Rob Kapito
President, BlackRock Advisors, LLC
Total Returns as of January 31, 2013 | | | | 6-month | | 12-month |
US large cap equities (S&P 500® Index) | | | | | 9.91 | % | | | 16.78 | % |
US small cap equities (Russell 2000® Index) | | | | | 15.51 | | | | 15.47 | |
International equities (MSCI Europe, Australasia, Far East Index) | | | | | 18.61 | | | | 17.25 | |
Emerging market equities (MSCI Emerging Markets Index) | | | | | 13.11 | | | | 7.64 | |
3-month Treasury bill (BofA Merrill Lynch 3-Month US Treasury Bill Index) | | | | | 0.07 | | | | 0.11 | |
US Treasury securities (BofA Merrill Lynch 10-Year US Treasury Index) | | | | | (2.90 | ) | | | 1.28 | |
US investment grade bonds (Barclays US Aggregate Bond Index) | | | | | (0.29 | ) | | | 2.59 | |
Tax-exempt municipal bonds (S&P Municipal Bond Index) | | | | | 2.21 | | | | 5.50 | |
US high yield bonds (Barclays US Corporate High Yield 2% Issuer Capped Index) | | | | | 7.37 | | | | 13.87 | |
Past performance is no guarantee of future results. Index performance is shown for illustrative purposes only. You cannot invest directly in an index.
| | THIS PAGE NOT PART OF YOUR FUND REPORT | 3 |
| |
| Fund Summary as of January 31, 2013 | BlackRock Emerging Markets Long/Short Equity Fund
|
Investment Objective
BlackRock Emerging Markets Long/Short Equity Fund’s (the “Fund”) investment objective is to seek total return over the long term.
Portfolio Management Commentary
How did the Fund perform?
| • | | For the six-month period ended January 31, 2013, the Fund underperformed its benchmark, the BofA Merrill Lynch 3-Month US Treasury Bill Index. |
What factors influenced performance?
| • | | As part of its investment strategy, the Fund uses derivatives, including total return swaps, to achieve exposure to a market or to hedge market and/or equity risks. Through its use of total return swaps, the Fund’s performance is attributable to effective stock selection based on bottom-up security analysis coupled with a long-short approach to controlling the Fund’s exposure to trends in emerging markets. |
| • | | Stock selection within Brazil, China and South Korea detracted from performance during the period. Long positions in several Brazilian utilities hurt returns, particularly holdings in power generator Cia Energetica de Sao Paulo, which fell approximately 50% over the six-month period. New government policies in Brazil geared to improving industrial productivity threaten the profitability of many utility companies. The new policies seek to reduce input costs for the industrial sector by renewing concessions, which results in less profitable pricing for the utilities companies. Although the Fund held a mix of long and short utilities positions within Brazil, the long positions tended to be in companies most negatively impacted by the new government policies. Another significant detractor was the Fund’s short position in Brilliance China Automotive Holdings Ltd., which is the only Chinese automaker to have a joint venture agreement to produce automobiles locally for German luxury carmaker BMW. Brilliance China’s stock rose approximately 55% on upbeat news late in the period relating mostly to positive sales momentum in the BMW 5 series and anticipation around the next BMW model to be produced in China. |
| • | | Positive performance in the Fund came from stock selection within Thailand, Taiwan and Mexico. A large contributor was the Fund’s long position in Airports of Thailand PCL, owner and operator of several Thai airports including regional gateway New Bangkok International Airport. The company’s resident airlines continue to expand amid the strong traffic growth in Asian markets. The stock rose approximately 53% as research analysts raised their earnings forecasts over the period. Also having a positive impact on results was the Fund’s short position in Taiwanese petrochemical firm Formosa Plastics Corp., which was closed during the period. The stock significantly lagged the market as end demand for petrochemicals was muted during most of the period due mainly to a slowdown in Chinese textiles and construction. Formosa’s earnings reports fell short of forecasts and many analysts maintained a negative view on the stock. |
| • | | Also during the period, the Fund maintained a position in cash and cash equivalents as collateral against the Fund’s exposure to total return swaps. The Fund’s cash and cash equivalents balance did not have a material impact on performance. |
Describe recent portfolio activity.
| • | | During the six-month period, the Fund’s positioning within the food industry changed across regions as a result of the reallocation of risk to long and short positions in other industries where recent data releases and price movements created opportunities. In addition, the Fund took some profits in several food positions that had performed well in the Europe-Middle East-Africa (“EMEA”) and Latin American regions. Overall, the Fund reduced its net long position in Latin American food companies during the period, moved its short exposure to the industry in EMEA closer to neutral, and increased its short exposure to food companies in Emerging Asia. |
Describe portfolio positioning at period end.
| • | | At period end, the Fund held gross exposure (i.e., total of long and short positions) in Emerging Asia at 58% of total investments, particularly within China, Taiwan and South Korea. In Latin America, the Fund maintained gross exposure at 21% with the largest weights in Brazil and Mexico. The Fund held 21% gross exposure to emerging markets in the EMEA region where South Africa was the largest exposure. The Fund maintained a near-neutral position within each country; that is, the Fund’s long and short positions within each country were nearly equal in order to focus on stock selection within each market rather than positioning based on country or other macro views. The Fund’s overall net market exposure (i.e., total long positions minus total short positions) of net assets at period end was 25%, reflecting a cautious view on the market and the Fund’s focus on long and short stock selection as the primary source of performance rather than market movements. |
The views expressed reflect the opinions of BlackRock as of the date of this report and are subject to change based on changes in market, economic or other conditions. These views are not intended to be a forecast of future events and are no guarantee of future results.
| 4 | BLACKROCK FUNDS | JANUARY 31, 2013
|
| |
| | BlackRock Emerging Markets Long/Short Equity Fund
|
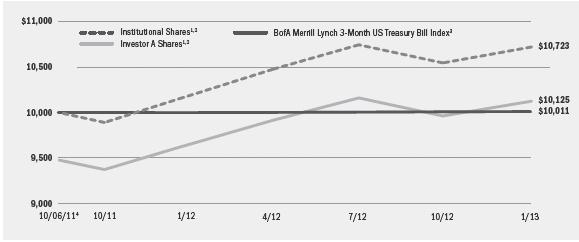
Total Return Based on a $10,000 Investment
| 1 | | Assuming maximum sales charges, if any, transaction costs and other operating expenses, including investment advisory fees. Institutional Shares do not have a sales charge. |
| 2 | | Under normal conditions, the Fund invests at least 80% of its total assets in global equity instruments and related derivative instruments issued by, or tied economically to, companies in emerging markets. |
| 3 | | This unmanaged index measures returns of three-month Treasury bills. |
| 4 | | Commencement of operations. |
Performance Summary for the Period Ended January 31, 2013
| | | | | | Average Annual Total Returns5
|
|
| | | | | | 1 Year
| | Since Inception6
|
|
|
|
|
| 6-Month
Total Returns
|
| w/o sales
charge
|
| w/sales
charge
|
| w/o sales
charge
|
| w/sales
charge
|
Institutional | | | | | (0.23 | )% | | | 5.47 | % | | | N/A | | | | 5.43 | % | | | N/A | |
Investor A | | | | | (0.35 | ) | | | 5.15 | | | | (0.37 | )% | | | 5.15 | | | | 0.95 | % |
Investor C | | | | | (0.70 | ) | | | 4.39 | | | | 3.39 | | | | 4.34 | | | | 4.34 | |
BofA Merrill Lynch 3-Month US Treasury Bill Index | | | | | 0.07 | | | | 0.11 | | | | N/A | | | | 0.08 | | | | N/A | |
| 5 | | Assuming maximum sales charges, if any. Average annual total returns with and without sales charges reflect reductions for distribution and service fees. See “About Fund Performance” on page 7 for a detailed description of share classes, including any related sales charges and fees. |
| 6 | | The Fund commenced operations on October 6, 2011. |
| | N/A — Not applicable as share class and index do not have a sales charge. |
| | Past performance is not indicative of future results. |
Expense Example
| | | | Actual
| | Hypothetical8
|
| |
|
|
|
| Beginning
Account Value
August 1, 2012
|
| Ending
Account Value
January 31, 2013
|
| Expenses Paid
During the Period7
|
| Beginning
Account Value
August 1, 2012
|
| Ending
Account Value
January 31, 2013
|
| Expenses Paid
During the Period7
|
| Annualized
Expense Ratio
|
| Institutional | | | | $ | 1,000.00 | | | $ | 997.70 | | | $ | 8.56 | | | $ | 1,000.00 | | | $ | 1,016.61 | | | $ | 8.64 | | | | 1.70 | % |
| Investor A | | | | $ | 1,000.00 | | | $ | 996.50 | | | $ | 9.86 | | | $ | 1,000.00 | | | $ | 1,015.31 | | | $ | 9.96 | | | | 1.96 | % |
| Investor C | | | | $ | 1,000.00 | | | $ | 993.00 | | | $ | 13.66 | | | $ | 1,000.00 | | | $ | 1,011.51 | | | $ | 13.79 | | | | 2.72 | % |
| 7 | | For each class of the Fund, expenses are equal to the annualized expense ratio for the class, multiplied by the average account value over the period, multiplied by 184/365 (to reflect the one-half year period shown). |
| 8 | | Hypothetical 5% annual return before expenses is calculated by pro rating the number of days in the most recent fiscal half year divided by 365. |
See “Disclosure of Expenses” on page 7 for further information on how expenses were calculated.
| BLACKROCK FUNDS | JANUARY 31, 2013 | 5
|
| |
| Fund Summary as of January 31, 2013 | BlackRock Global Long/Short Equity Fund
|
Investment Objective
BlackRock Global Long/Short Equity Fund’s (the “Fund”) investment objective is to seek total return over the long term.
Expense Example
| | | | Actual
| | Hypothetical2
|
| |
|
|
|
| Beginning
Account Value
December 20, 2012
|
| Ending
Account Value
January 31, 2013
|
| Expenses Paid
During the Period1
|
| Beginning
Account Value
December 20, 2012
|
| Ending
Account Value
January 31, 2013
|
| Expenses Paid
During the Period1
|
| Annualized
Expense Ratio
|
| Institutional | | | | $ | 1,000.00 | | | $ | 1,026.00 | | | $ | 2.04 | | | $ | 1,000.00 | | | $ | 1,003.75 | | | $ | 2.02 | | | | 1.75 | % |
| Investor A | | | | $ | 1,000.00 | | | $ | 1,026.00 | | | $ | 2.34 | | | $ | 1,000.00 | | | $ | 1,003.45 | | | $ | 2.32 | | | | 2.00 | % |
| Investor C | | | | $ | 1,000.00 | | | $ | 1,025,00 | | | $ | 3.20 | | | $ | 1,000.00 | | | $ | 1,002.55 | | | $ | 3.17 | | | | 2.75 | % |
| 1 | | For each class of the Fund, expenses are equal to the annualized expense ratio for the class, multiplied by the average account value over the period, multiplied by 42/365 (to reflect the period from December 20, 2012, the commencement of operations, to January 31, 2013). |
| 2 | | Hypothetical 5% annual return before expenses is calculated by pro rating the number of days in the most recent fiscal half year divided by 365. |
See “Disclosure of Expenses” on page 7 for further information on how expenses were calculated.
| 6 | BLACKROCK FUNDS | JANUARY 31, 2013
|
| • | | Institutional Shares are not subject to any sales charge. These shares bear no ongoing distribution or service fees and are available only to eligible investors. |
| • | | Investor A Shares are subject to a maximum initial sales charge (front-end load) of 5.25% and a service fee of 0.25% per year (but no distribution fee). |
| • | | Investor C Shares are subject to a 1.00% contingent deferred sales charge (“CDSC”) if redeemed within one year of purchase. In addition, these shares are subject to a distribution fee of 0.75% per year and a service fee of 0.25% per year. |
Refer to www.blackrock.com/funds to obtain performance data current to the most recent month end. Performance information reflects past performance and does not guarantee future results. Current performance may be lower or higher than the performance data quoted.
Performance results do not reflect the deduction of taxes that a shareholder would pay on fund distributions or the redemption of fund shares. Investment return and principal value of shares will fluctuate so that shares, when redeemed, may be worth more or less than their original cost. Dividends paid to each class of shares will vary because of the different levels of service, distribution and transfer agency fees applicable to each class, which are deducted from the income available to be paid to shareholders.
BlackRock Advisors, LLC (the “Manager”), the Funds’ investment advisor, waived and/or reimbursed a portion of each Fund’s expenses. Without such waiver and/or reimbursement, each Fund’s performance would have been lower. The Manager is under no obligation to waive or reimburse or to continue waiving or reimbursing its fees after the applicable termination date. See Note 3 of the Notes to Financial Statements for additional information on waivers and reimbursements.
Shareholders of each Fund may incur the following charges: (a) transactional expenses, such as sales charges; and (b) operating expenses, including investment advisory fees, service and distribution fees, including 12b-1 fees, and other Fund expenses. The expense examples shown on the previous pages (which are based on a hypothetical investment of $1,000 invested on August 1, 2012 (BlackRock Emerging Markets Long/Short Equity Fund) or December 20, 2012 (BlackRock Global Long/Short Equity Fund) and held through January 31, 2013) are intended to assist shareholders both in calculating expenses based on an investment in each Fund and in comparing these expenses with similar costs of investing in other mutual funds.
The expense examples provide information about actual account values and actual expenses. In order to estimate the expenses a shareholder paid during the period covered by this report, shareholders can divide their account value by $1,000 and then multiply the result by the number corresponding to their Fund and share class under the heading entitled “Expenses Paid During the Period.”
The expense examples also provide information about hypothetical account values and hypothetical expenses based on each Fund’s actual expense ratio and an assumed rate of return of 5% per year before expenses. In order to assist shareholders in comparing the ongoing expenses of investing in these Funds and other funds, compare the 5% hypothetical examples with the 5% hypothetical examples that appear in other funds’ shareholder reports.
The expenses shown in the expense examples are intended to highlight shareholders’ ongoing costs only and do not reflect any transactional expenses, such as sales charges, if any. Therefore, the hypothetical examples are useful in comparing ongoing expenses only, and will not help shareholders determine the relative total expenses of owning different funds. If these transactional expenses were included, shareholder expenses would have been higher.
| BLACKROCK FUNDS | JANUARY 31, 2013 | 7
|
| |
| Derivative Financial Instruments |
|
The Funds may invest in various derivative financial instruments, including swaps, as specified in Note 2 of the Notes to Financial Statements, which may constitute forms of economic leverage. Such derivative financial instruments are used to obtain exposure to a security, index and/or market without owning or taking physical custody of securities or to hedge market and/or equity risks. Derivative financial instruments involve risks, including the imperfect correlation between the value of a derivative financial instrument and the underlying asset, possible default of the counterparty to the transaction or illiquidity of the derivative financial instrument. The Funds’ ability to use a derivative financial instrument successfully depends on the investment advisor’s ability to predict pertinent market movements accurately, which cannot be assured. The use of derivative financial instruments may result in losses greater than if they had not been used, may require a Fund to sell or purchase portfolio investments at inopportune times or for distressed values, may limit the amount of appreciation a Fund can realize on an investment, may result in lower dividends paid to shareholders or may cause a Fund to hold an investment that it might otherwise sell. The Funds’ investments in these instruments are discussed in detail in the Notes to Financial Statements.
Portfolio Information as of January 31, 2013
BlackRock Emerging Markets Long/Short Equity Fund
| | | | Percent of Total Investments1
|
|
Geographic Allocation
|
|
|
| Long
|
| Short
|
| Total
|
Taiwan | | | | | 9 | % | | | 7 | % | | | 16 | % |
China | | | | | 8 | | | | 5 | | | | 13 | |
Brazil | | | | | 7 | | | | 6 | | | | 13 | |
South Korea | | | | | 7 | | | | 5 | | | | 12 | |
South Africa | | | | | 4 | | | | 4 | | | | 8 | |
Hong Kong | | | | | 3 | | | | 3 | | | | 6 | |
Mexico | | | | | 3 | | | | 2 | | | | 5 | |
Thailand | | | | | 3 | | | | 1 | | | | 4 | |
Turkey | | | | | 2 | | | | 2 | | | | 4 | |
Russia | | | | | 2 | | | | 2 | | | | 4 | |
Malaysia | | | | | 2 | | | | 1 | | | | 3 | |
Indonesia | | | | | 2 | | | | 1 | | | | 3 | |
Chile | | | | | 1 | | | | 1 | | | | 2 | |
Poland | | | | | 1 | | | | 1 | | | | 2 | |
Israel | | | | | 1 | | | | 1 | | | | 2 | |
United Kingdom | | | | | 1 | | | | — | | | | 1 | |
Panama | | | | | 1 | | | | — | | | | 1 | |
Philippines | | | | | — | | | | 1 | | | | 1 | |
Total
| | | | | 57 | % | | | 43 | % | | | 100 | % |
BlackRock Global Long/Short Equity Fund
| | | | Percent of Total Investments1
|
|
Geographic Allocation
|
|
|
| Long
|
| Short
|
| Total
|
United States | | | | | 30 | % | | | 25 | % | | | 55 | % |
Japan | | | | | 5 | | | | 4 | | | | 9 | |
Australia | | | | | 3 | | | | 4 | | | | 7 | |
Canada | | | | | 1 | | | | 4 | | | | 5 | |
Germany | | | | | 3 | | | | 2 | | | | 5 | |
United Kingdom | | | | | 1 | | | | 3 | | | | 4 | |
Italy | | | | | 2 | | | | 1 | | | | 3 | |
Spain | | | | | 3 | | | | — | | | | 3 | |
France | | | | | 1 | | | | 1 | | | | 2 | |
Nertherlands | | | | | 1 | | | | — | | | | 1 | |
Singapore | | | | | 1 | | | | — | | | | 1 | |
China | | | | | — | | | | 1 | | | | 1 | |
Norway | | | | | 1 | | | | — | | | | 1 | |
Ireland | | | | | — | | | | 1 | | | | 1 | |
Israel | | | | | 1 | | | | — | | | | 1 | |
Austria | | | | | 1 | | | | — | | | | 1 | |
Total
| | | | | 54 | % | | | 46 | % | | | 100 | % |
| 1 | | Total investments include the gross notional values of long and short positions of the underlying derivative contracts utilized by the Fund and exclude short-term securities. |
| 8 | BLACKROCK FUNDS | JANUARY 31, 2013
|
| |
| Schedule of Investments January 31, 2013 (Unaudited) | BlackRock Emerging Markets Long/Short Equity Fund
(Percentages shown are based on Net Assets)
|
Short-Term Securities
|
|
|
| Shares
|
| Value
|
BlackRock Liquidity Funds, TempFund, Institutional Class, 0.10% (a)(b) | | | | | 523,031,393 | | | $ | 523,031,393 | |
Total Short-Term Securities
(Cost — $523,031,393*) — 101.3% | | | | | | | | | 523,031,393 | |
Liabilities in Excess of Other Assets — (1.3)% | | | | | | | | | (6,591,798 | ) |
Net Assets — 100.0% | | | | | | | | $ | 516,439,595 | |
Notes to Schedule of Investments
| * | | | | Cost for federal income tax purposes. |
| (a) | | | | Investments in issuers considered to be an affiliate of the Fund during the six months ended January 31, 2013, for purposes of Section 2(a)(3) of the Investment Company Act of 1940, as amended, were as follows: |
Affiliate
|
|
|
| Shares Held at
July 31, 2012
|
| Net
Activity
|
| Shares Held at
January 31, 2013
|
| Income
|
| Gain
|
BlackRock Liquidity Funds, TempFund, Institutional Class | | | | | 195,668,859 | | | | 327,362,534 | | | | 523,031,393 | | | $ | 248,306 | | | $ | 4,412 | |
| (b) | | | | Represents the current yield as of report date. |
| • | | | | Total return swaps outstanding as of January 31, 2013 were as follows:1 |
Reference Entity
|
|
|
| Counterparty
|
| Expiration
Date
|
| Notional
Amount
|
| Unrealized
Appreciation
|
| Net Value of
Reference
Entities
|
Basket of Equity Securities Long/Short: | | | | Goldman Sachs Group, Inc. | | 6/17/13 | | $ | 39,402,338 | | | $ | 4,416,037 | 2 | | $ | 43,579,880 | |
| | | | Morgan Stanley & Co., Inc. | | 12/19/14 | | $ | 35,090,485 | | | | 7,663,363 | 3 | | | 42,583,404 | |
| | | | UBS AG | | Open4 | | $ | 38,412,097 | | | | 5,153,846 | 5 | | | 43,254,341 | |
Total | | | | | | | | | | | | $ | 17,233,246 | | | $ | 129,417,625 | |
| | | | | | | | | | | | | | | | | | |
| 1 | | The Fund receives or pays the total return on a portfolio of long and short positions underlying the custom basket and pays or receives a specific LIBOR or Federal Funds floating rate, which is denominated in various foreign currencies based on the currencies of the securities underlying the custom basket. |
| 2 | | Amount includes $(238,495) of dividends and financing income payable from the Fund to the counterparty. |
| 3 | | Amount includes $(170,444) of dividends and financing income payable from the Fund to the counterparty. |
| 4 | | Certain swaps have no stated expiration and can be terminated by either party at any time. |
| 5 | | Amount includes $(311,602) of dividends and financing income payable from the Fund to the counterparty. |
Portfolio Abbreviations
To simplify the listings of portfolio holdings in the Schedules of Investments, the names and descriptions of many of the securities have been abbreviated according to the following list: | | ADR
AUD
DKK
EUR
GBP
GDR
LIBOR
NOK
| | American Depositary Receipts
Australian Dollar
Danish Krone
Euro
British Pound
Global Depositary Receipts
London Interbank Offered Rate
Norwegian Krone |
See Notes to Financial Statements.
| BLACKROCK FUNDS | JANUARY 31, 2013 | 9
|
| |
| Schedule of Investments (continued) | BlackRock Emerging Markets Long/Short Equity Fund
|
The following table represents the individual long and short positions and related values of the basket of equity securities underlying the total return swap with Goldman Sachs Group, Inc. as of January 31, 2013:
| | | | | Shares | | Value |
Reference Entity — Long
|
Argentina | | | | | | | | | | |
Banco Macro SA — ADR | | | | | 12,561 | | | $ | 209,141 | |
MercadoLibre, Inc. | | | | | 4,838 | | | | 427,679 | |
Ternium SA — ADR | | | | | 15,267 | | | | 360,759 | |
| | | | | | | | | 997,579 | |
Brazil | | | | | | | | | | |
AES Tiete SA, Preference Shares | | | | | 259,300 | | | | 2,701,923 | |
Amil Participacoes SA | | | | | 17,100 | | | | 268,090 | |
Arteris SA | | | | | 5,100 | | | | 53,040 | |
Banco Bradesco SA — ADR | | | | | 9,952 | | | | 182,918 | |
Banco Bradesco SA, Preference Shares | | | | | 62,200 | | | | 1,143,203 | |
Banco do Brasil SA | | | | | 80,200 | | | | 982,690 | |
Banco do Estado do Rio Grande do Sul, Preference Shares | | | | | 22,000 | | | | 188,365 | |
Banco Santander Brasil SA | | | | | 39,500 | | | | 290,594 | |
Banco Santander Brasil SA — ADR | | | | | 72,214 | | | | 535,828 | |
BM&FBovespa SA | | | | | 47,000 | | | | 329,013 | |
Braskem SA, Preference A Shares | | | | | 12,800 | | | | 96,481 | |
Cia de Bebidas das Americas, Preference Shares | | | | | 29,200 | | | | 1,375,429 | |
Cia de Bebidas das Americas, Preference Shares — ADR | | | | | 99,368 | | | | 4,676,258 | |
Cia Energetica de Minas Gerais — ADR | | | | | 51,689 | | | | 567,544 | |
Cia Energetica de Minas Gerais, Preference Shares | | | | | 8,900 | | | | 96,538 | |
Cia Energetica de Sao Paulo, Preference B Shares | | | | | 50,100 | | | | 497,138 | |
Cia Siderurgica Nacional SA | | | | | 95,300 | | | | 514,463 | |
Cia Siderurgica Nacional SA — ADR | | | | | 45,532 | | | | 247,239 | |
Cielo SA | | | | | 3,100 | | | | 87,675 | |
Cyrela Brazil Realty SA Empreendimentos e Participacoes | | | | | 30,700 | | | | 270,563 | |
Duratex SA | | | | | 51,000 | | | | 354,453 | |
Embraer SA | | | | | 18,100 | | | | 149,519 | |
Embraer SA — ADR | | | | | 5,064 | | | | 166,960 | |
Gafisa SA | | | | | 57,800 | | | | 144,257 | |
Gafisa SA — ADR | | | | | 78,734 | | | | 387,371 | |
Itau Unibanco Holdings SA — ADR | | | | | 18,465 | | | | 318,152 | |
Itau Unibanco Holdings SA, Preference Shares | | | | | 55,800 | | | | 962,528 | |
Itausa — Investimentos Itau SA, Preference Shares | | | | | 175,780 | | | | 889,779 | |
Lojas Americanas SA, Preference Shares | | | | | 101,500 | | | | 905,744 | |
Marfrig Alimentos SA | | | | | 53,300 | | | | 274,349 | |
Metalurgica Gerdau SA, Preference Shares | | | | | 44,100 | | | | 493,628 | |
Multiplus SA | | | | | 164,900 | | | | 3,544,189 | |
Natura Cosmeticos SA | | | | | 23,900 | | | | 644,502 | |
Odontoprev SA | | | | | 65,100 | | | | 331,818 | |
PDG Realty SA Empreendimentos e Participacoes | | | | | 46,000 | | | | 72,996 | |
Petroleo Brasileiro SA, Preference Shares | | | | | 78,300 | | | | 710,907 | |
Porto Seguro SA | | | | | 37,800 | | | | 453,672 | |
Rossi Residencial SA | | | | | 39,200 | | | | 82,678 | |
Souza Cruz SA | | | | | 27,900 | | | | 461,649 | |
Sul America SA | | | | | 9,800 | | | | 91,634 | |
Tractebel Energia SA | | | | | 98,200 | | | | 1,745,197 | |
Vale SA, Preference A Shares | | | | | 69,300 | | | | 1,346,784 | |
| | | | | | | | | 29,637,758 | |
| | | | | | | | | | | |
| | | | | Shares | | Value |
Reference Entity — Long
|
Canada | | | | | | | | | | |
Coeur d’Alene Mines Corp. | | | | | 2,033 | | | $ | 44,116 | |
Gran Tierra Energy, Inc. | | | | | 16,028 | | | | 85,429 | |
Methanex Corp. | | | | | 4,421 | | | | 158,995 | |
| | | | | | | | | 288,540 | |
Chile | | | | | | | | | | |
Banco Santander Chile SA — ADR | | | | | 1,629 | | | | 49,196 | |
Sociedad Quimica y Minera de Chile SA — ADR | | | | | 36,736 | | | | 2,088,074 | |
| | | | | | | | | 2,137,270 | |
China | | | | | | | | | | |
Agricultural Bank of China Ltd., Class H | | | | | 371,000 | | | | 202,030 | |
Air China Ltd., Class H | | | | | 230,000 | | | | 197,250 | |
Bank of China Ltd., Class H | | | | | 1,295,000 | | | | 638,065 | |
Bank of Communications Co. Ltd., Class H | | | | | 98,000 | | | | 83,198 | |
Beijing Capital International Airport Co. Ltd., Class H | | | | | 612,000 | | | | 509,575 | |
China BlueChemical Ltd., Class H | | | | | 1,102,000 | | | | 791,755 | |
China Coal Energy Co. | | | | | 308,000 | | | | 343,539 | |
China Construction Bank, Class H | | | | | 1,115,000 | | | | 961,833 | |
China Merchants Bank Co. Ltd., Class H | | | | | 26,500 | | | | 63,524 | |
China Minsheng Banking Corp. Ltd., Class H | | | | | 336,000 | | | | 482,434 | |
China Mobile Ltd. | | | | | 235,000 | | | | 2,569,538 | |
China Oilfield Services Ltd., Class H | | | | | 486,000 | | | | 1,052,254 | |
China Petroleum & Chemical Corp., Class H | | | | | 186,000 | | | | 225,672 | |
China Shenhua Energy Co. Ltd., Class H | | | | | 111,000 | | | | 477,313 | |
China Southern Airlines Co. Ltd., Class H | | | | | 358,000 | | | | 215,248 | |
China Telecom Corp. Ltd., Class H | | | | | 1,040,000 | | | | 566,435 | |
CNOOC Ltd. | | | | | 588,000 | | | | 1,210,036 | |
Dongfang Electric Corp. Ltd. | | | | | 121,600 | | | | 235,716 | |
Dongfeng Motor Group Co. Ltd., Class H | | | | | 930,000 | | | | 1,522,202 | |
ENN Energy Holdings Ltd. | | | | | 42,000 | | | | 201,206 | |
Evergrande Real Estate Group Ltd. | | | | | 1,195,000 | | | | 631,439 | |
Golden Eagle Retail Group Ltd. | | | | | 539,000 | | | | 1,160,917 | |
Great Wall Motor Co. Ltd. | | | | | 410,000 | | | | 1,666,875 | |
Huaneng Power International, Inc., Class H | | | | | 96,000 | | | | 98,951 | |
Industrial and Commercial Bank of China Ltd., Class H | | | | | 1,023,000 | | | | 770,431 | |
Intime Department Store Group Co. Ltd. | | | | | 174,500 | | | | 229,542 | |
Jiangsu Expressway Co. Ltd., Class H | | | | | 1,984,000 | | | | 2,045,727 | |
Lenovo Group Ltd. | | | | | 2,724,000 | | | | 2,837,337 | |
Longfor Properties Co. Ltd. | | | | | 105,500 | | | | 197,864 | |
Parkson Retail Group Ltd. | | | | | 1,010,000 | | | | 779,035 | |
Sany Heavy Equipment International Holdings Co. Ltd. | | | | | 1,922,000 | | | | 912,143 | |
Shanghai Electric Group Co. Ltd., Class H | | | | | 3,152,000 | | | | 1,304,869 | |
Sihuan Pharmaceutical Holdings Group Ltd. | | | | | 1,817,000 | | | | 805,714 | |
Sun Art Retail Group Ltd. | | | | | 1,447,500 | | | | 2,105,253 | |
Tencent Holdings Ltd. | | | | | 22,900 | | | | 799,825 | |
Tingyi Cayman Islands Holding Corp. | | | | | 228,000 | | | | 640,432 | |
Tsingtao Brewery Co. Ltd., Class H | | | | | 258,000 | | | | 1,491,238 | |
Uni-President China Holdings Ltd. | | | | | 407,000 | | | | 477,520 | |
Wumart Stores, Inc., Class H | | | | | 147,000 | | | | 293,523 | |
Zhejiang Expressway Co. Ltd., Class H | | | | | 766,000 | | | | 680,436 | |
Zijin Mining Group Co. Ltd., Class H | | | | | 568,000 | | | | 218,750 | |
Zoomlion Heavy Industry Science and Technology Co. Ltd., Class H | | | | | 728,000 | | | | 990,864 | |
| | | | | | | | | 33,687,508 | |
See Notes to Financial Statements.
| 10 | BLACKROCK FUNDS | JANUARY 31, 2013
|
| |
| Schedule of Investments (continued) | BlackRock Emerging Markets Long/Short Equity Fund
|
| | | | | Shares | | Value |
Reference Entity — Long
|
Colombia | | | | | | | | | | |
Petrominerales Ltd. | | | | | 98,787 | | | $ | 879,515 | |
Hong Kong | | | | | | | | | | |
Anta Sports Products Ltd. | | | | | 387,000 | | | | 361,253 | |
Belle International Holdings Ltd. | | | | | 212,000 | | | | 471,517 | |
Bosideng International Holdings Ltd. | | | | | 1,728,000 | | | | 490,234 | |
China Gas Holdings Ltd. | | | | | 98,000 | | | | 85,223 | |
China Lumena New Materials Corp. | | | | | 322,000 | | | | 77,659 | |
China Resources Enterprise Ltd. | | | | | 426,000 | | | | 1,527,429 | |
China Resources Gas Group Ltd. | | | | | 94,000 | | | | 208,675 | |
China Taiping Insurance Holdings Co. Ltd. | | | | | 69,200 | | | | 146,040 | |
China Unicom Hong Kong Ltd. | | | | | 264,000 | | | | 422,456 | |
Citic Pacific Ltd. | | | | | 589,000 | | | | 947,388 | |
Dongyue Group | | | | | 278,000 | | | | 185,707 | |
Geely Automobile Holdings Ltd. | | | | | 1,185,000 | | | | 619,050 | |
GOME Electrical Appliances Holdings Ltd. | | | | | 1,372,000 | | | | 164,813 | |
Guangdong Investment Ltd. | | | | | 1,826,000 | | | | 1,515,855 | |
Haier Electronics Group Co. Ltd. | | | | | 227,000 | | | | 378,455 | |
Huabao International Holdings Ltd. | | | | | 866,000 | | | | 472,905 | |
KWG Property Holding Ltd. | | | | | 158,000 | | | | 119,900 | |
MMG Ltd. | | | | | 1,656,000 | | | | 670,603 | |
Nine Dragons Paper Holdings Ltd. | | | | | 382,000 | | | | 334,911 | |
Ports Design Ltd. | | | | | 254,500 | | | | 220,461 | |
Want Want China Holdings Ltd. | | | | | 587,000 | | | | 777,677 | |
| | | | | | | | | 10,198,211 | |
Indonesia | | | | | | | | | | |
Astra Agro Lestari Tbk PT | | | | | 9,500 | | | | 18,390 | |
Bumi Resources Tbk PT | | | | | 718,500 | | | | 50,180 | |
Indo Tambangraya Megah Tbk PT | | | | | 26,000 | | | | 110,681 | |
Indocement Tunggal Prakarsa Tbk PT | | | | | 690,500 | | | | 1,542,062 | |
Kalbe Farma Tbk PT | | | | | 1,472,000 | | | | 164,604 | |
Perusahaan Gas Negara Persero Tbk PT | | | | | 2,811,500 | | | | 1,349,746 | |
Telekomunikasi Indonesia Persero Tbk PT | | | | | 75,500 | | | | 75,617 | |
Unilever Indonesia Tbk PT | | | | | 77,000 | | | | 174,383 | |
| | | | | | | | | 3,485,663 | |
Israel | | | | | | | | | | |
Check Point Software Technologies Ltd. | | | | | 14,284 | | | | 714,200 | |
Israel Chemicals Ltd. | | | | | 179,066 | | | | 2,378,293 | |
| | | | | | | | | 3,092,493 | |
Malaysia | | | | | | | | | | |
Axiata Group Bhd | | | | | 356,700 | | | | 723,338 | |
Berjaya Sports Toto Bhd | | | | | 322,715 | | | | 451,985 | |
British American Tobacco Malaysia Bhd | | | | | 43,600 | | | | 804,973 | |
DiGi.Com Bhd | | | | | 1,464,700 | | | | 2,319,453 | |
Lafarge Malayan Cement Bhd | | | | | 211,000 | | | | 631,574 | |
Petronas Chemicals Group Bhd | | | | | 2,270,500 | | | | 4,348,077 | |
Tenaga Nasional Bhd | | | | | 193,500 | | | | 436,327 | |
UMW Holdings Bhd | | | | | 77,000 | | | | 300,863 | |
YTL Power International Bhd | | | | | 246,700 | | | | 120,702 | |
| | | | | | | | | 10,137,292 | |
Mexico | | | | | | | | | | |
Alfa SAB, Class A | | | | | 722,129 | | | | 1,733,959 | |
America Movil, SAB de CV, Series L — ADR | | | | | 180,716 | | | | 4,546,815 | |
Fomento Economico Mexicano SAB de CV — ADR | | | | | 10,892 | | | | 1,175,138 | |
Grupo Aeroportuario del Pacifico SAB de CV — ADR | | | | | 25,924 | | | | 1,613,510 | |
| | | | | | | | | | | |
| | | | | Shares | | Value |
Reference Entity — Long
|
Mexico (concluded) | | | | | | | | | | |
Grupo Aeroportuario del Pacifico SAB de CV, B Shares | | | | | 289,100 | | | $ | 1,801,276 | |
Grupo Carso SAB de CV, Series A1 | | | | | 54,270 | | | | 263,483 | |
Grupo Televisa SAB — ADR | | | | | 68,605 | | | | 237,567 | |
Grupo Televisa SAB, Series CPO | | | | | 42,400 | | | | 1,921,626 | |
Industrias Penoles SAB de CV | | | | | 2,245 | | | | 110,271 | |
| | | | | | | | | 13,403,645 | |
Panama | | | | | | | | | | |
Banco Latinoamericana de Comercio Exterior SA | | | | | 13,742 | | | | 318,814 | |
Copa Holdings SA, Class A | | | | | 49,591 | | | | 5,435,174 | |
| | | | | | | | | 5,753,988 | |
Peru | | | | | | | | | | |
Southern Copper Corp. | | | | | 4,327 | | | | 170,441 | |
Philippines | | | | | | | | | | |
Aboitiz Power Corp. | | | | | 644,100 | | | | 603,484 | |
Manila Electric Co. | | | | | 42,330 | | | | 302,280 | |
| | | | | | | | | 905,764 | |
Poland | | | | | | | | | | |
KGHM Polska Miedz SA | | | | | 24,047 | | | | 1,471,468 | |
PGE SA | | | | | 382,272 | | | | 2,108,294 | |
Powszechny Zaklad Ubezpieczen SA | | | | | 4,901 | | | | 645,954 | |
Synthos SA | | | | | 136,622 | | | | 231,884 | |
Tauron Polska Energia SA | | | | | 464,633 | | | | 710,368 | |
| | | | | | | | | 5,167,968 | |
Russia | | | | | | | | | | |
AK Transneft OAO, Preference Shares | | | | | 256 | | | | 601,880 | |
Gazprom OAO | | | | | 458,060 | | | | 2,166,365 | |
LSR Group — GDR | | | | | 119,940 | | | | 601,499 | |
Lukoil OAO | | | | | 15,844 | | | | 1,066,576 | |
Lukoil OAO — ADR | | | | | 7,956 | | | | 536,469 | |
Mechel — ADR | | | | | 107,654 | | | | 726,664 | |
Mobile Telesystems OJSC — ADR | | | | | 11,346 | | | | 223,062 | |
Novolipetsk Steel OJSC — GDR | | | | | 4,837 | | | | 102,714 | |
Rosneft OAO | | | | | 5,660 | | | | 50,383 | |
Sberbank RF | | | | | 186,400 | | | | 679,861 | |
Severstal OAO | | | | | 28,870 | | | | 362,441 | |
Severstal OAO — GDR | | | | | 21,220 | | | | 264,690 | |
Sistema JSFC — GDR | | | | | 28,974 | | | | 635,962 | |
Tatneft OAO, Class S | | | | | 101,200 | | | | 747,993 | |
TMK OAO — GDR | | | | | 1,855 | | | | 28,244 | |
VTB Bank OJSC | | | | | 84,980,000 | | | | 157,841 | |
| | | | | | | | | 8,952,644 | |
South Africa | | | | | | | | | | |
African Bank Investments Ltd. | | | | | 13,375 | | | | 46,110 | |
AVI Ltd. | | | | | 118,852 | | | | 726,802 | |
Barloworld Ltd. | | | | | 13,782 | | | | 128,974 | |
Bidvest Group Ltd. | | | | | 80,916 | | | | 1,931,654 | |
FirstRand Ltd. | | | | | 329,794 | | | | 1,189,041 | |
Gold Fields Ltd. — ADR | | | | | 16,984 | | | | 197,354 | |
Harmony Gold Mining Co. Ltd. — ADR | | | | | 50,308 | | | | 324,987 | |
Imperial Holdings Ltd. | | | | | 77,421 | | | | 1,685,646 | |
Kumba Iron Ore Ltd. | | | | | 4,766 | | | | 320,948 | |
Liberty Holdings Ltd. | | | | | 76,893 | | | | 989,759 | |
Life Healthcare Group Holdings Ltd. | | | | | 170,414 | | | | 599,358 | |
Mr Price Group Ltd. | | | | | 5,491 | | | | 75,794 | |
Nedbank Group Ltd. | | | | | 31,645 | | | | 686,698 | |
See Notes to Financial Statements.
| BLACKROCK FUNDS | JANUARY 31, 2013 | 11
|
| |
| Schedule of Investments (continued) | BlackRock Emerging Markets Long/Short Equity Fund
|
| | | | | Shares | | Value |
Reference Entity — Long
|
South Africa (concluded) | | | | | | | | | | |
Netcare Ltd. | | | | | 384,889 | | | $ | 843,361 | |
Redefine Properties Ltd. | | | | | 75,350 | | | | 80,784 | |
Reunert Ltd. | | | | | 55,720 | | | | 464,717 | |
RMI Holdings | | | | | 20,009 | | | | 51,189 | |
Sappi Ltd. | | | | | 551,545 | | | | 1,928,106 | |
Vodacom Group Ltd. | | | | | 212,156 | | | | 2,950,898 | |
Woolworths Holdings Ltd. | | | | | 191,115 | | | | 1,357,995 | |
| | | | | | | | | 16,580,175 | |
South Korea | | | | | | | | | | |
Asiana Airlines, Inc. | | | | | 78,360 | | | | 434,071 | |
CJ O Shopping Co. Ltd. | | | | | 4,089 | | | | 1,111,110 | |
Daelim Industrial Co. Ltd. | | | | | 1,880 | | | | 159,969 | |
Daewoo Engineering & Construction Co. Ltd. | | | | | 10,160 | | | | 84,472 | |
Dongbu Insurance Co. Ltd. | | | | | 17,070 | | | | 732,380 | |
Dongkuk Steel Mill Co. Ltd. | | | | | 3,770 | | | | 45,189 | |
Doosan Corp. | | | | | 14,596 | | | | 1,722,327 | |
Doosan Heavy Industries & Construction Co. Ltd. | | | | | 13,340 | | | | 570,516 | |
Doosan Infracore Co. Ltd. | | | | | 21,180 | | | | 313,346 | |
Duksan Hi-Metal Co. Ltd. | | | | | 16,622 | | | | 341,355 | |
E-Mart Co. Ltd. | | | | | 3,755 | | | | 834,016 | |
Grand Korea Leisure Co. Ltd. | | | | | 8,960 | | | | 252,966 | |
GS Retail Co. Ltd. | | | | | 1,790 | | | | 45,094 | |
Haansoft, Inc. | | | | | 15,185 | | | | 260,845 | |
Hanwha Chemical Corp. | | | | | 4,110 | | | | 72,691 | |
Hanwha Corp. | | | | | 20,600 | | | | 632,427 | |
Honam Petrochemical Corp. | | | | | 535 | | | | 124,149 | |
Huvis Corp. | | | | | 37,420 | | | | 383,170 | |
Huvitz Co. Ltd. | | | | | 22,245 | | | | 355,500 | |
Hyundai Heavy Industries Co. Ltd. | | | | | 1,310 | | | | 258,665 | |
Hyundai Hysco Co. Ltd. | | | | | 1,020 | | | | 35,303 | |
Hyundai Mobis | | | | | 1,418 | | | | 371,345 | |
Hyundai Steel Co. | | | | | 10,392 | | | | 791,502 | |
Hyundai Wia Corp. | | | | | 1,679 | | | | 226,610 | |
Industrial Bank of Korea | | | | | 21,890 | | | | 247,337 | |
KEPCO Engineering & Construction Co., Inc. | | | | | 2,126 | | | | 156,441 | |
Kia Motors Corp. | | | | | 68,747 | | | | 3,265,427 | |
Korea Electric Power Corp. | | | | | 8,340 | | | | 247,534 | |
Korea Exchange Bank | | | | | 114,580 | | | | 797,536 | |
Korea Investment Holdings Co. Ltd. | | | | | 3,290 | | | | 127,790 | |
Korean Air Lines Co. Ltd. | | | | | 1,700 | | | | 70,981 | |
Kumho Petrochemical Co. Ltd. | | | | | 4,648 | | | | 508,423 | |
LG Chem Ltd. | | | | | 663 | | | | 185,511 | |
LG Corp. | | | | | 2,774 | | | | 163,418 | |
LG Display Co. Ltd. | | | | | 33,030 | | | | 886,969 | |
Lotte Confectionery Co. Ltd. | | | | | 176 | | | | 278,476 | |
Lotte Shopping Co. Ltd. | | | | | 3,531 | | | | 1,208,250 | |
LS Industrial Systems Co. Ltd. | | | | | 7,095 | | | | 439,262 | |
Macrogen, Inc. | | | | | 22,520 | | | | 597,942 | |
Mirae Asset Securities Co. Ltd. | | | | | 11,290 | | | | 391,517 | |
NEO Holdings Co. Ltd. | | | | | 14,596 | | | | — | |
Orion Corp. | | | | | 109 | | | | 101,882 | |
Paradise Co. Ltd. | | | | | 17,095 | | | | 301,497 | |
Partron Co. Ltd. | | | | | 5,952 | | | | 115,637 | |
Posco ICT Co. Ltd. | | | | | 26,646 | | | | 178,106 | |
Samsung Card Co. | | | | | 20,220 | | | | 664,992 | |
Samsung Electro-Mechanics Co. Ltd. | | | | | 5,726 | | | | 482,413 | |
Samsung Electronics Co. Ltd. | | | | | 508 | | | | 675,860 | |
Samsung Engineering Co. Ltd. | | | | | 3,236 | | | | 461,906 | |
Samsung Fine Chemicals Co. Ltd. | | | | | 4,067 | | | | 196,835 | |
Samsung Heavy Industries Co. Ltd. | | | | | 23,000 | | | | 808,182 | |
| | | | | | | | | | | |
| | | | | Shares | | Value |
Reference Entity — Long
|
South Korea (concluded) | | | | | | | | | | |
Silicon Works Co. Ltd. | | | | | 16,639 | | | $ | 308,159 | |
SK Holdings Co. Ltd. | | | | | 4,129 | | | | 652,534 | |
SK Networks Co. Ltd. | | | | | 28,280 | | | | 209,026 | |
SK Telecom Co. Ltd. — ADR | | | | | 8,951 | | | | 151,719 | |
SM Entertainment Co. | | | | | 9,769 | | | | 361,568 | |
STX Offshore & Shipbuilding Co. Ltd. | | | | | 16,440 | | | | 105,275 | |
Woongjin Coway Co. Ltd. | | | | | 22,920 | | | | 995,584 | |
Woori Finance Holdings Co. Ltd. | | | | | 43,270 | | | | 508,756 | |
Woori Investment & Securities Co. Ltd. | | | | | 5,840 | | | | 66,225 | |
YG Entertainment, Inc. | | | | | 6,574 | | | | 377,656 | |
| | | | | | | | | 27,455,644 | |
Taiwan | | | | | | | | | | |
ALI Corp. | | | | | 167,000 | | | | 185,453 | |
ASUSTek Computer, Inc. | | | | | 76,000 | | | | 871,001 | |
Capella Microsystems Taiwan, Inc. | | | | | 90,000 | | | | 693,187 | |
Capital Securities Corp. | | | | | 585,000 | | | | 228,148 | |
Career Technology MFG. Co. Ltd. | | | | | 47,000 | | | | 59,948 | |
Cathay Financial Holding Co. Ltd. | | | | | 102,000 | | | | 113,720 | |
Chang Hwa Commercial Bank | | | | | 36,380 | | | | 20,098 | |
Cheng Shin Rubber Industry Co. Ltd. | | | | | 316,000 | | | | 825,777 | |
Chicony Electronics Co. Ltd. | | | | | 287,000 | | | | 795,260 | |
Chimei Innolux Corp. | | | | | 97,000 | | | | 50,510 | |
China Airlines Ltd. | | | | | 602,000 | | | | 264,327 | |
Chipbond Technology Corp. | | | | | 15,000 | | | | 30,863 | |
CTCI Corp. | | | | | 914,000 | | | | 1,751,693 | |
Delta Electronics, Inc. | | | | | 37,000 | | | | 134,052 | |
E.Sun Financial Holding Co. Ltd. | | | | | 113,350 | | | | 64,927 | |
Elan Microelectronics Corp. | | | | | 396,000 | | | | 734,813 | |
Eva Airways Corp. | | | | | 963,000 | | | | 617,087 | |
Far Eastern New Century Corp. | | | | | 783,010 | | | | 907,810 | |
Far EasTone Telecommunications Co. Ltd. | | | | | 256,000 | | | | 651,333 | |
Faraday Technology Corp. | | | | | 380,000 | | | | 476,635 | |
Formosa Plastics Corp. | | | | | 31,000 | | | | 84,230 | |
Formosa Taffeta Co. Ltd. | | | | | 169,000 | | | | 163,141 | |
Global Unichip Corp. | | | | | 248,000 | | | | 806,685 | |
Integrated Memory Logic Ltd. | | | | | 46,894 | | | | 140,931 | |
Inventec Co. Ltd. | | | | | 320,000 | | | | 128,096 | |
Lite-On Technology Corp. | | | | | 390 | | | | 562 | |
Merida Industry Co. Ltd. | | | | | 792,000 | | | | 3,619,434 | |
Phison Electronics Corp. | | | | | 14,000 | | | | 94,634 | |
POU Chen Corp. | | | | | 1,370,000 | | | | 1,369,006 | |
President Chain Store Corp. | | | | | 975,000 | | | | 5,269,565 | |
Radiant Opto-Electronics Corp. | | | | | 91,420 | | | | 354,893 | |
Senao International Co. Ltd. | | | | | 34,000 | | | | 109,503 | |
Sercomm Corp. | | | | | 211,000 | | | | 312,668 | |
Silitech Technology Corp. | | | | | 67,000 | | | | 125,832 | |
Taishin Financial Holding Co. Ltd. | | | | | 494,118 | | | | 195,828 | |
Taiwan Business Bank | | | | | 1,535,000 | | | | 467,691 | |
Taiwan Cement Corp. | | | | | 100,000 | | | | 135,299 | |
Taiwan Cooperative Financial Holding | | | | | 400 | | | | 223 | |
Taiwan Fertilizer Co. Ltd. | | | | | 24,000 | | | | 59,565 | |
Taiwan Mobile Co. Ltd. | | | | | 454,000 | | | | 1,615,384 | |
Taiwan Semiconductor Manufacturing Co. Ltd. | | | | | 1,308,000 | | | | 4,482,155 | |
Taiwan Semiconductor Manufacturing Co. Ltd. — ADR | | | | | 341,060 | | | | 6,050,404 | |
Teco Electric and Machinery Co. Ltd. | | | | | 2,168,000 | | | | 1,803,649 | |
Tong Hsing Electronic Industries Ltd. | | | | | 82,000 | | | | 316,208 | |
Transcend Information, Inc. | | | | | 59,000 | | | | 161,302 | |
Uni-President Enterprises Corp. | | | | | 1,159,270 | | | | 2,036,435 | |
Wan Hai Lines Ltd. | | | | | 264,000 | | | | 143,983 | |
See Notes to Financial Statements.
| 12 | BLACKROCK FUNDS | JANUARY 31, 2013
|
| |
| Schedule of Investments (continued) | BlackRock Emerging Markets Long/Short Equity Fund
|
| | | | | Shares | | Value |
Reference Entity — Long
|
Taiwan (concluded) | | | | | | | | | | |
Ways Technical Corp. Ltd. | | | | | 48,000 | | | $ | 130,199 | |
Yang Ming Marine Transport Corp. | | | | | 584,000 | | | | 282,209 | |
| | | | | | | | | 39,936,356 | |
Thailand | | | | | | | | | | |
Advanced Info Service PCL | | | | | 191,500 | | | | 1,348,592 | |
Airports of Thailand PCL | | | | | 205,500 | | | | 727,037 | |
Bangkok Dusit Medical Services PCL | | | | | 15,800 | | | | 70,469 | |
BEC World PCL | | | | | 675,400 | | | | 1,642,069 | |
CP ALL PCL | | | | | 2,895,000 | | | | 4,538,607 | |
PTT Global Chemical PCL | | | | | 286,000 | | | | 767,270 | |
Thai Airways International PCL | | | | | 144,800 | | | | 112,169 | |
| | | | | | | | | 9,206,213 | |
Turkey | | | | | | | | | | |
BIM Birlesik Magazalar AS | | | | | 7,256 | | | | 351,819 | |
Coca-Cola Icecek AS | | | | | 36,911 | | | | 897,478 | |
Emlak Konut Gayrimenkul Yatirim Ortakligi AS | | | | | 615,221 | | | | 1,087,785 | |
Enka Insaat ve Sanayi AS | | | | | 1,036,729 | | | | 3,113,088 | |
Ford Otomotiv Sanayi AS | | | | | 9,454 | | | | 107,530 | |
Koza Altin Isletmeleri AS | | | | | 24,462 | | | | 602,083 | |
TAV Havalimanlari Holding AS | | | | | 173,036 | | | | 1,077,055 | |
Tupras Turkiye Petrol Rafinerileri AS | | | | | 4,988 | | | | 137,590 | |
Turk Hava Yollari | | | | | 931,887 | | | | 3,461,800 | |
Turk Telekomunikasyon AS | | | | | 20,931 | | | | 87,775 | |
| | | | | | | | | 10,924,003 | |
United Kingdom | | | | | | | | | | |
Antofagasta Plc | | | | | 85,971 | | | | 1,558,888 | |
British American Tobacco Plc | | | | | 11,051 | | | | 573,239 | |
Evraz Plc | | | | | 312,058 | | | | 1,428,815 | |
Fresnillo Plc | | | | | 15,431 | | | | 405,644 | |
Hochschild Mining Plc | | | | | 22,375 | | | | 150,038 | |
Lonmin Plc | | | | | 8,908 | | | | 50,300 | |
Mondi Plc | | | | | 2,979 | | | | 35,400 | |
Old Mutual Plc | | | | | 175,115 | | | | 522,026 | |
SABMiller Plc | | | | | 2,206 | | | | 108,613 | |
| | | | | | | | | 4,832,963 | |
Total Reference Entity — Long | | | | | | | | | 237,831,633 | |
|
Reference Entity — Short |
Brazil | | | | | | | | | | |
Anhanguera Educacional Participacoes SA | | | | | (18,700 | ) | | | (363,886 | ) |
BR Malls Participacoes SA | | | | | (6,000 | ) | | | (77,676 | ) |
BR Properties SA | | | | | (120,200 | ) | | | (1,560,333 | ) |
BRF — Brasil Foods SA — ADR | | | | | (105,459 | ) | | | (2,341,190 | ) |
CETIP SA — Mercador Organizados | | | | | (67,204 | ) | | | (845,386 | ) |
Cia Brasileira de Distribuicao Grupo Pao de Acucar, Preference Shares | | | | | (18,000 | ) | | | (848,771 | ) |
Cia Brasileira de Distribuicao Grupo Pao de Acucar, Preference Shares — ADR | | | | | (36,976 | ) | | | (1,765,234 | ) |
Cia de Saneamento de Minas Gerais-COPASA | | | | | (7,400 | ) | | | (180,081 | ) |
Cia de Transmissao de Energia Eletrica Paulista | | | | | (100 | ) | | | (1,758 | ) |
CPFL Energia SA — ADR | | | | | (28,242 | ) | | | (584,892 | ) |
Diagnosticos da America SA | | | | | (236,000 | ) | | | (1,676,953 | ) |
Gol Linhas Aereas Inteligentes SA, Preference Shares | | | | | (13,300 | ) | | | (96,777 | ) |
HRT Participacoes em Petroleo SA | | | | | (192,400 | ) | | | (362,317 | ) |
Hypermarcas SA | | | | | (115,800 | ) | | | (1,000,206 | ) |
| | | | | | | | | | | |
| | | | | Shares | | Value |
Reference Entity — Short |
Brazil (concluded) | | | | | | | | | | |
Kroton Educacional SA | | | | | (112,500 | ) | | $ | (2,762,573 | ) |
Localiza Rent a Car SA | | | | | (46,100 | ) | | | (847,295 | ) |
MPX Energia SA | | | | | (468,600 | ) | | | (2,322,586 | ) |
OGX Petroleo e Gas Participacoes SA | | | | | (29,600 | ) | | | (60,944 | ) |
Oi SA Preference Shares | | | | | (424,200 | ) | | | (1,714,822 | ) |
Raia Drogasil SA | | | | | (163,100 | ) | | | (1,822,369 | ) |
Suzano Papel e Celulose SA, Preference Shares | | | | | (59,700 | ) | | | (218,851 | ) |
Telefonica Brasil SA — ADR | | | | | (117,839 | ) | | | (2,967,186 | ) |
| | | | | | | | | (24,422,086 | ) |
Chile | | | | | | | | | | |
Enersis SA — ADR | | | | | (40,232 | ) | | | (790,559 | ) |
Latam Airlines Group SA — ADR | | | | | (79,840 | ) | | | (1,955,281 | ) |
| | | | | | | | | (2,745,840 | ) |
China | | | | | �� | | | | | |
Aluminum Corp. of China Ltd. — ADR | | | | | (18,234 | ) | | | (218,808 | ) |
Anhui Conch Cement Co. Ltd., Class H | | | | | (72,000 | ) | | | (282,686 | ) |
BBMG Corp., Class H | | | | | (2,885,500 | ) | | | (2,693,100 | ) |
Brilliance China Automotive Holdings Ltd. | | | | | (2,424,000 | ) | | | (3,254,239 | ) |
China Communications Construction Co. Ltd., Class H | | | | | (1,497,000 | ) | | | (1,521,881 | ) |
China Communications Services Corp. Ltd., Class H | | | | | (4,190,000 | ) | | | (2,549,407 | ) |
China COSCO Holdings Co. Ltd., Class H | | | | | (80,000 | ) | | | (41,579 | ) |
China Life Insurance Co. Ltd., Class H | | | | | (444,000 | ) | | | (1,481,820 | ) |
China Longyuan Power Group Corp., Class H | | | | | (416,000 | ) | | | (348,628 | ) |
China National Building Material Co. Ltd., Class H | | | | | (970,000 | ) | | | (1,548,159 | ) |
China Pacific Insurance Group Co. Ltd., Class H | | | | | (864,800 | ) | | | (3,379,556 | ) |
China Railway Group Ltd., Class H | | | | | (1,291,000 | ) | | | (736,238 | ) |
China Shanshui Cement Group Ltd. | | | | | (893,000 | ) | | | (656,240 | ) |
China Shipping Development Co. Ltd., Class H | | | | | (456,000 | ) | | | (251,249 | ) |
China ZhengTong Auto Services Holdings Ltd. | | | | | (111,000 | ) | | | (98,873 | ) |
Country Garden Holdings Co. Ltd. | | | | | (1,029,000 | ) | | | (548,268 | ) |
Daphne International Holdings Ltd. | | | | | (68,000 | ) | | | (87,545 | ) |
Datang International Power Generation Co. Ltd. | | | | | (770,000 | ) | | | (338,262 | ) |
Guangzhou Automobile Group Co. Ltd., Class H | | | | | (1,944,000 | ) | | | (1,627,615 | ) |
Hengan International Group Co. Ltd. | | | | | (81,500 | ) | | | (817,516 | ) |
Jiangxi Copper Co. Ltd., Class H | | | | | (219,000 | ) | | | (594,573 | ) |
Metallurgical Corp. of China Ltd., Class H | | | | | (741,000 | ) | | | (155,796 | ) |
PetroChina Co. Ltd. | | | | | (316,000 | ) | | | (448,110 | ) |
Shandong Weigao Group Medical Polymer Co. Ltd., Class H | | | | | (1,772,000 | ) | | | (1,711,666 | ) |
Shui On Land Ltd. | | | | | (259,500 | ) | | | (125,853 | ) |
Sino-Ocean Land Holdings Ltd. | | | | | (497,000 | ) | | | (396,994 | ) |
Sinopec Shanghai Petrochemical Co. Ltd., Class H | | | | | (1,800,000 | ) | | | (668,050 | ) |
Soho China Ltd. | | | | | (202,000 | ) | | | (181,824 | ) |
Zhaojin Mining Industry Co. Ltd., Class H | | | | | (60,000 | ) | | | (90,297 | ) |
Zhongsheng Group Holdings Ltd. | | | | | (257,000 | ) | | | (384,474 | ) |
Zhuzhou CSR Times Electric Co. Ltd., Class H | | | | | (60,000 | ) | | | (192,262 | ) |
| | | | | | | | | (27,431,568 | ) |
Colombia | | | | | | | | | | |
BanColombia SA — ADR | | | | | (9,825 | ) | | | (682,936 | ) |
Hong Kong | | | | | | | | | | |
Beijing Enterprises Holdings Ltd. | | | | | (115,000 | ) | | | (829,149 | ) |
China Agri-Industries Holdings Ltd. | | | | | (1,735,000 | ) | | | (1,060,078 | ) |
China Everbright International Ltd. | | | | | (5,095,000 | ) | | | (2,808,337 | ) |
China Mengniu Dairy Co. Ltd. | | | | | (217,000 | ) | | | (634,841 | ) |
See Notes to Financial Statements.
| BLACKROCK FUNDS | JANUARY 31, 2013 | 13
|
| |
| Schedule of Investments (continued) | BlackRock Emerging Markets Long/Short Equity Fund
|
| | | | | Shares | | Value |
Reference Entity — Short |
Hong Kong (concluded) | | | | | | | | | | |
China Merchants Holdings International Co. Ltd. | | | | | (648,380 | ) | | $ | (2,298,129 | ) |
China Overseas Land & Investment Ltd. | | | | | (52,000 | ) | | | (161,279 | ) |
China Resources Cement Holdings Ltd. | | | | | (1,898,000 | ) | | | (1,215,808 | ) |
China Resources Land Ltd. | | | | | (804,000 | ) | | | (2,448,467 | ) |
China Resources Power Holdings Co. Ltd. | | | | | (38,000 | ) | | | (105,141 | ) |
China State Construction International Holdings Ltd. | | | | | (1,180,000 | ) | | | (1,549,140 | ) |
Chow Tai Fook Jewellery Group Ltd. | | | | | (651,400 | ) | | | (1,037,768 | ) |
Dah Chong Hong Holdings Ltd. | | | | | (405,000 | ) | | | (468,189 | ) |
Franshion Properties China Ltd. | | | | | (2,746,000 | ) | | | (1,009,718 | ) |
Kingboard Chemical Holdings Ltd. | | | | | (294,000 | ) | | | (970,222 | ) |
Lee & Man Paper Manufacturing Ltd. | | | | | (296,000 | ) | | | (199,773 | ) |
Shanghai Industrial Holdings Ltd. | | | | | (1,138,000 | ) | | | (4,041,939 | ) |
Yingde Gases | | | | | (181,500 | ) | | | (203,606 | ) |
Yuexiu Property Co. Ltd. | | | | | (2,084,000 | ) | | | (744,731 | ) |
| | | | | | | | | (21,786,315 | ) |
Indonesia | | | | | | | | | | |
Astra International Tbk PT | | | | | (3,826,000 | ) | | | (2,888,704 | ) |
Bank Central Asia Tbk PT | | | | | (888,000 | ) | | | (879,809 | ) |
Bank Danamon Indonesia Tbk PT | | | | | (126,500 | ) | | | (79,211 | ) |
Bank Mandiri Persero Tbk PT | | | | | (147,500 | ) | | | (137,126 | ) |
Bank Negara Indonesia Persero Tbk PT | | | | | (284,000 | ) | | | (114,480 | ) |
Gudang Garam Tbk PT | | | | | (13,895 | ) | | | (73,983 | ) |
Indofood Sukses Makmur Tbk PT | | | | | (288,500 | ) | | | (178,704 | ) |
Indosat Tbk PT | | | | | (459,500 | ) | | | (321,093 | ) |
| | | | | | | | | (4,673,110 | ) |
Israel | | | | | | | | | | |
Avner Oil Exploration LLP | | | | | (300,605 | ) | | | (202,699 | ) |
Bezeq The Israeli Telecommunication Corp. Ltd. | | | | | (1,004,189 | ) | | | (1,176,824 | ) |
Teva Pharmaceutical Industries Ltd. ADR | | | | | (6,672 | ) | | | (253,469 | ) |
| | | | | | | | | (1,632,992 | ) |
Luxembourg | | | | | | | | | | |
Kernel Holding SA | | | | | (35,626 | ) | | | (800,565 | ) |
Malaysia | | | | | | | | | | |
CIMB Group Holdings Bhd | | | | | (54,900 | ) | | | (127,392 | ) |
Felda Global Ventures Holdings Bhd | | | | | (256,200 | ) | | | (377,662 | ) |
Genting Bhd | | | | | (85,000 | ) | | | (259,841 | ) |
Genting Malaysia Bhd | | | | | (276,200 | ) | | | (326,304 | ) |
Genting Plantations Bhd | | | | | (35,100 | ) | | | (93,042 | ) |
IJM Corp. Bhd | | | | | (200,900 | ) | | | (326,023 | ) |
IOI Corp. Bhd | | | | | (179,300 | ) | | | (286,831 | ) |
Kuala Lumpur Kepong Bhd | | | | | (71,400 | ) | | | (498,674 | ) |
Malaysia Airports Holdings Bhd | | | | | (97,700 | ) | | | (173,263 | ) |
Maxis Bhd | | | | | (130,000 | ) | | | (266,527 | ) |
MISC Bhd | | | | | (334,800 | ) | | | (479,517 | ) |
MMC Corp. Bhd | | | | | (90,200 | ) | | | (70,764 | ) |
PPB Group Bhd | | | | | (70,000 | ) | | | (280,721 | ) |
Sapurakencana Petroleum Bhd | | | | | (707,700 | ) | | | (665,329 | ) |
Sime Darby Bhd | | | | | (735,600 | ) | | | (2,202,636 | ) |
| | | | | | | | | (6,434,526 | ) |
Mexico | | | | | | | | | | |
Arca Continental SAB de CV | | | | | (55,100 | ) | | | (420,186 | ) |
Cemex SAB de CV ADR | | | | | (187,357 | ) | | | (2,032,823 | ) |
Cemex SAB de CV | | | | | (305,700 | ) | | | (333,480 | ) |
Compartamos SAB de CV | | | | | (250,300 | ) | | | (388,996 | ) |
El Puerto de Liverpool SAB de CV | | | | | (70,980 | ) | | | (786,638 | ) |
| | | | | | | | | | | |
| | | | | Shares | | Value |
Reference Entity — Short |
Mexico (concluded) | | | | | | | | | | |
Genomma Lab Internacional SAB de CV, Series B | | | | | (1,256,450 | ) | | $ | (2,868,729 | ) |
Grupo Financiero Banorte SAB de CV, Series O | | | | | (333,000 | ) | | | (2,189,693 | ) |
Grupo Modelo SAB de CV, Series C | | | | | (273,500 | ) | | | (2,327,243 | ) |
Kimberly-Clark de Mexico SAB de CV, Series A | | | | | (163,400 | ) | | | (457,380 | ) |
Mexichem SAB de CV | | | | | (134,800 | ) | | | (762,495 | ) |
Minera Frisco SAB de CV, Series A1 | | | | | (75,300 | ) | | | (323,122 | ) |
| | | | | | | | | (12,890,785 | ) |
Peru | | | | | | | | | | |
Cia de Minas Buenaventura SA — ADR | | | | | (465 | ) | | | (13,759 | ) |
Philippines | | | | | | | | | | |
International Container Terminal Services, Inc. | | | | | (29,700 | ) | | | (55,556 | ) |
Philippine Long Distance Telephone Co. — ADR | | | | | (21,537 | ) | | | (1,483,253 | ) |
| | | | | | | | | (1,538,809 | ) |
Poland | | | | | | | | | | |
Asseco Poland SA | | | | | (126,935 | ) | | | (1,847,534 | ) |
Cyfrowy Polsat SA | | | | | (93,042 | ) | | | (504,158 | ) |
Polskie Gornictwo Naftowe i Gazownictwo SA | | | | | (836,550 | ) | | | (1,488,427 | ) |
Powszechna Kasa Oszczednosci Bank Polski SA | | | | | (8,174 | ) | | | (91,385 | ) |
| | | | | | | | | (3,931,504 | ) |
Russia | | | | | | | | | | |
Federal Grid Co. Unified Energy System JSC | | | | | (42,360,000 | ) | | | (305,662 | ) |
Federal Hydrogenerating Co. JSC | | | | | (18,743,000 | ) | | | (471,980 | ) |
Surgutneftegas OJSC — ADR | | | | | (16,533 | ) | | | (171,393 | ) |
Uralkali OJSC — GDR -GDR | | | | | (75,958 | ) | | | (2,890,221 | ) |
| | | | | | | | | (3,839,256 | ) |
South Africa | | | | | | | | | | |
Anglo American Platinum Ltd. | | | | | (23,743 | ) | | | (1,164,092 | ) |
ArcelorMittal South Africa Ltd. | | | | | (54,660 | ) | | | (214,389 | ) |
Discovery Holdings Ltd. | | | | | (386,786 | ) | | | (2,860,595 | ) |
The Foschini Group Ltd. | | | | | (405,978 | ) | | | (5,314,268 | ) |
Growthpoint Properties Ltd. | | | | | (36,021 | ) | | | (101,439 | ) |
Massmart Holdings Ltd. | | | | | (60,422 | ) | | | (1,233,529 | ) |
MTN Group Ltd. | | | | | (12,846 | ) | | | (251,340 | ) |
Northam Platinum Ltd. | | | | | (123,943 | ) | | | (507,779 | ) |
Pick n Pay Stores Ltd. | | | | | (996,948 | ) | | | (5,072,259 | ) |
Sasol Ltd. — ADR | | | | | (7,043 | ) | | | (304,469 | ) |
Shoprite Holdings Ltd. | | | | | (136,597 | ) | | | (2,570,455 | ) |
Steinhoff International Holdings Ltd. | | | | | (46,097 | ) | | | (139,891 | ) |
Tiger Brands Ltd. | | | | | (21,907 | ) | | | (720,595 | ) |
| | | | | | | | | (20,455,100 | ) |
South Korea | | | | | | | | | | |
Amorepacific Corp. | | | | | (174 | ) | | | (174,925 | ) |
Cheil Industries, Inc. | | | | | (318 | ) | | | (25,492 | ) |
Cheil Worldwide, Inc. | | | | | (47,510 | ) | | | (977,742 | ) |
CJ CheilJedang Corp. | | | | | (10,136 | ) | | | (3,453,300 | ) |
Cosmax, Inc. | | | | | (16,230 | ) | | | (621,502 | ) |
Daewoo International Corp. | | | | | (13,000 | ) | | | (444,146 | ) |
Daewoo Shipbuilding & Marine Engineering Co. Ltd. | | | | | (17,420 | ) | | | (476,926 | ) |
Daou Technology, Inc. | | | | | (8,210 | ) | | | (126,412 | ) |
Daum Communications Corp. | | | | | (7,527 | ) | | | (705,849 | ) |
GS Engineering & Construction Corp. | | | | | (18,159 | ) | | | (928,720 | ) |
Hotel Shilla Co. Ltd. | | | | | (6,850 | ) | | | (288,672 | ) |
Hyundai Department Store Co. Ltd. | | | | | (343 | ) | | | (50,915 | ) |
Hyundai Development Co. | | | | | (24,880 | ) | | | (533,474 | ) |
See Notes to Financial Statements.
| 14 | BLACKROCK FUNDS | JANUARY 31, 2013
|
| |
| Schedule of Investments (continued) | BlackRock Emerging Markets Long/Short Equity Fund
|
| | | | | Shares | | Value |
Reference Entity — Short |
South Korea (concluded) | | | | | | | | | | |
Hyundai Engineering & Construction Co. Ltd. | | | | | (148 | ) | | $ | (9,324 | ) |
Hyundai Greenfood Co. Ltd. | | | | | (9,980 | ) | | | (150,734 | ) |
Hyundai Mipo Dockyard | | | | | (26,636 | ) | | | (2,863,742 | ) |
KCC Corp. | | | | | (1,431 | ) | | | (382,367 | ) |
Kolon Industries, Inc. | | | | | (2,509 | ) | | | (142,002 | ) |
Korea Aerospace Industries Ltd. | | | | | (2,160 | ) | | | (50,081 | ) |
Korea Gas Corp. | | | | | (1,720 | ) | | | (105,351 | ) |
Korea Zinc Co. Ltd. | | | | | (7 | ) | | | (2,468 | ) |
LG Fashion Corp. | | | | | (6,390 | ) | | | (166,655 | ) |
LG Innotek Co. Ltd. | | | | | (1,520 | ) | | | (106,742 | ) |
LG Uplus Corp. | | | | | (180,300 | ) | | | (1,348,020 | ) |
LS Corp. | | | | | (8,959 | ) | | | (752,839 | ) |
Mando Corp. | | | | | (1,554 | ) | | | (172,687 | ) |
NCSoft Corp. | | | | | (2,807 | ) | | | (355,683 | ) |
Nexen Tire Corp. | | | | | (6,260 | ) | | | (72,708 | ) |
Osstem Implant Co. Ltd. | | | | | (1,637 | ) | | | (51,865 | ) |
Pharmicell Co. Ltd. | | | | | (3,720 | ) | | | (16,654 | ) |
S-Oil Corp. | | | | | (4,598 | ) | | | (413,620 | ) |
S1 Corp. | | | | | (23,326 | ) | | | (1,399,050 | ) |
Samsung C&T Corp. | | | | | (2,369 | ) | | | (137,977 | ) |
Samsung SDI Co. Ltd. | | | | | (500 | ) | | | (65,437 | ) |
Samsung Techwin Co. Ltd. | | | | | (17,770 | ) | | | (940,047 | ) |
Seoul Semiconductor Co. Ltd. | | | | | (5,198 | ) | | | (129,172 | ) |
SK C&C Co. Ltd. | | | | | (4,978 | ) | | | (472,886 | ) |
SK Hynix, Inc. | | | | | (2,680 | ) | | | (59,981 | ) |
Wonik IPS Co. Ltd. | | | | | (81,035 | ) | | | (352,730 | ) |
Yuhan Corp. | | | | | (2,125 | ) | | | (358,094 | ) |
| | | | | | | | | (19,886,991 | ) |
Taiwan | | | | | | | | | | |
Advanced Semiconductor Engineering, Inc. | | | | | (516,366 | ) | | | (416,781 | ) |
Advanced Semiconductor Engineering, Inc. —ADR | | | | | (36,634 | ) | | | (146,170 | ) |
Airtac International Group | | | | | (130,000 | ) | | | (760,203 | ) |
Asia Cement Corp. | | | | | (646,000 | ) | | | (822,308 | ) |
AU Optronics Corp. | | | | | (86,000 | ) | | | (34,983 | ) |
AU Optronics Corp. — ADR | | | | | (90,143 | ) | | | (358,769 | ) |
Catcher Technology Co. Ltd. | | | | | (92,000 | ) | | | (411,684 | ) |
Cheng Uei Precision Industry Co. Ltd. | | | | | (84,959 | ) | | | (160,122 | ) |
China Development Financial Holding Corp. | | | | | (2,639,000 | ) | | | (729,868 | ) |
China Motor Corp. | | | | | (348,000 | ) | | | (317,378 | ) |
China Petrochemical Development Corp. | | | | | (2,010,425 | ) | | | (1,237,412 | ) |
China Steel Corp. | | | | | (309,000 | ) | | | (291,467 | ) |
Chinatrust Financial Holding Co. Ltd. | | | | | (1,377,000 | ) | | | (789,162 | ) |
Chunghwa Telecom Co. Ltd. | | | | | (900,000 | ) | | | (2,868,034 | ) |
Compal Electronics, Inc. | | | | | (215,000 | ) | | | (156,361 | ) |
Epistar Corp. | | | | | (237,000 | ) | | | (450,793 | ) |
Feng Hsin Iron & Steel Co. | | | | | (76,000 | ) | | | (136,514 | ) |
First Financial Holding Co. Ltd. | | | | | (2,645,000 | ) | | | (1,612,975 | ) |
Formosa Chemicals & Fibre Corp. | | | | | (74,000 | ) | | | (201,115 | ) |
Foxconn Technology Co. Ltd. | | | | | (303,000 | ) | | | (886,774 | ) |
Highwealth Construction Corp. | | | | | (96,800 | ) | | | (201,206 | ) |
Hon Hai Precision Industry Co. Ltd. | | | | | (16,500 | ) | | | (47,240 | ) |
Hotai Motor Co. Ltd. | | | | | (7,000 | ) | | | (55,869 | ) |
Hua Nan Financial Holdings Co. Ltd. | | | | | (200,000 | ) | | | (115,508 | ) |
ILI Technology Corp. | | | | | (20,000 | ) | | | (65,144 | ) |
Kinsus Interconnect Technology Corp. | | | | | (145,000 | ) | | | (455,322 | ) |
LCY Chemical Corp. | | | | | (66,001 | ) | | | (87,551 | ) |
Macronix International | | | | | (3,774,000 | ) | | | (1,085,527 | ) |
Motech Industries, Inc. | | | | | (9,000 | ) | | | (10,110 | ) |
| | | | | | | | | | | |
| | | | | Shares | | Value |
Reference Entity — Short |
Taiwan (concluded) | | | | | | | | | | |
Nan Kang Rubber Tire Co. Ltd. | | | | | (258,112 | ) | | $ | (302,657 | ) |
Neo Solar Power Corp. | | | | | (55,000 | ) | | | (41,989 | ) |
Powertech Technology, Inc. | | | | | (8,000 | ) | | | (12,048 | ) |
Ruentex Industries Ltd. | | | | | (1,743,000 | ) | | | (4,433,183 | ) |
Shin Kong Financial Holding Co. Ltd. | | | | | (951,000 | ) | | | (268,430 | ) |
Synnex Technology International Corp. | | | | | (354,000 | ) | | | (718,634 | ) |
Tripod Technology Corp. | | | | | (136,000 | ) | | | (274,331 | ) |
U-Ming Marine Transport Corp. | | | | | (41,000 | ) | | | (66,266 | ) |
United Microelectronics Corp. | | | | | (11,274,000 | ) | | | (4,404,050 | ) |
United Microelectronics Corp. ADR | | | | | (154,143 | ) | | | (302,120 | ) |
Visual Photonics Epitaxy Co. Ltd. | | | | | (164,000 | ) | | | (191,825 | ) |
WPG Holdings Ltd. | | | | | (1,410,000 | ) | | | (1,899,857 | ) |
Yuanta Financial Holding Co. Ltd. | | | | | (1,619,000 | ) | | | (878,004 | ) |
Yulon Motor Co. Ltd. | | | | | (220,000 | ) | | | (408,334 | ) |
Zhen Ding Technology Holding Ltd. | | | | | (760,000 | ) | | | (1,867,986 | ) |
| | | | | | | | | (30,982,064 | ) |
Thailand | | | | | | | | | | |
PTT PCL | | | | | (3,300 | ) | | | (37,736 | ) |
Turkey | | | | | | | | | | |
Anadolu Efes Biracilik Ve Malt Sanayii | | | | | (14,381 | ) | | | (214,829 | ) |
Asya Katilim Bankasi AS | | | | | (1,421,474 | ) | | | (1,802,836 | ) |
Dogan Sirketler Grubu Holding | | | | | (2,061,039 | ) | | | (1,266,195 | ) |
KOC Holding AS | | | | | (674,022 | ) | | | (3,517,063 | ) |
Turkcell Iletisim Hizmetleri | | | | | (31,647 | ) | | | (197,777 | ) |
Turkcell Iletisim Hizmetleri AS — ADR | | | | | (9,762 | ) | | | (152,678 | ) |
Turkiye Halk Bankasi | | | | | (88,183 | ) | | | (870,712 | ) |
Turkiye Sise ve Cam Fabrikalari | | | | | (518,663 | ) | | | (904,984 | ) |
| | | | | | | | | (8,927,074 | ) |
United States | | | | | | | | | | |
AES Corp. | | | | | (82,049 | ) | | | (889,411 | ) |
NII Holdings, Inc. | | | | | (35,618 | ) | | | (249,326 | ) |
| | | | | | | | | (1,138,737 | ) |
Total Reference Entity — Short | | | | | | | | | (194,251,753 | ) |
Net Value of Reference Entity — Goldman Sachs Group, Inc. | $ | 43,579,880 | |
See Notes to Financial Statements.
| BLACKROCK FUNDS | JANUARY 31, 2013 | 15
|
| |
| Schedule of Investments (continued) | BlackRock Emerging Markets Long/Short Equity Fund
|
The following table represents the individual long and short positions and related values of the basket of equity securities underlying the total return swap with Morgan Stanley & Co., Inc. as of January 31, 2013:
| | | | | Shares | | Value |
Reference Entity — Long |
Argentina | | | | | | | | | | |
Banco Macro SA — ADR | | | | | 8,522 | | | $ | 141,891 | |
Brazil | | | | | | | | | | |
AES Tiete SA, Preference Shares | | | | | 82,900 | | | | 863,823 | |
Amil Participacoes SA | | | | | 20,200 | | | | 316,692 | |
Arteris SA | | | | | 9,100 | | | | 94,640 | |
Banco do Brasil SA | | | | | 53,400 | | | | 654,310 | |
Banco Santander Brasil SA | | | | | 8,900 | | | | 65,476 | |
Banco Santander Brasil SA — ADR | | | | | 35,253 | | | | 261,577 | |
BM&F Bovespa SA | | | | | 63,200 | | | | 442,417 | |
Cia de Bebidas das Americas, Preference Shares | | | | | 18,400 | | | | 866,708 | |
Cia de Bebidas das Americas, Preference Shares — ADR | | | | | 37,413 | | | | 1,760,656 | |
Cia Energetica de Minas Gerais — ADR | | | | | 27,756 | | | | 304,760 | |
Cia Energetica de Minas Gerais, Preference Shares | | | | | 2,300 | | | | 24,948 | |
Cia Energetica de Sao Paulo, Preference B Shares | | | | | 17,400 | | | | 172,659 | |
Cia Paranaense de Energia, Preference B Shares | | | | | 3,300 | | | | 54,024 | |
Cia Siderurgica Nacional SA | | | | | 59,400 | | | | 320,662 | |
Cia Siderurgica Nacional SA — ADR | | | | | 152,042 | | | | 825,588 | |
Duratex SA | | | | | 108,300 | | | | 752,691 | |
Gafisa SA | | | | | 48,400 | | | | 120,796 | |
Gafisa SA — ADR | | | | | 8,538 | | | | 42,007 | |
Itau Unibanco Holdings SA — ADR | | | | | 75,857 | | | | 1,307,016 | |
Itausa — Investimentos Itau SA, Preference Shares | | | | | 255,470 | | | | 1,293,162 | |
Marfrig Alimentos SA | | | | | 33,300 | | | | 171,404 | |
Metalurgica Gerdau SA, Preference Shares | | | | | 33,100 | | | | 370,502 | |
MMX Mineracao e Metalicos SA | | | | | 30,600 | | | | 52,092 | |
Multiplus SA | | | | | 44,800 | | | | 962,884 | |
Natura Cosmeticos SA | | | | | 3,400 | | | | 91,687 | |
PDG Realty SA Empreendimentos e Participacoes | | | | | 45,500 | | | | 72,202 | |
Porto Seguro SA | | | | | 31,800 | | | | 381,661 | |
Rossi Residencial SA | | | | | 202,900 | | | | 427,941 | |
Souza Cruz SA | | | | | 80,800 | | | | 1,336,962 | |
Sul America SA | | | | | 13,500 | | | | 126,231 | |
Tractebel Energia SA | | | | | 70,100 | | | | 1,245,809 | |
| | | | | | | | | 15,783,987 | |
Canada | | | | | | | | | | |
Goldcorp, Inc. | | | | | 4,559 | | | | 160,575 | |
Gran Tierra Energy, Inc. | | | | | 66,838 | | | | 356,247 | |
Methanex Corp. | | | | | 8,952 | | | | 321,945 | |
| | | | | | | | | 838,767 | |
Chile | | | | | | | | | | |
AES Gener SA | | | | | 1,145,755 | | | | 787,078 | |
Aguas Andinas SA, Series A | | | | | 769,727 | | | | 565,316 | |
Cia Cervecerias Unidas SA | | | | | 18,695 | | | | 302,396 | |
ENTEL Chile SA | | | | | 152,053 | | | | 3,295,288 | |
| | | | | | | | | 4,950,078 | |
| | | | | | | | | | | |
| | | | | Shares | | Value |
Reference Entity — Long |
China | | | | | | | | | | |
Agricultural Bank of China Ltd., Class H | | | | | 303,000 | | | $ | 165,000 | |
Anta Sports Products Ltd. | | | | | 371,000 | | | | 346,318 | |
Bank of China Ltd., Class H | | | | | 1,291,000 | | | | 636,095 | |
Beijing Capital International Airport Co. Ltd., Class H | | | | | 806,000 | | | | 671,107 | |
China BlueChemical Ltd., Class H | | | | | 592,000 | | | | 425,335 | |
China Construction Bank, Class H | | | | | 812,000 | | | | 700,456 | |
China Merchants Bank Co. Ltd., Class H | | | | | 207,000 | | | | 496,205 | |
China Mobile Ltd. | | | | | 136,500 | | | | 1,492,519 | |
China Oilfield Services Ltd., Class H | | | | | 934,000 | | | | 2,022,233 | |
China Petroleum & Chemical Corp., Class H | | | | | 70,000 | | | | 84,930 | |
China Shenhua Energy Co. Ltd., Class H | | | | | 14,000 | | | | 60,202 | |
China Southern Airlines Co. Ltd., Class H | | | | | 24,000 | | | | 14,430 | |
China Telecom Corp. Ltd., Class H | | | | | 3,028,000 | | | | 1,649,197 | |
CNOOC Ltd. | | | | | 591,000 | | | | 1,216,210 | |
ENN Energy Holdings Ltd. | | | | | 32,000 | | | | 153,300 | |
Golden Eagle Retail Group Ltd. | | | | | 186,000 | | | | 400,613 | |
Great Wall Motor Co. Ltd. | | | | | 150,500 | | | | 611,865 | |
Guangzhou R&F Properties Co. Ltd., Class H | | | | | 470,800 | | | | 854,514 | |
Huaneng Power International, Inc., Class H | | | | | 120,000 | | | | 123,688 | |
Industrial and Commercial Bank of China Ltd., Class H | | | | | 673,000 | | | | 506,843 | |
Intime Department Store Group Co. Ltd. | | | | | 196,000 | | | | 257,823 | |
Jiangsu Expressway Co. Ltd., Class H | | | | | 938,000 | | | | 967,183 | |
Longfor Properties Co. Ltd. | | | | | 435,000 | | | | 815,839 | |
Parkson Retail Group Ltd. | | | | | 208,500 | | | | 160,821 | |
Sany Heavy Equipment International Holdings Co. Ltd. | | | | | 1,503,000 | | | | 713,294 | |
Shanghai Electric Group Co. Ltd., Class H | | | | | 1,834,000 | | | | 759,242 | |
Shanghai Pharmaceuticals Holding Co. Ltd., Class H | | | | | 130,700 | | | | 261,591 | |
Sihuan Pharmaceutical Holdings Group Ltd. | | | | | 551,000 | | | | 244,331 | |
Sinopharm Group Co. | | | | | 88,400 | | | | 270,758 | |
Sun Art Retail Group Ltd. | | | | | 589,000 | | | | 856,645 | |
Tencent Holdings Ltd. | | | | | 5,300 | | | | 185,112 | |
Tingyi Cayman Islands Holding Corp. | | | | | 296,000 | | | | 831,438 | |
Tsingtao Brewery Co. Ltd., Class H | | | | | 66,000 | | | | 381,480 | |
Wumart Stores, Inc., Class H | | | | | 363,000 | | | | 724,823 | |
Yanzhou Coal Mining Co. Ltd. | | | | | 762,000 | | | | 1,298,416 | |
Zhejiang Expressway Co. Ltd., Class H | | | | | 1,486,000 | | | | 1,320,010 | |
Zijin Mining Group Co. Ltd., Class H | | | | | 590,000 | | | | 227,223 | |
Zoomlion Heavy Industry Science and Technology Co. Ltd., Class H | | | | | 130,600 | | | | 177,757 | |
| | | | | | | | | 23,084,846 | |
Colombia | | | | | | | | | | |
Pacific Rubiales Energy Corp. | | | | | 4,049 | | | | 94,466 | |
Petrominerales Ltd. | | | | | 72,574 | | | | 646,137 | |
| | | | | | | | | 740,603 | |
Czech Republic | | | | | | | | | | |
CEZ AS | | | | | 17,785 | | | | 576,766 | |
Egypt | | | | | | | | | | |
Commercial International Bank Egypt SAE | | | | | 15,083 | | | | 79,557 | |
Telecom Egypt | | | | | 257,301 | | | | 555,585 | |
| | | | | | | | | 635,142 | |
Hong Kong | | | | | | | | | | |
Agile Property Holdings Ltd. | | | | | 72,000 | | | | 102,155 | |
Belle International Holdings Ltd. | | | | | 156,000 | | | | 346,965 | |
See Notes to Financial Statements.
| 16 | BLACKROCK FUNDS | JANUARY 31, 2013
|
| |
| Schedule of Investments (continued) | BlackRock Emerging Markets Long/Short Equity Fund
|
| | | | | Shares | | Value |
Reference Entity — Long |
Hong Kong (concluded) | | | | | | | | | | |
Bosideng International Holdings Ltd. | | | | | 334,000 | | | $ | 94,756 | |
China Lumena New Materials Corp. | | | | | 734,000 | | | | 177,024 | |
China Resources Enterprise Ltd. | | | | | 270,000 | | | | 968,089 | |
China Taiping Insurance Holdings Co. Ltd. | | | | | 133,800 | | | | 282,372 | |
Citic Pacific Ltd. | | | | | 616,000 | | | | 990,817 | |
COSCO Pacific Ltd. | | | | | 30,000 | | | | 48,684 | |
Dongyue Group | | | | | 330,000 | | | | 220,444 | |
Geely Automobile Holdings Ltd. | | | | | 210,000 | | | | 109,705 | |
GOME Electrical Appliances Holdings Ltd. | | | | | 461,000 | | | | 55,378 | |
Guangdong Investment Ltd. | | | | | 1,514,000 | | | | 1,256,848 | |
Haier Electronics Group Co. Ltd. | | | | | 38,000 | | | | 63,354 | |
Hengdeli Holdings Ltd. | | | | | 124,000 | | | | 43,536 | |
Huabao International Holdings Ltd. | | | | | 540,000 | | | | 294,883 | |
KWG Property Holding Ltd. | | | | | 327,000 | | | | 248,147 | |
MMG Ltd. | | | | | 2,596,000 | | | | 1,051,259 | |
Nine Dragons Paper Holdings Ltd. | | | | | 401,000 | | | | 351,569 | |
Ports Design Ltd. | | | | | 359,500 | | | | 311,418 | |
Skyworth Digital Holdings Ltd. | | | | | 270,000 | | | | 164,238 | |
Want Want China Holdings Ltd. | | | | | 572,000 | | | | 757,804 | |
| | | | | | | | | 7,939,445 | |
Hungary | | | | | | | | | | |
Magyar Telekom Telecommunications Plc | | | | | 313,712 | | | | 592,410 | |
MOL Hungarian Oil and Gas Plc | | | | | 5,909 | | | | 508,721 | |
OTP Bank Plc | | | | | 29,118 | | | | 626,172 | |
| | | | | | | | | 1,727,303 | |
Indonesia | | | | | | | | | | |
Astra Agro Lestari Tbk PT | | | | | 142,000 | | | | 274,880 | |
Indo Tambangraya Megah Tbk PT | | | | | 85,500 | | | | 363,971 | |
Indocement Tunggal Prakarsa Tbk PT | | | | | 573,000 | | | | 1,279,655 | |
Perusahaan Gas Negara Persero Tbk PT | | | | | 3,252,000 | | | | 1,561,221 | |
Semen Gresik Persero Tbk PT | | | | | 1,180,500 | | | | 1,910,445 | |
Telekomunikasi Indonesia Persero Tbk PT | | | | | 44,500 | | | | 44,569 | |
Unilever Indonesia Tbk PT | | | | | 677,000 | | | | 1,533,211 | |
| | | | | | | | | 6,967,952 | |
Israel | | | | | | | | | | |
Bank Hapoalim BM | | | | | 39,084 | | | | 164,776 | |
Check Point Software Technologies Ltd. | | | | | 18,983 | | | | 949,150 | |
Israel Chemicals Ltd. | | | | | 150,761 | | | | 2,002,356 | |
| | | | | | | | | 3,116,282 | |
Luxembourg | | | | | | | | | | |
Millicom International Cellular SA | | | | | 4,057 | | | | 373,244 | |
Malaysia | | | | | | | | | | |
Berjaya Sports Toto Bhd | | | | | 309,948 | | | | 434,104 | |
British American Tobacco Malaysia Bhd | | | | | 26,200 | | | | 483,722 | |
DiGi.Com Bhd | | | | | 1,048,000 | | | | 1,659,580 | |
Lafarge Malayan Cement Bhd | | | | | 82,300 | | | | 246,344 | |
Petronas Chemicals Group Bhd | | | | | 1,063,800 | | | | 2,037,210 | |
Tenaga Nasional Bhd | | | | | 108,000 | | | | 243,531 | |
UMW Holdings Bhd | | | | | 417,300 | | | | 1,630,519 | |
| | | | | | | | | 6,735,010 | |
Mexico | | | | | | | | | | |
America Movil SA de CV | | | | | 510,700 | | | | 641,458 | |
Fomento Economico Mexicano SA de CV | | | | | 10,500 | | | | 113,377 | |
Grupo Aeroportuario del Pacifico SAB de CV — ADR | | | | | 21,499 | | | | 1,338,098 | |
| | | | | | | | | | | |
| | | | | Shares | | Value |
Reference Entity — Long |
Mexico (concluded) | | | | | | | | | | |
Grupo Aeroportuario del Pacifico SAB de CV, B Shares | | | | | 87,300 | | | $ | 543,934 | |
Grupo Bimbo SA de CV | | | | | 36,100 | | | | 93,355 | |
Grupo Carso SAB de CV, Series A1 | | | | | 127,100 | | | | 617,077 | |
Grupo Mexico SA de CV, Series B | | | | | 20,800 | | | | 77,509 | |
Grupo Televisa SAB, Series CPO | | | | | 17,000 | | | | 95,251 | |
Grupo Televisa SAB — ADR | | | | | 9,497 | | | | 266,011 | |
Industrias Penoles SAB de CV | | | | | 3,770 | | | | 185,176 | |
| | | | | | | | | 3,971,246 | |
Peru | | | | | | | | | | |
Credicorp Ltd. | | | | | 1,050 | | | | 164,567 | |
Southern Copper Corp. | | | | | 11,577 | | | | 456,018 | |
| | | | | | | | | 620,585 | |
Philippines | | | | | | | | | | |
Aboitiz Power Corp. | | | | | 517,700 | | | | 485,054 | |
Metropolitan Bank & Trust | | | | | 110,320 | | | | 285,888 | |
| | | | | | | | | 770,942 | |
Poland | | | | | | | | | | |
Enea SA | | | | | 9,483 | | | | 46,875 | |
Grupa Lotos SA | | | | | 22,812 | | | | 295,495 | |
PGE SA | | | | | 45,089 | | | | 248,673 | |
Powszechny Zaklad Ubezpieczen SA | | | | | 1,314 | | | | 173,186 | |
Synthos SA | | | | | 74,868 | | | | 127,071 | |
| | | | | | | | | 891,300 | |
Russia | | | | | | | | | | |
LSR Group — GDR | | | | | 49,740 | | | | 249,446 | |
Lukoil OAO | | | | | 26,413 | | | | 1,778,053 | |
Lukoil OAO — ADR | | | | | 10,307 | | | | 694,996 | |
Mobile Telesystems OJSC — ADR | | | | | 23,861 | | | | 469,107 | |
Novolipetsk Steel OJSC — GDR | | | | | 4,435 | | | | 94,177 | |
Severstal OAO | | | | | 22,440 | | | | 281,717 | |
Severstal OAO — GDR | | | | | 18,396 | | | | 229,465 | |
Sistema JSFC — GDR | | | | | 19,025 | | | | 417,587 | |
TMK OAO — GDR | | | | | 9,561 | | | | 145,574 | |
| | | | | | | | | 4,360,122 | |
South Africa | | | | | | | | | | |
AVI Ltd. | | | | | 64,204 | | | | 392,619 | |
Bidvest Group Ltd. | | | | | 80,436 | | | | 1,920,196 | |
FirstRand Ltd. | | | | | 385,865 | | | | 1,391,199 | |
Gold Fields Ltd. | | | | | 23,708 | | | | 274,757 | |
Gold Fields Ltd. — ADR | | | | | 33,394 | | | | 388,038 | |
Harmony Gold Mining Co. Ltd. | | | | | 193 | | | | 1,244 | |
Harmony Gold Mining Co. Ltd. — ADR | | | | | 28,797 | | | | 186,029 | |
Imperial Holdings Ltd. | | | | | 52,136 | | | | 1,135,129 | |
Kumba Iron Ore Ltd. | | | | | 7,411 | | | | 499,065 | |
Liberty Holdings Ltd. | | | | | 11,438 | | | | 147,229 | |
Life Healthcare Group Holdings Ltd. | | | | | 102,328 | | | | 359,894 | |
MMI Holdings Ltd. | | | | | 163,409 | | | | 422,553 | |
Mr Price Group Ltd. | | | | | 10,870 | | | | 150,042 | |
PPC Ltd. | | | | | 25,750 | | | | 94,278 | |
Remgro Ltd. | | | | | 537 | | | | 9,785 | |
Reunert Ltd. | | | | | 40,920 | | | | 341,282 | |
The Spar Group Ltd. | | | | | 10,080 | | | | 132,617 | |
Vodacom Group Ltd. | | | | | 64,309 | | | | 894,480 | |
Woolworths Holdings Ltd. | | | | | 238,770 | | | | 1,696,611 | |
| | | | | | | | | 10,437,047 | |
See Notes to Financial Statements.
| BLACKROCK FUNDS | JANUARY 31, 2013 | 17
|
| |
| Schedule of Investments (continued) | BlackRock Emerging Markets Long/Short Equity Fund
|
| | | | | Shares | | Value |
Reference Entity — Long |
South Korea | | | | | | | | | | |
Asiana Airlines, Inc. | | | | | 57,480 | | | $ | 318,407 | |
CJ O Shopping Co. Ltd. | | | | | 4,095 | | | | 1,112,740 | |
Daelim Industrial Co. Ltd. | | | | | 1,131 | | | | 96,237 | |
Dongkuk Steel Mill Co. Ltd. | | | | | 27,450 | | | | 329,026 | |
Doosan Corp. | | | | | 5,350 | | | | 631,300 | |
Doosan Infracore Co. Ltd. | | | | | 27,230 | | | | 402,853 | |
E-Mart Co. Ltd. | | | | | 1,950 | | | | 433,111 | |
Grand Korea Leisure Co. Ltd. | | | | | 7,580 | | | | 214,005 | |
GS Retail Co. Ltd. | | | | | 2,100 | | | | 52,904 | |
Haansoft, Inc. | | | | | 18,562 | | | | 318,855 | |
Hanwha Corp. | | | | | 20,570 | | | | 631,506 | |
Honam Petrochemical Corp. | | | | | 520 | | | | 120,668 | |
Huvis Corp. | | | | | 37,690 | | | | 385,935 | |
Hyosung Corp. | | | | | 1,600 | | | | 93,778 | |
Hyundai Mobis | | | | | 332 | | | | 86,944 | |
Hyundai Steel Co. | | | | | 4,075 | | | | 310,370 | |
Hyundai Wia Corp. | | | | | 472 | | | | 63,705 | |
Industrial Bank of Korea | | | | | 2,630 | | | | 29,717 | |
KB Financial Group, Inc. | | | | | 11,920 | | | | 424,339 | |
KEPCO Engineering & Construction Co., Inc. | | | | | 4,617 | | | | 339,741 | |
Kia Motors Corp. | | | | | 26,960 | | | | 1,280,578 | |
Korea Exchange Bank | | | | | 50,730 | | | | 353,107 | |
Korea Investment Holdings Co. Ltd. | | | | | 2,240 | | | | 87,006 | |
Korean Air Lines Co. Ltd. | | | | | 3,750 | | | | 156,576 | |
LG Corp. | | | | | 10,779 | | | | 634,995 | |
LG Display Co. Ltd. | | | | | 16,590 | | | | 445,498 | |
Lotte Shopping Co. Ltd. | | | | | 3,448 | | | | 1,179,849 | |
LS Industrial Systems Co. Ltd. | | | | | 13,293 | | | | 822,989 | |
Macrogen, Inc. | | | | | 9,428 | | | | 250,328 | |
Mirae Asset Securities Co. Ltd. | | | | | 7,070 | | | | 245,175 | |
NEO Holdings Co. Ltd. | | | | | 5,350 | | | | — | |
NHN Corp. | | | | | 1,330 | | | | 294,139 | |
Paradise Co. Ltd. | | | | | 27,954 | | | | 493,012 | |
Partron Co. Ltd. | | | | | 33,000 | | | | 641,133 | |
Samsung Card Co. | | | | | 11,680 | | | | 384,130 | |
Samsung Electro-Mechanics Co. Ltd. | | | | | 907 | | | | 76,414 | |
Samsung Electronics Co. Ltd. | | | | | 2,647 | | | | 3,521,659 | |
Samsung Engineering Co. Ltd. | | | | | 1,119 | | | | 159,726 | |
Samsung Fire & Marine Insurance Co. Ltd. | | | | | 899 | | | | 181,937 | |
Samsung Heavy Industries Co. Ltd. | | | | | 1,040 | | | | 36,544 | |
Samsung Life Insurance Co. Ltd. | | | | | 636 | | | | 61,334 | |
Silicon Works Co. Ltd. | | | | | 5,575 | | | | 103,250 | |
SK Holdings Co. Ltd. | | | | | 3,819 | | | | 603,542 | |
SK Networks Co. Ltd. | | | | | 6,000 | | | | 44,348 | |
SK Telecom Co. Ltd. — ADR | | | | | 17,732 | | | | 300,557 | |
SM Entertainment Co. | | | | | 1,242 | | | | 45,969 | |
Woori Finance Holdings Co. Ltd. | | | | | 29,380 | | | | 345,441 | |
Woori Investment & Securities Co. Ltd. | | | | | 28,800 | | | | 326,587 | |
YG Entertainment, Inc. | | | | | 2,079 | | | | 119,432 | |
| | | | | | | | | 19,591,396 | |
Taiwan | | | | | | | | | | |
ASUSTek Computer, Inc. | | | | | 127,000 | | | | 1,455,489 | |
Capella Microsystems Taiwan, Inc. | | | | | 89,000 | | | | 685,485 | |
Capital Securities Corp. | | | | | 393,000 | | | | 153,269 | |
Chimei Innolux Corp. | | | | | 1,144,000 | | | | 595,702 | |
Chipbond Technology Corp. | | | | | 224,000 | | | | 460,886 | |
CTCI Corp. | | | | | 300,000 | | | | 574,954 | |
Delta Electronics, Inc. | | | | | 385,000 | | | | 1,394,861 | |
Elan Microelectronics Corp. | | | | | 27,000 | | | | 50,101 | |
| | | | | | | | | | | |
| | | | | Shares | | Value |
Reference Entity — Long |
Taiwan (concluded) | | | | | | | | | | |
Eva Airways Corp. | | | | | 1,059,000 | | | $ | 678,603 | |
Far Eastern New Century Corp. | | | | | 131,950 | | | | 152,981 | |
Far EasTone Telecommunications Co. Ltd. | | | | | 498,000 | | | | 1,267,047 | |
Faraday Technology Corp. | | | | | 402,000 | | | | 504,230 | |
Farglory Land Development Co. Ltd. | | | | | 42,000 | | | | 77,377 | |
Formosa Plastics Corp. | | | | | 99,000 | | | | 268,994 | |
Formosa Taffeta Co. Ltd. | | | | | 315,000 | | | | 304,080 | |
Global Unichip Corp. | | | | | 304,000 | | | | 988,840 | |
HTC Corp. | | | | | 60,000 | | | | 591,732 | |
Integrated Memory Logic Ltd. | | | | | 98,000 | | | | 294,520 | |
Novatek Microelectronics Corp. | | | | | 114,000 | | | | 453,582 | |
Pou Chen Corp. | | | | | 1,237,000 | | | | 1,236,102 | |
President Chain Store Corp. | | | | | 553,000 | | | | 2,988,789 | |
Sercomm Corp. | | | | | 70,000 | | | | 103,729 | |
Siliconware Precision Industries Co. | | | | | 244,000 | | | | 254,885 | |
Silitech Technology Corp. | | | | | 72,000 | | | | 135,223 | |
Taishin Financial Holding Co. Ltd. | | | | | 171,639 | | | | 68,024 | |
Taiwan Mobile Co. Ltd. | | | | | 134,000 | | | | 476,788 | |
Taiwan Semiconductor Manufacturing Co. Ltd. | | | | | 285,000 | | | | 976,616 | |
Taiwan Semiconductor Manufacturing Co. Ltd. — ADR | | | | | 36,811 | | | | 653,027 | |
Teco Electric and Machinery Co. Ltd. | | | | | 427,000 | | | | 355,239 | |
Tong Hsing Electronic Industries Ltd. | | | | | 81,000 | | | | 312,352 | |
Transcend Information, Inc. | | | | | 181,000 | | | | 494,841 | |
Uni-President China Holdings Ltd. | | | | | 561,000 | | | | 658,204 | |
Uni-President Enterprises Corp. | | | | | 742,460 | | | | 1,304,244 | |
Wan Hai Lines Ltd. | | | | | 225,000 | | | | 122,713 | |
Ways Technical Corp. Ltd. | | | | | 93,000 | | | | 252,260 | |
| | | | | | | | | 21,345,769 | |
Thailand | | | | | | | | | | |
Advanced Info Service PCL | | | | | 388,200 | | | | 2,733,803 | |
Bangkok Dusit Medical Services PCL | | | | | 13,800 | | | | 61,549 | |
BEC World PCL | | | | | 901,700 | | | | 2,192,262 | |
CP ALL PCL | | | | | 759,700 | | | | 1,191,012 | |
PTT Global Chemical PCL | | | | | 1,327,400 | | | | 3,561,100 | |
| | | | | | | | | 9,739,726 | |
Turkey | | | | | | | | | | |
BIM Birlesik Magazalar AS | | | | | 18,357 | | | | 890,068 | |
Brisa Bridgestone Sabanci Sanayi ve Ticaret | | | | �� | 51,000 | | | | 152,529 | |
Coca-Cola Icecek AS | | | | | 3,797 | | | | 92,323 | |
Emlak Konut Gayrimenkul Yatirim Ortakligi AS | | | | | 851,948 | | | | 1,506,347 | |
Enka Insaat ve Sanayi AS | | | | | 57,046 | | | | 171,298 | |
Eregli Demir ve Celik Fabrikalari TAS | | | | | 254,373 | | | | 361,681 | |
Ford Otomotiv Sanayi AS | | | | | 8,810 | | | | 100,205 | |
TAV Havalimanlari Holding AS | | | | | 61,291 | | | | 381,503 | |
Tupras Turkiye Petrol Rafinerileri AS | | | | | 1,548 | | | | 42,700 | |
Turk Hava Yollari | | | | | 120,641 | | | | 448,160 | |
Turk Telekomunikasyon AS | | | | | 17,077 | | | | 71,613 | |
Turkiye Is Bankasi (Isabank), C Shares | | | | | 63,025 | | | | 232,891 | |
| | | | | | | | | 4,451,318 | |
United Kingdom | | | | | | | | | | |
Antofagasta Plc | | | | | 42,547 | | | | 771,493 | |
British American Tobacco Plc | | | | | 8,412 | | | | 436,348 | |
Evraz Plc | | | | | 600,261 | | | | 2,748,405 | |
Hochschild Mining Plc | | | | | 3,382 | | | | 22,678 | |
Lonmin Plc | | | | | 88,915 | | | | 502,070 | |
See Notes to Financial Statements.
| 18 | BLACKROCK FUNDS | JANUARY 31, 2013
|
| |
| Schedule of Investments (continued) | BlackRock Emerging Markets Long/Short Equity Fund
|
| | | | | Shares | | Value |
Reference Entity — Long |
United Kingdom (concluded) | | | | | | | | | | |
SABMiller Plc | | | | | 20,655 | | | $ | 1,016,957 | |
| | | | | | | | | 5,497,951 | |
Total Reference Entity — Long | | | | | | | | | 155,288,718 | |
|
Reference Entity — Short |
Brazil | | | | | | | | | | |
All America Latina Logistica SA | | | | | (16,300 | ) | | | (70,967 | ) |
Anhanguera Educacional Participacoes SA | | | | | (20,900 | ) | | | (406,696 | ) |
BR Malls Participacoes SA | | | | | (87,600 | ) | | | (1,134,069 | ) |
BR Properties SA | | | | | (12,700 | ) | | | (164,861 | ) |
CETIP SA — Mercador Organizados | | | | | (12,900 | ) | | | (162,274 | ) |
Cia Brasileira de Distribuicao Grupo Pao de Acucar, Preference Shares | | | | | (18,600 | ) | | | (877,063 | ) |
Cia Brasileira de Distribuicao Grupo Pao de Acucar, Preference Shares — ADR | | | | | (4,136 | ) | | | (197,453 | ) |
Cia Hering | | | | | (48,500 | ) | | | (922,580 | ) |
Cosan SA Industria e Comercio | | | | | (11,500 | ) | | | (271,424 | ) |
CPFL Energia SA — ADR | | | | | (14,614 | ) | | | (302,656 | ) |
Diagnosticos da America SA | | | | | (57,500 | ) | | | (408,580 | ) |
Fibria Celulose SA | | | | | (3,800 | ) | | | (46,561 | ) |
Gerdau SA | | | | | (18,100 | ) | | | (158,790 | ) |
Gerdau SA — ADR | | | | | (17,917 | ) | | | (158,207 | ) |
Gol Linhas Aereas Inteligentes SA — ADR | | | | | (2,470 | ) | | | (17,982 | ) |
Gol Linhas Aereas Inteligentes SA, Preference Shares | | | | | (12,800 | ) | | | (93,139 | ) |
Hypermarcas SA | | | | | (245,800 | ) | | | (2,123,062 | ) |
Klabin SA | | | | | (9,100 | ) | | | (62,377 | ) |
Kroton Educacional SA | | | | | (187,200 | ) | | | (4,596,922 | ) |
Localiza Rent a Car SA | | | | | (86,800 | ) | | | (1,595,340 | ) |
MPX Energia SA | | | | | (210,800 | ) | | | (1,044,817 | ) |
MRV Engenharia e Participacoes SA | | | | | (23,500 | ) | | | (134,532 | ) |
Multiplan Empreendimentos Imobiliarios SA | | | | | (8,100 | ) | | | (234,090 | ) |
Oi SA | | | | | (59,100 | ) | | | (238,911 | ) |
Raia Drogasil SA | | | | | (193,500 | ) | | | (2,162,038 | ) |
Telefonica Brasil SA — ADR | | | | | (65,952 | ) | | | (1,660,671 | ) |
Tim Participacoes SA | | | | | (179,700 | ) | | | (794,115 | ) |
| | | | | | | | | (20,040,177 | ) |
Canada | | | | | | | | | | |
AuRico Gold, Inc. | | | | | (69,376 | ) | | | (487,593 | ) |
Chile | | | | | | | | | | |
Enersis SA — ADR | | | | | (123 | ) | | | (2,417 | ) |
Latam Airlines Group SA — ADR | | | | | (52,717 | ) | | | (1,291,039 | ) |
SACI Falabella | | | | | (1,801 | ) | | | (20,932 | ) |
| | | | | | | | | (1,314,388 | ) |
China | | | | | | | | | | |
Anhui Conch Cement Co. Ltd., Class H | | | | | (149,500 | ) | | | (586,965 | ) |
BBMG Corp., Class H | | | | | (296,500 | ) | | | (276,730 | ) |
Brilliance China Automotive Holdings Ltd. | | | | | (114,000 | ) | | | (153,046 | ) |
China Communications Construction Co. Ltd., Class H | | | | | (146,000 | ) | | | (148,427 | ) |
China Communications Services Corp. Ltd., Class H | | | | | (88,000 | ) | | | (53,544 | ) |
China Life Insurance Co. Ltd., Class H | | | | | (89,000 | ) | | | (297,032 | ) |
China Longyuan Power Group Corp., Class H | | | | | (324,000 | ) | | | (271,528 | ) |
China National Building Material Co. Ltd., Class H | | | | | (388,000 | ) | | | (619,264 | ) |
| | | | | | | | | | | |
| | | | | Shares | | Value |
Reference Entity — Short |
China (concluded) | | | | | | | | | | |
China Pacific Insurance Group Co. Ltd., Class H | | | | | (9,600 | ) | | $ | (37,516 | ) |
China Railway Group Ltd., Class H | | | | | (51,000 | ) | | | (29,084 | ) |
China Shanshui Cement Group Ltd. | | | | | (335,000 | ) | | | (246,182 | ) |
China Shipping Development Co. Ltd., Class H | | | | | (1,904,000 | ) | | | (1,049,076 | ) |
CITIC Securities Co. Ltd. | | | | | (32,500 | ) | | | (86,768 | ) |
Country Garden Holdings Co. Ltd. | | | | | (883,000 | ) | | | (470,476 | ) |
Guangzhou Automobile Group Co. Ltd., Class H | | | | | (42,000 | ) | | | (35,164 | ) |
Hengan International Group Co. Ltd. | | | | | (8,500 | ) | | | (85,262 | ) |
Jiangxi Copper Co. Ltd., Class H | | | | | (23,000 | ) | | | (62,444 | ) |
Metallurgical Corp. of China Ltd., Class H | | | | | (3,474,000 | ) | | | (730,412 | ) |
Shandong Weigao Group Medical Polymer Co. Ltd., Class H | | | | | (20,000 | ) | | | (19,319 | ) |
Sinopec Shanghai Petrochemical Co. Ltd., Class H | | | | | (482,000 | ) | | | (178,889 | ) |
Soho China Ltd. | | | | | (129,000 | ) | | | (116,115 | ) |
Zhaojin Mining Industry Co. Ltd., Class H | | | | | (21,500 | ) | | | (32,356 | ) |
Zhongsheng Group Holdings Ltd. | | | | | (434,000 | ) | | | (649,268 | ) |
| | | | | | | | | (6,234,867 | ) |
Czech Republic | | | | | | | | | | |
Telefonica Czech Republic AS | | | | | (163,942 | ) | | | (2,834,707 | ) |
Hong Kong | | | | | | | | | | |
China Agri-Industries Holdings Ltd. | | | | | (427,000 | ) | | | (260,895 | ) |
China Everbright International Ltd. | | | | | (5,163,000 | ) | | | (2,845,818 | ) |
China Mengniu Dairy Co. Ltd. | | | | | (36,000 | ) | | | (105,319 | ) |
China Merchants Holdings International Co. Ltd. | | | | | (6,000 | ) | | | (21,266 | ) |
China Resources Cement Holdings Ltd. | | | | | (116,000 | ) | | | (74,306 | ) |
China Resources Land Ltd. | | | | | (188,000 | ) | | | (572,527 | ) |
China State Construction International Holdings Ltd. | | | | | (746,000 | ) | | | (979,372 | ) |
Dah Chong Hong Holdings Ltd. | | | | | (321,000 | ) | | | (371,083 | ) |
Franshion Properties China Ltd. | | | | | (202,000 | ) | | | (74,276 | ) |
Kingboard Chemical Holdings Ltd. | | | | | (61,500 | ) | | | (202,955 | ) |
Lee & Man Paper Manufacturing Ltd. | | | | | (135,000 | ) | | | (91,113 | ) |
Shanghai Industrial Holdings Ltd. | | | | | (39,000 | ) | | | (138,520 | ) |
| | | | | | | | | (5,737,450 | ) |
Hungary | | | | | | | | | | |
Richter Gedeon Nyrt | | | | | (327 | ) | | | (56,314 | ) |
Indonesia | | | | | | | | | | |
Astra International Tbk PT | | | | | (585,000 | ) | | | (441,686 | ) |
Gudang Garam Tbk PT | | | | | (27,500 | ) | | | (146,422 | ) |
| | | | | | | | | (588,108 | ) |
Israel | | | | | | | | | | |
Teva Pharmaceutical Industries Ltd. — ADR | | | | | (36,013 | ) | | | (1,368,134 | ) |
Luxembourg | | | | | | | | | | |
Kernel Holding SA | | | | | (3,452 | ) | | | (77,571 | ) |
Malaysia | | | | | | | | | | |
Genting Bhd | | | | | (468,100 | ) | | | (1,430,958 | ) |
Genting Malaysia Bhd | | | | | (158,400 | ) | | | (187,134 | ) |
Genting Plantations Bhd | | | | | (7,100 | ) | | | (18,821 | ) |
IOI Corp. Bhd | | | | | (371,300 | ) | | | (593,979 | ) |
Kuala Lumpur Kepong Bhd | | | | | (27,400 | ) | | | (191,368 | ) |
MISC Bhd | | | | | (13,500 | ) | | | (19,335 | ) |
PPB Group Bhd | | | | | (7,000 | ) | | | (28,072 | ) |
Sime Darby Bhd | | | | | (200,000 | ) | | | (598,868 | ) |
UEM Land Holdings Bhd | | | | | (18,700 | ) | | | (13,244 | ) |
| | | | | | | | | (3,081,779 | ) |
See Notes to Financial Statements.
| BLACKROCK FUNDS | JANUARY 31, 2013 | 19
|
| |
| Schedule of Investments (continued) | BlackRock Emerging Markets Long/Short Equity Fund
|
| | | | | Shares | | Value |
Reference Entity — Short |
Mexico | | | | | | | | | | |
Cemex SAB de CV — ADR | | | | | (76,181 | ) | | $ | (826,564 | ) |
Minera Frisco SAB de CV, Series A1 | | | | | (13,100 | ) | | | (56,214 | ) |
| | | | | | | | | (882,778 | ) |
Peru | | | | | | | | | | |
Cia de Minas Buenaventura SA — ADR | | | | | (33,671 | ) | | | (996,325 | ) |
Philippines | | | | | | | | | | |
Philippine Long Distance Telephone Co. — ADR | | | | | (28,839 | ) | | | (1,986,142 | ) |
Poland | | | | | | | | | | |
Telekomunikacja Polska SA | | | | | (67,362 | ) | | | (261,565 | ) |
Russia | | | | | | | | | | |
NovaTek OAO — GDR | | | | | (784 | ) | | | (91,749 | ) |
Uralkali OJSC — GDR | | | | | (27,128 | ) | | | (1,032,227 | ) |
X5 Retail Group NV — GDR | | | | | (9,421 | ) | | | (160,089 | ) |
| | | | | | | | | (1,284,065 | ) |
South Africa | | | | | | | | | | |
African Rainbow Minerals Ltd. | | | | | (21,185 | ) | | | (477,045 | ) |
Aspen Pharmacare Holdings Ltd. | | | | | (145,915 | ) | | | (2,686,857 | ) |
Aveng Ltd. | | | | | (367,862 | ) | | | (1,285,160 | ) |
Clicks Group Ltd. | | | | | (53,966 | ) | | | (361,696 | ) |
Discovery Holdings Ltd. | | | | | (154,597 | ) | | | (1,143,370 | ) |
Exxaro Resources Ltd. | | | | | (50,877 | ) | | | (999,137 | ) |
Foschini Group Ltd. | | | | | (83,193 | ) | | | (1,089,000 | ) |
Growthpoint Properties Ltd. | | | | | (1,174,222 | ) | | | (3,306,743 | ) |
Impala Platinum Holdings Ltd. | | | | | (16,944 | ) | | | (307,111 | ) |
Investec Ltd. | | | | | (56,782 | ) | | | (410,292 | ) |
Massmart Holdings Ltd. | | | | | (110,975 | ) | | | (2,265,580 | ) |
Sanlam Ltd. | | | | | (52,898 | ) | | | (268,425 | ) |
Sasol Ltd. — ADR | | | | | (2,399 | ) | | | (103,709 | ) |
Shoprite Holdings Ltd. | | | | | (78,518 | ) | | | (1,477,536 | ) |
Steinhoff International Holdings Ltd. | | | | | (7,292 | ) | | | (22,129 | ) |
Tiger Brands Ltd. | | | | | (54,373 | ) | | | (1,788,512 | ) |
Truworths International Ltd. | | | | | (112,609 | ) | | | (1,279,692 | ) |
| | | | | | | | | (19,271,994 | ) |
South Korea | | | | | | | | | | |
Amorepacific Corp. | | | | | (1,518 | ) | | | (1,526,072 | ) |
Cheil Industries, Inc. | | | | | (25,183 | ) | | | (2,018,794 | ) |
CJ CheilJedang Corp. | | | | | (1,273 | ) | | | (433,707 | ) |
CJ Corp. | | | | | (2,129 | ) | | | (243,935 | ) |
Com2uSCorp | | | | | (1,976 | ) | | | (66,394 | ) |
Daewoo International Corp. | | | | | (2,550 | ) | | | (87,121 | ) |
Daewoo Shipbuilding & Marine Engineering Co. Ltd. | | | | | (33,830 | ) | | | (926,201 | ) |
Daum Communications Corp. | | | | | (1,679 | ) | | | (157,449 | ) |
GS Engineering & Construction Corp. | | | | | (16,066 | ) | | | (821,676 | ) |
Hyundai Development Co. | | | | | (89,230 | ) | | | (1,913,259 | ) |
Hyundai Engineering & Construction Co. Ltd. | | | | | (6,187 | ) | | | (389,759 | ) |
Hyundai Mipo Dockyard | | | | | (2,274 | ) | | | (244,487 | ) |
Interflex Co. Ltd. | | | | | (153 | ) | | | (5,433 | ) |
Kolon Industries, Inc. | | | | | (4,106 | ) | | | (232,387 | ) |
Korea Aerospace Industries Ltd. | | | | | (2,800 | ) | | | (64,920 | ) |
Korea Electric Power Corp. — ADR | | | | | (45,901 | ) | | | (688,974 | ) |
Korea Gas Corp. | | | | | (8,050 | ) | | | (493,065 | ) |
Korea Zinc Co. Ltd. | | | | | (1,082 | ) | | | (381,519 | ) |
LG Fashion Corp. | | | | | (37,260 | ) | | | (971,762 | ) |
LG Household & Health Care Ltd. | | | | | (838 | ) | | | (466,902 | ) |
LG Uplus Corp. | | | | | (125,950 | ) | | | (941,670 | ) |
LS Corp. | | | | | (2,286 | ) | | | (192,096 | ) |
| | | | | | | | | | | |
| | | | | Shares | | Value |
Reference Entity — Short |
South Korea (concluded) | | | | | | | | | | |
Melfas, Inc. | | | | | (1,247 | ) | | $ | (21,538 | ) |
NCSoft Corp. | | | | | (1,719 | ) | | | (217,820 | ) |
Nexen Tire Corp. | | | | | (2,000 | ) | | | (23,229 | ) |
S-Oil Corp. | | | | | (265 | ) | | | (23,838 | ) |
S1 Corp. | | | | | (1,362 | ) | | | (81,690 | ) |
Samsung C&T Corp. | | | | | (6,290 | ) | | | (366,347 | ) |
Samsung SDI Co. Ltd. | | | | | (856 | ) | | | (112,028 | ) |
Samsung Techwin Co. Ltd. | | | | | (14,349 | ) | | | (759,074 | ) |
Sapphire Technology Co. Ltd. | | | | | (797 | ) | | | (20,641 | ) |
Seohee Construction Co. Ltd. | | | | | (86,284 | ) | | | (73,929 | ) |
Seoul Semiconductor Co. Ltd. | | | | | (4,834 | ) | | | (120,126 | ) |
SK Hynix, Inc. | | | | | (70,090 | ) | | | (1,568,691 | ) |
STS Semiconductor & Telecommunications | | | | | (9,599 | ) | | | (49,476 | ) |
Wonik IPS Co. Ltd. | | | | | (507 | ) | | | (2,207 | ) |
| | | | | | | | | (16,708,216 | ) |
Taiwan | | | | | | | | | | |
Advanced Semiconductor Engineering, Inc. —ADR | | | | | (14,239 | ) | | | (56,814 | ) |
Airtac International Group | | | | | (5,000 | ) | | | (29,239 | ) |
Asia Cement Corp. | | | | | (434,000 | ) | | | (552,449 | ) |
AU Optronics Corp. — ADR | | | | | (127,975 | ) | | | (509,340 | ) |
Cheng Uei Precision Industry Co. Ltd. | | | | | (609 | ) | | | (1,148 | ) |
China Development Financial Holding Corp. | | | | | (199,000 | ) | | | (55,037 | ) |
Chunghwa Telecom Co. Ltd. | | | | | (359,000 | ) | | | (1,144,027 | ) |
Chunghwa Telecom Co. Ltd. — ADR | | | | | (58,563 | ) | | | (1,872,259 | ) |
Coretronic Corp. | | | | | (7,000 | ) | | | (5,425 | ) |
Formosa Chemicals & Fibre Corp. | | | | | (154,000 | ) | | | (418,536 | ) |
Highwealth Construction Corp. | | | | | (5,000 | ) | | | (10,393 | ) |
Hon Hai Precision Industry Co. Ltd. | | | | | (12,100 | ) | | | (34,642 | ) |
Hotai Motor Co. Ltd. | | | | | (45,000 | ) | | | (359,156 | ) |
Hua Nan Financial Holdings Co. Ltd. | | | | | (1,213,000 | ) | | | (700,559 | ) |
Kinsus Interconnect Technology Corp. | | | | | (73,000 | ) | | | (229,231 | ) |
Macronix International | | | | | (383,937 | ) | | | (110,433 | ) |
Nan Kang Rubber Tire Co. Ltd. | | | | | (25,933 | ) | | | (30,408 | ) |
Nan Ya Plastics Corp. | | | | | (444,000 | ) | | | (903,272 | ) |
Synnex Technology International Corp. | | | | | (80,000 | ) | | | (162,403 | ) |
TSRC Corp. | | | | | (93,500 | ) | | | (189,845 | ) |
Walsin Lihwa Corp. | | | | | (288,000 | ) | | | (97,148 | ) |
WPG Holdings Ltd. | | | | | (244,000 | ) | | | (328,770 | ) |
Yuanta Financial Holding Co. Ltd. | | | | | (841,000 | ) | | | (456,085 | ) |
Yulon Motor Co. Ltd. | | | | | (28,000 | ) | | | (51,970 | ) |
| | | | | | | | | (8,308,589 | ) |
Thailand | | | | | | | | | | |
Bangchak Petroleum PCL | | | | | (154,100 | ) | | | (186,036 | ) |
Charoen Pokphand Foods PCL | | | | | (3,709,900 | ) | | | (4,416,548 | ) |
Jasmine International PCL | | | | | (2,736,100 | ) | | | (550,523 | ) |
Siam Commercial Bank PCL | | | | | (32,400 | ) | | | (194,487 | ) |
Total Access Communication PCL | | | | | (20,100 | ) | | | (58,305 | ) |
| | | | | | | | | (5,405,899 | ) |
Turkey | | | | | | | | | | |
Akbank TAS | | | | | (13,578 | ) | | | (68,662 | ) |
Anadolu Efes Biracilik Ve Malt Sanayii | | | | | (5,067 | ) | | | (75,693 | ) |
Arcelik | | | | | (420,332 | ) | | | (2,748,439 | ) |
Dogan Sirketler Grubu Holding | | | | | (1,981,016 | ) | | | (1,217,033 | ) |
Haci Omer Sabanci Holding | | | | | (204,350 | ) | | | (1,177,623 | ) |
KOC Holding AS | | | | | (309,181 | ) | | | (1,613,314 | ) |
Turkcell Iletisim Hizmetleri | | | | | (352,880 | ) | | | (2,205,314 | ) |
Turkcell Iletisim Hizmetleri AS — ADR | | | | | (53,348 | ) | | | (834,363 | ) |
See Notes to Financial Statements.
| 20 | BLACKROCK FUNDS | JANUARY 31, 2013
|
| |
| Schedule of Investments (continued) | BlackRock Emerging Markets Long/Short Equity Fund
|
| | | | | Shares | | Value |
Reference Entity — Short |
Turkey (concluded) | | | | | | | | | | |
Turkiye Vakiflar Bankasi Tao | | | | | (258,071 | ) | | $ | (754,125 | ) |
| | | | | | | | | (10,694,566 | ) |
United Kingdom | | | | | | | | | | |
Anglo American Plc | | | | | (41,506 | ) | | | (1,245,981 | ) |
BHP Billiton Plc | | | | | (50,284 | ) | | | (1,726,372 | ) |
| | | | | | | | | (2,972,353 | ) |
United States | | | | | | | | | | |
AES Corp. | | | | | (111,922 | ) | | | (1,213,235 | ) |
NII Holdings, Inc. | | | | | (128,357 | ) | | | (898,499 | ) |
| | | | | | | | | (2,111,734 | ) |
Total Reference Entity — Short | | | | | | | | | (112,705,314 | ) |
Net Value of Reference Entity — Morgan Stanley & Co., Inc. | $ | 42,583,404 | |
The following table represents the individual long and short positions and related values of the basket of equity securities underlying the total return swap with UBS AG as of January 31, 2013:
Reference Entity — Long |
Argentina | | | | | | | | | | |
Banco Macro SA — ADR | | | | | 13,429 | | | | 223,593 | |
Ternium SA — ADR | | | | | 15,239 | | | | 360,097 | |
| | | | | | | | | 583,690 | |
Brazil | | | | | | | | | | |
AES Tiete SA, Preference Shares | | | | | 56,100 | | | | 584,566 | |
Amil Participacoes SA | | | | | 43,100 | | | | 675,713 | |
Banco Bradesco SA — ADR | | | | | 19,220 | | | | 353,264 | |
Banco do Brasil SA | | | | | 47,100 | | | | 577,116 | |
Banco Santander Brasil SA | | | | | 44,300 | | | | 325,907 | |
BM&F Bovespa SA | | | | | 152,900 | | | | 1,070,342 | |
Cia de Bebidas das Americas, Preference Shares | | | | | 97,100 | | | | 4,573,772 | |
Cia de Bebidas das Americas, Preference Shares — ADR | | | | | 30,062 | | | | 1,414,718 | |
Cia Energetica de Minas Gerais — ADR | | | | | 7,409 | | | | 81,350 | |
Cia Energetica de Minas Gerais, Preference Shares | | | | | 18,000 | | | | 195,244 | |
Cia Energetica de Sao Paulo, Preference B Shares | | | | | 45,200 | | | | 448,516 | |
Cia Siderurgica Nacional SA | | | | | 130,500 | | | | 704,484 | |
Cia Siderurgica Nacional SA — ADR | | | | | 62,470 | | | | 339,212 | |
Cielo SA | | | | | 2,800 | | | | 79,190 | |
Duratex SA | | | | | 84,000 | | | | 583,805 | |
Gafisa SA | | | | | 136,800 | | | | 341,425 | |
Gafisa SA — ADR | | | | | 50,857 | | | | 250,216 | |
Itau Unibanco Holding SA, Preference Shares | | | | | 18,400 | | | | 317,392 | |
Itau Unibanco Holdings SA — ADR | | | | | 2,925 | | | | 50,398 | |
Itausa — Investimentos Itau SA, Preference Shares | | | | | 96,710 | | | | 489,536 | |
Lojas Americanas SA, Preference Shares | | | | | 65,300 | | | | 582,710 | |
Marfrig Alimentos SA | | | | | 102,000 | | | | 525,021 | |
Metalurgica Gerdau SA, Preference Shares | | | | | 23,300 | | | | 260,806 | |
Multiplus SA | | | | | 41,300 | | | | 887,659 | |
Natura Cosmeticos SA | | | | | 39,100 | | | | 1,054,395 | |
Odontoprev SA | | | | | 246,800 | | | | 1,257,951 | |
| | | | | | | | | | | |
| | | | | Shares | | Value |
Reference Entity — Long |
Brazil (concluded) | | | | | | | | | | |
PDG Realty SA Empreendimentos e Participacoes | | | | | 157,000 | | | $ | 249,137 | |
Porto Seguro SA | | | | | 27,300 | | | | 327,652 | |
Rossi Residencial SA | | | | | 273,000 | | | | 575,790 | |
Souza Cruz SA | | | | | 92,000 | | | | 1,522,284 | |
Sul America SA | | | | | 8,800 | | | | 82,284 | |
Totvs SA | | | | | 2,200 | | | | 47,914 | |
Tractebel Energia SA | | | | | 65,800 | | | | 1,169,389 | |
Vale SA, Preference ‘A’ Shares | | | | | 43,800 | | | | 851,214 | |
| | | | | | | | | 22,850,372 | |
Canada | | | | | | | | | | |
Coeur d’Alene Mines Corp. | | | | | 7,477 | | | | 162,251 | |
Methanex Corp. | | | | | 26,079 | | | | 937,892 | |
| | | | | | | | | 1,100,143 | |
Chile | | | | | | | | | | |
AES Gener SA | | | | | 562,074 | | | | 386,117 | |
Aguas Andinas SA, Series A | | | | | 1,266,313 | | | | 930,027 | |
Banco de Credito e Inversiones | | | | | 2,153 | | | | 168,138 | |
Cia Cervecerias Unidas SA | | | | | 18,904 | | | | 305,777 | |
ENTEL Chile SA | | | | | 101,990 | | | | 2,210,324 | |
Sociedad Quimica y Minera de Chile SA — ADR | | | | | 15,566 | | | | 884,771 | |
Sociedad Quimica y Minera de Chile SA, Series B | | | | | 4,832 | | | | 275,341 | |
| | | | | | | | | 5,160,495 | |
China | | | | | | | | | | |
Agile Property Holdings Ltd. | | | | | 46,000 | | | | 65,266 | |
Agricultural Bank of China Ltd., Class H | | | | | 290,000 | | | | 157,921 | |
Air China Ltd., Class H | | | | | 196,000 | | | | 168,091 | |
Anta Sports Products Ltd. | | | | | 424,000 | | | | 395,792 | |
Bank of China Ltd., Class H | | | | | 915,000 | | | | 450,834 | |
Bank of Communications Co. Ltd., Class H | | | | | 59,000 | | | | 50,088 | |
Beijing Capital International Airport Co. Ltd., Class H | | | | | 1,026,000 | | | | 854,288 | |
China BlueChemical Ltd. | | | | | 816,000 | | | | 586,273 | |
China Construction Bank, Class H | | | | | 978,000 | | | | 843,653 | |
China Merchants Bank Co. Ltd. | | | | | 72,000 | | | | 172,593 | |
China Minsheng Banking Corp. Ltd., Class H | | | | | 68,000 | | | | 97,636 | |
China Mobile Ltd. | | | | | 124,500 | | | | 1,361,308 | |
China Oilfield Services Ltd., Class H | | | | | 464,000 | | | | 1,004,621 | |
China Petroleum & Chemical Corp., Class H | | | | | 148,000 | | | | 179,567 | |
China Shenhua Energy Co. Ltd., Class H | | | | | 42,500 | | | | 182,754 | |
China Telecom Corp. Ltd., Class H | | | | | 3,102,000 | | | | 1,689,501 | |
CNOOC Ltd. | | | | | 232,000 | | | | 477,429 | |
Dongfeng Motor Group Co. Ltd., Class H | | | | | 1,506,000 | | | | 2,464,984 | |
ENN Energy Holdings Ltd. | | | | | 72,000 | | | | 344,924 | |
Golden Eagle Retail Group Ltd. | | | | | 312,000 | | | | 671,997 | |
Guangzhou R&F Properties Co. Ltd., Class H | | | | | 19,600 | | | | 35,573 | |
Industrial and Commercial Bank of China Ltd., Class H | | | | | 1,208,000 | | | | 909,756 | |
Intime Department Store Group Co. Ltd. | | | | | 250,000 | | | | 328,855 | |
Jiangsu Expressway Co. Ltd., Class H | | | | | 584,000 | | | | 602,169 | |
Lenovo Group Ltd. | | | | | 670,000 | | | | 697,877 | |
Parkson Retail Group Ltd. | | | | | 94,500 | | | | 72,890 | |
Sany Heavy Equipment International Holdings Co. Ltd. | | | | | 470,000 | | | | 223,053 | |
Shanghai Electric Group Co. Ltd., Class H | | | | | 1,790,000 | | | | 741,026 | |
Shanghai Pharmaceuticals Holding Co. Ltd., Class H | | | | | 112,800 | | | | 225,764 | |
See Notes to Financial Statements.
| BLACKROCK FUNDS | JANUARY 31, 2013 | 21
|
| |
| Schedule of Investments (continued) | BlackRock Emerging Markets Long/Short Equity Fund
|
| | | | Shares | | Value |
Reference Entity — Long |
China (concluded) | | | | | | | | | | |
Sun Art Retail Group Ltd. | | | | | 156,000 | | | $ | 226,887 | |
Tingyi Cayman Islands Holding Corp. | | | | | 140,000 | | | | 393,248 | |
Tsingtao Brewery Co. Ltd., Class H | | | | | 84,000 | | | | 485,519 | |
Wumart Stores, Inc., Class H | | | | | 106,000 | | | | 211,656 | |
Yanzhou Coal Mining Co. Ltd. | | | | | 164,000 | | | | 279,449 | |
Zhejiang Expressway Co. Ltd. | | | | | 18,000 | | | | 15,989 | |
Zijin Mining Group Co. Ltd., Class H | | | | | 540,000 | | | | 207,966 | |
Zoomlion Heavy Industry Science and Technology Co. Ltd., Class H | | | | | 757,000 | | | | 1,030,341 | |
| | | | | | | | | 18,907,538 | |
Colombia | | | | | | | | | | |
Petrominerales Ltd. | | | | | 33,870 | | | | 301,550 | |
Czech Republic | | | | | | | | | | |
CEZ AS | | | | | 85,429 | | | | 2,770,456 | |
Egypt | | | | | | | | | | |
Telecom Egypt Co. | | | | | 44,033 | | | | 95,080 | |
Hong Kong | | | | | | | | | | |
Belle International Holdings Ltd. | | | | | 294,000 | | | | 653,896 | |
Bosideng International Holdings Ltd. | | | | | 1,574,000 | | | | 446,544 | |
China Everbright Ltd. | | | | | 28,000 | | | | 52,773 | |
China Resources Enterprise Ltd. | | | | | 382,000 | | | | 1,369,666 | |
Citic Pacific Ltd. | | | | | 346,000 | | | | 556,530 | |
COSCO Pacific Ltd. | | | | | 132,000 | | | | 214,211 | |
Dongyue Group | | | | | 132,000 | | | | 88,178 | |
GOME Electrical Appliances Holdings Ltd. | | | | | 2,880,000 | | | | 345,962 | |
Guangdong Investment Ltd. | | | | | 398,000 | | | | 330,400 | |
Haier Electronics Group Co. Ltd. | | | | | 168,000 | | | | 280,090 | |
Huabao International Holdings Ltd. | | | | | 295,000 | | | | 161,093 | |
Kunlun Energy Co. Ltd. | | | | | 40,000 | | | | 83,133 | |
KWG Property Holding Ltd. | | | | | 857,000 | | | | 650,343 | |
MMG Ltd. | | | | | 1,280,000 | | | | 518,340 | |
Skyworth Digital Holdings Ltd. | | | | | 1,334,000 | | | | 811,459 | |
Want Want China Holdings Ltd. | | | | | 138,000 | | | | 182,827 | |
| | | | | | | | | 6,745,445 | |
Hungary | | | | | | | | | | |
Magyar Telekom Plc | | | | | 689,671 | | | | 1,302,366 | |
MOL Hungarian Oil and Gas Plc | | | | | 558 | | | | 48,040 | |
OTP Bank Plc | | | | | 41,208 | | | | 886,164 | |
| | | | | | | | | 2,236,570 | |
Indonesia | | | | | | | | | | |
Astra Agro Lestari Tbk PT | | | | | 194,500 | | | | 376,507 | |
Indo Tambangraya Megah Tbk PT | | | | | 54,000 | | | | 229,877 | |
Indocement Tunggal Prakarsa Tbk PT | | | | | 398,500 | | | | 889,952 | |
Kalbe Farma Tbk PT | | | | | 967,000 | | | | 108,133 | |
Perusahaan Gas Negara Persero Tbk PT | | | | | 2,240,500 | | | | 1,075,620 | |
Semen Gresik Persero Tbk PT | | | | | 236,000 | | | | 381,927 | |
Telekomunikasi Indonesia Persero Tbk PT | | | | | 208,000 | | | | 208,324 | |
Telekomunikasi Indonesia Tbk PT — ADR | | | | | 23,982 | | | | 950,886 | |
Unilever Indonesia Tbk PT | | | | | 138,000 | | | | 312,530 | |
| | | | | | | | | 4,533,756 | |
Israel | | | | | | | | | | |
Check Point Software Technologies Ltd. | | | | | 26,100 | | | | 1,305,000 | |
Israel Chemicals Ltd. | | | | | 43,773 | | | | 581,378 | |
| | | | | | | | | 1,886,378 | |
| | | | | | | | | | | |
| | | | | Shares | | Value |
Reference Entity — Long |
Luxembourg | | | | | | | | | | |
Millicom International Cellular SA | | | | | 5,634 | | | $ | 518,328 | |
Malaysia | | | | | | | | | | |
Berjaya Sports Toto Bhd | | | | | 360,073 | | | | 504,308 | |
British American Tobacco Malaysia Bhd | | | | | 49,400 | | | | 912,056 | |
DiGi.Com Bhd | | | | | 1,197,600 | | | | 1,896,482 | |
Lafarge Malayan Cement Bhd | | | | | 255,300 | | | | 764,174 | |
Tenaga Nasional Bhd | | | | | 277,800 | | | | 626,417 | |
UMW Holdings Bhd | | | | | 86,100 | | | | 336,419 | |
| | | | | | | | | 5,039,856 | |
Mexico | | | | | | | | | | |
Alfa SA, Class A | | | | | 1,138,700 | | | | 2,734,220 | |
America Movil SAB de CV, Series L | | | | | 1,021,900 | | | | 1,283,543 | |
Banco Latinoamericana De Comercio Exterior SA | | | | | 5,698 | | | | 132,194 | |
Fomento Economico Mexicano SA de CV | | | | | 92,100 | | | | 994,479 | |
Grupo Aeroportuario del Pacifico SAB de CV, B Shares | | | | | 107,600 | | | | 670,416 | |
Grupo Carso SAB de CV, Series A1 | | | | | 217,872 | | | | 1,057,779 | |
Grupo Televisa SAB, Series CPO | | | | | 90,300 | | | | 505,952 | |
Grupo Televisa SAB — ADR | | | | | 2,245 | | | | 62,882 | |
Industrias Penoles SAB de CV | | | | | 4,975 | | | | 244,364 | |
| | | | | | | | | 7,685,829 | |
Peru | | | | | | | | | | |
Southern Copper Corp. | | | | | 28,599 | | | | 1,126,515 | |
Philippines | | | | | | | | | | |
Aboitiz Power Corp. | | | | | 833,200 | | | | 780,659 | |
Ayala Land, Inc. | | | | | 908,300 | | | | 647,454 | |
Manila Electric Co. | | | | | 19,730 | | | | 140,893 | |
SM Prime Holdings, Inc. | | | | | 147,300 | | | | 63,471 | |
| | | | | | | | | 1,632,477 | |
Poland | | | | | | | | | | |
Enea SA | | | | | 13,037 | | | | 64,443 | |
KGHM Polska Miedz SA | | | | | 26,464 | | | | 1,619,367 | |
PGE SA | | | | | 65,164 | | | | 359,390 | |
Powszechny Zaklad Ubezpieczen SA | | | | | 1,323 | | | | 174,372 | |
Synthos SA | | | | | 47,417 | | | | 80,480 | |
Tauron Polska Energia SA | | | | | 84,607 | | | | 129,354 | |
| | | | | | | | | 2,427,406 | |
Russia | | | | | | | | | | |
AK Transneft OAO, Preference Shares | | | | | 75 | | | | 176,332 | |
Gazprom OAO | | | | | 149,210 | | | | 705,679 | |
IDGC Holding JSC | | | | | 4,222,000 | | | | 308,398 | |
LSR Group — GDR | | | | | 30,981 | | | | 155,370 | |
Lukoil OAO | | | | | 5,876 | | | | 395,557 | |
Lukoil OAO — ADR | | | | | 14,000 | | | | 944,012 | |
Mechel — ADR | | | | | 96,080 | | | | 648,540 | |
Pharmstandard OJSC — GDR | | | | | 10,294 | | | | 200,012 | |
Rosneft Oil Co. | | | | | 21,250 | | | | 189,158 | |
Sberbank RF | | | | | 146,120 | | | | 532,947 | |
Severstal OAO | | | | | 17,400 | | | | 218,444 | |
Severstal OAO — GDR | | | | | 50,771 | | | | 633,299 | |
Sistema JSFC -GDR | | | | | 8,370 | | | | 183,717 | |
TMK OAO — GDR | | | | | 4,723 | | | | 71,911 | |
| | | | | | | | | 5,363,376 | |
See Notes to Financial Statements.
| 22 | BLACKROCK FUNDS | JANUARY 31, 2013
|
| |
| Schedule of Investments (continued) | BlackRock Emerging Markets Long/Short Equity Fund
|
| | | | Shares | | Value |
Reference Entity — Long |
South Africa | | | | | | | | | | |
AngloGold Ashanti Ltd. | | | | | 4,575 | | | $ | 127,884 | |
AVI Ltd. | | | | | 5,381 | | | | 32,906 | |
Barloworld Ltd. | | | | | 6,864 | | | | 64,234 | |
Bidvest Group Ltd. | | | | | 22,454 | | | | 536,029 | |
FirstRand Ltd. | | | | | 555,866 | | | | 2,004,122 | |
Gold Fields Ltd. — ADR | | | | | 52,448 | | | | 609,446 | |
Harmony Gold Mining Co. Ltd. | | | | | 6,403 | | | | 41,263 | |
Harmony Gold Mining Co. Ltd. — ADR | | | | | 13,510 | | | | 87,274 | |
Imperial Holdings Ltd. | | | | | 73,691 | | | | 1,604,435 | |
Kumba Iron Ore Ltd. | | | | | 1,116 | | | | 75,153 | |
Liberty Holdings Ltd. | | | | | 12,553 | | | | 161,581 | |
Life Healthcare Group Holdings Ltd. | | | | | 206,163 | | | | 725,089 | |
MMI Holdings Ltd. | | | | | 163,382 | | | | 422,483 | |
Mr. Price Group Ltd. | | | | | 22,656 | | | | 312,729 | |
Nedbank Group Ltd. | | | | | 12,338 | | | | 267,735 | |
PPC Ltd. | | | | | 37,619 | | | | 137,734 | |
Redefine Properties Ltd. | | | | | 183,707 | | | | 196,955 | |
Remgro Ltd. | | | | | 35,678 | | | | 650,103 | |
Sappi Ltd. | | | | | 242,639 | | | | 848,224 | |
The Spar Group Ltd. | | | | | 34,266 | | | | 450,818 | |
Vodacom Group Ltd. | | | | | 182,868 | | | | 2,543,528 | |
Woolworths Holdings Ltd. | | | | | 287,897 | | | | 2,045,689 | |
| | | | | | | | | 13,945,414 | |
South Korea | | | | | | | | | | |
Asiana Airlines, Inc. | | | | | 27,610 | | | | 152,944 | |
CJ O Shopping Co. Ltd. | | | | | 3,865 | | | | 1,050,242 | |
Daelim Industrial Co. Ltd. | | | | | 1,574 | | | | 133,932 | |
Daewoo Engineering & Construction Co. Ltd. | | | | | 11,830 | | | | 98,356 | |
Daewoo Securities Co. Ltd. | | | | | 9,160 | | | | 100,516 | |
Dongbu Insurance Co. Ltd. | | | | | 45,960 | | | | 1,971,892 | |
Doosan Corp. | | | | | 4,082 | | | | 481,676 | |
Doosan Heavy Industries & Construction Co. Ltd. | | | | | 1 | | | | 43 | |
E-Mart Co. Ltd. | | | | | 2,568 | | | | 570,374 | |
EG Corp. | | | | | 2,522 | | | | 88,736 | |
Grand Korea Leisure Co. Ltd. | | | | | 14,750 | | | | 416,434 | |
GS Retail Co. Ltd. | | | | | 2,520 | | | | 63,485 | |
Haansoft, Inc. | | | | | 10,096 | | | | 173,427 | |
Hankook Tire Co. Ltd. | | | | | 607 | | | | 9,424 | |
Hankook Tire Co. Ltd. | | | | | 2,093 | | | | 86,076 | |
Hanwha Chemical Corp. | | | | | 27,890 | | | | 493,274 | |
Hanwha Corp. | | | | | 13,370 | | | | 410,464 | |
Himart Co. Ltd. | | | | | 863 | | | | 58,205 | |
Huvis Corp. | | | | | 19,350 | | | | 198,138 | |
Hyundai Hysco Co. Ltd. | | | | | 1,480 | | | | 51,224 | |
Hyundai Mobis | | | | | 261 | | | | 68,351 | |
Hyundai Wia Corp. | | | | | 8,432 | | | | 1,138,043 | |
Industrial Bank of Korea | | | | | 7,780 | | | | 87,907 | |
KEPCO Engineering & Construction Co., Inc. | | | | | 1,037 | | | | 76,307 | |
Kia Motors Corp. | | | | | 32,308 | | | | 1,534,604 | |
Korea Exchange Bank | | | | | 84,370 | | | | 587,259 | |
Korea Investment Holdings Co. Ltd. | | | | | 1,080 | | | | 41,949 | |
Korean Air Lines Co. Ltd. | | | | | 22,270 | | | | 929,855 | |
Kumho Petrochemical Co. Ltd. | | | | | 607 | | | | 66,397 | |
LG Corp. | | | | | 1,054 | | | | 62,092 | |
LG Display Co. Ltd. | | | | | 33,580 | | | | 901,738 | |
Lotte Confectionery Co. Ltd. | | | | | 36 | | | | 56,961 | |
LS Industrial Systems Co. Ltd. | | | | | 674 | | | | 41,728 | |
Macrogen, Inc. | | | | | 8,940 | | | | 237,371 | |
| | | | | | | | | | | |
| | | | | Shares | | Value |
Reference Entity — Long |
South Korea (concluded) | | | | | | | | | | |
Mirae Asset Securities Co. Ltd. | | | | | 12,500 | | | $ | 433,478 | |
NEO Holdings Co. Ltd. | | | | | 4,082 | | | | — | |
Orion Corp. | | | | | 1,004 | | | | 938,437 | |
Paradise Co. Ltd. | | | | | 7,485 | | | | 132,010 | |
Partron Co. Ltd. | | | | | 5,920 | | | | 115,015 | |
POSCO | | | | | 253 | | | | 82,706 | |
Samsung Card Co. | | | | | 7,340 | | | | 241,397 | |
Samsung Electro-Mechanics Co. Ltd. | | | | | 1,722 | | | | 145,078 | |
Samsung Electronics Co. Ltd. | | | | | 826 | | | | 1,098,938 | |
Samsung Engineering Co. Ltd. | | | | | 5,633 | | | | 804,054 | |
Samsung Fine Chemicals Co. Ltd. | | | | | 2,369 | | | | 114,655 | |
Samsung Heavy Industries Co. Ltd. | | | | | 55,160 | | | | 1,938,230 | |
Silicon Works Co. Ltd. | | | | | 4,752 | | | | 88,008 | |
SK Holdings Co. Ltd. | | | | �� | 2,803 | | | | 442,977 | |
SK Networks Co. Ltd. | | | | | 14,900 | | | | 110,130 | |
STX Offshore & Shipbuilding Co. Ltd. | | | | | 56,340 | | | | 360,780 | |
Woori Finance Holdings Co. Ltd. | | | | | 110,330 | | | | 1,297,227 | |
Woori Investment & Securities Co. Ltd. | | | | | 19,250 | | | | 218,291 | |
YG Entertainment, Inc. | | | | | 1,477 | | | | 84,849 | |
| | | | | | | | | 21,085,684 | |
Taiwan | | | | | | | | | | |
ALI Corp. | | | | | 421,000 | | | | 467,518 | |
ASUSTek Computer, Inc. | | | | | 46,000 | | | | 527,185 | |
Capella Microsystems Taiwan, Inc. | | | | | 147,000 | | | | 1,132,206 | |
Capital Securities Corp. | | | | | 194,000 | | | | 75,659 | |
Cathay Financial Holding Co. Ltd. | | | | | 34,000 | | | | 37,907 | |
Chang Hwa Commercial Bank | | | | | 84,530 | | | | 46,698 | |
Cheng Shin Rubber Industry Co. Ltd. | | | | | 157,000 | | | | 410,275 | |
Chicony Electronics Co. Ltd. | | | | | 564,000 | | | | 1,562,811 | |
Chimei Innolux Corp. | | | | | 281,000 | | | | 146,322 | |
Chipbond Technology Corp. | | | | | 328,000 | | | | 674,869 | |
CTCI Corp. | | | | | 279,000 | | | | 534,707 | |
E.Sun Financial Holding Co. Ltd. | | | | | 140,000 | | | | 80,193 | |
Elan Microelectronics Corp. | | | | | 510,000 | | | | 946,350 | |
Eva Airways Corp. | | | | | 1,085,000 | | | | 695,264 | |
Far Eastern New Century Corp. | | | | | 222,310 | | | | 257,743 | |
Far EasTone Telecommunications Co. Ltd. | | | | | 521,000 | | | | 1,325,565 | |
Faraday Technology Corp. | | | | | 361,000 | | | | 452,804 | |
Farglory Land Development Co. Ltd. | | | | | 121,000 | | | | 222,920 | |
Formosa Taffeta Co. Ltd. | | | | | 139,000 | | | | 134,181 | |
Global Unichip Corp. | | | | | 21,000 | | | | 68,308 | |
Integrated Memory Logic Ltd. | | | | | 141,000 | | | | 423,749 | |
Largan Precision Co. Ltd. | | | | | 6,000 | | | | 157,005 | |
Mega Financial Holding Co. Ltd. | | | | | 305 | | | | 250 | |
Merida Industry Co. Ltd. | | | | | 235,000 | | | | 1,073,948 | |
Novatek Microelectronics Corp. | | | | | 280,000 | | | | 1,114,061 | |
Phison Electronics Corp. | | | | | 113,000 | | | | 763,831 | |
Pou Chen Corp. | | | | | 1,125,000 | | | | 1,124,184 | |
President Chain Store Corp. | | | | | 77,000 | | | | 416,161 | |
Radiant Opto-Electronics Corp. | | | | | 67,901 | | | | 263,592 | |
Sercomm Corp. | | | | | 322,000 | | | | 477,151 | |
Standard Foods Corp. | | | | | 40,000 | | | | 111,788 | |
Taishin Financial Holding Co. Ltd. | | | | | 1,697,501 | | | | 672,754 | |
Taiwan Fertilizer Co. Ltd. | | | | | 283,000 | | | | 702,366 | |
Taiwan Mobile Co. Ltd. | | | | �� | 248,000 | | | | 882,413 | |
Taiwan Semiconductor Manufacturing Co. Ltd. | | | | | 256,000 | | | | 877,241 | |
Taiwan Semiconductor Manufacturing Co. Ltd. — ADR | | | | | 52,353 | | | | 928,742 | |
Teco Electric and Machinery Co. Ltd. | | | | | 494,000 | | | | 410,979 | |
Tong Hsing Electronic Industries Ltd. | | | | | 88,000 | | | | 339,345 | |
See Notes to Financial Statements.
| BLACKROCK FUNDS | JANUARY 31, 2013 | 23
|
| |
| Schedule of Investments (continued) | BlackRock Emerging Markets Long/Short Equity Fund
|
| | | | Shares | | Value |
Reference Entity — Long |
Taiwan (concluded) | | | | | | | | | | |
Uni-President China Holdings Ltd. | | | | | 849,000 | | | $ | 996,106 | |
Uni-President Enterprises Corp. | | | | | 1,439,050 | | | | 2,527,911 | |
Wan Hai Lines Ltd. | | | | | 792,000 | | | | 431,950 | |
Ways Technical Corp. Ltd. | | | | | 84,000 | | | | 227,848 | |
Yang Ming Marine Transport Corp. | | | | | 344,000 | | | | 166,232 | |
| | | | | | | | | 24,889,092 | |
Thailand | | | | | | | | | | |
Advanced Info Service PCL | | | | | 141,600 | | | | 997,183 | |
Airports of Thailand PCL | | | | | 408,200 | | | | 1,444,168 | |
BEC World PCL | | | | | 141,300 | | | | 343,536 | |
CP ALL PCL | | | | | 311,100 | | | | 487,724 | |
PTT Global Chemical PCL | | | | | 721,800 | | | | 1,936,419 | |
Thai Airways International PCL | | | | | 70,700 | | | | 54,769 | |
| | | | | | | | | 5,263,799 | |
Turkey | | | | | | | | | | |
BIM Birlesik Magazalar AS | | | | | 21,644 | | | | 1,049,443 | |
Brisa Bridgestone Sabanci Sanayi ve Ticaret | | | | | 102,000 | | | | 305,057 | |
Coca-Cola Icecek AS | | | | | 27,036 | | | | 657,371 | |
Emlak Konut Gayrimenkul Yatirim Ortakligi AS | | | | | 374,591 | | | | 662,322 | |
Enka Insaat ve Sanayi AS | | | | | 392,196 | | | | 1,177,686 | |
Eregli Demir ve Celik Fabrikalari TAS | | | | | 342,356 | | | | 486,780 | |
Ford Otomotiv Sanayi AS | | | | | 14,468 | | | | 164,559 | |
TAV Havalimanlari Holding AS | | | | | 244,032 | | | | 1,518,966 | |
Turk Hava Yollari | | | | | 176,362 | | | | 655,154 | |
Turk Telekomunikasyon AS | | | | | 84,457 | | | | 354,174 | |
Turkiye Is Bankasi (Isabank), C Shares | | | | | 239,013 | | | | 883,207 | |
| | | | | | | | | 7,914,719 | |
United Kingdom | | | | | | | | | | |
Antofagasta Plc | | | | | 3,890 | | | | 70,536 | |
British American Tobacco Plc | | | | | 1,509 | | | | 78,275 | |
Evraz Plc | | | | | 40,863 | | | | 187,098 | |
Hochschild Mining Plc | | | | | 8,106 | | | | 54,356 | |
Lonmin Plc | | | | | 31,952 | | | | 180,421 | |
SABMiller Plc | | | | | 7,461 | | | | 367,345 | |
| | | | | | | | | 938,031 | |
Total Reference Entity — Long | | | | | | | | | 165,001,999 | |
|
Reference Entity — Short |
Brazil | | | | | | | | | | |
BR Malls Participacoes SA | | | | | (400 | ) | | | (5,178 | ) |
BR Properties SA | | | | | (35,800 | ) | | | (464,725 | ) |
Bradespar SA Preference Shares | | | | | (63,521 | ) | | | (985,343 | ) |
BRF — Brasil Foods SA — ADR | | | | | (14,135 | ) | | | (313,797 | ) |
CETIP SA — Mercador Organizados | | | | | (9,300 | ) | | | (116,989 | ) |
Cia Brasileira de Distribuicao Grupo Pao de Acucar, Preference Shares — ADR | | | | | (93,900 | ) | | | (4,482,786 | ) |
Cia de Transmissao de Energia Eletrica Paulista | | | | | (8,300 | ) | | | (145,881 | ) |
CPFL Energia SA — ADR | | | | | (58,590 | ) | | | (1,213,399 | ) |
Diagnosticos da America SA | | | | | (20,500 | ) | | | (145,668 | ) |
Fibria Celulose SA — ADR | | | | | (37,519 | ) | | | (462,984 | ) |
Gerdau SA — ADR | | | | | (115,000 | ) | | | (1,015,450 | ) |
Gol Linhas Aereas Inteligentes SA — ADR | | | | | (203,518 | ) | | | (1,481,611 | ) |
Gol Linhas Aereas Inteligentes SA, Preference Shares | | | | | (5,400 | ) | | | (39,293 | ) |
HRT Participacoes em Petroleo SA | | | | | (64,200 | ) | | | (120,898 | ) |
Hypermarcas SA | | | | | (48,000 | ) | | | (414,593 | ) |
| | | | | | | | | | | |
| | | | | Shares | | Value |
Reference Entity — Short |
Brazil (concluded) | | | | | | | | | | |
Iochpe-Maxion SA | | | | | (119,700 | ) | | $ | (1,568,870 | ) |
Oi SA | | | | | (29,476 | ) | | | (119,156 | ) |
Raia Drogasil SA | | | | | (99,300 | ) | | | (1,109,511 | ) |
Telefonica Brasil SA — ADR | | | | | (13,282 | ) | | | (334,441 | ) |
| | | | | | | | | (14,540,573 | ) |
Canada | | | | | | | | | | |
AuRico Gold, Inc. | | | | | (54,335 | ) | | | (381,881 | ) |
Pan American Silver Corp. | | | | | (12,157 | ) | | | (212,327 | ) |
| | | | | | | | | (594,208 | ) |
Chile | | | | | | | | | | |
Colbun SA | | | | | (2,135,079 | ) | | | (673,413 | ) |
E.CL SA | | | | | (103,156 | ) | | | (243,652 | ) |
Empresa Nacional de Electricidad SA — ADR | | | | | (27,921 | ) | | | (1,441,003 | ) |
Empresas CMPC SA | | | | | (72,379 | ) | | | (280,517 | ) |
Enersis SA — ADR | | | | | (2,008 | ) | | | (39,457 | ) |
Latam Airlines Group SA | | | | | (29,820 | ) | | | (737,116 | ) |
Latam Airlines Group SA — ADR | | | | | (123,179 | ) | | | (3,016,654 | ) |
SACI Falabella | | | | | (59,181 | ) | | | (687,808 | ) |
Vina Concha y Toro SA | | | | | (74,700 | ) | | | (149,756 | ) |
| | | | | | | | | (7,269,376 | ) |
China | | | | | | | | | | |
Aluminum Corp. of China Ltd. — ADR | | | | | (7,499 | ) | | | (89,988 | ) |
Angang Steel Co. Ltd., Class H | | | | | (206,000 | ) | | | (152,544 | ) |
Anhui Conch Cement Co. Ltd., Class H | | | | | (585,500 | ) | | | (2,298,784 | ) |
Baoxin Auto Group Ltd. | | | | | (90,500 | ) | | | (94,037 | ) |
BBMG Corp., Class H | | | | | (647,500 | ) | | | (604,326 | ) |
Brilliance China Automotive Holdings Ltd. | | | | | (1,078,000 | ) | | | (1,447,223 | ) |
China Communications Construction Co. Ltd., Class H | | | | | (501,000 | ) | | | (509,327 | ) |
China Life Insurance Co. Ltd., Class H | | | | | (30,000 | ) | | | (100,123 | ) |
China National Building Material Co. Ltd., Class H | | | | | (458,000 | ) | | | (730,987 | ) |
China Pacific Insurance Group Co. Ltd., Class H | | | | | (66,200 | ) | | | (258,703 | ) |
China Railway Group Ltd. | | | | | (294,000 | ) | | | (167,664 | ) |
China Shanshui Cement Group Ltd. | | | | | (89,000 | ) | | | (65,404 | ) |
China Shipping Development Co. Ltd., Class H | | | | | (1,784,000 | ) | | | (982,958 | ) |
China ZhengTong Auto Services Holdings Ltd. | | | | | (17,500 | ) | | | (15,588 | ) |
CITIC Securities Co. Ltd. | | | | | (217,000 | ) | | | (579,342 | ) |
Country Garden Holdings Co. Ltd. | | | | | (467,527 | ) | | | (249,106 | ) |
Daphne International Holdings Ltd. | | | | | (264,000 | ) | | | (339,881 | ) |
Guangzhou Automobile Group Co. Ltd., Class H | | | | | (516,000 | ) | | | (432,021 | ) |
Hengan International Group Co. Ltd. | | | | | (10,500 | ) | | | (105,324 | ) |
Metallurgical Corp. of China Ltd., Class H | | | | | (3,332,000 | ) | | | (700,556 | ) |
PetroChina Co. Ltd., Class H | | | | | (50,000 | ) | | | (70,903 | ) |
Ping An Insurance Group Co., Class H | | | | | (31,500 | ) | | | (282,623 | ) |
Shandong Weigao Group Medical Polymer Co. Ltd. | | | | | (1,876,000 | ) | | | (1,812,125 | ) |
Shui On Land Ltd. | | | | | (357,500 | ) | | | (173,382 | ) |
Sino-Ocean Land Holdings Ltd. | | | | | (87,500 | ) | | | (69,893 | ) |
Weichai Power Co. Ltd., Class H | | | | | (169,800 | ) | | | (700,694 | ) |
Zhongsheng Group Holdings Ltd. | | | | | (591,500 | ) | | | (884,889 | ) |
Zhuzhou CSR Times Electric Co. Ltd. | | | | | (15,000 | ) | | | (48,066 | ) |
| | | | | | | | | (13,966,461 | ) |
Hong Kong | | | | | | | | | | |
Beijing Enterprises Holdings Ltd. | | | | | (17,500 | ) | | | (126,175 | ) |
China Agri-Industries Holdings Ltd. | | | | | (377,100 | ) | | | (230,407 | ) |
China Everbright International Ltd. | | | | | (625,000 | ) | | | (344,497 | ) |
China Mengniu Dairy Co. Ltd. | | | | | (86,000 | ) | | | (251,596 | ) |
See Notes to Financial Statements.
| 24 | BLACKROCK FUNDS | JANUARY 31, 2013
|
| |
| Schedule of Investments (continued) | BlackRock Emerging Markets Long/Short Equity Fund
|
| | | | Shares | | Value |
Reference Entity — Short |
Hong Kong (concluded) | | | | | | �� | | | | |
China Merchants Holdings International Co. Ltd. | | | | | (66,000 | ) | | $ | (233,931 | ) |
China Overseas Land & Investment Ltd. | | | | | (36,000 | ) | | | (111,654 | ) |
China Resources Cement Holdings Ltd. | | | | | (1,638,000 | ) | | | (1,049,259 | ) |
China Resources Land Ltd. | | | | | (152,000 | ) | | | (462,894 | ) |
China State Construction International Holdings Ltd. | | | | | (1,778,000 | ) | | | (2,334,213 | ) |
Chow Tai Fook Jewellery Group Ltd. | | | | | (213,200 | ) | | | (339,656 | ) |
Dah Chong Hong Holdings Ltd. | | | | | (52,000 | ) | | | (60,113 | ) |
Franshion Properties China Ltd. | | | | | (378,000 | ) | | | (138,992 | ) |
Kingboard Chemical Holdings Ltd. | | | | | (9,000 | ) | | | (29,701 | ) |
Shanghai Industrial Holdings Ltd. | | | | | (122,000 | ) | | | (433,319 | ) |
Yingde Gases | | | | | (70,500 | ) | | | (79,087 | ) |
Yuexiu Property Co. Ltd. | | | | | (656,000 | ) | | | (234,426 | ) |
| | | | | | | | | (6,459,920 | ) |
Hungary | | | | | | | | | | |
Richter Gedeon Nyrt | | | | | (10,175 | ) | | | (1,752,291 | ) |
India | | | | | | | | | | |
Larsen & Toubro Ltd. — GDR | | | | | (1,993 | ) | | | (58,007 | ) |
Indonesia | | | | | | | | | | |
Astra International Tbk PT | | | | | (290,000 | ) | | | (218,956 | ) |
Israel | | | | | | | | | | |
Avner Oil Exploration LLP | | | | | (566,370 | ) | | | (381,906 | ) |
Bezeq The Israeli Telecommunication Corp. Ltd. | | | | | (863,618 | ) | | | (1,012,086 | ) |
Isramco Negev 2 LP | | | | | (2,217,420 | ) | | | (365,899 | ) |
| | | | | | | | | (1,759,891 | ) |
Malaysia | | | | | | | | | | |
Genting Bhd | | | | | (220,200 | ) | | | (673,140 | ) |
Maxis Bhd | | | | | (1,001,000 | ) | | | (2,052,259 | ) |
Sime Darby Bhd | | | | | (259,400 | ) | | | (776,732 | ) |
UEM Land Holdings Bhd | | | | | (126,400 | ) | | | (89,521 | ) |
| | | | | | | | | (3,591,652 | ) |
Mexico | | | | | | | | | | |
Arca Continental SAB de CV | | | | | (3,100 | ) | | | (23,640 | ) |
Cemex SAB de CV — ADR | | | | | (22,200 | ) | | | (240,870 | ) |
Cemex SAB de CV | | | | | (12,100 | ) | | | (13,200 | ) |
Coca-Cola Femsa SAB de CV — ADR | | | | | (4,343 | ) | | | (686,541 | ) |
El Puerto de Liverpool SAB de CV | | | | | (22,900 | ) | | | (253,790 | ) |
Genomma Lab Internacional SAB de CV, Series B | | | | | (164,900 | ) | | | (376,500 | ) |
Grupo Financiero Banorte SAB de CV | | | | | (16,500 | ) | | | (113,771 | ) |
Grupo Financiero Inbursa SAB de CV | | | | | (23,300 | ) | | | (65,293 | ) |
Grupo Modelo SAB de CV | | | | | (59,400 | ) | | | (505,442 | ) |
Kimberly-Clark de Mexico SAB de CV | | | | | (16,800 | ) | | | (47,026 | ) |
Mexichem SAB de CV | | | | | (559,500 | ) | | | (3,164,806 | ) |
Minera Frisco SAB de CV, Class A1 | | | | | (262,900 | ) | | | (1,128,138 | ) |
| | | | | | | | | (6,619,017 | ) |
Philippines | | | | | | | | | | |
GT Capital Holdings, Inc. | | | | | (19,040 | ) | | | (322,208 | ) |
Philippine Long Distance Telephone Co. — ADR | | | | | (26,069 | ) | | | (1,795,372 | ) |
| | | | | | | | | (2,117,580 | ) |
Poland | | | | | | | | | | |
Powszechna Kasa Oszczednosci Bank Polski SA | | | | | (53,167 | ) | | | (594,403 | ) |
Telekomunikacja Polska SA | | | | | (31,281 | ) | | | (121,463 | ) |
| | | | | | | | | (715,866 | ) |
| | | | | | | | | | | |
| | | | | Shares | | Value |
Reference Entity — Short |
Russia | | | | | | | | | | |
Magnit OJSC — GDR | | | | | (15,235 | ) | | $ | (676,279 | ) |
MMC Norilsk Nickel OJSC — ADR | | | | | (278,950 | ) | | | (5,557,043 | ) |
NovaTek OAO — GDR | | | | | (3,652 | ) | | | (427,381 | ) |
Uralkali OJSC — GDR | | | | | (88,665 | ) | | | (3,373,726 | ) |
| | | | | | | | | (10,034,429 | ) |
South Africa | | | | | | | | | | |
ArcelorMittal South Africa Ltd. | | | | | (22,455 | ) | | | (88,074 | ) |
Aspen Pharmacare Holdings Ltd. | | | | | (168 | ) | | | (3,093 | ) |
Clicks Group Ltd. | | | | | (13,511 | ) | | | (90,555 | ) |
Discovery Holdings Ltd. | | | | | (36,954 | ) | | | (273,305 | ) |
Exxaro Resources Ltd. | | | | | (1,476 | ) | | | (28,986 | ) |
Foschini Group Ltd. | | | | | (3,218 | ) | | | (42,124 | ) |
Northam Platinum Ltd. | | | | | (2,512 | ) | | | (10,291 | ) |
Sasol Ltd. — ADR | | | | | (3,466 | ) | | | (149,835 | ) |
Steinhoff International Holdings Ltd. | | | | | (20,844 | ) | | | (63,255 | ) |
| | | | | | | | | (749,518 | ) |
South Korea | | | | | | | | | | |
Amorepacific Corp. | | | | | (206 | ) | | | (207,095 | ) |
Cheil Worldwide, Inc. | | | | | (28,420 | ) | | | (584,875 | ) |
Com2uSCorp | | | | | (3,808 | ) | | | (127,949 | ) |
Cosmax, Inc. | | | | | (16,880 | ) | | | (646,392 | ) |
Daewoo International Corp. | | | | | (6,480 | ) | | | (221,390 | ) |
Daou Technology, Inc. | | | | | (12,490 | ) | | | (192,312 | ) |
Daum Communications Corp. | | | | | (770 | ) | | | (72,207 | ) |
Dongyang Mechatronics Corp. | | | | | (6,250 | ) | | | (63,162 | ) |
Hanjin Heavy Industries & Construction Co. Ltd. | | | | | (2,240 | ) | | | (20,166 | ) |
Hotel Shilla Co. Ltd. | | | | | (20,227 | ) | | | (852,405 | ) |
Hyundai Development Co. | | | | | (5,850 | ) | | | (125,435 | ) |
Hyundai Mipo Dockyard | | | | | (947 | ) | | | (101,816 | ) |
Infraware, Inc. | | | | | (18,635 | ) | | | (170,596 | ) |
Interflex Co. Ltd. | | | | | (3,880 | ) | | | (137,783 | ) |
KCC Corp. | | | | | (962 | ) | | | (257,049 | ) |
Kolon Industries, Inc. | | | | | (18,678 | ) | | | (1,057,118 | ) |
Korea Aerospace Industries Ltd. | | | | | (41,710 | ) | | | (967,076 | ) |
Korea Electric Power Corp. — ADR | | | | | (23,247 | ) | | | (348,937 | ) |
Korea Gas Corp. | | | | | (6,330 | ) | | | (387,714 | ) |
LG Fashion Corp. | | | | | (21,860 | ) | | | (570,121 | ) |
Lock & Lock Co. Ltd. | | | | | (46,530 | ) | | | (1,154,549 | ) |
Mando Corp. | | | | | (267 | ) | | | (29,670 | ) |
Melfas, Inc. | | | | | (7,145 | ) | | | (123,406 | ) |
NCSoft Corp. | | | | | (547 | ) | | | (69,312 | ) |
Neowiz Games Corp. | | | | | (2,691 | ) | | | (50,119 | ) |
Nexen Tire Corp. | | | | | (13,370 | ) | | | (155,288 | ) |
Pharmicell Co. Ltd. | | | | | (36,810 | ) | | | (164,790 | ) |
S-MAC Co. Ltd. | | | | | (8,901 | ) | | | (119,024 | ) |
Seohee Construction Co. Ltd. | | | | | (51,770 | ) | | | (44,357 | ) |
Seoul Semiconductor Co. Ltd. | | | | | (3,764 | ) | | | (93,536 | ) |
SK Chemicals Co. Ltd. | | | | | (18,598 | ) | | | (1,021,817 | ) |
STS Semiconductor & Telecommunications | | | | | (28,416 | ) | | | (146,465 | ) |
WeMade Entertainment Co. Ltd. | | | | | (2,183 | ) | | | (73,844 | ) |
Wonik IPS Co. Ltd. | | | | | (2,602 | ) | | | (11,326 | ) |
Yuhan Corp. | | | | | (1,460 | ) | | | (246,032 | ) |
| | | | | | | | | (10,615,133 | ) |
Taiwan | | | | | | | | | | |
Advanced Semiconductor Engineering, Inc. — ADR | | | | | (179,502 | ) | | | (716,214 | ) |
Asia Cement Corp. | | | | | (1,708,000 | ) | | | (2,174,152 | ) |
AU Optronics Corp. | | | | | (660,000 | ) | | | (268,476 | ) |
See Notes to Financial Statements.
| BLACKROCK FUNDS | JANUARY 31, 2013 | 25
|
| |
| Schedule of Investments (continued) | BlackRock Emerging Markets Long/Short Equity Fund
|
| | | | Shares | | Value |
Reference Entity — Short |
Taiwan (continued) | | | | | | | | | | |
AU Optronics Corp. — ADR | | | | | (67,955 | ) | | $ | (270,461 | ) |
Catcher Technology Co. Ltd. | | | | | (247,000 | ) | | | (1,105,282 | ) |
China Life Insurance Co. Ltd. | | | | | (247,000 | ) | | | (244,413 | ) |
China Petrochemical Development Corp. | | | | | (51,700 | ) | | | (31,821 | ) |
Chunghwa Telecom Co. Ltd. — ADR | | | | | (34,695 | ) | | | (1,109,199 | ) |
Clevo Co. | | | | | (126,174 | ) | | | (175,561 | ) |
Coretronic Corp. | | | | | (50,000 | ) | | | (38,750 | ) |
Epistar Corp. | | | | | (579,000 | ) | | | (1,101,306 | ) |
Everlight Electronics Co. Ltd. | | | | | (130,000 | ) | | | (182,443 | ) |
Formosa Chemicals & Fibre Corp. | | | | | (608,000 | ) | | | (1,652,403 | ) |
Formosa International Hotels Corp. | | | | | (44,900 | ) | | | (549,382 | ) |
G Tech Optoelectronics Corp. | | | | | (720,000 | ) | | | (1,680,441 | ) |
Genesis Photonics, Inc. | | | | | (913,000 | ) | | | (715,108 | ) |
Getac Technology Corp. | | | | | (314,000 | ) | | | (162,335 | ) |
Gintech Energy Corp. | | | | | (81,000 | ) | | | (79,368 | ) |
Green Energy Technology, Inc. | | | | | (182,000 | ) | | | (159,369 | ) |
Hon Hai Precision Industry Co. Ltd. — GDR | | | | | (36,668 | ) | | | (210,108 | ) |
Hotai Motor Co. Ltd. | | | | | (82,000 | ) | | | (654,462 | ) |
ILI Technology Corp. | | | | | (54,834 | ) | | | (178,605 | ) |
Kinsus Interconnect Technology Corp. | | | | | (89,000 | ) | | | (279,474 | ) |
Macronix International | | | | | (4,438,280 | ) | | | (1,276,596 | ) |
Motech Industries, Inc. | | | | | (158,000 | ) | | | (177,479 | ) |
MStar Semiconductor, Inc. | | | | | (25,000 | ) | | | (190,227 | ) |
Nan Kang Rubber Tire Co. Ltd. | | | | | (1,269,936 | ) | | | (1,489,101 | ) |
Nan Ya Plastics Corp. | | | | | (1,438,000 | ) | | | (2,925,461 | ) |
Powertech Technology, Inc. | | | | | (20,000 | ) | | | (30,119 | ) |
Ruentex Development Co. Ltd. | | | | | (106,000 | ) | | | (233,602 | ) |
Ruentex Industries Ltd. | | | | | (99,000 | ) | | | (251,799 | ) |
Shin Zu Shing Co. Ltd. | | | | | (15,000 | ) | | | (45,658 | ) |
Sino-American Silicon Products, Inc. | | | | | (305,000 | ) | | | (410,347 | ) |
Solartech Energy Corp. | | | | | (408,000 | ) | | | (289,128 | ) |
Synnex Technology International Corp. | | | | | (1,264,000 | ) | | | (2,565,970 | ) |
Taiwan Glass Industry Corp. | | | | | (163,000 | ) | | | (159,827 | ) |
TSRC Corp. | | | | | (369,600 | ) | | | (750,447 | ) |
United Microelectronics Corp. — ADR | | | | | (299,430 | ) | | | (586,883 | ) |
Visual Photonics Epitaxy Co. Ltd. | | | | | (49,000 | ) | | | (57,314 | ) |
| | | | | | | | | | | |
| | | | | Shares | | Value |
Reference Entity — Short |
Taiwan (concluded) | | | | | | | | | | |
Wistron Corp. | | | | | (603,000 | ) | | $ | (698,764 | ) |
Yulon Motor Co. Ltd. | | | | | (1,811,000 | ) | | | (3,361,335 | ) |
| | | | | | | | | (29,239,190 | ) |
Thailand | | | | | | | | | | |
Banpu PCL | | | | | (15,100 | ) | | | (196,472 | ) |
Charoen Pokphand Foods PCL | | | | | (2,438,700 | ) | | | (2,903,214 | ) |
Indorama Ventures PCL | | | | | (751,400 | ) | | | (661,444 | ) |
IRPC PCL | | | | | (259,700 | ) | | | (38,319 | ) |
Krung Thai Bank PCL | | | | | (138,625 | ) | | | (106,456 | ) |
PTT Exploration & Production PCL | | | | | (90,300 | ) | | | (502,676 | ) |
PTT PCL | | | | | (37,100 | ) | | | (424,249 | ) |
Sansiri PCL | | | | | (1,559,100 | ) | | | (216,454 | ) |
Siam Cement PCL | | | | | (21,900 | ) | | | (339,815 | ) |
Thai Union Frozen Products PCL | | | | | (1,341,100 | ) | | | (3,080,662 | ) |
| | | | | | | | | (8,469,761 | ) |
Turkey | | | | | | | | | | |
Arcelik | | | | | (91,067 | ) | | | (595,463 | ) |
Asya Katilim Bankasi AS | | | | | (118,718 | ) | | | (150,569 | ) |
Dogan Sirketler Grubu Holding | | | | | (184,186 | ) | | | (113,154 | ) |
Dogan Yayin Holding | | | | | (124,837 | ) | | | (62,539 | ) |
KOC Holding AS | | | | | (8,641 | ) | | | (45,089 | ) |
Turkcell Iletisim Hizmetleri AS — ADR | | | | | (40,961 | ) | | | (640,630 | ) |
| | | | | | | | | (1,607,444 | ) |
United Kingdom | | | | | | | | | | |
Anglo American Plc | | | | | (13,609 | ) | | | (408,533 | ) |
United States | | | | | | | | | | |
AES Corp. | | | | | (72,001 | ) | | | (780,491 | ) |
NII Holdings, Inc. | | | | | (25,623 | ) | | | (179,361 | ) |
| | | | | | | | | (959,852 | ) |
Total Reference Entity — Short | | | | | | | | | (121,747,658 | ) |
Net Value of Reference Entity — UBS AG | | | | | | | | $ | 43,254,341 | |
| • | | | | Fair Value Measurements — Various inputs are used in determining the fair value of investments and derivative financial instruments. These inputs to valuation techniques are categorized into a disclosure hierarchy consisting of three broad levels for financial statement purposes as follows: |
| • | | | | Level 1 — unadjusted price quotations in active markets/exchanges for identical assets and liabilities that the Fund has the ability to access |
| • | | | | Level 2 — other observable inputs (including, but not limited to, quoted prices for similar assets or liabilities in markets that are active, quoted prices for identical or similar assets or liabilities in markets that are not active, inputs other than quoted prices that are observable for the assets or liabilities (such as interest rates, yield curves, volatilities, prepayment speeds, loss severities, credit risks and default rates) or other market-corroborated inputs) |
| • | | | | Level 3 — unobservable inputs based on the best information available in the circumstances, to the extent observable inputs are not available (including the Fund’s own assumptions used in determining the fair value of investments and derivative financial instruments) |
| | | | | The hierarchy gives the highest priority to unadjusted quoted prices in active markets for identical assets or liabilities (Level 1 measurements) and the lowest priority to unobservable inputs (Level 3 measurements). Accordingly, the degree of judgment exercised in determining fair value is greatest for instruments categorized in Level 3. The inputs used to measure fair value may fall into different levels of the fair value hierarchy. In such cases, for disclosure purposes, the level in the fair value hierarchy within which the fair value measurement falls in its entirety is determined based on the lowest level input that is significant to the fair value measurement in its entirety. |
| | | | | Changes in valuation techniques may result in transfers into or out of an assigned level within the disclosure hierarchy. In accordance with the Fund’s policy, transfers between different levels of the fair value disclosure hierarchy are deemed to have occurred as of the beginning of the reporting period. The categorization of a value determined for investments and derivative financial instruments is based on the pricing transparency of the investment and derivative financial instrument and is not necessarily an indication of the risks associated with investing in those securities. For information about the Fund’s policy regarding valuation of investments and derivative financial instruments and other significant accounting policies, please refer to Note 1 of the Notes to Financial Statements. |
See Notes to Financial Statements.
| 26 | BLACKROCK FUNDS | JANUARY 31, 2013
|
| |
| Schedule of Investments (concluded) | BlackRock Emerging Markets Long/Short Equity Fund
|
| | | | | The following tables summarize the Fund’s investments and derivative financial instruments categorized in the disclosure hierarchy as of January 31, 2013: |
|
|
|
| Level 1
|
| Level 2
|
| Level 3
|
| Total
|
Assets:
| | | | | | | | | | | | | | | | | | |
Investments:
| | | | | | | | | | | | | | | | | | |
Short-Term Securities | | | | $ | 523,031,393 | | | | — | | | | — | | | $ | 523,031,393 | |
|
|
|
| Level 1
|
| Level 2
|
| Level 3
|
| Total
|
Derivative Financial Instruments1
| | | | | | | | | | | | | | | | | | |
Assets:
| | | | | | | | | | | | | | | | | | |
Equity contracts | | | | | — | | | $ | 17,233,246 | | | | — | | | $ | 17,233,246 | |
| 1 | Derivative financial instruments are swaps, which are valued at the unrealized appreciation/depreciation on the instrument. |
| | | | | Certain of the Fund’s assets are held at carrying amount, which approximates fair value for financial statement purposes. As of January 31, 2013, cash received as collateral for swaps of $32,524,288 is categorized as Level 2 within the disclosure hierarchy. |
| | | | | |
| | | | | There were no transfers between levels during the six months ended January 31, 2013. |
See Notes to Financial Statements.
| BLACKROCK FUNDS | JANUARY 31, 2013 | 27
|
| |
| Schedule of Investments January 31, 2013 (Unaudited) | BlackRock Global Long/Short Equity Fund
(Percentages shown are based on Net Assets)
|
Short-Term Securities
|
|
|
| Shares
|
| Value
|
BlackRock Liquidity Funds, TempFund, Institutional Class, 0.10% (a)(b) | | | | | 25,351,620 | | | $ | 25,351,620 | |
Total Short-Term Securities
(Cost — $25,351,620*) — 98.8% | | | | | | | | | 25,351,620 | |
Other Assets Less Liabilities — 1.2% | | | | | | | | | 298,798 | |
Net Assets — 100.0% | | | | | | | | $ | 25,650,418 | |
Notes to Schedule of Investments
| * | | | | Cost for federal income tax purposes. |
| (a) | | | | Investments in issuers considered to be an affiliate of the Fund during the period ended January 31, 2013, for purposes of Section 2(a)(3) of the Investment Company Act of 1940, as amended, were as follows: |
Affiliate
|
|
|
| Net
Activity
|
| Shares Held at
January 31, 2013
|
| Income
|
BlackRock Liquidity Funds, TempFund, Institutional Class | | | | | 25,351,620 | | | | 25,351,620 | | | $ | 3,389 | |
| (b) | | | | Represents the current yield as of report date. |
| • | | | | Total return swaps outstanding as of January 31, 2013 were as follows:1 |
Reference Entity
|
|
|
| Counterparty
|
| Expiration
Date
|
| Notional
Amount
|
| Unrealized
Appreciation
(Depreciation)
|
| Net Value of
Reference
Entities
|
Basket of Equity Securities Long/Short: | | | | Bank of America Merrill Lynch | | Open2 | | $ | 1,165,828 | | | $ | 199,276 | 3 | | $ | 1,359,231 | |
| | | | Deutsche Bank AG | | Open2 | | $ | 167,294 | | | | 250,973 | 4 | | | 416,763 | |
| | | | Goldman Sachs Group, Inc. | | Open2 | | $ | 1,308,325 | | | | 40,173 | 5 | | | 1,349,860 | |
| | | | UBS AG | | Open2 | | $ | 767,533 | | | | (240,788 | )6 | | | 530,568 | |
| | | | | | | | | | | | | | | | | | |
Total | | | | | | | | | | | | $ | 249,634 | | | $ | 3,656,422 | |
| | | | | | | | | | | | | | | | | | |
| 1 | | The Fund receives or pays the total return on a portfolio of long and short positions underlying the custom basket and pays or receives a specific LIBOR or Federal Funds floating rate, which is denominated in various foreign currencies based on the currencies of the securities underlying the custom basket. |
| 2 | | Certain swaps have no stated expiration and can be terminated by either party at any time. |
| 3 | | Amount includes $(5,873) of dividends and financing income payable from the Fund to the counterparty. |
| 4 | | Amount includes $(1,504) of dividends and financing income payable from the Fund to the counterparty. |
| 5 | | Amount includes $1,362 of dividends and financing income payable from the counterparty to the Fund. |
| 6 | | Amount includes $3,823 of dividends and financing income payable from the counterparty to the Fund. |
| • | | | | Foreign currency exchange contracts as of January 31, 2013 were as follows: |
Currency Purchased
| Currency Sold
|
| Counterparty
|
|
| Settlement
Date
|
|
| Unrealized
Appreciation
(Depreciation)
|
|
GBP | | | | 4,611 | | | USD | 7,313 | | Deutsche Bank AG | | 2/01/13 | | | — | |
USD | | | | 15,123 | | | AUD | 14,500 | | Deutsche Bank AG | | 2/01/13 | | $ | 2 | |
USD | | | | 4,795 | | | DKK | 26,348 | | Deutsche Bank AG | | 2/01/13 | | | (1 | ) |
USD | | | | 66,174 | | | EUR | 48,730 | | Deutsche Bank AG | | 2/01/13 | | | 9 | |
USD | | | | 1,986 | | | NOK | 10,846 | | Deutsche Bank AG | | 2/01/13 | | | — | |
Total | | | | | | | | | | | | | | $ | 10 | |
| | | | | | | | | | | | | | | | |
See Notes to Financial Statements.
| 28 | BLACKROCK FUNDS | JANUARY 31, 2013
|
| |
| Schedule of Investments (continued) | BlackRock Global Long/Short Equity Fund
|
The following table represents the individual long and short positions and related values of the basket of equity securities underlying the total return swap with Bank of America Merrill Lynch as of January 31, 2013:
| | | | | Shares | | Value |
Reference Entity — Long
|
Australia | | | | | | | | | | |
Tronox Ltd., Class A | | | | | 2,165 | | | $ | 41,027 | |
Canada | | | | | | | | | | |
IMAX Corp. | | | | | 1,742 | | | | 41,163 | |
Israel | | | | | | | | | | |
Stratasys Ltd. | | | | | 308 | | | | 24,172 | |
Netherlands | | | | | | | | | | |
LyondellBasell Industries NV, Class A | | | | | 2,028 | | | | 128,616 | |
Singapore | | | | | | | | | | |
Avago Technologies Ltd. | | | | | 12,280 | | | | 439,255 | |
United States | | | | | | | | | | |
The ADT Corp. | | | | | 5,206 | | | | 247,285 | |
Advance Auto Parts, Inc. | | | | | 343 | | | | 25,217 | |
Air Lease Corp | | | | | 663 | | | | 15,826 | |
Alere, Inc. | | | | | 7,382 | | | | 156,941 | |
Allison Transmission Holdings, Inc. | | | | | 422 | | | | 9,402 | |
Alon USA Energy, Inc. | | | | | 5,225 | | | | 102,514 | |
American Eagle Outfitters, Inc. | | | | | 1,019 | | | | 20,594 | |
American International Group, Inc. | | | | | 146 | | | | 5,523 | |
Apple, Inc. | | | | | 691 | | | | 314,619 | |
Assured Guaranty Ltd. | | | | | 9,584 | | | | 173,758 | |
CIT Group, Inc. | | | | | 91 | | | | 3,854 | |
Coach, Inc. | | | | | 4,861 | | | | 247,911 | |
Commercial Metals Co. | | | | | 547 | | | | 9,107 | |
Computer Sciences Corp. | | | | | 143 | | | | 5,977 | |
CoreLogic, Inc. | | | | | 119 | | | | 3,123 | |
Corning, Inc. | | | | | 4,355 | | | | 52,260 | |
CVR Energy, Inc. | | | | | 2,817 | | | | 165,499 | |
Cytec Industries, Inc. | | | | | 331 | | | | 24,262 | |
Delek US Holdings, Inc. | | | | | 4,283 | | | | 145,493 | |
Discovery Communications, Inc., Class C | | | | | 291 | | | | 18,540 | |
Expedia, Inc. | | | | | 2,323 | | | | 151,576 | |
Express Scripts Holding Co. | | | | | 3,414 | | | | 182,376 | |
First Republic Bank | | | | | 70 | | | | 2,498 | |
First Solar, Inc. | | | | | 2,242 | | | | 63,180 | |
Fortinet, Inc. | | | | | 11,105 | | | | 261,967 | |
Fortune Brands Home & Security, Inc. | | | | | 267 | | | | 8,742 | |
Geospace Technologies Corp. | | | | | 1,712 | | | | 154,354 | |
Groupon, Inc. | | | | | 14,113 | | | | 77,621 | |
Health Net, Inc. | | | | | 251 | | | | 6,827 | |
HollyFrontier Corp. | | | | | 5,111 | | | | 266,896 | |
IAC/InterActiveCorp. | | | | | 856 | | | | 35,310 | |
Jabil Circuit, Inc. | | | | | 55 | | | | 1,040 | |
Kronos Worldwide, Inc. | | | | | 839 | | | | 16,268 | |
Lender Processing Services, Inc. | | | | | 1,190 | | | | 28,608 | |
Lorillard, Inc. | | | | | 1,976 | | | | 77,202 | |
Marathon Petroleum Corp. | | | | | 3,395 | | | | 251,943 | |
Matson, Inc. | | | | | 1,540 | | | | 42,211 | |
Mead Johnson Nutrition Co. | | | | | 717 | | | | 54,492 | |
Michael Kors Holdings Ltd. | | | | | 4,500 | | | | 252,585 | |
Monster Beverage Corp. | | | | | 2,984 | | | | 142,934 | |
Myriad Genetics, Inc. | | | | | 3,096 | | | | 83,778 | |
Penn National Gaming, Inc. | | | | | 147 | | | | 7,153 | |
Post Holdings, Inc. | | | | | 40 | | | | 1,520 | |
priceline.com, Inc. | | | | | 679 | | | | 465,434 | |
| | | | | | | | | | | |
| | | | | Shares | | Value |
Reference Entity — Long
|
United States (concluded) | | | | | | | | | | |
R.R. Donnelley & Sons Co. | | | | | 24,474 | | | $ | 225,161 | |
Realogy Holdings Corp. | | | | | 3,097 | | | | 138,653 | |
Riverbed Technology, Inc. | | | | | 6,993 | | | | 135,664 | |
Ross Stores, Inc. | | | | | 237 | | | | 14,149 | |
Rovi Corp. | | | | | 341 | | | | 5,896 | |
Service Corp. International | | | | | 1,673 | | | | 24,978 | |
Skyworks Solutions, Inc. | | | | | 1,904 | | | | 45,582 | |
SolarWinds, Inc. | | | | | 1,145 | | | | 62,311 | |
Spirit AeroSystems Holdings, Inc., Class A | | | | | 1,205 | | | | 19,208 | |
Telephone & Data Systems, Inc. | | | | | 4,876 | | | | 123,314 | |
Tesoro Corp. | | | | | 11,622 | | | | 565,875 | |
TripAdvisor, Inc. | | | | | 1,342 | | | | 62,108 | |
US Airways Group, Inc. | | | | | 105 | | | | 1,499 | |
VeriSign, Inc. | | | | | 12,382 | | | | 537,503 | |
WABCO Holdings, Inc. | | | | | 166 | | | | 10,402 | |
The Warnaco Group, Inc. | | | | | 2,153 | | | | 157,621 | |
Western Refining, Inc. | | | | | 4,828 | | | | 162,366 | |
Westlake Chemical Corp. | | | | | 1,320 | | | | 121,255 | |
| | | | | | | | | 6,797,765 | |
Total Reference Entity — Long | | | | | | | | | 7,471,998 | |
|
Reference Entity — Short |
Canada | | | | | | | | | | |
Kodiak Oil & Gas Corp. | | | | | (1,161 | ) | | | (10,681 | ) |
United States | | | | | | | | | | |
Acme Packet, Inc. | | | | | (1,092 | ) | | | (26,394 | ) |
Acuity Brands, Inc. | | | | | (3,221 | ) | | | (221,605 | ) |
Aeropostale, Inc. | | | | | (11,070 | ) | | | (149,777 | ) |
Alpha Natural Resources, Inc. | | | | | (18,919 | ) | | | (167,622 | ) |
Arch Coal, Inc. | | | | | (14,353 | ) | | | (102,193 | ) |
Ariad Pharmaceuticals, Inc. | | | | | (880 | ) | | | (17,494 | ) |
Avon Products, Inc. | | | | | (12,451 | ) | | | (211,418 | ) |
Big Lots, Inc. | | | | | (2,015 | ) | | | (64,782 | ) |
Bill Barrett Corp. | | | | | (259 | ) | | | (4,136 | ) |
Cabela’s, Inc. | | | | | (3,999 | ) | | | (206,428 | ) |
Carrizo Oil & Gas, Inc. | | | | | (157 | ) | | | (3,372 | ) |
Chesapeake Energy Corp. | | | | | (1,041 | ) | | | (21,007 | ) |
Chipotle Mexican Grill, Inc. | | | | | (95 | ) | | | (29,166 | ) |
Cliffs Natural Resources, Inc. | | | | | (4,432 | ) | | | (165,358 | ) |
Compuware Corp. | | | | | (8,982 | ) | | | (104,371 | ) |
Diamond Offshore Drilling, Inc. | | | | | (59 | ) | | | (4,430 | ) |
Dolby Laboratories, Inc., Class A | | | | | (1,215 | ) | | | (39,257 | ) |
DreamWorks Animation SKG, Inc., Class A | | | | | (304 | ) | | | (5,293 | ) |
Electronic Arts, Inc. | | | | | (25,188 | ) | | | (396,207 | ) |
Forest City Enterprises, Inc., Class A | | | | | (1,258 | ) | | | (21,273 | ) |
The Goodyear Tire & Rubber Co. | | | | | (2,883 | ) | | | (39,670 | ) |
Guess?, Inc. | | | | | (4,495 | ) | | | (121,770 | ) |
Guidewire Software, Inc. | | | | | (2,575 | ) | | | (85,284 | ) |
Gulfport Energy Corp. | | | | | (191 | ) | | | (7,883 | ) |
Halcon Resources Corp. | | | | | (13,551 | ) | | | (103,530 | ) |
Hanesbrands, Inc. | | | | | (407 | ) | | | (15,254 | ) |
Health Management Associates, Inc. | | | | | (14,313 | ) | | | (149,428 | ) |
Herman Miller, Inc. | | | | | (305 | ) | | | (7,534 | ) |
HMS Holdings Corp. | | | | | (8,848 | ) | | | (241,196 | ) |
Hornbeck Offshore Services, Inc. | | | | | (1,475 | ) | | | (54,295 | ) |
Incyte Corp. Ltd. | | | | | (1,310 | ) | | | (24,078 | ) |
Integrated Device Technology, Inc. | | | | | (15,848 | ) | | | (114,581 | ) |
See Notes to Financial Statements.
| BLACKROCK FUNDS | JANUARY 31, 2013 | 29
|
| |
| Schedule of Investments (continued) | BlackRock Global Long/Short Equity Fund
|
| | | | | Shares | | Value |
Reference Entity — Short |
United States (concluded) | | | | | | | | | | |
International Rectifier Corp. | | | | | (16,115 | ) | | $ | (314,081 | ) |
Intrepid Potash, Inc. | | | | | (7,488 | ) | | | (174,470 | ) |
Itron, Inc. | | | | | (69 | ) | | | (3,201 | ) |
KB Home | | | | | (3,245 | ) | | | (61,882 | ) |
Laredo Petroleum Holdings, Inc. | | | | | (453 | ) | | | (8,358 | ) |
Level 3 Communications, Inc. | | | | | (17,465 | ) | | | (416,016 | ) |
Life Time Fitness, Inc. | | | | | (2,452 | ) | | | (124,390 | ) |
Micron Technology, Inc. | | | | | (10,356 | ) | | | (78,291 | ) |
Navistar International Corp. | | | | | (1,883 | ) | | | (49,127 | ) |
Northern Oil and Gas, Inc. | | | | | (3,611 | ) | | | (59,726 | ) |
Office Depot, Inc. | | | | | (32,730 | ) | | | (141,721 | ) |
ON Semiconductor Corp. | | | | | (17,016 | ) | | | (133,576 | ) |
PDC Energy, Inc. | | | | | (459 | ) | | | (16,997 | ) |
Questar Corp. | | | | | (1,174 | ) | | | (27,272 | ) |
Rex Energy Corp. | | | | | (2,208 | ) | | | (28,991 | ) |
Salesforce.com, Inc. | | | | | (725 | ) | | | (124,794 | ) |
SEACOR Holdings, Inc. | | | | | (350 | ) | | | (31,840 | ) |
Signet Jewelers Ltd. | | | | | (4,319 | ) | | | (270,283 | ) |
Sotheby’s | | | | | (3,817 | ) | | | (137,107 | ) |
StanCorp Financial Group, Inc. | | | | | (849 | ) | | | (33,018 | ) |
Stillwater Mining Co. | | | | | (414 | ) | | | (5,572 | ) |
Superior Energy Services, Inc. | | | | | (6,387 | ) | | | (159,483 | ) |
Susser Holdings Corp. | | | | | (496 | ) | | | (20,763 | ) |
TCF Financial Corp. | | | | | (2,724 | ) | | | (37,210 | ) |
Tenet Healthcare Corp. | | | | | (7,872 | ) | | | (305,670 | ) |
Tiffany & Co. | | | | | (2,309 | ) | | | (151,817 | ) |
Ulta Salon Cosmetics & Fragrance, Inc. | | | | | (1,037 | ) | | | (101,439 | ) |
Universal Corp. | | | | | (242 | ) | | | (13,160 | ) |
ValueClick, Inc. | | | | | (2,079 | ) | | | (42,557 | ) |
VeriFone Systems, Inc. | | | | | (2,972 | ) | | | (103,188 | ) |
| | | | | | | | | (6,102,086 | ) |
Total Reference Entity — Short | | | | | | | | | (6,112,767 | ) |
Net Value of Reference Entity — Bank of America Merrill Lynch | $ | 1,359,231 | |
The following table represents the individual long and short positions and related values of the basket of equity securities underlying the total return swap with Deutsche Bank AG as of January 31, 2013:
Reference Entity — Long |
Australia | | | | | | | | | | |
Beadell Resources Ltd. | | | | | 170,299 | | | | 175,830 | |
BlueScope Steel Ltd. | | | | | 37,637 | | | | 133,040 | |
Goodman Fielder Ltd. | | | | | 59,179 | | | | 41,123 | |
JB Hi-Fi Ltd. | | | | | 21,021 | | | | 217,395 | |
Medusa Mining Ltd. | | | | | 19,737 | | | | 102,158 | |
Seven West Media Ltd. | | | | | 18,467 | | | | 40,483 | |
| | | | | | | | | 710,029 | |
Canada | | | | | | | | | | |
B2Gold Corp. | | | | | 1,242 | | | | 4,781 | |
Constellation Software, Inc. | | | | | 50 | | | | 6,266 | |
Dollarama, Inc. | | | | | 125 | | | | 7,605 | |
Dundee Precious Metals, Inc. | | | | | 742 | | | | 6,606 | |
Gildan Activewear, Inc. | | | | | 747 | | | | 27,494 | |
Industrial Alliance Insurance & Financial Services, Inc. | | | | | 106 | | | | 3,704 | |
Inmet Mining Corp. | | | | | 882 | | | | 63,669 | |
MacDonald Dettwiler & Associates Ltd. | | | | | 53 | | | | 3,333 | |
| | | | | | | | | | | |
| | | | | Shares | | Value |
Reference Entity — Long |
Canada (concluded) | | | | | | | | | | |
West Fraser Timber Co. Ltd. | | | | | 154 | | | $ | 12,363 | |
Westjet Airlines Ltd. | | | | | 1,725 | | | | 36,942 | |
Whitecap Resources, Inc. | | | | | 3,673 | | | | 35,242 | �� |
| | | | | | | | | 208,005 | |
China | | | | | | | | | | |
China Shanshui Cement Group Ltd. | | | | | 4,000 | | | | 2,939 | |
China Southern Airlines Co. Ltd., Class H | | | | | 16,000 | | | | 9,620 | |
Shimao Property Holdings Ltd. | | | | | 16,500 | | | | 36,486 | |
| | | | | | | | | 49,045 | |
France | | | | | | | | | | |
Altran Technologies SA | | | | | 1,375 | | | | 10,403 | |
Teleperformance | | | | | 1,565 | | | | 62,359 | |
| | | | | | | | | 72,762 | |
Germany | | | | | | | | | | |
Aareal Bank AG | | | | | 11,758 | | | | 280,105 | |
Aixtron SE NA | | | | | 1,946 | | | | 26,608 | |
Deutsche Bank AG, Registered Shares | | | | | 3,555 | | | | 183,862 | |
Deutsche Lufthansa AG, Registered Shares | | | | | 2,068 | | | | 41,078 | |
Duerr AG | | | | | 17 | | | | 1,663 | |
Gildemeister AG | | | | | 334 | | | | 8,228 | |
SMA Solar Technology AG | | | | | 178 | | | | 4,586 | |
TUI AG | | | | | 4,011 | | | | 43,525 | |
| | | | | | | | | 589,655 | |
Italy | | | | | | | | | | |
Fiat SpA | | | | | 91,553 | | | | 560,387 | |
Impregilo SpA | | | | | 25,360 | | | | 131,540 | |
UniCredit SpA | | | | | 3,447 | | | | 22,251 | |
| | | | | | | | | 714,178 | |
Japan | | | | | | | | | | |
Daikyo, Inc. | | | | | 59,000 | | | | 157,987 | |
Dena Co. Ltd. | | | | | 2,300 | | | | 72,739 | |
FUJIFILM Holdings Corp. | | | | | 19,800 | | | | 394,804 | |
Gree, Inc. | | | | | 9,700 | | | | 144,229 | |
HIS Co. Ltd. | | | | | 2,000 | | | | 68,249 | |
Hitachi High-Technologies Corp. | | | | | 3,900 | | | | 77,453 | |
Kyowa Exeo Corp. | | | | | 6,700 | | | | 68,133 | |
Leopalace21 Corp. | | | | | 200 | | | | 771 | |
Minebea Co. Ltd. | | | | | 3,000 | | | | 10,156 | |
NET One Systems Co. Ltd. | | | | | 2,300 | | | | 22,084 | |
Nippon Paper Group, Inc. | | | | | 2,000 | | | | 28,341 | |
Nomura Real Estate Holdings, Inc. | | | | | 2,200 | | | | 40,146 | |
Ship Healthcare Holdings, Inc. | | | | | 3,800 | | | | 108,718 | |
UNY Group Holdings Co. Ltd | | | | | 5,000 | | | | 37,066 | |
Yamada Denki Co. Ltd. | | | | | 8,170 | | | | 314,633 | |
| | | | | | | | | 1,545,509 | |
Netherlands | | | | | | | | | | |
CSM | | | | | 5,791 | | | | 134,063 | |
Norway | | | | | | | | | | |
Kvaerner ASA | | | | | 2,662 | | | | 7,695 | |
Storebrand ASA | | | | | 15,259 | | | | 78,116 | |
| | | | | | | | | 85,811 | |
See Notes to Financial Statements.
| 30 | BLACKROCK FUNDS | JANUARY 31, 2013
|
| |
| Schedule of Investments (continued) | BlackRock Global Long/Short Equity Fund
|
| | | | Shares | | Value |
Reference Entity — Long |
Spain | | | | | | | | | | |
Amadeus IT Holding SA, Class A Shares | | | | | 15,487 | | | $ | 388,088 | |
Banco Popular Espanol SA | | | | | 109,222 | | | | 98,770 | |
Inditex SA | | | | | 449 | | | | 62,756 | |
| | | | | | | | | 549,614 | |
Switzerland | | | | | | | | | | |
BKW AG | | | | | 444 | | | | 15,415 | |
United Kingdom | | | | | | | | | | |
Afren Plc | | | | | 4,021 | | | | 9,159 | |
Ashtead Group Plc | | | | | 1,515 | | | | 10,902 | |
Dialog Semiconductor Plc | | | | | 223 | | | | 3,977 | |
Dixons Retail Plc | | | | | 205,963 | | | | 89,851 | |
Home Retail Group Plc | | | | | 1,716 | | | | 3,264 | |
Ophir Energy Plc | | | | | 149 | | | | 1,210 | |
Pace Plc | | | | | 13,502 | | | | 48,332 | |
Rockhopper Exploration Plc | | | | | 3,062 | | | | 7,570 | |
| | | | | | | | | 174,265 | |
United States | | | | | | | | | | |
Coastal Energy Co. | | | | | 600 | | | | 13,211 | |
Gran Tierra Energy, Inc. | | | | | 8,684 | | | | 46,319 | |
| | | | | | | | | 59,530 | |
Total Reference Entity — Long | | | | | | | | | 4,907,881 | |
|
Reference Entity — Short |
Canada | | | | | | | | | | |
BlackPearl Resources, Inc. | | | | | (3,417 | ) | | | (10,620 | ) |
Catamaran Corp. | | | | | (4,019 | ) | | | (208,525 | ) |
Celtic Exploration Ltd. | | | | | (1,587 | ) | | | (42,277 | ) |
CGI Group, Inc., Class A | | | | | (3,917 | ) | | | (105,092 | ) |
Enerplus Corp. | | | | | (4,809 | ) | | | (64,560 | ) |
Niko Resources Ltd. | | | | | (139 | ) | | | (1,451 | ) |
Novagold Resources, Inc. | | | | | (21,532 | ) | | | (95,851 | ) |
Penn West Petroleum Ltd. | | | | | (392 | ) | | | (3,966 | ) |
SNC-Lavalin Group, Inc. | | | | | (3,184 | ) | | | (142,217 | ) |
Tahoe Resources, Inc. | | | | | (9,653 | ) | | | (155,722 | ) |
Veresen, Inc. | | | | | (421 | ) | | | (5,420 | ) |
| | | | | | | | | (835,701 | ) |
China | | | | | | | | | | |
Yanzhou Coal Mining Co. Ltd. | | | | | (228,000 | ) | | | (388,502 | ) |
Denmark | | | | | | | | | | |
FLSmidth & Co. A/S | | | | | (444 | ) | | | (27,510 | ) |
Finland | | | | | | | | | | |
Cargotec OYJ | | | | | (914 | ) | | | (25,746 | ) |
Outokumpu OYJ | | | | | (1,502 | ) | | | (1,555 | ) |
| | | | | | | | | (27,301 | ) |
France | | | | | | | | | | |
Accor SA | | | | | (565 | ) | | | (22,055 | ) |
Vallourec SA | | | | | (386 | ) | | | (20,945 | ) |
Veolia Environnement SA | | | | | (13,316 | ) | | | (170,490 | ) |
| | | | | | | | | (213,490 | ) |
| | | | | | | | | | | |
| | | | | Shares | | Value |
Reference Entity — Short |
Germany | | | | | | | | | | |
ElringKlinger AG | | | | | (2,928 | ) | | $ | (103,530 | ) |
Hochtief AG | | | | | (791 | ) | | | (51,618 | ) |
Kloeckner & Co. SE | | | | | (10,109 | ) | | | (127,918 | ) |
Stada Arzneimittel AG | | | | | (504 | ) | | | (18,574 | ) |
| | | | | | | | | (301,640 | ) |
Japan | | | | | | | | | | |
Acom Co. Ltd. | | | | | (1,220 | ) | | | (31,887 | ) |
Asics Corp. | | | | | (4,600 | ) | | | (65,513 | ) |
Chubu Electric Power Co., Inc. | | | | | (700 | ) | | | (8,842 | ) |
The Chugoku Electric Power Co., Inc. | | | | | (600 | ) | | | (7,895 | ) |
Daikin Industries Ltd. | | | | | (2,500 | ) | | | (95,523 | ) |
Don Quijote Co. Ltd. | | | | | (1,300 | ) | | | (51,759 | ) |
Fujitsu Ltd. | | | | | (4,000 | ) | | | (16,197 | ) |
Hirose Electric Co. Ltd. | | | | | (600 | ) | | | (71,422 | ) |
Hokkaido Electric Power Co., Inc. | | | | | (8,400 | ) | | | (80,497 | ) |
Hokuetsu Kishu Paper Co. Ltd. | | | | | (1,000 | ) | | | (5,106 | ) |
Hulic Co. Ltd. | | | | | (3,600 | ) | | | (22,828 | ) |
J Front Retailing Co. Ltd. | | | | | (4,000 | ) | | | (21,941 | ) |
Japan Tobacco, Inc. | | | | | (5,600 | ) | | | (174,726 | ) |
The Kansai Electric Power Co., Inc. | | | | | (5,000 | ) | | | (47,638 | ) |
Kyushu Electric Power Co., Inc. | | | | | (5,300 | ) | | | (51,013 | ) |
M3, Inc. | | | | | (1 | ) | | | (1,632 | ) |
Mazda Motor Corp. | | | | | (9,000 | ) | | | (24,346 | ) |
Mitsui Chemicals, Inc. | | | | | (4,000 | ) | | | (9,486 | ) |
Mitsui OSK Lines Ltd. | | | | | (13,000 | ) | | | (42,894 | ) |
Mitsumi Electric Co. Ltd. | | | | | (300 | ) | | | (1,602 | ) |
Murata Manufacturing Co. Ltd. | | | | | (600 | ) | | | (36,999 | ) |
NEC Corp. | | | | | (52,000 | ) | | | (126,867 | ) |
Nikon Corp. | | | | | (2,600 | ) | | | (74,342 | ) |
Rohm Co. Ltd. | | | | | (500 | ) | | | (16,623 | ) |
Sysmex Corp. | | | | | (200 | ) | | | (9,542 | ) |
Taiheiyo Cement Corp. | | | | | (23,000 | ) | | | (62,617 | ) |
Tohoku Electric Power Co., Inc. | | | | | (6,400 | ) | | | (52,105 | ) |
Tokyo Electric Power Co., Inc. | | | | | (42,900 | ) | | | (99,926 | ) |
| | | | | | | | | (1,311,768 | ) |
Netherlands | | | | | | | | | | |
European Aeronautic Defence and Space Co. NV | | | | | (4,421 | ) | | | (207,262 | ) |
Portugal | | | | | | | | | | |
Jeronimo Martins SGPS SA | | | | | (1,713 | ) | | | (36,442 | ) |
Sweden | | | | | | | | | | |
Elekta AB, B Shares | | | | | (8,989 | ) | | | (133,274 | ) |
Husqvarna AB, B Shares | | | | | (2,212 | ) | | | (14,301 | ) |
| | | | | | | | | (147,575 | ) |
United Kingdom | | | | | | | | | | |
Electrocomponents Plc | | | | | (26,314 | ) | | | (102,899 | ) |
Eurasian Natural Resources Corp. Plc | | | | | (23,023 | ) | | | (120,354 | ) |
Ferrexpo Plc | | | | | (166 | ) | | | (670 | ) |
Hunting Plc | | | | | (24,496 | ) | | | (329,189 | ) |
International Personal Finance Plc | | | | | (12,667 | ) | | | (81,085 | ) |
Lonmin Plc | | | | | (32,085 | ) | | | (183,190 | ) |
The Weir Group Plc | | | | | (5,609 | ) | | | (176,540 | ) |
| | | | | | | | | (993,927 | ) |
Total Reference Entity — Short | | | | | | | | | (4,491,118 | ) |
Net Value of Reference Entity — Deutsche Bank AG | $ | 416,763 | |
See Notes to Financial Statements.
| BLACKROCK FUNDS | JANUARY 31, 2013 | 31
|
| |
| Schedule of Investments (continued) | BlackRock Global Long/Short Equity Fund
|
The following table represents the individual long and short positions and related values of the basket of equity securities underlying the total return swap with Goldman Sachs Group, Inc. as of January 31, 2013:
| | | | Shares | | Value |
Reference Entity — Long |
Australia | | | | | | | | | | |
Tronox Ltd., Class A | | | | | 3,502 | | | $ | 66,363 | |
Canada | | | | | | | | | | |
IMAX Corp. | | | | | 66 | | | | 1,559 | |
Israel | | | | | | | | | | |
Mellanox Technologies Ltd. | | | | | 1,558 | | | | 82,917 | |
Stratasys Ltd. | | | | | 1,619 | | | | 127,059 | |
| | | | | | | | | 209,976 | |
Panama | | | | | | | | | | |
Copa Holdings SA, Class A | | | | | 25 | | | | 2,740 | |
Singapore | | | | | | | | | | |
Avago Technologies Ltd. | | | | | 4,380 | | | | 156,673 | |
United States | | | | | | | | | | |
The ADT Corp. | | | | | 7,427 | | | | 352,782 | |
Air Lease Corp | | | | | 3,281 | | | | 78,317 | |
Alere, Inc. | | | | | 106 | | | | 2,254 | |
Allison Transmission Holdings, Inc. | | | | | 262 | | | | 5,837 | |
Alon USA Energy, Inc. | | | | | 7,890 | | | | 154,802 | |
American International Group, Inc. | | | | | 2,799 | | | | 105,886 | |
Apple, Inc. | | | | | 1,096 | | | | 499,020 | |
Assured Guaranty Ltd. | | | | | 26,538 | | | | 481,134 | |
Brink’s Co. | | | | | 1,835 | | | | 49,563 | |
CIT Group, Inc. | | | | | 181 | | | | 7,665 | |
Coach, Inc. | | | | | 9,821 | | | | 500,871 | |
Commercial Metals Co. | | | | | 200 | | | | 3,330 | |
Computer Sciences Corp. | | | | | 1,464 | | | | 61,195 | |
CoreLogic, Inc. | | | | | 4,946 | | | | 129,783 | |
CVR Energy, Inc. | | | | | 5,264 | | | | 309,260 | |
Delek US Holdings, Inc. | | | | | 1,040 | | | | 35,329 | |
Expedia, Inc. | | | | | 912 | | | | 59,508 | |
Express Scripts Holding Co. | | | | | 10,641 | | | | 568,442 | |
First Solar, Inc. | | | | | 11,552 | | | | 325,535 | |
Fortinet, Inc. | | | | | 2,651 | | | | 62,537 | |
Fortune Brands Home & Security, Inc. | | | | | 680 | | | | 22,263 | |
Gardner Denver, Inc. | | | | | 3,540 | | | | 249,110 | |
Groupon, Inc. | | | | | 5,507 | | | | 30,289 | |
HollyFrontier Corp. | | | | | 4,799 | | | | 250,604 | |
IAC/InterActiveCorp. | | | | | 92 | | | | 3,795 | |
Ingredion, Inc. | | | | | 437 | | | | 28,873 | |
Jabil Circuit, Inc. | | | | | 2,081 | | | | 39,352 | |
Kronos Worldwide, Inc. | | | | | 128 | | | | 2,482 | |
Lender Processing Services, Inc. | | | | | 4,227 | | | | 101,617 | |
Lorillard, Inc. | | | | | 5,823 | | | | 227,505 | |
LSI Corp. | | | | | 1,889 | | | | 13,299 | |
Marathon Petroleum Corp. | | | | | 178 | | | | 13,209 | |
Matson, Inc. | | | | | 4,319 | | | | 118,384 | |
MBIA, Inc. | | | | | 24,700 | | | | 212,667 | |
Michael Kors Holdings Ltd. | | | | | 2,454 | | | | 137,743 | |
Monster Beverage Corp. | | | | | 907 | | | | 43,445 | |
Myriad Genetics, Inc. | | | | | 4,926 | | | | 133,298 | |
Penn National Gaming, Inc. | | | | | 2,184 | | | | 106,273 | |
Post Holdings, Inc. | | | | | 295 | | | | 11,207 | |
R.R. Donnelley & Sons Co. | | | | | 8,237 | | | | 75,780 | |
Realogy Holdings Corp. | | | | | 8,743 | | | | 391,424 | |
Riverbed Technology, Inc. | | | | | 19,239 | | | | 373,237 | |
| | | | | | | | | | | |
| | | | | Shares | | Value |
Reference Entity — Long |
United States (concluded) | | | | | | | | | | |
Rovi Corp. | | | | | 248 | | | $ | 4,288 | |
Service Corp. International | | | | | 290 | | | | 4,330 | |
SolarWinds, Inc. | | | | | 335 | | | | 18,231 | |
Spirit AeroSystems Holdings, Inc., Class A | | | | | 31,584 | | | | 503,449 | |
Telephone & Data Systems, Inc. | | | | | 2,557 | | | | 64,667 | |
Thoratec Corp. | | | | | 857 | | | | 31,306 | |
TripAdvisor, Inc. | | | | | 6,436 | | | | 297,858 | |
US Airways Group, Inc. | | | | | 2,810 | | | | 40,127 | |
Valero Energy Corp. | | | | | 5,444 | | | | 238,066 | |
VeriSign, Inc. | | | | | 5,096 | | | | 221,217 | |
Visteon Corp. | | | | | 125 | | | | 7,036 | |
WABCO Holdings, Inc. | | | | | 405 | | | | 25,377 | |
The Warnaco Group, Inc. | | | | | 218 | | | | 15,960 | |
Western Digital Corp. | | | | | 2,177 | | | | 102,319 | |
Western Refining, Inc. | | | | | 2,150 | | | | 72,305 | |
Westlake Chemical Corp. | | | | | 348 | | | | 31,966 | |
| | | | | | | | | 8,057,408 | |
Total Reference Entity — Long | | | | | | | | | 8,494,719 | |
|
Reference Entity — Short |
Canada | | | | | | | | | | |
Kodiak Oil & Gas Corp. | | | | | (23,435 | ) | | | (215,602 | ) |
Ireland | | | | | | | | | | |
Seagate Technology Plc | | | | | (10,191 | ) | | | (346,290 | ) |
Switzerland | | | | | | | | | | |
Weatherford International Ltd. | | | | | (772 | ) | | | (10,306 | ) |
United Kingdom | | | | | | | | | | |
Rowan Cos. Plc | | | | | (74 | ) | | | (2,552 | ) |
United States | | | | | | | | | | |
Acme Packet, Inc. | | | | | (607 | ) | | | (14,671 | ) |
Acuity Brands, Inc. | | | | | (1,882 | ) | | | (129,482 | ) |
Aeropostale, Inc. | | | | | (6,664 | ) | | | (90,164 | ) |
Allegheny Technologies, Inc. | | | | | (168 | ) | | | (5,317 | ) |
Alnylam Pharmaceuticals, Inc. | | | | | (365 | ) | | | (8,807 | ) |
Approach Resources, Inc. | | | | | (3,200 | ) | | | (85,088 | ) |
Atmel Corp. | | | | | (6,968 | ) | | | (46,686 | ) |
Avon Products, Inc. | | | | | (168 | ) | | | (2,853 | ) |
Berry Petroleum Co., Class A | | | | | (2,628 | ) | | | (96,763 | ) |
Big Lots, Inc. | | | | | (900 | ) | | | (28,935 | ) |
BioMarin Pharmaceutical, Inc. | | | | | (9,583 | ) | | | (526,011 | ) |
Cabela’s, Inc. | | | | | (3,375 | ) | | | (174,217 | ) |
CarMax, Inc. | | | | | (1,732 | ) | | | (68,275 | ) |
Chesapeake Energy Corp. | | | | | (4,357 | ) | | | (87,924 | ) |
Chipotle Mexican Grill, Inc. | | | | | (39 | ) | | | (11,973 | ) |
Ciena Corp. | | | | | (9,909 | ) | | | (155,175 | ) |
Con-way, Inc. | | | | | (284 | ) | | | (8,912 | ) |
Concho Resources, Inc. | | | | | (28 | ) | | | (2,554 | ) |
Concur Technologies, Inc. | | | | | (6,891 | ) | | | (461,008 | ) |
DeVry, Inc. | | | | | (5,942 | ) | | | (149,560 | ) |
Electronic Arts, Inc. | | | | | (3,975 | ) | | | (62,527 | ) |
Engility Holdings, Inc. | | | | | (63 | ) | | | (1,213 | ) |
Forest City Enterprises, Inc., Class A | | | | | (3,160 | ) | | | (53,436 | ) |
Freescale Semiconductor Ltd. | | | | | (130 | ) | | | (1,878 | ) |
Genworth Financial, Inc., Class A | | | | | (2,415 | ) | | | (22,146 | ) |
The Goodyear Tire & Rubber Co. | | | | | (374 | ) | | | (5,146 | ) |
Greenhill & Co., Inc. | | | | | (323 | ) | | | (19,025 | ) |
See Notes to Financial Statements.
| 32 | BLACKROCK FUNDS | JANUARY 31, 2013
|
| |
| Schedule of Investments (continued) | BlackRock Global Long/Short Equity Fund
|
| | | | Shares | | Value |
Reference Entity — Short |
United States (concluded) | | | | | | | | | | |
Guess?, Inc. | | | | | (11,610 | ) | | $ | (314,515 | ) |
Gulfport Energy Corp. | | | | | (135 | ) | | | (5,571 | ) |
Halcon Resources Corp. | | | | | (3,684 | ) | | | (28,146 | ) |
Hanesbrands, Inc. | | | | | (482 | ) | | | (18,065 | ) |
Health Management Associates, Inc. | | | | | (30,774 | ) | | | (321,281 | ) |
Herman Miller, Inc. | | | | | (168 | ) | | | (4,150 | ) |
HMS Holdings Corp. | | | | | (5,892 | ) | | | (160,616 | ) |
HomeAway, Inc. | | | | | (7,883 | ) | | | (188,956 | ) |
Hornbeck Offshore Services, Inc. | | | | | (2,659 | ) | | | (97,878 | ) |
Integrated Device Technology, Inc. | | | | | (12,535 | ) | | | (90,628 | ) |
International Rectifier Corp. | | | | | (1,450 | ) | | | (28,260 | ) |
Intrepid Potash, Inc. | | | | | (5,778 | ) | | | (134,627 | ) |
IPG Photonics Corp. | | | | | (1,923 | ) | | | (125,918 | ) |
Ironwood Pharmaceuticals, Inc. | | | | | (1,726 | ) | | | (22,127 | ) |
Itron, Inc. | | | | | (394 | ) | | | (18,278 | ) |
Janus Capital Group, Inc. | | | | | (4,941 | ) | | | (45,951 | ) |
Laredo Petroleum Holdings, Inc. | | | | | (8,405 | ) | | | (155,072 | ) |
Level 3 Communications, Inc. | | | | | (863 | ) | | | (20,557 | ) |
Life Time Fitness, Inc. | | | | | (6,862 | ) | | | (348,109 | ) |
McMoRan Exploration Co. | | | | | (6,015 | ) | | | (95,097 | ) |
Navistar International Corp. | | | | | (3,911 | ) | | | (102,038 | ) |
Netflix, Inc. | | | | | (834 | ) | | | (137,810 | ) |
Newfield Exploration Co. | | | | | (251 | ) | | | (7,404 | ) |
Northern Oil and Gas, Inc. | | | | | (729 | ) | | | (12,058 | ) |
Office Depot, Inc. | | | | | (697 | ) | | | (3,018 | ) |
ON Semiconductor Corp. | | | | | (16,636 | ) | | | (130,593 | ) |
PDC Energy, Inc. | | | | | (538 | ) | | | (19,922 | ) |
Questar Corp. | | | | | (5,939 | ) | | | (137,963 | ) |
Rackspace Hosting, Inc. | | | | | (1,773 | ) | | | (133,596 | ) |
Rex Energy Corp. | | | | | (1,938 | ) | | | (25,446 | ) |
Salesforce.com, Inc. | | | | | (1,321 | ) | | | (227,384 | ) |
SEACOR Holdings, Inc. | | | | | (463 | ) | | | (42,119 | ) |
Signet Jewelers Ltd. | | | | | (169 | ) | | | (10,576 | ) |
Sotheby’s | | | | | (4,245 | ) | | | (152,480 | ) |
Spectrum Brands Holdings, Inc. | | | | | (153 | ) | | | (7,748 | ) |
Staples, Inc. | | | | | (2,579 | ) | | | (34,765 | ) |
TCF Financial Corp. | | | | | (7,579 | ) | | | (103,529 | ) |
Tenet Healthcare Corp. | | | | | (6,713 | ) | | | (260,666 | ) |
Tiffany & Co. | | | | | (1,735 | ) | | | (114,076 | ) |
Ulta Salon Cosmetics & Fragrance, Inc. | | | | | (3,024 | ) | | | (295,808 | ) |
Universal Corp. | | | | | (50 | ) | | | (2,719 | ) |
ValueClick, Inc. | | | | | (2,547 | ) | | | (52,137 | ) |
VeriFone Systems, Inc. | | | | | (296 | ) | | | (10,277 | ) |
W&T Offshore, Inc. | | | | | (138 | ) | | | (2,429 | ) |
| | | | | | | | | (6,570,109 | ) |
Total Reference Entity — Short | | | | | | | | | (7,144,859 | ) |
Net Value of Reference Entity — Goldman Sachs Group, Inc. | $ | 1,349,860 | |
The following table represents the individual long and short positions and related values of the basket of equity securities underlying the total return swap with UBS AG as of January 31, 2013:
| | | | Shares | | Value |
Reference Entity — Long |
Australia | | | | | | | | | | |
Beadell Resources Ltd. | | | | | 47,318 | | | $ | 48,855 | |
BlueScope Steel Ltd. | | | | | 73,118 | | | | 258,459 | |
Goodman Fielder Ltd. | | | | | 112,501 | | | | 78,175 | |
JB Hi-Fi Ltd. | | | | | 9,181 | | | | 94,948 | |
Medusa Mining Ltd. | | | | | 10,569 | | | | 54,705 | |
Qantas Airways Ltd. | | | | | 159,203 | | | | 254,490 | |
Seven West Media Ltd. | | | | | 2,178 | | | | 4,775 | |
| | | | | | | | | 794,407 | |
Austria | | | | | | | | | | |
AMS AG | | | | | 1,753 | | | | 215,653 | |
Voestalpine AG | | | | | 214 | | | | 7,846 | |
| | | | | | | | | 223,499 | |
Canada | | | | | | | | | | |
Bankers Petroleum Ltd. | | | | | 17,608 | | | | 54,197 | |
Constellation Software, Inc. | | | | | 56 | | | | 7,018 | |
Dundee Precious Metals, Inc. | | | | | 12,995 | | | | 115,696 | |
Gildan Activewear, Inc. | | | | | 3,443 | | | | 126,722 | |
Inmet Mining Corp. | | | | | 159 | | | | 11,478 | |
Nevsun Resources Ltd. | | | | | 2,063 | | | | 8,729 | |
TransForce, Inc. | | | | | 111 | | | | 2,465 | |
West Fraser Timber Co. Ltd. | | | | | 20 | | | | 1,606 | |
Westjet Airlines Ltd. | | | | | 746 | | | | 15,976 | |
| | | | | | | | | 343,887 | |
China | | | | | | | | | | |
Jiangxi Copper Co. Ltd., Class H | | | | | 15,000 | | | | 40,724 | |
France | | | | | | | | | | |
Altran Technologies SA | | | | | 14,985 | | | | 113,371 | |
Arkema | | | | | 1,356 | | | | 153,743 | |
Teleperformance | | | | | 5,726 | | | | 228,159 | |
| | | | | | | | | 495,273 | |
Germany | | | | | | | | | | |
Aareal Bank AG | | | | | 12,224 | | | | 291,206 | |
Aixtron SE NA | | | | | 4,745 | | | | 64,878 | |
Deutsche Bank AG, Registered Shares | | | | | 3,318 | | | | 171,605 | |
Duerr AG | | | | | 246 | | | | 24,070 | |
Gildemeister AG | | | | | 482 | | | | 11,873 | |
SMA Solar Technology AG | | | | | 322 | | | | 8,296 | |
TUI AG | | | | | 22,037 | | | | 239,133 | |
| | | | | | | | | 811,061 | |
Hong Kong | | | | | | | | | | |
Hengdeli Holdings Ltd. | | | | | 4,000 | | | | 1,404 | |
Kunlun Energy Co. Ltd. | | | | | 14,000 | | | | 29,097 | |
| | | | | | | | | 30,501 | |
Italy | | | | | | | | | | |
Autogrill SpA | | | | | 693 | | | | 8,498 | |
Impregilo SpA | | | | | 14,581 | | | | 75,631 | |
Intesa Sanpaolo SpA | | | | | 97,712 | | | | 199,171 | |
UniCredit SpA | | | | | 23,526 | | | | 151,864 | |
| | | | | | | | | 435,164 | |
See Notes to Financial Statements.
| BLACKROCK FUNDS | JANUARY 31, 2013 | 33
|
| |
| Schedule of Investments (continued) | BlackRock Global Long/Short Equity Fund
|
| | | | Shares | | Value |
Reference Entity — Long |
Japan | | | | | | | | | | |
All Nippon Airways Co. Ltd. | | | | | 9,000 | | | $ | 17,622 | |
COMSYS Holdings Corp. | | | | | 3,100 | | | | 37,387 | |
CyberAgent, Inc. | | | | | 55 | | | | 115,335 | |
Daikyo, Inc. | | | | | 4,000 | | | | 10,711 | |
Dena Co. Ltd. | | | | | 700 | | | | 22,138 | |
Gree, Inc. | | | | | 9,300 | | | | 138,281 | |
HIS Co. Ltd. | | | | | 3,300 | | | | 112,610 | |
Hitachi High-Technologies Corp. | | | | | 900 | | | | 17,874 | |
The Japan Steel Works Ltd. | | | | | 1,000 | | | | 5,770 | |
Leopalace21 Corp. | | | | | 18,300 | | | | 70,545 | |
Lintec Corp. | | | | | 200 | | | | 3,699 | |
Mitsubishi Motors Corp. | | | | | 62,000 | | | | 64,465 | |
NET One Systems Co. Ltd. | | | | | 200 | | | | 1,920 | |
Nexon Co. Ltd. | | | | | 4,600 | | | | 48,553 | |
Shikoku Electric Power Co., Inc. | | | | | 800 | | | | 9,814 | |
Ship Healthcare Holdings, Inc. | | | | | 2,100 | | | | 60,081 | |
United ArrowsLtd. | | | | | 3,000 | | | | 72,602 | |
UNY Group Holdings Co. Ltd | | | | | 1,200 | | | | 8,896 | |
Yamada Denki Co. Ltd. | | | | | 3,270 | | | | 125,930 | |
| | | | | | | | | 944,233 | |
Netherlands | | | | | | | | | | |
CSM | | | | | 6,677 | | | | 154,574 | |
Norway | | | | | | | | | | |
Kvaerner ASA | | | | | 11,461 | | | | 33,131 | |
Storebrand ASA | | | | | 56,796 | | | | 290,757 | |
| | | | | | | | | 323,888 | |
Spain | | | | | | | | | | |
Amadeus IT Holding SA, Class A | | | | | 3,035 | | | | 76,054 | |
Banco Popular Espanol SA | | | | | 176,463 | | | | 159,577 | |
Inditex SA | | | | | 3,394 | | | | 474,372 | |
| | | | | | | | | 710,003 | |
Switzerland | | | | | | | | | | |
BKW AG | | | | | 3,911 | | | | 135,784 | |
United Kingdom | | | | | | | | | | |
Ashtead Group Plc | | | | | 2,722 | | | | 19,588 | |
Dixons Retail Plc | | | | | 466,965 | | | | 203,713 | |
Home Retail Group Plc | | | | | 64,247 | | | | 122,220 | |
Ophir Energy Plc | | | | | 958 | | | | 7,778 | |
Pace Plc | | | | | 9,646 | | | | 34,529 | |
Rockhopper Exploration Plc | | | | | 4,811 | | | | 11,894 | |
TalkTalk Telecom Group Plc | | | | | 4,256 | | | | 15,971 | |
| | | | | | | | | 415,693 | |
United States | | | | | | | | | | |
Coastal Energy Co. | | | | | 12,850 | | | | 282,921 | |
Total Reference Entity — Long | | | | | | | | | 6,141,612 | |
|
Reference Entity — Short |
Australia | | | | | | | | | | |
Alumina Ltd. | | | | | (226,335 | ) | | | (261,461 | ) |
Aquila Resources Ltd. | | | | | (39,977 | ) | | | (130,447 | ) |
Ausdrill Ltd. | | | | | (48,037 | ) | | | (150,344 | ) |
Boart Longyear Ltd. | | | | | (8,293 | ) | | | (17,810 | ) |
Bradken Ltd. | | | | | (1,183 | ) | | | (7,719 | ) |
Cochlear Ltd. | | | | | (118 | ) | | | (9,931 | ) |
| | | | | | | | | | | |
| | | | | Shares | | Value |
Reference Entity — Short |
Australia (concluded) | | | | | | | | | | |
CSR Ltd. | | | | | (10,017 | ) | | $ | (21,127 | ) |
Energy Resources of Australia Ltd. | | | | | (15,802 | ) | | | (22,871 | ) |
GWA Group Ltd. | | | | | (32,321 | ) | | | (84,868 | ) |
Harvey Norman Holdings Ltd. | | | | | (87,544 | ) | | | (179,269 | ) |
Iluka Resources Ltd. | | | | | (6,586 | ) | | | (66,759 | ) |
Linc Energy Ltd. | | | | | (20,163 | ) | | | (51,351 | ) |
Lynas Corp. Ltd. | | | | | (83,425 | ) | | | (55,811 | ) |
Paladin Energy Ltd. | | | | | (291,502 | ) | | | (349,104 | ) |
Ten Network Holdings Ltd. | | | | | (644,641 | ) | | | (226,545 | ) |
Whitehaven Coal Ltd. | | | | | (75,623 | ) | | | (259,444 | ) |
| | | | | | | | | (1,894,861 | ) |
Canada | | | | | | | | | | |
CGI Group, Inc., Class A | | | | | (12,090 | ) | | | (324,371 | ) |
Enerplus Corp. | | | | | (17,618 | ) | | | (236,520 | ) |
Penn West Petroleum Ltd. | | | | | (14,022 | ) | | | (141,851 | ) |
Trican Well Service Ltd. | | | | | (1,600 | ) | | | (21,897 | ) |
Turquoise Hill Resources Ltd. | | | | | (15,374 | ) | | | (118,380 | ) |
Veresen, Inc. | | | | | (499 | ) | | | (6,424 | ) |
| | | | | | | | | (849,443 | ) |
Denmark | | | | | | | | | | |
FLSmidth & Co. A/S | | | | | (900 | ) | | | (55,764 | ) |
France | | | | | | | | | | |
Accor SA | | | | | (6,516 | ) | | | (254,352 | ) |
Air France-KLM | | | | | (12,081 | ) | | | (131,354 | ) |
Alcatel-Lucent | | | | | (45,405 | ) | | | (75,874 | ) |
Vallourec SA | | | | | (1,001 | ) | | | (54,315 | ) |
| | | | | | | | | (515,895 | ) |
Germany | | | | | | | | | | |
ElringKlinger AG | | | | | (3,458 | ) | | | (122,270 | ) |
Kloeckner & Co. SE | | | | | (6,632 | ) | | | (83,921 | ) |
Puma SE | | | | | (1,202 | ) | | | (379,946 | ) |
| | | | | | | | | (586,137 | ) |
Italy | | | | | | | | | | |
Fiat Industrial SpA | | | | | (27,528 | ) | | | (354,262 | ) |
Snam SpA | | | | | (25,512 | ) | | | (128,929 | ) |
| | | | | | | | | (483,191 | ) |
Japan | | | | | | | | | | |
Casio Computer Co. Ltd. | | | | | (5,200 | ) | | | (44,858 | ) |
Dentsu, Inc. | | | | | (1,200 | ) | | | (33,555 | ) |
Don Quijote Co. Ltd. | | | | | (2,800 | ) | | | (111,482 | ) |
Hirose Electric Co. Ltd. | | | | | (200 | ) | | | (23,807 | ) |
J Trust Co. Ltd. | | | | | (1,800 | ) | | | (31,251 | ) |
K’s Holdings Corp. | | | | | (2,000 | ) | | | (54,378 | ) |
The Kansai Electric Power Co., Inc. | | | | | (5,400 | ) | | | (51,449 | ) |
Kyushu Electric Power Co., Inc. | | | | | (4,800 | ) | | | (46,200 | ) |
Murata Manufacturing Co. Ltd. | | | | | (1,500 | ) | | | (92,499 | ) |
NEC Corp. | | | | | (38,000 | ) | | | (92,710 | ) |
Nikon Corp. | | | | | (1,900 | ) | | | (54,327 | ) |
Nuflare Technology, Inc. | | | | | (1 | ) | | | (6,954 | ) |
| | | | | | | | | (643,470 | ) |
Switzerland | | | | | | | | | | |
Temenos Group AG | | | | | (4,712 | ) | | | (96,306 | ) |
See Notes to Financial Statements.
| 34 | BLACKROCK FUNDS | JANUARY 31, 2013
|
| |
| Schedule of Investments (concluded) | BlackRock Global Long/Short Equity Fund
|
| | | | Shares | | Value |
Reference Entity — Short |
United Kingdom | | | | | | | | | | |
African Barrick Gold Plc | | | | | (3,760 | ) | | $ | (21,202 | ) |
Essar Energy Plc | | | | | (98,652 | ) | | | (204,272 | ) |
Hunting Plc | | | | | (18,475 | ) | | | (248,276 | ) |
Lonmin Plc | | | | | (1,833 | ) | | | (10,465 | ) |
The Weir Group Plc | | | | | (56 | ) | | | (1,762 | ) |
| | | | | | | | | (485,977 | ) |
Total Reference Entity — Short | | | | | | | | | (5,611,044 | ) |
Net Value of Reference Entity — UBS AG | | | | | | | | $ | 530,568 | |
| • | | | | Fair Value Measurements — Various inputs are used in determining the fair value of investments and derivative financial instruments. These inputs to valuation techniques are categorized into a disclosure hierarchy consisting of three broad levels for financial statement purposes as follows: |
| • | | | | Level 1 — unadjusted price quotations in active markets/exchanges for identical assets and liabilities that the Fund has the ability to access |
| • | | | | Level 2 — other observable inputs (including, but not limited to, quoted prices for similar assets or liabilities in markets that are active, quoted prices for identical or similar assets or liabilities in markets that are not active, inputs other than quoted prices that are observable for the assets or liabilities (such as interest rates, yield curves, volatilities, prepayment speeds, loss severities, credit risks and default rates) or other market-corroborated inputs) |
| • | | | | Level 3 — unobservable inputs based on the best information available in the circumstances, to the extent observable inputs are not available (including the Fund’s own assumptions used in determining the fair value of investments and derivative financial instruments) |
| | | | | The hierarchy gives the highest priority to unadjusted quoted prices in active markets for identical assets or liabilities (Level 1 measurements) and the lowest priority to unobservable inputs (Level 3 measurements). Accordingly, the degree of judgment exercised in determining fair value is greatest for instruments categorized in Level 3. The inputs used to measure fair value may fall into different levels of the fair value hierarchy. In such cases, for disclosure purposes, the level in the fair value hierarchy within which the fair value measurement falls in its entirety is determined based on the lowest level input that is significant to the fair value measurement in its entirety. |
| | | | | Changes in valuation techniques may result in transfers into or out of an assigned level within the disclosure hierarchy. In accordance with the Fund’s policy, transfers between different levels of the fair value disclosure hierarchy are deemed to have occurred as of the beginning of the reporting period. The categorization of a value determined for investments and derivative financial instruments is based on the pricing transparency of the investment and derivative financial instrument and is not necessarily an indication of the risks associated with investing in those securities. For information about the Fund’s policy regarding valuation of investments and derivative financial instruments and other significant accounting policies, please refer to Note 1 of the Notes to Financial Statements. |
| | | | | The following tables summarize the Fund’s investments and derivative financial instruments categorized in the disclosure hierarchy as of January 31, 2013: |
|
|
|
| Level 1
|
| Level 2
|
| Level 3
|
| Total
|
Assets:
| | | | | | | | | | | | | | | | | | |
Investments:
| | | | | | | | | | | | | | | | | | |
Short-Term Securities | | | | $ | 25,351,620 | | | | — | | | | — | | | $ | 25,351,620 | |
|
|
|
| Level 1
|
| Level 2
|
| Level 3
|
| Total
|
Derivative Financial Instruments1
| | | | | | | | | | | | | | | | | | |
Assets:
| | | | | | | | | | | | | | | | | | |
Equity contracts | | | | | — | | | $ | 490,422 | | | | — | | | $ | 490,422 | |
Foreign currency exchange contracts | | | | | — | | | | 11 | | | | — | | | | 11 | |
Liabilities:
| | | | | | | | | | | | | | | | | | |
Equity contracts | | | | | — | | | | (240,788 | ) | | | — | | | | (240,788 | ) |
Foreign currency exchange contracts | | | | | — | | | | (1 | ) | | | — | | | | (1 | ) |
Total
| | | | | — | | | $ | 249,644 | | | | — | | | $ | 249,644 | |
| 1 | Derivative financial instruments are swaps and foreign currency exchange contracts, which are valued at the unrealized appreciation/depreciation on the instrument. |
| | | | | Certain of the Fund’s assets are held at carrying amount, which approximates fair value for financial statement purposes. As of January 31, 2013, foreign currency of $17,831 is categorized as Level 1 within the disclosure hierarchy. |
See Notes to Financial Statements.
| BLACKROCK FUNDS | JANUARY 31, 2013 | 35
|
| |
| Statements of Assets and Liabilities |
|
January 31, 2013 (Unaudited)
| | | | BlackRock
Emerging
Markets
Long/Short
Equity Fund | | BlackRock
Global
Long/Short
Equity Fund | |
Assets
|
Investments at value — affiliated1 | | | | $ | 523,031,393 | | | $ | 25,351,620 | |
Unrealized appreciation on swaps | | | | | 17,233,246 | | | | 490,422 | |
Unrealized appreciation on foreign currency exchange contracts | | | | | — | | | | 11 | |
Capital shares sold receivable | | | | | 10,839,095 | | | | — | |
Swaps receivable | | | | | — | | | | 110,824 | |
Foreign currency at value2 | | | | | — | | | | 17,831 | |
Deferred offering costs | | | | | — | | | | 150,377 | |
Prepaid expenses | | | | | 50,213 | | | | — | |
Total assets | | | | | 551,153,947 | | | | 26,121,085 | |
| |
Liabilities
|
Cash received as collateral for swaps | | | | | 32,524,288 | | | | — | |
Capital shares redeemed payable | | | | | 1,201,067 | | | | — | |
Investment advisory fees payable | | | | | 591,908 | | | | 13,974 | |
Swaps payable | | | | | 242,369 | | | | 33,831 | |
Unrealized depreciation on swaps | | | | | — | | | | 240,788 | |
Unrealized depreciation on foreign currency exchange contracts | | | | | — | | | | 1 | |
Service and distribution fees payable | | | | | 44,540 | | | | 20 | |
Administration fees payable | | | | | 41,427 | | | | — | |
Officer’s and Trustees’ fees payable | | | | | — | | | | 304 | |
Offering costs payable | | | | | 361 | | | | 169,949 | |
Other accrued expenses payable | | | | | 68,392 | | | | 11,800 | |
Total liabilities | | | | | 34,714,352 | | | | 470,667 | |
Net Assets | | | | $ | 516,439,595 | | | $ | 25,650,418 | |
| |
Net Assets Consist of
|
Paid-in capital | | | | $ | 509,772,138 | | | $ | 25,000,250 | |
Accumulated net investment loss | | | | | (3,967,074 | ) | | | (47,158 | ) |
Accumulated net realized gain (loss) | | | | | (6,598,715 | ) | | | 447,688 | |
Net unrealized appreciation/depreciation | | | | | 17,233,246 | | | | 249,638 | |
Net Assets | | | | $ | 516,439,595 | | | $ | 25,650,418 | |
| |
Net Asset Value
|
Institutional:
| | | | | | | | | | |
Net assets | | | | $ | 353,622,114 | | | $ | 25,609,408 | |
Shares outstanding3 | | | | | 33,140,813 | | | | 2,496,025 | |
Net asset value | | | | $ | 10.67 | | | $ | 10.26 | |
Investor A:
| | | | | | | | | | |
Net assets | | | | $ | 146,401,337 | | | $ | 20,514 | |
Shares outstanding3 | | | | | 13,758,421 | | | | 2,000 | |
Net asset value | | | | $ | 10.64 | | | $ | 10.26 | |
Investor C:
| | | | | | | | | | |
Net assets | | | | $ | 16,416,144 | | | $ | 20,496 | |
Shares outstanding3 | | | | | 1,554,838 | | | | 2,000 | |
Net asset value | | | | $ | 10.56 | | | $ | 10.25 | |
1 Investments at cost — affiliated | | | | $ | 523,031,393 | | | $ | 25,351,620 | |
2 Foreign currency at cost | | | | | — | | | $ | 17,837 | |
3 Unlimited number of shares authorized, $0.001 par value.
| | | | | | | | | | |
See Notes to Financial Statements.
| 36 | BLACKROCK FUNDS | JANUARY 31, 2013
|
Six Months Ended January 31, 2013 (Unaudited)
| | | | BlackRock
Emerging
Markets
Long/Short
Equity Fund | | BlackRock
Global
Long/Short
Equity Fund1 |
Investment Income
|
Dividends — affiliated | | | | $ | 248,306 | | | $ | 3,389 | |
| |
Expenses
|
Investment advisory | | | | | 2,678,212 | | | | 43,301 | |
Administration | | | | | 133,902 | | | | 2,165 | |
Service — Investor A | | | | | 126,345 | | | | 6 | |
Service and distribution — Investor C | | | | | 68,565 | | | | 23 | |
Transfer agent — Institutional | | | | | 45,791 | | | | 57 | |
Transfer agent — Investor A | | | | | 22,499 | | | | 6 | |
Transfer agent — Investor C | | | | | 3,817 | | | | 6 | |
Administration — Institutional | | | | | 30,288 | | | | 721 | |
Administration — Investor A | | | | | 12,634 | | | | — | |
Administration — Investor C | | | | | 1,714 | | | | — | |
Organization and offering | | | | | 53,655 | | | | 93,873 | |
Professional | | | | | 41,806 | | | | 8,610 | |
Printing | | | | | 18,278 | | | | 2,940 | |
Officer and Trustees | | | | | 5,845 | | | | 504 | |
Registration | | | | | 2,288 | | | | — | |
Custodian | | | | | 1,375 | | | | 420 | |
Miscellaneous | | | | | 7,777 | | | | 379 | |
Recoupment of past waived fees | | | | | 72,265 | | | | — | |
Recoupment of past waived fees — class specific | | | | | 40,524 | | | | — | |
Total expenses | | | | | 3,367,580 | | | | 153,011 | |
Less fees waived by Manager | | | | | (110,401 | ) | | | (25,208 | ) |
Less administration fees waived | | | | | — | | | | (2,165 | ) |
Less administration fees waived — Institutional | | | | | — | | | | (721 | ) |
Less transfer agent fees waived and/or reimbursed — Institutional | | | | | (11,494 | ) | | | (57 | ) |
Less transfer agent fees waived and/or reimbursed — Investor A | | | | | (5,348 | ) | | | (6 | ) |
Less transfer agent fees waived and/or reimbursed — Investor C | | | | | (996 | ) | | | (6 | ) |
Less fees reimbursed by Manager | | | | | — | | | | (74,301 | ) |
Total expenses after fees waived and/or reimbursed | | | | | 3,239,341 | | | | 50,547 | |
Net investment loss | | | | | (2,991,035 | ) | | | (47,158 | ) |
| |
Realized and Unrealized Gain (Loss)
|
Net realized gain (loss) from:
| | | | | | | | | | |
Capital gain distributions received from affiliated investment companies | | | | | 4,412 | | | | — | |
Swaps | | | | | (5,611,472 | ) | | | 447,885 | |
Foreign currency transactions | | | | | — | | | | (197 | ) |
| | | | | (5,607,060 | ) | | | 447,688 | |
Net change in unrealized appreciation/depreciation on:
| | | | | | | | | | |
Swaps | | | | | 8,629,431 | | | | 249,634 | |
Foreign currency translations | | | | | — | | | | 4 | |
| | | | | 8,629,431 | | | | 249,638 | |
Total realized and unrealized gain | | | | | 3,022,371 | | | | 697,326 | |
Net Increase in Net Assets Resulting from Operations | | | | $ | 31,336 | | | $ | 650,168 | |
| 1 | | Reflects the period from December 20, 2012 (commencement of operations) to January 31, 2013. |
See Notes to Financial Statements.
| BLACKROCK FUNDS | JANUARY 31, 2013 | 37
|
| |
| Statements of Changes in Net Assets |
|
| | | | BlackRock Emerging Markets
Long/Short Equity Fund
|
|
Increase (Decrease) in Net Assets:
| | | | Six Months
Ended
January 31,
2013
(Unaudited) | | Period
October 6,
20111
to July 31,
2012 |
Operations
|
Net investment loss | | | | $ | (2,991,035 | ) | | $ | (1,090,674 | ) |
Net realized gain (loss) | | | | | (5,607,060 | ) | | | 441,320 | |
Net change in unrealized appreciation/depreciation | | | | | 8,629,431 | | | | 8,603,815 | |
Net increase in net assets resulting from operations | | | | | 31,336 | | | | 7,954,461 | |
| |
Dividends and Distributions to Shareholders From
|
Net investment income:
| | | | | | | | | | |
Institutional | | | | | — | | | | (36,801 | )2 |
Investor A | | | | | — | | | | (2,914 | )2 |
Investor C | | | | | — | | | | (288 | )2 |
Net realized gain:
| | | | | | | | | | |
Institutional | | | | | (1,024,141 | ) | | | — | |
Investor A | | | | | (375,842 | ) | | | — | |
Investor C | | | | | (21,166 | ) | | | — | |
Decrease in net assets resulting from dividends and distributions to shareholders | | | | | (1,421,149 | ) | | | (40,003 | ) |
| |
Capital Share Transactions
|
Net increase in net assets derived from capital share transactions | | | | | 323,270,868 | | | | 186,644,082 | |
| |
Net Assets
|
Total increase in net assets | | | | | 321,881,055 | | | | 194,558,540 | |
Beginning of period | | | | | 194,558,540 | | | | — | |
End of period | | | | $ | 516,439,595 | | | $ | 194,558,540 | |
Accumulated net investment loss | | | | $ | (3,967,074 | ) | | $ | (976,039 | ) |
| 1 | | Commencement of operations. |
| 2 | | Dividends and distributions are determined in accordance with federal income tax regulations. |
See Notes to Financial Statements.
| 38 | BLACKROCK FUNDS | JANUARY 31, 2013
|
| |
| Statement of Changes in Net Assets |
|
| | | | BlackRock Global
Long/Short
Equity Fund
|
Increase (Decrease) in Net Assets:
| | | | Period
December 20,
20121 to
January 31,
2013
(Unaudited) |
Operations
|
Net investment loss | | | | $ | (47,158 | ) |
Net realized gain | | | | | 447,688 | |
Net change in unrealized appreciation/depreciation | | | | | 249,638 | |
Net increase in net assets resulting from operations | | | | | 650,168 | |
| |
Capital Share Transactions
|
Net increase in net assets derived from capital share transactions | | | | | 25,000,250 | |
| |
Net Assets
|
Total increase in net assets | | | | | 25,650,418 | |
Beginning of period | | | | | — | |
End of period | | | | $ | 25,650,418 | |
Accumulated net investment loss | | | | $ | (47,158 | ) |
| 1 | | Commencement of operations. |
See Notes to Financial Statements.
| BLACKROCK FUNDS | JANUARY 31, 2013 | 39
|
| |
| Financial Highlights | BlackRock Emerging Markets Long/Short Equity Fund
|
| | | | Institutional
|
|
| | | | Six Months
Ended
January 31,
2013
(Unaudited) | | Period
October 6,
20111 to
July 31,
2012 |
Per Share Operating Performance
|
Net asset value, beginning of period | | | | $ | 10.73 | | | $ | 10.00 | |
Net investment loss2 | | | | | (0.08 | ) | | | (0.14 | ) |
Net realized and unrealized gain | | | | | 0.07 | | | | 0.89 | |
Net increase (decrease) from investment operations | | | | | (0.01 | ) | | | 0.75 | |
Dividends and distributions from:
| | | | | | | | | | |
Net investment income | | | | | — | | | | (0.02 | )3 |
Net realized gain | | | | | (0.05 | ) | | | — | |
Total dividends and distributions | | | | | (0.05 | ) | | | (0.02 | ) |
Net asset value, end of period | | | | $ | 10.67 | | | $ | 10.73 | |
| |
Total Investment Return4
|
Based on net asset value5 | | | | | (0.23)% | | | | 7.47% | |
| |
Ratios to Average Net Assets
|
Total expenses6 | | | | | 1.77% | | | | 2.13% | 7 |
Total expenses after fees waived and/or reimbursed6 | | | | | 1.70% | | | | 1.75% | |
Net investment loss6 | | | | | (1.56)% | | | | (1.61)% | |
| |
Supplemental Data
|
Net assets, end of period (000) | | | | $ | 353,622 | | | $ | 126,707 | |
| 1 | | Commencement of operations. |
| 2 | | Based on average shares outstanding. |
| 3 | | Dividends and distributions are determined in accordance with federal income tax regulations. |
| 4 | | Where applicable, total investment returns include the reinvestment of dividends and distributions. |
| 5 | | Aggregate total investment return. |
| 7 | | Organization costs were not annualized in the calculation of the expense ratios. If these expenses were annualized, the total expenses would have been 2.15%. |
See Notes to Financial Statements.
| 40 | BLACKROCK FUNDS | JANUARY 31, 2013
|
| |
| Financial Highlights (continued) | BlackRock Emerging Markets Long/Short Equity Fund
|
| | | | Investor A
|
|
| | | | Six Months
Ended
January 31,
2013
(Unaudited) | | Period
October 6,
20111 to
July 31,
2012 |
Per Share Operating Performance
|
Net asset value, beginning of period | | | | $ | 10.71 | | | $ | 10.00 | |
Net investment loss2 | | | | | (0.10 | ) | | | (0.16 | ) |
Net realized and unrealized gain | | | | | 0.07 | | | | 0.88 | |
Net increase (decrease) from investment operations | | | | | (0.03 | ) | | | 0.72 | |
Dividends and distributions from:
| | | | | | | | | | |
Net investment income | | | | | — | | | | (0.01 | )3 |
Net realized gain | | | | | (0.04 | ) | | | — | |
Total dividends and distributions | | | | | (0.04 | ) | | | (0.01 | ) |
Net asset value, end of period | | | | $ | 10.64 | | | $ | 10.71 | |
| |
Total Investment Return4
|
Based on net asset value5 | | | | | (0.35)% | | | | 7.24% | |
| |
Ratios to Average Net Assets
|
Total expenses6 | | | | | 2.03% | | | | 2.19% | 7 |
Total expenses after fees waived and/or reimbursed6 | | | | | 1.96% | | | | 2.00% | |
Net investment loss6 | | | | | (1.82)% | | | | (1.85)% | |
| |
Supplemental Data
|
Net assets, end of period (000) | | | | $ | 146,401 | | | $ | 57,655 | |
| 1 | | Commencement of operations. |
| 2 | | Based on average shares outstanding. |
| 3 | | Dividends and distributions are determined in accordance with federal income tax regulations. |
| 4 | | Where applicable, total investment returns exclude the effects of any sales charges and include the reinvestment of dividends and distributions. |
| 5 | | Aggregate total investment return. |
| 7 | | Organization costs were not annualized in the calculation of the expense ratios. If these expenses were annualized, the total expenses would have been 2.20%. |
See Notes to Financial Statements.
| BLACKROCK FUNDS | JANUARY 31, 2013 | 41
|
| |
| Financial Highlights (concluded) | BlackRock Emerging Markets Long/Short Equity Fund
|
| | | | Investor C
|
|
| | | | Six Months
Ended
January 31,
2013
(Unaudited) | | Period
October 6,
20111 to
July 31,
2012 |
Per Share Operating Performance
|
Net asset value, beginning of period | | | | $ | 10.65 | | | $ | 10.00 | |
Net investment loss2 | | | | | (0.14 | ) | | | (0.22 | ) |
Net realized and unrealized gain | | | | | 0.07 | | | | 0.87 | |
Net increase (decrease) from investment operations | | | | | (0.07 | ) | | | 0.65 | |
Distributions from net realized gain | | | | | (0.02 | ) | | | (0.00 | )3 |
Net asset value, end of period | | | | $ | 10.56 | | | $ | 10.65 | |
| |
Total Investment Return4
|
Based on net asset value5 | | | | | (0.70)% | | | | 6.53% | |
| |
Ratios to Average Net Assets
|
Total expenses6 | | | | | 2.78% | | | | 3.00% | 7 |
Total expenses after fees waived and/or reimbursed6 | | | | | 2.72% | | | | 2.75% | |
Net investment loss6 | | | | | (2.57)% | | | | (2.61)% | |
| |
Supplemental Data
|
Net assets, end of period (000) | | | | $ | 16,416 | | | $ | 10,196 | |
| 1 | | Commencement of operations. |
| 2 | | Based on average shares outstanding. |
| 3 | | Distributions are determined in accordance with federal income tax regulations. |
| 4 | | Where applicable, total investment returns exclude the effects of any sales charges and include the reinvestment of dividends and distributions. |
| 5 | | Aggregate total investment return. |
| 7 | | Organization costs were not annualized in the calculation of the expense ratios. If these expenses were annualized, the total expenses would have been 3.00%. |
See Notes to Financial Statements.
| 42 | BLACKROCK FUNDS | JANUARY 31, 2013
|
| |
| Financial Highlights | BlackRock Global Long/Short Equity Fund
|
| | | | Institutional
|
| Investor A
|
| Investor C
|
| | | | Period
December 20,
20121
to January 31,
2013
(Unaudited) | | Period
December 20,
20121
to January 31,
2013
(Unaudited) | | Period
December 20,
20121
to January 31,
2013
(Unaudited) |
Per Share Operating Performance
|
Net asset value, beginning of period | | | | $ | 10.00 | | | $ | 10.00 | | | $ | 10.00 | |
Net investment loss2 | | | | | (0.02 | ) | | | (0.02 | ) | | | (0.03 | ) |
Net realized and unrealized gain | | | | | 0.28 | | | | 0.28 | | | | 0.28 | |
Net increase from investment operations | | | | | 0.26 | | | | 0.26 | | | | 0.25 | |
Net asset value, end of period | | | | $ | 10.26 | | | $ | 10.26 | | | $ | 10.25 | |
| |
Total Investment Return3
|
Based on net asset value4 | | | | | 2.60% | | | | 2.60% | | | | 2.50% | |
| |
Ratios to Average Net Assets
|
Total expenses5,6 | | | | | 2.05% | | | | 2.29% | | | | 3.02% | |
Total expenses after fees waived and/or reimbursed5 | | | | | 1.75% | | | | 2.00% | | | | 2.75% | |
Net investment loss5 | | | | | (1.63)% | | | | (1.86)% | | | | (2.60)% | |
| |
Supplemental Data
|
Net assets, end of period (000) | | | | $ | 25,609 | | | $ | 21 | | | $ | 20 | |
| 1 | | Commencement of operations. |
| 2 | | Based on average shares outstanding. |
| 3 | | Where applicable, total investment returns exclude the effects of any sales charges and include the reinvestment of dividends and distributions. |
| 4 | | Aggregate total investment return. |
| 6 | | Organization costs were not annualized in the calculation of the expense ratios. If these expenses were annualized, the total expenses for Institutional, Investor A and Investor B would have been 5.30%, 5.80% and 6.54%, respectively. |
See Notes to Financial Statements.
| BLACKROCK FUNDS | JANUARY 31, 2013 | 43
|
| |
| Notes to Financial Statements (Unaudited) |
|
1. Organization and Significant Accounting Policies:
BlackRock FundsSM (the “Trust”) is registered under the Investment Company Act of 1940, as amended (the “1940 Act”), as an open-end management investment company. The Trust is organized as a Massachusetts business trust. BlackRock Emerging Markets Long/Short Equity Fund (“Emerging Markets Long/Short Equity”) and BlackRock Global Long/Short Equity Fund (“Global Long/Short Equity”) (collectively, the “Funds” or individually, a “Fund”) are each a series of the Trust. The Funds are classified as diversified. The Funds’ financial statements are prepared in conformity with accounting principles generally accepted in the United States of America (“US GAAP”), which may require management to make estimates and assumptions that affect the reported amounts of assets and liabilities in the financial statements and the reported amounts of increases and decreases in net assets from operations during the reporting period. Actual results could differ from those estimates. Each Fund offers multiple classes of shares. Institutional Shares are sold without a sales charge and only to certain eligible investors. Investor A Shares are generally sold with a front-end sales charge. Investor C Shares may be subject to a CDSC. All classes of shares have identical voting, dividend, liquidation and other rights and the same terms and conditions, except that Investor A and Investor C shares also bear certain expenses related to the shareholder servicing of such shares, and Investor C Shares also bear certain expenses related to the distribution of such shares. Each class has exclusive voting rights with respect to matters relating to its shareholder servicing and distribution expenditures.
The following is a summary of significant accounting policies followed by the Funds:
Valuation: US GAAP defines fair value as the price the Funds would receive to sell an asset or pay to transfer a liability in an orderly transaction between market participants at the measurement date. The Funds determine the fair value of their financial instruments at market value using independent dealers or pricing services under policies approved by the Board of Trustees of the Trust (the “Board”). The BlackRock Global Valuation Methodologies Committee (the “Global Valuation Committee”) is the committee formed by management to develop global pricing policies and procedures and to provide oversight of the pricing function for the Funds for all financial instruments.
Equity investments traded on a recognized securities exchange or the NASDAQ Global Market System (“NASDAQ”) are valued at the last reported sale price that day or the NASDAQ official closing price, if applicable. For equity investments traded on more than one exchange, the last reported sale price on the exchange where the stock is primarily traded is used. Equity investments traded on a recognized exchange for which there were no sales on that day are valued at the last available bid (long positions) or ask (short positions) price. If no bid or ask price is available, the prior day’s price will be used, unless it is determined that such prior day’s price no longer reflects the fair value of the security. Swap agreements are valued utilizing quotes received daily by the Funds’ pricing service or through brokers, which are derived using daily swap curves and models that incorporate a number of market data factors, such as discounted cash flows, trades and values of the underlying reference instruments. Investments in open-end registered investment companies are valued at net asset value (“NAV”) each business day. Short-term securities with remaining maturities of 60 days or less may be valued at amortized cost, which approximates fair value.
Securities and other assets and liabilities denominated in foreign currencies are translated into US dollars using exchange rates determined as of the close of business on the New York Stock Exchange (“NYSE”). Foreign currency exchange contracts are valued at the mean between the bid and ask prices and are determined as of the close of business on the NYSE. Interpolated values are derived when the settlement date of the contract is an interim date for which quotations are not available.
In the event that application of these methods of valuation results in a price for an investment that is deemed not to be representative of the market value of such investment, or if a price is not available, the investment will be valued by the Global Valuation Committee, or its delegate, in accordance with a policy approved by the Board as reflecting fair value (“Fair Value Assets”). When determining the price for Fair Value Assets, the Global Valuation Committee, or its delegate, seeks to determine the price that each Fund might reasonably expect to receive from the current sale of that asset in an arm’s-length transaction. Fair value determinations shall be based upon all available factors that the Global Valuation Committee, or its delegate, deems relevant consistent with the principals of fair value measurement, which include the market approach, income approach and/or in the case of recent investments, the cost approach, as appropriate. A market approach generally consists of using comparable market transactions. The income approach generally is used to discount future cash flows to present value and adjusted for liquidity as appropriate. These factors include but are not limited to: (i) attributes specific to the investment or asset; (ii) the principal market for the investment or asset; (iii) the customary participants in the principal market for the investment or asset; (iv) data assumptions by market participants for the investment or asset, if reasonably available; (v) quoted prices for similar investments or assets in active markets; and (vi) other factors, such as future cash flows, interest rates, yield curves, volatilities, prepayment speeds, loss severities, credit risks, recovery rates, liquidation amounts and/or default rates. Due to the inherent uncertainty of valuations of such investments, the fair values may differ from the values that would have been used had an active market existed. The Global Valuation Committee, or its delegate, employs various methods for calibrating valuation approaches for investments where an active market does not exist, including regular due diligence of the Funds’ pricing vendors, a
| 44 | BLACKROCK FUNDS | JANUARY 31, 2013
|
| |
| Notes to Financial Statements (continued) |
|
regular review of key inputs and assumptions, transactional back-testing or disposition analysis to compare unrealized gains and losses to realized gains and losses, reviews of missing or stale prices and large movements in market values and reviews of any market related activity. The pricing of all Fair Value Assets is subsequently reported to the Board or a committee thereof on a quarterly basis.
Generally, trading in foreign instruments is substantially completed each day at various times prior to the close of business on the NYSE. Occasionally, events affecting the values of such instruments may occur between the foreign market close and the close of business on the NYSE that may not be reflected in the computation of the Funds’ net assets. If events (for example, a company announcement, market volatility or a natural disaster) occur during such periods that are expected to affect the value of such instruments materially, those instruments may be Fair Value Assets and valued at their fair value, as determined in good faith by the Global Valuation Committee using a pricing service and/or policies approved by the Board. Each business day, the Funds use a pricing service to assist with the valuation of certain foreign exchange-traded equity securities and foreign exchange-traded and OTC options (the “Systematic Fair Value Price”). Using current market factors, the Systematic Fair Value Price is designed to value such foreign securities and foreign options at fair value as of the close of business on the NYSE, which follows the close of the local markets.
Investment Transactions and Investment Income: For financial reporting purposes, investment transactions are recorded on the dates the transactions are entered into (the trade dates). Realized gains and losses on investment transactions are determined on the identified cost basis. Interest income, including amortization and accretion of premiums and discounts on debt securities, is recognized on the accrual basis. Income and realized and unrealized gains and losses are allocated daily to each class based on its relative net assets.
Dividends and Distributions: Dividends and distributions paid by the Funds are recorded on the ex-dividend dates. The portion of distributions that exceeds a Fund’s current and accumulated earnings and profits, which are measured on a tax basis, will constitute a nontaxable return of capital. Distributions in excess of a Fund’s taxable income and net capital gains, but not in excess of a Fund’s earnings and profits will be taxable to shareholders as ordinary income and will not constitute a nontaxable return of capital. The character and timing of dividends and distributions are determined in accordance with federal income tax regulations, which may differ from US GAAP.
Income Taxes: It is each Fund’s policy to comply with the requirements of the Internal Revenue Code of 1986, as amended, applicable to regulated investment companies and to distribute substantially all of their taxable income to their shareholders. Therefore, no federal income tax provision is required.
Each Fund files US federal and various state and local tax returns. No income tax returns are currently under examination. The statute of limitations on Emerging Markets Long/Short Equity’s US federal tax returns remains open for the period ended July 31, 2012. The statutes of limitations on Emerging Markets Long/Short Equity’s state and local tax returns may remain open for an additional year depending upon the jurisdiction. Management does not believe there are any uncertain tax positions that require recognition of a tax liability.
Segregation and Collateralization: In cases in which the 1940 Act and the interpretive positions of the Securities and Exchange Commission (“SEC”) require that each Fund either deliver collateral or segregate assets in connection with certain investments (e.g., swaps), each Fund will, consistent with SEC rules and/or certain interpretive letters issued by the SEC, segregate collateral or designate on its books and records cash or liquid securities having a market value at least equal to the amount that would otherwise be required to be physically segregated. Furthermore, based on requirements and agreements with certain exchanges and third party broker-dealers, each party in such transactions has requirements to deliver/deposit securities as collateral for certain investments.
Recent Accounting Standards: In December 2011, the Financial Accounting Standards Board (the “FASB”) issued guidance that will expand current disclosure requirements on the offsetting of certain assets and liabilities. The new disclosures will be required for investments and derivative financial instruments subject to master netting or similar agreements, which are eligible for offset in the Statements of Assets and Liabilities and will require an entity to disclose both gross and net information about such investments and transactions in the financial statements. In January 2013, the FASB issued guidance that clarifies which investments and transactions are subject to the offsetting disclosure requirements. The scope of the disclosure requirements for offsetting will be limited to derivative instruments, repurchase agreements and reverse repurchase agreements, and securities borrowing and securities lending transactions. The guidance is effective for financial statements with fiscal years beginning on or after January 1, 2013, and interim periods within those fiscal years. Management is evaluating the impact of this guidance on the Funds’ financial statement disclosures.
Organization and Offering Costs: Upon commencement of operations, organization costs associated with the establishment of the Funds were expensed by the Funds and reimbursed by the Manager. During the period ended January 31, 2013, the Manager reimbursed Global Long/Short Equity $74,301, which is included in fees waived by Manager in the Statements of Operations. Offering costs are amortized over a 12-month period beginning with the commencement of operations.
| BLACKROCK FUNDS | JANUARY 31, 2013 | 45
|
| |
| Notes to Financial Statements (continued) |
|
Other: Expenses directly related to a Fund or its classes are charged to that Fund or class. Other operating expenses shared by several funds are pro rated among those funds on the basis of relative net assets or other appropriate methods. Expenses directly related to the Funds and other shared expenses pro rated to the Funds are allocated daily to each class based on its relative net assets or other appropriate methods.
The Funds have an arrangement with the custodian whereby fees may be reduced by credits earned on uninvested cash balances, which, if applicable, are shown as fees paid indirectly in the Statements of Operations. The custodian imposes fees on overdrawn cash balances, which can be offset by accumulated credits earned or may result in additional custody charges.
2. Derivative Financial Instruments:
The Funds engage in various portfolio investment strategies using derivative contracts both to increase the returns of the Fund and/or to economically hedge, or protect, its exposure to certain risks such as equity risk. These contracts may be transacted on an exchange or over-the-counter (“OTC”).
Losses may arise if the value of the contract decreases due to an unfavorable change in the market rates or values of the underlying instrument or if the counterparty does not perform under the contract. The Funds’ maximum risk of loss from counterparty credit risk on OTC derivatives is generally the aggregate unrealized gain netted against any collateral pledged by/posted to the counterparty.
The Funds may mitigate counterparty risk by procuring collateral and through netting provisions included within an International Swaps and Derivatives Association, Inc. master agreement (“ISDA Master Agreement”) implemented between the Fund and each of its respective counterparties. An ISDA Master Agreement allows each Fund to offset with each separate counterparty certain derivative financial instrument’s payables and/or receivables with collateral held. The amount of collateral moved to/from applicable counterparties is generally based upon minimum transfer amounts of up to $500,000. To the extent amounts due to the Funds from its counterparties are not fully collateralized, contractually or otherwise, the Funds bear the risk of loss from counterparty non-performance. See Note 1 “Segregation and Collateralization” for information with respect to collateral practices. In addition, the Funds manage counterparty risk by entering into agreements only with counterparties that it believes have the financial resources to honor its obligations and by monitoring the financial stability of those counterparties.
Certain ISDA Master Agreements allow counterparties to OTC derivatives to terminate derivative contracts prior to maturity in the event the Funds’ net assets decline by a stated percentage or the Funds fail to meet the terms of their ISDA Master Agreements, which would cause the Funds to accelerate payment of any net liability owed to the counterparty.
Foreign Currency Exchange Contracts: The Funds enter into foreign currency exchange contracts as an economic hedge against either specific transactions or portfolio instruments or to obtain exposure to foreign currencies (foreign currency exchange rate risk). A foreign currency exchange contract is an agreement between two parties to buy and sell a currency at a set exchange rate on a future date. Foreign currency exchange contracts, when used by the Fund, help to manage the overall exposure to the currencies in which some of the investments held by the Fund are denominated. The contract is marked-to-market daily and the change in market value is recorded by the Fund as an unrealized gain or loss. When the contract is closed, the Funds record a realized gain or loss equal to the difference between the value at the time it was opened and the value at the time it was closed. The use of foreign currency exchange contracts involves the risk that the value of a foreign currency exchange contract changes unfavorably due to movements in the value of the referenced foreign currencies and the risk that the counterparty to the contract does not perform its obligations under the agreement.
Swaps: The Funds enter into swap agreements, in which the Funds and a counterparty agree either to make periodic net payments on a specified notional amount or a net payment upon termination. Swap agreements are privately negotiated in the OTC market and may be entered into as a bilateral contract or centrally cleared (“centrally cleared swaps”). In a centrally cleared swap, immediately following execution of the swap agreement, the swap agreement is novated to a central counterparty (the “CCP”) and the Funds face the CCP through a future commission merchant. Unlike a bilateral swap agreement, for centrally cleared swaps, the Funds have no credit exposure to the counterparty as the CCP stands between the Funds and the counterparty. These payments received or made by the Funds are recorded in the Statements of Operations as realized gains or losses, respectively. Any upfront fees paid are recorded as assets and any upfront fees received are recorded as liabilities and are shown as swap premiums paid and swap premiums received, respectively in the Statements of Assets and Liabilities and amortized over the term of the swap. Swaps are marked-to-market daily and changes in value are recorded as unrealized appreciation (depreciation). The daily change in valuation of centrally cleared swaps, if any, is recorded as a receivable or payable for variation margin in the Statements of Assets and Liabilities. When the swap is terminated, the Funds will record a realized gain or loss equal to the difference between the proceeds from (or cost of) the closing transaction and the Funds’ basis in the contract, if any. Generally, the basis of the contracts is the premium received or paid. Swap transactions involve, to varying degrees, elements of interest rate, credit and market risk in excess of the amounts recognized in the Statements of Assets and Liabilities. Such risks involve the possibility that there will be no liquid market for these agreements, that the counterparty to the agreements may default on its obligation to perform
| 46 | BLACKROCK FUNDS | JANUARY 31, 2013
|
| |
| Notes to Financial Statements (continued) |
|
or disagree as to the meaning of the contractual terms in the agreements, and that there may be unfavorable changes in interest rates and/or market values associated with these transactions.
• | | Total return swaps — The Funds enter into total return swaps to obtain exposure to securities (both long and short) or markets without owning such securities or investing directly in that market or to transfer the risk/return of one market (e.g., fixed income) to another market (e.g., equity) (equity risk and/or interest rate risk). Total return swaps are agreements in which there is an exchange of cash flows whereby one party commits to make payments based on the total return (coupons plus capital gains/losses) of an underlying instrument in exchange for fixed or floating rate interest payments. The agreement allows the Manager to change the composition of the basket of securities by trading in and out of the underlying equity positions at its discretion and the resulting gains or losses are recorded in the Statements of Operations. The unrealized appreciation (depreciation) on total return swaps includes dividends on the underlying basket of equity securities and financing income payable from the Funds to the counterparty. To the extent the total return of the instrument or index underlying the transaction exceeds or falls short of the offsetting interest rate obligation, the Funds will receive a payment from or make a payment to the counterparty. |
Derivative Financial Instruments Categorized by Risk Exposure:
|
|
Fair Values of Derivative Financial Instruments as of January 31, 2013
|
|
Asset Derivatives
|
|
| | | |
|
| Emerging
Markets
Long/Short
Equity
|
| Global
Long/Short
Equity
|
| | | | Statements of
Assets
And Liabilities
Location
|
| Value
|
Equity contracts | | | | Unrealized appreciation on swaps
| | $ | 17,233,246 | | | $ | 490,422 | |
Foreign currency exchange contracts | | | | Unrealized appreciation on foreign currency exchange contracts
| | | — | | | | 11 | |
|
Total
| | | | | | | | $ | 17,233,246 | | | $ | 490,433 | |
Liability Derivatives
|
|
| | | |
|
| Global
Long/Short
Equity
|
|
|
|
| Statements of
Assets And
Liabilities Location
|
| Value
|
Equity contracts | | | | Unrealized depreciation on swaps
| | $ | (240,788 | ) |
Foreign currency exchange contracts | | | | Unrealized depreciation on foreign currency exchange contracts
| | | (1 | ) |
|
Total
| | | | | | | | $ | (240,789 | ) |
The Effect of Derivative Financial Instruments
in the Statements of Operations
Period Ended January 31, 2013
|
|
Net Realized Gain (Loss) From
|
|
| | | | Emerging
Markets
Long/Short
Equity
|
| Global
Long/Short
Equity
|
Equity contracts:
| | | | | | | | | | |
Swaps | | | | $ | (5,611,472 | ) | | $ | 447,885 | |
Foreign currency exchange contracts:
| | | | | | | | | | |
Foreign currency transactions | | | | | — | | | | (197 | ) |
Total
| | | | $ | (5,611,472 | ) | | $ | 447,688 | |
Net Change in Unrealized Appreciation/Depreciation on
|
|
| | | | Emerging
Markets
Long/Short
Equity | | Global
Long/Short
Equity |
Equity contracts:
| | | | | | | | | | |
Swaps | | | | $ | 8,629,431 | | | $ | 249,634 | |
Foreign currency exchange contracts:
| | | | | | | | | | |
Foreign currency translations | | | | | — | | | | 10 | |
Total
| | | | $ | 8,629,431 | | | $ | 249,644 | |
For the six months ended January 31, 2013, the average quarterly balances of outstanding derivative financial instruments were as follows:
|
|
|
| Emerging
Markets
Long/Short
Equity
|
| Global
Long/Short
Equity
|
Foreign currency exchange contracts:
| | | | | | | | | | |
Average number of contracts — US dollars puchased | | | | | — | | | | 4 | 1 |
Average number of contracts — US dollars sold | | | | | — | | | | 1 | 1 |
Average US dollar amounts purchased | | | | | — | | | $ | 88,078 | 1 |
Average US dollar amounts sold | | | | | — | | | $ | 7,313 | 1 |
Total return swaps:
| | | | | | | | | | |
Average number of contracts | | | | | 3 | | | | 4 | 1 |
Average notional value | | | | $ | 96,949,274 | | | $ | 3,408,980 | 1 |
| 1 | | Actual contract amount shown due to limited activity. |
3. Investment Advisory Agreement and Other Transactions with Affiliates:
The PNC Financial Services Groups, Inc. (“PNC”) is the largest stockholder and an affiliate, for 1940 Act purposes, of BlackRock, Inc. (“BlackRock”).
The Trust, on behalf of the Funds, entered into an Investment Advisory Agreement with the Manager, the Funds’ investment advisor, an indirect, wholly owned subsidiary of BlackRock, to provide investment advisory and administration services. The Manager is responsible for the management of each Fund’s portfolio and provides the necessary personnel, facilities, equipment and certain other services necessary to
| BLACKROCK FUNDS | JANUARY 31, 2013 | 47
|
| |
| Notes to Financial Statements (continued) |
|
the operations of each Fund. For such services, each Fund pays the Manager a monthly fee based on a percentage of the Funds’ average daily net assets at the following annual rates:
Average Daily Net Assets
|
|
|
| Investment
Advisory Fee
|
First $1 Billion | | | | 1.50 | % |
$1 Billion — $3 Billion | | | | 1.41 | % |
$3 Billion — $5 Billion | | | | 1.35 | % |
$5 Billion — $10 Billion | | | | 1.31 | % |
Greater than $10 Billion | | | | 1.28 | % |
The Manager voluntarily agreed to waive its advisory fees by the amount of investment advisory fees each Fund pays to the Manager indirectly through its investment in affiliated money market funds. However, the Manager does not waive its advisory fees by the amount of investment advisory fees paid in connection with its investment in other affiliated investment companies, if any. These amounts are included in fees waived by Manager in the Statements of Operations. For the period ended January 31, 2013, the amounts waived were as follows:
Emerging Markets Long/Short Equity | $ | 108,054 |
Global Long/Short Equity | $ | 1,971 |
The Manager, with respect to each Fund, entered into a sub-advisory agreement with BlackRock Fund Advisors, an affiliate of the Manager. The Manager pays BlackRock Fund Advisors for services it provides, a monthly fee that is a percentage of the investment advisory fees paid by each Fund to the Manager.
The Trust, on behalf of the Funds, entered into a Distribution Agreement and Distribution and Service Plan with BlackRock Investments, LLC (“BRIL”), an affiliate of the Manager. Pursuant to the Distribution and Service Plan and in accordance with Rule 12b-1 under the 1940 Act, each Fund pays BRIL ongoing service and distribution fees. The fees are accrued daily and paid monthly at annual rates based upon the average daily net assets of the shares of each Fund as follows:
| Service
Fee
| Distribution
Fee
|
Investor A | 0.25 | % | — | |
Investor C | 0.25 | % | 0.75 | % |
Pursuant to sub-agreements with BRIL, broker-dealers and BRIL provide shareholder servicing and distribution services to the Funds. The ongoing service and/or distribution fee compensates BRIL and each broker-dealer for providing shareholder servicing and/or distribution related services to Investor A and Investor C shareholders.
Pursuant to written agreements, certain financial intermediaries, some of which may be affiliates, provide the Funds with sub-accounting, recordkeeping, sub-transfer agency and other administrative services with respect to sub-accounts they service. For these services, these entities receive an asset based fee or an annual fee per shareholder account, which will vary depending on share class and/or net assets.
The Manager maintains a call center, which is responsible for providing certain shareholder services to the Funds, such as responding to shareholder inquiries and processing transactions based upon instructions from shareholders with respect to the subscription and redemption of Fund shares. For the period ended January 31, 2013, the Funds reimbursed the Manager the following amounts for costs incurred in running the call center, which are included in transfer agent — class specific in the Statements of Operations:
|
|
|
| Emerging Markets
Long/Short Equity
|
Institutional | | | | $ | 217 | |
Investor A | | | | $ | 182 | |
Investor C | | | | $ | 10 | |
The Trust, on behalf of the Funds, entered into an Administration Agreement with the Manager and State Street Bank and Trust Company as co-administrators (together, the “Administrators”) to provide administrative services (other than investment advice and related portfolio activities). The Administrators receive a combined administration fee computed daily and payable monthly, based on a percentage of the average daily net assets of the Funds. The combined administration fee is paid at the following annual rates: 0.075% of the first $500 million, 0.065% of the next $500 million and 0.055% of the average daily net assets in excess of $1 billion. In addition, each of the share classes is charged an administration fee based on the following percentages of average daily net assets of each respective class: 0.025% of the first $500 million, 0.015% of the next $500 million and 0.005% of the average daily net assets in excess of $1 billion. In addition, the Administrators may have, at their discretion, voluntarily waived all or any portion of their administration fees for a Fund or a share class which are included in administration fees waived and administration fees waived — class specific in the Statements of Operations. For the period ended January 31, 2013, Emerging Markets Long/Short Equity paid the Manager $178,538 in return for these services, which are included in administration, administration — class specific, administration fees waived and administration fees waived — class specific in the Statements of Operations.
The Manager contractually agreed to waive and/or reimburse fees or expenses, excluding interest expense, dividend expense, income tax expense, acquired fund fees and expenses and certain other fund expenses, which constitute extraordinary expenses not incurred in the ordinary course of the Funds’ business, in order to limit expenses as a percentage of average daily net assets are as follows: 1.75% for Institutional, 2.00% for Investor A and 2.75% for Investor C. The Manager has agreed not to reduce or discontinue this contractual
| 48 | BLACKROCK FUNDS | JANUARY 31, 2013
|
| |
| Notes to Financial Statements (continued) |
|
waiver or reimbursement prior for December 1, 2013 for Emerging Markets Long/Short Equity and prior to December 31, 2013 for Global Long/Short Equity unless approved by the Board, including a majority of the independent trustees or by a vote of the majority of the outstanding voting securities of the Funds.
These amounts are included in fees waived by Manager, administration fees waived, administration fees waived — class specific, transfer agent fees waived and/or reimbursed and fees reimbursed by Manager respectively, in the Statements of Operations.
If during a Fund’s fiscal year the operating expenses of a share class, that at any time during the prior two fiscal years received a waiver or reimbursement from the Manager, are less than the expense limit for that share class, the Manager is entitled to be reimbursed by such share class up to the lesser of (a) the amount of fees waived or expenses reimbursed during those prior two fiscal years, provided that: (1) the Fund, of which the share class is a part, has more than $50 million in assets for the fiscal year and (2) the Manager or an affiliate continues to serve as the Fund’s investment advisor or administrator. In the event the expense limit for a share class is changed subsequent to a fiscal year in which the Manager becomes entitled to reimbursement for fees waived or reimbursed, the amount available to reimburse the Manager shall be calculated by reference to the expense limit for that share class in effect at the time the Manager became entitled to receive such reimbursement, rather than the subsequently changed expense limit for that share class.
For the six months ended January 31, 2013 the Manager recouped the following fund level and class specific waivers and/or reimbursements previously recorded by the Funds:
|
|
|
| Emerging Markets
Long/Short Equity
|
Fund | | | | $ | 72,265 | |
Institutional | | | | $ | 28,432 | |
Investor A | | | | $ | 10,784 | |
Investor C | | | | $ | 1,308 | |
On January 31, 2013, the amounts subject to possible future recoupment under the expense limitation agreement for Emerging Markets Long/Short Equity are $1,547 for Investor C, expiring July 31, 2014. On January 31, 2013, for each Fund, the Fund level and class specific waivers and/or reimbursements subject to possible future recoupment under the expense limitation agreement, expiring July 31, 2015, are as follows:
| Emerging Markets
Long/Short Equity
|
| Global Long/Short
Equity
|
Fund | $ | 2,347 | | $ | 25,402 |
Institutional | $ | 11,494 | | $ | 778 |
Investor A | $ | 5,348 | | $ | 6 |
Investor C | $ | 996 | | $ | 6 |
For the period ended January 31, 2013, affiliates earned underwriting discounts, direct commissions and dealer concessions on sales of the Funds’ Investor A Shares, as follows:
Emerging Markets Long/Short Equity | $ | 13,431 |
For the period ended January 31, 2013, affiliates received CDSCs as follows:
| Emerging Markets
Long/Short Equity
|
Investor C | $4,882 |
Certain officers and/or trustees of the Trust are officers and/or directors of BlackRock or its affiliates. The Funds reimburse the Manager for a portion of the compensation paid to the Trust’s Chief Compliance Officer, which is included in the officer and trustees in the Statements of Operations.
4. Borrowings:
The Trust, on behalf of Emerging Markets Long/Short Equity, along with certain other funds managed by the Manager and its affiliates, is a party to a $500 million credit agreement with a group of lenders. The Fund may borrow under the credit agreement to fund shareholder redemptions. Effective November 2011 to November 2012, the credit agreement had the following terms: a commitment fee of 0.065% per annum based on the Fund’s pro rata share of the unused portion of the credit agreement and interest at a rate equal to the higher of (a) the one-month LIBOR plus 0.80% per annum or (b) the Fed Funds rate plus 0.80% per annum on amounts borrowed. In addition, the Fund paid administration and arrangement fees which were allocated to the Fund based on its net assets as of October 31, 2011. The credit agreement, which expired in November 2012, was renewed with the same terms until November 2013. Effective November 2012 to November 2013, the credit agreement has the following terms: a commitment fee of 0.065% per annum based on the Fund’s pro rata share of the unused portion of the credit agreement and interest at a rate equal to the higher of (a) the one-month LIBOR plus 0.80% per annum or (b) the Fed Funds rate plus 0.80% per annum on amounts borrowed. In addition, the Fund paid administration and arrangement fees, which were allocated to the Fund based on its net assets as of October 31, 2012. The Fund did not borrow under the credit agreement during the six months ended January 31, 2013.
| BLACKROCK FUNDS | JANUARY 31, 2013 | 49
|
| |
| Notes to Financial Statements (continued) |
|
5. Concentration, Market and Credit Risk:
In the normal course of business, the Funds invest in securities and enter into transactions where risks exist due to fluctuations in the market (market risk) or failure of the issuer of a security to meet all its obligations (issuer credit risk). The value of securities held by the Funds may decline in response to certain events, including those directly involving the issuers whose securities are owned by the Funds; conditions affecting the general economy; overall market changes; local, regional or global political, social or economic instability; and currency and interest rate and price fluctuations. Similar to issuer credit risk, the Funds may be exposed to counterparty credit risk, or the risk that an entity with which the Funds have unsettled or open transactions may fail to or be unable to perform on its commitments. The Funds manage counterparty credit risk by entering into transactions only with counterparties that it believes have the financial resources to honor their obligations and by monitoring the financial stability of those counterparties. Financial assets, which potentially expose the Funds to market, issuer and counterparty credit risks, consist principally of financial instruments and receivables due from counterparties. The extent of the Funds’ exposure to market, issuer and counterparty credit risks with respect to these financial assets is generally approximated by their value recorded in the Statements of Assets and Liabilities, less any collateral held by the Funds.
The Funds invest a substantial amount of their assets in issuers located in a single country or a limited number of countries. When the Funds concentrate their investments in this manner, they assume the risk that economic, political and social conditions in those countries may have a significant impact on their investment performance. Foreign issuers may not be subject to the same uniform accounting, auditing and financial reporting standards and practices as used in the US. Foreign securities markets may also be less liquid, more volatile, and less subject to governmental supervision not typically associated with investing in US securities. Please see the Schedules of Investments for concentrations in specific countries.
The Funds invest a significant portion of their assets in securities of issuers located in Europe or with significant exposure to European issuers or countries. The European financial markets have recently experienced volatility and adverse trends due to concerns about economic downturns in, or rising government debt levels of several European countries, including Greece, Ireland, Italy, Portugal and Spain. As of January 31, 2013, these events have adversely affected the exchange rate of the euro and may continue to spread to other countries in Europe, including countries that do not use the euro. These events may affect the value and liquidity of certain of the Funds’ investments.
As of January 31, 2013, the Funds had the following industry classifications:
Emerging Markets Long/Short Equity
|
| Percent of Total
Investments
|
Industry
|
| Long
|
| Short
|
| Total
|
Wireless Telecommunication Services | | | 5 | % | | | 1 | % | | | 6 | % |
Chemicals | | | 3 | | | | 3 | | | | 6 | |
Food & Staples Retailing | | | 3 | | | | 3 | | | | 6 | |
Semiconductors & Semiconductor Equipment | | | 3 | | | | 2 | | | | 5 | |
Metals & Mining | | | 3 | | | | 2 | | | | 5 | |
Industrial Conglomerates | | | 3 | | | | 2 | | | | 5 | |
Food Products | | | 2 | | | | 3 | | | | 5 | |
Commercial Banks | | | 3 | | | | 1 | | | | 4 | |
Diversified Telecommunication Services | | | 1 | | | | 3 | | | | 4 | |
Oil, Gas & Consumable Fuels | | | 2 | | | | 1 | | | | 3 | |
Airlines | | | 2 | | | | 1 | | | | 3 | |
Automobiles | | | 1 | | | | 2 | | | | 3 | |
Construction Materials | | | 1 | | | | 2 | | | | 3 | |
Real Estate Management & Development | | | 1 | | | | 2 | | | | 3 | |
Construction & Engineering | | | 1 | | | | 2 | | | | 3 | |
Beverages | | | 2 | | | | — | | | | 2 | |
Transportation Infrastructure | | | 2 | | | | — | | | | 2 | |
Independent Power Producers & Energy Trader | | | 1 | | | | 1 | | | | 2 | |
Electric Utilities | | | 1 | | | | 1 | | | | 2 | |
Insurance | | | 1 | | | | 1 | | | | 2 | |
Machinery | | | 1 | | | | 1 | | | | 2 | |
Textiles, Apparel & Luxury Goods | | | 1 | | | | 1 | | | | 2 | |
Electronic Equipment, Instruments & Components | | | 1 | | | | 1 | | | | 2 | |
Commercial Services & Supplies | | | 1 | | | | 1 | | | | 2 | |
Other1 | | | 12 | | | | 6 | | | | 18 | |
Total
| | | 57 | % | | | 43 | % | | | 100 | % |
Global Long/Short Equity
|
| Percent of Total
Investments
|
Industry
|
| Long
|
| Short
|
| Total
|
Oil, Gas & Consumable Fuels | | | 6 | % | | | 7 | % | | | 13 | % |
Specialty Retail | | | 3 | | | | 5 | | | | 8 | |
Semiconductors & Semiconductor Equipment | | | 3 | | | | 2 | | | | 5 | |
Metals & Mining | | | 2 | | | | 3 | | | | 5 | |
Health Care Providers & Services | | | 2 | | | | 3 | | | | 5 | |
Textiles, Apparel & Luxury Goods | | | 3 | | | | 1 | | | | 4 | |
Internet & Catalog Retail | | | 3 | | | | 1 | | | | 4 | |
Software | | | 1 | | | | 3 | | | | 4 | |
Insurance | | | 3 | | | | — | | | | 3 | |
Computer & Peripherals | | | 2 | | | | 1 | | | | 3 | |
IT Services | | | 2 | | | | 1 | | | | 3 | |
Hotels, Restaurant & Leisure | | | 1 | | | | 2 | | | | 3 | |
Machinery | | | 1 | | | | 2 | | | | 3 | |
Energy Equipment & Services | | | — | | | | 3 | | | | 3 | |
Internet Software & Services | | | 2 | | | | — | | | | 2 | |
Commercial Services & Supplies | | | 2 | | | | — | | | | 2 | |
Real Estate Management & Development | | | 2 | | | | — | | | | 2 | |
Communications Equipment | | | 1 | | | | 1 | | | | 2 | |
Chemicals | | | 1 | | | | 1 | | | | 2 | |
Electronic Equipment, Instruments & Components | | | 1 | | | | 1 | | | | 2 | |
Construction & Engineering | | | 1 | | | | 1 | | | | 2 | |
Other1 | | | 12 | | | | 8 | | | | 20 | |
Total
| | | 54 | % | | | 46 | % | | | 100 | % |
| 1 | | All other industries held were each 1% or less of investments. |
| 50 | BLACKROCK FUNDS | JANUARY 31, 2013
|
| |
| Notes to Financial Statements (concluded) |
|
6. Capital Share Transactions:
Transactions in capital shares for each class were as follows:
| | | | Six Months Ended
January 31, 2013
| | |
| Period October 6, 20111
to July 31, 2012
|
|
Emerging Markets Long/Short Equity
|
|
|
| Shares
|
| Amount
|
|
|
| Shares
|
| Amount
|
Institutional
|
Shares sold | | | | | 24,142,623 | | | $ | 257,815,621 | | | | | | | | 14,335,931 | | | $ | 147,470,381 | |
Shares issued to shareholders in reinvestment of dividends | | | | | 83,729 | | | | 893,386 | | | | | | | | 777 | | | | 7,719 | |
Shares redeemed | | | | | (2,896,727 | ) | | | (30,876,711 | ) | | | | | | | (2,525,520 | ) | | | (26,197,219 | ) |
Net increase | | | | | 21,329,625 | | | $ | 227,832,296 | | | | | | | | 11,811,188 | | | $ | 121,280,881 | |
|
Investor A
|
Shares sold | | | | | 9,496,413 | | | $ | 101,070,216 | | | | | | | | 5,587,807 | | | $ | 57,667,190 | |
Shares issued to shareholders in reinvestment of dividends | | | | | 34,501 | | | | 367,092 | | | | | | | | 271 | | | | 2,690 | |
Shares redeemed | | | | | (1,156,083 | ) | | | (12,319,609 | ) | | | | | | | (204,488 | ) | | | (2,113,675 | ) |
Net increase | | | | | 8,374,831 | | | $ | 89,117,699 | | | | | | | | 5,383,590 | | | $ | 55,556,205 | |
|
Investor C
|
Shares sold | | | | | 670,128 | | | $ | 7,088,048 | | | | | | | | 977,816 | | | $ | 10,017,164 | |
Shares issued to shareholders in reinvestment of dividends | | | | | 1,924 | | | | 20,338 | | | | | | | | 24 | | | | 236 | |
Shares redeemed | | | | | (74,605 | ) | | | (787,513 | ) | | | | | | | (20,449 | ) | | | (210,404 | ) |
Net increase | | | | | 597,447 | | | $ | 6,320,873 | | | | | | | | 957,391 | | | $ | 9,806,996 | |
Total Net Increase | | | | | 30,301,903 | | | $ | 323,270,868 | | | | | | | | 18,152,169 | | | $ | 186,644,082 | |
| | | | Period December 20, 20121
to January 31, 2013
|
Global Long/Short Equity
|
|
|
| Shares
|
| Amount
|
Institutional
|
Shares sold | | | | | 2,496,025 | | | $ | 24,960,250 | |
Net increase | | | | | 2,496,025 | | | $ | 24,960,250 | |
|
Investor A
|
Shares sold | | | | | 2,000 | | | $ | 20,000 | |
Net increase | | | | | 2,000 | | | $ | 20,000 | |
|
Investor C
|
Shares sold | | | | | 2,000 | | | $ | 20,000 | |
Net increase | | | | | 2,000 | | | $ | 20,000 | |
Total Net Increase | | | | | 2,500,025 | | | $ | 25,000,250 | |
| 1 | | Commencement of operations. |
For Global Long/Short Equity, at January 31, 2013, the following shares of the Fund were owned by affiliates:
Institutional | 2,496,000 |
Investor A | 2,000 |
Investor C | 2,000 |
7. Subsequent Events:
Management has evaluated the impact of all subsequent events on each Fund through the date the financial statements were issued and has determined that there were no subsequent events requiring adjustment or additional disclosure in the financial statements.
| BLACKROCK FUNDS | JANUARY 31, 2013 | 51
|
| |
Disclosure of Investment Advisory Agreement and Sub-Advisory Agreement
|
The Board of Trustees (the “Board,” and the members of which are referred to as “Board Members”) of BlackRock FundsSM (the “Trust”) met on September 20-21, 2012 to consider the approval of the Trust’s proposed investment advisory agreement (the “Advisory Agreement”) with BlackRock Advisors, LLC (the “Manager”) on behalf of BlackRock Global Long/Short Equity Fund (the “Fund”), a portfolio of the Trust. The Advisory Agreement was the same agreement that had previously been approved by the Board with respect to other portfolios of the Trust. The Board also considered the approval of the sub-advisory agreement between the Manager and BlackRock Fund Advisors (the “Sub-Advisor”) with respect to the Fund (the “Sub-Advisory Agreement”). The Sub-Advisory Agreement was substantially the same as the sub-advisory agreements previously approved with respect to certain other portfolios of the Trust. The Manager and the Sub-Advisor are referred to herein as “BlackRock.” The Advisory Agreement and the Sub-Advisory Agreement are referred to herein as the “Agreements.” The Fund commenced operations in December 2012.
Activities and Composition of the Board
The Board consists of fourteen individuals, twelve of whom are not “interested persons” of the Trust or the Fund as defined in the Investment Company Act of 1940, as amended (the “1940 Act”) (the “Independent Board Members”). The Board Members are responsible for the oversight of the operations of the Trust and perform the various duties imposed on the directors of investment companies by the 1940 Act. The Independent Board Members have retained independent legal counsel to assist them in connection with their duties. The Co-Chairs of the Board are each Independent Board Members. The Board has established five standing committees: an Audit Committee, a Governance and Nominating Committee, a Compliance Committee, a Performance Oversight and Contract Committee and an Executive Committee, each of which is chaired by an Independent Board Member and composed of Independent Board Members (except for the Executive Committee, which also has one interested Board Member).
The Agreements
Pursuant to the 1940 Act, the Board is required to consider the initial approval of the Agreements. In connection with this process, the Board assessed, among other things, the nature, scope and quality of the services to be provided to the Fund by BlackRock, its personnel and its affiliates, including investment management, administrative and shareholder services, oversight of fund accounting and custody, marketing services, risk oversight, compliance and assistance in meeting applicable legal and regulatory requirements.
Board Considerations in Approving the Agreements
The Approval Process: At an in-person meeting held on September 20-21, 2012, the Board reviewed materials relating to its consideration of the Agreements. The Board considered all factors it believed relevant with respect to the Trust and the Fund, including, among other factors: (a) the nature, extent and quality of the services to be provided by BlackRock; (b) the investment performance of BlackRock portfolio management; (c) the advisory fee and the cost of the services to be provided and profits to be realized by BlackRock and its affiliates from their relationship with the Fund; (d) economies of scale; (e) fall out benefits to BlackRock as a result of its relationship with the Fund; (f) possible alternatives to the proposed Agreements; (g) the policies and practices of BlackRock with respect to portfolio transactions for the Fund; and (h) other factors deemed relevant by the Board Members.
In determining to approve the Agreements, the Board met with the relevant investment advisory personnel from BlackRock and considered all information it deemed reasonably necessary to evaluate the terms of the Agreements. The Board received materials in advance of the September 2012 meeting relating to its consideration of the Agreements, including (a) fees and estimated expense ratios of each class of the Fund, and for a representative class of the Fund, in comparison to the fees and expense ratios of a peer group of funds; (b) information regarding BlackRock’s economic outlook for the Fund and its general investment outlook for the markets; (c) information regarding fees paid to service providers that are affiliates of BlackRock; and (d) information outlining the legal duties of the Board under the 1940 Act with respect to the consideration and approval of the Agreements. The Board also noted information received at prior Board meetings concerning compliance records and regulatory matters relating to BlackRock.
The Board also considered other matters it deemed important to the approval process, such as services related to the valuation and pricing of Fund portfolio holdings, direct and indirect benefits to BlackRock and its affiliates from their relationship with the Fund and advice from independent legal counsel with respect to the review process and materials submitted for the Board’s review. The Board noted the willingness of BlackRock personnel to engage in open, candid discussions with the Board. The Board did not identify any particular information as controlling, and each Board Member may have attributed different weights to the various items considered.
A. Nature, Extent and Quality of the Services: The Board, including the Independent Board Members, reviewed the nature, extent and quality of services to be provided by BlackRock, including the investment advisory services to be provided to the Fund. The Board received information concerning the investment philosophy and investment process to be used by BlackRock in managing the Fund, as well as a description of the capabilities, personnel and services of BlackRock. In connection with this review, the Board considered BlackRock’s in-house research capabilities as well as other resources available to its personnel. The Board considered the scope of the services provided by BlackRock to the Fund under the Agreements relative to services typically provided by third parties to other funds. The Board noted that the standard of care applicable under the Agreements was comparable to that found generally in investment company advisory agreements. The Board concluded that the scope of BlackRock’s services to be provided to the Fund was consistent with the Fund’s operational requirements, including, in addition to seeking to meet its investment objective, compliance with investment restrictions, tax and reporting requirements and related shareholder services.
| 52 | BLACKROCK FUNDS | JANUARY 31, 2013
|
| |
Disclosure of Investment Advisory Agreement and Sub-Advisory Agreement (continued)
|
The Board, including the Independent Board Members, also considered the quality of the administrative and non-investment advisory services to be provided by BlackRock and its affiliates to the Fund. The Board evaluated the procedures of BlackRock designed to fulfill its fiduciary duty to the Fund with respect to possible conflicts of interest, including BlackRock’s code of ethics (regulating the personal trading of BlackRock’s officers and employees), the procedures by which BlackRock allocates trades among its various investment advisory clients, the integrity of the systems in place to ensure compliance with the foregoing and the record of BlackRock in these matters. The Board also noted information received at prior Board meetings concerning standards of BlackRock with respect to the execution of portfolio transactions.
The Board, including the Independent Board Members, considered, among other factors, the number, education and experience of BlackRock’s investment personnel generally and the portfolio management team for the Fund. The Board also took into account the time and attention to be devoted by senior management of BlackRock to the Fund. The Board also considered the business reputation of BlackRock and its financial resources and concluded that BlackRock would be able to meet any reasonably foreseeable obligation under the Agreements.
B. The Investment Performance of the Fund and BlackRock: The Board, including the Independent Board Members, previously received and considered information about BlackRock’s investment performance for other funds. The Board, however, could not consider the performance history of the Fund because the Fund was newly organized and had not yet commenced operations as of the September 2012 meeting.
C. Consideration of the Advisory Fees and the Cost of the Services and Profits to be Realized by BlackRock and its Affiliates from their Relationship with the Fund: In connection with the initial approval of the Agreements, the Board, including the Independent Board Members, reviewed the Fund’s contractual management fee ratio (a combination of the advisory fee and the administration fee, if any) compared with the other funds in the Fund’s peer group of funds. Both the peer group and the funds within the peer group (collectively, “Peers”) were selected by Lipper, Inc. (“Lipper”), which is not affiliated with BlackRock. It also compared the Fund’s estimated total expense ratio, as well as the Fund’s estimated actual management fee ratio, to those of its Peers. The Board noted that the Fund has an advisory fee arrangement that includes breakpoints that adjust the fee rate downward as the size of the Fund increases above certain contractually specified levels. The Board considered the fee waivers and expense reimbursement arrangements in place, including the contractual agreement by BlackRock to waive fees and/or reimburse expenses in order to limit, to a specified amount, the Fund’s total operating expenses as a percentage of the Fund’s average daily net assets on a class-by-class basis, as applicable. Additionally, the Board noted information received at prior Board meetings concerning the services rendered, and the fee rates offered, to other clients advised by BlackRock.
The Board noted that although the Fund’s contractual management fee ratio (a combination of the advisory fee and the administration fee, if any) was above the median contractual management fee ratio paid by the Fund’s Peers, in each case before taking into account any expense reimbursements or fee waivers, it was near the median fee of the Fund’s largest competitors, as determined by BlackRock. The Board also noted that the Fund’s Peers do not include many of the funds that BlackRock believes to be the Fund’s most direct competitors.
Following consideration of this information, the Board, including the independent Board Members, concluded that the fees to be paid pursuant to the Agreements were fair and reasonable in light of the services provided.
As the Fund had not commenced operations as of the date of the September 2012 meeting, BlackRock was not able to provide the Board with specific information concerning the expected profits to be realized by BlackRock and its affiliates from their relationships with the Fund. BlackRock, however, will provide the Board with such information at future meetings.
D. Economies of Scale: The Board, including the Independent Board Members, considered the extent to which economies of scale might be realized in respect of the management of the Fund in tandem with other portfolios of the Trust. Since the Fund is newly formed, BlackRock was not able to provide the Board with specific information concerning the extent to which economies of scale would be realized as the Fund grows and whether fee levels would reflect such economies of scale, if any.
E. Other Factors Deemed Relevant by the Board Members: The Board, including the Independent Board Members, also took into account other ancillary or “fall-out” benefits that BlackRock or its affiliates may derive from their respective relationships with the Fund, both tangible and intangible, such as BlackRock’s ability to leverage its investment professionals who manage other portfolios and risk management personnel, an increase in BlackRock’s profile in the investment advisory community, and the engagement of BlackRock’s affiliates as service providers to the Fund, including for administrative, distribution, securities lending and cash management services. The Board also considered BlackRock’s overall operations and its efforts to expand the scale of, and improve the quality of, its operations. The Board also noted that BlackRock may use and benefit from third party research obtained by soft dollars generated by certain registered fund transactions to assist in managing all or a number of its other client accounts. The Board further noted that it had considered the investment by BlackRock’s funds in ETFs without any offset against the management fees payable by the funds to BlackRock.
The Board, including all of the Independent Board Members, concluded that these ancillary benefits that BlackRock and its affiliates could receive with regard to providing investment advisory and other services to the Fund were consistent with those generally available to other mutual fund sponsors.
| BLACKROCK FUNDS | JANUARY 31, 2013 | 53
|
| |
Disclosure of Investment Advisory Agreement and Sub-Advisory Agreement (concluded)
|
Conclusion
The Board, including the Independent Board Members, unanimously approved (i) the Advisory Agreement between the Manager and the Trust on behalf of the Fund, (ii) the Sub-Advisory Agreement between the Manager and the Sub-Advisor with respect to the Fund, each for a two-year term ending September 20, 2014. Based upon its evaluation of all of the aforementioned factors in their totality, the Board, including the Independent Board Members, was satisfied that the terms of the Agreements were fair and reasonable and in the best interest of the Fund and its shareholders. In arriving at a decision to approve the Agreements, the Board did not identify any single factor or group of factors as all-important or controlling, but considered all factors together, and different Board Members may have attributed different weights to the various factors considered. The Independent Board Members were also assisted by the advice of independent legal counsel in making this determination.
| 54 | BLACKROCK FUNDS | JANUARY 31, 2013
|
Ronald W. Forbes, Co-Chairman of the Board and Trustee
Rodney D. Johnson, Co-Chairman of the Board and Trustee
Paul L. Audet, Trustee
David O. Beim, Trustee
Henry Gabbay, Trustee
Dr. Matina S. Horner, Trustee
Herbert I. London, Trustee
Ian A. MacKinnon, Trustee
Cynthia A. Montgomery, Trustee
Joseph P. Platt, Trustee
Robert C. Robb, Jr., Trustee
Toby Rosenblatt, Trustee
Kenneth L. Urish, Trustee
Frederick W. Winter, Trustee
John M. Perlowski, President and Chief Executive Officer
Richard Hoerner, CFA, Vice President
Brendan Kyne, Vice President
Simon Mendelson, Vice President
Christopher Stavrakos, CFA, Vice President
Neal Andrews, Chief Financial Officer
Jay Fife, Treasurer
Brian Kindelan, Chief Compliance Officer and
Anti-Money Laundering Officer
Benjamin Archibald, Secretary
Investment Advisor and
Co-Administrator
BlackRock Advisors, LLC
Wilmington, DE 19809
Sub-Advisor
BlackRock Fund Advisors
San Francisco, CA 94105
Custodian, Accounting Agent and
Co-Administrator
State Street Bank and Trust Company
Boston, MA 02110
Transfer Agent
BNY Mellon Investment Servicing (US) Inc.
Wilmington, DE 19809
Independent Registered Public Accounting Firm
PricewaterhouseCoopers LLP
Philadelphia, PA 19103
Distributor
BlackRock Investments, LLC
New York, NY 10022
Legal Counsel
Sidley Austin LLP
New York, NY 10019
Address of the Funds
100 Bellevue Parkway
Wilmington, DE 19809
| BLACKROCK FUNDS | JANUARY 31, 2013 | 55
|
General Information
Electronic Delivery
Electronic copies of most financial reports and prospectuses are available on the Funds’ website or shareholders can sign up for e-mail notifications of quarterly statements, annual and semi-annual reports and prospectuses by enrolling in the Funds’ electronic delivery program.
Shareholders Who Hold Accounts with Investment Advisors, Banks or Brokerages:
Please contact your financial advisor. Please note that not all investment advisors, banks or brokerages may offer this service.
Shareholders Who Hold Accounts Directly with BlackRock:
1) | | Access the BlackRock website at
http://www.blackrock.com/edelivery |
2) | | Select “eDelivery” under the “More Information” section |
Householding
The Funds will mail only one copy of shareholder documents, including prospectuses, annual and semi-annual reports and proxy statements, to shareholders with multiple accounts at the same address. This practice is commonly called “householding” and is intended to reduce expenses and eliminate duplicate mailings of shareholder documents. Mailings of your shareholder documents may be householded indefinitely unless you instruct us otherwise. If you do not want the mailing of these documents to be combined with those for other members of your household, please call the Funds at (800) 441-7762.
| 56 | BLACKROCK FUNDS | JANUARY 31, 2013
|
| |
| Additional Information (continued) |
|
General Information (concluded)
Availability of Quarterly Schedule of Investments
The Funds file their complete schedule of portfolio holdings with the SEC for the first and third quarters of each fiscal year on Form N-Q. The Funds’ Forms N-Q are available on the SEC’s website at
http://www.sec.gov and may also be reviewed and copied at the SEC’s Public Reference Room in Washington, DC. Information on how to access documents on the SEC’s website without charge may be obtained by calling (800) SEC-0330. The Funds’ Forms N-Q may also be obtained upon request and without charge by calling (800) 441-7762.
Availability of Proxy Voting Policies and Procedures
A description of the policies and procedures that the Funds use to determine how to vote proxies relating to portfolio securities is available (1) without charge, upon request, by calling (800) 441-7762; (2) at http://www.blackrock.com; and (3) on the SEC’s website at http://www.sec.gov.
Availability of Proxy Voting Record
Information about how the Funds voted proxies relating to securities held in the Funds’ portfolio during the most recent 12-month period ended June 30 is available upon request and without charge (1) at http://www.blackrock.com or by calling (800) 441-7762 and (2) on the SEC’s website at http://www.sec.gov.
Shareholder Privileges
Account Information
Call us at (800) 441-7762 from 8:00 AM to 6:00 PM EST on any business day to get information about your account balances, recent transactions and share prices. You can also reach us on the Web at http://www.blackrock.com/funds.
Automatic Investment Plans
Investor Class shareholders who want to invest regularly can arrange to have $50 or more automatically deducted from their checking or savings account and invested in any of the BlackRock funds.
Systematic Withdrawal Plans
Investor Class shareholders can establish a systematic withdrawal plan and receive periodic payments of $50 or more from their BlackRock funds, as long as their account balance is at least $10,000.
Retirement Plans
Shareholders may make investments in conjunction with Traditional, Rollover, Roth, Coverdell, Simple IRAs, SEP IRAs and 403(b) Plans.
| BLACKROCK FUNDS | JANUARY 31, 2013 | 57
|
| |
| Additional Information (concluded) |
|
BlackRock Privacy Principles
BlackRock is committed to maintaining the privacy of its current and former fund investors and individual clients (collectively, “Clients”) and to safeguarding their non-public personal information. The following information is provided to help you understand what personal information BlackRock collects, how we protect that information and why in certain cases we share such information with select parties.
If you are located in a jurisdiction where specific laws, rules or regulations require BlackRock to provide you with additional or different privacy-related rights beyond what is set forth below, then BlackRock will comply with those specific laws, rules or regulations.
BlackRock obtains or verifies personal non-public information from and about you from different sources, including the following: (i) information we receive from you or, if applicable, your financial intermediary, on applications, forms or other documents; (ii) information about your transactions with us, our affiliates, or others; (iii) information we receive from a consumer reporting agency; and (iv) from visits to our websites.
BlackRock does not sell or disclose to non-affiliated third parties any non-public personal information about its Clients, except as permitted by law or as is necessary to respond to regulatory requests or to service Client accounts. These non-affiliated third parties are required to protect the confidentiality and security of this information and to use it only for its intended purpose.
We may share information with our affiliates to service your account or to provide you with information about other BlackRock products or services that may be of interest to you. In addition, BlackRock restricts access to non-public personal information about its Clients to those BlackRock employees with a legitimate business need for the information. BlackRock maintains physical, electronic and procedural safeguards that are designed to protect the non-public personal information of its Clients, including procedures relating to the proper storage and disposal of such information.
| 58 | BLACKROCK FUNDS | JANUARY 31, 2013
|
| A World-Class Mutual Fund Family |
|
BlackRock offers a diverse lineup of open-end mutual funds crossing all investment styles and managed by experts in equity, fixed income and tax-exempt investing.
Equity Funds
BlackRock ACWI ex-US Index Fund
BlackRock All-Cap Energy & Resources Portfolio
BlackRock Basic Value Fund
BlackRock Capital Appreciation Fund
BlackRock China Fund
BlackRock Commodity Strategies Fund
BlackRock Disciplined Small Cap Core Fund
BlackRock Emerging Markets Fund
BlackRock Emerging Markets Long/Short
Equity Fund
BlackRock Energy & Resources Portfolio
BlackRock Equity Dividend Fund
BlackRock EuroFund
BlackRock Flexible Equity Fund
BlackRock Focus Growth Fund
BlackRock Global Dividend Income Portfolio
| BlackRock Global Long/Short Equity Fund
BlackRock Global Opportunities Portfolio
BlackRock Global SmallCap Fund
BlackRock Health Sciences Opportunities Portfolio
BlackRock Index Equity Portfolio
BlackRock India Fund
BlackRock International Fund
BlackRock International Index Fund
BlackRock International Opportunities Portfolio
BlackRock Large Cap Core Fund
BlackRock Large Cap Core Plus Fund
BlackRock Large Cap Growth Fund
BlackRock Large Cap Value Fund
BlackRock Latin America Fund
BlackRock Long-Horizon Equity Fund
BlackRock Mid-Cap Growth Equity Portfolio | BlackRock Mid Cap Value Opportunities Fund
BlackRock Natural Resources Trust
BlackRock Pacific Fund
BlackRock Real Estate Securities Fund
BlackRock Russell 1000 Index Fund
BlackRock Science & Technology
Opportunities Portfolio
BlackRock Small Cap Growth Equity Portfolio
BlackRock Small Cap Growth Fund II
BlackRock Small Cap Index Fund
BlackRock S&P 500 Index Fund
BlackRock S&P 500 Stock Fund
BlackRock U.S. Opportunities Portfolio
BlackRock Value Opportunities Fund
BlackRock World Gold Fund |
Taxable Fixed Income Funds
BlackRock Bond Index Fund
BlackRock Core Bond Portfolio
BlackRock CoreAlpha Bond Fund
BlackRock Emerging Market Local Debt Portfolio
BlackRock Floating Rate Income Portfolio
BlackRock Global Long/Short Credit Fund
BlackRock GNMA Portfolio | BlackRock High Yield Bond Portfolio
BlackRock Inflation Protected Bond Portfolio
BlackRock International Bond Portfolio
BlackRock Long Duration Bond Portfolio
BlackRock Low Duration Bond Portfolio
BlackRock Secured Credit Portfolio | BlackRock Strategic Income
Opportunities Portfolio
BlackRock Total Return Fund
BlackRock U.S. Government Bond Portfolio
BlackRock U.S. Mortgage Portfolio
BlackRock World Income Fund |
Municipal Fixed Income Funds
BlackRock California Municipal Bond Fund
BlackRock High Yield Municipal Fund
BlackRock Intermediate Municipal Fund | BlackRock National Municipal Fund
BlackRock New Jersey Municipal Bond Fund
BlackRock New York Municipal Bond Fund | BlackRock Pennsylvania Municipal Bond Fund
BlackRock Short-Term Municipal Fund |
Mixed Asset Funds
| BlackRock Balanced Capital Fund | LifePath Active Portfolios | | LifePath Index Portfolio |
| BlackRock Global Allocation Fund | 2015 | 2040 | | Retirement | 2040 |
| BlackRock Managed Volatility Portfolio | 2020 | 2045 | | 2020 | 2045 |
| BlackRock Multi-Asset Income Portfolio | 2025 | 2050 | | 2025 | 2050 |
| BlackRock Multi-Asset Real Return Fund | 2030 | 2055 | | 2030 | 2055 |
| BlackRock Strategic Risk Allocation Fund | 2035 | | | 2035 | |
| BlackRock Prepared Portfolios | LifePath Portfolios | | |
| Conservative Prepared Portfolio | Retirement | 2040 | | | |
| Moderate Prepared Portfolio | 2020 | 2045 | | | |
| Growth Prepared Portfolio | 2025 | 2050 | | | |
| Aggressive Growth Prepared Portfolio | 2030 | 2055 | | | |
| 2035 | | | | |
BlackRock mutual funds are currently distributed by BlackRock Investments, LLC. You should consider the investment objectives, risks, charges and expenses of the funds under consideration carefully before investing. Each fund’s prospectus contains this and other information and is available at www.blackrock.com or by calling (800) 441-7762 or from your financial advisor. The prospectus should be read carefully before investing.
| BLACKROCK FUNDS | JANUARY 31, 2013 | 59
|
The report is transmitted to shareholders only. It is not authorized for use as an offer of sale or a solicitation of an offer to buy shares of the Funds unless accompanied or preceded by that Fund’s current prospectus. Past performance results shown in this report should not be considered a representation of future performance. Investment returns and principal value of shares will fluctuate so that shares, when redeemed, may be worth more or less than their original cost. Statements and other information herein are as dated and are subject to change. Please see the Funds’ prospectus for a description of risks associated with global investments.
| #EMLSGLS-1/13-SAR | | | | |  | |
JANUARY 31, 2013
| SEMI-ANNUAL REPORT (UNAUDITED) | | |
BlackRock FundsSM
Not FDIC Insured • May Lose Value • No Bank Guarantee |
Table of Contents
| | Page |
Dear Shareholder | | | | | 3 | |
Semi-Annual Report:
| | | | | | |
Fund Summary | | | | | 4 | |
About Fund Performance | | | | | 6 | |
Disclosure of Expenses | | | | | 6 | |
Portfolio Information | | | | | 7 | |
Financial Statements: | | | | | | |
Consolidated Schedule of Investments | | | | | 8 | |
Consolidated Statement of Assets and Liabilities | | | | | 11 | |
Consolidated Statement of Operations | | | | | 12 | |
Consolidated Statements of Changes in Net Assets | | | | | 13 | |
Consolidated Financial Highlights | | | | | 14 | |
Notes to Consolidated Financial Statements | | | | | 17 | |
Officers and Trustees | | | | | 23 | |
Additional Information | | | | | 24 | |
A World-Class Mutual Fund Family | | | | | 26 | |
| 2 | BLACKROCK INDIA FUND | JANUARY 31, 2013
|
Financial markets have substantially improved over the past year, providing investors with considerable relief compared to where things were during the global turmoil seen in 2011. Despite a number of headwinds, higher-risk asset classes boasted strong returns as investors sought meaningful yields in the ongoing low-interest-rate environment.
Rising investor confidence drove equity markets higher in early 2012, while climbing US Treasury yields pressured higher-quality fixed income assets. The second quarter, however, brought a market reversal as Europe’s debt crisis boiled over once again. Political instability in Greece and severe deficit and liquidity problems in Spain raised the specter of a euro collapse. Alongside the drama in Europe, investors were discouraged by gloomy economic reports from various parts of the world. A slowdown in China, a key powerhouse for global growth, emerged as a particular concern. But as the outlook for the global economy worsened, investors grew increasingly optimistic that the world’s largest central banks would soon intervene to stimulate growth. This theme, along with the European Central Bank’s (“ECB’s”) firm commitment to preserve the euro currency bloc, drove most asset classes higher through the summer. Policy relief came in early September, when the ECB announced its decision to support the eurozone’s troubled peripheral countries with unlimited purchases of short term sovereign debt. Days later, the US Federal Reserve announced its own much-anticipated stimulus package.
Although financial markets world-wide were buoyed by accommodative monetary policy, risk assets weakened in the fall. Global trade slowed as many European countries fell into recession and growth continued to decelerate in China, where a once-a-decade leadership change compounded uncertainty. In the United States, stocks slid on lackluster corporate earnings reports and market volatility rose during the lead up to the US Presidential election. In the post-election environment, investors grew increasingly concerned over automatic tax increases and spending cuts that had been scheduled to take effect at the beginning of 2013 (known as the “fiscal cliff”). There was widespread fear that the fiscal cliff would push the nation into recession unless politicians could agree upon alternate measures to reduce the deficit before the end of 2012. Worries that bipartisan gridlock would preclude a timely budget deal triggered higher levels of volatility in financial markets around the world in the months leading up to the last day of the year. Ultimately, the United States averted the worst of the fiscal cliff with a last-minute tax deal; however, decisions relating to spending cuts and the debt ceiling continue to weigh on investors’ minds.
Investors shook off the nerve-wracking finale to 2012 and began the New Year with a powerful equity rally. Key indicators signaled broad-based improvements in the world’s major economies, particularly China. In the United States, economic data was mixed, but pointed to a continued recovery. The risk of inflation remained low and the US Federal Reserve showed no signs of curtailing its stimulus programs. Additionally, January saw the return of funds that investors had pulled out of the market in late 2012 amid uncertainty about tax-rate increases ahead of the fiscal cliff deadline. In fixed income markets, rising US Treasuries yields dragged down higher-quality asset classes, while high yield bonds continued to benefit from investor demand for yield in the low-rate environment.
On the whole, riskier asset classes outperformed lower-risk investments for the 6- and 12-month periods ended January 31, 2013. International equities were the strongest performers. US stocks and high yield bonds also generated significant returns. Emerging market equities were particularly volatile, but still posted gains for both the 6- and 12-month periods. US Treasury yields remained low, but experienced increasing volatility in recent months. Rising yields near the end of the period resulted in negative returns for Treasuries and investment-grade bonds for the 6-month period. Tax-exempt municipal bonds, however, benefited from favorable supply-and-demand dynamics. Near-zero short term interest rates continued to keep yields on money market securities near their all-time lows.
While investors continue to face a host of unknowns, we believe new opportunities abound. BlackRock was built to provide the global market insight, breadth of capabilities, unbiased investment advice and deep risk management expertise these times require. We encourage you to visit www.blackrock.com/newworld for more information.
Sincerely,
Rob Kapito
President, BlackRock Advisors, LLC

“Despite a number of headwinds, higher-risk asset classes boasted strong returns as investors sought meaningful yields in the ongoing low-interest-rate environment.”
Rob Kapito
President, BlackRock Advisors, LLC
Total Returns as of January 31, 2013 | | | | 6-month | | 12-month |
US large cap equities (S&P 500® Index) | | | | | 9.91 | % | | | 16.78 | % |
US small cap equities (Russell 2000® Index) | | | | | 15.51 | | | | 15.47 | |
International equities (MSCI Europe, Australasia, Far East Index) | | | | | 18.61 | | | | 17.25 | |
Emerging market equities (MSCI Emerging Markets Index) | | | | | 13.11 | | | | 7.64 | |
3-month Treasury bill (BofA Merrill Lynch 3-Month US Treasury Bill Index) | | | | | 0.07 | | | | 0.11 | |
US Treasury securities (BofA Merrill Lynch 10-Year US Treasury Index) | | | | | (2.90 | ) | | | 1.28 | |
US investment grade bonds (Barclays US Aggregate Bond Index) | | | | | (0.29 | ) | | | 2.59 | |
Tax-exempt municipal bonds (S&P Municipal Bond Index) | | | | | 2.21 | | | | 5.50 | |
US high yield bonds (Barclays US Corporate High Yield 2% Issuer Capped Index) | | | | | 7.37 | | | | 13.87 | |
Past performance is no guarantee of future results. Index performance is shown for illustrative purposes only. You cannot invest directly in an index.
| | THIS PAGE NOT PART OF YOUR FUND REPORT | 3 |
| |
| Fund Summary as of January 31, 2013 |
|
Investment Objective
BlackRock India Fund’s (the “Fund”) investment objective is to seek to maximize total return from a portfolio of equity securities of Indian companies or instruments with similar economic characteristics. Total return means the combination of capital appreciation and investment income.
Portfolio Management Commentary
How did the Fund perform?
| • | For the six-month period ended January 31, 2013, the Fund outperformed its benchmark, the MSCI India Index. |
What factors influenced performance?
| • | The Fund’s outperformance versus its benchmark index was attributable mainly to stock selection. An overweight to United Spirits Ltd. (beverages) was the largest contributor to outperformance for the period. Overweight positions in Motherson Sumi Systems Ltd. (auto components) and Shriram City Union Finance Ltd. (consumer finance) also had a significant positive impact on returns, as did underweight positions in Hindustan Unilever Ltd. (household products) and HDFC Bank Ltd. (commercial banks). From a sector perspective, overweights in consumer staples, financials and consumer discretionary contributed to the Fund’s relative outperformance. |
| • | Relative to its benchmark index, the Fund’s underweights to the information technology (“IT”), telecommunication services and materials sectors detracted from performance. At the individual stock level, underweight positions in Infosys Ltd. (IT services) and Axis Bank Ltd. (commercial banks) along with an overweight position in NIIT Technologies Ltd. (IT software) hindered results during the period. |
Describe recent portfolio activity.
| • | During the six-month period, the Fund added exposure to financials, utilities, IT, materials and consumer discretionary, and reduced exposure to consumer staples. |
| • | Notable new positions established during the period included GAIL India Ltd. (gas utilities), Tata Power Co. Ltd. (electric utilities), Tech Mahindra Ltd. and Wipro Ltd. (IT services), Wockhardt Ltd. and Strides Arcolab Ltd. (pharmaceuticals), Pantaloon Retail India Ltd. (multiline retail), SITI Cable Network Ltd. (media), NTPC Ltd. and JSW Energy Ltd. (independent power producers & energy traders), Gujarat Mineral Development Corp. Ltd. (metals & mining), Power Finance Corp. Ltd. (diversified financial services) and United Phosphorus Ltd. (chemicals). |
| • | The Fund sold its positions in Hindustan Unilever Ltd. (household products), Marico Ltd. (personal products), Sun Pharmaceuticals Industries Ltd. and Ranbaxy Laboratories Ltd. (pharmaceuticals), Crompton Greaves Ltd. (electrical equipment), Tata Steel Ltd. (metals & mining), Yes Bank Ltd. (commercial banks), Multi Commodity Exchange of India Ltd. (diversified financial services), Raymond Ltd. (textiles, apparel & luxury goods) and Exide Industries Ltd. (auto components). |
Describe portfolio positioning at period end.
| • | Relative to the MSCI India Index, the Fund ended the period with its most notable overweights in the consumer discretionary, industrials, utilities and health care sectors, and underweights in IT, energy and consumer staples. |
The views expressed reflect the opinions of BlackRock as of the date of this report and are subject to change based on changes in market, economic or other conditions. These views are not intended to be a forecast of future events and are no guarantee of future results.
Derivative Financial Instruments
The Fund may invest in various derivative financial instruments, including foreign currency exchange contracts, as specified in Note 2 of the Notes to Consolidated Financial Statements, which may constitute forms of economic leverage. Such derivative financial instruments are used to obtain exposure to a security, index and/or market without owning or taking physical custody of securities or to hedge market and/or equity risks. Derivative financial instruments involve risks, including the imperfect correlation between the value of a derivative financial instrument and the underlying asset, possible default of the counterparty to the transaction or illiquidity of the derivative financial instrument. The Fund’s ability to use a derivative financial instrument successfully depends on the investment advisor’s ability to predict pertinent market movements accurately, which cannot be assured. The use of derivative financial instruments may result in losses greater than if they had not been used, may require the Fund to sell or purchase portfolio investments at inopportune times or for distressed values, may limit the amount of appreciation the Fund can realize on an investment, may result in lower dividends paid to shareholders or may cause the Fund to hold an investment that it might otherwise sell. The Fund’s investments in these instruments are discussed in detail in the Notes to Consolidated Financial Statements.
| 4 | BLACKROCK INDIA FUND | JANUARY 31, 2013
|
Total Return Based on a $10,000 Investment
| 1 | | Assuming maximum sales charges, if any, transaction costs and other operating expenses, including investment advisory fees. Institutional Shares do not have a sales charge. |
| 2 | | The Fund invests at least 80% of its total assets in equity securities of Indian companies or in instruments with similar economic characteristics. |
| 3 | | This unmanaged index is a free-float weighted equity index representing about 59 companies in India. |
| 4 | | Commencement of operations. |
Performance Summary for the Period Ended January 31, 2013
| | | | | | Average Annual Total Returns5
|
|
| | | | | | 1 Year
| | Since Inception6
|
|
|
|
|
| 6-Month
Total Returns
|
| w/o sales
charge
|
| w/sales
charge
|
| w/o sales
charge
|
| w/sales
charge
|
Institutional | | | | | 25.43 | % | | | 18.14 | % | | | N/A | | | | (0.16 | )% | | | N/A | |
Investor A | | | | | 25.38 | | | | 17.80 | | | | 11.61 | % | | | (0.40 | ) | | | (3.44 | )% |
Investor C | | | | | 24.87 | | | | 16.83 | | | | 15.83 | | | | (1.21 | ) | | | (1.21 | ) |
MSCI India Index | | | | | 22.32 | | | | 9.34 | | | | N/A | | | | (3.39 | ) | | | N/A | |
| 5 | | Assuming maximum sales charges, if any. Average annual total returns with and without sales charges reflect reductions for distribution and service fees, if any. See “About Fund Performance” on page 6 for a detailed description of share classes, including related fees, if any. |
| 6 | | The Fund commenced operations on May 5, 2011. |
| | N/A — Not applicable as share class and index do not have a sales charge. |
| | Past performance is not indicative of future results. |
Expense Example
| | | | Actual
| | Hypothetical8
|
| |
|
|
|
| Beginning
Account Value
August 1, 2012
|
| Ending
Account Value
January 31, 2013
|
| Expenses Paid
During the Period7
|
| Beginning
Account Value
August 1, 2012
|
| Ending
Account Value
January 31, 2013
|
| Expenses Paid
During the Period7
|
| Annualized
Expense Ratio
|
| Institutional | | | | $ | 1,000.00 | | | $ | 1,254.30 | | | $ | 9.89 | | | $ | 1,000.00 | | | ��$ | 1,016.41 | | | $ | 8.84 | | | | 1.74 | % |
| Investor A | | | | $ | 1,000.00 | | | $ | 1,253.80 | | | $ | 11.30 | | | $ | 1,000.00 | | | $ | 1,015.21 | | | $ | 10.11 | | | | 1.99 | % |
| Investor C | | | | $ | 1,000.00 | | | $ | 1,248.70 | | | $ | 15.53 | | | $ | 1,000.00 | | | $ | 1,011.41 | | | $ | 13.89 | | | | 2.74 | % |
| 7 | | For each class of the Fund, expenses are equal to the annualized expense ratio for the class, multiplied by the average account value over the period, multiplied by 184/365 (to reflect the one-half year period shown). |
| 8 | | Hypothetical 5% annual return before expenses is calculated by pro rating the number of days in the most recent fiscal half year divided by 365. |
| | See “Disclosure of Expenses” on page 6 for further information on how expenses were calculated. |
| BLACKROCK INDIA FUND | JANUARY 31, 2013 | 5
|
| • | Institutional Shares are not subject to any sales charge. These shares bear no ongoing distribution or service fees and are available only to eligible investors. |
| • | Investor A Shares are subject to a maximum initial sales charge (front-end load) of 5.25% and a service fee of 0.25% per year (but no distribution fee). |
| • | Investor C Shares are subject to a 1.00% contingent deferred sales charge (“CDSC”) if redeemed within one year of purchase. In addition, these shares are subject to a distribution fee of 0.75% per year and a service fee of 0.25% per year. |
Performance information reflects past performance and does not guarantee future results. Current performance may be lower or higher than the performance data quoted. Refer to www.blackrock.com/funds to obtain performance data current to the most recent month end. Performance results do not reflect the deduction of taxes that a shareholder would pay on fund distributions or the redemption of fund shares. Figures shown in the performance table on the previous page assume reinvestment of all dividends and capital gain distributions, if any, at net asset value (“NAV”) on the ex-dividend date. Investment return and principal value of shares will fluctuate so that shares, when redeemed, may be worth more or less than their original cost.
The Fund’s investment advisor waived and/or reimbursed a portion of the Fund’s expenses. Without such waiver and/or reimbursement, the Fund’s performance would have been lower. BlackRock Advisors, LLC (the “Manager”) is under no obligation to waive or reimburse or to continue waiving or reimbursing its fees after the applicable termination date. See Note 3 of the Notes to Consolidated Financial Statements for additional information on waivers and reimbursements. Dividends paid to each class of shares will vary because of the different levels of service, distribution and transfer agency fees applicable to each class, which are deducted from the income available to be paid to shareholders.
Shareholders of the Fund may incur the following charges: (a) transactional expenses, such as sales charges; and (b) operating expenses, including investment advisory fees, service and distribution fees, including 12b-1 fees, and other Fund expenses. The expense example shown on the previous page (which is based on a hypothetical investment of $1,000 invested on August 1, 2012 and held through January 31, 2013) is intended to assist shareholders both in calculating expenses based on an investment in the Fund and in comparing these expenses with similar costs of investing in other mutual funds.
The expense example provides information about actual account values and actual expenses. In order to estimate the expenses a shareholder paid during the period covered by this report, shareholders can divide their account value by $1,000 and then multiply the result by the number corresponding to their share class under the heading entitled “Expenses Paid During the Period.”
The expense example also provides information about hypothetical account values and hypothetical expenses based on the Fund’s actual expense ratio and an assumed rate of return of 5% per year before expenses. In order to assist shareholders in comparing the ongoing expenses of investing in the Fund and other funds, compare the 5% hypothetical example with the 5% hypothetical examples that appear in other funds’ shareholder reports.
The expenses shown in the expense example are intended to highlight shareholders’ ongoing costs only and do not reflect any transactional expenses, such as sales charges, if any. Therefore, the hypothetical example is useful in comparing ongoing expenses only, and will not help shareholders determine the relative total expenses of owning different funds. If these transactional expenses were included, shareholder expenses would have been higher.
| 6 | BLACKROCK INDIA FUND | JANUARY 31, 2013
|
As of January 31, 2013
Ten Largest Holdings
| Percent of
Long-Term Investments
|
|
ICICI Bank Ltd. | | | | | 6 | % |
Infosys Ltd. | | | | | 4 | |
Reliance Industries Ltd. | | | | | 4 | |
State Bank of India | | | | | 4 | |
Bharat Petroleum Corp. Ltd. | | | | | 3 | |
Induslnd Bank Ltd. | | | | | 3 | |
HDFC Bank Ltd. | | | | | 3 | |
United Spirits Ltd. | | | | | 3 | |
Bharti Airtel Ltd. | | | | | 2 | |
Tata Consultancy Services Ltd. | | | | | 2 | |
Sector Allocation
| Percent of
Long-Term Investments
|
|
Financials | | | | | 31 | % |
Information Technology | | | | | 12 | |
Consumer Discretionary | | | | | 10 | |
Energy | | | | | 10 | |
Materials | | | | | 8 | |
Consumer Staples | | | | | 7 | |
Industrials | | | | | 7 | |
Health Care | | | | | 7 | |
Utilities | | | | | 6 | |
Telecommunication Services | | | | | 2 | |
For Fund compliance purposes, the Fund’s sector classifications refer to any one or more of the sector sub-classifications used by one or more widely recognized market indexes or ratings group indexes, and/or as defined by Fund management. These definitions may not apply for purposes of this report, which may combine such sector sub-classifications for reporting ease.
| BLACKROCK INDIA FUND | JANUARY 31, 2013 | 7
|
| |
| Consolidated Schedule of Investments January 31, 2013 (Unaudited) | (Percentages shown are based on Net Assets)
|
Common Stocks
|
|
|
|
Shares
|
| Value
|
Air Freight & Logistics — 0.9% | | | | | | | | | | |
Blue Dart Express Ltd. | | | | | 1,487 | | | $ | 56,229 | |
Auto Components — 1.0% | | | | | | | | | | |
Motherson Sumi Systems Ltd. | | | | | 16,655 | | | | 61,842 | |
Automobiles — 3.4% | | | | | | | | | | |
Bajaj Auto Ltd. | | | | | 1,454 | | | | 55,436 | |
Maruti Suzuki India Ltd. | | | | | 2,223 | | | | 66,135 | |
Tata Motors Ltd., Class A | | | | | 28,908 | | | | 90,466 | |
| | | | | | | | | 212,037 | |
Beverages — 3.6% | | | | | | | | | | |
United Breweries Ltd. | | | | | 2,826 | | | | 38,773 | |
United Spirits Ltd. | | | | | 5,381 | | | | 182,543 | |
| | | | | | | | | 221,316 | |
Building Products — 0.8% | | | | | | | | | | |
Kajaria Ceramics Ltd. | | | | | 13,053 | | | | 52,344 | |
Capital Markets — 0.5% | | | | | | | | | | |
JM Financial Ltd. | | | | | 78,716 | | | | 30,236 | |
Chemicals — 2.1% | | | | | | | | | | |
Godrej Industries Ltd. | | | | | 8,264 | | | | 47,316 | |
Solar Industries India Ltd. | | | | | 769 | | | | 15,327 | |
United Phosphorus Ltd. | | | | | 17,947 | | | | 44,889 | |
Zuari Agro Chemicals Ltd. (FKA Zuari Holdings Ltd.) (a) | | | | | 4,836 | | | | 21,757 | |
| | | | | | | | | 129,289 | |
Commercial Banks — 21.2% | | | | | | | | | | |
Axis Bank Ltd. | | | | | 3,291 | | | | 93,158 | |
Bank of Baroda | | | | | 2,323 | | | | 37,904 | |
HDFC Bank Ltd. | | | | | 15,114 | | | | 182,911 | |
ICICI Bank Ltd. | | | | | 16,519 | | | | 368,895 | |
IndusInd Bank Ltd. | | | | | 23,491 | | | | 192,495 | |
Karur Vysya Bank Ltd. | | | | | 12,234 | | | | 121,664 | |
Punjab National Bank | | | | | 2,480 | | | | 43,741 | |
State Bank of India | | | | | 4,753 | | | | 217,894 | |
Union Bank of India | | | | | 13,626 | | | | 65,233 | |
| | | | | | | | | 1,323,895 | |
Construction & Engineering — 2.4% | | | | | | | | | | |
IVRCL Ltd. (a) | | | | | 48,106 | | | | 31,131 | |
Larsen & Toubro Ltd. | | | | | 4,191 | | | | 121,566 | |
| | | | | | | | | 152,697 | |
Construction Materials — 1.3% | | | | | | | | | | |
Grasim Industries Ltd. | | | | | 420 | | | | 24,546 | |
Shree Cement Ltd. | | | | | 700 | | | | 58,719 | |
| | | | | | | | | 83,265 | |
Consumer Finance — 3.2% | | | | | | | | | | |
Bajaj Finance Ltd. | | | | | 2,895 | | | | 70,370 | |
Mahindra & Mahindra Financial Services Ltd. (a) | | | | | 1,235 | | | | 24,077 | |
Shriram City Union Finance Ltd. | | | | | 3,048 | | | | 62,993 | |
Sundaram Finance Ltd. | | | | | 4,570 | | | | 42,031 | |
| | | | | | | | | 199,471 | |
Common Stocks
|
|
|
|
Shares
|
| Value
|
Diversified Financial Services — 1.6% | | | | | | | | | | |
IDFC Ltd. (FKA Infrastructure Development Finance Co. Ltd.) | | | | | 16,114 | | | $ | 51,397 | |
Power Finance Corp. Ltd. | | | | | 12,500 | | | | 49,565 | |
| | | | | | | | | 100,962 | |
Electric Utilities — 2.7% | | | | | | | | | | |
CESC Ltd. | | | | | 8,939 | | | | 52,254 | |
Power Grid Corp. of India Ltd. | | | | | 15,417 | | | | 31,951 | |
Tata Power Co. Ltd. | | | | | 45,322 | | | | 86,145 | |
| | | | | | | | | 170,350 | |
Electrical Equipment — 0.9% | | | | | | | | | | |
Havells India Ltd. | | | | | 3,506 | | | | 43,411 | |
Triveni Turbine Ltd. | | | | | 11,679 | | | | 12,713 | |
| | | | | | | | | 56,124 | |
Food Products — 1.2% | | | | | | | | | | |
Nestlé India Ltd. | | | | | 437 | | | | 38,989 | |
Tata Global Beverages Ltd. | | | | | 11,771 | | | | 32,999 | |
| | | | | | | | | 71,988 | |
Gas Utilities — 1.3% | | | | | | | | | | |
GAIL India Ltd. | | | | | 12,977 | | | | 83,478 | |
Household Products — 0.4% | | | | | | | | | | |
Jyothy Laboratories Ltd. | | | | | 8,715 | | | | 24,758 | |
Independent Power Producers &
Energy Traders — 1.9% | | | | | | | | | | |
JSW Energy Ltd. | | | | | 42,463 | | | | 56,821 | |
NTPC Ltd. (a) | | | | | 20,071 | | | | 59,332 | |
| | | | | | | | | 116,153 | |
Industrial Conglomerates — 2.0% | | | | | | | | | | |
Jaiprakash Associates Ltd. | | | | | 35,226 | | | | 57,643 | |
MAX India Ltd. | | | | | 14,002 | | | | 65,725 | |
| | | | | | | | | 123,368 | |
IT Services — 9.3% | | | | | | | | | | |
CMC Ltd. | | | | | 442 | | | | 11,384 | |
HCL Technologies Ltd. | | | | | 2,326 | | | | 30,128 | |
Hexaware Technologies Ltd. | | | | | 12,498 | | | | 18,533 | |
Infosys Ltd. | | | | | 4,305 | | | | 226,099 | |
Satyam Computer Services Ltd. (a) | | | | | 12,983 | | | | 29,156 | |
Tata Consultancy Services Ltd. | | | | | 5,356 | | | | 135,407 | |
Tech Mahindra Ltd. | | | | | 4,883 | | | | 91,452 | |
Wipro Ltd. | | | | | 5,232 | | | | 40,483 | |
| | | | | | | | | 582,642 | |
Media — 3.5% | | | | | | | | | | |
Dish TV India Ltd. (a) | | | | | 35,570 | | | | 48,115 | |
SITI Cable Network Ltd. (a) | | | | | 140,067 | | | | 67,940 | |
TV18 Broadcast Ltd. (a) | | | | | 43,481 | | | | 27,350 | |
Zee Entertainment Enterprises Ltd. | | | | | 16,880 | | | | 73,056 | |
| | | | | | | | | 216,461 | |
Metals & Mining — 4.0% | | | | | | | | | | |
Gujarat Mineral Development Corp. Ltd. | | | | | 13,815 | | | | 50,045 | |
Hindalco Industries Ltd. | | | | | 35,620 | | | | 77,810 | |
JSW Steel Ltd. | | | | | 2,832 | | | | 47,013 | |
Sterlite Industries India Ltd. | | | | | 36,178 | | | | 77,190 | |
| | | | | | | | | 252,058 | |
Portfolio Abbreviation
See Notes to Consolidated Financial Statements.
| 8 | BLACKROCK INDIA FUND | JANUARY 31, 2013
|
| |
| Consolidated Schedule of Investments (continued) | (Percentages shown are based on Net Assets)
|
Common Stocks
|
|
|
|
Shares
|
| Value
|
Multiline Retail — 1.0% | | | | | | | | | | |
Pantaloon Retail India Ltd. (a) | | | | | 13,386 | | | $ | 63,296 | |
Oil, Gas & Consumable Fuels — 9.5% | | | | | | | | | | |
Bharat Petroleum Corp. Ltd. | | | | | 25,910 | | | | 200,093 | |
Cairn India Ltd. | | | | | 4,052 | | | | 24,630 | |
Coal India Ltd. | | | | | 3,523 | | | | 23,410 | |
Oil & Natural Gas Corp. Ltd. | | | | | 19,094 | | | | 121,943 | |
Reliance Industries Ltd. | | | | | 13,423 | | | | 223,775 | |
| | | | | | | | | 593,851 | |
Personal Products — 0.4% | | | | | | | | | | |
Colgate-Palmolive India Ltd. | | | | | 959 | | | | 24,380 | |
Pharmaceuticals — 6.5% | | | | | | | | | | |
Cadila Healthcare Ltd. | | | | | 2,031 | | | | 32,994 | |
Cipla Ltd. | | | | | 3,552 | | | | 27,165 | |
Dr. Reddy’s Laboratories Ltd. | | | | | 2,359 | | | | 84,907 | |
Glenmark Pharmaceuticals Ltd. | | | | | 6,655 | | | | 62,880 | |
Lupin Ltd. | | | | | 3,150 | | | | 35,802 | |
Strides Arcolab Ltd. | | | | | 2,233 | | | | 45,535 | |
Sun Pharma Advanced Research Co. Ltd. (a) | | | | | 15,163 | | | | 33,415 | |
Wockhardt Ltd. (a) | | | | | 2,555 | | | | 83,831 | |
| | | | | | | | | 406,529 | |
Real Estate Management & Development — 2.0% | | | | | | | | | | |
Prestige Estates Projects Ltd. | | | | | 13,824 | | | | 46,912 | |
Sobha Developers Ltd. | | | | | 9,281 | | | | 74,884 | |
| | | | | | | | | 121,796 | |
Software — 2.0% | | | | | | | | | | |
NIIT Technologies Ltd. | | | | | 13,190 | | | | 65,522 | |
Oracle Financial Services Software Ltd. (a) | | | | | 936 | | | | 56,149 | |
| | | | | | | | | 121,671 | |
Common Stocks
|
|
|
|
Shares
|
| Value
|
Textiles, Apparel & Luxury Goods — 0.9% | | | | | | | | | | |
Arvind Ltd. | | | | | 23,056 | | | $ | 40,857 | |
SRF Ltd. (a) | | | | | 3,705 | | | | 13,440 | |
| | | | | | | | | 54,297 | |
Thrifts & Mortgage Finance — 2.0% | | | | | | | | | | |
Housing Development Finance Corp. | | | | | 8,415 | | | | 124,493 | |
Tobacco — 1.6% | | | | | | | | | | |
ITC Ltd. | | | | | 17,148 | | | | 99,173 | |
Wireless Telecommunication Services — 2.3% | | | | | | | | | | |
Bharti Airtel Ltd. | | | | | 22,251 | | | | 142,071 | |
Total Common Stocks — 97.4% | | 6,072,520 | |
|
Rights | | | | | | | | | | |
Consumer Finance — 0.0% | | | | | | | | | | |
Bajaj Finance Ltd. (Expires 2/21/2013) (a) | | | | | 457 | | | | 1,648 | |
Total Long-Term Investments
(Cost — $5,113,233) — 97.4% | | 6,074,168 | |
|
Short-Term Securities | | | | | | | | | | |
BlackRock Liquidity Funds, TempFund, Institutional Class, 0.10% (b)(c) | | | | | 60,974 | | | | 60,974 | |
Total Short-Term Securities
(Cost — $60,974) — 1.0% | | 60,974 | |
Total Investments (Cost—$5,174,207) — 98.4% | | 6,135,142 | |
Other Assets Less Liabilities — 1.6% | | 97,461 | |
Net Assets — 100.0% | $ | 6,232,603 | |
Notes to Consolidated Schedule of Investments
| (a) | | | | Non-income producing security. |
| (b) | | | | Investments in issuers considered to be an affiliate of the Fund during the six months ended January 31, 2013, for purposes of Section 2(a)(3) of the Investment Company Act of 1940, as amended, were as follows: |
Affiliate
| | | | Shares
Held at
July 31, 2012 | | Net
Activity | | Shares
Held at
January 31, 2013 | | Income |
BlackRock Liquidity Funds, TempFund, Institutional Class | | | | | 32,591 | | | | 28,383 | | | | 60,974 | | | $ | 38 | |
| (c) | | Represents the current yield as of report date. |
| • | | For Fund compliance purposes, the Fund’s sector classifications refer to any one or more of the sector sub-classifications used by one or more widely recognized market indexes or ratings group indexes, and/or as defined by Fund management. These definitions may not apply for purposes of this report, which may combine such sector sub-classifications for reporting ease. |
| • | | Fair Value Measurements — Various inputs are used in determining the fair value of investments. These inputs to valuation techniques are categorized into a disclosure hierarchy consisting of three broad levels for financial statement purposes as follows: |
| | • | | Level 1 — unadjusted price quotations in active markets/exchanges for identical assets and liabilities that the Fund has the ability to access |
| | • | | Level 2 — other observable inputs (including, but not limited to, quoted prices for similar assets or liabilities in markets that are active, quoted prices for identical or similar assets or liabilities in markets that are not active, inputs other than quoted prices that are observable for the assets or liabilities (such as interest rates, yield curves, volatilities, prepayment speeds, loss severities, credit risks and default rates) or other market-corroborated inputs) |
| | • | | Level 3 — unobservable inputs based on the best information available in the circumstances, to the extent observable inputs are not available (including the Fund’s own assumptions used in determining the fair value of investments) |
| | | The hierarchy gives the highest priority to unadjusted quoted prices in active markets for identical assets or liabilities (Level 1 measurements) and the lowest priority to unobservable inputs (Level 3 measurements). Accordingly, the degree of judgment exercised in determining fair value is greatest for instruments categorized in Level 3. The inputs used to measure fair value may fall into different levels of the fair value hierarchy. In such cases, for disclosure purposes, the level in the fair value hierarchy within which the fair value measurement falls in its entirety is determined based on the lowest level input that is significant to the fair value measurement in its entirety. |
See Notes to Consolidated Financial Statements.
| BLACKROCK INDIA FUND | JANUARY 31, 2013 | 9
|
| |
| Consolidated Schedule of Investments (concluded) |
|
Changes in valuation techniques may result in transfers into or out of an assigned level within the disclosure hierarchy. In accordance with the Fund’s policy, transfers between different levels of the fair value disclosure hierarchy are deemed to have occurred as of the beginning of the reporting period. The categorization of a value determined for investments is based on the pricing transparency of the investment and is not necessarily an indication of the risks associated with investing in those securities. For information about the Fund’s policy regarding valuation of investments and other significant accounting policies, please refer to Note 1 of the Notes to Consolidated Financial Statements.
The following table summarizes the Fund’s investments categorized in the disclosure hierarchy as of January 31, 2013:
|
|
|
| Level 1
|
| Level 2
|
| Level 3
|
| Total
|
Assets:
| | | | | | | |
Investments: | | | | | | | | | | | | | | | | | | |
Long-Term Investments: | | | | | | | | | | | | | | | | | | |
Common Stocks: | | | | | | | | | | | | | | | | | | |
Air Freight & Logistics | | | | $ | 56,229 | | | | — | | | | — | | | $ | 56,229 | |
Auto Components | | | | | 61,842 | | | | — | | | | — | | | | 61,842 | |
Automobiles | | | | | — | | | $ | 212,037 | | | | — | | | | 212,037 | |
Beverages | | | | | 182,543 | | | | 38,773 | | | | — | | | | 221,316 | |
Building Products | | | | | 52,344 | | | | — | | | | — | | | | 52,344 | |
Capital Markets | | | | | — | | | | 30,236 | | | | — | | | | 30,236 | |
Chemicals | | | | | 37,084 | | | | 92,205 | | | | — | | | | 129,289 | |
Commercial Banks | | | | | — | | | | 1,323,895 | | | | — | | | | 1,323,895 | |
Construction & Engineering | | | | | — | | | | 152,697 | | | | — | | | | 152,697 | |
Construction Materials | | | | | — | | | | 83,265 | | | | — | | | | 83,265 | |
Consumer Finance | | | | | 42,031 | | | | 157,440 | | | | — | | | | 199,471 | |
Diversified Financial Services | | | | | — | | | | 100,962 | | | | — | | | | 100,962 | |
Electric Utilities | | | | | — | | | | 170,350 | | | | — | | | | 170,350 | |
Electrical Equipment | | | | | 12,713 | | | | 43,411 | | | | — | | | | 56,124 | |
Food Products | | | | | 38,989 | | | | 32,999 | | | | — | | | | 71,988 | |
Gas Utilities | | | | | — | | | | 83,478 | | | | — | | | | 83,478 | |
Household Products | | | | | — | | | | 24,758 | | | | — | | | | 24,758 | |
Independent Power Producers & Energy Traders | | | | | — | | | | 116,153 | | | | — | | | | 116,153 | |
Industrial Conglomerates | | | | | — | | | | 123,368 | | | | — | | | | 123,368 | |
IT Services | | | | | 11,384 | | | | 571,258 | | | | — | | | | 582,642 | |
Media | | | | | 116,055 | | | | 100,406 | | | | — | | | | 216,461 | |
Metals & Mining | | | | | — | | | | 252,058 | | | | — | | | | 252,058 | |
Multiline Retail | | | | | — | | | | 63,296 | | | | — | | | | 63,296 | |
Oil, Gas & Consumable Fuels | | | | | — | | | | 593,851 | | | | — | | | | 593,851 | |
Personal Products | | | | | — | | | | 24,380 | | | | — | | | | 24,380 | |
Pharmaceuticals | | | | | — | | | | 406,529 | | | | — | | | | 406,529 | |
Real Estate Management & Development | | | | | — | | | | 121,796 | | | | — | | | | 121,796 | |
Software | | | | | — | | | | 121,671 | | | | — | | | | 121,671 | |
Textiles, Apparel & Luxury Goods | | | | | 13,440 | | | | 40,857 | | | | — | | | | 54,297 | |
Thrifts & Mortgage Finance | | | | | — | | | | 124,493 | | | | — | | | | 124,493 | |
Tobacco | | | | | — | | | | 99,173 | | | | — | | | | 99,173 | |
Wireless Telecommunication Services | | | | | — | | | | 142,071 | | | | — | | | | 142,071 | |
Rights: | | | | | | | | | | | | | | | | | | |
Consumer Finance | | | | | — | | | | 1,648 | | | | — | | | | 1,648 | |
Short-Term Securities | | | | | 60,974 | | | | — | | | | — | | | | 60,974 | |
Total
| | | | $ | 685,628 | | | $ | 5,449,514 | | | | — | | | $ | 6,135,142 | |
Certain of the Fund’s assets are held at carrying amount, which approximates fair value for financial statement purposes. As of January 31, 2013, foreign currency at value of $126,781 is categorized as Level 1 within the disclosure hierarchy.
Certain foreign securities are fair valued utilizing an external pricing service to reflect any significant market movements between the time the Fund values such foreign securities and the earlier closing of foreign markets. Such fair valuations are categorized as Level 2 in the disclosure hierarchy. As of July 31, 2012, there were securities with a value of $216,868 that were systematically fair valued due to significant market movements, but were not valued using systematic fair values as of January 31, 2013. Therefore, these securities were transferred from Level 2 to Level 1 during the period July 31, 2012 to January 31, 2013.
See Notes to Consolidated Financial Statements.
| 10 | BLACKROCK INDIA FUND | JANUARY 31, 2013
|
| |
| Consolidated Statement of Assets and Liabilities |
|
January 31, 2013 (Unaudited)
| |
Assets |
Investments at value — unaffiliated (cost — $5,113,233) | | | | $ | 6,074,168 | |
Investments at value — affiliated (cost — $60,974) | | | | | 60,974 | |
Foreign currency at value (cost — $126,165) | | | | | 126,781 | |
Capital shares sold receivable | | | | | 104,091 | |
Investments sold receivable | | | | | 70,319 | |
Receivable from Manager | | | | | 27,001 | |
Dividends receivable | | | | | 157 | |
Total assets | | | | | 6,463,491 | |
| | | | | | | |
Liabilities |
Investments purchased payable | | | | | 111,971 | |
Professional fees payable | | | | | 43,193 | |
Registration fees payable | | | | | 22,463 | |
Officer’s and Trustees’ fees payable | | | | | 18,141 | |
Transfer agent fees payable | | | | | 14,174 | |
Service and distribution fees payable | | | | | 470 | |
Other accrued expenses payable | | | | | 20,476 | |
Total liabilities | | | | | 230,888 | |
Net Assets | | | | $ | 6,232,603 | |
| | | | | | | |
Net Assets Consist of |
Paid-in capital | | | | $ | 5,906,857 | |
Accumulated net investment loss | | | | | (24,380 | ) |
Accumulated net realized loss | | | | | (611,661 | ) |
Net unrealized appreciation/depreciation | | | | | 961,787 | |
Net Assets | | | | $ | 6,232,603 | |
| | | | | | | |
Net Asset Value |
Institutional — Based on net assets of $4,496,464 and 452,541 shares outstanding, unlimited shares authorized, $0.001 par value | | | | $ | 9.94 | |
Investor A — Based on net assets of $1,401,335 and 141,286 shares outstanding, unlimited shares authorized, $0.001 par value | | | | $ | 9.92 | |
Investor C — Based on net assets of $334,804 and 34,197 shares outstanding, unlimited shares authorized, $0.001 par value | | | | $ | 9.79 | |
See Notes to Consolidated Financial Statements.
| BLACKROCK INDIA FUND | JANUARY 31, 2013 | 11
|
| |
| Consolidated Statement of Operations |
|
Six Months Ended January 31, 2013 (Unaudited)
| |
Investment Income |
Dividends — unaffiliated | | | | $ | 19,240 | |
Dividends — affiliated | | | | | 38 | |
Total income | | | | | 19,278 | |
| | | | | | | |
Expenses |
Investment advisory | | | | | 23,979 | |
Professional | | | | | 78,200 | |
Administration | | | | | 25,606 | |
Custodian | | | | | 22,328 | |
Registration | | | | | 17,994 | |
Officer and Trustees | | | | | 17,864 | |
Printing | | | | | 11,840 | |
Service — Investor A | | | | | 634 | |
Service and distribution — Investor C | | | | | 1,061 | |
Transfer agent — Institutional | | | | | 326 | |
Transfer agent — Investor A | | | | | 634 | |
Transfer agent — Investor C | | | | | 336 | |
Administration — Institutional | | | | | 510 | |
Administration — Investor A | | | | | 63 | |
Administration — Investor C | | | | | 26 | |
Miscellaneous | | | | | 16,041 | |
Total expenses | | | | | 217,442 | |
Less transfer agent fees waived and/or reimbursed — Institutional | | | | | (326 | ) |
Less transfer agent fees waived and/or reimbursed — Investor A | | | | | (634 | ) |
Less transfer agent fees waived and/or reimbursed — Investor C | | | | | (336 | ) |
Less administration fees waived — Institutional | | | | | (510 | ) |
Less administration fees waived — Investor A | | | | | (63 | ) |
Less administration fees waived — Investor C | | | | | (26 | ) |
Less administration fees waived | | | | | (1,798 | ) |
Less fees waived and/or reimbursed by Manager | | | | | (170,091 | ) |
Total expenses after fees waived and/or reimbursed | | | | | 43,658 | |
Net investment loss | | | | | (24,380 | ) |
| | | | | | | |
Realized and Unrealized Gain |
Net realized gain from: | | | | | | |
Investments | | | | | 143,217 | |
Foreign currency transactions | | | | | 2,009 | |
| | | | | 145,226 | |
Net change in unrealized appreciation/depreciation on: | | | | | | |
Investments | | | | | 931,129 | |
Foreign currency translations | | | | | 939 | |
| | | | | 932,068 | |
Total realized and unrealized gain | | | | | 1,077,294 | |
Net Increase in Net Assets Resulting from Operations | | | | $ | 1,052,914 | |
See Notes to Consolidated Financial Statements.
| 12 | BLACKROCK INDIA FUND | JANUARY 31, 2013
|
| |
| Consolidated Statements of Changes in Net Assets |
|
Increase in Net Assets:
| | | | Six Months
Ended
January 31,
2013
(Unaudited) | | | | Year Ended
July 31,
2012 |
Operations |
Net investment income (loss) | | | | $ | (24,380 | ) | | | | | | $ | 25,928 | |
Net realized gain (loss) | | | | | 145,226 | | | | | | | | (732,192 | ) |
Net change in unrealized appreciation/depreciation | | | | | 932,068 | | | | | | | | (129,018 | ) |
Net increase (decrease) in net assets resulting from operations | | | | | 1,052,914 | | | | | | | | (835,282 | ) |
| | | | | | | | | | | | | | | |
Dividends to Shareholders From |
Net investment income: | | | | | | | | | | | | | | |
Institutional | | | | | (13,572 | ) | | | | | | | (268 | )1 |
Investor A | | | | | (640 | ) | | | | | | | — | |
Decrease in net assets resulting from dividends to shareholders | | | | | (14,212 | ) | | | | | | | (268 | ) |
| | | | | | | | | | | | | | | |
Capital Share Transactions |
Net increase in net assets derived from capital share transactions | | | | | 1,142,164 | | | | | | | | 897,468 | |
| | | | | | | | | | | | | | |
Net Assets |
Total increase in net assets | | | | | 2,180,866 | | | | | | | | 61,918 | |
Beginning of period | | | | | 4,051,737 | | | | | | | | 3,989,819 | |
End of period | | | | $ | 6,232,603 | | | | | | | $ | 4,051,737 | |
| | | | | | | | | | | | | | |
Undistributed (accumulated) net investment income (loss) | | | | $ | (24,380 | ) | | | | | | $ | 14,212 | |
| | | | | | | | | | | | | | |
| 1 | | Dividends are determined in accordance with federal income tax regulations. |
See Notes to Consolidated Financial Statements.
| BLACKROCK INDIA FUND | JANUARY 31, 2013 | 13
|
| |
| Consolidated Financial Highlights |
|
| | | | Institutional
|
|
| | | | Six Months
Ended
January 31,
2013
(Unaudited) | | Year
Ended
July 31,
2012 | | Period
May 5,
20111
to July 31,
2011 |
Per Share Operating Performance |
Net asset value, beginning of period | | | | $ | 7.95 | | | $ | 10.29 | | | $ | 10.00 | |
Net investment income (loss)2 | | | | | (0.04 | ) | | | 0.07 | | | | 0.02 | |
Net realized and unrealized gain (loss) | | | | | 2.06 | | | | (2.41 | ) | | | 0.27 | |
Net increase (decrease) from investment operations | | | | | 2.02 | | | | (2.34 | ) | | | 0.29 | |
Dividends from net investment income | | | | | (0.03 | ) | | | (0.00 | )3,4 | | | — | |
Net asset value, end of period | | | | $ | 9.94 | | | $ | 7.95 | | | $ | 10.29 | |
| | | | | | | | | | | | | | | |
Total Investment Return5 |
Based on net asset value | | | | | 25.43% | 6 | | | (22.73)% | | | | 2.90% | 6 |
| | | | | | | | | | | | | |
Ratios to Average Net Assets |
Total expenses | | | | | 8.98% | 7 | | | 16.97% | | | | 27.14% | 8 |
Total expenses after fees waived and/or reimbursed | | | | | 1.75% | 7 | | | 1.75% | | | | 1.75% | 8 |
Net investment income (loss) | | | | | (0.93)% | 7 | | | 0.79% | | | | 0.77% | 8 |
| | | | | | | | | | | | | |
Supplemental Data |
Net assets, end of period (000) | | | | $ | 4,496 | | | $ | 3,558 | | | $ | 3,077 | |
Portfolio turnover | | | | | 62% | | | | 219% | | | | 45% | |
| 1 | | Commencement of operations. |
| 2 | | Based on average shares outstanding. |
| 3 | | Dividends are determined in accordance with federal income tax regulations. |
| 4 | | Amount is greater than $(0.01) per share. |
| 5 | | Where applicable, total investment returns include the reinvestment of dividends and distributions. |
| 6 | | Aggregate total investment return. |
| 8 | | Certain expenses incurred during the period May 5, 2011 to July 31, 2011 have been included in the ratio, but not annualized. If these expenses were annualized, the annualized ratio of total expenses, total expenses after fees waived and/or reimbursed and net investment income would have been 40.60%, 1.75% and 0.77%, respectively. |
See Notes to Consolidated Financial Statements.
| 14 | BLACKROCK INDIA FUND | JANUARY 31, 2013
|
| |
| Consolidated Financial Highlights (continued) |
|
| | | | Investor A
|
|
| | | | Six Months
Ended
January 31,
2013
(Unaudited) | | Year
Ended
July 31,
2012 | | Period
May 5,
20111
to July 31,
2011 |
Per Share Operating Performance |
Net asset value, beginning of period | | | | $ | 7.92 | | | $ | 10.28 | | | $ | 10.00 | |
Net investment income (loss)2 | | | | | (0.06 | ) | | | 0.01 | | | | 0.00 | 3 |
Net realized and unrealized gain (loss) | | | | | 2.07 | | | | (2.37 | ) | | | 0.28 | |
Net increase (decrease) from investment operations | | | | | 2.01 | | | | (2.36 | ) | | | 0.28 | |
Dividends from net investment income | | | | | (0.01 | ) | | | — | | | | — | |
Net asset value, end of period | | | | $ | 9.92 | | | $ | 7.92 | | | $ | 10.28 | |
| | | | | | | | | | | | | | | |
Total Investment Return4 |
Based on net asset value | | | | | 25.38% | 5 | | | (22.96)% | | | | 2.80% | 5 |
| | | | | | | | | | | | | | | |
Ratios to Average Net Assets |
Total expenses | | | | | 9.32% | 6 | | | 17.38% | | | | 28.03% | 7 |
Total expenses after fees waived and/or reimbursed | | | | | 2.00% | 6 | | | 2.00% | | | | 2.00% | 7 |
Net investment income (loss) | | | | | (1.32)% | 6 | | | 0.16% | | | | 0.05% | 7 |
| | | | | | | | | | | | | | | |
Supplemental Data |
Net assets, end of period (000) | | | | $ | 1,401 | | | $ | 333 | | | $ | 797 | |
Portfolio turnover | | | | | 62% | | | | 219% | | | | 45% | |
| 1 | | Commencement of operations. |
| 2 | | Based on average shares outstanding. |
| 3 | | Amount is less than $0.01 per share. |
| 4 | | Where applicable, total investment returns exclude the effects of any sales charges and include the reinvestment of dividends and distributions. |
| 5 | | Aggregate total investment return. |
| 7 | | Certain expenses incurred during the period May 5, 2011 to July 31, 2011 have been included in the ratio, but not annualized. If these expenses were annualized, the annualized ratio of total expenses, total expenses after fees waived and/or reimbursed and net investment income would have been 44.35%, 2.00% and 0.05%, respectively. |
See Notes to Consolidated Financial Statements.
| BLACKROCK INDIA FUND | JANUARY 31, 2013 | 15
|
| |
| Consolidated Financial Highlights (concluded) |
|
| | | | Investor C
|
|
| | | | Six Months
Ended
January 31,
2013
(Unaudited) | | Year
Ended
July 31,
2012 | | Period
May 5,
20111
to July 31,
2011 |
Per Share Operating Performance |
Net asset value, beginning of period | | | | $ | 7.84 | | | $ | 10.26 | | | $ | 10.00 | |
Net investment loss2 | | | | | (0.09 | ) | | | (0.01 | ) | | | (0.01 | ) |
Net realized and unrealized gain (loss) | | | | | 2.04 | | | | (2.41 | ) | | | 0.27 | |
Net increase (decrease) from investment operations | | | | | 1.95 | | | | (2.42 | ) | | | 0.26 | |
Net asset value, end of period | | | | $ | 9.79 | | | $ | 7.84 | | | $ | 10.26 | |
| | | | | | | | | | | | | | | |
Total Investment Return3 |
Based on net asset value | | | | | 24.87% | 4 | | | (23.59)% | | | | 2.60% | 4 |
| | | | | | | | | | | | | | | |
Ratios to Average Net Assets |
Total expenses | | | | | 10.22% | 5 | | | 18.68% | | | | 28.42% | 6 |
Total expenses after fees waived and/or reimbursed | | | | | 2.75% | 5 | | | 2.75% | | | | 2.75% | 6 |
Net investment loss | | | | | (2.01)% | 5 | | | (0.12)% | | | | (0.49)% | 6 |
| | | | | | | | | | | | | | | |
Supplemental Data |
Net assets, end of period (000) | | | | $ | 335 | | | $ | 161 | | | $ | 116 | |
Portfolio turnover | | | | | 62% | | | | 219% | | | | 45% | |
| 1 | | Commencement of operations. |
| 2 | | Based on average shares outstanding. |
| 3 | | Where applicable, total investment returns exclude the effects of any sales charges and include the reinvestment of dividends and distributions. |
| 4 | | Aggregate total investment return. |
| 6 | | Certain expenses incurred during the period May 5, 2011 to July 31, 2011 have been included in the ratio, but not annualized. If these expenses were annualized, the annualized ratio of total expenses, total expenses after fees waived and/or reimbursed and net investment loss would have been 43.43%, 2.75% and (0.49)%, respectively. |
See Notes to Consolidated Financial Statements.
| 16 | BLACKROCK INDIA FUND | JANUARY 31, 2013
|
| |
| Notes to Consolidated Financial Statements (Unaudited) |
|
1. Organization and Significant Accounting Policies:
BlackRock India Fund (the “Fund”), a series of BlackRock FundsSM (the “Trust”), is registered as an open-end management investment company under the Investment Company Act of 1940, as amended (the “1940 Act”). The Trust is organized as a Massachusetts business trust. The Fund is classified as diversified. The Fund’s financial statements are prepared in conformity with accounting principles generally accepted in the United States of America (“US GAAP”), which may require management to make estimates and assumptions that affect the reported amounts of assets and liabilities in the financial statements and the reported amounts of increases and decreases in net assets from operations during the reporting period. Actual results could differ from those estimates. The Fund offers multiple classes of shares. Institutional Shares are sold without a sales charge and only to certain eligible investors. Investor A Shares are generally sold with a front-end sales charge. Investor C Shares may be subject to a CDSC. All classes of shares have identical voting, dividend, liquidation and other rights and the same terms and conditions, except that Investor A and Investor C Shares bear certain expenses related to the shareholder servicing of such shares, and Investor C Shares also bear certain expenses related to the distribution of such shares. Each class has exclusive voting rights with respect to matters relating to its shareholder servicing and distribution expenditures.
The following is a summary of significant accounting policies followed by the Fund:
Basis of Consolidation: The accompanying consolidated financial statements include the accounts of BlackRock India Fund (Mauritius) Limited (the “Subsidiary”), which is a wholly owned subsidiary of the Fund organized in Mauritius, which primarily invests in equity securities issued by companies that are domiciled in India. Through this investment structure, the Fund expects to obtain certain benefits under a current tax treaty between Mauritius and India. Intercompany accounts and transactions have been eliminated. The Subsidiary is subject to the same investment policies and restrictions that apply to the Fund.
Valuation: US GAAP defines fair value as the price the Fund would receive to sell an asset or pay to transfer a liability in an orderly transaction between market participants at the measurement date. The Fund determines the fair values of its financial instruments at market value using independent dealers or pricing services under policies approved by the Board of Trustees of the Trust (the “Board”). The BlackRock Global Valuation Methodologies Committee (the “Global Valuation Committee”) is the committee formed by management to develop global pricing policies and procedures and to provide oversight of the pricing function for the Fund for all financial instruments.
Equity investments traded on a recognized securities exchange or the NASDAQ Global Market System (“NASDAQ”) are valued at the last reported sale price that day or the NASDAQ official closing price, if applicable. For equity investments traded on more than one exchange, the last reported sale price on the exchange where the stock is primarily traded is used. Equity investments traded on a recognized exchange for which there were no sales on that day are valued at the last available bid price. If no bid price is available, the prior day’s price will be used, unless it is determined that such prior day’s price no longer reflects the fair value of the security. Financial futures contracts traded on exchanges are valued at their last sale price. Investments in open-end registered investment companies are valued at NAV each business day. Short-term securities with remaining maturities of 60 days or less may be valued at amortized cost, which approximates fair value.
Securities and other assets and liabilities denominated in foreign currencies are translated into US dollars using exchange rates determined as of the close of business on the New York Stock Exchange (“NYSE”). Foreign currency exchange contracts are valued at the mean between the bid and ask prices and are determined as of the close of business on the NYSE. Interpolated values are derived when the settlement date of the contract is an interim date for which quotations are not available.
In the event that application of these methods of valuation results in a price for an investment that is deemed not to be representative of the market value of such investment, or if a price is not available, the investment will be valued by the Global Valuation Committee, or its delegate, in accordance with a policy approved by the Board as reflecting fair value (“Fair Value Assets”). When determining the price for Fair Value Assets, the Global Valuation Committee, or its delegate, seeks to determine the price that the Fund might reasonably expect to receive from the current sale of that asset in an arm’s-length transaction. Fair value determinations shall be based upon all available factors that the Global Valuation Committee, or its delegate, deems relevant consistent with the principles of fair value measurement, which include the market approach, income approach and/or in the case of recent investments, the cost approach, as appropriate. A market approach generally consists of using comparable market transactions. The income approach generally is used to discount future cash flows to present value and adjusted for liquidity as appropriate. These factors include but are not limited to: (i) attributes specific to the investment or asset; (ii) the principal market for the investment or asset; (iii) the customary participants in the principal market for the investment or asset; (iv) data assumptions by market participants for the investment or asset, if reasonably available; (v) quoted prices for similar investments or assets in active markets; and (vi) other factors, such as future cash flows, interest rates, yield curves, volatilities, prepayment speeds, loss severities, credit risks, recovery rates, liquidation amounts and/or default rates. Due to the inherent uncertainty of valuations of
| BLACKROCK INDIA FUND | JANUARY 31, 2013 | 17
|
| |
| Notes to Consolidated Financial Statements (continued) |
|
such investments, the fair values may differ from the values that would have been used had an active market existed. The Global Valuation Committee, or its delegate, employs various methods for calibrating valuation approaches for investments where an active market does not exist, including regular due diligence of the Fund’s pricing vendors, a regular review of key inputs and assumptions, transactional back-testing or disposition analysis to compare unrealized gains and losses to realized gains and losses, reviews of missing or stale prices and large movements in market values and reviews of any market related activity. The pricing of all Fair Value Assets is subsequently reported to the Board or a committee thereof on a quarterly basis.
Generally, trading in foreign instruments is substantially completed each day at various times prior to the close of business on the NYSE. Occasionally, events affecting the values of such instruments may occur between the foreign market close and the close of business on the NYSE that may not be reflected in the computation of the Fund’s net assets. If events (for example, a company announcement, market volatility or a natural disaster) occur during such periods that are expected to affect the value of such instruments materially, those instruments may be Fair Value Assets and valued at their fair value, as determined in good faith by the Global Valuation Committee using a pricing service and/or policies approved by the Board. Each business day, the Fund uses a pricing service to assist with the valuation of certain foreign exchange-traded equity securities and foreign exchange-traded and over-the-counter options (the “Systematic Fair Value Price”). Using current market factors, the Systematic Fair Value Price is designed to value such foreign securities and foreign options at fair value as of the close of business on the NYSE, which follows the close of the local markets.
Foreign Currency: The Fund’s books and records are maintained in US dollars. Purchases and sales of investment securities are recorded at the rates of exchange prevailing on the respective date of such transactions. Generally, when the US dollar rises in value against a foreign currency, the Fund’s investments denominated in that currency will lose value because its currency is worth fewer US dollars; the opposite effect occurs if the US dollar falls in relative value.
The Fund does not isolate the portion of the results of operations arising as a result of changes in the foreign exchange rates from the changes in the market prices of investments held or sold for financial reporting purposes. Accordingly, the effects of changes in foreign currency exchange rates on investments are not segregated in the Consolidated Statement of Operations from the effects of changes in market prices of those investments but are included as a component of net realized and unrealized gain (loss) from investments. The Fund reports realized currency gains (losses) on foreign currency related transactions as components of net realized gain (loss) for financial reporting purposes, whereas such components are treated as ordinary income for federal income tax purposes.
Segregation and Collateralization: In cases in which the 1940 Act and the interpretive positions of the Securities and Exchange Commission (“SEC”) require that the Fund either deliver collateral or segregate assets in connection with certain investments (e.g., foreign currency exchange contracts), the Fund will, consistent with SEC rules and/or certain interpretive letters issued by the SEC, segregate collateral or designate on its books and records cash or liquid securities having a market value at least equal to the amount that would otherwise be required to be physically segregated. Furthermore, based on requirements and agreements with certain exchanges and third party broker-dealers, a Fund engaging in such transactions may have requirements to deliver/deposit securities to/with an exchange or broker-dealer as collateral for certain investments.
Investment Transactions and Investment Income: For financial reporting purposes, investment transactions are recorded on the dates the transactions are entered into (the trade dates). Realized gains and losses on investment transactions are determined on the identified cost basis. Dividend income is recorded on the ex-dividend dates. Dividends from foreign securities where the ex-dividend date may have passed are subsequently recorded when the Fund is informed of the ex-dividend date. Interest income, including amortization and accretion of premiums and discounts on debt securities, is recognized on the accrual basis. Income and realized and unrealized gains and losses are allocated daily to each class based on its relative net assets.
Dividends and Distributions: Dividends and distributions paid by the Fund are recorded on the ex-dividend dates. Distributions of capital gains are recorded on the ex-dividend dates. The portion of distributions that exceeds the Fund’s current and accumulated earnings and profits, which are measured on a tax basis, will constitute a nontaxable return of capital. Distributions in excess of the Fund’s taxable income and net capital gains, but not in excess of the Fund’s earnings and profits, will be taxable to shareholders as ordinary income and will not constitute a nontaxable return of capital. The character and timing of dividends and distributions are determined in accordance with federal income tax regulations, which may differ from US GAAP.
Income Taxes: It is the Fund’s policy to comply with the requirements of the Internal Revenue Code of 1986, as amended, applicable to regulated investment companies and to distribute substantially all of its taxable income to its shareholders. Therefore, no federal income tax provision is required.
The Fund files US federal and various state and local tax returns. No income tax returns are currently under examination. The statute of limitations on the Fund’s US federal tax returns remains open for the year ended July 31, 2012 and the period ended July 31, 2011. The statutes of limitations on the Fund’s state and local tax returns
| 18 | BLACKROCK INDIA FUND | JANUARY 31, 2013
|
| |
| Notes to Consolidated Financial Statements (continued) |
|
may remain open for an additional year depending on the jurisdiction. Management does not believe there are any uncertain tax positions that require recognition of a tax liability.
The Fund conducts its investment activities in India through its Subsidiary and leverages the Double Tax Avoidance Agreement (“DTAA”) between Mauritius and India. To benefit from the DTAA, the Subsidiary satisfies certain conditions, including residence in Mauritius. Under current regulations, a fund that is a tax resident of Mauritius, but has no branch or permanent establishment in India, is not subject to capital gains tax in India on the sale of securities or to tax on dividends paid by Indian companies. The Subsidiary is subject to tax in Mauritius on its net investment income at a rate of 15%; however, tax credits reduce the effective Mauritius income tax rate to a maximum of 3%. Income tax expense, if any, is disclosed in the Consolidated Statement of Operations.
As a result of legislative changes enacted by the 2012 India Finance Act (the “Act”) and its general anti-avoidance rules (“GAAR”), the Subsidiary’s ability to leverage the treaty between Mauritius and India may be adversely impacted, and therefore the Fund may be subject to taxes on capital gains and/or dividends realized on Indian securities. The Act also includes provisions that impose Indian tax on the transfer of shares of an Indian company. Implementation of GAAR, which was originally effective April 1, 2013, has been deferred until April 1, 2015 pending final enactment of the Finance Bill of 2013. Until more definitive guidance on the legislative changes is available, the impact to the Fund, if any, cannot be determined.
Recent Accounting Standards: In December 2011, the Financial Accounting Standards Board (the “FASB”) issued guidance that will expand current disclosure requirements on the offsetting of certain assets and liabilities. The new disclosures will be required for investments and derivative financial instruments subject to master netting or similar agreements, which are eligible for offset in the Consolidated Statement of Assets and Liabilities and will require an entity to disclose both gross and net information about such investments and transactions in the financial statements. In January 2013, the FASB issued guidance that clarifies which investments and transactions are subject to the offsetting disclosure requirements. The scope of the disclosure requirements for offsetting will be limited to derivative instruments, repurchase agreements and reverse repurchase agreements, and securities borrowing and securities lending transactions.The guidance is effective for financial statements with fiscal years beginning on or after January 1, 2013, and interim periods within those fiscal years. Management is evaluating the impact of this guidance on the Fund’s financial statement disclosures.
Other: Expenses directly related to the Fund or its classes are charged to the Fund or class. Other operating expenses shared by several funds are pro rated among those funds on the basis of relative net assets or other appropriate methods. Expenses directly related to the Fund and other shared expenses pro rated to the Fund are allocated daily to each class based on its relative net assets or other appropriate methods.
The Fund has an arrangement with the custodian whereby fees may be reduced by credits earned on uninvested cash balances, which, if applicable, are shown as fees paid indirectly in the Consolidated Statement of Operations. The custodian imposes fees on overdrawn cash balances, which can be offset by accumulated credits earned or may result in additional custody charges.
2. Derivative Financial Instruments:
The Fund engages in various portfolio investment strategies using derivative contracts both to increase the returns of the Fund and/or to economically hedge, or protect, its exposure to certain risks such as foreign currency exchange rate risk. These contracts may be transacted on an exchange.
Losses may arise if the value of the contract decreases due to an unfavorable change in the market rates or values of the underlying instrument or if the counterparty does not perform under the contract.
Foreign Currency Exchange Contracts: The Fund enters into foreign currency exchange contracts as an economic hedge against either specific transactions or portfolio instruments or to obtain exposure to foreign currencies (foreign currency exchange rate risk). A foreign currency exchange contract is an agreement between two parties to buy and sell a currency at a set exchange rate on a future date. Foreign currency exchange contracts, when used by the Fund, help to manage the overall exposure to the currencies, in which some of the investments held by the Fund are denominated. The contract is marked-to-market daily and the change in market value is recorded by the Fund as an unrealized gain or loss. When the contract is closed, the Fund records a realized gain or loss equal to the difference between the value at the time it was opened and the value at the time it was closed. The use of foreign currency exchange contracts involves the risk that the value of a foreign currency exchange contract changes unfavorably due to movements in the value of the referenced foreign currencies and the risk that the counterparty to the contract does not perform its obligations under the agreement.
Derivative Financial Instruments Categorized by Risk Exposure:
The Effect of Derivative Financial Instruments in the Statement of Operations
Six Months Ended January 31, 2013
|
|
| | | | Net Realized Loss From
|
Foreign currency exchange contracts: | | | | | | |
Foreign currency transactions | | | | $(538) |
| BLACKROCK INDIA FUND | JANUARY 31, 2013 | 19
|
| |
| Notes to Consolidated Financial Statements (continued) |
|
For the six months ended January 31, 2013, the actual contract amounts of outstanding derivative financial instruments were as follows:
Foreign currency exchange contracts: | | | | | | |
Average number of contracts — US dollars purchased | | | | | 7 | |
Average number of contracts — US dollars sold | | | | | 15 | |
Average US dollar amounts purchased | | | | $ | 71,834 | |
Average US dollar amounts sold | | | | $ | 559,847 | |
3. Investment Advisory Agreement and Other Transactions with Affiliates:
The PNC Financial Services Group, Inc. (“PNC”) is the largest stockholder and an affiliate, for 1940 Act purposes, of BlackRock, Inc. (“BlackRock”).
The Trust, on behalf of the Fund, entered into an Investment Advisory Agreement with the Manager, the Fund’s investment advisor, an indirect, wholly owned subsidiary of BlackRock, to provide investment advisory and administration services. The Manager is responsible for the management of the Fund’s portfolio and provides the necessary personnel, facilities, equipment and certain other services necessary to the operations of the Fund. For such services, the Fund pays the Manager a monthly fee based on a percentage of the Fund’s average daily net assets at the following annual rates:
Average Daily Net Assets
|
|
|
| Investment
Advisory
Fee
|
First $1 Billion | | | | | 1.00 | % |
$1 — $3 Billion | | | | | 0.94 | % |
$3 — $5 Billion | | | | | 0.90 | % |
$5 — $10 Billion | | | | | 0.87 | % |
Greater than $10 Billion | | | | | 0.85 | % |
The Trust, on behalf of the Fund, entered into an Administration Agreement with the Manager and State Street Bank and Trust Company (collectively, the “Administrator”) to provide administrative services (other than investment advice and related portfolio activities).
The Fund pays the Administrator a monthly fee based upon the average daily value of the Fund’s net assets at the following annual rates:
Average Daily Net Assets
|
|
|
| Administration
Fee
|
First $500 Million | | | | | 0.075 | % |
$500 Million — $1 Billion | | | | | 0.065 | % |
Greater than $1 Billion | | | | | 0.055 | % |
In addition, each of the share classes is charged an administration fee based on the following percentages of average daily net assets of each respective class:
Average Daily Net Assets
|
|
|
| Administration
Fee
|
First $500 Million | | | | | 0.025 | % |
$500 Million — $1 Billion | | | | | 0.015 | % |
Greater than $1 Billion | | | | | 0.005 | % |
In addition, the Manager may have, at their discretion, voluntarily waived all or any portion of their administration fees for a Fund or a share class which are included in administration fees waived and administration fees waived — class specific in the Statement of Operations. For the six months ended January 31, 2013, the Fund paid $23,808 to the Manager in return for these services, which are included in administration, administration — class specific and administration fees waived — class specific in the Consolidated Statement of Operations.
The Manager contractually agreed to waive and/or reimburse fees or expenses, excluding interest expense, dividend expense, income tax expense, acquired fund fees and expenses and certain other fund expenses, which constitute extraordinary expenses not incurred in the ordinary course of the Fund’s business, in order to limit expenses. The current expense limitations as a percentage of average daily net assets are as follows: 1.75% for Institutional; 2.00% for Investor A and 2.75% for Investor C. The Manager has agreed not to reduce or discontinue this contractual waiver or reimbursement prior to December 1, 2013 unless approved by the Board, including a majority of the Independent Trustees, or by a vote of the majority of the outstanding voting securities of the Fund. These amounts are included in fees waived and/or reimbursed by Manager, shown as administration fees waived, administration fees waived — class specific and transfer agent fees waived and/or reimbursed — class specific, respectively, in the Consolidated Statement of Operations.
For the six months ended January 31, 2013, the Manager waived and/or reimbursed $170,070, which is included in fees waived and/or reimbursed by Manager in the Consolidated Statement of Operations, and waived $1,798 in administration fees, which is shown as administration fees waived in the Consolidated Statement of Operations.
The Manager voluntarily agreed to waive its investment advisory fees by the amount of investment advisory fees the Fund pays to the Manager indirectly through its investment in affiliated money market funds. However, the Manager does not waive its investment advisory fees by the amount of investment advisory fees paid in connection with the Fund’s investment in other affiliated investment companies, if any. For the six months ended January 31, 2013, the Manager waived $21, which is included in fees waived and/or reimbursed by Manager in the Consolidated Statement of Operations.
The Manager provides investment management and other services to the Subsidiary. The Manager does not receive separate compensation from the Subsidiary for providing investment management or administrative services. However, the Fund pays the Manager based on the Fund’s net assets, which includes the assets of the Subsidiary.
If during the Fund’s fiscal year the operating expenses of a share class, that at any time during the prior two fiscal years received a waiver or reimbursement from the Manager, are less than the expense limit for
| 20 | BLACKROCK INDIA FUND | JANUARY 31, 2013
|
| |
| Notes to Consolidated Financial Statements (continued) |
|
that share class, the Manager is entitled to be reimbursed by such share class up to the lesser of (a) the amount of fees waived or expenses reimbursed during those prior two fiscal years under the agreement and (b) the amount by which the expense limit for that share class exceeds the operating expenses of the share class for the current fiscal year, provided that: (1) the Fund, of which the share class is a part, has more than $50 million in assets for the fiscal year and (2) the Manager or an affiliate continues to serve as the Fund’s investment advisor or administrator. In the event the expense limit for a share class is changed subsequent to a fiscal year in which the Manager becomes entitled to reimbursement for fees waived or reimbursed, the amount available to reimburse the Manager shall be calculated by reference to the expense limit for that share class in effect at the time the Manager became entitled to receive such reimbursement, rather than the subsequently changed expense limit for that share class.
On January 31, 2013, the Fund level and class specific waivers and/or reimbursements subject to possible future recoupment under the expense limitation agreement are as follows:
| | | | | Expiring July 31,
|
|
|
|
| 2013
|
| 2014
|
| 2015
|
Fund Level | | | | $ | 164,986 | | | $ | 585,745 | | | $ | 171,868 | |
Institutional | | | | $ | 1,583 | | | $ | 801 | | | $ | 836 | |
Investor A | | | | $ | 26 | | | $ | 1,829 | | | $ | 697 | |
Investor C | | | | $ | 13 | | | $ | 517 | | | $ | 362 | |
The Trust, on behalf of the Fund, entered into a Distribution Agreement and Distribution and Service Plan with BlackRock Investments, LLC (“BRIL”), an affiliate of the Manager. Pursuant to the Distribution and Service Plan and in accordance with Rule 12b-1 under the 1940 Act, the Fund pays BRIL ongoing service and distribution fees. The fees are accrued daily and paid monthly at annual rates based upon the average daily net assets of the shares of the Fund as follows:
|
|
|
| Service
Fees
|
| Distribution
Fees
|
Investor A | | | | | 0.25 | % | | | — | |
Investor C | | | | | 0.25 | % | | | 0.75 | % |
Pursuant to sub-agreements with BRIL, broker-dealers and BRIL provide shareholder servicing and distribution services to the Fund. The ongoing service and/or distribution fee compensates BRIL and each broker-dealer for providing shareholder servicing and/or distribution related services to Investor A and Investor C shareholders.
For the six months ended January 31, 2013, affiliates earned underwriting discounts, direct commissions and dealer concessions on sales of the Fund’s Investor A Shares, which totaled $216.
For the six months ended January 31, 2013, affiliates received CDSCs of $23 for Class C Shares.
Certain officers and/or trustees of the Trust are officers and/or directors of BlackRock or its affiliates. The Fund reimburses the Manager for a portion of the compensation paid to the Trust’s Chief Compliance Officer, which is included in officer and trustees in the Consolidated Statement of Operations.
4. Investments:
Purchases and sales of investments, excluding short-term securities, for the six months ended January 31, 2013 were $3,917,170 and $2,946,438, respectively.
5. Income Tax Information:
As of July 31, 2012, the Fund had a capital loss carryforward available to offset future realized capital gains of $177,480. This capital loss carryforward has no expiration date.
As of January 31, 2013, gross unrealized appreciation and gross unrealized depreciation based on cost for federal income tax purposes were as follows:
Tax cost | | | | $ | 5,371,408 | |
Gross unrealized appreciation | | | | $ | 920,254 | |
Gross unrealized depreciation | | | | | (156,520 | ) |
Net unrealized appreciation | | | | $ | 763,734 | |
6. Borrowings:
The Trust, on behalf of the Fund, along with certain other funds managed by the Manager and its affiliates, is a party to a $500 million credit agreement with a group of lenders. The Fund may borrow under the credit agreement to fund shareholder redemptions. Effective November 2011 to November 2012, the credit agreement had the following terms: a commitment fee of 0.065% per annum based on the Fund’s pro rata share of the unused portion of the credit agreement and interest at a rate equal to the higher of (a) the one-month London Interbank Offered Rate (“LIBOR”) plus 0.80% per annum or (b) the Fed Funds rate plus 0.80% per annum on amounts borrowed. In addition, the Fund paid administration and arrangement fees which were allocated to the Fund based on its net assets as of October 31, 2011. The credit agreement, which expired in November 2012, was renewed with the same terms until November 2013. Effective November 2012 to November 2013, the credit agreement has the following terms: a commitment fee of 0.065% per annum based on the Fund’s pro rata share of the unused portion of the credit agreement and interest at a rate equal to the higher of (a) the one-month LIBOR plus 0.80% per annum or (b) the Fed Funds rate plus 0.80% per annum on amounts borrowed. In addition, the Fund paid administration and arrangement fees, which were allocated to the Fund based on its net assets as of October 31, 2012. The Fund did not borrow under the credit agreement during the six months ended January 31, 2013.
| BLACKROCK INDIA FUND | JANUARY 31, 2013 | 21
|
| |
| Notes to Consolidated Financial Statements (concluded) |
|
7. Concentration, Market and Credit Risk:
In the normal course of business, the Fund invests in securities and enters into transactions where risks exist due to fluctuations in the market (market risk) or failure of the issuer of a security to meet all its obligations (issuer credit risk). The value of securities held by the Fund may decline in response to certain events, including those directly involving the issuers whose securities are owned by the Fund; conditions affecting the general economy; overall market changes; local, regional or global political, social or economic instability; and currency and interest rate and price fluctuations. Similar to issuer credit risk, the Fund may be exposed to counterparty credit risk, or the risk that an entity with which the Fund has unsettled or open transactions may fail to or be unable to perform on its commitments. The Fund manages counterparty credit risk by entering into transactions only with counterparties that it believes have the financial resources to honor their obligations and by monitoring the financial stability of those counterparties. Financial assets, which potentially expose the Fund to market, issuer and counterparty credit risks, consist principally of financial instruments and receivables due from counterparties. The extent of the Fund’s exposure to market, issuer and counterparty credit risks with respect to these financial assets is generally approximated by their value recorded in the Consolidated Statement of Assets and Liabilities, less any collateral held by the Fund.
As of January 31, 2013, the Fund invested a significant portion of its assets in securities in the financial sector. Changes in economic conditions affecting the financial sector would have a greater impact on the Fund and could affect the value, income and/or liquidity of positions in such securities.
The Fund invests a substantial amount of its assets in issuers located in a single country or a limited number of countries. At January 31, 2013, the Fund invested 97% of its assets in India. When the Fund concentrates its investments in this manner, it assumes the risk that economic, political and social conditions in India may have a significant impact on their investment performance. Foreign issuers may not be subject to the same uniform accounting, auditing and financial reporting standards and practices as used in the United States. Foreign securities markets may also be less liquid, more volatile, and less subject to governmental supervision not typically associated with investing in US securities.
8. Capital Share Transactions:
Transactions in capital shares for each class were as follows:
| | | | Six Months Ended
January 31, 2013
|
| |
| Year Ended
July 31, 2012
|
|
|
|
| Shares
|
| Amount
|
|
|
| Shares
|
| Amount
|
Institutional
|
Shares sold | | | | | 5,973 | | | $ | 58,083 | | | | | | | | 154,370 | | | $ | 1,146,699 | |
Shares issued to shareholders in reinvestment of dividends | | | | | 483 | | | | 4,627 | | | | | | | | 1 | | | | 6 | |
Shares redeemed | | | | | (1,726 | ) | | | (15,790 | ) | | | | | | | (5,531 | ) | | | (44,269 | ) |
Net increase | | | | | 4,730 | | | $ | 46,920 | | | | | | | | 148,840 | | | $ | 1,102,436 | |
|
Investor A
|
Shares sold | | | | | 119,828 | | | $ | 1,154,359 | | | | | | | | 52,030 | | | $ | 415,670 | |
Shares issued to shareholders in reinvestment of dividends | | | | | 65 | | | | 620 | | | | | | | | — | | | | — | |
Shares redeemed | | | | | (20,580 | ) | | | (190,266 | ) | | | | | | | (87,516 | ) | | | (699,622 | ) |
Net increase (decrease) | | | | | 99,313 | | | $ | 964,713 | | | | | | | | (35,486 | ) | | $ | (283,952 | ) |
|
Investor C
|
Shares sold | | | | | 16,511 | | | $ | 155,329 | | | | | | | | 10,166 | | | $ | 86,412 | |
Shares redeemed | | | | | (2,846 | ) | | | (24,798 | ) | | | | | | | (956 | ) | | | (7,428 | ) |
Net increase | | | | | 13,665 | | | $ | 130,531 | | | | | | | | 9,210 | | | $ | 78,984 | |
Total Net Increase | | | | | 117,708 | | | $ | 1,142,164 | | | | | | | | 122,564 | | | $ | 897,468 | |
At January 31, 2013, shares owned by affiliates were as follows:
|
|
|
| Shares
|
Institutional | | | | | 296,000 | |
Investor A | | | | | 2,000 | |
Investor C | | | | | 2,000 | |
9. Subsequent Events:
Management has evaluated the impact of all subsequent events on the Fund through the date the financial statements were issued and has determined that there were no subsequent events requiring adjustment or additional disclosure in the financial statements.
| 22 | BLACKROCK INDIA FUND | JANUARY 31, 2013
|
Ronald W. Forbes, Co-Chairman of the Board and Trustee
Rodney D. Johnson, Co-Chairman of the Board and Trustee
Paul L. Audet, Trustee
David O. Beim, Trustee
Henry Gabbay, Trustee
Dr. Matina S. Horner, Trustee
Herbert I. London, Trustee
Ian A. MacKinnon, Trustee
Cynthia A. Montgomery, Trustee
Joseph P. Platt, Trustee
Robert C. Robb, Jr., Trustee
Toby Rosenblatt, Trustee
Kenneth L. Urish, Trustee
Frederick W. Winter, Trustee
John M. Perlowski, President and Chief Executive Officer
Richard Hoerner, CFA, Vice President
Brendan Kyne, Vice President
Simon Mendelson, Vice President
Christopher Stavrakos, CFA, Vice President
Neal Andrews, Chief Financial Officer
Jay Fife, Treasurer
Brian Kindelan, Chief Compliance Officer and
Anti-Money Laundering Officer
Benjamin Archibald, Secretary
Investment Advisor
BlackRock Advisors, LLC
Wilmington, DE 19809
Custodian and Accounting Agent
State Street Bank and Trust Company
Boston, MA 02110
Transfer Agent
BNY Mellon Investment Servicing (US) Inc.
Wilmington, DE 19809
Independent Registered Public Accounting Firm
Deloitte & Touche LLP
Boston, MA 02116
Distributor
BlackRock Investments, LLC
New York, NY 10022
Legal Counsel
Sidley Austin LLP
New York, NY 10019
Address of the Fund
100 Bellevue Parkway
Wilmington, DE 19809
| BLACKROCK INDIA FUND | JANUARY 31, 2013 | 23
|
General Information
Electronic Delivery
Electronic copies of most financial reports and prospectuses are available on the Fund’s website or shareholders can sign up for e-mail notifications of quarterly statements, annual and semi-annual reports and prospectuses by enrolling in the Fund’s electronic delivery program.
Shareholders Who Hold Accounts with Investment Advisors, Banks or Brokerages:
Please contact your financial advisor. Please note that not all investment advisors, banks or brokerages may offer this service.
Shareholders Who Hold Accounts Directly with BlackRock:
1) | | Access the BlackRock website at
http://www.blackrock.com/edelivery |
2) | | Select “eDelivery” under the “More Information” section |
Householding
The Fund will mail only one copy of shareholder documents, including prospectuses, annual and semi-annual reports and proxy statements, to shareholders with multiple accounts at the same address. This practice is commonly called “householding” and is intended to reduce expenses and eliminate duplicate mailings of shareholder documents. Mailings of your shareholder documents may be householded indefinitely unless you instruct us otherwise. If you do not want the mailing of these documents to be combined with those for other members of your household, please call the Fund at (800) 441-7762.
Availability of Quarterly Schedule of Investments
The Fund files its complete schedule of portfolio holdings with the SEC for the first and third quarters of each fiscal year on Form N-Q. The Fund’s Forms N-Q are available on the SEC’s website at http://www.sec.gov and may also be reviewed and copied at the SEC’s Public Reference Room in Washington, DC. Information on how to access documents on the SEC’s website without charge may be obtained by calling (800) SEC-0330. The Fund’s Forms N-Q may also be obtained upon request and without charge by calling (800) 441-7762.
Availability of Proxy Voting Policies and Procedures
A description of the policies and procedures that the Fund uses to determine how to vote proxies relating to portfolio securities is available (1) without charge, upon request, by calling (800) 441-7762; (2) at http://www.blackrock.com; and (3) on the SEC’s website at http://www.sec.gov.
Availability of Proxy Voting Record
Information about how the Fund voted proxies relating to securities held in the Fund’s portfolio during the most recent 12-month period ended June 30 is available upon request and without charge (1) at http://www.blackrock.com or by calling (800) 441-7762 and (2) on the SEC’s website at http://www.sec.gov.
| 24 | BLACKROCK INDIA FUND | JANUARY 31, 2013
|
| |
| Additional Information (concluded) |
|
Shareholder Privileges
Account Information
Call us at (800) 441-7762 from 8:00 AM to 6:00 PM EST on any business day to get information about your account balances, recent transactions and share prices. You can also reach us on the Web at http://www.blackrock.com/funds.
Automatic Investment Plans
Investor Class shareholders who want to invest regularly can arrange to have $50 or more automatically deducted from their checking or savings account and invested in any of the BlackRock funds.
Systematic Withdrawal Plans
Investor Class shareholders can establish a systematic withdrawal plan and receive periodic payments of $50 or more from their BlackRock funds, as long as their account balance is at least $10,000.
Retirement Plans
Shareholders may make investments in conjunction with Traditional, Rollover, Roth, Coverdell, Simple IRAs, SEP IRAs and 403(b) Plans.
BlackRock Privacy Principles
BlackRock is committed to maintaining the privacy of its current and former fund investors and individual clients (collectively, “Clients”) and to safeguarding their non-public personal information. The following information is provided to help you understand what personal information BlackRock collects, how we protect that information and why in certain cases we share such information with select parties.
If you are located in a jurisdiction where specific laws, rules or regulations require BlackRock to provide you with additional or different privacy-related rights beyond what is set forth below, then BlackRock will comply with those specific laws, rules or regulations.
BlackRock obtains or verifies personal non-public information from and about you from different sources, including the following: (i) information we receive from you or, if applicable, your financial intermediary, on applications, forms or other documents; (ii) information about your transactions with us, our affiliates, or others; (iii) information we receive from a consumer reporting agency; and (iv) from visits to our websites.
BlackRock does not sell or disclose to non-affiliated third parties any non-public personal information about its Clients, except as permitted by law or as is necessary to respond to regulatory requests or to service Client accounts. These non-affiliated third parties are required to protect the confidentiality and security of this information and to use it only for its intended purpose.
We may share information with our affiliates to service your account or to provide you with information about other BlackRock products or services that may be of interest to you. In addition, BlackRock restricts access to non-public personal information about its Clients to those BlackRock employees with a legitimate business need for the information. BlackRock maintains physical, electronic and procedural safeguards that are designed to protect the non-public personal information of its Clients, including procedures relating to the proper storage and disposal of such information.
| BLACKROCK INDIA FUND | JANUARY 31, 2013 | 25
|
| |
| A World-Class Mutual Fund Family |
|
BlackRock offers a diverse lineup of open-end mutual funds crossing all investment styles and managed by experts in equity, fixed income and tax-exempt investing.
Equity Funds
BlackRock ACWI ex-US Index Fund
BlackRock All-Cap Energy & Resources Portfolio
BlackRock Basic Value Fund
BlackRock Capital Appreciation Fund
BlackRock China Fund
BlackRock Commodity Strategies Fund
BlackRock Disciplined Small Cap Core Fund
BlackRock Emerging Markets Fund
BlackRock Emerging Markets Long/Short
Equity Fund
BlackRock Energy & Resources Portfolio
BlackRock Equity Dividend Fund
BlackRock EuroFund
BlackRock Flexible Equity Fund
BlackRock Focus Growth Fund
BlackRock Global Dividend Income Portfolio
BlackRock Global Long/Short Equity Fund
BlackRock Global Opportunities Portfolio
BlackRock Global SmallCap Fund
BlackRock Health Sciences Opportunities Portfolio
BlackRock Index Equity Portfolio
BlackRock India Fund
BlackRock International Fund
BlackRock International Index Fund
BlackRock International Opportunities Portfolio
BlackRock Large Cap Core Fund
BlackRock Large Cap Core Plus Fund
BlackRock Large Cap Growth Fund
BlackRock Large Cap Value Fund
BlackRock Latin America Fund
BlackRock Long-Horizon Equity Fund
BlackRock Mid-Cap Growth Equity Portfolio
BlackRock Mid Cap Value Opportunities Fund
BlackRock Natural Resources Trust
BlackRock Pacific Fund
BlackRock Real Estate Securities Fund
BlackRock Russell 1000 Index Fund
BlackRock Science & Technology Opportunities Portfolio
BlackRock Small Cap Growth Equity Portfolio
BlackRock Small Cap Growth Fund II
BlackRock Small Cap Index Fund
BlackRock S&P 500 Index Fund
BlackRock S&P 500 Stock Fund
BlackRock U.S. Opportunities Portfolio
BlackRock Value Opportunities Fund
BlackRock World Gold Fund
Taxable Fixed Income Funds
BlackRock Bond Index Fund
BlackRock Core Bond Portfolio
BlackRock CoreAlpha Bond Fund
BlackRock Emerging Market Local Debt Portfolio
BlackRock Floating Rate Income Portfolio
BlackRock Global Long/Short Credit Fund
BlackRock GNMA Portfolio
BlackRock High Yield Bond Portfolio
BlackRock Inflation Protected Bond Portfolio
BlackRock International Bond Portfolio
BlackRock Long Duration Bond Portfolio
BlackRock Low Duration Bond Portfolio
BlackRock Secured Credit Portfolio
BlackRock Strategic Income
Opportunities Portfolio
BlackRock Total Return Fund
BlackRock U.S. Government Bond Portfolio
BlackRock U.S. Mortgage Portfolio
BlackRock World Income Fund
Municipal Fixed Income Funds
BlackRock California Municipal Bond Fund
BlackRock High Yield Municipal Fund
BlackRock Intermediate Municipal Fund
BlackRock National Municipal Fund
BlackRock New Jersey Municipal Bond Fund
BlackRock New York Municipal Bond Fund
BlackRock Pennsylvania Municipal Bond Fund
BlackRock Short-Term Municipal Fund
Mixed Asset Funds
| BlackRock Balanced Capital Fund | LifePath Active Portfolios | | LifePath Index Portfolio |
| BlackRock Global Allocation Fund | 2015 | 2040 | | Retirement | 2040 |
| BlackRock Managed Volatility Portfolio | 2020 | 2045 | | 2020 | 2045 |
| BlackRock Multi-Asset Income Portfolio | 2025 | 2050 | | 2025 | 2050 |
| BlackRock Multi-Asset Real Return Fund | 2030 | 2055 | | 2030 | 2055 |
| BlackRock Strategic Risk Allocation Fund | 2035 | | | 2035 | |
| BlackRock Prepared Portfolios | LifePath Portfolios | | |
| Conservative Prepared Portfolio | Retirement | 2040 | | | |
| Moderate Prepared Portfolio | 2020 | 2045 | | | |
| Growth Prepared Portfolio | 2025 | 2050 | | | |
| Aggressive Growth Prepared Portfolio | 2030 | 2055 | | | |
| 2035 | | | | |
BlackRock mutual funds are currently distributed by BlackRock Investments, LLC. You should consider the investment objectives, risks, charges and expenses of the funds under consideration carefully before investing. Each fund’s prospectus contains this and other information and is available at www.blackrock.com or by calling (800) 441-7762 or from your financial advisor. The prospectus should be read carefully before investing.
| 26 | BLACKROCK INDIA FUND | JANUARY 31, 2013
|
The report is transmitted to shareholders only. It is not authorized for use as an offer of sale or a solicitation of an offer to buy shares of the Funds unless accompanied or preceded by that Fund’s current prospectus. Past performance results shown in this report should not be considered a representation of future performance. Investment returns and principal value of shares will fluctuate so that shares, when redeemed, may be worth more or less than their original cost. Statements and other information herein are as dated and are subject to change. Please see the Funds’ prospectus for a description of risks associated with global investments.
| #INDIA-1/13-SAR | | | | | | |
| Item 2 – | Code of Ethics – Not Applicable to this semi-annual report |
| Item 3 – | Audit Committee Financial Expert – Not Applicable to this semi-annual report |
| Item 4 – | Principal Accountant Fees and Services – Not Applicable to this semi-annual report |
| Item 5 – | Audit Committee of Listed Registrants – Not Applicable |
| Item 6 – | Investments
(a) The registrant’s Schedule of Investments is included as part of the Report to Stockholders filed under Item 1 of this Form.
(b) Not Applicable due to no such divestments during the semi-annual period covered since the previous Form N-CSR filing. |
| Item 7 – | Disclosure of Proxy Voting Policies and Procedures for Closed-End Management Investment Companies – Not Applicable |
| Item 8 – | Portfolio Managers of Closed-End Management Investment Companies – Not Applicable |
| Item 9 – | Purchases of Equity Securities by Closed-End Management Investment Company and Affiliated Purchasers – Not Applicable |
| Item 10 – | Submission of Matters to a Vote of Security Holders – There have been no material changes to these procedures. |
| Item 11 – | Controls and Procedures |
| | (a) – The registrant’s principal executive and principal financial officers, or persons performing similar functions, have concluded that the registrant’s disclosure controls and procedures (as defined in Rule 30a-3(c) under the Investment Company Act of 1940, as amended (the “1940 Act”)) are effective as of a date within 90 days of the filing of this report based on the evaluation of these controls and procedures required by Rule 30a-3(b) under the 1940 Act and Rule 15d -15(b) under the Securities Exchange Act of 1934, as amended. |
| | (b) – There were no changes in the registrant’s internal control over financial reporting (as defined in Rule 30a-3(d) under the 1940 Act) that occurred during the second fiscal quarter of the period covered by this report that have materially affected, or are reasonably likely to materially affect, the registrant’s internal control over financial reporting. |
| Item 12 – | Exhibits attached hereto |
| | (a)(1) – Code of Ethics – Not Applicable to this semi-annual report |
| | (a)(2) – Certifications – Attached hereto |
| | (a)(3) – Not Applicable |
| | (b) – Certifications – Attached hereto |
Pursuant to the requirements of the Securities Exchange Act of 1934 and the Investment Company Act of 1940, the registrant has duly caused this report to be signed on its behalf by the undersigned, thereunto duly authorized.
BlackRock Funds
| By: | /s/ John M. Perlowski | |
| | John M. Perlowski |
| | Chief Executive Officer (principal executive officer) of |
| | BlackRock Funds |
Date: April 3, 2013
Pursuant to the requirements of the Securities Exchange Act of 1934 and the Investment Company Act of 1940, this report has been signed below by the following persons on behalf of the registrant and in the capacities and on the dates indicated.
| By: | /s/ John M. Perlowski | |
| | John M. Perlowski |
| | Chief Executive Officer (principal executive officer) of |
| | BlackRock Funds |
Date: April 3, 2013
| By: | /s/ Neal J. Andrews | |
| | Neal J. Andrews |
| | Chief Financial Officer (principal financial officer) of |
| | BlackRock Funds |
Date: April 3, 2013